UNITED STATES
SECURITIES AND EXCHANGE COMMISSION
WASHINGTON, D.C. 20549
FORM N-CSR
CERTIFIED SHAREHOLDER REPORT OF REGISTERED MANAGEMENT
INVESTMENT COMPANIES
Investment Company Act file number 811-08228
The Timothy Plan
(Exact name of registrant as specified in charter)
The Timothy Plan
1055 Maitland Center Commons
Maitland, FL 32751
(Address of principal executive offices) (Zip code)
Art Ally
The Timothy Plan
1055 Maitland Center Commons
Maitland, FL 32751
(Name and address of agent for service)
Registrant's telephone number, including area code: 800-846-7526
Date of fiscal year end: 9/30
Date of reporting period: 9/30/10
Form N-CSR is to be used by management investment companies to file reports with the Commission not later than 10 days after the transmission to stockholders of any report that is required to be transmitted to stockholders under Rule 30e-1 under the Investment Company Act of 1940 (17 CFR 270.30e-1). The Commission may use the information provided on Form N-CSR in its regulatory, disclosure review, inspection and policymaking roles.
A registrant is required to disclose the information specified by Form N-CSR, and the Commission will make this information public. A registrant is not required to respond to the collection of information contained in Form N-CSR unless the Form displays a currently valid Office of Management and Budget ("OMB") control number. Please direct comments concerning the accuracy of the information collection burden estimate and any suggestions for reducing the burden to Secretary, Securities and Exchange Commission, 450 Fifth Street, NW, Washington, DC 20549-0609. The OMB has reviewed this collection of information under the clearance requirements of 44 U.S.C. § 3507.
Item 1. Reports to Stockholders.
The Registrant’s audited annual financial reports transmitted to shareholders pursuant to Rule 30e-1 under the Investment Company Act of 1940 are as follows:
Letter from the President
September 30, 2010
Arthur D. Ally
Dear Shareholder,
You may recall that last year (2009), in order to improve reporting efficiency and accuracy in tax reporting to our shareholders, Timothy Plan’s Board of Trustees approved changing the Fund Family’s fiscal year from December 31st to September 30th. Therefore, this year’s Annual Report covers the period October 1, 2009 through September 30, 2010.
As you probably have noticed, the markets have been interestingly unsettled over the past twelve months. In fact, the S&P 500 stock index had positive performance in seven of those months and negative performance in five of those months – but, fortunately, with an upward bias. And, I am pleased to report, nearly all of our various funds have performed in line with (at or near) their respective indexes.
We, along with our various fund’s sub-advisors, expect this pattern to continue into 2011 (i.e. unsettled with a slight upward bias) although, as you no doubt realize, we cannot guarantee that outcome. I am confident, however, of a couple of things:
| · | That the mid-term elections could result in a reversal of the liberal bias in Congress to conservative which, if it happens, should be positive for the capital markets, and |
| · | Our sub-advisory teams (i.e. money management firms) remain among the best in the industry and they all continue to honor our overall policy that they manage their respective funds with a conservative bias. |
You will find each of their annual review letters along with their economic outlook in the pages that follow.
Finally, I would once again like to thank you for your moral convictions that led you to the Timothy Plan Family.
Yours in Christ,
Arthur D. Ally,
President
Timothy Plan Fund Performance
Letter from the ManagerSeptember 30, 2010
Aggressive Growth Fund
We are pleased to report that the Fund has advanced (pre-tax) 20.18% Class A, 18.94% Class B and 19.14% Class C, over the last twelve months ending September 30, 2010. Our benchmark, the Russell Midcap Index posted an 18.27% gain over the same period. “High quality” issues are beginning to regain a leadership position in this market, and the “low quality” bounce has definitely lost steam after the unprecedented gains in the spring of 2009. As valuations climbed for weaker companies, investors continued to shift towards higher quality in a more meaningful way as these are the companies that have far better prospects for sustained growth. We will continue to focus, as always, on companies that can execute well in periods of turbulence and uncertainty, and grow faster than their peers during periods of expansion. In a gradual and unsteady recovery, we expect investors to continue to favor companies with strong fundamentals and above average growth potential; two key characteristics we apply with our time-tested, bottom-up approach to small and mid cap investing.
CHARTWELL INVESTMENT PARTNERS, LP
Timothy Plan Fund Performance
Fund Performance – (Unaudited)
September 30, 2010
Aggressive Growth Fund
| | | | | | 5 year | | | Average | | |
| | | 1 Year | | | Average | | | Annual Return | | |
| Fund/Index | | Total Return | | | Annual Return | | | Since Inception | | |
| Timothy Aggressive Growth Fund - Class A (With Sales Charge) | | | 13.63 | % | | | -2.03 | % | | | -4.06 | % | (a) |
| Russell Mid-Cap Growth Index | | | 18.27 | % | | | 2.86 | % | | | -0.23 | % | (a) |
| Timothy Aggressive Growth Fund - Class B | | | 18.94 | % | | | -1.66 | % | | | -4.24 | % | (b) |
| Russell Mid-Cap Growth Index | | | 18.27 | % | | | 2.86 | % | | | -0.04 | % | (b) |
| Timothy Aggressive Growth Fund - Class C* | | | 17.95 | % | | | -1.65 | % | | | 0.65 | % | (c) |
| Russell Mid-Cap Growth Index | | | 18.27 | % | | | 2.86 | % | | | 5.14 | % | (c) |
| (a) For the period October 5, 2000 (commencement of investment in accordance with objective) to September 30, 2010. |
| (b) For the Period October 9, 2000 (commencement of share class operations) to September 30, 2010. |
| (c) For the Period February 3, 2004 (commencement of share class operations) to September 30, 2010. |
| *With Maximum Deferred Sales Charge | | | | | | |
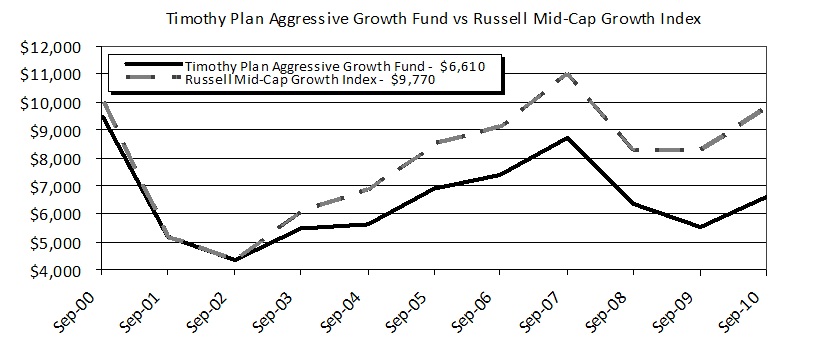
The chart shows the value of a hypothetical initial investment of $10,000 in the Fund’s A shares and the Russell Mid-Cap Growth Index on October 5, 2000 and held through September 30, 2010. The Russell Mid-Cap Growth Index is a widely recognized, unmanaged index of common stock prices. Performance figures include the change in value of the stocks in the index and the reinvestment of dividends. The index return does not reflect expenses, which have been deducted from the Fund’s return. The returns shown do not reflect deduction of taxes that a shareholder would pay on Fund distributions or the redemption of the Fund shares. THE FUND’S RETURN REPRESENTS PAST PERFORMANCE AND IS NOT PREDICTIVE OF FUTURE RESULTS.
Timothy Plan Fund Performance
Letter from the Manager
September 30, 2010
International Fund
The last twelve months have been trying times for market participants as equities experienced a roller coaster ride. The economic rebound and market rally that began in March of 2009 hit the wall in the first half of 2010 due to the European sovereign debt crisis and fears of a double-dip recession. This was followed by a sharp equity rally in the third quarter of 2010.
The portfolio began its fiscal year with a tilt towards cyclical sectors, taking advantage of the economic and equity rebound in the second half of 2009. As more evidence suggested the European sovereign debt crisis was being mishandled by European authorities, we decreased the Fund’s exposure to European financials and the PIIGS countries (Portugal, Ireland, Italy, Greece, Spain). All told, the Fund performed very well versus its respective benchmark, the MSCI EAFE index, during the last twelve months as 8 of the 10 sectors in the Fund outperformed their index returns. The sectors that performed the best during this period for the Fund were Materials and Industrials with exposures to Japanese trading companies and metals and mining companies performing well. Th e Fund’s continued underweight position in Financials was also a positive as the sector proved to be the worst performing in the EAFE benchmark during the last twelve months.
The cash weighting in the Fund proved to be a drag to performance as equity markets rallied. In addition, the Energy and Consumer Discretionary sectors detracted from performance as our Brazilian holding in the energy sector declined as it prepared for the world’s largest equity offering given its vast capital needs. The Fund’s stocks in Japan, Germany, Hong Kong, Singapore, and Canada performed particularly well while those in France, Greece, Australia, and Spain hurt performance during this period. The absolute weight in emerging markets helped the Fund’s performance for the year as emerging market equities continued to outperform the developed markets. We still believe emerging market companies offer superior growth at reasonable valuations and wi ll continue to be selective in our exposure there.
Although developed economies are likely to grow GDP below 2% per annum for the foreseeable future, global growth is likely to remain robust on the back of emerging market economic growth. The world is ever changing and we remain vigilant in finding those companies across the globe whose management teams are taking advantage and benefitting from a shifting global competitive landscape and realizing growth opportunities in new markets around the world.
EAGLE GLOBAL ADVISORS
Timothy Plan Fund Performance
Fund Performance – (Unaudited)
September 30, 2010
International Fund
| | | | | | 5 year | | | Average | | |
| | | 1 Year | | | Average | | | Annual Return | | |
| Fund/Index | | Total Return | | | Annual Return | | | Since Inception | | (a) |
| Timothy International Fund - Class A (With Sales Charge) | | | -1.79 | % | | | N/A | | | | -8.00 | % | |
| MSCI EAFE Index | | | 3.94 | % | | | N/A | | | | -6.90 | % | |
| Timothy International Fund - Class C* | | | 2.23 | % | | | N/A | | | | -7.18 | % | |
| MSCI EAFE Index | | | 3.94 | % | | | N/A | | | | -6.90 | % | |
| | | | | | | | | | | | | | |
| (a) For the period May 3, 2007 (commencement of investment in accordance with objective) to September 30, 2010. |
| *With Maximum Deferred Sales Charge | | | | | | | | | | | | | |
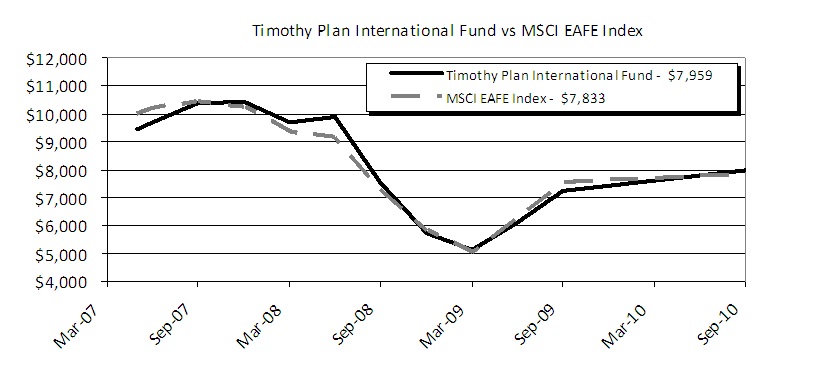
The chart shows the value of a hypothetical initial investment of $10,000 in the Fund’s A shares and the MSCI EAFE Index on May 3, 2007 and held through September 30, 2010. The MSCI EAFE Index is a widely recognized unmanaged index of equity prices and is representative of equity market performance of developed countries, excluding the U.S. and Canada. Performance figures include the change in value of the stocks in the index and the reinvestment of dividends. The index return does not reflect expenses, which have been deducted from the Fund’s return. The returns shown do not reflect deduction of taxes that a shareholder would pay on Fund distributions or the redemption of the Fund shares. THE FUND’S RETURN REPRESENTS PAST PERFORMANCE AND IS NOT PREDICTIVE OF FUTURE RESULTS.
Timothy Plan Fund Performance
Letter from the Manager
September 30, 2010
Large/Mid Cap Growth Fund
We are pleased to report that the Fund has advanced (pre-tax) 11.55% Class A, 10.80% Class B and 10.78% Class C, over the last twelve months ending September 30, 2010. Our benchmark, Russell 1000 Growth index, posted a 12.65% gain over the same period of time. “High quality” issues are beginning to regain a leadership position in this market, and the “low quality” bounce has definitely lost steam after the unprecedented gains in the spring of 2009. As valuations climbed for weaker companies, investors continued to shift towards higher quality in a more meaningful way as these companies have far better prospects for sustained growth. We will continue to focus, as always, on companies that can execute well in periods of turbulence and uncertainty, and are expected to grow faster than their peers during periods of expansion. In a gradual and unsteady recovery, we expect investors to continue to favor companies with strong fundamentals and above average growth potential; two key characteristics we apply with our time-tested, bottom-up approach to mid and large cap investing.
CHARTWELL INVESTMENT PARTNERS, LP
Timothy Plan Fund Performance
Fund Performance – (Unaudited)
September 30, 2010
Large/Mid Cap Growth Fund
| |
| | | | | | 5 year | | | Average | | |
| | | 1 Year | | | Average | | | Annual Return | | |
| Fund/Index | | Total Return | | | Annual Return | | | Since Inception | | |
| Timothy Large/Mid Cap Growth Fund - Class A (With Sales Charge) | | | 5.46 | % | | | -1.39 | % | | | -4.56 | % | (a) |
| Russell 1000 Growth Index | | | 12.65 | % | | | 2.06 | % | | | -3.25 | % | (a) |
| Timothy Large/Mid Cap Growth Fund - Class B | | | 10.80 | % | | | -1.02 | % | | | -4.71 | % | (b) |
| Russell 1000 Growth Index | | | 12.65 | % | | | 2.06 | % | | | -2.98 | % | (b) |
| Timothy Large/Mid Cap Growth Fund - Class C* | | | 9.67 | % | | | -1.05 | % | | | -0.09 | % | (c) |
| Russell 1000 Growth Index | | | 12.65 | % | | | 2.06 | % | | | 2.50 | % | (c) |
| | | | | | | | | | | | | | |
| (a) For the period October 5, 2000 (commencement of investment in accordance with objective) to September 30, 2010. |
| (b) For the Period October 9, 2000 (commencement of share class operations) to September 30, 2010. |
| (c) For the Period February 3, 2004 (commencement of share class operations) to September 30, 2010. |
| *With Maximum Deferred Sales Charge | | | | | | | | | | | | | |
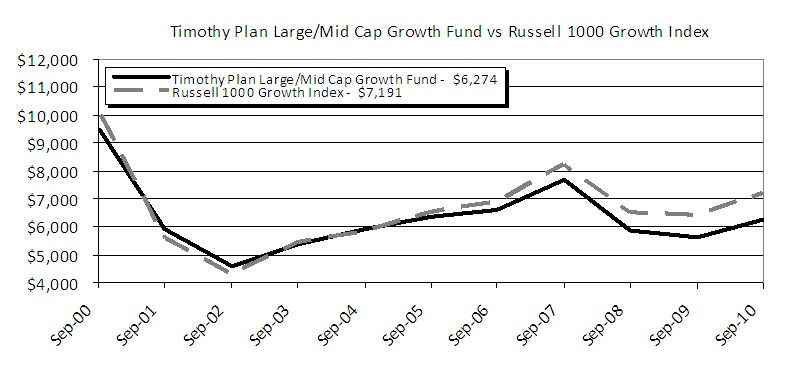
The chart shows the value of a hypothetical initial investment of $10,000 in the Fund’s A shares and the Russell 1000 Growth Index on October 5, 2000 and held through September 30, 2010. The Russell 1000 Growth Index is a widely recognized, unmanaged index of common stock prices. Performance figures include the change in value of the stocks in the index and the reinvestment of dividends. The index return does not reflect expenses, which have been deducted from the Fund’s return. The returns shown do not reflect deduction of taxes that a shareholder would pay on Fund distributions or the redemption of the Fund shares. THE FUND’S RETURN REPRESENTS PAST PERFORMANCE AND IS NOT PREDICTIVE OF FUTURE RESULTS.
Timothy Plan Fund Performance
Letter from the Manager
September 30, 2010
Small Cap Value Fund
We are pleased to provide you with our report for the Timothy Plan Small-Cap Value Fund for the twelve months ending September 30, 2010.
During the past 12 months, small cap equity markets remained especially volatile. 2009 finished with solid gains that were buoyed by better than expected corporate earnings, the Federal Reserve’s commitment to maintaining an accommodative interest rate policy, economic data indicating improvement in consumer spending, industrial production and even housing and employment showed signs of recovery. 2010 however, began with a selloff as investors recognized 2009 gains and viewed sovereign debt problems in Europe, as a reason to grow cautious. Investor optimism was once again revived as global economic data remained supportive of a broad-based recovery, corporate earnings again exceeded expectations and the U.S. Congress passed a healthcare reform bill – an event that at least removed some uncertainty surrounding its potential impact. That rally once again favored high beta, lower- quality securities and continued through May, when Greek sovereign debt was downgraded to junk status. The resulting concern about the health of certain European economies, combined with China’s intentions to slow economic growth, led the market to begin pricing in the potential for a “double dip” global recession. The effects of the BP platform explosion and oil spill in the Gulf of Mexico engendered regulatory uncertainty and served to reinforce expectations that a significant slowdown was likely. The closing quarter of the fiscal year was marked by even more volatility; a sell off in August on fears of a double dip recession led to the largest one month rebound in September since 1939 as equities reached valuation levels relative to bonds not seen in decades.
For the twelve months ending September 30, 2010, the Timothy Plan Small-Cap Value Fund produced a return of 11.7%, while the Russell 2000 Index produced a return of 13.4%. Security selection in Financial Services, Materials & Processing and Technology proved to be detractors. Through much of the last twelve months, stable growers have lagged the market and impacted relative performance across many sectors. Sectors such as Consumer Discretionary, Technology, and Materials & Processing were heavily impacted by the low quality, high beta rally, which had a large impact on relative performance in 2009 and 2010 due to our focus on high quality and lower beta. Individual detractors included companies such as Knight Capital Group, Stifel Financial and Calamos Asset M anagement, which are tied to market performance and fell as investors worried that they may experience margin pressure, weak inflows or revenue weakness. Bank related holdings such as FirstMerit, East West Bancorp and Chemical Financial all experienced weakness in sympathy with the overall banking industry on concerns about poor revenue growth and deteriorating credit quality. However, smaller regional banks have generally performed well when compared to larger market cap banks.
Investors bid down Technology’s ManTech after the resignation of its President and COO despite reporting in line earnings, and new contracts. MKS Instruments also detracted from performance as it experienced the strain of being a more volatile and economically sensitive company. Conversely, top contributor to relative performance, Quest Software, rode higher on strong license revenue growth. Materials & Processing company Northwest Pipe fell on an announced sales decline resulting from volume decreases across their product lines, reduced pricing and less favorable product mix.
Security selection in Producer Durables, Energy and Consumer Discretionary stocks was additive to relative performance. Producer Durables’ A.O. Smith Corp. and BE Aerospace, continue to beat expectations for both earnings and revenues and Genesee & Wyoming has experienced an increase in carload volumes and a more favorable pricing environment while BE Aerospace, Chattem and Casey’s General Store were top performers in Consumer Staples as was Brink’s Home Security Holding in Consumer Discretionary after all received takeover offers at substantial premiums. Energy holding Rex Energy Corp. rose on rumors of a potentially positive joint venture in a Marcellus shale plant in Pennsylvania and Approach Resources reported better earnings and reserves despite issues that tempo rarily curtailed production.
Management of the fund is deeply rooted in our decades old investment philosophy that seeks to deliver a superior rate of return while controlling risk. It remains our firm belief that the discipline of quantifying and managing downside risk is paramount and it will remain a hallmark of the Westwood investment process. We have always focused on companies that maintain a discipline for managing risk and believe those companies not dependent upon the capital markets to recapitalize or fund growth will ultimately benefit from the stress of others. Looking for high quality companies that are typically characterized by strong free cash flow generation, declining debt levels, and rising return on equity will continue to define the core of our investment process. We thank you for your continued confidence.
WESTWOOD MANAGEMENT CORPORATION
Timothy Plan Fund Performance
Fund Performance – (Unaudited)
September 30, 2010
Small Cap Value Fund
| | | | | | 5 year | | | 10 Year | | |
| | | 1 Year | | | Average | | | Average | | |
| Fund/Index | | Total Return | | | Annual Return | | | Annual Return | | |
| Timothy Small Cap Value Fund - Class A (With Sales Charge) | | | 3.96 | % | | | 0.35 | % | | | 3.21 | % | |
| Russell 2000 Index | | | 13.35 | % | | | 1.60 | % | | | 4.00 | % | |
| Timothy Small Cap Value Fund - Class B | | | 9.19 | % | | | 0.76 | % | | | 3.01 | % | |
| Russell 2000 Index | | | 13.35 | % | | | 1.60 | % | | | 4.00 | % | |
| Timothy Small Cap Value Fund - Class C* | | | 8.14 | % | | | 0.77 | % | | | 1.18 | % | (a) |
| Russell 2000 Index | | | 13.35 | % | | | 1.60 | % | | | 3.69 | % | (a) |
| | | | | | | | | | | | | | |
| (a) For the period February 3, 2004 (commencement of share class operations) to September 30, 2010. |
| *With Maximum Deferred Sales Charge | | | | | | | | | | | | | |
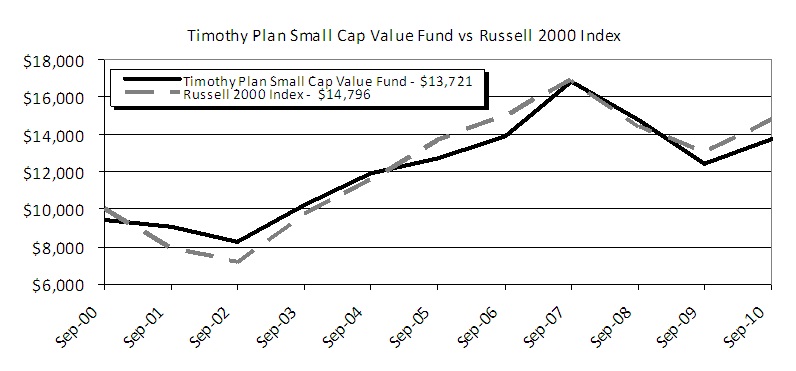
The chart shows the value of a hypothetical initial investment of $10,000 in the Fund’s A shares and the Russell 2000 Index on September 30, 2000 and held through September 30, 2010. The Russell 2000 Index is a widely recognized, unmanaged index of common stock prices. Performance figures include the change in value of the stocks in the index and the reinvestment of dividends. The index return does not reflect expenses, which have been deducted from the Fund’s return. The returns shown do not reflect deduction of taxes that a shareholder would pay on Fund distributions or the redemption of the Fund shares. THE FUND’S RETURN REPRESENTS PAST PERFORMANCE AND IS NOT PREDICTIVE OF FUTURE RESULTS.
Timothy Plan Fund Performance
Letter from the Manager
September 30, 2010
Large/Mid Cap Value Fund
We are pleased to provide you with our report for the Timothy Plan Large/Mid-Cap Value Fund for the twelve months ending September 30, 2010.
During the past 12 months, equity markets remained volatile. 2009 finished with solid gains that were buoyed by better than expected corporate earnings, the Federal Reserve’s commitment to maintaining an accommodative interest rate policy, economic data indicating improvement in consumer spending, industrial production and even housing and employment showed signs of recovery. 2010 however, began with a selloff as investors recognized 2009 gains and viewed sovereign debt problems in Europe, as a reason to grow cautious. Investor optimism was once again revived as global economic data remained supportive of a broad-based recovery, corporate earnings again exceeded expectations and the U.S. Congress passed a healthcare reform bill – an event that at least removed some u ncertainty surrounding its potential impact. That rally once again favored high beta, lower- quality securities and continued through May, when Greek sovereign debt was downgraded to junk status. The resulting concern about the health of certain European economies, combined with China’s intentions to slow economic growth, led the market to begin pricing in the potential for a “double dip” global recession and an aversion to all foreign revenue sources through the 2nd quarter 2010. The effects of the BP platform explosion and oil spill in the Gulf of Mexico engendered regulatory uncertainty and served to reinforce expectations that a significant slowdown was likely. The closing quarter of the fiscal year was marked by even more volatility, an improvement in investor sentiment regarding global economic growth and a decline in investor appetite for risk . A sell off in August on fears of a double dip recession led to the largest one month rebound in September since 1939 as equities reached valuation levels relative to bonds not seen in decades.
For the twelve months ending September 30, 2010, the Timothy Plan Large/Mid-Cap Value Fund produced a return of 12.5%, while the S&P 500 Index produced a return of 10.2%. Security selection in the Technology, Consumer Discretionary, Financial Services and Producer Durables stocks aided relative performance. Top performing securities included Sybase and McAfee in Technology, which both received takeover offers at significant premiums. Borg Warner and Advance Auto Parts have performed well as earnings have strengthened on rising global auto demand and market share gains. Producer Durables stocks Deere continues to benefit from strong global agricultural trends while fluctuating optimism over industrial demand has pulled Union Pacific, Emerson Electric and Flowserve generally higher on their leverage to global trends. Financial Services as a whole outperformed the index sector due to a relative underweight in large banking companies which have underperformed on fears continued credit deterioration and most recently, the potential implications resulting from “robo-signings” in home foreclosures. While our smaller banks holdings have fallen in sympathy with their larger peers, our holdings in insurance companies have performed well based on the stability provided by their revenue streams.
Security selection in Health Care, Energy and Materials & Processing proved to be detractors for the prior twelve months. Foster Wheeler, in Material & Processing declined after reporting earnings below expectations, Energy companies EQT fell on lower natural gas prices and disappointment as benefits from the Marcellus shale have been slow to materialize while Anadarko, which has an interest in the BP Gulf of Mexico well, fell on fears of the potential financial impact to the company. National Oilwell Varco and Halliburton offset a portion of the impact as they recovered from summer’s industry-wide concerns over increased regulation that were prompted by the oil spill. Utility holding NextEra Energy, formerly FPL Group, fell after receiving an unfavorable rate ruling from its state regulator and FirstEnergy fell after announcing an acquisition of peer Allegheny Energy.
Management of the fund is deeply rooted in our decades old investment philosophy that seeks to deliver a superior rate of return while controlling risk. It remains our firm belief that the discipline of quantifying and managing downside risk is paramount and it will remain a hallmark of the Westwood investment process. We have always focused on companies that maintain a discipline for managing risk and believe those companies not dependent upon the capital markets to recapitalize or fund growth will ultimately benefit from the stress of others. Looking for high quality companies that are typically characterized by strong free cash flow generation, declining debt levels, and rising return on equity will continue to define the core of our investment process. We thank you for your continued confidence.
WESTWOOD MANAGEMENT CORPORATION
Timothy Plan Fund Performance
Fund Performance – (Unaudited)
September 30, 2010
Large/Mid Cap Value Fund
| | | | | | 5 year | | | 10 Year | | |
| | | 1 Year | | | Average | | | Average | | |
| Fund/Index | | Total Return | | | Annual Return | | | Annual Return | | |
| Timothy Large/Mid Cap Value Fund - Class A (With Sales Charge) | | | 4.87 | % | | | 1.16 | % | | | 4.46 | % | |
| S&P 500 Index | | | 10.18 | % | | | 0.64 | % | | | -0.43 | % | |
| Timothy Large/Mid Cap Value Fund - Class B | | | 10.10 | % | | | 1.54 | % | | | 4.25 | % | |
| S&P 500 Index | | | 10.18 | % | | | 0.64 | % | | | 0.32 | % | |
| Timothy Large/Mid Cap Value Fund - Class C* | | | 9.02 | % | | | 1.55 | % | | | 4.65 | % | (a) |
| S&P 500 Index | | | 10.18 | % | | | 0.64 | % | | | 2.12 | % | (a) |
| | | | | | | | | | | | | | |
| (a) For the period February 3, 2004 (commencement of share class operations) to September 30, 2010. |
| *With Maximum Deferred Sales Charge | | | | | | | | | | | | | |
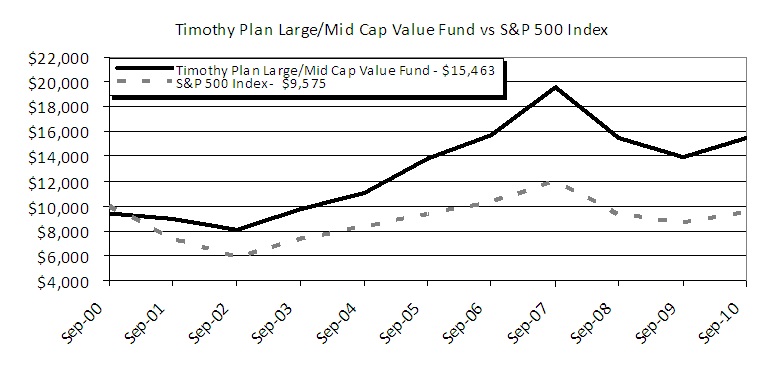
The chart shows the value of a hypothetical initial investment of $10,000 in the Fund’s A shares and the S&P 500 Index on September 30, 2000 and held through September 30, 2010. The S&P 500 Index is a widely recognized, unmanaged index of common stock prices. Performance figures include the change in value of the stocks in the index and the reinvestment of dividends. The index return does not reflect expenses, which have been deducted from the Fund’s return. The returns shown do not reflect deduction of taxes that a shareholder would pay on Fund distributions or the redemption of the Fund shares. THE FUND’S RETURN REPRESENTS PAST PERFORMANCE AND IS NOT PREDICTIVE OF FUTURE RESULTS.
Timothy Plan Fund Performance
Letter from the Manager
September 30, 2010
Fixed Income Fund
There are numerous reasons to be optimistic that monetary and fiscal policies over the past two years successfully averted a global depression and generated positive economic growth over the past 4 quarters. However, there is also convincing evidence the pace of recovery will remain subdued with below-trend GDP growth keeping interest rates low over the next few quarters.
The U.S. economy, where 70% of GDP is consumer consumption, is dependent on job and income growth. During the past decade, U.S. consumers took on debt as asset prices rose faster than incomes leading them to think there was no need to rein in spending. Now consumers are in a period of austerity after experiencing a damaging recession. Employment growth continues weak confirmed by the lackluster improvement in initial jobless claims, and continuing claims remain at alarmingly historic highs. Worse, an estimated 70% of income growth since 1Q09 has been due to government transfer payments which does not lead to sustainable growth. With the U.S. budget deficit at a 60-year high, the current electoral mood may eliminate additional bail-out funding possibilities. A decline in federal, state, and local government spending will likely be a drag on the recovery.
In reaction to this environment the bond market saw lower rates over the twelve months ended September 30, 2010. While short term rates remained very low, intermediate and longer maturity rates declined sharply especially over the past two quarters. The Treasury ten year reached 2.5% on September 30th having declined from 3.3% twelve months ago. Barclays reports their U.S. Treasury index return at 7.3% over the past year. Corporate bond yields declined more rapidly as investors searched for yield against a background of modest economic improvement and higher corporate earnings. The Barclays Investment Grade Corporate bond index return was 12.3% over the past y ear. Although mortgage rates also declined, their return reported in the Barclays Agency Mortgage Backed Securities index was a more modest 5.7%.
Timothy Fixed Income Fund A shares generated an attractive 7.1% total return over the twelve months ended September 30, 2010, but trailed the 8.2% return of the Barclays Aggregate index. The performance difference was due to the portfolio’s more conservative risk posture. The fund had no exposure to Commercial Mortgage Backed Securities (CMBS) which rebounded 23.2% on the strength of the U.S. Government’s PPIP initiative. However, commercial real estate fundamentals remain poor as delinquency and default rates continue to grow, so the portfolio continues to have no exposure. Also, the portfolio had a lower interest rate risk position that modestly detracted from results. Fund performance was aided by a significant overweight in industrial and utility corporate bonds.
The portfolio is conservatively structured with an average credit quality of AA with an average maturity of 5.7 years as of September 30th. Investment grade corporate bonds continue to be over-weighted to add yield, and the portfolio has a 7% position in Treasury Inflation Protected Securities which are starting to perform well. The portfolio has no exposure to subprime loans or CMBS as all mortgage holdings are in GNMA issues having the full faith and credit of the U.S. Treasury.
BARROW, HANLEY, MEWHINNEY & STRAUSS
Timothy Plan Fund Performance
Fund Performance – (Unaudited)
September 30, 2010
Fixed Income Fund
| |
| | | | | | 5 year | | | 10 Year | | |
| | | 1 Year | | | Average | | | Average | | |
| Fund/Index | | Total Return | | | Annual Return | | | Annual Return | | |
| Timothy Fixed Income Fund - Class A (With Sales Charge) | | | 2.23 | % | | | 3.85 | % | | | 4.76 | % | |
| Barclays Capital U.S. Aggregate Bond Index | | | 8.16 | % | | | 6.20 | % | | | 6.41 | % | |
| Timothy Fixed Income Fund - Class B | | | 6.28 | % | | | 4.04 | % | | | 4.37 | % | |
| Barclays Capital U.S. Aggregate Bond Index | | | 8.16 | % | | | 6.20 | % | | | 6.41 | % | |
| Timothy Fixed Income Fund - Class C* | | | 5.30 | % | | | 4.05 | % | | | 3.39 | % | (a) |
| Barclays Capital U.S. Aggregate Bond Index | | | 8.16 | % | | | 6.20 | % | | | 5.42 | % | (a) |
| | | | | | | | | | | | | | |
| (a) For the period February 3, 2004 (commencement of share class operations) to September 30, 2010. |
| *With Maximum Deferred Sales Charge | | | | | | | | | | | | | |
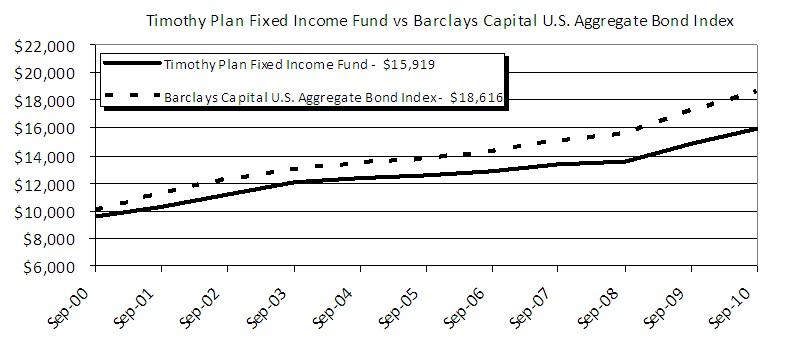
The chart shows the value of a hypothetical initial investment of $10,000 in the Fund’s A shares and the Barclays Capital U.S. Aggregate Bond Index on September 30, 2000 and held through September 30, 2010. The Barclays Capital U.S. Aggregate Bond Index is a widely recognized, unmanaged index of bond prices. Performance figures include the change in value of the bonds in the index and the reinvestment of interest. The index return does not reflect expenses, which have been deducted from the Fund’s return. The returns shown do not reflect deduction of taxes that a shareholder would pay on Fund distributions or the redemption of the Fund shares. THE FUND’S RETURN REPRESENTS PAST PERFORMANCE AND IS NOT PREDICTIVE OF FUTURE RESULTS.
Timothy Plan Fund Performance
Letter from the Manager
September 30, 2010
High Yield Bond Fund
The pace of U.S. economic recovery will likely remain subdued with below-trend GDP growth keeping interest rates low over the next few quarters. The key determinate to a stronger GDP lies in employment growth which continues to be weak. However, despite slow economic growth over the past four quarters corporate earnings have improved nicely propelling both the stock market and high yield (HY) bonds to higher prices. The S&P 500 is up 10.2% over the trailing twelve months ended September 30, 2010 which has supported a rally in the HY market.
The Barclays Ba/B High Yield index on 9/30/09 had a yield of 8.80% and declined to 6.90% by 9/30/10 generating a 16.8% return. Lower yields were a combination of the lower risk free rate of U.S. Treasuries and tighter yield spreads for HY bonds. For example, the Treasury ten year note declined from 3.3% to 2.5% over the trailing year. The yield spread over Treasuries of the Ba/B index declined from 615 basis points (bps) a year ago to 530 bps on September 30th primarily due to improved company earnings and a declining risk of default. Despite the well publicized but anticipated filing by Blockbuster defaulting on $930 million in HY bonds, the par-weighted default rate in HY has decreased for the 11th consecutive month down to 5.1% from a cyclical high of 13.8% as reported by Moody’s.
Improved HY market conditions allowed $32B in new supply to be sold during September, which was the second largest month on record. New issuance is running at an annual pace of $239B, which would be a new record. Many HY issuers have taken advantage of greatly improved pricing to refinance and eliminate potential liquidity problems by increasing the maturity schedule of their debt.
The Timothy High Yield Fund A shares generated an attractive return of 15.0% for the trailing twelve months ended 9/30/10, but trailed the Barclays Ba/B index benchmark result of 16.8%. This shortfall comes after last fiscal year’s result of 45.1% for the fund’s A shares compared to 38.8% for the Barclays Ba/B index. The portfolio being concentrated in 50 issues can cause performance relative to the benchmark to be somewhat volatile. One common theme to the underperforming issues was downward pressure on natural gas prices. The top five issues detracting from performance included: Dynegy, Energy Future Holdings, Cemex, Omnicare, and Helix Energy. Top five issues aiding performance for the trailing year included: Momentive Performance, Atlas Pipeline, Navistar Intl, N RG Energy, and Crum & Forster (upgraded to investment grade ratings).
The portfolio has an average quality of B1/B+/BB- with an average maturity of 6.9 years. Security selection focuses heavily on manageable debt levels, decent growth prospects, and good liquidity. We maintain our themes of consumers seeking to spend less by “trading down” (pre-paid wireless), yet spending on necessities (Energy). Secured bonds that pledge collateral to back the securities and good covenant protection are stressed in the portfolio holdings. We believe that the high yield fund provides an attractive risk/reward opportunity for investors able to withstand volatility.
BARROW, HANLEY, MEWHINNEY & STRAUSS
Timothy Plan Fund Performance
Fund Performance – (Unaudited)
September 30, 2010
High Yield Bond Fund
| |
| | | | | | 5 year | | | Average | | |
| | | 1 Year | | | Average | | | Annual Return | | |
| Fund/Index | | Total Return | | | Annual Return | | | Since Inception | | (a) |
| Timothy High Yield Bond Fund - Class A (With Sales Charge) | | | 9.81 | % | | | N/A | | | | 3.10 | % | |
| Barclays Capital U.S. Corporate High Yield Bond Index | | | 16.71 | % | | | N/A | | | | 6.73 | % | |
| Timothy High Yield Bond Fund - Class C* | | | 13.21 | % | | | N/A | | | | 3.74 | % | |
| Barclays Capital U.S. Corporate High Yield Bond Index | | | 16.71 | % | | | N/A | | | | 6.73 | % | |
| | | | | | | | | | | | | | |
| (a) For the period May 7, 2007 (commencement of investment in accordance with objective) to September 30, 2010. |
| *With Maximum Deferred Sales Charge | | | | | | | | | | �� | | | |
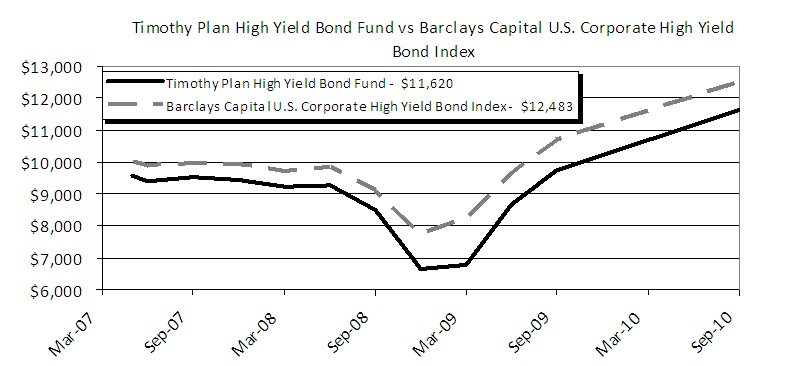
The chart shows the value of a hypothetical initial investment of $10,000 in the Fund’s A shares and the Barclays Capital U.S. Corporate High Yield Bond Index on May 7, 2007 and held through September 30, 2010. The Barclays Capital U.S. Corporate High Yield Bond Index is a widely recognized, unmanaged index of non-investment grade, fixed rate, taxable corporate bonds. Performance figures include the change in value of the bonds in the index and the reinvestment of interest. The index return does not reflect expenses, which have been deducted from the Fund’s return. The returns shown do not reflect deduction of taxes that a shareholder would pay on Fund distributions or the redemption of the Fund shares. THE FUND’S RETURN REPRESENTS PAST PERFORMANCE AND IS NOT PREDICTIVE OF FUTURE RESULTS.
Timothy Plan Fund Performance
Letter from the Manager
September 30, 2010
Defensive Strategies Fund
Dear Shareholder,
In order to improve reporting efficiency and accuracy in tax reporting to our shareholders, Timothy Plan’s Board of Trustees approved changing the Fund Family’s fiscal year from December 31st to September 30th. Since the Defensive Strategies Fund began operation November 4, 2009, this year’s Annual Report for this Fund covers the period November 4, 2009 through September 30, 2010.
The Defensive Strategies Fund was created in an attempt to do what its name implies, i.e. hedge against a possible scenario of hyper-inflation which could result from the seemingly unbridled spending spree of our leadership in Washington, DC. We have also, however, built in the flexibility to adjust to a possible risk of extreme deflation with the ability to convert our inflation sensitive assets to cash and fixed income securities that should perform well during a deflationary environment. Of course, although we will do our very best to be successful, we cannot guarantee results in either scenario.
While no one can predict future events, I am confident of a couple of things:
| · | The mid-term elections could result in a reversal of the liberal bias in Congress to conservative which, if it happens, should be positive for the capital markets, and |
| · | Our sub-advisory team (i.e. money management firms that manage the various sleeves of this Fund) are, in our opinion, among the best in the industry and they each continue to honor our overall policy that they manage their respective Fund sleeve with a conservative bias. |
Finally, I would once again like to thank you for your moral convictions that led you to become part of the Timothy Plan Family.
Yours in Christ,
Arthur D. Ally
Fund Advisor
Timothy Plan Fund Performance
Fund Performance – (Unaudited)
September 30, 2010
Defensive Strategies Fund
| |
| | | | | | 5 year | | | Average | | |
| | | 1 Year | | | Average | | | Annual Return | | |
| Fund/Index | | Total Return | | | Annual Return | | | Since Inception | | (a) |
| Timothy Defensive Strategies Fund - Class A (With Sales Charge) | | | N/A | | | | N/A | | | | 5.38 | % | |
| Dow Jones Moderately Conservative US Portfolio Index | | | N/A | | | | N/A | | | | 13.00 | % | |
| Timothy Defensive Strategies Fund - Class C* | | | N/A | | | | N/A | | | | 9.08 | % | |
| Dow Jones Moderately Conservative US Portfolio Index | | | N/A | | | | N/A | | | | 13.00 | % | |
| | | | | | | | | | | | | | |
| (a) For the period November 4, 2009 (commencement of investment in accordance with objective) to September 30, 2010. |
| *With Maximum Deferred Sales Charge | | | | | | | | | | | | | |
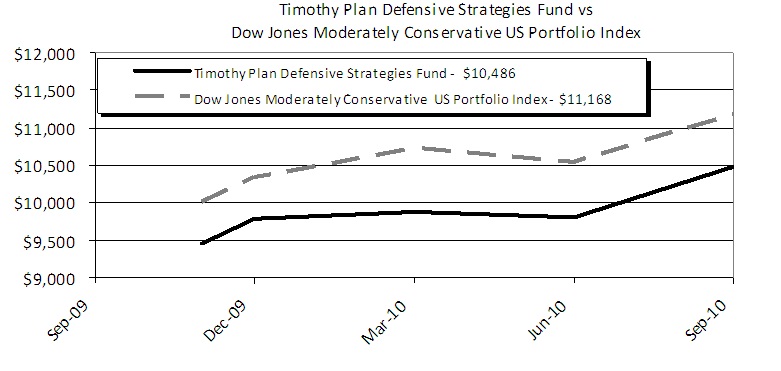
The chart shows the value of a hypothetical initial investment of $10,000 in the Fund’s A shares and the Dow Jones Moderately Conservative US Portfolio Index on November 4, 2009 and held through September 30, 2010. The Dow Jones Moderately Conservative US Portfolio is a widely recognized, unmanaged index of stocks, bonds and cash. Performance figures include the change in value of the asset classes in the index and the reinvestment of dividends. The index return does not reflect expenses, which have been deducted from the Fund’s return. The returns shown do not reflect deduction of taxes that a shareholder would pay on Fund distributions or the redemption of the Fund shares. THE FUND’S RETURN REPRESENTS PAST PERFORMANCE AND IS NOT PREDICTIVE OF FUTURE RESULTS.
Timothy Plan Fund Performance
Letter from the Manager
September 30, 2010
Strategic Growth Fund
Dear Strategic Growth Fund Shareholder,
Your Strategic Growth Fund is a compilation of several of Timothy’s underlying funds and, as such, its performance is directly related to the performance of those underlying funds. As a review, your specific asset mix is approximately as follows:
· Large/Mid Cap Value Fund | = | | 20.00 | % |
· Small Cap Value Fund | = | | 7.50 | % |
· Large/Mid Cap Growth Fund | = | | 20.00 | % |
· Aggressive Growth Fund | = | | 7.50 | % |
· International Fund | = | | 25.00 | % |
· High Yield Bond Fund | = | | 10.00 | % |
· Defensive Strategies Fund | = | | 10.00 | % |
Since your performance is so directly related to our underlying funds, I am pleased to report that, in my opinion, all of our funds are now managed by firms that are as good as, if not better than, any mutual fund family in the industry. Please refer to each individual manager’s comments within this report for more detailed information as to why the funds under their responsibility performed as they did.
As you probably have noticed, the markets have been interestingly unsettled over the past twelve months. In fact, the S&P 500 stock index had positive performance in seven of those months and negative performance in five of those months – but, fortunately, with an upward bias. And, I am pleased to report, nearly all of our underlying funds have performed in line with (at or near) their respective indexes.
We, along with our various fund’s sub-advisors, expect this pattern to continue into 2011 (i.e. unsettled with a slight upward bias) although we cannot guarantee that outcome. I am hopeful, however, that the mid-term elections could result in a reversal of the liberal bias in Congress to conservative which, if it happens, should be positive for the capital markets.
As you well know, however, no one can guarantee future results. The one thing I can assure you of is that every one of our managers will be working very hard on your behalf.
Sincerely,
Arthur D. Ally,
President
Timothy Plan Fund Performance
Fund Performance – (Unaudited)
September 30, 2010
Strategic Growth Fund
| |
| | | | | | 5 year | | | Average | | |
| | | 1 Year | | | Average | | | Annual Return | | |
| Fund/Index | | Total Return | | | Annual Return | | | Since Inception | | |
| Timothy Strategic Growth Fund - Class A (With Sales Charge) | | | 2.69 | % | | | -1.04 | % | | | -1.46 | % | (a) |
| Dow Jones Global Moderately Aggressive Portfolio Index | | | 11.72 | % | | | 3.91 | % | | | 4.63 | % | (a) |
| Timothy Strategic Growth Fund - Class B | | | 7.95 | % | | | -0.66 | % | | | -1.62 | % | (b) |
| Dow Jones Global Moderately Aggressive Portfolio Index | | | 11.72 | % | | | 3.91 | % | | | 4.80 | % | (b) |
| Timothy Strategic Growth Fund - Class C* | | | 6.90 | % | | | -0.66 | % | | | 0.84 | % | (c) |
| Dow Jones Global Moderately Aggressive Portfolio Index | | | 11.72 | % | | | 3.91 | % | | | 5.84 | % | (c) |
| | | | | | | | | | | | | | |
| (a) For the period October 5, 2000 (commencement of investment in accordance with objective) to September 30, 2010. |
| (b) For the Period October 9, 2000 (commencement of share class operations) to September 30, 2010. |
| (c) For the Period February 3, 2004 (commencement of share class operations) to September 30, 2010. |
| *With Maximum Deferred Sales Charge | | | | | | | | | | | | | |
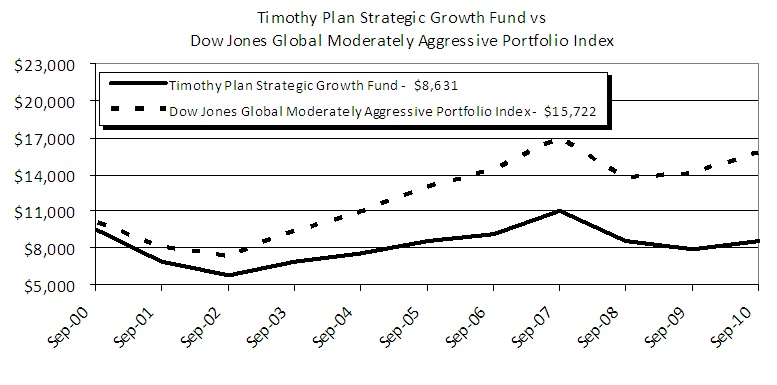
The chart shows the value of a hypothetical initial investment of $10,000 in the Fund’s A shares and the Dow Jones Global Moderately Aggressive Portfolio Index on October 5, 2000 and held through September 30, 2010. The Dow Jones Global Moderately Aggressive Portfolio Index is a widely recognized index that measures global stocks, bonds, and cash which are in turn represented by multiple sub-indexes. Performance figures include the change in value of the investments in the indexes and the reinvestment of dividends. The index returns do not reflect expenses, which have been deducted from the Fund’s return. The returns shown do not reflect deduction of taxes that a shareholder would pay on Fund distributions or the redemption of the Fund shares. THE FUND’S RETURN REPRESENTS PAST PERFOR MANCE AND IS NOT PREDICTIVE OF FUTURE RESULTS.
Timothy Plan Fund Performance
Letter from the Manager
September 30, 2010
Conservative Growth Fund
Dear Conservative Growth Fund Shareholder,
Your Conservative Growth Fund is a compilation of several of Timothy’s underlying funds and, as such, its performance is directly related to the performance of those underlying funds. As a review, your specific asset mix is approximately as follows:
· Large/Mid Cap Value Fund | = | | 15.00 | % |
· Small Cap Value Fund | = | | 5.00 | % |
· Large/Mid Cap Growth Fund | = | | 12.00 | % |
· Aggressive Growth Fund | = | | 3.00 | % |
· Fixed Income Fund | = | | 30.00 | % |
· International Fund | = | | 10.00 | % |
· High Yield Bond Fund | = | | 10.00 | % |
· Defensive Strategies Fund | = | | 15.00 | % |
Since your performance is so directly related to our underlying funds, I am pleased to report that, in my opinion, all of our funds are now managed by firms that are as good as, if not better than, any mutual fund family in the industry. Please refer to each individual manager’s comments within this report for more detailed information as to why the funds under their responsibility performed as they did.
As you probably have noticed, the markets have been interestingly unsettled over the past twelve months. In fact, the S&P 500 stock index had positive performance in seven of those months and negative performance in five of those months – but, fortunately, with an upward bias. And, I am pleased to report, nearly all of our underlying funds have performed in line with (at or near) their respective indexes.
We, along with our various fund’s sub-advisors, expect this pattern to continue into 2011 (i.e. unsettled with a slight upward bias) although we cannot guarantee that outcome. I am hopeful, however, that the mid-term elections could result in a reversal of the liberal bias in Congress to conservative which, if it happens, should be positive for the capital markets.
As you well know, however, no one can guarantee future results. The one thing I can assure you of is that every one of our managers will be working very hard on your behalf.
Sincerely,
Arthur D. Ally,
President
Timothy Plan Fund Performance
Fund Performance – (Unaudited)
September 30, 2010
Convservative Growth Fund
| |
| | | | | | 5 year | | | Average | | |
| | | 1 Year | | | Average | | | Annual Return | | |
| Fund/Index | | Total Return | | | Annual Return | | | Since Inception | | |
| Timothy Conservative Growth Fund - Class A (With Sales Charge) | | | 2.51 | % | | | 1.07 | % | | | 1.40 | % | (a) |
| Dow Jones Global Moderate Portfolio Index | | | 10.72 | % | | | 4.37 | % | | | 5.23 | % | (a) |
| Timothy Conservative Growth Fund - Class B | | | 7.68 | % | | | 1.46 | % | | | 1.21 | % | (b) |
| Dow Jones Global Moderate Portfolio Index | | | 10.72 | % | | | 4.37 | % | | | 5.35 | % | (b) |
| Timothy Conservative Growth Fund - Class C* | | | 6.50 | % | | | 1.48 | % | | | 2.30 | % | (c) |
| Dow Jones Global Moderate Portfolio Index | | | 10.72 | % | | | 4.37 | % | | | 5.66 | % | (c) |
| | | | | | | | | | | | | | |
| (a) For the period October 5, 2000 (commencement of investment in accordance with objective) to September 30, 2010. |
| (b) For the Period October 9, 2000 (commencement of share class operations) to September 30, 2010. |
| (c) For the Period February 3, 2004 (commencement of share class operations) to September 30, 2010. |
| *With Maximum Deferred Sales Charge | | | | | | | | | | | | | |

The chart shows the value of a hypothetical initial investment of $10,000 in the Fund’s A shares and the Dow Jones Global Moderate Portfolio Index on October 5, 2000 and held through September 30, 2010. The Dow Jones Global Moderate Portfolio Index is a widely recognized index that measures stocks, bonds, and cash which in turn are represented by multiple sub-indexes. Performance figures include the change in value of the investments in the indexes and the reinvestment of dividends. The index returns do not reflect expenses, which have been deducted from the Fund’s return. The returns shown do not reflect deduction of taxes that a shareholder would pay on Fund distributions or the redemption of the Fund shares. THE FUND’S RETURN REPRESENTS PAST PERFORMANCE AND IS NOT PREDICTIVE OF FU TURE RESULTS.
Timothy Plan Fund Performance
Fund Profile - (Unaudited)
September 30, 2010
Aggressive Growth Fund
| Top Ten Holdings | | | Industries | |
| (% of Net Assets) | | | (% of Net Assets) | |
| | | | | |
| SBA Communications Corp. - Class A | 3.30% | | Information Technology | 28.58% |
| Cash Equivalent - Fidelity Institutional Money Market Portfolio | 3.02% | | Health Care | 17.60% |
| Gartner, Inc. | 2.90% | | Industrials | 15.28% |
| Sapient Corp. | 2.29% | | Consumer Discretionary | 13.71% |
| NICE Systems, Ltd. (ADR) | 2.21% | | Financials | 7.67% |
| Bruker Corp. | 2.07% | | Telecommunications | 6.24% |
| Discover Financial Services | 1.85% | | Energy | 6.10% |
| Informatica Corp. | 1.84% | | Short-Term Investments | 3.02% |
| Whiting Petroleum Corp. | 1.74% | | Materials | 0.96% |
| Varian Medical Systems, Inc. | 1.58% | | Other Assets Less Liabilities | 0.84% |
| | 22.80% | | | 100.00% |
International Fund
| Top Ten Holdings | | | Industries | |
| (% of Net Assets) | | | (% of Net Assets) | |
| | | | | |
| Cash Equivalent - Fidelity Institutional Money Market Portfolio | 4.74% | | Financials | 17.33% |
| Henkel AG & Co. KGaA (ADR) | 4.54% | | Industrials | 15.77% |
| Keppel Corp., Ltd. (ADR) | 3.90% | | Consumer Discretionary | 12.51% |
| Fresenius Medical Care AG & Co. KGaA (ADR) | 3.82% | | Consumer Staples | 10.37% |
| BOC Hong Kong (Holdings), Ltd. (ADR) | 3.41% | | Telecommunications | 9.07% |
| Honda Motor Co., Ltd. (ADR) | 3.35% | | Materials | 8.96% |
| Singapore Telecommunications, Ltd. (ADR) | 3.33% | | Energy | 7.38% |
| America Movil SAB de C.V. - Series L (ADR) | 3.26% | | Health Care | 6.69% |
| DBS Group Holdings, Ltd. (ADR) | 3.23% | | Short-Term Investments | 4.74% |
| Canon, Inc. (ADR) | 3.14% | | Utilities | 4.44% |
| | 36.72% | | Information Technology | 3.14% |
| | | | Liabilities in Excess of Other Assets | (0.40)% |
| | | | | 100.00% |
Large/Mid Cap Growth Fund
| Top Ten Holdings | | | Industries | |
| (% of Net Assets) | | | (% of Net Assets) | |
| | | | | |
| Exxon Mobil Corp. | 3.84% | | Health Care | 20.15% |
| Cash Equivalent - Fidelity Institutional Money Market Portfolio | 3.44% | | Financials | 17.20% |
| Paychex, Inc. | 3.30% | | Information Technology | 15.89% |
| Invesco, Ltd. | 2.69% | | Energy | 12.81% |
| T. Rowe Price Group, Inc. | 2.53% | | Industrials | 12.45% |
| Occidental Petroleum Corp. | 2.11% | | Consumer Discretionary | 8.96% |
| AmerisourceBergen Corp. | 2.09% | | Telecommunications | 4.89% |
| Gartner, Inc. | 2.08% | | Short-Term Investments | 3.44% |
| Medco Health Solutions, Inc. | 1.97% | | Other Assets Less Liabilities | 2.15% |
| Jarden Corp. | 1.93% | | Materials | 2.06% |
| | 25.98% | | | 100.00% |
Timothy Plan Top Ten Holdings / Industries
Fund Profile - (Unaudited)
September 30, 2010
Small Cap Value Fund
| Top Ten Holdings | | | Industries | |
| (% of Net Assets) | | | (% of Net Assets) | |
| | | | | |
| Cash Equivalent - Fidelity Institutional Money Market Portfolio | 6.69% | | Industrials | 26.63% |
| Wolverine World Wide, Inc. | 2.36% | | Financials | 23.71% |
| CryoLife, Inc. | 2.29% | | Consumer Discretionary | 12.07% |
| Texas Capital Bancshares, Inc. | 2.23% | | Information Technology | 9.58% |
| Sensient Technologies Corp. | 2.22% | | Energy | 8.29% |
| Rollins, Inc. | 2.19% | | Short-Term Investments | 6.69% |
| Genesee & Wyoming, Inc. - Class A | 2.19% | | Consumer Staples | 4.30% |
| ManTech International Corp. - Class A | 2.19% | | Utilities | 4.12% |
| Calamos Asset Management, Inc. - Class A | 2.19% | | Materials | 3.23% |
| Geosources, Inc. | 2.18% | | Health Care | 2.29% |
| | 26.73% | | Liabilities in Excess of Other Assets | (0.91)% |
| | | | | 100.00% |
| | | | | |
Large/Mid Cap Value Fund
| Top Ten Holdings | | | Industries | |
| (% of Net Assets) | | | (% of Net Assets) | |
| | | | | |
| Exxon Mobil Corp. | 3.54% | | Financials | 26.41% |
| Deere & Co. | 3.29% | | Energy | 20.42% |
| Union Pacific Corp. | 2.91% | | Industrials | 11.68% |
| Emerson Electric Co. | 2.82% | | Health Care | 10.14% |
| BorgWarner, Inc. | 2.70% | | Consumer Staples | 8.88% |
| Flowserve Corp. | 2.66% | | Consumer Discretionary | 8.69% |
| Invesco, Ltd. | 2.62% | | Utilities | 6.79% |
| McKesson Corp. | 2.59% | | Information Technology | 2.56% |
| Advance Auto Parts, Inc. | 2.58% | | Short-Term Investments | 2.16% |
| CA, Inc. | 2.56% | | Materials | 2.12% |
| | 28.27% | | Other Assets Less Liabilities | 0.15% |
| | | | | 100.00% |
Fixed Income Fund
| Top Ten Holdings | | | Industries | |
| (% of Net Assets) | | | (% of Net Assets) | |
| | | | | |
| Cash Equivalent - Fidelity Institutional Money Market Portfolio | 16.21% | | Government | 27.88% |
| GNMA Pool 4520, 5.00%, 08/20/2039 | 4.69% | | Mortgage-Backed Securities | 25.28% |
| TIPS, 2.00%, 01/15/2014 | 4.22% | | Short-Term Investments | 16.21% |
| U.S. Treasury Note, 3.50%, 05/15/2020 | 4.02% | | Financials | 9.94% |
| GNMA Pool 717072, 5.00%, 05/15/2039 | 3.55% | | TIPS | 6.93% |
| U.S. Treasury Note, 4.75%, 05/15/2014 | 3.46% | | Energy | 6.17% |
| U.S. Treasury Note, 3.875%, 05/15/2018 | 3.34% | | Utilities | 4.97% |
| U.S. Treasury Bond, 3.125%, 05/15/2019 | 3.14% | | Consumer Discretionary | 3.72% |
| GNMA Pool 4541, 5.00%, 09/20/2039 | 2.88% | | Industrials | 2.92% |
| TIPS, 2.50%, 07/15/2016 | 2.72% | | Telecommunications | 0.80% |
| | 48.23% | | Information Technology | 0.79% |
| | | | Liabilities in Excess of Other Assets | (5.61)% |
| | | | | 100.00% |
Timothy Plan Top Ten Holdings / Industries
Fund Profile - (Unaudited)
September 30, 2010
High Yield Bond Fund
| Top Ten Holdings | | | Industries | |
| (% of Net Assets) | | | (% of Net Assets) | |
| | | | | |
| Omnicare, Inc., 7.75%, 06/01/2020 | 4.54% | | Energy | 35.01% |
| Cricket Communications, Inc., 9.375% 11/01/2014 | 2.64% | | Industrials | 16.89% |
| Goodyear Tire & Rubber Co., 10.50%, 05/15/2016 | 2.51% | | Consumer Discretionary | 10.60% |
| Lyondell Chemical Co., 8.00%, 11/01/2017 | 2.42% | | Utilities | 9.82% |
| United Rentals North America, Inc., 9.25%, 12/15/2019 | 2.40% | | Financials | 9.19% |
| Cloud Peak Energy Resources LLC, 8.50%, 12/15/2019 | 2.38% | | Materials | 5.61% |
| Navistar International Corp., 8.25%, 11/01/2021 | 2.37% | | Telecommunications | 4.92% |
| Nova Chemicals Corp., 8.625%, 11/01/2019 | 2.35% | | Health Care | 4.54% |
| Intergen NV, 9.00%, 06/30/2017 | 2.34% | | Other Assets Less Liabilities | 2.19% |
| Navios Maritime Holdings, Inc., 8.875%, 11/01/2017 | 2.34% | | Short-Term Investments | 1.23% |
| | 26.29% | | | 100.00% |
Defensive Strategies Fund
| Top Ten Holdings | | | Industries | |
| (% of Net Assets) | | | (% of Net Assets) | |
| | | | | |
| PowerShares DB Agriculture Fund | 8.82% | | TIPS | 44.07% |
| PowerShares DB Energy Fund | 6.62% | | ETFs | 30.92% |
| TIPS, 2.375%, 01/15/2017 | 6.55% | | REITs | 18.52% |
| Cash Equivalent - Fidelity Institutional Money Market Portfolio | 6.13% | | Short-Term Investments | 6.13% |
| PowerShares DB Base Metals Fund | 5.48% | | Consumer Discretionary | 0.18% |
| TIPS, 2.375%, 01/15/2025 | 5.31% | | Other Assets Less Liabilities | 0.18% |
| TIPS, 2.125%, 01/15/2019 | 4.95% | | | 100.00% |
| TIPS, 2.00%, 07/15/2014 | 4.55% | | | |
| TIPS, 2.00%, 01/15/2016 | 4.36% | | | |
| PowerShares DB Commodity Index Tracking Fund | 4.17% | | | |
| | 56.94% | | | |
Money Market Fund
| Top Ten Holdings | | | Industries | |
| (% of Net Assets) | | | (% of Net Assets) | |
| | | | | |
| U.S. Treasury Bill, 0.12%, 10/07/2010 | 11.59% | | U.S. Treasuries | 89.99% |
| U.S. Treasury Bill, 0.10%, 10/14/2010 | 11.20% | | Money Market Instruments | 9.92% |
| U.S. Treasury Bill, 0.13%, 10/21/2010 | 11.20% | | Other Assets Less Liabilities | 0.09% |
| U.S. Treasury Bill, 0.14%, 10/28/2010 | 11.20% | | | 100.00% |
| U.S. Treasury Bill, 0.13%, 11/04/2010 | 11.20% | | | |
| U.S. Treasury Bill, 0.13%, 11/12/2010 | 11.20% | | | |
| U.S. Treasury Bill, 0.13%, 11/18/2010 | 11.20% | | | |
| U.S. Treasury Bill, 0.15%, 11/26/2010 | 11.20% | | | |
| Cash Equivalent - Fidelity Institutional Money Market Portfolio | 9.92% | | | |
| | 99.91% | | | |
Timothy Plan Top Ten Holdings / Industries
Fund Profile - (Unaudited)
September 30, 2010
| Strategic Growth Fund | | | Conservative Growth Fund | |
| | | | | |
| Asset Allocation | | | Asset Allocation | |
| (% of Net Assets) | | | (% of Net Assets) | |
| | | | | |
| International | 25.22% | | Fixed Income | 29.88% |
| Large/Mid Cap Growth | 20.23% | | Defensive Strategies | 14.97% |
| Large/Mid Cap Value | 19.94% | | Large/Mid Cap Value | 14.97% |
| High Yield Bond | 9.69% | | Large/Mid Cap Growth | 12.03% |
| Defensive Strategies | 9.67% | | International | 10.03% |
| Aggressive Growth | 7.67% | | High Yield Bond | 9.95% |
| Small Cap Value | 7.52% | | Small Cap Value | 5.05% |
| Short-Term Investments | 0.13% | | Aggressive Growth | 3.04% |
| Liabilities in Excess of Other Assets | (0.07)% | | Other Assets Less Liabilities | 0.08% |
| | 100.00% | | | 100.00% |
| | | | | |
Timothy Plan Top Ten Holdings / Industries
Expense Examples – (Unaudited)
September 30, 2010
As a shareholder of a Fund, you incur two types of costs: direct costs, such as wire fees and low balance fees; and indirect costs, including management fees, and other Fund operating expenses. This example is intended to help you understand your indirect costs, also referred to as “ongoing costs”, (in dollars) of investing in each Fund, and to compare these costs with the ongoing costs of investing in other mutual funds.
This example is based on an investment of $1,000 invested at the beginning of the period and held for the entire six-month period of April 1, 2010, through September 30, 2010.
Actual Expenses
The first line of the following tables provides information about actual account values and actual expenses. You may use the information in this line, together with the amount you invested at the beginning of the period, to estimate the expenses that you paid over the period. Simply divide your account value by $1,000 (for example, an $8,600 account value divided by $1,000 = 8.6), then multiply the result by the number in the first line under the heading “Expenses Paid During Period” to estimate the expenses you paid on your account during this period.
Hypothetical Example for Comparison Purposes
The second line of the tables provides information about hypothetical account values and hypothetical expenses based on each Fund’s actual expense ratio and an assumed rate of return of 5% per year before expenses, which is not the Fund’s actual return. The hypothetical account values and expenses may not be used to estimate the actual ending account balance or expenses you paid for the period. You may use this information to compare ongoing costs of investing in each Fund and other funds. To do so, compare this 5% hypothetical example with the 5% hypothetical examples that appear in the shareholder reports of other funds.
Please note that the expenses shown in the tables are meant to highlight your ongoing costs only and do not reflect any direct costs, such as wire fees or low balance fees. Therefore, the second line of the table is useful in comparing ongoing costs only, and will not help you determine the relative total costs of owning different funds. In addition, if these direct costs were included, your costs would be higher.
AGGRESSIVE GROWTH FUND
| | | | | | | | | Expenses Paid During Period* | |
| | | | | | | | | | |
| | | | | | | | | 4/1/2010 through | |
| | | 4/1/2010 | | | 9/30/2010 | | | 9/30/2010 | |
| | | | | | | | | | |
| Actual - Class A | | $ | 1,000.00 | | | $ | 1,048.36 | | | $ | 9.46 | |
| Hypothetical - Class A ** | | $ | 1,000.00 | | | $ | 1,015.83 | | | $ | 9.31 | |
| Actual - Class B | | $ | 1,000.00 | | | $ | 1,042.02 | | | $ | 13.27 | |
| Hypothetical - Class B ** | | $ | 1,000.00 | | | $ | 1,012.07 | | | $ | 13.08 | |
| Actual - Class C | | $ | 1,000.00 | | | $ | 1,044.03 | | | $ | 13.29 | |
| Hypothetical - Class C ** | | $ | 1,000.00 | | | $ | 1,012.07 | | | $ | 13.08 | |
| * | Expenses are equal to the Fund’s annualized expense ratio of 1.84% for Class A, 2.59% for Class B, and 2.59% for Class C, which is net of any expenses paid indirectly, multiplied by the average account value over the period, multiplied by 183 days/365 days (to reflect the partial year period). The Aggressive Growth Fund’s ending account value on the first line of each share class in the table is based on its actual total return of 4.84% for Class A, 4.20% for Class B, and 4.40% for Class C for the six-month period of April 1, 2010, to September 30, 2010. |
** Assumes a 5% return before expenses.
INTERNATIONAL FUND
| | | | | | | | | Expenses Paid During Period* | |
| | | | | | | | | | |
| | | | | | | | | 4/1/2010 through | |
| | | 4/1/2010 | | | 9/30/2010 | | | 9/30/2010 | |
| | | | | | | | | | |
| Actual - Class A | | $ | 1,000.00 | | | $ | 985.93 | | | $ | 8.62 | |
| Hypothetical - Class A ** | | $ | 1,000.00 | | | $ | 1,016.39 | | | $ | 8.75 | |
| Actual - Class C | | $ | 1,000.00 | | | $ | 983.14 | | | $ | 12.33 | |
| Hypothetical - Class C ** | | $ | 1,000.00 | | | $ | 1,012.63 | | | $ | 12.51 | |
Timothy Plan Expense Examples
Expense Examples – (Unaudited)
September 30, 2010
| * | Expenses are equal to the Fund’s annualized expense ratio of 1.73% for Class A and 2.48% for Class C, which is net of any expenses paid indirectly, multiplied by the average account value over the period, multiplied by 183 days/365 days (to reflect the partial year period). The International Fund’s ending account value on the first line of each share class in the table is based on its actual total return of -1.41% for Class A and -1.69% for Class C for the six-month period of April 1, 2010, to September 30, 2010. |
| | ** Assumes a 5% return before expenses. |
LARGE/MID CAP GROWTH FUND
| | | | | | | | | Expenses Paid During Period* | |
| | | | | | | | | | |
| | | | | | | | | 4/1/2010 through | |
| | | 4/1/2010 | | | 9/30/2010 | | | 9/30/2010 | |
| | | | | | | | | | |
| Actual - Class A | | $ | 1,000.00 | | | $ | 1,006.72 | | | $ | 8.34 | |
| Hypothetical - Class A ** | | $ | 1,000.00 | | | $ | 1,016.75 | | | $ | 8.39 | |
| Actual - Class B | | $ | 1,000.00 | | | $ | 1,001.81 | | | $ | 12.05 | |
| Hypothetical - Class B ** | | $ | 1,000.00 | | | $ | 1,013.03 | | | $ | 12.12 | |
| Actual - Class C | | $ | 1,000.00 | | | $ | 1,003.62 | | | $ | 12.10 | |
| Hypothetical - Class C ** | | $ | 1,000.00 | | | $ | 1,012.99 | | | $ | 12.16 | |
| * | Expenses are equal to the Fund’s annualized expense ratio of 1.66% for Class A, 2.40% for Class B, and 2.41% for Class C, which is net of any expenses paid indirectly, multiplied by the average account value over the period, multiplied by 183 days/365 days (to reflect the partial year period). The Large/Mid Cap Growth Fund’s ending account value on the first line of each share class in the table is based on its actual total return of 0.67% for Class A, 0.18% for Class B, and 0.36% for Class C for the six-month period of April 1, 2010, to September 30, 2010. |
| | ** Assumes a 5% return before expenses. |
SMALL CAP VALUE FUND
| | | | | | | | | Expenses Paid During Period* | |
| | | | | | | | | | |
| | | | | | | | | 4/1/2010 through | |
| | | 4/1/2010 | | | 9/30/2010 | | | 9/30/2010 | |
| | | | | | | | | | |
| Actual - Class A | | $ | 1,000.00 | | | $ | 982.58 | | | $ | 7.87 | |
| Hypothetical - Class A ** | | $ | 1,000.00 | | | $ | 1,017.13 | | | $ | 8.01 | |
| Actual - Class B | | $ | 1,000.00 | | | $ | 977.91 | | | $ | 11.56 | |
| Hypothetical - Class B ** | | $ | 1,000.00 | | | $ | 1,013.38 | | | $ | 11.77 | |
| Actual - Class C | | $ | 1,000.00 | | | $ | 979.06 | | | $ | 11.58 | |
| Hypothetical - Class C ** | | $ | 1,000.00 | | | $ | 1,013.37 | | | $ | 11.78 | |
| * | Expenses are equal to the Fund’s annualized expense ratio of 1.58% for Class A, 2.33% for Class B, and 2.33 % for Class C, which is net of any expenses paid indirectly, multiplied by the average account value over the period, multiplied by 183 days/365 days (to reflect the partial year period). The Small Cap Value Fund’s ending account value on the first line of each share class in the table is based on its actual total return of -1.74% for Class A, -2.21% for Class B, and -2.09% for Class C for the six-month period of April 1, 2010, to September 30, 2010. |
| | ** Assumes a 5% return before expenses. |
LARGE/MID CAP VALUE FUND
| | | | | | | | | Expenses Paid During Period* | |
| | | | | | | | | | |
| | | | | | | | | 4/1/2010 through | |
| | | 4/1/2010 | | | 9/30/2010 | | | 9/30/2010 | |
| | | | | | | | | | |
| Actual - Class A | | $ | 1,000.00 | | | $ | 1,023.34 | | | $ | 8.02 | |
| Hypothetical - Class A ** | | $ | 1,000.00 | | | $ | 1,017.14 | | | $ | 8.00 | |
| Actual - Class B | | $ | 1,000.00 | | | $ | 1,019.05 | | | $ | 11.79 | |
| Hypothetical - Class B ** | | $ | 1,000.00 | | | $ | 1,013.39 | | | $ | 11.75 | |
| Actual - Class C | | $ | 1,000.00 | | | $ | 1,019.08 | | | $ | 11.80 | |
| Hypothetical - Class C ** | | $ | 1,000.00 | | | $ | 1,013.38 | | | $ | 11.77 | |
Timothy Plan Expense Examples
Expense Examples – (Unaudited)
September 30, 2010
| * | Expenses are equal to the Fund’s annualized expense ratio of 1.58% for Class A, 2.33% for Class B, and 2.33% for Class C, which is net of any expenses paid indirectly, multiplied by the average account value over the period, multiplied by 183 days/365 days (to reflect the partial year period). The Large/Mid Cap Value Fund’s ending account value on the first line of each share class in the table is based on its actual total return of 2.33 % for Class A, 1.91% for Class B, and 1.91% for Class C for the six-month period of April 1, 2010, to September 30, 2010. |
| | ** Assumes a 5% return before expenses. |
FIXED INCOME FUND
| | | | | | | | | Expenses Paid During Period* | |
| | | | | | | | | | |
| | | | | | | | | 4/1/2010 through | |
| | | 4/1/2010 | | | 9/30/2010 | | | 9/30/2010 | |
| | | | | | | | | | |
| Actual - Class A | | $ | 1,000.00 | | | $ | 1,052.44 | | | $ | 6.23 | |
| Hypothetical - Class A ** | | $ | 1,000.00 | | | $ | 1,019.00 | | | $ | 6.13 | |
| Actual - Class B | | $ | 1,000.00 | | | $ | 1,048.70 | | | $ | 10.04 | |
| Hypothetical - Class B ** | | $ | 1,000.00 | | | $ | 1,015.26 | | | $ | 9.88 | |
| Actual - Class C | | $ | 1,000.00 | | | $ | 1,049.47 | | | $ | 10.08 | |
| Hypothetical - Class C ** | | $ | 1,000.00 | | | $ | 1,015.23 | | | $ | 9.91 | |
| * | Expenses are equal to the Fund’s annualized expense ratio of 1.21% for Class A, 1.96% for Class B, and 1.96% for Class C, which is net of any expenses paid indirectly, multiplied by the average account value over the period, multiplied by 183 days/365 days (to reflect the partial year period). The Fixed Income Fund’s ending account value on the first line of each share class in the table is based on its actual total return of 5.24% for Class A, 4.87% for Class B, and 4.95% for Class C for the six-month period of April 1, 2010, to September 30, 2010. |
| | ** Assumes a 5% return before expenses. |
HIGH YIELD BOND FUND
| | | | | | | | | Expenses Paid During Period* | |
| | | | | | | | | | |
| | | | | | | | | 4/1/2010 through | |
| | | 4/1/2010 | | | 9/30/2010 | | | 9/30/2010 | |
| | | | | | | | | | |
| Actual - Class A | | $ | 1,000.00 | | | $ | 1,060.11 | | | $ | 7.32 | |
| Hypothetical - Class A ** | | $ | 1,000.00 | | | $ | 1,017.96 | | | $ | 7.17 | |
| Actual - Class C | | $ | 1,000.00 | | | $ | 1,057.13 | | | $ | 11.20 | |
| Hypothetical - Class C ** | | $ | 1,000.00 | | | $ | 1,014.18 | | | $ | 10.97 | |
| * | Expenses are equal to the Fund’s annualized expense ratio of 1.42% for Class A and 2.17% for Class C, which is net of any expenses paid indirectly, multiplied by the average account value over the period, multiplied by 183 days/365 days (to reflect the partial year period). The High Yield Bond Fund’s ending account value on the first line of each share class in the table is based on its actual total return of 6.01% for Class A and 5.71% for Class C for the six-month period of April 1, 2010, to September 30, 2010. |
| | ** Assumes a 5% return before expenses. |
DEFENSIVE STRATEGIES FUND
| | | | | | | | | Expenses Paid During Period* | |
| | | | | | | | | | |
| | | | | | | | | 4/1/2010 through | |
| | | 4/1/2010 | | | 9/30/2010 | | | 9/30/2010 | |
| | | | | | | | | | |
| Actual - Class A | | $ | 1,000.00 | | | $ | 1,061.21 | | | $ | 7.76 | |
| Hypothetical - Class A ** | | $ | 1,000.00 | | | $ | 1,017.54 | | | $ | 7.60 | |
| Actual - Class C | | $ | 1,000.00 | | | $ | 1,056.36 | | | $ | 11.66 | |
| Hypothetical - Class C ** | | $ | 1,000.00 | | | $ | 1,013.73 | | | $ | 11.41 | |
| * | Expenses are equal to the Fund’s annualized expense ratio of 1.50% for Class A and 2.26% for Class C, which is net of any expenses paid indirectly, multiplied by the average account value over the period, multiplied by 183 days/365 days (to reflect the partial year period). The Defensive Strategies Fund’s ending account value on the first line of each share class in the table is based on its actual total return of 6.12% for Class A and 5.64% for Class C for the period of April 1, 2010, to September 30, 2010. |
| | ** Assumes a 5% return before expenses. |
Timothy Plan Expense Examples
Expense Examples – (Unaudited)
September 30, 2010
MONEY MARKET FUND
| | | | | | | | | Expenses Paid During Period* | |
| | | | | | | | | | |
| | | | | | | | | 4/1/2010 through | |
| | | 4/1/2010 | | | 9/30/2010 | | | 9/30/2010 | |
| | | | | | | | | | |
| Actual | | $ | 1,000.00 | | | $ | 1,000.45 | | | $ | 0.25 | |
| Hypothetical ** | | $ | 1,000.00 | | | $ | 1,024.82 | | | $ | 0.25 | |
| * | Expenses are equal to the Fund’s annualized expense ratio of 0.05%, which is net of any expenses paid indirectly, multiplied by the average account value over the period, multiplied by 183 days/365 days (to reflect the partial year period). The Money Market Fund’s ending account value on the first line of each share class in the table is based on its actual total return of 0.05% for the six-month period of April 1, 2010, to September 30, 2010. |
| | ** Assumes a 5% return before expenses. |
STRATEGIC GROWTH FUND
| | | | | | | | | Expenses Paid During Period* | |
| | | | | | | | | | |
| | | | | | | | | 4/1/2010 through | |
| | | 4/1/2010 | | | 9/30/2010 | | | 9/30/2010 | |
| | | | | | | | | | |
| Actual - Class A | | $ | 1,000.00 | | | $ | 1,014.06 | | | $ | 5.58 | |
| Hypothetical - Class A ** | | $ | 1,000.00 | | | $ | 1,019.52 | | | $ | 5.60 | |
| Actual - Class B | | $ | 1,000.00 | | | $ | 1,009.92 | | | $ | 9.35 | |
| Hypothetical - Class B ** | | $ | 1,000.00 | | | $ | 1,015.77 | | | $ | 9.38 | |
| Actual - Class C | | $ | 1,000.00 | | | $ | 1,009.95 | | | $ | 9.35 | |
| Hypothetical - Class C ** | | $ | 1,000.00 | | | $ | 1,015.76 | | | $ | 9.38 | |
| * | Expenses are equal to the Fund’s annualized expense ratio of 1.11% for Class A, 1.86% for Class B, and 1.86% for Class C, which is net of any expenses paid indirectly, multiplied by the average account value over the period, multiplied by 183 days/365 days (to reflect the partial year period). The Strategic Growth Fund’s ending account value on the first line of each share class in the table is based on its actual total return of 1.41% for Class A, 0.99% for Class B, and 1.00% for Class C for the six-month period of April 1, 2010, to September 30, 2010. |
| | ** Assumes a 5% return before expenses. |
CONSERVATIVE GROWTH FUND
| | | | | | | | | Expenses Paid During Period* | |
| | | | | | | | | | |
| | | | | | | | | 4/1/2010 through | |
| | | 4/1/2010 | | | 9/30/2010 | | | 9/30/2010 | |
| | | | | | | | | | |
| Actual - Class A | | $ | 1,000.00 | | | $ | 1,031.54 | | | $ | 5.67 | |
| Hypothetical - Class A ** | | $ | 1,000.00 | | | $ | 1,019.49 | | | $ | 5.64 | |
| Actual - Class B | | $ | 1,000.00 | | | $ | 1,028.33 | | | $ | 9.45 | |
| Hypothetical - Class B ** | | $ | 1,000.00 | | | $ | 1,015.75 | | | $ | 9.39 | |
| Actual - Class C | | $ | 1,000.00 | | | $ | 1,027.16 | | | $ | 9.47 | |
| Hypothetical - Class C ** | | $ | 1,000.00 | | | $ | 1,015.73 | | | $ | 9.42 | |
| * | Expenses are equal to the Fund’s annualized expense ratio of 1.11% for Class A, 1.86% for Class B, and 1.86% for Class C, which is net of any expenses paid indirectly, multiplied by the average account value over the period, multiplied by 183 days/365 days (to reflect the partial year period). The Conservative Growth Fund’s ending account value on the first line of each share class in the table is based on its actual total return of 3.15% for Class A, 2.83% for Class B, and 2.72% for Class C for the six-month period of April 1, 2010, to September 30, 2010. |
| | ** Assumes a 5% return before expenses. |
Timothy Plan Expense Examples
Schedule of Investments | Aggressive Growth | | | |
| As of September 30, 2010 | | | |
| | | | | | |
| Common Stocks - 96.14% | | | |
| Number of Shares | | Fair Value | |
| | | | | | |
| | | BANKS - 0.93% | | | |
| | 3,640 | | Signature Bank * | | $ | 141,378 | |
| | | | | | | | |
| | | | CHEMICALS - 0.96% | | | | |
| | 9,192 | | Solutia, Inc. * | | | 147,256 | |
| | | | | | | | |
| | | | CONSUMER GOODS - 2.27% | | | | |
| | 6,899 | | Jarden Corp. | | | 214,766 | |
| | 3,200 | | Steven Madden, Ltd. * | | | 131,392 | |
| | | | | | | 346,158 | |
| | | | | | | | |
| | | | EDUCATION - 2.18% | | | | |
| | 2,738 | | DeVry, Inc. | | | 134,737 | |
| | 6,845 | | K12, Inc. * | | | 198,710 | |
| | | | | | | 333,447 | |
| | | | | | | | |
| | | | FINANCIAL / INVESTMENT SERVICES - 5.65% | | | | |
| | 2,125 | | Cardtronics, Inc. * | | | 32,789 | |
| | 16,909 | | Discover Financial Services | | | 282,042 | |
| | 1,849 | | Greenhill & Co., Inc. | | | 146,663 | |
| | 9,702 | | Invesco, Ltd. | | | 205,973 | |
| | 4,515 | | MSCI, Inc. - Class A * | | | 149,943 | |
| | 4,375 | | PennantPark Investment Corp. | | | 46,419 | |
| | | | | | | 863,829 | |
| | | | | | | | |
| | | | HEALTHCARE - 10.57% | | | | |
| | 22,540 | | Bruker Corp.* | | | 316,236 | |
| | 3,005 | | Catalyst Health Solutions, Inc. * | | | 105,806 | |
| | 3,780 | | Cepheid, Inc. * | | | 70,724 | |
| | 888 | | Dendreon Corp. * | | | 36,568 | |
| | 4,324 | | Express Scripts, Inc.* | | | 210,579 | |
| | 1,570 | | HMS Holdings Corp. * | | | 92,536 | |
| | 5,000 | | Incyte Corp. Ltd. * | | | 79,950 | |
| | 6,835 | | MedAssets, Inc. * | | | 143,808 | |
| | 3,350 | | Nektar Therapeutics * | | | 49,480 | |
| | 3,147 | | Sirona Dental Systems, Inc. * | | | 113,418 | |
| | 2,730 | | SXC Health Solutions Corp. * | | | 99,563 | |
| | 3,990 | | Varian Medical Systems, Inc. * | | | 241,395 | |
| | 3,867 | | Wright Medical Group, Inc. * | | | 55,723 | |
| | | | | | | 1,615,786 | |
| | | | | | | | |
| | | | INDUSTRIALS / MACHINERY - 8.97% | | | | |
| | 13,725 | | AerCap Holdings NV * | | | 162,367 | |
| | 4,569 | | Babcock & Wilcox Co. * | | | 97,228 | |
| | 3,100 | | Baldor Electric Co. | | | 125,240 | |
| | 845 | | Flowserve Corp. | | | 92,460 | |
| | 3,888 | | Gardner Denver, Inc. | | | 208,708 | |
The accompanying notes are an integral part of these financial statements.
Timothy Plan Scheduled of Investments
Schedule of Investments | Aggressive Growth
As of September 30, 2010
Common Stocks - 96.14% (continued) | | | |
| Number of Shares | | | | Fair Value | |
| | | | | | |
| | | INDUSTRIALS / MACHINERY - 8.97% (continued) | | | |
| | 2,491 | | Goodrich Corp. | | $ | 183,661 | |
| | 2,895 | | Greif, Inc. - Class A | | | 170,342 | |
| | 2,887 | | Ingersoll-Rand Plc | | | 103,095 | |
| | 5,435 | | Kennametal, Inc. | | | 168,105 | |
| | 4,788 | | Orion Marine Group, Inc.* | | | 59,419 | |
| | | | | | | 1,370,625 | |
| | | | | | | | |
| | | | INFORMATION TECHNOLOGY - 19.87% | | | | |
| | 2,996 | | Advent Software, Inc. * | | | 156,361 | |
| | 6,061 | | Ariba, Inc. * | | | 114,553 | |
| | 23,199 | | Art Technology Group, Inc. * | | | 95,812 | |
| | 11,328 | | Brightpoint, Inc. * | | | 79,183 | |
| | 3,481 | | Cognizant Technology Solutions Corp. - Class A * | | | 224,420 | |
| | 4,766 | | Concur Technologies, Inc. * | | | 235,631 | |
| | 2,258 | | Equinix, Inc.* | | | 231,106 | |
| | 926 | | F5 Networks, Inc. * | | | 96,128 | |
| | 15,062 | | Gartner, Inc. * | | | 443,425 | |
| | 8,410 | | iGate Corp. | | | 152,557 | |
| | 7,325 | | Informatica Corp. * | | | 281,353 | |
| | 4,065 | | MICROS Systems, Inc. * | | | 172,071 | |
| | 7,245 | | Parametric Technology Corp. * | | | 141,567 | |
| | 4,750 | | Plexus Corp. * | | | 139,413 | |
| | 8,275 | | Rackspace Hosting, Inc. * | | | 214,985 | |
| | 7,015 | | Radiant Systems, Inc. * | | | 119,957 | |
| | 4,237 | | VanceInfo Technologies, Inc. (ADR) * | | | 137,025 | |
| | | | | | | 3,035,547 | |
| | | | | | | | |
| | | | INSTRUMENTS - 1.34% | | | | |
| | 1,647 | | Mettler-Toledo International, Inc. * | | | 204,953 | |
| | | | | | | | |
| | | | INSURANCE - 1.09% | | | | |
| | 9,761 | | Assured Guaranty, Ltd. | | | 167,011 | |
| | | | | | | | |
| | | | MISCELLANEOUS SERVICES - 8.04% | | | | |
| | 2,263 | | Alliance Data Systems Corp. * | | | 147,683 | |
| | 2,875 | | Ancestry.com, Inc. * | | | 65,435 | |
| | 3,600 | | Constant Contact, Inc. * | | | 77,148 | |
| | 1,675 | | Discovery Communications, Inc. - Class A * | | | 72,946 | |
| | 6,400 | | Gaylord Entertainment Co. * | | | 195,200 | |
| | 4,581 | | GSI Commerce, Inc. * | | | 113,151 | |
| | 15,155 | | Kforce, Inc. * | | | 207,927 | |
| | 29,189 | | Sapient Corp. | | | 349,392 | |
| | | | | | | 1,228,882 | |
| | | | | | | | |
| | | | OIL / NATURAL GAS - 6.09% | | | | |
| | 12,575 | | EXCO Resources, Inc. | | | 186,990 | |
| | 2,200 | | Lufkin Industries, Inc. | | | 96,580 | |
| | 16,859 | | Rex Energy Corp. * | | | 215,795 | |
| | 8,467 | | Venoco, Inc. * | | | 166,207 | |
| | 2,786 | | Whiting Petroleum Corp. * | | | 266,091 | |
| | | | | | | 931,663 | |
| | | | | | | |
The accompanying notes are an integral part of these financial statements.
Timothy Plan Scheduled of Investments
Schedule of Investments | Aggressive Growth
As of September 30, 2010
Common Stocks - 96.14% (continued) | | | |
| Number of Shares | | | | Fair Value | |
| | | | | | |
| | | PHARMACEUTICALS - 5.69% | | | |
| | 1,789 | | Alexion Pharmaceuticals, Inc. * | | $ | 115,140 | |
| | 1,200 | | Human Genome Sciences, Inc. * | | | 35,748 | |
| | 5,645 | | Impax Laboratories, Inc. * | | | 111,771 | |
| | 8,930 | | Isis Pharmaceuticals, Inc. * | | | 75,012 | |
| | 1,653 | | Regeneron Pharmaceuticals, Inc. * | | | 45,292 | |
| | 5,483 | | Salix Pharmaceuticals, Ltd. * | | | 217,785 | |
| | 2,700 | | Savient Pharmaceuticals, Inc. * | | | 61,749 | |
| | 3,699 | | United Therapeutics Corp. * | | | 207,181 | |
| | | | | | | 869,678 | |
| | | | | | | | |
| | | | RESTAURANTS - 1.42% | | | | |
| | 1,675 | | PF Chang's China Bistro, Inc. | | | 77,385 | |
| | 9,958 | | Texas Roadhouse, Inc. * | | | 140,009 | |
| | | | | | | 217,394 | |
| | | | | | | | |
| | | | RETAIL - 6.09% | | | | |
| | 4,325 | | Citi Trends, Inc. * | | | 104,708 | |
| | 3,597 | | Fossil, Inc. * | | | 193,483 | |
| | 3,260 | | Group 1 Automotive, Inc. * | | | 97,409 | |
| | 1,725 | | Jo-Ann Stores, Inc. * | | | 76,849 | |
| | 2,408 | | Kohl's Corp. * | | | 126,853 | |
| | 2,402 | | O'Reilly Automotive, Inc. * | | | 127,786 | |
| | 6,975 | | Ulta Salon Cosmetics & Fragrance, Inc. * | | | 203,670 | |
| | | | | | | 930,758 | |
| | | | | | | | |
| | | | SEMICONDUCTORS - 4.75% | | | | |
| | 16,388 | | Cypress Semiconductor Corp. * | | | 206,161 | |
| | 10,073 | | Marvell Technology Group, Ltd. * | | | 176,378 | |
| | 5,037 | | Netlogic Microsystems, Inc. * | | | 138,920 | |
| | 1,891 | | Silicon Laboratories, Inc. * | | | 69,305 | |
| | 6,550 | | Skyworks Solutions, Inc. * | | | 135,454 | |
| | | | | | | 726,218 | |
| | | | | | | | |
| | | | TELECOMMUNICATIONS - 6.24% | | | | |
| | 5,202 | | Aruba Networks, Inc. * | | | 111,011 | |
| | 10,796 | | NICE Systems, Ltd. (ADR) * | | | 337,807 | |
| | 12,510 | | SBA Communications Corp. - Class A * | | | 504,153 | |
| | | | | | | 952,971 | |
| | | | | | | | |
| | | | TRANSPORTATION - 3.99% | | | | |
| | 4,182 | | Atlas Air Worldwide Holdings, Inc. * | | | 210,355 | |
| | 2,775 | | CH Robinson Worldwide, Inc. | | | 194,028 | |
| | 1,750 | | Hub Group, Inc. - Class A * | | | 51,205 | |
| | 16,070 | | RailAmerica, Inc. * | | | 154,754 | |
| | | | | | | 610,342 | |
| | | | | | | | |
| | | | Total Common Stocks (cost $11,897,804) | | | 14,693,896 | |
| | | | | | | | |
The accompanying notes are an integral part of these financial statements.
Timothy Plan Scheduled of Investments
Schedule of Investments | Aggressive Growth
As of September 30, 2010
| Money Market Fund - 3.02% | | | |
| Number of Shares | | | | Fair Value | |
| | | | | | |
| | 461,632 | | Fidelity Institutional Money Market Portfolio, 0.20% (A) | | $ | 461,632 | |
| | | | | | | | |
| | | | Total Money Market Fund (cost $461,632) | | | 461,632 | |
| | | | | | | | |
| | | | TOTAL INVESTMENTS (cost $12,359,436) - 99.16% | | $ | 15,155,528 | |
| | | | | | | | |
| | | | OTHER ASSETS LESS LIABILITIES - 0.84% | | | 128,102 | |
| | | | | | | | |
| | | | NET ASSETS - 100.00% | | $ | 15,283,630 | |
| | | | | | | | |
| | | | | | | | |
| | | | | | | | |
| (ADR) American Depositary Receipt. | | | | |
| * Non-income producing securities. | | | | |
| (A) Variable rate security; the rate shown represents the yield at September 30, 2010. | | | | |
The accompanying notes are an integral part of these financial statements.
Timothy Plan Scheduled of Investments
Schedule of Investments | International
As of September 30, 2010
| | | | | | |
| Common Stocks - 95.66% | | | |
| Number of Shares | | | | Fair Value | |
| | | | | | |
| | | AUTOMOTIVE - 5.01% | | | |
| | 40,000 | | Fiat SpA (ADR) (B) | | $ | 614,000 | |
| | 35,000 | | Honda Motor Co., Ltd. (ADR) | | | 1,245,650 | |
| | | | | | | 1,859,650 | |
| | | | | | | | |
| | | | BANKS - 11.04% | | | | |
| | 25,600 | | Banco Bradesco SA (ADR) | | | 521,728 | |
| | 20,000 | | BOC Hong Kong (Holdings), Ltd. (ADR) (B) | | | 1,265,600 | |
| | 28,000 | | DBS Group Holdings, Ltd. (ADR) (B) | | | 1,201,200 | |
| | 19,400 | | Intesa Sanpaolo SpA (ADR) (B) | | | 377,136 | |
| | 64,000 | | Societe Generale (ADR) (B) | | | 734,720 | |
| | | | | | | 4,100,384 | |
| | | | | | | | |
| | | | BUILDING & CONSTRUCTION - 4.43% | | | | |
| | 28,900 | | Desarrolladora Homex SAB de C.V. (ADR) * | | | 935,493 | |
| | 28,000 | | Vinci SA (ADR) (B) | | | 349,440 | |
| | 109,000 | | Wienerberger AG (ADR) (B) * | | | 359,068 | |
| | | | | | | 1,644,001 | |
| | | | | | | | |
| | | | CHEMICALS - 7.06% | | | | |
| | 12,500 | | Agrium, Inc. | | | 937,375 | |
| | 37,400 | | Henkel AG & Co. KGaA (ADR) (B) | | | 1,684,870 | |
| | | | | | | 2,622,245 | |
| | | | | | | | |
| | | | CONSUMER GOODS - 6.49% | | | | |
| | 33,550 | | FUJIFILM Holdings Corp. (ADR) (B) | | | 1,107,150 | |
| | 14,000 | | Kerry Group PLC (ADR) (B) | | | 491,870 | |
| | 36,000 | | Shiseido Co, Ltd. (ADR)(B) | | | 811,080 | |
| | | | | | | 2,410,100 | |
| | | | | | | | |
| | | | DIVERSIFIED OPERATIONS - 6.96% | | | | |
| | 106,000 | | Keppel Corp., Ltd. (ADR) (B) | | | 1,449,020 | |
| | 24,000 | | Mitsubishi Corp. (ADR) (B) | | | 1,134,720 | |
| | | | | | | 2,583,740 | |
| | | | | | | | |
| | | | ELECTRIC POWER - 4.44% | | | | |
| | 60,000 | | Hongkong Electric Holdings, Ltd. (ADR) (B) | | | 363,000 | |
| | 12,000 | | International Power PLC (ADR) (B) | | | 732,000 | |
| | 8,200 | | RWE AG (ADR)(B) | | | 552,680 | |
| | | | | | | 1,647,680 | |
| | | | | | | | |
| | | | FINANCIAL / INVESTMENT SERVICES - 2.49% | | | | |
| | 164,000 | | 3i Group PLC (ADR) (B) | | | 370,197 | |
| | 14,500 | | ORIX Corp. (ADR) | | | 554,770 | |
| | | | | | | 924,967 | |
| | | | | | | | |
| | | | HEALTHCARE - 6.69% | | | | |
| | 23,000 | | Fresenius Medical Care AG & Co. KGaA (ADR) | | | 1,420,020 | |
| | 23,500 | | Smith & Nephew PLC (ADR) | | | 1,066,900 | |
| | | | | | | 2,486,920 | |
| | | | | | | | |
The accompanying notes are an integral part of these financial statements.
Timothy Plan Scheduled of Investments
Schedule of Investments | International
As of September 30, 2010
Common Stocks - 95.66% (continued) | | | |
| Number of Shares | | Fair Value | |
| | | | | | |
| | | INDUSTRIALS - 4.40% | | | |
| | 33,000 | | Atlas Copco AB - Class B (ADR) (B) | | $ | 580,800 | |
| | 63,000 | | Cookson Group PLC (ADR) (B) * | | | 543,035 | |
| | 23,000 | | Nidec Corp. (ADR) | | | 511,750 | |
| | | | | | | 1,635,585 | |
| | | | | | | | |
| | | | INFORMATION TECHNOLOGY - 3.14% | | | | |
| | 25,000 | | Canon, Inc. (ADR) | | | 1,168,000 | |
| | | | | | | | |
| | | | INSURANCE - 3.80% | | | | |
| | 26,000 | | Tokio Marine Holdings, Inc. (ADR) (B) | | | 698,360 | |
| | 30,500 | | Zurich Financial Services AG (ADR) (B) | | | 712,175 | |
| | | | | | | 1,410,535 | |
| | | | | | | | |
| | | | MINERALS & MINING - 6.44% | | | | |
| | 32,380 | | Anglo American plc (ADR) (B) | | | 643,391 | |
| | 58,000 | | Thompson Creek Metals Co., Inc. * | | | 625,240 | |
| | 40,500 | | Vale SA (ADR) | | | 1,123,875 | |
| | | | | | | 2,392,506 | |
| | | | | | | | |
| | | | OIL / NATURAL GAS - 7.38% | | | | |
| | 32,780 | | Petroleo Brasileiro S.A. (ADR) | | | 1,075,840 | |
| | 33,668 | | Statoil ASA (ADR) | | | 706,354 | |
| | 18,600 | | Total S.A. (ADR) | | | 959,760 | |
| | | | | | | 2,741,954 | |
| | | | | | | | |
| | | | RETAIL - 2.32% | | | | |
| | 37,000 | | William Morrison Supermarkets plc (ADR) (B) | | | 862,840 | |
| | | | | | | | |
| | | | SERVICES - 4.50% | | | | |
| | 44,000 | | ABB, Ltd. (ADR) * | | | 929,280 | |
| | 30,600 | | Focus Media Holding, Ltd. (ADR) * | | | 743,580 | |
| | | | | | | 1,672,860 | |
| | | | | | | | |
| | | | TELECOMMUNICATIONS - 9.07% | | | | |
| | 22,700 | | America Movil SAB de C.V. - Series L (ADR) | | | 1,210,591 | |
| | 52,000 | | Singapore Telecommunications, Ltd. (ADR) (B) | | | 1,238,120 | |
| | 55,000 | | Turkcell Iletisim Hizmetleri AS (ADR) | | | 921,800 | |
| | | | | | | 3,370,511 | |
| | | | | | | | |
| | | | Total Common Stocks (cost $31,626,535) | | | 35,534,478 | |
| | | | | | | | |
The accompanying notes are an integral part of these financial statements.
Timothy Plan Scheduled of Investments
Schedule of Investments | International
As of September 30, 2010
| Money Market Fund - 4.74% | | | |
| Number of Shares | | Fair Value | |
| | | | | | |
| | 1,760,671 | | Fidelity Institutional Money Market Portfolio, 0.20% (A) | | $ | 1,760,671 | |
| | | | | | | | |
| | | | Total Money Market Fund (cost $1,760,671) | | | 1,760,671 | |
| | | | | | | | |
| | | | TOTAL INVESTMENTS (cost $33,387,206) - 100.40% | | $ | 37,295,149 | |
| | | | | | | | |
| | | | LIABILITIES IN EXCESS OF OTHER ASSETS - (0.40)% | | | (147,541 | ) |
| | | | | | | | |
| | | | | | | | |
| | | | NET ASSETS - 100.00% | | $ | 37,147,608 | |
| | | | | | | | |
| (ADR) American Depositary Receipt. | | | | |
| * Non-income producing securities. | | | | |
| (A) Variable rate security; the rate shown represents the yield at September 30, 2010. | | | | |
| (B) Securities are priced using an evaluated bid provided by an independent pricing source, which is based on the Fund's Good Faith Pricing Guidelines. | |
| Such values are approved by the Board of Trustees and are considered Level 2 securities in accordance with GAAP valuation methods. | |
| The total value of such securities at September 30, 2010 is $18,876,472, which represents 51% of net assets. | |
| | | | | | | | |
| | | | | | | | |
| | | | | | | | |
| | | | | | | | |
| | | | | | | | |
| Diversification of Assets | | | | |
| Country | | | | Percentage of Net Assets | |
| Austria | | | | | 0.96 | % |
| Brazil | | | | | 7.33 | % |
| Canada | | | | | 4.21 | % |
| China | | | | | 2.00 | % |
| France | | | | | 5.50 | % |
| Germany | | | | | 9.85 | % |
| Hong Kong | | | | | 4.38 | % |
| Ireland | | | | | 1.32 | % |
| Italy | | | | | 2.67 | % |
| Japan | | | | | 19.47 | % |
| Mexico | | | | | 5.78 | % |
| Norway | | | | | 1.90 | % |
| Singapore | | | | | 10.47 | % |
| Sweden | | | | | 1.56 | % |
| Switzerland | | | | | 4.42 | % |
| Turkey | | | | | 2.48 | % |
| United Kingdom | | | | 11.36 | % |
| Total | | | | | 95.66 | % |
| Money Market Funds | | | 4.74 | % |
| Liabilities in Excess of Other Assets | | | -0.40 | % |
| Grand Total | | | | | 100.00 | % |
| | | | | | | | |
The accompanying notes are an integral part of these financial statements.
Timothy Plan Scheduled of Investments
Schedule of Investments | Large/Mid Cap Growth
As of September 30, 2010
| Common Stocks - 94.41% | | | |
| Number of Shares | | Fair Value | |
| | | | | | |
| | | CONSUMER GOODS - 3.74% | | | |
| | 14,480 | | Emerson Electric Co. | | $ | 762,517 | |
| | 26,050 | | Jarden Corp. | | | 810,936 | |
| | | | | | | 1,573,453 | |
| | | | | | | | |
| | | | DIVERSIFIED OPERATIONS - 0.69% | | | | |
| | 8,150 | | Ingersoll-Rand PLC | | | 291,036 | |
| | | | | | | | |
| | | | EDUCATION - 0.79% | | | | |
| | 6,795 | | DeVry, Inc. | | | 334,382 | |
| | | | | | | | |
| | | | FINANCIAL / INVESTMENT SERVICES - 12.78% | | | | |
| | 6,800 | | Affliiated Managers Group, Inc. * | | | 530,468 | |
| | 43,050 | | Discover Financial Services | | | 718,074 | |
| | 6,000 | | Franklin Resources, Inc. | | | 641,400 | |
| | 6,225 | | Greenhill & Co., Inc. | | | 493,767 | |
| | 53,355 | | Invesco, Ltd. | | | 1,132,727 | |
| | 14,175 | | MSCI, Inc. - Class A * | | | 470,752 | |
| | 16,050 | | SEI Investments Co. | | | 326,457 | |
| | 21,250 | | T. Rowe Price Group, Inc. | | | 1,063,881 | |
| | | | | | | 5,377,526 | |
| | | | | | | | |
| | | | HEALTHCARE - 16.12% | | | | |
| | 28,660 | | AmerisourceBergen Corp. | | | 878,716 | |
| | 51,565 | | Bruker Corp. * | | | 723,457 | |
| | 6,870 | | C.R. Bard, Inc. | | | 559,424 | |
| | 12,230 | | Covidien PLC | | | 491,524 | |
| | 7,110 | | DaVita, Inc. * | | | 490,803 | |
| | 3,498 | | Dendreon Corp. * | | | 144,048 | |
| | 14,960 | | Express Scripts, Inc. * | | | 728,552 | |
| | 15,900 | | Medco Health Solutions, Inc. * | | | 827,754 | |
| | 12,570 | | Patterson Cos, Inc. | | | 360,130 | |
| | 12,600 | | St. Jude Medical, Inc. * | | | 495,684 | |
| | 9,270 | | Sirona Dental Systems, Inc. * | | | 334,091 | |
| | 12,400 | | Varian Medical Systems, Inc. * | | | 750,200 | |
| | | | | | | 6,784,383 | |
| | | | | | | | |
| | | | INDUSTRIALS / MACHINERY - 10.51% | | | | |
| | 13,422 | | Babcock & Wilcox Co. * | | | 285,620 | |
| | 5,200 | | Danaher Corp. | | | 211,172 | |
| | 3,150 | | Flowserve Corp. | | | 344,673 | |
| | 12,475 | | Gardner Denver, Inc. | | | 669,658 | |
| | 10,550 | | Goodrich Corp. | | | 777,851 | |
| | 10,589 | | Greif, Inc. - Class A | | | 623,057 | |
| | 22,350 | | Johnson Controls, Inc. | | | 681,675 | |
| | 16,900 | | Kennametal, Inc. | | | 522,717 | |
| | 7,370 | | Pall Corp. | | | 306,887 | |
| | | | | | | 4,423,310 | |
| | | | | | | | |
| | | | | | | | |
The accompanying notes are an integral part of these financial statements.
Timothy Plan Scheduled of Investments
Schedule of Investments | Large/Mid Cap Growth
As of September 30, 2010
Common Stocks - 94.41% (Continued) | | | |
| Number of Shares | | Fair Value | |
| | | | | | |
| | | INFORMATION TECHNOLOGY - 11.90% | | | |
| | 8,700 | | Cognizant Technology Solutions Corp. - Class A * | | $ | 560,889 | |
| | 11,000 | | Concur Technologies, Inc. * | | | 543,840 | |
| | 7,140 | | Equinix, Inc. * | | | 730,779 | |
| | 2,295 | | F5 Networks, Inc. * | | | 238,244 | |
| | 10,000 | | FLIR Systems, Inc. * | | | 257,000 | |
| | 29,793 | | Gartner, Inc. * | | | 877,106 | |
| | 13,196 | | Informatica Corp. * | | | 506,858 | |
| | 29,000 | | Jabil Circuit, Inc. | | | 417,890 | |
| | 13,000 | | MICROS Systems, Inc. * | | | 550,290 | |
| | 12,475 | | Rackspace Hosting, Inc. * | | | 324,101 | |
| | | | | | | 5,006,997 | |
| | | | | | | | |
| | | | INSTRUMENTS - 3.28% | | | | |
| | 6,095 | | Mettler-Toledo International, Inc. * | | | 758,462 | |
| | 13,000 | | Thermo Fisher Scientific, Inc. * | | | 622,440 | |
| | | | | | | 1,380,902 | |
| | | | | | | | |
| | | | INSURANCE - 1.13% | | | | |
| | 27,801 | | Assured Guaranty, Ltd | | | 475,675 | |
| | | | | | | | |
| | | | MISCELLANEOUS SERVICES - 6.31% | | | | |
| | 6,910 | | Alliance Data Systems Corp. * | | | 450,947 | |
| | 5,330 | | Aptargroup, Inc. | | | 243,421 | |
| | 3,500 | | Discovery Communications, Inc. - Class A * | | | 152,425 | |
| | 50,490 | | Paychex, Inc. | | | 1,387,970 | |
| | 35,100 | | Sapient Corp. | | | 420,147 | |
| | | | | | | 2,654,910 | |
| | | | | | | | |
| | | | OIL & NATURAL GAS - 12.81% | | | | |
| | 9,150 | | Cameron International Corp. * | | | 393,084 | |
| | 39,100 | | EXCO Resources, Inc. | | | 581,417 | |
| | 26,170 | | Exxon Mobil Corp. | | | 1,617,044 | |
| | 11,350 | | Occidental Petroleum Corp. | | | 888,705 | |
| | 30,870 | | Statoil ASA (ADR) | | | 647,653 | |
| | 7,650 | | Sunoco, Inc. | | | 279,225 | |
| | 12,300 | | Valero Energy Corp. | | | 215,373 | |
| | 8,040 | | Whiting Petroleum Corp. * | | | 767,900 | |
| | | | | | | 5,390,401 | |
| | | | | | | | |
| | | | PHARMACEUTICALS - 2.55% | | | | |
| | 3,145 | | Alexion Pharmaceuticals, Inc. * | | | 202,412 | |
| | 5,775 | | Human Genome Sciences, Inc. * | | | 172,037 | |
| | 9,130 | | Salix Pharmaceuticals, Ltd. * | | | 362,644 | |
| | 6,020 | | United Therapeutics Corp. * | | | 337,180 | |
| | | | | | | 1,074,273 | |
| | | | | | | | |
| | | | RETAIL - 2.45% | | | | |
| | 6,500 | | Kohl's Corp. * | | | 342,420 | |
| | 6,164 | | O'Reilly Automotive, Inc. * | | | 327,925 | |
| | 12,320 | | Ulta Salon Cosmetics & Fragrance, Inc. * | | | 359,744 | |
| | | | | | | 1,030,089 | |
| | | | | | | | |
The accompanying notes are an integral part of these financial statements.
Timothy Plan Scheduled of Investments
Schedule of Investments | Large/Mid Cap Growth
As of September 30, 2010
Common Stocks - 94.41% (Continued) | | | |
| Number of Shares | | Fair Value | |
| | | | | | |
| | | SEMICONDUCTORS - 2.99% | | | |
| | 28,950 | | Marvell Technology Group, Ltd. * | | $ | 506,914 | |
| | 21,120 | | NVIDIA Corp. * | | | 246,682 | |
| | 4,600 | | Silicon Laboratories, Inc. * | | | 168,590 | |
| | 16,210 | | Skyworks Solutions, Inc. * | | | 335,223 | |
| | | | | | | 1,257,409 | |
| | | | | | | | |
| | | | TELECOMMUNICATIONS - 4.89% | | | | |
| | 10,000 | | L-3 Communications Holdings, Inc. | | | 722,700 | |
| | 20,850 | | NICE Systems, Ltd. (ADR) * | | | 652,396 | |
| | 16,975 | | SBA Communications Corp. - Class A * | | | 684,093 | |
| | | | | | | 2,059,189 | |
| | | | | | | | |
| | | | TRANSPORTATION - 1.47% | | | | |
| | 8,875 | | CH Robinson Worldwide, Inc. | | | 620,540 | |
| | | | | | | | |
| | | | Total Common Stocks (cost $35,786,470) | | | 39,734,475 | |
| | | | | | | | |
| Money Market Fund - 3.44% | | | | |
| Number of Shares | | Fair Value | |
| | | | | | | | |
| | 1,447,190 | | Fidelity Institutional Money Market Portfolio, 0.20% (A) | | | 1,447,190 | |
| | | | | | | | |
| | | | Total Money Market Fund (cost $1,447,190) | | | 1,447,190 | |
| | | | | | | | |
| | | | TOTAL INVESTMENTS (cost $37,233,660) - 97.85% | | $ | 41,181,665 | |
| | | | | | | | |
| | | | OTHER ASSETS LESS LIABILITIES - 2.15% | | | 906,795 | |
| | | | | | | | |
| | | | NET ASSETS - 100.00% | | $ | 42,088,460 | |
| | | | | | | | |
| | | | | | | | |
| *Non-income producing securities. | | | | |
| (ADR) American Depositary Receipt. | | | | |
| (A) Variable rate security; the rate shown represents the yield at September 30, 2010. | | | | |
The accompanying notes are an integral part of these financial statements.
Timothy Plan Scheduled of Investments
Schedule of Investments | Small Cap Value
As of September 30, 2010
| Common Stocks - 90.11% | | | |
| Number of Shares | | Fair Value | |
| | | | | | |
| | | AEROSPACE EQUIPMENT - 3.24% | | | |
| | 28,500 | | Moog, Inc. - Class A * | | $ | 1,012,035 | |
| | 13,500 | | Teledyne Technologies, Inc. * | | | 537,570 | |
| | | | | | | 1,549,605 | |
| | | | | | | | |
| | | | BANKS - 13.43% | | | | |
| | 13,908 | | Bancfirst Corp. | | | 562,718 | |
| | 25,274 | | Chemical Financial Corp. | | | 521,655 | |
| | 31,600 | | East West Bancorp., Inc. | | | 514,448 | |
| | 2,902 | | First Citizens BancShares, Inc. - Class A | | | 537,654 | |
| | 30,200 | | First Financial Bancorp | | | 503,736 | |
| | 53,600 | | FirstMerit Corp. | | | 981,952 | |
| | 8,073 | | Suffolk Bancorp | | | 204,408 | |
| | 12,450 | | SVB Financial Group * | | | 526,884 | |
| | 61,726 | | Texas Capital Bancshares, Inc. * | | | 1,066,008 | |
| | 28,100 | | UMB Financial Corp. | | | 997,831 | |
| | | | | | | 6,417,294 | |
| | | | | | | | |
| | | | CHEMICALS - 2.22% | | | | |
| | 34,759 | | Sensient Technologies Corp. | | | 1,059,802 | |
| | | | | | | | |
| | | | CONSTRUCTION - 4.25% | | | | |
| | 36,400 | | Astec Industries, Inc. * | | | 1,038,492 | |
| | 38,417 | | Layne Christensen Co. * | | | 994,616 | |
| | | | | | | 2,033,108 | |
| | | | | | | | |
| | | | CONSUMER GOODS - 4.56% | | | | |
| | 13,200 | | Diamond Foods, Inc. | | | 541,068 | |
| | 16,400 | | Jarden Corp. | | | 510,532 | |
| | 38,800 | | Wolverine World Wide, Inc. | | | 1,125,588 | |
| | | | | | | 2,177,188 | |
| | | | | | | | |
| | | | ELECTRIC POWER - 4.12% | | | | |
| | 46,900 | | Avista Corp. | | | 979,272 | |
| | 33,400 | | Cleco Corp. | | | 989,308 | |
| | | | | | | 1,968,580 | |
| | | | | | | | |
| | | | FINANCIAL & INVESTMENT SERVICES - 4.08% | | | | |
| | 90,817 | | Calamos Asset Management, Inc. - Class A | | | 1,044,396 | |
| | 72,900 | | Knight Capital Group, Inc. - Class A * | | | 903,231 | |
| | | | | | | 1,947,627 | |
| | | | | | | | |
| | | | HEALTHCARE - 2.29% | | | | |
| | 180,120 | | CryoLife, Inc. * | | | 1,093,328 | |
| | | | | | | | |
| | | | INDUSTRIALS - 11.56% | | | | |
| | 41,483 | | AAON, Inc. | | | 975,680 | |
| | 17,598 | | A.O. Smith Corp. | | | 1,018,748 | |
| | 29,300 | | Kaydon Corp. | | | 1,013,780 | |
| | 11,200 | | Lennox International, Inc. | | | 466,928 | |
| | 72,787 | | Twin Disc, Inc. | | | 1,015,379 | |
| | 21,600 | | Wabtec Corp. | | | 1,032,264 | |
| | | | | | | 5,522,779 | |
| | | | | | | | |
The accompanying notes are an integral part of these financial statements.
Timothy Plan Scheduled of Investments
Schedule of Investments | Small Cap Value
As of September 30, 2010
Common Stocks - 90.11% (Continued) | | | |
| Number of Shares | | Fair Value | |
| | | | | | |
| | | INFORMATION TECHNOLOGY - 7.46% | | | |
| | 30,791 | | Benchmark Electronics, Inc.* | | $ | 504,972 | |
| | 26,400 | | ManTech International Corp. - Class A * | | | 1,045,440 | |
| | 40,900 | | Quest Software, Inc. * | | | 1,005,731 | |
| | 35,800 | | SYNNEX Corp. * | | | 1,007,412 | |
| | | | | | | 3,563,555 | |
| | | | | | | | |
| | | | INSURANCE - 2.09% | | | | |
| | 20,482 | | Infinity Property & Casualty Corp. | | | 998,907 | |
| | | | | | | | |
| | | | MINING - 1.01% | | | | |
| | 44,700 | | Thompson Creek Metals Company, Inc. * | | | 481,866 | |
| | | | | | | | |
| | | | MISCELLANEOUS SERVICES - 5.63% | | | | |
| | 22,500 | | Dawson Geophysical Co. * | | | 599,625 | |
| | 12,800 | | John Wiley & Sons, Inc. - Class A | | | 523,008 | |
| | 23,300 | | Rent-A-Center, Inc. | | | 521,454 | |
| | 44,800 | | Rollins, Inc. | | | 1,047,424 | |
| | | | | | | 2,691,511 | |
| | | | | | | | |
| | | | OIL & NATURAL GAS - 7.04% | | | | |
| | 22,600 | | Approach Resources, Inc. * | | | 252,668 | |
| | 35,900 | | Atlas Energy, Inc. * | | | 1,028,176 | |
| | 65,465 | | Georesources, Inc. * | | | 1,040,894 | |
| | 81,300 | | Rex Energy Corp. * | | | 1,040,640 | |
| | | | | | | 3,362,378 | |
| | | | | | | | |
| | | | RESTAURANTS - 2.18% | | | | |
| | 39,500 | | Papa Johns International, Inc. * | | | 1,042,010 | |
| | | | | | | | |
| | | | RETAIL - 7.45% | | | | |
| | 12,200 | | BJ's Wholesale Club, Inc. * | | | 506,300 | |
| | 10,856 | | Childrens Place Retail Stores, Inc./The * | | | 529,447 | |
| | 35,700 | | Finish Line, Inc./The - Class A | | | 496,587 | |
| | 22,900 | | Jo-Ann Stores, Inc. * | | | 1,020,195 | |
| | 69,597 | | Spartan Stores, Inc. | | | 1,009,157 | |
| | | | | | | 3,561,686 | |
| | | | | | | | |
| | | | SEMICONDUCTORS - 2.12% | | | | |
| | 56,400 | | MKS Instruments, Inc. * | | | 1,014,072 | |
| | | | | | | | |
| | | | TRANSPORTATION - 5.38% | | | | |
| | 24,100 | | Genesee & Wyoming, Inc. - Class A * | | | 1,045,699 | |
| | 26,864 | | Landstar System, Inc. | | | 1,037,488 | |
| | 32,781 | | Saia Inc. * | | | 489,420 | |
| | | | | | | 2,572,607 | |
| | | | | | | | |
| | | | Total Common Stocks (cost $39,797,097) | | | 43,057,903 | |
| | | | | | | | |
The accompanying notes are an integral part of these financial statements.
Timothy Plan Scheduled of Investments
Schedule of Investments | Small Cap Value
As of September 30, 2010
| REITs - 4.11% | | | |
| Number of Shares | | Fair Value | |
| | | | | | |
| | 18,600 | | Equity Lifestyle Properties, Inc. | | | 1,013,328 | |
| | 40,600 | | Healthcare Realty Trust, Inc. | | | 949,634 | |
| | | | | | | | |
| | | | Total REITs (cost $1,834,193) | | | 1,962,962 | |
| | | | | | | | |
The accompanying notes are an integral part of these financial statements.
Timothy Plan Scheduled of Investments
Schedule of Investments | Small Cap Value
As of September 30, 2010
| Money Market Fund - 6.69% | | | |
| Number of Shares | | Fair Value | |
| | | | | | |
| | 3,195,474 | | Fidelity Institutional Money Market Portfolio, 0.20% (A) | | $ | 3,195,474 | |
| | | | | | | | |
| | | | Total Money Market Fund (cost $3,195,474) | | | 3,195,474 | |
| | | | | | | | |
| | | | TOTAL INVESTMENTS (cost $44,826,764) - 100.91% | | $ | 48,216,339 | |
| | | | | | | | |
| | | | LIABILITIES IN EXCESS OF OTHER ASSETS - (0.91)% | | | (434,466 | ) |
| | | | | | | | |
| | | | NET ASSETS - 100.00% | | $ | 47,781,873 | |
| | | | | | | | |
| | | | | | | | |
| * Non-income producing securities. | | | | |
| (A) Variable rate security; the rate shown represents the yield at September 30, 2010. | | | | |
The accompanying notes are an integral part of these financial statements.
Timothy Plan Scheduled of Investments
Schedule of Investments | Large/Mid Cap Value
As of September 30, 2010
| Common Stocks - 90.72% | | | |
| Number of Shares | | Fair Value | |
| | | | | | |
| | | BANKS - 1.90% | | | |
| | 72,000 | | BB&T Corp. | | $ | 1,733,760 | |
| | | | | | | | |
| | | | CONSUMER GOODS - 12.04% | | | | |
| | 46,900 | | BorgWarner, Inc. * | | | 2,467,878 | |
| | 56,900 | | Dr Pepper Snapple Group, Inc. | | | 2,021,088 | |
| | 48,800 | | Emerson Electric Co. | | | 2,569,808 | |
| | 33,400 | | JM Smucker Co./The | | | 2,021,702 | |
| | 66,800 | | Sysco Corp. | | | 1,905,136 | |
| | | | | | | 10,985,612 | |
| | | | | | | | |
| | | | ELECTRIC POWER - 6.79% | | | | |
| | 57,800 | | American Electric Power Co., Inc. | | | 2,094,094 | |
| | 47,000 | | Dominion Resources, Inc. | | | 2,052,020 | |
| | 53,300 | | FirstEnergy Corp. | | | 2,054,182 | |
| | | | | | | 6,200,296 | |
| | | | | | | | |
| | | | FINANCIAL & INVESTMENT SERVICES - 8.49% | | | | |
| | 10,900 | | BlackRock, Inc. | | | 1,855,725 | |
| | 57,800 | | Eaton Vance Corp. | | | 1,678,512 | |
| | 17,100 | | Franklin Resources, Inc. | | | 1,827,990 | |
| | 112,600 | | Invesco, Ltd. | | | 2,390,498 | |
| | | | | | | 7,752,725 | |
| | | | | | | | |
| | | | HEALTHCARE - 10.14% | | | | |
| | 74,000 | | CareFusion Corp. * | | | 1,838,160 | |
| | 56,600 | | Covidien PLC | | | 2,274,754 | |
| | 22,800 | | CR Bard, Inc. | | | 1,856,604 | |
| | 28,800 | | DENTSPLY International, Inc. | | | 920,736 | |
| | 38,300 | | McKesson Corp. | | | 2,366,174 | |
| | | | | | | 9,256,428 | |
| | | | | | | | |
| | | | INDUSTRIALS - 2.12% | | | | |
| | 15,200 | | Precision Castparts Corp. | | | 1,935,720 | |
| | | | | | | | |
| | | | | | | | |
| | | | INFORMATION TECHNOLOGY - 2.56% | | | | |
| | 110,600 | | CA, Inc. | | | 2,335,872 | |
| | | | | | | | |
| | | | | | | | |
| | | | | | | | |
The accompanying notes are an integral part of these financial statements.
Timothy Plan Scheduled of Investments
Schedule of Investments | Large/Mid Cap Value
As of September 30, 2010
Common Stocks - 90.72% (Continued) | | | |
| Number of Shares | | Fair Value | |
| | | | | | |
| | | INSURANCE - 9.04% | | | |
| | 37,700 | | ACE, Ltd. | | $ | 2,196,025 | |
| | 25,400 | | Arch Capital Group, Ltd. * | | | 2,128,520 | |
| | 63,000 | | Axis Capital Holdings, Ltd. | | | 2,075,220 | |
| | 60,100 | | Willis Group Holdings, PLC | | | 1,852,282 | |
| | | | | | | 8,252,047 | |
| | | | | | | | |
| | | | MACHINERY - 5.95% | | | | |
| | 43,000 | | Deere & Co. | | | 3,000,540 | |
| | 22,200 | | Flowserve Corp. | | | 2,429,124 | |
| | | | | | | 5,429,664 | |
| | | | | | | | |
| | | | OIL & NATURAL GAS - 20.42% | | | | |
| | 34,100 | | Anadarko Petroleum Corp. | | | 1,945,405 | |
| | 18,400 | | Apache Corp. | | | 1,798,784 | |
| | 18,600 | | ConocoPhillips | | | 1,068,198 | |
| | 7,300 | | Devon Energy Corp. | | | 472,602 | |
| | 45,200 | | EQT Corp. | | | 1,629,912 | |
| | 52,300 | | Exxon Mobil Corp. | | | 3,231,617 | |
| | 60,700 | | Marathon Oil Corp. | | | 2,009,170 | |
| | 34,700 | | Murphy Oil Corp. | | | 2,148,624 | |
| | 46,300 | | National Oilwell Varco, Inc. | | | 2,058,961 | |
| | 29,000 | | Occidental Petroleum Corp. | | | 2,270,700 | |
| | | | | | | 18,633,973 | |
| | | | | | | | |
| | | | RETAIL - 8.36% | | | | |
| | 40,100 | | Advance Auto Parts, Inc. | | | 2,353,068 | |
| | 33,500 | | Costco Wholesale Corp. | | | 2,160,415 | |
| | 17,300 | | Kohls Corp. * | | | 911,364 | |
| | 29,300 | | Sherwin-Williams Co./The | | | 2,201,602 | |
| | | | | | | 7,626,449 | |
| | | | | | | | |
| | | | TRANSPORTATION - 2.91% | | | | |
| | 32,500 | | Union Pacific Corp. | | | 2,658,500 | |
| | | | | | | | |
| | | | Total Common Stocks (cost $73,458,133) | | | 82,801,046 | |
| | | | | | | | |
| Master Limited Partnerships - 2.06% | | | | |
| Number of Shares | | Fair Value | |
| | | | | | | | |
| | 53,700 | | Lazard, Ltd. - Class A | | | 1,883,796 | |
| | | | | | | | |
| | | | Total Master Limited Partnerships (cost $2,107,162) | | | 1,883,796 | |
| | | | | | | | |
| REITs - 4.91% | | | | |
| Number of Shares | | Fair Value | |
| | | | | | | | |
| | 61,400 | | HCP, Inc. | | | 2,209,172 | |
| | 23,400 | | Public Storage | | | 2,270,736 | |
| | | | | | | | |
| | | | Total REITs (cost $3,613,173) | | | 4,479,908 | |
| | | | | | | | |
The accompanying notes are an integral part of these financial statements.
Timothy Plan Scheduled of Investments
Schedule of Investments | Large/Mid Cap Value
As of September 30, 2010
| Money Market Fund - 2.16% | | | |
| Number of Shares | | Fair Value | |
| | | | | | |
| | 1,975,210 | | Fidelity Institutional Money Market Portfolio, 0.20% (A) | | $ | 1,975,210 | |
| | | | | | | | |
| | | | Total Money Market Fund (cost $1,975,210) | | | 1,975,210 | |
| | | | | | | | |
| | | | TOTAL INVESTMENTS (cost $81,153,678) - 99.85% | | $ | 91,139,960 | |
| | | | | | | | |
| | | | OTHER ASSETS LESS LIABILITIES - 0.15% | | | 139,937 | |
| | | | | | | | |
| | | | NET ASSETS - 100.00% | | $ | 91,279,897 | |
| | | | | | | | |
| | | | | | | | |
| * Non-income producing securities. | | | | |
| (A) Variable rate security; the rate shown represents the yield at September 30, 2010. | | | | |
The accompanying notes are an integral part of these financial statements.
Timothy Plan Scheduled of Investments
Schedule of Investments | Fixed Income
As of September 30, 2010
| Bonds and Notes - 89.40% | | | |
| Par Value | | | | Fair Value | |
| | | | | | |
| | | ASSET-BACKED SECURITIES - 0.51% | | | |
| $ | 190,339 | | John Deere Owner Trust, 2.59%, 10/15/2013 | | $ | 192,675 | |
| | 145,000 | | John Deere Owner Trust, 3.96%, 05/16/2016 | | | 152,624 | |
| | | | | | | | |
| | | | Total Asset-Backed Securities (cost $335,991) | | | 345,299 | |
| | | | | | | | |
| | | | CORPORATE BONDS - 28.81% | | | | |
| | 500,000 | | America Movil SAB de C.V., 5.00%, 03/30/2020 | | | 541,768 | |
| | 1,000,000 | | Cameron International Corp., 6.375%, 07/15/2018 | | | 1,139,925 | |
| | 750,000 | | Canadian National Railway Co., 5.80%, 06/01/2016 | | | 893,612 | |
| | 750,000 | | ConocoPhillips, 4.60%, 01/15/2015 | | | 843,151 | |
| | 500,000 | | Covidien International Finance SA, 5.45%, 10/15/2012 | | | 544,668 | |
| | 910,000 | | CRH America, Inc., 6.00%, 09/30/2016 | | | 1,020,143 | |
| | 950,000 | | Dominion Resources, Inc., 5.00%, 03/15/2013 | | | 1,036,386 | |
| | 100,000 | | Entergy Gulf States, Inc., 5.70%, 06/01/2015 | | | 100,173 | |
| | 500,000 | | Enterprise Products Operating, LLC, 6.125%, 10/15/2039 | | | 540,077 | |
| | 900,000 | | ERP Operating LP, 5.125%, 03/15/2016 | | | 986,637 | |
| | 500,000 | | Express Scripts, Inc., 5.25%, 06/15/2012 | | | 533,994 | |
| | 500,000 | | Johnson Controls, Inc., 5.00%, 03/30/2020 | | | 550,550 | |
| | 750,000 | | Kinder Morgan Energy Partners LP, 5.125%, 11/15/2014 | | | 829,381 | |
| | 500,000 | | L-3 Communications, Corp., 5.20%, 10/15/2019 | | | 541,459 | |
| | 750,000 | | Marathon Oil Corp., 6.00%, 10/01/2017 | | | 874,083 | |
| | 1,000,000 | | NASDAQ OMX Group, Inc./The, 4.00%, 01/15/2015 | | | 1,034,461 | |
| | 750,000 | | Nisource Finance Corp., 5.40%, 07/15/2014 | | | 835,278 | |
| | 500,000 | | Oneok, Inc., 5.20%, 06/15/2015 | | | 550,527 | |
| | 300,000 | | Protective Life Secured Trusts, 5.75%, 01/15/2019 | | | 302,257 | |
| | 750,000 | | PSI Energy, Inc., 6.05%, 06/15/2016 | | | 886,886 | |
| | 750,000 | | Simon Property Group LP, 5.75%, 12/01/2015 | | | 855,017 | |
| | 500,000 | | Transocean, Inc., 6.00%, 03/15/2018 | | | 532,600 | |
| | 1,000,000 | | Tyco Electronics Group SA, 6.00%, 10/01/2012 | | | 1,081,917 | |
| | 300,000 | | Unitrin, Inc., 4.875%, 11/01/2010 | | | 300,413 | |
| | 500,000 | | Valero Energy Corp., 6.625%, 06/15/2037 | | | 503,692 | |
| | 750,000 | | Weatherford International, Ltd., 4.95%, 10/15/2013 | | | 809,135 | |
| | 750,000 | | Willis North America, Inc., 6.20%, 03/28/2017 | | | 800,249 | |
| | | | | | | | |
| | | | Total Corporate Bonds (cost $17,738,108) | | | 19,468,439 | |
| | | | | | | | |
| | | | U.S. GOVERNMENT & AGENCY OBLIGATIONS - 60.08% | | | | |
| | | | Government Notes & Bonds - 27.87% | | | | |
| | 1,500,000 | | Federal Farm Credit Bank, 4.875%, 01/17/2017 | | | 1,745,344 | |
| | 1,500,000 | | Federal Farm Credit Bank, 5.125%, 08/25/2016 | | | 1,787,878 | |
| | 1,000,000 | | Federal Home Loan Bank, 5.00%, 11/17/2017 | | | 1,186,364 | |
| | 1,500,000 | | Federal Home Loan Bank, 5.50%, 08/13/2014 | | | 1,749,626 | |
| | 2,000,000 | | U.S. Treasury Bond, 3.125%, 05/15/2019 | | | 2,125,470 | |
| | 1,500,000 | | U.S. Treasury Bond, 4.375%, 05/15/2040 | | | 1,684,931 | |
| | 1,000,000 | | U.S. Treasury Bond, 5.00%, 05/15/2037 | | | 1,241,875 | |
| | 2,500,000 | | U.S. Treasury Note, 3.50%, 05/15/2020 | | | 2,714,065 | |
| | 2,000,000 | | U.S. Treasury Note, 3.875%, 05/15/2018 | | | 2,258,438 | |
| | 2,050,000 | | U.S. Treasury Note, 4.75%, 05/15/2014 | | | 2,339,882 | |
| | | | | | | | |
| | | | Total Government Notes & Bonds (cost $17,830,147) | | | 18,833,873 | |
The accompanying notes are an integral part of these financial statements.
Timothy Plan Scheduled of Investments
Schedule of Investments | Fixed Income
As of September 30, 2010
Bonds and Notes - 89.40% (continued) | | | |
| Par Value | | | | Fair Value | |
| | | | | | |
| | | U.S. GOVERNMENT & AGENCY OBLIGATIONS - 60.08% (continued) | | | |
| | | Government Mortgage-Backed Securities - 25.28% | | | |
| $ | 122,907 | | GNMA Pool 3584, 6.00%, 07/20/2034 | | $ | 134,378 | |
| | 269,366 | | GNMA Pool 3612, 6.50%, 09/20/2034 | | | 299,447 | |
| | 838,479 | | GNMA Pool 3625, 6.00%, 10/20/2034 | | | 917,741 | |
| | 362,095 | | GNMA Pool 3637, 5.50%, 11/20/2034 | | | 390,942 | |
| | 562,381 | | GNMA Pool 3665, 5.50%, 01/20/2035 | | | 606,749 | |
| | 278,160 | | GNMA Pool 3679, 6.00%, 02/20/2035 | | | 303,718 | |
| | 725,734 | | GNMA Pool 3711, 5.50%, 05/20/2035 | | | 782,990 | |
| | 717,869 | | GNMA Pool 3865, 6.00%, 06/20/2036 | | | 781,850 | |
| | 519,424 | | GNMA Pool 3910, 6.00%, 10/20/2036 | | | 565,719 | |
| | 954,792 | | GNMA Pool 3939, 5.00%, 01/20/2037 | | | 1,020,353 | |
| | 1,059,428 | | GNMA Pool 4058, 5.00%, 12/20/2037 | | | 1,132,174 | |
| | 1,217,040 | | GNMA Pool 4072, 5.50%, 01/20/2038 | | | 1,309,049 | |
| | 2,965,834 | | GNMA Pool 4520, 5.00%, 08/20/2039 | | | 3,169,228 | |
| | 1,818,266 | | GNMA Pool 4541, 5.00%, 09/20/2039 | | | 1,942,961 | |
| | 46,407 | | GNMA Pool 585163, 5.00%, 02/15/2018 | | | 49,696 | |
| | 47,660 | | GNMA Pool 585180, 5.00%, 02/15/2018 | | | 51,039 | |
| | 41,454 | | GNMA Pool 592492, 5.00%, 03/15/2018 | | | 44,393 | |
| | 39,501 | | GNMA Pool 599821, 5.00%, 01/15/2018 | | | 42,301 | |
| | 599,540 | | GNMA Pool 604182, 5.50%, 04/15/2033 | | | 648,501 | |
| | 326,331 | | GNMA Pool 663776, 6.50%, 01/15/2037 | | | 359,354 | |
| | 2,247,676 | | GNMA Pool 717072, 5.00%, 05/15/2039 | | | 2,397,299 | |
| | 120,235 | | GNMA Pool 781694, 6.00%, 12/15/2031 | | | 131,958 | |
| | | | | | | | |
| | | | Total Government Mortgage-Backed Securities (cost $16,114,688) | | | 17,081,840 | |
| | | | | | | | |
| | | | Treasury Inflation Protection Securities - 6.93% | | | | |
| | 2,654,708 | | TIPS, 2.00%, 01/15/2014 | | | 2,849,664 | |
| | 1,619,265 | | TIPS, 2.50%, 07/15/2016 | | | 1,835,842 | |
| | | | | | | | |
| | | | Total Treasury Inflation Protection Securities (cost $4,320,531) | | | 4,685,506 | |
| | | | | | | | |
| | | | Total U.S. Government & Agency Obligations (cost $38,265,366) | | | 40,601,219 | |
| | | | | | | | |
| | | | Total Bonds and Notes (cost $56,339,464) | | | 60,414,957 | |
| | | | | | | | |
| | | | | | | | |
| Money Market Fund - 16.21% | | | | |
| Number of Shares | | Fair Value | |
| | | | | | | | |
| | 10,951,503 | | Fidelity Institutional Money Market Portfolio, 0.20% (A) | | | 10,951,503 | |
| | | | | | | | |
| | | | Total Money Market Fund (cost $10,951,503) | | | 10,951,503 | |
| | | | | | | | |
| | | | TOTAL INVESTMENTS (cost $67,290,968) - 105.61% | | $ | 71,366,460 | |
| | | | | | | | |
| | | | LIABILITIES IN EXCESS OF OTHER ASSETS - (5.61)% | | | (3,786,068 | ) |
| | | | | | | | |
| | | | NET ASSETS - 100.00% | | $ | 67,580,392 | |
| | | | | | | | |
| (A) Variable rate security; the rate shown represents the yield at September 30, 2010. | | | | |
The accompanying notes are an integral part of these financial statements.
Timothy Plan Scheduled of Investments
Schedule of Investments | High Yield Bond
As of September 30, 2010
| | | | | | |
| Bonds and Notes - 96.58% | | | |
| Par Value | | | | Fair Value | |
| | | | | | |
| | | CONVERTIBLE CORPORATE BONDS - 1.92% | | | |
| $ | 500,000 | | Hornbeck Offshore Services, Inc., 1.625%, 11/15/2026 (B) | | $ | 435,700 | |
| | | | | | | | |
| | | | Total Convertible Corporate Bonds (cost $377,500) | | | 435,700 | |
| | | | | | | | |
| | | | CORPORATE BONDS - 94.66% | | | | |
| | 250,000 | | Actuant Corp., 6.875%, 06/15/2017 | | | 256,250 | |
| | 250,000 | | Arch Coal, Inc., 8.75%, 08/01/2016 | | | 276,875 | |
| | 500,000 | | Ashtead Holdings PLC, 8.625%, 08/01/2015 (A) | | | 517,500 | |
| | 500,000 | | Atlas Pipeline Partners LP, 8.125%, 12/15/2015 | | | 507,500 | |
| | 500,000 | | Berry Petroleum Co., 8.25%, 11/01/2016 | | | 515,000 | |
| | 500,000 | | Cemex Finance LLC, 9.50%, 12/14/2016 (A) | | | 505,600 | |
| | 500,000 | | Cloud Peak Energy Resources LLC, 8.50%, 12/15/2019 | | | 538,750 | |
| | 500,000 | | Comstock Resources, Inc., 8.375%, 10/15/2017 | | | 518,125 | |
| | 100,000 | | Concho Resources, Inc., 8.625%, 10/01/2017 | | | 106,500 | |
| | 250,000 | | Continental Resources, Inc., 7.125%, 04/01/2021 (A) | | | 261,250 | |
| | 500,000 | | Copano Energy Finance Corp., 7.75%, 06/01/2018 | | | 507,500 | |
| | 575,000 | | Cricket Communications, Inc., 9.375% 11/01/2014 | | | 598,000 | |
| | 500,000 | | Crosstex Energy LP, 8.875%, 02/15/2018 | | | 526,250 | |
| | 500,000 | | Crum & Forster Holdings Corp., 7.75%, 05/01/2017 | | | 523,125 | |
| | 500,000 | | Duquesne Light Holdings, Inc., 6.40%, 09/15/2010 (A) | | | 509,471 | |
| | 500,000 | | Dynegy Holdings, Inc., 7.75%, 06/01/2019 | | | 345,000 | |
| | 99,000 | | Energy Future Holdings Corp., 10.875%, 11/01/2017 | | | 59,895 | |
| | 256,000 | | Energy Future Intermediate Holding Co., LLC, 10.00%, 12/01/2020 | | | 255,338 | |
| | 500,000 | | Forest Oil Corp., 7.25%, 06/15/2019 | | | 513,750 | |
| | 500,000 | | Geo Group, Inc., 7.75%, 10/15/2017 (A) | | | 527,500 | |
| | 500,000 | | Goodyear Tire & Rubber Co., 10.50%, 05/15/2016 | | | 568,750 | |
| | 500,000 | | Helix Energy Solutions Group, Inc., 9.50%, 01/15/2016 (A) | | | 508,750 | |
| | 500,000 | | Intergen NV, 9.00%, 06/30/2017 (A) | | | 531,250 | |
| | 420,000 | | Ipalco Enterprises, Inc., 7.25%, 04/01/2016 (A) | | | 453,600 | |
| | 500,000 | | Janus Capital Group, Inc., 6.95%, 06/15/2017 | | | 523,006 | |
| | 130,000 | | Kansas City Southern Railway, 13.00%, 12/15/2013 | | | 158,112 | |
| | 500,000 | | Lyondell Chemical Co., 8.00%, 11/01/2017 (A) | | | 547,500 | |
| | 250,000 | | MarkWest Energy Partners L.P., 6.875%, 11/01/2014 | | | 254,687 | |
| | 500,000 | | MetroPCS Wireless, Inc., 7.875%, 09/01/2018 | | | 517,500 | |
| | 500,000 | | Momentive Performance Materials, Inc., 9.75%, 12/01/2014 | | | 515,000 | |
| | 500,000 | | Navios Maritime Holdings, Inc., 8.875%, 11/01/2017 (A) | | | 530,000 | |
| | 500,000 | | Navistar International Corp., 8.25%, 11/01/2021 | | | 536,250 | |
| | 500,000 | | Nova Chemicals Corp., 8.625%, 11/01/2019 | | | 533,125 | |
| | 500,000 | | NRG Energy, Inc., 7.375%, 01/15/2017 | | | 513,750 | |
| | 1,000,000 | | Omnicare, Inc., 7.75%, 06/01/2020 | | | 1,027,500 | |
| | 250,000 | | PolyOne Corp., 7.375%, 09/15/2020 | | | 258,438 | |
| | 250,000 | | Pride International, Inc., 6.875%, 08/15/2020 | | | 273,438 | |
| | 500,000 | | Sanmina-SCI Corp., 8.125%, 03/01/2016 | | | 515,000 | |
| | 500,000 | | Sealy Mattress Co., 8.25%, 06/15/2014 | | | 506,250 | |
| | 250,000 | | Service Corp. International, 7.00%, 06/15/2017 | | | 265,625 | |
| | 500,000 | | Swift Energy Co., 7.125%, 06/01/2017 | | | 497,500 | |
| | 150,000 | | Targa Resources Partners LP, 7.875%, 10/15/2018 (A) | | | 157,125 | |
| | 310,000 | | Tesoro Corp., 9.75%, 06/01/2019 | | | 342,550 | |
| | 250,000 | | Texas Industries, Inc., 9.25%, 08/15/2020 (A) | | | 260,625 | |
| | | | | | | | |
The accompanying notes are an integral part of these financial statements.
Timothy Plan Scheduled of Investments
Schedule of Investments | High Yield Bond
As of September 30, 2010
Bonds and Notes - 96.58% (continued) | | | |
| Par Value | | | Fair Value | |
| | | | | | |
| | | CORPORATE BONDS - 94.66% (continued) | | | |
| $ | 500,000 | | United Rentals North America, Inc., 9.25%, 12/15/2019 | | $ | 543,750 | |
| | 500,000 | | United States Steel Corp., 6.05%, 06/01/2017 | | | 498,125 | |
| | 500,000 | | USG Corp., 9.50%, 01/15/2018 | | | 493,125 | |
| | 500,000 | | W & T Offshore, Inc., 8.25%, 06/15/2014 (A) | | | 482,500 | |
| | 250,000 | | Whiting Petroleum Corp., 7.00%, 02/01/2014 | | | 265,000 | |
| | | | | | | | |
| | | | Total Corporate Bonds (cost $20,490,549) | | | 21,447,010 | |
| | | | | | | | |
| Money Market Fund - 1.23% | | | | |
| Number of Shares | | Fair Value | |
| | | | | | | | |
| | 279,072 | | Fidelity Institutional Money Market Portfolio, 0.20% (B) | | | 279,072 | |
| | | | | | | | |
| | | | Total Money Market Fund (cost $279,072) | | | 279,072 | |
| | | | | | | | |
| | | | TOTAL INVESTMENTS (cost $21,147,121) - 97.81% | | $ | 22,161,782 | |
| | | | | | | | |
| | | | OTHER ASSETS LESS LIABILITIES - 2.19% | | | 494,470 | |
| | | | | | | | |
| | | | NET ASSETS - 100.00% | | $ | 22,656,252 | |
| | | | | | | | |
| | | | | | | | |
| | | | | | | | |
| (A) 144A Security - Security exempt from registration under Rule 144A of the Securities Act of 1933. The securities may be resold in transactions | |
| exempt from registration typically only to qualified institutional buyers. Unless otherwise indicated, these securities are not considered to be illiquid. | |
| (B) Variable rate security; the rate shown represents either the rate or the yield at September 30, 2010. | |
| | | | | | | | |
The accompanying notes are an integral part of these financial statements.
Timothy Plan Scheduled of Investments
Schedule of Investments | Defensive Strategies
As of September 30, 2010
| Common Stocks - 0.18% | | | |
| Number of Shares | | Fair Value | |
| | | | | | |
| | | MISCELLANEOUS SERVICES - 0.18% | | | |
| | 1,700 | | Gaylord Enterntainment Co. * | | $ | 51,850 | |
| | | | | | | | |
| | | | Total Common Stocks (cost $45,999) | | | 51,850 | |
| | | | | | | | |
| REITs - 18.52% | | | | | | |
| Number of Shares | | Fair Value | |
| | | | | | | | |
| | 2,600 | | Acadia Realty Trust | | | 49,400 | |
| | 1,500 | | Alexandria Real Estate Equities, Inc. | | | 105,000 | |
| | 2,200 | | AMB Property Corp. | | | 58,234 | |
| | 2,600 | | Apartment Investment & Management Co. - Class A | | | 55,588 | |
| | 2,600 | | Associated Estates Realty Corp. | | | 36,348 | |
| | 1,250 | | AvalonBay Communities, Inc. | | | 129,913 | |
| | 4,000 | | BioMed Realty Trust, Inc. | | | 71,680 | |
| | 3,000 | | Boston Properties, Inc. | | | 249,360 | |
| | 2,700 | | BRE Properties, Inc. | | | 112,050 | |
| | 2,600 | | Camden Property Trust | | | 124,722 | |
| | 1,300 | | CBL & Associates Properties, Inc. | | | 16,978 | |
| | 2,100 | | Cogdell Spencer, Inc. | | | 13,272 | |
| | 3,600 | | Colonial Properties Trust | | | 58,284 | |
| | 700 | | CommonWealth REIT | | | 17,920 | |
| | 26 | | Cousins Properties, Inc. | | | 186 | |
| | 14,200 | | DiamondRock Hospitality Co. * | | | 134,758 | |
| | 2,900 | | Digital Realty Trust, Inc. | | | 178,930 | |
| | 2,100 | | DuPont Fabros Technology, Inc. | | | 52,815 | |
| | 2,800 | | Entertainment Properties Trust | | | 120,904 | |
| | 1,100 | | Equity Lifestyle Properties, Inc. | | | 59,928 | |
| | 4,900 | | Equity Residential | | | 233,093 | |
| | 850 | | Essex Property Trust, Inc. | | | 93,024 | |
| | 2,100 | | Extra Space Storage, Inc. | | | 33,684 | |
| | 1,700 | | Federal Realty Investment Trust | | | 138,822 | |
| | 2,200 | | First Potomac Realty Trust | | | 33,000 | |
| | 5,000 | | HCP, Inc. | | | 179,900 | |
| | 3,300 | | Health Care Realty Trust, Inc. | | | 77,187 | |
| | 1,200 | | Highwoods Properties, Inc. | | | 38,964 | |
| | 4,300 | | Hospitality Properties Trust | | | 96,019 | |
| | 1,600 | | Kilroy Realty Corp. | | | 53,024 | |
| | 8,000 | | Kimco Realty Corp. | | | 126,000 | |
| | 2,863 | | Macerich Co./The | | | 122,966 | |
| | 3,000 | | National Retail Properties, Inc. | | | 75,330 | |
| | 4,300 | | Nationwide Health Properties, Inc. | | | 166,281 | |
| | 3,600 | | Omega Healthcare Investors, Inc. | | | 80,820 | |
| | 1,600 | | Plum Creek Timber Co., Inc. | | | 56,480 | |
| | 5,400 | | ProLogis | | | 63,612 | |
| | 900 | | PS Business Parks, Inc. | | | 50,913 | |
| | 3,200 | | Public Storage | | | 310,528 | |
| | 2,100 | | Ramco-Gershenson Properties Trust | | | 22,491 | |
| | 1,700 | | Rayonier, Inc. | | | 85,204 | |
| | 2,400 | | Regency Centers Corp. | | | 94,728 | |
| | 6,629 | | Simon Property Group, Inc. | | | 614,773 | |
| | 1,850 | | SL Green Realty Corp. | | | 117,160 | |
| | 1,600 | | Taubman Centers, Inc. | | | 71,376 | |
| | 3,800 | | UDR, Inc. | | | 80,256 | |
| | 4,300 | | Ventas, Inc. | | | 221,751 | |
The accompanying notes are an integral part of these financial statements.
Timothy Plan Scheduled of Investments
Schedule of Investments | Defensive Strategies
As of September 30, 2010
REITs - 18.52% (Continued) | | | |
| Number of Shares | | Fair Value | |
| | | | | | |
| | 2,816 | | Vornado Realty Trust | | $ | 240,852 | |
| | 2,100 | | Washington Real Estate Investment Trust | | | 66,633 | |
| | 2,700 | | Weingarten Realty Investors | | | 58,914 | |
| | | | | | | | |
| | | | Total REITs (cost $4,425,308) | | | 5,350,055 | |
| | | | | | | | |
| Exchange Traded Funds - 30.92% | | | | |
| Number of Shares | | Fair Value | |
| | | | | | | | |
| | 30,100 | | iShares Silver Trust * | | | 641,431 | |
| | 3,500 | | iShares Dow Jones US Real Estate Index Fund | | | 185,080 | |
| | 92,700 | | PowerShares DB Agriculture Fund * | | | 2,547,396 | |
| | 72,300 | | PowerShares DB Base Metals Fund * | | | 1,583,370 | |
| | 50,000 | | PowerShares DB Commodity Index Tracking Fund * | | | 1,205,500 | |
| | 79,100 | | PowerShares DB Energy Fund * | | | 1,911,056 | |
| | 6,700 | | SPDR Gold Shares * | | | 856,997 | |
| | | | | | | | |
| | | | Total Exchange-Traded Funds (cost $8,415,983) | | | 8,930,830 | |
| | | | | | | | |
| | | | | | | | |
| | | | | | | | |
| | | | | | | | |
| Bonds and Notes - 44.07% | | | | |
| Par Value | | | Fair Value | |
| | | | | | | | |
| | | | TREASURY INFLATION PROTECTION SECURITIES | | | | |
| $ | 713,588 | | TIPS, 1.625%, 01/15/2015 | | | 763,483 | |
| | 756,554 | | TIPS, 1.875%, 07/15/2015 | | | 823,402 | |
| | 943,896 | | TIPS, 2.00%, 01/15/2014 | | | 1,013,214 | |
| | 1,214,399 | | TIPS, 2.00%, 07/15/2014 | | | 1,314,776 | |
| | 1,147,838 | | TIPS, 2.00%, 01/15/2016 | | | 1,259,395 | |
| | 1,269,275 | | TIPS, 2.125%, 01/15/2019 | | | 1,430,712 | |
| | 1,330,056 | | TIPS, 2.375%, 01/15/2025 | | | 1,532,785 | |
| | 1,675,628 | | TIPS, 2.375%, 01/15/2017 | | | 1,890,842 | |
| | 507,710 | | TIPS, 2.50%, 01/15/2029 | | | 600,525 | |
| | 606,255 | | TIPS, 3.00%, 07/15/2012 | | | 644,240 | |
| | 673,950 | | TIPS, 3.625%, 04/15/2028 | | | 903,567 | |
| | 397,845 | | TIPS, 3.875%, 04/15/2029 | | | 554,496 | |
| | | | | | | | |
| | | | Total Treasury Inflation Protection Securities (cost $12,054,525) | | | 12,731,437 | |
| | | | | | | | |
| Money Market Fund - 6.13% | | | | |
| Number of Shares | | Fair Value | |
| | | | | | | | |
| | 1,770,275 | | Fidelity Institutional Money Market Portfolio, 0.20% (A) | | | 1,770,275 | |
| | | | | | | | |
| | | | Total Money Market Fund (cost $1,770,275) | | | 1,770,275 | |
| | | | | | | | |
| | | | TOTAL INVESTMENTS (cost $26,712,090) - 99.82% | | $ | 28,834,447 | |
| | | | | | | | |
| | | | OTHER ASSETS LESS LIABILITIES - 0.18% | | | 52,714 | |
| | | | | | | | |
| | | | NET ASSETS - 100.00% | | $ | 28,887,161 | |
| | | | | | | | |
| | | | | | | | |
| | | | | | | | |
| * Non-income producing securities. | | | | |
| (A) Variable rate security; the rate shown represents the yield at September 30, 2010. | | | | |
The accompanying notes are an integral part of these financial statements.
Timothy Plan Scheduled of Investments
Schedule of Investments | Money Market
As of September 30, 2010
| Short Term Investments - 99.91% | | | |
| Par Value | | | | Fair Value | |
| | | | | | |
| | | Money Market Fund - 9.92% | | | |
| $ | 1,328,543 | | Fidelity Institutional Money Market Portfolio, 0.20% (B) | | $ | 1,328,543 | |
| | | | | | | | |
| | | | Total Money Market Fund (cost $1,328,543) | | | 1,328,543 | |
| | | | | | | | |
| | | | U.S. Government & Government Agencies (A) - 89.99% | | | | |
| | 1,550,000 | | U.S. Treasury Bill, 0.12%, 10/07/2010 | | | 1,549,965 | |
| | 1,500,000 | | U.S. Treasury Bill, 0.10%, 10/14/2010 | | | 1,499,926 | |
| | 1,500,000 | | U.S. Treasury Bill, 0.13%, 10/21/2010 | | | 1,499,887 | |
| | 1,500,000 | | U.S. Treasury Bill, 0.14%, 10/28/2010 | | | 1,499,869 | |
| | 1,500,000 | | U.S. Treasury Bill, 0.13%, 11/04/2010 | | | 1,499,823 | |
| | 1,500,000 | | U.S. Treasury Bill, 0.13%, 11/12/2010 | | | 1,499,746 | |
| | 1,500,000 | | U.S. Treasury Bill, 0.13%, 11/18/2010 | | | 1,499,700 | |
| | 1,500,000 | | U.S. Treasury Bill, 0.15%, 11/26/2010 | | | 1,499,685 | |
| | | | | | | | |
| | | | Total U.S. Government Agencies (amortized cost $12,048,601) | | | 12,048,601 | |
| | | | | | | | |
| | | | TOTAL INVESTMENTS (cost $13,377,144) - 99.91% | | $ | 13,377,144 | |
| | | | | | | | |
| | | | OTHER ASSETS LESS LIABILITIES - 0.09% | | | 12,576 | |
| | | | | | | | |
| | | | TOTAL NET ASSETS - 100.00% | | $ | 13,389,720 | |
| | | | | | | | |
| (A) Discount note; the rate shown represents the yield at September 30, 2010. | | | | |
| (B) Variable rate security; the rate shown represents the yield at September 30, 2010. | | | | |
The accompanying notes are an integral part of these financial statements.
Timothy Plan Scheduled of Investments
Schedule of Investments | Strategic Growth
As of September 30, 2010
Mutual Funds (A) - 99.94% | | | |
| Number of Shares | | Fair Value | |
| | | | | | |
| | 647,689 | | Timothy Plan Aggressive Growth Fund* | | $ | 3,510,474 | |
| | 413,214 | | Timothy Plan Defensive Strategies Fund | | | 4,421,387 | |
| | 486,788 | | Timothy Plan High Yield Bond Fund | | | 4,429,768 | |
| | 1,496,194 | | Timothy Plan International Fund | | | 11,535,656 | |
| | 1,544,240 | | Timothy Plan Large/Mid Cap Growth Fund* | | | 9,249,998 | |
| | 770,133 | | Timothy Plan Large/Mid Cap Value Fund | | | 9,118,380 | |
| | 304,944 | | Timothy Plan Small Cap Value Fund* | | | 3,439,772 | |
| | | | | | | | |
| | | | Total Mutual Funds (cost $50,229,087) | | | 45,705,435 | |
| | | | | | | | |
| Money Market Fund - 0.13% | | | | |
| Number of Shares | | Fair Value | |
| | | | | | | | |
| | 59,657 | | Fidelity Institutional Money Market Portfolio, 0.20% (B) | | | 59,657 | |
| | | | | | | | |
| | | | Total Money Market Fund (cost $59,657) | | | 59,657 | |
| | | | | | | | |
| | | | Total Investments (cost $50,288,744) - 100.07% | | $ | 45,765,092 | |
| | | | | | | | |
| | | | LIABILITIES IN EXCESS OF OTHER ASSETS - (0.07)% | | | (33,775 | ) |
| | | | | | | | |
| | | | TOTAL NET ASSETS - 100.00% | | $ | 45,731,317 | |
| | | | | | | | |
| | | | | | | | |
| | | | | | | | |
| * Non-income producing securities | | | | |
| (A) Affiliated Funds - Class A. | | | | |
| (B) Variable rate security; the rate shown represents the yield at September 30, 2010. | | | | |
The accompanying notes are an integral part of these financial statements.
Timothy Plan Scheduled of Investments
Schedule of Investments | Conservative Growth
As of September 30, 2010
Mutual Funds (A) - 99.92% | | | |
| Number of Shares | | Fair Value | |
| | | | | | |
| | 256,664 | | Timothy Plan Aggressive Growth Fund* | | $ | 1,391,120 | |
| | 639,880 | | Timothy Plan Defensive Strategies Fund | | | 6,846,720 | |
| | 1,294,050 | | Timothy Plan Fixed Income Fund | | | 13,665,164 | |
| | 500,159 | | Timothy Plan High Yield Bond Fund | | | 4,551,447 | |
| | 594,705 | | Timothy Plan International Fund | | | 4,585,175 | |
| | 917,285 | | Timothy Plan Large/Mid Cap Growth Fund* | | | 5,494,536 | |
| | 578,251 | | Timothy Plan Large/Mid Cap Value Fund | | | 6,846,492 | |
| | 204,743 | | Timothy Plan Small Cap Value Fund* | | | 2,309,501 | |
| | | | | | | | |
| | | | Total Mutual Funds (cost $44,678,352) | | | 45,690,155 | |
| | | | | | | | |
| | | | TOTAL INVESTMENTS (cost $44,678,352) - 99.92% | | $ | 45,690,155 | |
| | | | | | | | |
| | | | OTHER ASSETS LESS LIABILITIES - 0.08% | | | 36,931 | |
| | | | | | | | |
| | | | NET ASSETS - 100.00% | | $ | 45,727,086 | |
| | | | | | | | |
| | | | | | | | |
| | | | | | | | |
| * Non-income producing securities | | | | |
| (A) Affiliated Funds - Class A. | | | | |
The accompanying notes are an integral part of these financial statements.
Timothy Plan Scheduled of Investments
Statements of Assets & Liabilities
As of September 30, 2010
| Assets | | | | | | |
| | | Aggressive Growth | | | International | |
| | | | | | | |
Cost, Investments in Unaffiliated Securities [NOTE 1] | | $ | 12,359,436 | | | $ | 33,387,206 | |
| | | | | | | | | |
Fair Value, Investments in Unaffiliated Securities [NOTE 1] | | $ | 15,155,528 | | | $ | 37,295,149 | |
| | | | | | | | | |
| Receivable for: | | | | | | | | |
| Investments Sold | | | 374,509 | | | | - | |
| Fund Shares Sold | | | 18,164 | | | | 14,017 | |
| Interest | | | 62 | | | | 518 | |
| Dividends | | | 5,078 | | | | 85,081 | |
| Tax Reclaim | | | 40 | | | | 23,371 | |
| Prepaid Expenses | | | 12,287 | | | | 12,571 | |
| | | | | | | | | |
| Total Assets | | | 15,565,668 | | | | 37,430,707 | |
| | | | | | | | | |
| Liabilities | | | | | | | | |
| | | | | | | | | |
| | | | | | | | | |
| Accrued Advisory Fees | | | 10,379 | | | | 29,828 | |
| Accrued 12b-1 Fees | | | 4,249 | | | | 8,603 | |
| Accrued Expenses | | | 12,546 | | | | 24,276 | |
| Payable for: | | | | | | | | |
| Investments Purchased | | | 239,864 | | | | 175,690 | |
| Fund Shares Redeemed | | | 15,000 | | | | 44,702 | |
| | | | | | | | | |
| Total Liabilities | | | 282,038 | | | | 283,099 | |
| | | | | | | | | |
| Net Assets | | $ | 15,283,630 | | | $ | 37,147,608 | |
| | | | | | | | | |
| Sources of Net Assets | | | | | | | | |
| | | | | | | | | |
| | | | | | | | | |
| Net Assets Consisted of: | | | | | | | | |
| Paid-in Capital | | $ | 19,459,278 | | | $ | 48,539,078 | |
| Accumulated Undistributed Net Investment Income (Loss) | | | - | | | | 140,572 | |
| Accumulated Net Realized Gain (Loss) on Investments | | | (6,971,740 | ) | | | (15,439,985 | ) |
| Net Unrealized Appreciation (Depreciation) on Investments | | | 2,796,092 | | | | 3,907,943 | |
| | | | | | | | | |
| Net Assets | | $ | 15,283,630 | | | $ | 37,147,608 | |
| | | | | | | | | |
| | | | | | | | | |
The accompanying notes are an integral part of these financial statements.
Timothy Plan Statement of Assets and Liabilities
Statements of Assets & Liabilities
As of September 30, 2010
| Assets | | | | | | |
| | | Large/Mid Cap Growth | | | Small Cap Value | |
| | | | | | | |
Cost, Investments in Unaffiliated Securities [NOTE 1] | | $ | 37,233,660 | | | $ | 44,826,764 | |
| | | | | | | | | |
Fair Value, Investments in Unaffiliated Securities [NOTE 1] | | $ | 41,181,665 | | | $ | 48,216,339 | |
| | | | | | | | | |
| Receivable for: | | | | | | | | |
| Investments Sold | | | 1,075,836 | | | | 1,408,138 | |
| Fund Shares Sold | | | 63,433 | | | | 42,824 | |
| Interest | | | 194 | | | | 325 | |
| Dividends | | | 24,122 | | | | 35,932 | |
| Tax Reclaim | | | 114 | | | | - | |
| Prepaid Expenses | | | 13,756 | | | | 12,987 | |
| | | | | | | | | |
| Total Assets | | | 42,359,120 | | | | 49,716,545 | |
| | | | | | | | | |
| Liabilities | | | | | | | | |
| | | | | | | | | |
| | | | | | | | | |
| Accrued Advisory Fees | | | 28,760 | | | | 32,377 | |
| Accrued 12b-1 Fees | | | 10,414 | | | | 13,960 | |
| Accrued Expenses | | | 28,529 | | | | 30,842 | |
| Payable for: | | | | | | | | |
| Investments Purchased | | | 78,259 | | | | 1,752,001 | |
| Fund Shares Redeemed | | | 124,698 | | | | 105,492 | |
| | | | | | | | | |
| Total Liabilities | | | 270,660 | | | | 1,934,672 | |
| | | | | | | | | |
| Net Assets | | $ | 42,088,460 | | | $ | 47,781,873 | |
| | | | | | | | | |
| Sources of Net Assets | | | | | | | | |
| | | | | | | | | |
| | | | | | | | | |
| Net Assets Consisted of: | | | | | | | | |
| Paid-in Capital | | $ | 45,362,090 | | | $ | 58,441,211 | |
| Accumulated Net Realized Gain (Loss) on Investments | | | (7,221,635 | ) | | | (14,048,913 | ) |
| Net Unrealized Appreciation (Depreciation) on Investments | | | 3,948,005 | | | | 3,389,575 | |
| | | | | | | | | |
| Net Assets | | $ | 42,088,460 | | | $ | 47,781,873 | |
| | | | | | | | | |
| | | | | | | | | |
The accompanying notes are an integral part of these financial statements.
Timothy Plan Statement of Assets and Liabilities
Statements of Assets & Liabilities
As of September 30, 2010
| Assets | | | | | | |
| | | Large/Mid Cap Value | | | Fixed Income | |
| | | | | | | |
Cost, Investments in Unaffiliated Securities [NOTE 1] | | $ | 81,153,678 | | | $ | 67,290,968 | |
| | | | | | | | | |
Fair Value, Investments in Unaffiliated Securities [NOTE 1] | | $ | 91,139,960 | | | $ | 71,366,460 | |
| | | | | | | | | |
| Receivable for: | | | | | | | | |
| Investments Sold | | | 3,074,920 | | | | 188,599 | |
| Fund Shares Sold | | | 114,112 | | | | 176,825 | |
| Interest | | | 443 | | | | 556,890 | |
| Dividends | | | 139,127 | | | | - | |
| Prepaid Expenses | | | 14,960 | | | | 17,121 | |
| | | | | | | | | |
| Total Assets | | | 94,483,522 | | | | 72,305,895 | |
| | | | | | | | | |
| Liabilities | | | | | | | | |
| | | | | | | | | |
| | | | | | | | | |
| Accrued Advisory Fees | | | 62,556 | | | | 24,457 | |
| Accrued 12b-1 Fees | | | 24,815 | | | | 18,903 | |
| Accrued Expenses | | | 63,958 | | | | 38,803 | |
| Payable for: | | | | | | | | |
| Investments Purchased | | | 2,960,458 | | | | 4,520,515 | |
| Fund Shares Redeemed | | | 91,838 | | | | 122,825 | |
| | | | | | | | | |
| Total Liabilities | | | 3,203,625 | | | | 4,725,503 | |
| | | | | | | | | |
| Net Assets | | $ | 91,279,897 | | | $ | 67,580,392 | |
| | | | | | | | | |
| Sources of Net Assets | | | | | | | | |
| | | | | | | | | |
| | | | | | | | | |
| Net Assets Consisted of: | | | | | | | | |
| Paid-in Capital | | $ | 101,671,308 | | | $ | 65,174,494 | |
| Accumulated Undistributed Net Investment Income (Loss) | | | 253,772 | | | | 32,167 | |
| Accumulated Net Realized Gain (Loss) on Investments | | | (20,631,465 | ) | | | (1,701,761 | ) |
| Net Unrealized Appreciation (Depreciation) on Investments | | | 9,986,282 | | | | 4,075,492 | |
| | | | | | | | | |
| Net Assets | | $ | 91,279,897 | | | $ | 67,580,392 | |
| | | | | | | | | |
The accompanying notes are an integral part of these financial statements.
Timothy Plan Statement of Assets and Liabilities
Statements of Assets & Liabilities
As of September 30, 2010
| Assets | | | | | | |
| | | High Yield Bond | | | Defensive Strategies | |
| | | | | | | |
Cost, Investments in Unaffiliated Securities [NOTE 1] | | $ | 21,147,121 | | | $ | 26,712,090 | |
| | | | | | | | | |
Fair Value, Investments in Unaffiliated Securities [NOTE 1] | | $ | 22,161,782 | | | $ | 28,834,447 | |
| | | | | | | | | |
| Receivable for: | | | | | | | | |
| Investments Sold | | | - | | | | 112,354 | |
| Fund Shares Sold | | | 28,028 | | | | 16,797 | |
| Interest | | | 517,609 | | | | 65,544 | |
| Dividends | | | - | | | | 13,274 | |
| Prepaid Expenses | | | 12,113 | | | | 24,096 | |
| | | | | | | | | |
| Total Assets | | | 22,719,532 | | | | 29,066,512 | |
| | | | | | | | | |
| Liabilities | | | | | | | | |
| | | | | | | | | |
| | | | | | | | | |
| Accrued Advisory Fees | | | 11,017 | | | | 13,996 | |
| Accrued 12b-1 Fees | | | 5,215 | | | | 9,129 | |
| Accrued Expenses | | | 20,314 | | | | 26,347 | |
| Payable for: | | | | | | | | |
| Investments Purchased | | | - | | | | 121,182 | |
| Fund Shares Redeemed | | | 26,734 | | | | 8,697 | |
| | | | | | | | | |
| Total Liabilities | | | 63,280 | | | | 179,351 | |
| | | | | | | | | |
| Net Assets | | $ | 22,656,252 | | | $ | 28,887,161 | |
| | | | | | | | | |
| Sources of Net Assets | | | | | | | | |
| | | | | | | | | |
| | | | | | | | | |
| Net Assets Consisted of: | | | | | | | | |
| Paid-in Capital | | $ | 24,077,903 | | | $ | 26,864,657 | |
| Accumulated Undistributed Net Investment Income (Loss) | | | 24 | | | | 3,027 | |
| Accumulated Net Realized Gain (Loss) on Investments | | | (2,436,336 | ) | | | (102,880 | ) |
| Net Unrealized Appreciation (Depreciation) on Investments | | | 1,014,661 | | | | 2,122,357 | |
| | | | | | | | | |
| Net Assets | | $ | 22,656,252 | | | $ | 28,887,161 | |
The accompanying notes are an integral part of these financial statements.
Timothy Plan Statement of Assets and Liabilities
Statements of Assets & Liabilities
As of September 30, 2010
| Assets | | | |
| | | Money Market | |
| | | | |
Cost, Investments in Unaffiliated Securities [NOTE 1] | | $ | 13,377,144 | |
| | | | | |
Fair Value, Investments in Unaffiliated Securities [NOTE 1] | | $ | 13,377,144 | |
| | | | | |
| Receivable for: | | | | |
| Waiver of Advisory Fees | | | 5,004 | |
| Fund Shares Sold | | | 29,534 | |
| Interest | | | 216 | |
| Prepaid Expenses | | | 8,616 | |
| | | | | |
| Total Assets | | | 13,420,514 | |
| | | | | |
| Liabilities | | | | |
| | | | | |
| | | | | |
| Accrued Expenses | | | 11,062 | |
| Payable for: | | | | |
| Fund Shares Redeemed | | | 19,622 | |
| Fund Distributions | | | 110 | |
| | | | | |
| Total Liabilities | | | 30,794 | |
| | | | | |
| Net Assets | | $ | 13,389,720 | |
| | | | | |
| Sources of Net Assets | | | | |
| | | | | |
| | | | | |
| Net Assets Consisted of: | | | | |
| Paid-in Capital | | $ | 13,381,135 | |
| Accumulated Undistributed Net Investment Income (Loss) | | | 7,884 | |
| Accumulated Net Realized Gain (Loss) on Investments | | | 701 | |
| | | | | |
| Net Assets | | $ | 13,389,720 | |
| | | | | |
The accompanying notes are an integral part of these financial statements.
Timothy Plan Statement of Assets and Liabilities
Statements of Assets & Liabilities
As of September 30, 2010
| Assets | | | | | | |
| | | Strategic Growth | | | Conservative Growth | |
| | | | | | | |
Cost, Investments in Unaffiliated Securities [NOTE 1] | | $ | 59,657 | | | $ | - | |
Cost, Investments in Affiliated Securities [NOTE 1] | | | 50,229,087 | | | | 44,678,352 | |
| Total Cost, Investments | | $ | 50,288,744 | | | $ | 44,678,352 | |
| | | | | | | | | |
Fair Value, Investments in Unaffiliated Securities [NOTE 1] | | $ | 59,657 | | | $ | - | |
Fair Value, Investments in Affiliated Securities [NOTE 1] | | | 45,705,435 | | | | 45,690,155 | |
| Total Fair Value, Investments | | $ | 45,765,092 | | | $ | 45,690,155 | |
| | | | | | | | | |
| Receivable for: | | | | | | | | |
| Investments Sold | | | - | | | | 150,000 | |
| Fund Shares Sold | | | 148,773 | | | | 42,855 | |
| Interest | | | 6 | | | | 6 | |
| Prepaid Expenses | | | 14,781 | | | | 15,341 | |
| | | | | | | | | |
| Total Assets | | | 45,928,652 | | | | 45,898,357 | |
| | | | | | | | | |
| Liabilities | | | | | | | | |
| | | | | | | | | |
| | | | | | | | | |
| Accrued Advisory Fees | | | 23,747 | | | | 24,109 | |
| Accrued 12b-1 Fees | | | 7,047 | | | | 6,535 | |
| Accrued Expenses | | | 21,774 | | | | 22,280 | |
| Payable for: | | | | | | | | |
| Fund Shares Redeemed | | | 144,767 | | | | 112,816 | |
| To custodian (overdraft) | | | - | | | | 5,531 | |
| | | | | | | | | |
| Total Liabilities | | | 197,335 | | | | 171,271 | |
| | | | | | | | | |
| Net Assets | | $ | 45,731,317 | | | $ | 45,727,086 | |
| | | | | | | | | |
| Sources of Net Assets | | | | | | | | |
| | | | | | | | | |
| | | | | | | | | |
| Net Assets Consisted of: | | | | | | | | |
| Paid-in Capital | | $ | 59,700,727 | | | $ | 51,677,734 | |
| Accumulated Undistributed Net Investment Income (Loss) | | | 41,292 | | | | 393,362 | |
| Accumulated Net Realized Gain (Loss) on Investments | | | (9,487,050 | ) | | | (7,355,813 | ) |
| Net Unrealized Appreciation (Depreciation) on Investments | | | (4,523,652 | ) | | | 1,011,803 | |
| | | | | | | | | |
| Net Assets | | $ | 45,731,317 | | | $ | 45,727,086 | |
The accompanying notes are an integral part of these financial statements.
Timothy Plan Statement of Assets and Liabilities
Statements of Assets & Liabilities
As of September 30, 2010
Net Assets (unlimited shares of $0.001 par beneficial interest authorized) | | | | | | | |
| | | Aggressive Growth | | International | | | Large/Mid Cap Growth | |
| | | | | | | | | | |
| Class A Shares: | | | | | | | | | |
| Net Assets | | $ | 13,247,031 | | | $ | 35,206,404 | | | $ | 38,864,836 | |
| | | | | | | | | | | | | |
| Shares Outstanding | | | 2,446,298 | | | | 4,563,890 | | | | 6,488,598 | |
| | | | | | | | | | | | | |
| Net Asset Value and Redemption Price per Share | | $ | 5.42 | | | $ | 7.71 | | | $ | 5.99 | |
Offering Price Per Share (NAV / 0.945) | | $ | 5.74 | | | $ | 8.16 | | | $ | 6.34 | |
| | | | | | | | | | | | | |
| Class B Shares: | | | | | | | | | | | | |
| Net Assets | | $ | 366,962 | | | | N/A | | | $ | 700,369 | |
| | | | | | | | | | | | | |
| Shares Outstanding | | | 73,923 | | | | N/A | | | | 126,420 | |
| | | | | | | | | | | | | |
| Net Asset Value, Offering and Redemption | | | | | | | | | | | | |
| Price per Share | | $ | 4.96 | | | | N/A | | | $ | 5.54 | |
| | | | | | | | | | | | | |
| Class C Shares: | | | | | | | | | | | | |
| Net Assets | | $ | 1,669,637 | | | $ | 1,941,204 | | | $ | 2,523,255 | |
| | | | | | | | | | | | | |
| Shares Outstanding | | | 335,433 | | | | 256,151 | | | | 454,771 | |
| | | | | | | | | | | | | |
| Net Asset Value and Offering Price per Share | | $ | 4.98 | | | $ | 7.58 | | | $ | 5.55 | |
Minimum Redemption Price Per Share (NAV * 0.99) | | $ | 4.93 | | | $ | 7.50 | | | $ | 5.49 | |
| | | | | | | | | | | | | |
| | | | | | | | | | | | | |
Net Assets (unlimited shares of $0.001 par beneficial interest authorized) | | | | | | | | |
| | | Small Cap Value | | | Large/Mid Cap Value | | Fixed Income | |
| | | | | | | | | | | | | |
| Class A Shares: | | | | | | | | | | | | |
| Net Assets | | $ | 40,481,916 | | | $ | 80,700,422 | | | $ | 58,831,153 | |
| | | | | | | | | | | | | |
| Shares Outstanding | | | 3,589,069 | | | | 6,816,473 | | | | 5,571,929 | |
| | | | | | | | | | | | | |
| Net Asset Value and Redemption Price per Share | | $ | 11.28 | | | $ | 11.84 | | | $ | 10.56 | |
| Offering Price Per Share * | | $ | 11.94 | | | $ | 12.53 | | | $ | 11.06 | |
| | | | | | | | | | | | | |
| Class B Shares: | | | | | | | | | | | | |
| Net Assets | | $ | 3,113,986 | | | $ | 1,095,409 | | | $ | 311,166 | |
| | | | | | | | | | | | | |
| Shares Outstanding | | | 319,591 | | | | 102,347 | | | | 30,376 | |
| | | | | | | | | | | | | |
| Net Asset Value, Offering and Redemption | | | | | | | | | | | | |
| Price per Share | | $ | 9.74 | | | $ | 10.70 | | | $ | 10.24 | |
| | | | | | | | | | | | | |
| Class C Shares: | | | | | | | | | | | | |
| Net Assets | | $ | 4,185,971 | | | $ | 9,484,066 | | | $ | 8,438,073 | |
| | | | | | | | | | | | | |
| Shares Outstanding | | | 426,421 | | | | 887,927 | | | | 825,863 | |
| | | | | | | | | | | | | |
| Net Asset Value and Offering Price per Share | | $ | 9.82 | | | $ | 10.68 | | | $ | 10.22 | |
Minimum Redemption Price Per Share (NAV * 0.99) | | $ | 9.72 | | | $ | 10.57 | | | $ | 10.12 | |
| | | | | | | | | | | | | |
| | | | | | | | | | | | | |
| *NAV / 0.945 for Small Cap Value Fund and Large / Mid Cap Value Fund and 0.955 for Fixed Income Fund. | |
The accompanying notes are an integral part of these financial statements.
Timothy Plan Statement of Assets and Liabilities
Statements of Assets & Liabilities
As of September 30, 2010
Net Assets (unlimited shares of $0.001 par beneficial interest authorized) | | | | | | | |
| | | High Yield Bond | | | Defensive Strategies | | | Money Market | |
| | | | | | | | | | |
| Class A Shares: | | | | | | | | | |
| Net Assets | | $ | 21,616,900 | | | $ | 23,359,906 | | | $ | 13,389,720 | |
| | | | | | | | | | | | | |
| Shares Outstanding | | | 2,374,510 | | | | 2,183,334 | | | | 13,381,173 | |
| | | | | | | | | | | | | |
| Net Asset Value and Redemption Price per Share | | $ | 9.10 | | | $ | 10.70 | | | $ | 1.00 | |
Offering Price Per Share * | | $ | 9.53 | | | $ | 11.32 | | | | N/A | |
| | | | | | | | | | | | | |
| Class B Shares: | | | | | | | | | | | | |
| Net Assets | | | N/A | | | | N/A | | | | N/A | |
| | | | | | | | | | | | | |
| Shares Outstanding | | | N/A | | | | N/A | | | | N/A | |
| | | | | | | | | | | | | |
| Net Asset Value, Offering and Redemption | | | | | | | | | | | | |
| Price per Share | | | N/A | | | | N/A | | | | N/A | |
| | | | | | | | | | | | | |
| Class C Shares: | | | | | | | | | | | | |
| Net Assets | | $ | 1,039,352 | | | $ | 5,527,255 | | | | N/A | |
| | | | | | | | | | | | | |
| Shares Outstanding | | | 113,386 | | | | 522,353 | | | | N/A | |
| | | | | | | | | | | | | |
| Net Asset Value and Offering Price per Share | | $ | 9.17 | | | $ | 10.58 | | | | N/A | |
Minimum Redemption Price Per Share (NAV * 0.99) | | $ | 9.08 | | | $ | 10.47 | | | | N/A | |
| | | | | | | | | | | | | |
| | | | | | | | | | | | | |
Net Assets (unlimited shares of $0.001 par beneficial interest authorized) | | | | |
| | | Strategic Growth | | | Conservative Growth | |
| | | | | | | |
| Class A Shares: | | | | | | |
| Net Assets | | $ | 34,098,204 | | | $ | 35,031,477 | |
| | | | | | | | | |
| Shares Outstanding | | | 5,251,834 | | | | 3,967,844 | |
| | | | | | | | | |
| Net Asset Value and Redemption Price per Share | | $ | 6.49 | | | $ | 8.83 | |
Offering Price Per Share (NAV / 0.945) | | $ | 6.87 | | | $ | 9.34 | |
| | | | | | | | | |
| Class B Shares: | | | | | | | | |
| Net Assets | | $ | 4,683,099 | | | $ | 3,330,379 | |
| | | | | | | | | |
| Shares Outstanding | | | 766,063 | | | | 399,068 | |
| | | | | | | | | |
| Net Asset Value, Offering and Redemption | | | | | | | | |
| Price per Share | | $ | 6.11 | | | $ | 8.35 | |
| | | | | | | | | |
| Class C Shares: | | | | | | | | |
| Net Assets | | $ | 6,950,014 | | | $ | 7,365,230 | |
| | | | | | | | | |
| Shares Outstanding | | | 1,140,448 | | | | 884,889 | |
| | | | | | | | | |
| Net Asset Value and Offering Price per Share | | $ | 6.09 | | | $ | 8.32 | |
Minimum Redemption Price Per Share (NAV * 0.99) | | $ | 6.03 | | | $ | 8.24 | |
| | | | | | | | | |
| | | | | | | | | |
| *NAV / 0.955 for High Yield Bond Fund and 0.945 for Defensive Strategies Fund. Money Market Fund is not subject to a sales load. | |
The accompanying notes are an integral part of these financial statements.
Timothy Plan Statement of Assets and Liabilities
For the Fiscal Year Ended September 30, 2010
| | | Aggressive Growth | | | International | | |
| Investment Income | | | | | | | |
| | | | | | | | |
| Interest from: | | | | | | | |
| Unaffiliated Investments | | $ | 528 | | | $ | 4,216 | | |
| Dividends from: | | | | | | | | | |
| Unaffiliated Investments | | | 39,830 | | | | 834,855 | | (A) |
| | | | | | | | | | |
| Total Investment Income | | | 40,358 | | | | 839,071 | | |
| | | | | | | | | | |
| Expenses | | | | | | | | | |
| | | | | | | | | | |
Investment Advisory Fees [NOTE 4] | | | 126,990 | | | | 362,072 | | |
12b-1 Fees [NOTE 4] | | | | | | | | | |
| Class A | | | 32,463 | | | | 86,128 | | |
| Class B | | | 3,746 | | | | - | | |
| Class C | | | 15,802 | | | | 17,558 | | |
| Fund Accounting, Transfer Agency, & Administration Fees | | | 39,814 | | | | 88,000 | | |
| Registration Fees | | | 27,166 | | | | 28,174 | | |
| Custodian Fees | | | 19,702 | | | | 9,299 | | |
| Sub-Transfer Agency Fees | | | 17,729 | | | | 18,133 | | |
| Audit Fees | | | 3,494 | | | | 12,168 | | |
| Printing Expense | | | 3,069 | | | | 8,555 | | |
| CCO Expense | | | 1,804 | | | | 4,646 | | |
| Trustee Fees | | | 1,476 | | | | 4,234 | | |
| Miscellaneous Expense | | | 976 | | | | 1,170 | | |
| Insurance Expense | | | 682 | | | | 1,577 | | |
| | | | | | | | | | |
| Total Expenses | | | 294,913 | | | | 641,714 | | |
| | | | | | | | | | |
| | | | | | | | | | |
| Total Net Expenses | | | 294,913 | | | | 641,714 | | |
| | | | | | | | | | |
| Net Investment Income (Loss) | | | (254,555 | ) | | | 197,357 | | |
| | | ` | | | | | | |
| Realized and Unrealized Gain (Loss) on Investments | | | | | | | | | |
| | | | | | | | | | |
| Net Realized Gain (Loss) on Unaffiliated Investments | | | 3,285,274 | | | | (1,864,844 | ) | |
| Change in Unrealized Appreciation (Depreciation) | | | | | | | | | |
| of Investments | | | (700,397 | ) | | | 2,989,598 | | |
| Net Realized and Unrealized Gain (Loss) on Investments | | | 2,584,877 | | | | 1,124,754 | | |
| | | | | | | | | | |
| Net Increase (Decrease) in Net Assets | | | | | | | | | |
| Resulting from Operations | | $ | 2,330,322 | | | $ | 1,322,111 | | |
| | | | | | | | | | |
| | | | | | | | | | |
| (A) Net of foreign withholding taxes of $70,376. | | | | | | | | | |
The accompanying notes are an integral part of these financial statements.
Timothy Plan Statement of Operations
For the Fiscal Year Ended September 30, 2010
| | | Large/Mid Cap Growth | | | | Small Cap Value | |
| Investment Income | | | | | | | |
| | | | | | | | |
| Interest from: | | | | | | | |
| Unaffiliated Investments | | $ | 2,889 | | | | $ | 2,585 | |
| Dividends from: | | | | | | | | | |
| Unaffiliated Investments | | | 378,088 | | (A) | | | 516,662 | |
| | | | | | | | | | |
| Total Investment Income | | | 380,977 | | | | | 519,247 | |
| | | | | | | | | | |
| Expenses | | | | | | | | | |
| | | | | | | | | | |
Investment Advisory Fees [NOTE 4] | | | 353,558 | | | | | 413,759 | |
12b-1 Fees [NOTE 4] | | | | | | | | | |
| Class A | | | 95,683 | | | | | 102,314 | |
| Class B | | | 9,768 | | | | | 36,441 | |
| Class C | | | 23,449 | | | | | 41,077 | |
| Fund Accounting, Transfer Agency, & Administration Fees | | | 101,307 | | | | | 120,767 | |
| Sub-Transfer Agency Fees | | | 55,113 | | | | | 40,118 | |
| Registration Fees | | | 29,611 | | | | | 28,806 | |
| Custodian Fees | | | 13,402 | | | | | 13,096 | |
| Audit Fees | | | 10,762 | | | | | 11,416 | |
| Printing Expense | | | 7,775 | | | | | 7,934 | |
| CCO Expense | | | 5,385 | | | | | 5,846 | |
| Trustee Fees | | | 4,736 | | | | | 5,860 | |
| Insurance Expense | | | 1,821 | | | | | 2,213 | |
| Miscellaneous Expense | | | 1,172 | | | | | 1,053 | |
| | | | | | | | | | |
| Total Expenses | | | 713,542 | | | | | 830,700 | |
| | | | | | | | | | |
| | | | | | | | | | |
| Total Net Expenses | | | 713,542 | | | | | 830,700 | |
| | | | | | | | | | |
| Net Investment Income (Loss) | | | (332,565 | ) | | | | (311,453 | ) |
| | | | | | | | | | |
| Realized and Unrealized Gain (Loss) on Investments | | | | | | | | | |
| | | | | | | | | | |
| Capital Gain Dividends from REIT's | | | - | | | | | 16,268 | |
| Net Realized Gain (Loss) on Unaffiliated Investments | | | 3,947,518 | | | | | 6,310,642 | |
| Change in Unrealized Appreciation (Depreciation) | | | | | | | | | |
| of Investments | | | 952,504 | | | | | (1,924,103 | ) |
| Net Realized and Unrealized Gain (Loss) on Investments | | | 4,900,022 | | | | | 4,402,807 | |
| | | | | | | | | | |
| Net Increase (Decrease) in Net Assets | | | | | | | | | |
| Resulting from Operations | | $ | 4,567,457 | | | | $ | 4,091,354 | |
| | | | | | | | | | |
| | | | | | | | | | |
| | | | | | | | | | |
| (A) Net of foreign withholding taxes of $4,264. | | | | | | | | | |
The accompanying notes are an integral part of these financial statements.
Timothy Plan Statement of Operations
For the Fiscal Year Ended September 30, 2010
| | | Large/Mid Cap Value | | | Fixed Income | |
| Investment Income | | | | | | |
| | | | | | | |
| Interest from: | | | | | | |
| Unaffiliated Investments | | $ | 4,464 | | | $ | 2,367,410 | |
| Dividends from: | | | | | | | | |
| Unaffiliated Investments | | | 1,804,630 | | | | - | |
| | | | | | | | | |
| Total Investment Income | | | 1,809,094 | | | | 2,367,410 | |
| | | | | | | | | |
| Expenses | | | | | | | | |
| | | | | | | | | |
Investment Advisory Fees [NOTE 4] | | | 781,242 | | | | 355,280 | |
12b-1 Fees [NOTE 4] | | | | | | | | |
| Class A | | | 202,217 | | | | 129,825 | |
| Class B | | | 14,253 | | | | 5,510 | |
| Class C | | | 95,986 | | | | 67,323 | |
| Fund Accounting, Transfer Agency, & Administration Fees | | | 224,619 | | | | 148,305 | |
| Sub-Transfer Agency Fees | | | 96,656 | | | | 64,383 | |
| Registration Fees | | | 31,050 | | | | 34,664 | |
| Audit Fees | | | 22,065 | | | | 15,085 | |
| Custodian Fees | | | 18,520 | | | | 13,470 | |
| Printing Expense | | | 17,167 | | | | 11,595 | |
| CCO Expense | | | 11,972 | | | | 7,251 | |
| Trustee Fees | | | 10,709 | | | | 6,424 | |
| Insurance Expense | | | 4,059 | | | | 2,284 | |
| Miscellaneous Expense | | | 1,235 | | | | 970 | |
| | | | | | | | | |
| Total Expenses | | | 1,531,750 | | | | 862,369 | |
| | | | | | | | | |
Fees Waived by Adviser [NOTE 4] | | | - | | | | (88,819 | ) |
| | | | | | | | | |
| Total Net Expenses | | | 1,531,750 | | | | 773,550 | |
| | | | | | | | | |
| Net Investment Income (Loss) | | | 277,344 | | | | 1,593,860 | |
| | | | | | | | | |
| Realized and Unrealized Gain (Loss) on Investments | | | | | | | | |
| | | | | | | | | |
| Capital Gain Dividends from REIT's | | | 14,140 | | | | - | |
| Net Realized Gain (Loss) on Unaffiliated Investments | | | 5,661,957 | | | | 391,226 | |
| Change in Unrealized Appreciation (Depreciation) | | | | | | | | |
| of Investments | | | 3,112,652 | | | | 2,074,852 | |
| Net Realized and Unrealized Gain (Loss) on Investments | | | 8,788,749 | | | | 2,466,078 | |
| | | | | | | | | |
| Net Increase (Decrease) in Net Assets | | | | | | | | |
| Resulting from Operations | | $ | 9,066,093 | | | $ | 4,059,938 | |
| | | | | | | | | |
The accompanying notes are an integral part of these financial statements.
Timothy Plan Statement of Operations
For the Fiscal Year Ended September 30, 2010
| | | High Yield Bond | | | Defensive Strategies * | |
| Investment Income | | | | | | |
| | | | | | | |
| Interest from: | | | | | | |
| Unaffiliated Investments | | $ | 1,682,021 | | | $ | 230,581 | |
| Dividends from: | | | | | | | | |
| Unaffiliated Investments | | | - | | | | 143,419 | |
| | | | | | | | | |
| Total Investment Income | | | 1,682,021 | | | | 374,000 | |
| | | | | | | | | |
| Expenses | | | | | | | | |
| | | | | | | | | |
Investment Advisory Fees [NOTE 4] | | | 123,822 | | | | 136,802 | |
12b-1 Fees [NOTE 4] | | | | | | | | |
| Class A | | | 49,605 | | | | 49,450 | |
| Class C | | | 7,949 | | | | 30,203 | |
| Fund Accounting, Transfer Agency, & Administration Fees | | | 53,694 | | | | 57,401 | |
| Registration Fees | | | 27,421 | | | | 33,260 | |
| Audit Fees | | | 14,482 | | | | 15,167 | |
| Sub-Transfer Agency Fees | | | 7,759 | | | | 21,084 | |
| Printing Expense | | | 4,669 | | | | 9,597 | |
| Custodian Fees | | | 4,230 | | | | 7,911 | |
| CCO Expense | | | 2,605 | | | | 2,709 | |
| Trustee Fees | | | 2,283 | | | | 1,699 | |
| Miscellaneous Expense | | | 1,169 | | | | 1,683 | |
| Insurance Expense | | | 802 | | | | 643 | |
| | | | | | | | | |
| Total Expenses | | | 300,490 | | | | 367,609 | |
| | | | | | | | | |
| | | | | | | | | |
| Total Net Expenses | | | 300,490 | | | | 367,609 | |
| | | | | | | | | |
| Net Investment Income (Loss) | | | 1,381,531 | | | | 6,391 | |
| | | | | | | | | |
| Realized and Unrealized Gain (Loss) on Investments | | | | | | | | |
| | | | | | | | | |
| Capital Gain Dividends from REIT's | | | - | | | | 31,216 | |
| Net Realized Gain (Loss) on Unaffiliated Investments | | | 452,770 | | | | 404,252 | |
| Change in Unrealized Appreciation (Depreciation) | | | | | | | | |
| of Investments | | | 1,010,351 | | | | 2,122,357 | |
| Net Realized and Unrealized Gain (Loss) on Investments | | | 1,463,121 | | | | 2,557,825 | |
| | | | | | | | | |
| Net Increase (Decrease) in Net Assets | | | | | | | | |
| Resulting from Operations | | $ | 2,844,652 | | | $ | 2,564,216 | |
| | | | | | | | | |
| | | | | | | | | |
| * For the period November 4, 2009 (commencement of operations) through September 30, 2010. | | | | | |
The accompanying notes are an integral part of these financial statements.
Timothy Plan Statement of Operations
For the Fiscal Year Ended September 30, 2010
| | | Money Market | |
| Investment Income | | | |
| | | | |
| Interest from: | | | |
| Unaffiliated Investments | | $ | 22,614 | |
| | | | | |
| Total Investment Income | | | 22,614 | |
| | | | | |
| Expenses | | | | |
| | | | | |
Investment Advisory Fees [NOTE 4] | | | 99,615 | |
| Fund Accounting, Transfer Agency, & Administration Fees | | | 38,767 | |
| Registration Fees | | | 21,504 | |
| Custodian Fees | | | 12,994 | |
| Sub-Transfer Agency Fees | | | 4,743 | |
| Audit Fees | | | 3,005 | |
| Printing Expense | | | 2,953 | |
| CCO Expense | | | 2,304 | |
| Trustee Fees | | | 2,186 | |
| Insurance Expense | | | 982 | |
| Miscellaneous Expense | | | 475 | |
| | | | | |
| Total Expenses | | | 189,528 | |
| | | | | |
Fees Waived by Adviser [NOTE 4] | | | (33,205 | ) |
Expenses Reimbursed by Adviser [NOTE 4] | | | (143,776 | ) |
| | | | | |
| Total Net Expenses | | | 12,547 | |
| | | | | |
| Net Investment Income (Loss) | | | 10,067 | |
| | | | | |
| Realized and Unrealized Gain (Loss) on Investments | | | | |
| | | | | |
| Net Realized Gain (Loss) on Unaffiliated Investments | | | 701 | |
| Net Realized and Unrealized Gain (Loss) on Investments | | | 701 | |
| | | | | |
| Net Increase (Decrease) in Net Assets | | | | |
| Resulting from Operations | | $ | 10,768 | |
| | | | | |
The accompanying notes are an integral part of these financial statements.
Timothy Plan Statement of Operations
For the Fiscal Year Ended September 30, 2010
| | | Strategic Growth | | | Conservative Growth | |
| Investment Income | | | | | | |
| | | | | | | |
| Interest from: | | | | | | |
| Unaffiliated Investments | | $ | 101 | | | $ | 115 | |
| Dividends from: | | | | | | | | |
| Affiliated Investments | | | 628,840 | | | | 997,832 | |
| | | | | | | | | |
| Total Investment Income | | | 628,941 | | | | 997,947 | |
| | | | | | | | | |
| Expenses | | | | | | | | |
| | | | | | | | | |
Investment Advisory Fees [NOTE 4] | | | 288,948 | | | | 297,911 | |
12b-1 Fees [NOTE 4] | | | | | | | | |
| Class B | | | 39,083 | | | | 33,092 | |
| Class C | | | 53,275 | | | | 54,765 | |
| Fund Accounting, Transfer Agency, & Administration Fees | | | 106,030 | | | | 110,245 | |
| Sub-Transfer Agency Fees | | | 23,375 | | | | 26,231 | |
| Registration Fees | | | 28,710 | | | | 30,192 | |
| Printing Expense | | | 15,846 | | | | 16,148 | |
| Audit Fees | | | 10,494 | | | | 11,353 | |
| Custodian Fees | | | 9,472 | | | | 11,008 | |
| CCO Expense | | | 5,321 | | | | 5,505 | |
| Trustee Fees | | | 4,394 | | | | 5,090 | |
| Insurance Expense | | | 1,724 | | | | 1,978 | |
| Miscellaneous Expense | | | 977 | | | | 977 | |
| | | | | | | | | |
| Total Expenses | | | 587,649 | | | | 604,495 | |
| | | | | | | | | |
| | | | | | | | | |
| Total Net Expenses | | | 587,649 | | | | 604,495 | |
| | | | | | | | | |
| Net Investment Income (Loss) | | | 41,292 | | | | 393,452 | |
| | | | | | | | | |
| Realized and Unrealized Gain (Loss) on Investments | | | | | | | | |
| | | | | | | | | |
| Capital Gain Dividends from Affiliated Investments | | | 15,230 | | | | 23,585 | |
| Net Realized Gain (Loss) on Affiliated Investments | | | (4,580,132 | ) | | | (4,077,746 | ) |
| Change in Unrealized Appreciation (Depreciation) | | | | | | | | |
| of Investments | | | 8,000,124 | | | | 7,145,318 | |
| Net Realized and Unrealized Gain (Loss) on Investments | | | 3,435,222 | | | | 3,091,157 | |
| | | | | | | | | |
| Net Increase (Decrease) in Net Assets | | | | | | | | |
| Resulting from Operations | | $ | 3,476,514 | | | $ | 3,484,609 | |
| | | | | | | | | |
The accompanying notes are an integral part of these financial statements.
Timothy Plan Statement of Operations
Statements of Changes in Net Assets | Aggressive Growth
| Increase (Decrease) in Net Assets | | | | | | | | | | | | |
| | | Year ended | | | | Period ended | | Year ended | | |
| | | 09/30/10 | | | | 09/30/09 | | (A) | | 12/31/08 | | |
| | | | | | | | | | | | | |
| Operations: | | | | | | | | | | | | |
| Net Investment Income (Loss) | | $ | (254,555 | ) | | | $ | (201,996 | ) | | | $ | (339,070 | ) | |
| Net Realized Gain (Loss) on Investments | | | 3,285,274 | | | | | (2,667,673 | ) | | | | (7,557,154 | ) | |
Net Increase from Payment by Affiliate [NOTE 9] | | | - | | | | | - | | | | | 24,684 | | |
| Change in Unrealized Appreciation (Depreciation) of Investments | | | (700,397 | ) | | | | 6,229,851 | | | | | (5,095,846 | ) | |
| Net Increase (Decrease) in Net Assets (resulting from operations) | | | 2,330,322 | | | | | 3,360,182 | | | | | (12,967,386 | ) | |
| | | | | | | | | | | | | | | | |
| Distributions to Shareholders From: | | | | | | | | | | | | | | | |
| Net Realized Gains: | | | | | | | | | | | | | | | |
| Class A | | | - | | | | | - | | | | | (42,783 | ) | |
| Class B | | | - | | | | | - | | | | | (1,613 | ) | |
| Class C | | | - | | | | | - | | | | | (4,029 | ) | |
| Total Distributions | | | - | | | | | - | | | | | (48,425 | ) | |
| | | | | | | | | | | | | | | | |
| Capital Share Transactions: | | | | | | | | | | | | | | | |
| Proceeds from Shares Sold: | | | | | | | | | | | | | | | |
| Class A | | | 1,860,320 | | (B) | | | 1,228,054 | | (C) | | | 7,041,334 | | (D) |
| Class B | | | 23,703 | | | | | - | | | | | 3,577 | | |
| Class C | | | 354,687 | | | | | 190,027 | | | | | 343,835 | | |
| Dividends Reinvested: | | | | | | | | | | | | | | | |
| Class A | | | - | | | | | - | | | | | 42,015 | | |
| Class B | | | - | | | | | - | | | | | 1,381 | | |
| Class C | | | - | | | | | - | | | | | 3,918 | | |
| Cost of Shares Redeemed: | | | | | | | | | | | | | | | |
| Class A | | | (7,615,959 | ) | | | | (1,839,116 | ) | | | | (5,038,562 | ) | |
| Class B | | | (93,874 | ) | (B) | | | (179,275 | ) | (C) | | | (144,927 | ) | (D) |
| Class C | | | (433,734 | ) | | | | (237,480 | ) | | | | (306,988 | ) | |
| Net Increase (Decrease) in Net Assets (resulting from | | | | | | | | | | | | | | | |
| capital share transactions) | | | (5,904,857 | ) | | | | (837,790 | ) | | | | 1,945,583 | | |
| | | | | | | | | | | | | | | | |
| Total Increase (Decrease) in Net Assets | | | (3,574,535 | ) | | | | 2,522,392 | | | | | (11,070,228 | ) | |
| | | | | | | | | | | | | | | | |
| Net Assets: | | | | | | | | | | | | | | | |
| Beginning of period | | | 18,858,165 | | | | | 16,335,773 | | | | | 27,406,001 | | |
| | | | | | | | | | | | | | | | |
| End of period | | $ | 15,283,630 | | | | $ | 18,858,165 | | | | $ | 16,335,773 | | |
| | | | | | | | | | | | | | | | |
| Accumulated Undistributed Net Investment Income (Loss) | | $ | - | | | | $ | - | | | | $ | - | | |
| | | | | | | | | | | | | | | | |
| Shares of Capital Stock of the Fund Sold and Redeemed: | | | | | | | | | | | | | | | |
| Shares Sold: | | | | | | | | | | | | | | | |
| Class A | | | 370,914 | | (B) | | | 331,324 | | (C) | | | 1,298,923 | | (D) |
| Class B | | | 5,437 | | | | | - | | | | | 624 | | |
| Class C | | | 78,689 | | | | | 53,423 | | | | | 68,482 | | |
| Shares Reinvested: | | | | | | | | | | | | | | | |
| Class A | | | - | | | | | - | | | | | 11,929 | | |
| Class B | | | - | | | | | - | | | | | 422 | | |
| Class C | | | - | | | | | - | | | | | 1,195 | | |
| Shares Redeemed: | | | | | | | | | | | | | | | |
| Class A | | | (1,694,190 | ) | | | | (490,930 | ) | | | | (916,790 | ) | |
| Class B | | | (21,099 | ) | (B) | | | (52,300 | ) | (C) | | | (30,246 | ) | (D) |
| Class C | | | (96,731 | ) | | | | (68,122 | ) | | | | (58,719 | ) | |
| Net Increase (Decrease) in Number of Shares Outstanding | | | (1,356,980 | ) | | | | (226,605 | ) | | | | 375,820 | | |
| | | | | | | | | | | | | | | | |
| | | | | | | | | | | | | | | | |
| (A) | The Fund elected to change its fiscal year end from December 31 to September 30. The information presented is for January 1, 2009 through September 30, 2009. | | | | | |
| (B) | Includes automatic conversion of Class B shares ($32,688 representing 7,631 shares) to Class A shares ($32,688 representing 7,030 shares). | | | | | |
| (C) | Includes automatic conversion of Class B shares ($138,616 representing 40,607 shares) to Class A shares ($138,616 representing 37,670 shares). | | | | | |
| (D) | Includes automatic conversion of Class B shares ($16,599 representing 4,811 shares) to Class A shares ($16,599 representing 4,474 shares). | | | | | |
The accompanying notes are an integral part of these financial statements.
Timothy Plan Statement of Changes
Statements of Changes in Net Assets | International
| Increase (Decrease) in Net Assets | | | | | | | | | | |
| | | | | | | | | | | |
| | | | | | | | | | | |
| Operations: | | | | | | | | | | |
| Net Investment Income (Loss) | | $ | 197,357 | | | $ | 415,092 | | | | $ | 455,363 | |
| Net Realized Gain (Loss) on Investments | | | (1,864,844 | ) | | | (5,756,467 | ) | | | | (7,208,911 | ) |
| Change in Unrealized Appreciation (Depreciation) of Investments | | | 2,989,598 | | | | 13,894,617 | | | | | (17,417,187 | ) |
| Net Increase (Decrease) in Net Assets (resulting from operations) | | | 1,322,111 | | | | 8,553,242 | | | | | (24,170,735 | ) |
| | | | | | | | | | | | | | |
| Distributions to Shareholders From: | | | | | | | | | | | | | |
| Net Investment Income: | | | | | | | | | | | | | |
| Class A | | | (466,907 | ) | | | - | | | | | (432,699 | ) |
| Class C | | | (16,268 | ) | | | - | | | | | (12,503 | ) |
| Total Distributions | | | (483,175 | ) | | | - | | | | | (445,202 | ) |
| | | | | | | | | | | | | | |
| Capital Share Transactions: | | | | | | | | | | | | | |
| Proceeds from Shares Sold: | | | | | | | | | | | | | |
| Class A | | | 9,293,475 | | | | 5,238,049 | | | | | 20,334,914 | |
| Class C | | | 857,791 | | | | 344,856 | | | | | 808,369 | |
| Dividends Reinvested: | | | | | | | | | | | | | |
| Class A | | | 428,150 | | | | - | | | | | 388,442 | |
| Class C | | | 13,857 | | | | - | | | | | 12,206 | |
| Cost of Shares Redeemed: | | | | | | | | | | | | | |
| Class A | | | (12,582,095 | ) | | | (7,490,528 | ) | | | | (7,993,400 | ) |
| Class C | | | (367,443 | ) | | | (179,451 | ) | | | | (352,076 | ) |
| Net Increase (Decrease) in Net Assets (resulting from | | | | | | | | | | | | | |
| capital share transactions) | | | (2,356,265 | ) | | | (2,087,074 | ) | | | | 13,198,455 | |
| | | | | | | | | | | | | | |
| Total Increase (Decrease) in Net Assets | | | (1,517,329 | ) | | | 6,466,168 | | | | | (11,417,482 | ) |
| | | | | | | | | | | | | | |
| Net Assets: | | | | | | | | | | | | | |
| Beginning of period | | | 38,664,937 | | | | 32,198,769 | | | | | 43,616,251 | |
| | | | | | | | | | | | | | |
| End of period | | $ | 37,147,608 | | | $ | 38,664,937 | | | | $ | 32,198,769 | |
| | | | | | | | | | | | | | |
| Accumulated Undistributed Net Investment Income (Loss) | | $ | 140,572 | | | $ | 426,390 | | | | $ | 10,777 | |
| | | | | | | | | | | | | | |
| Shares of Capital Stock of the Fund Sold and Redeemed: | | | | | | | | | | | | | |
| Shares Sold: | | | | | | | | | | | | | |
| Class A | | | 1,254,272 | | | | 870,021 | | | | | 2,304,470 | |
| Class C | | | 113,556 | | | | 54,460 | | | | | 84,402 | |
| Shares Reinvested: | | | | | | | | | | | | | |
| Class A | | | 54,682 | | | | - | | | | | 67,673 | |
| Class C | | | 1,792 | | | | - | | | | | 2,145 | |
| Shares Redeemed: | | | | | | | | | | | | | |
| Class A | | | (1,697,642 | ) | | | (1,188,414 | ) | | | | (945,119 | ) |
| Class C | | | (50,328 | ) | | | (31,068 | ) | | | | (38,919 | ) |
| Net Increase (Decrease) in Number of Shares Outstanding | | | (323,668 | ) | | | (295,001 | ) | | | | 1,474,652 | |
| | | | | | | | | | | | | | |
| | | | | | | | | | | | | | |
| | | | | | | | | | | | | | |
| (A) | The Fund elected to change its fiscal year end from December 31 to September 30. The information presented is for January 1, 2009 through September 30, 2009. | |
The accompanying notes are an integral part of these financial statements.
Timothy Plan Statement of Changes
Statements of Changes in Net Assets | Large/Mid Cap Growth
| Increase (Decrease) in Net Assets | | | | | | | | | | | |
| | | Year ended 09/30/10 | | | | Period ended 09/30/09 | | (A) | | Year ended 12/31/08 | |
| | | | | | | | | | | | |
| Operations: | | | | | | | | | | | |
| Net Investment Income (Loss) | | $ | (332,565 | ) | | | $ | (164,775 | ) | | | $ | (340,626 | ) |
| Net Realized Gain (Loss) on Investments | | | 3,947,518 | | | | | (2,950,198 | ) | | | | (7,879,763 | ) |
| Change in Unrealized Appreciation (Depreciation) of Investments | | | 952,504 | | | | | 10,218,574 | | | | | (12,968,068 | ) |
| Net Increase (Decrease) in Net Assets (resulting from operations) | | | 4,567,457 | | | | | 7,103,601 | | | | | (21,188,457 | ) |
| | | | | | | | | | | | | | | |
| Distributions to Shareholders From: | | | | | | | | | | | | | | |
| Net Realized Gains: | | | | | | | | | | | | | | |
| Class A | | | - | | | | | - | | | | | (61,850 | ) |
| Class B | | | - | | | | | - | | | | | (2,112 | ) |
| Class C | | | - | | | | | - | | | | | (4,038 | ) |
| Total Distributions | | | - | | | | | - | | | | | (68,000 | ) |
| | | | | | | | | | | | | | | |
| Capital Share Transactions: | | | | | | | | | | | | | | |
| Proceeds from Shares Sold: | | | | | | | | | | | | | | |
| Class A | | | 6,385,933 | | (B) | | | 2,870,891 | | | | | 15,166,919 | |
| Class B | | | 21,288 | | | | | 3,853 | | | | | 17,054 | |
| Class C | | | 691,586 | | | | | 335,469 | | | | | 775,006 | |
| Dividends Reinvested: | | | | | | | | | | | | | | |
| Class A | | | - | | | | | - | | | | | 56,381 | |
| Class B | | | - | | | | | - | | | | | 1,861 | |
| Class C | | | - | | | | | - | | | | | 3,555 | |
| Cost of Shares Redeemed: | | | | | | | | | | | | | | |
| Class A | | | (7,716,915 | ) | | | | (5,919,458 | ) | | | | (16,452,855 | ) |
| Class B | | | (558,323 | ) | (B) | | | (97,613 | ) | | | | (288,063 | ) |
| Class C | | | (525,440 | ) | | | | (550,408 | ) | | | | (761,081 | ) |
| Net Increase (Decrease) in Net Assets (resulting from | | | | | | | | | | | | | | |
| capital share transactions) | | | (1,701,871 | ) | | | | (3,357,266 | ) | | | | (1,481,223 | ) |
| | | | | | | | | | | | | | | |
| Total Increase (Decrease) in Net Assets | | | 2,865,586 | | | | | 3,746,335 | | | | | (22,737,680 | ) |
| | | | | | | | | | | | | | | |
| Net Assets: | | | | | | | | | | | | | | |
| Beginning of period | | | 39,222,874 | | | | | 35,476,539 | | | | | 58,214,219 | |
| | | | | | | | | | | | | | | |
| End of period | | $ | 42,088,460 | | | | $ | 39,222,874 | | | | $ | 35,476,539 | |
| | | | | | | | | | | | | | | |
| Accumulated Undistributed Net Investment Income (Loss) | | $ | - | | | | $ | - | | | | $ | - | |
| | | | | | | | | | | | | | | |
| Shares of Capital Stock of the Fund Sold and Redeemed: | | | | | | | | | | | | | | |
| Shares Sold: | | | | | | | | | | | | | | |
| Class A | | | 1,144,683 | | (B) | | | 640,864 | | | | | 2,613,667 | |
| Class B | | | 4,052 | | | | | 928 | | | | | 3,097 | |
| Class C | | | 130,866 | | | | | 78,171 | | | | | 134,417 | |
| Shares Reinvested: | | | | | | | | | | | | | | |
| Class A | | | - | | | | | - | | | | | 13,424 | |
| Class B | | | - | | | | | - | | | | | 474 | |
| Class C | | | - | | | | | - | | | | | 902 | |
| Shares Redeemed: | | | | | | | | | | | | | | |
| Class A | | | (1,361,041 | ) | | | | (1,345,096 | ) | | | | (2,941,853 | ) |
| Class B | | | (103,590 | ) | (B) | | | (23,674 | ) | | | | (52,411 | ) |
| Class C | | | (99,562 | ) | | | | (133,643 | ) | | | | (131,734 | ) |
| Net Increase (Decrease) in Number of Shares Outstanding | | | (284,592 | ) | | | | (782,450 | ) | | | | (360,017 | ) |
| | | | | | | | | | | | | | | |
| | | | | | | | | | | | | | | |
| | | | | | | | | | | | | | | |
| (A) | The Fund elected to change its fiscal year end from December 31 to September 30. The information presented is for January 1, 2009 through September 30, 2009. |
| (B) | Includes automatic conversion of Class B shares ($391,947 representing 71,554 shares) to Class A shares ($391,947 representing 66,349 shares). |
The accompanying notes are an integral part of these financial statements.
Timothy Plan Statement of Changes
Statements of Changes in Net Assets | Small Cap Value
| Increase (Decrease) in Net Assets | | | | | | | | | | | | |
| | | Year ended 09/30/10 | | | | Period ended 09/30/09 | | (A) | | Year ended 12/31/08 | | |
| | | | | | | | | | | | | |
| Operations: | | | | | | | | | | | | |
| Net Investment Income (Loss) | | $ | (311,453 | ) | | | $ | (296,132 | ) | | | $ | (51,484 | ) | |
| Capital Gain Dividends from REITs | | | 16,268 | | | | | 23,271 | | | | | 97,582 | | |
| Net Realized Gain (Loss) on Investments | | | 6,310,642 | | | | | (1,480,291 | ) | | | | (18,562,090 | ) | |
| Change in Unrealized Appreciation (Depreciation) of Investments | | | (1,924,103 | ) | | | | 9,015,718 | | | | | (6,072,615 | ) | |
| Net Increase (Decrease) in Net Assets (resulting from operations) | | | 4,091,354 | | | | | 7,262,566 | | | | | (24,588,607 | ) | |
| | | | | | | | | | | | | | | | |
| Distributions to Shareholders From: | | | | | | | | | | | | | | | |
| Net Realized Gains: | | | | | | | | | | | | | | | |
| Class A | | | - | | | | | - | | | | | (349,483 | ) | |
| Class B | | | - | | | | | - | | | | | (38,730 | ) | |
| Class C | | | - | | | | | - | | | | | (35,945 | ) | |
| Total Distributions | | | - | | | | | - | | | | | (424,158 | ) | |
| | | | | | | | | | | | | | | | |
| Capital Share Transactions: | | | | | | | | | | | | | | | |
| Proceeds from Shares Sold: | | | | | | | | | | | | | | | |
| Class A | | | 5,432,696 | | (B) | | | 4,308,472 | | (C) | | | 13,566,159 | | (D) |
| Class B | | | 15,444 | | | | | - | | | | | 11,760 | | |
| Class C | | | 869,702 | | | | | 424,218 | | | | | 1,147,220 | | |
| Dividends Reinvested: | | | | | | | | | | | | | | | |
| Class A | | | - | | | | | - | | | | | 334,156 | | |
| Class B | | | - | | | | | - | | | | | 36,572 | | |
| Class C | | | - | | | | | - | | | | | 35,715 | | |
| Cost of Shares Redeemed: | | | | | | | | | | | | | | | |
| Class A | | | (15,636,285 | ) | | | | (5,977,541 | ) | | | | (13,027,054 | ) | |
| Class B | | | (1,288,320 | ) | (B) | | | (620,618 | ) | (C) | | | (994,846 | ) | (D) |
| Class C | | | (889,192 | ) | | | | (935,477 | ) | | | | (1,608,258 | ) | |
| Net Increase (Decrease) in Net Assets (resulting from | | | | | | | | | | | | | | | |
| capital share transactions) | | | (11,495,955 | ) | | | | (2,800,946 | ) | | | | (498,576 | ) | |
| | | | | | | | | | | | | | | | |
| Total Increase (Decrease) in Net Assets | | | (7,404,601 | ) | | | | 4,461,620 | | | | | (25,511,341 | ) | |
| | | | | | | | | | | | | | | | |
| Net Assets: | | | | | | | | | | | | | | | |
| Beginning of period | | | 55,186,474 | | | | | 50,724,854 | | | | | 76,236,195 | | |
| | | | | | | | | | | | | | | | |
| End of period | | $ | 47,781,873 | | | | $ | 55,186,474 | | | | $ | 50,724,854 | | |
| | | | | | | | | | | | | | | | |
| Accumulated Undistributed Net Investment Income (Loss) | | $ | - | | | | $ | - | | | | $ | - | | |
| | | | | | | | | | | | | | | | |
| Shares of Capital Stock of the Fund Sold and Redeemed: | | | | | | | | | | | | | | | |
| Shares Sold: | | | | | | | | | | | | | | | |
| Class A | | | 491,833 | | (B) | | | 511,073 | | (C) | | | 1,181,260 | | (D) |
| Class B | | | 1,620 | | | | | - | | | | | 1,107 | | |
| Class C | | | 90,254 | | | | | 55,575 | | | | | 112,080 | | |
| Shares Reinvested: | | | | | | | | | | | | | | | |
| Class A | | | - | | | | | - | | | | | 40,211 | | |
| Class B | | | - | | | | | - | | | | | 5,030 | | |
| Class C | | | - | | | | | - | | | | | 4,872 | | |
| Shares Redeemed: | | | | | | | | | | | | | | | |
| Class A | | | (1,515,665 | ) | | | | (698,823 | ) | | | | (1,131,872 | ) | |
| Class B | | | (136,357 | ) | (B) | | | (82,249 | ) | (C) | | | (98,662 | ) | (D) |
| Class C | | | (94,152 | ) | | | | (123,231 | ) | | | | (156,226 | ) | |
| Net Increase (Decrease) in Number of Shares Outstanding | | | (1,162,467 | ) | | | | (337,655 | ) | | | | (42,200 | ) | |
| | | | | | | | | | | | | | | | |
| (A) | The Fund elected to change its fiscal year end from December 31 to September 30. The information presented is for January 1, 2009 through September 30, 2009. | | | |
| (B) | Includes automatic conversion of Class B shares ($665,559 representing 70,422 shares) to Class A shares ($665,559 representing 61,038 shares). | | | |
| (C) | Includes automatic conversion of Class B shares ($132,891 representing 16,408 shares) to Class A shares ($132,891 representing 14,308 shares). | | | |
| (D) | Includes automatic conversion of Class B shares ($54,856 representing 4,594 shares) to Class A shares ($54,856 representing 4,042 shares). | | | |
The accompanying notes are an integral part of these financial statements.
Timothy Plan Statement of Changes
Statements of Changes in Net Assets | Large/Mid Cap Value
| Increase (Decrease) in Net Assets | | | | | | | | | | | | |
| | | Year ended 09/30/10 | | | | Period ended 09/30/09 | | (A) | | Year ended 12/31/08 | | |
| | | | | | | | | | | | | |
| Operations: | | | | | | | | | | | | |
| Net Investment Income (Loss) | | $ | 277,344 | | | | $ | 290,749 | | | | $ | 315,403 | | |
| Capital Gain Dividends from REITs | | | 14,140 | | | | | 56,992 | | | | | 119,453 | | |
| Net Realized Gain (Loss) on Investments | | | 5,661,957 | | | | | (5,325,537 | ) | | | | (21,143,902 | ) | |
| Change in Unrealized Appreciation (Depreciation) of Investments | | | 3,112,652 | | | | | 19,278,975 | | | | | (34,286,147 | ) | |
| Net Increase (Decrease) in Net Assets (resulting from operations) | | | 9,066,093 | | | | | 14,301,179 | | | | | (54,995,193 | ) | |
| | | | | | | | | | | | | | | | |
| Distributions to Shareholders From: | | | | | | | | | | | | | | | |
| Net Investment Income: | | | | | | | | | | | | | | | |
| Class A | | | (356,852 | ) | | | | - | | | | | (261,651 | ) | |
| Class B | | | (5,573 | ) | | | | - | | | | | (5,389 | ) | |
| Class C | | | (32,368 | ) | | | | - | | | | | (20,404 | ) | |
| Net Realized Gains: | | | | | | | | | | | | | | | |
| Class A | | | - | | | | | - | | | | | (1,032,217 | ) | |
| Class B | | | - | | | | | - | | | | | (38,228 | ) | |
| Class C | | | - | | | | | - | | | | | (138,289 | ) | |
| Total Distributions | | | (394,793 | ) | | | | - | | | | | (1,496,178 | ) | |
| | | | | | | | | | | | | | | | |
| Capital Share Transactions: | | | | | | | | | | | | | | | |
| Proceeds from Shares Sold: | | | | | | | | | | | | | | | |
| Class A | | | 17,995,566 | | (B) | | | 13,727,988 | | (C) | | | 43,215,602 | | (D) |
| Class B | | | 16,897 | | | | | 10,649 | | | | | 50,993 | | |
| Class C | | | 1,801,079 | | | | | 1,187,000 | | | | | 5,604,263 | | |
| Dividends Reinvested: | | | | | | | | | | | | | | | |
| Class A | | | 307,025 | | | | | - | | | | | 1,159,102 | | |
| Class B | | | 5,078 | | | | | - | | | | | 40,065 | | |
| Class C | | | 24,598 | | | | | - | | | | | 114,538 | | |
| Cost of Shares Redeemed: | | | | | | | | | | | | | | | |
| Class A | | | (28,066,046 | ) | | | | (13,355,139 | ) | | | | (30,185,260 | ) | |
| Class B | | | (766,541 | ) | (B) | | | (770,992 | ) | (C) | | | (1,740,640 | ) | (D) |
| Class C | | | (2,767,557 | ) | | | | (1,517,058 | ) | | | | (3,787,995 | ) | |
| Net Increase (Decrease) in Net Assets (resulting from | | | | | | | | | | | | | | | |
| capital share transactions) | | | (11,449,901 | ) | | | | (717,552 | ) | | | | 14,470,668 | | |
| | | | | | | | | | | | | | | | |
| Total Increase (Decrease) in Net Assets | | | (2,778,601 | ) | | | | 13,583,627 | | | | | (42,020,703 | ) | |
| | | | | | | | | | | | | | | | |
| Net Assets: | | | | | | | | | | | | | | | |
| Beginning of period | | | 94,058,498 | | | | | 80,474,871 | | | | | 122,495,574 | | |
| | | | | | | | | | | | | | | | |
| End of period | | $ | 91,279,897 | | | | $ | 94,058,498 | | | | $ | 80,474,871 | | |
| | | | | | | | | | | | | | | | |
| Accumulated Undistributed Net Investment Income (Loss) | | $ | 253,772 | | | | $ | 318,708 | | | | $ | 27,959 | | |
| | | | | | | | | | | | | | | | |
| Shares of Capital Stock of the Fund Sold and Redeemed: | | | | | | | | | | | | | | | |
| Shares Sold: | | | | | | | | | | | | | | | |
| Class A | | | 1,609,716 | | (B) | | | 1,527,499 | | (C) | | | 3,330,953 | | (D) |
| Class B | | | 1,735 | | | | | 1,346 | | | | | 4,127 | | |
| Class C | | | 178,749 | | | | | 141,471 | | | | | 449,463 | | |
| Shares Reinvested: | | | | | | | | | | | | | | | |
| Class A | | | 27,364 | | | | | - | | | | | 133,382 | | |
| Class B | | | 497 | | | | | - | | | | | 5,040 | | |
| Class C | | | 2,416 | | | | | - | | | | | 14,443 | | |
| Shares Redeemed: | | | | | | | | | | | | | | | |
| Class A | | | (2,542,612 | ) | | | | (1,464,060 | ) | | | | (2,512,832 | ) | |
| Class B | | | (76,437 | ) | (B) | | | (93,370 | ) | (C) | | | (157,284 | ) | (D) |
| Class C | | | (274,697 | ) | | | | (188,471 | ) | | | | (328,671 | ) | |
| Net Increase (Decrease) in Number of Shares Outstanding | | | (1,073,269 | ) | | | | (75,585 | ) | | | | 938,621 | | |
| | | | | | | | | | | | | | | | |
| (A) | The Fund elected to change its fiscal year end from December 31 to September 30. The information presented is for January 1, 2009 through September 30, 2009. | | | |
| (B) | Includes automatic conversion of Class B shares ($485,983 representing 48,535 shares) to Class A shares ($485,983 representing 44,047 shares). | | | |
| (C) | Includes automatic conversion of Class B shares ($547,116 representing 65,891 shares) to Class A shares ($547,116 representing 60,101 shares). | | | |
| (D) | Includes automatic conversion of Class B shares ($826,012 representing 75,819 shares) to Class A shares ($826,012 representing 69,567 shares). | | | |
The accompanying notes are an integral part of these financial statements.
Timothy Plan Statement of Changes
Statements of Changes in Net Assets | Fixed Income
| Increase (Decrease) in Net Assets | | | | | | | | | | | | |
| | | | | | | | | | | |
| | | Year ended 09/30/10 | | | | Period ended 09/30/09 | | (A) | | Year ended 12/31/08 | | |
| | | | | | | | | | | | | |
| Operations: | | | | | | | | | | | | |
| Net Investment Income (Loss) | | $ | 1,593,860 | | | | $ | 1,121,628 | | | | $ | 2,054,010 | | |
| Net Realized Gain (Loss) on Investments | | | 391,226 | | | | | (363,079 | ) | | | | (988,457 | ) | |
| Change in Unrealized Appreciation (Depreciation) of Investments | | | 2,074,852 | | | | | 3,043,140 | | | | | (1,280,539 | ) | |
| Net Increase (Decrease) in Net Assets (resulting from operations) | | | 4,059,938 | | | | | 3,801,689 | | | | | (214,986 | ) | |
| | | | | | | | | | | | | | | | |
| Distributions to Shareholders From: | | | | | | | | | | | | | | | |
| Net Investment Income: | | | | | | | | | | | | | | | |
| Class A | | | (1,463,500 | ) | | | | (1,030,855 | ) | | | | (1,899,067 | ) | |
| Class B | | | (10,119 | ) | | | | (18,994 | ) | | | | (53,131 | ) | |
| Class C | | | (152,405 | ) | | | | (84,563 | ) | | | | (101,092 | ) | |
| Total Distributions | | | (1,626,024 | ) | | | | (1,134,412 | ) | | | | (2,053,290 | ) | |
| | | | | | | | | | | | | | | | |
| Capital Share Transactions: | | | | | | | | | | | | | | | |
| Proceeds from Shares Sold: | | | | | | | | | | | | | | | |
| Class A | | | 23,371,938 | | (B) | | | 15,547,916 | | (C) | | | 16,330,862 | | (D) |
| Class B | | | 11,214 | | | | | 26,344 | | | | | 200,402 | | |
| Class C | | | 4,581,705 | | | | | 3,291,479 | | | | | 1,644,103 | | |
| Dividends Reinvested: | | | | | | | | | | | | | | | |
| Class A | | | 1,366,616 | | | | | 971,951 | | | | | 1,755,420 | | |
| Class B | | | 8,325 | | | | | 16,644 | | | | | 45,365 | | |
| Class C | | | 128,869 | | | | | 62,936 | | | | | 84,663 | | |
| Cost of Shares Redeemed: | | | | | | | | | | | | | | | |
| Class A | | | (16,116,013 | ) | | | | (8,207,233 | ) | | | | (23,998,355 | ) | |
| Class B | | | (512,736 | ) | (B) | | | (547,920 | ) | (C) | | | (910,988 | ) | (D) |
| Class C | | | (1,762,597 | ) | | | | (1,239,605 | ) | | | | (1,567,477 | ) | |
| Net Increase (Decrease) in Net Assets (resulting from | | | | | | | | | | | | | | | |
| capital share transactions) | | | 11,077,321 | | | | | 9,922,512 | | | | | (6,416,005 | ) | |
| | | | | | | | | | | | | | | | |
| Total Increase (Decrease) in Net Assets | | | 13,511,235 | | | | | 12,589,789 | | | | | (8,684,281 | ) | |
| | | | | | | | | | | | | | | | |
| Net Assets: | | | | | | | | | | | | | | | |
| Beginning of period | | | 54,069,157 | | | | | 41,479,368 | | | | | 50,163,649 | | |
| | | | | | | | | | | | | | | | |
| End of period | | $ | 67,580,392 | | | | $ | 54,069,157 | | | | $ | 41,479,368 | | |
| | | | | | | | | | | | | | | | |
| Accumulated Undistributed Net Investment Income (Loss) | | $ | 32,167 | | | | $ | (12,064 | ) | | | $ | 720 | | |
| | | | | | | | | | | | | | | | |
| Shares of Capital Stock of the Fund Sold and Redeemed: | | | | | | | | | | | | | | | |
| Shares Sold: | | | | | | | | | | | | | | | |
| Class A | | | 2,264,804 | | (B) | | | 1,572,537 | | (C) | | | 1,643,240 | | (D) |
| Class B | | | 1,122 | | | | | 2,732 | | | | | 21,569 | | |
| Class C | | | 459,586 | | | | | 342,893 | | | | | 173,695 | | |
| Shares Reinvested: | | | | | | | | | | | | | | | |
| Class A | | | 132,845 | | | | | 98,066 | | | | | 179,043 | | |
| Class B | | | 839 | | | | | 1,741 | | | | | 4,761 | | |
| Class C | | | 12,923 | | | | | 6,535 | | | | | 8,898 | | |
| Shares Redeemed: | | | | | | | | | | | | | | | |
| Class A | | | (1,567,585 | ) | | | | (836,481 | ) | | | | (2,456,337 | ) | |
| Class B | | | (51,241 | ) | (B) | | | (57,366 | ) | (C) | | | (94,932 | ) | (D) |
| Class C | | | (177,159 | ) | | | | (129,520 | ) | | | | (165,113 | ) | |
| Net Increase (Decrease) in Number of Shares Outstanding | | | 1,076,134 | | | | | 1,001,137 | | | | | (685,176 | ) | |
| | | | | | | | | | | | | | | | |
| | | | | | | | | | | | | | | | |
| (A) | The Fund elected to change its fiscal year end from December 31 to September 30. The information presented is for January 1, 2009 through September 30, 2009. | | | |
| (B) | Includes automatic conversion of Class B shares ($329,284 representing 32,881 shares) to Class A shares ($329,284 representing 31,865 shares). | | | |
| (C) | Includes automatic conversion of Class B shares ($335,825 representing 35,147 shares) to Class A shares ($335,825 representing 34,072 shares). | | | |
| (D) | Includes automatic conversion of Class B shares ($357,407 representing 37,235 shares) to Class A shares ($357,407 representing 36,109 shares). | | | |
The accompanying notes are an integral part of these financial statements.
Timothy Plan Statement of Changes
Statements of Changes in Net Assets | High Yield Bond
| Increase (Decrease) in Net Assets | | | | | | | | | | |
| | | | | | | | | (A) | | | |
| | | | | | | | | | | | |
| | Operations: | | | | | | | | | | |
| | Net Investment Income (Loss) | | $ | 1,381,531 | | | $ | 997,484 | | | | $ | 1,290,824 | |
| | Net Realized Gain (Loss) on Investments | | | 452,770 | | | | (1,807,422 | ) | | | | (1,081,685 | ) |
| | Change in Unrealized Appreciation (Depreciation) of Investments | | | 1,010,351 | | | | 6,648,416 | | | | | (5,758,446 | ) |
| | Net Increase (Decrease) in Net Assets (resulting from operations) | | | 2,844,652 | | | | 5,838,478 | | | | | (5,549,307 | ) |
| | | | | | | | | | | | | | | |
| | Distributions to Shareholders From: | | | | | | | | | | | | | |
| | Net Investment Income: | | | | | | | | | | | | | |
| | Class A | | | (1,331,309 | ) | | | (993,063 | ) | | | | (1,259,132 | ) |
| | Class C | | | (50,198 | ) | | | (21,558 | ) | | | | (14,892 | ) |
| | Net Realized Gains: | | | | | | | | | | | | | |
| | Class A | | | - | | | | - | | | | | (10,252 | ) |
| | Class C | | | - | | | | - | | | | | (105 | ) |
| | Total Distributions | | | (1,381,507 | ) | | | (1,014,621 | ) | | | | (1,284,381 | ) |
| | | | | | | | | | | | | | | |
| | Capital Share Transactions: | | | | | | | | | | | | | |
| | Proceeds from Shares Sold: | | | | | | | | | | | | | |
| | Class A | | | 6,933,191 | | | | 6,181,963 | | | | | 5,512,203 | |
| | Class C | | | 548,832 | | | | 379,942 | | | | | 265,375 | |
| | Dividends Reinvested: | | | | | | | | | | | | | |
| | Class A | | | 1,261,483 | | | | 951,405 | | | | | 1,226,938 | |
| | Class C | | | 35,472 | | | | 15,955 | | | | | 9,733 | |
| | Cost of Shares Redeemed: | | | | | | | | | | | | | |
| | Class A | | | (6,727,086 | ) | | | (6,409,997 | ) | | | | (7,001,568 | ) |
| | Class C | | | (145,950 | ) | | | (79,706 | ) | | | | (280,184 | ) |
| | Net Increase (Decrease) in Net Assets (resulting from | | | | | | | | | | | | | |
| | capital share transactions) | | | 1,905,942 | | | | 1,039,562 | | | | | (267,503 | ) |
| | | | | | | | | | | | | | | |
| | Total Increase (Decrease) in Net Assets | | | 3,369,087 | | | | 5,863,419 | | | | | (7,101,191 | ) |
| | | | | | | | | | | | | | | |
| | Net Assets: | | | | | | | | | | | | | |
| | Beginning of period | | | 19,287,165 | | | | 13,423,746 | | | | | 20,524,937 | |
| | | | | | | | | | | | | | | |
| | End of period | | $ | 22,656,252 | | | $ | 19,287,165 | | | | $ | 13,423,746 | |
| | | | | | | | | | | | | | | |
| | Accumulated Undistributed Net Investment Income (Loss) | | $ | 24 | | | $ | - | | | | $ | 16,800 | |
| | | | | | | | | | | | | | | |
| | Shares of Capital Stock of the Fund Sold and Redeemed: | | | | | | | | | | | | | |
| | Shares Sold: | | | | | | | | | | | | | |
| | Class A | | | 782,374 | | | | 829,334 | | | | | 686,555 | |
| | Class C | | | 61,641 | | | | 50,127 | | | | | 29,745 | |
| | Shares Reinvested: | | | | | | | | | | | | | |
| | Class A | | | 142,723 | | | | 131,606 | | | | | 154,308 | |
| | Class C | | | 3,983 | | | | 2,126 | | | | | 1,237 | |
| | Shares Redeemed: | | | | | | | | | | | | | |
| | Class A | | | (766,222 | ) | | | (876,583 | ) | | | | (837,295 | ) |
| | Class C | | | (16,540 | ) | | | (10,343 | ) | | | | (33,648 | ) |
| | Net Increase (Decrease) in Number of Shares Outstanding | | | 207,959 | | | | 126,267 | | | | | 902 | |
| | | | | | | | | | | | | | | |
| | | | | | | | | | | | | | | |
| | | | | | | | | | | | | | | |
| | | | | | | | | | | | | | | |
| (A) | The Fund elected to change its fiscal year end from December 31 to September 30. The information presented is for January 1, 2009 through September 30, 2009. | |
The accompanying notes are an integral part of these financial statements.
Timothy Plan Statement of Changes
Statements of Changes in Net Assets | Defensive Strategies
| Increase (Decrease) in Net Assets | | | |
| | | Period ended 09/30/10 (A) | |
| | | | |
| Operations: | | | |
| Net Investment Income (Loss) | | $ | 6,391 | |
| Capital Gain Dividends from REITs | | | 31,216 | |
| Net Realized Gain (Loss) on Investments | | | 404,252 | |
| Change in Unrealized Appreciation (Depreciation) of Investments | | | 2,122,357 | |
| Net Increase (Decrease) in Net Assets (resulting from operations) | | | 2,564,216 | |
| | | | | |
| Distributions to Shareholders From: | | | | |
| Net Investment Income: | | | | |
| Class A | | | (2,918 | ) |
| Class C | | | (445 | ) |
| Net Realized Gains: | | | | |
| Class A | | | (434,295 | ) |
| Class C | | | (104,053 | ) |
| Return of Capital: | | | | |
| Class A | | | (397,132 | ) |
| Class C | | | (80,358 | ) |
| Total Distributions | | | (1,019,201 | ) |
| | | | | |
| Capital Share Transactions: | | | | |
| Proceeds from Shares Sold: | | | | |
| Class A | | | 24,560,497 | |
| Class C | | | 5,422,174 | |
| Dividends Reinvested: | | | | |
| Class A | | | 829,995 | |
| Class C | | | 184,556 | |
| Cost of Shares Redeemed: | | | | |
| Class A | | | (3,422,455 | ) |
| Class C | | | (232,621 | ) |
| Net Increase (Decrease) in Net Assets (resulting from | | | | |
| capital share transactions) | | | 27,342,146 | |
| | | | | |
| Total Increase (Decrease) in Net Assets | | | 28,887,161 | |
| | | | | |
| Net Assets: | | | | |
| Beginning of period | | | - | |
| | | | | |
| End of period | | $ | 28,887,161 | |
| | | | | |
| Accumulated Undistributed Net Investment Income (Loss) | | $ | 3,027 | |
| | | | | |
| Shares of Capital Stock of the Fund Sold and Redeemed: | | | | |
| Shares Sold: | | | | |
| Class A | | | 2,434,205 | |
| Class C | | | 527,240 | |
| Shares Reinvested: | | | | |
| Class A | | | 77,678 | |
| Class C | | | 17,476 | |
| Shares Redeemed: | | | | |
| Class A | | | (328,549 | ) |
| Class C | | | (22,363 | ) |
| Net Increase (Decrease) in Number of Shares Outstanding | | | 2,705,687 | |
| | | | | |
| | | | | |
| | | | | |
| (A) | For the period November 4, 2009 (commencement of operations) through September 30, 2010. | | | | | |
The accompanying notes are an integral part of these financial statements.
Timothy Plan Statement of Changes
Statements of Changes in Net Assets | Money Market
| Increase (Decrease) in Net Assets | | | | | | | | | |
| | | Year ended 09/30/10 | | | Period ended 09/30/09 (A) | | | Year ended 12/31/08 | |
| | | | | | | | | | |
| Operations: | | | | | | | | | |
| Net Investment Income (Loss) | | $ | 10,067 | | | $ | 19,717 | | | $ | 555,536 | |
| Net Realized Gain (Loss) on Investments | | | 701 | | | | 5,397 | | | | 2,939 | |
| Net Increase (Decrease) in Net Assets (resulting from operations) | | | 10,768 | | | | 25,114 | | | | 558,475 | |
| | | | | | | | | | | | | |
| Distributions to Shareholders From: | | | | | | | | | | | | |
| Net Investment Income: | | | (10,048 | ) | | | (19,743 | ) | | | (556,735 | ) |
| Total Distributions | | | (10,048 | ) | | | (19,743 | ) | | | (556,735 | ) |
| | | | | | | | | | | | | |
| Capital Share Transactions: | | | | | | | | | | | | |
| Proceeds from Shares Sold | | | 62,161,696 | | | | 66,347,945 | | | | 134,018,704 | |
| Dividends Reinvested | | | 8,029 | | | | 8,798 | | | | 173,650 | |
| Cost of Shares Redeemed | | | (75,948,932 | ) | | | (73,053,550 | ) | | | (145,767,742 | ) |
| Net Increase (Decrease) in Net Assets (resulting from | | | | | | | | | | | | |
| capital share transactions) | | | (13,779,207 | ) | | | (6,696,807 | ) | | | (11,575,388 | ) |
| | | | | | | | | | | | | |
| Total Increase (Decrease) in Net Assets | | | (13,778,487 | ) | | | (6,691,436 | ) | | | (11,573,648 | ) |
| | | | | | | | | | | | | |
| Net Assets: | | | | | | | | | | | | |
| Beginning of period | | | 27,168,207 | | | | 33,859,643 | | | | 45,433,291 | |
| | | | | | | | | | | | | |
| End of period | | $ | 13,389,720 | | | $ | 27,168,207 | | | $ | 33,859,643 | |
| | | | | | | | | | | | | |
| Accumulated Undistributed Net Investment Income (Loss) | | $ | 7,884 | | | $ | 7,683 | | | $ | - | |
| | | | | | | | | | | | | |
| Shares of Capital Stock of the Fund Sold and Redeemed: | | | | | | | | | | | | |
| Shares Sold | | | 62,161,697 | | | | 66,347,945 | | | | 134,018,704 | |
| Shares Reinvested | | | 8,029 | | | | 8,798 | | | | 173,650 | |
| Shares Redeemed | | | (75,948,933 | ) | | | (73,053,550 | ) | | | (145,767,742 | ) |
| Net Increase (Decrease) in Number of Shares Outstanding | | | (13,779,207 | ) | | | (6,696,807 | ) | | | (11,575,388 | ) |
| (A) | The Fund elected to change its fiscal year end from December 31 to September 30. The information presented is for January 1, 2009 through September 30, 2009. |
The accompanying notes are an integral part of these financial statements.
Timothy Plan Statement of Changes
Statements of Changes in Net Assets | Strategic Growth
| Increase (Decrease) in Net Assets | | | | | | | | | | | |
| | | | | | | | | | | | |
| | | | | | | | | | | | |
| Operations: | | | | | | | | | | | |
| Net Investment Income (Loss) | | $ | 41,292 | | | | $ | (143,802 | ) | | | $ | (86,991 | ) |
| Net Realized Gain (Loss) on Investments | | | (4,580,132 | ) | | | | (2,575,633 | ) | | | | (2,291,137 | ) |
| Capital Gain Distributions from Affiliated Funds | | | 15,230 | | | | | - | | | | | 94,136 | |
| Change in Unrealized Appreciation (Depreciation) of Investments | | | 8,000,124 | | | | | 10,776,761 | | | | | (25,435,252 | ) |
| Net Increase (Decrease) in Net Assets (resulting from operations) | | | 3,476,514 | | | | | 8,057,326 | | | | | (27,719,244 | ) |
| | | | | | | | | | | | | | | |
| Distributions to Shareholders From: | | | | | | | | | | | | | | |
| Net Investment Income: | | | | | | | | | | | | | | |
| Class A | | | - | | | | | - | | | | | (426,205 | ) |
| Class B | | | - | | | | | - | | | | | (34,098 | ) |
| Class C | | | - | | | | | - | | | | | (46,567 | ) |
| Net Realized Gains: | | | | | | | | | | | | | | |
| Class A | | | - | | | | | - | | | | | (2,393,506 | ) |
| Class B | | | - | | | | | - | | | | | (647,982 | ) |
| Class C | | | - | | | | | - | | | | | (641,388 | ) |
| Total Distributions | | | - | | | | | - | | | | | (4,189,746 | ) |
| | | | | | | | | | | | | | | |
| Capital Share Transactions: | | | | | | | | | | | | | | |
| Proceeds from Shares Sold: | | | | | | | | | | | | | | |
| Class A | | | 10,177,043 | | (B) | | | 4,315,979 | | (C) | | | 8,353,300 | |
| Class B | | | 76,783 | | | | | - | | | | | 40,771 | |
| Class C | | | 1,472,104 | | | | | 1,239,886 | | | | | 3,061,956 | |
| Dividends Reinvested: | | | | | | | | | | | | | | |
| Class A | | | - | | | | | - | | | | | 2,708,511 | |
| Class B | | | - | | | | | - | | | | | 664,039 | |
| Class C | | | - | | | | | - | | | | | 649,068 | |
| Cost of Shares Redeemed: | | | | | | | | | | | | | | |
| Class A | | | (8,677,400 | ) | | | | (5,107,122 | ) | | | | (8,908,535 | ) |
| Class B | | | (1,985,860 | ) | (B) | | | (1,520,998 | ) | (C) | | | (2,618,810 | ) |
| Class C | | | (2,688,307 | ) | | | | (1,478,861 | ) | | | | (1,952,558 | ) |
| Net Increase (Decrease) in Net Assets (resulting from | | | | | | | | | | | | | | |
| capital share transactions) | | | (1,625,637 | ) | | | | (2,551,116 | ) | | | | 1,997,742 | |
| | | | | | | | | | | | | | | |
| Total Increase (Decrease) in Net Assets | | | 1,850,877 | | | | | 5,506,210 | | | | | (29,911,248 | ) |
| | | | | | | | | | | | | | | |
| Net Assets: | | | | | | | | | | | | | | |
| Beginning of period | | | 43,880,440 | | | | | 38,374,230 | | | | | 68,285,478 | |
| | | | | | | | | | | | | | | |
| End of period | | $ | 45,731,317 | | | | $ | 43,880,440 | | | | $ | 38,374,230 | |
| | | | | | | | | | | | | | | |
| Accumulated Undistributed Net Investment Income (Loss) | | $ | 41,292 | | | | $ | - | | | | $ | - | |
| | | | | | | | | | | | | | | |
| Shares of Capital Stock of the Fund Sold and Redeemed: | | | | | | | | | | | | | | |
| Shares Sold: | | | | | | | | | | | | | | |
| Class A | | | 1,638,898 | | (B) | | | 852,285 | | (C) | | | 1,069,597 | |
| Class B | | | 13,219 | | | | | - | | | | | 5,849 | |
| Class C | | | 252,813 | | | | | 261,910 | | | | | 401,854 | |
| Shares Reinvested: | | | | | | | | | | | | | | |
| Class A | | | - | | | | | - | | | | | 577,508 | |
| Class B | | | - | | | | | - | | | | | 148,555 | |
| Class C | | | - | | | | | - | | | | | 145,531 | |
| Shares Redeemed: | | | | | | | | | | | | | | |
| Class A | | | (1,424,189 | ) | | | | (1,054,172 | ) | | | | (1,257,672 | ) |
| Class B | | | (343,379 | ) | (B) | | | (309,613 | ) | (C) | | | (382,517 | ) |
| Class C | | | (460,286 | ) | | | | (305,442 | ) | | | | (287,154 | ) |
| Net Increase (Decrease) in Number of Shares Outstanding | | | (322,924 | ) | | | | (555,032 | ) | | | | 421,551 | |
| | | | | | | | | | | | | | | |
| | | | | | | | | | | | | | | |
| (A) | The Fund elected to change its fiscal year end from December 31 to September 30. The information presented is for January 1, 2009 through September 30, 2009. |
| (B) | Includes automatic conversion of Class B shares ($942,809 representing 163,586 shares) to Class A shares ($942,809 representing 154,781 shares). |
| (C) | Includes automatic conversion of Class B shares ($383,724 representing 75,072 shares) to Class A shares ($383,724 representing 71,387 shares). |
The accompanying notes are an integral part of these financial statements.
Timothy Plan Statement of Changes
Statements of Changes in Net Assets | Conservative Growth
| Increase (Decrease) in Net Assets | | | | | | | | | | |
| | | Year ended 09/30/10 | | | | Period ended 09/30/09(A) | | | Year ended 12/31/08 | |
| | | | | | | | | | | |
| Operations: | | | | | | | | | | |
| Net Investment Income (Loss) | | $ | 393,452 | | | | $ | 164,857 | | | $ | 570,702 | |
| Net Realized Gain (Loss) on Investments | | | (4,077,746 | ) | | | | (2,036,120 | ) | | | (1,179,921 | ) |
| Capital Gain Distributions from Affiliated Funds | | | 23,585 | | | | | - | | | | 78,533 | |
| Change in Unrealized Appreciation (Depreciation) of Investments | | | 7,145,318 | | | | | 8,547,732 | | | | (16,268,127 | ) |
| Net Increase (Decrease) in Net Assets (resulting from operations) | | | 3,484,609 | | | | | 6,676,469 | | | | (16,798,813 | ) |
| | | | | | | | | | | | | | |
| Distributions to Shareholders From: | | | | | | | | | | | | | |
| Net Investment Income: | | | | | | | | | | | | | |
| Class A | | | (456,632 | ) | | | | - | | | | (549,071 | ) |
| Class B | | | (61,754 | ) | | | | - | | | | (62,140 | ) |
| Class C | | | (89,581 | ) | | | | - | | | | (86,071 | ) |
| Net Realized Gains: | | | | | | | | | | | | | |
| Class A | | | - | | | | | - | | | | (1,263,508 | ) |
| Class B | | | - | | | | | - | | | | (279,532 | ) |
| Class C | | | - | | | | | - | | | | (323,507 | ) |
| Total Distributions | | | (607,967 | ) | | | | - | | | | (2,563,829 | ) |
| | | | | | | | | | | | | | |
| Capital Share Transactions: | | | | | | | | | | | | | |
| Proceeds from Shares Sold: | | | | | | | | | | | | | |
| Class A | | | 9,573,831 | | (B) | | | 8,047,031 | | | | 9,080,398 | |
| Class B | | | 84,058 | | | | | 1,965 | | | | 125,202 | |
| Class C | | | 1,948,340 | | | | | 1,565,900 | | | | 3,387,529 | |
| Dividends Reinvested: | | | | | | | | | | | | | |
| Class A | | | 406,673 | | | | | - | | | | 1,706,832 | |
| Class B | | | 57,996 | | | | | - | | | | 314,982 | |
| Class C | | | 83,067 | | | | | - | | | | 361,461 | |
| Cost of Shares Redeemed: | | | | | | | | | | | | | |
| Class A | | | (10,282,385 | ) | | | | (5,818,596 | ) | | | (9,239,640 | ) |
| Class B | | | (2,370,007 | ) | (B) | | | (1,053,283 | ) | | | (1,655,818 | ) |
| Class C | | | (2,601,447 | ) | | | | (1,669,268 | ) | | | (1,524,513 | ) |
| Net Increase (Decrease) in Net Assets (resulting from | | | | | | | | | | | | | |
| capital share transactions) | | | (3,099,874 | ) | | | | 1,073,749 | | | | 2,556,433 | |
| | | | | | | | | | | | | | |
| Total Increase (Decrease) in Net Assets | | | (223,232 | ) | | | | 7,750,218 | | | | (16,806,209 | ) |
| | | | | | | | | | | | | | |
| Net Assets: | | | | | | | | | | | | | |
| Beginning of period | | | 45,950,318 | | | | | 38,200,100 | | | | 55,006,309 | |
| | | | | | | | | | | | | | |
| End of period | | $ | 45,727,086 | | | | $ | 45,950,318 | | | $ | 38,200,100 | |
| | | | | | | | | | | | | | |
| Accumulated Undistributed Net Investment Income (Loss) | | $ | 393,362 | | | | $ | 607,877 | | | $ | 443,020 | |
| | | | | | | | | | | | | | |
| Shares of Capital Stock of the Fund Sold and Redeemed: | | | | | | | | | | | | | |
| Shares Sold: | | | | | | | | | | | | | |
| Class A | | | 1,132,186 | | (B) | | | 1,088,656 | | | | 955,118 | |
| Class B | | | 10,502 | | | | | 233 | | | | 14,045 | |
| Class C | | | 248,499 | | | | | 228,382 | | | | 382,297 | |
| Shares Reinvested: | | | | | | | | | | | | | |
| Class A | | | 48,356 | | | | | - | | | | 251,742 | |
| Class B | | | 7,259 | | | | | - | | | | 48,608 | |
| Class C | | | 10,422 | | | | | - | | | | 55,954 | |
| Shares Redeemed: | | | | | | | | | | | | | |
| Class A | | | (1,226,929 | ) | | | | (851,746 | ) | | | (1,062,328 | ) |
| Class B | | | (296,980 | ) | (B) | | | (159,124 | ) | | | (196,137 | ) |
| Class C | | | (331,829 | ) | | | | (244,046 | ) | | | (179,730 | ) |
| Net Increase (Decrease) in Number of Shares Outstanding | | | (398,514 | ) | | | | 62,355 | | | | 269,569 | |
| | | | | | | | | | | | | | |
| | | | | | | | | | | | | | |
| (A) | The Fund elected to change its fiscal year end from December 31 to September 30. The information presented is for January 1, 2009 through September 30, 2009. |
| (B) | Includes automatic conversion of Class B shares ($949,372 representing 118,537 shares) to Class A shares ($949,372 representing 112,309 shares). |
The accompanying notes are an integral part of these financial statements.
Timothy Plan Statement of Changes
Financial Highlights | Aggressive Growth (Class A Shares)
| The table below sets forth financial data for one share of capital stock outstanding throughout each period presented. | | | |
| | | | | | | | | | | | | | | | |
| | | | | | | | | | | | | | | | |
| | | | | Year | | Period | | Year | | Year | | Year | | Year | |
| | | | | ended | | ended | | ended | | ended | | ended | | ended | |
| | | | | 9/30/10 | | 9/30/09 | (A) | 12/31/08 | | 12/31/07 | | 12/31/06 | | 12/31/05 | |
| | | | | | | | | | | | | | | | |
| Per Share Operating Performance: | | | | | | | | | | | | | | |
| Net Asset Value at Beginning of Period | | | $ 4.51 | | $ 3.71 | | $ 6.80 | | $ 7.04 | | $ 7.38 | | $ 6.95 | |
| | | | | | | | | | | | | | | | |
| Income from Investment Operations: | | | | | | | | | | | | | | |
| Net Investment Income (Loss) | | | (0.09) | | (0.05) | | (0.07) | | (0.06) | | (0.08) | | (0.09) | (B) |
| Net Realized and Unrealized | | | | | | | | | | | | | | |
| Gain (Loss) on Investments | | | 1.00 | | 0.85 | | (3.01) | | 0.59 | | 0.65 | | 0.70 | |
| Total from Investment Operations | | | 0.91 | | 0.80 | | (3.08) | | 0.53 | | 0.57 | | 0.61 | |
| | | | | | | | | | | | | | | | |
| Less Distributions: | | | | | | | | | | | | | | |
| Dividends from Realized Gains | | | - | | - | | (0.01) | | (0.77) | | (0.91) | | (0.18) | |
| Total Distributions | | | - | | - | | (0.01) | | (0.77) | | (0.91) | | (0.18) | |
| | | | | | | | | | | | | | | | |
| Net Asset Value at End of Period | | | $ 5.42 | | $ 4.51 | | $ 3.71 | | $ 6.80 | | $ 7.04 | | $ 7.38 | |
| | | | | | | | | | | | | | | | |
Total Return (C)(D) | | | 20.18% | | 21.56% | (F) | -45.27% | | 7.66% | | 7.50% | | 8.73% | |
| | | | | | | | | | | | | | | | |
| Ratios/Supplemental Data: | | | | | | | | | | | | | | |
| Net Assets, | | | | | | | | | | | | | | |
| End of Period (in 000s) | | | $ 13,247 | | $ 17,007 | | $ 14,575 | | $ 24,041 | | $ 23,187 | | $ 18,403 | |
| | | | | | | | | | | | | | | | |
| Ratio of Expenses to Average | | | | | | | | | | | | | | |
| Net Assets: | | | | | | | | | | | | | | |
| | | | | | | | | | | | | | | | |
| Before Reimbursement and | | | 1.88% | | 1.85% | (G) | 1.72% | | 1.52% | | 1.59% | | 1.59% | |
| Waiver/Recoupment of | | | | | | | | | | | | | | |
| Expenses by Adviser | | | | | | | | | | | | | | |
| After Reimbursement and | | | 1.88% | | 1.85% | (G) | 1.72% | | 1.55% | | 1.60% | | 1.60% | |
| Waiver/Recoupment of | | | | | | | | | | | | | | |
| Expenses by Adviser | | | | | | | | | | | | | | |
| | | | | | | | | | | | | | | | |
| Ratio of Net Investment Income | | | | | | | | | | | | | | |
| (Loss) to Average Net Assets: | | | | | | | | | | | | | | |
| | | | | | | | | | | | | | | | |
| Before Reimbursement and | | | (1.61)% | | (1.58)% | (G) | (1.33)% | | (0.94)% | | (1.17)% | | (1.32)% | |
| Waiver/Recoupment of | | | | | | | | | | | | | | |
| Expenses by Adviser | | | | | | | | | | | | | | |
| After Reimbursement and | | | (1.61)% | | (1.58)% | (G) | (1.33)% | | (0.97)% | | (1.18)% | | (1.33)% | |
| Waiver/Recoupment of | | | | | | | | | | | | | | |
| Expenses by Adviser | | | | | | | | | | | | | | |
| | | | | | | | | | | | | | | | |
| Portfolio Turnover | | | 88.96% | | 135.90% | | 243.59% | (E) | 58.55% | | 96.39% | | 102.63% | |
| | | | | | | | | | | | | | | | |
| | | | | | | | | | | | | | | | |
| | | | | | | | | | | | | | | | |
| | | | | | | | | | | | | | | | |
| | | | | | | | | | | | | | | | |
| (A) | The Fund elected to change its fiscal year end from December to September. The information presented is for January 1, 2009 through September 30, 2009. | |
| (B) | Per share amounts calculated using average shares method. | | | | | | | | | | | | | |
| (C) | Total return calculation does not reflect sales load. | | | | | | | | | | | | | |
| (D) | Total return in the above table represents the rate that the investor would have earned or lost on an investment in the Fund assuming reinvestment of dividends. | |
| | Total return would have been higher or lower if certain expenses had not been reimbursed, waived or recouped. | | | | | |
| (E) | On January 1, 2008, Chartwell Investment Partners became sub-adviser for the Fund. | | | | | |
| (F) | For periods of less than one full year, total return is not annualized. | | | | | | | | | |
| (G) | Annualized. | | | | | | | | | | | | | | |
The accompanying notes are an integral part of these financial statements.
Timothy Plan Financial Highlights
Financial Highlights | Aggressive Growth (Class B Shares)
| The table below sets forth financial data for one share of capital stock outstanding throughout each period presented. | | | |
| | | | | | | | | | | | | | | | |
| | | | | | | | | | | | | | | | |
| | | | | Year | | Period | | Year | | Year | | Year | | Year | |
| | | | | ended | | ended | | ended | | ended | | ended | | ended | |
| | | | | 9/30/10 | | 9/30/09 | (A) | 12/31/08 | | 12/31/07 | | 12/31/06 | | 12/31/05 | |
| | | | | | | | | | | | | | | | |
| Per Share Operating Performance: | | | | | | | | | | | | | | |
| Net Asset Value at Beginning of Period | | | $ 4.17 | | $ 3.45 | | $ 6.36 | | $ 6.68 | | $ 7.09 | | $ 6.74 | |
| | | | | | | | | | | | | | | | |
| Income from Investment Operations: | | | | | | | | | | | | | | |
| Net Investment Income (Loss) | | | (0.12) | | (0.07) | | (0.12) | | (0.12) | | (0.14) | | (0.14) | (B) |
| Net Realized and Unrealized | | | | | | | | | | | | | | |
| Gain (Loss) on Investments | | | 0.91 | | 0.79 | | (2.78) | | 0.57 | | 0.64 | | 0.67 | |
| Total from Investment Operations | | | 0.79 | | 0.72 | | (2.90) | | 0.45 | | 0.50 | | 0.53 | |
| | | | | | | | | | | | | | | | |
| Less Distributions: | | | | | | | | | | | | | | |
| Dividends from Realized Gains | | | - | | - | | (0.01) | | (0.77) | | (0.91) | | (0.18) | |
| Total Distributions | | | - | | - | | (0.01) | | (0.77) | | (0.91) | | (0.18) | |
| | | | | | | | | | | | | | | | |
| Net Asset Value at End of Period | | | $ 4.96 | | $ 4.17 | | $ 3.45 | | $ 6.36 | | $ 6.68 | | $ 7.09 | |
| | | | | | | | | | | | | | | | |
Total Return (C)(D) | | | 18.94% | | 20.87% | (F) | -45.57% | | 6.87% | | 6.83% | | 7.82% | |
| | | | | | | | | | | | | | | | |
| Ratios/Supplemental Data: | | | | | | | | | | | | | | |
| Net Assets, | | | | | | | | | | | | | | |
| End of Period (in 000s) | | | $ 367 | | $ 373 | | $ 489 | | $ 1,088 | | $ 1,247 | | $ 1,392 | |
| | | | | | | | | | | | | | | | |
| Ratio of Expenses to Average | | | | | | | | | | | | | | |
| Net Assets: | | | | | | | | | | | | | | |
| | | | | | | | | | | | | | | | |
| Before Reimbursement and | | | 2.63% | | 2.60% | (G) | 2.45% | | 2.26% | | 2.32% | | 2.34% | |
| Waiver/Recoupment of | | | | | | | | | | | | | | |
| Expenses by Adviser | | | | | | | | | | | | | | |
| After Reimbursement and | | | 2.63% | | 2.60% | (G) | 2.45% | | 2.29% | | 2.35% | | 2.35% | |
| Waiver/Recoupment of | | | | | | | | | | | | | | |
| Expenses by Adviser | | | | | | | | | | | | | | |
| | | | | | | | | | | | | | | | |
| Ratio of Net Investment Income | | | | | | | | | | | | | | |
| (Loss) to Average Net Assets: | | | | | | | | | | | | | | |
| | | | | | | | | | | | | | | | |
| Before Reimbursement and | | | (2.36)% | | (2.33)% | (G) | (2.06)% | | (1.70)% | | (1.90)% | | (2.07)% | |
| Waiver/Recoupment of | | | | | | | | | | | | | | |
| Expenses by Adviser | | | | | | | | | | | | | | |
| After Reimbursement and | | | (2.36)% | | (2.33)% | (G) | (2.06)% | | (1.73)% | | (1.93)% | | (2.08)% | |
| Waiver/Recoupment of | | | | | | | | | | | | | | |
| Expenses by Adviser | | | | | | | | | | | | | | |
| | | | | | | | | | | | | | | | |
| Portfolio Turnover | | | 88.96% | | 135.90% | | 243.59% | (E) | 58.55% | | 96.39% | | 102.63% | |
| | | | | | | | | | | | | | | | |
| | | | | | | | | | | | | | | | |
| | | | | | | | | | | | | | | | |
| | | | | | | | | | | | | | | | |
| | | | | | | | | | | | | | | | |
| (A) | The Fund elected to change its fiscal year end from December to September. The information presented is for January 1, 2009 through September 30, 2009. | |
| (B) | Per share amounts calculated using average shares method. | | | | | | | | | | | | | |
| (C) | Total return calculation does not reflect redemption fee. | | | | | | | | | | | | | |
| (D) | Total return in the above table represents the rate that the investor would have earned or lost on an investment in the Fund assuming reinvestment of dividends. | |
| | Total return would have been higher or lower if certain expenses had not been reimbursed, waived or recouped. | | | |
| (E) | On January 1, 2008, Chartwell Investment Partners became sub-adviser for the Fund. | | | | | |
| (F) | For periods of less than one full year, total return is not annualized. | | | | | | | |
| (G) | Annualized. | | | | | | | | | | | | | | |
The accompanying notes are an integral part of these financial statements.
Timothy Plan Financial Highlights
Financial Highlights | Aggressive Growth (Class C Shares)
| The table below sets forth financial data for one share of capital stock outstanding throughout each period presented. | | | |
| | | | | | | | | | | | | | | | |
| | | | | | | | | | | | | | | | |
| | | | | Year | | Period | | Year | | Year | | Year | | Year | |
| | | | | ended | | ended | | ended | | ended | | ended | | ended | |
| | | | | 9/30/10 | | 9/30/09 | (A) | 12/31/08 | | 12/31/07 | | 12/31/06 | | 12/31/05 | |
| | | | | | | | | | | | | | | | |
| Per Share Operating Performance: | | | | | | | | | | | | | | |
| Net Asset Value at Beginning of Period | | | $ 4.18 | | $ 3.46 | | $ 6.37 | | $ 6.69 | | $ 7.11 | | $ 6.75 | |
| | | | | | | | | | | | | | | | |
| Income from Investment Operations: | | | | | | | | | | | | | | |
| Net Investment Income (Loss) | | | (0.11) | | (0.06) | | (0.11) | | (0.10) | | (0.11) | | (0.14) | (B) |
| Net Realized and Unrealized | | | | | | | | | | | | | | |
| Gain (Loss) on Investments | | | 0.91 | | 0.78 | | (2.79) | | 0.55 | | 0.60 | | 0.68 | |
| Total from Investment Operations | | | 0.80 | | 0.72 | | (2.90) | | 0.45 | | 0.49 | | 0.54 | |
| | | | | | | | | | | | | | | | |
| Less Distributions: | | | | | | | | | | | | | | |
| Dividends from Realized Gains | | | - | | - | | (0.01) | | (0.77) | | (0.91) | | (0.18) | |
| Total Distributions | | | - | | - | | (0.01) | | (0.77) | | (0.91) | | (0.18) | |
| | | | | | | | | | | | | | | | |
| Net Asset Value at End of Period | | | $ 4.98 | | $ 4.18 | | $ 3.46 | | $ 6.37 | | $ 6.69 | | $ 7.11 | |
| | | | | | | | | | | | | | | | |
Total Return (C)(D) | | | 19.14% | | 20.81% | (F) | -45.50% | | 6.86% | | 6.65% | | 7.96% | |
| | | | | | | | | | | | | | | | |
| Ratios/Supplemental Data: | | | | | | | | | | | | | | |
| Net Assets, | | | | | | | | | | | | | | |
| End of Period (in 000s) | | | $ 1,670 | | $ 1,477 | | $ 1,272 | | $ 2,277 | | $ 1,937 | | $ 1,358 | |
| | | | | | | | | | | | | | | | |
| Ratio of Expenses to Average | | | | | | | | | | | | | | |
| Net Assets: | | | | | | | | | | | | | | |
| | | | | | | | | | | | | | | | |
| Before Reimbursement and | | | 2.63% | | 2.60% | (G) | 2.47% | | 2.27% | | 2.35% | | 2.34% | |
| Waiver/Recoupment of | | | | | | | | | | | | | | |
| Expenses by Adviser | | | | | | | | | | | | | | |
| After Reimbursement and | | | 2.63% | | 2.60% | (G) | 2.47% | | 2.30% | | 2.35% | | 2.35% | |
| Waiver/Recoupment of | | | | | | | | | | | | | | |
| Expenses by Adviser | | | | | | | | | | | | | | |
| | | | | | | | | | | | | | | | |
| Ratio of Net Investment Income | | | | | | | | | | | | | | |
| (Loss) to Average Net Assets: | | | | | | | | | | | | | | |
| | | | | | | | | | | | | | | | |
| Before Reimbursement and | | | (2.35)% | | (2.33)% | (G) | (2.08)% | | (1.70)% | | (1.94)% | | (2.07)% | |
| Waiver/Recoupment of | | | | | | | | | | | | | | |
| Expenses by Adviser | | | | | | | | | | | | | | |
| After Reimbursement and | | | (2.35)% | | (2.33)% | (G) | (2.08)% | | (1.73)% | | (1.94)% | | (2.08)% | |
| Waiver/Recoupment of | | | | | | | | | | | | | | |
| Expenses by Adviser | | | | | | | | | | | | | | |
| | | | | | | | | | | | | | | | |
| Portfolio Turnover | | | 88.96% | | 135.90% | | 243.59% | (E) | 58.55% | | 96.39% | | 102.63% | |
| | | | | | | | | | | | | | | | |
| | | | | | | | | | | | | | | | |
| | | | | | | | | | | | | | | | |
| (A) | The Fund elected to change its fiscal year end from December to September. The information presented is for January 1, 2009 through September 30, 2009. | |
| (B) | Per share amounts calculated using average shares method. | | | | | | | | | | | | | |
| (C) | Total return calculation does not reflect redemption fee. | | | | | | | | | | | | | |
| (D) | Total return in the above table represents the rate that the investor would have earned or lost on an investment in the Fund assuming reinvestment of dividends. | |
| | Total return would have been higher or lower if certain expenses had not been reimbursed, waived or recouped. | |
| (E) | On January 1, 2008, Chartwell Investment Partners became sub-adviser for the Fund. | |
| (F) | For periods of less than one full year, total return is not annualized. | | | | | | | | | |
| (G) | Annualized. | | | | | | | | | | | | | | |
The accompanying notes are an integral part of these financial statements.
Timothy Plan Financial Highlights
Financial Highlights | International (Class A Shares)
| The table below sets forth financial data for one share of capital stock outstanding throughout each period presented. |
| | | | | | | | | | | | | | | | |
| | | | | | | | | | | | | | | | |
| | | | | | | | | Year | | Period | | Year | | Period | |
| | | | | | | | | ended | | ended | | ended | | ended | |
| | | | | | | | | 9/30/10 | | 9/30/09 | (A) | 12/31/08 | | 12/31/07 | (B) |
| | | | | | | | | | | | | | | | |
| Per Share Operating Performance: | | | | | | | | | | | | | | |
| Net Asset Value at Beginning of Period | | | | | | | $ 7.52 | | $ 5.92 | | $ 11.00 | | $ 10.00 | |
| | | | | | | | | | | | | | | | |
| Income from Investment Operations: | | | | | | | | | | | | | | |
| Net Investment Income (Loss) | | | | | | | 0.04 | (C) | 0.08 | | 0.09 | | 0.04 | |
| Net Realized and Unrealized | | | | | | | | | | | | | | |
| Gain (Loss) on Investments | | | | | | | 0.26 | | 1.52 | | (5.08) | | 1.00 | |
| Total from Investment Operations | | | | | | | 0.30 | | 1.60 | | (4.99) | | 1.04 | |
| | | | | | | | | | | | | | | | |
| Less Distributions: | | | | | | | | | | | | | | |
| Dividends from Net Investment | | | | | | | | | | | | | | |
| Income | | | | | | | (0.11) | | - | | (0.09) | | (0.04) | |
| Total Distributions | | | | | | | (0.11) | | - | | (0.09) | | (0.04) | |
| | | | | | | | | | | | | | | | |
| Net Asset Value at End of Period | | | | | | | $ 7.71 | | $ 7.52 | | $ 5.92 | | $ 11.00 | |
| | | | | | | | | | | | | | | | |
Total Return (D)(E) | | | | | | | 3.93% | | 27.03% | (F) | -45.38% | | 10.39% | (F) |
| | | | | | | | | | | | | | | | |
| Ratios/Supplemental Data: | | | | | | | | | | | | | | |
| Net Assets, | | | | | | | | | | | | | | |
| End of Period (in 000s) | | | | | | | $ 35,206 | | $ 37,248 | | $ 31,214 | | $ 42,298 | |
| | | | | | | | | | | | | | | | |
| Ratio of Expenses to Average | | | | | | | | | | | | | | |
| Net Assets: | | | | | | | | | | | | | | |
| | | | | | | | | | | | | | | | |
| After Reimbursement and | | | | | | | 1.74% | | 1.72% | | 1.66% | | 1.69% | |
| Waiver/Recoupment of | | | | | | | | | | (G) | | | | (G) |
| Expenses by Adviser | | | | | | | | | | | | | | |
| | | | | | | | | | | | | | | | |
| Ratio of Net Investment Income | | | | | | | | | | | | | | |
| (Loss) to Average Net Assets: | | | | | | | | | | | | | | |
| | | | | | | | | | | | | | | | |
| After Reimbursement and | | | | | | | 0.58% | | 1.68% | | 1.12% | | 0.58% | |
| Waiver/Recoupment of | | | | | | | | | | (G) | | | | (G) |
| Expenses by Adviser | | | | | | | | | | | | | | |
| | | | | | | | | | | | | | | | |
| Portfolio Turnover | | | | | | | 40.51% | | 38.27% | | 32.36% | | 13.18% | |
| | | | | | | | | | | | | | | | |
| | | | | | | | | | | | | | | | |
| | | | | | | | | | | | | | | | |
| | | | | | | | | | | | | | | | |
| | | | | | | | | | | | | | | | |
| | | | | | | | | | | | | | | | |
| (A) | The Fund elected to change its fiscal year end from December to September. The information presented is for January 1, 2009 through September 30, 2009. |
| (B) | For the period May 3, 2007 (Commencement of Operations) to December 31, 2007. | | | | | |
| (C) | Per share amounts calculated using average shares method. | | | | | | | | | | | | | |
| (D) | Total return calculation does not reflect sales load. | | | | | | | | | | | | | |
| (E) | Total return in the above table represents the rate that the investor would have earned or lost on an investment in the Fund assuming reinvestment of dividends. |
| (F) | For periods of less than one full year, total return is not annualized. | | | | | | | | | | | |
| (G) | Annualized. | | | | | | | | | | | | | | |
The accompanying notes are an integral part of these financial statements.
Timothy Plan Financial Highlights
Financial Highlights | International (Class C Shares)
| The table below sets forth financial data for one share of capital stock outstanding throughout each period presented. | | | |
| | | | | | | | | | | |
| | | | | | | | | | | |
| | | | Year | | Period | | Year | | Period | |
| | | | ended | | ended | | ended | | ended | |
| | | | 9/30/10 | | 9/30/09 | (A) | 12/31/08 | | 12/31/07 | (B) |
| | | | | | | | | | | |
| Per Share Operating Performance: | | | | | | | | | |
| Net Asset Value at Beginning of Period | | $ 7.41 | | $ 5.87 | | $ 10.97 | | $ 10.00 | |
| | | | | | | | | | | |
| Income from Investment Operations: | | | | | | | | | |
| Net Investment Income (Loss) | | (0.01) | (C) | 0.04 | | 0.04 | | (0.02) | |
| Net Realized and Unrealized | | | | | | | | | |
| Gain (Loss) on Investments | | 0.25 | | 1.50 | | (5.07) | | 0.99 | |
| Total from Investment Operations | | 0.24 | | 1.54 | | (5.03) | | 0.97 | |
| | | | | | | | | | | |
| Less Distributions: | | | | | | | | | |
| Dividends from Net Investment | | | | | | | | | |
| Income | | (0.07) | | - | | (0.07) | | - | * |
| Total Distributions | | (0.07) | | - | | (0.07) | | - | |
| | | | | | | | | | | |
| Net Asset Value at End of Period | | $ 7.58 | | $ 7.41 | | $ 5.87 | | $ 10.97 | |
| | | | | | | | | | | |
Total Return (D)(E) | | 3.27% | | 26.24% | (F) | -45.79% | | 9.71% | (F) |
| | | | | | | | | | | |
| Ratios/Supplemental Data: | | | | | | | | | |
| Net Assets, | | | | | | | | | |
| End of Period (in 000s) | | $ 1,941 | | $ 1,417 | | $ 984 | | $ 1,318 | |
| | | | | | | | | | | |
| Ratio of Expenses to Average | | | | | | | | | |
| Net Assets: | | | | | | | | | |
| | | | | | | | | | | |
| After Reimbursement and | | 2.49% | | 2.47% | | 2.40% | | 2.48% | |
| Waiver/Recoupment of | | | | | (G) | | | | (G) |
| Expenses by Adviser | | | | | | | | | |
| | | | | | | | | | | |
| Ratio of Net Investment Income | | | | | | | | | |
| (Loss) to Average Net Assets: | | | | | | | | | |
| | | | | | | | | | | |
| After Reimbursement and | | (0.15)% | | 0.85% | | 0.45% | | (0.44)% | |
| Waiver/Recoupment of | | | | | (G) | | | | (G) |
| Expenses by Adviser | | | | | | | | | |
| | | | | | | | | | | |
| Portfolio Turnover | | 40.51% | | 38.27% | | 32.36% | | 13.18% | |
| | | | | | | | | | | |
| | | | | | | | | | | |
| | | | | | | | | | | |
| | | | | | | | | | | |
| | *Amount is less than $0.005 per share. | | | | | | | | | |
| | | | | | | | | | | |
| (A) | The Fund elected to change its fiscal year end from December to September. The information presented is for January 1, 2009 through September 30, 2009. |
| (B) | For the period May 3, 2007 (Commencement of Operations) to December 31, 2007. | | | | | | | | | |
| (C) | Per share amounts calculated using average shares method. | | | | | | | | | |
| (D) | Total return calculation does not reflect redemption fee. | | | | | | | | | |
| (E) | Total return in the above table represents the rate that the investor would have earned or lost on an investment in the Fund assuming reinvestment of dividends. |
| (F) | For periods of less than one full year, total return is not annualized. | | | | | | | | | |
| (G) | Annualized. | | | | | | | | | |
The accompanying notes are an integral part of these financial statements.
Timothy Plan Financial Highlights
Financial Highlights | Large/Mid Cap Growth (Class A Shares)
| The table below sets forth financial data for one share of capital stock outstanding throughout each period presented. |
| | | | | | | | | | | | | | | | |
| | | | | | | | | | | | | | | | |
| | | | | Year | | Period | | Year | | Year | | Year | | Year | |
| | | | | ended | | ended | | ended | | ended | | ended | | ended | |
| | | | | 9/30/10 | | 9/30/09 | (A) | 12/31/08 | | 12/31/07 | | 12/31/06 | | 12/31/05 | |
| | | | | | | | | | | | | | | | |
| Per Share Operating Performance: | | | | | | | | | | | | | | |
| Net Asset Value at Beginning of Period | | | $ 5.37 | | $ 4.38 | | $ 6.89 | | $ 7.25 | | $ 6.92 | | $ 6.69 | |
| | | | | | | | | | | | | | | | |
| Income from Investment Operations: | | | | | | | | | | | | | | |
| Net Investment Income (Loss) | | | (0.04) | | (0.02) | | (0.04) | | (0.03) | | (0.04) | | (0.05) | (B) |
| Net Realized and Unrealized | | | | | | | | | | | | | | |
| Gain (Loss) on Investments | | | 0.66 | | 1.01 | | (2.46) | | 0.39 | | 0.37 | | 0.28 | |
| Total from Investment Operations | | | 0.62 | | 0.99 | | (2.50) | | 0.36 | | 0.33 | | 0.23 | |
| | | | | | | | | | | | | | | | |
| Less Distributions: | | | | | | | | | | | | | | |
| Dividends from Realized Gains | | | - | | - | | (0.01) | | (0.72) | | - | | - | |
| Total Distributions | | | - | | - | | (0.01) | | (0.72) | | - | | - | |
| | | | | | | | | | | | | | | | |
| Net Asset Value at End of Period | | | $ 5.99 | | $ 5.37 | | $ 4.38 | | $ 6.89 | | $ 7.25 | | $ 6.92 | |
| | | | | | | | | | | | | | | | |
Total Return (C)(D) | | | 11.55% | | 22.60% | (F) | -36.30% | | 5.09% | | 4.77% | | 3.44% | |
| | | | | | | | | | | | | | | | |
| Ratios/Supplemental Data: | | | | | | | | | | | | | | |
| Net Assets, | | | | | | | | | | | | | | |
| End of Period (in 000s) | | | $ 38,865 | | $ 35,973 | | $ 32,484 | | $ 53,183 | | $ 65,510 | | $ 53,901 | |
| | | | | | | | | | | | | | | | |
| Ratio of Expenses to Average | | | | | | | | | | | | | | |
| Net Assets: | | | | | | | | | | | | | | |
| | | | | | | | | | | | | | | | |
| Before Reimbursement and | | | 1.66% | | 1.67% | (G) | 1.56% | | 1.46% | | 1.52% | | 1.60% | |
| Waiver/Recoupment of | | | | | | | | | | | | | | |
| Expenses by Adviser | | | | | | | | | | | | | | |
| After Reimbursement and | | | 1.66% | | 1.67% | (G) | 1.56% | | 1.46% | | 1.53% | | 1.60% | |
| Waiver/Recoupment of | | | | | | | | | | | | | | |
| Expenses by Adviser | | | | | | | | | | | | | | |
| | | | | | | | | | | | | | | | |
| Ratio of Net Investment Income | | | | | | | | | | | | | | |
| (Loss) to Average Net Assets: | | | | | | | | | | | | | | |
| | | | | | | | | | | | | | | | |
| Before Reimbursement and | | | (0.74)% | | (0.58)% | (G) | (0.64)% | | (0.37)% | | (0.56)% | | (0.80)% | |
| Waiver/Recoupment of | | | | | | | | | | | | | | |
| Expenses by Adviser | | | | | | | | | | | | | | |
| After Reimbursement and | | | (0.74)% | | (0.58)% | (G) | (0.64)% | | (0.37)% | | (0.57)% | | (0.80)% | |
| Waiver/Recoupment of | | | | | | | | | | | | | | |
| Expenses by Adviser | | | | | | | | | | | | | | |
| | | | | | | | | | | | | | | | |
| Portfolio Turnover | | | 77.68% | | 77.98% | | 176.94% | (E) | 44.62% | | 60.46% | | 38.61% | |
| | | | | | | | | | | | | | | | |
| | | | | | | | | | | | | | | | |
| | | | | | | | | | | | | | | | |
| | | | | | | | | | | | | | | | |
| (A) | The Fund elected to change its fiscal year end from December to September. The information presented is for January 1, 2009 through September 30, 2009. |
| (B) | Per share amounts calculated using average shares method. | | | | | | | | | | | | | |
| (C) | Total return calculation does not reflect sales load. | | | | | | | | | | | | | |
| (D) | Total return in the above table represents the rate that the investor would have earned or lost on an investment in the Fund assuming reinvestment of dividends. |
| | Total return would have been higher or lower if certain expenses had not been reimbursed, waived or recouped. | | | | | |
| (E) | On January 1, 2008, Chartwell Investment Partners became sub-adviser for the Fund. | | | | | |
| (F) | For periods of less than one full year, total return is not annualized. | | | | | | | |
| (G) | Annualized. | | | | | | | | | | | | | | |
| | | | | | | | | | | | | | | | |
The accompanying notes are an integral part of these financial statements.
Timothy Plan Financial Highlights
Financial Highlights | Large/Mid Cap Growth (Class B Shares)
| The table below sets forth financial data for one share of capital stock outstanding throughout each period presented. |
| | | | | | | | | | | | | | | | |
| | | | | | | | | | | | | | | | |
| | | | | Year | | Period | | Year | | Year | | Year | | Year | |
| | | | | ended | | ended | | ended | | ended | | ended | | ended | |
| | | | | 9/30/10 | | 9/30/09 | (A) | 12/31/08 | | 12/31/07 | | 12/31/06 | | 12/31/05 | |
| | | | | | | | | | | | | | | | |
| Per Share Operating Performance: | | | | | | | | | | | | | | |
| Net Asset Value at Beginning of Period | | | $ 5.00 | | $ 4.11 | | $ 6.50 | | $ 6.94 | | $ 6.68 | | $ 6.50 | |
| | | | | | | | | | | | | | | | |
| Income from Investment Operations: | | | | | | | | | | | | | | |
| Net Investment Income (Loss) | | | (0.08) | (B) | (0.04) | | (0.08) | | (0.08) | | (0.09) | | (0.10) | (B) |
| Net Realized and Unrealized | | | | | | | | | | | | | | |
| Gain (Loss) on Investments | | | 0.62 | | 0.93 | | (2.30) | | 0.36 | | 0.35 | | 0.28 | |
| Total from Investment Operations | | | 0.54 | | 0.89 | | (2.38) | | 0.28 | | 0.26 | | 0.18 | |
| | | | | | | | | | | | | | | | |
| Less Distributions: | | | | | | | | | | | | | | |
| Dividends from Realized Gains | | | - | | - | | (0.01) | | (0.72) | | - | | - | |
| Total Distributions | | | - | | - | | (0.01) | | (0.72) | | - | | - | |
| | | | | | | | | | | | | | | | |
| Net Asset Value at End of Period | | | $ 5.54 | | $ 5.00 | | $ 4.11 | | $ 6.50 | | $ 6.94 | | $ 6.68 | |
| | | | | | | | | | | | | | | | |
Total Return (C)(D) | | | 10.80% | | 21.65% | (F) | -36.63% | | 4.16% | | 3.89% | | 2.77% | |
| | | | | | | | | | | | | | | | |
| Ratios/Supplemental Data: | | | | | | | | | | | | | | |
| Net Assets, | | | | | | | | | | | | | | |
| End of Period (in 000s) | | | $ 700 | | $ 1,130 | | $ 1,022 | | $ 1,935 | | $ 2,245 | | $ 2,307 | |
| | | | | | | | | | | | | | | | |
| Ratio of Expenses to Average | | | | | | | | | | | | | | |
| Net Assets: | | | | | | | | | | | | | | |
| | | | | | | | | | | | | | | | |
| Before Reimbursement and | | | 2.40% | | 2.42% | (G) | 2.30% | | 2.21% | | 2.26% | | 2.35% | |
| Waiver/Recoupment of | | | | | | | | | | | | | | |
| Expenses by Adviser | | | | | | | | | | | | | | |
| After Reimbursement and | | | 2.40% | | 2.42% | (G) | 2.30% | | 2.21% | | 2.28% | | 2.35% | |
| Waiver/Recoupment of | | | | | | | | | | | | | | |
| Expenses by Adviser | | | | | | | | | | | | | | |
| | | | | | | | | | | | | | | | |
| Ratio of Net Investment Income | | | | | | | | | | | | | | |
| (Loss) to Average Net Assets: | | | | | | | | | | | | | | |
| | | | | | | | | | | | | | | | |
| Before Reimbursement and | | | (1.51)% | | (1.32)% | (G) | (1.38)% | | (1.10)% | | (1.31)% | | (1.55)% | |
| Waiver/Recoupment of | | | | | | | | | | | | | | |
| Expenses by Adviser | | | | | | | | | | | | | | |
| After Reimbursement and | | | (1.51)% | | (1.32)% | (G) | (1.38)% | | (1.10)% | | (1.33)% | | (1.55)% | |
| Waiver/Recoupment of | | | | | | | | | | | | | | |
| Expenses by Adviser | | | | | | | | | | | | | | |
| | | | | | | | | | | | | | | | |
| Portfolio Turnover | | | 77.68% | | 77.98% | | 176.94% | (E) | 44.62% | | 60.46% | | 38.61% | |
| | | | | | | | | | | | | | | | |
| | | | | | | | | | | | | | | | |
| | | | | | | | | | | | | | | | |
| | | | | | | | | | | | | | | | |
| (A) | The Fund elected to change its fiscal year end from December to September. The information presented is for January 1, 2009 through September 30, 2009. | |
| (B) | Per share amounts calculated using average shares method. | | | | | | | | | | | | | |
| (C) | Total return calculation does not reflect redemption fee. | | | | | | | | | | | | | |
| (D) | Total return in the above table represents the rate that the investor would have earned or lost on an investment in the Fund assuming reinvestment of dividends. | |
| | Total return would have been higher or lower if certain expenses had not been reimbursed, waived or recouped. | |
| (E) | On January 1, 2008, Chartwell Investment Partners became sub-adviser for the Fund. | |
| (F) | For periods of less than one full year, total return is not annualized. | | | | | | | |
| (G) | Annualized. | | | | | | | | | | | | | | |
| | | | | | | | | | | | | | | | |
The accompanying notes are an integral part of these financial statements.
Timothy Plan Financial Highlights
Financial Highlights | Large/Mid Cap Growth (Class C Shares)
| The table below sets forth financial data for one share of capital stock outstanding throughout each period presented. |
| | | | | | | | | | | | | | | | |
| | | | | | | | | | | | | | | | |
| | | | | Year | | Period | | Year | | Year | | Year | | Year | |
| | | | | ended | | ended | | ended | | ended | | ended | | ended | |
| | | | | 9/30/10 | | 9/30/09 | (A) | 12/31/08 | | 12/31/07 | | 12/31/06 | | 12/31/05 | |
| | | | | | | | | | | | | | | | |
| Per Share Operating Performance: | | | | | | | | | | | | | | |
| Net Asset Value at Beginning of Period | | | $ 5.01 | | $ 4.11 | | $ 6.51 | | $ 6.95 | | $ 6.69 | | $ 6.52 | |
| | | | | | | | | | | | | | | | |
| Income from Investment Operations: | | | | | | | | | | | | | | |
| Net Investment Income (Loss) | | | (0.08) | | (0.04) | | (0.08) | | (0.07) | | (0.07) | | (0.08) | (B) |
| Net Realized and Unrealized | | | | | | | | | | | | | | |
| Gain (Loss) on Investments | | | 0.62 | | 0.94 | | (2.31) | | 0.35 | | 0.33 | | 0.25 | |
| Total from Investment Operations | | | 0.54 | | 0.90 | | (2.39) | | 0.28 | | 0.26 | | 0.17 | |
| | | | | | | | | | | | | | | | |
| Less Distributions: | | | | | | | | | | | | | | |
| Dividends from Realized Gains | | | - | | - | | (0.01) | | (0.72) | | - | | - | |
| Total Distributions | | | - | | - | | (0.01) | | (0.72) | | - | | - | |
| | | | | | | | | | | | | | | | |
| Net Asset Value at End of Period | | | $ 5.55 | | $ 5.01 | | $ 4.11 | | $ 6.51 | | $ 6.95 | | $ 6.69 | |
| | | | | | | | | | | | | | | | |
Total Return (C)(D) | | | 10.78% | | 21.90% | (F) | -36.73% | | 4.15% | | 3.89% | | 2.61% | |
| | | | | | | | | | | | | | | | |
| Ratios/Supplemental Data: | | | | | | | | | | | | | | |
| Net Assets, | | | | | | | | | | | | | | |
| End of Period (in 000s) | | | $ 2,523 | | $ 2,120 | | $ 1,971 | | $ 3,097 | | $ 2,222 | | $ 1,496 | |
| | | | | | | | | | | | | | | | |
| Ratio of Expenses to Average | | | | | | | | | | | | | | |
| Net Assets: | | | | | | | | | | | | | | |
| | | | | | | | | | | | | | | | |
| Before Reimbursement and | | | 2.41% | | 2.42% | (G) | 2.31% | | 2.22% | | 2.27% | | 2.35% | |
| Waiver/Recoupment of | | | | | | | | | | | | | | |
| Expenses by Adviser | | | | | | | | | | | | | | |
| After Reimbursement and | | | 2.41% | | 2.42% | (G) | 2.31% | | 2.22% | | 2.27% | | 2.35% | |
| Waiver/Recoupment of | | | | | | | | | | | | | | |
| Expenses by Adviser | | | | | | | | | | | | | | |
| | | | | | | | | | | | | | | | |
| Ratio of Net Investment Income | | | | | | | | | | | | | | |
| (Loss) to Average Net Assets: | | | | | | | | | | | | | | |
| | | | | | | | | | | | | | | | |
| Before Reimbursement and | | | (1.49)% | | (1.33)% | (G) | (1.39)% | | (1.12)% | | (1.31)% | | (1.55)% | |
| Waiver/Recoupment of | | | | | | | | | | | | | | |
| Expenses by Adviser | | | | | | | | | | | | | | |
| After Reimbursement and | | | (1.49)% | | (1.33)% | (G) | (1.39)% | | (1.12)% | | (1.31)% | | (1.55)% | |
| Waiver/Recoupment of | | | | | | | | | | | | | | |
| Expenses by Adviser | | | | | | | | | | | | | | |
| | | | | | | | | | | | | | | | |
| Portfolio Turnover | | | 77.68% | | 77.98% | | 176.94% | (E) | 44.62% | | 60.46% | | 38.61% | |
| | | | | | | | | | | | | | | | |
| | | | | | | | | | | | | | | | |
| | | | | | | | | | | | | | | | |
| (A) | The Fund elected to change its fiscal year end from December to September. The information presented is for January 1, 2009 through September 30, 2009. | |
| (B) | Per share amounts calculated using average shares method. | | | | | | | | | | | | | |
| (C) | Total return calculation does not reflect redemption fee. | | | | | | | | | | | | | |
| (D) | Total return in the above table represents the rate that the investor would have earned or lost on an investment in the Fund assuming reinvestment of dividends. | |
| | Total return would have been higher or lower if certain expenses had not been reimbursed, waived or recouped. | | | | | |
| (E) | On January 1, 2008, Chartwell Investment Partners became sub-adviser for the Fund. | | | | | |
| (F) | For periods of less than one full year, total return is not annualized. | | | | | | | | | |
| (G) | Annualized. | | | | | | | | | | | | | | |
| | | | | | | | | | | | | | | | |
| | | | | | | | | | | | | | | | |
The accompanying notes are an integral part of these financial statements.
Timothy Plan Financial Highlights
Financial Highlights | Small Cap Value (Class A Shares)
| The table below sets forth financial data for one share of capital stock outstanding throughout each period presented. |
| | | | | | | | | | | | | | | | |
| | | | | | | | | | | | | | | | |
| | | | | Year | | Period | | Year | | Year | | Year | | Year | |
| | | | | ended | | ended | | ended | | ended | | ended | | ended | |
| | | | | 9/30/10 | | 9/30/09 | (A) | 12/31/08 | | 12/31/07 | | 12/31/06 | | 12/31/05 | |
| | | | | | | | | | | | | | | | |
| Per Share Operating Performance: | | | | | | | | | | | | | | |
| Net Asset Value at Beginning of Period | | | $ 10.25 | | $ 8.88 | | $ 13.27 | | $ 14.94 | | $ 15.27 | | $ 15.59 | |
| | | | | | | | | | | | | | | | |
| Income from Investment Operations: | | | | | | | | | | | | | | |
| Net Investment Income (Loss) | | | (0.06) | | (0.05) | | 0.01 | | 0.04 | | 0.22 | | 0.01 | (B) |
| Net Realized and Unrealized | | | | | | | | | | | | | | |
| Gain (Loss) on Investments | | | 1.09 | | 1.42 | | (4.33) | | 0.36 | | 2.77 | | (0.17) | |
| Total from Investment Operations | | | 1.03 | | 1.37 | | (4.32) | | 0.40 | | 2.99 | | (0.16) | |
| | | | | | | | | | | | | | | | |
| Less Distributions: | | | | | | | | | | | | | | |
| Dividends from Net Investment | | | | | | | | | | | | | | |
| Income | | | - | | - | | - | | (0.03) | | (0.22) | | - | |
| Dividends from Realized Gains | | | - | | - | | (0.07) | | (2.04) | | (3.10) | | (0.16) | |
| Total Distributions | | | - | | - | | (0.07) | | (2.07) | | (3.32) | | (0.16) | |
| | | | | | | | | | | | | | | | |
| Net Asset Value at End of Period | | | $ 11.28 | | $ 10.25 | | $ 8.88 | | $ 13.27 | | $ 14.94 | | $ 15.27 | |
| | | | | | | | | | | | | | | | |
Total Return (C)(D) | | | 10.05% | | 15.43% | (E) | -32.50% | | 2.87% | | 19.69% | | -1.01% | |
| | | | | | | | | | | | | | | | |
| Ratios/Supplemental Data: | | | | | | | | | | | | | | |
| Net Assets, | | | | | | | | | | | | | | |
| End of Period (in 000s) | | | $ 40,482 | | $ 47,268 | | $ 42,651 | | $ 62,525 | | $ 66,097 | | $ 49,008 | |
| | | | | | | | | | | | | | | | |
| Ratio of Expenses to Average | | | | | | | | | | | | | | |
| Net Assets: | | | | | | | | | | | | | | |
| | | | | | | | | | | | | | | | |
| After Reimbursement and | | | 1.59% | | 1.59% | (F) | 1.50% | | 1.44% | | 1.52% | | 1.56% | |
| Waiver/Recoupment of | | | | | | | | | | | | | | |
| Expenses by Adviser | | | | | | | | | | | | | | |
| | | | | | | | | | | | | | | | |
| Ratio of Net Investment Income | | | | | | | | | | | | | | |
| (Loss) to Average Net Assets: | | | | | | | | | | | | | | |
| | | | | | | | | | | | | | | | |
| After Reimbursement and | | | (0.51)% | | (0.71)% | (F) | 0.05% | | 0.24% | | 1.39% | | 0.05% | |
| Waiver/Recoupment of | | | | | | | | | | | | | | |
| Expenses by Adviser | | | | | | | | | | | | | | |
| | | | | | | | | | | | | | | | |
| Portfolio Turnover | | | 64.37% | | 57.15% | | 110.16% | | 59.84% | | 148.02% | | 44.24% | |
| | | | | | | | | | | | | | | | |
| | | | | | | | | | | | | | | | |
| | | | | | | | | | | | | | | | |
| | | | | | | | | | | | | | | | |
| | | | | | | | | | | | | | | | |
| (A) | The Fund elected to change its fiscal year end from December to September. The information presented is for January 1, 2009 through September 30, 2009. | |
| (B) | Per share amounts calculated using average shares method. | | | | | | | | | | | | | |
| (C) | Total return calculation does not reflect sales load. | | | | | | | | | | | | | |
| (D) | Total return in the above table represents the rate that the investor would have earned or lost on an investment in the Fund assuming reinvestment of dividends. | |
| (E) | For periods of less than one full year, total return is not annualized. | | | | | | | | | |
| (F) | Annualized. | | | | | | | | | | | | | | |
| | | | | | | | | | | | | | | | |
The accompanying notes are an integral part of these financial statements.
Timothy Plan Financial Highlights
Financial Highlights | Small Cap Value (Class B Shares)
| The table below sets forth financial data for one share of capital stock outstanding throughout each period presented. |
| | | | | | | | | | | | | | | | |
| | | | | | | | | | | | | | | | |
| | | | | Year | | Period | | Year | | Year | | Year | | Year | |
| | | | | ended | | ended | | ended | | ended | | ended | | ended | |
| | | | | 9/30/10 | | 9/30/09 | (A) | 12/31/08 | | 12/31/07 | | 12/31/06 | | 12/31/05 | |
| | | | | | | | | | | | | | | | |
| Per Share Operating Performance: | | | | | | | | | | | | | | |
| Net Asset Value at Beginning of Period | | | $ 8.92 | | $ 7.78 | | $ 11.72 | | $ 13.49 | | $ 14.09 | | $ 14.51 | |
| | | | | | | | | | | | | | | | |
| Income from Investment Operations: | | | | | | | | | | | | | | |
| Net Investment Income (Loss) | | | (0.12) | (B) | (0.09) | | (0.08) | | (0.08) | | 0.14 | | (0.10) | (B) |
| Net Realized and Unrealized | | | | | | | | | | | | | | |
| Gain (Loss) on Investments | | | 0.94 | | 1.23 | | (3.79) | | 0.35 | | 2.50 | | (0.16) | |
| Total from Investment Operations | | | 0.82 | | 1.14 | | (3.87) | | 0.27 | | 2.64 | | (0.26) | |
| | | | | | | | | | | | | | | | |
| Less Distributions: | | | | | | | | | | | | | | |
| Dividends from Net Investment | | | | | | | | | | | | | | |
| Income | | | - | | - | | - | | - | | (0.14) | | - | |
| Dividends from Realized Gains | | | - | | - | | (0.07) | | (2.04) | | (3.10) | | (0.16) | |
| Total Distributions | | | - | | - | | (0.07) | | (2.04) | | (3.24) | | (0.16) | |
| | | | | | | | | | | | | | | | |
| Net Asset Value at End of Period | | | $ 9.74 | | $ 8.92 | | $ 7.78 | | $ 11.72 | | $ 13.49 | | $ 14.09 | |
| | | | | | | | | | | | | | | | |
Total Return (C)(D) | | | 9.19% | | 14.65% | (E) | -32.95% | | 2.22% | | 18.82% | | -1.77% | |
| | | | | | | | | | | | | | | | |
| Ratios/Supplemental Data: | | | | | | | | | | | | | | |
| Net Assets, | | | | | | | | | | | | | | |
| End of Period (in 000s) | | | $ 3,114 | | $ 4,052 | | $ 4,173 | | $ 7,370 | | $ 11,750 | | $ 16,072 | |
| | | | | | | | | | | | | | | | |
| Ratio of Expenses to Average | | | | | | | | | | | | | | |
| Net Assets: | | | | | | | | | | | | | | |
| | | | | | | | | | | | | | | | |
| After Reimbursement and | | | 2.34% | | 2.34% | (F) | 2.24% | | 2.19% | | 2.27% | | 2.31% | |
| Waiver/Recoupment of | | | | | | | | | | | | | | |
| Expenses by Adviser | | | | | | | | | | | | | | |
| | | | | | | | | | | | | | | | |
| Ratio of Net Investment Income | | | | | | | | | | | | | | |
| (Loss) to Average Net Assets: | | | | | | | | | | | | | | |
| | | | | | | | | | | | | | | | |
| After Reimbursement and | | | (1.25)% | | (1.45)% | (F) | (0.69)% | | (0.57)% | | 0.69% | | (0.70)% | |
| Waiver/Recoupment of | | | | | | | | | | | | | | |
| Expenses by Adviser | | | | | | | | | | | | | | |
| | | | | | | | | | | | | | | | |
| Portfolio Turnover | | | 64.37% | | 57.15% | | 110.16% | | 59.84% | | 148.02% | | 44.24% | |
| | | | | | | | | | | | | | | | |
| | | | | | | | | | | | | | | | |
| | | | | | | | | | | | | | | | |
| | | | | | | | | | | | | | | | |
| | | | | | | | | | | | | | | | |
| (A) | The Fund elected to change its fiscal year end from December to September. The information presented is for January 1, 2009 through September 30, 2009. | |
| (B) | Per share amounts calculated using average shares method. | | | | | | | | | | | | | |
| (C) | Total return calculation does not reflect redemption fee. | | | | | | | | | | | | | |
| (D) | Total return in the above table represents the rate that the investor would have earned or lost on an investment in the Fund assuming reinvestment of dividends. | |
| (E) | For periods of less than one full year, total return is not annualized. | | | | | | | | | |
| (F) | Annualized. | | | | | | | | | | | | | | |
| | | | | | | | | | | | | | | | |
The accompanying notes are an integral part of these financial statements.
Timothy Plan Financial Highlights
Financial Highlights | Small Cap Value (Class C Shares)
| The table below sets forth financial data for one share of capital stock outstanding throughout each period presented. |
| | | | | | | | | | | | | | | | |
| | | | | | | | | | | | | | | | |
| | | | | Year | | Period | | Year | | Year | | Year | | Year | |
| | | | | ended | | ended | | ended | | ended | | ended | | ended | |
| | | | | 9/30/10 | | 9/30/09 | (A) | 12/31/08 | | 12/31/07 | | 12/31/06 | | 12/31/05 | |
| | | | | | | | | | | | | | | | |
| Per Share Operating Performance: | | | | | | | | | | | | | | |
| Net Asset Value at Beginning of Period | | | $ 8.99 | | $ 7.83 | | $ 11.80 | | $ 13.58 | | $ 14.12 | | $ 14.55 | |
| | | | | | | | | | | | | | | | |
| Income from Investment Operations: | | | | | | | | | | | | | | |
| Net Investment Income (Loss) | | | (0.12) | | (0.09) | | (0.07) | | (0.05) | | 0.09 | | (0.10) | (B) |
| Net Realized and Unrealized | | | | | | | | | | | | | | |
| Gain (Loss) on Investments | | | 0.95 | | 1.25 | | (3.83) | | 0.31 | | 2.56 | | (0.17) | |
| Total from Investment Operations | | | 0.83 | | 1.16 | | (3.90) | | 0.26 | | 2.65 | | (0.27) | |
| | | | | | | | | | | | | | | | |
| Less Distributions: | | | | | | | | | | | | | | |
| Dividends from Net Investment | | | | | | | | | | | | | | |
| Income | | | - | | - | | - | | - | | (0.09) | | - | |
| Dividends from Realized Gains | | | - | | - | | (0.07) | | (2.04) | | (3.10) | | (0.16) | |
| Total Distributions | | | - | | - | | (0.07) | | (2.04) | | (3.19) | | (0.16) | |
| | | | | | | | | | | | | | | | |
| Net Asset Value at End of Period | | | $ 9.82 | | $ 8.99 | | $ 7.83 | | $ 11.80 | | $ 13.58 | | $ 14.12 | |
| | | | | | | | | | | | | | | | |
Total Return (C)(D) | | | 9.23% | | 14.81% | (E) | -32.99% | | 2.13% | | 18.80% | | -1.84% | |
| | | | | | | | | | | | | | | | |
| Ratios/Supplemental Data: | | | | | | | | | | | | | | |
| Net Assets, | | | | | | | | | | | | | | |
| End of Period (in 000s) | | | $ 4,186 | | $ 3,867 | | $ 3,901 | | $ 6,341 | | $ 4,054 | | $ 2,258 | |
| | | | | | | | | | | | | | | | |
| Ratio of Expenses to Average | | | | | | | | | | | | | | |
| Net Assets: | | | | | | | | | | | | | | |
| | | | | | | | | | | | | | | | |
| After Reimbursement and | | | 2.34% | | 2.34% | (F) | 2.25% | | 2.19% | | 2.27% | | 2.31% | |
| Waiver/Recoupment of | | | | | | | | | | | | | | |
| Expenses by Adviser | | | | | | | | | | | | | | |
| | | | | | | | | | | | | | | | |
| Ratio of Net Investment Income | | | | | | | | | | | | | | |
| (Loss) to Average Net Assets: | | | | | | | | | | | | | | |
| | | | | | | | | | | | | | | | |
| After Reimbursement and | | | (1.26)% | | (1.45)% | (F) | (0.70)% | | (0.47)% | | 0.61% | | (0.70)% | |
| Waiver/Recoupment of | | | | | | | | | | | | | | |
| Expenses by Adviser | | | | | | | | | | | | | | |
| | | | | | | | | | | | | | | | |
| Portfolio Turnover | | | 64.37% | | 57.15% | | 110.16% | | 59.84% | | 148.02% | | 44.24% | |
| | | | | | | | | | | | | | | | |
| | | | | | | | | | | | | | | | |
| | | | | | | | | | | | | | | | |
| | | | | | | | | | | | | | | | |
| (A) | The Fund elected to change its fiscal year end from December to September. The information presented is for January 1, 2009 through September 30, 2009. | |
| (B) | Per share amounts calculated using average shares method. | | | | | | | | | | | | | |
| (C) | Total return calculation does not reflect redemption fee. | | | | | | | | | | | | | |
| (D) | Total return in the above table represents the rate that the investor would have earned or lost on an investment in the Fund assuming reinvestment of dividends. | |
| (E) | For periods of less than one full year, total return is not annualized. | | | | | | | | | |
| (F) | Annualized. | | | | | | | | | | | | | | |
| | | | | | | | | | | | | | | | |
| | | | | | | | | | | | | | | | |
The accompanying notes are an integral part of these financial statements.
Timothy Plan Financial Highlights
Financial Highlights | Large/Mid Cap Value (Class A Shares)
| The table below sets forth financial data for one share of capital stock outstanding throughout each period presented. |
| | | | | | | | | | | | | | | | |
| | | | | | | | | | | | | | | | |
| | | | | Year | | Period | | Year | | Year | | Year | | Year | |
| | | | | ended | | ended | | ended | | ended | | ended | | ended | |
| | | | | 9/30/10 | | 9/30/09 | (A) | 12/31/08 | | 12/31/07 | | 12/31/06 | | 12/31/05 | |
| | | | | | | | | | | | | | | | |
| Per Share Operating Performance: | | | | | | | | | | | | | | |
| Net Asset Value at Beginning of Period | | | $ 10.72 | | $ 9.10 | | $ 15.48 | | $ 14.31 | | $ 12.99 | | $ 12.68 | |
| | | | | | | | | | | | | | | | |
| Income from Investment Operations: | | | | | | | | | | | | | | |
| Net Investment Income (Loss) | | | 0.05 | | 0.04 | | 0.05 | | 0.15 | | 0.16 | | 0.02 | (B) |
| Net Realized and Unrealized | | | | | | | | | | | | | | |
| Gain (Loss) on Investments | | | 1.12 | | 1.58 | | (6.26) | | 2.26 | | 2.24 | | 2.44 | |
| Total from Investment Operations | | | 1.17 | | 1.62 | | (6.21) | | 2.41 | | 2.40 | | 2.46 | |
| | | | | | | | | | | | | | | | |
| Less Distributions: | | | | | | | | | | | | | | |
| Dividends from Net Investment | | | | | | | | | | | | | | |
| Income | | | (0.05) | | - | | (0.03) | | (0.16) | | (0.16) | | - | * |
| Dividends from Realized Gains | | | - | | - | | (0.14) | | (1.08) | | (0.90) | | (2.15) | |
| Distributions from Return of | | | | | | | | | | | | | | |
| Capital | | | - | | - | | - | | - | | (0.02) | | - | |
| Total Distributions | | | (0.05) | | - | | (0.17) | | (1.24) | | (1.08) | | (2.15) | |
| | | | | | | | | | | | | | | | |
| Net Asset Value at End of Period | | | $ 11.84 | | $ 10.72 | | $ 9.10 | | $ 15.48 | | $ 14.31 | | $ 12.99 | |
| | | | | | | | | | | | | | | | |
Total Return (C)(D) | | | 10.94% | | 17.80% | (E) | -40.05% | | 17.02% | | 18.41% | | 19.42% | |
| | | | | | | | | | | | | | | | |
| Ratios/Supplemental Data: | | | | | | | | | | | | | | |
| Net Assets, | | | | | | | | | | | | | | |
| End of Period (in 000s) | | | $ 80,700 | | $ 82,784 | | $ 69,695 | | $ 103,828 | | $ 84,203 | | $ 51,753 | |
| | | | | | | | | | | | | | | | |
| Ratio of Expenses to Average | | | | | | | | | | | | | | |
| Net Assets: | | | | | | | | | | | | | | |
| | | | | | | | | | | | | | | | |
| After Reimbursement and | | | 1.58% | | 1.57% | (F) | 1.51% | | 1.44% | | 1.51% | | 1.55% | |
| Waiver/Recoupment of | | | | | | | | | | | | | | |
| Expenses by Adviser | | | | | | | | | | | | | | |
| | | | | | | | | | | | | | | | |
| Ratio of Net Investment Income | | | | | | | | | | | | | | |
| (Loss) to Average Net Assets: | | | | | | | | | | | | | | |
| | | | | | | | | | | | | | | | |
| After Reimbursement and | | | 0.39% | | 0.57% | (F) | 0.39% | | 0.99% | | 1.20% | | 0.15% | |
| Waiver/Recoupment of | | | | | | | | | | | | | | |
| Expenses by Adviser | | | | | | | | | | | | | | |
| | | | | | | | | | | | | | | | |
| Portfolio Turnover | | | 38.31% | | 32.46% | | 76.74% | | 47.52% | | 52.16% | | 129.22% | |
| | | | | | | | | | | | | | | | |
| | | | | | | | | | | | | | | | |
| | *Amount is less than $0.005 per share. | | | | | | | | | | | | | | |
| | | | | | | | | | | | | | | | |
| (A) | The Fund elected to change its fiscal year end from December to September. The information presented is for January 1, 2009 through September 30, 2009. | |
| (B) | Per share amounts calculated using average shares method. | | | | | | | | | | | | | |
| (C) | Total return calculation does not reflect sales load. | | | | | | | | | | | | | |
| (D) | Total return in the above table represents the rate that the investor would have earned or lost on an investment in the Fund assuming reinvestment of dividends. | |
| (E) | For periods of less than one full year, total return is not annualized. | | | | | | | | | |
| (F) | Annualized. | | | | | | | | | | | | | | |
| | | | | | | | | | | | | | | | |
The accompanying notes are an integral part of these financial statements.
Timothy Plan Financial Highlights
Financial Highlights | Large/Mid Cap Value (Class B Shares)
| The table below sets forth financial data for one share of capital stock outstanding throughout each period presented. |
| | | | | | | | | | | | | | | | |
| | | | | | | | | | | | | | | | |
| | | | | Year | | Period | | Year | | Year | | Year | | Year | |
| | | | | ended | | ended | | ended | | ended | | ended | | ended | |
| | | | | 9/30/10 | | 9/30/09 | (A) | 12/31/08 | | 12/31/07 | | 12/31/06 | | 12/31/05 | |
| | | | | | | | | | | | | | | | |
| Per Share Operating Performance: | | | | | | | | | | | | | | |
| Net Asset Value at Beginning of Period | | | $ 9.75 | | $ 8.32 | | $ 14.27 | | $ 13.26 | | $ 12.10 | | $ 12.02 | |
| | | | | | | | | | | | | | | | |
| Income from Investment Operations: | | | | | | | | | | | | | | |
| Net Investment Income (Loss) | | | (0.04) | (B) | (0.03) | | (0.04) | (B) | 0.04 | | 0.05 | | (0.08) | (B) |
| Net Realized and Unrealized | | | | | | | | | | | | | | |
| Gain (Loss) on Investments | | | 1.02 | | 1.46 | | (5.75) | | 2.08 | | 2.08 | | 2.31 | |
| Total from Investment Operations | | | 0.98 | | 1.43 | | (5.79) | | 2.12 | | 2.13 | | 2.23 | |
| | | | | | | | | | | | | | | | |
| Less Distributions: | | | | | | | | | | | | | | |
| Dividends from Net Investment | | | | | | | | | | | | | | |
| Income | | | (0.03) | | - | | (0.02) | | (0.03) | | (0.05) | | - | |
| Dividends from Realized Gains | | | - | | - | | (0.14) | | (1.08) | | (0.90) | | (2.15) | |
| Distributions from Return of | | | | | | | | | | | | | | |
| Capital | | | - | | - | | - | | - | | (0.02) | | - | |
| Total Distributions | | | (0.03) | | - | | (0.16) | | (1.11) | | (0.97) | | (2.15) | |
| | | | | | | | | | | | | | | | |
| Net Asset Value at End of Period | | | $ 10.70 | | $ 9.75 | | $ 8.32 | | $ 14.27 | | $ 13.26 | | $ 12.10 | |
| | | | | | | | | | | | | | | | |
Total Return (C)(D) | | | 10.10% | | 17.19% | (E) | -40.55% | | 16.21% | | 17.54% | | 18.56% | |
| | | | | | | | | | | | | | | | |
| Ratios/Supplemental Data: | | | | | | | | | | | | | | |
| Net Assets, | | | | | | | | | | | | | | |
| End of Period (in 000s) | | | $ 1,095 | | $ 1,722 | | $ 2,236 | | $ 5,945 | | $ 6,470 | | $ 6,496 | |
| | | | | | | | | | | | | | | | |
| Ratio of Expenses to Average | | | | | | | | | | | | | | |
| Net Assets: | | | | | | | | | | | | | | |
| | | | | | | | | | | | | | | | |
| After Reimbursement and | | | 2.32% | | 2.33% | (F) | 2.24% | | 2.19% | | 2.26% | | 2.30% | |
| Waiver/Recoupment of | | | | | | | | | | | | | | |
| Expenses by Adviser | | | | | | | | | | | | | | |
| | | | | | | | | | | | | | | | |
| Ratio of Net Investment Income | | | | | | | | | | | | | | |
| (Loss) to Average Net Assets: | | | | | | | | | | | | | | |
| | | | | | | | | | | | | | | | |
| After Reimbursement and | | | (0.38)% | | (0.17)% | (F) | (0.37)% | | 0.24% | | 0.28% | | (0.60)% | |
| Waiver/Recoupment of | | | | | | | | | | | | | | |
| Expenses by Adviser | | | | | | | | | | | | | | |
| | | | | | | | | | | | | | | | |
| Portfolio Turnover | | | 38.31% | | 32.46% | | 76.74% | | 47.52% | | 52.16% | | 129.22% | |
| | | | | | | | | | | | | | | | |
| | | | | | | | | | | | | | | | |
| | | | | | | | | | | | | | | | |
| | | | | | | | | | | | | | | | |
| (A) | The Fund elected to change its fiscal year end from December to September. The information presented is for January 1, 2009 through September 30, 2009. | |
| (B) | Per share amounts calculated using average shares method. | | | | | | | | | | | | | |
| (C) | Total return calculation does not reflect redemption fee. | | | | | | | | | | | | | |
| (D) | Total return in the above table represents the rate that the investor would have earned or lost on an investment in the Fund assuming reinvestment of dividends. | |
| (E) | For periods of less than one full year, total return is not annualized. | | | | | | | | | |
| (F) | Annualized. | | | | | | | | | | | | | | |
| | | | | | | | | | | | | | | | |
The accompanying notes are an integral part of these financial statements.
Timothy Plan Financial Highlights
Financial Highlights | Large/Mid Cap Value (Class C Shares)
| The table below sets forth financial data for one share of capital stock outstanding throughout each period presented. |
| | | | | | | | | | | | | | | | |
| | | | | | | | | | | | | | | | |
| | | | | Year | | Period | | Year | | Year | | Year | | Year | |
| | | | | ended | | ended | | ended | | ended | | ended | | ended | |
| | | | | 9/30/10 | | 9/30/09 | (A) | 12/31/08 | | 12/31/07 | | 12/31/06 | | 12/31/05 | |
| | | | | | | | | | | | | | | | |
| Per Share Operating Performance: | | | | | | | | | | | | | | |
| Net Asset Value at Beginning of Period | | | $ 9.73 | | $ 8.31 | | $ 14.24 | | $ 13.28 | | $ 12.12 | | $ 12.04 | |
| | | | | | | | | | | | | | | | |
| Income from Investment Operations: | | | | | | | | | | | | | | |
| Net Investment Income (Loss) | | | (0.05) | | (0.01) | | (0.04) | | 0.02 | | 0.07 | | (0.08) | (B) |
| Net Realized and Unrealized | | | | | | | | | | | | | | |
| Gain (Loss) on Investments | | | 1.03 | | 1.43 | | (5.73) | | 2.10 | | 2.08 | | 2.31 | |
| Total from Investment Operations | | | 0.98 | | 1.42 | | (5.77) | | 2.12 | | 2.15 | | 2.23 | |
| | | | | | | | | | | | | | | | |
| Less Distributions: | | | | | | | | | | | | | | |
| Dividends from Net Investment | | | | | | | | | | | | | | |
| Income | | | (0.03) | | - | | (0.02) | | (0.08) | | (0.07) | | - | |
| Dividends from Realized Gains | | | - | | - | | (0.14) | | (1.08) | | (0.90) | | (2.15) | |
| Distributions from Return of | | | | | | | | | | | | | | |
| Capital | | | - | | - | | - | | - | | (0.02) | | - | |
| Total Distributions | | | (0.03) | | - | | (0.16) | | (1.16) | | (0.99) | | (2.15) | |
| | | | | | | | | | | | | | | | |
| Net Asset Value at End of Period | | | $ 10.68 | | $ 9.73 | | $ 8.31 | | $ 14.24 | | $ 13.28 | | $ 12.12 | |
| | | | | | | | | | | | | | | | |
Total Return (C)(D) | | | 10.12% | | 17.09% | (E) | -40.49% | | 16.13% | | 17.63% | | 18.53% | |
| | | | | | | | | | | | | | | | |
| Ratios/Supplemental Data: | | | | | | | | | | | | | | |
| Net Assets, | | | | | | | | | | | | | | |
| End of Period (in 000s) | | | $ 9,484 | | $ 9,552 | | $ 8,544 | | $ 12,722 | | $ 6,353 | | $ 2,774 | |
| | | | | | | | | | | | | | | | |
| Ratio of Expenses to Average | | | | | | | | | | | | | | |
| Net Assets: | | | | | | | | | | | | | | |
| | | | | | | | | | | | | | | | |
| After Reimbursement and | | | 2.33% | | 2.32% | (F) | 2.26% | | 2.19% | | 2.25% | | 2.30% | |
| Waiver/Recoupment of | | | | | | | | | | | | | | |
| Expenses by Adviser | | | | | | | | | | | | | | |
| | | | | | | | | | | | | | | | |
| Ratio of Net Investment Income | | | | | | | | | | | | | | |
| (Loss) to Average Net Assets: | | | | | | | | | | | | | | |
| | | | | | | | | | | | | | | | |
| After Reimbursement and | | | (0.35)% | | (0.18)% | (F) | (0.35)% | | 0.18% | | 0.53% | | (0.60)% | |
| Waiver/Recoupment of | | | | | | | | | | | | | | |
| Expenses by Adviser | | | | | | | | | | | | | | |
| | | | | | | | | | | | | | | | |
| Portfolio Turnover | | | 38.31% | | 32.46% | | 76.74% | | 47.52% | | 52.16% | | 129.22% | |
| | | | | | | | | | | | | | | | |
| | | | | | | | | | | | | | | | |
| (A) | The Fund elected to change its fiscal year end from December to September. The information presented is for January 1, 2009 through September 30, 2009. | |
| (B) | Per share amounts calculated using average shares method. | | | | | | | | | | | | | |
| (C) | Total return calculation does not reflect redemption fee. | | | | | | | | | | | | | |
| (D) | Total return in the above table represents the rate that the investor would have earned or lost on an investment in the Fund assuming reinvestment of dividends. | |
| (E) | For periods of less than one full year, total return is not annualized. | | | | | | | | | |
| (F) | Annualized. | | | | | | | | | | | | | | |
| | | | | | | | | | | | | | | | |
| | | | | | | | | | | | | | | | |
The accompanying notes are an integral part of these financial statements.
Timothy Plan Financial Highlights
Financial Highlights | Fixed Income (Class A Shares)
| The table below sets forth financial data for one share of capital stock outstanding throughout each period presented. |
| | | | | | | | | | | | | | | | |
| | | | | | | | | | | | | | | | |
| | | | | Year | | Period | | Year | | Year | | Year | | Year | |
| | | | | ended | | ended | | ended | | ended | | ended | | ended | |
| | | | | 9/30/10 | | 9/30/09 | (A) | 12/31/08 | | 12/31/07 | | 12/31/06 | | 12/31/05 | |
| | | | | | | | | | | | | | | | |
| Per Share Operating Performance: | | | | | | | | | | | | | | |
| Net Asset Value at Beginning of Period | | | $ 10.14 | | $ 9.56 | | $ 9.99 | | $ 9.94 | | $ 10.06 | | $ 10.32 | |
| | | | | | | | | | | | | | | | |
| Income from Investment Operations: | | | | | | | | | | | | | | |
| Net Investment Income (Loss) | | | 0.29 | (B) | 0.24 | | 0.43 | | 0.44 | | 0.42 | | 0.34 | (B) |
| Net Realized and Unrealized | | | | | | | | | | | | | | |
| Gain (Loss) on Investments | | | 0.42 | | 0.58 | | (0.43) | | 0.06 | | (0.12) | | (0.23) | |
| Total from Investment Operations | | | 0.71 | | 0.82 | | - | | 0.50 | | 0.30 | | 0.11 | |
| | | | | | | | | | | | | | | | |
| Less Distributions: | | | | | | | | | | | | | | |
| Dividends from Net Investment | | | | | | | | | | | | | | |
| Income | | | (0.29) | | (0.24) | | (0.43) | | (0.45) | | (0.41) | | (0.34) | |
| Dividends from Realized Gains | | | - | | - | | - | | - | | (0.01) | | (0.03) | |
| Total Distributions | | | (0.29) | | (0.24) | | (0.43) | | (0.45) | | (0.42) | | (0.37) | |
| | | | | | | | | | | | | | | | |
| Net Asset Value at End of Period | | | $ 10.56 | | $ 10.14 | | $ 9.56 | | $ 9.99 | | $ 9.94 | | $ 10.06 | |
| | | | | | | | | | | | | | | | |
Total Return (C)(D) | | | 7.07% | | 8.70% | (E) | -0.05% | | 5.19% | | 3.11% | | 1.11% | |
| | | | | | | | | | | | | | | | |
| Ratios/Supplemental Data: | | | | | | | | | | | | | | |
| Net Assets, | | | | | | | | | | | | | | |
| End of Period (in 000s) | | | $ 58,831 | | $ 48,074 | | $ 37,367 | | $ 45,371 | | $ 39,023 | | $ 29,402 | |
| | | | | | | | | | | | | | | | |
| Ratio of Expenses to Average | | | | | | | | | | | | | | |
| Net Assets: | | | | | | | | | | | | | | |
| | | | | | | | | | | | | | | | |
| Before Reimbursement and | | | 1.36% | | 1.35% | (F) | 1.29% | | 1.21% | | 1.32% | | 1.31% | |
| Waiver/Recoupment of | | | | | | | | | | | | | | |
| Expenses by Adviser | | | | | | | | | | | | | | |
| After Reimbursement and | | | 1.21% | | 1.20% | (F) | 1.14% | | 1.06% | | 1.35% | | 1.35% | |
| Waiver/Recoupment of | | | | | | | | | | | | | | |
| Expenses by Adviser | | | | | | | | | | | | | | |
| | | | | | | | | | | | | | | | |
| Ratio of Net Investment Income | | | | | | | | | | | | | | |
| (Loss) to Average Net Assets: | | | | | | | | | | | | | | |
| | | | | | | | | | | | | | | | |
| Before Reimbursement and | | | 2.63% | | 3.24% | (F) | 4.11% | | 4.33% | | 4.42% | | 3.33% | |
| Waiver/Recoupment of | | | | | | | | | | | | | | |
| Expenses by Adviser | | | | | | | | | | | | | | |
| After Reimbursement and | | | 2.78% | | 3.39% | (F) | 4.26% | | 4.48% | | 4.39% | | 3.29% | |
| Waiver/Recoupment of | | | | | | | | | | | | | | |
| Expenses by Adviser | | | | | | | | | | | | | | |
| | | | | | | | | | | | | | | | |
| Portfolio Turnover | | | 25.68% | | 22.18% | | 35.01% | | 44.98% | | 76.28% | | 39.46% | |
| | | | | | | | | | | | | | | | |
| | | | | | | | | | | | | | | | |
| | | | | | | | | | | | | | | | |
| | | | | | | | | | | | | | | | |
| | | | | | | | | | | | | | | | |
| (A) | The Fund elected to change its fiscal year end from December to September. The information presented is for January 1, 2009 through September 30, 2009. | |
| (B) | Per share amounts calculated using average shares method. | | | | | | | | | | | | | |
| (C) | Total return calculation does not reflect sales load. | | | | | | | | | | | | | |
| (D) | Total return in the above table represents the rate that the investor would have earned or lost on an investment in the Fund assuming reinvestment of dividends. | |
| | Total return would have been higher or lower if certain expenses had not been reimbursed, waived or recouped. | | | | | | | |
| (E) | For periods of less than one full year, total return is not annualized. | | | | | | | | | |
| (F) | Annualized. | | | | | | | | | | | | | | |
| | | | | | | | | | | | | | | | |
The accompanying notes are an integral part of these financial statements.
Timothy Plan Financial Highlights
Financial Highlights | Fixed Income (Class B Shares)
| The table below sets forth financial data for one share of capital stock outstanding throughout each period presented. |
| | | | | | | | | | | | | | | | |
| | | | | | | | | | | | | | | | |
| | | | | Year | | Period | | Year | | Year | | Year | | Year | |
| | | | | ended | | ended | | ended | | ended | | ended | | ended | |
| | | | | 9/30/10 | | 9/30/09 | (A) | 12/31/08 | | 12/31/07 | | 12/31/06 | | 12/31/05 | |
| | | | | | | | | | | | | | | | |
| Per Share Operating Performance: | | | | | | | | | | | | | | |
| Net Asset Value at Beginning of Period | | | $ 9.83 | | $ 9.28 | | $ 9.70 | | $ 9.66 | | $ 9.81 | | $ 10.06 | |
| | | | | | | | | | | | | | | | |
| Income from Investment Operations: | | | | | | | | | | | | | | |
| Net Investment Income (Loss) | | | 0.21 | (B) | 0.20 | | 0.35 | | 0.37 | | 0.36 | | 0.25 | (B) |
| Net Realized and Unrealized | | | | | | | | | | | | | | |
| Gain (Loss) on Investments | | | 0.40 | | 0.53 | | (0.41) | | 0.05 | | (0.15) | | (0.20) | |
| Total from Investment Operations | | | 0.61 | | 0.73 | | (0.06) | | 0.42 | | 0.21 | | 0.05 | |
| | | | | | | | | | | | | | | | |
| Less Distributions: | | | | | | | | | | | | | | |
| Dividends from Net Investment | | | | | | | | | | | | | | |
| Income | | | (0.20) | | (0.18) | | (0.36) | | (0.38) | | (0.35) | | (0.27) | |
| Dividends from Realized Gains | | | - | | - | | - | | - | | (0.01) | | (0.03) | |
| Total Distributions | | | (0.20) | | (0.18) | | (0.36) | | (0.38) | | (0.36) | | (0.30) | |
| | | | | | | | | | | | | | | | |
| Net Asset Value at End of Period | | | $ 10.24 | | $ 9.83 | | $ 9.28 | | $ 9.70 | | $ 9.66 | | $ 9.81 | |
| | | | | | | | | | | | | | | | |
Total Return (C)(D) | | | 6.28% | | 7.98% | (E) | -0.66% | | 4.47% | | 2.20% | | 0.47% | |
| | | | | | | | | | | | | | | | |
| Ratios/Supplemental Data: | | | | | | | | | | | | | | |
| Net Assets, | | | | | | | | | | | | | | |
| End of Period (in 000s) | | | $ ��311 | | $ 783 | | $ 1,230 | | $ 1,951 | | $ 2,786 | | $ 3,126 | |
| | | | | | | | | | | | | | | | |
| Ratio of Expenses to Average | | | | | | | | | | | | | | |
| Net Assets: | | | | | | | | | | | | | | |
| | | | | | | | | | | | | | | | |
| Before Reimbursement and | | | 2.11% | | 2.10% | (F) | 2.04% | | 1.93% | | 1.99% | | 2.07% | |
| Waiver/Recoupment of | | | | | | | | | | | | | | |
| Expenses by Adviser | | | | | | | | | | | | | | |
| After Reimbursement and | | | 1.96% | | 1.95% | (F) | 1.89% | | 1.78% | | 2.10% | | 2.10% | |
| Waiver/Recoupment of | | | | | | | | | | | | | | |
| Expenses by Adviser | | | | | | | | | | | | | | |
| | | | | | | | | | | | | | | | |
| Ratio of Net Investment Income | | | | | | | | | | | | | | |
| (Loss) to Average Net Assets: | | | | | | | | | | | | | | |
| | | | | | | | | | | | | | | | |
| Before Reimbursement and | | | 1.91% | | 2.49% | (F) | 3.34% | | 3.62% | | 3.74% | | 2.57% | |
| Waiver/Recoupment of | | | | | | | | | | | | | | |
| Expenses by Adviser | | | | | | | | | | | | | | |
| After Reimbursement and | | | 2.06% | | 2.64% | (F) | 3.49% | | 3.77% | | 3.63% | | 2.54% | |
| Waiver/Recoupment of | | | | | | | | | | | | | | |
| Expenses by Adviser | | | | | | | | | | | | | | |
| | | | | | | | | | | | | | | | |
| Portfolio Turnover | | | 25.68% | | 22.18% | | 35.01% | | 44.98% | | 76.28% | | 39.46% | |
| | | | | | | | | | | | | | | | |
| | | | | | | | | | | | | | | | |
| | | | | | | | | | | | | | | | |
| | | | | | | | | | | | | | | | |
| | | | | | | | | | | | | | | | |
| (A) | The Fund elected to change its fiscal year end from December to September. The information presented is for January 1, 2009 through September 30, 2009. | |
| (B) | Per share amounts calculated using average shares method. | | | | | | | | | | | | | |
| (C) | Total return calculation does not reflect redemption fee. | | | | | | | | |
| (D) Total return in the above table represents the rate that the investor would have earned or lost on an investment in the Fund assuming reinvestment of dividends. |
| Total return would have been higher or lower if certain expenses had not been reimbursed, waived or recouped. | | | | | |
| (E) | For periods of less than one full year, total return is not annualized. | | | | | | | | | |
| (F) | Annualized. | | | | | | | | | | | | | | |
| | | | | | | | | | | | | | | | |
The accompanying notes are an integral part of these financial statements.
Timothy Plan Financial Highlights
Financial Highlights | Fixed Income (Class C Shares)
| The table below sets forth financial data for one share of capital stock outstanding throughout each period presented. |
| | | | | | | | | | | | | | | | |
| | | | | | | | | | | | | | | | |
| | | | | Year | | Period | | Year | | Year | | Year | | Year | |
| | | | | ended | | ended | | ended | | ended | | ended | | ended | |
| | | | | 9/30/10 | | 9/30/09 | (A) | 12/31/08 | | 12/31/07 | | 12/31/06 | | 12/31/05 | |
| | | | | | | | | | | | | | | | |
| Per Share Operating Performance: | | | | | | | | | | | | | | |
| Net Asset Value at Beginning of Period | | | $ 9.82 | | $ 9.28 | | $ 9.69 | | $ 9.66 | | $ 9.78 | | $ 10.04 | |
| | | | | | | | | | | | | | | | |
| Income from Investment Operations: | | | | | | | | | | | | | | |
| Net Investment Income (Loss) | | | 0.21 | | 0.18 | | 0.33 | | 0.37 | | 0.33 | | 0.25 | (B) |
| Net Realized and Unrealized | | | | | | | | | | | | | | |
| Gain (Loss) on Investments | | | 0.41 | | 0.56 | | (0.40) | | 0.04 | | (0.12) | | (0.20) | |
| Total from Investment Operations | | | 0.62 | | 0.74 | | (0.07) | | 0.41 | | 0.21 | | 0.05 | |
| | | | | | | | | | | | | | | | |
| Less Distributions: | | | | | | | | | | | | | | |
| Dividends from Net Investment | | | | | | | | | | | | | | |
| Income | | | (0.22) | | (0.20) | | (0.34) | | (0.38) | | (0.32) | | (0.28) | |
| Dividends from Realized Gains | | | - | | - | | - | | - | | (0.01) | | (0.03) | |
| Total Distributions | | | (0.22) | | (0.20) | | (0.34) | | (0.38) | | (0.33) | | (0.31) | |
| | | | | | | | | | | | | | | | |
| Net Asset Value at End of Period | | | $ 10.22 | | $ 9.82 | | $ 9.28 | | $ 9.69 | | $ 9.66 | | $ 9.78 | |
| | | | | | | | | | | | | | | | |
Total Return (D)(E) | | | 6.36% | | 8.02% | (E) | -0.72% | | 4.37% | | 2.26% | | 0.47% | |
| | | | | | | | | | | | | | | | |
| Ratios/Supplemental Data: | | | | | | | | | | | | | | |
| Net Assets, | | | | | | | | | | | | | | |
| End of Period (in 000s) | | | $ 8,438 | | $ 5,212 | | $ 2,883 | | $ 2,842 | | $ 3,019 | | $ 1,927 | |
| | | | | | | | | | | | | | | | |
| Ratio of Expenses to Average | | | | | | | | | | | | | | |
| Net Assets: | | | | | | | | | | | | | | |
| | | | | | | | | | | | | | | | |
| Before Reimbursement and | | | 2.12% | | 2.10% | (F) | 2.06% | | 1.96% | | 2.10% | | 2.07% | |
| Waiver/Recoupment of | | | | | | | | | | | | | | |
| Expenses by Adviser | | | | | | | | | | | | | | |
| After Reimbursement and | | | 1.97% | | 1.95% | (F) | 1.91% | | 1.81% | | 2.10% | | 2.10% | |
| Waiver/Recoupment of | | | | | | | | | | | | | | |
| Expenses by Adviser | | | | | | | | | | | | | | |
| | | | | | | | | | | | | | | | |
| Ratio of Net Investment Income | | | | | | | | | | | | | | |
| (Loss) to Average Net Assets: | | | | | | | | | | | | | | |
| | | | | | | | | | | | | | | | |
| Before Reimbursement and | | | 1.88% | | 2.50% | (F) | 3.33% | | 3.59% | | 3.64% | | 2.57% | |
| Waiver/Recoupment of | | | | | | | | | | | | | | |
| Expenses by Adviser | | | | | | | | | | | | | | |
| After Reimbursement and | | | 2.03% | | 2.65% | (F) | 3.48% | | 3.74% | | 3.64% | | 2.54% | |
| Waiver/Recoupment of | | | | | | | | | | | | | | |
| Expenses by Adviser | | | | | | | | | | | | | | |
| | | | | | | | | | | | | | | | |
| Portfolio Turnover | | | 25.68% | | 22.18% | | 35.01% | | 44.98% | | 76.28% | | 39.46% | |
| | | | | | | | | | | | | | | | |
| | | | | | | | | | | | | | | | |
| | | | | | | | | | | | | | | | |
| (A) | The Fund elected to change its fiscal year end from December to September. The information presented is for January 1, 2009 through September 30, 2009. | |
| (B) | Per share amounts calculated using average shares method. | | | | | | | | | | | | | |
| (C) | Total return calculation does not reflect redemption fee. | | | | | | | | | | | | | |
| (D) | Total return in the above table represents the rate that the investor would have earned or lost on an investment in the Fund assuming reinvestment of dividends. | |
| | Total return would have been higher or lower if certain expenses had not been reimbursed, waived or recouped. | | | | | |
| (E) | For periods of less than one full year, total return is not annualized. | | | | | | | | | |
| (F) | Annualized. | | | | | | | | | | | | | | |
| | | | | | | | | | | | | | | | |
| | | | | | | | | | | | | | | | |
The accompanying notes are an integral part of these financial statements.
Timothy Plan Financial Highlights
Financial Highlights | High Yield Bond (Class A Shares)
| The table below sets forth financial data for one share of capital stock outstanding throughout each period presented. |
| | | | | | | | | | | | | | | | |
| | | | | | | | | | | | | | | | |
| | | | | | | | | Year | | Period | | Year | | Period | |
| | | | | | | | | ended | | ended | | ended | | ended | |
| | | | | | | | | 9/30/10 | | 9/30/09 | (A) | 12/31/08 | | 12/31/07 | (B) |
| | | | | | | | | | | | | | | | |
| Per Share Operating Performance: | | | | | | | | | | | | | | |
| Net Asset Value at Beginning of Period | | | | | | | $ 8.46 | | $ 6.23 | | $ 9.53 | | $ 10.00 | |
| | | | | | | | | | | | | | | | |
| Income from Investment Operations: | | | | | | | | | | | | | | |
| Net Investment Income (Loss) | | | | | | | 0.60 | | 0.48 | | 0.61 | | 0.36 | |
| Net Realized and Unrealized | | | | | | | | | | | | | | |
| Gain (Loss) on Investments | | | | | | | 0.63 | | 2.23 | | (3.30) | | (0.47) | |
| Total from Investment Operations | | | | | | | 1.23 | | 2.71 | | (2.69) | | (0.11) | |
| | | | | | | | | | | | | | | | |
| Less Distributions: | | | | | | | | | | | | | | |
| Dividends from Net Investment | | | | | | | | | | | | | | |
| Income | | | | | | | (0.59) | | (0.48) | | (0.60) | | (0.36) | |
| Dividends from Realized Gains | | | | | | | - | | - | | (0.01) | | - | |
| Total Distributions | | | | | | | (0.59) | | (0.48) | | (0.61) | | (0.36) | |
| | | | | | | | | | | | | | | | |
| Net Asset Value at End of Period | | | | | | | $ 9.10 | | $ 8.46 | | $ 6.23 | | $ 9.53 | |
| | | | | | | | | | | | | | | | |
Total Return (C)(D) | | | | | | | 14.98% | | 45.11% | (E) | -29.55% | | -1.14% | (E) |
| | | | | | | | | | | | | | | | |
| Ratios/Supplemental Data: | | | | | | | | | | | | | | |
| Net Assets, | | | | | | | | | | | | | | |
| End of Period (in 000s) | | | | | | | $ 21,617 | | $ 18,740 | | $ 13,283 | | $ 20,284 | |
| | | | | | | | | | | | | | | | |
| Ratio of Expenses to Average | | | | | | | | | | | | | | |
| Net Assets: | | | | | | | | | | | | | | |
| | | | | | | | | | | | | | | | |
| Before Reimbursement and | | | | | | | 1.43% | | 1.46% | | 1.41% | | 1.45% | |
| Waiver/Recoupment of | | | | | | | | | | (F) | | | | (F) |
| Expenses by Adviser | | | | | | | | | | | | | | |
| After Reimbursement and | | | | | | | 1.43% | | 1.46% | | 1.41% | | 1.35% | |
| Waiver/Recoupment of | | | | | | | | | | (F) | | | | (F) |
| Expenses by Adviser | | | | | | | | | | | | | | |
| | | | | | | | | | | | | | | | |
| Ratio of Net Investment Income | | | | | | | | | | | | | | |
| (Loss) to Average Net Assets: | | | | | | | | | | | | | | |
| | | | | | | | | | | | | | | | |
| Before Reimbursement and | | | | | | | 6.72% | | 8.75% | | 7.06% | | 5.67% | |
| Waiver/Recoupment of | | | | | | | | | | (F) | | | | (F) |
| Expenses by Adviser | | | | | | | | | | | | | | |
| After Reimbursement and | | | | | | | 6.72% | | 8.75% | | 7.06% | | 5.77% | |
| Waiver/Recoupment of | | | | | | | | | | (F) | | | | (F) |
| Expenses by Adviser | | | | | | | | | | | | | | |
| | | | | | | | | | | | | | | | |
| Portfolio Turnover | | | | | | | 39.84% | | 33.82% | | 27.85% | | 23.46% | |
| | | | | | | | | | | | | | | | |
| | | | | | | | | | | | | | | | |
| | | | | | | | | | | | | | | | |
| | | | | | | | | | | | | | | | |
| (A) | The Fund elected to change its fiscal year end from December to September. The information presented is for January 1, 2009 through September 30, 2009. | |
| (B) | For the period May 7, 2007 (Commencement of Operations) to December 31, 2007. | |
| (C) | Total return calculation does not reflect sales load. | | | | | | | | | | | | | |
| (D) | Total return in the above table represents the rate that the investor would have earned or lost on an investment in the Fund assuming reinvestment of dividends. | |
| | Total return would have been higher or lower if certain expenses had not been reimbursed, waived or recouped. | | | | | |
| (E) | For periods of less than one full year, total return is not annualized. | | | | | | | |
| (F) | Annualized. | | | | | | | | | | | | | | |
| | | | | | | | | | | | | | | | |
The accompanying notes are an integral part of these financial statements.
Timothy Plan Financial Highlights
Financial Highlights | High Yield Bond (Class C Shares)
| The table below sets forth financial data for one share of capital stock outstanding throughout each period presented. |
| | | | | | | | | | | | | | | | |
| | | | | | | | | | | | | | | | |
| | | | | | | | | Year | | Period | | Year | | Period | |
| | | | | | | | | ended | | ended | | ended | | ended | |
| | | | | | | | | 9/30/10 | | 9/30/09 | (A) | 12/31/08 | | 12/31/07 | (B) |
| | | | | | | | | | | | | | | | |
| Per Share Operating Performance: | | | | | | | | | | | | | | |
| Net Asset Value at Beginning of Period | | | | | | | $ 8.51 | | $ 6.29 | | $ 9.60 | | $ 10.00 | |
| | | | | | | | | | | | | | | | |
| Income from Investment Operations: | | | | | | | | | | | | | | |
| Net Investment Income (Loss) | | | | | | | 0.53 | (C) | 0.43 | (C) | 0.53 | | 0.26 | |
| Net Realized and Unrealized | | | | | | | | | | | | | | |
| Gain (Loss) on Investments | | | | | | | 0.66 | | 2.24 | | (3.33) | | (0.40) | |
| Total from Investment Operations | | | | | | | 1.19 | | 2.67 | | (2.80) | | (0.14) | |
| | | | | | | | | | | | | | | | |
| Less Distributions: | | | | | | | | | | | | | | |
| Dividends from Net Investment | | | | | | | | | | | | | | |
| Income | | | | | | | (0.53) | | (0.45) | | (0.50) | | (0.26) | |
| Dividends from Realized Gains | | | | | | | - | | - | | (0.01) | | - | |
| Total Distributions | | | | | | | (0.53) | | (0.45) | | (0.51) | | (0.26) | |
| | | | | | | | | | | | | | | | |
| Net Asset Value at End of Period | | | | | | | $ 9.17 | | $ 8.51 | | $ 6.29 | | $ 9.60 | |
| | | | | | | | | | | | | | | | |
Total Return (D)(E) | | | | | | | 14.36% | | 43.90% | (F) | -30.17% | | -1.38% | (F) |
| | | | | | | | | | | | | | | | |
| Ratios/Supplemental Data: | | | | | | | | | | | | | | |
| Net Assets, | | | | | | | | | | | | | | |
| End of Period (in 000s) | | | | | | | $ 1,039 | | $ 547 | | $ 141 | | $ 241 | |
| | | | | | | | | | | | | | | | |
| Ratio of Expenses to Average | | | | | | | | | | | | | | |
| Net Assets: | | | | | | | | | | | | | | |
| | | | | | | | | | | | | | | | |
| Before Reimbursement and | | | | | | | 2.18% | | 2.20% | | 2.14% | | 2.20% | |
| Waiver/Recoupment of | | | | | | | | | | (G) | | | | (G) |
| Expenses by Adviser | | | | | | | | | | | | | | |
| After Reimbursement and | | | | | | | 2.18% | | 2.20% | | 2.14% | | 2.10% | |
| Waiver/Recoupment of | | | | | | | | | | (G) | | | | (G) |
| Expenses by Adviser | | | | | | | | | | | | | | |
| | | | | | | | | | | | | | | | |
| Ratio of Net Investment Income | | | | | | | | | | | | | | |
| (Loss) to Average Net Assets: | | | | | | | | | | | | | | |
| | | | | | | | | | | | | | | | |
| Before Reimbursement and | | | | | | | 5.99% | | 7.55% | | 6.26% | | 5.24% | |
| Waiver/Recoupment of | | | | | | | | | | (G) | | | | (G) |
| Expenses by Adviser | | | | | | | | | | | | | | |
| After Reimbursement and | | | | | | | 5.99% | | 7.55% | | 6.26% | | 5.34% | |
| Waiver/Recoupment of | | | | | | | | | | (G) | | | | (G) |
| Expenses by Adviser | | | | | | | | | | | | | | |
| | | | | | | | | | | | | | | | |
| Portfolio Turnover | | | | | | | 39.84% | | 33.82% | | 27.85% | | 23.46% | |
| | | | | | | | | | | | | | | | |
| | | | | | | | | | | | | | | | |
| | | | | | | | | | | | | | | | |
| (A) | The Fund elected to change its fiscal year end from December to September. The information presented is for January 1, 2009 through September 30, 2009. | |
| (B) | For the period May 7, 2007 (Commencement of Operations) to December 31, 2007. | |
| (C) | Per share amounts calculated using average shares method. | | | | | | | | | | | | | |
| (D) | Total return calculation does not reflect redemption fee. | | | | | | | | | | | | | |
| (E) | Total return in the above table represents the rate that the investor would have earned or lost on an investment in the Fund assuming reinvestment of dividends. | |
| | Total return would have been higher or lower if certain expenses had not been reimbursed, waived or recouped. | | | | | |
| (F) | For periods of less than one full year, total return is not annualized. | | | | | | | | | |
| (G) | Annualized. | | | | | | | | | | | | | | |
| | | | | | | | | | | | | | | | |
The accompanying notes are an integral part of these financial statements.
Timothy Plan Financial Highlights
Financial Highlights | Defensive Strategies (Class A Shares)
| The table below sets forth financial data for one share of capital stock outstanding throughout each period presented. |
| | | | | | | | | | | | | | | | |
| | | | | | | | | | | | | | | | |
| | | | | | | | | | | | | | | Period | |
| | | | | | | | | | | | | | | ended | |
| | | | | | | | | | | | | | | 9/30/10 | (A) |
| | | | | | | | | | | | | | | | |
| Per Share Operating Performance: | | | | | | | | | | | | | | |
| Net Asset Value at Beginning of Period | | | | | | | | | | | | | $ 10.00 | |
| | | | | | | | | | | | | | | | |
| Income from Investment Operations: | | | | | | | | | | | | | | |
| Net Investment Income (Loss) | | | | | | | | | | | | | 0.02 | |
| Net Realized and Unrealized | | | | | | | | | | | | | | |
| Gain (Loss) on Investments | | | | | | | | | | | | | 1.08 | |
| Total from Investment Operations | | | | | | | | | | | | | 1.10 | |
| | | | | | | | | | | | | | | | |
| Less Distributions: | | | | | | | | | | | | | | |
| Dividends from Net Investment | | | | | | | | | | | | | | |
| Income | | | | | | | | | | | | | - | |
| Dividends from Realized Gains | | | | | | | | | | | | | (0.21) | |
| Distributions from Return of | | | | | | | | | | | | | | |
| Capital | Capital | | | | | | | | | | | | | (0.19) | |
| Total Distributions | | | | | | | | | | | | | (0.40) | |
| | | | | | | | | | | | | | | | |
| Net Asset Value at End of Period | | | | | | | | | | | | | $ 10.70 | |
| | | | | | | | | | | | | | | | |
Total Return (B)(C) | | | | | | | | | | | | | 10.97% | (D) |
| | | | | | | | | | | | | | | | |
| Ratios/Supplemental Data: | | | | | | | | | | | | | | |
| Net Assets, | | | | | | | | | | | | | | |
| End of Period (in 000s) | | | | | | | | | | | | | $ 23,360 | |
| | | | | | | | | | | | | | | | |
| Ratio of Expenses to Average | | | | | | | | | | | | | | |
| Net Assets: | | | | | | | | | | | | | | |
| | | | | | | | | | | | | | | | |
| After Reimbursement and | | | | | | | | | | | | | 1.51% | |
| Waiver/Recoupment of | | | | | | | | | | | | | | (E) |
| Expenses by Adviser | | | | | | | | | | | | | | |
| | | | | | | | | | | | | | | | |
| Ratio of Net Investment Income | | | | | | | | | | | | | | |
| (Loss) to Average Net Assets: | | | | | | | | | | | | | | |
| | | | | | | | | | | | | | | | |
| After Reimbursement and | | | | | | | | | | | | | 0.13% | |
| Waiver/Recoupment of | | | | | | | | | | | | | | (E) |
| Expenses by Adviser | | | | | | | | | | | | | | |
| | | | | | | | | | | | | | | | |
| Portfolio Turnover | | | | | | | | | | | | | 41.21% | |
| | | | | | | | | | | | | | | | |
| | | | | | | | | | | | | | | | |
| | | | | | | | | | | | | | | | |
| | | | | | | | | | | | | | | | |
| (A) | For the period November 4, 2009 (Commencement of Operations) to September 30, 2010. | | | | | | | |
| (B) | Total return calculation does not reflect sales load. | | | | | | | | | | | | | |
| (C) | Total return in the above table represents the rate that the investor would have earned or lost on an investment in the Fund assuming reinvestment of dividends. | |
| | Total return would have been higher or lower if certain expenses had not been reimbursed, waived or recouped. | | | | | |
| (D) | For periods of less than one full year, total return is not annualized. | | | | | | | | | |
| (E) | Annualized. | | | | | | | | | | | | | | |
| | | | | | | | | | | | | | | | |
The accompanying notes are an integral part of these financial statements.
Timothy Plan Financial Highlights
Financial Highlights | Defensive Strategies (Class C Shares)
| The table below sets forth financial data for one share of capital stock outstanding throughout each period presented. |
| | | | | | | | | | | | | | | | |
| | | | | | | | | | | | | | | | |
| | | | | | | | | | | | | | | Period | |
| | | | | | | | | | | | | | | ended | |
| | | | | | | | | | | | | | | 9/30/10 | (A) |
| | | | | | | | | | | | | | | | |
| Per Share Operating Performance: | | | | | | | | | | | | | | |
| Net Asset Value at Beginning of Period | | | | | | | | | | | | | $ 10.00 | |
| | | | | | | | | | | | | | | | |
| Income from Investment Operations: | | | | | | | | | | | | | | |
| Net Investment Income (Loss) | | | | | | | | | | | | | (0.06) | (B) |
| Net Realized and Unrealized | | | | | | | | | | | | | | |
| Gain (Loss) on Investments | | | | | | | | | | | | | 1.08 | |
| Total from Investment Operations | | | | | | | | | | | | | 1.02 | |
| | | | | | | | | | | | | | | | |
| Less Distributions: | | | | | | | | | | | | | | |
| Dividends from Net Investment | | | | | | | | | | | | | | |
| Income | | | | | | | | | | | | | - | |
| Dividends from Realized Gains | | | | | | | | | | | | | (0.21) | |
| Distributions from Return of | | | | | | | | | | | | | | |
| Capital | Capital | | | | | | | | | | | | | (0.23) | |
| Total Distributions | | | | | | | | | | | | | (0.44) | |
| | | | | | | | | | | | | | | | |
| Net Asset Value at End of Period | | | | | | | | | | | | | $ 10.58 | |
| | | | | | | | | | | | | | | | |
Total Return (C)(D) | | | | | | | | | | | | | 10.18% | (E) |
| | | | | | | | | | | | | | | | |
| Ratios/Supplemental Data: | | | | | | | | | | | | | | |
| Net Assets, | | | | | | | | | | | | | | |
| End of Period (in 000s) | | | | | | | | | | | | | $ 5,527 | |
| | | | | | | | | | | | | | | | |
| Ratio of Expenses to Average | | | | | | | | | | | | | | |
| Net Assets: | | | | | | | | | | | | | | |
| | | | | | | | | | | | | | | | |
| Before Reimbursement and | | | | | | | | | | | | | 2.28% | |
| Waiver/Recoupment of | | | | | | | | | | | | | | (F) |
| Expenses by Adviser | | | | | | | | | | | | | | |
| After Reimbursement and | | | | | | | | | | | | | 2.28% | |
| Waiver/Recoupment of | | | | | | | | | | | | | | (F) |
| Expenses by Adviser | | | | | | | | | | | | | | |
| | | | | | | | | | | | | | | | |
| Ratio of Net Investment Income | | | | | | | | | | | | | | |
| (Loss) to Average Net Assets: | | | | | | | | | | | | | | |
| | | | | | | | | | | | | | | | |
| Before Reimbursement and | | | | | | | | | | | | | (0.64)% | |
| Waiver/Recoupment of | | | | | | | | | | | | | | (F) |
| Expenses by Adviser | | | | | | | | | | | | | | |
| After Reimbursement and | | | | | | | | | | | | | (0.64)% | |
| Waiver/Recoupment of | | | | | | | | | | | | | | (F) |
| Expenses by Adviser | | | | | | | | | | | | | | |
| | | | | | | | | | | | | | | | |
| Portfolio Turnover | | | | | | | | | | | | | 41.21% | |
| | | | | | | | | | | | | | | | |
| | | | | | | | | | | | | | | | |
| | | | | | | | | | | | | | | | |
| (A) | For the period November 4, 2009 (Commencement of Operations) to September 30, 2010. | | | | | |
| (B) | Per share amounts calculated using average shares method. | | | | | | | | | | | | | |
| (C) | Total return calculation does not reflect redemption fee. | | | | | | | | | | | | | |
| (D) | Total return in the above table represents the rate that the investor would have earned or lost on an investment in the Fund assuming reinvestment of dividends. | |
| | Total return would have been higher or lower if certain expenses had not been reimbursed, waived or recouped. | | | |
| (E) | For periods of less than one full year, total return is not annualized. | | | | | | | | | |
| (F) | Annualized. | | | | | | | | | | | | | | |
The accompanying notes are an integral part of these financial statements.
Timothy Plan Financial Highlights
Financial Highlights | Money Market
| The table below sets forth financial data for one share of capital stock outstanding throughout each period presented. |
| | | | | | | | | | | | | | | | |
| | | | | | | | | | | | | | | | |
| | | | | Year | | Period | | Year | | Year | | Year | | Year | |
| | | | | ended | | ended | | ended | | ended | | ended | | ended | |
| | | | | 9/30/10 | | 9/30/09 | (A) | 12/31/08 | | 12/31/07 | | 12/31/06 | | 12/31/05 | |
| | | | | | | | | | | | | | | | |
| Per Share Operating Performance: | | | | | | | | | | | | | | |
| Net Asset Value at Beginning of Period | | | $ 1.00 | | $ 1.00 | | $ 1.00 | | $ 1.00 | | $ 1.00 | | $ 1.00 | |
| | | | | | | | | | | | | | | | |
| Income from Investment Operations: | | | | | | | | | | | | | | |
| Net Investment Income (Loss) | | | - | * | - | * | 0.02 | | 0.04 | | 0.04 | | 0.03 | (B) |
| Total from Investment Operations | | | - | | - | | 0.02 | | 0.04 | | 0.04 | | 0.03 | |
| | | | | | | | | | | | | | | | |
| Less Distributions: | | | | | | | | | | | | | | |
| Dividends from Net Investment | | | | | | | | | | | | | | |
| Income | | | - | * | - | * | (0.02) | | (0.04) | | (0.04) | | (0.03) | |
| Dividends from Realized Gains | | | - | | - | | - | | - | | - | | - | * |
| Total Distributions | | | - | | - | | (0.02) | | (0.04) | | (0.04) | | (0.03) | |
| | | | | | | | | | | | | | | | |
| Net Asset Value at End of Period | | | $ 1.00 | | $ 1.00 | | $ 1.00 | | $ 1.00 | | $ 1.00 | | $ 1.00 | |
| | | | | | | | | | | | | | | | |
Total Return (C)(D) | | | 0.07% | | 0.07% | (E) | 1.82% | | 4.26% | | 4.17% | | 2.48% | |
| | | | | | | | | | | | | | | | |
| Ratios/Supplemental Data: | | | | | | | | | | | | | | |
| Net Assets, | | | | | | | | | | | | | | |
| End of Period (in 000s) | | | $ 13,390 | | $ 27,168 | | $ 33,860 | | $ 45,433 | | $ 19,813 | | $ 5,195 | |
| | | | | | | | | | | | | | | | |
| Ratio of Expenses to Average | | | | | | | | | | | | | | |
| Net Assets: | | | | | | | | | | | | | | |
| | | | | | | | | | | | | | | | |
| Before Reimbursement and | | | 1.15% | | 1.05% | (F) | 1.00% | | 0.99% | | 1.21% | | 1.13% | |
| Waiver/Recoupment of | | | | | | | | | | | | | | |
| Expenses by Adviser | | | | | | | | | | | | | | |
| After Reimbursement and | | | 0.08% | | 0.33% | (F) | 0.64% | | 0.78% | | 0.85% | | 0.66% | |
| Waiver/Recoupment of | | | | | | | | (D) | | | | | | |
| Expenses by Adviser | | | | | | | | | | | | | | |
| | | | | | | | | | | | | | | | |
| Ratio of Net Investment Income | | | | | | | | | | | | | | |
| (Loss) to Average Net Assets: | | | | | | | | | | | | | | |
| | | | | | | | | | | | | | | | |
| Before Reimbursement and | | | (1.02)% | | (0.63)% | (F) | 1.45% | | 3.85% | | 3.85% | | 2.03% | |
| Waiver/Recoupment of | | | | | | | | | | | | | | |
| Expenses by Adviser | | | | | | | | | | | | | | |
| After Reimbursement and | | | 0.05% | | 0.09% | (F) | 1.81% | | 4.05% | | 4.21% | | 2.50% | |
| Waiver/Recoupment of | | | | | | | | | | | | | | |
| Expenses by Adviser | | | | | | | | | | | | | | |
| | | | | | | | | | | | | | | | |
| | | | | | | | | | | | | | | | |
| | | | | | | | | | | | | | | | |
| | | | | | | | | | | | | | | | |
| | | | | | | | | | | | | | | | |
| | | | | | | | | | | | | | | | |
| | *Amount is less than $0.005 per share. | | | | | | | | | | | | | | |
| | | | | | | | | | | | | | | | |
| (A) | The Fund elected to change its fiscal year end from December to September. The information presented is for January 1, 2009 through September 30, 2009. | |
| (B) | Per share amounts calculated using average shares method. | | | | | | | | | | | | | |
| (C) | Total return in the above table represents the rate that the investor would have earned or lost on an investment in the Fund assuming reinvestment of dividends. | |
| | Total return would have been higher or lower if certain expenses had not been reimbursed, waived or recouped. | | | | | |
| (D) | The expense ratio after reimbursement of expenses by Adviser includes a 0.01% reimbursement of expenses by the Administrator for a processing error. | |
| (E) | For periods of less than one full year, total return is not annualized. | | | | | | | |
| (F) | Annualized. | | | | | | | | | | | | | | |
The accompanying notes are an integral part of these financial statements.
Timothy Plan Financial Highlights
Financial Highlights | Strategic Growth (Class A Shares)
| The table below sets forth financial data for one share of capital stock outstanding throughout each period presented. |
| | | | | | | | | | | | | | | | |
| | | | | | | | | | | | | | | | |
| | | | | Year | | Period | | Year | | Year | | Year | | Year | |
| | | | | ended | | ended | | ended | | ended | | ended | | ended | |
| | | | | 9/30/10 | | 9/30/09 | (A) | 12/31/08 | | 12/31/07 | | 12/31/06 | | 12/31/05 | |
| | | | | | | | | | | | | | | | |
| Per Share Operating Performance: | | | | | | | | | | | | | | |
| Net Asset Value at Beginning of Period | | | $ 5.97 | | $ 4.86 | | $ 9.12 | | $ 9.69 | | $ 9.18 | | $ 8.64 | |
| | | | | | | | | | | | | | | | |
| Income from Investment Operations: | | | | | | | | | | | | | | |
| Net Investment Income (Loss) | | | 0.02 | | (0.01) | | 0.01 | | 0.10 | | 0.14 | | (0.10) | (B) |
| Net Realized and Unrealized | | | | | | | | | | | | | | |
| Gain (Loss) on Investments | | | 0.50 | | 1.12 | | (3.66) | | 0.90 | | 0.82 | | 0.64 | |
| Total from Investment Operations | | | 0.52 | | 1.11 | | (3.65) | | 1.00 | | 0.96 | | 0.54 | |
| | | | | | | | | | | | | | | | |
| Less Distributions: | | | | | | | | | | | | | | |
| Dividends from Net Investment | | | | | | | | | | | | | | |
| Income | | | - | | - | | (0.09) | | (0.10) | | (0.05) | | - | |
| Dividends from Realized Gains | | | - | | - | | (0.52) | | (1.47) | | (0.40) | | - | * |
| Total Distributions | | | - | | - | | (0.61) | | (1.57) | | (0.45) | | - | |
| | | | | | | | | | | | | | | | |
| Net Asset Value at End of Period | | | $ 6.49 | | $ 5.97 | | $ 4.86 | | $ 9.12 | | $ 9.69 | | $ 9.18 | |
| | | | | | | | | | | | | | | | |
Total Return (C)(D) | | | 8.71% | | 22.84% | (G) | -39.82% | | 10.45% | | 10.41% | | 6.25% | |
| | | | | | | | | | | | | | | | |
| Ratios/Supplemental Data: | | | | | | | | | | | | | | |
| Net Assets, | | | | | | | | | | | | | | |
| End of Period (in 000s) | | | $ 34,098 | | $ 30,066 | | $ 25,440 | | $ 44,231 | | $ 37,204 | | $ 26,451 | |
| | | | | | | | | | | | | | | | |
| Ratio of Expenses to Average | | | | | | | | | | | | | | |
| Net Assets: | | | | | | | | | | | | | | |
| | | | | | | | | | | | | | | | |
| Before Reimbursement and | | | 1.11% | | 1.11% | (H) | 1.03% | | 1.00% | | 1.07% | | 1.11% | |
| Waiver/Recoupment of | | | | | | | | | | | | | | |
Expenses by Adviser (E) | | | | | | | | | | | | | | |
| After Reimbursement and | | | 1.11% | | 1.11% | (H) | 1.03% | | 1.00% | | 1.07% | | 1.15% | |
| Waiver/Recoupment of | | | | | | | | | | | | | | |
Expenses by Adviser (E) | | | | | | | | | | | | | | |
| | | | | | | | | | | | | | | | |
| Ratio of Net Investment Income | | | | | | | | | | | | | | |
| (Loss) to Average Net Assets: | | | | | | | | | | | | | | |
| | | | | | | | | | | | | | | | |
| Before Reimbursement and | | | 0.30% | | (0.25)% | (H) | 0.12% | | 1.10% | | 1.49% | | (1.10)% | |
| Waiver/Recoupment of | | | | | | | | | | | | | | |
Expenses by Adviser (E)(F) | | | | | | | | | | | | | | |
| After Reimbursement and | | | 0.30% | | (0.25)% | (H) | 0.12% | | 1.10% | | 1.49% | | (1.14)% | |
| Waiver/Recoupment of | | | | | | | | | | | | | | |
Expenses by Adviser (E)(F) | | | | | | | | | | | | | | |
| | | | | | | | | | | | | | | | |
| Portfolio Turnover | | | 25.36% | | 5.21% | | 16.61% | | 45.00% | | 10.55% | | 1.61% | |
| | | | | | | | | | | | | | | | |
| *Amount is less than $0.005 per share. | | | | | | | | | | | | | | |
| | | | | | | | | | | | | | | | |
| (A) | The Fund elected to change its fiscal year end from December to September. The information presented is for January 1, 2009 through September 30, 2009. | |
| (B) | Per share amounts calculated using average shares method. | | | | | | | | | | | | | |
| (C) | Total return calculation does not reflect sales load. | | | | | | | | | | | | | |
| (D) | Total return in the above table represents the rate that the investor would have earned or lost on an investment in the Fund assuming reinvestment of dividends. | |
| | Total return would have been higher or lower if certain expenses had not been reimbursed, waived or recouped. | | | | |
| (E) | These ratios exclude the impact of expenses of the underlying security holdings as represented in the Schedule of Investments. | | | |
| (F) | Recognition of net investment income (loss) by the Fund is affected by the timing of the declaration of dividends by the underlying investment companies | |
| | in which the Fund invests. | | | | | | | | | | | | | | |
| (G) | For periods of less than one full year, total return is not annualized. | | | | | | | | | |
| (H) | Annualized. | | | | | | | | | | | | | | |
The accompanying notes are an integral part of these financial statements.
Timothy Plan Financial Highlights
Financial Highlights | Strategic Growth (Class B Shares)
| The table below sets forth financial data for one share of capital stock outstanding throughout each period presented. |
| | | | | | | | | | | | | | | | |
| | | | | | | | | | | | | | | | |
| | | | | Year | | Period | | Year | | Year | | Year | | Year | |
| | | | | ended | | ended | | ended | | ended | | ended | | ended | |
| | | | | 9/30/10 | | 9/30/09 | (A) | 12/31/08 | | 12/31/07 | | 12/31/06 | | 12/31/05 | |
| | | | | | | | | | | | | | | | |
| Per Share Operating Performance: | | | | | | | | | | | | | | |
| Net Asset Value at Beginning of Period | | | $ 5.66 | | $ 4.63 | | $ 8.70 | | $ 9.30 | | $ 8.85 | | $ 8.39 | |
| | | | | | | | | | | | | | | | |
| Income from Investment Operations: | | | | | | | | | | | | | | |
| Net Investment Income (Loss) | | | (0.03) | | (0.04) | | (0.04) | | 0.01 | | 0.05 | | (0.16) | (B) |
| Net Realized and Unrealized | | | | | | | | | | | | | | |
| Gain (Loss) on Investments | | | 0.48 | | 1.07 | | (3.48) | | 0.87 | | 0.80 | | 0.62 | |
| Total from Investment Operations | | | 0.45 | | 1.03 | | (3.52) | | 0.88 | | 0.85 | | 0.46 | |
| | | | | | | | | | | | | | | | |
| Less Distributions: | | | | | | | | | | | | | | |
| Dividends from Net Investment | | | | | | | | | | | | | | |
| Income | | | - | | - | | (0.03) | | (0.01) | | - | | - | |
| Dividends from Realized Gains | | | - | | - | | (0.52) | | (1.47) | | (0.40) | | - | * |
| Total Distributions | | | - | | - | | (0.55) | | (1.48) | | (0.40) | | - | |
| | | | | | | | | | | | | | | | |
| Net Asset Value at End of Period | | | $ 6.11 | | $ 5.66 | | $ 4.63 | | $ 8.70 | | $ 9.30 | | $ 8.85 | |
| | | | | | | | | | | | | | | | |
Total Return (C)(D) | | | 7.95% | | 22.25% | (G) | -40.33% | | 9.65% | | 9.53% | | 5.49% | |
| | | | | | | | | | | | | | | | |
| Ratios/Supplemental Data: | | | | | | | | | | | | | | |
| Net Assets, | | | | | | | | | | | | | | |
| End of Period (in 000s) | | | $ 4,683 | | $ 6,207 | | $ 6,511 | | $ 14,219 | | $ 16,177 | | $ 17,467 | |
| | | | | | | | | | | | | | | | |
| Ratio of Expenses to Average | | | | | | | | | | | | | | |
| Net Assets: | | | | | | | | | | | | | | |
| | | | | | | | | | | | | | | | |
| Before Reimbursement and | | | 1.86% | | 1.86% | (H) | 1.77% | | 1.74% | | 1.81% | | 1.86% | |
| Waiver/Recoupment of | | | | | | | | | | | | | | |
Expenses by Adviser (E) | | | | | | | | | | | | | | |
| After Reimbursement and | | | 1.86% | | 1.86% | (H) | 1.77% | | 1.74% | | 1.82% | | 1.90% | |
| Waiver/Recoupment of | | | | | | | | | | | | | | |
Expenses by Adviser (E) | | | | | | | | | | | | | | |
| | | | | | | | | | | | | | | | |
| Ratio of Net Investment Income | | | | | | | | | | | | | | |
| (Loss) to Average Net Assets: | | | | | | | | | | | | | | |
| | | | | | | | | | | | | | | | |
| Before Reimbursement and | | | (0.46)% | | (1.02)% | (H) | (0.70)% | | 0.06% | | 0.44% | | (1.85)% | |
| Waiver/Recoupment of | | | | | | | | | | | | | | |
Expenses by Adviser (E)(F) | | | | | | | | | | | | | | |
| After Reimbursement and | | | (0.46)% | | (1.02)% | (H) | (0.70)% | | 0.06% | | 0.43% | | (1.89)% | |
| Waiver/Recoupment of | | | | | | | | | | | | | | |
Expenses by Adviser (E)(F) | | | | | | | | | | | | | | |
| | | | | | | | | | | | | | | | |
| Portfolio Turnover | | | 25.36% | | 5.21% | | 16.61% | | 45.00% | | 10.55% | | 1.61% | |
| | | | | | | | | | | | | | | | |
| *Amount is less than $0.005 per share. | | | | | | | | | | | | | | |
| | | | | | | | | | | | | | | | |
| (A) | The Fund elected to change its fiscal year end from December to September. The information presented is for January 1, 2009 through September 30, 2009. | |
| (B) | Per share amounts calculated using average shares method. | | | | | | | | | | | | | |
| (C) | Total return calculation does not reflect redemption fee. | | | | | | | | | | | | | |
| (D) | Total return in the above table represents the rate that the investor would have earned or lost on an investment in the Fund assuming reinvestment of dividends. | |
| | Total return would have been higher or lower if certain expenses had not been reimbursed, waived or recouped. | | | | | |
| (E) | These ratios exclude the impact of expenses of the underlying security holdings as represented in the Schedule of Investments. | | | |
| (F) | Recognition of net investment income (loss) by the Fund is affected by the timing of the declaration of dividends by the underlying investment companies in which the Fund invests. | |
| (G) | For periods of less than one full year, total return is not annualized. | | | | | |
| (H) | Annualized. | | | | | | | | | | | | | | |
The accompanying notes are an integral part of these financial statements.
Timothy Plan Financial Highlights
Financial Highlights | Strategic Growth (Class C Shares)
| The table below sets forth financial data for one share of capital stock outstanding throughout each period presented. |
| | | | | | | | | | | | | | | | |
| | | | | | | | | | | | | | | | |
| | | | | Year | | Period | | Year | | Year | | Year | | Year | |
| | | | | ended | | ended | | ended | | ended | | ended | | ended | |
| | | | | 9/30/10 | | 9/30/09 | (A) | 12/31/08 | | 12/31/07 | | 12/31/06 | | 12/31/05 | |
| | | | | | | | | | | | | | | | |
| Per Share Operating Performance: | | | | | | | | | | | | | | |
| Net Asset Value at Beginning of Period | | | $ 5.64 | | $ 4.62 | | $ 8.70 | | $ 9.31 | | $ 8.86 | | $ 8.39 | |
| | | | | | | | | | | | | | | | |
| Income from Investment Operations: | | | | | | | | | | | | | | |
| Net Investment Income (Loss) | | | (0.03) | | (0.04) | | (0.05) | | 0.03 | | 0.06 | | (0.16) | (B) |
| Net Realized and Unrealized | | | | | | | | | | | | | | |
| Gain (Loss) on Investments | | | 0.48 | | 1.06 | | (3.47) | | 0.86 | | 0.79 | | 0.63 | |
| Total from Investment Operations | | | 0.45 | | 1.02 | | (3.52) | | 0.89 | | 0.85 | | 0.47 | |
| | | | | | | | | | | | | | | | |
| Less Distributions: | | | | | | | | | | | | | | |
| Dividends from Net Investment | | | | | | | | | | | | | | |
| Income | | | - | | - | | (0.04) | | (0.03) | | - | | - | |
| Dividends from Realized Gains | | | - | | - | | (0.52) | | (1.47) | | (0.40) | | - | * |
| Total Distributions | | | - | | - | | (0.56) | | (1.50) | | (0.40) | | - | |
| | | | | | | | | | | | | | | | |
| Net Asset Value at End of Period | | | $ 6.09 | | $ 5.64 | | $ 4.62 | | $ 8.70 | | $ 9.31 | | $ 8.86 | |
| | | | | | | | | | | | | | | | |
Total Return (C)(D) | | | 7.98% | | 22.08% | (G) | -40.32% | | 9.73% | | 9.51% | | 5.61% | |
| | | | | | | | | | | | | | | | |
| Ratios/Supplemental Data: | | | | | | | | | | | | | | |
| Net Assets, | | | | | | | | | | | | | | |
| End of Period (in 000s) | | | $ 6,950 | | $ 7,608 | | $ 6,423 | | $ 9,836 | | $ 7,609 | | $ 5,462 | |
| | | | | | | | | | | | | | | | |
| Ratio of Expenses to Average | | | | | | | | | | | | | | |
| Net Assets: | | | | | | | | | | | | | | |
| | | | | | | | | | | | | | | | |
| Before Reimbursement and | | | 1.86% | | 1.85% | (H) | 1.78% | | 1.75% | | 1.81% | | 1.86% | |
| Waiver/Recoupment of | | | | | | | | | | | | | | |
Expenses by Adviser (E) | | | | | | | | | | | | | | |
| After Reimbursement and | | | 1.86% | | 1.85% | (H) | 1.78% | | 1.75% | | 1.81% | | 1.90% | |
| Waiver/Recoupment of | | | | | | | | | | | | | | |
Expenses by Adviser (E) | | | | | | | | | | | | | | |
| | | | | | | | | | | | | | | | |
| Ratio of Net Investment Income | | | | | | | | | | | | | | |
| (Loss) to Average Net Assets: | | | | | | | | | | | | | | |
| | | | | | | | | | | | | | | | |
| Before Reimbursement and | | | (0.46)% | | (1.00)% | (H) | (0.61)% | | 0.43% | | 0.76% | | (1.85)% | |
| Waiver/Recoupment of | | | | | | | | | | | | | | |
Expenses by Adviser (E)(F) | | | | | | | | | | | | | | |
| After Reimbursement and | | | (0.46)% | | (1.00)% | (H) | (0.61)% | | 0.43% | | 0.76% | | (1.89)% | |
| Waiver/Recoupment of | | | | | | | | | | | | | | |
Expenses by Adviser (E)(F) | | | | | | | | | | | | | | |
| | | | | | | | | | | | | | | | |
| Portfolio Turnover | | | 25.36% | | 5.21% | | 16.61% | | 45.00% | | 10.55% | | 1.61% | |
| | | | | | | | | | | | | | | | |
| *Amount is less than $0.005 per share. | | | | | | | | | | | | | | |
| | | | | | | | | | | | | | | | |
| (A) | The Fund elected to change its fiscal year end from December to September. The information presented is for January 1, 2009 through September 30, 2009. | |
| (B) | Per share amounts calculated using average shares method. | | | | | | | | | | | | | |
| (C) | Total return calculation does not reflect redemption fee. | | | | | | | | | | | | | |
| (D) | Total return in the above table represents the rate that the investor would have earned or lost on an investment in the Fund assuming reinvestment of dividends. | |
| | Total return would have been higher or lower if certain expenses had not been reimbursed, waived or recouped. |
| (E) These ratios exclude the impact of expenses of the underlying security holdings as represented in the Schedule of Investments. | | | |
| (F) | Recognition of net investment income (loss) by the Fund is affected by the timing of the declaration of dividends by the underlying investment companies | | | |
| | in which the Fund invests. | | | | | | | | | | | | | | |
| (G) | For periods of less than one full year, total return is not annualized. | | | | | | | | | | | |
| (H) | Annualized. | | | | | | | | | | | | | | |
| | | | | | | | | | | | | | | | |
The accompanying notes are an integral part of these financial statements.
Timothy Plan Financial Highlights
Financial Highlights | Conservative Growth (Class A Shares)
| The table below sets forth financial data for one share of capital stock outstanding throughout each period presented. |
| | | | | | | | | | | | | | | | |
| | | | | | | | | | | | | | | | |
| | | | | Year | | Period | | Year | | Year | | Year | | Year | |
| | | | | ended | | ended | | ended | | ended | | ended | | ended | |
| | | | | 9/30/10 | | 9/30/09 | (A) | 12/31/08 | | 12/31/07 | | 12/31/06 | | 12/31/05 | |
| | | | | | | | | | | | | | | | |
| Per Share Operating Performance: | | | | | | | | | | | | | | |
| Net Asset Value at Beginning of Period | | | $ 8.25 | | $ 6.94 | | $ 10.49 | | $ 11.10 | | $ 10.83 | | $ 10.26 | |
| | | | | | | | | | | | | | | | |
| Income from Investment Operations: | | | | | | | | | | | | | | |
| Net Investment Income (Loss) | | | 0.09 | | 0.04 | | 0.13 | | 0.22 | | 0.32 | | (0.01) | (B) |
| Net Realized and Unrealized | | | | | | | | | | | | | | |
| Gain (Loss) on Investments | | | 0.60 | | 1.27 | | (3.18) | | 0.75 | | 0.75 | | 0.58 | |
| Total from Investment Operations | | | 0.69 | | 1.31 | | (3.05) | | 0.97 | | 1.07 | | 0.57 | |
| | | | | | | | | | | | | | | | |
| Less Distributions: | | | | | | | | | | | | | | |
| Dividends from Net Investment | | | | | | | | | | | | | | |
| Income | | | (0.11) | | - | | (0.15) | | (0.20) | | (0.22) | | - | |
| Dividends from Realized Gains | | | - | | - | | (0.35) | | (1.38) | | (0.58) | | - | |
| Distributions from Return of | | | | | | | | | | | | | | |
| Capital | | | - | | - | | - | | - | | - | | - | |
| Total Distributions | | | (0.11) | | - | | (0.50) | | (1.58) | | (0.80) | | - | |
| | | | | | | | | | | | | | | | |
| Net Asset Value at End of Period | | | $ 8.83 | | $ 8.25 | | $ 6.94 | | $ 10.49 | | $ 11.10 | | $ 10.83 | |
| | | | | | | | | | | | | | | | |
Total Return (C)(D) | | | 8.47% | | 18.88% | (G) | -28.88% | | 8.85% | | 9.86% | | 5.56% | |
| | | | | | | | | | | | | | | | |
| Ratios/Supplemental Data: | | | | | | | | | | | | | | |
| Net Assets, | | | | | | | | | | | | | | |
| End of Period (in 000s) | | | $ 35,031 | | $ 33,128 | | $ 26,206 | | $ 38,102 | | $ 33,189 | | $ 27,765 | |
| | | | | | | | | | | | | | | | |
| Ratio of Expenses to Average | | | | | | | | | | | | | | |
| Net Assets: | | | | | | | | | | | | | | |
| | | | | | | | | | | | | | | | |
| Before Reimbursement and | | | 1.13% | | 1.10% | (H) | 1.02% | | 1.02% | | 1.08% | | 1.13% | |
| Waiver/Recoupment of | | | | | | | | | | | | | | |
Expenses by Adviser (E) | | | | | | | | | | | | | | |
| After Reimbursement and | | | 1.13% | | 1.10% | (H) | 1.02% | | 1.02% | | 1.09% | | 1.15% | |
| Waiver/Recoupment of | | | | | | | | | | | | | | |
Expenses by Adviser (E) | | | | | | | | | | | | | | |
| | | | | | | | | | | | | | | | |
| Ratio of Net Investment Income | | | | | | | | | | | | | | |
| (Loss) to Average Net Assets: | | | | | | | | | | | | | | |
| | | | | | | | | | | | | | | | |
| Before Reimbursement and | | | 1.07% | | 0.82% | (H) | 1.36% | | 2.09% | | 2.98% | | (0.11)% | |
| Waiver/Recoupment of | | | | | | | | | | | | | | |
Expenses by Adviser (E)(F) | | | | | | | | | | | | | | |
| After Reimbursement and | | | 1.07% | | 0.82% | (H) | 1.36% | | 2.09% | | 2.97% | | (0.13)% | |
| Waiver/Recoupment of | | | | | | | | | | | | | | |
Expenses by Adviser (E)(F) | | | | | | | | | | | | | | |
| | | | | | | | | | | | | | | | |
| Portfolio Turnover | | | 30.89% | | 15.74% | | 25.72% | | 40.54% | | 6.12% | | 3.61% | |
| | | | | | | | | | | | | | | | |
| (A) | The Fund elected to change its fiscal year end from December to September. The information presented is for January 1, 2009 through September 30, 2009. | |
| (B) | Per share amounts calculated using average shares method. | | | | | | | | | | | | | |
| (C) | Total return calculation does not reflect sales load. | | | | | | | | | | | | | |
| (D) | Total return in the above table represents the rate that the investor would have earned or lost on an investment in the Fund assuming reinvestment of dividends. | |
| | Total return would have been higher or lower if certain expenses had not been reimbursed, waived or recouped. | | | | | |
| (E) | These ratios exclude the impact of expenses of the underlying security holdings as represented in the Schedule of Investments. | | | |
| (F) | Recognition of net investment income (loss) by the Fund is affected by the timing of the declaration of dividends by the underlying investment companies | | | |
| | in which the Fund invests. | | | | | | | | | | | | | | |
| (G) | For periods of less than one full year, total return is not annualized. | | | | | | | | | |
| (H) | Annualized. | | | | | | | | | | | | | | |
The accompanying notes are an integral part of these financial statements.
Timothy Plan Financial Highlights
Financial Highlights | Conservative Growth (Class B Shares)
| The table below sets forth financial data for one share of capital stock outstanding throughout each period presented. |
| | | | | | | | | | | | | | | | |
| | | | | | | | | | | | | | | | |
| | | | | Year | | Period | | Year | | Year | | Year | | Year | |
| | | | | ended | | ended | | ended | | ended | | ended | | ended | |
| | | | | 9/30/10 | | 9/30/09 | (A) | 12/31/08 | | 12/31/07 | | 12/31/06 | | 12/31/05 | |
| | | | | | | | | | | | | | | | |
| Per Share Operating Performance: | | | | | | | | | | | | | | |
| Net Asset Value at Beginning of Period | | | $ 7.85 | | $ 6.64 | | $ 10.03 | | $ 10.67 | | $ 10.43 | | $ 9.96 | |
| | | | | | | | | | | | | | | | |
| Income from Investment Operations: | | | | | | | | | | | | | | |
| Net Investment Income (Loss) | | | 0.01 | (B) | - | (B) | 0.05 | (B) | 0.14 | | 0.22 | | (0.09) | (B) |
| Net Realized and Unrealized | | | | | | | | | | | | | | |
| Gain (Loss) on Investments | | | 0.59 | | 1.21 | | (3.01) | | 0.71 | | 0.72 | | 0.56 | |
| Total from Investment Operations | | | 0.60 | | 1.21 | | (2.96) | | 0.85 | | 0.94 | | 0.47 | |
| | | | | | | | | | | | | | | | |
| Less Distributions: | | | | | | | | | | | | | | |
| Dividends from Net Investment | | | | | | | | | | | | | | |
| Income | | | (0.10) | | - | | (0.08) | | (0.11) | | (0.12) | | - | |
| Dividends from Realized Gains | | | - | | - | | (0.35) | | (1.38) | | (0.58) | | - | |
| Total Distributions | | | (0.10) | | - | | (0.43) | | (1.49) | | (0.70) | | - | |
| | | | | | | | | | | | | | | | |
| Net Asset Value at End of Period | | | $ 8.35 | | $ 7.85 | | $ 6.64 | | $ 10.03 | | $ 10.67 | | $ 10.43 | |
| | | | | | | | | | | | | | | | |
Total Return (C)(D) | | | 7.68% | | 18.22% | (G) | -29.37% | | 8.05% | | 9.00% | | 4.72% | |
| | | | | | | | | | | | | | | | |
| Ratios/Supplemental Data: | | | | | | | | | | | | | | |
| Net Assets, | | | | | | | | | | | | | | |
| End of Period (in 000s) | | | $ 3,330 | | $ 5,322 | | $ 5,556 | | $ 9,740 | | $ 10,423 | | $ 11,652 | |
| | | | | | | | | | | | | | | | |
| Ratio of Expenses to Average | | | | | | | | | | | | | | |
| Net Assets: | | | | | | | | | | | | | | |
| | | | | | | | | | | | | | | | |
| Before Reimbursement and | | | 1.87% | | 1.85% | (H) | 1.76% | | 1.76% | | 1.82% | | 1.88% | |
| Waiver/Recoupment of | | | | | | | | | | | | | | |
Expenses by Adviser (E) | | | | | | | | | | | | | | |
| After Reimbursement and | | | 1.87% | | 1.85% | (H) | 1.76% | | 1.76% | | 1.85% | | 1.90% | |
| Waiver/Recoupment of | | | | | | | | | | | | | | |
Expenses by Adviser (E) | | | | | | | | | | | | | | |
| | | | | | | | | | | | | | | | |
| Ratio of Net Investment Income | | | | | | | | | | | | | | |
| (Loss) to Average Net Assets: | | | | | | | | | | | | | | |
| | | | | | | | | | | | | | | | |
| Before Reimbursement and | | | 0.15% | | (0.01)% | (H) | 0.53% | | 1.14% | | 1.88% | | (0.86)% | |
| Waiver/Recoupment of | | | | | | | | | | | | | | |
Expenses by Adviser (E)(F) | | | | | | | | | | | | | | |
| After Reimbursement and | | | 0.15% | | (0.01)% | (H) | 0.53% | | 1.14% | | 1.85% | | (0.88)% | |
| Waiver/Recoupment of | | | | | | | | | | | | | | |
Expenses by Adviser (E)(F) | | | | | | | | | | | | | | |
| | | | | | | | | | | | | | | | |
| Portfolio Turnover | | | 30.89% | | 15.74% | | 25.72% | | 40.54% | | 6.12% | | 3.61% | |
| | | | | | | | | | | | | | | | |
| | | | | | | | | | | | | | | | |
| (A) | The Fund elected to change its fiscal year end from December to September. The information presented is for January 1, 2009 through September 30, 2009. | |
| (B) | Per share amounts calculated using average shares method. | | | | | | | | | | | | | |
| (C) | Total return calculation does not reflect redemption fee. | | | | | | | | | | | | | |
| (D) | Total return in the above table represents the rate that the investor would have earned or lost on an investment in the Fund assuming reinvestment of dividends. | |
| | Total return would have been higher or lower if certain expenses had not been reimbursed, waived or recouped. | | | |
| (E) | These ratios exclude the impact of expenses of the underlying security holdings as represented in the Schedule of Investments. | | | |
| (F) | Recognition of net investment income (loss) by the Fund is affected by the timing of the declaration of dividends by the underlying investment companies | |
| | in which the Fund invests. | | | | | | | | | | | | | | |
| (G) | For periods of less than one full year, total return is not annualized. | | | | | | | | | | | |
| (H) | Annualized. | | | | | | | | | | | | | | |
| | | | | | | | | | | | | | | | |
The accompanying notes are an integral part of these financial statements.
Timothy Plan Financial Highlights
Financial Highlights | Conservative Growth (Class C Shares)
| The table below sets forth financial data for one share of capital stock outstanding throughout each period presented. |
| | | | | | | | | | | | | | | | |
| | | | | | | | | | | | | | | | |
| | | | | Year | | Period | | Year | | Year | | Year | | Year | |
| | | | | ended | | ended | | ended | | ended | | ended | | ended | |
| | | | | 9/30/10 | | 9/30/09 | (A) | 12/31/08 | | 12/31/07 | | 12/31/06 | | 12/31/05 | |
| | | | | | | | | | | | | | | | |
| Per Share Operating Performance: | | | | | | | | | | | | | | |
| Net Asset Value at Beginning of Period | | | $ 7.83 | | $ 6.61 | | $ 10.02 | | $ 10.68 | | $ 10.44 | | $ 9.97 | |
| | | | | | | | | | | | | | | | |
| Income from Investment Operations: | | | | | | | | | | | | | | |
| Net Investment Income (Loss) | | | 0.02 | | - | * | 0.06 | (B) | 0.12 | | 0.23 | | (0.09) | (B) |
| Net Realized and Unrealized | | | | | | | | | | | | | | |
| Gain (Loss) on Investments | | | 0.57 | | 1.22 | | (3.03) | | 0.72 | | 0.73 | | 0.56 | |
| Total from Investment Operations | | | 0.59 | | 1.22 | | (2.97) | | 0.84 | | 0.96 | | 0.47 | |
| | | | | | | | | | | | | | | | |
| Less Distributions: | | | | | | | | | | | | | | |
| Dividends from Net Investment | | | | | | | | | | | | | | |
| Income | | | (0.10) | | - | | (0.09) | | (0.12) | | (0.14) | | - | |
| Dividends from Realized Gains | | | - | | - | | (0.35) | | (1.38) | | (0.58) | | - | |
| Total Distributions | | | (0.10) | | - | | (0.44) | | (1.50) | | (0.72) | | - | |
| | | | | | | | | | | | | | | | |
| Net Asset Value at End of Period | | | $ 8.32 | | $ 7.83 | | $ 6.61 | | $ 10.02 | | $ 10.68 | | $ 10.44 | |
| | | | | | | | | | | | | | | | |
Total Return (C)(D) | | | 7.57% | | 18.46% | (G) | -29.45% | | 7.98% | | 9.16% | | 4.71% | |
| | | | | | | | | | | | | | | | |
| Ratios/Supplemental Data: | | | | | | | | | | | | | | |
| Net Assets, | | | | | | | | | | | | | | |
| End of Period (in 000s) | | | $ 7,365 | | $ 7,500 | | $ 6,438 | | $ 7,164 | | $ 5,833 | | $ 4,361 | |
| | | | | | | | | | | | | | | | |
| Ratio of Expenses to Average | | | | | | | | | | | | | | |
| Net Assets: | | | | | | | | | | | | | | |
| | | | | | | | | | | | | | | | |
| Before Reimbursement and | | | 1.88% | | 1.85% | (H) | 1.77% | | 1.77% | | 1.84% | | 1.88% | |
| Waiver/Recoupment of | | | | | | | | | | | | | | |
Expenses by Adviser (E) | | | | | | | | | | | | | | |
| After Reimbursement and | | | 1.88% | | 1.85% | (H) | 1.77% | | 1.77% | | 1.84% | | 1.90% | |
| Waiver/Recoupment of | | | | | | | | | | | | | | |
Expenses by Adviser (E) | | | | | | | | | | | | | | |
| | | | | | | | | | | | | | | | |
| Ratio of Net Investment Income | | | | | | | | | | | | | | |
| (Loss) to Average Net Assets: | | | | | | | | | | | | | | |
| | | | | | | | | | | | | | | | |
| Before Reimbursement and | | | 0.29% | | 0.05% | (H) | 0.72% | | 1.40% | | 2.36% | | (0.86)% | |
| Waiver/Recoupment of | | | | | | | | | | | | | | |
Expenses by Adviser (E)(F) | | | | | | | | | | | | | | |
| After Reimbursement and | | | 0.29% | | 0.05% | (H) | 0.72% | | 1.40% | | 2.36% | | (0.88)% | |
| Waiver/Recoupment of | | | | | | | | | | | | | | |
Expenses by Adviser (E)(F) | | | | | | | | | | | | | | |
| | | | | | | | | | | | | | | | |
| Portfolio Turnover | | | 30.89% | | 15.74% | | 25.72% | | 40.54% | | 6.12% | | 3.61% | |
| | | | | | | | | | | | | | | | |
| *Amount is less than $0.005 per share. | | | | | | | | | | | | | | |
| (A) | The Fund elected to change its fiscal year end from December to September. The information presented is for January 1, 2009 through September 30, 2009. |
| (B) | Per share amounts calculated using average shares method. | | | | | | | | | | | |
| (C) | Total return calculation does not reflect redemption fee. | | | | | | | | | | | |
| (D) | Total return in the above table represents the rate that the investor would have earned or lost on an investment in the Fund assuming reinvestment of dividends. |
| | Total return would have been higher or lower if certain expenses had not been reimbursed, waived or recouped. | | | |
| (E) | These ratios exclude the impact of expenses of the underlying security holdings as represented in the Schedule of Investments. | |
| (F) | Recognition of net investment income (loss) by the Fund is affected by the timing of the declaration of dividends by the underlying investment companies |
| | in which the Fund invests. | | | | | | | | | | | | | | |
| (G) | For periods of less than one full year, total return is not annualized. | | | | | | | | | |
| (H) | Annualized. | | | | | | | | | | | | | | |
| | | | | | | | | | | | | | | | |
The accompanying notes are an integral part of these financial statements.
Timothy Plan Financial Highlights
Notes to Financial Statements
September 30, 2010
Timothy Plan Family of Funds
Note 1 | Significant Accounting PoliciesThe Timothy Plan (the “Trust”) is organized as a series of a Delaware business trust pursuant to a trust agreement dated December 16, 1993. The Trust is registered under the Investment Company Act of 1940, as amended, as an open-end diversified management investment company. As of September 30, 2010, the Trust consisted of thirteen series. These financial statements include the following eleven series: Timothy Plan Aggressive Growth Fund, Timothy Plan International Fund, Timothy Plan Large/Mid Cap Growth Fund, Timothy Plan Small Cap Value Fund, Timothy Plan Large/Mid Cap Value Fund, Timothy Plan Fixed Income Fund, Timothy Plan High Yield Bond Fund, Timothy Plan Defensive Strategies Fund, Timothy Plan Money Market Fund, Timothy Plan Strategic Growth Fund and Timothy Plan Conservative Growth Fund (the &# 8220;Funds”).
The Timothy Plan Aggressive Growth Fund’s investment objective is long-term growth of capital. The Fund seeks to achieve its investment objective by normally investing at least 80% of the Fund’s total assets in U.S. common stocks without regard to market capitalizations and investing in the securities of a limited number of companies which the Fund’s Adviser believes show a high probability for superior growth.
The Timothy Plan International Fund’s investment objective is long-term growth of capital. The Fund seeks to achieve its investment objective by normally investing at least 80% of the Fund’s total assets in the common stock and similar securities of foreign companies through the purchase of American Depositary Receipts (“ADRs”) without regard to market capitalization, investing its assets in the ADRs of companies which the Fund’s investment manager believes show a high probability for superior growth, and allocating investments across countries and regions considering the size of the market in each country and region relative to the size of the international market as a whole. Although the Fund maintains a diversified investment portfolio, the political or economic developments within a particul ar country or region may have an adverse effect on the ability of domiciled issuers to meet their obligations. Additionally, political or economic developments may have an effect on the liquidity and volatility of portfolio securities and currency holdings.
The Timothy Plan Large/Mid Cap Growth Fund’s investment objective is long-term growth of capital. Current income is not a significant investment consideration and any such income realized will be considered incidental to the Fund’s investment objective. The Fund seeks to achieve its investment objective by normally investing at least 80% of the Fund’s total assets in U.S. common stocks with market capitalizations in excess of $2 billion.
The Timothy Plan Small Cap Value Fund’s primary objective is long-term capital growth, with a secondary objective of current income. The Fund seeks to achieve its investment objective by primarily investing at least 80% of its assets in U.S. common stocks whose market capitalization is generally less than $2 billion.
The Timothy Plan Large/Mid Cap Value Fund’s investment objective is long-term capital growth, with a secondary objective of current income. The Fund seeks to achieve its investment objective by primarily investing in U.S. common stocks. The Fund will invest at least 80% of its assets in the common stock of companies whose total market capitalization generally exceeds $2 billion.
The Timothy Plan Fixed Income Fund seeks to generate a high level of current income consistent with prudent investment risk. To achieve its investment objective, the Fund normally invests in a diversified portfolio of debt securities. These include corporate bonds, U.S. Government and agency securities, convertible securities and preferred securities. The Fund will generally only purchase high quality securities.
The Timothy Plan High Yield Bond Fund’s investment objective is to generate a high level of current income. To achieve its investment objective, the Fund normally invests in a diversified portfolio of debt securities. These include corporate bonds, U.S. Government and agency securities, convertible securities and preferred securities. The Fund will generally purchase securities that are not investment-grade, meaning securities with a rating of “BBB” or lower as rated by Standard and Poor’s or a comparable rating by another nationally recognized rating agency. Investments in these higher yielding securities are generally accompanied by a greater degree of credit risk than higher rated securities. Additionally, lower rated securities may be more susceptible to adverse ec onomic and competitive industry conditions than investment-grade securities.
Timothy Plan Notes to Financial Statements
Notes to Financial Statements
September 30, 2010
Timothy Plan Family of Funds
The Timothy Plan Defensive Strategies Fund’s investment objective is the protection of principal through aggressive, proactive reactions to prevailing economic conditions. To achieve its investment objectives, the Fund normally invests in Real Estate Investment Trusts (“REITs”), commodities based exchange-traded funds (“ETFs”), and Treasury Inflation Protection Securities (“TIPS”).
The Timothy Plan Money Market Fund seeks to generate a high level of current income consistent with the preservation of capital. To achieve its investment objective, the Fund normally invests in short-term debt instruments, such as obligations of the U.S. Government and its agencies, certificates of deposit, banker’s acceptances, commercial paper and short-term corporate notes.
The Timothy Plan Strategic Growth Fund seeks to generate medium to high levels of long-term capital growth. The Fund seeks to achieve its investment objective by normally investing at least 75% of its net assets in the following Funds which are other series of the Trust: approximately 5-10% of its net assets in the Timothy Plan Small Cap Value Fund; approximately 15-25% of its net assets in the Timothy Plan Large/Mid Cap Value Fund; approximately 15-25% of its net assets in the Timothy Plan Large/Mid Cap Growth Fund; approximately 5-15% of its net assets in the Timothy Plan High Yield Bond Fund; approximately 20-30% of its net assets in the Timothy Plan International Fund; approximately 5%-10% of its net assets in the Timothy Plan Aggressive Growth Fund; and approximately 5%-15% of its net assets in the Timothy Plan Defensiv e Strategies Fund. The Fund may also invest in the Timothy Plan Money Market Fund.
The Timothy Plan Conservative Growth Fund seeks to generate moderate levels of long-term capital growth with a secondary objective of current income. The Fund seeks to achieve its investment objective by normally investing at least 75% of its net assets in the following Funds which are other series of the Trust: approximately 0-10% of its net assets in the Timothy Plan Small Cap Value Fund; approximately 10-20% of its net assets in the Timothy Plan Large/Mid Cap Value Fund; approximately 5-15% of its net assets in the Timothy Plan Large/Mid Cap Growth Fund; approximately 0-5% of its net assets in the Timothy Plan Aggressive Growth Fund; approximately 5-15% of its net assets in the Timothy Plan High Yield Bond Fund; approximately 5-15% of its net assets in the Timothy Plan International Fund; approximately 20%-40% of its net assets in the Timothy Plan Fixed Income Fund; and approximately 10-30% of its net assets in the Timothy Plan Defensive Strategies Fund . The Fund may also invest in the Timothy Plan Money Market Fund.
The following is a summary of significant accounting policies consistently followed by the Funds in the preparation of their financial statements. The policies are in conformity with accounting principles generally accepted in the United States of America (“GAAP”) for investment companies.
A. Security Valuation and Fair Value Measurements
All investments in securities are recorded at their estimated fair value as described in Note 2.
B. Investment Income and Securities Transactions
Security transactions are accounted for on the date the securities are purchased or sold (trade date). Dividend income is recognized on the ex-dividend date. Interest income and expenses are recognized on an accrual basis. The Timothy Plan Large/Mid Cap Growth Fund, Large/Mid Cap Value Fund, Small Cap Value Fund and Defensive Strategies Fund have made certain investments in REITs and master limited partnerships (“MLPs”). Dividend income from REITs and MLPs is recognized on the ex-dividend date. It is common for distributions from REITs and MLPs to exceed taxable earnings and profits, resulting in the excess portion of such dividends being designated as a return of capital. Income or loss from the MLPs is reclassified upon receipt of the MLPs’ K-1. Withholding taxes on foreign dividends have been provided for in accordance with the Funds’ understanding of the applicable country’s tax rules and rates. Discounts and premiums on securities purchased are amortized over the lives of the respective securities. The ability of issuers of debt securities held by the Funds to meet their obligations may be affected by economic and political developments in a specific country or region.
Timothy Plan Notes to Financial Statements
Notes to Financial Statements
September 30, 2010
Timothy Plan Family of Funds
C. Net Asset Value Per Share
The Net Asset Value (“NAV”) per share of the capital stock of the Funds is determined daily as of the close of trading on the New York Stock Exchange by dividing the value of its net assets by the number of Fund shares outstanding. The NAV is calculated separately for each class of the following Funds: Timothy Plan Aggressive Growth Fund, Timothy Plan International Fund, Timothy Plan Large/Mid Cap Growth Fund, Timothy Plan Small Cap Value Fund, Timothy Plan Large/Mid Cap Value Fund, Timothy Plan Fixed Income Fund, Timothy Plan High Yield Bond Fund, Timothy Plan Defensive Strategies Fund, Timothy Plan Money Market Fund, Timothy Plan Strategic Growth Fund and Timothy Plan Conservative Growth Fund. The asset value of the classes may differ because of different fees and expenses charged to each class.
D. Expenses
Expenses incurred by the Trust that do not relate to a specific Fund of the Trust are allocated to the individual Funds based on each Fund’s relative net assets or another appropriate basis as determined by the Board of Trustees (the “Board”).
E. Classes
There are three classes of shares currently offered by the Trust: Class A shares are offered with a front-end sales charge and ongoing service/distribution fees; Class C shares are offered with a contingent deferred sales charge (“CDSC”) that ends after the first year and ongoing service and distribution fees; No-Load shares are offered without sales charges or ongoing service/distribution fees (The Timothy Plan Money Market Fund only). The Trust previously has offered Class B shares to the public, which contain a contingent deferred sales charge that declines to zero over a period of years and are subject to an ongoing service/distribution fee. Sales of Class B shares to new shareholders were suspended by the Board during their meeting on February 27, 2004, with the suspension effective May, 2004, therefore, the CDSC fee n o longer applies to Class B shares.
Class B shares automatically convert to Class A shares once the economic equivalent of the highest front-end sales charge paid at time of purchase has been received by a Fund, in the form of Rule 12b-1 distribution fees, paid by all Class B shares owned by an investor.
Class specific expenses are borne by each specific class. Income, expenses, and realized and unrealized gains/losses are allocated to the respective classes on the basis of relative daily net assets.
F. Use of Estimates
In the preparation of financial statements in conformity with GAAP, management makes estimates and assumptions that affect the reported amounts of assets and liabilities and disclosure of contingent assets and liabilities at the date of the financial statements, as well as the reported amounts of revenues and expenses during the reporting period. Actual results could differ from those estimates.
Timothy Plan Notes to Financial Statements
Notes to Financial Statements
September 30, 2010
Timothy Plan Family of Funds
G. Federal Income Taxes
It is the policy of each Fund to continue to comply with all requirements under subchapter M of the Internal Revenue Code applicable to regulated investment companies and to distribute substantially all of its taxable income to its shareholders. Each Fund also intends to distribute sufficient net investment income and net capital gains, if any, so that it will not be subject to excise tax on undistributed income or gains. Therefore, no federal income tax or excise provision is required.
As of September 30, 2010, the Funds did not have a liability for any unrecognized tax benefits. The Funds recognize interest and penalties, if any, related to unrecognized tax benefits as income tax expense in the statements of operations. During the fiscal year ended September 30, 2010, the Funds did not incur any interest or penalties. The Funds are not subject to examination by U.S. federal tax authorities for tax years before 2007 and are not aware of any tax positions for which it is reasonably possible that the total amounts of unrecognized tax benefits will change materially within the next twelve months.
H. Distributions to Shareholders
Distributions to shareholders, which are determined in accordance with income tax regulations, are recorded on the ex-dividend date. The treatment for financial reporting purposes of distributions made to shareholders during the period from net investment income or net realized capital gains may differ from their ultimate treatment for federal income tax purposes. These differences are caused primarily by differences in the timing of the recognition of certain components of income, expense or realized capital gain for federal income tax purposes. Where such differences are permanent in nature, they are reclassified in the components of net assets based on their ultimate characterization for federal income tax purposes. Any such reclassifications will have no effect on net assets, results of operations, or NAVs per share of the Funds. Reclassifications for the fiscal year ended September 30, 2010 are as follows:
| | | Amount | | Reclassified from: | Reclassified to: |
| Aggressive Growth Fund | | $ | 254,555 | | Net Investment Loss | Paid-in Capital |
| Aggressive Growth Fund | | $ | (1,099 | ) | Accumulated Realized Loss | Paid-in Capital |
| Large/Mid Cap Growth Fund | | $ | 332,565 | | Net Investment Loss | Paid-in Capital |
| Large/Mid Cap Growth Fund | | $ | (2,074 | ) | Accumulated Realized Loss | Paid-in Capital |
| Small Cap Value Fund | | $ | 311,453 | | Net Investment Loss | Paid-in Capital |
| Small Cap Value Fund | | $ | 515 | | Accumulated Realized Gains | Net Investment Loss |
| Large/Mid Cap Value Fund | | $ | 52,513 | | Net Investment Loss | Paid-in Capital |
| Large/Mid Cap Value Fund | | $ | (77,389 | ) | Accumulated Realized Loss | Paid-in Capital |
| Fixed Income Fund | | $ | 76,395 | | Net Investment Loss | Accumulated Realized Loss |
| Money Market Fund | | $ | 182 | | Net Investment Income | Paid-in Capital |
| Defensive Strategies | | $ | 315,883 | | Net Investment Income | Paid-in Capital |
| Defensive Strategies | | $ | 161,606 | | Accumulated Realized Loss | Net Investment Income |
Fair value is defined as the price that a Fund would receive upon selling an investment in a timely transaction to an independent buyer in the principal or most advantageous market of the investment. GAAP established a three-tier hierarchy to maximize the use of observable market data and minimize the use of unobservable inputs and to establish classification of fair value measurements for disclosure purposes.
Inputs refer broadly to the assumptions that market participants would use in pricing the asset or liability, including assumptions about risk (the risk inherent in a particular valuation technique used to measure fair value including such a pricing model and/or the risk inherent in the inputs to the valuation technique). Inputs may be observable or unobservable.
Timothy Plan Notes to Financial Statements
Notes to Financial Statements
September 30, 2010
Timothy Plan Family of Funds
Observable inputs are inputs that reflect the assumptions market participants would use in pricing the asset or liability developed based on market data obtained from sources independent of the reporting entity. Unobservable inputs are inputs that reflect the reporting entity’s own assumptions about the assumptions market participants would use in pricing the asset or liability developed based on the best information available in the circumstances.
Various inputs are used in determining the value of the Funds’ investments. These inputs are summarized in the three broad levels listed below.
·Level 1 – quoted prices in active markets for identical securities
·Level 2 – other significant observable inputs (including, but not limited to, quoted prices for an identical security in an inactive market, quoted prices for similar securities, interest rates, prepayment speeds, credit risk, etc.)
·Level 3 – significant unobservable inputs (including each Fund’s own assumptions in determining fair value of investments based on the best information available)
The inputs used to measure fair value may fall into different levels of the fair value hierarchy. In such cases, for disclosure purposes, the level in the fair value hierarchy within which the fair value measurement falls in its entirety, is determined based on the lowest level input that is significant to the fair value measurement in its entirety.
Each Fund generally determines the total value of each class of its shares by using market prices for the securities comprising its portfolio. Equity securities, including common stock, ADRs, REITs, MLPs, and ETFs are generally valued by using market quotations, but may be valued on the basis of prices furnished by a pricing service when the Adviser or Sub-Adviser believes such prices more accurately reflect the fair value of such securities. Securities that are traded on any stock exchange are generally valued by the pricing service at the last quoted sale price. Lacking a last sale price, an exchange traded security is generally valued by the pricing service at its last bid price. Securities traded in the NASDAQ over-the-counter market are generally valued by the pricing service at the NASDAQ Official Closing Price. When using the market quotations or close prices provided by the pricing service and when the market is considered active, the security will be classified as a Level 1 security. Sometimes, when the market is considered inactive, an equity security (such as some ADRs owned by the International Fund) owned by the Funds will be valued by the pricing service at an evaluated bid, with inputs such as the underlying securities price, the exchange rate for the currency and the ADR factor. When this happens, the security will generally be classified as a Level 2 security. When market quotations are not readily available, when the Adviser or Sub-Adviser determines that the market quotation or the price provided by the pricing service does not accurately reflect the current fair value, or when restricted or illiquid securities are being valued, such securities are valued as determined in good faith by the Adviser or Sub-Adviser, in conformity with guidelines adopted by and subject to review b y the Board. These securities will generally be categorized as Level 3 securities.
Investments in mutual funds, including money market mutual funds, are generally priced at the ending NAV provided by the service agent of the funds. These securities will be categorized as Level 1 securities.
Fixed income securities such as corporate bonds, restricted corporate bonds, asset-backed securities, mortgage-backed securities, U.S. Government securities and U.S. government agency securities, when valued using market quotations in an active market, will be categorized as Level 1 securities. However, they may be valued on the basis of prices furnished by a pricing service when the Adviser or Sub-Adviser believes such prices more accurately reflect the fair value of such securities. A pricing service utilizes electronic data processing techniques based on yield spreads relating to securities with similar characteristics to determine prices for normal institutional-size trading units of debt securities without regard to sale or bid prices. These securities will generally be categorized as Level 2 securities. If the Adviser or Sub-Advi ser decides that a price provided by the pricing service does not accurately reflect the fair value of the securities, when prices are not readily available from a pricing service, or when restricted or illiquid securities are being valued, securities are valued at fair value as determined in good faith by the Adviser or Sub-Adviser, in conformity with guidelines adopted by and subject to review of the Board. These securities will be categorized as Level 3 securities.
Timothy Plan Notes to Financial Statements
Notes to Financial Statements
September 30, 2010
Timothy Plan Family of Funds
Short-term investments in fixed income securities, (those with maturities of less than 60 days when acquired, or which subsequently are within 60 days of maturity), are valued by using the amortized cost method of valuation, which the Board has determined will represent fair value. These securities will be classified as Level 2 securities.
The Timothy Plan Money Market Fund uses the amortized cost method to compute its NAV. This means that securities purchased by the Fund are not marked to market. Instead, any premium paid or discount realized will be amortized or accrued over the life of the security and credited/debited daily against the total assets of the Fund. This also means that, under most circumstances, the Money Market Fund will not sell securities prior to maturity date except to satisfy redemption requests.
The Board has delegated to the Adviser and/or Sub-Advisers responsibility for determining the value of Fund portfolio securities under certain circumstances. Under such circumstances, the Adviser or Sub-Adviser will use its best efforts to arrive at the fair value of a security held by the Fund under all reasonably ascertainable facts and circumstances. The Adviser must prepare a report for the Board not less than quarterly containing a complete listing of any securities for which fair value pricing was employed and detailing the specific reasons for such fair value pricing. The Board has adopted written policies and procedures to guide the Adviser and Sub-Advisers with respect to the circumstances under which, and the methods to be used, in fair valuing securities.
The following is a summary of the inputs used to value each Fund’s assets as of September 30, 2010:
| Aggressive Growth Fund | | VALUATION INPUTS | |
| Assets | | Level 1: Quoted Prices in Active Markets | | | Level 2: Other Significant Observable Inputs | | | Level 3: Significant Unobservable Inputs | | | Total | |
| Common Stocks * | | $ | 14,219,064 | | | $ | - | | | $ | - | | | $ | 14,219,064 | |
| American Depositary Receipts * | | $ | 474,832 | | | $ | - | | | $ | - | | | $ | 474,832 | |
| Money Market Funds | | $ | 461,632 | | | $ | - | | | $ | - | | | $ | 461,632 | |
| Total | | $ | 15,155,528 | | | $ | - | | | $ | - | | | $ | 15,155,528 | |
| *Refer to the Schedule of Investments for industry classifications. | | | | | | | | | |
| | | | | | | | | | | | | | | | | |
| International Fund | | VALUATION INPUTS | |
| Assets | | Level 1: Quoted Prices in Active Markets | | | Level 2: Other Significant Observable Inputs | | | Level 3: Significant Unobservable Inputs | | | Total | |
| Common Stocks * | | $ | 1,562,615 | | | $ | - | | | $ | - | | | $ | 1,562,615 | |
| American Depositary Receipts * | | $ | 15,095,391 | | | $ | 18,876,472 | | | $ | - | | | $ | 33,971,863 | |
| Money Market Funds | | $ | 1,760,671 | | | $ | - | | | $ | - | | | $ | 1,760,671 | |
| Total | | $ | 18,418,677 | | | $ | 18,876,472 | | | $ | - | | | $ | 37,295,149 | |
| *Refer to the Schedule of Investments for industry classifications. | | | | | | | | | |
| | | | | | | | | | | | | | | | | |
| Large/Mid Cap Growth Fund | | VALUATION INPUTS | |
| Assets | | Level 1: Quoted Prices in Active Markets | | | Level 2: Other Significant Observable Inputs | | | Level 3: Significant Unobservable Inputs | | | Total | |
| Common Stocks * | | $ | 38,434,426 | | | $ | - | | | $ | - | | | $ | 38,434,426 | |
| American Depositary Receipts * | | $ | 1,300,049 | | | $ | - | | | $ | - | | | $ | 1,300,049 | |
| Money Market Funds | | $ | 1,447,190 | | | $ | - | | | $ | - | | | $ | 1,447,190 | |
| Total | | $ | 41,181,665 | | | $ | - | | | $ | - | | | $ | 41,181,665 | |
Timothy Plan Notes to Financial Statements
Notes to Financial Statements
September 30, 2010
Timothy Plan Family of Funds
| Small Cap Value Fund | | VALUATION INPUTS | |
| Assets | | Level 1: Quoted Prices in Active Markets | | | Level 2: Other Significant Observable Inputs | | | Level 3: Significant Unobservable Inputs | | | Total | |
| Common Stocks * | | $ | 43,057,903 | | | $ | - | | | $ | - | | | $ | 43,057,903 | |
| REITs | | $ | 1,962,962 | | | $ | - | | | $ | - | | | $ | 1,962,962 | |
| Money Market Funds | | $ | 3,195,474 | | | $ | - | | | $ | - | | | $ | 3,195,474 | |
| Total | | $ | 48,216,339 | | | $ | - | | | $ | - | | | $ | 48,216,339 | |
| *Refer to the Schedule of Investments for industry classifications. | | | | | | | | | |
| | | | | | | | | | | | | | | | | |
| Large/Mid Cap Value Fund | | VALUATION INPUTS | |
| Assets | | Level 1: Quoted Prices in Active Markets | | | Level 2: Other Significant Observable Inputs | | | Level 3: Significant Unobservable Inputs | | | Total | |
| Common Stocks * | | $ | 82,801,046 | | | $ | - | | | $ | - | | | $ | 82,801,046 | |
| Master Limited Partnerships | | $ | 1,883,796 | | | $ | - | | | $ | - | | | $ | 1,883,796 | |
| REITs | | $ | 4,479,908 | | | $ | - | | | $ | - | | | $ | 4,479,908 | |
| Money Market Funds | | $ | 1,975,210 | | | $ | - | | | $ | - | | | $ | 1,975,210 | |
| Total | | $ | 91,139,960 | | | $ | - | | | $ | - | | | $ | 91,139,960 | |
| *Refer to the Schedule of Investments for industry classifications. | | | | | | | | | |
| | | | | | | | | | | | | | | | | |
| Fixed Income Fund | | VALUATION INPUTS | |
| Assets | | Level 1: Quoted Prices in Active Markets | | | Level 2: Other Significant Observable Inputs | | | Level 3: Significant Unobservable Inputs | | | Total | |
| Asset-Backed Securities | | $ | - | | | $ | 345,299 | | | $ | - | | | $ | 345,299 | |
| Corporate Bonds | | $ | - | | | $ | 19,468,439 | | | $ | - | | | $ | 19,468,439 | |
| U.S. Government Agencies | | $ | - | | | $ | 6,469,212 | | | $ | - | | | $ | 6,469,212 | |
| Mortgaged-Backed Securities | | $ | - | | | $ | 17,081,840 | | | $ | - | | | $ | 17,081,840 | |
| U.S. Government Treasuries | | $ | - | | | $ | 12,364,661 | | | $ | - | | | $ | 12,364,661 | |
| U.S. Treasury TIPS | | $ | - | | | $ | 4,685,506 | | | $ | - | | | $ | 4,685,506 | |
| Money Market Funds | | $ | 10,951,503 | | | $ | - | | | $ | - | | | $ | 10,951,503 | |
| Total | | $ | 10,951,503 | | | $ | 60,414,957 | | | $ | - | | | $ | 71,366,460 | |
| | | | | | | | | | | | | | | | | |
| High Yield Bond Fund | | VALUATION INPUTS | |
| Assets | | Level 1: Quoted Prices in Active Markets | | | Level 2: Other Significant Observable Inputs | | | Level 3: Significant Unobservable Inputs | | | Total | |
| Convertible Corporate Bonds | | $ | - | | | $ | 435,700 | | | $ | - | | | $ | 435,700 | |
| Corporate Bonds | | $ | - | | | $ | 15,654,339 | | | $ | - | | | $ | 15,654,339 | |
| 144A Securities | | $ | - | | | $ | 5,792,671 | | | $ | - | | | $ | 5,792,671 | |
| Money Market Funds | | $ | 279,072 | | | $ | - | | | $ | - | | | $ | 279,072 | |
| Total | | $ | 279,072 | | | $ | 21,882,710 | | | $ | - | | | $ | 22,161,782 | |
Timothy Plan Notes to Financial Statements
Notes to Financial Statements
September 30, 2010
Timothy Plan Family of Funds
| Defensive Strategies Fund | | VALUATION INPUTS | |
| Assets | | Level 1: Quoted Prices in Active Markets | | | Level 2: Other Significant Observable Inputs | | | Level 3: Significant Unobservable Inputs | | | Total | |
| Common Stocks * | | $ | 51,850 | | | $ | - | | | $ | - | | | $ | 51,850 | |
| REITs | | $ | 5,350,055 | | | $ | - | | | $ | - | | | $ | 5,350,055 | |
| Exchange-Traded Funds | | $ | 8,930,830 | | | $ | - | | | $ | - | | | $ | 8,930,830 | |
| U.S. Treasury TIPS | | $ | - | | | $ | 12,731,437 | | | $ | - | | | $ | 12,731,437 | |
| Money Market Funds | | $ | 1,770,275 | | | $ | - | | | $ | - | | | $ | 1,770,275 | |
| Total | | $ | 16,103,010 | | | $ | 12,731,437 | | | $ | - | | | $ | 28,834,447 | |
| *Refer to the Schedule of Investments for industry classifications. | | | | | | | | | |
| | | | | | | | | | | | | | | | | |
| Money Market Fund | | VALUATION INPUTS | |
| Assets | | Level 1: Quoted Prices in Active Markets | | | Level 2: Other Significant Observable Inputs | | | Level 3: Significant Unobservable Inputs | | | Total | |
| U.S. Government Treasuries | | $ | - | | | $ | 12,048,601 | | | | | | | $ | 12,048,601 | |
| Money Market Funds | | $ | 1,328,543 | | | $ | - | | | $ | - | | | $ | 1,328,543 | |
| Total | | $ | 1,328,543 | | | $ | 12,048,601 | | | $ | - | | | $ | 13,377,144 | |
| | | | | | | | | | | | | | | | | |
| Strategic Growth Fund | | VALUATION INPUTS | |
| Assets | | Level 1: Quoted Prices in Active Markets | | | Level 2: Other Significant Observable Inputs | | | Level 3: Significant Unobservable Inputs | | | Total | |
| Mutual Funds | | $ | 45,705,435 | | | $ | - | | | $ | - | | | $ | 45,705,435 | |
| Money Market Funds | | $ | 59,657 | | | $ | - | | | $ | - | | | $ | 59,657 | |
| Total | | $ | 45,765,092 | | | $ | - | | | $ | - | | | $ | 45,765,092 | |
| | | | | | | | | | | | | | | | | |
| Conservative Growth Fund | | VALUATION INPUTS | |
| Assets | | Level 1: Quoted Prices in Active Markets | | | Level 2: Other Significant Observable Inputs | | | Level 3: Significant Unobservable Inputs | | | Total | |
| Mutual Funds | | $ | 45,690,155 | | | $ | - | | | $ | - | | | $ | 45,690,155 | |
| Total | | $ | 45,690,155 | | | $ | - | | | $ | - | | | $ | 45,690,155 | |
The Funds did not hold any assets at any time during the reporting period in which significant unobservable inputs were used in determining fair value; therefore, no reconciliation of Level 3 securities is included for this reporting period. The Funds did not hold any derivative instruments during the reporting period.
Timothy Plan Notes to Financial Statements
Notes to Financial Statements
September 30, 2010
Timothy Plan Family of Funds
Note 3 | Purchases and Sales of Securities
The following is a summary of the cost of purchases and proceeds from the sale of securities, other than short-term investments, for the fiscal year ended September 30, 2010:
| | | PURCHASES | | | | | | SALES | | | | |
| | | U.S. Gov't | | | | | | U.S. Gov't | | | | |
| Funds | | Obligations | | | Other | | | Obligations | | | Other | |
| Aggressive Growth Fund | | $ | - | | | $ | 12,762,328 | | | $ | - | | | $ | 19,439,646 | |
| International Fund | | $ | - | | | $ | 13,603,758 | | | $ | - | | | $ | 16,921,450 | |
| Large/Mid Cap Growth Fund | | $ | - | | | $ | 30,103,473 | | | $ | - | | | $ | 32,550,573 | |
| Small Cap Value Fund | | $ | - | | | $ | 29,930,736 | | | $ | - | | | $ | 42,513,972 | |
| Large/Mid Cap Value Fund | | $ | - | | | $ | 33,687,745 | | | $ | - | | | $ | 44,974,105 | |
| Fixed Income Fund | | $ | 18,179,234 | | | $ | 5,453,987 | | | $ | 10,856,516 | | | $ | 2,657,410 | |
| High Yield Bond Fund | | $ | - | | | $ | 10,543,023 | | | $ | - | | | $ | 7,775,873 | |
| Defensive Strategies Fund | | $ | 16,583,749 | | | $ | 17,130,720 | | | $ | 5,117,700 | | | $ | 4,051,134 | |
| Strategic Growth Fund | | $ | - | | | $ | 11,166,553 | | | $ | - | | | $ | 12,795,434 | |
| Conservative Growth Fund | | $ | - | | | $ | 14,072,845 | | | $ | - | | | $ | 17,427,696 | |
Timothy Partners, Ltd., (“TPL”) is the investment adviser for the Funds pursuant to an investment advisory agreement (the “Agreement”) that was renewed by the Board on February 26, 2010. TPL supervises the investment of the assets of each Fund in accordance with the objectives, policies and restrictions of the Trust. Under the terms of the Agreement, as amended, TPL receives a fee, accrued daily and paid monthly, at an annual rate of 1.00% of the average daily net assets of the Timothy Plan International Fund; 0.85% of the average daily net assets of the Timothy Plan Aggressive Growth, the Timothy Plan Small Cap Value, the Timothy Plan Large/Mid Cap Growth, and the Timothy Plan Large/Mid Cap Value Funds; 0.60% of the average daily net assets of the Timothy Plan Fixed Income, the Timothy Plan High Yield Bond, the Timothy Plan Defensive Strategies, and the Timothy Plan Money Market Funds; and 0.65% of the average daily net assets of the Timothy Plan Conservative Growth and the Timothy Plan Strategic Growth Funds. TPL has voluntarily agreed to reduce the fee it receives from the Timothy Plan Fixed Income and the Timothy Plan Money Market to 0.45% and 0.40%, respectively. Additionally, TPL has voluntarily agreed to reduce fees payable to it by the Timothy Plan Money Market Fund and reimburse other expenses to the extent necessary to limit the Fund’s aggregate annual operating expenses as follows:
| Voluntary Caps | | Period | | |
| | | | | |
| 15 basis points | | September 16 - November 4, 2009 | |
| 10 basis points | | November 5 - December 6, 2009 | |
| 5 basis points | | December 7, 2009 - current | |
Such voluntary fee reductions/reimbursements may be authorized by TPL at any time, but such action shall not obligate TPL to waive any fees in the near future. Such voluntary fee reductions/reimbursements are not subject to future recoupment. An officer and trustee of the Funds is also an officer and owner of the Adviser.
Timothy Plan Notes to Financial Statements
Notes to Financial Statements
September 30, 2010
Timothy Plan Family of Funds
For the fiscal year ended September 30, 2010, TPL waived and reimbursed the Funds as follows:
| | | Fiscal year ended | |
| | | September 30, 2010 | |
| | | | |
| Fixed Income Fund | | $ | 88,819 | |
| Money Market Fund | | $ | 176,981 | |
| | | 2010 | |
| | | | |
| High Yield Bond Fund* | | $ | 12,185 | |
The Timothy Plan Aggressive Growth, Timothy Plan International Fund, Timothy Plan Large/Mid Cap Growth, Timothy Plan Small Cap Value, Timothy Plan Large/Mid Cap Value, Timothy Plan Fixed Income, Timothy Plan High Yield Bond, and Defensive Strategies Funds have adopted shareholder services plans (the “Plans”) pursuant to Rule 12b-1 under the Investment Company Act of 1940, as amended. The Plans provide that the Funds will pay TPL or others for expenses that relate to the promotion or distribution of shares. Under the Class A Plan, the Funds will pay TPL a fee at an annual rate of 0.25%, payable monthly, of the average daily net assets attributable to such class of shares. Under the Class B and C Plans, the Funds will pay TPL a fee at an annual rate of 1.00%, payable monthly, of which, 0.25% m ay be a service fee and 0.75% may be payable to outside broker/dealers, of the average daily net assets attributable to such class of shares.
The Timothy Plan Conservative Growth and Timothy Plan Strategic Growth Funds have adopted shareholder services plans (the “Plans”) pursuant to Rule 12b-1 under the Investment Company Act of 1940, as amended. The Plans provide that the Funds will pay TPL or others for expenses that relate to the promotion or distribution of shares. Class A shares of the Funds do not impose a service fee. Under the Class B and C Plans, the Fund will pay TPL a fee at an annual rate of 0.75%, payable monthly to outside broker/dealers, of the average daily net assets attributable to such class of shares. For the fiscal year ended September 30, 2010, the Funds paid TPL under the terms of the Plans as follows:
| Funds | | 12b-1 Fees | |
| | | Fiscal Year ended | |
| | | September 30, 2010 | |
| Aggressive Growth Fund | | $ | 52,011 | |
| International Fund | | $ | 103,686 | |
| Large/Mid Cap Growth Fund | | $ | 128,900 | |
| Small Cap Value Fund | | $ | 179,832 | |
| Large/Mid Cap Value Fund | | $ | 312,456 | |
| Fixed Income Fund | | $ | 202,658 | |
| High Yield Bond Fund | | $ | 57,554 | |
| Defensive Strategies Fund | | $ | 79,653 | |
| Strategic Growth Fund | | $ | 92,358 | |
| Conservative Growth Fund | | $ | 87,857 | |
TPL also serves as the principal underwriter of the Funds’ shares. An officer and trustee of the Funds is also an officer of the principal underwriter. For the fiscal year ended September 30, 2010, TPL received sales charges deducted from the proceeds of sales of Class A capital shares and CDSC fees deducted from the redemption of Class B and C capital shares as follows:
| | | Sales Charges | | | CDSC Fees | | | CDSC Fees | |
| Funds | | Class A) | | | (Class B) | | | (Class C) | |
| Aggressive Growth Fund | | $ | 3,435 | | | $ | - | | | $ | 199 | |
| International Fund | | $ | 9,658 | | | $ | - | | | $ | 362 | |
| Large/Mid Cap Growth Fund | | $ | 6,743 | | | $ | - | | | $ | 136 | |
| Small Cap Value Fund | | $ | 7,942 | | | $ | - | | | $ | 519 | |
| Large/Mid Cap Value Fund | | $ | 21,983 | | | $ | - | | | $ | 1,077 | |
| Fixed Income Fund | | $ | 29,616 | | | $ | - | | | $ | 1,135 | |
| High Yield Bond Fund | | $ | 6,050 | | | $ | - | | | $ | 312 | |
| Defensive Strategies Fund | | $ | 7,537 | | | $ | - | | | $ | 782 | |
| Strategic Growth Fund | | $ | 14,438 | | | $ | - | | | $ | 2,980 | |
| Conservative Growth Fund | | $ | 20,236 | | | $ | - | | | $ | 1,808 | |
Timothy Plan Notes to Financial Statements
Notes to Financial Statements
September 30, 2010
Timothy Plan Family of Funds
Note 5 | Control Ownership
The beneficial ownership, either directly or indirectly, of more than 25% of the voting securities of a Fund creates presumption of control of the Fund under Section 2(a) 9 of the Investment Company Act of 1940. As of September 30, 2010, the following shareholders, for the benefit of their customers, may be considered to control the Funds:
| Funds | % of Fund | Owned By |
| Large/Mid Cap Growth Fund, Class B | 28.74% | National Financial Services |
Certain Timothy Plan Funds own shares of other Timothy Plan Funds. U.S. Bank, N.A., custodian of the Timothy Plan Funds, holds these shares in omnibus accounts, some of which are controlled by National Financial Services, Inc. The following shows the percentage of each Timothy Plan Fund that is held by U.S. Bank, N.A., as custodian of the Timothy Funds. These accounts can be considered affiliated to the Timothy Plan.
| | | % of Fund Owned by Other | |
| | | Timothy Plan Funds | |
| Aggressive Growth Fund, Class A | | | 55.90 | % |
| International Fund, Class A | | | 69.67 | % |
| Large/Mid Cap Growth Fund, Class A | | | 59.46 | % |
| Small Cap Value Fund, Class A | | | 22.50 | % |
| Large/Mid Cap Value Fund, Class A | | | 31.68 | % |
| Fixed Income Fund, Class A | | | 44.46 | % |
| High Yield Bond Fund, Class A | | | 68.65 | % |
| Defensive Strategies Fund, Class A | | | 82.14 | % |
Timothy Plan Notes to Financial Statements
Notes to Financial Statements
September 30, 2010
Timothy Plan Family of Funds
Note 6 | Unrealized Appreciation (Depreciation)
At September 30, 2010, for federal income tax purposes, the cost and the composition of gross unrealized appreciation (depreciation) of investment securities are as follows:
| | | | | | | | | | | | Net Appreciation | |
| Funds | | Cost | | | Appreciation | | | (Depreciation) | | | (Depreciation) | |
| Aggressive Growth Fund | | $ | 12,474,757 | | | $ | 2,989,104 | | | $ | (308,333 | ) | | $ | 2,680,771 | |
| International Fund | | $ | 34,709,782 | | | $ | 5,501,089 | | | $ | (2,915,722 | ) | | $ | 2,585,367 | |
| Large/Mid Cap Growth Fund | | $ | 37,274,736 | | | $ | 5,508,878 | | | $ | (1,601,949 | ) | | $ | 3,906,929 | |
| Small Cap Value Fund | | $ | 44,862,547 | | | $ | 4,765,664 | | | $ | (1,411,872 | ) | | $ | 3,353,792 | |
| Large/Mid Cap Value Fund | | $ | 81,229,112 | | | $ | 13,227,291 | | | $ | (3,316,443 | ) | | $ | 9,910,848 | |
| Fixed Income Fund | | $ | 67,298,176 | | | $ | 4,071,852 | | | $ | (3,568 | ) | | $ | 4,068,284 | |
| High Yield Bond Fund | | $ | 21,147,121 | | | $ | 1,259,874 | | | $ | (245,213 | ) | | $ | 1,014,661 | |
| Defensive Strategies Fund | | $ | 26,811,943 | | | $ | 2,141,306 | | | $ | (118,802 | ) | | $ | 2,022,504 | |
| Money Market Fund | | $ | 13,377,144 | | | $ | - | | | $ | - | | | $ | - | |
| Strategic Growth Fund | | $ | 56,241,908 | | | $ | 723,986 | | | $ | (11,200,802 | ) | | $ | (10,476,816 | ) |
| Conservative Growth Fund | | $ | 50,271,534 | | | $ | 1,661,363 | | | $ | (6,242,742 | ) | | $ | (4,581,379 | ) |
The tax character of distributions paid during the fiscal year ended September 30, 2010 and the fiscal period ended September 30, 2009 and the fiscal year ended December 31, 2008 were as follows:
| | | | | | | | | | | | | |
| | | Aggressive Growth | | | International | | | | | | Small Cap Value | |
| Year ended September 30, 2010 | | | | | | | | | | | | |
| Ordinary Income | | $ | - | | | $ | 552,642 | | | $ | - | | | $ | - | |
| Short-term Capital Gains | | | - | | | | - | | | | - | | | | - | |
| Long-term Capital Gains | | | - | | | | - | | | | - | | | | - | |
| Return of Capital | | | - | | | | - | | | | - | | | | - | |
| | | $ | - | | | $ | 552,642 | * | | $ | - | | | $ | - | |
| | | | | | | | | | | | | | | | | |
| Year ended December 31, 2008 | | | | | | | | | | | | | | | | |
| Ordinary Income | | $ | - | | | $ | 445,202 | | | $ | - | | | $ | - | |
| Short-term Capital Gains | | | - | | | | - | | | | - | | | | 424,158 | |
| Long-term Capital Gains | | | 48,425 | | | | - | | | | 68,000 | | | | - | |
| | | $ | 48,425 | | | $ | 445,202 | | | $ | 68,000 | | | $ | 424,158 | |
| | | | | | | | | | | | | | | | | |
Timothy Plan Notes to Financial Statements
Notes to Financial Statements
September 30, 2010
Timothy Plan Family of Funds
| | | | | | | | | | | | | |
| | | | | | Fixed Income | | | High Yield Bond | | | Defensive Strategies | |
| Year ended September 30, 2010 | | | | | | | | | | | | |
| Ordinary Income | | $ | 394,793 | | | $ | 1,626,024 | | | $ | 1,381,507 | | | $ | 3,363 | |
| Short-term Capital Gains | | | - | | | | - | | | | - | | | | 502,028 | |
| Long-term Capital Gains | | | - | | | | - | | | | - | | | | 36,320 | |
| Return of Capital | | | - | | | | - | | | | - | | | | 477,490 | |
| | | $ | 394,793 | | | $ | 1,626,024 | | | $ | 1,381,507 | | | $ | 1,019,201 | |
| | | | | | | | | | | | | | | | | |
| Period ended September 30, 2009 | | | | | | | | | | | | | | | | |
| Ordinary Income | | $ | - | | | $ | 1,134,412 | | | $ | 1,014,621 | | | $ | - | |
| Short-term Capital Gains | | | - | | | | - | | | | - | | | | - | |
| Long-term Capital Gains | | | - | | | | - | | | | - | | | | - | |
| Return of Capital | | | - | | | | - | | | | - | | | | - | |
| | | $ | - | | | $ | 1,134,412 | | | $ | 1,014,621 | | | $ | - | |
| | | | | | | | | | | | | | | | | |
| Year ended December 31, 2008 | | | | | | | | | | | | | | | | |
| Ordinary Income | | $ | 287,444 | | | $ | 2,053,290 | | | $ | 1,274,024 | | | | | |
| Short-term Capital Gains | | | 531,542 | | | | - | | | | 10,357 | | | | | |
| Long-term Capital Gains | | | 677,192 | | | | - | | | | - | | | | | |
| | | $ | 1,496,178 | | | $ | 2,053,290 | | | $ | 1,284,381 | | | | | |
| | | | | | | | | | | | | | | | | |
| | | | | | | | | | | | | | | | | |
| | | | | | | | | | | | | | | | |
| | | Money Market | | | Strategic Growth | | | | | | | | |
| Year ended September 30, 2010 | | | | | | | | | | | | | | | | |
| Ordinary Income | | $ | 4,652 | | | $ | - | | | $ | 607,967 | | | | | |
| Short-term Capital Gains | | | 5,396 | | | | - | | | | - | | | | | |
| Long-term Capital Gains | | | - | | | | - | | | | - | | | | | |
| Return of Capital | | | - | | | | - | | | | - | | | | | |
| | | $ | 10,048 | | | $ | - | | | $ | 607,967 | | | | | |
| | | | | | | | | | | | | | | | | |
| Period ended September 30, 2009 | | | | | | | | | | | | | | | | |
| Ordinary Income | | $ | 17,430 | | | $ | - | | | $ | - | | | | | |
| Short-term Capital Gains | | | 2,313 | | | | - | | | | - | | | | | |
| Long-term Capital Gains | | | - | | | | - | | | | - | | | | | |
| Return of Capital | | | - | | | | - | | | | - | | | | | |
| | | $ | 19,743 | | | $ | - | | | $ | - | | | | | |
| | | | | | | | | | | | | | | | | |
| Year ended December 31, 2008 | | | | | | | | | | | | | | | | |
| Ordinary Income | | $ | 556,735 | | | $ | 506,870 | | | $ | 697,282 | | | | | |
| Short-term Capital Gains | | | - | | | | 230,982 | | | | 58,044 | | | | | |
| Long-term Capital Gains | | | - | | | | 3,451,894 | | | | 1,808,503 | | | | | |
| | | $ | 556,735 | | | $ | 4,189,746 | | | $ | 2,563,829 | | | | | |
Timothy Plan Notes to Financial Statements
Notes to Financial Statements
September 30, 2010
Timothy Plan Family of Funds
As of September 30, 2010, the components of distributable earnings on a tax basis were as follows:
| | | Aggressive | | | | | | Large/Mid Cap | | | | |
| | | Growth | | | International | | | Growth | | | Small Cap Value | |
| | | | | | | | | | | | | |
| Undistributed Ordinary Income | | $ | - | | | $ | 191,289 | | | $ | - | | | $ | - | |
| Capital Loss Carryforward | | | (6,856,419 | ) | | | (14,168,126 | ) | | | (7,180,559 | ) * | | | (14,013,130 | ) |
| Unrealized Appreciation (Depreciation) | | | 2,680,771 | | | | 2,585,367 | | | | 3,906,929 | | | | 3,353,792 | |
| | | $ | (4,175,648 | ) | | $ | (11,391,470 | ) | | $ | (3,273,630 | ) | | $ | (10,659,338 | ) |
| | | | | | | | | | | | | | | | | |
| * Following the 2005 acquisition by the Timothy Plan Large/Mid Cap Growth Fund of the NOAH Fund Equity Portfolio, the Timothy Fund acquired all capital loss carryforwards available to the NOAH Fund. In accordance with Section 382 of the Internal Revenue Code, loss limitations were appropriately applied to the available capital loss carryforward. Of the capital losses subject to Section 382, the Fund may only utilize $358,459 in a given year. | |
| | | | | | | | | | | | | | | | | |
| | | | | | | | | | | | | | | |
| | | | | | Fixed Income | | | High Yield Bond | | | | |
| | | | | | | | | | | | | | | | | |
| Undistributed Ordinary Income | | $ | 250,652 | | | $ | 36,542 | | | $ | 24 | | | $ | - | |
| Capital Loss Carryforward | | | (20,552,911 | ) | | | (1,698,928 | ) | | | (2,436,336 | ) | | | - | |
| Unrealized Appreciation (Depreciation) | | | 9,910,848 | | | | 4,068,284 | | | | 1,014,661 | | | | 2,022,504 | |
| | | $ | (10,391,411 | ) | | $ | 2,405,898 | | | $ | (1,421,651 | ) | | $ | 2,022,504 | |
| | | | | | | | | | | | | | | | | |
| | | | | | | | | | | | | | | | |
| | | Money Market | | | Strategic Growth | | | | | | | | |
| | | | | | | | | | | | | | | | | |
| Undistributed Ordinary Income | | $ | 8,585 | | | $ | 41,292 | | | $ | 393,362 | | | | | |
| Capital Loss Carryforward | | | - | | | | (3,533,886 | ) | | | (1,762,631 | ) | | | | |
| Unrealized Appreciation (Depreciation) | | | - | | | | (10,476,816 | ) | | | (4,581,379 | ) | | | | |
| | | $ | 8,585 | | | $ | (13,969,410 | ) | | $ | (5,950,648 | ) | | | | |
| | | | | | | | | | | | | | | | | |
Timothy Plan Notes to Financial Statements
Notes to Financial Statements
September 30, 2010
Timothy Plan Family of Funds
Note 8 | Capital Loss Carryforwards
At September 30, 2010, the following capital loss carryforwards are available to offset future capital gains.
| Funds | | Loss Carryforward | | | Year Expiring | |
| | | | | | | |
| Aggressive Growth Fund | | $ | 721,254 | | | | 2016 | |
| | | $ | 6,135,166 | | | | 2017 | |
| International Fund | | $ | 498,385 | | | | 2015 | |
| | | $ | 4,243,183 | | | | 2016 | |
| | | $ | 8,833,573 | | | | 2017 | |
| | | $ | 592,985 | | | | 2018 | |
| Large/Mid Cap Growth Fund * | | $ | 269,745 | | | | 2016 | |
| | | $ | 6,910,814 | | | | 2017 | |
| Small Cap Value Fund | | $ | 2,451,379 | | | | 2016 | |
| | | $ | 11,561,751 | | | | 2017 | |
| Large/Mid Cap Value Fund | | $ | 9,111,565 | | | | 2016 | |
| | | $ | 11,441,346 | | | | 2017 | |
| Fixed Income Fund | | $ | 234,407 | | | | 2014 | |
| | | $ | 77,304 | | | | 2015 | |
| | | $ | 252,039 | | | | 2016 | |
| | | $ | 1,135,178 | | | | 2017 | |
| High Yield Bond Fund | | $ | 362,525 | | | | 2016 | |
| | | $ | 2,073,811 | | | | 2017 | |
| Strategic Growth Fund | | $ | 844,160 | | | | 2016 | |
| | | $ | 2,564,555 | | | | 2017 | |
| | | $ | 125,171 | | | | 2018 | |
| Conservative Growth Fund | | $ | 1,762,631 | | | | 2017 | |
| | | | | | | | | |
| * Please refer to Note 7 for additional information regarding the availability of capital loss carryforwards within the Timothy Large / Mid Cap Growth Fund. | |
To the extent these loss carryforwards are used to offset future capital gains, it is probable that the amount, which is offset, will not be distributed to shareholders.
Note 9 | Payment by Affiliate
During the year ended December 31, 2008, the Sub-Adviser for the Timothy Plan Aggressive Growth Fund reimbursed the Fund $24,684 due to an investing error during the transition of sub-advisers. The Sub-Adviser reimbursed the Fund for the difference in performance relative to the intended portfolio and the transaction costs of rebalancing the portfolio.
Timothy Plan Notes to Financial Statements
REPORT OF INDEPENDENT REGISTERED PUBLIC ACCOUNTING FIRM
To the Shareholders and Board of Trustees
The Timothy Plan
We have audited the accompanying statements of assets and liabilities, including the schedules of investments, of Timothy Plan Aggressive Growth Fund, Timothy Plan International Fund, Timothy Plan Large/Mid Cap Growth Fund, Timothy Plan Small Cap Value Fund, Timothy Plan Large/Mid Cap Value Fund, Timothy Plan Fixed Income Fund, Timothy Plan High Yield Bond Fund, Timothy Plan Defensive Strategies Fund, Timothy Plan Money Market Fund, Timothy Plan Strategic Growth Fund and Timothy Plan Conservative Growth Fund (the “Funds”), eleven of the series constituting The Timothy Plan, as of September 30, 2010, and the related statements of operations for the period then ended, the statements of changes in net assets for each of the periods then ended, and the financial highlights for each of the periods indicated. These fin ancial statements and financial highlights are the responsibility of the Funds’ management. Our responsibility is to express an opinion on these financial statements and financial highlights based on our audits.
We conducted our audits in accordance with the standards of the Public Company Accounting Oversight Board (United States). Those standards require that we plan and perform the audit to obtain reasonable assurance about whether the financial statements and financial highlights are free of material misstatement. An audit includes examining, on a test basis, evidence supporting the amounts and disclosures in the financial statements. Our procedures included confirmation of securities owned as of September 30, 2010 by correspondence with the Funds’ custodian and brokers or by other appropriate auditing procedures where the reply from the broker was not received. An audit also includes assessing the accounting principles used and significant estimates made by management, as well as evaluating the overall financia l statement presentation. We believe that our audits provide a reasonable basis for our opinion.
In our opinion, the financial statements and financial highlights referred to above present fairly, in all material respects, the financial position of Timothy Plan Aggressive Growth Fund, Timothy Plan International Fund, Timothy Plan Large/Mid Cap Growth Fund, Timothy Plan Small Cap Value Fund, Timothy Plan Large/Mid Cap Value Fund, Timothy Plan Fixed Income Fund, Timothy Plan High Yield Bond Fund, Timothy Plan Defensive Strategies Fund, Timothy Plan Money Market Fund, Timothy Plan Strategic Growth Fund and Timothy Plan Conservative Growth Fund as of September 30, 2010, and the results of their operations, the changes in their net assets and their financial highlights for the periods then ended indicated above, in conformity with accounting principles generally accepted in the United States of America.
COHEN FUND AUDIT SERVICES, LTD.
Westlake, Ohio
November 29, 2010
Officers and Trustees of the Trust
As of September 30, 2010 (Unaudited)
Timothy Plan Family of Funds
| Name, Age and Address | Position(s) Held With Trust | Term of Office and Length of Time Served | Number of Portfolios in Fund Complex Overseen by Trustee |
Arthur D. Ally* 1055 Maitland Center Commons Maitland, FL Born: 1942 | Chairman and President | Indefinite; Trustee and President since 1994 | 13 |
| | Principal Occupation During Past 5 Years | Other Directorships Held by Trustee |
| | President and controlling shareholder of Covenant Funds, Inc. (“CFI”), a holding company. President and general partner of Timothy Partners, Ltd. (“TPL”), the investment adviser and principal underwriter to each Fund. CFI is also the managing general partner of TPL. | None |
| | | | |
| | | | |
| Name, Age and Address | Position(s) Held With Trust | Term of Office and Length of Time Served | Number of Portfolios in Fund Complex Overseen by Trustee |
Joseph E. Boatwright** 1410 Hyde Park Drive Winter Park, FL Born: 1930 | Trustee, Secretary | Indefinite; Trustee and Secretary since 1995 | 13 |
| | Principal Occupation During Past 5 Years | Other Directorships Held by Trustee |
| | Retired Minister. Currently serves as a consultant to the Greater Orlando Baptist Association. Served as Senior Pastor to Aloma Baptist Church from 1970-1996. | None |
| | | | |
| | | | |
| Name, Age and Address | Position(s) Held With Trust | Term of Office and Length of Time Served | Number of Portfolios in Fund Complex Overseen by Trustee |
Mathew D. Staver** 1055 Maitland Center Commons Maitland , FL Born: 1956 | Trustee | Indefinite; Trustee since 2000 | 13 |
| | Principal Occupation During Past 5 Years | Other Directorships Held by Trustee |
| | Attorney specializing in free speech, appellate practice and religious liberty constitutional law. Founder of Liberty Counsel, a religious civil liberties education and legal defense organization. Host of two radio programs devoted to religious freedom issues. Editor of a monthly newsletter devoted to religious liberty topics. Mr. Staver has argued before the United States Supreme Court and has published numerous legal articles. | None |
| | | | |
| * Mr. Ally is an "interested" Trustee, as that term is defined in the 1940 Act, because of his positions with and financial interests in CFI and TPL. |
| ** Messrs. Boatwright and Staver are "interested" Trustees, as that term is defined in the 1940 Act, because each has a limited partnership intereset in TPL. |
| | | | |
| Name, Age and Address | Position(s) Held With Trust | Term of Office and Length of Time Served | Number of Portfolios in Fund Complex Overseen by Trustee |
Richard W. Copeland 1112 Glen Falls Road DeLand, FL Born: 1947 | Trustee | Indefinite; Trustee since 2005 | 13 |
| | Principal Occupation During Past 5 Years | Other Directorships Held by Trustee |
| | Principal of Copeland & Covert, Attorneys at Law; specializing in tax and estate planning. B.A. from Mississippi College, JD from University of Florida and LLM Taxation from University of Miami. Associate Professor Stetson University for past 35 years. | None |
| | | | |
| | | | |
| Name, Age and Address | Position(s) Held With Trust | Term of Office and Length of Time Served | Number of Portfolios in Fund Complex Overseen by Trustee |
Deborah Honeycutt 160 Deer Forest Trail Fayetteville, GA Born: 1947 | Trustee | Indefinite; Trustee since 2010 | 13 |
| | Principal Occupation During Past 5 Years | Other Directorships Held by Trustee |
| | Dr. Honeycutt is a licensed physician currently serving as Medical Director of Clayton State University Health Services in Morrow, GA, CEO of Minority Health Services in Atlanta, and as a volunteer at Good Sheperd Clinic. Dr. Honeycutt received her B.A. and M.D. at the University of Illinois. | None |
| | | | |
| | | | |
| Name, Age and Address | Position(s) Held With Trust | Term of Office and Length of Time Served | Number of Portfolios in Fund Complex Overseen by Trustee |
Bill Johnson 203 E. Main Street Fremont, MI Born: 1946 | Trustee | Indefinite; Trustee since 2005 | 13 |
| | Principal Occupation During Past 5 Years | Other Directorships Held by Trustee |
| | President (and Founder) of American Decency Association, Freemont, MI since 1999. Previously served as Michigan State Director for American Family Association (1987-1999). Previously a public school teacher for 18 years. B.S. from Michigan State University and a Masters of Religious Education from Grand Rapids Baptist Seminary. | None |
| | | | |
| | | | |
| Name, Age and Address | Position(s) Held With Trust | Term of Office and Length of Time Served | Number of Portfolios in Fund Complex Overseen by Trustee |
John C. Mulder 2925 Professional Place Colorado Springs, CO Born: 1950 | Trustee | Indefinite; Trustee since 2005 | 13 |
| | Principal Occupation During Past 5 Years | Other Directorships Held by Trustee |
| | President of WaterStone (formerly the Christian Community Foundation and National Foundation) since 2001. Prior: 22 years of executive experience for a group of banks and a trust company. B.A. in Economics from Wheaton College and MBA from University of Chicago. | None |
| | | | |
| | | | |
| Name, Age and Address | Position(s) Held With Trust | Term of Office and Length of Time Served | Number of Portfolios in Fund Complex Overseen by Trustee |
Charles E. Nelson 1145 Cross Creek Circle Altamonte Springs, FL Born: 1934 | Trustee | Indefinite; Trustee since 2000 | 13 |
| | Principal Occupation During Past 5 Years | Other Directorships Held by Trustee |
| | Certified Public Accountant, semi-retired. Former non-profit industry accounting officer. Former financial executive with commercial bank. Former partner national accounting firm. | None |
| | | | |
| | | | |
| Name, Age and Address | Position(s) Held With Trust | Term of Office and Length of Time Served | Number of Portfolios in Fund Complex Overseen by Trustee |
Wesley W. Pennington 442 Raymond Avenue Longwood, FL Born: 1930 | Trustee | Indefinite; Trustee since 1994 | 13 |
| | Principal Occupation During Past 5 Years | Other Directorships Held by Trustee |
| | Retired Air Force Officer. Past President, Westwind Holdings, Inc., a development company, since 1997. Past President and controlling shareholder, Weston, Inc., a fabric treatment company, from 1979-1997. President, Designer Services Group 1980-1988. | None |
| | | | |
| | | | |
| Name, Age and Address | Position(s) Held With Trust | Term of Office and Length of Time Served | Number of Portfolios in Fund Complex Overseen by Trustee |
Scott Preissler, Ph.D. 608 Pintail Place Flower Mound, TX Born: 1960 | Trustee | Indefinite; Trustee since 2004 | 13 |
| | Principal Occupation During Past 5 Years | Other Directorships Held by Trustee |
| | Chairman of Stewardship Studies at Southwestern Baptist Theological Seminary, Ft. Worth, TX. Also serves as Founder and Chairman of the International Center for Biblical Stewardship. Previously, President and CEO of Christian Stewardship Association where he was affiliated for 14 years. | None |
| | | | |
| | | | |
| Name, Age and Address | Position(s) Held With Trust | Term of Office and Length of Time Served | Number of Portfolios in Fund Complex Overseen by Trustee |
Alan M. Ross 11210 West Road Roswell, GA Born: 1951 | Trustee | Indefinite; Trustee since 2004 | 13 |
| | Principal Occupation During Past 5 Years | Other Directorships Held by Trustee |
| | Founder and CEO of Corporate Development Institute which he founded in 2000. Previously he served as President and CEO of Fellowship of Companies for Christ and has authored three books: Beyond World Class, Unconditional Excellence, Breaking Through to Prosperity. | None |
| | | | |
| | | | |
| Name, Age and Address | Position(s) Held With Trust | Term of Office and Length of Time Served | Number of Portfolios in Fund Complex Overseen by Trustee |
Dr. David J. Tolliver 4000 E. Maplewood Drive Excelsior Springs, MO Born: 1951 | Trustee | Indefinite; Trustee since 2005 | 13 |
| | Principal Occupation During Past 5 Years | Other Directorships Held by Trustee |
| | Executive Director of Southern Baptist Convention of Missouri since 2007. Previously pastored three churches in St. Louis, MO area (1986-2007). Currently serves on Board of Trustees of Midwestern Baptist Theological Seminary. Past President, Missouri Baptist Convention (2003-2004). | None |
| | | | |
Timothy Plan Officers and Trustees
Disclosures
September 30, 2010 – (Unaudited)
Timothy Plan Family of Funds
N-Q Disclosure & Proxy Procedures (Unaudited)
The SEC has adopted the requirement that all Funds file a complete schedule of investments with the SEC for their first and third fiscal quarters on Form N-Q for fiscal quarters ending after July 9, 2004. For the Timothy Plan Funds this would be for the fiscal quarters ending December 31 and June 30. The Form N-Q filing must be made within 60 days of the end of the quarter. The Timothy Plan Funds’ Forms N-Q are available on the SEC’s website at www.sec.gov, or they may be reviewed and copied at the SEC’s Public Reference Room in Washington, DC (call 1-800-732-0330 for information on the operation of the Public Reference Room).
The Trust has adopted Portfolio Proxy Voting Policies and Procedures under which the Portfolio’s vote proxies related to securities (“portfolio proxies”) held by the Portfolios. A description of the Trust’s Portfolio Proxy Voting Policies and Procedures is available (i) without charge, upon request, by calling the Company toll-free at 1-800-846-7526 and (ii) on the SEC’s website at www.sec.gov. In addition, the Funds are required to file Form N-PX, with its complete voting record for the 12 months ended June 30th, no later than August 31st of each year. The first such filing was due August 31, 2004. The Trust’s current Form N-PX is available (i) without charge, upon request, by calling the Company toll-free at 1-800-846-7526 and (ii) on the SE C’s website at www.sec.gov.
FEDERAL TAX INFORMATION (Unaudited)
The form 1099-DIV you receive in January 2011 will show the tax status of all distributions paid to your account in the calendar year 2010. Shareholders are advised to consult their own tax adviser with respect to the tax consequences of their investment in the Funds. As required by the Internal Revenue Code regulations, shareholders must be notified within 60 days of the Funds’ fiscal year end regarding the status of qualified dividend income for individuals and the dividends received deduction for corporations.
Qualified Dividend Income:
The table below provides the Qualified Dividend Income percentages for the year:
| Conservative Growth | | | 100 | % |
| Large/Mid Cap Value | | | 100 | % |
| International | | | 100 | % |
| Defensive Strategies | | | 24 | % |
These rates above represent the dividend income paid by the Funds which qualify for the reduced rate of 15% pursuant to the Internal Revenue Code.
Dividend Received Deduction:
| Conservative Growth | | | 100 | % |
| Large/Mid Cap Value | | | 100 | % |
| International | | | 100 | % |
| Defensive Strategies | | | 26 | % |
Corporate shareholders are generally entitled to take the dividends received deduction on the portion of the Funds’ dividend distribution that qualifies under tax law. For the Fund’s fiscal 2010 ordinary income dividends, the table above provides the qualifying percentages for the Funds.
Disclosures
September 30, 2010 – (Unaudited)
Timothy Plan Family of Funds
Foreign Tax Credit (Unaudited)
The Funds’ shareholders may choose either the foreign tax credit or an itemized deduction, if eligible, for a portion of foreign taxes paid by the Fund. Generally, it is more advantageous to report the amount as a foreign tax credit on Form 1116, instead of as an itemized deduction on Form 1040. Information needed to claim the foreign tax credit is presented in the table below for Timothy Plan International Fund.
| | | Foreign Source | | | Foreign | |
| Country | | Income % | | | Taxes % | |
| | | | | | | |
| AUSTRIA | | | 4.20 | % | | | 0.00 | % |
| BRAZIL | | | 5.09 | % | | | 9.13 | % |
| CANADA | | | 0.14 | % | | | 0.28 | % |
| FRANCE | | | 7.89 | % | | | 20.21 | % |
| GERMANY | | | 10.19 | % | | | 19.93 | % |
| HONG KONG | | | 6.40 | % | | | 0.00 | % |
| INDIA | | | 0.18 | % | | | 0.00 | % |
| IRELAND | | | 0.52 | % | | | 0.00 | % |
| ITALY | | | 1.93 | % | | | 5.02 | % |
| JAPAN | | | 17.77 | % | | | 17.44 | % |
| LUXEMBOURG | | | 1.35 | % | | | 2.01 | % |
| MEXICO | | | 2.50 | % | | | 0.00 | % |
| NORWAY | | | 2.91 | % | | | 5.63 | % |
| SPAIN | | | 3.34 | % | | | 7.07 | % |
| SWEDEN | | | 1.24 | % | | | 2.41 | % |
| SWITZERLAND | | | 4.96 | % | | | 9.58 | % |
| TURKEY | | | 3.07 | % | | | 0.00 | % |
| OTHER | | | 26.33 | % | | | 1.29 | % |
| | | | | | | | | |
| TOTAL | | | 100.00 | % | | | 100.00 | % |
BOARD OF TRUSTEES Arthur D. Ally Joseph E. Boatwright Rick Copeland Deborah Honeycutt Bill Johnson John C. Mulder Charles E. Nelson Wesley W. Pennington Scott Preissler Alan Ross Mathew D. Staver David Tolliver OFFICERS Arthur D. Ally, President Joseph E. Boatwright, Secretary INVESTMENT ADVISER Timothy Partners, Ltd. 1055 Maitland Center Commons Maitland, FL 32751 DISTRIBUTOR Timothy Partners, Ltd. 1055 Maitland Center Commons Maitland, FL 32751 TRANSFER AGENT Huntington Asset Services, Inc. 2960 N Meridian Street, Suite 300 Indianapolis, IN 46208 INDEPENDENT REGISTERED PUBLIC ACCOUNTING FIRM Cohen Fund Audit Services, Ltd. 800 Westpoint Parkway, Suite 1100 Westlake, OH 44145-1524 LEGAL COUNSEL David Jones & Assoc., P.C. 395 Sawdust Road, Suite 2148 The Woodlands, TX 77380 | |
| |  |
For additional information or a prospectus, please call: 1-800-846-7526 Visit the Timothy Plan web site on the internet at: www.timothyplan.com This report is submitted for the general information of the shareholders of the Funds. It is not authorized for distribution to prospective investors in the Funds unless preceded or accompanied by an effective Prospectus which includes details regarding the Funds’ objectives, policies, expenses and other information. Distributed by Timothy Partners, Ltd. | HEADQUARTERS The Timothy Plan 1055 Maitland Center Commons Maitland, Florida 32751 (800) 846-7526 www.timothyplan.com invest@timothyplan.com SHAREHOLDER SERVICES Huntington Asset Services, Inc. 2960 N Meridian Street, Suite 300 Indianapolis, IN 46208 (800) 662-0201 |
Item 2. Code of Ethics.
(a) As of the end of the period covered by this report, the registrant has adopted a code of ethics that applies to the registrant's principal executive officer, principal financial officer, principal accounting officer or controller, or persons performing similar functions, regardless of whether these individuals are employed by the registrant or a third party.
(b) For purposes of this item, “code of ethics” means written standards that are reasonably designed to deter wrongdoing and to promote:
| | (1) | Honest and ethical conduct, including the ethical handling of actual or apparent conflicts of interest between personal and professional relationships; |
| | (2) | Full, fair, accurate, timely, and understandable disclosure in reports and documents that a registrant files with, or submits to, the Commission and in other public communications made by the registrant; |
(3) Compliance with applicable governmental laws, rules, and regulations;
| | (4) | The prompt internal reporting of violations of the code to an appropriate person or persons identified in the code; and |
(5) Accountability for adherence to the code.
(c) Amendments: During the period covered by the report, there have not been any amendments to the provisions of the code of ethics.
(d) Waivers: During the period covered by the report, the registrant has not granted any express or implicit waivers from the provisions of the code of ethics.
(e) Posting: We do not intend to post the Code of Ethics for the Officers or any amendments or waivers on a website.
(f) Availability: The Code of Ethics for the Officers can be obtained, free of charge by calling the toll free number for the appropriate Fund.
Item 3. Audit Committee Financial Expert.
(a) The registrant has an Audit committee currently composed of three independent Trustees, Mr. Wesley Pennington, Mr. John Mulder and Mr. Charles Nelson. The registrant’s board of trustees has determined that Mr. Charles Nelson is qualified to serve as an Audit Committee Financial Expert, and has designated him as such.
Item 4. Principal Accountant Fees and Services.
The Timothy Plan Registrant Adviser
| Nature of the fees: | preparation of the 1120 RIC |
Registrant
| (e) | (1) | Audit Committee’s Pre-Approval Policies |
The Audit Committee Charter requires the Audit Committee to be responsible for the selection, retention or termination of auditors and, in connection therewith, to (i) evaluate the proposed fees and other compensation, if any, to be paid to the auditors, (ii) evaluate the independence of the auditors, (iii) pre-approve all audit services and, when appropriate, any non-audit services provided by the independent auditors to the Trust, (iv) pre-approve, when appropriate, any non-audit services provided by the independent auditors to the Trust's investment adviser, or any entity controlling, controlled by, or under common control with the investment adviser and that provides ongoing services to the Trust if the engagement relates directly to the operations and financial reporting of the Trust, and (v) receive the auditors’ specific representations as to their independence;
| | (2) | Percentages of Services Approved by the Audit Committee |
Audit-Related Fees: 0 %
Tax Fees: 0 %
All Other Fees: 0 %
(f) During audit of registrant's financial statements for the most recent fiscal year, less than 50 percent of the hours expended on the principal accountant's engagement were attributed to work performed by persons other than the principal accountant's full-time, permanent employees.
(g) The aggregate non-audit fees billed by the registrant's accountant for services rendered to the registrant, and rendered to the registrant's investment adviser (not including any sub-adviser whose role is primarily portfolio management and is subcontracted with or overseen by another investment adviser), and any entity controlling, controlled by, or under common control with the adviser that provides ongoing services to the registrant:
(h) Not applicable. The auditor performed no services for the registrant’s investment adviser or any entity controlling, controlled by, or under common control with the investment adviser that provides ongoing services to the registrant.
Item 5. Audit Committee of Listed Companies. Not applicable.
Item 6. Schedule of Investments. Not applicable – schedule filed with Item 1.
Item 7. Disclosure of Proxy Voting Policies and Procedures for Closed-End Funds. Not applicable.
Item 8. Portfolio Managers of Closed-End Management Investment Companies. Not applicable.
Item 9. Purchases of Equity Securities by Closed-End Management Investment Company and Affiliated Purchasers. Not applicable.
Item 10. Submission of Matters to a Vote of Security Holders
The registrant has not adopted procedures by which shareholders may recommend nominees to the registrant’s board of trustees.
Item 11. Controls and Procedures.
(a) Based on an evaluation of the registrant’s disclosure controls and procedures as of November 19, 2010, the disclosure controls and procedures are reasonably designed to ensure that the information required in filings on Forms N-CSR is recorded, processed, summarized, and reported on a timely basis.
(b) There were no significant changes in the registrant’s internal control over financial reporting that occurred during the registrant’s second fiscal quarter of the period covered by this report that has materially affected, or is reasonably likely to materially affect, the registrant’s internal control over financial reporting.
Item 12. Exhibits.
(a)(1) Code is filed herewith
| (a)(2) | Certifications by the registrant's principal executive officer and principal financial officer, pursuant to Section 302 of the Sarbanes- Oxley Act of 2002 and required by Rule 30a-2 under the Investment Company Act of 1940 are filed herewith. |
(a)(3) Not Applicable
| (b) | Certification pursuant to 18 U.S.C. Section 1350, as adopted pursuant to Section 906 of the Sarbanes-Oxley Act of 2002 is filed herewith. |
SIGNATURES
Pursuant to the requirements of the Securities Exchange Act of 1934 and the Investment Company Act of 1940, the registrant has duly caused this report to be signed on its behalf by the undersigned, thereunto duly authorized.
(Registrant) The Timothy Plan
| By | /s/ Arthur D. Ally | |
| | Arthur D. Ally, President |
| | |
| Date | 11/30/10 | |
Pursuant to the requirements of the Securities Exchange Act of 1934 and the Investment Company Act of 1940, this report has been signed below by the following persons on behalf of the registrant and in the capacities and on the dates indicated.
| By | /s/ Arthur D. Ally | |
| | Arthur D. Ally, President |
| | |
| Date | 11/30/10 | |