| | |
OMB APPROVAL |
|
OMB Number: | | 3235-0570 |
|
Expires: | | Nov. 30, 2005 |
|
Estimated average burden
|
hours per response: 5.0 |
|
UNITED STATES
SECURITIES AND EXCHANGE COMMISSION
Washington, D.C. 20549
FORM N-CSR
CERTIFIED SHAREHOLDER REPORT OF REGISTERED
MANAGEMENT INVESTMENT COMPANIES
Investment Company Act file number 811-08228
Timothy Plan
(Exact name of registrant as specified in charter)
| | |
| 1304 W. Fairbanks Ave. Winter Park, FL | | 32789 |
|
| (Address of principal executive offices) | | (Zip code) |
Arthur Ally
(Name and address of agent for service)
Registrant’s telephone number, including area code: (407) 644-1986
Date of fiscal year end: 12/31
Date of reporting period: 12/31/2003
Form N-CSR is to be used by management investment companies to file reports with the Commission not later than 10 days after the transmission to stockholders of any report that is required to be transmitted to stockholders under Rule 30e-1 under the Investment Company Act of 1940 (17 CFR 270.30e-1). The Commission may use the information provided on Form N-CSR in its regulatory, disclosure review, inspection, and policymaking roles.
A registrant is required to disclose the information specified by Form N-CSR, and the Commission will make this information public. A registrant is not required to respond to the collection of information contained in Form N-CSR unless the Form displays a currently valid Office of Management and Budget (“OMB”) control number. Please direct comments concerning the accuracy of the information collection burden estimate and any suggestions for reducing the burden to Secretary, Securities and Exchange Commission, 450 Fifth Street, NW, Washington, DC 20549-0609. The OMB has reviewed this collection of information under the clearance requirements of 44 U.S.C. § 3507.
| ITEM 1. | | [INSERT ANNUAL REPORT] |

Annual Report
December 31, 2003
Timothy Plan Family of Funds:
Aggressive Growth Fund
Large/Mid-Cap Growth Fund
Small-Cap Value Fund
Large/Mid-Cap Value Fund
Fixed-Income Fund
Money Market Fund
Strategic Growth Fund
Conservative Growth Fund
LETTER FROM THE PRESIDENT
December 31, 2003
ARTHUR D. ALLY
Dear Timothy Plan Shareholder:
It seems like only yesterday that I was writing these comments for the year ended 12-31-02. I must say, however, that this one is a lot less painful to write. I am sure those of you who were with us during the years of 2000, 2001, and 2002 vividly recall the negative market environment we all suffered. In fact, that existed right on through the first quarter of 2003, but then, the pendulum finally began to swing back to positive territory.
Although I will leave market comments to our various sub-advisors (see their letters enclosed,) I must confess that I was very happy with our overall 2003 performance and am looking forward to what I believe will be a pleasant 2004.
Our various funds may not be top performers at any given time but, given the quality of our money management sub-advisory firms, we are confident that we should be able to compete with any other funds over full market cycles. Of course, in this industry we cannot (and must not) ever make any guarantees of that fact.
In the meantime, the mission of Timothy goes on. You might be interested to know that we have created a six module seminar series on Biblical Stewardship that will be presented by a variety of Christian financial planners all over the country. We have been burdened for some time over the lack of teaching in this critical area in the church, even though God’s Word says more about that subject than any other by a very large margin. We are hopeful that this new seminar series will fill that void. In fact, if any of you have an interest in this series being presented in your church, please let us know. You can either email us at info@timothyplan.com or call us at 1-800-846-7526.
Once again, thanks for being part of the Timothy Plan family.
Sincerely,

Arthur D. Ally,
President
Letter From The President [1]
RETURNS FOR THE YEAR ENDED
December 31, 2003
TIMOTHY PLAN SMALL CAP VALUE FUND
| | | | | | | | | |
Fund/Index
| | 12 Month Total Return
| | | 5 Year Average
Annual Return
| | | Average Annual
Total Return Since Inception
| |
Timothy Small Cap Value Fund – Class A (a) (With sales charge) | | 31.53 | % | | 7.84 | % | | 6.62 | % |
Russell 2000 Index (a) | | 47.25 | % | | 7.13 | % | | 9.32 | % |
Timothy Small Cap Value Fund – Class B (b) (With CDSC) | | 30.88 | % | | 7.92 | % | | 7.03 | % |
Russell 2000 Index (b) | | 47.25 | % | | 7.13 | % | | 8.95 | % |
| (a) | For the period March 24, 1994 (commencement of investment in accordance with objective) to December 31, 2003. |
| (b) | For the period August 25, 1995 (commencement of investment in accordance with objective) to December 31, 2003. |
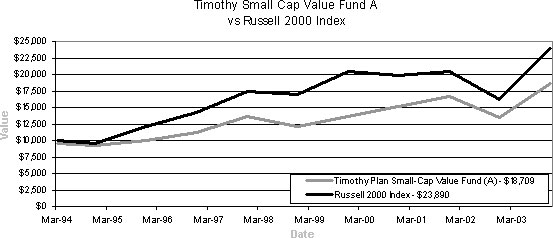
The chart shows the value of a hypothetical initial investment of $10,000 in the Fund A shares, and the Russell 2000 Index on March 24, 1994 and held through December 31, 2003. The Russell 2000 Index is widely recognized, unmanaged index of common stock prices. Performance figures include the change in value of the stocks in the index and the reinvestment of dividends. The index return does not reflect expenses, which have been deducted from the Fund’s return. The returns shown do not reflect deduction of taxes that a shareholder would pay on fund distributions or the redemption of the fund shares. THE FUND’S RETURN REPRESENTS PAST PERFORMANCE AND IS NOT PREDICTIVE OF FUTURE RESULTS.
Timothy Plan Performance Graphs [2]
RETURNS FOR THE YEAR ENDED
December 31, 2003
TIMOTHY PLAN SMALL CAP VALUE FUND
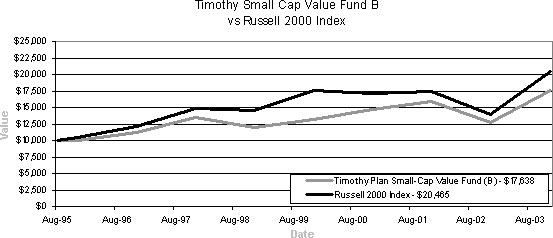
The chart shows the value of a hypothetical initial investment of $10,000 in the Fund B shares, and the Russell 2000 Index on August 25, 1995 and held through December 31, 2003. The Russell 2000 Index is widely recognized, unmanaged index of common stock prices. Performance figures include the change in value of the stocks in the index and the reinvestment of dividends. The index return does not reflect expenses, which have been deducted from the Fund’s return. The returns shown do not reflect deduction of taxes that a shareholder would pay on fund distributions or the redemption of the fund shares. THE FUND’S RETURN REPRESENTS PAST PERFORMANCE AND IS NOT PREDICTIVE OF FUTURE RESULTS.
Timothy Plan Performance Graphs [3]
RETURNS FOR THE YEAR ENDED
December 31, 2003
TIMOTHY PLAN LARGE/MID CAP VALUE FUND
| | | | | | | | |
Fund/Index
| | 12 Month Total Return
| | | 5 Year Average Annual Return
| | Average Annual Total Return Since Inception
| |
Timothy Large/Mid – Cap Value Fund – Class A (e) (With sales charge) | | 21.27 | % | | N/A | | 2.53 | % |
S&P 500 Index (e) | | 28.69 | % | | N/A | | -3.61 | % |
Timothy Large/Mid – Cap Value Fund – Class B (f) (With CDSC) | | 20.56 | % | | N/A | | 2.48 | % |
S&P 500 Index (f) | | 28.69 | % | | N/A | | -3.79 | % |
| (e) | For the period July 14, 1999 (commencement of investment in accordance with objective) to December 31, 2003. |
| (f) | For the period July 15, 1999 (commencement of investment in accordance with objective) to December 31, 2003. |
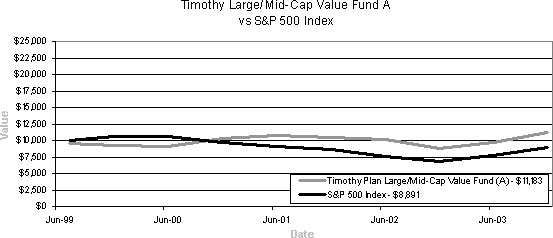
The chart shows the value of a hypothetical initial investment of $10,000 in the Fund A shares, and the S&P 500 Index on July 14, 1999 and held through December 31, 2003. The S&P 500 Index is widely recognized, unmanaged index of common stock prices. Performance figures include the change in value of the stocks in the index and the reinvestment of dividends. The index return does not reflect expenses, which have been deducted from the Fund’s return. The returns shown do not reflect deduction of taxes that a shareholder would pay on fund distributions or the redemption of the fund shares. THE FUND’S RETURN REPRESENTS PAST PERFORMANCE AND IS NOT PREDICTIVE OF FUTURE RESULTS.
Timothy Plan Performance Graphs [4]
RETURNS FOR THE YEAR ENDED
December 31, 2003
TIMOTHY PLAN LARGE/MID CAP VALUE FUND
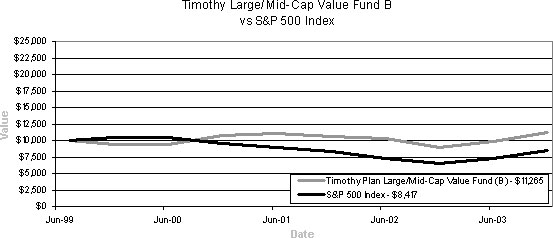
The chart shows the value of a hypothetical initial investment of $10,000 in the Fund B shares, and the S&P 500 Index on July 15, 1999 and held through December 31, 2003. The S&P 500 Index is widely recognized, unmanaged index of common stock prices. Performance figures include the change in value of the stocks in the index and the reinvestment of dividends. The index return does not reflect expenses, which have been deducted from the Fund’s return. The returns shown do not reflect deduction of taxes that a shareholder would pay on fund distributions or the redemption of the fund shares. THE FUND’S RETURN REPRESENTS PAST PERFORMANCE AND IS NOT PREDICTIVE OF FUTURE RESULTS.
Timothy Plan Performance Graphs [5]
RETURNS FOR THE YEAR ENDED
December 31, 2003
TIMOTHY PLAN FIXED INCOME FUND
| | | | | | | | |
Fund/Index
| | 12 Month Total Return
| | | 5 Year Average
Annual Return
| | Average Annual
Total Return Since Inception
| |
Timothy Fixed Income Fund – Class A (c) (With sales charge) | | 1.21 | % | | N/A | | 4.32 | % |
Dow Jones Bond Index (c) | | 9.87 | % | | N/A | | 9.13 | % |
Salomon Brothers Broad Investment Grade Index (c) | | 4.21 | % | | N/A | | 7.95 | % |
Timothy Fixed Income Fund – Class B (d) (With CDSC) | | -0.31 | % | | N/A | | 4.26 | % |
Dow Jones Bond Index (d) | | 9.87 | % | | N/A | | 9.58 | % |
Salomon Brothers Broad Investment Grade Index (d) | | 4.21 | % | | N/A | | 7.95 | % |
| (c) | For the period July 14, 1999 (commencement of investment in accordance with objective) to December 31, 2003. |
| (d) | For the period August 5, 1999 (commencement of investment in accordance with objective) to December 31, 2003. |
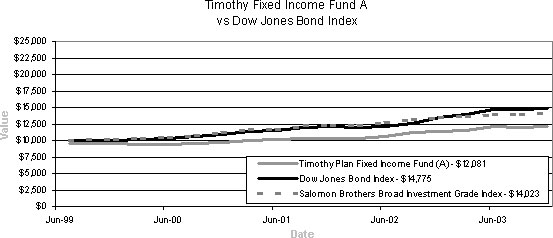
The chart shows the value of a hypothetical initial investment of $10,000 in the Fund A shares, and the Dow Jones Bond Index on July 14, 1999 and held through December 31, 2003. The Dow Jones Bond Index is widely recognized, unmanaged index of bond prices. Performance figures include the change in value of the bonds in the index and the reinvestment of interest. The index return does not reflect expenses, which have been deducted from the Fund’s return. The returns shown do not reflect deduction of taxes that a shareholder would pay on fund distributions or the redemption of the fund shares. THE FUND’S RETURN REPRESENTS PAST PERFORMANCE AND IS NOT PREDICTIVE OF FUTURE RESULTS.
Timothy Plan Performance Graphs [6]
RETURNS FOR THE YEAR ENDED
December 31, 2003
TIMOTHY PLAN FIXED INCOME FUND
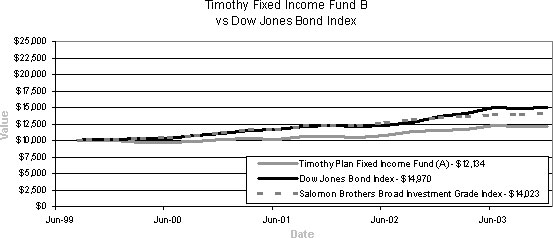
The chart shows the value of a hypothetical initial investment of $10,000 in the Fund B shares, and the Dow Jones Bond Index on August 5, 1999 and held through December 31, 2003. The Dow Jones Bond Index is widely recognized, unmanaged index of bond prices. Performance figures include the change in value of the bonds in the index and the reinvestment of interest. The index return does not reflect expenses, which have been deducted from the Fund’s return. The returns shown do not reflect deduction of taxes that a shareholder would pay on fund distributions or the redemption of the fund shares. THE FUND’S RETURN REPRESENTS PAST PERFORMANCE AND IS NOT PREDICTIVE OF FUTURE RESULTS.
Timothy Plan Performance Graphs [7]
RETURNS FOR THE YEAR ENDED
December 31, 2003
TIMOTHY PLAN AGGRESSIVE GROWTH FUND
| | | | | | | | |
Fund/Index
| | 12 Month Total Return
| | | 5 Year Average
Annual Return
| | Average Annual
Total Return Since Inception
| |
Timothy Aggressive Growth Fund – Class A (g) (With sales charge) | | 31.74 | % | | N/A | | -14.57 | % |
Russell Mid Cap Growth Index (g) | | 42.71 | % | | N/A | | -11.31 | % |
Timothy Aggressive Growth Fund – Class B (h) (With CDSC) | | 31.26 | % | | N/A | | -14.36 | % |
Russell Mid Cap Growth Index (h) | | 42.71 | % | | N/A | | -10.82 | % |
| (g) | For the period October 5, 2000 (commencement of investment in accordance with objective) to December 31, 2003. |
| (h) | For the period October 9, 2000 (commencement of investment in accordance with objective) to December 31, 2003. |
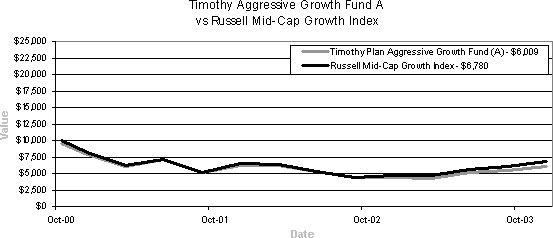
The chart shows the value of a hypothetical initial investment of $10,000 in the Fund A shares, and the Russell Mid Cap Growth Index on October 5, 2000 and held through December 31, 2003. The Russell Mid Cap Growth Index is widely recognized, unmanaged index of common stock prices. Performance figures include the change in value of the stocks in the index and the reinvestment of dividends. The index return does not reflect expenses, which have been deducted from the Fund’s return. The returns shown do not reflect deduction of taxes that a shareholder would pay on fund distributions or the redemption of the fund shares. THE FUND’S RETURN REPRESENTS PAST PERFORMANCE AND IS NOT PREDICTIVE OF FUTURE RESULTS.
Timothy Plan Performance Graphs [8]
RETURNS FOR THE YEAR ENDED
December 31, 2003
TIMOTHY PLAN AGGRESSIVE GROWTH FUND
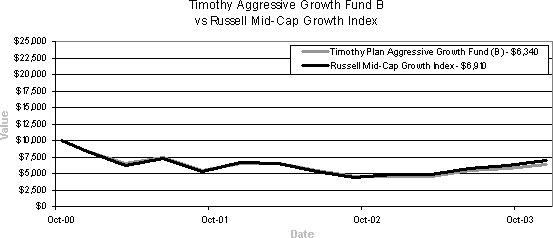
The chart shows the value of a hypothetical initial investment of $10,000 in the Fund B shares, and the Russell Mid Cap Growth Index on October 9, 2000 and held through December 31, 2003. The Russell Mid Cap Growth Index is widely recognized, unmanaged index of common stock prices. Performance figures include the change in value of the stocks in the index and the reinvestment of dividends. The index return does not reflect expenses, which have been deducted from the Fund’s return. The returns shown do not reflect deduction of taxes that a shareholder would pay on fund distributions or the redemption of the fund shares. THE FUND’S RETURN REPRESENTS PAST PERFORMANCE AND IS NOT PREDICTIVE OF FUTURE RESULTS.
Timothy Plan Performance Graphs [9]
RETURNS FOR THE YEAR ENDED
December 31, 2003
TIMOTHY PLAN LARGE/MID CAP GROWTH FUND
| | | | | | | | |
Fund/Index
| | 12 Month Total Return
| | | 5 Year Average
Annual Return
| | Average Annual
Total Return Since Inception
| |
Timothy Large/Mid Cap Growth Fund – Class A (i) (With sales charge) | | 13.74 | % | | N/A | | -15.28 | % |
Russell 1000 Growth Index (i) | | 29.75 | % | | N/A | | -14.69 | % |
Timothy Large/Mid Cap Growth Fund – Class B (j) (With CDSC) | | 13.40 | % | | N/A | | -15.00 | % |
Russell 1000 Growth Index (j) | | 29.75 | % | | N/A | | -14.00 | % |
| (i) | For the period October 5, 2000 (commencement of investment in accordance with objective) to December 31, 2003. |
| (j) | For the period October 9, 2000 (commencement of investment in accordance with objective) to December 31, 2003. |
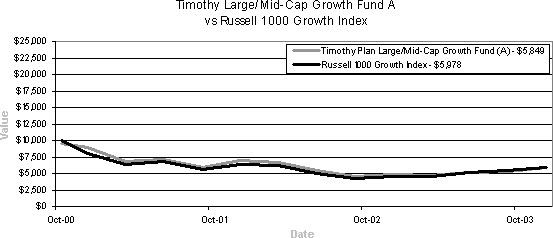
The chart shows the value of a hypothetical initial investment of $10,000 in the Fund A shares, and the Russell 1000 Growth Index on October 5, 2000 and held through December 31, 2003. The Russell 1000 Growth Index is widely recognized, unmanaged index of common stock prices. Performance figures include the change in value of the stocks in the index and the reinvestment of dividends. The index return does not reflect expenses, which have been deducted from the Fund’s return. The returns shown do not reflect deduction of taxes that a shareholder would pay on fund distributions or the redemption of the fund shares. THE FUND’S RETURN REPRESENTS PAST PERFORMANCE AND IS NOT PREDICTIVE OF FUTURE RESULTS.
Timothy Plan Performance Graphs [10]
RETURNS FOR THE YEAR ENDED
December 31, 2003
TIMOTHY PLAN LARGE/MID CAP GROWTH FUND
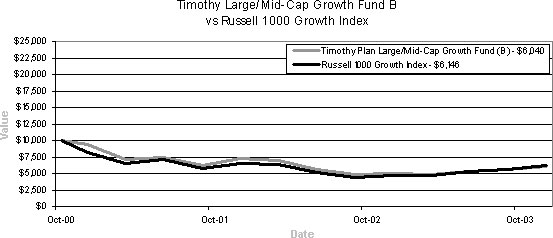
The chart shows the value of a hypothetical initial investment of $10,000 in the Fund B shares, and the Russell 1000 Growth Index on October 9, 2000 and held through December 31, 2003. The Russell 1000 Growth Index is widely recognized, unmanaged index of common stock prices. Performance figures include the change in value of the stocks in the index and the reinvestment of dividends. The index return does not reflect expenses, which have been deducted from the Fund’s return. The returns shown do not reflect deduction of taxes that a shareholder would pay on fund distributions or the redemption of the fund shares. THE FUND’S RETURN REPRESENTS PAST PERFORMANCE AND IS NOT PREDICTIVE OF FUTURE RESULTS.
Timothy Plan Performance Graphs [11]
RETURNS FOR THE YEAR ENDED
December 31, 2003
TIMOTHY PLAN STRATEGIC GROWTH FUND
| | | | | | | | |
Fund/Index
| | 12 Month Total Return
| | | 5 Year Average
Annual Return
| | Average Annual
Total Return Since Inception
| |
Timothy Strategic Growth Fund – Class A (m) (With sales charge) | | 21.09 | % | | N/A | | -7.84 | % |
S&P 500 Index (m) | | 28.69 | % | | N/A | | -6.16 | % |
Timothy Strategic Growth Fund – Class B (n) (With CDSC) | | 20.23 | % | | N/A | | -7.54 | % |
S&P 500 Index (n) | | 28.69 | % | | N/A | | -5.47 | % |
| (m) | For the period October 5, 2000 (commencement of investment in accordance with objective) to December 31, 2003. |
| (n) | For the period October 9, 2000 (commencement of investment in accordance with objective) to December 31, 2003. |
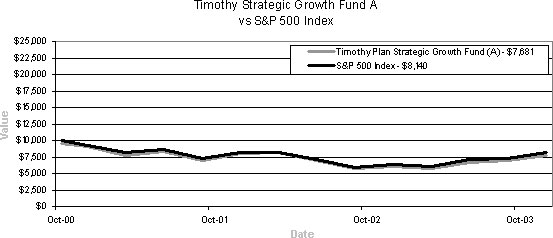
The chart shows the value of a hypothetical initial investment of $10,000 in the Fund A shares, and the S&P 500 Index on October 5, 2000 and held through December 31, 2003. The S&P 500 Index is widely recognized, unmanaged index of common stock prices. Performance figures include the change in value of the stocks in the index and the reinvestment of dividends. The index return does not reflect expenses, which have been deducted from the Fund’s return. The returns shown do not reflect deduction of taxes that a shareholder would pay on fund distributions or the redemption of the fund shares. THE FUND’S RETURN REPRESENTS PAST PERFORMANCE AND IS NOT PREDICTIVE OF FUTURE RESULTS.
Timothy Plan Performance Graphs [12]
RETURNS FOR THE YEAR ENDED
December 31, 2003
TIMOTHY PLAN STRATEGIC GROWTH FUND

The chart shows the value of a hypothetical initial investment of $10,000 in the Fund B shares, and the S&P 500 Index on October 9, 2000 and held through December 31, 2003. The S&P 500 Index is widely recognized, unmanaged index of common stock prices. Performance figures include the change in value of the stocks in the index and the reinvestment of dividends. The index return does not reflect expenses, which have been deducted from the Fund’s return. The returns shown do not reflect deduction of taxes that a shareholder would pay on fund distributions or the redemption of the fund shares. THE FUND’S RETURN REPRESENTS PAST PERFORMANCE AND IS NOT PREDICTIVE OF FUTURE RESULTS.
Timothy Plan Performance Graphs [13]
RETURNS FOR THE YEAR ENDED
December 31, 2003
TIMOTHY PLAN CONSERVATIVE GROWTH FUND
| | | | | | | | |
Fund/Index
| | 12 Month Total Return
| | | 5 Year Average
Annual Return
| | Average Annual
Total Return Since Inception
| |
Timothy Conservative Growth Fund – Class A (k) (With sales charge) | | 13.91 | % | | N/A | | -2.05 | % |
S&P 500 Index (k) | | 28.69 | % | | N/A | | -6.16 | % |
Timothy Conservative Growth Fund – Class B (l) (With CDSC) | | 14.20 | % | | N/A | | -1.81 | % |
S&P 500 Index (l) | | 28.69 | % | | N/A | | -5.47 | % |
| (k) | For the period October 5, 2000 (commencement of investment in accordance with objective) to December 31, 2003. |
| (l) | For the period October 9, 2000 (commencement of investment in accordance with objective) to December 31, 2003. |
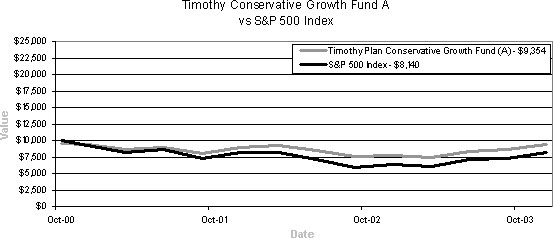
The chart shows the value of a hypothetical initial investment of $10,000 in the Fund A shares, and the S&P 500 Index on October 5, 2000 and held through December 31, 2003. The S&P 500 Index is widely recognized, unmanaged index of common stock prices. Performance figures include the change in value of the stocks in the index and the reinvestment of dividends. The index return does not reflect expenses, which have been deducted from the Fund’s return. The returns shown do not reflect deduction of taxes that a shareholder would pay on fund distributions or the redemption of the fund shares. THE FUND’S RETURN REPRESENTS PAST PERFORMANCE AND IS NOT PREDICTIVE OF FUTURE RESULTS.
Timothy Plan Performance Graphs [14]
RETURNS FOR THE YEAR ENDED
December 31, 2003
TIMOTHY PLAN CONSERVATIVE GROWTH FUND
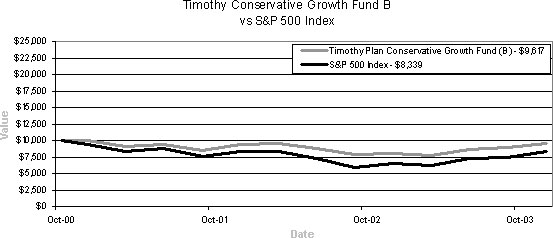
The chart shows the value of a hypothetical initial investment of $10,000 in the Fund B shares, and the S&P 500 Index on October 9, 2000 and held through December 31, 2003. The S&P 500 Index is widely recognized, unmanaged index of common stock prices. Performance figures include the change in value of the stocks in the index and the reinvestment of dividends. The index return does not reflect expenses, which have been deducted from the Fund’s return. The returns shown do not reflect deduction of taxes that a shareholder would pay on fund distributions or the redemption of the fund shares. THE FUND’S RETURN REPRESENTS PAST PERFORMANCE AND IS NOT PREDICTIVE OF FUTURE RESULTS.
Timothy Plan Performance Graphs [15]
OFFICERS AND TRUSTEES OF THE TRUST
As of December 31, 2003
TIMOTHY PLAN FAMILY OF FUNDS
| | | | | | |
Name, Age and Address
| | Position(s) Held With Trust
| | Term of Office and Length of Time Served
| | Number of Portfolios in Fund
Complex Overseen by Trustee
|
Arthur D. Ally* 1304 W Fairbanks Avenue Winter Park, FL | | Chairman and President | | Indefinite; Trustee and President since 1994 | | 11 |
| | | Principal Occupation During Past 5 Years
| | Other Directorships Held by Trustee
|
Born: 1942 | | President and controlling shareholder of Covenant Funds, Inc. (“CFI”), a holding company. President and general partner of Timothy Partners, Ltd. (“TPL”), the investment adviser and principal underwriter to each Fund. CFI is also the managing general partner of TPL. | | None |
| | | |
Name, Age and Address
| | Position(s) Held With Trust
| | Term of Office and Length of Time Served
| | Number of Portfolios in Fund
Complex Overseen by Trustee
|
Joseph E. Boatwright** 1410 Hyde Park Drive Winter Park, FL | | Trustee, Secretary | | Indefinite; Trustee and Secretary since 1995 | | 11 |
| | | Principal Occupation During Past 5 Years
| | Other Directorships Held by Trustee
|
Born: 1930 | | Retired Minister. Currently serves as a consultant to the Greater Orlando Baptist Association. Served as Senior Pastor to Aloma Baptist Church from 1970-1996. | | None |
| | | |
Name, Age and Address
| | Position(s) Held With Trust
| | Term of Office and Length of Time Served
| | Number of Portfolios in Fund
Complex Overseen by Trustee
|
Jock M. Sneddon** 6001 Vineland Drive Orlando, FL | | Trustee | | Indefinite; Trustee since 1997 | | 11 |
| | | Principal Occupation During Past 5 Years
| | Other Directorships Held by Trustee
|
| | | Physician, Florida Hospital Centra Care. | | None |
The accompanying notes are an integral part of these financial statements.
Timothy Plan Small-Cap Value Fund [16]
OFFICERS AND TRUSTEES OF THE TRUST
As of December 31, 2003
TIMOTHY PLAN FAMILY OF FUNDS
| | | | | | |
Name, Age and Address
| | Position(s) Held With Trust
| | Term of Office and Length of Time Served
| | Number of Portfolios in Fund
Complex Overseen by Trustee
|
Mathew D. Staver** 210 East Palmetto Avenue Longwood, FL 32750 | | Trustee | | Indefinite; Trustee since 2000 | | 11 |
| | | Principal Occupation During Past 5 Years
| | Other Directorships Held by Trustee
|
Born: 1956 | | Attorney specializing in free speech, appellate practice and religious liberty constitutional law. Founder of Liberty Counsel, a religious civil liberties education and legal defense organization. Host of two radio programs devoted to religious freedom issues. Editor of a monthly newsletter devoted to religious liberty topics. Mr. Staver has argued before the United States Supreme Court and has published numerous legal articles. | | None |
| | | |
Name, Age and Address
| | Position(s) Held With Trust
| | Term of Office and Length of Time Served
| | Number of Portfolios in Fund
Complex Overseen by Trustee
|
Bill Dodson 7120 N Whitney Avenue Fresno, CA 93720 | | Trustee | | Trustee from 2001 - 12/01/03 | | 11 |
| | | Principal Occupation During Past 5 Years
| | Other Directorships Held by Trustee
|
Born: 1960 | | Vice President – Sales, CPCF, Inc. a registered broker-dealer and a subsidiary of the California Baptist Foundation and the California Southern Baptist Convention. Mr. Dodson is a General Securities Principal (Series 24) and licensed minister. Mr. Dodson has previous experience as a General Securities Representative (Series 7) with two national brokerage firms. | | None |
| | | |
Name, Age and Address
| | Position(s) Held With Trust
| | Term of Office and Length of Time Served
| | Number of Portfolios in Fund
Complex Overseen by Trustee
|
W. Thomas Fyler, Jr. 640 Ft. Washington Avenue Suite 6C New York, NY 10040 | | Trustee | | Trustee from 1998 - 12/01/03 | | 11 |
| | | Principal Occupation During Past 5 Years
| | Other Directorships Held by Trustee
|
Born: 1957 | | President, controlling shareholder of W.T. Fyler, Jr./Ephesus, Inc., a New York State registered investment advisory firm. Founding member of the National Association of Christian Financial Consultants. | | None |
The accompanying notes are an integral part of these financial statements.
Timothy Plan Small-Cap Value Fund [17]
OFFICERS AND TRUSTEES OF THE TRUST
As of December 31, 2003
TIMOTHY PLAN FAMILY OF FUNDS
| | | | | | |
Name, Age and Address
| | Position(s) Held With Trust
| | Term of Office and Length of Time Served
| | Number of Portfolios in Fund
Complex Overseen by Trustee
|
Mark A. Minnella 1215 Fern Ridge Parkway Suite 110 Creve Coeur, MO 63141 | | Trustee | | Trustee from 2000 - 12/01/03 | | 11 |
| | | Principal Occupation During Past 5 Years
| | Other Directorships Held by Trustee
|
Born: 1955 | | Principal and co-founder of Integrity Investors, LLC., a registered investment advisory firm. Co-founder, President and director of the National Association of Christian Financial Consultants. Mr. Minnella is a Registered Investment Principal (NASD Series 24), and a registered investment adviser (NASD Series 65). | | None |
| | | |
Name, Age and Address
| | Position(s) Held With Trust
| | Term of Office and Length of Time Served
| | Number of Portfolios in Fund
Complex Overseen by Trustee
|
Charles E. Nelson 1145 Cross Creek Circle Altamonte Springs, FL | | Trustee | | Indefinite; Trustee since 2000 | | 11 |
| | | Principal Occupation During Past 5 Years
| | Other Directorships Held by Trustee
|
Born: 1934 | | Certified Public Accountant. Director of Operations, National Multiple Sclerosis Society Mid Florida Chapter. Formerly Director of Finance, Hospice of the Comforter, Inc. Formerly Comptroller, Florida United Methodist Children’s Home, Inc. Formerly Credit Specialist with the Resolution Trust Corporation and Senior Executive Vice President, Barnett Bank of Central Florida, N.A. Formerly managing partner, Arthur Andersen, CPA firm, Orlando, Florida branch. | | None |
| | | |
Name, Age and Address
| | Position(s) Held With Trust
| | Term of Office and Length of Time Served
| | Number of Portfolios in Fund
Complex Overseen by Trustee
|
Wesley W. Pennington 442 Raymond Avenue Longwood, FL | | Trustee | | Indefinite; Trustee and Treasurer since 1994 | | 11 |
| | | Principal Occupation During Past 5 Years
| | Other Directorships Held by Trustee
|
Born: 1930 | | Retired Air Force Officer. Past President, Westwind Holdings, Inc., a development company, since 1997. Past President and controlling shareholder, Weston, Inc., a fabric treatment company, form 1979-1997. President, Designer Services Group 1980-1988. | | None |
The accompanying notes are an integral part of these financial statements.
Timothy Plan Small-Cap Value Fund [18]
OFFICERS AND TRUSTEES OF THE TRUST
As of December 31, 2003
TIMOTHY PLAN FAMILY OF FUNDS
| | | | | | |
Name, Age and Address
| | Position(s) Held With Trust
| | Term of Office and Length of Time Served
| | Number of Portfolios in Fund
Complex Overseen by Trustee
|
Scott Preissler, Ph.D. P O Box 50434 Indianapolis, IN 46250 | | Trustee | | Indefinate; New as of 1/1/04 | | 11 |
| | | Principal Occupation During Past 5 Years
| | Other Directorships Held by Trustee
|
Born: 1960 | | President and CEO of Christian Stewardship Association where he has been affiliated for the past 14 years. | | None |
| | | |
Name, Age and Address
| | Position(s) Held With Trust
| | Term of Office and Length of Time Served
| | Number of Portfolios in Fund
Complex Overseen by Trustee
|
Alan M. Ross 11210 West Road Roswell, Ga 30075 | | Trustee | | Indefinate; New as of 1/1/04 | | 11 |
| | | Principal Occupation During Past 5 Years
| | Other Directorships Held by Trustee
|
Born: 1951 | | Founder and CEO of Corporate Development Institute which he founded five years ago. Previously he served as President and CEO of Fellowship of Companies for Christ and has authored three books: Beyond World Class, Unconditional Excellence, Breaking Through to Prosperity. | | None |
| | | |
Name, Age and Address
| | Position(s) Held With Trust
| | Term of Office and Length of Time Served
| | Number of Portfolios in Fund
Complex Overseen by Trustee
|
Robert Scraper P O Box 1315 Houston, Tx 77251 | | Trustee | | Indefinate; New as of 1/1/04 | | 11 |
| | | Principal Occupation During Past 5 Years
| | Other Directorships Held by Trustee
|
Born: 1946 | | Senior Vice President - Investments for Frost National Bank of Texas since 1987. | | None |
The accompanying notes are an integral part of these financial statements.
Timothy Plan Small-Cap Value Fund [19]
LETTER FROM THE MANAGER
December 31, 2003
SMALL CAP VALUE FUND
For 2003, the Timothy Plan returned 38.81% versus 47.25% for the Russell 2000. As you can see, the year 2003 turned out to be a challenging year for us in terms of outperforming the Russell 2000.
The crux of the performance issue was confined to the early part of the year: during that period, there was a capitulation decline followed by a significant short covering rally in the equity markets, where the stocks that had gone down the most from 3/00 through 3/03 went up the most; low quality stocks did well; high valuation stocks did well; high volatility stocks did well; the stocks of companies who lose money did well.
It was very difficult to outperform the Russell 2000 during this period if one owned high quality stocks (as the Timothy Plan Small Cap Value Fund does) and if one exercised price disciplines, which Awad did.
The remainder of the year was more of a traditional relative value environment and during this period, Timothy performed competitively relative to the Russell 2000.
The current consensus is that 2004 will bring another good year. Of course, the consensus can always be wrong.
Looking at both positives and negatives on the horizon, it seems to me that the prudent approach is to be carefully optimistic by sticking to companies with good balance sheets, sound business models, understandable accounting, good governance and attractive valuations. Our goal, and our strategy, is to position the Fund to benefit from such a portfolio structure.
James D. Awad
Chairman
Awad Asset Management
Letter From The Manager [20]
SCHEDULE OF INVESTMENTS
As of December 31, 2003
COMMON STOCKS - 94.74%
| | | | | |
number of shares
| | | | market value
|
| | | | | | |
| | | APPLICATION SOFTWARE - 2.21% | | | |
33,000 | | BARRA, Inc. | | $ | 1,171,170 |
| | | | |
|
|
| | | BALL & ROLLER BEARINGS - 3.20% | | | |
65,600 | | Kaydon Corp. | | | 1,695,104 |
| | | | |
|
|
| | | CANNED, FROZEN & PRESERVED FRUIT, VEGETABLES & FOOD SPECIALTIES - 2.47% | | | |
38,000 | | Corn Products International, Inc. | | | 1,309,100 |
| | | | |
|
|
| | | CONSUMER CREDIT REPORTING, COLLECTION AGENCIES - 3.14% | | | |
72,900 | | NCO Group, Inc. * | | | 1,659,933 |
| | | | |
|
|
| | | DIVERSIFIED HOLDINGS - 1.89% | | | |
100,000 | | Quanta Holdings ^ | | | 1,000,000 |
| | | | |
|
|
| | | ELECTRIC & OTHER SERVICES COMBINED - 3.44% | | | |
59,500 | | ALLETE, Inc. | | | 1,820,700 |
| | | | |
|
|
| | | HEALTH CARE SOFTWARE - 3.04% | | | |
60,000 | | Covance Inc. * | | | 1,608,000 |
| | | | |
|
|
| | | HEALTH CARE SUPPLIES - 1.07% | | | |
30,000 | | Sola International Inc. * | | | 564,000 |
| | | | |
|
|
| | | INVESTMENT COMPANIES - 2.58% | | | |
70,000 | | MCG Capital Corp. | | | 1,365,000 |
| | | | |
|
|
| | | MEDICAL SERVICES - 3.50% | | | |
75,000 | | Inverseek Research Group, Inc. * | | | 1,854,750 |
| | | | |
|
|
| | | MISCELLANEOUS ELECTRICAL MACHINERY, EQUIPMENT & SUPPLIES - 4.12% | | | |
104,000 | | Rayovac Corp. * | | | 2,178,800 |
| | | | |
|
|
| | | MISCELLANEOUS PLASTIC PRODUCTS - 4.19% | | | |
90,000 | | Spartech Corp. | | | 2,217,600 |
| | | | |
|
|
| | | PHARMACEUTICAL PREPARATIONS - 2.18% | | | |
45,300 | | K-V Pharmaceutical Co. - Class A * | | | 1,155,150 |
| | | | |
|
|
| | | PHOTOGRAPHIC EQUIPMENT & SUPPLIES - 1.60% | | | |
91,800 | | Concord Camera Corp. * | | | 849,150 |
| | | | |
|
|
| | | PUBLISHING - 4.19% | | | |
63,000 | | Interactive Data Corporation * | | | 1,043,280 |
45,000 | | John Wiley & Sons, Inc., Class A | | | 1,171,350 |
| | | | |
|
|
| | | | | | 2,214,630 |
| | | | |
|
|
| | | REIT - HOTELS - 2.06% | | | |
100,000 | | Highland Hospitality Corp.* | | | 1,090,000 |
| | | | |
|
|
The accompanying notes are an integral part of these financial statements.
Timothy Plan Small-Cap Value Fund [21]
SCHEDULE OF INVESTMENTS
As of December 31, 2003
COMMON STOCKS - 94.74% (cont.)
| | | | | |
number of shares
| | | | market value
|
| | | RETAIL-EATING PLACES - 5.47% | | | |
62,000 | | Brinker Intl, Inc. * | | $ | 2,055,920 |
29,500 | | Ruby Tuesday, Inc. | | | 840,455 |
| | | | |
|
|
| | | | | | 2,896,375 |
| | | | |
|
|
| | | RETAIL-FAMILY CLOTHING STORES - 3.41% | | | |
64,700 | | Stage Stores, Inc. * | | | 1,805,130 |
| | | | |
|
|
| | | SERVICES - BUSINESS SERVICES - 7.15% | | | |
68,000 | | Sourcecorp,Inc. * | | | 1,742,840 |
50,000 | | Startek, Inc. | | | 2,039,500 |
| | | | |
|
|
| | | | | | 3,782,340 |
| | | | |
|
|
| | | SERVICES - DATA PROCESSING - 5.21% | | | |
57,500 | | Ceridian Corporation * | | | 1,204,050 |
119,000 | | infoUSA, Inc. * | | | 882,980 |
45,000 | | The BISYS Group, Inc.* | | | 669,600 |
| | | | |
|
|
| | | | | | 2,756,630 |
| | | | |
|
|
| | | SERVICES - DIVERSIFIED/COMMERCIAL - 3.93% | | | |
92,000 | | The Brink’s Company | | | 2,080,120 |
| | | | |
|
|
| | | SPECIAL INDUSTRY MACHINERY - 2.76% | | | |
143,000 | | Axcelis Technologies, Inc. * | | | 1,461,460 |
| | | | |
|
|
| | | SPECIALTY STORES - 5.71% | | | |
48,500 | | Sonic Automotive, Inc. | | | 1,111,620 |
61,000 | | United Auto Group, Inc. | | | 1,909,300 |
| | | | |
|
|
| | | | | | 3,020,920 |
| | | | |
|
|
| | | STATE COMMERCIAL BANKS - 3.21% | | | |
42,000 | | North Fork Bancorp, Inc. | | | 1,699,740 |
| | | | |
|
|
| | | TECHNOLOGY DISTRIBUTION - 2.10% | | | |
28,000 | | Tech Data Corporation * | | | 1,111,320 |
| | | | |
|
|
| | | TELEPHONE & TELEGRAPH APPARATUS - 3.39% | | | |
55,000 | | Plantronics, Inc. * | | | 1,795,750 |
| | | | |
|
|
| | | TELECOMMUNICATIONS - 4.28% | | | |
39,500 | | Allstream, Inc. Cl B Ltd Voting | | | 2,265,325 |
| | | | |
|
|
| | | THRIFTS & MORTGAGE FINANCE - 3.24% | | | |
46,000 | | The PMI Group, Inc. | | | 1,712,580 |
| | | | |
|
|
| | | Total Common Stocks (cost $37,631,989) | | | 50,140,777 |
| | | | |
|
|
The accompanying notes are an integral part of these financial statements.
Timothy Plan Small-Cap Value Fund [22]
SCHEDULE OF INVESTMENTS
As of December 31, 2003
SHORT-TERM INVESTMENTS - 5.29%
| | | | | | |
number of shares
| | | | market value
| |
479,541 | | Federated Cash Trust Series II Treasury | | $ | 479,541 | |
2,319,030 | | First American Treasury Obligations Fund Class A | | | 2,319,030 | |
| | | | |
|
|
|
| | | Total Short-Term Investments (cost $2,798,571) | | | 2,798,571 | |
| | | | |
|
|
|
| | | TOTAL INVESTMENTS - 100.03% (identified cost $40,430,560) | | | 52,939,348 | |
| | | LIABILITIES IN EXCESS OF OTHER ASSETS, NET - (0.03)% | | | (16,833 | ) |
| | | | |
|
|
|
| | | NET ASSETS - 100.00% | | $ | 52,922,515 | |
| | | | |
|
|
|
| * | Non-income producing securities |
| ^ | SEC Rule 144A security. Such securities are traded only among qualified institutional buyers. |
The accompanying notes are an integral part of these financial statements.
Timothy Plan Small-Cap Value Fund [23]
STATEMENT OF ASSETS AND LIABILITIES
As of December 31, 2003
ASSETS
| | | |
| | | amount
|
Investments in Securities at Value (identified cost $40,430,560) [NOTE 1] | | $ | 52,939,348 |
| |
Receivables: | | | |
Interest | | | 808 |
Dividends | | | 198,243 |
Fund Shares Sold | | | 68,881 |
| | |
|
|
Total Assets | | $ | 53,207,280 |
| | |
|
|
| |
LIABILITIES | | | |
| |
| | | amount
|
Accrued Advisory Fees | | | 37,358 |
Accrued 12b-1 Fees | | | 22,668 |
Payable for Fund Shares Redeemed | | | 177,667 |
Accrued Expenses | | | 47,072 |
| | |
|
|
Total Liabilities | | $ | 284,765 |
| | |
|
|
| |
NET ASSETS | | | |
| |
| | | amount
|
Class A Shares: | | | |
Net Assets (unlimited shares of $0.001 par beneficial interest authorized; 2,212,202 shares outstanding) | | $ | 34,184,840 |
Net Asset Value and Redemption Price Per Class A Share ($34,184,840/2,212,202 shares) | | $ | 15.45 |
Offering Price Per Share ($15.45/0.9475) | | $ | 16.31 |
Class B Shares: | | | |
Net Assets (unlimited shares of $0.001 par beneficial interest authorized; 1,284,314 shares outstanding) | | $ | 18,737,675 |
Net Asset Value and Offering Price Per Class B Share ($18,737,675/1,284,314 shares) | | $ | 14.59 |
Maximum Redemption Price Per Class B Share ($14.59 x 0.95) | | $ | 13.86 |
| |
Net Assets | | $ | 52,922,515 |
| | |
|
|
| |
SOURCES OF NET ASSETS | | | |
| |
| | | amount
|
At December 31, 2003, Net Assets Consisted of: | | | |
Paid-in Capital | | $ | 40,070,284 |
Accumulated Net Realized Gain on Investments | | | 343,443 |
Net Unrealized Appreciation in Value of Investments | | | 12,508,788 |
| | |
|
|
Net Assets | | $ | 52,922,515 |
| | |
|
|
The accompanying notes are an integral part of these financial statements.
Timothy Plan Small-Cap Value Fund [24]
STATEMENT OF OPERATIONS
For the Year Ended December 31, 2003
INVESTMENT INCOME
| | | | |
| | | amount
| |
Interest | | $ | 15,929 | |
Dividends | | | 457,008 | |
| | |
|
|
|
Total Investment Income | | | 472,937 | |
| | |
|
|
|
| |
EXPENSES | | | | |
| |
| | | amount
| |
Investment Advisory Fees [NOTE 3] | | | 358,203 | |
Fund Accounting, Transfer Agency, & Administration Fees | | | 133,681 | |
12b-1 Fess (Class A = $66,308, Class B =$116,605) [NOTE 3] | | | 182,913 | |
Service Fees (Class B) [NOTE 3] | | | 38,868 | |
Auditing Fees | | | 30,079 | |
Legal Expense | | | 4,620 | |
Registration Fees | | | 38,925 | |
Insurance Expense | | | 5,524 | |
Custodian Fees | | | 14,956 | |
Printing Expense | | | 10,455 | |
Miscellaneous Expense | | | 16,066 | |
| | |
|
|
|
Total Net Expenses | | | 834,290 | |
| | |
|
|
|
Net Investment (Loss) | | | (361,353 | ) |
| | |
|
|
|
| |
REALIZED AND UNREALIZED GAIN ON INVESTMENTS | | | | |
| |
| | | amount
| |
Net Realized Gain on Investments | | | 404,190 | |
Change in Unrealized Appreciation of Investments | | | 14,360,903 | |
| | |
|
|
|
Net Realized and Unrealized Gain on Investments | | | 14,765,093 | |
| | |
|
|
|
Increase in Net Assets Resulting from Operations | | $ | 14,403,740 | |
| | |
|
|
|
The accompanying notes are an integral part of these financial statements.
Timothy Plan Small-Cap Value Fund [25]
STATEMENT OF CHANGES IN NET ASSETS
INCREASE (DECREASE) IN NET ASSETS
| | | | | | | | |
| | | year ended
12/31/03
| | | year ended
12/31/02
| |
Operations: | | | | | | | | |
Net Investment Income (Loss) | | $ | (361,353 | ) | | $ | (289,491 | ) |
Net Change in Unrealized Appreciation (Depreciation) of Investments | | | 14,360,903 | | | | (8,276,735 | ) |
Net Realized Gain (Loss) on Investments | | | 404,190 | | | | (42,848 | ) |
| | |
|
|
| |
|
|
|
Increase (Decrease) in Net Assets (resulting from operations) | | | 14,403,740 | | | | (8,609,074 | ) |
| | |
|
|
| |
|
|
|
Distributions to Shareholders From: | | | | | | | | |
Net Capital Gains: | | | | | | | | |
Class A | | | — | | | | (10,661 | ) |
Class B | | | — | | | | (7,238 | ) |
| | |
|
|
| |
|
|
|
Total Net Distributions | | | — | | | | (17,899 | ) |
| | |
|
|
| |
|
|
|
Capital Share Transactions: | | | | | | | | |
Proceeds from Shares Sold: | | | | | | | | |
Class A | | | 5,160,950 | | | | 9,346,918 | |
Class B | | | 1,586,031 | | | | 3,251,284 | |
Dividends Reinvested: | | | | | | | | |
Class A | | | — | | | | 7,026 | |
Class B | | | — | | | | 6,948 | |
Cost of Shares Redeemed: | | | | | | | | |
Class A | | | (2,831,326 | ) | | | (3,430,730 | ) |
Class B | | | (2,509,798 | ) | | | (2,724,918 | ) |
| | |
|
|
| |
|
|
|
Increase in Net Assets (resulting from capital share transactions) | | | 1,405,857 | | | | 6,456,528 | |
| | |
|
|
| |
|
|
|
Total Increase (Decrease) in Net Assets | | | 15,809,597 | | | | (2,170,445 | ) |
| | |
Net Assets: | | | | | | | | |
Beginning of Year | | | 37,112,918 | | | | 39,283,363 | |
| | |
|
|
| |
|
|
|
End of Year | | $ | 52,922,515 | | | $ | 37,112,918 | |
| | |
|
|
| |
|
|
|
Shares of Capital Stock of the Fund Sold and Redeemed: | | | | | | | | |
Shares Sold: | | | | | | | | |
Class A | | | 413,932 | | | | 728,940 | |
Class B | | | 134,512 | | | | 257,853 | |
Shares Reinvested: | | | | | | | | |
Class A | | | — | | | | 632 | |
Class B | | | — | | | | 657 | |
Shares Redeemed: | | | | | | | | |
Class A | | | (233,248 | ) | | | (267,247 | ) |
Class B | | | (220,892 | ) | | | (223,459 | ) |
| | |
|
|
| |
|
|
|
Net Increase in Number of Shares Outstanding | | | 94,304 | | | | 497,376 | |
| | |
|
|
| |
|
|
|
The accompanying notes are an integral part of these financial statements.
Timothy Plan Small-Cap Value Fund [26]
FINANCIAL HIGHLIGHTS
The table below set forth financial data for one share of capital stock outstanding throughout each year presented.
SMALL-CAP VALUE FUND - CLASS A SHARES
| | | | | | | | | | | | | | | | | | | | |
| | | year
ended
12/31/03
| | | year
ended
12/31/02
| | | year
ended
12/31/01
| | | year
ended
12/31/00
| | | year
ended
12/31/99
| |
Per Share Operating Performance: | | | | | | | | | | | | | | | | | | | | |
Net Asset Value at Beginning of Year | | $ | 11.13 | | | $ | 13.79 | | | $ | 12.61 | | | $ | 12.26 | | | $ | 10.89 | |
| | |
|
|
| |
|
|
| |
|
|
| |
|
|
| |
|
|
|
Income from Investment Operations: | | | | | | | | | | | | | | | | | | | | |
Net Investment Income (Loss) | | | (0.07 | ) | | | (0.05 | ) | | | (0.09 | ) | | | (0.05 | ) | | | (0.02 | ) |
Net Realized and Unrealized Gain (Loss) on Investments | | | 4.39 | | | | (2.60 | ) | | | 1.30 | | | | 1.43 | | | | 1.39 | |
| | |
|
|
| |
|
|
| |
|
|
| |
|
|
| |
|
|
|
Total from Investment Operations | | | 4.32 | | | | (2.65 | ) | | | 1.21 | | | | 1.38 | | | | 1.37 | |
| | |
|
|
| |
|
|
| |
|
|
| |
|
|
| |
|
|
|
Less Distributions: | | | | | | | | | | | | | | | | | | | | |
Dividends from Realized Gains | | | — | | | | (0.01 | ) | | | (0.03 | ) | | | (1.03 | ) | | | — | |
Dividends from Net Investment Income | | | — | | | | — | | | | — | | | | — | | | | — | |
| | |
|
|
| |
|
|
| |
|
|
| |
|
|
| |
|
|
|
Total Distributions | | | — | | | | (0.01 | ) | | | (0.03 | ) | | | (1.03 | ) | | | — | |
| | |
|
|
| |
|
|
| |
|
|
| |
|
|
| |
|
|
|
Net Asset Value at End of Year | | $ | 15.45 | | | $ | 11.13 | | | $ | 13.79 | | | $ | 12.61 | | | $ | 12.26 | |
| | |
|
|
| |
|
|
| |
|
|
| |
|
|
| |
|
|
|
Total Return (A) | | | 38.81 | % | | | (19.25 | )% | | | 9.66 | % | | | 11.23 | % | | | 12.58 | % |
| | | | | |
Ratios/Supplemental Data: | | | | | | | | | | | | | | | | | | | | |
Net Assets, End of Year (in 000s) | | $ | 34,185 | | | $ | 22,603 | | | $ | 21,632 | | | $ | 15,217 | | | $ | 13,377 | |
| | | | | |
Ratio of Expenses to Average Net Assets: | | | | | | | | | | | | | | | | | | | | |
Before Reimbursement of Expenses by Advisor | | | 1.71 | % | | | 1.75 | % | | | 1.89 | % | | | 1.97 | % | | | 2.22 | % |
After Reimbursement of Expenses by Advisor | | | 1.71 | % | | | 1.75 | % | | | 1.89 | % | | | 1.76 | % | | | 1.60 | % |
| | | | | |
Ratio of Net Investment (Loss) to Average Net Assets: | | | | | | | | | | | | | | | | | | | | |
Before Reimbursement of Expenses by Advisor | | | (0.55 | )% | | | (0.46 | )% | | | (0.80 | )% | | | (0.48 | )% | | | (0.82 | )% |
After Reimbursement of Expenses by Advisor | | | (0.55 | )% | | | (0.46 | )% | | | (0.80 | )% | | | (0.27 | )% | | | (0.20 | )% |
| | | | | |
Portfolio Turnover | | | 47.99 | % | | | 66.95 | % | | | 61.41 | % | | | 99.17 | % | | | 78.79 | % |
| (A) | Total Return Calculation Does Not Reflect Sales Load. |
The accompanying notes are an integral part of these financial statements.
Timothy Plan Small-Cap Value Fund [27]
FINANCIAL HIGHLIGHTS
The table below set forth financial data for one share of capital stock outstanding throughout each year presented.
SMALL-CAP VALUE FUND - CLASS B SHARES
| | | | | | | | | | | | | | | | | | | | |
| | | year
ended
12/31/03
| | | year
ended
12/31/02
| | | year
ended
12/31/01
| | | year
ended
12/31/00
| | | year
ended
12/31/99
| |
Per Share Operating Performance: | | | | | | | | | | | | | | | | | | | | |
Net Asset Value at Beginning of Year | | $ | 10.59 | | | $ | 13.22 | | | $ | 12.19 | | | $ | 11.88 | | | $ | 10.70 | |
| | |
|
|
| |
|
|
| |
|
|
| |
|
|
| |
|
|
|
Income from Investment Operations: | | | | | | | | | | | | | | | | | | | | |
Net Investment Income (Loss) | | | (0.16 | ) | | | (0.14 | ) | | | (0.22 | ) | | | (0.10 | ) | | | (0.11 | ) |
Net Realized and Unrealized Gain (Loss) on Investments | | | 4.16 | | | | (2.48 | ) | | | 1.28 | | | | 1.39 | | | | 1.29 | |
| | |
|
|
| |
|
|
| |
|
|
| |
|
|
| |
|
|
|
Total from Investment Operations | | | 4.00 | | | | (2.62 | ) | | | 1.06 | | | | 1.29 | | | | 1.18 | |
| | |
|
|
| |
|
|
| |
|
|
| |
|
|
| |
|
|
|
Less Distributions: | | | | | | | | | | | | | | | | | | | | |
Dividends from Realized Gains | | | — | | | | (0.01 | ) | | | (0.03 | ) | | | (0.98 | ) | | | — | |
Dividends from Net Investment Income | | | — | | | | — | | | | — | | | | — | | | | — | |
| | |
|
|
| |
|
|
| |
|
|
| |
|
|
| |
|
|
|
Total Distributions | | | — | | | | (0.01 | ) | | | (0.03 | ) | | | (0.98 | ) | | | — | |
| | |
|
|
| |
|
|
| |
|
|
| |
|
|
| |
|
|
|
Net Asset Value at End of Year | | $ | 14.59 | | | $ | 10.59 | | | $ | 13.22 | | | $ | 12.19 | | | $ | 11.88 | |
| | |
|
|
| |
|
|
| |
|
|
| |
|
|
| |
|
|
|
Total Return (A) | | | 37.77 | % | | | (19.85 | )% | | | 8.77 | % | | | 10.87 | % | | | 11.03 | % |
| | | | | |
Ratios/Supplemental Data: | | | | | | | | | | | | | | | | | | | | |
Net Assets, End of Year (in 000s) | | $ | 18,738 | | | $ | 14,509 | | | $ | 17,651 | | | $ | 16,631 | | | $ | 14,351 | |
| | | | | |
Ratio of Expenses to Average Net Assets: | | | | | | | | | | | | | | | | | | | | |
Before Reimbursement of Expenses by Advisor | | | 2.47 | % | | | 2.49 | % | | | 2.72 | % | | | 2.72 | % | | | 2.72 | % |
After Reimbursement of Expenses by Advisor | | | 2.47 | % | | | 2.49 | % | | | 2.72 | % | | | 2.51 | % | | | 2.35 | % |
| | | | | |
Ratio of Net Investment Income (Loss) to Average Net Assets: | | | | | | | | | | | | | | | | | | | | |
Before Reimbursement of Expenses by Advisor | | | (1.39 | )% | | | (1.12 | )% | | | (1.78 | )% | | | (1.23 | )% | | | (1.34 | )% |
After Reimbursement of Expenses by Advisor | | | (1.39 | )% | | | (1.12 | )% | | | (1.78 | )% | | | (1.02 | )% | | | (0.97 | )% |
| | | | | |
Portfolio Turnover | | | 47.99 | % | | | 66.95 | % | | | 61.41 | % | | | 99.17 | % | | | 78.79 | % |
| (A) | Total Return Calculation Does Not Reflect Redemption Fee. |
The accompanying notes are an integral part of these financial statements.
Timothy Plan Small-Cap Value Fund [28]
LETTER FROM THE MANAGER
December 31, 2003
LARGE/MID CAP VALUE FUND
The Timothy Large/Mid-Cap Value Fund posted a solid gain in 2003, slightly lagging the surging S&P 500 and Russell 1000 Value indices. The market was led by lower-quality companies, many of which participate in the technology and telecom sectors, as speculation trumped investment. We were under-weighted in these sectors, but are confident that the market will rotate, once again, toward higher-quality issues. In this regard, we were pleased with the fund’s overall performance given our focus on higher-quality stocks and look forward to coming periods.
From the depths of despair at the end of March, the stock market roared to a strong year as it climbed the proverbial “wall of worry” yet again. The economic highlight of the year was a sparkling 8.2% GDP number for the third quarter, which was reflected in stronger-than-expected corporate earnings growth. More importantly, revenue growth was apparent throughout a broad spectrum of companies, which should quell concerns that recent earnings gains were largely driven by cost cuts and that earnings growth could not be sustained on cost cutting alone. This, in turn, led to continued exceptional productivity gains. Finally, various job growth statistics gained traction such that, by year-end, investors, economists and consumers were all in a holiday mood. Even scrooge-like corporate chieftains and CFOs were talking about increased capital investment for 2004.
What is most amazing is the huge rise in confidence that we will experience sustainable domestic economic growth in the 4% range for the year 2004 in what is now increasingly being viewed as a synchronized global recovery. There exist signs of a 10% increase in capital expenditures for 2004, when just a few months ago anything more than a nominal increase seemed problematic. The ISM manufacturing report for December had the factory index at the highest reading for this particular index since 1983. All major component indexes, including production and orders, showed increases, while inventories and imports showed a decline. That certainly bodes well for increased production and job growth in the first quarter of 2004. The tax cuts, low interest rates, low inflation and deficit spending have certainly ignited the economy.
Clearly, monetary and fiscal policies remain stimulative. The real Fed Funds rate (the nominal rate less inflation) is still negative, and the fiscal stimulus put in place last year with the third tax cut by the Bush Administration should provide one more kick when tax refunds are sent in the first half of 2004. Accelerated depreciation allowances for capital investment should contribute to economic activity. Although job growth was problematic in 2003, the situation is likely to improve as productivity decelerates and corporate profit gains embolden CEOs.
Going forward, we anticipate the economy will post solid growth and continue to broaden. We expect the market to continue to perform well relative to fixed income and other assets, and that healthcare, which lagged in 2003, and energy issues should perform well in 2004. Finally, as mentioned above, we anticipate a rotation from lower-quality to higher-quality issues during the new year.
Fox Asset Management LLC
Letter From The Manager [29]
SCHEDULE OF INVESTMENTS
As of December 31, 2003
COMMON STOCKS - 87.82%
| | | | |
number of shares
| | | | market value
|
| | | COMPUTERS - MEMORY DEVICES - 1.02% | | |
30,000 | | Western Digital Corp.* | | $353,700 |
| | | | |
|
| | | CRUDE PETROLEUM & NATURAL GAS - 5.63% | | |
18,000 | | Anadarko Petroleum Corp. | | 918,180 |
12,705 | | Apache Corp. | | 1,030,376 |
| | | | |
|
| | | | | 1,948,556 |
| | | | |
|
| | | DRUG DISTRIBUTION - 4.93% | | |
13,000 | | AmerisourceBergen Corporation | | 729,950 |
16,000 | | Cardinal Health, Inc. | | 978,560 |
| | | | |
|
| | | | | 1,708,510 |
| | | | |
|
| | | ELECTRIC LIGHTING & WIRING EQUIPMENT - 2.17% | | |
13,000 | | Cooper Industries, Inc., Class A | | 753,090 |
| | | | |
|
| | | ELECTRIC SERVICES - 1.76% | | |
20,000 | | American Electric Power Co., Inc. | | 610,200 |
| | | | |
|
| | | ELECTRONIC INSTRUMENTS - 1.87% | | |
10,000 | | Emerson Electric Co. | | 647,500 |
| | | | |
|
| | | ENERGY - 1.97% | | |
13,000 | | Royal Dutch Petroleum Company GDR | | 681,070 |
| | | | |
|
| | | GENERAL INDUSTRIAL MACHINERY & EQUIPMENT - 3.14% | | |
16,000 | | Ingersoll-Rand Company Ltd. | | 1,086,080 |
| | | | |
|
| | | INSURANCE - 5.72% | | |
25,000 | | Dean Fods Co.* | | 821,750 |
20,000 | | PartnerRe Ltd. | | 1,161,000 |
| | | | |
|
| | | | | 1,982,750 |
| | | | |
|
| | | MEDICAL - HOSPITALS - 5.18% | | |
35,000 | | Community Health Care* | | 930,300 |
36,000 | | Health Management Associates, Inc. | | 864,000 |
| | | | |
|
| | | | | 1,794,300 |
| | | | |
|
| | | METAL MINING - 1.93% | | |
6,000 | | Rio Tinto Plc (a) | | 667,860 |
| | | | |
|
| | | MILLWOOD, VENEER, PLYWOOD & STRUCTURAL WOOD MEMBERS - 2.83% | | |
35,700 | | Masco Corp. | | 978,537 |
| | | | |
|
The accompanying notes are an integral part of these financial statements.
Timothy Plan Large/Mid-Cap Value Fund [30]
SCHEDULE OF INVESTMENTS
As of December 31, 2003
COMMON STOCKS - 87.82% (Cont.)
| | | | | |
number of shares
| | | | market value
|
| | | MISCELLANEOUS CHEMICAL PRODUCTS - 1.65% | | | |
18,000 | | Cabot Corp. | | $ | 573,120 |
| | | | |
|
|
| | | MISCELLANEOUS INDUSTRIAL & COMMERCIAL MACHINERY & EQUIPMENT - 2.57% | | | |
12,000 | | ITT Industries, Inc. | | | 890,520 |
| | | | |
|
|
| | | MISCELLANEOUS SHOPPING GOODS STORES - 1.16% | | | |
24,000 | | Office Depot, Inc. * | | | 401,040 |
| | | | |
|
|
| | | NATIONAL COMMERCIAL BANKS - 3.88% | | | |
15,000 | | Compass Bancshares, Inc. | | | 589,650 |
23,000 | | SouthTrust Corp. | | | 752,790 |
| | | | |
|
|
| | | | | | 1,342,440 |
| | | | |
|
|
| | | NATURAL GAS TRANSMISSION & DISTRIBUTION - 1.86% | | | |
15,000 | | Equitable Resources, Inc. | | | 643,800 |
| | | | |
|
|
| | | OIL COMPANY - EXPLORATION & PRODUCTION - 2.15% | | | |
13,000 | | Devon Energy Corp. | | | 744,380 |
| | | | |
|
|
| | | PUBLIC BUILDING AND RELATED FURNITURE - 2.48% | | | |
14,000 | | Lear Corp. | | | 858,620 |
| | | | |
|
|
| | | RADIO TELEPHONE COMMUNICATIONS - 2.58% | | | |
14,000 | | Dominion Resources, Inc. | | | 893,620 |
| | | | |
|
|
| | | REAL ESTATE INVESTMENT TRUSTS - 1.80% | | | |
15,000 | | Mack-Cali Realty Corp. | | | 624,300 |
| | | | |
|
|
| | | RETAIL - DRUG STORES & PROPRIETARY STORES - 3.75% | | | |
36,000 | | CVS Corp. | | | 1,300,320 |
| | | | |
|
|
| | | RETAIL-EATING PLACES - 2.55% | | | |
20,000 | | Outback Steakhouse, Inc. | | | 884,200 |
| | | | |
|
|
| | | RETAIL-GROCERY STORES - 2.67% | | | |
50,000 | | Kroger Co. * | | | 925,500 |
| | | | |
|
|
| | | SCIENTIFIC INSTRUMENTS- 1.92% | | | |
20,000 | | Waters Corp.* | | | 663,200 |
| | | | |
|
|
| | | SPECIAL INDUSTRY MACHINERY - 1.63% | | | |
20,000 | | Veeco Instruments, Inc. * | | | 564,000 |
| | | | |
|
|
| | | STATE COMMERCIAL BANK - 2.84% | | | |
15,000 | | Bank of New York, Inc. | | | 496,800 |
28,000 | | The Colonial Bancgroup, Inc. | | | 484,960 |
| | | | |
|
|
| | | | | | 981,760 |
| | | | |
|
|
The accompanying notes are an integral part of these financial statements.
Timothy Plan Large/Mid-Cap Value Fund [31]
SCHEDULE OF INVESTMENTS
As of December 31, 2003
COMMON STOCKS - 87.82% (Cont.)
| | | | | |
number of shares
| | | | market value
|
| | | SURETY INSURANCE - 2.65% | | | |
15,500 | | MBIA, Inc. | | $ | 918,065 |
| | | | |
|
|
| | | TRANSPORTATION - RAILROAD - 3.87% | | | |
15,000 | | Canadian Pacific Railway Ltd | | | 422,250 |
13,200 | | Union Pacific Corp. | | | 917,136 |
| | | | |
|
|
| | | | | | 1,339,386 |
| | | | |
|
|
| | | UNSUPPORTED PLASTICS FILM & SHEET - 3.44% | | | |
22,000 | | Sealed Air Corp. * | | | 1,191,080 |
| | | | |
|
|
| | | UTILITIES - 1.90% | | | |
15,000 | | Public Service Enterprise Group Incorporated | | | 657,000 |
| | | | |
|
|
| | | WHOLESALE-DRUGS PROPRIETARIES & DRUGGISTS’ SUNDRIES - 2.32% | | | |
25,000 | | McKesson Corp. | | | 804,000 |
| | | | |
|
|
| | | Total Common Stocks (cost $24,018,448) | | | 30,412,504 |
| | | | |
|
|
SHORT-TERM INVESTMENTS - 8.84% | | | |
number of shares
| | | | market value
|
1,530,000 | | Federated Cash Trust Series II Treasury Fund | | | 1,530,000 |
1,530,000 | | First American Treasury Obligations Fund, Class A | | | 1,530,000 |
| | | | |
|
|
| | | Total Short-Term Investments (cost $3,060,000) | | | 3,060,000 |
| | | | |
|
|
| | | TOTAL INVESTMENTS - 96.66% (identified cost $27,078,448) | | | 33,472,504 |
| | | OTHER ASSETS AND LIABILITIES, NET - 3.34% | | | 1,157,897 |
| | | | |
|
|
| | | NET ASSETS - 100.00% | | $ | 34,630,401 |
| | | | |
|
|
| * | Non-income producing securities |
| (a) | American Depositary Receipt |
| GDR | - Global Depositary Receipt |
The accompanying notes are an integral part of these financial statements.
Timothy Plan Large/Mid-Cap Value Fund [32]
STATEMENT OF ASSETS AND LIABILITIES
As of December 31, 2003
ASSETS
| | | | |
| | | amount
| |
Investments in Securities at Value (identified cost $27,078,448) [NOTE 1] | | $ | 33,472,504 | |
Cash | | | 1,034,469 | |
Receivables: | | | | |
Interest | | | 654 | |
Dividends | | | 28,767 | |
Fund Shares Sold | | | 154,885 | |
Fund Shares Commission Receivable from Advisor | | | 1,535 | |
| | |
|
|
|
Total Assets | | $ | 34,692,814 | |
| | |
|
|
|
| |
LIABILITIES | | | | |
| |
| | | amount
| |
Accrued Advisory Fees | | $ | 24,359 | |
Accrued 12b-1 Fees | | | 10,455 | |
Payable for Fund Shares Redeemed | | | 11,094 | |
Accrued Expenses | | | 16,505 | |
| | |
|
|
|
Total Liabilities | | $ | 62,413 | |
| | |
|
|
|
| |
NET ASSETS | | | | |
| |
| | | amount
| |
Class A Shares: | | | | |
Net Assets (unlimited shares of $0.001 par beneficial interest authorized;2,519,970 shares outstanding) | | $ | 29,373,813 | |
Net Asset Value and Redemption price Per Class A Share ($29,373,813 /2,519,970 shares) | | $ | 11.66 | |
Offering Price Per Share ($11.66 / 0.9475) | | $ | 12.31 | |
Class B Shares: | | | | |
Net Assets (unlimited shares of $0.001 par beneficial interest authorized; 471,931 shares outstanding) | | $ | 5,256,588 | |
Net Asset Value and Offering Price Per Class B Share ($5,256,588 / 471,931 shares) | | $ | 11.14 | |
Redemption Price Per Share ($11.14 x 0.95) | | $ | 10.58 | |
| |
Net Assets | | $ | 34,630,401 | |
| | |
|
|
|
| |
SOURCES OF NET ASSETS | | | | |
| |
| | | amount
| |
At December 31, 2003, Net Assets Consisted of: | | | | |
Paid-in Capital | | $ | 30,622,451 | |
Net Accumulated Realized Loss on Investments | | | (2,386,106 | ) |
Net Unrealized Appreciation in Value of Investments | | | 6,394,056 | |
| | |
|
|
|
Net Assets | | $ | 34,630,401 | |
| | |
|
|
|
The accompanying notes are an integral part of these financial statements.
Timothy Plan Large/Mid-Cap Value Fund [33]
STATEMENT OF OPERATIONS
For the Year Ended December 31, 2003
INVESTMENT INCOME
| | | | |
| | | amount
| |
Interest | | $ | 7,503 | |
Dividends | | | 444,333 | |
| | |
|
|
|
Total Investment Income | | | 451,836 | |
| | |
|
|
|
| |
EXPENSES | | | | |
| |
| | | amount
| |
Investment Advisory Fees [NOTE 3] | | | 220,308 | |
Fund Accounting, Transfer Agency, & Administration Fees | | | 73,968 | |
12b-1 Fees (Class A = $54,190, Class B = $31,818) [NOTE 3] | | | 86,008 | |
Registration Fees | | | 17,363 | |
Custodian Fees | | | 8,982 | |
Auditing Fees | | | 12,414 | |
Servicing Fees (Class B) [NOTE 3] | | | 10,606 | |
Insurance Expense | | | 3,201 | |
Legal fees | | | 2,800 | |
Printing Expense | | | 9,044 | |
Miscellaneous Expense | | | 13,504 | |
| | |
|
|
|
Total Net Expenses | | | 458,198 | |
| | |
|
|
|
Net Investment Income | | | (6,362 | ) |
| | |
|
|
|
| |
| REALIZED AND UNREALIZED GAIN (LOSS) ON INVESTMENTS | | | | |
| |
| | | amount
| |
Net Realized Loss on Investments | | | (2,007,875 | ) |
Change in Unrealized Appreciation of Investments | | | 8,760,648 | |
| | |
|
|
|
Net Realized and Unrealized Gain (Loss) on Investments | | | 6,752,773 | |
| | |
|
|
|
Increase in Net Assets Resulting from Operations | | $ | 6,746,411 | |
| | |
|
|
|
The accompanying notes are an integral part of these financial statements.
Timothy Plan Large/Mid-Cap Value Fund [34]
STATEMENT OF CHANGES IN NET ASSETS
INCREASE (DECREASE) IN NET ASSETS
| | | | | | | | |
| | | year ended
12/31/03
| | | year ended
12/31/02
| |
Operations: | | | | | | | | |
Net Investment (Loss) | | $ | (6,362 | ) | | $ | (9,849 | ) |
Net Change in Unrealized Appreciation (Depreciation) of Investments | | | 8,760,648 | | | | (3,360,595 | ) |
Net Realized (Loss) on Investments | | | (2,007,875 | ) | | | (225,785 | ) |
| | |
|
|
| |
|
|
|
Increase (Decrease) in Net Assets (resulting from operations) | | | 6,746,411 | | | | (3,596,229 | ) |
| | |
|
|
| |
|
|
|
Distributions to Shareholders From: | | | | | | | | |
Net Realized Gains | | | | | | | | |
Class A | | | — | | | | — | |
Class B | | | — | | | | — | |
Net Income: | | | | | | | | |
Class A | | | — | | | | — | |
Class B | | | — | | | | — | |
| | |
|
|
| |
|
|
|
Total Distribution | | | — | | | | — | |
| | |
|
|
| |
|
|
|
Capital Share Transactions: | | | | | | | | |
Proceeds from Shares Sold: | | | | | | | | |
Class A | | | 7,698,937 | | | | 9,987,080 | |
Class B | | | 1,010,636 | | | | 1,423,017 | |
Dividends Reinvested: | | | | | | | | |
Class A | | | — | | | | — | |
Class B | | | — | | | | — | |
Cost of Shares Redeemed: | | | | | | | | |
Class A | | | (1,871,381 | ) | | | (3,102,811 | ) |
Class B | | | (618,894 | ) | | | (579,499 | ) |
| | |
|
|
| |
|
|
|
Increase in Net Assets (resulting from capital share transactions) | | | 6,219,298 | | | | 7,727,787 | |
| | |
|
|
| |
|
|
|
Total Increase in Net Assets | | | 12,965,709 | | | | 4,131,558 | |
| | |
Net Assets: | | | | | | | | |
Beginning of Year | | | 21,664,692 | | | | 17,533,134 | |
| | |
|
|
| |
|
|
|
End of Year | | $ | 34,630,401 | | | $ | 21,664,692 | |
| | |
|
|
| |
|
|
|
Shares of Capital Stock of the Fund Sold and Redeemed: | | | | | | | | |
Shares Sold: | | | | | | | | |
Class A | | | 760,502 | | | | 976,004 | |
Class B | | | 106,213 | | | | 145,864 | |
Shares Reinvested: | | | | | | | | |
Class A | | | — | | | | — | |
Class B | | | — | | | | — | |
Shares Redeemed: | | | | | | | | |
Class A | | | (201,057 | ) | | | (295,672 | ) |
Class B | | | (68,824 | ) | | | (61,386 | ) |
| | |
|
|
| |
|
|
|
Net Increase in Number of Shares Outstanding | | | 596,834 | | | | 764,810 | |
| | |
|
|
| |
|
|
|
The accompanying notes are an integral part of these financial statements.
Timothy Plan Large/Mid-Cap Value Fund [35]
FINANCIAL HIGHLIGHTS
The table below set forth financial data for one share of capital stock outstanding throughout each period presented.
LARGE/MID-CAP VALUE FUND - CLASS A SHARES
| | | | | | | | | | | | | | | | | | | | |
| | | year ended
12/31/03
| | | year ended
12/31/02
| | | year
ended
12/31/01
| | | year
ended
12/31/00
| | | period
ended
12/31/99 (B)
| |
Per Share Operating Performance: | | | | | | | | | | | | | | | | | | | | |
Net Asset Value at Beginning of Period | | $ | 9.11 | | | $ | 10.83 | | | $ | 10.83 | | | $ | 9.68 | | | $ | 10.00 | |
| | |
|
|
| |
|
|
| |
|
|
| |
|
|
| |
|
|
|
Income from Investment Operations: | | | | | | | | | | | | | | | | | | | | |
Net Investment Income (Loss) | | | 0.01 | | | | 0.01 | | | | (0.02 | ) | | | 0.04 | | | | 0.02 | |
Net Realized and Unrealized Gain (Loss) on Investments | | | 2.54 | | | | (1.73 | ) | | | 0.06 | | | | 1.16 | | | | (0.30 | ) |
| | |
|
|
| |
|
|
| |
|
|
| |
|
|
| |
|
|
|
Total from Investment Operations | | | 2.55 | | | | (1.72 | ) | | | 0.04 | | | | 1.20 | | | | (0.28 | ) |
| | |
|
|
| |
|
|
| |
|
|
| |
|
|
| |
|
|
|
Less Distributions: | | | | | | | | | | | | | | | | | | | | |
Dividends from Realized Gains | | | — | | | | — | | | | (0.04 | ) | | | (0.02 | ) | | | (0.02 | ) |
Dividends from Net Investment Income | | | — | | | | — | | | | — | | | | (0.03 | ) | | | (0.02 | ) |
| | |
|
|
| |
|
|
| |
|
|
| |
|
|
| |
|
|
|
Total Distributions | | | — | | | | — | | | | (0.04 | ) | | | (0.05 | ) | | | (0.04 | ) |
| | |
|
|
| |
|
|
| |
|
|
| |
|
|
| |
|
|
|
Net Asset Value at End of Period | | $ | 11.66 | | | $ | 9.11 | | | $ | 10.83 | | | $ | 10.83 | | | $ | 9.68 | |
| | |
|
|
| |
|
|
| |
|
|
| |
|
|
| |
|
|
|
Total Return(A) (D) | | | 27.99 | % | | | (15.88 | )% | | | 0.33 | % | | | 12.35 | % | | | (3.28 | )% |
| | | | | |
Ratios/Supplemental Data: | | | | | | | | | | | | | | | | | | | | |
Net Assets, End of Period (in 000s) | | $ | 29,374 | | | $ | 17,856 | | | $ | 13,858 | | | $ | 4,493 | | | $ | 846 | |
Ratio of Expenses to Average Net Assets: | | | | | | | | | | | | | | | | | | | | |
Before Reimbursement of Expenses by Advisor | | | 1.64 | % | | | 1.76 | % | | | 1.70 | % | | | 2.70 | % | | | 4.69 | %(C) |
After Reimbursement of Expenses by Advisor | | | 1.64 | % | | | 1.76 | % | | | 1.70 | % | | | 1.65 | % | | | 1.60 | %(C) |
| | | | | |
Ratio of Net Investment Income (Loss) to Average Net Assets: | | | | | | | | | | | | | | | | | | | | |
Before Reimbursement of Expenses by Advisor | | | 0.10 | % | | | 0.11 | % | | | (0.20 | )% | | | (0.30 | )% | | | (2.34 | )%(C) |
After Reimbursement of Expenses by Advisor | | | 0.10 | % | | | 0.11 | % | | | (0.20 | )% | | | 0.67 | % | | | 0.75 | %(C) |
Portfolio Turnover | | | 39.44 | % | | | 36.79 | % | | | 26.44 | % | | | 50.98 | % | | | 8.02 | % |
| (A) | Total Return Calculation Does Not Reflect Sales Load. |
| (B) | For the Period July 14, 1999 (Commencement of Operations) to December 31, 1999. |
| (D) | For Periods Of Less Than One Full Year, Total Returns Are Not Annualized. |
The accompanying notes are an integral part of these financial statements.
Timothy Plan Large/Mid-Cap Value Fund [36]
FINANCIAL HIGHLIGHTS
The table below set forth financial data for one share of capital stock outstanding throughout each period presented.
LARGE/MID-CAP VALUE FUND - CLASS B SHARES
| | | | | | | | | | | | | | | | | | | | |
| | | year
ended
12/31/03
| | | year
ended
12/31/02
| | | year
ended
12/31/01
| | | year
ended
12/31/00
| | | period
ended
12/31/99(B)
| |
Per Share Operating Performance: | | | | | | | | | | | | | | | | | | | | |
Net Asset Value at Beginning of Period | | $ | 8.77 | | | $ | 10.50 | | | $ | 10.60 | | | $ | 9.36 | | | $ | 10.00 | |
| | |
|
|
| |
|
|
| |
|
|
| |
|
|
| |
|
|
|
Income from Investment Operations: | | | | | | | | | | | | | | | | | | | | |
Net Investment Income (Loss) | | | (0.06 | ) | | | (0.06 | ) | | | (0.12 | ) | | | 0.01 | | | | 0.02 | |
Net Realized and Unrealized Gain (Loss) on Investments | | | 2.43 | | | | (1.67 | ) | | | 0.06 | | | | 1.28 | | | | (0.62 | ) |
| | |
|
|
| |
|
|
| |
|
|
| |
|
|
| |
|
|
|
Total from Investment Operations | | | 2.37 | | | | (1.73 | ) | | | (0.06 | ) | | | 1.29 | | | | (0.60 | ) |
| | |
|
|
| |
|
|
| |
|
|
| |
|
|
| |
|
|
|
Less Distributions: | | | | | | | | | | | | | | | | | | | | |
Dividends from Realized Gains | | | — | | | | — | | | | (0.04 | ) | | | (0.02 | ) | | | (0.02 | ) |
Dividends from Net Investment Income | | | — | | | | — | | | | — | | | | (0.03 | ) | | | (0.02 | ) |
| | |
|
|
| |
|
|
| |
|
|
| |
|
|
| |
|
|
|
Total Distributions | | | — | | | | — | | | | (0.04 | ) | | | (0.05 | ) | | | (0.04 | ) |
| | |
|
|
| |
|
|
| |
|
|
| |
|
|
| |
|
|
|
Net Asset Value at End of Year | | $ | 11.14 | | | $ | 8.77 | | | $ | 10.50 | | | $ | 10.60 | | | $ | 9.36 | |
| | |
|
|
| |
|
|
| |
|
|
| |
|
|
| |
|
|
|
Total Return(A) (D) | | | 27.02 | % | | | (16.48 | )% | | | (0.61 | )% | | | 13.73 | % | | | (4.78 | )% |
| | | | | |
Ratios/Supplemental Data: | | | | | | | | | | | | | | | | | | | | |
Net Assets, End of Period (in 000s) | | $ | 5,257 | | | $ | 3,809 | | | $ | 3,675 | | | $ | 2,665 | | | $ | 525 | |
| | | | | |
Ratio of Expenses to Average Net Assets: | | | | | | | | | | | | | | | | | | | | |
Before Reimbursement of Expenses by Advisor | | | 2.42 | % | | | 2.55 | % | | | 2.66 | % | | | 3.45 | % | | | 5.87 | %(C) |
After Reimbursement of Expenses by Advisor | | | 2.42 | % | | | 2.55 | % | | | 2.66 | % | | | 2.40 | % | | | 2.35 | %(C) |
| | | | | |
Ratio of Net Investment Income (Loss) to Average Net Assets: | | | | | | | | | | | | | | | | | | | | |
Before Reimbursement of Expenses by Advisor | | | (0.66 | )% | | | (0.71 | )% | | | (1.12 | )% | | | (1.13 | )% | | | (2.34 | )%(C) |
After Reimbursement of Expenses by Advisor | | | (0.66 | )% | | | (0.71 | )% | | | (1.12 | )% | | | (0.08 | )% | | | 1.15 | %(C) |
Portfolio Turnover | | | 39.44 | % | | | 36.79 | % | | | 26.44 | % | | | 50.98 | % | | | 8.02 | % |
| (A) | Total Return Calculation Does Not Reflect Redemption Fee. |
| (B) | For the Period July 15, 1999 (Commencement of Operations) to December 31, 1999. |
| (D) | For Periods Of Less Than One Full Year, Total Returns Are Not Annualized. |
The accompanying notes are an integral part of these financial statements.
Timothy Plan Large/Mid-Cap Value Fund [37]
LETTER FROM THE MANAGER
December 31, 2003
FIXED INCOME FUND
The persistent message by the Federal Reserve Bank for the past several years that inflation was diminishing plus the relative strength of the economy led us to believe that interest rates were likely to come back to “normal”. With that in mind, we planned a strategy that would enable our shareholders to participate in what we saw as a continuing bull market in bonds.
When we first started managing this fund, we built liquidity into the portfolio by the simple process of purchasing relatively short-term bonds. By 2002, we were reasonably confident that we achieved that objective. In 2003, we extended our program to include both very short-term issues and very long-term issues, creating what is referred to in the investment community as a “bar-bell” structure. This gave us both a liquid block and a more volatile block, which we expected to outperform shorter-term issues in line with our forecasts.
As long-term sector prices rose more quickly than we had anticipated, we took some profits and began to restructure the portfolio into more short-term issues to make it less volatile and less subject to major market swings. We believe this provided better than average income and minimized the losses that could have come about if the Federal Reserve Bank had reversed its program and started to raise rates.
This strategy proved to be effective and we now have a portfolio that has a shorter average maturity, lower volatility, and could prove to be a reasonable provider of a decent income without increasing the risk.
The current year should reflect the presence of a presidential election without allowing politics to favor any party. We also believe that people should recognize that, with inflation under control, this is now a market that we think of as “normal” and investors should get used to the generally lower interest rate environment.
Mike Carr
President
Carr & Associates
Letter From The Manager [38]
SCHEDULE OF INVESTMENTS
As of December 31, 2003
BONDS - 98.60%
| | | | | |
par value
| | | | market value
|
| | | CORPORATE BONDS - 97.49% | | | |
$ 300,000 | | Ahold Finance USA, Inc., 6.875%, 05/01/2029 | | $ | 269,250 |
300,000 | | American General Finance Corp., 5.375%, 10/01/2012 | | | 309,892 |
500,000 | | Amvescap Plc., 6.60%, 05/15/2005 | | | 529,523 |
250,000 | | Appalachian Power Co., 3.60%, 05/15/2008 | | | 247,283 |
200,000 | | Archer Daniels Midland Co., 6.625%, 05/01/2029 | | | 219,898 |
700,000 | | Arrow Electronics, 6.875%, 07/13/2013 | | | 747,200 |
200,000 | | Avery Dennison Corp., 4.875%, 01/15/2013 | | | 199,276 |
250,000 | | Avnet, Inc., 7.875%, 02/15/2005 | | | 262,500 |
400,000 | | Bear Stearns Co., Inc., 4.50%, 10/28/2010 | | | 402,932 |
500,000 | | Bear Stearns Co., Inc., 7.25%, 05/24/2016 | | | 507,414 |
375,000 | | Cendant Corp., 6.25%, 01/15/2008 | | | 409,499 |
250,000 | | Cendant Corp., 6.25%, 03/15/2010 | | | 272,282 |
300,000 | | Cingular Wireless, 5.625%, 12/15/2006 | | | 322,016 |
400,000 | | CIT Group, Inc., 6.50%, 02/07/2006 | | | 433,409 |
250,000 | | CIT Group, Inc., 4.125%, 02/21/2006 | | | 258,834 |
200,000 | | CNA Financial, 6.50%, 04/15/2005 | | | 207,842 |
310,000 | | CNA Financial, 6.45%, 01/15/2008 | | | 327,660 |
125,000 | | Computer Sciences Corp., 6.75%, 06/15/2006 | | | 137,159 |
300,000 | | Computer Sciences Corp., 3.50%, 04/15/2008 | | | 298,868 |
150,000 | | Cooper Tire & Rubber Co., 7.625%, 03/15/2027 | | | 168,010 |
300,000 | | Credit Suisse First Boston, 6.50%, 01/15/2012 | | | 334,435 |
920,000 | | CSX Transportation, 4.875%, 11/01/2009 | | | 952,324 |
300,000 | | Deere & Co., 6.55%, 10/01/2028 | | | 327,032 |
500,000 | | Deutsche Telekom, 3.875%, 07/22/2008 | | | 502,271 |
950,000 | | Dominion Resources, Inc., 5.00%, 03/15/2013 | | | 947,646 |
315,000 | | Donnelley R R&Son, 6.625%, 04/15/2029 | | | 327,618 |
187,000 | | Duke Energy Field, 5.75%, 11/15/2006 | | | 200,315 |
500,000 | | Florida Power Corp., 4.80%, 03/01/2013 | | | 497,591 |
1,000,000 | | Horace Mann Educators Corp., 1.425%, 05/14/2032 | | | 466,250 |
400,000 | | Household Finance Corp., 6.75%, 05/15/2011 | | | 450,960 |
200,000 | | Household Finance Corp., 5.60%, 02/15/2013 | | | 202,329 |
250,000 | | HSBC USA Capital Trust, 7.53%, 12/04/2026 | | | 274,043 |
500,000 | | Huntington National Bank, 3.125%, 05/15/2008 | | | 487,603 |
250,000 | | IBP, Inc., 6.125%, 02/01/2006 | | | 262,082 |
500,000 | | ICI Wilmington, Inc., 6.95%, 09/15/2004 | | | 515,681 |
250,000 | | ICI Wilmington, Inc., 5.625%, 12/01/2013 | | | 251,677 |
250,000 | | International Lease Finance Corp., 5.75%, 02/15/2007 | | | 270,649 |
200,000 | | International Lease Finance Corp., 5.80%, 08/15/2007 | | | 216,432 |
300,000 | | Jersey Cent Power & Light Co., 6.75%, 11/01/2025 | | | 295,145 |
100,000 | | John Deere Capital Corp., 5.10%, 01/15/2013 | | | 102,635 |
The accompanying notes are an integral part of these financial statements.
Timothy Plan Fixed Income Fund [39]
SCHEDULE OF INVESTMENTS
As of December 31, 2003
BONDS - 98.60% (Cont.)
| | | | | |
par value
| | | | market value
|
| | | CORPORATE BONDS - 97.49% (cont.) | | | |
$ 300,000 | | Kraft Food, Inc., 5.25%, 06/01/2007 | | $ | 319,420 |
600,000 | | Kraft Food, Inc., 5.625%, 11/01/2011 | | | 633,182 |
300,000 | | Kraft Food, Inc., 6.50%, 11/01/2031 | | | 314,492 |
500,000 | | Kroger Co., 5.50%, 02/01/2013 | | | 509,449 |
250,000 | | Lehman Brothers Holdings, Inc., 7.00%, 2/1/2008 | | | 282,613 |
250,000 | | Lowe’s Cos., Inc., 6.875%, 02/15/2028 | | | 282,698 |
50,000 | | National Rural Utilities Finance Corp., 6.00%, 01/15/2004 | | | 50,061 |
250,000 | | National Rural Utilities Finance Corp., 5.75%, 08/28/2009 | | | 271,215 |
750,000 | | Nisoursce Finance Corp., 5.40%, 07/15/2014 | | | 760,888 |
300,000 | | Public Service Electric & Gas Co., 7.00%, 09/01/2024 | | | 307,360 |
250,000 | | The Sherman-Williams Co., 7.375%, 02/01/2027 | | | 294,170 |
50,000 | | Travelers Property & Casualty Corp., 6.75%, 11/15/2006 | | | 55,814 |
900,000 | | Union Pacific Corp., 3.875%, 02/15/2009 | | | 894,384 |
300,000 | | Unitrin, Inc., 5.75%, 7/1/2007 | | | 317,792 |
135,000 | | Wisconsin Energy Corp., 6.50%, 04/01/2011 | | | 149,025 |
| | | | |
|
|
| | | | | | 19,858,028 |
| | | | |
|
|
| | | MUNICIPAL BONDS - 1.11% | | | |
200,000 | | North Carolina Eastern Municipal Power Agency, 3.98%, 01/01/2007 | | | 199,330 |
25,000 | | Texas State University, 6.41% 03/15/2009 | | | 27,484 |
| | | | |
|
|
| | | | | | 226,814 |
| | | | |
|
|
| | | Total Bonds (amortized cost $19,525,540) | | | 20,084,842 |
| | | | |
|
|
| |
| SHORT-TERM INVESTMENTS - 0.84% | | | |
| |
number of shares/principal amount
| | market value
|
| | | MONEY MARKET FUNDS - 0.84% | | | |
171,713 | | First American Treasury Obligations Fund, Class A (cost $171,713) | | | 171,713 |
| | | | |
|
|
| | | TOTAL INVESTMENTS - 99.44%(identified cost $19,697,253) | | | 20,256,555 |
| | | OTHER ASSETS AND LIABILITIES, NET - 0.56% | | | 112,913 |
| | | | |
|
|
| | | NET ASSETS - 100.00% | | $ | 20,369,468 |
| | | | |
|
|
The accompanying notes are an integral part of these financial statements.
Timothy Plan Fixed Income Fund [40]
STATEMENT OF ASSETS AND LIABILITIES
As of December 31, 2003
ASSETS
| | | | |
| | | amount
| |
Investments in Securities at Value (identified cost $19,697,253) [NOTE 1] | | $ | 20,256,555 | |
Receivables: | | | | |
Interest | | | 308,647 | |
Fund Shares Sold | | | 128,283 | |
Fund Share Commissions Receivable from Advisor | | | 360 | |
| | |
|
|
|
Total Assets | | $ | 20,693,845 | |
| | |
|
|
|
| |
| LIABILITIES | | | | |
| |
| | | amount
| |
Accrued Advisory Fees | | | 3,923 | |
Accrued 12b-1 Fees | | | 6,943 | |
Payable for Fund Shares Redeemed | | | 47,749 | |
Payable for Distributions | | | 253,498 | |
Accrued Expenses | | | 12,264 | |
| | |
|
|
|
Total Liabilities | | $ | 324,377 | |
| | |
|
|
|
| |
| NET ASSETS | | | | |
| |
| | | amount
| |
Class A Shares: | | | | |
Net Assets (unlimited shares of $0.001 par beneficial interest authorized; 1,582,313 shares outstanding) | | $ | 16,312,866 | |
Net Asset Value and Redemption price Per Class A Share ($16,312,866 / 1,582,313 shares) | | $ | 10.31 | |
Offering Price Per Share ($10.31 / 0.9575) | | $ | 10.77 | |
| |
Class B Shares: | | | | |
Net Assets (unlimited shares of $0.001 par beneficial interest authorized; 402,608 shares outstanding) | | $ | 4,056,602 | |
Net Asset Value and Offering Price Per Class B Share ($4,056,602 / 402,608 shares) | | $ | 10.08 | |
Redemption Price Per Share ($10.08 X 0.95) | | $ | 9.58 | |
| |
Net Assets | | $ | 20,369,468 | |
| | |
|
|
|
| |
| SOURCES OF NET ASSETS | | | | |
| |
| | | amount
| |
At December 31, 2003, Net Assets Consisted of: | | | | |
Paid-in Capital | | $ | 19,835,354 | |
Accumulated Net Realized Loss on Investments | | | (25,188 | ) |
Net Unrealized Appreciation in Value of Investments | | | 559,302 | |
| | |
|
|
|
Net Assets | | $ | 20,369,468 | |
| | |
|
|
|
The accompanying notes are an integral part of these financial statements.
Timothy Plan Fixed Income Fund [41]
STATEMENT OF OPERATIONS
For the year ended December 31, 2003
INVESTMENT INCOME
| | | | |
| | | amount
| |
Interest | | $ | 875,855 | |
| | |
|
|
|
Total Investment Income | | | 875,855 | |
| | |
|
|
|
| |
| EXPENSES | | | | |
| |
| | | amount
| |
Investment Advisory Fees [NOTE 3] | | | 104,105 | |
Fund Accounting, Transfer Agency, & Administration Fees | | | 58,227 | |
Auditing Fees | | | 8,916 | |
12b-1 Fees (Class A = $33,629, Class B = $29,245) [NOTE 3] | | | 62,874 | |
Registration Fees | | | 19,859 | |
Custodian Fees | | | 3,860 | |
Printing Expense | | | 3,644 | |
Insurance Expense | | | 1,828 | |
Legal Expense | | | 2,624 | |
Service Fees (Class B) [NOTE 3] | | | 9,748 | |
Miscellaneous Expense | | | 2,361 | |
| | |
|
|
|
Total Expenses | | | 278,046 | |
| |
Expenses Waived and Reimbursed by Advisor [NOTE 3] | | | (14,224 | ) |
| | |
|
|
|
Total Net Expenses | | | 263,822 | |
| | |
|
|
|
Net Investment Income | | | 612,033 | |
| | |
|
|
|
| |
| REALIZED AND UNREALIZED GAIN ON INVESTMENTS | | | | |
| |
| | | amount
| |
Net Realized Gain on Investments | | | 255,972 | |
Change in Unrealized Appreciation of Investments | | | 1,126 | |
| | |
|
|
|
Net Realized and Unrealized Gain on Investments | | | 257,098 | |
| | |
|
|
|
Increase in Net Assets Resulting from Operations | | $ | 869,131 | |
| | |
|
|
|
The accompanying notes are an integral part of these financial statements.
Timothy Plan Fixed Income Fund [42]
STATEMENT OF CHANGES IN NET ASSETS
INCREASE (DECREASE) IN NET ASSETS
| | | | | | | | |
| | | year ended
12/31/03
| | | year ended
12/31/02
| |
Operations: | | | | | | | | |
Net Investment Income | | $ | 612,033 | | | $ | 448,050 | |
Net Change in Unrealized Appreciation of Investments | | | 1,126 | | | | 592,315 | |
Net Realized Gain on Investments | | | 255,972 | | | | 30,257 | |
| | |
|
|
| |
|
|
|
Increase in Net Assets (resulting from operations) | | | 869,131 | | | | 1,070,622 | |
| | |
|
|
| |
|
|
|
Distributions to Shareholders: | | | | | | | | |
Net Income | | | | | | | | |
Class A | | | (496,860 | ) | | | (366,715 | ) |
Class B | | | (115,173 | ) | | | (82,816 | ) |
Net Realized Gain | | | | | | | | |
Class A | | | (224,113 | ) | | | (20,422 | ) |
Class B | | | (57,047 | ) | | | (5,584 | ) |
| | |
|
|
| |
|
|
|
Total Distributions | | | (893,193 | ) | | | (475,537 | ) |
| | |
|
|
| |
|
|
|
Capital Share Transactions: | | | | | | | | |
Proceeds from Shares Sold: | | | | | | | | |
Class A | | | 8,407,611 | | | | 6,265,246 | |
Class B | | | 2,460,525 | | | | 2,123,831 | |
Dividends Reinvested: | | | | | | | | |
Class A | | | 270,926 | | | | 137,979 | |
Class B | | | 142,930 | | | | 67,373 | |
Cost of Shares Redeemed: | | | | | | | | |
Class A | | | (2,707,453 | ) | | | (1,287,658 | ) |
Class B | | | (1,391,936 | ) | | | (489,870 | ) |
| | |
|
|
| |
|
|
|
Increase in Net Assets (resulting from capital share transactions) | | | 7,182,603 | | | | 6,816,901 | |
| | |
|
|
| |
|
|
|
Total Increase in Net Assets | | | 7,158,541 | | | | 7,411,986 | |
| | |
Net Assets: | | | | | | | | |
Beginning of Year | | | 13,210,927 | | | | 5,798,941 | |
| | |
|
|
| |
|
|
|
End of Year | | $ | 20,369,468 | | | $ | 13,210,927 | |
| | |
|
|
| |
|
|
|
Shares of Capital Stock of the Fund Sold and Redeemed: | | | | | | | | |
Shares Sold: | | | | | | | | |
Class A | | | 804,587 | | | | 640,087 | |
Class B | | | 241,728 | | | | 219,360 | |
Shares Reinvested: | | | | | | | | |
Class A | | | 26,091 | | | | 13,832 | |
Class B | | | 14,078 | | | | 6,858 | |
Shares Redeemed: | | | | | | | | |
Class A | | | (260,671 | ) | | | (132,225 | ) |
Class B | | | (136,428 | ) | | | (50,448 | ) |
| | |
|
|
| |
|
|
|
Net Increase in Number of Shares Outstanding | | | 689,385 | | | | 697,464 | |
| | |
|
|
| |
|
|
|
The accompanying notes are an integral part of these financial statements.
Timothy Plan Fixed Income Fund [43]
FINANCIAL HIGHLIGHTS
The table below set forth financial data for one share of capital stock outstanding throughout each period presented.
FIXED INCOME FUND - CLASS A SHARES
| | | | | | | | | | | | | | | | | | | | |
| | | year
ended
12/31/03
| | | year
ended
12/31/02
| | | year
ended
12/31/01
| | | year
ended
12/31/00
| | | period
ended
12/31/99 (B)
| |
Per Share Operating Performance: | | | | | | | | | | | | | | | | | | | | |
Net Asset Value, Beginning | | $ | 10.25 | | | $ | 9.73 | | | $ | 9.53 | | | $ | 9.81 | | | $ | 10.00 | |
| | |
|
|
| |
|
|
| |
|
|
| |
|
|
| |
|
|
|
Income from Investment Operations: | | | | | | | | | | | | | | | | | | | | |
Net Investment Income | | | 0.37 | | | | 0.45 | | | | 0.40 | | | | 0.49 | | | | 0.12 | |
Net Realized and Unrealized Gain (Loss) on Investments | | | 0.21 | | | | 0.53 | | | | 0.20 | | | | (0.27 | ) | | | (0.18 | ) |
| | |
|
|
| |
|
|
| |
|
|
| |
|
|
| |
|
|
|
Total from Investment Operations | | | 0.58 | | | | 0.98 | | | | 0.60 | | | | 0.22 | | | | (0.06 | ) |
| | |
|
|
| |
|
|
| |
|
|
| |
|
|
| |
|
|
|
Less Distributions: | | | | | | | | | | | | | | | | | | | | |
Dividends from Net Investment Income | | | (0.37 | ) | | | (0.44 | ) | | | (0.40 | ) | | | (0.50 | ) | | | (0.13 | ) |
Dividends from Net Realized Gain | | | (0.15 | ) | | | (0.02 | ) | | | — | | | | — | | | | — | |
| | |
|
|
| |
|
|
| |
|
|
| |
|
|
| |
|
|
|
Total Distributions | | | (0.52 | ) | | | (0.46 | ) | | | (0.40 | ) | | | (0.50 | ) | | | (0.13 | ) |
| | |
|
|
| |
|
|
| |
|
|
| |
|
|
| |
|
|
|
Net Asset Value at End of Period | | $ | 10.31 | | | $ | 10.25 | | | $ | 9.73 | | | $ | 9.53 | | | $ | 9.81 | |
| | |
|
|
| |
|
|
| |
|
|
| |
|
|
| |
|
|
|
Total Return (A)(D) | | | 5.70 | % | | | 10.32 | % | | | 6.37 | % | | | 2.32 | % | | | (0.42 | )% |
| | | | | |
Ratios/Supplemental Data: | | | | | | | | | | | | | | | | | | | | |
Net Assets, End of Period (in 000s) | | $ | 16,313 | | | $ | 10,374 | | | $ | 4,773 | | | $ | 667 | | | $ | 124 | |
| | | | | |
Ratio of Expenses to Average Net Assets: | | | | | | | | | | | | | | | | | | | | |
Before Reimbursement and Waiver of Expenses by Advisor | | | 1.43 | % | | | 1.74 | % | | | 2.44 | % | | | 8.99 | % | | | 13.92 | %(C) |
After Reimbursement and Waiver of Expenses by Advisor | | | 1.35 | % | | | 1.35 | % | | | 1.35 | % | | | 1.35 | % | | | 1.35 | %(C) |
| | | | | |
Ratio of Net Investment Income (Loss) to Average Net Assets: | | | | | | | | | | | | | | | | | | | | |
Before Reimbursement and Waiver of Expenses by Advisor | | | 3.61 | % | | | 4.49 | % | | | 3.91 | % | | | (2.19 | )% | | | (9.88 | )%(C) |
After Reimbursement and Waiver of Expenses by Advisor | | | 3.69 | % | | | 4.88 | % | | | 5.00 | % | | | 5.45 | % | | | 2.70 | %(C) |
| | | | | |
Portfolio Turnover | | | 62.06 | % | | | 18.10 | % | | | 20.28 | % | | | 35.54 | % | | | 21.25 | % |
| (A) | Total Return Calculation Does Not Reflect Sales Load. |
| (B) | For the Period July 14, 1999 (Commencement of Operations) to December 31, 1999. |
| (D) | For Periods Of Less Than One Full Year, Total Return Is Not Annualized. |
The accompanying notes are an integral part of these financial statements.
Timothy Plan Fixed Income Fund [44]
FINANCIAL HIGHLIGHTS
The table below set forth financial data for one share of capital stock outstanding throughout each period presented.
FIXED INCOME FUND - CLASS B SHARES
| | | | | | | | | | | | | | | | | | | | |
| | | year
ended
12/31/03
| | | year
ended
12/31/02
| | | year
ended
12/31/01
| | | year
ended
12/31/00
| | | period
ended
12/31/99 (B)
| |
Per Share Operating Performance: | | | | | | | | | | | | | | | | | | | | |
Net Asset Value, Beginning | | $ | 10.02 | | | $ | 9.55 | | | $ | 9.54 | | | $ | 9.80 | | | $ | 10.00 | |
| | |
|
|
| |
|
|
| |
|
|
| |
|
|
| |
|
|
|
Income from Investment Operations: | | | | | | | | | | | | | | | | | | | | |
Net Investment Income | | | 0.29 | | | | 0.37 | | | | 0.40 | | | | 0.45 | | | | 0.15 | |
Net Realized and Unrealized Gain (Loss) on Investments | | | 0.21 | | | | 0.52 | | | | (0.01 | ) | | | (0.25 | ) | | | (0.22 | ) |
| | |
|
|
| |
|
|
| |
|
|
| |
|
|
| |
|
|
|
Total from Investment Operations | | | 0.50 | | | | 0.89 | | | | 0.39 | | | | 0.20 | | | | (0.07 | ) |
| | |
|
|
| |
|
|
| |
|
|
| |
|
|
| |
|
|
|
Less Distributions: | | | | | | | | | | | | | | | | | | | | |
Dividends from Net Investment Income | | | (0.29 | ) | | | (0.40 | ) | | | (0.38 | ) | | | (0.46 | ) | | | (0.13 | ) |
Dividends from Net Realized Gain | | | (0.15 | ) | | | (0.02 | ) | | | — | | | | — | | | | — | |
| | |
|
|
| |
|
|
| |
|
|
| |
|
|
| |
|
|
|
Total Distributions | | | (0.44 | ) | | | (0.42 | ) | | | (0.38 | ) | | | (0.46 | ) | | | (0.13 | ) |
| | |
|
|
| |
|
|
| |
|
|
| |
|
|
| |
|
|
|
Net Asset Value at End of Period | | $ | 10.08 | | | $ | 10.02 | | | $ | 9.55 | | | $ | 9.54 | | | $ | 9.80 | |
| | |
|
|
| |
|
|
| |
|
|
| |
|
|
| |
|
|
|
Total Return (A) (D) | | | 4.93 | % | | | 9.52 | % | | | 4.13 | % | | | 2.12 | % | | | (0.92 | )% |
| | | | | |
Ratios/Supplemental Data: | | | | | | | | | | | | | | | | | | | | |
Net Assets, End of Period (in 000s) | | $ | 4,057 | | | $ | 2,837 | | | $ | 1,026 | | | $ | 506 | | | $ | 243 | |
| | | | | |
Ratio of Expenses to Average Net Assets: | | | | | | | | | | | | | | | | | | | | |
Before Reimbursement and Waiver of Expenses by Advisor | | | 2.18 | % | | | 2.61 | % | | | 3.46 | % | | | 9.74 | % | | | 14.73 | %(C) |
After Reimbursement and Waiver of Expenses by Advisor | | | 2.10 | % | | | 2.10 | % | | | 2.10 | % | | | 2.10 | % | | | 2.10 | %(C) |
| | | | | |
Ratio of Net Investment Income to Average Net Assets: | | | | | | | | | | | | | | | | | | | | |
Before Reimbursement and Waiver of Expenses by Advisor | | | 2.87 | % | | | 3.57 | % | | | 2.93 | % | | | (2.94 | )% | | | (2.20 | )%(C) |
After Reimbursement and Waiver of Expenses by Advisor | | | 2.95 | % | | | 4.08 | % | | | 4.29 | % | | | 4.70 | % | | | 10.42 | %(C) |
| | | | | |
Portfolio Turnover | | | 62.06 | % | | | 18.10 | % | | | 20.28 | % | | | 35.54 | % | | | 21.25 | % |
| (A) | Total Return Calculation Does Not Reflect Sales Load. |
| (B) | For the Period August 5, 1999 (Commencement of Operations) to December 31, 1999. |
| (D) | For Periods Of Less Than One Full Year, Total Return Is Not Annualized. |
The accompanying notes are an integral part of these financial statements.
Timothy Plan Fixed Income Fund [45]
LETTER FROM THE MANAGER
December 31, 2003
AGGRESSIVE GROWTH FUND
The positive finish to the month and year were driven by investor expectations that economic growth will continue to be strong well into 2004 and that corporate profits will continue to record double-digit growth. Within the market as a whole, small and mid cap companies recorded the strongest advances in the year; however, growth and value styles produced similar returns, with neither style dominating. As the year came to a close, most U.S. stock indexes ended at or very close to their 52 week highs, completing a year that by any standard provided one of the broadest market advances in quite some time.
The portfolio delivered outstanding absolute returns for the year, but trailed the benchmark Russell Mid Cap Growth Index slightly. The greatest area of strength during the year was Information Technology. Technology companies benefiting from strong end markets performed exceptionally well, including SanDisk Corp. (storage products based on flash memory), Network Appliance (network area storage systems), and Yahoo! (internet searching services and portals). The portfolio also delivered strong results in the Health Care sector. Helping performance for the year were Teva Pharmaceutical (generic drugs) and Guidant Corp. (health care equipment and devices).
The two areas that acted as a drag on relative performance were Cash and Consumer Discretionary stocks. In a strongly rising market, cash will particularly detract from the portfolio’s relative performance. Cash is not used strategically in the portfolio, but rather it is maintained as a cushion for portfolio management needs. In the Consumer Discretionary sector, the portfolio’s holdings generated a positive rate of return for the year, but lagged the return of consumer related stocks. PETsMART Inc. (specialty retailer focused on pet supplies) and Brinker International (casual dining restaurants) produced weak results in a strong performing sector.
2003 was a very solid year for mid cap growth stocks and can be characterized as a broad market advance. Every major sector in both the portfolio and the benchmark generated a positive rate of return, a sharp contrast to the past three years (2000 – 2002). The key to positive returns in 2004 is earnings growth. Importantly, the strength in earnings growth and positive revisions is persisting, which is a favorable sign as we move into the first half of 2004. Having said that, as stock prices have risen considerably over the past year, we remain sensitive to valuations and will take action, by trimming or selling positions, when it is warranted. We do not expect the coming year to mirror that of 2003 where a broad mix of stocks advanced sharply. In our view, strong stock selection will be required to produce attractive absolute and relative returns – an environment we welcome, as bottom up stock picking represents the core of our investment approach.
Provident Investment Counsel, Inc.
Letter From The Manager [46]
SCHEDULE OF INVESTMENTS
As of December 31, 2003
| | | | | |
| COMMON STOCKS - 95.26% | | | |
| | |
number of shares
| | | | market value
|
| | | AIR TRANSPORTATION, SCHEDULED - 1.34% | | | |
| 5,700 | | JetBlue Airways Corp.* | | $ | 151,164 |
| | | | |
|
|
| | | APPAREL MANUFACTURERS - 1.42% | | | |
| 4,250 | | Coach, Inc.* | | | 160,438 |
| | | | |
|
|
| | | AUTO MANUFACTURERS - 2.89% | | | |
| 6,800 | | Navistar International Corp.* | | | 325,652 |
| | | | |
|
|
| | | BIOMEDICAL - 1.65% | | | |
| 4,500 | | ICOS Corp.* | | | 185,760 |
| | | | |
|
|
| | | COMMUNICATIONS EQUIPMENT - 2.12% | | | |
| 6,450 | | UTStarcom, Inc.* | | | 239,102 |
| | | | |
|
|
| | | COMPUTER STORAGE DEVICES - 5.01% | | | |
| 16,250 | | Maxtor Corp. | | | 180,375 |
| 8,150 | | Network Appliance, Inc.* | | | 167,319 |
| 3,550 | | Sandisk Corp.* | | | 217,047 |
| | | | |
|
|
| | | | | | 564,741 |
| | | | |
|
|
| | | DRILLING OIL & GAS WELLS - 1.34% | | | |
| 5,550 | | Ensco International, Inc. | | | 150,794 |
| | | | |
|
|
| | | EDUCATIONAL SERVICES - 4.59% | | | |
| 2,650 | | Corinthian Colleges, Inc. | | | 147,234 |
| 4,300 | | Education Management Corp.* | | | 133,472 |
| 2,500 | | ITT Educational Services, Inc.* | | | 117,425 |
| 1,100 | | Strayer Educational, Inc. | | | 119,713 |
| | | | |
|
|
| | | | | | 517,844 |
| | | | |
|
|
| | | ELECTRONICS - 2.06% | | | |
| 7,350 | | Tektronix, Inc. | | | 232,260 |
| | | | |
|
|
| | | ENTERTAINMENT & LEISURE - 1.55% | | | |
| 5,500 | | Brunswick Corp. | | | 175,065 |
| | | | |
|
|
| | | FINANCIAL SERVICES - 5.81% | | | |
| 2,150 | | Bear Stearns Cos., Inc. | | | 171,892 |
| 7,400 | | CIT Group, Inc. | | | 266,030 |
| 9,400 | | Friedman Billings Ramsey Group, Inc. | | | 216,952 |
| | | | |
|
|
| | | | | | 654,874 |
| | | | |
|
|
| | | HOUSEHOLD AUDIO & VIDEO EQUIPMENT - 1.84% | | | |
| 2,800 | | Harman International Industries, Inc. | | | 207,144 |
| | | | |
|
|
| | | INTERNET SECURITY - 1.72% | | | |
| 5,600 | | Symantec Corp.* | | | 194,040 |
| | | | |
|
|
| | | LINEN SUPPLY & RELATED ITEMS - 0.62% | | | |
| 1,400 | | Cintas Corporations | | | 70,182 |
| | | | |
|
|
The accompanying notes are an integral part of these financial statements.
Timothy Aggressive Growth Fund [47]
SCHEDULE OF INVESTMENTS
As of December 31, 2003
| | | | | |
| COMMON STOCKS - 95.26% (cont.) | | | |
| | |
number of shares
| | | | market value
|
| | | MACHINERY - 1.23% | | | |
| 3,900 | | Rockwell Automation, Inc. | | $ | 138,840 |
| | | | |
|
|
| | | MEDICAL - DRUGS - 5.52% | | | |
| 3,350 | | Angiotech Pharmaceuticals* | | | 154,100 |
| 7,300 | | Caremark RX, Inc. * | | | 184,909 |
| 4,400 | | Taro Pharmaceutical Industries, LTD * | | | 283,800 |
| | | | |
|
|
| | | | | | 622,809 |
| | | | |
|
|
| | | MEDICAL PRODUCTS - 3.50% | | | |
| 2,500 | | Inamed Corp.* | | | 120,150 |
| 3,900 | | Zimmer Holdings, Inc.* | | | 274,560 |
| | | | |
|
|
| | | | | | 394,710 |
| | | | |
|
|
| | | OIL, GAS, FIELD SERVICES - 5.10% | | | |
| 5,450 | | BJ Services Co.* | | | 195,655 |
| 7,350 | | Patterson-UTI Energy, Inc.* | | | 241,962 |
| 4,850 | | XTO Energy, Inc. | | | 137,255 |
| | | | |
|
|
| | | | | | 574,872 |
| | | | |
|
|
| | | PHARMACEUTICAL PREPARATIONS - 2.74% | | | |
| 7,650 | | Omnicare, Inc. | | | 308,983 |
| | | | |
|
|
| | | PRINTED CIRCUIT BOARDS - 1.68% | | | |
| 6,685 | | Jabil Circuit, Inc.* | | | 189,185 |
| | | | |
|
|
| | | RETAIL - HOME FURNITURE, FURNISHINGS & EQUIPMENT STORES - 2.17% | | | |
| 5,650 | | Bed Bath & Beyond, Inc.* | | | 244,928 |
| | | | |
|
|
| | | RETAIL - RESTAURANTS - 1.28% | | | |
| 3,650 | | Panera Bread Co. Class A* | | | 144,284 |
| | | | |
|
|
| | | RETAIL - RETAIL STORES - 3.51% | | | |
| 7,400 | | Ross Stores, Inc. | | | 195,582 |
| 5,750 | | Williams-Sonoma, Inc.* | | | 199,928 |
| | | | |
|
|
| | | | | | 395,510 |
| | | | |
|
|
| | | RETAIL - VARIETY STORES - 3.12% | | | |
| 6,629 | | Dollar Tree Stores, Inc.* | | | 199,268 |
| 4,250 | | Family Dollar Stores, Inc. | | | 152,490 |
| | | | |
|
|
| | | | | | 351,758 |
| | | | |
|
|
| | | SEMICONDUCTORS & RELATED DEVICES - 10.47% | | | |
| 14,000 | | Amkor Technology, Inc.* | | | 254,940 |
| 11,550 | | ATI Technologies, Inc.* | | | 174,636 |
| 7,250 | | Intersil Corp.* | | | 180,163 |
| 6,150 | | Lam Research Corp.* | | | 198,645 |
| 3,650 | | Maxim Integrated Products, Inc. | | | 181,770 |
| 3,700 | | Qlogic Corp.* | | | 190,920 |
| | | | |
|
|
| | | | | | 1,181,074 |
| | | | |
|
|
| | | SERVICES - COMMERCIAL - 1.46% | | | |
| 4,150 | | Iron Mountain, Inc.* | | | 164,091 |
| | | | |
|
|
The accompanying notes are an integral part of these financial statements.
Timothy Aggressive Growth Fund [48]
SCHEDULE OF INVESTMENTS
As of December 31, 2003
COMMON STOCKS - 95.26% (cont.)
| | | | | |
number of
shares
| | | | market value
|
| | | SERVICES - COMPUTER INTEGRATED SYSTEMS DESIGN - 1.54% | | | |
| 3,800 | | Cognizant Technology Solutions Corp.* | | $ | 173,432 |
| | | | |
|
|
| | | SERVICES - EQUIPMENT RENTAL & LEASING - 1.56% | | | |
| 5,875 | | Rent-A-Center, Inc.* | | | 175,545 |
| | | | |
|
|
| | | SERVICES - HELP SUPPLY SERVICES - 2.02% | | | |
| 4,850 | | Manpower, Inc. | | | 228,338 |
| | | | |
|
|
| | | SERVICES - PREPACKAGED SOFTWARE - 4.41% | | | |
| 6,900 | | Cognos, Inc.* | | | 211,278 |
| 4,150 | | Mercury Interactive Corp.* | | | 201,856 |
| 1,850 | | National Instruments Corp. | | | 84,120 |
| | | | |
|
|
| | | | | | 497,254 |
| | | | |
|
|
| | | SERVICES - TRANSPORTATION - 1.44% | | | |
| 6,000 | | JB Hunt Transport Services, Inc.* | | | 162,060 |
| | | | |
|
|
| | | SERVICES - WASTE DISPOSAL - 1.63% | | | |
| 3,950 | | Stericycle, Inc.* | | | 184,465 |
| | | | |
|
|
| | | SERVICES - WEB HOSTING/DESIGN - 1.27% | | | |
| 8,050 | | Macromedia, Inc.* | | | 143,612 |
| | | | |
|
|
| | | SURGICAL & MEDICAL INSTRUMENTS & APPARATUS - 1.23% | | | |
| 2,300 | | Guidant Corp. | | | 138,460 |
| | | | |
|
|
| | | TELEVISION BROADCASTING STATIONS - 2.52% | | | |
| 7,150 | | Univision Communications, Inc.* | | | 283,783 |
| | | | |
|
|
| | | WIRELESS EQUIPMENT - 1.90% | | | |
| 15,950 | | Nextel Partners, Inc.* | | | 214,527 |
| | | | |
|
|
| | | Total Common Stocks (cost $9,316,563) | | | 10,741,580 |
| | | | |
|
|
SHORT-TERM INVESTMENTS - 4.42%
| | | | | |
number of
shares
| | | | market value
|
| 25,932 | | Federated Cash Trust Series II Treasury | | | 25,932 |
| 472,870 | | First American Treasury Obligations Fund Class A | | | 472,870 |
| | | | |
|
|
| | | Total Short-Term Investments (cost $498,802) | | | 498,802 |
| | | | |
|
|
| | | TOTAL INVESTMENTS - 99.68% (identified cost $9,815,365) | | | 11,240,382 |
| | | OTHER ASSETS AND LIABILITIES, NET - 0.32% | | | 35,582 |
| | | | |
|
|
| | | NET ASSETS - 100.00% | | $ | 11,275,964 |
| | | | |
|
|
| * | Non-income producing securities |
| (a) | American Depositary Receipt |
The accompanying notes are an integral part of these financial statements.
Timothy Aggressive Growth Fund [49]
STATEMENT OF ASSETS AND LIABILITIES
As of December 31, 2003
ASSETS
| | | | |
| | | amount
| |
Investments in Securities at Value (identified cost $9,815,365) [NOTE 1] | | $ | 11,240,382 | |
Receivables: | | | | |
Interest | | | 154 | |
Dividends | | | 3,743 | |
Fund Shares Sold | | | 58,145 | |
Prepaid expenses | | | 3,840 | |
Due from Advisor | | | 8,725 | |
Fund Shares Commissions Receivable from Advisor | | | 782 | |
| | |
|
|
|
Total Assets | | $ | 11,315,771 | |
| | |
|
|
|
| |
LIABILITIES | | | | |
| |
| | | amount
| |
Accrued 12b-1 fees | | $ | 3,143 | |
Payable for Investment Securities Purchased | | | 27,830 | |
Payable for Fund Shares Redeemed | | | 1,150 | |
Accrued Expenses | | | 7,684 | |
| | |
|
|
|
Total Liabilities | | $ | 39,807 | |
| | |
|
|
|
| |
NET ASSETS | | | | |
| |
| | | amount
| |
Class A Shares: | | | | |
Net Assets (unlimited shares of $0.001 par beneficial interest authorized; 1,565,928 shares outstanding) | | $ | 9,920,202 | |
Net Asset Value and Redemption price Per Class A Share ($9,920,202 / 1,565,928 shares) | | $ | 6.34 | |
Offering Price Per Share ($6.34/ 0.9475) | | $ | 6.69 | |
Class B Shares: | | | | |
Net Assets (unlimited shares of $0.001 par beneficial interest authorized; 219,048 shares outstanding) | | $ | 1,355,762 | |
Net Asset Value and Offering Price Per Class B Share ($1,355,762 / 219,048 shares) | | $ | 6.19 | |
Maximum Redemption Price Per Class B Share ($6.19 x 0.95) | | $ | 5.88 | |
| |
Net Assets | | $ | 11,275,964 | |
| | |
|
|
|
| |
SOURCES OF NET ASSETS | | | | |
| |
| | | amount
| |
At December 31, 2003, Net Assets Consisted of: | | | | |
Paid-in Capital | | $ | 10,726,793 | |
Accumulated Net Realized Loss on Investments | | | (875,846 | ) |
Net Unrealized Appreciation in Value of Investments | | | 1,425,017 | |
| | |
|
|
|
Net Assets | | $ | 11,275,964 | |
| | |
|
|
|
The accompanying notes are an integral part of these financial statements.
Timothy Aggressive Growth Fund [50]
STATEMENT OF OPERATIONS
For the year ended December 31, 2003
INVESTMENT INCOME
| | | | |
| | | amount
| |
Interest | | $ | 1,633 | |
Dividends | | | 16,608 | |
| | |
|
|
|
Total Investment Income | | | 18,241 | |
| | |
|
|
|
| |
EXPENSES | | | | |
| |
| | | amount
| |
Investment Advisory Fees [NOTE 3] | | | 64,226 | |
Custodian Fees | | | 12,385 | |
Fund Accounting, Transfer Agency, & Administration Fees | | | 23,708 | |
Registration Fees | | | 3,495 | |
12b-1 Fees (Class A =$16,721, Class B =$6,477) [NOTE 3] | | | 23,198 | |
Auditing Fees | | | 2,326 | |
Service Fees (Class B) [NOTE 3] | | | 2,171 | |
Legal Expense | | | 2,741 | |
Printing Expense | | | 2,067 | |
Insurance Expense | | | 2,231 | |
Miscellaneous Expense | | | 7,345 | |
| | |
|
|
|
Total Expenses | | | 145,893 | |
| |
Expenses Waived and Reimbursed by Advisor [NOTE 3] | | | (18,414 | ) |
| | |
|
|
|
Total Net Expenses | | | 127,479 | |
| | |
|
|
|
Net Investment Loss | | | (109,238 | ) |
| | |
|
|
|
| |
| REALIZED AND UNREALIZED GAIN ON INVESTMENTS | | | | |
| |
| | | amount
| |
Net Realized Gain on Investments | | | 990,816 | |
Change in Unrealized Appreciation of Investments | | | 1,548,135 | |
| | |
|
|
|
Net Realized and Unrealized Gain on Investments | | | 2,538,951 | |
| | |
|
|
|
Increase in Net Assets Resulting from Operations | | $ | 2,429,713 | |
| | |
|
|
|
The accompanying notes are an integral part of these financial statements.
Timothy Aggressive Growth Fund [51]
STATEMENT OF CHANGES IN NET ASSETS
INCREASE (DECREASE) IN NET ASSETS
| | | | | | | | |
| | | year ended
12/31/03
| | | year ended
12/31/02
| |
Operations: | | | | | | | | |
Net Investment Loss | | $ | (109,238 | ) | | $ | (67,721 | ) |
Net Change in Unrealized Appreciation (Depreciation) of Investments | | | 1,548,135 | | | | (395,808 | ) |
Net Realized Gain (Loss) on Investments | | | 990,816 | | | | (1,224,764 | ) |
| | |
|
|
| |
|
|
|
Increase (Decrease) in Net Assets (resulting from operations) | | | 2,429,713 | | | | (1,688,293 | ) |
| | |
|
|
| |
|
|
|
Capital Share Transactions: | | | | | | | | |
Proceeds from Shares Sold: | | | | | | | | |
Class A | | | 3,315,661 | | | | 3,330,868 | |
Class B | | | 616,695 | | | | 408,599 | |
Cost of Shares Redeemed: | | | | | | | | |
Class A | | | (433,883 | ) | | | (440,288 | ) |
Class B | | | (54,443 | ) | | | (121,158 | ) |
| | |
|
|
| |
|
|
|
Increase in Net Assets (resulting from capital share transactions) | | | 3,444,030 | | | | 3,178,021 | |
| | |
|
|
| |
|
|
|
Total Increase in Net Assets | | | 5,873,743 | | | | 1,489,728 | |
| | |
Net Assets: | | | | | | | | |
Beginning of Year | | | 5,402,221 | | | | 3,912,493 | |
| | |
|
|
| |
|
|
|
End of Year | | $ | 11,275,964 | | | $ | 5,402,221 | |
| | |
|
|
| |
|
|
|
Shares of Capital Stock of the Fund Sold and Redeemed: | | | | | | | | |
Shares Sold: | | | | | | | | |
Class A | | | 579,856 | | | | 611,101 | |
Class B | | | 113,584 | | | | 77,504 | |
Shares Redeemed: | | | | | | | | |
Class A | | | (84,490 | ) | | | (71,715 | ) |
Class B | | | (11,506 | ) | | | (21,856 | ) |
| | |
|
|
| |
|
|
|
Net Increase in Number of Shares Outstanding | | | 597,444 | | | | 595,034 | |
| | |
|
|
| |
|
|
|
The accompanying notes are an integral part of these financial statements.
Timothy Aggressive Growth Fund [52]
FINANCIAL HIGHLIGHTS
The table below set forth financial data for one share of capital stock outstanding throughout each period.
AGGRESSIVE GROWTH FUND - CLASS A SHARES
| | | | | | | | | | | | | | | | |
| | | year
ended
12/31/03
| | | year
ended
12/31/02
| | | year
ended
12/31/01
| | | period ended
12/31/00 (B)
| |
Per Share Operating Performance: | | | | | | | | | | | | | | | | |
Net Asset Value at Beginning of Period | | $ | 4.56 | | | $ | 6.61 | | | $ | 8.35 | | | $ | 10.00 | |
| | |
|
|
| |
|
|
| |
|
|
| |
|
|
|
Income from Investment Operations: | | | | | | | | | | | | | | | | |
Net Investment Loss | | | (0.06 | ) | | | (0.05 | ) | | | (0.05 | ) | | | — | |
Net Realized and Unrealized Gain (Loss) on Investments | | | 1.84 | | | | (2.00 | ) | | | (1.69 | ) | | | (1.65 | ) |
| | |
|
|
| |
|
|
| |
|
|
| |
|
|
|
Total from Investment Operations | | | 1.78 | | | | (2.05 | ) | | | (1.74 | ) | | | (1.65 | ) |
| | |
|
|
| |
|
|
| |
|
|
| |
|
|
|
Less Distributions: | | | | | | | | | | | | | | | | |
Dividends from Realized Gains | | | — | | | | — | | | | — | | | | — | |
Dividends from Net Investment Income | | | — | | | | — | | | | — | | | | — | |
| | |
|
|
| |
|
|
| |
|
|
| |
|
|
|
Total Distributions | | | — | | | | — | | | | — | | | | — | |
| | |
|
|
| |
|
|
| |
|
|
| |
|
|
|
Net Asset Value at End of Period | | $ | 6.34 | | | $ | 4.56 | | | $ | 6.61 | | | $ | 8.35 | |
| | |
|
|
| |
|
|
| |
|
|
| |
|
|
|
Total Return (A) (D) | | | 39.04 | % | | | (31.01 | )% | | | (20.84 | )% | | | (16.50 | )% |
| | | | |
Ratios/Supplemental Data: | | | | | | | | | | | | | | | | |
Net Assets, End of Period (in 000s) | | $ | 9,920 | | | $ | 4,878 | | | $ | 3,510 | | | $ | 717 | |
| | | | |
Ratio of Expenses to Average Net Assets: | | | | | | | | | | | | | | | | |
Before Reimbursement and Waiver of Expenses by Advisor | | | 1.85 | % | | | 2.64 | % | | | 3.87 | % | | | 10.20 | %(C) |
After Reimbursement and Waiver of Expenses by Advisor | | | 1.60 | % | | | 1.60 | % | | | 1.60 | % | | | 1.60 | %(C) |
| | | | |
Ratio of Net Investment Loss to Average Net Assets: | | | | | | | | | | | | | | | | |
Before Reimbursement and Waiver of Expenses by Advisor | | | (1.60 | )% | | | (2.44 | )% | | | (3.53 | )% | | | (8.91 | )%(C) |
After Reimbursement and Waiver of Expenses by Advisor | | | (1.35 | )% | | | (1.40 | )% | | | (1.26 | )% | | | (0.31 | )%(C) |
| | | | |
Portfolio Turnover | | | 119.33 | % | | | 134.34 | % | | | 113.39 | % | | | 19.00 | % |
| (A) | Total Return Calculation Does Not Reflect Sales Load. |
| (B) | For The Period October 4, 2000 (commencement of operations) to December 31, 2000. |
| (D) | For Periods of Less Than A Full Year, The Total Return Is Not Annualized. |
The accompanying notes are an integral part of these financial statements.
Timothy Aggressive Growth Fund [53]
FINANCIAL HIGHLIGHTS
The table below set forth financial data for one share of capital stock outstanding throughout each period.
AGGRESSIVE GROWTH FUND - CLASS B SHARES
| | | | | | | | | | | | | | | | |
| | | year
ended
12/31/03
| | | year
ended
12/31/02
| | | year
ended
12/31/01
| | | period
ended
12/31/00 (B)
| |
Per Share Operating Performance: | | | | | | | | | | | | | | | | |
Net Asset Value at Beginning of Period | | $ | 4.48 | | | $ | 6.56 | | | $ | 8.34 | | | $ | 10.00 | |
| | |
|
|
| |
|
|
| |
|
|
| |
|
|
|
Income from Investment Operations: | | | | | | | | | | | | | | | | |
Net Investment Loss | | | (0.08 | ) | | | (0.08 | ) | | | (0.11 | ) | | | — | |
Net Realized and Unrealized Gain (Loss) on Investments | | | 1.79 | | | | (2.00 | ) | | | (1.67 | ) | | | (1.66 | ) |
| | |
|
|
| |
|
|
| |
|
|
| |
|
|
|
Total from Investment Operations | | | 1.71 | | | | (2.08 | ) | | | (1.78 | ) | | | (1.66 | ) |
| | |
|
|
| |
|
|
| |
|
|
| |
|
|
|
Less Distributions: | | | | | | | | | | | | | | | | |
Dividends from Realized Gains | | | — | | | | — | | | | — | | | | — | |
Dividends from Net Investment Income | | | — | | | | — | | | | — | | | | — | |
| | |
|
|
| |
|
|
| |
|
|
| |
|
|
|
Total Distributions | | | — | | | | — | | | | — | | | | — | |
| | |
|
|
| |
|
|
| |
|
|
| |
|
|
|
Net Asset Value at End of Period | | $ | 6.19 | | | $ | 4.48 | | | $ | 6.56 | | | $ | 8.34 | |
| | |
|
|
| |
|
|
| |
|
|
| |
|
|
|
Total Return (A) (D) | | | 38.17 | % | | | (31.71 | )% | | | (21.34 | )% | | | (16.60 | )% |
| | | | |
Ratios/Supplemental Data: | | | | | | | | | | | | | | | | |
Net Assets, End of Period (in 000s) | | $ | 1,356 | | | $ | 525 | | | $ | 402 | | | $ | 248 | |
| | | | |
Ratio of Expenses to Average Net Assets: | | | | | | | | | | | | | | | | |
Before Reimbursement of Expenses by Advisor | | | 2.60 | % | | | 3.70 | % | | | 4.63 | % | | | 10.95 | %(C) |
After Reimbursement of Expenses by Advisor | | | 2.35 | % | | | 2.35 | % | | | 2.35 | % | | | 2.35 | %(C) |
| | | | |
Ratio of Net Investment Loss to Average Net Assets: | | | | | | | | | | | | | | | | |
Before Reimbursement of Expenses by Advisor | | | (2.35 | )% | | | (3.50 | )% | | | (4.24 | )% | | | (9.66 | )%(C) |
After Reimbursement of Expenses by Advisor | | | (2.10 | )% | | | (2.15 | )% | | | (1.96 | )% | | | (1.06 | )%(C) |
| | | | |
Portfolio Turnover | | | 119.33 | % | | | 134.34 | % | | | 113.39 | % | | | 19.00 | % |
| (A) | Total Return Calculation Does Not Reflect Redemption Fee. |
| (B) | For The Period October 6, 2000 (commencement of operations) to December 31, 2000. |
| (D) | For Periods of Less Than A Full Year, The Total Return Is Not Annualized. |
The accompanying notes are an integral part of these financial statements.
Timothy Aggressive Growth Fund [54]
LETTER FROM THE MANAGER
December 31, 2003
LARGE/MID CAP GROWTH FUND
The year started inauspiciously with the prospect of war with Iraq, an outbreak of corporate scandal and the gloom of a down market. These issues formed the backdrop of an early-stage recovery marked by disappointing employment trends and the threat of deflation leading to a double-dip recession. However, gradual economic improvement – especially in the second half of 2003 – brightened investors’ outlook for 2004. The year-end returns of the major indexes were uniformly positive - the S&P 500 Index gained 28.7%, the Dow Jones Industrial Average gained 28.3% and the Russell 1000® Growth Index gained 29.7%.
For the full year 2003, The Timothy Plan® Large/Mid-Cap Growth Fund under-performed the benchmark Russell 1000® Growth Index. This was largely the result of the market favoring lower-quality, more cyclically sensitive companies, especially within the Technology sector. The fund’s performance was limited by under-weighting the strong Technology sector, by stock selections within the Consumer Discretionary sector (e.g., retailer Kohl’s) and stock selections within the weak Financial Services sector (e.g., data processor ADP). However, performance did benefit from stock selections within the weak Healthcare sector (e.g., medical supplier Zimmer Holdings) and over-weighting the Producer Durables sector (e.g., electronic equipment maker Molex). As of December 31, the fund remained fully invested in 39 companies and diversified among the major economic sectors.
To help sustain the recovery, the Fed is expected to keep short-term interest rates close to 1 percent, at least into the middle of 2004. In addition, the economic stimulus package should give consumers and businesses more discretionary income. Although rising interest rates pose a threat to the housing sector, one of the brightest parts of the economy, the business spending outlook has improved considerably due to a number of factors working in concert: improved confidence, increased profitability, tax-incentives and less concern with reducing inventory. We expect the market will begin to favor companies with solid earnings – the primary driver of stock prices – and strong fundamentals. As the recovery matures, more-established companies with sustainable earnings and solid fundamentals typically outperform. Second, a weak dollar and increased international opportunity point toward a broad synchronized recovery that should favor large, multinational companies with diverse global exposure. Finally, many investors who fled to the sidelines at the start of the recession will likely take the opportunity to buy high-quality stocks that are at more attractive valuations.
Rittenhouse Asset Management, Inc.
Letter From The Manager [55]
SCHEDULE OF INVESTMENTS
As of December 31, 2003
COMMON STOCKS - 95.59%
| | | | | |
number of shares
| | | | market value
|
| | | ACCIDENT & HEALTH INSURANCE - 2.81% | | | |
| 20,000 | | AFLAC, Inc. | | $ | 723,600 |
| | | | |
|
|
| | | AEROSPACE & DEFENSE - 1.79% | | | |
| 9,000 | | L-3 Communications Holdings, Inc. * | | | 462,240 |
| | | | |
|
|
| | | AIRCRAFT ENGINES & ENGINE PARTS - 1.84% | | | |
| 5,000 | | United Technologies Corp. | | | 473,850 |
| | | | |
|
|
| | | BIOLOGICAL PRODUCTS (NO DIAGNOSTIC SUBSTANCES) - 6.41% | | | |
| 18,925 | | Amgen, Inc. * | | | 1,169,565 |
| 19,000 | | MedImmune, Inc. * | | | 482,600 |
| | | | |
|
|
| | | | | | 1,652,165 |
| | | | |
|
|
| | | COMMERCIAL SERVICES & SUPPLIES - 1.58% | | | |
| 6,000 | | Apollo Group, Inc.* | | | 408,000 |
| | | | |
|
|
| | | COMMUNICATIONS EQUIPMENT - 3.36% | | | |
| 51,000 | | Nokia Oyj (a) | | | 867,000 |
| | | | |
|
|
| | | COMPUTERS & PERIPHERALS - 2.60% | | | |
| 52,000 | | EMC Corporation* | | | 671,840 |
| | | | |
|
|
| | | ELECTRONIC CONNECTORS - 1.89% | | | |
| 14,000 | | Molex, Inc. | | | 488,460 |
| | | | |
|
|
| | | FINANCE - CONSUMER LOANS - 2.19% | | | |
| 15,000 | | SLM Corp. | | | 565,200 |
| | | | |
|
|
| | | FIRE, MARINE & CASUALTY INSURANCE - 4.54% | | | |
| 17,650 | | American International Group, Inc. | | | 1,169,842 |
| | | | |
|
|
| | | FOOD & STAPLES RETAILING - 2.88% | | | |
| 14,000 | | Wal-Mart Stores, Inc. | | | 742,700 |
| | | | |
|
|
| | | FUNCTIONS RELATED TO DEPOSITORY BANKING - 1.50% | | | |
| 26,000 | | Concord EFS, Inc. * | | | 385,840 |
| | | | |
|
|
| | | GENERAL INDUSTRIAL MACHINERY & EQUIPMENT - 1.95% | | | |
| 6,000 | | Illinois Tool Works, Inc. | | | 503,460 |
| | | | |
|
|
| | | HEALTH CARE EQUIPMENT & SUPPLIES - 3.42% | | | |
| 24,000 | | Boston Scientific Corporation * | | | 882,240 |
| | | | |
|
|
| | | MULTILINE RETAIL - 0.83% | | | |
| 6,000 | | Family Dollar Stores, Inc. | | | 215,280 |
| | | | |
|
|
| | | NATIONAL COMMERCIAL BANKS - 1.85% | | | |
| 19,250 | | MBNA Corp. | | | 478,363 |
| | | | |
|
|
| | | ORTHOPEDIC, PROSTHETIC & SURGICAL APPLIANCES & SUPPLIES - 6.42% | | | |
| 11,000 | | Biomet, Inc. | | | 400,510 |
| 9,000 | | St Jude Medical, Inc. * | | | 552,150 |
| 10,000 | | Zimmer Holdings, Inc. * | | | 704,000 |
| | | | |
|
|
| | | | | | 1,656,660 |
| | | | |
|
|
The accompanying notes are an integral part of these financial statements
Timothy Plan Large/Mid-Cap Growth Fund [56]
SCHEDULE OF INVESTMENTS
As of December 31, 2003
COMMON STOCKS - 95.59% - continued
| | | | | |
number of shares
| | | | market value
|
| | | OFFICE ELECTRONICS - 2.83% | | | |
| 11,000 | | Zebra Technologies Corporation * | | $ | 730,070 |
| | | | |
|
|
| | | PERFUMES, COSMETICS & OTHER TOILET PREPARATIONS - 2.91% | | | |
| 15,000 | | Colgate Palmolive Co. | | | 750,750 |
| | | | |
|
|
| | | PHARMACEUTICAL PREPARATIONS - 2.38% | | | |
| 8,000 | | Allergan, Inc. | | | 614,480 |
| | | | |
|
|
| | | RETAIL-DEPARTMENT STORES - 1.92% | | | |
| 11,000 | | Kohl’s Corp. * | | | 494,340 |
| | | | |
|
|
| | | RETAIL-HOME FURNITURE, FURNISHINGS & EQUIPMENT STORES - 2.86% | | | |
| 17,000 | | Bed Bath & Beyond, Inc. * | | | 736,950 |
| | | | |
|
|
| | | RETAIL-LUMBER & OTHER BUILDING MATERIALS DEALERS - 2.15% | | | |
| 10,000 | | Lowe’s Companies, Inc. | | | 553,900 |
| | | | |
|
|
| | | RETAIL-OFFICE SUPPLIES - 1.69% | | | |
| 16,000 | | Staples, Inc.* | | | 436,800 |
| | | | |
|
|
| | | SEMICONDUCTORS & RELATED DEVICES - 8.72% | | | |
| 20,000 | | Analog Devices | | | 913,000 |
| 22,000 | | Applied Materials, Inc. * | | | 493,900 |
| 20,000 | | Linear Technology Corp. | | | 841,400 |
| | | | |
|
|
| | | | | | 2,248,300 |
| | | | |
|
|
| | | SERVICES-COMPUTER PROCESSING AND DATA PREPARATION - 1.08% | | | |
| 7,000 | | Automatic Data Processing, Inc. | | | 277,270 |
| | | | |
|
|
| | | SERVICES-PREPACKAGED SOFTWARE - 1.60% | | | |
| 29,675 | | Siebel Systems, Inc. * | | | 411,592 |
| | | | |
|
|
| | | SOFTWARE - 6.83% | | | |
| 6,000 | | Mercury Interactive Corporation * | | | 291,840 |
| 17,000 | | SAP AG (a) | | | 706,520 |
| 22,000 | | Symantec Corporation * | | | 762,300 |
| | | | |
|
|
| | | | | | 1,760,660 |
| | | | |
|
|
| | | SURGICAL & MEDICAL INSTRUMENTS & APPARATUS - 4.28% | | | |
| 13,000 | | Stryker Corp. | | | 1,105,130 |
| | | | |
|
|
| | | TRUCKING & COURIER SERVICES (NO AIR) - 1.45% | | | |
| 5,000 | | United Parcel Service, Inc., Class B | | | 372,750 |
| | | | |
|
|
| | | THERAPEUTICS - 2.70% | | | |
| 12,000 | | Gilead Sciences, Inc. * | | | 697,680 |
| | | | |
|
|
| | | WHOLESALE-GROCERIES & RELATED PRODUCTS - 4.33% | | | |
| 30,000 | | Sysco Corp. | | | 1,116,900 |
| | | | |
|
|
| | | Total Common Stocks (cost $21,777,084) | | | 24,654,312 |
| | | | |
|
|
The accompanying notes are an integral part of these financial statements.
Timothy Plan Large/Mid-Cap Growth Fund [57]
SCHEDULE OF INVESTMENTS
As of December 31, 2003
SHORT-TERM INVESTMENTS - 3.52%
| | | | | |
number of shares
| | | | market value
|
| 907,646 | | First American Treasury Obligations Fund, Class A (Cost $907,646) | | $ | 907,646 |
| | | | |
|
|
| | | TOTAL INVESTMENTS - 99.11% (identified cost $22,684,730) | | | 25,561,958 |
| | | OTHER ASSETS LESS LIABILITIES, NET - 0.89% | | | 230,769 |
| | | | |
|
|
| | | NET ASSETS - 100.00% | | $ | 25,792,727 |
| | | | |
|
|
| * | Non-income producing securities |
| (a) | American Depositary Receipt |
The accompanying notes are an integral part of these financial statements.
Timothy Plan Large/Mid-Cap Growth Fund [58]
STATEMENT OF ASSETS AND LIABILITIES
As of December 31, 2003
ASSETS
| | | | |
| | | amount
| |
Investments in Securities at Value (identified cost $22,684,730 ) [NOTE 1] | | $ | 25,561,958 | |
Receivables: | | | | |
Interest | | | 171 | |
Dividends | | | 13,375 | |
Fund Shares Sold | | | 237,817 | |
Prepaid Expenses | | | 7,359 | |
Fund Shares Commissions Receivable from Advisor | | | 1,079 | |
| | |
|
|
|
Total Assets | | $ | 25,821,759 | |
| | |
|
|
|
| |
LIABILITIES | | | | |
| |
| | | amount
| |
Accrued Advisory Fees | | $ | 5,783 | |
Accrued 12b-1 Fees | | | 6,748 | |
Payable for Fund Shares Redeemed | | | 1,948 | |
Accrued expenses | | | 14,553 | |
| | |
|
|
|
Total Liabilities | | $ | 29,032 | |
| | |
|
|
|
| |
NET ASSETS | | | | |
| |
| | | amount
| |
Class A Shares: | | | | |
Net Assets (unlimited shares of $0.001 par beneficial interest authorized; 3,792,643 shares outstanding) | | $ | 23,407,424 | |
Net Asset Value and Redemption Price Per Class A Share ($23,407,424/3,792,643 shares) | | $ | 6.17 | |
Offering Price Per Share ($6.17/0.9475) | | $ | 6.51 | |
Class B Shares: | | | | |
Net Assets (unlimited shares of $0.001 par beneficial interest authorized; 394,817 shares outstanding) | | $ | 2,385,303 | |
Net Asset Value and Offering Price Per Class B Share ($2,385,303/394,817 shares) | | $ | 6.04 | |
Maximum Redemption Price Per Class B Share ($6.04 x 0.95 ) | | $ | 5.74 | |
| |
Net Assets | | $ | 25,792,727 | |
| | |
|
|
|
| |
SOURCES OF NET ASSETS | | | | |
| |
| | | amount
| |
At December 31, 2003, Net Assets Consisted of: | | | | |
Paid-in Capital | | $ | 26,848,736 | |
Accumulated Net Realized Loss on Investments | | | (3,933,237 | ) |
Net Unrealized Appreciation in Value of Investments | | | 2,877,228 | |
| | |
|
|
|
Net Assets | | $ | 25,792,727 | |
| | |
|
|
|
The accompanying notes are an integral part of these financial statements.
Timothy Plan Large/Mid-Cap Growth Fund [59]
STATEMENT OF OPERATIONS
For the Year Ended December 31, 2003
INVESTMENT INCOME
| | | | |
| |
| | | amount
| |
Interest | | $ | 7,420 | |
Dividends | | | 99,032 | |
| | |
|
|
|
Total Investment Income | | | 106,452 | |
| | |
|
|
|
| |
EXPENSES | | | | |
| |
| | | amount
| |
Investment Advisory Fees [NOTE 3] | | | 158,566 | |
Fund Accounting, Transfer Agency, & Administration Fees | | | 55,944 | |
12b-1 Fees (Class A = $42,110, Class B = $13,579) [NOTE 3] | | | 55,689 | |
Service Fees (Class B) [NOTE 3] | | | 4,526 | |
Registration Fees | | | 7,893 | |
Custodian Fees | | | 7,174 | |
Printing Expense | | | 5,074 | |
Auditing Fees | | | 4,972 | |
Insurance Expense | | | 2,065 | |
Legal Expense | | | 7,226 | |
Miscellaneous Expense | | | 6,967 | |
| | |
|
|
|
Total Expenses | | | 316,096 | |
| |
Expenses Waived and Reimbursed by Advisor [NOTE 3] | | | (4,937 | ) |
| | |
|
|
|
Total Net Expenses | | | 311,159 | |
| | |
|
|
|
Net Investment Loss | | | (204,707 | ) |
| | |
|
|
|
| |
REALIZED AND UNREALIZED GAIN (LOSS) ON INVESTMENTS | | | | |
| |
| | | amount
| |
Net Realized Loss on Investments | | | (626,200 | ) |
Change in Unrealized Appreciation of Investments | | | 4,364,035 | |
| | |
|
|
|
Net Realized and Unrealized Gain (Loss) on Investments | | | 3,737,835 | |
| | |
|
|
|
Increase in Net Assets Resulting from Operations | | $ | 3,533,128 | |
| | |
|
|
|
The accompanying notes are an integral part of these financial statements.
Timothy Plan Large/Mid-Cap Growth Fund [60]
STATEMENT OF CHANGES IN NET ASSETS
INCREASE (DECREASE) IN NET ASSETS
| | | | | | | | |
| | | year ended
12/31/03
| | | year ended
12/31/02
| |
Operations: | | | | | | | | |
Net Investment Loss | | $ | (204,707 | ) | | $ | (131,104 | ) |
Net Change in Unrealized Appreciation (Depreciation) of Investments | | | 4,364,035 | | | | (1,277,088 | ) |
Net Realized Loss on Investments | | | (626,200 | ) | | | (2,799,300 | ) |
| | |
|
|
| |
|
|
|
Increase (Decrease) in Net Assets (resulting from operations) | | | 3,533,128 | | | | (4,207,492 | ) |
| | |
|
|
| |
|
|
|
Capital Share Transactions: | | | | | | | | |
Proceeds from Shares Sold: | | | | | | | | |
Class A | | | 8,342,710 | | | | 9,248,432 | |
Class B | | | 902,768 | | | | 996,860 | |
Cost of Shares Redeemed: | | | | | | | | |
Class A | | | (1,175,274 | ) | | | (1,215,853 | ) |
Class B | | | (165,119 | ) | | | (239,508 | ) |
| | |
|
|
| |
|
|
|
Increase in Net Assets (resulting from capital share transactions) | | | 7,905,085 | | | | 8,789,931 | |
| | |
|
|
| |
|
|
|
Total Increase in Net Assets | | | 11,438,213 | | | | 4,582,439 | |
| | |
Net Assets: | | | | | | | | |
Beginning of Year | | | 14,354,514 | | | | 9,772,075 | |
| | |
|
|
| |
|
|
|
End of Year | | $ | 25,792,727 | | | $ | 14,354,514 | |
| | |
|
|
| |
|
|
|
Shares of Capital Stock of the Fund Sold and Redeemed: | | | | | | | | |
Shares Sold: | | | | | | | | |
Class A | | | 1,481,784 | | | | 1,523,174 | |
Class B | | | 168,169 | | | | 173,694 | |
Shares Redeemed: | | | | | | | | |
Class A | | | (226,472 | ) | | | (202,436 | ) |
Class B | | | (32,039 | ) | | | (42,116 | ) |
| | |
|
|
| |
|
|
|
Net Increase in Number of Shares Outstanding | | | 1,391,442 | | | | 1,452,316 | |
| | |
|
|
| |
|
|
|
The accompanying notes are an integral part of these financial statements.
Timothy Plan Large/Mid-Cap Growth Fund [61]
FINANCIAL HIGHLIGHTS
The table below set forth financial data for one share of capital stock outstanding throughout each period presented.
LARGE/MID CAP GROWTH FUND - CLASS A SHARES
| | | | | | | | | | | | | | | | |
| | | year
ended
12/31/03
| | | year
ended
12/31/02
| | | year
ended
12/31/01
| | | period
ended
12/31/00 (B)
| |
Per Share Operating Performance: | | | | | | | | | | | | | | | | |
Net Asset Value at Beginning of Period | | $ | 5.14 | | | $ | 7.28 | | | $ | 9.43 | | | $ | 10.00 | |
| | |
|
|
| |
|
|
| |
|
|
| |
|
|
|
Income from Investment Operations: | | | | | | | | | | | | | | | | |
Net Investment Loss | | | (0.05 | ) | | | (0.04 | ) | | | (0.04 | ) | | | — | |
Net Realized and Unrealized Gain (Loss) on Investments | | | 1.08 | | | | (2.10 | ) | | | (2.11 | ) | | | (0.57 | ) |
| | |
|
|
| |
|
|
| |
|
|
| |
|
|
|
Total from Investment Operations | | | 1.03 | | | | (2.14 | ) | | | (2.15 | ) | | | (0.57 | ) |
| | |
|
|
| |
|
|
| |
|
|
| |
|
|
|
Net Asset Value at End of Period | | $ | 6.17 | | | $ | 5.14 | | | $ | 7.28 | | | $ | 9.43 | |
| | |
|
|
| |
|
|
| |
|
|
| |
|
|
|
Total Return (A)(D) | | | 20.04 | % | | | (29.40 | )% | | | (22.80 | )% | | | (5.69 | )% |
| | | | |
Ratios/Supplemental Data: | | | | | | | | | | | | | | | | |
Net Assets, End of Period (in 000s) | | $ | 23,407 | | | $ | 13,044 | | | $ | 8,854 | | | $ | 1,547 | |
| | | | |
Ratio of Expenses to Average Net Assets: | | | | | | | | | | | | | | | | |
Before Reimbursement and Waiver of Expenses by Advisor | | | 1.62 | % | | | 1.80 | % | | | 2.32 | % | | | 5.55 | %(C) |
After Reimbursement and Waiver of Expenses by Advisor | | | 1.60 | % | | | 1.60 | % | | | 1.60 | % | | | 1.60 | %(C) |
| | | | |
Ratio of Net Investment Loss to Average Net Assets: | | | | | | | | | | | | | | | | |
Before Reimbursement and Waiver of Expenses by Advisor | | | (1.05 | )% | | | (1.21 | )% | | | (1.72 | )% | | | (3.98 | )%(C) |
After Reimbursement and Waiver of Expenses by Advisor | | | (1.03 | )% | | | (1.01 | )% | | | (1.00 | )% | | | (0.03 | )%(C) |
| | | | |
Portfolio Turnover | | | 53.43 | % | | | 52.28 | % | | | 20.47 | % | | | 4.46 | % |
| (A) | Total Return Calculation Does Not Reflect Sales Load. |
| (B) | For the period October 5, 2000 (commencement of operations) to December 31, 2000. |
| (D) | For periods of less than a full year, the total return is not annualized. |
The accompanying notes are an integral part of these financial statements.
Timothy Plan Large/Mid-Cap Growth Fund [62]
FINANCIAL HIGHLIGHTS
The table below set forth financial data for one share of capital stock outstanding throughout each period presented.
LARGE/MID CAP GROWTH FUND - CLASS B SHARES
| | | | | | | | | | | | | | | | |
| | | year
ended
12/31/03
| | | year
ended
12/31/02
| | | year
ended
12/31/01
| | | period
ended
12/31/00 (B)
| |
Per Share Operating Performance: | | | | | | | | | | | | | | | | |
Net Asset Value at Beginning of Period | | $ | 5.07 | | | $ | 7.22 | | | $ | 9.41 | | | $ | 10.00 | |
| | |
|
|
| |
|
|
| |
|
|
| |
|
|
|
Income from Investment Operations: | | | | | | | | | | | | | | | | |
Net Investment Loss | | | (0.08 | ) | | | (0.07 | ) | | | (0.08 | ) | | | (0.01 | ) |
Net Realized and Unrealized Gain (Loss) on Investments | | | 1.05 | | | | (2.08 | ) | | | (2.11 | ) | | | (0.58 | ) |
| | |
|
|
| |
|
|
| |
|
|
| |
|
|
|
Total from Investment Operations | | | 0.97 | | | | (2.15 | ) | | | (2.19 | ) | | | (0.59 | ) |
| | |
|
|
| |
|
|
| |
|
|
| |
|
|
|
Net Asset Value at End of Period | | $ | 6.04 | | | $ | 5.07 | | | $ | 7.22 | | | $ | 9.41 | |
| | |
|
|
| |
|
|
| |
|
|
| |
|
|
|
Total Return (A)(D) | | | 19.13 | % | | | (29.92 | )% | | | (23.27 | )% | | | (5.89 | )% |
| | | | |
Ratios/Supplemental Data: | | | | | | | | | | | | | | | | |
Net Assets, End of Period (in 000s) | | $ | 2,385 | | | $ | 1,311 | | | $ | 918 | | | $ | 444 | |
| | | | |
Ratio of Expenses to Average Net Assets: | | | | | | | | | | | | | | | | |
Before Reimbursement of Expenses by Advisor | | | 2.38 | % | | | 2.72 | % | | | 3.66 | % | | | 6.30 | %(C) |
After Reimbursement of Expenses by Advisor | | | 2.35 | % | | | 2.35 | % | | | 2.35 | % | | | 2.35 | %(C) |
| | | | |
Ratio of Net Investment Loss to Average Net Assets: | | | | | | | | | | | | | | | | |
Before Reimbursement of Expenses by Advisor | | | (1.74 | )% | | | (2.12 | )% | | | (3.11 | )% | | | (4.73 | )%(C) |
After Reimbursement of Expenses by Advisor | | | (1.71 | )% | | | (1.75 | )% | | | (1.80 | )% | | | (0.78 | )%(C) |
| | | | |
Portfolio Turnover | | | 53.43 | % | | | 52.28 | % | | | 20.47 | % | | | 4.46 | % |
| (A) | Total Return Calculation Does Not Reflect Sales Load. |
| (B) | For the period October 9, 2000 (Commencement of operations) to December 31, 2000. |
| (D) | For periods of less than a full year, the total return is not annualized. |
The accompanying notes are an integral part of these financial statements.
Timothy Plan Large/Mid-Cap Growth Fund [63]
LETTER FROM THE MANAGER
December 31, 2003
STRATEGIC GROWTH FUND
The Timothy Plan Strategic Growth Fund is an asset allocation fund that only invests in our underlying traditional funds on a prescribed basis. The comments of our various sub-advisors in the preceding section of this report for their analysis of our 2003 investment results and their estimate of the climate for 2004 are therefore applicable to the Strategic Growth Fund as well.
Although we manage this fund internally, our investment decisions are limited to keeping our allocation model in balance. For example, in 2003, we strived to keep the assets in this fund invested in a manner that maintained the following allocation as closely as possible: 35% in our Large/Mid Cap Growth Fund; 25% in our Large/Mid Cap Value Fund; 20% in our Small Cap Value Fund; and 20% in our Aggressive Growth Fund.
We believe our two asset allocation funds offered our investors two distinct advantages:
| 1. | We monitored the allocation percentages on a continuous basis in order to keep them at or near their prescribed levels, and |
| 2. | Since we are a mutual fund, we were able to direct the new investment dollars we received in such a manner that we maintained the prescribed percentages. By doing so we were able to overcome the necessity of selling what went up to buy more of what went down to keep their allocation in place. Our activities in 2003 consequently avoided generating unwelcome capital gains in taxable accounts. |
We will continue to follow this approach in 2004.
Arthur D. Ally
President
The Timothy Plan
Letter From The Manager [64]
SCHEDULE OF INVESTMENTS
As of December 31, 2003
| | | | | |
| MUTUAL FUNDS - 99.75% | | | |
| | |
number of shares
| | | | market value
|
| 920,796 | | Timothy Aggressive Growth Fund, Class A * | | $ | 5,837,845 |
| 1,666,873 | | Timothy Large/Mid-Cap Growth Fund, Class A * | | | 10,284,604 |
| 624,180 | | Timothy Large/Mid-Cap Value Fund, Class A * | | | 7,277,940 |
| 376,976 | | Timothy Small Cap Value Fund, Class A * | | | 5,824,276 |
| | | | |
|
|
| | | TOTAL COMMON STOCK (Cost $27,748,235) | | | 29,224,665 |
| | | | |
|
|
| |
| SHORT-TERM INVESTMENTS - 0.15% | | | |
| | |
number of shares
| | | | market value
|
| 45,065 | | First American Treasury Obligations Fund, Class A (cost $45,065) | | | 45,065 |
| | | | |
|
|
| | | TOTAL INVESTMENTS - 99.90% (identified cost $27,793,300) | | | 29,269,730 |
| | |
| | | OTHER ASSETS AND LIABILITIES, Net - 0.10% | | | 27,705 |
| | | | |
|
|
| | | NET ASSETS - 100.00% | | $ | 29,297,435 |
| | | | |
|
|
| * | Non-income producing securities |
The accompanying notes are an integral part of these financial statements.
Timothy Plan Strategic Growth Fund [65]
STATEMENT OF ASSETS AND LIABILITIES
As of December 31, 2003
| | | | |
| ASSETS | | | | |
| |
| | | amount
| |
Investments in Securities at Value (identified cost $27,793,300) [NOTE 1] | | $ | 29,269,730 | |
Receivables: | | | | |
Fund Shares Sold | | | 203,606 | |
Interest Receivable | | | 28 | |
Fund Shares Commissions Receivable from Advisor | | | 2,538 | |
Prepaid expenses | | | 10,751 | |
| | |
|
|
|
Total Assets | | $ | 29,486,653 | |
| | |
|
|
|
| |
| LIABILITIES | | | | |
| |
| | | amount
| |
Payable for Fund Shares Redeemed | | | 153,696 | |
Accrued 12b-1 Fees | | | 16,223 | |
Accrued Support Service Fee | | | 6,022 | |
Accrued Expenses | | | 13,277 | |
| | |
|
|
|
Total Liabilities | | $ | 189,218 | |
| | |
|
|
|
| |
| NET ASSETS | | | | |
| |
| | | amount
| |
Class A Shares: | | | | |
Net Assets (unlimited shares of $0.001 par beneficial interest authorized; 1,599,171 shares outstanding) | | $ | 12,947,882 | |
Net Asset Value and Redemption Price Per Class A Share ($12,947,882/ 1,599,171 shares) | | $ | 8.10 | |
Offering Price Per Share ($8.10/0.9475) | | $ | 8.55 | |
Class B Shares: | | | | |
Net Assets (unlimited shares of $0.001 par beneficial interest authorized; 2,064,357 shares outstanding) | | $ | 16,349,553 | |
Net Asset Value and Offering Price Per Class B Share ($16,349,553 / 2,064,357 shares) | | $ | 7.92 | |
Maximum Redemption Price Per Class B Share ($7.92 x 0.95) | | $ | 7.52 | |
| |
| Net Assets | | $ | 29,297,435 | |
| | |
|
|
|
| |
| SOURCES OF NET ASSETS | | | | |
| |
| | | amount
| |
At December 31, 2003, Net Assets Consisted of: | | | | |
Paid-in Capital | | | 27,971,131 | |
Net Accumulated Realized Loss on Investments | | | (150,126 | ) |
Net Unrealized Appreciation in Value of Investments | | | 1,476,430 | |
| | |
|
|
|
| Net Assets | | $ | 29,297,435 | |
| | |
|
|
|
The accompanying notes are an integral part of these financial statements.
Timothy Plan Strategic Growth Fund [66]
STATEMENT OF OPERATIONS
For the Year Ended December 31, 2003
| | | | |
| INVESTMENT INCOME | | | | |
| |
| | | amount
| |
Interest | | $ | 324 | |
| | |
|
|
|
Total Investment Income | | | 324 | |
| | |
|
|
|
| |
| EXPENSES | | | | |
| |
| | | amount
| |
Investment Advisory Fees [NOTE 3] | | | 32,473 | |
Fund Accounting, Transfer Agency, & Administration Fees | | | 68,028 | |
12b-1 Fees (Class A = $23,388, Class B = $92,200) [NOTE 3] | | | 115,588 | |
Custodian Fees | | | 8,119 | |
Auditing Fees | | | 5,820 | |
Service Fees (Class B) [NOTE 3] | | | 30,733 | |
Service Support Fees (Class A = $23,388, Class B = $30,733) [NOTE 3] | | | 54,121 | |
Registrations Expense | | | 10,519 | |
Legal Expense | | | 3,391 | |
Insurance Expense | | | 2,451 | |
Printing Expense | | | 5,902 | |
Miscellaneous Expense | | | 8,293 | |
| | |
|
|
|
Total Expenses | | | 345,438 | |
| |
Expenses Waived and Reimbursed by Advisor [NOTE 3] | | | (4,281 | ) |
| | |
|
|
|
Total Net Expenses | | | 341,157 | |
| | |
|
|
|
Net Investment Loss | | | (340,833 | ) |
| | |
|
|
|
| |
| REALIZED AND UNREALIZED GAIN (LOSS) ON INVESTMENTS | | | | |
| |
| | | amount
| |
Net Realized Loss on Investment Securities | | | (129,881 | ) |
Change in Unrealized Appreciation of Investments | | | 5,970,876 | |
| | |
|
|
|
Net Realized and Unrealized Gain (Loss) on Investments | | | 5,840,995 | |
| | |
|
|
|
Increase in Net Assets Resulting from Operations | | $ | 5,500,162 | |
| | |
|
|
|
The accompanying notes are an integral part of these financial statements.
Timothy Plan Strategic Growth Fund [67]
STATEMENT OF CHANGES IN NET ASSETS
INCREASE IN NET ASSETS
| | | | | | | | |
| | | year ended 12/31/03
| | | year ended 12/31/02
| |
| | |
Operations: | | | | | | | | |
Net Investment Loss | | $ | (340,833 | ) | | $ | (254,455 | ) |
Net Change in Unrealized Appreciation (Depreciation) of Investments | | | 5,970,876 | | | | (4,365,635 | ) |
Capital Gain Distributions from Other Investment Companies | | | — | | | | 1,559 | |
Net Realized Loss on Investments | | | (129,881 | ) | | | (21,847 | ) |
| | |
|
|
| |
|
|
|
Increase (Decrease) in Net Assets (resulting from operations) | | | 5,500,162 | | | | (4,640,378 | ) |
| | |
|
|
| |
|
|
|
Distributions to Shareholders: | | | | | | | | |
Net Capital Gains: | | | | | | | | |
Class A | | | — | | | | (233 | ) |
Class B | | | — | | | | (298 | ) |
| | |
|
|
| |
|
|
|
Total Distributions | | | — | | | | (531 | ) |
| | |
|
|
| |
|
|
|
Capital Share Transactions: | | | | | | | | |
Proceeds from Shares Sold: | | | | | | | | |
Class A | | | 4,418,101 | | | | 5,482,338 | |
Class B | | | 5,701,431 | | | | 6,156,072 | |
Dividends Reinvested: | | | | | | | | |
Class A | | | — | | | | 226 | |
Class B | | | — | | | | 280 | |
Cost of Shares Redeemed: | | | | | | | | |
Class A | | | (1,316,051 | ) | | | (772,079 | ) |
Class B | | | (1,830,172 | ) | | | (1,118,254 | ) |
| | |
|
|
| |
|
|
|
Increase in Net Assets (resulting from capital share transactions) | | | 6,973,309 | | | | 9,748,583 | |
| | |
|
|
| |
|
|
|
Total Increase in Net Assets | | | 12,473,471 | | | | 5,107,674 | |
| | |
Net Assets: | | | | | | | | |
Beginning of Year | | | 16,823,964 | | | | 11,716,290 | |
| | |
|
|
| |
|
|
|
End of Year | | $ | 29,297,435 | | | $ | 16,823,964 | |
| | |
|
|
| |
|
|
|
Shares of Capital Stock of the Fund Sold and Redeemed: | | | | | | | | |
Shares Sold: | | | | | | | | |
Class A | | | 619,737 | | | | 728,315 | |
Class B | | | 822,402 | | | | 827,148 | |
| | |
Cost of Shares Reinvested: | | | | | | | | |
Class A | | | — | | | | 35 | |
Class B | | | — | | | | 44 | |
| | |
Shares Redeemed: | | | | | | | | |
Class A | | | (193,580 | ) | | | (106,990 | ) |
Class B | | | (262,101 | ) | | | (159,680 | ) |
| | |
|
|
| |
|
|
|
Net Increase in Number of Shares Outstanding | | | 986,458 | | | | 1,288,872 | |
| | |
|
|
| |
|
|
|
The accompanying notes are an integral part of these financial statements.
Timothy Plan Strategic Growth Fund [68]
FINANCIAL HIGHLIGHTS
The table below set forth financial data for one share of capital stock outstanding throughout each period presented.
STRATEGIC GROWTH FUND - CLASS A SHARES
| | | | | | | | | | | | | | | | |
| | | year
ended
12/31/03
| | | year
ended
12/31/02
| | | year
ended
12/31/01
| | | period
ended
12/31/00 (D)
| |
Per Share Operating Performance: | | | | | | | | | | | | | | | | |
Net Asset Value at Beginning of Period | | $ | 6.33 | | | $ | 8.47 | | | $ | 9.61 | | | $ | 10.00 | |
| | |
|
|
| |
|
|
| |
|
|
| |
|
|
|
Income from Investment Operations: | | | | | | | | | | | | | | | | |
Net Investment Loss | | | (0.07 | ) | | | (0.07 | ) | | | (0.05 | ) | | | (0.01 | ) |
Net Realized and Unrealized Gain (Loss) on Investments | | | 1.84 | | | | (2.07 | ) | | | (1.08 | ) | | | (0.38 | ) |
| | |
|
|
| |
|
|
| |
|
|
| |
|
|
|
Total from Investment Operations | | | 1.77 | | | | (2.14 | ) | | | (1.13 | ) | | | (0.39 | ) |
| | |
|
|
| |
|
|
| |
|
|
| |
|
|
|
Less Distributions: | | | | | | | | | | | | | | | | |
Dividends from Realized Gains | | | — | | | | — | * | | | (0.01 | ) | | | — | |
Dividends from Net Investment Income | | | — | | | | — | | | | — | | | | — | |
| | |
|
|
| |
|
|
| |
|
|
| |
|
|
|
Total Distributions | | | — | | | | — | | | | (0.01 | ) | | | — | |
| | |
|
|
| |
|
|
| |
|
|
| |
|
|
|
Net Asset Value at End of Period | | $ | 8.10 | | | $ | 6.33 | | | $ | 8.47 | | | $ | 9.61 | |
| | |
|
|
| |
|
|
| |
|
|
| |
|
|
|
Total Return (A) (B) | | | 27.96 | % | | | (25.26 | )% | | | (11.72 | )% | | | (3.90 | )% |
| | | | |
Ratios/Supplemental Data: | | | | | | | | | | | | | | | | |
Net Assets, End of Period (in 000s) | | $ | 12,948 | | | $ | 7,430 | | | $ | 4,675 | | | $ | 456 | |
| | | | |
Ratio of Expenses to Average Net Assets: | | | | | | | | | | | | | | | | |
Before Reimbursement and waiver of Expenses by Advisor | | | 1.17 | % | | | 1.34 | % | | | 1.68 | % | | | 6.80 | %(C) |
After Reimbursement and waiver of Expenses by Advisor | | | 1.15 | % | | | 1.25 | % | | | 1.25 | % | | | 1.25 | %(C) |
| | | | |
Ratio of Net Investment Loss to Average Net Assets: | | | | | | | | | | | | | | | | |
Before Reimbursement and waiver of Expenses by Advisor | | | (1.17 | )% | | | (1.34 | )% | | | (1.61 | )% | | | (6.22 | )%(C) |
After Reimbursement and waiver of Expenses by Advisor | | | (1.15 | )% | | | (1.25 | )% | | | (1.18 | )% | | | (0.67 | )%(C) |
| | | | |
Portfolio Turnover | | | 0.53 | % | | | 0.67 | % | | | 0.15 | % | | | 0.30 | % |
| (A) | Total Return Calculation Does Not Reflect Sales Load. |
| (B) | For Periods Of Less Than A Full Year, The Total Return is Not Annualized. |
| (D) | For the Period October 5, 2000 (commencement of operations) to December 31, 2000. |
| * | Distribution was less than $0.01 per share |
The accompanying notes are an integral part of these financial statements.
Timothy Plan Strategic Growth Fund [69]
FINANCIAL HIGHLIGHTS
The table below set forth financial data for one share of capital stock outstanding throughout each period presented.
STRATEGIC GROWTH FUND - CLASS B SHARES
| | | | | | | | | | | | | | | | |
| | | year
ended
12/31/03
| | | year
ended
12/31/02
| | | year
ended
12/31/01
| | | period
ended
12/31/00 (D)
| |
Per Share Operating Performance: | | | | | | | | | | | | | | | | |
Net Asset Value at Beginning of Period | | $ | 6.25 | | | $ | 8.42 | | | $ | 9.61 | | | $ | 10.00 | |
| | |
|
|
| |
|
|
| |
|
|
| |
|
|
|
Income from Investment Operations: | | | | | | | | | | | | | | | | |
Net Investment Loss | | | (0.11 | ) | | | (0.12 | ) | | | (0.09 | ) | | | (0.03 | ) |
Net Realized and Unrealized Gain (Loss) on Investments | | | 1.78 | | | | (2.05 | ) | | | (1.09 | ) | | | (0.36 | ) |
| | |
|
|
| |
|
|
| |
|
|
| |
|
|
|
Total from Investment Operations | | | 1.67 | | | | (2.17 | ) | | | (1.18 | ) | | | (0.39 | ) |
| | |
|
|
| |
|
|
| |
|
|
| |
|
|
|
Less Distributions: | | | | | | | | | | | | | | | | |
Dividends from Realized Gains | | | — | | | | — | * | | | (0.01 | ) | | | — | |
Dividends from Net Investment Income | | | — | | | | — | | | | — | | | | — | |
| | |
|
|
| |
|
|
| |
|
|
| |
|
|
|
Total Distributions | | | — | | | | — | | | | (0.01 | ) | | | — | |
| | |
|
|
| |
|
|
| |
|
|
| |
|
|
|
Net Asset Value at End of Period | | $ | 7.92 | | | $ | 6.25 | | | $ | 8.42 | | | $ | 9.61 | |
| | |
|
|
| |
|
|
| |
|
|
| |
|
|
|
Total Return (A) (B) | | | 26.72 | % | | | (25.77 | )% | | | (12.24 | )% | | | (3.90 | )% |
| | | | |
Ratios/Supplemental Data: | | | | | | | | | | | | | | | | |
Net Assets, End of Period (in 000s) | | $ | 16,350 | | | $ | 9,394 | | | $ | 7,042 | | | $ | 904 | |
| | | | |
Ratio of Expenses to Average Net Assets: | | | | | | | | | | | | | | | | |
Before Reimbursement of Expenses by Advisor | | | 1.92 | % | | | 2.10 | % | | | 2.27 | % | | | 7.55 | %(C) |
After Reimbursement of Expenses by Advisor | | | 1.90 | % | | | 2.00 | % | | | 2.00 | % | | | 2.00 | %(C) |
| | | | |
Ratio of Net Investment Loss to Average Net Assets: | | | | | | | | | | | | | | | | |
Before Reimbursement of Expenses by Advisor | | | (1.92 | )% | | | (2.10 | )% | | | (2.21 | )% | | | (6.97 | )%(C) |
After Reimbursement of Expenses by Advisor | | | (1.90 | )% | | | (2.00 | )% | | | (1.94 | )% | | | (1.42 | )%(C) |
| | | | |
Portfolio Turnover | | | 0.53 | % | | | 0.67 | % | | | 0.15 | % | | | 0.30 | % |
| (A) | Total Return Calculation Does Not Reflect Redemption Fee. |
| (B) | For Periods Of Less Than A Full Year, The Total Return is Not Annualized |
| (D) | For the Period October 9, 2000 (commencement of operations) to December 31, 2000. |
| * | Distribution was less than $0.01 per share |
The accompanying notes are an integral part of these financial statements.
Timothy Plan Strategic Growth Fund [70]
LETTER FROM THE MANAGER
December 31, 2003
CONSERVATIVE GROWTH FUND
The Timothy Plan Conservative Growth Fund is an asset allocation fund that only invests in our underlying traditional funds on a prescribed basis. The comments of our various sub-advisors in the preceding section of this report for their analysis of our 2003 investment results and their estimate of the climate for 2004 are therefore applicable to the Conservative Growth Fund as well.
Although we manage this fund internally, our investment decisions are limited to keeping our allocation model in balance. For example, in 2003, we strived to keep the assets in this fund invested in a manner that maintained the following allocation as closely as possible: 30% in our Fixed Income Fund; 30% in our Large/Mid Cap Value Fund; 20% in our Small Cap Value Fund; and 20% in our Large/Mid Cap Growth Fund.
We believe our two asset allocation funds offered our investors two distinct advantages:
| 1. | We monitor the allocation percentages on a continuous basis in order to keep them at or near their prescribed levels, and |
| 2. | Since we are a mutual fund, we were able to direct the new investment dollars we received in such a manner that we maintained the prescribed percentages. By doing so we were able to overcome the necessity of selling what went up to buy more of what went down to keep their allocation in place. Our activities in 2003 consequently avoided generating unwelcome capital gains in taxable accounts. |
We will continue to follow this approach in 2004.
Arthur D. Ally
President
The Timothy Plan
Letter From The Manager [71]
SCHEDULE OF INVESTMENTS
As of December 31, 2003
| | | | | |
| COMMON STOCKS - 98.78% | | | |
| |
number of shares
| | market value
|
| 774,815 | | Timothy Fixed Income Fund, Class A | | $ | 7,988,341 |
| 901,215 | | Timothy Large/Mid-Cap Growth Fund, Class A * | | | 5,560,495 |
| 708,954 | | Timothy Large/Mid-Cap Value Fund, Class A * | | | 8,266,400 |
| 357,928 | | Timothy Small Cap Value Fund, Class A * | | | 5,529,987 |
| | | | |
|
|
| | | Total Common Stocks (cost $25,366,198) | | | 27,345,223 |
| | | | |
|
|
| |
| SHORT-TERM INVESTMENTS - 0.18% | | | |
| | |
number of shares
| | | | market value
|
| 50,280 | | First American Treasury Obligations Fund, Class A (cost $50,280) | | | 50,280 |
| | | | |
|
|
| | | TOTAL INVESTMENTS - 98.96% (identified cost $25,416,478) | | | 27,395,503 |
| | |
| | | OTHER ASSETS AND LIABILITIES, NET - 1.04% | | | 288,458 |
| | | | |
|
|
| | | NET ASSETS - 100.00% | | $ | 27,683,961 |
| | | | |
|
|
| * | Non-income producing securities |
The accompanying notes are an integral part of these financial statements.
Timothy Plan Conservative Growth Fund [72]
STATEMENT OF ASSETS AND LIABILITIES
As of December 31, 2003
| | | |
| ASSETS | | | |
| |
| | | amount
|
Investments in Securities at Value (identified cost $25,416,478) [NOTE 1] | | $ | 27,395,503 |
Receivables: | | | |
Dividends | | | 180,648 |
Interest | | | 22 |
Fund Shares Sold | | | 133,236 |
Fund Share Commissions Receivable from Advisor | | | 5,377 |
Prepaid Expenses | | | 12,081 |
| | |
|
|
Total Assets | | | 27,726,867 |
| | |
|
|
| |
| LIABILITIES | | | |
| |
| | | amount
|
Payables: | | | |
Accrued 12b-1 fees | | | 13,104 |
Accrued Support Service Fee | | | 5,693 |
Capital Gain Distributions | | | 1,256 |
Fund Shares Redeemed | | | 11,695 |
Accrued Expenses | | | 11,841 |
| | |
|
|
Total Liabilities | | | 43,589 |
| | |
|
|
| |
| NET ASSETS | | | |
| |
| | | amount
|
Class A Shares: | | | |
Net Assets (unlimited shares of $0.001 par beneficial interest authorized; 1,601,139 shares outstanding) | | $ | 15,764,997 |
Net Asset Value and Redemption price Per Class A Share ($15,764,997 / 1,601,139 shares) | | $ | 9.85 |
Offering Price Per Share ($9.85 / 0.9475) | | $ | 10.40 |
Class B Shares: | | | |
Net Assets (unlimited shares of $0.001 par beneficial interest authorized; 1,241,750 shares outstanding) | | $ | 11,918,281 |
Net Asset Value and Offering Price Per Class B Share ($11,918,281 / 1,241,750 shares) | | $ | 9.60 |
Maximum Redemption Price Per Share ($9.60 x 0.95) | | $ | 9.12 |
| |
Net Assets | | $ | 27,683,278 |
| | |
|
|
| |
| SOURCES OF NET ASSETS | | | |
| |
| | | amount
|
At December 31, 2003, Net Assets Consisted of: | | | |
Paid-in Capital | | $ | 25,632,518 |
Accumulated Net Realized Gain on Investments | | | 71,735 |
Net Unrealized Appreciation in Value of Investments | | | 1,979,025 |
| | |
|
|
Net Assets | | $ | 27,683,278 |
| | |
|
|
The accompanying notes are an integral part of these financial statements.
Timothy Plan Conservative Growth Fund [73]
STATEMENT OF OPERATIONS
For the Year Ended December 31, 2003
| | | | |
| INVESTMENT INCOME | | | | |
| | | amount
| |
Interest | | $ | 226 | |
Dividends | | | 253,888 | |
| | |
|
|
|
Total Investment Income | | | 254,114 | |
| | |
|
|
|
| |
| EXPENSES | | | | |
| |
| | | amount
| |
Investment Advisory Fees [NOTE 3] | | | 31,909 | |
Fund Accounting, Transfer Agency, & Administration Fees | | | 66,722 | |
12b-1 Fees (Class A =$29,373, Class B =$71,429) [NOTE 3] | | | 100,802 | |
Service Fees (Class B) [NOTE 3] | | | 23,809 | |
Service Support Fees (Class A =$29,373, Class B =$23,809) [NOTE 3] | | | 53,182 | |
Custodian Fees | | | 6,702 | |
Auditing Fees | | | 6,950 | |
Insurance Expense | | | 2,483 | |
Legal Expense | | | 3,333 | |
Registration Expense | | | 13,480 | |
Printing Expense | | | 5,898 | |
Miscellaneous Expense | | | 7,878 | |
| | |
|
|
|
Total Expenses | | | 323,148 | |
| |
Expenses Waived and Reimbursed by Advisor [NOTE 3] | | | (7,081 | ) |
| | |
|
|
|
Total Net Expenses | | | 316,067 | |
| | |
|
|
|
Net Investment Loss | | | (61,953 | ) |
| | |
|
|
|
| |
| REALIZED AND UNREALIZED GAIN ON INVESTMENTS | | | | |
| |
| | | amount
| |
Net Realized Gain on Investments | | | 32,579 | |
Capital Gain Distributions from other Investment Companies | | | 91,213 | |
Change in Unrealized Appreciation of Investments | | | 3,966,514 | |
| | |
|
|
|
Net Realized and Unrealized Gain on Investments | | | 4,090,306 | |
| | |
|
|
|
Increase in Net Assets Resulting from Operations | | $ | 4,028,353 | |
| | |
|
|
|
The accompanying notes are an integral part of these financial statements.
Timothy Plan Conservative Growth Fund [74]
STATEMENT OF CHANGES IN NET ASSETS
| | | | | | | | |
| INCREASE (DECREASE) IN NET ASSETS | | | | | | | | |
| | |
| | | year ended 12/31/03
| | | year ended 12/31/02
| |
Operations: | | | | | | | | |
Net Investment Loss | | $ | (61,953 | ) | | $ | (9,606 | ) |
Net Change in Unrealized Appreciation (Depreciation) of Investments | | | 3,966,514 | | | | (2,136,114 | ) |
Capital Gain Distributions From Other Investment Companies | | | 91,213 | | | | 7,227 | |
Net Realized Gain on Investments | | | 32,579 | | | | — | |
| | |
|
|
| |
|
|
|
Increase (Decrease) in Net Assets (resulting from operations) | | | 4,028,353 | | | | (2,138,493 | ) |
| | |
|
|
| |
|
|
|
Distributions to shareholders: | | | | | | | | |
Net Income | | | | | | | | |
Class A | | | — | | | | (116 | ) |
Class B | | | — | | | | (97 | ) |
Capital Gains | | | | | | | | |
Class A | | | (12,327 | ) | | | — | |
Class B | | | (9,562 | ) | | | — | |
| | |
|
|
| |
|
|
|
Total Distributions | | | (21,889 | ) | | | (213 | ) |
| | |
|
|
| |
|
|
|
Capital Share Transactions: | | | | | | | | |
Proceeds from Shares Sold: | | | | | | | | |
Class A | | | 6,862,856 | | | | 6,269,947 | |
Class B | | | 4,356,123 | | | | 5,548,608 | |
Cost of Shares Redeemed: | | | | | | | | |
Class A | | | (2,944,043 | ) | | | (1,299,346 | ) |
Class B | �� | | (2,037,267 | ) | | | (1,089,694 | ) |
Cost of Shares Reinvested: | | | | | | | | |
Class A | | | 11,585 | | | | 109 | |
Class B | | | 9,048 | | | | 92 | |
| | |
|
|
| |
|
|
|
Increase in Net Assets (resulting from capital share transactions) | | | 6,258,302 | | | | 9,429,716 | |
| | |
|
|
| |
|
|
|
Total Increase in Net Assets | | | 10,264,766 | | | | 7,291,010 | |
| | |
Net Assets: | | | | | | | | |
Beginning of Year | | | 17,418,512 | | | | 10,127,502 | |
| | |
|
|
| |
|
|
|
End of Year | | $ | 27,683,278 | | | $ | 17,418,512 | |
| | |
|
|
| |
|
|
|
Shares of Capital Stock of the Fund Sold: | | | | | | | | |
Shares Sold: | | | | | | | | |
Class A | | | 771,505 | | | | 708,893 | |
Class B | | | 508,353 | | | | 634,425 | |
Cost of Shares Redeemed: | | | | | | | | |
Class A | | | (338,974 | ) | | | (155,281 | ) |
Class B | | | (241,339 | ) | | | (125,870 | ) |
Cost of Shares Reinvested: | | | | | | | | |
Class A | | | 1,184 | | | | 13 | |
Class B | | | 949 | | | | 11 | |
| | |
|
|
| |
|
|
|
Net Increase in Number of Shares Outstanding | | | 701,678 | | | | 1,062,191 | |
| | |
|
|
| |
|
|
|
The accompanying notes are an integral part of these financial statements.
Timothy Plan Conservative Growth Fund [75]
FINANCIAL HIGHLIGHTS
The table below set forth financial data for one share of capital stock outstanding throughout each period presented.
CONSERVATIVE GROWTH FUND - CLASS A SHARES
| | | | | | | | | | | | | | | | |
| | | year ended 12/31/03
| | | year
ended
12/31/02
| | | year
ended
12/31/01
| | | period
ended
12/31/00 (D)
| |
Per Share Operating Performance: | | | | | | | | | | | | | | | | |
Net Asset Value at Beginning of Period | | $ | 8.20 | | | $ | 9.43 | | | $ | 9.98 | | | $ | 10.00 | |
| | |
|
|
| |
|
|
| |
|
|
| |
|
|
|
Income from Investment Operations: | | | | | | | | | | | | | | | | |
Net Investment Income (Loss) | | | — | | | | 0.02 | | | | (0.01 | ) | | | 0.02 | |
Net Realized and Unrealized Gain (Loss) on Investments | | | 1.66 | | | | (1.25 | ) | | | (0.53 | ) | | | (0.04 | ) |
| | |
|
|
| |
|
|
| |
|
|
| |
|
|
|
Total from Investment Operations | | | 1.66 | | | | (1.23 | ) | | | (0.54 | ) | | | (0.02 | ) |
| | |
|
|
| |
|
|
| |
|
|
| |
|
|
|
Less Distributions: | | | | | | | | | | | | | | | | |
Dividends from Realized Gains | | | (0.01 | ) | | | — | | | | (0.01 | ) | | | — | |
Dividends from Net Investment Income | | | — | | | | — | * | | | (0.00 | ) * | | | — | |
| | |
|
|
| |
|
|
| |
|
|
| |
|
|
|
Total Distributions | | | (0.01 | ) | | | — | | | | (0.01 | ) | | | — | |
| | |
|
|
| |
|
|
| |
|
|
| |
|
|
|
Net Asset Value at End of Period | | $ | 9.85 | | | $ | 8.20 | | | $ | 9.43 | | | $ | 9.98 | |
| | |
|
|
| |
|
|
| |
|
|
| |
|
|
|
Total Return (A) (B) | | | 20.22 | % | | | (13.03 | )% | | | (5.41 | )% | | | (0.20 | )% |
| | | | |
Ratios/Supplimental Data: | | | | | | | | | | | | | | | | |
Net Assets, End of Period (in 000s) | | $ | 15,765 | | | $ | 9,573 | | | $ | 5,787 | | | $ | 297 | |
| | | | |
Ratio of Expenses to Average Net Assets: | | | | | | | | | | | | | | | | |
Before Reimbursement and Waiver of Expenses by Advisor | | | 1.18 | % | | | 1.38 | % | | | 1.74 | % | | | 9.91 | % (C) |
After Reimbursement and Waiver of Expenses by Advisor | | | 1.15 | % | | | 1.20 | % | | | 1.20 | % | | | 1.20 | % (C) |
| | | | |
Ratio of Net Investment Income (Loss) to Average Net Assets: | | | | | | | | | | | | | | | | |
Before Reimbursement and Waiver of Expenses by Advisor | | | 0.02 | % | | | 0.06 | % | | | (0.17 | )% | | | (7.41 | )% (C) |
After Reimbursement and Waiver of Expenses by Advisor | | | 0.05 | % | | | 0.24 | % | | | 0.37 | % | | | 1.30 | % (C) |
| | | | |
Portfolio Turnover | | | 2.51 | % | | | 0.00 | % | | | 4.03 | % | | | 0.56 | % |
| (A) | Total Return Calculation Does Not Reflect Sales Load. |
| (B) | For Periods Of Less Than A Full Year, The Total Return Is Not Annualized. |
| (D) | For the period October 5, 2000 (Commencement of Operations) to December 31, 2000. |
| * | Distribution was less than $0.01 per share. |
The accompanying notes are an integral part of these financial statements.
Timothy Plan Conservative Growth Fund [76]
FINANCIAL HIGHLIGHTS
The table below set forth financial data for one share of capital stock outstanding throughout each period presented.
CONSERVATIVE GROWTH FUND - CLASS B SHARES
| | | | | | | | | | | | | | | | |
| | | year
ended
12/31/03
| | | year
ended
12/31/02
| | | year
ended
12/31/01
| | | period
ended
12/31/00 (D)
| |
Per Share Operating Performance: | | | | | | | | | | | | | | | | |
Net Asset Value at Beginning of Period | | $ | 8.06 | | | $ | 9.33 | | | $ | 9.96 | | | $ | 10.00 | |
| | |
|
|
| |
|
|
| |
|
|
| |
|
|
|
Income from Investment Operations: | | | | | | | | | | | | | | | | |
Net Investment Loss | | | (0.06 | ) | | | (0.03 | ) | | | (0.02 | ) | | | — | |
Net Realized and Unrealized Gain (Loss) on Investments | | | 1.61 | | | | (1.24 | ) | | | (0.60 | ) | | | (0.04 | ) |
| | |
|
|
| |
|
|
| |
|
|
| |
|
|
|
Total from Investment Operations | | | 1.55 | | | | (1.27 | ) | | | (0.62 | ) | | | (0.04 | ) |
| | |
|
|
| |
|
|
| |
|
|
| |
|
|
|
Less Distributions: | | | | | | | | | | | | | | | | |
Dividends from Realized Gains | | | (0.01 | ) | | | — | | | | (0.01 | ) | | | — | |
Dividends from Net Investment Income | | | — | | | | — | * | | | 0.00 | * | | | — | |
| | |
|
|
| |
|
|
| |
|
|
| |
|
|
|
Total Distributions | | | (0.01 | ) | | | — | | | | (0.01 | ) | | | — | |
| | |
|
|
| |
|
|
| |
|
|
| |
|
|
|
Net Asset Value at End of Period | | $ | 9.60 | | | $ | 8.06 | | | $ | 9.33 | | | $ | 9.96 | |
| | |
|
|
| |
|
|
| |
|
|
| |
|
|
|
Total Return (A) (B) | | | 19.20 | % | | | (13.64 | )% | | | (6.23 | )% | | | (0.40 | )% |
| | | | |
Ratios/Supplimental Data: | | | | | | | | | | | | | | | | |
Net Assets, End of Period (in 000s) | | $ | 11,918 | | | $ | 7,846 | | | $ | 4,340 | | | $ | 481 | |
| | | | |
Ratio of Expenses to Average Net Assets: | | | | | | | | | | | | | | | | |
Before Reimbursement and Waiver of Expenses by Advisor | | | 1.94 | % | | | 2.13 | % | | | 2.70 | % | | | 10.66 | % (C) |
After Reimbursement and Waiver of Expenses by Advisor | | | 1.90 | % | | | 1.95 | % | | | 1.95 | % | | | 1.95 | % (C) |
| | | | |
Ratio of Net Investment Income (Loss) to Average Net Assets: | | | | | | | | | | | | | | | | |
Before Reimbursement and Waiver of Expenses by Advisor | | | (0.76 | )% | | | (0.67 | )% | | | (1.19 | )% | | | (8.16 | )% (C) |
After Reimbursement and Waiver of Expenses by Advisor | | | (0.72 | )% | | | (0.49 | )% | | | (0.44 | )% | | | 0.55 | % (C) |
| | | | |
Portfolio Turnover | | | 2.51 | % | | | 0.00 | % | | | 4.03 | % | | | 0.56 | % |
| (A) | Total Return Calculation Does Not Reflect Sales Load. |
| (B) | For Periods Of Less Than A Full Year, The Total Return Is Not Annualized. |
| (D) | For the period October 9, 2000 (Commencement of Operations) to December 31, 2000. |
| * | Distribution was less than $0.01 per share. |
The accompanying notes are an integral part of these financial statements.
Timothy Plan Conservative Growth Fund [77]
SCHEDULE OF INVESTMENTS
As of December 31, 2003
SHORT TERM INVESTMENTS - 99.84%
| | | | | |
par value
| | | | market value
|
| | | Government Agencies - 97.20% | | | |
| $600,000 | | Federal Home Loan Bank, 0.90%, 01/09/2004 | | $ | 599,867 |
| 261,000 | | Federal Home Loan Bank, 1.03%, 01/28/2004 | | | 260,333 |
| 500,000 | | Federal Home Loan Bank, 1.03%, 02/11/2004 | | | 499,407 |
| 500,000 | | Federal Home Loan Bank, 1.00%, 02/13/2004 | | | 499,397 |
| 500,000 | | Federal Home Loan Bank, 1.01%, 03/15/2004 | | | 498,962 |
| 300,000 | | Federal Home Loan Bank, 1.01%, 04/01/2004 | | | 299,241 |
| 800,000 | | Federal Home Loan Bank, 1.07%, 04/23/2004 | | | 797,338 |
| | | | |
|
|
| | | Total Government Agencies (amortized cost $3,454,545) | | | 3,454,545 |
| | | | |
|
|
| | | Money Market Instruments - 2.64% | | | |
| 93,749 | | First American Treasury Obligation Fund Class A, 0.31%, (a) (Cost $93,749) | | | 93,749 |
| | | | |
|
|
| | | TOTAL INVESTMENTS - 99.84% (identified cost $3,548,294) | | | 3,548,294 |
| | | OTHER ASSETS AND LIABILITIES, NET - 0.16% | | | 5,713 |
| | | | |
|
|
| | | NET ASSETS - 100.00% | | $ | 3,554,007 |
| | | | |
|
|
| (a) | Variable rate security; the rate shown represents the rate at December 31, 2003. |
The accompanying notes are an integral part of these financial statements.
Timothy Plan Money Market Fund [78]
STATEMENT OF ASSETS AND LIABILITIES
As of December 31, 2003
ASSETS
| | | | |
| | | amount
| |
Investments in Securities at Value (identified cost $3,548,294) [NOTE 1] | | $ | 3,548,294 | |
Receivables: | | | | |
Interest | | | 20 | |
Fund Shares Sold | | | 3,520 | |
From Investment Advisor | | | 6,286 | |
Prepaid Expenses | | | 4,355 | |
| | |
|
|
|
Total Assets | | $ | 3,562,475 | |
| | |
|
|
|
| |
| LIABILITIES | | | | |
| |
| | | amount
| |
Payable for Fund Shares Redeemed | | $ | 3,150 | |
Distribution Payable | | | 944 | |
Accrued Expenses | | | 4,374 | |
| | |
|
|
|
Total Liabilities | | $ | 8,468 | |
| | |
|
|
|
| |
| NET ASSETS | | | | |
| |
| | | amount
| |
Net Assets | | $ | 3,554,007 | |
| | |
|
|
|
Shares of Capital Stock Outstanding (par value $0.001, unlimited shares authorized) | | $ | 3,553,917 | |
Net Asset Value, Offering and Redemption Price Per Share ($3,554,007 / 3,553,917 shares) | | $ | 1.00 | |
| |
| SOURCES OF NET ASSETS | | | | |
| |
| | | amount
| |
At December 31, 2003, Net Assets Consisted of: | | | | |
Paid-in Capital | | $ | 3,553,991 | |
Accumulated Undistributed Net Investment Income | | | 213 | |
Accumulated Net Realized Loss on Investments | | | (197 | ) |
| | |
|
|
|
Net Assets | | $ | 3,554,007 | |
| | |
|
|
|
The accompanying notes are an integral part of these financial statements.
Timothy Plan Money Market Fund [79]
STATEMENT OF OPERATIONS
For the Year Ended December 31, 2003
INVESTMENT INCOME
| | | | |
| | | amount
| |
Interest | | $ | 38,338 | |
| | |
|
|
|
Total Investment Income | | | 38,338 | |
| | |
|
|
|
| |
| EXPENSES | | | | |
| |
| | | amount
| |
Investment Advisory Fees [NOTE 3] | | | 22,066 | |
Fund Accounting, Transfer Agency, & Administration Fees | | | 18,400 | |
Auditing Fees | | | 471 | |
Insurance Fees | | | 535 | |
Legal Fees | | | 450 | |
Registration Fees | | | 3,971 | |
Custodian Fees | | | 3,125 | |
Printing Fees | | | 832 | |
Miscellaneous Expense | | | 1,683 | |
| | |
|
|
|
Total Expenses | | | 51,533 | |
| |
Expenses Waived and Reimbursed by Advisor [NOTE 3] | | | (33,904 | ) |
| | |
|
|
|
Total Net Expenses | | | 17,629 | |
| | |
|
|
|
Net Investment Income | | | 20,709 | |
| | |
|
|
|
| |
| REALIZED AND UNREALIZED (LOSS) ON INVESTMENTS | | | | |
| |
| | | amount
| |
Net Realized Losses on Investments | | | (197 | ) |
| | |
|
|
|
Increase in Net Assets Resulting from Operations | | $ | 20,512 | |
| | |
|
|
|
The accompanying notes are an integral part of these financial statements.
Timothy Plan Money Market Fund [80]
STATEMENT OF CHANGES IN NET ASSETS
INCREASE IN NET ASSETS
| | | | | | | | |
| | | year ended 12/31/03
| | | year ended 12/31/02
| |
Operations: | | | | | | | | |
Net Investment Income | | $ | 20,709 | | | $ | 25,914 | |
Net Realized Losses on Investments | | | (197 | ) | | | — | |
| | |
|
|
| |
|
|
|
Increase in Net Assets (resulting from operations) | | | 20,512 | | | | 25,914 | |
| | |
|
|
| |
|
|
|
Distributions to Shareholders: | | | | | | | | |
From Net Investment Income | | | (20,720 | ) | | | (25,691 | ) |
| | |
|
|
| |
|
|
|
Capital Share Transactions: | | | | | | | | |
Proceeds from Shares Sold | | | 3,118,604 | | | | 3,588,622 | |
Dividends Reinvested | | | 19,635 | | | | 25,035 | |
Cost of Shares Redeemed | | | (3,128,052 | ) | | | (2,844,283 | ) |
| | |
|
|
| |
|
|
|
Increase in Net Assets (resulting from capital share transactions) | | | 10,187 | | | | 769,374 | |
| | |
|
|
| |
|
|
|
Total Increase in Net Assets | | | 9,979 | | | | 769,597 | |
| | |
Net Assets: | | | | | | | | |
Beginning of Year | | | 3,544,028 | | | | 2,774,431 | |
| | |
|
|
| |
|
|
|
End of Year (including accumulated net investment income of $213 and $224, respectively) | | $ | 3,554,007 | | | $ | 3,544,028 | |
| | |
|
|
| |
|
|
|
Shares of Capital Stock of the Fund Sold and Redeemed: | | | | | | | | |
Shares Sold | | | 3,118,604 | | | | 3,588,547 | |
Shares Reinvested | | | 19,635 | | | | 25,035 | |
Shares Redeemed | | | (3,128,052 | ) | | | (2,844,283 | ) |
| | |
|
|
| |
|
|
|
Net Increase in Number of Shares Outstanding | | | 10,187 | | | | 769,299 | |
| | |
|
|
| |
|
|
|
The accompanying notes are an integral part of these financial statements.
Timothy Plan Money Market Fund [81]
FINANCIAL HIGHLIGHTS
The table below set forth financial data for one share of capital stock outstanding throughout each period presented.
MONEY MARKET FUND - CLASS A SHARES
| | | | | | | | | | | | | | | | | | | | |
| | | year
ended
12/31/03
| | | year
ended
12/31/02
| | | year
ended
12/31/01
| | | year
ended
12/31/00
| | | period
ended
12/31/99 (B)
| |
Per Share Operating Performance: | | | | | | | | | | | | | | | | | | | | |
Net Asset Value at Beginning of Period | | $ | 1.00 | | | $ | 1.00 | | | $ | 1.00 | | | $ | 1.00 | | | $ | 1.00 | |
| | |
|
|
| |
|
|
| |
|
|
| |
|
|
| |
|
|
|
Income from Investment Operations: | | | | | | | | | | | | | | | | | | | | |
Net Investment Income | | | 0.01 | | | | 0.01 | | | | 0.03 | | | | 0.05 | | | | 0.02 | |
| | |
|
|
| |
|
|
| |
|
|
| |
|
|
| |
|
|
|
Total from Investment Operations | | | 0.01 | | | | 0.01 | | | | 0.03 | | | | 0.05 | | | | 0.02 | |
| | |
|
|
| |
|
|
| |
|
|
| |
|
|
| |
|
|
|
Less Distributions: | | | | | | | | | | | | | | | | | | | | |
Dividends from Realized Gains | | | — | | | | — | | | | — | | | | — | | | | — | |
Dividends from Net Investment Income | | | (0.01 | ) | | | (0.01 | ) | | | (0.03 | ) | | | (0.05 | ) | | | (0.02 | ) |
| | |
|
|
| |
|
|
| |
|
|
| |
|
|
| |
|
|
|
Total Distributions | | | (0.01 | ) | | | (0.01 | ) | | | (0.03 | ) | | | (0.05 | ) | | | (0.02 | ) |
| | |
|
|
| |
|
|
| |
|
|
| |
|
|
| |
|
|
|
Net Asset Value at End of Period | | $ | 1.00 | | | $ | 1.00 | | | $ | 1.00 | | | $ | 1.00 | | | $ | 1.00 | |
| | |
|
|
| |
|
|
| |
|
|
| |
|
|
| |
|
|
|
Total Return (A) | | | 0.59 | % | | | 0.80 | % | | | 3.34 | % | | | 5.34 | % | | | 1.78 | % |
| | | | | |
Ratios/Supplimental Data: | | | | | | | | | | | | | | | | | | | | |
Net Assets, End of Period (in 000s) | | $ | 3,554 | | | $ | 3,544 | | | $ | 2,774 | | | $ | 1,403 | | | $ | 760 | |
| | | | | |
Ratio of Expenses to Average Net Assets: | | | | | | | | | | | | | | | | | | | | |
Before Reimbursement of Expenses by Advisor | | | 1.40 | % | | | 1.85 | % | | | 2.33 | % | | | 4.53 | % | | | 5.75 | % (C) |
After Reimbursement of Expenses by Advisor | | | 0.48 | % | | | 0.85 | % | | | 0.73 | % | | | 0.85 | % | | | 0.85 | % (C) |
| | | | | |
Ratio of Net Investment Income (Loss) to Average Net Assets: | | | | | | | | | | | | | | | | | | | | |
Before Reimbursement of Expenses by Advisor | | | (0.36 | )% | | | (0.22 | )% | | | 1.45 | % | | | 1.58 | % | | | (0.73 | )% (C) |
After Reimbursement of Expenses by Advisor | | | 0.56 | % | | | 0.78 | % | | | 3.05 | % | | | 5.25 | % | | | 4.17 | % (C) |
| (B) | For the Period July 9, 1999 (Commencement of Operations) to December 31, 1999. |
The accompanying notes are an integral part of these financial statements.
Timothy Plan Money Market Fund [82]
NOTES TO FINANCIAL STATEMENTS
December 31, 2003
TIMOTHY PLAN FAMILY OF FUNDS
Note 1 – Significant Accounting Policies
The Timothy Plan (the “Trust”) is organized as a series of a Delaware business trust pursuant to a trust agreement dated December 16, 1993. The Trust is registered under the Investment Company Act of 1940, as amended, as an open-end diversified management investment company. The Trust currently consists of eleven series. These financials include the following eight series: The Timothy Plan Aggressive Growth Fund, The Timothy Plan Conservative Growth Fund, The Timothy Plan Fixed Income Fund, The Timothy Plan Small-Cap Value Fund, The Timothy Plan Large/Mid-Cap Growth Fund, The Timothy Plan Large/Mid-Cap Value Fund, The Timothy Plan Money Market Fund, and The Timothy Plan Strategic Growth Fund, (“the Funds”).
The Timothy Plan Aggressive Growth Fund’s investment objective is long-term growth of capital. The Fund seeks to achieve its investment objective by normally investing at least 65% of the Fund’s total assets in US common stocks without regard to market capitalizations and investing in the securities of a limited number of companies which the Fund’s Adviser believes show a high probability for superior growth.
The Timothy Plan Conservative Growth Fund seeks to generate moderate levels of long-term capital growth with a secondary objective of current income. The Fund seeks to achieve its investment objective by normally investing at least 75% of its net assets in the following Funds: approximately 15%-20% of its net assets in the Timothy Plan Small-Cap Value Fund; approximately 25%-30% of its net assets in the Timothy Plan Large/Mid-Cap Value Fund; approximately 15%-20% of its net assets in the Timothy Plan Large/Mid-Cap Growth Fund; and approximately 25%-30% in the Timothy Plan Fixed Income Fund.
The Timothy Plan Fixed Income Fund seeks to generate a high level of current income consistent with prudent investment risk. To achieve its goal, the Fund normally invests in a diversified portfolio of debt securities. These include corporate bonds, U.S. Government and agency securities and preferred securities. The Fund will only purchase high quality securities.
The Timothy Plan Small-Cap Value Fund’s primary objective is long-term capital growth, with a secondary objective of current income. The Fund seeks to achieve its investment objective by investing primarily in common stocks and ADRs while abiding by ethical standards established for investments by the Fund.
The Timothy Plan Large/Mid-Cap Growth Fund’s investment objective is long-term growth of capital. Current income is not a significant investment consideration and any such income realized will be considered incidental to the Fund’s investment objective. The Fund seeks to achieve its investment objective by normally investing at least 65% of the Fund’s total assets in US common stocks with market capitalizations in excess of $2 billion.
The Timothy Plan Large/Mid-Cap Value Fund’s investment objective is long-term capital growth, with a secondary objective of current income. The Fund seeks to achieve its objectives by primarily investing in common stocks and ADRs. The Fund will invest in the common stock of companies whose total market capitalization generally exceeds $2 billion.
The Timothy Plan Money Market Fund seeks to generate a high level of current income consistent with the preservation of capital. To achieve its goal, the Fund normally invests in short-term debt instruments, such as obligations of the U.S. Government and its agencies, certificates of deposit, bankers acceptances, commercial paper and short-term corporate notes.
The Timothy Plan Strategic Growth Fund seeks to generate medium to high levels of long-term capital growth. The Fund seeks to achieve its investment objective by normally investing at least 75% of its net assets in the following Funds: approximately 15%-20% of its net assets in the Timothy Plan Small-Cap Value Fund; approximately 20%-25% of its net assets in the Timothy Plan Large/Mid-Cap Value Fund; approximately 30%-35% of its net assets in the Timothy Plan Large/Mid-Cap Growth Fund; and approximately 15%-20% in the Timothy Plan Aggressive Growth Fund.
Timothy Plan Notes to Financial Statements [83]
NOTES TO FINANCIAL STATEMENTS
December 31, 2003
TIMOTHY PLAN FAMILY OF FUNDS
The following is a summary of significant accounting policies consistently followed by the Funds in the preparation of its financial statements. The policies are in conformity with accounting principles generally accepted in the United States of America for investment companies.
A. Security Valuation
Investments in securities traded on a national securities exchange are valued at the NASDAQ official closing price on the last business day of the period. Unlisted securities, or listed securities in which there were no sales, are valued at the mean of the closing bid and ask prices. Short-term obligations with remaining maturities of 60 days or less are valued at cost plus accrued interest, which approximates market value.
B. Investment Income and Securities Transactions
Security transactions are accounted for on the date the securities are purchased or sold (trade date). Cost is determined and gains and losses are based on the identified cost basis for both financial statement and federal income tax purposes. Dividend income and distributions to shareholders are reported on the ex-dividend date. Interest income and expenses are accrued daily. The Timothy Plan Small-Cap Value Fund and The Timothy Plan Large/Mid-Cap Value Fund have made certain investments in real estate investment trusts (“REITs”) which pay dividends to their shareholders based upon available funds from operations. It is quite common for these dividends to exceed the REIT’s taxable earnings and profits resulting in the excess portion of such dividends being designated as a return of capital.
C. Net Asset Value Per Share
Net asset value per share of the capital stock of the Funds is determined daily as of the close of trading on the New York Stock Exchange by dividing the value of its net assets by the number of Fund shares outstanding. Net Asset Value is calculated separately for each class of the following Funds, The Timothy Plan Aggressive Growth Fund, The Timothy Plan Conservative Growth Fund, The Timothy Plan Fixed Income Fund, The Timothy Plan Small-Cap Value Fund, The Timothy Plan Large/Mid-Cap Growth Fund, The Timothy Plan Large/Mid-Cap Value Fund, The Timothy Plan Strategic Growth Fund. The asset value of the classes may differ because of different fees and expenses charged to each class.
D. Classes
Class specific expenses are borne by that class. Income, expenses, and realized and unrealized gains/losses are allocated to the respective classes on the basis of relative daily net assets.
E. Use of Estimates
In preparing financial statements in conformity with accounting principles generally accepted in the United States of America, management makes estimates and assumptions that affect the reported amounts of assets and liabilities at the date of the financial statements, as well as the reported amounts of revenues and expenses during the reporting period. Actual results could differ from those estimates.
F. Federal Income Taxes
It is the policy of the Fund to comply with all requirements of the Internal Revenue Code applicable to regulated investment companies and to distribute substantially all of its taxable income to its shareholders. Therefore, no federal income tax provision is required.
G. Repurchase Agreements
In connection with transactions in repurchase agreements, it is the Funds’ policy that its custodian take possession of the underlying collateral securities, the fair value of which exceeds the principal amount of the repurchase transaction, including accrued interest, at all times. If the seller defaults, and the fair value of the collateral declines, realization of the collateral by the Funds may be delayed or limited.
Timothy Plan Notes to Financial Statements [84]
NOTES TO FINANCIAL STATEMENTS
December 31, 2003
TIMOTHY PLAN FAMILY OF FUNDS
Note 2 – Purchases and Sales of Securities
The following is a summary of the cost of purchases and proceeds from the sale of securities, other than short-term investments, for the year ended December 31, 2003:
| | | | | | |
funds
| | purchases
| | sales
|
Aggressive Growth Fund | | $ | 11,897,409 | | $ | 8,552,117 |
Conservative Growth Fund | | $ | 6,536,590 | | $ | 531,590 |
Fixed Income Fund | | $ | 17,821,836 | | $ | 10,350,421 |
Large/Mid-Cap Growth Fund | | $ | 16,841,278 | | $ | 9,346,878 |
Large/Mid-Cap Value Fund | | $ | 13,545,511 | | $ | 9,373,236 |
Small-Cap Value Fund | | $ | 25,070,539 | | $ | 18,281,424 |
Strategic Growth Fund | | $ | 6,724,993 | | $ | 114,993 |
Note 3 – Investment Management Fee and Other Transactions with Affiliates
Timothy Partners, LTD., (“TPL”) is the investment advisor for the Funds pursuant to an investment advisory agreement (the “Agreement”) effective January 19, 1994. Under the terms of the Agreement, as amended, TPL receives a fee, accrued daily and paid monthly, at an annual rate of 0.85% of the average daily net assets of The Timothy Plan Aggressive Growth, The Timothy Plan Small-Cap Value, The Timothy Plan Large/Mid-Cap Growth and The Timothy Plan Large/Mid-Cap Value Funds; 0.60% of the average daily net assets of The Timothy Plan Fixed Income and Timothy Plan Money Market Funds; and 0.15% of the average daily net assets of The Timothy Plan Conservative Growth and The Timothy Plan Strategic Growth Funds. Effective May 16, 2003, TPL voluntarily undertook to waive its advisory fee for the Timothy Plan Money Market Fund. The voluntary undertaking may be modified or terminated at any time. TPL has voluntarily agreed to reduce fees payable to it by the Funds and reimburse other expenses to the extent necessary to limit the Funds’ aggregate annual operating expenses, excluding brokerage commissions and other portfolio transaction expenses, interest, taxes, capital expenditures and extraordinary expenses to 0.25% for the Timothy Plan Money Market Fund and to the specified percentages listed below for each class of shares:
| | | | | | |
funds
| | class A
| | | class B
| |
Aggressive Growth Fund | | 1.60 | % | | 2.35 | % |
Conservative Growth Fund | | 1.15 | % | | 1.90 | % |
Fixed Income Fund | | 1.35 | % | | 2.10 | % |
Large/Mid-Cap Growth Fund | | 1.60 | % | | 2.35 | % |
Large/Mid-Cap Value Fund | | N/A | | | N/A | |
Small-Cap Value Fund | | N/A | | | N/A | |
Strategic Growth Fund | | 1.15 | % | | 1.90 | % |
Timothy Plan Notes to Financial Statements [85]
NOTES TO FINANCIAL STATEMENTS
December 31, 2003
TIMOTHY PLAN FAMILY OF FUNDS
For the year ended December 31, 2003, TPL waived and reimbursed the Funds as follows:
| | | |
funds
| | waivers and
reimbursements
|
Aggressive Growth Fund | | $ | 18,414 |
Conservative Growth Fund | | $ | 7,081 |
Fixed Income Fund | | $ | 14,224 |
Large/Mid-Cap Growth Fund | | $ | 4,937 |
Large/Mid-Cap Value Fund | | $ | — |
Money Market Fund | | $ | 33,904 |
Small-Cap Value Fund | | $ | — |
Strategic Growth Fund | | $ | 4,281 |
For the Timothy Plan Aggressive Growth Fund, The Timothy Plan Conservative Growth Fund, The Timothy Plan Fixed Income Fund, The Timothy Plan Large/Mid-Cap Growth Fund, the Timothy Plan Money Market Fund and The Timothy Plan Strategic Growth Fund; the Funds have agreed to repay these expenses within the following three years provided the Funds are able to effect such reimbursements and remain in compliance with applicable limitations.
At December 31, 2003, the cumulative amount available for reimbursement that has been paid and/or waived by the Advisor on behalf of the Funds are as follows:
| | | |
funds
| | |
Aggressive Growth Fund | | $ | 120,788 |
Conservative Growth Fund | | $ | 60,925 |
Fixed Income Fund | | $ | 85,944 |
Large/Mid-Cap Growth Fund | | $ | 72,907 |
Money Market Fund | | $ | 99,438 |
Strategic Growth Fund | | $ | 37,983 |
At December 31, 2003, the Advisor may recapture a portion of the above amounts no later than the dates as stated below:
| | | | | | | | | |
funds
| | 12/31/2001
| | 12/31/2002
| | 12/31/2003
|
Aggressive Growth Fund | | $ | 53,162 | | $ | 49,212 | | $ | 18,414 |
Conservative Growth Fund | | $ | 27,566 | | $ | 26,278 | | $ | 7,081 |
Fixed Income Fund | | $ | 32,486 | | $ | 39,234 | | $ | 14,224 |
Large/Mid-Cap Growth Fund | | $ | 41,329 | | $ | 26,641 | | $ | 4,937 |
Money Market Fund | | $ | 32,358 | | $ | 33,176 | | $ | 33,904 |
Strategic Growth Fund | | $ | 19,993 | | $ | 13,709 | | $ | 4,281 |
The Timothy Plan Aggressive Growth, Timothy Plan Conservative Growth, Timothy Plan Fixed Income, Timothy Plan Large/Mid-Cap Growth, Timothy Plan Large/Mid-Cap Value, Timothy Plan Small-Cap Value, and Timothy Plan Strategic Growth Funds have adopted shareholder services plans (the “Plans”) pursuant to Rule 12b-1 under the Investment Company Act of 1940, as amended. The Plans provide that the Fund will pay TPL or others for expenses that relate to the promotion or distribution of shares. Under the Class A Plan, the Funds will pay TPL a fee at an annual rate of 0.25%, payable monthly, of the average daily net assets attributable to such class of shares. Under the
Timothy Plan Notes to Financial Statements [86]
NOTES TO FINANCIAL STATEMENTS
December 31, 2003
TIMOTHY PLAN FAMILY OF FUNDS
Class B Plans, the Fund will pay TPL a fee at an annual rate of 1.00%, payable monthly, of which, 0.25% may be a service fee and 0.75% may be payable to outside broker/dealers, of the average daily net assets attributable to such class of shares. For the year ended December 31, 2003, the Funds paid TPL under the terms of the Plan as follows.
Class A and B shares of the Assets Allocation Funds each may pay fees for shareholder administrative support services to broker-dealers and other financial organizations at an annual rate of 0.25% of the average daily net asset value of that Class. Shareholder support services may include: assisting investors in processing purchase, exchange and redemption requests; processing dividend and distribution payments from the Funds; providing information periodically to customers showing their positions in Fund shares; providing sub-accounting; and forwarding sales literature and advertising.
| | | | | | | | | |
funds
| | distribution
costs
| | service fees
| | service support
fees
|
Aggressive Growth Fund | | $ | 23,198 | | $ | 2,171 | | $ | — |
Conservative Growth Fund | | $ | 100,802 | | $ | 23,809 | | $ | 53,182 |
Fixed Income Fund | | $ | 62,874 | | $ | 9,748 | | $ | — |
Large/Mid-Cap Growth Fund | | $ | 55,689 | | $ | 4,526 | | $ | — |
Large/Mid-Cap Value Fund | | $ | 86,008 | | $ | 10,606 | | $ | — |
Small-Cap Value Fund | | $ | 182,913 | | $ | 38,868 | | $ | — |
Strategic Growth Fund | | $ | 115,588 | | $ | 30,733 | | $ | 54,121 |
Note 4 - Unrealized Appreciation (Depreciation)
At December 31, 2003, the cost for federal income tax purposes is and the composition of gross unrealized appreciation (depreciation) of investment securities is as follows:
| | | | | | | | | | | | | |
funds
| | cost
| | app
| | dep
| | | net app. / dep.
|
Aggressive Growth Fund | | $ | 9,829,501 | | $ | 1,645,961 | | $ | (235,080 | ) | | $ | 1,410,881 |
Conservative Growth Fund | | $ | 25,435,956 | | $ | 2,497,089 | | $ | (537,542 | ) | | $ | 1,959,547 |
Fixed Income Fund | | $ | 19,697,253 | | $ | 674,204 | | $ | (114,902 | ) | | $ | 559,302 |
Large/Mid-Cap Growth Fund | | $ | 22,684,730 | | $ | 3,772,677 | | $ | (895,449 | ) | | $ | 2,877,228 |
Large/Mid-Cap Value Fund | | $ | 27,181,748 | | $ | 6,584,220 | | $ | (293,464 | ) | | $ | 6,290,756 |
Money Market Fund | | $ | 3,548,294 | | | N/A | | | N/A | | | | N/A |
Small-Cap Value Fund | | $ | 40,430,560 | | $ | 13,071,504 | | $ | (562,716 | ) | | $ | 12,508,788 |
Strategic Growth Fund | | $ | 27,892,528 | | $ | 2,745,220 | | $ | (1,368,018 | ) | | $ | 1,377,202 |
Timothy Plan Notes to Financial Statements [87]
NOTES TO FINANCIAL STATEMENTS
December 31, 2003
TIMOTHY PLAN FAMILY OF FUNDS
Note 5 – Distributions to Shareholders
The tax character of distributions paid during 2003 and 2002 were as follows:
| | | | | | | | | | | | | | | |
| | | Aggressive
Growth Fund
| | | Conservative
Growth Fund
| | Fixed Income
Fund
| | | Large/Mid-Cap Growth Fund
| |
2003 | | | | | | | | | | | | | | | |
Ordinary Income | | $ | — | | | $ | — | | $ | 661,331 | | | $ | — | |
Long-term Capital Gains | | | — | | | | 21,889 | | | 231,862 | | | | — | |
| | |
|
|
| |
|
| |
|
|
| |
|
|
|
| | | $ | — | | | $ | 21,889 | | $ | 893,193 | | | $ | — | |
| | |
|
|
| |
|
| |
|
|
| |
|
|
|
2002 | | | | | | | | | | | | | | | |
Ordinary Income | | $ | — | | | $ | 213 | | $ | 461,329 | | | $ | — | |
Long-term Capital Gains | | | — | | | | — | | | 14,208 | | | | — | |
| | |
|
|
| |
|
| |
|
|
| |
|
|
|
| | | $ | — | | | $ | 213 | | $ | 475,537 | | | $ | — | |
| | |
|
|
| |
|
| |
|
|
| |
|
|
|
|
As of December 31, 2003, the components of distributable earnings on a tax basis were as follows: | |
| | | | |
Undistributed Ordinary Income | | $ | — | | | $ | — | | $ | — | | | $ | — | |
Undistributed Long-term Capital Gains | | | — | | | | 91,213 | | | — | | | | — | |
Post-October Losses* | | | — | | | | — | | | (25,188 | ) | | | — | |
Capital Loss Carryforward | | | (861,710 | ) | | | — | | | — | | | | (3,933,237 | ) |
Unrealized Appreciation (Depreciation) | | | 1,410,881 | | | | 1,959,547 | | | 559,302 | | | | 2,877,228 | |
| | |
|
|
| |
|
| |
|
|
| |
|
|
|
| | | $ | 549,171 | | | $ | 2,050,760 | | $ | 534,114 | | | $ | (1,056,009 | ) |
| | |
|
|
| |
|
| |
|
|
| |
|
|
|
The tax character of distributions paid during 2003 and 2002 were as follows:
| | | | | | | | | | | | | | | |
| | | Large/Mid-Cap
Value Fund
| | | Money Market
Fund
| | | Small-Cap Value Fund
| | Strategic Growth Fund
| |
2003 | | | | | | | | | | | | | | | |
Ordinary Income | | $ | — | | | $ | 20,720 | | | $ | — | | $ | — | |
Long-term Capital Gains | | | — | | | | — | | | | — | | | — | |
| | |
|
|
| |
|
|
| |
|
| |
|
|
|
| | | $ | — | | | $ | 20,720 | | | $ | — | | $ | — | |
| | |
|
|
| |
|
|
| |
|
| |
|
|
|
2002 | | | | | | | | | | | | | | | |
Ordinary Income | | $ | — | | | $ | 25,691 | | | $ | — | | $ | — | |
Long-term Capital Gains | | | — | | | | — | | | | 17,899 | | | 531 | |
| | |
|
|
| |
|
|
| |
|
| |
|
|
|
| | | $ | — | | | $ | 25,691 | | | $ | 17,899 | | $ | 531 | |
| | |
|
|
| |
|
|
| |
|
| |
|
|
|
|
| As of December 31, 2003, the components of distributable earnings on a tax basis were as follows: | |
| | | | |
Undistributed Ordinary Income | | $ | — | | | $ | 213 | | | $ | — | | $ | — | |
Undistributed Long-term Capital Gains | | | — | | | | 4 | | | | 343,443 | | | 1,602 | |
Post-October Loss* | | | — | | | | (201 | ) | | | | | | — | |
Capital Loss Carryforward | | | (2,282,806 | ) | | | — | | | | | | | (52,500 | ) |
Unrealized Appreciation (Depreciation) | | | 6,290,756 | | | | — | | | | 12,508,788 | | | 1,377,202 | |
| | |
|
|
| |
|
|
| |
|
| |
|
|
|
| | | $ | 4,007,950 | | | $ | 16 | | | $ | 12,852,231 | | $ | 1,326,304 | |
| | |
|
|
| |
|
|
| |
|
| |
|
|
|
| * | For U.S. federal income tax purposes, net realized capital losses from investments incurred after October 31, 2003, within the prior fiscal year are deemed to arise on the first day of the current fiscal year. |
Timothy Plan Notes to Financial Statements [88]
NOTES TO FINANCIAL STATEMENTS
December 31, 2003
TIMOTHY PLAN FAMILY OF FUNDS
Dividends from net investment income and distributions from net realized capital gains are determined in accordance with U.S. Federal tax regulations, which may differ from those amounts determined under accounting principles generally accepted in the United States of America. These book/tax differences are either temporary or permanent in nature. To the extent these differences are permanent, they are charged or credited to paid-in-capital or accumulated net realized gain, as appropriate, in the period that the differences arise. Accordingly, the following permanent differences as of December 31, 2003, primarily attributable to certain net operating losses, which for tax purposes are not available to offset future income, were reclassified to the following accounts:
| | | | | | | | | | |
| | | ordinary income
| | realized gain/(loss)
| | paid-in-capital
| |
Aggressive Growth Fund | | $ | 109,238 | | $ | — | | $ | (109,238 | ) |
Conservative Growth Fund | | $ | 61,953 | | $ | — | | $ | (61,953 | ) |
Fixed Income Fund | | $ | — | | $ | — | | $ | — | |
Large/Mid-Cap Growth Fund | | $ | 204,707 | | $ | — | | $ | (204,707 | ) |
Large/Mid-Cap Value Fund | | $ | 6,362 | | $ | — | | $ | (6,362 | ) |
Money Market Fund | | $ | — | | $ | — | | $ | — | |
Small-Cap Value Fund | | $ | 361,353 | | $ | — | | $ | (361,353 | ) |
Strategic Growth Fund | | $ | 340,833 | | $ | — | | $ | (340,833 | ) |
Note 6 – Capital Loss Carryforwards
| | | | | |
| | | loss carryforward
| | year expiring
|
Aggressive Growth Fund | | $ | 861,710 | | 2010 |
Large/Mid-Cap Growth Fund | | $ | 278,925 | | 2009 |
| | | | 2,962,228 | | 2010 |
| | | | 692,084 | | 2011 |
Large/Mid-Cap Value Fund | | $ | 141,935 | | 2009 |
| | | | 82,427 | | 2010 |
| | | | 2,058,444 | | 2011 |
Strategic Growth Fund | | $ | 52,500 | | 2011 |
To the extent these loss carryforwards are used to offset future capital gains, it is probable that the amount, which is offset, will not be distributed to shareholders.
Timothy Plan Notes to Financial Statements [89]
NOTES TO FINANCIAL STATEMENTS
December 31, 2003
TIMOTHY PLAN FAMILY OF FUNDS
Note 7 – Subsequent Events
On December 5, 2004, the shareholders of the Timothy Plan Conservative Growth Fund and the Timothy Plan Strategic Growth Fund each approved an increase in the investment advisory fees paid to Timothy Partners, Ltd. (“TPL”), investment adviser to each Fund, for services rendered to the Funds. The shareholders of each Fund approved an increase in the investment advisory fee paid to TPL by each Fund, from an annual rate of 0.15% of average daily net assets to an annual rate of 0.65% of average daily net assets of each Fund. Concurrently with the investment advisory fee increase, the Board of Trustees approved and ordered a reduction in Service and Distribution (12b-1) Fees of 0.25% annually for each Share Class of each Fund, and terminated an administrative services agreement between each Fund and TPL, which agreement paid TPL an annual fee equal to 0.25% of the average daily net assets of each Fund. As a result of the above-described contractual restructurings, overall expense ratios of each Fund remain unchanged from those stated as of December 31, 2003. The new expense structuring of each Fund took effect on January 1, 2004.
Timothy Plan Notes to Financial Statements [90]
REPORT OF INDEPENDENT CERTIFIED PUBLIC ACCOUNTANTS
December 31, 2003
TIMOTHY PLAN FAMILY OF FUNDS
To the Shareholders and Board of Trustees
The Timothy Plan
Winter Park, Florida
We have audited the accompanying statements of assets and liabilities of The Timothy Plan (comprising respectively; The Timothy Aggressive Growth Fund, The Timothy Conservative Growth Fund, The Timothy Fixed Income Fund, The Timothy Small-Cap Value Fund, The Timothy Large/Mid-Cap Growth Fund, The Timothy Large/Mid-Cap Value Fund, The Timothy Money Market Fund and The Timothy Strategic Growth Fund), including the portfolios of investments as of December 31, 2003, and the related statements of operations for the year then ended, the statements of changes in net assets for each of the two years or periods then ended and the financial highlights for each of the periods indicated thereon. These financial statements and financial highlights are the responsibility of the Funds’ management. Our responsibility is to express an opinion on these financial statements and financial highlights based on our audits.
We conducted our audits in accordance with auditing standards generally accepted in the United States of America. Those standards require that we plan and perform the audit to obtain reasonable assurance about whether the financial statements and financial highlights are free of material misstatement. An audit includes examining, on a test basis, evidence supporting the amounts and disclosures in the financial statements. Our procedures included confirmation of securities owned as of December 31, 2003, by correspondence with the custodian and brokers. An audit also includes assessing the accounting principles used and significant estimates made by management, as well as evaluating the overall financial statement presentation. We believe that our audits provide a reasonable basis for our opinion.
In our opinion, the financial statements and financial highlights referred to above present fairly, in all material respects, the financial position of The Timothy Plan as of December 31, 2003, the results of its operations for the year then ended, the changes in its net assets for each of the two years or periods in the period then ended and the financial highlights for each of the periods indicated thereon, in conformity with accounting principles generally accepted in the United States of America.

TAIT, WELLER & BAKER
Philadelphia, Pennsylvania
February 13, 2004
BOARD OF TRUSTEES
Arthur D. Ally
Joseph E. Boatwright
William Dodson
W. Thomas Fyler, Jr.
Mark A. Minnella
Charles E. Nelson
Wesley W. Pennington
Jock M. Sneddon
Mat D. Staver
OFFICERS
Arthur D. Ally, President
Joseph E. Boatwright, Secretary
INVESTMENT ADVISOR
Timothy Partners, LTD.
1304 West Fairbanks Avenue
Winter Park, FL 32789
DISTRIBUTOR
Timothy Partners, LTD.
1304 West Fairbanks Avenue
Winter Park, FL 32789
TRANSFER AGENT
Citco-Quaker Fund Services, Inc.
1288 Valley Forge Road, Suite 88
Valley Forge, PA 19482
AUDITORS
Tait, Weller & Baker
1818 Market Street, Suite 2400
Philadelphia, PA 19103
LEGAL COUNSEL
David Jones & Associates PC
395 Sawdust Road, #2148
The Woodlands, TX 77380
For additional information or a prospectus, please call: 1-800-846-7526
Visit the Timothy Plan web site on the internet at: www.timothyplan.com
This report is submitted for the general information of the shareholders of the Fund. It is not authorized for distribution to prospective investors in the Fund unless preceded or accompanied by an effective Prospectus which includes details regarding the Fund’s objectives, policies, expenses and other information. Distributed by Timothy Partners, Ltd.

The Timothy Plan
1304 West Fairbanks Avenue
Winter Park, FL 32789
www.timothyplan.com
E-mail info@timothyplan.com
Tel (800) 846-7526
The Registrant’s Code of Ethics is attached hereto as an exhibit. As of the end of the period covered by this report, the Registrant has adopted a code of ethics that applies to its principal executive officer, principal financial officer, principal accounting officer or persons performing similar functions. No waivers from a provision of the Code were granted during the period covered by this report.
| ITEM 3. | | AUDIT COMMITTEE FINANCIAL EXPERT. |
The Board of Trustees of the Timothy Plan Trust has two audit committee financial experts. They are Mr. Charles Nelson and Mr. Robert Scraper. Both financial experts are independent trustees as defined in Section 2(a)(19)of the Act (15 USC 80a-2(a)(19)).
Mr. Nelson is a CPA. He is the former managing partner of the local (Orlando, FL) branch of Arthur Anderson, CPA firm.
Mr. Scraper has served as Senior Vice President of Investments for Frost National Bank for the past sixteen years.
| ITEM 4. | | PRINCIPAL ACCOUNTANT FEES AND SERVICES. |
(a) The aggregate audit fees billed to The Timothy Plan Funds for the last two fiscal years by the principal accountant were $53,000.00 and $73,000.00 respectively.
(b) Audit-Related Fees. Not Applicable
(c) Tax Fees. Not Applicable
(d) All Other Fees. Fees billed to the fund for professional services by Tait Weller for tax preparation for the Trust’s funds last two fiscal years were $22,000 each year.
(e) In accordance with Section 10A(i) of the Securities and Exchange Act of 1940, and further pursuant to paragraph (c)(7)(i)(A) of Rule 2-01of Regulation S-K, the Trust’s principal accountant was approved by a unanimous vote of the Trust’s audit committee prior to the engagement of the Trust’s principal accountant. Each year, the Trust’s audit committee considers the renewal or replacement of the principal accountants for the Trust. Considerations include, among other things, the experience, reports from references provided, history with regulatory agencies, the industry reputation enjoyed by service providers bidding for the opportunity to serve the Trust, and the competitiveness of the fee schedule(s) proposed by each candidate.
(f) Not Applicable.
(g) Not Applicable
(h) Not applicable
| ITEM 5. | | AUDIT COMMITTEE OF LISTED REGISTRANTS. |
Not applicable.
| ITEM 7. | | DISCLOSURE OF PROXY VOTING POLICIES AND PROCEDURES FOR CLOSED-END MANAGEMENT INVESTMENT COMPANIES. |
Not applicable.
| ITEM 9. | | CONTROLS AND PROCEDURES. |
Based on their evaluation of registrant’s disclosure controls and procedures (as defined in rule 30a-2(c) under the Investment Company Act of 1940 (17 CFR 270.30a-2(c)) as of January 26, 2004, Registrant’s principal executive officer and principal financial officer found registrant’s disclosure controls and procedures to be appropriately designed to ensure that information required to be disclosed by registrant in the reports that it files under the Securities Exchange Act of 1934 (a) is accumulated and communicated to registrant’s management, including its principal executive officer and principal financial officer, to allow timely decisions regarding required disclosure, and (b) is recorded, processed, summarized and reported, within the time periods specified in the rules and forms adopted by the U.S. Securities and Exchange Commission.
There have been no significant changes in Registrant’s internal controls or in other factors that could significantly affect registrant’s internal controls subsequent to the date of the most recent evaluation as indicated, including no significant deficiencies or material weaknesses that required corrective action.
(a) Code of Ethics is attached hereto as EX-99.CODE ETH.
(b) Certifications pursuant to Section 302 of the Sarbanes-Oxley Act of 2002 are attached hereto as EX-99.CERT.
(c) Certifications pursuant to Section 906 of the Sarbanes-Oxley Act of 2002 are attached hereto as EX-906CERT.
SIGNATURES
[See General Instruction F]
Pursuant to the requirements of the Securities Exchange Act of 1934 and the Investment Company Act of 1940, the registrant has duly caused this report to be signed on its behalf by the undersigned, thereunto duly authorized.
| | |
| (Registrant) | | Timothy Plan |
| | |
|
| By (Signature and Title)* | | Arthur Ally RESIDENT AND TREASURER |
| | |
|
| Date | | 03/03/2004 |
| | |
|
Pursuant to the requirements of the Securities Exchange Act of 1934 and the Investment Company Act of 1940, this report has been signed below by the following persons on behalf of the registrant and in the capacities and on the dates indicated.
| | |
| By (Signature and Title)* | | Arthur Ally PRESIDENT |
| | |
|
| Date | | 03/03/2004 |
| | |
|
| By (Signature and Title)* | | Arthur Ally TREASURER |
| | |
|
| Date | | 03/03/2004 |
| | |
|
| * | Print the name and title of each signing officer under his or her signature. |