UNITED STATES
SECURITIES AND EXCHANGE COMMISSION
WASHINGTON, D.C. 20549
FORM N-CSR
CERTIFIED SHAREHOLDER REPORT OF REGISTERED MANAGEMENT
INVESTMENT COMPANIES
Investment Company Act file number 811-08228
The Timothy Plan
(Exact name of registrant as specified in charter)
The Timothy Plan
1055 Maitland Center Commons
Maitland, FL 32751
(Address of principal executive offices) (Zip code)
Art Ally
The Timothy Plan
1055 Maitland Center Commons
Maitland, FL 32751
(Name and address of agent for service)
Registrant’s telephone number, including area code: 800-846-7526
Date of fiscal year end: 12/31
Date of reporting period: 12/31/2008
Form N-CSR is to be used by management investment companies to file reports with the Commission not later than 10 days after the transmission to stockholders of any report that is required to be transmitted to stockholders under Rule 30e-1 under the Investment Company Act of 1940 (17 CFR 270.30e-1). The Commission may use the information provided on Form N-CSR in its regulatory, disclosure review, inspection and policymaking roles.
A registrant is required to disclose the information specified by Form N-CSR, and the Commission will make this information public. A registrant is not required to respond to the collection of information contained in Form N-CSR unless the Form displays a currently valid Office of Management and Budget (“OMB”) control number. Please direct comments concerning the accuracy of the information collection burden estimate and any suggestions for reducing the burden to Secretary, Securities and Exchange Commission, 450 Fifth Street, NW, Washington, DC 20549-0609. The OMB has reviewed this collection of information under the clearance requirements of 44 U.S.C. § 3507.
| Item 1. | Reports to Stockholders. |
The Registrant’s audited annual financial reports transmitted to shareholders pursuant to Rule 30e-1 under the Investment Company Act of 1940 are as follows:

ANNUAL REPORT
DECEMBER 31, 2008
| | |
| TIMOTHY PLAN FAMILY OF FUNDS: |
| |
| Small Cap Value Fund | | Strategic Growth Fund |
| Large/Mid Cap Value Fund | | Conservative Growth Fund |
| Fixed Income Fund | | Money Market Fund |
| Aggressive Growth Fund | | High Yield Bond Fund |
| Large/Mid Cap Growth Fund | | International Fund |
LETTER FROM THE PRESIDENT
December 31, 2008
ARTHUR D. ALLY
Dear Shareholder,
As you well know, 2008 was, by far, the worst year – in terms of financial market performance – in modern history. Even though we did not own any of the companies that made the headlines since they failed one or more of our moral screens, nevertheless, when the market goes into a reactionary free-fall, none of us are immune to the fallout. The prices of good, solid companies (which we believe make up the majority of our portfolio holdings) have declined along with the prices of those we would consider not-so-good.
We have completed our efforts to upgrade the managers of all our funds and, in my opinion, all of our funds are now managed by firms that are as good as, if not better than, any mutual fund family in the industry. Please refer to each individual manager’s comments within this report for more detailed information as to why the funds under their responsibility performed as they did.
As a review, here is what we ask of our money managers – in priority order:
| | (1) | Do not violate our moral and ethical screens. We provide them with our continuously updated screen list and they apply their economic analysis to any company not on our screen list. |
| | (2) | Preservation of principal is job #1 – ahead of performance. This does not mean that the value of your investment will not decline during times of market declines as we witnessed in 2008. What it does mean is that we expect them to manage our funds as conservatively as reasonably possible. Then, |
| | (3) | Out-perform their specific market index over a full market cycle – which we consider to be approximately five years or so. |
For what it is worth, all of our various managers believe we are either at or very near the bottom of this violent market. If they are right, as I believe they are – although no one can know for sure, then the potential rewards for current and new investments could far outweigh the risks. We fully expect 2009 to be rather rocky but also believe we could see a sustained recovery begin sometime during the last half of the year. As you well know, however, no one can guarantee future results. The one thing I can assure you of is that every one of our managers will be working very hard to achieve those three objectives listed above
In conclusion, the Timothy Plan is serious about our mission (to genuinely screen our investments and attempt to deliver competitive investment results) and our commitment to continuously pursue Kingdom Class quality in everything we do. Thank you for being part of the Timothy Plan family.
|
| Sincerely, |
|
 |
| Arthur D. Ally |
| President |
Letter From The President [1]
RETURNS FOR THE YEAR ENDED
December 31, 2008
TIMOTHY PLAN SMALL CAP VALUE FUND (unaudited)
| | | | | | |
| Fund/Index | | 1 Year Total Return | | 5 Year Average
Annual Return | | 10 Year Average
Annual Return |
Timothy Small Cap Value Fund – Class A (With sales charge) | | (36.20)% | | (2.80)% | | 2.94% |
Russell 2000 Index | | (33.79)% | | (0.93)% | | 3.02% |
Timothy Small Cap Value Fund – Class B* | | (33.62)% | | (2.39)% | | 2.74% |
Russell 2000 Index | | (33.79)% | | (0.93)% | | 3.02% |
Timothy Small Cap Value Fund – Class C* | | (33.66)% | | N/A | | (2.98)% (a) |
Russell 2000 Index | | (33.79)% | | N/A | | (1.74)% (a) |
(a) For the period February 3, 2004 (commencement of investment in accordance with objective) to December 31, 2008.
* With Maximum Deferred Sales Charge.
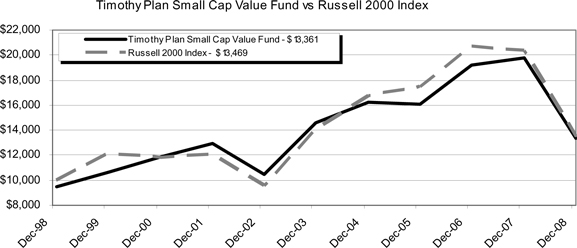
The chart shows the value of a hypothetical initial investment of $10,000 in the Fund A shares, and the Russell 2000 Index on December 31, 1998 and held through December 31, 2008. The Russell 2000 Index is a widely recognized, unmanaged index of common stock prices. Performance figures include the change in value of the stocks in the index and the reinvestment of dividends. The index return does not reflect expenses, which have been deducted from the Fund’s return. The returns shown do not reflect deduction of taxes that a shareholder would pay on fund distributions or the redemption of the fund shares. THE FUND’S RETURN REPRESENTS PAST PERFORMANCE AND IS NOT PREDICTIVE OF FUTURE RESULTS.
Timothy Plan Performance Graphs [2]
RETURNS FOR THE YEAR ENDED
December 31, 2008
TIMOTHY PLAN LARGE/MID CAP VALUE FUND (unaudited)
| | | | | | |
| Fund/Index | | 1 Year Total Return | | 5 Year Average
Annual Return | | Average Annual
Total Return Since Inception |
Timothy Large/Mid Cap Value Fund – Class A (With sales charge) | | (43.35)% | | 0.38% | | 1.97% (a) |
S&P 500 Index | | (36.99)% | | (2.20)% | | (2.86)% (a) |
Timothy Large/Mid Cap Value Fund – Class B* | | (41.07)% | | 0.79% | | 1.70% (b) |
S&P 500 Index | | (36.99)% | | (2.20)% | | (2.95)% (b) |
Timothy Large/Mid Cap Value Fund – Class C* | | (41.08)% | | N/A | | 1.00% (c) |
S&P 500 Index | | (36.99)% | | N/A | | (2.68)% (c) |
(a) For the period July 14, 1999 (commencement of investment in accordance with objective) to December 31, 2008.
(b) For the period July 15, 1999 (commencement of investment in accordance with objective) to December 31, 2008.
(c) For the period February 3, 2004 (commencement of investment in accordance with objective) to December 31, 2008.
* With Maximum Deferred Sales Charge.
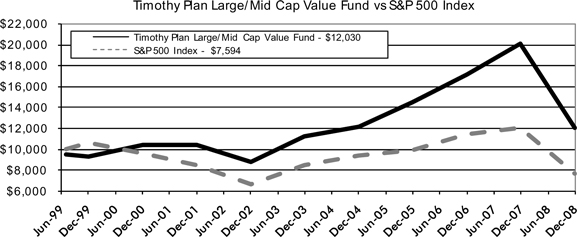
The chart shows the value of a hypothetical initial investment of $10,000 in the Fund A shares, and the S&P 500 Index on July 14, 1999 and held through December 31, 2008. The S&P 500 Index is a widely recognized, unmanaged index of common stock prices. Performance figures include the change in value of the stocks in the index and the reinvestment of dividends. The index return does not reflect expenses, which have been deducted from the Fund’s return. The returns shown do not reflect deduction of taxes that a shareholder would pay on fund distributions or the redemption of the fund shares. THE FUND’S RETURN REPRESENTS PAST PERFORMANCE AND IS NOT PREDICTIVE OF FUTURE RESULTS.
Timothy Plan Performance Graphs [3]
RETURNS FOR THE YEAR ENDED
December 31, 2008
TIMOTHY PLAN FIXED INCOME FUND (unaudited)
| | | | | | |
| Fund/Index | | 1 Year Total Return | | 5 Year Average
Annual Return | | Average Annual
Total Return Since Inception |
Timothy Fixed Income Fund – Class A (With sales charge) | | (4.54)% | | 1.60% | | 3.35% (a) |
Barclays Capital U.S. Aggregate Bond Index | | 5.24% | | 4.66% | | 6.06% (a) |
Timothy Fixed Income Fund – Class B* | | (1.66)% | | 1.79% | | 3.05% (b) |
Barclays Capital U.S. Aggregate Bond Index | | 5.24% | | 4.66% | | 6.06% (b) |
Timothy Fixed Income Fund – Class C* | | (1.72)% | | N/A | | 1.72% (c) |
Barclays Capital U.S. Aggregate Bond Index | | 5.24% | | N/A | | 4.53% (c) |
(a) For the period July 14, 1999 (commencement of investment in accordance with objective) to December 31, 2008.
(b) For the period August 5, 1999 (commencement of investment in accordance with objective) to December 31, 2008.
(c) For the period February 3, 2004 (commencement of investment in accordance with objective) to December 31, 2008.
* With Maximum Deferred Sales Charge.
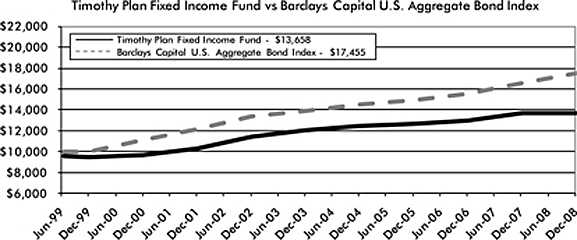
The chart shows the value of a hypothetical initial investment of $10,000 in the Fund A shares, and the Barclays Capital U.S. Aggregate Bond Index on July 14, 1999 and held through December 31, 2008. The Barclays Capital U.S. Aggregate Bond Index is a widely recognized, unmanaged index of bond prices. The index returns does not reflect expenses, which have been deducted from the Fund’s return. The returns shown do not reflect deduction of taxes that a shareholder would pay on fund distributions or the redemption of the fund shares. THE FUND’S RETURN REPRESENTS PAST PERFORMANCE AND IS NOT PREDICTIVE OF FUTURE RESULTS.
Timothy Plan Performance Graphs [4]
RETURNS FOR THE YEAR ENDED
December 31, 2008
TIMOTHY PLAN AGGRESSIVE GROWTH FUND (unaudited)
| | | | | | |
| Fund/Index | | 1 Year Total Return | | 5 Year Average
Annual Return | | Average Annual
Total Return Since Inception |
Timothy Aggressive Growth Fund – Class A (With sales charge) | | (48.31)% | | (6.53)% | | (9.19)% (a) |
Russell Mid-Cap Growth Index | | (44.32)% | | (2.33)% | | (5.96)% (a) |
Timothy Aggressive Growth Fund – Class B* | | (46.12)% | | (6.11)% | | (9.23)% (b) |
Russell Mid-Cap Growth Index | | (44.32)% | | (2.33)% | | (5.75)% (b) |
Timothy Aggressive Growth Fund – Class C* | | (46.05)% | | N/A | | (6.34)% (c) |
Russell Mid-Cap Growth Index | | (44.32)% | | N/A | | (3.00)% (c) |
(a) For the period October 5, 2000 (commencement of investment in accordance with objective) to December 31, 2008.
(b) For the period October 9, 2000 (commencement of investment in accordance with objective) to December 31, 2008.
(c) For the period February 3, 2004 (commencement of investment in accordance with objective) to December 31, 2008.
* With Maximum Deferred Sales Charge.
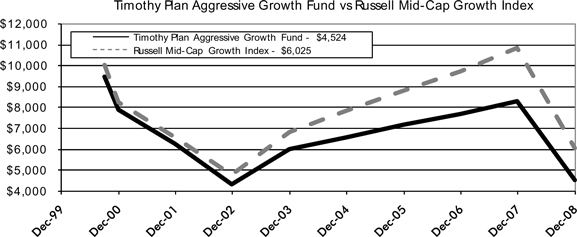
The chart shows the value of a hypothetical initial investment of $10,000 in the Fund A shares, and the Russell Mid-Cap Growth Index on October 5, 2000 and held through December 31, 2008. The Russell Mid-Cap Growth Index is a widely recognized, unmanaged index of common stock prices. Performance figures include the change in value of the stocks in the index and the reinvestment of dividends. The index return does not reflect expenses, which have been deducted from the Fund’s return. The returns shown do not reflect deduction of taxes that a shareholder would pay on fund distributions or the redemption of the fund shares. THE FUND’S RETURN REPRESENTS PAST PERFORMANCE AND IS NOT PREDICTIVE OF FUTURE RESULTS.
Timothy Plan Performance Graphs [5]
RETURNS FOR THE YEAR ENDED
December 31, 2008
TIMOTHY PLAN LARGE/MID CAP GROWTH FUND (unaudited)
| | | | | | |
| Fund/Index | | 1 Year Total Return | | 5 Year Average
Annual Return | | Average Annual
Total Return Since Inception |
Timothy Large/Mid Cap Growth Fund – Class A (With sales charge) | | (39.80)% | | (5.76)% | | (9.04)% (a) |
Russell 1000 Growth Index | | (38.44)% | | (3.42)% | | (8.01)% (a) |
Timothy Large/Mid Cap Growth Fund – Class B* | | (37.27)% | | (5.38)% | | (9.07)% (b) |
Russell 1000 Growth Index | | (38.44)% | | (3.42)% | | (7.71)% (b) |
Timothy Large/Mid Cap Growth Fund – Class C* | | (37.21)% | | N/A | | (6.01)% (c) |
Russell 1000 Growth Index | | (38.44)% | | N/A | | (3.88)% (c) |
(a) For the period October 5, 2000 (commencement of investment in accordance with objective) to December 31, 2008.
(b) For the period October 9, 2000 (commencement of investment in accordance with objective) to December 31, 2008.
(c) For the period February 3, 2004 (commencement of investment in accordance with objective) to December 31, 2008.
* With Maximum Deferred Sales Charge.
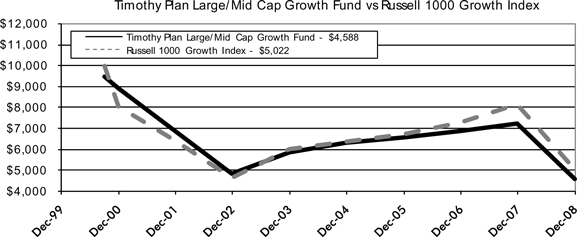
The chart shows the value of a hypothetical initial investment of $10,000 in the Fund A shares, and the Russell 1000 Growth Index on October 5, 2000 and held through December 31, 2008. The Russell 1000 Growth Index is a widely recognized, unmanaged index of common stock prices. Performance figures include the change in value of the stocks in the index and the reinvestment of dividends. The index return does not reflect expenses, which have been deducted from the Fund’s return. The returns shown do not reflect deduction of taxes that a shareholder would pay on fund distributions or the redemption of the fund shares. THE FUND’S RETURN REPRESENTS PAST PERFORMANCE AND IS NOT PREDICTIVE OF FUTURE RESULTS.
Timothy Plan Performance Graphs [6]
RETURNS FOR THE YEAR ENDED
December 31, 2008
TIMOTHY PLAN STRATEGIC GROWTH FUND (unaudited)
| | | | | | |
| Fund/Index | | 1 Year Total Return | | 5 Year Average
Annual Return | | Average Annual
Total Return Since Inception |
Timothy Strategic Growth Fund – Class A (With sales charge) | | (43.12)% | | (4.44)% | | (5.17)% (a) |
S&P 500 Index | | (36.99)% | | (2.20)% | | (3.77)% (a) |
Dow Jones Moderately Aggressive Portfolio Index | | (33.17)% | | 1.15% | | 1.31% (a) |
Timothy Strategic Growth Fund – Class B* | | (40.92)% | | (4.08)% | | (5.22)% (b) |
S&P 500 Index | | (36.99)% | | (2.20)% | | (3.49)% (b) |
Dow Jones Moderately Aggressive Portfolio Index | | (33.17)% | | 1.15% | | 1.51% (b) |
Timothy Strategic Growth Fund – Class C* | | (40.92)% | | N/A | | (4.40)% (c) |
S&P 500 Index | | (36.99)% | | N/A | | (2.68)% (c) |
Dow Jones Moderately Aggressive Portfolio Index | | (33.17)% | | N/A | | 0.68% (c) |
(a) For the period October 5, 2000 (commencement of investment in accordance with objective) to December 31, 2008.
(b) For the period October 9, 2000 (commencement of investment in accordance with objective) to December 31, 2008.
(c) For the period February 3, 2004 (commencement of investment in accordance with objective) to December 31, 2008.
* With Maximum Deferred Sales Charge.
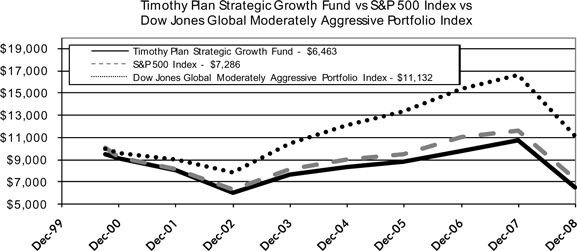
The chart shows the value of a hypothetical initial investment of $10,000 in the Fund A shares, and the S&P 500 Index on October 5, 2000 and held through December 31, 2008. The S&P 500 Index is a widely recognized, unmanaged index of common stock prices. The Dow Jones Global Moderately Aggressive Portfolio Index is a widely recognized index that measures global stocks, bonds, and cash which are in turn represented by multiple subindexes. Performance figures include the change in value of the investments in the indexes and the reinvestment of dividends. The index returns do not reflect expenses, which have been deducted from the Fund’s return. The returns shown do not reflect deduction of taxes that a shareholder would pay on fund distributions or the redemption of the fund shares. THE FUND’S RETURN REPRESENTS PAST PERFORMANCE AND IS NOT PREDICTIVE OF FUTURE RESULTS.
Timothy Plan Performance Graphs [7]
RETURNS FOR THE YEAR ENDED
December 31, 2008
TIMOTHY PLAN CONSERVATIVE GROWTH FUND (unaudited)
| | | | | | |
| Fund/Index | | 1 Year Total Return | | 5 Year Average
Annual Return | | Average Annual
Total Return Since Inception |
Timothy Conservative Growth Fund – Class A (With sales charge) | | (32.79)% | | (2.02)% | | (1.39)% (a) |
S&P 500 Index | | (36.99)% | | (2.20)% | | (3.77)% (a) |
Dow Jones Global Moderate Portfolio Index | | (24.75)% | | 2.00% | | 2.71% (a) |
Timothy Conservative Growth Fund – Class B* | | (30.08)% | | (1.64)% | | (1.47)% (b) |
S&P 500 Index | | (36.99)% | | (2.20)% | | (3.49)% (b) |
Dow Jones Global Moderate Portfolio Index | | (24.75)% | | 2.00% | | 2.85% (b) |
Timothy Conservative Growth Fund – Class C* | | (30.16)% | | N/A | | (1.84)% (c) |
S&P 500 Index | | (36.99)% | | N/A | | (2.68)% (c) |
Dow Jones Global Moderate Portfolio Index | | (24.75)% | | N/A | | 1.60% (c) |
(a) For the period October 5, 2000 (commencement of investment in accordance with objective) to December 31, 2008.
(b) For the period October 9, 2000 (commencement of investment in accordance with objective) to December 31, 2008.
(c) For the period February 3, 2004 (commencement of investment in accordance with objective) to December 31, 2008.
* With Maximum Deferred Sales Charge.
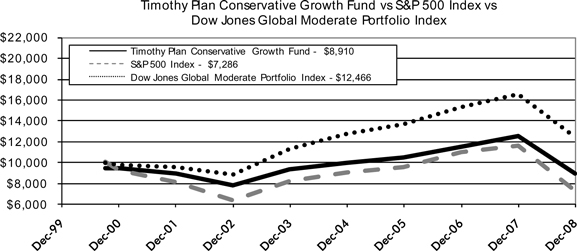
The chart shows the value of a hypothetical initial investment of $10,000 in the Fund A shares, and the S&P 500 Index on October 5, 2000 and held through December 31, 2008. The S&P 500 Index is a widely recognized, unmanaged index of common stock prices. The Dow Jones Global Moderate Portfolio Index is a widely recognized index that measures stocks, bonds, and cash which in turn are represented by multiple subindexes. Performance figures include the change in value of the investments in the indexes and the reinvestment of dividends. The index returns do not reflect expenses, which have been deducted from the Fund’s return. The returns shown do not reflect deduction of taxes that a shareholder would pay on fund distributions or the redemption of the fund shares. THE FUND’S RETURN REPRESENTS PAST PERFORMANCE AND IS NOT PREDICTIVE OF FUTURE RESULTS.
Timothy Plan Performance Graphs [8]
RETURNS FOR THE YEAR ENDED
December 31, 2008
TIMOTHY PLAN HIGH YIELD BOND FUND (unaudited)
| | | | | | |
| Fund/Index | | 1 Year Total Return | | 5 Year Average
Annual Return | | Total Return Since Inception |
Timothy High Yield Bond Fund – Class A (With sales charge) | | (32.72)% | | N/A | | (21.81)% (a) |
Barclays Capital U.S. Corporate High-Yield Bond Index | | (22.22)% | | N/A | | (14.54)% (a) |
Timothy High Yield Bond Fund – Class C* | | (30.87)% | | N/A | | (20.15)% (b) |
Barclays Capital U.S. Corporate High-Yield Bond Index | | (22.22)% | | N/A | | (14.54)% (b) |
(a) For the period May 7, 2007 (commencement of investment in accordance with objective) to December 31, 2008.
(b) For the period May 7, 2007 (commencement of investment in accordance with objective) to December 31, 2008.
* With Maximum Deferred Sales Charge.
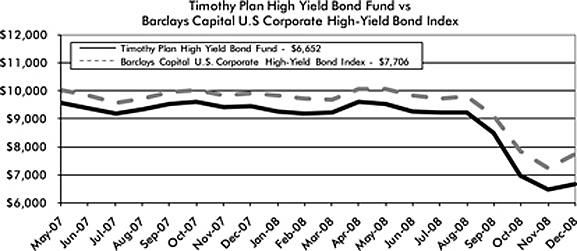
The chart shows the value of a hypothetical initial investment of $10,000 in the Fund A shares, and the Barclays Capital U.S. Corporate High-Yield Bond Index on May 7, 2007 and held through December 31, 2008. The Barclays Capital U.S. Corporate High-Yield Bond Index is a widely recognized, unmanaged index of non-investment grade, fixed rate, taxable corporate bonds. The index return does not reflect expenses, which have been deducted from the Fund’s return. The returns shown do not reflect deduction of taxes that a shareholder would pay on fund distributions or the redemption of the fund shares. THE FUND’S RETURN REPRESENTS PAST PERFORMANCE AND IS NOT PREDICTIVE OF FUTURE RESULTS.
Timothy Plan Performance Graphs [9]
RETURNS FOR THE YEAR ENDED
December 31, 2008
TIMOTHY PLAN INTERNATIONAL FUND (unaudited)
| | | | | | |
| Fund/Index | | 1 Year Total Return | | 5 Year Average
Annual Return | | Total Return Since Inception |
Timothy International Fund – Class A (With sales charge) | | (48.39)% | | N/A | | (28.62)% (a) |
MSCI EAFE Index | | (43.07)% | | N/A | | (27.63)% (a) |
Timothy International Fund – Class C* | | (46.33)% | | N/A | | (26.76)% (b) |
MSCI EAFE Index | | (43.07)% | | N/A | | (27.63)% (b) |
(a) For the period May 3, 2007 (commencement of investment in accordance with objective) to December 31, 2008.
(b) For the period May 3, 2007 (commencement of investment in accordance with objective) to December 31, 2008.
* With Maximum Deferred Sales Charge.
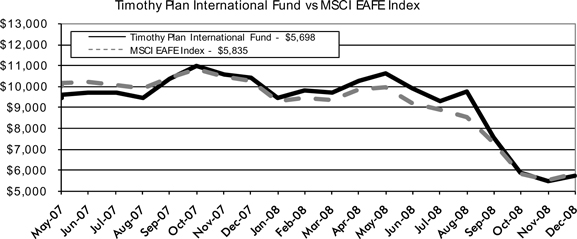
The chart shows the value of a hypothetical initial investment of $10,000 in the Fund A shares, and the MSCI EAFE Index on May 3, 2007 and held through December 31, 2008. The MSCI EAFE Index is a widely recognized unmanaged index of equity prices and is representative of equity market performance of developed countries, excluding the U.S. and Canada. Performance figures include the change in value of the stocks in the index and the reinvestment of dividends. The index return does not reflect expenses, which have been deducted from the Fund’s return. The returns shown do not reflect deduction of taxes that a shareholder would pay on fund distributions or the redemption of the fund shares. THE FUND’S RETURN REPRESENTS PAST PERFORMANCE AND IS NOT PREDICTIVE OF FUTURE RESULTS.
Timothy Plan Performance Graphs [10]
OFFICERS AND TRUSTEES OF THE TRUST
As of December 31, 2008 (Unaudited)
TIMOTHY PLAN FAMILY OF FUNDS
| | | | | | |
| Name, Age and Address | | Position(s) Held With Trust | | Term of Office and Length of Time Served | | Number of Portfolios in Fund Complex Overseen by Trustee |
Arthur D. Ally* 1055 Maitland Center Commons Maitland, FL Born: 1942 | | Chairman and President | | Indefinite; Trustee and President since 1994 | | 12 |
| | | | Other Directorships |
| | Principal Occupation During Past 5 Years | | Held by Trustee |
| | President and controlling shareholder of Covenant Funds, Inc. (“CFI”), a holding company. President and general partner of Timothy Partners, Ltd. (“TPL”), the investment adviser and principal underwriter to each Fund. CFI is also the managing general partner of TPL. | | None |
|
|
| Name, Age and Address | | Position(s) Held With Trust | | Term of Office and Length of Time Served | | Number of Portfolios
in Fund Complex
Overseen by Trustee |
Joseph E. Boatwright** 1410 Hyde Park Drive Winter Park, FL Born: 1930 | | Trustee, Secretary | | Indefinite; Trustee and Secretary since 1995 | | 12 |
| | | | Other Directorships |
| | Principal Occupation During Past 5 Years | | Held by Trustee |
| | Retired Minister. Currently serves as a consultant to the Greater Orlando Baptist Association. Served as Senior Pastor to Aloma Baptist Church from 1970-1996. | | None |
| | | | | | |
| Name, Age and Address | | Position(s) Held With Trust | | Term of Office and Length of Time Served | | Number of Portfolios
in Fund Complex
Overseen by Trustee |
Mathew D. Staver** 1055 Maitland Center Commons Maitland, FL Born: 1956 | | Trustee | | Indefinite; Trustee since 2000 | | 12 |
| | | | Other Directorships |
| | Principal Occupation During Past 5 Years | | Held by Trustee |
| | Attorney specializing in free speech, appellate practice and religious liberty constitutional law. Founder of Liberty Counsel, a religious civil liberties education and legal defense organization. Host of two radio programs devoted to religious freedom issues. Editor of a monthly newsletter devoted to religious liberty topics. Mr. Staver has argued before the United States Supreme Court and has published numerous legal articles. | | None |
* Mr. Ally is an “interested” Trustee, as that term is defined in the 1940 Act, because of his positions with and financial interests in CFI and TPL.
** Messrs. Boatwright and Staver are “interested” Trustees, as that term is defined in the 1940 Act, because each has a limited partnership intereset in TPL.
Timothy Plan Officers and Trustees [11]
OFFICERS AND TRUSTEES OF THE TRUST
As of December 31, 2008 (Unaudited)
TIMOTHY PLAN FAMILY OF FUNDS
| | | | | | |
| Name, Age and Address | | Position(s) Held With Trust | | Term of Office and Length of Time Served | | Number of Portfolios in Fund Complex Overseen by Trustee |
Richard W. Copeland 631 Palm Springs Drive Altamonte Springs, FL Born: 1947 | | Trustee | | Indefinite; Trustee since 2005 | | 12 |
| | | | Other Directorships |
| | Principal Occupation During Past 5 Years | | Held by Trustee |
| | Principal of Richard W. Copeland, Attorney at Law for 33 years specializing in tax and estate planning. B.A. from Mississippi College, JD and LLM Taxation from University of Miami. Associate Professor Stetson University for past 31 years. | | None |
| | | | | | |
| Name, Age and Address | | Position(s) Held With Trust | | Term of Office and Length of Time Served | | Number of Portfolios in Fund Complex Overseen by Trustee |
Bill Johnson 203 E. Main Street Fremont, MI Born: 1946 | | Trustee | | Indefinite; Trustee since 2005 | | 12 |
| | | | Other Directorships |
| | Principal Occupation During Past 5 Years | | Held by Trustee |
| | President (and Founder) of American Decency Association, Freemont, MI since 1999. Previously served as Michigan State Director for American Family Association (1987-1999). Previously a public school teacher for 18 years. B.S. from Michigan State University and a Masters of Religious Education from Grand Rapids Baptist Seminary. | | None |
| | | | | | |
| Name, Age and Address | | Position(s) Held With Trust | | Term of Office and Length of Time Served | | Number of Portfolios in Fund Complex Overseen by Trustee |
Kathryn Tindal Martinez 4398 New Broad Street Orlando, FL Born: 1949 | | Trustee | | Indefinite; Trustee since 2005 | | 12 |
| | | | Other Directorships |
| | Principal Occupation During Past 5 Years | | Held by Trustee |
| | Served on board of directors from 1991 to present, including House of Hope, B.E.T.A., Childrens’ Home Society, and Susan B. Anthony List. Previously a private school teacher and insurance adjuster. B.A. received from Florida State University State University and MAT from Rollins College, FL. | | None |
Timothy Plan Officers and Trustees [12]
OFFICERS AND TRUSTEES OF THE TRUST
As of December 31, 2008 (Unaudited)
TIMOTHY PLAN FAMILY OF FUNDS
| | | | | | |
| Name, Age and Address | | Position(s) Held With Trust | | Term of Office and Length of Time Served | | Number of Portfolios in Fund Complex Overseen by Trustee |
John C. Mulder 2925 Professional Place Colorado Springs, CO Born: 1950 | | Trustee | | Indefinite; Trustee since 2005 | | 12 |
| | | | Other Directorships |
| | Principal Occupation During Past 5 Years | | Held by Trustee |
| | President Christian Community Foundation and National Foundation since 2001. Prior: 22 years of executive experience for a group of banks and a trust company. B.A. in Economics from Wheaton College and MBA from University of Chicago. | | None |
| | | | | | |
| Name, Age and Address | | Position(s) Held With Trust | | Term of Office and Length of Time Served | | Number of Portfolios in Fund Complex Overseen by Trustee |
Charles E. Nelson 1145 Cross Creek Circle Altamonte Springs, FL Born: 1934 | | Trustee | | Indefinite; Trustee since 2005 | | 12 |
| | | | Other Directorships |
| | Principal Occupation During Past 5 Years | | Held by Trustee |
| | Certified Public Accountant. Director of Operations, National Multiple Sclerosis Society Mid Florida Chapter. Formerly Director of Finance, Hospice of the Comforter, Inc. Formerly Comptroller, Florida United Methodist Children’s Home, Inc. Formerly Credit Specialist with the Resolution Trust Corporation and Senior Executive Vice President, Barnett Bank of Central Florida, N.A. Formerly managing partner, Arthur Andersen, CPA firm, Orlando, Florida branch. | | None |
| | | | | | |
| Name, Age and Address | | Position(s) Held With Trust | | Term of Office and Length of Time Served | | Number of Portfolios in Fund Complex Overseen by Trustee |
Wesley W. Pennington 442 Raymond Avenue Longwood, FL Born: 1930 | | Trustee | | Indefinite; Trustee since 2005 | | 12 |
| | | | Other Directorships |
| | Principal Occupation During Past 5 Years | | Held by Trustee |
| | Retired Air Force Officer. Past President, Westwind Holdings, Inc., a development company, since 1997. Past President and controlling shareholder, Weston, Inc., a fabric treatment company, from 1979-1997. President, Designer Services Group 1980-1988. | | None |
Timothy Plan Officers and Trustees [13]
OFFICERS AND TRUSTEES OF THE TRUST
As of December 31, 2008 (Unaudited)
TIMOTHY PLAN FAMILY OF FUNDS
| | | | | | |
| Name, Age and Address | | Position(s) Held With Trust | | Term of Office and Length of Time Served | | Number of Portfolios in Fund Complex Overseen by Trustee |
Scott Preissler, Ph.D. 608 Pintail Place Flower Mound, TX Born: 1960 | | Trustee | | Indefinite; Trustee since 2005 | | 12 |
| | | | Other Directorships |
| | Principal Occupation During Past 5 Years | | Held by Trustee |
| | Chairman of Stewardship Studies at Southwestern Baptist Theological Seminary, Ft. Worth, TX. Also serves as Founder and Chairman of the International Center for Biblical Stewardship. Previously, President and CEO of Christian Stewardship Association where he was affiliated for 14 years. | | None |
| | | | | | |
| Name, Age and Address | | Position(s) Held With Trust | | Term of Office and Length of Time Served | | Number of Portfolios in Fund Complex Overseen by Trustee |
Alan M. Ross 11210 West Road Roswell, GA Born: 1951 | | Trustee | | Indefinite; Trustee since 2005 | | 12 |
| | | | Other Directorships |
| | Principal Occupation During Past 5 Years | | Held by Trustee |
| | Founder and CEO of Corporate Development Institute which he founded in 2000. Previously he served as President and CEO of Fellowship of Companies for Christ and has authored three books: Beyond World Class, Unconditional Excellence, Breaking Through to Prosperity. | | None |
| | | | | | |
| Name, Age and Address | | Position(s) Held With Trust | | Term of Office and Length of Time Served | | Number of Portfolios in Fund Complex Overseen by Trustee |
Dr. David J. Tolliver 4000 E. Maplewood Drive Excelsior Springs, MO Born: 1951 | | Trustee | | Indefinite; Trustee since 2005 | | 12 |
| | | | Other Directorships |
| | Principal Occupation During Past 5 Years | | Held by Trustee |
| | Executive Director of Southern Baptist Convention of Missouri since 2007. Previously pastored three churches in St. Louis, MO area (1986-2007). Currently serves on Board of Trustees of Midwestern Baptist Theological Seminary. Past President, Missouri Baptist Convention (2003-2004). | | None |
Timothy Plan Officers and Trustees [14]
LETTER FROM THE MANAGER
December 31, 2008
SMALL CAP VALUE FUND
We are pleased to provide you with our report for the Timothy Plan Small Cap Value Fund for the year ending December 31, 2008.
2008 will long be remembered as one of the most difficult and volatile periods in the history of the U.S. stock market. What began in the summer of 2007 as a credit contraction, resulting from a glut of leverage, eventually morphed into a severe global recession, creating a tremendous amount of fear and uncertainty among investors and a complete aversion to risk. This fear resulted in a volatile decline in virtually all publicly traded asset classes and led to the worst calendar year performance for U.S. stocks since 1931. The environment of the last several years, where risk premiums and volatility had fallen to historically low levels aided by a glut of excess liquidity, has drastically changed. The new “normal” environment will be characterized by higher risk premiums with increased volatility, lower levels of available credit and deleveraging. The economy is experiencing a dramatic shift into recession and we are witnessing one of the most challenging periods in generations as most investments have struggled and values have fallen sharply. Within this environment, a successful investment is viewed in relative terms. However, at some point, the deleveraging process will be complete and there will be a return to a more normal market environment.
Our management style and philosophy are deeply rooted in our decades old investment philosophy that seeks to deliver a superior rate of return while controlling risk. It remains our firm belief that the discipline of quantifying and managing downside risk is paramount and it shall remain a hallmark of the Westwood investment process. Looking for high-quality companies that are typically characterized by strong free cash flow generation, declining debt levels, and rising return on equity will continue to define the core of our process.
For the year ending December 31, 2008, the Timothy Plan Small Cap Value Fund produced a return of -32.5%, which was a bit better than the -33.79% produced by the Russell 2000 Index.
Strong performance in the Technology, Health Care and Financial Services sectors was the primary driver of relative performance. The best performing securities included ManTech International in Technology, which posted stronger than expected earnings throughout the year, Gentiva Health Services in Health Care and asset manager Stifel Financial and regional bank United Bankshares in Financial Services. Additionally, investors continued to favor defensive stocks such as those in the Utility sector, and positions in Central Vermont Public Service, Avista Corp. and Westar Energy benefitted from this preference.
Relative performance was hindered by our exposure to the Materials & Processing, Energy and Autos & Transportation sectors. Laggards for the period were RTI International, GrafTech International and Layne Christensen in the Materials & Processing sector, which sold off in concert with falling metals and commodity prices as well as fears of a global recession. Other detractors for the period included Energy companies Atlas America, NATCO Group and Targa Resources which fell in sympathy with falling crude and natural gas prices. Additionally, shipping companies Arlington Tankers and Ocean Freight sold off as falling crude oil demand negatively impacted shipping rates.
Through all the volatility, we believe the markets are now less risky and long-term investors can recover and eventually benefit from recent events. Historically, the markets have consistently rewarded investors over the long-term and significant rallies often happen when they are least expected. Therefore, we encourage you, through all of the noise, to remain focused on your long-term priorities. Acting on your behalf, we will honor the trust you have placed in us and will continue to rely upon our disciplined investment process to manage the Fund in a disciplined and prudent fashion.
WESTWOOD MANAGEMENT CORPORATION
Letter From The Manager [15]
FUND PROFILE
December 31, 2008
TIMOTHY PLAN SMALL CAP VALUE FUND
FUND PROFILE (unaudited):
| | |
| Top Ten Holdings |
| (% of Net Assets) |
| |
Timothy Money Market Fund | | 4.84% |
J & J Snack Foods Corp. | | 2.94% |
Moog, Inc. - Class A | | 2.77% |
Marcus Corp. | | 2.70% |
Mack-Cali Realty Corp. | | 2.56% |
Tupperware Brands Corp. | | 2.55% |
Teledyne Technologies, Inc. | | 2.50% |
Aptargroup, Inc. | | 2.50% |
Wolverine World Wide, Inc. | | 2.47% |
ManTech International Corp. - Class A | | 2.44% |
| | |
| | 28.27% |
| | |
| | |
| Industries |
| (% of Net Assets) |
| |
Financials | | 26.12% |
Industrials | | 22.97% |
Consumer Discretionary | | 13.04% |
Information Technology | | 11.16% |
Consumer Staples | | 10.38% |
Utilities | | 5.83% |
Short-Term Investments | | 4.84% |
Materials | | 2.50% |
Health Care | | 2.13% |
Energy | | 2.10% |
Liabilities in Excess of Other Assets | | (1.07)% |
| | |
| | 100.00% |
| | |
EXPENSE EXAMPLE (unaudited):
As a shareholder of the Fund, you incur two types of costs: direct costs, such as wire fees and low balance fees; and indirect costs, including management fees, and other Fund operating expenses. This example is intended to help you understand your indirect costs, also referred to as “ongoing costs,” (in dollars) of investing in the Fund, and to compare these costs with the ongoing costs of investing in other mutual funds.
This example is based on an investment of $1,000 invested at the beginning of the period and held for the entire six-month period of July 1, 2008, through December 31, 2008.
Actual Expenses
The first line of the table below provides information about actual account values and actual expenses. You may use the information in this line, together with the amount you invested at the beginning of the period, to estimate the expenses that you paid over the period. Simply divide your account value by $1,000 (for example, an $8,600 account value divided by $1,000 = 8.6), then multiply the result by the number in the first line under the heading “Expenses Paid During Period” to estimate the expenses you paid on your account during this period.
Timothy Plan Top Ten Holdings / Industries [16]
FUND PROFILE
December 31, 2008
TIMOTHY PLAN SMALL CAP VALUE FUND
Hypothetical example for comparison purposes (unaudited)
The second line of the table provides information about hypothetical account values and hypothetical expenses based on the Fund’s actual expense ratio and an assumed rate of return of 5% per year before expenses, which is not the Fund’s actual return. The hypothetical account values and expenses may not be used to estimate the actual ending account balance or expenses you paid for the period. You may use this information to compare ongoing costs of investing in the Fund and other funds. To do so, compare this 5% hypothetical example with the 5% hypothetical examples that appear in the shareholder reports of other funds.
Please note that the expenses shown in the table are meant to highlight your ongoing costs only and do not reflect any direct costs, such as wire fees or low balance fees. Therefore, the second line of the table is useful in comparing ongoing costs only, and will not help you determine the relative total costs of owning different funds. In addition, if these direct costs were included, your costs would be higher.
| | | | | | | | | |
| | | Beginning
Account Value | | Ending Account
Value | | Expenses Paid
During Period* |
| | | 7/1/2008 | | 12/31/2008 | | 7/1/2008 through
12/31/2008 |
| | | |
Actual - Class A | | $ | 1,000.00 | | $ | 710.37 | | $ | 6.86 |
| | | |
Hypothetical - Class A | | $ | 1,000.00 | | $ | 1,017.12 | | $ | 8.09 |
(5% return before expenses) | | | | | | | | | |
| | | |
Actual - Class B | | $ | 1,000.00 | | $ | 708.56 | | $ | 10.07 |
| | | |
Hypothetical - Class B | | $ | 1,000.00 | | $ | 1,013.35 | | $ | 11.86 |
(5% return before expenses) | | | | | | | | | |
| | | |
Actual - Class C | | $ | 1,000.00 | | $ | 707.95 | | $ | 10.07 |
| | | |
Hypothetical - Class C | | $ | 1,000.00 | | $ | 1,013.35 | | $ | 11.87 |
(5% return before expenses) | | | | | | | | | |
| * | Expenses are equal to the Fund’s annualized expense ratio of 1.59% for Class A, 2.34% for Class B, and 2.35% for Class C, which is net of any expenses paid indirectly, multiplied by the average account value over the period, multiplied by 184 days/366 days (to reflect the partial year period.) The Fund’s ending account value on the first line of each share class in the table is based on its actual total return of (28.96)% for Class A, (29.14)% for Class B, and (29.21)% for Class C for the six-month period of July 1, 2008, to December 31, 2008. |
Timothy Plan Top Ten Holdings / Industries [17]
SMALL CAP VALUE FUND
SCHEDULE OF INVESTMENTS
As of December 31, 2008
COMMON STOCKS - 88.98%
| | | | | |
| number of shares | | | | market value |
| | |
| | AEROSPACE/DEFENSE - 5.27% | | | |
| 38,400 | | Moog, Inc. - Class A * | | $ | 1,404,288 |
| 28,500 | | Teledyne Technologies, Inc. * | | | 1,269,675 |
| | | | | |
| | | | | 2,673,963 |
| | | | | |
| | |
| | APPLICATIONS SOFTWARE - 2.18% | | | |
| 57,500 | | Progress Software Corp. * | | | 1,107,450 |
| | | | | |
| | |
| | BUILDING PRODUCTS - AIR & HEATING - 2.43% | | | |
| 38,100 | | Lennox International, Inc. | | | 1,230,249 |
| | | | | |
| | |
| | COMMERCIAL BANKS - CENTRAL U.S. - 3.17% | | | |
| 33,326 | | Texas Capital Bancshares, Inc. * | | | 445,235 |
| 23,700 | | UMB Financial Corp. | | | 1,164,618 |
| | | | | |
| | | | | 1,609,853 |
| | | | | |
| | |
| | COMMERCIAL BANKS - EASTERN U.S. - 2.30% | | | |
| 80,400 | | National Penn Bancshares, Inc. | | | 1,166,604 |
| | | | | |
| | |
| | COMMERCIAL BANKS - SOUTHERN US - 2.21% | | | |
| 33,800 | | United Bankshares, Inc. | | | 1,122,836 |
| | | | | |
| | |
| | COMPUTER SERVICES - 2.25% | | | |
| 83,300 | | Perot Systems Corp. - Class A * | | | 1,138,711 |
| | | | | |
| | |
| | CONSUMER PRODUCTS - MISCELLANEOUS - 2.55% | | | |
| 57,000 | | Tupperware Brands Corp. | | | 1,293,900 |
| | | | | |
| | |
| | COSMETICS & TOILETRIES - 2.24% | | | |
| 15,900 | | Chattem, Inc. * | | | 1,137,327 |
| | | | | |
| | |
| | DIVERSIFIED MANUFACTURING OPERATIONS - 2.32% | | | |
| 39,798 | | A.O. Smith Corp. | | | 1,174,837 |
| | | | | |
| | |
| | ELECTRIC - INTEGRATED - 5.83% | | | |
| 29,300 | | Avista Corp. | | | 567,834 |
| 27,600 | | Central Vermont Public Service Corp. | | | 658,536 |
| 50,100 | | Cleco Corp. | | | 1,143,783 |
| 28,700 | | Westar Energy, Inc. | | | 588,637 |
| | | | | |
| | | | | 2,958,790 |
| | | | | |
| | |
| | ELECTRONIC COMPONENTS - MISCELLANEOUS - 2.27% | | | |
| 90,300 | | Benchmark Electronics, Inc. * | | | 1,153,131 |
| | | | | |
| | |
| | ENTERPRISE SOFTWARE/SERVICES - 2.44% | | | |
| 22,800 | | ManTech International Corp. - Class A * | | | 1,235,532 |
| | | | | |
| | |
| | FINANCE - INVESTMENT BANKER/BROKER - 4.48% | | | |
| 72,700 | | Knight Capital Group, Inc. - Class A * | | | 1,174,105 |
| 23,900 | | Stifel Financial Corp. * | | | 1,095,815 |
| | | | | |
| | | | | 2,269,920 |
| | | | | |
The accompanying notes are an integral part of these financial statements.
The Timothy Small Cap Value Fund [18]
SMALL CAP VALUE FUND
SCHEDULE OF INVESTMENTS
As of December 31, 2008
COMMON STOCKS - - 88.98% (continued)
| | | | | |
| number of shares | | | | market value |
| | |
| | FOOD - MISCELLANEOUS/DIVERSIFIED - 3.95% | | | |
| 25,400 | | Diamond Foods, Inc. | | $ | 511,810 |
| 41,602 | | J & J Snack Foods Corp. | | | 1,492,680 |
| | | | | |
| | | | | 2,004,490 |
| | | | | |
| | |
| | FOOTWEAR & RELATED APPAREL - 2.47% | | | |
| 59,500 | | Wolverine World Wide, Inc. | | | 1,251,880 |
| | | | | |
| | |
| | HOTELS & MOTELS - 2.70% | | | |
| 84,400 | | Marcus Corp. | | | 1,369,812 |
| | | | | |
| | |
| | MACHINERY - CONSTRUCTION/MINING - 1.06% | | | |
| 17,100 | | Astec Industries, Inc. * | | | 535,743 |
| | | | | |
| | |
| | MACHINERY - GENERAL INDUSTRY - 1.85% | | | |
| 34,500 | | The Middleby Corp. * | | | 940,815 |
| | | | | |
| | |
| | MEDICAL - OUTPATIENT/HOME MEDICINE - 2.13% | | | |
| 36,900 | | Gentiva Health Services, Inc. * | | | 1,079,694 |
| | | | | |
| | |
| | METAL PROCESSORS & FABRICATORS - 2.40% | | | |
| 35,500 | | Kaydon Corp. | | | 1,219,425 |
| | | | | |
| | |
| | MISCELLANEOUS MANUFACTURING - 2.50% | | | |
| 36,000 | | Aptargroup, Inc. | | | 1,268,640 |
| | | | | |
| | |
| | OFFICE FURNISHINGS - ORIGINAL - 1.84% | | | |
| 103,600 | | Knoll, Inc. | | | 934,472 |
| | | | | |
| | |
| | OIL COMPANY - EXPLORATION & PRODUCTION - 2.10% | | | |
| 41,000 | | Penn Virginia Corp. | | | 1,065,180 |
| | | | | |
| | |
| | PROPERTY/CASUALTY INSURANCE - 2.21% | | | |
| 95,500 | | SeaBright Insurance Holdings, Inc. * | | | 1,121,170 |
| | | | | |
| | |
| | PUBLISHING - BOOKS - 2.28% | | | |
| 32,500 | | John Wiley & Sons, Inc. - Class A | | | 1,156,350 |
| | | | | |
| | |
| | REINSURANCE - 2.19% | | | |
| 37,100 | | IPC Holdings, Ltd. | | | 1,109,290 |
| | | | | |
| | |
| | RETAIL - APPAREL/SHOES - 3.04% | | | |
| 62,000 | | Aeropostale, Inc. * | | | 998,200 |
| 24,850 | | The Buckle, Inc. | | | 542,227 |
| | | | | |
| | | | | 1,540,427 |
| | | | | |
| | |
| | RETAIL - CONVENIENCE STORE- 2.18% | | | |
| 48,500 | | Casey’s General Stores, Inc. | | | 1,104,345 |
| | | | | |
| | |
| | RETAIL - DISCOUNT- 2.01% | | | |
| 29,800 | | BJ’s Wholesale Club, Inc. * | | | 1,020,948 |
| | | | | |
The accompanying notes are an integral part of these financial statements.
The Timothy Small Cap Value Fund [19]
SMALL CAP VALUE FUND
SCHEDULE OF INVESTMENTS
As of December 31, 2008
COMMON STOCKS - - 88.98% (continued)
| | | | | |
| number of shares | | | | market value |
| | |
| | SAVINGS & LOANS/THRIFTS - EASTERN U.S. - 2.31% | | | |
| 72,600 | | First Niagara Financial Group, Inc. | | $ | 1,173,942 |
| | | | | |
| | |
| | SEMICONDUCTOR EQUIPMENT - 2.02% | | | |
| 69,300 | | MKS Instruments, Inc. * | | | 1,024,947 |
| | | | | |
| | |
| | STEEL PIPE & TUBE - 2.42% | | | |
| 28,800 | | Northwest Pipe Co. * | | | 1,227,168 |
| | | | | |
| | |
| | TRANSPORTATION - RAIL - 1.14% | | | |
| 18,900 | | Genesee & Wyoming, Inc. * | | | 576,450 |
| | | | | |
| | |
| | TRANSPORTATION - TRUCK - 2.24% | | | |
| 29,600 | | Landstar System, Inc. | | | 1,137,528 |
| | | | | |
| | |
| | Total Common Stocks (cost $48,155,005) | | | 45,135,819 |
| | | | | |
| |
| REITs - 7.25% | | | |
| number of shares | | | | market value |
| | |
| | OFFICE PROPERTY - 2.56% | | | |
| 53,000 | | Mack-Cali Realty Corp. | | | 1,298,500 |
| | | | | |
| | |
| | MANUFACTURED HOMES- 2.39% | | | |
| 31,600 | | Equity Lifestyle Properties, Inc. | | | 1,212,176 |
| | | | | |
| | |
| | PAPER & RELATED PRODUCTS - 2.30% | | | |
| 44,800 | | Potlatch Corp. | | | 1,165,248 |
| | | | | |
| | |
| | Total REITs (cost $4,358,778) | | | 3,675,924 |
| | | | | |
| |
| SHORT TERM INVESTMENTS - 4.84% | | | |
| number of shares | | | | market value |
| | |
| 2,455,408 | | Timothy Plan Money Market Fund, 0.38% (A) (B) | | | 2,455,408 |
| | | | | |
| | |
| | Total Short Term Investments (cost $2,455,408) | | | 2,455,408 |
| | | | | |
| | |
| | TOTAL INVESTMENTS (cost $54,969,191) - 101.07% | | $ | 51,267,151 |
| | | | | |
| | |
| | LIABILITIES IN EXCESS OF OTHER ASSETS - (1.07)% | | | (542,297) |
| | | | | |
| | |
| | NET ASSETS - 100.00% | | $ | 50,724,854 |
| | | | | |
* Non-income producing securities.
(A) Variable rate security; the rate shown represents the yield at December 31, 2008.
(B) Affiliated fund.
The accompanying notes are an integral part of these financial statements.
The Timothy Small Cap Value Fund [20]
SMALL CAP VALUE FUND
STATEMENT OF ASSETS AND LIABILITIES
As of December 31, 2008
| | | |
ASSETS | | | |
| | | amount |
Investments in Unaffiliated Securities at Value (cost $52,513,783) [NOTE 1] | | $ | 48,811,743 |
Investments in Affiliated Securities at Value (cost $2,455,408) [NOTE 1] | | | 2,455,408 |
Receivables for: | | | |
Investments Sold | | | 279,566 |
Fund Shares Sold | | | 69,740 |
Interest | | | 1,672 |
Dividends | | | 54,325 |
Prepaid Expenses | | | 14,634 |
| | | |
| |
Total Assets | | $ | 51,687,088 |
| | | |
| |
| | | |
| | | amount |
| |
Payable for Investments Purchased | | $ | 408,026 |
Payable for Fund Shares Redeemed | | | 448,044 |
Payable for Capital Gain Distributions | | | 27 |
Accrued Advisory Fees | | | 34,523 |
Accrued 12b-1 Fees Class A | | | 8,540 |
Accrued 12b-1 Fees Class B | | | 3,368 |
Accrued 12b-1 Fees Class C | | | 3,089 |
Accrued Expenses | | | 56,617 |
| | | |
| |
Total Liabilities | | $ | 962,234 |
| | | |
| |
| | | |
| | | amount |
| |
Class A Shares: | | | |
Net Assets (unlimited shares of $0.001 par beneficial interest authorized; 4,800,651 shares outstanding) | | $ | 42,650,849 |
Net Asset Value and Redemption Price Per Class A Share ($42,650,849 / 4,800,651 shares) | | $ | 8.88 |
Offering Price Per Share ($8.88 / 0.945) | | $ | 9.40 |
Class B Shares: | | | |
Net Assets (unlimited shares of $0.001 par beneficial interest authorized; 536,577 shares outstanding) | | $ | 4,172,819 |
Net Asset Value and Offering Price Per Class B Share ($4,172,819 / 536,577 shares) | | $ | 7.78 |
Minimum Redemption Price Per Class B Share ($7.78 * 0.99) | | $ | 7.70 |
Class C Shares: | | | |
Net Assets (unlimited shares of $0.001 par beneficial interest authorized; 497,975 shares outstanding) | | $ | 3,901,186 |
Net Asset Value and Offering Price Per Class C Share ($3,901,186 / 497,975 shares) | | $ | 7.83 |
Minimum Redemption Price Per Share ($7.83 * 0.99) | | $ | 7.75 |
| |
Net Assets | | $ | 50,724,854 |
| | | |
| |
| | | |
| | | amount |
| |
At December 31, 2008, Net Assets Consisted of: | | | |
Paid-in Capital | | $ | 73,346,155 |
Accumulated Undistributed Net Realized Gain (Loss) on Investments | | | (18,919,261) |
Net Unrealized Appreciation (Depreciation) in Value of Investments | | | (3,702,040) |
| | | |
| |
Net Assets | | $ | 50,724,854 |
| | | |
The accompanying notes are an integral part of these financial statements.
The Timothy Small Cap Value Fund [21]
SMALL CAP VALUE FUND
STATEMENT OF OPERATIONS
For the Year Ended December 31, 2008
| | | |
INVESTMENT INCOME | | | |
| | | amount |
| |
Interest on Affiliated Investments | | $ | 84,371 |
Dividends | | | 959,366 |
| | | |
| |
Total Investment Income | | | 1,043,737 |
| | | |
| |
| | | |
| | | amount |
| |
Investment Advisory Fees [NOTE 3] | | | 572,983 |
12b-1 Fees (Class A = $140,048, Class B = $60,750, Class C = $53,156) [NOTE 3] | | | 253,954 |
Fund Accounting, Transfer Agency, & Administration Fees | | | 118,881 |
Registration Fees | | | 27,409 |
Custodian Fees | | | 17,798 |
Audit Fees | | | 14,659 |
Out-of-Pocket Expense | | | 65,327 |
Printing Expense | | | 8,025 |
CCO Fees | | | 6,065 |
Trustee Fees | | | 7,229 |
Insurance Expense | | | 2,891 |
| | | |
| |
Total Net Expenses | | | 1,095,221 |
| | | |
| |
Net Investment Income (Loss) | | | (51,484) |
| | | |
| |
REALIZED AND UNREALIZED GAIN (LOSS) ON INVESTMENTS | | | |
| | | amount |
| |
Capital Gain Dividends from REIT’s | | | 97,582 |
Net Realized Gain (Loss) on Unaffiliated Investments | | | (18,562,090) |
Change in Unrealized Appreciation/Depreciation of Investments | | | (6,072,615) |
| | | |
Net Realized and Unrealized Gain (Loss) on Investments | | | (24,537,123) |
| | | |
| |
Net Increase (Decrease) in Net Assets Resulting from Operations | | $ | (24,588,607) |
| | | |
The accompanying notes are an integral part of these financial statements.
The Timothy Small Cap Value Fund [22]
SMALL CAP VALUE FUND
STATEMENTS OF CHANGES IN NET ASSETS
INCREASE (DECREASE) IN NET ASSETS
| | | | | | | | |
| | | year ended
12/31/08 | | | year ended
12/31/07 | |
| | |
Operations: | | | | | | | | |
Net Investment Income (Loss) | | $ | (51,484) | | | $ | 78,768 | |
Capital Gain Dividends from REIT’s | | | 97,582 | | | | 168,117 | |
Net Realized Gain (Loss) on Investments | | | (18,562,090) | | | | 10,221,870 | |
Net Change in Unrealized Appreciation/Depreciation of Investments | | | (6,072,615) | | | | (7,505,450) | |
| | | | | | | | |
Net Increase (Decrease) in Net Assets (resulting from operations) | | | (24,588,607) | | | | 2,963,305 | |
| | | | | | | | |
| | |
Distributions to Shareholders From: | | | | | | | | |
Net Investment Income: | | | | | | | | |
Class A | | | - | | | | (121,858) | |
Class B | | | - | | | | - | |
Class C | | | - | | | | - | |
Net Capital Gains: | | | | | | | | |
Class A | | | (349,483) | | | | (8,305,482) | |
Class B | | | (38,730) | | | | (1,106,005) | |
Class C | | | (35,945) | | | | (932,321) | |
| | | | | | | | |
Total Distributions | | | (424,158) | | | | (10,465,666) | |
| | | | | | | | |
| | |
Capital Share Transactions: | | | | | | | | |
Proceeds from Shares Sold: | | | | | | | | |
Class A | | | 13,566,159 | * | | | 18,486,727 | ** |
Class B | | | 11,760 | | | | 62,488 | |
Class C | | | 1,147,220 | | | | 3,383,795 | |
Dividends Reinvested: | | | | | | | | |
Class A | | | 334,156 | | | | 8,131,543 | |
Class B | | | 36,572 | | | | 1,032,903 | |
Class C | | | 35,715 | | | | 868,022 | |
Cost of Shares Redeemed: | | | | | | | | |
Class A | | | (13,027,054) | | | | (24,191,844) | |
Class B | | | (994,846) | * | | | (4,906,273) | ** |
Class C | | | (1,608,258) | | | | (1,029,804) | |
| | | | | | | | |
Net Increase (Decrease) in Net Assets (resulting from capital share transactions) | | | (498,576) | | | | 1,837,557 | |
| | | | | | | | |
| | |
Total Increase (Decrease) in Net Assets | | | (25,511,341) | | | | (5,664,804) | |
| | | | | | | | |
| | |
Net Assets: | | | | | | | | |
Beginning of year | | | 76,236,195 | | | | 81,900,999 | |
| | | | | | | | |
| | |
End of year | | $ | 50,724,854 | | | $ | 76,236,195 | |
| | | | | | | | |
Accumulated Undistributed Net Investment Income | | $ | - | | | $ | - | |
| | | | | | | | |
| | |
Shares of Capital Stock of the Fund Sold and Redeemed: | | | | | | | | |
Shares Sold: | | | | | | | | |
Class A | | | 1,181,260 | * | | | 1,172,591 | ** |
Class B | | | 1,107 | | | | 4,292 | |
Class C | | | 112,080 | | | | 236,102 | |
Shares Reinvested: | | | | | | | | |
Class A | | | 40,211 | | | | 622,152 | |
Class B | | | 5,030 | | | | 89,506 | |
Class C | | | 4,872 | | | | 74,699 | |
Shares Redeemed: | | | | | | | | |
Class A | | | (1,131,872) | | | | (1,508,848) | |
Class B | | | (98,662) | * | | | (335,637) | ** |
Class C | | | (156,226) | | | | (72,154) | |
| | | | | | | | |
Net Increase (Decrease) in Number of Shares Outstanding | | | (42,200) | | | | 282,703 | |
| | | | | | | | |
| | |
| * | | Includes automatic conversion of Class B shares ($54,856 representing 4,594 shares) to Class A shares ($54,856 representing 4,042 shares). |
| ** | | Includes automatic conversion of Class B shares ($3,722,878 representing 252,808 shares) to Class A shares ($3,722,878 representing 227,751 shares). |
The accompanying notes are an integral part of these financial statements.
The Timothy Small Cap Value Fund [23]
SMALL CAP VALUE FUND
FINANCIAL HIGHLIGHTS
The table below sets forth financial data for one share of capital stock outstanding throughout each period presented.
SMALL CAP VALUE FUND - CLASS A SHARES
| | | | | | | | | | | | | | | | | |
| | | year ended
12/31/08 | | year ended
12/31/07 | | year ended
12/31/06 | | year ended
12/31/05 | | | year ended
12/31/04 | |
| | | | | |
Per Share Operating Performance: | | | | | | | | | | | | | | | | | |
Net Asset Value at Beginning of Year | | $ | 13.27 | | $ | 14.94 | | $ | 15.27 | | $ | 15.59 | | | $ | 15.45 | |
| | | | | | | | | | | | | | | | | |
| | | | | |
Income from Investment Operations: | | | | | | | | | | | | | | | | | |
Net Investment Income (Loss) | | | 0.01 | | | 0.04 | | | 0.22 | | | 0.01 | (A) | | | (0.04) | (A) |
Net Realized and Unrealized Gain (Loss) on Investments | | | (4.33) | | | 0.36 | | | 2.77 | | | (0.17) | | | | 1.83 | |
| | | | | | | | | | | | | | | | | |
Total from Investment Operations | | | (4.32) | | | 0.40 | | | 2.99 | | | (0.16) | | | | 1.79 | |
| | | | | | | | | | | | | | | | | |
| | | | | |
Less Distributions: | | | | | | | | | | | | | | | | | |
Dividends from Realized Gains | | | (0.07) | | | (2.04) | | | (3.10) | | | (0.16) | | | | (1.65) | |
Dividends from Net Investment Income | | | - | | | (0.03) | | | (0.22) | | | - | | | | - | |
| | | | | | | | | | | | | | | | | |
Total Distributions | | | (0.07) | | | (2.07) | | | (3.32) | | | (0.16) | | | | (1.65) | |
| | | | | | | | | | | | | | | | | |
| | | | | |
Net Asset Value at End of Year | | $ | 8.88 | | $ | 13.27 | | $ | 14.94 | | $ | 15.27 | | | $ | 15.59 | |
| | | | | | | | | | | | | | | | | |
| | | | | |
Total Return (B)(C) | | | (32.50)% | | | 2.87% | | | 19.69% | | | (1.01)% | | | | 11.60% | |
| | | | | |
Ratios/Supplemental Data: | | | | | | | | | | | | | | | | | |
Net Assets, End of Year (in 000s) | | $ | 42,651 | | $ | 62,525 | | $ | 66,097 | | $ | 49,008 | | | $ | 42,542 | |
| | | | | |
Ratio of Expenses to Average Net Assets: | | | | | | | | | | | | | | | | | |
| | | | | |
Before Reimbursement and Waiver/Recoupment
of Expenses by Adviser | | | 1.50% | | | 1.44% | | | 1.52% | | | 1.56% | | | | 1.48% | |
After Reimbursement and Waiver/Recoupment
of Expenses by Adviser | | | 1.50% | | | 1.44% | | | 1.52% | | | 1.56% | | | | 1.48% | |
| | | | | |
Ratio of Net Investment Income (Loss) to Average Net Assets: | | | | | | | | | | | | | | | | | |
Before Reimbursement and Waiver/Recoupment of Expenses by Adviser | | | 0.05% | | | 0.24% | | | 1.39% | | | 0.05% | | | | (0.30)% | |
After Reimbursement and Waiver/Recoupment of Expenses by Adviser | | | 0.05% | | | 0.24% | | | 1.39% | | | 0.05% | | | | (0.30)% | |
| | | | | |
Portfolio Turnover | | | 110.16% | | | 59.84% | | | 148.02% | | | 44.24% | | | | 57.59% | |
| | |
| (A) | | Per share amounts calculated using average shares method. |
| (B) | | Total return calculation does not reflect sales load. |
| (C) | | Total return in the above table represents the rate that the investor would have earned or lost on an investment in the Fund assuming reinvestment of dividends. |
The accompanying notes are an integral part of these financial statements.
The Timothy Small Cap Value Fund [24]
SMALL CAP VALUE FUND
FINANCIAL HIGHLIGHTS
The table below sets forth financial data for one share of capital stock outstanding throughout each period presented.
SMALL CAP VALUE FUND - CLASS B SHARES
| | | | | | | | | | | | | | | | | |
| | | year
ended
12/31/08 | | year
ended
12/31/07 | | year
ended
12/31/06 | | year
ended
12/31/05 | | | year
ended
12/31/04 | |
| | | | | |
Per Share Operating Performance: | | | | | | | | | | | | | | | | | |
Net Asset Value at Beginning of Year | | $ | 11.72 | | $ | 13.49 | | $ | 14.09 | | $ | 14.51 | | | $ | 14.59 | |
| | | | | | | | | | | | | | | | | |
| | | | | |
Income from Investment Operations: | | | | | | | | | | | | | | | | | |
Net Investment Income (Loss) | | | (0.08) | | | (0.08) | | | 0.14 | | | (0.10) | (A) | | | (0.15) | (A) |
Net Realized and Unrealized Gain (Loss) on Investments | | | (3.79) | | | 0.35 | | | 2.50 | | | (0.16) | | | | 1.72 | |
| | | | | | | | | | | | | | | | | |
Total from Investment Operations | | | (3.87) | | | 0.27 | | | 2.64 | | | (0.26) | | | | 1.57 | |
| | | | | | | | | | | | | | | | | |
| | | | | |
Less Distributions: | | | | | | | | | | | | | | | | | |
Dividends from Realized Gains | | | (0.07) | | | (2.04) | | | (3.10) | | | (0.16) | | | | (1.65) | |
Dividends from Net Investment Income | | | - | | | - | | | (0.14) | | | - | | | | - | |
| | | | | | | | | | | | | | | | | |
Total Distributions | | | (0.07) | | | (2.04) | | | (3.24) | | | (0.16) | | | | (1.65) | |
| | | | | | | | | | | | | | | | | |
| | | | | |
Net Asset Value at End of Year | | $ | 7.78 | | $ | 11.72 | | $ | 13.49 | | $ | 14.09 | | | $ | 14.51 | |
| | | | | | | | | | | | | | | | | |
| | | | | |
Total Return (B)(C) | | | (32.95)% | | | 2.22% | | | 18.82% | | | (1.77)% | | | | 10.78% | |
| | | | | |
Ratios/Supplemental Data: | | | | | | | | | | | | | | | | | |
Net Assets, End of Year (in 000s) | | $ | 4,173 | | $ | 7,370 | | $ | 11,750 | | $ | 16,072 | | | $ | 19,306 | |
| | | | | |
Ratio of Expenses to Average Net Assets: | | | | | | | | | | | | | | | | | |
Before Reimbursement and Waiver/Recoupment of Expenses by Adviser | | | 2.24% | | | 2.19% | | | 2.27% | | | 2.31% | | | | 2.23% | |
After Reimbursement and Waiver/Recoupment of Expenses by Adviser | | | 2.24% | | | 2.19% | | | 2.27% | | | 2.31% | | | | 2.23% | |
| | | | | |
Ratio of Net Investment Income (Loss) to Average Net Assets: | | | | | | | | | | | | | | | | | |
Before Reimbursement and Waiver/Recoupment of Expenses by Adviser | | | (0.69)% | | | (0.57)% | | | 0.69% | | | (0.70)% | | | | (1.05)% | |
After Reimbursement and Waiver/Recoupment of Expenses by Adviser | | | (0.69)% | | | (0.57)% | | | 0.69% | | | (0.70)% | | | | (1.05)% | |
| | | | | |
Portfolio Turnover | | | 110.16% | | | 59.84% | | | 148.02% | | | 44.24% | | | | 57.59% | |
| | |
| (A) | | Per share amounts calculated using average shares method. |
| (B) | | Total return calculation does not reflect redemption fee. |
| (C) | | Total return in the above table represents the rate that the investor would have earned or lost on an investment in the Fund assuming reinvestment of dividends. |
The accompanying notes are an integral part of these financial statements.
The Timothy Small Cap Value Fund [25]
SMALL CAP VALUE FUND
FINANCIAL HIGHLIGHTS
The table below sets forth financial data for one share of capital stock outstanding throughout each period presented.
SMALL CAP VALUE FUND - CLASS C SHARES
| | | | | | | | | | | | | | | | | |
| | | year
ended
12/31/08 | | year
ended
12/31/07 | | year
ended
12/31/06 | | year
ended
12/31/05 | | | period
ended
12/31/04 (A) | |
| | | | | |
Per Share Operating Performance: | | | | | | | | | | | | | | | | | |
Net Asset Value at Beginning of Period | | $ | 11.80 | | $ | 13.58 | | $ | 14.12 | | $ | 14.55 | | | $ | 15.00 | |
| | | | | | | | | | | | | | | | | |
| | | | | |
Income from Investment Operations: | | | | | | | | | | | | | | | | | |
Net Investment Income (Loss) | | | (0.07) | | | (0.05) | | | 0.09 | | | (0.10) | (B) | | | (0.05) | (B) |
Net Realized and Unrealized Gain (Loss) on Investments | | | (3.83) | | | 0.31 | | | 2.56 | | | (0.17) | | | | 1.25 | |
| | | | | | | | | | | | | | | | | |
Total from Investment Operations | | | (3.90) | | | 0.26 | | | 2.65 | | | (0.27) | | | | 1.20 | |
| | | | | | | | | | | | | | | | | |
| | | | | |
Less Distributions: | | | | | | | | | | | | | | | | | |
Dividends from Realized Gains | | | (0.07) | | | (2.04) | | | (3.10) | | | (0.16) | | | | (1.65) | |
Dividends from Net Investment Income | | | - | | | - | | | (0.09) | | | - | | | | - | |
| | | | | | | | | | | | | | | | | |
Total Distributions | | | (0.07) | | | (2.04) | | | (3.19) | | | (0.16) | | | | (1.65) | |
| | | | | | | | | | | | | | | | | |
| | | | | |
Net Asset Value at End of Period | | $ | 7.83 | | $ | 11.80 | | $ | 13.58 | | $ | 14.12 | | | $ | 14.55 | |
| | | | | | | | | | | | | | | | | |
| | | | | |
Total Return (C)(D) | | | (32.99)% | | | 2.13% | | | 18.80% | | | (1.84)% | | | | 8.02% | (E) |
| | | | | |
Ratios/Supplemental Data: | | | | | | | | | | | | | | | | | |
Net Assets, End of Period (in 000s) | | $ | 3,901 | | $ | 6,341 | | $ | 4,054 | | $ | 2,258 | | | $ | 1,442 | |
| | | | | |
Ratio of Expenses to Average Net Assets: | | | | | | | | | | | | | | | | | |
Before Reimbursement and Waiver/Recoupment of Expenses by Adviser | | | 2.25% | | | 2.19% | | | 2.27% | | | 2.31% | | | | 2.23% | (F) |
After Reimbursement and Waiver/Recoupment of Expenses by Adviser | | | 2.25% | | | 2.19% | | | 2.27% | | | 2.31% | | | | 2.23% | (F) |
| | | | | |
Ratio of Net Investment Income (Loss) to Average Net Assets: | | | | | | | | | | | | | | | | | |
Before Reimbursement and Waiver/Recoupment of Expenses by Adviser | | | (0.70)% | | | (0.47)% | | | 0.61% | | | (0.70)% | | | | (1.05)% | (F) |
After Reimbursement and Waiver/Recoupment of Expenses by Adviser | | | (0.70)% | | | (0.47)% | | | 0.61% | | | (0.70)% | | | | (1.05)% | (F) |
| | | | | |
Portfolio Turnover | | | 110.16% | | | 59.84% | | | 148.02% | | | 44.24% | | | | 57.59% | |
| | |
| (A) | | For the period February 3, 2004 (Commencement of Operations) to December 31, 2004. |
| (B) | | Per share amounts calculated using average shares method. |
| (C) | | Total return calculation does not reflect redemption fee. |
| (D) | | Total return in the above table represents the rate that the investor would have earned or lost on an investment in the Fund assuming reinvestment of dividends. |
| (E) | | For periods of less than one full year, total return is not annualized. |
| (F) | | Annualized. |
The accompanying notes are an integral part of these financial statements.
The Timothy Small Cap Value Fund [26]
LETTER FROM THE MANAGER
December 31, 2008
LARGE / MID CAP VALUE FUND
We are pleased to provide you with our report for the Timothy Plan Large/Mid Cap Value Fund for the year ending December 31, 2008.
This year has been filled with upheaval and the U.S. financial system has been changed forever. The environment of the last several years, where risk premiums and volatility had fallen to historically low levels aided by a glut of excess liquidity, has drastically changed. The new “normal” environment will be characterized by higher risk premiums with increased volatility, lower levels of available credit and deleveraging. The economy is experiencing a dramatic shift into recession and we are witnessing one of the most challenging periods in generations as most investments have struggled and values have fallen sharply.
Since the summer of 2007, we have been faced with one crisis after another, which has prompted the Federal Reserve and Treasury Department to ultimately take unprecedented actions in an attempt to stabilize the financial system and stem the pace of a worldwide economic slowdown. Within this environment, a successful investment is viewed in relative terms. However, at some point, the deleveraging process will be complete and there will be a return to a more normal market environment.
Our management style and philosophy are deeply rooted in our decades old investment philosophy that seeks to deliver a superior rate of return while controlling risk. It remains our firm belief that the discipline of quantifying and managing downside risk is paramount and it shall remain a hallmark of the Westwood investment process. We have always focused on companies that maintain a discipline for managing risk. Looking for high-quality companies that are typically characterized by strong free cash flow generation, declining debt levels, and rising return on equity will continue to define the core of our process.
For the year ending December 31, 2008, the Timothy Plan Large/Mid Cap Value Fund produced a return of -40.05%, while the S&P 500 Index produced a return of -36.99%.
An overweight and strong performance in the Real Estate Investment Trust sector as well as strong security selection in the Financial Services sector aided performance. The best performing securities included Equity Residential in REITs, which was sold mid-year and McAfee Inc., which reported strong demand throughout the year. J.M. Smucker Co. was added during the year, as it showed solid defensive characteristics yet was priced at an attractive level with several positive catalysts ahead. Other names that were positive contributors to performance during the quarter were insurance company Arch Capital Group Ltd., Utility companies FPL Group and American Electric Power Co. and software company CA Inc.
Relative performance was hindered by exposure to Materials & Processing, Health Care and Energy. Within Materials & Processing, Freeport-McMoRan Copper & Gold and Allegheny Technologies sold off in concert with falling metals prices and fears of a global recession. Within Health Care, returns were hurt by our exposure to the drug discovery and medical devices areas, with Thermo Fisher Scientific and Zimmer Holdings having large negative impacts to the portfolio as peers reported lower results and valuations contracted. Other detractors included companies within the Energy sector such as Transocean, which fell on concerns of a reduction in capital expenditures by oil exploration firms.
Through all the volatility, we believe the markets are now less risky and long-term investors can recover and eventually benefit from recent events. Historically, the markets have consistently rewarded investors over the long-term and significant rallies often happen when they are least expected. Therefore, we encourage you, through all of the noise, to remain focused on your long-term priorities. Acting on your behalf, we will honor the trust you have placed in us and will continue to rely upon our disciplined investment process to manage the Fund in a disciplined and prudent fashion.
WESTWOOD MANAGEMENT CORPORATION
Letter From The Manager [27]
FUND PROFILE
December 31, 2008
TIMOTHY PLAN LARGE / MID CAP VALUE FUND
FUND PROFILE (unaudited):
| | |
Top Ten Holdings (% of Net Assets) |
| |
Timothy Money Market Fund | | 10.37% |
Exxon Mobil Corp. | | 4.50% |
Laboratory Corp. of America Holdings | | 2.64% |
Public Storage | | 2.61% |
McAfee, Inc. | | 2.54% |
Covidien, Ltd. | | 2.54% |
Advance Auto Parts, Inc. | | 2.52% |
Emerson Electric Co. | | 2.52% |
Harris Corp. | | 2.52% |
Thermo Fisher Scientific, Inc. | | 2.52% |
| | |
| | 35.28% |
| | |
| | |
Industries (% of Net Assets) |
| |
Financials | | 25.99% |
Energy | | 16.43% |
Health Care | | 11.17% |
Utilities | | 10.68% |
Short-Term Investments | | 10.37% |
Information Technology | | 10.00% |
Consumer Staples | | 9.49% |
Industrials | | 6.49% |
Consumer Discretionary | | 5.00% |
Liabilities in Excess of Other Assets | | (5.62)% |
| | |
| | 100.00% |
| | |
EXPENSE EXAMPLE (unaudited)
As a shareholder of the Fund, you incur two types of costs: direct costs, such as wire fees and low balance fees; and indirect costs, including management fees, and other Fund operating expenses. This example is intended to help you understand your indirect costs, also referred to as “ongoing costs,” (in dollars) of investing in the Fund, and to compare these costs with the ongoing costs of investing in other mutual funds.
This example is based on an investment of $1,000 invested at the beginning of the period and held for the entire six-month period of July 1, 2008, through December 31, 2008.
Actual Expenses
The first line of the table below provides information about actual account values and actual expenses. You may use the information in this line, together with the amount you invested at the beginning of the period, to estimate the expenses that you paid over the period. Simply divide your account value by $1,000 (for example, an $8,600 account value divided by $1,000 = 8.6), then multiply the result by the number in the first line under the heading “Expenses Paid During Period” to estimate the expenses you paid on your account during this period.
Timothy Plan Top Ten Holdings / Industries [28]
FUND PROFILE
December 31, 2008
TIMOTHY PLAN LARGE / MID CAP VALUE FUND
Hypothetical example for comparison purposes (unaudited)
The second line of the table provides information about hypothetical account values and hypothetical expenses based on the Fund’s actual expense ratio and an assumed rate of return of 5% per year before expenses, which is not the Fund’s actual return. The hypothetical account values and expenses may not be used to estimate the actual ending account balance or expenses you paid for the period. You may use this information to compare ongoing costs of investing in the Fund and other funds. To do so, compare this 5% hypothetical example with the 5% hypothetical examples that appear in the shareholder reports of other funds.
Please note that the expenses shown in the table are meant to highlight your ongoing costs only and do not reflect any direct costs, such as wire fees or low balance fees. Therefore, the second line of the table is useful in comparing ongoing costs only, and will not help you determine the relative total costs of owning different funds. In addition, if these direct costs were included, your costs would be higher.
| | | | | | | | | |
| | | Beginning
Account Value | | Ending Account
Value | | Expenses Paid
During Period* |
| | | 7/ 1/ 2008 | | 12/ 31/ 2008 | | 7/ 1/ 2008 through
12/ 31/ 2008 |
| | | |
Actual - Class A | | $ | 1,000.00 | | $ | 657.67 | | $ | 6.86 |
| | | |
Hypothetical - Class A | | $ | 1,000.00 | | $ | 1,016.86 | | $ | 8.35 |
(5% return before expenses) | | | | | | | | | |
| | | |
Actual - Class B | | $ | 1,000.00 | | $ | 655.38 | | $ | 5.34 |
| | | |
Hypothetical - Class B | | $ | 1,000.00 | | $ | 1,018.68 | | $ | 6.51 |
(5% return before expenses) | | | | | | | | | |
| | | |
Actual - Class C | | $ | 1,000.00 | | $ | 655.42 | | $ | 9.96 |
| | | |
Hypothetical - Class C | | $ | 1,000.00 | | $ | 1,013.10 | | $ | 12.11 |
(5% return before expenses) | | | | | | | | | |
| * | Expenses are equal to the Fund’s annualized expense ratio of 1.65% for Class A, 2.38% for Class B, and 2.39% for Class C, which is net of any expenses paid indirectly, multiplied by the average account value over the period, multiplied by 184 days/366 days (to reflect the partial year period.) The Fund’s ending account value on the first line of each share class in the table is based on its actual total return of (34.23)% for Class A, (34.46)% for Class B, and (34.46)% for Class C for the six-month period of July 1, 2008, to December 31, 2008. |
Timothy Plan Top Ten Holdings / Industries [29]
LARGE / MID CAP VALUE FUND
SCHEDULE OF INVESTMENTS
As of December 31, 2008
COMMON STOCKS - - 88.23%
| | | | | |
| number of shares | | | | market value |
| | |
| | AGRICULTURAL OPERATIONS - 1.00% | | | |
| 15,500 | | Bunge, Ltd. | | $ | 802,435 |
| | | | | |
| | |
| | BEVERAGES - NON-ALCOHOLIC - 2.00% | | | |
| 99,100 | | Dr Pepper Snapple Group, Inc. * | | | 1,610,375 |
| | | | | |
| | |
| | COSMETICS & TOILETRIES - 2.36% | | | |
| 27,700 | | Colgate-Palmolive Co. | | | 1,898,558 |
| | | | | |
| | |
| | DENTAL SUPPLIES & EQUIPMENT - 0.99% | | | |
| 28,200 | | Dentsply International, Inc. | | | 796,368 |
| | | | | |
| | |
| | ELECTRIC - INTEGRATED - 10.68% | | | |
| 52,200 | | American Electric Power Co., Inc. | | | 1,737,216 |
| 45,400 | | Dominion Resources, Inc. | | | 1,627,136 |
| 33,500 | | FirstEnergy Corp. | | | 1,627,430 |
| 36,500 | | FPL Group, Inc. | | | 1,837,045 |
| 47,700 | | Southern Co. | | | 1,764,900 |
| | | | | |
| | | | | 8,593,727 |
| | | | | |
| | |
| | ELECTRIC PRODUCTS - MISCELLANEOUS - 2.52% | | | |
| 55,400 | | Emerson Electric Co. | | | 2,028,194 |
| | | | | |
| | |
| | ENGINEERING/R&D SERVICES - 1.97% | | | |
| 67,900 | | Foster Wheeler, Ltd. * | | | 1,587,502 |
| | | | | |
| | |
| | ENTERPRISE SOFTWARE/SERVICES - 4.95% | | | |
| 73,100 | | BMC Software, Inc. * | | | 1,967,121 |
| 108,800 | | CA, Inc. | | | 2,016,064 |
| | | | | |
| | | | | 3,983,185 |
| | | | | |
| | |
| | FOOD - CONFECTIONERY - 2.10% | | | |
| 39,000 | | The JM Smucker Co. | | | 1,691,040 |
| | | | | |
| | |
| | INSTRUMENTS - SCIENTIFIC - 2.51% | | | |
| 59,300 | | Thermo Fisher Scientific, Inc. * | | | 2,020,351 |
| | | | | |
| | |
| | INSURANCE BROKERS - 2.05% | | | |
| 66,400 | | Willis Group Holdings, Ltd. | | | 1,652,032 |
| | | | | |
| | |
| | INTERNET SECURITY - 2.54% | | | |
| 59,100 | | McAfee, Inc. * | | | 2,043,087 |
| | | | | |
| | |
| | INVESTMENT MANAGEMENT/ADVISORY SERVICES - 8.38% | | | |
| 13,000 | | BlackRock, Inc. | | | 1,743,950 |
| 80,000 | | Eaton Vance Corp. | | | 1,680,800 |
| 26,000 | | Franklin Resources, Inc. | | | 1,658,280 |
| 114,800 | | Invesco, Ltd. | | | 1,657,712 |
| | | | | |
| | | | | 6,740,742 |
| | | | | |
The accompanying notes are an integral part of these financial statements.
The Timothy Large/Mid Cap Value Fund [30]
LARGE / MID CAP VALUE FUND
SCHEDULE OF INVESTMENTS
As of December 31, 2008
COMMON STOCKS - - 88.23% (continued)
| | | | | |
| number of shares | | | | market value |
| | |
| | MACHINERY - PUMPS - 2.00% | | | |
| 31,200 | | Flowserve Corp. | | $ | 1,606,800 |
| | | | | |
| | |
| | MEDICAL LABS & TESTING SERVICES - 2.64% | | | |
| 33,000 | | Laboratory Corp. of America Holdings * | | | 2,125,530 |
| | | | | |
| | |
| | MEDICAL - WHOLESALE DRUG DISTRIBUTION - 2.49% | | | |
| 58,200 | | Cardinal Health, Inc. | | | 2,006,154 |
| | | | | |
| | |
| | MEDICAL PRODUCTS - 2.53% | | | |
| 56,300 | | Covidien, Ltd. | | | 2,040,312 |
| | | | | |
| | |
| | MULTI-LINE INSURANCE - 2.03% | | | |
| 30,800 | | ACE, Ltd. | | | 1,629,936 |
| | | | | |
| | |
| | OIL COMPANY - EXPLORATION & PRODUCTION - 5.64% | | | |
| 22,700 | | Apache Corp. | | | 1,691,831 |
| 13,100 | | Devon Energy Corp. | | | 860,801 |
| 33,200 | | Occidental Petroleum Corp. | | | 1,991,668 |
| | | | | |
| | | | | 4,544,300 |
| | | | | |
| | OIL COMPANY - INTEGRATED - 10.78% | | | |
| 32,700 | | ConocoPhillips | | | 1,693,860 |
| 45,400 | | Exxon Mobil Corp. | | | 3,624,282 |
| 62,300 | | Marathon Oil Corp. | | | 1,704,528 |
| 37,300 | | Murphy Oil Corp. | | | 1,654,255 |
| | | | | |
| | | | | 8,676,925 |
| | | | | |
| | PROPERTY/CASUALTY INSURANCE - 2.17% | | | |
| 24,900 | | Arch Capital Group, Ltd. * | | | 1,745,490 |
| | | | | |
| | |
| | REINSURANCE - 2.19% | | | |
| 60,600 | | Axis Capital Holdings, Ltd. | | | 1,764,672 |
| | | | | |
| | |
| | RETAIL - AUTO PARTS - 2.52% | | | |
| 60,300 | | Advance Auto Parts, Inc. | | | 2,029,095 |
| | | | | |
| | |
| | RETAIL - DISCOUNT - 2.03% | | | |
| 31,100 | | Costco Wholesale Corp. | | | 1,632,750 |
| | | | | |
| | |
| | SUPER-REGIONAL BANKS - US - 2.16% | | | |
| 35,400 | | PNC Financial Services Group, Inc. | | | 1,734,600 |
| | | | | |
| | |
| | TELECOMMUNICATION EQUIPMENT - 2.52% | | | |
| 53,200 | | Harris Corp. | | | 2,024,260 |
| | | | | |
| | |
| | TOYS - 2.47% | | | |
| 124,500 | | Mattel, Inc. | | | 1,992,000 |
| | | | | |
| | |
| | Total Common Stocks (cost $82,494,199) | | | 71,000,420 |
| | | | | |
The accompanying notes are an integral part of these financial statements.
The Timothy Large/Mid Cap Value Fund [31]
LARGE / MID CAP VALUE FUND
SCHEDULE OF INVESTMENTS
As of December 31, 2008
MASTER LIMITED PARTNERSHIPS - 2.06%
| | | | | |
| number of shares | | | | market value |
| | |
55,800 | | Lazard, Ltd. - Class A | | $ | 1,659,492 |
| | | | | |
| | |
| | Total Master Limited Partnerships (cost $2,262,890) | | | 1,659,492 |
| | | | | |
| |
| REITs - 4.96% | | | |
| number of shares | | | | market value |
| | |
| | REITS - HEALTHCARE - 2.35% | | | |
68,000 | | HCP, Inc. | | | 1,888,360 |
| | | | | |
| | |
| | REITS - STORAGE - 2.61% | | | |
26,400 | | Public Storage | | | 2,098,800 |
| | | | | |
| | |
| | Total REITs (cost $4,295,328) | | | 3,987,160 |
| | | | | |
| |
| SHORT-TERM INVESTMENTS - 10.37% | | | |
| number of shares | | | | market value |
| | |
8,346,550 | | Timothy Plan Money Market Fund, 0.38% (A) (B) | | | 8,346,550 |
| | | | | |
| | |
| | Total Short-Term Investments (cost $8,346,550) | | | 8,346,550 |
| | | | | |
| | |
| | TOTAL INVESTMENTS (cost $97,398,967) - 105.62% | | $ | 84,993,622 |
| | | | | |
| | |
| | LIABILITIES IN EXCESS OF OTHER ASSETS - (5.62)% | | | (4,518,751) |
| | | | | |
| | |
| | NET ASSETS - 100.00% | | $ | 80,474,871 |
| | | | | |
* Non-income producing securities.
(A) Variable rate security; the rate shown represents the yield at December 31, 2008.
(B) Affiliated fund.
The accompanying notes are an integral part of these financial statements.
The Timothy Large/Mid Cap Value Fund [32]
LARGE / MID CAP VALUE FUND
STATEMENT OF ASSETS AND LIABILITIES
As of December 31, 2008
ASSETS
| | | |
| | | amount |
| |
Investments in Unaffiliated Securities at Value (cost $89,052,417) [NOTE 1] | | $ | 76,647,072 |
Investments in Affiliated Securities at Value (cost $8,346,550) [NOTE 1] | | | 8,346,550 |
Receivables for: | | | |
Fund Shares Sold | | | 241,352 |
Interest | | | 3,423 |
Dividends | | | 61,349 |
Prepaid Expenses | | | 16,125 |
| | | |
| |
Total Assets | | $ | 85,315,871 |
| | | |
| |
LIABILITIES | | | |
| | | amount |
| |
Payable for Investments Purchased | | $ | 4,330,596 |
Payable for Fund Shares Redeemed | | | 338,624 |
Payable for Distributions | | | 178 |
Accrued Advisory Fees | | | 54,837 |
Accrued 12b-1 Fees Class A | | | 13,931 |
Accrued 12b-1 Fees Class B | | | 1,911 |
Accrued 12b-1 Fees Class C | | | 6,880 |
Accrued Expenses | | | 94,043 |
| | | |
| |
Total Liabilities | | $ | 4,841,000 |
| | | |
| |
NET ASSETS | | | |
| | | amount |
| |
Class A Shares: | | | |
Net Assets (unlimited shares of $0.001 par beneficial interest authorized; 7,658,566 shares outstanding) | | $ | 69,695,242 |
Net Asset Value and Redemption Price Per Class A Share ($69,695,242 / 7,658,566 shares) | | $ | 9.10 |
Offering Price Per Share ($9.10 / 0.945) | | $ | 9.63 |
Class B Shares: | | | |
Net Assets (unlimited shares of $0.001 par beneficial interest authorized; 268,576 shares outstanding) | | $ | 2,235,530 |
Net Asset Value and Offering Price Per Class B Share ($2,235,530 / 268,576 shares) | | $ | 8.32 |
Minimum Redemption Price Per Class B Share ($8.32 * 0.99) | | $ | 8.24 |
Class C Shares: | | | |
Net Assets (unlimited shares of $0.001 par beneficial interest authorized; 1,028,459 shares outstanding) | | $ | 8,544,099 |
Net Asset Value and Offering Price Per Class C Share ($8,544,099 / 1,028,459 shares) | | $ | 8.31 |
Minimum Redemption Price Per Share ($8.31 * 0.99) | | $ | 8.23 |
| |
Net Assets | | $ | 80,474,871 |
| | | |
| |
SOURCES OF NET ASSETS | | | |
| | | amount |
| |
At December 31, 2008, Net Assets Consisted of: | | | |
Paid-in Capital | | $ | 113,813,885 |
Accumulated Undistributed Net Investment Income | | | 27,959 |
Accumulated Undistributed Net Realized Gain (Loss) on Investments | | | (20,961,628) |
Net Unrealized Appreciation (Depreciation) in Value of Investments | | | (12,405,345) |
| | | |
| |
Net Assets | | $ | 80,474,871 |
| | | |
The accompanying notes are an integral part of these financial statements.
The Timothy Large/Mid Cap Value Fund [33]
LARGE / MID CAP VALUE FUND
STATEMENT OF OPERATIONS
For the Year Ended December 31, 2008
INVESTMENT INCOME
| | | |
| | | amount |
| |
Interest on Affiliated Investments | | $ | 79,855 |
Dividends | | | 2,033,093 |
| | | |
| |
Total Investment Income | | | 2,112,948 |
| | | |
| |
EXPENSES | | | |
| | | amount |
| |
Investment Advisory Fees [NOTE 3] | | | 943,946 |
12b-1 Fees (Class A = $236,916, Class B = $42,308, Class C = $120,552) [NOTE 3] | | | 399,776 |
Fund Accounting, Transfer Agency, & Administration Fees | | | 195,563 |
Out-of-Pocket Expense | | | 130,384 |
Registration Fees | | | 34,523 |
Custodian Fees | | | 26,002 |
Audit Fees | | | 24,355 |
Printing Expense | | | 14,403 |
Trustee Expense | | | 13,339 |
CCO Fees | | | 9,961 |
Insurance Expense | | | 4,466 |
Miscellaneous Expense | | | 827 |
| | | |
| |
Total Net Expenses | | | 1,797,545 |
| | | |
| |
Net Investment Income (Loss) | | | 315,403 |
| | | |
| |
REALIZED AND UNREALIZED GAIN (LOSS) ON INVESTMENTS | | | |
| | | amount |
| |
Capital Gain Dividends from REIT’s | | | 119,453 |
Net Realized Gain (Loss) on Unaffiliated Investments | | | (21,143,902) |
Change in Unrealized Appreciation/Depreciation of Investments | | | (34,286,147) |
| | | |
Net Realized and Unrealized Gain (Loss) on Investments | | | (55,310,596) |
| | | |
| |
Net Increase (Decrease) in Net Assets Resulting from Operations | | $ | (54,995,193) |
| | | |
The accompanying notes are an integral part of these financial statements.
The Timothy Large/Mid Cap Value Fund [34]
LARGE / MID CAP VALUE FUND
STATEMENTS OF CHANGES IN NET ASSETS
INCREASE (DECREASE) IN NET ASSETS
| | | | | | | | |
| | | year ended
12/31/08 | | | year ended
12/31/07 | |
| | |
Operations: | | | | | | | | |
Net Investment Income (Loss) | | $ | 315,403 | | | $ | 963,589 | |
Capital Gain Dividends from REIT’s | | | 119,453 | | | | 94,669 | |
Net Realized Gain (Loss) on Investments | | | (21,143,902) | | | | 9,372,484 | |
Net Change in Unrealized Appreciation/Depreciation of Investments | | | (34,286,147) | | | | 6,232,108 | |
| | | | | | | | |
Net Increase (Decrease) in Net Assets (resulting from operations) | | | (54,995,193) | | | | 16,662,850 | |
| | | | | | | | |
| | |
Distributions to Shareholders From: | | | | | | | | |
Net Investment Income: | | | | | | | | |
Class A | | | (261,651) | | | | (974,907) | |
Class B | | | (5,389) | | | | (12,990) | |
Class C | | | (20,404) | | | | (62,881) | |
Net Realized Gains: | | | | | | | | |
Class A | | | (1,032,217) | | | | (6,755,829) | |
Class B | | | (38,228) | | | | (427,838) | |
Class C | | | (138,289) | | | | (894,168) | |
| | | | | | | | |
Total Distributions | | | (1,496,178) | | | | (9,128,613) | |
| | | | | | | | |
| | |
Capital Share Transactions: | | | | | | | | |
Proceeds from Shares Sold: | | | | | | | | |
Class A | | | 43,215,602 | * | | | 37,682,954 | ** |
Class B | | | 50,993 | | | | 149,745 | |
Class C | | | 5,604,263 | | | | 6,564,189 | |
Dividends Reinvested: | | | | | | | | |
Class A | | | 1,159,102 | | | | 6,885,837 | |
Class B | | | 40,065 | | | | 398,079 | |
Class C | | | 114,538 | | | | 804,848 | |
Cost of Shares Redeemed: | | | | | | | | |
Class A | | | (30,185,260) | | | | (31,613,048) | |
Class B | | | (1,740,640) | * | | | (1,608,532) | ** |
Class C | | | (3,787,995) | | | | (1,328,079) | |
| | | | | | | | |
Net Increase (Decrease) in Net Assets (resulting from capital share transactions) | | | 14,470,668 | | | | 17,935,993 | |
| | | | | | | | |
| | |
Total Increase (Decrease) in Net Assets | | | (42,020,703) | | | | 25,470,230 | |
| | | | | | | | |
| | |
Net Assets: | | | | | | | | |
Beginning of year | | | 122,495,574 | | | | 97,025,344 | |
| | | | | | | | |
| | |
End of year | | $ | 80,474,871 | | | $ | 122,495,574 | |
| | | | | | | | |
| | |
Accumulated Undistributed Net Investment Income | | $ | 27,959 | | | $ | - | |
| | | | | | | | |
| | |
Shares of Capital Stock of the Fund Sold and Redeemed: | | | | | | | | |
Shares Sold: | | | | | | | | |
Class A | | | 3,330,953 | * | | | 2,372,294 | ** |
Class B | | | 4,127 | | | | 10,331 | |
Class C | | | 449,463 | | | | 447,094 | |
Shares Reinvested: | | | | | | | | |
Class A | | | 133,382 | | | | 453,612 | |
Class B | | | 5,040 | | | | 28,434 | |
Class C | | | 14,443 | | | | 57,613 | |
Shares Redeemed: | | | | | | | | |
Class A | | | (2,512,832) | | | | (2,002,383) | |
Class B | | | (157,284) | * | | | (109,857) | ** |
Class C | | | (328,671) | | | | (89,822) | |
| | | | | | | | |
Net Increase (Decrease) in Number of Shares Outstanding | | | 938,621 | | | | 1,167,316 | |
| | | | | | | | |
| | |
| * | | Includes automatic conversion of Class B shares ($826,012 representing 75,819 shares) to Class A shares ($826,012 representing 69,567 shares). |
| ** | | Includes automatic conversion of Class B shares ($434,662 representing 29,227 shares) to Class A shares ($434,662 representing 26,988 shares). |
The accompanying notes are an integral part of these financial statements.
The Timothy Large/Mid Cap Value Fund [35]
LARGE / MID CAP VALUE FUND
FINANCIAL HIGHLIGHTS
The table below sets forth financial data for one share of capital stock outstanding throughout each period presented.
LARGE / MID CAP VALUE FUND - CLASS A SHARES
| | | | | | | | | | | | | | | | | |
| | | year
ended
12/31/08 | | year
ended
12/31/07 | | year
ended
12/31/06 | | year ended
12/31/05 | | | year
ended
12/31/04 | |
| | | | | |
Per Share Operating Performance: | | | | | | | | | | | | | | | | | |
Net Asset Value at Beginning of Year | | $ | 15.48 | | $ | 14.31 | | $ | 12.99 | | $ | 12.68 | | | $ | 11.66 | |
| | | | | | | | | | | | | | | | | |
| | | | | |
Income from Investment Operations: | | | | | | | | | | | | | | | | | |
Net Investment Income (Loss) | | | 0.05 | | | 0.15 | | | 0.16 | | | 0.02 | (A) | | | (0.01) ( | A) |
Net Realized and Unrealized Gain (Loss) on Investments | | | (6.26) | | | 2.26 | | | 2.24 | | | 2.44 | | | | 1.03 | |
| | | | | | | | | | | | | | | | | |
Total from Investment Operations | | | (6.21) | | | 2.41 | | | 2.40 | | | 2.46 | | | | 1.02 | |
| | | | | | | | | | | | | | | | | |
| | | | | |
Less Distributions: | | | | | | | | | | | | | | | | | |
Dividends from Realized Gains | | | (0.14) | | | (1.08) | | | (0.90) | | | (2.15) | | | | - | |
Dividends from Net Investment Income | | | (0.03) | | | (0.16) | | | (0.16) | | | - | * | | | - | |
Distributions from Return of Capital | | | - | | | - | | | (0.02) | | | - | | | | - | |
| | | | | | | | | | | | | | | | | |
Total Distributions | | | (0.17) | | | (1.24) | | | (1.08) | | | (2.15) | | | | - | |
| | | | | | | | | | | | | | | | | |
| | | | | |
Net Asset Value at End of Year | | $ | 9.10 | | $ | 15.48 | | $ | 14.31 | | $ | 12.99 | | | $ | 12.68 | |
| | | | | | | | | | | | | | | | | |
| | | | | |
Total Return (B)(C) | | | (40.05)% | | | 17.02% | | | 18.41% | | | 19.42% | | | | 8.75% | |
| | | | | |
Ratios/Supplemental Data: | | | | | | | | | | | | | | | | | |
Net Assets, End of Year (in 000s) | | $ | 69,695 | | $ | 103,828 | | $ | 84,203 | | $ | 51,753 | | | $ | 43,120 | |
| | | | | |
Ratio of Expenses to Average Net Assets: | | | | | | | | | | | | | | | | | |
Before Reimbursement and Waiver/Recoupment of Expenses by Adviser | | | 1.51% | | | 1.44% | | | 1.51% | | | 1.55% | | | | 1.52% | |
After Reimbursement and Waiver/Recoupment of Expenses by Adviser | | | 1.51% | | | 1.44% | | | 1.51% | �� | | 1.55% | | | | 1.52% | |
| | | | | |
Ratio of Net Investment Income (Loss) to Average Net Assets: | | | | | | | | | | | | | | | | | |
Before Reimbursement and Waiver/Recoupment of Expenses by Adviser | | | 0.39% | | | 0.99% | | | 1.20% | | | 0.15% | | | | (0.11)% | |
After Reimbursement and Waiver/Recoupment of Expenses by Adviser | | | 0.39% | | | 0.99% | | | 1.20% | | | 0.15% | | | | (0.11)% | |
| | | | | |
Portfolio Turnover | | | 76.74% | | | 47.52% | | | 52.16% | | | 129.22% | | | | 29.09% | |
| | |
| * | | Distribution amounted to less than 0.01 per share |
| (A) | | Per share amounts calculated using average shares method. |
| (B) | | Total return calculation does not reflect sales load. |
| (C) | | Total return in the above table represents the rate that the investor would have earned or lost on an investment in the Fund assuming reinvestment of dividends. |
The accompanying notes are an integral part of these financial statements.
The Timothy Large/Mid Cap Value Fund [36]
LARGE / MID CAP VALUE FUND
FINANCIAL HIGHLIGHTS
The table below sets forth financial data for one share of capital stock outstanding throughout each period presented.
| | | | | | | | | | | | | | | | | |
| LARGE / MID CAP VALUE FUND - CLASS B SHARES | | | | | | | | | | |
| | | year
ended
12/31/08 | | | year
ended
12/31/07 | | year
ended
12/31/06 | | year
ended
12/31/05 | | | year
ended
12/31/04 |
| | | | | |
Per Share Operating Performance: | | | | | | | | | | | | | | | | | |
Net Asset Value at Beginning of Year | | $ | 14.27 | | | $ | 13.26 | | $ | 12.10 | | $ | 12.02 | | | $ | 11.14 |
| | | | | | | | | | | | | | | | | |
| | | | | |
Income from Investment Operations: | | | | | | | | | | | | | | | | | |
Net Investment Income (Loss) | | | (0.04) | (A) | | | 0.04 | | | 0.05 | | | (0.08) | (A) | | | (0.10) (A) |
Net Realized and Unrealized Gain (Loss) on Investments | | | (5.75) | | | | 2.08 | | | 2.08 | | | 2.31 | | | | 0.98 |
| | | | | | | | | | | | | | | | | |
Total from Investment Operations | | | (5.79) | | | | 2.12 | | | 2.13 | | | 2.23 | | | | 0.88 |
| | | | | | | | | | | | | | | | | |
| | | | | |
Less Distributions: | | | | | | | | | | | | | | | | | |
Dividends from Realized Gains | | | (0.14) | | | | (1.08) | | | (0.90) | | | (2.15) | | | | - |
Dividends from Net Investment Income | | | (0.02) | | | | (0.03) | | | (0.05) | | | - | | | | - |
Distributions from Return of Capital | | | - | | | | - | | | (0.02) | | | - | | | | - |
| | | | | | | | | | | | | | | | | |
Total Distributions | | | (0.16) | | | | (1.11) | | | (0.97) | | | (2.15) | | | | - |
| | | | | | | | | | | | | | | | | |
| | | | | |
Net Asset Value at End of Year | | $ | 8.32 | | | $ | 14.27 | | $ | 13.26 | | $ | 12.10 | | | $ | 12.02 |
| | | | | | | | | | | | | | | | | |
| | | | | |
Total Return (B)(C) | | | (40.55)% | | | | 16.21% | | | 17.54% | | | 18.56% | | | | 7.90% |
| | | | | |
Ratios/Supplemental Data: | | | | | | | | | | | | | | | | | |
Net Assets, End of Year (in 000s) | | $ | 2,236 | | | $ | 5,945 | | $ | 6,470 | | $ | 6,496 | | | $ | 5,642 |
| | | | | |
Ratio of Expenses to Average Net Assets: | | | | | | | | | | | | | | | | | |
Before Reimbursement and Waiver/Recoupment of Expenses by Adviser | | | 2.24% | | | | 2.19% | | | 2.26% | | | 2.30% | | | | 2.27% |
After Reimbursement and Waiver/Recoupment of Expenses by Adviser | | | 2.24% | | | | 2.19% | | | 2.26% | | | 2.30% | | | | 2.27% |
| | | | | |
Ratio of Net Investment Income (Loss) to Average Net Assets: | | | | | | | | | | | | | | | | | |
Before Reimbursement and Waiver/Recoupment of Expenses by Adviser | | | (0.37)% | | | | 0.24% | | | 0.28% | | | (0.60)% | | | | (0.86)% |
After Reimbursement and Waiver/Recoupment of Expenses by Adviser | | | (0.37)% | | | | 0.24% | | | 0.28% | | | (0.60)% | | | | (0.86)% |
| | | | | |
Portfolio Turnover | | | 76.74% | | | | 47.52% | | | 52.16% | | | 129.22% | | | | 29.09% |
| | |
| (A) | | Per share amounts calculated using average shares method. |
| (B) | | Total return calculation does not reflect redemption fee. |
| (C) | | Total return in the above table represents the rate that the investor would have earned or lost on an investment in the Fund assuming reinvestment of dividends. |
The accompanying notes are an integral part of these financial statements.
The Timothy Large/Mid Cap Value Fund [37]
LARGE / MID CAP VALUE FUND
FINANCIAL HIGHLIGHTS
The table below sets forth financial data for one share of capital stock outstanding throughout each period presented.
LARGE / MID CAP VALUE FUND - CLASS C SHARES
| | | | | | | | | | | | | | | | | |
| | | year
ended
12/31/08 | | year
ended
12/31/07 | | year
ended
12/31/06 | | year
ended
12/31/05 | | | period
ended
12/31/04 (A) | |
| | | | | |
Per Share Operating Performance: | | | | | | | | | | | | | | | | | |
Net Asset Value at Beginning of Period | | $ | 14.24 | | $ | 13.28 | | $ | 12.12 | | $ | 12.04 | | | $ | 11.05 | |
| | | | | | | | | | | | | | | | | |
| | | | | |
Income from Investment Operations: | | | | | | | | | | | | | | | | | |
Net Investment Income (Loss) | | | (0.04) | | | 0.02 | | | 0.07 | | | (0.08) | (B) | | | (0.04) | (B) |
Net Realized and Unrealized Gain (Loss) on Investments | | | (5.73) | | | 2.10 | | | 2.08 | | | 2.31 | | | | 1.03 | |
| | | | | | | | | | | | | | | | | |
Total from Investment Operations | | | (5.77) | | | 2.12 | | | 2.15 | | | 2.23 | | | | 0.99 | |
| | | | | | | | | | | | | | | | | |
| | | | | |
Less Distributions: | | | | | | | | | | | | | | | | | |
Dividends from Realized Gains | | | (0.14) | | | (1.08) | | | (0.90) | | | (2.15) | | | | - | |
Dividends from Net Investment Income | | | (0.02) | | | (0.08) | | | (0.07) | | | - | | | | - | |
Distributions from Return of Capital | | | - | | | - | | | (0.02) | | | - | | | | - | |
| | | | | | | | | | | | | | | | | |
Total Distributions | | | (0.16) | | | (1.16) | | | (0.99) | | | (2.15) | | | | - | |
| | | | | | | | | | | | | | | | | |
| | | | | |
Net Asset Value at End of Period | | $ | 8.31 | | $ | 14.24 | | $ | 13.28 | | $ | 12.12 | | | $ | 12.04 | |
| | | | | | | | | | | | | | | | | |
| | | | | |
Total Return (C)(D) | | | (40.49)% | | | 16.13% | | | 17.63% | | | 18.53% | | | | 8.96% | (E) |
| | | | | |
Ratios/Supplemental Data: | | | | | | | | | | | | | | | | | |
Net Assets, End of Period (in 000s) | | $ | 8,544 | | $ | 12,722 | | $ | 6,353 | | $ | 2,774 | | | $ | 1,174 | |
| | | | | |
Ratio of Expenses to Average Net Assets: | | | | | | | | | | | | | | | | | |
Before Reimbursement and Waiver/Recoupment of Expenses by Adviser | | | 2.26% | | | 2.19% | | | 2.25% | | | 2.30% | | | | 2.27% | (F) |
After Reimbursement and Waiver/Recoupment of Expenses by Adviser | | | 2.26% | | | 2.19% | | | 2.25% | | | 2.30% | | | | 2.27% | (F) |
| | | | | |
Ratio of Net Investment Income (Loss) to Average Net Assets: | | | | | | | | | | | | | | | | | |
Before Reimbursement and Waiver/Recoupment of Expenses by Adviser | | | (0.35)% | | | 0.18% | | | 0.53% | | | (0.60)% | | | | (0.86)% | (F) |
After Reimbursement and Waiver/Recoupment of Expenses by Adviser | | | (0.35)% | | | 0.18% | | | 0.53% | | | (0.60)% | | | | (0.86)% | (F) |
| | | | | |
Portfolio Turnover | | | 76.74% | | | 47.52% | | | 52.16% | | | 129.22% | | | | 29.09% | |
| | |
| (A) | | For the period February 3, 2004 (Commencement of Operations) to December 31, 2004. |
| (B) | | Per share amounts calculated using average shares method. |
| (C) | | Total return calculation does not reflect redemption fee. |
| (D) | | Total return in the above table represents the rate that the investor would have earned or lost on an investment in the Fund assuming reinvestment of dividends. |
| (E) | | For periods of less than one full year, total return is not annualized. |
| (F) | | Annualized. |
The accompanying notes are an integral part of these financial statements.
The Timothy Large/Mid Cap Value Fund [38]
LETTER FROM THE MANAGER
December 31, 2008
FIXED INCOME FUND
Early 2008 saw significant problems in low quality mortgage securities and the housing industry. The negative impact to the financial industry initiated a slowdown in U.S. and global economies that become a full-blown recession as 2008 came to an end. The economy suffers as housing remains in a downward spiral, retail sales in December were twice as bad as estimated, and manufacturing activity has hit the proverbial brick wall. The auto industry may be the first of many to follow the financial sector in securing a temporary bankruptcy reprieve funded by tax payers. The decline in the economy is most profound in the devastating loss of over 2.6 million jobs during the year. The length and depth of this recession is now the primary source of concern in the market.
With the private economy and financial institutions in trouble, the government’s response has been aggressive on the monetary front with promised fiscal stimulus in the works. After the decision December 16th to lower the Federal Funds Target Rate to a range of 0.00% to 0.25%, the Federal Reserve continued to focus on utilizing and creating every available tool at their disposal. As the “flight to quality” pushed U.S. Treasury rates to historic lows, the sector generated a 13.7% return in 2008 according to Barclays indices. The Treasury rally drove yields into uncharted territory with 3 month T-Bills ending the year at 0.08% and shorter maturities actually trading at negative rates. The benchmark U.S. Treasury 10 year note spent most of the year trading between 3.5% and 4.0% before dropping sharply in the fourth quarter to close the year at only 2.06%.
On the other hand, investment grade corporate bond yield spreads moved higher to levels last witnessed in 1933. The fear of risk in the financial system drove yields higher as the Barclays investment grade corporate index ended 2008 at 7.5% some 595 basis points above the U.S. Treasury sector. We believe this represents an opportunity to find fundamentally sound corporate issuers at great values.
Timothy Plan Fixed Income Fund Class A shares outperformed the Morningstar median by 423 basis points in 2008 with a return of (0.05%) vs. (4.28%) for the median Intermediate Fund. The challenge over the past year has been in preserving capital. Although the Timothy Plan Fixed Income Fund achieved a favorable position within the peer universe, returns lagged the Barclays Capital U.S. Aggregate Bond Index (formerly known as the Lehman Brothers U.S. Aggregate Bond Index). The primary reason was an underweight in Treasuries that generated a 13.7% return as reported by Barclays vs. an over-weight in corporate bonds that generated a (4.9%) return in the Barclays Index.
The portfolio is structured to generate an income advantage compared to the Barclays Capital U.S. Aggregate Bond Index primarily from an over-weight in corporate bonds. A defensive structure is seen in the AA average credit quality and average maturity of 5.1 years. The portfolio increased the allocation in the Treasury sector to Treasury Inflation Protected Securities in the fourth quarter to 8%. The portfolio has no exposure to subprime loans or commercial mortgage-backed securities, and the mortgage holdings are Government National Mortgage Association issues having the full faith and credit of the U.S. Treasury.
BARROW, HANLEY, MEWHINNEY & STRAUSS
Letter From The Manager [39]
FUND PROFILE
December 31, 2008
TIMOTHY PLAN FIXED INCOME FUND
FUND PROFILE (unaudited):
| | |
| Top Ten Holdings |
| (% of Net Assets) |
| |
GNMA Pool 4072, 5.50%, 1/20/2038 | | 6.07% |
Timothy Plan Money Market Fund | | 4.38% |
GNMA Pool 3939, 5.00%, 1/20/2037 | | 4.06% |
U.S. Treasury Inflation Indexed Bond, 2.00%, 1/15/2014 | | 4.02% |
GNMA Pool 4058, 5.00%, 12/20/2037 | | 3.95% |
U.S. Treasury Inflation Indexed Bond, 2.50%, 7/15/2016 | | 3.85% |
GNMA Pool 3865, 6.00%, 6/20/2036 | | 3.61% |
U.S. Treasury Bond, 5.00%, 5/15/2037 | | 3.49% |
GNMA Pool 3625, 6.00%, 10/20/2034 | | 3.30% |
U.S. Treasury Bond, 12.5%, 8/15/2014 | | 3.23% |
| | |
| | 39.96% |
| | |
| | |
| Industries |
| (% of Net Assets) |
| |
Mortgage Securities | | 38.05% |
Government | | 22.72% |
Financials | | 8.76% |
Energy | | 8.70% |
Utilities | | 6.59% |
Industrials | | 4.68% |
Short-Term Investments | | 4.38% |
Materials | | 1.97% |
Information Technology | | 1.63% |
Health Care | | 1.18% |
Other Assets Less Liabilities | | 1.34% |
| | |
| | 100.00% |
| | |
EXPENSE EXAMPLE (unaudited):
As a shareholder of the Fund, you incur two types of costs: direct costs, such as wire fees and low balance fees; and indirect costs, including management fees, and other Fund operating expenses. This example is intended to help you understand your indirect costs, also referred to as “ongoing costs,” (in dollars) of investing in the Fund, and to compare these costs with the ongoing costs of investing in other mutual funds.
This example is based on an investment of $1,000 invested at the beginning of the period and held for the entire six-month period of July 1, 2008, through December 31, 2008.
Actual Expenses
The first line of the table below provides information about actual account values and actual expenses. You may use the information in this line, together with the amount you invested at the beginning of the period, to estimate the expenses that you paid over the period. Simply divide your account value by $1,000 (for example, an $8,600 account value divided by $1,000 = 8.6), then multiply the result by the number in the first line under the heading “Expenses Paid During Period” to estimate the expenses you paid on your account during this period.
Timothy Plan Top Ten Holdings / Industries [40]
FUND PROFILE
December 31, 2008
TIMOTHY PLAN FIXED INCOME FUND
Hypothetical example for comparison purposes (unaudited)
The second line of the table provides information about hypothetical account values and hypothetical expenses based on the Fund’s actual expense ratio and an assumed rate of return of 5% per year before expenses, which is not the Fund’s actual return. The hypothetical account values and expenses may not be used to estimate the actual ending account balance or expenses you paid for the period. You may use this information to compare ongoing costs of investing in the Fund and other funds. To do so, compare this 5% hypothetical example with the 5% hypothetical examples that appear in the shareholder reports of other funds.
Please note that the expenses shown in the table are meant to highlight your ongoing costs only and do not reflect any direct costs, such as wire fees or low balance fees. Therefore, the second line of the table is useful in comparing ongoing costs only, and will not help you determine the relative total costs of owning different funds. In addition, if these direct costs were included, your costs would be higher.
| | | | | | | | | |
| | | Beginning
Account Value | | Ending Account
Value | | Expenses Paid
During Period* |
| | | 7/1/2008 | | 12/31/2008 | | 7/1/2008 through
12/31/2008 |
| | | |
Actual - Class A | | $ | 1,000.00 | | $ | 993.57 | | $ | 6.28 |
| | | |
Hypothetical - Class A | | $ | 1,000.00 | | $ | 1,018.83 | | $ | 6.36 |
(5% return before expenses) | | | | | | | | | |
| | | |
Actual - Class B | | $ | 1,000.00 | | $ | 990.55 | | $ | 10.09 |
| | | |
Hypothetical - Class B | | $ | 1,000.00 | | $ | 1,014.99 | | $ | 10.22 |
(5% return before expenses) | | | | | | | | | |
| | | |
Actual - Class C | | $ | 1,000.00 | | $ | 990.10 | | $ | 10.19 |
| | | |
Hypothetical - Class C | | $ | 1,000.00 | | $ | 1,014.90 | | $ | 10.32 |
(5% return before expenses) | | | | | | | | | |
| * | Expenses are equal to the Fund’s annualized expense ratio of 1.25% for Class A, 2.02% for Class B, and 2.04% for Class C, which is net of any expenses paid indirectly, multiplied by the average account value over the period, multiplied by 184 days/366 days (to reflect the partial year period.) The Fund’s ending account value on the first line of each share class in the table is based on its actual total return of -0.64% for Class A, -0.94% for Class B, and -0.99% for Class C for the six-month period of July 1, 2008, to December 31, 2008. |
Timothy Plan Top Ten Holdings / Industries [41]
FIXED INCOME FUND
SCHEDULE OF INVESTMENTS
As of December 31, 2008
BONDS AND NOTES - 94.28%
| | | | | | |
| par value | | | | market value |
| | |
| | | CORPORATE BONDS - 33.51% | | | |
| $ | 750,000 | | Anadarko Finance Co., 6.75%, 05/01/2011 | | $ | 750,665 |
| | 750,000 | | Canadian National Railway Co., 5.80%, 06/01/2016 | | | 771,517 |
| | 750,000 | | CIT Group, Inc., 5.00%, 02/13/2014 | | | 545,674 |
| | 500,000 | | Covidien International Finance S.A., 5.45%, 10/15/2012 | | | 489,597 |
| | 910,000 | | CRH America, Inc., 6.00%, 09/30/2016 | | | 567,515 |
| | 950,000 | | Dominion Resources, Inc., 5.00%, 03/15/2013 | | | 916,118 |
| | 500,000 | | Entergy Gulf States, Inc., 5.70%, 06/01/2015 | | | 451,993 |
| | 900,000 | | ERP Operating LP, 5.125%, 03/15/2016 | | | 637,642 |
| | 750,000 | | FedEx Corp., 5.50%, 08/15/2009 | | | 750,915 |
| | 250,000 | | International Paper Co., 4.25%, 01/15/2009 | | | 249,915 |
| | 750,000 | | Kinder Morgan Energy Partners LP, 5.125%, 11/15/2014 | | | 654,196 |
| | 750,000 | | Marathon Oil Corp., 6.00%, 10/01/2017 | | | 640,542 |
| | 250,000 | | National Rural Utilities Cooperative Finance Corp., 5.75%, 08/28/2009 | | | 251,652 |
| | 750,000 | | Nisource Finance Corp., 5.40%, 07/15/2014 | | | 513,755 |
| | 500,000 | | Oneok, Inc., 5.20%, 06/15/2015 | | | 414,499 |
| | 500,000 | | PC Financial Partnership, 5.00%, 11/15/2014 | | | 418,550 |
| | 300,000 | | Protective Life Secured Trusts, 5.75%, 01/15/2019 | | | 237,550 |
| | 750,000 | | PSI Energy, Inc., 6.05%, 06/15/2016 | | | 748,855 |
| | 750,000 | | Simon Property Group LP, 5.75%, 12/01/2015 | | | 490,523 |
| | 750,000 | | SLM Corp., 4.00%, 01/15/2010 | | | 679,055 |
| | 500,000 | | Transocean, Inc., 6.00%, 03/15/2018 | | | 456,180 |
| | 750,000 | | Tyco Electronics Group S.A., 6.00%, 10/01/2012 | | | 677,125 |
| | 300,000 | | Unitrin, Inc., 4.875%, 11/01/2010 | | | 271,824 |
| | 750,000 | | Weatherford International, Ltd., 4.95%, 10/15/2013 | | | 653,162 |
| | 750,000 | | Willis North America, Inc., 6.20%, 03/28/2017 | | | 520,345 |
| | 135,000 | | Wisconsin Energy Corp., 6.50%, 04/01/2011 | | | 139,735 |
| | | | | | |
| | | Total Corporate Bonds (cost $16,142,736) | | | 13,899,099 |
| | | | | | |
| | |
| | | U.S. GOVERNMENT & AGENCY OBLIGATIONS - 60.77% | | | |
| | 1,000,000 | | Federal Home Loan Bank, 5.50%, 08/13/2014 | | | 1,154,430 |
| | 198,541 | | GNMA Pool 3584, 6.00%, 07/20/2034 | | | 204,912 |
| | 450,467 | | GNMA Pool 3612, 6.50%, 09/20/2034 | | | 471,966 |
| | 1,326,785 | | GNMA Pool 3625, 6.00%, 10/20/2034 | | | 1,368,886 |
| | 539,810 | | GNMA Pool 3637, 5.50%, 11/20/2034 | | | 556,180 |
| | 840,544 | | GNMA Pool 3665, 5.50%, 01/20/2035 | | | 865,627 |
| | 444,817 | | GNMA Pool 3679, 6.00%, 02/20/2035 | | | 458,859 |
| | 1,123,511 | | GNMA Pool 3711, 5.50%, 05/20/2035 | | | 1,157,039 |
| | 1,452,269 | | GNMA Pool 3865, 6.00%, 06/20/2036 | | | 1,498,090 |
| | 1,111,150 | | GNMA Pool 3910, 6.00%, 10/20/2036 | | | 1,146,208 |
| | 1,641,318 | | GNMA Pool 3939, 5.00%, 01/20/2037 | | | 1,685,095 |
| | 1,595,701 | | GNMA Pool 4058, 5.00%, 12/20/2037 | | | 1,638,262 |
| | 2,446,180 | | GNMA Pool 4072, 5.50%, 01/20/2038 | | | 2,518,230 |
The accompanying notes are an integral part of these financial statements.
Timothy Plan Fixed Income Fund [42]
FIXED INCOME FUND
SCHEDULE OF INVESTMENTS
As of December 31, 2008
BONDS AND NOTES - 94.28% (continued)
| | | | | | |
| par value | | | | market value |
| | |
| | | U.S. GOVERNMENT & AGENCY OBLIGATIONS - 60.77% (continued) | | | |
| $ | 68,118 | | GNMA Pool 585163, 5.00%, 02/15/2018 | | $ | 71,501 |
| | 76,252 | | GNMA Pool 585180, 5.00%, 02/15/2018 | | | 80,039 |
| | 75,621 | | GNMA Pool 592492, 5.00%, 03/15/2018 | | | 79,376 |
| | 61,527 | | GNMA Pool 599821, 5.00%, 01/15/2018 | | | 64,583 |
| | 916,150 | | GNMA Pool 604182, 5.50%, 04/15/2033 | | | 946,994 |
| | 745,674 | | GNMA Pool 663776, 6.50%, 01/15/2037 | | | 776,892 |
| | 186,597 | | GNMA Pool 781694, 6.00%, 12/15/2031 | | | 193,515 |
| | 1,250,000 | | U.S. Treasury Bond, 12.5%, 08/15/2014 | | | 1,338,184 |
| | 300,000 | | U.S. Treasury Bond, 5.375%, 02/15/2031 | | | 412,312 |
| | 1,000,000 | | U.S. Treasury Bond, 5.00%, 05/15/2037 | | | 1,449,219 |
| | 1,758,720 | | U.S. Treasury Inflation Indexed Bond, 2.00%, 01/15/2014 | | | 1,666,938 |
| | 1,609,125 | | U.S. Treasury Inflation Indexed Bond, 2.50%, 07/15/2016 | | | 1,596,931 |
| | 1,050,000 | | U.S. Treasury Note, 4.75%, 05/15/2014 | | | 1,235,966 |
| | 500,000 | | U.S. Treasury Note, 3.875%, 05/15/2018 | | | 570,313 |
| | | | | | |
| | |
| | | Total U.S. Government & Agency Obligations (cost $24,005,410) | | | 25,206,547 |
| | | | | | |
| | |
| | | Total Bonds and Notes (cost $40,148,146) | | | 39,105,646 |
| | | | | | |
| |
| | SHORT TERM INVESTMENTS - 4.38% | | | |
| number of shares | | | | market value |
| | |
| | 1,819,144 | | Timothy Plan Money Market Fund, 0.38% (A) (B) | | | 1,819,144 |
| | | | | | |
| | |
| | | Total Short-Term Investments (cost $1,819,144) | | | 1,819,144 |
| | | | | | |
| | |
| | | TOTAL INVESTMENTS (cost $41,967,290) - 98.66% | | $ | 40,924,790 |
| | | | | | |
| | |
| | | OTHER ASSETS LESS LIABILITIES - 1.34% | | | 554,578 |
| | | | | | |
| | |
| | | NET ASSETS - 100.00% | | $ | 41,479,368 |
| | | | | | |
(A) Variable rate security; the rate shown represents the yield at December 31, 2008.
(B) Affiliated fund.
The accompanying notes are an integral part of these financial statements.
Timothy Plan Fixed Income Fund [43]
FIXED INCOME FUND
STATEMENT OF ASSETS AND LIABILITIES
As of December 31, 2008
| | | |
ASSETS | | | |
| | | amount |
Investments in Unaffiliated Securities at Value (cost $40,148,146) [NOTE 1] | | $ | 39,105,646 |
Investments in Affiliated Securities at Value (cost $1,819,144) [NOTE 1] | | | 1,819,144 |
Receivables for: | | | |
Interest | | | 421,897 |
Fund Shares Sold | | | 436,631 |
Prepaid Expenses | | | 11,622 |
| | | |
| |
Total Assets | | $ | 41,794,940 |
| | | |
LIABILITIES | | | |
| | | amount |
| |
Payable for Fund Shares Redeemed | | $ | 242,818 |
Accrued Advisory Fees | | | 15,635 |
Accrued 12b-1 Fees Class A | | | 7,821 |
Accrued 12b-1 Fees Class B | | | 1,033 |
Accrued 12b-1 Fees Class C | | | 2,426 |
Accrued Expenses | | | 45,839 |
| | | |
| |
Total Liabilities | | $ | 315,572 |
| | | |
NET ASSETS | | | |
| | | amount |
| |
Class A Shares: | | | |
Net Assets (unlimited shares of $0.001 par beneficial interest authorized; 3,907,743 shares outstanding) | | $ | 37,366,899 |
Net Asset Value and Redemption Price Per Class A Share ($37,366,899 / 3,907,743 shares) | | $ | 9.56 |
Offering Price Per Share ($9.56 / 0.955) | | $ | 10.01 |
Class B Shares: | | | |
Net Assets (unlimited shares of $0.001 par beneficial interest authorized; 132,549 shares outstanding) | | $ | 1,229,680 |
Net Asset Value and Offering Price Per Class B Share ($1,229,680 / 132,549 shares) | | $ | 9.28 |
Minimum Redemption Price Per Class B Share ($9.28 * 0.99) | | $ | 9.19 |
Class C Shares: | | | |
Net Assets (unlimited shares of $0.001 par beneficial interest authorized; 310,605 shares outstanding) | | $ | 2,882,789 |
Net Asset Value and Offering Price Per Class C Share ($2,882,789 / 310,605 shares) | | $ | 9.28 |
Minimum Redemption Price Per Share ($9.28 * 0.99) | | $ | 9.19 |
| |
Net Assets | | $ | 41,479,368 |
| | | |
SOURCES OF NET ASSETS | | | |
| | | amount |
| |
At December 31, 2008, Net Assets Consisted of: | | | |
Paid-in Capital | | $ | 44,174,661 |
Accumulated Undistributed Net Investment Income | | | 720 |
Accumulated Net Realized Gain (Loss) on Investments | | | (1,653,513) |
Net Unrealized Appreciation (Depreciation) in Value of Investments | | | (1,042,500) |
| | | |
| |
Net Assets | | $ | 41,479,368 |
| | | |
The accompanying notes are an integral part of these financial statements.
Timothy Plan Fixed Income Fund [44]
FIXED INCOME FUND
STATEMENT OF OPERATIONS
For the Year Ended December 31, 2008
| | | |
INVESTMENT INCOME | | | |
| | | amount |
| |
Interest on Unaffiliated Investments | | $ | 2,592,912 |
Interest on Affiliated Investments | | | 51,996 |
| | | |
| |
Total Investment Income | | | 2,644,908 |
| | | |
| |
EXPENSES | | | |
| | | amount |
Investment Advisory Fees [NOTE 3] | | | 294,056 |
12b-1 Fees (Class A = $111,814, Class B = $14,885, Class C = $27,951) [NOTE 3] | | | 154,650 |
Fund Accounting, Transfer Agency, & Administration Fees | | | 86,977 |
Out-of-Pocket Expense | | | 52,779 |
Registration Fees | | | 26,966 |
Custodian Fees | | | 11,660 |
Audit Fees | | | 10,592 |
Miscellaneous Expense | | | 8,238 |
Printing Expense | | | 6,354 |
Trustee Fees | | | 5,837 |
CCO Fees | | | 4,325 |
Insurance Expense | | | 1,978 |
| | | |
| |
Total Expenses | | | 664,412 |
| | | |
| |
Fees Waived by Adviser | | | (73,514) |
| | | |
| |
Total Net Expenses | | | 590,898 |
| | | |
| |
Net Investment Income | | | 2,054,010 |
| | | |
| |
REALIZED AND UNREALIZED GAIN (LOSS) ON INVESTMENTS | | | |
| | | amount |
| |
Net Realized Gain (Loss) on Unaffiliated Investments | | | (988,457) |
Change in Unrealized Appreciation/Depreciation of Investments | | | (1,280,539) |
| | | |
Net Realized and Unrealized (Loss) on Investments | | | (2,268,996) |
| | | |
| |
Net Increase (Decrease) in Net Assets Resulting from Operations | | $ | (214,986) |
| | | |
The accompanying notes are an integral part of these financial statements.
Timothy Plan Fixed Income Fund [45]
FIXED INCOME FUND
STATEMENTS OF CHANGES IN NET ASSETS
INCREASE (DECREASE) IN NET ASSETS
| | | | | | | | |
| | | year ended
12/31/08 | | | year ended
12/31/07 | |
| | |
Operations: | | | | | | | | |
Net Investment Income (Loss) | | $ | 2,054,010 | | | $ | 2,039,013 | |
Net Realized Gain (Loss) on Investments | | | (988,457) | | | | 7,734 | |
Change in Unrealized Appreciation/Depreciation of Investments | | | (1,280,539) | | | | 303,475 | |
| | | | | | | | |
Net Increase (Decrease) in Net Assets (resulting from operations) | | | (214,986) | | | | 2,350,222 | |
| | | | | | | | |
| | |
Distributions to Shareholders From: | | | | | | | | |
Net Investment Income: | | | | | | | | |
Class A | | | (1,899,067) | | | | (1,888,174) | |
Class B | | | (53,131) | | | | (98,490) | |
Class C | | | (101,092) | | | | (105,639) | |
| | | | | | | | |
Total Distributions | | | (2,053,290) | | | | (2,092,303) | |
| | | | | | | | |
| | |
Capital Share Transactions: | | | | | | | | |
Proceeds from Shares Sold: | | | | | | | | |
Class A | | | 16,330,862 | * | | | 15,931,332 | ** |
Class B | | | 200,402 | | | | 5,513 | |
Class C | | | 1,644,103 | | | | 1,174,029 | |
Dividends Reinvested: | | | | | | | | |
Class A | | | 1,755,420 | | | | 1,725,714 | |
Class B | | | 45,365 | | | | 78,291 | |
Class C | | | 84,663 | | | | 87,251 | |
Cost of Shares Redeemed: | | | | | | | | |
Class A | | | (23,998,355) | | | | (11,547,204) | |
Class B | | | (910,988) | * | | | (923,283) | ** |
Class C | | | (1,567,477) | | | | (1,454,401) | |
| | | | | | | | |
Net Increase (Decrease) in Net Assets (resulting from capital share transactions) | | | (6,416,005) | | | | 5,077,242 | |
| | | | | | | | |
| | |
Total Increase (Decrease) in Net Assets | | | (8,684,281) | | | | 5,335,161 | |
| | | | | | | | |
| | |
Net Assets: | | | | | | | | |
Beginning of year | | | 50,163,649 | | | | 44,828,488 | |
| | | | | | | | |
| | |
End of year | | $ | 41,479,368 | | | $ | 50,163,649 | |
| | | | | | | | |
Accumulated Undistributed Net Investment Income | | $ | 720 | | | $ | - | |
| | | | | | | | |
| | |
Shares of Capital Stock of the Fund Sold and Redeemed: | | | | | | | | |
Shares Sold: | | | | | | | | |
Class A | | | 1,643,240 | * | | | 1,598,004 | ** |
Class B | | | 21,569 | | | | 569 | |
Class C | | | 173,695 | | | | 121,089 | |
Shares Reinvested: | | | | | | | | |
Class A | | | 179,043 | | | | 174,453 | |
Class B | | | 4,761 | | | | 8,142 | |
Class C | | | 8,898 | | | | 9,079 | |
Shares Redeemed: | | | | | | | | |
Class A | | | (2,456,337) | | | | (1,158,035) | |
Class B | | | (94,932) | * | | | (95,863) | ** |
Class C | | | (165,113) | | | | (149,711) | |
| | | | | | | | |
Net Increase (Decrease) in Number of Shares Outstanding | | | (685,176) | | | | 507,727 | |
| | | | | | | | |
| | |
| * | | Includes automatic conversion of Class B shares ($357,407 representing 37,235 shares) to Class A shares ($357,407 representing 36,109 shares). |
| ** | | Includes automatic conversion of Class B shares ($91,918 representing 9,421 shares) to Class A shares ($91,918 representing 9,149 shares). |
The accompanying notes are an integral part of these financial statements.
Timothy Plan Fixed Income Fund [46]
FIXED INCOME FUND
FINANCIAL HIGHLIGHTS
The table below sets forth financial data for one share of capital stock outstanding throughout each period presented.
FIXED INCOME FUND - CLASS A SHARES
| | | | | | | | | | | | | | | | | |
| | | year
ended
12/31/08 | | year
ended
12/31/07 | | year
ended
12/31/06 | | year
ended
12/31/05 | | | year
ended
12/31/04 | |
| | | | | |
Per Share Operating Performance: | | | | | | | | | | | | | | | | | |
Net Asset Value at Beginning of Year | | $ | 9.99 | | $ | 9.94 | | $ | 10.06 | | $ | 10.32 | | | $ | 10.31 | |
| | | | | | | | | | | | | | | | | |
| | | | | |
Income from Investment Operations: | | | | | | | | | | | | | | | | | |
Net Investment Income (Loss) | | | 0.43 | | | 0.44 | | | 0.42 | | | 0.34 | (A) | | | 0.34 | (A) |
Net Realized and Unrealized Gain (Loss) on Investments | | | (0.43) | | | 0.06 | | | (0.12) | | | (0.23) | | | | 0.01 | |
| | | | | | | | | | | | | | | | | |
Total from Investment Operations | | | - | | | 0.50 | | | 0.30 | | | 0.11 | | | | 0.35 | |
| | | | | | | | | | | | | | | | | |
| | | | | |
Less Distributions: | | | | | | | | | | | | | | | | | |
Dividends from Net Investment Income | | | (0.43) | | | (0.45) | | | (0.41) | | | (0.34) | | | | (0.34) | |
Dividends from Net Realized Gains | | | - | | | - | | | (0.01) | | | (0.03) | | | | - | |
| | | | | | | | | | | | | | | | | |
Total Distributions | | | (0.43) | | | (0.45) | | | (0.42) | | | (0.37) | | | | (0.34) | |
| | | | | | | | | | | | | | | | | |
| | | | | |
Net Asset Value at End of Year | | $ | 9.56 | | $ | 9.99 | | $ | 9.94 | | $ | 10.06 | | | $ | 10.32 | |
| | | | | | | | | | | | | | | | | |
| | | | | |
Total Return (B)(C) | | | (0.05)% | | | 5.19% | | | 3.11% | | | 1.11% | | | | 3.44% | |
| | | | | |
Ratios/Supplemental Data: | | | | | | | | | | | | | | | | | |
Net Assets, End of Year (in 000s) | | $ | 37,367 | | $ | 45,371 | | $ | 39,023 | | $ | 29,402 | | | $ | 23,131 | |
| | | | | |
Ratio of Expenses to Average Net Assets: | | | | | | | | | | | | | | | | | |
Before Reimbursement and Waiver/Recoupment of Expenses by Adviser | | | 1.29% | | | 1.21% | | | 1.32% | | | 1.31% | | | | 1.31% | |
After Reimbursement and Waiver/Recoupment of Expenses by Adviser | | | 1.14% | | | 1.06% | | | 1.35% | | | 1.35% | | | | 1.35% | |
| | | | | |
Ratio of Net Investment Income (Loss) to Average Net Assets: | | | | | | | | | | | | | | | | | |
Before Reimbursement and Waiver/Recoupment of Expenses by Adviser | | | 4.11% | | | 4.33% | | | 4.42% | | | 3.33% | | | | 3.49% | |
After Reimbursement and Waiver/Recoupment of Expenses by Adviser | | | 4.26% | | | 4.48% | | | 4.39% | | | 3.29% | | | | 3.45% | |
| | | | | |
Portfolio Turnover | | | 35.01% | | | 44.98% | | | 76.28% | | | 39.46% | | | | 35.95% | |
| | |
| (A) | | Per share amounts calculated using average shares method. |
| (B) | | Total return calculation does not reflect sales load. |
| (C) | | Total return in the above table represents the rate that the investor would have earned or lost on an investment in the Fund assuming reinvestment of dividends. Total return would have been higher or lower if certain expenses had not been reimbursed, waived or recouped. |
The accompanying notes are an integral part of these financial statements.
Timothy Plan Fixed Income Fund [47]
FIXED INCOME FUND
FINANCIAL HIGHLIGHTS
The table below sets forth financial data for one share of capital stock outstanding throughout each period presented.
FIXED INCOME FUND - CLASS B SHARES
| | | | | | | | | | | | | | | | | |
| | | year
ended
12/31/08 | | year
ended
12/31/07 | | year
ended
12/31/06 | | year
ended
12/31/05 | | | year
ended
12/31/04 | |
| | | | | |
Per Share Operating Performance: | | | | | | | | | | | | | | | | | |
Net Asset Value at Beginning of Year | | $ | 9.70 | | $ | 9.66 | | $ | 9.81 | | $ | 10.06 | | | $ | 10.08 | |
| | | | | | | | | | | | | | | | | |
| | | | | |
Income from Investment Operations: | | | | | | | | | | | | | | | | | |
Net Investment Income (Loss) | | | 0.35 | | | 0.37 | | | 0.36 | | | 0.25 | (A) | | | 0.27 | (A) |
Net Realized and Unrealized Gain (Loss) on Investments | | | (0.41) | | | 0.05 | | | (0.15) | | | (0.20) | | | | (0.01) | |
| | | | | | | | | | | | | | | | | |
Total from Investment Operations | | | (0.06) | | | 0.42 | | | 0.21 | | | 0.05 | | | | 0.26 | |
| | | | | | | | | | | | | | | | | |
| | | | | |
Less Distributions: | | | | | | | | | | | | | | | | | |
Dividends from Net Investment Income | | | (0.36) | | | (0.38) | | | (0.35) | | | (0.27) | | | | (0.28) | |
Dividends from Net Realized Gains | | | - | | | - | | | (0.01) | | | (0.03) | | | | - | |
| | | | | | | | | | | | | | | | | |
Total Distributions | | | (0.36) | | | (0.38) | | | (0.36) | | | (0.30) | | | | (0.28) | |
| | | | | | | | | | | | | | | | | |
| | | | | |
Net Asset Value at End of Year | | $ | 9.28 | | $ | 9.70 | | $ | 9.66 | | $ | 9.81 | | | $ | 10.06 | |
| | | | | | | | | | | | | | | | | |
| | | | | |
Total Return (B)(C) | | | (0.66)% | | | 4.47% | | | 2.20% | | | 0.47% | | | | 2.57% | |
| | | | | |
Ratios/Supplemental Data: | | | | | | | | | | | | | | | | | |
Net Assets, End of Year (in 000s) | | $ | 1,230 | | $ | 1,951 | | $ | 2,786 | | $ | 3,126 | | | $ | 3,839 | |
| | | | | |
Ratio of Expenses to Average Net Assets: | | | | | | | | | | | | | | | | | |
Before Reimbursement and Waiver/Recoupment of Expenses by Adviser | | | 2.04% | | | 1.93% | | | 1.99% | | | 2.07% | | | | 2.06% | |
After Reimbursement and Waiver/Recoupment of Expenses by Adviser | | | 1.89% | | | 1.78% | | | 2.10% | | | 2.10% | | | | 2.10% | |
| | | | | |
Ratio of Net Investment Income (Loss) to Average Net Assets: | | | | | | | | | | | | | | | | | |
Before Reimbursement and Waiver/Recoupment of Expenses by Adviser | | | 3.34% | | | 3.62% | | | 3.74% | | | 2.57% | | | | 2.74% | |
After Reimbursement and Waiver/Recoupment of Expenses by Adviser | | | 3.49% | | | 3.77% | | | 3.63% | | | 2.54% | | | | 2.70% | |
| | | | | |
Portfolio Turnover | | | 35.01% | | | 44.98% | | | 76.28% | | | 39.46% | | | | 35.95% | |
| | |
| (A) | | Per share amounts calculated using average shares method. |
| (B) | | Total return calculation does not reflect redemption fee. |
| (C) | | Total return in the above table represents the rate that the investor would have earned or lost on an investment in the Fund assuming reinvestment of dividends. Total return would have been higher or lower if certain expenses had not been reimbursed, waived or recouped. |
The accompanying notes are an integral part of these financial statements.
Timothy Plan Fixed Income Fund [48]
FIXED INCOME FUND
FINANCIAL HIGHLIGHTS
The table below sets forth financial data for one share of capital stock outstanding throughout each period presented.
FIXED INCOME FUND - CLASS C SHARES
| | | | | | | | | | | | | | | | | |
| | | year
ended
12/31/08 | | year
ended
12/31/07 | | year
ended
12/31/06 | | year
ended
12/31/05 | | | period
ended
12/31/04 (A) | |
| | | | | |
Per Share Operating Performance: | | | | | | | | | | | | | | | | | |
Net Asset Value at Beginning of Period | | $ | 9.69 | | $ | 9.66 | | $ | 9.78 | | $ | 10.04 | | | $ | 10.15 | |
| | | | | | | | | | | | | | | | | |
| | | | | |
Income from Investment Operations: | | | | | | | | | | | | | | | | | |
Net Investment Income (Loss) | | | 0.33 | | | 0.37 | | | 0.33 | | | 0.25 | (B) | | | 0.26 | (B) |
Net Realized and Unrealized Gain (Loss) on Investments | | | (0.40) | | | 0.04 | | | (0.12) | | | (0.20) | | | | (0.05) | |
| | | | | | | | | | | | | | | | | |
Total from Investment Operations | | | (0.07) | | | 0.41 | | | 0.21 | | | 0.05 | | | | 0.21 | |
| | | | | | | | | | | | | | | | | |
| | | | | |
Less Distributions: | | | | | | | | | | | | | | | | | |
Dividends from Net Investment Income | | | (0.34) | | | (0.38) | | | (0.32) | | | (0.28) | | | | (0.32) | |
Dividends from Net Realized Gains | | | - | | | - | | | (0.01) | | | (0.03) | | | | - | |
| | | | | | | | | | | | | | | | | |
Total Distributions | | | (0.34) | | | (0.38) | | | (0.33) | | | (0.31) | | | | (0.32) | |
| | | | | | | | | | | | | | | | | |
| | | | | |
Net Asset Value at End of Period | | $ | 9.28 | | $ | 9.69 | | $ | 9.66 | | $ | 9.78 | | | $ | 10.04 | |
| | �� | | | | | | | | | | | | | | | |
| | | | | |
Total Return (C)(D) | | | (0.72)% | | | 4.37% | | | 2.26% | | | 0.47% | | | | 2.12% | (E) |
| | | | | |
Ratios/Supplemental Data: | | | | | | | | | | | | | | | | | |
Net Assets, End of Period (in 000s) | | $ | 2,883 | | $ | 2,842 | | $ | 3,019 | | $ | 1,927 | | | $ | 907 | |
| | | | | |
Ratio of Expenses to Average Net Assets: | | | | | | | | | | | | | | | | | |
Before Reimbursement and Waiver/Recoupment of Expenses by Adviser | | | 2.06% | | | 1.96% | | | 2.10% | | | 2.07% | | | | 2.06% | (F) |
After Reimbursement and Waiver/Recoupment of Expenses by Adviser | | | 1.91% | | | 1.81% | | | 2.10% | | | 2.10% | | | | 2.10% | (F) |
| | | | | |
Ratio of Net Investment Income (Loss) to Average Net Assets: | | | | | | | | | | | | | | | | | |
Before Reimbursement and Waiver/Recoupment of Expenses by Adviser | | | 3.33% | | | 3.59% | | | 3.64% | | | 2.57% | | | | 2.74% | (F) |
After Reimbursement and Waiver/Recoupment of Expenses by Adviser | | | 3.48% | | | 3.74% | | | 3.64% | | | 2.54% | | | | 2.70% | (F) |
| | | | | |
Portfolio Turnover | | | 35.01% | | | 44.98% | | | 76.28% | | | 39.46% | | | | 35.95% | |
| | |
| (A) | | For the period February 3, 2004 (Commencement of Operations) to December 31, 2004. |
| (B) | | Per share amounts calculated using average shares method. |
| (C) | | Total return calculation does not reflect redemption fee. |
| (D) | | Total return in the above table represents the rate that the investor would have earned or lost on an investment in the Fund assuming reinvestment of dividends. Total return would have been higher or lower if certain expenses had not been reimbursed, waived or recouped. |
| (E) | | For periods of less than one full year, total return is not annualized. |
| (F) | | Annualized. |
The accompanying notes are an integral part of these financial statements.
Timothy Plan Fixed Income Fund [49]
LETTER FROM THE MANAGER
December 31, 2008
AGGRESSIVE GROWTH FUND
Over the last twelve months, the portfolio was able to track the performance of the index, but in absolute terms, it was still disappointing for both the portfolio and small/mid cap growth managers as a whole. Active managers didn’t fare much better with the Lipper Small-Cap Growth Index losing 42.62% and the Lipper Mid-Cap Growth Index down 44.04%.
Small cap stocks lost the least amount of ground in 2008. The Russell 2000 was down 33.79%, while the Russell 1000 and Midcap Indexes trailed at -37.60% and -41.46%, respectively. Stylistically, Growth stocks lagged Value at all market cap levels after outperforming by a wide margin in 2007. Our top performing sectors in relation to the benchmark during 2008 were Financial Services, Technology and Business Services. Energy, Basic Industry and Capital Spending lagged the index.
For 2009, we are forecasting an environment conducive to growth stock investing: economies that stabilize and transition to positive growth, new winners and losers among companies, consolidation within industry sectors, appealing earnings growth and valuation expansion. We can’t say when this will occur, nor identify all the obstacles that could arise in the interim.
Accordingly, we continue to adjust and position the portfolio as opportunities present themselves, focusing not just on survivors but on the eventual “thrivers,” those with products and franchises built to weather the storm and pick up speed in the next period of expansion.
CHARTWELL INVESTMENT PARTNERS, LP
Letter From The Manager [50]
FUND PROFILE
December 31, 2008
TIMOTHY PLAN AGGRESSIVE GROWTH FUND
FUND PROFILE (unaudited):
| | |
Top Ten Holdings (% of Net Assets) |
| |
The Geo Group, Inc. | | 3.38% |
Timothy Plan Money Market Fund | | 3.17% |
DeVry, Inc. | | 2.87% |
American Tower Corp. - Class A | | 2.37% |
Dollar Tree, Inc. | | 2.12% |
Ametek, Inc. | | 2.02% |
Mettler Toledo International, Inc. | | 2.02% |
Concur Technologies, Inc. | | 1.85% |
Range Resources Corp. | | 1.79% |
Amphenol Corp. - Class A | | 1.76% |
| | |
| | 23.35% |
| | |
| | |
| | |
Industries (% of Net Assets) |
| |
Information Technology | | 30.84% |
Health Care | | 17.04% |
Industrials | | 15.68% |
Financials | | 13.18% |
Consumer Discretionary | | 7.80% |
Energy | | 6.52% |
Short-Term Investments | | 3.17% |
Materials | | 2.40% |
Telecommunication | | 2.37% |
Consumer Staples | | 0.67% |
Other Assets Less Liabilities | | 0.33% |
| | |
| | 100.00% |
| | |
EXPENSE EXAMPLE (unaudited):
As a shareholder of the Fund, you incur two types of costs: direct costs, such as wire fees and low balance fees; and indirect costs, including management fees, and other Fund operating expenses. This example is intended to help you understand your indirect costs, also referred to as “ongoing costs,” (in dollars) of investing in the Fund, and to compare these costs with the ongoing costs of investing in other mutual funds.
This example is based on an investment of $1,000 invested at the beginning of the period and held for the entire six-month period of July 1, 2008, through December 31, 2008.
Actual Expenses
The first line of the table below provides information about actual account values and actual expenses. You may use the information in this line, together with the amount you invested at the beginning of the period, to estimate the expenses that you paid over the period. Simply divide your account value by $1,000 (for example, an $8,600 account value divided by $1,000 = 8.6), then multiply the result by the number in the first line under the heading “Expenses Paid During Period” to estimate the expenses you paid on your account during this period.
Timothy Plan Top Ten Holdings / Industries [51]
FUND PROFILE
December 31, 2008
TIMOTHY PLAN AGGRESSIVE GROWTH FUND
Hypothetical example for comparison purposes (unaudited)
The second line of the table provides information about hypothetical account values and hypothetical expenses based on the Fund’s actual expense ratio and an assumed rate of return of 5% per year before expenses, which is not the Fund’s actual return. The hypothetical account values and expenses may not be used to estimate the actual ending account balance or expenses you paid for the period. You may use this information to compare ongoing costs of investing in the Fund and other funds. To do so, compare this 5% hypothetical example with the 5% hypothetical examples that appear in the shareholder reports of other funds.
Please note that the expenses shown in the table are meant to highlight your ongoing costs only and do not reflect any direct costs, such as wire fees or low balance fees. Therefore, the second line of the table is useful in comparing ongoing costs only, and will not help you determine the relative total costs of owning different funds. In addition, if these direct costs were included, your costs would be higher.
| | | | | | | | | |
| | | Beginning
Account Value | | Ending Account
Value | | Expenses Paid
During Period* |
| | | 7/1/2008 | | 12/31/2008 | | 7/1/2008 through
12/31/2008 |
| | | |
Actual - Class A | | $ | 1,000.00 | | $ | 606.12 | | $ | 8.02 |
| | | |
Hypothetical - Class A | | $ | 1,000.00 | | $ | 1,015.14 | | $ | 10.07 |
(5% return before expenses) | | | | | | | | | |
| | | |
Actual - Class B | | $ | 1,000.00 | | $ | 605.17 | | $ | 11.02 |
| | | |
Hypothetical - Class B | | $ | 1,000.00 | | $ | 1,011.41 | | $ | 13.81 |
(5% return before expenses) | | | | | | | | | |
| | | |
Actual - Class C | | $ | 1,000.00 | | $ | 605.86 | | $ | 11.09 |
| | | |
Hypothetical - Class C | | $ | 1,000.00 | | $ | 1,011.33 | | $ | 13.89 |
(5% return before expenses) | | | | | | | | | |
| * | Expenses are equal to the Fund’s annualized expense ratio of 1.99% for Class A, 2.73% for Class B, and 2.75% for Class C, which is net of any expenses paid indirectly, multiplied by the average account value over the period, multiplied by 184 days/366 days (to reflect the partial year period.) The Fund’s ending account value on the first line of each share class in the table is based on its actual total return of (39.39)% for Class A, (39.48)% for Class B, and (39.41)% for Class C for the six-month period of July 1, 2008, to December 31, 2008. |
Timothy Plan Top Ten Holdings / Industries [52]
AGGRESSIVE GROWTH FUND
SCHEDULE OF INVESTMENTS
As of December 31, 2008
COMMON STOCKS - - 95.05.%
| | | | | |
| number of shares | | | | market value |
| | |
| | AGRICULTURAL CHEMICALS - 0.48% | | | |
| 3,800 | | Intrepid Potash, Inc. * | | $ | 78,926 |
| | | | | |
| | |
| | AUTOMOTIVE/TRUCK PARTS & EQUIPMENT - ORIGINAL - 0.76% | | | |
| 14,980 | | Titan International, Inc. | | | 123,585 |
| | | | | |
| | |
| | COAL - 0.96% | | | |
| 5,500 | | Consol Energy, Inc. | | | 157,190 |
| | | | | |
| | |
| | COMMERCIAL BANKS - SOUTHERN U.S. - 0.65% | | | |
| 3,600 | | Bank of the Ozarks, Inc. | | | 106,704 |
| | | | | |
| | |
| | COMMERCIAL SERVICES - 1.50% | | | |
| 1,575 | | Alliance Data Systems Corp. * | | | 73,285 |
| 1,375 | | HMS Holdings Corp. * | | | 43,340 |
| 6,458 | | Quanta Services, Inc. * | | | 127,868 |
| | | | | |
| | | | | 244,493 |
| | | | | |
| | |
| | COMMERCIAL SERVICES - FINANCIAL - 4.04% | | | |
| 4,150 | | BankRate, Inc. * | | | 157,700 |
| 1,820 | | Global Payments, Inc. | | | 59,678 |
| 3,835 | | Heartland Payment Systems, Inc. | | | 67,112 |
| 8,175 | | Lender Processing Services, Inc. | | | 240,754 |
| 9,772 | | Net 1 UEPS Technologies, Inc. * | | | 133,876 |
| | | | | |
| | | | | 659,120 |
| | | | | |
| | |
| | COMPUTER AIDED DESIGN - 2.17% | | | |
| 8,850 | | Ansys, Inc. * | | | 246,826 |
| 8,560 | | Parametric Technology Corp. * | | | 108,284 |
| | | | | |
| | | | | 355,110 |
| | | | | |
| | |
| | COMPUTER MEMORY DEVICES - 1.39% | | | |
| 4,178 | | Data Domain, Inc. * | | | 78,546 |
| 7,495 | | NetApp, Inc. * | | | 104,705 |
| 6,670 | | Netezza Corp. * | | | 44,289 |
| | | | | |
| | | | | 227,540 |
| | | | | |
| | |
| | COMPUTER SERVICES - 3.72% | | | |
| 6,215 | | CACI International, Inc. - Class A * | | | 280,234 |
| 9,025 | | Cognizant Technology Solutions Corp. - Class A * | | | 162,991 |
| 7,105 | | Syntel, Inc. | | | 164,268 |
| | | | | |
| | | | | 607,493 |
| | | | | |
| | |
| | CONSULTING SERVICES - 3.58% | | | |
| 4,995 | | FTI Consulting, Inc. * | | | 223,177 |
| 6,000 | | Navigant Consulting, Inc. * | | | 95,220 |
| 13,650 | | SAIC, Inc. * | | | 265,902 |
| | | | | |
| | | | | 584,299 |
| | | | | |
The accompanying notes are an integral part of these financial statements.
Timothy Plan Aggressive Growth Fund [53]
AGGRESSIVE GROWTH FUND
SCHEDULE OF INVESTMENTS
As of December 31, 2008
COMMON STOCKS - - 95.05% (continued)
| | | | | |
| number of shares | | | | market value |
| | |
| | CONTAINERS - PAPER/PLASTIC - 1.08% | | | |
| 7,100 | | Pactiv Corp. * | | $ | 176,648 |
| | | | | |
| | |
| | COSMETICS & TOILETRIES - 0.67% | | | |
| 1,525 | | Chattem, Inc. * | | | 109,083 |
| | | | | |
| | |
| | DENTAL SUPPLIES & EQUIPMENT - 0.39% | | | |
| 6,050 | | Sirona Dental Systems, Inc. * | | | 63,525 |
| | | | | |
| | |
| | DIAGNOSTIC EQUIPMENT - 0.24% | | | |
| 1,500 | | Immucor, Inc. * | | | 39,870 |
| | | | | |
| | |
| | DIAGNOSTIC KITS - 0.16% | | | |
| 1,040 | | Meridian Bioscience, Inc. | | | 26,489 |
| | | | | |
| | |
| | DISTRIBUTION/WHOLESALE - 1.15% | | | |
| 13,665 | | FGX International Holdings, Ltd. * | | | 187,757 |
| | | | | |
| | |
| | DIVERSIFIED MANUFACTURING OPERATIONS - 0.64% | | | |
| 3,786 | | Harsco Corp. | | | 104,796 |
| | | | | |
| | |
| | ELECTRIC PRODUCTS - MISCELLANEOUS - 2.02% | | | |
| 10,938 | | Ametek, Inc. | | | 330,437 |
| | | | | |
| | |
| | ELECTRONIC COMPONENTS - SEMICONDUCTORS - 3.31% | | | |
| 11,000 | | Broadcom Corp. - Class A * | | | 186,670 |
| 4,550 | | Microsemi Corp. * | | | 57,512 |
| 6,255 | | Netlogic Microsystems, Inc. * | | | 137,673 |
| 8,950 | | Xilinx, Inc. | | | 159,489 |
| | | | | |
| | | | | 541,344 |
| | | | | |
| | |
| | ELECTRONIC CONNECTORS - 1.76% | | | |
| 11,964 | | Amphenol Corp. - Class A | | | 286,897 |
| | | | | |
| | |
| | ELECTRONIC MEASURING INSTRUMENTS - 1.57% | | | |
| 2,410 | | Axsys Technologies, Inc. * | | | 132,213 |
| 4,050 | | Flir Systems, Inc. * | | | 124,254 |
| | | | | |
| | | | | 256,467 |
| | | | | |
| | |
| | ENGINEERING/R&D SERVICES - 1.44% | | | |
| 6,515 | | Stanley, Inc. * | | | 235,973 |
| | | | | |
| | |
| | ENTERPRISE SOFTWARE/SERVICES - 4.48% | | | |
| 24,528 | | Ariba, Inc. * | | | 176,847 |
| 9,190 | | Concur Technologies, Inc. * | | | 301,616 |
| 18,425 | | Informatica Corp. * | | | 252,975 |
| | | | | |
| | | | | 731,438 |
| | | | | |
The accompanying notes are an integral part of these financial statements.
Timothy Plan Aggressive Growth Fund [54]
AGGRESSIVE GROWTH FUND
SCHEDULE OF INVESTMENTS
As of December 31, 2008
COMMON STOCKS - - 95.05% (continued)
| | | | | |
| number of shares | | | | market value |
| | |
| | ENVIRONMENTAL CONSULTING & ENGINEERING - 1.71% | | | |
| 11,537 | | Tetra Tech, Inc. * | | $ | 278,619 |
| | | | | |
| | |
| | FINANCE - INVESTMENT BANKER/BROKER - 2.32% | | | |
| 5,570 | | Interactive Brokers Group, Inc.* | | | 99,647 |
| 6,075 | | Stifel Financial Corp. * | | | 278,539 |
| | | | | |
| | | | | 378,186 |
| | | | | |
| | |
| | HOSPITAL BEDS/EQUIPMENT - 0.51% | | | |
| 5,090 | | Hill-Rom Holdings, Inc. | | | 83,781 |
| | | | | |
| | |
| | INDUSTRIAL GASES - 0.84% | | | |
| 3,500 | | Airgas, Inc. | | | 136,465 |
| | | | | |
| | |
| | INSTRUMENTS - CONTROLS - 2.02% | | | |
| 4,890 | | Mettler Toledo International, Inc. * | | | 329,586 |
| | | | | |
| | |
| | INSTRUMENTS - SCIENTIFIC - 0.79% | | | |
| 3,500 | | Waters Corp. * | | | 128,275 |
| | | | | |
| | |
| | INTERNET APPLICATIONS SOFTWARE - 0.47% | | | |
| 4,260 | | Vocus, Inc. * | | | 77,575 |
| | | | | |
| | |
| | INTERNET INFRASTRUCTURE SOFTWARE - 0.28% | | | |
| 2,025 | | F5 Networks, Inc. * | | | 46,292 |
| | | | | |
| | |
| | INTERNET SECURITY - 1.28% | | | |
| 6,040 | | McAfee Inc. * | | | 208,803 |
| | | | | |
| | |
| | INVESTMENT MANAGEMENT/ADVISORY SERVICES - 0.54% | | | |
| 5,200 | | Federated Investors, Inc. - Class B | | | 88,192 |
| | | | | |
| | |
| | MACHINERY - PUMPS - 0.89% | | | |
| 2,819 | | Flowserve Corp. | | | 145,178 |
| | | | | |
| | |
| | MEDICAL - BIOMEDICAL/GENE - 2.22% | | | |
| 5,270 | | Alexion Pharmaceuticals, Inc. * | | | 190,721 |
| 1,500 | | OSI Pharmaceuticals, Inc. * | | | 58,575 |
| 1,800 | | United Therapeutics Corp. * | | | 112,590 |
| | | | | |
| | | | | 361,886 |
| | | | | |
| | |
| | MEDICAL - DRUGS - 2.17% | | | |
| 2,990 | | Cephalon, Inc. * | | | 230,350 |
| 14,433 | | Eurand NV * | | | 124,268 |
| | | | | |
| | | | | 354,618 |
| | | | | |
The accompanying notes are an integral part of these financial statements.
Timothy Plan Aggressive Growth Fund [55]
AGGRESSIVE GROWTH FUND
SCHEDULE OF INVESTMENTS
As of December 31, 2008
COMMON STOCKS - - 95.05% (continued)
| | | | | |
| number of shares | | | | market value |
| | |
| | MEDICAL - GENERIC DRUGS - 1.05% | | | |
| 5,320 | | Perrigo Co. | | $ | 171,889 |
| | | | | |
| | |
| | MEDICAL - OUTPATIENT/HOME MEDICAL CARE - 1.52% | | | |
| 3,200 | | Amedisys, Inc. * | | | 132,288 |
| 3,975 | | Gentiva Health Services, Inc. * | | | 116,308 |
| | | | | |
| | | | | 248,596 |
| | | | | |
| | |
| | MEDICAL - WHOLESALE DRUG DISTRIBUTION - 0.42% | | | |
| 1,925 | | AmerisourceBergen Corp. | | | 68,645 |
| | | | | |
| | |
| | MEDICAL LABS & TESTING SERVICES - 0.47% | | | |
| 3,931 | | Icon plc (ADR) * | | | 77,401 |
| | | | | |
| | |
| | MEDICAL PRODUCTS - 2.21% | | | |
| 1,100 | | Haemonetics Corp. * | | | 62,150 |
| 6,610 | | Henry Shein, Inc. * | | | 242,521 |
| 2,625 | | Luminex Corp. * | | | 56,070 |
| | | | | |
| | | | | 360,741 |
| | | | | |
| | |
| | MEDICAL STERILIZATION PRODUCTS - 0.45% | | | |
| 3,100 | | STERIS Corp. | | | 74,059 |
| | | | | |
| | |
| | METAL PROCESSORS & FABRICATION - 0.34% | | | |
| 2,742 | | RBC Bearings, Inc. * | | | 55,608 |
| | | | | |
| | |
| | MULTI-LINE INSURANCE - 0.56% | | | |
| 3,400 | | HCC Insurance Holdings, Inc. | | | 90,950 |
| | | | | |
| | |
| | OIL - FIELD SERVICES - 1.58% | | | |
| 16,230 | | Superior Energy Services, Inc. * | | | 258,544 |
| | | | | |
| | |
| | OIL COMPANY - EXPLORATION & PRODUCTION - 2.56% | | | |
| 2,675 | | Comstock Resources, Inc. * | | | 126,394 |
| 8,501 | | Range Resources Corp. | | | 292,349 |
| | | | | |
| | | | | 418,743 |
| | | | | |
| | |
| | OIL FIELD MACHINERY & EQUIPMENT - 1.41% | | | |
| 9,431 | | National Oilwell Varco, Inc. * | | | 230,494 |
| | | | | |
| | |
| | PATIENT MONITORING EQUIPMENT - 1.99% | | | |
| 4,275 | | CardioNet, Inc. * | | | 105,379 |
| 7,389 | | Masimo Corp. * | | | 220,414 |
| | | | | |
| | | | | 325,793 |
| | | | | |
The accompanying notes are an integral part of these financial statements.
Timothy Plan Aggressive Growth Fund [56]
AGGRESSIVE GROWTH FUND
SCHEDULE OF INVESTMENTS
As of December 31, 2008
COMMON STOCKS - - 95.05% (continued)
| | | | | |
| number of shares | | | | market value |
| | |
| | PHARMACY SERVICES - 0.78% | | | |
| 5,200 | | Catalyst Health Solutions, Inc. * | | $ | 126,620 |
| | | | | |
| | |
| | PHYSICAL THERAPY/REHAB CENTERS - 0.46% | | | |
| 2,700 | | Psychiatric Solutions, Inc. * | | | 75,195 |
| | | | | |
| | |
| | PRINTING - COMMERCIAL - 0.78% | | | |
| 6,885 | | VistaPrint, Ltd. * | | | 128,130 |
| | | | | |
| | |
| | PRIVATE CORRECTIONS - 3.38% | | | |
| 30,620 | | The Geo Group, Inc. * | | | 552,079 |
| | | | | |
| | |
| | PROPERTY/CASUALTY INSURANCE - 0.51% | | | |
| 4,725 | | Fidelity National Financial, Inc. - Class A | | | 83,869 |
| | | | | |
| | |
| | REINSURANCE - 5.40% | | | |
| 3,300 | | Allied World Assurance Co. Holdings, Ltd. | | | 133,980 |
| 4,800 | | IPC Holdings, Ltd. | | | 143,520 |
| 3,850 | | PartnerRe, Ltd. | | | 274,390 |
| 4,300 | | Platinum Underwriters Holdings, Ltd. | | | 155,144 |
| 6,700 | | Validus Holdings, Ltd. | | | 175,272 |
| | | | | |
| | | | | 882,306 |
| | | | | |
| | |
| | RETAIL - APPAREL/SHOE - 0.92% | | | |
| 1,800 | | Aeropostale, Inc. * | | | 28,980 |
| 5,600 | | The Childrens Place Retail Stores, Inc. * | | | 121,408 |
| | | | | |
| | | | | 150,388 |
| | | | | |
| | |
| | RETAIL - DISCOUNT - 2.12% | | | |
| 8,280 | | Dollar Tree, Inc. * | | | 346,104 |
| | | | | |
| | |
| | RETAIL - PAWN SHOPS - 0.60% | | | |
| 6,400 | | Ezcorp, Inc. - Class A * | | | 97,344 |
| | | | | |
| | |
| | RETAIL - RESTAURANTS - 0.74% | | | |
| 15,520 | | Texas Roadhouse, Inc. - Class A * | | | 120,280 |
| | | | | |
| | |
| | SAVINGS & LOANS/THRIFTS - EASTERN U.S. - 1.16% | | | |
| 3,500 | | Astoria Financial Corp. | | | 57,680 |
| 7,350 | | People’s United Financial, Inc. | | | 131,050 |
| | | | | |
| | | | | 188,730 |
| | | | | |
| | |
| | SCHOOLS - 2.87% | | | |
| 8,180 | | DeVry, Inc. | | | 469,614 |
| | | | | |
The accompanying notes are an integral part of these financial statements.
Timothy Plan Aggressive Growth Fund [57]
AGGRESSIVE GROWTH FUND
SCHEDULE OF INVESTMENTS
As of December 31, 2008
COMMON STOCKS - - 95.05% (continued)
| | | | | |
| number of shares | | | | market value |
| | |
| | TELECOMMUNICATION EQUIPMENT - 2.30% | | | |
| 2,025 | | Comtech Telecommunications Corp. * | | $ | 92,785 |
| 12,555 | | Nice Systems, Ltd. (ADR) * | | | 282,111 |
| | | | | |
| | | | | 374,896 |
| | | | | |
| | |
| | THERAPEUTICS - 0.94% | | | |
| 5,050 | | BioMarin Pharmaceutical, Inc. * | | | 89,890 |
| 4,500 | | Isis Pharmaceuticals, Inc. * | | | 63,810 |
| | | | | |
| | | | | 153,700 |
| | | | | |
| | |
| | TRANSPORTATION - AIR FREIGHT - 0.96% | | | |
| 8,330 | | Atlas Air Worldwide Holdings, Inc. * | | | 157,437 |
| | | | | |
| | |
| | WIRELESS EQUIPMENT - 2.37% | | | |
| 13,190 | | American Tower Corp. - Class A * | | | 386,731 |
| | | | | |
| | Total Common Stocks (cost $18,204,817) | | | 15,527,526 |
| | | | | |
| |
| MASTER LIMITED PARTNERSHIPS - 1.45% | | | |
| number of shares | | | | market value |
| | |
| 7,941 | | Lazard, Ltd. - Class A | | | 236,165 |
| | | | | |
| | Total Master Limited Partnerships (cost $292,236) | | | 236,165 |
| | | | | |
| |
| SHORT TERM INVESTMENTS - 3.17% | | | |
| number of shares | | | | market value |
| | |
| 518,126 | | Timothy Plan Money Market Fund, 0.38% (A) (B) | | | 518,126 |
| | | | | |
| | |
| | Total Short-Term Investments (cost $518,126) | | | 518,126 |
| | | | | |
| | |
| | TOTAL INVESTMENTS (cost $19,015,179) - 99.67% | | $ | 16,281,817 |
| | | | | |
| | |
| | OTHER ASSETS LESS LIABILITIES - 0.33% | | | 53,956 |
| | | | | |
| | |
| | NET ASSETS - 100.00% | | $ | 16,335,773 |
| | | | | |
(ADR) American Depositary Receipt.
* Non-income producing securities.
(A) Variable rate security; the rate shown represents the yield at December 31, 2008.
(B) Affiliated fund.
The accompanying notes are an integral part of these financial statements.
Timothy Plan Aggressive Growth Fund [58]
AGGRESSIVE GROWTH FUND
STATEMENT OF ASSETS AND LIABILITIES
As of December 31, 2008
| | | |
ASSETS | | | |
| | | amount |
Investments in Unaffiliated Securities at Value (cost $18,497,053) [NOTE 1] | | $ | 15,763,691 |
Investments in Affiliated Securities at Value (cost $518,126) [NOTE 1] | | | 518,126 |
Receivables for: | | | |
Investments Sold | | | 151,677 |
Fund Shares Sold | | | 99,073 |
Interest | | | 390 |
Dividends | | | 2,713 |
Prepaid Expenses | | | 12,408 |
| | | |
| |
Total Assets | | $ | 16,548,078 |
| | | |
| |
LIABILITIES | | | |
| | | amount |
| |
Payable for Investments Purchased | | $ | 123,887 |
Payable for Fund Shares Redeemed | | | 47,639 |
Accrued Advisory Fees | | | 11,160 |
Accrued 12b-1 Fees Class A | | | 2,946 |
Accrued 12b-1 Fees Class B | | | 416 |
Accrued 12b-1 Fees Class C | | | 1,036 |
Accrued Expenses | | | 25,221 |
| | | |
| |
Total Liabilities | | $ | 212,305 |
| | | |
| |
NET ASSETS | | | |
| | | amount |
| |
Class A Shares: | | | |
Net Assets (unlimited shares of $0.001 par beneficial interest authorized; 3,929,180 shares outstanding) | | $ | 14,574,553 |
Net Asset Value and Redemption Price Per Class A Share ($14,574,553 / 3,929,180 shares) | | $ | 3.71 |
Offering Price Per Share ($3.71 / 0.945) | | $ | 3.93 |
Class B Shares: | | | |
Net Assets (unlimited shares of $0.001 par beneficial interest authorized; 141,885 shares outstanding) | | $ | 488,989 |
Net Asset Value and Offering Price Per Class B Share ($488,989 / 141,885 shares) | | $ | 3.45 |
Minimum Redemption Price Per Class B Share ($3.45 * 0.99) | | $ | 3.42 |
Class C Shares: | | | |
Net Assets (unlimited shares of $0.001 par beneficial interest authorized; 368,174 shares outstanding) | | $ | 1,272,231 |
Net Asset Value and Offering Price Per Class C Share ($1,272,231 / 368,174 shares) | | $ | 3.46 |
Minimum Redemption Price Per Share ($3.46 * 0.99) | | $ | 3.43 |
| |
Net Assets | | $ | 16,335,773 |
| | | |
| |
SOURCES OF NET ASSETS | | | |
| | | amount |
| |
At December 31, 2008, Net Assets Consisted of: | | | |
Paid-in Capital | | $ | 26,657,362 |
Accumulated Undistributed Net Realized Gain (Loss) on Investments | | | (7,588,227) |
Net Unrealized Appreciation (Depreciation) in Value of Investments | | | (2,733,362) |
| | | |
| |
Net Assets | | $ | 16,335,773 |
| | | |
The accompanying notes are an integral part of these financial statements.
Timothy Plan Aggressive Growth Fund [59]
AGGRESSIVE GROWTH FUND
STATEMENT OF OPERATIONS
For the Year Ended December 31, 2008
| | | |
INVESTMENT INCOME | | | |
| | | amount |
| |
Interest on Affiliated Investments | | $ | 22,474 |
Dividends | | | 71,461 |
| | | |
| |
Total Investment Income | | | 93,935 |
| | | |
| |
EXPENSES | | | |
| | | amount |
| |
Investment Advisory Fees [NOTE 3] | | | 204,332 |
12b-1 Fees (Class A = $53,323, Class B = $8,247, Class C = $18,852) [NOTE 3] | | | 80,422 |
Fund Accounting, Transfer Agency, & Administration Fees | | | 42,697 |
Out-of-Pocket Expense | | | 37,315 |
Registration Fees | | | 24,972 |
Custodian Fees | | | 23,797 |
Audit Fees | | | 5,278 |
Miscellaneous Expense | | | 5,173 |
Printing Expense | | | 3,111 |
Trustee Fees | | | 2,907 |
CCO Fees | | | 2,148 |
Insurance Expense | | | 853 |
| | | |
| |
Total Net Expenses | | | 433,005 |
| | | |
| |
Net Investment Income (Loss) | | | (339,070) |
| | | |
| |
REALIZED AND UNREALIZED GAIN (LOSS) ON INVESTMENTS | | | |
| | | amount |
| |
Net Realized Gain (Loss) on Unaffiliated Investments | | | (7,557,154) |
Net Increase from Payments by Affiliates [NOTE 4] | | | 24,684 |
Change in Unrealized Appreciation/Depreciation of Investments | | | (5,095,846) |
| | | |
Net Realized and Unrealized Gain (Loss) on Investments | | | (12,628,316) |
| | | |
| |
Net Increase (Decrease) in Net Assets Resulting from Operations | | $ | (12,967,386) |
| | | |
The accompanying notes are an integral part of these financial statements.
Timothy Plan Aggressive Growth Fund [60]
AGGRESSIVE GROWTH FUND
STATEMENTS OF CHANGES IN NET ASSETS
INCREASE (DECREASE) IN NET ASSETS
| | | | | | | |
| | | year ended
12/31/08 | | | year ended
12/31/07 |
| | |
Operations: | | | | | | | |
Net Investment Income (Loss) | | $ | (339,070) | | | $ | (288,823) |
Net Realized Gain (Loss) on Investments | | | (7,557,154) | | | | 3,055,958 |
Net Increase from Payments by Affiliates [NOTE 4] | | | 24,684 | | | | - |
Net Change in Unrealized Appreciation/Depreciation of Investments | | | (5,095,846) | | | | (713,394) |
| | | | | | | |
Net Increase (Decrease) in Net Assets (resulting from operations) | | | (12,967,386) | | | | 2,053,741 |
| | | | | | | |
| | |
Distributions to Shareholders From: | | | | | | | |
Net Realized Gains: | | | | | | | |
Class A | | | (42,783) | | | | (2,436,130) |
Class B | | | (1,613) | | | | (119,047) |
Class C | | | (4,029) | | | | (245,732) |
| | | | | | | |
Total Distributions | | | (48,425) | | | | (2,800,909) |
| | | | | | | |
| | |
Capital Share Transactions: | | | | | | | |
Proceeds from Shares Sold: | | | | | | | |
Class A | | | 7,041,334 | * | | | 8,677,760 |
Class B | | | 3,577 | | | | 2,250 |
Class C | | | 343,835 | | | | 601,086 |
Dividends Reinvested: | | | | | | | |
Class A | | | 42,015 | | | | 2,356,131 |
Class B | | | 1,381 | | | | 101,485 |
Class C | | | 3,918 | | | | 225,263 |
Cost of Shares Redeemed: | | | | | | | |
Class A | | | (5,038,562) | | | | (9,581,967) |
Class B | | | (144,927) | * | | | (231,161) |
Class C | | | (306,988) | | | | (368,948) |
| | | | | | | |
Net Increase (Decrease) in Net Assets (resulting from capital share transactions) | | | 1,945,583 | | | | 1,781,899 |
| | | | | | | |
Total Increase (Decrease) in Net Assets | | | (11,070,228) | | | | 1,034,731 |
| | | | | | | |
| | |
Net Assets: | | | | | | | |
Beginning of year | | | 27,406,001 | | | | 26,371,270 |
| | | | | | | |
| | |
End of year | | $ | 16,335,773 | | | $ | 27,406,001 |
| | | | | | | |
Accumulated Undistributed Net Investment Income | | $ | - | | | $ | - |
| | | | | | | |
| | |
Shares of Capital Stock of the Fund Sold and Redeemed: | | | | | | | |
Shares Sold: | | | | | | | |
Class A | | | 1,298,923 | * | | | 1,134,927 |
Class B | | | 624 | | | | 280 |
Class C | | | 68,482 | | | | 84,165 |
Shares Reinvested: | | | | | | | |
Class A | | | 11,929 | | | | 351,662 |
Class B | | | 422 | | | | 16,186 |
Class C | | | 1,195 | | | | 35,870 |
Shares Redeemed: | | | | | | | |
Class A | | | (916,790) | | | | (1,244,805) |
Class B | | | (30,246) | * | | | (32,039) |
Class C | | | (58,719) | | | | (52,200) |
| | | | | | | |
Net Increase (Decrease) in Number of Shares Outstanding | | | 375,820 | | | | 294,046 |
| | | | | | | |
| | |
| * | | Includes automatic conversion of Class B shares ($16,599 representing 4,811 shares) to Class A shares ($16,599 representing 4,474 shares). |
The accompanying notes are an integral part of these financial statements.
Timothy Plan Aggressive Growth Fund [61]
AGGRESSIVE GROWTH FUND
FINANCIAL HIGHLIGHTS
The table below sets forth financial data for one share of capital stock outstanding throughout each period presented.
AGGRESSIVE GROWTH FUND - CLASS A SHARES
| | | | | | | | | | | | | | | | | | |
| | | year
ended
12/31/08 | | | year
ended
12/31/07 | | year
ended
12/31/06 | | year
ended
12/31/05 | | | year
ended
12/31/04 | |
| | | | | |
Per Share Operating Performance: | | | | | | | | | | | | | | | | | | |
Net Asset Value at Beginning of Year | | $ | 6.80 | | | $ | 7.04 | | $ | 7.38 | | $ | 6.95 | | | $ | 6.34 | |
| | | | | | | | | | | | | | | | | | |
| | | | | |
Income from Investment Operations: | | | | | | | | | | | | | | | | | | |
Net Investment Income (Loss) | | | (0.07) | | | | (0.06) | | | (0.08) | | | (0.09) | (A) | | | (0.07) | (A) |
Net Realized and Unrealized Gain (Loss) on Investments | | | (3.01) | | | | 0.59 | | | 0.65 | | | 0.70 | | | | 0.68 | |
| | | | | | | | | | | | | | | | | | |
Total from Investment Operations | | | (3.08) | | | | 0.53 | | | 0.57 | | | 0.61 | | | | 0.61 | |
| | | | | | | | | | | | | | | | | | |
| | | | | |
Less Distributions: | | | | | | | | | | | | | | | | | | |
Dividends from Realized Gains | | | (0.01) | | | | (0.77) | | | (0.91) | | | (0.18) | | | | - | |
| | | | | | | | | | | | | | | | | | |
Total Distributions | | | (0.01) | | | | (0.77) | | | (0.91) | | | (0.18) | | | | - | |
| | | | | | | | | | | | | | | | | | |
| | | | | |
Net Asset Value at End of Year | | $ | 3.71 | | | $ | 6.80 | | $ | 7.04 | | $ | 7.38 | | | $ | 6.95 | |
| | | | | | | | | | | | | | | | | | |
| | | | | |
Total Return (B)(C) | | | (45.27)% | | | | 7.66% | | | 7.50% | | | 8.73% | | | | 9.62% | |
| | | | | |
Ratios/Supplemental Data: | | | | | | | | | | | | | | | | | | |
Net Assets, End of Year (in 000s) | | $ | 14,575 | | | $ | 24,041 | | $ | 23,187 | | $ | 18,403 | | | $ | 16,453 | |
| | | | | |
Ratio of Expenses to Average Net Assets: | | | | | | | | | | | | | | | | | | |
Before Reimbursement and Waiver/Recoupment of Expenses by Adviser | | | 1.72% | | | | 1.52% | | | 1.59% | | | 1.59% | | | | 1.66% | |
After Reimbursement and Waiver/Recoupment of Expenses by Adviser | | | 1.72% | | | | 1.55% | | | 1.60% | | | 1.60% | | | | 1.60% | |
| | | | | |
Ratio of Net Investment Income (Loss) to Average Net Assets: | | | | | | | | | | | | | | | | | | |
Before Reimbursement and Waiver/Recoupment of Expenses by Adviser | | | (1.33)% | | | | (0.94)% | | | (1.17)% | | | (1.32)% | | | | (1.38)% | |
After Reimbursement and Waiver/Recoupment of Expenses by Adviser | | | (1.33)% | | | | (0.97)% | | | (1.18)% | | | (1.33)% | | | | (1.32)% | |
| | | | | |
Portfolio Turnover | | | 243.59% | (D) | | | 58.55% | | | 96.39% | | | 102.63% | | | | 102.46% | |
| | |
| (A) | | Per share amounts calculated using average shares method. |
| (B) | | Total return calculation does not reflect sales load. |
| (C) | | Total return in the above table represents the rate that the investor would have earned or lost on an investment in the Fund assuming reinvestment of dividends. Total return would have been higher or lower if certain expenses had not been reimbursed, waived or recouped. |
| (D) | | On January 1, 2008, Chartwell Investment Partners became sub-adviser for the Fund |
The accompanying notes are an integral part of these financial statements.
Timothy Plan Aggressive Growth Fund [62]
AGGRESSIVE GROWTH FUND
FINANCIAL HIGHLIGHTS
The table below sets forth financial data for one share of capital stock outstanding throughout each period presented.
AGGRESSIVE GROWTH FUND - CLASS B SHARES
| | | | | | | | | | | | | | | | | | |
| | | year
ended
12/31/08 | | | year
ended
12/31/07 | | year
ended
12/31/06 | | year
ended
12/31/05 | | | year
ended
12/31/04 | |
| | | | | |
Per Share Operating Performance: | | | | | | | | | | | | | | | | | | |
Net Asset Value at Beginning of Year | | $ | 6.36 | | | $ | 6.68 | | $ | 7.09 | | $ | 6.74 | | | $ | 6.19 | |
| | | | | | | | | | | | | | | | | | |
| | | | | |
Income from Investment Operations: | | | | | | | | | | | | | | | | | | |
Net Investment Income (Loss) | | | (0.12) | | | | (0.12) | | | (0.14) | | | (0.14) | (A) | | | (0.13) | (A) |
Net Realized and Unrealized Gain (Loss) on Investments | | | (2.78) | | | | 0.57 | | | 0.64 | | | 0.67 | | | | 0.68 | |
| | | | | | | | | | | | | | | | | | |
Total from Investment Operations | | | (2.90) | | | | 0.45 | | | 0.50 | | | 0.53 | | | | 0.55 | |
| | | | | | | | | | | | | | | | | | |
| | | | | |
Less Distributions: | | | | | | | | | | | | | | | | | | |
Dividends from Realized Gains | | | (0.01) | | | | (0.77) | | | (0.91) | | | (0.18) | | | | - | |
| | | | | | | | | | | | | | | | | | |
Total Distributions | | | (0.01) | | | | (0.77) | | | (0.91) | | | (0.18) | | | | - | |
| | | | | | | | | | | | | | | | | | |
| | | | | |
Net Asset Value at End of Year | | $ | 3.45 | | | $ | 6.36 | | $ | 6.68 | | $ | 7.09 | | | $ | 6.74 | |
| | | | | | | | | | | | | | | | | | |
| | | | | |
Total Return (B)(C) | | | (45.57)% | | | | 6.87% | | | 6.83% | | | 7.82% | | | | 8.89% | |
| | | | | |
Ratios/Supplemental Data: | | | | | | | | | | | | | | | | | | |
Net Assets, End of Year (in 000s) | | $ | 489 | | | $ | 1,088 | | $ | 1,247 | | $ | 1,392 | | | $ | 1,519 | |
| | | | | |
Ratio of Expenses to Average Net Assets: | | | | | | | | | | | | | | | | | | |
Before Reimbursement and Waiver/Recoupment of Expenses by Adviser | | | 2.45% | | | | 2.26% | | | 2.32% | | | 2.34% | | | | 2.41% | |
After Reimbursement and Waiver/Recoupment of Expenses by Adviser | | | 2.45% | | | | 2.29% | | | 2.35% | | | 2.35% | | | | 2.35% | |
| | | | | |
Ratio of Net Investment Income (Loss) to Average Net Assets: | | | | | | | | | | | | | | | | | | |
Before Reimbursement and Waiver/Recoupment of Expenses by Adviser | | | (2.06)% | | | | (1.70)% | | | (1.90)% | | | (2.07)% | | | | (2.13)% | |
After Reimbursement and Waiver/Recoupment of Expenses by Adviser | | | (2.06)% | | | | (1.73)% | | | (1.93)% | | | (2.08)% | | | | (2.07)% | |
| | | | | |
Portfolio Turnover | | | 243.59% | (D) | | | 58.55% | | | 96.39% | | | 102.63% | | | | 102.46% | |
| | |
| (A) | | Per share amounts calculated using average shares method. |
| (B) | | Total return calculation does not reflect redemption fee. |
| (C) | | Total return in the above table represents the rate that the investor would have earned or lost on an investment in the Fund assuming reinvestment of dividends. Total return would have been higher or lower if certain expenses had not been reimbursed, waived or recouped. |
| (D) | | On January 1, 2008, Chartwell Investment Partners became sub-adviser for the Fund |
The accompanying notes are an integral part of these financial statements.
Timothy Plan Aggressive Growth Fund [63]
AGGRESSIVE GROWTH FUND
FINANCIAL HIGHLIGHTS
The table below sets forth financial data for one share of capital stock outstanding throughout each period presented.
AGGRESSIVE GROWTH FUND - CLASS C SHARES
| | | | | | | | | | | | | | | | | | |
| | | year
ended
12/31/08 | | | year
ended
12/31/07 | | year
ended
12/31/06 | | year
ended
12/31/05 | | | period ended
12/31/04 (A) | |
| | | | | |
Per Share Operating Performance: | | | | | | | | | | | | | | | | | | |
Net Asset Value at Beginning of Period | | $ | 6.37 | | | $ | 6.69 | | $ | 7.11 | | $ | 6.75 | | | $ | 6.24 | |
| | | | | | | | | | | | | | | | | | |
| | | | | |
Income from Investment Operations: | | | | | | | | | | | | | | | | | | |
Net Investment Income (Loss) | | | (0.11) | | | | (0.10) | | | (0.11) | | | (0.14) | (B) | | | (0.06) | (B) |
Net Realized and Unrealized Gain (Loss) on Investments | | | (2.79) | | | | 0.55 | | | 0.60 | | | 0.68 | | | | 0.57 | |
| | | | | | | | | | | | | | | | | | |
Total from Investment Operations | | | (2.90) | | | | 0.45 | | | 0.49 | | | 0.54 | | | | 0.51 | |
| | | | | | | | | | | | | | | | | | |
| | | | | |
Less Distributions: | | | | | | | | | | | | | | | | | | |
Dividends from Realized Gains | | | (0.01) | | | | (0.77) | | | (0.91) | | | (0.18) | | | | - | |
| | | | | | | | | | | | | | | | | | |
Total Distributions | | | (0.01) | | | | (0.77) | | | (0.91) | | | (0.18) | | | | - | |
| | | | | | | | | | | | | | | | | | |
| | | | | |
Net Asset Value at End of Period | | $ | 3.46 | | | $ | 6.37 | | $ | 6.69 | | $ | 7.11 | | | $ | 6.75 | |
| | | | | | | | | | | | | | | | | | |
| | | | | |
Total Return (C)(D) | | | (45.50)% | | | | 6.86% | | | 6.65% | | | 7.96% | | | | 8.17% | (E) |
| | | | | |
Ratios/Supplemental Data: | | | | | | | | | | | | | | | | | | |
Net Assets, End of Period (in 000s) | | $ | 1,272 | | | $ | 2,277 | | $ | 1,937 | | $ | 1,358 | | | $ | 690 | |
| | | | | |
Ratio of Expenses to Average Net Assets: | | | | | | | | | | | | | | | | | | |
Before Reimbursement and Waiver/Recoupment of Expenses by Adviser | | | 2.47% | | | | 2.27% | | | 2.35% | | | 2.34% | | | | 2.41% | (F) |
After Reimbursement and Waiver/Recoupment of Expenses by Adviser | | | 2.47% | | | | 2.30% | | | 2.35% | | | 2.35% | | | | 2.35% | (F) |
| | | | | |
Ratio of Net Investment Income (Loss) to Average Net Assets: | | | | | | | | | | | | | | | | | | |
Before Reimbursement and Waiver/Recoupment of Expenses by Adviser | | | (2.08)% | | | | (1.70)% | | | (1.94)% | | | (2.07)% | | | | (2.13)% | (F) |
After Reimbursement and Waiver/Recoupment of Expenses by Adviser | | | (2.08)% | | | | (1.73)% | | | (1.94)% | | | (2.08)% | | | | (2.07)% | (F) |
| | | | | |
Portfolio Turnover | | | 243.59% | (G) | | | 58.55% | | | 96.39% | | | 102.63% | | | | 102.46% | |
| | |
| (A) | | For the period February 3, 2004 (Commencement of Operations) to December 31, 2004. |
| (B) | | Per share amounts calculated using average shares method. |
| (C) | | Total return calculation does not reflect redemption fee. |
| (D) | | Total return in the above table represents the rate that the investor would have earned or lost on an investment in the Fund assuming reinvestment of dividends. Total return would have been higher or lower if certain expenses had not been reimbursed, waived or recouped. |
| (E) | | For periods of less than one full year, total return is not annualized. |
| (F) | | Annualized. |
| (G) | | On January 1, 2008, Chartwell Investment Partners became sub-adviser for the Fund |
The accompanying notes are an integral part of these financial statements.
Timothy Plan Aggressive Growth Fund [64]
LETTER FROM THE MANAGER
December 31, 2008
LARGE / MID CAP GROWTH FUND
It was a difficult year for most investment styles and asset classes throughout most markets around the world. Even though we performed well relative to the index, the portfolio and benchmark struggled on an absolute-basis for the full year. Active management, in general, performed poorly against broader indexes and, in particular, active growth managers struggled most against their benchmarks when compared to other styles.
Where possible, investors retreated to value as the economy slipped into crisis and formerly high growth, and sometimes highly valued, companies suffered the most performance compression. In other words, some of what worked the best in 2007 performed the worst in 2008.
Our top performing sectors in relation to the benchmark during 2008 were Energy, Business Services and Technology. Consumer Staples, Capital Spending and Basic Industry lagged the index. A selection that added value was SandRidge Energy Inc. (SD), an explorer and developer of oil and gas properties in the U.S., moved higher along with commodity prices in the first and second quarters of the year. Fortunately, we liquidated our position in June, while the stock subsequently dropped 91% in the second half of the year.
We are mindful that the economy may have an exceedingly long road to climb out of its present state of recession. Many rightly are concerned at what level of earnings the indices will stabilize, when that will occur and at what multiple to capitalize them. Our feeling is that direction is probably more important than magnitude at this point. If credit markets move toward normalization, our belief is that corporate interest rates will fall and the equity market will rise.
CHARTWELL INVESTMENT PARTNERS, LP
Letter From The Manager [65]
FUND PROFILE
December 31, 2008
TIMOTHY PLAN LARGE / MID CAP GROWTH FUND
FUND PROFILE (unaudited):
| | |
| Top Ten Holdings |
| (% of Net Assets) |
| |
Exxon Mobil Corp. | | 6.78% |
Paychex, Inc. | | 5.97% |
Lowe’s Companies, Inc. | | 5.47% |
Timothy Plan Money Market Fund | | 3.57% |
Medco Health Solutions, Inc. | | 3.50% |
Colgate-Palmolive Co. | | 2.84% |
T. Rowe Price Group, Inc. | | 2.62% |
L-3 Communications Holdings, Inc. | | 2.57% |
Occidental Petroleum Corp. | | 2.24% |
DeVry, Inc. | | 2.18% |
| | |
| | 37.74% |
| | |
| | |
| Industries |
| (% of Net Assets) |
| |
Information Technology | | 19.84% |
Health Care | | 19.31% |
Energy | | 15.29% |
Financials | | 12.42% |
Consumer Discretionary | | 11.90% |
Industrials | | 11.79% |
Short-Term Investments | | 3.57% |
Consumer Staples | | 2.85% |
Materials | | 1.76% |
Telecommunication | | 1.58% |
Liabilities in Excess of Other Assets | | (0.31)% |
| | |
| | 100.00% |
| | |
EXPENSE EXAMPLE (unaudited):
As a shareholder of the Fund, you incur two types of costs: direct costs, such as wire fees and low balance fees; and indirect costs, including management fees, and other Fund operating expenses. This example is intended to help you understand your indirect costs, also referred to as “ongoing costs,” (in dollars) of investing in the Fund, and to compare these costs with the ongoing costs of investing in other mutual funds.
This example is based on an investment of $1,000 invested at the beginning of the period and held for the entire six-month period of July 1, 2008, through December 31, 2008.
Actual Expenses
The first line of the table below provides information about actual account values and actual expenses. You may use the information in this line, together with the amount you invested at the beginning of the period, to estimate the expenses that you paid over the period. Simply divide your account value by $1,000 (for example, an $8,600 account value divided by $1,000 = 8.6), then multiply the result by the number in the first line under the heading “Expenses Paid During Period” to estimate the expenses you paid on your account during this period.
Timothy Plan Top Ten Holdings / Industries [66]
FUND PROFILE
December 31, 2008
TIMOTHY PLAN LARGE / MID CAP GROWTH FUND
Hypothetical example for comparison purposes (unaudited)
The second line of the table provides information about hypothetical account values and hypothetical expenses based on the Fund’s actual expense ratio and an assumed rate of return of 5% per year before expenses, which is not the Fund’s actual return. The hypothetical account values and expenses may not be used to estimate the actual ending account balance or expenses you paid for the period. You may use this information to compare ongoing costs of investing in the Fund and other funds. To do so, compare this 5% hypothetical example with the 5% hypothetical examples that appear in the shareholder reports of other funds.
Please note that the expenses shown in the table are meant to highlight your ongoing costs only and do not reflect any direct costs, such as wire fees or low balance fees. Therefore, the second line of the table is useful in comparing ongoing costs only, and will not help you determine the relative total costs of owning different funds. In addition, if these direct costs were included, your costs would be higher.
| | | | | | | | | |
| | | Beginning
Account Value | | Ending Account
Value | | Expenses Paid
During Period* |
| | | 7/1/2008 | | 12/31/2008 | | 7/1/2008 through
12/31/2008 |
| | | |
Actual - Class A | | $ | 1,000.00 | | $ | 710.17 | | $ | 7.37 |
| | | |
Hypothetical - Class A | | $ | 1,000.00 | | $ | 1,016.52 | | $ | 8.69 |
(5% return before expenses) | | | | | | | | | |
| | | |
Actual - Class B | | $ | 1,000.00 | | $ | 708.93 | | $ | 10.53 |
| | | |
Hypothetical - Class B | | $ | 1,000.00 | | $ | 1,012.81 | | $ | 12.40 |
(5% return before expenses) | | | | | | | | | |
| | | |
Actual - Class C | | $ | 1,000.00 | | $ | 709.43 | | $ | 10.57 |
| | | |
Hypothetical - Class C | | $ | 1,000.00 | | $ | 1,012.77 | | $ | 12.44 |
(5% return before expenses) | | | | | | | | | |
| * | Expenses are equal to the Fund’s annualized expense ratio of 1.71% for Class A, 2.45% for Class B, and 2.46% for Class C, which is net of any expenses paid indirectly, multiplied by the average account value over the period, multiplied by 184 days/366 days (to reflect the partial year period.) The Fund’s ending account value on the first line of each share class in the table is based on its actual total return of (28.98)% for Class A, (21.11)% for Class B, and (29.06)% for Class C for the six-month period of July 1, 2008, to December 31, 2008. |
Timothy Plan Top Ten Holdings / Industries [67]
LARGE / MID CAP GROWTH FUND
SCHEDULE OF INVESTMENTS
As of December 31, 2008
COMMON STOCKS - - 95.56%
| | | | | |
| number of shares | | | | market value |
| | |
| | AGRICULTURAL CHEMICALS - 0.24% | | | |
| 4,050 | | Intrepid Potash, Inc. * | | $ | 84,118 |
| | | | | |
| | |
| | AUTOMOTIVE/TRUCK PARTS & EQUIPMENT - ORIGINAL - 0.81% | | | |
| 15,830 | | Johnson Controls, Inc. | | | 287,473 |
| | | | | |
| | |
| | COAL - 0.51% | | | |
| 6,275 | | Consol Energy, Inc. | | | 179,340 |
| | | | | |
| | |
| | COMMERCIAL SERVICE - FINANCIAL - 7.93% | | | |
| 2,530 | | Global Payments, Inc. | | | 82,959 |
| 20,800 | | Lender Processing Services, Inc. | | | 612,560 |
| 80,570 | | Paychex, Inc. | | | 2,117,380 |
| | | | | |
| | | | | 2,812,899 |
| | | | | |
| | |
| | COMMERCIAL SERVICES - 1.00% | | | |
| 2,360 | | Alliance Data Systems Corp. * | | | 109,811 |
| 12,376 | | Quanta Services, Inc. * | | | 245,045 |
| | | | | |
| | | | | 354,856 |
| | |
| | COMPUTER AIDED DESIGN - 1.29% | | | |
| 16,465 | | Ansys, Inc. * | | | 459,209 |
| | | | | |
| | |
| | COMPUTER MEMORY DEVICES - 0.64% | | | |
| 16,150 | | NetApp, Inc. * | | | 225,615 |
| | | | | |
| | |
| | COMPUTER SERVICES - 0.54% | | | |
| 10,625 | | Cognizant Technology Solutions Corp. - Class A * | | | 191,888 |
| | | | | |
| | |
| | CONSULTING SERVICES - 2.52% | | | |
| 9,581 | | FTI Consulting, Inc. * | | | 428,079 |
| 23,900 | | SAIC, Inc. * | | | 465,572 |
| | | | | |
| | | | | 893,651 |
| | | | | |
| | |
| | CONTAINERS - PAPER/PLASTIC - 0.80% | | | |
| 11,475 | | Pactiv Corp. * | | | 285,498 |
| | | | | |
| | |
| | COSMETICS & TOILETRIES - 2.84% | | | |
| 14,720 | | Colgate-Palmolive Co. | | | 1,008,909 |
| | | | | |
| | |
| | DATA PROCESSING/MANAGEMENT - 0.85% | | | |
| 19,130 | | SEI Investments Co. | | | 300,532 |
| | | | | |
| | |
| | DIALYSIS CENTERS - 1.17% | | | |
| 8,360 | | DaVita, Inc. * | | | 414,405 |
| | | | | |
| | |
| | DISPOSABLE MEDICAL PRODUCTS - 2.01% | | | |
| 8,480 | | C.R. Bard, Inc. | | | 714,525 |
| | | | | |
The accompanying notes are an integral part of these financial statements.
The Timothy Large/Mid Growth Fund [68]
LARGE / MID CAP GROWTH FUND
SCHEDULE OF INVESTMENTS
As of December 31, 2008
COMMON STOCKS - - 95.56% (continued)
| | | | | |
| number of shares | | | | market value |
| | |
| | DIVERSIFIED MANUFACTURING OPERATIONS - 2.10% | | | |
| 9,800 | | Danaher Corp. | | $ | 554,778 |
| 6,927 | | Harsco Corp. | | | 191,739 |
| | | | | |
| | | | | 746,517 |
| | | | | |
| | ELECTRIC PRODUCTS - MISCELLANEOUS - 1.61% | | | |
| 18,919 | | Ametek, Inc. | | | 571,543 |
| | | | | |
| | |
| | ELECTRONIC COMPONENTS - SEMICONDUCTORS - 2.21% | | | |
| 17,305 | | Broadcom Corp. - Class A * | | | 293,666 |
| 24,550 | | Nvidia Corp. * | | | 198,118 |
| 25,975 | | ON Semiconductor Corp. * | | | 88,315 |
| 11,525 | | Xilinx, Inc. | | | 205,375 |
| | | | | |
| | | | | 785,474 |
| | | | | |
| | ELECTRONIC CONNECTORS - 1.44% | | | |
| 21,322 | | Amphenol Corp. - Class A | | | 511,302 |
| | | | | |
| | |
| | ELECTRONIC MEASURING INSTRUMENTS - 0.72% | | | |
| 8,375 | | Flir Systems, Inc. * | | | 256,945 |
| | | | | |
| | |
| | ELECTRONICS - MILITARY - 2.57% | | | |
| 12,350 | | L-3 Communications Holdings, Inc. | | | 911,183 |
| | | | | |
| | |
| | FINANCE - INVESTMENT BANKER/BROKER - 0.57% | | | |
| 11,265 | | Interactive Brokers Group, Inc. - Class A * | | | 201,531 |
| | | | | |
| | |
| | INDUSTRIAL GASES - 0.72% | | | |
| 6,550 | | Airgas, Inc. | | | 255,385 |
| | | | | |
| | |
| | INSTRUMENTS - CONTROL - 1.60% | | | |
| 8,425 | | Mettler Toledo International, Inc. * | | | 567,845 |
| | | | | |
| | |
| | INSTRUMENTS - SCIENTIFIC - 2.15% | | | |
| 16,060 | | Thermo Fisher Scientific, Inc. * | | | 547,164 |
| 5,850 | | Waters Corp. * | | | 214,403 |
| | | | | |
| | | | | 761,567 |
| | |
| | INTERNET INFRASTRUCTURE SOFTWARE - 0.26% | | | |
| 4,000 | | F5 Networks, Inc. * | | | 91,440 |
| | | | | |
| | |
| | INTERNET SECURITY - 1.17% | | | |
| 11,975 | | McAfee, Inc. * | | | 413,976 |
| | | | | |
| | |
| | INVESTMENT MANAGEMENT/ADVISORY SERVICES - 5.21% | | | |
| 9,560 | | Franklin Resources, Inc. | | | 609,737 |
| 14,135 | | Legg Mason, Inc. | | | 309,698 |
| 26,250 | | T. Rowe Price Group, Inc. | | | 930,300 |
| | | | | |
| | | | | 1,849,735 |
| | | | | |
The accompanying notes are an integral part of these financial statements.
The Timothy Large/Mid Growth Fund [69]
LARGE / MID CAP GROWTH FUND
SCHEDULE OF INVESTMENTS
As of December 31, 2008
COMMON STOCKS - - 95.56% (continued)
| | | | | |
| number of shares | | | | market value |
| | |
| | LIFE/HEALTH INSURANCE - 1.15% | | | |
| 8,890 | | Aflac, Inc. | | $ | 407,518 |
| | | | | |
| | |
| | MACHINERY - PUMPS - 0.70% | | | |
| 4,821 | | Flowserve Corp. | | | 248,282 |
| | | | | |
| | |
| | MEDICAL - BIOMEDICAL/GENE - 1.33% | | | |
| 8,920 | | Alexion Pharmaceuticals, Inc. * | | | 322,815 |
| 2,410 | | United Therapeutics Corp. * | | | 150,745 |
| | | | | |
| | | | | 473,560 |
| | |
| | MEDICAL - DRUGS - 1.07% | | | |
| 4,935 | | Cephalon, Inc. * | | | 380,192 |
| | | | | |
| | |
| | MEDICAL - GENERIC DRUGS - 0.97% | | | |
| 10,610 | | Perrigo Co. | | | 342,809 |
| | | | | |
| | |
| | MEDICAL - WHOLESALE DRUG DISTRIBUTION - 0.21% | | | |
| 2,075 | | AmerisourceBergen Corp. | | | 73,995 |
| | | | | |
| | |
| | MEDICAL INSTRUMENTS - 1.45% | | | |
| 15,565 | | St. Jude Medical, Inc. * | | | 513,022 |
| | | | | |
| | |
| | MEDICAL LABS & TESTING SERVICES - 2.15% | | | |
| 11,850 | | Laboratory Corp. of America Holdings * | | | 763,258 |
| | | | | |
| | |
| | MEDICAL PRODUCTS - 2.04% | | | |
| 11,088 | | Henry Schein, Inc. * | | | 406,819 |
| 7,830 | | Zimmer Holdings, Inc. * | | | 316,489 |
| | | | | |
| | | | | 723,308 |
| | |
| | MULTI-LINE INSURANCE - 0.47% | | | |
| 6,275 | | HCC Insurance Holdings, Inc. | | | 167,856 |
| | | | | |
| | |
| | OIL - FIELD SERVICES - 1.30% | | | |
| 28,965 | | Superior Energy Services, Inc. * | | | 461,412 |
| | | | | |
| | |
| | OIL COMPANIES - EXPLORATION & PRODUCTION - 3.69% | | | |
| 13,240 | | Occidental Petroleum Corp. | | | 794,268 |
| 14,936 | | Range Resources Corp. | | | 513,649 |
| | | | | |
| | | | | 1,307,917 |
| | |
| | OIL COMPANIES - INTEGRATED - 8.47% | | | |
| 30,130 | | Exxon Mobil Corp. | | | 2,405,278 |
| 36,010 | | StatoilHydro ASA (ADR) | | | 599,927 |
| | | | | |
| | | | | 3,005,205 |
| | | | | |
The accompanying notes are an integral part of these financial statements.
The Timothy Large/Mid Growth Fund [70]
LARGE / MID CAP GROWTH FUND
SCHEDULE OF INVESTMENTS
As of December 31, 2008
COMMON STOCKS - - 95.56% (continued)
| | | | | |
| number of shares | | | | market value |
| | |
| | OIL FIELD MACHINERY & EQUIPMENT - 1.83% | | | |
| 11,140 | | Cameron International Corp. * | | $ | 228,370 |
| 17,217 | | National-Oilwell Varco, Inc. * | | | 420,783 |
| | | | | |
| | | | | 649,153 |
| | | | | |
| | |
| | PHARMACY SERVICES - 4.32% | | | |
| 5,275 | | Express Scripts, Inc. * | | | 290,019 |
| 29,630 | | Medco Health Solutions, Inc. * | | | 1,241,793 |
| | | | | |
| | | | | 1,531,812 |
| | | | | |
| | |
| | PRINTING - COMMERCIAL - 0.68% | | | |
| 12,976 | | VistaPrint, Ltd. * | | | 241,483 |
| | | | | |
| | |
| | PRIVATE CORRECTIONS - 1.60% | | | |
| 31,400 | | The Geo Group, Inc. * | | | 566,142 |
| | | | | |
| | |
| | PROPERTY/CASUALTY INSURANCE - 0.25% | | | |
| 5,025 | | Fidelity National Financial, Inc. - Class A | | | 89,194 |
| | | | | |
| | |
| | REINSURANCE - 2.09% | | | |
| 6,675 | | PartnerRe, Ltd. | | | 475,727 |
| 7,400 | | Platinum Underwriters Holdings, Ltd. | | | 266,992 |
| | | | | |
| | | | | 742,719 |
| | | | | |
| | |
| | RETAIL - AUTO PARTS - 1.21% | | | |
| 14,000 | | O’Reilly Automotive, Inc. * | | | 430,360 |
| | | | | |
| | |
| | RETAIL - BUILDING PRODUCTS - 5.47% | | | |
| 90,170 | | Lowe’s Companies, Inc. | | | 1,940,458 |
| | | | | |
| | |
| | RETAIL - DISCOUNT - 1.72% | | | |
| 14,570 | | Dollar Tree, Inc. * | | | 609,026 |
| | | | | |
| | |
| | SAVINGS & LOANS/THRIFTS - EASTERN U.S. - 0.65% | | | |
| 12,975 | | People’s United Financial, Inc. | | | 231,344 |
| | | | | |
| | |
| | SCHOOLS - 2.18% | | | |
| 13,464 | | DeVry, Inc. | | | 772,968 |
| | | | | �� |
| | |
| | TELECOMMUNICATION EQUIPMENT - 1.05% | | | |
| 16,550 | | Nice Systems, Ltd. (ADR) * | | | 371,878 |
| | | | | |
| | |
| | THERAPEUTICS - 0.45% | | | |
| 8,925 | | BioMarin Pharmaceutical, nc. * | | | 158,865 |
| | | | | |
| | |
| | WIRELESS EQUIPMENT - 1.58% | | | |
| 19,147 | | American Tower Corp. - Class A * | | | 561,390 |
| | | | | |
| | |
| | Total Common Stocks (cost $41,004,216) | | | 33,902,487 |
| | | | | |
The accompanying notes are an integral part of these financial statements.
The Timothy Large/Mid Growth Fund [71]
LARGE / MID CAP GROWTH FUND
SCHEDULE OF INVESTMENTS
As of December 31, 2008
MASTER LIMITED PARTNERSHIPS - 1.18%
| | | | | |
| number of shares | | | | market value |
| | |
| 14,013 | | Lazard, Ltd. - Class A | | $ | 416,747 |
| | | | | |
| | |
| | Total Master Limited Partnerships (cost $538,091) | | | 416,747 |
| | | | | |
| |
| SHORT-TERM INVESTMENTS - 3.57% | | | |
| number of shares | | | | market value |
| 1,268,104 | | Timothy Plan Money Market Fund, 0.38% (A) (B) | | $ | 1,268,104 |
| | | | | |
| | |
| | Total Short-Term Investments (cost $1,268,104) | | | 1,268,104 |
| | | | | |
| | |
| | TOTAL INVESTMENTS (cost $42,810,411) - 100.31% | | $ | 35,587,338 |
| | | | | |
| | |
| | LIABILITIES IN EXCESS OF OTHER ASSETS - (0.31)% | | | (110,799) |
| | | | | |
| | |
| | NET ASSETS - 100.00% | | $ | 35,476,539 |
| | | | | |
*Non-income producing securities.
(ADR) American Depositary Receipt.
(A) Variable rate security; the rate shown represents the yield at December 31, 2008.
(B) Affiliated fund.
The accompanying notes are an integral part of these financial statements.
The Timothy Large/Mid Growth Fund [72]
LARGE / MID CAP GROWTH FUND
STATEMENT OF ASSETS AND LIABILITIES
As of December 31, 2008
ASSETS
| | | |
| | | amount |
| |
Investments in Unaffiliated Securities at Value (cost $41,542,307) [NOTE 1] | | $ | 34,319,234 |
Investments in Affiliated Securities at Value (cost $1,268,104) [NOTE 1] | | | 1,268,104 |
Receivables for: | | | |
Investments Sold | | | 84,639 |
Fund Shares Sold | | | 110,365 |
Dividends | | | 15,919 |
Interest | | | 668 |
Prepaid Expenses | | | 15,412 |
| | | |
| |
Total Assets | | $ | 35,814,341 |
| | | |
| |
LIABILITIES | | | |
| | | amount |
| |
Payable for Investments Purchased | | $ | 165,633 |
Payable for Fund Shares Redeemed | | | 96,292 |
Accrued Advisory Fees | | | 24,802 |
Accrued 12b-1 Fees Class A | | | 6,685 |
Accrued 12b-1 Fees Class B | | | 838 |
Accrued 12b-1 Fees Class C | | | 1,599 |
Accrued Expenses | | | 41,953 |
| | | |
| |
Total Liabilities | | $ | 337,802 |
| | | |
| |
NET ASSETS | | | |
| | | amount |
| |
Class A Shares: | | | |
Net Assets (unlimited shares of $0.001 par beneficial interest authorized; 7,409,188 shares outstanding) | | $ | 32,484,169 |
Net Asset Value and Redemption Price Per Class A Share ($32,484,169 / 7,409,188 shares) | | $ | 4.38 |
Offering Price Per Share ($4.38/ 0.945) | | $ | 4.63 |
Class B Shares: | | | |
Net Assets (unlimited shares of $0.001 par beneficial interest authorized; 248,704 shares outstanding) | | $ | 1,021,770 |
Net Asset Value and Offering Price Per Class B Share ($1,021,770 / 248,704 shares) | | $ | 4.11 |
Minimum Redemption Price Per Class B Share ($4.11* 0.99) | | $ | 4.07 |
Class C Shares: | | | |
Net Assets (unlimited shares of $0.001 par beneficial interest authorized; 478,939 shares outstanding) | | $ | 1,970,600 |
Net Asset Value and Offering Price Per Class C Share ($1,970,600 / 478,939 shares) | | $ | 4.11 |
Minimum Redemption Price Per Share ($4.11 * 0.99) | | $ | 4.07 |
| |
Net Assets | | $ | 35,476,539 |
| | | |
| |
SOURCES OF NET ASSETS | | | |
| | | amount |
| |
At June 30, 2008, Net Assets Consisted of: | | | |
Paid-in Capital | | $ | 52,296,504 |
Accumulated Net Realized Gain (Loss) on Investments | | | (9,596,892) |
Net Unrealized Appreciation (Depreciation) in Value of Investments | | | (7,223,073) |
| | | |
| |
Net Assets | | $ | 35,476,539 |
| | | |
The accompanying notes are an integral part of these financial statements.
The Timothy Large/Mid Growth Fund [73]
LARGE / MID CAP GROWTH FUND
STATEMENT OF OPERATIONS
For the Year Ended December 31, 2008
| | | |
INVESTMENT INCOME | | | |
| | | amount |
| |
Interest on Affiliated Investments | | $ | 41,980 |
Dividends | | | 402,475 |
| | | |
| |
Total Investment Income | | | 444,455 |
| | | |
| |
EXPENSES | | | |
| | | amount |
| |
Investment Advisory Fees [NOTE 3] | | | 409,706 |
12b-1 Fees (Class A = $110,009, Class B = $15,180, Class C = $26,792) [NOTE 3] | | | 151,981 |
Fund Accounting, Transfer Agency, & Administration Fees | | | 85,066 |
Out-of-Pocket Expense | | | 62,973 |
Registration Fees | | | 24,764 |
Custodian Fees | | | 20,549 |
Audit Fees | | | 10,512 |
Printing Expense | | | 6,021 |
Trustee Fees | | | 5,732 |
CCO Fees | | | 5,508 |
Insurance Expense | | | 1,829 |
Miscellaneous Expense | | | 440 |
| |
Total Expenses | | | 785,081 |
| | | |
| |
Net Investment Income (Loss) | | | (340,626) |
| | | |
| |
REALIZED AND UNREALIZED GAIN (LOSS) ON INVESTMENTS | | | |
| | | amount |
| |
Net Realized Gain (Loss) on Unaffiliated Investments | | | (7,879,763) |
Change in Unrealized Appreciation/Depreciation of Investments | | | (12,968,068) |
| | | |
Net Realized and Unrealized Gain (Loss) on Investments | | | (20,847,831) |
| | | |
| |
Net Increase (Decrease) in Net Assets Resulting from Operations | | $ | (21,188,457) |
| | | |
The accompanying notes are an integral part of these financial statements.
The Timothy Large/Mid Growth Fund [74]
LARGE / MID CAP GROWTH FUND
STATEMENTS OF CHANGES IN NET ASSETS
INCREASE (DECREASE) IN NET ASSETS
| | | | | | |
| | | year ended
12/31/08 | | year ended
12/31/07 |
| | |
Operations: | | | | | | |
Net Investment Income (Loss) | | $ | (340,626) | | $ | (270,411) |
Net Realized Gain (Loss) on Investments | | | (7,879,763) | | | 6,418,965 |
Change in Unrealized Appreciation/Depreciation of Investments | | | (12,968,068) | | | (2,180,509) |
| | | | | | |
Net Increase (Decrease) in Net Assets (resulting from operations) | | | (21,188,457) | | | 3,968,045 |
| | | | | | |
| | |
Distributions to Shareholders From: | | | | | | |
Net Realized Gains: | | | | | | |
Class A | | | (61,850) | | | (5,198,735) |
Class B | | | (2,112) | | | (196,179) |
Class C | | | (4,038) | | | (313,091) |
| | | | | | |
Total Distributions | | | (68,000) | | | (5,708,005) |
| | | | | | |
| | |
Capital Share Transactions: | | | | | | |
Proceeds from Shares Sold: | | | | | | |
Class A | | | 15,166,919 | | | 18,312,526 |
Class B | | | 17,054 | | | 22,736 |
Class C | | | 775,006 | | | 1,307,432 |
Dividends Reinvested: | | | | | | |
Class A | | | 56,381 | | | 4,726,540 |
Class B | | | 1,861 | | | 169,167 |
Class C | | | 3,555 | | | 274,366 |
Cost of Shares Redeemed: | | | | | | |
Class A | | | (16,452,855) | | | (33,943,282) |
Class B | | | (288,063) | | | (408,268) |
Class C | | | (761,081) | | | (483,913) |
| | | | | | |
Net Increase (Decrease) in Net Assets (resulting from capital share transactions) | | | (1,481,223) | | | (10,022,696) |
| | | | | | |
Total Increase (Decrease) in Net Assets | | | (22,737,680) | | | (11,762,656) |
| | | | | | |
| | |
Net Assets: | | | | | | |
Beginning of year | | | 58,214,219 | | | 69,976,875 |
| | | | | | |
End of year | | $ | 35,476,539 | | $ | 58,214,219 |
| | | | | | |
Accumulated Undistributed Net Investment Income | | $ | - | | $ | - |
| | | | | | |
| | |
Shares of Capital Stock of the Fund Sold and Redeemed: | | | | | | |
Shares Sold: | | | | | | |
Class A | | | 2,613,667 | | | 2,375,173 |
Class B | | | 3,097 | | | 2,996 |
Class C | | | 134,417 | | | 179,541 |
Shares Reinvested: | | | | | | |
Class A | | | 13,424 | | | 692,026 |
Class B | | | 474 | | | 26,227 |
Class C | | | 902 | | | 42,471 |
Shares Redeemed: | | | | | | |
Class A | | | (2,941,853) | | | (4,378,224) |
Class B | | | (52,411) | | | (55,188) |
Class C | | | (131,734) | | | (66,397) |
| | | | | | |
Net Increase (Decrease) in Number of Shares Outstanding | | | (360,017) | | | (1,181,375) |
| | | | | | |
The accompanying notes are an integral part of these financial statements.
The Timothy Large/Mid Growth Fund [75]
LARGE / MID CAP GROWTH FUND
FINANCIAL HIGHLIGHTS
The table below sets forth financial data for one share of capital stock outstanding throughout each period presented.
LARGE / MID CAP GROWTH FUND - CLASS A SHARES
| | | | | | | | | | | | | | | | | | |
| | | year ended
12/31/08 | | | year
ended
12/31/07 | | year
ended
12/31/06 | | year
ended
12/31/05 | | | year
ended
12/31/04 | |
| | | | | |
Per Share Operating Performance: | | | | | | | | | | | | | | | | | | |
Net Asset Value at Beginning of Year | | $ | 6.89 | | | $ | 7.25 | | $ | 6.92 | | $ | 6.69 | | | $ | 6.17 | |
| | | | | | | | | | | | | | | | | | |
| | | | | |
Income from Investment Operations: | | | | | | | | | | | | | | | | | | |
Net Investment Income (Loss) | | | (0.04) | | | | (0.03) | | | (0.04) | | | (0.05) | (A) | | | (0.05) | (A) |
Net Realized and Unrealized Gain (Loss) on Investments | | | (2.46) | | | | 0.39 | | | 0.37 | | | 0.28 | | | | 0.57 | |
| | | | | | | | | | | | | | | | | | |
Total from Investment Operations | | | (2.50) | | | | 0.36 | | | 0.33 | | | 0.23 | | | | 0.52 | |
| | | | | | | | | | | | | | | | | | |
| | | | | |
Less Distributions: | | | | | | | | | | | | | | | | | | |
Dividends from Realized Gains | | | (0.01) | | | | (0.72) | | | - | | | - | | | | - | |
| | | | | | | | | | | | | | | | | | |
Total Distributions | | | (0.01) | | | | (0.72) | | | - | | | - | | | | - | �� |
| | | | | | | | | | | | | | | | | | |
| | | | | |
Net Asset Value at End of Year | | $ | 4.38 | | | $ | 6.89 | | $ | 7.25 | | $ | 6.92 | | | $ | 6.69 | |
| | | | | | | | | | | | | | | | | | |
| | | | | |
Total Return (B)(C) | | | (36.30)% | | | | 5.09% | | | 4.77% | | | 3.44% | | | | 8.43% | |
| | | | | |
Ratios/Supplemental Data: | | | | | | | | | | | | | | | | | | |
Net Assets, End of Year (in 000s) | | $ | 32,484 | | | $ | 53,183 | | $ | 65,510 | | $ | 53,901 | | | $ | 36,869 | |
| | | | | |
Ratio of Expenses to Average Net Assets: | | | | | | | | | | | | | | | | | | |
Before Reimbursement and Waiver/Recoupment of Expenses by Adviser | | | 1.56% | | | | 1.46% | | | 1.52% | | | 1.60% | | | | 1.55% | |
After Reimbursement and Waiver/Recoupment of Expenses by Adviser | | | 1.56% | | | | 1.46% | | | 1.53% | | | 1.60% | | | | 1.60% | |
| | | | | |
Ratio of Net Investment Income (Loss) to Average Net Assets: | | | | | | | | | | | | | | | | | | |
Before Reimbursement and Waiver/Recoupment of Expenses by Adviser | | | (0.64)% | | | | (0.37)% | | | (0.56)% | | | (0.80)% | | | | (0.95)% | |
After Reimbursement and Waiver/Recoupment of Expenses by Adviser | | | (0.64)% | | | | (0.37)% | | | (0.57)% | | | (0.80)% | | | | (1.00)% | |
| | | | | |
Portfolio Turnover | | | 176.94% | (D) | | | 44.62% | | | 60.46% | | | 38.61% | | | | 60.25% | |
| | |
| (A) | | Per share amounts calculated using average shares method. |
| (B) | | Total return calculation does not reflect sales load. |
| (C) | | Total return in the above table represents the rate that the investor would have earned or lost on an investment in the Fund assuming reinvestment of dividends. Total return would have been higher or lower if certain expenses had not been reimbursed, waived or recouped. |
| (D) | | On January 1, 2008, Chartwell Investment Partners became sub-adviser for the Fund |
The accompanying notes are an integral part of these financial statements.
The Timothy Large/Mid Growth Fund [76]
LARGE / MID CAP GROWTH FUND
FINANCIAL HIGHLIGHTS
The table below sets forth financial data for one share of capital stock outstanding throughout each period presented.
LARGE / MID CAP GROWTH FUND - CLASS B SHARES
| | | | | | | | | | | | | | | | | | |
| | | year ended
12/31/08 | | | year ended
12/31/07 | | year ended
12/31/06 | | year ended
12/31/05 | | | year ended
12/31/04 | |
| | | | | |
Per Share Operating Performance: | | | | | | | | | | | | | | | | | | |
Net Asset Value at Beginning of Year | | $ | 6.50 | | | $ | 6.94 | | $ | 6.68 | | $ | 6.50 | | | $ | 6.04 | |
| | | | | | | | | | | | | | | | | | |
| | | | | |
Income from Investment Operations: | | | | | | | | | | | | | | | | | | |
Net Investment Income (Loss) | | | (0.08) | | | | (0.08) | | | (0.09) | | | (0.10) | (A) | | | (0.11) | (A) |
Net Realized and Unrealized Gain (Loss) on Investments | | | (2.30) | | | | 0.36 | | | 0.35 | | | 0.28 | | | | 0.57 | |
| | | | | | | | | | | | | | | | | | |
Total from Investment Operations | | | (2.38) | | | | 0.28 | | | 0.26 | | | 0.18 | | | | 0.46 | |
| | | | | | | | | | | | | | | | | | |
| | | | | |
Less Distributions: | | | | | | | | | | | | | | | | | | |
Dividends from Realized Gains | | | (0.01) | | | | (0.72) | | | - | | | - | | | | - | |
| | | | | | | | | | | | | | | | | | |
Total Distributions | | | (0.01) | | | | (0.72) | | | - | | | - | | | | - | |
| | | | | | | | | | | | | | | | | | |
| | | | | |
Net Asset Value at End of Year | | $ | 4.11 | | | $ | 6.50 | | $ | 6.94 | | $ | 6.68 | | | $ | 6.50 | |
| | | | | | | | | | | | | | | | | | |
| | | | | |
Total Return (B)(C) | | | (36.63)% | | | | 4.16% | | | 3.89% | | | 2.77% | | | | 7.62% | |
| | | | | |
Ratios/Supplemental Data: | | | | | | | | | | | | | | | | | | |
Net Assets, End of Year (in 000s) | | $ | 1,022 | | | $ | 1,935 | | $ | 2,245 | | $ | 2,307 | | | $ | 2,688 | |
| | | | | |
Ratio of Expenses to Average Net Assets: | | | | | | | | | | | | | | | | | | |
| | | | | |
Before Reimbursement and Waiver/Recoupment of Expenses by Adviser | | | 2.30% | | | | 2.21% | | | 2.26% | | | 2.35% | | | | 2.30% | |
After Reimbursement and Waiver/Recoupment of Expenses by Adviser | | | 2.30% | | | | 2.21% | | | 2.28% | | | 2.35% | | | | 2.35% | |
| | | | | |
Ratio of Net Investment Income (Loss) to Average Net Assets: | | | | | | | | | | | | | | | | | | |
Before Reimbursement and Waiver/Recoupment of Expenses by Adviser | | | (1.38)% | | | | (1.10)% | | | (1.31)% | | | (1.55)% | | | | (1.70)% | |
After Reimbursement and Waiver/Recoupment of Expenses by Adviser | | | (1.38)% | | | | (1.10)% | | | (1.33)% | | | (1.55)% | | | | (1.75)% | |
| | | | | |
Portfolio Turnover | | | 176.94% | (D) | | | 44.62% | | | 60.46% | | | 38.61% | | | | 60.25% | |
| | |
| (A) | | Per share amounts calculated using average shares method. |
| (B) | | Total return calculation does not reflect redemption fee. |
| (C) | | Total return in the above table represents the rate that the investor would have earned or lost on an investment in the Fund assuming reinvestment of dividends. |
| | Total return would have been higher or lower if certain expenses had not been reimbursed, waived or recouped. |
| (D) | | On January 1, 2008, Chartwell Investment Partners became sub-adviser for the Fund |
The accompanying notes are an integral part of these financial statements.
The Timothy Large/Mid Growth Fund [77]
LARGE / MID CAP GROWTH FUND
FINANCIAL HIGHLIGHTS
The table below sets forth financial data for one share of capital stock outstanding throughout each period presented.
LARGE / MID CAP GROWTH FUND - CLASS C SHARES
| | | | | | | | | | | | | | | | | | |
| | | year ended
12/31/08 | | | year ended
12/31/07 | | year ended
12/31/06 | | year ended
12/31/05 | | | year ended
12/31/04 (A) | |
| | | | | |
Per Share Operating Performance: | | | | | | | | | | | | | | | | | | |
Net Asset Value at Beginning of Period | | $ | 6.51 | | | $ | 6.95 | | $ | 6.69 | | $ | 6.52 | | | $ | 6.22 | |
| | | | | | | | | | | | | | | | | | |
| | | | | |
Income from Investment Operations: | | | | | | | | | | | | | | | | | | |
Net Investment Income (Loss) | | | (0.08) | | | | (0.07) | | | (0.07) | | | (0.08) | (B) | | | (0.05) | (B) |
Net Realized and Unrealized Gain (Loss) on Investments | | | (2.31) | | | | 0.35 | | | 0.33 | | | 0.25 | | | | 0.35 | |
| | | | | | | | | | | | | | | | | | |
Total from Investment Operations | | | (2.39) | | | | 0.28 | | | 0.26 | | | 0.17 | | | | 0.30 | |
| | | | | | | | | | | | | | | | | | |
| | | | | |
Less Distributions: | | | | | | | | | | | | | | | | | | |
Dividends from Realized Gains | | | (0.01) | | | | (0.72) | | | - | | | - | | | | - | |
| | | | | | | | | | | | | | | | | | |
Total Distributions | | | (0.01) | | | | (0.72) | | | - | | | - | | | | - | |
| | | | | | | | | | | | | | | | | | |
| | | | | |
Net Asset Value at End of Period | | $ | 4.11 | | | $ | 6.51 | | $ | 6.95 | | $ | 6.69 | | | $ | 6.52 | |
| | | | | | | | | | | | | | | | | | |
| | | | | |
Total Return (C)(D) | | | (36.73)% | | | | 4.15% | | | 3.89% | | | 2.61% | | | | 4.82% | (E) |
| | | | | |
Ratios/Supplemental Data: | | | | | | | | | | | | | | | | | | |
Net Assets, End of Period (in 000s) | | $ | 1,971 | | | $ | 3,097 | | $ | 2,222 | | $ | 1,496 | | | $ | 967 | |
| | | | | |
Ratio of Expenses to Average Net Assets: | | | | | | | | | | | | | | | | | | |
| | | | | |
Before Reimbursement and Waiver/Recoupment of Expenses by Adviser | | | 2.31% | | | | 2.22% | | | 2.27% | | | 2.35% | | | | 2.30% | (F) |
After Reimbursement and Waiver/Recoupment of Expenses by Adviser | | | 2.31% | | | | 2.22% | | | 2.27% | | | 2.35% | | | | 2.35% | (F) |
| | | | | |
Ratio of Net Investment Income (Loss) to Average Net Assets: | | | | | | | | | | | | | | | | | | |
Before Reimbursement and Waiver/Recoupment of Expenses by Adviser | | | (1.39)% | | | | (1.12)% | | | (1.31)% | | | (1.55)% | | | | (1.70)% | (F) |
After Reimbursement and Waiver/Recoupment of Expenses by Adviser | | | (1.39)% | | | | (1.12)% | | | (1.31)% | | | (1.55)% | | | | (1.75)% | (F) |
| | | | | |
Portfolio Turnover | | | 176.94% | (G) | | | 44.62% | | | 60.46% | | | 38.61% | | | | 60.25% | |
| | |
| (A) | | For the period February 3, 2004 (Commencement of Operations) to December 31, 2004. |
| (B) | | Per share amounts calculated using average shares method. |
| (C) | | Total return calculation does not reflect redemption fee. |
| (D) | | Total return in the above table represents the rate that the investor would have earned or lost on an investment in the Fund assuming reinvestment of dividends. |
| | Total return would have been higher or lower if certain expenses had not been reimbursed, waived or recouped. |
| (E) | | For periods of less than one full year, total return is not annualized. |
| (F) | | Annualized. |
| (G) | | On January 1, 2008, Chartwell Investment Partners became sub-adviser for the Fund |
The accompanying notes are an integral part of these financial statements.
The Timothy Large/Mid Growth Fund [78]
LETTER FROM THE MANAGER
December 31, 2008
STRATEGIC GROWTH FUND
Dear Strategic Growth Fund Shareholder,
As I stated in my President’s Letter at the front of this report, 2008 was, by far, the worst year – in terms of financial market performance – in modern history. Your Strategic Growth Fund is a compilation of several of Timothy’s underlying funds and, as such, its performance is directly related to the performance of those underlying funds. As a review, your specific asset mix is approximately as follows:
| | | | | | |
| | • Large/Mid Cap Value Fund | | 20.0% | | |
| | • Small Cap Value Fund | | 12.5% | | |
| | • Large/Mid Cap Growth Fund | | 20.0% | | |
| | • Aggressive Growth Fund | | 12.5% | | |
| | • International Fund | | 25.0% | | |
| | • High Yield Bond Fund | | 10.0% | | |
Since your performance is so directly related to our underlying funds, you will be pleased to know that we have completed our efforts to upgrade the managers of all our funds and, in my opinion, all of our funds are now managed by firms that are as good as, if not better than, any mutual fund family in the industry. Please refer to each individual manager’s comments within this report for more detailed information as to why the funds under their responsibility performed as they did.
For what it is worth, all of our various managers believe we are either at or very near the bottom of this violent market. If they are right, as I believe they are – although no one can know for sure, then the potential rewards for current and new investments could far outweigh the risks. We fully expect 2009 to be rather rocky but also believe we could see a sustained recovery begin sometime during the last half of the year. As you well know, however, no one can guarantee future results. The one thing I can assure you of is that every one of our managers will be working very hard on your behalf.
ARTHUR D. ALLY
President, The Timothy Plan
Letter From The Manager [79]
FUND PROFILE
December 31, 2008
TIMOTHY PLAN STRATEGIC GROWTH FUND
FUND PROFILE (unaudited):
| | |
| Asset Allocation |
| (% of Net Assets) |
| |
International | | 24.79% |
Large/Mid Cap Value | | 20.13% |
Large/Mid Cap Growth | | 20.07% |
Small Cap Value | | 12.70% |
Aggressive Growth | | 12.65% |
High Yield Bond | | 9.91% |
Short-Term Investments | | 0.40% |
Liabilities in Excess of Other Assets | | (0.65)% |
| | |
| | 100.00% |
| | |
EXPENSE EXAMPLE (unaudited):
As a shareholder of the Fund, you incur two types of costs: direct costs, such as wire fees and low balance fees; and indirect costs, including management fees, and other Fund operating expenses. This example is intended to help you understand your indirect costs, also referred to as “ongoing costs,” (in dollars) of investing in the Fund, and to compare these costs with the ongoing costs of investing in other mutual funds.
This example is based on an investment of $1,000 invested at the beginning of the period and held for the entire six-month period of July 1, 2008, through December 31, 2008.
Actual Expenses
The first line of the table below provides information about actual account values and actual expenses. You may use the information in this line, together with the amount you invested at the beginning of the period, to estimate the expenses that you paid over the period. Simply divide your account value by $1,000 (for example, an $8,600 account value divided by $1,000 = 8.6), then multiply the result by the number in the first line under the heading “Expenses Paid During Period” to estimate the expenses you paid on your account during this period.
Timothy Plan Top Ten Holdings / Industries [80]
FUND PROFILE
December 31, 2008
TIMOTHY PLAN STRATEGIC GROWTH FUND
Hypothetical example for comparison purposes (unaudited)
The second line of the table provides information about hypothetical account values and hypothetical expenses based on the Fund’s actual expense ratio and an assumed rate of return of 5% per year before expenses, which is not the Fund’s actual return. The hypothetical account values and expenses may not be used to estimate the actual ending account balance or expenses you paid for the period. You may use this information to compare ongoing costs of investing in the Fund and other funds. To do so, compare this 5% hypothetical example with the 5% hypothetical examples that appear in the shareholder reports of other funds.
Please note that the expenses shown in the table are meant to highlight your ongoing costs only and do not reflect any direct costs, such as wire fees or low balance fees. Therefore, the second line of the table is useful in comparing ongoing costs only, and will not help you determine the relative total costs of owning different funds. In addition, if these direct costs were included, your costs would be higher.
| | | | | | | | | |
| | | Beginning
Account Value | | Ending Account
Value | | Expenses Paid
During Period* |
| | | 7/1/2008 | | 12/31/2008 | | 7/1/2008 through
12/31/2008 |
| | | |
Actual - Class A | | $ | 1,000.00 | | $ | 650.32 | | $ | 4.62 |
| | | |
Hypothetical - Class A | | $ | 1,000.00 | | $ | 1,019.54 | | $ | 5.65 |
(5% return before expenses) | | | | | | | | | |
| | | |
Actual - Class B | | $ | 1,000.00 | | $ | 646.51 | | $ | 7.68 |
| | | |
Hypothetical - Class B | | $ | 1,000.00 | | $ | 1,015.81 | | $ | 9.40 |
(5% return before expenses) | | | | | | | | | |
| | | |
Actual - Class C | | $ | 1,000.00 | | $ | 647.41 | | $ | 7.73 |
| | | |
Hypothetical - Class C | | $ | 1,000.00 | | $ | 1,015.76 | | $ | 9.45 |
(5% return before expenses) | | | | | | | | | |
| * | Expenses are equal to the Fund’s annualized expense ratio of 1.11% for Class A, 1.86% for Class B, and 1.87% for Class C, which is net of any expenses paid indirectly, multiplied by the average account value over the period, multiplied by 184 days/366 days (to reflect the partial year period.) The Fund’s ending account value on the first line of each share class in the table is based on its actual total return of (34.97)% for Class A, (35.35)% for Class B, and (35.26)% for Class C for the six-month period of July 1, 2008, to December 31, 2008. |
Timothy Plan Top Ten Holdings / Industries [81]
STRATEGIC GROWTH FUND
SCHEDULE OF INVESTMENTS
As of December 31, 2008
MUTUAL FUNDS (A) - 100.25%
| | | | | |
| number of shares | | | | market value |
| | |
1,308,186 | | Timothy Plan Aggressive Growth Fund | | $ | 4,853,371 |
610,744 | | Timothy Plan High Yield Bond Fund | | | 3,804,937 |
1,606,927 | | Timothy Plan International Fund | | | 9,513,010 |
1,758,612 | | Timothy Plan Large/Mid Cap Growth Fund | | | 7,702,722 |
848,871 | | Timothy Plan Large/Mid Cap Value Fund | | | 7,724,726 |
548,696 | | Timothy Plan Small Cap Value Fund | | | 4,872,416 |
| | | | | |
| | Total Mutual Funds (cost $61,771,719) | | | 38,471,182 |
| | | | | |
| |
| SHORT-TERM INVESTMENTS - 0.40% | | | |
| number of shares | | | | market value |
| | |
151,319 | | Timothy Plan Money Market, 0.38% (A) (B) | | | 151,319 |
| | | | | |
| | |
| | Total Short-Term Investments (cost $151,319) | | | 151,319 |
| | | | | |
| | |
| | Total Investments (cost $61,923,038) - 100.65% | | $ | 38,622,501 |
| | | | | |
| | |
| | LIABILITIES IN EXCESS OF OTHER ASSETS - (0.65)% | | | (248,271) |
| | | | | |
| | |
| | TOTAL NET ASSETS - 100.00% | | $ | 38,374,230 |
| | | | | |
(A) Affiliated Funds - Class A.
(B) Variable rate security; the rate shown represents the yield at December 31, 2008.
The accompanying notes are an integral part of these financial statements.
The Timothy Strategic Growth Fund [82]
STRATEGIC GROWTH FUND
STATEMENT OF ASSETS AND LIABILITIES
As of December 31, 2008
ASSETS
| | | |
| | | amount |
| |
Investments in Afflilated Securities at Value (cost $61,923,038) [NOTE 1] | | $ | 38,622,501 |
Receivables for: | | | |
Investments Sold | | | 131,386 |
Fund Shares Sold | | | 11,815 |
Interest | | | 41 |
Prepaid Expenses | | | 14,451 |
| | | |
| |
Total Assets | | $ | 38,780,194 |
| | | |
| |
LIABILITIES | | | |
| | | amount |
| |
Payable for Investments Purchased | | $ | 231,386 |
Payable for Fund Shares Redeemed | | | 104,784 |
Accrued Advisory Fees | | | 20,273 |
Accrued 12b-1 Fees Class B | | | 3,981 |
Accrued 12b-1 Fees Class C | | | 3,937 |
Accrued Expenses | | | 41,603 |
| | | |
| |
Total Liabilities | | $ | 405,964 |
| | | |
| |
NET ASSETS | | | |
| | | amount |
| |
Class A Shares: | | | |
Net Assets (unlimited shares of $0.001 par beneficial interest authorized; 5,239,012 shares outstanding) | | $ | 25,439,661 |
Net Asset Value and Redemption Price Per Class A Share ($25,439,661 / 5,239,012 shares) | | $ | 4.86 |
Offering Price Per Share ($4.86 / 0.945) | | $ | 5.14 |
Class B Shares: | | | |
Net Assets (unlimited shares of $0.001 par beneficial interest authorized; 1,405,836 shares outstanding) | | $ | 6,511,116 |
Net Asset Value and Offering Price Per Class B Share ($6,511,116 / 1,405,836 shares) | | $ | 4.63 |
Minimum Redemption Price Per Class B Share ($4.63 * 0.99) | | $ | 4.58 |
Class C Shares: | | | |
Net Assets (unlimited shares of $0.001 par beneficial interest authorized; 1,391,453 shares outstanding) | | $ | 6,423,453 |
Net Asset Value and Offering Price Per Class C Share ($6,423,453 / 1,391,453 shares) | | $ | 4.62 |
Minimum Redemption Price Per Share ($4.62* 0.99) | | $ | 4.57 |
| |
Net Assets | | $ | 38,374,230 |
| | | |
| |
SOURCES OF NET ASSETS | | | |
| | | amount |
| |
At December 31, 2008, Net Assets Consisted of: | | | |
Paid-in Capital | | $ | 64,021,237 |
Accumulated Undistributed Net Realized Gain (Loss) on Investments | | | (2,346,470 |
Net Unrealized Appreciation (Depreciation) in Value of Investments | | | (23,300,537) |
| | | |
| |
Net Assets | | $ | 38,374,230 |
| | | |
The accompanying notes are an integral part of these financial statements.
The Timothy Strategic Growth Fund [83]
STRATEGIC GROWTH FUND
STATEMENT OF OPERATIONS
For the Year Ended December 31, 2008
INVESTMENT INCOME
| | | |
| | | amount |
| |
Interest on Affiliated Investments | | $ | 1,347 |
Dividends on Affiliated Investments | | | 652,645 |
| | | |
| |
Total Investment Income | | | 653,992 |
| | | |
| |
EXPENSES | | | |
| | | amount |
| |
Investment Advisory Fees [NOTE 3] | | | 374,071 |
12b-1 Fees (Class B = $81,487, Class C = $67,727) [NOTE 3] | | | 149,214 |
Fund Accounting, Transfer Agency, & Administration Fees | | | 102,713 |
Out-of-Pocket Expense | | | 36,558 |
Registration Fees | | | 27,994 |
Custodian Fees | | | 15,817 |
Audit Fees | | | 12,658 |
Printing Expense | | | 7,339 |
Trustee Fees | | | 6,967 |
CCO Fees | | | 5,201 |
Insurance Expense | | | 2,451 |
| | | |
| |
Total Net Expenses | | | 740,983 |
| | | |
| |
Net Investment Income (Loss) | | | (86,991) |
| | | |
| |
REALIZED AND UNREALIZED GAIN (LOSS) ON INVESTMENTS | | | |
| | | amount |
| |
Net Realized Gain (Loss) on Affiliated Investments | | | (2,291,137) |
Capital Gain Distributions from Affiliated Funds | | | 94,136 |
Change in Unrealized Appreciation/Depreciation of Investments | | | (25,435,252) |
| | | |
Net Realized and Unrealized Gain (Loss) on Investments | | | (27,632,253) |
| | | |
| |
Net Increase (Decrease) in Net Assets Resulting from Operations | | $ | (27,719,244) |
| | | |
The accompanying notes are an integral part of these financial statements.
The Timothy Strategic Growth Fund [84]
STRATEGIC GROWTH FUND
STATEMENTS OF CHANGES IN NET ASSETS
INCREASE (DECREASE) IN NET ASSETS
| | | | | | |
| | | year ended
12/31/08 | | year ended
12/31/07 |
| | |
Operations: | | | | | | |
Net Investment Income (Loss) | | $ | (86,991) | | $ | 511,879 |
Net Realized Gain (Loss) on Investments | | | (2,291,137) | | | 6,565,375 |
Capital Gain Distributions from Affiliated Funds | | | 94,136 | | | 3,251,955 |
Net Change in Unrealized Appreciation/Depreciation of Investments | | | (25,435,252) | | | (4,039,020) |
| | | | | | |
Net Increase (Decrease) in Net Assets (resulting from operations) | | | (27,719,244) | | | 6,290,189 |
| | | | | | |
| | |
Distributions to Shareholders From: | | | | | | |
Net Investment Income: | | | | | | |
Class A | | | (426,205) | | | (405,747) |
Class B | | | (34,098) | | | (18,421) |
Class C | | | (46,567) | | | (28,235) |
Net Realized Gains: | | | | | | |
Class A | | | (2,393,506) | | | (6,021,247) |
Class B | | | (647,982) | | | (2,063,406) |
Class C | | | (641,388) | | | (1,404,504) |
| | | | | | |
Total Distributions | | | (4,189,746) | | | (9,941,560) |
| | | | | | |
| | |
Capital Share Transactions: | | | | | | |
Proceeds from Shares Sold: | | | | | | |
Class A | | | 8,353,300 | | | 10,300,074 |
Class B | | | 40,771 | | | 15,469 |
Class C | | | 3,061,956 | | | 3,622,211 |
Dividends Reinvested: | | | | | | |
Class A | | | 2,708,511 | | | 6,126,626 |
Class B | | | 664,039 | | | 1,970,773 |
Class C | | | 649,068 | | | 1,321,604 |
Cost of Shares Redeemed: | | | | | | |
Class A | | | (8,908,535) | | | (6,913,320) |
Class B | | | (2,618,810) | | | (3,430,584) |
Class C | | | (1,952,558) | | | (2,065,721) |
| | | | | | |
Net Increase (Decrease) in Net Assets (resulting from capital share transactions) | | | 1,997,742 | | | 10,947,132 |
| | | | | | |
| | |
Total Increase (Decrease) in Net Assets | | | (29,911,248) | | | 7,295,761 |
| | | | | | |
| | |
Net Assets: | | | | | | |
Beginning of year | | | 68,285,478 | | | 60,989,717 |
| | | | | | |
| | |
End of year | | $ | 38,374,230 | | $ | 68,285,478 |
| | | | | | |
| | |
Accumulated Undistributed Net Investment Income | | $ | — | | $ | 506,728 |
| | | | | | |
| | |
Shares of Capital Stock of the Fund Sold and Redeemed: | | | | | | |
Shares Sold: | | | | | | |
Class A | | | 1,069,597 | | | 992,053 |
Class B | | | 5,849 | | | 1,553 |
Class C | | | 401,854 | | | 365,100 |
Shares Reinvested: | | | | | | |
Class A | | | 577,508 | | | 679,983 |
Class B | | | 148,555 | | | 229,161 |
Class C | | | 145,531 | | | 153,854 |
Shares Redeemed: | | | | | | |
Class A | | | (1,257,672) | | | (661,415) |
Class B | | | (382,517) | | | (335,910) |
Class C | | | (287,154) | | | (204,654) |
| | | | | | |
Net Increase (Decrease) in Number of Shares Outstanding | | | 421,551 | | | 1,219,725 |
| | | | | | |
The accompanying notes are an integral part of these financial statements.
The Timothy Strategic Growth Fund [85]
STRATEGIC GROWTH FUND
FINANCIAL HIGHLIGHTS
The table below sets forth financial data for one share of capital stock outstanding throughout each period presented.
STRATEGIC GROWTH FUND - CLASS A SHARES
| | | | | | | | | | | | | | | | | |
| | | year
ended
12/31/08 | | year
ended
12/31/07 | | year
ended
12/31/06 | | year
ended
12/31/05 | | | year
ended
12/31/04 | |
| | | | | |
Per Share Operating Performance: | | | | | | | | | | | | | | | | | |
Net Asset Value at Beginning of Year | | $ | 9.12 | | $ | 9.69 | | $ | 9.18 | | $ | 8.64 | | | $ | 8.10 | |
| | | | | | | | | | | | | | | | | |
| | | | | |
Income from Investment Operations: | | | | | | | | | | | | | | | | | |
Net Investment Income (Loss) | | | 0.01 | | | 0.10 | | | 0.14 | | | (0.10) | (A) | | | (0.05) | (A) |
Net Realized and Unrealized Gain (Loss) on Investments | | | (3.66) | | | 0.90 | | | 0.82 | | | 0.64 | | | | 0.71 | |
| | | | | | | | | | | | | | | | | |
Total from Investment Operations | | | (3.65) | | | 1.00 | | | 0.96 | | | 0.54 | | | | 0.66 | |
| | | | | | | | | | | | | | | | | |
| | | | | |
Less Distributions: | | | | | | | | | | | | | | | | | |
Dividends from Realized Gains | | | (0.52) | | | (1.47) | | | (0.40) | | | - | * | | | (0.12) | |
Dividends from Net Investment Income | | | (0.09) | | | (0.10) | | | (0.05) | | | - | | | | - | |
| | | | | | | | | | | | | | | | | |
Total Distributions | | | (0.61) | | | (1.57) | | | (0.45) | | | - | | | | (0.12) | |
| | | | | | | | | | | | | | | | | |
| | | | | |
Net Asset Value at End of Year | | $ | 4.86 | | $ | 9.12 | | $ | 9.69 | | $ | 9.18 | | | $ | 8.64 | |
| | | | | | | | | | | | | | | | | |
| | | | | |
Total Return (B)(C) | | | (39.82)% | | | 10.45% | | | 10.41% | | | 6.25% | | | | 8.09% | |
| | | | | |
Ratios/Supplemental Data: | | | | | | | | | | | | | | | | | |
Net Assets, End of Year (in 000s) | | $ | 25,440 | | $ | 44,231 | | $ | 37,204 | | $ | 26,451 | | | $ | 21,019 | |
| | | | | |
Ratio of Expenses to Average Net Assets: | | | | | | | | | | | | | | | | | |
Before Reimbursement and Waiver/Recoupment of Expenses by Adviser (D) | | | 1.03% | | | 1.00% | | | 1.07% | | | 1.11% | | | | 1.13% | |
After Reimbursement and Waiver/Recoupment of Expenses by Adviser (D) | | | 1.03% | | | 1.00% | | | 1.07% | | | 1.15% | | | | 1.15% | |
| | | | | |
Ratio of Net Investment Income (Loss) to Average Net Assets: | | | | | | | | | | | | | | | | | |
Before Reimbursement and Waiver/Recoupment of Expenses by Adviser (D) (E) | | | 0.12% | | | 1.10% | | | 1.49% | | | (1.10)% | | | | (0.74)% | |
After Reimbursement and Waiver/Recoupment of Expenses by Adviser (D) (E) | | | 0.12% | | | 1.10% | | | 1.49% | | | (1.14)% | | | | (0.76)% | |
| | | | | |
Portfolio Turnover | | | 16.61% | | | 45.00% | | | 10.55% | | | 1.61% | | | | 0.46% | |
| | |
| * | | Distributions amounted to less than 0.01 per share |
| (A) | | Per share amounts calculated using average shares method. |
| (B) | | Total return calculation does not reflect sales load. |
| (C) | | Total return in the above table represents the rate that the investor would have earned or lost on an investment in the Fund assuming reinvestment of dividends. Total return would have been higher or lower if certain expenses had not been reimbursed, waived or recouped. |
| (D) | | These ratios exclude the impact of expenses of the underlying security holdings as represented in the schedule of investments. |
| (E) | | Recognition of net investment income (loss) by the Fund is affected by the timing of the declaration of dividends by the underlying investment companies in which the Fund invests. |
The accompanying notes are an integral part of these financial statements.
The Timothy Strategic Growth Fund [86]
STRATEGIC GROWTH FUND
FINANCIAL HIGHLIGHTS
The table below sets forth financial data for one share of capital stock outstanding throughout each period presented.
STRATEGIC GROWTH FUND - CLASS B SHARES
| | | | | | | | | | | | | | | | | |
| | | year
ended
12/31/08 | | year
ended
12/31/07 | | year
ended
12/31/06 | | year
ended
12/31/05 | | | year
ended
12/31/04 | |
| | | | | |
Per Share Operating Performance: | | | | | | | | | | | | | | | | | |
Net Asset Value at Beginning of Year | | $ | 8.70 | | $ | 9.30 | | $ | 8.85 | | $ | 8.39 | | | $ | 7.92 | |
| | | | | | | | | | | | | | | | | |
| | | | | |
Income from Investment Operations: | | | | | | | | | | | | | | | | | |
Net Investment Income (Loss) | | | (0.04) | | | 0.01 | | | 0.05 | | | (0.16) | (A) | | | (0.12) | (A) |
Net Realized and Unrealized Gain (Loss) on Investments | | | (3.48) | | | 0.87 | | | 0.80 | | | 0.62 | | | | 0.71 | |
| | | | | | | | | | | | | | | | | |
Total from Investment Operations | | | (3.52) | | | 0.88 | | | 0.85 | | | 0.46 | | | | 0.59 | |
| | | | | | | | | | | | | | | | | |
| | | | | |
Less Distributions: | | | | | | | | | | | | | | | | | |
Dividends from Realized Gains | | | (0.52) | | | (1.47) | | | (0.40) | | | - | * | | | (0.12) | |
Dividends from Net Investment Income | | | (0.03) | | | (0.01) | | | - | | | - | | | | - | |
| | | | | | | | | | | | | | | | | |
Total Distributions | | | (0.55) | | | (1.48) | | | (0.40) | | | - | | | | (0.12) | |
| | | | | | | | | | | | | | | | | |
| | | | | |
Net Asset Value at End of Year | | $ | 4.63 | | $ | 8.70 | | $ | 9.30 | | $ | 8.85 | | | $ | 8.39 | |
| | | | | | | | | | | | | | | | | |
| | | | | |
Total Return (B)(C) | | | (40.33)% | | | 9.65% | | | 9.53% | | | 5.49% | | | | 7.39% | |
| | | | | |
Ratios/Supplemental Data: | | | | | | | | | | | | | | | | | |
Net Assets, End of Year (in 000s) | | $ | 6,511 | | $ | 14,219 | | $ | 16,177 | | $ | 17,467 | | | $ | 18,535 | |
| | | | | |
Ratio of Expenses to Average Net Assets: | | | | | | | | | | | | | | | | | |
Before Reimbursement and Waiver/Recoupment of Expenses by Adviser (D) | | | 1.77% | | | 1.74% | | | 1.81% | | | 1.86% | | | | 1.88% | |
After Reimbursement and Waiver/Recoupment of Expenses by Adviser (D) | | | 1.77% | | | 1.74% | | | 1.82% | | | 1.90% | | | | 1.90% | |
| | | | | |
Ratio of Net Investment Income (Loss) to Average Net Assets: | | | | | | | | | | | | | | | | | |
Before Reimbursement and Waiver/Recoupment of Expenses by Adviser (D) (E) | | | (0.70)% | | | 0.06% | | | 0.44% | | | (1.85)% | | | | (1.49)% | |
After Reimbursement and Waiver/Recoupment of Expenses by Adviser (D) (E) | | | (0.70)% | | | 0.06% | | | 0.43% | | | (1.89)% | | | | (1.51)% | |
| | | | | |
Portfolio Turnover | | | 16.61% | | | 45.00% | | | 10.55% | | | 1.61% | | | | 0.46% | |
| | |
| * | | Distributions amounted to less than 0.01 per share |
| (A) | | Per share amounts calculated using average shares method. |
| (B) | | Total return calculation does not reflect redemption fee. |
| (C) | | Total return in the above table represents the rate that the investor would have earned or lost on an investment in the Fund assuming reinvestment of dividends. |
| | Total return would have been higher or lower if certain expenses had not been reimbursed, waived or recouped. |
| (D) | | These ratios exclude the impact of expenses of the underlying security holdings as represented in the schedule of investments. |
| (E) | | Recognition of net investment income (loss) by the Fund is affected by the timing of the declaration of dividends by the underlying investment companies in which the Fund invests. |
The accompanying notes are an integral part of these financial statements.
The Timothy Strategic Growth Fund [87]
STRATEGIC GROWTH FUND
FINANCIAL HIGHLIGHTS
The table below sets forth financial data for one share of capital stock outstanding throughout each period presented.
STRATEGIC GROWTH FUND - CLASS C SHARES
| | | | | | | | | | | | | | | | | |
| | | year
ended
12/31/08 | | year
ended
12/31/07 | | year
ended
12/31/06 | | year
ended
12/31/05 | | | period
ended
12/31/04 (A) | |
| | | | | |
Per Share Operating Performance: | | | | | | | | | | | | | | | | | |
Net Asset Value at Beginning of Period | | $ | 8.70 | | $ | 9.31 | | $ | 8.86 | | $ | 8.39 | | | $ | 8.03 | |
| | | | | | | | | | | | | | | | | |
| | | | | |
Income from Investment Operations: | | | | | | | | | | | | | | | | | |
Net Investment Income (Loss) | | | (0.05) | | | 0.03 | | | 0.06 | | | (0.16) | (B) | | | (0.05) | (B) |
Net Realized and Unrealized Gain (Loss) on Investments | | | (3.47) | | | 0.86 | | | 0.79 | | | 0.63 | | | | 0.53 | |
| | | | | | | | | | | | | | | | | |
Total from Investment Operations | | | (3.52) | | | 0.89 | | | 0.85 | | | 0.47 | | | | 0.48 | |
| | | | | | | | | | | | | | | | | |
| | | | | |
Less Distributions: | | | | | | | | | | | | | | | | | |
Dividends from Realized Gains | | | (0.52) | | | (1.47) | | | (0.40) | | | - | * | | | (0.12) | |
Dividends from Net Investment Income | | | (0.04) | | | (0.03) | | | - | | | - | | | | - | |
| | | | | | | | | | | | | | | | | |
Total Distributions | | | (0.56) | | | (1.50) | | | (0.40) | | | - | | | | (0.12) | |
| | | | | | | | | | | | | | | | | |
| | | | | |
Net Asset Value at End of Period | | $ | 4.62 | | $ | 8.70 | | $ | 9.31 | | $ | 8.86 | | | $ | 8.39 | |
| | | | | | | | | | | | | | | | | |
| | | | | |
Total Return (C)(D) | | | (40.32)% | | | 9.73% | | | 9.51% | | | 5.61% | | | | 5.92% | (E) |
| | | | | |
Ratios/Supplemental Data: | | | | | | | | | | | | | | | | | |
Net Assets, End of Priod (in 000s) | | $ | 6,423 | | $ | 9,836 | | $ | 7,609 | | $ | 5,462 | | | $ | 2,204 | |
| | | | | |
Ratio of Expenses to Average Net Assets: | | | | | | | | | | | | | | | | | |
Before Reimbursement and Waiver/Recoupment of Expenses by Adviser (G) | | | 1.78% | | | 1.75% | | | 1.81% | | | 1.86% | | | | 1.88% | (F) |
After Reimbursement and Waiver/Recoupment of Expenses by Adviser (G) | | | 1.78% | | | 1.75% | | | 1.81% | | | 1.90% | | | | 1.90% | (F) |
| | | | | |
Ratio of Net Investment Income (Loss) to Average Net Assets: | | | | | | | | | | | | | | | | | |
Before Reimbursement and Waiver/Recoupment of Expenses by Adviser (G) (H) | | | (0.61)% | | | 0.43% | | | 0.76% | | | (1.85)% | | | | (1.49)% | (F) |
After Reimbursement and Waiver/Recoupment of Expenses by Adviser (G) (H) | | | (0.61)% | | | 0.43% | | | 0.76% | | | (1.89)% | | | | (1.51)% | (F) |
| | | | | |
Portfolio Turnover | | | 16.61% | | | 45.00% | | | 10.55% | | | 1.61% | | | | 0.46% | |
| | |
| * | | Distributions amounted to less than 0.01 per share |
| (A) | | For the period February 3, 2004 (Commencement of Operations) to December 31, 2004. |
| (B) | | Per share amounts calculated using average shares method. |
| (C) | | Total return calculation does not reflect redemption fee. |
| (D) | | Total return in the above table represents the rate that the investor would have earned or lost on an investment in the Fund assuming reinvestment of dividends. |
| | Total return would have been higher or lower if certain expenses had not been reimbursed, waived or recouped. |
| (E) | | For periods of less than one full year, total return is not annualized. |
| (F) | | Annualized. |
| (G) | | These ratios exclude the impact of expenses of the underlying security holdings as represented in the schedule of investments. |
| (H) | | Recognition of net investment income (loss) by the Fund is affected by the timing of the declaration of dividends by the underlying investment companies in which the Fund invests. |
The accompanying notes are an integral part of these financial statements.
The Timothy Strategic Growth Fund [88]
LETTER FROM THE MANAGER
December 31, 2008
CONSERVATIVE GROWTH FUND
Dear Conservative Growth Fund Shareholder,
As I stated in my President’s Letter at the front of this report, 2008 was, by far, the worst year – in terms of financial market performance – in modern history. Your Conservative Growth Fund is a compilation of several of Timothy’s underlying funds and, as such, its performance is directly related to the performance of those underlying funds. As a review, your specific asset mix is approximately as follows:
| | | |
• Large/Mid Cap Value Fund | | 20.0 | % |
• Small Cap Value Fund | | 10.0 | % |
• Large/Mid Cap Growth Fund | | 10.0 | % |
• Aggressive Growth Fund | | 5.0 | % |
• International Fund | | 15.0 | % |
• High Yield Bond Fund | | 10.0 | % |
• Fixed Income Fund | | 30.0 | % |
Since your performance is so directly related to our underlying funds, you will be pleased to know that we have completed our efforts to upgrade the managers of all our funds and, in my opinion, all of our funds are now managed by firms that are as good as, if not better than, any mutual fund family in the industry. Please refer to each individual manager’s comments within this report for more detailed information as to why the funds under their responsibility performed as they did.
For what it is worth, all of our various managers believe we are either at or very near the bottom of this violent market. If they are right, as I believe they are – although no one can know for sure, then the potential rewards for current and new investments could far outweigh the risks. We fully expect 2009 to be rather rocky but also believe we could see a sustained recovery begin sometime during the last half of the year. As you well know, however, no one can guarantee future results. The one thing I can assure you of is that every one of our managers will be working very hard on your behalf.
ARTHUR D. ALLY
President, The Timothy Plan
Letter From The Manager [89]
FUND PROFILE
December 31, 2008
TIMOTHY PLAN CONSERVATIVE GROWTH FUND
FUND PROFILE (unaudited):
| | |
| Industries |
| (% of Net Assets) |
| |
Fixed Income | | 29.67% |
Large/Mid-Cap Value | | 20.22% |
International | | 14.94% |
Small Cap Value | | 10.20% |
Large/Mid-Cap Growth | | 10.08% |
High Yield Bond | | 9.96% |
Aggressive Growth | | 5.08% |
Liabilities in Excess of Other Assets | | (0.15)% |
| | |
| | 100.00% |
| | |
EXPENSE EXAMPLE (unaudited):
As a shareholder of the Fund, you incur two types of costs: direct costs, such as wire fees and low balance fees; and indirect costs, including management fees, and other Fund operating expenses. This example is intended to help you understand your indirect costs, also referred to as “ongoing costs,” (in dollars) of investing in the Fund, and to compare these costs with the ongoing costs of investing in other mutual funds.
This example is based on an investment of $1,000 invested at the beginning of the period and held for the entire six-month period of July 1, 2008, through December 31, 2008.
Actual Expenses
The first line of the table below provides information about actual account values and actual expenses. You may use the information in this line, together with the amount you invested at the beginning of the period, to estimate the expenses that you paid over the period. Simply divide your account value by $1,000 (for example, an $8,600 account value divided by $1,000 = 8.6), then multiply the result by the number in the first line under the heading “Expenses Paid During Period” to estimate the expenses you paid on your account during this period.
Timothy Plan Top Ten Holdings / Industries [90]
FUND PROFILE
December 31, 2008
TIMOTHY PLAN CONSERVATIVE GROWTH FUND
Hypothetical example for comparison purposes (unaudited)
The second line of the table provides information about hypothetical account values and hypothetical expenses based on the Fund’s actual expense ratio and an assumed rate of return of 5% per year before expenses, which is not the Fund’s actual return. The hypothetical account values and expenses may not be used to estimate the actual ending account balance or expenses you paid for the period. You may use this information to compare ongoing costs of investing in the Fund and other funds. To do so, compare this 5% hypothetical example with the 5% hypothetical examples that appear in the shareholder reports of other funds.
Please note that the expenses shown in the table are meant to highlight your ongoing costs only and do not reflect any direct costs, such as wire fees or low balance fees. Therefore, the second line of the table is useful in comparing ongoing costs only, and will not help you determine the relative total costs of owning different funds. In addition, if these direct costs were included, your costs would be higher.
| | | | | | | | | |
| | | Beginning
Account Value | | Ending
Account Value | | Expenses Paid
During Period* |
| | | 7/1/2008 | | 12/31/2008 | | 7/1/2008 through
12/31/2008 |
| | | |
Actual - Class A | | $ | 1,000.00 | | $ | 747.51 | | $ | 4.72 |
| | | |
Hypothetical - Class A | | $ | 1,000.00 | | $ | 1,019.74 | | $ | 5.45 |
(5% return before expenses) | | | | | | | | | |
| | | |
Actual - Class B | | $ | 1,000.00 | | $ | 744.87 | | $ | 7.99 |
| | | |
Hypothetical - Class B | | $ | 1,000.00 | | $ | 1,015.98 | | $ | 9.23 |
(5% return before expenses) | | | | | | | | | |
| | | |
Actual - Class C | | $ | 1,000.00 | | $ | 744.10 | | $ | 8.00 |
| | | |
Hypothetical - Class C | | $ | 1,000.00 | | $ | 1,015.97 | | $ | 9.24 |
(5% return before expenses) | | | | | | | | | |
| * | Expenses are equal to the Fund’s annualized expense ratio of 1.07% for Class A, 1.82% for Class B, and 1.82% for Class C, which is net of any expenses paid indirectly, multiplied by the average account value over the period, multiplied by 184 days/366 days (to reflect the partial year period.) The Fund’s ending account value on the first line of each share class in the table is based on its actual total return of (25.25)% for Class A, (25.51)% for Class B, and (25.59)% for Class C for the six-month period of July 1, 2008, to December 31, 2008. |
Timothy Plan Top Ten Holdings / Industries [91]
CONSERVATIVE GROWTH FUND
SCHEDULE OF INVESTMENTS
As of December 31, 2008
MUTUAL FUNDS (A) - 100.15%
| | | | | |
| number of shares | | | | market value |
| | |
523,189 | | Timothy Plan Aggressive Growth Fund | | $ | 1,941,031 |
1,185,579 | | Timothy Plan Fixed Income Fund | | | 11,334,135 |
610,557 | | Timothy Plan High Yield Bond Fund | | | 3,803,769 |
963,870 | | Timothy Plan International Fund | | | 5,706,112 |
879,201 | | Timothy Plan Large/Mid Cap Growth Fund | | | 3,850,901 |
848,807 | | Timothy Plan Large/Mid Cap Value Fund | | | 7,724,142 |
438,846 | | Timothy Plan Small Cap Value Fund | | | 3,896,955 |
| | | | | |
| | Total Mutual Funds (cost $52,938,292) | | | 38,257,045 |
| | | | | |
| | |
| | Total Investments (cost $52,938,292) - 100.15% | | $ | 38,257,045 |
| | | | | |
| | |
| | LIABILITIES IN EXCESS OF OTHER ASSETS - (0.15)% | | | (56,945) |
| | | | | |
| | |
| | TOTAL NET ASSETS - 100.00% | | $ | 38,200,100 |
| | | | | |
(A) Affiliated Funds - Class A.
The accompanying notes are an integral part of these financial statements.
Timothy Plan Conservative Growth Fund [92]
CONSERVATIVE GROWTH FUND
STATEMENT OF ASSETS AND LIABILITIES
As of December 31, 2008
| | | |
ASSETS | | | |
| | | amount |
Investments in Affiliated Securities at Value (cost $52,938,292) [NOTE 1] | | $ | 38,257,045 |
Receivables for: | | | |
Investments Sold | | | 300,784 |
Fund Shares Sold | | | 12,787 |
Interest | | | 4 |
Prepaid Expenses | | | 14,182 |
| | | |
| |
Total Assets | | $ | 38,584,802 |
| | | |
| |
LIABILITIES | | | |
| | | amount |
| |
Payable to Custodian | | $ | 183,926 |
Payable for Investments Purchased | | | 100,784 |
Payable for Fund Shares Redeemed | | | 34,227 |
Accrued Advisory Fees | | | 20,682 |
Accrued 12b-1 Fees Class B | | | 3,440 |
Accrued 12b-1 Fees Class C | | | 3,940 |
Accrued Expenses | | | 37,703 |
| | | |
| |
Total Liabilities | | $ | 384,702 |
| | | |
| |
NET ASSETS | | | |
| | | amount |
| |
Class A Shares: | | | |
Net Assets (unlimited shares of $0.001 par beneficial interest authorized; 3,777,321 shares outstanding) | | $ | 26,206,171 |
Net Asset Value and Redemption Price Per Class A Share ($26,206,171 / 3,777,321 shares) | | $ | 6.94 |
Offering Price Per Share ($6.94 / 0.945) | | $ | 7.34 |
Class B Shares: | | | |
Net Assets (unlimited shares of $0.001 par beneficial interest authorized; 837,178 shares outstanding) | | $ | 5,555,617 |
Net Asset Value and Offering Price Per Class B Share ($5,555,617 / 837,178 shares) | | $ | 6.64 |
Minimum Redemption Price Per Class B Share ($6.64 * 0.99) | | $ | 6.57 |
Class C Shares: | | | |
Net Assets (unlimited shares of $0.001 par beneficial interest authorized; 973,461 shares outstanding) | | $ | 6,438,312 |
Net Asset Value and Offering Price Per Class C Share ($6,438,312 / 973,461 shares) | | $ | 6.61 |
Minimum Redemption Price Per Share ($6.61 * 0.99) | | $ | 6.54 |
| |
Net Assets | | $ | 38,200,100 |
| | | |
| |
SOURCES OF NET ASSETS | | | |
| | | amount |
| |
At December 31, 2008, Net Assets Consisted of: | | | |
Paid-in Capital | | $ | 53,703,859 |
Accumulated Undistributed Net Investment Income | | | 443,020 |
Accumulated Undistributed Net Realized Gain (Loss) on Investments | | | (1,265,532) |
Net Unrealized Appreciation (Depreciation) in Value of Investments | | | (14,681,247) |
| | | |
| |
Net Assets | | $ | 38,200,100 |
| | | |
The accompanying notes are an integral part of these financial statements.
Timothy Plan Conservative Growth Fund [93]
CONSERVATIVE GROWTH FUND
STATEMENT OF OPERATIONS
For the Year Ended December 31, 2008
| | | |
INVESTMENT INCOME | | | |
| | | amount |
| |
Interest on Affiliated Investments | | $ | 1,445 |
Dividends on Affiliated Investments | | | 1,195,721 |
| | | |
| |
Total Investment Income | | | 1,197,166 |
| | | |
| |
EXPENSES | | | |
| | | amount |
| |
Investment Advisory Fee [NOTE 3] | | | 326,412 |
12b-1 Fees (Class B = $59,950, Class C = $55,214) [NOTE 3] | | | 115,164 |
Fund Accounting, Transfer Agency, & Administration Fees | | | 89,476 |
Registration Fees | | | 28,652 |
Out-of-Pocket Expense | | | 28,125 |
Audit Fees | | | 10,935 |
Custodian Fees | | | 9,420 |
Printing Expense | | | 6,240 |
Trustee Fees | | | 5,514 |
CCO Fees | | | 4,485 |
Insurance Expense | | | 2,041 |
| | | |
| |
Total Expenses | | | 626,464 |
| | | |
| |
Net Investment Income (Loss) | | | 570,702 |
| | | |
| |
REALIZED AND UNREALIZED GAIN (LOSS) ON INVESTMENTS | | | |
| | | amount |
| |
Net Realized Gain (Loss) on Affiliated Investments | | | (1,179,921) |
Capital Gain Distributions from Affiliated Funds | | | 78,533 |
Change in Unrealized Appreciation/Depreciation of Investments | | | (16,268,127) |
| | | |
Net Realized and Unrealized Gain (Loss) on Investments | | | (17,369,515) |
| | | |
| |
Net Increase (Decrease) in Net Assets Resulting from Operations | | $ | (16,798,813) |
| | | |
The accompanying notes are an integral part of these financial statements.
Timothy Plan Conservative Growth Fund [94]
CONSERVATIVE GROWTH FUND
STATEMENTS OF CHANGES IN NET ASSETS
INCREASE (DECREASE) IN NET ASSETS
| | | | | | |
| | | year ended
12/31/08 | | year ended
12/31/07 |
Operations: | | | | | | |
Net Investment Income (Loss) | | $ | 570,702 | | $ | 966,363 |
Net Realized Gain (Loss) on Investments | | | (1,179,921) | | | 4,679,415 |
Capital Gain Distributions from Affiliated Funds | | | 78,533 | | | 1,656,195 |
Net Change in Unrealized Appreciation/Depreciation of Investments | | | (16,268,127) | | | (3,022,147) |
| | | | | | |
Net Increase (Decrease) in Net Assets (resulting from operations) | | | (16,798,813) | | | 4,279,826 |
| | | | | | |
| | |
Distributions to Shareholders From: | | | | | | |
Net Investment Income: | | | | | | |
Class A | | | (549,071) | | | (645,101) |
Class B | | | (62,140) | | | (95,736) |
Class C | | | (86,071) | | | (77,718) |
Capital Gains: | | | | | | |
Class A | | | (1,263,508) | | | (4,368,631) |
Class B | | | (279,532) | | | (1,174,644) |
Class C | | | (323,507) | | | (859,370) |
| | | | | | |
Total Distributions | | | (2,563,829) | | | (7,221,200) |
| | | | | | |
| | |
Capital Share Transactions: | | | | | | |
Proceeds from Shares Sold: | | | | | | |
Class A | | | 9,080,398 | | | 8,850,423 |
Class B | | | 125,202 | | | 72,819 |
Class C | | | 3,387,529 | | | 2,466,071 |
Dividends Reinvested: | | | | | | |
Class A | | | 1,706,832 | | | 4,750,165 |
Class B | | | 314,982 | | | 1,183,084 |
Class C | | | 361,461 | | | 887,255 |
Cost of Shares Redeemed: | | | | | | |
Class A | | | (9,239,640) | | | (6,630,974) |
Class B | | | (1,655,818) | | | (1,489,383) |
Class C | | | (1,524,513) | | | (1,586,678) |
| | | | | | |
Net Increase (Decrease) in Net Assets (resulting from capital share transactions) | | | 2,556,433 | | | 8,502,782 |
| | | | | | |
| | |
Total Increase (Decrease) in Net Assets | | | (16,806,209) | | | 5,561,408 |
| | | | | | |
| | |
Net Assets: | | | | | | |
Beginning of year | | | 55,006,309 | | | 49,444,901 |
| | | | | | |
| | |
End of year | | $ | 38,200,100 | | $ | 55,006,309 |
| | | | | | |
Accumulated Undistributed Net Investment Income | | $ | 443,020 | | $ | 569,599 |
| | | | | | |
| | |
Shares of Capital Stock of the Fund Sold and Redeemed: | | | | | | |
Shares Sold: | | | | | | |
Class A | | | 955,118 | | | 754,177 |
Class B | | | 14,045 | | | 6,546 |
Class C | | | 382,297 | | | 219,423 |
Shares Reinvested: | | | | | | |
Class A | | | 251,742 | | | 456,309 |
Class B | | | 48,608 | | | 118,786 |
Class C | | | 55,954 | | | 89,172 |
Shares Redeemed: | | | | | | |
Class A | | | (1,062,328) | | | (567,858) |
Class B | | | (196,137) | | | (131,104) |
Class C | | | (179,730) | | | (139,998) |
| | | | | | |
Net Increase (Decrease) in Number of Shares Outstanding | | | 269,569 | | | 805,453 |
| | | | | | |
The accompanying notes are an integral part of these financial statements.
Timothy Plan Conservative Growth Fund [95]
CONSERVATIVE GROWTH FUND
FINANCIAL HIGHLIGHTS
The table below sets forth financial data for one share of capital stock outstanding throughout each period presented.
CONSERVATIVE GROWTH FUND - CLASS A SHARES
| | | | | | | | | | | | | | | | | |
| | | year
ended
12/31/08 | | year
ended
12/31/07 | | year
ended
12/31/06 | | year
ended
12/31/05 | | | year
ended
12/31/04 | |
Per Share Operating Performance: | | | | | | | | | | | | | | | | | |
Net Asset Value at Beginning of Year | | $ | 10.49 | | $ | 11.10 | | $ | 10.83 | | $ | 10.26 | | | $ | 9.85 | |
| | | | | | | | | | | | | | | | | |
| | | | | |
Income from Investment Operations: | | | | | | | | | | | | | | | | | |
Net Investment Income (Loss) | | | 0.13 | | | 0.22 | | | 0.32 | | | (0.01) | (A) | | | 0.02 | (A) |
Net Realized and Unrealized Gain (Loss) on Investments | | | (3.18) | | | 0.75 | | | 0.75 | | | 0.58 | | | | 0.61 | |
| | | | | | | | | | | | | | | | | |
Total from Investment Operations | | | (3.05) | | | 0.97 | | | 1.07 | | | 0.57 | | | | 0.63 | |
| | | | | | | | | | | | | | | | | |
| | | | | |
Less Distributions: | | | | | | | | | | | | | | | | | |
Dividends from Realized Gains | | | (0.35) | | | (1.38) | | | (0.58) | | | - | | | | (0.19) | |
Dividends from Net Investment Income | | | (0.15) | | | (0.20) | | | (0.22) | | | - | | | | - | |
Distributions from Return of Capital | | | - | | | - | | | - | | | - | | | | (0.03) | |
| | | | | | | | | | | | | | | | | |
Total Distributions | | | (0.50) | | | (1.58) | | | (0.80) | | | - | | | | (0.22) | |
| | | | | | | | | | | | | | | | | |
Net Asset Value at End of Year | | $ | 6.94 | | $ | 10.49 | | $ | 11.10 | | $ | 10.83 | | | $ | 10.26 | |
| | | | | | | | | | | | | | | | | |
| | | | | |
Total Return (B)(C) | | | (28.88)% | | | 8.85% | | | 9.86% | | | 5.56% | | | | 6.41% | |
| | | | | |
Ratios/Supplemental Data: | | | | | | | | | | | | | | | | | |
Net Assets, End of Year (in 000s) | | $ | 26,206 | | $ | 38,102 | | $ | 33,189 | | $ | 27,765 | | | $ | 23,241 | |
| | | | | |
Ratio of Expenses to Average Net Assets: | | | | | | | | | | | | | | | | | |
Before Reimbursement and Waiver/Recoupment of Expenses by Adviser (D) | | | 1.02% | | | 1.02% | | | 1.08% | | | 1.13% | | | | 1.14% | |
After Reimbursement and Waiver/Recoupment of Expenses by Adviser (D) | | | 1.02% | | | 1.02% | | | 1.09% | | | 1.15% | | | | 1.15% | |
| | | | | |
Ratio of Net Investment Income (Loss) to Average Net Assets: | | | | | | | | | | | | | | | | | |
Before Reimbursement and Waiver/Recoupment of Expenses by Adviser (D) (E) | | | 1.36% | | | 2.09% | | | 2.98% | | | (0.11)% | | | | 0.27% | |
After Reimbursement and Waiver/Recoupment of Expenses by Adviser (D) (E) | | | 1.36% | | | 2.09% | | | 2.97% | | | (0.13)% | | | | 0.26% | |
| | | | | |
Portfolio Turnover | | | 25.72% | | | 40.54% | | | 6.12% | | | 3.61% | | | | 0.00% | |
| | |
| (A) | | Per share amounts calculated using average shares method. |
| (B) | | Total return calculation does not reflect sales load. |
| (C) | | Total return in the above table represents the rate that the investor would have earned or lost on an investment in the Fund assuming reinvestment of dividends. |
| | Total return would have been higher or lower if certain expenses had not been reimbursed, waived or recouped. |
| (D) | | These ratios exclude the impact of expenses of the underlying security holdings as represented in the schedule of investments. |
| (E) | | Recognition of net investment income (loss) by the Fund is affected by the timing of the declaration of dividends by the underlying investment companies in which the Fund invests. |
The accompanying notes are an integral part of these financial statements.
Timothy Plan Conservative Growth Fund [96]
CONSERVATIVE GROWTH FUND
FINANCIAL HIGHLIGHTS
The table below sets forth financial data for one share of capital stock outstanding throughout each period presented.
CONSERVATIVE GROWTH FUND - CLASS B SHARES
| | | | | | | | | | | | | | | | | | |
| | | year
ended
12/31/08 | | | year
ended
12/31/07 | | year
ended
12/31/06 | | year
ended
12/31/05 | | | year
ended
12/31/04 | |
Per Share Operating Performance: | | | | | | | | | | | | | | | | | | |
Net Asset Value at Beginning of Year | | $ | 10.03 | | | $ | 10.67 | | $ | 10.43 | | $ | 9.96 | | | $ | 9.60 | |
| | | | | | | | | | | | | | | | | | |
| | | | | |
Income from Investment Operations: | | | | | | | | | | | | | | | | | | |
Net Investment Income (Loss) | | | 0.05 | (A) | | | 0.14 | | | 0.22 | | | (0.09) | (A) | | | (0.05) | (A) |
Net Realized and Unrealized Gain (Loss) on Investments | | | (3.01) | | | | 0.71 | | | 0.72 | | | 0.56 | | | | 0.60 | |
| | | | | | | | | | | | | | | | | | |
Total from Investment Operations | | | (2.96) | | | | 0.85 | | | 0.94 | | | 0.47 | | | | 0.55 | |
| | | | | | | | | | | | | | | | | | |
| | | | | |
Less Distributions: | | | | | | | | | | | | | | | | | | |
Dividends from Realized Gains | | | (0.35) | | | | (1.38) | | | (0.58) | | | - | | | | (0.19) | |
Dividends from Net Investment Income | | | (0.08) | | | | (0.11) | | | (0.12) | | | - | | | | - | |
| | | | | | | | | | | | | | | | | | |
Total Distributions | | | (0.43) | | | | (1.49) | | | (0.70) | | | - | | | | (0.19) | |
| | | | | | | | | | | | | | | | | | |
| | | | | |
Net Asset Value at End of Year | | $ | 6.64 | | | $ | 10.03 | | $ | 10.67 | | $ | 10.43 | | | $ | 9.96 | |
| | | | | | | | | | | | | | | | | | |
| | | | | |
Total Return (B)(C) | | | (29.37)% | | | | 8.05% | | | 9.00% | | | 4.72% | | | | 5.72% | |
| | | | | |
Ratios/Supplemental Data: | | | | | | | | | | | | | | | | | | |
Net Assets, End of Year (in 000s) | | $ | 5,556 | | | $ | 9,740 | | $ | 10,423 | | $ | 11,652 | | | $ | 12,870 | |
| | | | | |
Ratio of Expenses to Average Net Assets: | | | | | | | | | | | | | | | | | | |
Before Reimbursement and Waiver/Recoupment of Expenses by Adviser (D) | | | 1.76% | | | | 1.76% | | | 1.82% | | | 1.88% | | | | 1.89% | |
After Reimbursement and Waiver/Recoupment of Expenses by Adviser (D) | | | 1.76% | | | | 1.76% | | | 1.85% | | | 1.90% | | | | 1.90% | |
| | | | | |
Ratio of Net Investment Income (Loss) to Average Net Assets: | | | | | | | | | | | | | | | | | | |
Before Reimbursement and Waiver/Recoupment of Expenses by Adviser (D) (E) | | | 0.53% | | | | 1.14% | | | 1.88% | | | (0.86)% | | | | (0.48)% | |
After Reimbursement and Waiver/Recoupment of Expenses by Adviser (D) (E) | | | 0.53% | | | | 1.14% | | | 1.85% | | | (0.88)% | | | | (0.49)% | |
| | | | | |
Portfolio Turnover | | | 25.72% | | | | 40.54% | | | 6.12% | | | 3.61% | | | | 0.00% | |
| | |
| (A) | | Per share amounts calculated using average shares method. |
| (B) | | Total return calculation does not reflect redemption fee. |
| (C) | | Total return in the above table represents the rate that the investor would have earned or lost on an investment in the Fund assuming reinvestment of dividends. |
| | Total return would have been higher or lower if certain expenses had not been reimbursed, waived or recouped. |
| (D) | | These ratios exclude the impact of expenses of the underlying security holdings as represented in the schedule of investments. |
| (E) | | Recognition of net investment income (loss) by the Fund is affected by the timing of the declaration of dividends by the underlying investment companies in which the Fund invests. |
The accompanying notes are an integral part of these financial statements.
Timothy Plan Conservative Growth Fund [97]
CONSERVATIVE GROWTH FUND
FINANCIAL HIGHLIGHTS
The table below sets forth financial data for one share of capital stock outstanding throughout each period presented.
CONSERVATIVE GROWTH FUND - CLASS C SHARES
| | | | | | | | | | | | | | | | | | |
| | | year
ended
12/31/08 | | | year
ended
12/31/07 | | year
ended
12/31/06 | | year
ended
12/31/05 | | | period
ended
12/31/04 (A) | |
Per Share Operating Performance: | | | | | | | | | | | | | | | | | | |
Net Asset Value at Beginning of Period | | $ | 10.02 | | | $ | 10.68 | | $ | 10.44 | | $ | 9.97 | | | $ | 9.69 | |
| | | | | | | | | | | | | | | | | | |
| | | | | |
Income from Investment Operations: | | | | | | | | | | | | | | | | | | |
Net Investment Income (Loss) | | | 0.06 | (B) | | | 0.12 | | | 0.23 | | | (0.09) | (B) | | | (0.02) | (B) |
Net Realized and Unrealized Gain (Loss) on Investments | | | (3.03) | | | | 0.72 | | | 0.73 | | | 0.56 | | | | 0.49 | |
| | | | | | | | | | | | | | | | | | |
Total from Investment Operations | | | (2.97) | | | | 0.84 | | | 0.96 | | | 0.47 | | | | 0.47 | |
| | | | | | | | | | | | | | | | | | |
| | | | | |
Less Distributions: | | | | | | | | | | | | | | | | | | |
Dividends from Realized Gains | | | (0.35) | | | | (1.38) | | | (0.58) | | | - | | | | (0.19) | |
Dividends from Net Investment Income | | | (0.09) | | | | (0.12) | | | (0.14) | | | - | | | | - | |
| | | | | | | | | | | | | | | | | | |
Total Distributions | | | (0.44) | | | | (1.50) | | | (0.72) | | | - | | | | (0.19) | |
| | | | | | | | | | | | | | | | | | |
| | | | | |
Net Asset Value at End of Period | | $ | 6.61 | | | $ | 10.02 | | $ | 10.68 | | $ | 10.44 | | | $ | 9.97 | |
| | | | | | | | | | | | | | | | | | |
| | | | | |
Total Return (C)(D) | | | (29.45)% | | | | 7.98% | | | 9.16% | | | 4.71% | | | | 4.84% | (E) |
| | | | | |
Ratios/Supplemental Data: | | | | | | | | | | | | | | | | | | |
Net Assets, End of Period (in 000s) | | $ | 6,438 | | | $ | 7,164 | | $ | 5,833 | | $ | 4,361 | | | $ | 2,638 | |
| | | | | |
Ratio of Expenses to Average Net Assets: | | | | | | | | | | | | | | | | | | |
Before Reimbursement and Waiver/Recoupment of Expenses by Adviser (G) | | | 1.77% | | | | 1.77% | | | 1.84% | | | 1.88% | | | | 1.89% | (F) |
After Reimbursement and Waiver/Recoupment of Expenses by Adviser (G) | | | 1.77% | | | | 1.77% | | | 1.84% | | | 1.90% | | | | 1.90% | (F) |
| | | | | |
Ratio of Net Investment Income (Loss) to Average Net Assets: | | | | | | | | | | | | | | | | | | |
Before Reimbursement and Waiver/Recoupment of Expenses by Adviser (G) (H) | | | 0.72% | | | | 1.40% | | | 2.36% | | | (0.86)% | | | | (0.48)% | (F) |
After Reimbursement and Waiver/Recoupment of Expenses by Adviser (G) (H) | | | 0.72% | | | | 1.40% | | | 2.36% | | | (0.88)% | | | | (0.49)% | (F) |
| | | | | |
Portfolio Turnover | | | 25.72% | | | | 40.54% | | | 6.12% | | | 3.61% | | | | 0.00% | |
| | |
| (A) | | For the period February 3, 2004 (Commencement of Operations) to December 31, 2004. |
| (B) | | Per share amounts calculated using average shares method. |
| (C) | | Total return calculation does not reflect redemption fee. |
| (D) | | Total return in the above table represents the rate that the investor would have earned or lost on an investment in the Fund assuming reinvestment of dividends. |
| | Total return would have been higher or lower if certain expenses had not been reimbursed, waived or recouped. |
| (E) | | For periods of less than one full year, total return is not annualized. |
| (F) | | Annualized. |
| (G) | | These ratios exclude the impact of expenses of the underlying security holdings as represented in the schedule of investments. |
| (H) | | Recognition of net investment income (loss) by the Fund is affected by the timing of the declaration of dividends by the underlying investment companies in which the Fund invests. |
The accompanying notes are an integral part of these financial statements.
Timothy Plan Conservative Growth Fund [98]
FUND PROFILE
December 31, 2008
TIMOTHY PLAN MONEY MARKET FUND
FUND PROFILE (unaudited):
| | |
| Top Ten Holdings |
| (% of Net Assets) |
| |
U.S. Treasury Inflation Indexed Bond, 3.875%, 1/15/2009 | | 9.68% |
Federal Home Loan Bank, 0.17%, 2/17/2009 | | 5.91% |
Federal Home Loan Bank, 0.74%, 1/20/2009 | | 5.90% |
Federal Home Loan Bank, 0.18%, 3/30/2009 | | 5.90% |
Federal Home Loan Bank, 0.18%, 3/31/2009 | | 5.90% |
U.S. Treasury Bill, 0.00%, 1/02/2009 | | 4.43% |
Federal Home Loan Bank, 0.29%, 1/22/2009 | | 4.43% |
Federal Home Loan Bank, 0.15%, 3/13/2009 | | 4.43% |
Federal Home Loan Bank, 0.79%, 3/02/2009 | | 4.42% |
Federal Home Loan Bank, 1.08%, 2/18/2009 | | 4.42% |
| | |
| | 55.42% |
| | |
| | |
| Industries |
| (% of Net Assets) |
| |
Government | | 98.37% |
Money Market Instruments | | 1.63% |
| | |
| | 100.00% |
| | |
EXPENSE EXAMPLE (unaudited):
As a shareholder of the Fund, you incur two types of costs: direct costs, such as wire fees and low balance fees; and indirect costs, including management fees, and other Fund operating expenses. This example is intended to help you understand your indirect costs, also referred to as “ongoing costs,” (in dollars) of investing in the Fund, and to compare these costs with the ongoing costs of investing in other mutual funds.
This example is based on an investment of $1,000 invested at the beginning of the period and held for the entire six-month period of July 1, 2008, through December 31, 2008.
Actual Expenses
The first line of the table below provides information about actual account values and actual expenses. You may use the information in this line, together with the amount you invested at the beginning of the period, to estimate the expenses that you paid over the period. Simply divide your account value by $1,000 (for example, an $8,600 account value divided by $1,000 = 8.6), then multiply the result by the number in the first line under the heading “Expenses Paid During Period” to estimate the expenses you paid on your account during this period.
Timothy Plan Top Ten Holdings / Industries [99]
FUND PROFILE
December 31, 2008
TIMOTHY PLAN MONEY MARKET FUND
Hypothetical example for comparison purposes (unaudited)
The second line of the table provides information about hypothetical account values and hypothetical expenses based on the Fund’s actual expense ratio and an assumed rate of return of 5% per year before expenses, which is not the Fund’s actual return. The hypothetical account values and expenses may not be used to estimate the actual ending account balance or expenses you paid for the period. You may use this information to compare ongoing costs of investing in the Fund and other funds. To do so, compare this 5% hypothetical example with the 5% hypothetical examples that appear in the shareholder reports of other funds.
Please note that the expenses shown in the table are meant to highlight your ongoing costs only and do not reflect any direct costs, such as wire fees or low balance fees. Therefore, the second line of the table is useful in comparing ongoing costs only, and will not help you determine the relative total costs of owning different funds. In addition, if these direct costs were included, your costs would be higher.
| | | | | | | | | |
| | | Beginning
Account Value | | Ending Account
Value | | Expenses Paid
During Period* |
| | | 7/ 1/ 2008 | | 12/ 31/ 2008 | | 7/1/2008 through
12/ 31/ 2008 |
Actual | | $ | 1,000.00 | | $ | 1,006.80 | | $ | 2.67 |
| | | |
Hypothetical | | $ | 1,000.00 | | $ | 1,022.48 | | $ | 2.69 |
(5% return before expenses) | | | | | | | | | |
| * | Expenses are equal to the Fund’s annualized expense ratio of 0.53%, which is net of any expenses paid indirectly, multiplied by the average account value over the period, multiplied by 184 days/366 days (to reflect the partial year period.) The Fund’s ending account value on the first line in the table is based on its actual total return of 0.68% for the six-month period of July 1, 2008, to December 31, 2008. |
Timothy Plan Top Ten Holdings / Industries [100]
MONEY MARKET FUND
SCHEDULE OF INVESTMENTS
As of December 31, 2008
SHORT-TERM INVESTMENTS - 100.00%
| | | | | |
| par value | | | | market value |
| | |
| | U.S. Government Agencies - 84.26% | | | |
| $ 1,200,000 | | Federal Home Loan Bank, 1.86%, 01/07/2009 | | $ | 1,199,600 |
| 1,050,000 | | Federal Home Loan Bank, 1.99%, 01/09/2009 | | | 1,049,510 |
| 1,250,000 | | Federal Home Loan Bank, 0.52%, 01/14/2009 | | | 1,249,759 |
| 2,000,000 | | Federal Home Loan Bank, 0.74%, 01/20/2009 | | | 1,999,200 |
| 1,400,000 | | Federal Home Loan Bank, 1.26%, 01/21/2009 | | | 1,399,002 |
| 1,500,000 | | Federal Home Loan Bank, 0.29%, 01/22/2009 | | | 1,499,741 |
| 1,375,000 | | Federal Home Loan Bank, 0.67%, 02/11/2009 | | | 1,373,955 |
| 1,200,000 | | Federal Home Loan Bank, 0.82%, 02/13/2009 | | | 1,198,835 |
| 2,000,000 | | Federal Home Loan Bank, 0.17%, 02/17/2009 | | | 1,999,556 |
| 1,500,000 | | Federal Home Loan Bank, 1.08%, 02/18/2009 | | | 1,497,840 |
| 1,385,000 | | Federal Home Loan Bank, 1.15%, 02/20/2009 | | | 1,382,788 |
| 1,500,000 | | Federal Home Loan Bank, 0.79%, 03/02/2009 | | | 1,497,950 |
| 1,200,000 | | Federal Home Loan Bank, 0.96%, 03/11/2009 | | | 1,197,738 |
| 1,500,000 | | Federal Home Loan Bank, 0.15%, 03/13/2009 | | | 1,499,556 |
| 1,500,000 | | Federal Home Loan Bank, 0.68%, 03/18/2009 | | | 1,497,783 |
| 1,500,000 | | Federal Home Loan Bank, 1.18%, 03/25/2009 | | | 1,495,850 |
| 1,500,000 | | Federal Home Loan Bank, 1.40%, 03/27/2009 | | | 1,494,930 |
| 2,000,000 | | Federal Home Loan Bank, 0.18%, 03/30/2009 | | | 1,999,120 |
| 2,000,000 | | Federal Home Loan Bank, 0.18%, 03/31/2009 | | | 1,999,110 |
| | | | | |
| | |
| | Total U.S. Government Agencies (amortized cost $28,531,823) | | | 28,531,823 |
| | | | | |
| | |
| | Money Market Instruments - 1.63% | | | |
| 550,242 | | Fidelity Institutional Money Market Portfolio, 2.03% (A) | | | 550,242 |
| | | | | |
| | |
| | Total Money Market Instruments (cost $550,242) | | | 550,242 |
| | | | | |
| | |
| | U.S. Treasury Bills - 14.11% | | | |
| 1,500,000 | | U.S. Treasury Bill, 0.00%, 01/02/2009 | | | 1,500,000 |
| 3,302,500 | | U.S. Treasury Inflation Indexed Bond, 3.875%, 01/15/2009 | | | 3,276,975 |
| | | | | |
| | |
| | Total U.S. Treasury Bills (amortized cost $4,776,975) | | | 4,776,975 |
| | | | | |
| | |
| | TOTAL INVESTMENTS (cost $33,859,040) - 100.00% | | $ | 33,859,040 |
| | | | | |
| | |
| | OTHER ASSETS LESS LIABILITIES - 0.00% | | | 603 |
| | | | | |
| | |
| | TOTAL NET ASSETS - 100.00% | | $ | 33,859,643 |
| | | | | |
(A) Variable rate security; the rate shown represents the yield at December 31, 2008.
The accompanying notes are an integral part of these financial statements.
Timothy Plan Money Market Fund [101]
MONEY MARKET FUND
STATEMENT OF ASSETS AND LIABILITIES
As of December 31, 2008
| | | |
ASSETS | | | |
| | | amount |
| |
Investments in Unaffiliated Securities at Value (cost $33,859,040) [NOTE 1] | | $ | 33,859,040 |
Receivables: | | | |
Interest | | | 65,260 |
Fund Shares Sold | | | 11,204 |
Advisor Reimbursement | | | 1,967 |
Prepaid Expenses | | | 9,011 |
| | | |
| |
Total Assets | | $ | 33,946,482 |
| | | |
| |
LIABILITIES | | | |
| | | amount |
| |
Payable for Fund Shares Redeemed | | $ | 53,814 |
Payable for Distributions | | | 12,144 |
Accrued Expenses | | | 20,881 |
| | | |
| |
Total Liabilities | | $ | 86,839 |
| | | |
| |
NET ASSETS | | | |
| | | amount |
| |
Net Assets | | $ | 33,859,643 |
| | | |
| |
Shares of Capital Stock Outstanding (par value $0.001, unlimited shares authorized) | | | 33,857,187 |
| | | |
Net Asset Value, Offering and Redemption Price Per Share ($33,859,643 / 33,857,187 shares) | | $ | 1.00 |
| | | |
| |
SOURCES OF NET ASSETS | | | |
| | | amount |
| |
At December 31, 2008, Net Assets Consisted of: | | | |
Paid-in Capital | | $ | 33,857,331 |
Accumulated Undistributed Net Realized Gain (Loss) on Investments | | | 2,312 |
| | | |
| |
Net Assets | | $ | 33,859,643 |
| | | |
The accompanying notes are an integral part of these financial statements.
Timothy Plan Money Market Fund [102]
MONEY MARKET FUND
STATEMENT OF OPERATIONS
For the Year Ended December 31, 2008
| | | |
| INVESTMENT INCOME | | |
| | | amount |
| |
Interest on Unaffiliated Investments | | $ | 750,287 |
| | | |
| |
Total Investment Income | | | 750,287 |
| | | |
| |
| EXPENSES | | | |
| | | amount |
| |
Investment Advisory Fees [NOTE 3] | | | 183,719 |
Fund Accounting, Transfer Agency, & Administration Fees | | | 53,654 |
Registration Fees | | | 18,104 |
Custodian Fees | | | 18,006 |
Out-of-Pocket Expense | | | 13,494 |
Audit Fees | | | 6,524 |
Printing Expense | | | 5,031 |
Trustee Fees | | | 3,430 |
CCO Fees | | | 2,234 |
Insurance Expense | | | 1,111 |
Miscellaneous Expense | | | 736 |
| | | |
| |
Total Expenses | | | 306,043 |
| | | |
| |
Fees Waived by Adviser | | | (107,015) |
Fees Waived by Administrator (A) | | | (4,277) |
| | | |
| |
Total Net Expenses | | | 194,751 |
| | | |
| |
Net Investment Income (Loss) | | | 555,536 |
| | | |
| |
| REALIZED AND UNREALIZED GAIN (LOSS) ON INVESTMENTS | | | |
| | | amount |
| |
| | | |
Net Realized Gain (Loss) on Unaffiliated Investments | | | 2,939 |
| | | |
| |
Net Increase (Decrease) in Net Assets Resulting from Operations | | $ | 558,475 |
| | | |
| | |
| (A) | | The Administrator reimbused the Fund for a loss caused by a processing error. |
The accompanying notes are an integral part of these financial statements.
Timothy Plan Money Market Fund [103]
MONEY MARKET FUND
STATEMENTS OF CHANGES IN NET ASSETS
INCREASE (DECREASE) IN NET ASSETS
| | | | | | |
| | | year ended
12/31/08 | | year ended
12/31/07 |
| | |
Operations: | | | | | | |
Net Investment Income (Loss) | | $ | 555,536 | | $ | 1,245,341 |
Net Realized Gain (Loss) on Investments | | | 2,939 | | | 1,649 |
| | | | | | |
Net Increase (Decrease) in Net Assets (resulting from operations) | | | 558,475 | | | 1,246,990 |
| | | | | | |
| | |
Distributions to Shareholders From: | | | | | | |
Net Investment Income | | | (556,735) | | | (1,245,883) |
| | | | | | |
Total Distributions | | | (556,735) | | | (1,245,883) |
| | | | | | |
| | |
Capital Share Transactions: | | | | | | |
Proceeds from Shares Sold: | | | 134,018,704 | | | 178,091,297 |
Dividends Reinvested: | | | 173,650 | | | 232,944 |
Cost of Shares Redeemed: | | | (145,767,742) | | | (152,705,330) |
| | | | | | |
Net Increase (Decrease) in Net Assets (resulting from capital share transactions) | | | (11,575,388) | | | 25,618,911 |
| | | | | | |
| | |
Total Increase (Decrease) in Net Assets | | | (11,573,648) | | | 25,620,018 |
| | | | | | |
| | |
Net Assets: | | | | | | |
Beginning of year | | | 45,433,291 | | | 19,813,273 |
| | | | | | |
| | |
End of year | | $ | 33,859,643 | | $ | 45,433,291 |
| | | | | | |
Accumulated Undistributed Net Investment Income | | $ | - | | $ | - |
| | | | | | |
| | |
Shares of Capital Stock of the Fund Sold and Redeemed: | | | | | | |
Shares Sold: | | | 134,018,704 | | | 178,090,978 |
Shares Reinvested: | | | 173,650 | | | 232,944 |
Shares Redeemed: | | | (145,767,742) | | | (152,705,330) |
| | | | | | |
Net Increase (Decrease) in Number of Shares Outstanding | | | (11,575,388) | | | 25,618,592 |
| | | | | | |
The accompanying notes are an integral part of these financial statements.
Timothy Plan Money Market Fund [104]
MONEY MARKET FUND
FINANCIAL HIGHLIGHTS
The table below sets forth financial data for one share of capital stock outstanding throughout each period presented.
MONEY MARKET FUND
| | | | | | | | | | | | | | | | | |
| | | year
ended
12/31/08 | | year
ended
12/31/07 | | year
ended
12/31/06 | | year
ended
12/31/05 | | | year ended
12/31/04 | |
| | | | | |
Per Share Operating Performance: | | | | | | | | | | | | | | | | | |
Net Asset Value at Beginning of Year | | $ | 1.00 | | $ | 1.00 | | $ | 1.00 | | $ | 1.00 | | | $ | 1.00 | |
| | | | | | | | | | | | | | | | | |
| | | | | |
Income from Investment Operations: | | | | | | | | | | | | | | | | | |
Net Investment Income (Loss) | | | 0.02 | | | 0.04 | | | 0.04 | | | 0.03 | (A) | | | 0.01 | (A) |
| | | | | | | | | | | | | | | | | |
Total from Investment Operations | | | 0.02 | | | 0.04 | | | 0.04 | | | 0.03 | | | | 0.01 | |
| | | | | | | | | | | | | | | | | |
| | | | | |
Less Distributions: | | | | | | | | | | | | | | | | | |
Dividends from Realized Gains | | | - | | | - | | | - | | | (0.00) | * | | | - | |
Dividends from Net Investment Income | | | (0.02) | | | (0.04) | | | (0.04) | | | (0.03) | | | | (0.01) | |
| | | | | | | | | | | | | | | | | |
Total Distributions | | | (0.02) | | | (0.04) | | | (0.04) | | | (0.03) | | | | (0.01) | |
| | | | | | | | | | | | | | | | | |
| | | | | |
Net Asset Value at End of Year | | $ | 1.00 | | $ | 1.00 | | $ | 1.00 | | $ | 1.00 | | | $ | 1.00 | |
| | | | | | | | | | | | | | | | | |
Total Return (B) | | | 1.82% | | | 4.26% | | | 4.17% | | | 2.48% | | | | 0.97% | |
| | | | | |
Ratios/Supplemental Data: | | | | | | | | | | | | | | | | | |
Net Assets, End of Year (in 000s) | | $ | 33,860 | | $ | 45,433 | | $ | 19,813 | | $ | 5,195 | | | $ | 3,698 | |
| | | | | |
Ratio of Expenses to Average Net Assets: | | | | | | | | | | | | | | | | | |
Before Reimbursement and Waiver/Recoupment of Expenses by Adviser | | | 1.00% | | | 0.99% | | | 1.21% | | | 1.13% | | | | 1.20% | |
After Reimbursement and Waiver/Recoupment of Expenses by Adviser (C) | | | 0.64% | | | 0.78% | | | 0.85% | | | 0.66% | | | | 0.25% | |
| | | | | |
Ratio of Net Investment Income (Loss) to Average Net Assets: | | | | | | | | | | | | | | | | | |
Before Reimbursement and Waiver/Recoupment of Expenses by Adviser | | | 1.45% | | | 3.85% | | | 3.85% | | | 2.03% | | | | 0.07% | |
After Reimbursement and Waiver/Recoupment of Expenses by Adviser | | | 1.81% | | | 4.05% | | | 4.21% | | | 2.50% | | | | 1.02% | |
| | |
| * | | Amount Distributed less than 0.01 per share |
| (A) | | Per share amounts calculated using average shares method. |
| (B) | | Total return in the above table represents the rate that the investor would have earned or lost on an investment in the Fund assuming reinvestment of dividends. Total return would have been lower if certain expenses had not been reimbursed or waived. |
| (C) | | The expense ratio after reimbursement of expenses by Adviser includes a 0.01% reimbursement of expenses by the Administrator for a processing error. |
The accompanying notes are an integral part of these financial statements.
Timothy Plan Money Market Fund [105]
LETTER FROM THE MANAGER
December 31, 2008
HIGH YIELD BOND FUND
Problems in the financial sector created a slowdown in the U.S. economy in early 2008 reflected in the high yield bond market through declining prices and rising yields. After a brief respite in the second quarter, the last half of the year saw a full-blown recession develop and high yield bonds followed the equity markets lower. The economy is suffering as housing remains in a downward spiral, retail sales in December were twice as bad as estimated, and manufacturing activity has hit the proverbial brick wall. The length and depth of this recession is now the primary source of concern in the market. These concerns are reflected in the Barclays Capital U.S. Corporate High-Yield Bond Index’s yield to maturity that began the year at 8.8% and rose to 15.9% by year end.
As rates for high yield bonds moved steadily higher in 2008 the amount of issuance declined. For the year new issues totaled a low $49.7 billion, but only $1.3 billion in three new issues were sold in the fourth quarter. The high yield market continues to face challenging economic conditions, diminished access to capital markets, and stringent lending standards. In this harsh environment the high yield bond default rate remains at a fairly low 3.4% at year end. Moody’s forecasts that default rates are headed up to at least 10% in 2009 duplicating the record years of 1991 and 2001. All these concerns have driven prices lower, yields higher, and are creating potential opportunities.
The Barclays Capital U.S. Corporate High-Yield Bond Index saw yield spreads widened 872 basis points in 2008 representing the biggest increase ever. The initial 8.8% yield could not offset the price decline and the Barclays Index generated a (22.22%) return in 2008. All sectors of the high yield market were down in 2008 with Ba rated issues at (17.5%), B rated issues at (26.7%), and Caa rated issues at (44.4%).
The Timothy Plan High Yield Bond Fund Class A shares returned (29.55%) for the year trailing the (26.4%) for Morningstar’s median high yield fund in 2008. Energy holdings and low exposure to the auto industry that worked well in the first three quarters of 2008 reversed course hurting fourth quarter, and thereby, year to date results. The portfolio lagged the Barclays Capital U.S. Corporate High-Yield Bond Index return of (22.22%) for the year. Issuers negatively impacting performance included: Pilgrim’s Pride, Hawker Beechcraft, Noranda Alluminum, Seitel Acquisition, Sanmina-SCI and Momentive Performance. These issuers under-performed in part because of recession concerns, but more importantly they did not obtain needed access to funding through bank loans or capital market issuance in the fourth quarter. Portfolio results were aided by the following issues that were actually up in the fourth quarter: CIT Group, NRG, and Reliant Energy.
The Fund’s Class A shares have a 30 day SEC yield of 14.6% as of December 31st. The portfolio is diversified with 45 issuers, has an average quality of Ba3/BB-, and has an average maturity of 6.8 years. We believe good fundamental credit selection will drive better performance comparisons over time, and that the high yield fund provides an attractive risk/reward opportunity for investors able to withstand volatility.
BARROW, HANLEY, MEWHINNEY & STRAUSS
Letter From The Manager [106]
FUND PROFILE
December 31, 2008
TIMOTHY PLAN HIGH YIELD BOND FUND
FUND PROFILE (unaudited):
| | |
Top Ten Holdings (% of Net Assets) |
| |
Timothy Plan Money Market Fund | | 3.88% |
NRG Energy, Inc., 7.375%, 01/15/2017 | | 3.44% |
CIT Group, Inc., 4.75%, 12/15/2010 | | 3.28% |
Goodyear Tire & Rubber Co., 8.625%, 12/01/2011 | | 3.12% |
Reliant Energy Inc., 7.625%, 06/15/2014 | | 3.11% |
Intergen NV, 9.00%, 06/30/2017 | | 3.07% |
Georgia-Pacific LLC, 7.70%, 06/15/2015 | | 2.85% |
Janus Capital Group Inc., 6.70%, 06/15/2017 | | 2.78% |
Terra Capital Inc., 7.00%, 02/01/2017 | | 2.76% |
Forest Oil Corp., 7.25%, 06/15/2019 | | 2.74% |
| | |
| | 31.03% |
| | |
| | |
Industries (% of Net Assets) |
| |
Energy | | 24.52% |
Financials | | 18.06% |
Utilities | | 14.86% |
Materials | | 10.93% |
Consumer Discretionary | | 8.48% |
Industrials | | 6.73% |
Consumer Staples | | 5.09% |
Telecommunication Services | | 4.80% |
Short-Term Investments | | 3.88% |
Information Technology | | 1.47% |
Other Assets Less Liabilities | | 1.18% |
| | |
| | 100.00% |
| | |
EXPENSE EXAMPLE (unaudited):
As a shareholder of the Fund, you incur two types of costs: direct costs, such as wire fees and low balance fees; and indirect costs, including management fees, and other Fund operating expenses. This example is intended to help you understand your indirect costs, also referred to as “ongoing costs,” (in dollars) of investing in the Fund, and to compare these costs with the ongoing costs of investing in other mutual funds.
This example is based on an investment of $1,000 invested at the beginning of the period and held for the entire period of July 1, 2008, through December 31, 2008.
Actual Expenses
The first line of the table below provides information about actual account values and actual expenses. You may use the information in this line, together with the amount you invested at the beginning of the period, to estimate the expenses that you paid over the period. Simply divide your account value by $1,000 (for example, an $8,600 account value divided by $1,000 = 8.6), then multiply the result by the number in the first line under the heading “Expenses Paid During Period” to estimate the expenses you paid on your account during this period.
Timothy Plan Top Ten Holdings / Industries [107]
FUND PROFILE
December 31, 2008
TIMOTHY PLAN HIGH YIELD BOND FUND
Hypothetical example for comparison purposes (unaudited)
The second line of the table provides information about hypothetical account values and hypothetical expenses based on the Fund’s actual expense ratio and an assumed rate of return of 5% per year before expenses, which is not the Fund’s actual return. The hypothetical account values and expenses may not be used to estimate the actual ending account balance or expenses you paid for the period. You may use this information to compare ongoing costs of investing in the Fund and other funds. To do so, compare this 5% hypothetical example with the 5% hypothetical examples that appear in the shareholder reports of other funds.
Please note that the expenses shown in the table are meant to highlight your ongoing costs only and do not reflect any direct costs, such as wire fees or low balance fees. Therefore, the second line of the table is useful in comparing ongoing costs only, and will not help you determine the relative total costs of owning different funds. In addition, if these direct costs were included, your costs would be higher.
| | | | | | | | | |
| | | Beginning
Account Value | | Ending Account
Value | | Expenses Paid
During Period* |
| | | 7/1/2008 | | 12/31/2008 | | 7/1/2008 through
12/ 31/ 2008 |
| | | |
Actual - Class A | | $ | 1,000.00 | | $ | 717.41 | | $ | 6.42 |
| | | |
Hypothetical - Class A | | $ | 1,000.00 | | $ | 1,017.66 | | $ | 7.54 |
(5% return before expenses) | | | | | | | | | |
| | | |
Actual - Class C | | $ | 1,000.00 | | $ | 713.92 | | $ | 9.43 |
| | | |
Hypothetical - Class C | | $ | 1,000.00 | | $ | 1,014.14 | | $ | 11.08 |
(5% return before expenses) | | | | | | | | | |
| * | Expenses are equal to the Fund’s annualized expense ratio of 1.49% for Class A and 2.19% for Class C, which is net of any expenses paid indirectly, multiplied by the average account value over the period, multiplied by 184 days/366 days (to reflect the partial year period) The Fund’s ending account value on the first line of each share class in the table is based on its actual total return of (28.26)% for Class A and (28.61)% for Class C for the six-month period of July 1, 2008 to December 31, 2008. |
Timothy Plan Top Ten Holdings / Industries [108]
HIGH YIELD BOND FUND
SCHEDULE OF INVESTMENTS
As of December 31, 2008
BONDS AND NOTES- 94.94%
| | | | | |
| par value | | | | market value |
| | |
| | CORPORATE BONDS - 94.94% | | | |
| $ 250,000 | | Actuant Corp, 6.875%, 06/15/2017 | | $ | 189,375 |
| 500,000 | | American Axle & Manufacturing Inc., 7.875%, 03/01/2017 | | | 157,500 |
| 500,000 | | Ashtead Holdings plc, 8.625%, 08/01/2015 (A) | | | 265,000 |
| 500,000 | | Atlas Pipeline Partners LP, 8.125%, 12/15/2015 | | | 340,000 |
| 500,000 | | Berry Petroleum Co., 8.25%, 11/01/2016 | | | 272,500 |
| 500,000 | | China Properties Group, Ltd., 9.125%, 05/04/2014 (A) | | | 197,500 |
| 500,000 | | CIT Group, Inc., 4.75%, 12/15/2010 | | | 440,327 |
| 200,000 | | Copano Energy LLC, 7.75%, 06/01/2018 (A) | | | 136,000 |
| 500,000 | | Crum & Forster Holdings Corp., 7.75%, 05/01/2017 | | | 355,000 |
| 500,000 | | Dynegy Holdings, Inc., 7.75%, 06/01/2019 | | | 347,500 |
| 150,000 | | El Paso Corp., 12.00%, 12/12/2013 | | | 147,750 |
| 500,000 | | Energy Future Holdings Corp., 10.875%, 11/01/2017 (A) | | | 357,500 |
| 500,000 | | Felcor Lodging LP, 4.4425%, 12/01/2011 (B) | | | 312,500 |
| 500,000 | | Forest Oil Corp., 7.25%, 06/15/2019 | | | 367,500 |
| 250,000 | | Frontier Communications Corp., 9.25%, 05/15/2011 | | | 238,750 |
| 500,000 | | Georgia-Pacific LLC, 7.70%, 06/15/2015 | | | 382,500 |
| 501,000 | | Goodyear Tire & Rubber Co., 8.625%, 12/01/2011 | | | 418,335 |
| 500,000 | | Hawker Beechcraft Acquisition Co. LLC, 8.50%, 04/01/2015 | | | 207,500 |
| 500,000 | | Helix Energy Solutions Group, Inc., 9.50%, 01/15/2016 (A) | | | 267,500 |
| 500,000 | | Intergen NV, 9.00%, 06/30/2017 (A) | | | 412,500 |
| 420,000 | | Ipalco Enterprises, Inc., 7.25%, 04/01/2016 (A) | | | 346,500 |
| 500,000 | | Janus Capital Group Inc., 6.70%, 06/15/2017 | | | 373,231 |
| 200,000 | | Kansas City Southern Railway, 13.00%, 12/15/2013 | | | 201,500 |
| 400,000 | | Liberty Mutual Group, Inc., 10.75%, 06/15/2058 (A) (E) | | | 220,284 |
| 500,000 | | Markwest Energy Partners LP, 6.875%, 11/01/2014 | | | 317,500 |
| 500,000 | | Momentive Performance Materials, Inc., 9.75%, 12/01/2014 | | | 215,000 |
| 500,000 | | Noranda Aluminum Acquisition Corp., 6.595%, 05/15/2015 (B) | | | 172,500 |
| 500,000 | | NRG Energy, Inc., 7.375%, 01/15/2017 | | | 461,250 |
| 500,000 | | Pilgrim’ Pride Corp., 7.625%, 05/01/2015 (C) | | | 137,500 |
| 500,000 | | Reliant Energy Inc., 7.625%, 06/15/2014 | | | 417,500 |
| 500,000 | | Sanmina-SCI Corp., 8.125%, 03/01/2016 | | | 197,500 |
| 500,000 | | Sealy Mattress Co., 8.25%, 06/15/2014 | | | 297,500 |
| 500,000 | | Seitel Inc., 9.75%, 02/15/2014 | | | 182,500 |
| 250,000 | | Service Corp. International, 7.00%, 06/15/2017 | | | 188,750 |
| 500,000 | | SLM Corp., 5.00%, 04/15/2015 | | | 317,590 |
| 500,000 | | Smithfield Foods, Inc., 7.00%, 08/01/2011 | | | 357,500 |
| 500,000 | | Swift Energy Co., 7.125%, 06/01/2017 | | | 285,000 |
| 500,000 | | Terra Capital Inc., 7.00%, 02/01/2017 | | | 370,000 |
The accompanying notes are an integral part of these financial statements.
Timothy Plan High Yield Bond Fund [109]
HIGH YIELD BOND FUND
SCHEDULE OF INVESTMENTS
As of December 31, 2008
BONDS AND NOTES- 94.94% (continued)
| | | | | |
| par value | | | | market value |
| | |
| | CORPORATE BONDS - 94.94% (continued) | | | |
| $ 250,000 | | Texas Industries, Inc., 7.25%, 07/15/2013 | | $ | 194,375 |
| 500,000 | | United States Steel Corp., 6.05%, 06/01/2017 | | | 327,388 |
| 500,000 | | USG Corp., 9.00%, 01/15/2018 (E) | | | 318,750 |
| 200,000 | | Videotron, Ltd., 9.125%, 04/15/2018 (A) | | | 187,000 |
| 400,000 | | Vimpel Communications, 9.125%, 04/30/2018 (A) | | | 218,000 |
| 500,000 | | W & T Offshore Inc., 8.25%, 06/15/2014 (A) | | | 272,500 |
| 500,000 | | Whiting Petroleum Corp., 7.00%, 02/01/2014 | | | 355,000 |
| | | | | |
| | |
| | Total Bonds and Notes (cost $19,389,261) | | | 12,745,155 |
| | | | | |
|
| SHORT TERM INVESTMENTS - 3.88% |
| number of shares | | | | market value |
| 520,827 | | Timothy Plan Money Market Fund, 0.38% (B) (D) | | | 520,827 |
| | | | | |
| | |
| | Total Short Term Investments (cost $520,827) | | | 520,827 |
| | | | | |
| | |
| | TOTAL INVESTMENTS (cost $19,910,088) - 98.82% | | $ | 13,265,982 |
| | | | | |
| | |
| | OTHER ASSETS LESS LIABILITIES - 1.18% | | | 157,764 |
| | | | | |
| | |
| | NET ASSETS - 100.00% | | $ | 13,423,746 |
| | | | | |
| | |
| (A) | | 144A Security—Security exempt from registration under Rule 144A of the Securities Act of 1933. The securities may be resold in transactions exempt
from registration typically only to qualified institutional buyers. Unless otherwise indicated, these securities are not considered to be illiquid. |
| (B) | | Variable rate security; the rate shown represents the yield at December 31, 2008. |
| (C) | | Defaulted security. |
| (D) | | Affiliated fund. |
| (E) | | Multi-Coupon Security: the rate shown represents the coupon at December 31, 2008. |
The accompanying notes are an integral part of these financial statements.
Timothy Plan High Yield Bond Fund [110]
HIGH YIELD BOND FUND
STATEMENT OF ASSETS AND LIABILITIES
As of December 31, 2008
| | | |
ASSETS | | | |
| | | amount |
Investments in Unaffiliated Securities at Value (cost $19,389,261) [NOTE 1] | | $ | 12,745,155 |
Investments in Affiliated Securities at Value (cost $ 520,827) [NOTE 1] | | | 520,827 |
Receivables for: | | | |
Fund Shares Sold | | | 26,351 |
Interest | | | 278,139 |
Prepaid Expenses | | | 9,426 |
| | | |
Total Assets | | $ | 13,579,898 |
| | | |
LIABILITIES | | | |
| | | amount |
Payable for Fund Shares Redeemed | | $ | 124,488 |
Accrued Advisory Fees | | | 6,355 |
Accrued 12b-1 Fees Class A | | | 2,632 |
Accrued 12b-1 Fees Class C | | | 111 |
Accrued Expenses | | | 22,566 |
| | | |
Total Liabilities | | $ | 156,152 |
| | | |
NET ASSETS | | | |
| | | amount |
Class A Shares: | | | |
Net Assets (unlimited shares of $0.001 par beneficial interest authorized; 2,131,278 shares outstanding) | | $ | 13,282,914 |
Net Asset Value and Redemption Price Per Class A Share ($13,282,914 / 2,131,278 shares) | | $ | 6.23 |
Offering Price Per Share ($6.23 / 0.955) | | $ | 6.52 |
Class C Shares: | | | |
Net Assets (unlimited shares of $0.001 par beneficial interest authorized; 22,392 shares outstanding) | | $ | 140,832 |
Net Asset Value and Offering Price Per Class C Share ($140,832 / 22,392 shares) | | $ | 6.29 |
Minimum Redemption Price Per Share ($6.29 * 0.99) | | $ | 6.23 |
Net Assets | | $ | 13,423,746 |
| | | |
SOURCES OF NET ASSETS | | | |
| | | amount |
At December 31, 2008, Net Assets Consisted of: | | | |
Paid-in Capital | | $ | 21,132,778 |
Accumulated Undistributed Net Investment Income | | | 16,800 |
Accumulated Undistributed Net Realized Gain (Loss) on Investments | | | (1,081,726) |
Net Unrealized (Depreciation) in Value of Investments | | | (6,644,106) |
| | | |
Net Assets | | $ | 13,423,746 |
| | | |
The accompanying notes are an integral part of these financial statements.
Timothy Plan High Yield Bond Fund [111]
HIGH YIELD BOND FUND
STATEMENT OF OPERATIONS
For the Year Ended December 31, 2008
INVESTMENT INCOME
| | | |
| | | amount |
| |
Interest on Unaffiliated Investments | | $ | 1,532,151 |
Interest on Affiliated Investments | | | 14,215 |
Dividends | | | 4,648 |
| | | |
| |
Total Investment Income | | | 1,551,014 |
| | | |
| |
EXPENSES | | | |
| | | amount |
| |
Investment Advisory Fees [NOTE 3] | | | 109,836 |
12b-1 Fees (Class A = $45,151, Class C = $2,457) [NOTE 3] | | | 47,608 |
Fund Accounting, Transfer Agency, & Administration Fees | | | 32,354 |
Registration Fees | | | 31,040 |
Audit Fees | | | 14,482 |
Out-of-Pocket Expense | | | 8,089 |
Miscellaneous Expense | | | 5,636 |
Custodian Fees | | | 4,471 |
Printing Expense | | | 2,249 |
Trustee Fees | | | 2,109 |
CCO Fees | | | 1,643 |
Insurance Expense | | | 673 |
| | | |
| |
Total Net Expenses | | | 260,190 |
| | | |
| |
Net Investment Income (Loss) | | | 1,290,824 |
| | | |
| |
REALIZED AND UNREALIZED GAIN (LOSS) ON INVESTMENTS | | | |
| | | amount |
| |
Net Realized Gain (Loss) on Unaffiliated Investments | | | (1,081,685) |
Change in Unrealized Appreciation/Depreciation of Investments | | | (5,758,446) |
| | | |
Net Realized and Unrealized Gain (Loss) on Investments | | | (6,840,131) |
| | | |
| |
Net Increase (Decrease) in Net Assets Resulting from Operations | | $ | (5,549,307) |
| | | |
The accompanying notes are an integral part of these financial statements.
Timothy Plan High Yield Bond Fund [112]
HIGH YIELD BOND FUND
STATEMENTS OF CHANGES IN NET ASSETS
INCREASE (DECREASE) IN NET ASSETS
| | | | | | |
| | | year ended
12/31/08 | | period ended
12/31/07 (A) |
| | |
Operations: | | | | | | |
Net Investment Income (Loss) | | $ | 1,290,824 | | $ | 691,810 |
Net Realized Gain (Loss) on Investments | | | (1,081,685) | | | 12,797 |
Change in Unrealized Appreciation/Depreciation of Investments | | | (5,758,446) | | | (885,660) |
| | | | | | |
Net Increase (Decrease) in Net Assets (resulting from operations) | | | (5,549,307) | | | (181,053) |
| | | | | | |
| | |
Distributions to Shareholders From: | | | | | | |
Net Realized Gains: | | | | | | |
Class A | | | (10,252) | | | - |
Class C | | | (105) | | | - |
Net Investment Income: | | | | | | |
Class A | | | (1,259,132) | | | (690,140) |
Class C | | | (14,892) | | | (4,151) |
| | | | | | |
Total Distributions | | | (1,284,381) | | | (694,291) |
| | | | | | |
| | |
Capital Share Transactions: | | | | | | |
Proceeds from Shares Sold: | | | | | | |
Class A | | | 5,512,203 | | | 21,463,514 |
Class C | | | 265,375 | | | 251,123 |
Dividends Reinvested: | | | | | | |
Class A | | | 1,226,938 | | | 665,546 |
Class C | | | 9,733 | | | 2,132 |
Cost of Shares Redeemed: | | | | | | |
Class A | | | (7,001,568) | | | (972,985) |
Class C | | | (280,184) | | | (9,049) |
| | | | | | |
Net Increase (Decrease) in Net Assets (resulting from capital share transactions) | | | (267,503) | | | 21,400,281 |
| | | | | | |
| | |
Total Increase (Decrease) in Net Assets | | | (7,101,191) | | | 20,524,937 |
| | | | | | |
| | |
Net Assets: | | | | | | |
Beginning of period | | | 20,524,937 | | | - |
| | | | | | |
| | |
End of period | | $ | 13,423,746 | | $ | 20,524,937 |
| | | | | | |
| | |
Accumulated Undistributed Net Investment Income (Loss) | | $ | 16,800 | | $ | - |
| | | | | | |
| | |
Shares of Capital Stock of the Fund Sold and Redeemed: | | | | | | |
Shares Sold: | | | | | | |
Class A | | | 686,555 | | | 2,159,291 |
Class C | | | 29,745 | | | 25,773 |
Shares Reinvested: | | | | | | |
Class A | | | 154,308 | | | 68,973 |
Class C | | | 1,237 | | | 221 |
Shares Redeemed: | | | | | | |
Class A | | | (837,295) | | | (100,554) |
Class C | | | (33,648) | | | (936) |
| | | | | | |
Net Increase (Decrease) in Number of Shares Outstanding | | | 902 | | | 2,152,768 |
| | | | | | |
| | |
| (A) | | For the period May 7, 2007 (commencement of operations) through December 31, 2007. |
The accompanying notes are an integral part of these financial statements.
Timothy Plan High Yield Bond Fund [113]
HIGH YIELD BOND FUND
FINANCIAL HIGHLIGHTS
The table below sets forth financial data for one share of capital stock outstanding throughout each period presented.
HIGH YIELD BOND FUND - CLASS A SHARES
| | | | | | | |
| | | year ended
12/31/08 | | period ended
12/31/07 (A) | |
Per Share Operating Performance: | | | | | | | |
Net Asset Value at Beginning of Period | | $ | 9.53 | | $ | 10.00 | |
| | | | | | | |
| | |
Income from Investment Operations: | | | | | | | |
Net Investment Income (Loss) | | | 0.61 | | | 0.36 | |
Net Realized and Unrealized Gain (Loss) on Investments | | | (3.30) | | | (0.47) | |
| | | | | | | |
Total from Investment Operations | | | (2.69) | | | (0.11) | |
| | | | | | | |
| | |
Less Distributions: | | | | | | | |
Dividends from Net Investment Income | | | (0.60) | | | (0.36) | |
Dividends from Net Realized Gains | | | (0.01) | | | - | |
| | | | | | | |
Total Distributions | | | (0.61) | | | (0.36) | |
| | | | | | | |
| | |
Net Asset Value at End of Period | | $ | 6.23 | | $ | 9.53 | |
| | | | | | | |
| | |
Total Return (B)(C) | | | (29.55)% | | | (1.14)% | (D) |
| | |
Ratios/Supplemental Data: | | | | | | | |
Net Assets, End of Period (in 000s) | | $ | 13,283 | | $ | 20,284 | |
| | |
Ratio of Expenses to Average Net Assets: | | | | | | | |
Before Reimbursement and Waiver/Recoupment of Expenses by Adviser | | | 1.41% | | | 1.45% | (E) |
After Reimbursement and Waiver/Recoupment of Expenses by Adviser | | | 1.41% | | | 1.35% | (E) |
| | |
Ratio of Net Investment Income (Loss) to Average Net Assets: | | | | | | | |
Before Reimbursement and Waiver/Recoupment of Expenses by Adviser | | | 7.06% | | | 5.67% | (E) |
After Reimbursement and Waiver/Recoupment of Expenses by Adviser | | | 7.06% | | | 5.77% | (E) |
| | |
Portfolio Turnover | | | 27.85% | | | 23.46% | |
| | |
| (A) | | For the period May 7, 2007 (commencement of operations) through December 31, 2007. |
| (B) | | Total return calculation does not reflect sales load. |
| (C) | | Total return in the above table represents the rate that the investor would have earned or lost on an investment in the Fund assuming reinvestment of dividends. |
| | Total return would have been higher or lower if certain expenses had not been reimbursed, waived or recouped. |
| (D) | | For periods of less than one full year, total return is not annualized. |
| (E) | | Annualized. |
The accompanying notes are an integral part of these financial statements.
Timothy Plan High Yield Bond Fund [114]
HIGH YIELD BOND FUND
FINANCIAL HIGHLIGHTS
The table below sets forth financial data for one share of capital stock outstanding throughout each period presented.
HIGH YIELD BOND FUND - CLASS C SHARES
| | | | | | | |
| | | year
ended
12/31/08 | | period ended
12/31/07 (A) | |
Per Share Operating Performance: | | | | | | | |
Net Asset Value at Beginning of Period | | $ | 9.60 | | $ | 10.00 | |
| | | | | | | |
| | |
Income from Investment Operations: | | | | | | | |
Net Investment Income (Loss) | | | 0.53 | | | 0.26 | |
Net Realized and Unrealized Gain (Loss) on Investments | | | (3.33) | | | (0.40) | |
| | | | | | | |
Total from Investment Operations | | | (2.80) | | | (0.14) | |
| | | | | | | |
| | |
Less Distributions: | | | | | | | |
Dividends from Net Investment Income | | | (0.50) | | | (0.26) | |
Dividends from Net Realized Gains | | | (0.01) | | | - | |
| | | | | | | |
Total Distributions | | | (0.51) | | | (0.26) | |
| | | | | | | |
| | |
Net Asset Value at End of Period | | $ | 6.29 | | $ | 9.60 | |
| | | | | | | |
| | |
Total Return (B)(C) | | | (30.17)% | | | (1.38)% | (D) |
| | |
Ratios/Supplemental Data: | | | | | | | |
Net Assets, End of Period (in 000s) | | $ | 141 | | $ | 241 | |
| | |
Ratio of Expenses to Average Net Assets: | | | | | | | |
Before Reimbursement and Waiver/Recoupment of Expenses by Adviser | | | 2.14% | | | 2.20% | (E) |
After Reimbursement and Waiver/Recoupment of Expenses by Adviser | | | 2.14% | | | 2.10% | (E) |
| | |
Ratio of Net Investment Income (Loss) to Average Net Assets: | | | | | | | |
Before Reimbursement and Waiver/Recoupment of Expenses by Adviser | | | 6.26% | | | 5.24% | (E) |
After Reimbursement and Waiver/Recoupment of Expenses by Adviser | | | 6.26% | | | 5.34% | (E) |
| | |
Portfolio Turnover | | | 27.85% | | | 23.46% | |
| | |
| (A) | | For the period May 7, 2007 (commencement of operations) through December 31, 2007. |
| (B) | | Total return calculation does not reflect redemption fee. |
| (C) | | Total return in the above table represents the rate that the investor would have earned or lost on an investment in the Fund assuming reinvestment of dividends. Total return would have been higher or lower if certain expenses had not been reimbursed, waived or recouped. |
| (D) | | For periods of less than one full year, total return is not annualized. |
| (E) | | Annualized. |
The accompanying notes are an integral part of these financial statements.
Timothy Plan High Yield Bond Fund [115]
LETTER FROM THE MANAGER
December 31, 2008
INTERNATIONAL FUND
The year 2008 is sure to go down as one of the worst equity market performances in the last century both in the US and in international markets. The financial crisis that erupted in 2007 bled into 2008 and ballooned into a massive global credit crisis that brought the global financial system to its knees. The volatility that the markets and the Fund encountered in 2008 was unprecedented as fear and widespread pessimism spread throughout global markets.
The Fund’s focus on investing in high quality, larger capitalization, non-US global stocks helped it steer away from companies on the brink of bankruptcy. We continue to focus our attention on those companies with proven management teams that we believe can create value for the fund’s shareholders over time. Although the fund slightly underperformed versus its international benchmark, the MSCI EAFE (Morgan Staley Capital International Europe, Australasia, and Far East index) for all of 2008, we were able to shift the portfolio throughout the year to have more defensive characteristics. We decreased the fund’s weightings in the Energy, Materials, and Industrials sectors while at the same time increasing weightings in Health Care, Telecom Services, and cash.
The Fund’s underweighting position throughout the year in both the Consumer Discretionary and Financials sectors was additive to performance as both of these sectors were among the three worst performing sectors in the EAFE index. However, our allocation to the emerging markets detracted from performance as these markets fell more than the developed market index. Although we have actively reduced our exposure in the emerging markets we continue to believe that some of these markets offer attractive long-term opportunities for shareholders.
The Fund’s positions in the Utilities, Materials, and Industrials sectors performed worse than the sector average. Most of this underperformance was related to those companies geared to the commodities and global growth cycle which declined faster than others. Positive attribution came in the holdings in the Telecom Services and the Consumer Staples sectors. The Fund’s underweight in Japan during the year also detracted from performance as Japan was the best performing major market in the world, mostly on the back of its strong currency movement.
Even though we believe equity returns in 2009 will be volatile, we also believe that the opportunities offered today from the massive equity selloff in 2008 will strongly reward investors over the long-term.
EAGLE GLOBAL ADVISORS
Letter From The Manager [116]
FUND PROFILE
December 31, 2008
TIMOTHY PLAN INTERNATIONAL FUND
FUND PROFILE (unaudited):
| | |
| Top Ten Holdings |
| (% of Net Assets) |
| |
Timothy Plan Money Market Fund | | 16.59% |
Total S.A. (ADR) | | 3.80% |
Telefonica S.A. (ADR) | | 3.79% |
Novo Nordisk A/S (ADR) | | 3.67% |
Fresenius Medical Care AG & Co. KGaA (ADR) | | 3.37% |
Singapore Telecommunications, Ltd. (ADR) | | 3.35% |
Henkel AG & Co. KGaA (ADR) | | 3.31% |
Smith & Nephew plc (ADR) | | 3.01% |
Shiseido Co., Ltd. (ADR) | | 2.88% |
Banco Santander Central Hispano S.A. (ADR) | | 2.68% |
| | |
| | 46.45% |
| | |
| | |
| Industries |
| (% of Net Assets) |
| |
Short-Term Investments | | 16.59% |
Telecommunication Services | | 14.31% |
Financials | | 14.07% |
Health Care | | 11.48% |
Utilities | | 8.87% |
Consumer Staples | | 8.43% |
Industrials | | 7.22% |
Energy | | 7.18% |
Information Technology | | 6.96% |
Materials | | 4.10% |
Consumer Discretionary | | 2.19% |
Liabilities in Excess of Other Assets | | (1.40)% |
| | |
| | 100.00% |
| | |
EXPENSE EXAMPLE (unaudited):
As a shareholder of the Fund, you incur two types of costs: direct costs, such as wire fees and low balance fees; and indirect costs, including management fees, and other Fund operating expenses. This example is intended to help you understand your indirect costs, also referred to as “ongoing costs,” (in dollars) of investing in the Fund, and to compare these costs with the ongoing costs of investing in other mutual funds.
This example is based on an investment of $1,000 invested at the beginning of the period and held for the entire period of July 1, 2008 through December 31, 2008.
Actual Expenses
The first line of the table below provides information about actual account values and actual expenses. You may use the information in this line, together with the amount you invested at the beginning of the period, to estimate the expenses that you paid over the period. Simply divide your account value by $1,000 (for example, an $8,600 account value divided by $1,000 = 8.6), then multiply the result by the number in the first line under the heading “Expenses Paid During Period” to estimate the expenses you paid on your account during this period.
Timothy Plan Top Ten Holdings / Industries [117]
FUND PROFILE
December 31, 2008
TIMOTHY PLAN INTERNATIONAL FUND
Hypothetical example for comparison purposes (unaudited)
The second line of the table provides information about hypothetical account values and hypothetical expenses based on the Fund’s actual expense ratio and an assumed rate of return of 5% per year before expenses, which is not the Fund’s actual return. The hypothetical account values and expenses may not be used to estimate the actual ending account balance or expenses you paid for the period. You may use this information to compare ongoing costs of investing in the Fund and other funds. To do so, compare this 5% hypothetical example with the 5% hypothetical examples that appear in the shareholder reports of other funds.
Please note that the expenses shown in the table are meant to highlight your ongoing costs only and do not reflect any direct costs, such as wire fees or low balance fees. Therefore, the second line of the table is useful in comparing ongoing costs only, and will not help you determine the relative total costs of owning different funds. In addition, if these direct costs were included, your costs would be higher.
| | | | | | | | | |
| | | Beginning
Account Value | | Ending Account
Value | | Expenses Paid
During Period* |
| | | 7/ 1/ 2008 | | 12/ 31/ 2008 | | 7/ 1/ 2008 through
12/ 31/ 2008 |
| | | |
Actual - Class A | | $ | 1,000.00 | | $ | 575.45 | | $ | 6.90 |
| | | |
Hypothetical - Class A | | $ | 1,000.00 | | $ | 1,016.38 | | $ | 8.83 |
(5% return before expenses) | | | | | | | | | |
| | | |
Actual - Class C | | $ | 1,000.00 | | $ | 573.52 | | $ | 9.83 |
| | | |
Hypothetical - Class C | | $ | 1,000.00 | | $ | 1,012.64 | | $ | 12.58 |
(5% return before expenses) | | | | | | | | | |
| * | Expenses are equal to the Fund’s annualized expense ratio of 1.74% for Class A and 2.49% for Class C, which is net of any expenses paid indirectly, multiplied by the average account value over the period, multiplied by 184 days/366 days (to reflect the partial year period) The Fund’s ending account value on the first line of each share class in the table is based on its actual total return of (42.46)% for Class A and (42.65)% for Class C for the six-month period of July 1, 2008 to December 31, 2008. |
Timothy Plan Top Ten Holdings / Industries [118]
INTERNATIONAL FUND
SCHEDULE OF INVESTMENTS
As of December 31, 2008
COMMON STOCKS - 84.81%
| | | | | |
| number of shares | | | | market value |
| | |
| | AGRICULTURAL CHEMICALS - 1.32% | | | |
| 12,500 | | Agrium, Inc. | | $ | 426,625 |
| | | | | |
| | |
| | AUTOMOTIVE - CARS & LIGHT TRUCKS - 2.19% | | | |
| 33,000 | | Honda Motor Co., Ltd. (ADR) | | | 704,220 |
| | | | | |
| | |
| | CELLULAR TELECOMMUNICATIONS - 4.76% | | | |
| 13,000 | | America Movil SAB de C.V. - Series L (ADR) | | | 402,870 |
| 16,000 | | NTT DoCoMo, Inc. (ADR) | | | 313,920 |
| 56,000 | | Turkcell Iletisim Hizmetleri AS (ADR) | | | 816,480 |
| | | | | |
| | | | | 1,533,270 |
| | | | | |
| | |
| | COMMERCIAL BANKS - NON-US - 6.55% | | | |
| 91,000 | | Banco Santander Central Hispano S.A. (ADR) | | | 863,590 |
| 13,000 | | BOC Hong Kong Holdings, Ltd. (ADR) (B) | | | 294,548 |
| 20,000 | | DBS Group Holdings, Ltd. (ADR) (B) | | | 537,000 |
| 19,500 | | Intesa Sanpaolo (ADR) (B) | | | 412,688 |
| | | | | |
| | | | | 2,107,826 |
| | | | | |
| | |
| | COMPUTER SERVICES - 1.48% | | | |
| 25,000 | | Cap Gemini S.A. (ADR) (B) | | | 477,828 |
| | | | | |
| | |
| | COSMETICS & TOILETRIES - 2.88% | | | |
| 46,000 | | Shiseido Co., Ltd. (ADR) (B) | | | 926,090 |
| | | | | |
| | |
| | DIALYSIS CENTERS - 3.37% | | | |
| 23,000 | | Fresenius Medical Care AG & Co. KGaA (ADR) | | | 1,085,140 |
| | | | | |
| | |
| | DIVERSIFIED BANKING INSTITUTIONS - 2.64% | | | |
| 137,100 | | Mitsubishi UFJ Financial Group, Inc. (ADR) | | | 851,391 |
| | | | | |
| | |
| | DIVERSIFIED MINERALS - 1.84% | | | |
| 24,380 | | Anglo American plc (ADR) | | | 283,296 |
| 29,000 | | Companhia Vale do Rio Doce (ADR) | | | 308,850 |
| | | | | |
| | | | | 592,146 |
| | | | | |
| | |
| | DIVERSIFIED OPERATIONS - 1.79% | | | |
| 96,000 | | Keppel Corp., Ltd. (ADR) (B) | | | 577,037 |
| | | | | |
| | |
| | ELECTRIC - INTEGRATED - 6.08% | | | |
| 68,000 | | HongKong Electric Holdings (ADR) (B) | | | 381,670 |
| 6,000 | | International Power plc (ADR) (B) | | | 207,252 |
| 9,100 | | RWE AG (ADR) (B) | | | 801,088 |
| 32,500 | | Scottish & Southern Energy plc (ADR) (B) | | | 568,666 |
| | | | | |
| | | | | 1,958,676 |
| | | | | |
| | |
| | ENGINEERING/R&D SERVICES - 2.10% | | | |
| 45,000 | | ABB, Ltd. (ADR) | | | 675,450 |
| | | | | |
The accompanying notes are an integral part of these financial statements.
Timothy Plan International Fund [119]
INTERNATIONAL FUND
SCHEDULE OF INVESTMENTS
As of December 31, 2008
COMMON STOCKS - 84.81% (continued)
| | | | | |
| number of shares | | | | market value |
| | |
| | FINANCE - CONSUMER LOANS - 1.08% | | | |
| 28,000 | | Promise Co., Ltd. (ADR) (B) | | $ | 347,491 |
| | | | | |
| | |
| | FOOD - MISCELLANEOUS/DIVERSIFIED - 2.24% | | | |
| 60,000 | | Groupe Danone (ADR) (B) | | | 720,264 |
| | | | | |
| | |
| | IMPORT/EXPORT - 2.52% | | | |
| 6,000 | | Marubeni Corp. (ADR) (B) | | | 222,394 |
| 21,525 | | Mitsubishi Corp. (ADR) (B) | | | 587,930 |
| | | | | |
| | | | | 810,324 |
| | | | | |
| | |
| | MACHINERY - CONSTRUCTION & MINING - 0.82% | | | |
| 35,000 | | Atlas Copco AB - Class B (ADR) (B) | | | 263,343 |
| | | | | |
| | |
| | MEDICAL PRODUCTS - 3.01% | | | |
| 30,000 | | Smith & Nephew plc (ADR) | | | 969,000 |
| | | | | |
| | |
| | MEDICAL - DRUGS - 5.10% | | | |
| 23,000 | | Novo Nordisk A/S (ADR) | | | 1,181,970 |
| 18,000 | | Takeda Pharmaceutical Co., Ltd. (ADR) (B) | | | 460,672 |
| | | | | |
| | | | | 1,642,642 |
| | | | | |
| | |
| | METAL - DIVERSIFIED - 0.94% | | | |
| 3,400 | | Rio Tinto plc (ADR) | | | 302,294 |
| | | | | |
| | |
| | MULTI-LINE INSURANCE - 3.80% | | | |
| 34,000 | | AXA S.A.(ADR) | | | 763,980 |
| 21,500 | | Zurich Financial Services AG (ADR) (B) | | | 458,543 |
| | | | | |
| | | | | 1,222,523 |
| | | | | |
| | |
| | OFFICE AUTOMATION & EQUIPMENT - 2.24% | | | |
| 23,000 | | Canon, Inc. (ADR) | | | 722,200 |
| | | | | |
| | |
| | OIL COMPANIES - INTEGRATED - 6.21% | | | |
| 26,200 | | Petroleo Brasileiro S.A. (ADR) | | | 534,742 |
| 14,668 | | StatoilHydro ASA (ADR) | | | 244,369 |
| 22,100 | | Total S.A. (ADR) | | | 1,222,130 |
| | | | | |
| | | | | 2,001,241 |
| | | | | |
| | |
| | OIL - FIELD SERVICES - 0.97% | | | |
| 54,000 | | Acergy S.A. (ADR) | | | 312,120 |
| | | | | |
| | |
| | PHOTO EQUIPMENT & SUPPLIES - 1.24% | | | |
| 18,000 | | FUJIFILM Holdings Corp. (ADR) | | | 399,960 |
| | | | | |
| | |
| | PROPERTY/CASUALTY INSURANCE - 1.99% | | | |
| 22,500 | | Tokio Marine Holdings, Inc. (ADR) (B) | | | 640,375 |
| | | | | |
The accompanying notes are an integral part of these financial statements.
Timothy Plan International Fund [120]
INTERNATIONAL FUND
SCHEDULE OF INVESTMENTS
As of December 31, 2008
COMMON STOCKS - 84.81% (continued)
| | | | | |
| number of shares | | | | market value |
| | |
| | SOAP & CLEANING PREPARATIONS - 3.31% | | | |
| 40,400 | | Henkel AG & Co. KGaA (ADR) (B) | | $ | 1,067,000 |
| | | | | |
| | |
| | TELECOMMUNICATION SERVICES - 5.76% | | | |
| 49,594 | | Chunghwa Telecom Co., Ltd. (ADR) | | | 773,666 |
| 61,000 | | Singapore Telecommunications, Ltd. (ADR) (B) | | | 1,079,645 |
| | | | | |
| | | | | 1,853,311 |
| | | | | |
| | |
| | TELEPHONE - INTEGRATED - 3.79% | | | |
| 18,100 | | Telefonica S.A. (ADR) | | | 1,219,759 |
| | | | | |
| | |
| | WATER - 2.79% | | | |
| 27,000 | | United Utilities Group plc (ADR) (B) | | | 486,405 |
| 13,000 | | Veolia Environnement (ADR) | | | 412,230 |
| | | | | |
| | | | | 898,635 |
| | | | | |
| | |
| | Total Common Stocks (cost $40,284,453) | | | 27,308,181 |
| | | | | |
| |
| SHORT TERM INVESTMENTS - 16.59% | | | |
| number of shares | | | | market value |
| | |
| 5,340,991 | | Timothy Plan Money Market Fund, 0.38% (A) (C) | | | 5,340,991 |
| | | | | |
| | |
| | Total Short-Term Investments (cost $5,340,991) | | | 5,340,991 |
| | | | | |
| | |
| | TOTAL INVESTMENTS (cost $45,625,444) - 101.40% | | $ | 32,649,172 |
| | | | | |
| | |
| | LIABILITIES IN EXCESS OF OTHER ASSETS - (1.40)% | | | (450,403) |
| | | | | |
| | |
| | NET ASSETS - 100.00% | | $ | 32,198,769 |
| | | | | |
(ADR) American Depositary Receipt.
(A) Variable rate security; the rate shown represents the yield at December 31, 2008.
(B) Securities are priced using an evaluated bid provided by an independent pricing source, which is based on the Fund's Good Faith Pricing Guidelines.
Such values are approved by the Board of Trustees. The total value of such securities at December 31, 2008 is $11,517,929, which represents 36% of net assets.
(C) Affiliated fund.
The accompanying notes are an integral part of these financial statements.
Timothy Plan International Fund [121]
INTERNATIONAL FUND
SCHEDULE OF INVESTMENTS
As of December 31, 2008
DIVERSIFICATION OF ASSETS
| | |
| country | | percentage of net assets |
Japan | | 19.18% |
France | | 11.17% |
Germany | | 9.17% |
United Kingdom | | 8.75% |
Singapore | | 6.81% |
Spain | | 6.47% |
Denmark | | 3.67% |
Switzerland | | 3.52% |
Brazil | | 2.62% |
Turkey | | 2.54% |
Taiwan | | 2.40% |
Hong Kong | | 2.10% |
Canada | | 1.33% |
Italy | | 1.28% |
Mexico | | 1.25% |
Luxembourg | | 0.97% |
Sweden | | 0.82% |
Norway | | 0.76% |
| | |
Total | | 84.81% |
Money Market Securities | | 16.59% |
Liablilities in excess of other assets | | (1.40)% |
| | |
Grand Total | | 100.00% |
The accompanying notes are an integral part of these financial statements.
Timothy Plan International Fund [122]
INTERNATIONAL FUND
STATEMENT OF ASSETS AND LIABILITIES
As of December 31, 2008
| | | |
ASSETS | | | |
| | | amount |
Investments in Unaffiliated Securities at Value (cost $40,284,453) [NOTE 1] | | $ | 27,308,181 |
Investments in Affiliated Securities at Value (cost $5,340,991) [NOTE 1] | | | 5,340,991 |
Receivables for: | | | |
Investments Sold | | | 34,344 |
Fund Shares Sold | | | 241,895 |
Interest | | | 2,625 |
Dividends | | | 63,062 |
Prepaid Expenses | | | 9,172 |
| | | |
| |
Total Assets | | $ | 33,000,270 |
| | | |
| |
LIABILITIES | | | |
| | | amount |
Payable for Investments Purchased | | $ | 686,803 |
Payable for Fund Shares Redeemed | | | 43,031 |
Accrued Advisory Fees | | | 30,077 |
Accrued 12b-1 Fees Class A | | | 6,172 |
Accrued 12b-1 Fees Class C | | | 799 |
Accrued Expenses | | | 34,619 |
| | | |
| |
Total Liabilities | | $ | 801,501 |
| | | |
| |
NET ASSETS | | | |
| | | amount |
| |
Class A Shares: | | | |
Net Assets (unlimited shares of $0.001 par beneficial interest authorized; 5,270,971 shares outstanding) | | $ | 31,214,369 |
Net Asset Value and Redemption Price Per Class A Share ($31,214,369 / 5,270,971 shares) | | $ | 5.92 |
Offering Price Per Share ($5.92 / 0.945) | | $ | 6.26 |
Class C Shares: | | | |
Net Assets (unlimited shares of $0.001 par beneficial interest authorized; 167,739 shares outstanding) | | $ | 984,400 |
Net Asset Value and Offering Price Per Class C Share ($984,400 / 167,739 shares) | | $ | 5.87 |
Minimum Redemption Price Per Share ($5.87 * 0.99) | | $ | 5.81 |
| |
Net Assets | | $ | 32,198,769 |
| | | |
| |
SOURCES OF NET ASSETS | | | |
| | | amount |
| |
At December 31, 2008, Net Assets Consisted of: | | | |
Paid-in Capital | | $ | 52,982,938 |
Accumulated Undistributed Net Investment Income | | | 10,777 |
Accumulated Net Realized Gain (Loss) on Investments | | | (7,818,674) |
Net Unrealized Appreciation (Depreciation) in Value of Investments | | | (12,976,272) |
| | | |
| |
Net Assets | | $ | 32,198,769 |
The accompanying notes are an integral part of these financial statements.
Timothy Plan International Fund [123]
INTERNATIONAL FUND
STATEMENT OF OPERATIONS
For the Year Ended December 31, 2008
| | | |
INVESTMENT INCOME | | | |
| | | amount |
| |
Interest on Affiliated Investments | | $ | 52,411 |
Dividends (net of foreign withholding taxes of $44,580) | | | 1,102,043 |
| | | |
| |
Total Investment Income | | | 1,154,454 |
| | | |
| |
EXPENSES | | | |
| | | amount |
| |
Investment Advisory Fees [NOTE 3] | | | 416,037 |
12b-1 Fees (Class A = $100,534, Class C = $13,902.) [NOTE 3] | | | 114,436 |
Fund Accounting, Transfer Agency, & Administration Fees | | | 73,598 |
Registration Fees | | | 30,433 |
Miscellaneous Expense | | | 2,634 |
Out-of-Pocket Expense | | | 21,515 |
Custodian Fees | | | 12,640 |
Audit Fees | | | 12,539 |
Printing Expense | | | 7,271 |
CCO Fees | | | 3,716 |
Trustee Fees | | | 2,800 |
Insurance Expense | | | 1,472 |
| | | |
| |
Total Net Expenses | | | 699,091 |
| | | |
| |
Net Investment Income (Loss) | | | 455,363 |
| | | |
| |
REALIZED AND UNREALIZED GAIN (LOSS) ON INVESTMENTS | | | |
| | | amount |
| |
Net Realized Gain (Loss) on Unaffiliated Investments | | | (7,208,911) |
Change in Unrealized Appreciation/Depreciation of Investments | | | (17,417,187) |
| | | |
Net Realized and Unrealized Gain (Loss) on Investments | | | (24,626,098) |
| | | |
| |
Net Increase (Decrease) in Net Assets Resulting from Operations | | $ | (24,170,735) |
| | | |
The accompanying notes are an integral part of these financial statements.
Timothy Plan International Fund [124]
INTERNATIONAL FUND
STATEMENTS OF CHANGES IN NET ASSETS
INCREASE (DECREASE) IN NET ASSETS
| | | | | | |
| | | year ended
12/31/08 | | period ended
12/31/07 (A) |
| | |
Operations: | | | | | | |
Net Investment Income (Loss) | | $ | 455,363 | | $ | 142,508 |
Net Realized Gain (Loss) on Investments | | | (7,208,911) | | | (609,763) |
Change in Unrealized Appreciation/Depreciation of Investments | | | (17,417,187) | | | 4,440,915 |
| | | | | | |
Net Increase (Decrease) in Net Assets (resulting from operations) | | | (24,170,735) | | | 3,973,660 |
| | | | | | |
| | |
Distributions to Shareholders From: | | | | | | |
Net Investment Income: | | | | | | |
Class A | | | (432,699) | | | (141,809) |
Class C | | | (12,503) | | | (83) |
| | | | | | |
Total Distributions | | | (445,202) | | | (141,892) |
| | | | | | |
| | |
Capital Share Transactions: | | | | | | |
Proceeds from Shares Sold: | | | | | | |
Class A | | | 20,334,914 | | | 43,574,309 |
Class C | | | 808,369 | | | 1,298,293 |
Dividends Reinvested: | | | | | | |
Class A | | | 388,442 | | | 134,123 |
Class C | | | 12,206 | | | 74 |
Cost of Shares Redeemed: | | | | | | |
Class A | | | (7,993,400) | | | (5,166,189) |
Class C | | | (352,076) | | | (56,127) |
| | | | | | |
Net Increase (Decrease) in Net Assets (resulting from capital share transactions) | | | 13,198,455 | | | 39,784,483 |
| | | | | | |
Total Increase (Decrease) in Net Assets | | | (11,417,482) | | | 43,616,251 |
| | | | | | |
| | |
Net Assets: | | | | | | |
Beginning of period | | | 43,616,251 | | | - |
| | | | | | |
| | |
End of period | | $ | 32,198,769 | | $ | 43,616,251 |
| | | | | | |
Accumulated Undistributed Net Investment Income | | $ | 10,777 | | $ | 616 |
| | | | | | |
| | |
Shares of Capital Stock of the Fund Sold and Redeemed: | | | | | | |
Shares Sold: | | | | | | |
Class A | | | 2,304,470 | | | 4,303,658 |
Class C | | | 84,402 | | | 125,260 |
Shares Reinvested: | | | | | | |
Class A | | | 67,673 | | | 12,642 |
Class C | | | 2,145 | | | 7 |
Shares Redeemed: | | | | | | |
Class A | | | (945,119) | | | (472,353) |
Class C | | | (38,919) | | | (5,156) |
| | | | | | |
Net Increase (Decrease) in Number of Shares Outstanding | | | 1,474,652 | | | 3,964,058 |
| | | | | | |
| | |
| (A) | | For the period May 3, 2007 (Commencement of operations) through December 31, 2007. |
The accompanying notes are an integral part of these financial statements.
Timothy Plan International Fund [125]
INTERNATIONAL FUND
FINANCIAL HIGHLIGHTS
The table below sets forth financial data for one share of capital stock outstanding throughout each period presented.
INTERNATIONAL FUND - CLASS A SHARES
| | | | | | | |
| | | year ended
12/31/08 | | period ended
12/31/07 (A) | |
| | |
Per Share Operating Performance: | | | | | | | |
Net Asset Value at Beginning of Period | | $ | 11.00 | | $ | 10.00 | |
| | | | | | | |
| | |
Income from Investment Operations: | | | | | | | |
Net Investment Income (Loss) | | | 0.09 | | | 0.04 | |
Net Realized and Unrealized Gain (Loss) on Investments | | | (5.08) | | | 1.00 | |
| | | | | | | |
Total from Investment Operations | | | (4.99) | | | 1.04 | |
| | | | | | | |
| | |
Less Distributions: | | | | | | | |
Dividends from Net Investment Income | | | (0.09) | | | (0.04) | |
| | | | | | | |
Total Distributions | | | (0.09) | | | (0.04) | |
| | | | | | | |
| | |
Net Asset Value at End of Period | | $ | 5.92 | | $ | 11.00 | |
| | | | | | | |
| | |
Total Return (B)(C) | | | (45.38)% | | | 10.39% | (D) |
| | |
Ratios/Supplemental Data: | | | | | | | |
Net Assets, End of Period (in 000s) | | $ | 31,214 | | $ | 42,298 | |
| | |
Ratio of Expenses to Average Net Assets: | | | | | | | |
Before Reimbursement and Waiver/Recoupment of Expenses by Adviser | | | 1.66% | | | 1.69% | (E) |
After Reimbursement and Waiver/Recoupment of Expenses by Adviser | | | 1.66% | | | 1.69% | (E) |
| | |
Ratio of Net Investment Income (Loss) to Average Net Assets: | | | | | | | |
Before Reimbursement and Waiver/Recoupment of Expenses by Adviser | | | 1.12% | | | 0.58% | (E) |
After Reimbursement and Waiver/Recoupment of Expenses by Adviser | | | 1.12% | | | 0.58% | (E) |
| | |
Portfolio Turnover | | | 32.36% | | | 13.18% | |
| | |
| (A) | | For the period May 3, 2007 (Commencement of operations) through December 31, 2007. |
| (B) | | Total return calculation does not reflect sales load. |
| (C) | | Total return in the above table represents the rate that the investor would have earned or lost on an investment in the Fund assuming reinvestment of dividends. |
| (D) | | For periods of less than one full year, total return is not annualized. |
| (E) | | Annualized. |
The accompanying notes are an integral part of these financial statements.
Timothy Plan International Fund [126]
INTERNATIONAL FUND
FINANCIAL HIGHLIGHTS
The table below sets forth financial data for one share of capital stock outstanding throughout each period presented.
INTERNATIONAL FUND - CLASS C SHARES
| | | | | | | |
| | | year
ended
12/31/08 | | period ended
12/31/07 (A) | |
| | |
Per Share Operating Performance: | | | | | | | |
Net Asset Value at Beginning of Period | | $ | 10.97 | | $ | 10.00 | |
| | | | | | | |
| | |
Income from Investment Operations: | | | | | | | |
Net Investment Income (Loss) | | | 0.04 | | | (0.02) | |
Net Realized and Unrealized Gain (Loss) on Investments | | | (5.07) | | | 0.99 | |
| | | | | | | |
Total from Investment Operations | | | (5.03) | | | 0.97 | |
| | | | | | | |
| | |
Less Distributions: | | | | | | | |
Dividends from Net Investment Income | | | (0.07) | | | - | * |
| | | | | | | |
Total Distributions | | | (0.07) | | | - | |
| | | | | | | |
| | |
Net Asset Value at End of Period | | $ | 5.87 | | $ | 10.97 | |
| | | | | | | |
| | |
Total Return (B)(C) | | | (45.79)% | | | 9.71% | (D) |
| | |
Ratios/Supplemental Data: | | | | | | | |
Net Assets, End of Period (in 000s) | | $ | 984 | | $ | 1,318 | |
| | |
Ratio of Expenses to Average Net Assets: | | | | | | | |
Before Reimbursement and Waiver/Recoupment of Expenses by Adviser | | | 2.40% | | | 2.48% | (E) |
After Reimbursement and Waiver/Recoupment of Expenses by Adviser | | | 2.40% | | | 2.48% | (E) |
| | |
Ratio of Net Investment Income (Loss) to Average Net Assets: | | | | | | | |
Before Reimbursement and Waiver/Recoupment of Expenses by Adviser | | | 0.45% | | | (0.44)% | (E) |
After Reimbursement and Waiver/Recoupment of Expenses by Adviser | | | 0.45% | | | (0.44)% | (E) |
| | |
Portfolio Turnover | | | 32.36% | | | 13.18% | |
| | |
| * | | Distributions amounted to less than 0.01 per share |
| |
| (A) | | For the period May 3, 2007 (Commencement of operations) through December 31, 2007. |
| (B) | | Total return calculation does not reflect redemption fee. |
| (C) | | Total return in the above table represents the rate that the investor would have earned or lost on an investment in the Fund assuming reinvestment of dividends. |
| (D) | | For periods of less than one full year, total return is not annualized. |
| (E) | | Annualized. |
The accompanying notes are an integral part of these financial statements.
Timothy Plan International Fund [127]
NOTES TO FINANCIAL STATEMENTS
December 31, 2008
TIMOTHY PLAN FAMILY OF FUNDS
Note 1 – Significant Accounting Policies
The Timothy Plan (the “Trust”) is organized as a series of a Delaware business trust pursuant to a trust agreement dated December 16, 1993. The Trust is registered under the Investment Company Act of 1940, as amended, as an open-end diversified management investment company. The Trust currently consists of twelve series. These financial statements include the following ten series: Timothy Plan Aggressive Growth Fund, Timothy Plan Conservative Growth Fund, Timothy Plan Fixed Income Fund, Timothy Plan High Yield Bond Fund, Timothy Plan International Fund, Timothy Plan Small Cap Value Fund, Timothy Plan Large/Mid Cap Growth Fund, Timothy Plan Large/Mid Cap Value Fund, Timothy Plan Money Market Fund and Timothy Plan Strategic Growth Fund (the “Funds”).
The Timothy Plan Aggressive Growth Fund’s investment objective is long-term growth of capital. The Fund seeks to achieve its investment objective by normally investing at least 80% of the Fund’s total assets in U.S. common stocks without regard to market capitalizations and investing in the securities of a limited number of companies which the Fund’s Adviser believes show a high probability for superior growth.
The Timothy Plan Conservative Growth Fund seeks to generate moderate levels of long-term capital growth with a secondary objective of current income. The Fund seeks to achieve its investment objective by normally investing at least 75% of its net assets in the following Funds which are other series of the Trust: approximately 5%-15% of its net assets in the Timothy Plan Small Cap Value Fund; approximately 15%-25% of its net assets in the Timothy Plan Large/Mid Cap Value Fund; approximately 5%-15% of its net assets in the Timothy Plan Large/Mid Cap Growth Fund; approximately 0-10% of its net assets in the Timothy Plan Aggressive Growth Fund; approximately 5-15% in the Timothy Plan High Yield Bond Fund; approximately 10-20% of its net assets in the Timothy Plan International Fund; and approximately 20%-40% in the Timothy Plan Fixed Income Fund. The Fund may also invest in the Timothy Plan Money Market Fund.
The Timothy Plan Fixed Income Fund seeks to generate a high level of current income consistent with prudent investment risk. To achieve its investment objective, the Fund normally invests in a diversified portfolio of debt securities. These include corporate bonds, U.S. Government and agency securities, convertible securities and preferred securities. The Fund will generally only purchase high quality securities.
The Timothy Plan High Yield Bond Fund’s investment objective is to generate a high level of current income. To achieve its investment objective, the Fund normally invests in a diversified portfolio of debt securities. These include corporate bonds, U.S. Government and agency securities, convertible securities and preferred securities. The Fund will generally purchase securities that are not investment grade, meaning securities with a rating of “BBB” or lower as rated by Standard and Poor’s or a comparable rating by another nationally recognized rating agency. Investments in these higher yielding securities are generally accompanied by a greater degree of credit risk than higher rated securities. Additionally, lower rated securities may be more susceptible to adverse economic and competitive industry conditions than investment-grade securities.
The Timothy Plan International Fund’s investment objective is long-term growth of capital. The Fund seeks to achieve its investment objective by normally investing at least 80% of the Fund’s total assets in the common stock and similar securities of foreign companies through the purchase of American Depository Receipts (ADR’s) without regard to market capitalization, investing its assets in the ADR’s of companies which the Fund’s investment manager believes show a high probability for superior growth, and allocating investments across countries and regions considering the size of the market in each country and region relative to the size of the international market as a whole. Although the Fund maintains a diversified investment portfolio, the political or economic developments within a particular country or region may have an adverse effect on the ability of domiciled issuers to meet their obligations. Additionally, political or economic developments may have an effect on the liquidity and volatility of portfolio securities and currency holdings.
The Timothy Plan Small Cap Value Fund’s primary objective is long-term capital growth, with a secondary objective of current income. The Fund seeks to achieve its investment objective by primarily investing at least 80% of its assets in U.S. common stocks whose market capitalization is generally less than $2 billion.
Timothy Plan Notes to Financial Statements [128]
NOTES TO FINANCIAL STATEMENTS
December 31, 2008
TIMOTHY PLAN FAMILY OF FUNDS
The Timothy Plan Large/Mid Cap Growth Fund’s investment objective is long-term growth of capital. Current income is not a significant investment consideration and any such income realized will be considered incidental to the Fund’s investment objective. The Fund seeks to achieve its investment objective by normally investing at least 80% of the Fund’s total assets in U.S. common stocks with market capitalizations in excess of $2 billion.
The Timothy Plan Large/Mid Cap Value Fund’s investment objective is long-term capital growth, with a secondary objective of current income. The Fund seeks to achieve its investment objective by primarily investing in U.S. common stocks. The Fund will invest at least 80% of its assets in the common stock of companies whose total market capitalization generally exceeds $2 billion.
The Timothy Plan Money Market Fund seeks to generate a high level of current income consistent with the preservation of capital. To achieve its investment objective, the Fund normally invests in short-term debt instruments, such as obligations of the U.S. Government and its agencies, certificates of deposit, banker’s acceptances, commercial paper and short-term corporate notes.
The Timothy Plan Strategic Growth Fund seeks to generate medium to high levels of long-term capital growth. The Fund seeks to achieve its investment objective by normally investing at least 75% of its net assets in the following Funds which are other series of the Trust: approximately 10%-15% of its net assets in the Timothy Plan Small Cap Value Fund; approximately 15%-25% of its net assets in the Timothy Plan Large/Mid Cap Value Fund; approximately 15%-25% of its net assets in the Timothy Plan Large/Mid Cap Growth Fund; approximately 0-20% of its net assets in the Timothy Plan High Yield Bond Fund; approximately 20-30% of its net assets in the Timothy International Fund; and approximately 10%-15% in the Timothy Plan Aggressive Growth Fund. The Fund may also invest in the Timothy Plan Money Market Fund.
The following is a summary of significant accounting policies consistently followed by the Funds in the preparation of their financial statements. The policies are in conformity with accounting principles generally accepted in the United States of America for investment companies.
A. Security Valuation
The Funds generally determine the total value of each Class of its shares by using market prices for the securities comprising its portfolio. Investments in securities traded on a national securities exchange are valued at the NASDAQ official closing price on the last business day of the period. Fixed income securities are valued by a pricing service when the Adviser believes such prices are accurate and reflect the fair market value of such securities. Securities for which quotations are not readily available, or the Adviser feels the price provided by the pricing service does not accurately reflect the fair market value of the securities, are valued at fair market value as determined in good faith by each Fund’s investment manager, in conformity with guidelines adopted by and subject to the review and supervision of the Board of Trustees (the “Board”). Short-term obligations with remaining maturities of 60 days or less are valued at amortized cost, which the Board has determined approximates market value.
Investment securities denominated in foreign currencies are translated into U.S. dollar amounts at the date of valuation. Purchases and sales of investment securities and income and expense items denominated in foreign currencies are translated into U.S. dollar amounts on the respective dates of such transactions. The Funds do not isolate that portion of the results of operations resulting from changes in foreign exchange rates on investments from the fluctuations arising from changes in market prices of securities held. Such fluctuations are included in the net realized and unrealized gain or loss from investments. Reported net realized foreign exchange gains or losses arise from sales of foreign currencies, currency gains or losses realized between the trade and settlement dates on securities transactions, and the difference between the amounts of dividends, interest and foreign withholding taxes recorded on the Fund’s books and the U.S. dollar equivalent of the amounts actually received or paid. Net unrealized foreign exchange gains and losses arise from changes in the fair values of assets and liabilities, other than investments in securities at fiscal period end, resulting from changes in exchange rates.
Timothy Plan Notes to Financial Statements [129]
NOTES TO FINANCIAL STATEMENTS
December 31, 2008
TIMOTHY PLAN FAMILY OF FUNDS
The Timothy Plan Money Market Fund uses the amortized cost method to compute its NAV. This means that securities purchased by the Fund are not marked to market. Instead, any premium paid or discount realized will be amortized or accrued over the life of the security and credited/debited daily against the total assets of the Fund. This also means that, under most circumstances, the Money Market Fund will not sell securities prior to maturity date except to satisfy redemption requests.
The Board has delegated to the Adviser and/or Sub-Advisers responsibility for determining the value of Fund portfolio securities under certain circumstances. Under such circumstances, the Adviser or Sub-Adviser will use its best efforts to arrive at the fair value of a security held by the Fund under all reasonably ascertainable facts and circumstances. The Adviser must prepare a report for the Board not less than quarterly containing a complete listing of any securities for which fair value pricing was employed and detailing the specific reasons for such fair value pricing. The Board has adopted written policies and procedures to guide the Adviser and Sub-Advisers with respect to the circumstances under which, and the methods to be used, in fair valuing securities.
The Funds generally invest the vast majority of their assets in frequently traded exchange listed securities of domestic issuers with relatively liquid markets and calculate their NAV as of the time those exchanges close. The Funds typically do not invest in securities on foreign exchanges or in illiquid or restricted securities. Accordingly, there may be very limited circumstances under which any Fund would hold securities that would need to be fair value priced, except in the International Fund where a portion of the ADRs are considered fair valued. They are priced using the evaluated bid price provided by the pricing service.
The Funds adopted Financial Accounting Standards Board (“FASB”) Statement of Financial Accounting Standards No. 157, Fair Value Measurements (“FAS 157”), effective January 1, 2008. In accordance with FAS 157, fair value is defined as the price that the Funds would receive upon selling an investment in a timely transaction to an independent buyer in the principal or most advantageous market of the investment. FAS 157 established a three-tier hierarchy to maximize the use of observable market data and minimize the use of unobservable inputs and to establish classification of fair value measurements for disclosure purposes. Inputs refer broadly to the assumptions that market participants would use in pricing the asset or liability, including assumptions about risk, for example, the risk inherent in a particular valuation technique used to measure fair value including such a pricing model and/or the risk inherent in the inputs to the valuation technique. Inputs may be observable or unobservable. Observable inputs are inputs that reflect the assumptions market participants would use in pricing the asset or liability developed based on market data obtained from sources independent of the reporting entity. Unobservable inputs are inputs that reflect the reporting entity’s own assumptions about the assumptions market participants would use in pricing the asset or liability developed based on the best information available in the circumstances.
Various inputs are used in determining the value of the Funds’ investments. These inputs are summarized in the three broad levels listed below.
| | |
• | | Level 1 – quoted prices in active markets for identical securities |
• | | Level 2 – other significant observable inputs (including quoted prices for similar securities, interest rates, prepayment speeds, credit risk, etc.) |
• | | Level 3 – significant unobservable inputs (including the Fund’s own assumptions in determining fair value of investments) |
Timothy Plan Notes to Financial Statements [130]
NOTES TO FINANCIAL STATEMENTS
December 31, 2008
TIMOTHY PLAN FAMILY OF FUNDS
The following is a summary of the inputs used to value the Timothy Plan Small Cap Value Fund’s assets as of December 31, 2008:
| | | | | |
| Valuation Inputs | | Investments in Securities | | Other Financial Instruments
(i.e., off-balance sheet items)* |
Level 1 – Quoted Prices in Active Markets | | $ | 51,267,151 | | $ - |
Level 2 – Other Significant Observable Inputs | | $ | - | | $ - |
Level 3 – Significant Unobservable Inputs | | $ | - | | $ - |
Total | | $ | 51,267,151 | | $ - |
*Other financial instruments include futures, forwards, and swap contracts.
FAS 157 requires a reconciliation of assets in which significant unobservable inputs (Level 3) were used in determining fair value. The Timothy Plan Small Cap Value Fund did not hold any assets at any time during the year ended December 31, 2008 in which significant unobservable inputs were used in determining fair value; therefore, no reconciliation is included for this reporting period.
The following is a summary of the inputs used to value the Timothy Plan Large/Mid Cap Value Fund’s assets as of December 31, 2008:
| | | | | |
| Valuation Inputs | | Investments in Securities | | Other Financial Instruments
(i.e., off-balance sheet items)* |
Level 1 – Quoted Prices in Active Markets | | $ | 84,993,622 | | $ - |
Level 2 – Other Significant Observable Inputs | | $ | - | | $ - |
Level 3 – Significant Unobservable Inputs | | $- | | | $ - |
Total | | $ | 84,993,622 | | $ - |
*Other financial instruments include futures, forwards, and swap contracts.
FAS 157 requires a reconciliation of assets in which significant unobservable inputs (Level 3) were used in determining fair value. The Timothy Plan Large/Mid Cap Value Fund did not hold any assets at any time during the year ended December 31, 2008 in which significant unobservable inputs were used in determining fair value; therefore, no reconciliation is included for this reporting period.
The following is a summary of the inputs used to value the Timothy Plan Fixed Income Fund’s assets as of December 31, 2008:
| | | | | |
| Valuation Inputs | | Investments in Securities | | Other Financial Instruments
(i.e., off-balance sheet items)* |
Level 1 – Quoted Prices in Active Markets | | $ | 1,819,144 | | $ - |
Level 2 – Other Significant Observable Inputs | | $ | 39,105,646 | | $ - |
Level 3 – Significant Unobservable Inputs | | $ | - | | $ - |
Total | | $ | 40,924,790 | | $ - |
*Other financial instruments include futures, forwards, and swap contracts.
FAS 157 requires a reconciliation of assets in which significant unobservable inputs (Level 3) were used in determining fair value. The Timothy Plan Fixed Income Fund did not hold any assets at any time during the year ended December 31, 2008 in which significant unobservable inputs were used in determining fair value; therefore, no reconciliation is included for this reporting period.
Timothy Plan Notes to Financial Statements [131]
NOTES TO FINANCIAL STATEMENTS
December 31, 2008
TIMOTHY PLAN FAMILY OF FUNDS
The following is a summary of the inputs used to value the Timothy Plan Aggressive Growth Fund’s assets as of December 31, 2008:
| | | | | |
| Valuation Inputs | | Investments in Securities | | Other Financial Instruments
(i.e., off-balance sheet items)* |
Level 1 – Quoted Prices in Active Markets | | $ | 16,281,817 | | $ - |
Level 2 – Other Significant Observable Inputs | | $ | - | | $ - |
Level 3 – Significant Unobservable Inputs | | $ | - | | $ - |
Total | | $ | 16,281,817 | | $ - |
*Other financial instruments include futures, forwards, and swap contracts.
FAS 157 requires a reconciliation of assets in which significant unobservable inputs (Level 3) were used in determining fair value. The Timothy Plan Aggressive Growth Fund did not hold any assets at any time during the year ended December 31, 2008 in which significant unobservable inputs were used in determining fair value; therefore, no reconciliation is included for this reporting period.
The following is a summary of the inputs used to value the Timothy Plan Large/Mid Cap Growth Fund’s assets as of December 31, 2008:
| | | | | |
| Valuation Inputs | | Investments in Securities | | Other Financial Instruments
(i.e., off-balance sheet items)* |
Level 1 – Quoted Prices in Active Markets | | $ | 35,587,338 | | $ - |
Level 2 – Other Significant Observable Inputs | | $ | - | | $ - |
Level 3 – Significant Unobservable Inputs | | $ | - | | $ - |
Total | | $ | 35,587,338 | | $ - |
*Other financial instruments include futures, forwards, and swap contracts.
FAS 157 requires a reconciliation of assets in which significant unobservable inputs (Level 3) were used in determining fair value. The Timothy Plan Large/Mid Cap Growth Fund did not hold any assets at any time during the year ended December 31, 2008 in which significant unobservable inputs were used in determining fair value; therefore, no reconciliation is included for this reporting period.
The following is a summary of the inputs used to value the Timothy Plan Strategic Growth Fund’s assets as of December 31, 2008:
| | | | | |
| Valuation Inputs | | Investments in Securities | | Other Financial Instruments
(i.e., off-balance sheet items)* |
Level 1 – Quoted Prices in Active Markets | | $ | 38,622,501 | | $ - |
Level 2 – Other Significant Observable Inputs | | $ | - | | $ - |
Level 3 – Significant Unobservable Inputs | | $ | - | | $ - |
Total | | $ | 38,622,501 | | $ - |
*Other financial instruments include futures, forwards, and swap contracts.
FAS 157 requires a reconciliation of assets in which significant unobservable inputs (Level 3) were used in determining fair value. The Timothy Plan Strategic Growth Fund did not hold any assets at any time during the year ended December 31, 2008 in which significant unobservable inputs were used in determining fair value; therefore, no reconciliation is included for this reporting period.
Timothy Plan Notes to Financial Statements [132]
NOTES TO FINANCIAL STATEMENTS
December 31, 2008
TIMOTHY PLAN FAMILY OF FUNDS
The following is a summary of the inputs used to value the Timothy Plan Conservative Growth Fund’s assets as of December 31, 2008:
| | | | | |
| Valuation Inputs | | Investments in Securities | | Other Financial Instruments
(i.e., off-balance sheet items)* |
Level 1 – Quoted Prices in Active Markets | | $ | 38,257,045 | | $ - |
Level 2 – Other Significant Observable Inputs | | $ | - | | $ - |
Level 3 – Significant Unobservable Inputs | | $ | - | | $ - |
Total | | $ | 38,257,045 | | $ - |
*Other financial instruments include futures, forwards, and swap contracts.
FAS 157 requires a reconciliation of assets in which significant unobservable inputs (Level 3) were used in determining fair value. The Timothy Plan Conservative Growth Fund did not hold any assets at any time during the year ended December 31, 2008 in which significant unobservable inputs were used in determining fair value; therefore, no reconciliation is included for this reporting period.
The following is a summary of the inputs used to value the Timothy Plan Money Market Fund’s assets as of December 31, 2008:
| | | | | |
| Valuation Inputs | | Investments in Securities | | Other Financial Instruments
(i.e., off-balance sheet items)* |
Level 1 – Quoted Prices in Active Markets | | $ | 550,242 | | $ - |
Level 2 – Other Significant Observable Inputs | | $ | 33,308,798 | | $ - |
Level 3 – Significant Unobservable Inputs | | $ | - | | $ - |
Total | | $ | 33,859,040 | | $ - |
*Other financial instruments include futures, forwards, and swap contracts.
FAS 157 requires a reconciliation of assets in which significant unobservable inputs (Level 3) were used in determining fair value. The Timothy Plan Money Market Fund did not hold any assets at any time during the year ended December 31, 2008 in which significant unobservable inputs were used in determining fair value; therefore, no reconciliation is included for this reporting period.
The following is a summary of the inputs used to value the Timothy Plan High Yield Bond Fund’s assets as of December 31, 2008:
| | | | | |
| Valuation Inputs | | Investments in Securities | | Other Financial Instruments
(i.e., off-balance sheet items)* |
Level 1 – Quoted Prices in Active Markets | | $ | 520,827 | | $ - |
Level 2 – Other Significant Observable Inputs | | $ | 12,745,155 | | $ - |
Level 3 – Significant Unobservable Inputs | | $ | - | | $ - |
Total | | $ | 13,265,982 | | $ - |
*Other financial instruments include futures, forwards, and swap contracts.
FAS 157 requires a reconciliation of assets in which significant unobservable inputs (Level 3) were used in determining fair value. The Timothy Plan High Yield Bond Fund did not hold any assets at any time during the year ended December 31, 2008 in which significant unobservable inputs were used in determining fair value; therefore, no reconciliation is included for this reporting period.
Timothy Plan Notes to Financial Statements [133]
NOTES TO FINANCIAL STATEMENTS
December 31, 2008
TIMOTHY PLAN FAMILY OF FUNDS
The following is a summary of the inputs used to value the Timothy Plan International Fund’s assets as of December 31, 2008:
| | | | | |
| Valuation Inputs | | Investments in Securities | | Other Financial Instruments
(i.e., off-balance sheet items)* |
Level 1 – Quoted Prices in Active Markets | | $ | 21,131,243 | | $ - |
Level 2 – Other Significant Observable Inputs | | $ | 11,517,929 | | $ - |
Level 3 – Significant Unobservable Inputs | | $ | - | | $ - |
Total | | $ | 32,649,172 | | $ - |
*Other financial instruments include futures, forwards, and swap contracts.
FAS 157 requires a reconciliation of assets in which significant unobservable inputs (Level 3) were used in determining fair value. The Timothy Plan International Fund did not hold any assets at any time during the year ended December 31, 2008 in which significant unobservable inputs were used in determining fair value; therefore, no reconciliation is included for this reporting period.
In March 2008, FASB issued the Statement on Financial Accounting Standards (SFAS) No. 161, Disclosures about Derivative Instruments and Hedging Activities. SFAS 161 is effective for fiscal years and interim periods beginning after November 15, 2008. SFAS 161 requires enhanced disclosures about the Funds’ derivative and hedging activities, including how such activities are accounted for and their effect on the Funds’ financial positions, performance and cash flows. Management is currently evaluating the impact the adoption of SFAS 161 will have on the Funds’ financial statements and related disclosures.
B. Investment Income and Securities Transactions
Security transactions are accounted for on the date the securities are purchased or sold (trade date). Dividend income is recognized on the ex-dividend date. Interest income and expenses are recognized on an accrual basis. The Timothy Plan Aggressive Growth Fund, Large/Mid Cap Growth Fund, Large/Mid Cap Value Fund, and Small Cap Value Fund have made certain investments in real estate investment trusts (“REITs”) and master limited partnerships (“MLPs”). It is common for distributions from REITs and MLPs to exceed taxable earnings and profits resulting in the excess portion of such dividends being designated as a return of capital. The calendar year-end amounts of ordinary income and return of capital for MLPs are reported to the Funds after the end of the fiscal year; accordingly, these amounts are estimated for accounting purposes until the characterization of MLP distributions is received. Estimates are based on the most recent MLP distribution information available. Withholding taxes on foreign dividends have been provided for in accordance with the Funds’ understanding of the applicable country’s tax rules and rates. Discounts and premiums on securities purchased are amortized over the lives of the respective securities.
C. Net Asset Value Per Share
Net asset value per share of the capital stock of the Funds is determined daily as of the close of trading on the New York Stock Exchange by dividing the value of its net assets by the number of Fund shares outstanding. Net Asset Value is calculated separately for each class of the following Funds, Timothy Plan Aggressive Growth Fund, Timothy Plan Conservative Growth Fund, Timothy Plan Fixed Income Fund, Timothy Plan High Yield Bond Fund, Timothy Plan International Fund, Timothy Plan Small Cap Value Fund, Timothy Plan Large/Mid Cap Growth Fund, Timothy Plan Large/Mid Cap Value Fund, and Timothy Plan Strategic Growth Fund. The asset value of the classes may differ because of different fees and expenses charged to each class.
D. Expenses
Expenses incurred by the Trust that do not relate to a specific fund of the Trust are allocated to the individual Funds based on each Fund’s relative net assets or another appropriate basis (as determined by the Board).
Timothy Plan Notes to Financial Statements [134]
NOTES TO FINANCIAL STATEMENTS
December 31, 2008
TIMOTHY PLAN FAMILY OF FUNDS
E. Classes
There are three Classes of shares currently offered by the Trust; Class A shares are offered with a front-end sales charge and ongoing service/distribution fees; Class C shares are offered with a contingent deferred sales charge (“CDSC”) that ends after the first year and ongoing service and distribution fees; No-Load shares are offered without sales charges or ongoing service/distribution fees (The Timothy Plan Money Market Fund only). The Trust previously has offered Class B shares to the public, which contain a contingent deferred sales charge that declines to zero over a period of years and are subject to an ongoing service/distribution fee. Sales of Class B shares to new shareholders were suspended by the Board during their meeting on February 27, 2004, with the suspension effective May, 2004. The amount of the CDSC fee varies depending on the number of years Class B shares for each Fund are held, except for the Money Market Fund, International Fund and High Yield Bond Fund which do not offer Class B shares. The following CDSC fees apply:
| | |
| Redemption Within: | | Percentage |
| |
First Year | | 5% |
Second Year | | 4% |
Third Year | | 3% |
Fourth Year | | 2% |
Fifth Year | | 1% |
Sixth Year & thereafter | | None |
Since Class B shares have not been offered since 2004, the maximum CDSC fee charged as of December 31, 2008 would be 1%.
Class B shares automatically convert to Class A shares once the economic equivalent of the highest front-end sales charge paid at time of purchase has been received by a Fund, in the form of Rule 12b-1 distribution fees, paid by all Class B shares owned by an investor.
Class specific expenses are borne by each specific class. Income, expenses, and realized and unrealized gains/losses are allocated to the respective classes on the basis of relative daily net assets.
F. Use of Estimates
In preparing financial statements in conformity with accounting principles generally accepted in the United States of America, management makes estimates and assumptions that affect the reported amounts of assets and liabilities and disclosure of contingent assets and liabilities at the date of the financial statements, as well as the reported amounts of revenues and expenses during the reporting period. Actual results could differ from those estimates.
G. Federal Income Taxes
It is the policy of each Fund to continue to comply with all requirements under subchapter M of the Internal Revenue Code applicable to regulated investment companies and to distribute substantially all of its taxable income to its shareholders. Therefore, no federal income tax provision is required.
As of and during the year ended December 31, 2008, the Funds did not have a liability for any unrecognized tax benefits. The Funds recognize interest and penalties, if any, related to unrecognized tax benefits as income tax expense in the statements of operations. During the year, the Funds did not incur any interest or penalties. The Funds are not subject to examination by U.S. federal tax authorities for tax years before 2005.
Timothy Plan Notes to Financial Statements [135]
NOTES TO FINANCIAL STATEMENTS
December 31, 2008
TIMOTHY PLAN FAMILY OF FUNDS
H. Distributions to Shareholders
Distributions to shareholders, which are determined in accordance with income tax regulations, are recorded on the ex-dividend date. The treatment for financial reporting purposes of distributions made to shareholders during the year from net investment income or net realized capital gains may differ from their ultimate treatment for federal income tax purposes. These differences are caused primarily by differences in the timing of the recognition of certain components of income, expense or realized capital gain for federal income tax purposes. Where such differences are permanent in nature, they are reclassified in the components of net assets based on their ultimate characterization for federal income tax purposes. Any such reclassifications will have no effect on net assets, results of operations, or net asset values per share of the Funds. Accordingly, the following permanent differences as of December 31, 2008, primarily attributable to certain net operating losses, which for tax purposes are not available to offset future income, distributions in excess of current year earnings, expiration of capital loss carryforwards, and permanent book to tax differences arising from tax-exempt interest income, were reclassified to the following accounts:
| | | | | | | | | | | |
| | | Ordinary
Income | | Net Realized
Gain | | Paid-in-Capital | | |
| | | | |
Aggressive Growth Fund | | $ | 339,070 | | $ | - | | $ | (339,070) | | |
Large/Mid Cap Growth Fund | | $ | 340,626 | | $ | 3,293,611 | | $ | (3,634,237) | | |
Money Market Fund | | $ | 1,199 | | $ | (1,199) | | $ | - | | |
Small Cap Value Fund | | $ | 51,484 | | $ | - | | $ | (51,484) | | |
Strategic Growth Fund | | $ | 86,991 | | $ | - | | $ | (86,991) | | |
Note 2 – Purchases and Sales of Securities
The following is a summary of the cost of purchases and proceeds from the sale of securities, other than short-term investments, for the year ended December 31, 2008:
| | | | | | | | | | | | |
| | | PURCHASES | | SALES |
| Funds | | U.S. Gov’t
Obligations | | Other | | U.S. Gov’t
Obligations | | Other |
| | | | |
Aggressive Growth Fund | | $ | - | | $ | 65,449,923 | | $ | - | | $ | 55,292,092 |
Conservative Growth Fund | | $ | - | | $ | 13,658,287 | | $ | - | | $ | 12,954,033 |
Fixed Income Fund | | $ | 14,983,087 | | $ | 1,009,450 | | $ | 10,558,802 | | $ | 9,708,499 |
High Yield Bond Fund | | $ | - | | $ | 5,557,288 | | $ | - | | $ | 4,753,416 |
International Fund | | $ | - | | $ | 22,081,211 | | $ | - | | $ | 12,508,017 |
Large/Mid Cap Growth Fund | | $ | - | | $ | 86,053,951 | | $ | - | | $ | 82,443,322 |
Large/Mid Cap Value Fund | | $ | - | | $ | 94,550,576 | | $ | - | | $ | 82,772,384 |
Small Cap Value Fund | | $ | - | | $ | 78,748,389 | | $ | - | | $ | 70,559,668 |
Strategic Growth Fund | | $ | - | | $ | 9,637,073 | | $ | - | | $ | 11,425,292 |
Timothy Plan Notes to Financial Statements [136]
NOTES TO FINANCIAL STATEMENTS
December 31, 2008
TIMOTHY PLAN FAMILY OF FUNDS
Note 3 – Investment Management Fee and Other Transactions with Affiliates
Timothy Partners, Ltd., (“TPL”) is the investment adviser for the Funds pursuant to an investment advisory agreement (the “Agreement”) that was renewed by the Board on February 29, 2008. TPL supervises the investment of the assets of each Fund in accordance with the objectives, policies and restrictions of the Trust. Under the terms of the Agreement, as amended, TPL receives a fee, accrued daily and paid monthly, at an annual rate of 1.00% of the average daily net assets of the Timothy Plan International Fund; 0.85% of the average daily net assets of the Timothy Plan Aggressive Growth, Timothy Plan Small Cap Value, Timothy Plan Large/Mid Cap Growth, and Timothy Plan Large/Mid Cap Value Funds; 0.60% of the average daily net assets of the Timothy Plan Fixed Income, the Timothy Plan High Yield Bond and Timothy Plan Money Market Funds; and 0.65% of the average daily net assets of the Timothy Plan Conservative Growth and Timothy Plan Strategic Growth Funds. TPL has voluntarily agreed to reduce the fee it receives from Timothy Plan Fixed Income and Timothy Plan Money Market to 0.45% and 0.40%, respectively. Additionally, TPL has voluntarily agreed to reduce fees payable to it by the Timothy Plan Money Market Fund and reimburse other expenses to the extent necessary to limit the Fund’s aggregate annual operating expenses, excluding brokerage commissions and other portfolio transaction expenses, interest, taxes, capital expenditures and extraordinary expenses, to 0.65%. Such voluntary fee reductions/reimbursements may be authorized by TPL at any time, but such action shall not obligate TPL to waive any fees in the near future. An officer and trustee of the Funds is also an officer and owner of the Adviser. For the period January 1, 2008 to April 30, 2008, TPL had contractually agreed to reduce fees payable to it by certain Funds and reimburse other expenses to the extent necessary to limit those Funds’ aggregate annual operating expenses, excluding brokerage commissions and other portfolio transaction expenses, interest, taxes, capital expenditures and extraordinary expenses, to the specified percentages listed below for the share classes as indicated:
| | | | | | | | | | | | | | |
Funds | | Class A | | | | | Class B | | | | Class C | | | |
High Yield Bond Fund | | 1.35 | % | | | | N/A | | | | 2.10 | % | | |
International Fund | | 1.75 | % | | | | N/A | | | | 2.50 | % | | |
Money Market Fund * | | 0.85 | % | | | | N/A | | | | N/A | | | |
The agreements to waive and reimburse expenses are effective through April 30, 2008 for the Timothy Plan High Yield Bond and the Timothy Plan International Funds. The Timothy Plan High Yield Bond Fund has agreed to repay waived expenses within the following three years provided the Fund is able to effect such reimbursements and remain in compliance with applicable expense limitations. As of December 31, 2008, the Adviser can no longer recoup $21,956 of reimbursed expenses from the Timothy Plan Money Market Fund due to a voluntary waiver.
For the year ended December 31, 2008, TPL waived and reimbursed the Funds or received recoupment from the Funds as follows:
| | | | | |
| Funds | | Waivers and Reimbursements
(recoupments) | | |
Fixed Income Fund | | $ | 73,514 | | |
Money Market Fund | | $ | 107,015 | | |
At December 31, 2008, the Adviser may recapture a portion of the reimbursed amounts no later than the dates as stated below:
| | | | | | | | |
| | | DECEMBER 31, | | |
Funds | | 2009 | | 2010 | | |
High Yield Bond Fund | | $ | - | | $ | 12,185 | | |
Money Market Fund * | | $ | 21,997 | | $ | - | | |
* The Timothy Plan Money Market Fund was able to incur recoupment expenses as a result of previous waiver/recoupment agreements.
Timothy Plan Notes to Financial Statements [137]
NOTES TO FINANCIAL STATEMENTS
December 31, 2008
TIMOTHY PLAN FAMILY OF FUNDS
The Timothy Plan Aggressive Growth, Timothy Plan Fixed Income, Timothy Plan High Yield Bond, Timothy Plan International Fund, Timothy Plan Large/Mid Cap Growth, Timothy Plan Large/Mid Cap Value, and Timothy Plan Small Cap Value Funds have adopted shareholder services plans (the “Plans”) pursuant to Rule 12b-1 under the Investment Company Act of 1940, as amended. The Plans provide that the Funds will pay TPL or others for expenses that relate to the promotion or distribution of shares. Under the Class A Plan, the Funds will pay TPL a fee at an annual rate of 0.25%, payable monthly, of the average daily net assets attributable to such class of shares. Under the Class B and C Plans, the Funds will pay TPL a fee at an annual rate of 1.00%, payable monthly, of which, 0.25% may be a service fee and 0.75% may be payable to outside broker/dealers, of the average daily net assets attributable to such class of shares.
The Timothy Plan Conservative Growth and Timothy Plan Strategic Growth Funds have adopted shareholder services plans (the “Plans”) pursuant to Rule 12b-1 under the Investment Company Act of 1940, as amended. The Plans provide that the Funds will pay TPL or others for expenses that relate to the promotion or distribution of shares. Class A shares of the Funds do not impose a service fee. Under the Class B and C Plans, the Fund will pay TPL a fee at an annual rate of 0.75%, payable monthly to outside broker/dealers, of the average daily net assets attributable to such class of shares. For the year ended December 31, 2008, the Funds paid TPL under the terms of the Plan’s as follows:
| | | | | |
Funds | | 12b-1 Fees | | |
Aggressive Growth Fund | | $ | 80,422 | | |
Conservative Growth Fund | | $ | 115,164 | | |
Fixed Income Fund | | $ | 154,650 | | |
High Yield Bond Fund | | $ | 47,608 | | |
International Fund | | $ | 114,436 | | |
Large/Mid Cap Growth Fund | | $ | 151,981 | | |
Large/Mid Cap Value Fund | | $ | 399,776 | | |
Small Cap Value Fund | | $ | 253,954 | | |
Strategic Growth Fund | | $ | 149,214 | | |
TPL also serves as the principal underwriter of the Funds’ shares. An officer and trustee of the Funds is also an officer of the principal underwriter. For the year ended December 31, 2008, TPL received sales charges deducted from the proceeds of sales of Class A capital shares and CDSC fees deducted from the redemption of Class B and C capital shares as follows:
| | | | | | | | | |
Funds | | Sales Charges (Class A) | | CDSC Fees (Class B) | | CDSC Fees (Class C) |
Aggressive Growth Fund | | $ | 3,653 | | $ | 267 | | $ | 180 |
Conservative Growth Fund | | $ | 29,333 | | $ | 3,074 | | $ | 3,051 |
Fixed Income Fund | | $ | 17,349 | | $ | 851 | | $ | 2,347 |
High Yield Bond Fund | | $ | 1,775 | | $ | N/A | | $ | 486 |
International Fund | | $ | 11,152 | | $ | N/A | | $ | 436 |
Large/Mid Cap Growth Fund | | $ | 8,414 | | $ | 644 | | $ | 861 |
Large/Mid Cap Value Fund | | $ | 41,150 | | $ | 1,210 | | $ | 3,772 |
Small Cap Value Fund | | $ | 11,765 | | $ | 1,525 | | $ | 997 |
Strategic Growth Fund | | $ | 24,644 | | $ | 4,569 | | $ | 1,982 |
Timothy Plan Notes to Financial Statements [138]
NOTES TO FINANCIAL STATEMENTS
December 31, 2008
TIMOTHY PLAN FAMILY OF FUNDS
Note 4 – Payment by Affiliate
During the year ended December 31, 2008, the Sub-Adviser for the Timothy Plan Aggressive Growth Fund reimbursed the Fund $24,684 due to an investing error during the transition of sub-advisers. The Sub-Adviser reimbursed the Fund for the difference in performance relative to the intended portfolio and the transaction costs of rebalancing the portfolio.
Note 5 – Control Ownership
The beneficial ownership, either directly or indirectly, of more than 25% of the voting securities of a Fund creates presumption of control of the Fund under Section 2(a) 9 of the Investment Company Act of 1940. As of December 31, 2008, the following shareholders, for the benefit of their customers, may be considered to control the Funds:
| | | | |
| % of Fund Owned By: | | National Financial Services | | Merrill Lynch Pierce Fenner |
| | |
Large/Mid Cap Value Fund, Class C | | N/A | | 25.68% |
Large/Mid Cap Growth Fund, Class B | | 27.90% | | N/A |
Certain Timothy Plan Funds own shares of other Timothy Plan Funds. U.S. Bank, N.A., custodian of the Timothy Plan Funds, holds these shares in omnibus accounts, some of which are controlled by National Financial Services, Inc. The following shows the percentage of each Timothy Plan Fund that is held by U.S. Bank, N.A., as custodian of the Timothy Funds. These accounts can be considered affiliated to the Timothy Plan.
| | | | |
| | | % of Fund Owned By Other
Timothy Plan Funds: | | |
| | |
Aggressive Growth Fund, Class A | | 70.69% | | |
Fixed Income Fund, Class A | | 56.11% | |
High Yield Bond Fund, Class A | | 92.64% | |
International Fund, Class A | | 76.01% | |
Large/Mid Cap Growth Fund, Class A | | 54.79% | |
Large/Mid Cap Value Fund, Class A | | 35.83% | |
Money Market Fund | | 60.91% | |
Small Cap Value Fund, Class A | | 32.72% | |
Timothy Plan Notes to Financial Statements [139]
NOTES TO FINANCIAL STATEMENTS
December 31, 2008
TIMOTHY PLAN FAMILY OF FUNDS
Note 6 – Unrealized Appreciation (Depreciation)
At December 31, 2008, for federal income tax purposes, the cost and the composition of gross unrealized appreciation (depreciation) of investment securities is as follows:
| | | | | | | | | | | | | | |
| Funds | | Cost | | App | | Dep | | | Net App/Dep | |
| | | | |
Aggressive Growth Fund | | $ | 22,880,209 | | $ | 609,119 | | $ | (7,207,511 | ) | | $ | (6,598,392 | ) |
Conservative Growth Fund | | $ | 54,203,824 | | $ | - | | $ | (15,946,779 | ) | | $ | (15,946,779 | ) |
Fixed Income Fund | | $ | 42,733,637 | | $ | 1,394,353 | | $ | (3,203,200 | ) | | $ | (1,808,847 | ) |
High Yield Bond Fund | | $ | 20,176,478 | | $ | 80,174 | | $ | (6,990,670 | ) | | $ | (6,910,496 | ) |
International Fund | | $ | 48,714,134 | | $ | 150,379 | | $ | (16,215,341 | ) | | $ | (16,064,962 | ) |
Large/Mid Cap Growth Fund | | $ | 47,126,357 | | $ | 984,032 | | $ | (12,523,051 | ) | | $ | (11,539,019 | ) |
Large/Mid Cap Value Fund | | $ | 103,832,070 | | $ | 2,067,619 | | $ | (20,906,067 | ) | | $ | (18,838,448 | ) |
Money Market Fund | | $ | 33,859,040 | | $ | - | | $ | - | | | $ | - | |
Small Cap Value Fund | | $ | 65,188,188 | | $ | 3,331,560 | | $ | (17,252,597 | ) | | $ | (13,921,037 | ) |
Strategic Growth Fund | | $ | 63,425,393 | | $ | - | | $ | (24,802,892 | ) | | $ | (24,802,892 | ) |
The differences between book basis and tax basis appreciation (depreciation) are primarily attributable to the deferral on wash sales and post-October losses.
Note 7 – Distributions to Shareholders
The tax character of distributions paid during 2008 and 2007 were as follows:
| | | | | | | | | | | | | |
| | | Aggressive
Growth Fund | | Conservative
Growth | | Fixed Income
Fund | | High Yield Bond
Fund | |
| | | | |
2008 | | | | | | | | | | | | | |
Ordinary Income | | $ | - | | $ | 697,282 | | $ | 2,053,290 | | $ | 1,274,024 | |
Short-term Capital Gains | | | - | | | 58,044 | | | - | | | 10,357 | |
Long-term Capital Gains | | | 48,425 | | | 1,808,503 | | | - | | | - | |
| | | | |
| | $ | 48,425 | | $ | 2,563,829 | | $ | 2,053,290 | | $ | 1,284,381 | |
| | | | |
2007 | | | | | | | | | | | | | |
Ordinary Income | | $ | - | | $ | 818,555 | | $ | 2,092,303 | | $ | 694,291 | |
Short-term Capital Gains | | | - | | | 85,576 | | | - | | | - | |
Long-term Capital Gains | | | 2,800,909 | | | 6,317,069 | | | - | | | - | |
| | | | |
| | $ | 2,800,909 | | $ | 7,221,200 | | $ | 2,092,303 | | $ | 694,291 | |
| | | | |
Timothy Plan Notes to Financial Statements [140]
NOTES TO FINANCIAL STATEMENTS
December 31, 2008
TIMOTHY PLAN FAMILY OF FUNDS
As of December 31, 2008, the components of distributable earnings on a tax basis were as follows:
| | | | | | | | | | | | | | | | |
| | | Aggressive
Growth Fund | | | Conservative
Growth | | | Fixed Income
Fund | | | High Yield Bond
Fund | |
| | | | |
Undistributed Ordinary Income | | $ | - | | | $ | 443,020 | | | $ | 12,170 | | | $ | 16,759 | |
Undistributed Long-term Capital Gains | | | - | | | | - | | | | - | | | | - | |
Capital Loss Carryforward | | | (3,723,197 | ) | | | - | | | | (898,616 | ) | | | (815,295 | ) |
Unrealized Appreciation (Depreciation) | | | (6,598,392 | ) | | | (15,946,779 | ) | | | (1,808,847 | ) | | | (6,910,496 | ) |
| | | | |
| | $ | (10,321,589 | ) | | $ | (15,503,759 | ) | | $ | (2,695,293 | ) | | $ | (7,709,032 | ) |
| | | | |
The tax character of distributions paid during 2008 and 2007 were as follows:
| | | | | | | | | | | | | |
| | | International
Fund | | Large/Mid Cap
Growth Fund | | Large/Mid Cap
Value Fund | | Money Market
Fund | |
| | | | |
2008 | | | | | | | | | | | | | |
Ordinary Income | | $ | 445,202 | | $ | - | | $ | 287,444 | | $ | 556,735 | |
Short-term Capital Gains | | | - | | | - | | | 531,542 | | | - | |
Long-term Capital Gains | | | - | | | 68,000 | | | 677,192 | | | - | |
| | | | |
| | $ | 445,202 | | $ | 68,000 | | $ | 1,496,178 | | $ | 556,735 | |
| | | | |
2007 | | | | | | | | | | | | | |
Ordinary Income | | $ | 141,892 | | $ | - | | $ | 1,050,778 | | $ | 1,245,883 | |
Long-term Capital Gains | | | - | | | 757,225 | | | 1,244,931 | | | - | |
Return of Capital | | | - | | | 4,950,780 | | | 6,832,904 | | | - | |
| | | | |
| | $ | 141,892 | | $ | 5,708,005 | | $ | 9,128,613 | | $ | 1,245,883 | |
| | | | |
As of December 31, 2008, the components of distributable earnings on a tax basis were as follows:
| | | | | | | | | | | | | | | | |
| | | International
Fund | | | Large/Mid Cap
Growth Fund | | | Large/Mid Cap
Value Fund | | | Money Market
Fund | |
| | | | |
Undistributed Ordinary Income | | $ | 22,361 | | | $ | - | | | $ | 121,686 | | | $ | 2,312 | |
Undistributed Long-term Capital Gains | | | - | | | | - | | | | - | | | | - | |
Capital Loss Carryforward | | | (4,741,568 | ) | | | (5,280,946 | )* | | | (14,622,252 | ) | | | - | |
Unrealized Appreciation (Depreciation) | | | (16,064,962 | ) | | | (11,539,019 | ) | | | (18,838,448 | ) | | | - | |
| | | | |
| | $ | (20,784,169 | ) | | $ | (16,819,965 | ) | | $ | (33,339,014 | ) | | $ | 2,312 | |
| | | | |
| | * | Following the 2005 acquisition by the Timothy Plan Large/Mid Cap Growth Fund of the NOAH Fund Equity Portfolio, the Timothy Fund acquired all capital loss carryforwards available to the NOAH Fund. In accordance with Section 382 of the Internal Revenue Code, loss limitations were appropriately applied to the available capital loss carryforward. Of the capital losses subject to Section 382, the Fund may only utilize $358,459 in a given year. |
Timothy Plan Notes to Financial Statements [141]
NOTES TO FINANCIAL STATEMENTS
December 31, 2008
TIMOTHY PLAN FAMILY OF FUNDS
The tax character of distributions paid during 2008 and 2007 were as follows:
| | | | | | | | | | |
| | | | | Small Cap
Value Fund | | Strategic
Growth Fund | | |
| | | | |
| | 2008 | | | | | | | | |
| | Ordinary Income | | $ | - | | $ | 506,870 | | |
| | Short-term Capital Gains | | | 424,158 | | | 230,982 | | |
| | Long-term Capital Gains | | | - | | | 3,451,894 | | |
| | | | | | | | | | |
| | | | $ | 424,158 | | $ | 4,189,746 | | |
| | | | | | | | | | |
| | 2007 | | | | | | | | |
| | Ordinary Income | | $ | 121,858 | | $ | 452,403 | | |
| | Long-term Capital Gains | | | 5,348,060 | | | - | | |
| | Return of Capital | | | 4,995,748 | | | 9,489,157 | | |
| | | | | | | | | | |
| | | | $ | 10,465,666 | | $ | 9,941,560 | | |
| | | | | | | | | | |
| |
| | As of December 31, 2008, the components of distributable earnings on a tax basis were as follows: |
| | | | |
| | | | | Small Cap Value Fund | | Strategic
Growth Fund | | |
| | | | |
| | Undistributed Ordinary Income | | $ | - | | $ | - | | |
| | Undistributed Long-term Capital Gains | | | - | | | - | | |
| | Capital Loss Carryforward | | | (8,700,264) | | | (844,115) | | |
| | Unrealized Appreciation (Depreciation) | | | (13,921,037) | | | (24,802,892) | | |
| | | | | | | | | | |
| | | | $ | (22,621,301) | | $ | (25,647,007) | | |
| | | | | | | | | | |
Note 8 – Capital Loss Carryforwards
At December 31, 2008, the following capital loss carryforwards are available to offset futures capital gains.
| | | | | | | | | | | |
| | | | | | | Loss Carryforward | | Year Expiring | | |
| | Aggressive Growth Fund | | | | $ | 3,723,197 | | 2016 | | |
| | Fixed Income Fund | | | | $ | 569,273 | | 2014 | | |
| | | | | | $ | 77,304 | | 2015 | | |
| | | | | | $ | 252,039 | | 2016 | | |
| | High Yield Bond Fund | | | | $ | 815,295 | | 2016 | | |
| | International Fund | | | | $ | 498,385 | | 2015 | | |
| | | | | | $ | 4,243,183 | | 2016 | | |
| | Large/Mid Cap Growth Fund* | | | | $ | 1,380,010 | | 2009 | | |
| | | | | | $ | 3,900,936 | | 2016 | | |
| | Large/Mid Cap Value Fund | | | | $ | 14,622,252 | | 2016 | | |
| | Small Cap Value Fund | | | | $ | 8,700,264 | | 2016 | | |
| | Strategic Growth Fund | | | | $ | 844,115 | | 2016 | | |
| | * | | Please refer to Note 7 for additional information regarding the availability of capital loss carryforwards within the Timothy Plan Large/Mid Cap Growth Fund. |
Timothy Plan Notes to Financial Statements [142]
NOTES TO FINANCIAL STATEMENTS
December 31, 2008
TIMOTHY PLAN FAMILY OF FUNDS
To the extent these loss carryforwards are used to offset future capital gains, it is probable that the amount, which is offset, will not be distributed to shareholders.
In 2008, the following capital loss carryforwards expired:
| | | | | | | | | | | |
| | | | | | | Loss Carryforward | | | | |
| | | | | |
| | | | Large/Mid Cap Growth Fund | | $ | 3,293,611 | | | | |
Note 9 – Post-October Losses Under current tax laws, net capital losses incurred after October 31, within a Fund’s fiscal year, are deemed to arise on the first business day of the following fiscal year for tax purposes. For the year ended December 31, 2008, the Funds deferred post-October capital losses of: |
| | | | | | | | | | | |
| | | | | |
| | | | | | | Post-October
Capital Losses | | | | |
| | | | | |
| | | | Aggressive Growth Fund | | $ | 3,237,011 | | | | |
| | | | Conservative Growth Fund | | $ | 424,561 | | | | |
| | | | Fixed Income Fund | | $ | 752,064 | | | | |
| | | | High Yield Bond Fund | | $ | 266,390 | | | | |
| | | | International Fund | | $ | 3,041,974 | | | | |
| | | | Large/Mid Cap Growth Fund | | $ | 3,613,105 | | | | |
| | | | Large/Mid Cap Value Fund | | $ | 6,333,225 | | | | |
| | | | Small Cap Value Fund | | $ | 9,768,887 | | | | |
| | | | Strategic Growth Fund | | $ | 487,167 | | | | |
Timothy Plan Notes to Financial Statements [143]
NOTES TO FINANCIAL STATEMENTS
December 31, 2008
TIMOTHY PLAN FAMILY OF FUNDS
N-Q Disclosure & Proxy Procedures (Unaudited)
The SEC has adopted the requirement that all Funds file a complete schedule of investments with the SEC for their first and third fiscal quarters on Form N-Q for fiscal quarters ending after July 9, 2004. For the Timothy Plan Funds this would be for the fiscal quarters ending March 31 and September 30. The Form N-Q filing must be made within 60 days of the end of the quarter. The Timothy Plan Funds’ Forms N-Q are available on the SEC’s website at www.sec.gov, or they may be reviewed and copied at the SEC’s Public Reference Room in Washington, DC (call 1-800-732-0330 for information on the operation of the Public Reference Room).
The Trust has adopted Portfolio Proxy Voting Policies and Procedures under which the Portfolio’s vote proxies related to securities (“portfolio proxies”) held by the Portfolios. A description of the Trust’s Portfolio Proxy Voting Policies and Procedures is available (i) without charge, upon request, by calling the Company toll-free at 1-800-846-7526 and (ii) on the SEC’s website at www.sec.gov. In addition, the Funds are required to file Form N-PX, with its complete voting record for the 12 months ended June 30th, no later than August 31st of each year. The first such filing was due August 31, 2004. The Trust’s current Form N-PX is available (i) without charge, upon request, by calling the Company toll-free at 1-800-846-7526 and (ii) on the SEC’s website at www.sec.gov.
Timothy Plan Notes to Financial Statements [144]
| | | | |
 | | Cohen Fund Audit Services, Ltd. 800 Westpoint Pkwy., Suite 1100 Westlake, OH 44145-1524 www.cohenfund.com | | 440.835.8500
440.835.1093 fax |
| | |
| | |
| | |
To The Shareholders and Board of Trustees
The Timothy Plan
REPORT OF INDEPENDENT REGISTERED PUBLIC ACCOUNTING FIRM
We have audited the accompanying statements of assets and liabilities, including the schedules of investments, of Timothy Plan Strategic Growth Fund, Timothy Plan Conservative Growth Fund, Timothy Plan Aggressive Growth Fund, Timothy Plan Large/Mid Cap Growth Fund, Timothy Plan Small Cap Value Fund, Timothy Plan Large/Mid Cap Value Fund, Timothy Plan Fixed Income Fund, Timothy Plan Money Market Fund, Timothy Plan High Yield Bond Fund, and Timothy Plan International Fund (the “Funds”), ten of the series constituting The Timothy Plan, as of December 31, 2008, and the related statements of operations for the year then ended, the statements of changes in net assets for each of the two years in the period then ended and the financial highlights for each of the four years in the period then ended for the Timothy Plan Strategic Growth Fund, Timothy Plan Conservative Growth Fund, Timothy Plan Aggressive Growth Fund, Timothy Plan Large/Mid Cap Growth Fund, Timothy Plan Small Cap Value Fund, Timothy Plan Large/Mid Cap Value Fund, Timothy Plan Fixed Income Fund, and Timothy Plan Money Market Fund, and the related statements of operations for the year then ended, the statements of changes in net assets for each of the two periods in the period then ended and the financial highlights for each of the two periods in the period then ended for the Timothy Plan High Yield Bond Fund and Timothy Plan International Fund. These financial statements and financial highlights are the responsibility of the Funds’ management. Our responsibility is to express an opinion on these financial statements and financial highlights based on our audits. The financial highlights for the periods indicated prior to December 31, 2005 were audited by another independent accounting firm who expressed unqualified opinions on those highlights.
We conducted our audits in accordance with the standards of the Public Company Accounting Oversight Board (United States). Those standards require that we plan and perform the audit to obtain reasonable assurance about whether the financial statements and financial highlights are free of material misstatement. An audit includes examining, on a test basis, evidence supporting the amounts and disclosures in the financial statements. Our procedures included confirmation of securities owned as of December 31, 2008, by correspondence with the Funds’ custodian and brokers. An audit also includes assessing the accounting principles used and significant estimates made by management, as well as evaluating the overall financial statement presentation. We believe that our audits, provide a reasonable basis for our opinion.
In our opinion, the financial statements and financial highlights referred to above present fairly, in all material respects, the financial positions of Timothy Plan Strategic Growth Fund, Timothy Plan Conservative Growth Fund, Timothy Plan Aggressive Growth Fund, Timothy Plan Large/Mid Cap Growth Fund, Timothy Plan Small Cap Value Fund, Timothy Plan Large/Mid Cap Value Fund, Timothy Plan Fixed Income Fund, Timothy Plan Money Market Fund, Timothy Plan High Yield Bond Fund, and Timothy Plan International Fund, ten of the series constituting The Timothy Plan, as of December 31, 2008, and the results of their operations, the changes in their net assets and their financial highlights for the periods then ended indicated above, in conformity with accounting principles generally accepted in the United States of America.
Cohen Fund Audit Services, Ltd.
Westlake, Ohio
February 26, 2009

[THIS PAGE LEFT INTENTIONALLY BLANK]
| | |
BOARD OF TRUSTEES Arthur D. Ally Joseph E. Boatwright Rick Copeland Bill Johnson Kathryn T. Martinez John C. Mulder Charles E. Nelson Wesley W. Pennington Scott Preissler Alan Ross Mathew D. Staver David Tolliver OFFICERS Arthur D. Ally, President Joseph E. Boatwright, Secretary INVESTMENT ADVISER Timothy Partners, LTD. 1055 Maitland Center Commons Maitland, FL 32751 DISTRIBUTOR Timothy Partners, LTD. 1055 Maitland Center Commons Maitland, FL 32751 TRANSFER AGENT Unified Fund Services, Inc. 2960 N Meridian Street, Suite 300 Indianapolis, IN 46208 INDEPENDENT REGISTERED PUBLIC ACCOUNTING FIRM Cohen Fund Audit Services, Ltd. 800 Westpoint Parkway, Suite 1100 Westlake, OH 44145-1524 LEGAL COUNSEL David Jones & Assoc., P.C. 395 Sawdust Road, Suite 2148 The Woodlands, TX 77380 | |  |
| | |
| | HEADQUARTERS |
| | The Timothy Plan 1055 Maitland Center Commons Maitland, Florida 32751 (800) 846-7526 |
| For additional information or a prospectus, please call: 1-800-846-7525 | | www.timothyplan.com invest@timothyplan.com |
| Visit the Timothy Plan web site on the internet at: www.timothyplan.com | | |
| | SHAREHOLDER SERVICES |
| This report is submitted for the general information of the shareholders of the Funds. It is not authorized for distribution to prospective investors in the Funds unless preceded or accompanied by an effective Prospectus which includes details regarding the Funds’ objectives, policies, expenses and other information. Distributed by Timothy Partners, Ltd. | | Unified Fund Services, Inc. 2960 N Meridian Street, Suite 300 Indianapolis, IN 46208 (800) 662-0201 |
(a) As of the end of the period covered by this report, the registrant has adopted a code of ethics that applies to the registrant’s principal executive officer, principal financial officer, principal accounting officer or controller, or persons performing similar functions, regardless of whether these individuals are employed by the registrant or a third party.
(b) For purposes of this item, “code of ethics” means written standards that are reasonably designed to deter wrongdoing and to promote:
| | (1) | Honest and ethical conduct, including the ethical handling of actual or apparent conflicts of interest between personal and professional relationships; |
| | (2) | Full, fair, accurate, timely, and understandable disclosure in reports and documents that a registrant files with, or submits to, the Commission and in other public communications made by the registrant; |
| | (3) | Compliance with applicable governmental laws, rules, and regulations; |
| | (4) | The prompt internal reporting of violations of the code to an appropriate person or persons identified in the code; and |
| | (5) | Accountability for adherence to the code. |
(c) Amendments: During the period covered by the report, there have not been any amendments to the provisions of the code of ethics.
(d) Waivers: During the period covered by the report, the registrant has not granted any express or implicit waivers from the provisions of the code of ethics.
(e) Posting: We do not intend to post the Code of Ethics for the Officers or any amendments or waivers on a website.
(f) Availability: The Code of Ethics for the Officers can be obtained, free of charge by calling the toll free number for the appropriate Fund.
| Item 3. | Audit Committee Financial Expert. |
(a) The registrant has an Audit committee currently composed of three independent Trustees, Mr. Wesley Pennington, Mr. John Mulder and Mr. Charles Nelson. The registrant’s board of trustees has determined that Mr. Charles Nelson is qualified to serve as an Audit Committee Financial Expert, and has designated him as such.
| Item 4. | Principal Accountant Fees and Services. |
(a) Audit Fees
| | | |
The Timothy Plan | | |
FY 2008 | | $ | 109,000 |
FY 2007 | | $ | 105,400 |
(b) Audit-Related Fees
| | | | | | |
The Timothy Plan | | Registrant | | Adviser |
FY 2008 | | $ | 0 | | $ | 0 |
FY 2007 | | $ | 0 | | $ | 0 |
Nature of the fees: | | | | | | |
(c) Tax Fees
| | | |
The Timothy Plan | | |
FY 2008 | | $ | 24,000 |
FY 2007 | | $ | 24,000 |
Nature of the fees: preparation of the 1120 RIC
(d) All Other Fees
| | | | | |
The Timothy Plan | | Registrant | | Adviser |
FY 2008 | | $ | 0 | | |
FY 2007 | | $ | 0 | | |
Nature of the fees:
| (e) (1) | Audit Committee’s Pre-Approval Policies |
The Audit Committee Charter requires the Audit Committee to be responsible for the selection, retention or termination of auditors and, in connection therewith, to (i) evaluate the proposed fees and other compensation, if any, to be paid to the auditors, (ii) evaluate the independence of the auditors, (iii) pre-approve all audit services and, when appropriate, any non-audit services provided by the independent auditors to the Trust, (iv) pre-approve, when appropriate, any non-audit services provided by the independent auditors to the Trust’s investment adviser, or any entity controlling, controlled by, or under common control with the investment adviser and that provides ongoing services to the Trust if the engagement relates directly to the operations and financial reporting of the Trust, and (v) receive the auditors’ specific representations as to their independence;
| | (2) | Percentages of Services Approved by the Audit Committee |
| | | |
| | | Registrant | |
Audit-Related Fees: | | 100 | % |
Tax Fees: | | 100 | % |
All Other Fees: | | 100 | % |
(f) During audit of registrant’s financial statements for the most recent fiscal year, less than 50 percent of the hours expended on the principal accountant’s engagement were attributed to work performed by persons other than the principal accountant’s full-time, permanent employees.
(g) The aggregate non-audit fees billed by the registrant’s accountant for services rendered to the registrant, and rendered to the registrant’s investment adviser (not including any sub-adviser whose role is primarily portfolio management and is subcontracted with or overseen by another investment adviser), and any entity controlling, controlled by, or under common control with the adviser that provides ongoing services to the registrant:
| | | | | | |
| | | Registrant | | Adviser |
FY 2008 | | $ | 0 | | $ | 0 |
FY 2007 | | $ | 0 | | $ | 0 |
(h) Not applicable. The auditor performed no services for the registrant’s investment adviser or any entity controlling, controlled by, or under common control with the investment adviser that provides ongoing services to the registrant.
| Item 5. | Audit Committee of Listed Companies. Not applicable. |
| Item 6. | Schedule of Investments. Not applicable – schedule filed with Item 1. |
| Item 7. | Disclosure of Proxy Voting Policies and Procedures for Closed-End Funds. Not applicable. |
| Item 8. | Portfolio Managers of Closed-End Management Investment Companies. Not applicable. |
| Item 9. | Purchases of Equity Securities by Closed-End Management Investment Company and Affiliated Purchasers. Not applicable. |
| Item 10. | Submission of Matters to a Vote of Security Holders |
The registrant has not adopted procedures by which shareholders may recommend nominees to the registrant’s board of trustees.
| Item 11. | Controls and Procedures. |
(a) Based on an evaluation of the registrant’s disclosure controls and procedures as of February 29, 2007, the disclosure controls and procedures are reasonably designed to ensure that the information required in filings on Forms N-CSR is recorded, processed, summarized, and reported on a timely basis.
(b) There were no significant changes in the registrant’s internal control over financial reporting that occurred during the registrant’s second fiscal quarter of the period covered by this report that has materially affected, or is reasonably likely to materially affect, the registrant’s internal control over financial reporting.
| | |
| (a)(1) | | Code is filed herewith |
| |
| (a)(2) | | Certifications by the registrant’s principal executive officer and principal financial officer, pursuant to Section 302 of the Sarbanes- Oxley Act of 2002 and required by Rule 30a-2 under the Investment Company Act of 1940 are filed herewith. |
| |
| (a)(3) | | Not Applicable |
| |
| (b) | | Certification pursuant to 18 U.S.C. Section 1350, as adopted pursuant to Section 906 of the Sarbanes-Oxley Act of 2002 is filed herewith. |
SIGNATURES
Pursuant to the requirements of the Securities Exchange Act of 1934 and the Investment Company Act of 1940, the registrant has duly caused this report to be signed on its behalf by the undersigned, thereunto duly authorized.
| | |
| (Registrant) The Timothy Plan |
| |
| By* | | /s/ Arthur D. Ally |
| | Arthur D. Ally, President |
Date 2/27/09
Pursuant to the requirements of the Securities Exchange Act of 1934 and the Investment Company Act of 1940, this report has been signed below by the following persons on behalf of the registrant and in the capacities and on the dates indicated.
| | |
| |
| By* | | /s/ Arthur D. Ally |
| | Arthur D. Ally, President |
Date 2/27/09
| | |
| |
| By* | | /s/ Arthur D. Ally |
| | Arthur D. Ally, Treasurer |
Date 2/27/09