UNITED STATES
SECURITIES AND EXCHANGE COMMISSION
WASHINGTON, D.C. 20549
FORM N-CSR
CERTIFIED SHAREHOLDER REPORT OF REGISTERED
MANAGEMENT INVESTMENT COMPANIES
Investment Company Act file number 811-08228
The Timothy Plan
(Exact name of registrant as specified in charter)
1055 Maitland Center Commons, Maitland, FL 32751
(Address of principal executive offices) (Zip code)
Art Ally, The Timothy Plan
1055 Maitland Center Commons, Maitland, FL 32751
(Name and address of agent for service)
Registrant’s telephone number, including area code: 800-846-7526
Date of fiscal year end: 9/30
Date of reporting period: 9/30/11
Form N-CSR is to be used by management investment companies to file reports with the Commission not later than 10 days after the transmission to stockholders of any report that is required to be transmitted to stockholders under Rule 30e-1 under the Investment Company Act of 1940 (17 CFR 270.30e-1). The Commission may use the information provided on Form N-CSR in its regulatory, disclosure review, inspection and policymaking roles.
A registrant is required to disclose the information specified by Form N-CSR, and the Commission will make this information public. A registrant is not required to respond to the collection of information contained in Form N-CSR unless the Form displays a currently valid Office of Management and Budget (“OMB”) control number. Please direct comments concerning the accuracy of the information collection burden estimate and any suggestions for reducing the burden to Secretary, Securities and Exchange Commission, 450 Fifth Street, NW, Washington, DC 20549-0609. The OMB has reviewed this collection of information under the clearance requirements of 44 U.S.C. § 3507.
Item 1. Reports to Stockholders.
The Registrant’s audited annual financial reports transmitted to shareholders pursuant to Rule 30e-1 under the Investment Company Act of 1940 are as follows:
Letter from the President
September 30, 2011
Arthur D. Ally
Dear Shareholder,
Just as in last year’s report, the markets have continued to be unsettled over the past twelve months. The S&P 500 stock index had positive performance in the first seven of those months (October through April) and negative performance in the last five (May through September) which resulted in slightly positive performance for the full twelve months. And, I am pleased to report, nearly all of our various funds have performed in line with (at or near) their respective indexes over the past twelve months.
As I reported last year, we, along with our various funds’ sub-advisors, expect this pattern to continue into 2012 (i.e. unsettled with a slight upward bias) although, as you probably realize, we cannot guarantee that outcome. I am confident, however, of a couple of things:
| • | If the 2012 elections result in replacing the liberal members of Congress (as well as the current Administration) with common sense conservatives, the capital markets could react very favorably, and |
| • | All of our sub-advisors are, in our opinion, among the best in the industry and they each continue to honor our overall policy that they manage their respective Funds with a conservative bias. |
You will find each of our sub-advisors’ annual review letters along with their economic outlook in the pages that follow.
Finally, I would once again like to thank you for your moral convictions that led you to the Timothy Plan Family.
Yours in Christ, |
|
Arthur D. Ally, |
President |
1
Letter from the Manager
September 30, 2011
Aggressive Growth Fund
We are pleased to report that the fund advanced 4.0% over the last 12 months ending September 30, 2011. This is a 320bps outperformance against our benchmark, the Russell Midcap Growth index, which advanced 0.80% over the same period.
The world markets limped to the finish-line in September in reaction to the ongoing European economic crisis and the reluctance of our government and political leaders to make the difficult decisions necessary to reduce America’s deficit spending.
It feels like markets are adrift with no clear trends and few safe harbors. Any news, bad or good, seems to result in exaggerated short term market moves. All stocks up or all stocks down. The secular is trumped by the cyclical. All of this strengthens our long term resolve around identifying the strongest, best commercially positioned enterprises able to take market share and hold profit margins against a difficult macroeconomic backdrop. As you would expect from us, we have used the volatility of this environment to upgrade where possible and to take some profits when presented with unusual short term price movements.
We are staying careful and selective, but also optimistic about the many small and mid cap growth companies being thrown over the side by markets consumed with pressing economic and political events that one day should be resolved.
Chartwell Investment Partners, L.P.
2
Fund Performance - (Unaudited)
September 30, 2011
Aggressive Growth Fund
| Fund/Index | 1 Year Total Return | 5 Year Average Annual Return | 10 Year Average Annual Return | |||||
Timothy Aggressive Growth Fund - Class A (With Sales Charge) | -2.96% | -2.73% | 2.71% | |||||
Russell Mid-Cap Growth Index | 0.80% | 1.64% | 6.70% | |||||
Timothy Aggressive Growth Fund - Class C * | 1.01% | -2.34% | 0.80% | (a) | ||||
Russell Mid-Cap Growth Index | 0.80% | 1.64% | 4.56% | (a) |
| (a) | For the period February 3, 2004 (commencement of investment in accordance with objective) to September 30, 2011. |
| * | With Maximum Deferred Sales Charge |
Timothy Plan Aggressive Growth Fund vs. Russell Mid-Cap Growth Index
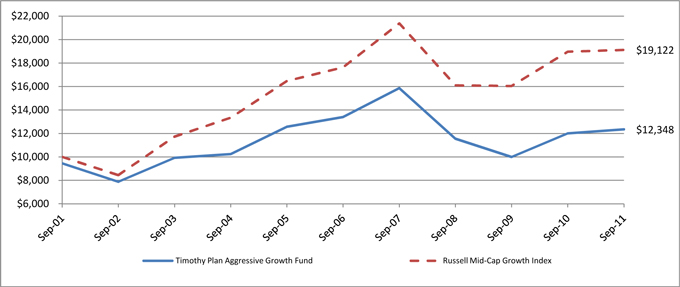
The chart shows the value of a hypothetical initial investment of $10,000 in the Fund’s A shares and the Russell Mid-Cap Growth Index on September 30, 2001 and held through September 30, 2011. The Russell Mid-Cap Growth Index is a widely recognized, unmanaged index of common stock prices. Performance figures include the change in value of the stocks in the index and the reinvestment of dividends. The index return does not reflect expenses, which have been deducted from the Fund’s return. The returns shown do not reflect deduction of taxes that a shareholder would pay on Fund distributions or the redemption of Fund shares. THE FUND’S RETURN REPRESENTS PAST PERFORMANCE AND IS NOT PREDICTIVE OF FUTURE RESULTS.
3
Letter from the Manager
September 30, 2011
International Fund
Financial markets suffered greatly during the last twelve months and in particular in the last quarter of the fiscal year as politicians in Europe and the US “kicked the can down the road”. Equity market confidence dwindled as the infamous S&P downgrade of the US credit rating added to global fears of financial meltdown on the back of Europe’s sovereign debt crisis. The last two months of the fiscal year for the Fund were particularly difficult in the equity markets as stock prices plummeted and began to price in lower economic growth and earnings declines in 2012.
The portfolio maintained its underweight exposure to financials throughout the fiscal year but did suffer from some financial positions in Europe as those stocks fell dramatically in the latter part of the fiscal year. With concerns about the contagion effect of debt fears into Italy and Spain from Greece and Portugal, markets became very concerned about unsustainable and uncontrollable default risks in the Eurozone economies. The proposed European Financial Stability Fund as well as increased efforts from the ECB, EU, IMF, and the European Commission all failed to calm markets. We believe the only sustainable “fix” to the Eurozone sovereign debt crisis is fiscal integration of the region. Markets continue to be concerned that there are no such plans in the works and that Eurozone governments are unlikely to all agree on true fixes until significant pressure and financial harm has been placed on those markets. For that reason, the Fund remains heavily underweight the European region versus the MSCI EAFE benchmark.
The allocation effect proved positive during the year as allocations to all sectors added positively to performance, in particular an underweight to Financials and a larger weight in cash. In addition, stock selection in the Telecom Services, Utilities, and Health Care also added to performance. Unfortunately, stock selection in the Consumer Discretionary, Energy, Consumer Staples, and Financials was negative and outweighed the positive effects. From a country standpoint, the Fund had strong stock selection in Singapore and Germany but not so good selection in France, the UK, and Japan. In addition, an overall allocation to commodity countries such as Russia, Canada, and Brazil also hurt performance as commodity prices rolled over in 2011.
The portfolio continues to move towards a more defensive posture as we are concerned about economic growth in the developed economies and global events surrounding unsustainable debt trends in Europe and the US. In the near term, the Fund is likely to maintain a tilt towards defensive sectors such as Health Care, Consumer Staples, Telecom Services, and Utilities and a larger than normal cash level while also maintaining lower weights in the cyclical sectors such as Industrials, Materials, and Consumer Discretionary.
Eagle Global Advisors
4
Fund Performance - (Unaudited)
September 30, 2011
International Fund
| Fund/Index | 1 Year Total Return | 5 Year Average Annual Return | Average Annual Return Since Inception (a) | |||
Timothy International Fund - Class A (With Sales Charge) | -19.42% | N/A | -9.57% | |||
MSCI EAFE Index | -9.36% | N/A | -7.82% | |||
Timothy International Fund - Class C * | -16.40% | N/A | -9.12% | |||
MSCI EAFE Index | -9.36% | N/A | -7.82% |
| (a) | For the period May 3, 2007 (commencement of investment in accordance with objective) to September 30, 2011. |
| * | With Maximum Deferred Sales Charge |
Timothy Plan International Fund vs. MSCI EAFE Index
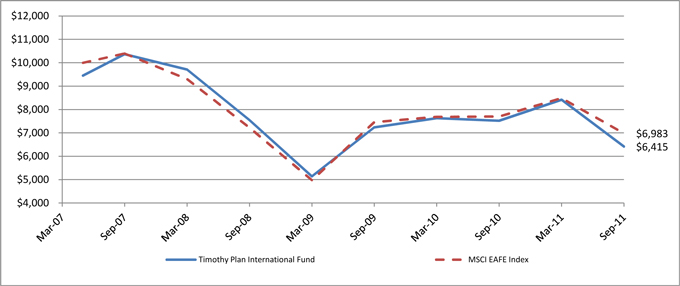
The chart shows the value of a hypothetical initial investment of $10,000 in the Fund’s A shares and the MSCI EAFE Index on May 3, 2007 and held through September 30, 2011. The MSCI EAFE Index is a widely recognized unmanaged index of equity prices and is representative of equity market performance of developed countries, excluding the U.S. and Canada. Performance figures include the change in value of the stocks in the index and the reinvestment of dividends. The index return does not reflect expenses, which have been deducted from the Fund’s return. The returns shown do not reflect deduction of taxes that a shareholder would pay on Fund distributions or the redemption of Fund shares. THE FUND’S RETURN REPRESENTS PAST PERFORMANCE AND IS NOT PREDICTIVE OF FUTURE RESULTS.
5
Letter from the Manager
September 30, 2011
Large/Mid Cap Growth Fund
We are pleased to report that the fund has advanced 2.4% over the last 12 months ending September 30, 2011. The portfolio’s performance was slightly less than that of the benchmark, the Russell Growth Index, which returned 3.8% over the same period.
The world markets limped to the finish-line in September in reaction to the ongoing European economic crisis and the reluctance of our government and political leaders to make the difficult decisions necessary to reduce America’s deficit spending.
It feels like markets are adrift with no clear trends and few safe harbors. Any news, bad or good, seems to result in exaggerated short term market moves. All stocks up or all stocks down. The secular is trumped by the cyclical. All of this strengthens our long term resolve around identifying the strongest, best commercially positioned enterprises able to take market share and hold profit margins against a difficult macroeconomic backdrop. As you would expect from us, we have used the volatility of this environment to upgrade where possible and to take some profits when presented with unusual short term price movements.
We are staying careful and selective, but also optimistic about the many large and mid cap growth companies being thrown over the side by markets consumed with pressing economic and political events that one day should be resolved.
Chartwell Investment Partners, L.P.
6
Fund Performance - (Unaudited)
September 30, 2011
Large/Mid Cap Growth Fund
| Fund/Index | 1 Year Total Return | 5 Year Average Annual Return | 10 Year Average | |||||
Timothy Large/Mid Cap Growth Fund - Class A (With Sales Charge) | -4.57% | -1.88% | 0.70% | |||||
Russell 1000 Growth Index | 3.78% | 1.62% | 3.01% | |||||
Timothy Large/Mid Cap Growth Fund - Class C * | -0.64% | -1.49% | -0.03% | (a) | ||||
Russell 1000 Growth Index | 3.78% | 1.62% | 2.62% | (a) | ||||
| (a) | For the period February 3, 2004 (commencement of investment in accordance with objective) to September 30, 2011. |
| * | With Maximum Deferred Sales Charge |
Timothy Plan Large/Mid Cap Growth Fund vs. Russell 1000 Growth Index
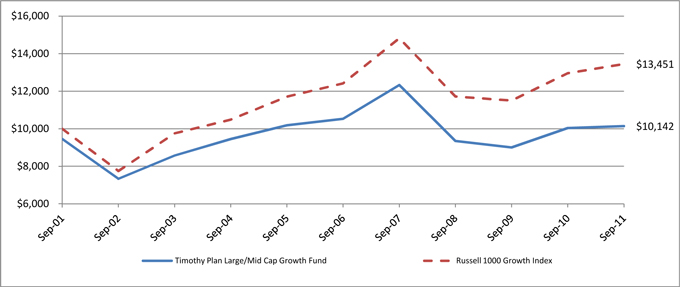
The chart shows the value of a hypothetical initial investment of $10,000 in the Fund’s A shares and the Russell 1000 Growth Index on September 30, 2001 and held through September 30, 2011. The Russell 1000 Growth Index is a widely recognized, unmanaged index of common stock prices. Performance figures include the change in value of the stocks in the index and the reinvestment of dividends. The index return does not reflect expenses, which have been deducted from the Fund’s return. The returns shown do not reflect deduction of taxes that a shareholder would pay on Fund distributions or the redemption of Fund shares. THE FUND’S RETURN REPRESENTS PAST PERFORMANCE AND IS NOT PREDICTIVE OF FUTURE RESULTS.
7
Letter from the Manager
September 30, 2011
Small Cap Value Fund
We are pleased to provide you with our report for the Timothy Plan Small-Cap Value Fund for the twelve months ending September 30, 2011 and would like to thank you for entrusting your assets with us.
The past twelve months equity markets again remained volatile and macro forces such as the tsunami in Japan, political unrest in the Middle East and the Eurozone contagion fears contributed to global economic uncertainty. Volatility was the norm and the term ‘flash recession’ was coined as U.S. Equity Markets gyrated from standstill one month to a bounce back the next. Stock prices tend to be more impacted by macro forces when fear and volatility are rising. During such periods, it can be difficult for active managers who employ bottom-up, fundamental research to generate high levels of alpha and stock price correlations become high because investors don’t differentiate between companies based upon fundamental execution. However, volatility in the markets has, and should continue to lead investors to seek out the most stable or safest components of the risk-based asset classes. This, along with good relative valuations, should drive demand for U.S. high quality companies with the ability to pay attractive dividends to shareholders. We believe that a focus on these high quality companies with under-appreciated earnings growth potential is the best way for managers to exploit this demand in a slow revenue growth environment.
As we take on 2012, we will, as long-term investors, remain disciplined, keep emotions in check and be opportunistic.
For the twelve months ending September 30, 2011, the Timothy Plan Small-Cap Value Fund produced a return of -2.2%, while the Russell 2000 Index produced a return of -3.6%. Smaller market capitalization company stocks, which tend to have revenues that are more sensitive to the business cycle, underperformed the broad U.S. market. Security selection was the primary driver of relative performance and centered in the Consumer Discretionary, Producer Durables, Utilities and Energy sectors. Defensive stocks, companies with predominately domestic revenue sources, and high quality companies were the best performers and Utilities firms benefitted from the investor flight to safety. In Energy, Atlas Energy L.P. and GeoResources Inc. reported good production numbers, while Cloud Peak Energy Inc. has been a top performer after signing a favorable lease with the U.S. government to mine coal in Wyoming. In Financial Services, Heartland Payment Systems Inc. has been a steady performer since the Durbin amendment regarding fees for debit interchange was passed. Texas Capital Bancshares Inc. and smaller locally-based financial holdings have fared well as they have not been affected by the concerns of larger globally exposed banks.
Security selection in Health Care and Financial Services was the largest detractor to performance. Health Care holdings were detractors due to a combination of uncertainty in health care reform and hospitals experiencing budget constraints. Other detractors to the portfolio came from Materials and Processing’s Kraton Performance Polymers Inc., as an uncertain outlook hurt performance but we expect to gain some clarity on the company’s outlook with a recent bounce back in butadiene prices. Technology’s Veeco Instruments Inc. also suffered as markets expected LED orders and growth in China to slowdown. Producer Durable’s trucking company Saia Inc. detracted from the portfolio as it fell on worries of an economic slowdown.
Westwood Management Corporation
8
Fund Performance - (Unaudited)
September 30, 2011
Small Cap Value Fund
| Fund/Index | 1 Year Total Return | 5 Year Average Annual Return | 10 Year Average Annual Return | |||||
Timothy Small Cap Value Fund - Class A (With Sales Charge) | -9.38% | -2.24% | 3.81% | |||||
Russell 2000 Index | -3.53% | -1.02% | 6.12% | |||||
Timothy Small Cap Value Fund - Class C * | -5.79% | -1.85% | 0.38% | (a) | ||||
Russell 2000 Index | -3.53% | -1.02% | 2.68% | (a) |
| (a) | For the period February 3, 2004 (commencement of investment in accordance with objective) to September 30, 2011. |
| * | With Maximum Deferred Sales Charge |
Timothy Plan Small Cap Value Fund vs. Russell 2000 Index
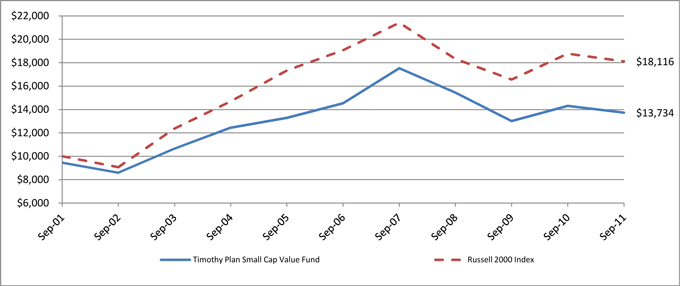
The chart shows the value of a hypothetical initial investment of $10,000 in the Fund’s A shares and the Russell 2000 Index on September 30, 2001 and held through September 30, 2011. The Russell 2000 Index is a widely recognized, unmanaged index of common stock prices. Performance figures include the change in value of the stocks in the index and the reinvestment of dividends. The index return does not reflect expenses, which have been deducted from the Fund’s return. The returns shown do not reflect deduction of taxes that a shareholder would pay on Fund distributions or the redemption of Fund shares. THE FUND’S RETURN REPRESENTS PAST PERFORMANCE AND IS NOT PREDICTIVE OF FUTURE RESULTS.
9
Letter from the Manager
September 30, 2011
Large/Mid Cap Value Fund
We are pleased to provide you with our report for the Timothy Plan Large/Mid-Cap Value Fund for the twelve months ending September 30, 2011 and would like to thank you for entrusting your assets with us.
The past twelve months equity markets again remained volatile and macro forces such as the tsunami in Japan, political unrest in the Middle East and the Eurozone contagion fears contributed to global economic uncertainty. Volatility was the norm and the term ‘flash recession’ was coined as U.S. Equity Markets gyrated from standstill one month to a bounce back the next. Stock prices tend to be more impacted by macro forces when fear and volatility are rising. During such periods, it can be difficult for active managers who employ bottom-up, fundamental research to generate high levels of alpha and stock price correlations become high because investors don’t differentiate between companies based upon fundamental execution. However, volatility in the markets has, and should continue to lead investors to seek out the most stable or safest components of the risk-based asset classes. This, along with good relative valuations, should drive demand for U.S. high quality companies with the ability to pay attractive dividends to shareholders. We believe that a focus on these high quality companies with under-appreciated earnings growth potential is the best way for managers to exploit this demand in a slow revenue growth environment.
As we take on 2012, we will, as long-term investors, remain disciplined, keep emotions in check and be opportunistic.
For the twelve months ending September 30, 2011, the Timothy Plan Large/Mid-Cap Value Fund produced a return of 1.8%, while the S&P 500 Index produced a return of 1.1%. Security selection in the Financial Services, Materials & processing and Utilities sectors combined with an overweight in the Energy sector aided relative performance. Three of the top performers were in the Energy sector, including EQT Corp., National Oilwell Varco Inc. and Exxon Mobil Corp., and each performed well despite periodic investor concerns surrounding slowing demand for energy products. During the period, the Financial Services index sector was impacted by investors selling securities which carried global economic exposure with little regard for each company’s fundamental merits and the fund’s weighting in the sector negatively impacted performance as our holdings in asset managers suffered along with the market. Companies such as Lazard Ltd. and INVESCO Ltd. were among the worst performers for the period. Holdings in insurance companies performed well however. Other top performers included BorgWarner Inc., which continues to take market share and Goodrich Corp., which rose on optimism surrounding the commercial aerospace industry.
Security selection and underweights in Technology and Health Care were the largest detractors for the prior twelve months. Both sectors outperformed the overall market and in Health Care, defensive stocks, companies with predominately domestic revenue sources, and high quality companies were the best performers. In Technology, the largest index members were large contributors to index performance and rose after reporting strong earnings growth. Our underweight position in both sectors detracted from relative performance along with performance from holdings such as TE Connectivity Ltd., which fell due to its exposure to global markets and St. Jude Medical Inc., which began to underperform when growth in a core business slowed unexpectedly. Last, other bottom performing securities are all considered economically-sensitive and include Flowserve Corp., General Dynamics Corp. and Emerson Electric Co.
Westwood Management Corporation
10
Fund Performance - (Unaudited)
September 30, 2011
Large/Mid cap Value Fund
| Fund/Index | 1 Year Total Return | 5 Year Average Annual Return | 10 Year Average Annual Return | |||||
Timothy Large/Mid Cap Value Fund - Class A (With Sales Charge) | -5.32% | -1.35% | 5.65% | |||||
S&P 500 Index | 1.14% | -1.18% | 2.82% | |||||
Timothy Large/Mid Cap Value Fund - Class C * | -1.52% | -0.97% | 3.96% | (a) | ||||
S&P 500 Index | 1.14% | -1.18% | 2.00% | (a) |
| (a) | For the period February 3, 2004 (commencement of investment in accordance with objective) to September 30, 2011. |
| * | With Maximum Deferred Sales Charge |
Timothy Plan Large/Mid Cap Value Fund vs. S&P 500 Index
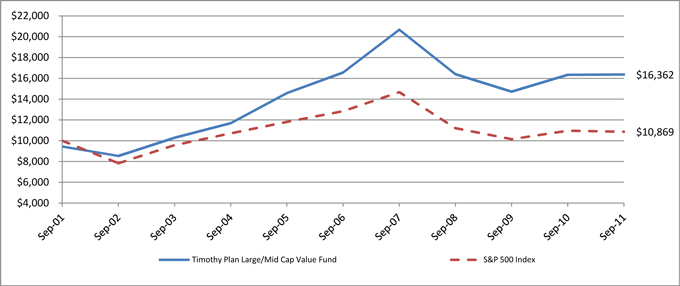
The chart shows the value of a hypothetical initial investment of $10,000 in the Fund’s A shares and the S&P 500 Index on September 30, 2001 and held through September 30, 2011. The S&P 500 Index is a widely recognized, unmanaged index of common stock prices. Performance figures include the change in value of the stocks in the index and the reinvestment of dividends. The index return does not reflect expenses, which have been deducted from the Fund’s return. The returns shown do not reflect deduction of taxes that a shareholder would pay on Fund distributions or the redemption of Fund shares. THE FUND’S RETURN REPRESENTS PAST PERFORMANCE AND IS NOT PREDICTIVE OF FUTURE RESULTS.
11
Letter from the Manager
September 30, 2011
Fixed Income Fund
The accommodative monetary and fiscal policies instituted in late 2010 and the second half of 2011 have greatly assisted in the recovery of the U.S. economy; however, these policies are still struggling to create a self-sustaining pace of economic expansion. In fact, macroeconomic factors suppressed any sense of optimism about the economy while at the same time limiting the acceleration of future economic growth and inevitably keeping interest rates low for the foreseeable future.
The U.S. economy continued to face underlying structural problems in housing, employment and manufacturing which have been the lifeline of previous economic recoveries. Throughout the past 12 months, housing starts have continued to decline while foreclosures have trended higher. Unemployment remains painfully high as aggregate demand remains weak and employers have become reluctant to hire because of the uncertainty surrounding the regulatory environment. In addition, the political will of the U.S. Government to resolve the mounting debt burdens and oversized deficits created angst among consumers causing them to save more and spend less. Furthermore, consumer confidence continued to wane as the news spread that a solution to the Eurozone debt crisis will require drastic measures which may impede global growth.
Consequently, the Federal Reserve implemented another round of monetary easing, known as Quantitative Easing 2 (QE2), in late 2010 and once again in September of 2011 (Operation Twist) in hopes of accelerating economic growth. In reaction to these measures, investors sought risky assets and a sharp sell-off ensued in U.S. Treasury issues in late 2010 and into the first half of 2011. A complete reversal began in July 2011 when investors abandoned “risk-on” trades and sought the safety of U.S. Treasuries due to the political rhetoric surrounding the Debt Ceiling and budget debates. Over the twelve months ending September 30, 2011, U.S. Treasury Bonds saw lower rates across the yield curve. The ten-year Treasury yield declined from 2.51% on September 30, 2010 to 1.92% for the period ending September 30, 2011.
Timothy Fixed Income Fund A shares generated a return of 4.42% over the twelve months ended September 30, 2011 as compared to 3.53% for the Morningstar Intermediate median fund and a 5.26% return for the Barclays Aggregate index. The portfolio’s underweight to Treasuries detracted from relative results as the flight to safety in the second half of 2011 generated higher returns for U.S. Treasury bonds. Corporate bond spreads ended wider over the last 12 months and the Barclays Investment Grade Corporate bond index returned 4.40%. An underweight to the Financial sector helped performance as the sector was up only 1.35% for the past 12 months. Fund performance was also aided by a defensive position in Treasury Inflation Protected Securities (TIPS).
The portfolio is conservatively structured with an average credit quality of AA+ and an average maturity of 6.1 years, as of September 30th. Investment grade corporate bonds continue to be over-weighted to add yield, and we have recently taken gains and reduced our position in TIPS from 7% to 5% as TIPS have performed well in the past 12 months. The portfolio’s modest overweight in MBS provides attractive “yield carry” in GNMA issues that have a full faith and credit guarantee of the U.S. Treasury.
BARROW, HANLEY, MEWHINNEY & STRAUSS
12
Fund Performance - (Unaudited)
September 30, 2011
Fixed Income Fund
| Fund/Index | 1 Year Total Return | 5 Year Average Annual Return | 10 Year Average Annual Return | |||||
Timothy Fixed Income Fund - Class A (With Sales Charge) | -0.30% | 4.29% | 4.93% | |||||
Barclays Capital U.S. Aggregate Bond Index | 5.26% | 6.53% | 5.66% | |||||
Timothy Fixed Income Fund - Class C * | 2.68% | 4.47% | 3.43% | (a) | ||||
Barclays Capital U.S. Aggregate Bond Index | 5.26% | 6.53% | 5.43% | (a) |
| (a) | For the period February 3, 2004 (commencement of investment in accordance with objective) to September 30, 2011. |
| * | With Maximum Deferred Sales Charge |
Timothy Plan Fixed Income Fund vs. Barclays Capital U.S. Aggregate Bond Index
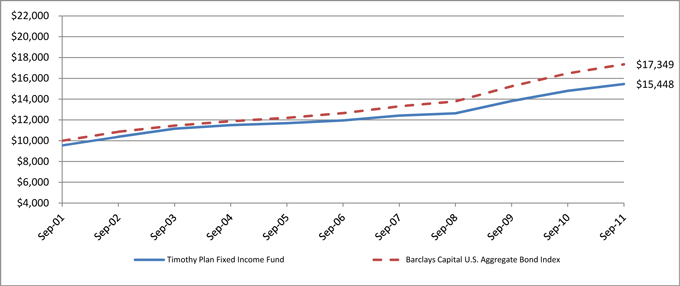
The chart shows the value of a hypothetical initial investment of $10,000 in the Fund’s A shares and the Barclays Capital U.S. Aggregate Bond Index on September 30, 2001 and held through September 30, 2011. The Barclays Capital U.S. Aggregate Bond Index is a widely recognized, unmanaged index of bond prices. Performance figures include the change in value of the bonds in the index and the reinvestment of interest. The index return does not reflect expenses, which have been deducted from the Fund’s return. The returns shown do not reflect deduction of taxes that a shareholder would pay on Fund distributions or the redemption of Fund shares. THE FUND’S RETURN REPRESENTS PAST PERFORMANCE AND IS NOT PREDICTIVE OF FUTURE RESULTS.
13
Letter from the Manager
September 30, 2011
High Yield Bond Fund
As the High Yield Fund’s year end September 30, 2011 came to a close several factors drove capital market volatility sharply higher: the uncertainty over economic growth after QE2, the partisan debate to raise the debt ceiling; the S&P downgrade of the U.S. government’s vaunted AAA credit rating; and the continued threat of a European banking crisis resulting from Greek insolvency. In September, the Federal Reserve said there were “significant downside risks to the economic outlook”, prompting revival of a monetary policy initiative first implemented during the Kennedy administration. Known colloquially as “Operation Twist”, the Fed is now purchasing $400B of long-term (6-to-30 year) Treasury bonds, while selling an equal amount of shorter (<3 year) Treasury securities. By targeting purchases at the long end of the yield curve, the Fed wants to lower long-term interest rates to stimulate growth and increase the attractiveness of risk assets. However, the Fed’s admission that economic growth was much worse than anticipated, ignited yet another crisis of confidence among investors.
The U.S. economy continues to face underlying structural problems in housing, employment and manufacturing which have been the lifeline of previous economic recoveries. Throughout the past 12 months, housing starts have continued to decline while foreclosures have trended higher. Unemployment remains painfully high as aggregate demand remains weak and employers have become reluctant to hire because of the uncertainty surrounding the regulatory environment. In addition, the political will of the U.S. Government to resolve the mounting debt burdens and oversized deficits created angst among consumers causing them to save more and spend less. Furthermore, consumer confidence continued to wane as the news spread that a solution to the Eurozone debt crisis will require drastic measures which may impede global growth.
In reaction to the economic outlook investors sold risky assets and sought out the relative safety of U.S. Treasury bonds. Over the twelve months ending September 30, 2011, U.S. Treasury Bonds saw lower rates across the yield curve. The ten-year Treasury yield declined from 2.51% on September 30, 2010 to 1.92% for the period ending September 30, 2011. High Yield spreads over Treasury bonds moved higher in sympathy with lower stock prices, but default risk continues to moderate as the par-weighted default rate in HY has decreased for 21 consecutive months to 2.1% from a cyclical high of 14.6% as reported by Moody’s and is forecast to remain low.
Timothy High Yield Fund A shares generated a return of 1.51% over the twelve months ended September 30, 2011 as compared to 0.77% for the Morningstar High Yield median fund and a 2.58% return for the Barclays Ba/B High Yield Index. Timothy High Yield Fund A shares outperformed the Morningstar median fund in the 3Q down market improving the fund’s relative performance on a trailing one year basis. The portfolio has concentrated holdings that will lead to volatility of performance, both absolute and relative to the benchmark, but with an income yield of 8.1%, an average quality of Ba3/B+, and an average maturity of 5.8 years it is well positioned. The portfolio is overweight in Energy and underweight in finance. Secured bonds that pledge collateral to back the securities and good covenant protection are stressed in the portfolio holdings.
BARROW, HANLEY, MEWHINNEY & STRAUSS
14
Fund Performance - (Unaudited)
September 30, 2011
High Yield Bond Fund
| Fund/Index | 1 Year Total Return | 5 Year Average Annual Return | Average Annual Return Since Inception (a) | |||
Timothy High Yield Bond Fund - Class A (With Sales Charge) | -3.10% | N/A | 2.74% | |||
Barclays Capital U.S. Corporate High Yield Bond Index | 2.58% | N/A | 5.64% | |||
Timothy High Yield Bond Fund - Class C * | -0.28% | N/A | 3.05% | |||
Barclays Capital U.S. Corporate High Yield Bond Index | 2.58% | N/A | 5.64% |
| (a) | For the period May 7, 2007 (commencement of investment in accordance with objective) to September 30, 2011. |
| * | With Maximum Deferred Sales Charge |
Timothy Plan High Yield Bond Fund vs. Barclays Capital U.S. Corporate High Yield Bond Index
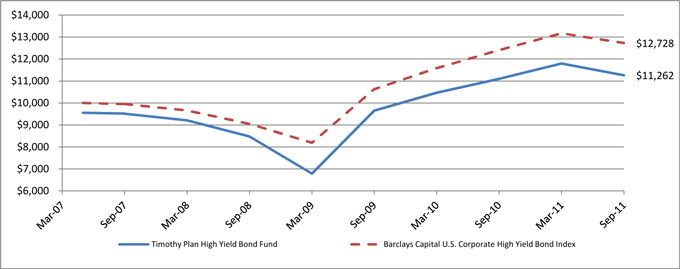
The chart shows the value of a hypothetical initial investment of $10,000 in the Fund’s A shares and the Barclays Capital U.S. Corporate High Yield Bond Index on May 7, 2007 and held through September 30, 2011. The Barclays Capital U.S. Corporate High Yield Bond Index is a widely recognized unmanaged index of non-investment grade, fixed rate, taxable corporate bonds. Performance figures include the change in value of the bonds in the index and the reinvestment of interest. The index return does not reflect expenses, which have been deducted from the Fund’s return. The returns shown do not reflect deduction of taxes that a shareholder would pay on Fund distributions or the redemption of Fund shares. THE FUND’S RETURN REPRESENTS PAST PERFORMANCE AND IS NOT PREDICTIVE OF FUTURE RESULTS.
15
Letter from the Manager
September 30, 2011
Defensive Strategies Fund
Dear Shareholder,
As a reminder, the Defensive Strategies Fund has been designed and managed to do what its name implies, i.e. hedge against a possible scenario of hyper-inflation which could result from our nation’s leadership’s proven unwillingness to address our core problems of too much spending, too much taxation and too many onerous government regulations. If we elect a real reform government in the 2012 elections, we believe many of these problems could be solved. We have, therefore, built in the flexibility to either adjust to a possible risk of extreme deflation with the ability to convert our inflation sensitive assets to cash and fixed income securities that should perform well during a deflationary environment or to a more normal, traditional investment strategy. As I stated in last year’s report, although we will do our very best to be successful, we cannot guarantee results in any of these scenarios.
While no one can predict future events, as I stated in my President’s letter, I am confident of a couple of things:
| • | If the 2012 elections result in replacing the liberal members of Congress (as well as the current Administration) with common sense conservatives, the capital markets could react very favorably, and |
| • | Our sub-advisors (i.e. money management firms that manage the various sleeves of this Fund) are, in our opinion, among the best in the industry and they each continue to honor our overall policy that they manage their respective Fund sleeve with a conservative bias. |
Finally, I would once again like to thank you for your moral convictions that led you to become part of the Timothy Plan Family.
Yours in Christ, | ||
 | ||
Arthur D. Ally | ||
Fund Advisor | ||
16
Fund Performance - (Unaudited)
September 30, 2011
Defensive Strategies Fund
| Fund/Index | 1 Year Total Return | 5 Year Average Annual Return | Average Annual Return Since Inception (a) | |||
Timothy Defensive Strategies Fund - Class A (With Sales Charge) | 0.08% | N/A | 5.66% | |||
Dow Jones Moderately Conservative US Portfolio Index | 2.29% | N/A | 8.29% | |||
Timothy Defensive Strategies Fund - Class C * | 4.28% | N/A | 8.11% | |||
Dow Jones Moderately Conservative US Portfolio Index | 2.29% | N/A | 8.29% |
| (a) | For the period November 4, 2009 (commencement of investment in accordance with objective) to September 30, 2011. |
| * | With Maximum Deferred Sales Charge |
Timothy Plan Defensive Strategies Fund vs. Dow Jones Moderately Conservative US Portfolio Index
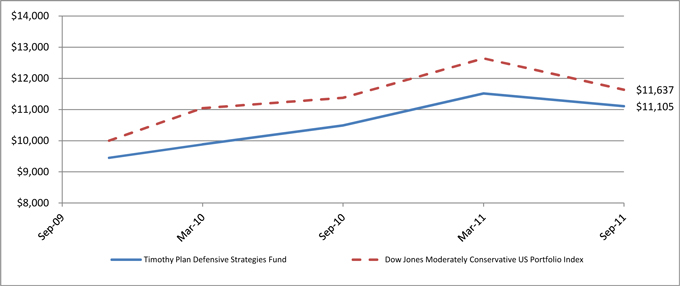
The chart shows the value of a hypothetical initial investment of $10,000 in the Fund’s A shares and the Dow Jones Moderately Conservative US Portfolio Index on November 4, 2009 and held through September 30, 2011. The Dow Jones Moderately Conservative US Portfolio Index is a widely recognized unmanaged index of stocks, bonds and cash. Performance figures include the change in value of the asset classes in the index and the reinvestment of dividends. The index return does not reflect expenses, which have been deducted from the Fund’s return. The returns shown do not reflect deduction of taxes that a shareholder would pay on Fund distributions or the redemption of Fund shares. THE FUND’S RETURN REPRESENTS PAST PERFORMANCE AND IS NOT PREDICTIVE OF FUTURE RESULTS.
17
Letter from the Manager
September 30, 2011
Strategic Growth Fund
Dear Strategic Growth Fund Shareholder:
The Timothy Plan Strategic Growth Fund is simply an asset allocation fund that invests in a number of Timothy Plan underlying funds. Although the allocation percentages will vary slightly from time to time as a result of changing economic conditions, the allocation at September 30, 2011 was as follows:
Ÿ Large/Mid-Cap Growth Fund | (20%) | * Small-Cap Value Fund | (7.5%) | |||||
Ÿ Large/Mid-Cap Value Fund | (20%) | * Aggressive Growth Fund | (7.5%) | |||||
Ÿ International Fund | (25%) | * High-Yield Bond Fund | (10%) | |||||
Ÿ Defensive Strategies Fund | (10%) |
You might be interested to know that, due to political and economic uncertainty along with the addition of our new Israel Common Values Fund, we have slightly adjusted the allocation percentages in October to the following:
Ÿ Large/Mid-Cap Growth Fund | (17.5%) | * Small-Cap Value Fund | ( 7.5%) | |||||
Ÿ Large/Mid-Cap Value Fund | (17.5%) | * Aggressive Growth Fund | ( 7.5%) | |||||
Ÿ International Fund | (20.0%) | * High-Yield Bond Fund | (10.0%) | |||||
Ÿ Defensive Strategies Fund | (15.0%) | * Israel Common Values | ( 5.0%) |
I am pleased to report that, while performance had not been what we had hoped it would have been, the overall performance of the fund was fairly comparable to its market benchmark -the Dow Jones Global Moderately Aggressive Index.
Without a doubt, the volatility and uncertainty of the markets over the past six-months has been unsettling for many investors; however as a group, although our sub-advisors expect this pattern to continue into 2012, they also expect a somewhat upward bias with respect to performance.
As you know, no one can guarantee future performance. However, the one thing that I can assure you of is every one of our sub-advisors is doing their very best and our team here at Timothy is working very hard to provide you an investment in which you can feel comfortable.
Sincerely, | ||
| ||
Arthur D. Ally, President | ||
18
Fund Performance - (Unaudited)
September 30, 2011
Strategic Growth Fund
| Fund/Index | 1 Year Total Return | 5 Year Average Annual Return | 10 Year Average Annual Return | |||||
Timothy Strategic Growth Fund - Class A (With Sales Charge) | -8.64% | -2.94% | 1.91% | |||||
Dow Jones Global Moderately Aggressive Portfolio Index | -1.59% | 1.51% | 6.74% | |||||
Timothy Strategic Growth Fund - Class C * | -5.43% | -2.64% | 0.13% | (a) | ||||
Dow Jones Global Moderately Aggressive Portfolio Index | -1.59% | 1.51% | 4.85% | (a) |
| (a) | For the period February 3, 2004 (commencement of investment in accordance with objective) to September 30, 2011. |
| * | With Maximum Deferred Sales Charge |
Timothy Plan Strategic Growth Fund vs. Dow Jones Global Moderately Aggressive Portfolio Index
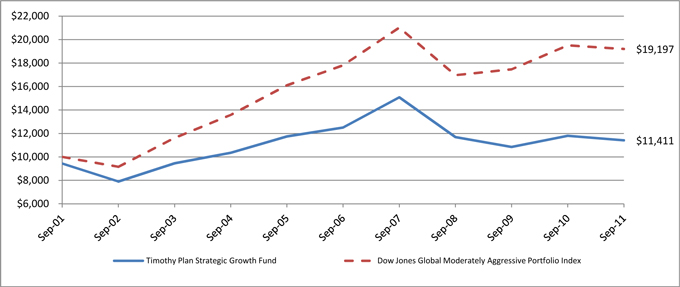
The chart shows the value of a hypothetical initial investment of $10,000 in the Fund’s A shares and the Dow Jones Global Moderately Aggressive Portfolio Index on September 30, 2001 and held through September 30, 2011. The Dow Jones Global Moderately Aggressive Portfolio Index is a widely recognized index that measures global stocks, bonds and cash which are in turn represented by multiple sub-indexes. Performance figures include the change in value of the investments in the indexes and the reinvestment of dividends. The index return does not reflect expenses, which have been deducted from the Fund’s return. The returns shown do not reflect deduction of taxes that a shareholder would pay on Fund distributions or the redemption of Fund shares. THE FUND’S RETURN REPRESENTS PAST PERFORMANCE AND IS NOT PREDICTIVE OF FUTURE RESULTS.
19
Letter from the Manager
September 30, 2011
Conservative Growth Fund
Dear Conservative Growth Fund Shareholder:
The Timothy Plan Conservative Growth Fund is simply an asset allocation fund that invests in a number of Timothy Plan underlying funds. Although the allocation percentages will vary slightly from time to time as a result of changing economic conditions, the allocation at September 30, 2011 was as follows:
Ÿ Large/Mid-Cap Growth Fund | (12%) | * Small-Cap Value Fund | (5.0%) | |||||
Ÿ Large/Mid-Cap Value Fund | (15%) | * Aggressive Growth Fund | (3.0%) | |||||
Ÿ International Fund | (10%) | * High-Yield Bond Fund | (10%) | |||||
Ÿ Defensive Strategies Fund | (15%) | * Fixed Income Fund | (30%) |
You might be interested to know that, due to political and economic uncertainty along with the addition of our new Israel Common Values Fund, we have slightly adjusted the allocation percentages in October to the following:
Ÿ Large/Mid-Cap Growth Fund | (10.0 | %) | * Small-Cap Value Fund | ( 5.0 | %) | |||||||
Ÿ Large/Mid-Cap Value Fund | (15.0 | %) | * Aggressive Growth Fund | ( 2.0 | %) | |||||||
Ÿ International Fund | ( 9.0 | %) | * High-Yield Bond Fund | ( 8.0 | %) | |||||||
Ÿ Defensive Strategies Fund | (20.0 | %) | * Fixed Income Fund | (28.0 | %) | |||||||
Ÿ Israel Common Values Fund | ( 3.0 | %) |
I am pleased to report that, while performance had not been what we had hoped it would have been, the overall performance of the fund was comparable to its market benchmark - the Dow Jones Global Moderate Index. Even though this has been designed to be a conservatively allocated fund, the volatility and uncertainty of the markets over the past six-months has been unsettling for many investors; however as a group, although our sub-advisors expect this pattern to continue into 2012, they also expect a somewhat upward bias with respect to performance.
As you know, no one can guarantee future performance. However, the one thing that I can assure you of is every one of our sub-advisors is doing their very best and our team here at Timothy is working very hard to provide you an investment in which you can feel comfortable.
Sincerely, | ||
| ||
Arthur D. Ally, President | ||
20
Fund Performance - (Unaudited)
September 30, 2011
Conservative Growth Fund
| Fund/Index | 1 Year Total Return | 5 Year Average Annual Return | 10 Year Average Annual Return | |||||
Timothy Conservative Growth Fund - Class A (With Sales Charge) | -4.99% | -0.01% | 3.65% | |||||
Dow Jones Global Moderate Portfolio Index | 0.46% | 2.80% | 6.64% | |||||
Timothy Conservative Growth Fund - Class C * | -1.25% | 0.39% | 1.96% | (a) | ||||
Dow Jones Global Moderate Portfolio Index | 0.46% | 2.80% | 4.98% | (a) |
| (a) | For the period February 3, 2004 (commencement of investment in accordance with objective) to September 30, 2011. |
| * | With Maximum Deferred Sales Charge |
Timothy Plan Conservative Growth Fund vs. Dow Jones Global Moderate Portfolio Index
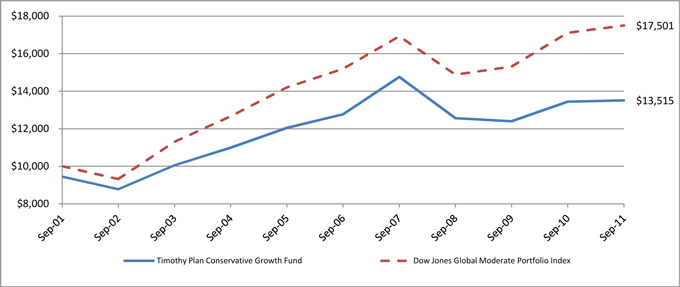
The chart shows the value of a hypothetical initial investment of $10,000 in the Fund’s A shares and the Dow Jones Global Moderate Portfolio Index on September 30, 2001 and held through September 30, 2011. The Dow Jones Global Moderate Portfolio Index is a widely recognized index that measures global stocks, bonds and cash which are in turn represented by multiple sub-indexes. Performance figures include the change in value of the investments in the indexes and the reinvestment of dividends. The index return does not reflect expenses, which have been deducted from the Fund’s return. The returns shown do not reflect deduction of taxes that a shareholder would pay on Fund distributions or the redemption of Fund shares. THE FUND’S RETURN REPRESENTS PAST PERFORMANCE AND IS NOT PREDICTIVE OF FUTURE RESULTS.
21
Fund Profile - (Unaudited)
September 30, 2011
Aggressive Growth Fund
Top Ten Holdings (% of Net Assets) | ||
Discover Financial Services | 3.28% | |
Amerisource Bergen Corp. | 3.22% | |
Airgas, Inc. | 2.65% | |
Clean Harbors, Inc. | 2.59% | |
Intercontinental Exchange, Inc. | 2.42% | |
Ross Stores | 2.36% | |
AutoZone, Inc. | 2.22% | |
Fiserv, Inc. | 2.19% | |
Tractor Supply Company | 2.10% | |
Synchronoss Technologies, Inc. | 1.98% | |
| ||
| 25.01% | ||
| ||
International Fund
Top Ten Holdings (% of Net Assets) | ||
Henkel AG & Co. | 4.89% | |
Singapore Telecommunications | 4.61% | |
Fresenius Medical Care - ADR | 4.07% | |
Smith & Nephew PLC - ADR | 3.97% | |
DBS Group Holdings - Spon ADR | 3.59% | |
William Morrison Supermarkets PLC | 2.93% | |
Lukoil ADR | 2.86% | |
Shire Pharmaceuticals ADR | 2.52% | |
Canon, Inc. ADR | 2.43% | |
ABB Ltd. ADR | 2.40% | |
| ||
| 34.27% | ||
| ||
Large/Mid Cap Growth
Top Ten Holdings (% of Net Assets) | ||
Amerisource Bergen Corp. | 4.85% | |
Exxon Mobil Corp. | 3.59% | |
Autozone, Inc. | 3.57% | |
Airgas, Inc. | 2.89% | |
Occidental Petroleum Corp. | 2.88% | |
Emerson Electric Co. | 2.87% | |
Intercontinental Exchange, Inc. | 2.77% | |
Sirona Dental Systems, Inc. | 2.56% | |
Discover Financial Services | 2.55% | |
Amphenol Corp. | 2.27% | |
| ||
| 30.80% | ||
| ||
| ||
Industries (% of Net Assets) | ||
Information Technology | 19.20% | |
Retail | 13.20% | |
Healthcare | 12.20% | |
Financial/Investment Services | 9.80% | |
Industrials/Machinery | 7.20% | |
Oil/Natural Gas | 4.80% | |
Miscellaneous Services | 3.80% | |
Banks | 3.40% | |
Chemicals | 2.70% | |
Restaurants | 2.30% | |
Other Assets Less Liabilities | 21.40% | |
| ||
| 100.00% | ||
| ||
Industries (% of Net Assets) | ||
Banks | 9.00% | |
Chemicals | 8.70% | |
Telecommunications | 8.40% | |
Healthcare | 8.00% | |
Oil/Natural Gas | 7.10% | |
Consumer Goods | 5.50% | |
Minerals & Mining | 5.30% | |
Information Technology | 4.70% | |
Retail | 4.10% | |
Electric Power | 3.80% | |
Other Assets Less Liabilities | 35.40% | |
| ||
| 100.00% | ||
| ||
Industries (% of Net Assets) | ||
Health Care | 14.30% | |
Information Technology | 12.80% | |
Financial/Investment Services | 9.00% | |
Retail | 8.40% | |
Oil/Natural Gas | 7.80% | |
Consumer Goods | 5.00% | |
Industrials/Machinery | 4.50% | |
Semiconductors | 3.00% | |
Chemicals | 2.90% | |
Telecommunications | 2.70% | |
Other Assets Less Liabilities | 29.60% | |
| ||
| 100.00% | ||
| ||
22
Fund Profile - (Unaudited)
September 30, 2011
Small Cap Value Fund
Top Ten Holdings (% of Net Assets) | ||
Landstar Systems, Inc. | 2.40% | |
DCT Industrial Trust, Inc. | 2.40% | |
Columbia Banking System, Inc. | 2.38% | |
Healthcare Realty Trust | 2.38% | |
Knight Capital Group | 2.37% | |
Northwestern Corp. | 2.35% | |
Cleco Corp. | 2.31% | |
AMERISAFE, Inc. | 2.31% | |
Rent-A-Center, Inc. | 2.31% | |
Chemical Financial Corp. | 2.31% | |
| ||
| 23.52% | ||
| ||
Large/Mid Cap Value Fund
Top Ten Holdings (% of Net Assets) | ||
ExxonMobil Corp. | 3.42% | |
EQT Corp. | 2.77% | |
Firstenergy Corp. | 2.75% | |
Dominion Resource, Inc. | 2.74% | |
CA, Inc. | 2.72% | |
Ace Ltd. | 2.62% | |
Covidien PLC | 2.61% | |
Precision Castparts Corp. | 2.53% | |
Dr Pepper Snapple Group | 2.53% | |
Advanced Auto Parts | 2.53% | |
| ||
| 27.22% | ||
| ||
Fixed Income
Top Ten Holdings (% of Net Assets) | ||
U.S Treasury Bond, 3.125%, 5/15/2019 | 6.59% | |
GMNA Pool 701961, 4.50%, 6/15/2039 | 6.24% | |
GMNA Pool 4947, 5.00%, 2/15/2041 | 4.70% | |
Federal Farm Credit Bank, 5.125%, 8/25/2016 | 4.36% | |
GMNA Pool 4520, 5.00%, 8/20/2039 | 3.98% | |
U.S Treasury Bond, 3.875%, 5/15/2018 | 3.43% | |
U.S Treasury Bond, 3.125%, 5/15/2021 | 3.29% | |
U.S Treasury Bond, 4.375%, 5/15/2040 | 2.85% | |
TIPS, 2.50%, 7/15/2016 | 2.85% | |
GMNA Pool 717072, 5.00%, 5/15/2041 | 2.53% | |
| ||
| 40.82% | ||
| ||
| ||
Industries (% of Net Assets) | ||
Banks | 14.80% | |
REITs | 12.60% | |
Miscellaneous Services | 7.40% | |
Industrials | 7.20% | |
Oil/Natural Gas | 6.30% | |
Electric Power | 5.80% | |
Insurance | 5.70% | |
Transportation | 5.50% | |
Healthcare | 4.60% | |
Financial & Investment Services | 4.40% | |
Other Assets Less Liabilities | 25.70% | |
| ||
| 100.00% | ||
| ||
Industries (% of Net Assets) | ||
Oil/Natural Gas | 19.60% | |
Consumer Goods | 11.30% | |
Healthcare | 11.10% | |
Insurance | 9.40% | |
Electric Power | 7.60% | |
Financial & Investment Services | 5.60% | |
Retail | 5.00% | |
Information Technology | 4.80% | |
REITs | 4.60% | |
Industrials | 4.50% | |
Other Assets Less Liabilities | 16.50% | |
| ||
| 100.00% | ||
| ||
Industries (% of Net Assets) | ||
Government Mortgage-Backed Securities | 35.10% | |
Government Notes & Bonds | 32.00% | |
Corporate Bonds | 23.70% | |
TIPS | 5.30% | |
Asset-Backed Securities | 0.30% | |
Other Assets Less Liabilities | 3.60% | |
| ||
| 100.00% | ||
| ||
23
Fund Profile - (Unaudited)
September 30, 2011
High Yield Bond Fund
Top Ten Holdings (% of Net Assets) | ||||
Genesis Energy LP, 7.875%, 12/15/2018 | 2.95% | |||
Nova Chemicals Corp., 8.625%, 11/1/2019 | 2.24% | |||
United Rentals North America, Inc., 9.25%, 12/15/2019 | 2.14% | |||
Cloud Peak Energy Resources LLC, 8.50%, 12/15/2019 | 2.14% | |||
NRG Energy, Inc., 7.375%, 1/15/2017 | 2.13% | |||
Energy Transfer Equity LP, 7.50%, 10/15/2020 | 2.12% | |||
Navistar International Corp., 8.25%, 11/01/2021 | 2.12% | |||
Crosstex Energy LP, 8.875%, 2/15/2018 | 2.12% | |||
Copano Energy Finance Corp., 7.75%, 6/01/2018 | 2.11% | |||
Helix Energy Solutions Group, Inc., 9.50%, 1/15/2016 | 2.11% | |||
|
| |||
| 22.18% | ||||
|
| |||
Money Market Fund
Top Ten Holdings (% of Net Assets) | ||||
U.S. Treasure Bill, 0.090%, 10/27/2011 | 12.45% | |||
Federal Home Loan Bank, 0.060%, 11/4/2011 | 11.21% | |||
Federal Home Loan Bank, 0.060%, 11/14/2011 | 9.96% | |||
Federal Home Loan Bank, 0.080%, 10/26/2011 | 7.47% | |||
Federal Home Loan Bank, 0.020%, 11/30/2011 | 7.31% | |||
Federal Home Loan Bank, 0.035%, 10/12/2011 | 7.06% | |||
Federal Home Loan Bank, 0.070%, 10/14/2011 | 7.06% | |||
Federal Home Loan Bank, 0.120%, 10/3/2011 | 6.64% | |||
Federal Home Loan Bank, 0.040%, 11/15/2011 | 4.21% | |||
U.S. Treasury Bill, 0.015%, 10/13/2011 | 4.15% | |||
|
| |||
| 77.52% | ||||
|
| |||
Industries (% of Net Assets) | ||||
Corporate Bonds | 96.20% | |||
Other Assets Less Liabilities | 3.80% | |||
|
| |||
| 100.00% | ||||
|
|
Industries (% of Net Assets) | ||||
U.S Government and Government Agencies | 90.60% | |||
Other Assets Less Liabilities | 9.40% | |||
|
| |||
| 100.00% | ||||
|
|
24
Fund Profile - (Unaudited)
September 30, 2011
Defensive Strategies Fund
Top Ten Holdings (% of Net Assets) | ||||
SPDR - Gold Trust | 5.43% | |||
TIPS, 2.375%, 1/15/2025 | 3.00% | |||
TIPS, 1.75%, 1/15/2028 | 2.72% | |||
TIPS, 2.125%, 1/15/2019 | 2.70% | |||
PowerShares DB Agriculture Fund | 2.66% | |||
TIPS, 2.375%, 1/15/2017 | 2.38% | |||
TIPS, 2.00%, 1/15/2016 | 2.33% | |||
PowerShares DB Commodity Index | 2.28% | |||
GNMA Pool 4947, 5.00%, 2/20/2041 | 2.12% | |||
TIPS, 1.125%, 1/15/2021 | 2.07% | |||
|
| |||
| 27.69% | ||||
|
| |||
Strategic Growth Fund
Top Ten Holdings (% of Net Assets) | ||||
Timothy Plan - International Fund | 19.34% | |||
Timothy Plan - Large/Mid Cap Growth Fund | 18.08% | |||
Timothy Plan - Large/Mid Cap Value Fund | 17.53% | |||
Timothy Plan - Defensive Strategies Fund | 15.13% | |||
Timothy Plan - High Yield Bond Fund | 10.61% | |||
Timothy Plan - Aggressive Growth Fund | 7.69% | |||
Timothy Plan - Small Cap Value Fund | 7.34% | |||
|
| |||
| 95.72% | ||||
|
| |||
Conservative Growth Fund
Top Ten Holdings (% of Net Assets) | ||||
Timothy Plan - Fixed Income Fund | 28.57% | |||
Timothy Plan - Defensive Strategies Fund | 19.31% | |||
Timothy Plan - Large/Mid Cap Value Fund | 14.47% | |||
Timothy Plan - Large/Mid Cap Growth Fund | 9.95% | |||
Timothy Plan - International Fund | 8.38% | |||
Timothy Plan - High Yield Bond Fund | 8.06% | |||
Timothy Plan - Small Cap Value Fund | 4.71% | |||
Timothy Plan - Aggressive Growth Fund | 1.98% | |||
|
| |||
| 95.43% | ||||
|
| |||
Industries (% of Net Assets) | ||||
TIPS | 25.61% | |||
Exchange Traded Funds | 15.03% | |||
REITs | 13.82% | |||
Oil & Gas Services | 6.65% | |||
Oil & Gas | 6.63% | |||
Mining | 4.43% | |||
Coal | 4.14% | |||
Iron/Steel | 3.36% | |||
Mortgage-Backed Securities | 3.23% | |||
Machinery | 2.20% | |||
Food | 1.22% | |||
Other Assets Less Liabilities | 13.68% | |||
|
| |||
| 100.00% | ||||
|
| |||
Industries (% of Net Assets) | ||||
Mutual Funds | 95.70% | |||
Other Assets Less Liabilities | 4.30% | |||
|
| |||
| 100.00% | ||||
|
| |||
Industries (% of Net Assets) | ||||
Mutual Funds | 95.40% | |||
Other Assets Less Liabilities | 4.60% | |||
|
| |||
| 100.00% | ||||
|
| |||
25
Schedule of Investments | Aggressive Growth
As of September 30, 2011
| Shares | Fair Value | |||||
COMMON STOCKS - 92.6% | ||||||
AEROSPACE/DEFENSE - 0.9% | ||||||
| 1,475 | Transdigm Group, Inc. * | $ | 120,463 | |||
|
| |||||
BANKS - 3.4% | ||||||
| 350 | Cardinal Financial Corp. | 3,017 | ||||
| 7,975 | First Midwest Bancorp, Inc. | 58,377 | ||||
| 3,476 | Nara Bancorp, Inc.* | 21,099 | ||||
| 4,615 | Signature Bank * | 220,274 | ||||
| 11,323 | Webster Financial Corp. | 173,242 | ||||
|
| |||||
| 476,009 | ||||||
|
| |||||
BIOTECHNOLOGY - 0.3% | ||||||
| 5,875 | NPS Pharmaceutical, Inc. * | 38,246 | ||||
|
| |||||
CHEMICALS - 2.7% | ||||||
| 5,825 | Airgas, Inc. | 371,752 | ||||
|
| |||||
COMMERCIAL SERVICES - 1.3% | ||||||
| 9,550 | Kenexa Corp. * | 149,362 | ||||
| 1,450 | PARAXEL International Corp. * | 27,448 | ||||
|
| |||||
| 176,810 | ||||||
|
| |||||
CONSUMER GOODS - 0.8% | ||||||
| 3,660 | Steven Madden, Ltd. * | 110,166 | ||||
|
| |||||
DISTRIBUTION/WHOLESALE - 1.1% | ||||||
| 2,175 | MWI Veterinary Supply, Inc. * | 149,684 | ||||
|
| |||||
EDUCATION - 0.6% | ||||||
| 3,345 | K12, Inc. * | 85,164 | ||||
|
| |||||
ELECTRICAL - 1.0% | ||||||
| 5,615 | Belden CDT, Inc. | 144,811 | ||||
|
| |||||
FINANCIAL / INVESTMENT SERVICES - 9.8% | ||||||
| 1,475 | Affiliated Managers Group, Inc. * | 115,124 | ||||
| 10,535 | Cardtronics, Inc. * | 241,462 | ||||
| 20,079 | Discover Financial Services | 460,612 | ||||
| 8,411 | FleetCor Technologies, Inc. * | 220,873 | ||||
| 2,875 | IntercontinentalExchange, Inc. * | 339,998 | ||||
|
| |||||
| 1,378,069 | ||||||
|
| |||||
HEALTHCARE - 12.2% | ||||||
| 12,120 | Amerisource Bergen Corp. | 451,712 | ||||
| 3,900 | Bruker Corp.* | 52,767 | ||||
| 2,700 | Catalyst Health Solutions, Inc. * | 155,763 | ||||
| 3,030 | Cepheid, Inc. * | 117,655 | ||||
| 4,950 | Cyberonics, Inc. * | 140,085 | ||||
| 1,225 | ExamWorks Group, Inc. * | 12,471 | ||||
| 2,730 | Healthspring, Inc. * | 99,536 | ||||
| 3,925 | Hill-Rom Holdings, Inc. | 117,829 | ||||
| 175 | Intuitive Surgical, Inc. * | 63,749 | ||||
| 9,175 | NxStage Medical, Inc. * | 191,391 | ||||
| 5,882 | Sirona Dental Systems, Inc. * | 249,456 | ||||
| 7,112 | Skilled Healthcare Group, Inc. - Class A * | 25,674 | ||||
| 650 | SXC Health Solutions Corp. * | 36,205 | ||||
|
| |||||
| 1,714,293 | ||||||
|
| |||||
The accompanying notes are an integral part of these financial statements.
26
Schedule of Investments | Aggressive Growth (Continued)
As of September 30, 2011
| Shares | Fair Value | |||||
INDUSTRIALS / MACHINERY - 7.2% | ||||||
| 7,085 | Clean Harbors, Inc. * | $ | 363,460 | |||
| 1,818 | Gardner Denver, Inc. | 115,534 | ||||
| 1,225 | HEICO Corp. | 60,319 | ||||
| 1,800 | HEICO Corp. - Class A | 60,588 | ||||
| 3,325 | Robbins & Myers, Inc. | 115,411 | ||||
| 7,000 | Rush Enterprises, Inc. - Class A * | 99,120 | ||||
| 11,635 | United Rentals, Inc. * | 195,933 | ||||
|
| |||||
| 1,010,365 | ||||||
|
| |||||
INFORMATION TECHNOLOGY - 19.2% | ||||||
| 1,675 | AboveNet, Inc. | 89,780 | ||||
| 1,317 | Advent Software, Inc. * | 27,459 | ||||
| 9,036 | Ariba, Inc. * | 250,388 | ||||
| 2,370 | Cerner Corp. * | 162,392 | ||||
| 3,830 | Cognizant Technology Solutions Corp. - Class A * | 240,141 | ||||
| 2,180 | ComScore, Inc. * | 36,777 | ||||
| 6,050 | Fiserv, Inc. * | 307,159 | ||||
| 2,062 | Gartner Group, Inc. * | 71,902 | ||||
| 1,150 | Informatica Corp. * | 47,092 | ||||
| 6,975 | Interactive Intelligence Group * | 189,371 | ||||
| 7,550 | Jack Henry & Associates, Inc. | 218,799 | ||||
| 21,365 | KIT Digital, Inc. * | 179,466 | ||||
| 3,895 | Parametric Technology Corp. * | 59,905 | ||||
| 2,200 | RiverBed technology, Inc. * | 43,912 | ||||
| 2,725 | Shutterfly, Inc. * | 112,215 | ||||
| 925 | Super Micro Computer. * | 11,590 | ||||
| 11,155 | Synchronoss Technologies, Inc. * | 277,871 | ||||
| 2,515 | Syntel, Inc. | 108,623 | ||||
| 1,135 | Taleo Corp. - Class A * | 29,192 | ||||
| 850 | Teradata Corp. * | 45,500 | ||||
| 3,725 | Tibco Software Incorporated. * | 83,403 | ||||
| 2,805 | VeriFone Systems, Inc. * | 98,231 | ||||
|
| |||||
| 2,691,168 | ||||||
|
| |||||
INSURANCE - 0.9% | ||||||
| 6,675 | Alterra Capital Holdings Ltd. | 126,625 | ||||
|
| |||||
INVESTMENT COMPANIES - 0.3% | ||||||
| 3,275 | Ares Capital Corp. | 45,097 | ||||
|
| |||||
METAL FABRICATE HARDWARE - 0.1% | ||||||
| 375 | RBC Bearing, Inc. * | 12,746 | ||||
|
| |||||
MISCELLANEOUS SERVICES - 3.8% | ||||||
| 1,775 | Donaldson Company, Inc. | 97,270 | ||||
| 2,550 | Gaylord Entertainment Co. * | 49,317 | ||||
| 20,500 | HFF, Inc. - Class A * | 179,170 | ||||
| 14,750 | MDC Partners, Inc. - Class A | 212,695 | ||||
|
| |||||
| 538,452 | ||||||
|
| |||||
The accompanying notes are an integral part of these financial statements.
27
Schedule of Investments | Aggressive Growth (Continued)
As of September 30, 2011
| Shares | Fair Value | |||||
OIL / NATURAL GAS - 4.8% | ||||||
| 15,530 | Key Energy Services, Inc. * | $ | 147,380 | |||
| 36,200 | Kodiak Oil & Gas Corp. * | 188,602 | ||||
| 4,625 | Newpark Resources * | 28,166 | ||||
| 3,200 | Oil States International * | 162,944 | ||||
| 8,669 | Rex Energy Corp. * | 109,663 | ||||
| 1,222 | Whiting Petroleum Corp. * | 42,868 | ||||
|
| |||||
| 679,623 | ||||||
|
| |||||
PHARMACEUTICALS - 1.6% | ||||||
| 25,165 | Akorn, Inc. * | 196,539 | ||||
| 1,500 | Impax Labs, Inc. * | 26,865 | ||||
|
| |||||
| 223,404 | ||||||
|
| |||||
RESTAURANTS - 2.3% | ||||||
| 7,360 | Cheesecake Factory, Inc. * | 181,424 | ||||
| 5,165 | Domino’s Pizza * | 140,746 | ||||
|
| |||||
| 322,170 | ||||||
|
| |||||
RETAIL - 13.2% | ||||||
| 975 | Autozone, Inc. * | 311,210 | ||||
| 11,530 | Express, Inc. | 233,944 | ||||
| 3,500 | Family Dollar Stores, Inc. | 178,010 | ||||
| 3,150 | Genesco, Inc. * | 162,319 | ||||
| 3,590 | GNC Acquisition Holdings, Inc. * | 72,231 | ||||
| 2,560 | Group 1 Automotive, Inc. | 91,008 | ||||
| 2,175 | Hibbett Sports, Inc. * | 73,710 | ||||
| 1,775 | Nu Skin Enterprises, Inc. - Class A | 71,923 | ||||
| 3,965 | Pier 1 Imports, Inc. * | 38,778 | ||||
| 4,200 | Ross Stores, Inc. | 330,498 | ||||
| 4,710 | Tractor Supply Company | 294,610 | ||||
|
| |||||
| 1,858,241 | ||||||
|
| |||||
SEMICONDUCTORS - 2.1% | ||||||
| 3,160 | Avago Technologies, Ltd. | 103,553 | ||||
| 1,175 | Cavium, Inc. * | 31,737 | ||||
| 6,518 | Cypress Semiconductor Corp. * | 97,574 | ||||
| 8,955 | ON Semiconductor Corp. * | 64,207 | ||||
|
| |||||
| 297,071 | ||||||
|
| |||||
TELECOMMUNICATIONS - 1.4% | ||||||
| 2,025 | ACME Packet, Inc. * | 86,245 | ||||
| 5,600 | Polycom Incorporated. * | 102,872 | ||||
| 225 | SBA Communications Corp. - Class A * | 7,758 | ||||
|
| |||||
| 196,875 | ||||||
|
| |||||
TRANSPORTATION - 1.6% | ||||||
| 1,252 | Atlas Air Worldwide Holdings, Inc. * | 41,679 | ||||
| 1,350 | Genesse & Wyoming, Inc. - Class A * | 62,803 | ||||
| 4,325 | Hub Group, Inc. - Class A * | 122,268 | ||||
|
| |||||
| 226,750 | ||||||
|
| |||||
TOTAL COMMON STOCKS (Cost $14,232,735) | 12,994,054 | |||||
|
| |||||
REITs - 1.3% | ||||||
| 1,150 | Essex Property Trust, Inc. | 138,046 | ||||
| 1,775 | Tanger Factory Outlet Centers | 46,168 | ||||
|
| |||||
TOTAL REITs (Cost $203,808) | 184,214 | |||||
|
| |||||
The accompanying notes are an integral part of these financial statements.
28
Schedule of Investments | Aggressive Growth (Continued)
As of September 30, 2011
| Shares | Fair Value | |||||
MONEY MARKET FUND - 6.0% | ||||||
| 840,354 | Fidelity Institutional Money Market Portfolio, 0.07% (A) (Cost $840,354) | $ | 840,354 | |||
|
| |||||
TOTAL INVESTMENTS (Cost $15,276,897)(B) - 99.90% | $ | 14,018,622 | ||||
|
| |||||
ASSETS IN EXCESS OF OTHER LIABILITIES - 0.10% | 7,011 | |||||
|
| |||||
NET ASSETS - 100.00% | $ | 14,025,633 | ||||
|
| |||||
* Non-income producing securities. | ||||||
(A) Variable rate security; the rate shown represents the yield at September 30, 2011. | ||||||
(B) Represents cost for financial reporting purposes. Aggregate cost for federal tax purposes is $15,405,819 and differs from fair value by net unrealized appreciation (depreciation) of securities as follows: | ||||||
| Unrealized appreciation | $ | 436,931 | ||||||
| Unrealized depreciation | (1,824,128 | ) | ||||||
|
| |||||||
| Net unrealized depreciation | $ | (1,387,197 | ) | |||||
|
|
The accompanying notes are an integral part of these financial statements.
29
Schedule of Investments | International
As of September 30, 2011
| Shares | Fair Value | |||||
COMMON STOCKS - 91.0% | ||||||
AUTOMOTIVE - 2.8% | ||||||
| 72,000 | Fiat SpA (ADR) | $ | 396,000 | |||
| 13,800 | Magna International, Inc. | 454,986 | ||||
|
| |||||
| 850,986 | ||||||
|
| |||||
BANKS - 9.0% | ||||||
| 25,600 | Banco Bradesco SA (ADR) | 378,624 | ||||
| 9,000 | Bank Hapoalim BM (ADR) | 163,350 | ||||
| 13,000 | BOC Hong Kong Holdings, Ltd. (ADR) | 553,800 | ||||
| 30,000 | DBS Group Holdings, Ltd. (ADR) | 1,072,500 | ||||
| 61,000 | Sberbank of Russia * | 524,600 | ||||
|
| |||||
| 2,692,874 | ||||||
|
| |||||
BUILDING & CONSTRUCTION - 2.2% | ||||||
| 40,000 | Vinci SA (ADR) | 427,600 | ||||
| 89,000 | Wienerberger AG (ADR) | 218,940 | ||||
|
| |||||
| 646,540 | ||||||
|
| |||||
CHEMICALS - 8.7% | ||||||
| 10,000 | Agrium, Inc. | 666,600 | ||||
| 33,400 | Henkel AG & Co. KGaA (ADR) | 1,460,582 | ||||
| 8,800 | Syngenta AG - ADR | 456,456 | ||||
|
| |||||
| 2,583,638 | ||||||
|
| |||||
COMMERCIAL SERVICES - 0.5% | ||||||
| 30,000 | Anhui Expressway Co. Ltd. * | 152,220 | ||||
|
| |||||
CONSUMER GOODS - 5.5% | ||||||
| 9,000 | CSM NV (ADR) | 179,550 | ||||
| 22,550 | FUJIFILM Holdings Corp. (ADR) | 521,356 | ||||
| 14,000 | Kerry Group PLC | 506,100 | ||||
| 23,000 | Shiseido Co, Ltd. (ADR) | 440,910 | ||||
|
| |||||
| 1,647,916 | ||||||
|
| |||||
DISTRIBUTION/WHOLESALE - 2.3% | ||||||
| 36,000 | ITOCHU Corp. | 684,720 | ||||
|
| |||||
ELECTRIC POWER - 3.8% | ||||||
| 44,000 | Enel S.p.A | 194,480 | ||||
| 6,000 | International Power PLC (ADR) | 284,400 | ||||
| 85,000 | Power Assets Holdings, Ltd. (ADR) | 650,250 | ||||
|
| |||||
| 1,129,130 | ||||||
|
| |||||
ELECTRICAL - 2.4% | ||||||
| 14,300 | Hitachi Ltd. (ADR) | 706,706 | ||||
|
| |||||
FINANCIAL / INVESTMENT SERVICES - 2.6% | ||||||
| 104,000 | 3i Group PLC (ADR) | 150,800 | ||||
| 16,300 | ORIX Corp. (ADR) | 631,299 | ||||
|
| |||||
| 782,099 | ||||||
|
| |||||
FOOD - 0.9% | ||||||
| 30,000 | Marine Harvest (ADR) | 256,200 | ||||
|
| |||||
HEALTHCARE - 8.0% | ||||||
| 18,000 | Fresenius Medical Care AG & Co. KGaA (ADR) | 1,215,540 | ||||
| 26,500 | Smith & Nephew PLC (ADR) | 1,184,285 | ||||
|
| |||||
| 2,399,825 | ||||||
|
| |||||
The accompanying notes are an integral part of these financial statements.
30
Schedule of Investments | International (Continued)
As of September 30, 2011
| Shares | Fair Value | |||||
INDUSTRIALS - 2.2% | ||||||
| 25,000 | Atlas Copco AB - Class B (ADR) | $ | 389,750 | |||
| 40,000 | Cookson Group PLC (ADR) | 269,812 | ||||
|
| |||||
| 659,562 | ||||||
|
| |||||
INFORMATION TECHNOLOGY - 4.7% | ||||||
| 16,000 | Canon, Inc. (ADR) | 724,160 | ||||
| 91,300 | Infineon Technologies AG (ADR) | 674,707 | ||||
|
| |||||
| 1,398,867 | ||||||
|
| |||||
INSURANCE - 2.3% | ||||||
| 33,000 | Zurich Financial Services AG (ADR) * | 692,670 | ||||
|
| |||||
MINERALS & MINING - 5.3% | ||||||
| 22,380 | Anglo American PLC (ADR) | 382,250 | ||||
| 3,000 | Barrick Gold Corp. | 139,950 | ||||
| 8,700 | BHP Billiton PLC (ADR) | 461,796 | ||||
| 28,600 | Vale SA (ADR) | 600,600 | ||||
|
| |||||
| 1,584,596 | ||||||
|
| |||||
OIL / NATURAL GAS - 7.1% | ||||||
| 62,000 | Afren PLC (ADR) * | 393,605 | ||||
| 17,000 | Lukoil OAO (ADR) | 853,230 | ||||
| 67,400 | Precision Drilling Corp. * | 558,746 | ||||
| 14,168 | Statoil ASA (ADR) | 305,320 | ||||
|
| |||||
| 2,110,901 | ||||||
|
| |||||
OIL & GAS SERVICE - 1.4% | ||||||
| 22,000 | Subsea 7 SA * | 421,300 | ||||
|
| |||||
PHARMACEUTICAL - 2.5% | ||||||
| 8,000 | Shire Pharmaceutical (ADR) | 751,440 | ||||
|
| |||||
RETAIL - 4.1% | ||||||
| 15,000 | Walmart de Mexico SAB de CV (ADR) | 345,750 | ||||
| 39,000 | William Morrison Supermarkets PLC (ADR) | 873,600 | ||||
|
| |||||
| 1,219,350 | ||||||
|
| |||||
SERVICES - 3.5% | ||||||
| 42,000 | ABB, Ltd. (ADR) * | 717,360 | ||||
| 19,000 | Focus Media Holding, ADR * | 319,865 | ||||
|
| |||||
| 1,037,225 | ||||||
|
| |||||
SOFTWARE - 0.8% | ||||||
| 6,700 | VeriFone Systems, Inc. * | 234,634 | ||||
|
| |||||
TELECOMMUNICATIONS - 8.4% | ||||||
| 18,400 | America Movil SAB de C.V. - Series L (ADR) | 406,272 | ||||
| 21,000 | Globe Telecom, Inc. | 426,483 | ||||
| 6,300 | Philippine Long Dist. Sp. (ADR) | 312,039 | ||||
| 57,000 | Singapore Telecommunications, Ltd. (ADR) | 1,376,322 | ||||
|
| |||||
| 2,521,116 | ||||||
|
| |||||
TOTAL COMMON STOCKS (Cost $30,212,919) | 27,164,515 | |||||
|
| |||||
The accompanying notes are an integral part of these financial statements.
31
Schedule of Investments | International (Continued)
As of September 30, 2011
| Shares | Fair Value | |||||
MONEY MARKET FUND - 8.3% | ||||||
| 2,451,762 | Fidelity Institutional Money Market Portfolio, 0.07% (A) (Cost $2,451,762) | $ | 2,451,762 | |||
|
| |||||
TOTAL INVESTMENTS (Cost $32,664,681)(B) - 99.3% | $ | 29,616,277 | ||||
|
| |||||
ASSETS IN EXCESS OF OTHER LIABILITIES - 0.7% | 233,819 | |||||
|
| |||||
NET ASSETS - 100.00% | $ | 29,850,096 | ||||
|
| |||||
(ADR) American Depositary Receipt. |
| |||||
* Non-income producing securities. | ||||||
(A) Variable rate security; the rate shown represents the yield at September 30, 2011. | ||||||
(B) Represents cost for financial reporting purposes. Aggregate cost for federal tax purposes is $32,686,584 and differs from fair value by net unrealized appreciation (depreciation) of securities as follows: | ||||||
| Unrealized appreciation | $ | 2,183,163 | ||||||
| Unrealized depreciation | (5,253,470 | ) | ||||||
|
| |||||||
| Net unrealized depreciation | $ | (3,070,307 | ) | |||||
|
|
| Diversification of Assets | ||||||
| Country | % of Net Assets | |||||
| Austria | 0.73% | |||||
| Brazil | 3.28% | |||||
| Canada | 6.10% | |||||
| China | 1.58% | |||||
| France | 1.43% | |||||
| Germany | 11.23% | |||||
| Hong Kong | 4.03% | |||||
| Ireland | 4.21% | |||||
| Israel | 0.55% | |||||
| Italy | 1.98% | |||||
| Japan | 12.43% | |||||
| Mexico | 2.52% | |||||
| Netherlands | 0.60% | |||||
| Norway | 1.88% | |||||
| Phillipines | 2.47% | |||||
| Russia | 4.62% | |||||
| Singapore | 8.20% | |||||
| Sweden | 1.31% | |||||
| Switzerland | 6.25% | |||||
| United Kingdom | 14.81% | |||||
| United States | 0.79% | |||||
|
| |||||
| Total | 91.00% | |||||
| Money Market Funds | 8.28% | |||||
| Assets in Excess of Other Liabilities | 0.72% | |||||
|
| |||||
| Grand Total | 100.00% | |||||
|
| |||||
The accompanying notes are an integral part of these financial statements.
32
Schedule of Investments | Large/Mid Cap Growth
As of September 30, 2011
| Shares | Fair Value | |||||
COMMON STOCKS - 89.2% | ||||||
AEROSPACE/DEFENSE - 2.6% | ||||||
| 9,200 | General Dynamics, Corp. | $ | 523,388 | |||
| 5,550 | Transdigm Group, Inc. * | 453,268 | ||||
|
| |||||
| 976,656 | ||||||
|
| |||||
BANKS - 2.1% | ||||||
| 49,502 | Webster Financial Corp. | 757,381 | ||||
|
| |||||
BEVERAGES - 1.6% | ||||||
| 14,910 | Dr. Pepper Snapple Group, Inc. | 578,209 | ||||
|
| |||||
CHEMICALS - 2.9% | ||||||
| 16,755 | Airgas, Inc. | 1,069,304 | ||||
|
| |||||
COMMERCIAL SERVICES - 1.7% | ||||||
| 41,500 | Western Union Co. | 634,535 | ||||
|
| |||||
CONSUMER GOODS - 5.0% | ||||||
| 25,730 | Emerson Electric Co. | 1,062,906 | ||||
| 17,270 | McCormick & Co., Inc. | 797,183 | ||||
|
| |||||
| 1,860,089 | ||||||
|
| |||||
ELECTRONICS - 2.3% | ||||||
| 20,620 | Amphenol Corp. - Class A | 840,677 | ||||
|
| |||||
ENVIRONMENTAL CONTROL - 1.4% | ||||||
| 10,455 | Clean Harbors, Inc. * | 536,342 | ||||
|
| |||||
FINANCIAL / INVESTMENT SERVICES - 9.0% | ||||||
| 5,350 | Affiliated Managers Group, Inc. * | 417,568 | ||||
| 41,110 | Discover Financial Services | 943,063 | ||||
| 19,405 | FleetCor Technologies, Inc. * | 509,575 | ||||
| 8,665 | IntercontinentalExchange, Inc. * | 1,024,723 | ||||
| 29,050 | SEI Investments Co. | 446,789 | ||||
|
| |||||
| 3,341,718 | ||||||
|
| |||||
HEALTHCARE - 14.3% | ||||||
| 48,160 | AmerisourceBergen Corp. | 1,794,923 | ||||
| 8,645 | Bruker Corp. * | 116,967 | ||||
| 6,870 | C.R. Bard, Inc. | 601,400 | ||||
| 5,410 | Catalyst Health Solutions, Inc. * | 312,103 | ||||
| 1,175 | Intuitive Surgical, Inc. * | 428,029 | ||||
| 19,560 | Patterson Cos., Inc. | 560,003 | ||||
| 22,295 | Sirona Dental Systems, Inc. * | 945,531 | ||||
| 15,040 | St. Jude Medical, Inc. | 544,298 | ||||
|
| |||||
| 5,303,254 | ||||||
|
| |||||
INDUSTRIALS / MACHINERY - 4.5% | ||||||
| 7,390 | Gardner Denver, Inc. | 469,635 | ||||
| 27,600 | Johnson Controls, Inc. | 727,812 | ||||
| 28,495 | United Rentals, Inc. * | 479,856 | ||||
|
| |||||
| 1,677,303 | ||||||
|
| |||||
The accompanying notes are an integral part of these financial statements.
33
Schedule of Investments | Large/Mid Cap Growth (Continued)
As of September 30, 2011
| Shares | Fair Value | |||||
INFORMATION TECHNOLOGY - 12.8% | ||||||
| 25,400 | Ariba, Inc. * | $ | 703,834 | |||
| 9,830 | Avago Technologies Ltd. | 322,129 | ||||
| 4,530 | Cerner Corp. * | 310,396 | ||||
| 10,370 | Cognizant Technology Solutions Corp. - Class A * | 650,199 | ||||
| 12,350 | Fiserv, Inc. * | 627,010 | ||||
| 4,296 | Informatica Corp. * | 175,921 | ||||
| 24,700 | Parametric Technology Corp. * | 379,886 | ||||
| 20,825 | Polycom, Inc. * | 382,555 | ||||
| 10,050 | Riverbed Technology, Inc. * | 200,598 | ||||
| 9,775 | Taleo Corp. - Class A * | 251,413 | ||||
| 4,075 | Teradata Corp. * | 218,135 | ||||
| 14,500 | VeriFone Systems, Inc. * | 507,790 | ||||
|
| |||||
| 4,729,866 | ||||||
|
| |||||
INSURANCE - 1.9% | ||||||
| 11,460 | Ace Ltd. | 694,476 | ||||
|
| |||||
INTERNET - 0.6% | ||||||
| 9,375 | Tibco Software, Inc. * | 209,906 | ||||
|
| |||||
INVESTMENT COMPANIES - 1.2% | ||||||
| 32,050 | Ares Capital Corp. | 441,329 | ||||
|
| |||||
MISCELLANEOUS SERVICES - 1.2% | ||||||
| 7,850 | Donaldson Co., Inc. | 430,180 | ||||
|
| |||||
OIL & NATURAL GAS - 7.8% | ||||||
| 8,330 | Ensco PLC (ADR) | 336,782 | ||||
| 18,260 | Exxon Mobil Corp. | 1,326,224 | ||||
| 14,910 | Occidental Petroleum Corp. | 1,066,065 | ||||
| 4,855 | Whiting Petroleum Corp. * | 170,313 | ||||
|
| |||||
| 2,899,384 | ||||||
|
| |||||
OIL & NATURAL GAS SERVICES - 1.6% | ||||||
| 21,300 | Key Energy Services, Inc. * | 202,137 | ||||
| 7,575 | Oil States International, Inc. * | 385,719 | ||||
|
| |||||
| 587,856 | ||||||
|
| |||||
PHARMACEUTICALS - 0.6% | ||||||
| 3,750 | SXC Health Solutions Corp. * | 208,875 | ||||
|
| |||||
RETAIL - 8.4% | ||||||
| 4,135 | Autozone, Inc. * | 1,319,851 | ||||
| 13,325 | Family Dollar Stores, Inc. | 677,709 | ||||
| 8,650 | Ross Stores, Inc. | 680,668 | ||||
| 6,660 | Tractor Supply Co. | 416,583 | ||||
|
| |||||
| 3,094,811 | ||||||
|
| |||||
SEMICONDUCTORS - 3.0% | ||||||
| 8,075 | Cypress Semiconductor Corp. * | 120,883 | ||||
| 21,600 | Microchip Technology, Inc. | 671,976 | ||||
| 46,325 | ON Semiconductor Corp. * | 332,150 | ||||
|
| |||||
| 1,125,009 | ||||||
|
| |||||
The accompanying notes are an integral part of these financial statements.
34
Schedule of Investments | Large/Mid Cap Growth (Continued)
As of September 30, 2011
| Shares | Fair Value | |||||
TELECOMMUNICATIONS - 2.7% | ||||||
| 6,775 | ACME Packet, Inc. * | $ | 288,547 | |||
| 10,600 | L-3 Communications Holdings, Inc. | 656,882 | ||||
| 1,550 | SBA Communications Corp. - Class A * | 53,444 | ||||
|
| |||||
| 998,873 | ||||||
|
| |||||
TOTAL COMMON STOCKS (Cost $36,798,041) | 32,996,033 | |||||
|
| |||||
REITs - 1.3% | ||||||
| 3,945 | Essex Property Trust, Inc. (Cost $529,623) | 473,558 | ||||
|
| |||||
MONEY MARKET FUND - 10.1% | ||||||
| 3,719,044 | Fidelity Institutional Money Market Portfolio, 0.07% (A) (Cost $3,719,044) | 3,719,044 | ||||
|
| |||||
TOTAL INVESTMENTS (Cost $41,046,708)(B) - 100.6% | $ | 37,188,635 | ||||
|
| |||||
LIABILITIES IN EXCESS OF OTHER ASSETS - (0.6)% | (210,714 | ) | ||||
|
| |||||
NET ASSETS - 100.00% | $ | 36,977,921 | ||||
|
| |||||
*Non-income producing securities. (ADR) American Depositary Receipt. (A) Variable rate security; the rate shown represents the yield at September 30, 2011. (B) Represents cost for financial reporting purposes. Aggregate cost for federal tax purposes is $41,158,624 and differs from fair value by net unrealized appreciation (depreciation) of securities as follows: |
| |||||
| Unrealized appreciation | $ | 911,973 | ||||||
| Unrealized depreciation | (4,881,962 | ) | ||||||
|
| |||||||
| Net unrealized depreciation | $ | (3,969,989 | ) | |||||
|
|
The accompanying notes are an integral part of these financial statements.
35
Schedule of Investments | Small Cap Value
As of September 30, 2011
| Shares | Fair Value | |||||
COMMON STOCKS - 85.0% | ||||||
AEROSPACE EQUIPMENT - 2.0% | ||||||
| 26,400 | Moog, Inc. - Class A * | $ | 861,168 | |||
|
| |||||
BANKS - 14.8% | ||||||
| 15,428 | Bancfirst Corp. | 511,592 | ||||
| 38,833 | Center Financial Corp. * | 182,127 | ||||
| 64,703 | Chemical Financial Corp. | 990,603 | ||||
| 71,308 | Columbia Banking System, Inc. | 1,021,131 | ||||
| 5,989 | First Citizens BancShares, Inc. - Class A | 859,661 | ||||
| 63,800 | First Financial Bancorp | 880,440 | ||||
| 29,692 | Nara Bancorp, Inc. * | 180,230 | ||||
| 21,300 | SVB Financial Group * | 788,100 | ||||
| 36,000 | Wintrust Financial Corp. | 929,160 | ||||
|
| |||||
| 6,343,044 | ||||||
|
| |||||
COAL - 2.0% | ||||||
| 52,000 | Cloud Peak Energy, Inc. * | 881,400 | ||||
|
| |||||
CONSTRUCTION - 2.0% | ||||||
| 38,070 | Layne Christensen Co. * | 879,417 | ||||
|
| |||||
CONSUMER GOODS - 2.1% | ||||||
| 27,000 | Wolverine World Wide, Inc. | 897,750 | ||||
|
| |||||
ELECTRIC POWER - 5.8% | ||||||
| 21,000 | Avista Corp. | 500,850 | ||||
| 29,100 | Cleco Corp. | 993,474 | ||||
| 31,600 | NorthWestern Corp. | 1,009,304 | ||||
|
| |||||
| 2,503,628 | ||||||
|
| |||||
ELECTRIC & EQUIPMENT - 1.1% | ||||||
| 24,000 | EnerSys * | 480,480 | ||||
|
| |||||
FINANCIAL & INVESTMENT SERVICES - 4.4% | ||||||
| 85,317 | Calamos Asset Management, Inc. - Class A | 854,023 | ||||
| 83,700 | Knight Capital Group, Inc. - Class A * | 1,017,792 | ||||
|
| |||||
| 1,871,815 | ||||||
|
| |||||
FOOD - 2.3% | ||||||
| 20,265 | J & J Snack Food Corp. | 973,733 | ||||
|
| |||||
HEALTHCARE - 4.6% | ||||||
| 102,631 | Natus Medical, Inc. * | 976,021 | ||||
| 28,680 | Orthofix International NV * | 989,747 | ||||
|
| |||||
| 1,965,768 | ||||||
|
| |||||
INDUSTRIALS - 7.2% | ||||||
| 26,897 | A.O. Smith Corp. | 861,511 | ||||
| 20,005 | Hurco Cos., Inc. * | 406,102 | ||||
| 33,000 | Kaydon Corp. | 946,440 | ||||
| 35,600 | TAL International Group, Inc. | 887,864 | ||||
|
| |||||
| 3,101,917 | ||||||
|
| |||||
The accompanying notes are an integral part of these financial statements.
36
Schedule of Investments | Small Cap Value (Continued)
As of September 30, 2011
| Shares | Fair Value | |||||
INFORMATION TECHNOLOGY - 4.3% | ||||||
| 14,600 | ManTech International Corp. - Class A | $ | 458,148 | |||
| 78,006 | Pervasive Solftware, Inc. * | 468,036 | ||||
| 35,600 | SYNNEX Corp. * | 932,720 | ||||
|
| |||||
| 1,858,904 | ||||||
|
| |||||
INSURANCE - 5.7% | ||||||
| 53,923 | AMERISAFE, Inc. * | 992,722 | ||||
| 37,400 | Employers Holdings, Inc. | 477,224 | ||||
| 25,670 | Safety Insurance Group, Inc. | 971,096 | ||||
|
| |||||
| 2,441,042 | ||||||
|
| |||||
MISCELLANEOUS SERVICES - 7.4% | ||||||
| 46,200 | Harsco Corp. | 895,818 | ||||
| 98,166 | Matrix Service, Co. * | 835,393 | ||||
| 63,100 | Pioneer Drilling, Co. * | 453,058 | ||||
| 36,100 | Rent-A-Center, Inc. | 990,945 | ||||
|
| |||||
| 3,175,214 | ||||||
|
| |||||
OIL & NATURAL GAS - 6.3% | ||||||
| 23,900 | Approach Resources, Inc. * | 406,061 | ||||
| 173,626 | Gastar Exploration Ltd. * | 520,878 | ||||
| 24,361 | GeoResources, Inc. * | 433,382 | ||||
| 173,700 | Kodiak Oil& Gas Corp. * | 904,977 | ||||
| 18,200 | Swift Energy Co. * | 442,988 | ||||
|
| |||||
| 2,708,286 | ||||||
|
| |||||
RESTAURANTS - 1.3% | ||||||
| 17,600 | Papa Johns International, Inc. * | 535,040 | ||||
|
| |||||
RETAIL - 1.6% | ||||||
| 74,100 | Kirkland’s, Inc. * | 679,497 | ||||
|
| |||||
SEMICONDUCTORS - 3.5% | ||||||
| 47,000 | Kraton Performance Polymers, Inc. * | 760,460 | ||||
| 30,800 | Veeco Instruments, Inc. * | 751,520 | ||||
|
| |||||
| 1,511,980 | ||||||
|
| |||||
TRANSPORTATION - 5.5% | ||||||
| 10,400 | Genesee & Wyoming, Inc. - Class A * | 483,809 | ||||
| 26,064 | Landstar System, Inc. | 1,031,092 | ||||
| 80,863 | Saia, Inc. * | 850,679 | ||||
|
| |||||
| 2,365,580 | ||||||
|
| |||||
TELECOMMUNICATIONS - 1.1% | ||||||
| 111,000 | Tellabs,Inc. | 476,190 | ||||
|
| |||||
TOTAL COMMON STOCKS (Cost $44,116,776) | 36,511,853 | |||||
|
| |||||
REITs - 12.6% | ||||||
| 63,965 | Coresite Realty Corp. | 917,898 | ||||
| 234,700 | DCT Industrial Trust, Inc. | 1,030,333 | ||||
| 137,457 | DiamondRock Hospitality | 960,824 | ||||
| 60,600 | Healthcare Realty Trust, Inc. | 1,021,110 | ||||
| 30,700 | Potlatch Corp. | 967,664 | ||||
| 18,600 | Washington Real Estate Investment Trust | 524,148 | ||||
|
| |||||
TOTAL REITs (Cost $6,075,000) | 5,421,977 | |||||
|
| |||||
The accompanying notes are an integral part of these financial statements.
37
Schedule of Investments | Small Cap Value (Continued)
As of September 30, 2011
| Shares | Fair Value | |||||
MONEY MARKET FUND - 2.3% | ||||||
| 971,390 | Fidelity Institutional Money Market Portfolio, 0.07% (A) (Cost $971,390) | $ | 971,390 | |||
|
| |||||
TOTAL INVESTMENTS (Cost $51,163,166)(B) - 99.9% | $ | 42,905,220 | ||||
|
| |||||
ASSETS IN EXCESS OF OTHER LIABILITIES - 0.1% | 48,889 | |||||
|
| |||||
NET ASSETS - 100.00% | $ | 42,954,109 | ||||
|
| |||||
* Non income producing securities. (A) Variable rate security; the rate shown represents the yield at September 30, 2011. (B) Represents cost for financial reporting purposes. Aggregate cost for federal tax purposes is $51,284,270 and differs from fair value by net unrealized appreciation (depreciation) of securities as follows: |
| |||||
| Unrealized appreciation | $ | 1,215,699 | ||||||
| Unrealized depreciation | (9,594,749 | ) | ||||||
|
| |||||||
| Net unrealized depreciation | $ | (8,379,050 | ) | |||||
|
|
The accompanying notes are an integral part of these financial statements.
38
Schedule of Investments | Large/Mid Cap Value
As of September 30, 2011
| Shares | Fair Value | |||||
COMMON STOCKS - 88.2% | ||||||
AEROSPACE/DEFENSE - 1.0% | ||||||
| 7,173 | Goodrich, Corp. | $ | 865,638 | |||
|
| |||||
AUTO - 1.0% | ||||||
| 21,300 | Lear Corp. | 913,770 | ||||
|
| |||||
BANKS - 1.9% | ||||||
| 54,400 | CIT Group, Inc. * | 1,652,128 | ||||
|
| |||||
CONSUMER GOODS - 11.3% | ||||||
| 28,500 | BorgWarner, Inc. * | 1,725,105 | ||||
| 56,900 | Dr Pepper Snapple Group, Inc. | 2,206,582 | ||||
| 51,500 | Emerson Electric Co. | 2,127,465 | ||||
| 26,100 | JM Smucker Co./The | 1,902,429 | ||||
| 71,300 | Sysco Corp. | 1,846,670 | ||||
|
| |||||
| 9,808,251 | ||||||
|
| |||||
ELECTRIC POWER - 7.6% | ||||||
| 49,000 | American Electric Power Co., Inc. | 1,862,980 | ||||
| 47,000 | Dominion Resources, Inc. | 2,386,190 | ||||
| 53,300 | FirstEnergy Corp. | 2,393,703 | ||||
|
| |||||
| 6,642,873 | ||||||
|
| |||||
FINANCIAL & INVESTMENT SERVICES - 5.6% | ||||||
| 69,300 | Eaton Vance Corp. | 1,543,311 | ||||
| 17,100 | Franklin Resources, Inc. | 1,635,444 | ||||
| 112,600 | Invesco, Ltd. | 1,746,426 | ||||
|
| |||||
| 4,925,181 | ||||||
|
| |||||
HEALTHCARE - 11.1% | ||||||
| 79,700 | CareFusion Corp. * | 1,908,815 | ||||
| 51,600 | Covidien PLC | 2,275,560 | ||||
| 22,800 | CR Bard, Inc. | 1,995,912 | ||||
| 28,800 | DENTSPLY International, Inc. | 883,872 | ||||
| 117,000 | Hologic, Inc. * | 1,779,570 | ||||
| 23,400 | St. Jude Medical, Inc. | 846,846 | ||||
|
| |||||
| 9,690,575 | ||||||
|
| |||||
INDUSTRIALS - 4.5% | ||||||
| 30,800 | General Dynamics Corp. | 1,752,212 | ||||
| 14,200 | Precision Castparts Corp. | 2,207,532 | ||||
|
| |||||
| 3,959,744 | ||||||
|
| |||||
INFORMATION TECHNOLOGY - 4.8% | ||||||
| 122,300 | CA, Inc. | 2,373,843 | ||||
| 63,500 | TE Connectivity Ltd. | 1,786,890 | ||||
|
| |||||
| 4,160,733 | ||||||
|
| |||||
INSURANCE - 9.4% | ||||||
| 37,700 | ACE, Ltd. | 2,284,620 | ||||
| 63,100 | Arch Capital Group, Ltd. * | 2,061,792 | ||||
| 67,700 | Axis Capital Holdings, Ltd. | 1,756,138 | ||||
| 60,100 | Willis Group Holdings, PLC (ADR) | 2,065,637 | ||||
|
| |||||
| 8,168,187 | ||||||
|
| |||||
The accompanying notes are an integral part of these financial statements.
39
Schedule of Investments | Large/Mid Cap Value (Continued)
As of September 30, 2011
| Shares | Fair Value | |||||
MACHINERY - 1.9% | ||||||
| 22,200 | Flowserve Corp. | $ | 1,642,800 | |||
|
| |||||
OIL & NATURAL GAS - 19.6% | ||||||
| 28,300 | Anadarko Petroleum Corp. | 1,784,315 | ||||
| 20,600 | Apache Corp. | 1,652,944 | ||||
| 18,600 | ConocoPhillips | 1,177,752 | ||||
| 45,200 | EQT Corp. | 2,411,872 | ||||
| 41,000 | Exxon Mobil Corp. | 2,977,830 | ||||
| 44,400 | Marathon Oil Corp. | 958,152 | ||||
| 29,300 | Marathon Petroleum Corp. | 792,858 | ||||
| 34,700 | Murphy Oil Corp. | 1,532,352 | ||||
| 33,000 | National Oilwell Varco, Inc. | 1,690,260 | ||||
| 29,000 | Occidental Petroleum Corp. | 2,073,500 | ||||
|
| |||||
| 17,051,835 | ||||||
|
| |||||
RETAIL - 5.0% | ||||||
| 37,900 | Advance Auto Parts, Inc. | 2,201,990 | ||||
| 29,300 | Sherwin-Williams Co./The | 2,177,576 | ||||
| �� |
|
| ||||
| 4,379,566 | ||||||
|
| |||||
SEMICONDUCTORS - 1.0% | ||||||
| 26,900 | Microchip Technology, Inc. | 836,859 | ||||
|
| |||||
TRANSPORTATION - 2.5% | ||||||
| 26,400 | Union Pacific Corp. | 2,156,088 | ||||
|
| |||||
TOTAL COMMON STOCKS (Cost $73,309,028) | 76,854,228 | |||||
|
| |||||
MASTER LIMITED PARTNERSHIPS - 1.9% | ||||||
| 78,800 | Lazard, Ltd. - Class A | 1,662,680 | ||||
|
| |||||
TOTAL MASTER LIMITED PARTNERSHIPS (Cost $2,711,146) | 1,662,680 | |||||
|
| |||||
REITs - 4.6% | ||||||
| 51,100 | HCP, Inc. | 1,791,566 | ||||
| 19,700 | Public Storage | 2,193,595 | ||||
|
| |||||
TOTAL REITs (Cost $3,033,852 ) | 3,985,161 | |||||
|
| |||||
MONEY MARKET FUND - 6.6% | ||||||
| 5,748,933 | Fidelity Institutional Money Market Portfolio, 0.07% (A) (Cost $5,748,933) | 5,748,933 | ||||
|
| |||||
TOTAL INVESTMENTS (Cost $84,802,959 )(B) - 101.3% | $ | 88,251,002 | ||||
|
| |||||
LIABILITIES IN EXCESS OF OTHER ASSETS - (1.3)% | (1,093,019 | ) | ||||
|
| |||||
NET ASSETS - 100.00% | $ | 87,157,983 | ||||
|
| |||||
* Non-income producing securities. (ADR) American Depositary Receipt. (A) Variable rate security; the rate shown represents the yield at September 30, 2011. (B) Represents cost for financial reporting purposes. Aggregate cost for federal tax purposes is $84,839,247 and differs from fair value by net unrealized appreciation (depreciation) of securities as follows: |
| |||||
| Unrealized appreciation | $ | 10,777,782 | ||||||
| Unrealized depreciation | (7,366,027 | ) | ||||||
|
| |||||||
| Net unrealized appreciation | $ | 3,411,755 | ||||||
|
|
The accompanying notes are an integral part of these financial statements.
40
Schedule of Investments | Fixed Income
As of September 30, 2011
| Par Value | Fair Value | |||||
BONDS AND NOTES - 96.4% | ||||||
ASSET-BACKED SECURITIES - 0.3% | ||||||
| $ 30,842 | John Deere Owner Trust, 2.59%, 10/15/2013 | $ | 30,960 | |||
| 145,000 | John Deere Owner Trust, 3.96%, 05/16/2016 | 147,910 | ||||
|
| |||||
TOTAL ASSET-BACKED SECURITIES (Cost $176,095 ) | 178,870 | |||||
|
| |||||
CORPORATE BONDS - 23.7% | ||||||
| 500,000 | America Movil SAB de C.V., 5.00%, 03/30/2020 | 533,000 | ||||
| 1,000,000 | Cameron International Corp., 6.375%, 07/15/2018 | 1,177,155 | ||||
| 750,000 | Canadian National Railway Co., 5.80%, 06/01/2016 | 876,340 | ||||
| 750,000 | ConocoPhillips, 4.60%, 01/15/2015 | 822,235 | ||||
| 500,000 | Covidien International Finance SA, 5.45%, 10/15/2012 | 523,747 | ||||
| 950,000 | Dominion Resources, Inc., 5.00%, 03/15/2013 | 1,004,647 | ||||
| 350,000 | Energy Transfer Partners LP, 6.70%, 07/01/2018 | 392,294 | ||||
| 500,000 | Enterprise Products Operating, LLC, 6.125%, 10/15/2039 | 546,287 | ||||
| 900,000 | ERP Operating LP, 5.125%, 03/15/2016 | 966,480 | ||||
| 500,000 | Express Scripts, Inc., 5.25%, 06/15/2012 | 514,050 | ||||
| 500,000 | Johnson Controls, Inc., 5.00%, 03/30/2020 | 552,603 | ||||
| 750,000 | Kinder Morgan Energy Partners LP, 5.125%, 11/15/2014 | 814,351 | ||||
| 500,000 | L-3 Communications, Corp., 5.20%, 10/15/2019 | 528,428 | ||||
| 750,000 | Marathon Oil Corp., 6.00%, 10/01/2017 | 858,218 | ||||
| 750,000 | Nisource Finance Corp., 5.40%, 07/15/2014 | 812,735 | ||||
| 500,000 | Oneok, Inc., 5.20%, 06/15/2015 | 550,865 | ||||
| 750,000 | Simon Property Group LP, 5.75%, 12/01/2015 | 828,348 | ||||
| 500,000 | Transocean, Inc., 6.00%, 03/15/2018 | 533,670 | ||||
| 1,000,000 | Tyco Electronics Group SA, 6.00%, 10/01/2012 | 1,048,102 | ||||
| 500,000 | Valero Energy Corp., 6.625%, 06/15/2037 | 538,900 | ||||
| 750,000 | Weatherford International, Ltd., 4.95%, 10/15/2013 | 793,775 | ||||
| 750,000 | Willis North America, Inc., 6.20%, 03/28/2017 | 819,947 | ||||
|
| |||||
TOTAL CORPORATE BONDS (Cost $14,731,780 ) | 16,036,177 | |||||
|
| |||||
U.S. GOVERNMENT & AGENCY OBLIGATIONS - 72.4% | ||||||
GOVERNMENT NOTES & BONDS - 32.0% | ||||||
| 1,500,000 | Federal Farm Credit Bank, 4.875%, 01/17/2017 | 1,757,942 | ||||
| 2,500,000 | Federal Farm Credit Bank, 5.125%, 08/25/2016 | 2,952,842 | ||||
| 1,000,000 | Federal Home Loan Bank, 5.00%, 11/17/2017 | 1,205,662 | ||||
| 1,500,000 | Federal Home Loan Bank, 5.50%, 08/13/2014 | 1,707,429 | ||||
| 4,000,000 | U.S. Treasury Bond, 3.125%, 05/15/2019 | 4,456,876 | ||||
| 1,500,000 | U.S. Treasury Bond, 4.375%, 05/15/2040 | 1,931,019 | ||||
| 1,000,000 | U.S. Treasury Bond, 5.00%, 05/15/2037 | 1,392,344 | ||||
| 2,000,000 | U.S. Treasury Note, 3.125%, 05/15/2021 | 2,223,281 | ||||
| 2,000,000 | U.S. Treasury Note, 3.875%, 05/15/2018 | 2,323,282 | ||||
| 1,550,000 | U.S. Treasury Note, 4.75%, 05/15/2014 | 1,726,373 | ||||
|
| |||||
TOTAL GOVERNMENT NOTES & BONDS (Cost $19,765,475 ) | 21,677,050 | |||||
|
| |||||
GOVERNMENT MORTGAGE-BACKED SECURITIES - 35.1% | ||||||
| 99,481 | GNMA Pool 3584, 6.00%, 07/20/2034 | 112,192 | ||||
| 221,163 | GNMA Pool 3612, 6.50%, 09/20/2034 | 254,680 | ||||
| 701,312 | GNMA Pool 3625, 6.00%, 10/20/2034 | 786,010 | ||||
| 291,323 | GNMA Pool 3637, 5.50%, 11/20/2034 | 324,765 | ||||
| 455,931 | GNMA Pool 3665, 5.50%, 01/20/2035 | 508,269 | ||||
The accompanying notes are an integral part of these financial statements.
41
Schedule of Investments | Fixed Income (Continued)
As of September 30, 2011
| Par Value | Fair Value | |||||
GOVERNMENT MORTGAGE-BACKED SECURITIES - 35.1% (Continued) | ||||||
| $ 229,767 | GNMA Pool 3679, 6.00%, 02/20/2035 | $ | 257,516 | |||
| 585,515 | GNMA Pool 3711, 5.50%, 05/20/2035 | 652,180 | ||||
| 533,609 | GNMA Pool 3865, 6.00%, 06/20/2036 | 597,053 | ||||
| 377,692 | GNMA Pool 3910, 6.00%, 10/20/2036 | 422,598 | ||||
| 732,854 | GNMA Pool 3939, 5.00%, 01/20/2037 | 808,079 | ||||
| 863,893 | GNMA Pool 4058, 5.00%, 12/20/2037 | 952,568 | ||||
| 919,334 | GNMA Pool 4072, 5.50%, 01/20/2038 | 1,019,124 | ||||
| 2,447,715 | GNMA Pool 4520, 5.00%, 08/20/2039 | 2,694,372 | ||||
| 1,509,893 | GNMA Pool 4541, 5.00%, 09/20/2039 | 1,662,046 | ||||
| 2,890,711 | GNMA Pool 4947, 5.00%, 02/20/2041 | 3,180,203 | ||||
| 35,533 | GNMA Pool 585163, 5.00%, 02/15/2018 | 38,474 | ||||
| 33,054 | GNMA Pool 585180, 5.00%, 02/15/2018 | 35,789 | ||||
| 26,878 | GNMA Pool 592492, 5.00%, 03/15/2018 | 29,102 | ||||
| 28,475 | GNMA Pool 599821, 5.00%, 01/15/2018 | 30,831 | ||||
| 465,494 | GNMA Pool 604182, 5.50%, 04/15/2033 | 517,368 | ||||
| 295,612 | GNMA Pool 663776, 6.50%, 01/15/2037 | 336,036 | ||||
| 3,871,313 | GNMA Pool 701961, 4.50%, 06/15/2039 | 4,222,255 | ||||
| 1,726,370 | GNMA Pool 717072, 5.00%, 05/15/2039 | 1,898,049 | ||||
| 983,075 | GNMA Pool 734437, 4.50%, 05/15/2041 | 1,070,043 | ||||
| 96,528 | GNMA Pool 781694, 6.00%, 12/15/2031 | 108,328 | ||||
| 1,126,334 | GNMA Pool 782858, 6.00%, 11/15/2039 | 1,257,482 | ||||
|
| |||||
TOTAL GOVERNMENT MORTGAGE-BACKED SECURITIES (Cost $22,356,627 ) | 23,775,412 | |||||
|
| |||||
TREASURY INFLATION PROTECTED SECURITIES (TIPS) - 5.3% | ||||||
| 1,250,000 | TIPS, 2.00%, 01/15/2014 | 1,623,408 | ||||
| 1,500,000 | TIPS, 2.50%, 07/15/2016 | 1,926,659 | ||||
|
| |||||
TOTAL TREASURY INFLATION PROTECTED SECURITIES (TIPS) (Cost $3,233,745 ) | 3,550,067 | |||||
|
| |||||
TOTAL U.S. GOVERNMENT & AGENCY OBLIGATIONS (Cost $45,355,847 ) | 49,002,529 | |||||
|
| |||||
TOTAL BONDS AND NOTES (Cost $60,263,722 ) | 65,217,576 | |||||
|
| |||||
| Shares | ||||||
MONEY MARKET FUND - 2.2% | ||||||
| 1,487,248 | Fidelity Institutional Money Market Portfolio, 0.07% (A) (Cost $1,487,248) | 1,487,248 | ||||
|
| |||||
TOTAL INVESTMENTS ( Cost $61,750,970)(B) - 98.6% | $ | 66,704,824 | ||||
|
| |||||
ASSETS IN EXCESS OF OTHER LIABILITIES - 1.4% | 965,097 | |||||
|
| |||||
NET ASSETS - 100.00% | $ | 67,669,921 | ||||
|
| |||||
(A) Variable rate security; the rate shown represents the yield at September 30, 2011.
(B) Represents cost for financial reporting purposes. Aggregate cost for federal tax purposes is $61,750,970 and differs from fair value by net unrealized appreciation (depreciation) of securities as follows:
| Unrealized appreciation | $ | 4,953,854 | ||||||
| Unrealized depreciation | - | |||||||
|
| |||||||
| Net unrealized appreciation | $ | 4,953,854 | ||||||
|
|
The accompanying notes are an integral part of these financial statements.
42
Schedule of Investments | High Yield Bond
As of September 30, 2011
| Par Value | Fair Value | |||||
CORPORATE BONDS - 96.2% | ||||||
| $ 250,000 | Actuant Corp., 6.875%, 6/15/2017 | $ | 253,438 | |||
| 500,000 | AmeriGas Partners LP, 6.50%, 5/20/2021 | 485,000 | ||||
| 500,000 | Berry Petroleum Co., 8.25%, 11/01/2016 | 510,625 | ||||
| 500,000 | Calfrac Holdings LP, 7.50%,12/01/2020 (A) | 475,000 | ||||
| 500,000 | Calumet Special, 9.375%, 5/1/2019 (A) | 467,500 | ||||
| 500,000 | Cemex Finance LLC, 9.50%, 12/14/2016 (A) | 367,500 | ||||
| 500,000 | Cloud Peak Energy Resources LLC, 8.50%, 12/15/2019 | 520,625 | ||||
| 500,000 | CommScope, Inc., 8.25%, 1/15/2019 (A) | 493,750 | ||||
| 500,000 | Comstock Resources, Inc., 8.375%, 10/15/2017 | 481,250 | ||||
| 250,000 | Continental Resources, Inc., 7.125%, 4/01/2021 | 253,750 | ||||
| 500,000 | Copano Energy Finance Corp., 7.75%, 6/01/2018 | 513,750 | ||||
| 500,000 | Covanta Holding Corp., 7.25%, 12/01/2020 | 501,539 | ||||
| 500,000 | Crosstex Energy LP, 8.875%, 2/15/2018 | 515,000 | ||||
| 500,000 | Energy Transfer Equity LP, 7.50%, 10/15/2020 | 516,250 | ||||
| 250,000 | Equinix, Inc., 7.00%, 7/15/2021 | 249,688 | ||||
| 500,000 | FMG Resources August 2006 Pty Ltd., 7.00%, 11/01/2015 (A) | 467,500 | ||||
| 500,000 | Forest Oil Corp., 7.25%, 6/15/2019 | 495,000 | ||||
| 500,000 | Frac Tech Services LLC, 7.125%, 11/15/2018 (A) | 510,000 | ||||
| 750,000 | Genesis Energy LP, 7.875%, 12/15/2018 (A) | 716,250 | ||||
| 500,000 | Geo Group, Inc./The, 6.625%, 2/15/2011 | 482,500 | ||||
| 329,000 | Goodyear Tire & Rubber Co., 10.50%, 5/15/2016 | 357,788 | ||||
| 500,000 | Helix Energy Solutions Group, Inc., 9.50%, 1/15/2016 (A) | 513,125 | ||||
| 500,000 | Hypermarcas SA, 6.50%, 4/20/2021 (A) | 460,000 | ||||
| 500,000 | Intergen NV, 9.00%, 6/30/2017 (A) | 508,125 | ||||
| 250,000 | Iron Mountain, 7.75%, 10/1/2019 | 249,687 | ||||
| 500,000 | Kindred Healthcare, 8.25%, 6/1/2019 (A) | 384,375 | ||||
| 500,000 | MarkWest Energy Partners L.P., 6.75%, 11/01/2020 | 510,000 | ||||
| 500,000 | MedAssets, Inc., 8.00%, 11/15/2018 (A) | 476,875 | ||||
| 500,000 | MEMC Electronic Materials, Inc., 7.75%, 4/01/2019 (A) | 430,000 | ||||
| 500,000 | MPT Operating Partnership LP, 6.875%, 5/1/2021 (A) | 477,500 | ||||
| 500,000 | Navios Maritime Holdings, Inc., 8.875%, 11/01/2017 | 490,000 | ||||
| 500,000 | Navistar International Corp., 8.25%, 11/01/2021 | 515,625 | ||||
| 500,000 | Nova Chemicals Corp., 8.625%, 11/01/2019 | 543,750 | ||||
| 500,000 | NRG Energy, Inc., 7.375%, 1/15/2017 | 516,875 | ||||
| 500,000 | OGX Petroleo, 8.50%, 6/1/2018 (A) | 450,625 | ||||
| 500,000 | Omnicare, Inc., 7.75%, 6/01/2020 | 512,500 | ||||
| 500,000 | PolyOne Corp., 7.375%, 9/15/2020 | 503,750 | ||||
| 250,000 | Polypore International, Inc., 7.50%, 11/15/2017 | 252,188 | ||||
| 500,000 | QBE Cap Funding II LP, 7.25%, 5/24/2041 (A) | 452,708 | ||||
| 250,000 | R R Donnelley & Sons Co., 7.25%, 5/15/2018 | 226,000 | ||||
| 500,000 | Reynolds Group Issuer, Inc., 9.00%, 4/15/2019 (A) | 421,875 | ||||
| 500,000 | Sanmina-SCI Corp, 7.00%, 5/15/2019 (A) | 442,500 | ||||
| 500,000 | Sealy Mattress Co., 8.25%, 6/15/2014 | 473,750 | ||||
| 500,000 | Suncoke Energy, 7.625%, 8/1/2019 (A) | 491,250 | ||||
| 500,000 | Swift Energy Co., 7.125%, 6/01/2017 | 494,375 | ||||
| 500,000 | Targa Resources Partners LP, 7.875%, 10/15/2018 | 507,500 | ||||
| 410,000 | Tesoro Corp., 9.75%, 6/01/2019 | 444,850 | ||||
| 500,000 | Texas Industries, Inc., 9.25%, 8/15/2020 | 391,250 | ||||
The accompanying notes are an integral part of these financial statements.
43
Schedule of Investments | High Yield Bond (Continued)
As of September 30, 2011
| Par Value | Fair Value | |||||
CORPORATE BONDS - 96.2% (continued) | ||||||
| $ 500,000 | United Rentals North America, Inc., 9.25%, 12/15/2019 | $ | 521,250 | |||
| 500,000 | United States Steel Corp., 6.05%,06/01/2017 | 457,500 | ||||
| 500,000 | USG Corp., 9.75%, 01/15/2018 | 404,375 | ||||
| 250,000 | Vanguard Health Holding Co., LLC, 7.75%,02/01/2019 (A) | 224,062 | ||||
|
| |||||
TOTAL CORPORATE BONDS (Cost $24,279,878 ) | 23,381,948 | |||||
|
| |||||
| Shares | ||||||
MONEY MARKET FUND - 1.3% | ||||||
| 318,984 | Fidelity Institutional Money Market Portfolio, 0.07% (B) (Cost $318,984) | 318,984 | ||||
|
| |||||
TOTAL INVESTMENTS (Cost $24,598,862)(C) - 97.5% | $ | 23,700,932 | ||||
|
| |||||
ASSETS IN EXCESS OF OTHER LIABILITIES - 2.5% | 603,046 | |||||
|
| |||||
NET ASSETS - 100.00% | $ | 24,303,978 | ||||
|
| |||||
(A) 144A Security - Security exempt from registration under Rule 144A of the Securities Act of 1933. The securities may be resold in transactions exempt from registration typically only to qualified institutional buyers. Unless otherwise indicated, these securities are not considered to be illiquid.
(B) Variable rate security; the rate shown represents the yield at September 30, 2011.
(C) Represents cost for financial reporting purposes. Aggregate cost for federal tax purposes is $24,598,862 and differs from fair value by net unrealized appreciation (depreciation) of securities as follows:
| Unrealized appreciation | $ | 358,120 | ||||||
| Unrealized depreciation | (1,256,050) | |||||||
|
| |||||||
| Net unrealized depreciation | $ | (897,930) | ||||||
|
|
The accompanying notes are an integral part of these financial statements.
44
Schedule of Investments | Money Market
As of September 30, 2011
| Par Value | Fair Value | |||||
U.S. GOVERNMENT & GOVERNMENT AGENCIES (A) - 90.6% | ||||||
| $ 800,000 | Federal Home Loan Bank, 0.120%, 10/3/2011 | $ | 799,995 | |||
| 150,000 | Federal Home Loan Bank, 0.030%, 10/11/2011 | 149,999 | ||||
| 850,000 | Federal Home Loan Bank, 0.035%, 10/12/2011 | 849,991 | ||||
| 850,000 | Federal Home Loan Bank, 0.070%, 10/14/2011 | 849,983 | ||||
| 200,000 | Federal Home Loan Bank, 0.080%, 10/19/2011 | 199,994 | ||||
| 900,000 | Federal Home Loan Bank, 0.080%, 10/26/2011 | 899,956 | ||||
| 1,350,000 | Federal Home Loan Bank, 0.060%, 11/4/2011 | 1,349,935 | ||||
| 100,000 | Federal Home Loan Bank, 0.020%, 11/10/2011 | 99,998 | ||||
| 1,200,000 | Federal Home Loan Bank, 0.060%, 11/14/2011 | 1,199,912 | ||||
| 507,000 | Federal Home Loan Bank, 0.040%, 11/15/2011 | 506,983 | ||||
| 200,000 | Federal Home Loan Bank, 0.040%, 11/18/2011 | 199,989 | ||||
| 880,000 | Federal Home Loan Bank, 0.020%, 11/30/2011 | 879,967 | ||||
| 257,000 | Federal Home Loan Bank, 0.040%, 12/7/2011 | 256,982 | ||||
| 372,000 | Federal Home Loan Bank, 0.030%, 12/14/2011 | 371,981 | ||||
| 200,000 | Federal Home Loan Bank, 0.020%, 12/21/2011 | 199,991 | ||||
| 100,000 | Federal Home Loan Bank, 0.020%, 12/23/2011 | 99,997 | ||||
| 500,000 | U.S. Treasury Bill, 0.015%, 10/13/2011 | 499,998 | ||||
| 1,500,000 | U.S. Treasury Bill, 0.090%, 10/27/2011 | 1,499,908 | ||||
|
| |||||
TOTAL U.S. GOVERNMENT & GOVERNMENT AGENCIES | ||||||
(Cost $10,915,559) | 10,915,559 | |||||
|
| |||||
| Shares | ||||||
MONEY MARKET FUND - 8.7% | ||||||
| 1,043,580 | Fidelity Institutional Money Market Portfolio, 0.07% (B) | |||||
(Cost $1,043,580) | 1,043,580 | |||||
|
| |||||
TOTAL INVESTMENTS (Cost $11,959,139)(C) - 99.3% | $ | 11,959,139 | ||||
|
| |||||
ASSETS IN EXCESS OF OTHER LIABILITIES - 0.7% | 85,273 | |||||
|
| |||||
TOTAL NET ASSETS - 100.00% | $ | 12,044,412 | ||||
|
| |||||
(A) Discount note; the rate shown represents the yield at September 30, 2011.
(B) Variable rate security; the rate shown represents the yield at September 30, 2011.
(C) Represents cost for financial reporting purposes. Aggregate cost for federal tax purposes is substantially the same.
The accompanying notes are an integral part of these financial statements.
45
Schedule of Investments | Defensive Strategies
As of September 30, 2011
| Shares | Fair Value | |||||
COMMON STOCKS - 32.8% | ||||||
CHEMICALS - 1.1% | ||||||
| 14,527 | Ashland, Inc. | $ | 641,222 | |||
|
| |||||
COAL - 4.1% | ||||||
| 32,306 | Alpha Natural Resources Inc. * | 571,493 | ||||
| 41,475 | Arch Coal Inc. | 604,706 | ||||
| 66,943 | Patriot Coal Corp. * | 566,338 | ||||
| 17,688 | Peabody Energy Corp. | 599,269 | ||||
|
| |||||
| 2,341,806 | ||||||
|
| |||||
FOOD - 1.2% | ||||||
| 39,724 | Tyson Foods Inc. - Class A | 689,609 | ||||
|
| |||||
FOREST - 1.1% | ||||||
| 26,076 | MeadWestvaco Corp. | 640,427 | ||||
|
| |||||
IRON / STEEL - 3.3% | ||||||
| 16,502 | Allegheny Technologies Inc. | 610,409 | ||||
| 41,226 | ArcelorMittal - NY Registered Shares | 655,906 | ||||
| 28,762 | United States Steel Corp. | 633,052 | ||||
|
| |||||
| 1,899,367 | ||||||
|
| |||||
MACHINERY - 2.2% | ||||||
| 17,675 | AGCO Corp. * | 611,025 | ||||
| 24,193 | CNH Global NV * | 634,824 | ||||
|
| |||||
| 1,245,849 | ||||||
|
| |||||
METAL - 1.1% | ||||||
| 65,350 | Commercial Metals Co. | 621,478 | ||||
|
| |||||
MINING - 4.4% | ||||||
| 69,168 | Century Aluminum Co. * | 618,362 | ||||
| 29,541 | Coeur d’Alene Mines Corp. * | 633,359 | ||||
| 117,007 | Hecla Mining Co. * | 627,157 | ||||
| 14,147 | Kaiser Aluminum Corp. | 626,429 | ||||
|
| |||||
| 2,505,307 | ||||||
|
| |||||
OIL & GAS - 6.6% | ||||||
| 9,632 | Anadarko Petroleum Corp. | 607,298 | ||||
| 53,785 | Denbury Resources Inc. * | 618,527 | ||||
| 15,112 | Helmerich & Payne Inc. | 613,547 | ||||
| 29,656 | Marathon Oil Corp. | 639,977 | ||||
| 13,275 | Transocean, Ltd. | 633,748 | ||||
| 35,773 | Valero Energy Corp. | 636,044 | ||||
|
| |||||
| 3,749,141 | ||||||
|
| |||||
OIL & GAS SERVICES - 6.6% | ||||||
| 13,329 | Baker Hughes Inc. | 615,266 | ||||
| 14,748 | Cameron International Corp. * | 612,632 | ||||
| 25,410 | Hornbeck Offshore Services Inc. * | 632,963 | ||||
| 12,103 | National Oilwell Varco Inc. | 619,916 | ||||
| 8,131 | SEACOR Holdings Inc. | 652,187 | ||||
| 51,066 | Weatherford International Ltd. * | 623,516 | ||||
|
| |||||
| 3,756,480 | ||||||
|
| |||||
The accompanying notes are an integral part of these financial statements.
46
Schedule of Investments | Defensive Strategies (Continued)
As of September 30, 2011
| Shares | Fair Value | |||||
PACKAGING & CONTAINERS - 1.1% | ||||||
| 40,119 | Owens-Illinois, Inc. * | $ | 606,599 | |||
|
| |||||
TOTAL COMMON STOCKS (Cost$20,675,958 ) | 18,697,285 | |||||
|
| |||||
REITs - 13.9% | ||||||
| 2,700 | Acadia Realty Trust | 50,490 | ||||
| 2,300 | Alexandria Real Estate Equities Inc. | 141,197 | ||||
| 1,350 | AvalonBay Communities Inc. | 153,968 | ||||
| 3,600 | Boston Properties Inc. | 320,760 | ||||
| 2,900 | BRE Properties Inc. | 122,786 | ||||
| 4,200 | Brookfield Office Properties Inc. | 57,834 | ||||
| 2,000 | Camden Property Trust | 110,520 | ||||
| 6,300 | Colonial Properties Trust | 114,408 | ||||
| 9,400 | DCT Industrial Trust Inc. | 41,266 | ||||
| 7,000 | DDR Corp. | 76,300 | ||||
| 8,100 | DiamondRock Hospitality Co. | 56,619 | ||||
| 2,400 | Digital Realty Trust Inc. | 132,384 | ||||
| 4,800 | Douglas Emmett Inc. | 82,080 | ||||
| 2,500 | Duke Realty Corp. | 26,250 | ||||
| 5,100 | DuPont Fabros Technology Inc. | 100,419 | ||||
| 4,700 | Education Realty Trust Inc. | 40,373 | ||||
| 2,300 | Entertainment Properties Trust | 89,654 | ||||
| 8,800 | Equity Residential | 456,456 | ||||
| 1,650 | Essex Property Trust Inc. | 198,066 | ||||
| 4,200 | Extra Space Storage Inc. | 78,246 | ||||
| 1,400 | Federal Realty Investment Trust | 115,374 | ||||
| 5,400 | FelCor Lodging Trust Inc. * | 12,582 | ||||
| 2,300 | First Potomac Realty Trust | 28,681 | ||||
| 13,826 | General Growth Properties Inc. | 167,295 | ||||
| 9,400 | HCP Inc. | 329,564 | ||||
| 6,500 | Health Care REIT Inc. | 304,200 | ||||
| 2,300 | Home Properties Inc. | 130,548 | ||||
| 11,000 | Hospitality Properties Trust | 233,530 | ||||
| 3,100 | Kilroy Realty Corp. | 97,030 | ||||
| 12,200 | Kimco Realty Corp. | 183,366 | ||||
| 6,800 | Lexington Realty Trust | 44,472 | ||||
| 5,900 | Liberty Property Trust | 171,749 | ||||
| 5,663 | Macerich Co./The | 241,414 | ||||
| 3,600 | National Retail Properties Inc. | 96,732 | ||||
| 12,094 | ProLogis Inc. | 293,279 | ||||
| 1,300 | PS Business Parks Inc. | 64,402 | ||||
| 3,700 | Public Storage | 411,995 | ||||
| 1,100 | Rayonier Inc. | 40,469 | ||||
| 1,900 | Regency Centers Corp. | 67,127 | ||||
| 8,729 | Simon Property Group Inc. | 960,015 | ||||
| 3,350 | SL Green Realty Corp. | 194,802 | ||||
| 7,100 | Strategic Hotels & Resorts Inc. * | 30,601 | ||||
| 1,600 | Taubman Centers Inc. | 80,496 | ||||
| 5,100 | UDR Inc. | 112,914 | ||||
The accompanying notes are an integral part of these financial statements.
47
Schedule of Investments | Defensive Strategies (Continued)
As of September 30, 2011
| Shares | Fair Value | |||||
REITs - 13.9% (Continued) | ||||||
| 7,459 | Ventas Inc. | $ | 368,475 | |||
| 5,716 | Vornado Realty Trust | 426,528 | ||||
| 3,400 | Washington Real Estate Investment Trust | 95,812 | ||||
| 5,400 | Weingarten Realty Investors | 114,318 | ||||
|
| |||||
Total REITs (Cost $8,047,569 ) | 7,867,846 | |||||
|
| |||||
EXCHANGE TRADED FUNDS - 15.0% | ||||||
| 19,300 | iShares Silver Trust * | 558,349 | ||||
| 56,400 | PowerShares DB Agriculture Fund * | 1,672,260 | ||||
| 29,800 | PowerShares DB Base Metals Fund * | 552,790 | ||||
| 43,300 | PowerShares DB Commodity Index Tracking Fund * | 1,114,109 | ||||
| 43,500 | PowerShares DB Energy Fund * | 1,118,385 | ||||
| 22,000 | SPDR Gold Shares * | 3,477,760 | ||||
|
| |||||
TOTAL EXCHANGE TRADED FUNDS (Cost $8,215,924 ) | 8,493,653 | |||||
|
| |||||
| Par Value | ||||||
BONDS AND NOTES - 28.7% | ||||||
GOVERNMENT MORTGAGE-BACKED SECURITIES - 3.2% | ||||||
| $ 1,093,282 | GNMA Pool 004947, 5.00%, 02/20/2041 | 1,202,769 | ||||
| 563,167 | GNMA Pool 782858, 6.00%, 11/15/2039 | 628,741 | ||||
|
| |||||
TOTAL GOVERNMENT MORTGAGE-BACKED SECURITIES (Cost $1,787,370 ) | 1,831,510 | |||||
|
| |||||
TREASURY INFLATION PROECTED SECURITIES (TIPS) - 25.5% | ||||||
| 500,000 | TIPS, 3.625%, 04/15/2028 | 1,005,383 | ||||
| 300,000 | TIPS, 3.875%, 04/15/2029 | 620,246 | ||||
| 1,150,000 | TIPS, 2.375%, 01/15/2025 | 1,703,048 | ||||
| 1,235,000 | TIPS, 1.75%, 01/15/2028 | 1,544,500 | ||||
| 500,000 | TIPS, 2.50%, 01/15/2029 | 676,124 | ||||
| 500,000 | TIPS, 3.00%, 07/15/2012 | 646,102 | ||||
| 645,000 | TIPS, 2.00%, 01/15/2014 | 837,679 | ||||
| 550,000 | TIPS, 2.00%, 07/15/2014 | 709,621 | ||||
| 325,000 | TIPS, 1.625%, 01/15/2015 | 414,034 | ||||
| 1,045,000 | TIPS, 2.00%, 01/15/2016 | 1,322,764 | ||||
| 1,050,000 | TIPS, 2.375%, 01/15/2017 | 1,353,394 | ||||
| 300,000 | TIPS, 1.625%, 01/15/2018 | 362,115 | ||||
| 1,250,000 | TIPS, 2.125%, 01/15/2019 | 1,532,985 | ||||
| 501,255 | TIPS, 1.25%, 07/15/2020 | 573,666 | ||||
| 1,040,000 | TIPS, 1.125%, 01/15/2021 | 1,173,182 | ||||
|
| |||||
TOTAL TREASURY INFLATION PROTECTED SECURITIES (TIPS) (Cost $13,208,762 ) | 14,474,843 | |||||
|
| |||||
TOTAL BONDS AND NOTES (Cost $14,996,132 ) | 16,306,353 | |||||
|
| |||||
The accompanying notes are an integral part of these financial statements.
48
Schedule of Investments | Defensive Strategies (Continued)
As of September 30, 2011
| Shares | Fair Value | |||||
MONEY MARKET FUND - 46.5% | ||||||
| 26,400,191 | Fidelity Institutional Money Market Portfolio, 0.07% (A) (Cost $ 26,400,191) | $ | 26,400,191 | |||
|
| |||||
TOTAL INVESTMENTS (Cost $78,335,774)(B) - 136.9% | $ | 77,765,328 | ||||
|
| |||||
LIABILITIES IN EXCESS OF OTHER ASSETS - (36.9)% | (20,995,543) | |||||
|
| |||||
NET ASSETS - 100.00% | $ | 56,769,785 | ||||
|
| |||||
* Non-income producing securities.
(A) Variable rate security; the rate shown represents the yield at September 30, 2011.
(B) Represents cost for financial reporting purposes. Aggregate cost for federal tax purposes is $79,489,331 and differs from fair value by net unrealized appreciation (depreciation) of securities as follows:
Unrealized appreciation | $ | 2,269,125 | ||
Unrealized depreciation | (3,993,128 | ) | ||
|
| |||
Net unrealized depreciation | $ | (1,724,003 | ) | |
|
|
The accompanying notes are an integral part of these financial statements.
49
Schedule of Investments | Strategic Growth
As of September 30, 2011
| Shares | Fair Value | |||||
| MUTUAL FUNDS (A) - 95.7% | ||||||
520,780 | Timothy Plan Aggressive Growth Fund* | $ | 2,900,745 | |||
505,786 | Timothy Plan Defensive Strategies Fund | 5,705,270 | ||||
459,631 | Timothy Plan High Yield Bond Fund | 4,003,385 | ||||
1,115,411 | Timothy Plan International Fund | 7,294,785 | ||||
1,127,377 | Timothy Plan Large/Mid Cap Growth Fund* | 6,820,628 | ||||
558,877 | Timothy Plan Large/Mid Cap Value Fund | 6,611,510 | ||||
256,007 | Timothy Plan Small Cap Value Fund* | 2,769,995 | ||||
| TOTAL MUTUAL FUNDS (Cost $39,842,425) | 36,106,318 | |||||
|
| |||||
| MONEY MARKET FUND - 4.3% | ||||||
1,627,940 | Fidelity Institutional Money Market Portfolio, 0.07% (B) (Cost $1,627,940) | 1,627,940 | ||||
|
| |||||
| TOTAL INVESTMENTS (Cost $41,470,365)(C) - 100.0% | $ | 37,734,258 | ||||
|
| |||||
| LIABILITIES IN EXCESS OF OTHER ASSETS - (0.0)% | (18,858) | |||||
|
| |||||
| TOTAL NET ASSETS - 100.00% | $ | 37,715,400 | ||||
|
| |||||
* Non-income producing securities
(A) Affiliated Funds - Class A.
(B) Variable rate security; the rate shown represents the yield at September 30, 2011.
(C) Represents cost for financial reporting purposes. Aggregate cost for federal tax purposes is $44,307,226 and differs from fair value by net unrealized appreciation (depreciation) of securities as follows:
| Unrealized appreciation | $ | 81,715 | ||||||
| Unrealized depreciation | (6,654,683) | |||||||
|
| |||||||
| Net unrealized depreciation | $ | (6,572,968) | ||||||
|
|
The accompanying notes are an integral part of these financial statements.
50
Schedule of Investments | Conservative Growth
As of September 30, 2011
| Shares | Fair Value | |||||
| �� | MUTUAL FUNDS (A) - 95.4% | |||||
| 153,515 | Timothy Plan Aggressive Growth Fund* | $ | 855,080 | |||
| 741,297 | Timothy Plan Defensive Strategies Fund | 8 ,361,835 | ||||
| 1,153,712 | Timothy Plan Fixed Income Fund | 12,367,797 | ||||
| 400,835 | Timothy Plan High Yield Bond Fund | 3,491,270 | ||||
| 554,824 | Timothy Plan International Fund | 3,628,549 | ||||
| 712,134 | Timothy Plan Large/Mid Cap Growth Fund* | 4 ,308,413 | ||||
| 529,525 | Timothy Plan Large/Mid Cap Value Fund | 6,264,276 | ||||
| 188,648 | Timothy Plan Small Cap Value Fund* | 2 ,041,175 | ||||
|
| |||||
TOTAL MUTUAL FUNDS (Cost $40,084,552) | 41,318,395 | |||||
|
| |||||
MONEY MARKET FUNDS - 4.6% | ||||||
| 2,007,243 | Fidelity Institutional Money Market Portfolio, 0.07% (B) (Cost $2,007,243) | 2,007,243 | ||||
|
| |||||
TOTAL INVESTMENTS (Cost $42,091,795)(C) - 100.0% | $ | 43,325,638 | ||||
|
| |||||
LIABILITIES IN EXCESS OF OTHER ASSETS - 0.0% | (31,447) | |||||
|
| |||||
NET ASSETS - 100.00% | $ | 43,294,191 | ||||
|
| |||||
* Non-income producing securities
(A) Affiliated Funds - Class A.
(B) Variable rate security; the rate shown represents the yield at September 30, 2011.
(C) Represents cost for financial reporting purposes. Aggregate cost for federal tax purposes is $44,276,289 and differs from fair value by net unrealized appreciation (depreciation) of securities as follows:
| Unrealized appreciation | $ 1,027,028 | |||||
| Unrealized depreciation | (1,977,679) | |||||
| ||||||
| Net unrealized depreciation | $ (950,651) | |||||
|
The accompanying notes are an integral part of these financial statements.
51
Timothy Plan Funds
Statements of Assets and Liabilities
September 30, 2011
Aggressive Growth Fund
| International Fund
| Large/Mid Cap Growth Fund
| Small Cap Value Fund
| Large/Mid Cap Value Fund
| Fixed Income Fund
| |||||||||||||||||||
| ||||||||||||||||||||||||
ASSETS: | ||||||||||||||||||||||||
Investments, at cost | $ | 15,276,897 | $ | 32,664,681 | $ | 41,046,708 | $ | 51,163,166 | $ | 84,802,959 | $ | 61,750,970 | ||||||||||||
|
|
|
|
|
|
|
|
|
|
|
| |||||||||||||
Investments, at value | $ | 14,018,622 | $ | 29,616,277 | $ | 37,188,635 | $ | 42,905,220 | $ | 88,251,002 | $ | 66,704,824 | ||||||||||||
Cash | - | 20,994 | - | - | - | - | ||||||||||||||||||
Receivable for securities sold | 283,015 | 235,794 | 228,476 | 141,059 | - | - | ||||||||||||||||||
Receivable for fund shares sold | 10,535 | 5,598 | 17,495 | 33,559 | 86,699 | 500,493 | ||||||||||||||||||
Dividends and interest receivable | 3,192 | 61,355 | 35,274 | 43,776 | 111,539 | 554,947 | ||||||||||||||||||
Prepaid expenses and other assets | 12,264 | 42,486 | 19,668 | �� | 19,358 | 25,988 | 22,457 | |||||||||||||||||
|
|
|
|
|
|
|
|
|
|
|
| |||||||||||||
Total Assets | 14,327,628 | 29,982,504 | 37,489,548 | 43,142,972 | 88,475,228 | 67,782,721 | ||||||||||||||||||
|
|
|
|
|
|
|
|
|
|
|
| |||||||||||||
LIABILITIES: | ||||||||||||||||||||||||
Payable for securities purchased | 267,495 | 45,580 | 436,985 | 104,571 | 672,750 | - | ||||||||||||||||||
Accrued advisory fees | 10,713 | 26,921 | 27,152 | 31,805 | 64,529 | 25,056 | ||||||||||||||||||
Accrued 12b-1 fees | 4,285 | 7,678 | 9,725 | 11,869 | 24,738 | 18,907 | ||||||||||||||||||
Payable for fund shares redeemed | 6,862 | 26,376 | 14,515 | 15,804 | 510,092 | 35,442 | ||||||||||||||||||
Accrued expenses and other liabilities | 12,640 | 25,853 | 23,250 | 24,814 | 45,136 | 33,395 | ||||||||||||||||||
|
|
|
|
|
|
|
|
|
|
|
| |||||||||||||
Total Liabilities | 301,995 | 132,408 | 511,627 | 188,863 | 1,317,245 | 112,800 | ||||||||||||||||||
|
|
|
|
|
|
|
|
|
|
|
| |||||||||||||
Net Assets | $ | 14,025,633 | $ | 29,850,096 | $ | 36,977,921 | $ | 42,954,109 | $ | 87,157,983 | $ | 67,669,921 | ||||||||||||
|
|
|
|
|
|
|
|
|
|
|
| |||||||||||||
NET ASSETS CONSIST OF: | ||||||||||||||||||||||||
Paid in capital | $ | 17,493,782 | $ | 46,936,978 | $ | 39,138,251 | $ | 54,686,457 | $ | 97,339,114 | $ | 64,099,443 | ||||||||||||
Undistributed net investment income (loss) | 193 | 973,777 | 856 | - | 232,082 | 60,137 | ||||||||||||||||||
Accumulated net realized gain (loss) on investments | (2,210,067 | ) | (15,012,255 | ) | 1,696,887 | (3,474,402 | ) | (13,861,256 | ) | (1,443,513 | ) | |||||||||||||
Net unrealized appreciation (depreciation) on investments | (1,258,275 | ) | (3,048,404 | ) | (3,858,073 | ) | (8,257,946 | ) | 3,448,043 | 4,953,854 | ||||||||||||||
|
|
|
|
|
|
|
|
|
|
|
| |||||||||||||
Net Assets | $ | 14,025,633 | $ | 29,850,096 | $ | 36,977,921 | $ | 42,954,109 | $ | 87,157,983 | $ | 67,669,921 | ||||||||||||
|
|
|
|
|
|
|
|
|
|
|
| |||||||||||||
Class A | ||||||||||||||||||||||||
Net Assets | $ | 12,259,199 | $ | 28,422,994 | $ | 34,251,818 | $ | 39,144,613 | $ | 78,255,369 | $ | 59,405,039 | ||||||||||||
Shares of beneficial interest outstanding | 2,202,214 | 4,347,660 | 5,657,844 | 3,616,840 | 6,613,336 | 5,539,160 | ||||||||||||||||||
Net Asset Value, offering price and redemption price per share | $ | 5.57 | $ | 6.54 | $ | 6.05 | $ | 10.82 | $ | 11.83 | $ | 10.72 | ||||||||||||
|
|
|
|
|
|
|
|
|
|
|
| |||||||||||||
Offering Price Per Share (NAV / 0.945) *(NAV / 0.955) | $ | 5.89 | $ | 6.92 | $ | 6.40 | $ | 11.45 | $ | 12.52 | $ | 11.23 | ||||||||||||
|
|
|
|
|
|
|
|
|
|
|
| |||||||||||||
Class C | ||||||||||||||||||||||||
Net Assets | $ | 1,766,434 | $ | 1,427,102 | $ | 2,726,103 | $ | 3,809,496 | $ | 8,902,614 | $ | 8,264,882 | ||||||||||||
Shares of beneficial interest outstanding | 348,897 | 223,425 | 489,815 | 407,532 | 838,935 | 795,933 | ||||||||||||||||||
Net Asset Value, offering price and redemption price per share | $ | 5.06 | $ | 6.39 | $ | 5.57 | $ | 9.35 | $ | 10.61 | $ | 10.38 | ||||||||||||
|
|
|
|
|
|
|
|
|
|
|
| |||||||||||||
Minimum Redemption Price Per Share (NAV * 0.99) | $ | 5.01 | $ | 6.33 | $ | 5.51 | $ | 9.26 | $ | 10.50 | $ | 10.28 | ||||||||||||
|
|
|
|
|
|
|
|
|
|
|
| |||||||||||||
The accompanying notes are an integral part of these financial statements.
52
Timothy Plan Funds
Statements of Assets and Liabilities
September 30, 2011
High Yield Fund | Money Market Fund | Defensive Strategies Fund | Strategic Growth Fund | Conservative Fund | ||||||||||||||||
ASSETS: | ||||||||||||||||||||
Investments, at cost | $ | 24,598,862 | $ | 11,959,139 | $ | 78,335,774 | $ | 41,470,365 | $ | 42,091,795 | ||||||||||
|
|
|
|
|
|
|
|
|
| |||||||||||
Investments, at value | $ | 23,700,932 | $ | 11,959,139 | $ | 77,765,328 | $ | 37,734,258 | $ | 43,325,638 | ||||||||||
Dividends and interest receivable | 627,411 | 57 | 94,734 | 65,253 | 76 | |||||||||||||||
Receivable for securities sold | - | - | 182,774 | - | - | |||||||||||||||
Advisor waiver receivable | - | 3,577 | - | - | - | |||||||||||||||
Receivable for fund shares sold | 23,357 | 92,319 | 494,204 | 10,974 | 30,138 | |||||||||||||||
Prepaid expenses and other assets | 18,668 | 13,275 | 20,733 | 19,664 | 19,981 | |||||||||||||||
|
|
|
|
|
|
|
|
|
| |||||||||||
Total Assets | 24,370,368 | 12,068,367 | 78,557,773 | 37,830,149 | 43,375,833 | |||||||||||||||
|
|
|
|
|
|
|
|
|
| |||||||||||
LIABILITIES: | ||||||||||||||||||||
Accrued advisory fees | 12,423 | 5,288 | 28,871 | 21,285 | 23,900 | |||||||||||||||
Accrued 12b-1 fees | 5,920 | - | 19,248 | 4,128 | 5,071 | |||||||||||||||
Dividends payable | - | 48 | - | - | - | |||||||||||||||
Payable for securities purchased | - | - | 21,586,752 | 65,170 | - | |||||||||||||||
Payable for fund shares redeemed | 34,147 | 6,526 | 128,308 | 2,305 | 30,702 | |||||||||||||||
Accrued expenses and other liabilities | 13,900 | 12,093 | 24,809 | 21,861 | 21,969 | |||||||||||||||
|
|
|
|
|
|
|
|
|
| |||||||||||
Total Liabilities | 66,390 | 23,955 | 21,787,988 | 114,749 | 81,642 | |||||||||||||||
|
|
|
|
|
|
|
|
|
| |||||||||||
Net Assets | $ | 24,303,978 | $ | 12,044,412 | $ | 56,769,785 | $ | 37,715,400 | $ | 43,294,191 | ||||||||||
|
|
|
|
|
|
|
|
|
| |||||||||||
NET ASSETS CONSIST OF: | ||||||||||||||||||||
Paid in capital | $ | 26,987,274 | $ | 12,037,294 | $ | 54,415,337 | $ | 52,455,334 | $ | 49,388,436 | ||||||||||
Undistributed net investment income (loss) | 9,460 | 8,822 | (900,105) | 14,351 | 134,095 | |||||||||||||||
Accumulated net realized gain (loss) on investments | (1,794,826) | (1,704) | 3,824,999 | (11,018,178) | (7,462,183) | |||||||||||||||
Net unrealized appreciation (depreciation) on investments | (897,930) | - | (570,446) | (3,736,107) | 1,233,843 | |||||||||||||||
|
|
|
|
|
|
|
|
|
| |||||||||||
Net Assets | $ | 24,303,978 | $ | 12,044,412 | $ | 56,769,785 | $ | 37,715,400 | $ | 43,294,191 | ||||||||||
|
|
|
|
|
|
|
|
|
| |||||||||||
Class A | ||||||||||||||||||||
Net Assets | $ | 23,109,556 | $ | 12,044,412 | $ | 43,669,866 | $ | 31,269,203 | $ | 35,331,201 | ||||||||||
Shares of beneficial interest outstanding | 2,653,149 | 12,035,604 | 3,870,229 | 4,990,427 | 4,016,174 | |||||||||||||||
Net Asset Value, offering price and redemption price per share | $ | 8.71 | $ | 1.00 | $ | 11.28 | $ | 6.27 | $ | 8.80 | ||||||||||
|
|
|
|
|
|
|
|
|
| |||||||||||
Offering Price Per Share (NAV/ 0.945) *(NAV / 0.955) | $ | 9.12 | N/A | $ | 11.94 | $ | 6.63 | $ | 9.31 | |||||||||||
|
|
|
|
|
|
|
|
|
| |||||||||||
Class C | ||||||||||||||||||||
Net Assets | $ | 1,194,422 | N/A | $ | 13,099,919 | $ | 6,446,197 | $ | 7,962,990 | |||||||||||
Shares of beneficial interest outstanding | 135,961 | N/A | 1,181,718 | 1,106,667 | 966,189 | |||||||||||||||
Net Asset Value, offering price and redemption price per share | $ | 8.79 | N/A | $ | 11.09 | $ | 5.82 | $ | 8.24 | |||||||||||
|
|
|
|
|
|
|
|
|
| |||||||||||
Minimum Redemption Price Per Share (NAV *0.99) | $ | 8.70 | N/A | $ | 10.98 | $ | 5.76 | $ | 8.16 | |||||||||||
|
|
|
|
|
|
|
|
|
| |||||||||||
The accompanying notes are an integral part of these financial statements.
53
Timothy Plan Funds
Statements of Operations
For the Year Ended September 30, 2011
Aggressive Growth Fund
| International Fund
| Large/Mid Cap Fund
| Small Cap Value Fund
| Large/Mid Cap Value Fund
| Fixed Income Fund
| |||||||||||||||||||
Investment Income: | ||||||||||||||||||||||||
Interest income | $ | 794 | $ | 3,174 | $ | 3,813 | $ | 2,142 | $ | 3,981 | $ | 2,585,981 | ||||||||||||
Dividend income | 54,790 | 1,791,359 | 437,722 | 619,242 | 1,874,792 | - | ||||||||||||||||||
Foreign tax withheld | (425) | (78,668) | (3,483) | - | (1,979) | - | ||||||||||||||||||
|
|
|
|
|
|
|
|
|
|
|
| |||||||||||||
Total Investment Income | 55,159 | 1,715,865 | 438,052 | 621,384 | 1,876,794 | 2,585,981 | ||||||||||||||||||
|
|
|
|
|
|
|
|
|
|
|
| |||||||||||||
Operating Expenses: | ||||||||||||||||||||||||
Investment Advisory Fees | 159,802 | 414,505 | 388,930 | 451,870 | 869,305 | 402,731 | ||||||||||||||||||
12b-1 Fees | ||||||||||||||||||||||||
Class A | 43,466 | 98,823 | 109,449 | 129,090 | 233,815 | 148,997 | ||||||||||||||||||
Class C | 20,329 | 19,212 | 29,636 | 47,830 | 102,560 | 79,838 | ||||||||||||||||||
Custody fees | 32,282 | 16,038 | 22,052 | 17,312 | 18,895 | 15,644 | ||||||||||||||||||
Fund Accounting fees | 30,145 | 68,231 | 74,255 | 87,138 | 164,833 | 107,390 | ||||||||||||||||||
Transfer Agent fees | 20,339 | 28,750 | 56,793 | 44,570 | 100,560 | 69,279 | ||||||||||||||||||
Registration fees | 24,518 | 21,170 | 18,075 | 18,093 | 20,977 | 21,124 | ||||||||||||||||||
Administration fees | 5,720 | 11,850 | 12,535 | 14,327 | 27,299 | 18,506 | ||||||||||||||||||
Printing expenses | 4,186 | 12,327 | 7,839 | 10,281 | 15,610 | 11,526 | ||||||||||||||||||
Audit fees | 3,554 | 9,509 | 9,895 | 11,579 | 21,864 | 18,486 | ||||||||||||||||||
Trustees’ fees | 2,762 | 6,119 | 6,638 | 7,660 | 14,929 | 10,241 | ||||||||||||||||||
Non 12b-1 Shareholder Servicing fees | 2,735 | 1,690 | 7,605 | 4,216 | 12,648 | 8,977 | ||||||||||||||||||
Compliance officer fees | 2,668 | 5,846 | 6,295 | 7,960 | 13,867 | 9,374 | ||||||||||||||||||
Insurance expenses | 434 | 992 | 1,034 | 1,210 | 2,353 | 1,463 | ||||||||||||||||||
Miscellaneous expenses | 4,909 | 3,449 | 4,594 | 3,927 | 3,645 | 8,341 | ||||||||||||||||||
|
|
|
|
|
|
|
|
|
|
|
| |||||||||||||
Total Operating Expenses | 357,849 | 718,511 | 755,625 | 857,063 | 1,623,160 | 931,917 | ||||||||||||||||||
Less: Expenses waived and / or reimbursed by Advisor | - | - | - | - | - | (100,683) | ||||||||||||||||||
|
|
|
|
|
|
|
|
|
|
|
| |||||||||||||
Net Operating Expenses | 357,849 | 718,511 | 755,625 | 857,063 | 1,623,160 | 831,234 | ||||||||||||||||||
|
|
|
|
|
|
|
|
|
|
|
| |||||||||||||
Net Investment Income (Loss) | (302,690) | 997,354 | (317,573) | (235,679) | 253,634 | 1,754,747 | ||||||||||||||||||
|
|
|
|
|
|
|
|
|
|
|
| |||||||||||||
Realized and Unrealized Gain (Loss) on Investments: | ||||||||||||||||||||||||
Net realized gain (loss) on investments | 4,761,306 | 482,597 | 8,917,696 | 10,547,043 | 6,770,993 | 344,476 | ||||||||||||||||||
Capital gain dividends from REITs | - | - | - | 30,331 | - | - | ||||||||||||||||||
Net change in unrealized appreciation (depreciation) on investments | (4,054,367) | (6,956,347) | (7,806,078) | (11,647,521) | (6,538,239) | 878,362 | ||||||||||||||||||
|
|
|
|
|
|
|
|
|
|
|
| |||||||||||||
Net Realized and Unrealized Gain (Loss) on Investments | 706,939 | (6,473,750) | 1,111,618 | (1,070,147) | 232,754 | 1,222,838 | ||||||||||||||||||
|
|
|
|
|
|
|
|
|
|
|
| |||||||||||||
Net Increase (Decrease) in Net Assets Resulting From Operations | $ | 404,249 | $ | (5,476,396) | $ | 794,045 | $ | (1,305,826) | $ | 486,388 | $ | 2,977,585 | ||||||||||||
|
|
|
|
|
|
|
|
|
|
|
| |||||||||||||
The accompanying notes are an integral part of these financial statements.
54
Timothy Plan Funds
Statements of Operations
For the Year Ended September 30, 2011
High Yield Bond Fund
| Money Market Fund
| Defensive Strategies Fund
| Strategic Growth Fund
| Conservative Growth Fund
| ||||||||||||||||
Investment Income: | ||||||||||||||||||||
Interest income | $ | 1,841,200 | $ | 11,304 | $ | 685,201 | $ | 201 | $ | 227 | ||||||||||
Dividend income | - | - | 158,138 | 383,945 | 722,380 | |||||||||||||||
Foreign tax withheld | - | - | (162) | - | - | |||||||||||||||
|
|
|
|
|
|
|
|
|
| |||||||||||
Total Investment Income | 1,841,200 | 11,304 | 843,177 | 384,146 | 722,607 | |||||||||||||||
|
|
|
|
|
|
|
|
|
| |||||||||||
Operating Expenses: | ||||||||||||||||||||
Investment Advisory Fees | 155,310 | 69,717 | 243,737 | 307,920 | 310,564 | |||||||||||||||
12b-1 Fees | ||||||||||||||||||||
Class A | 61,773 | - | 75,798 | 15,714 | 11,735 | |||||||||||||||
Class C | 11,758 | - | 103,034 | 57,804 | 63,124 | |||||||||||||||
Fund Accounting fees | 40,143 | 20,225 | 57,356 | 78,421 | 77,486 | |||||||||||||||
Registration fees | 18,476 | 13,266 | 17,319 | 18,628 | 19,046 | |||||||||||||||
Transfer Agent fees | 17,024 | 5,574 | 32,316 | 32,889 | 32,237 | |||||||||||||||
Administration fees | 8,210 | 3,628 | 12,871 | 12,855 | 13,104 | |||||||||||||||
Audit fees | 7,199 | 3,947 | 13,333 | 10,599 | 10,902 | |||||||||||||||
Custody fees | 5,856 | 11,625 | 14,874 | 11,701 | 11,130 | |||||||||||||||
Printing expenses | 5,037 | 4,275 | 6,263 | 9,879 | 9,536 | |||||||||||||||
Trustees’ fees | 3,924 | 2,333 | 6,597 | 6,768 | 7,133 | |||||||||||||||
Compliance officer fees | 3,826 | 2,243 | 5,449 | 6,730 | 6,873 | |||||||||||||||
Non 12b-1 Shareholder Servicing fees | 736 | 818 | 1,890 | 1,045 | 1,545 | |||||||||||||||
Insurance expenses | 517 | 263 | 733 | 1,154 | 1,100 | |||||||||||||||
Miscellaneous expenses | 5,419 | 1,978 | 8,405 | 1,978 | 1,728 | |||||||||||||||
|
|
|
|
|
|
|
|
|
| |||||||||||
Total Operating Expenses | 345,208 | 139,892 | 599,975 | 574,085 | 577,243 | |||||||||||||||
Less: Expenses waived and / or reimbursed by Advisor | - | (134,104) | - | - | - | |||||||||||||||
|
|
|
|
|
|
|
|
|
| |||||||||||
Net Operating Expenses | 345,208 | 5,788 | 599,975 | 574,085 | 577,243 | |||||||||||||||
|
|
|
|
|
|
|
|
|
| |||||||||||
Net Investment Income (Loss) | 1,495,992 | 5,516 | 243,202 | (189,939) | 145,364 | |||||||||||||||
|
|
|
|
|
|
|
|
|
| |||||||||||
Realized and Unrealized Gain (loss) on Investments: | ||||||||||||||||||||
Net realized gain (loss) on investments | 641,510 | (1,704) | 2,886,487 | (1,558,069) | (117,573) | |||||||||||||||
Capital gain dividends from REITs | - | - | 42,437 | - | - | |||||||||||||||
Net change in unrealized appreciation (depreciation) on investments | (1,912,591) | - | (2,692,803) | 787,545 | 222,040 | |||||||||||||||
|
|
|
|
|
|
|
|
|
| |||||||||||
Net Realized and Unrealized Gain (loss) on Investments | (1,271,081) | (1,704) | 236,121 | (770,524) | 104,467 | |||||||||||||||
|
|
|
|
|
|
|
|
|
| |||||||||||
Net Increase (Decrease) in Net Assets Resulting From Operations | $ | 224,911 | $ | 3,812 | $ | 479,323 | $ | (960,463) | $ | 249,831 | ||||||||||
|
|
|
|
|
|
|
|
|
| |||||||||||
The accompanying notes are an integral part of these financial statements.
55
Timothy Plan Funds
Statements of Changes in Net Assets
| Aggressive Growth Fund | International Fund | Large/Mid Cap Growth Fund | ||||||||||||||||||||||
|
|
|
|
|
| |||||||||||||||||||
| Year Ended September 30, 2011 | Year Ended September 30, 2010 | Year Ended September 30, 2011 | Year Ended September 30, 2010 | Year Ended September 30, 2011 | Year Ended September 30, 2010 | |||||||||||||||||||
Operations: | ||||||||||||||||||||||||
Net investment income (loss) | $ | (302,690) | $ | (254,555) | $ | 997,354 | $ | 197,357 | $ | (317,573) | $ | (332,565) | ||||||||||||
Net realized gain (loss) on investments | 4,761,306 | 3,285,274 | 482,597 | (1,864,844) | 8,917,696 | 3,947,518 | ||||||||||||||||||
Net change in unrealized appreciation (depreciation) on investments | (4,054,367) | (700,397) | (6,956,347) | 2,989,598 | (7,806,078) | 952,504 | ||||||||||||||||||
|
|
|
|
|
|
|
|
|
|
|
| |||||||||||||
Net increase (decrease) in net assets resulting from operations | 404,249 | 2,330,322 | (5,476,396) | 1,322,111 | 794,045 | 4,567,457 | ||||||||||||||||||
|
|
|
|
|
|
|
|
|
|
|
| |||||||||||||
Distributions to Shareholders: | ||||||||||||||||||||||||
Net investment income | ||||||||||||||||||||||||
Class A | - | - | (212,572) | (466,907) | - | - | ||||||||||||||||||
Class B | - | - | - | - | - | - | ||||||||||||||||||
Class C | - | - | (6,909) | (16,268) | - | - | ||||||||||||||||||
|
|
|
|
|
|
|
|
|
|
|
| |||||||||||||
Total dividends and distributions to shareholders | - | - | (219,481) | (483,175) | - | - | ||||||||||||||||||
|
|
|
|
|
|
|
|
|
|
|
| |||||||||||||
Share Transactions of Beneficial Interest: | ||||||||||||||||||||||||
Net proceeds from shares sold | ||||||||||||||||||||||||
Class A | 10,987,506 | (A) | 1,860,320 | (B) | 16,623,458 | 9,293,475 | 8,167,751 | (C) | 6,385,933 | (D) | ||||||||||||||
Class B | - | 23,703 | - | - | 82 | 21,288 | ||||||||||||||||||
Class C | 550,241 | 354,687 | 450,556 | 857,791 | 1,011,733 | 691,586 | ||||||||||||||||||
Reinvestment of dividends and distributions | ||||||||||||||||||||||||
Class A | - | - | 195,030 | 428,150 | - | - | ||||||||||||||||||
Class B | - | - | - | - | - | - | ||||||||||||||||||
Class C | - | - | 5,363 | 13,857 | - | - | ||||||||||||||||||
Cost of shares redeemed | ||||||||||||||||||||||||
Class A | (12,290,951) | (7,615,959) | (18,174,455) | (12,582,095) | (13,512,323) | (7,716,915) | ||||||||||||||||||
Class B | (434,859) | (A) | (93,874) | (B) | - | - | (796,263) | (C) | (558,323) | (D) | ||||||||||||||
Class C | (474,183) | (433,734) | (701,587) | (367,443) | (775,564) | (525,440) | ||||||||||||||||||
|
|
|
|
|
|
|
|
|
|
|
| |||||||||||||
Net increase (decrease) in net assets from share transactions of beneficial interest | (1,662,246) | (5,904,857) | (1,601,635) | (2,356,265) | (5,904,584) | (1,701,871) | ||||||||||||||||||
|
|
|
|
|
|
|
|
|
|
|
| |||||||||||||
Total Increase (Decrease) in Net Assets | (1,257,997) | (3,574,535) | (7,297,512) | (1,517,329) | (5,110,539) | 2,865,586 | ||||||||||||||||||
Net Assets: | ||||||||||||||||||||||||
Beginning of year | 15,283,630 | 18,858,165 | 37,147,608 | 38,664,937 | 42,088,460 | 39,222,874 | ||||||||||||||||||
|
|
|
|
|
|
|
|
|
|
|
| |||||||||||||
End of year* | $ | 14,025,633 | $ | 15,283,630 | $ | 29,850,096 | $ | 37,147,608 | $ | 36,977,921 | $ | 42,088,460 | ||||||||||||
|
|
|
|
|
|
|
|
|
|
|
| |||||||||||||
* Includes undistributed net investment income (loss) at end of year | $ | 193 | $ | - | $ | 973,777 | $ | 140,572 | $ | 856 | $ | - | ||||||||||||
|
|
|
|
|
|
|
|
|
|
|
| |||||||||||||
Share Activity: | ||||||||||||||||||||||||
Shares Sold | ||||||||||||||||||||||||
Class A | 1,698,086 | 370,914 | 2,028,026 | 1,254,272 | 1,202,215 | 1,144,683 | ||||||||||||||||||
Class B | - | 5,437 | - | - | - | 4,052 | ||||||||||||||||||
Class C | 94,047 | 78,689 | 55,985 | 113,556 | 157,496 | 130,866 | ||||||||||||||||||
Shares Reinvested | ||||||||||||||||||||||||
Class A | - | - | 23,898 | 54,682 | - | - | ||||||||||||||||||
Class B | - | - | - | - | - | - | ||||||||||||||||||
Class C | - | - | 669 | 1,792 | - | - | ||||||||||||||||||
Shares Redeemed | ||||||||||||||||||||||||
Class A | (1,942,170) | (1,694,190) | (2,268,154) | (1,697,642) | (2,032,969) | (1,361,041) | ||||||||||||||||||
Class B | (73,923) | (21,099) | - | - | (126,420) | (103,590) | ||||||||||||||||||
Class C | (80,583) | (96,731) | (89,380) | (50,328) | (122,452) | (99,562) | ||||||||||||||||||
|
|
|
|
|
|
|
|
|
|
|
| |||||||||||||
Net increase (decrease) in shares of beneficial interest outstanding | (304,543) | (1,356,980) | (248,956) | (323,668) | (922,130) | (284,592) | ||||||||||||||||||
|
|
|
|
|
|
|
|
|
|
|
| |||||||||||||
| (A) | Includes automatic conversion of Class B shares ($410,353 representing 69,764.999 shares) to Class A shares ($410,353 representing 63,709.878 shares). |
| (B) | Includes automatic conversion of Class B shares ($32,688 representing 7,631 shares) to Class A shares ($32,688 representing 7,030 shares). |
| (C) | Includes automatic conversion of Class B shares ($735,720 representing 116,705.41 shares) to Class A shares ($735,720 representing 107,627.76 shares). |
| (D) | Includes automatic conversion of Class B shares ($391,947 representing 71,554 shares) to Class A shares ($391,947 representing 66,349 shares). |
The accompanying notes are an integral part of these financial statements.
56
Timothy Plan Funds
Statements of Changes in Net Assets (Continued)
| Small Cap Value Fund
| Large/ Mid Cap Value Fund
| Fixed Income Fund
| ||||||||||||||||||||||
| Year Ended | Year Ended | Year Ended | Year Ended | Year Ended | Year Ended | |||||||||||||||||||
| September 30, 2011 | September 30, 2010 | September 30, 2011 | September 30, 2010 | September 30, 2011 | September 30, 2010 | |||||||||||||||||||
Operations: | ||||||||||||||||||||||||
Net investment income (loss) | $ | (235,679) | $ | (311,453) | $ | 253,634 | $ | 277,344 | $ | 1,754,747 | $ | 1,593,860 | ||||||||||||
Captial Gain Dividends from REITs | 30,331 | 16,268 | - | 14,140 | - | - | ||||||||||||||||||
Net realized gain (loss) on investments | 10,547,043 | 6,310,642 | 6,770,993 | 5,661,957 | 344,476 | 391,226 | ||||||||||||||||||
Net change in unrealized appreciation (depreciation) on investments | (11,647,521) | (1,924,103) | (6,538,239) | 3,112,652 | 878,362 | 2,074,852 | ||||||||||||||||||
|
|
|
|
|
|
|
|
|
|
|
| |||||||||||||
Net increase (decrease) in net assets resulting from operations | (1,305,826) | 4,091,354 | 486,388 | 9,066,093 | 2,977,585 | 4,059,938 | ||||||||||||||||||
|
|
|
|
|
|
|
|
|
|
|
| |||||||||||||
Distributions to Shareholders: | ||||||||||||||||||||||||
Net investment income | ||||||||||||||||||||||||
Class A | - | - | (261,906) | (356,852) | (1,648,039) | (1,463,500) | ||||||||||||||||||
Class B | - | - | (81) | (5,573) | (2,453) | (10,119) | ||||||||||||||||||
Class C | - | - | (14,121) | (32,368) | (162,513) | (152,405) | ||||||||||||||||||
|
|
|
|
|
|
|
|
|
|
|
| |||||||||||||
Total dividends and distributions to shareholders | - | - | (276,108) | (394,793) | (1,813,005) | (1,626,024) | ||||||||||||||||||
|
|
|
|
|
|
|
|
|
|
|
| |||||||||||||
Share Transactions of Beneficial Interest: | ||||||||||||||||||||||||
Net proceeds from shares sold | ||||||||||||||||||||||||
Class A | 12,441,689 | (A) | 5,432,696 | (B) | 22,263,854 | (C) | 17,995,566 | (D) | 19,544,113 | (E) | 23,371,938 | (F) | ||||||||||||
Class B | 4,993 | 15,444 | 5,970 | 16,897 | 17,176 | 11,214 | ||||||||||||||||||
Class C | 813,467 | 869,702 | 1,981,583 | 1,801,079 | 2,724,932 | 4,581,705 | ||||||||||||||||||
Reinvestment of dividends and distributions | ||||||||||||||||||||||||
Class A | - | - | 227,621 | 307,025 | 1,507,072 | 1,366,616 | ||||||||||||||||||
Class B | - | - | - | 5,078 | 1,695 | 8,325 | ||||||||||||||||||
Class C | - | - | 11,456 | 24,598 | 139,301 | 128,869 | ||||||||||||||||||
Cost of shares redeemed | ||||||||||||||||||||||||
Class A | (12,228,520) | (15,636,285) | (25,029,749) | (28,066,046) | (21,533,493) | (16,116,013) | ||||||||||||||||||
Class B | (3,517,825) | (A) | (1,288,320) | (B) | (1,243,569) | (C) | (766,541) | (D) | (324,671) | (E) | (512,736) | (F) | ||||||||||||
Class C | (1,035,742) | (889,192) | (2,549,360) | (2,767,557) | (3,151,176) | (1,762,597) | ||||||||||||||||||
|
|
|
|
|
|
|
|
|
|
|
| |||||||||||||
Net increase (decrease) in net assets from share transactions of beneficial interest | (3,521,938) | (11,495,955) | (4,332,194) | (11,449,901) | (1,075,051) | 11,077,321 | ||||||||||||||||||
|
|
|
|
|
|
|
|
|
|
|
| |||||||||||||
Total Increase (Decrease) in Net Assets | (4,827,764) | (7,404,601) | (4,121,914) | (2,778,601) | 89,529 | 13,511,235 | ||||||||||||||||||
Net Assets: | ||||||||||||||||||||||||
Beginning of year | 47,781,873 | 55,186,474 | 91,279,897 | 94,058,498 | 67,580,392 | 54,069,157 | ||||||||||||||||||
|
|
|
|
|
|
|
|
|
|
|
| |||||||||||||
End of year* | $ | 42,954,109 | $ | 47,781,873 | $ | 87,157,983 | $ | 91,279,897 | $ | 67,669,921 | $ | 67,580,392 | ||||||||||||
|
|
|
|
|
|
|
|
|
|
|
| |||||||||||||
* Includes undistributed net investment income (loss) at end of year | $ | - | $ | - | $ | 232,082 | $ | 253,772 | $ | 60,137 | $ | 32,167 | ||||||||||||
|
|
|
|
|
|
|
|
|
|
|
| |||||||||||||
Share Activity: | ||||||||||||||||||||||||
Shares Sold | ||||||||||||||||||||||||
Class A | 962,077 | 491,833 | 1,667,993 | 1,609,716 | 1,858,115 | 2,264,804 | ||||||||||||||||||
Class B | 438 | 1,620 | 545 | 1,735 | 1,689 | 1,122 | ||||||||||||||||||
Class C | 71,686 | 90,254 | 164,522 | 178,749 | 268,029 | 459,586 | ||||||||||||||||||
Shares Reinvested | ||||||||||||||||||||||||
Class A | - | - | 17,216 | 27,364 | 144,648 | 132,845 | ||||||||||||||||||
Class B | - | - | - | 497 | 169 | 839 | ||||||||||||||||||
Class C | - | - | 960 | 2,416 | 13,842 | 12,923 | ||||||||||||||||||
Shares Redeemed | ||||||||||||||||||||||||
Class A | (934,306) | (1,515,665) | (1,888,346) | (2,542,612) | (2,035,532) | (1,567,585) | ||||||||||||||||||
Class B | (320,029) | (136,357) | (102,892) | (76,437) | (32,234) | (51,241) | ||||||||||||||||||
Class C | (90,575) | (94,152) | (214,474) | (274,697) | (311,801) | (177,159) | ||||||||||||||||||
|
|
|
|
|
|
|
|
|
|
|
| |||||||||||||
Net increase (decrease) in shares of beneficial interest outstanding | (310,709) | (1,162,467) | (354,476) | (1,073,269) | (93,075) | 1,076,134 | ||||||||||||||||||
|
|
|
|
|
|
|
|
|
|
|
| |||||||||||||
| (A) | Includes automatic conversion of Class B shares ($3,411,659 representing 310,664.84 shares) to Class A shares ($3,411,659 representing 267,768.61 shares). |
| (B) | Includes automatic conversion of Class B shares ($665,559 representing 70,422 shares) to Class A shares ($665,559 representing 61,038 shares). |
| (C) | Includes automatic conversion of Class B shares ($1,146,134 representing 95,005.48 shares) to Class A shares ($1,146,134 representing 85,851 shares). |
| (D) | Includes automatic conversion of Class B shares ($485,983 representing 48,535 shares) to Class A shares ($485,983 representing 44,047 shares). |
| (E) | Includes automatic conversion of Class B shares ($305,905 representing 30,369.32 shares) to Class A shares ($305,905 representing 29,462.54 shares). |
| (F) | Includes automatic conversion of Class B shares ($329,284 representing 32,881 shares) to Class A shares ($329,284 representing 31,865 shares). |
The accompanying notes are an integral part of these financial statements.
57
Timothy Plan Funds
Statements of Changes in Net Assets (Continued)
| High Yield Bond Fund | Money Market Fund | Defensive Strategies Fund | ||||||||||||||||||||||
|
|
|
|
|
| |||||||||||||||||||
| Year Ended September 30, 2011 | Year Ended September 30, 2010 | Year Ended September 30, 2011 | Year Ended September 30, 2010 | Year Ended September 30, 2011 | (A) Period Ended September 30, 2010 | |||||||||||||||||||
Operations: | ||||||||||||||||||||||||
Net investment income (loss) | $ | 1,495,992 | $ | 1,381,531 | $ | 5,516 | $ | 10,067 | $ | 243,202 | $ | 6,391 | ||||||||||||
Captial Gain Dividends from REITs | - | - | - | - | 42,437 | 31,216 | ||||||||||||||||||
Net realized gain (loss) on investments | 641,510 | 452,770 | (1,704) | 701 | 2,886,487 | 404,252 | ||||||||||||||||||
Net change in unrealized appreciation (depreciation) on investments | (1,912,591) | 1,010,351 | - | - | (2,692,803) | 2,122,357 | ||||||||||||||||||
|
|
|
|
|
|
|
|
|
|
|
| |||||||||||||
Net increase (decrease) in net assets resulting from operations | 224,911 | 2,844,652 | 3,812 | 10,768 | 479,323 | 2,564,216 | ||||||||||||||||||
|
|
|
|
|
|
|
|
|
|
|
| |||||||||||||
Distributions to Shareholders: | ||||||||||||||||||||||||
From net realized gains | ||||||||||||||||||||||||
Class A | - | - | - | - | (112,375) | (434,295) | ||||||||||||||||||
Class C | - | - | - | - | (33,422) | (104,053) | ||||||||||||||||||
Net investment income | ||||||||||||||||||||||||
Class A | (1,427,454) | (1,331,309) | (5,496) | (10,048) | - | (2,918) | ||||||||||||||||||
Class C | (59,102) | (50,198) | - | - | - | (445) | ||||||||||||||||||
From return of capital | ||||||||||||||||||||||||
Class A | - | - | - | - | - | (397,132) | ||||||||||||||||||
Class C | - | - | - | - | - | (80,358) | ||||||||||||||||||
|
|
|
|
|
|
|
|
|
|
|
| |||||||||||||
Total dividends and distributions to shareholders | (1,486,556) | (1,381,507) | (5,496) | (10,048) | (145,797) | (1,019,201) | ||||||||||||||||||
|
|
|
|
|
|
|
|
|
|
|
| |||||||||||||
Share Transactions of Beneficial Interest: | ||||||||||||||||||||||||
Net proceeds from shares sold | ||||||||||||||||||||||||
Class A | 12,333,861 | 6,933,191 | 11,028,908 | 62,161,696 | 28,601,051 | 24,560,497 | ||||||||||||||||||
Class C | 610,998 | 548,832 | - | - | 8,352,520 | 5,422,174 | ||||||||||||||||||
Reinvestment of dividends and distributions | ||||||||||||||||||||||||
Class A | 1,345,820 | 1,261,483 | 5,149 | 8,029 | 111,243 | 829,995 | ||||||||||||||||||
Class C | 41,814 | 35,472 | - | - | 33,336 | 184,556 | ||||||||||||||||||
Cost of shares redeemed | ||||||||||||||||||||||||
Class A | (10,987,110) | (6,727,086) | (12,377,681) | (75,948,932) | (8,638,114) | (3,422,455) | ||||||||||||||||||
Class C | (436,012) | (145,950) | - | - | (910,938) | (232,621) | ||||||||||||||||||
|
|
|
|
|
|
|
|
|
|
|
| |||||||||||||
Net increase (decrease) in net assets from share transactions of beneficial interest | 2,909,371 | 1,905,942 | (1,343,624) | (13,779,207) | 27,549,098 | 27,342,146 | ||||||||||||||||||
|
|
|
|
|
|
|
|
|
|
|
| |||||||||||||
Total Increase (Decrease) in Net Assets | 1,647,726 | 3,369,087 | (1,345,308) | (13,778,487) | 27,882,624 | 28,887,161 | ||||||||||||||||||
Net Assets: | ||||||||||||||||||||||||
Beginning of year | 22,656,252 | 19,287,165 | 13,389,720 | 27,168,207 | 28,887,161 | - | ||||||||||||||||||
|
|
|
|
|
|
|
|
|
|
|
| |||||||||||||
End of year* | $ | 24,303,978 | $ | 22,656,252 | $ | 12,044,412 | $ | 13,389,720 | $ | 56,769,785 | $ | 28,887,161 | ||||||||||||
|
|
|
|
|
|
|
|
|
|
|
| |||||||||||||
* Includes undistributed net investment income (loss) at end of year | $ | 9,460 | $ | 24 | $ | 8,822 | $ | 7,884 | $ | (900,105) | $ | 3,027 | ||||||||||||
|
|
|
|
|
|
|
|
|
|
|
| |||||||||||||
Share Activity: | ||||||||||||||||||||||||
Shares Sold | ||||||||||||||||||||||||
Class A | 1,320,132 | 782,374 | 11,028,909 | 62,161,697 | 2,412,710 | 2,434,205 | ||||||||||||||||||
Class C | 64,843 | 61,641 | - | - | 734,318 | 527,240 | ||||||||||||||||||
Shares Reinvested | ||||||||||||||||||||||||
Class A | 147,305 | 142,723 | 5,149 | 8,029 | 9,995 | 77,678 | ||||||||||||||||||
Class C | 4,549 | 3,983 | - | - | 3,033 | 17,476 | ||||||||||||||||||
Shares Redeemed | ||||||||||||||||||||||||
Class A | (1,188,798) | (766,222) | (12,379,627) | (75,948,933) | (735,810) | (328,549) | ||||||||||||||||||
Class C | (46,817) | (16,540) | - | - | (77,986) | (22,363) | ||||||||||||||||||
|
|
|
|
|
|
|
|
|
|
|
| |||||||||||||
Net increase (decrease) in shares of beneficial interest outstanding | 301,214 | 207,959 | (1,345,569 | ) | (13,779,207 | ) | 2,346,260 | 2,705,687 | ||||||||||||||||
|
|
|
|
|
|
|
|
|
|
|
| |||||||||||||
The accompanying notes are an integral part of these financial statements.
58
Timothy Plan Funds
Statements of Changes in Net Assets (Continued)
| Strategic Growth Fund
| Conservative Growth Fund
| |||||||||||||||
| Year Ended September 30, 2011 | Year Ended September 30, 2010 | Year Ended September 30, 2011 | Year Ended September 30, 2010 | |||||||||||||
Operations: | ||||||||||||||||
Net investment income (loss) | $ | (189,939) | $ | 41,292 | $ | 145,364 | $ | 393,452 | ||||||||
Net realized gain (loss) on investments | (1,558,069) | (4,580,132) | (117,573) | (4,077,746) | ||||||||||||
Capital gain distributions from affiliated funds | - | 15,230 | - | 23,585 | ||||||||||||
Net change in unrealized appreciation (depreciation) on investments | 787,545 | 8,000,124 | 222,040 | 7,145,318 | ||||||||||||
|
|
|
|
|
|
|
| |||||||||
Net increase (decrease) in net assets resulting from operations | (960,463) | 3,476,514 | 249,831 | 3,484,609 | ||||||||||||
|
|
|
|
|
|
|
| |||||||||
Distributions to Shareholders: | ||||||||||||||||
Net Investment Income | ||||||||||||||||
Class A | - | - | (322,689) | (456,632) | ||||||||||||
Class B | - | - | (12,992) | (61,754) | ||||||||||||
Class C | - | - | (57,747) | (89,581) | ||||||||||||
From return of capital | ||||||||||||||||
Class A | (41,359) | - | - | - | ||||||||||||
|
|
|
|
|
|
|
| |||||||||
Total dividends and distributions to shareholders | (41,359) | - | (393,428) | (607,967) | ||||||||||||
|
|
|
|
|
|
|
| |||||||||
Share Transactions of Beneficial Interest: | ||||||||||||||||
Net proceeds from shares sold | ||||||||||||||||
Class A | 11,602,959 | (A) | 10,177,043 | (B) | 11,948,847 | (C) | 9,573,831 | (D) | ||||||||
Class B | 915 | 76,783 | 86,938 | 84,058 | ||||||||||||
Class C | 1,483,698 | 1,472,104 | 2,242,908 | 1,948,340 | ||||||||||||
Reinvestment of dividends and distributions | ||||||||||||||||
Class A | 37,242 | - | 285,257 | 406,673 | ||||||||||||
Class B | - | - | 12,537 | 57,996 | ||||||||||||
Class C | - | - | 53,050 | 83,067 | ||||||||||||
Cost of shares redeemed | ||||||||||||||||
Class A | (13,360,343) | (8,677,400) | (11,723,735) | (10,282,385) | ||||||||||||
Class B | (5,109,691) | (A) | (1,985,860) | (B) | (3,617,843) | (C) | (2,370,007) | (D) | ||||||||
Class C | (1,668,875) | (2,688,307) | (1,577,257) | (2,601,447) | ||||||||||||
|
|
|
|
|
|
|
| |||||||||
Net increase (decrease) in net assets from share transactions of beneficial interest | (7,014,095) | (1,625,637) | (2,289,298) | (3,099,874) | ||||||||||||
|
|
|
|
|
|
|
| |||||||||
Total Increase (Decrease) in Net Assets | (8,015,917) | 1,850,877 | (2,432,895) | (223,232) | ||||||||||||
Net Assets: | ||||||||||||||||
Beginning of year | 45,731,317 | 43,880,440 | 45,727,086 | 45,950,318 | ||||||||||||
|
|
|
|
|
|
|
| |||||||||
End of year* | $ | 37,715,400 | $ | 45,731,317 | $ | 43,294,191 | $ | 45,727,086 | ||||||||
|
|
|
|
|
|
|
| |||||||||
* Includes undistributed net investment income (loss) at end of year | $ | 14,351 | $ | 41,292 | $ | 134,095 | $ | 393,362 | ||||||||
|
|
|
|
|
|
|
| |||||||||
Share Activity: | ||||||||||||||||
Shares Sold | ||||||||||||||||
Class A | 1,612,904 | 1,638,898 | 1,273,358 | 1,132,186 | ||||||||||||
Class B | 135 | 13,219 | 9,964 | 10,502 | ||||||||||||
Class C | 221,382 | 252,813 | 254,069 | 248,499 | ||||||||||||
Shares Reinvested | ||||||||||||||||
Class A | 5,216 | - | 30,839 | 48,356 | ||||||||||||
Class B | - | - | 1,434 | 7,259 | ||||||||||||
Class C | - | - | 6,084 | 10,422 | ||||||||||||
Shares Redeemed | ||||||||||||||||
Class A | (1,879,526 | ) | (1,424,189 | ) | (1,255,867 | ) | (1,226,929 | ) | ||||||||
Class B | (766,198 | ) | (343,379 | ) | (410,466 | ) | (296,980 | ) | ||||||||
Class C | (255,163 | ) | (460,286 | ) | (178,853 | ) | (331,829 | ) | ||||||||
|
|
|
|
|
|
|
| |||||||||
Net increase (decrease) in shares of beneficial interest outstanding | (1,061,251) | (322,924) | (269,438) | (398,514) | ||||||||||||
|
|
|
|
|
|
|
| |||||||||
| (A) | Includes automatic conversion of Class shares ($2,385,212 representing 341,496.09 shares) to Class A shares ($2,385,212 representing 320,934.11 shares). |
| (B) | Includes automatic conversion of Class B shares ($942,809 representing 163,586 shares) to Class A shares ($942,809 representing 154,781 shares). |
| (C) | Includes automatic conversion of Class B shares ($3,374,998 representing 382,807.56 shares) to Class A shares ($3,374,998 representing 360,845.90 shares). |
| (D) | Includes automatic conversion of Class B shares ($949,372 representing 118,537 shares) to Class A shares ($949,372 representing 112,309 shares). |
The accompanying notes are an integral part of these financial statements.
59
Timothy Aggressive Growth Fund (Class A Shares)
Selected data based on a share outstanding throughout each period
For the Year ended September 30, 2011 | For the Year ended September 30, 2010 | For the Period ended September 30, 2009 (A) | For the Year ended December 31, 2008 | For the Year ended December 31, 2007 | For the Year ended December 31, 2006 | |||||||||||||||||||
Net asset value, beginning of period | $ | 5.42 | $ | 4.51 | $ | 3.71 | $ | 6.80 | $ | 7.04 | $ | 7.38 | ||||||||||||
|
|
|
|
|
|
|
|
|
|
|
| |||||||||||||
INCOME (LOSS) FROM INVESTMENT OPERATIONS: | ||||||||||||||||||||||||
Net investment income (loss) | (0.10) | (B) | (0.09) | (0.05) | (0.07) | (0.06) | (0.08) | |||||||||||||||||
Net realized and unrealized gain (loss) on investments | 0.25 | 1.00 | 0.85 | (3.01) | 0.59 | 0.65 | ||||||||||||||||||
|
|
|
|
|
|
|
|
|
|
|
| |||||||||||||
Total from investment operations | 0.15 | 0.91 | 0.80 | (3.08) | 0.53 | 0.57 | ||||||||||||||||||
|
|
|
|
|
|
|
|
|
|
|
| |||||||||||||
LESS DISTRIBUTIONS: | ||||||||||||||||||||||||
From net investment income | - | - | - | - | - | - | ||||||||||||||||||
From net realized gains on investments | - | - | - | (0.01) | (0.77) | (0.91) | ||||||||||||||||||
|
|
|
|
|
|
|
|
|
|
|
| |||||||||||||
Total distributions | - | - | - | (0.01) | (0.77) | (0.91) | ||||||||||||||||||
|
|
|
|
|
|
|
|
|
|
|
| |||||||||||||
Net asset value, end of period | $ | 5.57 | $ | 5.42 | $ | 4.51 | $ | 3.71 | $ | 6.80 | $ | 7.04 | ||||||||||||
|
|
|
|
|
|
|
|
|
|
|
| |||||||||||||
Total return (C)(D) | 2.77% | 20.18% | 21.56% | (F) | (45.27)% | 7.66% | 7.50% | |||||||||||||||||
RATIOS/SUPPLEMENTAL DATA: | ||||||||||||||||||||||||
Net assets, end of period (in 000’s) | $ | 12,259 | $ | 13,247 | $ | 17,007 | $ | 14,575 | $ | 24,041 | $ | 23,187 | ||||||||||||
Ratios to average net assets | ||||||||||||||||||||||||
Expenses, before reimbursement | 1.81% | 1.88% | 1.85% | (G) | 1.72% | 1.52% | 1.59% | |||||||||||||||||
Expenses, net reimbursement | 1.81% | 1.88% | 1.85% | (G) | 1.72% | 1.55% | 1.60% | |||||||||||||||||
Net investment income (loss), before reimbursement | (1.52)% | (1.61)% | (1.58)% | (G) | (1.33)% | (0.94)% | (1.17)% | |||||||||||||||||
Net investment income (loss), net reimbursement | (1.52)% | (1.61)% | (1.58)% | (G) | (1.33)% | (0.97)% | (1.18)% | |||||||||||||||||
Portfolio turnover rate | 201% | 89% | 136% | 244% | (E) | 59% | 96% | |||||||||||||||||
| (A) | The Fund elected to change its fiscal year end from December to September. The information presented is for January 1, 2009 through September 30, 2009. |
| (B) | Per share amounts calculated using average shares method, which more appropriately presents the per share data for the period. |
| (C) | Total return calculation does not reflect sales load. |
| (D) | Total return in the above table represents the rate that the investor would have earned or lost on an investment in the Fund assuming reinvestment of dividends. |
Total return would have been higher or lower if certain expenses had not been reimbursed, waived or recouped.
| (E) | On January 1, 2008, Chartwell Investment Partners became sub-advisor for the Fund. |
| (F) | For periods of less than one full year, total return is not annualized. |
| (G) | Annualized. |
The accompanying notes are an integral part of these financial statements.
60
Timothy Aggressive Growth Fund (Class C Shares)
Selected data based on a share outstanding throughout each period
For the Year ended September 30, 2011 | For the Year ended September 30, 2010 | For the Period ended September 30, 2009 (A) | For the Year ended December 31, 2008 | For the Year ended December 31, 2007 | For the Year ended December 31, 2006 | |||||||||||||||||||
Net asset value, beginning of period | $ | 4.98 | $ | 4.18 | $ | 3.46 | $ | 6.37 | $ | 6.69 | $ | 7.11 | ||||||||||||
|
|
|
|
|
|
|
|
|
|
|
| |||||||||||||
INCOME (LOSS) FROM INVESTMENT OPERATIONS: | ||||||||||||||||||||||||
Net investment income (loss) | (0.13) | (B) | (0.11) | (0.06) | (0.11) | (0.10) | (0.11) | |||||||||||||||||
Net realized and unrealized gain (loss) on investments | 0.21 | 0.91 | 0.78 | (2.79) | 0.55 | 0.60 | ||||||||||||||||||
|
|
|
|
|
|
|
|
|
|
|
| |||||||||||||
Total from investment operations | 0.08 | 0.80 | 0.72 | (2.90) | 0.45 | 0.49 | ||||||||||||||||||
|
|
|
|
|
|
|
|
|
|
|
| |||||||||||||
LESS DISTRIBUTIONS: | ||||||||||||||||||||||||
From net investment income | - | - | - | - | - | - | ||||||||||||||||||
From net realized gains on investments | - | - | - | (0.01) | (0.77) | (0.91) | ||||||||||||||||||
|
|
|
|
|
|
|
|
|
|
|
| |||||||||||||
Total distributions | - | - | - | (0.01) | (0.77) | (0.91) | ||||||||||||||||||
|
|
|
|
|
|
|
|
|
|
|
| |||||||||||||
Net asset value, end of period | $ | 5.06 | $ | 4.98 | $ | 4.18 | $ | 3.46 | $ | 6.37 | $ | 6.69 | ||||||||||||
|
|
|
|
|
|
|
|
|
|
|
| |||||||||||||
Total return (C)(D) | 1.61% | 19.14% | 20.81% | (F) | (45.50)% | 6.86% | 6.65% | |||||||||||||||||
RATIOS/SUPPLEMENTAL DATA: | ||||||||||||||||||||||||
Net assets, end of period (in 000’s) | $ | 1,766 | $ | 1,670 | $ | 1,477 | $ | 1,272 | $ | 2,277 | $ | 1,937 | ||||||||||||
Ratios to average net assets | ||||||||||||||||||||||||
Expenses, before reimbursement | 2.57% | 2.63% | 2.60% | (G) | 2.47% | 2.27% | 2.35% | |||||||||||||||||
Expenses, net reimbursement | 2.57% | 2.63% | 2.60% | (G) | 2.47% | 2.30% | 2.35% | |||||||||||||||||
Net investment income (loss), before reimbursement | (2.28)% | (2.35)% | (2.33)% | (G) | (2.08)% | (1.70)% | (1.94)% | |||||||||||||||||
Net investment income (loss), net reimbursement | (2.28)% | (2.35)% | (2.33)% | (G) | (2.08)% | (1.73)% | (1.94)% | |||||||||||||||||
Portfolio turnover rate | 201% | 89% | 136% | 244% | (E) | 59% | 96% | |||||||||||||||||
| (A) | The Fund elected to change its fiscal year end from December to September. The information presented is for January 1, 2009 through September 30, 2009. |
| (B) | Per share amounts calculated using average shares method, which more appropriately presents the per share data for the period. |
| (C) | Total return calculation does not reflect redemption fee. |
| (D) | Total return in the above table represents the rate that the investor would have earned or lost on an investment in the Fund assuming reinvestment of dividends. |
Total return would have been higher or lower if certain expenses had not been reimbursed, waived or recouped.
| (E) | On January 1, 2008, Chartwell Investment Partners became sub-advisor for the Fund. |
| (F) | For periods of less than one full year, total return is not annualized. |
| (G) | Annualized. |
The accompanying notes are an integral part of these financial statements.
61
Timothy International Fund (Class A Shares)
Selected data based on a share outstanding throughout each period
For the Year ended September 30, 2011 | For the Year ended September 30, 2010 | For the Period ended September 30, 2009 (A) | For the Year ended December 31, 2008 | For the Period ended December 31, 2007 (C) | ||||||||||||||||
Net asset value, beginning of period | $ | 7.71 | $ | 7.52 | $ | 5.92 | $ | 11.00 | $ | 10.00 | ||||||||||
|
|
|
|
|
|
|
|
|
| |||||||||||
INCOME (LOSS) FROM INVESTMENT OPERATIONS: | ||||||||||||||||||||
Net investment income (loss) | 0.20 | (B) | 0.04 | 0.08 | 0.09 | 0.04 | ||||||||||||||
Net realized and unrealized gain (loss) on investments | (1.33) | 0.26 | 1.52 | (5.08) | 1.00 | |||||||||||||||
|
|
|
|
|
|
|
|
|
| |||||||||||
Total from investment operations | (1.13) | 0.30 | 1.60 | (4.99) | 1.04 | |||||||||||||||
|
|
|
|
|
|
|
|
|
| |||||||||||
LESS DISTRIBUTIONS: | ||||||||||||||||||||
From net investment income | (0.04) | (0.11) | - | (0.09) | (0.04) | |||||||||||||||
From net realized gains on investments | - | - | - | - | - | |||||||||||||||
|
|
|
|
|
|
|
|
|
| |||||||||||
Total distributions | (0.04) | (0.11) | - | (0.09) | (0.04) | |||||||||||||||
|
|
|
|
|
|
|
|
|
| |||||||||||
Net asset value, end of period | $ | 6.54 | $ | 7.71 | $ | 7.52 | $ | 5.92 | $ | 11.00 | ||||||||||
|
|
|
|
|
|
|
|
|
| |||||||||||
Total return (D)(E) | (14.72)% | 3.93% | 27.03% | (F) | (45.38)% | 10.39% | (F) | |||||||||||||
RATIOS/SUPPLEMENTAL DATA: | ||||||||||||||||||||
Net assets, end of period (in 000’s) | $ | 28,423 | $ | 35,206 | $ | 37,248 | $ | 31,214 | $ | 42,298 | ||||||||||
Ratio of Expenses to average net assets | 1.70% | 1.74% | 1.72% | (G) | 1.66% | 1.69% | (G) | |||||||||||||
Ratio of Net investment income (loss) to average net assets | 2.45% | 0.58% | 1.68% | (G) | 1.12% | 0.58% | (G) | |||||||||||||
Portfolio turnover rate | 62% | 41% | 38% | 32% | 13% | |||||||||||||||
| (A) | The Fund elected to change its fiscal year end from December to September. The information presented is for January 1, 2009 through September 30, 2009. |
| (B) | Per share amounts calculated using average shares method, which more appropriately presents the per share data for the period. |
| (C) | For the period May 3, 2007 (Commencement of Operations) to December 31, 2007. |
| (D) | Total return calculation does not reflect sales load. |
| (E) | Total return in the above table represents the rate that the investor would have earned or lost on an investment in the Fund assuming reinvestment of dividends. |
| (F) | For periods of less than one full year, total return is not annualized. |
| (G) | Annualized. |
The accompanying notes are an integral part of these financial statements.
62
Timothy International Fund (Class C Shares)
Selected data based on a share outstanding throughout each period
| For the Year ended September 30, 2011 | For the Year ended September 30, 2010 | For the Period ended September 30, 2009 (A) | For the Year Ended December 31, 2008 | For the Period ended December 31, 2007 (C) | ||||||||||||||||
Net asset value, beginning of period | $ | 7.58 | $ | 7.41 | $ | 5.87 | $ | 10.97 | $ | 10.00 | ||||||||||
|
|
|
|
|
|
|
|
|
| |||||||||||
INCOME (LOSS) FROM |
| |||||||||||||||||||
Net Investment Income (loss) | 0.13 | (B) | (0.01) | 0.04 | 0.04 | (0.02) | ||||||||||||||
Net realized and unrealized gain (loss) on Investments | (1.29) | 0.25 | 1.50 | (5.07) | 0.99 | |||||||||||||||
|
|
|
|
|
|
|
|
|
| |||||||||||
Total from Investment operations | (1.16) | 0.24 | 1.54 | (5.03) | 0.97 | |||||||||||||||
|
|
|
|
|
|
|
|
|
| |||||||||||
LESS DISTRIBUTIONS: |
| |||||||||||||||||||
From net Investment Income | (0.03) | (0.07) | - | (0.07) | - | * | ||||||||||||||
From net realized gains on Investments | - | - | - | - | - | |||||||||||||||
|
|
|
|
|
|
|
|
|
| |||||||||||
Total distributions | (0.03) | (0.07) | - | (0.07) | - | |||||||||||||||
|
|
|
|
|
|
|
|
|
| |||||||||||
Net asset value, end of period | $ | 6.39 | $ | 7.58 | $ | 7.41 | $ | 5.87 | $ | 10.97 | ||||||||||
|
|
|
|
|
|
|
|
|
| |||||||||||
Total return (D)(E) | (15.40)% | 3.27% | 26.24% | (F) | (45.79)% | 9.71% | (F) | |||||||||||||
RATIOS/SUPPLEMENTAL DATA: |
| |||||||||||||||||||
Net assets, end of period (in 000’s) | $ | 1,427 | $ | 1,941 | $ | 1,417 | $ | 984 | $ | 1,318 | ||||||||||
Ratio of Expenses to average net assets | 2.45% | 2.49% | 2.47% | (G) | 2.40% | 2.48% | (G) | |||||||||||||
Ratio of Net Investment Income (loss) to average net assets | 1.58% | (0.15)% | 0.85% | (G) | 0.45% | (0.44)% | (G) | |||||||||||||
Portfolio turnover rate | 62% | 41% | 38% | 32% | 15% | |||||||||||||||
*Amount is less than $0.005 per share.
(A) The Fund elected to change its fiscal year end from December to September. The information presented is for January 1, 2009 through September 30, 2009.
(B) Per share amounts calculated using average shares method, which more appropriately presents the per share data for the period.
(C) For the period May 3, 2007 (Commencement of Operations) to December 31, 2007.
(D) Total return calculation does not reflect redemption fee.
(E) Total return in the above table represents the rate that the Investor would have earned or lost on an Investment in the Fund assuming reinvestment of dividends.
(F) For periods of less than one full year, total return is not annualized.
(G) Annualized.
The accompanying notes are an integral part of these financial statements.
63
Timothy Large/Mid Cap Growth Fund (Class A Shares)
Selected data based on a share outstanding throughout each period
| For the Year ended September 30, 2011 | For the Year ended 2010 | For the Period ended September 30, 2009 (A) | For the Year ended December 31, 2008 | For the Year ended December 31, 2007 | For the Year ended December 31, 2006 | |||||||||||||||||||
Net asset value, beginning of period | $ | 5.99 | $ | 5.37 | $ | 4.38 | $ | 6.89 | $ | 7.25 | $ | 6.92 | ||||||||||||
|
|
|
|
|
|
|
|
|
|
|
| |||||||||||||
INCOME (LOSS) FROM INVESTMENT OPERATIONS: | ||||||||||||||||||||||||
Net Investment Income (loss) | (0.04 | ) (B) | (0.04 | ) | (0.02 | ) | (0.04 | ) | (0.03 | ) | (0.04 | ) | ||||||||||||
Net realized and unrealized gain on Investments | 0.10 | 0.66 | 1.01 | (2.46 | ) | 0.39 | 0.37 | |||||||||||||||||
|
|
|
|
|
|
|
|
|
|
|
| |||||||||||||
Total from Investment operations | 0.06 | 0.62 | 0.99 | (2.50 | ) | 0.36 | 0.33 | |||||||||||||||||
|
|
|
|
|
|
|
|
|
|
|
| |||||||||||||
LESS DISTRIBUTIONS: |
| |||||||||||||||||||||||
From net Investment Income | - | - | - | - | - | - | ||||||||||||||||||
From net realized gains on Investments | - | - | - | (0.01 | ) | (0.72 | ) | - | ||||||||||||||||
|
|
|
|
|
|
|
|
|
|
|
| |||||||||||||
Total distributions | - | - | - | (0.01 | ) | (0.72 | ) | - | ||||||||||||||||
|
|
|
|
|
|
|
|
|
|
|
| |||||||||||||
Net asset value, end of period | $ | 6.05 | $ | 5.99 | $ | 5.37 | $ | 4.38 | $ | 6.89 | $ | 7.25 | ||||||||||||
|
|
|
|
|
|
|
|
|
|
|
| |||||||||||||
Total return (C)(D) | 1.00% | 11.55% | 22.60% | (F) | (36.30)% | 5.09% | 4.77% | |||||||||||||||||
RATIOS/SUPPLEMENTAL DATA: | ||||||||||||||||||||||||
Net assets, end of period (in 000’s) | $ | 34,252 | $ | 38,865 | $ | 35,973 | $ | 32,484 | $ | 53,183 | $ | 65,510 | ||||||||||||
Ratios to average net assets | ||||||||||||||||||||||||
Expenses, before reimbursement | 1.60% | 1.66% | 1.67% | (G) | 1.56% | 1.46% | 1.52% | |||||||||||||||||
Expenses, net reimbursement | 1.60% | 1.66% | 1.67% | (G) | 1.56% | 1.46% | 1.53% | |||||||||||||||||
Net Investment Income (loss), before reimbursement | (0.64)% | (0.74)% | (0.58)% | (G) | (0.64)% | (0.37)% | (0.56)% | |||||||||||||||||
Net Investment Income (loss), net reimbursement | (0.64)% | (0.74)% | (0.58)% | (G) | (0.64)% | (0.37)% | (0.57)% | |||||||||||||||||
Portfolio turnover rate | 150% | 78% | 78% | 177% | (E) | 45% | 60% | |||||||||||||||||
(A) The Fund elected to change its fiscal year end from December to September. The information presented is for January 1, 2009 through September 30, 2009.
(B) Per share amounts calculated using average shares method, which more appropriately presents the per share data for the period.
(C) Total return calculation does not reflect sales load.
(D) Total return in the above table represents the rate that the Investor would have earned or lost on an Investment in the Fund assuming reinvestment of dividends. Total return would have been higher or lower if certain expenses had not been reimbursed, waived or recouped.
(E) On January 1, 2008, Chartwell Investment Partners became sub-advisor for the Fund.
(F) For periods of less than one full year, total return is not annualized.
(G) Annualized.
The accompanying notes are an integral part of these financial statements.
64
Timothy Large/Mid Cap Growth Fund (Class C Shares)
Selected data based on a share outstanding throughout each period
| For the Year ended September 30, 2011 | For the Year ended 2010 | For the Period ended September 30, 2009 (A) | For the Year ended December 31, 2008 | For the Year ended December 31, 2007 | For the Year December 31, 2006 | |||||||||||||||||||
Net asset value, beginning of period | $ | 5.55 | $ | 5.01 | $ | 4.11 | $ | 6.51 | $ | 6.95 | $ | 6.69 | ||||||||||||
|
|
|
|
|
|
|
|
|
|
|
| |||||||||||||
INCOME (LOSS) FROM INVESTMENT OPERATIONS: | ||||||||||||||||||||||||
Net Investment Income (loss) | (0.09 | ) (B) | (0.08 | ) | (0.04 | ) | (0.08 | ) | (0.07 | ) | (0.07 | ) | ||||||||||||
Net realized and unrealized gain (loss) on Investments | 0.11 | 0.62 | 0.94 | (2.31 | ) | 0.35 | 0.33 | |||||||||||||||||
|
|
|
|
|
|
|
|
|
|
|
| |||||||||||||
Total from Investment operations | 0.02 | 0.54 | 0.90 | (2.39 | ) | 0.28 | 0.26 | |||||||||||||||||
|
|
|
|
|
|
|
|
|
|
|
| |||||||||||||
LESS DISTRIBUTIONS: | ||||||||||||||||||||||||
From net Investment Income | - | - | - | - | - | - | ||||||||||||||||||
From net realized gains on Investments | - | - | - | (0.01 | ) | (0.72 | ) | - | ||||||||||||||||
|
|
|
|
|
|
|
|
|
|
|
| |||||||||||||
Total distributions | - | - | - | (0.01 | ) | (0.72 | ) | - | ||||||||||||||||
|
|
|
|
|
|
|
|
|
|
|
| |||||||||||||
Net asset value, end of period | $ | 5.57 | $ | 5.55 | $ | 5.01 | $ | 4.11 | $ | 6.51 | $ | 6.95 | ||||||||||||
|
|
|
|
|
|
|
|
|
|
|
| |||||||||||||
Total return (C)(D) | 0.36% | 10.78% | 21.90% | (F) | (36.73)% | 4.15% | 3.89% | |||||||||||||||||
RATIOS/SUPPLEMENTAL DATA: | ||||||||||||||||||||||||
Net assets, end of period (in 000’s) | $ | 2,726 | $ | 2,523 | $ | 2,120 | $ | 1,971 | $ | 3,097 | $ | 2,222 | ||||||||||||
Ratios to average net assets | ||||||||||||||||||||||||
Expenses, before reimbursement | 2.35% | 2.41% | 2.42% | (G) | 2.31% | 2.22% | 2.27% | |||||||||||||||||
Expenses, net reimbursement | 2.35% | 2.41% | 2.42% | (G) | 2.31% | 2.22% | 2.27% | |||||||||||||||||
Net Investment Income (loss), before reimbursement | (1.38)% | (1.49)% | (1.33)% | (G) | (1.39)% | (1.12)% | (1.31)% | |||||||||||||||||
Net Investment Income (loss), net reimbursement | (1.38)% | (1.49)% | (1.33)% | (G) | (1.39)% | (1.12)% | (1.31)% | |||||||||||||||||
Portfolio turnover rate | 150% | 78% | 78% | 177% | (E) | 45% | 60% | |||||||||||||||||
(A) The Fund elected to change its fiscal year end from December to September. The information presented is for January 1, 2009 through September 30, 2009.
(B) Per share amounts calculated using average shares method, which more appropriately presents the per share data for the period.
(C) Total return calculation does not reflect redemption fee.
(D) Total return in the above table represents the rate that the Investor would have earned or lost on an Investment in the Fund assuming reinvestment of dividends. Total return would have been higher or lower if certain expenses had not been reimbursed, waived or recouped.
(E) On January 1, 2008, Chartwell Investment Partners became sub-advisor for the Fund.
(F) For periods of less than one full year, total return is not annualized.
(G) Annualized.
The accompanying notes are an integral part of these financial statements.
65
Timothy Small Cap Value Fund (Class A Shares)
Selected data based on a share outstanding throughout each period
| For the Year ended September 30, 2011 | For the Year ended September 30, 2010 | For the Period ended September 30, 2009 (A) | For the Year ended December 31, 2008 | For the Year ended December 31, 2007 | For the Year ended December 31, 2006 | |||||||||||||||||||
Net asset value, beginning of period | $ | 11.28 | $ | 10.25 | $ | 8.88 | $ | 13.27 | $ | 14.94 | $ | 15.27 | ||||||||||||
|
|
|
|
|
|
|
|
|
|
|
| |||||||||||||
INCOME (LOSS) FROM INVESTMENT OPERATIONS: |
| |||||||||||||||||||||||
Net investment income (loss) | (0.05) | (B) | (0.06) | (0.05) | 0.01 | 0.04 | 0.22 | |||||||||||||||||
Net realized and unrealized gain (loss) on investments | (0.41) | (C) | 1.09 | 1.42 | (4.33) | 0.36 | 2.77 | |||||||||||||||||
|
|
|
|
|
|
|
|
|
|
|
| |||||||||||||
Total from investment operations | (0.46) | 1.03 | 1.37 | (4.32) | 0.40 | 2.99 | ||||||||||||||||||
|
|
|
|
|
|
|
|
|
|
|
| |||||||||||||
LESS DISTRIBUTIONS: |
| |||||||||||||||||||||||
From net investment income | - | - | - | - | (0.03) | (0.22) | ||||||||||||||||||
From net realized gains on investments | - | - | - | (0.07) | (2.04) | (3.10) | ||||||||||||||||||
|
|
|
|
|
|
|
|
|
|
|
| |||||||||||||
Total distributions | - | - | - | (0.07) | (2.07) | (3.32) | ||||||||||||||||||
|
|
|
|
|
|
|
|
|
|
|
| |||||||||||||
Net asset value, end of period | $ | 10.82 | $ | 11.28 | $ | 10.25 | $ | 8.88 | $ | 13.27 | $ | 14.94 | ||||||||||||
|
|
|
|
|
|
|
|
|
|
|
| |||||||||||||
Total return (D)(E) | (4.08)% | 10.05% | 15.43% | (F) | (32.50)% | 2.87% | 19.69% | |||||||||||||||||
RATIOS/SUPPLEMENTAL DATA: |
| |||||||||||||||||||||||
Net assets, end of period (in 000’s) | $ | 39,145 | $ | 40,482 | $ | 47,268 | $ | 42,651 | $ | 62,525 | $ | 66,097 | ||||||||||||
Ratio of Expenses to average net assets | 1.53% | 1.59% | 1.59% | (G) | 1.50% | 1.44% | 1.52% | |||||||||||||||||
Ratio of Net investment income (loss) to average net assets | (0.36)% | (0.51)% | (0.71)% | (G) | 0.05% | 0.24% | 1.39% | |||||||||||||||||
Portfolio turnover rate | 102% | 64% | 57% | 110% | 60% | 148% | ||||||||||||||||||
| (A) | The Fund elected to change its fiscal year end from December to September. The information presented is for January 1, 2009 through September 30, 2009. |
| (B) | Per share amounts calculated using average shares method, which more appropriately presents the per share data for the period. |
| (C) | Realized and unrealized gains and losses per share in this caption are balancing amounts necessary to reconcile the change in net asset value per share for the period, and may not agree to the aggregate gains and losses in the Statement of Operations due to the fluctuations in share transactions. |
| (D) | Total return calculation does not reflect sales load. |
| (E) | Total return in the above table represents the rate that the investor would have earned or lost on an investment in the Fund assuming reinvestment of dividends. |
| (F) | For periods of less than one full year, total return is not annualized. |
| (G) | Annualized. |
The accompanying notes are an integral part of these financial statements.
66
Timothy Small Cap Value Fund (Class C Shares)
Selected data based on a share outstanding throughout each period
| For the Year ended September 30, 2011 | For the Year ended September 30, 2010 | For the Period ended September 30, 2009 (A) | For the Year ended December 31, 2008 | For the Year ended December 31, 2007 | For the Year ended December 31, 2006 | |||||||||||||||||||
| Net asset value, beginning of period | $ | 9.82 | $ | 8.99 | $ | 7.83 | $ | 11.80 | $ | 13.58 | $ | 14.12 | ||||||||||||
|
|
|
|
|
|
|
|
|
|
|
| |||||||||||||
INCOME (LOSS) FROM INVESTMENT OPERATIONS: |
| |||||||||||||||||||||||
| Net investment income (loss) | (0.13) | (B) | (0.12) | (0.09) | (0.07) | (0.05) | 0.09 | |||||||||||||||||
| Net realized and unrealized gain (loss) on investments | (0.34) | (C) | 0.95 | 1.25 | (3.83) | 0.31 | 2.56 | |||||||||||||||||
|
|
|
|
|
|
|
|
|
|
|
| |||||||||||||
| Total from investment operations | (0.47) | 0.83 | 1.16 | (3.90) | 0.26 | 2.65 | ||||||||||||||||||
|
|
|
|
|
|
|
|
|
|
|
| |||||||||||||
LESS DISTRIBUTIONS: |
| |||||||||||||||||||||||
| From net investment income | - | - | - | - | - | (0.09) | ||||||||||||||||||
| From net realized gains on investments | - | - | - | (0.07) | (2.04) | (3.10) | ||||||||||||||||||
|
|
|
|
|
|
|
|
|
|
|
| |||||||||||||
| Total distributions | - | - | - | (0.07) | (2.04) | (3.19) | ||||||||||||||||||
|
|
|
|
|
|
|
|
|
|
|
| |||||||||||||
| Net asset value, end of period | $ | 9.35 | $ | 9.82 | $ | 8.99 | $ | 7.83 | $ | 11.80 | $ | 13.58 | ||||||||||||
|
|
|
|
|
|
|
|
|
|
|
| |||||||||||||
| Total return (D)(E) | (4.79)% | 9.23% | 14.81% | (F) | (32.99)% | 2.13% | 18.80% | |||||||||||||||||
RATIOS/SUPPLEMENTAL DATA: |
| |||||||||||||||||||||||
| Net assets, end of period (in 000’s) | $ | 3,809 | $ | 4,186 | $ | 3,867 | $ | 3,901 | $ | 6,341 | $ | 4,054 | ||||||||||||
| Ratio of Expenses to average net assets | 2.28% | 2.34% | 2.34% | (G) | 2.25% | 2.19% | 2.27% | |||||||||||||||||
| Ratio of Net investment income (loss) to average net assets | (1.12)% | (1.26)% | (1.45)% | (G) | (0.70)% | (0.47)% | 0.61% | |||||||||||||||||
| Portfolio turnover rate | 102% | 64% | 57% | 110% | 60% | 148% | ||||||||||||||||||
| (A) | The Fund elected to change its fiscal year end from December to September. The information presented is for January 1, 2009 through September 30, 2009. |
| (B) | Per share amounts calculated using average shares method, which more appropriately presents the per share data for the period. |
| (C) | Realized and unrealized gains and losses per share in this caption are balancing amounts necessary to reconcile the change in net asset value per share for the period, and may not agree to the aggregate gains and losses in the Statement of Operations due to the fluctuations in share transactions. |
| (D) | Total return calculation does not reflect redemption fee. |
| (E) | Total return in the above table represents the rate that the investor would have earned or lost on an investment in the Fund assuming reinvestment of dividends. |
| (F) | For periods of less than one full year, total return is not annualized. |
| (G) | Annualized. |
The accompanying notes are an integral part of these financial statements.
67
Timothy Large/Mid Cap Value Fund (Class A Shares)
Selected data based on a share outstanding throughout each period
| For the Year ended September 30, 2011 | For the Year ended September 30, 2010 | For the Period ended September 30, 2009 (A) | For the Year ended December 31, 2008 | For the Year ended December 31, 2007 | For the Year ended December 31, 2006 | |||||||||||||||||||
| Net asset value, Beginning of period | $ | 11.84 | $ | 10.72 | $ | 9.10 | $ | 15.48 | $ | 14.31 | 12.99 | |||||||||||||
|
|
|
|
|
|
|
|
|
|
|
| |||||||||||||
INCOME (LOSS) FROM |
| |||||||||||||||||||||||
| Net investment income (loss) | 0.04 | (B) | 0.05 | 0.04 | 0.05 | 0.15 | 0.16 | |||||||||||||||||
| Net realized and unrealized gain (loss) on investments | (0.01 | ) (C) | 1.12 | 1.58 | (6.26) | 2.26 | 2.24 | |||||||||||||||||
|
|
|
|
|
|
|
|
|
|
|
| |||||||||||||
| Total from investment operations | 0.03 | 1.17 | 1.62 | (6.21) | 2.41 | 2.40 | ||||||||||||||||||
|
|
|
|
|
|
|
|
|
|
|
| |||||||||||||
LESS DISTRIBUTIONS: |
| |||||||||||||||||||||||
| From net investment income | (0.04) | (0.05) | - | (0.03) | (0.16) | (0.16) | ||||||||||||||||||
| From net realized gains on investments | - | - | - | (0.14) | (1.08) | (0.90) | ||||||||||||||||||
| From return of capital | - | - | - | - | - | (0.02) | ||||||||||||||||||
|
|
|
|
|
|
|
|
|
|
|
| |||||||||||||
| Total distributions | (0.04) | (0.05) | - | (0.17) | (1.24) | (1.08) | ||||||||||||||||||
|
|
|
|
|
|
|
|
|
|
|
| |||||||||||||
| Net asset value, end of period | $ | 11.83 | $ | 11.84 | $ | 10.72 | $ | 9.10 | $ | 15.48 | 14.31 | |||||||||||||
|
|
|
|
|
|
|
|
|
|
|
| |||||||||||||
| Total return (D)(E) | 0.20% | 10.94% | 17.80 | % (F) | (40.05)% | 17.02% | 18.41% | |||||||||||||||||
RATIOS/SUPPLEMENTAL |
| |||||||||||||||||||||||
| Net assets, end of period (in 000’s) | $ | 78,255 | $ | 80,700 | $ | 82,784 | $ | 69,695 | $ | 103,828 | $ | 84,203 | ||||||||||||
| Ratio of Expenses to average net assets | 1.51% | 1.58% | 1.57 | % (G) | 1.51% | 1.44% | 1.51% | |||||||||||||||||
| Ratio of Net investment income (loss) to average net assets | 0.33% | 0.39% | 0.57 | % (G) | 0.39% | 0.99% | 1.20% | |||||||||||||||||
| Portfolio turnover rate | 19% | 38% | 32% | 77% | 48% | 52% | ||||||||||||||||||
| (A) | The Fund elected to change its fiscal year end from December to September. The information presented is for January 1, 2009 through September 30, 2009. |
| (B) | Per share amounts calculated using average shares method, which more appropriately presents the per share data for the period. |
| (C) | Realized and unrealized gains and losses per share in this caption are balancing amounts necessary to reconcile the change in net asset value per share for the period, and may not agree to the aggregate gains and losses in the Statement of Operations due to the fluctuations in share transactions. |
| (D) | Total return calculation does not reflect sales load. |
| (E) | Total return in the above table represents the rate that the investor would have earned or lost on an investment in the Fund assuming reinvestment of dividends. |
| (F) | For periods of less than one full year, total return is not annualized. |
| (G) | Annualized. |
The accompanying notes are an integral part of these financial statements.
68
Timothy Large/Mid Cap Value Fund (Class C Shares)
Selected data based on a share outstanding throughout each period
| For the Year ended September 30, 2011 | For the Year ended 2010 | For the Period ended September 30, 2009 (A) | For the Year ended December 31, 2008 | For the Year December 31, 2007 | For the Year December 31, 2006 | |||||||||||||||||||
| Net asset value, Beginning of period | $ | 10.68 | $ | 9.73 | $ | 8.31 | $ | 14.24 | $ | 13.28 | 12.12 | |||||||||||||
|
|
|
|
|
|
|
|
|
|
|
| |||||||||||||
INCOME (LOSS) FROM INVESTMENT OPERATIONS: | ||||||||||||||||||||||||
Net investment income (loss) | (0.05) | (B) | (0.05 | ) | (0.01 | ) | (0.04 | ) | 0.02 | 0.07 | ||||||||||||||
Net realized and unrealized gain (loss) on investments | - | (C) | 1.03 | 1.43 | (5.73 | ) | 2.10 | 2.08 | ||||||||||||||||
|
|
|
|
|
|
|
|
|
|
|
| |||||||||||||
Total from investment operations | (0.05) | 0.98 | 1.42 | (5.77 | ) | 2.12 | 2.15 | |||||||||||||||||
|
|
|
|
|
|
|
|
|
|
|
| |||||||||||||
LESS DISTRIBUTIONS: | ||||||||||||||||||||||||
From net investment income | (0.02 | ) | (0.03 | ) | - | (0.02 | ) | (0.08 | ) | (0.07 | ) | |||||||||||||
From net realized gains on investments | - | - | - | (0.14 | ) | (1.08 | ) | (0.90 | ) | |||||||||||||||
From return of capital | - | - | - | - | - | (0.02 | ) | |||||||||||||||||
|
|
|
|
|
|
|
|
|
|
|
| |||||||||||||
Total distributions | (0.02 | ) | (0.03 | ) | - | (0.16 | ) | (1.16 | ) | (0.99 | ) | |||||||||||||
|
|
|
|
|
|
|
|
|
|
|
| |||||||||||||
| Net asset value, end of period | $ | 10.61 | $ | 10.68 | $ | 9.73 | $ | 8.31 | $ | 14.24 | 13.28 | |||||||||||||
|
|
|
|
|
|
|
|
|
|
|
| |||||||||||||
Total return (D)(E) | (0.52)% | 10.12% | 17.09% | (F) | (40.49)% | 16.13% | 17.63 | |||||||||||||||||
RATIOS/SUPPLEMENTAL DATA: | ||||||||||||||||||||||||
Net assets, end of period (in 000’s) | $ | 8,903 | $ | 9,484 | $ | 9,552 | $ | 8,544 | $ | 12,722 | 6,353 | |||||||||||||
Ratio of Expenses to average net assets | 2.26% | 2.33% | 2.32% | (G) | 2.26% | 2.19% | 2.25% | |||||||||||||||||
Ratio of Net investment income (loss) to average net assets | (0.43)% | (0.35)% | (0.18)% | (G) | (0.35)% | 0.18% | 0.53% | |||||||||||||||||
Portfolio turnover rate | 19% | 38% | 32% | 77% | 48% | 52% | ||||||||||||||||||
| (A) | The Fund elected to change its fiscal year end from December to September. The information presented is for January 1, 2009 through September 30, 2009. |
| (B) | Per share amounts calculated using average shares method, which more appropriately presents the per share data for the period. |
| (C) | Realized and unrealized gains and losses per share in this caption are balancing amounts necessary to reconcile the change in net asset value per share for the period, and may not agree to the aggregate gains and losses in the Statement of Operations due to the fluctuations in share transactions. |
| (D) | Total return calculation does not reflect redemption fee. |
| (E) | Total return in the above table represents the rate that the investor would have earned or lost on an investment in the Fund assuming reinvestment of dividends. |
| (F) | For periods of less than one full year, total return is not annualized. |
| (G) | Annualized. |
The accompanying notes are an integral part of these financial statements.
69
Timothy Fixed Income Fund (Class A Shares)
Selected data based on a share outstanding throughout each period
| For the Year ended September 30, 2011 | For the Year ended September 30, 2010 | For the Period ended September 30, 2009 (A) | For the Year ended December 31, 2008 | For the Year ended December 31, 2007 | For the Year ended December 31, 2006 | |||||||||||||||||||||||||||||||
Net asset value, beginning of period | $ | 10.56 | $ | 10.14 | $ | 9.56 | $ | 9.99 | $ | 9.94 | 10.06 | |||||||||||||||||||||||||
|
|
|
|
|
|
|
|
|
|
|
| |||||||||||||||||||||||||
INCOME (LOSS) FROM INVESTMENT OPERATIONS: | ||||||||||||||||||||||||||||||||||||
Net investment income (loss) | 0.28 | (B) | 0.29 | (B) | 0.24 | 0.43 | 0.44 | 0.42 | ||||||||||||||||||||||||||||
Net realized and unrealized gain (loss) on investments | 0.18 | 0.42 | 0.58 | (0.43) | 0.06 | (0.12) | ||||||||||||||||||||||||||||||
|
|
|
|
|
|
|
|
|
|
|
| |||||||||||||||||||||||||
Total from investment operations | 0.46 | 0.71 | 0.82 | - | 0.50 | 0.30 | ||||||||||||||||||||||||||||||
|
|
|
|
|
|
|
|
|
|
|
| |||||||||||||||||||||||||
LESS DISTRIBUTIONS: | ||||||||||||||||||||||||||||||||||||
From net investment income | (0.30) | (0.29) | (0.24) | (0.43) | (0.45) | (0.41) | ||||||||||||||||||||||||||||||
From net realized gains on investments | - | - | - | - | - | (0.01) | ||||||||||||||||||||||||||||||
|
|
|
|
|
|
|
|
|
|
|
| |||||||||||||||||||||||||
Total distributions | (0.30) | (0.29) | (0.24) | (0.43) | (0.45) | (0.42) | ||||||||||||||||||||||||||||||
|
|
|
|
|
|
|
|
|
|
|
| |||||||||||||||||||||||||
Net asset value, end of period | $ | 10.72 | $ | 10.56 | $ | 10.14 | $ | 9.56 | $ | 9.99 | 9.94 | |||||||||||||||||||||||||
|
|
|
|
|
|
|
|
|
|
|
| |||||||||||||||||||||||||
Total return (C)(D) | 4.42 | % | 7.07 | % | 8.70 | % | (E) | (0.05) | % | 5.19 | % | 3.11 | % | |||||||||||||||||||||||
RATIOS/SUPPLEMENTAL DATA: | ||||||||||||||||||||||||||||||||||||
Net assets, end of period (in 000’s) | $ | 59,405 | $ | 58,831 | $ | 48,074 | $ | 37,367 | $ | 45,371 | 39,023 | |||||||||||||||||||||||||
Ratios to average net assets | ||||||||||||||||||||||||||||||||||||
Expenses, before waiver and reimbursement | 1.27 | % | 1.36 | % | 1.35 | % | (F) | 1.29 | % | 1.21 | % | 1.32 | % | |||||||||||||||||||||||
Expenses, net waiver and reimbursement | 1.15 | % | 1.21 | % | 1.20 | % | (F) | 1.14 | % | 1.06 | % | 1.35 | % | |||||||||||||||||||||||
Net investment income (loss), before waiver and reimbursement | 2.58 | % | 2.63 | % | 3.24 | % | (F) | 4.11 | % | 4.33 | % | 4.42 | % | |||||||||||||||||||||||
Net investment income (loss), net waiver and reimbursement | 2.71 | % | 2.78 | % | 3.39 | % | (F) | 4.26 | % | 4.48 | % | 4.39 | % | |||||||||||||||||||||||
Portfolio turnover rate | 22 | % | 26% | 22% | 35% | 45% | 76% | |||||||||||||||||||||||||||||
| (A) | The Fund elected to change its fiscal year end from December to September. The information presented is for January 1, 2009 through September 30, 2009. |
| (B) | Per share amounts calculated using average shares method, which more appropriately presents the per share data for the period. |
| (C) | Total return calculation does not reflect sales load. |
| (D) | Total return in the above table represents the rate that the investor would have earned or lost on an investment in the Fund assuming reinvestment of dividends. Total return would have been higher or lower if certain expenses had not been reimbursed, waived or recouped. |
| (E) | For periods of less than one full year, total return is not annualized. |
| (F) | Annualized. |
The accompanying notes are an integral part of these financial statements.
70
Timothy Fixed Income Fund (Class C Shares)
Selected data based on a share outstanding throughout each period
| For the Year ended September 30, 2011 | For the Year ended 2010 | For the Period ended September 30, 2009 (A) | For the Year ended December 31, 2008 | For the Year ended December 31, 2007 | For the Year December 31, 2006 | |||||||||||||||||||
Net asset value, beginning of period | $ | 10.22 | $ | 9.82 | $ | 9.28 | $ | 9.69 | $ | 9.66 | 9.78 | |||||||||||||
|
|
|
|
|
|
|
|
|
|
|
| |||||||||||||
INCOME (LOSS) FROM INVESTMENT OPERATIONS: | ||||||||||||||||||||||||
Net investment income (loss) | 0.20 | (B) | 0.21 | 0.18 | 0.33 | 0.37 | 0.33 | |||||||||||||||||
Net realized and unrealized gain (loss) on investments | 0.17 | 0.41 | 0.56 | (0.40 | ) | 0.04 | (0.12 | ) | ||||||||||||||||
|
|
|
|
|
|
|
|
|
|
|
| |||||||||||||
Total from investment operations | 0.37 | 0.62 | 0.74 | (0.07 | ) | 0.41 | 0.21 | |||||||||||||||||
|
|
|
|
|
|
|
|
|
|
|
| |||||||||||||
LESS DISTRIBUTIONS: | ||||||||||||||||||||||||
From net investment income | (0.21 | ) | (0.22 | ) | (0.20 | ) | (0.34 | ) | (0.38 | ) | (0.32 | ) | ||||||||||||
From net realized gains on investments | - | - | - | - | - | (0.01 | ) | |||||||||||||||||
|
|
|
|
|
|
|
|
|
|
|
| |||||||||||||
Total distributions | (0.21 | ) | (0.22 | ) | (0.20 | ) | (0.34 | ) | (0.38 | ) | (0.33 | ) | ||||||||||||
|
|
|
|
|
|
|
|
|
|
|
| |||||||||||||
Net asset value, end of period | $ | 10.38 | $ | 10.22 | $ | 9.82 | $ | 9.28 | $ | 9.69 | 9.66 | |||||||||||||
Total return (C)(D) | 3.68% | 6.36% | 8.02% | (E) | (0.72)% | 4.37% | 2.26 | % | ||||||||||||||||
RATIOS/SUPPLEMENTAL DATA: | ||||||||||||||||||||||||
Net assets, end of period (in 000’s) | $ | 8,265 | $ | 8,438 | $ | 5,212 | $ | 2,883 | $ | 2,842 | 3,019 | |||||||||||||
Ratios to average net assets | ||||||||||||||||||||||||
Expenses, before waiver and reimbursement | 2.23% | 2.12% | 2.10% | (F) | 2.06 | % | 1.96% | 2.10% | ||||||||||||||||
Expenses, net waiver and reimbursement | 1.90% | 1.97% | 1.95% | (F) | 1.91 | % | 1.81% | 2.10% | ||||||||||||||||
Net investment income (loss), before waiver and reimbursement | 1.61% | 1.88% | 2.50% | (F) | 3.33 | % | 3.59% | 3.64% | ||||||||||||||||
Net investment income (loss), net waiver and reimbursement | 1.95% | 2.03% | 2.65% | (F) | 3.48 | % | 3.74% | 3.64% | ||||||||||||||||
Portfolio turnover rate | 22% | 26% | 22% | 35 | % | 45% | 76% | |||||||||||||||||
| (A) | The Fund elected to change its fiscal year end from December to September. The information presented is for January 1, 2009 through September 30, 2009. |
| (B) | Per share amounts calculated using average shares method, which more appropriately presents the per share data for the period. |
| (C) | Total return calculation does not reflect redemption fee. |
| (D) | Total return in the above table represents the rate that the investor would have earned or lost on an investment in the Fund assuming reinvestment of dividends. Total return would have been higher or lower if certain expenses had not been reimbursed, waived or recouped. |
| (E) | For periods of less than one full year, total return is not annualized. |
| (F) | Annualized. |
The accompanying notes are an integral part of these financial statements.
71
Timothy High Yield Bond Fund (Class A Shares)
Selected data based on a share outstanding throughout each period
| For the Year ended September 30, 2011 | For the Year ended September 30, 2010 | For the Period ended September 30, 2009 (A) | For the Year ended December 31, 2008 | For the Period ended December 31, 2007 (C) | ||||||||||||||||
| ||||||||||||||||||||
Net asset value, Beginning of period | $ | 9.10 | $ | 8.46 | $ | 6.23 | $ | 9.53 | 10.00 | |||||||||||
|
|
|
|
|
|
|
|
|
| |||||||||||
INCOME (LOSS) FROM INVESTMENT OPERATIONS: | ||||||||||||||||||||
Net investment income (loss) | 0.54 | (B) | 0.60 | 0.48 | 0.61 | 0.36 | ||||||||||||||
Net realized and unrealized gain (loss) on investments | (0.39) | 0.63 | 2.23 | (3.30) | (0.47) | |||||||||||||||
|
|
|
|
|
|
|
|
|
| |||||||||||
Total from investment operations | 0.15 | 1.23 | 2.71 | (2.69) | (0.11) | |||||||||||||||
|
|
|
|
|
|
|
|
|
| |||||||||||
LESS DISTRIBUTIONS: | ||||||||||||||||||||
From net investment income | (0.54) | (0.59) | (0.48) | (0.60) | (0.36) | |||||||||||||||
From net realized gains on investments | - | - | - | (0.01) | - | |||||||||||||||
|
|
|
|
|
|
|
|
|
| |||||||||||
Total distributions | (0.54) | (0.59) | (0.48) | (0.61) | (0.36) | |||||||||||||||
|
|
|
|
|
|
|
|
|
| |||||||||||
Net asset value, end of period | $ | 8.71 | $ | 9.10 | $ | 8.46 | $ | 6.23 | 9.53 | |||||||||||
|
|
|
|
|
|
|
|
|
| |||||||||||
Total return (D)(E) | 1.48% | 14.98% | 45.11% | (F) | (29.55)% | (1.14)% | (F) | |||||||||||||
RATIOS/SUPPLEMENTAL DATA: | ||||||||||||||||||||
Net assets, end of period (in 000’s) | $ | 23,110 | $ | 21,617 | $ | 18,740 | $ | 13,283 | $ | 20,284 | ||||||||||
Ratios to average net assets | ||||||||||||||||||||
Expenses, before waiver and reimbursement | 1.30% | 1.43% | 1.46% | (G) | 1.41% | 1.45% | (G) | |||||||||||||
Expenses, net waiver and reimbursement | 1.30% | 1.43% | 1.46% | (G) | 1.41% | 1.35% | (G) | |||||||||||||
Net investment income (loss), before waiver and reimbursement | 5.81% | 6.72% | 8.75% | (G) | 7.06% | 5.67% | (G) | |||||||||||||
Net investment income (loss), net waiver and reimbursement | 5.81% | 6.72% | 8.75% | (G) | 7.06% | 5.77% | (G) | |||||||||||||
Portfolio turnover rate | 60% | 40% | 34% | 28% | 23% | |||||||||||||||
| ||||||||||||||||||||
| (A) | The Fund elected to change its fiscal year end from December to September. The information presented is for January 1, 2009 through September 30, 2009. |
| (B) | Per share amounts calculated using average shares method, which more appropriately presents the per share data for the period. |
| (C) | For the period May 7, 2007 (Commencement of Operations) to December 31, 2007. |
| (D) | Total return calculation does not reflect sales load. |
| (E) | Total return in the above table represents the rate that the investor would have earned or lost on an investment in the Fund assuming reinvestment of dividends. Total return would have been higher or lower if certain expenses had not been reimbursed, waived or recouped. |
| (F) | For periods of less than one full year, total return is not annualized. |
| (G) | Annualized. |
The accompanying notes are an integral part of these financial statements.
72
Timothy High Yield Bond Fund (Class C Shares)
Selected data based on a share outstanding throughout each period
For the Year ended September 30, 2011 | For the Year ended September 30, 2010 | For the Period ended September 30, 2009 (A) | For the Year ended December 31, 2008 | For the Period ended December 31, 2007 (C) | ||||||||||||||||
Net asset value, beginning of period | $ | 9.17 | $ | 8.51 | $ | 6.29 | $ | 9.60 | 10.00 | |||||||||||
|
|
|
|
|
|
|
|
|
| |||||||||||
INCOME (LOSS) FROM INVESTMENT OPERATIONS: | ||||||||||||||||||||
Net investment income (loss) | 0.47 | (B) | 0.53 | (B) | 0.43 | (B) | 0.53 | 0.26 | ||||||||||||
Net realized and unrealized gain (loss) on investments | (0.39 | ) | 0.66 | 2.24 | (3.33 | ) | (0.40 | ) | ||||||||||||
|
|
|
|
|
|
|
|
|
| |||||||||||
Total from investment operations | 0.08 | 1.19 | 2.67 | (2.80 | ) | (0.14 | ) | |||||||||||||
|
|
|
|
|
|
|
|
|
| |||||||||||
LESS DISTRIBUTIONS: | ||||||||||||||||||||
From net investment income | (0.46 | ) | (0.53 | ) | (0.45 | ) | (0.50 | ) | (0.26 | ) | ||||||||||
From net realized gains on investments | - | - | - | (0.01 | ) | - | ||||||||||||||
Total distributions | (0.46 | ) | (0.53 | ) | (0.45 | ) | (0.51 | ) | (0.26 | ) | ||||||||||
|
|
|
|
|
|
|
|
|
| |||||||||||
Net asset value, end of period | $ | 8.79 | $ | 9.17 | $ | 8.51 | $ | 6.29 | 9.60 | |||||||||||
|
|
|
|
|
|
|
|
|
| |||||||||||
Total return (D)(E) | 0.72% | 14.36% | 43.90% | (F) | (30.17 | )% | (1.38 | )% (F) | ||||||||||||
RATIOS/SUPPLEMENTAL DATA: | ||||||||||||||||||||
Net assets, end of period (in 000’s) | $ | 1,194 | $ | 1,039 | $ | 547 | $ | 141 | $ | 241 | ||||||||||
Ratios to average net assets | ||||||||||||||||||||
Expenses, before wavier and reimbursement | 2.05% | 2.18% | 2.20% | (G) | 2.14% | 2.20% | (G) | |||||||||||||
Expenses, net waiver and reimbursement | 2.05% | 2.18% | 2.20% | (G) | 2.14% | 2.10% | (G) | |||||||||||||
Net investment income (loss), before waiver and reimbursement | 5.06% | 5.99% | 7.55% | (G) | 6.26% | 5.24% | (G) | |||||||||||||
Net investment income (loss), net waiver and reimbursement | 5.06% | 5.99% | 7.55% | (G) | 6.26% | 5.34% | (G) | |||||||||||||
Portfolio turnover rate | 60% | 40% | 34% | 28% | 23% | |||||||||||||||
| (A) | The Fund elected to change its fiscal year end from December to September. The information presented is for January 1, 2009 through September 30, 2009. |
| (B) | Per share amounts calculated using average shares method, which more appropriately presents the per share data for the period. |
| (C) | For the period May 7, 2007 (Commencement of Operations) to December 31, 2007. |
| (D) | Total return calculation does not reflect redemption fee. |
| (E) | Total return in the above table represents the rate that the investor would have earned or lost on an investment in the Fund assuming reinvestment of dividends. Total return would have been higher or lower if certain expenses had not been reimbursed, waived or recouped. |
| (F) | For periods of less than one full year, total return is not annualized. |
| (G) | Annualized. |
The accompanying notes are an integral part of these financial statements.
73
Timothy Money Market Fund
Selected data based on a share outstanding throughout each period
| For the Year ended September 30, 2011 | For the Year ended 2010 | For the Period ended September 30, 2009 (A) | For the Year ended December 31, 2008 | For the Year ended December 31, 2007 | For the Year December 31, 2006 | |||||||||||||||||||
Net asset value, beginning of period | $ | 1.00 | $ | 1.00 | $ | 1.00 | $ | 1.00 | $ | 1.00 | $ | 1.00 | ||||||||||||
|
|
|
|
|
|
|
|
|
|
|
| |||||||||||||
INCOME (LOSS) FROM INVESTMENT OPERATIONS: | ||||||||||||||||||||||||
Net investment income (loss) | - | (B)* | - | * | - | * | 0.02 | 0.04 | 0.04 | |||||||||||||||
|
|
|
|
|
|
|
|
|
|
|
| |||||||||||||
Total from investment operations | - | - | - | 0.02 | 0.04 | 0.04 | ||||||||||||||||||
|
|
|
|
|
|
|
|
|
|
|
| |||||||||||||
LESS DISTRIBUTIONS: | ||||||||||||||||||||||||
From net investment income | - | * | - | * | - | * | (0.02 | ) | (0.04 | ) | (0.04 | ) | ||||||||||||
|
|
|
|
|
|
|
|
|
|
|
| |||||||||||||
Total distributions | - | - | - | (0.02 | ) | (0.04 | ) | (0.04 | ) | |||||||||||||||
|
|
|
|
|
|
|
|
|
|
|
| |||||||||||||
Net asset value, end of period | $ | 1.00 | $ | 1.00 | $ | 1.00 | $ | 1.00 | $ | 1.00 | $ | 1.00 | ||||||||||||
|
|
|
|
|
|
|
|
|
|
|
| |||||||||||||
Total return (C) | 0.04% | 0.07% | 0.07% | (E) | 1.82% | 4.26% | 4.17% | |||||||||||||||||
RATIOS/SUPPLEMENTAL DATA: | ||||||||||||||||||||||||
Net assets, end of period (in 000’s) | $ | 12,044 | $ | 13,390 | $ | 27,168 | $ | 33,860 | $ | 45,433 | $ | 19,813 | ||||||||||||
Ratios to average net assets | ||||||||||||||||||||||||
Expenses, before waiver and reimbursement | 1.20% | 1.15% | 1.05% | (F) | 1.00% | 0.99% | 1.21% | |||||||||||||||||
Expenses, net waiver and reimbursement | 0.05% | 0.08% | 0.33% | (F) | 0.64% | (D) | 0.78% | 0.85% | ||||||||||||||||
Net investment income (loss), before waiver and reimbursement | (1.11)% | (1.02)% | (0.63)% | (F) | 1.45% | 3.85% | 3.85% | |||||||||||||||||
Net investment income (loss), net waiver and reimbursement | 0.05% | 0.05% | 0.09% | (F) | 1.81% | 4.05% | 4.21% | |||||||||||||||||
| * | Amount is less than $0.005 per share. |
| (A) | The Fund elected to change its fiscal year end from December to September. The information presented is for January 1, 2009 through September 30, 2009. |
| (B) | Per share amounts calculated using average shares method, which more appropriately presents the per share data for the period. |
| (C) | Total return in the above table represents the rate that the investor would have earned or lost on an investment in the Fund assuming reinvestment of dividends. Total return would have been higher or lower if certain expenses had not been reimbursed, waived or recouped. |
| (D) | The expense ratio after reimbursement of expenses by Advisor includes a 0.01% reimbursement of expenses by the Administrator for a processing error. |
| (E) | For periods of less than one full year, total return is not annualized. |
| (F) | Annualized. |
The accompanying notes are an integral part of these financial statements.
74
Timothy Defensive Strategies Fund (Class A Shares)
Selected data based on a share outstanding throughout each period
| For the Year ended September 30, 2011 | For the Period ended September 30, 2010(A) | |||||||
| ||||||||
Net asset value, beginning of period | $ | 10.70 | $ | 10.00 | ||||
|
|
|
| |||||
INCOME (LOSS) FROM INVESTMENT OPERATIONS: | ||||||||
Net investment income (loss) | 0.09 | (B) | 0.02 | |||||
Net realized and unrealized gain (loss) on investments | 0.54 | 1.08 | ||||||
|
|
|
| |||||
Total from investment operations | 0.63 | 1.10 | ||||||
|
|
|
| |||||
LESS DISTRIBUTIONS: | ||||||||
From net investment income | - | - | ||||||
From net realized gains on investments | (0.05) | (0.21) | ||||||
From return of capital | - | (0.19) | ||||||
|
|
|
| |||||
Total distributions | (0.05) | (0.40) | ||||||
|
|
|
| |||||
Net asset value, end of period | $ | 11.28 | $ | 10.70 | ||||
|
|
|
| |||||
Total return (C)(D) | 5.88% | 10.97% | (E) | |||||
RATIOS/SUPPLEMENTAL DATA: | ||||||||
Net assets, end of period (in 000’s) | $ | 43,670 | $ | 23,360 | ||||
Ratio of Expenses to average net assets | 1.29% | 1.51% | (F) | |||||
Ratio of Net investment income (loss) to average net assets | 0.75% | 0.13% | (F) | |||||
Portfolio turnover rate | 64% | 41% | ||||||
| ||||||||
(A) For the period November 4, 2009 (Commencement of Operations) to September 30, 2010.
(B) Per share amounts calculated using average shares method, which more appropriately presents the per share data for the period.
(C) Total return calculation does not reflect sales load.
Total return in the above table represents the rate that the investor would have earned or lost on an investment in the Fund assuming reinvestment of dividends.
(D) Total return would have been higher or lower if certain expenses had not been reimbursed, waived or recouped.
(E) For periods of less than one full year, total return is not annualized.
(F) Annualized.
The accompanying notes are an integral part of these financial statements.
75
Timothy Defensive Strategies Fund (Class C Shares)
Selected data based on a share outstanding throughout each period
| For the Year ended September 30, 2011 | For the Period ended September 30, 2010 (A) | |||||||
| ||||||||
Net asset value, beginning of period | $ | 10.58 | $ | 10.00 | ||||
|
|
|
| |||||
INCOME (LOSS) FROM INVESTMENT OPERATIONS: | ||||||||
Net Investment Income (loss) (B) | 0.02 | (0.06) | ||||||
Net realized and unrealized gain (loss) on Investments | 0.54 | 1.08 | ||||||
|
|
|
| |||||
Total from Investment operations | 0.56 | 1.02 | ||||||
|
|
|
| |||||
LESS DISTRIBUTIONS: | ||||||||
From net Investment Income | - | - | ||||||
From net realized gains on Investments | (0.05) | (0.21) | ||||||
From return of capital | - | (0.23) | ||||||
|
|
|
| |||||
Total distributions | (0.05) | (0.44) | ||||||
|
|
|
| |||||
Net asset value, end of period | $ | 11.09 | $ | 10.58 | ||||
|
|
|
| |||||
Total return (C)(D) | 5.28% | 10.18% | (E) | |||||
RATIOS/SUPPLEMENTAL DATA: | ||||||||
Net assets, end of period (in 000’s) | $ | 13,100 | $ | 5,527 | ||||
Ratio of Expenses to average net assets | 2.03% | 2.28% | (F) | |||||
Ratio of Net Investment Income (loss) to average net assets | 0.15% | (0.64)% | (F) | |||||
Portfolio turnover rate | 64% | 41% | ||||||
| ||||||||
(A) For the period November 4, 2009 (Commencement of Operations) to September 30, 2010.
(B) Per share amounts calculated using average shares method, which more appropriately presents the per share data for the period.
(C) Total return calculation does not reflect redemption fee.
(D) Total return in the above table represents the rate that the Investor would have earned or lost on an investment in the Fund assuming reinvestment of dividends. Total return would have been higher or lower if certain expenses had not been reimbursed, waived or recouped.
(E) For periods of less than one full year, total return is not annualized.
(F) Annualized.
The accompanying notes are an integral part of these financial statements.
76
Timothy Strategic Growth Fund (Class A Shares)
Selected data based on a share outstanding throughout each period
For the Year ended September 30, 2011 | For the Year ended September 30, 2010 | For the Period ended September 30, 2009 (A) | For the Year ended December 31, 2008 | For the Year 2007 | For the Year ended December 31, 2006 | |||||||||||||||||||
Net asset value, Beginning of period | $ | 6.49 | $ | 5.97 | $ | 4.86 | $ | 9.12 | $ | 9.69 | 9.18 | |||||||||||||
|
|
|
|
|
|
|
|
|
|
|
| |||||||||||||
INCOME (LOSS) FROM INVESTMENT OPERATIONS: | ||||||||||||||||||||||||
Net Investment Income (loss) | (0.02) | (B) | 0.02 | (0.01) | 0.01 | 0.10 | 0.14 | |||||||||||||||||
Net realized and unrealized gain (loss) on Investments | (0.19) | 0.50 | 1.12 | (3.66) | 0.90 | 0.82 | ||||||||||||||||||
|
|
|
|
|
|
|
|
|
|
|
| |||||||||||||
Total from Investment operations | (0.21) | 0.52 | 1.11 | (3.65) | 1.00 | 0.96 | ||||||||||||||||||
|
|
|
|
|
|
|
|
|
|
|
| |||||||||||||
LESS DISTRIBUTIONS: | ||||||||||||||||||||||||
From net Investment Income | - | - | - | (0.09) | (0.10) | (0.05) | ||||||||||||||||||
From net realized gains on Investments | - | - | - | (0.52) | (1.47) | (0.40) | ||||||||||||||||||
From return of capital | (0.01) | - | - | - | - | - | ||||||||||||||||||
|
|
|
|
|
|
|
|
|
|
|
| |||||||||||||
Total distributions | (0.01) | - | - | (0.61) | (1.57) | (0.45) | ||||||||||||||||||
|
|
|
|
|
|
|
|
|
|
|
| |||||||||||||
Net asset value, end of period | $ | 6.27 | $ | 6.49 | $ | 5.97 | $ | 4.86 | $ | 9.12 | 9.69 | |||||||||||||
|
|
|
|
|
|
|
|
|
|
|
| |||||||||||||
Total return (C)(D) | (3.29)% | 8.71% | 22.84% | (G) | (39. 82)% | 10.45% | 10.41% | |||||||||||||||||
RATIOS/SUPPLEMENTAL DATA: | ||||||||||||||||||||||||
Net assets, end of period (in 000’s) | $ | 31,269 | $ | 34,098 | $ | 30,066 | $ | 25,440 | $ | 44,231 | $ | 37,204 | ||||||||||||
Ratio of Expenses to average net assets | 1.05% | 1.11% | 1.11% | (H) | 1.03% | 1.00% | 1.07% | |||||||||||||||||
Ratio of Net Investment Income (loss) to average net assets | (0.23)% | 0.30% | (0.25)% | (H) | 0.12% | 1.10% | 1.49% | |||||||||||||||||
Portfolio turnover rate | 22% | 25% | 5% | 17% | 45% | 11% | ||||||||||||||||||
| (A) | The Fund elected to change its fiscal year end from December to September. The information presented is for January 1, 2009 through September 30, 2009. |
| (B) | Per share amounts calculated using average shares method, which more appropriately presents the per share data for the period. |
| (C) | Total return calculation does not reflect sales load. |
| (D) | Total return in the above table represents the rate that the Investor would have earned or lost on an investment in the Fund assuming reinvestment of dividends. |
| (E) | These ratios exclude the impact of expenses of the underlying security holdings as represented in the Schedule of Investments. |
| (F) | Recognition of net investment income (loss) by the Fund is affected by the timing of the declaration of dividends by the underlying investment companies in which the Fund invests. |
| (G) | For periods of less than one full year, total return is not annualized. |
| (H) | Annualized. |
The accompanying notes are an integral part of these financial statements.
77
Timothy Strategic Growth Fund (Class C Shares)
Selected data based on a share outstanding throughout each period
| For the Year ended September 30, 2011 | For the Year ended 2010 | For the Period 2009 (A) | For the Year 2008 | For the Year 2007 | For the Year 2006 | |||||||||||||||||||
Net asset value, beginning of period | $ | 6.09 | $ | 5.64 | $ | 4.62 | $ | 8.70 | $ | 9.31 | $ | 8.86 | ||||||||||||
|
|
|
|
|
|
|
|
|
|
|
| |||||||||||||
INCOME (LOSS) FROM INVESTMENT OPERATIONS: | ||||||||||||||||||||||||
Net Investment Income (loss) | (0.07) | (B) | (0.03) | (0.04) | (0.05) | 0.03 | 0.06 | |||||||||||||||||
Net realized and unrealized gain (loss) on Investments | (0.20) | 0.48 | 1.06 | (3.47) | 0.86 | 0.79 | ||||||||||||||||||
|
|
|
|
|
|
|
|
|
|
|
| |||||||||||||
Total from Investment operations | (0.27) | 0.45 | 1.02 | (3.52) | 0.89 | 0.85 | ||||||||||||||||||
|
|
|
|
|
|
|
|
|
|
|
| |||||||||||||
LESS DISTRIBUTIONS: | ||||||||||||||||||||||||
From net Investment Income | - | - | - | (0.04) | (0.03) | - | ||||||||||||||||||
From net realized gains on Investments | - | - | - | (0.52) | (1.47) | (0.40) | ||||||||||||||||||
|
|
|
|
|
|
|
|
|
|
|
| |||||||||||||
Total distributions | - | - | - | (0.56) | (1.50) | (0.40) | ||||||||||||||||||
|
|
|
|
|
|
|
|
|
|
|
| |||||||||||||
Net asset value, end of period | $ | 5.82 | $ | 6.09 | $ | 5.64 | $ | 4.62 | $ | 8.70 | $ | 9.31 | ||||||||||||
|
|
|
|
|
|
|
|
|
|
|
| |||||||||||||
Total return (C)(D) | (4.43)% | 7.98% | 22.08% | (G) | (40.32)% | 9.73% | 9.51% | |||||||||||||||||
RATIOS/SUPPLEMENTAL DATA: | ||||||||||||||||||||||||
Net assets, end of period (in 000’s) | $ | 6,446 | $ | 6,950 | $ | 7,608 | $ | 6,423 | $ | 9,836 | $ | 7,609 | ||||||||||||
Ratio of Expenses to average net assets | 1.82% | 1.86% | 1.85% | (H) | 1.78% | 1.75% | 1.81% | |||||||||||||||||
Ratio of Net Investment Income (loss) to average net assets | (1.00)% | (0.46)% | (1.00)% | (H) | (0.61)% | 0.43% | 0.76% | |||||||||||||||||
Portfolio turnover rate | 22% | 25% | 5% | 17% | 45% | 11% | ||||||||||||||||||
| (A) | The Fund elected to change its fiscal year end from December to September. The information presented is for January 1, 2009 through September 30, 2009. |
| (B) | Per share amounts calculated using average shares method, which more appropriately presents the per share data for the period. |
| (C) | Total return calculation does not reflect redemption fee. |
| (D) | Total return in the above table represents the rate that the Investor would have earned or lost on an Investment in the Fund assuming reinvestment of dividends. |
| (E) | These ratios exclude the impact of expenses of the underlying security holdings as represented in the Schedule of Investments. |
| (F) | Recognition of net Investment Income (loss) by the Fund is affected by the timing of the declaration of dividends by the underlying investment companies in which the Fund invests. |
| (G) | For periods of less than one full year, total return is not annualized. |
| (H) | Annualized. |
The accompanying notes are an integral part of these financial statements.
78
Timothy Conservative Growth Fund (Class A Shares)
Selected data based on a share outstanding throughout each period
| For the Year ended September 30, 2011 | For the Year ended September 30, 2010 | For the Period ended September 30, 2009 (A) | For the Year ended December 31, 2008 | For the Year ended December 31, 2007 | For the Year ended December 31, 2006 | |||||||||||||||||||
Net asset value, beginning of period | $ | 8.83 | $ | 8.25 | $ | 6.94 | $ | 10.49 | $ | 11.10 | $ | 10.83 | ||||||||||||
|
|
|
|
|
|
|
|
|
|
|
| |||||||||||||
INCOME (LOSS)FROM INVESTMENT OPERATIONS: | ||||||||||||||||||||||||
Net Investment Income (loss) | 0.04 | (B) | 0.09 | 0.04 | 0.13 | 0.22 | 0.32 | |||||||||||||||||
Net realized and unrealized gain (loss) on Investments | 0.01 | 0.60 | 1.27 | (3.18 | ) | 0.75 | 0.75 | |||||||||||||||||
|
|
|
|
|
|
|
|
|
|
|
| |||||||||||||
Total from Investment operations | 0.05 | 0.69 | 1.31 | (3.05 | ) | 0.97 | 1.07 | |||||||||||||||||
|
|
|
|
|
|
|
|
|
|
|
| |||||||||||||
LESS DISTRIBUTIONS: | ||||||||||||||||||||||||
From net Investment Income | (0.08 | ) | (0.11 | ) | - | (0.15 | ) | (0.20 | ) | (0.22 | ) | |||||||||||||
From net realized gains on Investments | - | - | - | (0.35 | ) | (1.38 | ) | (0.58 | ) | |||||||||||||||
|
|
|
|
|
|
|
|
|
|
|
| |||||||||||||
Total distributions | (0.08 | ) | (0.11 | ) | - | (0.50 | ) | (1.58 | ) | (0.80 | ) | |||||||||||||
|
|
|
|
|
|
|
|
|
|
|
| |||||||||||||
Net asset value, end of period | $ | 8.80 | $ | 8.83 | $ | 8.25 | $ | 6.94 | $ | 10.49 | $ | 11.10 | ||||||||||||
|
|
|
|
|
|
|
|
|
|
|
| |||||||||||||
Total return (C)(D) | 0.50% | 8.47% | 18.88% | (G) | (28.88)% | 8.85% | 9.86% | |||||||||||||||||
RATIOS/SUPPLEMENTAL DATA: | ||||||||||||||||||||||||
Net assets, end of period (in 000’s) | $ | 35,331 | $ | 35,031 | $ | 33,128 | $ | 26,206 | $ | 38,102 | $ | 33,189 | ||||||||||||
Expenses, before waiver and reimbursement (E) | 1.05% | 1.13% | 1.10% | (H) | 1.02% | 1.02% | 1.08% | |||||||||||||||||
Expenses, net waiver and reimbursement (E) | 1.05% | 1.13% | 1.10% | (H) | 1.02% | 1.02% | 1.09% | |||||||||||||||||
Net investment income (loss), before waiver and reimbursement (E)(F) | 0.48% | 1.07% | 0.82% | (H) | 1.36% | 2.09% | 2.98% | |||||||||||||||||
Net investment income (loss), net waiver and | 0.48% | 1.07% | 0.82% | (H) | 1.36% | 2.09% | 2.97% | |||||||||||||||||
Portfolio turnover rate | 23% | 31% | 16% | 28% | 41% | 6% | ||||||||||||||||||
| (A) | The Fund elected to change its fiscal year end from December to September. The information presented is for January 1, 2009 through September 30, 2009. |
| (B) | Per share amounts calculated using average shares method, which more appropriately presents the per share data for the period. |
| (C) | Total return calculation does not reflect sales load. |
| (D) | Total return in the above table represents the rate that the Investor would have earned or lost on an investment in the Fund assuming reinvestment of dividends. |
| (E) | These ratios exclude the impact of expenses of the underlying security holdings as represented in the Schedule of Investments. |
| (F) | Recognition of net investment income (loss) by the Fund is affected by the timing of the declaration of dividends by the underlying investment companies in which the Fund invests. |
| (G) | For periods of less than one full year, total return is not annualized. |
| (H) | Annualized. |
The accompanying notes are an integral part of these financial statements.
79
Timothy Conservative Growth Fund (Class C Shares)
Selected data based on a share outstanding throughout each period
| For the Year ended September 30, 2011 | For the Year ended 2010 | For the Period ended September 30, 2009 (A) | For the Year ended December 31, 2008 | For the Year ended December 31, 2007 | For the Year December 31, 2006 | |||||||||||||||||||
Net asset value, beginning of period | $ | 8.32 | $ | 7.83 | $ | 6.61 | $ | 10.02 | $ | 10.68 | $ | 10.44 | ||||||||||||
|
|
|
|
|
|
|
|
|
|
|
| |||||||||||||
INCOME (LOSS) FROM INVESTMENT OPERATIONS: | ||||||||||||||||||||||||
Net investment income (loss) | (0.02 | ) (B) | 0.02 | - | * | 0.06 | 0.12 | 0.23 | ||||||||||||||||
Net realized and unrealized gain (loss) on investments | 0.00 | * | 0.57 | 1.22 | (3.03 | ) | 0.72 | 0.73 | ||||||||||||||||
|
|
|
|
|
|
|
|
|
|
|
| |||||||||||||
Total from investment operations | (0.02 | ) | 0.59 | 1.22 | (2.97 | ) | 0.84 | 0.96 | ||||||||||||||||
|
|
|
|
|
|
|
|
|
|
|
| |||||||||||||
LESS DISTRIBUTIONS: | ||||||||||||||||||||||||
From net investment income | (0.06 | ) | (0.10 | ) | - | (0.09 | ) | (0.12 | ) | (0.14 | ) | |||||||||||||
From net realized gains on investments | - | - | - | (0.35 | ) | (1.38 | ) | (0.58 | ) | |||||||||||||||
|
|
|
|
|
|
|
|
|
|
|
| |||||||||||||
Total distributions | (0.06 | ) | (0.10 | ) | - | (0.44 | ) | (1.50 | ) | (0.72 | ) | |||||||||||||
|
|
|
|
|
|
|
|
|
|
|
| |||||||||||||
Net asset value, end of period | $ | 8.24 | $ | 8.32 | $ | 7.83 | $ | 6.61 | $ | 10.02 | $ | 10.68 | ||||||||||||
|
|
|
|
|
|
|
|
|
|
|
| |||||||||||||
Total return (C)(D) | (0.25 | )% | 7.57 | % | 18.46 | % (G) | (29.45 | )% | 7.98 | % | 9.16 | % | ||||||||||||
RATIOS/SUPPLEMENTAL DATA: | ||||||||||||||||||||||||
Net assets, end of period (in 000’s) | $ | 7,963 | $ | 7,365 | $ | 7,500 | $ | 6,438 | $ | 7,164 | $ | 5,833 | ||||||||||||
Expenses, before waiver and reimbursement (E) | 1.80 | % | 1.88 | % | 1.85 | % (H) | 1.77 | % | 1.77 | % | 1.84 | % | ||||||||||||
Expenses, net waiver and reimbursement (E) | 1.80 | % | 1.88 | % | 1.85 | % (H) | 1.77 | % | 1.77 | % | 1.84 | % | ||||||||||||
Net investment income (loss), before waiver and reimbursement (E)(F) | (0.27 | )% | 0.29 | % | 0.05 | % (H) | 0.72 | % | 1.40 | % | 2.36 | % | ||||||||||||
Net investment income (loss), net waiver and reimbursement (E)(F) | (0.27 | )% | 0.29 | % | 0.05 | % (H) | 0.72 | % | 1.40 | % | 2.36 | % | ||||||||||||
Portfolio turnover rate | 23 | % | 31 | % | 16 | % | 26 | % | 41 | % | 6 | % | ||||||||||||
| * | Amount is less than $0.005 per share. |
| (A) | The Fund elected to change its fiscal year end from December to September. The information presented is for January 1, 2009 through September 30, 2009. |
| (B) | Per share amounts calculated using average shares method, which more appropriately presents the per share data for the period. |
| (C) | Total return calculation does not reflect redemption fee. |
| (D) | Total return in the above table represents the rate that the investor would have earned or lost on an investment in the Fund assuming reinvestment of dividends. |
| (E) | These ratios exclude the impact of expenses of the underlying security holdings as represented in the Schedule of Investments. |
| (F) | Recognition of net investment income (loss) by the Fund is affected by the timing of the declaration of dividends by the underlying investment companies in which the Fund invests. |
| (G) | For periods of less than one full year, total return is not annualized. |
| (H) | Annualized. |
The accompanying notes are an integral part of these financial statements.
80
Notes to Financial Statements
September 30, 2011
Timothy Plan Family of Funds
Note 1 | Significant Accounting Policies
The Timothy Plan (the “Trust”) is organized as a series of a Delaware business trust pursuant to a trust agreement dated December 16, 1993. The Trust is registered under the Investment Company Act of 1940, as amended, as an open-end diversified management investment company. As of September 30, 2011, the Trust consisted of thirteen series. These financial statements include the following eleven series: Timothy Plan Aggressive Growth Fund, Timothy Plan International Fund, Timothy Plan Large/Mid Cap Growth Fund, Timothy Plan Small Cap Value Fund, Timothy Plan Large/Mid Cap Value Fund, Timothy Plan Fixed Income Fund, Timothy Plan High Yield Bond Fund, Timothy Plan Defensive Strategies Fund, Timothy Plan Money Market Fund, Timothy Plan Strategic Growth Fund and Timothy Plan Conservative Growth Fund (the “Funds”).
The Timothy Plan Aggressive Growth Fund’s investment objective is long-term growth of capital. The Fund seeks to achieve its investment objective by normally investing at least 80% of the Fund’s total assets in U.S. common stocks without regard to market capitalizations and investing in the securities of a limited number of companies which the Fund’s Advisor believes show a high probability for superior growth.
The Timothy Plan International Fund’s investment objective is long-term growth of capital. The Fund seeks to achieve its investment objective by normally investing at least 80% of the Fund’s total assets in the common stock and similar securities of foreign companies through the purchase of American Depositary Receipts (“ADRs”) without regard to market capitalization, investing its assets in the ADRs of companies which the Fund’s investment manager believes show a high probability for superior growth, and allocating investments across countries and regions considering the size of the market in each country and region relative to the size of the international market as a whole. Although the Fund maintains a diversified investment portfolio, the political or economic developments within a particular country or region may have an adverse effect on the ability of domiciled issuers to meet their obligations. Additionally, political or economic developments may have an effect on the liquidity and volatility of portfolio securities and currency holdings.
The Timothy Plan Large/Mid Cap Growth Fund’s investment objective is long-term growth of capital. Current income is not a significant investment consideration and any such income realized will be considered incidental to the Fund’s investment objective. The Fund seeks to achieve its investment objective by normally investing at least 80% of the Fund’s total assets in U.S. common stocks with market capitalizations in excess of $2 billion.
The Timothy Plan Small Cap Value Fund’s primary objective is long-term capital growth, with a secondary objective of current income. The Fund seeks to achieve its investment objective by primarily investing at least 80% of its assets in U.S. common stocks whose market capitalization is generally less than $2 billion.
The Timothy Plan Large/Mid Cap Value Fund’s investment objective is long-term capital growth, with a secondary objective of current income. The Fund seeks to achieve its investment objective by primarily investing in U.S. common stocks. The Fund will invest at least 80% of its assets in the common stock of companies whose total market capitalization generally exceeds $2 billion.
The Timothy Plan Fixed Income Fund seeks to generate a high level of current income consistent with prudent investment risk. To achieve its investment objective, the Fund normally invests in a diversified portfolio of debt securities. These include corporate bonds, U.S. Government and agency securities, convertible securities and preferred securities. The Fund will generally only purchase high quality securities.
The Timothy Plan High Yield Bond Fund’s investment objective is to generate a high level of current income. To achieve its investment objective, the Fund normally invests in a diversified portfolio of debt securities. These include corporate bonds, U.S. Government and agency securities, convertible securities and preferred securities. The Fund will generally purchase securities that are not investment-grade, meaning securities with a rating of “BBB” or lower as rated by Standard and Poor’s or a comparable rating by another nationally recognized rating agency. Investments in these higher yielding securities are generally accompanied by a greater degree of credit risk than higher rated securities. Additionally, lower rated securities may be more susceptible to adverse economic and competitive industry conditions than investment-grade securities.
81
Notes to Financial Statements
September 30, 2011
Timothy Plan Family of Funds
The Timothy Plan Defensive Strategies Fund’s investment objective is the protection of principal through aggressive, proactive reactions to prevailing economic conditions. To achieve its investment objective, the Fund normally invests in Real Estate Investment Trusts (“REITs”), commodities based Exchange-Traded Funds (“ETFs”), and Treasury Inflation Protected Securities (“TIPS”).
The Timothy Plan Money Market Fund seeks to generate a high level of current income consistent with the preservation of capital. To achieve its investment objective, the Fund normally invests in short-term debt instruments, such as obligations of the U.S. Government and its agencies, certificates of deposit, banker’s acceptances, commercial paper and short-term corporate notes.
The Timothy Plan Strategic Growth Fund seeks to generate medium to high levels of long-term capital growth. The Fund seeks to achieve its investment objective by normally investing at least 75% of its net assets in the following Funds which are other series of the Trust: approximately 5-10% of its net assets in the Timothy Plan Small Cap Value Fund; approximately 15-25% of its net assets in the Timothy Plan Large/Mid Cap Value Fund; approximately 15-25% of its net assets in the Timothy Plan Large/Mid Cap Growth Fund; approximately 5-15% of its net assets in the Timothy Plan High Yield Bond Fund; approximately 20-30% of its net assets in the Timothy Plan International Fund; approximately 5%-10% of its net assets in the Timothy Plan Aggressive Growth Fund; and approximately 5%-15% of its net assets in the Timothy Plan Defensive Strategies Fund. The Fund may also invest in the Timothy Plan Money Market Fund.
The Timothy Plan Conservative Growth Fund seeks to generate moderate levels of long-term capital growth with a secondary objective of current income. The Fund seeks to achieve its investment objective by normally investing at least 75% of its net assets in the following Funds which are other series of the Trust: approximately 0-10% of its net assets in the Timothy Plan Small Cap Value Fund; approximately 10-20% of its net assets in the Timothy Plan Large/Mid Cap Value Fund; approximately 5-15% of its net assets in the Timothy Plan Large/Mid Cap Growth Fund; approximately 0-5% of its net assets in the Timothy Plan Aggressive Growth Fund; approximately 5-15% of its net assets in the Timothy Plan High Yield Bond Fund; approximately 5-15% of its net assets in the Timothy Plan International Fund; approximately 20%-40% of its net assets in the Timothy Plan Fixed Income Fund; and approximately 10-30% of its net assets in the Timothy Plan Defensive Strategies Fund. The Fund may also invest in the Timothy Plan Money Market Fund.
The following is a summary of significant accounting policies consistently followed by the Funds in the preparation of their financial statements. The policies are in conformity with accounting principles generally accepted in the United States of America (“GAAP”) for investment companies.
| A. | SECURITY VALUATION AND FAIR VALUE MEASUREMENTS |
All investments in securities are recorded at their estimated fair value as described in Note 2.
| B. | INVESTMENT INCOME AND SECURITIES TRANSACTIONS |
Security transactions are accounted for on the date the securities are purchased or sold (trade date). Dividend income is recognized on the ex-dividend date. Interest income and expenses are recognized on an accrual basis. The Timothy Plan Aggressive Growth Fund, Large/Mid Cap Growth Fund, Large/Mid Cap Value Fund, Small Cap Value Fund and Defensive Strategies Fund have made certain investments in REITs and Master Limited Partnerships (“MLPs”). Dividend income from REITs and MLPs is recognized on the ex-dividend date. It is common for distributions from REITs and MLPs to exceed taxable earnings and profits, resulting in the excess portion of such dividends being designated as a return of capital. Income or loss from the MLPs is reclassified upon receipt of the MLPs’ K-1. Withholding taxes on foreign dividends have been provided for in accordance with the Funds’ understanding of the applicable country’s tax rules and rates. Discounts and premiums on securities purchased are amortized over the lives of the respective securities. The ability of issuers of debt securities held by the Funds to meet their obligations may be affected by economic and political developments in a specific country or region.
82
Notes to Financial Statements
September 30, 2011
Timothy Plan Family of Funds
Investment securities denominated in foreign currencies are translated into U.S. dollar amounts at the date of valuation. Purchases and sales of investment securities and income and expense items denominated in foreign currencies are translated into U.S. dollar amounts on the respective dates of such transactions. The Funds do not isolate that portion of the results of operations resulting from changes in foreign exchange rates on investments from the fluctuations arising from changes in market prices of securities held. Such fluctuations are included in the net realized and unrealized gain or loss from investments. Reported net realized foreign exchange gains or losses arise from sales of foreign currencies, currency gains or losses realized between the trade and settlement dates on securities transactions, and the difference between the amounts of dividends, interest and foreign withholding taxes recorded on the Funds’ books and the U.S. dollar equivalent of the amounts actually received or paid. Net unrealized foreign exchange gains and losses arise from changes in the fair values of assets and liabilities, other than investments in securities at fiscal period end, resulting from changes in exchange rates.
| C. | NET ASSET VALUE PER SHARE |
The Net Asset Value (“NAV”) per share of the capital stock of the Funds is determined daily as of the close of trading on the New York Stock Exchange by dividing the value of its net assets by the number of Fund shares outstanding. The NAV is calculated separately for each class of the following Funds: Timothy Plan Aggressive Growth Fund, Timothy Plan International Fund, Timothy Plan Large/Mid Cap Growth Fund, Timothy Plan Small Cap Value Fund, Timothy Plan Large/Mid Cap Value Fund, Timothy Plan Fixed Income Fund, Timothy Plan High Yield Bond Fund, Timothy Plan Defensive Strategies Fund, Timothy Plan Money Market Fund, Timothy Plan Strategic Growth Fund and Timothy Plan Conservative Growth Fund. The asset value of the classes may differ because of different fees and expenses charged to each class.
| D. | EXPENSES |
Expenses incurred by the Trust that do not relate to a specific Fund of the Trust are allocated to the individual Funds based on each Fund’s relative net assets or another appropriate basis as determined by the Board of Trustees (the “Board”).
| E. | CLASSES |
There are three classes of shares currently offered by the Trust: Class A shares are offered with a front-end sales charge and ongoing service/distribution fees; Class C shares are offered with a contingent deferred sales charge (“CDSC”) that ends after the first year and ongoing service and distribution fees; No-Load shares are offered without sales charges or ongoing service/distribution fees (The Timothy Plan Money Market Fund only). The Trust previously has offered Class B shares to the public, which contain a contingent deferred sales charge that declines to zero over a period of years and are subject to an ongoing service/distribution fee. Sales of Class B shares to new shareholders were suspended by the Board during their meeting on February 27, 2004, with the suspension effective May, 2004, therefore, the CDSC fee no longer applies to Class B shares.
Class B shares automatically convert to Class A shares once the economic equivalent of the highest front-end sales charge paid at time of purchase has been received by a Fund, in the form of Rule 12b-1 distribution fees, paid by all Class B shares owned by an investor. As of September 30, 2011, all Class B shares have converted to Class A shares.
Class specific expenses are borne by each specific class. Income, expenses, and realized and unrealized gains/losses are allocated to the respective classes on the basis of relative daily net assets.
| F. | USE OF ESTIMATES |
In the preparation of financial statements in conformity with GAAP, management makes estimates and assumptions that affect the reported amounts of assets and liabilities and disclosure of contingent assets and liabilities at the date of the financial statements, as well as the reported amounts of revenues and expenses during the reporting period. Actual results could differ from those estimates.
83
Notes to Financial Statements
September 30, 2011
Timothy Plan Family of Funds
| G. | FEDERAL INCOME TAXES |
It is the policy of each Fund to continue to comply with all requirements under subchapter M of the Internal Revenue Code applicable to regulated investment companies and to distribute substantially all of its taxable income to its shareholders. Each Fund also intends to distribute sufficient net investment income and net capital gains, if any, so that it will not be subject to excise tax on undistributed income or gains. Therefore, no federal income tax or excise provision is required.
As of September 30, 2011, the Funds did not have a liability for any unrecognized tax benefits. The Funds recognize interest and penalties, if any, related to unrecognized tax benefits as income tax expense in the statements of operations. During the year ended September 30, 2011, the Funds did not incur any interest or penalties. The Funds are not subject to examination by U.S. federal tax authorities for tax years before 2008 and are not aware of any tax positions for which it is reasonably possible that the total amounts of unrecognized tax benefits will change materially within the next twelve months.
| H. | DISTRIBUTIONS TO SHAREHOLDERS |
Distributions to shareholders, which are determined in accordance with income tax regulations, are recorded on the ex-dividend date. The treatment for financial reporting purposes of distributions made to shareholders during the period from net investment income or net realized capital gains may differ from their ultimate treatment for federal income tax purposes. These differences are caused primarily by differences in the timing of the recognition of certain components of income, expense or realized capital gain for federal income tax purposes. Where such differences are permanent in nature, they are reclassified in the components of net assets based on their ultimate characterization for federal income tax purposes. Any such reclassifications will have no effect on net assets, results of operations, or NAVs per share of the Funds. Reclassifications for the fiscal year ended September 30, 2011 are as follows:
| Funds | Paid in Capital | Accumulated Undistributed Net Investment Income (Loss) | Accumulated Realized Gain (Loss) on Investments | |||||||||
Aggressive Growth Fund | $ | (303,250 | ) | $ | 302,883 | $ | 367 | |||||
International Fund | (465 | ) | 55,332 | (54,867 | ) | |||||||
Large/Mid Cap Growth Fund | (319,255 | ) | 318,429 | 826 | ||||||||
Small Cap Value Fund | (232,816 | ) | 235,679 | (2,863 | ) | |||||||
Large/Mid Cap Value Fund | - | 784 | (784 | ) | ||||||||
Fixed Income Fund | - | 86,228 | (86,228 | ) | ||||||||
High Yield Bond Fund | - | - | - | |||||||||
Money Market Fund | (217 | ) | 918 | (701 | ) | |||||||
Defensive Strategies Fund | 1,582 | (1,146,334 | ) | 1,144,752 | ||||||||
Strategic Growth Fund | (231,298 | ) | 204,357 | 26,941 | ||||||||
Conservative Growth Fund | - | (11,203 | ) | 11,203 | ||||||||
Note 2 | Security Valuation and Fair Value Measurements
Fair value is defined as the price that a Fund would receive upon selling an investment in a timely transaction to an independent buyer in the principal or most advantageous market of the investment. GAAP established a three-tier hierarchy to maximize the use of observable market data and minimize the use of unobservable inputs and to establish classification of fair value measurements for disclosure purposes.
84
Notes to Financial Statements
September 30, 2011
Timothy Plan Family of Funds
Inputs refer broadly to the assumptions that market participants would use in pricing the asset or liability, including assumptions about risk (the risk inherent in a particular valuation technique used to measure fair value including such a pricing model and/or the risk inherent in the inputs to the valuation technique). Inputs may be observable or unobservable. Observable inputs are inputs that reflect the assumptions market participants would use in pricing the asset or liability developed based on market data obtained from sources independent of the reporting entity. Unobservable inputs are inputs that reflect the reporting entity’s own assumptions about the assumptions market participants would use in pricing the asset or liability developed based on the best information available in the circumstances.
The Trust utilizes various methods to measure the fair value of all of its investments on a recurring basis. GAAP establishes a hierarchy that prioritizes inputs to valuation methods. The three levels of input are:
ŸLevel 1 – Unadjusted quoted prices in active markets for identical assets and liabilities that the Fund has the ability to access.
Ÿ Level 2 – Observable inputs other than quoted prices included in Level 1 that are observable for the asset or liability, either directly or indirectly. These inputs may include quoted prices for the identical instrument in an inactive market, prices for similar instruments, interest rates, prepayment speeds, credit risk, yield curves, default rates and similar data.
ŸLevel 3 – Unobservable inputs for the asset or liability, to the extent relevant observable inputs are not available, representing the Fund’s own assumptions about the assumptions a market participant would use in valuing the asset or liability, and would be based on the best information available.
The inputs used to measure fair value may fall into different levels of the fair value hierarchy. In such cases, for disclosure purposes, the level in the fair value hierarchy within which the fair value measurement falls in its entirety is determined based on the lowest level input that is significant to the fair value measurement in its entirety.
Each Fund generally determines the total value of each class of its shares by using market prices for the securities comprising its portfolio. Equity securities, including common stock, ADRs, REITs, MLPs, and ETFs are generally valued by using market quotations, but may be valued on the basis of prices furnished by a pricing service when the Advisor or Sub-Advisor believes such prices more accurately reflect the fair value of such securities. Securities that are traded on any stock exchange are generally valued by the pricing service at the last quoted sale price. Lacking a last sale price, an exchange traded security is generally valued by the pricing service at its last bid price. Securities traded in the NASDAQ over-the-counter market are generally valued by the pricing service at the NASDAQ Official Closing Price. When using the market quotations or close prices provided by the pricing service and when the market is considered active, the security will be classified as a Level 1 security. Sometimes, when the market is considered inactive, an equity security (such as some ADRs owned by the International Fund) owned by the Funds will be valued by the pricing service at an evaluated bid, with inputs such as the underlying securities price, the exchange rate for the currency and the ADR factor. When this happens, the security will generally be classified as a Level 2 security. When market quotations are not readily available, when the Advisor or Sub-Advisor determines that the market quotation or the price provided by the pricing service does not accurately reflect the current fair value, or when restricted or illiquid securities are being valued, such securities are valued as determined in good faith by the Advisor or Sub-Advisor, in conformity with guidelines adopted by and subject to review by the Board. These securities will generally be categorized as Level 3 securities.
Investments in mutual funds, including money market mutual funds, are generally priced at the ending NAV provided by the service agent of the funds. These securities will be categorized as Level 1 securities.
Fixed income securities such as corporate bonds, restricted corporate bonds, asset-backed securities, mortgage-backed securities, U.S. Government securities and U.S. government agency securities, when valued using market quotations in an active market, will be categorized as Level 1 securities. However, they may be valued on the basis of prices furnished by a pricing service when the Advisor or Sub-Advisor believes such prices more accurately reflect the fair value of such securities. A pricing service utilizes electronic data processing techniques based on yield spreads relating to securities with similar characteristics to determine prices for normal institutional-size trading units of debt securities without regard to sale or bid prices. These securities will generally be categorized as Level 2 securities. If the Advisor or Sub-Advisor decides that a price provided by the pricing service does not accurately reflect the fair value of the securities, when prices are not readily
85
Notes to Financial Statements
September 30, 2011
Timothy Plan Family of Funds
available from a pricing service, or when restricted or illiquid securities are being valued, securities are valued at fair value as determined in good faith by the Advisor or Sub-Advisor, in conformity with guidelines adopted by and subject to review of the Board. These securities will be categorized as Level 3 securities.
Short-term investments in fixed income securities (those with maturities of less than 60 days when acquired, or which subsequently are within 60 days of maturity) are valued by using the amortized cost method of valuation, which the Board has determined will represent fair value. These securities will be classified as Level 2 securities.
The Timothy Plan Money Market Fund uses the amortized cost method to compute its NAV. This means that securities purchased by the Fund are not marked to market. Instead, any premium paid or discount realized will be amortized or accrued over the life of the security and credited/debited daily against the total assets of the Fund. This also means that, under most circumstances, the Money Market Fund will not sell securities prior to maturity date except to satisfy redemption requests.
The Board has delegated to the Advisor and/or Sub-Advisors responsibility for determining the value of Fund portfolio securities under certain circumstances. Under such circumstances, the Advisor or Sub-Advisor will use its best efforts to arrive at the fair value of a security held by the Fund under all reasonably ascertainable facts and circumstances. The Advisor must prepare a report for the Board not less than quarterly containing a complete listing of any securities for which fair value pricing was employed and detailing the specific reasons for such fair value pricing. The Board has adopted written policies and procedures to guide the Advisor and Sub-Advisors with respect to the circumstances under which, and the methods to be used, in fair valuing securities.
The following is a summary of the inputs used to value each Fund’s assets as of September 30, 2011:
Aggressive Growth Fund
Assets | Level 1 | Level 2 | Level 3 | Total | ||||||||||||
Common Stocks | $ | 12,994,054 | $ | - | $ | - | $ | 12,994,054 | ||||||||
REITs | 184,214 | - | - | 184,214 | ||||||||||||
Money Market Fund | 840,354 | - | - | 840,354 | ||||||||||||
Total | $ | 14,018,622 | $ | - | $ | - | $ | 14,018,622 | ||||||||
International Fund | ||||||||||||||||
Assets | Level 1 | Level 2 | Level 3 | Total | ||||||||||||
Common Stocks | $ | 27,164,515 | $ | - | $ | - | $ | 27,164,515 | ||||||||
Money Market Fund | 2,451,762 | - | - | 2,451,762 | ||||||||||||
Total | $ | 29,616,277 | $ | - | $ | - | $ | 29,616,277 | ||||||||
Large/Mid Cap Growth Fund | ||||||||||||||||
Assets | Level 1 | Level 2 | Level 3 | Total | ||||||||||||
Common Stocks | $ | 32,996,033 | $ | - | $ | - | $ | 32,996,033 | ||||||||
REITs | 473,558 | - | - | 473,558 | ||||||||||||
Money Market Fund | 3,719,044 | - | - | 3,719,044 | ||||||||||||
Total | $ | 37,188,635 | $ | - | $ | - | $ | 37,188,635 | ||||||||
86
Notes to Financial Statements
September 30, 2011
Timothy Plan Family of Funds
Small Cap Value Fund | ||||||||||||||||
Assets | Level 1 | Level 2 | Level 3 | Total | ||||||||||||
Common Stocks | $ | 36,511,853 | $ | - | $ | - | $ | 36,511,853 | ||||||||
REITs | 5,421,977 | - | - | $ | 5,421,977 | |||||||||||
Money Market Fund | 971,390 | - | - | 971,390 | ||||||||||||
Total | $ | 42,905,220 | $ | - | $ | - | $ | 42,905,220 | ||||||||
Large/Mid Cap Value Fund | ||||||||||||||||
Assets | Level 1 | Level 2 | Level 3 | Total | ||||||||||||
Common Stocks | $ | 76,854,228 | $ | - | $ | - | $ | 76,854,228 | ||||||||
Master Limited Partnerships | 1,662,680 | - | - | 1,662,680 | ||||||||||||
REITs | 3,985,161 | - | - | 3,985,161 | ||||||||||||
Money Market Fund | 5,748,933 | - | - | 5,748,933 | ||||||||||||
Total | $ | 88,251,002 | $ | - | $ | - | $ | 88,251,002 | ||||||||
Fixed Income Fund | ||||||||||||||||
Assets | Level 1 | Level 2 | Level 3 | Total | ||||||||||||
Asset-Backed Securities | $ | - | $ | 178,870 | $ | - | $ | 178,870 | ||||||||
Corporate Bonds | - | 16,036,177 | - | 16,036,177 | ||||||||||||
U.S. Government Notes & Bonds | - | 21,677,050 | - | 21,677,050 | ||||||||||||
Government Mortgage-Backed Securities | - | 23,775,412 | - | 23,775,412 | ||||||||||||
Treasury Inflation Protected Securities | - | 3,550,067 | - | 3,550,067 | ||||||||||||
Money Market Fund | 1,487,248 | - | - | 1,487,248 | ||||||||||||
Total | $ | 1,487,248 | $ | 65,217,576 | $ | - | $ | 66,704,824 | ||||||||
High Yield Bond Fund | ||||||||||||||||
Assets | Level 1 | Level 2 | Level 3 | Total | ||||||||||||
Corporate Bonds | $ | 23,381,948 | $ | - | $ | 23,381,948 | ||||||||||
Money Market Fund | 318,984 | - | - | 318,984 | ||||||||||||
Total | $ | 318,984 | $ | 23,381,948 | $ | - | $ | 23,700,932 | ||||||||
Money Market Fund | ||||||||||||||||
Assets | Level 1 | Level 2 | Level 3 | Total | ||||||||||||
U.S. Government & Government Agencies | $ | - | $ | 10,915,559 | $ | - | $ | 10,915,559 | ||||||||
Money Market Fund | 1,043,580 | - | - | 1,043,580 | ||||||||||||
Total | $ | 1,043,580 | $ | 10,915,559 | $ | - | $ | 11,959,139 | ||||||||
87
Notes to Financial Statements
September 30, 2011
Timothy Plan Family of Funds
Defensive Strategies Fund | ||||||||||||||||
Assets | Level 1 | Level 2 | Level 3 | Total | ||||||||||||
Common Stocks | $ | 18,697,285 | $ | - | $ | - | $ | 18,697,285 | ||||||||
REITs | 7,867,846 | - | - | 7,867,846 | ||||||||||||
Exchange Traded Funds | 8,493,653 | - | - | 8,493,653 | ||||||||||||
Government Mortgage-Backed Securities | - | 1,831,510 | - | 1,831,510 | ||||||||||||
U.S. Treasury TIPS | - | 14,474,843 | - | 14,474,843 | ||||||||||||
Money Market Fund | 26,400,191 | - | - | 26,400,191 | ||||||||||||
Total | $ | 61,458,975 | $ | 16,306,353 | $ | - | $ | 77,765,328 | ||||||||
Strategic Growth Fund | ||||||||||||||||
Assets | Level 1 | Level 2 | Level 3 | Total | ||||||||||||
Mutual Funds | $ | 36,106,318 | $ | - | $ | - | $ | 36,106,318 | ||||||||
Money Market Fund | 1,627,940 | - | - | 1,627,940 | ||||||||||||
Total | $ | 37,734,258 | $ | - | $ | - | $ | 37,734,258 | ||||||||
Conservative Growth Fund | ||||||||||||||||
Assets | Level 1 | Level 2 | Level 3 | Total | ||||||||||||
Mutual Funds | $ | 41,318,395 | $ | - | $ | - | $ | 41,318,395 | ||||||||
Money Market Fund | 2,007,243 | - | - | 2,007,243 | ||||||||||||
Total | $ | 43,325,638 | $ | - | $ | - | $ | 43,325,638 | ||||||||
Refer to the Schedules of Investments for industry classifications.
The Funds did not hold any assets at any time during the reporting period in which significant unobservable inputs were used in determining fair value; therefore, no reconciliation of Level 3 securities is included for this reporting period. The Funds did not hold any derivative instruments during the reporting period. During the fiscal year ended September 30, 2011, transfers between Levels 1 and 2 are listed in the table below. The Funds’ policy is to recognize transfers at the end of the period.
The following amounts were transfers in/(out) of Level 2 assets:
International Fund |
| |||||||||
| | Common Stock - American Depositary Receipts | | Total | |||||||
Transfers into Level 2 from Level 1 | $ - | $ - | ||||||||
Transfers from Level 2 into Level 1 | (10,017,392) | (10,017,392) | ||||||||
Net Transfers in/(Out) of Level 2 | $ (10,017,392) | $ (10,017,392) | ||||||||
There were no transfers from Level 1 to Level 2. Transfers that were made out of Level 2 represent securities no longer being fair valued using observable inputs and are now being valued using quoted prices in active markets.
88
Notes to Financial Statements
September 30, 2011
Timothy Plan Family of Funds
Note 3 | Purchases and Sales of Securities
The following is a summary of the cost of purchases and proceeds from the sale of securities, other than short-term investments, for the fiscal year ended September 30, 2011:
| Purchases | Sales | |||||||||||||||||||
| Fund | U.S. Gov’t Obligations | Other | U.S. Gov’t Obligations | Other | ||||||||||||||||
Aggressive Growth Fund | $ | - | $36,038,177 | $ | - | $ | 37,797,194 | |||||||||||||
International Fund | - | 23,787,678 | 25,796,691 | |||||||||||||||||
Large/Mid Cap Growth Fund | - | 63,603,747 | 71,002,450 | |||||||||||||||||
Small Cap Value Fund | - | 52,727,924 | 54,952,300 | |||||||||||||||||
Large/Mid Cap Value Fund | - | 19,275,661 | 26,160,863 | |||||||||||||||||
Fixed Income Fund | 22,150,022 | 1,481,877 | 8,907,277 | 4,866,627 | ||||||||||||||||
High Yield Bond Fund | - | 16,701,760 | 14,458,535 | |||||||||||||||||
Defensive Strategies Fund | 7,571,849 | 36,850,112 | 4,933,179 | 16,567,083 | ||||||||||||||||
Strategic Growth Fund | - | 10,220,200 | 18,698,792 | |||||||||||||||||
Conservative Growth Fund | - | 11,166,181 | 15,642,417 | |||||||||||||||||
Note 4 | Investment Management Fee and Other Transactions with Affiliates
Timothy Partners, Ltd., (“TPL”) is the investment advisor for the Funds pursuant to an investment advisory agreement (the “Agreement”) that was renewed by the Board on February 25, 2011. TPL supervises the investment of the assets of each Fund in accordance with the objectives, policies and restrictions of the Trust. Under the terms of the Agreement, as amended, TPL receives a fee, accrued daily and paid monthly, at an annual rate of 1.00% of the average daily net assets of the Timothy Plan International Fund; 0.85% of the average daily net assets of the Timothy Plan Aggressive Growth, the Timothy Plan Small Cap Value, the Timothy Plan Large/Mid Cap Growth, and the Timothy Plan Large/Mid Cap Value Funds; 0.60% of the average daily net assets of the Timothy Plan Fixed Income, the Timothy Plan High Yield Bond, the Timothy Plan Defensive Strategies, and the Timothy Plan Money Market Funds; and 0.65% of the average daily net assets of the Timothy Plan Conservative Growth and the Timothy Plan Strategic Growth Funds. TPL has voluntarily agreed to reduce the fee it receives from the Timothy Plan Fixed Income and the Timothy Plan Money Market to 0.45% and 0.40%, respectively. Additionally, TPL has voluntarily agreed to reduce fees payable to it by the Timothy Plan Money Market Fund and reimburse other expenses to the extent necessary to limit the Fund’s aggregate annual operating expenses to 5 basis points.
Such voluntary fee reductions/reimbursements may be authorized by TPL at any time, but such action shall not obligate TPL to waive any fees in the near future. Such voluntary fee reductions/reimbursements are not subject to future recoupment. An officer and trustee of the Funds is also an officer and owner of the Advisor.
For the fiscal year ended September 30, 2011, TPL waived and reimbursed the Funds as follows:
| Fund | Fiscal Year Ended September 30, 2011 | |||||
Fixed Income Fund | $ | 100,683 | ||||
Money Market Fund | 134,104 | |||||
89
Notes to Financial Statements
September 30, 2011
Timothy Plan Family of Funds
Huntington Asset Services, Inc. served as the Funds’ administrator, fund account and transfer agent through August 5, 2011. Effective August 5, 2011, Gemini Fund Services, LLC (“GFS”) provides administrative, fund accounting, and transfer agency services to the Funds pursuant to agreements with the Trust, for which it receives from each Fund: (i) basis points in decreasing amounts as assets reach certain breakpoints; and (ii) any related out-of-pocket expenses. Fees are billed monthly as follows:
Fund Accounting and Fund Administration Fees:
Fund Complex Base annual fee:
25 basis points (0.25%) on the first $200 million of net assets
15 basis points (0.15%) on the next $200 million of net assets;
8 basis points (0.08%) on the next $600 million of net assets; and
6 basis points (0.06%) on net assets greater than $1 billion.
Transfer agency fees for the Funds are combined with the Fund Accounting and Fund Administration fees under the Trust’s agreement with GFS. Therefore, there is no separate base annual fee per Fund or share class.
An officer of the Trust is also an employee of GFS, and is not paid any fees directly by the Trust for serving in such capacity.
The Timothy Plan Aggressive Growth, Timothy Plan International, Timothy Plan Large/Mid Cap Growth, Timothy Plan Small Cap Value, Timothy Plan Large/Mid Cap Value, Timothy Plan Fixed Income, Timothy Plan High Yield Bond, and Timothy Plan Defensive Strategies Funds have adopted shareholder services plans (the “Plans”) pursuant to Rule 12b-1 under the Investment Company Act of 1940, as amended. The Plans provide that the Funds will pay TPL or others for expenses that relate to the promotion or distribution of shares. Under the Class A Plan, the Funds will pay TPL a fee at an annual rate of
0.25%, payable monthly, of the average daily net assets attributable to such class of shares. Under the Class C Plan, the Funds will pay TPL a fee at an annual rate of 1.00%, payable monthly, of which, 0.25% may be a service fee and 0.75% may be payable to outside broker/dealers, of the average daily net assets attributable to such class of shares. Class B shares were transferred in entirety to Class A Shares at June 30, 2011.
The Timothy Plan Conservative Growth and Timothy Plan Strategic Growth Funds have adopted shareholder services plans (the “Plans”) pursuant to Rule 12b-1 under the Investment Company Act of 1940, as amended. The Plans provide that the Funds will pay TPL or others for expenses that relate to the promotion or distribution of shares. Class A shares of the Funds do not impose a service fee. Under the Class B and C Plans, the Funds will pay TPL a fee at an annual rate of 0.75%, payable monthly to outside broker/dealers, of the average daily net assets attributable to such class of shares. Class B shares were transferred in entirety to Class A Shares at June 30, 2011. For the fiscal year ended September 30, 2011, the Funds paid TPL under the terms of the Plans as follows:
| Fund | 12b-1 Fees | |||
Fiscal Year Ended | ||||
Aggressive Growth Fund | $63,795 | |||
International Fund | 118,035 | |||
Large/Mid Cap Growth Fund | 139,085 | |||
Small Cap Value Fund | 176,920 | |||
Large/Mid Cap Value Fund | 336,375 | |||
Fixed Income Fund | 228,835 | |||
High Yield Bond Fund | 73,531 | |||
Defensive Strategies Fund | 178,832 | |||
Strategic Growth Fund | 73,518 | |||
Conservative Growth Fund | 74,859 |
90
Notes to Financial Statements
September 30, 2011
Timothy Plan Family of Funds
TPL also serves as the principal underwriter of the Funds’ shares. An officer and trustee of the Funds is also an officer of the principal underwriter. For the fiscal year ended September 30, 2011, TPL received sales charges deducted from the proceeds of sales of Class A capital shares and CDSC fees deducted from the redemption of C capital shares as follows:
| Fund | Sales Charges (Class A) | CDSC Fees (Class C) | ||||||||
Aggressive Growth Fund | $4,496 | $288 | ||||||||
International Fund | 6,379 | 753 | ||||||||
Large/Mid Cap Growth Fund | 8,073 | 782 | ||||||||
Small Cap Value Fund | 8,665 | 1,363 | ||||||||
Large/Mid Cap Value Fund | 23,440 | 1,615 | ||||||||
Fixed Income Fund | 28,578 | 4,122 | ||||||||
High Yield Bond Fund | 8,121 | 219 | ||||||||
Defensive Strategies Fund | 34,914 | 1,517 | ||||||||
Strategic Growth Fund | 15,104 | 1,621 | ||||||||
Conservative Growth Fund | 24,638 | 811 | ||||||||
Note 5 | Control Ownership
The beneficial ownership, either directly or indirectly, of more than 25% of the voting securities of a Fund creates the presumption of control of the Fund under Section 2(a) 9 of the Investment Company Act of 1940. At September 30, 2011 there were no shareholders with ownership, either directly or indirectly, of more than 25% of the voting securities of a Fund.
Certain Timothy Plan Funds own shares of other Timothy Plan Funds. U.S. Bank, N.A., custodian of the Timothy Plan Funds, holds these shares in omnibus accounts, some of which are controlled by National Financial Services, Inc. The following shows the percentage of each Timothy Plan Fund that is held by U.S. Bank, N.A., as custodian of the Timothy Funds. These accounts can be considered affiliated to the Timothy Plan.
| Funds | % of Fund Owned by Other Timothy Plan Funds | |||
Aggressive Growth Fund, Class A | 48.08 | % | ||
International Fund, Class A | 61.73 | % | ||
Large/Mid Cap Growth Fund, Class A | 52.72 | % | ||
Small Cap Value Fund, Class A | 20.15 | % | ||
Large/Mid Cap Value Fund, Class A | 27.33 | % | ||
Fixed Income Fund, Class A | 38.24 | % | ||
High Yield Bond Fund, Class A | 53.37 | % | ||
Defensive Strategies Fund, Class A | 54.51 | % | ||
91
Notes to Financial Statements
September 30, 2011
Timothy Plan Family of Funds
Note 6 | Distributions to Shareholders
The tax character of distributions paid during the fiscal year ended September 30, 2011 and the fiscal year ended September 30, 2010 were as follows:
|
| |||||||||||||||||
| Aggressive Growth | International * | Large/Mid Cap Growth | Small Cap Value | |||||||||||||||
|
| |||||||||||||||||
Year ended September 30, 2011 |
| |||||||||||||||||
Ordinary Income | $ | - | $ | 298,149 | $ | - | $ | - | ||||||||||
Short-term Capital Gains | - | - | - | - | ||||||||||||||
Long-term Capital Gains | - | - | - | - | ||||||||||||||
Return of Capital | - | - | - | - | ||||||||||||||
|
| |||||||||||||||||
| $ | - | $ | 298,149 | $ | - | $ | - | |||||||||||
|
| |||||||||||||||||
Year ended September 30, 2010 |
| |||||||||||||||||
Ordinary Income | $ | - | $ | 552,642 | $ | - | $ | - | ||||||||||
Short-term Capital Gains | - | - | - | - | ||||||||||||||
Long-term Capital Gains | - | - | - | - | ||||||||||||||
Return of Capital | - | - | - | - | ||||||||||||||
|
| |||||||||||||||||
| $ | - | $ | 552,642 | $ | - | $ | - | |||||||||||
|
| |||||||||||||||||
|
| |||||||||||||||||
| Large/Mid Cap Value | Fixed Income | High Yield Bond | Money Market | |||||||||||||||
|
| |||||||||||||||||
Year ended September 30, 2011 |
| |||||||||||||||||
Ordinary Income | $ | 276,108 | $ | 1,813,005 | $ | 1,486,556 | $ | 5,496 | ||||||||||
Short-term Capital Gains | - | - | - | - | ||||||||||||||
Long-term Capital Gains | - | - | - | - | ||||||||||||||
Return of Capital | - | - | - | - | ||||||||||||||
|
| |||||||||||||||||
| $ | 276,108 | $ | 1,813,005 | $ | 1,486,556 | $ | 5,496 | |||||||||||
|
| |||||||||||||||||
Year ended September 30, 2010 |
| |||||||||||||||||
Ordinary Income | $ | 394,793 | $ | 1,626,024 | $ | 1,381,507 | $ | 4,652 | ||||||||||
Short-term Capital Gains | - | - | - | 5,396 | ||||||||||||||
Long-term Capital Gains | - | - | - | - | ||||||||||||||
Return of Capital | - | - | - | - | ||||||||||||||
|
| |||||||||||||||||
| $ | 394,793 | $ | 1,626,024 | $ | 1,381,507 | $ | 10,048 | |||||||||||
|
| |||||||||||||||||
|
| |||||||||||||||||
| Defensive Strategies | Strategic Growth | Conservative Growth | ||||||||||||||||
|
| |||||||||||||||||
Year ended September 30, 2011 |
| |||||||||||||||||
Ordinary Income | $ | - | $ | - | $ | 393,428 | ||||||||||||
Short-term Capital Gains | 145,797 | - | - | |||||||||||||||
Long-term Capital Gains | - | - | - | |||||||||||||||
Return of Capital | - | 41,359 | - | |||||||||||||||
|
| |||||||||||||||||
| $ | 145,797 | $ | 41,359 | $ | 393,428 | |||||||||||||
|
| |||||||||||||||||
Year ended September 30, 2010 |
| |||||||||||||||||
Ordinary Income | $ | 3,363 | $ | - | $ | 607,967 | ||||||||||||
Short-term Capital Gains | 502,028 | - | - | |||||||||||||||
Long-term Capital Gains | 36,320 | - | - | |||||||||||||||
Return of Capital | 477,490 | - | - | |||||||||||||||
|
| |||||||||||||||||
| $ | 1,019,201 | $ | - | $ | 607,967 | |||||||||||||
|
| |||||||||||||||||
* The difference between ordinary distributions paid from book and ordinary distributions paid from tax relates to $78,668 and $69,497 of allowable foreign tax credits from fiscal years ended September 30, 2011 and September 30, 2010, respectively, which have been passed through to the Fund’s underlying shareholders.
92
Notes to Financial Statements
September 30, 2011
Timothy Plan Family of Funds
For the fiscal year ended September 30, 2011, the Funds made the following ordinary income distributions:
| Fund | Total Distribution Per Share | Total Distribution | ||||
International Fund, Class A | $0.040 | $212,572 | ||||
International Fund, Class C | 0.030 | 6,909 | ||||
Large/Mid Cap Value Fund, Class A | 0.040 | 261,906 | ||||
Large/Mid Cap Value Fund, Class B | 0.002 | 81 | ||||
Large/Mid Cap Value Fund, Class C | 0.020 | 14,121 | ||||
Fixed Income Fund, Class A | 0.450 | 1,648,039 | ||||
Fixed Income Fund, Class B | 0.090 | 2,453 | ||||
Fixed Income Fund, Class C | 0.280 | 162,513 | ||||
High Yield Bond Fund, Class A | 0.540 | 1,427,454 | ||||
High Yield Bond Fund, Class C | 0.460 | 59,102 | ||||
Money Market Fund | 0.00050813 | 5,496 | ||||
Strategic Growth Fund, Class A * | 0.010 | 41,359 | ||||
Conservative Growth Fund, Class A | 0.080 | 322,689 | ||||
Conservative Growth Fund, Class B | 0.060 | 12,992 | ||||
Conservative Growth Fund, Class C | 0.060 | 57,747 | ||||
*Strategic Growth Fund distribution was a Return of Capital. | ||||||
For the fiscal year ended September 30, 2011, the Funds made the following short-term capital gains distributions:
| Fund | Total Distribution Per Share | Total Distribution | ||||||||
Defensive Strategies Fund, Class A | $ | 0.0484 | $ | 112,375 | ||||||
Defensive Strategies Fund, Class C | $ | 0.0484 | $ | 33,422 | ||||||
The Aggressive Growth Fund, Large / Mid Cap Growth Fund and Small Cap Value Fund did not pay any distributions during the fiscal year ended September 30, 2011.
93
Notes to Financial Statements
September 30, 2011
Timothy Plan Family of Funds
As of September 30, 2011, the components of distributable earnings on a tax basis were as follows:
|
| |||||||||||||||||
| Aggressive Growth | International | Large/Mid Cap Growth | Small Cap Value | |||||||||||||||
|
| |||||||||||||||||
Undistributed Ordinary Income | $ | - | $ | 995,680 | $ | - | $ | - | ||||||||||
Long-Term Capital Gains | - | - | 1,809,659 | - | ||||||||||||||
Capital Loss Carry Forward | (2,080,952 | ) | (15,012,255 | ) | - | (3,353,298 | ) | |||||||||||
Post October and Other Losses | - | - | - | - | ||||||||||||||
Unrealized Appreciation (Depreciation) | (1,387,197 | ) | (3,070,307 | ) | (3,969,989 | ) | (8,379,050 | ) | ||||||||||
|
| |||||||||||||||||
| $ | (3,468,149 | ) | $ | (17,086,882 | ) | $ | (2,160,330 | ) | $ | (11,732,348 | ) | |||||||
|
| |||||||||||||||||
|
| |||||||||||||||||
| Large/Mid Cap Value | Fixed Income | High Yield Bond | Money Market | |||||||||||||||
|
| |||||||||||||||||
Undistributed Ordinary Income | $ | 191,808 | $ | 60,137 | $ | 9,460 | $ | 8,822 | ||||||||||
Long-Term Capital Gains | - | - | - | - | ||||||||||||||
Capital Loss Carry Forward | (13,784,694 | ) | (1,443,513 | ) | (1,794,826 | ) | - | |||||||||||
Post October and Other Losses | - | - | - | (1,704 | ) | |||||||||||||
Unrealized Appreciation (Depreciation) | 3,411,755 | 4,953,854 | (897,930 | ) | - | |||||||||||||
|
| |||||||||||||||||
| $ | (10,181,131 | ) | $ | 3,570,478 | $ | (2,683,296 | ) | $ | 7,118 | |||||||||
|
| |||||||||||||||||
|
| |||||||||||||||||
| Defensive Strategies | Strategic Growth | Conservative Growth | ||||||||||||||||
|
| |||||||||||||||||
Undistributed Ordinary Income | $ | 1,209,564 | $ | - | $ | 47,033 | ||||||||||||
Long-Term Capital Gains | 2,868,887 | - | - | |||||||||||||||
Capital Loss Carry Forward | - | (7,367,375 | ) | (5,190,627 | ) | |||||||||||||
Post October and Other Losses | - | (799,591 | ) | - | ||||||||||||||
Unrealized Appreciation (Depreciation) | (1,724,003 | ) | (6,572,968 | ) | (950,651 | ) | ||||||||||||
|
| |||||||||||||||||
| $ | 2,354,448 | $ | (14,739,934 | ) | $ | (6,094,245 | ) | |||||||||||
|
| |||||||||||||||||
Note 7 | Capital Loss Carryforwards
At September 30, 2011, the following capital loss carryforwards are available to offset future capital gains.
| Funds | Loss Carryforward | Year Expiring | ||||||||||
Aggressive Growth Fund | $ | 2,080,952 | 2017 | |||||||||
International Fund | $ | 498,385 | 2015 | |||||||||
| $ | 4,243,183 | 2016 | ||||||||||
| $ | 8,833,573 | 2017 | ||||||||||
| $ | 592,985 | 2018 | ||||||||||
| $ | 844,129 | 2019 | ||||||||||
Small Cap Value Fund | $ | 3,353,298 | 2017 | |||||||||
Large/Mid Cap Value Fund | $ | 2,343,348 | 2016 | |||||||||
| $ | 11,441,346 | 2017 | ||||||||||
Fixed Income Fund | $ | 56,297 | 2015 | |||||||||
| $ | 252,039 | 2016 | ||||||||||
| $ | 1,135,177 | 2017 | ||||||||||
High Yield Bond Fund | $ | 1,794,826 | 2017 | |||||||||
Strategic Growth Fund | $ | 844,160 | 2016 | |||||||||
| $ | 2,564,555 | 2017 | ||||||||||
| $ | 125,171 | 2018 | ||||||||||
| $ | 3,833,489 | 2019 | ||||||||||
Conservative Growth Fund | $ | 1,762,631 | 2017 | |||||||||
| $ | 3,427,996 | 2019 | ||||||||||
94
Notes to Financial Statements
September 30, 2011
Timothy Plan Family of Funds
To the extent these loss carryforwards are used to offset future capital gains, it is probable that the amount, which is offset, will not be distributed to shareholders.
The Regulated Investment Company Modernization Act of 2010 (the “Act”) was enacted on December 22, 2010. The Act makes changes to several tax rules impacting the Funds. In general, the provisions of the Act will be effective for the Funds fiscal year ending September 30, 2012. Although the Act provides several benefits, including unlimited carryover on future capital losses, there may be greater likelihood that all or a portion of the Funds pre-enactment capital loss carryovers may expire without being utilized due to the fact that post-enactment capital losses get utilized before pre-enactment capital loss carryovers. Relevant information regarding the impact of the Act on the Funds, if any, will be included in the September 30, 2012 annual report.
Note 8 | NEW ACCOUNTING PRONOUNCEMENTS
In May 2011, the FASB issued ASU No. 2011-04 “Amendments to Achieve Common Fair Value Measurement and Disclosure Requirements” in U.S. generally accepted accounting principles (“GAAP”) and the International Financial Reporting Standards (“IFRSs”). ASU No. 2011-04 amends FASB ASC Topic 820, Fair Value Measurements and Disclosures, to establish common requirements for measuring fair value and for disclosing information about fair value measurements in accordance with GAAP and IFRSs. ASU No. 2011-04 is effective for fiscal years beginning after December 15, 2011 and for interim periods within those fiscal years. Management is currently evaluating the impact these amendments may have on the Funds’ financial statements.
Note 9 | SUBSEQUENT EVENTS
The Independent Trustees approved a plan to liquidate the Money Market Fund at the November 18, 2011 board meeting. It is estimated that the liquidation will occur in the first quarter of the 2012 calendar year.
95
Notes to Financial Statements
September 30, 2011
Timothy Plan Family of Funds
Board Annual Approval/Renewals of Advisory and Sub-Advisory Agreements (Unaudited)
Timothy Partners, Ltd; Investment Advisor to all Funds
The continuance of the Investment Advisory Agreement (the “IA Agreement”) on behalf of each series of the Trust between the Trust and Timothy Partners, Ltd. (“TPL”) was last approved by the Board of Trustees (“the Board”), including a majority of the Trustees who are not interested persons of the Trust or any person who is a party to the Agreement, at an in-person meeting held on February 25, 2011. The Trust’s Board considered the factors described below prior to approving the Agreement. The Trustees, including the Independent Trustees, noted the Advisor’s experience in incorporating and implementing the unique, biblically-based management style that is a stated objective as set forth in the Funds’ prospectus.
To further assist the Board in making its determination as to whether the IA Agreement should be renewed, the Board requested and received the following information: a description of TPL’s business and any personnel changes, a description of the compensation received by TPL from the Funds, information relating to the Advisor’s policies and procedures regarding best execution, trade allocation, soft dollars, code of ethics and insider trading, and a description of any material legal proceedings or securities enforcement proceedings regarding TPL or its personnel. In addition, the Board requested and received financial statements of TPL for its fiscal year ended December 31, 2010. The Board also received a report from TPL relating to the fees charged by TPL, both as an aggregate and in relation to fees charged by other advisors to similar funds. The materials prepared by TPL were provided to the Board in advance of the meeting. The Board considered the fees charged by TPL in light of the services provided to the Funds by TPL, the unique nature of the Funds and their moral screening requirements, which are maintained by TPL, and TPL’s role as a manager of managers. After full and careful consideration, the Board, with the independent trustees separately concurring, agreed that the fees charged by TPL were fair and reasonable in light of the services provided to the Funds. The Board also discussed the nature, extent and quality of TPL’s services to the Funds. In particular, the Board noted with approval TPL’s commitment to maintaining certain targeted expense ratios for the Funds, its efforts in providing comprehensive and consistent moral screens to the investment managers, its efforts in maintaining appropriate oversight of the investment managers to each Fund, and its efforts to maintain ongoing regulatory compliance for the Funds. The Board also discussed TPL’s current fee structure and whether such structure would allow the Funds to realize economies of scale as they grow. The Board next considered the investment performance of each Fund and the Advisor’s performance in monitoring the investment managers of the underlying funds. The Board generally approved of each Fund’s performance, noting that the Funds invested in a manner that did not rely exclusively on investment performance. Further, the Board noted with approval that the investment managers of each Fund did not succumb to “style drift” in their management of each Fund’s assets, and that each Fund was committed to maintain its investment mandate, even if that meant under performance during periods when that style was out of favor. The Board noted with approval the Advisor’s ongoing efforts to maintain such consistent investment discipline. The Board also noted with approval that the Advisor’s business was devoted exclusively to serving the Funds, and that the Advisor did not realize any ancillary benefits or profits deriving from its relationship with the Funds. The Board further noted with approval the Advisor’s past activities on monitoring the performance of the underlying Funds’ various investment managers and the promptness and efficiency with which problems were brought to the Board’s attention and responsible remedies offered and executed. After careful discussion and consideration, the Board, including the separate concurrence of the independent Trustees, unanimously cast an affirmative vote, and determined that the renewal of the IA Agreement for another one-year period would be in the best interests of the Funds’ shareholders. In approving the renewal of the IA Agreement for an additional one year period, the Board did not place specific emphasis on any one factor discussed above, but considered all factors in equal light. Further, the Board had available and availed itself of the assistance of legal counsel at all times during its consideration of the IA Agreement renewal.
Barrow, Hanley Mewhinney & Strauss; Sub-Advisor for the Fixed Income, High Yield Bond, Defensive Strategies TIPS sleeve and Money Market Funds.
The Sub-Advisory Agreement between the Trust, TPL and Barrow, Hanley Mewhinney & Strauss (“BHM&S”), on behalf of the Timothy Plan Fixed Income, High Yield Bond, Defensive Strategies TIPS sleeve and Money Market Funds, was last renewed
96
Notes to Financial Statements
September 30, 2011
Timothy Plan Family of Funds
by the Board at a meeting held for that purpose, among others, on February 25, 2011. The Board considered the following factors in arriving at its conclusions to renew the BHM&S Sub-Advisory Agreement for an additional year. First, the Board considered the fees charged by BHM&S in light of the services provided by BHM&S. After full and careful consideration, the Board, with the independent trustees separately concurring, agreed that the fees charged by BHM&S and paid out of the fees received by TPL were fair and reasonable in light of the services provided by BHM&S. In reaching that determination, the Board relied on reports describing the fees paid to BHM&S and comparing those fees against fees paid to other investment advisors operating under similar circumstances. Next, the Board discussed the nature, extent and quality of BHM&S’s services to each Fund, including the investment performance of the Funds under BHM&S’s investment management. The Board generally approved of BHM&S’s performance, noting that the Funds managed by BHM&S invested in a manner that did not rely exclusively on investment performance. Further, the Board noted with approval that BHM&S did not succumb to “style drift” in its management of each Fund’s assets, and that BHM&S was committed to maintain its investment mandate, even if that meant under performance during periods when that style was out of favor. The Board noted with approval BHM&S’s ongoing efforts to maintain such consistent investment discipline. Next, the Board considered whether BHM&S’s current fee structure would allow the Funds to realize economies of scale as they grow. The Board decided that this particular factor was moot with respect to the BHM&S Sub-Advisory Agreement because BHM&S was paid out of the fees paid to TPL. After careful discussion and consideration, the Board, including the independent Trustees separately concurring, unanimously determined that the renewal of the BHM&S Sub-Advisory Agreement for another one-year period would be in the best interests of the Funds’ shareholders. In approving the renewal of the BHM&S Sub-Advisory Agreement for an additional one year period, the Board did not place specific emphasis on any one factor discussed above, but considered all factors in equal light. Further, the Board had available and availed itself of the assistance of legal counsel at all times during its consideration of the BHM&S Sub-Advisory Agreement renewal.
Westwood Holdings Group; Sub-Advisor to the Large/Mid Cap Value and the Small Cap Value Funds.
The Sub-Advisory Agreement between the Trust, TPL and Westwood Holdings Group (“Westwood”), on behalf of the Timothy Plan Small Cap Value and Large/Mid Cap Value Funds, was last renewed by the Board at a meeting held for that purpose, among others, on February 25, 2011. The Board considered the following factors in arriving at its conclusions to renew the Westwood Sub-Advisory Agreement for an additional year. First, the Board considered the fees charged by Westwood in light of the services provided by Westwood. After full and careful consideration, the Board, with the independent trustees separately concurring, agreed that the fees charged by Westwood and paid out of the fees received by TPL were fair and reasonable in light of the services provided by Westwood. In reaching that determination, the Board relied on reports describing the fees paid to Westwood and comparing those fees against fees paid to other investment advisors operating under similar circumstances. Next, the Board discussed the nature, extent and quality of Westwood’s services to each Fund, including the investment performance of the Funds under Westwood’s investment management. The Board generally approved of Westwood’s performance, noting that the Funds managed by Westwood invested in a manner that did not rely exclusively on investment performance. Further, the Board noted with approval that Westwood did not succumb to “style drift” in its management of each Fund’s assets, and that Westwood was committed to maintain its investment mandate, even if that meant under performance during periods when that style was out of favor. The Board noted with approval Westwood’s ongoing efforts to maintain such consistent investment discipline. Next, the Board considered whether Westwood’s current fee structure would allow the Funds to realize economies of scale as they grow. The Board decided that this particular factor was moot with respect to the Westwood Sub-Advisory Agreement because Westwood was paid out of the fees paid to TPL. After careful discussion and consideration, the Board, including the independent Trustees separately concurring, unanimously determined that the renewal of the Westwood Sub-Advisory Agreement for another one-year period would be in the best interests of the Funds’ shareholders. In approving the renewal of the Westwood Sub-Advisory Agreement for an additional one year period, the Board did not place specific emphasis on any one factor discussed above, but considered all factors in equal light. Further, the Board had available and availed itself of the assistance of legal counsel at all times during its consideration of the Westwood Sub-Advisory Agreement renewal.
97
Notes to Financial Statements
September 30, 2011
Timothy Plan Family of Funds
Chartwell Investment Partners; Sub-Advisor to the Aggressive Growth and Large/Mid Cap Growth Funds.
The Sub-Advisory Agreement between the Trust, TPL and Chartwell Investment Partners (“Chartwell”), on behalf of the Timothy Plan Aggressive Growth and Large/Mid Cap Growth Funds, was last renewed by the Board at a meeting held for that purpose, among others, on February 25, 2011. The Board considered the following factors in arriving at its conclusions to renew the Chartwell Sub-Advisory Agreement for an additional year. First, the Board considered the fees charged by Chartwell in light of the services provided by Chartwell. After full and careful consideration, the Board, with the independent trustees separately concurring, agreed that the fees charged by Chartwell and paid out of the fees received by TPL were fair and reasonable in light of the services provided by Chartwell. In reaching that determination, the Board relied on reports describing the fees paid to Chartwell and comparing those fees against fees paid to other investment advisors operating under similar circumstances. Next, the Board discussed the nature, extent and quality of Chartwell’s services to each Fund, including the investment performance of the Funds under Chartwell’s investment management. The Board generally approved of Chartwell’s performance, noting that the Funds managed by Chartwell invested in a manner that did not rely exclusively on investment performance. Further, the Board noted with approval that Chartwell did not succumb to “style drift” in its management of each Fund’s assets, and that Chartwell was committed to maintain its investment mandate, even if that meant under performance during periods when that style was out of favor. The Board noted with approval Chartwell’s ongoing efforts to maintain such consistent investment discipline. Next, the Board considered whether Chartwell’s current fee structure would allow the Funds to realize economies of scale as they grow. The Board decided that this particular factor was moot with respect to the Chartwell Sub-Advisory Agreement because Chartwell was paid out of the fees paid to TPL. After careful discussion and consideration, the Board, including the independent Trustees separately concurring, unanimously determined that the renewal of the Chartwell Sub-Advisory Agreement for another one-year period would be in the best interests of the Funds’ shareholders. In approving the renewal of the Chartwell Sub-Advisory Agreement for an additional one year period, the Board did not place specific emphasis on any one factor discussed above, but considered all factors in equal light. Further, the Board had available and availed itself of the assistance of legal counsel at all times during its consideration of the Chartwell Sub-Advisory Agreement renewal.
Eagle Global Advisors; Sub-Advisor to the International Fund.
The Sub-Advisory Agreement between the Trust, TPL and Eagle Global Advisors (“Eagle”), on behalf of the Timothy Plan International Fund, was last renewed by the Board at a meeting held for that purpose, among others, on February 25, 2011. The Board considered the following factors in arriving at its conclusions to renew the Eagle Sub-Advisory Agreement for an additional year. First, the Board considered the fees charged by Eagle in light of the services provided by Eagle. After full and careful consideration, the Board, with the independent trustees separately concurring, agreed that the fees charged by Eagle and paid out of the fees received by TPL were fair and reasonable in light of the services provided by Eagle. In reaching that determination, the Board relied on reports describing the fees paid to Eagle and comparing those fees against fees paid to other investment advisors operating under similar circumstances. Next, the Board discussed the nature, extent and quality of Eagle’s services to the Fund, including the investment performance of the Fund under Eagle’s investment management. The Board generally approved of Eagle’s performance, noting that the Fund managed by Eagle invested in a manner that did not rely exclusively on investment performance. Further, the Board noted with approval that Eagle did not succumb to “style drift” in its management of the Fund’s assets, and that Eagle was committed to maintain its investment mandate, even if that meant under performance during periods when that style was out of favor. The Board noted with approval Eagle’s ongoing efforts to maintain such consistent investment discipline. Next, the Board considered whether Eagle’s current fee structure would allow the Fund to realize economies of scale as it grows. The Board decided that this particular factor was moot with respect to the Eagle Sub-Advisory Agreement because Eagle was paid out of the fees paid to TPL. After careful discussion and consideration, the Board, including the independent Trustees separately concurring, unanimously determined that the renewal of the Eagle Sub-Advisory Agreement for another one-year period would be in the best interests of the Fund’s shareholders. In approving the renewal of the Eagle Sub-Advisory Agreement for an additional one year period, the Board did not place specific emphasis on any one factor discussed above, but considered all factors in equal light. Further, the Board had available and availed itself of the assistance of legal counsel at all times during its consideration of the Eagle Sub-Advisory Agreement renewal.
98
Notes to Financial Statements
September 30, 2011
Timothy Plan Family of Funds
Delaware Management Company; Sub-Advisor to the Defensive Strategies Fund REITs sleeve.
The Sub-Advisory Agreement between the Trust, TPL and Delaware Management Company (“Delaware”), on behalf of the Timothy Plan Defensive Strategies Fund REITs sleeve, was last renewed by the Board at a meeting held for that purpose, among others, on February 25, 2011. The Board considered the following factors in arriving at its conclusions to renew the Delaware Sub-Advisory Agreement for an additional year. First, the Board considered the fees charged by Delaware in light of the services provided by Delaware. After full and careful consideration, the Board, with the independent trustees separately concurring, agreed that the fees charged by Delaware and paid out of the fees received by TPL were fair and reasonable in light of the services provided by Delaware. In reaching that determination, the Board relied on reports describing the fees paid to Delaware and comparing those fees against fees paid to other investment advisors operating under similar circumstances. Next, the Board discussed the nature, extent and quality of Delaware’s services to the Fund, including the investment performance of the Fund under Delaware’s investment management. The Board generally approved of Delaware’s performance, noting that the Fund managed by Delaware invested in a manner that did not rely exclusively on investment performance. Further, the Board noted with approval that Delaware did not succumb to “style drift” in its management of the Fund’s assets, and that Delaware was committed to maintain its investment mandate, even if that meant under performance during periods when that style was out of favor. The Board noted with approval Delaware’s ongoing efforts to maintain such consistent investment discipline. Next, the Board considered whether Delaware’s current fee structure would allow the Fund to realize economies of scale as it grows. The Board decided that this particular factor was moot with respect to the Delaware Sub-Advisory Agreement because Delaware was paid out of the fees paid to TPL. After careful discussion and consideration, the Board, including the independent Trustees separately concurring, unanimously determined that the renewal of the Delaware Sub-Advisory Agreement for another one-year period would be in the best interests of the Fund’s shareholders. In approving the renewal of the Delaware Sub-Advisory Agreement for an additional one year period, the Board did not place specific emphasis on any one factor discussed above, but considered all factors in equal light. Further, the Board had available and availed itself of the assistance of legal counsel at all times during its consideration of the Delaware Sub-Advisory Agreement renewal.
99
REPORT OF INDEPENDENT REGISTERED PUBLIC ACCOUNTING FIRM
To the Shareholders and Board of Trustees
The Timothy Plan
We have audited the accompanying statements of assets and liabilities, including the schedules of investments, of Timothy Plan Aggressive Growth Fund, Timothy Plan International Fund, Timothy Plan Large/Mid Cap Growth Fund, Timothy Plan Small Cap Value Fund, Timothy Plan Large/Mid Cap Value Fund, Timothy Plan Fixed Income Fund, Timothy Plan High Yield Bond Fund, Timothy Plan Defensive Strategies Fund, Timothy Plan Money Market Fund, Timothy Plan Strategic Growth Fund and Timothy Plan Conservative Growth Fund (the “Funds”), eleven of the series constituting The Timothy Plan, as of September 30, 2011, and the related statements of operations for the year then ended, the statements of changes in net assets for each of the two periods in the period then ended, and the financial highlights for each of the periods indicated. These financial statements and financial highlights are the responsibility of Funds’ management. Our responsibility is to express an opinion on these financial statements and financial highlights based on our audits.
We conducted our audits in accordance with the standards of the Public Company Accounting Oversight Board (United States). Those standards require that we plan and perform the audit to obtain reasonable assurance about whether the financial statements and financial highlights are free of material misstatement. An audit includes examining, on a test basis, evidence supporting the amounts and disclosures in the financial statements. Our procedures included confirmation of securities owned as of September 30, 2011, by correspondence with the Funds’ custodian and brokers or by other appropriate auditing procedures where the reply from the broker was not received. An audit also includes assessing the accounting principles used and significant estimates made by management, as well as evaluating the overall financial statement presentation. We believe that our audits provide a reasonable basis for our opinion.
In our opinion, the financial statements and financial highlights referred to above present fairly, in all material respects, the financial position of Timothy Plan Aggressive Growth Fund, Timothy Plan International Fund, Timothy Plan Large/Mid Cap Growth Fund, Timothy Plan Small Cap Value Fund, Timothy Plan Large /Mid Cap Value Fund, Timothy Plan Fixed Income Fund, Timothy Plan High Yield Bond Fund, Timothy Plan Defensive Strategies Fund, Timothy Plan Money Market Fund, Timothy Plan Strategic Growth Fund and Timothy Plan Conservative Growth Fund as of September 30, 2011, and the results of their operations, the changes in their net assets and their financial highlights for the periods then ended indicated above, in conformity with accounting principles generally accepted in the United States of America.
COHEN FUND AUDIT SERVICES, LTD.
Westlake, Ohio
December 6, 2011
100
Expense Examples – (Unaudited)
September 30, 2011
As a shareholder of a Fund, you incur two types of costs: direct costs, such as wire fees and low balance fees; and indirect costs, including management fees, and other Fund operating expenses. This example is intended to help you understand your indirect costs, also referred to as “ongoing costs”, (in dollars) of investing in each Fund, and to compare these costs with the ongoing costs of investing in other mutual funds.
This example is based on an investment of $1,000 invested at the beginning of the period and held for the entire six-month period of April 1, 2011, through September 30, 2011.
Actual Expenses
The first line of the following tables provides information about actual account values and actual expenses. You may use the information in this line, together with the amount you invested at the beginning of the period, to estimate the expenses that you paid over the period. Simply divide your account value by $1,000 (for example, an $8,600 account value divided by $1,000 = 8.6), then multiply the result by the number in the first line under the heading “Expenses Paid During Period” to estimate the expenses you paid on your account during this period.
Hypothetical Example for Comparison Purposes
The second line of the tables provides information about hypothetical account values and hypothetical expenses based on each Fund’s actual expense ratio and an assumed rate of return of 5% per year before expenses, which is not the Fund’s actual return. The hypothetical account values and expenses may not be used to estimate the actual ending account balance or expenses you paid for the period. You may use this information to compare ongoing costs of investing in each Fund and other funds. To do so, compare this 5% hypothetical example with the 5% hypothetical examples that appear in the shareholder reports of other funds.
Please note that the expenses shown in the tables are meant to highlight your ongoing costs only and do not reflect any direct costs, such as wire fees or low balance fees. Therefore, the second line of the table is useful in comparing ongoing costs only, and will not help you determine the relative total costs of owning different funds. In addition, if these direct costs were included, your costs would be higher.
AGGRESSIVE GROWTH FUND | ||||||||||
Beginning Account Value | Ending Account Value | Expenses Paid During Period | ||||||||
| 4/1/2011 | 9/30/2011 | 4/1/2011 through 9/30/2011 | ||||||||
Actual - Class A * | $1,000.00 | $804.90 | $8.05 | |||||||
Hypothetical - Class A ** | $1,000.00 | $1,016.14 | $9.00 | |||||||
Actual - Class C * | $1,000.00 | $802.50 | $11.48 | |||||||
Hypothetical - Class C ** | $1,000.00 | $1,012.33 | $12.81 | |||||||
| * | Expenses are equal to the Fund’s annualized expense ratio of 1.78% for Class A and 2.54% for Class C, which is net of any expenses paid indirectly, multiplied by the average account value over the period, multiplied by 183 days/365 days (to reflect the partial year period). The Aggressive Growth Fund’s ending account value on the first line of each share class in the table is based on its actual total return of (19.51)% for Class A and (19.75)% for Class C for the six-month period of April 1, 2011, to September 30, 2011. |
| ** | Assumes a 5% return before expenses. |
INTERNATIONAL FUND | ||||||||||
Beginning Account Value | Ending Account Value | Expenses Paid During Period | ||||||||
| 4/1/2011 | 9/30/2011 | 4/1/2011 through 9/30/2011 | ||||||||
Actual - Class A * | $1,000.00 | $762.20 | $7.51 | |||||||
Hypothetical - Class A ** | $1,000.00 | $1,016.55 | $8.59 | |||||||
Actual - Class C * | $1,000.00 | $758.90 | $10.80 | |||||||
Hypothetical - Class C ** | $1,000.00 | $1,012.78 | $12.36 | |||||||
| * | Expenses are equal to the Fund’s annualized expense ratio of 1.70% for Class A and 2.45% for Class C, which is net of any expenses paid indirectly, multiplied by the average account value over the period, multiplied by 183 days/365 days (to reflect the partial year period). The International Fund’s ending account value on the first line of each share class in the table is based on its actual total return of (23.78)% for Class A and (24.11)% for Class C for the six-month period of April 1, 2011, to September 30, 2011. |
| ** | Assumes a 5% return before expenses. |
101
Expense Examples – (Unaudited)(Continued)
September 30, 2011
| LARGE/MID CAP GROWTH FUND | ||||||||||
Beginning Account Value | Ending Account Value | Expenses Paid During Period | ||||||||
| 4/1/2011 | 9/30/2011 | 4/1/2011 through 9/30/2011 | ||||||||
| Actual - Class A * | $1,000.00 | $824.30 | $7.32 | |||||||
| Hypothetical - Class A ** | $1,000.00 | $1,017.05 | $8.09 | |||||||
| Actual - Class C * | $1,000.00 | $821.50 | $10.73 | |||||||
| Hypothetical - Class C ** | $1,000.00 | $1,013.29 | $11.86 | |||||||
| * | Expenses are equal to the Fund’s annualized expense ratio of 1.60% for Class A and 2.35% for Class C, which is net of any expenses paid indirectly, multiplied by the average account value over the period, multiplied by 183 days/365 days (to reflect the partial year period). The Large/Mid Cap Growth Fund’s ending account value on the first line of each share class in the table is based on its actual total return of (17.57)% for Class A and (17.85)% for Class C for the six-month period of April 1, 2011, to September 30, 2011. |
| ** | Assumes a 5% return before expenses. |
| SMALL CAP VALUE FUND | ||||||||||
| Beginning Account Value | Ending Account Value | Expenses Paid During Period | ||||||||
| 4/1/2011 | 9/30/2011 | 4/1/2011 through 9/30/2011 | ||||||||
| Actual - Class A * | $1,000.00 | $755.60 | $6.73 | |||||||
| Hypothetical - Class A ** | $1,000.00 | $1,017.40 | $7.74 | |||||||
| Actual - Class C * | $1,000.00 | $753.40 | $10.02 | |||||||
| Hypothetical - Class C ** | $1,000.00 | $1,013.64 | $11.51 | |||||||
| * | Expenses are equal to the Fund’s annualized expense ratio of 1.53% for Class A and 2.28% for Class C, which is net of any expenses paid indirectly, multiplied by the average account value over the period, multiplied by 183 days/365 days (to reflect the partial year period). The Small Cap Value Fund’s ending account value on the first line of each share class in the table is based on its actual total return of (24.44)% for Class A and (24.66)% for Class C for the six-month period of April 1, 2011, to September 30, 2011. |
| ** | Assumes a 5% return before expenses. |
| LARGE/MID CAP VALUE FUND | ||||||||||
| Beginning Account Value | Ending Account Value | Expenses Paid During Period | ||||||||
| 4/1/2011 | 9/30/2011 | 4/1/2011 through 9/30/2011 | ||||||||
| Actual - Class A * | $1,000.00 | $831.30 | $6.93 | |||||||
| Hypothetical - Class A ** | $1,000.00 | $1,017.50 | $7.64 | |||||||
| Actual - Class C * | $1,000.00 | $828.30 | $10.36 | |||||||
| Hypothetical - Class C ** | $1,000.00 | $1,013.74 | $11.41 | |||||||
| * | Expenses are equal to the Fund’s annualized expense ratio of 1.51% for Class A and 2.26% for Class C, which is net of any expenses paid indirectly, multiplied by the average account value over the period, multiplied by 183 days/365 days (to reflect the partial year period). The Large/Mid Cap Value Fund’s ending account value on the first line of each share class in the table is based on its actual total return of (16.87)% for Class A and (17.17)% for Class C for the six-month period of April 1, 2011, to September 30, 2011. |
| ** | Assumes a 5% return before expenses. |
102
Expense Examples – (Unaudited)(Continued)
September 30, 2011
| FIXED INCOME FUND | ||||||||||
| Beginning Account Value | Ending Account Value | Expenses Paid During Period | ||||||||
| 4/1/2011 | 9/30/2011 | 4/1/2011 through 9/30/2011 | ||||||||
| Actual - Class A * | $1,000.00 | $1,057.40 | $5.93 | |||||||
| Hypothetical - Class A ** | $1,000.00 | $1,019.30 | $5.82 | |||||||
| Actual - Class C * | $1,000.00 | $1,054.60 | $9.79 | |||||||
| Hypothetical - Class C ** | $1,000.00 | $1,015.54 | $9.60 | |||||||
| * | Expenses are equal to the Fund’s annualized expense ratio of 1.15% for Class A and 1.90% for Class C, which is net of any expenses paid indirectly, multiplied by the average account value over the period, multiplied by 183 days/365 days (to reflect the partial year period). The Fixed Income Fund’s ending account value on the first line of each share class in the table is based on its actual total return of 5.74% for Class A and 5.46% for Class C for the six-month period of April 1, 2011, to September 30, 2011. |
| ** | Assumes a 5% return before expenses. |
| HIGH YIELD BOND FUND | ||||||||||
| Beginning Account Value | Ending Account Value | Expenses Paid During Period | ||||||||
| 4/1/2011 | 9/30/2011 | 4/1/2011 through 9/30/2011 | ||||||||
| Actual - Class A * | $1,000.00 | $954.40 | $6.37 | |||||||
| Hypothetical - Class A ** | $1,000.00 | $1,018.55 | $6.58 | |||||||
| Actual - Class C * | $1,000.00 | $952.30 | $10.03 | |||||||
| Hypothetical - Class C ** | $1,000.00 | $1,014.79 | $10.35 | |||||||
| * | Expenses are equal to the Fund’s annualized expense ratio of 1.30% for Class A and 2.05% for Class C, which is net of any expenses paid indirectly, multiplied by the average account value over the period, multiplied by 183 days/365 days (to reflect the partial year period). The High Yield Bond Fund’s ending account value on the first line of each share class in the table is based on its actual total return of (4.56)% for Class A and (4.77)% for Class C for the six-month period of April 1, 2011, to September 30, 2011. |
| ** | Assumes a 5% return before expenses. |
| MONEY MARKET FUND | ||||||||||
| Beginning Account Value | Ending Account Value | Expenses Paid During Period | ||||||||
| 4/1/2011 | 9/30/2011 | 4/1/2011 through 9/30/2011 | ||||||||
| Actual * | $1,000.00 | $1,000.00 | $0.25 | |||||||
| Hypothetical** | $1,000.00 | $1,024.82 | $0.25 | |||||||
| * | Expenses are equal to the Fund’s annualized expense ratio of 0.05%, which is net of any expenses paid indirectly, multiplied by the average account value over the period, multiplied by 183 days/365 days (to reflect the partial year period). The Money Market Fund’s ending account value is based on its actual total return of 0.00% for the six-month period of April 1, 2011, to September 30, 2011. |
| ** | Assumes a 5% return before expenses. |
103
Expense Examples – (Unaudited)(Continued)
September 30, 2011
| DEFENSIVE STRATEGIES FUND | ||||||||||
| Beginning Account Value | Ending Account Value | Expenses Paid During Period | ||||||||
| 4/1/2011 | 9/30/2011 | 4/1/2011 through 9/30/2011 | ||||||||
Actual - Class A * | $1,000.00 | $964.10 | $6.35 | |||||||
Hypothetical - Class A ** | $1,000.00 | $1,018.60 | $6.53 | |||||||
Actual - Class C * | $1,000.00 | $961.00 | $9.98 | |||||||
Hypothetical - Class C ** | $1,000.00 | $1,014.89 | $10.25 | |||||||
| * | Expenses are equal to the Fund’s annualized expense ratio of 1.29% for Class A and 2.03% for Class C, which is net of any expenses paid indirectly, multiplied by the average account value over the period, multiplied by 183 days/365 days (to reflect the partial year period). The Defensive Strategies Fund’s ending account value on the first line of each share class in the table is based on its actual total return of (3.59)% for Class A and (3.90)% for Class C for the period of April 1, 2011, to September 30, 2011. |
| ** | Assumes a 5% return before expenses. |
| STRATEGIC GROWTH FUND | ||||||||||
| Beginning Account Value | Ending Account Value | Expenses Paid During Period | ||||||||
| 4/1/2011 | 9/30/2011 | 4/1/2011 through 9/30/2011 | ||||||||
Actual - Class A * | $1,000.00 | $830.50 | $4.82 | |||||||
Hypothetical - Class A ** | $1,000.00 | $1,019.80 | $5.32 | |||||||
Actual - Class C * | $1,000.00 | $819.70 | $8.30 | |||||||
Hypothetical - Class C ** | $1,000.00 | $1,015.94 | $9.20 | |||||||
| * | Expenses are equal to the Fund’s annualized expense ratio of 1.05% for Class A and 1.82% for Class C, which is net of any expenses paid indirectly, multiplied by the average account value over the period, multiplied by 183 days/365 days (to reflect the partial year period). The Strategic Growth Fund’s ending account value on the first line of each share class in the table is based on its actual total return of (16.95)% for Class A and (18.03)% for Class C for the six-month period of April 1, 2011, to September 30, 2011. |
| ** | Assumes a 5% return before expenses. |
| CONSERVATIVE GROWTH FUND | ||||||||||
| Beginning Account Value | Ending Account Value | Expenses Paid During Period | ||||||||
| 4/1/2011 | 9/30/2011 | 4/1/2011 through 9/30/2011 | ||||||||
Actual - Class A * | $1,000.00 | $912.90 | $5.04 | |||||||
Hypothetical - Class A ** | $1,000.00 | $1,019.80 | $5.32 | |||||||
Actual - Class C * | $1,000.00 | $910.50 | $8.62 | |||||||
Hypothetical - Class C ** | $1,000.00 | $1,016.04 | $9.10 | |||||||
| * | Expenses are equal to the Fund’s annualized expense ratio of 1.05% for Class A and 1.80% for Class C, which is net of any expenses paid indirectly, multiplied by the average account value over the period, multiplied by 183 days/365 days (to reflect the partial year period). The Conservative Growth Fund’s ending account value on the first line of each share class in the table is based on its actual total return of (8.71)% for Class A and (8.95)% for Class C for the six-month period of April 1, 2011, to September 30, 2011. |
| ** | Assumes a 5% return before expenses. |
104
Officers and Trustees of the Trust
As of September 30, 2011 (Unaudited)
Timothy Plan Family of Funds
Name, Age and Address | Position(s) Held With Trust | Term of Office and Length of Time Served | Number of Portfolios in Fund Complex Overseen by Trustee | |||
Arthur D. Ally* | Chairman and President | Indefinite; Trustee and President since 1994 | 13 | |||
1055 Maitland Center Commons Maitland, FL | Principal Occupation During Past 5 Years | Other Directorships Held by Trustee | ||||
Born: 1942 | President and controlling shareholder of Covenant Funds, Inc. (“CFI”), a holding company. President and general partner of Timothy Partners, Ltd. (“TPL”), the investment adviser and principal underwriter to each Fund. CFI is also the managing general partner of TPL.
| None | ||||
Name, Age and Address | Position(s) Held With Trust | Term of Office and Length of Time Served | Number of Portfolios in Fund Complex Over seen by Trustee | |||
Joseph E. Boatwright** | Trustee, Secretary | Indefinite; Trustee and Secretary since 1995 | 13 | |||
1410 Hyde Park Drive Winter Park, FL | Principal Occupation During Past 5 Years | Other Directorships Held by Trustee | ||||
Born: 1930
| Retired Minister. Currently serves as a consultant to the Greater Orlando Baptist Association. Served as Senior Pastor to Aloma Baptist Church from 1970-1996.
| None | ||||
Name, Age and Address | Position(s) Held With Trust | Term of Office and Length of Time Served | Number of Portfolios in Fund Complex Overseen by Trustee | |||
Kenneth Blackwell | Trustee | Indefinite; Trustee since 2011 | 13 | |||
693 Windings Lane Cincinnati, OH | Principal Occupation During Past 5 Years | Other Directorships Held by Trustee | ||||
Born: 1948 | Secretary of State for the State of Ohio. Currently serving as an independent consultant or Fellow with the Family Research Council and the American Civil Rights Union, and is a Visiting Professor at Liberty University, Lynchburg, VA.
| None | ||||
*Mr. Ally is an “interested” Trustee, as that term is defined in the 1940 Act, because of his positions with and financial interests in CFI and TPL.
**Messrs. Boatwright and Staver are “interested” Trustees, as that term is defined in the 1940 Act, because each has a limited partnership intereset in TPL.
105
Officers and Trustees of the Trust (Continued)
As of September 30, 2011 (Unaudited)
Timothy Plan Family of Funds
Name, Age and Address | Position(s) Held With Trust | Term of Office and Length of Time Served | Number of Portfolios in Fund Complex Overseen by Trustee | |||
Richard W. Copeland | Trustee | Indefinite; Trustee since 2005 | 13 | |||
1112 Glen Falls Road DeLand, FL | Principal Occupation During Past 5 Years | Other Directorships Held by Trustee | ||||
Born: 1947 | Principal of Copeland & Covert, Attorneys at Law; specializing in tax and estate planning. B.A. from Mississippi College, JD from University of Florida and LLM Taxation from University of Miami. Associate Professor Stetson University for past 35 years.
| None | ||||
Name, Age and Address | Position(s) Held With Trust | Term of Office and Length of Time Served | Number of Portfolios in Fund Complex Overseen by Trustee | |||
Deborah Honeycutt | Trustee | Indefinite; Trustee since 2010 | 13 | |||
160 Deer Forest Trail Fayetteville, GA | Principal Occupation During Past 5 Years | Other Directorships Held by Trustee | ||||
Born: 1947 | Dr. Honeycutt is a licensed physician currently serving as Medical Director of Clayton State University Health Services in Morrow, GA, CEO of Minority Health Services in Atlanta, and as a volunteer at Good Sheperd Clinic. Dr. Honeycutt received her B.A. and M.D. at the University of Illinois.
| None | ||||
Name, Age and Address | Position(s) Held With Trust | Term of Office and Length of Time Served | Number of Portfolios in Fund Complex Overseen by Trustee | |||
Bill Johnson | Trustee | Indefinite; Trustee since 2005 | 13 | |||
203 E. Main Street Fremont, MI | Principal Occupation During Past 5 Years | Other Directorships Held by Trustee | ||||
Born: 1946 | President (and Founder) of American Decency Association, Freemont, MI since 1999. Previously served as Michigan State Director for American Family Association (1987-1999). Previously a public school teacher for 18 years. B.S. from Michigan State University and a Masters of Religious Education from Grand Rapids Baptist Seminary.
| None | ||||
106
Officers and Trustees of the Trust (Continued)
As of September 30, 2011 (Unaudited)
Timothy Plan Family of Funds
| Name, Age and Address | Position(s) Held With Trust | Term of Office and Length of Time Served | Number of Portfolios in Fund Complex Overseen by Trustee | |||
| John C. Mulder | Trustee | Indefinite; Trustee since 2005 | 13 | |||
2925 Professional Place Colorado Springs, CO | Principal Occupation During Past 5 Years | Other Directorships Held by Trustee | ||||
| Born: 1950 | President of WaterStone (formerly the Christian Community Foundation and National Foundation) since 2001. Prior: 22 years of executive experience for a group of banks and a trust company. B.A. in Economics from Wheaton College and MBA from University of Chicago.
| None | ||||
| Name, Age and Address | Position(s) Held With Trust | Term of Office and Length of Time Served | Number of Portfolios in Fund Complex Overseen by Trustee | |||
| Charles E. Nelson | Trustee | Indefinite; Trustee since 2000 | 13 | |||
1145 Cross Creek Circle Altamonte Springs, FL | Principal Occupation During Past 5 Years | Other Directorships Held by Trustee | ||||
Born: 1934 | Certified Public Accountant, semi-retired. Former non-profit industry accounting Officer. Former financial executive with commercial bank. Former partner national accounting firm.
| None | ||||
| Name, Age and Address | Position(s) Held With Trust | Term of Office and Length of Time Served | Number of Portfolios in Fund Complex Overseen by Trustee | |||
| Scott Preissler, Ph.D. | Trustee | Indefinite; Trustee since 2004 | 13 | |||
608 Pintail Place Flower Mound, TX | Principal Occupation During Past 5 Years | Other Directorships Held by Trustee | ||||
Born: 1960 | Chairman of Stewardship Studies at Southwestern Baptist Theological Seminary, Ft.Worth, TX. Also serves as Founder and Chairman of the International Center for Biblical Stewardship. Previously, President and CEO of Christian Stewardship Association where he was affiliated for 14 years.
| None | ||||
107
Officers and Trustees of the Trust (Continued)
As of September 30, 2011 (Unaudited)
Timothy Plan Family of Funds
| Name, Age and Address | Position(s) Held With Trust | Term of Office and Length of Time Served | Number of Portfolios in Fund Complex Overseen by Trustee | |||
Alan M. Ross 11210 West Road Roswell, GA | Trustee | Indefinite; Trustee since 2004 | 13 | |||
| Principal Occupation During Past 5 Years | Other Directorships Held by Trustee | |||||
Born: 1951 | Founder and CEO of Corporate Development Institute which he founded in 2000. Previously he served as President and CEO of Fellowship of Companies for Christ and has authored three books: Beyond World Class, Unconditional Excellence, Breaking Through to Prosperity.
| None | ||||
| Name, Age and Address | Position(s) Held With Trust | Term of Office and Length of Time Served | Number of Portfolios in Fund Complex Overseen by Trustee | |||
Mathew D. Staver ** 1055 Maitland Center Commons Maitland, FL
Born: 1956 | Trustee | Indefinite; Trustee since 2000 | 13 | |||
| Principal Occupation During Past 5 Years | Other Directorships Held by Trustee | |||||
Attorney specializing in free speech, appellate practice and religious liberty constitutional law. Founder of Liberty Counsel, a religious civil liberties education and legal defense organization. Host of two radio programs devoted to religious freedom issues. Editor of a monthly newsletter devoted to religious liberty topics. Mr. Staver has argued before the United States Supreme Court and has published numerous legal articles.
| None | |||||
| Name, Age and Address | Position(s) Held With Trust | Term of Office and Length of Time Served | Number of Portfolios in Fund Complex Overseen by Trustee | |||
Patrice Tsague 16176 SE Mercers Way Milwaukee, WI Born: 1973 | Trustee | Indefinite; Trustee since 2011 | 13 | |||
| Principal Occupation During Past 5 Years | Other Directorships Held by Trustee | |||||
President and Chief Servant Officer of the Nehemiah Project International Ministries Inc. since 1999.
| None | |||||
The Fund’s Statement of Additional Information includes additional information about the Trustees and is available free of charge, upon request, by calling toll-free at 1-800-846-7526.
108
Privacy Policy
The following is a description of the Trust’s policies regarding disclosure of nonpublic personal information that you provide to the Fund or that the Fund collects from other sources. In the event that you hold shares of a Fund through a broker-dealer or other financial intermediary, the privacy policy of your financial intermediary would govern how your nonpublic personal information would be shared with nonaffiliated third parties.
CATEGORIES OF INFORMATION THE FUND COLLECTS
The Fund collects the following nonpublic personal information about you:
1. Information the Fund receives from you on or in applications or other forms, correspondence, or conversations (such as your name, address, phone number, social security number, assets, income and date of birth); and
2. Information about your transactions with the Fund, its affiliates, or others (such as your account number and balance, payment history, parties to transactions, cost basis information, and other financial information).
CATEGORIES OF INFORMATION THE FUND DISCLOSES
The Fund does not disclose any nonpublic personal information about its current or former shareholders to unaffiliated third parties, except as required or permitted by law. The Fund is permitted by law to disclose all of the information it collects, as described above, to its service providers (such as the Fund’s custodian, administrator and transfer agent) to process your transactions and otherwise provide services to you.
CONFIDENTIALITY AND SECURITY
The Fund restricts access to your nonpublic personal information to those persons who require such information to provide products or services to you. The Fund maintains physical, electronic, and procedural safeguards that comply with federal standards to guard your nonpublic personal information.
Customer Identification Program
The Board of Trustees of the Trust has approved procedures designed to prevent and detect attempts to launder money as required under the USA PATRIOT Act. The day-to-day responsibility for monitoring and reporting any such activities has been delegated to the transfer agent, subject to the oversight and supervision of the Board.
BOARD OF TRUSTEES
Arthur D. Ally
Kenneth Blackwell
Joseph E. Boatwright
Rick Copeland
Deborah Honeycutt
Bill Johnson
John C. Mulder
Charles E. Nelson
Scott Preissler
Alan Ross
Mathew D. Staver
Patrice Tsague
OFFICERS
Arthur D. Ally, President
Joseph E. Boatwright, Secretary
INVESTMENT ADVISOR
Timothy Partners, Ltd.
1055 Maitland Center Commons Maitland, FL 32751
DISTRIBUTOR Timothy Partners, Ltd. 1055 Maitland Center Commons Maitland, FL 32751
TRANSFER AGENT Gemini Fund Services, LLC 4020 South 147th Street, Suite 2 Omaha, NE 68137
INDEPENDENT REGISTERED PUBLIC ACCOUNTING FIRM Cohen Fund Audit Services, Ltd. 800 Westpoint Parkway, Suite 1100 Westlake, OH 44145-1524
LEGAL COUNSEL David Jones & Assoc., P.C. 395 Sawdust Road, Suite 2148 The Woodlands, TX 77380 |  | |
| HEADQUARTERS | ||
For additional information or a prospectus, please call: 1-800-846-7526 Visit the Timothy Plan web site on the internet at: www.timothyplan.com
This report is submitted for the general information of the shareholders of the Funds. It is not authorized for distribution to prospective investors in the Funds unless preceded or accompanied by an effective Prospectus which includes details regarding the Funds’ objectives, policies, expenses and other information. Distributed by Timothy Partners, Ltd. | The Timothy Plan 1055 Maitland Center Commons Maitland, Florida 32751
(800) 846-7526
www.timothyplan.com invest@timothyplan.com
SHAREHOLDER SERVICES
Gemini Fund Services, LLC 4020 South 147th St, Ste. 2 | |
Omaha, NE 68137
(800) 662-0201 | ||
Item 2. Code of Ethics.
(a) As of the end of the period covered by this report, the registrant has adopted a code of ethics that applies to the registrant’s principal executive officer, principal financial officer, principal accounting officer or controller, or persons performing similar functions, regardless of whether these individuals are employed by the registrant or a third party.
(b) For purposes of this item, “code of ethics” means written standards that are reasonably designed to deter wrongdoing and to promote:
| (1) | Honest and ethical conduct, including the ethical handling of actual or apparent conflicts of interest between personal and professional relationships; |
| (2) | Full, fair, accurate, timely, and understandable disclosure in reports and documents that a registrant files with, or submits to, the Commission and in other public communications made by the registrant; |
| (3) | Compliance with applicable governmental laws, rules, and regulations; |
| (4) | The prompt internal reporting of violations of the code to an appropriate person or persons identified in the code; and |
| (5) | Accountability for adherence to the code. |
(c) Amendments: During the period covered by the report, there have not been any amendments to the provisions of the code of ethics.
(d) Waivers: During the period covered by the report, the registrant has not granted any express or implicit waivers from the provisions of the code of ethics.
(e) Posting: We do not intend to post the Code of Ethics for the Officers or any amendments or waivers on a website.
(f) Availability: The Code of Ethics for the Officers can be obtained, free of charge by calling the toll free number for the appropriate Fund.
Item 3. Audit Committee Financial Expert.
(a) The registrant has an Audit committee currently composed of three independent Trustees, Mr. Wesley Pennington, Mr. John Mulder and Mr. Charles Nelson. The registrant’s board of trustees has determined that Mr. Charles Nelson is qualified to serve as an Audit Committee Financial Expert, and has designated him as such.
Item 4. Principal Accountant Fees and Services.
| (a) | Audit Fees |
The Timothy Plan | ||
FY 2011 | $125,700 | |
FY 2010 | $ 125,400 | |
| (b) | Audit-Related Fees |
-2-
The Timothy Plan | Registrant | Adviser | ||||||||
FY 2011 | $ | 0 | $ | 0 | ||||||
FY 2010 | $ | 0 | $ | 0 | ||||||
Nature of the fees:
| (c) | Tax Fees |
The Timothy Plan | ||||
FY 2011 | $ | 0 | ||
FY 2010 | $ | 0 | ||
Nature of the fees: preparation of the 1120 RIC
| (d) | All Other Fees |
The Timothy Plan | Registrant | |||
FY 2011 | $ | 0 | ||
FY 2010 | $ | 0 | ||
(e) | (1) | Audit Committee’s Pre-Approval Policies | ||
The Audit Committee Charter requires the Audit Committee to be responsible for the selection, retention or termination of auditors and, in connection therewith, to (i) evaluate the proposed fees and other compensation, if any, to be paid to the auditors, (ii) evaluate the independence of the auditors, (iii) pre-approve all audit services and, when appropriate, any non-audit services provided by the independent auditors to the Trust, (iv) pre-approve, when appropriate, any non-audit services provided by the independent auditors to the Trust’s investment adviser, or any entity controlling, controlled by, or under common control with the investment adviser and that provides ongoing services to the Trust if the engagement relates directly to the operations and financial reporting of the Trust, and (v) receive the auditors’ specific representations as to their independence; | ||||
(2) | Percentages of Services Approved by the Audit Committee | |||
| Registrant | ||||
Audit-Related Fees: | 0 | % | ||
Tax Fees: | 0 | % | ||
All Other Fees: | 0 | % | ||
(f) During audit of registrant’s financial statements for the most recent fiscal year, less than 50 percent of the hours expended on the principal accountant’s engagement were attributed to work performed by persons other than the principal accountant’s full-time, permanent employees.
-3-
(g) The aggregate non-audit fees billed by the registrant’s accountant for services rendered to the registrant, and rendered to the registrant’s investment adviser (not including any sub-adviser whose role is primarily portfolio management and is subcontracted with or overseen by another investment adviser), and any entity controlling, controlled by, or under common control with the adviser that provides ongoing services to the registrant:
| Registrant | Adviser | |||||||
FY 2010 | $ | 0 | $ | 0 | ||||
FY 2009 | $ | 0 | $ | 0 | ||||
(h) Not applicable. The auditor performed no services for the registrant’s investment adviser or any entity controlling, controlled by, or under common control with the investment adviser that provides ongoing services to the registrant.
Item 5. Audit Committee of Listed Companies. Not applicable.
Item 6. Schedule of Investments. Not applicable – schedule filed with Item 1.
Item 7. Disclosure of Proxy Voting Policies and Procedures for Closed-End Funds. Not applicable.
Item 8. Portfolio Managers of Closed-End Management Investment Companies. Not applicable.
Item 9. Purchases of Equity Securities by Closed-End Management Investment Company and Affiliated Purchasers. Not applicable.
Item 10. Submission of Matters to a Vote of Security Holders
The registrant has not adopted procedures by which shareholders may recommend nominees to the registrant’s board of trustees.
Item 11. Controls and Procedures.
(a) Based on an evaluation of the registrant’s disclosure controls and procedures as of November 19, 2010, the disclosure controls and procedures are reasonably designed to ensure that the information required in filings on Forms N-CSR is recorded, processed, summarized, and reported on a timely basis.
(b) There were no significant changes in the registrant’s internal control over financial reporting that occurred during the registrant’s second fiscal quarter of the period covered by this report that has materially affected, or is reasonably likely to materially affect, the registrant’s internal control over financial reporting.
Item 12. Exhibits.
| (a)(1) | Code is filed herewith | |
| (a)(2) | Certifications by the registrant’s principal executive officer and principal financial officer, pursuant to Section 302 of the Sarbanes- Oxley Act of 2002 and required by Rule 30a-2 under the Investment Company Act of 1940 are filed herewith. | |
| (a)(3) | Not Applicable | |
| (b) | Certification pursuant to 18 U.S.C. Section 1350, as adopted pursuant to Section 906 of the Sarbanes-Oxley Act of 2002 is filed herewith. | |
-4-
SIGNATURES
Pursuant to the requirements of the Securities Exchange Act of 1934 and the Investment Company Act of 1940, the registrant has duly caused this report to be signed on its behalf by the undersigned, thereunto duly authorized.
(Registrant) The Timothy Plan
By | /s/ Arthur D. Ally | |
Arthur D. Ally, President | ||
Date | 12/9/11 | |
Pursuant to the requirements of the Securities Exchange Act of 1934 and the Investment Company Act of 1940, this report has been signed below by the following persons on behalf of the registrant and in the capacities and on the dates indicated.
By | /s/ Arthur D. Ally | |
Arthur D. Ally, President | ||
Date | 12/9/11 | |
-5-