UNITED STATES
SECURITIES AND EXCHANGE COMMISSION
WASHINGTON, D.C. 20549
FORM N-CSR
CERTIFIED SHAREHOLDER REPORT OF REGISTERED
MANAGEMENT INVESTMENT COMPANIES
Investment Company Act file number 811-08228
The Timothy Plan
(Exact name of registrant as specified in charter)
1055 Maitland Center Commons, Maitland, FL 32751
(Address of principal executive offices) (Zip code)
Art Ally, The Timothy Plan
1055 Maitland Center Commons, Maitland, FL 32751
(Name and address of agent for service)
Registrant’s telephone number, including area code: 800-846-7526
Date of fiscal year end: 9/30
Date of reporting period: 9/30/12
Form N-CSR is to be used by management investment companies to file reports with the Commission not later than 10 days after the transmission to stockholders of any report that is required to be transmitted to stockholders under Rule 30e-1 under the Investment Company Act of 1940 (17 CFR 270.30e-1). The Commission may use the information provided on Form N-CSR in its regulatory, disclosure review, inspection and policymaking roles.
A registrant is required to disclose the information specified by Form N-CSR, and the Commission will make this information public. A registrant is not required to respond to the collection of information contained in Form N-CSR unless the Form displays a currently valid Office of Management and Budget (“OMB”) control number. Please direct comments concerning the accuracy of the information collection burden estimate and any suggestions for reducing the burden to Secretary, Securities and Exchange Commission, 450 Fifth Street, NW, Washington, DC 20549-0609. The OMB has reviewed this collection of information under the clearance requirements of 44 U.S.C. § 3507.
Item 1. Reports to Stockholders.
The Registrant’s audited annual financial reports transmitted to shareholders pursuant to Rule 30e-1 under the Investment Company Act of 1940 are as follows:
-2-

ANNUAL REPORT
September 30, 2012
TIMOTHY PLAN FAMILY OF FUNDS
Letter from the President
September 30, 2012
Arthur D. Ally
Dear Shareholder,
As you review the details on the following pages, you should be pleased to see that all of our funds turned in, in our opinion, anywhere from respectable to good performance for the twelve months of our past fiscal year (10-1-11 thru 9-30-12). Of course, as you probably know, past performance does not guarantee future results.
However as I reported last year, although we cannot guarantee any actual outcome, I am confident of a couple of things:
| | • | | If the November, 2012 elections result in replacing a number of liberal members of Congress (as well as the current Administration) with common sense conservatives, the capital markets could react very favorably, and |
| | • | | All of our sub-advisors remain, in our opinion, among the best in the industry and they each continue to honor our overall policy that they manage their respective Funds both in accordance with our screening restrictions and with a conservative bias. |
You will find each of our sub-advisors’ annual review letters along with their economic outlook in the pages that follow.
Finally, I would once again like to thank you for your moral convictions that led you to becoming part of the Timothy Plan Family.
Yours in Christ,

ARTHUR D. ALLY,
President
Timothy Plan Fund Performance
[2]
Letter from the Manager
September 30, 2012
Aggressive Growth Fund
We are pleased to report that the Fund advanced 27.47% over the last 12 months ended September 30, 2012. This is a 0.77% percentage-point outperformance against our benchmark, the Russell Mid-Cap Growth index, which rose 26.7% over the same period.
The market had strong advances in 3 of the last 4 quarters, only pausing to take a breather in the second quarter of this year. We have rarely witnessed a time when the old adage of the market “climbing a wall of worry” has been more apt. The litany of concerns during the last year has included: the European Sovereign Debt crisis, China (and much of the world’s) slowing growth, the looming U.S. “fiscal cliff,” consumer de-leveraging and unprecedented government balance-sheet expansion, and a tightly-contested upcoming presidential election. The market has taken a “glass-half-full” view, and focused on the positives - central bankers’ massive amounts of easing, ongoing healthy corporate profits, a nascent recovery in housing, and the relative attractiveness of stocks given extremely-low bond yields.
After such a powerful rally - and with many issues yet to be resolved - we are keeping our guard up. We have recently had our cash balances a little higher than average, and we are being cautious with our stock selection. We think that earnings growth is going to slow and that negative surprises will be more commonplace, hence, with our portfolio holdings we are focusing as much on the sustainability of earnings as with the absolute level of earnings growth.
CHARTWELL INVESTMENT PARTNERS, L.P.
Performance data quoted above is historical. Past performance does not guarantee future results and current performance may be lower or higher than the performance data quoted. Class A shares performance quoted excludes sales charge.
Timothy Plan Fund Performance
[3]
Fund Performance | Aggressive Growth
As of September 30, 2012 - (Unaudited)
| | | | | | | | | | | | | | | | | | | | |
| Fund/Index | | 1 Year
Total Return | | 5 Year
Average
Annual Return | | 10 Year
Average
Annual Return | | |
Timothy Aggressive Growth Fund - Class A (With Sales Charge) | | | | 20.71 | % | | | | -1.26 | % | | | | 7.17 | % | | | | | |
Russell Mid-Cap Growth Index | | | | 26.69 | % | | | | 2.54 | % | | | | 11.11 | % | | | | | |
Timothy Aggressive Growth Fund - Class C * | | | | 27.08 | % | | | | -0.86 | % | | | | 3.49 | % | | | | (a) | |
Russell Mid-Cap Growth Index | | | | 26.69 | % | | | | 2.54 | % | | | | 6.91 | % | | | | (a) | |
| | (a) | For the period February 3, 2004 (commencement of investment in accordance with objective) to September 30, 2012. |
| | * | With Maximum Deferred Sales Charge |
Timothy Plan Aggressive Growth Fund vs. Russell Mid-Cap Growth Index
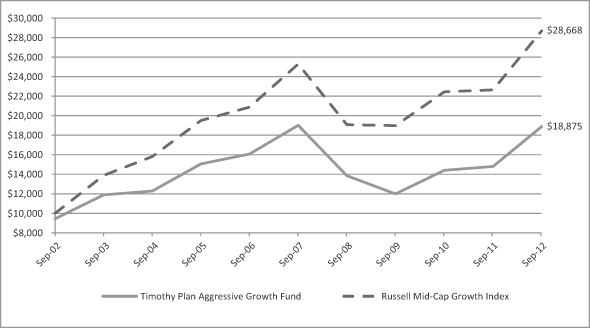
The chart shows the value of a hypothetical initial investment of $10,000 in the Fund’s Class A shares and the Russell Mid-Cap Growth Index on September 30, 2002 and held through September 30, 2012. The Russell Mid-Cap Growth Index is a widely recognized, unmanaged index of common stock prices. Performance figures include the change in value of the stocks in the index and the reinvestment of dividends. The index return does not reflect expenses, which have been deducted from the Fund’s return. The returns shown do not reflect deduction of taxes that a shareholder would pay on Fund distributions or the redemption of Fund shares. THE FUND’S RETURN REPRESENTS PAST PERFORMANCE AND IS NOT PREDICTIVE OF FUTURE RESULTS.
[4]
Letter from the Manager
September 30, 2012
International Fund
Central bankers around the world put on their full armor and deployed their bazookas with the Federal Reserve and the European Central Bank (ECB) leading the way. Bankers’ unprecedented use of unconventional monetary policies hit on all cylinders as the ECB’s Mario Draghi announced plans for unlimited buying of sovereign debt with yet another program, this time called the Outright Monetary Transactions (OMT) on top of the successful bank lending program named the LTRO earlier in the year. The Fed’s Ben Bernanke was not to be outdone as he announced open-ended buying of mortgage-backed securities to the tune of up to $40bn per month going forward.
These liquidity measures flooding the markets translate to very low interest rates for borrowers of all kinds, including corporations. The all-out assault from the ECB on speculative attacks on the euro and Eurozone sovereign markets seemed to soothe equity markets in Europe. With low valuations in the Eurozone, the ECB’s aggressive stance to protect the monetary union sent equity markets there surging in the third quarter of 2012, translating into significant gains for European equity markets. Although economic figures showed some signs of hope in the US housing market, most other global economic measures appear to show continued weakness across Europe, Japan, and even the emerging economies. Such uncertainty led to bouts of “risk on” and “risk off” markets during the year. In spite of such volatility and rotations in sector leadership, the Fund performed well relative to the MSCI EAFE benchmark for the year.
Strong stock selection in eight of the ten sectors helped the Fund outperform its benchmark. The best returns for the Fund relative to the benchmark came from the Telecom Services, Materials, and Financials sectors from a stock selection standpoint. In Telecoms, the Fund’s holdings in Philippines telcos proved the right strategy as they performed well for the period. In Materials, an overweight to agro-chemicals benefited the Fund as strong agricultural markets led to strong demand for fertilizers and specialty chemicals. For the Financials sector, even though the Fund was underweight the sector, which hurt performance, this was more than compensated by very good stock selection, in particular holdings in Singapore and Hong Kong. The Fund maintains an underweight to Japan as we find better opportunities in the emerging markets and Canada which have proven to be the right strategy given Japan’s poor performance during this period.
The portfolio’s defensive posture throughout the year, with higher than average cash levels, was the biggest drag on performance. In spite of this, the Fund performed well. We have reduced the cash to more normal levels and will continue to take advantage of volatile markets to invest in solid companies from around the world at a time that international equity valuations remain at attractive levels. The Financials sector along with Japan and the eurozone remain the largest underweights in the Fund while the largest overweights at the start of the new fiscal year are in telecom services, energy, Canada, and the emerging markets.
EAGLE GLOBAL ADVISORS
Timothy Plan Fund Performance
[5]
Fund Performance | International
As of September 30, 2012 - (Unaudited)
| | | | | | | | | | | | | | | |
| Fund/Index | | 1 Year
Total Return | | 5 Year
Average
Annual Return | | Average
Annual Return
Since Inception (a) |
Timothy International Fund - Class A (With Sales Charge) | | | | 9.38 | % | | | | -7.52 | % | | | | -5.36 | % |
MSCI EAFE Index | | | | 10.01 | % | | | | -8.07 | % | | | | -7.00 | % |
Timothy International Fund - Class C * | | | | 14.88 | % | | | | -7.15 | % | | | | -5.10 | % |
MSCI EAFE Index | | | | 10.01 | % | | | | -8.07 | % | | | | -7.00 | % |
| | (a) | For the period May 3, 2007 (commencement of investment in accordance with objective) to September 30, 2012. |
| | * | With Maximum Deferred Sales Charge |
Timothy Plan International Fund vs. MSCI EAFE Index
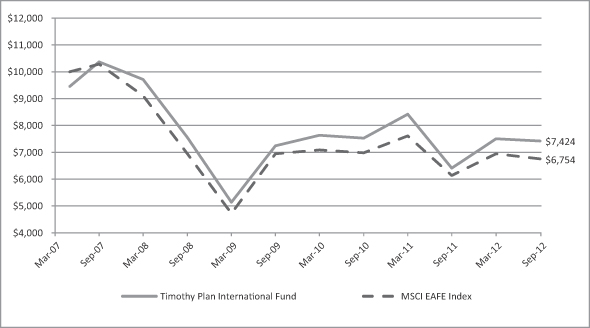
The chart shows the value of a hypothetical initial investment of $10,000 in the Fund’s Class A shares and the MSCI EAFE Index on May 3, 2007 and held through September 30, 2012. The MSCI EAFE Index is a widely recognized unmanaged index of equity prices and is representative of equity market performance of developed countries, excluding the U.S. and Canada. Performance figures include the change in value of the stocks in the index and the reinvestment of dividends. The index return does not reflect expenses, which have been deducted from the Fund’s return. The returns shown do not reflect deduction of taxes that a shareholder would pay on Fund distributions or the redemption of Fund shares. THE FUND’S RETURN REPRESENTS PAST PERFORMANCE AND IS NOT PREDICTIVE OF FUTURE RESULTS.
[6]
Letter from the Manager
September 30, 2012
Large/Mid Cap Growth Fund
We are pleased to report that the Fund advanced 26.61% over the last 12 months ending September 30, 2012, essentially matching the return of the benchmark, the Russell 1000 Growth Index, which rose 29.1% over the same period.
The market had strong advances in 3 of the last 4 quarters, only pausing to take a breather in the second quarter of this year. We have rarely witnessed a time when the old adage of the market “climbing a wall of worry” has been more apt. The litany of concerns during the last year has included: the European Sovereign Debt crisis, China (and much of the world’s) slowing growth, the looming U.S. “fiscal cliff,” consumer de-leveraging and unprecedented government balance-sheet expansion, and a tightly-contested upcoming presidential election. The market has taken a “glass-half-full” view, and focused on the positives - central bankers’ massive amounts of easing, ongoing healthy corporate profits, a nascent recovery in housing, and the relative attractiveness of stocks given extremely-low bond yields.
After such a powerful rally - and with many issues yet to be resolved - we are keeping our guard up. We have recently had our cash balances a little higher than average, and we are being cautious with our stock selection. We think that earnings growth is going to slow and that negative surprises will be more commonplace, hence, with our portfolio holdings we are focusing as much on the sustainability of earnings as with the absolute level of earnings growth.
CHARTWELL INVESTMENT PARTNERS, L.P.
Performance data quoted above is historical. Past performance does not guarantee future results and current performance may be lower or higher than the performance data quoted. Class A shares performance quoted excludes sales charge.
Timothy Plan Fund Performance
[7]
Fund Performance | Large/Mid Cap Growth
As of September 30, 2012 - (Unaudited)
| | | | | | | | | | | | | | | | | | | | |
| Fund/Index | | 1 Year
Total Return | | 5 Year
Average
Annual Return | | 10 Year
Average
Annual Return | | |
Timothy Large/Mid Cap Growth Fund - Class A (With Sales Charge) | | | | 19.69 | % | | | | -0.31 | % | | | | 5.16 | % | | | | | |
Russell 1000 Growth Index | | | | 29.19 | % | | | | 3.24 | % | | | | 8.41 | % | | | | | |
Timothy Large/Mid Cap Growth Fund - Class C * | | | | 25.47 | % | | | | 0.07 | % | | | | 2.63 | % | | | | (a) | |
Russell 1000 Growth Index | | | | 29.19 | % | | | | 3.24 | % | | | | 5.38 | % | | | | (a) | |
| | (a) | For the period February 3, 2004 (commencement of investment in accordance with objective) to September 30, 2012. |
| | * | With Maximum Deferred Sales Charge |
Timothy Plan Large/Mid Cap Growth Fund vs. Russell 1000 Growth Index
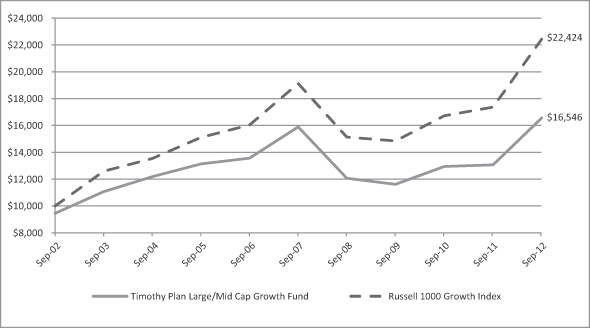
The chart shows the value of a hypothetical initial investment of $10,000 in the Fund’s Class A shares and the Russell 1000 Growth Index on September 30, 2002 and held through September 30, 2012. The Russell 1000 Growth Index is a widely recognized, unmanaged index of common stock prices. Performance figures include the change in value of the stocks in the index and the reinvestment of dividends. The index return does not reflect expenses, which have been deducted from the Fund’s return. The returns shown do not reflect deduction of taxes that a shareholder would pay on Fund distributions or the redemption of Fund shares. THE FUND’S RETURN REPRESENTS PAST PERFORMANCE AND IS NOT PREDICTIVE OF FUTURE RESULTS.
[8]
Letter from the Manager
September 30, 2012
Small Cap Value Fund
We are pleased to provide you with our report for the Timothy Plan Small Cap Value Fund for the twelve months ending September 30, 2012 and would like to thank you for entrusting your assets with us.
The past twelve months equity markets, while withstanding some volatility, generally moved higher. Stocks moved higher in 4th quarter 2011 and into the 1st quarter of 2012 on what appeared to be strengthening economic data and optimism surrounding the Europea n debt crisis. Investor sentiment turned negative by the second quarter as we saw renewed concerns over the European crisis and a slowdown in both the U.S. and Chinese economies. Third quarter markets turned higher again on hopes the U.S. and Europe would engineer more stimulus to help their respective economies. During such periods, it can be difficult for active managers who employ bottom-up, fundamental research to generate high levels of alpha. Investors have sought out economically-sensitive and global firms during much of the fiscal year, while the safe-haven, high-yielding securities led the market during times of uncertainty, such as in the 2nd quarter. We have historically outperformed for many years following an economic recovery, and even though the recovery has taken longer due to the depth of the financial crisis, we are pleased that our small-cap strategy has performed well. As we take on the next fiscal year, we will, as long-term investors, remain disciplined, keep emotions in check and be opportunistic.
For the twelve months ending September 30, 2012, the Timothy Plan Small Cap Value Fund produced a return of 36.23%, while the Russell 2000 Index produced a return of 31.18%. Smaller market capitalization company stocks, which tend to have revenues that are more sensitive to the business cycle, outperformed the broad U.S. market. Security selection was the primary driver of relative outperformance and centered in the Consumer Discretionary, Energy, Producer Durables and REITs (Real Estate Investment Trusts) sectors. Optimism about the economy aided the performance of economically-sensitive companies. Specifically, Saia and EnerSys surged along with an improvement in investor sentiment and confidence in the U.S. economy. North American heavy truck demand rose and also boosted SAIA based on its ability to achieve pricing power and control operating costs, which allows for greater operating leverage. An increase in water heater sales in China boosted earnings and made for a positive 2013 outlook for A.O. Smith Corp. Kodiak Oil & Gas announced an equity offering to accelerate their drilling programs and investors bid up the name due to continued confidence in their operations. Last, Chemical Financial performed very well. Holdings in Financial Services performed well as banks rallied on the positive results from the U.S. “stress test” and the stabilization of the U.S. housing market.
Security selection in Health Care coupled with an underweight in both Consumer Discretionary and Health Care detracted from performance. Consumer Discretionary and Health Care index sectors outperformed the market and our holdings failed to keep pace. In Energy, holdings related to natural gas and coal detracted from performance including Basic Energy Services, which provides ancillary services to natural gas companies. Basic Energy Services also experienced slower oil service activity and declined on pricing pressures among their varying lines of business. Gastar Exploration reported weak earnings and lower production guidance for the rest of the year. Also a drag on relative performance was Layne Christensen, which reported disappointing margins and a foreign corruption investigation, while Tellabs lowered forward guidance and reported slower revenue growth than previously expected. Last, in Financial Services, Knight Capital experienced a bug in the new trading software that erroneously unleashed orders for millions of shares onto U.S. exchanges. With investors worried about their survival, the stock was sold.
WESTWOOD MANAGEMENT CORPORATION
Performance data quoted above is historical. Past performance does not guarantee future results and current performance may be lower or higher than the performance data quoted. Class A shares performance quoted excludes sales charge.
Timothy Plan Fund Performance
[9]
Fund Performance | Small Cap Value
As of September 30, 2012 - (Unaudited)
| | | | | | | | | | | | | | | | | | | | |
| Fund/Index | | 1 Year
Total Return | | 5 Year
Average
Annual Return | | 10 Year
Average
Annual Return | | |
Timothy Small Cap Value Fund - Class A (With Sales Charge) | | | | 28.73 | % | | | | 0.17 | % | | | | 7.47 | % | | | | | |
Russell 2000 Index | | | | 31.18 | % | | | | 2.96 | % | | | | 10.55 | % | | | | | |
Timothy Small Cap Value Fund - Class C * | | | | 35.08 | % | | | | 0.55 | % | | | | 3.88 | % | | | | (a) | |
Russell 2000 Index | | | | 31.18 | % | | | | 2.96 | % | | | | 5.75 | % | | | | (a) | |
| | (a) | For the period February 3, 2004 (commencement of investment in accordance with objective) to September 30, 2012. |
| | * | With Maximum Deferred Sales Charge |
Timothy Plan Small Cap Value Fund vs. Russell 2000 Index
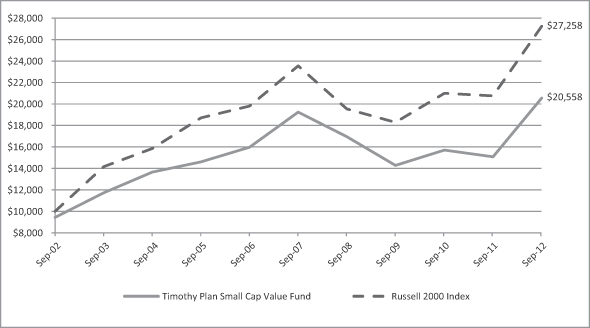
The chart shows the value of a hypothetical initial investment of $10,000 in the Fund’s Class A shares and the Russell 2000 Index on September 30, 2002 and held through September 30, 2012. The Russell 2000 Index is a widely recognized, unmanaged index of common stock prices. Performance figures include the change in value of the stocks in the index and the reinvestment of dividends. The index return does not reflect expenses, which have been deducted from the Fund’s return. The returns shown do not reflect deduction of taxes that a shareholder would pay on Fund distributions or the redemption of Fund shares. THE FUND’S RETURN REPRESENTS PAST PERFORMANCE AND IS NOT PREDICTIVE OF FUTURE RESULTS.
[10]
Letter from the Manager
September 30, 2012
Large/Mid Cap Value Fund
We are pleased to provide you with our report for the Timothy Plan Large/Mid Cap Value Fund for the twelve months ending September 30, 2012 and would like to thank you for entrusting your assets with us.
The past twelve months equity markets, while withstanding some volatility, generally moved higher. Stocks moved higher in 4th quarter 2011 and into the 1st quarter of 2012 on what appeared to be strengthening economic data and optimism surrounding the European debt crisis. Investor sentiment turned negative by the second quarter as we saw renewed concerns over the European crisis and a slowdown in both the U.S. and Chinese economies. Third quarter markets turned higher again on hopes the U.S. and Europe would engineer more stimulus to help their respective economies. During such periods, it can be difficult for active managers who employ bottom-up, fundamental research to generate high levels of alpha. Investors have sought out economically-sensitive and global firms during much of the fiscal year, while the safe-haven, high-yielding securities led the market during times of uncertainty, such as in the 2nd quarter. We have historically outperformed for many years following an economic recovery, but this recovery has taken longer due to the depth of the financial crisis. Fundamental analysis has worked during earnings season and when Euro fears are not driving sentiment. Looking ahead, volatility is likely to remain high given the U.S. election, U.S. fiscal cliff and global growth slowdown. However, we are confident that our positioning in high-quality companies with under-appreciated earnings growth potential should fare well in this environment.
For the twelve months ending September 30, 2012, the Timothy Plan Large/Mid Cap Value Fund produced a return of 25.39%, while the S&P 500 Index produced a return of 30.2%. Security selection in Energy, Producer Durables and Material & Processing aided relative performance. The Financial Services sector has been a consistent outperformer and our overweight in this sector also benefited the Fund. Many of the Fund’s top performers were in sectors levered to economic growth. Optimism about the global economy aided the performance of pro-cyclical, global companies, such as Energy holding National Oilwell Varco, Materials & Processing holding Sherwin-Williams and Producer Durables’ holdings Flowserve and Union Pacific. Additionally, company-specific news benefitted selected holdings such as Union Pacific, which was bid up as the company reported continued strong execution, including rising revenues and pricing. In Financial Services, INVESCO and other asset managers held in the portfolio rose with the market.
Security selection in Consumer Discretionary, Technology and Utilities was the largest detractor to relative performance in the prior twelve months. Technology and Consumer Discretionary index sectors outperformed the market and our holdings failed to keep pace. Technology’s Western Digital and Consumer Discretionary’s Lear Corp. suffered from concerns surrounding economic weakness as well as a decline in European auto sales, respectively. In Producer Durables, Xylem declined as its water infrastructure business could suffer slowdowns as the domestic economy remains slow. Goodrich lagged as commercial sales disappointed and last, FirstEnergy pulled back forward guidance based on new regulations and power auctions that could impact 2013 earnings.
WESTWOOD MANAGEMENT CORPORATION
Performance data quoted above is historical. Past performance does not guarantee future results and current performance may be lower or higher than the performance data quoted. Class A shares performance quoted excludes sales charge.
Timothy Plan Fund Performance
[11]
Fund Performance | Large/Mid Cap Value
As of September 30, 2012 - (Unaudited)
| | | | | | | | | | | | | | | | | | | | |
| Fund/Index | | 1 Year
Total Return | | 5 Year
Average
Annual Return | | 10 Year
Average
Annual Return | | |
Timothy Large/Mid Cap Value Fund - Class A (With Sales Charge) | | | | 18.48 | % | | | | -1.28 | % | | | | 8.55 | % | | | | | |
S&P 500 Index | | | | 30.20 | % | | | | 1.05 | % | | | | 8.01 | % | | | | | |
Timothy Large/Mid Cap Value Fund - Class C * | | | | 24.41 | % | | | | -0.91 | % | | | | 6.14 | % | | | | (a) | |
S&P 500 Index | | | | 30.20 | % | | | | 1.05 | % | | | | 8.01 | % | | | | (a) | |
| | (a) | For the period February 3, 2004 (commencement of investment in accordance with objective) to September 30, 2012. |
| | * | With Maximum Deferred Sales Charge |
Timothy Plan Large/Mid Cap Value Fund vs. S&P 500 Index
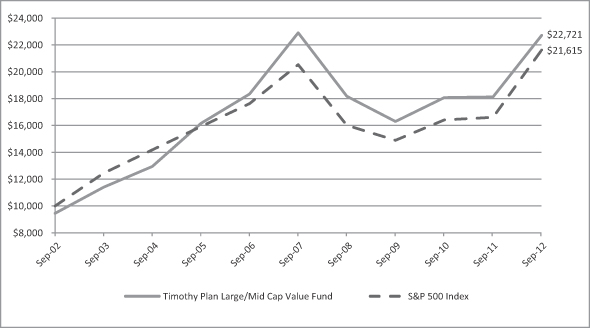
The chart shows the value of a hypothetical initial investment of $10,000 in the Fund’s Class A shares and the S&P 500 Index on September 30, 2002 and held through September 30, 2012. The S&P 500 Index is a widely recognized, unmanaged index of common stock prices. Performance figures include the change in value of the stocks in the index and the reinvestment of dividends. The index return does not reflect expenses, which have been deducted from the Fund’s return. The returns shown do not reflect deduction of taxes that a shareholder would pay on Fund distributions or the redemption of Fund shares. THE FUND’S RETURN REPRESENTS PAST PERFORMANCE AND IS NOT PREDICTIVE OF FUTURE RESULTS.
[12]
Letter from the Manager
September 30, 2012
Fixed Income Fund
Over the past 12-months, Central banks globally continued their response to weak economic news with more “balance sheet expansion” policies in hopes of promoting stronger economic growth. In the U.S., concern over the unemployment rate and potential downside risks to growth prompted the Federal Open Market Committee (FOMC) to institute yet another much anticipated round of Quantitative Easing (QE3). Unlike the first two rounds of QE, this program is open-ended and will further expand the Federal Reserve’s unprecedented $2.9 trillion balance sheet. Policy makers have committed to maintaining low interest rates for an extended period with little concern over potential ramifications.
The FOMC’s “all-in” action is the latest attempt to stimulate economic activity by increasing home sales, creating mortgage refinancing opportunities for homeowners, and inciting a “wealth effect” by reflating risk assets. There is no doubt the monetary actions implemented since the financial crisis began have muted the negative effects of consumer and corporate deleveraging. Evidence also confirms a firming in economic activity that includes better retail sales, auto sales, consumer confidence and stronger consumer spending. There is even encouraging news in the housing sector, as both sales and prices have enjoyed a recent rise, while foreclosures are reported to be “normalizing”. The question is whether extraordinary monetary policy measures alone can create lasting economic growth.
The unemployment rate has remained stubbornly above 8% over the past eleven months having finally moved to 7.8% in September 2012. However, the broader measure of labor that includes people involuntarily working part-time is at 14.7%, illustrating the economic malaise that remains. We would argue the effectiveness of the Fed’s policy tools needs an appropriate fiscal stimulus policy as well to be effective. A responsible resolution for the “Fiscal cliff” issues, including the U.S. government debt ceiling limit and a reasonable long term tax policy, is needed for business leaders. Their confidence level remains low with recent data indicating it is the lowest since 2009, coincidently the end of the last recession. In this environment the market has experienced declining interest rates, with the Treasury 10-Year bond yield falling from 1.92% on September 30, 2011 to 1.63% on September 30, 2012.
With all the uncertainty, the portfolio was managed in a cautious strategy resulting in the Timothy Fixed Income Fund A shares generating a total return of 3.73% over the twelve months ended September 30, 2012, as compared to a 5.16% return for the Barclays Aggregate index benchmark. The portfolio’s above market allocation to investment grade credit benefited performance as corporate bond yield spreads narrowed to Treasury rates. A defensive allocation to Treasury Inflation Protected Securities (TIPS) also aided fund performance as Barclays reported this sector was up 9.1%. However, offsetting these positions was an underweight in bank issues, which was the best performing industry, up 14.2% according to Barclays indices.
We continue to position the portfolio conservatively for the uncertainty of the current market environment. Investment grade corporate bonds are over-weighted to add yield, and our position in TIPS remains near 5%. The portfolio’s Mortgage Backed Securities are in GNMA issues that have a full faith and credit guarantee of the U.S. Treasury and provide an attractive yield.
BARROW, HANLEY, MEWHINNEY & STRAUSS
Performance data quoted above is historical. Past performance does not guarantee future results and current performance may be lower or higher than the performance data quoted. Class A shares performance quoted excludes sales charge.
Timothy Plan Fund Performance
[13]
Fund Performance | Fixed Income
As of September 30, 2012 - (Unaudited)
| | | | | | | | | | | | | | | | | | | | |
| Fund/Index | | 1 Year
Total Return | | 5 Year
Average
Annual Return | | 10 Year
Average
Annual Return | | |
Timothy Fixed Income Fund - Class A (With Sales Charge) | | | | -0.98 | % | | | | 4.25 | % | | | | 3.96 | % | | | | | |
Barclays Capital U.S. Aggregate Bond Index | | | | 5.16 | % | | | | 6.53 | % | | | | 5.32 | % | | | | | |
Timothy Fixed Income Fund - Class C * | | | | 2.88 | % | | | | 4.44 | % | | | | 3.37 | % | | | | (a) | |
Barclays Capital U.S. Aggregate Bond Index | | | | 5.16 | % | | | | 6.53 | % | | | | 5.40 | % | | | | (a) | |
| | (a) | For the period February 3, 2004 (commencement of investment in accordance with objective) to September 30, 2012. |
| | * | With Maximum Deferred Sales Charge |
Timothy Plan Fixed Income Fund vs. Barclays Capital U.S. Aggregate Bond Index
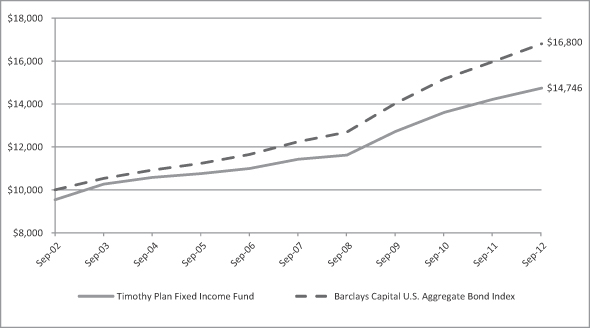
The chart shows the value of a hypothetical initial investment of $10,000 in the Fund’s Class A shares and the Barclays Capital U.S. Aggregate Bond Index on September 30, 2002 and held through September 30, 2012. The Barclays Capital U.S. Aggregate Bond Index is a widely recognized, unmanaged index of bond prices. Performance figures include the change in value of the bonds in the index and the reinvestment of interest. The index return does not reflect expenses, which have been deducted from the Fund’s return. The returns shown do not reflect deduction of taxes that a shareholder would pay on Fund distributions or the redemption of Fund shares. THE FUND’S RETURN REPRESENTS PAST PERFORMANCE AND IS NOT PREDICTIVE OF FUTURE RESULTS.
[14]
Letter from the Manager
September 30, 2012
High Yield Bond Fund
Continuing evidence of a slowing U.S. economy and a faltering global recovery continued to drive Central Banks globally to enact unprecedented expansionary monetary policies over the past 12 months. In the U.S., concern over the unemployment rate and realization of potential downside risks to growth prompted the Federal Open Market Committee (FOMC) to institute yet another much anticipated round of Quantitative Easing (QE3). Unlike the first two rounds of QE, this program is open-ended and will further expand the Federal Reserve’s unprecedented $2.9 trillion balance sheet. Policy makers have committed to maintaining low interest rates for an extended period with no concern over potential ramifications.
The FOMC’s “all-in” action is the latest attempt to stimulate economic activity by increasing home sales, creating mortgage refinancing opportunities for homeowners, and inciting a “wealth effect” by reflating risk assets. There is no doubt the monetary actions implemented since the financial crisis began have muted the negative effects of consumer and corporate deleveraging. Evidence also confirms a firming in economic activity that includes better retail sales, auto sales, consumer confidence and stronger consumer spending. The extended period of low interest rate policies by the Federal Reserve has created significant demand for income and increased the appetite for risk assets including High Yield (HY) bonds. For the first 9 months in 2012, inflows into HY mutual funds stood at $35.4 billion, setting an all-time record. The investor demand for yield helped drive the Barclays Ba/B High Yield Index yield spread down 238 basis points over the one-year period ended September 2012, leading to a strong total return.
Timothy High Yield Fund A shares returned 15.17% compared to 18.19% for the Barclays Ba/B High Yield Index benchmark for the 12 month period ended September 30, 2012. According to Barclays, the top performing sector in HY was Financials, especially Banks, while the worst performers in 2012 through September were Basic Industry and Energy. The 12 month performance lag for the Fund’s A shares was primarily a result of the 2Q12 return of -0.01%, as cyclical holdings and especially energy were weak performers. A contributing factor to this result was the bond market’s reaction to increased evidence of a global slowdown, especially in China. Also, the portfolio was underweight in the top performing financial sector. However, the portfolio rebounded during 3Q12 as the Fund’s A shares were up 4.94% versus 4.40% for the Barclays Ba/B High Yield Index, as concerns about a global recession faded allowing a recovery in cyclical holdings.
Current credit fundamentals remain supportive of the HY market. For example, Fitch reports HY default rates of only 2.2% which is about half of their long term average rate. The portfolio focuses on the higher rated portion of the HY market and has an overweight in the Utility sector and an underweight in Financials. Security selection for the portfolio focuses on a company’s sources and uses of cash, access to liquidity, debt maturity schedule and sustainable cash flow.
BARROW, HANLEY, MEWHINNEY & STRAUSS
Performance data quoted above is historical. Past performance does not guarantee future results and current performance may be lower or higher than the performance data quoted. Class A shares performance quoted excludes sales charge.
Timothy Plan Fund Performance
[15]
Fund Performance | High Yield Bond
As of September 30, 2012 - (Unaudited)
| | | | | | | | | | | | | | | |
| Fund/Index | | 1 Year
Total Return | | 5 Year
Average
Annual Return | | Average
Annual Return
Since Inception (a) |
Timothy High Yield Bond Fund - Class A (With Sales Charge) | | | | 9.99 | % | | | | 5.41 | % | | | | 4.93 | % |
Barclays Ba/B High Yield Index | | | | 18.19 | % | | | | 8.72 | % | | | | 7.97 | % |
Timothy High Yield Bond Fund - Class C * | | | | 14.33 | % | | | | 5.56 | % | | | | 5.05 | % |
Barclays Capital U.S. Corporate High Yield Bond Index | | | | 18.19 | % | | | | 8.72 | % | | | | 7.97 | % |
| | (a) | For the period May 7, 2007 (commencement of investment in accordance with objective) to September 30, 2012. |
| | * | With Maximum Deferred Sales Charge |
Timothy Plan High Yield Bond Fund vs. Barclays Capital U.S. Corporate High Yield Bond Index
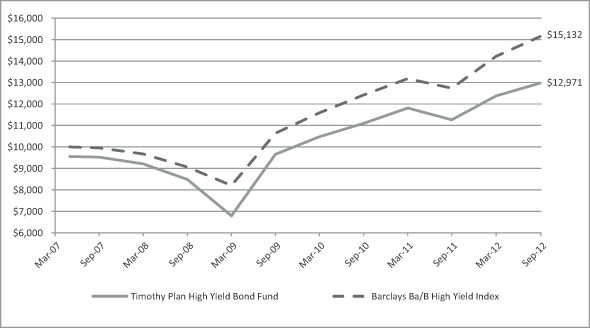
The chart shows the value of a hypothetical initial investment of $10,000 in the Fund’s Class A shares and the Barclays Capital U.S. Corporate High Yield Bond Index on May 7, 2007 and held through September 30, 2012. The Barclays Capital U.S. Corporate High Yield Bond Index is a widely recognized unmanaged index of non-investment grade, fixed rate, taxable corporate bonds. Performance figures include the change in value of the bonds in the index and the reinvestment of interest. The index return does not reflect expenses, which have been deducted from the Fund’s return. The returns shown do not reflect deduction of taxes that a shareholder would pay on Fund distributions or the redemption of Fund shares. THE FUND’S RETURN REPRESENTS PAST PERFORMANCE AND IS NOT PREDICTIVE OF FUTURE RESULTS.
[16]
Letter from the Manager
September 30, 2012
Israel Common Values Fund
The global backdrop of slowing economic growth across the world has affected global trade and henceforth reduced market expectations for GDP growth in Israel. The latest Bloomberg economist’s consensus estimates less than 3% GDP growth for Israel in 2012 then bouncing back above 3% in 2013 after two strong years of greater than 4% growth in 2010 and 2011. Even though growth has slowed somewhat, Israel appears to be weathering the storm much better than its developed market peers. Inflation is under control with most estimates hovering around 2% for both 2012 and 2013.
With the Arab Winter and Spring revolts and Iran’s nuclear ambitions, turmoil in the region hurt equity performance in the beginning of 2012. With the Muslim Brotherhood now in control of Egypt and with outright civil war in Syria, the Israeli equity market was soft for most of the beginning of 2012 before bouncing back strongly after aggressive central bank monetary policies across the world. Valuations remain reasonable and expectations appear modest for corporate results in the coming year.
The Timothy Plan Israel Common Values Fund performed well for the year in absolute terms and relative to the Israel TA-100 index mostly on the back of strong sector allocation in Telecom Services, Financials, and Information Technology and good stock selection in Telecom Services, Energy, and Industrials. Although the Fund benefited from larger than normal cash weightings in its first few months since inception, as the year progressed and markets rallied, cash was a drag to performance. The largest negative effect on the Fund’s performance was not owning enough of the big winners relative to their weight in the index as well as the significant underweight in the Health Care sector as the two largest firms there performed well.
The Fund has shifted to an overweight stance in Financials given better valuations and prospects there while maintaining the overweight to Consumer Staples and Information Technology. The two significant underweights remain Telecom Services where we believe competitive forces keep pressures on earnings in the sector while the large underweight in Health Care will likely remain for the foreseeable future as the two largest Health Care stocks in the index do not pass the Timothy screens. The Fund maintains its focus on directing its efforts in identifying those companies with the best prospects and that champion the entrepreneurial and innovative spirit of Israel.
EAGLE GLOBAL ADVISORS, LLC
Timothy Plan Fund Performance
[17]
Fund Performance | Israel Common Values
As of September 30, 2012 - (Unaudited)
| | | | | | | | | | | | | | | |
| Fund/Index | | 1 Year
Total Return | | 5 Year
Average
Annual Return | | Average
Annual Return
Since Inception (a) |
Timothy Israel Common Values Fund - Class A (With Sales Charge) | | | | N/A | | | | | N/A | | | | | -3.78 | % |
Israel TA 100 Index | | | | N/A | | | | | N/A | | | | | 7.46 | % |
Timothy Israel Common Values Fund - Class C * | | | | N/A | | | | | N/A | | | | | 1.00 | % |
Israel TA 100 Index | | | | N/A | | | | | N/A | | | | | 7.46 | % |
| | (a) | For the period October 12, 2011 (commencement of investment in accordance with objective) to September 30, 2012. |
| | * | With Maximum Deferred Sales Charge |
Timothy Israel Common Values Fund vs. Israel Tel Aviv 100 Index
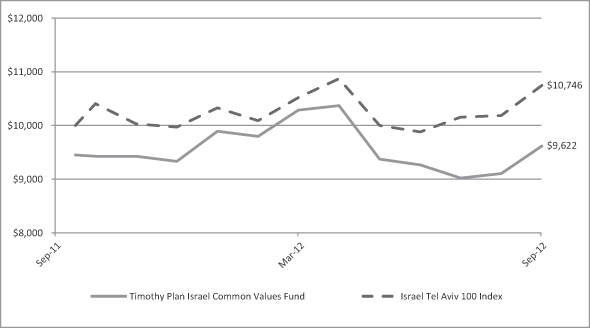
The chart shows the value of a hypothetical initial investment of $10,000 in the Fund’s Class A shares and the Israel TA 100 Index on October 12, 2011 and held through September 30, 2012. The Israel Tel Aviv 100 Index is an unmanaged index of equity prices representing the 100 most highly capitalized companies listed on the Tel Aviv Stock Exchange. Performance figures include the change in value of the stocks in the index and the reinvestment of dividends. The index return does not reflect expenses, which have been deducted from the Fund’s return. The returns shown do not reflect deduction of taxes that a shareholder would pay on Fund distributions or the redemption of Fund shares. THE FUND’S RETURN REPRESENTS PAST PERFORMANCE AND IS NOT PREDICTIVE OF FUTURE RESULTS.
[18]
Letter from the Manager
September 30, 2012
Defensive Strategies Fund
Dear Shareholder,
The Defensive Strategies Fund has been designed and managed to do what its name implies, i.e. hedge against a possible scenario of hyper-inflation which could result from our nation’s leadership’s proven unwillingness to address our core problems of too much spending, too much taxation and too many onerous government regulations. If we elect a real reform government in the November, 2012 elections, we believe many of these problems could be on a path to being solved. We have, therefore, built in the flexibility to either adjust to a possible risk of extreme deflation with the ability to convert our inflation sensitive assets to cash and fixed income securities that should perform well during a deflationary environment or to a more normal, traditional investment strategy. As I stated in last year’s report, although we will do our very best to be successful, we cannot guarantee results in any of these scenarios.
While no one can predict future events, as I stated in my President’s letter, I am confident of a couple of things:
| | • | | If the November, 2012 elections result in replacing a number of liberal members of Congress (as well as the current Administration) with common sense conservatives, the capital markets could react very favorably, and |
| | • | | Our sub-advisors (i.e. money management firms that manage the various sleeves of this Fund) are, in our opinion, among the best in the industry and they each continue to honor our overall policy that they manage their respective Fund sleeve both in accordance with our screening restrictions and with a conservative bias. |
Finally, I would once again like to thank you for your moral convictions that led you to become part of the Timothy Plan Family.
Yours in Christ,
ARTHUR D. ALLY
Fund Advisor
Timothy Plan Fund Performance
[19]
Fund Performance | Defensive Strategies
As of September 30, 2012 - (Unaudited)
| | | | | | | | | | | | | | | |
| Fund/Index | | 1 Year
Total Return | | 5 Year
Average
Annual Return | | Average
Annual Return
Since Inception (a) |
Timothy Defensive Strategies Fund - Class A (With Sales Charge) | | | | 8.52 | % | | | | N/A | | | | | 8.74 | % |
Dow Jones Moderately Conservative U.S. Portfolio Index | | | | 19.24 | % | | | | N/A | | | | | 11.94 | % |
Timothy Defensive Strategies Fund - Class C * | | | | 13.91 | % | | | | N/A | | | | | 10.07 | % |
Dow Jones Moderately Conservative U.S. Portfolio Index | | | | 19.24 | % | | | | N/A | | | | | 11.94 | % |
| | (a) | For the period November 4, 2009 (commencement of investment in accordance with objective) to September 30, 2012. |
| | * | With Maximum Deferred Sales Charge |
Timothy Plan Defensive Strategies Fund vs. Dow Jones Moderately Conservative U.S. Portfolio Index
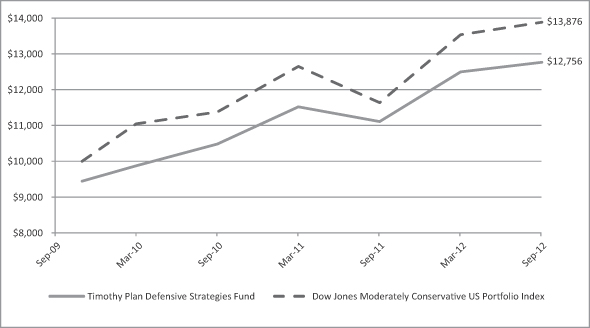
The chart shows the value of a hypothetical initial investment of $10,000 in the Fund’s Class A shares and the Dow Jones Moderately Conservative U.S. Portfolio Index on November 4, 2009 and held through September 30, 2012. The Dow Jones Moderately Conservative U.S. Portfolio Index is a widely recognized unmanaged index of stocks, bonds and cash. Performance figures include the change in value of the asset classes in the index and the reinvestment of dividends. The index return does not reflect expenses, which have been deducted from the Fund’s return. The returns shown do not reflect deduction of taxes that a shareholder would pay on Fund distributions or the redemption of Fund shares. THE FUND’S RETURN REPRESENTS PAST PERFORMANCE AND IS NOT PREDICTIVE OF FUTURE RESULTS.
[20]
Letter from the Manager
September 30, 2012
Strategic Growth Fund
Dear Strategic Growth Fund Shareholder:
The Timothy Plan Strategic Growth Fund is simply an asset allocation fund that invests in a number of Timothy Plan underlying funds. Although the allocation percentages will vary somewhat from time to time as a result of changing economic conditions, the allocation at September 30, 2012 was as follows:
| | | | | | | | | | |
• Large/Mid Cap Growth Fund | | | (16.45%) | | | • Small Cap Value Fund | | | ( 6.73%) | |
• Large/Mid Cap Value Fund | | | (16.53%) | | | • Aggressive Growth Fund | | | (6.25%) | |
• International Fund | | | (15.60%) | | | • High Yield Bond Fund | | | (12.85%) | |
• Defensive Strategies Fund | | | (17.16%) | | | • Israel Common Values Fund | | | (5.56%) | |
• Cash | | | (2.87%) | | | | | | | |
I am pleased to report that performance was, in our opinion, quite respectable over the past twelve months and was reasonably comparable to the Fund’s market benchmark - the Dow Jones Global Moderately Aggressive Portfolio Index. As we manage this Fund, we plan to continue to attempt to adjust to (what could be) rapidly changing economic conditions.
We realize that the volatility and uncertainty of the markets over the past twelve months may have been unsettling for many investors; however as a group, although our sub-advisors expect this pattern to continue into 2013, they also expect a somewhat upward bias with respect to performance in our underlying funds.
As you know, no one can guarantee future performance. However, the one thing that I can assure you of is that every one of our sub-advisors is doing their very best and our team here at Timothy is working very hard to provide you an investment with which you can feel comfortable.
Sincerely,
ARTHUR D. ALLY,
President
Timothy Plan Fund Performance
[21]
Fund Performance | Strategic Growth
As of September 30, 2012 - (Unaudited)
| | | | | | | | | | | | | | | | | | | | |
| Fund/Index | | 1 Year
Total Return | | 5 Year
Average
Annual Return | | 10 Year
Average
Annual Return | | |
Timothy Strategic Growth Fund - Class A (With Sales Charge) | | | | 12.22 | % | | | | -3.23 | % | | | | 4.92 | % | | | | | |
Dow Jones Global Moderately Aggressive Portfolio Index | | | | 19.63 | % | | | | 1.78 | % | | | | 9.63 | % | | | | | |
Timothy Strategic Growth Fund - Class C * | | | | 18.04 | % | | | | -2.90 | % | | | | 2.06 | % | | | | (a) | |
Dow Jones Global Moderately Aggressive Portfolio Index | | | | 19.63 | % | | | | 1.78 | % | | | | 6.46 | % | | | | (a) | |
| | (a) | For the period February 3, 2004 (commencement of investment in accordance with objective) to September 30, 2012. |
| | * | With Maximum Deferred Sales Charge |
Timothy Plan Strategic Growth Fund vs. Dow Jones Global Moderately Aggressive Portfolio Index
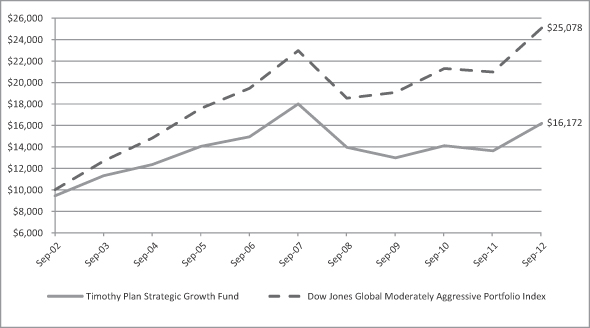
The chart shows the value of a hypothetical initial investment of $10,000 in the Fund’s Class A shares and the Dow Jones Global Moderately Aggressive Portfolio Index on September 30, 2002 and held through September 30, 2012. The Dow Jones Global Moderately Aggressive Portfolio Index is a widely recognized index that measures global stocks, bonds and cash which are in turn represented by multiple sub-indexes. Performance figures include the change in value of the investments in the index and the reinvestment of dividends. The index return does not reflect expenses, which have been deducted from the Fund’s return. The returns shown do not reflect deduction of taxes that a shareholder would pay on Fund distributions or the redemption of Fund shares. THE FUND’S RETURN REPRESENTS PAST PERFORMANCE AND IS NOT PREDICTIVE OF FUTURE RESULTS.
[22]
Letter from the Manager
September 30, 2012
Conservative Growth Fund
Dear Conservative Growth Fund Shareholder:
The Timothy Plan Conservative Growth Fund is simply an asset allocation fund that invests in a number of Timothy Plan underlying funds. Although the allocation percentages will vary slightly from time to time as a result of changing economic conditions, the allocation at September 30, 2012 was as follows:
| | | | | | | | | | |
• Large/Mid Cap Growth Fund | | | (11.67%) | | | • Small Cap Value Fund | | | (5.21%) | |
• Large/Mid Cap Value Fund | | | (14.22%) | | | • Aggressive Growth Fund | | | (2.36%) | |
• International Fund | | | (5.42%) | | | • High Yield Bond Fund | | | (8.53%) | |
• Defensive Strategies Fund | | | (18.09%) | | | • Fixed Income Fund | | | (29.27%) | |
• Israel Common Values Fund | | | (4.03%) | | | • Cash | | | (1.20%) | |
I am pleased to report that performance was, in our opinion, quite respectable over the past twelve months and reasonably comparable to the Fund’s market benchmark - the Dow Jones Global Moderate Portfolio Index. We plan to continue to manage this Fund conservatively as we attempt to adjust to (what could be) rapidly changing economic conditions.
We realize that the volatility and uncertainty of the markets over the past twelve months may have been unsettling for many investors; however as a group, although our sub-advisors expect this pattern to continue into 2013, they also expect a somewhat upward bias with respect to performance in our underlying Funds.
As you know, no one can guarantee future performance. However, the one thing that I can assure you of is that every one of our sub-advisors is doing their very best and our team here at Timothy is working very hard to provide you an investment with which you can feel comfortable.
Sincerely,
ARTHUR D. ALLY,
President
Timothy Plan Fund Performance
[23]
Fund Performance | Conservative Growth
As of September 30, 2012 - (Unaudited)
| | | | | | | | | | | | | | | | | | | | |
| Fund/Index | | 1 Year
Total Return | | 5 Year
Average
Annual Return | | 10 Year
Average
Annual Return | | |
Timothy Conservative Growth Fund - Class A (With Sales Charge) | | | | 7.02 | % | | | | -0.41 | % | | | | 5.12 | % | | | | | |
Dow Jones Global Moderate Portfolio Index | | | | 15.58 | % | | | | 3.02 | % | | | | 8.67 | % | | | | | |
Timothy Conservative Growth Fund - Class C * | | | | 12.50 | % | | | | 0.01 | % | | | | 3.12 | % | | | | (a) | |
Dow Jones Global Moderate Portfolio Index | | | | 15.58 | % | | | | 3.02 | % | | | | 6.16 | % | | | | (a) | |
| | (a) | For the period February 3, 2004 (commencement of investment in accordance with objective) to September 30, 2012. |
| | * | With Maximum Deferred Sales Charge |
Timothy Plan Conservative Growth Fund vs. Dow Jones Global Moderate Portfolio Index
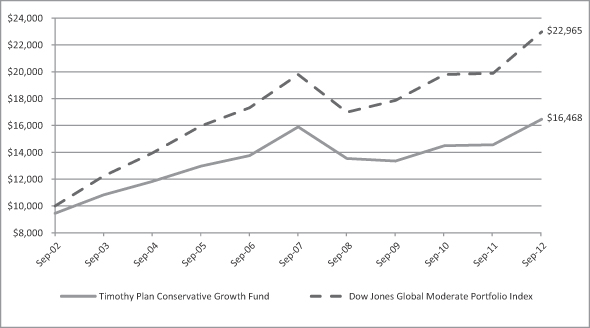
The chart shows the value of a hypothetical initial investment of $10,000 in the Fund’s Class A shares and the Dow Jones Global Moderate Portfolio Index on September 30, 2002 and held through September 30, 2012. The Dow Jones Global Moderate Portfolio Index is a widely recognized index that measures global stocks, bonds and cash which are in turn represented by multiple sub-indexes. Performance figures include the change in value of the investments in the index and the reinvestment of dividends. The index return does not reflect expenses, which have been deducted from the Fund’s return. The returns shown do not reflect deduction of taxes that a shareholder would pay on Fund distributions or the redemption of Fund shares. THE FUND’S RETURN REPRESENTS PAST PERFORMANCE AND IS NOT PREDICTIVE OF FUTURE RESULTS.
[24]
Fund Profile
As of September 30, 2012 - (Unaudited)
Aggressive Growth Fund
| | | | |
| Top Ten Holdings | | | |
| (% of Net Assets) | | | |
Genesse & Wyoming, Inc. | | | 2.45% | |
Casey’s General Stores, Inc. | | | 2.05% | |
FleetCor Technologies, Inc. | | | 2.00% | |
Dollar General Corp. | | | 1.95% | |
Ross Stores, Inc. | | | 1.91% | |
XL Group PLC | | | 1.86% | |
Sally Beauty Holdings, Inc. | | | 1.78% | |
Fiserv, Inc. | | | 1.65% | |
Group 1 Automotive, Inc. | | | 1.55% | |
American Campus Communities, Inc. | | | 1.52% | |
| | | | |
| | | 18.72% | |
| | | | |
| | | | |
| Top Ten Industries | | | |
| (% of Net Assets) | | | |
Retail | | | 19.10% | |
Information Technology | | | 13.50% | |
Financial/Investment Services | | | 8.90% | |
Healthcare | | | 6.20% | |
Banks | | | 5.80% | |
Oil & Natural Gas | | | 5.30% | |
Transportation | | | 3.70% | |
Electronics | | | 2.70% | |
Pharmaceuticals | | | 2.50% | |
Commercial Services | | | 2.40% | |
Other Assets Less Liabilities | | | 29.90% | |
| | | | |
| | | 100.00% | |
| | | | |
International Fund
| | | | |
| Top Ten Holdings | | | |
| (% of Net Assets) | | | |
Henkel AG & Co. (ADR) | | | 5.11% | |
Singapore Telecommunications, Ltd. (ADR) | | | 4.71% | |
Fresenius Medical Care AG & Co. (ADR) | | | 4.21% | |
Smith & Nephew PLC (ADR) | | | 3.68% | |
WM Morrison Supermarkets PLC (ADR) | | | 2.92% | |
DBS Group Holdings, Ltd. (ADR) | | | 2.92% | |
Agrium, Inc. | | | 2.80% | |
Lukoil OAO (ADR) | | | 2.74% | |
Zurich Insurance Group AG | | | 2.63% | |
Hitachi, Ltd. (ADR) | | | 2.35% | |
| | | | |
| | | 34.07% | |
| | | | |
| | | | |
| Top Ten Industries | | | |
| (% of Net Assets) | | | |
Chemicals | | | 10.10% | |
Banks | | | 10.00% | |
Telecommunications | | | 9.90% | |
Oil & Natural Gas | | | 8.60% | |
Healthcare | | | 7.90% | |
Industrials | | | 5.00% | |
Minerals & Mining | | | 4.40% | |
Automotive | | | 4.40% | |
Consumer Goods | | | 4.30% | |
Food | | | 3.70% | |
Other Assets Less Liabilities | | | 31.70% | |
| | | | |
| | | 100.00% | |
| | | | |
Large/Mid Cap Growth Fund
| | | | |
| Top Ten Holdings | | | |
| (% of Net Assets) | | | |
Exxon Mobil Corp. | | | 4.76% | |
Autozone, Inc. | | | 3.25% | |
Western Union Co. | | | 2.93% | |
Occidental Petroleum Corp. | | | 2.81% | |
McCormick & Co., Inc. | | | 2.71% | |
Amphenol Corp. - Class A | | | 2.58% | |
ACE, Ltd. | | | 2.47% | |
Covidien PLC | | | 2.39% | |
Thermo Fisher Scientific, Inc. | | | 2.35% | |
Amerisource Bergen Corp. | | | 2.04% | |
| | | | |
| | | 28.29% | |
| | | | |
| | | | |
| Top Ten Industries | | | |
| (% of Net Assets) | | | |
Retail | | | 12.90% | |
Oil & Natural Gas | | | 10.20% | |
Electronics | | | 8.80% | |
Healthcare | | | 8.80% | |
Financial/Investment Services | | | 6.40% | |
Consumer Goods | | | 5.10% | |
Information Technology | | | 5.00% | |
Banks | | | 3.90% | |
Insurance | | | 3.70% | |
Commercial Services | | | 3.70% | |
Other Assets Less Liabilities | | | 31.50% | |
| | | | |
| | | 100.00% | |
| | | | |
[25]
Fund Profile
As of September 30, 2012 - (Unaudited)
Small Cap Value Fund
| | | | |
| Top Ten Holdings | | | |
| (% of Net Assets) | | | |
Beacon Roofing Supply, Inc. | | | 2.43% | |
A.O. Smith Corp. | | | 2.40% | |
Orthofix International NV | | | 2.32% | |
J2 Global, Inc. | | | 2.25% | |
KapStone Paper and Packaging Corp. | | | 2.25% | |
Moog, Inc. | | | 2.23% | |
Children’s Place Retail Stores | | | 2.22% | |
Wolverine World Wide, Inc. | | | 2.21% | |
AMERISAFE, Inc. | | | 2.21% | |
NorthWestern Corp. | | | 2.20% | |
| | | | |
| | | 22.72% | |
| | | | |
| | | | |
| Top Ten Industries | | | |
| (% of Net Assets) | | | |
Banks | | | 16.20% | |
Industrials | | | 8.80% | |
REITs | | | 8.80% | |
Insurance | | | 6.40% | |
Electric Power | | | 5.50% | |
Oil & Natural Gas | | | 5.30% | |
Healthcare | | | 4.50% | |
Computers | | | 4.30% | |
Electric & Equipment | | | 4.30% | |
Transportation | | | 4.30% | |
Other Assets Less Liabilities | | | 31.60% | |
| | | | |
| | | 100.00% | |
| | | | |
Large/Mid Cap Value Fund
| | | | |
| Top Ten Holdings | | | |
| (% of Net Assets) | | | |
Covidien PLC | | | 3.25% | |
Exxon Mobil Corp. | | | 3.10% | |
Union Pacific Corp. | | | 2.82% | |
Flowserve Corp. | | | 2.69% | |
ACE, Ltd. | | | 2.56% | |
Invesco, Ltd. | | | 2.53% | |
Emerson Electric Co. | | | 2.51% | |
Public Storage, Inc. | | | 2.46% | |
EQT Corp. | | | 2.40% | |
Arch Capital Group, Ltd. | | | 2.36% | |
| | | | |
| | | 26.68% | |
| | | | |
| | | | |
| Top Ten Industries | | | |
| (% of Net Assets) | | | |
Oil & Natural Gas | | | 20.00% | |
Healthcare | | | 12.90% | |
Insurance | | | 9.00% | |
Consumer Goods | | | 8.70% | |
Financial & Investment Services | | | 6.60% | |
REITs | | | 6.50% | |
Electric Power | | | 5.90% | |
Retail | | | 4.60% | |
Information Technology | | | 4.20% | |
Industrials | | | 3.70% | |
Other Assets Less Liabilities | | | 17.90% | |
| | | | |
| | | 100.00% | |
| | | | |
Fixed Income Fund
| | | | |
| Top Ten Holdings | | | |
| (% of Net Assets) | | | |
Federal Farm Credit Bank, 5.125%, 8/25/2016 | | | 3.51% | |
GNMA Pool 4520, 5.00%, 8/20/2039 | | | 2.50% | |
GNMA Pool 4947, 5.00%, 2/20/2041 | | | 2.73% | |
GNMA Pool 701961, 4.50%, 6/15/2039 | | | 3.78% | |
GNMA Pool 783060, 4.00%, 8/15/2040 | | | 2.27% | |
GNMA Pool MA0155, 4.00%, 6/20/2042 | | | 4.81% | |
TIPS, 2.50%, 7/15/2016 | | | 2.36% | |
U.S Treasury Bond, 3.875%, 5/15/2018 | | | 2.80% | |
U.S Treasury Note, 3.125%, 5/15/2021 | | | 6.83% | |
U.S. Treasury Bond, 4.50%, 2/15/2036 | | | 4.79% | |
| | | | |
| | | 36.38% | |
| | | | |
| | | | |
| Top Ten Industries | | | |
| (% of Net Assets) | | | |
Corporate Bonds | | | 33.60% | |
Government Mortgage-Backed Securities | | | 29.50% | |
Government Notes & Bonds | | | 27.20% | |
TIPS | | | 4.30% | |
Other Assets Less Liabilities | | | 5.40% | |
| | | | |
| | | 100.00% | |
| | | | |
[26]
Fund Profile
As of September 30, 2012 - (Unaudited)
High Yield Bond Fund
| | | | |
| Top Ten Holdings | | | |
| (% of Net Assets) | | | |
Genesis Energy LP, 7.875%, 12/15/2018 | | | 2.28% | |
Energy Transfer Equity LP, 7.50%, 10/15/2020 | | | 1.63% | |
LyondellBasell Industries NV, 5.75%, 4/15/2024 | | | 1.63% | |
United Rentals North America, Inc., 9.25%, 12/15/2019 | | | 1.61% | |
Iron Mountain, 7.75%, 10/01/2019 | | | 1.61% | |
Schaeffler Finance BV, 8.50%, 2/15/2019 | | | 1.60% | |
Cloud Peak Energy Resources LLC, 8.50%, 12/15/2019 | | | 1.58% | |
Omnicare, Inc., 7.75%, 6/01/2020 | | | 1.58% | |
Targa Resources Partners LP, 7.875%, 10/15/2018 | | | 1.57% | |
Masco Corp., 5.95%, 3/15/2022 | | | 1.56% | |
| | | | |
| | | 16.65% | |
| | | | |
| | | | |
| Top Ten Industries | | | |
| (% of Net Assets) | | | |
Corporate Bonds | | | 95.00% | |
Other Assets Less Liabilities | | | 5.00% | |
| | | | |
| | | 100.00% | |
| | | | |
Israel Common Values Fund
| | | | |
| Top Ten Holdings | | | |
| (% of Net Assets) | | | |
Mellanox Technologies, Ltd. | | | 4.95% | |
Noble Energy, Inc. | | | 3.39% | |
Israel Chemicals, Ltd. | | | 3.31% | |
Elbit Systems, Ltd. | | | 3.11% | |
The Israel Chemicals, Ltd. | | | 3.09% | |
Rami Levi Chain Stores | | | 3.06% | |
Allot Communications, Ltd. | | | 3.03% | |
Bank Hapoalim BM | | | 3.03% | |
Bayside Land Corp., Ltd. | | | 2.99% | |
Gazit-Globe, Ltd. | | | 2.92% | |
| | | | |
| | | 32.88% | |
| | | | |
| | | | |
| Top Ten Industries | | | |
| (% of Net Assets) | | | |
Real Estate | | | 13.70% | |
Telecommunications | | | 11.20% | |
Oil & Natural Gas | | | 8.80% | |
Banks | | | 7.70% | |
Software | | | 7.60% | |
Semiconductors | | | 6.20% | |
Chemicals | | | 6.00% | |
Food | | | 5.60% | |
Healthcare Products | | | 4.30% | |
Biotechnology | | | 3.80% | |
Other Assets Less Liabilities | | | 25.10% | |
| | | | |
| | | 100.00% | |
| | | | |
[27]
Fund Profile
As of September 30, 2012 - (Unaudited)
Defensive Strategies Fund
| | | | |
| Top Ten Holdings | | | |
| (% of Net Assets) | | | |
SPDR Gold Shares | | | 6.69% | |
Exxon Mobil Corp. | | | 3.53% | |
TIPS, 1.75%, 1/15/2028 | | | 3.17% | |
PowerShares DB Agriculture Fund | | | 3.16% | |
TIPS, 2.00%, 1/15/2014 | | | 3.15% | |
Potash Corp. of Saskatchewan, Inc. | | | 3.04% | |
TIPS, 2.125%, 1/15/2019 | | | 2.85% | |
Syngenta AG (ADR) | | | 2.78% | |
TIPS, 1.625%, 1/15/2015 | | | 2.57% | |
TIPS, 1.125%, 1/15/2021 | | | 2.51% | |
| | | | |
| | | 33.45% | |
| | | | |
| | | | |
| Top Ten Industries | | | |
| (% of Net Assets) | | | |
TIPS | | | 26.60% | |
Exchange Traded Funds | | | 17.10% | |
REITs | | | 14.80% | |
Chemicals | | | 12.40% | |
Oil & Gas | | | 10.00% | |
Mining | | | 6.30% | |
Government Mortgage-Backed Securities | | | 2.50% | |
Oil & Gas Services | | | 0.90% | |
Iron/Steel | | | 0.70% | |
Machinery | | | 0.40% | |
Other Assets Less Liabilities | | | 8.30% | |
| | | | |
| | | 100.00% | |
| | | | |
Strategic Growth Fund
| | | | |
| Top Ten Holdings | | | |
| (% of Net Assets) | | | |
Timothy Plan - Defensive Strategies Fund | | | 17.16% | |
Timothy Plan - Large/Mid Cap Value Fund | | | 16.53% | |
Timothy Plan - Large/Mid Cap Growth Fund | | | 16.45% | |
Timothy Plan - International Fund | | | 15.60% | |
Timothy Plan - High Yield Bond Fund | | | 12.85% | |
Timothy Plan - Small Cap Value Fund | | | 6.73% | |
Timothy Plan - Aggressive Growth Fund | | | 6.25% | |
Timothy Plan - Israel Common Values Fund | | | 5.56% | |
| | | | |
| | | 97.13% | |
| | | | |
| | | | |
| Top Ten Industries | | | |
| (% of Net Assets) | | | |
Mutual Funds | | | 97.13% | |
Other Assets Less Liabilities | | | 2.87% | |
| | | | |
| | | 100.00% | |
| | | | |
Conservative Growth Fund
| | | | |
| Top Ten Holdings | | | |
| (% of Net Assets) | | | |
Timothy Plan - Fixed Income Fund | | | 29.27% | |
Timothy Plan - Defensive Strategies Fund | | | 18.09% | |
Timothy Plan - Large/Mid Cap Value Fund | | | 14.22% | |
Timothy Plan - Large/Mid Cap Growth Fund | | | 11.67% | |
Timothy Plan - High Yield Bond Fund | | | 8.53% | |
Timothy Plan - International Fund | | | 5.42% | |
Timothy Plan - Small Cap Value Fund | | | 5.21% | |
Timothy Plan - Israel Common Values Fund | | | 4.03% | |
Timothy Plan - Aggressive Growth Fund | | | 2.36% | |
| | | | |
| | | 98.80% | |
| | | | |
| | | | |
| Top Ten Industries | | | |
| (% of Net Assets) | | | |
Mutual Funds | | | 98.80% | |
Other Assets Less Liabilities | | | 1.20% | |
| | | | |
| | | 100.00% | |
| | | | |
[28]
| | |
| Timothy Plan Family of Funds | | Aggressive Growth |
| | |
Schedule of Investments | | As of September 30, 2012 |
| | | | | | | | | | | | |
| Common Stocks – 94.3% | | | | Shares | | Fair
Value |
AEROSPACE/DEFENSE – 0.7% | | | | | | | | | | | | |
BE Aerospace, Inc. | | * | | | | 2,840 | | | | $ | 119,564 | |
| | | | | | | | | | | | |
AUTO REPAIR – 0.7% | | | | | | | | | | | | |
Monro Muffler Brake, Inc. | | | | | | 3,520 | | | | | 123,869 | |
| | | | | | | | | | | | |
APPAREL – 1.7% | | | | | | | | | | | | |
Carter’s, Inc. | | * | | | | 2,300 | | | | | 123,832 | |
Crocs, Inc. | | * | | | | 2,530 | | | | | 41,011 | |
Oxford Industries, Inc. | | | | | | 2,150 | | | | | 121,367 | |
| | | | | | | | | | | | |
| | | | | | | | | | | 286,210 | |
| | | | | | | | | | | | |
BANKS – 5.8% | | | | | | | | | | | | |
CIT Group, Inc. | | * | | | | 5,675 | | | | | 223,538 | |
Cardinal Financial Corp. | | | | | | 11,905 | | | | | 170,241 | |
Cathay General Bancorp | | | | | | 12,750 | | | | | 220,065 | |
First Horizon National Corp. | | | | | | 5,800 | | | | | 55,854 | |
State Bank Financial Corp. | | | | | | 2,400 | | | | | 39,576 | |
TCF Financial Corp. | | | | | | 5,650 | | | | | 67,461 | |
Zions Bancorp | | | | | | 8,895 | | | | | 183,726 | |
| | | | | | | | | | | | |
| | | | | | | | | | | 960,461 | |
| | | | | | | | | | | | |
BIOTECHNOLOGY – 0.6% | | | | | | | | | | | | |
Dynavax Technologies Corp. | | * | | | | 10,330 | | | | | 49,171 | |
Incyte Corp, Ltd. | | * | | | | 3,155 | | | | | 56,948 | |
| | | | | | | | | | | | |
| | | | | | | | | | | 106,119 | |
| | | | | | | | | | | | |
CHEMICALS – 1.0% | | | | | | | | | | | | |
Ashland, Inc. | | | | | | 2,250 | | | | | 161,100 | |
| | | | | | | | | | | | |
COMMERCIAL SERVICES – 2.4% | | | | | | | | | | | | |
Team, Inc. | | * | | | | 3,906 | | | | | 124,406 | |
Verisk Analytics, Inc. | | * | | | | 2,960 | | | | | 140,926 | |
WNS Holdings, Ltd. | | * | | | | 12,365 | | | | | 126,618 | |
| | | | | | | | | | | | |
| | | | | | | | | | | 391,950 | |
| | | | | | | | | | | | |
CONSUMER GOODS – 0.9% | | | | | | | | | | | | |
Brunswick Corp. | | | | | | 6,910 | | | | | 156,373 | |
| | | | | | | | | | | | |
DISTRIBUTION/WHOLESALE – 1.9% | | | | | | | | | | | | |
MWI Veterinary Supply, Inc. | | * | | | | 570 | | | | | 60,808 | |
Wesco International, Inc. | | * | | | | 4,360 | | | | | 249,392 | |
| | | | | | | | | | | | |
| | | | | | | | | | | 310,200 | |
| | | | | | | | | | | | |
ELECTRICAL – 1.6% | | | | | | | | | | | | |
Hubbell, Inc. | | | | | | 775 | | | | | 62,573 | |
Universal Display Corp. | | * | | | | 5,700 | | | | | 195,966 | |
| | | | | | | | | | | | |
| | | | | | | | | | | 258,539 | |
| | | | | | | | | | | | |
ELECTRONICS – 2.7% | | | | | | | | | | | | |
Amphenol Corp. | | | | | | 2,850 | | | | | 167,808 | |
Trimble Navigation, Ltd. | | * | | | | 2,830 | | | | | 134,878 | |
Waters Corp. | | * | | | | 1,675 | | | | | 139,578 | |
| | | | | | | | | | | | |
| | | | | | | | | | | 442,264 | |
| | | | | | | | | | | | |
ENGINEERING & CONSTRUCTION – 0.5% | | | | | | | | | | | | |
Dycom Industries, Inc. | | * | | | | 5,740 | | | | | 82,541 | |
| | | | | | | | | | | | |
ENTERTAINMENT – 1.4% | | | | | | | | | | | | |
Six Flags Entertainment Corp. | | | | | | 3,895 | | | | | 229,026 | |
| | | | | | | | | | | | |
| | | | | | | | | | | | |
| Common Stocks (Continued) | | | | Shares | | Fair
Value |
FINANCIAL/INVESTMENT SERVICES – 8.9% | | | | | | | | | | | | |
Affiliated Managers Group, Inc. | | * | | | | 1,440 | | | | $ | 177,120 | |
Cardtronics, Inc. | | * | | | | 3,570 | | | | | 106,315 | |
Discover Financial Services | | | | | | 3,769 | | | | | 149,742 | |
FleetCor Technologies, Inc. | | * | | | | 7,426 | | | | | 332,685 | |
IntercontinentalExchange, Inc. | | * | | | | 715 | | | | | 95,388 | |
KBW, Inc. | | | | | | 3,625 | | | | | 59,704 | |
Ocwen Financial Corp. | | * | | | | 7,225 | | | | | 198,037 | |
Validus Holdings, Ltd. | | | | | | 1,225 | | | | | 41,540 | |
XL Group PLC | | | | | | 12,870 | | | | | 309,266 | |
| | | | | | | | | | | | |
| | | | | | | | | | | 1,469,797 | |
| | | | | | | | | | | | |
FOOD – 1.5% | | | | | | | | | | | | |
Hain Celestial Group, Inc. | | * | | | | 1,900 | | | | | 119,700 | |
McCormick & Co., Inc. | | | | | | 2,175 | | | | | 134,937 | |
| | | | | | | | | | | | |
| | | | | | | | | | | 254,637 | |
| | | | | | | | | | | | |
HEALTHCARE – 6.2% | | | | | | | | | | | | |
Cepheid, Inc. | | * | | | | 475 | | | | | 16,392 | |
Cyberonics, Inc. | | * | | | | 1,995 | | | | | 104,578 | |
Insulet Corp. | | * | | | | 1,710 | | | | | 36,902 | |
Intuitive Surgical, Inc. | | * | | | | 155 | | | | | 76,823 | |
IPC The Hospitalist Co. | | * | | | | 1,880 | | | | | 85,916 | |
NuVasive, Inc. | | * | | | | 3,725 | | | | | 85,340 | |
NxStage Medical, Inc. | | * | | | | 3,045 | | | | | 40,224 | |
Sirona Dental Systems, Inc. | | * | | | | 1,552 | | | | | 88,402 | |
Thoratec Corp. | | * | | | | 2,650 | | | | | 91,690 | |
Tornier NV | | * | | | | 6,200 | | | | | 117,490 | |
Trinity Biotech PLC | | | | | | 1,800 | | | | | 22,626 | |
Volcano Corp. | | * | | | | 5,950 | | | | | 169,991 | |
WellCare Health Plans, Inc. | | * | | | | 1,640 | | | | | 92,742 | |
| | | | | | | | | | | | |
| | | | | | | | | | | 1,029,116 | |
| | | | | | | | | | | | |
HOME BUILDERS – 1.2% | | | | | | | | | | | | |
D R Horton, Inc. | | | | | | 9,660 | | | | | 199,382 | |
| | | | | | | | | | | | |
HOUSEHOLD PRODUCTS – 0.5% | | | | | | | | | | | | |
Tumi Holdings, Inc. | | * | | | | 3,475 | | | | | 81,802 | |
| | | | | | | | | | | | |
INDUSTRIALS/MACHINERY – 2.3% | | | | | | | | | | | | |
Clean Harbors, Inc. | | * | | | | 1,815 | | | | | 88,663 | |
Rush Enterprises, Inc. – Class A | | * | | | | 8,100 | | | | | 156,006 | |
United Rentals, Inc. | | * | | | | 1,935 | | | | | 63,294 | |
Waste Connections, Inc. | | | | | | 2,360 | | | | | 71,390 | |
| | | | | | | | | | | | |
| | | | | | | | | | | 379,353 | |
| | | | | | | | | | | | |
INFORMATION TECHNOLOGY – 13.5% | | | | | | | | | | | | |
Active Network, Inc. | | * | | | | 10,265 | | | | | 128,620 | |
Aspen Technology, Inc. | | * | | | | 7,690 | | | | | 198,710 | |
Citrix Systems, Inc. | | * | | | | 1,200 | | | | | 91,884 | |
Cognizant Technology Solutions Corp. – Class A | | * | | | | 2,285 | | | | | 159,767 | |
F5 Networks, Inc. | | * | | | | 1,150 | | | | | 120,405 | |
Fair Isaac Corp. | | | | | | 3,515 | | | | | 155,574 | |
Fiserv, Inc. | | * | | | | 3,695 | | | | | 273,541 | |
Fortinet, Inc. | | * | | | | 2,160 | | | | | 52,142 | |
Informatica Corp. | | * | | | | 2,925 | | | | | 101,819 | |
Interactive Intelligence Group | | * | | | | 1,910 | | | | | 57,395 | |
| | |
| Timothy Plan Family of Funds | | Aggressive Growth (Continued) |
| | |
Schedule of Investments | | As of September 30, 2012 |
| | | | | | | | | | | | |
| Common Stocks (Continued) | | | | Shares | | Fair
Value |
INFORMATION TECHNOLOGY (continued) | | | | | | | | | | | | |
Manhattan Associates, Inc. | | * | | | | 2,740 | | | | $ | 156,920 | |
MedAssets, Inc. | | * | | | | 7,275 | | | | | 129,495 | |
Parametric Technology Corp. | | * | | | | 6,175 | | | | | 134,615 | |
QLIK Technologies, Inc. | | * | | | | 3,600 | | | | | 80,676 | |
Super Micro Computer, Inc. | | * | | | | 3,950 | | | | | 47,519 | |
Syntel, Inc. | | | | | | 1,110 | | | | | 69,275 | |
Teradata Corp. | | * | | | | 1,935 | | | | | 145,918 | |
Tibco Software, Inc. | | * | | | | 4,285 | | | | | 129,536 | |
| | | | | | | | | | | | |
| | | | | | | | | | | 2,233,811 | |
| | | | | | | | | | | | |
METAL FABRICATE HARDWARE – 0.4% | | | | | | | | | | | | |
RBC Bearing, Inc. | | * | | | | 1,480 | | | | | 71,188 | |
| | | | | | | | | | | | |
MISCELLANEOUS MANUFACTURING – 2.3% | | | | | | | | | | | | |
Hexcel Corp. | | * | | | | 5,830 | | | | | 140,037 | |
Trimas Corp. | | * | | | | 10,285 | | | | | 247,971 | |
| | | | | | | | | | | | |
| | | | | | | | | | | 388,008 | |
| | | | | | | | | | | | |
MISCELLANEOUS SERVICES – 1.1% | | | | | | | | | | | | |
HFF, Inc. – Class A | | * | | | | 12,600 | | | | | 187,740 | |
| | | | | | | | | | | | |
OIL & NATURAL GAS – 5.3% | | | | | | | | | | | | |
Approach Resources, Inc. | | * | | | | 3,925 | | | | | 118,260 | |
Cabot Oil & Gas Corp. | | | | | | 2,640 | | | | | 118,536 | |
Concho Resources, Inc. | | * | | | | 1,450 | | | | | 137,387 | |
Gulfport Energy Corp. | | * | | | | 1,775 | | | | | 55,487 | |
Kodiak Oil & Gas Corp. | | * | | | | 11,130 | | | | | 104,177 | |
Oil States International | | * | | | | 1,545 | | | | | 122,766 | |
Rex Energy Corp. | | * | | | | 10,949 | | | | | 146,169 | |
Thermon Group Holdings, Inc. | | * | | | | 3,125 | | | | | 78,094 | |
| | | | | | | | | | | | |
| | | | | | | | | | | 880,876 | |
| | | | | | | | | | | | |
PHARMACEUTICALS – 2.5% | | | | | | | | | | | | |
Akorn, Inc. | | * | | | | 9,705 | | | | | 128,300 | |
Catamaran Corp. | | * | | | | 753 | | | | | 73,771 | |
Impax Laboratories, Inc. | | * | | | | 5,480 | | | | | 142,261 | |
Mead Johnson Nutrition Co. | | | | | | 1,000 | | | | | 73,280 | |
| | | | | | | | | | | | |
| | | | | | | | | | | 417,612 | |
| | | | | | | | | | | | |
RETAIL – 19.1% | | | | | | | | | | | | |
Autozone, Inc. | | * | | | | 545 | | | | | 201,470 | |
Bloomin’ Brands, Inc. | | * | | | | 14,230 | | | | | 234,083 | |
Casey’s General Stores, Inc. | | | | | | 5,950 | | | | | 339,983 | |
Cheesecake Factory, Inc. | | | | | | 2,465 | | | | | 88,124 | |
Chico’s FAS, Inc. | | | | | | 4,950 | | | | | 89,645 | |
Dick’s Sporting Goods, Inc. | | | | | | 3,295 | | | | | 170,846 | |
Dollar General Corp. | | * | | | | 6,285 | | | | | 323,929 | |
Domino’s Pizza, Inc. | | | | | | 2,550 | | | | | 96,135 | |
Genesco, Inc. | | * | | | | 1,410 | | | | | 94,089 | |
Group 1 Automotive, Inc. | | | | | | 4,280 | | | | | 257,784 | |
Hibbett Sports, Inc. | | * | | | | 1,855 | | | | | 110,280 | |
| | | | | | | | | | | | |
| Common Stocks (Continued) | | | | Shares | | Fair
Value |
RETAIL (continued) | | | | | | | | | | | | |
Krispy Kreme Doughnuts, Inc. | | * | | | | 22,425 | | | | $ | 177,830 | |
Lululemon Athletica, Inc. | | * | | | | 900 | | | | | 66,546 | |
Panera Bread Co. | | * | | | | 495 | | | | | 84,591 | |
Pier 1 Imports, Inc. | | | | | | 7,070 | | | | | 132,492 | |
Ross Stores, Inc. | | | | | | 4,900 | | | | | 316,540 | |
Sally Beauty Holdings, Inc. | | * | | | | 11,815 | | | | | 296,438 | |
Texas Roadhouse, Inc. | | | | | | 4,950 | | | | | 84,645 | |
| | | | | | | | | | | | |
| | | | | | | | | | | 3,165,450 | |
| | | | | | | | | | | | |
SEMICONDUCTORS – 2.3% | | | | | | | | | | | | |
Avago Technologies, Ltd. | | | | | | 2,725 | | | | | 95,007 | |
Cavium, Inc. | | * | | | | 2,025 | | | | | 67,493 | |
Ultratech, Inc. | | * | | | | 5,610 | | | | | 176,042 | |
Volterra Semiconductor Corp. | | * | | | | 2,290 | | | | | 50,082 | |
| | | | | | | | | | | | |
| | | | | | | | | | | 388,624 | |
| | | | | | | | | | | | |
TELECOMMUNICATIONS – 1.6% | | | | | | | | | | | | |
Aruba Networks, Inc. | | * | | | | 3,125 | | | | | 70,266 | |
Finisar Corp. | | * | | | | 3,970 | | | | | 56,771 | |
NETGEAR, Inc. | | * | | | | 3,465 | | | | | 132,155 | |
| | | | | | | | | | �� | | |
| | | | | | | | | | | 259,192 | |
| | | | | | | | | | | | |
TRANSPORTATION – 3.7% | | | | | | | | | | | | |
Genesse & Wyoming, Inc. – Class A | | * | | | | 6,085 | | | | | 406,843 | |
Old Dominion Freight Line, Inc. | | * | | | | 7,040 | | | | | 212,326 | |
| | | | | | | | | | | | |
| | | | | | | | | | | 619,169 | |
| | | | | | | | | | | | |
Total Common Stocks
(Cost $14,180,732) | | | | | | | | | | $ | 15,653,973 | |
| | | | | | | | | | | | |
| | | |
| REITs – 2.1% | | | | Shares | | Fair
Value |
American Campus Communities, Inc. | | | | | | 5,750 | | | | $ | 252,310 | |
Tanger Factory Outlet Centers | | | | | | 3,075 | | | | | 99,415 | |
| | | | | | | | | | | | |
(Cost $366,326) | | | | | | | | | | $ | 351,725 | |
| | | | | | | | | | | | |
| | | |
| Money Market Fund – 1.1% | | | | Shares | | Fair
Value |
Fidelity Institutional Money Market
Portfolio, 0.11%
(Cost $177,764) | | (A) | | | | 177,764 | | | | $ | 177,764 | |
| | | | | | | | | | | | |
Total Investments
(Cost $14,724,822) – 97.5% | | (B) | | | | | | | | $ | 16,183,462 | |
Assets in Excess of Other
Liabilities – 2.5% | | | | | | | | | | | 415,319 | |
| | | | | | | | | | | | |
Net Assets – 100.00% | | | | | | | | | | $ | 16,598,781 | |
| | | | | | | | | | | | |
| | |
| Timothy Plan Family of Funds | | Aggressive Growth (Continued) |
| | |
Schedule of Investments | | As of September 30, 2012 |
| * | Non-income producing securities. |
| (REIT) | Real Estate Investment Trust. |
| (A) | Variable rate security; the rate shown represents the yield at September 30, 2012. |
| (B) | Represents cost for financial reporting purposes. Aggregate cost for federal tax purposes is $14,803,931 and differs from fair value by net unrealized appreciation (depreciation) of securities as follows: |
| | | | | |
Unrealized appreciation | | | $ | 1,643,324 | |
Unrealized depreciation | | | | (263,793 | ) |
| | | | | |
Net unrealized appreciation | | | $ | 1,379,531 | |
| | | | | |
The accompanying notes are an integral part of these financial statements.
[31]
| | |
| Timothy Plan Family of Funds | | International |
| | |
Schedule of Investments | | As of September 30, 2012 |
| | | | | | | | | | | | |
| Common Stocks – 94.7% | | | | Shares | | Fair Value |
AEROSPACE/DEFENSE – 2.0% | | | | | | | | | | | | |
BAE Systems PLC (ADR) | | | | | | 30,000 | | | | $ | 629,100 | |
| | | | | | | | | | | | |
AIRLINES – 1.6% | | | | | | | | | | | | |
Copa Holdings SA | | | | | | 6,100 | | | | | 495,747 | |
| | | | | | | | | | | | |
AUTOMOTIVE – 4.4% | | | | | | | | | | | | |
Fiat SpA (ADR) | | * | | | | 51,000 | | | | | 274,380 | |
Magna International, Inc. | | | | | | 11,800 | | | | | 510,468 | |
Valeo SA (ADR) | | | | | | 26,000 | | | | | 600,080 | |
| | | | | | | | | | | | |
| | | | | | | | | | | 1,384,928 | |
| | | | | | | | | | | | |
BANKS – 10.0% | | | | | | | | | | | | |
Banco Bilbao Vizcaya Argentaria SA | | | | | | 20,000 | | | | | 155,000 | |
Banco Bradesco SA (ADR) | | | | | | 11,100 | | | | | 178,377 | |
Bank Hapoalim BM (ADR) | | * | | | | 16,000 | | | | | 284,000 | |
BOC Hong Kong Holdings, Ltd. (ADR) | | | | | | 9,500 | | | | | 600,400 | |
DBS Group Holdings, Ltd. (ADR) | | | | | | 19,639 | | | | | 916,159 | |
Sberbank of Russia (ADR) | | | | | | 57,000 | | | | | 664,050 | |
Swedbank AB (ADR) | | | | | | 18,300 | | | | | 343,674 | |
| | | | | | | | | | | | |
| | | | | | | | | | | 3,141,660 | |
| | | | | | | | | | | | |
BUILDING & CONSTRUCTION – 1.4% | | | | | | | | | | | | |
Vinci SA (ADR) | | | | | | 40,000 | | | | | 422,800 | |
| | | | | | | | | | | | |
CHEMICALS – 10.1% | | | | | | | | | | | | |
Agrium, Inc. | | | | | | 8,500 | | | | | 879,410 | |
Henkel AG & Co. (ADR) | | | | | | 24,500 | | | | | 1,604,934 | |
Syngenta AG – (ADR) | | | | | | 9,000 | | | | | 673,650 | |
| | | | | | | | | | | | |
| | | | | | | | | | | 3,157,994 | |
| | | | | | | | | | | | |
CONSUMER GOODS – 4.3% | | | | | | | | | | | | |
FUJIFILM Holdings Corp. (ADR) | | | | | | 10,550 | | | | | 175,236 | |
Kerry Group PLC (ADR) | | | | | | 14,000 | | | | | 721,000 | |
Shiseido Co, Ltd. (ADR) | | | | | | 32,000 | | | | | 436,800 | |
| | | | | | | | | | | | |
| | | | | | | | | | | 1,333,036 | |
| | | | | | | | | | | | |
DISTRIBUTION/WHOLESALE – 2.2% | | | | | | | | | | | | |
ITOCHU Corp. (ADR) | | | | | | 34,000 | | | | | 682,720 | |
| | | | | | | | | | | | |
ELECTRIC POWER – 2.4% | | | | | | | | | | | | |
Power Assets Holdings, Ltd. (ADR) | | | | | | 90,000 | | | | | 762,300 | |
| | | | | | | | | | | | |
ELECTRICAL – 2.4% | | | | | | | | | | | | |
Hitachi, Ltd. (ADR) | | | | | | 13,300 | | �� | | | 738,150 | |
| | | | | | | | | | | | |
FINANCIAL/INVESTMENT SERVICES – 2.5% | | | | | | | | | | | | |
ORIX Corp. (ADR) | | | | | | 15,700 | | | | | 786,727 | |
| | | | | | | | | | | | |
FOOD – 3.7% | | | | | | | | | | | | |
Marine Harvest ASA (ADR) | | * | | | | 16,000 | | | | | 256,480 | |
WM Morrison Supermarkets PLC (ADR) | | | | | | 40,000 | | | | | 916,400 | |
| | | | | | | | | | | | |
| | | | | | | | | | | 1,172,880 | |
| | | | | | | | | | | | |
HEALTHCARE – 7.9% | | | | | | | | | | | | |
Fresenius Medical Care AG & Co. (ADR) | | | | | | 18,000 | | | | | 1,321,200 | |
Smith & Nephew PLC (ADR) | | | | | | 21,000 | | | | | 1,157,520 | |
| | | | | | | | | | | | |
| | | | | | | | | | | 2,478,720 | |
| | | | | | | | | | | | |
| | | | | | | | | | | | |
| Common Stocks – (Continued) | | | | Shares | | Fair Value |
INDUSTRIALS – 5.0% | | | | | | | | | | | | |
Assa Abloy AB (ADR) | | | | | | 30,000 | | | | $ | 485,100 | |
Atlas Copco AB (ADR) | | | | | | 27,000 | | | | | 561,060 | |
CNH Global NV (ADR) | | * | | | | 4,500 | | | | | 174,465 | |
Cookson Group PLC (ADR) | | | | | | 35,000 | | | | | 346,850 | |
| | | | | | | | | | | | |
| | | | | | | | | | | 1,567,475 | |
| | | | | | | | | | | | |
INFORMATION TECHNOLOGY – 1.4% | | | | | | | | | | | | |
Canon, Inc. (ADR) | | | | | | 14,000 | | | | | 448,140 | |
| | | | | | | | | | | | |
INSURANCE – 2.6% | | | | | | | | | | | | |
Zurich Insurance Group AG | | | | | | 33,000 | | | | | 825,990 | |
| | | | | | | | | | | | |
MINERALS & MINING – 4.4% | | | | | | | | | | | | |
Anglo American PLC (ADR) | | | | | | 13,980 | | | | | 204,807 | |
Barrick Gold Corp. | | | | | | 9,000 | | | | | 375,840 | |
BHP Billiton PLC (ADR) | | | | | | 9,000 | | | | | 562,140 | |
Vale SA (ADR) | | | | | | 14,600 | | | | | 253,456 | |
| | | | | | | | | | | | |
| | | | | | | | | | | 1,396,243 | |
| | | | | | | | | | | | |
OIL & NATURAL GAS – 8.6% | | | | | | | | | | | | |
Afren PLC (ADR) | | * | | | | 57,000 | | | | | 644,725 | |
Lukoil OAO (ADR) | | | | | | 14,000 | | | | | 861,560 | |
Precision Drilling Corp. | | * | | | | 18,400 | | | | | 144,256 | |
Statoil ASA (ADR) | �� | | | | | 27,168 | | | | | 700,663 | |
Transocean, Ltd. | | | | | | 8,000 | | | | | 359,120 | |
| | | | | | | | | | | | |
| | | | | | | | | | | 2,710,324 | |
| | | | | | | | | | | | |
OIL & GAS SERVICE – 1.9% | | | | | | | | | | | | |
Subsea 7 SA (ADR) | | | | | | 25,500 | | | | | 589,305 | |
| | | | | | | | | | | | |
PHARMACEUTICAL – 2.0% | | | | | | | | | | | | |
Shire PLC (ADR) | | | | | | 7,200 | | | | | 638,640 | |
| | | | | | | | | | | | |
RETAIL – 1.9% | | | | | | | | | | | | |
Arcos Dorados Holdings, Inc. (ADR) | | | | | | 20,400 | | | | | 314,772 | |
Seven & I Holdings Co., Ltd. (ADR) | | | | | | 4,800 | | | | | 293,520 | |
| | | | | | | | | | | | |
| | | | | | | | | | | 608,292 | |
| | | | | | | | | | | | |
SOFTWARE – 0.5% | | | | | | | | | | | | |
Open Text Corp. | | * | | | | 3,000 | | | | | 165,420 | |
| | | | | | | | | | | | |
TELECOMMUNICATIONS – 9.9% | | | | | | | | | | | | |
Globe Telecom, Inc. (ADR) | | | | | | 18,000 | | | | | 499,244 | |
Nippon Telegraph & Telephone Corp. (ADR) | | | | | | 24,000 | | | | | 569,040 | |
Philippine Long Distance Telephone Co. (ADR) | | | | | | 8,500 | | | | | 561,085 | |
Singapore Telecommunications, Ltd. (ADR) | | | | | | 57,000 | | | | | 1,479,150 | |
| | | | | | | | | | | | |
| | | | | | | | | | | 3,108,519 | |
| | | | | | | | | | | | |
TRANSPORTATION – 1.6% | | | | | | | | | | | | |
Canadian Pacific Railway, Ltd. | | | | | | 6,000 | | | | | 497,340 | |
| | | | | | | | | | | | |
Total Common Stocks
(Cost $26,899,190) | | | | | | | | | | $ | 29,742,450 | |
| | | | | | | | | | | | |
| | |
| Timothy Plan Family of Funds | | International (Continued) |
| | |
Schedule of Investments | | As of September 30, 2012 |
| | | | | | | | | | | | |
| Money Market Fund – 4.3% | | | | Shares | | Fair Value |
Fidelity Institutional Money Market Portfolio, 0.11%
(Cost $1,360,914) | | (A) | | | | 1,360,914 | | | | $ | 1,360,914 | |
| | | | | | | | | | | | |
Total Investments
(Cost $28,260,104) – 99.0% | | (B) | | | | | | | | $ | 31,103,364 | |
Assets in Excess of Other Liabilities – 1.0% | | | | | | | | | | | 308,367 | |
| | | | | | | | | | | | |
Net Assets – 100.00% | | | | | | | | | | $ | 31,411,731 | |
| | | | | | | | | | | | |
| * | Non-income producing securities. |
| (ADR) | American Depositary Receipt. |
| (A) | Variable rate security; the rate shown represents the yield at September 30, 2012. |
| (B) | Represents cost for financial reporting purposes. Aggregate cost for federal tax purposes is $28,387,614 and differs from fair value by net unrealized appreciation (depreciation) of securities as follows: |
| | | | | |
Unrealized appreciation | | | $ | 4,305,622 | |
Unrealized depreciation | | | | (1,589,872 | ) |
| | | | | |
Net unrealized appreciation | | | $ | 2,715,750 | |
| | | | | |
Diversification of Assets
| | | | |
Country | | % of
Net Assets | |
Argentina | | | 1.00% | |
Brazil | | | 1.37% | |
Canada | | | 8.19% | |
France | | | 3.26% | |
Germany | | | 9.32% | |
Hong Kong | | | 4.34% | |
Ireland | | | 4.33% | |
Israel | | | 0.90% | |
Italy | | | 0.87% | |
Japan | | | 13.15% | |
Netherlands | | | 0.56% | |
Norway | | | 3.05% | |
Panama | | | 1.58% | |
Philippines | | | 3.38% | |
Russia | | | 4.86% | |
Singapore | | | 7.63% | |
Spain | | | 0.49% | |
Sweden | | | 4.42% | |
Switzerland | | | 5.92% | |
United Kingdom | | | 16.08% | |
Total | | | 94.70% | |
Money Market Fund | | | 4.33% | |
Assets in Excess of Other Liabilities | | | 0.97% | |
| | | | |
Grand Total | | | 100.00% | |
| | | | |
The accompanying notes are an integral part of these financial statements.
[33]
| | |
| Timothy Plan Family of Funds | | Large/Mid Cap Growth |
| | |
Schedule of Investments | | As of September 30, 2012 |
| | | | | | | | | | | | |
| Common Stocks – 92.6% | | | | Shares | | Fair
Value |
AEROSPACE/DEFENSE – 2.7% | | | | | | | | | | | | |
BE Aerospace, Inc. | | * | | | | 8,925 | | | | $ | 375,743 | |
General Dynamics, Corp. | | | | | | 13,145 | | | | | 869,147 | |
| | | | | | | | | | | | |
| | | | | | | | | | | 1,244,890 | |
| | | | | | | | | | | | |
APPAREL – 1.1% | | | | | | | | | | | | |
Carter’s, Inc. | | * | | | | 9,050 | | | | | 487,252 | |
| | | | | | | | | | | | |
BANKS – 3.9% | | | | | | | | | | | | |
BB&T Corp. | | | | | | 22,585 | | | | | 748,919 | |
CIT Group, Inc. | | * | | | | 16,375 | | | | | 645,011 | |
Zions Bancorp | | | | | | 18,295 | | | | | 377,883 | |
| | | | | | | | | | | | |
| | | | | | | | | | | 1,771,813 | |
| | | | | | | | | | | | |
CHEMICALS – 1.1% | | | | | | | | | | | | |
Ashland, Inc. | | | | | | 6,880 | | | | | 492,608 | |
| | | | | | | | | | | | |
COMMERCIAL SERVICES – 3.7% | | | | | | | | | | | | |
Verisk Analytics, Inc. | | * | | | | 7,620 | | | | | 362,788 | |
Western Union Co. | | | | | | 73,935 | | | | | 1,347,096 | |
| | | | | | | | | | | | |
| | | | | | | | | | | 1,709,884 | |
| | | | | | | | | | | | |
CONSUMER GOODS – 5.1% | | | | | | | | | | | | |
Emerson Electric Co. | | | | | | 10,620 | | | | | 512,627 | |
JM Smucker Co. | | | | | | 6,625 | | | | | 571,936 | |
McCormick & Co., Inc. | | | | | | 20,065 | | | | | 1,244,833 | |
| | | | | | | | | | | | |
| | | | | | | | | | | 2,329,396 | |
| | | | | | | | | | | | |
DISTRIBUTION/WHOLESALE – 0.9% | | | | | | | | | | | | |
Wesco International, Inc. | | * | | | | 7,115 | | | | | 406,978 | |
| | | | | | | | | | | | |
ELECTRONICS – 8.8% | | | | | | | | | | | | |
Amphenol Corp. – Class A | | | | | | 20,150 | | | | | 1,186,432 | |
Jabil Circuit, Inc. | | | | | | 44,700 | | | | | 836,784 | |
Thermo Fisher Scientific, Inc. | | | | | | 18,360 | | | | | 1,080,119 | |
Trimble Navigation, Ltd. | | * | | | | 11,470 | | | | | 546,660 | |
Waters Corp. | | * | | | | 4,930 | | | | | 410,817 | |
| | | | | | | | | | | | |
| | | | | | | | | | | 4,060,812 | |
| | | | | | | | | | | | |
ELECTRICAL COMPONENTS &
EQUIPMENT – 0.4% | | | | | | | | | | | | |
Hubbell, Inc. – Class B | | | | | | 2,235 | | | | | 180,454 | |
| | | | | | | | | | | | |
ENTERTAINMENT – 1.8% | | | | | | | | | | | | |
Six Flags Entertainment Corp. | | | | | | 14,345 | | | | | 843,486 | |
| | | | | | | | | | | | |
ENVIRONMENTAL CONTROL – 0.5% | | | | | | | | | | | | |
Waste Connections, Inc. | | | | | | 7,595 | | | | | 229,749 | |
| | | | | | | | | | | | |
FINANCIAL/INVESTMENT SERVICES – 6.4% | | | | | | | | | | | | |
Affiliated Managers Group, Inc. | | * | | | | 3,760 | | | | | 462,480 | |
Blackrock, Inc. | | | | | | 4,155 | | | | | 740,837 | |
Discover Financial Services | | | | | | 12,480 | | | | | 495,830 | |
FleetCor Technologies, Inc. | | * | | | | 16,505 | | | | | 739,424 | |
IntercontinentalExchange, Inc. | | * | | | | 3,690 | | | | | 492,283 | |
| | | | | | | | | | | | |
| | | | | | | | | | | 2,930,854 | |
| | | | | | | | | | | | |
HEALTHCARE – 8.8% | | | | | | | | | | | | |
AmerisourceBergen Corp. | | | | | | 26,290 | | | | | 1,017,686 | |
Covidien PLC | | | | | | 18,485 | | | | | 1,098,379 | |
Intuitive Surgical, Inc. | | * | | | | 345 | | | | | 170,992 | |
| | | | | | | | | | | | |
| Common Stocks (Continued) | | | | Shares | | Fair
Value |
HEALTHCARE (continued) | | | | | | | | | | | | |
Sirona Dental Systems, Inc. | | * | | | | 10,315 | | | | $ | 587,542 | |
St. Jude Medical, Inc. | | | | | | 19,710 | | | | | 830,382 | |
Volcano Corp. | | * | | | | 11,630 | | | | | 332,269 | |
| | | | | | | | | | | | |
| | | | | | | | | | | 4,037,250 | |
| | | | | | | | | | | | |
HOME BUILDERS – 1.0% | | | | | | | | | | | | |
D R Horton, Inc. | | | | | | 21,580 | | | | | 445,411 | |
| | | | | | | | | | | | |
INDUSTRIALS/MACHINERY – 1.5% | | | | | | | | | | | | |
Rockwell Automation, Inc. | | | | | | 7,200 | | | | | 500,760 | |
United Rentals, Inc. | | * | | | | 5,610 | | | | | 183,503 | |
| | | | | | | | | | | | |
| | | | | | | | | | | 684,263 | |
| | | | | | | | | | | | |
INFORMATION TECHNOLOGY – 5.0% | | | | | | | | | | | | |
Cognizant Technology Solutions Corp. – Class A | | * | | | | 4,750 | | | | | 332,120 | |
Fiserv, Inc. | | * | | | | 9,995 | | | | | 739,930 | |
Fortinet, Inc. | | * | | | | 4,500 | | | | | 108,630 | |
Informatica Corp. | | * | | | | 8,875 | | | | | 308,939 | |
Parametric Technology Corp. | | * | | | | 12,755 | | | | | 278,059 | |
Teradata Corp. | | * | | | | 7,330 | | | | | 552,755 | |
| | | | | | | | | | | | |
| | | | | | | | | | | 2,320,433 | |
| | | | | | | | | | | | |
INSURANCE – 3.7% | | | | | | | | | | | | |
ACE, Ltd. | | | | | | 15,020 | | | | | 1,135,512 | |
XL Group PLC | | | | | | 24,415 | | | | | 586,692 | |
| | | | | | | | | | | | |
| | | | | | | | | | | 1,722,204 | |
| | | | | | | | | | | | |
INTERNET – 1.8% | | | | | | | | | | | | |
F5 Networks, Inc. | | * | | | | 2,950 | | | | | 308,865 | |
Tibco Software, Inc. | | * | | | | 17,500 | | | | | 529,025 | |
| | | | | | | | | | | | |
| | | | | | | | | | | 837,890 | |
| | | | | | | | | | | | |
MINING – 2.0% | | | | | | | | | | | | |
Freeport – McMoRan Copper & Gold, Inc. | | | | | | 23,190 | | | | | 917,860 | |
| | | | | | | | | | | | |
MISCELLANEOUS SERVICES – 2.2% | | | | | | | | | | | | |
Danaher Corp. | | | | | | 18,735 | | | | | 1,033,235 | |
| | | | | | | | | | | | |
OIL & NATURAL GAS – 10.2% | | | | | | | | | | | | |
Cabot Oil & Gas Corp. | | | | | | 8,835 | | | | | 396,691 | |
Concho Resources, Inc. | | * | | | | 8,435 | | | | | 799,216 | |
Exxon Mobil Corp. | | | | | | 23,930 | | | | | 2,188,399 | |
Occidental Petroleum Corp. | | | | | | 15,020 | | | | | 1,292,621 | |
| | | | | | | | | | | | |
| | | | | | | | | | | 4,676,927 | |
| | | | | | | | | | | | |
OIL & NATURAL GAS SERVICES – 0.9% | | | | | | | | | | | | |
Oil States International, Inc. | | * | | | | 5,130 | | | | | 407,630 | |
| | | | | | | | | | | | |
PHARMACEUTICALS – 1.5% | | | | | | | | | | | | |
Akorn, Inc. | | * | | | | 23,475 | | | | | 310,340 | |
Catamaran Corp. | | * | | | | 1,345 | | | | | 131,770 | |
Mead Johnson Nutrition Co. | | | | | | 3,200 | | | | | 234,496 | |
| | | | | | | | | | | | |
| | | | | | | | | | | 676,606 | |
| | | | | | | | | | | | |
RETAIL – 12.9% | | | | | | | | | | | | |
Autozone, Inc. | | * | | | | 4,040 | | | | | 1,493,467 | |
Chico’s FAS, Inc. | | | | | | 21,825 | | | | | 395,251 | |
Dick’s Sporting Goods, Inc. | | | | | | 9,765 | | | | | 506,315 | |
| | |
| Timothy Plan Family of Funds | | Large/Mid Cap Growth (Continued) |
| | |
Schedule of Investments | | As of September 30, 2012 |
| | | | | | | | | | | | |
| Common Stocks (Continued) | | | | Shares | | Fair
Value |
RETAIL (continued) | | | | | | | | | | | | |
Dollar General Corp. | | * | | | | 15,915 | | | | $ | 820,259 | |
Domino’s Pizza, Inc. | | | | | | 8,675 | | | | | 327,048 | |
Group 1 Automotive, Inc. | | | | | | 9,700 | | | | | 584,231 | |
Lululemon Athletica, Inc. | | * | | | | 3,650 | | | | | 269,881 | |
Panera Bread Co. | | * | | | | 1,455 | | | | | 248,645 | |
Ross Stores, Inc. | | | | | | 10,795 | | | | | 697,357 | |
Sally Beauty Holdings, Inc. | | * | | | | 23,670 | | | | | 593,880 | |
| | | | | | | | | | | | |
| | | | | | | | | | | 5,936,334 | |
| | | | | | | | | | | | |
SEMICONDUCTORS – 2.2% | | | | | | | | | | | | |
Avago Technologies, Ltd. | | | | | | 7,915 | | | | | 275,956 | |
Linear Technology Corp. | | | | | | 22,730 | | | | | 723,951 | |
| | | | | | | | | | | | |
| | | | | | | | | | | 999,907 | |
| | | | | | | | | | | | |
SOFTWARE – 0.5% | | | | | | | | | | | | |
Citrix Systems, Inc. | | * | | | | 3,175 | | | | | 243,110 | |
| | | | | | | | | | | | |
TRANSPORTATION – 2.0% | | | | | | | | | | | | |
Genesee & Wyoming, Inc. – Class A | | * | | | | 9,530 | | | | | 637,176 | |
Old Dominion Freight Line, Inc. | | * | | | | 9,615 | | | | | 289,988 | |
| | | | | | | | | | | | |
| | | | | | | | | | | 927,164 | |
| | | | | | | | | | | | |
Total Common Stocks
(Cost $39,470,445) | | | | | | | | | | $ | 42,554,400 | |
| | | | | | | | | | | | |
| | | | | | | | | | | | |
| REIT – 1.9% | | | | Shares | | Fair
Value |
American Campus Communities, Inc.
(Cost $911,850) | | | | | | 19,775 | | | | $ | 867,727 | |
| | | | | | | | | | | | |
| | | |
| Money Market Fund – 5.4% | | | | Shares | | Fair
Value |
Fidelity Institutional Money Market Portfolio, 0.11%
(Cost $2,458,455) | | (A) | | | | 2,458,455 | | | | $ | 2,458,455 | |
| | | | | | | | | | | | |
Total Investments
(Cost $42,840,750) – 99.9% | | (B) | | | | | | | | $ | 45,880,582 | |
Assets in Excess of Other
Liabilities – 0.1% | | | | | | | | | | | 48,187 | |
| | | | | | | | | | | | |
Net Assets – 100.00% | | | | | | | | | | $ | 45,928,769 | |
| | | | | | | | | | | | |
| * | Non-income producing securities. |
| (REIT) | Real Estate Investment Trust. |
| (ADR) | American Depositary Receipt. |
| (A) | Variable rate security; the rate shown represents the yield at September 30, 2012. |
| (B) | Represents cost for financial reporting purposes. Aggregate cost for federal tax purposes is $42,936,161 and differs from fair value by net unrealized appreciation (depreciation) of securities as follows: |
| | | | | |
Unrealized appreciation | | | $ | 3,464,413 | |
Unrealized depreciation | | | | (519,992 | ) |
| | | | | |
Net unrealized appreciation | | | $ | 2,944,421 | |
| | | | | |
The accompanying notes are an integral part of these financial statements.
[35]
| | |
| Timothy Plan Family of Funds | | Small Cap Value |
| | |
Schedule of Investments | | As of September 30, 2012 |
| | | | | | | | | | | | |
| Common Stocks – 89.4% | | | | Shares | | Fair
Value |
AEROSPACE EQUIPMENT – 2.2% | | | | | | | | | | | | |
Moog, Inc. – Class A | | * | | | | 31,200 | | | | $ | 1,181,544 | |
| | | | | | | | | | | | |
BANKS – 16.2% | | | | | | | | | | | | |
Bancfirst Corp. | | | | | | 12,228 | | | | | 525,315 | |
BBCN Bancorp, Inc. | | * | | | | 86,699 | | | | | 1,093,274 | |
Chemical Financial Corp. | | | | | | 44,503 | | | | | 1,076,973 | |
Columbia Banking System, Inc. | | | | | | 55,108 | | | | | 1,021,702 | |
First Financial Bancorp | | | | | | 63,800 | | | | | 1,078,858 | |
PrivateBancorp, Inc. | | | | | | 34,107 | | | | | 545,371 | |
State Bank Financial Corp. | | | | | | 64,654 | | | | | 1,066,145 | |
SVB Financial Group | | * | | | | 18,700 | | | | | 1,130,602 | |
Wintrust Financial Corp. | | | | | | 28,000 | | | | | 1,051,960 | |
| | | | | | | | | | | | |
| | | | | | | | | | | 8,590,200 | |
| | | | | | | | | | | | |
COMMERCIAL SERVICES – 1.1% | | | | | | | | | | | | |
Kelly Services, Inc. | | | | | | 43,900 | | | | | 553,140 | |
| | | | | | | | | | | | |
CONSUMER GOODS – 2.2% | | | | | | | | | | | | |
Wolverine World Wide, Inc. | | | | | | 26,400 | | | | | 1,171,368 | |
| | | | | | | | | | | | |
COMPUTERS – 4.3% | | | | | | | | | | | | |
CACI International, Inc. | | * | | | | 21,234 | | | | | 1,099,709 | |
J2 Global, Inc. | | | | | | 36,300 | | | | | 1,191,366 | |
| | | | | | | | | | | | |
| | | | | | | | | | | 2,291,075 | |
| | | | | | | | | | | | |
DISTRIBUTION/WHOLESALE – 2.4% | | | | | | | | | | | | |
Beacon Roofing Supply, Inc. | | * | | | | 45,200 | | | | | 1,288,200 | |
| | | | | | | | | | | | |
ELECTRIC POWER – 5.5% | | | | | | | | | | | | |
Allete | | | | | | 27,200 | | | | | 1,135,328 | |
Cleco Corp. | | | | | | 14,600 | | | | | 612,908 | |
NorthWestern Corp. | | | | | | 32,200 | | | | | 1,166,606 | |
| | | | | | | | | | | | |
| | | | | | | | | | | 2,914,842 | |
| | | | | | | | | | | | |
ELECTRIC & EQUIPMENT – 4.3% | | | | | | | | | | | | |
EnerSys | | * | | | | 15,312 | | | | | 540,360 | |
Coherent, Inc. | | * | | | | 24,627 | | | | | 1,129,394 | |
Littelfuse, Inc. | | | | | | 10,745 | | | | | 607,522 | |
| | | | | | | | | | | | |
| | | | | | | | | | | 2,277,276 | |
| | | | | | | | | | | | |
ENGINEERING & CONSTRUCTION – 1.1% | | | | | | | | | | | | |
Foster Wheeler AG | | * | | | | 24,600 | | | | | 589,416 | |
| | | | | | | | | | | | |
FOOD – 2.2% | | | | | | | | | | | | |
J & J Snack Food Corp. | | | | | | 20,124 | | | | | 1,153,709 | |
| | | | | | | | | | | | |
FOREST PRODUCTS & PAPER – 2.3% | | | | | | | | | | | | |
KapStone Paper and Packaging Corp. | | * | | | | 53,100 | | | | | 1,188,909 | |
| | | | | | | | | | | | |
HEALTHCARE – 4.5% | | | | | | | | | | | | |
Natus Medical, Inc. | | * | | | | 89,117 | | | | | 1,164,759 | |
Orthofix International NV | | * | | | | 27,380 | | | | | 1,225,255 | |
| | | | | | | | | | | | |
| | | | | | | | | | | 2,390,014 | |
| | | | | | | | | | | | |
HOLDING COMPANY – 1.1% | | | | | | | | | | | | |
National Bank Holdings Corp. | | * | | | | 29,600 | | | | | 576,016 | |
| | | | | | | | | | | | |
HOME BUILDERS – 1.1% | | | | | | | | | | | | |
Thor Industries, Inc. | | | | | | 15,900 | | | | | 577,488 | |
| | | | | | | | | | | | |
INDUSTRIALS – 8.8% | | | | | | | | | | | | |
A.O. Smith Corp. | | | | | | 22,097 | | | | | 1,271,461 | |
| | | | | | | | | | | | |
| Common Stocks (Continued) | | | | Shares | | Fair
Value |
INDUSTRIALS (Continued) | | | | | | | | | | | | |
Gorman-Rupp Co. | | | | | | 41,676 | | | | $ | 1,125,252 | |
Hurco Cos., Inc. | | * | | | | 23,405 | | | | | 535,507 | |
Kaydon Corp. | | | | | | 26,300 | | | | | 587,542 | |
TAL International Group, Inc. | | | | | | 34,096 | | | | | 1,158,582 | |
| | | | | | | | | | | | |
| | | | | | | | | | | 4,678,344 | |
| | | | | | | | | | | | |
INFORMATION TECHNOLOGY – 3.2% | | | | | | | | | | | | |
Pervasive Software, Inc. | | * | | | | 71,501 | | | | | 614,909 | |
SYNNEX Corp. | | * | | | | 33,600 | | | | | 1,094,688 | |
| | | | | | | | | | | | |
| | | | | | | | | | | 1,709,597 | |
| | | | | | | | | | | | |
INSURANCE – 6.4% | | | | | | | | | | | | |
AMERISAFE, Inc. | | * | | | | 43,146 | | | | | 1,170,982 | |
Employers Holdings, Inc. | | | | | | 28,500 | | | | | 522,405 | |
Endurance Specialty Holdings, Ltd. | | | | | | 15,600 | | | | | 600,600 | |
Safety Insurance Group, Inc. | | | | | | 23,770 | | | | | 1,090,568 | |
| | | | | | | | | | | | |
| | | | | | | | | | | 3,384,555 | |
| | | | | | | | | | | | |
MINING – 2.4% | | | | | | | | | | | | |
Hi-Crush Partners LP | | * | | | | 26,700 | | | | | 587,133 | |
US Silica Holdings, Inc. | | * | | | | 49,000 | | | | | 664,440 | |
| | | | | | | | | | | | |
| | | | | | | | | | | 1,251,573 | |
| | | | | | | | | | | | |
MISCELLANEOUS SERVICES – 4.1% | | | | | | | | | | | | |
Harsco Corp. | | | | | | 54,600 | | | | | 1,120,938 | |
Matrix Service Co. | | * | | | | 98,464 | | | | | 1,040,764 | |
| | | | | | | | | | | | |
| | | | | | | | | | | 2,161,702 | |
| | | | | | | | | | | | |
OIL & NATURAL GAS – 5.3% | | | | | | | | | | | | |
Berry Petroleum Co. | | | | | | 15,400 | | | | | 625,702 | |
Bonanza Creek Energy, Inc. | | * | | | | 24,886 | | | | | 586,314 | |
Gulfport Energy Corp. | | * | | | | 20,700 | | | | | 647,082 | |
Matador Resources Co. | | * | | | | 36,785 | | | | | 382,196 | |
Rex Energy Corp. | | * | | | | 43,800 | | | | | 584,730 | |
| | | | | | | | | | | | |
| | | | | | | | | | | 2,826,024 | |
| | | | | | | | | | | | |
PIPELINES – 1.1% | | | | | | | | | | | | |
EQT Midsteam Partners LP | | * | | | | 20,421 | | | | | 588,125 | |
| | | | | | | | | | | | |
RETAIL – 2.2% | | | | | | | | | | | | |
Children’s Place Retail Stores | | * | | | | 19,600 | | | | | 1,176,000 | |
| | | | | | | | | | | | |
TELECOMMUNICATIONS – 1.1% | | | | | | | | | | | | |
Tellabs, Inc. | | | | | | 162,800 | | | | | 576,312 | |
| | | | | | | | | | | | |
TRANSPORTATION – 4.3% | | | | | | | | | | | | |
Genesee & Wyoming, Inc. – Class A | | * | | | | 9,000 | | | | | 601,740 | |
Landstar System, Inc. | | | | | | 23,064 | | | | | 1,090,466 | |
Roadrunner Transportation System, Inc. | | * | | | | 34,400 | | | | | 556,592 | |
| | | | | | | | | | | | |
| | | | | | | | | | | 2,248,798 | |
| | | | | | | | | | | | |
Total Common Stocks
(Cost $42,306,510) | | | | | | | | | | $ | 47,344,227 | |
| | | | | | | | | | | | |
| | |
| Timothy Plan Family of Funds | | Small Cap Value (Continued) |
| | |
Schedule of Investments | | As of September 30, 2012 |
| | | | | | | | | | | | |
| REITs – 8.8% | | | | Shares | | Fair Value |
Coresite Realty Corp. | | | | | | 20,878 | | | | $ | 562,453 | |
CubeSmart | | | | | | 51,400 | | | | | 661,518 | |
DiamondRock Hospitality | | | | | | 117,657 | | | | | 1,133,037 | |
PS Business Parks, Inc. | | | | | | 8,400 | | | | | 561,288 | |
Potlatch Corp. | | | | | | 30,600 | | | | | 1,143,522 | |
Summit Hotel Properties, Inc. | | | | | | 69,097 | | | | | 590,089 | |
| | | | | | | | | | | | |
Total REITs
(Cost $4,002,042) | | | | | | | | | | $ | 4,651,907 | |
| | | | | | | | | | | | |
| | | |
| Money Market Fund – 0.9% | | | | Shares | | Fair Value |
Fidelity Institutional Money Market Portfolio, 0.11%
(Cost $470,879) | | (A) | | | | 470,879 | | | | $ | 470,879 | |
| | | | | | | | | | | | |
Total Investments
(Cost $46,779,431) – 99.1% | | (B) | | | | | | | | $ | 52,467,013 | |
Assets in Excess of Other
Liabilities – 0.9% | | | | | | | | | | | 445,793 | |
| | | | | | | | | | | | |
Net Assets – 100.00% | | | | | | | | | | $ | 52,912,806 | |
| | | | | | | | | | | | |
| * | Non-income producing securities. |
| (REIT) | Real Estate Investment Trust. |
| (A) | Variable rate security; the rate shown represents the yield at September 30, 2012. |
| (B) | Represents cost for financial reporting purposes. Aggregate cost for federal tax purposes is $46,885,293 and differs from fair value by net unrealized appreciation (depreciation) of securities as follows: |
| | | | | |
Unrealized appreciation | | | $ | 6,587,478 | |
Unrealized depreciation | | | | (1,005,758 | ) |
| | | | | |
Net unrealized appreciation | | | $ | 5,581,720 | |
| | | | | |
The accompanying notes are an integral part of these financial statements.
[37]
| | |
| Timothy Plan Family of Funds | | Large/Mid Cap Value |
| | |
Schedule of Investments | | As of September 30, 2012 |
| | | | | | | | | | | | |
| Common Stocks – 87.5% | | | | Shares | | Fair
Value |
AUTO – 0.9% | | | | | | | | | | | | |
Lear Corp. | | | | | | 25,600 | | | | $ | 967,424 | |
| | | | | | | | | | | | |
BANKS – 2.0% | | | | | | | | | | | | |
CIT Group, Inc. | | * | | | | 56,400 | | | | | 2,221,596 | |
| | | | | | | | | | | | |
COMPUTERS – 1.8% | | | | | | | | | | | | |
Western Digital Corp. | | | | | | 51,500 | | | | | 1,994,595 | |
| | | | | | | | | | | | |
CONSUMER GOODS – 8.7% | | | | | | | | | | | | |
BorgWarner, Inc. | | * | | | | 30,500 | | | | | 2,107,855 | |
Dr Pepper Snapple Group, Inc. | | | | | | 56,900 | | | | | 2,533,757 | |
Emerson Electric Co. | | | | | | 57,800 | | | | | 2,790,006 | |
JM Smucker Co. | | | | | | 26,100 | | | | | 2,253,213 | |
| | | | | | | | | | | | |
| | | | | | | | | | | 9,684,831 | |
| | | | | | | | | | | | |
ELECTRIC POWER – 5.9% | | | | | | | | | | | | |
American Electric Power Co., Inc. | | | | | | 49,000 | | | | | 2,153,060 | |
Dominion Resources, Inc. | | | | | | 39,900 | | | | | 2,112,306 | |
FirstEnergy Corp. | | | | | | 53,300 | | | | | 2,350,530 | |
| | | | | | | | | | | | |
| | | | | | | | | | | 6,615,896 | |
| | | | | | | | | | | | |
FINANCIAL & INVESTMENT
SERVICES – 6.6% | | | | | | | | | | | | |
Eaton Vance Corp. | | | | | | 80,800 | | | | | 2,339,968 | |
Franklin Resources, Inc. | | | | | | 17,100 | | | | | 2,138,697 | |
Invesco, Ltd. | | | | | | 112,600 | | | | | 2,813,874 | |
| | | | | | | | | | | | |
| | | | | | | | | | | 7,292,539 | |
| | | | | | | | | | | | |
HEALTHCARE – 12.9% | | | | | | | | | | | | |
CareFusion Corp. | | * | | | | 82,300 | | | | | 2,336,497 | |
Covidien PLC | | | | | | 60,900 | | | | | 3,618,678 | |
CR Bard, Inc. | | | | | | 22,800 | | | | | 2,386,020 | |
DENTSPLY International, Inc. | | | | | | 28,800 | | | | | 1,098,432 | |
Hologic, Inc. | | * | | | | 127,800 | | | | | 2,586,672 | |
St. Jude Medical, Inc. | | | | | | 56,400 | | | | | 2,376,132 | |
| | | | | | | | | | | | |
| | | | | | | | | | | 14,402,431 | |
| | | | | | | | | | | | |
INDUSTRIALS – 3.7% | | | | | | | | | | | | |
General Dynamics Corp. | | | | | | 32,600 | | | | | 2,155,512 | |
Precision Castparts Corp. | | | | | | 12,300 | | | | | 2,009,082 | |
| | | | | | | | | | | | |
| | | | | | | | | | | 4,164,594 | |
| | | | | | | | | | | | |
INFORMATION TECHNOLOGY – 4.2% | | | | | | | | | | | | |
CA, Inc. | | | | | | 98,500 | | | | | 2,537,852 | |
TE Connectivity, Ltd. | | | | | | 63,500 | | | | | 2,159,635 | |
| | | | | | | | | | | | |
| | | | | | | | | | | 4,697,487 | |
| | | | | | | | | | | | |
INSURANCE – 9.0% | | | | | | | | | | | | |
ACE, Ltd. | | | | | | 37,700 | | | | | 2,850,120 | |
Arch Capital Group, Ltd. | | * | | | | 63,100 | | | | | 2,630,008 | |
Axis Capital Holdings, Ltd. | | | | | | 67,700 | | | | | 2,364,084 | |
Willis Group Holdings, PLC (ADR) | | | | | | 60,100 | | | | | 2,218,892 | |
| | | | | | | | | | | | |
| | | | | | | | | | | 10,063,104 | |
| | | | | | | | | | | | |
MACHINERY – 3.6% | | | | | | | | | | | | |
Flowserve Corp. | | | | | | 23,400 | | | | | 2,989,116 | |
Xylem, Inc. | | | | | | 39,900 | | | | | 1,003,485 | |
| | | | | | | | | | | | |
| | | | | | | | | | | 3,992,601 | |
| | | | | | | | | | | | |
| | | | | | | | | | | | |
| Common Stocks (Continued) | | | | Shares | | Fair
Value |
| OIL & NATURAL GAS – 20.0% | | | | | | | | | | | | |
Anadarko Petroleum Corp. | | | | | | 29,000 | | | | $ | 2,027,680 | |
Apache Corp. | | | | | | 20,600 | | | | | 1,781,282 | |
ConocoPhillips | | | | | | 18,600 | | | | | 1,063,548 | |
EQT Corp. | | | | | | 45,200 | | | | | 2,666,800 | |
Exxon Mobil Corp. | | | | | | 37,700 | | | | | 3,447,665 | |
Marathon Oil Corp. | | | | | | 44,400 | | | | | 1,312,908 | |
Marathon Petroleum Corp. | | | | | | 29,300 | | | | | 1,599,487 | |
Murphy Oil Corp. | | | | | | 34,700 | | | | | 1,863,043 | |
National Oilwell Varco, Inc. | | | | | | 30,400 | | | | | 2,435,344 | |
Occidental Petroleum Corp. | | | | | | 29,000 | | | | | 2,495,740 | |
Phillips 66 | | | | | | 32,400 | | | | | 1,502,388 | |
| | | | | | | | | | | | |
| | | | | | | | | | | 22,195,885 | |
| | | | | | | | | | | | |
| RETAIL – 4.6% | | | | | | | | | | | | |
Advance Auto Parts, Inc. | | | | | | 37,500 | | | | | 2,566,500 | |
Sherwin-Williams Co. | | | | | | 16,900 | | | | | 2,516,579 | |
| | | | | | | | | | | | |
| | | | | | | | | | | 5,083,079 | |
| | | | | | | | | | | | |
| SEMICONDUCTORS – 0.8% | | | | | | | | | | | | |
Microchip Technology, Inc. | | | | | | 26,900 | | | | | 880,706 | |
| | | | | | | | | | | | |
| TRANSPORTATION – 2.8% | | | | | | | | | | | | |
Union Pacific Corp. | | | | | | 26,400 | | | | | 3,133,680 | |
| | | | | | | | | | | | |
Total Common Stocks
(Cost $75,975,368) | | | | | | | | | | $ | 97,390,448 | |
| | | | | | | | | | | | |
| | | |
| Master Limited Partnerships – 2.1% | | | | Shares | | Fair
Value |
Lazard, Ltd. – Class A
(Cost $2,711,146) | | | | | | 78,800 | | | | $ | 2,303,324 | |
| | | | | | | | | | | | |
| | | |
| REITs – 6.5% | | | | Shares | | Fair
Value |
HCP, Inc. | | | | | | 51,100 | | | | $ | 2,272,928 | |
Public Storage, Inc. | | | | | | 19,700 | | | | | 2,741,649 | |
Regency Centers Corp. | | | | | | 45,300 | | | | | 2,207,469 | |
| | | | | | | | | | | | |
(Cost $5,083,140) | | | | | | | | | | $ | 7,222,046 | |
| | | | | | | | | | | | |
| | | |
| Money Market Fund – 4.0% | | | | Shares | | Fair
Value |
Fidelity Institutional Money Market
Portfolio, 0.11%
(Cost $4,426,994) | | (A) | | | | 4,426,994 | | | | $ | 4,426,994 | |
| | | | | | | | | | | | |
Total Investments
(Cost $88,196,648) – 100.1% | | (B) | | | | | | | | $ | 111,342,812 | |
Liabilities in Excess of Other
Assets – (0.1)% | | | | | | | | | | | (41,637 | ) |
| | | | | | | | | | | | |
Net Assets – 100.00% | | | | | | | | | | $ | 111,301,175 | |
| | | | | | | | | | | | |
| | |
| Timothy Plan Family of Funds | | Large/Mid Cap Value (Continued) |
| | |
Schedule of Investments | | As of September 30, 2012 |
| * | Non-income producing securities. |
| (REIT) | Real Estate Investment Trust. |
| (ADR) | American Depositary Receipt. |
| (A) | Variable rate security; the rate shown represents the yield at September 30, 2012. |
| (B) | Represents cost for financial reporting purposes. Aggregate cost for federal tax purposes is $88,236,619 and differs from fair value by net unrealized appreciation (depreciation) of securities as follows: |
| | | | | |
Unrealized appreciation | | | $ | 25,594,488 | |
Unrealized depreciation | | | | (2,488,295 | ) |
| | | | | |
Net unrealized appreciation | | | $ | 23,106,193 | |
| | | | | |
The accompanying notes are an integral part of these financial statements.
[39]
| | |
| Timothy Plan Family of Funds | | Fixed Income |
| | |
Schedule of Investments | | As of September 30, 2012 |
| | | | | | | | | | | | |
| Bonds and Notes – 94.6% | | | | Par
Value | | Fair
Value |
CORPORATE BONDS – 33.6% | | | | | | | | | | | | |
ABB Finance USA, Inc.,
2.875%, 5/08/2022 | | | | | $ | 1,000,000 | | | | $ | 1,030,450 | |
Altera Corp.,
1.75%, 5/15/2017 | | | | | | 1,000,000 | | | | | 1,025,650 | |
Analog Devices, Inc.,
3.00%, 4/15/2016 | | | | | | 740,000 | | | | | 796,743 | |
Cameron International Corp.,
6.375%, 7/15/2018 | | | | | | 1,000,000 | | | | | 1,216,000 | |
Canadian National Railway Co.,
5.80%, 6/01/2016 | | | | | | 750,000 | | | | | 876,521 | |
Cliffs Natural Resources Inc.,
4.875%, 4/01/2021 | | | | | | 750,000 | | | | | 736,275 | |
Cooperatieve Centrale Raiffeisen-Boerenleenbank BA,
2.125%, 10/13/2015 | | | | | | 1,000,000 | | | | | 1,030,440 | |
Covidien International Finance SA,
2.8%, 6/15/2015 | | | | | | 500,000 | | | | | 526,476 | |
Eaton Corp.,
5.60%, 5/15/2018 | | | | | | 325,000 | | | | | 387,962 | |
Energy Transfer Partners LP,
6.70%, 7/01/2018 | | | | | | 750,000 | | | | | 891,595 | |
Enterprise Products Operating, LLC,
6.125%, 10/15/2039 | | | | | | 500,000 | | | | | 603,087 | |
ERP Operating LP,
5.125%, 3/15/2016 | | | | | | 900,000 | | | | | 1,014,600 | |
Freeport-McMoran Copper & Gold,
3.55%, 3/01/2022 | | | | | | 750,000 | | | | | 752,250 | |
Husky Energy, Inc.,
3.95%, 4/15/2022 | | | | | | 750,000 | | | | | 799,680 | |
John Sevier Combined Cycle
Generation LLC,
4.626%, 1/15/2042 | | | | | | 993,490 | | | | | 1,142,488 | |
Johnson Controls, Inc.,
5.00%, 3/30/2020 | | | | | | 750,000 | | | | | 854,722 | |
Kennametal Inc.,
3.875%, 2/15/2022 | | | | | | 1,000,000 | | | | | 1,042,500 | |
Kinder Morgan Energy Partners LP,
5.125%, 11/15/2014 | | | | | | 750,000 | | | | | 814,876 | |
L-3 Communications, Corp.,
5.20%, 10/15/2019 | | | | | | 500,000 | | | | | 563,804 | |
Marathon Oil Corp.,
6.00%, 10/01/2017 | | | | | | 750,000 | | | | | 918,419 | |
Nisource Finance Corp.,
5.40%, 7/15/2014 | | | | | | 750,000 | | | | | 804,362 | |
Oneok, Inc.,
4.25%, 2/01/2022 | | | | | | 500,000 | | | | | 540,675 | |
Oneok, Inc.,
5.20%, 6/15/2015 | | | | | | 500,000 | | | | | 544,985 | |
Petrobras Intl. Financial Co.,
3.50%, 2/06/2017 | | | | | | 750,000 | | | | | 782,925 | |
Phillips 66,
2.95%, 5/01/2017 | | (A) | | | | 1,000,000 | | | | | 1,059,032 | |
Plains All American Pipeline,
3.65%, 6/01/2022 | | | | | | 1,000,000 | | | | | 1,058,300 | |
| | | | | | | | | | | | |
| Bonds and Notes (Continued) | | | | Par
Value | | Fair
Value |
CORPORATE BONDS (continued) | | | | | | | | | | | | |
Rio Tinto Finance USA, Ltd.,
2.50%, 5/20/2016 | | | | | $ | 750,000 | | | | $ | 783,465 | |
Simon Property Group LP,
6.125%, 5/30/2018 | | | | | | 1,000,000 | | | | | 1,220,650 | |
Teck Cominco Ltd. – Cl. B,
6.00%, 8/15/2040 | | | | | | 500,000 | | | | | 526,860 | |
Transocean, Inc.,
6.00%, 3/15/2018 | | | | | | 500,000 | | | | | 583,250 | |
Tyco Electronics Group SA,
6.55%, 10/01/2017 | | | | | | 750,000 | | | | | 906,030 | |
Valero Energy Corp.,
6.625%, 6/15/2037 | | | | | | 500,000 | | | | | 605,481 | |
Weatherford International, Ltd.,
4.95%, 10/15/2013 | | | | | | 750,000 | | | | | 779,228 | |
Willis North America, Inc.,
6.20%, 3/28/2017 | | | | | | 750,000 | | | | | 855,541 | |
| | | | | | | | | | | | |
Total Corporate Bonds
(Cost $26,215,677) | | | | | | | | | | $ | 28,075,322 | |
| | | | | | | | | | | | |
U.S. GOVERNMENT & AGENCY OBLIGATIONS – 61.0% | | | | | | | | | | | | |
GOVERNMENT NOTES & BONDS – 27.2% | | | | | | | | | | | | |
Federal Farm Credit Bank,
4.875%, 1/17/2017 | | | | | | 1,500,000 | | | | | 1,771,745 | |
Federal Farm Credit Bank,
5.125%, 8/25/2016 | | | | | | 2,500,000 | | | | | 2,939,627 | |
Federal Home Loan Bank,
5.00%, 11/17/2017 | | | | | | 1,000,000 | | | | | 1,211,964 | |
Federal Home Loan Bank,
5.50%, 8/13/2014 | | | | | | 1,500,000 | | | | | 1,649,016 | |
U.S. Treasury Bond,
4.50%, 2/15/2036 | | | | | | 3,000,000 | | | | | 4,007,578 | |
U.S. Treasury Bond,
5.00%, 5/15/2037 | | | | | | 1,000,000 | | | | | 1,432,188 | |
U.S. Treasury Note,
3.125%, 5/15/2021 | | | | | | 5,000,000 | | | | | 5,717,969 | |
U.S. Treasury Note,
3.875%, 5/15/2018 | | | | | | 2,000,000 | | | | | 2,345,470 | |
U.S. Treasury Note,
4.75%, 5/15/2014 | | | | | | 1,550,000 | | | | | 1,663,465 | |
| | | | | | | | | | | | |
Total Government Notes & Bonds
(Cost $21,182,752) | | | | | | | | | | $ | 22,739,022 | |
| | | | | | | | | | | | |
GOVERNMENT MORTGAGE-BACKED SECURITIES – 29.5% | | | | | | | | | | | | |
GNMA Pool 3584,
6.00%, 7/20/2034 | | | | | | 77,185 | | | | | 89,339 | |
GNMA Pool 3612,
6.50%, 9/20/2034 | | | | | | 178,647 | | | | | 207,881 | |
GNMA Pool 3625,
6.00%, 10/20/2034 | | | | | | 563,434 | | | | | 642,063 | |
GNMA Pool 3637,
5.50%, 11/20/2034 | | | | | | 226,027 | | | | | 253,711 | |
GNMA Pool 3665,
5.50%, 1/20/2035 | | | | | | 357,810 | | | | | 401,636 | |
| | |
| Timothy Plan Family of Funds | | Fixed Income (Continued) |
| | |
Schedule of Investments | | As of September 30, 2012 |
| | | | | | | | | | | | |
| Bonds and Notes (Continued) | | | | Par
Value | | Fair
Value |
GOVERNMENT MORTGAGE-BACKED SECURITIES (continued) | | | | | | | | | | | | |
GNMA Pool 3679,
6.00%, 2/20/2035 | | | | | $ | 185,108 | | | | $ | 210,940 | |
GNMA Pool 3711,
5.50%, 5/20/2035 | | | | | | 453,421 | | | | | 508,108 | |
GNMA Pool 3865,
6.00%, 6/20/2036 | | | | | | 385,904 | | | | | 437,347 | |
GNMA Pool 3910,
6.00%, 10/20/2036 | | | | | | 279,545 | | | | | 316,809 | |
GNMA Pool 3939,
5.00%, 1/20/2037 | | | | | | 498,949 | | | | | 553,844 | |
GNMA Pool 4058,
5.00%, 12/20/2037 | | | | | | 620,118 | | | | | 688,345 | |
GNMA Pool 4072,
5.50%, 1/20/2038 | | | | | | 669,553 | | | | | 746,959 | |
GNMA Pool 4520,
5.00%, 8/20/2039 | | | | | | 1,882,784 | | | | | 2,091,109 | |
GNMA Pool 4541,
5.00%, 9/20/2039 | | | | | | 1,173,712 | | | | | 1,303,581 | |
GNMA Pool 4947,
5.00%, 2/20/2041 | | | | | | 2,050,641 | | | | | 2,281,384 | |
GNMA Pool 5204,
4.50%, 10/20/2041 | | | | | | 840,716 | | | | | 931,186 | |
GNMA Pool 783060,
4.00%, 8/15/2040 | | | | | | 1,718,385 | | | | | 1,899,467 | |
GNMA Pool 585163,
5.00%, 2/15/2018 | | | | | | 24,250 | | | | | 26,689 | |
GNMA Pool 585180,
5.00%, 2/15/2018 | | | | | | 23,005 | | | | | 25,318 | |
GNMA Pool 592492,
5.00%, 3/15/2018 | | | | | | 15,000 | | | | | 16,508 | |
GNMA Pool 599821,
5.00%, 1/15/2018 | | | | | | 20,161 | | | | | 21,666 | |
GNMA Pool 604182,
5.50%, 4/15/2033 | | | | | | 351,472 | | | | | 393,541 | |
GNMA Pool 663776,
6.50%, 1/15/2037 | | | | | | 204,699 | | | | | 237,076 | |
GNMA Pool 701961,
4.50%, 6/15/2039 | | | | | | 2,866,892 | | | | | 3,164,692 | |
GNMA Pool 717072,
5.00%, 5/15/2039 | | | | | | 1,216,962 | | | | | 1,346,699 | |
| | | | | | | | | | | | |
| Bonds and Notes (Continued) | | | | Par
Value | | Fair
Value |
GOVERNMENT MORTGAGE-BACKED SECURITIES (continued) | | | | | | | | | | | | |
GNMA Pool 734437,
4.50%, 5/15/2041 | | | | | $ | 765,419 | | | | $ | 843,584 | |
GNMA Pool 781694,
6.00%, 12/15/2031 | | | | | | 77,892 | | | | | 88,727 | |
GNMA Pool MA0155,
4.00%, 6/20/2042 | | | | | | 3,652,854 | | | | | 4,025,967 | |
GNMA Pool 782858,
5.00%, 09/20/2041 | | | | | | 874,149 | | | | | 968,732 | |
| | | | | | | | | | | | |
Total Government Mortgage-Backed Securities
(Cost $23,424,294) | | | | | | | | | | $ | 24,722,908 | |
| | | | | | | | | | | | |
TREASURY INFLATION PROTECTED
SECURITIES (TIPS) – 4.3% | | | | | | | | | | | | |
TIPS,
2.00%, 1/15/2014 | | | | | | 1,250,000 | | | | | 1,619,149 | |
TIPS,
2.50%, 7/15/2016 | | | | | | 1,500,000 | | | | | 1,975,738 | |
| | | | | | | | | | | | |
Total Treasury Inflation Protected Securities (TIPS)
(Cost $3,271,730) | | | | | | | | | | $ | 3,594,887 | |
| | | | | | | | | | | | |
Total U.S. Government & Agency Obligations
(Cost $47,878,776) | | | | | | | | | | $ | 51,056,817 | |
| | | | | | | | | | | | |
Total Bonds And Notes
(Cost $74,094,453) | | | | | | | | | | $ | 79,132,139 | |
| | | | | | | | | | | | |
| | | |
| Money Market Fund – 4.7% | | | | Shares | | Fair
Value |
Fidelity Institutional Money Market Portfolio, 0.11%
(Cost $3,930,701) | | (B) | | | | 3,930,701 | | | | $ | 3,930,701 | |
| | | | | | | | | | | | |
Total Investments
(Cost $78,025,154) – 99.3% | | (C) | | | | | | | | $ | 83,062,840 | |
Assets in Excess of Other
Liabilities – 0.7% | | | | | | | | | | | 618,924 | |
| | | | | | | | | | | | |
Net Assets – 100.00% | | | | | | | | | | $ | 83,681,764 | |
| | | | | | | | | | | | |
| (A) | 144A Security – Security exempt from registration under Rule 144A of the Securities Act of 1933. The 144A securities represent 1.27% of total net assets. The securities may be resold in transactions exempt from registration typically only to qualified institutional buyers. Unless otherwise indicated, these securities are not considered to be illiquid. |
| (B) | Variable rate security; the rate shown represents the yield at September 30, 2012. |
| (C) | Represents cost for financial reporting purposes. Aggregate cost for federal tax purposes is substantially the same and differs from fair value by net unrealized appreciation (depreciation) of securities as follows: |
| | | | | |
Unrealized appreciation | | | $ | 5,108,747 | |
Unrealized depreciation | | | | (71,061 | ) |
| | | | | |
Net unrealized appreciation | | | $ | 5,037,686 | |
| | | | | |
The accompanying notes are an integral part of these financial statements.
[41]
| | |
| Timothy Plan Family of Funds | | High Yield Bond |
| | |
Schedule of Investments | | As of September 30, 2012 |
| | | | | | | | | | | | |
| Corporate Bonds – 94.9% | | | | Par
Value | | Fair
Value |
Actuant Corp.,
5.625%, 6/15/2022 | | | | | $ | 500,000 | | | | $ | 516,875 | |
AmeriGas Partners LP,
7.00%, 5/20/2022 | | | | | | 500,000 | | | | | 540,000 | |
Anixter, Inc.,
5.625%, 5/01/2019 | | | | | | 500,000 | | | | | 523,125 | |
Arch Coal Inc.,
7.25%, 6/15/2021 | | | | | | 500,000 | | | | | 419,375 | |
ArcelorMittal,
6.50%, 2/25/2022 | | | | | | 500,000 | | | | | 493,340 | |
Atlas Pipeline Partners LP,
6.625%, 10/01/2020 | | (A) | | | | 100,000 | | | | | 101,250 | |
Audatex North America, Inc.,
6.75%, 06/15/2018 | | (A) | | | | 500,000 | | | | | 533,750 | |
Basic Energy Services, Inc.,
7.75%, 2/15/2019 | | | | | | 500,000 | | | | | 516,875 | |
Biomet, Inc.,
6.50%, 8/01/2020 | | (A) | | | | 450,000 | | | | | 467,437 | |
Calfrac Holdings LP,
7.50%, 12/01/2020 | | (A) | | | | 500,000 | | | | | 497,500 | |
Calumet Specialty Product Partners,
9.375%, 5/01/2019 | | | | | | 500,000 | | | | | 540,000 | |
Cemex Finance LLC,
9.50%, 12/14/2016 | | (A) | | | | 500,000 | | | | | 518,750 | |
CIT Group, Inc.,
4.25%, 8/15/2017 | | | | | | 500,000 | | | | | 521,390 | |
Cloud Peak Energy Resources LLC,
8.50%, 12/15/2019 | | | | | | 500,000 | | | | | 552,500 | |
CommScope, Inc.,
8.25%, 1/15/2019 | | (A) | | | | 500,000 | | | | | 538,750 | |
Comstock Resources, Inc.,
8.375%, 10/15/2017 | | | | | | 500,000 | | | | | 522,500 | |
Copano Energy Finance Corp.,
7.75%, 6/01/2018 | | | | | | 500,000 | | | | | 527,500 | |
Crosstex Energy LP,
8.875%, 2/15/2018 | | | | | | 500,000 | | | | | 535,937 | |
Energy Transfer Equity LP,
7.50%, 10/15/2020 | | | | | | 500,000 | | | | | 570,000 | |
EV Energy Partners/Fin,
8.00%, 4/15/2019 | | | | | | 500,000 | | | | | 522,500 | |
FMG Resources August 2006 Pty, Ltd.,
7.00%, 11/01/2015 | | (A) | | | | 500,000 | | | | | 500,000 | |
Forest Oil Corp.,
7.25%, 6/15/2019 | | | | | | 500,000 | | | | | 498,750 | |
FTS International Services LLC,
8.125%, 11/15/2018 | | (A) | | | | 500,000 | | | | | 535,000 | |
General Cable Corp.,
5.75%, 10/01/2022 | | (A) | | | | 250,000 | | | | | 253,125 | |
Genesis Energy LP,
7.875%, 12/15/2018 | | | | | | 750,000 | | | | | 798,750 | |
Geo Group, Inc.,
6.625%, 2/15/2021 | | | | | | 500,000 | | | | | 537,500 | |
Helix Energy Solutions Group, Inc.,
9.50%, 1/15/2016 | | (A) | | | | 289,000 | | | | | 302,005 | |
| | | | | | | | | | | | |
| Corporate Bonds (Continued) | | | | Par
Value | | Fair
Value |
Hologic, Inc.,
6.25%, 8/01/2020 | | (A) | | | $ | 500,000 | | | | $ | 532,500 | |
Hypermarcas SA,
6.50%, 4/20/2021 | | (A) | | | | 500,000 | | | | | 529,150 | |
Intergen NV,
9.00%, 6/30/2017 | | (A) | | | | 500,000 | | | | | 483,750 | |
Iron Mountain,
7.75%, 10/01/2019 | | | | | | 500,000 | | | | | 564,375 | |
Jabil Circuit, Inc.,
4.70%, 9/15/2022 | | | | | | 500,000 | | | | | 500,000 | |
Jaguar Land Rover PLC,
8.125%, 5/15/2021 | | (A) | | | | 500,000 | | | | | 541,250 | |
Kindred Healthcare,
8.25%, 6/01/2019 | | | | | | 500,000 | | | | | 490,000 | |
LyondellBasell Industries NV,
5.75%, 4/15/2024 | | | | | | 500,000 | | | | | 570,000 | |
Macquarie Bank, Ltd.,
6.625%, 4/07/2021 | | (A) | | | | 500,000 | | | | | 535,924 | |
MarkWest Energy Partners L.P.,
6.75%, 11/01/2020 | | | | | | 500,000 | | | | | 543,750 | |
Masco Corp.,
5.95%, 3/15/2022 | | | | | | 500,000 | | | | | 548,756 | |
Mcron Finance Sub LLC,
8.375%, 5/15/2019 | | (A) | | | | 500,000 | | | | | 515,000 | |
MedAssets, Inc.,
8.00%, 11/15/2018 | | | | | | 500,000 | | | | | 547,500 | |
MPT Operating Partnership LP,
6.875%, 5/01/2021 | | | | | | 500,000 | | | | | 547,500 | |
Navios Maritime Holdings, Inc.,
8.875%, 11/01/2017 | | | | | | 500,000 | | | | | 515,625 | |
Navistar International Corp.,
8.25%, 11/01/2021 | | | | | | 449,000 | | | | | 428,234 | |
NCR Corp.,
5.00%, 7/15/2022 | | (A) | | | | 250,000 | | | | | 252,500 | |
NRG Energy, Inc.,
7.625%, 1/15/2018 | | | | | | 500,000 | | | | | 543,750 | |
OGX Austria GmbH,
8.375%, 4/01/2022 | | (A) | | | | 500,000 | | | | | 436,875 | |
Omnicare, Inc.,
7.75%, 6/01/2020 | | | | | | 500,000 | | | | | 552,500 | |
PolyOne Corp.,
7.375%, 9/15/2020 | | | | | | 500,000 | | | | | 543,750 | |
Polypore International, Inc.,
7.50%, 11/15/2017 | | | | | | 250,000 | | | | | 270,625 | |
QBE Capital Funding III Ltd.,
7.25%, 5/24/2041 | | (A) | | | | 500,000 | | | | | 507,056 | |
R R Donnelley & Sons Co.,
7.25%, 5/15/2018 | | | | | | 250,000 | | | | | 249,375 | |
Resolute Energy Corp.,
8.50%, 5/01/2020 | | (A) | | | | 500,000 | | | | | 513,125 | |
Reynolds Group Issuer, Inc.,
9.00%, 4/15/2019 | | | | | | 500,000 | | | | | 512,500 | |
Sabra Health Care LP,
8.125%, 11/01/2018 | | (A) | | | | 500,000 | | | | | 547,500 | |
| | |
| Timothy Plan Family of Funds | | High Yield Bond (Continued) |
| | |
Schedule of Investments | | As of September 30, 2012 |
| | | | | | | | | | | | |
| Corporate Bonds (Continued) | | | | Par
Value | | Fair
Value |
Samson Investment Co.,
9.75%, 2/15/2020 | | (A) | | | $ | 500,000 | | | | $ | 515,625 | |
Sanmina-SCI Corp.,
7.00%, 5/15/2019 | | (A) | | | | 500,000 | | | | | 507,500 | |
Schaeffler Finance BV,
8.50%, 2/15/2019 | | (A) | | | | 500,000 | | | | | 562,500 | |
Sealy Mattress Co.,
8.25%, 6/15/2014 | | | | | | 500,000 | | | | | 508,125 | |
Servicemaster Co.,
8.00%, 2/15/2020 | | | | | | 500,000 | | | | | 532,500 | |
Suncoke Energy,
7.625%, 8/1/2019 | | | | | | 500,000 | | | | | 510,000 | |
Targa Resources Partners LP,
7.875%, 10/15/2018 | | | | | | 500,000 | | | | | 550,000 | |
Tesoro Corp.,
5.375%, 10/01/2022 | | | | | | 500,000 | | | | | 513,750 | |
Tesoro Logistics LP,
5.875%, 10/01/2020 | | (A) | | | | 250,000 | | | | | 256,875 | |
United Rentals North America, Inc.,
9.25%, 12/15/2019 | | | | | | 500,000 | | | | | 566,250 | |
| | | | | | | | | | | | |
| Corporate Bonds (Continued) | | | | Par
Value | | Fair
Value |
United States Steel Corp.,
7.50%, 3/15/2022 | | | | | $ | 500,000 | | | | $ | 496,250 | |
USG Corp.,
9.75%, 1/15/2018 | | | | | | 500,000 | | | | | 542,500 | |
Vanguard Health Holding Co., LLC,
7.75%, 02/01/2019 | | | | | | 500,000 | | | | | 534,375 | |
| | | | | | | | | | | | |
Total Corporate Bonds
(Cost $32,070,585) | | | | | | | | | | $ | 33,303,604 | |
| | | | | | | | | | | | |
| | | |
| Money Market Fund – 3.6% | | | | Shares | | Fair
Value |
Fidelity Institutional Money Market Portfolio, 0.11%
(Cost $1,248,011) | | (B) | | | | 1,248,011 | | | | $ | 1,248,011 | |
| | | | | | | | | | | | |
Total Investments
(Cost $33,318,596) – 98.5% | | (C) | | | | | | | | $ | 34,551,615 | |
Assets in Excess of Other
Liabilities – 1.5% | | | | | | | | | | | 523,341 | |
| | | | | | | | | | | | |
Net Assets – 100.00% | | | | | | | | | | $ | 35,074,956 | |
| | | | | | | | | | | | |
| (A) | 144A Security – Security exempt from registration under Rule 144A of the Securities Act of 1933. The 144A securities represent 32.7% of total net assets. The securities may be resold in transactions exempt from registration typically only to qualified institutional buyers. Unless otherwise indicated, these securities are not considered to be illiquid. |
| (B) | Variable rate security; the rate shown represents the yield at September 30, 2012. |
| (C) | Represents cost for financial reporting purposes. Aggregate cost for federal tax purposes is substantially the same and differs from fair value by net unrealized appreciation (depreciation) of securities as follows: |
| | | | | |
Unrealized appreciation | | | $ | 1,448,179 | |
Unrealized depreciation | | | | (215,160 | ) |
| | | | | |
Net unrealized appreciation | | | $ | 1,233,019 | |
| | | | | |
The accompanying notes are an integral part of these financial statements.
[43]
| | |
| Timothy Plan Family of Funds | | Israel Common Values |
| | |
Schedule of Investments | | As of September 30, 2012 |
| | | | | | | | | | | | |
| Common Stocks – 93.6% | | | | Shares | | Fair
Value |
AEROSPACE/DEFENSE – 3.1% | | | | | | | | | | | | |
Elbit Systems, Ltd. | | | | | | 7,501 | | | | $ | 255,334 | |
| | | | | | | | | | | | |
BANKS – 7.7% | | | | | | | | | | | | |
Bank Hapoalim BM (ADR) | | * | | | | 14,000 | | | | | 248,500 | |
Bank Leumi Le-Israel BM | | * | | | | 55,000 | | | | | 153,561 | |
First International Bank of Israel BM | | * | | | | 19,300 | | | | | 226,764 | |
| | | | | | | | | | | | |
| | | | | | | | | | | 628,825 | |
| | | | | | | | | | | | |
BIOTECHNOLOGY – 3.8% | | | | | | | | | | | | |
PROLOR Biotech, Inc. | | * | | | | 21,000 | | | | | 101,850 | |
Protalix BioTherapeutics, Inc. | | * | | | | 40,000 | | | | | 207,200 | |
| | | | | | | | | | | | |
| | | | | | | | | | | 309,050 | |
| | | | | | | | | | | | |
CHEMICALS – 6.0% | | | | | | | | | | | | |
Frutarom Industries, Ltd. | | | | | | 23,000 | | | | | 226,135 | |
Israel Chemicals, Ltd. (ADR) | | | | | | 22,000 | | | | | 271,480 | |
| | | | | | | | | | | | |
| | | | | | | | | | | 497,615 | |
| | | | | | | | | | | | |
COMMERCIAL SERVICES – 2.4% | | | | | | | | | | | | |
Nitsba Holdings, Ltd. | | * | | | | 25,000 | | | | | 197,991 | |
| | | | | | | | | | | | |
ELECTRONICS – 1.7% | | | | | | | | | | | | |
Ituran Location and Control, Ltd. | | | | | | 12,296 | | | | | 143,371 | |
| | | | | | | | | | | | |
ENERGY-ALTERNATE SOURCES – 2.8% | | | | | | | | | | | | |
Ormat Industries, Ltd. | | | | | | 47,300 | | | | | 227,823 | |
| | | | | | | | | | | | |
FOOD – 5.6% | | | | | | | | | | | | |
Osem Investments, Ltd. | | | | | | 15,000 | | | | | 206,380 | |
Rami Levi Chain Stores | | | | | | 8,200 | | | | | 250,899 | |
| | | | | | | | | | | | |
| | | | | | | | | | | 457,279 | |
| | | | | | | | | | | | |
HEALTHCARE PRODUCTS – 4.3% | | | | | | | | | | | | |
Given Imaging , Ltd. | | * | | | | 15,000 | | | | | 218,550 | |
Syneron Medical, Ltd. | | * | | | | 14,000 | | | | | 136,500 | |
| | | | | | | | | | | | |
| | | | | | | | | | | 355,050 | |
| | | | | | | | | | | | |
HOME BUILDERS – 3.0% | | | | | | | | | | | | |
Bayside Land Corp., Ltd. | | | | | | 1,300 | | | | | 245,223 | |
| | | | | | | | | | | | |
HOUSEHOLD PRODUCTS/WARES – 2.4% | | | | | | | | | | | | |
SodaStream International, Ltd. | | * | | | | 5,100 | | | | | 199,767 | |
| | | | | | | | | | | | |
INTERNET – 2.3% | | | | | | | | | | | | |
MagicJack VocalTec, Ltd. | | * | | | | 7,600 | | | | | 186,428 | |
| | | | | | | | | | | | |
OIL & NATURAL GAS – 8.8% | | | | | | | | | | | | |
Isramco Negev 2 LP | | * | | | | 1,786,664 | | | | | 220,491 | |
Noble Energy, Inc. | | | | | | 3,000 | | | | | 278,130 | |
Paz Oil Co., Ltd. | | | | | | 1,900 | | | | | 226,678 | |
| | | | | | | | | | | | |
| | | | | | | | | | | 725,299 | |
| | | | | | | | | | | | |
PHARMACEUTICALS – 1.0% | | | | | | | | | | | | |
Pluristem Therapeutics, Inc. | | * | | | | 20,200 | | | | | 79,588 | |
| | | | | | | | | | | | |
| | | | | | | | | | | | |
| Common Stocks (Continued) | | | | Shares | | Fair
Value |
REAL ESTATE – 13.7% | | | | | | | | | | | | |
Amot Investments, Ltd. | | | | | | 104,000 | | | | $ | 231,553 | |
Azrieli Group | | | | | | 4,500 | | | | | 93,341 | |
Gazit-Globe, Ltd. | | | | | | 22,000 | | | | | 239,919 | |
Industrial Buildings Corp. | | * | | | | 120,000 | | | | | 141,972 | |
Jerusalem Economy, Ltd. | | * | | | | 40,000 | | | | | 181,239 | |
Melisron, Ltd. | | | | | | 14,366 | | | | | 238,162 | |
| | | | | | | | | | | | |
| | | | | | | | | | | 1,126,186 | |
| | | | | | | | | | | | |
SEMICONDUCTORS – 6.2% | | | | | | | | | | | | |
Mellanox Technologies, Ltd. | | * | | | | 4,000 | | | | | 406,120 | |
Nova Measuring Instruments, Ltd. | | * | | | | 13,000 | | | | | 101,400 | |
| | | | | | | | | | | | |
| | | | | | | | | | | 507,520 | |
| | | | | | | | | | | | |
SOFTWARE – 7.6% | | | | | | | | | | | | |
Check Point Software Technologies, Ltd. | | * | | | | 4,400 | | | | | 211,904 | |
Magic Software Enterprises, Ltd. | | | | | | 40,600 | | | | | 178,640 | |
RADWARE, Ltd. | | * | | | | 6,500 | | | | | 234,130 | |
| | | | | | | | | | | | |
| | | | | | | | | | | 624,674 | |
| | | | | | | | | | | | |
TELECOMMUNICATIONS – 11.2% | | | | | | | | | | | | |
Allot Communications, Ltd. | | * | | | | 9,380 | | | | | 248,758 | |
Ceragon Networks, Ltd. | | * | | | | 26,600 | | | | | 151,620 | |
EZChip Semiconductor, Ltd. | | * | | | | 3,200 | | | | | 97,888 | |
Gilat Satellite Networks, Ltd. | | * | | | | 51,080 | | | | | 203,298 | |
NICE Systems, Ltd. (ADR) | | * | | | | 6,500 | | | | | 215,930 | |
| | | | | | | | | | | | |
| | | | | | | | | | | 917,494 | |
| | | | | | | | | | | | |
Total Common Stocks
(Cost $7,599,643) | | | | | | | | | | $ | 7,684,517 | |
| | | | | | | | | | | | |
| | | |
| Investment Companies – 3.1% | | | | Shares | | Fair
Value |
The Israel Corp., Ltd.
(Cost – $239,420) | | | | | | 400 | | | | $ | 253,755 | |
| | | | | | | | | | | | |
| | | |
| Warrants – 0.0% | | | | Shares | | Fair
Value |
Isramco Negev 2 LP, 10/17/12
(Cost – $0) | | * | | | | 64,998 | | | | $ | 166 | |
| | | | | | | | | | | | |
| | | |
| Money Market Fund – 1.9% | | | | Shares | | Fair
Value |
Fidelity Institutional Money Market
Portfolio, 0.11%
(Cost $157,639) | | (A) | | | | 157,639 | | | | $ | 157,639 | |
| | | | | | | | | | | | |
Total Investments
(Cost $7,996,702) – 98.6% | | (B) | | | | | | | | $ | 8,096,077 | |
Assets in Excess of Other
Liabilities – 1.4% | | | | | | | | | | | 104,641 | |
| | | | | | | | | | | | |
Net Assets – 100.00% | | | | | | | | | | $ | 8,200,718 | |
| | | | | | | | | | | | |
| | |
| Timothy Plan Family of Funds | | Israel Common Values (Continued) |
| | |
Schedule of Investments | | As of September 30, 2012 |
The accompanying notes are an integral part of these financial statements.
| * | Non-income producing securities. |
| (ADR) | American Depositary Receipt. |
| (A) | Variable rate security; the rate shown represents the yield at September 30, 2012. |
| (B) | Represents cost for financial reporting purposes. Aggregate cost for federal tax purposes is $8,034,036 and differs from fair value by net unrealized appreciation (depreciation) of securities as follows: |
| | | | | |
Unrealized appreciation | | | $ | 653,050 | |
Unrealized depreciation | | | | (591,009 | ) |
| | | | | |
Net unrealized appreciation | | | $ | 62,041 | |
| | | | | |
[45]
| | |
| Timothy Plan Family of Funds | | Defensive Strategies |
| | |
Schedule of Investments | | As of September 30, 2012 |
| | | | | | | | | | | | |
| Common Stocks – 32.1% | | | | Shares | | Fair
Value |
AGRICULTURE – 0.4% | | | | | | | | | | | | |
Bunge, Ltd. | | | | | | 3,911 | | | | $ | 262,233 | |
| | | | | | | | | | | | |
CHEMICALS – 12.4% | | | | | | | | | | | | |
Agrium, Inc. | | | | | | 10,425 | | | | | 1,078,570 | |
CF Industries Holdings, Inc. | | | | | | 4,260 | | | | | 946,742 | |
Intrepid Potash, Inc. | | * | | | | 6,407 | | | | | 137,622 | |
K+S AG | | | | | | 12,683 | | | | | 626,805 | |
Mosaic Co. | | | | | | 18,923 | | | | | 1,090,154 | |
Potash Corp. Of Saskatchewan, Inc. | | | | | | 49,922 | | | | | 2,167,613 | |
Sociedad Quimica y Minera de Chile SA | | | | | | 2,717 | | | | | 167,476 | |
Syngenta AG (ADR) | | | | | | 26,509 | | | | | 1,984,199 | |
Uralkali OJSC | | | | | | 15,906 | | | | | 658,031 | |
| | | | | | | | | | | | |
| | | | | | | | | | | 8,857,212 | |
| | | | | | | | | | | | |
COAL – 0.0% | | | | | | | | | | | | |
Peabody Energy Corp. | | | | | | 1,387 | | | | | 30,916 | |
| | | | | | | | | | | | |
FOOD – 0.4% | | | | | | | | | | | | |
Ingredion, Inc. | | | | | | 4,599 | | | | | 253,681 | |
| | | | | | | | | | | | |
IRON/STEEL – 0.7% | | | | | | | | | | | | |
Allegheny Technologies, Inc. | | | | | | 556 | | | | | 17,736 | |
ArcelorMittal – NY Registered Shares | | | | | | 4,696 | | | | | 67,810 | |
Cliffs Natural Resources, Inc. | | | | | | 1,326 | | | | | 51,886 | |
Gerdau SA – (ADR) | | | | | | 1,948 | | | | | 18,526 | |
JFE Holdings, Inc. | | | | | | 1 | | | | | 13 | |
Nippon Steel & Sumitomo Metal Corp. | | | | | | 14,829 | | | | | 30,492 | |
Nucor Corp. | | | | | | 1,434 | | | | | 54,865 | |
POSCO (ADR) | | | | | | 1,401 | | | | | 114,238 | |
ThyssenKrupp AG | | | | | | 2,358 | | | | | 50,175 | |
United States Steel Corp. | | | | | | 1,491 | | | | | 28,433 | |
Vale SA (ADR) | | | | | | 5,796 | | | | | 103,749 | |
| | | | | | | | | | | | |
| | | | | | | | | | | 537,923 | |
| | | | | | | | | | | | |
MACHINERY – 0.4% | | | | | | | | | | | | |
AGCO Corp. (ADR) | | * | | | | 5,472 | | | | | 259,811 | |
CNH Global NV | | * | | | | 1,046 | | | | | 40,553 | |
| | | | | | | | | | | | |
| | | | | | | | | | | 300,364 | |
| | | | | | | | | | | | |
MINING – 6.3% | | | | | | | | | | | | |
Agnico-Eagle Mines, Ltd. | | | | | | 1,562 | | | | | 81,037 | |
Allied Nevada Gold Corp. | | * | | | | 714 | | | | | 27,889 | |
Anglo American PLC | | | | | | 7,252 | | | | | 212,767 | |
AngloGold Ashanti, Ltd. (ADR) | | | | | | 4,288 | | | | | 150,294 | |
Antofagasta PLC | | | | | | 2,159 | | | | | 43,995 | |
Barrick Gold Corp | | | | �� | | 1,988 | | | | | 83,019 | |
BHP Billiton PLC (ADR) | | | | | | 3,127 | | | | | 195,312 | |
Cameco Corp. | | | | | | 1,675 | | | | | 32,579 | |
Cia de Minas Buenaventura SA | | | | | | 5,857 | | | | | 228,189 | |
Coeur d’Alene Mines Corp. | | * | | | | 1,753 | | | | | 50,539 | |
Detour Gold Corp. | | * | | | | 2,776 | | | | | 77,392 | |
Eldorado Gold Corp. | | | | | | 4,823 | | | | | 73,503 | |
Freeport-McMoRan Copper & Gold, Inc. | | | | | | 4,064 | | | | | 160,853 | |
Glencore International PLC | | | | | | 17,185 | | | | | 95,206 | |
Gold Fields, Ltd. (ADR) | | | | | | 19,825 | | | | | 254,751 | |
Goldcorp, Inc. | | | | | | 8,763 | | | | | 401,784 | |
Harmony Gold Mining Co., Ltd. (ADR) | | | | | | 7,086 | | | | | 59,593 | |
| | | | | | | | | | | | |
| Common Stocks (Continued) | | | | Shares | | Fair
Value |
MINING (continued) | | | | | | | | | | | | |
Hecla Mining Co. | | | | | | 7,246 | | | | $ | 47,461 | |
IAMGOLD Corp. | | | | | | 1,693 | | | | | 26,766 | |
Inmet Mining Corp. | | | | | | 2,755 | | | | | 133,228 | |
Kazakhmys PLC | | | | | | 549 | | | | | 6,138 | |
Kinross Gold Corp. | | | | | | 20,665 | | | | | 210,990 | |
MMC Norilsk Nickel OJSC | | | | | | 17,470 | | | | | 276,201 | |
New Gold, Inc. | | * | | | | 5,033 | | | | | 61,503 | |
Newmont Mining Corp. | | | | | | 5,078 | | | | | 284,419 | |
Osisko Mining Corp. | | * | | | | 4,603 | | | | | 46,390 | |
Pan American Silver Corp. | | | | | | 6,990 | | | | | 149,935 | |
Randgold Resources, Ltd. (ADR) | | | | | | 415 | | | | | 51,043 | |
Rio Tinto PLC (ADR) | | | | | | 3,816 | | | | | 178,436 | |
Royal Gold, Inc. | | | | | | 708 | | | | | 70,701 | |
Silver Wheaton Corp. | | | | | | 6,287 | | | | | 249,657 | |
Southern Copper Corp. | | | | | | 1,110 | | | | | 38,140 | |
Sterlite Industries India, Ltd. | | | | | | 2,071 | | | | | 15,719 | |
Teck Resources, Ltd. | | | | | | 2,275 | | | | | 66,999 | |
Turquoise Hill Resources, Ltd. | | * | | | | 6,071 | | | | | 51,482 | |
Xstrata PLC | | | | | | 9,696 | | | | | 149,907 | |
Yamana Gold, Inc. | | | | | | 7,817 | | | | | 149,383 | |
| | | | | | | | | | | | |
| | | | | | | | | | | 4,493,200 | |
| | | | | | | | | | | | |
OIL & GAS – 10.0% | | | | | | | | | | | | |
Anadarko Petroleum Corp. | | | | | | 3,441 | | | | | 240,595 | |
Apache Corp. | | | | | | 3,459 | | | | | 299,100 | |
BG Group PLC | | | | | | 23,465 | | | | | 473,612 | |
Canadian Natural Resources, Ltd. | | | | | | 2,950 | | | | | 90,830 | |
Chesapeake Energy Corp. | | | | | | 5,758 | | | | | 108,653 | |
ConocoPhillips | | | | | | 5,151 | | | | | 294,534 | |
Devon Energy Corp. | | | | | | 2,800 | | | | | 169,400 | |
EOG Resources, Inc. | | | | | | 1,642 | | | | | 183,986 | |
Encana Corp. | | | | | | 3,847 | | | | | 84,326 | |
Ensco PLC | | | | | | 1,360 | | | | | 74,202 | |
Exxon Mobil Corp. | | | | | | 27,522 | | | | | 2,516,887 | |
Inpex Corp. | | | | | | 24 | | | | | 143,580 | |
Lukoil OAO | | | | | | 5,077 | | | | | 312,743 | |
Marathon Oil Corp. | | | | | | 5,994 | | | | | 177,243 | |
Noble Energy, Inc. | | | | | | 442 | | | | | 40,978 | |
NovaTek OAO | | | | | | 506 | | | | | 59,860 | |
Occidental Petroleum Corp. | | | | | | 5,594 | | | | | 481,420 | |
Petroleo Brasileiro SA (ADR) | | | | | | 7,286 | | | | | 167,104 | |
Pioneer Natural Resources Co. | | | | | | 620 | | | | | 64,728 | |
Reliance Industries, Ltd. | | | | | | 5,915 | | | | | 186,204 | |
Total SA | | | | | | 14,122 | | | | | 701,283 | |
Transocean, Ltd. | | | | | | 3,281 | | | | | 147,284 | |
Valero Energy Corp. | | | | | | 3,007 | | | | | 95,262 | |
| | | | | | | | | | | | |
| | | | | | | | | | | 7,113,814 | |
| | | | | | | | | | | | |
OIL & GAS SERVICES – 0.9% | | | | | | | | | | | | |
Baker Hughes, Inc. | | | | | | 3,994 | | | | | 180,649 | |
Cameron International Corp. | | * | | | | 341 | | | | | 19,120 | |
Halliburton Co. | | | | | | 6,568 | | | | | 221,276 | |
National Oilwell Varco, Inc. | | | | | | 2,542 | | | | | 203,640 | |
| | | | | | | | | | | | |
| | | | | | | | | | | 624,685 | |
| | | | | | | | | | | | |
| | |
| Timothy Plan Family of Funds | | Defensive Strategies (Continued) |
| | |
Schedule of Investments | | As of September 30, 2012 |
| | | | | | | | | | | | |
| Common Stocks (Continued) | | | | Shares | | Fair
Value |
PIPELINES – 0.4% | | | | | | | | | | | | |
Kinder Morgan, Inc. | | | | | | 1,805 | | | | $ | 64,114 | |
TransCanada Corp. | | | | | | 5,071 | | | | | 230,589 | |
| | | | | | | | | | | | |
| | | | | | | | | | | 294,703 | |
| | | | | | | | | | | | |
TRANSPORTATION – 0.2% | | | | | | | | | | | | |
Viterra, Inc. | | | | | | 6,767 | | | | | 110,800 | |
| | | | | | | | | | | | |
Total Common Stocks
(Cost $20,878,128) | | | | | | | | | | $ | 22,879,531 | |
| | | | | | | | | | | | |
| | | |
| REITs – 14.8% | | | | Shares | | Fair
Value |
Acadia Realty Trust | | | | | | 2,800 | | | | $ | 69,496 | |
Apartment Investment & Management Co. | | | | | | 2,200 | | | | | 57,178 | |
AvalonBay Communities, Inc. | | | | | | 2,450 | | | | | 333,175 | |
Boston Properties, Inc. | | | | | | 4,800 | | | | | 530,928 | |
Brandywine Realty Trust | | | | | | 5,900 | | | | | 71,921 | |
BRE Properties, Inc. | | | | | | 3,000 | | | | | 140,670 | |
Camden Property Trust | | | | | | 2,100 | | | | | 135,429 | |
CBL & Associates Properties, Inc. | | | | | | 7,200 | | | | | 153,648 | |
Colonial Properties Trust | | | | | | 6,500 | | | | | 136,825 | |
DDR Corp. | | | | | | 17,400 | | | | | 267,264 | |
DiamondRock Hospitality Co. | | | | | | 22,200 | | | | | 213,786 | |
Digital Realty Trust, Inc. | | | | | | 2,390 | | | | | 166,942 | |
Douglas Emmett, Inc. | | | | | | 5,800 | | | | | 133,806 | |
Education Realty Trust, Inc. | | | | | | 9,300 | | | | | 101,370 | |
Equity Lifestyle Properties, Inc. | | | | | | 1,300 | | | | | 88,556 | |
Equity Residential | | | | | | 9,100 | | | | | 523,523 | |
Essex Property Trust, Inc. | | | | | | 1,750 | | | | | 259,420 | |
Extra Space Storage, Inc. | | | | | | 4,300 | | | | | 142,975 | |
Federal Realty Investment Trust | | | | | | 1,400 | | | | | 147,420 | |
FelCor Lodging Trust, Inc. | | * | | | | 5,600 | | | | | 26,544 | |
HCP, Inc. | | | | | | 9,800 | | | | | 435,904 | |
Health Care REIT, Inc. | | | | | | 4,900 | | | | | 282,975 | |
Highwoods Properties, Inc. | | | | | | 3,000 | | | | | 97,860 | |
Hospitality Properties Trust | | | | | | 11,400 | | | | | 271,092 | |
Kilroy Realty Corp. | | | | | | 3,100 | | | | | 138,818 | |
Kimco Realty Corp. | | | | | | 15,100 | | | | | 306,077 | |
Lexington Realty Trust | | | | | | 8,300 | | | | | 80,178 | |
Liberty Property Trust | | | | | | 6,100 | | | | | 221,064 | |
Macerich Co. | | | | | | 7,763 | | | | | 444,276 | |
National Retail Properties, Inc. | | | | | | 3,800 | | | | | 115,900 | |
PS Business Parks, Inc. | | | | | | 2,200 | | | | | 147,004 | |
Prologis, Inc. | | | | | | 11,994 | | | | | 420,150 | |
Public Storage | | | | | | 3,500 | | | | | 487,095 | |
Rayonier, Inc. | | | | | | 2,300 | | | | | 112,723 | |
Regency Centers Corp. | | | | | | 2,000 | | | | | 97,460 | |
SL Green Realty Corp. | | | | | | 4,550 | | | | | 364,319 | |
Simon Property Group, Inc. | | | | | | 8,429 | | | | | 1,279,606 | |
Strategic Hotels & Resorts, Inc. | | * | | | | 15,200 | | | | | 91,352 | |
Summit Hotel Properties, Inc. | | | | | | 4,100 | | | | | 35,014 | |
Taubman Centers, Inc. | | | | | | 3,200 | | | | | 245,536 | |
UDR, Inc. | | | | | | 8,000 | | | | | 198,560 | |
| | | | | | | | | | | | |
| REITs (Continued) | | | | Shares | | Fair
Value |
Ventas ,Inc. | | | | | | 7,459 | | | | $ | 464,323 | |
Vornado Realty Trust | | | | | | 4,716 | | | | | 382,232 | |
Weingarten Realty Investors | | | | | | 5,600 | | | | | 157,416 | |
| | | | | | | | | | | | |
Total REITs
(Cost $8,488,643) | | | | | | | | | | $ | 10,577,810 | |
| | | | | | | | | | | | |
| | | |
| Exchange Traded Funds – 17.1% | | | | Shares | | Fair
Value |
iShares Silver Trust | | * | | | | 44,000 | | | | $ | 1,473,120 | |
PowerShares DB Agriculture Fund | | * | | | | 76,600 | | | | | 2,252,806 | |
PowerShares DB Base Metals Fund | | * | | | | 52,800 | | | | | 1,045,440 | |
PowerShares DB Commodity Index Tracking Fund | | * | | | | 44,100 | | | | | 1,264,788 | |
PowerShares DB Energy Fund | | * | | | | 49,900 | | | | | 1,418,657 | |
SPDR Gold Shares | | * | | | | 27,750 | | | | | 4,773,555 | |
| | | | | | | | | | | | |
Total Exchange Traded Funds
(Cost $11,457,648) | | | | | | | | | | $ | 12,228,366 | |
| | | | | | | | | | | | |
| | | |
| Bonds and Notes – 29.1% | | | | Par
Value | | Fair
Value |
GOVERNMENT MORTGAGE-BACKED SECURITIES – 2.5% | | | | | | | | | | | | |
GNMA Pool 4947,
5.00%, 02/20/2041 | | | | | $ | 775,563 | | | | $ | 862,831 | |
GNMA Pool 5204,
4.50%, 10/20/2041 | | | | | | 840,716 | | | | | 931,186 | |
| | | | | | | | | | | | |
Total Government Mortgage-Backed Securities
(Cost $1,733,444) | | | | | | | | | | $ | 1,794,017 | |
| | | | | | | | | | | | |
TREASURY INFLATION PROTECTED SECURITIES (TIPS) – 26.6% | | | | | | | | | | | | |
TIPS,
1.75%, 01/15/2028 | | | | | | 1,585,000 | | | | | 2,248,603 | |
TIPS,
2.50%, 01/15/2029 | | | | | | 1,050,000 | | | | | 1,605,475 | |
TIPS,
2.375%, 01/15/2025 | | | | | | 950,000 | | | | | 1,567,990 | |
TIPS,
2.125%, 02/15/2041 | | | | | | 1,125,000 | | | | | 1,731,086 | |
TIPS,
2.00%, 01/15/2014 | | | | | | 1,745,000 | | | | | 2,260,332 | |
TIPS,
1.625%, 01/15/2015 | | | | | | 1,425,000 | | | | | 1,833,597 | |
TIPS,
2.00%, 01/15/2016 | | | | | | 745,000 | | | | | 964,500 | |
TIPS,
2.375%, 01/15/2017 | | | | | | 1,050,000 | | | | | 1,399,844 | |
TIPS,
1.625%, 01/15/2018 | | | | | | 300,000 | | | | | 383,914 | |
TIPS,
2.125%, 01/15/2019 | | | | | | 1,550,000 | | | | | 2,031,693 | |
TIPS,
1.25%, 07/15/2020 | | | | | | 900,000 | | | | | 1,131,533 | |
| | |
| Timothy Plan Family of Funds | | Defensive Strategies (Continued) |
| | |
Schedule of Investments | | As of September 30, 2012 |
| | | | | | | | | | | | |
| | | |
| Bonds and Notes (Continued) | | | | Par
Value | | Fair
Value |
TREASURY INFLATION PROTECTED SECURITIES (TIPS) (continued) | | | | | | | | | | | | |
TIPS,
1.125%, 01/15/2021 | | | | | $ | 1,440,000 | | | | $ | 1,787,265 | |
| | | | | | | | | | | | |
Total Treasury Inflation Protected Securities (TIPS)
(Cost $17,277,727) | | | | | | | | | | $ | 18,945,832 | |
| | | | | | | | | | | | |
Total Bonds and Notes
(Cost $19,011,171) | | | | | | | | | | $ | 20,739,849 | |
| | | | | | | | | | | | |
| | | | | | | | | | | | |
| | | |
| Money Market Fund – 6.8% | | | | Shares | | Fair
Value |
Fidelity Institutional Money Market Portfolio, 0.11%
(Cost $4,813,736) | | (A) | | | | 4,813,736 | | | | $ | 4,813,736 | |
| | | | | | | | | | | | |
Total Investments
(Cost $64,649,326) – 99.9% | | (B) | | | | | | | | $ | 71,239,292 | |
Assets in Excess of Other
Liabilities – 0.1% | | | | | | | | | | | 90,276 | |
| | | | | | | | | | | | |
Net Assets – 100.00% | | | | | | | | | | $ | 71,329,568 | |
| | | | | | | | | | | | |
| * | Non-income producing securities. |
| (REIT) | Real Estate Investment Trust. |
| (ADR) | American Depositary Receipt. |
| (A) | Variable rate security; the rate shown represents the yield at September 30, 2012. |
| (B) | Represents cost for financial reporting purposes. Aggregate cost for federal tax purposes is $65,053,724 and differs from fair value by net unrealized appreciation (depreciation) of securities as follows: |
| | | | | |
Unrealized appreciation | | | $ | 6,509,666 | |
Unrealized depreciation | | | | (324,098 | ) |
| | | | | |
Net unrealized appreciation | | | $ | 6,185,568 | |
| | | | | |
The accompanying notes are an integral part of these financial statements.
[48]
| | |
| Timothy Plan Family of Funds | | Strategic Growth |
| | |
Schedule of Investments | | As of September 30, 2012 |
| | | | | | | | | | | | |
| Mutual Funds – 97.1% | | (A) | | Shares | | Fair
Value |
Timothy Plan Aggressive Growth Fund | | * | | | | 343,419 | | | | $ | 2,441,709 | |
Timothy Plan Defensive Strategies Fund | | | | | | 553,522 | | | | | 6,708,692 | |
Timothy Plan High Yield Bond Fund | | | | | | 531,112 | | | | | 5,024,317 | |
Timothy Plan International Fund | | | | | | 834,098 | | | | | 6,097,260 | |
Timothy Plan Israel Common Values Fund | | | | | | 213,459 | | | | | 2,173,013 | |
Timothy Plan Large/Mid Cap Growth Fund | | * | | | | 880,856 | | | | | 6,430,246 | |
Timothy Plan Large/Mid Cap Value Fund | | | | | | 436,615 | | | | | 6,461,903 | |
Timothy Plan Small Cap Value Fund | | * | | | | 178,364 | | | | | 2,629,079 | |
| | | | | | | | | | | | |
Total Mutual Funds
(Cost $35,265,128) | | | | | | | | | | $ | 37,966,219 | |
| | | | | | | | | | | | |
| | | | | | | | | | | | |
| Money Market Fund – 3.0% | | | | Shares | | Fair
Value |
Fidelity Institutional Money Market Portfolio, 0.11%
(Cost $1,159,978) | | (B) | | | | 1,159,978 | | | | $ | 1,159,978 | |
| | | | | | | | | | | | |
Total Investments
(Cost $36,425,106) – 100.1% | | (C) | | | | | | | | $ | 39,126,197 | |
Liabilities in Excess of Other Assets – (0.1)% | | | | | | | | | | | (39,753 | ) |
| | | | | | | | | | | | |
Net Assets – 100.00% | | | | | | | | | | $ | 39,086,444 | |
| | | | | | | | | | | | |
| * | Non-income producing securities. |
| (A) | Affiliated Funds – Class A. |
| (B) | Variable rate security; the rate shown represents the yield at September 30, 2012. |
| (C) | Represents cost for financial reporting purposes. Aggregate cost for federal tax purposes is $39,188,041 and differs from fair value by net unrealized appreciation (depreciation) of securities as follows: |
| | | | | |
Unrealized appreciation | | | $ | 1,377,223 | |
Unrealized depreciation | | | | (1,439,067 | ) |
| | | | | |
Net unrealized depreciation | | | $ | (61,844 | ) |
| | | | | |
The accompanying notes are an integral part of these financial statements.
[49]
| | |
| Timothy Plan Family of Funds | | Conservative Growth |
| | |
Schedule of Investments | | As of September 30, 2012 |
| | | | | | | | | | | | |
| Mutual Funds – 98.8% | | (A) | | Shares | | Fair
Value |
Timothy Plan Aggressive Growth Fund | | * | | | | 163,674 | | | | $ | 1,163,720 | |
Timothy Plan Defensive Strategies Fund | | | | | | 735,035 | | | | | 8,908,629 | |
Timothy Plan Fixed Income Fund | | | | | | 1,325,550 | | | | | 14,408,732 | |
Timothy Plan High Yield Bond Fund | | | | | | 444,055 | | | | | 4,200,764 | |
Timothy Plan International Fund | | | | | | 365,310 | | | | | 2,670,417 | |
Timothy Plan Israel Common Values Fund | | | | | | 194,701 | | | | | 1,982,059 | |
Timothy Plan Large/Mid Cap Growth Fund | | * | | | | 786,727 | | | | | 5,743,105 | |
Timothy Plan Large/Mid Cap Value Fund | | | | | | 472,924 | | | | | 6,999,273 | |
Timothy Plan Small Cap Value Fund | | * | | | | 173,990 | | | | | 2,564,607 | |
| | | | | | | | | | | | |
Total Mutual Funds
(Cost $44,274,446) | | | | | | | | | | $ | 48,641,306 | |
| | | | | | | | | | | | |
| | | | | | | | | | | | |
| Money Market Fund – 1.3% | | | | Shares | | Fair
Value |
Fidelity Institutional Money Market Portfolio, 0.11%
(Cost $646,115) | | (B) | | | | 646,115 | | | | $ | 646,115 | |
| | | | | | | | | | | | |
Total Investments
(Cost $44,920,561) – 100.1% | | (C) | | | | | | | | $ | 49,287,421 | |
Liabilities in Excess of Other Assets – (0.1)% | | | | | | | | | | | (54,410 | ) |
| | | | | | | | | | | | |
Net Assets – 100.00% | | | | | | | | | | $ | 49,233,011 | |
| | | | | | | | | | | | |
| * | Non-income producing securities. |
| (A) | Affiliated Funds – Class A. |
| (B) | Variable rate security; the rate shown represents the yield at September 30, 2012. |
| (C) | Represents cost for financial reporting purposes. Aggregate cost for federal tax purposes is $46,618,332 and differs from fair value by net unrealized appreciation (depreciation) of securities as follows: |
| | | | | |
Unrealized appreciation | | | $ | 3,123,785 | |
Unrealized depreciation | | | | (454,696 | ) |
| | | | | |
Net unrealized appreciation | | | $ | 2,669,089 | |
| | | | | |
The accompanying notes are an integral part of these financial statements.
[50]
| | |
| Timothy Plan Family of Funds | | |
| | |
Statements of Assets and Liabilities | | September 30, 2012 |
| | | | | | | | | | | | | | | | | | | | | | | | | | | | | | |
| | | Aggressive
Growth
Fund | | International
Fund | | Large/Mid Cap
Growth
Fund | | Small Cap
Value
Fund | | Large/Mid Cap
Value
Fund | | Fixed
Income
Fund |
Assets: | | | | | | | | | | | | | | | | | | | | | | | | | | | | | | |
Investments, at cost | | | $ | 14,724,822 | | | | $ | 28,260,104 | | | | $ | 42,840,750 | | | | $ | 46,779,431 | | | | $ | 88,196,648 | | | | $ | 78,025,154 | |
| | | | | | | | | | | | | | | | | | | | | | | | | | | | | | |
Investments, at value | | | $ | 16,183,462 | | | | $ | 31,103,364 | | | | $ | 45,880,582 | | | | $ | 52,467,013 | | | | $ | 111,342,812 | | | | $ | 83,062,840 | |
Receivable for securities sold | | | | 655,283 | | | | | 196,289 | | | | | 526,435 | | | | | 1,240,386 | | | | | — | | | | | — | |
Receivable for fund shares sold | | | | 37,911 | | | | | 89,591 | | | | | 83,993 | | | | | 46,006 | | | | | 177,040 | | | | | 128,810 | |
Dividends and interest receivable | | | | 2,489 | | | | | 51,928 | | | | | 35,155 | | | | | 57,194 | | | | | 137,273 | | | | | 664,495 | |
Due from advisor | | | | — | | | | | — | | | | | — | | | | | — | | | | | — | | | | | 38,288 | |
Prepaid expenses and other assets | | | | 22,309 | | | | | 60,848 | | | | | 32,329 | | | | | 30,346 | | | | | 38,336 | | | | | 32,456 | |
| | | | | | | | | | | | | | | | | | | | | | | | | | | | | | |
Total assets | | | | 16,901,454 | | | | | 31,502,020 | | | | | 46,558,494 | | | | | 53,840,945 | | | | | 111,695,461 | | | | | 83,926,889 | |
| | | | | | | | | | | | | | | | | | | | | | | | | | | | | | |
Liabilities: | | | | | | | | | | | | | | | | | | | | | | | | | | | | | | |
Payable for securities purchased | | | | 232,854 | | | | | — | | | | | 538,617 | | | | | 833,261 | | | | | — | | | | | — | |
Accrued advisory fees | | | | 11,857 | | | | | 26,527 | | | | | 32,432 | | | | | 37,171 | | | | | 78,196 | | | | | 68,952 | |
Payable for fund shares redeemed | | | | 9,528 | | | | | 12,961 | | | | | 5,000 | | | | | 14,773 | | | | | 221,694 | | | | | 106,841 | |
Accrued 12b-1 fees | | | | 4,876 | | | | | 7,630 | | | | | 12,327 | | | | | 14,004 | | | | | 29,648 | | | | | 22,565 | |
Accrued expenses and other liabilities | | | | 43,558 | | | | | 43,171 | | | | | 41,349 | | | | | 28,930 | | | | | 64,748 | | | | | 46,767 | |
| | | | | | | | | | | | | | | | | | | | | | | | | | | | | | |
Total liabilities | | | | 302,673 | | | | | 90,289 | | | | | 629,725 | | | | | 928,139 | | | | | 394,286 | | | | | 245,125 | |
| | | | | | | | | | | | | | | | | | | | | | | | | | | | | | |
Net assets | | | $ | 16,598,781 | | | | $ | 31,411,731 | | | | $ | 45,928,769 | | | | $ | 52,912,806 | | | | $ | 111,301,175 | | | | $ | 83,681,764 | |
| | | | | | | | | | | | | | | | | | | | | | | | | | | | | | |
Net assets consist of: | | | | | | | | | | | | | | | | | | | | | | | | | | | | | | |
Paid in capital | | | $ | 16,294,626 | | | | $ | 44,802,802 | | | | $ | 40,450,691 | | | | $ | 49,770,944 | | | | $ | 99,420,053 | | | | $ | 78,968,569 | |
Undistributed net investment income (loss) | | | | (243,524 | ) | | | | 44,931 | | | | | — | | | | | 62,933 | | | | | 345,523 | | | | | — | |
Accumulated net realized gain (loss) on investments | | | | (910,961 | ) | | | | (16,279,262 | ) | | | | 2,438,246 | | | | | (2,608,653 | ) | | | | (11,610,565 | ) | | | | (324,491 | ) |
Net unrealized appreciation on investments | | | | 1,458,640 | | | | | 2,843,260 | | | | | 3,039,832 | | | | | 5,687,582 | | | | | 23,146,164 | | | | | 5,037,686 | |
| | | | | | | | | | | | | | | | | | | | | | | | | | | | | | |
Net assets | | | $ | 16,598,781 | | | | $ | 31,411,731 | | | | $ | 45,928,769 | | | | $ | 52,912,806 | | | | $ | 111,301,175 | | | | $ | 83,681,764 | |
| | | | | | | | | | | | | | | | | | | | | | | | | | | | | | |
Class A | | | | | | | | | | | | | | | | | | | | | | | | | | | | | | |
Net assets | | | $ | 14,397,547 | | | | $ | 29,794,271 | | | | $ | 41,445,799 | | | | $ | 47,975,904 | | | | $ | 100,632,129 | | | | $ | 74,685,062 | |
Shares of beneficial interest outstanding | | | | 2,027,332 | | | | | 4,073,807 | | | | | 5,675,438 | | | | | 3,255,187 | | | | | 6,800,169 | | | | | 6,872,721 | |
Net Asset Value, offering price and redemption price per share | | | $ | 7.10 | | | | $ | 7.31 | | | | $ | 7.30 | | | | $ | 14.74 | | | | $ | 14.80 | | | | $ | 10.87 | |
| | | | | | | | | | | | | | | | | | | | | | | | | | | | | | |
Offering price per share (NAV / 0.945)
*(NAV / 0.955) | | | $ | 7.51 | | | | $ | 7.74 | | | | $ | 7.72 | | | | $ | 15.60 | | | | $ | 15.66 | | | | $ | 11.38 | * |
| | | | | | | | | | | | | | | | | | | | | | | | | | | | | | |
Class C | | | | | | | | | | | | | | | | | | | | | | | | | | | | | | |
Net assets | | | $ | 2,201,234 | | | | $ | 1,617,460 | | | | $ | 4,482,970 | | | | $ | 4,936,902 | | | | $ | 10,669,046 | | | | $ | 8,996,702 | |
Shares of beneficial interest outstanding | | | | 342,327 | | | | | 226,164 | | | | | 675,763 | | | | | 390,741 | | | | | 808,098 | | | | | 855,685 | |
Net asset value, offering price and redemption price per share | | | $ | 6.43 | | | | $ | 7.15 | | | | $ | 6.63 | | | | $ | 12.63 | | | | $ | 13.20 | | | | $ | 10.51 | |
| | | | | | | | | | | | | | | | | | | | | | | | | | | | | | |
Minimum redemption price per share
(NAV * 0.99) | | | $ | 6.37 | | | | $ | 7.08 | | | | $ | 6.56 | | | | $ | 12.50 | | | | $ | 13.07 | | | | $ | 10.40 | |
| | | | | | | | | | | | | | | | | | | | | | | | | | | | | | |
The accompanying notes are an integral part of these financial statements.
[51]
| | |
| Timothy Plan Family of Funds | | |
| | |
Statements of Assets and Liabilities | | September 30, 2012 |
| | | | | | | | | | | | | | | | | | | | | | | | | |
| | | High Yield
Bond
Fund | | Israel Common
Values
Fund (1) | | Defensive
Strategies
Fund | | Strategic
Growth
Fund | | Conservative
Growth
Fund |
Assets: | | | | | | | | | | | | | | | | | | | | | | | | | |
Investments, at cost | | | $ | 33,318,596 | | | | $ | 7,996,702 | | | | $ | 64,649,326 | | | | $ | 36,425,106 | | | | $ | 44,920,561 | |
| | | | | | | | | | | | | | | | | | | | | | | | | |
Investments, at value | | | $ | 34,551,615 | | | | $ | 8,096,077 | | | | $ | 71,239,292 | | | | $ | 39,126,197 | | | | $ | 49,287,421 | |
Dividends and interest receivable | | | | 712,667 | | | | | 6,365 | | | | | 100,145 | | | | | 46 | | | | | 27 | |
Receivable for fund shares sold | | | | 128,935 | | | | | 3,686 | | | | | 95,238 | | | | | 1,416 | | | | | 4,245 | |
Receivable for securities sold | | | | — | | | | | 100,722 | | | | | 31,262 | | | | | — | | | | | — | |
Prepaid expenses and other assets | | | | 28,063 | | | | | 25,212 | | | | | 49,700 | | | | | 30,652 | | | | | 32,511 | |
| | | | | | | | | | | | | | | | | | | | | | | | | |
Total assets | | | | 35,421,280 | | | | | 8,232,062 | | | | | 71,515,637 | | | | | 39,158,311 | | | | | 49,324,204 | |
| | | | | | | | | | | | | | | | | | | | | | | | | |
Liabilities: | | | | | | | | | | | | | | | | | | | | | | | | | |
Payable for securities purchased | | | | 264,938 | | | | | — | | | | | 33,415 | | | | | — | | | | | — | |
Accrued advisory fees | | | | 17,003 | | | | | 6,829 | | | | | 35,114 | | | | | 21,000 | | | | | 26,343 | |
Payable for fund shares redeemed | | | | 27,221 | | | | | — | | | | | 38,258 | | | | | 4,035 | | | | | 21,081 | |
Accrued 12b-1 fees | | | | 8,117 | | | | | 1,838 | | | | | 24,958 | | | | | 4,236 | | | | | 5,701 | |
Accrued expenses and other liabilities | | | | 29,045 | | | | | 22,677 | | | | | 54,324 | | | | | 42,596 | | | | | 38,068 | |
| | | | | | | | | | | | | | | | | | | | | | | | | |
Total liabilities | | | | 346,324 | | | | | 31,344 | | | | | 186,069 | | | | | 71,867 | | | | | 91,193 | |
| | | | | | | | | | | | | | | | | | | | | | | | | |
Net assets | | | $ | 35,074,956 | | | | $ | 8,200,718 | | | | $ | 71,329,568 | | | | $ | 39,086,444 | | | | $ | 49,233,011 | |
| | | | | | | | | | | | | | | | | | | | | | | | | |
Net assets consist of: | | | | | | | | | | | | | | | | | | | | | | | | | |
Paid in capital | | | $ | 35,445,773 | | | | $ | 8,193,597 | | | | $ | 65,144,000 | | | | $ | 47,003,740 | | | | $ | 49,695,343 | |
Undistributed net investment income (loss) | | | | — | | | | | (84,330 | ) | | | | 172,609 | | | | | 182,207 | | | | | 276,345 | |
Accumulated net realized gain (loss) on investments | | | | (1,603,836 | ) | | | | (7,924 | ) | | | | (577,007 | ) | | | | (10,800,594 | ) | | | | (5,105,537 | ) |
Net unrealized appreciation on investments | | | | 1,233,019 | | | | | 99,375 | | | | | 6,589,966 | | | | | 2,701,091 | | | | | 4,366,860 | |
| | | | | | | | | | | | | | | | | | | | | | | | | |
Net assets | | | $ | 35,074,956 | | | | $ | 8,200,718 | | | | $ | 71,329,568 | | | | $ | 39,086,444 | | | | $ | 49,233,011 | |
| | | | | | | | | | | | | | | | | | | | | | | | | |
Class A | | | | | | | | | | | | | | | | | | | | | | | | | |
Net assets | | | $ | 33,391,500 | | | | $ | 7,983,498 | | | | $ | 52,528,632 | | | | $ | 32,250,198 | | | | $ | 40,041,922 | |
Shares of beneficial interest outstanding | | | | 3,528,606 | | | | | 785,188 | | | | | 4,335,523 | | | | | 4,332,265 | | | | | 4,023,502 | |
Net Asset Value, offering price and redemption price per share | | | $ | 9.46 | | | | $ | 10.17 | | | | $ | 12.12 | | | | $ | 7.44 | | | | $ | 9.95 | |
| | | | | | | | | | | | | | | | | | | | | | | | | |
Offering price per share (NAV / 0.945)
*(NAV / 0.955) | | | $ | 9.91 | * | | | $ | 10.76 | | | | $ | 12.83 | | | | $ | 7.87 | | | | $ | 10.53 | |
| | | | | | | | | | | | | | | | | | | | | | | | | |
Class C | | | | | | | | | | | | | | | | | | | | | | | | | |
Net assets | | | $ | 1,683,456 | | | | $ | 217,220 | | | | $ | 18,800,936 | | | | $ | 6,836,246 | | | | $ | 9,191,089 | |
Shares of beneficial interest outstanding | | | | 176,364 | | | | | 21,523 | | | | | 1,582,919 | | | | | 995,010 | | | | | 991,906 | |
Net Asset Value, offering price and redemption price per share | | | $ | 9.55 | | | | $ | 10.09 | | | | $ | 11.88 | | | | $ | 6.87 | | | | $ | 9.27 | |
| | | | | | | | | | | | | | | | | | | | | | | | | |
Minimum redemption price per share
(NAV * 0.99) | | | $ | 9.45 | | | | $ | 9.99 | | | | $ | 11.76 | | | | $ | 6.80 | | | | $ | 9.18 | |
| | | | | | | | | | | | | | | | | | | | | | | | | |
| (1) | The Israel Common Values Fund commenced operations on October 12, 2011. |
The accompanying notes are an integral part of these financial statements.
[52]
| | |
| Timothy Plan Family of Funds | | |
| | |
Statements of Operations | | For the Year Ended September 30, 2012 |
| | | | | | | | | | | | | | | | | | | | | | | | | | | | | | |
| | | Aggressive
Growth
Fund | | International
Fund | | Large/Mid Cap
Growth
Fund | | Small Cap
Value
Fund | | Large/Mid Cap
Value
Fund | | Fixed
Income
Fund |
Investment income: | | | | | | | | | | | | | | | | | | | | | | | | | | | | | | |
Interest income | | | $ | 1,048 | | | | $ | 3,402 | | | | $ | 3,687 | | | | $ | 3,568 | | | | $ | 7,769 | | | | $ | 2,386,103 | |
Dividend income | | | | 53,310 | | | | | 749,267 | | | | | 429,585 | | | | | 902,807 | | | | | 2,048,554 | | | | | — | |
Foreign tax withheld | | | | (283 | ) | | | | (71,631 | ) | | | | (1,039 | ) | | | | — | | | | | (2,414 | ) | | | | — | |
| | | | | | | | | | | | | | | | | | | | | | | | | | | | | | |
Total investment income | | | | 54,075 | | | | | 681,038 | | | | | 432,233 | | | | | 906,375 | | | | | 2,053,909 | | | | | 2,386,103 | |
| | | | | | | | | | | | | | | | | | | | | | | | | | | | | | |
Operating expenses: | | | | | | | | | | | | | | | | | | | | | | | | | | | | | | |
Investment advisory fees | | | | 135,500 | | | | | 309,274 | | | | | 351,787 | | | | | 431,057 | | | | | 876,340 | | | | | 450,567 | |
12b-1 Fees: | | | | | | | | | | | | | | | | | | | | | | | | | | | | | | |
Class A | | | | 34,511 | | | | | 73,519 | | | | | 94,369 | | | | | 114,994 | | | | | 232,013 | | | | | 166,139 | |
Class C | | | | 21,366 | | | | | 15,195 | | | | | 36,391 | | | | | 47,148 | | | | | 102,936 | | | | | 86,391 | |
Administration fees | | | | 34,893 | | | | | 71,401 | | | | | 95,648 | | | | | 120,229 | | | | | 241,751 | | | | | 177,494 | |
Registration fees | | | | 39,469 | | | | | 29,684 | | | | | 30,241 | | | | | 29,288 | | | | | 32,589 | | | | | 31,296 | |
Custody fees | | | | 26,099 | | | | | 11,082 | | | | | 17,555 | | | | | 13,343 | | | | | 19,552 | | | | | 16,045 | |
Non 12b-1 shareholder servicing fees | | | | 18,674 | | | | | 17,373 | | | | | 42,923 | | | | | 28,953 | | | | | 79,893 | | | | | 56,028 | |
Printing expenses | | | | 12,605 | | | | | 7,735 | | | | | 18,708 | | | | | 25,031 | | | | | 39,396 | | | | | 22,297 | |
Audit fees | | | | 11,130 | | | | | 12,232 | | | | | 11,130 | | | | | 9,130 | | | | | 11,130 | | | | | 11,130 | |
Compliance officer fees | | | | 5,406 | | | | | 5,288 | | | | | 7,633 | | | | | 6,358 | | | | | 15,396 | | | | | 10,666 | |
Trustees’ fees | | | | 3,644 | | | | | 5,382 | | | | | 6,735 | | | | | 6,358 | | | | | 14,718 | | | | | 11,411 | |
Legal fees | | | | 2,575 | | | | | 4,326 | | | | | 4,935 | | | | | 2,594 | | | | | 5,425 | | | | | 2,386 | |
Insurance expenses | | | | 411 | | | | | 988 | | | | | 1,109 | | | | | 1,374 | | | | | 2,789 | | | | | 1,981 | |
Miscellaneous expenses | | | | 7,716 | | | | | 11,109 | | | | | 5,108 | | | | | 7,585 | | | | | 20,677 | | | | | 7,729 | |
| | | | | | | | | | | | | | | | | | | | | | | | | | | | | | |
Total operating expenses | | | | 353,999 | | �� | | | 574,588 | | | | | 724,272 | | | | | 843,442 | | | | | 1,694,605 | | | | | 1,051,560 | |
Less: Expenses waived by advisor | | | | — | | | | | — | | | | | — | | | | | — | | | | | — | | | | | (112,642 | ) |
| | | | | | | | | | | | | | | | | | | | | | | | | | | | | | |
Net operating expenses | | | | 353,999 | | | | | 574,588 | | | | | 724,272 | | | | | 843,442 | | | | | 1,694,605 | | | | | 938,918 | |
| | | | | | | | | | | | | | | | | | | | | | | | | | | | | | |
Net investment income (loss) | | | | (299,924 | ) | | | | 106,450 | | | | | (292,039 | ) | | | | 62,933 | | | | | 359,304 | | | | | 1,447,185 | |
| | | | | | | | | | | | | | | | | | | | | | | | | | | | | | |
Realized and unrealized gain (loss) on investments: | | | | | | | | | | | | | | | | | | | | | | | | | | | | | | |
Net realized gain (loss) on investments | | | | 1,298,159 | | | | | (1,260,746 | ) | | | | 2,840,379 | | | | | 719,802 | | | | | 2,183,461 | | | | | 1,119,022 | |
Capital gain dividends from REITs | | | | 68 | | | | | — | | | | | 226 | | | | | 105,312 | | | | | — | | | | | — | |
Distributions of realized gains by underlying investment companies | | | | 84 | | | | | — | | | | | 723 | | | | | 27,521 | | | | | 14,053 | | | | | — | |
Net change in unrealized appreciation on investments | | | | 2,716,915 | | | | | 5,891,664 | | | | | 6,897,905 | | | | | 13,945,528 | | | | | 19,698,121 | | | | | 83,832 | |
| | | | | | | | | | | | | | | | | | | | | | | | | | | | | | |
Net realized and unrealized gain (loss) on investments | | | | 4,015,226 | | | | | 4,630,918 | | | | | 9,739,233 | | | | | 14,798,163 | | | | | 21,895,635 | | | | | 1,202,854 | |
| | | | | | | | | | | | | | | | | | | | | | | | | | | | | | |
Net increase in net assets resulting from operations | | | $ | 3,715,302 | | | | $ | 4,737,368 | | | | $ | 9,447,194 | | | | $ | 14,861,096 | | | | $ | 22,254,939 | | | | $ | 2,650,039 | |
| | | | | | | | | | | | | | | | | | | | | | | | | | | | | | |
The accompanying notes are an integral part of these financial statements.
[53]
| | |
| Timothy Plan Family of Funds | | |
| | |
Statements of Operations | | For the Year Ended September 30, 2012 |
| | | | | | | | | | | | | | | | | | | | | | | | | |
| | | High Yield
Bond
Fund | | Israel Common
Values
Fund (1) | | Defensive
Strategies
Fund | | Strategic
Growth
Fund | | Conservative
Growth
Fund |
Investment income: | | | | | | | | | | | | | | | | | | | | | | | | | |
Interest income | | | $ | 2,154,525 | | | | $ | 1,457 | | | | $ | 459,366 | | | | $ | 638 | | | | $ | 958 | |
Dividend income | | | | — | | | | | 121,924 | | | | | 684,564 | | | | | — | | | | | — | |
Dividend income from affiliated funds | | | | — | | | | | — | | | | | — | | | | | 691,106 | | | | | 866,199 | |
Foreign tax withheld | | | | — | | | | | (25,061 | ) | | | | (17,356 | ) | | | | — | | | | | — | |
| | | | | | | | | | | | | | | | | | | | | | | | | |
Total investment income | | | | 2,154,525 | | | | | 98,320 | | | | | 1,126,574 | | | | | 691,744 | | | | | 867,157 | |
| | | | | | | | | | | | | | | | | | | | | | | | | |
Operating expenses: | | | | | | | | | | | | | | | | | | | | | | | | | |
Investment advisory fees | | | | 178,462 | | | | | 73,221 | | | | | 442,293 | | | | | 258,482 | | | | | 310,375 | |
12b-1 Fees: | | | | | | | | | | | | | | | | | | | | | | | | | |
Class A | | | | 70,864 | | | | | 17,904 | | | | | 142,656 | | | | | — | | | | | — | |
Class C | | | | 13,982 | | | | | 1,604 | | | | | 166,532 | | | | | 52,009 | | | | | 66,728 | |
Administration fees | | | | 69,808 | | | | | 18,253 | | | | | 169,495 | | | | | 92,567 | | | | | 110,348 | |
Registration fees | | | | 27,983 | | | | | 43,809 | | | | | 39,402 | | | | | 30,082 | | | | | 31,817 | |
Non 12b-1 shareholder servicing fees | | | | 14,301 | | | | | 8,682 | | | | | 23,959 | | | | | 12,771 | | | | | 11,034 | |
Audit fees | | | | 12,736 | | | | | 11,133 | | | | | 13,040 | | | | | 4,130 | | | | | 11,033 | |
Printing expenses | | | | 11,144 | | | | | 9,900 | | | | | 22,667 | | | | | 19,996 | | | | | 18,471 | |
Custody fees | | | | 6,017 | | | | | 16,364 | | | | | 39,240 | | | | | 12,836 | | | | | 10,907 | |
Trustees’ fees | | | | 5,185 | | | | | 1,314 | | | | | 10,154 | | | | | 6,785 | | | | | 8,189 | |
Compliance officer fees | | | | 4,512 | | | | | 1,432 | | | | | 10,838 | | | | | 5,283 | | | | | 6,722 | |
Legal fees | | | | 3,246 | | | | | 1,261 | | | | | 7,619 | | | | | 3,141 | | | | | 5,182 | |
Insurance expenses | | | | 759 | | | | | 128 | | | | | 1,670 | | | | | 1,142 | | | | | 1,309 | |
Miscellaneous expenses | | | | 6,272 | | | | | 3,008 | | | | | 20,406 | | | | | 10,313 | | | | | 5,966 | |
| | | | | | | | | | | | | | | | | | | | | | | | | |
Total operating expenses | | | | 425,271 | | | | | 208,013 | | | | | 1,109,971 | | | | | 509,537 | | | | | 598,081 | |
Less: Expenses waived by advisor | | | | — | | | | | — | | | | | — | | | | | — | | | | | — | |
| | | | | | | | | | | | | | | | | | | | | | | | | |
Net operating expenses | | | | 425,271 | | | | | 208,013 | | | | | 1,109,971 | | | | | 509,537 | | | | | 598,081 | |
| | | | | | | | | | | | | | | | | | | | | | | | | |
Net investment income (loss) | | | | 1,729,254 | | | | | (109,693 | ) | | | | 16,603 | | | | | 182,207 | | | | | 269,076 | |
| | | | | | | | | | | | | | | | | | | | | | | | | |
Realized and unrealized gain (loss) on investments: | | | | | | | | | | | | | | | | | | | | | | | | | |
Net realized gain (loss) on investments | | | | 190,990 | | | | | 1,366 | | | | | 909,400 | | | | | (447,532 | ) | | | | 1,635,113 | |
Capital gain distributions from affiliated funds | | | | — | | | | | — | | | | | — | | | | | 628,601 | | | | | 644,601 | |
Capital gain dividends from REITs | | | | — | | | | | — | | | | | 52,388 | | | | | — | | | | | — | |
Net change in unrealized appreciation on investments | | | | 2,130,949 | | | | | 99,375 | | | | | 7,160,412 | | | | | 6,437,198 | | | | | 3,133,017 | |
| | | | | | | | | | | | | | | | | | | | | | | | | |
Net realized and unrealized gain on investments | | | | 2,321,939 | | | | | 100,741 | | | | | 8,122,200 | | | | | 6,618,267 | | | | | 5,412,731 | |
| | | | | | | | | | | | | | | | | | | | | | | | | |
Net increase (decrease) in net assets resulting from operations | | | $ | 4,051,193 | | | | $ | (8,952 | ) | | | $ | 8,138,803 | | | | $ | 6,800,474 | | | | $ | 5,681,807 | |
| | | | | | | | | | | | | | | | | | | | | | | | | |
| (1) | The Israel Common Values Fund commenced operations on October 12, 2011. |
The accompanying notes are an integral part of these financial statements.
[54]
| | |
| Timothy Plan Family of Funds | | |
| | |
Statements of Changes in Net Assets | | |
| | | | | | | | | | | | | | | | | | | | | | | | | | | | | | |
| | | Aggressive Growth Fund | | International Fund | | Large/Mid Cap Growth Fund |
| | | Year Ended
September 30,
2012 | | Year Ended
September 30,
2011 | | Year Ended
September 30,
2012 | | Year Ended
September 30,
2011 | | Year Ended
September 30,
2012 | | Year Ended
September 30,
2011 |
Operations: | | | | | | | | | | | | | | | | | | | | | | | | | | | | | | |
Net investment income (loss) | | | $ | (299,924 | ) | | | $ | (302,690 | ) | | | $ | 106,450 | | | | $ | 997,354 | | | | $ | (292,039 | ) | | | $ | (317,573 | ) |
Net realized gain (loss) on investments | | | | 1,298,159 | | | | | 4,761,306 | | | | | (1,260,746 | ) | | | | 482,597 | | | | | 2,840,379 | | | | | 8,917,696 | |
Capital gain dividends from REITs | | | | 68 | | | | | — | | | | | — | | | | | — | | | | | 226 | | | | | — | |
Distributions of realized gains by underlying investment companies | | | | 84 | | | | | — | | | | | — | | | | | — | | | | | 723 | | | | | — | |
Net change in unrealized appreciation (depreciation) on investments | | | | 2,716,915 | | | | | (4,054,367 | ) | | | | 5,891,664 | | | | | (6,956,347 | ) | | | | 6,897,905 | | | | | (7,806,078 | ) |
| | | | | | | | | | | | | | | | | | | | | | | | | | | | | | |
Net increase (decrease) in net assets resulting from operations | | | | 3,715,302 | | | | | 404,249 | | | | | 4,737,368 | | | | | (5,476,396 | ) | | | | 9,447,194 | | | | | 794,045 | |
| | | | | | | | | | | | | | | | | | | | | | | | | | | | | | |
Distributions to shareholders: | | | | | | | | | | | | | | | | | | | | | | | | | | | | | | |
Net investment income | | | | | | | | | | | | | | | | | | | | | | | | | | | | | | |
Class A | | | | — | | | | | — | | | | | (1,003,855 | ) | | | | (212,572 | ) | | | | — | | | | | — | |
Class C | | | | — | | | | | — | | | | | (37,702 | ) | | | | (6,909 | ) | | | | — | | | | | — | |
Net realized gains | | | | | | | | | | | | | | | | | | | | | | | | | | | | | | |
Class A | | | | — | | | | | — | | | | | — | | | | | — | | | | | (1,655,964 | ) | | | | — | |
Class C | | | | — | | | | | — | | | | | — | | | | | — | | | | | (154,620 | ) | | | | — | |
| | | | | | | | | | | | | | | | | | | | | | | | | | | | | | |
Total dividends and distributions to shareholders | | | | — | | | | | — | | | | | (1,041,557 | ) | | | | (219,481 | ) | | | | (1,810,584 | ) | | | | — | |
| | | | | | | | | | | | | | | | | | | | | | | | | | | | | | |
Share transactions of beneficial interest: | | | | | | | | | | | | | | | | | | | | | | | | | | | | | | |
Net proceeds from shares sold | | | | | | | | | | | | | | | | | | | | | | | | | | | | | | |
Class A | | | | 5,287,889 | | | | | 10,987,506 | (A) | | | | 9,560,090 | | | | | 16,623,458 | | | | | 10,978,227 | | | | | 8,167,751 | (B) |
Class B | | | | — | | | | | — | | | | | — | | | | | — | | | | | — | | | | | 82 | |
Class C | | | | 521,055 | | | | | 550,241 | | | | | 368,778 | | | | | 450,556 | | | | | 1,699,860 | | | | | 1,011,733 | |
Reinvestment of dividends and distributions | | | | | | | | | | | | | | | | | | | | | | | | | | | | | | |
Class A | | | | — | | | | | — | | | | | 913,673 | | | | | 195,030 | | | | | 1,589,285 | | | | | — | |
Class B | | | | — | | | | | — | | | | | — | | | | | — | | | | | — | | | | | — | |
Class C | | | | — | | | | | — | | | | | 29,877 | | | | | 5,363 | | | | | 114,500 | | | | | — | |
Cost of shares redeemed | | | | | | | | | | | | | | | | | | | | | | | | | | | | | | |
Class A | | | | (6,391,333 | ) | | | | (12,290,951 | ) | | | | (12,627,271 | ) | | | | (18,174,455 | ) | | | | (12,456,411 | ) | | | | (13,512,323 | ) |
Class B | | | | — | | | | | (434,859 | )(A) | | | | — | | | | | — | | | | | — | | | | | (796,263 | )(B) |
Class C | | | | (559,765 | ) | | | | (474,183 | ) | | | | (379,323 | ) | | | | (701,587 | ) | | | | (611,223 | ) | | | | (775,564 | ) |
| | | | | | | | | | | | | | | | | | | | | | | | | | | | | | |
Net increase (decrease) in net assets from share transactions of beneficial interest | | | | (1,142,154 | ) | | | | (1,662,246 | ) | | | | (2,134,176 | ) | | | | (1,601,635 | ) | | | | 1,314,238 | | | | | (5,904,584 | ) |
| | | | | | | | | | | | | | | | | | | | | | | | | | | | | | |
Total Increase (Decrease) in Net Assets | | | | 2,573,148 | | | | | (1,257,997 | ) | | | | 1,561,635 | | | | | (7,297,512 | ) | | | | 8,950,848 | | | | | (5,110,539 | ) |
| (A) | Includes automatic conversion of Class B shares ($410,353 representing 69,764.999 shares) to Class A shares ($410,353 representing 63,709.878 shares). |
| (B) | Includes automatic conversion of Class B shares ($735,720 representing 116,705.41 shares) to Class A shares ($735,720 representing 107,627.76 shares). |
The accompanying notes are an integral part of these financial statements.
[55]
| | |
| Timothy Plan Family of Funds | | |
| | |
Statements of Changes in Net Assets (Continued) | | |
| | | | | | | | | | | | | | | | | | | | | | | | | | | | | | |
| | | Aggressive Growth Fund | | International Fund | | Large/Mid Cap Growth Fund |
| | | Year Ended
September 30,
2012 | | Year Ended
September 30,
2011 | | Year Ended
September 30,
2012 | | Year Ended
September 30,
2011 | | Year Ended
September 30,
2012 | | Year Ended
September 30,
2011 |
Net assets: | | | | | | | | | | | | | | | | | | | | | | | | | | | | | | |
Beginning of period | | | | 14,025,633 | | | | | 15,283,630 | | | | | 29,850,096 | | | | | 37,147,608 | | | | | 36,977,921 | | | | | 42,088,460 | |
| | | | | | | | | | | | | | | | | | | | | | | | | | | | | | |
End of period* | | | $ | 16,598,781 | | | | $ | 14,025,633 | | | | $ | 31,411,731 | | | | $ | 29,850,096 | | | | $ | 45,928,769 | | | | $ | 36,977,921 | |
| | | | | | | | | | | | | | | | | | | | | | | | | | | | | | |
* Includes undistributed net investment income (loss) at end of year | | | $ | (243,524 | ) | | | $ | 193 | | | | $ | 44,931 | | | | $ | 973,777 | | | | $ | — | | | | $ | 856 | |
| | | | | | | | | | | | | | | | | | | | | | | | | | | | | | |
Share Activity: | | | | | | | | | | | | | | | | | | | | | | | | | | | | | | |
Shares Sold | | | | | | | | | | | | | | | | | | | | | | | | | | | | | | |
Class A | | | | 767,834 | | | | | 1,698,086 | | | | | 1,359,366 | | | | | 2,028,026 | | | | | 1,578,172 | | | | | 1,202,215 | |
Class B | | | | — | | | | | — | | | | | — | | | | | — | | | | | — | | | | | — | |
Class C | | | | 83,427 | | | | | 94,047 | | | | | 54,008 | | | | | 55,985 | | | | | 261,889 | | | | | 157,496 | |
Shares Reinvested | | | | | | | | | | | | | | | | | | | | | | | | | | | | | | |
Class A | | | | — | | | | | — | | | | | 137,809 | | | | | 23,898 | | | | | 248,326 | | | | | — | |
Class B | | | | — | | | | | — | | | | | — | | | | | — | | | | | — | | | | | — | |
Class C | | | | — | | | | | — | | | | | 4,582 | | | | | 669 | | | | | 19,606 | | | | | — | |
Shares Redeemed | | | | | | | | | | | | | | | | | | | | | | | | | | | | | | |
Class A | | | | (942,716 | ) | | | | (1,942,170 | ) | | | | (1,771,028 | ) | | | | (2,268,154 | ) | | | | (1,808,904 | ) | | | | (2,032,969 | ) |
Class B | | | | — | | | | | (73,923 | ) | | | | — | | | | | — | | | | | — | | | | | (126,420 | ) |
Class C | | | | (89,997 | ) | | | | (80,583 | ) | | | | (55,851 | ) | | | | (89,380 | ) | | | | (95,547 | ) | | | | (122,452 | ) |
| | | | | | | | | | | | | | | | | | | | | | | | | | | | | | |
Net increase (decrease) in shares of beneficial interest outstanding | | | | (181,452 | ) | | | | (304,543 | ) | | | | (271,114 | ) | | | | (248,956 | ) | | | | 203,542 | | | | | (922,130 | ) |
| | | | | | | | | | | | | | | | | | | | | | | | | | | | | | |
The accompanying notes are an integral part of these financial statements.
[56]
| | |
| Timothy Plan Family of Funds | | |
| | |
Statements of Changes in Net Assets | | |
| | | | | | | | | | | | | | | | | | | | | | | | | | | | | | |
| | | Small Cap Value Fund | | Large/Mid Cap Value Fund | | Fixed Income Fund |
| | | Year Ended
September 30,
2012 | | Year Ended
September 30,
2011 | | Year Ended
September 30,
2012 | | Year Ended
September 30,
2011 | | Year Ended
September 30,
2012 | | Year Ended
September 30,
2011 |
Operations: | | | | | | | | | | | | | | | | | | | | | | | | | | | | | | |
Net investment income (loss) | | | $ | 62,933 | | | | $ | (235,679 | ) | | | $ | 359,304 | | | | $ | 253,634 | | | | $ | 1,447,185 | | | | $ | 1,754,747 | |
Net realized gain on investments | | | | 719,802 | | | | | 10,547,043 | | | | | 2,183,461 | | | | | 6,770,993 | | | | | 1,119,022 | | | | | 344,476 | |
Capital gain dividends from REITs | | | | 105,312 | | | | | 30,331 | | | | | — | | | | | — | | | | | — | | | | | — | |
Distributions of realized gains by underlying investment companies | | | | 27,521 | | | | | — | | | | | 14,053 | | | | | — | | | | | — | | | | | — | |
Net change in unrealized appreciation (depreciation) on investments | | | | 13,945,528 | | | | | (11,647,521 | ) | | | | 19,698,121 | | | | | (6,538,239 | ) | | | | 83,832 | | | | | 878,362 | |
| | | | | | | | | | | | | | | | | | | | | | | | | | | | | | |
Net increase (decrease) in net assets resulting from operations | | | | 14,861,096 | | | | | (1,305,826 | ) | | | | 22,254,939 | | | | | 486,388 | | | | | 2,650,039 | | | | | 2,977,585 | |
| | | | | | | | | | | | | | | | | | | | | | | | | | | | | | |
Distributions to shareholders: | | | | | | | | | | | | | | | | | | | | | | | | | | | | | | |
Net investment income | | | | | | | | | | | | | | | | | | | | | | | | | | | | | | |
Class A | | | | — | | | | | — | | | | | (192,686 | ) | | | | (261,906 | ) | | | | (1,390,052 | ) | | | | (1,648,039 | ) |
Class B | | | | — | | | | | — | | | | | — | | | | | (81 | ) | | | | — | | | | | (2,453 | ) |
Class C | | | | — | | | | | — | | | | | — | | | | | (14,121 | ) | | | | (117,270 | ) | | | | (162,513 | ) |
From return of capital | | | | | | | | | | | | | | | | | | | | | | | | | | | | | | |
Class A | | | | — | | | | | — | | | | | — | | | | | — | | | | | (164,680 | ) | | | | — | |
Class C | | | | — | | | | | — | | | | | — | | | | | — | | | | | (22,138 | ) | | | | — | |
| | | | | | | | | | | | | | | | | | | | | | | | | | | | | | |
Total dividends and distributions to shareholders | | | | — | | | | | — | | | | | (192,686 | ) | | | | (276,108 | ) | | | | (1,694,140 | ) | | | | (1,813,005 | ) |
| | | | | | | | | | | | | | | | | | | | | | | | | | | | | | |
Share transactions of beneficial interest: | | | | | | | | | | | | | | | | | | | | | | | | | | | | | | |
Net proceeds from shares sold | | | | | | | | | | | | | | | | | | | | | | | | | | | | | | |
Class A | | | | 9,466,165 | | | | | 12,441,689 | (A) | | | | 22,377,135 | | | | | 22,263,854 | (B) | | | | 29,593,291 | | | | | 19,544,113 | (C) |
Class B | | | | — | | | | | 4,993 | | | | | — | | | | | 5,970 | | | | | — | | | | | 17,176 | |
Class C | | | | 741,076 | | | | | 813,467 | | | | | 1,527,688 | | | | | 1,981,583 | | | | | 2,584,354 | | | | | 2,724,932 | |
Reinvestment of dividends and distributions | | | | | | | | | | | | | | | | | | | | | | | | | | | | | | |
Class A | | | | — | | | | | — | | | | | 166,163 | | | | | 227,621 | | | | | 1,387,933 | | | | | 1,507,072 | |
Class B | | | | — | | | | | — | | | | | — | | | | | — | | | | | — | | | | | 1,695 | |
Class C | | | | — | | | | | — | | | | | — | | | | | 11,456 | | | | | 118,494 | | | | | 139,301 | |
Cost of shares redeemed | | | | | | | | | | | | | | | | | | | | | | | | | | | | | | |
Class A | | | | (14,169,607 | ) | | | | (12,228,520 | ) | | | | (20,066,761 | ) | | | | (25,029,749 | ) | | | | (16,548,854 | ) | | | | (21,533,493 | ) |
Class B | | | | — | | | | | (3,517,825 | )(A) | | | | — | | | | | (1,243,569 | )(B) | | | | — | | | | | (324,671 | )(C) |
Class C | | | | (940,033 | ) | | | | (1,035,742 | ) | | | | (1,923,286 | ) | | | | (2,549,360 | ) | | | | (2,079,274 | ) | | | | (3,151,176 | ) |
| | | | | | | | | | | | | | | | | | | | | | | | | | | | | | |
Net increase (decrease) in net assets from share transactions of beneficial interest | | | | (4,902,399 | ) | | | | (3,521,938 | ) | | | | 2,080,939 | | | | | (4,332,194 | ) | | | | 15,055,944 | | | | | (1,075,051 | ) |
| | | | | | | | | | | | | | | | | | | | | | | | | | | | | | |
Total Increase (Decrease) in Net Assets | | | | 9,958,697 | | | | | (4,827,764 | ) | | | | 24,143,192 | | | | | (4,121,914 | ) | | | | 16,011,843 | | | | | 89,529 | |
| (A) | Includes automatic conversion of Class B shares ($3,411,659 representing 310,664.84 shares) to Class A shares ($3,411,659 representing 267,768.61 shares). |
| (B) | Includes automatic conversion of Class B shares ($1,146,134 representing 95,005.48 shares) to Class A shares ($1,146,134 representing 85,851 shares). |
| (C) | Includes automatic conversion of Class B shares ($305,905 representing 30,369.32 shares) to Class A shares ($305,905 representing 29,462.54 shares). |
The accompanying notes are an integral part of these financial statements.
[57]
| | |
| Timothy Plan Family of Funds | | |
| | |
Statements of Changes in Net Assets (Continued) | | |
| | | | | | | | | | | | | | | | | | | | | | | | | | | | | | |
| | | Small Cap Value Fund | | Large/Mid Cap Value Fund | | Fixed Income Fund |
| | | Year Ended
September 30,
2012 | | Year Ended
September 30,
2011 | | Year Ended
September 30,
2012 | | Year Ended
September 30,
2011 | | Year Ended
September 30,
2012 | | Year Ended
September 30,
2011 |
Net assets: | | | | | | | | | | | | | | | | | | | | | | | | | | | | | | |
Beginning of period | | | | 42,954,109 | | | | | 47,781,873 | | | | | 87,157,983 | | | | | 91,279,897 | | | | | 67,669,921 | | | | | 67,580,392 | |
| | | | | | | | | | | | | | | | | | | | | | | | | | | | | | |
End of period* | | | $ | 52,912,806 | | | | $ | 42,954,109 | | | | $ | 111,301,175 | | | | $ | 87,157,983 | | | | $ | 83,681,764 | | | | $ | 67,669,921 | |
| | | | | | | | | | | | | | | | | | | | | | | | | | | | | | |
* Includes undistributed net investment income (loss) at end of year | | | $ | 62,933 | | | | $ | — | | | | $ | 345,523 | | | | $ | 232,082 | | | | $ | — | | | | $ | 60,137 | |
| | | | | | | | | | | | | | | | | | | | | | | | | | | | | | |
Share Activity: | | | | | | | | | | | | | | | | | | | | | | | | | | | | | | |
Shares Sold | | | | | | | | | | | | | | | | | | | | | | | | | | | | | | |
Class A | | | | 689,419 | | | | | 962,077 | | | | | 1,617,146 | | | | | 1,667,993 | | | | | 2,736,275 | | | | | 1,858,115 | |
Class B | | | | — | | | | | 438 | | | | | — | | | | | 545 | | | | | — | | | | | 1,689 | |
Class C | | | | 63,479 | | | | | 71,686 | | | | | 123,919 | | | | | 164,522 | | | | | 247,361 | | | | | 268,029 | |
Shares Reinvested | | | | | | | | | | | | | | | | | | | | | | | | | | | | | | |
Class A | | | | — | | | | | — | | | | | 12,494 | | | | | 17,216 | | | | | 128,523 | | | | | 144,648 | |
Class B | | | | — | | | | | — | | | | | — | | | | | — | | | | | — | | | | | 169 | |
Class C | | | | — | | | | | — | | | | | — | | | | | 960 | | | | | 11,334 | | | | | 13,842 | |
Shares Redeemed | | | | | | | | | | | | | | | | | | | | | | | | | | | | | | |
Class A | | | | (1,051,072 | ) | | | | (934,306 | ) | | | | (1,442,807 | ) | | | | (1,888,346 | ) | | | | (1,531,237 | ) | | | | (2,035,532 | ) |
Class B | | | | — | | | | | (320,029 | ) | | | | — | | | | | (102,892 | ) | | | | — | | | | | (32,234 | ) |
Class C | | | | (80,270 | ) | | | | (90,575 | ) | | | | (154,756 | ) | | | | (214,474 | ) | | | | (198,943 | ) | | | | (311,801 | ) |
| | | | | | | | | | | | | | | | | | | | | | | | | | | | | | |
Net increase (decrease) in shares of beneficial interest outstanding | | | | (378,444 | ) | | | | (310,709 | ) | | | | 155,996 | | | | | (354,476 | ) | | | | 1,393,313 | | | | | (93,075 | ) |
| | | | | | | | | | | | | | | | | | | | | | | | | | | | | | |
The accompanying notes are an integral part of these financial statements.
[58]
| | |
| Timothy Plan Family of Funds | | |
| | |
Statements of Changes in Net Assets | | |
| | | | | | | | | | | | | | | | | | | | | | | | | |
| | | High Yield Bond Fund | | Israel Common
Values Fund (1) | | Defensive Strategies Fund |
| | | Year Ended
September 30,
2012 | | Year Ended
September 30,
2011 | | Period Ended
September 30,
2012 | | Year Ended
September 30,
2012 | | Year Ended
September 30,
2011 |
Operations: | | | | | | | | | | | | | | | | | | | | | | | | | |
Net investment income (loss) | | | $ | 1,729,254 | | | | $ | 1,495,992 | | | | $ | (109,693 | ) | | | $ | 16,603 | | | | $ | 243,202 | |
Net realized gain (loss) on investments | | | | 190,990 | | | | | 641,510 | | | | | 1,366 | | | | | 909,400 | | | | | 2,886,487 | |
Capital gain dividends from REITs | | | | — | | | | | — | | | | | — | | | | | 52,388 | | | | | 42,437 | |
Net change in unrealized appreciation (depreciation) on investments | | | | 2,130,949 | | | | | (1,912,591 | ) | | | | 99,375 | | | | | 7,160,412 | | | | | (2,692,803 | ) |
| | | | | | | | | | | | | | | | | | | | | | | | | |
Net increase (decrease) in net assets resulting from operations | | | | 4,051,193 | | | | | 224,911 | | | | | (8,952 | ) | | | | 8,138,803 | | | | | 479,323 | |
| | | | | | | | | | | | | | | | | | | | | | | | | |
Distributions to shareholders: | | | | | | | | | | | | | | | | | | | | | | | | | |
Net investment income | | | | | | | | | | | | | | | | | | | | | | | | | |
Class A | | | | (1,666,004 | ) | | | | (1,427,454 | ) | | | | — | | | | | (463,463 | ) | | | | — | |
Class C | | | | (72,710 | ) | | | | (59,102 | ) | | | | — | | | | | (30,067 | ) | | | | — | |
From net realized gains | | | | | | | | | | | | | | | | | | | | | | | | | |
Class A | | | | — | | | | | — | | | | | — | | | | | (3,030,191 | ) | | | | (112,375 | ) |
Class C | | | | — | | | | | — | | | | | — | | | | | (856,233 | ) | | | | (33,422 | ) |
From return of capital | | | | | | | | | | | | | | | | | | | | | | | | | |
Class A | | | | (49,301 | ) | | | | — | | | | | — | | | | | (175,127 | ) | | | | — | |
Class C | | | | (2,413 | ) | | | | — | | | | | — | | | | | (52,013 | ) | | | | — | |
| | | | | | | | | | | | | | | | | | | | | | | | | |
Total dividends and distributions to shareholders | | | | (1,790,428 | ) | | | | (1,486,556 | ) | | | | — | | | | | (4,607,094 | ) | | | | (145,797 | ) |
| | | | | | | | | | | | | | | | | | | | | | | | | |
Share transactions of beneficial interest: | | | | | | | | | | | | | | | | | | | | | | | | | |
Net proceeds from shares sold | | | | | | | | | | | | | | | | | | | | | | | | | |
Class A | | | | 20,228,788 | | | | | 12,333,861 | | | | | 11,718,256 | | | | | 31,938,021 | | | | | 28,601,051 | |
Class C | | | | 734,558 | | | | | 610,998 | | | | | 336,402 | | | | | 6,490,538 | | | | | 8,352,520 | |
Reinvestment of dividends and distributions | | | | | | | | | | | | | | | | | | | | | | | | | |
Class A | | | | 1,538,720 | | | | | 1,345,820 | | | | | — | | | | | 3,264,161 | | | | | 111,243 | |
Class C | | | | 57,907 | | | | | 41,814 | | | | | — | | | | | 932,036 | | | | | 33,336 | |
Cost of shares redeemed | | | | | | | | | | | | | | | | | | | | | | | | | |
Class A | | | | (13,635,827 | ) | | | | (10,987,110 | ) | | | | (3,724,284 | ) | | | | (28,825,727 | ) | | | | (8,638,114 | ) |
Class C | | | | (413,933 | ) | | | | (436,012 | ) | | | | (120,704 | ) | | | | (2,770,955 | ) | | | | (910,938 | ) |
| | | | | | | | | | | | | | | | | | | | | | | | | |
Net increase (decrease) in net assets from share transactions of beneficial interest | | | | 8,510,213 | | | | | 2,909,371 | | | | | 8,209,670 | | | | | 11,028,074 | | | | | 27,549,098 | |
| | | | | | | | | | | | | | | | | | | | | | | | | |
Total Increase (Decrease) in Net Assets | | | | 10,770,978 | | | | | 1,647,726 | | | | | 8,200,718 | | | | | 14,559,783 | | | | | 27,882,624 | |
| (1) | The Israel Common Values Fund commenced operations on October 12, 2011. |
The accompanying notes are an integral part of these financial statements.
[59]
| | |
| Timothy Plan Family of Funds | | |
| | |
Statements of Changes in Net Assets (Continued) | | |
| | | | | | | | | | | | | | | | | | | | | | | | | |
| | | High Yield Bond Fund | | Israel Common
Values Fund (1) | | Defensive Strategies Fund |
| | | Year Ended
September 30,
2012 | | Year Ended
September 30,
2011 | | Period Ended
September 30,
2012 | | Year Ended
September 30,
2012 | | Year Ended
September 30,
2011 |
Net assets: | | | | | | | | | | | | | | | | | | | | | | | | | |
Beginning of period | | | | 24,303,978 | | | | | 22,656,252 | | | | | — | | | | | 56,769,785 | | | | | 28,887,161 | |
| | | | | | | | | | | | | | | | | | | | | | | | | |
End of period* | | | $ | 35,074,956 | | | | $ | 24,303,978 | | | | $ | 8,200,718 | | | | $ | 71,329,568 | | | | $ | 56,769,785 | |
| | | | | | | | | | | | | | | | | | | | | | | | | |
* Includes undistributed net investment income (loss) at end of period | | | $ | — | | | | $ | 9,460 | | | | $ | (84,330 | ) | | | $ | 172,609 | | | | $ | (900,105 | ) |
| | | | | | | | | | | | | | | | | | | | | | | | | |
Share Activity: | | | | | | | | | | | | | | | | | | | | | | | | | |
Shares Sold | | | | | | | | | | | | | | | | | | | | | | | | | |
Class A | | | | 2,188,769 | | | | | 1,320,132 | | | | | 1,153,664 | | | | | 2,657,882 | | | | | 2,412,710 | |
Class C | | | | 78,895 | | | | | 64,843 | | | | | 33,037 | | | | | 558,363 | | | | | 734,318 | |
Shares Reinvested | | | | | | | | | | | | | | | | | | | | | | | | | |
Class A | | | | 166,421 | | | | | 147,305 | | | | | — | | | | | 283,347 | | | | | 9,995 | |
Class C | | | | 6,212 | | | | | 4,549 | | | | | — | | | | | 82,046 | | | | | 3,033 | |
Shares Redeemed | | | | | | | | | | | | | | | | | | | | | | | | | |
Class A | | | | (1,479,733 | ) | | | | (1,188,798 | ) | | | | (368,476 | ) | | | | (2,475,935 | ) | | | | (735,810 | ) |
Class C | | | | (44,704 | ) | | | | (46,817 | ) | | | | (11,514 | ) | | | | (239,208 | ) | | | | (77,986 | ) |
| | | | | | | | | | | | | | | | | | | | | | | | | |
Net increase (decrease) in shares of beneficial interest outstanding | | | | 915,860 | | | | | 301,214 | | | | | 806,711 | | | | | 866,495 | | | | | 2,346,260 | |
| | | | | | | | | | | | | | | | | | | | | | | | | |
The accompanying notes are an integral part of these financial statements.
[60]
| | |
| Timothy Plan Family of Funds | | |
| | |
Statements of Changes in Net Assets | | |
| | | | | | | | | | | | | | | | | | | | |
| | | Strategic Growth Fund | | Conservative Growth Fund |
| | | Year Ended
September 30,
2012 | | Year Ended
September 30,
2011 | | Year Ended
September 30,
2012 | | Year Ended
September 30,
2011 |
Operations: | | | | | | | | | | | | | | | | | | | | |
Net investment income (loss) | | | $ | 182,207 | | | | $ | (189,939 | ) | | | $ | 269,076 | | | | $ | 145,364 | |
Net realized gain (loss) on investments | | | | (447,532 | ) | | | | (1,558,069 | ) | | | | 1,635,113 | | | | | (117,573 | ) |
Capital gain distributions from affiliated funds | | | | 628,601 | | | | | — | | | | | 644,601 | | | | | — | |
Net change in unrealized appreciation on investments | | | | 6,437,198 | | | | | 787,545 | | | | | 3,133,017 | | | | | 222,040 | |
| | | | | | | | | | | | | | | | | | | | |
Net increase (decrease) in net assets resulting from operations | | | | 6,800,474 | | | | | (960,463 | ) | | | | 5,681,807 | | | | | 249,831 | |
| | | | | | | | | | | | | | | | | | | | |
Distributions to shareholders: | | | | | | | | | | | | | | | | | | | | |
Net investment income | | | | | | | | | | | | | | | | | | | | |
Class A | | | | — | | | | | — | | | | | (49,894 | ) | | | | (322,689 | ) |
Class B | | | | — | | | | | — | | | | | — | | | | | (12,992 | ) |
Class C | | | | — | | | | | — | | | | | — | | | | | (57,747 | ) |
From return of capital | | | | | | | | | | | | | | | | | | | | |
Class A | | | | — | | | | | (41,359 | ) | | | | — | | | | | — | |
| | | | | | | | | | | | | | | | | | | | |
Total dividends and distributions to shareholders | | | | — | | | | | (41,359 | ) | | | | (49,894 | ) | | | | (393,428 | ) |
| | | | | | | | | | | | | | | | | | | | |
Share transactions of beneficial interest: | | | | | | | | | | | | | | | | | | | | |
Net proceeds from shares sold | | | | | | | | | | | | | | | | | | | | |
Class A | | | | 2,739,030 | | | | | 11,602,959 | (A) | | | | 5,968,016 | | | | | 11,948,847 | (B) |
Class B | | | | — | | | | | 915 | | | | | — | | | | | 86,938 | |
Class C | | | | 818,628 | | | | | 1,483,698 | | | | | 1,927,268 | | | | | 2,242,908 | |
Reinvestment of dividends and distributions | | | | | | | | | | | | | | | | | | | | |
Class A | | | | — | | | | | 37,242 | | | | | 46,328 | | | | | 285,257 | |
Class B | | | | — | | | | | — | | | | | — | | | | | 12,537 | |
Class C | | | | — | | | | | — | | | | | — | | | | | 53,050 | |
Cost of shares redeemed | | | | | | | | | | | | | | | | | | | | |
Class A | | | | (7,434,707 | ) | | | | (13,360,343 | ) | | | | (5,947,763 | ) | | | | (11,723,735 | ) |
Class B | | | | — | | | | | (5,109,691 | )(A) | | | | — | | | | | (3,617,843 | )(B) |
Class C | | | | (1,552,381 | ) | | | | (1,668,875 | ) | | | | (1,686,942 | ) | | | | (1,577,257 | ) |
| | | | | | | | | | | | | | | | | | | | |
Net increase (decrease) in net assets from share transactions of beneficial interest | | | | (5,429,430 | ) | | | | (7,014,095 | ) | | | | 306,907 | | | | | (2,289,298 | ) |
| | | | | | | | | | | | | | | | | | | | |
Total Increase (Decrease) in Net Assets | | | | 1,371,044 | | | | | (8,015,917 | ) | | | | 5,938,820 | | | | | (2,432,895 | ) |
| (A) | Includes automatic conversion of Class B shares ($2,385,212 representing 341,496.09 shares) to Class A shares ($2,385,212 representing 320,934.11 shares). |
| (B) | Includes automatic conversion of Class B shares ($3,374,998 representing 382,807.56 shares) to Class A shares ($3,374,998 representing 360,845.90 shares). |
The accompanying notes are an integral part of these financial statements.
[61]
| | |
| Timothy Plan Family of Funds | | |
| | |
Statements of Changes in Net Assets (Continued) | | |
| | | | | | | | | | | | | | | | | | | | |
| | | Strategic Growth Fund | | Conservative Growth Fund |
| | | Year Ended
September 30,
2012 | | Year Ended
September 30,
2011 | | Year Ended
September 30,
2012 | | Year Ended
September 30,
2011 |
Net assets: | | | | | | | | | | | | | | | | | | | | |
Beginning of period | | | | 37,715,400 | | | | | 45,731,317 | | | | | 43,294,191 | | | | | 45,727,086 | |
| | | | | | | | | | | | | | | | | | | | |
End of period* | | | $ | 39,086,444 | | | | $ | 37,715,400 | | | | $ | 49,233,011 | | | | $ | 43,294,191 | |
| | | | | | | | | | | | | | | | | | | | |
* Includes undistributed net investment income (loss) at end of year | | | $ | 182,207 | | | | $ | 14,351 | | | | $ | 276,345 | | | | $ | 134,095 | |
| | | | | | | | | | | | | | | | | | | | |
Share Activity: | | | | | | | | | | | | | | | | | | | | |
Shares Sold | | | | | | | | | | | | | | | | | | | | |
Class A | | | | 382,740 | | | | | 1,612,904 | | | | | 621,169 | | | | | 1,273,358 | |
Class B | | | | — | | | | | 135 | | | | | — | | | | | 9,964 | |
Class C | | | | 124,012 | | | | | 221,382 | | | | | 213,342 | | | | | 254,069 | |
Shares Reinvested | | | | | | | | | | | | | | | | | | | | |
Class A | | | | — | | | | | 5,216 | | | | | 4,939 | | | | | 30,839 | |
Class B | | | | — | | | | | — | | | | | — | | | | | 1,434 | |
Class C | | | | — | | | | | — | | | | | — | | | | | 6,084 | |
Shares Redeemed | | | | | | | | | | | | | | | | | | | | |
Class A | | | | (1,040,902 | ) | | | | (1,879,526 | ) | | | | (618,780 | ) | | | | (1,255,867 | ) |
Class B | | | | — | | | | | (766,198 | ) | | | | — | | | | | (410,466 | ) |
Class C | | | | (235,669 | ) | | | | (255,163 | ) | | | | (187,625 | ) | | | | (178,853 | ) |
| | | | | | | | | | | | | | | | | | | | |
Net increase (decrease) in shares of beneficial interest outstanding | | | | (769,819 | ) | | | | (1,061,251 | ) | | | | 33,045 | | | | | (269,438 | ) |
| | | | | | | | | | | | | | | | | | | | |
The accompanying notes are an integral part of these financial statements.
[62]
| | |
| Timothy Plan Family of Funds | | |
| | | | | | | | | | | | | | | | | | | | | | | | | | | | | | |
| | | Aggressive Growth |
| | | (Class A Shares) |
| | | For the Year Ended
September 30, | | For the Period
Ended
September 30,
2009 (A) | | For the Year Ended
December 31, |
| | | 2012 | | 2011 | | 2010 | | | 2008 | | 2007 |
Selected data based on a share outstanding throughout each period | | | | | | | | | | | | | | | | | | | | | | | | | | | | | | |
Net asset value, beginning of period | | | $ | 5.57 | | | | $ | 5.42 | | | | $ | 4.51 | | | | $ | 3.71 | | | | $ | 6.80 | | | | $ | 7.04 | |
| | | | | | | | | | | | | | | | | | | | | | | | | | | | | | |
Income (loss) from investment operations: | | | | | | | | | | | | | | | | | | | | | | | | | | | | | | |
Net investment income (loss) | | | | (0.12 | )(B) | | | | (0.10 | )(B) | | | | (0.09 | ) | | | | (0.05 | ) | | | | (0.07 | ) | | | | (0.06 | ) |
Net realized and unrealized gain (loss) on investments | | | | 1.65 | | | | | 0.25 | | | | | 1.00 | | | | | 0.85 | | | | | (3.01 | ) | | | | 0.59 | |
| | | | | | | | | | | | | | | | | | | | | | | | | | | | | | |
Total from investment operations | | | | 1.53 | | | | | 0.15 | | | | | 0.91 | | | | | 0.80 | | | | | (3.08 | ) | | | | 0.53 | |
| | | | | | | | | | | | | | | | | | | | | | | | | | | | | | |
Less Distributions: | | | | | | | | | | | | | | | | | | | | | | | | | | | | | | |
From net investment income | | | | — | | | | | — | | | | | — | | | | | — | | | | | — | | | | | — | |
From net realized gains on investments | | | | — | | | | | — | | | | | — | | | | | — | | | | | (0.01 | ) | | | | (0.77 | ) |
| | | | | | | | | | | | | | | | | | | | | | | | | | | | | | |
Total distributions | | | | — | | | | | — | | | | | — | | | | | — | | | | | (0.01 | ) | | | | (0.77 | ) |
| | | | | | | | | | | | | | | | | | | | | | | | | | | | | | |
Net asset value, end of period | | | $ | 7.10 | | | | $ | 5.57 | | | | $ | 5.42 | | | | $ | 4.51 | | | | $ | 3.71 | | | | $ | 6.80 | |
| | | | | | | | | | | | | | | | | | | | | | | | | | | | | | |
Total return (C)(D) | | | | 27.47 | % | | | | 2.77 | % | | | | 20.18 | % | | | | 21.56 | %(F) | | | | (45.27 | )% | | | | 7.66 | % |
Ratios/supplemental data: | | | | | | | | | | | | | | | | | | | | | | | | | | | | | | |
Net assets, end of period (in 000’s) | | | $ | 14,398 | | | | $ | 12,259 | | | | $ | 13,247 | | | | $ | 17,007 | | | | $ | 14,575 | | | | $ | 24,041 | |
Ratios to average net assets | | | | | | | | | | | | | | | | | | | | | | | | | | | | | | |
Expenses, before reimbursement | | | | 2.12 | % | | | | 1.81 | % | | | | 1.88 | % | | | | 1.85 | %(G) | | | | 1.72 | % | | | | 1.52 | % |
Expenses, net reimbursement | | | | 2.12 | % | | | | 1.81 | % | | | | 1.88 | % | | | | 1.85 | %(G) | | | | 1.72 | % | | | | 1.55 | % |
Net investment income (loss), before reimbursement | | | | (1.78 | )% | | | | (1.52 | )% | | | | (1.61 | )% | | | | (1.58 | )%(G) | | | | (1.33 | )% | | | | (0.94 | )% |
Net investment income (loss), net reimbursement | | | | (1.78 | )% | | | | (1.52 | )% | | | | (1.61 | )% | | | | (1.58 | )%(G) | | | | (1.33 | )% | | | | (0.97 | )% |
Portfolio turnover rate | | | | 147 | % | | | | 201 | % | | | | 89 | % | | | | 136 | % | | | | 244 | %(E) | | | | 59 | % |
| (A) | The Fund elected to change its fiscal year end from December to September. The information presented is for January 1, 2009 through September 30, 2009. |
| (B) | Per share amounts calculated using average shares method, which more appropriately presents the per share data for the period. |
| (C) | Total return calculation does not reflect sales load. |
| (D) | Total return in the above table represents the rate that the investor would have earned or lost on an investment in the Fund assuming reinvestment of dividends. Total return would have been higher or lower if certain expenses had not been reimbursed, waived or recouped. |
| (E) | On January 1, 2008, Chartwell Investment Partners became sub-advisor for the Fund. |
| (F) | For periods of less than one full year, total return is not annualized. |
The accompanying notes are an integral part of these financial statements.
[63]
| | |
| Timothy Plan Family of Funds | | |
| | | | | | | | | | | | | | | | | | | | | | | | | | | | | | |
| | | Aggressive Growth |
| | | (Class C Shares) |
| | | For the Year Ended
September 30, | | For the Period
Ended
September 30,
2009 (A) | | For the Year Ended
December 31, |
| | | 2012 | | 2011 | | 2010 | | | 2008 | | 2007 |
Selected data based on a share outstanding throughout each period | | | | | | | | | | | | | | | | | | | | | | | | | | | | | | |
Net asset value, beginning of period | | | $ | 5.06 | | | | $ | 4.98 | | | | $ | 4.18 | | | | $ | 3.46 | | | | $ | 6.37 | | | | $ | 6.69 | |
| | | | | | | | | | | | | | | | | | | | | | | | | | | | | | |
Income (loss) from investment operations: | | | | | | | | | | | | | | | | | | | | | | | | | | | | | | |
Net investment income (loss) | | | | (0.16 | )(B) | | | | (0.13 | )(B) | | | | (0.11 | ) | | | | (0.06 | ) | | | | (0.11 | ) | | | | (0.10 | ) |
Net realized and unrealized gain (loss) on investments | | | | 1.53 | | | | | 0.21 | | | | | 0.91 | | | | | 0.78 | | | | | (2.79 | ) | | | | 0.55 | |
| | | | | | | | | | | | | | | | | | | | | | | | | | | | | | |
Total from investment operations | | | | 1.37 | | | | | 0.08 | | | | | 0.80 | | | | | 0.72 | | | | | (2.90 | ) | | | | 0.45 | |
| | | | | | | | | | | | | | | | | | | | | | | | | | | | | | |
Less Distributions: | | | | | | | | | | | | | | | | | | | | | | | | | | | | | | |
From net investment income | | | | — | | | | | — | | | | | — | | | | | — | | | | | — | | | | | — | |
From net realized gains on investments | | | | — | | | | | — | | | | | — | | | | | — | | | | | (0.01 | ) | | | | (0.77 | ) |
| | | | | | | | | | | | | | | | | | | | | | | | | | | | | | |
Total distributions | | | | — | | | | | — | | | | | — | | | | | — | | | | | (0.01 | ) | | | | (0.77 | ) |
| | | | | | | | | | | | | | | | | | | | | | | | | | | | | | |
Net asset value, end of period | | | $ | 6.43 | | | | $ | 5.06 | | | | $ | 4.98 | | | | $ | 4.18 | | | | $ | 3.46 | | | | $ | 6.37 | |
| | | | | | | | | | | | | | | | | | | | | | | | | | | | | | |
Total return (C)(D) | | | | 27.08 | % | | | | 1.61 | % | | | | 19.14 | % | | | | 20.81 | %(F) | | | | (45.50 | )% | | | | 6.86 | % |
Ratios/supplemental data: | | | | | | | | | | | | | | | | | | | | | | | | | | | | | | |
Net assets, end of period (in 000’s) | | | $ | 2,201 | | | | $ | 1,766 | | | | $ | 1,670 | | | | $ | 1,477 | | | | $ | 1,272 | | | | $ | 2,277 | |
Ratios to average net assets | | | | | | | | | | | | | | | | | | | | | | | | | | | | | | |
Expenses, before reimbursement | | | | 2.87 | % | | | | 2.57 | % | | | | 2.63 | % | | | | 2.60 | %(G) | | | | 2.47 | % | | | | 2.27 | % |
Expenses, net reimbursement | | | | 2.87 | % | | | | 2.57 | % | | | | 2.63 | % | | | | 2.60 | %(G) | | | | 2.47 | % | | | | 2.30 | % |
Net investment income (loss), before reimbursement | | | | (2.53 | )% | | | | (2.28 | )% | | | | (2.35 | )% | | | | (2.33 | )%(G) | | | | (2.08 | )% | | | | (1.70 | )% |
Net investment income (loss), net reimbursement | | | | (2.53 | )% | | | | (2.28 | )% | | | | (2.35 | )% | | | | (2.33 | )%(G) | | | | (2.08 | )% | | | | (1.73 | )% |
Portfolio turnover rate | | | | 147 | % | | | | 201 | % | | | | 89 | % | | | | 136 | % | | | | 244 | %(E) | | | | 59 | % |
| (A) | The Fund elected to change its fiscal year end from December to September. The information presented is for January 1, 2009 through September 30, 2009. |
| (B) | Per share amounts calculated using average shares method, which more appropriately presents the per share data for the period. |
| (C) | Total return calculation does not reflect redemption fee. |
| (D) | Total return in the above table represents the rate that the investor would have earned or lost on an investment in the Fund assuming reinvestment of dividends. Total return would have been higher or lower if certain expenses had not been reimbursed, waived or recouped. |
| (E) | On January 1, 2008, Chartwell Investment Partners became sub-advisor for the Fund. |
| (F) | For periods of less than one full year, total return is not annualized. |
The accompanying notes are an integral part of these financial statements.
[64]
| | |
| Timothy Plan Family of Funds | | |
| | | | | | | | | | | | | | | | | | | | | | | | | | | | | | |
| | | International |
| | | (Class A Shares) |
| | | For the Year Ended
September 30, | | For the Period
Ended
September 30,
2009 (A) | | For the Year
Ended
December 31,
2008 | | For the Period
Ended
December 31,
2007 (C) |
| | | 2012 | | 2011 | | 2010 | | | |
Selected data based on a share outstanding throughout each period | | | | | | | | | | | | | | | | | | | | | | | | | | | | | | |
Net asset value, beginning of period | | | $ | 6.54 | | | | $ | 7.71 | | | | $ | 7.52 | | | | $ | 5.92 | | | | $ | 11.00 | | | | $ | 10.00 | |
| | | | | | | | | | | | | | | | | | | | | | | | | | | | | | |
Income (loss) from investment operations: | | | | | | | | | | | | | | | | | | | | | | | | | | | | | | |
Net investment income (loss) | | | | 0.03 | (B) | | | | 0.20 | (B) | | | | 0.04 | | | | | 0.08 | | | | | 0.09 | | | | | 0.04 | |
Net realized and unrealized gain (loss) on investments | | | | 0.97 | | | | | (1.33 | ) | | | | 0.26 | | | | | 1.52 | | | | | (5.08 | ) | | | | 1.00 | |
| | | | | | | | | | | | | | | | | | | | | | | | | | | | | | |
Total from investment operations | | | | 1.00 | | | | | (1.13 | ) | | | | 0.30 | | | | | 1.60 | | | | | (4.99 | ) | | | | 1.04 | |
| | | | | | | | | | | | | | | | | | | | | | | | | | | | | | |
Less Distributions: | | | | | | | | | | | | | | | | | | | | | | | | | | | | | | |
From net investment income | | | | (0.23 | ) | | | | (0.04 | ) | | | | (0.11 | ) | | | | — | | | | | (0.09 | ) | | | | (0.04 | ) |
From net realized gains on investments | | | | — | | | | | — | | | | | — | | | | | — | | | | | — | | | | | — | |
| | | | | | | | | | | | | | | | | | | | | | | | | | | | | | |
Total distributions | | | | (0.23 | ) | | | | (0.04 | ) | | | | (0.11 | ) | | | | — | | | | | (0.09 | ) | | | | (0.04 | ) |
| | | | | | | | | | | | | | | | | | | | | | | | | | | | | | |
Net asset value, end of period | | | $ | 7.31 | | | | $ | 6.54 | | | | $ | 7.71 | | | | $ | 7.52 | | | | $ | 5.92 | | | | $ | 11.00 | |
| | | | | | | | | | | | | | | | | | | | | | | | | | | | | | |
Total return (D)(E) | | | | 15.73 | % | | | | (14.72 | )% | | | | 3.93 | % | | | | 27.03 | %(F) | | | | (45.38 | )% | | | | 10.39 | %(F) |
Ratios/supplemental data: | | | | | | | | | | | | | | | | | | | | | | | | | | | | | | |
Net assets, end of period (in 000’s) | | | $ | 29,794 | | | | $ | 28,423 | | | | $ | 35,206 | | | | $ | 37,248 | | | | $ | 31,214 | | | | $ | 42,298 | |
Ratio of expenses to average net assets | | | | 1.82 | % | | | | 1.70 | % | | | | 1.74 | % | | | | 1.72 | %(G) | | | | 1.66 | % | | | | 1.69 | %(G) |
Ratio of net investment income (loss) to average net assets | | | | 0.38 | % | | | | 2.45 | % | | | | 0.58 | % | | | | 1.68 | %(G) | | | | 1.12 | % | | | | 0.58 | %(G) |
Portfolio turnover rate | | | | 34 | % | | | | 62 | % | | | | 41 | % | | | | 38 | % | | | | 32 | % | | | | 13 | % |
| (A) | The Fund elected to change its fiscal year end from December to September. The information presented is for January 1, 2009 through September 30, 2009. |
| (B) | Per share amounts calculated using average shares method, which more appropriately presents the per share data for the period. |
| (C) | For the period May 3, 2007 (Commencement of Operations) to December 31, 2007. |
| (D) | Total return calculation does not reflect sales load. |
| (E) | Total return in the above table represents the rate that the investor would have earned or lost on an investment in the Fund assuming reinvestment of dividends. |
| (F) | For periods of less than one full year, total return is not annualized. |
The accompanying notes are an integral part of these financial statements.
[65]
| | |
| Timothy Plan Family of Funds | | |
| | | | | | | | | | | | | | | | | | | | | | | | | | | | | | |
| | | International |
| | | (Class C Shares) |
| | | For the Year Ended
September 30, | | For the Period
Ended
September 30,
2009 (A) | | For the Year
Ended
December 31,
2008 | | For the Period
Ended
December 31,
2007 (C) |
| | | 2012 | | 2011 | | 2010 | | | |
Selected data based on a share outstanding throughout each period | | | | | | | | | | | | | | | | | | | | | | | | | | | | | | |
Net asset value, beginning of period | | | $ | 6.39 | | | | $ | 7.58 | | | | $ | 7.41 | | | | $ | 5.87 | | | | $ | 10.97 | | | | $ | 10.00 | |
| | | | | | | | | | | | | | | | | | | | | | | | | | | | | | |
Income (loss) from investment operations: | | | | | | | | | | | | | | | | | | | | | | | | | | | | | | |
Net investment income (loss) | | | | (0.02 | )(B) | | | | 0.13 | (B) | | | | (0.01 | ) | | | | 0.04 | | | | | 0.04 | | | | | (0.02 | ) |
Net realized and unrealized gain (loss) on investments | | | | 0.95 | | | | | (1.29 | ) | | | | 0.25 | | | | | 1.50 | | | | | (5.07 | ) | | | | 0.99 | |
| | | | | | | | | | | | | | | | | | | | | | | | | | | | | | |
Total from investment operations | | | | 0.93 | | | | | (1.16 | ) | | | | 0.24 | | | | | 1.54 | | | | | (5.03 | ) | | | | 0.97 | |
| | | | | | | | | | | | | | | | | | | | | | | | | | | | | | |
Less Distributions: | | | | | | | | | | | | | | | | | | | | | | | | | | | | | | |
From net investment income | | | | (0.17 | ) | | | | (0.03 | ) | | | | (0.07 | ) | | | | — | | | | | (0.07 | ) | | | | — | * |
From net realized gains on investments | | | | — | | | | | — | | | | | — | | | | | — | | | | | — | | | | | — | |
| | | | | | | | | | | | | | | | | | | | | | | | | | | | | | |
Total distributions | | | | (0.17 | ) | | | | (0.03 | ) | | | | (0.07 | ) | | | | — | | | | | (0.07 | ) | | | | — | |
| | | | | | | | | | | | | | | | | | | | | | | | | | | | | | |
Net asset value, end of period | | | $ | 7.15 | | | | $ | 6.39 | | | | $ | 7.58 | | | | $ | 7.41 | | | | $ | 5.87 | | | | $ | 10.97 | |
| | | | | | | | | | | | | | | | | | | | | | | | | | | | | | |
Total return (D)(E) | | | | 14.88 | % | | | | (15.40 | )% | | | | 3.27 | % | | | | 26.24 | %(F) | | | | (45.79 | )% | | | | 9.71 | %(F) |
Ratios/supplemental data: | | | | | | | | | | | | | | | | | | | | | | | | | | | | | | |
Net assets, end of period (in 000’s) | | | $ | 1,617 | | | | $ | 1,427 | | | | $ | 1,941 | | | | $ | 1,417 | | | | $ | 984 | | | | $ | 1,318 | |
Ratio of expenses to average net assets | | | | 2.57 | % | | | | 2.45 | % | | | | 2.49 | % | | | | 2.47 | %(G) | | | | 2.40 | % | | | | 2.48 | %(G) |
Ratio of net investment income (loss) to average net assets | | | | (0.32 | )% | | | | 1.58 | % | | | | (0.15 | )% | | | | 0.85 | %(G) | | | | 0.45 | % | | | | (0.44 | )%(G) |
Portfolio turnover rate | | | | 34 | % | | | | 62 | % | | | | 41 | % | | | | 38 | % | | | | 32 | % | | | | 13 | % |
| * | Amount is less than $0.005 per share. |
| (A) | The Fund elected to change its fiscal year end from December to September. The information presented is for January 1, 2009 through September 30, 2009. |
| (B) | Per share amounts calculated using average shares method, which more appropriately presents the per share data for the period. |
| (C) | For the period May 3, 2007 (Commencement of Operations) to December 31, 2007. |
| (D) | Total return calculation does not reflect redemption fee. |
| (E) | Total return in the above table represents the rate that the investor would have earned or lost on an investment in the Fund assuming reinvestment of dividends. |
| (F) | For periods of less than one full year, total return is not annualized. |
The accompanying notes are an integral part of these financial statements.
[66]
| | |
| Timothy Plan Family of Funds | | |
| | | | | | | | | | | | | | | | | | | | | | | | | | | | | | |
| | | Large/Mid Cap Growth |
| | | (Class A Shares) |
| | | For the Year Ended
September 30, | | For the Period
Ended
September 30,
2009 (A) | | For the Year Ended
December 31, |
| | | 2012 | | 2011 | | 2010 | | | 2008 | | 2007 |
Selected data based on a share outstanding throughout each period | | | | | | | | | | | | | | | | | | | | | | | | | | | | | | |
Net asset value, beginning of period | | | $ | 6.05 | | | | $ | 5.99 | | | | $ | 5.37 | | | | $ | 4.38 | | | | $ | 6.89 | | | | $ | 7.25 | |
| | | | | | | | | | | | | | | | | | | | | | | | | | | | | | |
Income (loss) from investment operations: | | | | | | | | | | | | | | | | | | | | | | | | | | | | | | |
Net investment income (loss) | | | | (0.04 | )(B) | | | | (0.04 | )(B) | | | | (0.04 | ) | | | | (0.02 | ) | | | | (0.04 | ) | | | | (0.03 | ) |
Net realized and unrealized gain (loss) on investments | | | | 1.61 | | | | | 0.10 | | | | | 0.66 | | | | | 1.01 | | | | | (2.46 | ) | | | | 0.39 | |
| | | | | | | | | | | | | | | | | | | | | | | | | | | | | | |
Total from investment operations | | | | 1.57 | | | | | 0.06 | | | | | 0.62 | | | | | 0.99 | | | | | (2.50 | ) | | | | 0.36 | |
| | | | | | | | | | | | | | | | | | | | | | | | | | | | | | |
Less Distributions: | | | | | | | | | | | | | | | | | | | | | | | | | | | | | | |
From net investment income | | | | — | | | | | — | | | | | — | | | | | — | | | | | — | | | | | — | |
From net realized gains on investments | | | | (0.32 | ) | | | | — | | | | | — | | | | | — | | | | | (0.01 | ) | | | | (0.72 | ) |
| | | | | | | | | | | | | | | | | | | | | | | | | | | | | | |
Total distributions | | | | (0.32 | ) | | | | — | | | | | — | | | | | — | | | | | (0.01 | ) | | | | (0.72 | ) |
| | | | | | | | | | | | | | | | | | | | | | | | | | | | | | |
Net asset value, end of period | | | $ | 7.30 | | | | $ | 6.05 | | | | $ | 5.99 | | | | $ | 5.37 | | | | $ | 4.38 | | | | $ | 6.89 | |
| | | | | | | | | | | | | | | | | | | | | | | | | | | | | | |
Total return (C)(D) | | | | 26.61 | % | | | | 1.00 | % | | | | 11.55 | % | | | | 22.60 | %(F) | | | | (36.30 | )% | | | | 5.09 | % |
Ratios/supplemental data: | | | | | | | | | | | | | | | | | | | | | | | | | | | | | | |
Net assets, end of period (in 000’s) | | | $ | 41,446 | | | | $ | 34,252 | | | | $ | 38,865 | | | | $ | 35,973 | | | | $ | 32,484 | | | | $ | 53,183 | |
Ratios to average net assets | | | | | | | | | | | | | | | | | | | | | | | | | | | | | | |
Expenses, before reimbursement | | | | 1.68 | % | | | | 1.60 | % | | | | 1.66 | % | | | | 1.67 | %(G) | | | | 1.56 | % | | | | 1.46 | % |
Expenses, net reimbursement | | | | 1.68 | % | | | | 1.60 | % | | | | 1.66 | % | | | | 1.67 | %(G) | | | | 1.56 | % | | | | 1.46 | % |
Net investment income (loss), before reimbursement | | | | (0.63 | )% | | | | (0.64 | )% | | | | (0.74 | )% | | | | (0.58 | )%(G) | | | | (0.64 | )% | | | | (0.37 | )% |
Net investment income (loss), net reimbursement | | | | (0.63 | )% | | | | (0.64 | )% | | | | (0.74 | )% | | | | (0.58 | )%(G) | | | | (0.64 | )% | | | | (0.37 | )% |
Portfolio turnover rate | | | | 127 | % | | | | 150 | % | | | | 78 | % | | | | 78 | % | | | | 177 | %(E) | | | | 45 | % |
| (A) | The Fund elected to change its fiscal year end from December to September. The information presented is for January 1, 2009 through September 30, 2009. |
| (B) | Per share amounts calculated using average shares method, which more appropriately presents the per share data for the period. |
| (C) | Total return calculation does not reflect sales load. |
| (D) | Total return in the above table represents the rate that the investor would have earned or lost on an investment in the Fund assuming reinvestment of dividends. Total return would have been higher or lower if certain expenses had not been reimbursed, waived or recouped. |
| (E) | On January 1, 2008, Chartwell Investment Partners became sub-advisor for the Fund. |
| (F) | For periods of less than one full year, total return is not annualized. |
The accompanying notes are an integral part of these financial statements.
[67]
| | |
| Timothy Plan Family of Funds | | |
| | | | | | | | | | | | | | | | | | | | | | | | | | | | | | |
| | | Large/Mid Cap Growth |
| | | (Class C Shares) |
| | | For the Year Ended
September 30, | | For the Period
Ended
September 30,
2009 (A) | | For the Year Ended
December 31, |
| | | 2012 | | 2011 | | 2010 | | | 2008 | | 2007 |
Selected data based on a share outstanding throughout each period | | | | | | | | | | | | | | | | | | | | | | | | | | | | | | |
Net asset value, beginning of period | | | $ | 5.57 | | | | $ | 5.55 | | | | $ | 5.01 | | | | $ | 4.11 | | | | $ | 6.51 | | | | $ | 6.95 | |
| | | | | | | | | | | | | | | | | | | | | | | | | | | | | | |
Income (loss) from investment operations: | | | | | | | | | | | | | | | | | | | | | | | | | | | | | | |
Net investment income (loss) | | | | (0.09 | )(B) | | | | (0.09 | )(B) | | | | (0.08 | ) | | | | (0.04 | ) | | | | (0.08 | ) | | | | (0.07 | ) |
Net realized and unrealized gain (loss) on investments | | | | 1.47 | | | | | 0.11 | | | | | 0.62 | | | | | 0.94 | | | | | (2.31 | ) | | | | 0.35 | |
| | | | | | | | | | | | | | | | | | | | | | | | | | | | | | |
Total from investment operations | | | | 1.38 | | | | | 0.02 | | | | | 0.54 | | | | | 0.90 | | | | | (2.39 | ) | | | | 0.28 | |
| | | | | | | | | | | | | | | | | | | | | | | | | | | | | | |
Less Distributions: | | | | | | | | | | | | | | | | | | | | | | | | | | | | | | |
From net investment income | | | | — | | | | | — | | | | | — | | | | | — | | | | | — | | | | | — | |
From net realized gains on investments | | | | (0.32 | ) | | | | — | | | | | — | | | | | — | | | | | (0.01 | ) | | | | (0.72 | ) |
| | | | | | | | | | | | | | | | | | | | | | | | | | | | | | |
Total distributions | | | | (0.32 | ) | | | | — | | | | | — | | | | | — | | | | | (0.01 | ) | | | | (0.72 | ) |
| | | | | | | | | | | | | | | | | | | | | | | | | | | | | | |
Net asset value, end of period | | | $ | 6.63 | | | | $ | 5.57 | | | | $ | 5.55 | | | | $ | 5.01 | | | | $ | 4.11 | | | | $ | 6.51 | |
| | | | | | | | | | | | | | | | | | | | | | | | | | | | | | |
Total return (C)(D) | | | | 25.47 | % | | | | 0.36 | % | | | | 10.78 | % | | | | 21.90 | %(F) | | | | (36.73 | )% | | | | 4.15 | % |
Ratios/supplemental data: | | | | | | | | | | | | | | | | | | | | | | | | | | | | | | |
Net assets, end of period (in 000’s) | | | $ | 4,483 | | | | $ | 2,726 | | | | $ | 2,523 | | | | $ | 2,120 | | | | $ | 1,971 | | | | $ | 3,097 | |
Ratios to average net assets | | | | | | | | | | | | | | | | | | | | | | | | | | | | | | |
Expenses, before reimbursement | | | | 2.44 | % | | | | 2.35 | % | | | | 2.41 | % | | | | 2.42 | %(G) | | | | 2.31 | % | | | | 2.22 | % |
Expenses, net reimbursement | | | | 2.44 | % | | | | 2.35 | % | | | | 2.41 | % | | | | 2.42 | %(G) | | | | 2.31 | % | | | | 2.22 | % |
Net investment income (loss), before reimbursement | | | | (1.38 | )% | | | | (1.38 | )% | | | | (1.49 | )% | | | | (1.33 | )%(G) | | | | (1.39 | )% | | | | (1.12 | )% |
Net investment income (loss), net reimbursement | | | | (1.38 | )% | | | | (1.38 | )% | | | | (1.49 | )% | | | | (1.33 | )%(G) | | | | (1.39 | )% | | | | (1.12 | )% |
Portfolio turnover rate | | | | 127 | % | | | | 150 | % | | | | 78 | % | | | | 78 | % | | | | 177 | %(E) | | | | 45 | % |
| (A) | The Fund elected to change its fiscal year end from December to September. The information presented is for January 1, 2009 through September 30, 2009. |
| (B) | Per share amounts calculated using average shares method, which more appropriately presents the per share data for the period. |
| (C) | Total return calculation does not reflect redemption fee. |
| (D) | Total return in the above table represents the rate that the investor would have earned or lost on an investment in the Fund assuming reinvestment of dividends. Total return would have been higher or lower if certain expenses had not been reimbursed, waived or recouped. |
| (E) | On January 1, 2008, Chartwell Investment Partners became sub-advisor for the Fund. |
| (F) | For periods of less than one full year, total return is not annualized. |
The accompanying notes are an integral part of these financial statements.
[68]
| | |
| Timothy Plan Family of Funds | | |
| | | | | | | | | | | | | | | | | | | | | | | | | | | | | | |
| | | Small Cap Value |
| | | (Class A Shares) |
| | | For the Year Ended
September 30, | | For the Period
Ended
September 30,
2009 (A) | | For the Year Ended
December 31, |
| | | 2012 | | 2011 | | 2010 | | | 2008 | | 2007 |
Selected data based on a share outstanding throughout each period | | | | | | | | | | | | | | | | | | | | | | | | | | | | | | |
Net asset value, beginning of period | | | $ | 10.82 | | | | $ | 11.28 | | | | $ | 10.25 | | | | $ | 8.88 | | | | $ | 13.27 | | | | $ | 14.94 | |
| | | | | | | | | | | | | | | | | | | | | | | | | | | | | | |
Income (loss) from investment operations: | | | | | | | | | | | | | | | | | | | | | | | | | | | | | | |
Net investment income (loss) | | | | 0.03 | (B) | | | | (0.05 | )(B) | | | | (0.06 | ) | | | | (0.05 | ) | | | | 0.01 | | | | | 0.04 | |
Net realized and unrealized gain (loss) on investments | | | | 3.89 | | | | | (0.41 | )(C) | | | | 1.09 | | | | | 1.42 | | | | | (4.33 | ) | | | | 0.36 | |
| | | | | | | | | | | | | | | | | | | | | | | | | | | | | | |
Total from investment operations | | | | 3.92 | | | | | (0.46 | ) | | | | 1.03 | | | | | 1.37 | | | | | (4.32 | ) | | | | 0.40 | |
| | | | | | | | | | | | | | | | | | | | | | | | | | | | | | |
Less Distributions: | | | | | | | | | | | | | | | | | | | | | | | | | | | | | | |
From net investment income | | | | — | | | | | — | | | | | — | | | | | — | | | | | — | | | | | (0.03 | ) |
From net realized gains on investments | | | | — | | | | | — | | | | | — | | | | | — | | | | | (0.07 | ) | | | | (2.04 | ) |
| | | | | | | | | | | | | | | | | | | | | | | | | | | | | | |
Total distributions | | | | — | | | | | — | | | | | — | | | | | — | | | | | (0.07 | ) | | | | (2.07 | ) |
| | | | | | | | | | | | | | | | | | | | | | | | | | | | | | |
Net asset value, end of period | | | $ | 14.74 | | | | $ | 10.82 | | | | $ | 11.28 | | | | $ | 10.25 | | | | $ | 8.88 | | | | $ | 13.27 | |
| | | | | | | | | | | | | | | | | | | | | | | | | | | | | | |
Total return (D)(E) | | | | 36.23 | % | | | | (4.08 | )% | | | | 10.05 | % | | | | 15.43 | %(F) | | | | (32.50 | )% | | | | 2.87 | % |
Ratios/supplemental data: | | | | | | | | | | | | | | | | | | | | | | | | | | | | | | |
Net assets, end of period (in 000’s) | | | $ | 47,976 | | | | $ | 39,145 | | | | $ | 40,482 | | | | $ | 47,268 | | | | $ | 42,651 | | | | $ | 62,525 | |
Ratio of expenses to average net assets | | | | 1.59 | % | | | | 1.53 | % | | | | 1.59 | % | | | | 1.59 | %(G) | | | | 1.50 | % | | | | 1.44 | % |
Ratio of net investment income (loss) to average net assets | | | | 0.19 | % | | | | (0.36 | )% | | | | (0.51 | )% | | | | (0.71 | )%(G) | | | | 0.05 | % | | | | 0.24 | % |
Portfolio turnover rate | | | | 65 | % | | | | 102 | % | | | | 64 | % | | | | 57 | % | | | | 110 | % | | | | 60 | % |
| (A) | The Fund elected to change its fiscal year end from December to September. The information presented is for January 1, 2009 through September 30, 2009. |
| (B) | Per share amounts calculated using average shares method, which more appropriately presents the per share data for the period. |
| (C) | Realized and unrealized gains and losses per share in this caption are balancing amounts necessary to reconcile the change in net asset value per share for the period, and may not agree to the aggregate gains and losses in the Statement of Operations due to the fluctuations in share transactions. |
| (D) | Total return calculation does not reflect sales load. |
| (E) | Total return in the above table represents the rate that the investor would have earned or lost on an investment in the Fund assuming reinvestment of dividends. |
| (F) | For periods of less than one full year, total return is not annualized. |
The accompanying notes are an integral part of these financial statements.
[69]
| | |
| Timothy Plan Family of Funds | | |
| | | | | | | | | | | | | | | | | | | | | | | | | | | | | | |
| | | Small Cap Value |
| | | (Class C Shares) |
| | | For the Year Ended
September 30, | | For the Period
Ended
September 30,
2009 (A) | | For the Year Ended
December 31, |
| | | 2012 | | 2011 | | 2010 | | | 2008 | | 2007 |
Selected data based on a share outstanding throughout each period | | | | | | | | | | | | | | | | | | | | | | | | | | | | | | |
Net asset value, beginning of period | | | $ | 9.35 | | | | $ | 9.82 | | | | $ | 8.99 | | | | $ | 7.83 | | | | $ | 11.80 | | | | $ | 13.58 | |
| | | | | | | | | | | | | | | | | | | | | | | | | | | | | | |
Income (loss) from investment operations: | | | | | | | | | | | | | | | | | | | | | | | | | | | | | | |
Net investment income (loss) | | | | (0.06 | )(B) | | | | (0.13 | )(B) | | | | (0.12 | ) | | | | (0.09 | ) | | | | (0.07 | ) | | | | (0.05 | ) |
Net realized and unrealized gain (loss) on investments | | | | 3.34 | | | | | (0.34 | )(C) | | | | 0.95 | | | | | 1.25 | | | | | (3.83 | ) | | | | 0.31 | |
| | | | | | | | | | | | | | | | | | | | | | | | | | | | | | |
Total from investment operations | | | | 3.28 | | | | | (0.47 | ) | | | | 0.83 | | | | | 1.16 | | | | | (3.90 | ) | | | | 0.26 | |
| | | | | | | | | | | | | | | | | | | | | | | | | | | | | | |
Less Distributions: | | | | | | | | | | | | | | | | | | | | | | | | | | | | | | |
From net investment income | | | | — | | | | | — | | | | | — | | | | | — | | | | | — | | | | | — | |
From net realized gains on investments | | | | — | | | | | — | | | | | — | | | | | — | | | | | (0.07 | ) | | | | (2.04 | ) |
| | | | | | | | | | | | | | | | | | | | | | | | | | | | | | |
Total distributions | | | | — | | | | | — | | | | | — | | | | | — | | | | | (0.07 | ) | | | | (2.04 | ) |
| | | | | | | | | | | | | | | | | | | | | | | | | | | | | | |
Net asset value, end of period | | | $ | 12.63 | | | | $ | 9.35 | | | | $ | 9.82 | | | | $ | 8.99 | | | | $ | 7.83 | | | | $ | 11.80 | |
| | | | | | | | | | | | | | | | | | | | | | | | | | | | | | |
Total return (D)(E) | | | | 35.08 | % | | | | (4.79 | )% | | | | 9.23 | % | | | | 14.81 | %(F) | | | | (32.99 | )% | | | | 2.13 | % |
Ratios/supplemental data: | | | | | | | | | | | | | | | | | | | | | | | | | | | | | | |
Net assets, end of period (in 000’s) | | | $ | 4,937 | | | | $ | 3,809 | | | | $ | 4,186 | | | | $ | 3,867 | | | | $ | 3,901 | | | | $ | 6,341 | |
Ratio of expenses to average net assets | | | | 2.34 | % | | | | 2.28 | % | | | | 2.34 | % | | | | 2.34 | %(G) | | | | 2.25 | % | | | | 2.19 | % |
Ratio of net investment income (loss) to average net assets | | | | (0.55 | )% | | | | (1.12 | )% | | | | (1.26 | )% | | | | (1.45 | )%(G) | | | | (0.70 | )% | | | | (0.47 | )% |
Portfolio turnover rate | | | | 65 | % | | | | 102 | % | | | | 64 | % | | | | 57 | % | | | | 110 | % | | | | 60 | % |
| (A) | The Fund elected to change its fiscal year end from December to September. The information presented is for January 1, 2009 through September 30, 2009. |
| (B) | Per share amounts calculated using average shares method, which more appropriately presents the per share data for the period. |
| (C) | Realized and unrealized gains and losses per share in this caption are balancing amounts necessary to reconcile the change in net asset value per share for the period, and may not agree to the aggregate gains and losses in the Statement of Operations due to the fluctuations in share transactions. |
| (D) | Total return calculation does not reflect redemption fee. |
| (E) | Total return in the above table represents the rate that the investor would have earned or lost on an investment in the Fund assuming reinvestment of dividends. |
| (F) | For periods of less than one full year, total return is not annualized. |
The accompanying notes are an integral part of these financial statements.
[70]
| | |
| Timothy Plan Family of Funds | | |
| | | | | | | | | | | | | | | | | | | | | | | | | | | | | | |
| | | Large/Mid Cap Value |
| | | (Class A Shares) |
| | | For the Year Ended
September 30, | | For the Period
Ended
September 30,
2009 (A) | | For the Year Ended
December 31, |
| | | 2012 | | 2011 | | 2010 | | | 2008 | | 2007 |
Selected data based on a share outstanding throughout each period | | | | | | | | | | | | | | | | | | | | | | | | | | | | | | |
Net asset value, beginning of period | | | $ | 11.83 | | | | $ | 11.84 | | | | $ | 10.72 | | | | $ | 9.10 | | | | $ | 15.48 | | | | $ | 14.31 | |
| | | | | | | | | | | | | | | | | | | | | | | | | | | | | | |
Income (loss) from investment operations: | | | | | | | | | | | | | | | | | | | | | | | | | | | | | | |
Net investment income (loss) | | | | 0.06 | (B) | | | | 0.04 | (B) | | | | 0.05 | | | | | 0.04 | | | | | 0.05 | | | | | 0.15 | |
Net realized and unrealized gain (loss) on investments | | | | 2.94 | | | | | (0.01 | )(C) | | | | 1.12 | | | | | 1.58 | | | | | (6.26 | ) | | | | 2.26 | |
| | | | | | | | | | | | | | | | | | | | | | | | | | | | | | |
Total from investment operations | | | | 3.00 | | | | | 0.03 | | | | | 1.17 | | | | | 1.62 | | | | | (6.21 | ) | | | | 2.41 | |
| | | | | | | | | | | | | | | | | | | | | | | | | | | | | | |
Less Distributions: | | | | | | | | | | | | | | | | | | | | | | | | | | | | | | |
From net investment income | | | | (0.03 | ) | | | | (0.04 | ) | | | | (0.05 | ) | | | | — | | | | | (0.03 | ) | | | | (0.16 | ) |
From net realized gains on investments | | | | — | | | | | — | | | | | — | | | | | — | | | | | (0.14 | ) | | | | (1.08 | ) |
From return of capital | | | | — | | | | | — | | | | | — | | | | | — | | | | | — | | | | | — | |
| | | | | | | | | | | | | | | | | | | | | | | | | | | | | | |
Total distributions | | | | (0.03 | ) | | | | (0.04 | ) | | | | (0.05 | ) | | | | — | | | | | (0.17 | ) | | | | (1.24 | ) |
| | | | | | | | | | | | | | | | | | | | | | | | | | | | | | |
Net asset value, end of period | | | $ | 14.80 | | | | $ | 11.83 | | | | $ | 11.84 | | | | $ | 10.72 | | | | $ | 9.10 | | | | $ | 15.48 | |
| | | | | | | | | | | | | | | | | | | | | | | | | | | | | | |
Total return (D)(E) | | | | 25.39 | % | | | | 0.20 | % | | | | 10.94 | % | | | | 17.80 | %(F) | | | | (40.05 | )% | | | | 17.02 | % |
Ratios/supplemental data: | | | | | | | | | | | | | | | | | | | | | | | | | | | | | | |
Net assets, end of period (in 000’s) | | | $ | 100,632 | | | | $ | 78,255 | | | | $ | 80,700 | | | | $ | 82,784 | | | | $ | 69,695 | | | | $ | 103,828 | |
Ratio of expenses to average net assets | | | | 1.57 | % | | | | 1.51 | % | | | | 1.58 | % | | | | 1.57 | %(G) | | | | 1.51 | % | | | | 1.44 | % |
Ratio of net investment income (loss) to average net assets | | | | 0.42 | % | | | | 0.33 | % | | | | 0.39 | % | | | | 0.57 | %(G) | | | | 0.39 | % | | | | 0.99 | % |
Portfolio turnover rate | | | | 7 | % | | | | 19 | % | | | | 38 | % | | | | 32 | % | | | | 77 | % | | | | 48 | % |
| (A) | The Fund elected to change its fiscal year end from December to September. The information presented is for January 1, 2009 through September 30, 2009. |
| (B) | Per share amounts calculated using average shares method, which more appropriately presents the per share data for the period. |
| (C) | Realized and unrealized gains and losses per share in this caption are balancing amounts necessary to reconcile the change in net asset value per share for the period, and may not agree to the aggregate gains and losses in the Statement of Operations due to the fluctuations in share transactions. |
| (D) | Total return calculation does not reflect sales load. |
| (E) | Total return in the above table represents the rate that the investor would have earned or lost on an investment in the Fund assuming reinvestment of dividends. |
| (F) | For periods of less than one full year, total return is not annualized. |
The accompanying notes are an integral part of these financial statements.
[71]
| | |
| Timothy Plan Family of Funds | | |
| | | | | | | | | | | | | | | | | | | | | | | | | | | | | | |
| | | Large/Mid Cap Value |
| | | (Class C Shares) |
| | | For the Year Ended
September 30, | | For the Period
Ended
September 30,
2009 (A) | | For the Year Ended
December 31, |
| | | 2012 | | 2011 | | 2010 | | | 2008 | | 2007 |
Selected data based on a share outstanding throughout each period | | | | | | | | | | | | | | | | | | | | | | | | | | | | | | |
Net asset value, beginning of period | | | $ | 10.61 | | | | $ | 10.68 | | | | $ | 9.73 | | | | $ | 8.31 | | | | $ | 14.24 | | | | $ | 13.28 | |
| | | | | | | | | | | | | | | | | | | | | | | | | | | | | | |
Income (loss) from investment operations: | | | | | | | | | | | | | | | | | | | | | | | | | | | | | | |
Net investment income (loss) | | | | (0.04 | )(B) | | | | (0.05 | )(B) | | | | (0.05 | ) | | | | (0.01 | ) | | | | (0.04 | ) | | | | 0.02 | |
Net realized and unrealized gain (loss) on investments | | | | 2.63 | | | | | — | (C) | | | | 1.03 | | | | | 1.43 | | | | | (5.73 | ) | | | | 2.10 | |
| | | | | | | | | | | | | | | | | | | | | | | | | | | | | | |
Total from investment operations | | | | 2.59 | | | | | (0.05 | ) | | | | 0.98 | | | | | 1.42 | | | | | (5.77 | ) | | | | 2.12 | |
| | | | | | | | | | | | | | | | | | | | | | | | | | | | | | |
Less Distributions: | | | | | | | | | | | | | | | | | | | | | | | | | | | | | | |
From net investment income | | | | — | | | | | (0.02 | ) | | | | (0.03 | ) | | | | — | | | | | (0.02 | ) | | | | (0.08 | ) |
From net realized gains on investments | | | | — | | | | | — | | | | | — | | | | | — | | | | | (0.14 | ) | | | | (1.08 | ) |
From return of capital | | | | — | | | | | — | | | | | — | | | | | — | | | | | — | | | | | — | |
| | | | | | | | | | | | | | | | | | | | | | | | | | | | | | |
Total distributions | | | | — | | | | | (0.02 | ) | | | | (0.03 | ) | | | | — | | | | | (0.16 | ) | | | | (1.16 | ) |
| | | | | | | | | | | | | | | | | | | | | | | | | | | | | | |
Net asset value, end of period | | | $ | 13.20 | | | | $ | 10.61 | | | | $ | 10.68 | | | | $ | 9.73 | | | | $ | 8.31 | | | | $ | 14.24 | |
| | | | | | | | | | | | | | | | | | | | | | | | | | | | | | |
Total return (D)(E) | | | | 24.41 | % | | | | (0.52 | )% | | | | 10.12 | % | | | | 17.09 | %(F) | | | | (40.49 | )% | | | | 16.13 | % |
Ratios/supplemental data: | | | | | | | | | | | | | | | | | | | | | | | | | | | | | | |
Net assets, end of period (in 000’s) | | | $ | 10,669 | | | | $ | 8,903 | | | | $ | 9,484 | | | | $ | 9,552 | | | | $ | 8,544 | | | | $ | 12,722 | |
Ratio of expenses to average net assets | | | | 2.32 | % | | | | 2.26 | % | | | | 2.33 | % | | | | 2.32 | %(G) | | | | 2.26 | % | | | | 2.19 | % |
Ratio of net investment income (loss) to average net assets | | | | (0.32 | )% | | | | (0.43 | )% | | | | (0.35 | )% | | | | (0.18 | )%(G) | | | | (0.35 | )% | | | | 0.18 | % |
Portfolio turnover rate | | | | 7 | % | | | | 19 | % | | | | 38 | % | | | | 32 | % | | | | 77 | % | | | | 48 | % |
| (A) | The Fund elected to change its fiscal year end from December to September. The information presented is for January 1, 2009 through September 30, 2009. |
| (B) | Per share amounts calculated using average shares method, which more appropriately presents the per share data for the period. |
| (C) | Realized and unrealized gains and losses per share in this caption are balancing amounts necessary to reconcile the change in net asset value per share for the period, and may not agree to the aggregate gains and losses in the Statement of Operations due to the fluctuations in share transactions. |
| (D) | Total return calculation does not reflect redemption fee. |
| (E) | Total return in the above table represents the rate that the investor would have earned or lost on an investment in the Fund assuming reinvestment of dividends. |
| (F) | For periods of less than one full year, total return is not annualized. |
The accompanying notes are an integral part of these financial statements.
[72]
| | |
| Timothy Plan Family of Funds | | |
| | | | | | | | | | | | | | | | | | | | | | | | | | | | | | |
| | | Fixed Income |
| | | (Class A Shares) |
| | | For the Year Ended
September 30, | | For the Period
Ended
September 30,
2009 (A) | | For the Year Ended
December 31, |
| | | 2012 | | 2011 | | 2010 | | | 2008 | | 2007 |
Selected data based on a share outstanding throughout each period | | | | | | | | | | | | | | | | | | | | | | | | | | | | | | |
Net asset value, beginning of period | | | $ | 10.72 | | | | $ | 10.56 | | | | $ | 10.14 | | | | $ | 9.56 | | | | $ | 9.99 | | | | $ | 9.94 | |
| | | | | | | | | | | | | | | | | | | | | | | | | | | | | | |
Income (loss) from investment operations: | | | | | | | | | | | | | | | | | | | | | | | | | | | | | | |
Net investment income (loss) | | | | 0.22 | (B) | | | | 0.28 | (B) | | | | 0.29 | (B) | | | | 0.24 | | | | | 0.43 | | | | | 0.44 | |
Net realized and unrealized gain (loss) on investments | | | | 0.18 | | | | | 0.18 | | | | | 0.42 | | | | | 0.58 | | | | | (0.43 | ) | | | | 0.06 | |
| | | | | | | | | | | | | | | | | | | | | | | | | | | | | | |
Total from investment operations | | | | 0.40 | | | | | 0.46 | | | | | 0.71 | | | | | 0.82 | | | | | — | | | | | 0.50 | |
| | | | | | | | | | | | | | | | | | | | | | | | | | | | | | |
Less Distributions: | | | | | | | | | | | | | | | | | | | | | | | | | | | | | | |
From net investment income | | | | (0.22 | ) | | | | (0.30 | ) | | | | (0.29 | ) | | | | (0.24 | ) | | | | (0.43 | ) | | | | (0.45 | ) |
From return of capital | | | | (0.03 | ) | | | | — | | | | | — | | | | | — | | | | | — | | | | | — | |
| | | | | | | | | | | | | | | | | | | | | | | | | | | | | | |
Total distributions | | | | (0.25 | ) | | | | (0.30 | ) | | | | (0.29 | ) | | | | (0.24 | ) | | | | (0.43 | ) | | | | (0.45 | ) |
| | | | | | | | | | | | | | | | | | | | | | | | | | | | | | |
Net asset value, end of period | | | $ | 10.87 | | | | $ | 10.72 | | | | $ | 10.56 | | | | $ | 10.14 | | | | $ | 9.56 | | | | $ | 9.99 | |
| | | | | | | | | | | | | | | | | | | | | | | | | | | | | | |
Total return (C)(D) | | | | 3.73 | % | | | | 4.42 | % | | | | 7.07 | % | | | | 8.70 | %(E) | | | | (0.05 | )% | | | | 5.19 | % |
Ratios/supplemental data: | | | | | | | | | | | | | | | | | | | | | | | | | | | | | | |
Net assets, end of period (in 000’s) | | | $ | 74,685 | | | | $ | 59,405 | | | | $ | 58,831 | | | | $ | 48,074 | | | | $ | 37,367 | | | | $ | 45,371 | |
Ratios to average net assets | | | | | | | | | | | | | | | | | | | | | | | | | | | | | | |
Expenses, before waiver and reimbursement | | | | 1.31 | % | | | | 1.27 | % | | | | 1.36 | % | | | | 1.35 | %(F) | | | | 1.29 | % | | | | 1.21 | % |
Expenses, net waiver and reimbursement | | | | 1.16 | % | | | | 1.15 | % | | | | 1.21 | % | | | | 1.20 | %(F) | | | | 1.14 | % | | | | 1.06 | % |
Net investment income (loss), before waiver and reimbursement | | | | 1.86 | % | | | | 2.58 | % | | | | 2.63 | % | | | | 3.24 | %(F) | | | | 4.11 | % | | | | 4.33 | % |
Net investment income (loss), net waiver and reimbursement | | | | 2.01 | % | | | | 2.71 | % | | | | 2.78 | % | | | | 3.39 | %(F) | | | | 4.26 | % | | | | 4.48 | % |
Portfolio turnover rate | | | | 19 | % | | | | 22 | % | | | | 26 | % | | | | 22 | % | | | | 35 | % | | | | 45 | % |
| (A) | The Fund elected to change its fiscal year end from December to September. The information presented is for January 1, 2009 through September 30, 2009. |
| (B) | Per share amounts calculated using average shares method, which more appropriately presents the per share data for the period. |
| (C) | Total return calculation does not reflect sales load. |
| (D) | Total return in the above table represents the rate that the investor would have earned or lost on an investment in the Fund assuming reinvestment of dividends. Total return would have been higher or lower if certain expenses had not been reimbursed, waived or recouped. |
| (E) | For periods of less than one full year, total return is not annualized. |
The accompanying notes are an integral part of these financial statements.
[73]
| | |
| Timothy Plan Family of Funds | | |
| | | | | | | | | | | | | | | | | | | | | | | | | | | | | | |
| | | Fixed Income |
| | | (Class C Shares) |
| | | For the Year Ended
September 30, | | For the Period
Ended
September 30,
2009 (A) | | For the Year Ended
December 31, |
| | | 2012 | | 2011 | | 2010 | | | 2008 | | 2007 |
Selected data based on a share outstanding throughout each period | | | | | | | | | | | | | | | | | | | | | | | | | | | | | | |
Net asset value, beginning of period | | | $ | 10.38 | | | | $ | 10.22 | | | | $ | 9.82 | | | | $ | 9.28 | | | | $ | 9.69 | | | | $ | 9.66 | |
| | | | | | | | | | | | | | | | | | | | | | | | | | | | | | |
Income (loss) from investment operations: | | | | | | | | | | | | | | | | | | | | | | | | | | | | | | |
Net investment income (loss) | | | | 0.13 | (B) | | | | 0.20 | (B) | | | | 0.21 | | | | | 0.18 | | | | | 0.33 | | | | | 0.37 | |
Net realized and unrealized gain (loss) on investments | | | | 0.17 | | | | | 0.17 | | | | | 0.41 | | | | | 0.56 | | | | | (0.40 | ) | | | | 0.04 | |
| | | | | | | | | | | | | | | | | | | | | | | | | | | | | | |
Total from investment operations | | | | 0.30 | | | | | 0.37 | | | | | 0.62 | | | | | 0.74 | | | | | (0.07 | ) | | | | 0.41 | |
| | | | | | | | | | | | | | | | | | | | | | | | | | | | | | |
Less Distributions: | | | | | | | | | | | | | | | | | | | | | | | | | | | | | | |
From net investment income | | | | (0.14 | ) | | | | (0.21 | ) | | | | (0.22 | ) | | | | (0.20 | ) | | | | (0.34 | ) | | | | (0.38 | ) |
From return of capital | | | | (0.03 | ) | | | | — | | | | | — | | | | | — | | | | | — | | | | | — | |
| | | | | | | | | | | | | | | | | | | | | | | | | | | | | | |
Total distributions | | | | (0.17 | ) | | | | (0.21 | ) | | | | (0.22 | ) | | | | (0.20 | ) | | | | (0.34 | ) | | | | (0.38 | ) |
| | | | | | | | | | | | | | | | | | | | | | | | | | | | | | |
Net asset value, end of period | | | $ | 10.51 | | | | $ | 10.38 | | | | $ | 10.22 | | | | $ | 9.82 | | | | $ | 9.28 | | | | $ | 9.69 | |
| | | | | | | | | | | | | | | | | | | | | | | | | | | | | | |
Total return (C)(D) | | | | 2.88 | % | | | | 3.68 | % | | | | 6.36 | % | | | | 8.02 | %(E) | | | | (0.72 | )% | | | | 4.37 | % |
Ratios/supplemental data: | | | | | | | | | | | | | | | | | | | | | | | | | | | | | | |
Net assets, end of period (in 000’s) | | | $ | 8,997 | | | | $ | 8,265 | | | | $ | 8,438 | | | | $ | 5,212 | | | | $ | 2,883 | | | | $ | 2,842 | |
Ratios to average net assets | | | | | | | | | | | | | | | | | | | | | | | | | | | | | | |
Expenses, before waiver and reimbursement | | | | 2.06 | % | | | | 2.23 | % | | | | 2.12 | % | | | | 2.10 | %(F) | | | | 2.06 | % | | | | 1.96 | % |
Expenses, net waiver and reimbursement | | | | 1.91 | % | | | | 1.90 | % | | | | 1.97 | % | | | | 1.95 | %(F) | | | | 1.91 | % | | | | 1.81 | % |
Net investment income (loss), before waiver and reimbursement | | | | 1.12 | % | | | | 1.61 | % | | | | 1.88 | % | | | | 2.50 | %(F) | | | | 3.33 | % | | | | 3.59 | % |
Net investment income (loss), net waiver and reimbursement | | | | 1.27 | % | | | | 1.95 | % | | | | 2.03 | % | | | | 2.65 | %(F) | | | | 3.48 | % | | | | 3.74 | % |
Portfolio turnover rate | | | | 19 | % | | | | 22 | % | | | | 26 | % | | | | 22 | % | | | | 35 | % | | | | 45 | % |
| (A) | The Fund elected to change its fiscal year end from December to September. The information presented is for January 1, 2009 through September 30, 2009. |
| (B) | Per share amounts calculated using average shares method, which more appropriately presents the per share data for the period. |
| (C) | Total return calculation does not reflect redemption fee. |
| (D) | Total return in the above table represents the rate that the investor would have earned or lost on an investment in the Fund assuming reinvestment of dividends. Total return would have been higher or lower if certain expenses had not been reimbursed, waived or recouped. |
| (E) | For periods of less than one full year, total return is not annualized. |
The accompanying notes are an integral part of these financial statements.
[74]
| | |
| Timothy Plan Family of Funds | | |
| | | | | | | | | | | | | | | | | | | | | | | | | | | | | | |
| | | High Yield Bond |
| | | (Class A Shares) |
| | | For the Year Ended
September 30, | | For the Period
Ended
September 30,
2009 (A) | | For the Year Ended
December 31, |
| | | 2012 | | 2011 | | 2010 | | | 2008 | | 2007 (C) |
Selected data based on a share outstanding throughout each period | | | | | | | | | | | | | | | | | | | | | | | | | | | | | | |
Net asset value, beginning of period | | | $ | 8.71 | | | | $ | 9.10 | | | | $ | 8.46 | | | | $ | 6.23 | | | | $ | 9.53 | | | | $ | 10.00 | |
| | | | | | | | | | | | | | | | | | | | | | | | | | | | | | |
Income (loss) from investment operations: | | | | | | | | | | | | | | | | | | | | | | | | | | | | | | |
Net investment income (loss) | | | | 0.54 | (B) | | | | 0.54 | (B) | | | | 0.60 | | | | | 0.48 | | | | | 0.61 | | | | | 0.36 | |
Net realized and unrealized gain (loss) on investments | | | | 0.76 | | | | | (0.39 | ) | | | | 0.63 | | | | | 2.23 | | | | | (3.30 | ) | | | | (0.47 | ) |
| | | | | | | | | | | | | | | | | | | | | | | | | | | | | | |
Total from investment operations | | | | 1.30 | | | | | 0.15 | | | | | 1.23 | | | | | 2.71 | | | | | (2.69 | ) | | | | (0.11 | ) |
| | | | | | | | | | | | | | | | | | | | | | | | | | | | | | |
Less Distributions: | | | | | | | | | | | | | | | | | | | | | | | | | | | | | | |
From net investment income | | | | (0.53 | ) | | | | (0.54 | ) | | | | (0.59 | ) | | | | (0.48 | ) | | | | (0.60 | ) | | | | (0.36 | ) |
From net realized gains on investments | | | | — | | | | | — | | | | | — | | | | | — | | | | | (0.01 | ) | | | | — | |
From return of capital | | | | (0.02 | ) | | | | — | | | | | — | | | | | — | | | | | — | | | | | — | |
| | | | | | | | | | | | | | | | | | | | | | | | | | | | | | |
Total distributions | | | | (0.55 | ) | | | | (0.54 | ) | | | | (0.59 | ) | | | | (0.48 | ) | | | | (0.61 | ) | | | | (0.36 | ) |
| | | | | | | | | | | | | | | | | | | | | | | | | | | | | | |
Net asset value, end of period | | | $ | 9.46 | | | | $ | 8.71 | | | | $ | 9.10 | | | | $ | 8.46 | | | | $ | 6.23 | | | | $ | 9.53 | |
| | | | | | | | | | | | | | | | | | | | | | | | | | | | | | |
Total return (D)(E) | | | | 15.17 | % | | | | 1.48 | % | | | | 14.98 | % | | | | 45.11 | %(F) | | | | (29.55 | )% | | | | (1.14 | )%(F) |
Ratios/supplemental data: | | | | | | | | | | | | | | | | | | | | | | | | | | | | | | |
Net assets, end of period (in 000’s) | | | $ | 33,392 | | | | $ | 23,110 | | | | $ | 21,617 | | | | $ | 18,740 | | | | $ | 13,283 | | | | $ | 20,284 | |
Ratios to average net assets | | | | | | | | | | | | | | | | | | | | | | | | | | | | | | |
Expenses, before waiver and reimbursement | | | | 1.39 | % | | | | 1.30 | % | | | | 1.43 | % | | | | 1.46 | %(G) | | | | 1.41 | % | | | | 1.45 | %(G) |
Expenses, net waiver and reimbursement | | | | 1.39 | % | | | | 1.30 | % | | | | 1.43 | % | | | | 1.46 | %(G) | | | | 1.41 | % | | | | 1.35 | %(G) |
Net investment income (loss), before waiver and reimbursement | | | | 5.84 | % | | | | 5.81 | % | | | | 6.72 | % | | | | 8.75 | %(G) | | | | 7.06 | % | | | | 5.67 | %(G) |
Net investment income (loss), net waiver and reimbursement | | | | 5.84 | % | | | | 5.81 | % | | | | 6.72 | % | | | | 8.75 | %(G) | | | | 7.06 | % | | | | 5.77 | %(G) |
Portfolio turnover rate | | | | 24 | % | | | | 60 | % | | | | 40 | % | | | | 34 | % | | | | 28 | % | | | | 23 | % |
| (A) | The Fund elected to change its fiscal year end from December to September. The information presented is for January 1, 2009 through September 30, 2009. |
| (B) | Per share amounts calculated using average shares method, which more appropriately presents the per share data for the period. |
| (C) | For the period May 7, 2007 (Commencement of Operations) to December 31, 2007. |
| (D) | Total return calculation does not reflect sales load. |
| (E) | Total return in the above table represents the rate that the investor would have earned or lost on an investment in the Fund assuming reinvestment of dividends. Total return would have been higher or lower if certain expenses had not been reimbursed, waived or recouped. |
| (F) | For periods of less than one full year, total return is not annualized. |
The accompanying notes are an integral part of these financial statements.
[75]
| | |
| Timothy Plan Family of Funds | | |
| | | | | | | | | | | | | | | | | | | | | | | | | | | | | | |
| | | High Yield Bond |
| | | (Class C Shares) |
| | | For the Year Ended
September 30, | | For the Period
Ended
September 30,
2009 (A) | | For the Year
Ended
December 31,
2008 | | For the Period
Ended
December 31,
2007 (C) |
| | | 2012 | | 2011 | | 2010 | | | |
Selected data based on a share outstanding throughout each period | | | | | | | | | | | | | | | | | | | | | | | | | | | | | | |
Net asset value, beginning of period | | | $ | 8.79 | | | | $ | 9.17 | | | | $ | 8.51 | | | | $ | 6.29 | | | | $ | 9.60 | | | | $ | 10.00 | |
| | | | | | | | | | | | | | | | | | | | | | | | | | | | | | |
Income (loss) from investment operations: | | | | | | | | | | | | | | | | | | | | | | | | | | | | | | |
Net investment income (loss) | | | | 0.47 | (B) | | | | 0.47 | (B) | | | | 0.53 | (B) | | | | 0.43 | (B) | | | | 0.53 | | | | | 0.26 | |
Net realized and unrealized gain (loss) on investments | | | | 0.77 | | | | | (0.39 | ) | | | | 0.66 | | | | | 2.24 | | | | | (3.33 | ) | | | | (0.40 | ) |
| | | | | | | | | | | | | | | | | | | | | | | | | | | | | | |
Total from investment operations | | | | 1.24 | | | | | 0.08 | | | | | 1.19 | | | | | 2.67 | | | | | (2.80 | ) | | | | (0.14 | ) |
| | | | | | | | | | | | | | | | | | | | | | | | | | | | | | |
Less Distributions: | | | | | | | | | | | | | | | | | | | | | | | | | | | | | | |
From net investment income | | | | (0.46 | ) | | | | (0.46 | ) | | | | (0.53 | ) | | | | (0.45 | ) | | | | (0.50 | ) | | | | (0.26 | ) |
From net realized gains on investments | | | | — | | | | | — | | | | | — | | | | | — | | | | | (0.01 | ) | | | | — | |
From return of capital | | | | (0.02 | ) | | | | — | | | | | — | | | | | — | | | | | — | | | | | — | |
| | | | | | | | | | | | | | | | | | | | | | | | | | | | | | |
Total distributions | | | | (0.48 | ) | | | | (0.46 | ) | | | | (0.53 | ) | | | | (0.45 | ) | | | | (0.51 | ) | | | | (0.26 | ) |
| | | | | | | | | | | | | | | | | | | | | | | | | | | | | | |
Net asset value, end of period | | | $ | 9.55 | | | | $ | 8.79 | | | | $ | 9.17 | | | | $ | 8.51 | | | | $ | 6.29 | | | | $ | 9.60 | |
| | | | | | | | | | | | | | | | | | | | | | | | | | | | | | |
Total return (D)(E) | | | | 14.33 | % | | | | 0.72 | % | | | | 14.36 | % | | | | 43.90 | %(F) | | | | (30.17 | )% | | | | (1.38 | )%(F) |
Ratios/supplemental data: | | | | | | | | | | | | | | | | | | | | | | | | | | | | | | |
Net assets, end of period (in 000’s) | | | $ | 1,683 | | | | $ | 1,194 | | | | $ | 1,039 | | | | $ | 547 | | | | $ | 141 | | | | $ | 241 | |
Ratios to average net assets | | | | | | | | | | | | | | | | | | | | | | | | | | | | | | |
Expenses, before wavier and reimbursement | | | | 2.14 | % | | | | 2.05 | % | | | | 2.18 | % | | | | 2.20 | %(G) | | | | 2.14 | % | | | | 2.20 | %(G) |
Expenses, net waiver and reimbursement | | | | 2.14 | % | | | | 2.05 | % | | | | 2.18 | % | | | | 2.20 | %(G) | | | | 2.14 | % | | | | 2.10 | %(G) |
Net investment income (loss), before waiver and reimbursement | | | | 5.08 | % | | | | 5.06 | % | | | | 5.99 | % | | | | 7.55 | %(G) | | | | 6.26 | % | | | | 5.24 | %(G) |
Net investment income (loss), net waiver and reimbursement | | | | 5.08 | % | | | | 5.06 | % | | | | 5.99 | % | | | | 7.55 | %(G) | | | | 6.26 | % | | | | 5.34 | %(G) |
Portfolio turnover rate | | | | 24 | % | | | | 60 | % | | | | 40 | % | | | | 34 | % | | | | 28 | % | | | | 23 | % |
| (A) | The Fund elected to change its fiscal year end from December to September. The information presented is for January 1, 2009 through September 30, 2009. |
| (B) | Per share amounts calculated using average shares method, which more appropriately presents the per share data for the period. |
| (C) | For the period May 7, 2007 (Commencement of Operations) to December 31, 2007. |
| (D) | Total return calculation does not reflect redemption fee. |
| (E) | Total return in the above table represents the rate that the investor would have earned or lost on an investment in the Fund assuming reinvestment of dividends. Total return would have been higher or lower if certain expenses had not been reimbursed, waived or recouped. |
| (F) | For periods of less than one full year, total return is not annualized. |
The accompanying notes are an integral part of these financial statements.
[76]
| | |
| Timothy Plan Family of Funds | | |
| | | | | |
| | | Israel Common Values |
| | | (Class A Shares) |
| | | For the Period
Ended
September 30,
2012 (A) |
| | |
Selected data based on a share outstanding throughout each period | | | | | |
Net asset value, beginning of period | | | $ | 10.00 | |
| | | | | |
Income (loss) from investment operations: | | | | | |
Net investment income (loss) (B) | | | | (0.15 | ) |
Net realized and unrealized gain on investments | | | | 0.32 | |
| | | | | |
Total from investment operations | | | | 0.17 | |
| | | | | |
Less Distributions: | | | | | |
From net investment income | | | | — | |
From net realized gains on investments | | | | — | |
| | | | | |
Total distributions | | | | — | |
| | | | | |
Net asset value, end of period | | | $ | 10.17 | |
| | | | | |
Total return (C)(D) | | | | 1.80 | %(E) |
Ratios/supplemental data: | | | | | |
Net assets, end of period (in 000’s) | | | $ | 7,983 | |
Ratio of expenses to average net assets | | | | 2.82 | %(F) |
Ratio of net investment income (loss) to average net assets | | | | (1.48 | )%(F) |
Portfolio turnover rate | | | | 37 | % |
| (A) | For the period October 12, 2011 (Commencement of Operations) to September 30, 2012. |
| (B) | Per share amounts calculated using average shares method, which more appropriately presents the per share data for the period. |
| (C) | Total return calculation does not reflect sales load. |
| (D) | Total return in the above table represents the rate that the investor would have earned or lost on an investment in the Fund assuming reinvestment of dividends. |
| (E) | For periods of less than one full year, total return is not annualized. |
The accompanying notes are an integral part of these financial statements.
[77]
| | |
| Timothy Plan Family of Funds | | |
| | | | | |
| | | Israel Common Values |
| | | (Class C Shares) |
| | | For the Period
Ended
September 30,
2012 (A) |
| | |
Selected data based on a share outstanding throughout each period | | | | | |
Net asset value, beginning of period | | | $ | 10.00 | |
| | | | | |
Income (loss) from investment operations: | | | | | |
Net investment income (loss) (B) | | | | (0.22 | ) |
Net realized and unrealized gain on investments | | | | 0.31 | |
| | | | | |
Total from investment operations | | | | 0.09 | |
| | | | | |
Less Distributions: | | | | | |
From net investment income | | | | — | |
From net realized gains on investments | | | | — | |
| | | | | |
Total distributions | | | | — | |
| | | | | |
Net asset value, end of period | | | $ | 10.09 | |
| | | | | |
Total return (C)(D) | | | | 1.00 | %(E) |
Ratios/supplemental data: | | | | | |
Net assets, end of period (in 000’s) | | | $ | 217 | |
Ratio of expenses to average net assets | | | | 3.53 | %(F) |
Ratio of net investment income (loss) to average net assets | | | | (2.21 | )%(F) |
Portfolio turnover rate | | | | 37 | % |
| (A) | For the period October 12, 2011 (Commencement of Operations) to September 30, 2012. |
| (B) | Per share amounts calculated using average shares method, which more appropriately presents the per share data for the period. |
| (C) | Total return calculation does not reflect redemption fee. |
| (D) | Total return in the above table represents the rate that the investor would have earned or lost on an investment in the Fund assuming reinvestment of dividends. |
| (E) | For periods of less than one full year, total return is not annualized. |
The accompanying notes are an integral part of these financial statements.
[78]
| | |
| Timothy Plan Family of Funds | | |
| | | | | | | | | | | | | | | |
| | | Defensive Strategies |
| | | (Class A Shares) |
| | | For the Year Ended
September 30, | | For the Period
Ended
September 30,
2010 (A) |
| | | 2012 | | 2011 | |
Selected data based on a share outstanding throughout each period | | | | | | | | | | | | | | | |
Net asset value, beginning of period | | | $ | 11.28 | | | | $ | 10.70 | | | | $ | 10.00 | |
| | | | | | | | | | | | | | | |
Income (loss) from investment operations: | | | | | | | | | | | | | | | |
Net investment income (loss) | | | | 0.02 | (B) | | | | 0.09 | (B) | | | | 0.02 | |
Net realized and unrealized gain (loss) on investments | | | | 1.62 | | | | | 0.54 | | | | | 1.08 | |
| | | | | | | | | | | | | | | |
Total from investment operations | | | | 1.64 | | | | | 0.63 | | | | | 1.10 | |
| | | | | | | | | | | | | | | |
Less Distributions: | | | | | | | | | | | | | | | |
From net investment income | | | | (0.10 | ) | | | | — | | | | | — | |
From net realized gains on investments | | | | (0.66 | ) | | | | (0.05 | ) | | | | (0.21 | ) |
From return of capital | | | | (0.04 | ) | | | | — | | | | | (0.19 | ) |
| | | | | | | | | | | | | | | |
Total distributions | | | | (0.80 | ) | | | | (0.05 | ) | | | | (0.40 | ) |
| | | | | | | | | | | | | | | |
Net asset value, end of period | | | $ | 12.12 | | | | $ | 11.28 | | | | $ | 10.70 | |
| | | | | | | | | | | | | | | |
Total return (C)(D) | | | | 14.87 | % | | | | 5.88 | % | | | | 10.97 | %(E) |
Ratios/supplemental data: | | | | | | | | | | | | | | | |
Net assets, end of period (in 000’s) | | | $ | 52,529 | | | | $ | 43,670 | | | | $ | 23,360 | |
Ratio of expenses to average net assets | | | | 1.33 | % | | | | 1.29 | % | | | | 1.51 | %(F) |
Ratio of net investment income (loss) to average net assets | | | | 0.20 | % | | | | 0.75 | % | | | | 0.13 | %(F) |
Portfolio turnover rate | | | | 247 | % | | | | 64 | % | | | | 41 | % |
| (A) | For the period November 4, 2009 (Commencement of Operations) to September 30, 2010. |
| (B) | Per share amounts calculated using average shares method, which more appropriately presents the per share data for the period. |
| (C) | Total return calculation does not reflect sales load. |
| (D) | Total return in the above table represents the rate that the investor would have earned or lost on an investment in the Fund assuming reinvestment of dividends. |
| (E) | For periods of less than one full year, total return is not annualized. |
The accompanying notes are an integral part of these financial statements.
[79]
| | |
| Timothy Plan Family of Funds | | |
| | | | | | | | | | | | | | | |
| | | Defensive Strategies |
| | | (Class C Shares) |
| | | For the Year Ended
September 30, | | For the Period
Ended
September 30,
2010 (A) |
| | | 2012 | | 2011 | |
Selected data based on a share outstanding throughout each period | | | | | | | | | | | | | | | |
Net asset value, beginning of period | | | $ | 11.09 | | | | $ | 10.58 | | | | $ | 10.00 | |
| | | | | | | | | | | | | | | |
Income (loss) from investment operations: | | | | | | | | | | | | | | | |
Net investment income (loss) | | | | (0.07 | )(B) | | | | 0.02 | (B) | | | | (0.06 | ) |
Net realized and unrealized gain (loss) on investments | | | | 1.58 | | | | | 0.54 | | | | | 1.08 | |
| | | | | | | | | | | | | | | |
Total from investment operations | | | | 1.51 | | | | | 0.56 | | | | | 1.02 | |
| | | | | | | | | | | | | | | |
Less Distributions: | | | | | | | | | | | | | | | |
From net investment income | | | | (0.02 | ) | | | | — | | | | | — | |
From net realized gains on investments | | | | (0.66 | ) | | | | (0.05 | ) | | | | (0.21 | ) |
From return of capital | | | | (0.04 | ) | | | | — | | | | | (0.23 | ) |
| | | | | | | | | | | | | | | |
Total distributions | | | | (0.72 | ) | | | | (0.05 | ) | | | | (0.44 | ) |
| | | | | | | | | | | | | | | |
Net asset value, end of period | | | $ | 11.88 | | | | $ | 11.09 | | | | $ | 10.58 | |
| | | | | | | | | | | | | | | |
Total return (C)(D) | | | | 13.91 | % | | | | 5.28 | % | | | | 10.18 | %(E) |
Ratios/supplemental data: | | | | | | | | | | | | | | | |
Net assets, end of period (in 000’s) | | | $ | 18,801 | | | | $ | 13,100 | | | | $ | 5,527 | |
Ratio of expenses to average net assets | | | | 2.09 | % | | | | 2.03 | % | | | | 2.28 | %(F) |
Ratio of net investment income (loss) to average net assets | | | | (0.60 | )% | | | | 0.15 | % | | | | (0.64 | )%(F) |
Portfolio turnover rate | | | | 247 | % | | | | 64 | % | | | | 41 | % |
| (A) | For the period November 4, 2009 (Commencement of Operations) to September 30, 2010. |
| (B) | Per share amounts calculated using average shares method, which more appropriately presents the per share data for the period. |
| (C) | Total return calculation does not reflect redemption fee. |
| (D) | Total return in the above table represents the rate that the investor would have earned or lost on an investment in the Fund assuming reinvestment of dividends. |
| (E) | For periods of less than one full year, total return is not annualized. |
The accompanying notes are an integral part of these financial statements.
[80]
| | |
| Timothy Plan Family of Funds | | |
| | | | | | | | | | | | | | | | | | | | | | | | | | | | | | |
| | | Strategic Growth |
| | | (Class A Shares) |
| | | For the Year Ended
September 30, | | For the Period
Ended
September 30,
2009 (A) | | For the Year Ended
December 31, |
| | | 2012 | | 2011 | | 2010 | | | 2008 | | 2007 |
Selected data based on a share outstanding throughout each period | | | | | | | | | | | | | | | | | | | | | | | | | | | | | | |
Net asset value, beginning of period | | | $ | 6.27 | | | | $ | 6.49 | | | | $ | 5.97 | | | | $ | 4.86 | | | | $ | 9.12 | | | | $ | 9.69 | |
| | | | | | | | | | | | | | | | | | | | | | | | | | | | | | |
Income (loss) from investment operations: | | | | | | | | | | | | | | | | | | | | | | | | | | | | | | |
Net investment income (loss) | | | | 0.04 | (B) | | | | (0.02 | )(B) | | | | 0.02 | | | | | (0.01 | ) | | | | 0.01 | | | | | 0.10 | |
Net realized and unrealized gain (loss) on investments | | | | 1.13 | | | | | (0.19 | ) | | | | 0.50 | | | | | 1.12 | | | | | (3.66 | ) | | | | 0.90 | |
| | | | | | | | | | | | | | | | | | | | | | | | | | | | | | |
Total from investment operations | | | | 1.17 | | | | | (0.21 | ) | | | | 0.52 | | | | | 1.11 | | | | | (3.65 | ) | | | | 1.00 | |
| | | | | | | | | | | | | | | | | | | | | | | | | | | | | | |
Less Distributions: | | | | | | | | | | | | | | | | | | | | | | | | | | | | | | |
From net investment income | | | | — | | | | | — | | | | | — | | | | | — | | | | | (0.09 | ) | | | | (0.10 | ) |
From net realized gains on investments | | | | — | | | | | — | | | | | — | | | | | — | | | | | (0.52 | ) | | | | (1.47 | ) |
From return of capital | | | | — | | | | | (0.01 | ) | | | | — | | | | | — | | | | | — | | | | | — | |
| | | | | | | | | | | | | | | | | | | | | | | | | | | | | | |
Total distributions | | | | — | | | | | (0.01 | ) | | | | — | | | | | — | | | | | (0.61 | ) | | | | (1.57 | ) |
| | | | | | | | | | | | | | | | | | | | | | | | | | | | | | |
Net asset value, end of period | | | $ | 7.44 | | | | $ | 6.27 | | | | $ | 6.49 | | | | $ | 5.97 | | | | $ | 4.86 | | | | $ | 9.12 | |
| | | | | | | | | | | | | | | | | | | | | | | | | | | | | | |
Total return (C)(D) | | | | 18.66 | % | | | | (3.29 | )% | | | | 8.71 | % | | | | 22.84 | %(G) | | | | (39.82 | )% | | | | 10.45 | % |
Ratios/supplemental data: | | | | | | | | | | | | | | | | | | | | | | | | | | | | | | |
Net assets, end of period (in 000’s) | | | $ | 32,250 | | | | $ | 31,269 | | | | $ | 34,098 | | | | $ | 30,066 | | | | $ | 25,440 | | | | $ | 44,231 | |
Ratio of expenses to average net assets (E) | | | | 1.15 | % | | | | 1.05 | % | | | | 1.11 | % | | | | 1.11 | %(H) | | | | 1.03 | % | | | | 1.00 | % |
Ratio of net investment income (loss) to average net assets (E)(F) | | | | 0.60 | % | | | | (0.23 | )% | | | | 0.30 | % | | | | (0.25 | )%(H) | | | | 0.12 | % | | | | 1.10 | % |
Portfolio turnover rate | | | | 33 | % | | | | 22 | % | | | | 25 | % | | | | 5 | % | | | | 17 | % | | | | 45 | % |
| (A) | The Fund elected to change its fiscal year end from December to September. The information presented is for January 1, 2009 through September 30, 2009. |
| (B) | Per share amounts calculated using average shares method, which more appropriately presents the per share data for the period. |
| (C) | Total return calculation does not reflect sales load. |
| (D) | Total return in the above table represents the rate that the investor would have earned or lost on an investment in the Fund assuming reinvestment of dividends. |
| (E) | These ratios exclude the impact of expenses of the underlying security holdings as represented in the Schedule of Investments. |
| (F) | Recognition of net investment income (loss) by the Fund is affected by the timing of the declaration of dividends by the underlying investment companies in which the Fund invests. |
| (G) | For periods of less than one full year, total return is not annualized. |
The accompanying notes are an integral part of these financial statements.
[81]
| | |
| Timothy Plan Family of Funds | | |
| | | | | | | | | | | | | | | | | | | | | | | | | | | | | | |
| | | Strategic Growth |
| | | (Class C Shares) |
| | | For the Year Ended
September 30, | | For the Period
Ended
September 30,
2009 (A) | | For the Year Ended
December 31, |
| | | 2012 | | 2011 | | 2010 | | | 2008 | | 2007 |
Selected data based on a share outstanding throughout each period | | | | | | | | | | | | | | | | | | | | | | | | | | | | | | |
Net asset value, beginning of period | | | $ | 5.82 | | | | $ | 6.09 | | | | $ | 5.64 | | | | $ | 4.62 | | | | $ | 8.70 | | | | $ | 9.31 | |
| | | | | | | | | | | | | | | | | | | | | | | | | | | | | | |
Income (loss) from investment operations: | | | | | | | | | | | | | | | | | | | | | | | | | | | | | | |
Net investment income (loss) | | | | (0.01 | )(B) | | | | (0.07 | )(B) | | | | (0.03 | ) | | | | (0.04 | ) | | | | (0.05 | ) | | | | 0.03 | |
Net realized and unrealized gain (loss) on investments | | | | 1.06 | | | | | (0.20 | ) | | | | 0.48 | | | | | 1.06 | | | | | (3.47 | ) | | | | 0.86 | |
| | | | | | | | | | | | | | | | | | | | | | | | | | | | | | |
Total from investment operations | | | | 1.05 | | | | | (0.27 | ) | | | | 0.45 | | | | | 1.02 | | | | | (3.52 | ) | | | | 0.89 | |
| | | | | | | | | | | | | | | | | | | | | | | | | | | | | | |
Less Distributions: | | | | | | | | | | | | | | | | | | | | | | | | | | | | | | |
From net investment income | | | | — | | | | | — | | | | | — | | | | | — | | | | | (0.04 | ) | | | | (0.03 | ) |
From net realized gains on investments | | | | — | | | | | — | | | | | — | | | | | — | | | | | (0.52 | ) | | | | (1.47 | ) |
| | | | | | | | | | | | | | | | | | | | | | | | | | | | | | |
Total distributions | | | | — | | | | | — | | | | | — | | | | | — | | | | | (0.56 | ) | | | | (1.50 | ) |
| | | | | | | | | | | | | | | | | | | | | | | | | | | | | | |
Net asset value, end of period | | | $ | 6.87 | | | | $ | 5.82 | | | | $ | 6.09 | | | | $ | 5.64 | | | | $ | 4.62 | | | | $ | 8.70 | |
| | | | | | | | | | | | | | | | | | | | | | | | | | | | | | |
Total return (C)(D) | | | | 18.04 | % | | | | (4.43 | )% | | | | 7.98 | % | | | | 22.08 | %(G) | | | | (40.32 | )% | | | | 9.73 | % |
Ratios/supplemental data: | | | | | | | | | | | | | | | | | | | | | | | | | | | | | | |
Net assets, end of period (in 000’s) | | | $ | 6,836 | | | | $ | 6,446 | | | | $ | 6,950 | | | | $ | 7,608 | | | | $ | 6,423 | | | | $ | 9,836 | |
Ratio of expenses to average net assets (E) | | | | 1.90 | % | | | | 1.82 | % | | | | 1.86 | % | | | | 1.85 | %(H) | | | | 1.78 | % | | | | 1.75 | % |
Ratio of net investment income (loss) to average net assets (E)(F) | | | | (0.22 | )% | | | | (1.00 | )% | | | | (0.46 | )% | | | | (1.00 | )%(H) | | | | (0.61 | )% | | | | 0.43 | % |
Portfolio turnover rate | | | | 33 | % | | | | 22 | % | | | | 25 | % | | | | 5 | % | | | | 17 | % | | | | 45 | % |
| (A) | The Fund elected to change its fiscal year end from December to September. The information presented is for January 1, 2009 through September 30, 2009. |
| (B) | Per share amounts calculated using average shares method, which more appropriately presents the per share data for the period. |
| (C) | Total return calculation does not reflect redemption fee. |
| (D) | Total return in the above table represents the rate that the investor would have earned or lost on an investment in the Fund assuming reinvestment of dividends. |
| (E) | These ratios exclude the impact of expenses of the underlying security holdings as represented in the Schedule of Investments. |
| (F) | Recognition of net investment income (loss) by the Fund is affected by the timing of the declaration of dividends by the underlying investment companies in which the Fund invests. |
| (G) | For periods of less than one full year, total return is not annualized. |
The accompanying notes are an integral part of these financial statements.
[82]
| | |
| Timothy Plan Family of Funds | | |
| | | | | | | | | | | | | | | | | | | | | | | | | | | | | | |
| | | Conservative Growth |
| | | (Class A Shares) |
| | | For the Year Ended
September 30, | | For the Period
Ended
September 30,
2009 (A) | | For the Year Ended
December 31, |
| | | 2012 | | 2011 | | 2010 | | | 2008 | | 2007 |
Selected data based on a share outstanding throughout each period | | | | | | | | | | | | | | | | | | | | | | | | | | | | | | |
Net asset value, beginning of period | | | $ | 8.80 | | | | $ | 8.83 | | | | $ | 8.25 | | | | $ | 6.94 | | | | $ | 10.49 | | | | $ | 11.10 | |
| | | | | | | | | | | | | | | | | | | | | | | | | | | | | | |
Income (loss) from investment operations: | | | | | | | | | | | | | | | | | | | | | | | | | | | | | | |
Net investment income (loss) | | | | 0.07 | (B) | | | | 0.04 | (B) | | | | 0.09 | | | | | 0.04 | | | | | 0.13 | | | | | 0.22 | |
Net realized and unrealized gain (loss) on investments | | | | 1.09 | | | | | 0.01 | | | | | 0.60 | | | | | 1.27 | | | | | (3.18 | ) | | | | 0.75 | |
| | | | | | | | | | | | | | | | | | | | | | | | | | | | | | |
Total from investment operations | | | | 1.16 | | | | | 0.05 | | | | | 0.69 | | | | | 1.31 | | | | | (3.05 | ) | | | | 0.97 | |
| | | | | | | | | | | | | | | | | | | | | | | | | | | | | | |
Less distributions: | | | | | | | | | | | | | | | | | | | | | | | | | | | | | | |
From net investment income | | | | (0.01 | ) | | | | (0.08 | ) | | | | (0.11 | ) | | | | — | | | | | (0.15 | ) | | | | (0.20 | ) |
From net realized gains on investments | | | | — | | | | | — | | | | | — | | | | | — | | | | | (0.35 | ) | | | | (1.38 | ) |
| | | | | | | | | | | | | | | | | | | | | | | | | | | | | | |
Total distributions | | | | (0.01 | ) | | | | (0.08 | ) | | | | (0.11 | ) | | | | — | | | | | (0.50 | ) | | | | (1.58 | ) |
| | | | | | | | | | | | | | | | | | | | | | | | | | | | | | |
Net asset value, end of period | | | $ | 9.95 | | | | $ | 8.80 | | | | $ | 8.83 | | | | $ | 8.25 | | | | $ | 6.94 | | | | $ | 10.49 | |
| | | | | | | | | | | | | | | | | | | | | | | | | | | | | | |
Total return (C)(D) | | | | 13.22 | % | | | | 0.50 | % | | | | 8.47 | % | | | | 18.88 | %(G) | | | | (28.88 | )% | | | | 8.85 | % |
Ratios/supplemental data: | | | | | | | | | | | | | | | | | | | | | | | | | | | | | | |
Net assets, end of period (in 000’s) | | | $ | 40,042 | | | | $ | 35,331 | | | | $ | 35,031 | | | | $ | 33,128 | | | | $ | 26,206 | | | | $ | 38,102 | |
Expenses, before waiver and reimbursement (E) | | | | 1.11 | % | | | | 1.05 | % | | | | 1.13 | % | | | | 1.10 | %(H) | | | | 1.02 | % | | | | 1.02 | % |
Expenses, net waiver and reimbursement (E) | | | | 1.11 | % | | | | 1.05 | % | | | | 1.13 | % | | | | 1.10 | %(H) | | | | 1.02 | % | | | | 1.02 | % |
Net investment income (loss), before waiver and reimbursement (E)(F) | | | | 0.71 | % | | | | 0.48 | % | | | | 1.07 | % | | | | 0.82 | %(H) | | | | 1.36 | % | | | | 2.09 | % |
Net investment income (loss), net waiver and reimbursement (E)(F) | | | | 0.71 | % | | | | 0.48 | % | | | | 1.07 | % | | | | 0.82 | %(H) | | | | 1.36 | % | | | | 2.09 | % |
Portfolio turnover rate | | | | 32 | % | | | | 23 | % | | | | 31 | % | | | | 16 | % | | | | 26 | % | | | | 41 | % |
| (A) | The Fund elected to change its fiscal year end from December to September. The information presented is for January 1, 2009 through September 30, 2009. |
| (B) | Per share amounts calculated using average shares method, which more appropriately presents the per share data for the period. |
| (C) | Total return calculation does not reflect sales load. |
| (D) | Total return in the above table represents the rate that the investor would have earned or lost on an investment in the Fund assuming reinvestment of dividends. |
| (E) | These ratios exclude the impact of expenses of the underlying security holdings as represented in the Schedule of Investments. |
| (F) | Recognition of net investment income (loss) by the Fund is affected by the timing of the declaration of dividends by the underlying investment companies in which the Fund invests. |
| (G) | For periods of less than one full year, total return is not annualized. |
The accompanying notes are an integral part of these financial statements.
[83]
| | |
| Timothy Plan Family of Funds | | |
| | | | | | | | | | | | | | | | | | | | | | | | | | | | | | |
| | | Conservative Growth |
| | | (Class C Shares) |
| | | For the Year Ended
September 30, | | For the Period
Ended
September 30,
2009 (A) | | For the Year Ended
December 31, |
| | | 2012 | | 2011 | | 2010 | | | 2008 | | 2007 |
Selected data based on a share outstanding throughout each period | | | | | | | | | | | | | | | | | | | | | | | | | | | | | | |
Net asset value, beginning of period | | | $ | 8.24 | | | | $ | 8.32 | | | | $ | 7.83 | | | | $ | 6.61 | | | | $ | 10.02 | | | | $ | 10.68 | |
| | | | | | | | | | | | | | | | | | | | | | | | | | | | | | |
Income (loss) from investment operations: | | | | | | | | | | | | | | | | | | | | | | | | | | | | | | |
Net investment income (loss) | | | | (0.01 | )(B) | | | | (0.02 | )(B) | | | | 0.02 | | | | | — | * | | | | 0.06 | | | | | 0.12 | |
Net realized and unrealized gain (loss) on investments | | | | 1.04 | | | | | 0.00 | * | | | | 0.57 | | | | | 1.22 | | | | | (3.03 | ) | | | | 0.72 | |
| | | | | | | | | | | | | | | | | | | | | | | | | | | | | | |
Total from investment operations | | | | 1.03 | | | | | (0.02 | ) | | | | 0.59 | | | | | 1.22 | | | | | (2.97 | ) | | | | 0.84 | |
| | | | | | | | | | | | | | | | | | | | | | | | | | | | | | |
Less Distributions: | | | | | | | | | | | | | | | | | | | | | | | | | | | | | | |
From net investment income | | | | — | | | | | (0.06 | ) | | | | (0.10 | ) | | | | — | | | | | (0.09 | ) | | | | (0.12 | ) |
From net realized gains on investments | | | | — | | | | | — | | | | | — | | | | | — | | | | | (0.35 | ) | | | | (1.38 | ) |
| | | | | | | | | | | | | | | | | | | | | | | | | | | | | | |
Total distributions | | | | — | | | | | (0.06 | ) | | | | (0.10 | ) | | | | — | | | | | (0.44 | ) | | | | (1.50 | ) |
| | | | | | | | | | | | | | | | | | | | | | | | | | | | | | |
Net asset value, end of period | | | $ | 9.27 | | | | $ | 8.24 | | | | $ | 8.32 | | | | $ | 7.83 | | | | $ | 6.61 | | | | $ | 10.02 | |
| | | | | | | | | | | | | | | | | | | | | | | | | | | | | | |
Total return (C)(D) | | | | 12.50 | % | | | | (0.25 | )% | | | | 7.57 | % | | | | 18.46 | %(G) | | | | (29.45 | )% | | | | 7.98 | % |
Ratios/supplemental data: | | | | | | | | | | | | | | | | | | | | | | | | | | | | | | |
Net assets, end of period (in 000’s) | | | $ | 9,191 | | | | $ | 7,963 | | | | $ | 7,365 | | | | $ | 7,500 | | | | $ | 6,438 | | | | $ | 7,164 | |
Expenses, before waiver and reimbursement (E) | | | | 1.86 | % | | | | 1.80 | % | | | | 1.88 | % | | | | 1.85 | %(H) | | | | 1.77 | % | | | | 1.77 | % |
Expenses, net waiver and reimbursement (E) | | | | 1.86 | % | | | | 1.80 | % | | | | 1.88 | % | | | | 1.85 | %(H) | | | | 1.77 | % | | | | 1.77 | % |
Net investment income (loss), before waiver and reimbursement (E)(F) | | | | (0.06 | )% | | | | (0.27 | )% | | | | 0.29 | % | | | | 0.05 | %(H) | | | | 0.72 | % | | | | 1.40 | % |
Net investment income (loss), net waiver and reimbursement (E)(F) | | | | (0.06 | )% | | | | (0.27 | )% | | | | 0.29 | % | | | | 0.05 | %(H) | | | | 0.72 | % | | | | 1.40 | % |
Portfolio turnover rate | | | | 32 | % | | | | 23 | % | | | | 31 | % | | | | 16 | % | | | | 26 | % | | | | 41 | % |
| * | Amount is less than $0.005 per share. |
| (A) | The Fund elected to change its fiscal year end from December to September. The information presented is for January 1, 2009 through September 30, 2009. |
| (B) | Per share amounts calculated using average shares method, which more appropriately presents the per share data for the period. |
| (C) | Total return calculation does not reflect redemption fee. |
| (D) | Total return in the above table represents the rate that the investor would have earned or lost on an investment in the Fund assuming reinvestment of dividends. |
| (E) | These ratios exclude the impact of expenses of the underlying security holdings as represented in the Schedule of Investments. |
| (F) | Recognition of net investment income (loss) by the Fund is affected by the timing of the declaration of dividends by the underlying investment companies |
| in | which the Fund invests. |
| (G) | For periods of less than one full year, total return is not annualized. |
The accompanying notes are an integral part of these financial statements.
[84]
Notes to Financial Statements
September 30, 2012
Timothy Plan Family of Funds
Note 1 | Significant Accounting Policies
The Timothy Plan (the “Trust”) is organized as a series of a Delaware business trust pursuant to a trust agreement dated December 16, 1993. The Trust is registered under the Investment Company Act of 1940, as amended, as an open-end diversified management investment company. As of September 30, 2012, the Trust consisted of thirteen series. These financial statements include the following eleven series: Timothy Plan Aggressive Growth Fund, Timothy Plan International Fund, Timothy Plan Large/Mid Cap Growth Fund, Timothy Plan Small Cap Value Fund, Timothy Plan Large/Mid Cap Value Fund, Timothy Plan Fixed Income Fund, Timothy Plan High Yield Bond Fund, Timothy Plan Defensive Strategies Fund, Timothy Plan Israel Common Values Fund, Timothy Plan Strategic Growth Fund and Timothy Plan Conservative Growth Fund (the “Funds”).
The Timothy Plan Aggressive Growth Fund’s investment objective is long-term growth of capital. The Fund seeks to achieve its investment objective by normally investing at least 80% of the Fund’s total assets in U.S. common stocks without regard to market capitalizations and investing in the securities of a limited number of companies which the Fund’s Advisor believes show a high probability for superior growth.
The Timothy Plan International Fund’s investment objective is long-term growth of capital. The Fund seeks to achieve its investment objective by normally investing at least 80% of the Fund’s total assets in the common stock and similar securities of foreign companies through the purchase of American Depositary Receipts (“ADRs”) without regard to market capitalization, investing its assets in the ADRs of companies which the Fund’s investment manager believes show a high probability for superior growth, and allocating investments across countries and regions considering the size of the market in each country and region relative to the size of the international market as a whole. Although the Fund maintains a diversified investment portfolio, the political or economic developments within a particular country or region may have an adverse effect on the ability of domiciled issuers to meet their obligations. Additionally, political or economic developments may have an effect on the liquidity and volatility of portfolio securities and currency holdings.
The Timothy Plan Large/Mid Cap Growth Fund’s investment objective is long-term growth of capital. Current income is not a significant investment consideration and any such income realized will be considered incidental to the Fund’s investment objective. The Fund seeks to achieve its investment objective by normally investing at least 80% of the Fund’s total assets in U.S. common stocks with market capitalizations in excess of $2 billion.
The Timothy Plan Small Cap Value Fund’s primary objective is long-term capital growth, with a secondary objective of current income. The Fund seeks to achieve its investment objective by primarily investing at least 80% of its assets in U.S. common stocks whose market capitalization is generally less than $2 billion.
The Timothy Plan Large/Mid Cap Value Fund’s investment objective is long-term capital growth, with a secondary objective of current income. The Fund seeks to achieve its investment objective by primarily investing in U.S. common stocks. The Fund will invest at least 80% of its assets in the common stock of companies whose total market capitalization generally exceeds $2 billion.
The Timothy Plan Fixed Income Fund seeks to generate a high level of current income consistent with prudent investment risk. To achieve its investment objective, the Fund normally invests in a diversified portfolio of debt securities. These include corporate bonds, U.S. Government and agency securities, convertible securities and preferred securities. The Fund will generally only purchase high quality securities.
The Timothy Plan High Yield Bond Fund’s investment objective is to generate a high level of current income. To achieve its investment objective, the Fund normally invests in a diversified portfolio of debt securities. These include corporate bonds, U.S. Government and agency securities, convertible securities and preferred securities. The Fund will generally purchase securities that are not investment-grade, meaning securities with a rating of “BBB” or lower as rated by Standard and Poor’s or a comparable rating by another nationally recognized rating agency. Investments in these higher yielding securities are generally accompanied by a greater degree of credit risk than higher rated securities. Additionally, lower rated securities may be more susceptible to adverse economic and competitive industry conditions than investment-grade securities.
Timothy Plan Notes to Financial Statements
[85]
Notes to Financial Statements
September 30, 2012
Timothy Plan Family of Funds
The Timothy Plan Defensive Strategies Fund’s investment objective is the protection of principal through aggressive, proactive reactions to prevailing economic conditions. To achieve its investment objective, the Fund normally invests in Real Estate Investment Trusts (“REITs”), commodities based Exchange-Traded Funds (“ETFs”), and Treasury Inflation Protected Securities (“TIPS”).
The Timothy Israel Common Values Fund seeks to provide long-term growth of capital. This Fund seeks to achieve its investment objectives by normally investing at least 80% of the Fund’s total assets in the common stock of companies domiciled and/or headquartered in Israel through the purchase of American Depository Receipts (ADRs) and direct investments in such companies on foreign stock exchanges, without regard to market capitalizations.
The Timothy Plan Strategic Growth Fund seeks to generate medium to high levels of long-term capital growth. The Fund seeks to achieve its investment objective by normally investing at least 75% of its net assets in the following Funds which are other series of the Trust: approximately 5-10% of its net assets in the Timothy Plan Small Cap Value Fund; approximately 15-25% of its net assets in the Timothy Plan Large/Mid Cap Value Fund; approximately 15-25% of its net assets in the Timothy Plan Large/Mid Cap Growth Fund; approximately 5-15% of its net assets in the Timothy Plan High Yield Bond Fund; approximately 20-30% of its net assets in the Timothy Plan International Fund; approximately 5%-10% of its net assets in the Timothy Plan Aggressive Growth Fund; approximately 5%-15% of its net assets in the Timothy Plan Defensive Strategies Fund; and approximately 5-10% of its net assets in the Timothy Plan Israel Common Values Fund.
The Timothy Plan Conservative Growth Fund seeks to generate moderate levels of long-term capital growth with a secondary objective of current income. The Fund seeks to achieve its investment objective by normally investing at least 75% of its net assets in the following Funds which are other series of the Trust: approximately 0-10% of its net assets in the Timothy Plan Small Cap Value Fund; approximately 10-20% of its net assets in the Timothy Plan Large/Mid Cap Value Fund; approximately 5-15% of its net assets in the Timothy Plan Large/Mid Cap Growth Fund; approximately 0-5% of its net assets in the Timothy Plan Aggressive Growth Fund; approximately 5-15% of its net assets in the Timothy Plan High Yield Bond Fund; approximately 5-15% of its net assets in the Timothy Plan International Fund; approximately 20%-40% of its net assets in the Timothy Plan Fixed Income Fund; approximately 10-30% of its net assets in the Timothy Plan Defensive Strategies Fund; and approximately 0-5% of its net assets in the Timothy Plan Israel Common Values Fund.
The following is a summary of significant accounting policies consistently followed by the Funds in the preparation of their financial statements. The policies are in conformity with accounting principles generally accepted in the United States of America (“GAAP”) for investment companies.
| A. | SECURITY VALUATION AND FAIR VALUE MEASUREMENTS |
All investments in securities are recorded at their estimated fair value as described in Note 2.
| B. | INVESTMENT INCOME AND SECURITIES TRANSACTIONS |
Security transactions are accounted for on the date the securities are purchased or sold (trade date). Dividend income is recognized on the ex-dividend date. Interest income and expenses are recognized on an accrual basis. The Timothy Plan Aggressive Growth Fund, Large/Mid Cap Growth Fund, Large/Mid Cap Value Fund, Small Cap Value Fund, Israel Common Values Fund and Defensive Strategies Fund have made certain investments in REITs and Master Limited Partnerships (“MLPs”). Dividend income from REITs and MLPs is recognized on the ex-dividend date. It is common for distributions from REITs and MLPs to exceed taxable earnings and profits, resulting in the excess portion of such dividends being designated as a return of capital. Income or loss from the MLPs is reclassified upon receipt of the MLPs’ K-1. Withholding taxes on foreign dividends have been provided for in accordance with the Funds’ understanding of the applicable country’s tax rules and rates. Discounts and premiums on securities purchased are amortized over the lives of the respective securities. The ability of issuers of debt securities held by the Funds to meet their obligations may be affected by economic and political developments in a specific country or region.
Timothy Plan Notes to Financial Statements
[86]
Notes to Financial Statements
September 30, 2012
Timothy Plan Family of Funds
Investment securities denominated in foreign currencies are translated into U.S. dollar amounts at the date of valuation. Purchases and sales of investment securities and income and expense items denominated in foreign currencies are translated into U.S. dollar amounts on the respective dates of such transactions. The Funds do not isolate that portion of the results of operations resulting from changes in foreign exchange rates on investments from the fluctuations arising from changes in market prices of securities held. Such fluctuations are included in the net realized and unrealized gain or loss from investments. Reported net realized foreign exchange gains or losses arise from sales of foreign currencies, currency gains or losses realized between the trade and settlement dates on securities transactions, and the difference between the amounts of dividends, interest and foreign withholding taxes recorded on the Funds’ books and the U.S. dollar equivalent of the amounts actually received or paid. Net unrealized foreign exchange gains and losses arise from changes in the fair values of assets and liabilities, other than investments in securities at fiscal period end, resulting from changes in exchange rates.
| C. | NET ASSET VALUE PER SHARE |
The Net Asset Value (“NAV”) per share of the capital stock of the Funds is determined daily as of the close of trading on the New York Stock Exchange by dividing the value of its net assets by the number of Fund shares outstanding. The NAV is calculated separately for each class of the following Funds: Timothy Plan Aggressive Growth Fund, Timothy Plan International Fund, Timothy Plan Large/Mid Cap Growth Fund, Timothy Plan Small Cap Value Fund, Timothy Plan Large/Mid Cap Value Fund, Timothy Plan Fixed Income Fund, Timothy Plan High Yield Bond Fund, Timothy Plan Defensive Strategies Fund, Timothy Plan Israel Common Values Fund, Timothy Plan Strategic Growth Fund and Timothy Plan Conservative Growth Fund. The net asset value of the classes may differ because of different fees and expenses charged to each class.
Expenses incurred by the Trust that do not relate to a specific Fund of the Trust are allocated to the individual Funds based on each Fund’s relative net assets or another appropriate basis as determined by the Board of Trustees (the “Board”).
There are two classes of shares currently offered by the Trust: Class A shares are offered with a front-end sales charge and ongoing service/distribution fees; Class C shares are offered with a contingent deferred sales charge (“CDSC”) that ends after the first year and ongoing service and distribution fees.
Class specific expenses are borne by each specific class. Income, expenses, and realized and unrealized gains/losses are allocated to the respective classes on the basis of relative daily net assets.
In the preparation of financial statements in conformity with GAAP, management makes estimates and assumptions that affect the reported amounts of assets and liabilities and disclosure of contingent assets and liabilities at the date of the financial statements, as well as the reported amounts of revenues and expenses during the reporting period. Actual results could differ from those estimates.
It is the policy of each Fund to continue to comply with all requirements under subchapter M of the Internal Revenue Code applicable to regulated investment companies and to distribute substantially all of its taxable income to its shareholders. Each Fund also intends to distribute sufficient net investment income and net capital gains, if any, so that it will not be subject to excise tax on undistributed income or gains. Therefore, no federal income tax or excise provision is required.
As of September 30, 2012, the Funds did not have a liability for any unrecognized tax benefits. The Funds recognize interest and penalties, if any, related to unrecognized tax benefits as income tax expense in the statements of operations. During the year ended September 30, 2012, the Funds did not incur any interest or penalties. The Funds are not subject to examination by U.S. federal tax authorities for tax years before 2009 and are not aware of any tax positions for which it is reasonably possible that the total amounts of unrecognized tax benefits will change materially within the next twelve months.
Timothy Plan Notes to Financial Statements
[87]
Notes to Financial Statements
September 30, 2012
Timothy Plan Family of Funds
| H. | DISTRIBUTIONS TO SHAREHOLDERS |
Distributions to shareholders, which are determined in accordance with income tax regulations, are recorded on the ex-dividend date. The treatment for financial reporting purposes of distributions made to shareholders during the period from net investment income or net realized capital gains may differ from their ultimate treatment for federal income tax purposes. These differences are caused primarily by differences in the timing of the recognition of certain components of income, expense or realized capital gain for federal income tax purposes. Where such differences are permanent in nature, they are reclassified in the components of net assets based on their ultimate characterization for federal income tax purposes. Any such reclassifications will have no effect on net assets, results of operations, or NAVs per share of the Funds. Reclassifications for the fiscal year ended September 30, 2012 are as follows:
| | | | | | | | | | | | |
| Fund | | Paid
in
Capital | | | Accumulated
Undistributed Net
Investment
Income (Loss) | | | Accumulated
Undistributed Net
Realized Gain (Loss)
on Investments | |
Aggressive Growth | | $ | (57,002 | ) | | $ | 56,207 | | | $ | 795 | |
| | | | | | | | | | | | |
International | | | - | | | | 6,261 | | | | (6,261 | ) |
| | | | | | | | | | | | |
Large/Mid Cap Growth | | | (1,798 | ) | | | 291,183 | | | | (289,385 | ) |
| | | | | | | | | | | | |
Small Cap Value | | | (13,114 | ) | | | - | | | | 13,114 | |
| | | | | | | | | | | | |
Large/Mid Cap Value | | | - | | | | (53,177 | ) | | | 53,177 | |
| | | | | | | | | | | | |
Fixed Income | | | (186,818 | ) | | | 186,818 | | | | - | |
| | | | | | | | | | | | |
High Yield Bond | | | (51,714 | ) | | | 51,714 | | | | - | |
| | | | | | | | | | | | |
Israel Common Values | | | (16,073 | ) | | | 25,363 | | | | (9,290 | ) |
| | | | | | | | | | | | |
Defensive Strategies | | | (299,411 | ) | | | 1,776,781 | | | | (1,477,370 | ) |
| | | | | | | | | | | | |
Strategic Growth | | | (22,164 | ) | | | (14,351 | ) | | | 36,515 | |
| | | | | | | | | | | | |
Conservative Growth | | | - | | | | (76,932 | ) | | | 76,932 | |
Note 2 | Security Valuation and Fair Value Measurements
Fair value is defined as the price that a Fund would receive upon selling an investment in a timely transaction to an independent buyer in the principal or most advantageous market of the investment. GAAP established a three-tier hierarchy to maximize the use of observable market data and minimize the use of unobservable inputs and to establish classification of fair value measurements for disclosure purposes.
Inputs refer broadly to the assumptions that market participants would use in pricing the asset or liability, including assumptions about risk (the risk inherent in a particular valuation technique used to measure fair value including such a pricing model and/or the risk inherent in the inputs to the valuation technique). Inputs may be observable or unobservable. Observable inputs are inputs that reflect the assumptions market participants would use in pricing the asset or liability developed based on market data obtained from sources independent of the reporting entity. Unobservable inputs are inputs that reflect the reporting entity’s own assumptions about the assumptions market participants would use in pricing the asset or liability developed based on the best information available in the circumstances.
The Trust utilizes various methods to measure the fair value of all of its investments on a recurring basis. GAAP establishes a hierarchy that prioritizes inputs to valuation methods. The three levels of input are:
•Level 1 – Unadjusted quoted prices in active markets for identical assets and liabilities that the Fund has the ability to access.
•Level 2 – Observable inputs other than quoted prices included in Level 1 that are observable for the asset or liability, either directly or indirectly. These inputs may include quoted prices for the identical instrument in an inactive market, prices for similar instruments, interest rates, prepayment speeds, credit risk, yield curves, default rates and similar data.
Timothy Plan Notes to Financial Statements
[88]
Notes to Financial Statements
September 30, 2012
Timothy Plan Family of Funds
•Level 3 – Unobservable inputs for the asset or liability, to the extent relevant observable inputs are not available, representing the Fund’s own assumptions about the assumptions a market participant would use in valuing the asset or liability, and would be based on the best information available.
The inputs used to measure fair value may fall into different levels of the fair value hierarchy. In such cases, for disclosure purposes, the level in the fair value hierarchy within which the fair value measurement falls in its entirety is determined based on the lowest level input that is significant to the fair value measurement in its entirety.
Each Fund generally determines the total value of each class of its shares by using market prices for the securities comprising its portfolio. Equity securities, including common stock, ADRs, REITs, MLPs, ETFs and warrants are generally valued by using market quotations, but may be valued on the basis of prices furnished by a pricing service when the Advisor or Sub-Advisor believes such prices more accurately reflect the fair value of such securities. Securities that are traded on any stock exchange are generally valued by the pricing service at the last quoted sale price. Lacking a last sale price, an exchange traded security is generally valued by the pricing service at its last bid price. Securities traded in the NASDAQ over-the-counter market are generally valued by the pricing service at the NASDAQ Official Closing Price. When using the market quotations or close prices provided by the pricing service and when the market is considered active, the security will be classified as a Level 1 security. Sometimes, when the market is considered inactive, an equity security (such as some ADRs owned by the International Fund) owned by the Funds will be valued by the pricing service at an evaluated bid, with inputs such as the underlying securities price, the exchange rate for the currency and the ADR factor. When this happens, the security will generally be classified as a Level 2 security. When market quotations are not readily available, when the Advisor or Sub-Advisor determines that the market quotation or the price provided by the pricing service does not accurately reflect the current fair value, or when restricted or illiquid securities are being valued, such securities are valued as determined in good faith by the Advisor or Sub-Advisor, in conformity with guidelines adopted by and subject to review by the Board. These securities will generally be categorized as Level 3 securities.
Investments in mutual funds, including money market mutual funds, are generally priced at the ending NAV provided by the service agent of the funds. These securities will be categorized as Level 1 securities.
Fixed income securities such as corporate bonds, restricted corporate bonds, asset-backed securities, mortgage-backed securities, U.S. government securities, U.S. government agency securities and treasury inflation protected securities, when valued using market quotations in an active market, will be categorized as Level 1 securities. However, they may be valued on the basis of prices furnished by a pricing service when the Advisor or Sub-Advisor believes such prices more accurately reflect the fair value of such securities. A pricing service utilizes electronic data processing techniques based on yield spreads relating to securities with similar characteristics to determine prices for normal institutional-size trading units of debt securities without regard to sale or bid prices. These securities will generally be categorized as Level 2 securities. If the Advisor or Sub-Advisor decides that a price provided by the pricing service does not accurately reflect the fair value of the securities, when prices are not readily available from a pricing service, or when restricted or illiquid securities are being valued, securities are valued at fair value as determined in good faith by the Advisor or Sub-Advisor, in conformity with guidelines adopted by and subject to review of the Board. These securities will be categorized as Level 3 securities.
Short-term investments in fixed income securities (those with maturities of less than 60 days when acquired, or which subsequently are within 60 days of maturity) are valued by using the amortized cost method of valuation, which the Board has determined will represent fair value. These securities will be classified as Level 2 securities.
The Board has delegated to the Advisor and/or Sub-Advisors responsibility for determining the value of Fund portfolio securities under certain circumstances. Under such circumstances, the Advisor or Sub-Advisor will use its best efforts to arrive at the fair value of a security held by the Fund under all reasonably ascertainable facts and circumstances. The Advisor must prepare a report for the Board not less than quarterly containing a complete listing of any securities for which fair value pricing was employed and detailing the specific reasons for such fair value pricing. The Board has adopted written policies and procedures to guide the Advisor and Sub-Advisors with respect to the circumstances under which, and the methods to be used, in fair valuing securities.
Timothy Plan Notes to Financial Statements
[89]
Notes to Financial Statements
September 30, 2012
Timothy Plan Family of Funds
The following is a summary of the inputs used to value each Fund’s assets as of September 30, 2012:
Aggressive Growth Fund
| | | | | | | | | | | | | | | | |
| Assets | | Level 1 | | | Level 2 | | | Level 3 | | | Total | |
Common Stocks | | $ | 15,653,973 | | | $ | - | | | $ | - | | | $ | 15,653,973 | |
REITs | | | 351,725 | | | | - | | | | - | | | | 351,725 | |
Money Market Fund | | | 177,764 | | | | - | | | | - | | | | 177,764 | |
Total | | $ | 16,183,462 | | | $ | - | | | $ | - | | | $ | 16,183,462 | |
International Fund
| | | | | | | | | | | | | | | | |
| Assets | | Level 1 | | | Level 2 | | | Level 3 | | | Total | |
Common Stocks | | $ | 29,742,450 | | | $ | - | | | $ | - | | | $ | 29,742,450 | |
Money Market Fund | | | 1,360,914 | | | | - | | | | - | | | | 1,360,914 | |
Total | | $ | 31,103,364 | | | $ | - | | | $ | - | | | $ | 31,103,364 | |
Large/Mid Cap Growth Fund
| | | | | | | | | | | | | | | | |
| Assets | | Level 1 | | | Level 2 | | | Level 3 | | | Total | |
Common Stocks | | $ | 42,554,400 | | | $ | - | | | $ | - | | | $ | 42,554,400 | |
REITs | | | 867,727 | | | | - | | | | - | | | | 867,727 | |
Money Market Fund | | | 2,458,455 | | | | - | | | | - | | | | 2,458,455 | |
Total | | $ | 45,880,582 | | | $ | - | | | $ | - | | | $ | 45,880,582 | |
Small Cap Value Fund
| | | | | | | | | | | | | | | | |
| Assets | | Level 1 | | | Level 2 | | | Level 3 | | | Total | |
Common Stocks | | $ | 47,344,227 | | | $ | - | | | $ | - | | | $ | 47,344,227 | |
REITs | | | 4,651,907 | | | | - | | | | - | | | $ | 4,651,907 | |
Money Market Fund | | | 470,879 | | | | - | | | | - | | | | 470,879 | |
Total | | $ | 52,467,013 | | | $ | - | | | $ | - | | | $ | 52,467,013 | |
Large/Mid Cap Value Fund
| | | | | | | | | | | | | | | | |
| Assets | | Level 1 | | | Level 2 | | | Level 3 | | | Total | |
Common Stocks | | $ | 97,390,448 | | | $ | - | | | $ | - | | | $ | 97,390,448 | |
Master Limited Partnerships | | | 2,303,324 | | | | - | | | | - | | | | 2,303,324 | |
REITs | | | 7,222,046 | | | | - | | | | - | | | | 7,222,046 | |
Money Market Fund | | | 4,426,994 | | | | - | | | | - | | | | 4,426,994 | |
Total | | $ | 111,342,812 | | | $ | - | | | $ | - | | | $ | 111,342,812 | |
Fixed Income Fund
| | | | | | | | | | | | | | | | |
| Assets | | Level 1 | | | Level 2 | | | Level 3 | | | Total | |
Corporate Bonds | | $ | - | | | $ | 28,075,322 | | | $ | - | | | $ | 28,075,322 | |
U.S. Government Notes & Bonds | | | - | | | | 22,739,022 | | | | - | | | | 22,739,022 | |
Government Mortgage-Backed Securities | | | - | | | | 24,722,908 | | | | - | | | | 24,722,908 | |
Treasury Inflation Protected Securities | | | - | | | | 3,594,887 | | | | - | | | | 3,594,887 | |
Money Market Fund | | | 3,930,701 | | | | - | | | | - | | | | 3,930,701 | |
Total | | $ | 3,930,701 | | | $ | 79,132,139 | | | $ | - | | | $ | 83,062,840 | |
Timothy Plan Notes to Financial Statements
[90]
Notes to Financial Statements
September 30, 2012
Timothy Plan Family of Funds
High Yield Bond Fund
| | | | | | | | | | | | | | | | |
| Assets | | Level 1 | | | Level 2 | | | Level 3 | | | Total | |
Corporate Bonds | | $ | - | | | $ | 33,303,604 | | | $ | - | | | $ | 33,303,604 | |
Money Market Fund | | | 1,248,011 | | | | - | | | | - | | | | 1,248,011 | |
Total | | $ | 1,248,011 | | | $ | 33,303,604 | | | $ | - | | | $ | 34,551,615 | |
Israel Common Values Fund
| | | | | | | | | | | | | | | | |
| Assets | | Level 1 | | | Level 2 | | | Level 3 | | | Total | |
Common Stocks | | $ | 7,684,517 | | | $ | - | | | $ | - | | | $ | 7,684,517 | |
Investment Companies | | | 253,755 | | | | - | | | | - | | | | 253,755 | |
Warrants | | | 166 | | | | - | | | | - | | | | 166 | |
Money Market Fund | | | 157,639 | | | | - | | | | - | | | | 157,639 | |
Total | | $ | 8,096,077 | | | $ | - | | | $ | - | | | $ | 8,096,077 | |
Defensive Strategies Fund
| | | | | | | | | | | | | | | | |
| Assets | | Level 1 | | | Level 2 | | | Level 3 | | | Total | |
Common Stocks | | $ | 22,879,531 | | | $ | - | | | $ | - | | | $ | 22,879,531 | |
REITs | | | 10,577,810 | | | | - | | | | - | | | | 10,577,810 | |
Exchange Traded Funds | | | 12,228,366 | | | | - | | | | - | | | | 12,228,366 | |
Government Mortgage-Backed Securities | | | - | | | | 1,794,017 | | | | - | | | | 1,794,017 | |
Treasury Inflation Protected Securities (TIPS) | | | - | | | | 18,945,832 | | | | - | | | | 18,945,832 | |
Money Market Fund | | | 4,813,736 | | | | - | | | | - | | | | 4,813,736 | |
Total | | $ | 50,499,443 | | | $ | 20,739,849 | | | $ | - | | | $ | 71,239,292 | |
Strategic Growth Fund
| | | | | | | | | | | | | | | | |
| Assets | | Level 1 | | | Level 2 | | | Level 3 | | | Total | |
Mutual Funds | | $ | 37,966,219 | | | $ | - | | | $ | - | | | $ | 37,966,219 | |
Money Market Fund | | | 1,159,978 | | | | - | | | | - | | | | 1,159,978 | |
Total | | $ | 39,126,197 | | | $ | - | | | $ | - | | | $ | 39,126,197 | |
Conservative Growth Fund
| | | | | | | | | | | | | | | | |
| Assets | | Level 1 | | | Level 2 | | | Level 3 | | | Total | |
Mutual Funds | | $ | 48,641,306 | | | $ | - | | | $ | - | | | $ | 48,641,306 | |
Money Market Fund | | | 646,115 | | | | - | | | | - | | | | 646,115 | |
Total | | $ | 49,287,421 | | | $ | - | | | $ | - | | | $ | 49,287,421 | |
Refer to the Schedules of Investments for industry classifications.
The Funds did not hold any assets at any time during the reporting period in which significant unobservable inputs were used in determining fair value; therefore, no reconciliation of Level 3 securities is included for this reporting period. The Funds did not hold any derivative instruments during the reporting period. During the year ended September 30, 2012, there were no transfers into and out of Level 1 and Level 2. The Funds’ policy is to recognize transfers at the end of the reporting period.
Timothy Plan Notes to Financial Statements
[91]
Notes to Financial Statements
September 30, 2012
Timothy Plan Family of Funds
Note 3 | Purchases and Sales of Securities
The following is a summary of the cost of purchases and proceeds from the sale of securities, other than short-term investments, for the fiscal year ended September 30, 2012:
| | | | | | | | | | | | | | | | |
| | | Purchases | | | Sales | |
| Fund | | U.S. Gov’t
Obligations | | | Other | | | U.S. Gov’t
Obligations | | | Other | |
Aggressive Growth | | $ | - | | | $ | 22,341,439 | | | $ | - | | | $ | 23,436,498 | |
International | | | - | | | | 9,649,214 | | | | - | | | | 11,730,336 | |
Large/Mid Cap Growth | | | - | | | | 49,959,372 | | | | - | | | | 49,606,115 | |
Small Cap Value | | | - | | | | 31,792,881 | | | | - | | | | 36,380,561 | |
Large/Mid Cap Value | | | - | | | | 10,308,849 | | | | - | | | | 7,048,547 | |
Fixed Income | | | 15,643,377 | | | | 16,753,880 | | | | 7,553,581 | | | | 5,680,834 | |
High Yield Bond | | | - | | | | 15,490,443 | | | | - | | | | 6,766,875 | |
Defensive Strategies | | | 13,707,623 | | | | 145,810,270 | | | | 10,729,735 | | | | 142,694,982 | |
Strategic Growth | | | - | | | | 12,915,015 | | | | - | | | | 16,946,213 | |
Conservative Growth | | | - | | | | 18,069,214 | | | | - | | | | 15,382,179 | |
Israel Common Values | | | - | | | | 10,272,499 | | | | - | | | | 2,421,248 | |
Note 4 | Investment Management Fee and Other Transactions with Affiliates
Timothy Partners, Ltd., (“TPL”) is the investment advisor for the Funds pursuant to an investment advisory agreement (the “Agreement”) that was renewed by the Board on February 24, 2012. TPL supervises the investment of the assets of each Fund in accordance with the objectives, policies and restrictions of the Trust. Under the terms of the Agreement, as amended, TPL receives a fee, accrued daily and paid monthly, at an annual rate of 1.00% of the average daily net assets of the Timothy Plan International Fund and Timothy Plan Israel Common Values Fund; 0.85% of the average daily net assets of the Timothy Plan Aggressive Growth, the Timothy Plan Small Cap Value, the Timothy Plan Large/Mid Cap Growth, and the Timothy Plan Large/Mid Cap Value Funds; 0.60% of the average daily net assets of the Timothy Plan Fixed Income, the Timothy Plan High Yield Bond, and the Timothy Plan Defensive Strategies Funds; and 0.65% of the average daily net assets of the Timothy Plan Conservative Growth and the Timothy Plan Strategic Growth Funds. TPL has voluntarily agreed to reduce the fee it receives from the Timothy Plan Fixed Income Fund to 0.45%. Such voluntary fee reductions/reimbursements may be authorized by TPL at any time, but such action shall not obligate TPL to waive any fees in the near future. Such voluntary fee reductions/reimbursements are not subject to future recoupment. An officer and trustee of the Funds is also an officer and owner of the Advisor.
For the fiscal year ended September 30, 2012, TPL waived and reimbursed the Fund as follows:
| | | | |
| Fund | | Fiscal Year Ended
September 30, 2012 | |
Fixed Income | | $ | 112,642 | |
Gemini Fund Services, LLC (“GFS”) provides administrative, fund accounting, and transfer agency services to the Funds pursuant to agreements with the Trust, for which it receives from each Fund: (i) basis points in decreasing amounts as assets reach certain breakpoints; and (ii) any related out-of-pocket expenses. Fees are billed monthly as follows:
Fund Accounting and Fund Administration Fees:
Fund Complex Base annual fee:
25 basis points (0.25%) on the first $200 million of net assets
15 basis points (0.15%) on the next $200 million of net assets;
8 basis points (0.08%) on the next $600 million of net assets; and
6 basis points (0.06%) on net assets greater than $1 billion.
Timothy Plan Notes to Financial Statements
[92]
Notes to Financial Statements
September 30, 2012
Timothy Plan Family of Funds
Transfer agency fees for the Funds are combined with the Fund Accounting and Fund Administration fees under the Trust’s agreement with GFS. Therefore, there is no separate base annual fee per Fund or share class.
An officer of the Trust is also an employee of GFS, and is not paid any fees directly by the Trust for serving in such capacity.
The Timothy Plan Aggressive Growth, Timothy Plan International, Timothy Plan Large/Mid Cap Growth, Timothy Plan Small Cap Value, Timothy Plan Large/Mid Cap Value, Timothy Plan Fixed Income, Timothy Plan High Yield Bond, Timothy Plan Defensive Strategies, and Timothy Plan Israel Common Values Funds have adopted shareholder services plans (the “Plans”) pursuant to Rule 12b-1 under the Investment Company Act of 1940, as amended. The Plans provide that the Funds will pay TPL or others for expenses that relate to the promotion or distribution of shares. Under the Class A Plan, the Funds will pay TPL a fee at an annual rate of 0.25%, payable monthly, of the average daily net assets attributable to such class of shares. Under the Class C Plan, the Funds will pay TPL a fee at an annual rate of 1.00%, payable monthly, of which, 0.25% may be a service fee and 0.75% may be payable to outside broker/dealers, of the average daily net assets attributable to such class of shares.
The Timothy Plan Conservative Growth and Timothy Plan Strategic Growth Funds have adopted shareholder services plans (the “Plans”) pursuant to Rule 12b-1 under the Investment Company Act of 1940, as amended. The Plans provide that the Funds will pay TPL or others for expenses that relate to the promotion or distribution of shares. Class A shares of the Funds do not impose a service fee. Under the Class C Plan, the Funds will pay TPL a fee at an annual rate of 0.75%, payable monthly to outside broker/dealers, of the average daily net assets attributable to such class of shares.
For the fiscal year ended September 30, 2012, the Funds paid TPL under the terms of the Plans as follows:
| | | | | |
| Fund | | 12b-1 Fees |
| | | Fiscal Year Ended September 30, 2012 |
Aggressive Growth | | | $ | 55,877 | |
International | | | | 88,714 | |
Large/Mid Cap Growth | | | | 130,760 | |
Small Cap Value | | | | 162,142 | |
Large/Mid Cap Value | | | | 334,949 | |
Fixed Income | | | | 252,530 | |
High Yield Bond | | | | 84,846 | |
Israel Common Values | | | | 19,508 | |
Defensive Strategies | | | | 309,188 | |
Strategic Growth | | | | 52,009 | |
Conservative Growth | | | | 66,728 | |
Timothy Plan Notes to Financial Statements
[93]
Notes to Financial Statements
September 30, 2012
Timothy Plan Family of Funds
TPL also serves as the principal underwriter of the Funds’ shares. An officer and trustee of the Funds is also an officer of the principal underwriter. For the fiscal year ended September 30, 2012, TPL received sales charges deducted from the proceeds of sales of Class A capital shares and CDSC fees deducted from the redemption of C capital shares as follows:
| | | | | | | | | | |
| Fund | | Sales Charges
(Class A) | | CDSC Fees
(Class C) |
Aggressive Growth | | | $ | 3,563 | | | | $ | 1,037 | |
International | | | | 5,570 | | | | | 230 | |
Large/Mid Cap Growth | | | | 12,216 | | | | | 1,256 | |
Small Cap Value | | | | 9,146 | | | | | 603 | |
Large/Mid Cap Value | | | | 22,605 | | | | | 1,304 | |
Fixed Income | | | | 36,920 | | | | | 764 | |
High Yield Bond | | | | 10,368 | | | | | 271 | |
Israel Common Values | | | | 2,400 | | | | | 47 | |
Defensive Strategies | | | | 34,172 | | | | | 3,565 | |
Strategic Growth | | | | 9,810 | | | | | 961 | |
Conservative Growth | | | | 21,180 | | | | | 1,775 | |
Note 5 | Control Ownership
The beneficial ownership, either directly or indirectly, of more than 25% of the voting securities of a Fund creates the presumption of control of the Fund under Section 2(a) 9 of the Investment Company Act of 1940. At September 30, 2012 there were no shareholders with ownership, either directly or indirectly, of more than 25% of the voting securities of a Fund.
Certain Timothy Plan Funds own shares of other Timothy Plan Funds. U.S. Bank, N.A., custodian of the Timothy Plan Funds, holds these shares in omnibus accounts, some of which are controlled by National Financial Services, Inc. The following shows the percentage of each Timothy Plan Fund that is held by U.S. Bank, N.A., as custodian of the Timothy Funds. These accounts can be considered affiliated to the Timothy Plan.
| | | | | |
| Fund - Class A | | % of Fund Owned by Other
Timothy Plan Funds |
Aggressive Growth | | | | 39.58 | % |
International | | | | 46.44 | % |
Large/Mid Cap Growth | | | | 47.94 | % |
Small Cap Value | | | | 17.74 | % |
Large/Mid Cap Value | | | | 22.02 | % |
Fixed Income | | | | 34.71 | % |
High Yield Bond | | | | 44.97 | % |
Israel Common Values | | | | 86.65 | % |
Defensive Strategies | | | | 49.40 | % |
Timothy Plan Notes to Financial Statements
[94]
Notes to Financial Statements
September 30, 2012
Timothy Plan Family of Funds
Note 6 | Distributions to Shareholders
The tax character of distributions paid during the fiscal year ended September 30, 2012 and the fiscal year ended September 30, 2011 were as follows:
| | | | | | | | | | | | | | | | | | | | |
| | | Aggressive Growth | | International * | | Large/Mid Cap Growth | | Small Cap Value |
Year ended September 30, 2012 | | | | | | | | | | | | | | | | | | | | |
Ordinary Income | | | $ | - | | | | $ | 1,113,188 | | | | $ | - | | | | $ | - | |
Short-term Capital Gains | | | | - | | | | | - | | | | | - | | | | | - | |
Long-term Capital Gains | | | | - | | | | | - | | | | | 1,810,584 | | | | | - | |
Return of Capital | | | | - | | | | | - | | | | | - | | | | | - | |
| | | | | |
| | | $ | - | | | | $ | 1,113,188 | | | | $ | 1,810,584 | | | | $ | - | |
| | | | | |
Year ended September 30, 2011 | | | | | | | | | | | | | | | | | | | | |
Ordinary Income | | | $ | - | | | | $ | 298,149 | | | | $ | - | | | | $ | - | |
Short-term Capital Gains | | | | - | | | | | - | | | | | - | | | | | - | |
Long-term Capital Gains | | | | - | | | | | - | | | | | - | | | | | - | |
Return of Capital | | | | - | | | | | - | | | | | - | | | | | - | |
| | | | | |
| | | $ | - | | | | $ | 298,149 | | | | $ | - | | | | $ | - | |
| | | | | |
| | | | | | | | | | | | | | | | | | | | |
| | | Large/Mid Cap Value | | Fixed Income | | High Yield Bond | | Israel Common Values |
Year ended September 30, 2012 | | | | | | | | | | | | | | | | | | | | |
Ordinary Income | | | $ | 192,686 | | | | $ | 1,507,322 | | | | $ | 1,738,714 | | | | $ | - | |
Short-term Capital Gains | | | | - | | | | | - | | | | | - | | | | | - | |
Long-term Capital Gains | | | | - | | | | | - | | | | | - | | | | | - | |
Return of Capital | | | | - | | | | | 186,818 | | | | | 51,714 | | | | | - | |
| | | | | |
| | | $ | 192,686 | | | | $ | 1,694,140 | | | | $ | 1,790,428 | | | | $ | - | |
| | | | | |
Year ended September 30, 2011 | | | | | | | | | | | | | | | | | | | | |
Ordinary Income | | | $ | 276,108 | | | | $ | 1,813,005 | | | | $ | 1,486,556 | | | | | | |
Short-term Capital Gains | | | | - | | | | | - | | | | | - | | | | | | |
Long-term Capital Gains | | | | - | | | | | - | | | | | - | | | | | | |
Return of Capital | | | | - | | | | | - | | | | | - | | | | | | |
| | | | | | | | | | |
| | | $ | 276,108 | | | | $ | 1,813,005 | | | | $ | 1,486,556 | | | | | | |
| | | | | | | | | | |
| | | | | | | | | | | | | | | | | | | | |
| | | Defensive Strategies | | Strategic Growth | | Conservative Growth | | |
Year ended September 30, 2012 | | | | | | | | | | | | | | | | | | | | |
Ordinary Income | | | $ | 199,461 | | | | $ | - | | | | $ | 49,894 | | | | | | |
Short-term Capital Gains | | | | 1,018,858 | | | | | - | | | | | - | | | | | | |
Long-term Capital Gains | | | | 3,161,636 | | | | | - | | | | | - | | | | | | |
Return of Capital | | | | 227,139 | | | | | - | | | | | - | | | | | | |
| | | | | | | | | | |
| | | $ | 4,607,094 | | | | $ | - | | | | $ | 49,894 | | | | | | |
| | | | | | | | | | |
Year ended September 30, 2011 | | | | | | | | | | | | | | | | | | | | |
Ordinary Income | | | $ | - | | | | $ | 41,359 | | | | $ | 393,428 | | | | | | |
Short-term Capital Gains | | | | 145,797 | | | | | - | | | | | - | | | | | | |
Long-term Capital Gains | | | | - | | | | | - | | | | | - | | | | | | |
Return of Capital | | | | - | | | | | - | | | | | - | | | | | | |
| | | | | | | | | | |
| | | $ | 145,797 | | | | $ | 41,359 | | | | $ | 393,428 | | | | | | |
| | | | | | | | | | |
| * | The difference between ordinary distributions paid from book and ordinary distributions paid from tax relates to $71,631 and $78,668 of allowable foreign tax credits from fiscal years ended September 30, 2012 and September 30, 2011, respectively, which have been passed through to the Fund’s underlying shareholders. |
Timothy Plan Notes to Financial Statements
[95]
Notes to Financial Statements
September 30, 2012
Timothy Plan Family of Funds
As of September 30, 2012, the components of distributable earnings on a tax basis were as follows:
| | | | | | | | | | | | | | | | | | | | |
| | | Aggressive Growth | | International | | Large/Mid Cap Growth | | Small Cap Value |
Undistributed Ordinary Income | | | $ | - | | | | $ | 172,441 | | | | $ | 1,244,970 | | | | $ | 62,933 | |
Long-Term Capital Gains | | | | - | | | | | - | | | | | 1,288,687 | | | | | - | |
Capital Loss Carry Forward | | | | (831,852 | ) | | | | (15,647,658 | ) | | | | - | | | | | (2,502,791 | ) |
Post October and Other Losses | | | | (243,524 | ) | | | | (631,604 | ) | | | | - | | | | | - | |
Unrealized Appreciation (Depreciation) | | | | 1,379,531 | | | | | 2,715,750 | | | | | 2,944,421 | | | | | 5,581,720 | |
| | | | | |
| | | $ | 304,155 | | | | $ | (13,391,071 | ) | | | $ | 5,478,078 | | | | $ | 3,141,862 | |
| | | | | |
| | | | | | | | | | | | | | | | | | | | |
| | | Large/Mid Cap Value | | Fixed Income | | High Yield Bond | | Israel Common Values |
Undistributed Ordinary Income | | | $ | 322,463 | | | | $ | - | | | | $ | - | | | | $ | - | |
Long-Term Capital Gains | | | | - | | | | | - | | | | | - | | | | | - | |
Capital Loss Carry Forward | | | | (11,547,534 | ) | | | | (324,491 | ) | | | | (1,603,836 | ) | | | | - | |
Post October and Other Losses | | | | - | | | | | - | | | | | - | | | | | (54,920 | ) |
Unrealized Appreciation (Depreciation) | | | | 23,106,193 | | | | | 5,037,686 | | | | | 1,233,019 | | | | | 62,041 | |
| | | | | |
| | | $ | 11,881,122 | | | | $ | 4,713,195 | | | | $ | (370,817 | ) | | | $ | 7,121 | |
| | | | | |
| | | | | | | | | | | | | | | | | | | | |
| | | Defensive Strategies | | Strategic Growth | | Conservative Growth | | |
Undistributed Ordinary Income | | | $ | - | | | | $ | 182,207 | | | | $ | 266,215 | | | | | | |
Long-Term Capital Gains | | | | - | | | | | - | | | | | - | | | | | | |
Capital Loss Carry Forward | | | | - | | | | | (8,037,659 | ) | | | | (3,397,636 | ) | | | | | |
Post October and Other Losses | | | | - | | | | | - | | | | | - | | | | | | |
Unrealized Appreciation (Depreciation) | | | | 6,185,568 | | | | | (61,844 | ) | | | | 2,669,089 | | | | | | |
| | | | | | | | | | |
| | | $ | 6,185,568 | | | | $ | (7,917,296 | ) | | | $ | (462,332 | ) | | | | | |
| | | | | | | | | | |
Note 7 | Capital Loss Carryforwards
At September 30, 2012, the following capital loss carryforwards are available to offset future capital gains.
| | | | | | | | | | | | | | | |
| | | Capital Loss Carry Forward | | Year
Expiring |
Fund | | Short-Term | | Long-Term | |
Aggressive Growth Fund | | | $ | 831,852 | | | | $ | - | | | 2017 |
International Fund | | | $ | 498,385 | | | | $ | - | | | 2015 |
| | | $ | 4,243,183 | | | | $ | - | | | 2016 |
| | | $ | 8,833,573 | | | | $ | - | | | 2017 |
| | | $ | 592,985 | | | | $ | - | | | 2018 |
| | | $ | 844,129 | | | | $ | - | | | 2019 |
| | | | $ | 630,789 | | | | $ | 4,614 | | | Non-Expiring |
Small Cap Value Fund | | | $ | 2,502,791 | | | | $ | - | | | 2017 |
Large/Mid Cap Value Fund | | | $ | 106,188 | | | | $ | - | | | 2016 |
| | | | $ | 11,441,346 | | | | $ | - | | | 2017 |
Fixed Income Fund | | | $ | 324,491 | | | | $ | - | | | 2017 |
High Yield Bond Fund | | | $ | 1,603,836 | | | | $ | - | | | 2017 |
Strategic Growth Fund | | | $ | 844,160 | | | | $ | - | | | 2016 |
| | | $ | 2,564,555 | | | | $ | - | | | 2017 |
| | | $ | 125,171 | | | | $ | - | | | 2018 |
| | | $ | 3,833,489 | | | | $ | - | | | 2019 |
| | | | $ | - | | | | $ | 670,284 | | | Non-Expiring |
Conservative Growth Fund | | | $ | 3,397,636 | | | | $ | - | | | 2019 |
Timothy Plan Notes to Financial Statements
[96]
Notes to Financial Statements
September 30, 2012
Timothy Plan Family of Funds
To the extent these loss carryforwards are used to offset future capital gains, it is probable that the amount, which is offset, will not be distributed to shareholders.
Late year losses incurred after December 31 within the fiscal year are deemed to arise on the first business day of the following fiscal year for tax purposes. The following Funds incurred and elected to defer such late year losses as follows:
| | | | |
| Fund | | Late Year
Losses | |
Aggressive Growth | | $ | 243,524 | |
| | | | |
Israel Common Values | | | 46,996 | |
The Regulated Investment Company Modernization Act of 2010 (the “Act”) was enacted on December 22, 2010. The Act makes changes to several tax rules impacting the Funds. In general, the provisions of the Act will be effective for the Funds fiscal year ending September 30, 2012. Although the Act provides several benefits, including unlimited carryover on future capital losses, there may be greater likelihood that all or a portion of the Funds pre-enactment capital loss carryovers may expire without being utilized due to the fact that post-enactment capital losses get utilized before pre-enactment capital loss carryovers.
Capital losses incurred after October 31 within the fiscal year are deemed to arise on the first business day of the following fiscal year for tax purposes. The following Funds incurred and elected to defer such capital losses as follows:
| | | | |
| Fund | | Capital Losses | |
International | | $ | 631,604 | |
| | | | |
Israel Common Values | | | 7,924 | |
Note 8 | New Accounting Pronouncements
In December 2011, the FASB issued ASU No. 2011-11 related to disclosures about offsetting assets and liabilities. The amendments in this ASU require an entity to disclose information about offsetting and related arrangements to enable users of its financial statements to understand the effect of those arrangements on its financial position. The ASU is effective for annual reporting periods beginning on or after January 1, 2013, and interim periods within those annual periods. The guidance requires retrospective application for all comparative periods presented. Management is currently evaluating the impact this amendment may have on the Funds’ financial statements.
Note 9 | Subsequent Events
The Funds are required to recognize in the financial statements the effects of all subsequent events that provide additional evidence about conditions that existed at the date of the Statement of Assets and Liabilities. For non-recognized subsequent events that must be disclosed to keep the financial statements from being misleading, the Funds are required to disclose the nature of the event as well as an estimate of its financial effect, or a statement that such an estimate cannot be made. Management has determined that there were no subsequent events to report through the issuance of these financial statements.
Timothy Plan Notes to Financial Statements
[97]
Notes to Financial Statements
September 30, 2012
Timothy Plan Family of Funds
Board Annual Approval/Renewals of Advisory and Sub-Advisory Agreements (Unaudited)
Timothy Partners, Ltd; Investment Advisor to all Funds.
The continuance of the Investment Advisory Agreement (the “IA Agreement”) on behalf of each series of the Trust between the Trust and Timothy Partners, Ltd. (“TPL”) was last approved by the Board of Trustees (“the Board”), including a majority of the Trustees who are not interested persons of the Trust or any person who is a party to the Agreement, at an in-person meeting held on February 24, 2012. The Trust’s Board considered the factors described below prior to approving the Agreement. The Trustees, including the Independent Trustees, noted the Advisor’s experience in incorporating and implementing the unique, biblically-based management style that is a stated objective as set forth in the Funds’ prospectus.
To further assist the Board in making its determination as to whether the IA Agreement should be renewed, the Board requested and received the following information: a description of TPL’s business and any personnel changes, a description of the compensation received by TPL from the Funds, information relating to the Advisor’s policies and procedures regarding best execution, trade allocation, soft dollars, code of ethics and insider trading, and a description of any material legal proceedings or securities enforcement proceedings regarding TPL or its personnel. In addition, the Board requested and received financial statements of TPL for its fiscal year ended December 31, 2011. The Board also received a report from TPL relating to the fees charged by TPL, both as an aggregate and in relation to fees charged by other advisors to similar funds. The materials prepared by TPL were provided to the Board in advance of the meeting. The Board considered the fees charged by TPL in light of the services provided to the Funds by TPL, the unique nature of the Funds and their moral screening requirements, which are maintained by TPL, and TPL’s role as a manager of managers. After full and careful consideration, the Board, with the independent trustees separately concurring, agreed that the fees charged by TPL were fair and reasonable in light of the services provided to the Funds. The Board also discussed the nature, extent and quality of TPL’s services to the Funds. In particular, the Board noted with approval TPL’s commitment to maintaining certain targeted expense ratios for the Funds, its efforts in providing comprehensive and consistent moral screens to the investment managers, its efforts in maintaining appropriate oversight of the investment managers to each Fund, and its efforts to maintain ongoing regulatory compliance for the Funds. The Board also discussed TPL’s current fee structure and whether such structure would allow the Funds to realize economies of scale as they grow. The Board next considered the investment performance of each Fund and the Advisor’s performance in monitoring the investment managers of the underlying funds. The Board generally approved of each Fund’s performance, noting that the Funds invested in a manner that did not rely exclusively on investment performance. Further, the Board noted with approval that the investment managers of each Fund did not succumb to “style drift” in their management of each Fund’s assets, and that each Fund was committed to maintain its investment mandate, even if that meant under performance during periods when that style was out of favor. The Board noted with approval the Advisor’s ongoing efforts to maintain such consistent investment discipline. The Board also noted with approval that the Advisor’s business was devoted exclusively to serving the Funds, and that the Advisor did not realize any ancillary benefits or profits deriving from its relationship with the Funds. The Board further noted with approval the Advisor’s past activities on monitoring the performance of the underlying Funds’ various investment managers and the promptness and efficiency with which problems were brought to the Board’s attention and responsible remedies offered and executed. After careful discussion and consideration, the Board, including the separate concurrence of the independent Trustees, unanimously cast an affirmative vote, and determined that the renewal of the IA Agreement for another one-year period would be in the best interests of the Funds’ shareholders. In approving the renewal of the IA Agreement for an additional one year period, the Board did not place specific emphasis on any one factor discussed above, but considered all factors in equal light. Further, the Board had available and availed itself of the assistance of legal counsel at all times during its consideration of the IA Agreement renewal.
Barrow, Hanley, Mewhinney & Strauss; Sub-Advisor for the Fixed Income, High Yield Bond, and Defensive Strategies TIPS sleeve.
The Sub-Advisory Agreement between the Trust, TPL and Barrow, Hanley, Mewhinney & Strauss (“BHM&S”), on behalf of the Timothy Plan Fixed Income, High Yield Bond and Defensive Strategies TIPS sleeve Funds, was last renewed by the Board at a meeting held for that purpose, among others, on February 24, 2012. The Board considered the following factors in arriving at its conclusions to renew the BHM&S Sub-Advisory Agreement for an additional year. First, the Board considered the fees charged by
Timothy Plan Notes to Financial Statements
[98]
Notes to Financial Statements
September 30, 2012
Timothy Plan Family of Funds
BHM&S in light of the services provided by BHM&S. After full and careful consideration, the Board, with the independent trustees separately concurring, agreed that the fees charged by BHM&S and paid out of the fees received by TPL were fair and reasonable in light of the services provided by BHM&S. In reaching that determination, the Board relied on reports describing the fees paid to BHM&S and comparing those fees against fees paid to other investment advisors operating under similar circumstances. Next, the Board discussed the nature, extent and quality of BHM&S’s services to each Fund, including the investment performance of the Funds under BHM&S’s investment management. The Board generally approved of BHM&S’s performance, noting that the Funds managed by BHM&S invested in a manner that did not rely exclusively on investment performance. Further, the Board noted with approval that BHM&S did not succumb to “style drift” in its management of each Fund’s assets, and that BHM&S was committed to maintain its investment mandate, even if that meant under performance during periods when that style was out of favor. The Board noted with approval BHM&S’s ongoing efforts to maintain such consistent investment discipline. Next, the Board considered whether BHM&S’s current fee structure would allow the Funds to realize economies of scale as they grow. The Board decided that this particular factor was moot with respect to the BHM&S Sub-Advisory Agreement because BHM&S was paid out of the fees paid to TPL. After careful discussion and consideration, the Board, including the independent Trustees separately concurring, unanimously determined that the renewal of the BHM&S Sub-Advisory Agreement for another one-year period would be in the best interests of the Funds’ shareholders. In approving the renewal of the BHM&S Sub-Advisory Agreement for an additional one year period, the Board did not place specific emphasis on any one factor discussed above, but considered all factors in equal light. Further, the Board had available and availed itself of the assistance of legal counsel at all times during its consideration of the BHM&S Sub-Advisory Agreement renewal.
Westwood Management Corporation; Sub-Advisor to the Large/Mid Cap Value and the Small Cap Value Funds.
The Sub-Advisory Agreement between the Trust, TPL and Westwood Management Corporation (“Westwood”), on behalf of the Timothy Plan Small Cap Value and Large/Mid Cap Value Funds, was last renewed by the Board at a meeting held for that purpose, among others, on February 24, 2012. The Board considered the following factors in arriving at its conclusions to renew the Westwood Sub-Advisory Agreement for an additional year. First, the Board considered the fees charged by Westwood in light of the services provided by Westwood. After full and careful consideration, the Board, with the independent trustees separately concurring, agreed that the fees charged by Westwood and paid out of the fees received by TPL were fair and reasonable in light of the services provided by Westwood. In reaching that determination, the Board relied on reports describing the fees paid to Westwood and comparing those fees against fees paid to other investment advisors operating under similar circumstances. Next, the Board discussed the nature, extent and quality of Westwood’s services to each Fund, including the investment performance of the Funds under Westwood’s investment management. The Board generally approved of Westwood’s performance, noting that the Funds managed by Westwood invested in a manner that did not rely exclusively on investment performance. Further, the Board noted with approval that Westwood did not succumb to “style drift” in its management of each Fund’s assets, and that Westwood was committed to maintain its investment mandate, even if that meant under performance during periods when that style was out of favor. The Board noted with approval Westwood’s ongoing efforts to maintain such consistent investment discipline. Next, the Board considered whether Westwood’s current fee structure would allow the Funds to realize economies of scale as they grow. The Board decided that this particular factor was moot with respect to the Westwood Sub-Advisory Agreement because Westwood was paid out of the fees paid to TPL. After careful discussion and consideration, the Board, including the independent Trustees separately concurring, unanimously determined that the renewal of the Westwood Sub-Advisory Agreement for another one-year period would be in the best interests of the Funds’ shareholders. In approving the renewal of the Westwood Sub-Advisory Agreement for an additional one year period, the Board did not place specific emphasis on any one factor discussed above, but considered all factors in equal light. Further, the Board had available and availed itself of the assistance of legal counsel at all times during its consideration of the Westwood Sub-Advisory Agreement renewal.
Chartwell Investment Partners; Sub-Advisor to the Aggressive Growth and Large/Mid Cap Growth Funds.
The Sub-Advisory Agreement between the Trust, TPL and Chartwell Investment Partners (“Chartwell”), on behalf of the Timothy Plan Aggressive Growth and Large/Mid Cap Growth Funds, was last renewed by the Board at a meeting held for that purpose, among others, on February 24, 2012. The Board considered the following factors in arriving at its conclusions to renew the Chartwell Sub-Advisory Agreement for an additional year. First, the Board considered the fees charged by Chartwell in light of
Timothy Plan Notes to Financial Statements
[99]
Notes to Financial Statements
September 30, 2012
Timothy Plan Family of Funds
the services provided by Chartwell. After full and careful consideration, the Board, with the independent trustees separately concurring, agreed that the fees charged by Chartwell and paid out of the fees received by TPL were fair and reasonable in light of the services provided by Chartwell. In reaching that determination, the Board relied on reports describing the fees paid to Chartwell and comparing those fees against fees paid to other investment advisors operating under similar circumstances. Next, the Board discussed the nature, extent and quality of Chartwell’s services to each Fund, including the investment performance of the Funds under Chartwell’s investment management. The Board generally approved of Chartwell’s performance, noting that the Funds managed by Chartwell invested in a manner that did not rely exclusively on investment performance. Further, the Board noted with approval that Chartwell did not succumb to “style drift” in its management of each Fund’s assets, and that Chartwell was committed to maintain its investment mandate, even if that meant under performance during periods when that style was out of favor. The Board noted with approval Chartwell’s ongoing efforts to maintain such consistent investment discipline. Next, the Board considered whether Chartwell’s current fee structure would allow the Funds to realize economies of scale as they grow. The Board decided that this particular factor was moot with respect to the Chartwell Sub-Advisory Agreement because Chartwell was paid out of the fees paid to TPL. After careful discussion and consideration, the Board, including the independent Trustees separately concurring, unanimously determined that the renewal of the Chartwell Sub-Advisory Agreement for another one-year period would be in the best interests of the Funds’ shareholders. In approving the renewal of the Chartwell Sub-Advisory Agreement for an additional one year period, the Board did not place specific emphasis on any one factor discussed above, but considered all factors in equal light. Further, the Board had available and availed itself of the assistance of legal counsel at all times during its consideration of the Chartwell Sub-Advisory Agreement renewal.
Eagle Global Advisors; Sub-Advisor to the International Fund and Israel Common Values Fund.
The Sub-Advisory Agreement between the Trust, TPL and Eagle Global Advisors (“Eagle”), on behalf of the Timothy Plan International Fund and Israel Common Values Fund, was last renewed by the Board at a meeting held for that purpose, among others, on February 24, 2012. The Board considered the following factors in arriving at its conclusions to renew the Eagle Sub-Advisory Agreement for an additional year. First, the Board considered the fees charged by Eagle in light of the services provided by Eagle. After full and careful consideration, the Board, with the independent trustees separately concurring, agreed that the fees charged by Eagle and paid out of the fees received by TPL were fair and reasonable in light of the services provided by Eagle. In reaching that determination, the Board relied on reports describing the fees paid to Eagle and comparing those fees against fees paid to other investment advisors operating under similar circumstances. Next, the Board discussed the nature, extent and quality of Eagle’s services to the Funds, including the investment performance of the Funds under Eagle’s investment management. The Board generally approved of Eagle’s performance, noting that the Funds managed by Eagle invested in a manner that did not rely exclusively on investment performance. Further, the Board noted with approval that Eagle did not succumb to “style drift” in its management of the Funds’ assets, and that Eagle was committed to maintain its investment mandate, even if that meant under performance during periods when that style was out of favor. The Board noted with approval Eagle’s ongoing efforts to maintain such consistent investment discipline. Next, the Board considered whether Eagle’s current fee structure would allow the Funds to realize economies of scale as they grow. The Board decided that this particular factor was moot with respect to the Eagle Sub-Advisory Agreement because Eagle was paid out of the fees paid to TPL. After careful discussion and consideration, the Board, including the independent Trustees separately concurring, unanimously determined that the renewal of the Eagle Sub-Advisory Agreement for another one-year period would be in the best interests of the Funds’ shareholders. In approving the renewal of the Eagle Sub-Advisory Agreement for an additional one year period, the Board did not place specific emphasis on any one factor discussed above, but considered all factors in equal light. Further, the Board had available and availed itself of the assistance of legal counsel at all times during its consideration of the Eagle Sub-Advisory Agreement renewal.
Delaware Management Company; Sub-Advisor to the Defensive Strategies Fund REITs sleeve.
The Sub-Advisory Agreement between the Trust, TPL and Delaware Management Company (“Delaware”), on behalf of the Timothy Plan Defensive Strategies Fund REITs sleeve, was last renewed by the Board at a meeting held for that purpose, among others, on February 24, 2012. The Board considered the following factors in arriving at its conclusions to renew the Delaware Sub-Advisory Agreement for an additional year. First, the Board considered the fees charged by Delaware in light of the services
Timothy Plan Notes to Financial Statements
[100]
Notes to Financial Statements
September 30, 2012
Timothy Plan Family of Funds
provided by Delaware. After full and careful consideration, the Board, with the independent trustees separately concurring, agreed that the fees charged by Delaware and paid out of the fees received by TPL were fair and reasonable in light of the services provided by Delaware. In reaching that determination, the Board relied on reports describing the fees paid to Delaware and comparing those fees against fees paid to other investment advisors operating under similar circumstances. Next, the Board discussed the nature, extent and quality of Delaware’s services to the Fund, including the investment performance of the Fund under Delaware’s investment management. The Board generally approved of Delaware’s performance, noting that the Fund managed by Delaware invested in a manner that did not rely exclusively on investment performance. Further, the Board noted with approval that Delaware did not succumb to “style drift” in its management of the Fund’s assets, and that Delaware was committed to maintain its investment mandate, even if that meant under performance during periods when that style was out of favor. The Board noted with approval Delaware’s ongoing efforts to maintain such consistent investment discipline. Next, the Board considered whether Delaware’s current fee structure would allow the Fund to realize economies of scale as it grows. The Board decided that this particular factor was moot with respect to the Delaware Sub-Advisory Agreement because Delaware was paid out of the fees paid to TPL. After careful discussion and consideration, the Board, including the independent Trustees separately concurring, unanimously determined that the renewal of the Delaware Sub-Advisory Agreement for another one-year period would be in the best interests of the Fund’s shareholders. In approving the renewal of the Delaware Sub-Advisory Agreement for an additional one year period, the Board did not place specific emphasis on any one factor discussed above, but considered all factors in equal light. Further, the Board had available and availed itself of the assistance of legal counsel at all times during its consideration of the Delaware Sub-Advisory Agreement renewal.
Timothy Plan Notes to Financial Statements
[101]
REPORT OF INDEPENDENT REGISTERED PUBLIC ACCOUNTING FIRM
To the Shareholders and Board of Trustees of
The Timothy Plan
We have audited the accompanying statements of assets and liabilities, of Timothy Plan Aggressive Growth Fund, Timothy Plan International Fund, Timothy Plan Large/Mid Cap Growth Fund, Timothy Plan Small Cap Value Fund, Timothy Plan Large/Mid Cap Value Fund, Timothy Plan Fixed Income Fund, Timothy Plan High Yield Bond Fund, Timothy Plan Defensive Strategies Fund, Timothy Plan Israel Common Values Fund, Timothy Plan Strategic Growth Fund and Timothy Plan Conservative Growth Fund (the “Funds”), eleven of the series constituting The Timothy Plan, including the schedules of investments, as of September 30, 2012, and the related statements of operations for the year or period then ended, the statements of changes in net assets for each of the years or periods then ended, and the financial highlights for each of the years or periods indicated. These financial statements and financial highlights are the responsibility of the Funds’ management. Our responsibility is to express an opinion on these financial statements and financial highlights based on our audits.
We conducted our audits in accordance with the standards of the Public Company Accounting Oversight Board (United States). Those standards require that we plan and perform the audit to obtain reasonable assurance about whether the financial statements and financial highlights are free of material misstatement. An audit includes examining, on a test basis, evidence supporting the amounts and disclosures in the financial statements. Our procedures included confirmation of securities owned as of September 30, 2012, by correspondence with the custodian and brokers or by other appropriate auditing procedures where the reply from the broker was not received. An audit also includes assessing the accounting principles used and significant estimates made by management, as well as evaluating the overall financial statement presentation. We believe that our audits provide a reasonable basis for our opinion.
In our opinion, the financial statements and financial highlights referred to above present fairly, in all material respects, the financial position of Timothy Plan Aggressive Growth Fund, Timothy Plan International Fund, Timothy Plan Large/Mid Cap Growth Fund, Timothy Plan Small Cap Value Fund, Timothy Plan Large/Mid Cap Value Fund, Timothy Plan Fixed Income Fund, Timothy Plan High Yield Bond Fund, Timothy Plan Defensive Strategies Fund, Timothy Plan Israel Common Values Fund, Timothy Plan Strategic Growth Fund and Timothy Plan Conservative Growth Fund as of September 30, 2012, the results of their operations, the changes in their net assets and the financial highlights for each of the periods indicated above, in conformity with accounting principles generally accepted in the United States of America.
COHEN FUND AUDIT SERVICES, LTD.
Cleveland, Ohio
November 29, 2012
[102]
Expense Examples – (UNAUDITED)
September 30, 2012
As a shareholder of a Fund, you incur two types of costs: direct costs, such as wire fees and low balance fees; and indirect costs, including management fees, and other Fund operating expenses. This example is intended to help you understand your indirect costs, also referred to as “ongoing costs”, (in dollars) of investing in each Fund, and to compare these costs with the ongoing costs of investing in other mutual funds.
This example is based on an investment of $1,000 invested at the beginning of the period and held for the entire six-month period of April 1, 2012, through September 30, 2012.
Actual Expenses
The first line of the following tables provides information about actual account values and actual expenses. You may use the information in this line, together with the amount you invested at the beginning of the period, to estimate the expenses that you paid over the period. Simply divide your account value by $1,000 (for example, an $8,600 account value divided by $1,000 = 8.6), then multiply the result by the number in the first line under the heading “Expenses Paid During Period” to estimate the expenses you paid on your account during this period.
Hypothetical Example for Comparison Purposes
The second line of the tables provides information about hypothetical account values and hypothetical expenses based on each Fund’s actual expense ratio and an assumed rate of return of 5% per year before expenses, which is not the Fund’s actual return. The hypothetical account values and expenses may not be used to estimate the actual ending account balance or expenses you paid for the period. You may use this information to compare ongoing costs of investing in each Fund and other funds. To do so, compare this 5% hypothetical example with the 5% hypothetical examples that appear in the shareholder reports of other funds.
Please note that the expenses shown in the tables are meant to highlight your ongoing costs only and do not reflect any direct costs, such as wire fees or low balance fees. Therefore, the second line of the table is useful in comparing ongoing costs only, and will not help you determine the relative total costs of owning different funds. In addition, if these direct costs were included, your costs would be higher.
AGGRESSIVE GROWTH FUND
| | | | | | | | | | | | | | | | | | | |
| | | Beginning Account
Value | | | | Ending Account
Value | | | | Expenses Paid
During Period |
| | | 4/1/2012 | | | | 9/30/2012 | | | | 4/1/2012 through
9/30/2012 |
Actual - Class A * | | | $ | 1,000.00 | | | | | | $ | 974.00 | | | | | | $ | 10.22 | |
Hypothetical - Class A ** | | | $ | 1,000.00 | | | | | | $ | 1,014.65 | | | | | | $ | 10.43 | |
Actual - Class C * | | | $ | 1,000.00 | | | | | | $ | 969.80 | | | | | | $ | 13.89 | |
Hypothetical - Class C ** | | | $ | 1,000.00 | | | | | | $ | 1,010.90 | | | | | | $ | 14.18 | |
| * | Expenses are equal to the Fund’s annualized expense ratio of 2.07% for Class A and 2.82% for Class C, which is net of any expenses paid indirectly, multiplied by the average account value over the period, multiplied by 183 days/366 days (to reflect the partial year period). The Aggressive Growth Fund’s ending account value on the first line of each share class in the table is based on its actual total return of (2.60)% for Class A and (3.02)% for Class C for the six-month period of April 1, 2012, to September 30, 2012. |
| ** | Assumes a 5% return before expenses. |
INTERNATIONAL FUND
| | | | | | | | | | | | | | | | | | | |
| | | Beginning Account
Value | | | | Ending Account
Value | | | | Expenses Paid
During Period |
| | | 4/1/2012 | | | | 9/30/2012 | | | | 4/1/2012 through
9/30/2012 |
Actual - Class A * | | | $ | 1,000.00 | | | | | | $ | 989.20 | | | | | | $ | 9.05 | |
Hypothetical - Class A ** | | | $ | 1,000.00 | | | | | | $ | 1,015.90 | | | | | | $ | 9.17 | |
Actual - Class C * | | | $ | 1,000.00 | | | | | | $ | 984.80 | | | | | | $ | 12.75 | |
Hypothetical - Class C ** | | | $ | 1,000.00 | | | | | | $ | 1,012.15 | | | | | | $ | 12.93 | |
| * | Expenses are equal to the Fund’s annualized expense ratio of 1.82% for Class A and 2.57% for Class C, which is net of any expenses paid indirectly, multiplied by the average account value over the period, multiplied by 183 days/366 days (to reflect the partial year period). The International Fund’s ending account value on the first line of each share class in the table is based on its actual total return of (1.08)% for Class A and (1.52)% for Class C for the six-month period of April 1, 2012, to September 30, 2012. |
| ** | Assumes a 5% return before expenses. |
[103]
Expense Examples – (UNAUDITED) (Continued)
September 30, 2012
LARGE/MID CAP GROWTH FUND
| | | | | | | | | | | | | | | | | | | |
| | | Beginning Account
Value | | | | Ending Account
Value | | | | Expenses Paid
During Period |
| | | 4/1/2012 | | | | 9/30/2012 | | | | 4/1/2012 through
9/30/2012 |
Actual - Class A * | | | $ | 1,000.00 | | | | | | $ | 993.20 | | | | | | $ | 8.42 | |
Hypothetical - Class A ** | | | $ | 1,000.00 | | | | | | $ | 1,016.55 | | | | | | $ | 8.52 | |
Actual - Class C * | | | $ | 1,000.00 | | | | | | $ | 1,011.90 | | | | | | $ | 12.27 | |
Hypothetical - Class C ** | | | $ | 1,000.00 | | | | | | $ | 1,012.80 | | | | | | $ | 12.28 | |
| * | Expenses are equal to the Fund’s annualized expense ratio of 1.69% for Class A and 2.44% for Class C, which is net of any expenses paid indirectly, multiplied by the average account value over the period, multiplied by 183 days/366 days (to reflect the partial year period). The Large/Mid Cap Growth Fund’s ending account value on the first line of each share class in the table is based on its actual total return of (0.68)% for Class A and (1.19)% for Class C for the six-month period of April 1, 2012, to September 30, 2012. |
| ** | Assumes a 5% return before expenses. |
SMALL CAP VALUE FUND
| | | | | | | | | | | | | | | | | | | |
| | | Beginning Account
Value | | | | Ending Account
Value | | | | Expenses Paid
During Period |
| | | 4/1/2012 | | | | 9/30/2012 | | | | 4/1/2012 through
9/30/2012 |
Actual - Class A * | | | $ | 1,000.00 | | | | | | $ | 1,018.00 | | | | | | $ | 8.02 | |
Hypothetical - Class A ** | | | $ | 1,000.00 | | | | | | $ | 1,017.05 | | | | | | $ | 8.02 | |
Actual - Class C * | | | $ | 1,000.00 | | | | | | $ | 1,013.60 | | | | | | $ | 11.78 | |
Hypothetical - Class C ** | | | $ | 1,000.00 | | | | | | $ | 1,013.30 | | | | | | $ | 11.78 | |
| * | Expenses are equal to the Fund’s annualized expense ratio of 1.59% for Class A and 2.34% for Class C, which is net of any expenses paid indirectly, multiplied by the average account value over the period, multiplied by 183 days/366 days (to reflect the partial year period). The Small Cap Value Fund’s ending account value on the first line of each share class in the table is based on its actual total return of 1.80% for Class A and 1.36% for Class C for the six-month period of April 1, 2012, to September 30, 2012. |
| ** | Assumes a 5% return before expenses. |
LARGE/MID CAP VALUE FUND
| | | | | | | | | | | | | | | | | | | |
| | | Beginning Account
Value | | | | Ending Account
Value | | | | Expenses Paid
During Period |
| | | 4/1/2012 | | | | 9/30/2012 | | | | 4/1/2012 through
9/30/2012 |
Actual - Class A * | | | $ | 1,000.00 | | | | | | $ | 1,010.90 | | | | | | $ | 7.44 | |
Hypothetical - Class A ** | | | $ | 1,000.00 | | | | | | $ | 1,017.60 | | | | | | $ | 7.47 | |
Actual - Class C * | | | $ | 1,000.00 | | | | | | $ | 1,006.90 | | | | | | $ | 11.19 | |
Hypothetical - Class C ** | | | $ | 1,000.00 | | | | | | $ | 1,013.85 | | | | | | $ | 11.23 | |
| * | Expenses are equal to the Fund’s annualized expense ratio of 1.48% for Class A and 2.23% for Class C, which is net of any expenses paid indirectly, multiplied by the average account value over the period, multiplied by 183 days/366 days (to reflect the partial year period). The Large/Mid Cap Value Fund’s ending account value on the first line of each share class in the table is based on its actual total return of 1.09% for Class A and 0.69% for Class C for the six-month period of April 1, 2012, to September 30, 2012. |
| ** | Assumes a 5% return before expenses. |
[104]
Expense Examples – (UNAUDITED) (Continued)
September 30, 2012
FIXED INCOME FUND
| | | | | | | | | | | | | | | | | | | |
| | | Beginning Account
Value | | | | Ending Account
Value | | | | Expenses Paid
During Period |
| | | 4/1/2012 | | | | 9/30/2012 | | | | 4/1/2012 through
9/30/2012 |
Actual - Class A * | | | $ | 1,000.00 | | | | | | $ | 1,029.00 | | | | | | $ | 5.88 | |
Hypothetical - Class A ** | | | $ | 1,000.00 | | | | | | $ | 1,019.20 | | | | | | $ | 5.86 | |
Actual - Class C * | | | $ | 1,000.00 | | | | | | $ | 1,024.30 | | | | | | $ | 9.67 | |
Hypothetical - Class C ** | | | $ | 1,000.00 | | | | | | $ | 1,015.45 | | | | | | $ | 9.62 | |
| * | Expenses are equal to the Fund’s annualized expense ratio of 1.16% for Class A and 1.91% for Class C, which is net of any expenses paid indirectly, multiplied by the average account value over the period, multiplied by 183 days/366 days (to reflect the partial year period). The Fixed Income Fund’s ending account value on the first line of each share class in the table is based on its actual total return of 2.90 for Class A and 2.43% for Class C for the six-month period of April 1, 2012, to September 30, 2012. |
| ** | Assumes a 5% return before expenses. |
HIGH YIELD BOND FUND
| | | | | | | | | | | | | | | | | | | |
| | | Beginning Account
Value | | | | Ending Account
Value | | | | Expenses Paid
During Period |
| | | 4/1/2012 | | | | 9/30/2012 | | | | 4/1/2012 through
9/30/2012 |
Actual - Class A * | | | $ | 1,000.00 | | | | | | $ | 1,049.10 | | | | | | $ | 7.12 | |
Hypothetical - Class A ** | | | $ | 1,000.00 | | | | | | $ | 1,018.05 | | | | | | $ | 7.01 | |
Actual - Class C * | | | $ | 1,000.00 | | | | | | $ | 1,046.10 | | | | | | $ | 10.95 | |
Hypothetical - Class C ** | | | $ | 1,000.00 | | | | | | $ | 1,014.30 | | | | | | $ | 10.78 | |
| * | Expenses are equal to the Fund’s annualized expense ratio of 1.39% for Class A and 2.14% for Class C, which is net of any expenses paid indirectly, multiplied by the average account value over the period, multiplied by 183 days/366 days (to reflect the partial year period). The High Yield Bond Fund’s ending account value on the first line of each share class in the table is based on its actual total return of 4.91% for Class A and 4.61% for Class C for the six-month period of April 1, 2012, to September 30, 2012. |
| ** | Assumes a 5% return before expenses. |
DEFENSIVE STRATEGIES FUND
| | | | | | | | | | | | | | | | | | | |
| | | Beginning Account
Value | | | | Ending Account
Value | | | | Expenses Paid
During Period |
| | | 4/1/2012 | | | | 9/30/2012 | | | | 4/1/2012 through
9/30/2012 |
Actual - Class A * | | | $ | 1,000.00 | | | | | | $ | 1,021.10 | | | | | | $ | 6.77 | |
Hypothetical - Class A ** | | | $ | 1,000.00 | | | | | | $ | 1,018.30 | | | | | | $ | 6.76 | |
Actual - Class C * | | | $ | 1,000.00 | | | | | | $ | 1,017.10 | | | | | | $ | 10.54 | |
Hypothetical - Class C ** | | | $ | 1,000.00 | | | | | | $ | 1,014.55 | | | | | | $ | 10.53 | |
| * | Expenses are equal to the Fund’s annualized expense ratio of 1.34% for Class A and 2.09% for Class C, which is net of any expenses paid indirectly, multiplied by the average account value over the period, multiplied by 183 days/366 days (to reflect the partial year period). The Defensive Strategies Fund’s ending account value on the first line of each share class in the table is based on its actual total return of 2.11% for Class A and 1.71% for Class C for the period of April 1, 2012, to September 30, 2012. |
| ** | Assumes a 5% return before expenses. |
[105]
Expense Examples – (UNAUDITED) (Continued)
September 30, 2012
STRATEGIC GROWTH FUND
| | | | | | | | | | | | | | | | | | | |
| | | Beginning Account
Value | | | | Ending Account
Value | | | | Expenses Paid
During Period |
| | | 4/1/2012 | | | | 9/30/2012 | | | | 4/1/2012 through
9/30/2012 |
Actual - Class A * | | | $ | 1,000.00 | | | | | | $ | 997.30 | | | | | | $ | 5.74 | |
Hypothetical - Class A ** | | | $ | 1,000.00 | | | | | | $ | 1,019.25 | | | | | | $ | 5.81 | |
Actual - Class C * | | | $ | 1,000.00 | | | | | | $ | 994.20 | | | | | | $ | 9.47 | |
Hypothetical - Class C ** | | | $ | 1,000.00 | | | | | | $ | 1,015.50 | | | | | | $ | 9.57 | |
| * | Expenses are equal to the Fund’s annualized expense ratio of 1.15% for Class A and 1.90% for Class C, which is net of any expenses paid indirectly, multiplied by the average account value over the period, multiplied by 183 days/366 days (to reflect the partial year period). The Strategic Growth Fund’s ending account value on the first line of each share class in the table is based on its actual total return of (0.27)% for Class A and (0.58)% for Class C for the six-month period of April 1, 2012, to September 30, 2012. |
| ** | Assumes a 5% return before expenses. |
CONSERVATIVE GROWTH FUND
| | | | | | | | | | | | | | | | | | | |
| | | Beginning Account
Value | | | | Ending Account
Value | | | | Expenses Paid
During Period |
| | | 4/1/2012 | | | | 9/30/2012 | | | | 4/1/2012 through
9/30/2012 |
Actual - Class A * | | | $ | 1,000.00 | | | | | | $ | 1,007.10 | | | | | | $ | 5.57 | |
Hypothetical - Class A ** | | | $ | 1,000.00 | | | | | | $ | 1,019.45 | | | | | | $ | 5.60 | |
Actual - Class C * | | | $ | 1,000.00 | | | | | | $ | 1,004.30 | | | | | | $ | 9.32 | |
Hypothetical - Class C ** | | | $ | 1,000.00 | | | | | | $ | 1,015.70 | | | | | | $ | 9.37 | |
| * | Expenses are equal to the Fund’s annualized expense ratio of 1.11% for Class A and 1.86% for Class C, which is net of any expenses paid indirectly, multiplied by the average account value over the period, multiplied by 183 days/366 days (to reflect the partial year period). The Conservative Growth Fund’s ending account value on the first line of each share class in the table is based on its actual total return of 0.71% for Class A and 0.43% for Class C for the six-month period of April 1, 2012, to September 30, 2012. |
| ** | Assumes a 5% return before expenses. |
ISRAEL COMMON VALUES FUND
| | | | | | | | | | | | | | | | | | | |
| | | Beginning Account
Value | | | | Ending Account
Value | | | | Expenses Paid
During Period |
| | | 4/1/2012 | | | | 9/30/2012 | | | | 4/1/2012 through
9/30/2012 |
Actual - Class A * | | | $ | 1,000.00 | | | | | | $ | 935.70 | | | | | | $ | 11.05 | |
Hypothetical - Class A ** | | | $ | 1,000.00 | | | | | | $ | 1,012.08 | | | | | | $ | 11.49 | |
Actual - Class C * | | | $ | 1,000.00 | | | | | | $ | 931.70 | | | | | | $ | 14.43 | |
Hypothetical - Class C ** | | | $ | 1,000.00 | | | | | | $ | 1,008.55 | | | | | | $ | 15.01 | |
| * | Expenses are equal to the Fund’s annualized expense ratio of 2.43% for Class A and 3.18% for Class C, which is net of any expenses paid indirectly, multiplied by the average account value over the period, multiplied by 183 days/366 days (to reflect the partial year period). The Israel Common Values Fund’s ending account value on the first line of each share class in the table is based on its actual total return of (6.43)% for Class A and (6.83)% for Class C for the six-month period of April 1, 2012, to September 30, 2012. |
| ** | Assumes a 5% return before expenses. |
[106]
Officers and Trustees of the Trust
As of September 30, 2012 (Unaudited)
Timothy Plan Family of Funds
| | | | | | |
| Name, Age and Address | | Position(s) Held With Trust | | Term of Office and Length of Time Served | | Number of Portfolios in Fund Complex Overseen by Trustee |
Arthur D. Ally* 1055 Maitland Center Commons Maitland, FL Born: 1942 | | Chairman and President | | Indefinite; Trustee and President since 1994 | | 13 |
| | Principal Occupation During Past 5 Years | | Other Directorships Held by Trustee |
| | President and controlling shareholder of Covenant Funds, Inc. (“CFI”), a holding company. President and general partner of Timothy Partners, Ltd. (“TPL”), the investment advisor and principal underwriter to each Fund. CFI is also the managing general partner of TPL. | | None |
| | | | | | |
| Name, Age and Address | | Position(s) Held With Trust | | Term of Office and Length of Time Served | | Number of Portfolios
in Fund Complex
Overseen by Trustee |
Kenneth Blackwell 1055 Maitland Center Commons Maitland, FL Born: 1948 | | Trustee | | Indefinite; Trustee since 2011 | | 13 |
| | Principal Occupation During Past 5 Years | | Other Directorships Held by Trustee |
| | Secretary of State for the State of Ohio. Currently serving as an independent consultant or Fellow with the Family Research Council and the American Civil Rights Union, and is a Visiting Professor at Liberty University, Lynchburg, VA. | | None |
| | | | | | |
| Name, Age and Address | | Position(s) Held With Trust | | Term of Office and Length of Time Served | | Number of Portfolios
in Fund Complex
Overseen by Trustee |
Joseph E. Boatwright** 1055 Maitland Center Commons Maitland, FL Born: 1930 | | Trustee, Secretary | | Indefinite; Trustee and Secretary since 1995 | | 13 |
| | Principal Occupation During Past 5 Years | | Other Directorships Held by Trustee |
| | Retired Minister. Currently serves as a consultant to the Greater Orlando Baptist Association. Served as Senior Pastor to Aloma Baptist Church from 1970-1996. | | None |
| * | Mr. Ally is an “interested” Trustee, as that term is defined in the 1940 Act, because of his positions with and financial interests in CFI and TPL. |
| ** | Messrs. Boatwright and Staver are “interested” Trustees, as that term is defined in the 1940 Act, because each has a limited partnership intereset in TPL. |
[107]
Officers and Trustees of the Trust (Continued)
As of September 30, 2012 (Unaudited)
Timothy Plan Family of Funds
| | | | | | |
| Name, Age and Address | | Position(s) Held With Trust | | Term of Office and Length of Time Served | | Number of Portfolios in Fund Complex Overseen by Trustee |
Richard W. Copeland 1055 Maitland Center Commons Maitland, FL Born: 1947 | | Trustee | | Indefinite; Trustee since 2005 | | 13 |
| | Principal Occupation During Past 5 Years | | Other Directorships Held by Trustee |
| | Principal of Copeland & Covert, Attorneys at Law; specializing in tax and estate planning. B.A. from Mississippi College, JD from University of Florida and LLM Taxation from University of Miami. Associate Professor Stetson University for past 35 years. | | None |
| | | | | | |
| Name, Age and Address | | Position(s) Held With Trust | | Term of Office and Length of Time Served | | Number of Portfolios in Fund Complex Overseen by Trustee |
Deborah Honeycutt 1055 Maitland Center Commons Maitland, FL Born: 1947 | | Trustee | | Indefinite; Trustee since 2010 | | 13 |
| | Principal Occupation During Past 5 Years | | Other Directorships Held by Trustee |
| | Dr. Honeycutt is a licensed physician currently serving as Medical Director of Clayton State University Health Services in Morrow, GA, CEO of Minority Health Services in Atlanta, and as a volunteer at Good Shepherd Clinic. Dr. Honeycutt received her B.A. and M.D. at the University of Illinois. | | None |
| | | | | | |
| Name, Age and Address | | Position(s) Held With Trust | | Term of Office and Length of Time Served | | Number of Portfolios in Fund Complex Overseen by Trustee |
Bill Johnson 1055 Maitland Center Commons Maitland, FL Born: 1946 | | Trustee | | Indefinite; Trustee since 2005 | | 13 |
| | Principal Occupation During Past 5 Years | | Other Directorships Held by Trustee |
| | President (and Founder) of American Decency Association, Freemont, MI since 1999. Previously served as Michigan State Director for American Family Association (1987-1999). Previously a public school teacher for 18 years. B.S. from Michigan State University and a Masters of Religious Education from Grand Rapids Baptist Seminary. | | None |
[108]
Officers and Trustees of the Trust (Continued)
As of September 30, 2012 (Unaudited)
Timothy Plan Family of Funds
| | | | | | |
| Name, Age and Address | | Position(s) Held With Trust | | Term of Office and Length of Time Served | | Number of Portfolios in Fund Complex Overseen by Trustee |
John C. Mulder 1055 Maitland Center Commons Maitland, FL Born: 1950 | | Trustee | | Indefinite; Trustee since 2005 | | 13 |
| | Principal Occupation During Past 5 Years | | Other Directorships Held by Trustee |
| | President of WaterStone (formerly the Christian Community Foundation and National Foundation) since 2001. Prior: 22 years of executive experience for a group of banks and a trust company. B.A. in Economics from Wheaton College and MBA from University of Chicago. | | None |
| | | | | | |
| Name, Age and Address | | Position(s) Held With Trust | | Term of Office and Length of Time Served | | Number of Portfolios
in Fund Complex
Overseen by Trustee |
Charles E. Nelson 1055 Maitland Center Commons Maitland, FL Born: 1934 | | Trustee | | Indefinite; Trustee since 2000 | | 13 |
| | Principal Occupation During Past 5 Years | | Other Directorships Held by Trustee |
| | Certified Public Accountant, semi-retired. Former non-profit industry accounting officer. Former financial executive with commercial bank. Former partner national accounting firm. | | None |
| | | | | | |
| Name, Age and Address | | Position(s) Held With Trust | | Term of Office and Length of Time Served | | Number of Portfolios
in Fund Complex
Overseen by Trustee |
Scott Preissler, Ph.D. 1055 Maitland Center Commons Maitland, FL Born: 1960 | | Trustee | | Indefinite; Trustee since 2004 | | 13 |
| | Principal Occupation During Past 5 Years | | Other Directorships Held by Trustee |
| | Chairman of Stewardship Studies at Southwestern Baptist Theological Seminary, Ft. Worth, TX. Also serves as Founder and Chairman of the International Center for Biblical Stewardship. Previously, President and CEO of Christian Stewardship Association where he was affiliated for 14 years. | | None |
[109]
Officers and Trustees of the Trust (Continued)
As of September 30, 2012 (Unaudited)
Timothy Plan Family of Funds
| | | | | | |
| Name, Age and Address | | Position(s) Held With Trust | | Term of Office and Length of Time Served | | Number of Portfolios in Fund Complex Overseen by Trustee |
Alan M. Ross 1055 Maitland Center Commons Maitland, FL Born: 1951 | | Trustee, Vice Chairman | | Indefinite; Trustee since 2004 | | 13 |
| | Principal Occupation During Past 5 Years | | Other Directorships Held by Trustee |
| | Founder and CEO of Corporate Development Institute which he founded in 2000. Previously he served as President and CEO of Fellowship of Companies for Christ and has authored three books: Beyond World Class, Unconditional Excellence, Breaking Through to Prosperity. | | None |
| | | | | | |
| Name, Age and Address | | Position(s) Held With Trust | | Term of Office and Length of Time Served | | Number of Portfolios in Fund Complex Overseen by Trustee |
Mathew D. Staver** 1055 Maitland Center Commons Maitland , FL Born: 1956 | | Trustee | | Indefinite; Trustee since 2000 | | 13 |
| | Principal Occupation During Past 5 Years | | Other Directorships Held by Trustee |
| | Attorney specializing in free speech, appellate practice and religious liberty constitutional law. Founder of Liberty Counsel, a religious civil liberties education and legal defense organization. Host of two radio programs devoted to religious freedom issues. Editor of a monthly newsletter devoted to religious liberty topics. Mr. Staver has argued before the United States Supreme Court and has published numerous legal articles. | | None |
| | | | | | |
| Name, Age and Address | | Position(s) Held With Trust | | Term of Office and Length of Time Served | | Number of Portfolios in Fund Complex Overseen by Trustee |
Patrice Tsague 1055 Maitland Center Commons Maitland, FL Born: 1973 | | Trustee | | Indefinite; Trustee since 2011 | | 13 |
| | Principal Occupation During Past 5 Years | | Other Directorships Held by Trustee |
| | President and Chief Servant Officer of the Nehemiah Project International Ministries Inc. since 1999. | | None |
The Fund’s Statement of Additional Information includes additional information about the Trustees and is available free of charge, upon request, by calling toll-free at 1-800-846-7526.
[110]
Timothy Plan Family of Funds
Privacy Policy
The following is a description of the Trust’s policies regarding disclosure of nonpublic personal information that you provide to the Fund or that the Fund collects from other sources. In the event that you hold shares of a Fund through a broker-dealer or other financial intermediary, the privacy policy of your financial intermediary would govern how your nonpublic personal information would be shared with nonaffiliated third parties.
CATEGORIES OF INFORMATION THE FUND COLLECTS
The Fund collects the following nonpublic personal information about you:
1. Information the Fund receives from you on or in applications or other forms, correspondence, or conversations (such as your name, address, phone number, social security number, assets, income and date of birth); and
2. Information about your transactions with the Fund, its affiliates, or others (such as your account number and balance, payment history, parties to transactions, cost basis information, and other financial information).
CATEGORIES OF INFORMATION THE FUND DISCLOS ES
The Fund does not disclose any nonpublic personal information about its current or former shareholders to unaffiliated third parties, except as required or permitted by law. The Fund is permitted by law to disclose all of the information it collects, as described above, to its service providers (such as the Fund’s custodian, administrator and transfer agent) to process your transactions and otherwise provide services to you.
CONFIDENTIALITY AND SECURITY
The Fund restricts access to your nonpublic personal information to those persons who require such information to provide products or services to you. The Fund maintains physical, electronic, and procedural safeguards that comply with federal standards to guard your nonpublic personal information.
Customer Identification Program
The Board of Trustees of the Trust has approved procedures designed to prevent and detect attempts to launder money as required under the USA PATRIOT Act. The day-to-day responsibility for monitoring and reporting any such activities has been delegated to the transfer agent, subject to the oversight and supervision of the Board.
Disclosures
HOW TO OBTAIN PROXY VOTING INFORMATION
Information regarding how the Funds voted proxies relating to Fund securities during the period ended June 30 as well as a description of the policies and procedures that the Funds use to determine how to vote proxies is available without charge, upon request, by calling 1-800-732-0330 or by referring to the Security and Exchange Commission’s (“SEC”) website at http://www.sec.gov.
HOW TO OBTAIN 1ST AND 3RD FISCAL QUARTER PORTFOLIO HOLDINGS
Each Fund files its complete schedule of portfolio holdings with the SEC for the first and third quarters of each fiscal year on Form N-Q. Form N-Q is available on the SEC’s website at http://www.sec.gov and may be reviewed and copied at the SEC’s Public Reference Room in Washington, DC (1-800-SEC-0330). The information on Form N-Q is available without charge, upon request, by calling 1-800-732-0330.
[111]
BOARD OF TRUSTEES
Arthur D. Ally
Kenneth Blackwell
Joseph E. Boatwright
Rick Copeland
Deborah Honeycutt
Bill Johnson
John C. Mulder
Charles E. Nelson
Scott Preissler
Alan Ross
Mathew D. Staver
Patrice Tsague
OFFICERS
Arthur D. Ally, President
Joseph E. Boatwright, Secretary
INVESTMENT ADVISOR
Timothy Partners, Ltd.
1055 Maitland Center Commons
Maitland, FL 32751
DISTRIBUTOR
Timothy Partners, Ltd.
1055 Maitland Center Commons
Maitland, FL 32751
TRANSFER AGENT
Gemini Fund Services, LLC
4020 South 147th Street, Suite 2
Omaha, NE 68137
INDEPENDENT REGISTERED PUBLIC ACCOUNTING FIRM
Cohen Fund Audit Services, Ltd.
1350 Euclid Ave., Suite 800
Cleveland, OH 44115
LEGAL COUNSEL
David Jones & Assoc., P.C.
422 Fleming St.
Key West, FL 33040
For additional information or a prospectus, please call: 1-800-846-7526
Visit the Timothy Plan web site on the internet at: www.timothyplan.com
This report is submitted for the general information of the shareholders of the Funds. It is not authorized for distribution to prospective investors in the Funds unless preceded or accompanied by an effective Prospectus which includes details regarding the Funds’ objectives, policies, expenses and other information. Distributed by Timothy Partners, Ltd.

HEADQUARTERS
The Timothy Plan
1055 Maitland Center Commons
Maitland, Florida 32751
(800) 846-7526
www.timothyplan.com
invest@timothyplan.com
SHAREHOLDER SERVICES
Gemini Fund Services, LLC
4020 South 147th St, Ste. 2
Omaha, NE 68137
(800) 662-0201
Item 2. Code of Ethics.
(a) As of the end of the period covered by this report, the registrant has adopted a code of ethics that applies to the registrant’s principal executive officer, principal financial officer, principal accounting officer or controller, or persons performing similar functions, regardless of whether these individuals are employed by the registrant or a third party.
(b) For purposes of this item, “code of ethics” means written standards that are reasonably designed to deter wrongdoing and to promote:
| | (1) | Honest and ethical conduct, including the ethical handling of actual or apparent conflicts of interest between personal and professional relationships; |
| | (2) | Full, fair, accurate, timely, and understandable disclosure in reports and documents that a registrant files with, or submits to, the Commission and in other public communications made by the registrant; |
| | (3) | Compliance with applicable governmental laws, rules, and regulations; |
| | (4) | The prompt internal reporting of violations of the code to an appropriate person or persons identified in the code; and |
| | (5) | Accountability for adherence to the code. |
(c) Amendments: During the period covered by the report, there have not been any amendments to the provisions of the code of ethics.
(d) Waivers: During the period covered by the report, the registrant has not granted any express or implicit waivers from the provisions of the code of ethics.
(e) Posting: We do not intend to post the Code of Ethics for the Officers or any amendments or waivers on a website.
(f) Availability: The Code of Ethics for the Officers can be obtained, free of charge by calling the toll free number for the appropriate Fund.
Item 3. Audit Committee Financial Expert.
(a) The registrant has an Audit committee currently composed of three independent Trustees, Mr. Wesley Pennington, Mr. John Mulder and Mr. Charles Nelson. The registrant’s board of trustees has determined that Mr. Charles Nelson is qualified to serve as an Audit Committee Financial Expert, and has designated him as such.
Item 4. Principal Accountant Fees and Services.
| | | | |
The Timothy Plan | | | |
FY 2012 | | $ | 142,700 | |
FY 2011 | | $ | 125,700 | |
-3-
| | | | | | | | |
The Timothy Plan | | Registrant | | | Adviser | |
FY 2012 | | $ | 0 | | | $ | 0 | |
FY 2011 | | $ | 0 | | | $ | 0 | |
Nature of the fees:
| | | | |
The Timothy Plan | | | |
FY 2012 | | $ | 0 | |
FY 2011 | | $ | 0 | |
Nature of the preparation of the 1120 RIC fees:
| | | | |
The Timothy Plan | | Registrant | |
FY 2012 | | $ | 0 | |
FY 2011 | | $ | 0 | |
| (e) | (1) Audit Committee’s Pre-Approval Policies |
The Audit Committee Charter requires the Audit Committee to be responsible for the selection, retention or termination of auditors and, in connection therewith, to (i) evaluate the proposed fees and other compensation, if any, to be paid to the auditors, (ii) evaluate the independence of the auditors, (iii) pre-approve all audit services and, when appropriate, any non-audit services provided by the independent auditors to the Trust, (iv) pre-approve, when appropriate, any non-audit services provided by the independent auditors to the Trust’s investment adviser, or any entity controlling, controlled by, or under common control with the investment adviser and that provides ongoing services to the Trust if the engagement relates directly to the operations and financial reporting of the Trust, and (v) receive the auditors’ specific representations as to their independence;
(2) Percentages of Services Approved by the Audit Committee
| | | | |
| | | Registrant | |
Audit-Related Fees: | | | 0 | % |
Tax Fees: | | | 0 | % |
All Other Fees: | | | 0 | % |
(f) During audit of registrant’s financial statements for the most recent fiscal year, less than 50 percent of the hours expended on the principal accountant’s engagement were attributed to work performed by persons other than the principal accountant’s full-time, permanent employees.
-4-
(g) The aggregate non-audit fees billed by the registrant’s accountant for services rendered to the registrant, and rendered to the registrant’s investment adviser (not including any sub-adviser whose role is primarily portfolio management and is subcontracted with or overseen by another investment adviser), and any entity controlling, controlled by, or under common control with the adviser that provides ongoing services to the registrant:
| | | | | | | | |
| | | Registrant | | | Adviser | |
FY 2012 | | $ | 0 | | | $ | 0 | |
FY 2011 | | $ | 0 | | | $ | 0 | |
(h) Not applicable. The auditor performed no services for the registrant’s investment adviser or any entity controlling, controlled by, or under common control with the investment adviser that provides ongoing services to the registrant.
Item 5. Audit Committee of Listed Companies. Not applicable.
Item 6. Schedule of Investments. Not applicable – schedule filed with Item 1.
Item 7. Disclosure of Proxy Voting Policies and Procedures for Closed-End Funds. Not applicable.
Item 8. Portfolio Managers of Closed-End Management Investment Companies. Not applicable.
Item 9. Purchases of Equity Securities by Closed-End Management Investment Company and Affiliated Purchasers. Not applicable.
Item 10. Submission of Matters to a Vote of Security Holders
The registrant has not adopted procedures by which shareholders may recommend nominees to the registrant’s board of trustees.
Item 11. Controls and Procedures.
(a) Based on an evaluation of the registrant’s disclosure controls and procedures as of November 19, 2010, the disclosure controls and procedures are reasonably designed to ensure that the information required in filings on Forms N-CSR is recorded, processed, summarized, and reported on a timely basis.
(b) There were no significant changes in the registrant’s internal control over financial reporting that occurred during the registrant’s second fiscal quarter of the period covered by this report that has materially affected, or is reasonably likely to materially affect, the registrant’s internal control over financial reporting.
Item 12. Exhibits.
| | |
| (a)(1) | | Code is filed herewith |
| |
| (a)(2) | | Certifications by the registrant’s principal executive officer and principal financial officer, pursuant to Section 302 of the Sarbanes- Oxley Act of 2002 and required by Rule 30a-2 under the Investment Company Act of 1940 are filed herewith. |
| |
| (a)(3) | | Not Applicable |
| |
| (b) | | Certification pursuant to 18 U.S.C. Section 1350, as adopted pursuant to Section 906 of the Sarbanes-Oxley Act of 2002 is filed herewith. |
-5-
SIGNATURES
Pursuant to the requirements of the Securities Exchange Act of 1934 and the Investment Company Act of 1940, the registrant has duly caused this report to be signed on its behalf by the undersigned, thereunto duly authorized.
(Registrant) The Timothy Plan
| | |
| By | | /s/ Arthur D. Ally |
| | Arthur D. Ally, President |
Date 12/6/12
Pursuant to the requirements of the Securities Exchange Act of 1934 and the Investment Company Act of 1940, this report has been signed below by the following persons on behalf of the registrant and in the capacities and on the dates indicated.
| | |
| By | | /s/ Arthur D. Ally |
| | Arthur D. Ally, President |
Date 12/6/12
-6-