UNITED STATES
SECURITIES AND EXCHANGE COMMISSION
WASHINGTON, D.C. 20549
FORM N-CSR
CERTIFIED SHAREHOLDER REPORT OF REGISTERED MANAGEMENT
INVESTMENT COMPANIES
Investment Company Act file number 811-08228
The Timothy Plan
(Exact name of registrant as specified in charter)
1055 Maitland Center Commons, Maitland, FL 32751 ��
(Address of principal executive offices) (Zip code)
Art Ally, The Timothy Plan
1055 Maitland Center Commons, Maitland, FL 32751
(Name and address of agent for service)
Registrant’s telephone number, including area code: 800-846-7526
Date of fiscal year end: 9/30
Date of reporting period: 9/30/13
Form N-CSR is to be used by management investment companies to file reports with the Commission not later than 10 days after the transmission to stockholders of any report that is required to be transmitted to stockholders under Rule 30e-1 under the Investment Company Act of 1940 (17 CFR 270.30e-1). The Commission may use the information provided on Form N-CSR in its regulatory, disclosure review, inspection and policymaking roles.
A registrant is required to disclose the information specified by Form N-CSR, and the Commission will make this information public. A registrant is not required to respond to the collection of information contained in Form N-CSR unless the Form displays a currently valid Office of Management and Budget (“OMB”) control number. Please direct comments concerning the accuracy of the information collection burden estimate and any suggestions for reducing the burden to Secretary, Securities and Exchange Commission, 450 Fifth Street, NW, Washington, DC 20549-0609. The OMB has reviewed this collection of information under the clearance requirements of 44 U.S.C. § 3507.
Item 1. Reports to Stockholders.
The Registrant’s audited annual financial reports transmitted to shareholders pursuant to Rule 30e-1 under the Investment Company Act of 1940 are as follows:

ANNUAL REPORT
September 30, 2013
TIMOTHY PLAN FAMILY OF FUNDS
Letter from the President
September 30, 2013
Arthur D. Ally
Dear Shareholder,
As you review the details on the following pages, you should be pleased to see that all of our funds turned in, in our opinion, anywhere from respectable to good performance for the twelve months of our past fiscal year (10-1-12 thru 9-30-13). Of course, as you probably know, past performance does not guarantee future results.
However as I reported last year, although we cannot guarantee any actual outcome, I remain confident that all of our sub-advisors remain, in our opinion, among the best in the industry and they each continue to honor our overall policy that they manage their respective funds both in accordance with our screening restrictions and with a conservative bias.
Please find each of our sub-advisors’ annual review letters along with their economic outlook in the pages that follow.
Finally, I would once again like to thank you for your moral convictions that led you to becoming part of the Timothy Plan Family.
Yours in Christ,

ARTHUR D. ALLY,
President
Timothy Plan Fund Performance
[2]
Letter from the Manager
September 30, 2013
Aggressive Growth Fund
We are pleased to report that the Aggressive Growth fund advanced 29% over the last 12 months ending September 30, 2013. This is a 1.5 percentage-point outperformance against our benchmark, the Russell Midcap Growth index, which rose 27.5% over the same period.
In a similar script to the analogous period last year, we are somewhat surprised at the strength of the overall market exhibited in the trailing twelve-month period. It has been driven by a combination of the removal – or tempering – of some key concerns, like the Fiscal Cliff, Europe’s sovereign debt crisis, budget battles, “tapering”, Syria, etc., as well as the emergence of some positives. Those positives include a solid rebound in housing, meaningful improvement in labor conditions (though far from targeted levels), the appointment of a new Fed chairperson, and of course, the continuation of Q.E. As Q.E. is gradually removed, however, the market might be challenged to maintain current levels, judging from what we saw last spring/summer just from the talk of tapering.
For the portfolio, there has been no change to our time-tested, bottom-up fundamental approach to managing small and mid-cap growth investments, although we have increased our turnover around market rallies and pullbacks. Our commitment to identifying quality investments at a time of unprecedented challenges is unaltered and should be rewarded as leading companies gain market share, protect margins, and manage ample capital for shareholder benefit over time.
CHARTWELL INVESTMENT PARTNERS, L.P.
Performance data quoted above is historical. Past performance does not guarantee future results and current performance may be lower or higher than the performance data quoted. Class A shares performance quoted excludes sales charge.
Timothy Plan Fund Performance
[3]
Fund Performance | Aggressive Growth
September 30, 2013 - (Unaudited)
| | | | | | | | | | | | | | | | | | | | |
| Fund/Index | | 1 Year
Total Return | | 5 Year
Average
Annual Return | | 10 Year
Average
Annual Return | | |
Timothy Aggressive Growth Fund - Class A (With Sales Charge) | | | | 19.84 | % | | | | 10.30 | % | | | | 6.61 | % | | | | | |
Russell Mid-Cap Growth Index | | | | 27.53 | % | | | | 13.92 | % | | | | 10.16 | % | | | | | |
Timothy Aggressive Growth Fund - Class C * | | | | 25.82 | % | | | | 10.76 | % | | | | 5.60 | % | | | | (a) | |
Russell Mid-Cap Growth Index | | | | 27.53 | % | | | | 13.92 | % | | | | 8.88 | % | | | | (a) | |
Timothy Aggressive Growth Fund - Class I | | | | N/A | | | | | N/A | | | | | 1.58 | % | | | | (b) | |
Russell Mid-Cap Growth Index | | | | N/A | | | | | N/A | | | | | 1.06 | % | | | | (b) | |
| | (a) | For the period February 3, 2004 (commencement of investment in accordance with objective) to September 30, 2013. |
| | (b) | For the period August 1, 2013 (commencement of investment in accordance with objective) to September 30, 2013. |
| | * | With Maximum Deferred Sales Charge |
Timothy Plan Aggressive Growth Fund vs. Russell Mid-Cap Growth Index

The chart shows the value of a hypothetical initial investment of $10,000 in the Fund’s Class A shares and the Russell Mid-Cap Growth Index on September 30, 2003 and held through September 30, 2013. The Russell Mid-Cap Growth Index is a widely recognized, unmanaged index of common stock prices. Performance figures include the change in value of the stocks in the index and the reinvestment of dividends. The index return does not reflect expenses, which have been deducted from the Fund’s return. The returns shown do not reflect deduction of taxes that a shareholder would pay on Fund distributions or the redemption of Fund shares. THE FUND’S RETURN REPRESENTS PAST PERFORMANCE AND IS NOT PREDICTIVE OF FUTURE RESULTS.
[4]
Letter from the Manager
September 30, 2013
International Fund
The Fund navigated well through a period that included significant changes from monetary policy in Japan, the improving fortunes of European economies, the worries over Chinese growth, and the looming Fed decision of whether to reduce its bond buying program, or tapering as it is more commonly referred.
Japan’s Prime Minister Shinzo Abe announced a major sea change for Japanese monetary policy during the 4th quarter of 2012 and into the first few months of 2013, which translated to a sharp rally in Japanese equities. With the goal of doubling the monetary base and aiming to reach a level of inflation of 2%, the markets cheered the new targets. As time passed, the third leg of PM Abe’s strategy, that of structural reforms, proved to be a longer term more difficult task leading Japanese stocks to give back some of their earlier gains. With better than expected economic data from China and data suggesting the Eurozone had finally clawed its way back from a six quarter long recession, European and emerging markets appeared to take over leadership from Japanese stocks in the third quarter of 2013 leading to broader gains in equity prices in those regions.
Sector allocation proved more difficult for the Fund during this period while stock selection was more neutral to performance. Underweight positions in the Fund to the Financials and Consumer Discretionary sectors hurt performance as those two sectors performed well on the back of better than expected economic news in Europe and China. An underweight to the Utilities sector added to performance as utilities in Europe struggled to keep up with benchmark returns on the back of weak electricity prices and bloated balance sheets. On the stock selection front, the portfolio had great attribution from individual stocks in the Consumer Discretionary and Industrials sectors. In particular in Discretionary was the portfolio’s exposure to auto parts companies Valeo SA in Europe and Magna Int’l in Canada which rallied on the back of rising margins and improving auto demand. In Industrials, good stock performance was led by Canadian Pacific, a rail company that is focusing on improving capital returns and from Copa Airlines, a Latin American airline benefitting from capacity expansions and growth in number of passengers.
The Fund added exposure to Japan and companies benefitting from the European recovery through this period and maintains a good allocation to both regions. Valuations are attractive in several parts of the world including Europe and the emerging markets and the Fund continues to have exposures to these areas. Global economic growth should perform better in 2014 than 2013 as Japan and Europe add to the recovery while growth in the emerging economies is likely to remain volatile but at high levels throughout the coming year.
EAGLE GLOBAL ADVISORS, LLC
Timothy Plan Fund Performance
[5]
Fund Performance | International
September 30, 2013 - (Unaudited)
| | | | | | | | | | | | | | | | | | | | |
| Fund/Index | | 1 Year
Total Return | | 5 Year
Average
Annual Return | | Average
Annual Return
Since Inception | | |
Timothy International Fund - Class A (With Sales Charge) | | | | 12.63 | % | | | | 2.08 | % | | | | -1.88 | % | | | | (a) | |
MSCI EAFE Index | | | | 20.35 | % | | | | 3.20 | % | | | | -3.18 | % | | | | (a) | |
Timothy International Fund - Class C * | | | | 18.32 | % | | | | 2.47 | % | | | | -1.77 | % | | | | (a) | |
MSCI EAFE Index | | | | 20.35 | % | | | | 3.20 | % | | | | -3.18 | % | | | | (a) | |
Timothy International Fund - Class I | | | | N/A | | | | | N/A | | | | | 2.25 | % | | | | (b) | |
MSCI EAFE Index | | | | N/A | | | | | N/A | | | | | 4.39 | % | | | | (b) | |
| | (a) | For the period May 3, 2007 (commencement of investment in accordance with objective) to September 30, 2013. |
| | (b) | For the period August 1, 2013 (commencement of investment in accordance with objective) to September 30, 2013. |
| | * | With Maximum Deferred Sales Charge |
Timothy Plan International Fund vs. MSCI EAFE Index
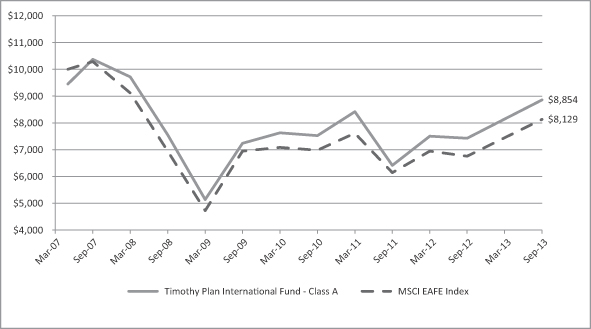
The chart shows the value of a hypothetical initial investment of $10,000 in the Fund’s Class A shares and the MSCI EAFE Index on May 3, 2007 and held through September 30, 2013. The MSCI EAFE Index is a widely recognized unmanaged index of equity prices and is representative of equity market performance of developed countries, excluding the U.S. and Canada. Performance figures include the change in value of the stocks in the index and the reinvestment of dividends. The index return does not reflect expenses, which have been deducted from the Fund’s return. The returns shown do not reflect deduction of taxes that a shareholder would pay on Fund distributions or the redemption of Fund shares. THE FUND’S RETURN REPRESENTS PAST PERFORMANCE AND IS NOT PREDICTIVE OF FUTURE RESULTS.
[6]
Letter from the Manager
September 30, 2013
Large/Mid Cap Growth Fund
We are pleased to report that the fund advanced 23.7% over the last 12 months ending September 30, 2013, outpacing the return of the benchmark, the Russell Growth Index, by 4.4 percentage points (R1G +19.3%) for the same period.
In a similar script to the analogous period last year, we are somewhat surprised at the strength of the overall market exhibited in the trailing twelve-month period. It has been driven by a combination of the removal – or tempering – of some key concerns, like the Fiscal Cliff, Europe’s sovereign debt crisis, budget battles, “tapering”, Syria, etc., as well as the emergence of some positives. Those positives include a solid rebound in housing, meaningful improvement in labor conditions (though far from targeted levels), the appointment of a new Fed chairperson, and of course, the continuation of Q.E. As Q.E. is gradually removed, however, the market might be challenged to maintain current levels, judging from what we saw last spring/summer just from the talk of tapering.
For the portfolio, there has been no change to our time-tested, bottom up fundamental approach to managing large and mid-cap growth investments, although we have increased our turnover around market rallies and pullbacks. Our commitment to identifying quality investments at a time of unprecedented challenges is unaltered and should be rewarded as leading companies gain market share, protect margins, and manage ample capital for shareholder benefit over time.
CHARTWELL INVESTMENT PARTNERS, L.P.
Performance data quoted above is historical. Past performance does not guarantee future results and current performance may be lower or higher than the performance data quoted. Class A shares performance quoted excludes sales charge.
Timothy Plan Fund Performance
[7]
Fund Performance | Large/Mid Cap Growth
September 30, 2013 - (Unaudited)
| | | | | | | | | | | | | | | | | | | | |
| Fund/Index | | 1 Year
Total Return | | 5 Year
Average
Annual Return | | 10 Year
Average
Annual Return | | |
Timothy Large/Mid Cap Growth Fund - Class A (With Sales Charge) | | | | 15.00 | % | | | | 9.54 | % | | | | 6.18 | % | | | | | |
Russell 1000 Growth Index | | | | 19.27 | % | | | | 12.07 | % | | | | 7.82 | % | | | | | |
Timothy Large/Mid Cap Growth Fund - Class C * | | | | 20.74 | % | | | | 9.96 | % | | | | 4.37 | % | | | | (a) | |
Russell 1000 Growth Index | | | | 19.27 | % | | | | 12.07 | % | | | | 6.74 | % | | | | (a) | |
Timothy Large/Mid Cap Growth Fund - Class I | | | | N/A | | | | | N/A | | | | | 0.72 | % | | | | (b) | |
Russell 1000 Growth Index | | | | N/A | | | | | N/A | | | | | 1.22 | % | | | | (b) | |
| | (a) | For the period February 3, 2004 (commencement of investment in accordance with objective) to September 30, 2013. |
| | (b) | For the period August 1, 2013 (commencement of investment in accordance with objective) to September 30, 2013. |
| | * | With Maximum Deferred Sales Charge |
Timothy Plan Large/Mid Cap Growth Fund vs. Russell 1000 Growth Index
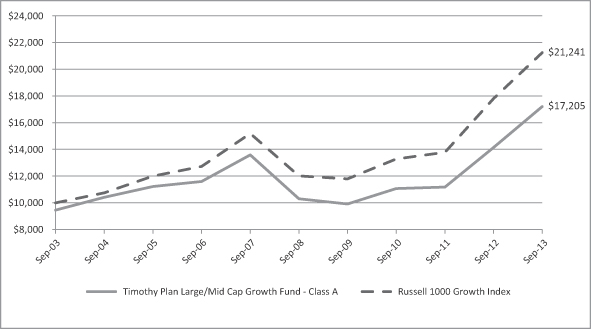
The chart shows the value of a hypothetical initial investment of $10,000 in the Fund’s Class A shares and the Russell 1000 Growth Index on September 30, 2003 and held through September 30, 2013. The Russell 1000 Growth Index is a widely recognized, unmanaged index of common stock prices. Performance figures include the change in value of the stocks in the index and the reinvestment of dividends. The index return does not reflect expenses, which have been deducted from the Fund’s return. The returns shown do not reflect deduction of taxes that a shareholder would pay on Fund distributions or the redemption of Fund shares. THE FUND’S RETURN REPRESENTS PAST PERFORMANCE AND IS NOT PREDICTIVE OF FUTURE RESULTS.
[8]
Letter from the Manager
September 30, 2013
Small Cap Value Fund
We are pleased to provide you with our report for the Timothy Plan Small-Cap Value Fund for the twelve months ending September 30, 2013 and would like to thank you for entrusting your assets with us.
Over the past twelve months equity markets, while withstanding a brief correction in late 2012, generally moved higher beginning in November 2012. Equity markets then moved forward and generally produced strong gain throughout the rest of fiscal 2013, propelled higher by rising investor confidence. Confidence was fueled by improving US economic data, relative stability in the US fiscal situation, better than expected 4Q corporate earnings, and assurances of continued stimulus to be provided by central banks around the globe.
For the twelve months ending September 30, 2013, the Timothy Plan Small-Cap Value Fund again produced a strong return of 39.9%, while the Russell 2000 Index produced a return of 30.1%. Smaller market capitalization company stocks, which tend to have revenues that are more sensitive to the business cycle, outperformed the broad US market. Security selection was the primary driver of relative outperformance and centered in the Energy, Materials & Processing, Producer Durables and Technology sectors. Optimism aided the performance of economically- sensitive companies. Specifically, KapStone Paper and Packaging Corp., US Silica Holdings Inc. and Roadrunner Transportation Systems Inc. surged along with an improvement in investor sentiment and confidence in the U.S. economy. Energy holdings Bonanza Creek Energy Inc. and Matrix Service Co. surged along with rising crude oil prices.
Security selection in Health Care coupled with an overweight in REITs and an underweight in Consumer Discretionary detracted from relative performance. The Health Care index sector outperformed the market and our holdings failed to keep pace. Specifically, Natus Medical Inc. fell on concerns of spending cuts for hospitals while Orthofix International suffered on the news they canceled their earnings call and announced that they found some accounting irregularities. Other detractors included Children’s Place Retail Stores Inc. due to concerns about the impact of Hurricane Sandy, as 31% of the company’s business will be impacted by the storm and Matador Resources Co., which reported disappointing well results in the Eagle Ford field.
Investors have sought out economically-sensitive and global firms during much of the fiscal year, while the safe-haven, high-yielding securities led the market during times of uncertainty, such as in the 2nd quarter. We have historically outperformed for many years following an economic recovery, and even though the recovery has taken longer due to the depth of the financial crisis, we are pleased that our small-cap strategy has performed well. As we take on the next fiscal year, we will, as long-term investors, remain disciplined, keep emotions in check and be opportunistic.
We thank you for your continued confidence in the Westwood process and investment teams and we look forward to serving your investment needs through the years ahead.
WESTWOOD MANAGEMENT CORPORATION
Performance data quoted above is historical. Past performance does not guarantee future results and current performance may be lower or higher than the performance data quoted. Class A shares performance quoted excludes sales charge.
Timothy Plan Fund Performance
[9]
Fund Performance | Small Cap Value
September 30, 2013 - (Unaudited)
| | | | | | | | | | | | | | | | | | | | |
| Fund/Index | | 1 Year
Total Return | | 5 Year
Average
Annual Return | | 10 Year
Average
Annual Return | | |
Timothy Small Cap Value Fund - Class A (With Sales Charge) | | | | 30.36 | % | | | | 9.59 | % | | | | 8.62 | % | | | | | |
Russell 2000 Index | | | | 30.06 | % | | | | 11.15 | % | | | | 9.64 | % | | | | | |
Timothy Small Cap Value Fund - Class C * | | | | 36.98 | % | | | | 10.00 | % | | | | 6.90 | % | | | | (a) | |
Russell 2000 Index | | | | 30.06 | % | | | | 11.15 | % | | | | 7.99 | % | | | | (a) | |
Timothy Small Cap Value Fund - Class I | | | | N/A | | | | | N/A | | | | | 3.10 | % | | | | (b) | |
Russell 2000 Index | | | | N/A | | | | | N/A | | | | | 1.58 | % | | | | (b) | |
| | (a) | For the period February 3, 2004 (commencement of investment in accordance with objective) to September 30, 2013. |
| | (b) | For the period August 1, 2013 (commencement of investment in accordance with objective) to September 30, 2013. |
| | * | With Maximum Deferred Sales Charge |
Timothy Plan Small Cap Value Fund vs. Russell 2000 Index
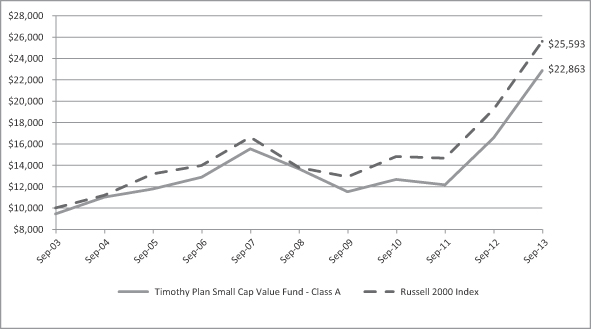
The chart shows the value of a hypothetical initial investment of $10,000 in the Fund’s Class A shares and the Russell 2000 Index on September 30, 2003 and held through September 30, 2013. The Russell 2000 Index is a widely recognized, unmanaged index of common stock prices. Performance figures include the change in value of the stocks in the index and the reinvestment of dividends. The index return does not reflect expenses, which have been deducted from the Fund’s return. The returns shown do not reflect deduction of taxes that a shareholder would pay on Fund distributions or the redemption of Fund shares. THE FUND’S RETURN REPRESENTS PAST PERFORMANCE AND IS NOT PREDICTIVE OF FUTURE RESULTS.
[10]
Letter from the Manager
September 30, 2013
Large/Mid Cap Value Fund
We are pleased to provide you with our report for the Timothy Plan Large/Mid-Cap Value Fund for the twelve months ending September 30, 2013 and would like to thank you for entrusting your assets with us.
Over the past twelve months equity markets, while withstanding a brief correction in late 2012, generally moved higher beginning in November 2012. Equity markets then moved forward and generally produced strong gain throughout the rest of fiscal 2013, propelled higher by rising investor confidence. Confidence was fueled by improving US economic data, relative stability in the US fiscal situation, better than expected 4Q corporate earnings, and assurances of continued stimulus to be provided by central banks around the globe.
For the twelve months ending September 30, 2013, the Timothy Plan Large/Mid-Cap Value Fund produced a return of 24.5%, while the S&P 500 Index produced a return of 19.3%. Security selection in Technology, Energy and Consumer Discretionary aided relative performance. The Technology sector has been a strong performer, which produced significant relative outperformance for the fund. Many of the fund’s top performers were in sectors levered to economic growth. Optimism aided the performance of pro-cyclical, global companies, such as Western Digital Corp., Flowserve Corp., TE Connectivity Ltd., Eaton Vance Corp. and Union Pacific Corp.
Security selection in Health Care, Financial Services and Consumer Staples was the largest detractor to relative performance in the prior twelve months. Index sectors Health Care and Financial Services sectors outperformed the market and our holdings failed to keep pace. Health Care holding DaVita HealthCare Partners Inc. and St. Jude Medical Inc. suffered as investors grew concerned about a potential cut in Medicare reimbursement rates and concern surrounding litigation with a supplier, respectively. REIT holding, Ventas Inc. suffered as investors reduced exposure to higher yielding securities in the face of a rising interest rate environment.
The Timothy Plan Large/Mid-Cap Value Fund has performed well in this strong US equity market, producing a gross total return of more than 20% in fiscal 2013. This compares favorably to the return of the S&P 500. Importantly, we have outperformed on almost all days in which the index has declined by 1% or more, which is evidence of our strong focus on risk management. Near-term concerns for the US equity market would include the potential government shutdown, as US legislators negotiate over the fiscal budget and debt ceiling. In addition, we need to continue to see improvement in the economy, specifically the job market, and wait for additional clarity on how the Fed will ultimately handle QE (Quantitative Easing) tapering. QE tapering, regardless of the degree or timing, will likely lead to higher rates and could force capital out of bonds and into stocks, but revenue growth for US companies is likely to remain challenged. The fund is oriented toward companies with high earnings visibility and good levels of ROIC, which should demand a premium in this environment. As a result, we believe we are well-positioned for the near term. Also, as stock correlations have fallen and the prospect of additional P/E multiple expansion has declined, it becomes much more important to practice sound, fundamental security selection in order to beat the market.
We thank you for your continued confidence in the Westwood process and investment teams and we look forward to serving your investment needs through the years ahead.
WESTWOOD MANAGEMENT CORPORATION
Performance data quoted above is historical. Past performance does not guarantee future results and current performance may be lower or higher than the performance data quoted. Class A shares performance quoted excludes sales charge.
Timothy Plan Fund Performance
[11]
Fund Performance | Large/Mid Cap Value
September 30, 2013 - (Unaudited)
| | | | | | | | | | | | | | | | | | | | |
| Fund/Index | | 1 Year
Total Return | | 5 Year
Average
Annual Return | | 10 Year
Average
Annual Return | | |
Timothy Large/Mid Cap Value Fund - Class A (With Sales Charge) | | | | 16.25 | % | | | | 7.77 | % | | | | 8.77 | % | | | | | |
S&P 500 Index | | | | 19.34 | % | | | | 10.02 | % | | | | 7.57 | % | | | | | |
Timothy Large/Mid Cap Value Fund - Class C * | | | | 22.12 | % | | | | 8.17 | % | | | | 7.69 | % | | | | (a) | |
S&P 500 Index | | | | 19.34 | % | | | | 10.02 | % | | | | 6.33 | % | | | | (a) | |
Timothy Large/Mid Cap Value Fund - Class I | | | | N/A | | | | | N/A | | | | | -0.33 | % | | | | (b) | |
S&P 500 Index | | | | N/A | | | | | N/A | | | | | -1.10 | % | | | | (b) | |
| | (a) | For the period February 3, 2004 (commencement of investment in accordance with objective) to September 30, 2013. |
| | (b) | For the period August 1, 2013 (commencement of investment in accordance with objective) to September 30, 2013. |
| | * | With Maximum Deferred Sales Charge |
Timothy Plan Large/Mid Cap Value Fund vs. S&P 500 Index
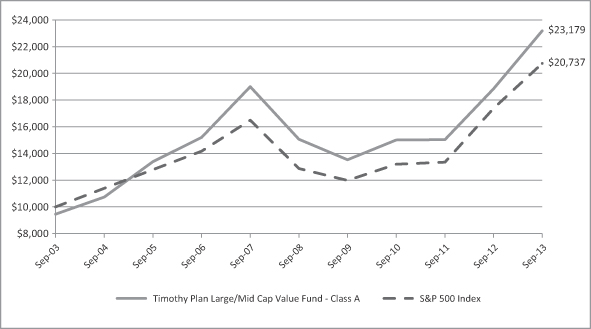
The chart shows the value of a hypothetical initial investment of $10,000 in the Fund’s Class A shares and the S&P 500 Index on September 30, 2003 and held through September 30, 2013. The S&P 500 Index is a widely recognized, unmanaged index of common stock prices. Performance figures include the change in value of the stocks in the index and the reinvestment of dividends. The index return does not reflect expenses, which have been deducted from the Fund’s return. The returns shown do not reflect deduction of taxes that a shareholder would pay on Fund distributions or the redemption of Fund shares. THE FUND’S RETURN REPRESENTS PAST PERFORMANCE AND IS NOT PREDICTIVE OF FUTURE RESULTS.
[12]
Letter from the Manager
September 30, 2013
Fixed Income Fund
The Federal Reserve (Fed.), and the speculation surrounding the continuation of their Quantitative Easing (QE) program, was a primary force behind the fixed income market’s performance over the past 12 months. The third phase of the Fed’s monetary stimulus program, which began in September 2012, sent rates lower over the remainder of the year and into the spring of 2013. However, worries surrounding the possibility of ending the program emerged on May 22nd, after Fed Chairman Ben Bernanke made reference to a possible ‘tapering’ of purchases that would begin in September. His reference shocked the bond market and launched a sharp increase in interest rates. Though the ‘tapering’ of the QE program did not occur, and the Fed continues its current $85B per month Treasury and MBS purchase program, the interest rate market remained extremely volatile throughout the summer and into early September 2013. This volatility saw the 10-year U.S. Treasury yield reach a 2013 YTD low of 1.63% on May 1st, only to rise to 3.00% by September 5th.
Despite having convinced most of the market in May that bond purchases would eventually be reduced in the fall, the Fed’s September 17th meeting produced a surprise announcement that they would not begin to ‘taper’ the QE program. This announcement spurred a relief rally in the bond market, as rates declined from their September peak and the Barclays Aggregate Index generated its first positive quarterly return since the fourth quarter of 2012. The Federal Reserve’s decision to back away from tapering was motivated by a U.S. economy that has continuously struggled to maintain a self-sustaining growth trajectory. The 12 months leading up to September saw quarterly GDP and inflation figures continue to trail the Fed’s targeted goals, with only short-lived catalysts driving upward change. Although the housing market experienced resurgence in many regions of the country, the rising mortgage rates that followed May’s QE-taper speculation revealed the fragility of the sector’s bounce back. The combination of these factors, as well as the likelihood of a turbulent fiscal debate and government shutdown in Washington, convinced the Fed to continue its QE program.
Interest rate volatility and an unstable economic environment motivated the Timothy Fixed Income Fund to maintain a conservative stance. The fund’s A shares fell by -2.91% during the one-year period ending September 30, 2013, versus the -1.68% mark posted by the Barclays Aggregate Index. An overweight to corporate issuers supported relative performance as Treasury returns struggled amidst the period’s rate volatility. On a relative basis, the fund’s Industrial holdings outperformed those of the index, benefitting returns. Although security selection within Financials supported returns, an underweight to the sector detracted from the Fund’s performance as Financials were the best performing sector for the period. An overweight to GNMA issues, which lagged the remaining portion of the mortgage sector, also hurt the Fund’s performance.
The strategy continues to maintain a cautious risk posture given the uncertainty of the current market environment. An overweight to corporate credit remains a bias in the portfolio in an effort to provide an attractive yield through the selection of fundamentally strong issuers. The Fund’s Treasury Inflation Protected Securities (TIPS) position was liquidated during the period to avoid further exposure to the volatile rates market. The Fund’s GNMA issues continue to provide the opportunity to earn a spread over Treasuries, while maintaining the full faith and credit guarantee of the U.S. Treasury.
BARROW, HANLEY, MEWHINNEY & STRAUSS
Performance data quoted above is historical. Past performance does not guarantee future results and current performance may be lower or higher than the performance data quoted. Class A shares performance quoted excludes sales charge.
Timothy Plan Fund Performance
[13]
Fund Performance | Fixed Income
September 30, 2013 - (Unaudited)
| | | | | | | | | | | | | | | | | | | | |
| Fund/Index | | 1 Year
Total Return | | 5 Year
Average
Annual Return | | 10 Year
Average
Annual Return | | |
Timothy Fixed Income Fund - Class A (With Sales Charge) | | | | -7.18 | % | | | | 3.33 | % | | | | 2.91 | % | | | | | |
Barclays Capital U.S. Aggregate Bond Index | | | | -1.68 | % | | | | 5.41 | % | | | | 4.59 | % | | | | | |
Timothy Fixed Income Fund - Class C * | | | | -3.57 | % | | | | 3.50 | % | | | | 2.63 | % | | | | (a) | |
Barclays Capital U.S. Aggregate Bond Index | | | | -1.68 | % | | | | 5.41 | % | | | | 4.64 | % | | | | (a) | |
Timothy Fixed Income Fund - Class I | | | | N/A | | | | | N/A | | | | | 0.90 | % | | | | (b) | |
Barclays Capital U.S. Aggregate Bond Index | | | | N/A | | | | | N/A | | | | | 0.98 | % | | | | (b) | |
| | (a) | For the period February 3, 2004 (commencement of investment in accordance with objective) to September 30, 2013. |
| | (b) | For the period August 1, 2013 (commencement of investment in accordance with objective) to September 30, 2013. |
| | * | With Maximum Deferred Sales Charge |
Timothy Plan Fixed Income Fund vs. Barclays Capital U.S. Aggregate Bond Index
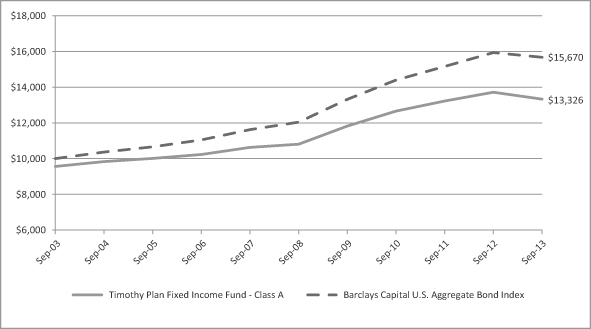
The chart shows the value of a hypothetical initial investment of $10,000 in the Fund’s Class A shares and the Barclays Capital U.S. Aggregate Bond Index on September 30, 2003 and held through September 30, 2013. The Barclays Capital U.S. Aggregate Bond Index is a widely recognized, unmanaged index of bond prices. Performance figures include the change in value of the bonds in the index and the reinvestment of interest. The index return does not reflect expenses, which have been deducted from the Fund’s return. The returns shown do not reflect deduction of taxes that a shareholder would pay on Fund distributions or the redemption of Fund shares. THE FUND’S RETURN REPRESENTS PAST PERFORMANCE AND IS NOT PREDICTIVE OF FUTURE RESULTS.
[14]
Letter from the Manager
September 30, 2013
High Yield Bond Fund
The Federal Reserve and its Quantitative Easing (QE) program were the primary instigators of volatility in all markets over the past year, including high yield fixed income. Just as rates were driven downward, and returns upward, by the launch of the program, speculation surrounding its end weighed negatively on markets over the past six months. Worries regarding QE began in earnest in May, after Fed Chairman Ben Bernanke’s May 22 reference to a possible ‘tapering’ of purchases shocked the bond market and launched a sharp increase in interest rates. Though the ‘tapering’ of QE has yet to come to fruition, and the Fed continues its current $85B per month Treasury and MBS purchase program, the interest rate market was extremely volatile throughout the summer and into September.
The Fed’s QE program, and the resulting suppression of potential fixed income returns, continues to propel the “search for yield” that has supported demand in the high yield market. The 12 month period saw strong investor inflows force the spread of the Barclays Ba/B Index over comparable Treasuries lower by 0.75%. The willingness of investors to finance the riskier portion of the bond market in search of higher returns has been a constant theme throughout the Fed’s post-crisis monetary stimulus.
The one year period ending September 30, 2013 saw the Timothy High Yield Fund A shares post a return of 4.30% compared to the 6.75% mark turned in by the Barclays Ba/B High Yield Index. Financials, particularly Bank issuers, led the way for the index, and the Fund’s underweight to the sector was the primary driver of underperformance. Security selection in Basic Industry, Capital Goods, and Consumer Products, within Industrials, benefitted performance as these issues outpaced the performance of the respective sub-sectors in the index. The Fund’s performance was particularly strong during the third quarter of 2013, as the high-quality high yield issuers favored by the strategy rebounded relative to their low-quality peers. The potential removal of the Fed’s QE support from the market provided an overall headwind to high yield returns in the latter half of the 12 month period.
Outside of the Federal Reserve’s effect on the market, corporate fundamentals remain strong and default rates below their historical average, but a keen focus on individual securities is always required in the high yield market. The portfolio will maintain a conservative risk position, striving to avoid potential rating downgrades, as market data indicates some firms have begun to re-lever in a race to finance themselves while low rates are still available. The Fund will continue to focus on credits that maintain healthy fundamentals and strong operations, giving them a greater probability of eventual ratings upgrades.
BARROW, HANLEY, MEWHINNEY & STRAUSS
Performance data quoted above is historical. Past performance does not guarantee future results and current performance may be lower or higher than the performance data quoted. Class A shares performance quoted excludes sales charge.
Timothy Plan Fund Performance
[15]
Fund Performance | High Yield Bond
September 30, 2013 - (Unaudited)
| | | | | | | | | | | | | | | | | | | | |
| Fund/Index | | 1 Year
Total Return | | 5 Year
Average
Annual Return | | Average
Annual Return
Since Inception | | |
Timothy High Yield Bond Fund - Class A (With Sales Charge) | | | | -0.33 | % | | | | 8.82 | % | | | | 4.85 | % | | | | (a) | |
Barclays Ba/B High Yield Index | | | | 6.07 | % | | | | 12.00 | % | | | | 7.68 | % | | | | (a) | |
Timothy High Yield Bond Fund - Class C * | | | | 3.54 | % | | | | 8.98 | % | | | | 4.81 | % | | | | (a) | |
Barclays Ba/B High Yield Index | | | | 6.07 | % | | | | 12.00 | % | | | | 7.68 | % | | | | (a) | |
Timothy High Yield Bond Fund - Class I | | | | N/A | | | | | N/A | | | | | 0.15 | % | | | | (b) | |
Barclays Ba/B High Yield Index | | | | N/A | | | | | N/A | | | | | 0.29 | % | | | | (b) | |
| | (a) | For the period May 7, 2007 (commencement of investment in accordance with objective) to September 30, 2013. |
| | (b) | For the period August 1, 2013 (commencement of investment in accordance with objective) to September 30, 2013. |
| | * | With Maximum Deferred Sales Charge |
Timothy Plan High Yield Bond Fund vs. Barclays Ba/B High Yield Index
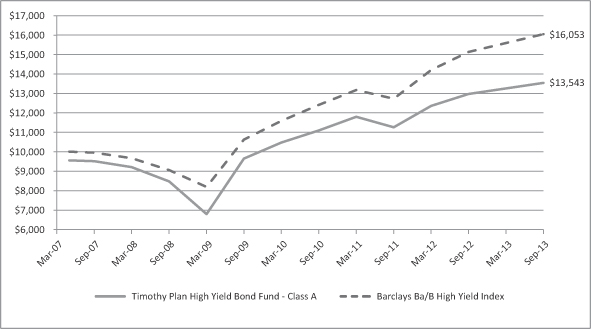
The chart shows the value of a hypothetical initial investment of $10,000 in the Fund’s Class A shares and the Barclays Capital U.S. Corporate High Yield Bond Index on May 7, 2007 and held through September 30, 2013. The Barclays Capital U.S. Corporate High Yield Bond Index is a widely recognized unmanaged index of non-investment grade, fixed rate, taxable corporate bonds. Performance figures include the change in value of the bonds in the index and the reinvestment of interest. The index return does not reflect expenses, which have been deducted from the Fund’s return. The returns shown do not reflect deduction of taxes that a shareholder would pay on Fund distributions or the redemption of Fund shares. THE FUND’S RETURN REPRESENTS PAST PERFORMANCE AND IS NOT PREDICTIVE OF FUTURE RESULTS.
[16]
Letter from the Manager
September 30, 2013
Israel Common Values Fund
The Fund performed very well in absolute and relative terms during this period. Israel’s economic performance continued to support rising asset prices as unemployment declined, GDP grew at healthy levels of over 3% and inflation remained under control. One major achievement of the country was the startup of production of the large offshore natural gas field Tamar. This new production is a significant boost to the future energy independence and growth of the country but also adds an economic challenge of a stronger currency. The shekel was one of the best performing currencies in the world versus the dollar during this twelve month period. This forced the central bank to lower interest rates and provide additional monetary stimulus to try and cap the strength of the currency. A strong currency is a headwind to Israeli exports which account for one third of GDP growth.
The Timothy Plan Israel Common Values Fund performed very well during this period on an absolute basis and relative to the Israel TA-100 index. Good allocation and strong stock selection led to the outperformance. Although an overweight to the IT sector and underweight to the Telecom Services sector were negative, an underweight to Health Care and an overweight to Consumer Staples more than offset this negative effect leading to positive allocation effect overall. From a stock selection standpoint, great stock selection in the Materials sector added to performance as a strong rally in leading flavors and ingredients company Frutarom Industries aided performance while an underweight to underperforming potash producer Israel Chemicals benefitted the Fund as well. Good performance from supermarket chain Rami Levi also helped the Fund during this period.
The prospects for Israel remain robust as the newfound natural gas reserves provide a boost to economic performance while the significant innovative drive of the corporate sector continues to birth new companies and give new life to established global leaders. The Fund maintains a strategic overweight to the IT sector while the Health Care sector remains the largest underweight. The improving global economic backdrop should lead to rising global trade which would be a good tailwind for Israeli export growth in the coming year.
EAGLE GLOBAL ADVISORS, LLC
Timothy Plan Fund Performance
[17]
Fund Performance | Israel Common Values
September 30, 2013 - (Unaudited)
| | | | | | | | | | | | | | | |
| Fund/Index | | 1 Year
Total Return | | Average
Annual Return
Since Inception | | |
Timothy Israel Common Values Fund - Class A (With Sales Charge) | | | | 17.94 | % | | | | 9.67 | % | | | | (a) | |
Israel TA 100 Index | | | | 20.19 | % | | | | 10.49 | % | | | | (a) | |
Timothy Israel Common Values Fund - Class C * | | | | 23.89 | % | | | | 11.99 | % | | | | (a) | |
Israel TA 100 Index | | | | 20.19 | % | | | | 10.49 | % | | | | (a) | |
Timothy Israel Common Values Fund - Class I | | | | N/A | | | | | 3.77 | % | | | | (b) | |
Israel TA 100 Index | | | | N/A | | | | | 5.75 | % | | | | (b) | |
| | (a) | For the period October 12, 2011 (commencement of investment in accordance with objective) to September 30, 2013. |
| | (b) | For the period August 1, 2013 (commencement of investment in accordance with objective) to September 30, 2013. |
| | * | With Maximum Deferred Sales Charge |
Timothy Plan Israel Common Values Fund vs. Israel Tel Aviv 100 Index
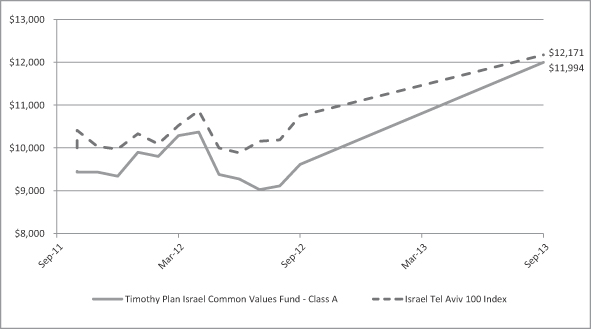
The chart shows the value of a hypothetical initial investment of $10,000 in the Fund’s Class A shares and the Israel TA 100 Index on October 12, 2011 and held through September 30, 2013. The Israel Tel Aviv 100 Index is an unmanaged index of equity prices representing the 100 most highly capitalized companies listed on the Tel Aviv Stock Exchange . Performance figures include the change in value of the stocks in the index and the reinvestment of dividends. The index return does not reflect expenses, which have been deducted from the Fund’s return. The returns shown do not reflect deduction of taxes that a shareholder would pay on Fund distributions or the redemption of Fund shares. THE FUND’S RETURN REPRESENTS PAST PERFORMANCE AND IS NOT PREDICTIVE OF FUTURE RESULTS.
[18]
Letter from the Manager
September 30, 2013
Defensive Strategies Fund
Dear Shareholder,
The Defensive Strategies Fund has been designed and managed to do what its name implies, i.e. hedge against a possible scenario of hyper-inflation which could result from our nation’s leadership’s proven unwillingness to address our core problems of too much spending, too much taxation and too many onerous government regulations. We have, therefore, built in the flexibility to either adjust to a possible risk of extreme deflation with the ability to convert our inflation sensitive assets to cash and fixed income securities that should perform well during a deflationary environment or to a more normal, traditional investment strategy. As I stated in last year’s report, although we will do our very best to be successful, we cannot guarantee results in any of these scenarios.
I would also like to point out that, since there does not exist an appropriate benchmark index with which to compare our performance, we have created a blended index comprised of roughly 1/3 each of U.S. Government TIPs, FTSE NAREIT Equity Index and Dow Jones UBS Commodity Index. We believe this better matches the makeup of our fund than the previously used Dow Jones US Moderate 40 Index which contains no commodities.
While no one can predict future events, as I stated in my President’s letter, I remain confident that our sub-advisors (i.e. money management firms that manage the various sleeves of this Fund) are, in our opinion, among the best in the industry and they each continue to honor our overall policy that they manage their respective Fund sleeve both in accordance with our screening restrictions and with a conservative bias.
Finally, I would once again like to thank you for your moral convictions that led you to become part of the Timothy Plan Family.
Yours in Christ,
ARTHUR D. ALLY
Fund Advisor
Timothy Plan Fund Performance
[19]
Fund Performance | Defensive Strategies
September 30, 2013 - (Unaudited)
| | | | | | | | | | | | | | | |
| Fund/Index | | 1 Year
Total Return | | Average
Annual Return
Since Inception | | |
Timothy Defensive Strategies Fund - Class A (With Sales Charge) | | | | -13.17 | % | | | | 4.16 | % | | | | (a) | |
Dow Jones Moderately Conservative U.S. Portfolio Index | | | | 14.26 | % | | | | 12.53 | % | | | | (a) | |
Timothy Defensive Strategies Fund Blended Index (c) | | | | -5.24 | % | | | | 7.42 | % | | | | (a) | |
Timothy Defensive Strategies Fund - Class C * | | | | -8.75 | % | | | | 4.91 | % | | | | (a) | |
Dow Jones Moderately Conservative U.S. Portfolio Index | | | | 14.26 | % | | | | 12.53 | % | | | | (a) | |
Timothy Defensive Strategies Fund Blended Index (c) | | | | -5.24 | % | | | | 7.42 | % | | | | (a) | |
Timothy Defensive Strategies Fund - Class I | | | | N/A | | | | | 0.00 | % | | | | (b) | |
Dow Jones Moderately Conservative U.S. Portfolio Index | | | | N/A | | | | | 0.18 | % | | | | (b) | |
Timothy Defensive Strategies Fund Blended Index (c) | | | | N/A | | | | | -0.32 | % | | | | (b) | |
| | (a) | For the period November 4, 2009 (commencement of investment in accordance with objective) to September 30, 2013. |
| | (b) | For the period August 1, 2013 (commencement of investment in accordance with objective) to September 30, 2013. |
| | (c) | The Timothy Defensive Strategies Fund Blended Index reflects an unmanaged portfolio of 33% of the Barclays U.S. TIPs Index, 33% of the FTSE NAREIT ALL REITs Index and 34% of the Dow Jones Commodity Total Return Index. |
| | * | With Maximum Deferred Sales Charge |
Timothy Plan Defensive Strategies Fund vs. Dow Jones Moderately Conservative U.S. Portfolio Index vs. The Timothy Defensive Strategies Fund Blended Index (c)
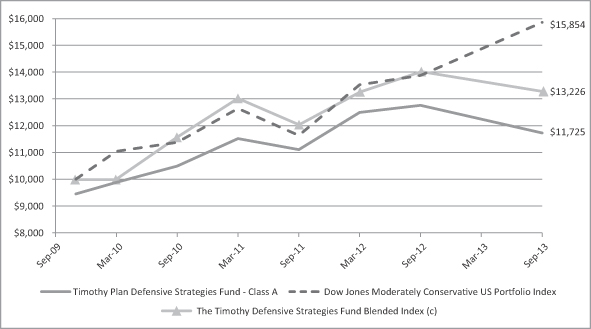
The chart shows the value of a hypothetical initial investment of $10,000 in the Fund’s Class A shares, Dow Jones Moderately Conservative U.S. Portfolio Index and the Timothy Defensive Strategies Fund Blended Index (c) on November 4, 2009 and held through September 30, 2013. The Dow Jones Moderately Conservative U.S. Portfolio Index is a widely recognized unmanaged index of stocks, bonds and cash. Performance figures include the change in value of the asset classes in the index and the reinvestment of dividends. The index return does not reflect expenses, which have been deducted from the Fund’s return. The returns shown do not reflect deduction of taxes that a shareholder would pay on Fund distributions or the redemption of Fund shares. THE FUND’S RETURN REPRESENTS PAST PERFORMANCE AND IS NOT PREDICTIVE OF FUTURE RESULTS.
[20]
Letter from the Manager
September 30, 2013
Strategic Growth Fund
Dear Strategic Growth Fund Shareholder:
The Timothy Plan Strategic Growth Fund is simply an asset allocation fund that invests in a number of Timothy Plan underlying funds. Although the allocation percentages will vary somewhat from time to time as a result of changing economic conditions, the allocation at September 30, 2013 was as follows:
| | | | | | | | | | |
• Large/Mid-Cap Growth Fund | | | (14.91%) | | | • Small-Cap Value Fund | | | (6.35%) | |
• Large/Mid-Cap Value Fund | | | (14.39%) | | | • Aggressive Growth Fund | | | (5.77%) | |
• International Fund | | | (15.18%) | | | • High-Yield Bond Fund | | | (12.71%) | |
• Defensive Strategies Fund | | | (14.42%) | | | • Israel Common Values | | | (5.12%) | |
• Emerging Markets Fund | | | (5.97%) | | | • Cash | | | (5.30%) | |
This year as last year, I am pleased to report that performance was, in our opinion, quite respectable over the past twelve months and reasonably comparable to the fund’s market benchmark - the Dow Jones Global Moderate Index. We plan to continue to manage this fund conservatively as we attempt to adjust to (what could be) rapidly changing economic conditions.
We continue to realize that the volatility and uncertainty of the markets may have been unsettling for many investors; however as a group, although our sub-advisors expect this pattern to continue into 2014, they also expect a somewhat upward bias with respect to performance in our underlying funds.
As you know, no one can guarantee future performance. However, the one thing that I can assure you of is that every one of our sub-advisors is doing their very best and our team here at Timothy is working very hard to provide you an investment with which you can feel comfortable.
Sincerely,
ARTHUR D. ALLY,
President
Timothy Plan Fund Performance
[21]
Fund Performance | Strategic Growth
September 30, 2013 - (Unaudited)
| | | | | | | | | | | | | | | | | | | | |
| Fund/Index | | 1 Year
Total Return | | 5 Year
Average
Annual Return | | 10 Year
Average
Annual Return | | |
Timothy Strategic Growth Fund - Class A (With Sales Charge) | | | | 6.62 | % | | | | 4.31 | % | | | | 4.90 | % | | | | | |
Dow Jones Global Moderately Aggressive Portfolio Index | | | | 16.54 | % | | | | 9.53 | % | | | | 8.70 | % | | | | | |
Timothy Strategic Growth Fund - Class C * | | | | 11.94 | % | | | | 4.64 | % | | | | 3.04 | % | | | | (a) | |
Dow Jones Global Moderately Aggressive Portfolio Index | | | | 16.54 | % | | | | 9.53 | % | | | | 7.46 | % | | | | (a) | |
| | (a) | For the period February 3, 2004 (commencement of investment in accordance with objective) to September 30, 2013. |
| | * | With Maximum Deferred Sales Charge |
Timothy Plan Strategic Growth Fund vs. Dow Jones Global Moderately Aggressive Portfolio Index
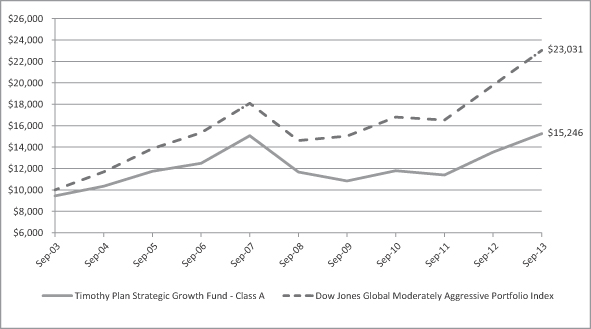
The chart shows the value of a hypothetical initial investment of $10,000 in the Fund’s Class A shares and the Dow Jones Global Moderately Aggressive Portfolio Index on September 30, 2003 and held through September 30, 2013. The Dow Jones Global Moderately Aggressive Portfolio Index is a widely recognized index that measures global stocks, bonds and cash which are in turn represented by multiple sub-indexes. Performance figures include the change in value of the investments in the index and the reinvestment of dividends. The index return does not reflect expenses, which have been deducted from the Fund’s return. The returns shown do not reflect deduction of taxes that a shareholder would pay on Fund distributions or the redemption of Fund shares. THE FUND’S RETURN REPRESENTS PAST PERFORMANCE AND IS NOT PREDICTIVE OF FUTURE RESULTS.
[22]
Letter from the Manager
September 30, 2013
Conservative Growth Fund
Dear Conservative Growth Fund Shareholder:
The Timothy Plan Conservative Growth Fund is simply an asset allocation fund that invests in a number of Timothy Plan underlying funds. Although the allocation percentages will vary slightly from time to time as a result of changing economic conditions, the allocation at September 30, 2013 was as follows:
| | | | | | | | | | |
• Large/Mid-Cap Growth Fund | | | (10.19%) | | | • Small-Cap Value Fund | | | (5.33%) | |
• Large/Mid-Cap Value Fund | | | (12.65%) | | | • Aggressive Growth Fund | | | (2.26%) | |
• International Fund | | | (4.98%) | | | • High-Yield Bond Fund | | | (8.47%) | |
• Defensive Strategies Fund | | | (14.92%) | | | • Fixed Income Fund | | | (29.21%) | |
• Israel Common Values Fund | | | (4.10%) | | | • Cash | | | (5.20%) | |
• Emerging Markets Fund | | | (2.99%) | | | | | | | |
This year as last year, I am pleased to report that performance was, in our opinion, quite respectable over the past twelve months and reasonably comparable to the fund’s market benchmark - the Dow Jones Global Moderate Index. We plan to continue to manage this fund conservatively as we attempt to adjust to (what could be) rapidly changing economic conditions.
We continue to realize that the volatility and uncertainty of the markets may have been unsettling for many investors; however as a group, although our sub-advisors expect this pattern to continue into 2014, they also expect a somewhat upward bias with respect to performance in our underlying funds.
As you know, no one can guarantee future performance. However, the one thing that I can assure you of is that every one of our sub-advisors is doing their very best and our team here at Timothy is working very hard to provide you an investment with which you can feel comfortable.
Sincerely,
ARTHUR D. ALLY,
President
Timothy Plan Fund Performance
[23]
Fund Performance | Conservative Growth
September 30, 2013 - (Unaudited)
| | | | | | | | | | | | | | | | | | | | |
| Fund/Index | | 1 Year
Total Return | | 5 Year
Average
Annual Return | | 10 Year
Average
Annual Return | | |
Timothy Conservative Growth Fund - Class A (With Sales Charge) | | | | 0.58 | % | | | | 4.15 | % | | | | 4.35 | % | | | | | |
Dow Jones Global Moderate Portfolio Index | | | | 11.46 | % | | | | 8.56 | % | | | | 7.66 | % | | | | | |
Timothy Conservative Growth Fund - Class C * | | | | 5.61 | % | | | | 4.56 | % | | | | 3.38 | % | | | | (a) | |
Dow Jones Global Moderate Portfolio Index | | | | 11.46 | % | | | | 8.56 | % | | | | 6.69 | % | | | | (a) | |
| | (a) | For the period February 3, 2004 (commencement of investment in accordance with objective) to September 30, 2013. |
| | * | With Maximum Deferred Sales Charge |
Timothy Plan Conservative Growth Fund vs. Dow Jones Global Moderate Portfolio Index
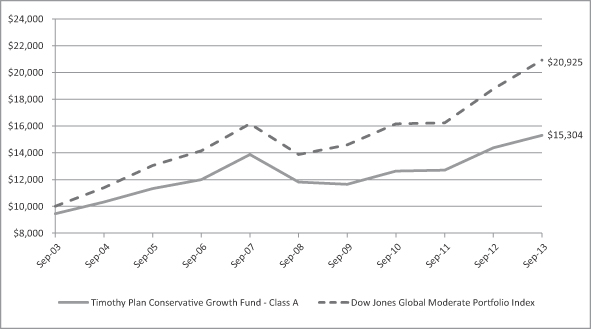
The chart shows the value of a hypothetical initial investment of $10,000 in the Fund’s Class A shares and the Dow Jones Global Moderate Portfolio Index on September 30, 2003 and held through September 30, 2013. The Dow Jones Global Moderate Portfolio Index is a widely recognized index that measures global stocks, bonds and cash which are in turn represented by multiple sub-indexes. Performance figures include the change in value of the investments in the index and the reinvestment of dividends. The index return does not reflect expenses, which have been deducted from the Fund’s return. The returns shown do not reflect deduction of taxes that a shareholder would pay on Fund distributions or the redemption of Fund shares. THE FUND’S RETURN REPRESENTS PAST PERFORMANCE AND IS NOT PREDICTIVE OF FUTURE RESULTS.
[24]
Letter from the Manager
September 30, 2013
Emerging Markets Fund
We will discuss sector-, country- and stock-specific factors that affected the Fund’s performance and describe changes in the Fund’s composition during the fiscal year ended September 30th, 2013. In addition, we will share insight into how the Fund is currently positioned for the future.
A number of investor concerns continued to drive volatility in emerging markets over the past year. After moving up cautiously in the fourth quarter of 2012, emerging-market equities - as represented by the MSCI Emerging Market Index - experienced unfavorable performance in the first half of 2013. News such as worse-than-expected economic growth in China and India contributed to negative market sentiment.
Market confidence returned after several positive developments from around the world, including the Federal Reserve’s announcement to continue its quantitative easing program and the expected euro zone recovery. The subsequent rebound of the MSCI Emerging Markets Index helped the index to deliver its overall positive performance for the period.
The Fund’s positions in materials, industrials and financials served as the biggest contributors to outperformance. In each of these sectors, we saw the benefit of a bottom-up stock selection as the Fund’s holdings in these areas generally outperformed those of the benchmark.
Notably strong individual performers included Singapore-domiciled electronics manufacturing services company Flextronics, South Korea’s Hyundai Motor and Austria-based commercial bank Erste Group Bank - each up more than 40% for the 12-month period. In our view, the Fund’s allocations to both Flextronics and Erste Group Bank highlight our distinctive investment approach that maintains the flexibility to invest in companies which are based outside of emerging markets, but conduct a significant portion of their business within such countries. We believe this approach could provide us with more opportunities to tap into potentially undervalued emerging-market investments.
From a country perspective, the Fund benefited most from its positions in South Korea, Singapore and Austria - where returns were mainly driven by the top performers mentioned above.
Offsetting some of the Fund’s strong performance were its Mexico-based holdings, among which homebuilders Urbi Desarrollos Urbanos and Desarrolladora Homex detracted most from performance. The Fund’s holdings in three electric utility providers - Russia-based RusHydro, Brazil-based Eletrobras and India-based Reliance Infrastructure - also hurt returns.
During the period, we sold select holdings as their prices appreciated toward our estimates of their intrinsic value in order to pursue what we believed were more attractive opportunities. For example, we exited the Fund’s positions in UAE-based Air Arabia and DP World, and Brazilian-based Itau Unibanco Holding. Another decision made during the period included initiating a position in Indonesian telecommunication services provider XL Axiata.
Amid the ups and downs of emerging-market equities over the past year, we believe the asset class remains attractive for patient, long-term investors. As of September 30, 2013, on a price-to-book (P/B) basis, the MSCI Emerging Markets Index was trading at a 20% discount to its 10-year average and a 25% discount to developed-market equities as represented by the MSCI World Index. The Timothy Plan Emerging Markets Fund offered even lower valuation metrics - trading at a 40% discount to the MSCI Emerging Market Index on a P/B basis.
With the general appeal of emerging-market equities growing, in our view it is important to discriminate between individual opportunities in the asset class. We believe our focus on company-specific fundamentals could help us largely avoid areas that are potentially overvalued and identify individual companies that might be undervalued.
We are excited about the prospect for the Timothy Plan Emerging Markets Fund and thank you for the trust you have placed in us.
BRANDES INVESTMENT PARTNERS, L.P.
Timothy Plan Fund Performance
[25]
Fund Performance | Emerging Markets
September 30, 2013 - (Unaudited)
| | | | | | | | | | |
| Fund/Index | | Average
Annual Return
Since Inception | | |
Timothy Emerging Markets Fund - Class A (With Sales Charge) | | | | -0.47 | % | | | | (a) | |
MSCI Emerging Markets Index | | | | -2.01 | % | | | | (a) | |
Timothy Emerging Markets Fund - Class C * | | | | 4.80 | % | | | | (a) | |
MSCI Emerging Markets Index | | | | -2.01 | % | | | | (a) | |
Timothy Emerging Markets Fund - Class I | | | | 5.72 | % | | | | (b) | |
MSCI Emerging Markets Index | | | | 3.49 | % | | | | (b) | |
| | (a) | For the period December 3, 2012 (commencement of investment in accordance with objective) to September 30, 2013. |
| | (b) | For the period August 1, 2013 (commencement of investment in accordance with objective) to September 30, 2013. |
| | * | With Maximum Deferred Sales Charge |
Timothy Plan Emerging Markets Fund vs. MSCI Emerging Markets Index
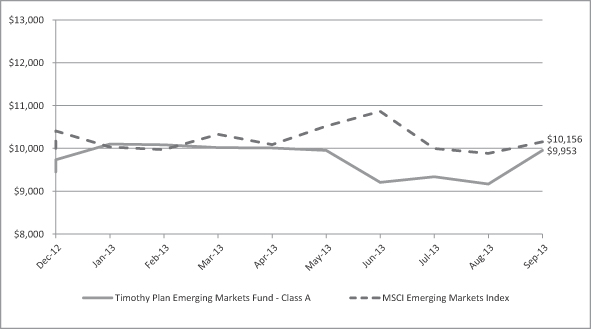
The chart shows the value of a hypothetical initial investment of $10,000 in the Fund’s Class A shares and the MSCI Emerging Markets Index on December 3, 2013 and held through September 30, 2013. The MSCI Emerging Markets Index is a free float-adjusted market capitalization index that is designed to measure equity market performance of emerging markets. The MSCI Emerging Markets Index consists of the following 21 emerging market country indices: Brazil, Chile, China, Colombia, Czech Republic, Egypt, Hungary, India, Indonesia, Korea, Malaysia, Mexico, Morocco, Peru, Philippines, Poland, Russia, South Africa, Taiwan, Thailand, and Turkey Performance figures include the change in value of the stocks in the index and the reinvestment of dividends. The index return does not reflect expenses, which have been deducted from the Fund’s return. The returns shown do not reflect deduction of taxes that a shareholder would pay on Fund distributions or the redemption of Fund shares. THE FUND’S RETURN REPRESENTS PAST PERFORMANCE AND IS NOT PREDICTIVE OF FUTURE RESULTS.
[26]
Fund Profile
As of September 30, 2013 - (Unaudited)
Aggressive Growth Fund
| | | | |
| Top Ten Industries | | | |
| (% of Net Assets) | | | |
Commercial Services | | | 13.6% | |
Retail | | | 9.7% | |
Financial/Investment Services | | | 6.9% | |
Software | | | 6.5% | |
Healthcare | | | 6.1% | |
Oil & Natural Gas | | | 5.7% | |
Banks | | | 5.6% | |
Apparel | | | 5.1% | |
Telecommunications | | | 4.8% | |
Electronics | | | 4.2% | |
Other Assets in Excess of Liabilities | | | 31.8% | |
| | | | |
| | | 100.0% | |
| | | | |
Large/Mid Cap Growth Fund
| | | | |
| Top Ten Industries | | | |
| (% of Net Assets) | | | |
Electronics | | | 10.9% | |
Retail | | | 9.9% | |
Semiconductors | | | 8.8% | |
Oil & Natural Gas | | | 6.2% | |
Healthcare | | | 5.1% | |
Commercial Services | | | 5.0% | |
Software | | | 4.3% | |
Miscellaneous Manufacturing | | | 4.0% | |
Banks | | | 3.8% | |
Diversified Financial Services | | | 3.4% | |
Other Assets in Excess of Liabilities | | | 38.1% | |
| | | | |
| | | 99.5% | |
| | | | |
Large/Mid Cap Value Fund
| | | | |
| Top Ten Industries | | | |
| (% of Net Assets) | | | |
Oil & Natural Gas | | | 10.3% | |
Healthcare | | | 8.6% | |
Banks | | | 6.1% | |
Chemicals | | | 6.1% | |
Retail | | | 5.7% | |
REITs | | | 5.2% | |
Insurance | | | 5.1% | |
Food | | | 4.6% | |
Electric Power | | | 4.1% | |
Electronics | | | 4.1% | |
Other Assets in Excess of Liabilities | | | 40.1% | |
| | | | |
| | | 100.0% | |
| | | | |
International Fund
| | | | |
| Top Ten Industries | | | |
| (% of Net Assets) | | | |
Banks | | | 10.8% | |
Telecommunications | | | 9.0% | |
Food | | | 7.5% | |
Insurance | | | 7.4% | |
Oil & Natural Gas | | | 7.1% | |
Healthcare | | | 5.6% | |
Automotive | | | 5.5% | |
Household Products | | | 4.1% | |
Minerals & Mining | | | 3.8% | |
Machinery | | | 3.5% | |
Other Assets in Excess of Liabilities | | | 35.7% | |
| | | | |
| | | 100.0% | |
| | | | |
Small Cap Value Fund
| | | | |
| Top Ten Industries | | | |
| (% of Net Assets) | | | |
Banks | | | 14.6% | |
REITs | | | 9.2% | |
Oil & Natural Gas | | | 6.4% | |
Building Materials | | | 6.0% | |
Electric & Equipment | | | 5.9% | |
Insurance | | | 4.5% | |
Electric Power | | | 4.4% | |
Machinery | | | 4.3% | |
Software | | | 4.1% | |
Computers | | | 3.1% | |
Other Assets in Excess of Liabilities | | | 37.5% | |
| | | | |
| | | 100.0% | |
| | | | |
Fixed Income Fund
| | | | |
| Top Ten Industries | | | |
| (% of Net Assets) | | | |
Corporate Bonds | | | 37.1% | |
Government Mortgage - Backed Securities | | | 31.4% | |
Government Notes & Bonds | | | 27.8% | |
Other Assets in Excess of Liabilities | | | 3.7% | |
| | | | |
| | | 100.0% | |
| | | | |
[27]
Fund Profile
As of September 30, 2013 - (Unaudited)
High Yield Bond Fund
| | | | |
| Top Ten Industries | | | |
| (% of Net Assets) | | | |
Corporate Bonds | | | 95.1% | |
Other Assets in Excess of Liabilities | | | 4.9% | |
| | | | |
| | | 100.0% | |
| | | | |
Defensive Strategies Fund
| | | | |
| Top Ten Industries | | | |
| (% of Net Assets) | | | |
REITs | | | 31.1% | |
TIPS | | | 28.1% | |
Exchange Traded Funds | | | 8.9% | |
Oil & Gas | | | 8.7% | |
Chemicals | | | 7.3% | |
Mining | | | 4.1% | |
Oil & Gas Services | | | 1.9% | |
Government Mortgage- Backed Securities | | | 1.9% | |
Pipelines | | | 0.9% | |
Agriculture | | | 0.7% | |
Other Assets in Excess of Liabilities | | | 6.4% | |
| | | | |
| | | 100.0% | |
| | | | |
Conservative Growth Fund
| | | | |
| Top Ten Industries | | | |
| (% of Net Assets) | | | |
Mutual Funds | | | 95.1% | |
Other Assets in Excess of Liabilities | | | 4.9% | |
| | | | |
| | | 100.0% | |
| | | | |
Israel Common Values Fund
| | | | |
| Top Ten Industries | | | |
| (% of Net Assets) | | | |
Real Estate | | | 16.2% | |
Oil & Natural Gas | | | 12.4% | |
Banks | | | 11.8% | |
Telecommunications | | | 8.1% | |
Food | | | 7.7% | |
Software | | | 6.4% | |
Chemicals | | | 4.2% | |
Semiconductors | | | 4.1% | |
Electronics | | | 4.0% | |
Healthcare Products | | | 3.5% | |
Other Assets in Excess of Liabilities | | | 21.6% | |
| | | | |
| | | 100.0% | |
| | | | |
Strategic Growth Fund
| | | | |
| Top Ten Industries | | | |
| (% of Net Assets) | | | |
Mutual Funds | | | 94.8% | |
Other Assets in Excess of Liabilities | | | 5.2% | |
| | | | |
| | | 100.0% | |
| | | | |
Emerging Markets Fund
| | | | |
| Top Ten Industries | | | |
| (% of Net Assets) | | | |
Banks | | | 18.0% | |
Oil & Natural Gas | | | 8.5% | |
Diversified Financial Services | | | 6.8% | |
Electric | | | 6.8% | |
Telecommunications | | | 6.7% | |
Food | | | 6.2% | |
Iron/Steel | | | 6.2% | |
Chemicals | | | 5.5% | |
Semiconductors | | | 4.9% | |
Preferred Stock | | | 3.8% | |
Other Assets in Excess of Liabilities | | | 26.6% | |
| | | | |
| | | 100.0% | |
| | | | |
[28]
| | |
| Timothy Plan Family of Funds | | Aggressive Growth |
| | |
Schedule of Investments | | As of September 30, 2013 |
| | | | | | | | | | | | |
| Common Stocks – 95.0% | | | | Shares | | Fair
Value |
AEROSPACE/DEFENSE – 0.8% | | | | | | | | | | | | |
B/E Aerospace, Inc. | | * | | | | 2,215 | | | | $ | 163,511 | |
| | | | | | | | | | | | |
APPAREL – 5.1% | | | | | | | | | | | | |
Carter’s, Inc. | | | | | | 1,975 | | | | | 149,883 | |
Hanesbrands, Inc. | | | | | | 4,915 | | | | | 306,254 | |
Steven Madden, Ltd. | | * | | | | 6,250 | | | | | 336,438 | |
Oxford Industries, Inc. | | | | | | 1,800 | | | | | 122,364 | |
VF Corp. | | | | | | 665 | | | | | 132,368 | |
| | | | | | | | | | | | |
| | | | | | | | | | | 1,047,307 | |
| | | | | | | | | | | | |
BANKS – 5.6% | | | | | | | | | | | | |
Cardinal Financial Corp. | | | | | | 5,605 | | | | | 92,651 | |
Cathay General Bancorp. | | | | | | 4,850 | | | | | 113,345 | |
First Horizon National Corp. | | | | | | 7,090 | | | | | 77,919 | |
Huntington Bancshares, Inc. | | | | | | 26,320 | | | | | 217,403 | |
PacWest Bancorp. | | | | | | 3,675 | | | | | 126,273 | |
Synovus Financial Corp. | | | | | | 75,525 | | | | | 249,232 | |
Zions Bancorp. | | | | | | 9,640 | | | | | 264,329 | |
| | | | | | | | | | | | |
| | | | | | | | | | | 1,141,152 | |
| | | | | | | | | | | | |
BIOTECHNOLOGY – 2.7% | | | | | | | | | | | | |
Aegerion Pharmaceuticals, Inc. | | * | | | | 625 | | | | | 53,569 | |
Alexion Pharmaceuticals, Inc. | | * | | | | 1,025 | | | | | 119,064 | |
Coronado Biosciences, Inc. | | * | | | | 3,175 | | | | | 22,289 | |
Incyte Corp, Ltd. | | * | | | | 2,730 | | | | | 104,149 | |
NPS Pharmaceuticals, Inc. | | * | | | | 2,150 | | | | | 68,392 | |
Vertex Pharmaceuticals, Inc. | | * | | | | 2,475 | | | | | 187,655 | |
| | | | | | | | | | | | |
| | | | | | | | | | | 555,118 | |
| | | | | | | | | | | | |
COMMERCIAL SERVICES – 13.6% | | | | | | | | | | | | |
Cardtronics, Inc. | | * | | | | 5,780 | | | | | 214,438 | |
Euronet Worldwide, Inc. | | * | | | | 4,840 | | | | | 192,632 | |
EVERTEC, Inc. | | | | | | 5,775 | | | | | 128,263 | |
FleetCor Technologies, Inc. | | * | | | | 2,109 | | | | | 232,327 | |
H&E Equipment Services, Inc. | | * | | | | 4,900 | | | | | 130,144 | |
H&R Block, Inc. | | | | | | 15,575 | | | | | 415,228 | |
Information Services Group, Inc. | | * | | | | 14,050 | | | | | 58,167 | |
K12, Inc. | | * | | | | 5,000 | | | | | 154,400 | |
KAR Auction Services, Inc. | | | | | | 4,000 | | | | | 112,840 | |
LifeLock, Inc. | | * | | | | 4,550 | | | | | 67,477 | |
MAXIMUS, Inc. | | | | | | 1,350 | | | | | 60,804 | |
SEI Investments Co. | | | | | | 4,865 | | | | | 150,377 | |
United Rentals, Inc. | | * | | | | 3,645 | | | | | 212,467 | |
Vantiv, Inc. – Cl. A | | * | | | | 9,100 | | | | | 254,254 | |
Verisk Analytics, Inc. | | * | | | | 2,385 | | | | | 154,930 | |
WNS Holdings, Ltd. – Cl. A | | * | | | | 12,195 | | | | | 258,778 | |
| | | | | | | | | | | | |
| | | | | | | | | | | 2,797,526 | |
| | | | | | | | | | | | |
COMPUTERS – 2.8% | | | | | | | | | | | | |
Cognizant Technology Solutions Corp. | | * | | | | 2,960 | | | | | 243,075 | |
IHS, Inc. | | * | | | | 1,525 | | | | | 174,125 | |
Manhattan Associates, Inc. | | * | | | | 690 | | | | | 65,861 | |
Mentor Graphics Corp. | | | | | | 4,380 | | | | | 102,361 | |
| | | | | | | | | | | | |
| | | | | | | | | | | 585,422 | |
| | | | | | | | | | | | |
| | | | | | | | | | | | |
| Common Stocks (Continued) | | | | Shares | | Fair
Value |
DISTRIBUTION/WHOLESALE – 1.9% | | | | | | | | | | | | |
MWI Veterinary Supply, Inc. | | * | | | | 470 | | | | $ | 70,199 | |
Wesco International, Inc. | | * | | | | 4,310 | | | | | 329,844 | |
| | | | | | | | | | | | |
| | | | | | | | | | | 400,043 | |
| | | | | | | | | | | | |
ELECTRICAL – 1.5% | | | | | | | | | | | | |
Acuity Brands, Inc. | | | | | | 1,225 | | | | | 112,725 | |
AMETEK, Inc. | | | | | | 2,680 | | | | | 123,334 | |
Hubbell, Inc. – Cl. B | | | | | | 730 | | | | | 76,460 | |
| | | | | | | | | | | | |
| | | | | | | | | | | 312,519 | |
| | | | | | | | | | | | |
ELECTRONICS – 4.2% | | | | | | | | | | | | |
Amphenol Corp. – Cl. A | | | | | | 3,535 | | | | | 273,538 | |
FEI Co. | | | | | | 1,280 | | | | | 112,384 | |
Mettler-Toledo International, Inc. | | * | | | | 530 | | | | | 127,247 | |
Trimble Navigation, Ltd. | | * | | | | 4,410 | | | | | 131,021 | |
Waters Corp. | | * | | | | 2,130 | | | | | 226,227 | |
| | | | | | | | | | | | |
| | | | | | | | | | | 870,417 | |
| | | | | | | | | | | | |
ENVIRONMENTAL CONTROL – 1.4% | | | | | | | | | | | | |
Mine Safety Appliances Co. | | | | | | 2,530 | | | | | 130,573 | |
Waste Connections, Inc. | | | | | | 3,510 | | | | | 159,389 | |
| | | | | | | | | | | | |
| | | | | | | | | | | 289,962 | |
| | | | | | | | | | | | |
FINANCIAL / INVESTMENT SERVICES – 6.9% | | | | | | | | | | | | |
Affiliated Managers Group, Inc. | | * | | | | 620 | | | | | 113,237 | |
Discover Financial Services | | | | | | 3,025 | | | | | 152,883 | |
Evercore Partners, Inc. | | | | | | 2,925 | | | | | 143,998 | |
IntercontinentalExchange, Inc. | | * | | | | 2,340 | | | | | 424,523 | |
Invesco, Ltd. | | | | | | 17,695 | | | | | 564,471 | |
Silvercrest Asset Management Group, Inc. | | * | | | | 1,675 | | | | | 22,830 | |
| | | | | | | | | | | | |
| | | | | | | | | | | 1,421,942 | |
| | | | | | | | | | | | |
HEALTHCARE – 6.1% | | | | | | | | | | | | |
Cepheid, Inc. | | * | | | | 1,375 | | | | | 53,680 | |
Cyberonics, Inc. | | * | | | | 945 | | | | | 47,949 | |
Globus Medical, Inc. | | * | | | | 6,500 | | | | | 113,490 | |
ICON PLC | | * | | | | 9,975 | | | | | 408,277 | |
ICU Medical, Inc. | | * | | | | 675 | | | | | 45,853 | |
Luminex Corp. | | * | | | | 4,900 | | | | | 98,000 | |
Masimo Corp. | | | | | | 3,100 | | | | | 82,584 | |
Sirona Dental Systems, Inc. | | * | | | | 1,227 | | | | | 82,123 | |
Tornier NV | | * | | | | 5,295 | | | | | 102,352 | |
Trinity Biotech PLC | | | | | | 3,275 | | | | | 71,264 | |
Volcano Corp. | | * | | | | 3,500 | | | | | 83,720 | |
Wright Medical Group, Inc. | | * | | | | 2,875 | | | | | 74,980 | |
| | | | | | | | | | | | |
| | | | | | | | | | | 1,264,272 | |
| | | | | | | | | | | | |
HOUSEHOLD PRODUCTS – 0.1% | | | | | | | | | | | | |
Helen of Troy, Ltd. | | * | | | | 475 | | | | | 20,995 | |
| | | | | | | | | | | | |
INSURANCE – 2.5% | | | | | | | | | | | | |
Assured Guaranty, Ltd. | | | | | | 13,325 | | | | | 249,844 | |
Radian Group, Inc. | | | | | | 19,308 | | | | | 268,960 | |
| | | | | | | | | | | | |
| | | | | | | | | | | 518,804 | |
| | | | | | | | | | | | |
INTERNET – 0.7% | | | | | | | | | | | | |
Equinix, Inc. | | * | | | | 795 | | | | | 146,002 | |
| | | | | | | | | | | | |
| | |
| Timothy Plan Family of Funds | | Aggressive Growth (Continued) |
| | |
Schedule of Investments | | As of September 30, 2013 |
| | | | | | | | | | | | |
| Common Stocks (Continued) | | | | Shares | | Fair
Value |
LEISURE – 0.4% | | | | | | | | | | | | |
Brunswick Corp. | | | | | | 2,235 | | | | $ | 89,199 | |
| | | | | | | | | | | | |
MACHINERY-DIVERSIFIED – 1.4% | | | | | | | | | | | | |
Flowserve Corp. | | | | | | 1,925 | | | | | 120,101 | |
Nordson Corp. | | | | | | 2,150 | | | | | 158,304 | |
| | | | | | | | | | | | |
| | | | | | | | | | | 278,405 | |
| | | | | | | | | | | | |
METAL FABRICATE/HARDWARE – 0.2% | | | | | | | | | | | | |
Rexnord Corp. | | * | | | | 1,600 | | | | | 33,280 | |
| | | | | | | | | | | | |
MISCELLANEOUS MANUFACTURING – 2.3% | | | | | | | | | | |
Actuant Corp. – Cl. A | | | | | | 2,675 | | | | | 103,897 | |
Hexcel Corp. | | * | | | | 4,975 | | | | | 193,030 | |
Trimas Corp. | | * | | | | 4,510 | | | | | 168,223 | |
| | | | | | | | | | | | |
| | | | | | | | | | | 465,150 | |
| | | | | | | | | | | | |
OIL & NATURAL GAS – 5.7% | | | | | | | | | | | | |
Approach Resources, Inc. | | * | | | | 3,850 | | | | | 101,178 | |
Cabot Oil & Gas Corp. – Cl. A | | | | | | 2,480 | | | | | 92,554 | |
Concho Resources, Inc. | | * | | | | 1,675 | | | | | 182,257 | |
Denbury Resources, Inc. | | * | | | | 13,575 | | | | | 249,916 | |
Gulfport Energy Corp. | | * | | | | 3,940 | | | | | 253,499 | |
Kodiak Oil & Gas Corp. | | * | | | | 15,175 | | | | | 183,010 | |
Rex Energy Corp. | | * | | | | 5,199 | | | | | 115,938 | |
| | | | | | | | | | | | |
| | | | | | | | | | | 1,178,352 | |
| | | | | | | | | | | | |
PHARMACEUTICALS – 1.6% | | | | | | | | | | | | |
Akorn, Inc. | | * | | | | 5,502 | | | | | 108,279 | |
BioMarin Pharmaceutical, Inc. | | * | | | | 1,325 | | | | | 95,692 | |
Infinity Pharmaceutical, Inc. | | * | | | | 4,425 | | | | | 77,216 | |
ViroPharma, Inc. | | * | | | | 1,225 | | | | | 48,142 | |
| | | | | | | | | | | | |
| | | | | | | | | | | 329,329 | |
| | | | | | | | | | | | |
REAL ESTATE – 1.0% | | | | | | | | | | | | |
HFF, Inc. – Cl. A | | | | | | 9,250 | | | | | 231,712 | |
| | | | | | | | | | | | |
RETAIL – 9.7% | | | | | | | | | | | | |
Cheesecake Factory, Inc. | | | | | | 2,900 | | | | | 127,455 | |
Del Frisco’s Restaurant Group, Inc. | | * | | | | 10,395 | | | | | 209,667 | |
Dick’s Sporting Goods, Inc. | | | | | | 2,450 | | | | | 130,781 | |
Domino’s Pizza, Inc. | | | | | | 2,124 | | | | | 144,326 | |
Express, Inc. | | * | | | | 5,435 | | | | | 128,212 | |
GNC Holdings, Inc. – Cl. A | | | | | | 2,850 | | | | | 155,696 | |
Group 1 Automotive, Inc. | | | | | | 5,480 | | | | | 425,686 | |
Krispy Kreme Doughnuts, Inc. | | * | | | | 2,020 | | | | | 39,067 | |
Mattress Firm Holding Corp. | | * | | | | 850 | | | | | 27,030 | |
MSC Industrial Direct Co., Inc | | | | | | 1,700 | | | | | 138,295 | |
Pier 1 Imports, Inc. | | | | | | 4,450 | | | | | 86,864 | |
Rush Enterprises, Inc. | | * | | | | 9,250 | | | | | 245,217 | |
Stage Stores, Inc. | | | | | | 5,975 | | | | | 114,720 | |
Wet Seal, Inc. | | * | | | | 4,325 | | | | | 16,997 | |
| | | | | | | | | | | | |
| | | | | | | | | | | 1,990,013 | |
| | | | | | | | | | | | |
SEMICONDUCTORS – 1.7% | | | | | | | | | | | | |
MaxLinear, Inc. | | * | | | | 7,689 | | | | | 63,742 | |
MKS Instruments, Inc. | | | | | | 4,020 | | | | | 106,892 | |
ON Semiconductor Corp. | | * | | | | 11,180 | | | | | 81,614 | |
Semtech Corp. | | * | | | | 3,265 | | | | | 97,917 | |
| | | | | | | | | | | | |
| | | | | | | | | | | 350,165 | |
| | | | | | | | | | | | |
| | | | | | | | | | | | |
| Common Stocks (Continued) | | | | Shares | | Fair
Value |
SOFTWARE – 6.5% | | | | | | | | | | | | |
Aspen Technology, Inc. | | * | | | | 2,090 | | | | $ | 72,210 | |
Cerner Corp. | | * | | | | 2,100 | | | | | 110,355 | |
Fair Isaac Corp. | | | | | | 1,910 | | | | | 105,585 | |
Informatica Corp. | | * | | | | 3,500 | | | | | 136,395 | |
Interactive Intelligence Group, Inc. | | * | | | | 785 | | | | | 49,840 | |
MedAssets, Inc. | | * | | | | 5,990 | | | | | 152,266 | |
Progress Software Corp. | | * | | | | 1,575 | | | | | 40,761 | |
PTC, Inc. | | * | | | | 10,970 | | | | | 311,877 | |
SS&C Technologies Holdings, Inc. | | * | | | | 2,875 | | | | | 109,537 | |
Synchronoss Technologies, Inc. | | * | | | | 1,675 | | | | | 63,750 | |
Tangoe, Inc. | | * | | | | 7,850 | | | | | 187,301 | |
| | | | | | | | | | | | |
| | | | | | | | | | | 1,339,877 | |
| | | | | | | | | | | | |
TELECOMMUNICATIONS – 4.8% | | | | | | | | | | | | |
Aruba Networks, Inc | | * | | | | 6,210 | | | | | 103,334 | |
CalAmp Corp. | | * | | | | 3,700 | | | | | 65,231 | |
Finisar Corp. | | * | | | | 7,760 | | | | | 175,609 | |
SBA Communications Corp. – Cl. A | | * | | | | 8,050 | | | | | 647,703 | |
| | | | | | | | | | | | |
| | | | | | | | | | | 991,877 | |
| | | | | | | | | | | | |
TRANSPORTATION – 3.8% | | | | | | | | | | | | |
Genesse & Wyoming, Inc. – Cl A | | * | | | | 3,160 | | | | | 293,785 | |
Old Dominion Freight Line, Inc. | | * | | | | 10,640 | | | | | 489,334 | |
| | | | | | | | | | | | |
| | | | | | | | | | | 783,119 | |
| | | | | | | | | | | | |
Total Common Stocks
(Cost $15,878,274) | | | | | | | | | | $ | 19,595,470 | |
| | | | | | | | | | | | |
| | |
| Master Limited Partnerships – 0.6% | | Shares | | Fair Value |
Lazard, Ltd. – Cl. A
(Cost $112,902) | | | | | | 3,235 | | | | $ | 116,525 | |
| | | | | | | | | | | | |
| | |
| REITs – 0.3% | | Shares | | Fair Value |
Lexington Realty Trust
(Cost $70,328) | | | | | | 5,800 | | | | $ | 65,134 | |
| | | | | | | | | | | | |
| | |
| Money Market Fund – 4.7% | | Shares | | Fair Value |
Fidelity Institutional Money Market Portfolio, 0.01%
(Cost $964,764) | | (A) | | | | 964,764 | | | | $ | 964,764 | |
| | | | | | | | | | | | |
Total Investments
(Cost $17,026,268) – 100.6% | | (B) | | | | | | | | $ | 20,741,893 | |
Liabilities in Excess of Other Assets – (0.6)% | | | | | | | | | | | (122,593 | ) |
| | | | | | | | | | | | |
Net Assets – 100.00% | | | | | | | | | | $ | 20,619,300 | |
| | | | | | | | | | | | |
| | |
| Timothy Plan Family of Funds | | Aggressive Growth (Continued) |
| | |
Schedule of Investments | | As of September 30, 2013 |
| * | Non-income producing securities. |
| REIT | – Real Estate Investment Trust. |
| (A) | Variable rate security; the rate shown represents the yield at September 30, 2013. |
| (B) | Represents cost for financial reporting purposes. Aggregate cost for federal tax purposes is $17,074,749 and differs from fair value by net unrealized appreciation (depreciation) of securities as follows: |
| | | | | |
Unrealized appreciation | | | $ | 3,835,575 | |
Unrealized depreciation | | | | (168,431 | ) |
| | | | | |
Net unrealized appreciation | | | $ | 3,667,144 | |
| | | | | |
The accompanying notes are an integral part of these financial statements.
[31]
| | |
| Timothy Plan Family of Funds | | International |
| | |
Schedule of Investments | | As of September 30, 2013 |
| | | | | | | | | | | | |
| Common Stocks – 96.1% | | | | Shares | | Fair Value |
AIRLINES – 1.7% | | | | | | | | | | | | |
Copa Holdings SA – Cl. A | | | | | | 5,100 | | | | $ | 707,217 | |
| | | | | | | | | | | | |
AUTOMOTIVE – 5.5% | | | | | | | | | | | | |
Magna International, Inc. | | | | | | 11,800 | | | | | 974,208 | |
Valeo SA (ADR) | | | | | | 30,000 | | | | | 1,280,100 | |
| | | | | | | | | | | | |
| | | | | | | | | | | 2,254,308 | |
| | | | | | | | | | | | |
BANKS – 10.8% | | | | | | | | | | | | |
Bank of East Asia, Ltd. (ADR) | | | | | | 107,000 | | | | | 448,330 | |
Bank Hapoalim BM (ADR) | | | | | | 18,000 | | | | | 455,580 | |
DBS Group Holdings, Ltd. (ADR) | | | | | | 20,139 | | | | | 1,056,291 | |
Sumitomo Mitsui Financial Group, Inc. | | | | | | 122,700 | | | | | 1,193,871 | |
Sberbank of Russia (ADR) | | | | | | 62,000 | | | | | 745,860 | |
Swedbank AB (ADR) | | | | | | 22,100 | | | | | 516,477 | |
| | | | | | | | | | | | |
| | | | | | | | | | | 4,416,409 | |
| | | | | | | | | | | | |
BUILDING MATERIALS – 2.0% | | | | | | | | | | | | |
Lafarge SA | | | | | | 47,000 | | | | | 814,510 | |
| | | | | | | | | | | | |
CHEMICALS – 3.0% | | | | | | | | | | | | |
Agrium, Inc. | | | | | | 6,300 | | | | | 529,389 | |
Syngenta AG (ADR) | | | | | | 8,500 | | | | | 691,050 | |
| | | | | | | | | | | | |
| | | | | | | | | | | 1,220,439 | |
| | | | | | | | | | | | |
DISTRIBUTION / WHOLESALE – 2.3% | | | | | | | | | | | | |
ITOCHU Corp. (ADR) | | | | | | 38,000 | | | | | 937,080 | |
| | | | | | | | | | | | |
ELECTRIC POWER – 0.9% | | | | | | | | | | | | |
Power Assets Holdings, Ltd. (ADR) | | | | | | 38,900 | | | | | 345,821 | |
| | | | | | | | | | | | |
ELECTRICAL – 2.1% | | | | | | | | | | | | |
Hitachi, Ltd. (ADR) | | | | | | 13,000 | | | | | 862,550 | |
| | | | | | | | | | | | |
FINANCIAL / INVESTMENT SERVICES – 3.4% | | | | | | | | | | | | |
ORIX Corp. (ADR) | | | | | | 17,200 | | | | | 1,407,304 | |
| | | | | | | | | | | | |
ENGINEERING & CONSTRUCTION – 2.3% | | | | | | | | | | | | |
Vinci SA (ADR) | | | | | | 65,000 | | | | | 941,850 | |
| | | | | | | | | | | | |
FOOD – 7.5% | | | | | | | | | | | | |
Kerry Group PLC (ADR) | | | | | | 14,000 | | | | | 849,800 | |
Marine Harvest ASA (ADR) | | | | | | 26,000 | | | | | 552,084 | |
Seven & I Holdings Co., Ltd. (ADR) | | | | | | 10,500 | | | | | 767,235 | |
WM Morrison Supermarkets PLC (ADR) | | | | | | 40,000 | | | | | 911,200 | |
| | | | | | | | | | | | |
| | | | | | | | | | | 3,080,319 | |
| | | | | | | | | | | | |
HAND / MACHINE TOOLS – 1.8% | | | | | | | | | | | | |
Techtronic Industries Co. (ADR) | | | | | | 55,100 | | | | | 721,369 | |
| | | | | | | | | | | | |
HEALTHCARE – 5.6% | | | | | | | | | | | | |
Fresenius Medical Care AG & Co. (ADR) | | | | | | 30,000 | | | | | 971,400 | |
Smith & Nephew PLC (ADR) | | | | | | 21,000 | | | | | 1,310,820 | |
| | | | | | | | | | | | |
| | | | | | | | | | | 2,282,220 | |
| | | | | | | | | | | | |
HOME BUILDERS – 2.4% | | | | | | | | | | | | |
Sekisui House, Ltd. (ADR) | | | | | | 65,000 | | | | | 872,950 | |
| | | | | | | | | | | | |
HOUSEHOLD PRODUCTS – 4.1% | | | | | | | | | | | | |
Henkel AG & Co. (ADR) | | | | | | 19,000 | | | | | 1,679,207 | |
| | | | | | | | | | | | |
| | | | | | | | | | | | |
| Common Stocks (continued) | | | | Shares | | Fair Value |
INSURANCE – 7.4% | | | | | | | | | | | | |
Aegon NV (ADR) | | | | | | 120,000 | | | | $ | 888,000 | |
Ageas (ADR) | | | | | | 25,000 | | | | | 1,013,750 | |
Muenchener Keuckversicherungs AG (ADR) | | | | | | 37,200 | | | | | 728,004 | |
Zurich Insurance Group AG (ADR) | | | | | | 15,900 | | | | | 408,471 | |
| | | | | | | | | | | | |
| | | | | | | | | | | 3,038,225 | |
| | | | | | | | | | | | |
MACHINERY – 3.5% | | | | | | | | | | | | |
Assa Abloy AB (ADR) | | | | | | 18,000 | | | | | 413,460 | |
Atlas Copco AB (ADR) | | | | | | 24,000 | | | | | 632,640 | |
CNH Global NV | | * | | | | 31,772 | | | | | 397,155 | |
| | | | | | | | | | | | |
| | | | | | | | | | | 1,443,255 | |
| | | | | | | | | | | | |
MINERALS & MINING – 3.8% | | | | | | | | | | | | |
BHP Billiton PLC (ADR) | | | | | | 13,000 | | | | | 765,180 | |
Vale SA (ADR) | | | | | | 55,700 | | | | | 791,497 | |
| | | | | | | | | | | | |
| | | | | | | | | | | 1,556,677 | |
| | | | | | | | | | | | |
MISCELLANEOUS MANUFACTURING – 2.6% | | | | | | | | | | | | |
FUJIFILM Holdings Corp. (ADR) | | | | | | 34,050 | | | | | 818,562 | |
Vesuvius PLC (ADR) | | | | | | 35,000 | | | | | 253,243 | |
| | | | | | | | | | | | |
| | | | | | | | | | | 1,071,805 | |
| | | | | | | | | | | | |
OFFICE / BUSINESS EQUIPMENT – 0.7% | | | | | | | | | | | | |
Canon, Inc. (ADR) | | | | | | 9,000 | | | | | 288,000 | |
| | | | | | | | | | | | |
OIL & NATURAL GAS – 7.1% | | | | | | | | | | | | |
Afren PLC (ADR) | | * | | | | 50,000 | | | | | 559,910 | |
Lukoil OAO (ADR) | | | | | | 14,000 | | | | | 889,840 | |
Statoil ASA (ADR) | | | | | | 40,868 | | | | | 926,886 | |
Transocean, Ltd. | | | | | | 12,000 | | | | | 534,000 | |
| | | | | | | | | | | | |
| | | | | | | | | | | 2,910,636 | |
| | | | | | | | | | | | |
OIL & GAS SERVICE – 2.0% | | | | | | | | | | | | |
Subsea 7 SA (ADR) | | | | | | 39,288 | | | | | 815,226 | |
| | | | | | | | | | | | |
PHARMACEUTICAL – 2.6% | | | | | | | | | | | | |
Shire PLC (ADR) | | | | | | 8,800 | | | | | 1,055,032 | |
| | | | | | | | | | | | |
SOFTWARE – 0.5% | | | | | | | | | | | | |
Open Text Corp. | | | | | | 3,000 | | | | | 223,950 | |
| | | | | | | | | | | | |
TELECOMMUNICATIONS – 9.0% | | | | | | | | | | | | |
Globe Telecom, Inc. (ADR) | | | | | | 15,000 | | | | | 551,217 | |
Nippon Telegraph & Telephone Corp. (ADR) | | | | | | 16,000 | | | | | 416,960 | |
Philippine Long Distance Telephone Co. (ADR) | | | | | | 10,500 | | | | | 712,320 | |
Singapore Telecommunications, Ltd. (ADR) | | | | | | 47,500 | | | | | 1,423,100 | |
Softbank Corp. (ADR) | | | | | | 16,852 | | | | | 587,292 | |
| | | | | | | | | | | | |
| | | | | | | | | | | 3,690,889 | |
| | | | | | | | | | | | |
TRANSPORTATION – 1.5% | | | | | | | | | | | | |
Canadian Pacific Railway, Ltd. | | | | | | 5,000 | | | | | 616,500 | |
| | | | | | | | | | | | |
Total Common Stocks
(Cost $31,383,407) | | | | | | | | | | $ | 39,253,748 | |
| | | | | | | | | | | | |
| | |
| Timothy Plan Family of Funds | | International (Continued) |
| | |
Schedule of Investments | | As of September 30, 2013 |
| | | | | | | | | | | | |
| Money Market Fund – 3.8% | | | | Shares | | Fair Value |
Fidelity Institutional Money Market Portfolio, 0.01%
(Cost $1,534,760) | | (A) | | | | 1,534,760 | | | | $ | 1,534,760 | |
| | | | | | | | | | | | |
Total Investments
(Cost $32,918,167) – 99.9% | | (B) | | | | | | | | $ | 40,788,508 | |
Other Assets in Excess of Liabilities – 0.1% | | | | | | | | | | | 90,013 | |
| | | | | | | | | | | | |
Net Assets – 100.00% | | | | | | | | | | $ | 40,878,521 | |
| | | | | | | | | | | | |
| * | Non-income producing securities. |
| (ADR) | American Depositary Receipt. |
| (A) | Variable rate security; the rate shown represents the yield at September 30, 2013. |
| (B) | Represents cost for financial reporting purposes. Aggregate cost for federal tax purposes is $33,520,463 and differs from fair value by net unrealized appreciation (depreciation) of securities as follows: |
| | | | | |
Unrealized appreciation | | | $ | 7,701,732 | |
Unrealized depreciation | | | | (433,687 | ) |
| | | | | |
Net unrealized appreciation | | | $ | 7,268,045 | |
| | | | | |
Diversification of Assets
| | | | |
Country | | % of
Net Assets | |
Belgium | | | 2.48% | |
Brazil | | | 1.94% | |
Canada | | | 5.73% | |
France | | | 7.43% | |
Germany | | | 8.27% | |
Hong Kong | | | 3.71% | |
Ireland | | | 4.66% | |
Israel | | | 1.11% | |
Japan | | | 19.94% | |
Netherlands | | | 3.14% | |
Norway | | | 3.62% | |
Panama | | | 1.73% | |
Philippines | | | 3.09% | |
Russia | | | 4.00% | |
Singapore | | | 6.07% | |
Sweden | | | 3.82% | |
Switzerland | | | 4.00% | |
United Kingdom | | | 11.29% | |
| | | | |
Total | | | 96.03% | |
Money Market Fund | | | 3.80% | |
Other Assets in Excess of Liabilities | | | 0.17% | |
| | | | |
Grand Total | | | 100.00% | |
| | | | |
The accompanying notes are an integral part of these financial statements.
[33]
| | |
| Timothy Plan Family of Funds | | Large/Mid Cap Growth |
| | |
Schedule of Investments | | As of September 30, 2013 |
| | | | | | | | | | | | |
| Common Stocks – 95.3% | | | | Shares | | Fair Value |
AEROSPACE/DEFENSE – 3.7 % | | | | | | | | | | | | |
B/E Aerospace, Inc. | | * | | | | 6,050 | | | | $ | 446,611 | |
General Dynamics Corp. | | | | | | 17,650 | | | | | 1,544,728 | |
| | | | | | | | | | | | |
| | | | | | | | | | | 1,991,339 | |
| | | | | | | | | | | | |
APPAREL – 1.8% | | | | | | | | | | | | |
Carter’s, Inc. | | | | | | 4,225 | | | | | 320,635 | |
Hanesbrands, Inc. | | | | | | 5,245 | | | | | 326,816 | |
VF Corp. | | | | | | 1,560 | | | | | 310,518 | |
| | | | | | | | | | | | |
| | | | | | | | | | | 957,969 | |
| | | | | | | | | | | | |
BANKS – 3.8 % | | | | | | | | | | | | |
BB&T Corp. | | | | | | 30,330 | | | | | 1,023,637 | |
Huntington Bancshares, Inc. | | | | | | 61,975 | | | | | 511,913 | |
Zions Bancorp. | | | | | | 17,925 | | | | | 491,503 | |
| | | | | | | | | | | | |
| | | | | | | | | | | 2,027,053 | |
| | | | | | | | | | | | |
BIOTECHNOLOGY – 0.9% | | | | | | | | | | | | |
Alexion Pharmaceuticals, Inc. | | * | | | | 2,575 | | | | | 299,112 | |
Vertex Pharmaceuticals, Inc. | | * | | | | 2,675 | | | | | 202,818 | |
| | | | | | | | | | | | |
| | | | | | | | | | | 501,930 | |
| | | | | | | | | | | | |
CHEMICALS – 2.2 % | | | | | | | | | | | | |
Praxair, Inc. | | | | | | 9,810 | | | | | 1,179,260 | |
| | | | | | | | | | | | |
COMMERCIAL SERVICES – 5.0 % | | | | | | | | | | | | |
FleetCor Technologies, Inc. | | * | | | | 2,467 | | | | | 271,765 | |
H&R Block, Inc. | | | | | | 16,225 | | | | | 432,559 | |
KAR Auction Services, Inc. | | | | | | 9,700 | | | | | 273,637 | |
SEI Investments Co. | | | | | | 9,075 | | | | | 280,508 | |
United Rentals, Inc. | | * | | | | 6,240 | | | | | 363,730 | |
Vantiv, Inc. – Cl. A | | * | | | | 22,745 | | | | | 635,495 | |
Verisk Analytics, Inc. – Cl. A | | * | | | | 6,070 | | | | | 394,307 | |
| | | | | | | | | | | | |
| | | | | | | | | | | 2,652,001 | |
| | | | | | | | | | | | |
COMPUTERS – 2.0 % | | | | | | | | | | | | |
Cognizant Technology Solutions Corp. – Cl. A | | * | | | | 8,825 | | | | | 724,709 | |
IHS, Inc. – Cl. A | | * | | | | 3,075 | | | | | 351,103 | |
| | | | | | | | | | | | |
| | | | | | | | | | | 1,075,812 | |
| | | | | | | | | | | | |
DISTRIBUTION/WHOLESALE – 0.9% | | | | | | | | | | | | |
Wesco International, Inc. | | * | | | | 6,240 | | | | | 477,547 | |
| | | | | | | | | | | | |
DIVERSIFIED FINANCIAL SERVICES – 3.4% | | | | | | | | | | | | |
Affiliated Managers Group, Inc. | | * | | | | 1,495 | | | | | 273,047 | |
Discover Financial Services | | | | | | 6,910 | | | | | 349,231 | |
IntercontinentalExchange, Inc. | | * | | | | 3,190 | | | | | 578,730 | |
Invesco, Ltd. | | | | | | 19,244 | | | | | 613,884 | |
| | | | | | | | | | | | |
| | | | | | | | | | | 1,814,892 | |
| | | | | | | | | | | | |
ELECTRICAL COMPONENTS &
EQUIPMENT – 0.9 % | | | | | | | | | | | | |
AMETEK, Inc. | | | | | | 6,320 | | | | | 290,846 | |
Hubbell, Inc. | | | | | | 1,680 | | | | | 175,963 | |
| | | | | | | | | | | | |
| | | | | | | | | | | 466,809 | |
| | | | | | | | | | | | |
ELECTRONICS – 10.9% | | | | | | | | | | | | |
Amphenol Corp. – Class A | | | | | | 20,720 | | | | | 1,603,314 | |
FEI Co. | | | | | | 1,775 | | | | | 155,845 | |
| | | | | | | | | | | | |
| Common Stocks (Continued) | | | | Shares | | Fair Value |
ELECTRONICS (continued) | | | | | | | | | | | | |
Jabil Circuit, Inc. | | | | | | 60,035 | | | | $ | 1,301,559 | |
Mettler-Toledo International, Inc. | | * | | | | 1,130 | | | | | 271,302 | |
Thermo Fisher Scientific, Inc. | | | | | | 19,845 | | | | | 1,828,717 | |
Trimble Navigation, Ltd. | | * | | | | 9,670 | | | | | 287,296 | |
Waters Corp. | | * | | | | 3,380 | | | | | 358,990 | |
| | | | | | | | | | | | |
| | | | | | | | | | | 5,807,023 | |
| | | | | | | | | | | | |
ENTERTAINMENT – 2.3% | | | | | | | | | | | | |
Cinemark Holdings, Inc. | | | | | | 39,295 | | | | | 1,247,223 | |
| | | | | | | | | | | | |
ENVIRONMENTAL CONTROL – 0.7% | | | | | | | | | | | | |
Waste Connections, Inc. | | | | | | 8,370 | | | | | 380,082 | |
| | | | | | | | | | | | |
FOOD – 1.8% | | | | | | | | | | | | |
JM Smucker and Co. | | | | | | 8,890 | | | | | 933,806 | |
| | | | | | | | | | | | |
HEALTHCARE – 5.1% | | | | | | | | | | | | |
Covidien PLC | | | | | | 24,825 | | | | | 1,512,834 | |
ICON PLC | | * | | | | 12,150 | | | | | 497,300 | |
Sirona Dental Systems, Inc. | | * | | | | 10,925 | | | | | 731,210 | |
| | | | | | | | | | | | |
| | | | | | | | | | | 2,741,344 | |
| | | | | | | | | | | | |
INSURANCE – 3.2% | | | | | | | | | | | | |
ACE, Ltd. | | | | | | 15,475 | | | | | 1,447,841 | |
Assured Guaranty, Ltd. | | | | | | 12,650 | | | | | 237,188 | |
| | | | | | | | | | | | |
| | | | | | | | | | | 1,685,029 | |
| | | | | | | | | | | | |
INTERNET – 0.6% | | | | | | | | | | | | |
Equinix, Inc. | | * | | | | 1,700 | | | | | 312,205 | |
| | | | | | | | | | | | |
MACHINERY – 3.0% | | | | | | | | | | | | |
Flowserve Corp. | | | | | | 3,925 | | | | | 244,881 | |
Nordson Corp. | | | | | | 4,525 | | | | | 333,176 | |
Rockwell Automation, Inc. | | | | | | 9,665 | | | | | 1,033,575 | |
| | | | | | | | | | | | |
| | | | | | | | | | | 1,611,632 | |
| | | | | | | | | | | | |
MINING – 2.9% | | | | | | | | | | | | |
Freeport – McMoRan Copper & Gold, Inc. | | | | | | 46,125 | | | | | 1,525,815 | |
| | | | | | | | | | | | |
MISCELLANEOUS MANUFACTURING – 4.0 % | | | | | | | | | | | | |
Actuant Corp. – Cl. A | | | | | | 9,825 | | | | | 381,603 | |
Danaher Corp. | | | | | | 25,180 | | | | | 1,745,478 | |
| | | | | | | | | | | | |
| | | | | | | | | | | 2,127,081 | |
| | | | | | | | | | | | |
OIL & NATURAL GAS – 6.2% | | | | | | | | | | | | |
Cabot Oil & Gas Corp. – Cl. A | | | | | | 5,970 | | | | | 222,800 | |
Concho Resources, Inc. | | * | | | | 4,590 | | | | | 499,438 | |
Denbury Resources, Inc | | * | | | | 22,700 | | | | | 417,907 | |
Gulfport Energy Corp. | | * | | | | 4,650 | | | | | 299,181 | |
Occidental Petroleum Corp. | | | | | | 20,180 | | | | | 1,887,637 | |
| | | | | | | | | | | | |
| | | | | | | | | | | 3,326,963 | |
| | | | | | | | | | | | |
PHARMACEUTICALS – 1.8% | | | | | | | | | | | | |
AmerisourceBergen Corp. | | | | | | 12,325 | | | | | 753,057 | |
BioMarin Pharmaceutical, Inc. | | * | | | | 2,775 | | | | | 200,411 | |
| | | | | | | | | | | | |
| | | | | | | | | | | 953,468 | |
| | | | | | | | | | | | |
| | |
| Timothy Plan Family of Funds | | Large/Mid Cap Growth (Continued) |
| | |
Schedule of Investments | | As of September 30, 2013 |
| | | | | | | | | | | | |
| Common Stocks (Continued) | | | | Shares | | Fair Value |
RETAIL – 9.9% | | | | | | | | | | | | |
AutoZone Inc. | | * | | | | 3,320 | | | | $ | 1,403,464 | |
Cheesecake Factory, Inc. | | | | | | 6,125 | | | | | 269,194 | |
Dick’s Sporting Goods, Inc. | | | | | | 5,300 | | | | | 282,914 | |
Domino’s Pizza, Inc. | | | | | | 2,234 | | | | | 151,800 | |
GNC Holdings, Inc. – Cl. A | | | | | | 6,125 | | | | | 334,609 | |
Group 1 Automotive, Inc. | | | | | | 6,375 | | | | | 495,210 | |
Lowe’s Cos., Inc. | | | | | | 21,990 | | | | | 1,046,944 | |
MSC Industrial Direct Co., Inc. | | | | | | 2,550 | | | | | 207,443 | |
PetSmart, Inc. | | | | | | 14,445 | | | | | 1,101,576 | |
| | | | | | | | | | | | |
| | | | | | | | | | | 5,293,154 | |
| | | | | | | | | | | | |
SEMICONDUCTORS – 8.8% | | | | | | | | | | | | |
Linear Technology Corp. | | | | | | 42,620 | | | | | 1,690,309 | |
Maxim Integrated Products, Inc. | | | | | | 29,430 | | | | | 877,014 | |
NVIDIA Corp. | | | | | | 65,270 | | | | | 1,015,601 | |
ON Semiconductor Corp. | | * | | | | 23,795 | | | | | 173,704 | |
Xilinx Inc. | | | | | | 20,555 | | | | | 963,207 | |
| | | | | | | | | | | | |
| | | | | | | | | | | 4,719,835 | |
| | | | | | | | | | | | |
SOFTWARE – 4.3 % | | | | | | | | | | | | |
Cerner Corp. | | * | | | | 4,425 | | | | | 232,534 | |
Informatica Corp. | | * | | | | 14,705 | | | | | 573,054 | |
PTC, Inc. | | * | | | | 20,810 | | | | | 591,628 | |
Vmware, Inc. – Cl. A | | * | | | | 11,290 | | | | | 913,361 | |
| | | | | | | | | | | | |
| | | | | | | | | | | 2,310,577 | |
| | | | | | | | | | | | |
| | | | | | | | | | | | |
| Common Stocks (Continued) | | | | Shares | | Fair Value |
TELECOMMUNICATIONS – 1.3% | | | | | | | | | | | | |
SBA Communcations Corp. Cl. A | | * | | | | 8,725 | | | | $ | 702,014 | |
| | | | | | | | | | | | |
TRANSPORTATION – 3.8% | | | | | | | | | | | | |
Genesee & Wyoming, Inc. – Class A | | * | | | | 3,280 | | | | | 304,942 | |
Norfolk Southern Corp. | | | | | | 16,350 | | | | | 1,264,672 | |
Old Dominion Freight Line, Inc. | | * | | | | 9,890 | | | | | 454,841 | |
| | | | | | | | | | | | |
| | | | | | | | | | | 2,024,455 | |
| | | | | | | | | | | | |
Total Common Stocks
(Cost $42,878,485) | | | | | | | | | | $ | 50,846,318 | |
| | | | | | | | | | | | |
| | | |
| Master Limited Partnerships – 0.5% | | | | Shares | | Fair Value |
Lazard, Ltd. – Cl. A
(Cost $238,871) | | | | | | 7,010 | | | | $ | 252,500 | |
| | | | | | | | | | | | |
| | | |
| Money Market Fund – 3.7% | | | | Shares | | Fair Value |
Fidelity Institutional Money Market Portfolio, 0.01%
(Cost $1,983,876) | | (A) | | | | 1,983,876 | | | | $ | 1,983,876 | |
| | | | | | | | | | | | |
Total Investments
(Cost $45,101,232) – 99.4% | | (B) | | | | | | | | $ | 53,082,694 | |
Other Assets in Excess of
Liabilities – 0.6% | | | | | | | | | | | 368,706 | |
| | | | | | | | | | | | |
Net Assets – 100.00% | | | | | | | | | | $ | 53,451,400 | |
| | | | | | | | | | | | |
| * | Non-income producing securities. |
| (A) | Variable rate security; the rate shown represents the yield at September 30, 2013. |
| (B) | Represents cost for financial reporting purposes. Aggregate cost for federal tax purposes is $45,176,581 and differs from fair value by net unrealized appreciation (depreciation) of securities as follows: |
| | | | | |
Unrealized appreciation | | | $ | 8,053,717 | |
Unrealized depreciation | | | | (147,604 | ) |
| | | | | |
Net unrealized appreciation | | | $ | 7,906,113 | |
| | | | | |
The accompanying notes are an integral part of these financial statements.
[35]
| | |
| Timothy Plan Family of Funds | | Small Cap Value |
| | |
Schedule of Investments | | As of September 30, 2013 |
| | | | | | | | | | | | |
| Common Stocks – 87.3% | | | | Shares | | Fair Value |
AEROSPACE EQUIPMENT – 2.1% | | | | | | | | | | | | |
Moog, Inc. – Class A | | * | | | | 25,802 | | | | $ | 1,513,804 | |
| | | | | | | | | | | | |
APPAREL – 2.0% | | | | | | | | | | | | |
Wolverine World Wide, Inc. | | | | | | 24,300 | | | | | 1,414,989 | |
| | | | | | | | | | | | |
BANKS – 14.6% | | | | | | | | | | | | |
Bancfirst Corp. | | | | | | 14,323 | | | | | 774,445 | |
BBCN Bancorp, Inc. | | | | | | 101,099 | | | | | 1,391,122 | |
Chemical Financial Corp. | | | | | | 53,247 | | | | | 1,486,656 | |
Columbia Banking System, Inc. | | | | | | 57,908 | | | | | 1,430,328 | |
First Financial Bancorp | | | | | | 63,800 | | | | | 967,846 | |
Pacific Continental Corp. | | | | | | 61,657 | | | | | 808,323 | |
PrivateBancorp, Inc. | | | | | | 74,907 | | | | | 1,603,010 | |
State Bank Financial Corp. | | | | | | 48,354 | | | | | 767,378 | |
Wintrust Financial Corp. | | | | | | 33,254 | | | | | 1,365,742 | |
| | | | | | | | | | | | |
| | | | | | | | | | | 10,594,850 | |
| | | | | | | | | | | | |
BUILDING MATERIALS – 6.0% | | | | | | | | | | | | |
Apogee Enterprises, Inc. | | | | | | 42,011 | | | | | 1,246,886 | |
Boise Cascade Co. | | * | | | | 57,450 | | | | | 1,548,278 | |
Trex Co., Inc. | | * | | | | 31,613 | | | | | 1,565,792 | |
| | | | | | | | | | | | |
| | | | | | | | | | | 4,360,956 | |
| | | | | | | | | | | | |
COMMERCIAL SERVICES – 2.0% | | | | | | | | | | | | |
Kelly Services, Inc. – Cl. A | | | | | | 72,800 | | | | | 1,417,416 | |
| | | | | | | | | | | | |
COMPUTERS – 3.1% | | | | | | | | | | | | |
CACI International, Inc. | | * | | | | 10,534 | | | | | 728,005 | |
J2 Global, Inc. | | | | | | 29,900 | | | | | 1,480,648 | |
| | | | | | | | | | | | |
| | | | | | | | | | | 2,208,653 | |
| | | | | | | | | | | | |
DISTRIBUTION/WHOLESALE – 2.2% | | | | | | | | | | | | |
Beacon Roofing Supply, Inc. | | * | | | | 43,700 | | | | | 1,611,219 | |
| | | | | | | | | | | | |
ELECTRIC POWER – 4.4% | | | | | | | | | | | | |
Allete, Inc. | | | | | | 33,400 | | | | | 1,613,220 | |
NorthWestern Corp. | | | | | | 34,200 | | | | | 1,536,264 | |
| | | | | | | | | | | | |
| | | | | | | | | | | 3,149,484 | |
| | | | | | | | | | | | |
ELECTRIC & EQUIPMENT – 5.9% | | | | | | | | | | | | |
EnerSys | | | | | | 13,612 | | | | | 825,296 | |
Coherent, Inc. | | | | | | 17,210 | | | | | 1,057,555 | |
Littelfuse, Inc. | | | | | | 20,345 | | | | | 1,591,386 | |
Watts Water Technologies, Inc. | | | | | | 14,300 | | | | | 806,091 | |
| | | | | | | | | | | | |
| | | | | | | | | | | 4,280,328 | |
| | | | | | | | | | | | |
ENGINEERING & CONSTRUCTION – 1.1% | | | | | | | | | | | | |
Foster Wheeler AG | | * | | | | 31,000 | | | | | 816,540 | |
| | | | | | | | | | | | |
FOOD – 1.1% | | | | | | | | | | | | |
J & J Snack Food Corp. | | | | | | 9,463 | | | | | 763,853 | |
| | | | | | | | | | | | |
FOREST PRODUCTS & PAPER – 2.2% | | | | | | | | | | | | |
KapStone Paper and Packaging Corp. | | | | | | 37,700 | | | | | 1,613,560 | |
| | | | | | | | | | | | |
HEALTHCARE – 1.2% | | | | | | | | | | | | |
Given Imaging, Ltd. | | * | | | | 43,406 | | | | | 834,697 | |
| | | | | | | | | | | | |
HOLDING COMPANY – 1.0% | | | | | | | | | | | | |
National Bank Holdings Corp. – Cl. A | | | | | | 35,100 | | | | | 720,954 | |
| | | | | | | | | | | | |
| | | | | | | | | | | | |
| Common Stocks (Continued) | | | | Shares | | Fair Value |
HOME BUILDERS – 2.2% | | | | | | | | | | | | |
Thor Industries, Inc. | | | | | | 27,000 | | | | $ | 1,567,080 | |
| | | | | | | | | | | | |
HOME FURNISHING – 2.2% | | | | | | | | | | | | |
DTS, Inc. | | * | | | | 76,843 | | | | | 1,613,703 | |
| | | | | | | | | | | | |
INSURANCE – 4.5% | | | | | | | | | | | | |
AMERISAFE, Inc. | | | | | | 26,245 | | | | | 931,960 | |
Employers Holdings, Inc. | | | | | | 26,600 | | | | | 791,084 | |
Endurance Specialty Holdings, Ltd. | | | | | | 15,000 | | | | | 805,800 | |
Safety Insurance Group, Inc. | | | | | | 14,197 | | | | | 752,015 | |
| | | | | | | | | | | | |
| | | | | | | | | | | 3,280,859 | |
| | | | | | | | | | | | |
INTERNET – 2.2% | | | | | | | | | | | | |
CyrusOne, Inc. | | | | | | 77,198 | | | | | 1,465,218 | |
| | | | | | | | | | | | |
LEISURE – 1.0% | | | | | | | | | | | | |
Arctic Cat, Inc. | | | | | | 12,506 | | | | | 713,467 | |
| | | | | | | | | | | | |
MACHINERY – 4.3% | | | | | | | | | | | | |
Gorman-Rupp Co. | | | | | | 41,876 | | | | | 1,680,065 | |
Hurco Cos, Inc. | | | | | | 23,405 | | | | | 605,253 | |
Hyster-Yale Materials Handling, Inc. – Cl. A | | | | | | 8,976 | | | | | 804,878 | |
| | | | | | | | | | | | |
| | | | | | | | | | | 3,090,196 | |
| | | | | | | | | | | | |
MINING – 1.1% | | | | | | | | | | | | |
US Silica Holdings, Inc | | .* | | | | 30,867 | | | | | 768,588 | |
| | | | | | | | | | | | |
OFFICE FURNISHINGS – 1.1% | | | | | | | | | | | | |
Knoll, Inc. | | | | | | 48,215 | | | | | 816,762 | |
| | | | | | | | | | | | |
OIL & NATURAL GAS – 6.4% | | | | | | | | | | | | |
Bonanza Creek Energy, Inc. | | * | | | | 34,012 | | | | | 1,641,419 | |
Carrizo Oil & Gas, Inc. | | * | | | | 10,000 | | | | | 372,900 | |
Kodiak Oil & Gas Corp. | | * | | | | 69,000 | | | | | 832,140 | |
Rex Energy Corp. | | * | | | | 35,400 | | | | | 789,420 | |
Synergy Resources Corp. | | * | | | | 101,028 | | | | | 985,023 | |
| | | | | | | | | | | | |
| | | | | | | | | | | 4,620,902 | |
| | | | | | | | | | | | |
OIL & GAS SERVICES – 2.3% | | | | | | | | | | | | |
Matrix Service Co. | | * | | | | 83,344 | | | | | 1,635,209 | |
| | | | | | | | | | | | |
PIPELINES – 1.3% | | | | | | | | | | | | |
Primoris Services Corp. | | | | | | 35,700 | | | | | 909,279 | |
| | | | | | | | | | | | |
RETAIL – 2.2% | | | | | | | | | | | | |
Children’s Place Retail Stores | | * | | | | 12,400 | | | | | 717,464 | |
Lithia Motors, Inc. | | | | | | 11,500 | | | | | 839,040 | |
| | | | | | | | | | | | |
| | | | | | | | | | | 1,556,504 | |
| | | | | | | | | | | | |
SOFTWARE – 4.1% | | | | | | | | | | | | |
AVG Technologies NV | | * | | | | 61,700 | | | | | 1,477,098 | |
Omnicell, Inc. | | * | | | | 61,621 | | | | | 1,459,185 | |
| | | | | | | | | | | | |
| | | | | | | | | | | 2,936,283 | |
| | | | | | | | | | | | |
TRANSPORTATION – 1.9% | | | | | | | | | | | | |
Roadrunner Transportation Systems, Inc. | | * | | | | 48,600 | | | | | 1,372,463 | |
| | | | | | | | | | | | |
TRUCKING & LEASING – 2.2% | | | | | | | | | | | | |
TAL International Group, Inc. | | | | | | 34,596 | | | | | 1,616,671 | |
| | | | | | | | | | | | |
Total Common Stocks
(Cost $48,059,123) | | | | | | | | | | $ | 63,264,487 | |
| | | | | | | | | | | | |
| | |
| Timothy Plan Family of Funds | | Small Cap Value (Continued) |
| | |
Schedule of Investments | | As of September 30, 2013 |
| | | | | | | | | | | | |
| Master Limited Partnerships – 2.3% | | | | Shares | | Fair Value |
EQT Midsteam Partners LP | | | | | | 15,621 | | | | $ | 769,022 | |
World Point Terminals LP | | * | | | | 44,600 | | | | | 892,000 | |
| | | | | | | | | | | | |
Total Master Limited Partnerships
(Cost $1,305,900) | | | | | | | | | | $ | 1,661,022 | |
| | | | | | | | | | | | |
| | | |
| REITs – 9.2% | | | | Shares | | Fair Value |
Coresite Realty Corp. | | | | | | 24,105 | | | | $ | 818,124 | |
CubeSmart | | | | | | 44,000 | | | | | 784,960 | |
Inland Real Estate Corp. | | | | | | 73,100 | | | | | 747,813 | |
PS Business Parks, Inc. | | | | | | 19,100 | | | | | 1,425,242 | |
Potlatch Corp. | | | | | | 38,500 | | | | | 1,527,680 | |
Summit Hotel Properties, Inc. | | | | | | 149,497 | | | | | 1,373,877 | |
| | | | | | | | | | | | |
Total REITs
(Cost $5,869,769) | | | | | | | | | | $ | 6,677,696 | |
| | | | | | | | | | | | |
| | | | | | | | | | | | |
| Money Market Fund – 2.0% | | | | Shares | | Fair Value |
Fidelity Institutional Money Market Portfolio, 0.01%
(Cost $1,414,034) | | (A) | | | | 1,414,034 | | | | $ | 1,414,034 | |
| | | | | | | | | | | | |
Total Investments
(Cost $56,648,826) – 100.8% | | (B) | | | | | | | | $ | 73,017,239 | |
Liabilities in Excess of Other Assets – (1.3)% | | | | | | | | | | | (506,331 | ) |
| | | | | | | | | | | | |
Net Assets – 100.00% | | | | | | | | | | $ | 72,510,908 | |
| | | | | | | | | | | | |
| * | Non-income producing securities. |
| REIT | – Real Estate Investment Trust. |
| (A) | Variable rate security; the rate shown represents the yield at September 30, 2013. |
| (B) | Represents cost for financial reporting purposes. Aggregate cost for federal tax purposes is $56,698,849, and differs from fair value by net unrealized appreciation (depreciation) of securities as follows: |
| | | | | |
Unrealized appreciation | | | $ | 16,678,519 | |
Unrealized depreciation | | | | (360,129 | ) |
| | | | | |
Net unrealized appreciation | | | $ | 16,318,390 | |
| | | | | |
The accompanying notes are an integral part of these financial statements.
[37]
| | |
| Timothy Plan Family of Funds | | Large/Mid Cap Value |
| | |
Schedule of Investments | | As of September 30, 2013 |
| | | | | | | | | | | | |
| Common Stocks – 90.5% | | | | Shares | | Fair
Value |
AEROSPACE / DEFENSE – 2.0% | | | | | | | | | | | | |
General Dynamics Corp. | | | | | | 29,500 | | | | $ | 2,581,840 | |
| | | | | | | | | | | | |
AUTO – 2.0% | | | | | | | | | | | | |
BorgWarner, Inc. | | | | | | 25,200 | | | | | 2,555,028 | |
| | | | | | | | | | | | |
BANKS – 6.1% | | | | | | | | | | | | |
CIT Group, Inc. | | * | | | | 50,800 | | | | | 2,477,516 | |
East West Bancorp, Inc. | | | | | | 85,700 | | | | | 2,738,115 | |
SVB Financial Group | | * | | | | 29,786 | | | | | 2,572,617 | |
| | | | | | | | | | | | |
| | | | | | | | | | | 7,788,248 | |
| | | | | | | | | | | | |
BEVERAGES – 2.0% | | | | | | | | | | | | |
Dr. Pepper Snapple Group, Inc. | | | | | | 56,900 | | | | | 2,550,258 | |
| | | | | | | | | | | | |
CHEMICALS – 6.1% | | | | | | | | | | | | |
Rockwood Holdings, Inc. | | | | | | 38,500 | | | | | 2,575,650 | |
Sherwin-Williams Co. | | | | | | 14,400 | | | | | 2,623,392 | |
Sigma-Aldrich Corp. | | | | | | 30,000 | | | | | 2,559,000 | |
| | | | | | | | | | | | |
| | | | | | | | | | | 7,758,042 | |
| | | | | | | | | | | | |
COMPUTERS – 1.0% | | | | | | | | | | | | |
Western Digital Corp. | | | | | | 19,900 | | | | | 1,261,660 | |
| | | | | | | | | | | | |
DISTRIBUTION / WHOLESALE – 3.2% | | | | | | | | | | | | |
WESCO International, Inc. | | * | | | | 16,600 | | | | | 1,270,398 | |
WW Grainger, Inc. | | | | | | 10,700 | | | | | 2,800,297 | |
| | | | | | | | | | | | |
| | | | | | | | | | | 4,070,695 | |
| | | | | | | | | | | | |
DIVERSIFIED FINANCIAL SERVICES – 3.5% | | | | | | | | | | | | |
Eaton Vance Corp. | | | | | | 32,200 | | | | | 1,250,326 | |
Franklin Resources, Inc. | | | | | | 27,100 | | | | | 1,369,905 | |
Invesco, Ltd. | | | | | | 59,200 | | | | | 1,888,480 | |
| | | | | | | | | | | | |
| | | | | | | | | | | 4,508,711 | |
| | | | | | | | | | | | |
ELECTRIC POWER – 4.1% | | | | | | | | | | | | |
Dominion Resources, Inc. | | | | | | 43,500 | | | | | 2,717,880 | |
NextEra Energy, Inc. | | | | | | 31,900 | | | | | 2,557,104 | |
| | | | | | | | | | | | |
| | | | | | | | | | | 5,274,984 | |
| | | | | | | | | | | | |
ELECTRONICS – 4.1% | | | | | | | | | | | | |
Amphenol Corp. | | | | | | 33,100 | | | | | 2,561,278 | |
Garmin, Ltd. | | | | | | 33,500 | | | | | 1,513,865 | |
TE Connectivity, Ltd. | | | | | | 23,800 | | | | | 1,232,364 | |
| | | | | | | | | | | | |
| | | | | | | | | | | 5,307,507 | |
| | | | | | | | | | | | |
FOOD – 4.6% | | | | | | | | | | | | |
JM Smucker Co. | | | | | | 23,400 | | | | | 2,457,936 | |
McCormick & Co., Inc. | | | | | | 34,900 | | | | | 2,258,030 | |
Sysco Corp. | | | | | | 38,800 | | | | | 1,235,004 | |
| | | | | | | | | | | | |
| | | | | | | | | | | 5,950,970 | |
| | | | | | | | | | | | |
HEALTHCARE – 8.6% | | | | | | | | | | | | |
Covidien PLC | | | | | | 40,500 | | | | | 2,468,070 | |
CR Bard, Inc. | | | | | | 21,400 | | | | | 2,465,280 | |
DaVita HealthCare Partners, Inc. | | * | | | | 40,000 | | | | | 2,276,000 | |
DENTSPLY International, Inc. | | | | | | 28,800 | | | | | 1,250,208 | |
Varian Medical Systems, Inc. | | * | | | | 34,800 | | | | | 2,600,604 | |
| | | | | | | | | | | | |
| | | | | | | | | | | 11,060,162 | |
| | | | | | | | | | | | |
| | | | | | | | | | | | |
| Common Stocks (Continued) | | | | Shares | | Fair
Value |
HOUSEHOLD PRODUCTS/WARES – 1.1% | | | | | | | | | | | | |
Tupperware Brands Corp. | | | | | | 16,300 | | | | $ | 1,407,831 | |
| | | | | | | | | | | | |
INSURANCE – 5.1% | | | | | | | | | | | | |
ACE, Ltd. | | | | | | 28,700 | | | | | 2,685,172 | |
Axis Capital Holdings, Ltd. | | | | | | 59,000 | | | | | 2,555,290 | |
Unumprovident Corp. | | | | | | 41,100 | | | | | 1,251,084 | |
| | | | | | | | | | | | |
| | | | | | | | | | | 6,491,546 | |
| | | | | | | | | | | | |
LEISURE TIME- 1.1% | | | | | | | | | | | | |
Polaris Industries, Inc. | | | | | | 11,200 | | | | | 1,446,816 | |
| | | | | | | | | | | | |
MACHINERY – 2.1% | | | | | | | | | | | | |
Flowserve Corp. | | | | | | 43,000 | | | | | 2,682,770 | |
| | | | | | | | | | | | |
METAL FABRICATE/HARDWARE – 2.0% | | | | | | | | | | | | |
Precision Castparts Corp. | | | | | | 11,500 | | | | | 2,613,260 | |
| | | | | | | | | | | | |
MISCELLANEOUS MANUFACTURING – 3.1% | | | | | | | | | | |
AO Smith Corp. | | | | | | 58,300 | | | | | 2,635,160 | |
SPX Corp. | | | | | | 15,600 | | | | | 1,320,384 | |
| | | | | | | | | | | | |
| | | | | | | | | | | 3,955,544 | |
| | | | | | | | | | | | |
OIL & NATURAL GAS – 10.3% | | | | | | | | | | | | |
Anadarko Petroleum Corp. | | | | | | 27,000 | | | | | 2,510,730 | |
EQT Corp. | | | | | | 14,700 | | | | | 1,304,184 | |
Marathon Petroleum Corp. | | | | | | 34,700 | | | | | 2,231,904 | |
National Oilwell Varco, Inc. | | | | | | 16,100 | | | | | 1,257,571 | |
Oasis Petroleum, Inc. | | * | | | | 68,200 | | | | | 3,350,666 | |
Occidental Petroleum Corp. | | | | | | 27,900 | | | | | 2,609,766 | |
| | | | | | | | | | | | |
| | | | | | | | | | | 13,264,821 | |
| | | | | | | | | | | | |
PACKAGING & CONTAINERS – 1.7% | | | | | | | | | | | | |
Rock Tenn Co. | | | | | | 22,000 | | | | | 2,227,940 | |
| | | | | | | | | | | | |
PHARMACEUTICALS – 2.1% | | | | | | | | | | | | |
Express Scirpts Holding Co. | | * | | | | 42,700 | | | | | 2,638,006 | |
Mallinckrodt PLC | | * | | | | 1 | | | | | 44 | |
| | | | | | | | | | | | |
| | | | | | | | | | | 2,638,050 | |
| | | | | | | | | | | | |
RETAIL – 5.7% | | | | | | | | | | | | |
Advance Auto Parts, Inc. | | | | | | 41,900 | | | | | 3,464,292 | |
Family Dollar Stores, Inc. | | | | | | 35,200 | | | | | 2,535,104 | |
PetSmart, Inc. | | | | | | 17,900 | | | | | 1,365,054 | |
| | | | | | | | | | | | |
| | | | | | | | | | | 7,364,450 | |
| | | | | | | | | | | | |
SEMICONDUCTORS – 4.1% | | | | | | | | | | | | |
Avago Technologies, Ltd. | | | | | | 63,500 | | | | | 2,738,120 | |
Microchip Technology, Inc. | | | | | | 32,000 | | | | | 1,289,280 | |
Skyworks Solutions, Inc. | | * | | | | 48,300 | | | | | 1,199,772 | |
| | | | | | | | | | | | |
| | | | | | | | | | | 5,227,172 | |
| | | | | | | | | | | | |
TEXTILES – 2.2% | | | | | | | | | | | | |
Mohawk Industries, Inc. | | * | | | | 21,400 | | | | | 2,787,350 | |
| | | | | | | | | | | | |
TRANSPORTATION – 2.6% | | | | | | | | | | | | |
Canadian National Railway Co. | | | | | | 32,700 | | | | | 3,314,799 | |
| | | | | | | | | | | | |
Total Common Stocks
(Cost $90,458,473) | | | | | | | | | | $ | 116,090,454 | |
| | | | | | | | | | | | |
| | |
| Timothy Plan Family of Funds | | Large/Mid Cap Value (Continued) |
| | |
Schedule of Investments | | As of September 30, 2013 |
| | | | | | | | | | | | |
| Master Limited Partnerships – 1.0% | | Shares | | Fair
Value |
Lazard, Ltd. – Cl. A
(Cost $934,664) | | | | | | 34,600 | | | | $ | 1,246,292 | |
| | | | | | | | | | | | |
| | | |
| REITs – 5.2% | | | | Shares | | Fair
Value |
HCP, Inc. | | | | | | 51,100 | | | | $ | 2,092,545 | |
Public Storage, Inc. | | | | | | 8,593 | | | | | 1,379,606 | |
Regency Centers Corp. | | | | | | 26,600 | | | | | 1,286,110 | |
Ventas, Inc. | | | | | | 31,500 | | | | | 1,937,250 | |
| | | | | | | | | | | | |
(Cost $5,729,841) | | | | | | | | | | $ | 6,695,511 | |
| | | | | | | | | | | | |
| | | | | | | | | | | | |
| Money Market Fund – 3.3% | | | | Shares | | Fair
Value |
Fidelity Institutional Money Market Portfolio, 0.01%
(Cost $4,287,834) | | (A) | | | | 4,287,834 | | | | $ | 4,287,834 | |
| | | | | | | | | | | | |
Total Investments
(Cost $101,410,812) – 100.0% | | (B) | | | | | | | | $ | 128,320,091 | |
Liabilities in Excess of Other Assets – 0.0% | | | | | | | | | | | (13,311 | ) |
| | | | | | | | | | | | |
Net Assets – 100.00% | | | | | | | | | | $ | 128,306,780 | |
| | | | | | | | | | | | |
| * | Non-income producing securities. |
| REIT | – Real Estate Investment Trust. |
| (A) | Variable rate security; the rate shown represents the yield at September 30, 2013. |
| (B) | Represents cost for financial reporting purposes. Aggregate cost for federal tax purposes is $101,448,604 and differs from fair value by net unrealized appreciation (depreciation) of securities as follows: |
| | | | | |
Unrealized appreciation | | | $ | 28,014,842 | |
Unrealized depreciation | | | | (1,143,355 | ) |
| | | | | |
Net unrealized appreciation | | | $ | 26,871,487 | |
| | | | | |
The accompanying notes are an integral part of these financial statements.
[39]
| | |
| Timothy Plan Family of Funds | | Fixed Income |
| | |
Schedule of Investments | | As of September 30, 2013 |
| | | | | | | | | | | | |
| Bonds and Notes – 96.3% | | | | Par Value | | Fair Value |
CORPORATE BONDS – 37.1% | | | | | | | | | | | | |
ABB Finance USA, Inc.,
2.875%, 5/08/2022 | | | | | $ | 1,000,000 | | | | $ | 967,502 | |
Altera Corp.,
1.75%, 5/15/2017 | | | | | | 1,000,000 | | | | | 992,535 | |
Analog Devices, Inc.,
3.00%, 4/15/2016 | | | | | | 740,000 | | | | | 771,836 | |
Boardwalk Pipelines LP,
5.75%, 9/15/2019 | | | | | | 1,000,000 | | | | | 1,113,383 | |
Cameron International Corp.,
6.375%, 7/15/2018 | | | | | | 1,000,000 | | | | | 1,177,850 | |
Canadian National Railway Co.,
5.80%, 6/01/2016 | | | | | | 750,000 | | | | | 838,005 | |
Cliffs Natural Resources Inc.,
4.875%, 4/01/2021 | | | | | | 750,000 | | | | | 708,650 | |
Cooperatieve Centrale Raiffeisen-Boerenleenbank BA,
2.125%, 10/13/2015 | | | | | | 1,000,000 | | | | | 1,024,974 | |
Covidien International Finance SA,
2.80%, 6/15/2015 | | | | | | 500,000 | | | | | 516,421 | |
Eaton Corp.,
5.60%, 5/15/2018 | | | | | | 325,000 | | | | | 371,182 | |
Energy Transfer Partners LP,
6.70%, 7/01/2018 | | | | | | 1,000,000 | | | | | 1,172,349 | |
Enterprise Products Operating, LLC,
6.125%, 10/15/2039 | | | | | | 500,000 | | | | | 555,081 | |
ERP Operating LP,
5.125%, 3/15/2016 | | | | | | 900,000 | | | | | 984,827 | |
Health Care REIT, Inc.,
3.75%, 3/15/2023 | | | | | | 1,000,000 | | | | | 947,774 | |
Husky Energy, Inc.,
3.95%, 4/15/2022 | | | | | | 750,000 | | | | | 754,195 | |
John Sevier Combined Cycle Generation LLC,
4.626%, 1/15/2042 | | | | | | 980,535 | | | | | 991,686 | |
Johnson Controls, Inc.,
5.00%, 3/30/2020 | | | | | | 750,000 | | | | | 823,394 | |
Kennametal Inc.,
3.875%, 2/15/2022 | | | | | | 1,000,000 | | | | | 968,838 | |
Kinder Morgan Energy Partners LP,
5.125%, 11/15/2014 | | | | | | 750,000 | | | | | 785,985 | |
Marathon Oil Corp.,
6.00%, 10/01/2017 | | | | | | 750,000 | | | | | 862,610 | |
Nisource Finance Corp.,
5.40%, 7/15/2014 | | | | | | 750,000 | | | | | 776,940 | |
Oneok, Inc.,
4.25%, 2/01/2022 | | | | | | 500,000 | | | | | 468,443 | |
Oneok, Inc.,
5.20%, 6/15/2015 | | | | | | 500,000 | | | | | 530,930 | |
Petrobras Intl. Financial Co.,
3.50%, 2/06/2017 | | | | | | 1,000,000 | | | | | 1,017,951 | |
Phillips 66,
2.95%, 5/01/2017 | | | | | | 1,000,000 | | | | | 1,035,981 | |
Plains All American Pipeline,
3.65%, 6/01/2022 | | | | | | 1,000,000 | | | | | 989,546 | |
| | | | | | | | | | | | |
| Bonds and Notes (Continued) | | | | Par Value | | Fair Value |
CORPORATE BONDS (continued) | | | | | | | | | | | | |
Rio Tinto Finance USA, Ltd.,
2.50%, 5/20/2016 | | | | | $ | 750,000 | | | | $ | 772,627 | |
Simon Property Group LP,
6.125%, 5/30/2018 | | | | | | 1,000,000 | | | | | 1,174,075 | |
Teck Cominco Ltd. – Cl. B,
6.00%, 8/15/2040 | | | | | | 500,000 | | | | | 466,179 | |
Transocean, Inc.,
6.00%, 3/15/2018 | | | | | | 500,000 | | | | | 563,939 | |
Trinity Acquisition PLC,
4.625%, 8/15/2013 | | | | | | 750,000 | | | | | 740,474 | |
Tyco Electronics Group SA,
6.55%, 10/01/2017 | | | | | | 750,000 | | | | | 865,571 | |
Valero Energy Corp.,
6.625%, 6/15/2037 | | | | | | 500,000 | | | | | 544,753 | |
Weatherford International, Ltd.,
4.95%, 10/15/2013 | | | | | | 750,000 | | | | | 750,951 | |
| | | | | | | | | | | | |
Total Corporate Bonds
(Cost $27,507,855) | | | | | | | | | | | 28,027,437 | |
| | | | | | | | | | | | |
U.S. GOVERNMENT & AGENCY OBLIGATIONS – 59.2% | | | | | | | | | | | | |
GOVERNMENT NOTES & BONDS – 27.8% | | | | | | | | | | | | |
Federal Farm Credit Bank,
4.875%, 1/17/2017 | | | | | | 1,500,000 | | | | | 1,695,163 | |
Federal Farm Credit Bank,
5.125%, 8/25/2016 | | | | | | 2,500,000 | | | | | 2,819,040 | |
Federal Home Loan Bank,
5.00%, 11/17/2017 | | | | | | 1,000,000 | | | | | 1,153,231 | |
U.S. Treasury Bond,
4.50%, 2/15/2036 | | | | | | 2,500,000 | | | | | 2,889,845 | |
U.S. Treasury Note,
3.125%, 5/15/2021 | | | | | | 9,000,000 | | | | | 9,620,856 | |
U.S. Treasury Note,
3.875%, 5/15/2018 | | | | | | 2,000,000 | | | | | 2,236,876 | |
U.S. Treasury Note,
4.75%, 5/15/2014 | | | | | | 550,000 | | | | | 565,963 | |
| | | | | | | | | | | | |
Total Government Notes & Bonds
(Cost $21,232,716) | | | | | | | | | | | 20,980,974 | |
| | | | | | | | | | | | |
GOVERNMENT MORTGAGE-BACKED
SECURITIES – 31.4% | | | | | | | | | | | | |
GNMA Pool 3584,
6.00%, 7/20/2034 | | | | | | 55,547 | | | | | 61,827 | |
GNMA Pool 3612,
6.50%, 9/20/2034 | | | | | | 136,790 | | | | | 155,209 | |
GNMA Pool 3625,
6.00%, 10/20/2034 | | | | | | 411,066 | | | | | 454,978 | |
GNMA Pool 3637,
5.50%, 11/20/2034 | | | | | | 157,532 | | | | | 174,719 | |
GNMA Pool 3665,
5.50%, 1/20/2035 | | | | | | 262,433 | | | | | 291,065 | |
GNMA Pool 3679,
6.00%, 2/20/2035 | | | | | | 138,780 | | | | | 159,554 | |
| | |
| Timothy Plan Family of Funds | | Fixed Income (Continued) |
| | |
Schedule of Investments | | As of September 30, 2013 |
| | | | | | | | | | | | |
| Bonds and Notes (Continued) | | | | Par Value | | Fair Value |
GOVERNMENT MORTGAGE-BACKED SECURITIES (Continued) | | | | | | | | | | | | |
GNMA Pool 3711,
5.50%, 5/20/2035 | | | | | $ | 304,024 | | | | $ | 337,210 | |
GNMA Pool 3865,
6.00%, 6/20/2036 | | | | | | 257,739 | | | | | 284,169 | |
GNMA Pool 3910,
6.00%, 10/20/2036 | | | | | | 181,048 | | | | | 199,673 | |
GNMA Pool 4058,
5.00%, 12/20/2037 | | | | | | 365,240 | | | | | 398,882 | |
GNMA Pool 4072,
5.50%, 1/20/2038 | | | | | | 418,113 | | | | | 461,188 | |
GNMA Pool 4520,
5.00%, 8/20/2039 | | | | | | 1,292,864 | | | | | 1,416,391 | |
GNMA Pool 4541,
5.00%, 9/20/2039 | | | | | | 817,476 | | | | | 895,947 | |
GNMA Pool 4947,
5.00%, 2/20/2041 | | | | | | 1,475,881 | | | | | 1,617,542 | |
GNMA Pool 5204,
4.50%, 10/20/2041 | | | | | | 597,477 | | | | | 646,597 | |
GNMA Pool 585163,
5.00%, 2/15/2018 | | | | | | 15,426 | | | | | 16,466 | |
GNMA Pool 585180,
5.00%, 2/15/2018 | | | | | | 14,489 | | | | | 15,467 | |
GNMA Pool 592492,
5.00%, 3/15/2018 | | | | | | 9,873 | | | | | 10,508 | |
GNMA Pool 599821,
5.00%, 1/15/2018 | | | | | | 12,743 | | | | | 13,561 | |
GNMA Pool 604182,
5.50%, 4/15/2033 | | | | | | 225,517 | | | | | 249,333 | |
GNMA Pool 663776,
6.50%, 1/15/2037 | | | | | | 173,834 | | | | | 204,375 | |
GNMA Pool 701961,
4.50%, 6/15/2039 | | | | | | 1,865,324 | | | | | 2,015,945 | |
GNMA Pool 734437,
4.50%, 5/15/2041 | | | | | | 547,314 | | | | | 593,308 | |
| | | | | | | | | | | | |
| Bonds and Notes (Continued) | | | | Par Value | | Fair Value |
GOVERNMENT MORTGAGE-BACKED SECURITIES (Continued) | | | | | | | | | | | | |
GNMA Pool 737556,
4.50%, 10/15/2040 | | | | | $ | 1,384,446 | | | | $ | 1,495,905 | |
GNMA Pool 781694,
6.00%, 12/15/2031 | | | | | | 57,302 | | | | | 63,887 | |
GNMA Pool 783060,
4.00%, 8/15/2040 | | | | | | 1,371,241 | | | | | 1,454,680 | |
GNMA Pool AD8801,
3.50%, 3/15/2043 | | | | | | 4,123,219 | | | | | 4,253,777 | |
GNMA Pool MA0155,
4.00%, 6/20/2042 | | | | | | 2,745,724 | | | | | 2,914,261 | |
GMNA Pool MA0220,
3.50%, 7/20/2042 | | | | | | 2,723,198 | | | | | 2,814,113 | |
| | | | | | | | | | | | |
Total Government Mortgage-Backed Securities
(Cost $23,614,047) | | | | | | | | | | | 23,670,537 | |
| | | | | | | | | | | | |
Total U.S. Government & Agency Obligations
(Cost $44,846,763) | | | | | | | | | | | 44,651,511 | |
| | | | | | | | | | | | |
Total Bonds and Notes
(Cost $72,354,618) | | | | | | | | | | $ | 72,678,948 | |
| | | | | | | | | | | | |
| | | |
| Money Market Fund – 3.0% | | | | Shares | | Fair Value |
Fidelity Institutional Money Market Portfolio, 0.01%
(Cost $2,260,955) | | (A) | | | | 2,260,955 | | | | $ | 2,260,955 | |
| | | | | | | | | | | | |
Total Investments
(Cost $74,615,573) – 99.3% | | (B) | | | | | | | | $ | 74,939,903 | |
Other Assets in Excess of
Liabilities – 0.7% | | | | | | | | | | | 575,455 | |
| | | | | | | | | | | | |
Net Assets – 100.00% | | | | | | | | | | $ | 75,515,358 | |
| | | | | | | | | | | | |
| GNMA | – Government National Mortgage Association. |
| (A) | Variable rate security; the rate shown represents the yield at September 30, 2013. |
| (B) | Represents cost for financial reporting purposes. Aggregate cost for federal tax purposes is $74,615,573 and differs from fair value by net unrealized appreciation (depreciation) of securities as follows: |
| | | | | |
Unrealized appreciation | | | $ | 1,975,371 | |
Unrealized depreciation | | | | (1,651,041 | ) |
| | | | | |
Net unrealized appreciation | | | $ | 324,330 | |
| | | | | |
The accompanying notes are an integral part of these financial statements.
[41]
| | |
| Timothy Plan Family of Funds | | High Yield Bond |
| | |
Schedule of Investments | | As of September 30, 2013 |
| | | | | | | | | | | | |
| Corporate Bonds – 95.1% | | | | Par Value | | Fair Value |
Actuant Corp.,
5.625%, 6/15/2022 | | | | | $ | 500,000 | | | | $ | 502,500 | |
AmeriGas Partners LP,
7.00%, 5/20/2022 | | | | | | 500,000 | | | | | 522,500 | |
Anixter, Inc.,
5.625%, 5/01/2019 | | | | | | 500,000 | | | | | 517,500 | |
ArcelorMittal,
6.75%, 2/25/2022 | | (B) | | | | 500,000 | | | | | 528,750 | |
Atlas Pipeline Partners LP,
5.875%, 8/01/2023 | | (A) | | | | 500,000 | | | | | 472,500 | |
Ball Corp.,
4.00%, 11/15/2023 | | | | | | 250,000 | | | | | 225,625 | |
Basic Energy Services, Inc.,
7.75%, 10/15/2022 | | | | | | 500,000 | | | | | 486,250 | |
Biomet, Inc.,
6.50%, 8/01/2020 | | | | | | 450,000 | | | | | 466,875 | |
Bombardier, Inc.,
6.125%, 1/15/2023 | | (A) | | | | 250,000 | | | | | 251,250 | |
Calfrac Holdings LP,
7.50%, 12/01/2020 | | (A) | | | | 500,000 | | | | | 506,250 | |
Calumet Specialty Product Partners,
9.375%, 5/01/2019 | | | | | | 500,000 | | | | | 551,250 | |
Cemex Finance LLC,
9.50%, 12/14/2016 | | (A) | | | | 165,000 | | | | | 175,931 | |
Cloud Peak Energy Resources LLC,
8.50%, 12/15/2019 | | | | | | 500,000 | | | | | 542,500 | |
CommScope, Inc.,
8.25%, 1/15/2019 | | (A) | | | | 500,000 | | | | | 548,750 | |
Concho Resources, Inc.,
5.50%, 4/01/2023 | | | | | | 100,000 | | | | | 99,250 | |
Continental Resouces, Inc.,
4.50%, 4/15/2023 | | | | | | 200,000 | | | | | 197,250 | |
Corrections Corp. of America,
4.125%, 4/01/2020 | | | | | | 125,000 | | | | | 119,062 | |
Crestwood Midstream Partners LP,
7.75%, 4/01/2019 | | | | | | 500,000 | | | | | 527,500 | |
Crosstex Energy LP,
8.875%, 2/15/2018 | | | | | | 500,000 | | | | | 533,750 | |
DCP Midstream, LLC.,
5.85%, 5/21/2043 | | (A) | | | | 500,000 | | | | | 460,000 | |
Digicel, Ltd.,
6.00%, 4/15/2021 | | (A) | | | | 500,000 | | | | | 471,250 | |
DuPont Fabros Technology LP,
5.875%, 9/15/2021 | | (A) | | | | 100,000 | | | | | 100,500 | |
Eldorado Gold Corp.,
6.125%, 12/15/2020 | | (A) | | | | 500,000 | | | | | 485,000 | |
Energy Transfer Equity LP,
7.50%, 10/15/2020 | | | | | | 500,000 | | | | | 537,500 | |
EV Energy Partners/Fin,
8.00%, 4/15/2019 | | | | | | 500,000 | | | | | 502,500 | |
FMG Resources August 2006 Pty, Ltd.,
7.00%, 11/01/2015 | | (A) | | | | 500,000 | | | | | 516,875 | |
Forest Oil Corp.,
7.25%, 6/15/2019 | | | | | | 500,000 | | | | | 502,500 | |
| | | | | | | | | | | | |
| Corporate Bonds (Continued) | | | | Par Value | | Fair Value |
FTI Consulting, Inc.,
6.00%, 11/15/2022 | | | | | $ | 500,000 | | | | $ | 498,750 | |
FTS International Services LLC,
8.125%, 11/15/2018 | | (A) (B) | | | | 320,000 | | | | | 348,800 | |
General Cable Corp.,
5.75%, 10/01/2022 | | (A) | | | | 250,000 | | | | | 240,625 | |
Genesis Energy LP,
5.75%, 2/15/2021 | | | | | | 500,000 | | | | | 492,500 | |
Geo Group, Inc.,
5.125%, 4/01/2023 | | (A) | | | | 200,000 | | | | | 184,000 | |
Gibraltar Industries, Inc.,
6.25%, 2/01/2021 | | (B) | | | | 500,000 | | | | | 507,500 | |
Hawk Acquisition Sub, Inc.,
4.25%, 10/15/2020 | | (A) | | | | 250,000 | | | | | 239,062 | |
Hercules Offshore, Inc.,
8.75%, 7/15/2021 | | (A) | | | | 500,000 | | | | | 532,500 | |
Hologic, Inc.,
6.25%, 8/01/2020 | | | | | | 500,000 | | | | | 523,125 | |
Hornbeck Offshore Services, Inc.,
5.00%, 3/01/2021 | | | | | | 500,000 | | | | | 481,250 | |
Hypermarcas SA,
6.50%, 4/20/2021 | | (A) | | | | 500,000 | | | | | 511,250 | |
Inergy Midstream LP,
6.00%, 12/15/2020 | | (A) | | | | 500,000 | | | | | 498,750 | |
ION Geophysical Corp.,
8.125%, 5/15/2018 | | (A) | | | | 500,000 | | | | | 470,000 | |
Iron Mountain,
6.00%, 8/15/2023 | | | | | | 750,000 | | | | | 748,125 | |
Jabil Circuit, Inc.,
4.70%, 9/15/2022 | | | | | | 500,000 | | | | | 481,250 | |
Jaguar Land Rover PLC,
8.125%, 5/15/2021 | | (A) | | | | 500,000 | | | | | 558,750 | |
Kindred Healthcare,
8.25%, 6/01/2019 | | | | | | 500,000 | | | | | 535,000 | |
Kodiak Oil & Gas Corp.,
5.50%, 2/01/2022 | | (A) | | | | 500,000 | | | | | 490,000 | |
Land O’ Lakes, Inc.,
6.00%, 11/15/2022 | | (A) | | | | 500,000 | | | | | 512,500 | |
LKQ Corp.,
4.75%, 5/15/2023 | | (A) | | | | 125,000 | | | | | 116,250 | |
Macquarie Bank, Ltd.,
6.625%, 4/07/2021 | | (A) | | | | 500,000 | | | | | 545,963 | |
Martin Midstream Partners LP,
7.25%, 2/15/2021 | | | | | | 500,000 | | | | | 508,125 | |
Mcron Finance Sub LLC,
8.375%, 5/15/2019 | | (A) | | | | 500,000 | | | | | 548,750 | |
MedAssets, Inc.,
8.00%, 11/15/2018 | | | | | | 500,000 | | | | | 541,250 | |
Millicom International Cellular SA,
4.75%, 5/22/2020 | | (A) | | | | 500,000 | | | | | 466,250 | |
MPT Operating Partnership LP,
6.375%, 2/15/2022 | | | | | | 500,000 | | �� | | | 508,750 | |
Navistar International Corp.,
8.25%, 11/01/2021 | | | | | | 449,000 | | | | | 456,858 | |
| | |
| Timothy Plan Family of Funds | | High Yield Bond (Continued) |
| | |
Schedule of Investments | | As of September 30, 2013 |
| | | | | | | | | | | | |
| Corporate Bonds (Continued) | | | | Par Value | | Fair Value |
NuStar Logistics LP,
6.75%, 2/01/2021 | | | | | $ | 300,000 | | | | $ | 306,750 | |
NXP Funding, LLC.,
5.75%, 2/15/2021 | | (A) | | | | 100,000 | | | | | 102,000 | |
Omnicare, Inc.,
7.75%, 6/01/2020 | | | | | | 500,000 | | | | | 550,313 | |
Pacific Drilling V, Ltd.,
5.375%, 6/01/2020 | | (A) | | | | 500,000 | | | | | 488,750 | |
Parker Drilling Co.,
7.50%, 8/01/2020 | | (A) | | | | 250,000 | | | | | 250,937 | |
Pinnacle Foods Finance, LLC.,
4.875%, 5/01/2021 | | (A) | | | | 250,000 | | | | | 233,750 | |
PolyOne Corp.,
7.375%, 9/15/2020 | | | | | | 500,000 | | | | | 551,875 | |
Polypore International, Inc.,
7.50%, 11/15/2017 | | | | | | 250,000 | | | | | 266,250 | |
QBE Capital Funding III Ltd.,
7.25%, 5/24/2041 | | (A) | | | | 500,000 | | | | | 527,774 | |
Regency Energy Partners LP,
4.50%, 11/01/2023 | | (A) | | | | 500,000 | | | | | 455,000 | |
Resolute Energy Corp.,
8.50%, 5/01/2020 | | | | | | 500,000 | | | | | 517,500 | |
Reynolds Group Issuer, Inc.,
9.00%, 4/15/2019 | | | | | | 500,000 | | | | | 527,500 | |
Sabra Health Care LP,
8.125%, 11/01/2018 | | | | | | 325,000 | | | | | 351,000 | |
Samson Investment Co.,
9.75%, 2/15/2020 | | (A) | | | | 500,000 | | | | | 532,500 | |
Sanmina-SCI Corp.,
7.00%, 5/15/2019 | | (A) | | | | 500,000 | | | | | 528,750 | |
Schaeffler Finance BV,
8.50%, 2/15/2019 | | (A) | | | | 500,000 | | | | | 560,000 | |
Sealed Air Corp.,
6.50%, 12/01/2020 | | (A) | | | | 200,000 | | | | | 210,500 | |
Sealed Air Corp.,
5.25%, 4/01/2023 | | (A) | | | | 500,000 | | | | | 476,250 | |
| | | | | | | | | | | | |
| Corporate Bonds (Continued) | | | | Par Value | | Fair Value |
SemGroup LP,
7.50%, 6/15/2021 | | (A) | | | $ | 250,000 | | | | $ | 256,250 | |
Servicemaster Co.,
8.00%, 2/15/2020 | | | | | | 500,000 | | | | | 497,500 | |
Steel Dynamics, Inc.,
5.25%, 4/15/2023 | | (A) | | | | 100,000 | | | | | 94,750 | |
Suncoke Energy,
7.625%, 8/01/2019 | | | | | | 500,000 | | | | | 538,750 | |
Targa Resources Partners LP,
4.25%, 11/15/2023 | | (A) | | | | 500,000 | | | | | 455,000 | |
Tesoro Corp.,
5.375%, 10/01/2022 | | | | | | 500,000 | | | | | 480,000 | |
Tesoro Logistics LP,
5.875%, 10/01/2020 | | | | | | 250,000 | | | | | 250,625 | |
United States Steel Corp.,
7.50%, 3/15/2022 | | | | | | 500,000 | | | | | 515,000 | |
USG Corp.,
9.75%, 1/15/2018 | | | | | | 500,000 | | | | | 581,250 | |
VeriSign, Inc.,
4.625%, 5/01/2023 | | (A) | | | | 500,000 | | | | | 472,500 | |
VimpelCom Holdings BV,
5.95%, 2/13/2023 | | (A) | | | | 500,000 | | | | | 475,330 | |
| | | | | | | | | | | | |
Total Corporate Bonds
(Cost $35,425,794) | | | | | | | | | | $ | 35,951,655 | |
| | | | | | | | | | | | |
| | | |
| Money Market Fund – 3.1% | | | | Shares | | Fair Value |
Fidelity Institutional Money Market Portfolio, 0.01%
(Cost $1,177,355) | | (B) | | | | 1,177,355 | | | | $ | 1,177,355 | |
| | | | | | | | | | | | |
Total Investments
(Cost $36,603,149) – 98.2% | | (C) | | | | | | | | $ | 37,129,010 | |
Other Assets in Excess of Liabilities – 1.8% | | | | | | | | | | | 684,517 | |
| | | | | | | | | | | | |
Net Assets – 100.00% | | | | | | | | | | $ | 37,813,527 | |
| | | | | | | | | | | | |
| (A) | 144A Security – Security exempt from registration under Rule 144A of the Securities Act of 1933. The 144A securities represent 43.3% of total net assets. The securities may be resold in transactions exempt from registration typically only to qualified institutional buyers. Unless otherwise indicated, these securities are not considered to be illiquid. |
| (B) | Variable rate security; the rate shown represents the yield at September 30, 2013. |
| (C) | Represents cost for financial reporting purposes. Aggregate cost for federal tax purposes is $36,603,149 and differs from fair value by net unrealized appreciation (depreciation) of securities as follows: |
| | | | | |
Unrealized appreciation | | | $ | 1,086,131 | |
Unrealized depreciation | | | | (560,270 | ) |
| | | | | |
Net unrealized appreciation | | | $ | 525,861 | |
| | | | | |
The accompanying notes are an integral part of these financial statements.
[43]
| | |
| Timothy Plan Family of Funds | | Israel Common Values |
| | |
Schedule of Investments | | As of September 30, 2013 |
| | | | | | | | | | | | |
| Common Stocks – 93.8% | | | | Shares | | Fair Value |
AEROSPACE/DEFENSE – 3.3% | | | | | | | | | | | | |
Elbit Systems, Ltd. | | | | | | 7,001 | | | | $ | 374,344 | |
| | | | | | | | | | | | |
BANKS – 11.8% | | | | | | | | | | | | |
Bank Hapoalim BM (ADR) | | | | | | 13,400 | | | | | 339,154 | |
Bank Leumi Le-Israel BM | | * | | | | 65,000 | | | | | 241,505 | |
First International Bank of Israel BM | | | | | | 19,300 | | | | | 316,667 | |
Israel Discount Bank, Ltd. | | * | | | | 120,000 | | | | | 216,121 | |
Mizrahi Tefahot, Ltd. | | | | | | 19,000 | | | | | 209,087 | |
| | | | | | | | | | | | |
| | | | | | | | | | | 1,322,534 | |
| | | | | | | | | | | | |
CHEMICALS – 4.2% | | | | | | | | | | | | |
Frutarom Industries, Ltd. | | | | | | 17,000 | | | | | 309,884 | |
Israel Chemicals, Ltd. (ADR) | | | | | | 19,400 | | | | | 165,676 | |
| | | | | | | | | | | | |
| | | | | | | | | | | 475,560 | |
| | | | | | | | | | | | |
COMMERCIAL SERVICES – 2.0% | | | | | | | | | | | | |
Nitsba Holdings, Ltd. | | * | | | | 17,000 | | | | | 219,286 | |
| | | | | | | | | | | | |
COMPUTERS – 1.0% | | | | | | | | | | | | |
Matrix IT, Ltd. | | | | | | 19,500 | | | | | 110,779 | |
| | | | | | | | | �� | | | |
ELECTRONICS – 4.0% | | | | | | | | | | | | |
Ituran Location and Control, Ltd. | | | | | | 12,296 | | | | | 226,861 | |
Orbotech, Ltd. | | * | | | | 18,700 | | | | | 224,213 | |
| | | | | | | | | | | | |
| | | | | | | | | | | 451,074 | |
| | | | | | | | | | | | |
ENERGY-ALTERNATE SOURCES – 2.1% | | | | | | | | | | | | |
Ormat Industries, Ltd. | | * | | | | 35,300 | | | | | 230,274 | |
| | | | | | | | | | | | |
FOOD – 7.7% | | | | | | | | | | | | |
Osem Investments, Ltd. | | | | | | 13,000 | | | | | 290,212 | |
Rami Levi Chain Stores | | | | | | 5,700 | | | | | 320,098 | |
Shufersal, Ltd. | | | | | | 59,000 | | | | | 253,852 | |
| | | | | | | | | | | | |
| | | | | | | | | | | 864,162 | |
| | | | | | | | | | | | |
HEALTHCARE PRODUCTS – 3.5% | | | | | | | | | | | | |
Given Imaging , Ltd. | | * | | | | 13,000 | | | | | 249,990 | |
Syneron Medical, Ltd. | | * | | | | 17,000 | | | | | 146,540 | |
| | | | | | | | | | | | |
| | | | | | | | | | | 396,530 | |
| | | | | | | | | | | | |
HOME BUILDERS – 2.4% | | | | | | | | | | | | |
Bayside Land Corp., Ltd. | | | | | | 1,000 | | | | | 268,847 | |
| | | | | | | | | | | | |
HOUSEHOLD PRODUCTS/WARES – 1.4% | | | | | | | | | | | | |
SodaStream International, Ltd. | | * | | | | 2,600 | | | | | 162,214 | |
| | | | | | | | | | | | |
INTERNET – 3.1% | | | | | | | | | | | | |
MagicJack VocalTec, Ltd. | | * | | | | 7,600 | | | | | 97,812 | |
Perion Network, Ltd. | | * | | | | 19,000 | | | | | 250,040 | |
| | | | | | | | | | | | |
| | | | | | | | | | | 347,852 | |
| | | | | | | | | | | | |
OIL & NATURAL GAS – 12.4% | | | | | | | | | | | | |
Delek Drilling – LP | | * | | | | 50,000 | | | | | 246,327 | |
Isramco Negev 2 LP | | * | | | | 1,536,664 | | | | | 282,421 | |
Noble Energy, Inc. | | | | | | 4,400 | | | | | 294,889 | |
Paz Oil Co., Ltd. | | * | | | | 1,900 | | | | | 311,907 | |
Ratio Oil Exploration LP | | * | | | | 2,100,000 | | | | | 251,347 | |
| | | | | | | | | | | | |
| | | | | | | | | | | 1,386,891 | |
| | | | | | | | | | | | |
| | | | | | | | | | | | |
| Common Stocks (Continued) | | | | Shares | | Fair Value |
REAL ESTATE – 16.2% | | | | | | | | | | | | |
Alony Hetz Properties & Investments | | | | | | 28,000 | | | | $ | 180,351 | |
Amot Investments, Ltd. | | | | | | 86,000 | | | | | 257,819 | |
Azrieli Group | | | | | | 7,500 | | | | | 238,031 | |
Gazit-Globe, Ltd. | | | | | | 17,000 | | | | | 228,014 | |
Industrial Buildings Corp. | | | | | | 120,000 | | | | | 212,037 | |
Jerusalem Economy, Ltd. | | | | | | 40,000 | | | | | 401,611 | |
Melisron, Ltd. | | | | | | 11,366 | | | | | 301,174 | |
| | | | | | | | | | | | |
| | | | | | | | | | | 1,819,037 | |
| | | | | | | | | | | | |
SEMICONDUCTORS – 4.1% | | | | | | | | | | | | |
Mellanox Technologies, Ltd. | | * | | | | 6,000 | | | | | 227,760 | |
Nova Measuring Instruments, Ltd. | | * | | | | 25,933 | | | | | 230,026 | |
| | | | | | | | | | | | |
| | | | | | | | | | | 457,786 | |
| | | | | | | | | | | | |
SOFTWARE – 6.5% | | | | | | | | | | | | |
Check Point Software Technologies,
Ltd. | | * | | | | 3,700 | | | | | 209,272 | |
Magic Software Enterprises, Ltd. | | | | | | 45,400 | | | | | 312,806 | |
RADWARE, Ltd. | | * | | | | 14,500 | | | | | 202,275 | |
| | | | | | | | | | | | |
| | | | | | | | | | | 724,353 | |
| | | | | | | | | | | | |
TELECOMMUNICATIONS – 8.1% | | | | | | | | | | | | |
Cellcom Israel, Ltd. | | * | | | | 18,500 | | | | | 204,425 | |
EZChip Semiconductor, Ltd. | | * | | | | 7,500 | | | | | 184,800 | |
NICE Systems, Ltd. (ADR) | | | | | | 6,500 | | | | | 268,905 | |
Partner Communications Co., Ltd. (ADR) | | * | | | | 32,500 | | | | | 256,425 | |
| | | | | | | | | | | | |
| | | | | | | | | | | 914,555 | |
| | | | | | | | | | | | |
Total Common Stocks
(Cost $8,333,543) | | | | | | | | | | $ | 10,526,078 | |
| | | | | | | | | | | | |
| | | |
| Investment Companies – 1.9% | | | | Shares | | Fair Value |
The Israel Corp., Ltd.
(Cost – $239,420) | | * | | | | 400 | | | | $ | 211,129 | |
| | | | | | | | | | | | |
| | | |
| Money Market Fund – 5.1% | | | | Shares | | Fair Value |
Fidelity Institutional Money Market Portfolio, 0.01%
(Cost $574,276) | | (A) | | | | 574,276 | | | | $ | 574,276 | |
| | | | | | | | | | | | |
Total Investments
(Cost $9,147,239) – 100.8% | | (B) | | | | | | | | $ | 11,311,483 | |
Liabilities in Excess of Other
Assets – (0.8)% | | | | | | | | | | | (72,805 | ) |
| | | | | | | | | | | | |
Net Assets – 100.00% | | | | | | | | | | $ | 11,238,678 | |
| | | | | | | | | | | | |
| | |
| Timothy Plan Family of Funds | | Israel Common Values (Continued) |
| | |
Schedule of Investments | | As of September 30, 2013 |
| * | Non-income producing securities. |
| (ADR) | American Depositary Receipt. |
| (A) | Variable rate security; the rate shown represents the yield at September 30, 2013. |
| (B) | Represents cost for financial reporting purposes. Aggregate cost for federal tax purposes is $9,850,689 and differs from fair value by net unrealized appreciation (depreciation) of securities as follows: |
| | | | | |
Unrealized appreciation | | | $ | 1,567,803 | |
Unrealized depreciation | | | | (107,009 | ) |
| | | | | |
Net unrealized appreciation | | | $ | 1,460,794 | |
| | | | | |
The accompanying notes are an integral part of these financial statements.
[45]
| | |
| Timothy Plan Family of Funds | | Defensive Strategies |
| | |
Schedule of Investments | | As of September 30, 2013 |
| | | | | | | | | | | | |
| Common Stocks – 24.5% | | | | Shares | | Fair Value |
AGRICULTURE – 0.7% | | | | | | | | | | | | |
Bunge, Ltd. | | | | | | 6,088 | | | | $ | 462,140 | |
| | | | | | | | | | | | |
CHEMICALS – 7.3% | | | | | | | | | | | | |
Agrium, Inc. | | | | | | 3,996 | | | | | 335,784 | |
American Vanguard Corp. | | | | | | 959 | | | | | 25,816 | |
CF Industries Holdings, Inc. | | | | | | 4,448 | | | | | 937,772 | |
Intrepid Potash, Inc. | | * | | | | 5,759 | | | | | 90,301 | |
K+S AG | | | | | | 7,983 | | | | | 207,009 | |
Mosaic Co. | | | | | | 10,698 | | | | | 460,227 | |
Potash Corp. Of Saskatchewan, Inc. | | | | | | 32,771 | | | | | 1,025,077 | |
Sociedad Quimica y Minera de Chile SA | | | | | | 3,862 | | | | | 117,984 | |
Syngenta AG (ADR) | | | | | | 18,774 | | | | | 1,526,326 | |
Uralkali OJSC | | | | | | 10,796 | | | | | 283,096 | |
| | | | | | | | | | | | |
| | | | | | | | | | | 5,009,392 | |
| | | | | | | | | | | | |
COAL – 0.0% | | | | | | | | | | | | |
Peabody Energy Corp. | | | | | | 1,103 | | | | | 19,027 | |
| | | | | | | | | | | | |
FOOD – 0.3% | | | | | | | | | | | | |
Ingredion, Inc. | | | | | | 3,387 | | | | | 224,118 | |
| | | | | | | | | | | | |
IRON / STEEL – 0.6% | | | | | | | | | | | | |
Allegheny Technologies, Inc. | | | | | | 2,356 | | | | | 71,905 | |
JFE Holdings, Inc. | | | | | | 1 | | | | | 26 | |
Nippon Steel & Sumitomo Metal Corp. | | | | | | 9,828 | | | | | 33,361 | |
POSCO (ADR) | | | | | | 979 | | | | | 72,094 | |
Severstal OAO | | | | | | 11,215 | | | | | 97,959 | |
ThyssenKrupp AG | | * | | | | 2,358 | | | | | 56,422 | |
Vale SA (ADR) | | | | | | 6,234 | | | | | 97,313 | |
| | | | | | | | | | | | |
| | | | | | | | | | | 429,080 | |
| | | | | | | | | | | | |
MACHINERY – 0.6% | | | | | | | | | | | | |
AGCO Corp. (ADR) | | | | | | 6,646 | | | | | 401,551 | |
CNH Global NV * | | | | | | 2,316 | | | | | 28,949 | |
| | | | | | | | | | | | |
| | | | | | | | | | | 430,500 | |
| | | | | | | | | | | | |
MINING – 4.1% | | | | | | | | | | | | |
Allied Nevada Gold Corp. | | * | | | | 3,102 | | | | | 12,966 | |
Anglo American PLC | | | | | | 7,252 | | | | | 178,195 | |
AngloGold Ashanti, Ltd. (ADR) | | | | | | 82 | | | | | 1,089 | |
Antofagasta PLC | | | | | | 2,159 | | | | | 28,605 | |
Barrick Gold Corp. | | | | | | 11,543 | | | | | 214,931 | |
BHP Billiton PLC (ADR) | | | | | | 234 | | | | | 13,773 | |
Cameco Corp. | | | | | | 451 | | | | | 8,150 | |
Cia de Minas Buenaventura SA | | | | | | 8,295 | | | | | 97,134 | |
Coeur d’Alene Mines Corp. | | * | | | | 1,877 | | | | | 22,618 | |
Eldorado Gold Corp. | | | | | | 7,567 | | | | | 50,775 | |
First Quantum Minerals, Ltd. | | | | | | 1,198 | | | | | 22,341 | |
Freeport-McMoRan Copper & Gold, Inc. | | | | | | 12,994 | | | | | 429,842 | |
Glencore International PLC | | | | | | 54,923 | | | | | 299,339 | |
Goldcorp, Inc. | | | | | | 909 | | | | | 23,643 | |
Harmony Gold Mining Co., Ltd. (ADR) | | | | | | 7,047 | | | | | 23,819 | |
Hecla Mining Co. | | | | | | 5,932 | | | | | 18,626 | |
IAMGOLD Corp. | | | | | | 6,495 | | | | | 30,851 | |
Kazakhmys PLC | | | | | | 549 | | | | | 2,364 | |
Kinross Gold Corp. | | | | | | 39,028 | | | | | 197,091 | |
MMC Norilsk Nickel OJSC | | | | | | 5,670 | | | | | 81,364 | |
| | | | | | | | | | | | |
| Common Stocks (Continued) | | | | Shares | | Fair Value |
MINING (continued) | | | | | | | | | | | | |
New Gold, Inc. | | * | | | | 4,211 | | | | $ | 25,182 | |
Newmont Mining Corp. | | | | | | 8,197 | | | | | 230,336 | |
Pan American Silver Corp. | | | | | | 359 | | | | | 3,787 | |
Randgold Resources, Ltd. (ADR) | | | | | | 746 | | | | | 53,361 | |
Rio Tinto PLC (ADR) | | | | | | 6,310 | | | | | 307,676 | |
Royal Gold, Inc. | | | | | | 136 | | | | | 6,618 | |
Sesa Goa, Ltd. | | * | | | | 987 | | | | | 11,123 | |
Silver Wheaton Corp. | | | | | | 8,490 | | | | | 210,297 | |
Southern Copper Corp. | | | | | | 5,122 | | | | | 139,523 | |
Yamana Gold, Inc. | | | | | | 7,265 | | | | | 75,556 | |
| | | | | | | | | | | | |
| | | | | | | | | | | 2,820,975 | |
| | | | | | | | | | | | |
OIL & GAS – 8.7% | | | | | | |
Anadarko Petroleum Corp. | | | | | | 492 | | | | | 45,751 | |
Apache Corp. | | | | | | 5,352 | | | | | 455,669 | |
BG Group PLC | | | | | | 23,465 | | | | | 448,387 | |
Canadian Natural Resources, Ltd. | | | | | | 1,428 | | | | | 44,896 | |
Chesapeake Energy Corp. | | | | | | 901 | | | | | 23,318 | |
ConocoPhillips | | | | | | 5,403 | | | | | 375,563 | |
Devon Energy Corp. | | | | | | 2,644 | | | | | 152,717 | |
Encana Corp. | | | | | | 1,870 | | | | | 32,407 | |
Ensco PLC – Cl. A | | | | | | 1,233 | | | | | 66,274 | |
EOG Resources, Inc. | | | | | | 384 | | | | | 65,004 | |
Inpex Corp. | | | | | | 30,400 | | | | | 358,850 | |
Lukoil OAO | | | | | | 8,352 | | | | | 529,517 | |
Marathon Oil Corp. | | | | | | 14,378 | | | | | 501,505 | |
Noble Energy, Inc. | | | | | | 647 | | | | | 43,355 | |
NovaTek OAO | | | | | | 4,297 | | | | | 568,063 | |
Occidental Petroleum Corp. | | | | | | 4,215 | | | | | 394,271 | |
Petroleo Brasileiro SA (ADR) | | | | | | 14,022 | | | | | 217,201 | |
Pioneer Natural Resources Co. | | | | | | 244 | | | | | 46,067 | |
Reliance Industries, Ltd. | | | | | | 5,915 | | | | | 155,505 | |
Rosneft OAO (ADR) | | | | | | 26,168 | | | | | 211,961 | |
Southwestern Energy Co. | | * | | | | 2,812 | | | | | 102,301 | |
Total SA | | | | | | 14,122 | | | | | 819,840 | |
Transocean, Ltd. | | | | | | 2,350 | | | | | 104,575 | |
Valero Energy Corp. | | | | | | 5,633 | | | | | 192,367 | |
| | | | | | | | | | | | |
| | | | | | | | | | | 5,955,364 | |
| | | | | | | | | | | | |
OIL & GAS SERVICES – 1.9% | | | | | | |
Baker Hughes, Inc. | | | | | | 2,827 | | | | | 138,806 | |
Cameron International Corp. | | * | | | | 2,899 | | | | | 169,215 | |
Halliburton Co. | | | | | | 14,031 | | | | | 675,593 | |
National Oilwell Varco, Inc. | | | | | | 4,145 | | | | | 323,766 | |
| | | | | | | | | | | | |
| | | | | | | | | | | 1,307,380 | |
| | | | | | | | | | | | |
PIPELINES – 0.3% | | | | | | |
Kinder Morgan, Inc. | | | | | | 3,591 | | | | | 127,732 | |
TransCanada Corp. | | | | | | 1,592 | | | | | 70,042 | |
| | | | | | | | | | | | |
| | | | | | | | | | | 197,774 | |
| | | | | | | | | | | | |
RETAIL – 0.0% | | | | | | |
CST Brands, Inc. | | | | | | 626 | | | | | 18,655 | |
| | | | | | | | | | | | |
Total Common Stocks
(Cost $17,634,622) | | | | | | | | | | $ | 16,874,405 | |
| | | | | | | | | | | | |
| | |
| Timothy Plan Family of Funds | | Defensive Strategies (Continued) |
| | |
Schedule of Investments | | As of September 30, 2013 |
| | | | | | | | | | | | |
| REITs – 31.1% | | | | Shares | | Fair Value |
Acadia Realty Trust | | | | | | 5,500 | | | | $ | 135,740 | |
Apartment Investment & Management Co. – Cl. A | | | | | | 4,400 | | | | | 122,936 | |
AvalonBay Communities, Inc. | | | | | | 4,850 | | | | | 616,386 | |
Boston Properties, Inc. | | | | | | 9,500 | | | | | 1,015,550 | |
Brandywine Realty Trust | | | | | | 11,800 | | | | | 155,524 | |
BRE Properties, Inc. | | | | | | 6,000 | | | | | 304,560 | |
Camden Property Trust | | | | | | 5,700 | | | | | 350,208 | |
CBL & Associates Properties, Inc. | | | | | | 14,300 | | | | | 273,130 | |
Colonial Properties Trust | | | | | | 12,800 | | | | | 287,872 | |
DDR Corp. | | | | | | 34,300 | | | | | 538,853 | |
DiamondRock Hospitality Co. | | | | | | 43,800 | | | | | 467,346 | |
Digital Realty Trust, Inc. | | | | | | 4,790 | | | | | 254,349 | |
Douglas Emmett, Inc. | | | | | | 11,400 | | | | | 267,558 | |
Education Realty Trust, Inc. | | | | | | 18,300 | | | | | 166,530 | |
Equity Lifestyle Properties, Inc. | | | | | | 5,200 | | | | | 177,684 | |
Equity Residential | | | | | | 18,000 | | | | | 964,260 | |
Essex Property Trust, Inc. | | | | | | 3,450 | | | | | 509,565 | |
Extra Space Storage, Inc. | | | | | | 8,600 | | | | | 393,450 | |
Federal Realty Investment Trust | | | | | | 2,800 | | | | | 284,060 | |
FelCor Lodging Trust, Inc. | | * | | | | 11,100 | | | | | 68,376 | |
First Industrial Realty Trust | | | | | | 20,700 | | | | | 336,789 | |
First Potomac Realty Trust | | | | | | 8,200 | | | | | 103,074 | |
HCP, Inc. | | | | | | 19,500 | | | | | 798,525 | |
Health Care REIT, Inc. | | | | | | 9,600 | | | | | 598,848 | |
Highwoods Properties, Inc. | | | | | | 6,000 | | | | | 211,860 | |
Hospitality Properties Trust | | | | | | 22,400 | | | | | 633,920 | |
Kilroy Realty Corp. | | | | | | 6,100 | | | | | 304,695 | |
Kimco Realty Corp. | | | | | | 29,800 | | | | | 601,364 | |
Lexington Realty Trust | | | | | | 26,200 | | | | | 294,226 | |
Liberty Property Trust | | | | | | 12,100 | | | | | 430,760 | |
Macerich Company | | | | | | 15,363 | | | | | 867,088 | |
National Retail Properties, Inc. | | | | | | 7,600 | | | | | 241,832 | |
Prologis, Inc. | | | | | | 23,694 | | | | | 891,368 | |
PS Business Parks, Inc. | | | | | | 4,400 | | | | | 328,328 | |
Public Storage | | | | | | 6,900 | | | | | 1,107,795 | |
Rayonier, Inc. | | | | | | 4,500 | | | | | 250,425 | |
Regency Centers Corp. | | | | | | 4,100 | | | | | 198,235 | |
SL Green Realty Corp. | | | | | | 9,050 | | | | | 804,002 | |
Simon Property Group, Inc. | | | | | | 15,729 | | | | | 2,331,510 | |
Strategic Hotels & Resorts, Inc. | | * | | | | 30,000 | | | | | 260,400 | |
Summit Hotel Properties, Inc. | | | | | | 8,000 | | | | | 73,520 | |
Taubman Centers, Inc. | | | | | | 6,300 | | | | | 424,053 | |
UDR, Inc. | | | | | | 15,700 | | | | | 372,090 | |
Ventas ,Inc. | | | | | | 14,659 | | | | | 901,529 | |
Washington REIT | | | | | | 6,600 | | | | | 166,782 | |
Weingarten Realty Investors | | | | | | 11,100 | | | | | 325,563 | |
| | | | | | | | | | | | |
Total REITs
(Cost $19,696,652) | | | | | | | | | | $ | 21,212,518 | |
| | | | | | | | | | | | |
| | | |
| Exchange Traded Funds – 8.9% | | | | Shares | | Fair Value |
iShares Silver Trust | | * | | | | 35,800 | | | | $ | 747,862 | |
PowerShares DB Agriculture Fund | | * | | | | 61,300 | | | | | 1,550,277 | |
| | | | | | | | | | | | |
| Exchange Traded Funds (Continued) | | | | Shares | | Fair Value |
PowerShares DB Base Metals Fund | | * | | | | 33,800 | | | | $ | 565,474 | |
PowerShares DB Commodity Index Tracking Fund | | * | | | | 29,300 | | | | | 754,768 | |
PowerShares DB Energy Fund | | * | | | | 28,000 | | | | | 788,480 | |
SPDR Gold Shares | | * | | | | 13,250 | | | | | 1,698,253 | |
| | | | | | | | | | | | |
Total Exchange Traded Funds
(Cost $7,121,845) | | | | | | | | | | $ | 6,105,114 | |
| | | | | | | | | | | | |
| | | |
| Bonds and Notes – 33.0% | | | | Par Value | | Fair Value |
GOVERNMENT MORTGAGE-BACKED SECURITIES – 1.9% | | | | | | | | | | | | |
GNMA Pool 4947,
5.00%, 2/20/2041 | | | | | $ | 558,186 | | | | $ | 611,763 | |
GNMA Pool 5204,
4.50%, 10/20/2041 | | | | | | 597,477 | | | | | 646,597 | |
| | | | | | | | | | | | |
Total Government Mortgage-Backed Securities
(Cost $1,236,960) | | | | | | | | | | $ | 1,258,360 | |
| | | | | | | | | | | | |
| | | |
| Coporate Bonds – 3.0% | | | | Par Value | | Fair Value |
HAND/MACHINE TOOLS – 0.7 % | | | | | | | | | | | | |
Kennametal Inc.,
3.875%, 2/15/2022 | | | | | | 500,000 | | | | | 484,419 | |
| | | | | | | | | | | | |
OIL & GAS – 0.7 % | | | | | | | | | | | | |
Petrobras International Finance Co.,
3.50%, 2/06/2017 | | | | | | 500,000 | | | | | 508,976 | |
| | | | | | | | | | | | |
PIPELINES – 0.9 % | | | | | | | | | | | | |
Energy Transfer Partners LP,
6.70%, 7/01/2018 | | | | | | 500,000 | | | | | 586,174 | |
| | | | | | | | | | | | |
REITS – 0.7 % | | | | | | | | | | | | |
Health Care REIT Inc.,
3.75%, 3/15/2023 | | | | | | 500,000 | | | | | 473,886 | |
| | | | | | | | | | | | |
Total Corporate Bonds
(Cost $2,050,427) | | | | | | | | | | $ | 2,053,455 | |
| | | | | | | | | | | | |
TREASURY INFLATION PROTECTED SECURITIES (TIPS) – 28.1% | | | | | | | | | | | | |
TIPS,
1.75%, 1/15/2028 | | | | | | 2,535,000 | | | | | 3,170,681 | |
TIPS,
2.50%, 1/15/2029 | | | | | | 1,350,000 | | | | | 1,808,076 | |
TIPS,
2.125%, 2/15/2041 | | | | | | 1,125,000 | | | | | 1,425,125 | |
TIPS,
2.00%, 1/15/2014 | | | | | | 3,145,000 | | | | | 3,996,937 | |
TIPS,
1.625%, 1/15/2018 | | | | | | 300,000 | | | | | 367,898 | |
TIPS,
2.00%, 1/15/2016 | | | | | | 745,000 | | | | | 938,334 | |
TIPS,
2.375%, 1/15/2017 | | | | | | 1,050,000 | | | | | 1,349,903 | |
| | |
| Timothy Plan Family of Funds | | Defensive Strategies (Continued) |
| | |
Schedule of Investments | | As of September 30, 2013 |
| | | | | | | | | | | | |
| Bonds and Notes (Continued) | | | | Par Value | | Fair Value |
TREASURY INFLATION PROTECTED SECURITIES (TIPS) (continued) | | | | | | | | | | | | |
TIPS,
2.00%, 1/15/2026 | | | | | $ | 850,000 | | | | $ | 1,156,008 | |
TIPS,
2.125%, 1/15/2019 | | | | | | 1,550,000 | | | | | 1,915,663 | |
TIPS,
1.125%, 1/15/2021 | | | | | | 2,775,000 | | | | | 3,193,747 | |
| | | | | | | | | | | | |
Total Treasury InFlation Protected Securities (TIPS)
(Cost $19,721,096) | | | | | | | | | | $ | 19,322,372 | |
| | | | | | | | | | | | |
Total bonds and Notes
(Cost $23,008,483) | | | | | | | | | | $ | 22,634,187 | |
| | | | | | | | | | | | |
| | | | | | | | | | | | |
| Money Market Fund – 2.4% | | | | Shares | | Fair Value |
Fidelity Institutional Money Market Portfolio, 0.01%
(Cost $1,663,185) | | (A) | | | | 1,663,185 | | | | $ | 1,663,185 | |
| | | | | | | | | | | | |
Total Investments
(Cost $69,124,787) – 99.9% | | (B) | | | | | | | | $ | 68,489,409 | |
Other Assets in Excess of
Liabilities – 0.1% | | | | | | | | | | | 88,555 | |
| | | | | | | | | | | | |
Net Assets – 100.00% | | | | | | | | | | $ | 68,577,964 | |
| | | | | | | | | | | | |
| * | Non-income producing securities. |
| GNMA | – Government National Mortgage Association. |
| REIT | – Real Estate Investment Trust. |
| (ADR) | American Depositary Receipt. |
| (A) | Variable rate security; the rate shown represents the yield at September 30, 2013. |
| (B) | Represents cost for financial reporting purposes. Aggregate cost for federal tax purposes is $69,306,450 and differs from fair value by net unrealized appreciation (depreciation) of securities as follows: |
| | | | | |
Unrealized appreciation | | | $ | 3,035,615 | |
Unrealized depreciation | | | | (3,852,656 | ) |
| | | | | |
Net unrealized depreciation | | | $ | (817,041 | ) |
| | | | | |
The accompanying notes are an integral part of these financial statements.
[48]
| | |
| Timothy Plan Family of Funds | | Strategic Growth |
| | |
Schedule of Investments | | As of September 30, 2013 |
| | | | | | | | | | | | |
| Mutual Funds – 94.8% | | (A) | | Shares | | Fair Value |
Timothy Plan Aggressive Growth Fund | | * | | | | 269,815 | | | | $ | 2,428,336 | |
Timothy Plan Defensive Strategies Fund | | | | | | 546,218 | | | | | 6,073,942 | |
Timothy Plan Emerging Markets Fund | | * | | | | 239,171 | | | | | 2,516,079 | |
Timothy Plan High Yield Bond Fund | | | | | | 570,000 | | | | | 5,352,301 | |
Timothy Plan International Fund | | | | | | 738,869 | | | | | 6,391,218 | |
Timothy Plan Israel Common Values Fund | | * | | | | 170,057 | | | | | 2,156,317 | |
Timothy Plan Large/Mid Cap Growth Fund | | | | | | 751,251 | | | | | 6,280,460 | |
Timothy Plan Large/Mid Cap Value Fund | | | | | | 334,264 | | | | | 6,060,213 | |
Timothy Plan Small Cap Value Fund | | | | | | 131,719 | | | | | 2,672,581 | |
| | | | | | | | | | | | |
Total Mutual Funds
(Cost $34,129,625) | | | | | | | | | | $ | 39,931,447 | |
| | | | | | | | | | | | |
| | | | | | | | | | | | |
| Money Market Fund – 5.3% | | | | Shares | | Fair Value |
Fidelity Institutional Money Market Portfolio, 0.01%
(Cost $2,216,528) | | (B) | | | | 2,216,528 | | | | $ | 2,216,528 | |
| | | | | | | | | | | | |
Total Investments
(Cost $36,346,153) – 100.1% | | (C) | | | | | | | | $ | 42,147,975 | |
Liabilities in Excess of Other Assets – (0.1)% | | | | | | | | | | | (14,730 | ) |
| | | | | | | | | | | | |
Net Assets – 100.00% | | | | | | | | | | $ | 42,133,245 | |
| | | | | | | | | | | | |
| * | Non-income producing securities. |
| (A) | Affiliated Funds – Class A. |
| (B) | Variable rate security; the rate shown represents the yield at September 30, 2013. |
| (C) | Represents cost for financial reporting purposes. Aggregate cost for federal tax purposes is $38,289,035 and differs from fair value by net unrealized appreciation (depreciation) of securities as follows: |
| | | | | |
Unrealized appreciation | | | $ | 4,560,835 | |
Unrealized depreciation | | | | (701,895 | ) |
| | | | | |
Net unrealized appreciation | | | $ | 3,858,940 | |
| | | | | |
The accompanying notes are an integral part of these financial statements.
[49]
| | |
| Timothy Plan Family of Funds | | Conservative Growth |
| | |
Schedule of Investments | | As of September 30, 2013 |
| | | | | | | | | | | | |
| Mutual Funds – 95.1% | | (A) | | Shares | | Fair Value |
Timothy Plan Aggressive Growth Fund | | * | | | | 137,005 | | | | $ | 1,233,047 | |
Timothy Plan Defensive Strategies Fund | | | | | | 733,221 | | | | | 8,153,421 | |
Timothy Plan Emerging Markets Fund | | * | | | | 155,168 | | | | | 1,632,370 | |
Timothy Plan Fixed Income Fund | | | | | | 1,531,534 | | | | | 15,958,588 | |
Timothy Plan High Yield Bond Fund | | | | | | 493,094 | | | | | 4,630,152 | |
Timothy Plan International Fund | | | | | | 314,362 | | | | | 2,719,228 | |
Timothy Plan Israel Common Values Fund | | * | | | | 176,615 | | | | | 2,239,483 | |
Timothy Plan Large/Mid Cap Growth Fund | | | | | | 666,047 | | | | | 5,568,156 | |
Timothy Plan Large/Mid Cap Value Fund | | | | | | 381,372 | | | | | 6,914,275 | |
Timothy Plan Small Cap Value Fund | | | | | | 143,579 | | | | | 2,913,220 | |
| | | | | | | | | | | | |
Total Mutual Funds
(Cost $46,760,271) | | | | | | | | | | $ | 51,961,940 | |
| | | | | | | | | | | | |
| | | | | | | | | | | | |
| Money Market Fund – 5.2% | | | | Shares | | Fair Value |
Fidelity Institutional Money Market Portfolio, 0.01%
(Cost $2,816,916) | | (B) | | | | 2,816,916 | | | | $ | 2,816,916 | |
| | | | | | | | | | | | |
Total Investments
(Cost $49,577,187) – 100.3% | | (C) | | | | | | | | $ | 54,778,856 | |
Liabilities in Excess of Other Assets – (0.3)% | | | | | | | | | | | (122,027 | ) |
| | | | | | | | | | | | |
Net Assets – 100.00% | | | | | | | | | | $ | 54,656,829 | |
| | | | | | | | | | | | |
| * | Non-income producing securities. |
| (A) | Affiliated Funds – Class A. |
| (B) | Variable rate security; the rate shown represents the yield at September 30, 2013. |
| (C) | Represents cost for financial reporting purposes. Aggregate cost for federal tax purposes is $50,780,098 and differs from fair value by net unrealized appreciation (depreciation) of securities as follows: |
| | | | | |
Unrealized appreciation | | | $ | 4,920,849 | |
Unrealized depreciation | | | | (922,091 | ) |
| | | | | |
Net unrealized appreciation | | | $ | 3,998,758 | |
| | | | | |
The accompanying notes are an integral part of these financial statements.
[50]
| | |
| Timothy Plan Family of Funds | | Emerging Markets |
| | |
Schedule of Investments | | As of September 30, 2013 |
| | | | | | | | | | | | |
| Common Stocks – 93.0% | | | | Shares | | Fair Value |
AEROSPACE/DEFENSE – 3.0% | | | | | | | | | | | | |
Embraer SA (ADR) | | | | | | 8,400 | | | | $ | 272,748 | |
| | | | | | | | | | | | |
AGRICULTURE – 1.7% | | | | | | | | | | | | |
Adecoagro SA | | * | | | | 20,140 | | | | | 149,237 | |
| | | | | | | | | | | | |
AUTOMOTIVE – 3.3% | | | | | | | | | | | | |
China Yuchai International, Ltd. | | | | | | 4,270 | | | | | 101,498 | |
Hyundai Mobis | | | | | | 740 | | | | | 196,940 | |
| | | | | | | | | | | | |
| | | | | | | | | | | 298,438 | |
| | | | | | | | | | | | |
BANKS – 18.0% | | | | | | | | | | | | |
Banco Bradesco SA | | | | | | 2,600 | | | | | 40,554 | |
Banco do Brasil SA | | | | | | 19,800 | | | | | 229,488 | |
Banco Latinoamericano de Comericio Exterior SA | | | | | | 8,530 | | | | | 212,568 | |
Banco Santander Brasil SA (ADR) | | | | | | 30,170 | | | | | 209,682 | |
Erste Group Bank AG | | | | | | 9,400 | | | | | 297,185 | |
Sberbank of Russia (ADR) | | | | | | 16,910 | | | | | 203,427 | |
Turkiye Garanti Bankasi AS | | | | | | 52,610 | | | | | 206,946 | |
Turkiye Vakiflar Bankasi Tao | | | | | | 92,200 | | | | | 210,043 | |
| | | | | | | | | | | | |
| | | | | | | | | | | 1,609,893 | |
| | | | | | | | | | | | |
BUILDING MATERIALS – 3.3% | | | | | | | | | | | | |
Cemex SAB de CV (ADR) | | * | | | | 19,060 | | | | | 213,091 | |
Desarrolladora Homex SAB de CV | | * | | | | 145,724 | | | | | 51,355 | |
Urbi Desarrollos Urbanos SAB de CV | | * | | | | 373,450 | | | | | 34,409 | |
| | | | | | | | | | | | |
| | | | | | | | | | | 298,855 | |
| | | | | | | | | | | | |
CHEMICALS – 5.5% | | | | | | | | | | | | |
Synthos SA | | | | | | 98,200 | | | | | 150,075 | |
Yingde Gases | | | | | | 351,500 | | | | | 343,564 | |
| | | | | | | | | | | | |
| | | | | | | | | | | 493,639 | |
| | | | | | | | | | | | |
COMPUTERS – 1.9% | | | | | | | | | | | | |
Compal Electronics | | | | | | 233,000 | | | | | 169,855 | |
| | | | | | | | | | | | |
DISTRIBUTION / WHOLESALE – 1.5% | | | | | | | | | | | | |
Aygaz AS | | | | | | 29,460 | | | | | 131,606 | |
| | | | | | | | | | | | |
DIVERSIFIED FINANCIAL SERVICES – 6.8% | | | | | | | | | | | | |
Hana Financial Group, Inc. | | | | | | 5,270 | | | | | 180,711 | |
KB Financial Group, Inc. | | | | | | 5,030 | | | | | 175,992 | |
Shinham Financial Group Co., Ltd. | | | | | | 6,100 | | | | | 247,771 | |
| | | | | | | | | | | | |
| | | | | | | | | | | 604,474 | |
| | | | | | | | | | | | |
ELECTRIC – 6.8% | | | | | | | | | | | | |
Centrais Eletricas Brasileiras SA | | | | | | 15,000 | | | | | 42,150 | |
Cia Paranaense de Energia (ADR) | | | | | | 10,480 | | | | | 146,301 | |
Reliance Infrastructure, Ltd. (ADR) | | | | | | 15,790 | | | | | 284,220 | |
RusHydro JSC | | | | | | 83,880 | | | | | 131,692 | |
| | | | | | | | | | | | |
| | | | | | | | | | | 604,363 | |
| | | | | | | | | | | | |
ELECTRONICS – 1.3% | | | | | | | | | | | | |
Flextronics International, Ltd. | | * | | | | 13,090 | | | | | 118,988 | |
| | | | | | | | | | | | |
FOOD – 6.2% | | | | | | | | | | | | |
First Pacific Co., Ltd. | | | | | | 220,000 | | | | | 243,117 | |
Lotte Confectionery Co., Ltd. | | | | | | 90 | | | | | 142,792 | |
Marfrig Alimentos SA | | * | | | | 37,200 | | | | | 100,437 | |
People’s Food Holdings, Ltd. | | | | | | 78,000 | | | | | 71,785 | |
| | | | | | | | | | | | |
| | | | | | | | | | | 558,131 | |
| | | | | | | | | | | | |
| | | | | | | | | | | | |
| Common Stocks (Continued) | | | | Shares | | Fair Value |
HOLDING COMPANY – 0.7% | | | | | | | | | | | | |
Haw Par Corp., Ltd. | | | | | | 10,260 | | | | $ | 60,497 | |
| | | | | | | | | | | | |
INTERNET – 1.8% | | | | | | | | | | | | |
AsiaInfo-Linkage, Inc. | | * | | | | 14,030 | | | | | 161,906 | |
| | | | | | | | | | | | |
IRON / STEEL – 6.2% | | | | | | | | | | | | |
POSCO | | | | | | 1,250 | | | | | 371,636 | |
Ternium SA (ADR) | | | | | | 7,820 | | | | | 187,836 | |
| | | | | | | | | | | | |
| | | | | | | | | | | 559,472 | |
| | | | | | | | | | | | |
OIL & NATURAL GAS – 8.5% | | | | | | | | | | | | |
Lukoil OAO (ADR) | | | | | | 5,724 | | | | | 363,817 | |
Petroleo Brasileiro SA | | | | | | 23,800 | | | | | 398,174 | |
| | | | | | | | | | | | |
| | | | | | | | | | | 761,991 | |
| | | | | | | | | | | | |
PHARMACEUTICAL – 0.8% | | | | | | | | | | | | |
Selcuk Ecza Deposu Ticaret ve Sanayi A.S. | | | | | | 70,580 | | | | | 69,408 | |
| | | | | | | | | | | | |
RETAIL – 3.4% | | | | | | | | | | | | |
Bosideng International Holdings, Ltd. | | | | | | 1,272,000 | | | | | 306,719 | |
| | | | | | | | | | | | |
SEMICONDUCTORS – 4.9% | | | | | | | | | | | | |
Samsung Electronics Co., Ltd. | | | | | | 343 | | | | | 436,315 | |
| | | | | | | | | | | | |
TELECOMMUNICATIONS – 6.7% | | | | | | | | | | | | |
Telefonica Brasil SA (ADR) | | | | | | 8,300 | | | | | 186,252 | |
Tim Participacoes SA (ADR) | | | | | | 13,100 | | | | | 308,767 | |
XL Axiata TBK PT | | | | | | 295,700 | | | | | 110,181 | |
| | | | | | | | | | | | |
| | | | | | | | | | | 605,200 | |
| | | | | | | | | | | | |
TEXTILES – 0.7% | | | | | | | | | | | | |
Weiqiao Textile Co. | | | | | | 103,000 | | | | | 60,431 | |
| | | | | | | | | | | | |
Total Common Stocks
(Cost $8,336,062) | | | | | | | | | | $ | 8,332,166 | |
| | | | | | | | | | | | |
| | | |
| Preferred Stock – 3.8% | | | | Shares | | Fair Value |
Hyundai Motor Co.
(Cost $213,785) | | | | | | 3,380 | | | | $ | 339,686 | |
| | | | | | | | | | | | |
| | | |
| REITs – 0.8% | | | | Shares | | Fair Value |
Fibra Uno Administracion SA de CV
(Cost $69,571) | | | | | | 26,700 | | | | $ | 73,592 | |
| | | | | | | | | | | | |
| | | |
| Money Market Fund – 1.7% | | | | Shares | | Fair Value |
Fidelity Institutional Money Market Portfolio, 0.01%
(Cost $156,462) | | (A) | | | | 156,462 | | | | $ | 156,462 | |
| | | | | | | | | | | | |
Total Investments
(Cost $8,775,880) – 99.3% | | (C) | | | | | | | | $ | 8,901,906 | |
Other Assets in Excess of Liabilities – 0.7% | | | | | | | | | | | 64,355 | |
| | | | | | | | | | | | |
Net Assets – 100.00% | | | | | | | | | | $ | 8,966,261 | |
| | | | | | | | | | | | |
| | |
| Timothy Plan Family of Funds | | Emerging Markets (Continued) |
| | |
Schedule of Investments | | As of September 30, 2013 |
| * | Non-income producing securities. |
| (ADR) | American Depositary Receipt. |
| REITs | – Real Estate Investment Trusts. |
| (A) | Variable rate security; the rate shown represents the yield at September 30, 2013. |
| (C) | Represents cost for financial reporting purposes. Aggregate cost for federal tax purposes is $8,788,385 and differs from fair value by net unrealized appreciation (depreciation) of securities as follows: |
| | | | | |
Unrealized appreciation | | | $ | 590,966 | |
Unrealized depreciation | | | | (477,445 | ) |
| | | | | |
Net unrealized appreciation | | | $ | 113,521 | |
| | | | | |
Diversification of Assets
| | | | |
Country | | % of
Net Assets | |
Austria | | | 3.31% | |
Brazil | | | 21.58% | |
China | | | 3.28% | |
Hong Kong | | | 9.96% | |
India | | | 3.17% | |
Indonesia | | | 1.23% | |
Luxembourg | | | 3.76% | |
Mexico | | | 4.15% | |
Panama | | | 2.37% | |
Poland | | | 1.67% | |
Russia | | | 7.80% | |
Singapore | | | 3.13% | |
South Korea | | | 23.33% | |
Taiwan | | | 1.89% | |
Turkey | | | 6.89% | |
UAE | | | 0.00% | |
Total | | | 97.52% | |
Money Market Fund | | | 1.75% | |
Other Assets In Excess of Liabilities | | | 0.73% | |
| | | | |
Grand Total | | | 100.00% | |
| | | | |
The accompanying notes are an integral part of these financial statements.
[52]
| | |
| Timothy Plan Family of Funds | | |
| | |
Statements of Assets and Liabilities | | September 30, 2013 |
| | | | | | | | | | | | | | | | | | | | | | | | | | | | | | |
| | | Aggressive
Growth Fund | | International
Fund | | Large/Mid Cap
Growth Fund | | Small Cap
Value Fund | | Large/Mid Cap
Value Fund | | Fixed
Income Fund |
Assets: | | | | | | | | | | | | | | | | | | | | | | | | | | | | | | |
Investments, at cost | | | $ | 17,026,268 | | | | $ | 32,918,167 | | | | $ | 45,101,232 | | | | $ | 56,648,826 | | | | $ | 101,410,812 | | | | $ | 74,615,573 | |
| | | | | | | | | | | | | | | | | | | | | | | | | | | | | | |
Investments, at value | | | $ | 20,741,893 | | | | $ | 40,788,508 | | | | $ | 53,082,694 | | | | $ | 73,017,239 | | | | $ | 128,320,091 | | | | $ | 74,939,903 | |
Receivable for securities sold | | | | 409,012 | | | | | 40,576 | | | | | 945,706 | | | | | 342,516 | | | | | — | | | | | — | |
Receivable for fund shares sold | | | | 30,096 | | | | | 108,630 | | | | | 117,630 | | | | | 118,332 | | | | | 299,773 | | | | | 141,194 | |
Dividends and interest receivable | | | | 5,374 | | | | | 44,285 | | | | | 31,691 | | | | | 60,892 | | | | | 113,768 | | | | | 622,394 | |
Cash | | | | — | | | | | — | | | | | — | | | | | — | | | | | 10,254 | | | | | — | |
Receivable for foreign tax reclaims | | | | — | | | | | 41,564 | | | | | — | | | | | — | | | | | — | | | | | — | |
Prepaid expenses and other assets | | | | 24,037 | | | | | 14,551 | | | | | 16,016 | | | | | 16,138 | | | | | 21,044 | | | | | 14,750 | |
| | | | | | | | | | | | | | | | | | | | | | | | | | | | | | |
Total Assets | | | | 21,210,412 | | | | | 41,038,114 | | | | | 54,193,737 | | | | | 73,555,117 | | | | | 128,764,930 | | | | | 75,718,241 | |
| | | | | | | | | | | | | | | | | | | | | | | | | | | | | | |
Liabilities: | �� | | | | | | | | | | | | | | | | | | | | | | | | | | | | | |
Payable for securities purchased | | | | 533,400 | | | | | 77,864 | | | | | 649,543 | | | | | 917,491 | | | | | — | | | | | — | |
Accrued advisory fees | | | | 14,416 | | | | | 33,677 | | | | | 38,019 | | | | | 50,768 | | | | | 92,822 | | | | | 28,415 | |
Payable for fund shares redeemed | | | | 7,416 | | | | | 7,089 | | | | | 15,187 | | | | | 30,600 | | | | | 289,021 | | | | | 119,214 | |
Accrued 12b-1 fees | | | | 5,838 | | | | | 9,790 | | | | | 13,949 | | | | | 19,118 | | | | | 34,991 | | | | | 20,135 | |
Accrued expenses and other liabilities | | | | 30,042 | | | | | 31,173 | | | | | 25,639 | | | | | 26,232 | | | | | 41,316 | | | | | 35,119 | |
| | | | | | | | | | | | | | | | | | | | | | | | | | | | | | |
Total Liabilities | | | | 591,112 | | | | | 159,593 | | | | | 742,337 | | | | | 1,044,209 | | | | | 458,150 | | | | | 202,883 | |
| | | | | | | | | | | | | | | | | | | | | | | | | | | | | | |
Net Assets | | | $ | 20,619,300 | | | | $ | 40,878,521 | | | | $ | 53,451,400 | | | | $ | 72,510,908 | | | | $ | 128,306,780 | | | | $ | 75,515,358 | |
| | | | | | | | | | | | | | | | | | | | | | | | | | | | | | |
Net assets consist of: | | | | | | | | | | | | | | | | | | | | | | | | | | | | | | |
Paid in capital | | | $ | 15,890,011 | | | | $ | 48,459,211 | | | | $ | 40,972,995 | | | | $ | 49,943,198 | | | | $ | 91,769,195 | | | | $ | 74,254,374 | |
Undistributed net investment income (loss) | | | | (183,314 | ) | | | | 100,574 | | | | | 2,846 | | | | | 26,038 | | | | | 583,125 | | | | | 770,920 | |
Accumulated net realized gain (loss) from investments | | | | 1,196,978 | | | | | (15,551,605 | ) | | | | 4,494,097 | | | | | 6,173,259 | | | | | 9,045,181 | | | | | 165,734 | |
Net unrealized appreciation on investments | | | | 3,715,625 | | | | | 7,870,341 | | | | | 7,981,462 | | | | | 16,368,413 | | | | | 26,909,279 | | | | | 324,330 | |
| | | | | | | | | | | | | | | | | | | | | | | | | | | | | | |
Net Assets | | | $ | 20,619,300 | | | | $ | 40,878,521 | | | | $ | 53,451,400 | | | | $ | 72,510,908 | | | | $ | 128,306,780 | | | | $ | 75,515,358 | |
| | | | | | | | | | | | | | | | | | | | | | | | | | | | | | |
Class A | | | | | | | | | | | | | | | | | | | | | | | | | | | | | | |
Net Assets | | | $ | 17,727,079 | | | | $ | 38,432,187 | | | | $ | 48,410,620 | | | | $ | 64,971,776 | | | | $ | 114,657,487 | | | | $ | 67,557,524 | |
Shares of beneficial interest outstanding | | | | 1,969,645 | | | | | 4,440,919 | | | | | 5,788,841 | | | | | 3,200,627 | | | | | 6,320,247 | | | | | 6,480,318 | |
Net Asset Value, offering price and redemption price per share | | | $ | 9.00 | | | | $ | 8.65 | | | | $ | 8.36 | | | | $ | 20.30 | | | | $ | 18.14 | | | | $ | 10.43 | |
| | | | | | | | | | | | | | | | | | | | | | | | | | | | | | |
Offering Price Per Share (NAV / 0.945)
*(NAV / 0.955) | | | $ | 9.52 | | | | $ | 9.15 | | | | $ | 8.85 | | | | $ | 21.48 | | | | $ | 19.20 | | | | $ | 10.92 | * |
| | | | | | | | | | | | | | | | | | | | | | | | | | | | | | |
Class C | | | | | | | | | | | | | | | | | | | | | | | | | | | | | | |
Net Assets | | | $ | 2,892,119 | | | | $ | 2,446,232 | | | | $ | 5,040,679 | | | | $ | 7,539,029 | | | | $ | 13,649,193 | | | | $ | 7,957,733 | |
Shares of beneficial interest outstanding | | | | 357,563 | | | | | 288,996 | | | | | 672,910 | | | | | 435,694 | | | | | 846,664 | | | | | 789,895 | |
Net Asset Value, offering price and redemption price per share | | | $ | 8.09 | | | | $ | 8.46 | | | | $ | 7.49 | | | | $ | 17.30 | | | | $ | 16.12 | | | | $ | 10.07 | |
| | | | | | | | | | | | | | | | | | | | | | | | | | | | | | |
Minimum Redemption Price Per Share
(NAV * 0.99) | | | $ | 8.01 | | | | $ | 8.38 | | | | $ | 7.42 | | | | $ | 17.13 | | | | $ | 15.96 | | | | $ | 9.97 | |
| | | | | | | | | | | | | | | | | | | | | | | | | | | | | | |
Class I | | | | | | | | | | | | | | | | | | | | | | | | | | | | | | |
Net Assets | | | $ | 101.62 | | | | $ | 102.21 | | | | $ | 100.67 | | | | $ | 103.09 | | | | $ | 99.70 | | | | $ | 100.94 | |
Shares of beneficial interest outstanding | | | | 11.274 | | | | | 11.820 | | | | | 12.034 | | | | | 5.081 | | | | | 5.498 | | | | | 9.759 | |
Net Asset Value, offering price and redemption price per share | | | $ | 9.01 | | | | $ | 8.65 | | | | $ | 8.37 | | | | $ | 20.29 | | | | $ | 18.13 | | | | $ | 10.34 | |
| | | | | | | | | | | | | | | | | | | | | | | | | | | | | | |
The accompanying notes are an integral part of these financial statements.
[53]
| | |
| Timothy Plan Family of Funds | | |
| | |
Statements of Assets and Liabilities | | September 30, 2013 |
| | | | | | | | | | | | | | | | | | | | | | | | | | | | | | |
| | | High Yield
Bond
Fund | | Israel Common
Values Fund | | Defensive
Strategies
Fund | | Strategic
Growth
Fund | | Conservative
Growth
Fund | | Emerging
Markets
Fund |
Assets: | | | | | | | | | | | | | | | | | | | | | | | | | | | | | | |
Investments, at cost | | | $ | 36,603,149 | | | | $ | 9,147,239 | | | | $ | 69,124,787 | | | | $ | 36,346,153 | | | | $ | 49,577,187 | | | | $ | 8,775,880 | |
| | | | | | | | | | | | | | | | | | | | | | | | | | | | | | |
Investments, at value | | | $ | 37,129,010 | | | | $ | 11,311,483 | | | | $ | 68,489,409 | | | | $ | 42,147,975 | | | | $ | 54,778,856 | | | | $ | 8,901,906 | |
Dividends and interest receivable | | | | 731,688 | | | | | 5,775 | | | | | 160,258 | | | | | 66,213 | | | | | 128,496 | | | | | 11,592 | |
Receivable for securities sold | | | | 101,250 | | | | | — | | | | | — | | | | | — | | | | | — | | | | | — | |
Receivable for fund shares sold | | | | 55,117 | | | | | 8,443 | | | | | 67,355 | | | | | 28,405 | | | | | 40,305 | | | | | 38,064 | |
Deposit with broker | | | | — | | | | | — | | | | | — | | | | | — | | | | | — | | | | | 507 | |
Cash | | | | — | | | | | 5,174 | | | | | — | | | | | — | | | | | — | | | | | — | |
Hong Kong Dollar (HKD)(Cost $16,962) | | | | — | | | | | — | | | | | — | | | | | — | | | | | — | | | | | 16,961 | |
Brazilian Real (BRL)(Cost $8,906) | | | | — | | | | | — | | | | | — | | | | | — | | | | | — | | | | | 9,303 | |
New Taiwan Dollar (TWD)(Cost $6,298) | | | | — | | | | | — | | | | | — | | | | | — | | | | | — | | | | | 6,334 | |
Singapore Dollar (SGD)(Cost $486) | | | | — | | | | | — | | | | | — | | | | | — | | | | | — | | | | | 491 | |
Receivable for foreign tax reclaims | | | | — | | | | | — | | | | | 8,606 | | | | | — | | | | | — | | | | | — | |
Prepaid expenses and other assets | | | | 15,804 | | | | | 27,989 | | | | | 30,084 | | | | | 18,020 | | | | | 18,044 | | | | | 21,965 | |
| | | | | | | | | | | | | | | | | | | | | | | | | | | | | | |
Total Assets | | | | 38,032,869 | | | | | 11,358,864 | | | | | 68,755,712 | | | | | 42,260,613 | | | | | 54,965,701 | | | | | 9,007,123 | |
| | | | | | | | | | | | | | | | | | | | | | | | | | | | | | |
Liabilities: | | | | | | | | | | | | | | | | | | | | | | | | | | | | | | |
Payable for securities purchased | | | | 100,000 | | | | | 86,932 | | | | | — | | | | | 66,205 | | | | | 128,476 | | | | | — | |
Payable for fund shares redeemed | | | | 64,668 | | | | | — | | | | | 82,352 | | | | | 7,345 | | | | | 118,331 | | | | | 8,600 | |
Accrued advisory fees | | | | 19,079 | | | | | 8,848 | | | | | 35,154 | | | | | 22,859 | | | | | 29,767 | | | | | 8,829 | |
Accrued 12b-1 fees | | | | 9,183 | | | | | 2,705 | | | | | 22,667 | | | | | 4,336 | | | | | 5,817 | | | | | 2,004 | |
Accrued expenses and other liabilities | | | | 26,412 | | | | | 21,701 | | | | | 37,575 | | | | | 26,623 | | | | | 26,481 | | | | | 21,429 | |
| | | | | | | | | | | | | | | | | | | | | | | | | | | | | | |
Total Liabilities | | | | 219,342 | | | | | 120,186 | | | | | 177,748 | | | | | 127,368 | | | | | 308,872 | | | | | 40,862 | |
| | | | | | | | | | | | | | | | | | | | | | | | | | | | | | |
Net Assets | | | $ | 37,813,527 | | | | $ | 11,238,678 | | | | $ | 68,577,964 | | | | $ | 42,133,245 | | | | $ | 54,656,829 | | | | $ | 8,966,261 | |
| | | | | | | | | | | | | | | | | | | | | | | | | | | | | | |
Net assets consist of: | | | | | | | | | | | | | | | | | | | | | | | | | | | | | | |
Paid in capital | | | $ | 38,564,608 | | | | $ | 9,249,775 | | | | $ | 69,034,524 | | | | $ | 45,548,657 | | | | $ | 52,362,412 | | | | $ | 8,607,324 | |
Undistributed net investment income (loss) | | | | 94,798 | | | | | (86,069 | ) | | | | 464,351 | | | | | 33,057 | | | | | 14,940 | | | | | (12,505 | ) |
Accumulated net realized gain (loss) from investments | | | | (1,371,740 | ) | | | | (89,272 | ) | | | | (285,533 | ) | | | | (9,250,291 | ) | | | | (2,922,192 | ) | | | | 244,979 | |
Net unrealized appreciation (depreciation) on investments | | | | 525,861 | | | | | 2,164,244 | | | | | (635,378 | ) | | | | 5,801,822 | | | | | 5,201,669 | | | | | 126,463 | |
| | | | | | | | | | | | | | | | | | | | | | | | | | | | | | |
Net Assets | | | $ | 37,813,527 | | | | $ | 11,238,678 | | | | $ | 68,577,964 | | | | $ | 42,133,245 | | | | $ | 54,656,829 | | | | $ | 8,966,261 | |
| | | | | | | | | | | | | | | | | | | | | | | | | | | | | | |
Class A | | | | | | | | | | | | | | | | | | | | | | | | | | | | | | |
Net Assets | | | $ | 35,577,723 | | | | $ | 10,295,116 | | | | $ | 51,859,430 | | | | $ | 34,465,601 | | | | $ | 44,238,165 | | | | $ | 8,674,893 | |
Shares of beneficial interest outstanding | | | | 3,786,274 | | | | | 811,263 | | | | | 4,661,577 | | | | | 4,131,468 | | | | | 4,209,745 | | | | | 823,912 | |
Net Asset Value, offering price and redemption price per share | | | $ | 9.40 | | | | $ | 12.69 | | | | $ | 11.12 | | | | $ | 8.34 | | | | $ | 10.51 | | | | $ | 10.53 | |
| | | | | | | | | | | | | | | | | | | | | | | | | | | | | | |
Offering Price Per Share (NAV / 0.945)
*(NAV / 0.955) | | | $ | 9.84 | * | | | $ | 13.43 | | | | $ | 11.77 | | | | $ | 8.83 | | | | $ | 11.12 | | | | $ | 11.14 | |
| | | | | | | | | | | | | | | | | | | | | | | | | | | | | | |
Class C | | | | | | | | | | | | | | | | | | | | | | | | | | | | | | |
Net Assets | | | $ | 2,235,704 | | | | $ | 943,458 | | | | $ | 16,718,434 | | | | $ | 7,667,644 | | | | $ | 10,418,664 | | | | $ | 291,262 | |
Shares of beneficial interest outstanding | | | | 235,906 | | | | | 75,497 | | | | | 1,544,600 | | | | | 997,277 | | | | | 1,064,647 | | | | | 27,804 | |
Net Asset Value, offering price and redemption price per share | | | $ | 9.48 | | | | $ | 12.50 | | | | $ | 10.82 | | | | $ | 7.69 | | | | $ | 9.79 | | | | $ | 10.48 | |
| | | | | | | | | | | | | | | | | | | | | | | | | | | | | | |
Minimum Redemption Price Per Share
(NAV * 0.99) | | | $ | 9.39 | | | | $ | 12.38 | | | | $ | 10.71 | | | | $ | 7.61 | | | | $ | 9.69 | | | | $ | 10.38 | |
| | | | | | | | | | | | | | | | | | | | | | | | | | | | | | |
Class I | | | | | | | | | | | | | | | | | | | | | | | | | | | | | | |
Net Assets | | | $ | 100.19 | | | | $ | 103.73 | | | | $ | 100.00 | | | | $ | — | | | | $ | — | | | | $ | 105.69 | |
Shares of beneficial interest outstanding | | | | 10.655 | | | | | 8.190 | | | | | 9.001 | | | | | — | | | | | — | | | | | 10.040 | |
Net Asset Value, offering price and redemption price per share | | | $ | 9.40 | | | | $ | 12.67 | | | | $ | 11.11 | | | | $ | — | | | | $ | — | | | | $ | 10.53 | |
| | | | | | | | | | | | | | | | | | | | | | | | | | | | | | |
The accompanying notes are an integral part of these financial statements.
[54]
| | |
| Timothy Plan Family of Funds | | |
| | |
Statements of Operations | | For the Year Ended September 30, 2013 |
| | | | | | | | | | | | | | | | | | | | | | | | | | | | | | |
| | | Aggressive
Growth
Fund | | International
Fund | | Large/Mid Cap
Growth Fund | | Small Cap
Value Fund | | Large/Mid
Cap Value
Fund | | Fixed
Income
Fund |
Investment Income: | | | | | | | | | | | | | | | | | | | | | | | | | | | | | | |
Interest income | | | $ | 281 | | | | $ | 683 | | | | $ | 1,003 | | | | $ | 737 | | | | $ | 2,293 | | | | $ | 2,303,380 | |
Dividend income | | | | 114,572 | | | | | 955,817 | | | | | 660,921 | | | | | 997,193 | | | | | 2,522,759 | | | | | — | |
Foreign tax withheld | | | | — | | | | | (109,637 | ) | | | | (80 | ) | | | | — | | | | | (3,802 | ) | | | | — | |
| | | | | | | | | | | | | | | | | | | | | | | | | | | | | | |
Total Investment Income | | | | 114,853 | | | | | 846,863 | | | | | 661,844 | | | | | 997,930 | | | | | 2,521,250 | | | | | 2,303,380 | |
| | | | | | | | | | | | | | | | | | | | | | | | | | | | | | |
Operating Expenses: | | | | | | | | | | | | | | | | | | | | | | | | | | | | | | |
Investment advisory fees | | | | 147,753 | | | | | 348,337 | | | | | 417,861 | | | | | 511,069 | | | | | 1,051,390 | | | | | 491,347 | |
12b-1 Fees: | | | | | | | | | | | | | | | | | | | | | | | | | | | | | | |
Class A | | | | 37,848 | | | | | 82,149 | | | | | 110,848 | | | | | 135,848 | | | | | 279,827 | | | | | 182,505 | |
Class C | | | | 22,436 | | | | | 19,739 | | | | | 48,210 | | | | | 57,866 | | | | | 117,622 | | | | | 88,892 | |
Administration fees | | | | 38,467 | | | | | 66,515 | | | | | 101,219 | | | | | 118,791 | | | | | 244,380 | | | | | 162,998 | |
Registration fees | | | | 34,891 | | | | | 42,054 | | | | | 41,931 | | | | | 42,698 | | | | | 46,589 | | | | | 45,635 | |
Custody fees | | | | 25,718 | | | | | 6,368 | | | | | 15,244 | | | | | 16,024 | | | | | 17,433 | | | | | 16,482 | |
Audit fees | | | | 12,480 | | | | | 14,659 | | | | | 11,875 | | | | | 14,075 | | | | | 14,276 | | | | | 11,537 | |
Printing expenses | | | | 9,455 | | | | | 19,492 | | | | | 22,536 | | | | | 37,622 | | | | | 53,845 | | | | | 32,954 | |
Non 12b-1 shareholder servicing fees | | | | 8,431 | | | | | 11,724 | | | | | 39,122 | | | | | 15,552 | | | | | 74,397 | | | | | 55,689 | |
Compliance officer fees | | | | 849 | | | | | 1,447 | | | | | — | | | | | 15,672 | | | | | 7,946 | | | | | 7,566 | |
Insurance expenses | | | | 579 | | | | | 1,175 | | | | | 1,696 | | | | | 1,939 | | | | | 4,092 | | | | | 3,141 | |
Trustees’ fees | | | | 476 | | | | | 2,420 | | | | | 4,247 | | | | | 7,134 | | | | | 11,864 | | | | | 6,971 | |
Miscellaneous expenses | | | | 647 | | | | | 694 | | | | | 1,749 | | | | | 2,679 | | | | | 1,427 | | | | | 2,978 | |
| | | | | | | | | | | | | | | | | | | | | | | | | | | | | | |
Total Operating Expenses | | | | 340,030 | | | | | 616,773 | | | | | 816,538 | | | | | 976,969 | | | | | 1,925,088 | | | | | 1,108,695 | |
Less: Expenses waived by Advisor | | | | — | | | | | — | | | | | — | | | | | — | | | | | — | | | | | (122,837 | ) |
| | | | | | | | | | | | | | | | | | | | | | | | | | | | | | |
Net Operating Expenses | | | | 340,030 | | | | | 616,773 | | | | | 816,538 | | | | | 976,969 | | | | | 1,925,088 | | | | | 985,858 | |
| | | | | | | | | | | | | | | | | | | | | | | | | | | | | | |
Net Investment Income (Loss) | | | | (225,177 | ) | | | | 230,090 | | | | | (154,694 | ) | | | | 20,961 | | | | | 596,162 | | | | | 1,317,522 | |
| | | | | | | | | | | | | | | | | | | | | | | | | | | | | | |
Realized and Unrealized Gain (Loss) on Investments: | | | | | | | | | | | | | | | | | | | | | | | | | | | | | | |
Net realized gain (loss) on investments | | | | 2,105,187 | | | | | 783,962 | | | | | 4,956,086 | | | | | 8,776,714 | | | | | 20,643,211 | | | | | 901,715 | |
Capital gain dividends from REITs | | | | 2,235 | | | | | — | | | | | — | | | | | 36,191 | | | | | 12,601 | | | | | — | |
Net change in unrealized appreciation (depreciation) on investments | | | | 2,256,985 | | | | | 5,027,081 | | | | | 4,941,630 | | | | | 10,680,831 | | | | | 3,763,115 | | | | | (4,713,356 | ) |
| | | | | | | | | | | | | | | | | | | | | | | | | | | | | | |
Net Realized and Unrealized Gain (Loss) on Investments | | | | 4,364,407 | | | | | 5,811,043 | | | | | 9,897,716 | | | | | 19,493,736 | | | | | 24,418,927 | | | | | (3,811,641 | ) |
| | | | | | | | | | | | | | | | | | | | | | | | | | | | | | |
Net Increase (Decrease) in Net Assets Resulting From Operations | | | $ | 4,139,230 | | | | $ | 6,041,133 | | | | $ | 9,743,022 | | | | $ | 19,514,697 | | | | $ | 25,015,089 | | | | $ | (2,494,119 | ) |
| | | | | | | | | | | | | | | | | | | | | | | | | | | | | | |
The accompanying notes are an integral part of these financial statements.
[55]
| | |
| Timothy Plan Family of Funds | | |
| | |
Statements of Operations | | For the Year Ended September 30, 2013 |
| | | | | | | | | | | | | | | | | | | | | | | | | | | | | | |
| | | High Yield
Bond Fund | | Israel Common
Values Fund | | Defensive
Strategies
Fund | | Strategic
Growth
Fund | | Conservative
Growth
Fund | | Emerging
Markets
Fund (1) |
Investment Income: | | | | | | | | | | | | | | | | | | | | | | | | | | | | | | |
Interest income | | | $ | 2,493,115 | | | | $ | 115 | | | | $ | 434,480 | | | | $ | 344 | | | | $ | 285 | | | | $ | 692 | |
Dividend income | | | | — | | | | | 195,166 | | | | | 927,313 | | | | | — | | | | | — | | | | | 136,281 | |
Dividend income from affiliated funds | | | | — | | | | | — | | | | | — | | | | | 522,463 | | | | | 670,704 | | | | | — | |
Foreign tax withheld | | | | — | | | | | (47,322 | ) | | | | (40,512 | ) | | | | — | | | | | — | | | | | (8,412 | ) |
| | | | | | | | | | | | | | | | | | | | | | | | | | | | | | |
Total Investment Income | | | | 2,493,115 | | | | | 147,959 | | | | | 1,321,281 | | | | | 522,807 | | | | | 670,989 | | | | | 128,561 | |
| | | | | | | | | | | | | | | | | | | | | | | | | | | | | | |
Operating Expenses: | | | | | | | | | | | | | | | | | | | | | | | | | | | | | | |
Investment advisory fees | | | | 231,475 | | | | | 88,903 | | | | | 445,578 | | | | | 257,086 | | | | | 334,749 | | | | | 73,220 | |
12b-1 fees: | | | | | | | | | | | | | | | | | | | | | | | | | | | | | | |
Class A | | | | 91,373 | | | | | 21,274 | | | | | 137,897 | | | | | — | | | | | — | | | | | 15,061 | |
Class C | | | | 20,302 | | | | | 3,805 | | | | | 191,043 | | | | | 53,296 | | | | | 72,184 | | | | | 1,190 | |
Administration fees | | | | 77,491 | | | | | 14,622 | | | | | 148,580 | | | | | 78,299 | | | | | 101,134 | | | | | 11,721 | |
Registration fees | | | | 41,364 | | | | | 31,480 | | | | | 46,042 | | | | | 41,343 | | | | | 42,063 | | | | | 31,168 | |
Audit fees | | | | 21,164 | | | | | 16,868 | | | | | 14,460 | | | | | 10,052 | | | | | 12,372 | | | | | 12,000 | |
Printing expenses | | | | 17,722 | | | | | 3,410 | | | | | 30,111 | | | | | 23,692 | | | | | 26,141 | | | | | 2,959 | |
Non 12b-1 shareholder servicing fees | | | | 11,145 | | | | | 1,463 | | | | | 14,060 | | | | | 5,396 | | | | | 6,966 | | | | | 7,096 | |
Custody fees | | | | 7,666 | | | | | 12,647 | | | | | 32,107 | | | | | 6,123 | | | | | 11,828 | | | | | 27,723 | |
Trustees’ fees | | | | 3,058 | | | | | 958 | | | | | 7,364 | | | | | 2,323 | | | | | 3,214 | | | | | 1,003 | |
Insurance expenses | | | | 1,341 | | | | | 255 | | | | | 2,802 | | | | | 1,448 | | | | | 1,846 | | | | | 282 | |
Compliance officer fees | | | | 1,140 | | | | | 3,701 | | | | | 9,936 | | | | | 1,979 | | | | | 469 | | | | | 1,004 | |
Miscellaneous expenses | | | | 1,659 | | | | | 1,543 | | | | | 327 | | | | | 289 | | | | | 2,344 | | | | | 2,909 | |
| | | | | | | | | | | | | | | | | | | | | | | | | | | | | | |
Total Operating Expenses | | | | 526,900 | | | | | 200,929 | | | | | 1,080,307 | | | | | 481,326 | | | | | 615,310 | | | | | 187,336 | |
Less: Expenses waived by Advisor | | | | — | | | | | — | | | | | — | | | | | — | | | | | — | | | | | — | |
| | | | | | | | | | | | | | | | | | | | | | | | | | | | | | |
Net Operating Expenses | | | | 526,900 | | | | | 200,929 | | | | | 1,080,307 | | | | | 481,326 | | | | | 615,310 | | | | | 187,336 | |
| | | | | | | | | | | | | | | | | | | | | | | | | | | | | | |
Net Investment Income (Loss) | | | | 1,966,215 | | | | | (52,970 | ) | | | | 240,974 | | | | | 41,481 | | | | | 55,679 | | | | | (58,775 | ) |
| | | | | | | | | | | | | | | | | | | | | | | | | | | | | | |
Realized and Unrealized Gain (Loss) on Investments: | | | | | | | | | | | | | | | | | | | | | | | | | | | | | | |
Net realized gain (loss) on investments | | | | 232,096 | | | | | (30,117 | ) | | | | 380,305 | | | | | 1,365,460 | | | | | 2,008,053 | | | | | 287,405 | |
Capital gain distributions from affiliated funds | | | | — | | | | | — | | | | | — | | | | | 184,843 | | | | | 165,162 | | | | | — | |
Capital gain dividends from REITs | | | | — | | | | | — | | | | | 95,795 | | | | | — | | | | | — | | | | | — | |
Net change in unrealized appreciation on investments | | | | (707,158 | ) | | | | 2,064,869 | | | | | (7,225,344 | ) | | | | 3,100,731 | | | | | 834,809 | | | | | 126,463 | |
| | | | | | | | | | | | | | | | | | | | | | | | | | | | | | |
Net Realized and Unrealized Gain (Loss) on Investments | | | | (475,062 | ) | | | | 2,034,752 | | | | | (6,749,244 | ) | | | | 4,651,034 | | | | | 3,008,024 | | | | | 413,868 | |
| | | | | | | | | | | | | | | | | | | | | | | | | | | | | | |
Net Increase (Decrease) in Net Assets Resulting From Operations | | | $ | 1,491,153 | | | | $ | 1,981,782 | | | | $ | (6,508,270 | ) | | | $ | 4,692,515 | | | | $ | 3,063,703 | | | | $ | 355,093 | |
| | | | | | | | | | | | | | | | | | | | | | | | | | | | | | |
| (1) | The Emerging Markets Fund commenced operations on December 3, 2012. |
The accompanying notes are an integral part of these financial statements.
[56]
| | |
| Timothy Plan Family of Funds | | |
| | |
Statements of Changes in Net Assets | | |
| | | | | | | | | | | | | | | | | | | | | | | | | | | | | | |
| | | Aggressive Growth Fund | | International Fund | | Large/Mid Cap Growth Fund |
| | | Year Ended
September 30,
2013 | | Year Ended
September 30,
2012 | | Year Ended
September 30,
2013 | | Year Ended
September 30,
2012 | | Year Ended
September 30,
2013 | | Year Ended
September 30,
2012 |
Operations: | | | | | | | | | | | | | | | | | | | | | | | | | | | | | | |
Net investment income (loss) | | | $ | (225,177 | ) | | | $ | (299,924 | ) | | | $ | 230,090 | | | | $ | 106,450 | | | | $ | (154,694 | ) | | | $ | (292,039 | ) |
Net realized gain (loss) from investments | | | | 2,105,187 | | | | | 1,298,159 | | | | | 783,962 | | | | | (1,260,746 | ) | | | | 4,956,086 | | | | | 2,840,379 | |
Capital gain dividends from REITs | | | | 2,235 | | | | | 68 | | | | | — | | | | | — | | | | | — | | | | | 226 | |
Distributions of realized gains by underlying investment companies | | | | — | | | | | 84 | | | | | — | | | | | — | | | | | — | | | | | 723 | |
Net change in unrealized appreciation on investments | | | | 2,256,985 | | | | | 2,716,915 | | | | | 5,027,081 | | | | | 5,891,664 | | | | | 4,941,630 | | | | | 6,897,905 | |
| | | | | | | | | | | | | | | | | | | | | | | | | | | | | | |
Net increase in net assets resulting from operations | | | | 4,139,230 | | | | | 3,715,302 | | | | | 6,041,133 | | | | | 4,737,368 | | | | | 9,743,022 | | | | | 9,447,194 | |
| | | | | | | | | | | | | | | | | | | | | | | | | | | | | | |
Distributions to Shareholders: | | | | | | | | | | | | | | | | | | | | | | | | | | | | | | |
Net investment income | | | | | | | | | | | | | | | | | | | | | | | | | | | | | | |
Class A | | | | — | | | | | — | | | | | (230,752 | ) | | | | (1,003,855 | ) | | | | — | | | | | — | |
Class C | | | | — | | | | | — | | | | | — | | | | | (37,702 | ) | | | | — | | | | | — | |
Net realized gains | | | | | | | | | | | | | | | | | | | | | | | | | | | | | | |
Class A | | | | — | | | | | — | | | | | — | | | | | — | | | | | (2,446,061 | ) | | | | (1,655,964 | ) |
Class C | | | | — | | | | | — | | | | | — | | | | | — | | | | | (296,634 | ) | | | | (154,620 | ) |
| | | | | | | | | | | | | | | | | | | | | | | | | | | | | | |
Total dividends and distributions to shareholders | | | | — | | | | | — | | | | | (230,752 | ) | | | | (1,041,557 | ) | | | | (2,742,695 | ) | | | | (1,810,584 | ) |
| | | | | | | | | | | | | | | | | | | | | | | | | | | | | | |
Share Transactions of Beneficial Interest: | | | | | | | | | | | | | | | | | | | | | | | | | | | | | | |
Net proceeds from shares sold | | | | | | | | | | | | | | | | | | | | | | | | | | | | | | |
Class A | | | | 4,388,489 | | | | | 5,287,889 | | | | | 10,977,091 | | | | | 9,560,090 | | | | | 9,051,293 | | | | | 10,978,227 | |
Class C | | | | 717,887 | | | | | 521,055 | | | | | 755,818 | | | | | 368,778 | | | | | 1,516,639 | | | | | 1,699,860 | |
Class I | | | | 100 | | | | | — | | | | | 100 | | | | | — | | | | | 100 | | | | | — | |
Reinvestment of dividends and distributions | | | | | | | | | | | | | | | | | | | | | | | | | | | | | | |
Class A | | | | — | | | | | — | | | | | 202,277 | | | | | 913,673 | | | | | 2,267,318 | | | | | 1,589,285 | |
Class C | | | | — | | | | | — | | | | | — | | | | | 29,877 | | | | | 239,483 | | | | | 114,500 | |
Cost of shares redeemed | | | | | | | | | | | | | | | | | | | | | | | | | | | | | | |
Class A | | | | (4,678,771 | ) | | | | (6,391,333 | ) | | | | (8,018,394 | ) | | | | (12,627,271 | ) | | | | (10,724,659 | ) | | | | (12,456,411 | ) |
Class C | | | | (546,416 | ) | | | | (559,765 | ) | | | | (260,483 | ) | | | | (379,323 | ) | | | | (1,827,870 | ) | | | | (611,223 | ) |
| | | | | | | | | | | | | | | | | | | | | | | | | | | | | | |
Net increase (decrease) in net assets from share transactions of beneficial interest | | | | (118,711 | ) | | | | (1,142,154 | ) | | | | 3,656,409 | | | | | (2,134,176 | ) | | | | 522,304 | | | | | 1,314,238 | |
| | | | | | | | | | | | | | | | | | | | | | | | | | | | | | |
Total Increase in Net Assets | | | | 4,020,519 | | | | | 2,573,148 | | | | | 9,466,790 | | | | | 1,561,635 | | | | | 7,522,631 | | | | | 8,950,848 | |
The accompanying notes are an integral part of these financial statements.
[57]
| | |
| Timothy Plan Family of Funds | | |
| | |
Statements of Changes in Net Assets (Continued) | | |
| | | | | | | | | | | | | | | | | | | | | | | | | | | | | | |
| | | Aggressive Growth Fund | | International Fund | | Large/Mid Cap Growth Fund |
| | | Year Ended
September 30,
2013 | | Year Ended
September 30,
2012 | | Year Ended
September 30,
2013 | | Year Ended
September 30,
2012 | | Year Ended
September 30,
2013 | | Year Ended
September 30,
2012 |
Net Assets: | | | | | | | | | | | | | | | | | | | | | | | | | | | | | | |
Beginning of year | | | | 16,598,781 | | | | | 14,025,633 | | | | | 31,411,731 | | | | | 29,850,096 | | | | | 45,928,769 | | | | | 36,977,921 | |
| | | | | | | | | | | | | | | | | | | | | | | | | | | | | | |
End of year* | | | $ | 20,619,300 | | | | $ | 16,598,781 | | | | $ | 40,878,521 | | | | $ | 31,411,731 | | | | $ | 53,451,400 | | | | $ | 45,928,769 | |
| | | | | | | | | | | | | | | | | | | | | | | | | | | | | | |
* Includes undistributed net investment income (loss) at end of year | | | $ | (183,314 | ) | | | $ | (243,524 | ) | | | $ | 100,574 | | | | $ | 44,931 | | | | $ | 2,846 | | | | $ | — | |
| | | | | | | | | | | | | | | | | | | | | | | | | | | | | | |
Share Activity: | | | | | | | | | | | | | | | | | | | | | | | | | | | | | | |
Shares Sold | | | | | | | | | | | | | | | | | | | | | | | | | | | | | | |
Class A | | | | 545,659 | | | | | 767,834 | | | | | 1,370,275 | | | | | 1,359,366 | | | | | 1,187,169 | | | | | 1,578,172 | |
Class C | | | | 97,012 | | | | | 83,427 | | | | | 96,698 | | | | | 54,008 | | | | | 221,194 | | | | | 261,889 | |
Class I | | | | 11 | | | | | — | | | | | 12 | | | | | — | | | | | 12 | | | | | — | |
Shares Reinvested | | | | | | | | | | | | | | | | | | | | | | | | | | | | | | |
Class A | | | | — | | | | | — | | | | | 26,720 | | | | | 137,809 | | | | | 324,831 | | | | | 248,326 | |
Class C | | | | — | | | | | — | | | | | — | | | | | 4,582 | | | | | 38,074 | | | | | 19,606 | |
Shares Redeemed | | | | | | | | | | | | | | | | | | | | | | | | | | | | | | |
Class A | | | | (603,346 | ) | | | | (942,716 | ) | | | | (1,029,883 | ) | | | | (1,771,028 | ) | | | | (1,398,597 | ) | | | | (1,808,904 | ) |
Class C | | | | (81,776 | ) | | | | (89,997 | ) | | | | (33,866 | ) | | | | (55,851 | ) | | | | (262,121 | ) | | | | (95,547 | ) |
| | | | | | | | | | | | | | | | | | | | | | | | | | | | | | |
Net increase (decrease) in shares of beneficial interest outstanding | | | | (42,440 | ) | | | | (181,452 | ) | | | | 429,956 | | | | | (271,114 | ) | | | | 110,562 | | | | | 203,542 | |
| | | | | | | | | | | | | | | | | | | | | | | | | | | | | | |
The accompanying notes are an integral part of these financial statements.
[58]
| | |
| Timothy Plan Family of Funds | | |
| | |
Statements of Changes in Net Assets | | |
| | | | | | | | | | | | | | | | | | | | | | | | | | | | | | |
| | | Small Cap Value Fund | | Large/Mid Cap Value Fund | | Fixed Income Fund |
| | | Year Ended
September 30,
2013 | | Year Ended
September 30,
2012 | | Year Ended
September 30,
2013 | | Year Ended
September 30,
2012 | | Year Ended
September 30,
2013 | | Year Ended
September 30,
2012 |
Operations: | | | | | | | | | | | | | | | | | | | | | | | | | | | | | | |
Net investment income | | | $ | 20,961 | | | | $ | 62,933 | | | | $ | 596,162 | | | | $ | 359,304 | | | | $ | 1,317,522 | | | | $ | 1,447,185 | |
Net realized gain from investments | | | | 8,776,714 | | | | | 719,802 | | | | | 20,643,211 | | | | | 2,183,461 | | | | | 901,715 | | | | | 1,119,022 | |
Capital gain dividends from REITs | | | | 36,191 | | | | | 105,312 | | | | | 12,601 | | | | | — | | | | | — | | | | | — | |
Distributions of realized gains by underlying investment companies | | | | — | | | | | 27,521 | | | | | — | | | | | 14,053 | | | | | — | | | | | — | |
Net change in unrealized appreciation (depreciation) on investments | | | | 10,680,831 | | | | | 13,945,528 | | | | | 3,763,115 | | | | | 19,698,121 | | | | | (4,713,356 | ) | | | | 83,832 | |
| | | | | | | | | | | | | | | | | | | | | | | | | | | | | | |
Net increase (decrease) in net assets resulting from operations | | | | 19,514,697 | | | | | 14,861,096 | | | | | 25,015,089 | | | | | 22,254,939 | | | | | (2,494,119 | ) | | | | 2,650,039 | |
| | | | | | | | | | | | | | | | | | | | | | | | | | | | | | |
Distributions to Shareholders: | | | | | | | | | | | | | | | | | | | | | | | | | | | | | | |
Net investment income | | | | | | | | | | | | | | | | | | | | | | | | | | | | | | |
Class A | | | | (88,849 | ) | | | | — | | | | | (358,626 | ) | | | | (192,686 | ) | | | | (903,855 | ) | | | | (1,390,052 | ) |
Class C | | | | — | | | | | — | | | | | — | | | | | — | | | | | (54,237 | ) | | | | (117,270 | ) |
From return of capital | | | | | | | | | | | | | | | | | | | | | | | | | | | | | | |
Class A | | | | — | | | | | — | | | | | — | | | | | — | | | | | — | | | | | (164,680 | ) |
Class C | | | | — | | | | | — | | | | | — | | | | | — | | | | | — | | | | | (22,138 | ) |
| | | | | | | | | | | | | | | | | | | | | | | | | | | | | | |
Total dividends and distributions to shareholders | | | | (88,849 | ) | | | | — | | | | | (358,626 | ) | | | | (192,686 | ) | | | | (958,092 | ) | | | | (1,694,140 | ) |
| | | | | | | | | | | | | | | | | | | | | | | | | | | | | | |
Share Transactions of Beneficial Interest: | | | | | | | | | | | | | | | | | | | | | | | | | | | | | | |
Net proceeds from shares sold | | | | | | | | | | | | | | | | | | | | | | | | | | | | | | |
Class A | | | | 11,969,015 | | | | | 9,466,165 | | | | | 30,287,293 | | | | | 22,377,135 | | | | | 22,378,103 | | | | | 29,593,291 | |
Class C | | | | 2,004,285 | | | | | 741,076 | | | | | 3,183,229 | | | | | 1,527,688 | | | | | 2,874,242 | | | | | 2,584,354 | |
Class I | | | | 100 | | | | | — | | | | | 100 | | | | | — | | | | | 100 | | | | | — | |
Reinvestment of dividends and distributions | | | | | | | | | | | | | | | | | | | | | | | | | | | | | | |
Class A | | | | 84,074 | | | | | — | | | | | 307,962 | | | | | 166,163 | | | | | 801,878 | | | | | 1,387,933 | |
Class C | | | | — | | | | | — | | | | | — | | | | | — | | | | | 45,593 | | | | | 118,494 | |
Cost of shares redeemed | | | | | | | | | | | | | | | | | | | | | | | | | | | | | | |
Class A | | | | (12,650,070 | ) | | | | (14,169,607 | ) | | | | (38,910,448 | ) | | | | (20,066,761 | ) | | | | (27,243,493 | ) | | | | (16,548,854 | ) |
Class C | | | | (1,235,150 | ) | | | | (940,033 | ) | | | | (2,518,994 | ) | | | | (1,923,286 | ) | | | | (3,570,618 | ) | | | | (2,079,274 | ) |
| | | | | | | | | | | | | | | | | | | | | | | | | | | | | | |
Net increase (decrease) in net assets from share transactions of beneficial interest | | | | 172,254 | | | | | (4,902,399 | ) | | | | (7,650,858 | ) | | | | 2,080,939 | | | | | (4,714,195 | ) | | | | 15,055,944 | |
| | | | | | | | | | | | | | | | | | | | | | | | | | | | | | |
Total Increase (Decrease) in Net Assets | | | | 19,598,102 | | | | | 9,958,697 | | | | | 17,005,605 | | | | | 24,143,192 | | | | | (8,166,406 | ) | | | | 16,011,843 | |
The accompanying notes are an integral part of these financial statements.
[59]
| | |
| Timothy Plan Family of Funds | | |
| | |
Statements of Changes in Net Assets (Continued) | | |
| | | | | | | | | | | | | | | | | | | | | | | | | | | | | | |
| | | Small Cap Value Fund | | Large/Mid Cap Value Fund | | Fixed Income Fund |
| | | Year Ended
September 30,
2013 | | Year Ended
September 30,
2012 | | Year Ended
September 30,
2013 | | Year Ended
September 30,
2012 | | Year Ended
September 30,
2013 | | Year Ended
September 30,
2012 |
Net Assets: | | | | | | | | | | | | | | | | | | | | | | | | | | | | | | |
Beginning of year | | | | 52,912,806 | | | | | 42,954,109 | | | | | 111,301,175 | | | | | 87,157,983 | | | | | 83,681,764 | | | | | 67,669,921 | |
| | | | | | | | | | | | | | | | | | | | | | | | | | | | | | |
End of year* | | | $ | 72,510,908 | | | | $ | 52,912,806 | | | | $ | 128,306,780 | | | | $ | 111,301,175 | | | | $ | 75,515,358 | | | | $ | 83,681,764 | |
| | | | | | | | | | | | | | | | | | | | | | | | | | | | | | |
* Includes undistributed net investment income (loss) at end of year | | | $ | 26,038 | | | | $ | 62,933 | | | | $ | 583,125 | | | | $ | 345,523 | | | | $ | 770,920 | | | | $ | — | |
| | | | | | | | | | | | | | | | | | | | | | | | | | | | | | |
Share Activity: | | | | | | | | | | | | | | | | | | | | | | | | | | | | | | |
Shares Sold | | | | | | | | | | | | | | | | | | | | | | | | | | | | | | |
Class A | | | | 692,720 | | | | | 689,419 | | | | | 1,833,499 | | | | | 1,617,146 | | | | | 2,088,605 | | | | | 2,736,275 | |
Class C | | | | 132,413 | | | | | 63,479 | | | | | 212,010 | | | | | 123,919 | | | | | 277,316 | | | | | 247,361 | |
Class I | | | | 5 | | | | | — | | | | | 5 | | | | | — | | | | | 10 | | | | | — | |
Shares Reinvested | | | | | | | | | | | | | | | | | | | | | | | | | | | | | | |
Class A | | | | 5,349 | | | | | — | | | | | 20,092 | | | | | 12,494 | | | | | 76,046 | | | | | 128,523 | |
Class C | | | | — | | | | | — | | | | | — | | | | | — | | | | | 4,489 | | | | | 11,334 | |
Shares Redeemed | | | | | | | | | | | | | | | | | | | | | | | | | | | | | | |
Class A | | | | (752,629 | ) | | | | (1,051,072 | ) | | | | (2,333,513 | ) | | | | (1,442,807 | ) | | | | (2,557,054 | ) | | | | (1,531,237 | ) |
Class C | | | | (87,460 | ) | | | | (80,270 | ) | | | | (173,444 | ) | | | | (154,756 | ) | | | | (347,595 | ) | | | | (198,943 | ) |
| | | | | | | | | | | | | | | | | | | | | | | | | | | | | | |
Net increase (decrease) in shares of beneficial interest outstanding | | | | (9,602 | ) | | | | (378,444 | ) | | | | (441,351 | ) | | | | 155,996 | | | | | (458,183 | ) | | | | 1,393,313 | |
| | | | | | | | | | | | | | | | | | | | | | | | | | | | | | |
The accompanying notes are an integral part of these financial statements.
[60]
| | |
| Timothy Plan Family of Funds | | |
| | |
Statements of Changes in Net Assets | | |
| | | | | | | | | | | | | | | | | | | | | | | | | | | | | | |
| | | High Yield Bond Fund | | Israel Common Values Fund | | Defensive Strategies Fund |
| | | Year Ended
September 30,
2013 | | Year Ended
September 30,
2012 | | Year Ended
September 30,
2013 | | Period Ended (1)
September 30,
2012 | | Year Ended
September 30,
2013 | | Year Ended
September 30,
2012 |
Operations: | | | | | | | | | | | | | | | | | | | | | | | | | | | | | | |
Net investment income (loss) | | | $ | 1,966,215 | | | | $ | 1,729,254 | | | | $ | (52,970 | ) | | | $ | (109,693 | ) | | | $ | 240,974 | | | | $ | 16,603 | |
Net realized gain (loss) from investments | | | | 232,096 | | | | | 190,990 | | | | | (30,117 | ) | | | | 1,366 | | | | | 380,305 | | | | | 909,400 | |
Capital gain dividends from REITs | | | | — | | | | | — | | | | | — | | | | | — | | | | | 95,795 | | | | | 52,388 | |
Net change in unrealized appreciation (depreciation) on investments | | | | (707,158 | ) | | | | 2,130,949 | | | | | 2,064,869 | | | | | 99,375 | | | | | (7,225,344 | ) | | | | 7,160,412 | |
| | | | | | | | | | | | | | | | | | | | | | | | | | | | | | |
Net increase (decrease) in net assets resulting from operations | | | | 1,491,153 | | | | | 4,051,193 | | | | | 1,981,782 | | | | | (8,952 | ) | | | | (6,508,270 | ) | | | | 8,138,803 | |
| | | | | | | | | | | | | | | | | | | | | | | | | | | | | | |
Distributions to Shareholders: | | | | | | | | | | | | | | | | | | | | | | | | | | | | | | |
Net investment income | | | | | | | | | | | | | | | | | | | | | | | | | | | | | | |
Class A | | | | (1,782,597 | ) | | | | (1,666,004 | ) | | | | — | | | | | — | | | | | (28 | ) | | | | (463,463 | ) |
Class C | | | | (88,820 | ) | | | | (72,710 | ) | | | | — | | | | | — | | | | | (10 | ) | | | | (30,067 | ) |
From net realized gains | | | | | | | | | | | | | | | | | | | | | | | | | | | | | | |
Class A | | | | — | | | | | — | | | | | — | | | | | — | | | | | (97,172 | ) | | | | (3,030,191 | ) |
Class C | | | | — | | | | | — | | | | | — | | | | | — | | | | | (35,276 | ) | | | | (856,233 | ) |
From return of capital | | | | | | | | | | | | | | | | | | | | | | | | | | | | | | |
Class A | | | | — | | | | | (49,301 | ) | | | | — | | | | | — | | | | | — | | | | | (175,127 | ) |
Class C | | | | — | | | | | (2,413 | ) | | | | — | | | | | — | | | | | — | | | | | (52,013 | ) |
| | | | | | | | | | | | | | | | | | | | | | | | | | | | | | |
Total dividends and distributions to shareholders | | | | (1,871,417 | ) | | | | (1,790,428 | ) | | | | — | | | | | — | | | | | (132,486 | ) | | | | (4,607,094 | ) |
| | | | | | | | | | | | | | | | | | | | | | | | | | | | | | |
Share Transactions of Beneficial Interest: | | | | | | | | | | | | | | | | | | | | | | | | | | | | | | |
Net proceeds from shares sold | | | | | | | | | | | | | | | | | | | | | | | | | | | | | | |
Class A | | | | 15,564,006 | | | | | 20,228,788 | | | | | 3,295,264 | | | | | 11,718,256 | | | | | 20,337,684 | | | | | 31,938,021 | |
Class C | | | | 1,124,628 | | | | | 734,558 | | | | | 738,558 | | | | | 336,402 | | | | | 5,060,845 | | | | | 6,490,538 | |
Class I | | | | 100 | | | | | — | | | | | 100 | | | | | — | | | | | 100 | | | | | — | |
Reinvestment of dividends and distributions | | | | | | | | | | | | | | | | | | | | | | | | | | | | | | |
Class A | | | | 1,572,663 | | | | | 1,538,720 | | | | | — | | | | | — | | | | | 92,047 | | | | | 3,264,161 | |
Class C | | | | 69,721 | | | | | 57,907 | | | | | — | | | | | — | | | | | 34,945 | | | | | 932,036 | |
Cost of shares redeemed | | | | | | | | | | | | | | | | | | | | | | | | | | | | | | |
Class A | | | | (14,596,227 | ) | | | | (13,635,827 | ) | | | | (2,878,944 | ) | | | | (3,724,284 | ) | | | | (16,279,364 | ) | | | | (28,825,727 | ) |
Class C | | | | (616,056 | ) | | | | (413,933 | ) | | | | (98,800 | ) | | | | (120,704 | ) | | | | (5,357,105 | ) | | | | (2,770,955 | ) |
| | | | | | | | | | | | | | | | | | | | | | | | | | | | | | |
Net increase in net assets from share transactions of beneficial interest | | | | 3,118,835 | | | | | 8,510,213 | | | | | 1,056,178 | | | | | 8,209,670 | | | | | 3,889,152 | | | | | 11,028,074 | |
| | | | | | | | | | | | | | | | | | | | | | | | | | | | | | |
Total Increase (Decrease) in Net Assets | | | | 2,738,571 | | | | | 10,770,978 | | | | | 3,037,960 | | | | | 8,200,718 | | | | | (2,751,604 | ) | | | | 14,559,783 | |
| (1) | The Israel Common Values Fund commenced operations on October 12, 2011. |
The accompanying notes are an integral part of these financial statements.
[61]
| | |
| Timothy Plan Family of Funds | | |
| | |
Statements of Changes in Net Assets (Continued) | | |
| | | | | | | | | | | | | | | | | | | | | | | | | | | | | | |
| | | High Yield Bond Fund | | Israel Common Values Fund | | Defensive Strategies Fund |
| | | Year Ended
September 30,
2013 | | Year Ended
September 30,
2012 | | Year Ended
September 30,
2013 | | Period Ended (1)
September 30,
2012 | | Year Ended
September 30,
2013 | | Year Ended
September 30,
2012 |
Net Assets: | | | | | | | | | | | | | | | | | | | | | | | | | | | | | | |
Beginning of year | | | | 35,074,956 | | | | | 24,303,978 | | | | | 8,200,718 | | | | | — | | | | | 71,329,568 | | | | | 56,769,785 | |
| | | | | | | | | | | | | | | | | | | | | | | | | | | | | | |
End of year* | | | $ | 37,813,527 | | | | $ | 35,074,956 | | | | $ | 11,238,678 | | | | $ | 8,200,718 | | | | $ | 68,577,964 | | | | $ | 71,329,568 | |
| | | | | | | | | | | | | | | | | | | | | | | | | | | | | | |
* Includes undistributed net investment income (loss) at end of period | | | $ | 94,798 | | | | $ | — | | | | $ | (86,069 | ) | | | $ | (84,330 | ) | | | $ | 464,351 | | | | $ | 172,609 | |
| | | | | | | | | | | | | | | | | | | | | | | | | | | | | | |
Share Activity: | | | | | | | | | | | | | | | | | | | | | | | | | | | | | | |
Shares Sold | | | | | | | | | | | | | | | | | | | | | | | | | | | | | | |
Class A | | | | 1,615,799 | | | | | 2,188,769 | | | | | 286,237 | | | | | 1,153,664 | | | | | 1,733,384 | | | | | 2,657,882 | |
Class C | | | | 116,063 | | | | | 78,895 | | | | | 63,533 | | | | | 33,037 | | | | | 437,490 | | | | | 558,363 | |
Class I | | | | 11 | | | | | | | | | | 8 | | | | | | | | | | 9 | | | | | | |
Shares Reinvested | | | | | | | | | | | | | | | | | | | | | | | | | | | | | | |
Class A | | | | 165,588 | | | | | 166,421 | | | | | — | | | | | — | | | | | 7,703 | | | | | 283,347 | |
Class C | | | | 7,288 | | | | | 6,212 | | | | | — | | | | | — | | | | | 2,990 | | | | | 82,046 | |
Shares Redeemed | | | | | | | | | | | | | | | | | | | | | | | | | | | | | | |
Class A | | | | (1,523,719 | ) | | | | (1,479,733 | ) | | | | (260,162 | ) | | | | (368,476 | ) | | | | (1,415,033 | ) | | | | (2,475,935 | ) |
Class C | | | | (63,809 | ) | | | | (44,704 | ) | | | | (9,559 | ) | | | | (11,514 | ) | | | | (478,799 | ) | | | | (239,208 | ) |
| | | | | | | | | | | | | | | | | | | | | | | | | | | | | | |
Net increase in shares of beneficial interest outstanding | | | | 317,221 | | | | | 915,860 | | | | | 80,057 | | | | | 806,711 | | | | | 287,744 | | | | | 866,495 | |
| | | | | | | | | | | | | | | | | | | | | | | | | | | | | | |
The accompanying notes are an integral part of these financial statements.
[62]
| | |
| Timothy Plan Family of Funds | | |
| | |
Statements of Changes in Net Assets | | |
| | | | | | | | | | | | | | | | | | | | | | | | | |
| | | Strategic Growth Fund | | Conservative Growth Fund | | Emerging
Markets Fund (1) |
| | | Year Ended
September 30,
2013 | | Year Ended
September 30,
2012 | | Year Ended
September 30,
2013 | | Year Ended
September 30,
2012 | | Period Ended
September 30,
2013 |
Operations: | | | | | | | | | | | | | | | | | | | | | | | | | |
Net investment income (loss) | | | $ | 41,481 | | | | $ | 182,207 | | | | $ | 55,679 | | | | $ | 269,076 | | | | $ | (58,775 | ) |
Net realized gain (loss) from investments | | | | 1,365,460 | | | | | (447,532 | ) | | | | 2,008,053 | | | | | 1,635,113 | | | | | 287,405 | |
Capital gain distributions from affiliated funds | | | | 184,843 | | | | | 628,601 | | | | | 165,162 | | | | | 644,601 | | | | | — | |
Net change in unrealized appreciation on investments | | | | 3,100,731 | | | | | 6,437,198 | | | | | 834,809 | | | | | 3,133,017 | | | | | 126,463 | |
| | | | | | | | | | | | | | | | | | | | | | | | | |
Net increase in net assets resulting from operations | | | | 4,692,515 | | | | | 6,800,474 | | | | | 3,063,703 | | | | | 5,681,807 | | | | | 355,093 | |
| | | | | | | | | | | | | | | | | | | | | | | | | |
Distributions to Shareholders: | | | | | | | | | | | | | | | | | | | | | | | | | |
Net Investment Income | | | | | | | | | | | | | | | | | | | | | | | | | |
Class A | | | | (190,626 | ) | | | | — | | | | | (306,948 | ) | | | | (49,894 | ) | | | | — | |
Class C | | | | (5 | ) | | | | — | | | | | (6 | ) | | | | — | | | | | — | |
| | | | | | | | | | | | | | | | | | | | | | | | | |
Total dividends and distributions to shareholders | | | | (190,631 | ) | | | | — | | | | | (306,954 | ) | | | | (49,894 | ) | | | | — | |
| | | | | | | | | | | | | | | | | | | | | | | | | |
Share Transactions of Beneficial Interest: | | | | | | | | | | | | | | | | | | | | | | | | | |
Net proceeds from shares sold | | | | | | | | | | | | | | | | | | | | | | | | | |
Class A | | | | 5,923,646 | | | | | 2,739,030 | | | | | 9,364,096 | | | | | 5,968,016 | | | | | 9,641,956 | |
Class C | | | | 1,239,023 | | | | | 818,628 | | | | | 2,556,007 | | | | | 1,927,268 | | | | | 323,894 | |
Class I | | | | — | | | | | — | | | | | — | | | | | — | | | | | 100 | |
Reinvestment of dividends and distributions | | | | | | | | | | | | | | | | | | | | | | | | | |
Class A | | | | 185,872 | | | | | — | | | | | 283,789 | | | | | 46,328 | | | | | — | |
Class C | | | | — | | | | | — | | | | | — | | | | | — | | | | | — | |
Cost of shares redeemed | | | | | | | | | | | | | | | | | | | | | | | | | |
Class A | | | | (7,599,802 | ) | | | | (7,434,707 | ) | | | | (7,690,796 | ) | | | | (5,947,763 | ) | | | | (1,321,810 | ) |
Class C | | | | (1,203,822 | ) | | | | (1,552,381 | ) | | | | (1,846,027 | ) | | | | (1,686,942 | ) | | | | (32,972 | ) |
| | | | | | | | | | | | | | | | | | | | | | | | | |
Net increase (decrease) in net assets from share transactions of beneficial interest | | | | (1,455,083 | ) | | | | (5,429,430 | ) | | | | 2,667,069 | | | | | 306,907 | | | | | 8,611,168 | |
| | | | | | | | | | | | | | | | | | | | | | | | | |
Total Increase (Decrease) in Net Assets | | | | 3,046,801 | | | | | 1,371,044 | | | | | 5,423,818 | | | | | 5,938,820 | | | | | 8,966,261 | |
| (1) | The Emerging Markets Fund commenced operations on December 3, 2012. |
The accompanying notes are an integral part of these financial statements.
[63]
| | |
| Timothy Plan Family of Funds | | |
| | |
Statements of Changes in Net Assets (Continued) | | |
| | | | | | | | | | | | | | | | | | | | | | | | | |
| | | Strategic Growth Fund | | Conservative Growth Fund | | Emerging
Markets Fund (1) |
| | | Year Ended
September 30,
2013 | | Year Ended
September 30,
2012 | | Year Ended
September 30,
2013 | | Year Ended
September 30,
2012 | | Period Ended
September 30,
2013 |
Net Assets: | | | | | | | | | | | | | | | | | | | | | | | | | |
Beginning of period | | | | 39,086,444 | | | | | 37,715,400 | | | | | 49,233,011 | | | | | 43,294,191 | | | | | — | |
| | | | | | | | | | | | | | | | | | | | | | | | | |
End of period* | | | $ | 42,133,245 | | | | $ | 39,086,444 | | | | $ | 54,656,829 | | | | $ | 49,233,011 | | | | $ | 8,966,261 | |
| | | | | | | | | | | | | | | | | | | | | | | | | |
* Includes undistributed net investment income (loss) at end of period | | | $ | 33,057 | | | | $ | 182,207 | | | | $ | 14,940 | | | | $ | 276,345 | | | | $ | (12,505 | ) |
| | | | | | | | | | | | | | | | | | | | | | | | | |
Share Activity: | | | | | | | | | | | | | | | | | | | | | | | | | |
Shares Sold | | | | | | | | | | | | | | | | | | | | | | | | | |
Class A | | | | 745,072 | | | | | 382,740 | | | | | 913,784 | | | | | 621,169 | | | | | 953,198 | |
Class C | | | | 168,878 | | | | | 124,012 | | | | | 266,950 | | | | | 213,342 | | | | | 31,033 | |
Class I | | | | — | | | | | — | | | | | — | | | | | — | | | | | 10 | |
Shares Reinvested | | | | | | | | | | | | | | | | | | | | | | | | | |
Class A | | | | 24,765 | | | | | — | | | | | 28,489 | | | | | 4,939 | | | | | — | |
Class C | | | | — | | | | | — | | | | | — | | | | | — | | | | | — | |
Shares Redeemed | | | | | | | | | | | | | | | | | | | | | | | | | |
Class A | | | | (970,634 | ) | | | | (1,040,902 | ) | | | | (756,030 | ) | | | | (618,780 | ) | | | | (129,286 | ) |
Class C | | | | (166,611 | ) | | | | (235,669 | ) | | | | (194,209 | ) | | | | (187,625 | ) | | | | (3,229 | ) |
| | | | | | | | | | | | | | | | | | | | | | | | | |
Net increase (decrease) in shares of beneficial interest outstanding | | | | (198,530 | ) | | | | (769,819 | ) | | | | 258,984 | | | | | 33,045 | | | | | 851,726 | |
| | | | | | | | | | | | | | | | | | | | | | | | | |
The accompanying notes are an integral part of these financial statements.
[64]
| | |
| Timothy Plan Family of Funds | | |
| | | | | | | | | | | | | | | | | | | | | | | | | | | | | | |
| | | Aggressive Growth |
| | | (Class A Shares) |
| | | For the Year Ended September 30, | | For the Period
Ended
September 30,
2009 (A) | | For the Year
Ended
December 31,
2008 |
| | | 2013 | | 2012 | | 2011 | | 2010 | | |
| Selected data based on a share outstanding throughout each period | | | | | | | | | | | | | | | | | | | | | | | | | | | | | | |
Net asset value, beginning of period | | | $ | 7.10 | | | | $ | 5.57 | | | | $ | 5.42 | | | | $ | 4.51 | | | | $ | 3.71 | | | | $ | 6.80 | |
| | | | | | | | | | | | | | | | | | | | | | | | | | | | | | |
Income (loss) from investment operations: | | | | | | | | | | | | | | | | | | | | | | | | | | | | | | |
Net investment income (loss) | | | | (0.09 | )(B) | | | | (0.12 | )(B) | | | | (0.10 | )(B) | | | | (0.09 | ) | | | | (0.05 | ) | | | | (0.07 | ) |
Net realized and unrealized gain (loss) on investments | | | | 1.99 | | | | | 1.65 | | | | | 0.25 | | | | | 1.00 | | | | | 0.85 | | | | | (3.01 | ) |
| | | | | | | | | | | | | | | | | | | | | | | | | | | | | | |
Total from investment operations | | | | 1.90 | | | | | 1.53 | | | | | 0.15 | | | | | 0.91 | | | | | 0.80 | | | | | (3.08 | ) |
| | | | | | | | | | | | | | | | | | | | | | | | | | | | | | |
Less Distributions: | | | | | | | | | | | | | | | | | | | | | | | | | | | | | | |
From net realized gains on investments | | | | — | | | | | — | | | | | — | | | | | — | | | | | — | | | | | (0.01 | ) |
| | | | | | | | | | | | | | | | | | | | | | | | | | | | | | |
Total distributions | | | | — | | | | | — | | | | | — | | | | | — | | | | | — | | | | | (0.01 | ) |
| | | | | | | | | | | | | | | | | | | | | | | | | | | | | | |
Net asset value, end of period | | | $ | 9.00 | | | | $ | 7.10 | | | | $ | 5.57 | | | | $ | 5.42 | | | | $ | 4.51 | | | | $ | 3.71 | |
| | | | | | | | | | | | | | | | | | | | | | | | | | | | | | |
Total return (C)(D) | | | | 26.76 | % | | | | 27.47 | % | | | | 2.77 | % | | | | 20.18 | % | | | | 21.56 | %(F) | | | | (45.27 | )% |
Ratios/supplemental data: | | | | | | | | | | | | | | | | | | | | | | | | | | | | | | |
Net assets, end of period (in 000’s) | | | $ | 17,727 | | | | $ | 14,398 | | | | $ | 12,259 | | | | $ | 13,247 | | | | $ | 17,007 | | | | $ | 14,575 | |
Ratio of expenses to average net assets | | | | 1.86 | % | | | | 2.12 | % | | | | 1.81 | % | | | | 1.88 | % | | | | 1.85 | %(G) | | | | 1.72 | % |
Ratio of net investment income (loss) to average net assets | | | | (1.20 | )% | | | | (1.78 | )% | | | | (1.52 | )% | | | | (1.61 | )% | | | | (1.58 | )%(G) | | | | (1.33 | )% |
Portfolio turnover rate | | | | 120 | % | | | | 147 | % | | | | 201 | % | | | | 89 | % | | | | 136 | %(F) | | | | 244 | %(E) |
| (A) | The Fund elected to change its fiscal year end from December to September. The information presented is for January 1, 2009 through September 30, 2009. |
| (B) | Per share amounts calculated using average shares method, which more appropriately presents the per share data for the period. |
| (C) | Total return calculation does not reflect sales load. |
| (D) | Total return in the above table represents the rate that the investor would have earned or lost on an investment in the Fund assuming reinvestment of dividends. Total return would have been higher or lower if certain expenses had not been reimbursed, waived or recouped. |
| (E) | On January 1, 2008, Chartwell Investment Partners became sub-advisor for the Fund. |
| (F) | For periods of less than one full year, total return and turnover are not annualized. |
The accompanying notes are an integral part of these financial statements.
[65]
| | |
| Timothy Plan Family of Funds | | |
| | | | | | | | | | | | | | | | | | | | | | | | | | | | | | |
| | | Aggressive Growth |
| | | (Class C Shares) |
| | | For the Year Ended September 30, | | For the Period
Ended
September 30,
2009 (A) | | For the Year
Ended
December 31,
2008 |
| | | 2013 | | 2012 | | 2011 | | 2010 | | |
| Selected data based on a share outstanding throughout each period | | | | | | | | | | | | | | | | | | | | | | | | | | | | | | |
Net asset value, beginning of period | | | $ | 6.43 | | | | $ | 5.06 | | | | $ | 4.98 | | | | $ | 4.18 | | | | $ | 3.46 | | | | $ | 6.37 | |
| | | | | | | | | | | | | | | | | | | | | | | | | | | | | | |
Income (loss) from investment operations: | | | | | | | | | | | | | | | | | | | | | | | | | | | | | | |
Net investment loss | | | | (0.14 | )(B) | | | | (0.16 | )(B) | | | | (0.13 | )(B) | | | | (0.11 | ) | | | | (0.06 | ) | | | | (0.11 | ) |
Net realized and unrealized gain (loss) on investments | | | | 1.80 | | | | | 1.53 | | | | | 0.21 | | | | | 0.91 | | | | | 0.78 | | | | | (2.79 | ) |
| | | | | | | | | | | | | | | | | | | | | | | | | | | | | | |
Total from investment operations | | | | 1.66 | | | | | 1.37 | | | | | 0.08 | | | | | 0.80 | | | | | 0.72 | | | | | (2.90 | ) |
| | | | | | | | | | | | | | | | | | | | | | | | | | | | | | |
Less Distributions: | | | | | | | | | | | | | | | | | | | | | | | | | | | | | | |
From net realized gains on investments | | | | — | | | | | — | | | | | — | | | | | — | | | | | — | | | | | (0.01 | ) |
| | | | | | | | | | | | | | | | | | | | | | | | | | | | | | |
Total distributions | | | | — | | | | | — | | | | | — | | | | | — | | | | | — | | | | | (0.01 | ) |
| | | | | | | | | | | | | | | | | | | | | | | | | | | | | | |
Net asset value, end of period | | | $ | 8.09 | | | | $ | 6.43 | | | | $ | 5.06 | | | | $ | 4.98 | | | | $ | 4.18 | | | | $ | 3.46 | |
| | | | | | | | | | | | | | | | | | | | | | | | | | | | | | |
Total return (C)(D) | | | | 25.82 | % | | | | 27.08 | % | | | | 1.61 | % | | | | 19.14 | % | | | | 20.81 | %(F) | | | | (45.50 | )% |
Ratios/supplemental data: | | | | | | | | | | | | | | | | | | | | | | | | | | | | | | |
Net assets, end of period (in 000’s) | | | $ | 2,892 | | | | $ | 2,201 | | | | $ | 1,766 | | | | $ | 1,670 | | | | $ | 1,477 | | | | $ | 1,272 | |
Ratio of expenses to average net assets | | | | 2.60 | % | | | | 2.87 | % | | | | 2.57 | % | | | | 2.63 | % | | | | 2.60 | %(G) | | | | 2.47 | % |
Ratio of net investment income (loss) to average net assets | | | | (1.94 | )% | | | | (2.53 | )% | | | | (2.28 | )% | | | | (2.35 | )% | | | | (2.33 | )%(G) | | | | (2.08 | )% |
Portfolio turnover rate | | | | 120 | % | | | | 147 | % | | | | 201 | % | | | | 89 | % | | | | 136 | %(F) | | | | 244 | %(E) |
| (A) | The Fund elected to change its fiscal year end from December to September. The information presented is for January 1, 2009 through September 30, 2009. |
| (B) | Per share amounts calculated using average shares method, which more appropriately presents the per share data for the period. |
| (C) | Total return calculation does not reflect redemption fee. |
| (D) | Total return in the above table represents the rate that the investor would have earned or lost on an investment in the Fund assuming reinvestment of dividends. Total return would have been higher or lower if certain expenses had not been reimbursed, waived or recouped. |
| (E) | On January 1, 2008, Chartwell Investment Partners became sub-advisor for the Fund. |
| (F) | For periods of less than one full year, total return and turnover are not annualized. |
The accompanying notes are an integral part of these financial statements.
[66]
| | |
| Timothy Plan Family of Funds | | |
| | | | | |
| | | Aggressive Growth |
| | | (Class I Shares) |
| | | For the Period
Ended
September 30,
2013 (A) |
Selected data based on a share outstanding throughout the period | | | | | |
Net asset value, beginning of period | | | $ | 8.87 | |
| | | | | |
Income (loss) from investment operations: | | | | | |
Net investment income (B) | | | | — | * |
Net realized and unrealized gain on investments | | | | 0.14 | |
| | | | | |
Total from investment operations | | | | 0.14 | |
| | | | | |
Less Distributions: | | | | | |
From net investment income | | | | — | |
From net realized gains on investments | | | | — | |
| | | | | |
Total distributions | | | | — | |
| | | | | |
Net asset value, end of period | | | $ | 9.01 | |
| | | | | |
Total return (C) | | | | 1.58 | %(D) |
Ratios/supplemental data: | | | | | |
Net assets, end of period | | | $ | 102 | |
Ratio of expenses to average net assets | | | | 1.61 | %(E) |
Ratio of net investment income (loss) to average net assets | | | | (0.95 | )%(E) |
Portfolio turnover rate | | | | 120 | %(D) |
| * | Amount is less than $0.005 per share. |
| (A) | For the period August 1, 2013 (Commencement of Operations) to September 30, 2013. |
| (B) | Per share amounts calculated using average shares method, which more appropriately presents the per share data for the period. |
| (C) | Total return in the above table represents the rate that the investor would have earned or lost on an investment in the Fund assuming reinvestment of dividends. |
| (D) | For periods of less than one full year, total return and turnover are not annualized. |
The accompanying notes are an integral part of these financial statements.
[67]
| | |
| Timothy Plan Family of Funds | | |
| | | | | | | | | | | | | | | | | | | | | | | | | | | | | | |
| | | International |
| | | (Class A Shares) |
| | | For the Year Ended September 30, | | For the Period
Ended
September 30,
2009 (A) | | For the Year
Ended
December 31,
2008 |
| | | 2013 | | 2012 | | 2011 | | 2010 | | |
| Selected data based on a share outstanding throughout each period | | | | | | | | | | | | | | | | | | | | | | | | | | | | | | |
Net asset value, beginning of period | | | $ | 7.31 | | | | $ | 6.54 | | | | $ | 7.71 | | | | $ | 7.52 | | | | $ | 5.92 | | | | $ | 11.00 | |
| | | | | | | | | | | | | | | | | | | | | | | | | | | | | | |
Income (loss) from investment operations: | | | | | | | | | | | | | | | | | | | | | | | | | | | | | | |
Net investment income (loss) | | | | 0.06 | (B) | | | | 0.03 | (B) | | | | 0.20 | (B) | | | | 0.04 | | | | | 0.08 | | | | | 0.09 | |
Net realized and unrealized gain (loss) on investments | | | | 1.34 | | | | | 0.97 | | | | | (1.33 | ) | | | | 0.26 | | | | | 1.52 | | | | | (5.08 | ) |
| | | | | | | | | | | | | | | | | | | | | | | | | | | | | | |
Total from investment operations | | | | 1.40 | | | | | 1.00 | | | | | (1.13 | ) | | | | 0.30 | | | | | 1.60 | | | | | (4.99 | ) |
| | | | | | | | | | | | | | | | | | | | | | | | | | | | | | |
Less Distributions: | | | | | | | | | | | | | | | | | | | | | | | | | | | | | | |
From net investment income | | | | (0.06 | ) | | | | (0.23 | ) | | | | (0.04 | ) | | | | (0.11 | ) | | | | — | | | | | (0.09 | ) |
| | | | | | | | | | | | | | | | | | | | | | | | | | | | | | |
Total distributions | | | | (0.06 | ) | | | | (0.23 | ) | | | | (0.04 | ) | | | | (0.11 | ) | | | | — | | | | | (0.09 | ) |
| | | | | | | | | | | | | | | | | | | | | | | | | | | | | | |
Net asset value, end of period | | | $ | 8.65 | | | | $ | 7.31 | | | | $ | 6.54 | | | | $ | 7.71 | | | | $ | 7.52 | | | | $ | 5.92 | |
| | | | | | | | | | | | | | | | | | | | | | | | | | | | | | |
Total return (C)(D) | | | | 19.25 | % | | | | 15.73 | % | | | | (14.72 | )% | | | | 3.93 | % | | | | 27.03 | %(E) | | | | (45.38 | )% |
Ratios/supplemental data: | | | | | | | | | | | | | | | | | | | | | | | | | | | | | | |
Net assets, end of period (in 000’s) | | | $ | 38,432 | | | | $ | 29,794 | | | | $ | 28,423 | | | | $ | 35,206 | | | | $ | 37,248 | | | | $ | 31,214 | |
Ratio of expenses to average net assets | | | | 1.73 | % | | | | 1.82 | % | | | | 1.70 | % | | | | 1.74 | % | | | | 1.72 | %(F) | | | | 1.66 | % |
Ratio of net investment income (loss) to average net assets | | | | 0.70 | % | | | | 0.38 | % | | | | 2.45 | % | | | | 0.58 | % | | | | 1.68 | %(F) | | | | 1.12 | % |
Portfolio turnover rate | | | | 29 | % | | | | 34 | % | | | | 62 | % | | | | 41 | % | | | | 38 | %(E) | | | | 32 | % |
| (A) | The Fund elected to change its fiscal year end from December to September. The information presented is for January 1, 2009 through September 30, 2009. |
| (B) | Per share amounts calculated using average shares method, which more appropriately presents the per share data for the period. |
| (C) | Total return calculation does not reflect sales load. |
| (D) | Total return in the above table represents the rate that the investor would have earned or lost on an investment in the Fund assuming reinvestment of dividends. |
| (E) | For periods of less than one full year, total return and turnover are not annualized. |
The accompanying notes are an integral part of these financial statements.
[68]
| | |
| Timothy Plan Family of Funds | | |
| | | | | | | | | | | | | | | | | | | | | | | | | | | | | | |
| | | International |
| | | (Class C Shares) |
| | | For the Year Ended September 30, | | For the Period
Ended
September 30,
2009 (A) | | For the Year
Ended
December 31,
2008 |
| | | 2013 | | 2012 | | 2011 | | 2010 | | |
| Selected data based on a share outstanding throughout each period | | | | | | | | | | | | | | | | | | | | | | | | | | | | | | |
Net asset value, beginning of period | | | $ | 7.15 | | | | $ | 6.39 | | | | $ | 7.58 | | | | $ | 7.41 | | | | $ | 5.87 | | | | $ | 10.97 | |
| | | | | | | | | | | | | | | | | | | | | | | | | | | | | | |
Income (loss) from investment operations: | | | | | | | | | | | | | | | | | | | | | | | | | | | | | | |
Net investment income (loss) | | | | — | (B) | | | | (0.02 | )(B) | | | | 0.13 | (B) | | | | (0.01 | ) | | | | 0.04 | | | | | 0.04 | |
Net realized and unrealized gain (loss) on investments | | | | 1.31 | | | | | 0.95 | | | | | (1.29 | ) | | | | 0.25 | | | | | 1.50 | | | | | (5.07 | ) |
| | | | | | | | | | | | | | | | | | | | | | | | | | | | | | |
Total from investment operations | | | | 1.31 | | | | | 0.93 | | | | | (1.16 | ) | | | | 0.24 | | | | | 1.54 | | | | | (5.03 | ) |
| | | �� | | | | | | | | | | | | | | | | | | | | | | | | | | | |
Less Distributions: | | | | | | | | | | | | | | | | | | | | | | | | | | | | | | |
From net investment income | | | | — | | | | | (0.17 | ) | | | | (0.03 | ) | | | | (0.07 | ) | | | | — | | | | | (0.07 | ) |
| | | | | | | | | | | | | | | | | | | | | | | | | | | | | | |
Total distributions | | | | — | | | | | (0.17 | ) | | | | (0.03 | ) | | | | (0.07 | ) | | | | — | | | | | (0.07 | ) |
| | | | | | | | | | | | | | | | | | | | | | | | | | | | | | |
Net asset value, end of period | | | $ | 8.46 | | | | $ | 7.15 | | | | $ | 6.39 | | | | $ | 7.58 | | | | $ | 7.41 | | | | $ | 5.87 | |
| | | | | | | | | | | | | | | | | | | | | | | | | | | | | | |
Total return (C)(D) | | | | 18.32 | % | | | | 14.88 | % | | | | (15.40 | )% | | | | 3.27 | % | | | | 26.24 | %(E) | | | | (45.79 | )% |
Ratios/supplemental data: | | | | | | | | | | | | | | | | | | | | | | | | | | | | | | |
Net assets, end of period (in 000’s) | | | $ | 2,446 | | | | $ | 1,617 | | | | $ | 1,427 | | | | $ | 1,941 | | | | $ | 1,417 | | | | $ | 984 | |
Ratio of expenses to average net assets | | | | 2.47 | % | | | | 2.57 | % | | | | 2.45 | % | | | | 2.49 | % | | | | 2.47 | %(F) | | | | 2.40 | % |
Ratio of net investment income (loss) to average net assets | | | | (0.01 | )% | | | | (0.32 | )% | | | | 1.58 | % | | | | (0.15 | )% | | | | 0.85 | %(F) | | | | 0.45 | % |
Portfolio turnover rate | | | | 29 | % | | | | 34 | % | | | | 62 | % | | | | 41 | % | | | | 38 | %(E) | | | | 32 | % |
| (A) | The Fund elected to change its fiscal year end from December to September. The information presented is for January 1, 2009 through September 30, 2009. |
| (B) | Per share amounts calculated using average shares method, which more appropriately presents the per share data for the period. |
| (C) | Total return calculation does not reflect redemption fee. |
| (D) | Total return in the above table represents the rate that the investor would have earned or lost on an investment in the Fund assuming reinvestment of dividends. |
| (E) | For periods of less than one full year, total return and turnover are not annualized. |
The accompanying notes are an integral part of these financial statements.
[69]
| | |
| Timothy Plan Family of Funds | | |
| | | | | |
| | | International |
| | | (Class I Shares) |
| | | For the Period
Ended
September 30,
2013 (A) |
| Selected data based on a share outstanding throughout the period | | | | | |
Net asset value, beginning of period | | | $ | 8.46 | |
| | | | | |
Income (loss) from investment operations: | | | | | |
Net investment income (B) | | | | 0.02 | |
Net realized and unrealized gain on investments | | | | 0.17 | |
| | | | | |
Total from investment operations | | | | 0.19 | |
| | | | | |
Less Distributions: | | | | | |
From net investment income | | | | — | |
From net realized gains on investments | | | | — | |
| | | | | |
Total distributions | | | | — | |
| | | | | |
Net asset value, end of period | | | $ | 8.65 | |
| | | | | |
Total return (C) | | | | 2.25 | %(D) |
Ratios/supplemental data: | | | | | |
Net assets, end of period | | | $ | 102 | |
Ratio of expenses to average net assets | | | | 1.48 | %(E) |
Ratio of net investment income to average net assets | | | | 0.95 | %(E) |
Portfolio turnover rate | | | | 29 | %(D) |
| (A) | For the period August 1, 2013 (Commencement of Operations) to September 30, 2013. |
| (B) | Per share amounts calculated using average shares method, which more appropriately presents the per share data for the period. |
| (C) | Total return in the above table represents the rate that the investor would have earned or lost on an investment in the Fund assuming reinvestment of dividends. |
| (D) | For periods of less than one full year, total return and turnover are not annualized. |
The accompanying notes are an integral part of these financial statements.
[70]
| | |
| Timothy Plan Family of Funds | | |
| | | | | | | | | | | | | | | | | | | | | | | | | | | | | | |
| | | Large/Mid Cap Growth |
| | | (Class A Shares) |
| | | For the Year Ended September 30, | | For the Period
Ended
September 30,
2009 (A) | | For the Year
Ended
December 31,
2008 |
| | | 2013 | | 2012 | | 2011 | | 2010 | | |
| Selected data based on a share outstanding throughout each period | | | | | | | | | | | | | | | | | | | | | | | | | | | | | | |
Net asset value, beginning of period | | | $ | 7.30 | | | | $ | 6.05 | | | | $ | 5.99 | | | | $ | 5.37 | | | | $ | 4.38 | | | | $ | 6.89 | |
| | | | | | | | | | | | | | | | | | | | | | | | | | | | | | |
Income (loss) from investment operations: | | | | | | | | | | | | | | | | | | | | | | | | | | | | | | |
Net investment loss | | | | (0.02 | )(B) | | | | (0.04 | )(B) | | | | (0.04 | )(B) | | | | (0.04 | ) | | | | (0.02 | ) | | | | (0.04 | ) |
Net realized and unrealized gain (loss) on investments | | | | 1.51 | | | | | 1.61 | | | | | 0.10 | | | | | 0.66 | | | | | 1.01 | | | | | (2.46 | ) |
| | | | | | | | | | | | | | | | | | | | | | | | | | | | | | |
Total from investment operations | | | | 1.49 | | | | | 1.57 | | | | | 0.06 | | | | | 0.62 | | | | | 0.99 | | | | | (2.50 | ) |
| | | | | | | | | | | | | | | | | | | | | | | | | | | | | | |
Less Distributions: | | | | | | | | | | | | | | | | | | | | | | | | | | | | | | |
From net realized gains on investments | | | | (0.43 | ) | | | | (0.32 | ) | | | | — | | | | | — | | | | | — | | | | | (0.01 | ) |
| | | | | | | | | | | | | | | | | | | | | | | | | | | | | | |
Total distributions | | | | (0.43 | ) | | | | (0.32 | ) | | | | — | | | | | — | | | | | — | | | | | (0.01 | ) |
| | | | | | | | | | | | | | | | | | | | | | | | | | | | | | |
Net asset value, end of period | | | $ | 8.36 | | | | $ | 7.30 | | | | $ | 6.05 | | | | $ | 5.99 | | | | $ | 5.37 | | | | $ | 4.38 | |
| | | | | | | | | | | | | | | | | | | | | | | | | | | | | | |
Total return (C)(D) | | | | 21.62 | % | | | | 26.61 | % | | | | 1.00 | % | | | | 11.55 | % | | | | 22.60 | %(F) | | | | (36.30 | )% |
Ratios/supplemental data: | | | | | | | | | | | | | | | | | | | | | | | | | | | | | | |
Net assets, end of period (in 000’s) | | | $ | 48,411 | | | | $ | 41,446 | | | | $ | 34,252 | | | | $ | 38,865 | | | | $ | 35,973 | | | | $ | 32,484 | |
Ratio of expenses to average net assets | | | | 1.59 | % | | | | 1.68 | % | | | | 1.60 | % | | | | 1.66 | % | | | | 1.67 | %(G) | | | | 1.56 | % |
Ratio of net investment income (loss) to average net assets | | | | (0.24 | )% | | | | (0.63 | )% | | | | (0.64 | )% | | | | (0.74 | )% | | | | (0.58 | )%(G) | | | | (0.64 | )% |
Portfolio turnover rate | | | | 91 | % | | | | 127 | % | | | | 150 | % | | | | 78 | % | | | | 78 | %(F) | | | | 177 | %(E) |
| (A) | The Fund elected to change its fiscal year end from December to September. The information presented is for January 1, 2009 through September 30, 2009. |
| (B) | Per share amounts calculated using average shares method, which more appropriately presents the per share data for the period. |
| (C) | Total return calculation does not reflect sales load. |
| (D) | Total return in the above table represents the rate that the investor would have earned or lost on an investment in the Fund assuming reinvestment of dividends. Total return would have been higher or lower if certain expenses had not been reimbursed, waived or recouped. |
| (E) | On January 1, 2008, Chartwell Investment Partners became sub-advisor for the Fund. |
| (F) | For periods of less than one full year, total return and turnover are not annualized. |
The accompanying notes are an integral part of these financial statements.
[71]
| | |
| Timothy Plan Family of Funds | | |
| | | | | | | | | | | | | | | | | | | | | | | | | | | | | | |
| | | Large/Mid Cap Growth |
| | | (Class C Shares) |
| | | For the Year Ended September 30, | | For the Period
Ended
September 30,
2009 (A) | | For the Year
Ended
December 31,
2008 |
| | | 2013 | | 2012 | | 2011 | | 2010 | | |
| Selected data based on a share outstanding throughout each period | | | | | | | | | | | | | | | | | | | | | | | | | | | | | | |
Net asset value, beginning of period | | | $ | 6.63 | | | | $ | 5.57 | | | | $ | 5.55 | | | | $ | 5.01 | | | | $ | 4.11 | | | | $ | 6.51 | |
| | | | | | | | | | | | | | | | | | | | | | | | | | | | | | |
Income (loss) from investment operations: | | | | | | | | | | | | | | | | | | | | | | | | | | | | | | |
Net investment loss | | | | (0.07 | )(B) | | | | (0.09 | )(B) | | | | (0.09 | )(B) | | | | (0.08 | ) | | | | (0.04 | ) | | | | (0.08 | ) |
Net realized and unrealized gain (loss) on investments | | | | 1.36 | | | | | 1.47 | | | | | 0.11 | | | | | 0.62 | | | | | 0.94 | | | | | (2.31 | ) |
| | | | | | | | | | | | | | | | | | | | | | | | | | | | | | |
Total from investment operations | | | | 1.29 | | | | | 1.38 | | | | | 0.02 | | | | | 0.54 | | | | | 0.90 | | | | | (2.39 | ) |
| | | | | | | | | | | | | | | | | | | | | | | | | | | | | | |
Less Distributions: | | | | | | | | | | | | | | | | | | | | | | | | | | | | | | |
From net realized gains on investments | | | | (0.43 | ) | | | | (0.32 | ) | | | | — | | | | | — | | | | | — | | | | | (0.01 | ) |
| | | | | | | | | | | | | | | | | | | | | | | | | | | | | | |
Total distributions | | | | (0.43 | ) | | | | (0.32 | ) | | | | — | | | | | — | | | | | — | | | | | (0.01 | ) |
| | | | | | | | | | | | | | | | | | | | | | | | | | | | | | |
Net asset value, end of period | | | $ | 7.49 | | | | $ | 6.63 | | | | $ | 5.57 | | | | $ | 5.55 | | | | $ | 5.01 | | | | $ | 4.11 | |
| | | | | | | | | | | | | | | | | | | | | | | | | | | | | | |
Total return (C)(D) | | | | 20.74 | % | | | | 25.47 | % | | | | 0.36 | % | | | | 10.78 | % | | | | 21.90 | %(F) | | | | (36.73 | )% |
Ratios/supplemental data: | | | | | | | | | | | | | | | | | | | | | | | | | | | | | | |
Net assets, end of period (in 000’s) | | | $ | 5,041 | | | | $ | 4,483 | | | | $ | 2,726 | | | | $ | 2,523 | | | | $ | 2,120 | | | | $ | 1,971 | |
Ratio of expenses to average net assets | | | | 2.34 | % | | | | 2.44 | % | | | | 2.35 | % | | | | 2.41 | % | | | | 2.42 | %(G) | | | | 2.31 | % |
Ratio of net investment income (loss) to average net assets | | | | (0.99 | )% | | | | (1.38 | )% | | | | (1.38 | )% | | | | (1.49 | )% | | | | (1.33 | )%(G) | | | | (1.39 | )% |
Portfolio turnover rate | | | | 91 | % | | | | 127 | % | | | | 150 | % | | | | 78 | % | | | | 78 | %(F) | | | | 177 | %(E) |
| (A) | The Fund elected to change its fiscal year end from December to September. The information presented is for January 1, 2009 through September 30, 2009. |
| (B) | Per share amounts calculated using average shares method, which more appropriately presents the per share data for the period. |
| (C) | Total return calculation does not reflect redemption fee. |
| (D) | Total return in the above table represents the rate that the investor would have earned or lost on an investment in the Fund assuming reinvestment of dividends. Total return would have been higher or lower if certain expenses had not been reimbursed, waived or recouped. |
| (E) | On January 1, 2008, Chartwell Investment Partners became sub-advisor for the Fund. |
| (F) | For periods of less than one full year, total return and turnover are not annualized. |
The accompanying notes are an integral part of these financial statements.
[72]
| | |
| Timothy Plan Family of Funds | | |
| | | | | |
| | | Large/Mid Cap Growth |
| | | (Class I Shares) |
| | | For the Period
Ended
September 30,
2013 (A) |
Selected data based on a share outstanding throughout the period | | | | | |
Net asset value, beginning of period | | | $ | 8.31 | |
| | | | | |
Income (loss) from investment operations: | | | | | |
Net investment income (B) | | | | 0.01 | |
Net realized and unrealized gain on investments | | | | 0.05 | |
| | | | | |
Total from investment operations | | | | 0.06 | |
| | | | | |
Less Distributions: | | | | | |
From net investment income | | | | — | |
From net realized gains on investments | | | | — | |
| | | | | |
Total distributions | | | | — | |
| | | | | |
Net asset value, end of period | | | $ | 8.37 | |
| | | | | |
Total return (C) | | | | 0.72 | %(D) |
Ratios/supplemental data: | | | | | |
Net assets, end of period | | | $ | 101 | |
Ratio of expenses to average net assets | | | | 1.34 | %(E) |
Ratio of net investment income (loss) to average net assets | | | | 0.01 | %(E) |
Portfolio turnover rate | | | | 91 | %(D) |
| (A) | For the period August 1, 2013 (Commencement of Operations) to September 30, 2013. |
| (B) | Per share amounts calculated using average shares method, which more appropriately presents the per share data for the period. |
| (C) | Total return in the above table represents the rate that the investor would have earned or lost on an investment in the Fund assuming reinvestment of dividends. |
| (D) | For periods of less than one full year, total return and turnover are not annualized. |
The accompanying notes are an integral part of these financial statements.
[73]
| | |
| Timothy Plan Family of Funds | | |
| | | | | | | | | | | | | | | | | | | | | | | | | | | | | | |
| | | Small Cap Value |
| | | (Class A Shares) |
| | | For the Year Ended September 30, | | For the Period
Ended
September 30,
2009 (A) | | For the Year
Ended
December 31,
2008 |
| | | 2013 | | 2012 | | 2011 | | 2010 | | |
| Selected data based on a share outstanding throughout each period | | | | | | | | | | | | | | | | | | | | | | | | | | | | | | |
Net asset value, beginning of period | | | $ | 14.74 | | | | $ | 10.82 | | | | $ | 11.28 | | | | $ | 10.25 | | | | $ | 8.88 | | | | $ | 13.27 | |
| | | | | | | | | | | | | | | | | | | | | | | | | | | | | | |
Income (loss) from investment operations: | | | | | | | | | | | | | | | | | | | | | | | | | | | | | | |
Net investment income (loss) | | | | 0.02 | (B) | | | | 0.03 | (B) | | | | (0.05 | )(B) | | | | (0.06 | ) | | | | (0.05 | ) | | | | 0.01 | |
Net realized and unrealized gain (loss) on investments | | | | 5.57 | | | | | 3.89 | | | | | (0.41 | )(C) | | | | 1.09 | | | | | 1.42 | | | | | (4.33 | ) |
| | | | | | | | | | | | | | | | | | | | | | | | | | | | | | |
Total from investment operations | | | | 5.59 | | | | | 3.92 | | | | | (0.46 | ) | | | | 1.03 | | | | | 1.37 | | | | | (4.32 | ) |
| | | | | | | | | | | | | | | | | | | | | | | | | | | | | | |
Less distributions: | | | | | | | | | | | | | | | | | | | | | | | | | | | | | | |
From net investment income | | | | (0.03 | ) | | | | — | | | | | — | | | | | — | | | | | — | | | | | — | |
From net realized gains on investments | | | | — | | | | | — | | | | | — | | | | | — | | | | | — | | | | | (0.07 | ) |
| | | | | | | | | | | | | | | | | | | | | | | | | | | | | | |
Total distributions | | | | (0.03 | ) | | | | — | | | | | — | | | | | — | | | | | — | | | | | (0.07 | ) |
| | | | | | | | | | | | | | | | | | | | | | | | | | | | | | |
Net asset value, end of period | | | $ | 20.30 | | | | $ | 14.74 | | | | $ | 10.82 | | | | $ | 11.28 | | | | $ | 10.25 | | | | $ | 8.88 | |
| | | | | | | | | | | | | | | | | | | | | | | | | | | | | | |
Total return (D)(E) | | | | 37.97 | % | | | | 36.23 | % | | | | (4.08 | )% | | | | 10.05 | % | | | | 15.43 | %(F) | | | | (32.50 | )% |
Ratios/supplemental data: | | | | | | | | | | | | | | | | | | | | | | | | | | | | | | |
Net assets, end of period (in 000’s) | | | $ | 64,972 | | | | $ | 47,976 | | | | $ | 39,145 | | | | $ | 40,482 | | | | $ | 47,268 | | | | $ | 42,651 | |
Ratio of expenses to average net assets | | | | 1.55 | % | | | | 1.59 | % | | | | 1.53 | % | | | | 1.59 | % | | | | 1.59 | %(G) | | | | 1.50 | % |
Ratio of net investment income (loss) to average net assets | | | | 0.11 | % | | | | 0.19 | % | | | | (0.36 | )% | | | | (0.51 | )% | | | | (0.71 | )%(G) | | | | 0.05 | % |
Portfolio turnover rate | | | | 73 | % | | | | 65 | % | | | | 102 | % | | | | 64 | % | | | | 57 | %(F) | | | | 110 | % |
| (A) | The Fund elected to change its fiscal year end from December to September. The information presented is for January 1, 2009 through September 30, 2009. |
| (B) | Per share amounts calculated using average shares method, which more appropriately presents the per share data for the period. |
| (C) | Realized and unrealized gains and losses per share in this caption are balancing amounts necessary to reconcile the change in net asset value per share for the period, and may not agree to the aggregate gains and losses in the Statement of Operations due to the fluctuations in share transactions. |
| (D) | Total return calculation does not reflect sales load. |
| (E) | Total return in the above table represents the rate that the investor would have earned or lost on an investment in the Fund assuming reinvestment of dividends. |
| (F) | For periods of less than one full year, total return and turnover are not annualized. |
The accompanying notes are an integral part of these financial statements.
[74]
| | |
| Timothy Plan Family of Funds | | |
| | | | | | | | | | | | | | | | | | | | | | | | | | | | | | |
| | | Small Cap Value |
| | | (Class C Shares) |
| | | For the Year Ended September 30, | | For the Period
Ended
September 30,
2009 (A) | | For the Year
Ended
December 31,
2008 |
| | | 2013 | | 2012 | | 2011 | | 2010 | | |
| Selected data based on a share outstanding throughout each period | | | | | | | | | | | | | | | | | | | | | | | | | | | | | | |
Net asset value, beginning of period | | | $ | 12.63 | | | | $ | 9.35 | | | | $ | 9.82 | | | | $ | 8.99 | | | | $ | 7.83 | | | | $ | 11.80 | |
| | | | | | | | | | | | | | | | | | | | | | | | | | | | | | |
Income (loss) from investment operations: | | | | | | | | | | | | | | | | | | | | | | | | | | | | | | |
Net investment loss | | | | (0.10 | )(B) | | | | (0.06 | )(B) | | | | (0.13 | )(B) | | | | (0.12 | ) | | | | (0.09 | ) | | | | (0.07 | ) |
Net realized and unrealized gain (loss) on investments | | | | 4.77 | | | | | 3.34 | | | | | (0.34 | )(C) | | | | 0.95 | | | | | 1.25 | | | | | (3.83 | ) |
| | | | | | | | | | | | | | | | | | | | | | | | | | | | | | |
Total from investment operations | | | | 4.67 | | | | | 3.28 | | | | | (0.47 | ) | | | | 0.83 | | | | | 1.16 | | | | | (3.90 | ) |
| | | | | | | | | | | | | | | | | | | | | | | | | | | | | | |
Less distributions: | | | | | | | | | | | | | | | | | | | | | | | | | | | | | | |
From net realized gains on investments | | | | — | | | | | — | | | | | — | | | | | — | | | | | — | | | | | (0.07 | ) |
| | | | | | | | | | | | | | | | | | | | | | | | | | | | | | |
Total distributions | | | | — | | | | | — | | | | | — | | | | | — | | | | | — | | | | | (0.07 | ) |
| | | | | | | | | | | | | | | | | | | | | | | | | | | | | | |
Net asset value, end of period | | | $ | 17.30 | | | | $ | 12.63 | | | | $ | 9.35 | | | | $ | 9.82 | | | | $ | 8.99 | | | | $ | 7.83 | |
| | | | | | | | | | | | | | | | | | | | | | | | | | | | | | |
Total return (D)(E) | | | | 36.98 | % | | | | 35.08 | % | | | | (4.79 | )% | | | | 9.23 | % | | | | 14.81 | %(F) | | | | (32.99 | )% |
Ratios/supplemental data: | | | | | | | | | | | | | | | | | | | | | | | | | | | | | | |
Net assets, end of period (in 000’s) | | | $ | 7,539 | | | | $ | 4,937 | | | | $ | 3,809 | | | | $ | 4,186 | | | | $ | 3,867 | | | | $ | 3,901 | |
Ratio of expenses to average net assets | | | | 2.30 | % | | | | 2.34 | % | | | | 2.28 | % | | | | 2.34 | % | | | | 2.34 | %(G) | | | | 2.25 | % |
Ratio of net investment income (loss) to average net assets | | | | (0.65 | )% | | | | (0.55 | )% | | | | (1.12 | )% | | | | (1.26 | )% | | | | (1.45 | )%(G) | | | | (0.70 | )% |
Portfolio turnover rate | | | | 73 | % | | | | 65 | % | | | | 102 | % | | | | 64 | % | | | | 57 | %(F) | | | | 110 | % |
| (A) | The Fund elected to change its fiscal year end from December to September. The information presented is for January 1, 2009 through September 30, 2009. |
| (B) | Per share amounts calculated using average shares method, which more appropriately presents the per share data for the period. |
| (C) | Realized and unrealized gains and losses per share in this caption are balancing amounts necessary to reconcile the change in net asset value per share for the period, and may not agree to the aggregate gains and losses in the Statement of Operations due to the fluctuations in share transactions. |
| (D) | Total return calculation does not reflect redemption fee. |
| (E) | Total return in the above table represents the rate that the investor would have earned or lost on an investment in the Fund assuming reinvestment of dividends. |
| (F) | For periods of less than one full year, total return and turnover are not annualized. |
The accompanying notes are an integral part of these financial statements.
[75]
| | |
| Timothy Plan Family of Funds | | |
| | | | | |
| | | Small Cap Value |
| | | (Class I Shares) |
| | | For the Period
Ended
September 30,
2013 (A) |
Selected data based on a share outstanding throughout the period | | | | | |
Net asset value, beginning of period | | | $ | 19.68 | |
| | | | | |
Income (loss) from investment operations: | | | | | |
Net investment income (B) | | | | (0.01 | ) |
Net realized and unrealized gain on investments | | | | 0.62 | |
| | | | | |
Total from investment operations | | | | 0.61 | |
| | | | | |
Net asset value, end of period | | | $ | 20.29 | |
| | | | | |
Total return (C) | | | | 3.10 | %(D) |
Ratios/supplemental data: | | | | | |
Net assets, end of period | | | $ | 103 | |
Ratio of expenses to average net assets | | | | 1.30 | %(E) |
Ratio of net investment income (loss) to average net assets | | | | 0.36 | %(E) |
Portfolio turnover rate | | | | 73 | %(D) |
| (A) | For the period August 1, 2013 (Commencement of Operations) to September 30, 2013. |
| (B) | Per share amounts calculated using average shares method, which more appropriately presents the per share data for the period. |
| (C) | Total return in the above table represents the rate that the investor would have earned or lost on an investment in the Fund assuming reinvestment of dividends. |
| (D) | For periods of less than one full year, total return and turnover are not annualized. |
The accompanying notes are an integral part of these financial statements.
[76]
| | |
| Timothy Plan Family of Funds | | |
| | | | | | | | | | | | | | | | | | | | | | | | | | | | | | |
| | | Large/Mid Cap Value |
| | | (Class A Shares) |
| | | For the Year Ended September 30, | | For the Period
Ended
September 30,
2009 (A) | | For the Year
Ended
December 31,
2008 |
| | | 2013 | | 2012 | | 2011 | | 2010 | | |
| Selected data based on a share outstanding throughout each period | | | | | | | | | | | | | | | | | | | | | | | | | | | | | | |
Net asset value, beginning of period | | | $ | 14.80 | | | | $ | 11.83 | | | | $ | 11.84 | | | | $ | 10.72 | | | | $ | 9.10 | | | | $ | 15.48 | |
| | | | | | | | | | | | | | | | | | | | | | | | | | | | | | |
Income (loss) from investment operations: | | | | | | | | | | | | | | | | | | | | | | | | | | | | | | |
Net investment income | | | | 0.09 | (B) | | | | 0.06 | (B) | | | | 0.04 | (B) | | | | 0.05 | | | | | 0.04 | | | | | 0.05 | |
Net realized and unrealized gain (loss) on investments | | | | 3.30 | | | | | 2.94 | | | | | (0.01 | )(C) | | | | 1.12 | | | | | 1.58 | | | | | (6.26 | ) |
| | | | | | | | | | | | | | | | | | | | | | | | | | | | | | |
Total from investment operations | | | | 3.39 | | | | | 3.00 | | | | | 0.03 | | | | | 1.17 | | | | | 1.62 | | | | | (6.21 | ) |
| | | | | | | | | | | | | | | | | | | | | | | | | | | | | | |
Less Distributions: | | | | | | | | | | | | | | | | | | | | | | | | | | | | | | |
From net investment income | | | | (0.05 | ) | | | | (0.03 | ) | | | | (0.04 | ) | | | | (0.05 | ) | | | | — | | | | | (0.03 | ) |
From net realized gains on investments | | | | — | | | | | — | | | | | — | | | | | — | | | | | — | | | | | (0.14 | ) |
| | | | | | | | | | | | | | | | | | | | | | | | | | | | | | |
Total distributions | | | | (0.05 | ) | | | | (0.03 | ) | | | | (0.04 | ) | | | | (0.05 | ) | | | | — | | | | | (0.17 | ) |
| | | | | | | | | | | | | | | | | | | | | | | | | | | | | | |
Net asset value, end of period | | | $ | 18.14 | | | | $ | 14.80 | | | | $ | 11.83 | | | | $ | 11.84 | | | | $ | 10.72 | | | | $ | 9.10 | |
| | | | | | | | | | | | | | | | | | | | | | | | | | | | | | |
Total return (D)(E) | | | | 23.00 | % | | | | 25.39 | % | | | | 0.20 | % | | | | 10.94 | % | | | | 17.80 | %(F) | | | | (40.05 | )% |
Ratios/supplemental data: | | | | | | | | | | | | | | | | | | | | | | | | | | | | | | |
Net assets, end of period (in 000’s) | | | $ | 114,657 | | | | $ | 100,632 | | | | $ | 78,255 | | | | $ | 80,700 | | | | $ | 82,784 | | | | $ | 69,695 | |
Ratio of expenses to average net assets | | | | 1.49 | % | | | | 1.57 | % | | | | 1.51 | % | | | | 1.58 | % | | | | 1.57 | %(G) | | | | 1.51 | % |
Ratio of net investment income (loss) to average net assets | | | | 0.55 | % | | | | 0.42 | % | | | | 0.33 | % | | | | 0.39 | % | | | | 0.57 | %(G) | | | | 0.39 | % |
Portfolio turnover rate | | | | 64 | % | | | | 7 | % | | | | 19 | % | | | | 38 | % | | | | 32 | %(F) | | | | 77 | % |
| (A) | The Fund elected to change its fiscal year end from December to September. The information presented is for January 1, 2009 through September 30, 2009. |
| (B) | Per share amounts calculated using average shares method, which more appropriately presents the per share data for the period. |
| (C) | Realized and unrealized gains and losses per share in this caption are balancing amounts necessary to reconcile the change in net asset value per share for the period, and may not agree to the aggregate gains and losses in the Statement of Operations due to the fluctuations in share transactions. |
| (D) | Total return calculation does not reflect sales load. |
| (E) | Total return in the above table represents the rate that the investor would have earned or lost on an investment in the Fund assuming reinvestment of dividends. |
| (F) | For periods of less than one full year, total return and turnover are not annualized. |
The accompanying notes are an integral part of these financial statements.
[77]
| | |
| Timothy Plan Family of Funds | | |
| | | | | | | | | | | | | | | | | | | | | | | | | | | | | | |
| | | Large/Mid Cap Value |
| | | (Class C Shares) |
| | | For the Year Ended September 30, | | For the Period
Ended
September 30,
2009 (A) | | For the Year
Ended
December 31,
2008 |
| | | 2013 | | 2012 | | 2011 | | 2010 | | |
| Selected data based on a share outstanding throughout each period | | | | | | | | | | | | | | | | | | | | | | | | | | | | | | |
Net asset value, beginning of period | | | $ | 13.20 | | | | $ | 10.61 | | | | $ | 10.68 | | | | $ | 9.73 | | | | $ | 8.31 | | | | $ | 14.24 | |
| | | | | | | | | | | | | | | | | | | | | | | | | | | | | | |
Income (loss) from investment operations: | | | | | | | | | | | | | | | | | | | | | | | | | | | | | | |
Net investment loss | | | | (0.03 | )(B) | | | | (0.04 | )(B) | | | | (0.05 | )(B) | | | | (0.05 | ) | | | | (0.01 | ) | | | | (0.04 | ) |
Net realized and unrealized gain (loss) on investments | | | | 2.95 | | | | | 2.63 | | | | | — | (C) | | | | 1.03 | | | | | 1.43 | | | | | (5.73 | ) |
| | | | | | | | | | | | | | | | | | | | | | | | | | | | | | |
Total from investment operations | | | | 2.92 | | | | | 2.59 | | | | | (0.05 | ) | | | | 0.98 | | | | | 1.42 | | | | | (5.77 | ) |
| | | | | | | | | | | | | | | | | | | | | | | | | | | | | | |
Less Distributions: | | | | | | | | | | | | | | | | | | | | | | | | | | | | | | |
From net investment income | | | | — | | | | | — | | | | | (0.02 | ) | | | | (0.03 | ) | | | | — | | | | | (0.02 | ) |
From net realized gains on investments | | | | — | | | | | — | | | | | — | | | | | — | | | | | — | | | | | (0.14 | ) |
| | | | | | | | | | | | | | | | | | | | | | | | | | | | | | |
Total distributions | | | | — | | | | | — | | | | | (0.02 | ) | | | | (0.03 | ) | | | | — | | | | | (0.16 | ) |
| | | | | | | | | | | | | | | | | | | | | | | | | | | | | | |
Net asset value, end of period | | | $ | 16.12 | | | | $ | 13.20 | | | | $ | 10.61 | | | | $ | 10.68 | | | | $ | 9.73 | | | | $ | 8.31 | |
| | | | | | | | | | | | | | | | | | | | | | | | | | | | | | |
Total return (D)(E) | | | | 22.12 | % | | | | 24.41 | % | | | | (0.52 | )% | | | | 10.12 | % | | | | 17.09 | %(F) | | | | (40.49 | )% |
Ratios/supplemental data: | | | | | | | | | | | | | | | | | | | | | | | | | | | | | | |
Net assets, end of period (in 000’s) | | | $ | 13,649 | | | | $ | 10,669 | | | | $ | 8,903 | | | | $ | 9,484 | | | | $ | 9,552 | | | | $ | 8,544 | |
Ratio of expenses to average net assets | | | | 2.23 | % | | | | 2.32 | % | | | | 2.26 | % | | | | 2.33 | % | | | | 2.32 | %(G) | | | | 2.26 | % |
Ratio of net investment income (loss) to average net assets | | | | (0.19 | )% | | | | (0.32 | )% | | | | (0.43 | )% | | | | (0.35 | )% | | | | (0.18 | )%(G) | | | | (0.35 | )% |
Portfolio turnover rate | | | | 64 | % | | | | 7 | % | | | | 19 | % | | | | 38 | % | | | | 32 | %(F) | | | | 77 | % |
| (A) | The Fund elected to change its fiscal year end from December to September. The information presented is for January 1, 2009 through September 30, 2009. |
| (B) | Per share amounts calculated using average shares method, which more appropriately presents the per share data for the period. |
| (C) | Realized and unrealized gains and losses per share in this caption are balancing amounts necessary to reconcile the change in net asset value per share for the period, and may not agree to the aggregate gains and losses in the Statement of Operations due to the fluctuations in share transactions. |
| (D) | Total return calculation does not reflect redemption fee. |
| (E) | Total return in the above table represents the rate that the investor would have earned or lost on an investment in the Fund assuming reinvestment of dividends. |
| (F) | For periods of less than one full year, total return and turnover are not annualized. |
The accompanying notes are an integral part of these financial statements.
[78]
| | |
| Timothy Plan Family of Funds | | |
| | | | | |
| | | Large/Mid Cap
Value |
| | | (Class I Shares) |
| | | For the Period
Ended
September 30,
2013 (A) |
| Selected data based on a share outstanding throughout each period | | | | | |
Net asset value, beginning of period | | | $ | 18.19 | |
| | | | | |
Income (loss) from investment operations: | | | | | |
Net investment income (B) | | | | 0.03 | |
Net realized and unrealized loss on investments | | | | (0.09 | ) |
| | | | | |
Total from investment operations | | | | (0.06 | ) |
| | | | | |
Less Distributions: | | | | | |
From net investment income | | | | — | |
From net realized gains on investments | | | | — | |
From return of capital | | | | — | |
| | | | | |
Total distributions | | | | — | |
| | | | | |
Net asset value, end of period | | | $ | 18.13 | |
| | | | | |
Total return (C) | | | | (0.33 | )%(D) |
Ratios/supplemental data: | | | | | |
Net assets, end of period | | | $ | 100 | |
Ratio of expenses to average net assets | | | | 1.24 | %(E) |
Ratio of net investment income (loss) to average net assets | | | | 0.80 | %(E) |
Portfolio turnover rate | | | | 64 | %(D) |
| (A) | For the period August 1, 2013 (Commencement of Operations) to September 30, 2013. |
| (B) | Per share amounts calculated using average shares method, which more appropriately presents the per share data for the period. |
| (C) | Total return in the above table represents the rate that the investor would have earned or lost on an investment in the Fund assuming reinvestment of dividends. |
| (D) | For periods of less than one full year, total return and turnover are not annualized. |
The accompanying notes are an integral part of these financial statements.
[79]
| | |
| Timothy Plan Family of Funds | | |
| | | | | | | | | | | | | | | | | | | | | | | | | | | | | | |
| | | Fixed Income |
| | | (Class A Shares) |
| | | For the Year Ended September 30, | | For the Period
Ended
September 30,
2009 (A) | | For the Year
Ended
December 31,
2008 |
| | | 2013 | | 2012 | | 2011 | | 2010 | | |
| Selected data based on a share outstanding throughout each period | | | | | | | | | | | | | | | | | | | | | | | | | | | | | | |
Net asset value, beginning of period | | | $ | 10.87 | | | | $ | 10.72 | | | | $ | 10.56 | | | | $ | 10.14 | | | | $ | 9.56 | | | | $ | 9.99 | |
| | | | | | | | | | | | | | | | | | | | | | | | | | | | | | |
Income (loss) from investment operations: | | | | | | | | | | | | | | | | | | | | | | | | | | | | | | |
Net investment income | | | | 0.18 | (B) | | | | 0.22 | (B) | | | | 0.28 | (B) | | | | 0.29 | (B) | | | | 0.24 | | | | | 0.43 | |
Net realized and unrealized gain (loss) on investments | | | | (0.49 | ) | | | | 0.18 | | | | | 0.18 | | | | | 0.42 | | | | | 0.58 | | | | | (0.43 | ) |
| | | | | | | | | | | | | | | | | | | | | | | | | | | | | | |
Total from investment operations | | | | (0.31 | ) | | | | 0.40 | | | | | 0.46 | | | | | 0.71 | | | | | 0.82 | | | | | — | |
| | | | | | | | | | | | | | | | | | | | | | | | | | | | | | |
Less distributions: | | | | | | | | | | | | | | | | | | | | | | | | | | | | | | |
From net investment income | | | | (0.13 | ) | | | | (0.22 | ) | | | | (0.30 | ) | | | | (0.29 | ) | | | | (0.24 | ) | | | | (0.43 | ) |
From return of capital | | | | — | | | | | (0.03 | ) | | | | — | | | | | — | | | | | — | | | | | — | |
| | | | | | | | | | | | | | | | | | | | | | | | | | | | | | |
Total distributions | | | | (0.13 | ) | | | | (0.25 | ) | | | | (0.30 | ) | | | | (0.29 | ) | | | | (0.24 | ) | | | | (0.43 | ) |
| | | | | | | | | | | | | | | | | | | | | | | | | | | | | | |
Net asset value, end of period | | | $ | 10.43 | | | | $ | 10.87 | | | | $ | 10.72 | | | | $ | 10.56 | | | | $ | 10.14 | | | | $ | 9.56 | |
| | | | | | | | | | | | | | | | | | | | | | | | | | | | | | |
Total return (C)(D) | | | | (2.82 | )% | | | | 3.73 | % | | | | 4.42 | % | | | | 7.07 | % | | | | 8.70 | %(E) | | | | (0.05 | )% |
Ratios/supplemental data: | | | | | | | | | | | | | | | | | | | | | | | | | | | | | | |
Net assets, end of period (in 000’s) | | | $ | 67,558 | | | | $ | 74,685 | | | | $ | 59,405 | | | | $ | 58,831 | | | | $ | 48,074 | | | | $ | 37,367 | |
Ratios to average net assets | | | | | | | | | | | | | | | | | | | | | | | | | | | | | | |
Expenses, before waiver and reimbursement | | | | 1.27 | % | | | | 1.31 | % | | | | 1.27 | % | | | | 1.36 | % | | | | 1.35 | %(F) | | | | 1.29 | % |
Expenses, net waiver and reimbursement | | | | 1.12 | % | | | | 1.16 | % | | | | 1.15 | % | | | | 1.21 | % | | | | 1.20 | %(F) | | | | 1.14 | % |
Net investment income (loss), before waiver and reimbursement | | | | 1.54 | % | | | | 1.86 | % | | | | 2.58 | % | | | | 2.63 | % | | | | 3.24 | %(F) | | | | 4.11 | % |
Net investment income (loss), net waiver and reimbursement | | | | 1.69 | % | | | | 2.01 | % | | | | 2.71 | % | | | | 2.78 | % | | | | 3.39 | %(F) | | | | 4.26 | % |
Portfolio turnover rate | | | | 25 | % | | | | 19 | % | | | | 22 | % | | | | 26 | % | | | | 22 | %(E) | | | | 35 | % |
| (A) | The Fund elected to change its fiscal year end from December to September. The information presented is for January 1, 2009 through September 30, 2009. |
| (B) | Per share amounts calculated using average shares method, which more appropriately presents the per share data for the period. |
| (C) | Total return calculation does not reflect sales load. |
| (D) | Total return in the above table represents the rate that the investor would have earned or lost on an investment in the Fund assuming reinvestment of dividends. Total return would have been higher or lower if certain expenses had not been reimbursed, waived or recouped. |
| (E) | For periods of less than one full year, total return and turnover are not annualized. |
The accompanying notes are an integral part of these financial statements.
[80]
| | |
| Timothy Plan Family of Funds | | |
| | | | | | | | | | | | | | | | | | | | | | | | | | | | | | |
| | | Fixed Income |
| | | (Class C Shares) |
| | | For the Year Ended September 30, | | For the Period
Ended
September 30,
2009 (A) | | For the Year
Ended
December 31,
2008 |
| | | 2013 | | 2012 | | 2011 | | 2010 | | |
| Selected data based on a share outstanding throughout each period | | | | | | | | | | | | | | | | | | | | | | | | | | | | | | |
Net asset value, beginning of period | | | $ | 10.51 | | | | $ | 10.38 | | | | $ | 10.22 | | | | $ | 9.82 | | | | $ | 9.28 | | | | $ | 9.69 | |
| | | | | | | | | | | | | | | | | | | | | | | | | | | | | | |
Income (loss) from investment operations: | | | | | | | | | | | | | | | | | | | | | | | | | | | | | | |
Net investment income | | | | 0.10 | (B) | | | | 0.13 | (B) | | | | 0.20 | (B) | | | | 0.21 | | | | | 0.18 | | | | | 0.33 | |
Net realized and unrealized gain (loss) on investments | | | | (0.48 | ) | | | | 0.17 | | | | | 0.17 | | | | | 0.41 | | | | | 0.56 | | | | | (0.40 | ) |
| | | | | | | | | | | | | | | | | | | | | | | | | | | | | | |
Total from investment operations | | | | (0.38 | ) | | | | 0.30 | | | | | 0.37 | | | | | 0.62 | | | | | 0.74 | | | | | (0.07 | ) |
| | | | | | | | | | | | | | | | | | | | | | | | | | | | | | |
Less distributions: | | | | | | | | | | | | | | | | | | | | | | | | | | | | | | |
From net investment income | | | | (0.06 | ) | | | | (0.14 | ) | | | | (0.21 | ) | | | | (0.22 | ) | | | | (0.20 | ) | | | | (0.34 | ) |
From return of capital | | | | — | | | | | (0.03 | ) | | | | — | | | | | — | | | | | — | | | | | — | |
| | | | | | | | | | | | | | | | | | | | | | | | | | | | | | |
Total distributions | | | | (0.06 | ) | | | | (0.17 | ) | | | | (0.21 | ) | | | | (0.22 | ) | | | | (0.20 | ) | | | | (0.34 | ) |
| | | | | | | | | | | | | | | | | | | | | | | | | | | | | | |
Net asset value, end of period | | | $ | 10.07 | | | | $ | 10.51 | | | | $ | 10.38 | | | | $ | 10.22 | | | | $ | 9.82 | | | | $ | 9.28 | |
| | | | | | | | | | | | | | | | | | | | | | | | | | | | | | |
Total return (C)(D) | | | | (3.57 | )% | | | | 2.88 | % | | | | 3.68 | % | | | | 6.36 | % | | | | 8.02 | %(E) | | | | (0.72 | )% |
Ratios/supplemental data: | | | | | | | | | | | | | | | | | | | | | | | | | | | | | | |
Net assets, end of period (in 000’s) | | | $ | 7,958 | | | | $ | 8,997 | | | | $ | 8,265 | | | | $ | 8,438 | | | | $ | 5,212 | | | | $ | 2,883 | |
Ratios to average net assets | | | | | | | | | | | | | | | | | | | | | | | | | | | | | | |
Expenses, before waiver and reimbursement | | | | 2.03 | % | | | | 2.06 | % | | | | 2.23 | % | | | | 2.12 | % | | | | 2.10 | %(F) | | | | 2.06 | % |
Expenses, net waiver and reimbursement | | | | 1.88 | % | | | | 1.91 | % | | | | 1.90 | % | | | | 1.97 | % | | | | 1.95 | %(F) | | | | 1.91 | % |
Net investment income (loss), before waiver and reimbursement | | | | 0.79 | % | | | | 1.12 | % | | | | 1.61 | % | | | | 1.88 | % | | | | 2.50 | %(F) | | | | 3.33 | % |
Net investment income (loss), net waiver and reimbursement | | | | 0.94 | % | | | | 1.27 | % | | | | 1.95 | % | | | | 2.03 | % | | | | 2.65 | %(F) | | | | 3.48 | % |
Portfolio turnover rate | | | | 25 | % | | | | 19 | % | | | | 22 | % | | | | 26 | % | | | | 22 | %(E) | | | | 35 | % |
| (A) | The Fund elected to change its fiscal year end from December to September. The information presented is for January 1, 2009 through September 30, 2009. |
| (B) | Per share amounts calculated using average shares method, which more appropriately presents the per share data for the period. |
| (C) | Total return calculation does not reflect redemption fee. |
| (D) | Total return in the above table represents the rate that the investor would have earned or lost on an investment in the Fund assuming reinvestment of dividends. Total return would have been higher or lower if certain expenses had not been reimbursed, waived or recouped. |
| (E) | For periods of less than one full year, total return and turnover are not annualized. |
The accompanying notes are an integral part of these financial statements.
[81]
| | |
| Timothy Plan Family of Funds | | |
| | | | | |
| | | Fixed Income |
| | | (Class I Shares) |
| | | For the Period
Ended
September 30,
2013 (A) |
Selected data based on a share outstanding throughout the period | | | | | |
Net asset value, beginning of period | | | $ | 10.35 | |
| | | | | |
Income (loss) from investment operations: | | | | | |
Net investment income (B) | | | | 0.04 | |
Net realized and unrealized gain on investments | | | | 0.05 | |
| | | | | |
Total from investment operations | | | | 0.09 | |
| | | | | |
Less distributions: | | | | | |
From net investment income | | | | (0.10 | ) |
| | | | | |
Total distributions | | | | (0.10 | ) |
| | | | | |
Net asset value, end of period | | | $ | 10.34 | |
| | | | | |
Total return (C) | | | | 0.90 | %(D) |
Ratios/supplemental data: | | | | | |
Net assets, end of period | | | $ | 101 | |
Ratios to average net assets | | | | | |
Expenses, before waiver and reimbursement | | | | 1.02 | %(E) |
Expenses, net waiver and reimbursement | | | | 0.87 | %(E) |
Net investment income (loss), before waiver and reimbursement | | | | 1.79 | %(E) |
Net investment income (loss), net waiver and reimbursement | | | | 1.94 | %(E) |
Portfolio turnover rate | | | | 25 | %(D) |
| (A) | For the period August 1, 2013 (Commencement of Operations) to September 30, 2013. |
| (B) | Per share amounts calculated using average shares method, which more appropriately presents the per share data for the period. |
| (C) | Total return in the above table represents the rate that the investor would have earned or lost on an investment in the Fund assuming reinvestment of dividends. |
| (D) | For periods of less than one full year, total return and turnover are not annualized. |
The accompanying notes are an integral part of these financial statements.
[82]
| | |
| Timothy Plan Family of Funds | | |
| | | | | | | | | | | | | | | | | | | | | | | | | | | | | | |
| | | High Yield Bond |
| | | (Class A Shares) |
| | | For the Year Ended September 30, | | For the Period
Ended
September 30,
2009 (A) | | For the Year
Ended
December 31,
2008 |
| | | 2013 | | 2012 | | 2011 | | 2010 | | |
| Selected data based on a share outstanding throughout each period | | | | | | | | | | | | | | | | | | | | | | | | | | | | | | |
Net asset value, beginning of period | | | $ | 9.46 | | | | $ | 8.71 | | | | $ | 9.10 | | | | $ | 8.46 | | | | $ | 6.23 | | | | $ | 9.53 | |
| | | | | | | | | | | | | | | | | | | | | | | | | | | | | | |
Income (loss) from investment operations: | | | | | | | | | | | | | | | | | | | | | | | | | | | | | | |
Net investment income | | | | 0.49 | (B) | | | | 0.54 | (B) | | | | 0.54 | (B) | | | | 0.60 | | | | | 0.48 | | | | | 0.61 | |
Net realized and unrealized gain (loss) on investments | | | | (0.08 | ) | | | | 0.76 | | | | | (0.39 | ) | | | | 0.63 | | | | | 2.23 | | | | | (3.30 | ) |
| | | | | | | | | | | | | | | | | | | | | | | | | | | | | | |
Total from investment operations | | | | 0.41 | | | | | 1.30 | | | | | 0.15 | | | | | 1.23 | | | | | 2.71 | | | | | (2.69 | ) |
| | | | | | | | | | | | | | | | | | | | | | | | | | | | | | |
Less Distributions: | | | | | | | | | | | | | | | | | | | | | | | | | | | | | | |
From net investment income | | | | (0.47 | ) | | | | (0.53 | ) | | | | (0.54 | ) | | | | (0.59 | ) | | | | (0.48 | ) | | | | (0.60 | ) |
From net realized gains on investments | | | | — | | | | | — | | | | | — | | | | | — | | | | | — | | | | | (0.01 | ) |
From return of capital | | | | — | | | | | (0.02 | ) | | | | — | | | | | — | | | | | — | | | | | — | |
| | | | | | | | | | | | | | | | | | | | | | | | | | | | | | |
Total distributions | | | | (0.47 | ) | | | | (0.55 | ) | | | | (0.54 | ) | | | | (0.59 | ) | | | | (0.48 | ) | | | | (0.61 | ) |
| | | | | | | | | | | | | | | | | | | | | | | | | | | | | | |
Net asset value, end of period | | | $ | 9.40 | | | | $ | 9.46 | | | | $ | 8.71 | | | | $ | 9.10 | | | | $ | 8.46 | | | | $ | 6.23 | |
| | | | | | | | | | | | | | | | | | | | | | | | | | | | | | |
Total return (C)(D) | | | | 4.42 | % | | | | 15.17 | % | | | | 1.48 | % | | | | 14.98 | % | | | | 45.11 | %(E) | | | | (29.55 | )% |
Ratios/supplemental data: | | | | | | | | | | | | | | | | | | | | | | | | | | | | | | |
Net assets, end of period (in 000’s) | | | $ | 35,578 | | | | $ | 33,392 | | | | $ | 23,110 | | | | $ | 21,617 | | | | $ | 18,740 | | | | $ | 13,283 | |
Ratio of expenses to average net assets | | | | 1.33 | % | | | | 1.39 | % | | | | 1.30 | % | | | | 1.43 | % | | | | 1.46 | %(F) | | | | 1.41 | % |
Ratio of net investment income (loss) to average net assets | | | | 5.13 | % | | | | 5.84 | % | | | | 5.81 | % | | | | 6.72 | % | | | | 8.75 | %(F) | | | | 7.06 | % |
Portfolio turnover rate | | | | 56 | % | | | | 24 | % | | | | 60 | % | | | | 40 | % | | | | 34 | %(E) | | | | 28 | % |
| (A) | The Fund elected to change its fiscal year end from December to September. The information presented is for January 1, 2009 through September 30, 2009. |
| (B) | Per share amounts calculated using average shares method, which more appropriately presents the per share data for the period. |
| (C) | Total return calculation does not reflect sales load. |
| (D) | Total return in the above table represents the rate that the investor would have earned or lost on an investment in the Fund assuming reinvestment of dividends. Total return would have been higher or lower if certain expenses had not been reimbursed, waived or recouped. |
| (E) | For periods of less than one full year, total return and turnover are not annualized. |
The accompanying notes are an integral part of these financial statements.
[83]
| | |
| Timothy Plan Family of Funds | | |
| | | | | | | | | | | | | | | | | | | | | | | | | | | | | | |
| | | High Yield Bond |
| | | (Class C Shares) |
| | | For the Year Ended September 30, | | For the Period
Ended
September 30,
2009 (A) | | For the Year
Ended
December 31,
2008 |
| | | 2013 | | 2012 | | 2011 | | 2010 | | |
| Selected data based on a share outstanding throughout each period | | | | | | | | | | | | | | | | | | | | | | | | | | | | | | |
Net asset value, beginning of period | | | $ | 9.55 | | | | $ | 8.79 | | | | $ | 9.17 | | | | $ | 8.51 | | | | $ | 6.29 | | | | $ | 9.60 | |
| | | | | | | | | | | | | | | | | | | | | | | | | | | | | | |
Income (loss) from investment operations: | | | | | | | | | | | | | | | | | | | | | | | | | | | | | | |
Net investment income | | | | 0.43 | (B) | | | | 0.47 | (B) | | | | 0.47 | (B) | | | | 0.53 | (B) | | | | 0.43 | (B) | | | | 0.53 | |
Net realized and unrealized gain (loss) on investments | | | | (0.09 | ) | | | | 0.77 | | | | | (0.39 | ) | | | | 0.66 | | | | | 2.24 | | | | | (3.33 | ) |
| | | | | | | | | | | | | | | | | | | | | | | | | | | | | | |
Total from investment operations | | | | 0.34 | | | | | 1.24 | | | | | 0.08 | | | | | 1.19 | | | | | 2.67 | | | | | (2.80 | ) |
| | | | | | | | | | | | | | | | | | | | | | | | | | | | | | |
Less Distributions: | | | | | | | | | | | | | | | | | | | | | | | | | | | | | | |
From net investment income | | | | (0.41 | ) | | | | (0.46 | ) | | | | (0.46 | ) | | | | (0.53 | ) | | | | (0.45 | ) | | | | (0.50 | ) |
From net realized gains on investments | | | | — | | | | | — | | | | | — | | | | | — | | | | | — | | | | | (0.01 | ) |
From return of capital | | | | — | | | | | (0.02 | ) | | | | — | | | | | — | | | | | — | | | | | — | |
| | | | | | | | | | | | | | | | | | | | | | | | | | | | | | |
Total distributions | | | | (0.41 | ) | | | | (0.48 | ) | | | | (0.46 | ) | | | | (0.53 | ) | | | | (0.45 | ) | | | | (0.51 | ) |
| | | | | | | | | | | | | | | | | | | | | | | | | | | | | | |
Net asset value, end of period | | | $ | 9.48 | | | | $ | 9.55 | | | | $ | 8.79 | | | | $ | 9.17 | | | | $ | 8.51 | | | | $ | 6.29 | |
| | | | | | | | | | | | | | | | | | | | | | | | | | | | | | |
Total return (C)(D) | | | | 3.54 | % | | | | 14.33 | % | | | | 0.72 | % | | | | 14.36 | % | | | | 43.90 | %(E) | | | | (30.17 | )% |
Ratios/supplemental data: | | | | | | | | | | | | | | | | | | | | | | | | | | | | | | |
Net assets, end of period (in 000’s) | | | $ | 2,236 | | | | $ | 1,683 | | | | $ | 1,194 | | | | $ | 1,039 | | | | $ | 547 | | | | $ | 141 | |
Ratio of expenses to average net assets | | | | 2.07 | % | | | | 2.14 | % | | | | 2.05 | % | | | | 2.18 | % | | | | 2.20 | %(F) | | | | 2.14 | % |
Ratio of net investment income (loss) to average net assets | | | | 4.39 | % | | | | 5.08 | % | | | | 5.06 | % | | | | 5.99 | % | | | | 7.55 | %(F) | | | | 6.26 | % |
Portfolio turnover rate | | | | 56 | % | | | | 24 | % | | | | 60 | % | | | | 40 | % | | | | 34 | %(E) | | | | 28 | % |
| (A) | The Fund elected to change its fiscal year end from December to September. The information presented is for January 1, 2009 through September 30, 2009. |
| (B) | Per share amounts calculated using average shares method, which more appropriately presents the per share data for the period. |
| (C) | Total return calculation does not reflect redemption fee. |
| (D) | Total return in the above table represents the rate that the investor would have earned or lost on an investment in the Fund assuming reinvestment of dividends. Total return would have been higher or lower if certain expenses had not been reimbursed, waived or recouped. |
| (E) | For periods of less than one full year, total return and turnover are not annualized. |
The accompanying notes are an integral part of these financial statements.
[84]
| | |
| Timothy Plan Family of Funds | | |
| | | | | |
| | | High Yield Bond |
| | | (Class I Shares) |
| | | For the Period
Ended
September 30,
2013 (A) |
Selected data based on a share outstanding throughout the period | | | | | |
Net asset value, beginning of period | | | $ | 9.48 | |
| | | | | |
Income (loss) from investment operations: | | | | | |
Net investment income (B) | | | | 0.07 | |
Net realized and unrealized loss on investments | | | | (0.06 | ) |
| | | | | |
Total from investment operations | | | | 0.01 | |
| | | | | |
Less Distributions: | | | | | |
From net investment income | | | | (0.09 | ) |
| | | | | |
Total distributions | | | | (0.09 | ) |
| | | | | |
Net asset value, end of period | | | $ | 9.40 | |
| | | | | |
Total return (C) | | | | 0.15 | %(D) |
Ratios/supplemental data: | | | | | |
Net assets, end of period | | | $ | 100 | |
Ratio of expenses to average net assets | | | | 1.08 | %(E) |
Ratio of net investment income (loss) to average net assets | | | | 5.38 | %(E) |
Portfolio turnover rate | | | | 56 | %(D) |
| (A) | For the period August 1, 2013 (Commencement of Operations) to September 30, 2013. |
| (B) | Per share amounts calculated using average shares method, which more appropriately presents the per share data for the period. |
| (C) | Total return in the above table represents the rate that the investor would have earned or lost on an investment in the Fund assuming reinvestment of dividends. |
| (D) | For periods of less than one full year, total return and turnover are not annualized. |
The accompanying notes are an integral part of these financial statements.
[85]
| | |
| Timothy Plan Family of Funds | | |
| | | | | | | | | | |
| | | Israel Common Values |
| | | (Class A Shares) |
| | | For the Year
Ended
September 30,
2013 | | For the Period
Ended
September 30,
2012 (A) |
| Selected data based on a share outstanding throughout each period | | | | | | | | | | |
Net asset value, beginning of period | | | $ | 10.17 | | | | $ | 10.00 | |
| | | | | | | | | | |
Income (loss) from investment operations: | | | | | | | | | | |
Net investment loss (B) | | | | (0.06 | ) | | | | (0.15 | ) |
Net realized and unrealized gain on investments | | | | 2.58 | | | | | 0.32 | |
| | | | | | | | | | |
Total from investment operations | | | | 2.52 | | | | | 0.17 | |
| | | | | | | | | | |
Less Distributions: | | | | | | | | | | |
From net investment income | | | | — | | | | | — | |
From net realized gains on investments | | | | — | | | | | — | |
| | | | | | | | | | |
Total distributions | | | | — | | | | | — | |
| | | | | | | | | | |
Net asset value, end of period | | | $ | 12.69 | | | | $ | 10.17 | |
| | | | | | | | | | |
Total return (C)(D) | | | | 24.78 | % | | | | 1.80 | %(E) |
Ratios/supplemental data: | | | | | | | | | | |
Net assets, end of period (in 000’s) | | | $ | 10,295 | | | | $ | 7,983 | |
Ratio of expenses to average net assets | | | | 2.24 | % | | | | 2.82 | %(F) |
Ratio of net investment income (loss) to average net assets | | | | (0.57 | %) | | | | (1.48 | %)(F) |
Portfolio turnover rate | | | | 30 | % | | | | 37 | %(E) |
| (A) | For the period October 12, 2011 (Commencement of Operations) to September 30, 2012. |
| (B) | Per share amounts calculated using average shares method, which more appropriately presents the per share data for the period. |
| (C) | Total return calculation does not reflect sales load. |
| (D) | Total return in the above table represents the rate that the investor would have earned or lost on an investment in the Fund assuming reinvestment of dividends. |
| (E) | For periods of less than one full year, total return and turnover are not annualized. |
The accompanying notes are an integral part of these financial statements.
[86]
| | |
| Timothy Plan Family of Funds | | |
| | | | | | | | | | |
| | | Israel Common Values |
| | | (Class C Shares) |
| | | For the Year
Ended
September 30,
2013 | | For the Period
Ended
September 30,
2012 (A) |
| Selected data based on a share outstanding throughout each period | | | | | | | | | | |
Net asset value, beginning of period | | | $ | 10.09 | | | | $ | 10.00 | |
| | | | | | | | | | |
Income (loss) from investment operations: | | | | | | | | | | |
Net investment loss (B) | | | | (0.13 | ) | | | | (0.22 | ) |
Net realized and unrealized gain on investments | | | | 2.54 | | | | | 0.31 | |
| | | | | | | | | | |
Total from investment operations | | | | 2.41 | | | | | 0.09 | |
| | | | | | | | | | |
Less Distributions: | | | | | | | | | | |
From net investment income | | | | — | | | | | — | |
From net realized gains on investments | | | | — | | | | | — | |
| | | | | | | | | | |
Total distributions | | | | — | | | | | — | |
| | | | | | | | | | |
Net asset value, end of period | | | $ | 12.50 | | | | $ | 10.09 | |
| | | | | | | | | | |
Total return (C)(D) | | | | 23.89 | % | | | | 1.00 | %(E) |
Ratios/supplemental data: | | | | | | | | | | |
Net assets, end of period (in 000’s) | | | $ | 943 | | | | $ | 217 | |
Ratio of expenses to average net assets | | | | 2.99 | % | | | | 3.53 | %(F) |
Ratio of net investment income (loss) to average net assets | | | | (1.32 | %) | | | | (2.21 | %)(F) |
Portfolio turnover rate | | | | 30 | % | | | | 37 | %(E) |
| (A) | For the period October 12, 2011 (Commencement of Operations) to September 30, 2012. |
| (B) | Per share amounts calculated using average shares method, which more appropriately presents the per share data for the period. |
| (C) | Total return calculation does not reflect redemption fee. |
| (D) | Total return in the above table represents the rate that the investor would have earned or lost on an investment in the Fund assuming reinvestment of dividends. |
| (E) | For periods of less than one full year, total return and turnover are not annualized. |
The accompanying notes are an integral part of these financial statements.
[87]
| | |
| Timothy Plan Family of Funds | | |
| | | | | |
| | | Israel Common Values |
| | | (Class I Shares) |
| | | For the Period
Ended
September 30,
2013 (A) |
| Selected data based on a share outstanding throughout the period | | | | | |
Net asset value, beginning of period | | | $ | 12.21 | |
| | | | | |
Income (loss) from investment operations: | | | | | |
Net investment loss (B) | | | | 0.01 | |
Net realized and unrealized gain on investments | | | | 0.45 | |
| | | | | |
Total from investment operations | | | | 0.46 | |
| | | | | |
Less Distributions: | | | | | |
From net investment income | | | | — | |
From net realized gains on investments | | | | — | |
| | | | | |
Total distributions | | | | — | |
| | | | | |
Net asset value, end of period | | | $ | 12.67 | |
| | | | | |
Total return (C) | | | | 3.77 | %(D) |
Ratios/supplemental data: | | | | | |
Net assets, end of period (in 000’s) | | | $ | 104 | |
Ratio of expenses to average net assets | | | | 1.99 | %(E) |
Ratio of net investment income (loss) to average net assets | | | | (0.32 | %)(E) |
Portfolio turnover rate | | | | 30 | %(D) |
| (A) | For the period August 1, 2013 (Commencement of Operations) to September 30, 2013. |
| (B) | Per share amounts calculated using average shares method, which more appropriately presents the per share data for the period. |
| (C) | Total return in the above table represents the rate that the investor would have earned or lost on an investment in the Fund assuming reinvestment of dividends. |
| (D) | For periods of less than one full year, total return and turnover are not annualized. |
The accompanying notes are an integral part of these financial statements.
[88]
| | |
| Timothy Plan Family of Funds | | |
| | | | | | | | | | | | | | | | | | | | |
| | | Defensive Strategies |
| | | (Class A Shares) |
| | | For the Year Ended September 30, | | For the Period
Ended
September 30,
2010 (A) |
| | | 2013 | | 2012 | | 2011 | |
Selected data based on a share outstanding throughout each period | | | | | | | | | | | | | | | | | | | | |
Net asset value, beginning of period | | | $ | 12.12 | | | | $ | 11.28 | | | | $ | 10.70 | | | | $ | 10.00 | |
| | | | | | | | | | | | | | | | | | | | |
Income (loss) from investment operations: | | | | | | | | | | | | | | | | | | | | |
Net investment income | | | | 0.06 | (B) | | | | 0.02 | (B) | | | | 0.09 | (B) | | | | 0.02 | |
Net realized and unrealized gain (loss) on investments | | | | (1.04 | ) | | | | 1.62 | | | | | 0.54 | | | | | 1.08 | |
| | | | | | | | | | | | | | | | | | | | |
Total from investment operations | | | | (0.98 | ) | | | | 1.64 | | | | | 0.63 | | | | | 1.10 | |
| | | | | | | | | | | | | | | | | | | | |
Less distributions: | | | | | | | | | | | | | | | | | | | | |
From net investment income | | | | — | | | | | (0.10 | ) | | | | — | | | | | — | |
From net realized gains on investments | | | | (0.02 | ) | | | | (0.66 | ) | | | | (0.05 | ) | | | | (0.21 | ) |
From return of capital | | | | — | | | | | (0.04 | ) | | | | — | | | | | (0.19 | ) |
| | | | | | | | | | | | | | | | | | | | |
Total distributions | | | | (0.02 | ) | | | | (0.80 | ) | | | | (0.05 | ) | | | | (0.40 | ) |
| | | | | | | | | | | | | | | | | | | | |
Net asset value, end of period | | | $ | 11.12 | | | | $ | 12.12 | | | | $ | 11.28 | | | | $ | 10.70 | |
| | | | | | | | | | | | | | | | | | | | |
Total return (C)(D) | | | | (8.09 | )% | | | | 14.87 | % | | | | 5.88 | % | | | | 10.97 | %(E) |
Ratios/supplemental data: | | | | | | | | | | | | | | | | | | | | |
Net assets, end of period (in 000’s) | | | $ | 51,859 | | | | $ | 52,529 | | | | $ | 43,670 | | | | $ | 23,360 | |
Ratio of expenses to average net assets | | | | 1.26 | % | | | | 1.33 | % | | | | 1.29 | % | | | | 1.51 | %(F) |
Ratio of net investment income (loss) to average net assets | | | | 0.52 | % | | | | 0.20 | % | | | | 0.75 | % | | | | 0.13 | %(F) |
Portfolio turnover rate | | | | 56 | % | | | | 247 | % | | | | 64 | % | | | | 41 | %(E) |
| (A) | For the period November 4, 2009 (Commencement of Operations) to September 30, 2010. |
| (B) | Per share amounts calculated using average shares method, which more appropriately presents the per share data for the period. |
| (C) | Total return calculation does not reflect sales load. |
| (D) | Total return in the above table represents the rate that the investor would have earned or lost on an investment in the Fund assuming reinvestment of dividends. |
| (E) | For periods of less than one full year, total return and turnover are not annualized. |
The accompanying notes are an integral part of these financial statements.
[89]
| | |
| Timothy Plan Family of Funds | | |
| | | | | | | | | | | | | | | | | | | | |
| | | Defensive Strategies |
| | | (Class C Shares) |
| | | For the Year Ended September 30, | | For the Period
Ended
September 30,
2010 (A) |
| | | 2013 | | 2012 | | 2011 | |
Selected data based on a share outstanding throughout each period | | | | | | | | | | | | | | | | | | | | |
Net asset value, beginning of period | | | $ | 11.88 | | | | $ | 11.09 | | | | $ | 10.58 | | | | $ | 10.00 | |
| | | | | | | | | | | | | | | | | | | | |
Income (loss) from investment operations: | | | | | | | | | | | | | | | | | | | | |
Net investment income (loss) | | | | (0.03 | )(B) | | | | (0.07 | )(B) | | | | 0.02 | (B) | | | | (0.06 | ) |
Net realized and unrealized gain (loss) on investments | | | | (1.01 | ) | | | | 1.58 | | | | | 0.54 | | | | | 1.08 | |
| | | | | | | | | | | | | | | | | | | | |
Total from investment operations | | | | (1.04 | ) | | | | 1.51 | | | | | 0.56 | | | | | 1.02 | |
| | | | | | | | | | | | | | | | | | | | |
Less distributions: | | | | | | | | | | | | | | | | | | | | |
From net investment income | | | | — | | | | | (0.02 | ) | | | | — | | | | | — | |
From net realized gains on investments | | | | (0.02 | ) | | | | (0.66 | ) | | | | (0.05 | ) | | | | (0.21 | ) |
From return of capital | | | | — | | | | | (0.04 | ) | | | | — | | | | | (0.23 | ) |
| | | | | | | | | | | | | | | | | | | | |
Total distributions | | | | (0.02 | ) | | | | (0.72 | ) | | | | (0.05 | ) | | | | (0.44 | ) |
| | | | | | | | | | | | | | | | | | | | |
Net asset value, end of period | | | $ | 10.82 | | | | $ | 11.88 | | | | $ | 11.09 | | | | $ | 10.58 | |
| | | | | | | | | | | | | | | | | | | | |
Total return (C)(D) | | | | (8.75 | )% | | | | 13.91 | % | | | | 5.28 | % | | | | 10.18 | %(E) |
Ratios/supplemental data: | | | | | | | | | | | | | | | | | | | | |
Net assets, end of period (in 000’s) | | | $ | 16,718 | | | | $ | 18,801 | | | | $ | 13,100 | | | | $ | 5,527 | |
Ratio of expenses to average net assets | | | | 2.02 | % | | | | 2.09 | % | | | | 2.03 | % | | | | 2.28 | %(F) |
Ratio of net investment income (loss) to average net assets | | | | (0.25 | )% | | | | (0.60 | )% | | | | 0.15 | % | | | | (0.64 | )%(F) |
Portfolio turnover rate | | | | 56 | % | | | | 247 | % | | | | 64 | % | | | | 41 | %(E) |
| (A) | For the period November 4, 2009 (Commencement of Operations) to September 30, 2010. |
| (B) | Per share amounts calculated using average shares method, which more appropriately presents the per share data for the period. |
| (C) | Total return calculation does not reflect redemption fee. |
| (D) | Total return in the above table represents the rate that the investor would have earned or lost on an investment in the Fund assuming reinvestment of dividends. |
| (E) | For periods of less than one full year, total return and turnover are not annualized. |
The accompanying notes are an integral part of these financial statements.
[90])
| | |
| Timothy Plan Family of Funds | | |
| | | | | |
| | | Defensive Strategies |
| | | (Class I Shares) |
| | | For the Period
Ended
September 30,
2013 (A) |
Selected data based on a share outstanding throughout the period | | | | | |
Net asset value, beginning of period | | | $ | 11.11 | |
| | | | | |
Income (loss) from investment operations: | | | | | |
Net investment income (B) | | | | 0.01 | |
Net realized and unrealized loss on investments | | | | (0.01 | ) |
| | | | | |
Total from investment operations | | | | 0.00 | |
| | | | | |
Less distributions: | | | | | |
From net investment income | | | | — | |
From net realized gains on investments | | | | — | |
| | | | | |
Total distributions | | | | — | |
| | | | | |
Net asset value, end of period | | | $ | 11.11 | |
| | | | | |
Total return (C) | | | | 0.00 | %(D) |
Ratios/supplemental data: | | | | | |
Net assets, end of period | | | $ | 100 | |
Ratio of expenses to average net assets | | | | 1.01 | %(E) |
Ratio of net investment income (loss) to average net assets | | | | 0.77 | %(E) |
Portfolio turnover rate | | | | 56 | %(D) |
| (A) | For the period August 1, 2013 (Commencement of Operations) to September 30, 2013. |
| (B) | Per share amounts calculated using average shares method, which more appropriately presents the per share data for the period. |
| (C) | Total return in the above table represents the rate that the investor would have earned or lost on an investment in the Fund assuming reinvestment of dividends. |
| (D) | For periods of less than one full year, total return and turnover are not annualized. |
The accompanying notes are an integral part of these financial statements.
[91]
| | |
| Timothy Plan Family of Funds | | |
| | | | | | | | | | | | | | | | | | | | | | | | | | | | | | |
| | | Strategic Growth |
| | | (Class A Shares) |
| | | For the Year Ended September 30, | | For the Period
Ended
September 30,
2009 (A) | | For the Year
Ended
December 31,
2008 |
| | | 2013 | | 2012 | | 2011 | | 2010 | | |
| Selected data based on a share outstanding throughout each period | | | | | | | | | | | | | | | | | | | | | | | | | | | | | | |
Net asset value, beginning of period | | | $ | 7.44 | | | | $ | 6.27 | | | | $ | 6.49 | | | | $ | 5.97 | | | | $ | 4.86 | | | | $ | 9.12 | |
| | | | | | | | | | | | | | | | | | | | | | | | | | | | | | |
Income (loss) from investment operations: | | | | | | | | | | | | | | | | | | | | | | | | | | | | | | |
Net investment income (loss) | | | | 0.02 | (B) | | | | 0.04 | (B) | | | | (0.02 | )(B) | | | | 0.02 | | | | | (0.01 | ) | | | | 0.01 | |
Net realized and unrealized gain (loss) on investments | | | | 0.93 | | | | | 1.13 | | | | | (0.19 | ) | | | | 0.50 | | | | | 1.12 | | | | | (3.66 | ) |
| | | | | | | | | | | | | | | | | | | | | | | | | | | | | | |
Total from investment operations | | | | 0.95 | | | | | 1.17 | | | | | (0.21 | ) | | | | 0.52 | | | | | 1.11 | | | | | (3.65 | ) |
| | | | | | | | | | | | | | | | | | | | | | | | | | | | | | |
Less Distributions: | | | | | | | | | | | | | | | | | | | | | | | | | | | | | | |
From net investment income | | | | (0.05 | ) | | | | — | | | | | — | | | | | — | | | | | — | | | | | (0.09 | ) |
From net realized gains on investments | | | | — | | | | | — | | | | | — | | | | | — | | | | | — | | | | | (0.52 | ) |
From return of capital | | | | — | | | | | — | | | | | (0.01 | ) | | | | — | | | | | — | | | | | — | |
| | | | | | | | | | | | | | | | | | | | | | | | | | | | | | |
Total distributions | | | | (0.05 | ) | | | | — | | | | | (0.01 | ) | | | | — | | | | | — | | | | | (0.61 | ) |
| | | | | | | | | | | | | | | | | | | | | | | | | | | | | | |
Net asset value, end of period | | | $ | 8.34 | | | | $ | 7.44 | | | | $ | 6.27 | | | | $ | 6.49 | | | | $ | 5.97 | | | | $ | 4.86 | |
| | | | | | | | | | | | | | | | | | | | | | | | | | | | | | |
Total return (C)(D) | | | | 12.78 | % | | | | 18.66 | % | | | | (3.29 | )% | | | | 8.71 | % | | | | 22.84 | %(G) | | | | (39.82 | )% |
Ratios/supplemental data: | | | | | | | | | | | | | | | | | | | | | | | | | | | | | | |
Net assets, end of period (in 000’s) | | | $ | 34,466 | | | | $ | 32,250 | | | | $ | 31,269 | | | | $ | 34,098 | | | | $ | 30,066 | | | | $ | 25,440 | |
Ratio of expenses to average net assets (E) | | | | 1.08 | % | | | | 1.15 | % | | | | 1.05 | % | | | | 1.11 | % | | | | 1.11 | %(H) | | | | 1.03 | % |
Ratio of net investment income (loss) to average net assets (E)(F) | | | | 0.24 | % | | | | (0.60 | )% | | | | (0.23 | )% | | | | 0.30 | % | | | | (0.25 | )%(H) | | | | 0.12 | % |
Portfolio turnover rate | | | | 19 | % | | | | 33 | % | | | | 22 | % | | | | 25 | % | | | | 5 | %(G) | | | | 17 | % |
| (A) | The Fund elected to change its fiscal year end from December to September. The information presented is for January 1, 2009 through September 30, 2009. |
| (B) | Per share amounts calculated using average shares method, which more appropriately presents the per share data for the period. |
| (C) | Total return calculation does not reflect sales load. |
| (D) | Total return in the above table represents the rate that the investor would have earned or lost on an investment in the Fund assuming reinvestment of dividends. |
| (E) | These ratios exclude the impact of expenses of the underlying security holdings as represented in the Schedule of Investments. |
| (F) | Recognition of net investment income (loss) by the Fund is affected by the timing of the declaration of dividends by the underlying investment companies in which the Fund invests. |
| (G) | For periods of less than one full year, total return and turnover are not annualized. |
The accompanying notes are an integral part of these financial statements.
[92]
| | |
| Timothy Plan Family of Funds | | |
| | | | | | | | | | | | | | | | | | | | | | | | | | | | | | |
| | | Strategic Growth |
| | | (Class C Shares) |
| | | For the Year Ended September 30, | | For the Period
Ended
September 30,
2009 (A) | | For the Year
Ended
December 31,
2008 |
| | | 2013 | | 2012 | | 2011 | | 2010 | | |
| Selected data based on a share outstanding throughout each period | | | | | | | | | | | | | | | | | | | | | | | | | | | | | | |
Net asset value, beginning of period | | | $ | 6.87 | | | | $ | 5.82 | | | | $ | 6.09 | | | | $ | 5.64 | | | | $ | 4.62 | | | | $ | 8.70 | |
| | | | | | | | | | | | | | | | | | | | | | | | | | | | | | |
Income (loss) from investment operations: | | | | | | | | | | | | | | | | | | | | | | | | | | | | | | |
Net investment loss | | | | (0.04 | )(B) | | | | (0.01 | )(B) | | | | (0.07 | )(B) | | | | (0.03 | ) | | | | (0.04 | ) | | | | (0.05 | ) |
Net realized and unrealized gain (loss) on investments | | | | 0.86 | | | | | 1.06 | | | | | (0.20 | ) | | | | 0.48 | | | | | 1.06 | | | | | (3.47 | ) |
| | | | | | | | | | | | | | | | | | | | | | | | | | | | | | |
Total from investment operations | | | | 0.82 | | | | | 1.05 | | | | | (0.27 | ) | | | | 0.45 | | | | | 1.02 | | | | | (3.52 | ) |
| | | | | | | | | | | | | | | | | | | | | | | | | | | | | | |
Less Distributions: | | | | | | | | | | | | | | | | | | | | | | | | | | | | | | |
From net investment income | | | | — | | | | | — | | | | | — | | | | | — | | | | | — | | | | | (0.04 | ) |
From net realized gains on investments | | | | — | | | | | — | | | | | — | | | | | — | | | | | — | | | | | (0.52 | ) |
| | | | | | | | | | | | | | | | | | | | | | | | | | | | | | |
Total distributions | | | | — | | | | | — | | | | | — | | | | | — | | | | | — | | | | | (0.56 | ) |
| | | | | | | | | | | | | | | | | | | | | | | | | | | | | | |
Net asset value, end of period | | | $ | 7.69 | | | | $ | 6.87 | | | | $ | 5.82 | | | | $ | 6.09 | | | | $ | 5.64 | | | | $ | 4.62 | |
| | | | | | | | | | | | | | | | | | | | | | | | | | | | | | |
Total return (C)(D) | | | | 11.94 | % | | | | 18.04 | % | | | | (4.43 | )% | | | | 7.98 | % | | | | 22.08 | %(G) | | | | (40.32 | )% |
Ratios/supplemental data: | | | | | | | | | | | | | | | | | | | | | | | | | | | | | | |
Net assets, end of period (in 000’s) | | | $ | 7,668 | | | | $ | 6,836 | | | | $ | 6,446 | | | | $ | 6,950 | | | | $ | 7,608 | | | | $ | 6,423 | |
Ratio of expenses to average net assets (E) | | | | 1.83 | % | | | | 1.90 | % | | | | 1.82 | % | | | | 1.86 | % | | | | 1.85 | %(H) | | | | 1.78 | % |
Ratio of net investment income (loss) to average net assets (E)(F) | | | | (0.52 | )% | | | | (0.22 | )% | | | | (1.00 | )% | | | | (0.46 | )% | | | | (1.00 | )%(H) | | | | (0.61 | )% |
Portfolio turnover rate | | | | 19 | % | | | | 33 | % | | | | 22 | % | | | | 25 | % | | | | 5 | %(G) | | | | 17 | % |
| (A) | The Fund elected to change its fiscal year end from December to September. The information presented is for January 1, 2009 through September 30, 2009. |
| (B) | Per share amounts calculated using average shares method, which more appropriately presents the per share data for the period. |
| (C) | Total return calculation does not reflect redemption fee. |
| (D) | Total return in the above table represents the rate that the investor would have earned or lost on an investment in the Fund assuming reinvestment of dividends. |
| (E) | These ratios exclude the impact of expenses of the underlying security holdings as represented in the Schedule of Investments. |
| (F) | Recognition of net investment income (loss) by the Fund is affected by the timing of the declaration of dividends by the underlying investment companies in which the Fund invests. |
| (G) | For periods of less than one full year, total return and turnover are not annualized. |
The accompanying notes are an integral part of these financial statements.
[93]
| | |
| Timothy Plan Family of Funds | | |
| | | | | | | | | | | | | | | | | | | | | | | | | | | | | | |
| | | Conservative Growth |
| | | (Class A Shares) |
| | | For the Year Ended September 30, | | For the Period
Ended
September 30,
2009 (A) | | For the Year
Ended
December 31,
2008 |
| | | 2013 | | 2012 | | 2011 | | 2010 | | |
| Selected data based on a share outstanding throughout each period | | | | | | | | | | | | | | | | | | | | | | | | | | | | | | |
Net asset value, beginning of period | | | $ | 9.95 | | | | $ | 8.80 | | | | $ | 8.83 | | | | $ | 8.25 | | | | $ | 6.94 | | | | $ | 10.49 | |
| | | | | | | | | | | | | | | | | | | | | | | | | | | | | | |
Income (loss) from investment operations: | | | | | | | | | | | | | | | | | | | | | | | | | | | | | | |
Net investment income | | | | 0.03 | (B) | | | | 0.07 | (B) | | | | 0.04 | (B) | | | | 0.09 | | | | | 0.04 | | | | | 0.13 | |
Net realized and unrealized gain (loss) on investments | | | | 0.61 | | | | | 1.09 | | | | | 0.01 | | | | | 0.60 | | | | | 1.27 | | | | | (3.18 | ) |
| | | | | | | | | | | | | | | | | | | | | | | | | | | | | | |
Total from investment operations | | | | 0.64 | | | | | 1.16 | | | | | 0.05 | | | | | 0.69 | | | | | 1.31 | | | | | (3.05 | ) |
| | | | | | | | | | | | | | | | | | | | | | | | | | | | | | |
Less Distributions: | | | | | | | | | | | | | | | | | | | | | | | | | | | | | | |
From net investment income | | | | (0.08 | ) | | | | (0.01 | ) | | | | (0.08 | ) | | | | (0.11 | ) | | | | — | | | | | (0.15 | ) |
From net realized gains on investments | | | | — | | | | | — | | | | | — | | | | | — | | | | | — | | | | | (0.35 | ) |
| | | | | | | | | | | | | | | | | | | | | | | | | | | | | | |
Total distributions | | | | (0.08 | ) | | | | (0.01 | ) | | | | (0.08 | ) | | | | (0.11 | ) | | | | — | | | | | (0.50 | ) |
| | | | | | | | | | | | | | | | | | | | | | | | | | | | | | |
Net asset value, end of period | | | $ | 10.51 | | | | $ | 9.95 | | | | $ | 8.80 | | | | $ | 8.83 | | | | $ | 8.25 | | | | $ | 6.94 | |
| | | | | | | | | | | | | | | | | | | | | | | | | | | | | | |
Total return (C)(D) | | | | 6.44 | % | | | | 13.22 | % | | | | 0.50 | % | | | | 8.47 | % | | | | 18.88 | %(G) | | | | (28.88 | )% |
Ratios/supplemental data: | | | | | | | | | | | | | | | | | | | | | | | | | | | | | | |
Net assets, end of period (in 000’s) | | | $ | 44,238 | | | | $ | 40,042 | | | | $ | 35,331 | | | | $ | 35,031 | | | | $ | 33,128 | | | | $ | 26,206 | |
Ratio of expenses to average net assets (E) | | | | 1.05 | % | | | | 1.11 | % | | | | 1.05 | % | | | | 1.13 | % | | | | 1.10 | %(H) | | | | 1.02 | % |
Ratio of net investment income (loss) to average net assets (E)(F) | | | | 0.25 | % | | | | 0.71 | % | | | | 0.48 | % | | | | 1.07 | % | | | | 0.82 | %(H) | | | | 1.36 | % |
Portfolio turnover rate | | | | 22 | % | | | | 32 | % | | | | 23 | % | | | | 31 | % | | | | 16 | %(G) | | | | 26 | % |
| (A) | The Fund elected to change its fiscal year end from December to September. The information presented is for January 1, 2009 through September 30, 2009. |
| (B) | Per share amounts calculated using average shares method, which more appropriately presents the per share data for the period. |
| (C) | Total return calculation does not reflect sales load. |
| (D) | Total return in the above table represents the rate that the investor would have earned or lost on an investment in the Fund assuming reinvestment of dividends. |
| (E) | These ratios exclude the impact of expenses of the underlying security holdings as represented in the Schedule of Investments. |
| (F) | Recognition of net investment income (loss) by the Fund is affected by the timing of the declaration of dividends by the underlying investment companies in which the Fund invests. |
| (G) | For periods of less than one full year, total return and turnover are not annualized. |
The accompanying notes are an integral part of these financial statements.
[94]
| | |
| Timothy Plan Family of Funds | | |
| | | | | | | | | | | | | | | | | | | | | | | | | | | | | | |
| | | Conservative Growth |
| | | (Class C Shares) |
| | | For the Year Ended September 30, | | For the Period
Ended
September 30,
2009 (A) | | For the Year
Ended
December 31,
2008 |
| | | 2013 | | 2012 | | 2011 | | 2010 | | |
| Selected data based on a share outstanding throughout each period | | | | | | | | | | | | | | | | | | | | | | | | | | | | | | |
Net asset value, beginning of period | | | $ | 9.27 | | | | $ | 8.24 | | | | $ | 8.32 | | | | $ | 7.83 | | | | $ | 6.61 | | | | $ | 10.02 | |
| | | | | | | | | | | | | | | | | | | | | | | | | | | | | | |
Income (loss) from investment operations: | | | | | | | | | | | | | | | | | | | | | | | | | | | | | | |
Net investment income (loss) | | | | (0.05 | )(B) | | | | (0.01 | )(B) | | | | (0.02 | )(B) | | | | 0.02 | | | | | — | * | | | | 0.06 | |
Net realized and unrealized gain (loss) on investments | | | | 0.57 | | | | | 1.04 | | | | | — | * | | | | 0.57 | | | | | 1.22 | | | | | (3.03 | ) |
| | | | | | | | | | | | | | | | | | | | | | | | | | | | | | |
Total from investment operations | | | | 0.52 | | | | | 1.03 | | | | | (0.02 | ) | | | | 0.59 | | | | | 1.22 | | | | | (2.97 | ) |
| | | | | | | | | | | | | | | | | | | | | | | | | | | | | | |
Less Distributions: | | | | | | | | | | | | | | | | | | | | | | | | | | | | | | |
From net investment income | | | | — | | | | | — | | | | | (0.06 | ) | | | | (0.10 | ) | | | | — | | | | | (0.09 | ) |
From net realized gains on investments | | | | — | | | | | — | | | | | — | | | | | — | | | | | — | | | | | (0.35 | ) |
| | | | | | | | | | | | | | | | | | | | | | | | | | | | | | |
Total distributions | | | | — | | | | | — | | | | | (0.06 | ) | | | | (0.10 | ) | | | | — | | | | | (0.44 | ) |
| | | | | | | | | | | | | | | | | | | | | | | | | | | | | | |
Net asset value, end of period | | | $ | 9.79 | | | | $ | 9.27 | | | | $ | 8.24 | | | | $ | 8.32 | | | | $ | 7.83 | | | | $ | 6.61 | |
| | | | | | | | | | | | | | | | | | | | | | | | | | | | | | |
Total return (C)(D) | | | | 5.61 | % | | | | 12.50 | % | | | | (0.25 | )% | | | | 7.57 | % | | | | 18.46 | %(G) | | | | (29.45 | )% |
Ratios/supplemental data: | | | | | | | | | | | | | | | | | | | | | | | | | | | | | | |
Net assets, end of period (in 000’s) | | | $ | 10,419 | | | | $ | 9,191 | | | | $ | 7,963 | | | | $ | 7,365 | | | | $ | 7,500 | | | | $ | 6,438 | |
Ratio of expenses to average net assets (E) | | | | 1.80 | % | | | | 1.86 | % | | | | 1.80 | % | | | | 1.88 | % | | | | 1.85 | %(H) | | | | 1.77 | % |
Ratio of net investment income (loss) to average net assets (E)(F) | | | | (0.50 | )% | | | | (0.06 | )% | | | | (0.27 | )% | | | | 0.29 | % | | | | 0.05 | %(H) | | | | 0.72 | % |
Portfolio turnover rate | | | | 22 | % | | | | 32 | % | | | | 23 | % | | | | 31 | % | | | | 16 | %(G) | | | | 26 | % |
| * | Amount is less than $0.005 per share. |
| (A) | The Fund elected to change its fiscal year end from December to September. The information presented is for January 1, 2009 through September 30, 2009. |
| (B) | Per share amounts calculated using average shares method, which more appropriately presents the per share data for the period. |
| (C) | Total return calculation does not reflect redemption fee. |
| (D) | Total return in the above table represents the rate that the investor would have earned or lost on an investment in the Fund assuming reinvestment of dividends. |
| (E) | These ratios exclude the impact of expenses of the underlying security holdings as represented in the Schedule of Investments. |
| (F) | Recognition of net investment income (loss) by the Fund is affected by the timing of the declaration of dividends by the underlying investment companies in which the Fund invests. |
| (G) | For periods of less than one full year, total return and turnover are not annualized. |
The accompanying notes are an integral part of these financial statements.
[95]
| | |
| Timothy Plan Family of Funds | | |
| | | | | |
| | | Emerging Markets |
| | | (Class A Shares) |
| | | For the Period
Ended
September 30,
2013 (A) |
Selected data based on a share outstanding throughout the period | | | | | |
Net asset value, beginning of period | | | $ | 10.00 | |
| | | | | |
Income (loss) from investment operations: | | | | | |
Net investment loss (B) | | | | (0.08 | ) |
Net realized and unrealized gain on investments | | | | 0.61 | |
| | | | | |
Total from investment operations | | | | 0.53 | |
| | | | | |
Less distributions: | | | | | |
From net investment income | | | | — | |
From net realized gains on investments | | | | — | |
| | | | | |
Total distributions | | | | — | |
| | | | | |
Net asset value, end of period | | | $ | 10.53 | |
| | | | | |
Total return (C)(D) | | | | 5.30 | %(E) |
Ratios/supplemental data: | | | | | |
Net assets, end of period (in 000’s) | | | $ | 8,675 | |
Ratio of expenses to average net assets | | | | 3.03 | %(F) |
Ratio of net investment income (loss) to average net assets | | | | (0.95 | %)(F) |
Portfolio turnover rate | | | | 19 | %(E) |
| (A) | For the period December 3, 2012 (Commencement of Operations) to September 30, 2013. |
| (B) | Per share amounts calculated using average shares method, which more appropriately presents the per share data for the period. |
| (C) | Total return calculation does not reflect sales load. |
| (D) | Total return in the above table represents the rate that the investor would have earned or lost on an investment in the Fund assuming reinvestment of dividends. |
| (E) | For periods of less than one full year, total return and turnover are not annualized. |
The accompanying notes are an integral part of these financial statements.
[96]
| | |
| Timothy Plan Family of Funds | | |
| | | | | |
| | | Emerging Markets |
| | | (Class C Shares) |
| | | For the Period
Ended
September 30,
2013 (A) |
Selected data based on a share outstanding throughout the period | | | | | |
Net asset value, beginning of period | | | $ | 10.00 | |
| | | | | |
Income (loss) from investment operations: | | | | | |
Net investment loss (B) | | | | (0.12 | ) |
Net realized and unrealized gain on investments | | | | 0.60 | |
| | | | | |
Total from investment operations | | | | 0.48 | |
| | | | | |
Less distributions: | | | | | |
From net investment income | | | | — | |
From net realized gains on investments | | | | — | |
| | | | | |
Total distributions | | | | — | |
| | | | | |
Net asset value, end of period | | | $ | 10.48 | |
| | | | | |
Total return (C)(D) | | | | 4.80 | %(E) |
Ratios/supplemental data: | | | | | |
Net assets, end of period (in 000’s) | | | $ | 291 | |
Ratio of expenses to average net assets | | | | 3.76 | %(F) |
Ratio of net investment income (loss) to average net assets | | | | (1.39 | %)(F) |
Portfolio turnover rate | | | | 19 | %(E) |
| (A) | For the period December 3, 2012 (Commencement of Operations) to September 30, 2013. |
| (B) | Per share amounts calculated using average shares method, which more appropriately presents the per share data for the period. |
| (C) | Total return calculation does not reflect redemption fee. |
| (D) | Total return in the above table represents the rate that the investor would have earned or lost on an investment in the Fund assuming reinvestment of dividends. |
| (E) | For periods of less than one full year, total return and turnover are not annualized. |
The accompanying notes are an integral part of these financial statements.
[97]
| | |
| Timothy Plan Family of Funds | | |
| | | | | |
| | | Emerging Markets |
| | | (Class I Shares) |
| | | For the Period
Ended
September 30,
2013 (A) |
Selected data based on a share outstanding throughout the period | | | | | |
Net asset value, beginning of period | | | $ | 9.96 | |
| | | | | |
Income (loss) from investment operations: | | | | | |
Net investment income (B) | | | | — | * |
Net realized and unrealized gain on investments | | | | 0.57 | |
| | | | | |
Total from investment operations | | | | 0.57 | |
| | | | | |
Less distributions: | | | | | |
From net investment income | | | | — | |
From net realized gains on investments | | | | — | |
| | | | | |
Total distributions | | | | — | |
| | | | | |
Net asset value, end of period | | | $ | 10.53 | |
| | | | | |
Total return (C) | | | | 5.72 | %(D) |
Ratios/supplemental data: | | | | | |
Net assets, end of period | | | $ | 106 | |
Ratio of expenses to average net assets | | | | 2.78 | %(E) |
Ratio of net investment income (loss) to average net assets | | | | (0.70 | %)(E) |
Portfolio turnover rate | | | | 19 | %(D) |
| * | Amount is less than $0.005 per share. |
| (A) | For the period August 1, 2013 (Commencement of Operations) to September 30, 2013. |
| (B) | Per share amounts calculated using average shares method, which more appropriately presents the per share data for the period. |
| (C) | Total return in the above table represents the rate that the investor would have earned or lost on an investment in the Fund assuming reinvestment of dividends. |
| (D) | For periods of less than one full year, total return and turnover are not annualized. |
The accompanying notes are an integral part of these financial statements.
[98]
Notes to Financial Statements
September 30, 2013
Timothy Plan Family of Funds
Note 1 | Significant Accounting Policies
The Timothy Plan (the “Trust”) is organized as a series of a Delaware business trust pursuant to a trust agreement dated December 16, 1993. The Trust is registered under the Investment Company Act of 1940, as amended, as an open-end diversified management investment company. As of September 30, 2013, the Trust consisted of fourteen series. These financial statements include the following twelve series: Timothy Plan Aggressive Growth Fund, Timothy Plan International Fund, Timothy Plan Large/Mid Cap Growth Fund, Timothy Plan Small Cap Value Fund, Timothy Plan Large/Mid Cap Value Fund, Timothy Plan Fixed Income Fund, Timothy Plan High Yield Bond Fund, Timothy Plan Defensive Strategies Fund, Timothy Plan Israel Common Values Fund, Timothy Plan Strategic Growth Fund, Timothy Plan Conservative Growth Fund and Timothy Plan Emerging Markets Fund (the “Funds”).
The Timothy Plan Aggressive Growth Fund’s investment objective is long-term growth of capital. The Fund seeks to achieve its investment objective by normally investing at least 80% of the Fund’s total assets in U.S. common stocks without regard to market capitalizations and investing in the securities of a limited number of companies which the Fund’s Advisor believes show a high probability for superior growth.
The Timothy Plan International Fund’s investment objective is long-term growth of capital. The Fund seeks to achieve its investment objective by normally investing at least 80% of the Fund’s total assets in the common stock and similar securities of foreign companies through the purchase of American Depositary Receipts (“ADRs”) without regard to market capitalization, investing its assets in the ADRs of companies which the Fund’s investment manager believes show a high probability for superior growth, and allocating investments across countries and regions considering the size of the market in each country and region relative to the size of the international market as a whole. Although the Fund maintains a diversified investment portfolio, the political or economic developments within a particular country or region may have an adverse effect on the ability of domiciled issuers to meet their obligations. Additionally, political or economic developments may have an effect on the liquidity and volatility of portfolio securities and currency holdings.
The Timothy Plan Large/Mid Cap Growth Fund’s investment objective is long-term growth of capital. Current income is not a significant investment consideration and any such income realized will be considered incidental to the Fund’s investment objective. The Fund seeks to achieve its investment objective by normally investing at least 80% of the Fund’s total assets in U.S. common stocks with market capitalizations in excess of $2 billion.
The Timothy Plan Small Cap Value Fund’s primary objective is long-term capital growth, with a secondary objective of current income. The Fund seeks to achieve its investment objective by primarily investing at least 80% of its assets in U.S. common stocks whose market capitalization is generally less than $2 billion.
The Timothy Plan Large/Mid Cap Value Fund’s investment objective is long-term capital growth, with a secondary objective of current income. The Fund seeks to achieve its investment objective by primarily investing in U.S. common stocks. The Fund will invest at least 80% of its assets in the common stock of companies whose total market capitalization generally exceeds $2 billion.
The Timothy Plan Fixed Income Fund seeks to generate a high level of current income consistent with prudent investment risk. To achieve its investment objective, the Fund normally invests in a diversified portfolio of debt securities. These include corporate bonds, U.S. Government and agency securities, convertible securities and preferred securities. The Fund will generally only purchase high quality securities.
The Timothy Plan High Yield Bond Fund’s investment objective is to generate a high level of current income. To achieve its investment objective, the Fund normally invests in a diversified portfolio of debt securities. These include corporate bonds, U.S. Government and agency securities, convertible securities and preferred securities. The Fund will generally purchase securities that are not investment-grade, meaning securities with a rating of “BBB” or lower as rated by Standard and Poor’s or a comparable rating by another nationally recognized rating agency. Investments in these higher yielding securities are generally accompanied by a greater degree of credit risk than higher rated securities. Additionally, lower rated securities may be more susceptible to adverse economic and competitive industry conditions than investment-grade securities.
Timothy Plan Notes to Financial Statements
[99]
Notes to Financial Statements
September 30, 2013
Timothy Plan Family of Funds
The Timothy Plan Defensive Strategies Fund’s investment objective is the protection of principal through aggressive, proactive reactions to prevailing economic conditions. To achieve its investment objective, the Fund normally invests in Real Estate Investment Trusts (“REITs”), commodities based Exchange-Traded Funds (“ETFs”), and Treasury Inflation Protected Securities (“TIPS”).
The Timothy Israel Common Values Fund seeks to provide long-term growth of capital. This Fund seeks to achieve its investment objectives by normally investing at least 80% of the Fund’s total assets in the common stock of companies domiciled and/or headquartered in Israel through the purchase of American Depository Receipts (ADRs) and direct investments in such companies on foreign stock exchanges, without regard to market capitalizations.
The Timothy Plan Strategic Growth Fund seeks to generate medium to high levels of long-term capital growth. The Fund seeks to achieve its investment objective by normally investing at least 75% of its net assets in the following Funds which are other series of the Trust: approximately 5-10% of its net assets in the Timothy Plan Small Cap Value Fund; approximately 15-25% of its net assets in the Timothy Plan Large/Mid Cap Value Fund; approximately 15-25% of its net assets in the Timothy Plan Large/Mid Cap Growth Fund; approximately 5-15% of its net assets in the Timothy Plan High Yield Bond Fund; approximately 20-30% of its net assets in the Timothy Plan International Fund; approximately 5%-10% of its net assets in the Timothy Plan Aggressive Growth Fund; approximately 5%-15% of its net assets in the Timothy Plan Defensive Strategies Fund; approximately 5-10% of its net assets in the Timothy Plan Israel Common Values Fund; and approximately 5%-10% of its net assets in the Timothy Plan Emerging Markets Fund.
The Timothy Plan Conservative Growth Fund seeks to generate moderate levels of long-term capital growth with a secondary objective of current income. The Fund seeks to achieve its investment objective by normally investing at least 75% of its net assets in the following Funds which are other series of the Trust: approximately 0-10% of its net assets in the Timothy Plan Small Cap Value Fund; approximately 10-20% of its net assets in the Timothy Plan Large/Mid Cap Value Fund; approximately 5-15% of its net assets in the Timothy Plan Large/Mid Cap Growth Fund; approximately 0-5% of its net assets in the Timothy Plan Aggressive Growth Fund; approximately 5-15% of its net assets in the Timothy Plan High Yield Bond Fund; approximately 5-15% of its net assets in the Timothy Plan International Fund; approximately 20%-40% of its net assets in the Timothy Plan Fixed Income Fund; approximately 10-30% of its net assets in the Timothy Plan Defensive Strategies Fund; approximately 0-5% of its net assets in the Timothy Plan Israel Common Values Fund; and approximately 0-5% of its net assets in the Timothy Plan Emerging Markets Fund.
The Emerging Markets Fund commenced operations on December 3, 2012. The Fund’s investment objective is long-term growth of capital. The Fund seeks to achieve its investment objectives by normally investing at least 80% of the Fund’s total assets in the common stock of companies domiciled and/or headquartered in countries that the Sub Advisor believes are experiencing rapid or above average growth or industrialization through the purchase of American Depository Receipts (ADRs) and direct investments in such companies on foreign stock exchanges, without regard to market capitalizations.
The following is a summary of significant accounting policies consistently followed by the Funds in the preparation of their financial statements. The policies are in conformity with accounting principles generally accepted in the United States of America (“GAAP”) for investment companies.
| A. | SECURITY VALUATION AND FAIR VALUE MEASUREMENTS |
All investments in securities are recorded at their estimated fair value as described in Note 2.
| B. | INVESTMENT INCOME AND SECURITIES TRANSACTIONS |
Security transactions are accounted for on the date the securities are purchased or sold (trade date). Dividend income is recognized on the ex-dividend date. Interest income and expenses are recognized on an accrual basis. The Timothy Plan Aggressive Growth Fund, Large/Mid Cap Growth Fund, Large/Mid Cap Value Fund, Small Cap Value Fund, Israel Common Values Fund, Defensive Strategies Fund and Emerging Markets Fund have made certain investments in REITs and Master Limited Partnerships (“MLPs”). Dividend income from REITs and MLPs is recognized on the ex-dividend date. It is common
Timothy Plan Notes to Financial Statements
[100]
Notes to Financial Statements
September 30, 2013
Timothy Plan Family of Funds
for distributions from REITs and MLPs to exceed taxable earnings and profits, resulting in the excess portion of such dividends being designated as a return of capital. Income or loss from the MLPs is reclassified upon receipt of the MLPs’ K-1. The calendar year-end amounts of ordinary income, capital gains, and return of capital included in distributions received from the Funds’ investments in real estate investment trusts (“REITS”) are reported to the Funds after the end of the calendar year; accordingly, the Funds estimate these amounts for accounting purposes until the characterization of REIT distributions is reported to the Funds after the end of the calendar year. Estimates are based on the most recent REIT distribution information available. Withholding taxes on foreign dividends have been provided for in accordance with the Funds’ understanding of the applicable country’s tax rules and rates. Discounts and premiums on securities purchased are amortized over the lives of the respective securities. The ability of issuers of debt securities held by the Funds to meet their obligations may be affected by economic and political developments in a specific country or region.
Investment securities denominated in foreign currencies are translated into U.S. dollar amounts at the date of valuation. Purchases and sales of investment securities and income and expense items denominated in foreign currencies are translated into U.S. dollar amounts on the respective dates of such transactions. The Funds do not isolate that portion of the results of operations resulting from changes in foreign exchange rates on investments from the fluctuations arising from changes in market prices of securities held. Such fluctuations are included in the net realized and unrealized gain or loss from investments. Reported net realized foreign exchange gains or losses arise from sales of foreign currencies, currency gains or losses realized between the trade and settlement dates on securities transactions, and the difference between the amounts of dividends, interest and foreign withholding taxes recorded on the Funds’ books and the U.S. dollar equivalent of the amounts actually received or paid. Net unrealized foreign exchange gains and losses arise from changes in the fair values of assets and liabilities, other than investments in securities at fiscal period end, resulting from changes in exchange rates.
| D. | NET ASSET VALUE PER SHARE |
The Net Asset Value (“NAV”) per share of the capital stock of the Funds is determined daily as of the close of trading on the New York Stock Exchange by dividing the value of its net assets by the number of Fund shares outstanding. The NAV is calculated separately for each class of each Fund in the Trust. The net asset value of the classes may differ because of different fees and expenses charged to each class.
Expenses incurred by the Trust that do not relate to a specific Fund of the Trust are allocated to the individual Funds based on each Fund’s relative net assets or another appropriate basis as determined by the Board of Trustees (the “Board”).
There are three classes of shares currently offered by the Trust: Class A shares are offered with a front-end sales charge and ongoing service/distribution fees; Class C shares are offered with a contingent deferred sales charge (“CDSC”) that ends after the first year and ongoing service and distribution fees; Class I shares, which commenced operations on August 1, 2013, are offered without any sales charges or ongoing service distribution fees.
Class specific expenses are borne by each specific class. Income, expenses, and realized and unrealized gains/losses are allocated to the respective classes on the basis of relative daily net assets.
In the preparation of financial statements in conformity with GAAP, management makes estimates and assumptions that affect the reported amounts of assets and liabilities and disclosure of contingent assets and liabilities at the date of the financial statements, as well as the reported amounts of revenues and expenses during the reporting period. Actual results could differ from those estimates.
Timothy Plan Notes to Financial Statements
[101]
Notes to Financial Statements
September 30, 2013
Timothy Plan Family of Funds
It is the policy of each Fund to continue to comply with all requirements under subchapter M of the Internal Revenue Code applicable to regulated investment companies and to distribute substantially all of its taxable income to its shareholders. Each Fund also intends to distribute sufficient net investment income and net capital gains, if any, so that it will not be subject to excise tax on undistributed income or gains. Therefore, no federal income tax or excise provision is required.
As of September 30, 2013, the Funds did not have a liability for any unrecognized tax benefits. The Funds recognize interest and penalties, if any, related to unrecognized tax benefits as income tax expense in the statements of operations. During the period ended September 30, 2013, the Funds did not incur any interest or penalties. The Funds are not subject to examination by U.S. federal tax authorities for tax years before 2010 and are not aware of any tax positions for which it is reasonably possible that the total amounts of unrecognized tax benefits will change materially within the next twelve months.
The Trust indemnifies its officers and trustees for certain liabilities that may arise from the performance of their duties to the Trust. Additionally, in the normal course of business, the Funds enter into contracts that contain a variety of representations and warranties and which provide general indemnities. The Funds’ maximum exposure under these arrangements is unknown, as this would involve future claims that may be made against the Funds that have not yet occurred. However, based on experience, the Funds expect the risk of loss due to these warranties and indemnities to be remote.
| J. | DISTRIBUTIONS TO SHAREHOLDERS |
Distributions to shareholders, which are determined in accordance with income tax regulations, are recorded on the ex-dividend date. The treatment for financial reporting purposes of distributions made to shareholders during the period from net investment income or net realized capital gains may differ from their ultimate treatment for federal income tax purposes. These differences are caused primarily by differences in the timing of the recognition of certain components of income, expense or realized capital gain for federal income tax purposes. Where such differences are permanent in nature, they are reclassified in the components of net assets based on their ultimate characterization for federal income tax purposes. Any such reclassifications will have no effect on net assets, results of operations, or Net Asset Values (NAVs) per share of the Funds. Reclassifications for the fiscal year ended September 30, 2013 are as follows:
| | | | | | | | | | | | |
| Fund | | Paid in Capital | | | Accumulated
Undistributed Net
Investment
Income (Loss) | | | Accumulated
Undistributed Net
Realized Gain (Loss)
on Investments | |
Aggressive Growth | | $ | (285,904 | ) | | $ | 285,387 | | | $ | 517 | |
| | | | | | | | | | | | |
International | | | - | | | | 56,305 | | | | (56,305 | ) |
| | | | | | | | | | | | |
Large/Mid Cap Growth | | | - | | | | 157,540 | | | | (157,540 | ) |
| | | | | | | | | | | | |
Small Cap Value | | | - | | | | 30,993 | | | | (30,993 | ) |
| | | | | | | | | | | | |
Large/Mid Cap Value | | | - | | | | 66 | | | | (66 | ) |
| | | | | | | | | | | | |
Fixed Income | | | - | | | | 411,490 | | | | (411,490 | ) |
| | | | | | | | | | | | |
High Yield Bond | | | - | | | | - | | | | - | |
| | | | | | | | | | | | |
Israel Common Values | | | - | | | | 51,231 | | | | (51,231 | ) |
| | | | | | | | | | | | |
Defensive Strategies | | | 1,372 | | | | 50,806 | | | | (52,178 | ) |
| | | | | | | | | | | | |
Strategic Growth | | | - | | | | - | | | | - | |
| | | | | | | | | | | | |
Conservative Growth | | | - | | | | (10,130 | ) | | | 10,130 | |
| | | | | | | | | | | | |
Emerging Markets | | | (3,844 | ) | | | 46,270 | | | | (42,426 | ) |
| | | | | | | | | | | | |
Timothy Plan Notes to Financial Statements
[102]
Notes to Financial Statements
September 30, 2013
Timothy Plan Family of Funds
Note 2 | Security Valuation and Fair Value Measurements
Fair value is defined as the price that a Fund would receive upon selling an investment in a timely transaction to an independent buyer in the principal or most advantageous market of the investment. GAAP established a three-tier hierarchy to maximize the use of observable market data and minimize the use of unobservable inputs and to establish classification of fair value measurements for disclosure purposes.
Inputs refer broadly to the assumptions that market participants would use in pricing the asset or liability, including assumptions about risk (the risk inherent in a particular valuation technique used to measure fair value including such a pricing model and/or the risk inherent in the inputs to the valuation technique). Inputs may be observable or unobservable. Observable inputs are inputs that reflect the assumptions market participants would use in pricing the asset or liability developed based on market data obtained from sources independent of the reporting entity. Unobservable inputs are inputs that reflect the reporting entity’s own assumptions about the assumptions market participants would use in pricing the asset or liability developed based on the best information available in the circumstances.
| VALUATION | OF FUND OF FUNDS |
A Fund may invest in portfolios of open-end or closed-end investment companies (the “Underlying Funds”). The Underlying Funds value securities in their portfolios for which market quotations are readily available at their market values (generally the last reported sale price) and all other securities and assets at their fair value based upon methods established by the board of directors of the Underlying Funds.
Open-ended funds are valued at their respective net asset values as reported by such investment companies. The shares of many closed-end investment companies, after their initial public offering, frequently trade at a price per share, which is different than the net asset value per share. The difference represents a market premium or market discount of such shares. There can be no assurances that the market discount or market premium on shares of any closed-end investment company purchased by the Fund will not change.
The Trust utilizes various methods to measure the fair value of all of its investments on a recurring basis. GAAP establishes a hierarchy that prioritizes inputs to valuation methods. The three levels of input are:
•Level 1 – Unadjusted quoted prices in active markets for identical assets and liabilities that the Fund has the ability to access.
•Level 2 – Observable inputs other than quoted prices included in Level 1 that are observable for the asset or liability, either directly or indirectly. These inputs may include quoted prices for the identical instrument in an inactive market, prices for similar instruments, interest rates, prepayment speeds, credit risk, yield curves, default rates and similar data.
•Level 3 – Unobservable inputs for the asset or liability, to the extent relevant observable inputs are not available, representing the Fund’s own assumptions about the assumptions a market participant would use in valuing the asset or liability, and would be based on the best information available.
The inputs used to measure fair value may fall into different levels of the fair value hierarchy. In such cases, for disclosure purposes, the level in the fair value hierarchy within which the fair value measurement falls in its entirety is determined based on the lowest level input that is significant to the fair value measurement in its entirety.
Each Fund generally determines the total value of each class of its shares by using market prices for the securities comprising its portfolio. Equity securities, including common stock, ADRs, REITs, MLPs, ETFs and warrants are generally valued by using market quotations, but may be valued on the basis of prices furnished by a pricing service when the Advisor or Sub-Advisor believes such prices more accurately reflect the fair value of such securities. Securities that are traded on any stock exchange are generally valued by the pricing service at the last quoted sale price. Lacking a last sale price, an exchange traded security is generally valued by the pricing service at its last bid price. Securities traded in the NASDAQ over-the-counter market are generally valued by the pricing service at the NASDAQ Official Closing Price. When using the market quotations or close prices provided by the pricing service and when the market is considered active, the security will be classified as a Level 1 security. When market
Timothy Plan Notes to Financial Statements
[103]
Notes to Financial Statements
September 30, 2013
Timothy Plan Family of Funds
quotations are not readily available, when the Advisor or Sub-Advisor determines that the market quotation or the price provided by the pricing service does not accurately reflect the current fair value, or when restricted or illiquid securities are being valued, such securities are valued as determined in good faith by the Advisor or Sub-Advisor, in conformity with guidelines adopted by and subject to review by the Board. These securities will generally be categorized as Level 3 securities.
Investments in mutual funds, including money market mutual funds, are generally priced at the ending NAV provided by the service agent of the funds. These securities will be categorized as Level 1 securities.
Fixed income securities such as corporate bonds, restricted corporate bonds, asset-backed securities, mortgage-backed securities, U.S. government securities, U.S. government agency securities and treasury inflation protected securities, when valued using market quotations in an active market, will be categorized as Level 1 securities. However, they may be valued on the basis of prices furnished by a pricing service when the Advisor or Sub-Advisor believes such prices more accurately reflect the fair value of such securities. A pricing service utilizes electronic data processing techniques based on yield spreads relating to securities with similar characteristics to determine prices for normal institutional-size trading units of debt securities without regard to sale or bid prices. These securities will generally be categorized as Level 2 securities. If the Advisor or Sub-Advisor decides that a price provided by the pricing service does not accurately reflect the fair value of the securities, when prices are not readily available from a pricing service, or when restricted or illiquid securities are being valued, securities are valued at fair value as determined in good faith by the Advisor or Sub-Advisor, in conformity with guidelines adopted by and subject to review of the Board. These securities will be categorized as Level 3 securities.
Short-term investments in fixed income securities (those with maturities of less than 60 days when acquired, or which subsequently are within 60 days of maturity) are valued by using the amortized cost method of valuation, which the Board has determined will represent fair value. These securities will be classified as Level 2 securities.
The Board has delegated to the Advisor and/or Sub-Advisors responsibility for determining the value of Fund portfolio securities under certain circumstances. Under such circumstances, the Advisor or Sub-Advisor will use its best efforts to arrive at the fair value of a security held by the Fund under all reasonably ascertainable facts and circumstances. The Advisor must prepare a report for the Board not less than quarterly containing a complete listing of any securities for which fair value pricing was employed and detailing the specific reasons for such fair value pricing. The Board has adopted written policies and procedures to guide the Advisor and Sub-Advisors with respect to the circumstances under which, and the methods to be used, in fair valuing securities.
The following is a summary of the inputs used to value each Fund’s assets as of September 30, 2013:
Aggressive Growth Fund
| | | | | | | | | | | | | | | | |
| Assets | | Level 1 | | | Level 2 | | | Level 3 | | | Total | |
Common Stocks | | $ | 19,595,470 | | | $ | - | | | $ | - | | | $ | 19,595,470 | |
REITs | | | 65,134 | | | | - | | | | - | | | | 65,134 | |
Master Limited Partnerships | | | 116,525 | | | | - | | | | - | | | | 116,525 | |
Money Market Fund | | | 964,764 | | | | - | | | | - | | | | 964,764 | |
Total | | $ | 20,741,893 | | | $ | - | | | $ | - | | | $ | 20,741,893 | |
International Fund
| | | | | | | | | | | | | | | | |
| Assets | | Level 1 | | | Level 2 | | | Level 3 | | | Total | |
Common Stocks | | $ | 39,253,748 | | | $ | - | | | $ | - | | | $ | 39,253,748 | |
Money Market Fund | | | 1,534,760 | | | | - | | | | - | | | | 1,534,760 | |
Total | | $ | 40,788,508 | | | $ | - | | | $ | - | | | $ | 40,788,508 | |
Timothy Plan Notes to Financial Statements
[104]
Notes to Financial Statements
September 30, 2013
Timothy Plan Family of Funds
Large/Mid Cap Growth Fund
| | | | | | | | | | | | | | | | |
| Assets | | Level 1 | | | Level 2 | | | Level 3 | | | Total | |
Common Stocks | | $ | 50,846,318 | | | $ | - | | | $ | - | | | $ | 50,846,318 | |
Master Limited Partnerships | | | 252,500 | | | | - | | | | - | | | | 252,500 | |
Money Market Fund | | | 1,983,876 | | | | - | | | | - | | | | 1,983,876 | |
Total | | $ | 53,082,694 | | | $ | - | | | $ | - | | | $ | 53,082,694 | |
Small Cap Value Fund
| | | | | | | | | | | | | | | | |
| Assets | | Level 1 | | | Level 2 | | | Level 3 | | | Total | |
Common Stocks | | $ | 63,264,487 | | | $ | - | | | $ | - | | | $ | 63,264,487 | |
Master Limited Partnerships | | | 1,661,022 | | | | - | | | | - | | | | 1,661,022 | |
REITs | | | 6,677,696 | | | | - | | | | - | | | | 6,677,696 | |
Money Market Fund | | | 1,414,034 | | | | - | | | | - | | | | 1,414,034 | |
Total | | $ | 73,017,239 | | | $ | - | | | $ | - | | | $ | 73,017,239 | |
Large/Mid Cap Value Fund
| | | | | | | | | | | | | | | | |
| Assets | | Level 1 | | | Level 2 | | | Level 3 | | | Total | |
Common Stocks | | $ | 116,090,454 | | | $ | - | | | $ | - | | | $ | 116,090,454 | |
Master Limited Partnerships | | | 1,246,292 | | | | - | | | | - | | | | 1,246,292 | |
REITs | | | 6,695,511 | | | | - | | | | - | | | | 6,695,511 | |
Money Market Fund | | | 4,287,834 | | | | - | | | | - | | | | 4,287,834 | |
Total | | $ | 128,320,091 | | | $ | - | | | $ | - | | | $ | 128,320,091 | |
Fixed Income Fund
| | | | | | | | | | | | | | | | |
| Assets | | Level 1 | | | Level 2 | | | Level 3 | | | Total | |
Corporate Bonds | | $ | - | | | $ | 28,027,437 | | | $ | - | | | $ | 28,027,437 | |
Government Notes & Bonds | | | - | | | | 20,980,974 | | | | - | | | | 20,980,974 | |
Government Mortgage-Backed Securities | | | - | | | | 23,670,537 | | | | - | | | | 23,670,537 | |
Money Market Fund | | | 2,260,955 | | | | - | | | | - | | | | 2,260,955 | |
Total | | $ | 2,260,955 | | | $ | 72,678,948 | | | $ | - | | | $ | 74,939,903 | |
High Yield Bond Fund
| | | | | | | | | | | | | | | | |
| Assets | | Level 1 | | | Level 2 | | | Level 3 | | | Total | |
Corporate Bonds | | $ | - | | | $ | 35,951,655 | | | $ | - | | | $ | 35,951,655 | |
Money Market Fund | | | 1,177,355 | | | | - | | | | - | | | | 1,177,355 | |
Total | | $ | 1,177,355 | | | $ | 35,951,655 | | | $ | - | | | $ | 37,129,010 | |
Israel Common Values Fund
| | | | | | | | | | | | | | | | |
| Assets | | Level 1 | | | Level 2 | | | Level 3 | | | Total | |
Common Stocks | | $ | 10,526,078 | | | $ | - | | | $ | - | | | $ | 10,526,078 | |
Investment Companies | | | 211,129 | | | | - | | | | - | | | | 211,129 | |
Money Market Fund | | | 574,276 | | | | - | | | | - | | | | 574,276 | |
Total | | $ | 11,311,483 | | | $ | - | | | $ | - | | | $ | 11,311,483 | |
Timothy Plan Notes to Financial Statements
[105]
Notes to Financial Statements
September 30, 2013
Timothy Plan Family of Funds
Defensive Strategies Fund
| | | | | | | | | | | | | | | | |
| Assets | | Level 1 | | | Level 2 | | | Level 3 | | | Total | |
Common Stocks | | $ | 16,874,405 | | | $ | - | | | $ | - | | | $ | 16,874,405 | |
REITs | | | 21,212,518 | | | | - | | | | - | | | | 21,212,518 | |
Exchange Traded Funds | | | 6,105,114 | | | | - | | | | - | | | | 6,105,114 | |
Government Mortgage-Backed Securities | | | - | | | | 1,258,360 | | | | - | | | | 1,258,360 | |
Corporate Bonds | | | - | | | | 2,053,455 | | | | - | | | | 2,053,455 | |
Treasury Inflation Protected Securities (TIPS) | | | - | | | | 19,322,372 | | | | - | | | | 19,322,372 | |
Money Market Fund | | | 1,663,185 | | | | - | | | | - | | | | 1,663,185 | |
Total | | $ | 45,855,222 | | | $ | 22,634,187 | | | $ | - | | | $ | 68,489,409 | |
Strategic Growth Fund
| | | | | | | | | | | | | | | | |
| Assets | | Level 1 | | | Level 2 | | | Level 3 | | | Total | |
Mutual Funds | | $ | 39,931,447 | | | $ | - | | | $ | - | | | $ | 39,931,447 | |
Money Market Fund | | | 2,216,528 | | | | - | | | | - | | | | 2,216,528 | |
Total | | $ | 42,147,975 | | | $ | - | | | $ | - | | | $ | 42,147,975 | |
Conservative Growth Fund
| | | | | | | | | | | | | | | | |
| Assets | | Level 1 | | | Level 2 | | | Level 3 | | | Total | |
Mutual Funds | | $ | 51,961,940 | | | $ | - | | | $ | - | | | $ | 51,961,940 | |
Money Market Fund | | | 2,816,916 | | | | - | | | | - | | | | 2,816,916 | |
Total | | $ | 54,778,856 | | | $ | - | | | $ | - | | | $ | 54,778,856 | |
Emerging Markets Fund
| | | | | | | | | | | | | | | | |
| Assets | | Level 1 | | | Level 2 | | | Level 3 | | | Total | |
Common Stocks | | $ | 8,297,757 | | | $ | 34,409 | | | $ | - | | | $ | 8,332,166 | |
Preferred Stock | | | 339,686 | | | | - | | | | - | | | | 339,686 | |
REITs | | | 73,592 | | | | - | | | | - | | | | 73,592 | |
Money Market Fund | | | 156,462 | | | | - | | | | - | | | | 156,462 | |
Total | | $ | 8,867,497 | | | $ | 34,409 | | | $ | - | | | $ | 8,901,906 | |
Refer to the Schedules of Investments for industry classifications.
The Funds did not hold any assets at any time during the reporting period in which significant unobservable inputs were used in determining fair value; therefore, no reconciliation of Level 3 securities is included for this reporting period. The Funds did not hold any derivative instruments during the reporting period. During the year ended September 30, 2013, transfers into and out of Level 1 and Level 2 are listed in the table below. The Funds’ policy is to recognize transfers at the end of the reporting period.
The following amounts were transfers in/(out) of Level 1/Level 2 assets:
| | | | | | | | |
| Emerging Markets Fund | |
| | | Common Stock -
Urbi Desarrollos Urbanos SAB de CV | | | Total | |
Transfers into Level 2 from Level 1 | | $ | 34,409 | | | $ | 34,409 | |
Transfers from Level 2 into Level 1 | | | - | | | | - | |
Net Transfers in/(Out) of Level 2 | | $ | 34,409 | | | $ | 34,409 | |
Timothy Plan Notes to Financial Statements
[106]
Notes to Financial Statements
September 30, 2013
Timothy Plan Family of Funds
There were no transfers from Level 2 to Level 1. Transfers that were made into Level 2 represent securities being fair valued using observable inputs. A quoted price was not available at the time of valuation, therefore a fair valued price using observable inputs was used. It is the Funds’ policy to recognize transfers into or out of Level 1 and Level 2 at the end of the reporting period.
Note 3 | Purchases and Sales of Securities
The following is a summary of the cost of purchases and proceeds from the sale of securities, other than short-term investments, for the fiscal year ended September 30, 2013:
| | | | | | | | | | | | | | | | |
| | | Purchases | | | Sales | |
| Fund | | U.S. Gov’t
Obligations | | | Other | | | U.S. Gov’t
Obligations | | | Other | |
Aggressive Growth | | $ | - | | | $ | 20,151,527 | | | $ | - | | | $ | 20,734,605 | |
International | | | - | | | | 13,473,695 | | | | - | | | | 9,773,438 | |
Large/Mid Cap Growth | | | - | | | | 42,846,669 | | | | - | | | | 45,059,076 | |
Small Cap Value | | | - | | | | 42,979,586 | | | | - | | | | 42,900,437 | |
Large/Mid Cap Value | | | - | | | | 76,124,173 | | | | - | | | | 83,407,138 | |
Fixed Income | | | 15,304,783 | | | | 4,458,888 | | | | 11,013,784 | | | | 10,577,189 | |
High Yield Bond | | | - | | | | 23,775,907 | | | | - | | | | 20,614,427 | |
Israel Common Values | | | - | | | | 3,334,470 | | | | - | | | | 2,570,403 | |
Defensive Strategies | | | 9,135,472 | | | | 37,006,421 | | | | 7,179,705 | | | | 31,730,345 | |
Strategic Growth | | | - | | | | 7,405,544 | | | | - | | | | 9,914,877 | |
Conservative Growth | | | - | | | | 11,569,326 | | | | - | | | | 11,129,997 | |
Emerging Markets* | | | - | | | | 9,426,015 | | | | - | | | | 1,095,220 | |
| * | The Emerging Markets Fund commenced operations on December 3, 2012. |
Note 4 | Investment Management Fee and Other Transactions with Affiliates
Timothy Partners, Ltd., (“TPL”) is the investment advisor for the Funds pursuant to an investment advisory agreement (the “Agreement”) that was renewed by the Board on February 22, 2013. TPL supervises the investment of the assets of each Fund in accordance with the objectives, policies and restrictions of the Trust. Under the terms of the Agreement, as amended, TPL receives a fee, accrued daily and paid monthly, at an annual rate of 1.10% of the average daily net assets of the Timothy Plan Emerging Markets Fund; 1.00% of the average daily net assets of the Timothy Plan International Fund and Timothy Plan Israel Common Values Fund; 0.85% of the average daily net assets of the Timothy Plan Aggressive Growth, the Timothy Plan Small Cap Value, the Timothy Plan Large/Mid Cap Growth, and the Timothy Plan Large/Mid Cap Value Funds; 0.60% of the average daily net assets of the Timothy Plan Fixed Income, the Timothy Plan High Yield Bond, and the Timothy Plan Defensive Strategies Funds; and 0.65% of the average daily net assets of the Timothy Plan Conservative Growth and the Timothy Plan Strategic Growth Funds. TPL has voluntarily agreed to reduce the fee it receives from the Timothy Plan Fixed Income Fund to 0.45%. Such voluntary fee reductions/reimbursements may be authorized by TPL at any time, but such action shall not obligate TPL to waive any fees in the near future. Such voluntary fee reductions/reimbursements are not subject to future recoupment. An officer and trustee of the Funds is also an officer and owner of the Advisor.
For the year ended September 30, 2013, TPL waived and reimbursed the Fund as follows:
| | | | |
| Fund | | Year Ended
September 30, 2013 | |
Fixed Income | | $ | 122,837 | |
Timothy Plan Notes to Financial Statements
[107]
Notes to Financial Statements
September 30, 2013
Timothy Plan Family of Funds
Gemini Fund Services, LLC (“GFS”) provides administrative, fund accounting, and transfer agency services to the Funds pursuant to agreements with the Trust, for which it receives from each Fund: (i) basis points in decreasing amounts as assets reach certain breakpoints; and (ii) any related out-of-pocket expenses. Fees are billed monthly as follows:
Fund Accounting and Fund Administration Fees:
Fund Complex Base annual fee:
25 basis points (0.25%) on the first $200 million of net assets
15 basis points (0.15%) on the next $200 million of net assets;
8 basis points (0.08%) on the next $600 million of net assets; and
6 basis points (0.06%) on net assets greater than $1 billion.
Transfer agency fees for the Funds are combined with the Fund Accounting and Fund Administration fees under the Trust’s agreement with GFS. Therefore, there is no separate base annual fee per Fund or share class.
An officer of the Trust is also an employee of GFS, and is not paid any fees directly by the Trust for serving in such capacity.
The Timothy Plan Aggressive Growth, Timothy Plan International, Timothy Plan Large/Mid Cap Growth, Timothy Plan Small Cap Value, Timothy Plan Large/Mid Cap Value, Timothy Plan Fixed Income, Timothy Plan High Yield Bond, Timothy Plan Defensive Strategies, Timothy Plan Israel Common Values, and Timothy Plan Emerging Markets Funds have adopted shareholder services plans (the “Plans”) pursuant to Rule 12b-1 under the Investment Company Act of 1940, as amended. The Plans provide that the Funds will pay TPL or others for expenses that relate to the promotion or distribution of shares. Under the Class A Plan, the Funds will pay TPL a fee at an annual rate of 0.25%, payable monthly, of the average daily net assets attributable to such class of shares. Under the Class C Plan, the Funds will pay TPL a fee at an annual rate of 1.00%, payable monthly, of which, 0.25% may be a service fee and 0.75% may be payable to outside broker/dealers, of the average daily net assets attributable to such class of shares.
The Timothy Plan Conservative Growth and Timothy Plan Strategic Growth Funds have adopted shareholder services plans (the “Plans”) pursuant to Rule 12b-1 under the Investment Company Act of 1940, as amended. The Plans provide that the Funds will pay TPL or others for expenses that relate to the promotion or distribution of shares. Class A shares of the Funds do not impose a service fee. Under the Class C Plan, the Funds will pay TPL a fee at an annual rate of 0.75%, payable monthly to outside broker/dealers, of the average daily net assets attributable to such class of shares.
For the year ended September 30, 2013, the Funds paid TPL under the terms of the Plans as follows:
| | | | | |
| Fund | | 12b-1 Fees |
| | | Year Ended
September 30, 2013 |
Aggressive Growth | | | $ | 60,284 | |
International | | | | 101,888 | |
Large/Mid Cap Growth | | | | 159,058 | |
Small Cap Value | | | | 193,714 | |
Large/Mid Cap Value | | | | 397,449 | |
Fixed Income | | | | 271,397 | |
High Yield Bond | | | | 111,675 | |
Israel Common Values | | | | 25,079 | |
Defensive Strategies | | | | 328,940 | |
Strategic Growth | | | | 53,296 | |
Conservative Growth | | | | 72,184 | |
Emerging Markets* | | | | 16,251 | |
| * | The Emerging Markets Fund commenced operations on December 3, 2012. |
Timothy Plan Notes to Financial Statements
[108]
Notes to Financial Statements
September 30, 2013
Timothy Plan Family of Funds
TPL also serves as the principal underwriter of the Funds’ shares. An officer and trustee of the Funds is also an officer of the principal underwriter. For the year ended September 30, 2013, TPL received sales charges deducted from the proceeds of sales of Class A capital shares and CDSC fees deducted from the redemption of Class C capital shares as follows:
| | | | | | | | | | |
| Fund | | Sales Charges (Class A) | | CDSC Fees
(Class C) |
Aggressive Growth | | | $ | 4,928 | | | | $ | 121 | |
International | | | | 9,448 | | | | | 155 | |
Large/Mid Cap Growth | | | | 14,042 | | | | | 1,098 | |
Small Cap Value | | | | 15,136 | | | | | 453 | |
Large/Mid Cap Value | | | | 36,709 | | | | | 2,287 | |
Fixed Income | | | | 25,939 | | | | | 2,572 | |
High Yield Bond | | | | 19,902 | | | | | 502 | |
Israel Common Values | | | | 4,682 | | | | | 1 | |
Defensive Strategies | | | | 31,787 | | | | | 8,118 | |
Strategic Growth | | | | 15,529 | | | | | 359 | |
Conservative Growth | | | | 28,152 | | | | | 1,291 | |
Emerging Markets Fund* | | | | 2,887 | | | | | 79 | |
| * | The Emerging Markets Fund commenced operations on December 3, 2012. |
Note 5 | Control Ownership
The beneficial ownership, either directly or indirectly, of more than 25% of the voting securities of a Fund creates the presumption of control of the Fund under Section 2(a) 9 of the Investment Company Act of 1940. At September 30, 2013 there were no shareholders with ownership, either directly or indirectly, of more than 25% of the voting securities of a Fund.
Certain Timothy Plan Funds own shares of other Timothy Plan Funds. U.S. Bank, N.A., custodian of the Timothy Plan Funds, holds these shares in omnibus accounts, some of which are controlled by National Financial Services, Inc. The following shows the percentage of each Timothy Plan Fund that is held by U.S. Bank, N.A., as custodian of the Timothy Funds. These accounts can be considered affiliated to the Timothy Plan.
| | | | | |
| Fund - Class A | | % of Fund Owned by Other
Timothy Plan Funds |
Aggressive Growth | | | | 33.28 | % |
International | | | | 38.13 | % |
Large/Mid Cap Growth | | | | 39.75 | % |
Small Cap Value | | | | 14.00 | % |
Large/Mid Cap Value | | | | 18.45 | % |
Fixed Income | | | | 39.50 | % |
High Yield Bond | | | | 45.55 | % |
Israel Common Values | | | | 69.52 | % |
Defensive Strategies | | | | 44.81 | % |
Emerging Markets | | | | 77.36 | % |
Timothy Plan Notes to Financial Statements
[109]
Notes to Financial Statements
September 30, 2013
Timothy Plan Family of Funds
Note 6 | Distributions to Shareholders
The tax character of distributions paid during the fiscal year ended September 30, 2013 and the fiscal year ended September 30, 2012 were as follows:
| | | | | | | | | | | | | | | | | | | | |
| | | Aggressive Growth | | International * | | Large/Mid Cap Growth | | Small Cap Value |
Year ended September 30, 2013 | | | | | | | | | | | | | | | | | | | | |
Ordinary Income | | | $ | - | | | | $ | 340,389 | | | | $ | 1,453,446 | | | | $ | 88,849 | |
Short-term Capital Gains | | | | - | | | | | - | | | | | - | | | | | - | |
Long-term Capital Gains | | | | - | | | | | - | | | | | 1,289,229 | | | | | - | |
Return of Capital | | | | - | | | | | - | | | | | - | | | | | - | |
| | | | | |
| | | $ | - | | | | $ | 340,389 | | | | $ | 2,742,675 | | | | $ | 88,849 | |
| | | | | |
Year ended September 30, 2012 | | | | | | | | | | | | | | | | | | | | |
Ordinary Income | | | $ | - | | | | $ | 1,113,188 | | | | $ | - | | | | $ | - | |
Short-term Capital Gains | | | | - | | | | | - | | | | | - | | | | | - | |
Long-term Capital Gains | | | | - | | | | | - | | | | | 1,810,584 | | | | | - | |
Return of Capital | | | | - | | | | | - | | | | | - | | | | | - | |
| | | | | |
| | | $ | - | | | | $ | 1,113,188 | | | | $ | 1,810,584 | | | | $ | - | |
| | | | | |
| | | | | | | | | | | | | | | | | | | | |
| | | Large/Mid Cap Value | | Fixed Income | | High Yield Bond | | Israel Common Values |
Year ended September 30, 2013 | | | | | | | | | | | | | | | | | | | | |
Ordinary Income | | | $ | 358,626 | | | | $ | 958,092 | | | | $ | 1,871,417 | | | | $ | - | |
Short-term Capital Gains | | | | - | | | | | - | | | | | - | | | | | - | |
Long-term Capital Gains | | | | - | | | | | - | | | | | - | | | | | - | |
Return of Capital | | | | - | | | | | - | | | | | - | | | | | - | |
| | | | | |
| | | $ | 358,626 | | | | $ | 958,092 | | | | $ | 1,871,417 | | | | $ | - | |
| | | | | |
Year ended September 30, 2012 | | | | | | | | | | | | | | | | | | | | |
Ordinary Income | | | $ | 192,686 | | | | $ | 1,507,322 | | | | $ | 1,738,714 | | | | $ | - | |
Short-term Capital Gains | | | | - | | | | | - | | | | | - | | | | | - | |
Long-term Capital Gains | | | | - | | | | | - | | | | | - | | | | | - | |
Return of Capital | | | | - | | | | | 186,818 | | | | | 51,714 | | | | | - | |
| | | | | |
| | | $ | 192,686 | | | | $ | 1,694,140 | | | | $ | 1,790,428 | | | | $ | - | |
| | | | | |
| | | | | | | | | | | | | | | | | | | | |
| | | Defensive Strategies | | Strategic Growth | | Conservative Growth | | Emerging Markets |
Year ended September 30, 2013 | | | | | | | | | | | | | | | | | | | | |
Ordinary Income | | | $ | 132,486 | | | | $ | 190,631 | | | | $ | 306,954 | | | | $ | - | |
Short-term Capital Gains | | | | - | | | | | - | | | | | - | | | | | - | |
Long-term Capital Gains | | | | - | | | | | - | | | | | - | | | | | - | |
Return of Capital | | | | - | | | | | - | | | | | - | | | | | - | |
| | | | | |
| | | $ | 132,486 | | | | $ | 190,631 | | | | $ | 306,954 | | | | $ | - | |
| | | | | |
Year ended September 30, 2012 | | | | | | | | | | | | | | | | | | | | |
Ordinary Income | | | $ | 199,461 | | | | $ | - | | | | $ | 49,894 | | | | | | |
Short-term Capital Gains | | | | 1,018,858 | | | | | - | | | | | - | | | | | | |
Long-term Capital Gains | | | | 3,161,636 | | | | | - | | | | | - | | | | | | |
Return of Capital | | | | 227,139 | | | | | - | | | | | - | | | | | | |
| | | | | | | | | | |
| | | $ | 4,607,094 | | | | $ | - | | | | $ | 49,894 | | | | | | |
| | | | | | | | | | |
| * | The difference between ordinary distributions paid from book and ordinary distributions paid from tax relates to $109,637 and $71,631 of allowable foreign tax credits from fiscal years ended September 30, 2013 and September 30, 2012, respectively, which have been passed through to the Fund’s underlying shareholders. |
Timothy Plan Notes to Financial Statements
[110]
Notes to Financial Statements
September 30, 2013
Timothy Plan Family of Funds
As of September 30, 2013, the components of distributable earnings on a tax basis were as follows:
| | | | | | | | | | | | | | | | | | | | |
| | | Aggressive Growth | | International | | Large/Mid Cap Growth | | Small Cap Value |
Undistributed Ordinary Income | | | $ | - | | | | $ | 702,870 | | | | $ | 2,481,804 | | | | $ | 2,038,761 | |
Long-Term Capital Gains | | | | 1,246,568 | | | | | - | | | | | 2,090,488 | | | | | 4,210,559 | |
Capital Loss Carry Forward | | | | - | | | | | (15,551,605 | ) | | | | - | | | | | - | |
Post October and Other Losses | | | | (184,423 | ) | | | | - | | | | | - | | | | | - | |
Unrealized Appreciation (Depreciation) | | | | 3,667,144 | | | | | 7,268,045 | | | | | 7,906,113 | | | | | 16,318,390 | |
| | | | | |
| | | $ | 4,729,289 | | | | $ | (7,580,690 | ) | | | $ | 12,478,405 | | | | $ | 22,567,710 | |
| | | | | |
| | | | | | | | | | | | | | | | | | | | |
| | | Large/Mid Cap Value | | Fixed Income | | High Yield Bond | | Israel Common Values |
Undistributed Ordinary Income | | | $ | 573,666 | | | | $ | 770,920 | | | | $ | 94,798 | | | | $ | 617,381 | |
Long-Term Capital Gains | | | | 9,092,432 | | | | | 165,734 | | | | | - | | | | | - | |
Capital Loss Carry Forward | | | | - | | | | | - | | | | | (1,371,740 | ) | | | | (44,289 | ) |
Post October and Other Losses | | | | - | | | | | - | | | | | - | | | | | (44,983 | ) |
Unrealized Appreciation (Depreciation) | | | | 26,871,487 | | | | | 324,330 | | | | | 525,861 | | | | | 1,460,794 | |
| | | | | |
| | | $ | 36,537,585 | | | | $ | 1,260,984 | | | | $ | (751,081 | ) | | | $ | 1,988,903 | |
| | | | | |
| | | | | | | | | | | | | | | | | | | | |
| | | Defensive Strategies | | Strategic Growth | | Conservative Growth | | Emerging Markets |
Undistributed Ordinary Income | | | $ | 360,481 | | | | $ | 33,057 | | | | $ | 14,940 | | | | $ | 244,979 | |
Long-Term Capital Gains | | | | - | | | | | - | | | | | - | | | | | - | |
Capital Loss Carry Forward | | | | - | | | | | (7,307,409 | ) | | | | (1,719,281 | ) | | | | - | |
Post October and Other Losses | | | | - | | | | | - | | | | | - | | | | | - | |
Unrealized Appreciation (Depreciation) | | | | (817,041 | ) | | | | 3,858,940 | | | | | 3,998,758 | | | | | 113,958 | |
| | | | | |
| | | $ | (456,560 | ) | | | $ | (3,415,412 | ) | | | $ | 2,294,417 | | | | $ | 358,937 | |
| | | | | |
The difference between book basis and tax basis unrealized appreciation (depreciation), undistributed net investment income (loss) and accumulated net realized gain (loss) from investments are primarily attributable to the tax deferral of losses on wash sales, mark-to-market on passive foreign investment companies, and adjustments for grantor trusts, partnerships and C Corporation return of capital distributions.
Note 7 | Capital Loss Carryforwards
At September 30, 2013, the following capital loss carryforwards are available to offset future capital gains.
| | | | | | | | | | | | | | | |
| | | Capital Loss Carry Forward | | Year
Expiring |
Fund | | Short-Term | | Long-Term | |
International Fund | | | $ | 498,385 | | | | $ | - | | | 2015 |
| | | $ | 4,243,183 | | | | $ | - | | | 2016 |
| | | $ | 8,833,573 | | | | $ | - | | | 2017 |
| | | $ | 592,985 | | | | $ | - | | | 2018 |
| | | $ | 844,129 | | | | $ | - | | | 2019 |
| | | | $ | 539,350 | | | | $ | - | | | Non-Expiring |
High Yield Bond Fund | | | $ | 1,371,740 | | | | $ | - | | | 2017 |
Israel Common Values Fund | | | $ | 27,954 | | | | $ | 16,335 | | | Non-Expiring |
Strategic Growth Fund | | | $ | 784,194 | | | | $ | - | | | 2016 |
| | | $ | 2,564,555 | | | | $ | - | | | 2017 |
| | | $ | 125,171 | | | | $ | - | | | 2018 |
| | | | $ | 3,833,489 | | | | $ | - | | | 2019 |
Conservative Growth Fund | | | $ | 1,719,281 | | | | $ | - | | | 2019 |
Timothy Plan Notes to Financial Statements
[111]
Notes to Financial Statements
September 30, 2013
Timothy Plan Family of Funds
To the extent these loss carryforwards are used to offset future capital gains, it is probable that the amount, which is offset, will not be distributed to shareholders.
Late year losses incurred after December 31 within the fiscal year are deemed to arise on the first business day of the following fiscal year for tax purposes. The following Funds incurred and elected to defer such late year losses as follows:
| | | | |
| Fund | | Late Year
Losses | |
Aggressive Growth | | $ | 184,423 | |
Capital losses incurred after October 31 within the fiscal year are deemed to arise on the first business day of the following fiscal year for tax purposes. The following Funds incurred and elected to defer such capital losses as follows:
| | | | |
| Fund | | Post October Losses | |
Israel Common Values | | | 44,983 | |
Note 8 | New Accounting Pronouncements
In December 2011, the Financial Accounting Standards Board (“FASB”) issued Accounting Standards Update (“ASU”) No. 2011-11 related to disclosures about offsetting assets and liabilities. In January 2013, the FASB issued ASU No. 2013-01 which gives additional clarification to ASU 2011-11. The amendments in this ASU require an entity to disclose information about offsetting and related arrangements to enable users of its financial statements to understand the effect of those arrangements on its financial position. The ASU is effective for annual reporting periods beginning on or after January 1, 2013, and interim periods within those annual periods. The guidance requires retrospective application for all comparative periods presented. Management is currently evaluating the impact these amendments may have on the Funds’ financial statements.
Note 9 | Subsequent Events
At the August 23, 2013 board meeting, the board approved to re-engage CoreCommodities as interim Sub-Advisor for the Defensive Strategies Fund for a period of 150 days due to a majority change in ownership. A shareholder proxy meeting is scheduled for December 6, 2013 for shareholder approval.
Timothy Plan Notes to Financial Statements
[112]
Notes to Financial Statements
September 30, 2013
Timothy Plan Family of Funds
Board Annual Approval/Renewals of Advisory and Sub-Advisory Agreements (Unaudited)
Timothy Partners, Ltd; Investment Advisor to all Funds.
The continuance of the Investment Advisory Agreement (the “IA Agreement”) on behalf of each series of the Trust between the Trust and Timothy Partners, Ltd. (“TPL”) was last approved by the Board of Trustees (“the Board”), including a majority of the Trustees who are not interested persons of the Trust or any person who is a party to the Agreement, at an in-person meeting held on February 22, 2013. The Trust’s Board considered the factors described below prior to approving the Agreement. The Trustees, including the Independent Trustees, noted the Advisor’s experience in incorporating and implementing the unique, biblically-based management style that is a stated objective as set forth in the Funds’ prospectus.
To further assist the Board in making its determination as to whether the IA Agreement should be renewed, the Board requested and received the following information: a description of TPL’s business and any personnel changes, a description of the compensation received by TPL from the Funds, information relating to the Advisor’s compliance and operational policies and procedures, and a description of any material legal proceedings or securities enforcement proceedings regarding TPL or its personnel (there were none of either). In addition, the Board requested and received financial statements of TPL for its fiscal year ended December 31, 2012. The Board also received a report from TPL relating to the fees charged by TPL, both as an aggregate and in relation to fees charged by other advisors to similar funds. The materials prepared by TPL were provided to the Board in advance of the meeting. The Board considered the fees charged by TPL in light of the services provided to the Funds by TPL, the unique nature of the Funds and their moral screening requirements, which are maintained by TPL, and TPL’s role as a manager of managers. After full and careful consideration, the Board, with the independent trustees separately concurring, agreed that the fees charged by TPL were fair and reasonable in light of the services provided to the Funds. The Board also discussed the nature, extent and quality of TPL’s services to the Funds. In particular, the Board noted with approval TPL’s commitment to maintaining certain targeted expense ratios for the Funds, its efforts in providing comprehensive and consistent moral screens to the investment managers, its efforts in maintaining appropriate oversight of the investment managers to each Fund, and its efforts to maintain ongoing regulatory compliance for the Funds. The Board also discussed TPL’s current fee structure and whether such structure would allow the Funds to realize economies of scale as they grow. The Board next considered the investment performance of each Fund and the Advisor’s performance in monitoring the investment managers of the underlying funds. The Board generally approved of each Fund’s performance, noting that the Funds invested in a manner that did not rely exclusively on investment performance. Further, the Board noted with approval that the investment managers of each Fund did not succumb to “style drift” in their management of each Fund’s assets, and that each Fund was committed to maintain its investment mandate, even if that meant under performance during periods when that style was out of favor. The Board noted with approval the Advisor’s ongoing efforts to maintain such consistent investment discipline. The Board also noted with approval that the Advisor’s business was devoted exclusively to serving the Funds, and that the Advisor did not realize any ancillary benefits or profits deriving from its relationship with the Funds. The Board further noted with approval the Advisor’s past activities on monitoring the performance of the underlying Funds’ various investment managers and the promptness and efficiency with which problems were brought to the Board’s attention and responsible remedies offered and executed. After careful discussion and consideration, the Board, including the separate concurrence of the independent Trustees, unanimously cast an affirmative vote, and determined that the renewal of the IA Agreement for another one-year period would be in the best interests of the Funds’ shareholders. In approving the renewal of the IA Agreement for an additional one year period, the Board did not place specific emphasis on any one factor discussed above, but considered all factors in equal light. Further, the Board had available and availed itself of the assistance of legal counsel at all times during its consideration of the IA Agreement renewal.
Barrow, Hanley, Mewhinney & Strauss; Sub-Advisor for the Fixed Income, High Yield Bond, and Defensive Strategies TIPS sleeve.
The Sub-Advisory Agreement between the Trust, TPL and Barrow, Hanley, Mewhinney & Strauss (“BHM&S”), on behalf of the Timothy Plan Fixed Income, High Yield Bond and Defensive Strategies TIPS sleeve Funds, was last renewed by the Board at a meeting held for that purpose, among others, on February 22, 2013. The Board considered the following factors in arriving at its conclusions to renew the BHM&S Sub-Advisory Agreement for an additional year. First, the Board considered the fees charged by
Timothy Plan Notes to Financial Statements
[113]
Notes to Financial Statements
September 30, 2013
Timothy Plan Family of Funds
BHM&S in light of the services provided by BHM&S. After full and careful consideration, the Board, with the independent trustees separately concurring, agreed that the fees charged by BHM&S and paid out of the fees received by TPL were fair and reasonable in light of the services provided by BHM&S. In reaching that determination, the Board relied on reports describing the fees paid to BHM&S and comparing those fees against fees paid to other investment advisors operating under similar circumstances. Next, the Board discussed the nature, extent and quality of BHM&S’s services to each Fund, including the investment performance of the Funds under BHM&S’s investment management. The Board generally approved of BHM&S’s performance, noting that the Funds managed by BHM&S invested in a manner that did not rely exclusively on investment performance. Further, the Board noted with approval that BHM&S did not succumb to “style drift” in its management of each Fund’s assets, and that BHM&S was committed to maintain its investment mandate, even if that meant under performance during periods when that style was out of favor. The Board noted with approval BHM&S’s ongoing efforts to maintain such consistent investment discipline. Next, the Board considered whether BHM&S’s current fee structure would allow the Funds to realize economies of scale as they grow. The Board decided that this particular factor was moot with respect to the BHM&S Sub-Advisory Agreement because BHM&S was paid out of the fees paid to TPL. After careful discussion and consideration, the Board, including the independent Trustees separately concurring, unanimously determined that the renewal of the BHM&S Sub-Advisory Agreement for another one-year period would be in the best interests of the Funds’ shareholders. In approving the renewal of the BHM&S Sub-Advisory Agreement for an additional one year period, the Board did not place specific emphasis on any one factor discussed above, but considered all factors in equal light. Further, the Board had available and availed itself of the assistance of legal counsel at all times during its consideration of the BHM&S Sub-Advisory Agreement renewal.
Westwood Management Corporation; Sub-Advisor to the Large/Mid Cap Value and the Small Cap Value Funds.
The Sub-Advisory Agreement between the Trust, TPL and Westwood Management Corporation (“Westwood”), on behalf of the Timothy Plan Small Cap Value and Large/Mid Cap Value Funds, was last renewed by the Board at a meeting held for that purpose, among others, on February 22, 2013. The Board considered the following factors in arriving at its conclusions to renew the Westwood Sub-Advisory Agreement for an additional year. First, the Board considered the fees charged by Westwood in light of the services provided by Westwood. After full and careful consideration, the Board, with the independent trustees separately concurring, agreed that the fees charged by Westwood and paid out of the fees received by TPL were fair and reasonable in light of the services provided by Westwood. In reaching that determination, the Board relied on reports describing the fees paid to Westwood and comparing those fees against fees paid to other investment advisors operating under similar circumstances. Next, the Board discussed the nature, extent and quality of Westwood’s services to each Fund, including the investment performance of the Funds under Westwood’s investment management. The Board generally approved of Westwood’s performance, noting that the Funds managed by Westwood invested in a manner that did not rely exclusively on investment performance. Further, the Board noted with approval that Westwood did not succumb to “style drift” in its management of each Fund’s assets, and that Westwood was committed to maintain its investment mandate, even if that meant under performance during periods when that style was out of favor. The Board noted with approval Westwood’s ongoing efforts to maintain such consistent investment discipline. Next, the Board considered whether Westwood’s current fee structure would allow the Funds to realize economies of scale as they grow. The Board decided that this particular factor was moot with respect to the Westwood Sub-Advisory Agreement because Westwood was paid out of the fees paid to TPL. After careful discussion and consideration, the Board, including the independent Trustees separately concurring, unanimously determined that the renewal of the Westwood Sub-Advisory Agreement for another one-year period would be in the best interests of the Funds’ shareholders. In approving the renewal of the Westwood Sub-Advisory Agreement for an additional one year period, the Board did not place specific emphasis on any one factor discussed above, but considered all factors in equal light. Further, the Board had available and availed itself of the assistance of legal counsel at all times during its consideration of the Westwood Sub-Advisory Agreement renewal.
Chartwell Investment Partners; Sub-Advisor to the Aggressive Growth and Large/Mid Cap Growth Funds.
The Sub-Advisory Agreement between the Trust, TPL and Chartwell Investment Partners (“Chartwell”), on behalf of the Timothy Plan Aggressive Growth and Large/Mid Cap Growth Funds, was last renewed by the Board at a meeting held for that purpose, among others, on February 22, 2013. The Board considered the following factors in arriving at its conclusions to renew the Chartwell Sub-Advisory Agreement for an additional year. First, the Board considered the fees charged by Chartwell in light of
Timothy Plan Notes to Financial Statements
[114]
Notes to Financial Statements
September 30, 2013
Timothy Plan Family of Funds
the services provided by Chartwell. After full and careful consideration, the Board, with the independent trustees separately concurring, agreed that the fees charged by Chartwell and paid out of the fees received by TPL were fair and reasonable in light of the services provided by Chartwell. In reaching that determination, the Board relied on reports describing the fees paid to Chartwell and comparing those fees against fees paid to other investment advisors operating under similar circumstances. Next, the Board discussed the nature, extent and quality of Chartwell’s services to each Fund, including the investment performance of the Funds under Chartwell’s investment management. The Board generally approved of Chartwell’s performance, noting that the Funds managed by Chartwell invested in a manner that did not rely exclusively on investment performance. Further, the Board noted with approval that Chartwell did not succumb to “style drift” in its management of each Fund’s assets, and that Chartwell was committed to maintain its investment mandate, even if that meant under performance during periods when that style was out of favor. The Board noted with approval Chartwell’s ongoing efforts to maintain such consistent investment discipline. Next, the Board considered whether Chartwell’s current fee structure would allow the Funds to realize economies of scale as they grow. The Board decided that this particular factor was moot with respect to the Chartwell Sub-Advisory Agreement because Chartwell was paid out of the fees paid to TPL. After careful discussion and consideration, the Board, including the independent Trustees separately concurring, unanimously determined that the renewal of the Chartwell Sub-Advisory Agreement for another one-year period would be in the best interests of the Funds’ shareholders. In approving the renewal of the Chartwell Sub-Advisory Agreement for an additional one year period, the Board did not place specific emphasis on any one factor discussed above, but considered all factors in equal light. Further, the Board had available and availed itself of the assistance of legal counsel at all times during its consideration of the Chartwell Sub-Advisory Agreement renewal.
Eagle Global Advisors; Sub-Advisor to the International Fund and Israel Common Values Fund.
The Sub-Advisory Agreement between the Trust, TPL and Eagle Global Advisors (“Eagle”), on behalf of the Timothy Plan International Fund and Israel Common Values Fund, was last renewed by the Board at a meeting held for that purpose, among others, on February 22, 2013. The Board considered the following factors in arriving at its conclusions to renew the Eagle Sub-Advisory Agreement for an additional year. First, the Board considered the fees charged by Eagle in light of the services provided by Eagle. After full and careful consideration, the Board, with the independent trustees separately concurring, agreed that the fees charged by Eagle and paid out of the fees received by TPL were fair and reasonable in light of the services provided by Eagle. In reaching that determination, the Board relied on reports describing the fees paid to Eagle and comparing those fees against fees paid to other investment advisors operating under similar circumstances. Next, the Board discussed the nature, extent and quality of Eagle’s services to the Funds, including the investment performance of the Funds under Eagle’s investment management. The Board generally approved of Eagle’s performance, noting that the Funds managed by Eagle invested in a manner that did not rely exclusively on investment performance. Further, the Board noted with approval that Eagle did not succumb to “style drift” in its management of the Funds’ assets, and that Eagle was committed to maintain its investment mandate, even if that meant under performance during periods when that style was out of favor. The Board noted with approval Eagle’s ongoing efforts to maintain such consistent investment discipline. Next, the Board considered whether Eagle’s current fee structure would allow the Funds to realize economies of scale as they grow. The Board decided that this particular factor was moot with respect to the Eagle Sub-Advisory Agreement because Eagle was paid out of the fees paid to TPL. After careful discussion and consideration, the Board, including the independent Trustees separately concurring, unanimously determined that the renewal of the Eagle Sub-Advisory Agreement for another one-year period would be in the best interests of the Funds’ shareholders. In approving the renewal of the Eagle Sub-Advisory Agreement for an additional one year period, the Board did not place specific emphasis on any one factor discussed above, but considered all factors in equal light. Further, the Board had available and availed itself of the assistance of legal counsel at all times during its consideration of the Eagle Sub-Advisory Agreement renewal.
Brandes Investment Partners; Sub-Advisor to the Emerging Markets Fund.
The Sub-Advisory Agreement between the Trust, TPL and Brandes Investment Partners (“Brandes”), on behalf of the Timothy Plan Emerging Market Fund, was initially approved by the Board at a meeting held for that purpose, among others, on November 18, 2012. The Board considered the following factors in arriving at its conclusions to approve the Brandes Sub-Advisory Agreement. First, the Board considered the fees charged by Brandes in light of the services to be provided by Brandes.
Timothy Plan Notes to Financial Statements
[115]
Notes to Financial Statements
September 30, 2013
Timothy Plan Family of Funds
After full and careful consideration, the Board, with the independent trustees separately concurring, agreed that the fees to be charged by Brandes and paid out of the fees received by TPL were fair and reasonable in light of the services provided by Brandes. In reaching that determination, the Board relied on reports describing the fees paid to Brandes and comparing those fees against fees paid to other investment advisors operating under similar circumstances. Next, the Board discussed the nature, extent and quality of Brandes proposed services to the Fund, including the investment performance of other Brandes accounts with similar investment mandates. The Board generally approved of Brandes’ performance, noting that the Fund invested in a manner that did not rely exclusively on investment performance. Further, the Board noted with approval that Brandes did not appear to succumb to “style drift” in its management of its client’s assets, and that Brandes was committed to maintain its investment mandate, even if that meant under performance during periods when that style was out of favor. The Board noted with approval Brandes’ ongoing efforts to maintain such consistent investment discipline. Next, the Board considered whether Brandes’ current fee structure would allow the Fund to realize economies of scale as it grows. The Board decided that this particular factor was moot with respect to the Eagle Sub-Advisory Agreement because Brandes was paid out of the fees paid to TPL. After careful discussion and consideration, the Board, including the independent Trustees separately concurring, unanimously determined that the approval of the Brandes Sub-Advisory Agreement would be in the best interests of the Fund’s shareholders. In approving the Brandes Sub-Advisory Agreement, the Board did not place specific emphasis on any one factor discussed above, but considered all factors in equal light. Further, the Board had available and availed itself of the assistance of legal counsel at all times during its consideration of the Brandes Sub-Advisory Agreement.
Delaware Management Company; Sub-Advisor to the Defensive Strategies Fund REITs sleeve.
The Sub-Advisory Agreement between the Trust, TPL and Delaware Management Company (“Delaware”), on behalf of the Timothy Plan Defensive Strategies Fund REITs sleeve, was last renewed by the Board at a meeting held for that purpose, among others, on February 22, 2013. The Board considered the following factors in arriving at its conclusions to renew the Delaware Sub-Advisory Agreement for an additional year. First, the Board considered the fees charged by Delaware in light of the services provided by Delaware. After full and careful consideration, the Board, with the independent trustees separately concurring, agreed that the fees charged by Delaware and paid out of the fees received by TPL were fair and reasonable in light of the services provided by Delaware. In reaching that determination, the Board relied on reports describing the fees paid to Delaware and comparing those fees against fees paid to other investment advisors operating under similar circumstances. Next, the Board discussed the nature, extent and quality of Delaware’s services to the Fund, including the investment performance of the Fund under Delaware’s investment management. The Board generally approved of Delaware’s performance, noting that the Fund managed by Delaware invested in a manner that did not rely exclusively on investment performance. Further, the Board noted with approval that Delaware did not succumb to “style drift” in its management of the Fund’s assets, and that Delaware was committed to maintain its investment mandate, even if that meant under performance during periods when that style was out of favor. The Board noted with approval Delaware’s ongoing efforts to maintain such consistent investment discipline. Next, the Board considered whether Delaware’s current fee structure would allow the Fund to realize economies of scale as it grows. The Board decided that this particular factor was moot with respect to the Delaware Sub-Advisory Agreement because Delaware was paid out of the fees paid to TPL. After careful discussion and consideration, the Board, including the independent Trustees separately concurring, unanimously determined that the renewal of the Delaware Sub-Advisory Agreement for another one-year period would be in the best interests of the Fund’s shareholders. In approving the renewal of the Delaware Sub-Advisory Agreement for an additional one year period, the Board did not place specific emphasis on any one factor discussed above, but considered all factors in equal light. Further, the Board had available and availed itself of the assistance of legal counsel at all times during its consideration of the Delaware Sub-Advisory Agreement renewal.
Timothy Plan Notes to Financial Statements
[116]
REPORT OF INDEPENDENT REGISTERED PUBLIC ACCOUNTING FIRM
To the Shareholders and Board of Trustees of
The Timothy Plan
We have audited the accompanying statements of assets and liabilities, including the schedules of investments, of The Timothy Plan, comprising Timothy Plan Aggressive Growth Fund, Timothy Plan International Fund, Timothy Plan Large/Mid Cap Growth Fund, Timothy Plan Small Cap Value Fund, Timothy Plan Large/Mid Cap Value Fund, Timothy Plan Fixed Income Fund, Timothy Plan High Yield Bond Fund, Timothy Plan Israel Common Values Fund, Timothy Plan Defensive Strategies Fund, Timothy Plan Strategic Growth Fund, Timothy Plan Conservative Growth Fund, and Timothy Plan Emerging Markets Fund (the “Funds”) as of September 30, 2013, and the related statements of operations for the year or period then ended, the statements of changes in net assets for each of the years or periods then ended, and the financial highlights for each of the years or periods indicated. These financial statements and financial highlights are the responsibility of the Funds’ management. Our responsibility is to express an opinion on these financial statements and financial highlights based on our audits.
We conducted our audits in accordance with the standards of the Public Company Accounting Oversight Board (United States). Those standards require that we plan and perform the audit to obtain reasonable assurance about whether the financial statements and financial highlights are free of material misstatement. An audit includes examining, on a test basis, evidence supporting the amounts and disclosures in the financial statements. Our procedures included confirmation of securities owned as of September 30, 2013, by correspondence with the custodian and brokers, or by other appropriate auditing procedures where replies from brokers were not received. An audit also includes assessing the accounting principles used and significant estimates made by management, as well as evaluating the overall financial statement presentation. We believe that our audits provide a reasonable basis for our opinion.
In our opinion, the financial statements and financial highlights referred to above present fairly, in all material respects, the financial position of Timothy Plan Aggressive Growth Fund, Timothy Plan International Fund, Timothy Plan Large/Mid Cap Growth Fund, Timothy Plan Small Cap Value Fund, Timothy Plan Large/Mid Cap Value Fund, Timothy Plan Fixed Income Fund, Timothy Plan High Yield Bond Fund, Timothy Plan Israel Common Values Fund, Timothy Plan Defensive Strategies Fund, Timothy Plan Strategic Growth Fund, Timothy Plan Conservative Growth Fund, and Timothy Plan Emerging Markets Fund, each a series constituting The Timothy Plan, as of September 30, 2013, the results of their operations for the year then ended, the changes in their net assets and the financial highlights for each of the years or periods indicated, in conformity with accounting principles generally accepted in the United States of America.
COHEN FUND AUDIT SERVICES, LTD.
Cleveland, Ohio
November 21, 2013
[117]
Important Tax Information – (UNAUDITED)
September 30, 2013
For the International Fund, in accordance with federal tax law, the fund elects to provide each shareholder with their portion of the fund’s foreign taxes paid and the income sourced from foreign countries. Accordingly, the fund hereby reports the following information regarding its fiscal year ended September 30, 2013:
| | • | | The total amount of taxes paid to foreign countries was $109,637 |
| | • | | The total amount of income sourced from foreign countries was $955,817. |
[118]
Expense Examples – (UNAUDITED)
September 30, 2013
As a shareholder of a Fund, you incur two types of costs: direct costs, such as wire fees and low balance fees; and indirect costs, including management fees, and other Fund operating expenses. This example is intended to help you understand your indirect costs, also referred to as “ongoing costs”, (in dollars) of investing in each Fund, and to compare these costs with the ongoing costs of investing in other mutual funds.
This example is based on an investment of $1,000 invested at the beginning of the period and held for the entire six-month period of April 1, 2013, through September 30, 2013.
Actual Expenses
The first line of the following tables provides information about actual account values and actual expenses. You may use the information in this line, together with the amount you invested at the beginning of the period, to estimate the expenses that you paid over the period. Simply divide your account value by $1,000 (for example, an $8,600 account value divided by $1,000 = 8.6), then multiply the result by the number in the first line under the heading “Expenses Paid During Period” to estimate the expenses you paid on your account during this period.
Hypothetical Example for Comparison Purposes
The second line of the tables provides information about hypothetical account values and hypothetical expenses based on each Fund’s actual expense ratio and an assumed rate of return of 5% per year before expenses, which is not the Fund’s actual return. The hypothetical account values and expenses may not be used to estimate the actual ending account balance or expenses you paid for the period. You may use this information to compare ongoing costs of investing in each Fund and other funds. To do so, compare this 5% hypothetical example with the 5% hypothetical examples that appear in the shareholder reports of other funds.
Please note that the expenses shown in the tables are meant to highlight your ongoing costs only and do not reflect any direct costs, such as wire fees or low balance fees. Therefore, the second line of the table is useful in comparing ongoing costs only, and will not help you determine the relative total costs of owning different funds. In addition, if these direct costs were included, your costs would be higher.
AGGRESSIVE GROWTH FUND
| | | | | | | | | | | | | | | | | | | |
| | | Beginning Account
Value | | | | Ending Account
Value | | | | Expenses Paid
During Period |
| | | 4/1/2013 | | | | 9/30/2013 | | | | 4/1/2013 through
9/30/2013 |
Actual - Class A * | | | $ | 1,000.00 | | | | | | $ | 1,129.20 | | | | | | $ | 9.93 | |
Hypothetical - Class A ** | | | $ | 1,000.00 | | | | | | $ | 1,015.74 | | | | | | $ | 9.40 | |
Actual - Class C * | | | $ | 1,000.00 | | | | | | $ | 1,123.80 | | | | | | $ | 13.84 | |
Hypothetical - Class C ** | | | $ | 1,000.00 | | | | | | $ | 1,012.03 | | | | | | $ | 13.11 | |
Actual - Class I *** | | | $ | 1,000.00 | | | | | | $ | 1,015.80 | | | | | | $ | 2.67 | |
Hypothetical - Class I **,*** | | | $ | 1,000.00 | | | | | | $ | 1,003.95 | | | | | | $ | 4.28 | |
| * | Expenses are equal to the Fund’s annualized expense ratio of 1.86% for Class A and 2.60% for Class C, which is net of any expenses paid indirectly, multiplied by the average account value over the period, multiplied by 183 days/365 days (to reflect the partial year period). The Aggressive Growth Fund’s ending account value on the first line of each share class in the table is based on its actual total return of 12.92% for Class A and 12.52% for Class C for the six-month period of April 1, 2013, to September 30, 2013. |
| ** | Assumes a 5% return before expenses. |
| *** | Expenses are equal to the Fund’s annualized expense ratio of 1.61% for Class I, which is net of any expenses paid indirectly, multiplied by the average account value over the period, multiplied by 60 days/365 days (to reflect the partial year period). The Aggressive Growth Fund’s ending account value on the first line of each share class in the table is based on its actual total return of 1.58% for Class I for the period of August 1, 2013, to September 30, 2013. |
[119]
Expense Examples – (UNAUDITED) (Continued)
September 30, 2013
INTERNATIONAL FUND
| | | | | | | | | | | | | | | | | | | |
| | | Beginning Account
Value | | | | Ending Account
Value | | | | Expenses Paid
During Period |
| | | 4/1/2013 | | | | 9/30/2013 | | | | 4/1/2013 through
9/30/2013 |
Actual - Class A * | | | $ | 1,000.00 | | | | | | $ | 1,084.00 | | | | | | $ | 9.04 | |
Hypothetical - Class A ** | | | $ | 1,000.00 | | | | | | $ | 1,016.39 | | | | | | $ | 8.74 | |
Actual - Class C * | | | $ | 1,000.00 | | | | | | $ | 1,080.50 | | | | | | $ | 12.88 | |
Hypothetical - Class C ** | | | $ | 1,000.00 | | | | | | $ | 1,012.68 | | | | | | $ | 12.46 | |
Actual - Class I *** | | | $ | 1,000.00 | | | | | | $ | 1,022.50 | | | | | | $ | 2.46 | |
Hypothetical - Class I **, *** | | | $ | 1,000.00 | | | | | | $ | 1,003.95 | | | | | | $ | 4.28 | |
| * | Expenses are equal to the Fund’s annualized expense ratio of 1.73% for Class A and 2.47% for Class C, which is net of any expenses paid indirectly, multiplied by the average account value over the period, multiplied by 183 days/365 days (to reflect the partial year period). The International Fund’s ending account value on the first line of each share class in the table is based on its actual total return of 8.40% for Class A and 8.05% for Class C for the six-month period of April 1, 2013, to September 30, 2013. |
| ** | Assumes a 5% return before expenses. |
| *** | Expenses are equal to the Fund’s annualized expense ratio of 1.48% for Class I, which is net of any expenses paid indirectly, multiplied by the average account value over the period, multiplied by 60 days/365 days (to reflect the partial year period). The International Fund’s ending account value on the first line of each share class in the table is based on its actual total return of 2.25% for Class I for the period of August 1, 2013, to September 30, 2013. |
LARGE/MID CAP GROWTH FUND
| | | | | | | | | | | | | | | | | | | |
| | | Beginning Account
Value | | | | Ending Account
Value | | | | Expenses Paid
During Period |
| | | 4/1/2013 | | | | 9/30/2013 | | | | 4/1/2013 through
9/30/2013 |
Actual - Class A * | | | $ | 1,000.00 | | | | | | $ | 1,101.40 | | | | | | $ | 8.38 | |
Hypothetical - Class A ** | | | $ | 1,000.00 | | | | | | $ | 1,017.10 | | | | | | $ | 8.04 | |
Actual - Class C * | | | $ | 1,000.00 | | | | | | $ | 1,096.60 | | | | | | $ | 12.30 | |
Hypothetical - Class C ** | | | $ | 1,000.00 | | | | | | $ | 1,013.34 | | | | | | $ | 11.81 | |
Actual - Class I *** | | | $ | 1,000.00 | | | | | | $ | 1,007.20 | | | | | | $ | 2.21 | |
Hypothetical - Class I **, *** | | | $ | 1,000.00 | | | | | | $ | 1,004.37 | | | | | | $ | 2.21 | |
| * | Expenses are equal to the Fund’s annualized expense ratio of 1.59% for Class A and 2.34% for Class C, which is net of any expenses paid indirectly, multiplied by the average account value over the period, multiplied by 183 days/365 days (to reflect the partial year period). The Large/Mid Cap Growth Fund’s ending account value on the first line of each share class in the table is based on its actual total return of 10.14% for Class A and 9.66% for Class C for the six-month period of April 1, 2013, to September 30, 2013. |
| ** | Assumes a 5% return before expenses. |
| *** | Expenses are equal to the Fund’s annualized expense ratio of 1.34% for Class I, which is net of any expenses paid indirectly, multiplied by the average account value over the period, multiplied by 60 days/365 days (to reflect the partial year period). The Large/Mid Cap Growth Fund’s ending account value on the first line of each share class in the table is based on its actual total return of 0.72% for Class I for the period of August 1, 2013, to September 30, 2013. |
SMALL CAP VALUE FUND
| | | | | | | | | | | | | | | | | | | |
| | | Beginning Account
Value | | | | Ending Account
Value | | | | Expenses Paid
During Period |
| | | 4/1/2013 | | | | 9/30/2013 | | | | 4/1/2013 through
9/30/2013 |
Actual - Class A * | | | $ | 1,000.00 | | | | | | $ | 1,153.90 | | | | | | $ | 8.37 | |
Hypothetical - Class A ** | | | $ | 1,000.00 | | | | | | $ | 1,017.30 | | | | | | $ | 7.84 | |
Actual - Class C * | | | $ | 1,000.00 | | | | | | $ | 1,148.70 | | | | | | $ | 12.39 | |
Hypothetical - Class C ** | | | $ | 1,000.00 | | | | | | $ | 1,013.54 | | | | | | $ | 11.61 | |
Actual - Class I *** | | | $ | 1,000.00 | | | | | | $ | 1,031.00 | | | | | | $ | 2.17 | |
Hypothetical - Class I **, *** | | | $ | 1,000.00 | | | | | | $ | 1,004.44 | | | | | | $ | 3.79 | |
| * | Expenses are equal to the Fund’s annualized expense ratio of 1.55% for Class A and 2.30% for Class C, which is net of any expenses paid indirectly, multiplied by the average account value over the period, multiplied by 183 days/365 days (to reflect the partial year period). The Small Cap Value Fund’s ending account value on the first line of each share class in the table is based on its actual total return of 15.39% for Class A and 14.87% for Class C for the six-month period of April 1, 2013, to September 30, 2013. |
| ** | Assumes a 5% return before expenses. |
| *** | Expenses are equal to the Fund’s annualized expense ratio of 1.30% for Class I, which is net of any expenses paid indirectly, multiplied by the average account value over the period, multiplied by 60 days/365 days (to reflect the partial year period). The Small Cap Value Fund’s ending account value on the first line of each share class in the table is based on its actual total return of 3.10% for Class I for the period of August 1, 2013, to September 30, 2013. |
[120]
Expense Examples – (UNAUDITED) (Continued)
September 30, 2013
LARGE/MID CAP VALUE FUND
| | | | | | | | | | | | | | | | | | | |
| | | Beginning Account
Value | | | | Ending Account
Value | | | | Expenses Paid
During Period |
| | | 4/1/2013 | | | | 9/30/2013 | | | | 4/1/2013 through
9/30/2013 |
Actual - Class A * | | | $ | 1,000.00 | | | | | | $ | 1,074.90 | | | | | | $ | 7.75 | |
Hypothetical - Class A ** | | | $ | 1,000.00 | | | | | | $ | 1,017.60 | | | | | | $ | 7.54 | |
Actual - Class C * | | | $ | 1,000.00 | | | | | | $ | 1,070.40 | | | | | | $ | 11.57 | |
Hypothetical - Class C ** | | | $ | 1,000.00 | | | | | | $ | 1,013.89 | | | | | | $ | 11.26 | |
Actual - Class I *** | | | $ | 1,000.00 | | | | | | $ | 996.70 | | | | | | $ | 2.03 | |
Hypothetical - Class I **, *** | | | $ | 1,000.00 | | | | | | $ | 1,004.55 | | | | | | $ | 3.67 | |
| * | Expenses are equal to the Fund’s annualized expense ratio of 1.49% for Class A and 2.23% for Class C, which is net of any expenses paid indirectly, multiplied by the average account value over the period, multiplied by 183 days/365 days (to reflect the partial year period). The Large/Mid Cap Value Fund’s ending account value on the first line of each share class in the table is based on its actual total return of 7.49% for Class A and 7.04% for Class C for the six-month period of April 1, 2013, to September 30, 2013. |
| ** | Assumes a 5% return before expenses. |
| *** | Expenses are equal to the Fund’s annualized expense ratio of 1.24% for Class I, which is net of any expenses paid indirectly, multiplied by the average account value over the period, multiplied by 60 days/365 days (to reflect the partial year period). The Large/Mid Cap Value Fund’s ending account value on the first line of each share class in the table is based on its actual total return of (0.33)% for Class I for the period of August 1, 2013, to September 30, 2013. |
FIXED INCOME FUND
| | | | | | | | | | | | | | | | | | | |
| | | Beginning Account
Value | | | | Ending Account
Value | | | | Expenses Paid
During Period |
| | | 4/1/2013 | | | | 9/30/2013 | | | | 4/1/2013 through
9/30/2013 |
Actual - Class A * | | | $ | 1,000.00 | | | | | | $ | 976.60 | | | | | | $ | 5.55 | |
Hypothetical - Class A ** | | | $ | 1,000.00 | | | | | | $ | 1,019.45 | | | | | | $ | 5.67 | |
Actual - Class C * | | | $ | 1,000.00 | | | | | | $ | 972.00 | | | | | | $ | 9.29 | |
Hypothetical - Class C ** | | | $ | 1,000.00 | | | | | | $ | 1,015.64 | | | | | | $ | 9.50 | |
Actual - Class I *** | | | $ | 1,000.00 | | | | | | $ | 1,009.00 | | | | | | $ | 1.44 | |
Hypothetical - Class I **, *** | | | $ | 1,000.00 | | | | | | $ | 1,005.13 | | | | | | $ | 3.10 | |
| * | Expenses are equal to the Fund’s annualized expense ratio of 1.12% for Class A and 1.88% for Class C, which is net of any expenses paid indirectly, multiplied by the average account value over the period, multiplied by 183 days/365 days (to reflect the partial year period). The Fixed Income Fund’s ending account value on the first line of each share class in the table is based on its actual total return of (2.34)% for Class A and (2.80)% for Class C for the six-month period of April 1, 2013, to September 30, 2013. |
| ** | Assumes a 5% return before expenses. |
| *** | Expenses are equal to the Fund’s annualized expense ratio of 0.87% for Class I, which is net of any expenses paid indirectly, multiplied by the average account value over the period, multiplied by 60 days/365 days (to reflect the partial year period). The Fixed Income Fund’s ending account value on the first line of each share class in the table is based on its actual total return of 0.90% for Class I for the period of August 1, 2013, to September 30, 2013. |
HIGH YIELD BOND FUND
| | | | | | | | | | | | | | | | | | | |
| | | Beginning Account
Value | | | | Ending Account
Value | | | | Expenses Paid
During Period |
| | | 4/1/2013 | | | | 9/30/2013 | | | | 4/1/2013 through
9/30/2013 |
Actual - Class A * | | | $ | 1,000.00 | | | | | | $ | 993.80 | | | | | | $ | 6.65 | |
Hypothetical - Class A ** | | | $ | 1,000.00 | | | | | | $ | 1,018.40 | | | | | | $ | 6.73 | |
Actual - Class C * | | | $ | 1,000.00 | | | | | | $ | 990.30 | | | | | | $ | 10.33 | |
Hypothetical - Class C ** | | | $ | 1,000.00 | | | | | | $ | 1,014.69 | | | | | | $ | 10.45 | |
Actual - Class I *** | | | $ | 1,000.00 | | | | | | $ | 1,001.50 | | | | | | $ | 1.78 | |
Hypothetical - Class I **, *** | | | $ | 1,000.00 | | | | | | $ | 1,004.82 | | | | | | $ | 3.41 | |
| * | Expenses are equal to the Fund’s annualized expense ratio of 1.33% for Class A and 2.07% for Class C, which is net of any expenses paid indirectly, multiplied by the average account value over the period, multiplied by 183 days/365 days (to reflect the partial year period). The High Yield Bond Fund’s ending account value on the first line of each share class in the table is based on its actual total return of (0.62)% for Class A and (0.97)% for Class C for the six-month period of April 1, 2013, to September 30, 2013. |
| ** | Assumes a 5% return before expenses. |
| *** | Expenses are equal to the Fund’s annualized expense ratio of 1.08% for Class I, which is net of any expenses paid indirectly, multiplied by the average account value over the period, multiplied by 60 days/365 days (to reflect the partial year period). The High Yield Bond Fund’s ending account value on the first line of each share class in the table is based on its actual total return of 0.15% for Class I for the period of August 1, 2013, to September 30, 2013. |
[121]
Expense Examples – (UNAUDITED) (Continued)
September 30, 2013
DEFENSIVE STRATEGIES FUND
| | | | | | | | | | | | | | | | | | | |
| | | Beginning Account
Value | | | | Ending Account
Value | | | | Expenses Paid
During Period |
| | | 4/1/2013 | | | | 9/30/2013 | | | | 4/1/2013 through
9/30/2013 |
Actual - Class A * | | | $ | 1,000.00 | | | | | | $ | 935.20 | | | | | | $ | 6.11 | |
Hypothetical - Class A ** | | | $ | 1,000.00 | | | | | | $ | 1,018.75 | | | | | | $ | 6.38 | |
Actual - Class C * | | | $ | 1,000.00 | | | | | | $ | 932.00 | | | | | | $ | 9.78 | |
Hypothetical - Class C ** | | | $ | 1,000.00 | | | | | | $ | 1,014.94 | | | | | | $ | 10.20 | |
Actual - Class I *** | | | $ | 1,000.00 | | | | | | $ | 1,000.00 | | | | | | $ | 1.66 | |
Hypothetical - Class I **, *** | | | $ | 1,000.00 | | | | | | $ | 1,004.90 | | | | | | $ | 3.33 | |
| * | Expenses are equal to the Fund’s annualized expense ratio of 1.26% for Class A and 2.02% for Class C, which is net of any expenses paid indirectly, multiplied by the average account value over the period, multiplied by 183 days/365 days (to reflect the partial year period). The Defensive Strategies Fund’s ending account value on the first line of each share class in the table is based on its actual total return of (6.48)% for Class A and (6.80)% for Class C for the period of April 1, 2013, to September 30, 2013. |
| ** | Assumes a 5% return before expenses. |
| *** | Expenses are equal to the Fund’s annualized expense ratio of 1.01% for Class I, which is net of any expenses paid indirectly, multiplied by the average account value over the period, multiplied by 60 days/365 days (to reflect the partial year period). The Defensive Strategies Fund’s ending account value on the first line of each share class in the table is based on its actual total return of 0.00% for Class I for the period of August 1, 2013, to September 30, 2013. |
STRATEGIC GROWTH FUND
| | | | | | | | | | | | | | | | | | | |
| | | Beginning Account
Value | | | | Ending Account
Value | | | | Expenses Paid
During Period |
| | | 4/1/2013 | | | | 9/30/2013 | | | | 4/1/2013 through
9/30/2013 |
Actual - Class A * | | | $ | 1,000.00 | | | | | | $ | 1,043.90 | | | | | | $ | 5.53 | |
Hypothetical - Class A ** | | | $ | 1,000.00 | | | | | | $ | 1,019.65 | | | | | | $ | 5.47 | |
Actual - Class C * | | | $ | 1,000.00 | | | | | | $ | 1,039.20 | | | | | | $ | 9.35 | |
Hypothetical - Class C ** | | | $ | 1,000.00 | | | | | | $ | 1,015.89 | | | | | | $ | 9.25 | |
| * | Expenses are equal to the Fund’s annualized expense ratio of 1.08% for Class A and 1.83% for Class C, which is net of any expenses paid indirectly, multiplied by the average account value over the period, multiplied by 183 days/365 days (to reflect the partial year period). The Strategic Growth Fund’s ending account value on the first line of each share class in the table is based on its actual total return of 4.39% for Class A and 3.92% for Class C for the six-month period of April 1, 2013, to September 30, 2013. |
| ** | Assumes a 5% return before expenses. |
CONSERVATIVE GROWTH FUND
| | | | | | | | | | | | | | | | | | | |
| | | Beginning Account
Value | | | | Ending Account
Value | | | | Expenses Paid
During Period |
| | | 4/1/2013 | | | | 9/30/2013 | | | | 4/1/2013 through
9/30/2013 |
Actual - Class A * | | | $ | 1,000.00 | | | | | | $ | 1,014.30 | | | | | | $ | 5.30 | |
Hypothetical - Class A ** | | | $ | 1,000.00 | | | | | | $ | 1,019.80 | | | | | | $ | 5.32 | |
Actual - Class C * | | | $ | 1,000.00 | | | | | | $ | 1,011.40 | | | | | | $ | 9.08 | |
Hypothetical - Class C ** | | | $ | 1,000.00 | | | | | | $ | 1,016.04 | | | | | | $ | 9.10 | |
| * | Expenses are equal to the Fund’s annualized expense ratio of 1.05% for Class A and 1.80% for Class C, which is net of any expenses paid indirectly, multiplied by the average account value over the period, multiplied by 183 days/365 days (to reflect the partial year period). The Conservative Growth Fund’s ending account value on the first line of each share class in the table is based on its actual total return of 1.43% for Class A and 1.14% for Class C for the six-month period of April 1, 2013, to September 30, 2013. |
| ** | Assumes a 5% return before expenses. |
[122]
Expense Examples – (UNAUDITED) (Continued)
September 30, 2013
ISRAEL COMMON VALUES FUND
| | | | | | | | | | | | | | | | | | | |
| | | Beginning Account
Value | | | | Ending Account
Value | | | | Expenses Paid
During Period |
| | | 4/1/2013 | | | | 9/30/2013 | | | | 4/1/2013 through
9/30/2013 |
Actual - Class A * | | | $ | 1,000.00 | | | | | | $ | 1,101.60 | | | | | | $ | 11.80 | |
Hypothetical - Class A ** | | | $ | 1,000.00 | | | | | | $ | 1,013.84 | | | | | | $ | 11.31 | |
Actual - Class C * | | | $ | 1,000.00 | | | | | | $ | 1,097.50 | | | | | | $ | 15.72 | |
Hypothetical - Class C ** | | | $ | 1,000.00 | | | | | | $ | 1,010.08 | | | | | | $ | 15.07 | |
Actual - Class I *** | | | $ | 1,000.00 | | | | | | $ | 1,037.70 | | | | | | $ | 3.33 | |
Hypothetical - Class I **, *** | | | $ | 1,000.00 | | | | | | $ | 1,003.30 | | | | | | $ | 4.92 | |
| * | Expenses are equal to the Fund’s annualized expense ratio of 2.24% for Class A and 2.99% for Class C, which is net of any expenses paid indirectly, multiplied by the average account value over the period, multiplied by 183 days/365 days (to reflect the partial year period). The Israel Common Values Fund’s ending account value on the first line of each share class in the table is based on its actual total return of 10.16% for Class A and 9.75% for Class C for the six-month period of April 1, 2013, to September 30, 2013. |
| ** | Assumes a 5% return before expenses. |
| *** | Expenses are equal to the Fund’s annualized expense ratio of 1.99% for Class I, which is net of any expenses paid indirectly, multiplied by the average account value over the period, multiplied by 60 days/365 days (to reflect the partial year period). The Israel Common Values Fund’s ending account value on the first line of each share class in the table is based on its actual total return of 3.77% for Class I for the period of August 1, 2013, to September 30, 2013. |
EMERGING MARKETS FUND
| | | | | | | | | | | | | | | | | | | |
| | | Beginning Account
Value | | | | Ending Account
Value | | | | Expenses Paid
During Period |
| | | 4/1/2013 | | | | 9/30/2013 | | | | 4/1/2013 through
9/30/2013 |
Actual - Class A * | | | $ | 1,000.00 | | | | | | $ | 993.40 | | | | | | $ | 9.60 | |
Hypothetical - Class A ** | | | $ | 1,000.00 | | | | | | $ | 1,009.88 | | | | | | $ | 15.27 | |
Actual - Class C * | | | $ | 1,000.00 | | | | | | $ | 989.60 | | | | | | $ | 11.89 | |
Hypothetical - Class C ** | | | $ | 1,000.00 | | | | | | $ | 1,006.37 | | | | | | $ | 18.76 | |
Actual - Class I *** | | | $ | 1,000.00 | | | | | | $ | 1,057.20 | | | | | | $ | 9.09 | |
Hypothetical - Class I **, *** | | | $ | 1,000.00 | | | | | | $ | 1,003.55 | | | | | | $ | 4.68 | |
| * | Expenses are equal to the Fund’s annualized expense ratio of 3.03% for Class A and 3.76% for Class C, which is net of any expenses paid indirectly, multiplied by the average account value over the period, multiplied by 183 days/365 days (to reflect the partial year period). The Emerging Markets Fund’s ending account value on the first line of each share class in the table is based on its actual total return of (0.66)% for Class A and (1.04)% for Class C for the period of April 1, 2013, to September 30, 2013. |
| ** | Assumes a 5% return before expenses. |
| *** | Expenses are equal to the Fund’s annualized expense ratio of 2.78% for Class I, which is net of any expenses paid indirectly, multiplied by the average account value over the period, multiplied by 60 days/365 days (to reflect the partial year period). The Emerging Markets Fund’s ending account value on the first line of each share class in the table is based on its actual total return of 5.72% for Class I for the period of August 1, 2013, to September 30, 2013. |
[123]
Officers and Trustees of the Trust
As of September 30, 2013 (Unaudited)
Timothy Plan Family of Funds
| | | | | | |
| Name, Age and Address | | Position(s) Held With Trust | | Term of Office and Length of Time Served | | Number of Portfolios
in Fund Complex
Overseen by Trustee |
Arthur D. Ally* 1055 Maitland Center Commons Maitland, FL Born: 1942 | | Chairman and President | | Indefinite; Trustee and President since 1994 | | 13 |
| | Principal Occupation During Past 5 Years | | Other Directorships Held by Trustee |
| | President and controlling shareholder of Covenant Funds, Inc. (“CFI”), a holding company. President and general partner of Timothy Partners, Ltd. (“TPL”), the investment advisor and principal underwriter to each Fund. CFI is also the managing general partner of TPL. | | None |
| | | | | | |
| Name, Age and Address | | Position(s) Held With Trust | | Term of Office and Length of Time Served | | Number of Portfolios
in Fund Complex
Overseen by Trustee |
Kenneth Blackwell 1055 Maitland Center Commons Maitland, FL Born: 1948 | | Trustee | | Indefinite; Trustee since 2011 | | 13 |
| | Principal Occupation During Past 5 Years | | Other Directorships Held by Trustee |
| | Secretary of State for the State of Ohio. Currently serving as an independent consultant or Fellow with the Family Research Council and the American Civil Rights Union, and is a Visiting Professor at Liberty University, Lynchburg, VA. | | None |
| | | | | | |
| Name, Age and Address | | Position(s) Held With Trust | | Term of Office and Length of Time Served | | Number of Portfolios
in Fund Complex
Overseen by Trustee |
Joseph E. Boatwright** 1055 Maitland Center Commons Maitland, FL Born: 1930 | | Trustee, Secretary | | Indefinite; Trustee and Secretary since 1995 | | 13 |
| | Principal Occupation During Past 5 Years | | Other Directorships Held by Trustee |
| | Retired Minister. Currently serves as a consultant to the Greater Orlando Baptist Association. Served as Senior Pastor to Aloma Baptist Church from 1970-1996. | | None |
| * | Mr. Ally is an “interested” Trustee, as that term is defined in the 1940 Act, because of his positions with and financial interests in CFI and TPL. |
| ** | Messrs. Boatwright and Staver are “interested” Trustees, as that term is defined in the 1940 Act, because each has a limited partnership intereset in TPL. |
[124]
Officers and Trustees of the Trust (Continued)
As of September 30, 2013 (Unaudited)
Timothy Plan Family of Funds
| | | | | | |
| Name, Age and Address | | Position(s) Held With Trust | | Term of Office and Length of Time Served | | Number of Portfolios
in Fund Complex
Overseen by Trustee |
Richard W. Copeland 1055 Maitland Center Commons Maitland, FL Born: 1947 | | Trustee | | Indefinite; Trustee since 2005 | | 13 |
| | Principal Occupation During Past 5 Years | | Other Directorships Held by Trustee |
| | Principal of Copeland & Covert, Attorneys at Law; specializing in tax and estate planning. B.A. from Mississippi College, JD from University of Florida and LLM Taxation from University of Miami. Associate Professor Stetson University for past 35 years. | | None |
| | | | | | |
| Name, Age and Address | | Position(s) Held With Trust | | Term of Office and Length of Time Served | | Number of Portfolios
in Fund Complex
Overseen by Trustee |
Deborah Honeycutt 1055 Maitland Center Commons Maitland, FL Born: 1947 | | Trustee | | Indefinite; Trustee since 2010 | | 13 |
| | Principal Occupation During Past 5 Years | | Other Directorships Held by Trustee |
| | Dr. Honeycutt is a licensed physician currently serving as Medical Director of Clayton State University Health Services in Morrow, GA, CEO of Minority Health Services in Atlanta, and as a volunteer at Good Shepherd Clinic. Dr. Honeycutt received her B.A. and M.D. at the University of Illinois. | | None |
| | | | | | |
| Name, Age and Address | | Position(s) Held With Trust | | Term of Office and Length of Time Served | | Number of Portfolios
in Fund Complex
Overseen by Trustee |
Bill Johnson 1055 Maitland Center Commons Maitland, FL Born: 1946 | | Trustee | | Indefinite; Trustee since 2005 | | 13 |
| | Principal Occupation During Past 5 Years | | Other Directorships Held by Trustee |
| | President (and Founder) of American Decency Association, Freemont, MI since 1999. Previously served as Michigan State Director for American Family Association (1987-1999). Previously a public school teacher for 18 years. B.S. from Michigan State University and a Masters of Religious Education from Grand Rapids Baptist Seminary. | | None |
[125]
Officers and Trustees of the Trust (Continued)
As of September 30, 2013 (Unaudited)
Timothy Plan Family of Funds
| | | | | | |
| Name, Age and Address | | Position(s) Held With Trust | | Term of Office and Length of Time Served | | Number of Portfolios
in Fund Complex
Overseen by Trustee |
John C. Mulder 1055 Maitland Center Commons Maitland, FL Born: 1950 | | Trustee | | Indefinite; Trustee since 2005 | | 13 |
| | Principal Occupation During Past 5 Years | | Other Directorships Held by Trustee |
| | President of WaterStone (formerly the Christian Community Foundation and National Foundation) since 2001. Prior: 22 years of executive experience for a group of banks and a trust company. B.A. in Economics from Wheaton College and MBA from University of Chicago. | | None |
| | | | | | |
| Name, Age and Address | | Position(s) Held With Trust | | Term of Office and Length of Time Served | | Number of Portfolios
in Fund Complex
Overseen by Trustee |
Charles E. Nelson 1055 Maitland Center Commons Maitland, FL Born: 1934 | | Trustee | | Indefinite; Trustee since 2000 | | 13 |
| | Principal Occupation During Past 5 Years | | Other Directorships Held by Trustee |
| | Certified Public Accountant, semi-retired. Former non-profit industry accounting officer. Former financial executive with commercial bank. Former partner national accounting firm. | | None |
| | | | | | |
| Name, Age and Address | | Position(s) Held With Trust | | Term of Office and Length of Time Served | | Number of Portfolios
in Fund Complex
Overseen by Trustee |
Scott Preissler, Ph.D. 1055 Maitland Center Commons Maitland, FL Born: 1960 | | Trustee | | Indefinite; Trustee since 2004 | | 13 |
| | Principal Occupation During Past 5 Years | | Other Directorships Held by Trustee |
| | Chairman of Stewardship Studies at Southwestern Baptist Theological Seminary, Ft. Worth, TX. Also serves as Founder and Chairman of the International Center for Biblical Stewardship. Previously, President and CEO of Christian Stewardship Association where he was affiliated for 14 years. | | None |
[126]
Officers and Trustees of the Trust (Continued)
As of September 30, 2013 (Unaudited)
Timothy Plan Family of Funds
| | | | | | |
| Name, Age and Address | | Position(s) Held With Trust | | Term of Office and Length of Time Served | | Number of Portfolios
in Fund Complex
Overseen by Trustee |
Alan M. Ross 1055 Maitland Center Commons Maitland, FL Born: 1951 | | Trustee, Vice Chairman | | Indefinite; Trustee since 2004 | | 13 |
| | Principal Occupation During Past 5 Years | | Other Directorships Held by Trustee |
| | Founder and CEO of Corporate Development Institute which he founded in 2000. Previously he served as President and CEO of Fellowship of Companies for Christ and has authored three books: Beyond World Class, Unconditional Excellence, Breaking Through to Prosperity. | | None |
| | | | | | |
| Name, Age and Address | | Position(s) Held With Trust | | Term of Office and Length of Time Served | | Number of Portfolios
in Fund Complex
Overseen by Trustee |
Mathew D. Staver** 1055 Maitland Center Commons Maitland, FL Born: 1956 | | Trustee | | Indefinite; Trustee since 2000 | | 13 |
| | Principal Occupation During Past 5 Years | | Other Directorships Held by Trustee |
| | Attorney specializing in free speech, appellate practice and religious liberty constitutional law. Founder of Liberty Counsel, a religious civil liberties education and legal defense organization. Host of two radio programs devoted to religious freedom issues. Editor of a monthly newsletter devoted to religious liberty topics. Mr. Staver has argued before the United States Supreme Court and has published numerous legal articles. | | None |
| | | | | | |
| Name, Age and Address | | Position(s) Held With Trust | | Term of Office and Length of Time Served | | Number of Portfolios
in Fund Complex
Overseen by Trustee |
Patrice Tsague 1055 Maitland Center Commons Maitland, FL Born: 1973 | | Trustee | | Indefinite; Trustee since 2011 | | 13 |
| | Principal Occupation During Past 5 Years | | Other Directorships Held by Trustee |
| | President and Chief Servant Officer of the Nehemiah Project International Ministries Inc. since 1999. | | None |
The Fund’s Statement of Additional Information includes additional information about the Trustees and is available free of charge, upon request, by calling toll-free at 1-800-846-7526.
[127]
Timothy Plan Family of Funds
Privacy Policy
The following is a description of the Trust’s policies regarding disclosure of nonpublic personal information that you provide to the Fund or that the Fund collects from other sources. In the event that you hold shares of a Fund through a broker-dealer or other financial intermediary, the privacy policy of your financial intermediary would govern how your nonpublic personal information would be shared with nonaffiliated third parties.
CATEGORIES OF INFORMATION THE FUND COLLECTS
The Fund collects the following nonpublic personal information about you:
1. Information the Fund receives from you on or in applications or other forms, correspondence, or conversations (such as your name, address, phone number, social security number, assets, income and date of birth); and
2. Information about your transactions with the Fund, its affiliates, or others (such as your account number and balance, payment history, parties to transactions, cost basis information, and other financial information).
CATEGORIES OF INFORMATION THE FUND DISCLOSES
The Fund does not disclose any nonpublic personal information about its current or former shareholders to unaffiliated third parties, except as required or permitted by law. The Fund is permitted by law to disclose all of the information it collects, as described above, to its service providers (such as the Fund’s custodian, administrator and transfer agent) to process your transactions and otherwise provide services to you.
CONFIDENTIALITY AND SECURITY
The Fund restricts access to your nonpublic personal information to those persons who require such information to provide products or services to you. The Fund maintains physical, electronic, and procedural safeguards that comply with federal standards to guard your nonpublic personal information.
Customer Identification Program
The Board of Trustees of the Trust has approved procedures designed to prevent and detect attempts to launder money as required under the USA PATRIOT Act. The day-to-day responsibility for monitoring and reporting any such activities has been delegated to the transfer agent, subject to the oversight and supervision of the Board.
Disclosures
HOW TO OBTAIN PROXY VOTING INFORMATION
Information regarding how the Funds voted proxies relating to Fund securities during the period ended June 30 as well as a description of the policies and procedures that the Funds use to determine how to vote proxies is available without charge, upon request, by calling 1-800-732-0330 or by referring to the Security and Exchange Commission’s (“SEC”) website at http://www.sec.gov.
HOW TO OBTAIN 1ST AND 3RD FISCAL QUARTER PORTFOLIO HOLDINGS
Each Fund files its complete schedule of portfolio holdings with the SEC for the first and third quarters of each fiscal year on Form N-Q. Form N-Q is available on the SEC’s website at http://www.sec.gov and may be reviewed and copied at the SEC’s Public Reference Room in Washington, DC (1-800-SEC-0330). The information on Form N-Q is available without charge, upon request, by calling 1-800-732-0330.
[128]
BOARD OF TRUSTEES
Arthur D. Ally
Kenneth Blackwell
Joseph E. Boatwright
Rick Copeland
Deborah Honeycutt
Bill Johnson
John C. Mulder
Charles E. Nelson
Scott Preissler
Alan Ross
Mathew D. Staver
Patrice Tsague
OFFICERS
Arthur D. Ally, President
Joseph E. Boatwright, Secretary
INVESTMENT ADVISOR
Timothy Partners, Ltd.
1055 Maitland Center Commons
Maitland, FL 32751
DISTRIBUTOR
Timothy Partners, Ltd.
1055 Maitland Center Commons
Maitland, FL 32751
TRANSFER AGENT
Gemini Fund Services, LLC
17605 Wright St., Suite 2
Omaha, NE 68130
INDEPENDENT REGISTERED PUBLIC ACCOUNTING FIRM
Cohen Fund Audit Services, Ltd.
1350 Euclid Ave., Suite 800
Cleveland, OH 44115
LEGAL COUNSEL
David Jones & Assoc., P.C.
422 Fleming St.
Key West, FL 33040
For additional information or a prospectus, please call: 1-800-846-7526
Visit the Timothy Plan web site on the internet at: www.timothyplan.com
This report is submitted for the general information of the shareholders of the Funds. It is not authorized for distribution to prospective investors in the Funds unless preceded or accompanied by an effective Prospectus which includes details regarding the Funds’ objectives, policies, expenses and other information. Distributed by Timothy Partners, Ltd.

HEADQUARTERS
The Timothy Plan
1055 Maitland Center Commons Maitland, Florida 32751
(800) 846-7526
www.timothyplan.com invest@timothyplan.com
SHAREHOLDER SERVICES
Gemini Fund Services, LLC
17605 Wright St., Suite 2 Omaha, NE 68130
(800) 662-0201
Item 2. Code of Ethics.
(a) As of the end of the period covered by this report, the registrant has adopted a code of ethics that applies to the registrant’s principal executive officer, principal financial officer, principal accounting officer or controller, or persons performing similar functions, regardless of whether these individuals are employed by the registrant or a third party.
(b) For purposes of this item, “code of ethics” means written standards that are reasonably designed to deter wrongdoing and to promote:
| | (1) | Honest and ethical conduct, including the ethical handling of actual or apparent conflicts of interest between personal and professional relationships; |
| | (2) | Full, fair, accurate, timely, and understandable disclosure in reports and documents that a registrant files with, or submits to, the Commission and in other public communications made by the registrant; |
| | (3) | Compliance with applicable governmental laws, rules, and regulations; |
| | (4) | The prompt internal reporting of violations of the code to an appropriate person or persons identified in the code; and |
| | (5) | Accountability for adherence to the code. |
(c) Amendments: During the period covered by the report, there have not been any amendments to the provisions of the code of ethics.
(d) Waivers: During the period covered by the report, the registrant has not granted any express or implicit waivers from the provisions of the code of ethics.
(e) Posting: We do not intend to post the Code of Ethics for the Officers or any amendments or waivers on a website.
(f) Availability: The Code of Ethics for the Officers can be obtained, free of charge by calling the toll free number for the appropriate Fund.
Item 3. Audit Committee Financial Expert.
(a) The registrant has an Audit committee currently composed of three independent Trustees, Mr. Wesley Pennington, Mr. John Mulder and Mr. Charles Nelson. The registrant’s board of trustees has determined that Mr. Charles Nelson is qualified to serve as an Audit Committee Financial Expert, and has designated him as such.
Item 4. Principal Accountant Fees and Services.
| | | | |
The Timothy Plan | | |
FY 2013 | | $149,400 | | |
FY 2012 | | $142,700 | | |
-2-
| | | | | | |
The Timothy Plan | | Registrant | | Adviser | | |
FY 2013 | | $0 | | $0 | | |
FY 2012 | | $0 | | $0 | | |
Nature of the fees:
| | | | |
The Timothy Plan | | |
FY 2013 | | $0 | | |
FY 2012 | | $0 | | |
Nature of the fees: preparation of the 1120 RIC
Registrant
| | | | |
The Timothy Plan | | |
FY 2013 | | $0 | | |
FY 2012 | | $0 | | |
(e) (1) Audit Committee’s Pre-Approval Policies
The Audit Committee Charter requires the Audit Committee to be responsible for the selection, retention or termination of auditors and, in connection therewith, to (i) evaluate the proposed fees and other compensation, if any, to be paid to the auditors, (ii) evaluate the independence of the auditors, (iii) pre-approve all audit services and, when appropriate, any non-audit services provided by the independent auditors to the Trust, (iv) pre-approve, when appropriate, any non-audit services provided by the independent auditors to the Trust’s investment adviser, or any entity controlling, controlled by, or under common control with the investment adviser and that provides ongoing services to the Trust if the engagement relates directly to the operations and financial reporting of the Trust, and (v) receive the auditors’ specific representations as to their independence;
(2) Percentages of Services Approved by the Audit Committee
Registrant
| | |
Audit-Related Fees: | | 0 % |
Tax Fees: | | 0 % |
All Other Fees: | | 0 % |
(f) During audit of registrant’s financial statements for the most recent fiscal year, less than 50 percent of the hours expended on the principal accountant’s engagement were attributed to work performed by persons other than the principal accountant’s full-time, permanent employees.
(g) The aggregate non-audit fees billed by the registrant’s accountant for services rendered to the registrant, and rendered to the registrant’s investment adviser (not including any sub-adviser whose role is primarily portfolio management and is subcontracted with or overseen by another investment adviser), and any entity controlling, controlled by, or under common control with the adviser that provides ongoing services to the registrant:
| | | | | | |
Registrant Adviser | | | | | | |
FY 2013 | | $0 | | $0 | | |
FY 2012 | | $0 | | $0 | | |
-3-
(h) Not applicable. The auditor performed no services for the registrant’s investment adviser or any entity controlling, controlled by, or under common control with the investment adviser that provides ongoing services to the registrant.
Item 5. Audit Committee of Listed Companies. Not applicable.
Item 6. Schedule of Investments. Not applicable – schedule filed with Item 1.
Item 7. Disclosure of Proxy Voting Policies and Procedures for Closed-End Funds. Not applicable.
Item 8. Portfolio Managers of Closed-End Management Investment Companies. Not applicable.
Item 9. Purchases of Equity Securities by Closed-End Management Investment Company and Affiliated Purchasers. Not applicable.
Item 10. Submission of Matters to a Vote of Security Holders
The registrant has not adopted procedures by which shareholders may recommend nominees to the registrant’s board of trustees.
Item 11. Controls and Procedures.
(a) Based on an evaluation of the registrant’s disclosure controls and procedures as of November 19, 2010, the disclosure controls and procedures are reasonably designed to ensure that the information required in filings on Forms N-CSR is recorded, processed, summarized, and reported on a timely basis.
(b) There were no significant changes in the registrant’s internal control over financial reporting that occurred during the registrant’s second fiscal quarter of the period covered by this report that has materially affected, or is reasonably likely to materially affect, the registrant’s internal control over financial reporting.
Item 12. Exhibits.
| | | | |
| (a)(1) | | | | Code is filed herewith |
| | |
| (a)(2) | | | | Certifications by the registrant’s principal executive officer and principal financial officer, pursuant to Section 302 of the Sarbanes- Oxley Act of 2002 and required by Rule 30a-2 under the Investment Company Act of 1940 are filed herewith. |
| | |
| (a)(3) | | | | Not Applicable |
| |
| (b) | | Certification pursuant to 18 U.S.C. Section 1350, as adopted pursuant to Section 906 of the Sarbanes-Oxley Act of 2002 is filed herewith. |
-4-
SIGNATURES
Pursuant to the requirements of the Securities Exchange Act of 1934 and the Investment Company Act of 1940, the registrant has duly caused this report to be signed on its behalf by the undersigned, thereunto duly authorized.
(Registrant) The Timothy Plan
| | |
By | | /s/ Arthur D. Ally |
| | Arthur D. Ally, President |
| |
Date | | 12/2/13 |
Pursuant to the requirements of the Securities Exchange Act of 1934 and the Investment Company Act of 1940, this report has been signed below by the following persons on behalf of the registrant and in the capacities and on the dates indicated.
| | |
By | | /s/ Arthur D. Ally |
| | Arthur D. Ally, President |
| |
Date | | 12/2/13 |
-5-