UNITED STATES
SECURITIES AND EXCHANGE COMMISSION
WASHINGTON, D.C. 20549
FORM N-CSR
CERTIFIED SHAREHOLDER REPORT OF REGISTERED MANAGEMENT
INVESTMENT COMPANIES
Investment Company Act file number 811-08228
The Timothy Plan
(Exact name of registrant as specified in charter)
1055 Maitland Center Commons, Maitland, FL 32751
(Address of principal executive offices) (Zip code)
Art Ally, The Timothy Plan
1055 Maitland Center Commons, Maitland, FL 32751
(Name and address of agent for service)
Registrant’s telephone number, including area code: 800-846-7526
Date of fiscal year end: 9/30
Date of reporting period: 9/30/14
Form N-CSR is to be used by management investment companies to file reports with the Commission not later than 10 days after the transmission to stockholders of any report that is required to be transmitted to stockholders under Rule 30e-1 under the Investment Company Act of 1940 (17 CFR 270.30e-1). The Commission may use the information provided on Form N-CSR in its regulatory, disclosure review, inspection and policymaking roles.
A registrant is required to disclose the information specified by Form N-CSR, and the Commission will make this information public. A registrant is not required to respond to the collection of information contained in Form N-CSR unless the Form displays a currently valid Office of Management and Budget (“OMB”) control number. Please direct comments concerning the accuracy of the information collection burden estimate and any suggestions for reducing the burden to Secretary, Securities and Exchange Commission, 450 Fifth Street, NW, Washington, DC 20549-0609. The OMB has reviewed this collection of information under the clearance requirements of 44 U.S.C. § 3507.
Item 1. Reports to Stockholders.
The Registrant’s audited annual financial reports transmitted to shareholders pursuant to Rule 30e-1 under the Investment Company Act of 1940 are as follows:
Letter from the President
September 30, 2014
Arthur D. Ally
Dear Fellow Shareholder,
As you review the important information that each of our sub-advisors have provided on the following pages, I hope you will share my satisfaction with how all of our funds have performed for our past fiscal year (10-1-13 thru 9-30-14). Of course, as you are no doubt aware, past performance does not guarantee future results.
However as I report each year, although we cannot guarantee, or even predict, future performance, I continue to believe that all of our sub-advisors are among the best in the industry. Additionally, each one continues to honor our policy of investing in strict conformity with our screening restrictions and with conservation of capital a foremost consideration.
Please find each of our sub-advisor’s annual review letters in the pages that follow. Each one discusses their respective Fund’s past performance, the reasons behind that performance, and their economic outlook for the next fiscal year.
Finally, I would once again like to thank you for your moral convictions that led you to becoming part of the Timothy Plan Family.
Yours in Christ,

Arthur D. Ally
President
1
Letter from the Manager
September 30, 2014
Aggressive Growth Fund
The Aggressive Growth Fund Class A advanced 8.2% over the 12 months ending September 30, 2014. This compares to +14.4% for the Russell MidCap Growth Index and +8.1% for the Russell 2500 Growth Index for the same period.
The upward march of the equity markets has been quite remarkable not only for its magnitude, but also for the absence of significant corrections during the climb. Except for the reverberations from the “polar vortex” of last winter, economic growth has accelerated from the “new-normal” +/- 2% to now averaging around +3% (GDP). This step-up in growth, accompanied by unusually-low inflation and contained interest rates, has provided for the “goldilocks” environment that has buoyed stocks. The market has also taken the end of Q.E. in stride and is preparing for the Fed to start raising rates in mid/later 2015. Europe continues to provide angst, as some countries teeter on the verge of recession, and deflation looms as a risk. Between this and China “hard-landing” fears, the U.S. stands out as relatively stable. Corporate profits are strong and balance sheets have rarely been in better shape. Volatility in energy markets and the normalization of interest rates could well provide the script for the year to come.
For the portfolio, there has been no change to our time-tested, bottom up fundamental approach to managing small and mid-cap growth investments, although we have increased our turnover around market rallies and pullbacks. Our commitment to identifying quality investments at a time of unprecedented challenges is unaltered and should be rewarded as leading companies gain market share, protect margins, and manage ample capital for shareholder benefit over time.
Chartwell Investment Partners, Inc.
2
Fund Performance - (Unaudited)
September 30, 2014
Aggressive Growth Fund
| | | | | | | | |
| Fund/Index | | 1 Year Total Return | | 5 Year Average Annual Return | | 10 Year Average Annual Return | | |
Timothy Aggressive Growth Fund - Class A (With Sales Charge) | | 2.31% | | 15.35% | | 7.13% | | |
Russell Mid-Cap Growth Index | | 14.43% | | 17.12% | | 10.24% | | |
Timothy Aggressive Growth Fund - Class C * | | 6.50% | | 15.75% | | 6.96% | | |
Russell Mid-Cap Growth Index | | 14.43% | | 17.12% | | 10.24% | | |
Timothy Aggressive Growth Fund - Class I | �� | 8.43% | | N/A | | 8.65% | | (a) |
Russell Mid-Cap Growth Index | | 14.43% | | 17.12% | | 13.30% | | (a) |
| (a) | For the period August 1, 2013 (commencement of investment in accordance with objective) to September 30, 2014. |
| * | With Maximum Deferred Sales Charge |
Timothy Plan Aggressive Growth Fund vs. Russell Mid-Cap Growth Index
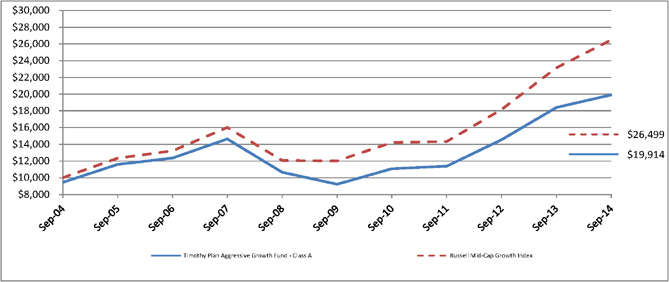
The chart shows the value of a hypothetical initial investment of $10,000 in the Fund’s Class A shares and the Russell Mid-Cap Growth Index on September 30, 2004 and held through September 30, 2014. The Russell Mid-Cap Growth Index is a widely recognized, unmanaged index of common stock prices. Performance figures include the change in value of the stocks in the index and the reinvestment of dividends. The index return does not reflect expenses, which have been deducted from the Fund’s return. The returns shown do not reflect deduction of taxes that a shareholder would pay on Fund distributions or the redemption of Fund shares. THE FUND’S RETURN REPRESENTS PAST PERFORMANCE AND IS NOT PREDICTIVE OF FUTURE RESULTS.
3
Letter from the Manager
September 30, 2014
International Fund
The Fund performed well during a difficult period. Weakening economic conditions in Europe and Japan together with increased geopolitical risks induced episodes of sharp swings in equity prices and volatility during this period.
Japan’s consumption tax increase in April led to a sharp decline in economic conditions in the country that proved too difficult to overcome. With a surprise announcement to hold snap elections, PM Shinzo Abe appears to be focused on gaining momentum to delay the next round of tax increases. A sharp acceleration in the expansion of Japan’s quantitative easing that includes buying equity ETFs and REITs led to another sharp depreciation of the Yen against most major currencies. While Japan’s economy failed to gain any momentum, the UK continued to perform well while the Eurozone decelerated throughout the year. With Eurozone inflation at dangerously low levels, economic growth decelerating, and a lack of bank lending, the European Central Bank maintained the foot on the accelerator with new monetary stimulus. With the US ending its QE program while Japan and the Eurozone expand theirs, the US dollar is likely to stay stronger for longer versus these currencies leading to some positive tailwinds for exporters from the Eurozone and Japan.
The good relative performance of the Fund during this period was mostly on the back of very good stock selection but sector allocation was also positive. An underweight to the Materials sector added the most from sector allocation as commodity prices declined markedly during the period on the back of a strong dollar, weaker Chinese demand, and supply increases. The soft commodity prices, the Russian incursion into Ukraine and subsequent Western sanctions as well as mismanagement of Brazil’s economy led to underperformance of the Fund’s positions in the emerging markets. Although, strong stock selection in the Health Care, Consumer Discretionary, IT, Consumer Staples, and Industrials sectors more than offset those headwinds. Of note was the Fund’s overweight to the global auto parts sector at a time of consolidation, margin improvement, and improving auto sales as both Valeo (France) and Magna (Canada) performed well. Other positive areas included good stock selection in Japanese IT with Fujifilm and Hitachi performing well in addition to Health Care where the Fund’s European holdings benefitted from M&A activity in the sector. The best country performance for the Fund relative to the benchmark was in the UK, France, and Canada.
We remain constructive on the attractive valuations of international equities relative to US equities. With the US slowly taking away the QE punch bowl while the Eurozone and Japan add to theirs, volatility is likely to remain for global equities, interest rates, and currencies on the back of uncertain monetary conditions. We are positive on international equities and believe companies outside the US have an opportunity to begin a margin upgrade cycle over the next few years that should benefit equity prices.
Eagle Global Advisors, LLC
4
Fund Performance - (Unaudited)
September 30, 2014
International Fund
| | | | | | | | |
| Fund/Index | | 1 Year Total Return | | 5 Year Average Annual Return | | Average Annual Return Since Inception |
Timothy International Fund - Class A (With Sales Charge) | | (0.99)% | | 3.89% | | (1.01)% | | (a) |
MSCI EAFE Index | | 1.53% | | 3.52% | | (2.56)% | | (a) |
Timothy International Fund - Class C * | | 2.87% | | 4.29% | | (1.03)% | | (a) |
MSCI EAFE Index | | 1.53% | | 3.52% | | (2.56)% | | (a) |
Timothy International Fund - Class I | | 4.85% | | N/A | | 6.15% | | (b) |
MSCI EAFE Index | | 1.53% | | 3.52% | | 5.12% | | (b) |
| (a) | For the period May 3, 2007 (commencement of investment in accordance with objective) to September 30, 2014. |
| (b) | For the period August 1, 2013 (commencement of investment in accordance with objective) to September 30, 2014. |
| * | With Maximum Deferred Sales Charge |
Timothy Plan International Fund vs. MSCI EAFE Index
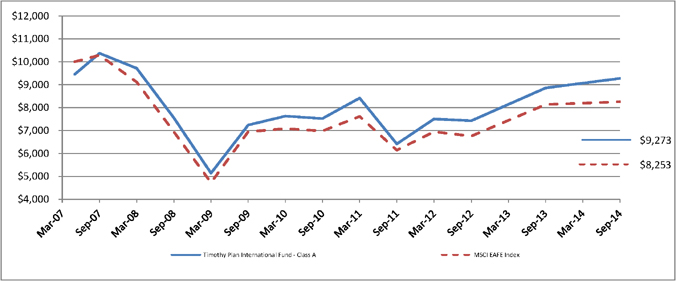
The chart shows the value of a hypothetical initial investment of $10,000 in the Fund’s Class A shares and the MSCI EAFE Index on May 3, 2007 and held through September 30, 2014. The MSCI EAFE Index is a widely recognized unmanaged index of equity prices and is representative of equity market performance of developed countries, excluding the U.S. and Canada. Performance figures include the change in value of the stocks in the index and the reinvestment of dividends. The index return does not reflect expenses, which have been deducted from the Fund’s return. The returns shown do not reflect deduction of taxes that a shareholder would pay on Fund distributions or the redemption of Fund shares. THE FUND’S RETURN REPRESENTS PAST PERFORMANCE AND IS NOT PREDICTIVE OF FUTURE RESULTS.
5
Letter from the Manager
September 30, 2014
Large/Mid Cap Growth Fund
The Large/Mid Cap Growth Fund Class A advanced 14.7% over the last 12 months ending September 30, 2014, while the return of the benchmark, the Russell 1000 Growth Index, was up 19.2% for the same period.
The upward march of the equity markets has been quite remarkable not only for its magnitude, but also for the absence of significant corrections during the climb. Except for the reverberations from the “polar vortex” of last winter, economic growth has accelerated from the “new-normal” +/- 2% to now averaging around +3% (GDP). This step-up in growth, accompanied by unusually-low inflation and contained interest rates, has provided for the “goldilocks” environment that has buoyed stocks. The market has also taken the end of Q.E. in stride and is preparing for the Fed to start raising rates in mid/later 2015. Europe continues to provide angst, as some countries teeter on the verge of recession, and deflation looms as a risk. Between this and China “hard-landing” fears, the U.S. stands out as relatively stable. Corporate profits are strong and balance sheets have rarely been in better shape. Volatility in energy markets and the normalization of interest rates could well provide the script for the year to come.
For the portfolio, there has been no change to our time-tested, bottom up fundamental approach to managing large and mid-cap growth investments, although we have increased our turnover around market rallies and pullbacks. Our commitment to identifying quality investments at a time of unprecedented challenges is unaltered and should be rewarded as leading companies gain market share, protect margins, and manage ample capital for shareholder benefit over time.
Chartwell Investment Partners, Inc.
6
Fund Performance - (Unaudited)
September 30, 2014
Large/Mid Cap Growth Fund
| | | | | | | | |
| Fund/Index | | 1 Year Total Return | | 5 Year Average Annual Return | | 10 Year Average Annual Return |
Timothy Large/Mid Cap Growth Fund - Class A (With Sales Charge) | | 8.08% | | 13.42% | | 5.98% | | |
Russell 1000 Growth Index | | 19.15% | | 16.50% | | 8.94% | | |
Timothy Large/Mid Cap Growth Fund - Class C * | | 12.48% | | 13.83% | | 5.75% | | |
Russell 1000 Growth Index | | 19.15% | | 16.50% | | 8.94% | | |
Timothy Large/Mid Cap Growth Fund - Class I | | 14.66% | | N/A | | 13.17% | | (a) |
Russell 1000 Growth Index | | 19.15% | | 16.50% | | 17.46% | | (a) |
| (a) | For the period August 1, 2013 (commencement of investment in accordance with objective) to September 30, 2014. |
| * | With Maximum Deferred Sales Charge |
Timothy Plan Large/Mid Cap Growth Fund vs. Russell 1000 Growth Index
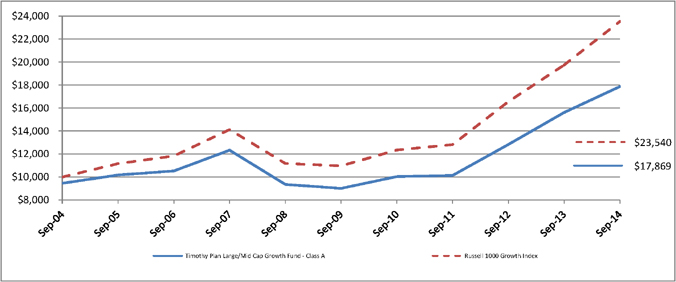
The chart shows the value of a hypothetical initial investment of $10,000 in the Fund’s Class A shares and the Russell 1000 Growth Index on September 30, 2004 and held through September 30, 2014. The Russell 1000 Growth Index is a widely recognized, unmanaged index of common stock prices. Performance figures include the change in value of the stocks in the index and the reinvestment of dividends. The index return does not reflect expenses, which have been deducted from the Fund’s return. The returns shown do not reflect deduction of taxes that a shareholder would pay on Fund distributions or the redemption of Fund shares. THE FUND’S RETURN REPRESENTS PAST PERFORMANCE AND IS NOT PREDICTIVE OF FUTURE RESULTS.
7
Letter from the Manager
September 30, 2014
Small Cap Value Fund
We are pleased to provide you with our report for the Timothy Plan Small-Cap Value Fund for the twelve months ending September 30, 2014 and would like to thank you for entrusting your assets with us.
Over the past twelve months equity markets, while withstanding brief corrections, generally moved higher. Equity market gains were fueled by US economic data, new relative stability in the US fiscal situation and better than expected 4Q corporate earnings. Despite concerns about the impact of weaker emerging market economies and ongoing conflicts in the Ukraine and with global terrorism, investors remained favorable to the equity asset class. Additionally, the anticipation of reduced monetary stimulus contributed to greater market volatility throughout the fiscal year, as well as higher dispersion among stock prices. This has historically caused a differentiated performance environment that favors higher quality, fundamentally sound companies with predictable earnings growth.
For the twelve months ending September 30, 2014, the Timothy Plan Small-Cap Value Fund Class A again produced a strong return of 7.6%, while the Russell 2000 Index produced a return of 3.9%. Small caps, however, have underperformed their large cap counterparts over this time period. Investors have shown a preference for large cap over this time period and small cap Energy, a top performer in 2013, has underperformed most recently through the 3rd quarter 2014. Security selection was the primary driver of relative outperformance and centered in the Health Care, Materials & Processing, Energy and Producer Durables sectors. Top performing securities were in sectors levered to economic growth and included Trex Company, KapStone Paper and Packaging, US Silica and Synergy Resources. Materials & Processing was the largest overall driver of relative outperformance with several holdings producing returns over 50% for the last 12 months.
Security selection in Consumer Discretionary coupled with overweight allocations in the Energy and Producer Durables sectors detracted from relative performance. Consumer Discretionary holding Arctic Cat was a bottom performer on an absolute basis, after it reported lower than expected guidance for 2015 revenues and earnings. Allocations to Energy and Producer Durables also negatively impacted performance as these sectors underperformed the index as a whole.
The Small Cap Value team is focusing on well-run companies with growth prospects that are underappreciated by the marketplace. We look for companies with above average growth and strong balance sheets that are generating good cash flows and superior relative returns. We have been finding many opportunities in the Energy, Materials & Processing and Producer Durables spaces leading us to overweight positions in these sectors. In Energy, we are finding exploration and production companies with best in class production growth that are selling at or below peer group multiples. In Materials & Processing, we have found value in stocks that are tied to a housing recovery that the market is somewhat skeptical about. In the Producer Durables space, our businesses will benefit from improving economic activity, while generating strong free cash flow and earnings growth. As economic growth continues, we feel our companies are positioned to achieve higher earnings and our portfolio should perform well.
We thank you for your continued confidence in the Westwood process and investment teams and we look forward to serving your investment needs through the years ahead.
Westwood Management Corporation
8
Fund Performance - (Unaudited)
September 30, 2014
Small Cap Value Fund
| | | | | | | | |
| Fund/Index | | 1 Year Total Return | | 5 Year Average Annual Return | | 10 Year Average Annual Return |
Timothy Small Cap Value Fund - Class A (With Sales Charge) | | 1.51% | | 15.01% | | 7.73% | | |
Russell 2000 Index | | 3.93% | | 14.29% | | 8.19% | | |
Timothy Small Cap Value Fund - Class C * | | 5.72% | | 15.46% | | 7.53% | | |
Russell 2000 Index | | 3.93% | | 14.29% | | 8.19% | | |
Timothy Small Cap Value Fund - Class I | | 7.69% | | N/A | | 9.40% | | (a) |
Russell 2000 Index | | 3.93% | | 14.29% | | 4.77% | | (a) |
| (a) | For the period August 1, 2013 (commencement of investment in accordance with objective) to September 30, 2014. |
| * | With Maximum Deferred Sales Charge |
Timothy Plan Small Cap Value Fund vs. Russell 2000 Index
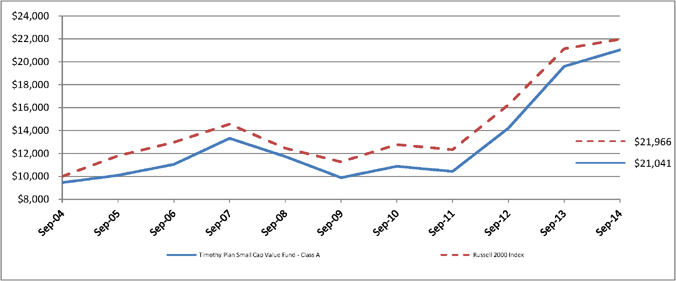
The chart shows the value of a hypothetical initial investment of $10,000 in the Fund’s Class A shares and the Russell 2000 Index on September 30, 2004 and held through September 30, 2014. The Russell 2000 Index is a widely recognized, unmanaged index of common stock prices. Performance figures include the change in value of the stocks in the index and the reinvestment of dividends. The index return does not reflect expenses, which have been deducted from the Fund’s return. The returns shown do not reflect deduction of taxes that a shareholder would pay on Fund distributions or the redemption of Fund shares. THE FUND’S RETURN REPRESENTS PAST PERFORMANCE AND IS NOT PREDICTIVE OF FUTURE RESULTS.
9
Letter from the Manager
September 30, 2014
Large/Mid Cap Value Fund
We are pleased to provide you with our report for the Timothy Plan Large/Mid-Cap Value Fund for the twelve months ending September 30, 2014 and would like to thank you for entrusting your assets with us.
Over the past twelve months equity markets, while withstanding brief corrections, generally moved higher. Equity market gains were fueled by US economic data, new relative stability in the US fiscal situation and better than expected 4Q corporate earnings. Despite concerns about the impact of weaker emerging market economies and ongoing conflicts in the Ukraine and with global terrorism, investors remained favorable to the equity asset class. Additionally, the anticipation of reduced monetary stimulus contributed to greater market volatility throughout the fiscal year, as well as higher dispersion among stock prices. This has historically caused a differentiated performance environment that favors higher quality, fundamentally sound companies with predictable earnings growth.
For the twelve months ending September 30, 2014, the Timothy Plan Large/Mid-Cap Value Fund Class A produced a return of 16.1%, while the S&P 500 Index produced a return of 19.7%. Security selection in Technology, Consumer Discretionary and Utilities sectors aided relative performance. The Technology sector has been a strong performer and produced significant returns for the fund. Many of the fund’s top performers were in sectors such as Technology, which are levered to economic growth. Optimism aided the performance of pro-cyclical companies, such as Avago Technologies, Skyworks Solutions and Advance Auto Parts.
Security selection in Health Care, Financial Services and Materials & Processing was the largest detractor to relative performance in the prior twelve months. Index sectors Health Care outperformed the market and our holdings failed to keep pace. Individual detractors to performance in the REIT sector included HCP Inc., which traded lower as investors rotated out of REITs on interest rate fears and the impact this could have on future acquisitions. Additionally, Energy holdings such as Oasis Petroleum and Anadarko Petroleum underperformed on falling oil and gas prices.
The Timothy Plan Large/Mid-Cap Value Fund performed well in the past twelve months on an absolute basis, producing a gross total return of nearly 18% in fiscal 2014.
The team remains focused on high-quality businesses with undervalued growth prospects, high returns on invested capital, strong balance sheets, and attractive future growth rates in earnings and cash flow. From a sector standpoint, we see value in many names within the industrial area. These businesses are able to benefit from improving economic activity, while maintaining stronger free cash flow profiles than other businesses in more commoditized areas of the market. Finally, many of our technology names continue to benefit from growth in mobile. As the number of handsets continues to grow, as well as the increased content within each handset, future earnings growth remains very attractive and underappreciated by the market in our view. As a result, we believe we are well-positioned. Given the current Fed outlook, we have historically outperformed when monetary stimulus is reduced, the economy matures and investor risk appetites fall. During such periods, a portfolio filled with high-quality companies that have visible earnings growth has provided an attractive risk-adjusted return for investors.
We thank you for your continued confidence in the Westwood process and investment teams and we look forward to serving your investment needs through the years ahead.
Westwood Management Corporation
10
Fund Performance - (Unaudited)
September 30, 2014
Large/Mid Cap Value Fund
| | | | | | | | |
| Fund/Index | | 1 Year Total Return | | 5 Year Average Annual Return | | 10 Year Average Annual Return |
Timothy Large/Mid Cap Value Fund - Class A (With Sales Charge) | | 9.74% | | 13.48% | | 9.00% | | |
S&P 500 Index | | 19.73% | | 15.70% | | 8.11% | | |
Timothy Large/Mid Cap Value Fund - Class C * | | 14.26% | | 13.90% | | 8.80% | | |
S&P 500 Index | | 19.73% | | 15.70% | | 8.11% | | |
Timothy Large/Mid Cap Value Fund - Class I | | 16.43% | | N/A | | 13.64% | | (a) |
S&P 500 Index | | 19.73% | | 15.70% | | 15.62% | | (a) |
| (a) | For the period August 1, 2013 (commencement of investment in accordance with objective) to September 30, 2014. |
| * | With Maximum Deferred Sales Charge |
Timothy Plan Large/Mid Cap Value Fund vs. S&P 500 Index
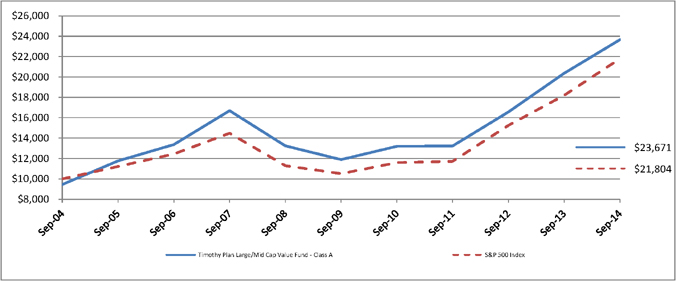
The chart shows the value of a hypothetical initial investment of $10,000 in the Fund’s Class A shares and the S&P 500 Index on September 30, 2004 and held through September 30, 2014. The S&P 500 Index is a widely recognized, unmanaged index of common stock prices. Performance figures include the change in value of the stocks in the index and the reinvestment of dividends. The index return does not reflect expenses, which have been deducted from the Fund’s return. The returns shown do not reflect deduction of taxes that a shareholder would pay on Fund distributions or the redemption of Fund shares. THE FUND’S RETURN REPRESENTS PAST PERFORMANCE AND IS NOT PREDICTIVE OF FUTURE RESULTS.
11
Letter from the Manager
September 30, 2014
Fixed Income Fund
TIMOTHY PLAN FIXED INCOME MANAGER’S COMMENTARY SEPTEMBER 2014
BARROW, HANLEY, MEWHINNEY & STRAUSS
The broad investment grade U.S. bond market as defined by the Barclays Aggregate index began the last 12 months with a yield of 2.34% and ended at 2.36% on September 30, 2014. Examining only the endpoint yields of the U. S. bond market disguises the fact that significant changes took place. Rates across the Treasury yield curve moved in quite different directions as the U.S. Treasury (UST) five year rate increased 37 basis points while the UST 30 year rate declined 49 basis points. The shorter maturity end of the UST yield curve saw rates rise as the Federal Reserve’s Quantitative Easing tapered toward an end generating market debates about the timing of the first policy rate increase. Higher short rates flattened the yield curve back toward a more normal historical relationship.
However, the decline in long rates over the past 12 months further flattened the UST yield curve and was not expected by most market participants. The past year began with U.S. economic data stronger thanks to a string of solid payroll increases and a boost in capital goods spending that led to higher long UST rates in 4Q13. However, Global economic growth slowed with persistently weak European GDP and faltering Chinese and emerging market economies leading to tepid inflation data from slumping commodity prices. Slowing global growth and lower inflation has global central banks engaging in massive monetary stimulus. These global concerns have led to demand for UST long bonds as a safe haven driving their yields lower. Even with the decline in UST rates they remain well above their developed market sovereign peers.
The yield spread sectors of the bond market, corporate and mortgage back bonds, also showed significant changes over the past 12 months. Following the improvement in the U.S. economy yield spreads to UST issues narrowed. From the beginning of the period Investment Grade Credit spreads narrowed from 141 basis points (bps) to 98 bps on June 30th generating higher returns for spread sectors. However with increased concerns over global growth and shareholder friendly actions by company managements modestly diluting bond holders interests, yield spreads widened back out to 112 bps by September 30, 2014 giving back some of the early performance gains.
The Timothy Fixed Income Fund Class A shares returned 2.64% over the 12 months ended September 30, 2014 with most of the return simply income. The Barclays Aggregate index was slightly better at 3.96% over the trailing 12 months. The portfolio’s positioning favored intermediate over long maturities in corporate bonds and higher coupon GNMA mortgages with their shorter average life which detracted from results over the past 12 months. We are keeping a close watch on the timing of the Fed’s first policy-rate increase and their decisions about what to do with a $4.4 trillion bloated balance sheet. The portfolio’s positioning remains focused on generating income consistent with a prudent level of risk.
BARROW, HANLEY, MEWHINNEY & STRAUSS
12
Fund Performance - (Unaudited)
September 30, 2014
Fixed Income Fund
| | | | | | | | |
| Fund/Index | | 1 Year Total Return | | 5 Year Average Annual Return | | 10 Year Average Annual Return |
Timothy Fixed Income Fund - Class A (With Sales Charge) | | (1.83)% | | 2.02% | | 2.88% | | |
Barclays Capital U.S. Aggregate Bond Index | | 3.96% | | 4.12% | | 4.62% | | |
Timothy Fixed Income Fund - Class C * | | 1.02% | | 2.22% | | 2.59% | | |
Barclays Capital U.S. Aggregate Bond Index | | 3.96% | | 4.12% | | 4.62% | | |
Timothy Fixed Income Fund - Class I | | 3.16% | | N/A | | 3.50% | | (a) |
Barclays Capital U.S. Aggregate Bond Index | | 3.96% | | 4.12% | | 4.25% | | (a) |
| (a) | For the period August 1, 2013 (commencement of investment in accordance with objective) to September 30, 2014. |
| * | With Maximum Deferred Sales Charge |
Timothy Plan Fixed Income Fund vs. Barclays Capital U.S. Aggregate Bond Index
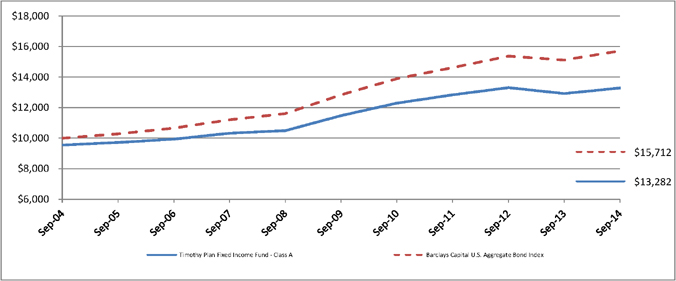
The chart shows the value of a hypothetical initial investment of $10,000 in the Fund’s Class A shares and the Barclays Capital U.S. Aggregate Bond Index on September 30, 2004 and held through September 30, 2014. The Barclays Capital U.S. Aggregate Bond Index is a widely recognized, unmanaged index of bond prices. Performance figures include the change in value of the bonds in the index and the reinvestment of interest. The index return does not reflect expenses, which have been deducted from the Fund’s return. The returns shown do not reflect deduction of taxes that a shareholder would pay on Fund distributions or the redemption of Fund shares. THE FUND’S RETURN REPRESENTS PAST PERFORMANCE AND IS NOT PREDICTIVE OF FUTURE RESULTS.
13
Letter from the Manager
September 30, 2014
High Yield Bond Fund
TIMOTHY PLAN HIGH YIELD MANAGER’S COMMENTARY SEPTEMBER 2014
BARROW, HANLEY, MEWHINNEY & STRAUSS
The U.S. High Yield bond market as defined by the Barclays BA/B index began the last 12 months with a yield of 5.53% and ended at 5.51% on September 30, 2014. Examining only these endpoint yields disguises the fact that significant changes took place. Rates across the Treasury yield curve moved in quite different directions as the U.S. Treasury (UST) five year rate increased 37 basis points while the 30 year rate declined 49 basis points. The short maturity end of the yield curve saw rates rise as the Federal Reserve’s Quantitative Easing tapered toward an end generating market debates about the timing of the first policy rate increase. The decline in long UST rates over the past 12 months was not expected by most market participants as global economic concerns led to demand for the safety of UST long bonds driving their yields lower.
The last 12 months began with U.S. economic data mostly stronger thanks to a string of solid payroll increases and a boost in capital goods spending. Against the backdrop of a good economy, corporate earnings gains, and the search for income High Yield bonds attracted significant buyers driving yield spreads narrower starting at 392 basis points (bps) at the beginning of the period down to 272 bps by June 30th for the Barclays BA/B index. The resultant rate decline from 5.53% to 4.45% generated significant market gains, and as 3Q14 began investors were quick to sell and recognize those gains.
Increased concern in the High Yield market from slowing global growth and slumping commodity prices led to yield spreads to widen to 361 bps. In 3Q14 High Yield rates rose over 100 bps from 4.45% to 5.51% ending the 12 month period only 2 bps from where it began. Price volatility came back to the High Yield market over the past 12 months, so income was essentially the primary source of returns.
The Timothy High Yield Fund Class A shares returned 5.71% over the 12 months ended September 30, 2014 with most of the return simply income. The Barclays Ba/B (3% cap) index was modestly higher at 7.25%. The portfolio’s positioning favored the energy sector and underweighted communications\media both of which detracted slightly from results. With today’s historically low yields and economic uncertainty we are keeping a close watch on any upticks in the default rate which remains very low. The portfolio’s positioning remains focused on generating income consistent with a reasonable level of risk.
BARROW, HANLEY, MEWHINNEY & STRAUSS
14
Fund Performance - (Unaudited)
September 30, 2014
High Yield Bond Fund
| | | | | | | | |
| Fund/Index | | 1 Year Total Return | | 5 Year
Average
Annual Return | | Average
Annual Return
Since Inception |
Timothy High Yield Bond Fund - Class A (With Sales Charge) | | 1.08% | | 7.21% | | 4.97% | | (a) |
Barclays Ba/B High Yield Index | | 7.25% | | 9.99% | | 7.62% | | (a) |
Timothy High Yield Bond Fund - Class C * | | 4.00% | | 7.42% | | 4.83% | | (a) |
Barclays Ba/B High Yield Index | | 7.25% | | 9.99% | | 7.62% | | (a) |
Timothy High Yield Bond Fund - Class I | | 6.07% | | N/A | | 5.33% | | (b) |
Barclays Ba/B High Yield Index | | 7.25% | | 9.99% | | 6.46% | | (b) |
| (a) | For the period May 7, 2007 (commencement of investment in accordance with objective) to September 30, 2014. |
| (b) | For the period August 1, 2013 (commencement of investment in accordance with objective) to September 30, 2014. |
| * | With Maximum Deferred Sales Charge |
Timothy Plan High Yield Bond Fund vs. Barclays Ba/B High Yield Index
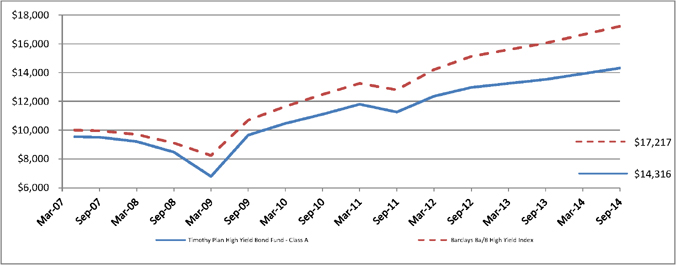
The chart shows the value of a hypothetical initial investment of $10,000 in the Fund’s Class A shares and the Barclays Ba/B High Yield Index on May 7, 2007 and held through September 30, 2014. The Barclays Ba/B High Yield Index measures the performance of bonds with Ba or B ratings. Performance figures include the change in value of the bonds in the index and the reinvestment of interest. The index return does not reflect expenses, which have been deducted from the Fund’s return. The returns shown do not reflect deduction of taxes that a shareholder would pay on Fund distributions or the redemption of Fund shares. THE FUND’S RETURN REPRESENTS PAST PERFORMANCE AND IS NOT PREDICTIVE OF FUTURE RESULTS.
15
Letter from the Manager
September 30, 2014
Israel Common Values Fund
Israel equities overall struggled during this period as economic conditions decelerated on the back of a worsening external environment and the effects of the Gaza war Operation Protective Edge. With more than 1/3 of GDP made up from exports, disappointing global trade had a negative effect on Israeli economic growth. With slowing growth, a strong currency, and declining inflation expectations, the Bank of Israel, under the new leadership of Ms. Karnit Flug, acted quickly by surprising the market with several interest rate cuts bringing the short term rate from 1.25% to 0.25% during this 12-month period. The shekel finally reacted to the lower rates and lower economic growth by depreciating sharply in the third quarter of 2014. This should lead to some relief for the Israeli export sector.
The Timothy Plan Israel Common Values Fund struggled a bit during this period mostly as a couple of screened out health care companies that are large components of the Israel TA-100 index had a great year. In spite of this, the Fund had good stock selection in Materials and Information Technology although an overweight to the IT sector detracted from performance. Moreover, an allocation to the food retail industry hurt performance as the government competition commission investigated the industry due to high food prices. On the positive front, Given Imaging, which manufactures diagnostic products for gastrointestinal disorders, was acquired leading to strong gains for the stock. Frutarom Industries, a global leading manufacturer of flavors and ingredients continued to perform well for the Fund. Other notable positive performance occurred in semiconductors with Tower Semi performing well in addition to pharmaceuticals with strong performance from Taro Pharma.
The near term prospects for global trade have deteriorated somewhat leading to signs of headwinds for the country’s GDP growth. Yet, the recent currency depreciation should alleviate some of the pressures on export companies. We remain positive on the prospects for innovation from Israeli companies translating into positive long term equity returns. While geopolitical risks have risen lately, history suggests that Israeli corporates are prepared to weather storms and come out stronger in the end.
Eagle Global Advisors, LLC
16
Fund Performance - (Unaudited)
September 30, 2014
Israel Common Values Fund
| | | | | | |
| Fund/Index | | 1 Year Total Return | | Average
Annual Return
Since Inception |
Timothy Israel Common Values Fund - Class A (With Sales Charge) | | (3.35)% | | 7.10% | | (a) |
Israel TA 100 Index | | 14.31% | | 10.10% | | (a) |
Timothy Israel Common Values Fund - Class C * | | 0.52% | | 8.31% | | (a) |
Israel TA 100 Index | | 14.31% | | 10.10% | | (a) |
Timothy Israel Common Values Fund - Class I | | 2.44% | | 5.39% | | (b) |
Israel TA 100 Index | | 14.31% | | 15.99% | | (b) |
| (a) | For the period October 12, 2011 (commencement of investment in accordance with objective) to September 30, 2014. |
| (b) | For the period August 1, 2013 (commencement of investment in accordance with objective) to September 30, 2014. |
| * | With Maximum Deferred Sales Charge |
Timothy Plan Israel Common Values Fund vs. Israel Tel Aviv 100 Index
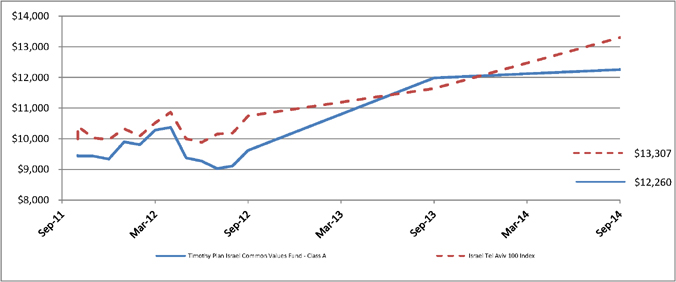
The chart shows the value of a hypothetical initial investment of $10,000 in the Fund’s Class A shares and the Israel TA 100 Index on October 12, 2011 and held through September 30, 2014. The Israel Tel Aviv 100 Index is an unmanaged index of equity prices representing the 100 most highly capitalized companies listed on the Tel Aviv Stock Exchange . Performance figures include the change in value of the stocks in the index and the reinvestment of dividends. The index return does not reflect expenses, which have been deducted from the Fund’s return. The returns shown do not reflect deduction of taxes that a shareholder would pay on Fund distributions or the redemption of Fund shares. THE FUND’S RETURN REPRESENTS PAST PERFORMANCE AND IS NOT PREDICTIVE OF FUTURE RESULTS.
17
Letter from the Manager
September 30, 2014
Defensive Strategies Fund
The Defensive Strategies Fund has been designed and managed to do what its name implies, i.e. hedge against a possible scenario of hyper-inflation which could result from our nation’s leadership’s proven unwillingness to address our core problems of too much spending, too much taxation and too many onerous government regulations. We have, therefore, built in the flexibility to either adjust to a possible risk of extreme deflation with the ability to convert our inflation sensitive assets to cash and fixed income securities that should perform well during a deflationary environment or to a more normal, traditional investment strategy. As I stated in last year’s report, although we will do our very best to be successful, we cannot guarantee results in any of these scenarios.
I would also like to point out that, since there does not exist an appropriate benchmark index with which to compare our performance, we have created a blended index comprised of roughly 1/3 each of U.S. Government TIPs, FTSE NAREIT Equity Index and Dow Jones UBS Commodity Index (the “Blended Index”). We believe this better matches the makeup of our fund than the previously used Dow Jones US Moderate 40 Index which contains no commodities.
For the fiscal year ended September 30, 2014, the Defensive Strategies Fund Class A achieved a total return of 3.06%, vs a total return of 2.58% for the Blended Index, the Fund’s benchmark. This Fund invests in four different categories of securities, each category being managed by a sub-advisers to our other Funds. The sub-advisers have provided discussions of the factors that affected their Fund’s performance, as well as their thoughts for the next fiscal year, and I encourage you to read them carefully. During the last fiscal year, we managed the Fund with a decidedly conservative bias, and we plan to continue to manage this fund conservatively as we attempt to adjust to (what could be) rapidly changing economic conditions.
While no one can predict future events, as I stated in my President’s letter, I remain confident that our sub-advisors (i.e. money management firms that manage the various sleeves of this Fund) are, in our opinion, among the best in the industry and they each continue to honor our overall policy that they manage their respective Fund sleeve both in accordance with our screening restrictions and with a conservative bias.
Finally, I would once again like to thank you for your moral convictions that led you to become part of the Timothy Plan family.
Yours in Christ,
Arthur D. Ally
Fund Advisor
18
Fund Performance - (Unaudited)
September 30, 2014
Defensive Strategies Fund
| | | | | | |
| Fund/Index | | 1 Year Total Return | | Average
Annual Return
Since Inception |
Timothy Defensive Strategies Fund - Class A (With Sales Charge) | | (2.63)% | | 3.93% | | (a) |
Dow Jones Moderately Conservative U.S. Portfolio Index | | 10.73% | | 12.16% | | (a) |
Timothy Defensive Strategies Fund Blended Index (c) | | 2.58% | | 6.42% | | (a) |
Timothy Defensive Strategies Fund - Class C * | | 1.27% | | 4.37% | | (a) |
Dow Jones Moderately Conservative U.S. Portfolio Index | | 10.73% | | 12.16% | | (a) |
Timothy Defensive Strategies Fund Blended Index (c) | | 2.58% | | 6.42% | | (a) |
Timothy Defensive Strategies Fund - Class I | | 3.39% | | 2.90% | | (b) |
Dow Jones Moderately Conservative U.S. Portfolio Index | | 10.73% | | 9.31% | | (b) |
Timothy Defensive Strategies Fund Blended Index (c) | | 2.58% | | 1.92% | | (b) |
| (a) | For the period November 4, 2009 (commencement of investment in accordance with objective) to September 30, 2014. |
| (b) | For the period August 1, 2013 (commencement of investment in accordance with objective) to September 30, 2014. |
| (c) | The Timothy Defensive Strategies Fund Blended Index reflects an unmanaged portfolio of 33% of the Barclays U.S. TIPs Index, 33% of the FTSE NAREIT ALL REITs Index and 34% of the Dow Jones Commodity Total Return Index. |
| * | With Maximum Deferred Sales Charge |
Timothy Plan Defensive Strategies Fund vs. Dow Jones Moderately Conservative U.S. Portfolio Index vs. The Timothy Defensive Strategies Fund Blended Index (c)
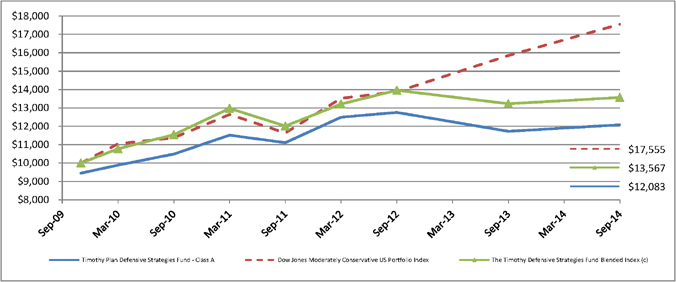
The chart shows the value of a hypothetical initial investment of $10,000 in the Fund’s Class A shares, Dow Jones Moderately Conservative U.S. Portfolio Index and the Timothy Defensive Strategies Fund Blended Index (c) on November 4, 2009 and held through September 30, 2014. The Dow Jones Moderately Conservative U.S. Portfolio Index is a widely recognized unmanaged index of stocks, bonds and cash. Performance figures include the change in value of the asset classes in the index and the reinvestment of dividends. The index return does not reflect expenses, which have been deducted from the Fund’s return. The returns shown do not reflect deduction of taxes that a shareholder would pay on Fund distributions or the redemption of Fund shares. THE FUND’S RETURN REPRESENTS PAST PERFORMANCE AND IS NOT PREDICTIVE OF FUTURE RESULTS.
19
Letter from the Manager
September 30, 2014
Strategic Growth Fund
Dear Strategic Growth Fund Shareholder:
The Timothy Plan Strategic Growth Fund is an asset allocation fund that invests in a number of Timothy Plan underlying funds. The allocation percentages will vary somewhat from time to time as a result of changing economic conditions, At September 30, 2014, this Fund was invested in the following underlying Timothy Plan Funds:
| | | | | | |
| Large/Mid-Cap Growth Fund | | (13.5%) | | Small-Cap Value Fund | | (6.25%) |
| | | |
| Large/Mid-Cap Value Fund | | (13.0%) | | Aggressive Growth Fund | | (5.75%) |
| | | |
| International Fund | | (15.25%) | | High-Yield Bond Fund | | (12.75%) |
| | | |
| Defensive Strategies Fund | | (12.5%) | | Israel Common Values Fund | | (5.0%) |
| | | |
| Emerging Markets Fund | | (6.0%) | | Growth & Income Fund | | (10.0%) |
For the fiscal year ended September 30, 2014, the Strategic Growth Fund Class A achieved a total return of 6.82%, vs a total return of 9.67% for the Dow Jones Global Moderate Index, the Fund’s benchmark. This Fund’s performance is directly affected by the factors that influence the performance of each of the underlying Funds. The sub-advisers to each underlying Fund have provided discussions of the factors that affected their Fund’s performance, as well as their thoughts for the next fiscal year, and I encourage you to read them carefully. During the last fiscal year, we managed the Fund with a decidedly conservative bias, and we plan to continue to manage this fund conservatively as we attempt to adjust to (what could be) rapidly changing economic conditions.
We continue to realize that the volatility and uncertainty of the markets may have been unsettling for many investors; however as a group, although our sub-advisors expect this pattern to continue into 2015, they also expect a somewhat upward bias with respect to performance in our underlying funds.
As you know, no one can guarantee future performance. However, the one thing that I can assure you of is that every one of our sub-advisors is doing their very best and our team here at Timothy is working very hard to provide you an investment with which you can feel comfortable.
Thank you for your continued support.
Arthur D. Ally
20
Fund Performance - (Unaudited)
September 30, 2014
Strategic Growth Fund
| | | | | | | | |
| Fund/Index | | 1 Year Total Return | | 5 Year
Average
Annual Return | | 10 Year Average
Annual Return |
Timothy Strategic Growth Fund - Class A (With Sales Charge) | | 0.89% | | 7.23% | | 4.06% |
Dow Jones Global Moderately Aggressive Portfolio Index | | 9.67% | | 10.95% | | 8.01% |
Timothy Strategic Growth Fund - Class C * | | 5.12% | | 7.64% | | 3.85% |
Dow Jones Global Moderately Aggressive Portfolio Index | | 9.67% | | 10.95% | | 8.01% |
| * | With Maximum Deferred Sales Charge |
Timothy Plan Strategic Growth Fund vs. Dow Jones Global Moderately Aggressive Portfolio Index
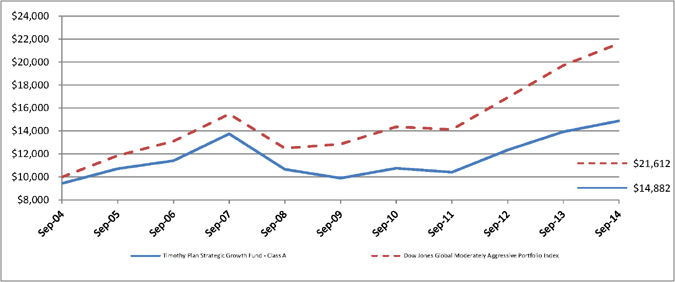
The chart shows the value of a hypothetical initial investment of $10,000 in the Fund’s Class A shares and the Dow Jones Global Moderately Aggressive Portfolio Index on September 30, 2004 and held through September 30, 2014. The Dow Jones Global Moderately Aggressive Portfolio Index is a widely recognized index that measures global stocks, bonds and cash which are in turn represented by multiple sub-indexes. Performance figures include the change in value of the investments in the index and the reinvestment of dividends. The index return does not reflect expenses, which have been deducted from the Fund’s return. The returns shown do not reflect deduction of taxes that a shareholder would pay on Fund distributions or the redemption of Fund shares. THE FUND’S RETURN REPRESENTS PAST PERFORMANCE AND IS NOT PREDICTIVE OF FUTURE RESULTS.
21
Letter from the Manager
September 30, 2014
Conservative Growth Fund
Dear Conservative Growth Fund Shareholder:
The Timothy Plan Conservative Growth Fund is an asset allocation fund that invests in a number of Timothy Plan underlying funds. The allocation percentages will vary slightly from time to time as a result of changing economic conditions, At September 30, 2014, the Fund was invested in the following underlying Timothy Plan Funds as follows:
| | | | | | |
| Large/Mid-Cap Growth Fund | | (8.25%) | | Small-Cap Value Fund | | (5.25%) |
| | | |
| Large/Mid-Cap Value Fund | | (7.75%) | | Aggressive Growth Fund | | (2.25%) |
| | | |
| International Fund | | (10.0%) | | High-Yield Bond Fund | | (8.5%) |
| | | |
| Defensive Strategies Fund | | (12.0%) | | Fixed Income Fund | | (29.0%) |
| | | |
| Israel Common Values Fund | | (4.0%) | | Growth & Income Fund | | (10.0%) |
| | | |
| Emerging Markets Fund | | (3.0%) | | | | |
For the fiscal year ended September 30, 2014, the Conservative Growth Fund Class A achieved a total return of 5.23%, vs a total return of 7.93% for the Dow Jones Global Moderate Index, the Fund’s benchmark. This Fund’s performance is directly affected by the factors that influence the performance of each of the underlying Funds. The sub-advisers to each underlying Fund have provided discussions of the factors that affected their Fund’s performance, as well as their thoughts for the next fiscal year, and I encourage you to read them carefully. During the last fiscal year, we managed the Fund with a decidedly conservative bias, and we plan to continue to manage this fund conservatively as we attempt to adjust to (what could be) rapidly changing economic conditions.
We continue to realize that the volatility and uncertainty of the markets may have been unsettling for many investors; however as a group, although our sub-advisors expect this pattern to continue into 2015, they also expect a somewhat upward bias with respect to performance in our underlying funds.
As you know, no one can guarantee future performance. However, the one thing that I can assure you of is that every one of our sub-advisors is doing their very best and our team here at Timothy is working very hard to provide you an investment with which you can feel comfortable.
Thank you for your continued support.
Arthur D. Ally
22
Fund Performance - (Unaudited)
September 30, 2014
Conservative Growth Fund
| | | | | | | | |
| Fund/Index | | 1 Year Total Return | | 5 Year
Average
Annual Return | | 10 Year Average
Annual Return |
Timothy Conservative Growth Fund - Class A (With Sales Charge) | | (0.45)% | | 5.49% | | 3.95% |
Dow Jones Global Moderate Portfolio Index | | 7.93% | | 9.12% | | 7.08% |
Timothy Conservative Growth Fund - Class C * | | 3.50% | | 5.88% | | 3.77% |
Dow Jones Global Moderate Portfolio Index | | 7.93% | | 9.12% | | 7.08% |
| * | With Maximum Deferred Sales Charge |
Timothy Plan Conservative Growth Fund vs. Dow Jones Global Moderate Portfolio Index
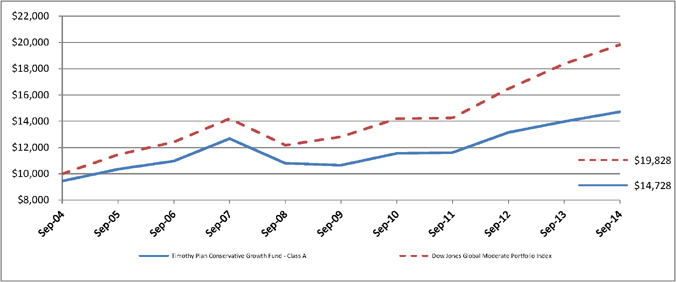
The chart shows the value of a hypothetical initial investment of $10,000 in the Fund’s Class A shares and the Dow Jones Global Moderate Portfolio Index on September 30, 2004 and held through September 30, 2014. The Dow Jones Global Moderate Portfolio Index is a widely recognized index that measures global stocks, bonds and cash which are in turn represented by multiple sub-indexes. Performance figures include the change in value of the investments in the index and the reinvestment of dividends. The index return does not reflect expenses, which have been deducted from the Fund’s return. The returns shown do not reflect deduction of taxes that a shareholder would pay on Fund distributions or the redemption of Fund shares. THE FUND’S RETURN REPRESENTS PAST PERFORMANCE AND IS NOT PREDICTIVE OF FUTURE RESULTS.
23
Letter from the Manager
September 30, 2014
Emerging Markets Fund
We will discuss sector-, country- and stock-specific factors that affected the Fund’s performance and describe changes in the Fund’s composition during the 12 months ended September 30th, 2014. In addition, we will share insight into how the Fund is currently positioned for the future.
The Markets
Emerging-market stocks declined in the third quarter of 2014 as the investor optimism that propelled them during the first half of the year seemed to dissipate. Fears that the U.S. Federal Reserve was moving closer to raising interest rates caused market concern about a potential repeat of last year’s sell-off and led investors to take a more cautious stance toward the asset class.
Russian equities fell on the heels of the Russia-Ukraine crisis escalation, while Brazilian stocks and currency suffered as investors’ hope of an economic reform was dimmed when President Dilma Rousseff regained popularity ahead of the upcoming presidential election.
Additionally, uncertainty over the ongoing pro-democracy protest in Hong Kong against the Chinese government further weighed on market sentiment toward emerging markets.
The Fund
As one might expect given the portfolio activity over the past year, the strategy’s allocations at the end of the third quarter were very similar to those earlier in 2014.
Allocation to companies in Russia continues to be a key investment topic. As of September 30, 2014, Russian equities, as a whole, traded at what we considered very attractive valuation multiples—lower than emerging markets as a group, or any other region/country in the world for that matter. We have maintained our holdings in Russia, and, in some cases, selectively averaged down on our positions. Additionally, as discussed earlier, we initiated a position in ITE Group, which is effectively a Russian company.
As the situation remains fluid with many unknowns, we have re-assessed the intrinsic value estimates of our holdings in Russia and are searching new opportunities there, while also considering the shorter-term implications of current or potential future sanctions. For example, Sberbank is being sanctioned by the European Union (EU) in regards to dealing with or purchasing securities issued after August 1, 2014. We continue to monitor the situation very closely. At the moment, Sberbank’s stock price seems depressed by current EU sanctions and the fear of more severe sanctions against Russia or Russian companies. Moreover, our analysis shows that the stock price also implies a very bleak scenario for Sberbank’s earnings, including margin compression on net interest income, a slowdown in loan and fee income growth, and deteriorating credit quality.
While the EU sanctions are designed to restrict Sberbank’s access to funding, Sberbank has actually low dependency on external funding, with its wholesale foreign-currency debt representing only 3% of total liabilities. Due to its systemic importance to the banking system in Russia and being approximately 51% owned by the Central Bank of Russia, Sberbank will likely have incremental access to central bank funding support if necessary.
24
Letter from the Manager
September 30, 2014
Emerging Markets Fund - Continued
We believe Sberbank has very attractive long-term growth prospects as the dominant retail and commercial banking franchise in Russia. We also think that the risk/reward proposition presented by Sberbank’s current stock price appears very favorable for the long-term investor.
Outlook
The number of events—and the gravity of some of them—evolving in emerging markets seemed to have led many short-term oriented investors and speculators to take on a “risk on, risk off” approach to emerging-market stocks. This can be seen in the market sentiment swings toward the asset class just over the last several months.
As long-time investors in emerging markets, however, we understand that while macroeconomic events need to be considered, they affect each emerging-market company differently. Our established global research infrastructure, which encompasses a team of analysts with extensive knowledge about their specific industries, allows us to think and invest independently from the market consensus.
Our willingness and ability to look beyond the short term give us confidence that the Brandes Emerging Market Strategy continues to offer compelling valuations and investment opportunities. As always, thank you for your business and continued trust.
Brandes Investment Partners, L.P.
This material is intended for informational purposes only. The information provided in this material should not be considered a recommendation to purchase or sell any particular security. It should not be assumed that any security transactions, holdings, or sectors discussed were or will be profitable, or that the investment recommendations or decisions we make in the future will be profitable or will equal the investment performance discussed herein. Portfolio holdings and allocations are subject to change at any time. Strategies discussed herein are subject to change at any time by the investment manager in its discretion due to market conditions or opportunities. Market conditions may impact performance.
International and emerging markets investing is subject to certain risks such as currency fluctuation and social and political changes, differences in financial reporting standards and less stringent regulation of securities markets which may result in greater share price volatility; such risks are increased when investing in emerging markets. Additional risks associated with emerging markets investing include smaller-sized markets, liquidity risks, and less established legal, political, social, and business systems to support securities markets. Some emerging markets countries may have fixed or managed currencies that are not free-floating against the U.S. dollar. Certain of these currencies have experienced, and may experience in the future, substantial fluctuations or a steady devaluation relative to the U.S. dollar. The foregoing reflects the thoughts and opinions of Brandes Investment Partners® exclusively and is subject to change without notice.
Brandes Investment Partners® is a registered trademark of Brandes Investment Partners, L.P. in the United States and Canada.
Index Guide
The MSCI Emerging Markets Index with gross dividends measures equity market performance of emerging markets.
25
Fund Performance - (Unaudited)
September 30, 2014
Emerging Markets Fund
| | | | | | |
| Fund/Index | | 1 Year Total Return | | Average
Annual Return
Since Inception |
Timothy Emerging Markets Fund - Class A (With Sales Charge) | | (4.81)% | | 0.07% | | (a) |
MSCI Emerging Markets Index | | 1.81% | | (0.13)% | | (a) |
Timothy Emerging Markets Fund - Class C * | | (1.14)% | | 2.45% | | (a) |
MSCI Emerging Markets Index | | 1.81% | | (0.13)% | | (a) |
Timothy Emerging Markets Fund - Class I | | 0.81% | | 5.62% | | (b) |
MSCI Emerging Markets Index | | 1.81% | | 4.59% | | (b) |
| (a) | For the period December 3, 2012 (commencement of investment in accordance with objective) to September 30, 2014. |
| (b) | For the period August 1, 2013 (commencement of investment in accordance with objective) to September 30, 2014. |
| * | With Maximum Deferred Sales Charge |
Timothy Plan Emerging Markets Fund vs. MSCI Emerging Markets Index
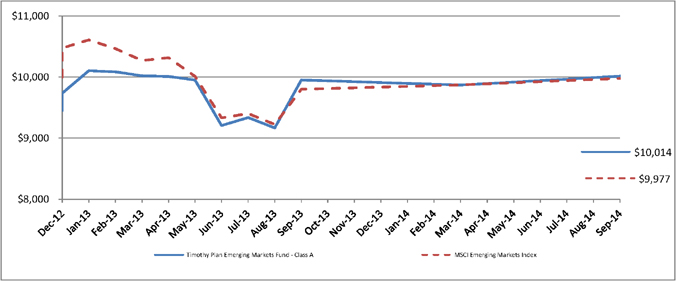
The chart shows the value of a hypothetical initial investment of $10,000 in the Fund’s Class A shares and the MSCI Emerging Markets Index on December 3, 2012 and held through September 30, 2014. The MSCI Emerging Markets Index is a free float-adjusted market capitalization index that is designed to measure equity market performance of emerging markets. The MSCI Emerging Markets Index consists of the following 21 emerging market country indices: Brazil, Chile, China, Colombia, Czech Republic, Egypt, Hungary, India, Indonesia, Korea, Malaysia, Mexico, Morocco, Peru, Philippines, Poland, Russia, South Africa, Taiwan, Thailand, and Turkey. Performance figures include the change in value of the stocks in the index and the reinvestment of dividends. The index return does not reflect expenses, which have been deducted from the Fund’s return. The returns shown do not reflect deduction of taxes that a shareholder would pay on Fund distributions or the redemption of Fund shares. THE FUND’S RETURN REPRESENTS PAST PERFORMANCE AND IS NOT PREDICTIVE OF FUTURE RESULTS.
26
Letter from the Manager
September 30, 2014
Growth & Income Fund
We are pleased to provide you with our first report for the Timothy Plan Growth and Income Fund for the period ending September 30, 2014. Like you, our company and some of our officers have invested some of corporate retirement and personal assets into the fund. We certainly thank you for entrusting your assets with us.
This is the first year of operation for the fund and it was an interesting time. Large capitalization stocks, with just a few minor setbacks, moved ahead. The same cannot be said of small capitalization stocks. They experienced a lot more volatility and didn’t make much progress. During this time bonds surprised many as longer term interest rates fell, leading to gains in those bonds. One of the major contributors to market activities was the Federal Reserve and its move to taper Quantitative Easing. This has certainly forced investors to revaluate risk and potential reward.
For the period starting 1 October 2013 through 30 September 2014, the Growth & Income Fund Class A returned 9.50%. A combination of 50% of the Russell 3000 Total Return Index and 50% Barclay’s Intermediate US/Govt Corp Index returned 9.36%. The Industrial and Basic Material sectors were the top performers while Consumer Cyclical and Utility stocks did the worst. Two of the top performers were American Railcar, which is a manufacturer of oil tanker railcars, and Trinity Industries, which supports the Energy and Transportation sectors.
This fund has two main objectives, growth and income but also the preservation of capital in declining markets. We have been managing similar assets for over 40 years. We will adjust equity and fixed income levels according to our analysis of risk. We do this on a weekly basis. Over the last year we saw lower risks in larger companies but higher risks in smaller companies. At the end of September, we actually saw over six in ten small stocks (less than $1 billion in market capitalization) in their personal bear market. That is falling 20% or more from their recent highs. At the time only about one in ten stocks in the S&P 500 were suffering in a like manner.
Our outlook has shifted some from seeing the better risk/reward opportunity moving from bonds to stocks. We don’t think interest rates will surge higher, but we think the best returns in bonds are probably behind us. At the same time, the September swoon in stocks appears to present some better opportunities for adding to equity levels. Our research points to a reasonably healthy outlook for stocks in the year ahead. However, we think volatility will tend to rise. If our research works well, this actually could give us opportunities to take advantage of these shifts.
We thank you for your trust in the James Investment Research Inc., we are grateful for the opportunity to serve you.
James Investment Research Inc.
27
Fund Performance - (Unaudited)
September 30, 2014
Growth & Income Fund
| | | | |
| Fund/Index | | Average
Annual Return
Since Inception |
Timothy Growth & Income Fund - Class A (With Sales Charge) | | 4.58% | | (a) |
Timothy Growth & Income Fund Blended Index (b) | | 9.36% | | (a) |
Timothy Growth & Income Fund - Class C * | | 7.70% | | (a) |
Timothy Growth & Income Fund Blended Index (b) | | 9.36% | | (a) |
Timothy Growth & Income Fund - Class I | | 9.60% | | (a) |
Timothy Growth & Income Fund Blended Index (b) | | 9.36% | | (a) |
| (a) | For the period October 1, 2013 (commencement of investment in accordance with objective) to September 30, 2014. |
| (b) | The Timothy Growth & Income Fund Blended Index reflects an unmanaged portfolio of 50% of the Barclays Intermediate Government/Credit Index and 50% of the Russell 3000 Total Return Index. |
| * | With Maximum Deferred Sales Charge |
Timothy Growth & Income Fund vs. Timothy Growth & Income Fund Blended Index (b)
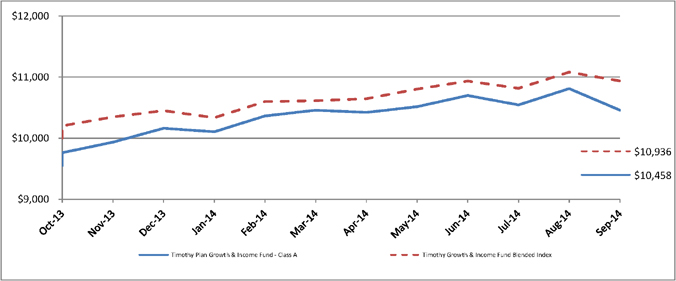
The chart shows the value of a hypothetical initial investment of $10,000 in the Fund’s Class A shares and the Timothy Growth & Income Fund Blended Index on October 1, 2013 and held through September 30, 2014. The Timothy Growth & Income Fund Blended Index reflects an unmanaged portfolio of 50% of the Barclays Intermediate Government/Credit Index and 50% of the Russell 3000 Total Return Index. Performance figures include the change in value of the stocks in the index and the reinvestment of dividends. The index return does not reflect expenses, which have been deducted from the Fund’s return. The returns shown do not reflect deduction of taxes that a shareholder would pay on Fund distributions or the redemption of Fund shares. THE FUND’S RETURN REPRESENTS PAST PERFORMANCE AND IS NOT PREDICTIVE OF FUTURE RESULTS.
28
Fund Profile
As of September 30, 2014 (Unaudited)
Aggressive Growth Fund
Top Ten Industries
(% of Net Assets)
| | | | |
Commercial Services | | | 12.3 | % |
Banks | | | 8.5 | % |
Diversified Financial Services | | | 7.7 | % |
Retail | | | 7.3 | % |
Healthcare | | | 7.1 | % |
Software | | | 6.8 | % |
Computers | | | 5.5 | % |
Apparel | | | 4.8 | % |
Oil & Natural Gas | | | 3.7 | % |
Telecommunications | | | 3.7 | % |
Other Assets Less Liabilities - Net | | | 32.6 | % |
| | | 100.0 | % |
Large/Mid Cap Growth Fund
Top Ten Industries
(% of Net Assets)
| | | | |
Retail | | | 12.9 | % |
Semiconductors | | | 10.0 | % |
Oil & Natural Gas | | | 8.2 | % |
Electronics | | | 6.1 | % |
Software | | | 5.9 | % |
Banks | | | 5.6 | % |
Chemicals | | | 4.8 | % |
Commercial Services | | | 4.1 | % |
Food | | | 3.8 | % |
Insurance | | | 3.5 | % |
Other Assets Less Liabilities - Net | | | 35.1 | % |
| | | 100.0 | % |
Large/Mid Cap Value Fund
Top Ten Industries
(% of Net Assets)
| | | | |
Electronics | | | 9.7 | % |
Oil & Natural Gas | | | 9.4 | % |
Semiconductors | | | 6.2 | % |
Banks | | | 6.1 | % |
Diversified Financial Services | | | 6.1 | % |
Food | | | 5.8 | % |
Retail | | | 5.1 | % |
Money Market Fund | | | 5.1 | % |
Healthcare Products | | | 4.0 | % |
Miscellaneous Manufacturing | | | 3.7 | % |
Other Assets Less Liabilities - Net | | | 38.8 | % |
| | | 100.0 | % |
High Yield Bond Fund
Top Ten Industries
(% of Net Assets)
| | | | |
Corporate Bonds | | | 97.4 | % |
Money Market Fund | | | 1.5 | % |
Other Assets Less Liabilities - Net | | | 1.1 | % |
| | | 100.0 | % |
International Fund
Top Ten Industries
(% of Net Assets)
| | | | |
Banks | | | 12.6 | % |
Automotive | | | 8.8 | % |
Insurance | | | 8.8 | % |
Healthcare | | | 8.6 | % |
Food | | | 5.8 | % |
Money Market Fund | | | 5.1 | % |
Oil & Natural Gas | | | 4.8 | % |
Pharmaceutical | | | 4.7 | % |
Diversified Financial Services | | | 4.6 | % |
Telecommunications | | | 4.4 | % |
Other Assets Less Liabilities - Net | | | 31.8 | % |
| | | 100.0 | % |
Small Cap Value Fund
Top Ten Industries
(% of Net Assets)
| | | | |
Banks | | | 14.8 | % |
Oil & Natural Gas | | | 9.3 | % |
REITs | | | 8.9 | % |
Building Materials | | | 7.9 | % |
Machinery | | | 5.2 | % |
Healthcare | | | 4.3 | % |
Insurance | | | 4.2 | % |
Electric | | | 3.9 | % |
Retail | | | 3.9 | % |
Transportation | | | 3.9 | % |
Other Assets Less Liabilities - Net | | | 33.7 | % |
| | | 100.0 | % |
Fixed Income Fund
Top Ten Industries
(% of Net Assets)
| | | | |
Corporate Bonds | | | 39.8 | % |
Government Mortgage - Backed Securities | | | 28.8 | % |
Government Notes & Bonds | | | 27.3 | % |
Money Market Fund | | | 3.7 | % |
Other Assets Less Liabilities - Net | | | 0.4 | % |
| | | 100.0 | % |
Israel Common Values Fund
Top Ten Industries
(% of Net Assets)
| | | | |
Oil & Natural Gas | | | 11.9 | % |
Real Estate | | | 11.2 | % |
Telecommunications | | | 10.8 | % |
Banks | | | 10.3 | % |
Software | | | 8.8 | % |
Semiconductors | | | 6.7 | % |
Pharmaceuticals | | | 5.0 | % |
Food | | | 4.5 | % |
Chemicals | | | 4.3 | % |
Electronics | | | 4.2 | % |
Other Assets Less Liabilities - Net | | | 22.3 | % |
| | | 100.0 | % |
29
Fund Profile (Continued)
As of September 30, 2014 (Unaudited)
Defensive Strategies Fund
Top Ten Industries
(% of Net Assets)
| | | | |
REITs | | | 30.0 | % |
TIPS | | | 25.2 | % |
Oil & Natural Gas | | | 8.5 | % |
Exchange Traded Funds | | | 8.4 | % |
Mining | | | 6.6 | % |
Chemicals | | | 5.5 | % |
Money Market Fund | | | 4.8 | % |
Corporate Bonds | | | 3.3 | % |
Government Mortgage - Backed Securities | | | 2.8 | % |
Oil & Gas Services | | | 1.9 | % |
Other Assets Less Liabilities - Net | | | 3.0 | % |
| | | 100.0 | % |
Conservative Growth Fund
Top Ten Industries
(% of Net Assets)
| | | | |
Mutual Funds | | | 99.7 | % |
Money Market Fund | | | 0.3 | % |
| | | 100.0 | % |
Growth & Income Fund
Top Ten Industries
(% of Net Assets)
| | | | |
Government Notes & Bonds | | | 49.0 | % |
Money Market Fund | | | 6.5 | % |
Commercial Services | | | 5.7 | % |
Oil & Natural Gas | | | 5.7 | % |
Insurance | | | 5.2 | % |
Chemicals | | | 4.3 | % |
Electric | | | 2.6 | % |
Retail | | | 2.3 | % |
Auto Parts & Equipment | | | 2.2 | % |
Miscellaneous Manufacturing | | | 2.1 | % |
Other Assets Less Liabilities - Net | | | 14.4 | % |
| | | 100.0 | % |
Strategic Growth Fund
Top Ten Industries
(% of Net Assets)
| | | | |
Mutual Funds | | | 100.3 | % |
Other Assets Less Liabilities - Net | | | (0.3 | %) |
| | | 100.0 | % |
Emerging Markets Fund
Top Ten Industries
(% of Net Assets)
| | | | |
Banks | | | 14.4 | % |
Food | | | 7.2 | % |
Retail | | | 7.2 | % |
Electric | | | 6.6 | % |
Diversified Financial Services | | | 6.4 | % |
Oil & Natural Gas | | | 6.3 | % |
Iron/Steel | | | 5.2 | % |
Automotive | | | 4.7 | % |
Preferred Stock | | | 4.7 | % |
Reits | | | 4.0 | % |
Other Assets Less Liabilities - Net | | | 33.3 | % |
| | | 100.0 | % |
30
Schedule of Investments | Aggressive Growth
As of September 30, 2014
| | | | | | |
| |
| Shares | | | | Fair Value | |
| |
| | |
| | COMMON STOCK - 96.2 % | | | | |
| | APPAREL - 4.8 % | | | | |
| 2,725 | | Carter’s, Inc. | | $ | 211,242 | |
| 1,330 | | Hanesbrands, Inc. | | | 142,895 | |
| 17,560 | | Steven Madden Ltd. * | | | 565,959 | |
| 2,710 | | VF Corp. | | | 178,941 | |
| | | | | | |
| | | | | 1,099,037 | |
| | | | | | |
| | BANKS - 8.5 % | | | | |
| 4,280 | | Cardinal Financial Corp. | | | 73,059 | |
| 19,975 | | First Horizon National Corp. | | | 245,293 | |
| 3,670 | | First NBC Bank Holding Co. * | | | 120,193 | |
| 3,700 | | PacWest Bancorp. | | | 152,551 | |
| 8,465 | | Popular, Inc. * | | | 249,167 | |
| 11,745 | | PrivateBancorp, Inc. | | | 351,293 | |
| 32,079 | | Synovus Financial Corp. | | | 758,348 | |
| | | | | | |
| | | | | 1,949,904 | |
| | | | | | |
| | BIOTECHNOLOGY - 2.0 % | | | | |
| 695 | | Alexion Pharmaceuticals, Inc. * | | | 115,245 | |
| 1,800 | | BioMarin Pharmaceutical, Inc. * | | | 129,888 | |
| 3,030 | | Incyte Corp. Ltd. * | | | 148,622 | |
| 2,845 | | MacroGenics, Inc. * | | | 59,461 | |
| | | | | | |
| | | | | 453,216 | |
| | | | | | |
| | COMMERCIAL SERVICES - 12.3 % | | | | |
| 2,900 | | Advisory Board Co. * | | | 135,111 | |
| 2,490 | | Cardtronics, Inc. * | | | 87,648 | |
| 1,150 | | DeVry Education Group, Inc. | | | 49,232 | |
| 2,270 | | Euronet Worldwide, Inc. * | | | 108,483 | |
| 1,179 | | FleetCor Technologies, Inc. * | | | 167,559 | |
| 3,050 | | H&E Equipment Services, Inc. | | | 122,854 | |
| 5,655 | | Heartland Payment Systems, Inc. | | | 269,856 | |
| 24,210 | | Information Services Group, Inc. * | | | 91,998 | |
| 2,195 | | MAXIMUS, Inc. | | | 88,085 | |
| 3,255 | | Monro Muffler Brake, Inc. | | | 157,965 | |
| 10,740 | | SEI Investments Co. | | | 388,358 | |
| 1,575 | | United Rentals, Inc. * | | | 174,983 | |
| 6,525 | | Vantiv, Inc. - Cl. A * | | | 201,623 | |
| 34,170 | | WNS Holdings Ltd. - Cl. A * | | | 769,167 | |
| | | | | | |
| | | | | 2,812,922 | |
| | | | | | |
| | COMPUTERS - 5.5 % | | | | |
| 6,595 | | Cognizant Technology Solutions Corp. * | | | 295,258 | |
| 8,625 | | Electronics For Imaging, Inc. * | | | 380,966 | |
| 2,605 | | iGATE Corp. * | | | 95,655 | |
| 1,550 | | IHS, Inc. - Cl. A * | | | 194,045 | |
| 2,080 | | Manhattan Associates, Inc. * | | | 69,513 | |
| 1,967 | | NetScout Systems, Inc. * | | | 90,088 | |
| 3,775 | | VeriFone Systems, Inc. * | | | 129,785 | |
| | | | | | |
| | | | | 1,255,310 | |
| | | | | | |
| | COSMETICS/PERSONAL CARE - 0.6 % | | | | |
| 5,400 | | Inter Parfums, Inc. | | | 148,500 | |
| | | | | | |
| | |
| | DISTRIBUTION/WHOLESALE - 1.5 % | | | | |
| 4,295 | | Wesco International, Inc. * | | | 336,127 | |
| | | | | | |
| | |
| | DIVERSIFIED FINANCIAL SERVICES - 7.7 % | | | | |
| 24,020 | | Cowen Group, Inc. * | | | 90,075 | |
| 8,835 | | E*TRADE Financial Corp. * | | | 199,582 | |
| 6,400 | | Encore Capital Group, Inc. * | | | 283,584 | |
| 2,975 | | Evercore Partners, Inc. - Cl. A | | | 139,825 | |
| 2,980 | | IntercontinentalExchange Group, Inc. | | | 581,249 | |
| 10,880 | | Invesco Ltd. | | | 429,542 | |
| 800 | | MarketAxess Holdings, Inc. | | | 49,488 | |
| | | | | | |
| | | | | 1,773,345 | |
| | | | | | |
| | ELECTRICAL - 0.4 % | | | | |
| 675 | | Acuity Brands, Inc. | | | 79,454 | |
| | | | | | |
| | |
| | ELECTRONICS - 2.7 % | | | | |
| 430 | | Mettler-Toledo International, Inc. * | | | 110,136 | |
| 2,895 | | Thermo Fisher Scientific, Inc. | | | 352,322 | |
| 4,785 | | Trimble Navigation Ltd. * | | | 145,943 | |
| | | | | | |
| | | | | 608,401 | |
| | | | | | |
The accompanying notes are an integral part of these financial statements.
31
Schedule of Investments | Aggressive Growth (Continued)
As of September 30, 2014
| | | | | | |
| |
| Shares | | | | Fair Value | |
| |
| |
| | ENVIRONMENTAL CONTROL - 1.2 % | |
| 2,310 | | MSA Safety, Inc. | | $ | 114,114 | |
| 3,060 | | Waste Connections, Inc. | | | 148,471 | |
| | | | | | |
| | | | | 262,585 | |
| | | | | | |
| | FOOD - 1.1 % | | | | |
| 2,515 | | Hain Celestial Group, Inc. * | | | 257,410 | |
| | | | | | |
| | |
| | HEALTHCARE - 7.1 % | | | | |
| 14,425 | | Bruker biosciences Corp. * | | | 267,079 | |
| 4,700 | | Globus Medical, Inc. - Cl. A * | | | 92,449 | |
| 4,580 | | ICON PLC * | | | 262,113 | |
| 1,350 | | IPC The Hospitalist Co., Inc. * | | | 60,467 | |
| 2,450 | | LDR Holding Corp. * | | | 76,269 | |
| 3,225 | | NuVasive, Inc. * | | | 112,455 | |
| 5,475 | | Spectranetics Corp * | | | 145,471 | |
| 12,195 | | Tornier NV * | | | 291,461 | |
| 3,375 | | Trinity Biotech PLC | | | 61,661 | |
| 8,605 | | Wright Medical Group, Inc. * | | | 260,732 | |
| | | | | | |
| | | | | 1,630,157 | |
| | | | | | |
| | HOLDING COMPANIES - 0.6 % | |
| 11,330 | | Horizon Pharma Plc * | | | 139,132 | |
| | | | | | |
| | |
| | HOME BUILDERS - 0.9 % | | | | |
| 5,155 | | Lennar Corp. | | | 200,168 | |
| | | | | | |
| | |
| | INSURANCE - 2.7 % | | | | |
| 12,475 | | Assured Guaranty Ltd. | | | 276,446 | |
| 23,868 | | Radian Group, Inc. | | | 340,358 | |
| | | | | | |
| | | | | 616,804 | |
| | | | | | |
| | INTERNET - 2.8 % | | | | |
| 3,950 | | Endurance International Group Holdings, Inc. * | | | 64,266 | |
| 16,725 | | Move, Inc. * | | | 350,556 | |
| 4,200 | | SPS Commerce, Inc. * | | | 223,230 | |
| | | | | | |
| | | | | 638,052 | |
| | | | | | |
| | LEISURE - 2.4 % | | | | |
| 12,775 | | Brunswick Corp. | | | 538,338 | |
| | | | | | |
| |
| | MACHINERY-DIVERSIFIED - 2.0 % | |
| 5,220 | | Columbus McKinnon Corp. | | | 114,788 | |
| 2,495 | | Flowserve Corp. | | | 175,947 | |
| 2,250 | | Nordson Corp. | | | 171,158 | |
| | | | | | |
| | | | | 461,893 | |
| | | | | | |
| | METAL FABRICATE/HARDWARE - 0.6 % | |
| 4,970 | | Rexnord Corp. * | | | 141,397 | |
| | | | | | |
| |
| | MISCELLANEOUS MANUFACTURING - 1.2 % | |
| 3,075 | | Hexcel Corp. * | | | 122,078 | |
| 5,995 | | TriMas Corp. * | | | 145,858 | |
| | | | | | |
| | | | | 267,936 | |
| | | | | | |
| | OIL & NATURAL GAS - 3.7 % | |
| 6,780 | | Cabot Oil & Gas Corp. - Cl. A | | | 221,638 | |
| 2,300 | | Carrizo Oil & Gas, Inc. * | | | 123,786 | |
| 10,900 | | Kodiak Oil & Gas Corp. * | | | 147,913 | |
| 17,359 | | Rex Energy Corp. * | | | 219,939 | |
| 1,600 | | Whiting Petroleum Corp. * | | | 124,080 | |
| | | | | | |
| | | | | 837,356 | |
| | | | | | |
| | PHARMACEUTICALS - 1.7 % | | | | |
| 6,517 | | Akorn, Inc. * | | | 236,371 | |
| 1,865 | | Catamaran Corp. * | | | 78,609 | |
| 475 | | Salix Pharmaceuticals Ltd. * | | | 74,214 | |
| | | | | | |
| | | | | 389,194 | |
| | | | | | |
| | REAL ESTATE - 0.9 % | | | | |
| 7,455 | | HFF, Inc. - Cl. A | | | 215,822 | |
| | | | | | |
The accompanying notes are an integral part of these financial statements.
32
Schedule of Investments | Aggressive Growth (Continued)
As of September 30, 2014
| | | | | | |
| |
| Shares | | | | Fair Value | |
| |
| | |
| | RETAIL - 7.3 % | | | | |
| 3,150 | | Advance Auto Parts, Inc. | | $ | 410,445 | |
| 4,900 | | Cheesecake Factory, Inc. | | | 222,950 | |
| 3,535 | | Del Frisco’s Restaurant Group, Inc. * | | | 67,660 | |
| 3,890 | | DSW, Inc. - Cl. A | | | 117,128 | |
| 6,545 | | Express, Inc. * | | | 102,167 | |
| 1,200 | | Fiesta Restaurant Group, Inc. * | | | 59,616 | |
| 1,600 | | Five Below, Inc. * | | | 63,376 | |
| 4,470 | | Krispy Kreme Doughnuts, Inc. * | | | 76,705 | |
| 1,445 | | Men’s Wearhouse, Inc. | | | 68,233 | |
| 6,025 | | Rush Enterprises, Inc. * | | | 201,536 | |
| 5,485 | | Sonic Corp. * | | | 122,645 | |
| 2,350 | | Tractor Supply Co. | | | 144,549 | |
| | | | | | |
| | | | | 1,657,010 | |
| | | | | | |
| | SEMICONDUCTORS - 2.4 % | | | | |
| 1,650 | | Avago Technologies Ltd. | | | 143,550 | |
| 4,375 | | Cypress Semiconductor Corp. | | | 43,203 | |
| 3,275 | | NXP Semiconductor NV * | | | 224,108 | |
| 5,305 | | Semtech Corp. * | | | 144,031 | |
| | | | | | |
| | | | | 554,892 | |
| | | | | | |
| | SOFTWARE - 6.8 % | | | | |
| 6,865 | | Aspen Technology, Inc. * | | | 258,948 | |
| 5,450 | | Cerner Corp. * | | | 324,657 | |
| 2,500 | | Informatica Corp. * | | | 85,600 | |
| 1,700 | | Interactive Intelligence Group, Inc. * | | | 71,060 | |
| 1,850 | | Proofpoint, Inc. * | | | 68,709 | |
| 7,775 | | PTC, Inc. * | | | 286,898 | |
| 3,200 | | SS&C Technologies Holdings, Inc. * | | | 140,448 | |
| 2,060 | | Synchronoss Technologies, Inc. * | | | 94,307 | |
| 2,575 | | Tyler Technologies, Inc. * | | | 227,630 | |
| | | | | | |
| | | | | 1,558,257 | |
| | | | | | |
| | TELECOMMUNICATIONS - 3.7 % | | | | |
| 11,660 | | 8x8, Inc. * | | | 77,889 | |
| 4,370 | | CalAmp Corp. * | | | 76,999 | |
| 4,450 | | Polycom, Inc. * | | | 54,668 | |
| 5,795 | | SBA Communications Corp. - Cl. A * | | | 642,666 | |
| | | | | | |
| | | | | 852,222 | |
| | | | | | |
| | TRANSPORTATION - 1.1 % | | | | |
| 1,000 | | Genesee & Wyoming, Inc. - Cl. A * | | | 95,310 | |
| 7,455 | | Swift Transportation Co. - Cl. A * | | | 156,406 | |
| | | | | | |
| | | | | 251,716 | |
| | | | | | |
| | |
| | TOTAL COMMON STOCK (Cost - $19,530,931) | | | 21,986,557 | |
| | | | | | |
| | |
| | MASTER LIMITED PARTNERSHIPS - 2.0% | | | | |
| 8,925 | | Lazard Ltd. - Cl. A (Cost $406,753) | | | 452,498 | |
| | | | | | |
| | |
| | REITs - 0.4 % | | | | |
| 9,125 | | Lexington Realty Trust - REIT (Cost $102,281) | | | 89,334 | |
| | | | | | |
| | |
| | MONEY MARKET FUND - 1.6 % | | | | |
| 377,838 | | Fidelity Institutional Money Market Portfolio, 0.01% (Cost $377,838)(A) | | | 377,838 | |
| | | | | | |
| | |
| | TOTAL INVESTMENTS - 100.2 % (Cost - $20,417,803)(B) | | $ | 22,906,227 | |
| | | | | | |
| | OTHER ASSETS LESS LIABILITIES - NET - (0.2) % | | | (40,090) | |
| | | | | | |
| | NET ASSETS - 100.0% | | $ | 22,866,137 | |
| | | | | | |
|
* Non-income producing securities REIT - Real Estate Investment Trust (A) Variable rate security; the rate shown represents the yield at September 30, 2014. (B) Represents cost for financial reporting purposes. Aggregate cost for federal tax purposes is $20,432,944 and differs from fair value by net unrealized appreciation (depreciation) of securities as follows: | |
| | |
| | Unrealized appreciation | | $ | 3,058,426 | |
| | Unrealized depreciation | | | (585,143 | ) |
| | | | | | |
| | Net unrealized appreciation | | $ | 2,473,283 | |
| | | | | | |
The accompanying notes are an integral part of these financial statements.
33
Schedule of Investments | International
As of September 30, 2014
| | | | | | |
| |
| Shares | | | | Fair Value | |
| |
| | |
| | COMMON STOCK - 94.5 % | | | | |
| | AIRLINES - 1.6 % | | | | |
| 9,000 | | Copa Holdings SA - Cl. A | | $ | 965,610 | |
| | | | | | |
| | |
| | AUTO MANUFACTURERS - 1.3 % | | | | |
| 93,000 | | Porsche Automobil Holding SE (ADR) | | | 739,350 | |
| | | | | | |
| | |
| | AUTOMOTIVE - 8.8 % | | | | |
| 27,500 | | Continental AG (ADR) | | | 1,041,425 | |
| 20,100 | | Magna International, Inc. | | | 1,907,691 | |
| 39,700 | | Valeo SA (ADR) | | | 2,203,350 | |
| | | | | | |
| | | | | 5,152,466 | |
| | | | | | |
| | BANKS - 12.6 % | | | | |
| 30,000 | | Bank Hapoalim BM (ADR) | | | 847,200 | |
| 197,000 | | Bank of East Asia Ltd. (ADR) | | | 783,469 | |
| 29,439 | | DBS Group Holdings Ltd. (ADR) | | | 1,701,574 | |
| 23,300 | | ICICI Bank Ltd. (ADR) | | | 1,144,030 | |
| 49,100 | | Intesa Sanpaolo SpA (ADR) | | | 886,992 | |
| 172,200 | | Sumitomo Mitsui Financial Group, Inc. (ADR) | | | 1,412,040 | |
| 24,100 | | Swedbank AB (ADR) | | | 604,669 | |
| | | | | | |
| | | | | 7,379,974 | |
| | | | | | |
| | BUILDING MATERIALS - 1.5 % | | | | |
| 49,000 | | Lafarge SA (ADR) | | | 882,000 | |
| | | | | | |
| | |
| | CHEMICALS - 0.6 % | | | | |
| 4,000 | | Agrium, Inc. | | | 356,000 | |
| | | | | | |
| | |
| | DIVERSIFIED FINANCIAL SERVICES - 4.6 % | | | | |
| 116,500 | | Daiwa Securities Group, Inc. (ADR) | | | 921,515 | |
| 25,900 | | ORIX Corp. (ADR) | | | 1,787,100 | |
| | | | | | |
| | | | | 2,708,615 | |
| | | | | | |
| | ELECTRIC POWER- 3.6 % | | | | |
| 91,300 | | Cia Energetica de Minas Gerais (ADR) * | | | 568,799 | |
| 23,300 | | Huaneng Power International, Inc. (ADR) | | | 1,017,278 | |
| 59,900 | | Power Assets Holdings Ltd. (ADR) | | | 524,125 | |
| | | | | | |
| | | | | 2,110,202 | |
| | | | | | |
| | ELECTRICAL - 2.1 % | | | | |
| 16,100 | | Hitachi Ltd. (ADR) | | | 1,231,650 | |
| | | | | | |
| | |
| | ELECTRONICS - 1.0 % | | | | |
| 36,000 | | Orbotech Ltd. * | | | 560,880 | |
| | | | | | |
| | |
| | ENGINEERING & CONSTRUCTION - 2.2 % | | | | |
| 88,000 | | Vinci SA (ADR) | | | 1,272,480 | |
| | | | | | |
| | FOOD - 5.8 % | | | | |
| 14,000 | | Kerry Group PLC (ADR) | | | 994,000 | |
| 81,800 | | Marine Harvest ASA (ADR) | | | 1,150,108 | |
| 15,800 | | Seven & I Holdings Co. Ltd. (ADR) | | | 1,226,712 | |
| | | | | | |
| | | | | 3,370,820 | |
| | | | | | |
| | HAND/MACHINE TOOLS - 2.5 % | | | | |
| 103,100 | | Techtronic Industries Co. (ADR) | | | 1,467,113 | |
| | | | | | |
| | |
| | HEALTHCARE - 8.6 % | | | | |
| 59,800 | | Fresenius Medical Care AG & Co. (ADR) | | | 2,075,060 | |
| 35,200 | | Smith & Nephew PLC (ADR) | | | 2,963,488 | |
| | | | | | |
| | | | | 5,038,548 | |
| | | | | | |
| | HOME BUILDERS - 1.4 % | | | | |
| 70,000 | | Sekisui House Ltd. (ADR) | | | 823,900 | |
| | | | | | |
| | |
| | INSURANCE - 8.8 % | | | | |
| 224,000 | | Aegon NV (ADR) | | | 1,841,280 | |
| 49,900 | | Ageas (ADR) | | | 1,641,960 | |
| 40,700 | | Muenchener Rueckversicherungs AG (ADR) | | | 804,232 | |
| 28,900 | | Zurich Insurance Group AG (ADR) | | | 861,480 | |
| | | | | | |
| | | | | 5,148,952 | |
| | | | | | |
| | INTERNET - 1.8 % | | | | |
| 70,000 | | Tencent Holdings Ltd. (ADR) | | | 1,037,400 | |
| | | | | | |
The accompanying notes are an integral part of these financial statements.
34
Schedule of Investments | International (Continued)
As of September 30, 2014
| | | | | | |
| |
| Shares | | | | Fair Value | |
| |
| | |
| | MACHINERY - 1.3 % | | | | |
| 30,000 | | Atlas Copco AB (ADR) | | $ | 773,085 | |
| | | | | | |
| | |
| | METAL FABRICATE/HARDWARE - 0.9 % | | | | |
| 20,000 | | Assa Abloy AB (ADR) | | | 513,100 | |
| | | | | | |
| | |
| | MINERALS & MINING - 1.2 % | | | | |
| 14,000 | | Rio Tinto PLC (ADR) | | | 688,520 | |
| | | | | | |
| | |
| | MISCELLANEOUS MANUFACTURING - 2.3 % | | | | |
| 44,538 | | FUJIFILM Holdings Corp. (ADR) | | | 1,369,053 | |
| | | | | | |
| | |
| | OIL & NATURAL GAS - 4.8 % | | | | |
| 189,000 | | Gran Tierra Energy, Inc. * | | | 1,047,060 | |
| 64,468 | | Statoil ASA - (ADR) | | | 1,750,951 | |
| | | | | | |
| | | | | 2,798,011 | |
| | | | | | |
| | OIL & GAS SERVICES - 1.0 % | | | | |
| 42,788 | | Subsea 7 SA (ADR) | | | 608,445 | |
| | | | | | |
| | |
| | PHARMACEUTICAL - 4.7 % | | | | |
| 10,500 | | Shire PLC (ADR) | | | 2,720,025 | |
| | | | | | |
| | |
| | RETAIL - 1.4 % | | | | |
| 77,000 | | Home Retail Group PLC (ADR) | | | 833,140 | |
| | | | | | |
| | |
| | SOFTWARE - 1.5 % | | | | |
| 16,000 | | Open Text Corp. | | | 886,720 | |
| | | | | | |
| | |
| | TELECOMMUNICATIONS - 4.4 % | | | | |
| 15,000 | | Globe Telecom, Inc. (ADR) | | | 541,725 | |
| 43,000 | | Nippon Telegraph & Telephone Corp. (ADR) | | | 1,337,730 | |
| 10,000 | | Philippine Long Distance Telephone Co. (ADR) | | | 689,800 | |
| | | | | | |
| | | | | 2,569,255 | |
| | | | | | |
| | TRANSPORTATION - 2.2 % | | | | |
| 6,200 | | Canadian Pacific Railway Ltd. | | | 1,286,314 | |
| | | | | | |
| | |
| | TOTAL COMMON STOCK (Cost - $48,385,290) | | | 55,291,628 | |
| | | | | | |
| | |
| | MONEY MARKET FUND - 5.1% | | | | |
| 2,972,365 | | Fidelity Institutional Money Market Portfolio, 0.01% (Cost $2,972,365)(A) | | | 2,972,365 | |
| | | | | | |
| | |
| | TOTAL INVESTMENTS (Cost - $51,357,655)(B) - 99.6 % | | $ | 58,263,993 | |
| | | | | | |
| | OTHER ASSETS LESS LIABILITIES - NET - 0.4 % | | | 241,583 | |
| | | | | | |
| | NET ASSETS - 100.00% | | $ | 58,505,576 | |
| | | | | | |
|
* Non-income producing securities. (ADR) American Depositary Receipt (A) Variable rate security; the rate shown represents the yield at September 30, 2014. (B) Represents cost for financial reporting purposes. Aggregate cost for federal tax purposes is $51,723,516 and differs from fair value by net unrealized appreciation (depreciation) of securities as follows: | |
| | |
| | Unrealized appreciation | | $ | 9,216,553 | |
| | Unrealized depreciation | | | (2,676,076) | |
| | | | | | |
| | Net unrealized appreciation | | $ | 6,540,477 | |
| | | | | | |
The accompanying notes are an integral part of these financial statements.
35
Schedule of Investments | International (Continued)
As of September 30, 2014
| | | | |
| Diversification of Assets | | | |
| |
| Country | | % of Net Assets | |
| |
| Belgium | | | 2.81% | |
| Brazil | | | 0.97% | |
| Britain | | | 8.71% | |
| Canada | | | 9.37% | |
| China | | | 3.51% | |
| France | | | 7.45% | |
| Germany | | | 7.97% | |
| Hong Kong | | | 4.74% | |
| India | | | 1.95% | |
| Ireland | | | 6.35% | |
| Israel | | | 2.41% | |
| Italy | | | 1.52% | |
| Japan | | | 17.28% | |
| Netherlands | | | 3.15% | |
| Norway | | | 4.96% | |
| Panama | | | 1.65% | |
| Philippines | | | 2.10% | |
| Singapore | | | 2.91% | |
| Sweden | | | 3.23% | |
| Switzerland | | | 1.47% | |
| | | | |
| Total | | | 94.51% | |
| Money Market Fund | | | 5.08% | |
| Other Assets in Excess of Liabilities | | | 0.41% | |
| | | | |
| Grand Total | | | 100.00% | |
| | | | |
The accompanying notes are an integral part of these financial statements.
36
Schedule of Investments | Large/Mid Cap Growth
As of September 30, 2014
| | | | | | |
| |
| Shares | | | | Fair Value | |
| |
| | |
| | COMMON STOCK - 94.9 % | | | | |
| | AEROSPACE/DEFENSE - 1.3 % | | | | |
| 6,540 | | General Dynamics Corp. | | $ | 831,169 | |
| | | | | | |
| | |
| | APPAREL - 3.2 % | | | | |
| 6,625 | | Carter’s, Inc. | | | 513,570 | |
| 1,420 | | Hanesbrands, Inc. | | | 152,565 | |
| 19,575 | | VF Corp. | | | 1,292,537 | |
| | | | | | |
| | | | | 1,958,672 | |
| | | | | | |
| | BANKS - 5.6 % | | | | |
| 35,085 | | BB&T Corp. | | | 1,305,513 | |
| 42,475 | | First Horizon National Corp. | | | 521,593 | |
| 16,725 | | Popular, Inc. * | | | 492,300 | |
| 12,750 | | PrivateBancorp, Inc. | | | 381,352 | |
| 34,088 | | Synovus Financial Corp. | | | 805,840 | |
| | | | | | |
| | | | | 3,506,598 | |
| | | | | | |
| | BIOTECHNOLOGY - 3.1 % | | | | |
| 775 | | Alexion Pharmaceuticals, Inc. * | | | 128,511 | |
| 5,725 | | BioMarin Pharmaceutical, Inc. * | | | 413,116 | |
| 12,685 | | Celgene Corp. * | | | 1,202,284 | |
| 3,550 | | Incyte Corp. * | | | 174,128 | |
| | | | | | |
| | | | | 1,918,039 | |
| | | | | | |
| | CHEMICALS - 4.8 % | | | | |
| 13,720 | | LyondellBasell Industries NV | | | 1,490,815 | |
| 11,360 | | Praxair, Inc. | | | 1,465,440 | |
| | | | | | |
| | | | | 2,956,255 | |
| | | | | | |
| | COMMERCIAL SERVICES - 4.1 % | | | | |
| 1,250 | | DeVry Education Group, Inc. | | | 53,513 | |
| 3,467 | | FleetCor Technologies, Inc. * | | | 492,730 | |
| 32,425 | | SEI Investments Co. | | | 1,172,488 | |
| 3,435 | | United Rentals, Inc. * | | | 381,629 | |
| 14,945 | | Vantiv, Inc. - Cl. A * | | | 461,801 | |
| | | | | | |
| | | | | 2,562,161 | |
| | | | | | |
| | COMPUTERS - 2.3 % | | | | |
| 10,350 | | Cognizant Technology Solutions Corp. - Cl. A * | | | 463,370 | |
| 9,340 | | Electronics For Imaging, Inc. * | | | 412,548 | |
| 3,550 | | IHS, Inc. - Cl. A * | | | 444,425 | |
| 4,075 | | VeriFone Systems, Inc. * | | | 140,099 | |
| | | | | | |
| | | | | 1,460,442 | |
| | | | | | |
| | DISTRIBUTION/WHOLESALE - 0.6 % | | | | |
| 4,565 | | Wesco International, Inc. * | | | 357,257 | |
| | | | | | |
| | |
| | DIVERSIFIED FINANCIAL SERVICES - 3.1 % | | | | |
| 20,585 | | E* TRADE Financial Corp. * | | | 465,015 | |
| 4,165 | | IntercontinentalExchange, Inc. | | | 812,383 | |
| 17,174 | | Invesco Ltd. | | | 678,030 | |
| | | | | | |
| | | | | 1,955,428 | |
| | | | | | |
| | ELECTRONICS - 6.1 % | | | | |
| 15,640 | | Amphenol Corp. | | | 1,561,810 | |
| 980 | | Mettler-Toledo International, Inc. * | | | 251,007 | |
| 13,525 | | Thermo Fisher Scientific, Inc. | | | 1,645,992 | |
| 11,270 | | Trimble Navigation Ltd. * | | | 343,735 | |
| | | | | | |
| | | | | 3,802,544 | |
| | | | | | |
| | ENVIRONMENTAL CONTROL - 0.6 % | | | | |
| 7,270 | | Waste Connections, Inc. | | | 352,740 | |
| | | | | | |
| | |
| | FOOD - 3.8 % | | | | |
| 6,075 | | Hain Celestial Group, Inc. * | | | 621,776 | |
| 10,290 | | JM Smucker Co. | | | 1,018,607 | |
| 20,730 | | Mondelez International, Inc. - Cl. A | | | 710,313 | |
| | | | | | |
| | | | | 2,350,696 | |
| | | | | | |
The accompanying notes are an integral part of these financial statements.
37
Schedule of Investments | Large/Mid Cap Growth (Continued)
As of September 30, 2014
| | | | | | |
| |
| Shares | | | | Fair Value | |
| |
| | |
| | HEALTHCARE - 1.3 % | | | | |
| 24,700 | | Bruker Biosciences, Corp. * | | $ | 457,321 | |
| 5,785 | | ICON PLC * | | | 331,076 | |
| | | | | | |
| | | | | 788,397 | |
| | | | | | |
| | HOME BUILDERS - 0.7 % | | | | |
| 11,455 | | Lennar Corp. | | | 444,798 | |
| | | | | | |
| | |
| | INSURANCE - 3.5 % | | | | |
| 17,905 | | ACE Ltd. | | | 1,877,697 | |
| 13,475 | | Assured Guaranty Ltd. | | | 298,606 | |
| | | | | | |
| | | | | 2,176,303 | |
| | | | | | |
| | LEISURE TIME - 0.9 % | | | | |
| 13,850 | | Brunswick Corp. | | | 583,639 | |
| | | | | | |
| | |
| | MACHINERY - 3.0 % | | | | |
| 5,535 | | Flowserve Corp. | | | 390,328 | |
| 5,225 | | Nordson Corp. | | | 397,465 | |
| 9,565 | | Rockwell Automation, Inc. | | | 1,051,002 | |
| | | | | | |
| | | | | 1,838,795 | |
| | | | | | |
| | MINING - 2.8 % | | | | |
| 53,360 | | Freeport-McMoRan, Inc. | | | 1,742,204 | |
| | | | | | |
| | |
| | OIL & NATURAL GAS - 8.2 % | | | | |
| 6,620 | | Cabot Oil & Gas Corp. | | | 216,408 | |
| 15,485 | | ConocoPhillips | | | 1,184,912 | |
| 12,985 | | Exxon Mobil Corp. | | | 1,221,239 | |
| 23,340 | | Occidental Petroleum Corp. | | | 2,244,141 | |
| 2,825 | | Whiting Petroleum Corp. * | | | 219,079 | |
| | | | | | |
| | | | | 5,085,779 | |
| | | | | | |
| | PHARMACEUTICALS - 2.2 % | | | | |
| 17,725 | | AbbVie, Inc. | | | 1,023,796 | |
| 4,100 | | Catamaran Corp. * | | | 172,815 | |
| 1,025 | | Salix Pharmaceuticals Ltd. * | | | 160,146 | |
| | | | | | |
| | | | | 1,356,757 | |
| | | | | | |
| | RETAIL - 12.9 % | | | | |
| 6,475 | | Advance Auto Parts, Inc. | | | 843,693 | |
| 3,825 | | AutoZone, Inc. * | | | 1,949,450 | |
| 13,600 | | Cheesecake Factory, Inc. | | | 618,800 | |
| 11,585 | | Costco Wholesale Corp. | | | 1,451,832 | |
| 24,530 | | Kohl’s Corp. | | | 1,497,066 | |
| 25,445 | | Lowe’s Cos, Inc. | | | 1,346,549 | |
| 5,250 | | Tractor Supply Co. | | | 322,928 | |
| | | | | | |
| | | | | 8,030,318 | |
| | | | | | |
| | SEMICONDUCTORS - 10.0 % | | | | |
| 3,875 | | Avago Technologies Ltd. | | | 337,125 | |
| 44,920 | | Linear Technology Corp. | | | 1,993,999 | |
| 34,055 | | Maxim Integrated Products, Inc. | | | 1,029,823 | |
| 75,525 | | NVIDIA Corp. | | | 1,393,436 | |
| 7,225 | | NXP Semiconductor NV * | | | 494,407 | |
| 23,780 | | Xilinx, Inc. | | | 1,007,083 | |
| | | | | | |
| | | | | 6,255,873 | |
| | | | | | |
The accompanying notes are an integral part of these financial statements.
38
Schedule of Investments | Large/Mid Cap Growth (Continued)
As of September 30, 2014
| | | | | | |
| |
| Shares | | | | Fair Value | |
| |
| | |
| | SOFTWARE - 5.9 % | | | | |
| 7,475 | | Aspen Technology, Inc. - Cl. A * | | $ | 281,957 | |
| 15,325 | | Cerner Corp. * | | | 912,910 | |
| 10,750 | | Check Point Software Technologies Ltd. * | | | 744,330 | |
| 2,705 | | Informatica Corp. * | | | 92,619 | |
| 11,435 | | PTC, Inc. * | | | 421,951 | |
| 13,060 | | VMware, Inc. - Cl. A * | | | 1,225,550 | |
| | | | | | |
| | | | | 3,679,317 | |
| | | | | | |
| | TELECOMMUNICATIONS - 1.8 % | | | | |
| 10,050 | | SBA Communications Corp. - Cl. A * | | | 1,114,545 | |
| | | | | | |
| | |
| | TRANSPORTATION - 3.1 % | | | | |
| 2,155 | | Genesee & Wyoming, Inc. - Cl. A * | | | 205,393 | |
| 12,425 | | Norfolk Southern Corp. | | | 1,386,630 | |
| 16,145 | | Swift Transportation Co. - Cl. A * | | | 338,722 | |
| | | | | | |
| | | | | 1,930,745 | |
| | | | | | |
| | |
| | TOTAL COMMON STOCK (Cost - $50,555,035) | | | 59,039,471 | |
| | | | | | |
| | |
| | MASTER LIMITED PARTNERSHIPS - 1.6% | | | | |
| 19,455 | | Lazard Ltd. - Cl. A (Cost $862,121) | | | 986,369 | |
| | | | | | |
| | |
| | MONEY MARKET FUND - 3.3 % | | | | |
| 2,017,276 | | Fidelity Institutional Money Market Portfolio, 0.01% (Cost $2,017,276)(A) | | | 2,017,276 | |
| | | | | | |
| | |
| | TOTAL INVESTMENTS ( Cost - $53,434,432)(B) - 99.8 % | | $ | 62,043,116 | |
| | | | | | |
| | OTHER ASSETS LESS LIABILITIES - NET - 0.2 % | | | 148,269 | |
| | | | | | |
| | NET ASSETS - 100.0% | | $ | 62,191,385 | |
| | | | | | |
|
* Non-income producing securities. (A) Variable rate security; the rate shown represents the yield at September 30, 2014. (B) Represents cost for financial reporting purposes. Aggregate cost for federal tax purposes is $53,473,316 and differs from fair value by net unrealized appreciation (depreciation) of securities as follows: | |
| | |
| | Unrealized appreciation | | $ | 9,077,397 | |
| | Unrealized depreciation | | | (507,597) | |
| | | | | | |
| | Net unrealized appreciation | | $ | 8,569,800 | |
| | | | | | |
The accompanying notes are an integral part of these financial statements.
39
Schedule of Investments | Small Cap Value
As of September 30, 2014
| | | | | | |
| |
| Shares | | | | Fair Value | |
| |
| | COMMON STOCK - 88.8 % | | | | |
| | AEROSPACE/EQUIPMENT- 2.1 % | | | | |
| 43,022 | | Kaman Corp. | | $ | 1,690,765 | |
| | | | | | |
| | |
| | APPAREL - 2.0 % | | | | |
| 65,400 | | Wolverine World Wide, Inc. | | | 1,638,924 | |
| | | | | | |
| | |
| | BANKS - 14.8 % | | | | |
| 14,323 | | BancFirst Corp. | | | 896,047 | |
| 108,899 | | BBCN Bancorp, Inc. | | | 1,588,836 | |
| 62,047 | | Chemical Financial Corp. | | | 1,668,444 | |
| 67,308 | | Columbia Banking System, Inc. | | | 1,669,912 | |
| 63,800 | | First Financial Bancorp | | | 1,009,954 | |
| 28,575 | | Opus Bank * | | | 875,252 | |
| 61,657 | | Pacific Continental Corp. | | | 792,292 | |
| 59,330 | | WesBanco, Inc. | | | 1,814,905 | |
| 35,954 | | Wintrust Financial Corp. | | | 1,606,065 | |
| | | | | | |
| | | | | 11,921,707 | |
| | | | | | |
| | BUILDING MATERIALS - 7.9 % | | | | |
| 37,211 | | Apogee Enterprises, Inc. | | | 1,480,998 | |
| 53,050 | | Boise Cascade Co. * | | | 1,598,927 | |
| 114,486 | | Continental Building Products, Inc. * | | | 1,671,496 | |
| 46,126 | | Trex Co., Inc. * | | | 1,594,576 | |
| | | | | | |
| | | | | 6,345,997 | |
| | | | | | |
| | CHEMICALS - 2.1 % | | | | |
| 46,590 | | A. Schulman, Inc. | | | 1,684,694 | |
| | | | | | |
| | |
| | COMMERCIAL SERVICES - 2.1 % | | | | |
| 106,000 | | Kelly Services, Inc. - Cl. A | | | 1,661,020 | |
| | | | | | |
| | |
| | COMPUTERS - 1.9 % | | | | |
| 31,600 | | J2 Global, Inc. | | | 1,559,776 | |
| | | | | | |
| | |
| | DISTRIBUTION/WHOLESALE - 1.1 % | | | | |
| 34,367 | | Beacon Roofing Supply, Inc. * | | | 875,671 | |
| | | | | | |
| | |
| | ELECTRIC - 3.9 % | | | | |
| 35,300 | | ALLETE, Inc. | | | 1,566,967 | |
| 34,800 | | NorthWestern Corp. | | | 1,578,528 | |
| | | | | | |
| | | | | 3,145,495 | |
| | | | | | |
| | ELECTRICAL & EQUIPMENT - 3.7 % | | | | |
| 19,445 | | Littelfuse, Inc. | | | 1,656,325 | |
| 22,210 | | Coherent, Inc. * | | | 1,363,028 | |
| | | | | | |
| | | | | 3,019,353 | |
| | | | | | |
| | FOOD - 2.1 % | | | | |
| 18,363 | | J & J Snack Foods Corp. | | | 1,718,042 | |
| | | | | | |
| | |
| | HEALTHCARE - 4.3 % | | | | |
| 26,700 | | Haemonetics Corp. * | | | 932,364 | |
| 19,765 | | Integra LifeSciences Holdings Corp. * | | | 981,135 | |
| 131,758 | | Merit Medical Systems, Inc. * | | | 1,565,285 | |
| | | | | | |
| | | | | 3,478,784 | |
| | | | | | |
| | HOME FURNISHINGS - 2.1 % | | | | |
| 65,128 | | DTS, Inc. * | | | 1,644,482 | |
| | | | | | |
| | |
| | INSURANCE - 4.2 % | | | | |
| 23,945 | | AMERISAFE, Inc. | | | 936,489 | |
| 86,000 | | Employers Holdings, Inc. | | | 1,655,500 | |
| 15,097 | | Safety Insurance Group, Inc. | | | 813,879 | |
| | | | | | |
| | | | | 3,405,868 | |
| | | | | | |
The accompanying notes are an integral part of these financial statements.
40
Schedule of Investments | Small Cap Value (Continued)
As of September 30, 2014
| | | | | | |
| |
| Shares | | | | Fair Value | |
| |
| | |
| | MACHINERY - 5.2 % | | | | |
| 21,262 | | Alamo Group, Inc. | | $ | 871,742 | |
| 53,193 | | Gorman-Rupp Co. | | | 1,597,918 | |
| 23,405 | | Hurco Cos, Inc. | | | 881,432 | |
| 12,162 | | Hyster-Yale Materials Handling, Inc. - CL. A | | | 871,042 | |
| | | | | | |
| | | | | 4,222,134 | |
| | | | | | |
| | MEDIA - 1.1 % | | | | |
| 19,700 | | Meredith Corp. | | | 843,160 | |
| | | | | | |
| | |
| | OFFICE FURNISHINGS - 1.0 % | | | | |
| 48,215 | | Knoll, Inc. | | | 834,602 | |
| | | | | | |
| | |
| | OIL & NATURAL GAS - 9.3 % | | | | |
| 14,972 | | Bonanza Creek Energy, Inc. * | | | 851,907 | |
| 47,694 | | Contango Oil & Gas Co. * | | | 1,585,349 | |
| 170,400 | | PetroQuest Energy, Inc. * | | | 957,648 | |
| 126,388 | | Rex Energy Corp. * | | | 1,601,336 | |
| 32,800 | | RSP Permian, Inc. * | | | 838,368 | |
| 137,892 | | Synergy Resources Corp. * | | | 1,680,903 | |
| | | | | | |
| | | | | 7,515,511 | |
| | | | | | |
| | OIL & GAS SERVICES - 1.0 % | | | | |
| 32,831 | | Matrix Service Co. * | | | 791,884 | |
| | | | | | |
| | |
| | PIPELINES - 1.1 % | | | | |
| 31,200 | | Primoris Services Corp. | | | 837,408 | |
| | | | | | |
| | |
| | RETAIL - 3.9 % | | | | |
| 20,000 | | Lithia Motors, Inc. | | | 1,513,800 | |
| 49,282 | | Rush Enterprises, Inc. * | | | 1,648,483 | |
| | | | | | |
| | | | | 3,162,283 | |
| | | | | | |
| | SEMICONDUCTORS - 2.2 % | | | | |
| 64,183 | | Semtech Corp. * | | | 1,742,568 | |
| | | | | | |
| | |
| | SOFTWARE - 3.8 % | | | | |
| 81,700 | | AVG Technologies NV * | | | 1,354,586 | |
| 63,021 | | Omnicell, Inc. * | | | 1,722,364 | |
| | | | | | |
| | | | | 3,076,950 | |
| | | | | | |
| | TRANSPORTATION - 3.9 % | | | | |
| 69,015 | | Heartland Express, Inc. | | | 1,653,599 | |
| 66,600 | | Roadrunner Transportation Systems, Inc. * | | | 1,517,814 | |
| | | | | | |
| | | | | 3,171,413 | |
| | | | | | |
| | TRUCKING & LEASING - 2.0 % | | | | |
| 38,896 | | TAL International Group, Inc. | | | 1,604,460 | |
| | | | | | |
| | |
| | TOTAL COMMON STOCK (Cost - $66,657,222) | | | 71,592,951 | |
| | | | | | |
| | |
| | MASTER LIMITED PARTNERSHIPS - 1.8 % | | | | |
| 24,900 | | Cone Midstream Partners LP * | | | 699,690 | |
| 39,170 | | World Point Terminals LP | | | 744,622 | |
| | | | | | |
| | TOTAL MASTER LIMITED PARTNERSHIPS (Cost - $1,474,844) | | | 1,444,312 | |
| | | | | | |
The accompanying notes are an integral part of these financial statements.
41
Schedule of Investments | Small Cap Value (Continued)
As of September 30, 2014
| | | | | | |
| |
| Shares | | | | Fair Value | |
| |
| | |
| | REITs - 8.9% | | | | |
| 67,093 | | CyrusOne, Inc. | | $ | 1,612,916 | |
| 73,100 | | Inland Real Estate Corp. | | | 724,421 | |
| 38,500 | | Potlatch Corp. | | | 1,548,085 | |
| 78,708 | | STAG Industrial, Inc. | | | 1,630,043 | |
| 155,897 | | Summit Hotel Properties, Inc. | | | 1,680,569 | |
| | | | | | |
| | TOTAL REITs (Cost - $6,460,597) | | | 7,196,034 | |
| | | | | | |
| | |
| | MONEY MARKET FUND - 0.5 % | | | | |
| 411,973 | | Fidelity Institutional Money Market Portfolio, 0.01% (Cost - $411,973)(A) | | | 411,973 | |
| | | | | | |
| | |
| | TOTAL INVESTMENTS (Cost - $75,004,636)(B) - 100.0 % | | $ | 80,645,270 | |
| | | | | | |
| | OTHER ASSETS LESS LIABILITIES - NET - 0.0 % | | | 17,917 | |
| | | | | | |
| | NET ASSETS - 100.0 % | | $ | 80,663,187 | |
| | | | | | |
|
* Non-income producing securities. REIT - Real Estate Investment Trust (A) Variable rate security; the rate shown represents the yield at September 30, 2014. (B) Represents cost for financial reporting purposes. Aggregate cost for federal tax purposes is $75,216,736 and differs from fair value by net unrealized appreciation (depreciation) of securities as follows: | |
| | |
| | Unrealized appreciation | | $ | 8,762,057 | |
| | Unrealized depreciation | | | (3,333,523) | |
| | | | | | |
| | Net unrealized appreciation | | $ | 5,428,534 | |
| | | | | | |
The accompanying notes are an integral part of these financial statements.
42
Schedule of Investments | Large/Mid Cap Value
As of September 30, 2014
| | | | | | |
| |
| Shares | | | | Fair Value | |
| |
| | |
| | COMMON STOCK - 95.1 % | | | | |
| | AEROSPACE/DEFENSE - 1.8 % | | | | |
| 33,550 | | B/E Aerospace, Inc. * | | $ | 2,816,187 | |
| | | | | | |
| | |
| | AUTO - 1.7 % | | | | |
| 50,400 | | BorgWarner, Inc. | | | 2,651,544 | |
| | | | | | |
| | |
| | BANKS - 6.1 % | | | | |
| 69,900 | | CIT Group, Inc. | | | 3,212,604 | |
| 89,800 | | East West Bancorp, Inc. | | | 3,053,200 | |
| 29,786 | | SVB Financial Group * | | | 3,338,713 | |
| | | | | | |
| | | | | 9,604,517 | |
| | | | | | |
| | BEVERAGES - 2.3 % | | | | |
| 56,900 | | Dr. Pepper Snapple Group, Inc. | | | 3,659,239 | |
| | | | | | |
| | |
| | CHEMICALS - 3.1 % | | | | |
| 20,300 | | Rockwood Holdings, Inc. | | | 1,551,935 | |
| 14,850 | | Sherwin-Williams Co. | | | 3,252,002 | |
| | | | | | |
| | | | | 4,803,937 | |
| | | | | | |
| | COMPUTERS - 2.4 % | | | | |
| 18,900 | | SanDisk Corp. | | | 1,851,255 | |
| 19,900 | | Western Digital Corp. | | | 1,936,668 | |
| | | | | | |
| | | | | 3,787,923 | |
| | | | | | |
| | DISTRIBUTION/WHOLESALE - 3.6 % | | | | |
| 34,600 | | WESCO International, Inc. * | | | 2,707,796 | |
| 11,900 | | WW Grainger, Inc. | | | 2,994,635 | |
| | | | | | |
| | | | | 5,702,431 | |
| | | | | | |
| | DIVERSIFIED FINANCIAL SERVICES - 6.1 % | | | | |
| 85,800 | | Eaton Vance Corp. | | | 3,237,234 | |
| 55,800 | | Franklin Resources, Inc. | | | 3,047,238 | |
| 84,000 | | Invesco Ltd. | | | 3,316,320 | |
| | | | | | |
| | | | | 9,600,792 | |
| | | | | | |
| | ELECTRIC POWER - 1.9 % | | | | |
| 31,900 | | NextEra Energy, Inc. | | | 2,994,772 | |
| | | | | | |
| | |
| | ELECTRONICS - 9.7 % | | | | |
| 33,100 | | Amphenol Corp. | | | 3,305,366 | |
| 65,600 | | PerkinElmer, Inc. | | | 2,860,160 | |
| 52,200 | | TE Connectivity Ltd. | | | 2,886,138 | |
| 25,100 | | Thermo Fisher Scientific, Inc. | | | 3,054,670 | |
| 65,900 | | Woodward, Inc. | | | 3,138,158 | |
| | | | | | |
| | | | | 15,244,492 | |
| | | | | | |
| | FOOD - 5.8 % | | | | |
| 30,000 | | JM Smucker Co. | | | 2,969,700 | |
| 43,200 | | McCormick & Co., Inc. | | | 2,890,080 | |
| 83,750 | | Sysco Corp. | | | 3,178,313 | |
| | | | | | |
| | | | | 9,038,093 | |
| | | | | | |
| | GAS - 2.0 % | | | | |
| 61,130 | | New Jersey Resources Corp. | | | 3,087,676 | |
| | | | | | |
| | |
| | HEALTHCARE - 4.0 % | | | | |
| 23,100 | | CR Bard, Inc. | | | 3,296,601 | |
| 65,700 | | DENTSPLY International, Inc. | | | 2,995,920 | |
| | | | | | |
| | | | | 6,292,521 | |
| | | | | | |
| | HOUSEHOLD PRODUCTS/WARES - 0.8 % | | | | |
| 18,900 | | Tupperware Brands Corp. | | | 1,304,856 | |
| | | | | | |
| | |
| | INSURANCE - 2.7 % | | | | |
| 59,000 | | Axis Capital Holdings Ltd. | | | 2,792,470 | |
| 41,100 | | Unumprovident Corp. | | | 1,413,018 | |
| | | | | | |
| | | | | 4,205,488 | |
| | | | | | |
The accompanying notes are an integral part of these financial statements.
43
Schedule of Investments | Large/Mid Cap Value (Continued)
As of September 30, 2014
| | | | | | |
| |
| Shares | | | | Fair Value | |
| |
| | |
| | MACHINERY - 1.9 % | | | | |
| 43,000 | | Flowserve Corp. | | $ | 3,032,360 | |
| | | | | | |
| | |
| | METAL FABRICATE/HARDWARE - 1.7 % | | | | |
| 11,500 | | Precision Castparts Corp. | | | 2,724,120 | |
| | | | | | |
| | |
| | MISCELLANEOUS MANUFACTURING - 3.7 % | | | | |
| 63,600 | | AO Smith Corp. | | | 3,007,008 | |
| 29,200 | | SPX Corp. | | | 2,742,756 | |
| | | | | | |
| | | | | 5,749,764 | |
| | | | | | |
| | OIL & NATURAL GAS - 9.4 % | | | | |
| 33,750 | | EOG Resources, Inc. | | | 3,341,925 | |
| 14,700 | | EQT Corp. | | | 1,345,638 | |
| 34,700 | | Marathon Petroleum Corp. | | | 2,938,049 | |
| 20,400 | | National Oilwell Varco, Inc. | | | 1,552,440 | |
| 62,500 | | Oasis Petroleum, Inc. * | | | 2,613,125 | |
| 30,900 | | Occidental Petroleum Corp. | | | 2,971,035 | |
| | | | | | |
| | | | | 14,762,212 | |
| | | | | | |
| | PHARMACEUTICALS - 2.0 % | | | | |
| 44,200 | | Express Scripts Holding Co. * | | | 3,121,846 | |
| 1 | | Mallinckrodt PLC * | | | 90 | |
| | | | | | |
| | | | | 3,121,936 | |
| | | | | | |
| | RETAIL - 5.1 % | | | | |
| 24,575 | | Advance Auto Parts, Inc. | | | 3,202,122 | |
| 33,725 | | MSC Industrial Direct Co., Inc. | | | 2,882,138 | |
| 26,600 | | PetSmart, Inc. | | | 1,864,394 | |
| | | | | | |
| | | | | 7,948,654 | |
| | | | | | |
| | SEMICONDUCTORS - 6.2 % | | | | |
| 42,400 | | Avago Technologies Ltd. | | | 3,688,800 | |
| 32,000 | | Microchip Technology, Inc. | | | 1,511,360 | |
| 78,300 | | Skyworks Solutions, Inc. | | | 4,545,315 | |
| | | | | | |
| | | | | 9,745,475 | |
| | | | | | |
| | TELECOMMUNICATIONS - 2.8 % | | | | |
| 95,500 | | Amdocs Ltd. | | | 4,381,540 | |
| | | | | | |
| | |
| | TEXTILES - 2.1 % | | | | |
| 24,100 | | Mohawk Industries, Inc. * | | | 3,249,162 | |
| | | | | | |
| | |
| | TRANSPORTATION - 2.1 % | | | | |
| 30,800 | | Union Pacific Corp. | | | 3,339,336 | |
| | | | | | |
| | |
| | TOTAL COMMON STOCK (Cost - $110,627,306) | | | 142,849,027 | |
| | | | | | |
| | |
| | MASTER LIMITED PARTNERSHIPS - 1.9% | | | | |
| 60,600 | | Lazard Ltd. - Cl. A (Cost $2,278,082) | | | 3,072,420 | |
| | | | | | |
| | |
| | REITs - 2.2 % | | | | |
| 26,600 | | Regency Centers Corp. | | | 1,431,878 | |
| 31,500 | | Ventas, Inc. | | | 1,951,425 | |
| | | | | | |
| | TOTAL REITs (Cost $3,708,336) | | | 3,383,303 | |
| | | | | | |
The accompanying notes are an integral part of these financial statements.
44
Schedule of Investments | Large/Mid Cap Value (Continued)
As of September 30, 2014
| | | | | | |
| |
| Shares | | | | Fair Value | |
| |
| | |
| | MONEY MARKET FUND - 5.1 % | | | | |
| 8,000,633 | | Fidelity Institutional Money Market Portfolio, 0.01% (Cost $8,000,633)(A) | | $ | 8,000,633 | |
| | | | | | |
| | |
| | TOTAL INVESTMENTS (Cost - $124,614,357)(B) - 100.2 % | | $ | 157,305,383 | |
| | | | | | |
| | OTHER ASSETS LESS LIABILITIES - NET - (0.2) % | | | (264,960 | ) |
| | | | | | |
| | NET ASSETS - 100.0% | | $ | 157,040,423 | |
| | | | | | |
|
* Non-income producing securities. REIT - Real Estate Investment Trust (A) Variable rate security; the rate shown represents the yield at September 30, 2014. (B) Represents cost for financial reporting purposes. Aggregate cost for federal tax purposes is $124,581,871 and differs from fair value by net unrealized appreciation (depreciation) of securities as follows: | |
| | |
| | Unrealized appreciation | | $ | 33,988,758 | |
| | Unrealized depreciation | | | (1,265,246) | |
| | | | | | |
| | Net unrealized appreciation | | $ | 32,723,512 | |
| | | | | | |
The accompanying notes are an integral part of these financial statements.
45
Schedule of Investments | Fixed Income
As of September 30, 2014
| | | | | | |
| |
| Par Value | | | | Fair Value | |
| |
| | |
| | BONDS AND NOTES - 95.9 % | | | | |
| | CORPORATE BONDS - 39.8 % | | | | |
| $ 1,000,000 | | ABB Finance USA, Inc., 2.875%, 5/08/2022 | | $ | 990,020 | |
| 1,000,000 | | Altera Corp., 1.750%, 5/15/2017 | | | 1,005,903 | |
| 740,000 | | Analog Devices, Inc., 3.000%, 4/15/2016 | | | 763,216 | |
| 1,000,000 | | Boardwalk Pipelines LP, 5.750%, 9/15/2019 | | | 1,092,364 | |
| 750,000 | | Canadian National Railway Co., 5.800%, 6/01/2016 | | | 813,030 | |
| 500,000 | | Covidien International Finance SA, 2.800%, 6/15/2015 | | | 508,197 | |
| 800,000 | | DCP Midstream Operating LP, 2.700%, 4/01/2019 | | | 802,805 | |
| 1,000,000 | | Delphi Automotive Systems Corp., 4.150%, 3/15/2024 | | | 1,022,079 | |
| 325,000 | | Eaton Corp., 5.600%, 5/15/2018 | | | 365,685 | |
| 1,200,000 | | Enable Midstream Partners LP, 3.900% 5/15/2024 (A) | | | 1,195,890 | |
| 1,000,000 | | Energy Transfer Partners LP, 6.700%, 7/01/2018 | | | 1,152,174 | |
| 500,000 | | Enterprise Products Operating, LLC, 6.125%, 10/15/2039 | | | 605,110 | |
| 900,000 | | Equity Residential, 5.125%, 3/15/2016 | | | 955,895 | |
| 1,000,000 | | Glencore Funding, LLC., 4.125%, 5/30/2023 (A) | | | 991,492 | |
| 1,000,000 | | Health Care REIT, Inc., 3.750%, 3/15/2023 | | | 989,076 | |
| 750,000 | | Husky Energy, Inc., 3.950%, 4/15/2022 | | | 778,580 | |
| 966,973 | | John Sevier Combined Cycle Generation LLC, 4.626%, 1/15/2042 | | | 1,053,308 | |
| 750,000 | | Johnson Controls, Inc., 5.000%, 3/30/2020 | | | 829,591 | |
| 1,000,000 | | Kennametal, Inc., 3.875%, 2/15/2022 | | | 1,008,816 | |
| 1,200,000 | | L-3 Comm Corp, 3.950%, 5/28/2024 | | | 1,193,020 | |
| 800,000 | | LYB International Finance BV, 4.000%, 7/15/2023 | | | 829,205 | |
| 500,000 | | Oneok, Inc., 4.250%, 2/01/2022 | | | 493,693 | |
| 1,000,000 | | Petrobras Intl. Financial Co., 3.500%, 2/06/2017 | | | 1,019,880 | |
| 1,000,000 | | Phillips 66, 2.950%, 5/01/2017 | | | 1,039,650 | |
| 1,000,000 | | Plains All American Pipeline, 3.650%, 6/01/2022 | | | 1,019,028 | |
| 1,000,000 | | Rabobank Nederland, 2.125%, 10/13/2015 | | | 1,017,162 | |
| 750,000 | | Rio Tinto Finance USA, Ltd., 2.500%, 5/20/2016 | | | 769,774 | |
| 1,000,000 | | Simon Property Group LP, 6.125%, 5/30/2018 | | | 1,148,302 | |
| 1,200,000 | | Sunoco Logistics Partners LP, 4.250%, 4/1/2024 | | | 1,218,138 | |
| 500,000 | | Transocean, Inc., 6.000%, 3/15/2018 | | | 539,557 | |
| 750,000 | | Trinity Acquisition PLC, 4.625%, 8/15/2023 | | | 782,234 | |
| 750,000 | | Tyco Electronics Group SA, 6.550%, 10/01/2017 | | | 854,606 | |
| 1,200,000 | | Venta Realty LP/CAP Corp., 3.250% 8/15/2022 | | | 1,168,894 | |
| | | | | | |
| | TOTAL CORPORATE BONDS (Cost - $29,345,103) | | | 30,016,374 | |
| | | | | | |
| | |
| | U.S. GOVERNMENT & AGENCY OBLIGATIONS - 56.1 % | | | | |
| | GOVERNMENT NOTES & BONDS - 27.3 % | | | | |
| 2,500,000 | | Federal Farm Credit Bank, 5.125%, 8/25/2016 | | | 2,712,358 | |
| 1,000,000 | | Federal Home Loan Bank, 5.000%, 11/17/2017 | | | 1,115,050 | |
| 2,500,000 | | U.S. Treasury Bond, 4.500%, 2/15/2036 | | | 3,086,720 | |
| 2,000,000 | | U.S. Treasury Note, 2.125%, 8/31/2020 | | | 2,010,859 | |
| 9,000,000 | | U.S. Treasury Note, 3.125%, 5/15/2021 | | | 9,538,947 | |
| 2,000,000 | | U.S. Treasury Note, 3.875%, 5/15/2018 | | | 2,177,110 | |
| | | | | | |
| | TOTAL GOVERNMENT NOTES & BONDS (Cost - $20,879,067) | | | 20,641,044 | |
| | | | | | |
The accompanying notes are an integral part of these financial statements.
46
Schedule of Investments | Fixed Income (Continued)
As of September 30, 2014
| | | | | | |
| |
| Par Value | | | | Fair Value | |
| |
| | |
| | GOVERNMENT MORTGAGE-BACKED SECURITIES - 28.8 % | | | | |
| $ 44,022 | | GNMA Pool 3584, 6.000%, 7/20/2034 | | $ | 50,716 | |
| 110,001 | | GNMA Pool 3612, 6.500%, 9/20/2034 | | | 129,190 | |
| 328,478 | | GNMA Pool 3625, 6.000%, 10/20/2034 | | | 377,824 | |
| 126,212 | | GNMA Pool 3637, 5.500%, 11/20/2034 | | | 143,325 | |
| 208,352 | | GNMA Pool 3665, 5.500%, 1/20/2035 | | | 236,640 | |
| 109,976 | | GNMA Pool 3679, 6.000%, 2/20/2035 | | | 126,681 | |
| 234,174 | | GNMA Pool 3711, 5.500%, 5/20/2035 | | | 265,972 | |
| 190,752 | | GNMA Pool 3865, 6.000%, 6/20/2036 | | | 217,207 | |
| 132,547 | | GNMA Pool 3910, 6.000%, 10/20/2036 | | | 151,320 | |
| 265,210 | | GNMA Pool 4058, 5.000%, 12/20/2037 | | | 292,128 | |
| 278,318 | | GNMA Pool 4072, 5.500%, 1/20/2038 | | | 315,557 | |
| 1,038,275 | | GNMA Pool 4520, 5.000%, 8/20/2039 | | | 1,154,511 | |
| 652,829 | | GNMA Pool 4541, 5.000%, 9/20/2039 | | | 725,904 | |
| 1,143,961 | | GNMA Pool 4947, 5.000%, 2/20/2041 | | | 1,272,649 | |
| 483,960 | | GNMA Pool 5204, 4.500%, 10/20/2041 | | | 526,765 | |
| 9,331 | | GNMA Pool 585163, 5.000%, 2/15/2018 | | | 9,902 | |
| 9,623 | | GNMA Pool 585180, 5.000%, 2/15/2018 | | | 10,212 | |
| 6,098 | | GNMA Pool 592492, 5.000%, 3/15/2018 | | | 6,494 | |
| 7,819 | | GNMA Pool 599821, 5.00%, 1/15/2018 | | | 8,255 | |
| 169,161 | | GNMA Pool 604182, 5.500%, 4/15/2033 | | | 189,158 | |
| 106,235 | | GNMA Pool 663776, 6.500%, 1/15/2037 | | | 120,590 | |
| 1,429,657 | | GNMA Pool 701961, 4.500%, 6/15/2039 | | | 1,552,966 | |
| 440,366 | | GNMA Pool 734437, 4.500%, 5/15/2041 | | | 479,408 | |
| 1,140,204 | | GNMA Pool 737556, 4.500%, 10/15/2040 | | | 1,241,419 | |
| 47,112 | | GNMA Pool 781694, 6.000%, 12/15/2031 | | | 53,688 | |
| 1,188,546 | | GNMA Pool 783060, 4.000%, 8/15/2040 | | | 1,264,374 | |
| 3,878,808 | | GNMA Pool AD8801, 3.500%, 3/15/2043 | | | 4,017,386 | |
| 4,056,051 | | GNMA Pool MA0155, 4.000%, 6/20/2042 | | | 4,308,716 | |
| 2,403,852 | | GNMA Pool MA0220, 3.500%, 7/20/2042 | | | 2,490,148 | |
| | | | | | |
| | TOTAL GOVERNMENT MORTGAGE-BACKED SECURITIES (Cost - $21,581,449) | | | 21,739,105 | |
| | | | | | |
| | |
| | TOTAL U.S. GOVERNMENT & AGENCY OBLIGATIONS (Cost - $42,460,516) | | | 42,380,149 | |
| | | | | | |
| | |
| | TOTAL BONDS AND NOTES (Cost - $71,805,619) | | | 72,396,523 | |
| | | | | | |
| | | | | | |
| Shares | | | | | |
| | MONEY MARKET FUND - 3.7 % | | | | |
| 2,777,823 | | Fidelity Institutional Money Market Portfolio, 0.01% (Cost - $2,777,823)(B) | | | 2,777,823 | |
| | | | | | |
| | |
| | TOTAL INVESTMENTS (Cost - $74,583,442)(C) - 99.6 % | | $ | 75,174,346 | |
| | | | | | |
| | OTHER ASSETS LESS LIABILITIES - NET - 0.4 % | | | 322,646 | |
| | | | | | |
| | NET ASSETS - 100.0 % | | $ | 75,496,992 | |
| | | | | | |
GNMA - Government National Mortgage Association
(A) 144A Security - Security exempt from registration under Rule 144A of the Securities Act of 1933. The 144A securities represent 2.90% of total net assets. The securities may be resold in transactions exempt from registration typically only to qualified institutional buyers. Unless otherwise indicated, these securities are not considered to be illiquid.
(B) Variable rate security; the rate shown represents the yield at September 30, 2014.
(C) Represents cost for financial reporting purposes. Aggregate cost for federal tax purposes is $74,583,442 and differs from fair value by net unrealized appreciation (depreciation) of securities as follows:
| | | | | | |
| | Unrealized appreciation | | $ | 1,577,171 | |
| | Unrealized depreciation | | | (986,267) | |
| | | | | | |
| | Net unrealized appreciation | | $ | 590,904 | |
| | | | | | |
The accompanying notes are an integral part of these financial statements.
47
Schedule of Investments | High Yield Bond
As of September 30, 2014
| | | | | | |
| |
| Par Value | | | | Fair Value | |
| |
| | |
| | CORPORATE BONDS - 97.4 % | | | | |
| $ 500,000 | | Access Midstream Partners LP, 5.875%, 4/15/2021 | | $ | 530,000 | |
| 500,000 | | Actuant Corp., 5.625%, 6/15/2022 | | | 522,500 | |
| 500,000 | | AmeriGas Partners LP, 7.000%, 5/20/2022 | | | 526,250 | |
| 500,000 | | Amstead Industries, Inc., 5.000%, 3/15/2022 (A) | | | 487,500 | |
| 250,000 | | Amstead Industries, Inc., 5.375%, 9/15/2024 (A) | | | 243,750 | |
| 500,000 | | Anixter, Inc., 5.625%, 5/01/2019 | | | 528,125 | |
| 500,000 | | Antero Resources Finance Corp., 5.375%, 11/1/2021 | | | 499,375 | |
| 500,000 | | ArcelorMittal, 6.750%, 2/25/2022 (C) | | | 539,375 | |
| 500,000 | | Atlas Pipeline Partners LP, 5.875%, 8/01/2023 | | | 491,250 | |
| 500,000 | | Basic Energy Services, Inc., 7.750%, 10/15/2022 | | | 522,500 | |
| 450,000 | | Biomet, Inc., 6.500%, 8/01/2020 | | | 478,125 | |
| 500,000 | | Bombardier, Inc., 6.125%, 1/15/2023 (A) | | | 503,125 | |
| 500,000 | | Braskem Finance, Ltd., 6.450%, 2/3/2024 | | | 521,250 | |
| 500,000 | | Calfrac Holdings LP, 7.500%, 12/01/2020 (A) | | | 525,000 | |
| 250,000 | | California Resources Corp., 6.000%, 11/5/2024 (A) | | | 257,500 | |
| 500,000 | | Calumet Specialty Product Partners, 6.500%, 4/15/2021 (A) | | | 477,500 | |
| 250,000 | | Cascades, Inc., 5.500%, 7/15/2022 (A) | | | 243,437 | |
| 415,000 | | Catamaran Corp., 4.750%, 3/15/2021 | | | 400,216 | |
| 500,000 | | Cemex Finance LLC, 6.000%, 4/1/2024 (A) | | | 499,850 | |
| 500,000 | | CGG Veritas, 6.500%, 6/1/2021 | | | 440,000 | |
| 500,000 | | Cloud Peak Energy Resources LLC, 8.500%, 12/15/2019 | | | 521,250 | |
| 500,000 | | CommScope, Inc., 5.000%, 6/15/2021 (A) | | | 492,500 | |
| 125,000 | | Corrections Corp. of America, 4.125%, 4/01/2020 | | | 123,125 | |
| 500,000 | | Crestwood Midstream Partners LP, 6.000%, 12/15/2020 | | | 505,000 | |
| 500,000 | | Crestwood Midstream Partners LP, 7.750%, 4/01/2019 | | | 526,250 | |
| 500,000 | | DCP Midstream, LLC., 5.850%, 5/21/2043 (A)(B) | | | 496,250 | |
| 500,000 | | Denbury Resources, Inc., 5.500%, 5/1/2022 | | | 495,625 | |
| 500,000 | | Digicel, Ltd., 6.000%, 4/15/2021 (A) | | | 496,250 | |
| 350,000 | | DuPont Fabros Technology LP, 5.875%, 9/15/2021 | | | 357,875 | |
| 500,000 | | Eldorado Gold Corp., 6.125%, 12/15/2020 (A) | | | 498,750 | |
| 500,000 | | Energy Transfer Equity LP, 5.875%, 1/15/2024 | | | 508,750 | |
| 500,000 | | EV Energy Partners/Fin, 8.000%, 4/15/2019 | | | 520,000 | |
| 500,000 | | Ferrellgas LP, 6.750%, 1/15/2022 | | | 490,000 | |
| 500,000 | | FTI Consulting, Inc., 6.000%, 11/15/2022 | | | 508,750 | |
| 500,000 | | General Cable Corp., 5.750%, 10/01/2022 (C) | | | 467,500 | |
| 500,000 | | Genesis Energy LP, 5.750%, 2/15/2021 | | | 490,625 | |
| 500,000 | | Geo Group, Inc., 5.125%, 4/01/2023 | | | 483,750 | |
| 500,000 | | Gibraltar Industries, Inc., 6.250%, 2/01/2021 (C) | | | 515,000 | |
| 500,000 | | Global Part/GLP Finance, 6.250%, 7/15/2022(A) | | | 500,000 | |
| 500,000 | | Group 1 Automotive, Inc., 5.000%, 6/1/2022 (A) | | | 486,250 | |
| 500,000 | | Hiland Partners LP, 5.500%, 5/15/2022 (A) | | | 487,500 | |
| 350,000 | | Hiland Partners LP, 7.250%, 10/1/2020 (A) | | | 372,750 | |
| 500,000 | | HJ Heinz Co., 4.250%, 10/15/2020 | | | 498,125 | |
| 500,000 | | Hologic, Inc., 6.250%, 8/01/2020 | | | 517,500 | |
| 500,000 | | Hornbeck Offshore Services, Inc., 5.000%, 3/01/2021 | | | 477,500 | |
| 750,000 | | Iron Mountain, 6.000%, 8/15/2023 | | | 772,500 | |
| 500,000 | | Iron Mountain, 7.750%, 10/1/2019 | | | 536,250 | |
| 500,000 | | Jaguar Land Rover PLC, 8.125%, 5/15/2021 (A) | | | 549,375 | |
| 500,000 | | Kinder Morgan, Inc., 5.000%, 2/15/2021 (A) | | | 523,750 | |
| 500,000 | | Kodiak Oil & Gas Corp., 5.500%, 2/01/2022 | | | 505,000 | |
| 500,000 | | Land O’ Lakes, Inc., 6.000%, 11/15/2022 (A) | | | 536,850 | |
| 125,000 | | LKQ Corp., 4.750%, 5/15/2023 | | | 121,250 | |
| 400,000 | | Mcron Finance Sub LLC, 8.375%, 5/15/2019 (A) | | | 432,000 | |
| 500,000 | | MedAssets, Inc., 8.000%, 11/15/2018 | | | 521,250 | |
| 500,000 | | Millicom International Cellular SA, 4.750%, 5/22/2020 (A) | | | 478,750 | |
| 500,000 | | MPT Operating Partnership LP, 6.375%, 2/15/2022 | | | 536,250 | |
The accompanying notes are an integral part of these financial statements.
48
Schedule of Investments | High Yield Bond (Continued)
As of September 30, 2014
| | | | | | |
| |
| Par Value | | | | Fair Value | |
| |
| | |
| | CORPORATE BONDS - 97.4 % (continued) | | | | |
| $ 500,000 | | Martin Midstream Partners LP, 7.250%, 2/15/2021 | | $ | 501,250 | |
| 250,000 | | NGL Energy Partners LP, 5.125%, 7/15/2019 (A) | | | 245,313 | |
| 500,000 | | NGL Energy Partners LP, 6.875%, 10/15/2021 (A) | | | 522,500 | |
| 500,000 | | NuStar Logistics LP, 6.750%, 2/01/2021 | | | 546,250 | |
| 500,000 | | Omnicare, Inc., 7.750%, 6/01/2020 | | | 531,250 | |
| 500,000 | | Oshkosh Corp., 8.500%, 3/1/2020 | | | 530,000 | |
| 500,000 | | Pacific Drilling V, Ltd., 5.375%, 6/01/2020 (A) | | | 460,000 | |
| 250,000 | | Parker Drilling Co., 6.750%, 7/15/2022 (A) | | | 252,500 | |
| 250,000 | | Parker Drilling Co., 7.500%, 8/01/2020 (A) | | | 262,500 | |
| 500,000 | | PolyOne Corp., 7.375%, 9/15/2020 | | | 528,125 | |
| 500,000 | | Regency Energy Partners LP, 4.500%, 11/01/2023 | | | 486,250 | |
| 500,000 | | Resolute Energy Corp., 8.500%, 5/01/2020 | | | 503,750 | |
| 500,000 | | Reynolds Group Issuer, Inc., 9.000%, 4/15/2019 | | | 523,125 | |
| 500,000 | | Rose Rock Midstream, 5.625%, 7/15/2022 (A) | | | 496,250 | |
| 1,000,000 | | Rosetta Resources, Inc., 5.875%, 6/1/2024 | | | 983,750 | |
| 500,000 | | Samson Investment Co., 9.750%, 2/15/2020 (C) | | | 456,250 | |
| 500,000 | | Sealed Air Corp., 5.250%, 4/01/2023 (A) | | | 492,500 | |
| 200,000 | | Sealed Air Corp., 6.500%, 12/01/2020 (A) | | | 214,250 | |
| 500,000 | | SemGroup LP, 7.500%, 6/15/2021 | | | 527,500 | |
| 500,000 | | Steel Dynamics, Inc., 5.250%, 4/15/2023 | | | 506,250 | |
| 500,000 | | Suburban Propane Partners, 5.500%, 6/1/2024 | | | 478,750 | |
| 500,000 | | Summit Midstream Holdings LLC, 7.500%, 7/1/2021 | | | 537,500 | |
| 182,000 | | Suncoke Energy, 7.625%, 8/01/2019 | | | 192,147 | |
| 500,000 | | Targa Resources Partners LP, 4.250%, 11/15/2023 | | | 482,500 | |
| 500,000 | | Tesoro Corp., 5.375%, 10/01/2022 | | | 505,000 | |
| 391,000 | | Tesoro Logistics LP, 5.875%, 10/01/2020 | | | 406,640 | |
| 500,000 | | Tullow Oil PLC, 6.000%, 11/1/2020 (A) | | | 502,500 | |
| 500,000 | | Ultra Pertoleum Corp., 6.125%, 10/1/2024 (A) | | | 480,000 | |
| 500,000 | | United States Steel Corp., 7.500%, 3/15/2022 | | | 541,250 | |
| 100,000 | | USG Corp., 5.875%, 11/1/2021 (A) | | | 102,500 | |
| 500,000 | | USG Corp., 9.750%, 1/15/2018 (C) | | | 582,500 | |
| 500,000 | | VeriSign, Inc., 4.625%, 5/01/2023 | | | 485,000 | |
| 500,000 | | VimpelCom Holdings BV, 5.950%, 2/13/2023 (A) | | | 461,250 | |
| 250,000 | | WhiteWave Foods Co., 5.375%, 10/1/2022 | | | 253,125 | |
| 500,000 | | WPX Energy, Inc., 5.250%, 9/15/2024 | | | 486,250 | |
| 250,000 | | WR Grace & Co., 5.125%, 10/1/2021 (A) | | | 254,688 | |
| | | | | | |
| | |
| | TOTAL CORPORATE BONDS (Cost $42,695,477) | | | 42,907,891 | |
| | | | | | |
| | | | | | |
| Shares | | | | | |
| | MONEY MARKET FUND - 1.5 % | | | | |
| 676,549 | | Fidelity Institutional Money Market Portfolio, 0.01% (Cost $676,549)(B) | | | 676,549 | |
| | | | | | |
| | |
| | TOTAL INVESTMENTS (Cost $43,372,026)(D) - 98.9 % | | $ | 43,584,440 | |
| | | | | | |
| | OTHER ASSETS IN EXCESS OF LIABILITIES - NET - 1.1 % | | | 465,043 | |
| | | | | | |
| | NET ASSETS - 100.0 % | | $ | 44,049,483 | |
| | | | | | |
(A) 144A Security - Security exempt from registration under Rule 144A of the Securities Act of 1933. The 144A securities represent 32.5% of total net assets. The securities may be resold in transactions exempt from registration typically only to qualified institutional buyers. Unless otherwise indicated, these securities are not considered to be illiquid.
(B) Variable rate security; the rate shown represents the yield at September 30, 2014.
(C) Step coupon security; interest rate shown reflects the rate currently in effect.
(D) Represents cost for financial reporting purposes. Aggregate cost for federal tax purposes is $43,372,026 and differs from fair value by net unrealized appreciation (depreciation) of securities as follows:
| | | | | | |
| | Unrealized appreciation | | $ | 885,897 | |
| | Unrealized depreciation | | | (673,483) | |
| | | | | | |
| | Net unrealized appreciation | | $ | 212,414 | |
| | | | | | |
The accompanying notes are an integral part of these financial statements.
49
Schedule of Investments | Israel Common Values
As of September 30, 2014
| | | | | | |
| |
| Shares | | | | Fair Value | |
| |
| | |
| | COMMON STOCK - 94.1 % | | | | |
| | AEROSPACE/DEFENSE - 2.7 % | | | | |
| 7,001 | | Elbit Systems Ltd. | | $ | 434,692 | |
| | | | | | |
| | |
| | BANKS - 10.3 % | | | | |
| 13,900 | | Bank Hapoalim BM (ADR) | | | 392,536 | |
| 92,000 | | Bank Leumi Le-Israel BM * | | | 372,585 | |
| 19,300 | | First International Bank Of Israel BM. | | | 295,202 | |
| 170,000 | | Israel Discount Bank Ltd. * | | | 292,555 | |
| 26,000 | | Mizrahi Tefahot Bank Ltd. * | | | 310,735 | |
| | | | | | |
| | | | | 1,663,613 | |
| | | | | | |
| | BUILDING MATERIALS - 2.3 % | | | | |
| 7,200 | | Caesar Stone SDot Yam Ltd. | | | 372,096 | |
| | | | | | |
| | |
| | CHEMICALS - 4.3 % | | | | |
| 17,000 | | Frutarom Industries Ltd. | | | 431,449 | |
| 37,400 | | Israel Chemicals Ltd. (ADR) | | | 265,914 | |
| | | | | | |
| | | | | 697,363 | |
| | | | | | |
| | COMMERCIAL SERVICES - 1.7 % | | | | |
| 17,000 | | Nitsba Holdings 1995 Ltd. * | | | 278,111 | |
| | | | | | |
| | |
| | COMPUTERS - 0.8 % | | | | |
| 24,210 | | Matrix IT Ltd. | | | 131,233 | |
| | | | | | |
| | |
| | ELECTRONICS - 4.2 % | | | | |
| 14,896 | | Ituran Location and Control Ltd. | | | 315,050 | |
| 23,500 | | Orbotech Ltd. * | | | 366,130 | |
| | | | | | |
| | | | | 681,180 | |
| | | | | | |
| | ENERGY ALTERNATE SOURCES - 1.9 % | | | | |
| 43,300 | | Ormat Industries | | | 304,761 | |
| | | | | | |
| | |
| | FOOD - 4.5 % | | | | |
| 13,000 | | Osem Investments Ltd. | | | 278,942 | |
| 5,700 | | Rami Levi Chain Stores | | | 282,362 | |
| 59,000 | | Shufersal Ltd. | | | 166,874 | |
| | | | | | |
| | | | | 728,178 | |
| | | | | | |
| | HOME BUILDERS - 1.8 % | | | | |
| 1,000 | | Bayside Land Corp. | | | 280,394 | |
| | | | | | |
| | |
| | HOUSEHOLD PRODUCTS/WARES - 1.9 % | | | | |
| 10,500 | | SodaStream International Ltd. * | | | 309,645 | |
| | | | | | |
| | |
| | INTERNET - 1.2 % | | | | |
| 34,000 | | Perion Network Ltd. * | | | 189,040 | |
| | | | | | |
| | |
| | INVESTMENT COMPANIES - 2.1 % | | | | |
| 600 | | Israel Corp. Ltd * | | | 337,613 | |
| | | | | | |
| | |
| | OIL & NATURAL GAS - 11.9 % | | | | |
| 338,000 | | Avner Oil Exploration LLP | | | 334,413 | |
| 61,000 | | Delek Drilling LP | | | 333,802 | |
| 1,536,664 | | Isramco Negev 2 LP * | | | 329,932 | |
| 5,000 | | Noble Energy Inc. | | | 341,800 | |
| 1,900 | | Paz Oil Co. Ltd. | | | 300,310 | |
| 2,100,000 | | Ratio Oil Exploration LP * | | | 277,028 | |
| | | | | | |
| | | | | 1,917,285 | |
| | | | | | |
| | PHARMACEUTICALS - 5.0 % | | | | |
| 39,000 | | OPKO Health Inc. * | | | 331,890 | |
| 3,100 | | Taro Pharmaceutical Industries Ltd. * | | | 476,966 | |
| | | | | | |
| | | | | 808,856 | |
| | | | | | |
The accompanying notes are an integral part of these financial statements.
50
Schedule of Investments | Israel Common Values (Continued)
As of September 30, 2014
| | | | | | |
| |
| Shares | | | | Fair Value | |
| |
| | |
| | REAL ESTATE - 11.2 % | | | | |
| 105,000 | | Amot Investments Ltd. | | $ | 344,860 | |
| 7,500 | | Azrieli Group | | | 257,526 | |
| 27,000 | | Gazit-Globe Ltd. | | | 336,758 | |
| 162,000 | | Industrial Buildings Corp. | | | 290,176 | |
| 34,000 | | Jerusalem Economy Ltd. | | | 271,051 | |
| 11,366 | | Melisron Ltd. | | | 305,540 | |
| | | | | | |
| | | | | 1,805,911 | |
| | | | | | |
| | SEMICONDUCTORS - 6.7 % | | | | |
| 7,000 | | Mellanox Technologies Ltd. * | | | 314,090 | |
| 33,533 | | Nova Measuring Instruments Ltd. * | | | 362,156 | |
| 40,100 | | Tower Semiconductor Ltd. * | | | 407,817 | |
| | | | | | |
| | | | | 1,084,063 | |
| | | | | | |
| | SOFTWARE - 8.8 % | | | | |
| 5,100 | | Check Point Software Technologies Ltd. * | | | 353,124 | |
| 42,900 | | Magic Software Enterprises Ltd. | | | 297,297 | |
| 18,000 | | RADWARE Ltd. * | | | 317,880 | |
| 8,000 | | Verint Systems Inc. * | | | 444,880 | |
| | | | | | |
| | | | | 1,413,181 | |
| | | | | | |
| | TELECOMMUNICATIONS - 10.8 % | | | | |
| 15,400 | | Allot Communications Ltd. * | | | 175,868 | |
| 28,200 | | Cellcom Israel, Ltd. * | | | 309,636 | |
| 14,000 | | EZchip Semiconductor Ltd. | | | 337,680 | |
| 8,700 | | NICE Systems Ltd. (ADR) | | | 354,873 | |
| 43,000 | | Partner Communications Co. Ltd. (ADR) * | | | 303,150 | |
| 9,200 | | Silicom Ltd. | | | 268,180 | |
| | | | | | |
| | | | | 1,749,387 | |
| | | | | | |
| | |
| | TOTAL COMMON STOCKS (Cost - $12,872,458) | | | 15,186,602 | |
| | | | | | |
| | |
| | REITs - 2.0 % | | | | |
| 45,000 | | Alony Hetz Properties & Investments Ltd. (Cost - $274,334) | | | 324,910 | |
| | | | | | |
| | |
| | MONEY MARKET FUND - 4.2 % | | | | |
| 676,183 | | Fidelity Institutional Money Market Portfolio, 0.01% (Cost $676,183)(A) | | | 676,183 | |
| | | | | | |
| | |
| | TOTAL INVESTMENTS (Cost $13,822,975)(B) - 100.3 % | | $ | 16,187,695 | |
| | | | | | |
| | OTHER ASSETS LESS LIABILITIES - NET - (0.3) % | | | (40,710) | |
| | | | | | |
| | NET ASSETS - 100.0 % | | $ | 16,146,985 | |
| | | | | | |
* Non-income producing securities.
(ADR) American Depositary Receipt
REIT - Real Estate Investment Trust
(A) Variable rate security; the rate shown represents the yield at September 30, 2014.
(B) Represents cost for financial reporting purposes. Aggregate cost for federal tax purposes is $14,624,723 and differs from fair value by net unrealized appreciation (depreciation) of securities as follows:
| | | | |
| Unrealized appreciation | | $ | 2,897,151 | |
Unrealized depreciation | | | (1,334,179) | |
| | | | |
Net unrealized appreciation | | $ | 1,562,972 | |
| | | | |
| | | | |
| Diversification of Assets | |
| |
| Country | | % of Net Assets | |
| |
Israel | | | 89.14% | |
United States | | | 11.12% | |
| | | | |
Total | | | 100.25% | |
| | | | |
Other Assets Less Liabilities - Net | | | -0.25% | |
| | | | |
Grand Total | | | 100.00% | |
| | | | |
The accompanying notes are an integral part of these financial statements.
51
Schedule of Investments | Defensive Strategies
As of September 30, 2014
| | | | | | |
| |
| Shares | | | | Fair Value | |
| |
| | |
| | COMMON STOCK - 26.0 % | | | | |
| | CHEMICALS - 5.5 % | | | | |
| 3,996 | | Agrium, Inc. | | $ | 355,644 | |
| 959 | | American Vanguard Corp. | | | 10,741 | |
| 4,448 | | CF Industries Holdings, Inc. | | | 1,241,971 | |
| 1,323 | | FMC Corp. | | | 75,662 | |
| 5,759 | | Intrepid Potash, Inc. * | | | 88,977 | |
| 11,989 | | K+S AG | | | 339,989 | |
| 7,761 | | Mosaic Co. | | | 344,666 | |
| 19,011 | | Potash Corp. of Saskatchewan, Inc. | | | 657,020 | |
| 768 | | Rayonier Advanced Materials, Inc. | | | 25,275 | |
| 8,356 | | Sociedad Quimica y Minera de Chile SA (ADR) | | | 218,426 | |
| 4,328 | | Syngenta AG (ADR) | | | 274,265 | |
| 5,904 | | Uralkali OJSC (GDR) | | | 104,370 | |
| | | | | | |
| | | | | 3,737,006 | |
| | | | | | |
| | COAL - 0.0 % | | | | |
| 1,103 | | Peabody Energy Corp. | | | 13,655 | |
| | | | | | |
| | |
| | ENVIRONMENTAL CONTROL - 0.1 % | | | | |
| 3,171 | | Darling Ingredients, Inc. * | | | 58,093 | |
| | | | | | |
| | |
| | FOOD - 0.7 % | | | | |
| 888 | | Hormel Foods Corp. | | | 45,634 | |
| 2,468 | | Ingredion, Inc. | | | 187,050 | |
| 6,770 | | Tyson Foods, Inc. | | | 266,535 | |
| | | | | | |
| | | | | 499,219 | |
| | | | | | |
| | IRON / STEEL - 1.8 % | | | | |
| 1,178 | | Allegheny Technologies, Inc. | | | 43,704 | |
| 6,888 | | ArcelorMittal | | | 94,297 | |
| 6,601 | | JFE Holdings, Inc. | | | 131,725 | |
| 55,828 | | Nippon Steel & Sumitomo Metal Corp. | | | 144,877 | |
| 979 | | POSCO (ADR) | | | 74,306 | |
| 502 | | Reliance Steel & Aluminum Co. | | | 34,337 | |
| 11,215 | | Severstal OAO (ADR) | | | 111,569 | |
| 2,358 | | ThyssenKrupp AG * | | | 61,866 | |
| 49,261 | | Vale SA (ADR) | | | 542,364 | |
| | | | | | |
| | | | | 1,239,045 | |
| | | | | | |
| | MACHINERY - 0.5 % | | | | |
| 3,416 | | AGCO Corp. | | | 155,291 | |
| 2,315 | | CNH Industrial NV | | | 18,358 | |
| 2,525 | | Joy Global, Inc. | | | 137,714 | |
| | | | | | |
| | | | | 311,363 | |
| | | | | | |
| | MINING - 6.6 % | | | | |
| 4,028 | | Agnico Eagle Mines Ltd. | | | 116,933 | |
| 3,102 | | Allied Nevada Gold Corp. * | | | 10,268 | |
| 7,252 | | Anglo American PLC | | | 162,746 | |
| 28,418 | | AngloGold Ashanti Ltd. (ADR) * | | | 341,016 | |
| 2,159 | | Antofagasta PLC | | | 25,241 | |
| 11,197 | | BHP Billiton Ltd. (ADR) | | | 659,279 | |
| 234 | | BHP Billiton PLC (ADR) | | | 12,994 | |
| 451 | | Cameco Corp. | | | 7,965 | |
| 8,295 | | Cia de Minas Buenaventura SA (ADR) | | | 96,056 | |
| 1,877 | | Coeur d’Alene Mines Corp. * | | | 9,310 | |
| 20,805 | | Eldorado Gold Corp. | | | 140,226 | |
| 1,198 | | First Quantum Minerals Ltd. | | | 23,169 | |
| 3,802 | | Franco-Nevada Corp. | | | 185,842 | |
| 15,487 | | Freeport-McMoRan Copper & Gold, Inc. | | | 505,651 | |
| 47,005 | | Glencore International PLC | | | 261,582 | |
| 9,446 | | Gold Fields Ltd. (ADR) | | | 36,839 | |
| 8,495 | | Goldcorp, Inc. | | | 195,640 | |
| 7,047 | | Harmony Gold Mining Co. Ltd. (ADR) * | | | 15,222 | |
| 5,932 | | Hecla Mining Co. | | | 14,711 | |
| 6,495 | | IAMGOLD Corp. * | | | 17,926 | |
| 549 | | Kazakhmys PLC * | | | 2,345 | |
The accompanying notes are an integral part of these financial statements.
52
Schedule of Investments | Defensive Strategies (Continued)
As of September 30, 2014
| | | | | | |
| |
| Shares | | | | Fair Value | |
| |
| | |
| | MINING (Continued) - 6.6 % | | | | |
| 39,028 | | Kinross Gold Corp. * | | $ | 128,792 | |
| 5,670 | | MMC Norilsk Nickel OJSC (ADR) | | | 105,349 | |
| 4,211 | | New Gold, Inc. * | | | 21,266 | |
| 4,098 | | Newmont Mining Corp. | | | 94,459 | |
| 2,912 | | Pan American Silver Corp. | | | 31,974 | |
| 2,323 | | Randgold Resources Ltd. (ADR) | | | 157,012 | |
| 8,492 | | Rio Tinto PLC (ADR) | | | 417,637 | |
| 2,101 | | Royal Gold, Inc. | | | 136,439 | |
| 987 | | Sesa Goa, Ltd. (ADR) | | | 17,036 | |
| 16,167 | | Silver Wheaton Corp. | | | 322,208 | |
| 5,122 | | Southern Copper Corp. | | | 151,867 | |
| 3,943 | | Teck Resources Ltd. | | | 74,811 | |
| 7,265 | | Yamana Gold, Inc. | | | 43,590 | |
| | | | | | |
| | | | | 4,543,401 | |
| | | | | | |
| | OIL & NATURAL GAS - 8.5 % | | | | |
| 492 | | Anadarko Petroleum Corp. | | | 49,908 | |
| 2,775 | | Apache Corp. | | | 260,489 | |
| 14,836 | | BG Group PLC | | | 274,245 | |
| 1,428 | | Canadian Natural Resources Ltd. | | | 55,463 | |
| 1,966 | | Cenovus Energy, Inc. | | | 52,988 | |
| 901 | | Chesapeake Energy Corp. | | | 20,714 | |
| 9,965 | | ConocoPhillips | | | 762,522 | |
| 2,644 | | Devon Energy Corp. | | | 180,268 | |
| 1,870 | | Encana Corp. | | | 39,663 | |
| 1,233 | | Ensco PLC - Cl. A | | | 50,935 | |
| 1,914 | | EOG Resources, Inc. | | | 189,524 | |
| 23,500 | | Inpex Corp. | | | 332,025 | |
| 15,277 | | Lukoil OAO (ADR) | | | 779,127 | |
| 14,378 | | Marathon Oil Corp. | | | 540,469 | |
| 647 | | Noble Energy, Inc. | | | 44,229 | |
| 901 | | NOVATEK OAO (GDR) | | | 93,884 | |
| 5,432 | | Occidental Petroleum Corp. | | | 522,287 | |
| 7,011 | | Petroleo Brasileiro SA (ADR) | | | 99,486 | |
| 244 | | Pioneer Natural Resources Co. | | | 48,060 | |
| 2,957 | | Reliance Industries Ltd. (GDR) | | | 90,189 | |
| 13,084 | | Rosneft OAO (GDR) | | | 76,240 | |
| 64 | | Seventy Seven Energy, Inc. * | | | 1,519 | |
| 2,812 | | Southwestern Energy Co. * | | | 98,279 | |
| 2,782 | | Statoil ASA (ADR) | | | 75,559 | |
| 14,122 | | Total SA | | | 917,594 | |
| 2,350 | | Transocean Ltd. | | | 75,130 | |
| 2,181 | | Valero Energy Corp. | | | 100,915 | |
| | | | | | |
| | | | | 5,831,711 | |
| | | | | | |
| | OIL & GAS SERVICES - 1.9 % | | | | |
| 2,827 | | Baker Hughes, Inc. | | | 183,924 | |
| 1,449 | | Cameron International Corp. * | | | 96,184 | |
| 1,954 | | FMC Technologies, Inc. * | | | 106,122 | |
| 11,405 | | Halliburton Co. | | | 735,737 | |
| 2,210 | | National Oilwell Varco, Inc. | | | 168,181 | |
| 552 | | NOW, Inc. * | | | 16,786 | |
| | | | | | |
| | | | | 1,306,934 | |
| | | | | | |
| | PIPELINES - 0.3 % | | | | |
| 3,591 | | Kinder Morgan, Inc. | | | 137,679 | |
| 1,592 | | TransCanada Corp. | | | 82,142 | |
| | | | | | |
| | | | | 219,821 | |
| | | | | | |
| | WATER - 0.1 % | | | | |
| 10,864 | | Cia de Saneamento Basico do Estado de Sao Paulo | | | 88,107 | |
| | | | | | |
| | |
| | TOTAL COMMON STOCK (Cost - $18,864,652) | | | 17,848,355 | |
| | | | | | |
The accompanying notes are an integral part of these financial statements.
53
Schedule of Investments | Defensive Strategies (Continued)
As of September 30, 2014
| | | | | | |
| |
| Shares | | | | Fair Value | |
| |
| | |
| | REITs - 29.3 % | | | | |
| 5,000 | | Acadia Realty Trust | | $ | 137,900 | |
| 4,000 | | Apartment Investment & Management Co. | | | 127,280 | |
| 4,350 | | AvalonBay Communities, Inc. | | | 613,220 | |
| 8,600 | | Boston Properties, Inc. | | | 995,536 | |
| 10,700 | | Brandywine Realty Trust | | | 150,549 | |
| 5,700 | | Camden Property Trust | | | 390,621 | |
| 13,000 | | CBL & Associates Properties, Inc. | | | 232,700 | |
| 31,100 | | DDR Corp. | | | 520,303 | |
| 39,700 | | DiamondRock Hospitality Co. | | | 503,396 | |
| 10,300 | | Douglas Emmett, Inc. | | | 264,401 | |
| 16,600 | | Education Realty Trust, Inc. | | | 170,648 | |
| 4,700 | | Equity Lifestyle Properties, Inc. | | | 199,092 | |
| 16,300 | | Equity Residential | | | 1,003,754 | |
| 4,754 | | Essex Property Trust, Inc. | | | 849,778 | |
| 7,800 | | Extra Space Storage, Inc. | | | 402,246 | |
| 2,500 | | Federal Realty Investment Trust | | | 296,150 | |
| 10,100 | | FelCor Lodging Trust, Inc. | | | 94,536 | |
| 18,800 | | First Industrial Realty Trust, Inc. | | | 317,908 | |
| 7,400 | | First Potomac Realty Trust | | | 86,950 | |
| 17,700 | | HCP, Inc. | | | 702,867 | |
| 8,700 | | Health Care REIT, Inc. | | | 542,619 | |
| 5,400 | | Highwoods Properties, Inc. | | | 210,060 | |
| 20,300 | | Hospitality Properties Trust | | | 545,055 | |
| 5,500 | | Kilroy Realty Corp. | | | 326,920 | |
| 27,000 | | Kimco Realty Corp. | | | 591,570 | |
| 23,700 | | Lexington Realty Trust | | | 232,023 | |
| 11,000 | | Liberty Property Trust | | | 365,860 | |
| 13,963 | | Macerich Co. | | | 891,258 | |
| 4,208 | | Mid-America Apartment Communities, Inc. | | | 276,255 | |
| 6,900 | | National Retail Properties, Inc. | | | 238,533 | |
| 1,183 | | Plum Creek Timber Co., Inc. | | | 46,149 | |
| 21,494 | | Prologis, Inc. | | | 810,324 | |
| 4,000 | | PS Business Parks, Inc. | | | 304,560 | |
| 5,700 | | Public Storage | | | 945,288 | |
| 6,406 | | Rayonier, Inc. | | | 199,483 | |
| 3,700 | | Regency Centers Corp. | | | 199,171 | |
| 12,229 | | Simon Property Group, Inc. | | | 2,010,692 | |
| 8,150 | | SL Green Realty Corp. | | | 825,758 | |
| 27,200 | | Strategic Hotels & Resorts, Inc. * | | | 316,880 | |
| 7,200 | | Summit Hotel Properties, Inc. | | | 77,616 | |
| 5,700 | | Taubman Centers, Inc. | | | 416,100 | |
| 14,200 | | UDR, Inc. | | | 386,950 | |
| 13,259 | | Ventas, Inc. | | | 821,395 | |
| 6,514 | | Washington Prime Group, Inc. | | | 113,864 | |
| 10,100 | | Weingarten Realty Investors | | | 318,150 | |
| | | | | | |
| | TOTAL REITs (Cost - $17,674,951) | | | 20,072,368 | |
| | | | | | |
| | |
| | EXCHANGE TRADED FUNDS - 8.4 % | | | | |
| 19,000 | | iShares Silver Trust * | | | 310,650 | |
| 82,100 | | PowerShares DB Agriculture Fund * | | | 2,097,655 | |
| 69,700 | | PowerShares DB Base Metals Fund * | | | 1,178,627 | |
| 49,800 | | PowerShares DB Commodity Index Tracking Fund * | | | 1,156,356 | |
| 25,000 | | PowerShares DB Energy Fund * | | | 672,997 | |
| 2,900 | | SPDR Gold Shares * | | | 337,009 | |
| | | | | | |
| | TOTAL EXCHANGE TRADED FUNDS (Cost - $6,464,282) | | | 5,753,294 | |
| | | | | | |
| Par Value | | | | | |
| | BONDS & NOTES - 31.3 % | | | | |
| | GOVERNMENT MORTGAGE-BACKED SECURITIES - 2.8 % | | | | |
| $ 884,844 | | GNMA Pool MA0155, 4.000%, 6/20/2042 | | | 939,964 | |
| 483,959 | | GNMA Pool 5204, 4.500%, 10/20/2041 | | | 526,765 | |
| 432,652 | | GNMA Pool 4947, 5.000%, 2/20/2041 | �� | | 481,323 | |
| | | | | | |
| | TOTAL GOVERNMENT MORTGAGE-BACKED SECURITIES (Cost - $1,924,816) | | | 1,948,052 | |
| | | | | | |
The accompanying notes are an integral part of these financial statements.
54
Schedule of Investments | Defensive Strategies (Continued)
As of September 30, 2014
| | | | | | |
| |
| Par Value | | | | Fair Value | |
| |
| | |
| | COPORATE BONDS - 3.3 % | | | | |
| | CHEMICALS - 0.6 % | | | | |
| $ 400,000 | | LYB International Finance BV, 4.000%, 7/15/2023 | | $ | 414,602 | |
| | | | | | |
| | |
| | OIL & GAS - 0.7 % | | | | |
| 500,000 | | Petrobras International Finance Co. SA, 3.50%, 2/6/2017 | | | 509,940 | |
| | | | | | |
| | |
| | PIPELINES - 1.3 % | | | | |
| 400,000 | | DCP Midstream Operating LP, 2.700%, 4/1/2019 | | | 401,402 | |
| 400,000 | | Energy Transfer Partners LP, 6.700%, 7/1/2018 | | | 460,870 | |
| | | | | | |
| | | | | 862,272 | |
| | | | | | |
| | REITs - 0.7 % | | | | |
| 500,000 | | Health Care REIT, Inc., 3.75%, 3/15/2023 | | | 494,538 | |
| | | | | | |
| | |
| | TOTAL CORPORATE BONDS (Cost - $2,242,898) | | | 2,281,352 | |
| | | | | | |
| | |
| | TREASURY INFLATION PROTECTED SECURITIES (TIPS) - 25.2 % | | | | |
| 2,575,000 | | TIPS, 1.125%, 1/15/2021 | | | 2,943,860 | |
| 500,000 | | TIPS, 1.250%, 7/15/2020 | | | 580,369 | |
| 1,650,000 | | TIPS, 1.625%, 1/15/2018 | | | 1,993,888 | |
| 2,535,000 | | TIPS, 1.750%, 1/15/2028 | | | 3,212,776 | |
| 745,000 | | TIPS, 2.000%, 1/15/2016 | | | 926,219 | |
| 850,000 | | TIPS, 2.000%, 1/15/2026 | | | 1,162,501 | |
| 1,550,000 | | TIPS, 2.125%, 1/15/2019 | | | 1,880,196 | |
| 625,000 | | TIPS, 2.125%, 2/15/2041 | | | 847,244 | |
| 1,050,000 | | TIPS, 2.375%, 1/15/2017 | | | 1,325,290 | |
| 395,000 | | TIPS, 2.375%, 1/15/2025 | | | 585,305 | |
| 1,350,000 | | TIPS, 2.500%, 1/15/2029 | | | 1,830,000 | |
| | | | | | |
| | TOTAL TREASURY INFLATION PROTECTED SECURITIES (TIPS) (Cost - $17,675,207) | | | 17,287,648 | |
| | | | | | |
| Shares | | | | | |
| | MONEY MARKET FUND - 4.8 % | | | | |
| 3,262,240 | | Fidelity Institutional Money Market Portfolio, 0.01% (Cost - $3,262,240)(A) | | | 3,262,240 | |
| | | | | | |
| | |
| | TOTAL INVESTMENTS (Cost - $68,109,046)(B) - 99.8 % | | $ | 68,453,309 | |
| | | | | | |
| | OTHER ASSETS IN EXCESS OF LIABILITIES - NET - 0.2 % | | | 158,466 | |
| | | | | | |
| | NET ASSETS - 100.0 % | | $ | 68,611,775 | |
| | | | | | |
* Non-income producing securities.
GNMA - Government National Mortgage Association
REIT - Real Estate Investment Trust
(ADR) American Depositary Receipt
(GDR) Global Depositary receipt
(A) Variable rate security; the rate shown represents the yield at September 30, 2014.
(B) Represents cost for financial reporting purposes. Aggregate cost for federal tax purposes is $68,098,755 and differs from fair value by net unrealized appreciation (depreciation) of securities as follows:
| | | | |
Unrealized appreciation | | $ | 4,800,117 | |
Unrealized depreciation | | | (4,445,563) | |
| | | | |
Net unrealized appreciation | | $ | 354,554 | |
| | | | |
The accompanying notes are an integral part of these financial statements.
55
Schedule of Investments | Strategic Growth
As of September 30, 2014
| | | | | | |
| |
| Shares | | | | Fair Value | |
| |
| | |
| | MUTUAL FUNDS (A) - 100.3 % | | | | |
| 290,580 | | Timothy Plan Aggressive Growth Fund | | $ | 2,667,524 | |
| 502,579 | | Timothy Plan Defensive Strategies Fund | | | 5,719,354 | |
| 248,955 | | Timothy Plan Emerging Markets Fund | | | 2,546,812 | |
| 426,068 | | Timothy Plan Growth & Income Fund * | | | 4,665,444 | |
| 630,532 | | Timothy Plan High Yield Bond Fund | | | 5,983,749 | |
| 784,166 | | Timothy Plan International Fund | | | 6,971,235 | |
| 187,486 | | Timothy Plan Israel Common Values Fund | | | 2,307,955 | |
| 726,025 | | Timothy Plan Large/Mid Cap Growth Fund | | | 6,287,374 | |
| 304,326 | | Timothy Plan Large/Mid Cap Value Fund | | | 5,967,827 | |
| 143,014 | | Timothy Plan Small Cap Value Fund | | | 2,828,821 | |
| | | | | | |
| | |
| | TOTAL MUTUAL FUNDS (Cost - $39,869,793) | | | 45,946,095 | |
| | | | | | |
| | |
| | TOTAL INVESTMENTS (Cost - $39,869,793)(B) - 100.3 % | | $ | 45,946,095 | |
| | | | | | |
| | OTHER ASSETS LESS LIABILITIES - NET - (0.3) % | | | (153,210) | |
| | | | | | |
| | NET ASSETS - 100.0 % | | $ | 45,792,885 | |
| | | | | | |
* Non-income producing securities.
(A) Affiliated Funds - Class A
(B) Represents cost for financial reporting purposes. Aggregate cost for federal tax purposes is $41,316,672 and differs from fair value by net unrealized appreciation (depreciation) of securities as follows:
| | | | |
Unrealized appreciation | | $ | 6,346,552 | |
Unrealized depreciation | | | (1,717,129) | |
| | | | |
Net unrealized appreciation | | $ | 4,629,423 | |
| | | | |
The accompanying notes are an integral part of these financial statements.
56
Schedule of Investments | Conservative Growth
As of September 30, 2014
| | | | | | |
| |
| Shares | | | | Fair Value | |
| |
| | |
| | MUTUAL FUNDS (A) - 99.7 % | | | | |
| 146,706 | | Timothy Plan Aggressive Growth Fund | | $ | 1,346,760 | |
| 629,393 | | Timothy Plan Defensive Strategies Fund | | | 7,162,496 | |
| 171,606 | | Timothy Plan Emerging Markets Fund | | | 1,755,528 | |
| 1,672,013 | | Timothy Plan Fixed Income Fund | | | 17,439,094 | |
| 544,933 | | Timothy Plan Growth & Income Fund * | | | 5,967,016 | |
| 537,887 | | Timothy Plan High Yield Bond Fund | | | 5,104,545 | |
| 666,622 | | Timothy Plan International Fund | | | 5,926,273 | |
| 194,497 | | Timothy Plan Israel Common Values Fund | | | 2,394,258 | |
| 566,804 | | Timothy Plan Large/Mid Cap Growth Fund | | | 4,908,520 | |
| 234,925 | | Timothy Plan Large/Mid Cap Value Fund | | | 4,606,876 | |
| 157,007 | | Timothy Plan Small Cap Value Fund | | | 3,105,603 | |
| | | | | | |
| | |
| | TOTAL MUTUAL FUNDS (Cost - $56,247,717) | | | 59,716,969 | |
| | | | | | |
| | |
| | MONEY MARKET FUND - 0.3 % | | | | |
| 162,747 | | Fidelity Institutional Money Market Portfolio, 0.01% (Cost - $162,747)(B) | | | 162,747 | |
| | | | | | |
| | |
| | TOTAL INVESTMENTS (Cost - $56,410,464)(C) - 100.0 % | | $ | 59,879,716 | |
| | | | | | |
| | OTHER ASSETS LESS LIABILITIES - NET - 0.0 % | | | 22,124 | |
| | | | | | |
| | NET ASSETS - 100.0 % | | $ | 59,901,840 | |
| | | | | | |
* Non-income producing securities.
(A) Affiliated Funds - Class A
(B) Variable rate security; the rate shown represents the yield at September 30, 2014.
(C) Represents cost for financial reporting purposes. Aggregate cost for federal tax purposes is $56,979,023 and differs from fair value by net unrealized appreciation (depreciation) of securities as follows:
| | | | |
Unrealized appreciation | | $ | 3,972,612 | |
Unrealized depreciation | | | (1,071,919) | |
| | | | |
Net unrealized appreciation | | $ | 2,900,693 | |
| | | | |
The accompanying notes are an integral part of these financial statements.
57
Schedule of Investments | Emerging Markets
As of September 30, 2014
| | | | | | |
| |
| Shares | | | | Fair Value | |
| |
| | |
| | COMMON STOCK - 85.9 % | | | | |
| | AEROSPACE/DEFENSE - 2.5 % | | | | |
| 7,820 | | Embraer SA (ADR) | | $ | 306,700 | |
| | | | | | |
| | |
| | AGRICULTURE- 2.1 % | | | | |
| 28,300 | | Adecoagro SA * | | | 249,040 | |
| | | | | | |
| | |
| | AIRLINES - 1.8 % | | | | |
| 2,067 | | Copa Holdings SA - Cl. A | | | 221,769 | |
| | | | | | |
| | |
| | APPAREL - 0.7 % | | | | |
| 29,000 | | Yue Yuen Industrial Holdings Ltd. | | | 87,949 | |
| | | | | | |
| | |
| | AUTOMOTIVE - 4.7 % | | | | |
| 4,270 | | China Yuchai International Ltd. | | | 79,166 | |
| 1,250 | | Hyundai Mobis Co. Ltd. | | | 304,442 | |
| 3,700 | | Kia Motors Corp. | | | 188,294 | |
| | | | | | |
| | | | | 571,902 | |
| | | | | | |
| | BANKS - 14.4 % | | | | |
| 7,600 | | Banco Bradesco SA | | | 109,564 | |
| 12,800 | | Banco do Brasil SA | | | 133,054 | |
| 2,880 | | Banco Latinoamericano de Comercio Exterior SA | | | 88,358 | |
| 13,480 | | Erste Group Bank AG | | | 308,728 | |
| 31,760 | | Sberbank of Russia (ADR) | | | 249,888 | |
| 12,730 | | Standard Chartered PLC | | | 235,419 | |
| 13,440 | | TCS Group Holding PLC (GDR) * | | | 63,034 | |
| 78,000 | | Turkiye Garanti Bankasi AS | | | 273,720 | |
| 144,200 | | Turkiye Vakiflar Bankasi Tao | | | 266,932 | |
| | | | | | |
| | | | | 1,728,697 | |
| | | | | | |
| | BUILDING MATERIALS - 2.1 % | | | | |
| 15,284 | | Cemex SAB de CV (ADR) * | | | 199,303 | |
| 145,724 | | Desarrolladora Homex SAB de CV * (A) | | | 24,041 | |
| 373,450 | | Urbi Desarrollos Urbanos SAB de CV * (A) | | | 25,593 | |
| | | | | | |
| | | | | 248,937 | |
| | | | | | |
| | CHEMICALS - 1.6 % | | | | |
| 198,500 | | Yingde Gases | | | 187,628 | |
| | | | | | |
| | |
| | COMMERCIAL SERVICES - 1.2 % | | | | |
| 52,200 | | ITE Group PLC | | | 143,469 | |
| | | | | | |
| | |
| | DISTRIBUTION / WHOLESALE - 2.0 % | | | | |
| 60,530 | | Aygaz AS | | | 246,931 | |
| | | | | | |
| | |
| | DIVERSIFIED FINANCIAL SERVICES - 6.4 % | | | | |
| 6,400 | | Hana Financial Group, Inc. | | | 233,508 | |
| 6,840 | | KB Financial Group, Inc. | | | 249,886 | |
| 6,100 | | Shinham Financial Group Co., Ltd. | | | 280,949 | |
| | | | | | |
| | | | | 764,343 | |
| | | | | | |
| | ELECTRIC - 6.6 % | | | | |
| 7,590 | | APR Energy PLC | | | 66,705 | |
| 55,830 | | Centrais Eletricas Brasileiras SA (ADR) | | | 150,741 | |
| 8,600 | | Cia Paranaense de Energia | | | 82,092 | |
| 10,480 | | Cia Paranaense de Energia (ADR) | | | 143,262 | |
| 9,670 | | Reliance Infrastructure Ltd. (GDR) | | | 268,826 | |
| 46,980 | | RusHydro JSC (ADR) | | | 84,564 | |
| | | | | | |
| | | | | 796,190 | |
| | | | | | |
The accompanying notes are an integral part of these financial statements.
58
Schedule of Investments | Emerging Markets (Continued)
As of September 30, 2014
| | | | | | |
| |
| Shares | | | | Fair Value | |
| |
| | |
| | FOOD - 7.2 % | | | | |
| 344,000 | | First Pacific Co., Ltd. | | $ | 358,384 | |
| 90 | | Lotte Confectionery Co., Ltd. | | | 185,849 | |
| 115,100 | | Marfrig Alimentos SA * | | | 316,733 | |
| | | | | | |
| | | | | 860,966 | |
| | | | | | |
| | HOLDING COMPANY - 0.6 % | | | | |
| 10,260 | | Haw Par Corp., Ltd. | | | 70,562 | |
| | | | | | |
| | |
| | INVESTMENT COMPANIES - 1.0 % | | | | |
| 8,670 | | Grupo Aval Acciones y Valores (ADR) | | | 117,478 | |
| | | | | | |
| | |
| | IRON/STEEL - 5.2 % | | | | |
| 1,460 | | POSCO | | | 454,516 | |
| 6,900 | | Ternium SA (ADR) | | | 165,945 | |
| | | | | | |
| | | | | 620,461 | |
| | | | | | |
| | OIL & NATURAL GAS - 6.3 % | | | | |
| 7,664 | | Lukoil OAO (ADR) | | | 390,098 | |
| 25,099 | | Petroleo Brasileiro SA (ADR) | | | 373,724 | |
| | | | | | |
| | | | | 763,822 | |
| | | | | | |
| | PHARMACEUTICAL - 0.7 % | | | | |
| 89,780 | | Selcuk Ecza Deposu Ticaret ve Sanayi A.S. | | | 82,309 | |
| | | | | | |
| | |
| | RETAIL - 7.2 % | | | | |
| 2,110,000 | | Bosideng International Holdings Ltd. | | | 304,328 | |
| 50,000 | | Chow Tai Fook Jewellery Group Ltd. | | | 65,033 | |
| 136,000 | | Lifestyle International Holdings Ltd. (A) | | | 255,702 | |
| 82,000 | | Luk Fook Holdings International Ltd. | | | 238,123 | |
| | | | | | |
| | | | | 863,186 | |
| | | | | | |
| | SEMICONDUCTORS - 4.1 % | | | | |
| 440 | | Samsung Electronics Co., Ltd. | | | 494,051 | |
| | | | | | |
| | |
| | TELECOMMUNICATIONS - 2.2 % | | | | |
| 510,700 | | XL Axiata TBK PT | | | 259,792 | |
| | | | | | |
| | |
| | TEXTILES - 0.7 % | | | | |
| 164,000 | | Weiqiao Textile Co. | | | 81,944 | |
| | | | | | |
| | |
| | TRANSPORTATION - 1.3 % | | | | |
| 18,500 | | Globaltrans Investment PLC (GDR) | | | 155,400 | |
| | | | | | |
| | |
| | WATER - 3.3 % | | | | |
| 48,900 | | Cia de Saneamento Basico do Estado de Sao Paulo | | | 396,303 | |
| | | | | | |
| | |
| | TOTAL COMMON STOCK (Cost - $11,025,583) | | | 10,319,829 | |
| | | | | | |
| | |
| | PREFERRED STOCK - 4.7 % | | | | |
| 6,700 | | Banco Bradesco SA | | | 95,742 | |
| 2,050 | | Hyundai Mobis | | | 229,243 | |
| 346,500 | | Surgutneftegas OAO * | | | 238,899 | |
| | | | | | |
| | TOTAL PREFERRED STOCK (Cost - $489,027) | | | 563,884 | |
| | | | | | |
The accompanying notes are an integral part of these financial statements.
59
Schedule of Investments | Emerging Markets (Continued)
As of September 30, 2014
| | | | | | |
| |
| Shares | | | | Fair Value | |
| |
| | |
| | REITs - 4.0 % | | | | |
| 175,710 | | Mexico Real Estate Management SA de CV | | $ | 310,053 | |
| 76,862 | | PLA Administradora Industrial S de RL de CV | | | 169,336 | |
| | | | | | |
| | TOTAL REITs (Cost - $459,488) | | | 479,389 | |
| | | | | | |
| | |
| | MONEY MARKET FUND - 2.9 % | | | | |
| 350,124 | | Fidelity Institutional Money Market Portfolio, 0.01% (Cost - $350,124)(B) | | | 350,124 | |
| | | | | | |
| | |
| | TOTAL INVESTMENTS (Cost - $12,324,222)(C) - 97.5 % | | $ | 11,713,226 | |
| | | | | | |
| | OTHER ASSETS IN EXCESS OF LIABILITIES - NET - 2.5 % | | | 305,775 | |
| | | | | | |
| | NET ASSETS - 100.0 % | | $ | 12,019,001 | |
| | | | | | |
* Non-income producing securities.
(ADR) American Depositary Receipt
(GDR) Global Depositary receipt
REITs - Real Estate Investment Trusts
(A) Illiquid security; the Advisor has determined the security to be illiquid. At September 30, 2014, the securities amounted to 2.5% of net assets.
(B) Variable rate security; the rate shown represents the yield at September 30, 2014.
(C) Represents cost for financial reporting purposes. Aggregate cost for federal tax purposes is $12,363,822 and differs from fair value by net unrealized appreciation (depreciation) of securities as follows:
| | | | |
Unrealized appreciation | | $ | 735,112 | |
Unrealized depreciation | | | (1,385,708) | |
| | | | |
Net unrealized depreciation | | $ | (650,596) | |
| | | | |
| | | | |
| Diversification of Assets | | | |
| |
| Country | | % of Net Assets | |
| |
Austria | | | 2.57% | |
Brazil | | | 17.54% | |
Britain | | | 3.15% | |
China | | | 0.68% | |
Colombia | | | 0.98% | |
Cyprus | | | 1.82% | |
Hong Kong | | | 12.46% | |
India | | | 2.24% | |
Indonesia | | | 2.16% | |
Luxembourg | | | 3.45% | |
Mexico | | | 6.06% | |
Panama | | | 2.58% | |
Russia | | | 8.02% | |
United States | | | 3.47% | |
Singapore | | | 1.25% | |
South Korea | | | 21.80% | |
Turkey | | | 7.24% | |
| | | | |
Total | | | 97.47% | |
| | | | |
Other Assets in Excess of Liabilities - Net | | | 2.53% | |
| | | | |
Grand Total | | | 100.00% | |
| | | | |
The accompanying notes are an integral part of these financial statements.
60
Schedule of Investments | Growth & Income
As of September 30, 2014
| | | | | | |
| |
| Shares | | | | Fair Value | |
| |
| | |
| | COMMON STOCK - 44.4 % | | | | |
| | AEROSPACE/DEFENSE - 0.6 % | | | | |
| 1,300 | | Alliant Techsystems, Inc. | | $ | 165,932 | |
| | | | | | |
| | |
| | AGRICULTURE - 0.9 % | | | | |
| 4,000 | | Andersons, Inc. | | | 251,520 | |
| | | | | | |
| | |
| | AUTO PARTS & EQUIPMENT - 2.2 % | | | | |
| 6,500 | | Goodyear Tire & Rubber Co. | | | 146,803 | |
| 3,300 | | Magna International, Inc. | | | 313,203 | |
| 4,000 | | Standard Motor Products, Inc. | | | 137,720 | |
| | | | | | |
| | | | | 597,726 | |
| | | | | | |
| | BANKS - 0.6 % | | | | |
| 5,145 | | Southside Bancshares, Inc. | | | 171,071 | |
| | | | | | |
| | |
| | BEVERAGES - 0.9 % | | | | |
| 4,000 | | Dr Pepper Snapple Group, Inc. | | | 257,240 | |
| | | | | | |
| | |
| | BIOTECHNOLOGY - 0.3 % | | | | |
| 10,000 | | PDL BioPharma, Inc. | | | 74,700 | |
| | | | | | |
| | |
| | CHEMICALS - 4.3 % | | | | |
| 3,500 | | Celanese Corp. | | | 204,820 | |
| 900 | | CF Industries Holdings, Inc. | | | 251,298 | |
| 10,000 | | Huntsman Corp. | | | 259,900 | |
| 5,000 | | Olin Corp. | | | 126,250 | |
| 4,000 | | Westlake Chemical Corp. | | | 346,360 | |
| | | | | | |
| | | | | 1,188,628 | |
| | | | | | |
| | COMMERCIAL SERVICES - 5.7 % | | | | |
| 2,800 | | Deluxe Corp. | | | 154,448 | |
| 5,000 | | DeVry Education Group, Inc. | | | 214,050 | |
| 7,000 | | H&R Block, Inc. | | | 217,070 | |
| 6,000 | | Multi-Color Corp. | | | 272,880 | |
| 18,200 | | RR Donnelley & Sons Co. | | | 299,572 | |
| 3,900 | | United Rentals, Inc. * | | | 433,290 | |
| | | | | | |
| | | | | 1,591,310 | |
| | | | | | |
| | COMPUTERS - 1.8 % | | | | |
| 6,000 | | Insight Enterprises, Inc. * | | | 135,780 | |
| 3,900 | | Western Digital Corp. | | | 379,548 | |
| | | | | | |
| | | | | 515,328 | |
| | | | | | |
| | DISTRIBUTION/WHOLESALE - 0.6 % | | | | |
| 2,800 | | Arrow Electronics, Inc. * | | | 154,980 | |
| | | | | | |
| | |
| | DIVERSIFIED FINANCIAL SERVICES - 0.7 % | | | | |
| 4,000 | | Piper Jaffray Cos * | | | 208,960 | |
| | | | | | |
| | |
| | ELECTRIC - 2.6 % | | | | |
| 10,500 | | Empire District Electric Co. | | | 253,575 | |
| 5,200 | | IDACORP, Inc. | | | 278,772 | |
| 5,700 | | Westar Energy, Inc. | | | 194,484 | |
| | | | | | |
| | | | | 726,831 | |
| | | | | | |
| | ELECTRONICS - 0.8 % | | | | |
| 5,600 | | Avnet, Inc. | | | 232,400 | |
| | | | | | |
The accompanying notes are an integral part of these financial statements.
61
Schedule of Investments | Growth & Income (Continued)
As of September 30, 2014
| | | | | | |
| |
| Shares | | | | Fair Value | |
| |
| | |
| | ENERGY-ALTERNATE SOURCES - 0.8 % | | | | |
| 6,000 | | Green Plains, Inc. | | $ | 224,340 | |
| | | | | | |
| | |
| | FOOD - 0.9 % | | | | |
| 3,000 | | Sanderson Farms, Inc. | | | 263,850 | |
| | | | | | |
| | |
| | GAS - 0.8 % | | | | |
| 6,600 | | UGI Corp. | | | 224,994 | |
| | | | | | |
| | |
| | HOUSEHOLD PRODUCTS/WARES - 1.6 % | | | | |
| 3,900 | | Helen of Troy Ltd. * | | | 204,828 | |
| 4,000 | | Jarden Corp. * | | | 240,440 | |
| | | | | | |
| | | | | 445,268 | |
| | | | | | |
| | INSURANCE - 5.2 % | | | | |
| 4,000 | | Allied World Assurance Co. Holdings AG | | | 147,360 | |
| 4,000 | | American Financial Group, Inc. | | | 231,560 | |
| 7,800 | | Montpelier Re Holdings Ltd. | | | 242,502 | |
| 7,400 | | Protective Life Corp. | | | 513,634 | |
| 9,100 | | Unum Group | | | 312,858 | |
| | | | | | |
| | | | | 1,447,914 | |
| | | | | | |
| | MISCELLANEOUS MANUFACTURING - 2.1 % | | | | |
| 4,700 | | American Railcar Industries, Inc. | | | 347,424 | |
| 6,000 | | Smith & Wesson Holding Corp. * | | | 56,640 | |
| 4,000 | | Trinity Industries, Inc. | | | 186,880 | |
| | | | | | |
| | | | | 590,944 | |
| | | | | | |
| | OIL & NATURAL GAS - 5.7 % | | | | |
| 70,000 | | Abraxas Petroleum Corp. * | | | 369,600 | |
| 2,800 | | Cimarex Energy Co. | | | 354,284 | |
| 2,800 | | ConocoPhillips | | | 214,256 | |
| 50,000 | | SandRidge Energy, Inc. * | | | 214,500 | |
| 5,000 | | Valero Energy Corp. | | | 231,350 | |
| 40,000 | | Warren Resources, Inc. * | | | 212,000 | |
| | | | | | |
| | | | | 1,595,990 | |
| | | | | | |
| | OIL & GAS SERVICES - 1.3 % | | | | |
| 3,000 | | Baker Hughes, Inc. | | | 195,180 | |
| 2,500 | | Halliburton Co. | | | 161,275 | |
| | | | | | |
| | | | | 356,455 | |
| | | | | | |
| | PHARMACEUTICALS - 1.0 % | | | | |
| 4,300 | | Omnicare, Inc. | | | 267,718 | |
| | | | | | |
| | |
| | RETAIL - 2.3 % | | | | |
| 2,200 | | Asbury Automotive Group, Inc. * | | | 141,724 | |
| 2,300 | | Dillard’s, Inc. | | | 250,654 | |
| 4,400 | | Foot Locker, Inc. | | | 244,860 | |
| | | | | | |
| | | | | 637,238 | |
| | | | | | |
| | TELECOMMUNICATIONS - 0.7 % | | | | |
| 57,000 | | Vonage Holdings Corp. * | | | 186,960 | |
| | | | | | |
| | |
| | TOTAL COMMON STOCK (Cost - $11,383,343) | | | 12,378,297 | |
| | | | | | |
The accompanying notes are an integral part of these financial statements.
62
Schedule of Investments | Growth & Income (Continued)
As of September 30, 2014
| | | | | | |
| |
| Par Value | | | | Fair Value | |
| |
| | |
| | BONDS & NOTES - 49.0 % | | | | |
| | GOVERNMENT NOTES & BONDS - 49.0 % | | | | |
| $ 200,000 | | Federal Home Loan Bank, 2.000%, 8/22/2014 (A) | | $ | 190,370 | |
| 250,000 | | Federal Home Loan Mortgage Corp., 1.500%, 12/27/2018 (A) | | | 250,590 | |
| 3,000,000 | | United States Treasury Note/Bond, 0.250%, 5/15/2016 | | | 2,992,089 | |
| 650,000 | | United States Treasury Note/Bond, 0.375%, 2/15/2016 | | | 650,889 | |
| 1,900,000 | | United States Treasury Note/Bond, 1.000%, 9/30/2016 | | | 1,914,472 | |
| 1,000,000 | | United States Treasury Note/Bond, 1.000%, 3/31/2017 | | | 1,003,164 | |
| 1,000,000 | | United States Treasury Note/Bond, 1.625%, 8/15/2022 | | | 949,727 | |
| 1,000,000 | | United States Treasury Note/Bond, 1.750%, 5/15/2023 | | | 947,969 | |
| 1,000,000 | | United States Treasury Note/Bond, 2.750%, 11/15/2023 | | | 1,025,156 | |
| 1,400,000 | | United States Treasury Note/Bond, 4.625%, 2/15/2017 | | | 1,525,782 | |
| 500,000 | | United States Treasury Note/Bond, 3.125%, 2/15/2042 | | | 495,234 | |
| 1,500,000 | | United States Treasury Note/Bond, 3.825%, 8/15/2040 | | | 1,698,633 | |
| | | | | | |
| | TOTAL BONDS & NOTES (Cost - $13,441,476) | | | 13,644,075 | |
| | | | | | |
| | | | | | |
| Shares | | | | | |
| | MONEY MARKET FUND - 6.5 % | | | | |
| 1,819,491 | | Fidelity Institutional Money Market Portfolio, 0.01% (Cost - $1,819,491)(B) | | | 1,819,491 | |
| | | | | | |
| | |
| | TOTAL INVESTMENTS - 99.9 % (Cost - $26,644,310)(C) | | $ | 27,841,863 | |
| | | | | | |
| | OTHER ASSETS LESS LIABILITIES - NET - 0.1 % | | | 17,854 | |
| | | | | | |
| | TOTAL NET ASSETS - 100.0 % | | $ | 27,859,717 | |
| | | | | | |
* Non-income producing securities.
(A) Step coupon security; interest rate shown reflects the rate currently in effect.
(B) Variable rate security; the rate shown represents the yield at September 30, 2014.
(C) Represents cost for financial reporting purposes. Aggregate cost for federal tax purposes is $26,646,038 and differs from fair value by net unrealized appreciation (depreciation) of securities as follows:
| | | | |
Unrealized appreciation | | $ | 1,643,021 | |
Unrealized depreciation | | | (447,196) | |
| | | | |
Net unrealized appreciation | | $ | 1,195,825 | |
| | | | |
The accompanying notes are an integral part of these financial statements.
63
Timothy Plan Funds
Statements of Assets and Liabilities
September 30, 2014
| | | | | | | | | | | | | | | | | | | | | | | | |
| | | Aggressive
Growth Fund | | | International Fund | | | Large/Mid Cap
Growth Fund | | | Small Cap Value
Fund | | | Large/Mid Cap
Value Fund | | | Fixed Income
Fund | |
| |
ASSETS: | | | | | | | | | | | | | | | | | | | | | | | | |
Investments, at cost | | $ | 20,417,803 | | | $ | 51,357,655 | | | $ | 53,434,432 | | | $ | 75,004,636 | | | $ | 124,614,357 | | | $ | 74,583,442 | |
| | | | | | | | | | | | | | | | | | | | | | | | |
Investments, at value | | $ | 22,906,227 | | | $ | 58,263,993 | | | $ | 62,043,116 | | | $ | 80,645,270 | | | $ | 157,305,383 | | | $ | 75,174,346 | |
Cash | | | 528 | | | | - | | | | 1,240 | | | | - | | | | 13,568 | | | | - | |
Dividends and interest receivable | | | 6,947 | | | | 48,637 | | | | 43,275 | | | | 74,776 | | | | 174,231 | | | | 573,925 | |
Receivable for fund shares sold | | | 3,822 | | | | 176,099 | | | | 131,154 | | | | 86,885 | | | | 276,809 | | | | 88,580 | |
Receivable for securities sold | | | 303,587 | | | | 601,324 | | | | 394,433 | | | | 405,031 | | | | - | | | | - | |
Receivable for foreign tax reclaims | | | - | | | | 58,288 | | | | - | | | | - | | | | 3,901 | | | | - | |
Prepaid expenses and other assets | | | 23,731 | | | | 11,136 | | | | 10,741 | | | | 12,540 | | | | 11,670 | | | | 12,669 | |
| | | | | | | | | | | | | | | | | | | | | | | | |
Total Assets | | | 23,244,842 | | | | 59,159,477 | | | | 62,623,959 | | | | 81,224,502 | | | | 157,785,562 | | | | 75,849,520 | |
| | | | | | | | | | | | | | | | | | | | | | | | |
| | | | | | |
LIABILITIES: | | | | | | | | | | | | | | | | | | | | | | | | |
Payable for fund shares redeemed | | | 37,577 | | | | 29,269 | | | | 165,886 | | | | 30,197 | | | | 513,439 | | | | 256,390 | |
Accrued advisory fees | | | 15,571 | | | | 49,535 | | | | 44,702 | | | | 58,708 | | | | 113,271 | | | | 26,173 | |
Accrued 12b-1 fees | | | 7,378 | | | | 14,999 | | | | 17,465 | | | | 23,340 | | | | 45,148 | | | | 20,284 | |
Payable for securities purchased | | | 284,926 | | | | 518,315 | | | | 164,917 | | | | 400,833 | | | | - | | | | - | |
Accrued expenses and other liabilities | | | 33,253 | | | | 41,783 | | | | 39,604 | | | | 48,237 | | | | 73,281 | | | | 49,681 | |
| | | | | | | | | | | | | | | | | | | | | | | | |
Total Liabilities | | | 378,705 | | | | 653,901 | | | | 432,574 | | | | 561,315 | | | | 745,139 | | | | 352,528 | |
| | | | | | | | | | | | | | | | | | | | | | | | |
| | | | | | |
Net Assets | | $ | 22,866,137 | | | $ | 58,505,576 | | | $ | 62,191,385 | | | $ | 80,663,187 | | | $ | 157,040,423 | | | $ | 75,496,992 | |
| | | | | | | | | | | | | | | | | | | | | | | | |
| | | | | | |
NET ASSETS CONSIST OF: | | | | | | | | | | | | | | | | | | | | | | | | |
Paid in capital | | $ | 17,798,346 | | | $ | 65,455,462 | | | $ | 47,365,243 | | | $ | 60,395,924 | | | $ | 109,486,531 | | | $ | 74,240,388 | |
Accumulated net investment income (loss) | | | 5,312 | | | | (365,861) | | | | 11,070 | | | | 38,593 | | | | 38,030 | | | | 505,149 | |
Accumulated net realized gain (loss) from investments | | | 2,574,055 | | | | (13,490,349) | | | | 6,206,388 | | | | 14,588,036 | | | | 14,825,068 | | | | 160,551 | |
Net unrealized appreciation on investments | | | 2,488,424 | | | | 6,906,324 | | | | 8,608,684 | | | | 5,640,634 | | | | 32,690,794 | | | | 590,904 | |
| | | | | | | | | | | | | | | | | | | | | | | | |
Net Assets | | $ | 22,866,137 | | | $ | 58,505,576 | | | $ | 62,191,385 | | | $ | 80,663,187 | | | $ | 157,040,423 | | | $ | 75,496,992 | |
| | | | | | | | | | | | | | | | | | | | | | | | |
| | | | | | |
Class A | | | | | | | | | | | | | | | | | | | | | | | | |
Net Assets | | $ | 19,267,763 | | | $ | 54,709,241 | | | $ | 56,073,171 | | | $ | 71,996,880 | | | $ | 138,820,620 | | | $ | 68,274,360 | |
Shares of beneficial interest outstanding | | | 2,099,141 | | | | 6,157,267 | | | | 6,474,980 | | | | 3,638,298 | | | | 7,080,003 | | | | 6,548,984 | |
Net Asset Value, offering price and redemption price per share | | $ | 9.18 | | | $ | 8.89 | | | $ | 8.66 | | | $ | 19.79 | | | $ | 19.61 | | | $ | 10.43 | |
| | | | | | | | | | | | | | | | | | | | | | | | |
Offering Price Per Share (NAV / 0.945) *(NAV / 0.955) | | $ | 9.71 | | | $ | 9.41 | | | $ | 9.16 | | | $ | 20.94 | | | $ | 20.75 | | | $ | 10.92 | * |
| | | | | | | | | | | | | | | | | | | | | | | | |
| | | | | | |
Class C | | | | | | | | | | | | | | | | | | | | | | | | |
Net Assets | | $ | 3,458,316 | | | $ | 3,335,730 | | | $ | 5,928,547 | | | $ | 8,134,779 | | | $ | 16,778,291 | | | $ | 7,119,958 | |
Shares of beneficial interest outstanding | | | 425,324 | | | | 384,593 | | | | 779,665 | | | | 494,661 | | | | 975,883 | | | | 707,343 | |
Net Asset Value, offering price and redemption price per share | | $ | 8.13 | | | $ | 8.67 | | | $ | 7.60 | | | $ | 16.45 | | | $ | 17.19 | | | $ | 10.07 | |
| | | | | | | | | | | | | | | | | | | | | | | | |
Minimum Redemption Price Per Share (NAV * 0.99) | | $ | 8.05 | | | $ | 8.58 | | | $ | 7.52 | | | $ | 16.28 | | | $ | 17.02 | | | $ | 9.97 | |
| | | | | | | | | | | | | | | | | | | | | | | | |
| | | | | | |
Class I | | | | | | | | | | | | | | | | | | | | | | | | |
Net Assets | | $ | 140,058 | | | $ | 460,605 | | | $ | 189,667 | | | $ | 531,528 | | | $ | 1,441,512 | | | $ | 102,674 | |
Shares of beneficial interest outstanding | | | 15,205 | | | | 51,856 | | | | 21,816 | | | | 26,793 | | | | 73,441 | | | | 9,913 | |
Net Asset Value, offering price and redemption price per share | | $ | 9.21 | | | $ | 8.88 | | | $ | 8.69 | | | $ | 19.84 | | | $ | 19.63 | | | $ | 10.36 | |
| | | | | | | | | | | | | | | | | | | | | | | | |
The accompanying notes are an integral part of these financial statements.
64
Timothy Plan Funds
Statements of Assets and Liabilities (continued)
September 30, 2014
| | | | | | | | | | | | | | | | | | | | | | | | | | | | |
| | | High Yield Bond Fund | | | Israel Common Values Fund | | | Defensive Strategies Fund | | | Strategic Growth Fund | | | Conservative Growth Fund | | | Emerging Markets Fund | | | Growth & Income Fund | |
| | | | | | | | |
| | | | | | | | |
| |
ASSETS: | | | | | | | | | | | | | | | | | | | | | | | | | | | | |
Investments, at cost | | $ | 43,372,026 | | | $ | 13,822,975 | | | $ | 68,109,046 | | | $ | 39,869,793 | | | $ | 56,410,464 | | | $ | 12,324,222 | | | $ | 26,644,310 | |
| | | | | | | | | | | | | | | | | | | | | | | | | | | | |
Investments, at value | | $ | 43,584,440 | | | $ | 16,187,695 | | | $ | 68,453,309 | | | $ | 45,946,095 | | | $ | 59,879,716 | | | $ | 11,713,226 | | | $ | 27,841,863 | |
Cash | | | - | | | | - | | | | 351 | | | | - | | | | - | | | | - | | | | - | |
Brazilian Real (BRL)(Cost $1,495) | | | - | | | | - | | | | - | | | | - | | | | - | | | | 1,495 | | | | - | |
New Taiwan Dollar (TWD)(Cost $46,358) | | | - | | | | - | | | | - | | | | - | | | | - | | | | 45,788 | | | | - | |
Dividends and interest receivable | | | 781,378 | | | | 5,619 | | | | 162,783 | | | | - | | | | - | | | | 7,722 | | | | 53,067 | |
Receivable for fund shares sold | | | 67,797 | | | | 7,512 | | | | 126,638 | | | | 4,152 | | | | 163,293 | | | | 266,859 | | | | 121,941 | |
Receivable for securities sold | | | - | | | | - | | | | - | | | | - | | | | - | | | | 66,436 | | | | - | |
Deposit with broker | | | - | | | | - | | | | - | | | | - | | | | - | | | | | | | | - | |
Receivable for foreign tax reclaims | | | - | | | | - | | | | 13,191 | | | | - | | | | - | | | | 2,338 | | | | 446 | |
Prepaid expenses and other assets | | | 12,499 | | | | 19,407 | | | | 26,018 | | | | 12,825 | | | | 15,793 | | | | 8,585 | | | | 19,812 | |
| | | | | | | | | | | | | | | | | | | | | | | | | | | | |
Total Assets | | | 44,446,114 | | | | 16,220,233 | | | | 68,782,290 | | | | 45,963,072 | | | | 60,058,802 | | | | 12,112,449 | | | | 28,037,129 | |
| | | | | | | | | | | | | | | | | | | | | | | | | | | | |
| | | | | | | |
LIABILITIES: | | | | | | | | | | | | | | | | | | | | | | | | | | | | |
Payable for securities purchased | | | 250,000 | | | | - | | | | - | | | | - | | | | - | | | | 47,945 | | | | - | |
Payable for fund shares redeemed | | | 80,601 | | | | 31,473 | | | | 72,690 | | | | 58,985 | | | | 79,550 | | | | 4,703 | | | | 127,760 | |
Accrued advisory fees | | | 21,602 | | | | 14,275 | | | | 33,730 | | | | 26,912 | | | | 34,675 | | | | 12,389 | | | | 19,193 | |
Accrued 12b-1 fees | | | 11,422 | | | | 5,090 | | | | 22,462 | | | | 5,436 | | | | 7,738 | | | | 3,266 | | | | 6,824 | |
Due to broker | | | - | | | | - | | | | - | | | | 45,995 | | | | - | | | | - | | | | - | |
Accrued expenses and other liabilities | | | 33,006 | | | | 22,410 | | | | 41,633 | | | | 32,859 | | | | 34,999 | | | | 25,145 | | | | 23,635 | |
| | | | | | | | | | | | | | | | | | | | | | | | | | | | |
Total Liabilities | | | 396,631 | | | | 73,248 | | | | 170,515 | | | | 170,187 | | | | 156,962 | | | | 93,448 | | | | 177,412 | |
| | | | | | | | | | | | | | | | | | | | | | | | | | | | |
| | | | | | | |
Net Assets | | $ | 44,049,483 | | | $ | 16,146,985 | | | $ | 68,611,775 | | | $ | 45,792,885 | | | $ | 59,901,840 | | | $ | 12,019,001 | | | $ | 27,859,717 | |
| | | | | | | | | | | | | | | | | | | | | | | | | | | | |
| | | | | | | |
NET ASSETS CONSIST OF: | | | | | | | | | | | | | | | | | | | | | | | | | | | | |
Paid in capital | | $ | 44,550,250 | | | $ | 14,754,400 | | | $ | 67,791,197 | | | $ | 46,443,097 | | | $ | 55,030,653 | | | $ | 12,009,753 | | | $ | 26,704,582 | |
Accumulated net investment income (loss) | | | 63,801 | | | | (801,748) | | | | 652,468 | | | | 534,610 | | | | 448,836 | | | | (18,863) | | | | (22,909) | |
Accumulated net realized gain (loss) from investments | | | (776,982) | | | | (170,357) | | | | (175,234) | | | | (7,261,124) | | | | 953,099 | | | | 650,530 | | | | (19,509) | |
Net unrealized appreciation (depreciation) investments | | | 212,414 | | | | 2,364,690 | | | | 343,344 | | | | 6,076,302 | | | | 3,469,252 | | | | (622,419) | | | | 1,197,553 | |
| | | | | | | | | | | | | | | | | | | | | | | | | | | | |
Net Assets | | $ | 44,049,483 | | | $ | 16,146,985 | | | $ | 68,611,775 | | | $ | 45,792,885 | | | $ | 59,901,840 | | | $ | 12,019,001 | | | $ | 27,859,717 | |
| | | | | | | | | | | | | | | | | | | | | | | | | | | | |
| | | | | | | |
Class A | | | | | | | | | | | | | | | | | | | | | | | | | | | | |
Net Assets | | $ | 41,037,575 | | | $ | 13,792,081 | | | $ | 54,053,939 | | | $ | 36,951,284 | | | $ | 47,542,815 | | | $ | 10,803,108 | | | $ | 24,271,700 | |
Shares of beneficial interest outstanding | | | 4,324,334 | | | | 1,120,850 | | | | 4,749,938 | | | | 4,152,678 | | | | 4,319,272 | | | | 1,056,457 | | | | 2,217,253 | |
Net Asset Value, offering price and redemption price per share | | $ | 9.49 | | | $ | 12.31 | | | $ | 11.38 | | | $ | 8.90 | | | $ | 11.01 | | | $ | 10.23 | | | $ | 10.95 | |
| | | | | | | | | | | | | | | | | | | | | | | | | | | | |
Offering Price Per Share (NAV / 0.945) *(NAV / 0.955) | | $ | 9.94 | * | | $ | 13.03 | | | $ | 12.04 | | | $ | 9.42 | | | $ | 11.65 | | | $ | 10.83 | | | $ | 11.59 | |
| | | | | | | | | | | | | | | | | | | | | | | | | | | | |
| | | | | | | |
Class C | | | | | | | | | | | | | | | | | | | | | | | | | | | | |
Net Assets | | $ | 2,771,112 | | | $ | 2,342,191 | | | $ | 14,460,730 | | | $ | 8,841,601 | | | $ | 12,359,025 | | | $ | 882,947 | | | $ | 2,080,656 | |
Shares of beneficial interest outstanding | | | 289,471 | | | | 194,356 | | | | 1,309,704 | | | | 1,085,199 | | | | 1,209,496 | | | | 87,468 | | | | 191,405 | |
Net Asset Value, offering price and redemption price per share | | $ | 9.57 | | | $ | 12.05 | | | $ | 11.04 | | | $ | 8.15 | | | $ | 10.22 | | | $ | 10.09 | | | $ | 10.87 | |
| | | | | | | | | | | | | | | | | | | | | | | | | | | | |
Minimum Redemption Price Per Share (NAV * 0.99) | | $ | 9.47 | | | $ | 11.93 | | | $ | 10.93 | | | $ | 8.07 | | | $ | 10.12 | | | $ | 9.99 | | | $ | 10.76 | |
| | | | | | | | | | | | | | | | | | | | | | | | | | | | |
| | | | | | | |
Class I | | | | | | | | | | | | | | | | | | | | | | | | | | | | |
Net Assets | | $ | 240,796 | | | $ | 12,713 | | | $ | 97,106 | | | $ | - | | | $ | - | | | $ | 332,946 | | | $ | 1,507,361 | |
Shares of beneficial interest outstanding | | | 25,348 | | | | 1,035 | | | | 8,545 | | | | - | | | | - | | | | 32,479 | | | | 137,573 | |
Net Asset Value, offering price and redemption price per share | | $ | 9.50 | | | $ | 12.29 | | | $ | 11.36 | | | $ | - | | | $ | - | | | $ | 10.25 | | | $ | 10.96 | |
| | | | | | | | | | | | | | | | | | | | | | | | | | | | |
The accompanying notes are an integral part of these financial statements.
65
Timothy Plan Funds
Statements of Operations
For the Year Ended September 30, 2014
| | | | | | | | | | | | | | | | | | | | | | | | |
| | | Aggressive | | | | | | Large/Mid Cap | | | | | | Large/Mid Cap | | | | |
| | | Growth | | | International | | | Growth | | | Small Cap Value | | | Value | | | Fixed Income | |
| | | Fund | | | Fund | | | Fund | | | Fund | | | Fund | | | Fund | |
| |
Investment Income: | | | | | | | | | | | | | | | | | | | | | | | | |
Interest income | | $ | 70 | | | $ | 219 | | | $ | 218 | | | $ | 170 | | | $ | 508 | | | $ | 2,120,482 | |
Dividend income | | | 122,791 | | | | 1,298,711 | | | | 819,529 | | | | 1,017,967 | | | | 2,164,537 | | | | - | |
Foreign tax withheld | | | - | | | | (186,200) | | | | 1,184 | | | | - | | | | (5,884) | | | | - | |
| | | | | | | | | | | | | | | | | | | | | | | | |
Total Investment Income | | | 122,861 | | | | 1,112,730 | | | | 820,931 | | | | 1,018,137 | | | | 2,159,161 | | | | 2,120,482 | |
| | | | | | | | | | | | | | | | | | | | | | | | |
| | | | | | |
Operating Expenses: | | | | | | | | | | | | | | | | | | | | | | | | |
Investment advisory fees | | | 190,679 | | | | 503,579 | | | | 500,518 | | | | 682,180 | | | | 1,250,651 | | | | 439,299 | |
12b-1 Fees: | | | | | | | | | | | | | | | | | | | | | | | | |
Class A | | | 47,679 | | | | 117,669 | | | | 132,932 | | | | 179,532 | | | | 326,700 | | | | 164,725 | |
Class C | | | 33,318 | | | | 30,930 | | | | 56,020 | | | | 81,234 | | | | 156,461 | | | | 73,234 | |
Administration fees | | | 49,091 | | | | 107,275 | | | | 122,969 | | | | 170,122 | | | | 313,471 | | | | 155,161 | |
Registration fees | | | 26,079 | | | | 27,916 | | | | 32,681 | | | | 35,284 | | | | 38,934 | | | | 30,746 | |
Custody fees | | | 18,998 | | | | 7,796 | | | | 15,666 | | | | 17,358 | | | | 22,303 | | | | 12,708 | |
Printing expenses | | | 14,811 | | | | 28,082 | | | | 31,987 | | | | 49,240 | | | | 66,295 | | | | 34,655 | |
Non 12b-1 shareholder servicing fees | | | 14,814 | | | | 25,904 | | | | 47,012 | | | | 39,854 | | | | 92,080 | | | | 63,725 | |
Audit fees | | | 12,450 | | | | 13,583 | | | | 13,793 | | | | 11,994 | | | | 13,793 | | | | 13,231 | |
Compliance officer fees | | | 2,305 | | | | 3,729 | | | | 4,622 | | | | 8,445 | | | | 14,564 | | | | 6,221 | |
Miscellaneous expenses | | | 2,048 | | | | 143 | | | | 1,538 | | | | 1,539 | | | | 1,544 | | | | 801 | |
Trustees’ fees | | | 2,521 | | | | 5,408 | | | | 6,234 | | | | 8,701 | | | | 19,404 | | | | 7,922 | |
Insurance expenses | | | 613 | | | | 1,244 | | | | 1,829 | | | | 2,059 | | | | 4,365 | | | | 2,347 | |
| | | | | | | | | | | | | | | | | | | | | | | | |
Total Operating Expenses | | | 415,406 | | | | 873,258 | | | | 967,801 | | | | 1,287,542 | | | | 2,320,565 | | | | 1,004,775 | |
Less: Expenses waived by Advisor | | | (2,076) | | | | (2,607) | | | | (2,794) | | | | (3,669) | | | | (7,079) | | | | (113,094) | |
| | | | | | | | | | | | | | | | | | | | | | | | |
Net Operating Expenses | | | 413,330 | | | | 870,651 | | | | 965,007 | | | | 1,283,873 | | | | 2,313,486 | | | | 891,681 | |
| | | | | | | | | | | | | | | | | | | | | | | | |
| | | | | | |
Net Investment Income (Loss) | | | (290,469) | | | | 242,079 | | | | (144,076) | | | | (265,736) | | | | (154,325) | | | | 1,228,801 | |
| | | | | | | | | | | | | | | | | | | | | | | | |
| | | | | | |
Realized and Unrealized
Gain (Loss) on Investments: | | | | | | | | | | | | | | | | | | | | | | | | |
Net realized gain (loss) on investments | | | 3,103,465 | | | | 2,085,424 | | | | 7,211,427 | | | | 16,166,118 | | | | 15,007,444 | | | | 381,634 | |
and foreign currency translations | | | | | | | (7) | | | | | | | | | | | | (72) | | | | | |
Capital gain dividends from REITs | | | 511 | | | | - | | | | - | | | | 68,810 | | | | 92,262 | | | | - | |
Net change in unrealized appreciation (depreciation) on investments | | | (1,227,201) | | | | (964,003) | | | | 627,222 | | | | (10,727,779) | | | | 5,781,747 | | | | 266,574 | |
and foreign currency translations | | | - | | | | (14) | | | | - | | | | - | | | | (232) | | | | - | |
| | | | | | | | | | | | | | | | | | | | | | | | |
Net Realized and Unrealized Gain on Investments | | | 1,876,775 | | | | 1,121,400 | | | | 7,838,649 | | | | 5,507,149 | | | | 20,881,149 | | | | 648,208 | |
| | | | | | | | | | | | | | | | | | | | | | | | |
| | | | | | |
Net Increase in Net Assets
Resulting From Operations | | $ | 1,586,306 | | | $ | 1,363,479 | | | $ | 7,694,573 | | | $ | 5,241,413 | | | $ | 20,726,824 | | | $ | 1,877,009 | |
| | | | | | | | | | | | | | | | | | | | | | | | |
The accompanying notes are an integral part of these financial statements.
66
Timothy Plan Funds
Statements of Operations (continued)
For the Year Ended September 30, 2014
| | | | | | | | | | | | | | | | | | | | | | | | | | | | |
| | | High Yield Bond Fund | | | Israel Common Values Fund | | | Defensive Strategies Fund | | | Strategic Growth Fund | | | Conservative Growth Fund | | | Emerging Markets Fund | | | Growth & Income Fund (1) | |
| | | | | | | | |
| | | | | | | | |
| |
Investment Income: | | | | | | | | | | | | | | | | | | | | | | | | | | | | |
Interest income | | $ | 2,458,507 | | | $ | 63 | | | $ | 485,024 | | | $ | 18 | | | $ | 20 | | | $ | 47 | | | $ | 125,979 | |
Dividend income | | | - | | | | 249,053 | | | | 931,973 | | | | - | | | | - | | | | 278,815 | | | | 154,132 | |
Dividend income from affiliated funds | | | - | | | | - | | | | - | | | | 1,089,252 | | | | 1,340,039 | | | | - | | | | - | |
Foreign tax withheld | | | - | | | | (56,302) | | | | (42,979) | | | | - | | | | - | | | | (28,397) | | | | (670) | |
| | | | | | | | | | | | | | | | | | | | | | | | | | | | |
Total Investment Income | | | 2,458,507 | | | | 192,814 | | | | 1,374,018 | | | | 1,089,270 | | | | 1,340,059 | | | | 250,465 | | | | 279,441 | |
| | | | | | | | | | | | | | | | | | | | | | | | | | | | |
| | | | | | | |
Operating Expenses: | | | | | | | | | | | | | | | | | | | | | | | | | | | | |
Investment advisory fees | | | 253,560 | | | | 143,113 | | | | 402,264 | | | | 295,758 | | | | 380,680 | | | | 127,053 | | | | 161,937 | |
12b-1 fees: | | | | | | | | | | | | | | | | | | | | | | | | | | | | |
Class A | | | 98,933 | | | | 31,005 | | | | 129,329 | | | | - | | | | - | | | | 24,693 | | | | 44,859 | |
Class C | | | 26,073 | | | | 19,008 | | | | 152,936 | | | | 64,014 | | | | 85,548 | | | | 5,233 | | | | 6,551 | |
Administration fees | | | 87,784 | | | | 30,024 | | | | 142,533 | | | | 96,035 | | | | 121,075 | | | | 22,567 | | | | 40,483 | |
Registration fees | | | 28,721 | | | | 30,411 | | | | 33,130 | | | | 29,109 | | | | 29,540 | | | | 31,932 | | | | 23,595 | |
Printing expenses | | | 23,772 | | | | 7,205 | | | | 37,916 | | | | 25,508 | | | | 28,812 | | | | 6,746 | | | | 14,511 | |
Non 12b-1 shareholder servicing fees | | | 13,324 | | | | 1,616 | | | | 14,145 | | | | 11,861 | | | | 13,526 | | | | 1,523 | | | | 2,103 | |
Audit fees | | | 13,246 | | | | 12,947 �� | | | | 13,445 | | | | 13,345 | | | | 12,848 | | | | 14,936 | | | | 11,996 | |
Custody fees | | | 6,787 | | | | 19,942 | | | | 32,067 | | | | 9,299 | | | | 11,266 | | | | 35,347 | | | | 6,691 | |
Compliance officer fees | | | 3,496 | | | | 466 | | | | 6,458 | | | | 3,677 | | | | 5,277 | | | | 950 | | | | 1,990 | |
Trustees’ fees | | | 4,624 | | | | 1,426 | | | | 6,760 | | | | 1,742 | | | | 6,668 | | | | 959 | | | | 2,397 | |
Insurance expenses | | | 1,464 | | | | 310 | | | | 1,983 | | | | 1,518 | | | | 1,960 | | | | 167 | | | | 363 | |
Miscellaneous expenses | | | 686 | | | | 1,150 | | | | 965 | | | | 452 | | | | 1,155 | | | | 1,554 | | | | 3,360 | |
| | | | | | | | | | | | | | | | | | | | | | | | | | | | |
Total Operating Expenses | | | 562,470 | | | | 298,623 | | | | 973,931 | | | | 552,318 | | | | 698,355 | | | | 273,660 | | | | 320,836 | |
Less: Expenses waived by Advisor | | | (1,964) | | | | - | | | | (3,066) | | | | - | | | | - | | | | (541) | | | | (1,200) | |
| | | | | | | | | | | | | | | | | | | | | | | | | | | | |
Net Operating Expenses | | | 560,506 | | | | 298,623 | | | | 970,865 | | | | 552,318 | | | | 698,355 | | | | 273,119 | | | | 319,636 | |
| | | | | | | | | | | | | | | | | | | | | | | | | | | | |
| | | | | | | |
Net Investment Income (Loss) | | | 1,898,001 | | | | (105,809) | | | | 403,153 | | | | 536,952 | | | | 641,704 | | | | (22,654) | | | | (40,195) | |
| | | | | | | | | | | | | | | | | | | | | | | | | | | | |
| | | | | | | |
Realized and Unrealized
Gain (Loss) on Investments: | | | | | | | | | | | | | | | | | | | | | | | | | | | | |
Net realized gain (loss) on investments | | | 594,758 | | | | (57,758) | | | | 68,440 | | | | 1,042,265 | | | | 2,930,268 | | | | 763,428 | | | | (19,509) | |
and foreign currency translations | | | | | | | 2,070 | | | | (33,444) | | | | | | | | | | | | (6,678) | | | | | |
Capital gain distributions from affiliated funds | | | - | | | | - | | | | - | | | | 946,902 | | | | 945,023 | | | | - | | | | - | |
Capital gain dividends from REITs | | | - | | | | - | | | | 227,729 | | | | - | | | | - | | | | - | | | | - | |
Net change in unrealized appreciation (depreciation) on investments | | | (313,447) | | | | 200,476 | | | | 979,641 | | | | 274,480 | | | | (1,732,417) | | | | (737,022) | | | | 1,197,553 | |
and foreign currency translations | | | - | | | | (30) | | | | (919) | | | | | | | | - | | | | (11,860) | | | | | |
| | | | | | | | | | | | | | | | | | | | | | | | | | | | |
Net Realized and Unrealized Gain on Investments | | | 281,311 | | | | 144,758 | | | | 1,241,447 | | | | 2,263,647 | | | | 2,142,874 | | | | 7,868 | | | | 1,178,044 | |
| | | | | | | | | | | | | | | | | | | | | | | | | | | | |
| | | | | | | |
Net Increase (Decrease) in Net Assets Resulting From Operations | | $ | 2,179,312 | | | $ | 38,949 | | | $ | 1,644,600 | | | $ | 2,800,599 | | | $ | 2,784,578 | | | | $ (14,786) | | | $ | 1,137,849 | |
| | | | | | | | | | | | | | | | | | | | | | | | | | | | |
(1) The Growth & Income Fund commenced operations on October 1, 2013.
The accompanying notes are an integral part of these financial statements.
67
Timothy Plan Funds
Statements of Changes in Net Assets
| | | | | | | | | | | | | | | | | | | | | | | | |
| | | Aggressive Growth Fund | | | International Fund | | | Large/Mid Cap Growth Fund | |
| | | | | | |
| | | Year Ended | | | Year Ended | | | Year Ended | | | Year Ended | | | Year Ended | | | Year Ended | |
| | | September 30, 2014 | | | September 30, 2013 | | | September 30, 2014 | | | September 30, 2013 | | | September 30, 2014 | | | September 30, 2013 | |
Operations: | | | | | | | | | | | | | | | | | | | | | | | | |
Net investment income (loss) | | $ | (290,469) | | | $ | (225,177) | | | $ | 242,079 | | | $ | 230,090 | | | $ | (144,076) | | | $ | (154,694) | |
Net realized gain from investments and foreign currency translations | | | 3,103,465 | | | | 2,105,187 | | | | 2,085,417 | | | | 783,962 | | | | 7,211,427 | | | | 4,956,086 | |
Capital gain dividends from REITs | | | 511 | | | | 2,235 | | | | - | | | | - | | | | - | | | | - | |
Net change in unrealized appreciation (depreciation) on investments and foreign currency translations | | | (1,227,201) | | | | 2,256,985 | | | | (964,017) | | | | 5,027,081 | | | | 627,222 | | | | 4,941,630 | |
| | | | | | | | | | | | | | | | | | | | | | | | |
Net increase in net assets resulting from operations | | | 1,586,306 | | | | 4,139,230 | | | | 1,363,479 | | | | 6,041,133 | | | | 7,694,573 | | | | 9,743,022 | |
| | | | | | | | | | | | | | | | | | | | | | | | |
| | | | | | |
Distributions to Shareholders: | | | | | | | | | | | | | | | | | | | | | | | | |
Net investment income | | | | | | | | | | | | | | | | | | | | | | | | |
Class A | | | - | | | | - | | | | (786,429) | | | | (230,752) | | | | - | | | | - | |
Class C | | | - | | | | - | | | | (36,943) | | | | - | | | | - | | | | - | |
Class I | | | - | | | | - | | | | (2,495) | | | | - | | | | - | | | | - | |
Net realized gains | | | | | | | | | | | | | | | | | | | | | | | | |
Class A | | | (1,036,995) | | | | - | | | | - | | | | - | | | | (4,768,553) | | | | (2,446,061) | |
Class C | | | (210,803) | | | | - | | | | - | | | | - | | | | (570,867) | | | | (296,634) | |
Class I | | | (6) | | | | - | | | | - | | | | - | | | | (7,416) | | | | - | |
| | | | | | | | | | | | | | | | | | | | | | | | |
Total dividends and distributions to shareholders | | | (1,247,804) | | | | - | | | | (825,867) | | | | (230,752) | | | | (5,346,836) | | | | (2,742,695) | |
| | | | | | | | | | | | | | | | | | | | | | | | |
| | | | | | |
Share Transactions of Beneficial Interest: | | | | | | | | | | | | | | | | | | | | | | | | |
Net proceeds from shares sold | | | | | | | | | | | | | | | | | | | | | | | | |
Class A | | | 6,409,636 | | | | 4,388,489 | | | | 25,864,557 | | | | 10,977,091 | | | | 13,745,035 | | | | 9,051,293 | |
Class C | | | 878,189 | | | | 717,887 | | | | 1,267,689 | | | | 755,818 | | | | 1,589,248 | | | | 1,516,639 | |
Class I | | | 140,850 | | | | 100 | | | | 478,803 | | | | 100 | | | | 187,251 | | | | 100 | |
Reinvestment of dividends and distributions | | | | | | | | | | | | | | | | | | | | | | | | |
Class A | | | 982,936 | | | | - | | | | 668,018 | | | | 202,277 | | | | 4,397,355 | | | | 2,267,318 | |
Class C | | | 199,968 | | | | - | | | | 29,829 | | | | - | | | | 457,708 | | | | 239,483 | |
Class I | | | 6 | | | | - | | | | 865 | | | | - | | | | 4,941 | | | | - | |
Cost of shares redeemed | | | | | | | | | | | | | | | | | | | | | | | | |
Class A | | | (6,177,331) | | | | (4,678,771) | | | | (10,760,223) | | | | (8,018,394) | | | | (12,696,431) | | | | (10,724,659) | |
Class C | | | (525,919) | | | | (546,416) | | | | (451,935) | | | | (260,483) | | | | (1,284,759) | | | | (1,827,870) | |
Class I | | | - | | | | - | | | | (8,160) | | | | - | | | | (8,100) | | | | - | |
| | | | | | | | | | | | | | | | | | | | | | | | |
Net increase (decrease) in net assets from share transactions of beneficial interest | | | 1,908,335 | | | | (118,711) | | | | 17,089,443 | | | | 3,656,409 | | | | 6,392,248 | | | | 522,304 | |
| | | | | | | | | | | | | | | | | | | | | | | | |
| | | | | | |
Total Increase in Net Assets | | | 2,246,837 | | | | 4,020,519 | | | | 17,627,055 | | | | 9,466,790 | | | | 8,739,985 | | | | 7,522,631 | |
| | | | | | |
Net Assets: | | | | | | | | | | | | | | | | | | | | | | | | |
Beginning of year | | | 20,619,300 | | | | 16,598,781 | | | | 40,878,521 | | | | 31,411,731 | | | | 53,451,400 | | | | 45,928,769 | |
| | | | | | | | | | | | | | | | | | | | | | | | |
End of year* | | $ | 22,866,137 | | | $ | 20,619,300 | | | $ | 58,505,576 | | | $ | 40,878,521 | | | $ | 62,191,385 | | | $ | 53,451,400 | |
| | | | | | | | | | | | | | | | | | | | | | | | |
* Includes undistributed net investment income (loss) at end of period | | $ | 5,312 | | | $ | (183,314) | | | $ | (365,861) | | | $ | 100,574 | | | $ | 11,070 | | | $ | 2,846 | |
| | | | | | | | | | | | | | | | | | | | | | | | |
| | | | | | |
Share Activity: | | | | | | | | | | | | | | | | | | | | | | | | |
Shares Sold | | | | | | | | | | | | | | | | | | | | | | | | |
Class A | | | 695,133 | | | | 545,659 | | | | 2,793,998 | | | | 1,370,275 | | | | 1,628,883 | | | | 1,187,169 | |
Class C | | | 107,432 | | | | 97,012 | | | | 142,416 | | | | 96,698 | | | | 212,413 | | | | 221,194 | |
Class I | | | 15,193 | | | | 11 | | | | 52,600 | | | | 12 | | | | 22,116 | | | | 12 | |
Shares Reinvested | | | | | | | | | | | | | | | | | | | | | | | | |
Class A | | | 109,215 | | | | - | | | | 74,472 | | | | 26,720 | | | | 547,621 | | | | 324,831 | |
Class C | | | 24,934 | | | | - | | | | 3,386 | | | | - | | | | 64,557 | | | | 38,074 | |
Class I | | | 1 | | | | - | | | | 97 | | | | - | | | | 615 | | | | - | |
Shares Redeemed | | | | | | | | | | | | | | | | | | | | | | | | |
Class A | | | (674,852) | | | | (603,346) | | | | (1,152,122) | | | | (1,029,883) | | | | (1,490,365) | | | | (1,398,597) | |
Class C | | | (64,605) | | | | (81,776) | | | | (50,205) | | | | (33,866) | | | | (170,215) | | | | (262,121) | |
Class I | | | - | | | | - | | | | (853) | | | | - | | | | (927) | | | | - | |
| | | | | | | | | | | | | | | | | | | | | | | | |
Net increase (decrease) in shares of beneficial interest outstanding | | | 212,451 | | | | (42,440) | | | | 1,863,789 | | | | 429,956 | | | | 814,698 | | | | 110,562 | |
| | | | | | | | | | | | | | | | | | | | | | | | |
|
| |
The accompanying notes are an integral part of these financial statements.
68
Timothy Plan Funds
Statements of Changes in Net Assets (Continued)
| | | | | | | | | | | | | | | | | | | | | | | | |
| | | Small Cap Value Fund | | | Large/Mid Cap Value Fund | | | Fixed Income Fund | |
| | | | | | |
| | | Year Ended | | | Year Ended | | | Year Ended | | | Year Ended | | | Year Ended | | | Year Ended | |
| | | September 30, 2014 | | | September 30, 2013 | | | September 30, 2014 | | | September 30, 2013 | | | September 30, 2014 | | | September 30, 2013 | |
Operations: | | | | | | | | | | | | | | | | | | | | | | | | |
Net investment income (loss) | | $ | (265,736) | | | $ | 20,961 | | | $ | (154,325) | | | $ | 596,162 | | | $ | 1,228,801 | | | $ | 1,317,522 | |
Net realized gain from investments and foreign currency translations | | | 16,166,118 | | | | 8,776,714 | | | | 15,007,372 | | | | 20,643,211 | | | | 381,634 | | | | 901,715 | |
Capital gain dividends from REITs | | | 68,810 | | | | 36,191 | | | | 92,262 | | | | 12,601 | | | | - | | | | - | |
Net change in unrealized appreciation (depreciation) on investments and foreign currency translations | | | (10,727,779) | | | | 10,680,831 | | | | 5,781,515 | | | | 3,763,115 | | | | 266,574 | | | | (4,713,356) | |
| | | | | | | | | | | | | | | | | | | | | | | | |
Net increase (decrease) in net assets resulting from operations | | | 5,241,413 | | | | 19,514,697 | | | | 20,726,824 | | | | 25,015,089 | | | | 1,877,009 | | | | (2,494,119) | |
| | | | | | | | | | | | | | | | | | | | | | | | |
| | | | | | |
Distributions to Shareholders: | | | | | | | | | | | | | | | | | | | | | | | | |
Net investment income | | | | | | | | | | | | | | | | | | | | | | | | |
Class A | | | (11) | | | | (88,849) | | | | (547,767) | | | | (358,626) | | | | (1,586,832) | | | | (903,855) | |
Class C | | | (1) | | | | - | | | | (24,189) | | | | - | | | | (127,779) | | | | (54,237) | |
Class I | | | - | | | | - | | | | (3,894) | | | | - | | | | (504) | | | | - | |
Net realized gains | | | | | | | | | | | | | | | | | | | | | | | | |
Class A | | | (6,644,863) | | | | - | | | | (7,988,763) | | | | - | | | | (148,647) | | | | - | |
Class C | | | (874,075) | | | | - | | | | (1,077,063) | | | | - | | | | (17,627) | | | | - | |
Class I | | | (22,910) | | | | - | | | | (44,330) | | | | - | | | | - | | | | - | |
| | | | | | | | | | | | | | | | | | | | | | | | |
Total dividends and distributions to shareholders | | | (7,541,860) | | | | (88,849) | | | | (9,686,006) | | | | (358,626) | | | | (1,881,389) | | | | (958,092) | |
| | | | | | | | | | | | | | | | | | | | | | | | |
| | | | | | |
Share Transactions of Beneficial Interest: | | | | | | | | | | | | | | | | | | | | | | | | |
Net proceeds from shares sold | | | | | | | | | | | | | | | | | | | | | | | | |
Class A | | | 16,704,368 | | | | 11,969,015 | | | | 36,404,955 | | | | 30,287,293 | | | | 14,643,117 | | | | 22,378,103 | |
Class C | | | 2,073,355 | | | | 2,004,285 | | | | 3,741,165 | | | | 3,183,229 | | | | 1,555,940 | | | | 2,874,242 | |
Class I | | | 545,152 | | | | 100 | | | | 1,526,368 | | | | 100 | | | | 102,000 | | | | 100 | |
Reinvestment of dividends and distributions | | | | | | | | | | | | | | | | | | | | | | | | |
Class A | | | 6,271,941 | | | | 84,074 | | | | 7,682,226 | | | | 307,962 | | | | 1,583,093 | | | | 801,878 | |
Class C | | | 810,924 | | | | - | | | | 930,680 | | | | - | | | | 119,773 | | | | 45,593 | |
Class I | | | 20,825 | | | | - | | | | 45,334 | | | | | | | | 503 | | | | | |
Cost of shares redeemed | | | | | | | | | | | | | | | | | | | | | | | | |
Class A | | | (14,065,378) | | | | (12,650,070) | | | | (29,948,477) | | | | (38,910,448) | | | | (15,512,285) | | | | (27,243,493) | |
Class C | | | (1,895,500) | | | | (1,235,150) | | | | (2,539,469) | | | | (2,518,994) | | | | (2,506,127) | | | | (3,570,618) | |
Class I | | | (12,961) | | | | - | | | | (149,957) | | | | - | | | | - | | | | - | |
| | | | | | | | | | | | | | | | | | | | | | | | |
Net increase (decrease) in net assets from share transactions of beneficial interest | | | 10,452,726 | | | | 172,254 | | | | 17,692,825 | | | | (7,650,858) | | | | (13,986) | | | | (4,714,195) | |
| | | | | | | | | | | | | | | | | | | | | | | | |
| | | | | | |
Total Increase (Decrease) in Net Assets | | | 8,152,279 | | | | 19,598,102 | | | | 28,733,643 | | | | 17,005,605 | | | | (18,366) | | | | (8,166,406) | |
| | | | | | |
Net Assets: | | | | | | | | | | | | | | | | | | | | | | | | |
Beginning of year | | | 72,510,908 | | | | 52,912,806 | | | | 128,306,780 | | | | 111,301,175 | | | | 75,515,358 | | | | 83,681,764 | |
| | | | | | | | | | | | | | | | | | | | | | | | |
End of year* | | $ | 80,663,187 | | | $ | 72,510,908 | | | $ | 157,040,423 | | | $ | 128,306,780 | | | $ | 75,496,992 | | | $ | 75,515,358 | |
| | | | | | | | | | | | | | | | | | | | | | | | |
* Includes undistributed net investment income (loss) at end of period | | $ | 38,593 | | | $ | 26,038 | | | $ | 38,030 | | | $ | 583,125 | | | $ | 505,149 | | | $ | 770,920 | |
| | | | | | | | | | | | | | | | | | | | | | | | |
| | | | | | |
Share Activity: | | | | | | | | | | | | | | | | | | | | | | | | |
Shares Sold | | | | | | | | | | | | | | | | | | | | | | | | |
Class A | | | 818,649 | | | | 692,720 | | | | 1,891,091 | | | | 1,833,499 | | | | 1,405,402 | | | | 2,088,605 | |
Class C | | | 121,983 | | | | 132,413 | | | | 221,857 | | | | 212,010 | | | | 154,641 | | | | 277,316 | |
Class I | | | 26,381 | | | | 5 | | | | 78,493 | | | | 5 | | | | 9,854 | | | | 10 | |
Shares Reinvested | | | | | | | | | | | | | | | | | | | | | | | | |
Class A | | | 311,572 | | | | 5,349 | | | | 421,869 | | | | 20,092 | | | | 153,197 | | | | 76,046 | |
Class C | | | 48,183 | | | | - | | | | 57,950 | | | | - | | | | 12,022 | | | | 4,489 | |
Class I | | | 1,034 | | | | - | | | | 2,492 | | | | - | | | | 49 | | | | - | |
Shares Redeemed | | | | | | | | | | | | | | | | | | | | | | | | |
Class A | | | (692,550) | | | | (752,629) | | | | (1,553,204) | | | | (2,333,513) | | | | (1,489,933) | | | | (2,557,054) | |
Class C | | | (111,199) | | | | (87,460) | | | | (150,588) | | | | (173,444) | | | | (249,215) | | | | (347,595) | |
Class I | | | (627) | | | | - | | | | (7,549) | | | | - | | | | - | | | | - | |
| | | | | | | | | | | | | | | | | | | | | | | | |
Net increase (decrease) in shares of beneficial interest outstanding | | | 523,426 | | | | (9,602) | | | | 962,411 | | | | (441,351) | | | | (3,983) | | | | (458,183) | |
| | | | | | | | | | | | | | | | | | | | | | | | |
|
| |
The accompanying notes are an integral part of these financial statements.
69
Timothy Plan Funds
Statements of Changes in Net Assets (Continued)
| | | | | | | | | | | | | | | | | | | | | | | | |
| | | High Yield Bond Fund | | | Israel Common Values Fund | | | Defensive Strategies Fund | |
| | | | | | |
| | | Year Ended | | | Year Ended | | | Year Ended | | | Year Ended | | | Year Ended | | | Year Ended | |
| | | September 30, 2014 | | | September 30, 2013 | | | September 30, 2014 | | | September 30, 2013 | | | September 30, 2014 | | | September 30, 2013 | |
Operations: | | | | | | | | | | | | | | | | | | | | | | | | |
Net investment income (loss) | | $ | 1,898,001 | | | $ | 1,966,215 | | | $ | (105,809) | | | $ | (52,970) | | | $ | 403,153 | | | $ | 240,974 | |
Net realized gain(loss) from investments and foreign currency translations | | | 594,758 | | | | 232,096 | | | | (55,688) | | | | (30,117) | | | | 34,996 | | | | 380,305 | |
Capital gain dividends from REITs | | | - | | | | - | | | | - | | | | - | | | | 227,729 | | | | 95,795 | |
Net change in unrealized appreciation (depreciation) on investments and foreign currency translations | | | (313,447) | | | | (707,158) | | | | 200,446 | | | | 2,064,869 | | | | 978,722 | | | | (7,225,344) | |
| | | | | | | | | | | | | | | | | | | | | | | | |
Net increase (decrease) in net assets resulting from operations | | | 2,179,312 | | | | 1,491,153 | | | | 38,949 | | | | 1,981,782 | | | | 1,644,600 | | | | (6,508,270) | |
| | | | | | | | | | | | | | | | | | | | | | | | |
| | | | | | |
Distributions to Shareholders: | | | | | | | | | | | | | | | | | | | | | | | | |
Net investment income | | | | | | | | | | | | | | | | | | | | | | | | |
Class A | | | (1,823,248) | | | | (1,782,597) | | | | (566,559) | | | | - | | | | (229,323) | | | | (28) | |
Class C | | | (100,879) | | | | (88,820) | | | | (68,279) | | | | - | | | | - | | | | (10) | |
Class I | | | (4,871) | | | | - | | | | (429) | | | | | | | | (140) | | | | | |
From net realized gains | | | | | | | | | | | | | | | | | | | | | | | | |
Class A | | | - | | | | - | | | | - | | | | - | | | | (110,890) | | | | (97,172) | |
Class C | | | - | | | | - | | | | - | | | | - | | | | (35,481) | | | | (35,276) | |
Class I | | | - | | | | - | | | | - | | | | - | | | | (37) | | | | - | |
| | | | | | | | | | | | | | | | | | | | | | | | |
Total dividends and distributions to shareholders | | | (1,928,998) | | | | (1,871,417) | | | | (635,267) | | | | - | | | | (375,871) | | | | (132,486) | |
| | | | | | | | | | | | | | | | | | | | | | | | |
| | | | | | |
Share Transactions of Beneficial Interest: | | | | | | | | | | | | | | | | | | | | | | | | |
Net proceeds from shares sold | | | | | | | | | | | | | | | | | | | | | | | | |
Class A | | | 12,655,436 | | | | 15,564,006 | | | | 5,259,493 | | | | 3,295,264 | | | | 14,684,600 | | | | 20,337,684 | |
Class C | | | 964,695 | | | | 1,124,628 | | | | 1,885,221 | | | | 738,558 | | | | 2,536,965 | | | | 5,060,845 | |
Class I | | | 242,798 | | | | 100 | | | | 12,976 | | | | 100 | | | | 98,526 | | | | 100 | |
Reinvestment of dividends and distributions | | | | | | | | | | | | | | | | | | | | | | | | |
Class A | | | 1,587,067 | | | | 1,572,663 | | | | 557,945 | | | | - | | | | 328,384 | | | | 92,047 | |
Class C | | | 78,579 | | | | 69,721 | | | | 67,882 | | | | - | | | | 35,220 | | | | 34,945 | |
Class I | | | 3,261 | | | | - | | | | 429 | | | | | | | | 177 | | | | | |
Cost of shares redeemed | | | | | | | | | | | | | | | | | | | | | | | | |
Class A | | | (9,020,977) | | | | (14,596,227) | | | | (1,843,406) | | | | (2,878,944) | | | | (13,798,083) | | | | (16,279,364) | |
Class C | | | (525,058) | | | | (616,056) | | | | (435,915) | | | | (98,800) | | | | (5,120,707) | | | | (5,357,105) | |
Class I | | | (159) | | | | - | | | | - | | | | - | | | | - | | | | - | |
| | | | | | | | | | | | | | | | | | | | | | | | |
Net increase (decrease) in net assets from share transactions of beneficial interest | | | 5,985,642 | | | | 3,118,835 | | | | 5,504,625 | | | | 1,056,178 | | | | (1,234,918) | | | | 3,889,152 | |
| | | | | | | | | | | | | | | | | | | | | | | | |
| | | | | | |
Total Increase (Decrease) in Net Assets | | | 6,235,956 | | | | 2,738,571 | | | | 4,908,307 | | | | 3,037,960 | | | | 33,811 | | | | (2,751,604) | |
| | | | | | |
Net Assets: | | | | | | | | | | | | | | | | | | | | | | | | |
Beginning of year | | | 37,813,527 | | | | 35,074,956 | | | | 11,238,678 | | | | 8,200,718 | | | | 68,577,964 | | | | 71,329,568 | |
| | | | | | | | | | | | | | | | | | | | | | | | |
End of year* | | $ | 44,049,483 | | | $ | 37,813,527 | | | $ | 16,146,985 | | | $ | 11,238,678 | | | $ | 68,611,775 | | | $ | 68,577,964 | |
| | | | | | | | | | | | | | | | | | | | | | | | |
* Includes undistributed net investment income (loss) at end of period | | $ | 63,801 | | | $ | 94,798 | | | $ | (801,748) | | | $ | (86,069) | | | $ | 652,468 | | | $ | 464,351 | |
| | | | | | | | | | | | | | | | | | | | | | | | |
| | | | | | |
Share Activity: | | | | | | | | | | | | | | | | | | | | | | | | |
Shares Sold | | | | | | | | | | | | | | | | | | | | | | | | |
Class A | | | 1,306,702 | | | | 1,615,799 | | | | 408,112 | | | | 286,237 | | | | 1,278,221 | | | | 1,733,384 | |
Class C | | | 99,011 | | | | 116,063 | | | | 148,327 | | | | 63,533 | | | | 225,931 | | | | 437,490 | |
Class I | | | 25,013 | | | | 11 | | | | 993 | | | | 8 | | | | 8,520 | | | | 9 | |
Shares Reinvested | | | | | | | | | | | | | | | | | | | | | | | | |
Class A | | | 165,224 | | | | 165,588 | | | | 44,671 | | | | - | | | | 30,210 | | | | 7,703 | |
Class C | | | 8,113 | | | | 7,288 | | | | 5,519 | | | | - | | | | 3,323 | | | | 2,990 | |
Class I | | | 341 | | | | - | | | | 34 | | | | | | | | 16 | | | | | |
Shares Redeemed | | | | | | | | | | | | | | | | | | | | | | | | |
Class A | | | (933,867) | | | | (1,523,719) | | | | (143,196) | | | | (260,162) | | | | (1,220,070) | | | | (1,415,033) | |
Class C | | | (53,559) | | | | (63,809) | | | | (34,987) | | | | (9,559) | | | | (464,150) | | | | (478,799) | |
Class I | | | (16) | | | | - | | | | - | | | | - | | | | - | | | | - | |
| | | | | | | | | | | | | | | | | | | | | | | | |
Net increase (decrease) in shares of beneficial interest outstanding | | | 616,962 | | | | 317,221 | | | | 429,473 | | | | 80,057 | | | | (137,999) | | | | 287,744 | |
| | | | | | | | | | | | | | | | | | | | | | | | |
|
| |
The accompanying notes are an integral part of these financial statements.
70
Timothy Plan Funds
Statements of Changes in Net Assets (Continued)
| | | | | | | | | | | | | | | | | | | | | | | | |
| | | Strategic Growth Fund | | | Conservative Growth Fund | | | Emerging Markets Fund | |
| | | | | | |
| | | Year Ended | | | Year Ended | | | Year Ended | | | Year Ended | | | Year Ended | | | Period Ended | |
| | | September 30, 2014 | | | September 30, 2013 | | | September 30, 2014 | | | September 30, 2013 | | | September 30, 2014 | | | September 30, 2013 (1) | |
Operations: | | | | | | | | | | | | | | | | | | | | | | | | |
Net investment income (loss) | | $ | 536,952 | | | $ | 41,481 | | | $ | 641,704 | | | $ | 55,679 | | | $ | (22,654) | | | $ | (58,775) | |
Net realized gain from investments and foreign currency translations | | | 1,042,265 | | | | 1,365,460 | | | | 2,930,268 | | | | 2,008,053 | | | | 756,750 | | | | 287,405 | |
Capital gain distributions from affiliated funds | | | 946,902 | | | | 184,843 | | | | 945,023 | | | | 165,162 | | | | - | | | | - | |
Net change in unrealized appreciation (depreciation) on investments and foreign currency translations | | | 274,480 | | | | 3,100,731 | | | | (1,732,417) | | | | 834,809 | | | | (748,882) | | | | 126,463 | |
| | | | | | | | | | | | | | | | | | | | | | | | |
Net increase (decrease) in net assets resulting from operations | | | 2,800,599 | | | | 4,692,515 | | | | 2,784,578 | | | | 3,063,703 | | | | (14,786) | | | | 355,093 | |
| | | | | | | | | | | | | | | | | | | | | | | | |
| | | | | | |
Distributions to Shareholders: | | | | | | | | | | | | | | | | | | | | | | | | |
Net Investment Income | | | | | | | | | | | | | | | | | | | | | | | | |
Class A | | | (35,399) | | | | (190,626) | | | | (207,808) | | | | (306,948) | | | | - | | | | - | |
Class C | | | - | | | | (5) | | | | - | | | | (6) | | | | - | | | | - | |
From net realized gains | | | | | | | | | | | | | | | | | | | | | | | | |
Class A | | | - | | | | - | | | | - | | | | - | | | | (317,280) | | | | - | |
Class C | | | - | | | | - | | | | - | | | | - | | | | (11,694) | | | | - | |
Class I | | | - | | | | - | | | | - | | | | - | | | | (5,929) | | | | - | |
| | | | | | | | | | | | | | | | | | | | | | | | |
Total dividends and distributions to shareholders | | | (35,399) | | | | (190,631) | | | | (207,808) | | | | (306,954) | | | | (334,903) | | | | - | |
| | | | | | | | | | | | | | | | | | | | | | | | |
| | | | | | |
Share Transactions of Beneficial Interest: | | | | | | | | | | | | | | | | | | | | | | | | |
Net proceeds from shares sold | | | | | | | | | | | | | | | | | | | | | | | | |
Class A | | | 6,219,152 | | | | 5,923,646 | | | | 9,569,686 | | | | 9,364,096 | | | | 4,724,864 | | | | 9,641,956 | |
Class C | | | 2,148,616 | | | | 1,239,023 | | | | 3,641,417 | | | | 2,556,007 | | | | 660,089 | | | | 323,894 | |
Class I | | | | | | | | | | | | | | | | | | | 342,547 | | | | 100 | |
Reinvestment of dividends and distributions | | | | | | | | | | | | | | | | | | | | | | | | |
Class A | | | 34,264 | | | | 185,872 | | | | 192,204 | | | | 283,789 | | | | 304,324 | | | | - | |
Class C | | | - | | | | - | | | | - | | | | - | | | | 11,626 | | | | - | |
Class I | | | | | | | | | | | | | | | | | | | 5,375 | | | | - | |
Cost of shares redeemed | | | | | | | | | | | | | | | | | | | | | | | | |
Class A | | | (6,076,309) | | | | (7,599,802) | | | | (8,588,545) | | | | (7,690,796) | | | | (2,603,515) | | | | (1,321,810) | |
Class C | | | (1,431,283) | | | | (1,203,822) | | | | (2,146,521) | | | | (1,846,027) | | | | (42,881) | | | | (32,972) | |
| | | | | | | | | | | | | | | | | | | | | | | | |
Net increase (decrease) in net assets from share transactions of beneficial interest | | | 894,440 | | | | (1,455,083) | | | | 2,668,241 | | | | 2,667,069 | | | | 3,402,429 | | | | 8,611,168 | |
| | | | | | | | | | | | | | | | | | | | | | | | |
Total Increase in Net Assets | | | 3,659,640 | | | | 3,046,801 | | | | 5,245,011 | | | | 5,423,818 | | | | 3,052,740 | | | | 8,966,261 | |
Net Assets: | | | | | | | | | | | | | | | | | | | | | | | | |
Beginning of year | | | 42,133,245 | | | | 39,086,444 | | | | 54,656,829 | | | | 49,233,011 | | | | 8,966,261 | | | | - | |
| | | | | | | | | | | | | | | | | | | | | | | | |
End of year* | | $ | 45,792,885 | | | $ | 42,133,245 | | | $ | 59,901,840 | | | $ | 54,656,829 | | | $ | 12,019,001 | | | $ | 8,966,261 | |
| | | | | | | | | | | | | | | | | | | | | | | | |
* Includes undistributed net investment income (loss) at end of period | | $ | 534,610 | | | $ | 33,057 | | | $ | 448,836 | | | $ | 14,940 | | | $ | (18,863) | | | $ | (12,505) | |
| | | | | | | | | | | | | | | | | | | | | | | | |
| | | | | | |
Share Activity: | | | | | | | | | | | | | | | | | | | | | | | | |
Shares Sold | | | | | | | | | | | | | | | | | | | | | | | | |
Class A | | | 702,938 | | | | 745,072 | | | | 873,829 | | | | 913,784 | | | | 451,606 | | | | 953,198 | |
Class C | | | 262,144 | | | | 168,878 | | | | 355,488 | | | | 266,950 | | | | 62,680 | | | | 31,033 | |
Class I | | | - | | | | - | | | | - | | | | - | | | | 31,939 | | | | 10 | |
Shares Reinvested | | | | | | | | | | | | | | | | | | | | | | | | |
Class A | | | 3,929 | | | | 24,765 | | | | 17,846 | | | | 28,489 | | | | 29,983 | | | | - | |
Class C | | | - | | | | - | | | | - | | | | - | | | | 1,153 | | | | - | |
Class I | | | - | | | | - | | | | - | | | | - | | | | 530 | | | | - | |
Shares Redeemed | | | | | | | | | | | | | | | | | | | | | | | | |
Class A | | | (685,657) | | | | (970,634) | | | | (782,148) | | | | (756,030) | | | | (249,044) | | | | (129,286) | |
Class C | | | (174,222) | | | | (166,611) | | | | (210,639) | | | | (194,209) | | | | (4,169) | | | | (3,229) | |
| | | | | | | | | | | | | | | | | | | | | | | | |
Net increase (decrease) in shares of beneficial interest outstanding | | | 109,132 | | | | (198,530) | | | | 254,376 | | | | 258,984 | | | | 324,678 | | | | 851,726 | |
| | | | | | | | | | | | | | | | | | | | | | | | |
(1) The Emerging Markets Fund commenced operations on December 3, 2012.
The accompanying notes are an integral part of these financial statements.
71
Timothy Plan Funds
Statements of Changes in Net Assets (Continued)
| | | | |
| | | Growth & Income Fund | |
| |
| | | Period Ended | |
| | | September 30, 2014 (1) | |
Operations: | | | | |
Net investment loss | | $ | (40,195) | |
Net realized loss from investments | | | (19,509) | |
Net change in unrealized appreciation on investments | | | 1,197,553 | |
| | | | |
Net increase in net assets resulting from operations | | | 1,137,849 | |
| | | | |
| |
Share Transactions of Beneficial Interest: | | | | |
Net proceeds from shares sold | | | | |
Class A | | | 25,295,734 | |
Class C | | | 2,142,623 | |
Class I | | | 1,571,449 | |
Cost of shares redeemed | | | | |
Class A | | | (2,187,755) | |
Class C | | | (54,308) | |
Class I | | | (45,875) | |
| | | | |
Net increase in net assets from share transactions of beneficial interest | | | 26,721,868 | |
| | | | |
| |
Total Increase in Net Assets | | | 27,859,717 | |
| |
Net Assets: | | | | |
Beginning of period | | | - | |
| | | | |
End of period* | | $ | 27,859,717 | |
| | | | |
* Includes accumulated net investment loss at end of period | | $ | (22,909) | |
| | | | |
| |
Share Activity: | | | | |
Shares Sold | | | | |
Class A | | | 2,421,373 | |
Class C | | | 196,355 | |
Class I | | | 141,740 | |
Shares Redeemed | | | | |
Class A | | | (204,120) | |
Class C | | | (4,950) | |
Class I | | | (4,167) | |
| | | | |
Net increase in shares of beneficial interest outstanding | | | 2,546,231 | |
| | | | |
(1) The Growth & Income Fund commenced operations on October 1, 2013.
The accompanying notes are an integral part of these financial statements.
72
Timothy Aggressive Growth Fund (Class A Shares)
Selected data based on a share outstanding throughout each year
| | | | | | | | | | | | | | | | | | | | |
| | | For the Year
ended
September 30,
2014 | | | For the Year
ended
September 30,
2013 | | | For the Year
ended
September 30,
2012 | | | For the Year
ended
September 30,
2011 | | | For the Year
ended
September 30,
2010 | |
| | | | | |
Net asset value, beginning of year | | $ | 9.00 | | | $ | 7.10 | | | $ | 5.57 | | | $ | 5.42 | | | $ | 4.51 | |
| | | | | | | | | | | | | | | | | | | | |
| | | | | |
INCOME FROM INVESTMENT OPERATIONS: | | | | | | | | | | | | | | | | | | | | |
Net investment loss | | | (0.11) | (A) | | | (0.09) | (A) | | | (0.12) | (A) | | | (0.10) | (A) | | | (0.09) | |
Net realized and unrealized gain on investments | | | 0.84 | | | | 1.99 | | | | 1.65 | | | | 0.25 | | | | 1.00 | |
| | | | | | | | | | | | | | | | | | | | |
Total from investment operations | | | 0.73 | | | | 1.90 | | | | 1.53 | | | | 0.15 | | | | 0.91 | |
| | | | | | | | | | | | | | | | | | | | |
LESS DISTRIBUTIONS: | | | | | | | | | | | | | | | | | | | | |
From net realized gains on investments | | | (0.55) | | | | - | | | | - | | | | - | | | | - | |
| | | | | | | | | | | | | | | | | | | | |
Total distributions | | | (0.55) | | | | - | | | | - | | | | - | | | | - | |
| | | | | | | | | | | | | | | | | | | | |
Net asset value, end of year | | $ | 9.18 | | | $ | 9.00 | | | $ | 7.10 | | | $ | 5.57 | | | $ | 5.42 | |
| | | | | | | | | | | | | | | | | | | | |
Total return (B)(C) | | | 8.22% | | | | 26.76% | | | | 27.47% | | | | 2.77% | | | | 20.18% | |
| | | | | |
RATIOS/SUPPLEMENTAL DATA: | | | | | | | | | | | | | | | | | | | | |
Net assets, end of year (in 000’s) | | $ | 19,268 | | | $ | 17,727 | | | $ | 14,398 | | | $ | 12,259 | | | $ | 13,247 | |
Ratios to average net assets | | | | | | | | | | | | | | | | | | | | |
Expenses, before waiver and reimbursement | | | 1.74% | | | | - | | | | - | | | | - | | | | - | |
Expenses, net waiver and reimbursement | | | 1.73% | | | | 1.86% | | | | 2.12% | | | | 1.81% | | | | 1.88% | |
Net investment loss, before waiver and reimbursement | | | (1.19)% | | | | - | | | | - | | | | - | | | | - | |
Net investment loss, net waiver and reimbursement | | | (1.18)% | | | | (1.20)% | | | | (1.78)% | | | | (1.52)% | | | | (1.61)% | |
Portfolio turnover rate | | | 91% | | | | 120% | | | | 147% | | | | 201% | | | | 89% | |
| (A) | Per share amounts calculated using average shares method, which more appropriately presents the per share data for the year. |
| (B) | Total return calculation does not reflect sales load. |
| (C) | Total return in the above table represents the rate that the investor would have earned or lost on an investment in the Fund assuming reinvestment of dividends. |
| | Total return would have been higher or lower if certain expenses had not been reimbursed, waived or recouped. |
The accompanying notes are an integral part of these financial statements.
73
Timothy Aggressive Growth Fund (Class C Shares)
Selected data based on a share outstanding throughout each year
| | | | | | | | | | | | | | | | | | | | |
| | | For the Year
ended
September 30,
2014 | | | For the Year
ended
September 30,
2013 | | | For the Year
ended
September 30,
2012 | | | For the Year
ended
September 30,
2011 | | | For the Year
ended
September 30,
2010 | |
| | | | | |
Net asset value, beginning of year | | $ | 8.09 | | | $ | 6.43 | | | $ | 5.06 | | | $ | 4.98 | | | $ | 4.18 | |
| | | | | | | | | | | | | | | | | | | | |
| | | | | |
INCOME FROM INVESTMENT OPERATIONS: | | | | | | | | | | | | | | | | | | | | |
Net investment loss | | | (0.16) | (A) | | | (0.14) | (A) | | | (0.16) | (A) | | | (0.13) | (A) | | | (0.11) | |
Net realized and unrealized gain on investments | | | 0.75 | | | | 1.80 | | | | 1.53 | | | | 0.21 | | | | 0.91 | |
| | | | | | | | | | | | | | | | | | | | |
Total from investment operations | | | 0.59 | | | | 1.66 | | | | 1.37 | | | | 0.08 | | | | 0.80 | |
| | | | | | | | | | | | | | | | | | | | |
| | | | | |
LESS DISTRIBUTIONS: | | | | | | | | | | | | | | | | | | | | |
From net realized gains on investments | | | (0.55) | | | | - | | | | - | | | | - | | | | - | |
| | | | | | | | | | | | | | | | | | | | |
Total distributions | | | (0.55) | | | | - | | | | - | | | | - | | | | - | |
| | | | | | | | | | | | | | | | | | | | |
Net asset value, end of year | | $ | 8.13 | | | $ | 8.09 | | | $ | 6.43 | | | $ | 5.06 | | | $ | 4.98 | |
| | | | | | | | | | | | | | | | | | | | |
| | | | | |
Total return (B)(C) | | | 7.37% | | | | 25.82% | | | | 27.08% | | | | 1.61% | | | | 19.14% | |
| | | | | |
RATIOS/SUPPLEMENTAL DATA: | | | | | | | | | | | | | | | | | | | | |
Net assets, end of year (in 000’s) | | $ | 3,458 | | | $ | 2,892 | | | $ | 2,201 | | | $ | 1,766 | | | $ | 1,670 | |
Ratios to average net assets | | | | | | | | | | | | | | | | | | | | |
Expenses, before waiver and reimbursement | | | 2.49% | | | | - | | | | - | | | | - | | | | - | |
Expenses, net waiver and reimbursement | | | 2.48% | | | | 2.60% | | | | 2.87% | | | | 2.57% | | | | 2.63% | |
Net investment loss, before waiver and reimbursement | | | (1.94)% | | | | - | | | | - | | | | - | | | | - | |
Net investment loss, net waiver and reimbursement | | | (1.93)% | | | | (1.94)% | | | | (2.53)% | | | | (2.28)% | | | | (2.35)% | |
Portfolio turnover rate | | | 91% | | | | 120% | | | | 147% | | | | 201% | | | | 89% | |
| (A) | Per share amounts calculated using average shares method, which more appropriately presents the per share data for the year. |
| (B) | Total return calculation does not reflect redemption fee. |
| (C) | Total return in the above table represents the rate that the investor would have earned or lost on an investment in the Fund assuming reinvestment of dividends. |
| | Total return would have been higher or lower if certain expenses had not been reimbursed, waived or recouped. |
The accompanying notes are an integral part of these financial statements.
74
Timothy Aggressive Growth Fund (Class I Shares)
Selected data based on a share outstanding throughout the period
| | | | | | | | | | |
| | | For the Year
ended
September 30,
2014 | | | For the Period ended September 30, 2013
(A) | | | |
| | | | | | | | | | |
Net asset value, beginning of period | | $ | 9.01 | | | $ | 8.87 | | | |
| | | | | | | | | | |
INCOME FROM INVESTMENT OPERATIONS: | | | | | | | | | | |
| | | |
Net investment income (loss) (B) | | | (0.07) | | | | - * | | | |
| | | |
Net realized and unrealized gain on investments | | | 0.82 | | | | 0.14 | | | |
| | | | | | | | | | |
Total from investment operations | | | 0.75 | | | | 0.14 | | | |
| | | | | | | | | | |
| | | |
LESS DISTRIBUTIONS: | | | | | | | | | | |
From net realized gains on investments | | | (0.55) | | | | - | | | |
| | | | | | | | | | |
Total distributions | | | (0.55) | | | | - | | | |
| | | | | | | | | | |
| | | |
Net asset value, end of period | | $ | 9.21 | | | $ | 9.01 | | | |
| | | | | | | | | | |
| | | |
Total return (C) | | | 8.43% | | | | 1.58% | (D) | | |
| | | |
RATIOS/SUPPLEMENTAL DATA: | | | | | | | | | | |
Net assets, end of period | | $ | 140 | | | $ | 102 | | | |
Ratios to average net assets | | | | | | | | | | |
Expenses, before waiver and reimbursement | | | 1.33% | | | | - | | | |
Expenses, net waiver and reimbursement | | | 1.28% | | | | 1.61% | (E) | | |
Net investment loss, before waiver and reimbursement | | | (0.78)% | | | | - | | | |
Net investment loss, net waiver and reimbursement | | | (0.73)% | | | | (0.95)% | (E) | | |
Portfolio turnover rate | | | 91% | | | | 120% | (D) | | |
| * | Amount is less than $0.005 per share. |
| (A) | For the period August 1, 2013 (Commencement of Operations) to September 30, 2013. |
| (B) | Per share amounts calculated using average shares method, which more appropriately presents the per share data for the period. |
| (C) | Total return in the above table represents the rate that the investor would have earned or lost on an investment in the Fund assuming reinvestment of dividends. |
| | Total return would have been higher or lower if certain expenses had not been reimbursed, waived or recouped. |
| (D) | For periods of less than one full year, total return and turnover are not annualized. |
The accompanying notes are an integral part of these financial statements.
75
Timothy International Fund (Class A Shares)
Selected data based on a share outstanding throughout each year
| | | | | | | | | | | | | | | | | | | | |
| | | For the Year
ended
September 30,
2014 | | | For the Year
ended
September 30,
2013 | | | For the Year
ended
September 30,
2012 | | | For the Year
ended
September 30,
2011 | | | For the Year
ended
September 30,
2010 | |
| | | | | |
Net asset value, beginning of year | | $ | 8.65 | | | $ | 7.31 | | | $ | 6.54 | | | $ | 7.71 | | | $ | 7.52 | |
| | | | | | | | | | | | | | | | | | | | |
| | | | | |
INCOME (LOSS) FROM INVESTMENT OPERATIONS: | | | | | | | | | | | | | | | | | | | | |
Net investment income | | | 0.05 | (A) | | | 0.06 | (A) | | | 0.03 | (A) | | | 0.20 | (A) | | | 0.04 | |
Net realized and unrealized gain (loss) on investments | | | 0.36 | | | | 1.34 | | | | 0.97 | | | | (1.33) | | | | 0.26 | |
| | | | | | | | | | | | | | | | | | | | |
Total from investment operations | | | 0.41 | | | | 1.40 | | | | 1.00 | | | | (1.13) | | | | 0.30 | |
| | | | | | | | | | | | | | | | | | | | |
| | | | | |
LESS DISTRIBUTIONS: | | | | | | | | | | | | | | | | | | | | |
From net investment income | | | (0.17) | | | | (0.06) | | | | (0.23) | | | | (0.04) | | | | (0.11) | |
| | | | | | | | | | | | | | | | | | | | |
Total distributions | | | (0.17) | | | | (0.06) | | | | (0.23) | | | | (0.04) | | | | (0.11) | |
| | | | | | | | | | | | | | | | | | | | |
| | | | | |
Net asset value, end of year | | $ | 8.89 | | | $ | 8.65 | | | $ | 7.31 | | | $ | 6.54 | | | $ | 7.71 | |
| | | | | | | | | | | | | | | | | | | | |
| | | | | |
Total return (B)(C) | | | 4.74% | | | | 19.25% | | | | 15.73% | | | | (14.72)% | | | | 3.93% | |
| | | | | |
RATIOS/SUPPLEMENTAL DATA: | | | | | | | | | | | | | | | | | | | | |
Net assets, end of year (in 000’s) | | $ | 54,709 | | | $ | 38,432 | | | $ | 29,794 | | | $ | 28,423 | | | $ | 35,206 | |
Ratios to average net assets | | | | | | | | | | | | | | | | | | | | |
Expenses, before waiver and reimbursement | | | 1.69% | | | | - | | | | - | | | | - | | | | - | |
Expenses, net waiver and reimbursement | | | 1.68% | | | | 1.73% | | | | 1.82% | | | | 1.70% | | | | 1.74% | |
Net investment income, before waiver and reimbursement | | | 0.52% | | | | - | | | | - | | | | - | | | | - | |
Net investment income, net waiver and reimbursement | | | 0.52% | | | | 0.70% | | | | 0.38% | | | | 2.45% | | | | 0.58% | |
Portfolio turnover rate | | | 31% | | | | 29% | | | | 34% | | | | 62% | | | | 41% | |
| (A) | Per share amounts calculated using average shares method, which more appropriately presents the per share data for the year. |
| (B) | Total return calculation does not reflect sales load. |
| (C) | Total return in the above table represents the rate that the investor would have earned or lost on an investment in the Fund assuming reinvestment of dividends. Total return would have been higher or lower if certain expenses had not been reimbursed, waived or recouped. |
The accompanying notes are an integral part of these financial statements.
76
Timothy International Fund (Class C Shares)
Selected data based on a share outstanding throughout each year
| | | | | | | | | | | | | | | | | | | | |
| | | For the Year
ended
September 30,
2014 | | | For the Year
ended
September 30,
2013 | | | For the Year
ended
September 30,
2012 | | | For the Year
ended
September 30,
2011 | | | For the Year
ended
September 30,
2010 | |
| | | | | |
Net asset value, beginning of year | | $ | 8.46 | | | $ | 7.15 | | | $ | 6.39 | | | $ | 7.58 | | | $ | 7.41 | |
| | | | | | | | | | | | | | | | | | | | |
| | | | | |
INCOME (LOSS) FROM INVESTMENT OPERATIONS: | | | | | | | | | | | | | | | | | | | | |
Net investment income (loss) | | | (0.02) | (A) | | | - * | (A) | | | (0.02) | (A) | | | 0.13 | (A) | | | (0.01) | |
Net realized and unrealized gain (loss) on investments | | | 0.35 | (D) | | | 1.31 | | | | 0.95 | | | | (1.29) | | | | 0.25 | |
| | | | | | | | | | | | | | | | | | | | |
Total from investment operations | | | 0.33 | | | | 1.31 | | | | 0.93 | | | | (1.16) | | | | 0.24 | |
| | | | | | | | | | | | | | | | | | | | |
| | | | | |
LESS DISTRIBUTIONS: | | | | | | | | | | | | | | | | | | | | |
From net investment income | | | (0.12) | | | | - | | | | (0.17) | | | | (0.03) | | | | (0.07) | |
| | | | | | | | | | | | | | | | | | | | |
Total distributions | | | (0.12) | | | | - | | | | (0.17) | | | | (0.03) | | | | (0.07) | |
| | | | | | | | | | | | | | | | | | | | |
| | | | | |
Net asset value, end of year | | $ | 8.67 | | | $ | 8.46 | | | $ | 7.15 | | | $ | 6.39 | | | $ | 7.58 | |
| | | | | | | | | | | | | | | | | | | | |
| | | | | |
Total return (B)(C) | | | 3.87% | | | | 18.32% | | | | 14.88% | | | | (15.40)% | | | | 3.27% | |
| | | | | |
RATIOS/SUPPLEMENTAL DATA: | | | | | | | | | | | | | | | | | | | | |
Net assets, end of year (in 000’s) | | $ | 3,336 | | | $ | 2,446 | | | $ | 1,617 | | | $ | 1,427 | | | $ | 1,941 | |
Ratios to average net assets | | | | | | | | | | | | | | | | | | | | |
Expenses, before waiver and reimbursement | | | 2.44% | | | | - | | | | - | | | | - | | | | - | |
Expenses, net waiver and reimbursement | | | 2.44% | | | | 2.47% | | | | 2.57% | | | | 2.45% | | | | 2.49% | |
Net investment income (loss), before waiver and reimbursement | | | (0.21)% | | | | - | | | | - | | | | - | | | | - | |
Net investment income (loss), net waiver and reimbursement | | | (0.20)% | | | | (0.01)% | | | | (0.32)% | | | | 1.58% | | | | (0.15)% | |
Portfolio turnover rate | | | 31% | | | | 29% | | | | 34% | | | | 62% | | | | 41% | |
*Amount is less than $0.005 per share.
| (A) | Per share amounts calculated using average shares method, which more appropriately presents the per share data for the year. |
| (B) | Total return calculation does not reflect redemption fee. |
| (C) | Total return in the above table represents the rate that the investor would have earned or lost on an investment in the Fund assuming reinvestment of dividends. |
| | Total return would have been higher or lower if certain expenses had not been reimbursed, waived or recouped. |
| (D) | Realized and unrealized gains per share in this caption are balancing amounts necessary to reconcile the change in net asset value per share for the period, and may not reconcile with the aggregate gains and losses in the Statements of Operations due to share transactions for the period. |
The accompanying notes are an integral part of these financial statements.
77
Timothy International Fund (Class I Shares)
Selected data based on a share outstanding throughout the period
| | | | | | | | | | |
| | | For the Year
ended
September 30,
2014 | | | For the Period ended
September 30, 2013
(A) | | | |
| | | | | | | | | | |
Net asset value, beginning of period | | $ | 8.65 | | | $ | 8.46 | | | |
| | | | | | | | | | |
| | | |
INCOME FROM INVESTMENT OPERATIONS: | | | | | | | | | | |
Net investment income (B) | | | 0.08 | | | | 0.02 | | | |
Net realized and unrealized gain on investments | | | 0.34 | | | | 0.17 | | | |
| | | | | | | | | | |
Total from investment operations | | | 0.42 | | | | 0.19 | | | |
| | | | | | | | | | |
| | | |
LESS DISTRIBUTIONS: | | | | | | | | | | |
From net investment income | | | (0.19) | | | | - | | | |
| | | | | | | | | | |
Total distributions | | | (0.19) | | | | - | | | |
| | | | | | | | | | |
Net asset value, end of period | | $ | 8.88 | | | $ | 8.65 | | | |
| | | | | | | | | | |
| | | |
Total return (C) | | | 4.85% | | | | 2.25% | (D) | | |
| | | |
RATIOS/SUPPLEMENTAL DATA: | | | | | | | | | | |
Net assets, end of period | | $ | 461 | | | $ | 102 | | | |
Ratios to average net assets | | | | | | | | | | |
Expenses, before waiver and reimbursement | | | 1.38% | | | | - | | | |
Expenses, net waiver and reimbursement | | | 1.38% | | | | 1.48% | (E) | | |
Net investment income, before waiver and reimbursement | | | 0.85% | | | | - | | | |
Net investment income, net waiver and reimbursement | | | 0.86% | | | | 0.95% | (E) | | |
Portfolio turnover rate | | | 31% | | | | 29% | (D) | | |
| (A) | For the period August 1, 2013 (Commencement of Operations) to September 30, 2013. |
| (B) | Per share amounts calculated using average shares method, which more appropriately presents the per share data for the period. |
| (C) | Total return in the above table represents the rate that the investor would have earned or lost on an investment in the Fund assuming reinvestment of dividends. |
| (D) | For periods of less than one full year, total return and turnover are not annualized. |
The accompanying notes are an integral part of these financial statements.
78
Timothy Large/Mid Cap Growth Fund (Class A Shares)
Selected data based on a share outstanding throughout each year
| | | | | | | | | | | | | | | | | | | | |
| | | For the Year
ended
September 30,
2014 | | | For the Year
ended
September 30,
2013 | | | For the Year
ended
September 30,
2012 | | | For the Year
ended
September 30,
2011 | | | For the Year
ended
September 30,
2010 | |
| | | | | |
Net asset value, beginning of year | | $ | 8.36 | | | $ | 7.30 | | | $ | 6.05 | | | $ | 5.99 | | | $ | 5.37 | |
| | | | | | | | | | | | | | | | | | | | |
| | | | | |
INCOME FROM INVESTMENT OPERATIONS: | | | | | | | | | | | | | | | | | | | | |
Net investment loss | | | (0.01) | (A) | | | (0.02) | (A) | | | (0.04) | (A) | | | (0.04) | (A) | | | (0.04) | |
Net realized and unrealized gain on investments | | | 1.15 | | | | 1.51 | | | | 1.61 | | | | 0.10 | | | | 0.66 | |
| | | | | | | | | | | | | | | | | | | | |
Total from investment operations | | | 1.14 | | | | 1.49 | | | | 1.57 | | | | 0.06 | | | | 0.62 | |
| | | | | | | | | | | | | | | | | | | | |
| | | | | |
LESS DISTRIBUTIONS: | | | | | | | | | | | | | | | | | | | | |
From net realized gains on investments | | | (0.84) | | | | (0.43) | | | | (0.32) | | | | - | | | | - | |
| | | | | | | | | | | | | | | | | | | | |
Total distributions | | | (0.84) | | | | (0.43) | | | | (0.32) | | | | - | | | | - | |
| | | | | | | | | | | | | | | | | | | | |
| | | | | |
Net asset value, end of year | | $ | 8.66 | | | $ | 8.36 | | | $ | 7.30 | | | $ | 6.05 | | | $ | 5.99 | |
| | | | | | | | | | | | | | | | | | | | |
Total return (B)(C) | | | 14.70% | | | | 21.62% | | | | 26.61% | | | | 1.00% | | | | 11.55% | |
| | | | | |
RATIOS/SUPPLEMENTAL DATA: | | | | | | | | | | | | | | | | | | | | |
Net assets, end of year (in 000’s) | | $ | 56,073 | | | $ | 48,411 | | | $ | 41,446 | | | $ | 34,252 | | | $ | 38,865 | |
Ratios to average net assets | | | | | | | | | | | | | | | | | | | | |
Expenses, before waiver and reimbursement | | | 1.57% | | | | - | | | | - | | | | - | | | | - | |
Expenses, net waiver and reimbursement | | | 1.57% | | | | 1.59% | | | | 1.68% | | | | 1.60% | | | | 1.66% | |
Net investment loss, before waiver and reimbursement | | | (0.18)% | | | | - | | | | - | | | | - | | | | - | |
Net investment loss, net waiver and reimbursement | | | (0.17)% | | | | (0.24)% | | | | (0.63)% | | | | (0.64)% | | | | (0.74)% | |
Portfolio turnover rate | | | 61% | | | | 91% | | | | 127% | | | | 150% | | | | 78% | |
| (A) | Per share amounts calculated using average shares method, which more appropriately presents the per share data for the year. |
| (B) | Total return calculation does not reflect sales load. |
| (C) | Total return in the above table represents the rate that the investor would have earned or lost on an investment in the Fund assuming reinvestment of dividends. |
| | Total return would have been higher or lower if certain expenses had not been reimbursed, waived or recouped. |
The accompanying notes are an integral part of these financial statements.
79
Timothy Large/Mid Cap Growth Fund (Class C Shares)
Selected data based on a share outstanding throughout each year
| | | | | | | | | | | | | | | | | | | | |
| | | For the Year
ended
September 30,
2014 | | | For the Year
ended
September 30,
2013 | | | For the Year
ended
September 30,
2012 | | | For the Year
ended
September 30,
2011 | | | For the Year
ended
September 30,
2010 | |
| | | | | |
Net asset value, beginning of year | | $ | 7.49 | | | $ | 6.63 | | | $ | 5.57 | | | $ | 5.55 | | | $ | 5.01 | |
| | | | | | | | | | | | | | | | | | | | |
| | | | | |
INCOME (LOSS) FROM INVESTMENT OPERATIONS: | | | | | | | | | | | | | | | | | | | | |
Net investment loss | | | (0.07) | (A) | | | (0.07) | (A) | | | (0.09) | (A) | | | (0.09) | (A) | | | (0.08) | |
Net realized and unrealized gain on investments | | | 1.02 | | | | 1.36 | | | | 1.47 | | | | 0.11 | | | | 0.62 | |
| | | | | | | | | | | | | | | | | | | | |
Total from investment operations | | | 0.95 | | | | 1.29 | | | | 1.38 | | | | 0.02 | | | | 0.54 | |
| | | | | | | | | | | | | | | | | | | | |
| | | | | |
LESS DISTRIBUTIONS: | | | | | | | | | | | | | | | | | | | | |
From net realized gains on investments | | | (0.84) | | | | (0.43) | | | | (0.32) | | | | - | | | | - | |
| | | | | | | | | | | | | | | | | | | | |
Total distributions | | | (0.84) | | | | (0.43) | | | | (0.32) | | | | - | | | | - | |
| | | | | | | | | | | | | | | | | | | | |
| | | | | |
Net asset value, end of year | | $ | 7.60 | | | $ | 7.49 | | | $ | 6.63 | | | $ | 5.57 | | | $ | 5.55 | |
| | | | | | | | | | | | | | | | | | | | |
| | | | | |
Total return (B)(C) | | | 13.84% | | | | 20.74% | | | | 25.47% | | | | 0.36% | | | | 10.78% | |
| | | | | |
RATIOS/SUPPLEMENTAL DATA: | | | | | | | | | | | | | | | | | | | | |
Net assets, end of year (in 000’s) | | $ | 5,929 | | | $ | 5,041 | | | $ | 4,483 | | | $ | 2,726 | | | $ | 2,523 | |
Ratios to average net assets | | | | | | | | | | | | | | | | | | | | |
Expenses, before waiver and reimbursement | | | 2.32% | | | | - | | | | - | | | | - | | | | - | |
Expenses, net waiver and reimbursement | | | 2.32% | | | | 2.34% | | | | 2.44% | | | | 2.35% | | | | 2.41% | |
Net investment loss, before waiver and reimbursement | | | (0.93)% | | | | - | | | | - | | | | - | | | | - | |
Net investment loss, net waiver and reimbursement | | | (0.93)% | | | | (0.99)% | | | | (1.38)% | | | | (1.38)% | | | | (1.49)% | |
Portfolio turnover rate | | | 61% | | | | 91% | | | | 127% | | | | 150% | | | | 78% | |
| (A) | Per share amounts calculated using average shares method, which more appropriately presents the per share data for the year. |
| (B) | Total return calculation does not reflect sales load. |
| (C) | Total return in the above table represents the rate that the investor would have earned or lost on an investment in the Fund assuming reinvestment of dividends. |
| | Total return would have been higher or lower if certain expenses had not been reimbursed, waived or recouped. |
The accompanying notes are an integral part of these financial statements.
80
Timothy Large/Mid Cap Growth Fund (Class I Shares)
Selected data based on a share outstanding throughout the period
| | | | | | | | | | |
| | | For the Year
ended
September 30,
2014 | | | For the Period ended
September 30, 2013
(A) | | | |
| | | | | | | | | | |
Net asset value, beginning of period | | $ | 8.37 | | | $ | 8.31 | | | |
| | | | | | | | | | |
| | | |
INCOME (LOSS) FROM INVESTMENT OPERATIONS: | | | | | | | | | | |
Net investment income (B) | | | 0.01 | | | | 0.01 | | | |
Net realized and unrealized gain on investments | | | 1.15 | (F) | | | 0.05 | | | |
| | | | | | | | | | |
Total from investment operations | | | 1.16 | | | | 0.06 | | | |
| | | | | | | | | | |
| | | |
LESS DISTRIBUTIONS: | | | | | | | | | | |
From net realized gains on investments | | | (0.84) | | | | - | | | |
| | | | | | | | | | |
Total distributions | | | (0.84) | | | | - | | | |
| | | | | | | | | | |
| | | |
Net asset value, end of period | | $ | 8.69 | | | $ | 8.37 | | | |
| | | | | | | | | | |
| | | |
Total return (C) | | | 14.94% | | | | 0.72% | (D) | | |
| | | |
RATIOS/SUPPLEMENTAL DATA: | | | | | | | | | | |
Net assets, end of period | | $ | 190 | | | $ | 101 | | | |
Ratios to average net assets | | | | | | | | | | |
Expenses, before waiver and reimbursement | | | 1.30% | | | | - | | | |
Expenses, net waiver and reimbursement | | | 1.29% | | | | 1.34% | (E) | | |
Net investment income, before waiver and reimbursement | | | 0.13% | | | | - | | | |
Net investment income, net waiver and reimbursement | | | 0.14% | | | | 0.01% | (E) | | |
Portfolio turnover rate | | | 61% | | | | 91% | (D) | | |
| (A) | For the period August 1, 2013 (Commencement of Operations) to September 30, 2013. |
| (B) | Per share amounts calculated using average shares method, which more appropriately presents the per share data for the period. |
| (C) | Total return in the above table represents the rate that the investor would have earned or lost on an investment in the Fund assuming reinvestment of dividends. |
| | Total return would have been higher or lower if certain expenses had not been reimbursed, waived or recouped. |
| (D) | For periods of less than one full year, total return and turnover are not annualized. |
| (F) | Realized and unrealized gains per share in this caption are balancing amounts necessary to reconcile the change in net asset value per share for the period, and may not reconcile with the aggregate gains and losses in the Statements of Operations due to share transactions for the period. |
The accompanying notes are an integral part of these financial statements.
81
Timothy Small Cap Value Fund (Class A Shares)
Selected data based on a share outstanding throughout each year
| | | | | | | | | | | | | | | | | | | | |
| | | For the Year
ended
September 30,
2014 | | | For the Year
ended
September 30,
2013 | | | For the Year
ended
September 30,
2012 | | | For the Year
ended
September 30,
2011 | | | For the Year
ended
September 30,
2010 | |
| | | | | |
Net asset value, beginning of year | | $ | 20.30 | | | $ | 14.74 | | | $ | 10.82 | | | $ | 11.28 | | | $ | 10.25 | |
| | | | | | | | | | | | | | | | | | | | |
| | | | | |
INCOME (LOSS) FROM INVESTMENT OPERATIONS: | | | | | | | | | | | | | | | | | | | | |
Net investment income (loss) | | | (0.04) | (A) | | | 0.02 | (A) | | | 0.03 | (A) | | | (0.05) | (A) | | | (0.06) | |
Net realized and unrealized gain (loss) on investments | | | 1.57 | | | | 5.57 | | | | 3.89 | | | | (0.41) | (B) | | | 1.09 | |
| | | | | | | | | | | | | | | | | | | | |
Total from investment operations | | | 1.53 | | | | 5.59 | | | | 3.92 | | | | (0.46) | | | | 1.03 | |
| | | | | | | | | | | | | | | | | | | | |
| | | | | |
LESS DISTRIBUTIONS: | | | | | | | | | | | | | | | | | | | | |
From net investment income | | | - | | | | (0.03) | | | | - | | | | - | | | | - | |
From net realized gains on investments | | | (2.04) | | | | - | | | | - | | | | - | | | | - | |
| | | | | | | | | | | | | | | | | | | | |
Total distributions | | | (2.04) | | | | (0.03) | | | | - | | | | - | | | | - | |
| | | | | | | | | | | | | | | | | | | | |
| | | | | |
Net asset value, end of year | | $ | 19.79 | | | $ | 20.30 | | | $ | 14.74 | | | $ | 10.82 | | | $ | 11.28 | |
| | | | | | | | | | | | | | | | | | | | |
| | | | | |
Total return (C)(D) | | | 7.61% | | | | 37.97% | | | | 36.23% | | | | (4.08)% | | | | 10.05% | |
| | | | | |
RATIOS/SUPPLEMENTAL DATA: | | | | | | | | | | | | | | | | | | | | |
Net assets, end of year (in 000’s) | | $ | 71,997 | | | $ | 64,972 | | | $ | 47,976 | | | $ | 39,145 | | | $ | 40,482 | |
Ratios to average net assets | | | | | | | | | | | | | | | | | | | | |
Expenses, before waiver and reimbursement | | | 1.53% | | | | - | | | | - | | | | - | | | | - | |
Expenses, net waiver and reimbursement | | | 1.52% | | | | 1.55% | | | | 1.59% | | | | 1.53% | | | | 1.59% | |
Net investment income (loss), before waiver and reimbursement | | | (0.25)% | | | | - | | | | - | | | | - | | | | - | |
Net investment income (loss), net waiver and reimbursement | | | (0.25)% | | | | 0.11% | | | | 0.19% | | | | (0.36)% | | | | (0.51)% | |
Portfolio turnover rate | | | 71% | | | | 73% | | | | 65% | | | | 102% | | | | 64% | |
| (A) | Per share amounts calculated using average shares method, which more appropriately presents the per share data for the year. |
| (B) | Realized and unrealized gains and losses per share in this caption are balancing amounts necessary to reconcile the change in net asset value per share for the period, and may not agree to the aggregate gains and losses in the Statement of Operations due to the fluctuations in share transactions. |
| (C) | Total return calculation does not reflect sales load. |
| (D) | Total return in the above table represents the rate that the investor would have earned or lost on an investment in the Fund assuming reinvestment of dividends. |
| | Total return would have been higher or lower if certain expenses had not been reimbursed, waived or recouped. |
The accompanying notes are an integral part of these financial statements.
82
Timothy Small Cap Value Fund (Class C Shares)
Selected data based on a share outstanding throughout each year
| | | | | | | | | | | | | | | | | | | | |
| | | For the Year
ended
September 30,
2014 | | | For the Year
ended
September 30,
2013 | | | For the Year
ended
September 30,
2012 | | | For the Year
ended
September 30,
2011 | | | For the Year
ended
September 30,
2010 | |
| | | | | |
Net asset value, beginning of year | | $ | 17.30 | | | $ | 12.63 | | | $ | 9.35 | | | $ | 9.82 | | | $ | 8.99 | |
| | | | | | | | | | | | | | | | | | | | |
| | | | | |
INCOME (LOSS) FROM INVESTMENT OPERATIONS: | | | | | | | | | | | | | | | | | | | | |
Net investment loss | | | (0.17) | (A) | | | (0.10) | (A) | | | (0.06) | (A) | | | (0.13) | (A) | | | (0.12) | |
Net realized and unrealized gain (loss) on investments | | | 1.36 | | | | 4.77 | | | | 3.34 | | | | (0.34) | (B) | | | 0.95 | |
| | | | | | | | | | | | | | | | | | | | |
Total from investment operations | | | 1.19 | | | | 4.67 | | | | 3.28 | | | | (0.47) | | | | 0.83 | |
| | | | | | | | | | | | | | | | | | | | |
| | | | | |
LESS DISTRIBUTIONS: | | | | | | | | | | | | | | | | | | | | |
From net realized gains on investments | | | (2.04) | | | | - | | | | - | | | | - | | | | - | |
| | | | | | | | | | | | | | | | | | | | |
Total distributions | | | (2.04) | | | | - | | | | - | | | | - | | | | - | |
| | | | | | | | | | | | | | | | | | | | |
| | | | | |
Net asset value, end of year | | $ | 16.45 | | | $ | 17.30 | | | $ | 12.63 | | | $ | 9.35 | | | $ | 9.82 | |
| | | | | | | | | | | | | | | | | | | | |
| | | | | |
Total return (C)(D) | | | 6.96% | | | | 36.98% | | | | 35.08% | | | | (4.79)% | | | | 9.23% | |
| | | | | |
RATIOS/SUPPLEMENTAL DATA: | | | | | | | | | | | | | | | | | | | | |
Net assets, end of year (in 000’s) | | $ | 8,135 | | | $ | 7,539 | | | $ | 4,937 | | | $ | 3,809 | | | $ | 4,186 | |
Ratios to average net assets | | | | | | | | | | | | | | | | | | | | |
Expenses, before waiver and reimbursement | | | 2.28% | | | | - | | | | - | | | | - | | | | - | |
Expenses, net waiver and reimbursement | | | 2.27% | | | | 2.30% | | | | 2.34% | | | | 2.28% | | | | 2.34% | |
Net investment loss, before waiver and reimbursement | | | (1.01)% | | | | - | | | | - | | | | - | | | | - | |
Net investment loss, net waiver and reimbursement | | | (1.01)% | | | | (0.65)% | | | | (0.55)% | | | | (1.12)% | | | | (1.26)% | |
Portfolio turnover rate | | | 71% | | | | 73% | | | | 65% | | | | 102% | | | | 64% | |
| (A) | Per share amounts calculated using average shares method, which more appropriately presents the per share data for the year. |
| (B) | Realized and unrealized gains and losses per share in this caption are balancing amounts necessary to reconcile the change in net asset value per share for the period, and may not agree to the aggregate gains and losses in the Statement of Operations due to the fluctuations in share transactions. |
| (C) | Total return calculation does not reflect redemption fee. |
| (D) | Total return in the above table represents the rate that the investor would have earned or lost on an investment in the Fund assuming reinvestment of dividends. |
| | Total return would have been higher or lower if certain expenses had not been reimbursed, waived or recouped. |
The accompanying notes are an integral part of these financial statements.
83
Timothy Small Cap Value Fund (Class I Shares)
Selected data based on a share outstanding throughout the period
| | | | | | | | | | |
| | | For the Year
ended
September 30,
2014 | | | For the Period ended
September 30, 2013
(A) | | | |
| | | | | | | | | | |
Net asset value, beginning of period | | $ | 20.29 | | | $ | 19.68 | | | |
| | | | | | | | | | |
| | | |
INCOME (LOSS) FROM INVESTMENT OPERATIONS: | | | | | | | | | | |
Net investment income (loss) (B) | | | 0.02 | | | | (0.01) | | | |
Net realized and unrealized gain on investments | | | 1.57 | (F) | | | 0.62 | | | |
| | | | | | | | | | |
Total from investment operations | | | 1.59 | | | | 0.61 | | | |
| | | | | | | | | | |
| | | |
LESS DISTRIBUTIONS: | | | | | | | | | | |
From net realized gains on investments | | | (2.04) | | | | - | | | |
| | | | | | | | | | |
Total distributions | | | (2.04) | | | | - | | | |
| | | �� | | | | | | | |
Net asset value, end of period | | $ | 19.84 | | | $ | 20.29 | | | |
| | | | | | | | | | |
Total return (C) | | | 7.93% | | | | 3.10% | (D) | | |
| | | |
RATIOS/SUPPLEMENTAL DATA: | | | | | | | | | | |
Net assets, end of period | | $ | 532 | | | $ | 103 | | | |
Ratios to average net assets | | | | | | | | | | |
Expenses, before waiver and reimbursement | | | 1.27% | | | | - | | | |
Expenses, net waiver and reimbursement | | | 1.27% | | | | 1.30% | (E) | | |
Net investment income, before waiver and reimbursement | | | 0.06% | | | | - | | | |
Net investment income, net waiver and reimbursement | | | 0.07% | | | | 0.36% | (E) | | |
Portfolio turnover rate | | | 71% | | | | 73% | (D) | | |
| (A) | For the period August 1, 2013 (Commencement of Operations) to September 30, 2013. |
| (B) | Per share amounts calculated using average shares method, which more appropriately presents the per share data for the period. |
| (C) | Total return in the above table represents the rate that the investor would have earned or lost on an investment in the Fund assuming reinvestment of dividends. |
| | Total return would have been higher or lower if certain expenses had not been reimbursed, waived or recouped. |
| (D) | For periods of less than one full year, total return and turnover are not annualized. |
| (F) | Realized and unrealized gains per share in this caption are balancing amounts necessary to reconcile the change in net asset value per share for the period, and may not reconcile with the aggregate gains and losses in the Statements of Operations due to share transactions for the period. |
The accompanying notes are an integral part of these financial statements.
84
Timothy Large/Mid Cap Value Fund (Class A Shares)
Selected data based on a share outstanding throughout each year
| | | | | | | | | | | | | | | | | | | | |
| | | For the Year ended September 30, 2014 | | | For the Year ended September 30, 2013 | | | For the Year ended September 30, 2012 | | | For the Year ended September 30, 2011 | | | For the Year ended September 30, 2010 | |
| | | | | |
Net asset value, beginning of year | | $ | 18.14 | | | $ | 14.80 | | | $ | 11.83 | | | $ | 11.84 | | | $ | 10.72 | |
| | | | | | | | | | | | | | | | | | | | |
| | | | | |
INCOME (LOSS) FROM INVESTMENT OPERATIONS: | | | | | | | | | | | | | | | | | | | | |
Net investment income (loss) | | | (0.01) | (A) | | | 0.09 | (A) | | | 0.06 | (A) | | | 0.04 | (A) | | | 0.05 | |
Net realized and unrealized gain (loss) on investments | | | 2.83 | | | | 3.30 | | | | 2.94 | | | | (0.01) | (B) | | | 1.12 | |
| | | | | | | | | | | | | | | | | | | | |
Total from investment operations | | | 2.82 | | | | 3.39 | | | | 3.00 | | | | 0.03 | | | | 1.17 | |
| | | | | | | | | | | | | | | | | | | | |
| | | | | |
LESS DISTRIBUTIONS: | | | | | | | | | | | | | | | | | | | | |
From net investment income | | | (0.09) | | | | (0.05) | | | | (0.03) | | | | (0.04) | | | | (0.05) | |
From net realized gains on investments | | | (1.26) | | | | - | | | | - | | | | - | | | | - | |
| | | | | | | | | | | | | | | | | | | | |
Total distributions | | | (1.35) | | | | (0.05) | | | | (0.03) | | | | (0.04) | | | | (0.05) | |
| | | | | | | | | | | | | | | | | | | | |
| | | | | |
Net asset value, end of year | | $ | 19.61 | | | $ | 18.14 | | | $ | 14.80 | | | $ | 11.83 | | | $ | 11.84 | |
| | | | | | | | | | | | | | | | | | | | |
| | | | | |
Total return (C)(D) | | | 16.13% | | | | 23.00% | | | | 25.39% | | | | 0.20% | | | | 10.94% | |
| | | | | |
RATIOS/SUPPLEMENTAL DATA: | | | | | | | | | | | | | | | | | | | | |
Net assets, end of year (in 000’s) | | $ | 138,821 | | | $ | 114,657 | | | $ | 100,632 | | | $ | 78,255 | | | $ | 80,700 | |
Ratios to average net assets | | | | | | | | | | | | | | | | | | | | |
Expenses, before waiver and reimbursement | | | 1.50% | | | | - | | | | - | | | | - | | | | - | |
Expenses, net waiver and reimbursement | | | 1.49% | | | | 1.49% | | | | 1.57% | | | | 1.51% | | | | 1.58% | |
Net investment loss, before waiver and reimbursement | | | (0.03)% | | | | - | | | | - | | | | - | | | | - | |
Net investment income (loss), net waiver and reimbursement | | | (0.03)% | | | | 0.55% | | | | 0.42% | | | | 0.33% | | | | 0.39% | |
Portfolio turnover rate | | | 37% | | | | 64% | | | | 7% | | | | 19% | | | | 38% | |
| (A) | Per share amounts calculated using average shares method, which more appropriately presents the per share data for the year. |
| (B) | Realized and unrealized gains and losses per share in this caption are balancing amounts necessary to reconcile the change in net asset value per share for the period, and may not agree to the aggregate gains and losses in the Statement of Operations due to the fluctuations in share transactions. |
| (C) | Total return calculation does not reflect sales load. |
| (D) | Total return in the above table represents the rate that the investor would have earned or lost on an investment in the Fund assuming reinvestment of dividends. Total return would have been higher or lower if certain expenses had not been reimbursed, waived or recouped. |
The accompanying notes are an integral part of these financial statements.
85
Timothy Large/Mid Cap Value Fund (Class C Shares)
Selected data based on a share outstanding throughout each year
| | | | | | | | | | | | | | | | | | | | |
| | | For the Year ended September 30, 2014 | | | For the Year ended September 30, 2013 | | | For the Year ended September 30, 2012 | | | For the Year ended September 30, 2011 | | | For the Year ended September 30, 2010 | |
| | | | | |
Net asset value, beginning of year | | $ | 16.12 | | | $ | 13.20 | | | $ | 10.61 | | | $ | 10.68 | | | $ | 9.73 | |
| | | | | | | | | | | | | | | | | | | | |
| | | | | |
INCOME (LOSS) FROM INVESTMENT OPERATIONS: | | | | | | | | | | | | | | | | | | | | |
Net investment loss | | | (0.13) | (A) | | | (0.03) | (A) | | | (0.04) | (A) | | | (0.05) | (A) | | | (0.05) | |
Net realized and unrealized gain (loss) on investments | | | 2.49 | | | | 2.95 | | | | 2.63 | | | | - | *(B) | | | 1.03 | |
| | | | | | | | | | | | | | | | | | | | |
Total from investment operations | | | 2.36 | | | | 2.92 | | | | 2.59 | | | | (0.05) | | | | 0.98 | |
| | | | | | | | | | | | | | | | | | | | |
| | | | | |
LESS DISTRIBUTIONS: | | | | | | | | | | | | | | | | | | | | |
From net investment income | | | (0.03) | | | | - | | | | - | | | | (0.02) | | | | (0.03) | |
From net realized gains on investments | | | (1.26) | | | | - | | | | - | | | | - | | | | - | |
| | | | | | | | | | | | | | | | | | | | |
Total distributions | | | (1.29) | | | | - | | | | - | | | | (0.02) | | | | (0.03) | |
| | | | | | | | | | | | | | | | | | | | |
| | | | | |
Net asset value, end of year | | $ | 17.19 | | | $ | 16.12 | | | $ | 13.20 | | | $ | 10.61 | | | $ | 10.68 | |
| | | | | | | | | | | | | | | | | | | | |
| | | | | |
Total return (C)(D) | | | 15.21% | | | | 22.12% | | | | 24.41% | | | | (0.52)% | | | | 10.12% | |
| | | | | |
RATIOS/SUPPLEMENTAL DATA: | | | | | | | | | | | | | | | | | | | | |
Net assets, end of year (in 000’s) | | $ | 16,778 | | | $ | 13,649 | | | $ | 10,669 | | | $ | 8,903 | | | $ | 9,484 | |
Ratios to average net assets | | | | | | | | | | | | | | | | | | | | |
Expenses, before waiver and reimbursement | | | 2.25% | | | | - | | | | - | | | | - | | | | - | |
Expenses, net waiver and reimbursement | | | 2.24% | | | | 2.23% | | | | 2.32% | | | | 2.26% | | | | 2.33% | |
Net investment loss, before waiver and reimbursement | | | (0.78)% | | | | - | | | | - | | | | - | | | | - | |
Net investment loss, net waiver and reimbursement | | | (0.77)% | | | | (0.19)% | | | | (0.32)% | | | | (0.43)% | | | | (0.35)% | |
Portfolio turnover rate | | | 37% | | | | 64% | | | | 7% | | | | 19% | | | | 38% | |
*Amount is less than $0.005 per share.
| (A) | Per share amounts calculated using average shares method, which more appropriately presents the per share data for the period. |
| (B) | Realized and unrealized gains and losses per share in this caption are balancing amounts necessary to reconcile the change in net asset value per share for the period, and may not agree to the aggregate gains and losses in the Statement of Operations due to the fluctuations in share transactions. |
| (C) | Total return calculation does not reflect redemption fee. |
| (D) | Total return in the above table represents the rate that the investor would have earned or lost on an investment in the Fund assuming reinvestment of dividends. Total return would have been higher or lower if certain expenses had not been reimbursed, waived or recouped. |
The accompanying notes are an integral part of these financial statements.
86
Timothy Large/Mid Cap Value Fund (Class I Shares)
Selected data based on a share outstanding throughout the period
| | | | | | | | | | | | | | |
| | | For the Year ended September 30, 2014 | | | For the Period ended September 30, 2013
(A) | | | | | | | |
| | | | | | | | | | | | | | |
Net asset value, beginning of period | | $ | 18.13 | | | $ | 18.19 | | | | | | | |
| | | | | | | | | | | | | | |
| | | | | |
INCOME (LOSS) FROM INVESTMENT OPERATIONS: | | | | | | | | | | | | | | |
Net investment income (B) | | | 0.05 | | | | 0.03 | | | | | | | |
Net realized and unrealized gain (loss) on investments | | | 2.82 | (F) | | | (0.09) | | | | | | | |
| | | | | | | | | | | | | | |
Total from investment operations | | | 2.87 | | | | (0.06) | | | | | | | |
| | | | | | | | | | | | | | |
| | | | | |
LESS DISTRIBUTIONS: | | | | | | | | | | | | | | |
From net investment income | | | (0.11) | | | | - | | | | | | | |
From net realized gains on investments | | | (1.26) | | | | - | | | | | | | |
| | | | | | | | | | | | | | |
Total distributions | | | (1.37) | | | | - | | | | | | | |
| | | | | | | | | | | | | | |
| | | | | |
Net asset value, end of period | | $ | 19.63 | | | $ | 18.13 | | | | | | | |
| | | | | | | | | | | | | | |
| | | | | |
Total return (C) | | | 16.09% | | | | (0.33)% | (D) | | | | | | |
| | | | | |
RATIOS/SUPPLEMENTAL DATA: | | | | | | | | | | | | | | |
Net assets, end of period | | $ | 1,442 | | | $ | 100 | | | | | | | |
Ratios to average net assets | | | | | | | | | | | | | | |
Expenses, before waiver and reimbursement | | | 1.23% | | | | - | | | | | | | |
Expenses, net waiver and reimbursement | | | 1.23% | | | | 1.24% | (E) | | | | | | |
Net investment income, before waiver and reimbursement | | | 0.25% | | | | - | | | | | | | |
Net investment income, net waiver and reimbursement | | | 0.26% | | | | 0.80% | (E) | | | | | | |
Portfolio turnover rate | | | 37% | | | | 64% | (D) | | | | | | |
| (A) | For the period August 1, 2013 (Commencement of Operations) to September 30, 2013. |
| (B) | Per share amounts calculated using average shares method, which more appropriately presents the per share data for the period. |
| (C) | Total return in the above table represents the rate that the investor would have earned or lost on an investment in the Fund assuming reinvestment of dividends. Total return would have been higher or lower if certain expenses had not been reimbursed, waived or recouped. |
| (D) | For periods of less than one full year, total return and turnover are not annualized. |
| (F) | Realized and unrealized gains per share in this caption are balancing amounts necessary to reconcile the change in net asset value per share for the period, and may not reconcile with the aggregate gains and losses in the Statements of Operations due to share transactions for the period. |
The accompanying notes are an integral part of these financial statements.
87
Timothy Fixed Income Fund (Class A Shares)
Selected data based on a share outstanding throughout each year
| | | | | | | | | | | | | | | | | | | | |
| | | For the Year ended September 30, 2014 | | | For the Year ended September 30, 2013 | | | For the Year ended September 30, 2012 | | | For the Year ended September 30, 2011 | | | For the Year ended September 30, 2010 | |
| | | | | |
Net asset value, beginning of year | | $ | 10.43 | | | $ | 10.87 | | | $ | 10.72 | | | $ | 10.56 | | | $ | 10.14 | |
| | | | | | | | | | | | | | | | | | | | |
| | | | | |
INCOME (LOSS) FROM INVESTMENT OPERATIONS: | | | | | | | | | | | | | | | | | | | | |
Net investment income (A) | | | 0.18 | | | | 0.18 | | | | 0.22 | | | | 0.28 | | | | 0.29 | |
Net realized and unrealized gain (loss) on investments | | | 0.09 | | | | (0.49) | | | | 0.18 | | | | 0.18 | | | | 0.42 | |
| | | | | | | | | | | | | | | | | | | | |
Total from investment operations | | | 0.27 | | | | (0.31) | | | | 0.40 | | | | 0.46 | | | | 0.71 | |
| | | | | | | | | | | | | | | | | | | | |
| | | | | |
LESS DISTRIBUTIONS: | | | | | | | | | | | | | | | | | | | | |
From net investment income | | | (0.25) | | | | (0.13) | | | | (0.22) | | | | (0.30) | | | | (0.29) | |
From net realized gains on investments | | | (0.03) | | | | - | | | | - | | | | - | | | | - | |
From return of capital | | | - | | | | - | | | | (0.03) | | | | - | | | | - | |
| | | | | | | | | | | | | | | | | | | | |
Total distributions | | | (0.28) | | | | (0.13) | | | | (0.25) | | | | (0.30) | | | | (0.29) | |
| | | | | | | | | | | | | | | | | | | | |
Net asset value, end of year | | $ | 10.43 | | | $ | 10.43 | | | $ | 10.87 | | | $ | 10.72 | | | $ | 10.56 | |
| | | | | | | | | | | | | | | | | | | | |
| | | | | |
Total return (B)(C) | | | 2.64% | | | | (2.82)% | | | | 3.73% | | | | 4.42% | | | | 7.07% | |
| | | | | |
RATIOS/SUPPLEMENTAL DATA: | | | | | | | | | | | | | | | | | | | | |
Net assets, end of year (in 000’s) | | $ | 68,274 | | | $ | 67,558 | | | $ | 74,685 | | | $ | 59,405 | | | $ | 58,831 | |
Ratios to average net assets | | | | | | | | | | | | | | | | | | | | |
Expenses, before waiver and reimbursement | | | 1.30% | | | | 1.27% | | | | 1.31% | | | | 1.27% | | | | 1.36% | |
Expenses, net waiver and reimbursement | | | 1.14% | | | | 1.12% | | | | 1.16% | | | | 1.15% | | | | 1.21% | |
Net investment income, before waiver and reimbursement | | | 1.60% | | | | 1.54% | | | | 1.86% | | | | 2.58% | | | | 2.63% | |
Net investment income, net waiver and reimbursement | | | 1.75% | | | | 1.69% | | | | 2.01% | | | | 2.71% | | | | 2.78% | |
Portfolio turnover rate | | | 18% | | | | 25% | | | | 19% | | | | 22% | | | | 26% | |
| (A) | Per share amounts calculated using average shares method, which more appropriately presents the per share data for the year. |
| (B) | Total return calculation does not reflect sales load. |
| (C) | Total return in the above table represents the rate that the investor would have earned or lost on an investment in the Fund assuming reinvestment of dividends. Total return would have been higher or lower if certain expenses had not been reimbursed, waived or recouped. |
The accompanying notes are an integral part of these financial statements.
88
Timothy Fixed Income Fund (Class C Shares)
Selected data based on a share outstanding throughout each year
| | | | | | | | | | | | | | | | | | | | |
| | | For the Year ended September 30, 2014 | | | For the Year ended September 30,
2013 | | | For the Year ended September 30, 2012 | | | For the Year ended September 30, 2011 | | | For the Year ended September 30, 2010 | |
| | | | | |
Net asset value, beginning of year | | $ | 10.07 | | | $ | 10.51 | | | $ | 10.38 | | | $ | 10.22 | | | $ | 9.82 | |
| | | | | | | | | | | | | | | | | | | | |
| | | | | |
INCOME (LOSS) FROM INVESTMENT OPERATIONS: | | | | | | | | | | | | | | | | | | | | |
| | | | | |
Net investment income | | | 0.10 | (A) | | | 0.10 | (A) | | | 0.13 | (A) | | | 0.20 | (A) | | | 0.21 | |
Net realized and unrealized gain (loss) on investments | | | 0.11 | | | | (0.48) | | | | 0.17 | | | | 0.17 | | | | 0.41 | |
| | | | | | | | | | | | | | | | | | | | |
Total from investment operations | | | 0.21 | | | | (0.38) | | | | 0.30 | | | | 0.37 | | | | 0.62 | |
| | | | | | | | | | | | | | | | | | | | |
| | | | | |
LESS DISTRIBUTIONS: | | | | | | | | | | | | | | | | | | | | |
From net investment income | | | (0.18) | | | | (0.06) | | | | (0.14) | | | | (0.21) | | | | (0.22) | |
From net realized gains on investments | | | (0.03) | | | | - | | | | - | | | | - | | | | - | |
From return of capital | | | - | | | | - | | | | (0.03) | | | | - | | | | - | |
| | | | | | | | | | | | | | | | | | | | |
Total distributions | | | (0.21) | | | | (0.06) | | | | (0.17) | | | | (0.21) | | | | (0.22) | |
| | | | | | | | | | | | | | | | | | | | |
| | | | | |
Net asset value, end of year | | $ | 10.07 | | | $ | 10.07 | | | $ | 10.51 | | | $ | 10.38 | | | $ | 10.22 | |
| | | | | | | | | | | | | | | | | | | | |
| | | | | |
Total return (B)(C) | | | 2.02% | | | | (3.57)% | | | | 2.88% | | | | 3.68% | | | | 6.36% | |
| | | | | |
RATIOS/SUPPLEMENTAL DATA: | | | | | | | | | | | | | | | | | | | | |
Net assets, end of year (in 000’s) | | $ | 7,120 | | | $ | 7,958 | | | $ | 8,997 | | | $ | 8,265 | | | $ | 8,438 | |
Ratios to average net assets | | | | | | | | | | | | | | | | | | | | |
Expenses, before waiver and reimbursement | | | 2.05% | | | | 2.03% | | | | 2.06% | | | | 2.23% | | | | 2.12% | |
Expenses, net waiver and reimbursement | | | 1.90% | | | | 1.88% | | | | 1.91% | | | | 1.90% | | | | 1.97% | |
Net investment income, before waiver and reimbursement | | | 0.85% | | | | 0.79% | | | | 1.12% | | | | 1.61% | | | | 1.88% | |
Net investment income, net waiver and reimbursement | | | 1.00% | | | | 0.94% | | | | 1.27% | | | | 1.95% | | | | 2.03% | |
Portfolio turnover rate | | | 18% | | | | 25% | | | | 19% | | | | 22% | | | | 26% | |
| (A) | Per share amounts calculated using average shares method, which more appropriately presents the per share data for the year. |
| (B) | Total return calculation does not reflect redemption fee. |
| (C) | Total return in the above table represents the rate that the investor would have earned or lost on an investment in the Fund assuming reinvestment of dividends. Total return would have been higher or lower if certain expenses had not been reimbursed, waived or recouped. |
The accompanying notes are an integral part of these financial statements.
89
Timothy Fixed Income Fund (Class I Shares)
Selected data based on a share outstanding throughout the period
| | | | | | | | | | | | | | |
| | | For the Year ended September 30, 2014 | | | For the Period ended September 30, 2013 (A) | | | | | | | |
| | | | | | | | | | | | | | |
Net asset value, beginning of period | | $ | 10.34 | | | $ | 10.35 | | | | | | | |
| | | | | | | | | | | | | | |
| | | | | |
INCOME (LOSS) FROM INVESTMENT OPERATIONS: | | | | | | | | | | | | | | |
Net investment income (B) | | | 0.41 | | | | 0.04 | | | | | | | |
Net realized and unrealized gain (loss) on investments | | | (0.08) | (F) | | | 0.05 | | | | | | | |
| | | | | | | | | | | | | | |
Total from investment operations | | | 0.33 | | | | 0.09 | | | | | | | |
| | | | | | | | | | | | | | |
| | | | | |
LESS DISTRIBUTIONS: | | | | | | | | | | | | | | |
From net investment income | | | (0.28) | | | | (0.10) | | | | | | | |
From net realized gains on investments | | | (0.03) | | | | - | | | | | | | |
| | | | | | | | | | | | | | |
Total distributions | | | (0.31) | | | | (0.10) | | | | | | | |
| | | | | | | | | | | | | | |
| | | | | |
Net asset value, end of period | | $ | 10.36 | | | $ | 10.34 | | | | | | | |
| | | | | | | | | | | | | | |
| | | | | |
Total return (C) | | | 3.16% | | | | 0.90% | (D) | | | | | | |
| | | | | |
RATIOS/SUPPLEMENTAL DATA: | | | | | | | | | | | | | | |
Net assets, end of period | | $ | 103 | | | $ | 101 | | | | | | | |
Ratios to average net assets | | | | | | | | | | | | | | |
Expenses, before waiver and reimbursement | | | (0.44)% | | | | 1.02% | (E) | | | | | | |
Expenses, net waiver and reimbursement | | | (0.64)% | | | | 0.87% | (E) | | | | | | |
Net investment income, before waiver and reimbursement | | | 3.72% | | | | 1.79% | (E) | | | | | | |
Net investment income, net waiver and reimbursement | | | 3.92% | | | | 1.94% | (E) | | | | | | |
Portfolio turnover rate | | | 18% | | | | 25% | (D) | | | | | | |
| (A) | For the period August 1, 2013 (Commencement of Operations) to September 30, 2013. |
| (B) | Per share amounts calculated using average shares method, which more appropriately presents the per share data for the period. |
| (C) | Total return in the above table represents the rate that the investor would have earned or lost on an investment in the Fund assuming reinvestment of dividends. Total return would have been higher or lower if certain expenses had not been reimbursed, waived or recouped. |
| (D) | For periods of less than one full year, total return and turnover are not annualized. |
| (F) | Realized and unrealized gains per share in this caption are balancing amounts necessary to reconcile the change in net asset value per share for the period, and may not reconcile with the aggregate gains and losses in the Statements of Operations due to share transactions for the period. |
The accompanying notes are an integral part of these financial statements.
90
Timothy High Yield Bond Fund (Class A Shares)
Selected data based on a share outstanding throughout each year
| | | | | | | | | | | | | | | | | | | | |
| | | For the Year ended September 30, 2014 | | | For the Year ended September 30, 2013 | | | For the Year ended September 30, 2012 | | | For the Year ended September 30, 2011 | | | For the Year ended September 30, 2010 | |
| | | | | |
Net asset value, beginning of year | | $ | 9.40 | | | $ | 9.46 | | | $ | 8.71 | | | $ | 9.10 | | | $ | 8.46 | |
| | | | | | | | | | | | | | | | | | | | |
| | | | | |
INCOME (LOSS) FROM INVESTMENT OPERATIONS: | | | | | | | | | | | | | | | | | | | | |
Net investment income | | | 0.44 | (A) | | | 0.49 | (A) | | | 0.54 | (A) | | | 0.54 | (A) | | | 0.60 | |
Net realized and unrealized gain (loss) on investments | | | 0.09 | | | | (0.08) | | | | 0.76 | | | | (0.39) | | | | 0.63 | |
| | | | | | | | | | | | | | | | | | | | |
Total from investment operations | | | 0.53 | | | | 0.41 | | | | 1.30 | | | | 0.15 | | | | 1.23 | |
| | | | | | | | | | | | | | | | | | | | |
| | | | | |
LESS DISTRIBUTIONS: | | | | | | | | | | | | | | | | | | | | |
From net investment income | | | (0.44) | | | | (0.47) | | | | (0.53)4 | | | | (0.54) | | | | (0.59) | |
From return of capital | | | - | | | | - | | | | (0.02) | | | | - | | | | - | |
| | | | | | | | | | | | | | | | | | | | |
Total distributions | | | (0.44) | | | | (0.47) | | | | (0.55) | | | | (0.54) | | | | (0.59) | |
| | | | | | | | | | | | | | | | | | | | |
| | | | | |
Net asset value, end of year | | $ | 9.49 | | | $ | 9.40 | | | $ | 9.46 | | | $ | 8.71 | | | $ | 9.10 | |
| | | | | | | | | | | | | | | | | | | | |
| | | | | |
Total return (B)(C) | | | 5.71% | | | | 4.42% | | | | 15.17% | | | | 1.48% | | | | 14.98% | |
| | | | | |
RATIOS/SUPPLEMENTAL DATA: | | | | | | | | | | | | | | | | | | | | |
Net assets, end of year (in 000’s) | | $ | 41,038 | | | $ | 35,578 | | | $ | 33,392 | | | $ | 23,110 | | | $ | 21,617 | |
Ratios to average net assets | | | | | | | | | | | | | | | | | | | | |
Expenses, before waiver and reimbursement | | | 1.28% | | | | - | | | | - | | | | - | | | | - | |
Expenses, net waiver and reimbursement | | | 1.28% | | | | 1.33% | | | | 1.39% | | | | 1.30% | | | | 1.43% | |
Net investment income, before waiver and reimbursement | | | 4.53% | | | | - | | | | - | | | | - | | | | - | |
Net investment income, net waiver and reimbursement | | | 4.53% | | | | 5.13% | | | | 5.84% | | | | 5.81% | | | | 6.72% | |
Portfolio turnover rate | | | 53% | | | | 56% | | | | 24% | | | | 60% | | | | 40% | |
| (A) | Per share amounts calculated using average shares method, which more appropriately presents the per share data for the year. |
| (B) | Total return calculation does not reflect sales load. |
| (C) | Total return in the above table represents the rate that the investor would have earned or lost on an investment in the Fund assuming reinvestment of dividends. Total return would have been higher or lower if certain expenses had not been reimbursed, waived or recouped. |
The accompanying notes are an integral part of these financial statements.
91
Timothy High Yield Bond Fund (Class C Shares)
Selected data based on a share outstanding throughout each year
| | | | | | | | | | | | | | | | | | | | |
| | | For the Year ended September 30, 2014 | | | For the Year ended September 30, 2013 | | | For the Year ended September 30, 2012 | | | For the Year ended September 30, 2011 | | | For the Year ended September 30, 2010 | |
| | | | | |
Net asset value, beginning of year | | $ | 9.48 | | | $ | 9.55 | | | $ | 8.79 | | | $ | 9.17 | | | $ | 8.51 | |
| | | | | | | | | | | | | | | | | | | | |
| | | | | |
INCOME (LOSS) FROM INVESTMENT OPERATIONS: | | | | | | | | | | | | | | | | | | | | |
Net investment income | | | 0.37 | (A) | | | 0.43 | (A) | | | 0.47 | (A) | | | 0.47 | (A) | | | 0.53 | (A) |
Net realized and unrealized gain (loss) on investments | | | 0.09 | | | | (0.09) | | | | 0.77 | | | | (0.39) | | | | 0.66 | |
| | | | | | | | | | | | | | | | | | | | |
Total from investment operations | | | 0.46 | | | | 0.34 | | | | 1.24 | | | | 0.08 | | | | 1.19 | |
| | | | | | | | | | | | | | | | | | | | |
| | | | | |
LESS DISTRIBUTIONS: | | | | | | | | | | | | | | | | | | | | |
From net investment income | | | (0.37) | | | | (0.41) | | | | (0.46) | | | | (0.46) | | | | (0.53) | |
From return of capital | | | - | | | | - | | | | (0.02) | | | | - | | | | - | |
| | | | | | | | | | | | | | | | | | | | |
Total distributions | | | (0.37) | | | | (0.41) | | | | (0.48) | | | | (0.46) | | | | (0.53) | |
| | | | | | | | | | | | | | | | | | | | |
| | | | | |
Net asset value, end of year | | $ | 9.57 | | | $ | 9.48 | | | $ | 9.55 | | | $ | 8.79 | | | $ | 9.17 | |
| | | | | | | | | | | | | | | | | | | | |
| | | | | |
Total return (B)(C) | | | 4.89% | | | | 3.54% | | | | 14.33% | | | | 0.72% | | | | 14.36% | |
| | | | | |
RATIOS/SUPPLEMENTAL DATA: | | | | | | | | | | | | | | | | | | | | |
Net assets, end of year (in 000’s) | | $ | 2,771 | | | $ | 2,236 | | | $ | 1,683 | | | $ | 1,194 | | | $ | 1,039 | |
Ratios to average net assets | | | | | | | | | | | | | | | | | | | | |
Expenses, before waiver and reimbursement | | | 2.03% | | | | - | | | | - | | | | - | | | | - | |
Expenses, net waiver and reimbursement | | | 2.03% | | | | 2.07% | | | | 2.14% | | | | 2.05% | | | | 2.18% | |
Net investment income, before waiver and reimbursement | | | 3.78% | | | | - | | | | - | | | | | | | | - | |
Net investment income, net waiver and reimbursement | | | 3.79% | | | | 4.39% | | | | 5.08% | | | | 5.06% | | | | 5.99% | |
Portfolio turnover rate | | | 53% | | | | 56% | | | | 24% | | | | 60% | | | | 40% | |
| (A) | Per share amounts calculated using average shares method, which more appropriately presents the per share data for the year. |
| (B) | Total return calculation does not reflect redemption fee. |
| (C) | Total return in the above table represents the rate that the investor would have earned or lost on an investment in the Fund assuming reinvestment of dividends. Total return would have been higher or lower if certain expenses had not been reimbursed, waived or recouped. |
The accompanying notes are an integral part of these financial statements.
92
Timothy High Yield Bond Fund (Class I Shares)
Selected data based on a share outstanding throughout the period
| | | | | | | | | | | | | | |
| | | For the Year ended September 30, 2014 | | | For the Period ended September 30, 2013 (A) | | | | | | | |
| | | | | |
| | | | | | | | | | | | | | |
Net asset value, beginning of period | | $ | 9.40 | | | $ | 9.48 | | | | | | | |
| | | | | | | | | | | | | | |
| | | | | |
INCOME (LOSS) FROM INVESTMENT OPERATIONS: | | | | | | | | | | | | | | |
Net investment income (B) | | | 0.47 | | | | 0.07 | | | | | | | |
Net realized and unrealized gain (loss) on investments | | | 0.10 | | | | (0.06) | | | | | | | |
| | | | | | | | | | | | | | |
Total from investment operations | | | 0.57 | | | | 0.01 | | | | | | | |
| | | | | | | | | | | | | | |
| | | | | |
LESS DISTRIBUTIONS: | | | | | | | | | | | | | | |
| | | | | |
From net investment income | | | (0.47) | | | | (0.09) | | | | | | | |
| | | | | | | | | | | | | | |
| | | | | |
Total distributions | | | (0.47) | | | | (0.09) | | | | | | | |
| | | | | | | | | | | | | | |
| | | | | |
Net asset value, end of period | | $ | 9.50 | | | $ | 9.40 | | | | | | | |
| | | | | | | | | | | | | | |
Total return (C) | | | 6.07% | | | | 0.15% | (D) | | | | | | |
| | | | | |
RATIOS/SUPPLEMENTAL DATA: | | | | | | | | | | | | | | |
Net assets, end of period | | $ | 241 | | | $ | 100 | | | | | | | |
Ratios to average net assets | | | | | | | | | | | | | | |
Expenses, before waiver and reimbursement | | | 0.90% | | | | | | | | | | | |
Expenses, net waiver and reimbursement | | | 0.89% | | | | 1.08% | (E) | | | | | | |
Net investment income, before waiver and reimbursement | | | 4.77% | | | | - | | | | | | | |
Net investment income, net waiver and reimbursement | | | 4.78% | | | | 5.38% | (E) | | | | | | |
Portfolio turnover rate | | | 53% | | | | 56% | (D) | | | | | | |
| (A) | For the period August 1, 2013 (Commencement of Operations) to September 30, 2013. |
| (B) | Per share amounts calculated using average shares method, which more appropriately presents the per share data for the period. |
| (C) | Total return in the above table represents the rate that the investor would have earned or lost on an investment in the Fund assuming reinvestment of dividends. Total return would have been higher or lower if certain expenses had not been reimbursed, waived or recouped. |
| (D) | For periods of less than one full year, total return and turnover are not annualized. |
The accompanying notes are an integral part of these financial statements.
93
Timothy Israel Common Values Fund (Class A Shares)
Selected data based on a share outstanding throughout each period
| | | | | | | | | | | | | | | | |
| | | For the Year ended September 30, 2014 | | | For the Year ended September 30, 2013 | | | For the Period ended September 30, 2012 (A) | | | | | |
| | | | | |
| | | | | | | | | | | | | | | | |
Net asset value, beginning of period | | $ | 12.69 | | | $ | 10.17 | | | $ | 10.00 | | | | | |
| | | | | | | | | | | | | | | | |
| | | | | |
INCOME (LOSS) FROM INVESTMENT OPERATIONS: | | | | | | | | | | | | | | | | |
Net investment loss(B) | | | (0.08) | | | | (0.06) | | | | (0.15) | | | | | |
Net realized and unrealized gain on investments | | | 0.37 | | | | 2.58 | | | | 0.32 | | | | | |
| | | | | | | | | | | | | | | | |
Total from investment operations | | | 0.29 | | | | 2.52 | | | | 0.17 | | | | | |
| | | | | | | | | | | | | | | | |
| | | | | |
LESS DISTRIBUTIONS: | | | | | | | | | | | | | | | | |
From net investment income | | | (0.67) | | | | - | | | | - �� | | | | | |
| | | | | | | | | | | | | | | | |
Total distributions | | | (0.67) | | | | - | | | | - | | | | | |
| | | | | | | | | | | | | | | | |
| | | | | |
Net asset value, end of period | | $ | 12.31 | | | $ | 12.69 | | | $ | 10.17 | | | | | |
| | | | | | | | | | | | | | | | |
| | | | | |
Total return (C)(D) | | | 2.21% | | | | 24.78% | | | | 1.80% | (E) | | | | |
| | | | | |
RATIOS/SUPPLEMENTAL DATA: | | | | | | | | | | | | | | | | |
Net assets, end of period (in 000’s) | | $ | 13,792 | | | $ | 10,295 | | | $ | 7,983 | | | | | |
Ratio of expenses to average net assets | | | 1.98% | | | | 2.24% | | | | 2.82% | (F) | | | | |
Ratio of net investment loss to average net assets | | | (0.64%) | | | | (0.57%) | | | | (1.48%) | (F) | | | | |
Portfolio turnover rate | | | 11% | | | | 30% | | | | 37% | (E) | | | | |
| (A) | For the period October 12, 2011 (Commencement of Operations) to September 30, 2012. |
| (B) | Per share amounts calculated using average shares method, which more appropriately presents the per share data for the period. |
| (C) | Total return calculation does not reflect sales load. |
| (D) | Total return in the above table represents the rate that the investor would have earned or lost on an investment in the Fund assuming reinvestment of dividends. |
| (E) | For periods of less than one full year, total return and turnover are not annualized. |
The accompanying notes are an integral part of these financial statements.
94
Timothy Israel Common Values Fund (Class C Shares)
Selected data based on a share outstanding throughout each period
| | | | | | | | | | | | | | | | |
| | | For the Year
ended
September 30,
2014 | | | For the Year
ended
September 30,
2013 | | | For the Period
ended
September 30,
2012 (A) | | | | | |
| | | | | |
| | | | | | | | | | | | | | | | |
Net asset value, beginning of period | | $ | 12.50 | | | $ | 10.09 | | | $ | 10.00 | | | | | |
| | | | | | | | | | | | | | | | |
| | | | | |
INCOME (LOSS) FROM INVESTMENT OPERATIONS: | | | | | | | | | | | | | | | | |
Net investment loss (B) | | | (0.18) | | | | (0.13) | | | | (0.22) | | | | | |
Net realized and unrealized gain on investments | | | 0.37 | | | | 2.54 | | | | 0.31 | | | | | |
| | | | | | | | | | | | | | | | |
Total from investment operations | | | 0.19 | | | | 2.41 | | | | 0.09 | | | | | |
| | | | | | | | | | | | | | | | |
| | | | | |
LESS DISTRIBUTIONS: | | | | | | | | | | | | | | | | |
From net investment income | | | (0.64) | | | | - | | | | - | | | | | |
| | | | | | | | | | | | | | | | |
Total distributions | | | (0.64) | | | | - | | | | - | | | | | |
| | | | | | | | | | | | | | | | |
| | | | | |
Net asset value, end of period | | $ | 12.05 | | | $ | 12.50 | | | $ | 10.09 | | | | | |
| | | | | | | | | | | | | | | | |
| | | | | |
Total return (C)(D) | | | 1.40% | | | | 23.89% | | | | 1.00% | (E) | | | | |
| | | | | |
RATIOS/SUPPLEMENTAL DATA: | | | | | | | | | | | | | | | | |
Net assets, end of period (in 000’s) | | $ | 2,342 | | | $ | 943 | | | $ | 217 | | | | | |
Ratio of expenses to average net assets | | | 2.74% | | | | 2.99% | | | | 3.53% | (F) | | | | |
Ratio of net investment loss to average net assets | | | (1.38%) | | | | (1.32%) | | | | (2.21%) | (F) | | | | |
Portfolio turnover rate | | | 11% | | | | 30% | | | | 37% | (E) | | | | |
| (A) | For the period October 12, 2011 (Commencement of Operations) to September 30, 2012. |
| (B) | Per share amounts calculated using average shares method, which more appropriately presents the per share data for the period. |
| (C) | Total return calculation does not reflect redemption fee. |
| (D) | Total return in the above table represents the rate that the investor would have earned or lost on an investment in the Fund assuming reinvestment of dividends. |
| (E) | For periods of less than one full year, total return and turnover are not annualized. |
The accompanying notes are an integral part of these financial statements.
95
Timothy Israel Common Values Fund (Class I Shares)
Selected data based on a share outstanding throughout the period
| | | | | | | | | | |
| | | For the Year
ended
September 30,
2014 | | | For the Period
ended
September 30, 2013
(A) | | | |
| | | |
| | | | | | | | | | |
Net asset value, beginning of period | | $ | 12.67 | | | $ | 12.21 | | | |
| | | | | | | | | | |
| | | |
INCOME (LOSS) FROM INVESTMENT OPERATIONS: | | | | | | | | | | |
Net investment income (loss) (B) | | | (0.05 | ) | | | 0.01 | | | |
Net realized and unrealized gain on investments | | | 0.37 | | | | 0.45 | | | |
| | | | | | | | | | |
Total from investment operations | | | 0.32 | | | | 0.46 | | | |
| | | | | | | | | | |
| | | |
LESS DISTRIBUTIONS: | | | | | | | | | | |
From net investment income | | | (0.70 | ) | | | - | | | |
| | | | | | | | | | |
Total distributions | | | (0.70 | ) | | | - | | | |
| | | | | | | | | | |
Net asset value, end of period | | $ | 12.29 | | | $ | 12.67 | | | |
| | | | | | | | | | |
Total return (C) | | | 2.36 | % | | | 3.77 | % (D) | | |
RATIOS/SUPPLEMENTAL DATA: | | | | | | | | | | |
Net assets, end of period (in 000’s) | | $ | 13 | | | $ | 104 | | | |
Ratio of expenses to average net assets | | | 1.78 | % | | | 1.99 | % (E) | | |
Ratio of net investment loss to average net assets | | | (0.36 | %) | | | (0.32 | %) (E) | | |
Portfolio turnover rate | | | 11 | % | | | 30 | % (D) | | |
| (A) | For the period August 1, 2013 (Commencement of Operations) to September 30, 2013. |
| (B) | Per share amounts calculated using average shares method, which more appropriately presents the per share data for the period. |
| (C) | Total return in the above table represents the rate that the investor would have earned or lost on an investment in the Fund assuming reinvestment of dividends. |
| (D) | For periods of less than one full year, total return and turnover are not annualized. |
The accompanying notes are an integral part of these financial statements.
96
Timothy Defensive Strategies Fund (Class A Shares)
Selected data based on a share outstanding throughout each period
| | | | | | | | | | | | | | | | | | | | |
| | | For the Year
ended
September 30,
2014 | | | For the Year
ended
September 30,
2013 | | | For the Year
ended
September 30,
2012 | | | For the Year
ended
September 30,
2011 | | | For the Period
ended
September 30,
2010 (A) | |
| | | | | |
Net asset value, beginning of period | | $ | 11.12 | | | $ | 12.12 | | | $ | 11.28 | | | $ | 10.70 | | | $ | 10.00 | |
| | | | | | | | | | | | | | | | | | | | |
| | | | | |
INCOME (LOSS) FROM INVESTMENT OPERATIONS: | | | | | | | | | | | | | | | | | | | | |
Net investment income | | | 0.09 | (B) | | | 0.06 | (B) | | | 0.02 | (B) | | | 0.09 | (B) | | | 0.02 | |
Net realized and unrealized gain (loss) on investments | | | 0.25 | | | | (1.04) | | | | 1.62 | | | | 0.54 | | | | 1.08 | |
| | | | | | | | | | | | | | | | | | | | |
Total from investment operations | | | 0.34 | | | | (0.98) | | | | 1.64 | | | | 0.63 | | | | 1.10 | |
| | | | | | | | | | | | | | | | | | | | |
| | | | | |
LESS DISTRIBUTIONS: | | | | | | | | | | | | | | | | | | | | |
From net investment income | | | (0.05) | | | | - | | | | (0.10) | | | | - | | | | - | |
From net realized gains on investments | | | (0.03) | | | | (0.02) | | | | (0.66) | | | | (0.05) | | | | (0.21) | |
From return of capital | | | - | | | | - | | | | (0.04) | | | | - | | | | (0.19) | |
| | | | | | | | | | | | | | | | | | | | |
Total distributions | | | (0.08) | | | | (0.02) | | | | (0.80) | | | | (0.05) | | | | (0.40) | |
| | | | | | | | | | | | | | | | | | | | |
| | | | | |
Net asset value, end of period | | $ | 11.38 | | | $ | 11.12 | | | $ | 12.12 | | | $ | 11.28 | | | $ | 10.70 | |
| | | | | | | | | | | | | | | | | | | | |
| | | | | |
Total return (C)(D) | | | 3.06% | | | | (8.09)% | | | | 14.87% | | | | 5.88% | | | | 10.97% | (E) |
| | | | | |
RATIOS/SUPPLEMENTAL DATA: | | | | | | | | | | | | | | | | | | | | |
Net assets, end of period (in 000’s) | | $ | 54,054 | | | $ | 51,859 | | | $ | 52,529 | | | $ | 43,670 | | | $ | 23,360 | |
Ratios to average net assets | | | | | | | | | | | | | | | | | | | | |
Expenses, before waiver and reimbursement | | | 1.28% | | | | - | | | | - | | | | - | | | | - | |
Expenses, net waiver and reimbursement | | | 1.28% | | | | 1.26% | | | | 1.33% | | | | 1.29% | | | | 1.51% | (F) |
Net investment income, before waiver and reimbursement | | | 0.78% | | | | - | | | | - | | | | - | | | | - | |
Net investment income, net waiver and reimbursement | | | 0.78% | | | | 0.52% | | | | 0.20% | | | | 0.75% | | | | 0.13% | (F) |
Portfolio turnover rate | | | 24% | | | | 56% | | | | 247% | | | | 64% | | | | 41% | (E) |
| (A) | For the period November 4, 2009 (Commencement of Operations) to September 30, 2010. |
| (B) | Per share amounts calculated using average shares method, which more appropriately presents the per share data for the period. |
| (C) | Total return calculation does not reflect sales load. |
| (D) | Total return in the above table represents the rate that the investor would have earned or lost on an investment in the Fund assuming reinvestment of dividends. Total return would have been higher or lower if certain expenses had not been reimbursed, waived or recouped. |
| (E) | For periods of less than one full year, total return and turnover are not annualized. |
The accompanying notes are an integral part of these financial statements.
97
Timothy Defensive Strategies Fund (Class C Shares)
Selected data based on a share outstanding throughout each period
| | | | | | | | | | | | | | | | | | | | |
| | | For the Year
ended
September 30,
2014 | | | For the Year
ended
September 30,
2013 | | | For the Year
ended
September 30,
2012 | | | For the Year
ended
September 30,
2011 | | | For the Period
ended
September 30,
2010 (A) | |
| | | | | |
Net asset value, beginning of period | | $ | 10.82 | | | $ | 11.88 | | | $ | 11.09 | | | $ | 10.58 | | | $ | 10.00 | |
| | | | | | | | | | | | | | | | | | | | |
| | | | | |
INCOME (LOSS) FROM INVESTMENT OPERATIONS: | | | | | | | | | | | | | | | | | | | | |
Net investment income (loss) | | | - | *(B) | | | (0.03) | (B) | | | (0.07) | (B) | | | 0.02 | (B) | | | (0.06) | |
Net realized and unrealized gain (loss) on investments | | | 0.25 | | | | (1.01) | | | | 1.58 | | | | 0.54 | | | | 1.08 | |
| | | | | | | | | | | | | | | | | | | | |
Total from investment operations | | | 0.25 | | | | (1.04) | | | | 1.51 | | | | 0.56 | | | | 1.02 | |
| | | | | | | | | | | | | | | | | | | | |
| | | | | |
LESS DISTRIBUTIONS: | | | | | | | | | | | | | | | | | | | | |
From net investment income | | | - | | | | - | | | | (0.02) | | | | - | | | | - | |
From net realized gains on investments | | | (0.03) | | | | (0.02) | | | | (0.66) | | | | (0.05) | | | | (0.21) | |
From return of capital | | | - | | | | - | | | | (0.04) | | | | - | | | | (0.23) | |
| | | | | | | | | | | | | | | | | | | | |
Total distributions | | | (0.03) | | | | (0.02) | | | | (0.72) | | | | (0.05) | | | | (0.44) | |
| | | | | | | | | | | | | | | | | | | | |
| | | | | |
Net asset value, end of period | | $ | 11.04 | | | $ | 10.82 | | | $ | 11.88 | | | $ | 11.09 | | | $ | 10.58 | �� |
| | | | | | | | | | | | | | | | | | | | |
| | | | | |
Total return (C)(D) | | | 2.27% | | | | (8.75)% | | | | 13.91% | | | | 5.28% | | | | 10.18% | (E) |
| | | | | |
RATIOS/SUPPLEMENTAL DATA: | | | | | | | | | | | | | | | | | | | | |
Net assets, end of period (in 000’s) | | $ | 14,461 | | | $ | 16,718 | | | $ | 18,801 | | | $ | 13,100 | | | $ | 5,527 | |
Ratios to average net assets | | | | | | | | | | | | | | | | | | | | |
Expenses, before waiver and reimbursement | | | 2.04% | | | | - | | | | - | | | | - | | | | - | |
Expenses, net waiver and reimbursement | | | 2.03% | | | | 2.02% | | | | 2.09% | | | | 2.03% | | | | 2.28% | (F) |
Net investment loss, before waiver and reimbursement | | | (0.02)% | | | | - | | | | - | | | | - | | | | - | |
Net investment income (loss), net waiver and reimbursement | | | (0.01)% | | | | (0.25)% | | | | (0.60)% | | | | 0.15% | | | | (0.64)% | (F) |
Portfolio turnover rate | | | 24% | | | | 56% | | | | 247% | | | | 64% | | | | 41% | (E) |
*Amount is less than $0.005 per share.
| (A) | For the period November 4, 2009 (Commencement of Operations) to September 30, 2010. |
| (B) | Per share amounts calculated using average shares method, which more appropriately presents the per share data for the period. |
| (C) | Total return calculation does not reflect redemption fee. |
| (D) | Total return in the above table represents the rate that the investor would have earned or lost on an investment in the Fund assuming reinvestment of dividends. |
| | Total return would have been higher or lower if certain expenses had not been reimbursed, waived or recouped. |
| (E) | For periods of less than one full year, total return and turnover are not annualized. |
The accompanying notes are an integral part of these financial statements.
98
Timothy Defensive Strategies Fund (Class I Shares)
Selected data based on a share outstanding throughout the period
| | | | | | | | | | |
| | | For the Year
ended
September 30,
2014 | | | For the Period ended
September 30, 2013 (A) | | | |
| | | |
| | | | | | | | | | |
Net asset value, beginning of period | | $ | 11.11 | | | $ | 11.11 | | | |
| | | | | | | | | | |
| | | |
INCOME (LOSS) FROM INVESTMENT OPERATIONS: | | | | | | | | | | |
Net investment income (B) | | | 0.18 | | | | 0.01 | | | |
Net realized and unrealized gain (loss) on investments | | | 0.20 | | | | (0.01) | | | |
| | | | | | | | | | |
Total from investment operations | | | 0.38 | | | | 0.00 | | | |
| | | | | | | | | | |
| | | |
LESS DISTRIBUTIONS: | | | | | | | | | | |
From net investment income | | | (0.10) | | | | - | | | |
From net realized gains on investments | | | (0.03) | | | | - | | | |
| | | | | | | | | | |
Total distributions | | | (0.13) | | | | - | | | |
| | | | | | | | | | |
| | | |
Net asset value, end of period | | $ | 11.36 | | | $ | 11.11 | | | |
| | | | | | | | | | |
| | | |
Total return (C) | | | 3.39% | | | | 0.00% | (D) | | |
| | | |
RATIOS/SUPPLEMENTAL DATA: | | | | | | | | | | |
Net assets, end of period | | $ | 97 | | | $ | 100 | | | |
Ratios to average net assets | | | | | | | | | | |
Expenses, before waiver and reimbursement | | | 0.74% | | | | - | | | |
Expenses, net waiver and reimbursement | | | 0.72% | | | | 1.01% | (E) | | |
Net investment income, before waiver and reimbursement | | | 1.50% | | | | - | | | |
Net investment income , net waiver and reimbursement | | | 1.52% | | | | 0.77% | (E) | | |
Portfolio turnover rate | | | 24% | | | | 56% | (D) | | |
| (A) | For the period August 1, 2013 (Commencement of Operations) to September 30, 2013. |
| (B) | Per share amounts calculated using average shares method, which more appropriately presents the per share data for the period. |
| (C) | Total return in the above table represents the rate that the investor would have earned or lost on an investment in the Fund assuming reinvestment of dividends. |
| | Total return would have been higher or lower if certain expenses had not been reimbursed, waived or recouped. |
| (D) | For periods of less than one full year, total return and turnover are not annualized. |
The accompanying notes are an integral part of these financial statements.
99
Timothy Strategic Growth Fund (Class A Shares)
Selected data based on a share outstanding throughout each year
| | | | | | | | | | | | | | | | | | | | |
| | | For the Year
ended
September 30,
2014 | | | For the Year
ended
September 30,
2013 | | | For the Year
ended
September 30,
2012 | | | For the Year
ended
September 30,
2011 | | | For the Year
ended
September 30,
2010 | |
| | | | | |
Net asset value, beginning of year | | $ | 8.34 | | | $ | 7.44 | | | $ | 6.27 | | | $ | 6.49 | | | $ | 5.97 | |
| | | | | | | | | | | | | | | | | | | | |
| | | | | |
INCOME (LOSS) FROM INVESTMENT OPERATIONS: | | | | | | | | | | | | | | | | | | | | |
Net investment income (loss) | | | 0.12 | (A) | | | 0.02 | (A) | | | 0.04 | (A) | | | (0.02) | (A) | | | 0.02 | |
Net realized and unrealized gain (loss) on investments | | | 0.45 | | | | 0.93 | | | | 1.13 | | | | (0.19) | | | | 0.50 | |
| | | | | | | | | | | | | | | | | | | | |
Total from investment operations | | | 0.57 | | | | 0.95 | | | | 1.17 | | | | (0.21) | | | | 0.52 | |
| | | | | | | | | | | | | | | | | | | | |
| | | | | |
LESS DISTRIBUTIONS: | | | | | | | | | | | | | | | | | | | | |
From net investment income | | | (0.01) | | | | (0.05) | | | | - | | | | - | | | | - | |
From return of capital | | | - | | | | - | | | | - | | | | (0.01) | | | | - | |
| | | | | | | | | | | | | | | | | | | | |
Total distributions | | | (0.01) | | | | (0.05) | | | | - | | | | (0.01) | | | | - | |
| | | | | | | | | | | | | | | | | | | | |
Net asset value, end of year | | $ | 8.90 | | | $ | 8.34 | | | $ | 7.44 | | | $ | 6.27 | | | $ | 6.49 | |
| | | | | | | | | | | | | | | | | | | | |
| | | | | |
Total return (B)(C) | | | 6.82% | | | | 12.78% | | | | 18.66% | | | | (3.29)% | | | | 8.71% | |
| | | | | |
RATIOS/SUPPLEMENTAL DATA: | | | | | | | | | | | | | | | | | | | | |
Net assets, end of year (in 000’s) | | $ | 36,951 | | | $ | 34,466 | | | $ | 32,250 | | | $ | 31,269 | | | $ | 34,098 | |
Ratio of expenses to average net assets (D) | | | 1.07% | | | | 1.08% | | | | 1.15% | | | | 1.05% | | | | 1.11% | |
Ratio of net investment income (loss), to average net assets (D)(E) | | | 1.34% | | | | 0.24% | | | | (0.60)% | | | | (0.23)% | | | | 0.30% | |
Portfolio turnover rate | | | 14% | | | | 19% | | | | 33% | | | | 22% | | | | 25% | |
| (A) | Per share amounts calculated using average shares method, which more appropriately presents the per share data for the year. |
| (B) | Total return calculation does not reflect sales load. |
| (C) | Total return in the above table represents the rate that the investor would have earned or lost on an investment in the Fund assuming reinvestment of dividends. |
| | Total return would have been higher or lower if certain expenses had not been reimbursed, waived or recouped. |
| (D) | These ratios exclude the impact of expenses of the underlying security holdings as represented in the Schedule of Investments. |
| (E) | Recognition of net investment income (loss) by the Fund is affected by the timing of the declaration of dividends by the underlying investment companies in which the Fund invests. |
The accompanying notes are an integral part of these financial statements.
100
Timothy Strategic Growth Fund (Class C Shares)
Selected data based on a share outstanding throughout each year
| | | | | | | | | | | | | | | | | | | | |
| | | For the Year
ended
September 30,
2014 | | | For the Year
ended
September 30,
2013 | | | For the Year
ended
September 30,
2012 | | | For the Year
ended
September 30,
2011 | | | For the Year
ended
September 30,
2010 | |
| | | | | |
Net asset value, beginning of year | | $ | 7.69 | | | $ | 6.87 | | | $ | 5.82 | | | $ | 6.09 | | | $ | 5.64 | |
| | | | | | | | | | | | | | | | | | | | |
| | | | | |
INCOME (LOSS) FROM INVESTMENT OPERATIONS: | | | | | | | | | | | | | | | | | | | | |
Net investment income (loss) | | | 0.03 | (A) | | | (0.04) | (A) | | | (0.01) | (A) | | | (0.07) | (A) | | | (0.03) | |
Net realized and unrealized gain (loss) on investments | | | 0.43 | | | | 0.86 | | | | 1.06 | | | | (0.20) | | | | 0.48 | |
| | | | | | | | | | | | | | | | | | | | |
Total from investment operations | | | 0.46 | | | | 0.82 | | | | 1.05 | | | | (0.27) | | | | 0.45 | |
| | | | | | | | | | | | | | | | | | | | |
Net asset value, end of year | | $ | 8.15 | | | $ | 7.69 | | | $ | 6.87 | | | $ | 5.82 | | | $ | 6.09 | |
| | | | | | | | | | | | | | | | | | | | |
| | | | | |
Total return (B)(C) | | | 5.98% | | | | 11.94% | | | | 18.04% | | | | (4.43)% | | | | 7.98% | |
| | | | | |
RATIOS/SUPPLEMENTAL DATA: | | | | | | | | | | | | | | | | | | | | |
Net assets, end of year (in 000’s) | | $ | 8,842 | | | $ | 7,668 | | | $ | 6,836 | | | $ | 6,446 | | | $ | 6,950 | |
Ratio of expenses to average net assets (D) | | | 1.82% | | | | 1.83% | | | | 1.90% | | | | 1.82% | | | | 1.86% | |
Ratio of net investment income (loss), to average net assets (D)(E) | | | 0.50% | | | | (0.52)% | | | | (0.22)% | | | | (1.00)% | | | | (0.46)% | |
Portfolio turnover rate | | | 14% | | | | 19% | | | | 33% | | | | 22% | | | | 25% | |
| (A) | Per share amounts calculated using average shares method, which more appropriately presents the per share data for the year. |
| (B) | Total return calculation does not reflect sales load. |
| (C) | Total return in the above table represents the rate that the investor would have earned or lost on an investment in the Fund assuming reinvestment of dividends. |
| | Total return would have been higher or lower if certain expenses had not been reimbursed, waived or recouped. |
| (D) | These ratios exclude the impact of expenses of the underlying security holdings as represented in the Schedule of Investments. |
| (E) | Recognition of net investment income (loss) by the Fund is affected by the timing of the declaration of dividends by the underlying investment companies in which the Fund invests. |
The accompanying notes are an integral part of these financial statements.
101
Timothy Conservative Growth Fund (Class A Shares)
Selected data based on a share outstanding throughout each year
| | | | | | | | | | | | | | | | | | | | |
| | | For the Year
ended
September 30,
2014 | | | For the Year
ended
September 30,
2013 | | | For the Year
ended
September 30,
2012 | | | For the Year
ended
September 30,
2011 | | | For the Year
ended
September 30,
2010 | |
| | | | | |
Net asset value, beginning of year | | $ | 10.51 | | | $ | 9.95 | | | $ | 8.80 | | | $ | 8.83 | | | $ | 8.25 | |
| | | | | | | | | | | | | | | | | | | | |
| | | | | |
INCOME (LOSS) FROM INVESTMENT OPERATIONS: | | | | | | | | | | | | | | | | | | | | |
Net investment income | | | 0.14 | (A) | | | 0.03 | (A) | | | 0.07 | (A) | | | 0.04 | (A) | | | 0.09 | |
Net realized and unrealized gain on investments | | | 0.41 | | | | 0.61 | | | | 1.09 | | | | 0.01 | | | | 0.60 | |
| | | | | | | | | | | | | | | | | | | | |
Total from investment operations | | | 0.55 | | | | 0.64 | | | | 1.16 | | | | 0.05 | | | | 0.69 | |
| | | | | | | | | | | | | | | | | | | | |
| | | | | |
LESS DISTRIBUTIONS: | | | | | | | | | | | | | | | | | | | | |
From net investment income | | | (0.05) | | | | (0.08) | | | | (0.01) | | | | (0.08) | | | | (0.11) | |
| | | | | | | | | | | | | | | | | | | | |
Total distributions | | | (0.05) | | | | (0.08) | | | | (0.01) | | | | (0.08) | | | | (0.11) | |
| | | | | | | | | | | | | | | | | | | | |
Net asset value, end of year | | $ | 11.01 | | | $ | 10.51 | | | $ | 9.95 | | | $ | 8.80 | | | $ | 8.83 | |
| | | | | | | | | | | | | | | | | | | | |
| | | | | |
Total return (B)(C) | | | 5.23% | | | | 6.44% | | | | 13.22% | | | | 0.50% | | | | 8.47% | |
| | | | | |
RATIOS/SUPPLEMENTAL DATA: | | | | | | | | | | | | | | | | | | | | |
Net assets, end of year (in 000’s) | | $ | 47,543 | | | $ | 44,238 | | | $ | 40,042 | | | $ | 35,331 | | | $ | 35,031 | |
Ratio of expenses to average net assets (D) | | | 1.05% | | | | 1.05% | | | | 1.11% | | | | 1.05% | | | | 1.13% | |
Ratio of net investment income to average net assets (D)(E) | | | 1.26% | | | | 0.25% | | | | 0.71% | | | | 0.48% | | | | 1.07% | |
Portfolio turnover rate | | | 19% | | | | 22% | | | | 32% | | | | 23% | | | | 31% | |
| (A) | Per share amounts calculated using average shares method, which more appropriately presents the per share data for the year. |
| (B) | Total return calculation does not reflect sales load. |
| (C) | Total return in the above table represents the rate that the investor would have earned or lost on an investment in the Fund assuming reinvestment of dividends. Total return would have been higher or lower if certain expenses had not been reimbursed, waived or recouped. |
| (D) | These ratios exclude the impact of expenses of the underlying security holdings as represented in the Schedule of Investments. |
| (E) | Recognition of net investment income (loss) by the Fund is affected by the timing of the declaration of dividends by the underlying investment companies in which the Fund invests. |
The accompanying notes are an integral part of these financial statements.
102
Timothy Conservative Growth Fund (Class C Shares)
Selected data based on a share outstanding throughout each year
| | | | | | | | | | | | | | | | | | | | |
| | | For the Year
ended
September 30,
2014 | | | For the Year
ended
September 30,
2013 | | | For the Year
ended
September 30,
2012 | | | For the Year
ended
September 30,
2011 | | | For the Year
ended
September 30,
2010 | |
| | | | | |
Net asset value, beginning of year | | $ | 9.79 | | | $ | 9.27 | | | $ | 8.24 | | | $ | 8.32 | | | $ | 7.83 | |
| | | | | | | | | | | | | | | | | | | | |
| | | | | |
INCOME (LOSS) FROM INVESTMENT OPERATIONS: | | | | | | | | | | | | | | | | | | | | |
Net investment income (loss) | | | 0.03 | (A) | | | (0.05) | (A) | | | (0.01) | (A) | | | (0.02) | (A) | | | 0.02 | |
Net realized and unrealized gain (loss) on investments | | | 0.40 | | | | 0.57 | | | | 1.04 | | | | - | * | | | 0.57 | |
| | | | | | | | | | | | | | | | | | | | |
Total from investment operations | | | 0.43 | | | | 0.52 | | | | 1.03 | | | | (0.02) | | | | 0.59 | |
| | | | | | | | | | | | | | | | | | | | |
| | | | | |
LESS DISTRIBUTIONS: | | | | | | | | | | | | | | | | | | | | |
From net investment income | | | - | | | | - | | | | - | | | | (0.06) | | | | (0.10) | |
| | | | | | | | | | | | | | | | | | | | |
Total distributions | | | - | | | | - | | | | - | | | | (0.06) | | | | (0.10) | |
| | | | | | | | | | | | | | | | | | | | |
Net asset value, end of year | | $ | 10.22 | | | $ | 9.79 | | | $ | 9.27 | | | $ | 8.24 | | | $ | 8.32 | |
| | | | | | | | | | | | | | | | | | | | |
| | | | | |
Total return (B)(C) | | | 4.39% | | | | 5.61% | | | | 12.50% | | | | (0.25)% | | | | 7.57% | |
| | | | | |
RATIOS/SUPPLEMENTAL DATA: | | | | | | | | | | | | | | | | | | | | |
Net assets, end of year (in 000’s) | | $ | 12,359 | | | $ | 10,419 | | | $ | 9,191 | | | $ | 7,963 | | | $ | 7,365 | |
Ratio of expenses to average net assets (D) | | | 1.79% | | | | 1.80% | | | | 1.86% | | | | 1.80% | | | | 1.88% | |
Ratio of net investment income (loss), to average net assets (D)(E) | | | 0.41% | | | | (0.50)% | | | | (0.06)% | | | | (0.27)% | | | | 0.29% | |
Portfolio turnover rate | | | 19% | | | | 22% | | | | 32% | | | | 23% | | | | 31% | |
*Amount is less than $0.005 per share.
| (A) | Per share amounts calculated using average shares method, which more appropriately presents the per share data for the year. |
| (B) | Total return calculation does not reflect sales load. |
| (C) | Total return in the above table represents the rate that the investor would have earned or lost on an investment in the Fund assuming reinvestment of dividends. Total return would have been higher or lower if certain expenses had not been reimbursed, waived or recouped. |
| (D) | These ratios exclude the impact of expenses of the underlying security holdings as represented in the Schedule of Investments. |
| (E) | Recognition of net investment income (loss) by the Fund is affected by the timing of the declaration of dividends by the underlying investment companies in which the Fund invests. |
The accompanying notes are an integral part of these financial statements.
103
Timothy Emerging Markets Fund (Class A Shares)
Selected data based on a share outstanding throughout the period
| | | | | | | | | | |
| | | For the Year
ended
September 30,
2014 | | | For the Period ended
September 30, 2013
(A) | | | |
|
| | | | | | | | | | |
Net asset value, beginning of period | | $ | 10.53 | | | $ | 10.00 | | | |
| | | | | | | | | | |
| | | |
INCOME (LOSS) FROM INVESTMENT OPERATIONS: | | | | | | | | | | |
Net investment loss (B) | | | (0.02) | | | | (0.08) | | | |
Net realized and unrealized gain (loss) on investments | | | 0.08 | | | | 0.61 | | | |
| | | | | | | | | | |
Total from investment operations | | | 0.06 | | | | 0.53 | | | |
| | | | | | | | | | |
| | | |
LESS DISTRIBUTIONS: | | | | | | | | | | |
From net investment income | | | - | | | | - | | | |
From net realized gains on investments | | | (0.36) | | | | - | | | |
| | | | | | | | | | |
Total distributions | | | (0.36) | | | | - | | | |
| | | | | | | | | | |
Net asset value, end of period | | $ | 10.23 | | | $ | 10.53 | | | |
| | | | | | | | | | |
| | | |
Total return (C)(D) | | | 0.61% | | | | 5.30% | (E) | | |
| | | |
RATIOS/SUPPLEMENTAL DATA: | | | | | | | | | | |
Net assets, end of period (in 000’s) | | $ | 10,803 | | | $ | 8,675 | | | |
Ratios to average net assets | | | | | | | | | | |
Expenses, before waiver and reimbursement | | | 2.55% | | | | - | | | |
Expenses, net waiver and reimbursement | | | 2.55% | | | | 3.03% | (F) | | |
Net investment loss, before waiver and reimbursement | | | (0.19%) | | | | - | | | |
Net investment loss, net waiver and reimbursement | | | (0.19%) | | | | (0.95%) | (F) | | |
Portfolio turnover rate | | | 39% | | | | 19% | (E) | | |
|
| (A) | For the period December 3, 2012 (Commencement of Operations) to September 30, 2013. |
| (B) | Per share amounts calculated using average shares method, which more appropriately presents the per share data for the period. |
| (C) | Total return calculation does not reflect sales load. |
| (D) | Total return in the above table represents the rate that the investor would have earned or lost on an investment in the Fund assuming reinvestment of dividends. Total return would have been higher or lower if certain expenses had not been reimbursed, waived or recouped. |
| (E) | For periods of less than one full year, total return and turnover are not annualized. |
The accompanying notes are an integral part of these financial statements.
104
Timothy Emerging Markets Fund (Class C Shares)
Selected data based on a share outstanding throughout the period
| | | | | | | | | | |
| | | For the Year
ended
September 30,
2014 | | | For the Period ended
September 30, 2013
(A) | | | |
|
| | | | | | | | | | |
Net asset value, beginning of period | | $ | 10.48 | | | $ | 10.00 | | | |
| | | | | | | | | | |
| | | |
INCOME (LOSS) FROM INVESTMENT OPERATIONS: | | | | | | | | | | |
Net investment loss(B) | | | (0.09) | | | | (0.12) | | | |
Net realized and unrealized gain (loss) on investments | | | 0.06 | | | | 0.60 | | | |
| | | | | | | | | | |
Total from investment operations | | | (0.03) | | | | 0.48 | | | |
| | | | | | | | | | |
| | | |
LESS DISTRIBUTIONS: | | | | | | | | | | |
From net investment income | | | - | | | | - | | | |
From net realized gains on investments | | | (0.36) | | | | - | | | |
| | | | | | | | | | |
Total distributions | | | (0.36) | | | | - | | | |
| | | | | | | | | | |
Net asset value, end of period | | $ | 10.09 | | | $ | 10.48 | | | |
| | | | | | | | | | |
Total return (C)(D) | | | (0.27)% | | | | 4.80% | (E) | | |
| | | |
RATIOS/SUPPLEMENTAL DATA: | | | | | | | | | | |
Net assets, end of period (in 000’s) | | $ | 883 | | | $ | 291 | | | |
Ratios to average net assets | | | | | | | | | | |
Expenses, before waiver and reimbursement | | | 3.25% | | | | - | | | |
Expenses, net waiver and reimbursement | | | 3.25% | | | | 3.76% | (F) | | |
Net investment loss, before waiver and reimbursement | | | (0.83%) | | | | - | | | |
Net investment loss, net waiver and reimbursement | | | (0.83%) | | | | (1.39%) | (F) | | |
Portfolio turnover rate | | | 39% | | | | 19% | (E) | | |
|
| (A) | For the period December 3, 2012 (Commencement of Operations) to September 30, 2013. |
| (B) | Per share amounts calculated using average shares method, which more appropriately presents the per share data for the period. |
| (C) | Total return calculation does not reflect redemption fee. |
| (D) | Total return in the above table represents the rate that the investor would have earned or lost on an investment in the Fund assuming reinvestment of dividends. Total return would have been higher or lower if certain expenses had not been reimbursed, waived or recouped. |
| (E) | For periods of less than one full year, total return and turnover are not annualized. |
The accompanying notes are an integral part of these financial statements.
105
Timothy Emerging Markets Fund (Class I Shares)
Selected data based on a share outstanding throughout the period
| | | | | | | | | | |
| | | For the Year ended September 30, 2014 | | | For the Period ended September 30, 2013
(A) | | | |
|
| | | | | | | | | | |
Net asset value, beginning of period | | $ | 10.53 | | | $ | 9.96 | | | |
| | | | | | | | | | |
INCOME (LOSS) FROM INVESTMENT OPERATIONS: | | | | | | | | | | |
Net investment income (loss) (B) | | | 0.03 | | | | - | * | | |
Net realized and unrealized gain on investments | | | 0.05 | (F) | | | 0.57 | | | |
| | | | | | | | | | |
Total from investment operations | | | 0.08 | | | | 0.57 | | | |
| | | | | | | | | | |
| | | |
LESS DISTRIBUTIONS: | | | | | | | | | | |
From net realized gains on investments | | | (0.36) | | | | - | | | |
| | | | | | | | | | |
Total distributions | | | (0.36) | | | | - | | | |
| | | | | | | | | | |
Net asset value, end of period | | $ | 10.25 | | | $ | 10.53 | | | |
| | | | | | | | | | |
| | | |
Total return (C) | | | 0.81% | | | | 5.72% | (D) | | |
| | | |
RATIOS/SUPPLEMENTAL DATA: | | | | | | | | | | |
Net assets, end of period | | $ | 333 | | | $ | 106 | | | |
Ratios to average net assets | | | | | | | | | | |
Expenses, before waiver and reimbursement | | | 2.25% | | | | - | | | |
Expenses, before waiver and reimbursement | | | 2.25% | | | | 2.78% | (E) | | |
Net investment income, before waiver and reimbursement | | | 0.25% | | | | - | | | |
Net investment income (loss), net waiver and reimbursement | | | 0.26% | | | | (0.70%) | (E) | | |
Portfolio turnover rate | | | 39% | | | | 19% | (D) | | |
|
*Amount is less than $0.005 per share.
| (A) | For the period August 1, 2013 (Commencement of Operations) to September 30, 2013. |
| (B) | Per share amounts calculated using average shares method, which more appropriately presents the per share data for the period. |
| (C) | Total return in the above table represents the rate that the investor would have earned or lost on an investment in the Fund assuming reinvestment of dividends. Total return would have been higher or lower if certain expenses had not been reimbursed, waived or recouped. |
| (D) | For periods of less than one full year, total return and turnover are not annualized. |
| (F) | Realized and unrealized gains per share in this caption are balancing amounts necessary to reconcile the change in net asset value per share for the period, and may not reconcile with the aggregate gains and losses in the Statements of Operations due to share transactions for the period. |
The accompanying notes are an integral part of these financial statements.
106
Timothy Growth & Income Fund (Class A Shares)
Selected data based on a share outstanding throughout the period
| | | | | | |
| | | For the Period ended
September 30, 2014
(A) | | | |
|
| | | | | | |
Net asset value, beginning of period | | $ | 10.00 | | | |
| | | | | | |
| | |
INCOME (LOSS) FROM INVESTMENT OPERATIONS: | | | | | | |
Net investment loss (B) | | | (0.02) | | | |
Net realized and unrealized gain on investments | | | 0.97 | | | |
| | | | | | |
Total from investment operations | | | 0.95 | | | |
| | | | | | |
Net asset value, end of period | | $ | 10.95 | | | |
| | | | | | |
| | |
Total return (C)(D) | | | 9.50% | (E) | | |
| | |
RATIOS/SUPPLEMENTAL DATA: | | | | | | |
Net assets, end of period (in 000’s) | | $ | 24,272 | | | |
Ratios to average net assets | | | | | | |
Expenses, before waiver and reimbursement | | | 1.68% | (F) | | |
Expenses, net waiver and reimbursement | | | 1.67% | (F) | | |
Net investment loss, before waiver and reimbursement | | | (0.21%) | (F) | | |
Net investment loss, net waiver and reimbursement | | | (0.21%) | (F) | | |
Portfolio turnover rate | | | 21% | (E) | | |
|
| (A) | For the period October 1, 2013 (Commencement of Operations) to September 30, 2014. |
| (B) | Per share amounts calculated using average shares method, which more appropriately presents the per share data for the period. |
| (C) | Total return calculation does not reflect sales load. |
| (D) | Total return in the above table represents the rate that the investor would have earned or lost on an investment in the Fund assuming reinvestment of dividends. |
| (E) | For periods of less than one full year, total return and turnover are not annualized. |
The accompanying notes are an integral part of these financial statements.
107
Timothy Growth & Income Fund (Class C Shares)
Selected data based on a share outstanding throughout the period
| | | | | | |
| | | For the | | | |
| | | Period ended | | | |
| | | September 30, 2014 | | | |
| | | (A) | | | |
|
| | | | | | |
Net asset value, beginning of period | | $ | 10.00 | | | |
| | | | | | |
| | |
INCOME (LOSS) FROM INVESTMENT OPERATIONS: | | | | | | |
Net investment loss (B) | | | (0.08) | | | |
Net realized and unrealized gain on investments | | | 0.95 | | | |
| | | | | | |
Total from investment operations | | | 0.87 | | | |
| | | | | | |
Net asset value, end of period | | $ | 10.87 | | | |
| | | | | | |
| | |
Total return (C)(D) | | | 8.70% | (E) | | |
| | |
RATIOS/SUPPLEMENTAL DATA: | | | | | | |
Net assets, end of period (in 000’s) | | $ | 2,081 | | | |
Ratios to average net assets | | | | | | |
Expenses, before waiver and reimbursement | | | 2.20% | (F) | | |
Expenses, net waiver and reimbursement | | | 2.19% | (F) | | |
Net investment loss, before waiver and reimbursement | | | (0.72%) | (F) | | |
Net investment loss, net waiver and reimbursement | | | (0.70%) | (F) | | |
Portfolio turnover rate | | | 21% | (E) | | |
|
| (A) | For the period October 1, 2013 (Commencement of Operations) to September 30, 2014. |
| (B) | Per share amounts calculated using average shares method, which more appropriately presents the per share data for the period. |
| (C) | Total return calculation does not reflect redemption fee. |
| (D) | Total return in the above table represents the rate that the investor would have earned or lost on an investment in the Fund assuming reinvestment of dividends. |
| (E) | For periods of less than one full year, total return and turnover are not annualized. |
The accompanying notes are an integral part of these financial statements.
108
Timothy Growth & Income Fund (Class I Shares)
Selected data based on a share outstanding throughout the period
| | | | | | |
| | | For the Period ended
September 30, 2014
(A) | | | |
|
| | | | | | |
Net asset value, beginning of period | | $ | 10.00 | | | |
| | | | | | |
INCOME (LOSS) FROM INVESTMENT OPERATIONS: | | | | | | |
Net investment income (B) | | | 0.04 | | | |
Net realized and unrealized gain on investments | | | 0.92 | (F) | | |
| | | | | | |
Total from investment operations | | | 0.96 | | | |
| | | | | | |
Net asset value, end of period | | $ | 10.96 | | | |
| | | | | | |
Total return (C) | | | 9.60% | (D) | | |
| | |
RATIOS/SUPPLEMENTAL DATA: | | | | | | |
Net assets, end of period (000’s) | | $ | 1,507 | | | |
Ratios to average net assets | | | | | | |
Expenses, before waiver and reimbursement | | | 1.18% | (E) | | |
Expenses, net waiver and reimbursement | | | 1.16% | (E) | | |
Net investment income (loss), before waiver and reimbursement | | | 0.30% | (E) | | |
Net investment income (loss), net waiver and reimbursement | | | 0.31% | (E) | | |
Portfolio turnover rate | | | 21% | (D) | | |
|
| (A) | For the period October 1, 2013 (Commencement of Operations) to September 30, 2014. |
| (B) | Per share amounts calculated using average shares method, which more appropriately presents the per share data for the period. |
| (C) | Total return in the above table represents the rate that the investor would have earned or lost on an investment in the Fund assuming reinvestment of dividends. |
| (D) | For periods of less than one full year, total return and turnover are not annualized. |
| (F) | Realized and unrealized gains per share in this caption are balancing amounts necessary to reconcile the change in net asset value per share for the period, and may not reconcile with the aggregate gains and losses in the Statements of Operations due to share transactions for the period. |
The accompanying notes are an integral part of these financial statements.
109
Notes to Financial Statements
September 30, 2014
Timothy Plan Family of Funds
Note 1 | Significant Accounting Policies
The Timothy Plan (the “Trust”) is organized as a series of a Delaware business trust pursuant to a trust agreement dated December 16, 1993. The Trust is registered under the Investment Company Act of 1940, as amended, as an open-end diversified management investment company. As of September 30, 2014, the Trust consisted of fifteen series. These financial statements include the following thirteen series: Timothy Plan Aggressive Growth Fund, Timothy Plan International Fund, Timothy Plan Large/Mid Cap Growth Fund, Timothy Plan Small Cap Value Fund, Timothy Plan Large/Mid Cap Value Fund, Timothy Plan Fixed Income Fund, Timothy Plan High Yield Bond Fund, Timothy Plan Defensive Strategies Fund, Timothy Plan Israel Common Values Fund, Timothy Plan Strategic Growth Fund, Timothy Plan Conservative Growth Fund, Timothy Plan Emerging Markets Fund and Timothy Plan Growth & Income Fund (the “Funds”).
The Timothy Plan Aggressive Growth Fund’s investment objective is long-term growth of capital. The Fund seeks to achieve its investment objective by normally investing at least 80% of the Fund’s total assets in U.S. common stocks without regard to market capitalizations and investing in the securities of a limited number of companies which the Fund’s Advisor believes show a high probability for superior growth.
The Timothy Plan International Fund’s investment objective is long-term growth of capital. The Fund seeks to achieve its investment objective by normally investing at least 80% of the Fund’s total assets in the common stock and similar securities of foreign companies through the purchase of American Depositary Receipts (“ADRs”) without regard to market capitalization, investing its assets in the ADRs of companies which the Fund’s advisor believes show a high probability for superior growth, and allocating investments across countries and regions considering the size of the market in each country and region relative to the size of the international market as a whole. Although the Fund maintains a diversified investment portfolio, the political or economic developments within a particular country or region may have an adverse effect on the ability of domiciled issuers to meet their obligations. Additionally, political or economic developments may have an effect on the liquidity and volatility of portfolio securities and currency holdings.
The Timothy Plan Large/Mid Cap Growth Fund’s investment objective is long-term growth of capital. Current income is not a significant investment consideration and any such income realized will be considered incidental to the Fund’s investment objective. The Fund seeks to achieve its investment objective by normally investing at least 80% of the Fund’s total assets in U.S. common stocks with market capitalizations in excess of $2 billion.
The Timothy Plan Small Cap Value Fund’s primary objective is long-term capital growth, with a secondary objective of current income. The Fund seeks to achieve its investment objective by primarily investing at least 80% of its assets in U.S. common stocks whose market capitalization is generally less than $2 billion.
The Timothy Plan Large/Mid Cap Value Fund’s investment objective is long-term capital growth, with a secondary objective of current income. The Fund seeks to achieve its investment objective by primarily investing in U.S. common stocks. The Fund will invest at least 80% of its assets in the common stock of companies whose total market capitalization generally exceeds $2 billion.
The Timothy Plan Fixed Income Fund seeks to generate a high level of current income consistent with prudent investment risk. To achieve its investment objective, the Fund normally invests in a diversified portfolio of debt securities. These include corporate bonds, U.S. Government and agency securities, convertible securities and preferred securities. The Fund will generally only purchase high quality securities.
The Timothy Plan High Yield Bond Fund’s investment objective is to generate a high level of current income. To achieve its investment objective, the Fund normally invests in a diversified portfolio of debt securities. These include corporate bonds, U.S. Government and agency securities, convertible securities and preferred securities. The Fund will generally purchase securities that are not investment-grade, meaning securities with a rating of “BBB” or lower as rated by Standard and Poor’s or a comparable rating by another nationally recognized rating agency. Investments in these higher yielding securities are generally accompanied by a greater degree of credit risk than higher rated securities. Additionally, lower rated securities may be more susceptible to adverse economic and competitive industry conditions than investment-grade securities.
110
Notes to Financial Statements
September 30, 2014
Timothy Plan Family of Funds
The Timothy Plan Defensive Strategies Fund’s investment objective is the protection of principal through aggressive, proactive reactions to prevailing economic conditions. To achieve its investment objective, the Fund normally invests in Real Estate Investment Trusts (“REITs”), commodities based Exchange-Traded Funds (“ETFs”), and Treasury Inflation Protected Securities (“TIPS”).
The Timothy Plan Israel Common Values Fund seeks to provide long-term growth of capital. This Fund seeks to achieve its investment objectives by normally investing at least 80% of the Fund’s total assets in the common stock of companies domiciled and/or headquartered in Israel through the purchase of American Depository Receipts (ADRs) and direct investments in such companies on foreign stock exchanges, without regard to market capitalizations.
The Timothy Plan Strategic Growth Fund seeks to generate medium to high levels of long-term capital growth. The Fund seeks to achieve its investment objective by normally investing at least 75% of its net assets in the following Funds which are other series of the Trust: approximately 2-10% of its net assets in the Timothy Plan Small Cap Value Fund; approximately 10-20% of its net assets in the Timothy Plan Large/Mid Cap Value Fund; approximately 10-20% of its net assets in the Timothy Plan Large/Mid Cap Growth Fund; approximately 6-18% of its net assets in the Timothy Plan High Yield Bond Fund; approximately 10-20% of its net assets in the Timothy Plan International Fund; approximately 2-10% of its net assets in the Timothy Plan Aggressive Growth Fund; approximately 10-30% of its net assets in the Timothy Plan Defensive Strategies Fund; approximately 0-10% of its net assets in the Timothy Plan Israel Common Values Fund; approximately 0-10% of its net assets in the Timothy Plan Emerging Markets Fund; and approximately 5-20% of its net assets in the Timothy Plan Growth & Income Fund.
The Timothy Plan Conservative Growth Fund seeks to generate moderate levels of long-term capital growth with a secondary objective of current income. The Fund seeks to achieve its investment objective by normally investing at least 75% of its net assets in the following Funds which are other series of the Trust: approximately 2-10% of its net assets in the Timothy Plan Small Cap Value Fund; approximately 5-15% of its net assets in the Timothy Plan Large/Mid Cap Value Fund; approximately 5-15% of its net assets in the Timothy Plan Large/Mid Cap Growth Fund; approximately 2-5% of its net assets in the Timothy Plan Aggressive Growth Fund; approximately 6-15% of its net assets in the Timothy Plan High Yield Bond Fund; approximately 0-10% of its net assets in the Timothy Plan International Fund; approximately 20%-40% of its net assets in the Timothy Plan Fixed Income Fund; approximately 10-30% of its net assets in the Timothy Plan Defensive Strategies Fund; approximately 0-10% of its net assets in the Timothy Plan Israel Common Values Fund; approximately 0-10% of its net assets in the Timothy Plan Emerging Markets Fund; and approximately 5-20% of its net assets in the Timothy Plan Growth & Income Fund.
The Timothy Plan Emerging Markets Fund commenced operations on December 3, 2012. The Fund’s investment objective is long-term growth of capital. The Fund seeks to achieve its investment objectives by normally investing at least 80% of the Fund’s total assets in the common stock of companies domiciled and/or headquartered in countries that the Fund’s Advisor believes are experiencing rapid or above average growth or industrialization through the purchase of American Depository Receipts (ADRs) and direct investments in such companies on foreign stock exchanges, without regard to market capitalizations.
The Timothy Plan Growth & Income Fund commenced operations on October 1, 2013. The Fund’s investment objective is to provide total return through a combination of growth and income and preservation of capital in declining markets. The Fund seeks to achieve its investment objectives by employing a proprietary investment model to select equity securities for the Fund that the Fund’s Advisor believes are undervalued and more likely to appreciate. The Fund’s Advisor focuses on characteristics such as management commitment, value and neglect, and on equity securities that are underrepresented by institutional investors. The Fund’s Advisor also assesses a number of fundamental factors such as earnings, earnings trends, price earnings multiples, return on assets and other financial statement data, as well as other proprietary calculations. The model evaluates over 8,500 companies of all capitalization ranges. For the Fund, the Fund’s Advisor refines the model by using a capitalization screen and evaluates thousands of companies within the appropriate capitalization range. The Fund’s Advisor normally will sell a security when the investment no longer meets the Fund’s Advisor investment criteria.
111
Notes to Financial Statements
September 30, 2014
Timothy Plan Family of Funds
The following is a summary of significant accounting policies consistently followed by the Funds in the preparation of their financial statements. The policies are in conformity with accounting principles generally accepted in the United States of America (“GAAP”) for investment companies.
| | A. | SECURITY VALUATION AND FAIR VALUE MEASUREMENTS |
All investments in securities are recorded at their estimated fair value as described in Note 2.
| | B. | INVESTMENT INCOME AND SECURITIES TRANSACTIONS |
Security transactions are accounted for on the date the securities are purchased or sold (trade date). The costing method for the Timothy Plan Funds is FIFO (first-in-first-out). Dividend income is recognized on the ex-dividend date. Interest income and expenses are recognized on an accrual basis. The Timothy Plan Aggressive Growth Fund, Large/Mid Cap Growth Fund, Large/Mid Cap Value Fund, Small Cap Value Fund, Israel Common Values Fund, Defensive Strategies Fund and Emerging Markets Fund have made certain investments in REITs and Master Limited Partnerships (“MLPs”). Dividend income from REITs and MLPs is recognized on the ex-dividend date. It is common for distributions from REITs and MLPs to exceed taxable earnings and profits, resulting in the excess portion of such dividends being designated as a return of capital. Income or loss from the MLPs is reclassified upon receipt of the MLPs’ K-1. The calendar year-end amounts of ordinary income, capital gains, and return of capital included in distributions received from the Funds’ investments in REITS are reported to the Funds after the end of the calendar year; accordingly, the Funds estimate these amounts for accounting purposes until the characterization of REIT distributions is reported to the Funds after the end of the calendar year. Estimates are based on the most recent REIT distribution information available. Withholding taxes on foreign dividends have been provided for in accordance with the Funds’ understanding of the applicable country’s tax rules and rates. Discounts and premiums on securities purchased are amortized over the lives of the respective securities. The ability of issuers of debt securities held by the Funds to meet their obligations may be affected by economic and political developments in a specific country or region.
Investment securities denominated in foreign currencies are translated into U.S. dollar amounts at the date of valuation. Purchases and sales of investment securities and income and expense items denominated in foreign currencies are translated into U.S. dollar amounts on the respective dates of such transactions. The Funds do not isolate that portion of the results of operations resulting from changes in foreign exchange rates on investments from the fluctuations arising from changes in market prices of securities held. Such fluctuations are included in the net realized and unrealized gain or loss from investments. Reported net realized foreign exchange gains or losses arise from sales of foreign currencies, currency gains or losses realized between the trade and settlement dates on securities transactions, and the difference between the amounts of dividends, interest and foreign withholding taxes recorded on the Funds’ books and the U.S. dollar equivalent of the amounts actually received or paid. Net unrealized foreign exchange gains and losses arise from changes in the fair values of assets and liabilities, other than investments in securities at fiscal period end, resulting from changes in exchange rates.
| | D. | NET ASSET VALUE PER SHARE |
The Net Asset Value (“NAV”) per share of the capital stock of the Funds is determined daily as of the close of trading on the New York Stock Exchange by dividing the value of its net assets by the number of Fund shares outstanding. The NAV is calculated separately for each class of each Fund in the Trust. The net asset value of the classes may differ because of different fees and expenses charged to each class.
Expenses incurred by the Trust that do not relate to a specific Fund of the Trust are allocated to the individual Funds based on each Fund’s relative net assets or another appropriate basis as determined by the Board of Trustees (the “Board”).
112
Notes to Financial Statements
September 30, 2014
Timothy Plan Family of Funds
There are three classes of shares currently offered by the Trust: Class A shares are offered with a front-end sales charge and ongoing service/distribution fees; Class C shares are offered with a contingent deferred sales charge (“CDSC”) that ends after the first year and ongoing service and distribution fees; Class I shares, which commenced operations on August 1, 2013, are offered without any sales charges or ongoing service distribution fees.
Class specific expenses are borne by each specific class. Income, expenses, and realized and unrealized gains/losses are allocated to the respective classes on the basis of relative daily net assets.
In the preparation of financial statements in conformity with GAAP, management makes estimates and assumptions that affect the reported amounts of assets and liabilities and disclosure of contingent assets and liabilities at the date of the financial statements, as well as the reported amounts of revenues and expenses during the year ended. Actual results could differ from those estimates.
It is the policy of each Fund to continue to comply with all requirements under subchapter M of the Internal Revenue Code applicable to regulated investment companies and to distribute substantially all of its taxable income to its shareholders. Each Fund also intends to distribute sufficient net investment income and net capital gains, if any, so that it will not be subject to excise tax on undistributed income or gains. Therefore, no federal income tax or excise provision is required.
As of September 30, 2014, the Funds did not have a liability for any unrecognized tax benefits. The Funds recognize interest and penalties, if any, related to unrecognized tax benefits as income tax expense in the Statements of Operations. During the year ended September 30, 2014, the Funds did not incur any interest or penalties. The Funds are not subject to examination by U.S. federal tax authorities for tax years before 2011, or since inception if after 2011, and are not aware of any tax positions for which it is reasonably possible that the total amounts of unrecognized tax benefits will change materially within the next twelve months.
The Trust indemnifies its officers and trustees for certain liabilities that may arise from the performance of their duties to the Trust. Additionally, in the normal course of business, the Funds enter into contracts that contain a variety of representations and warranties and which provide general indemnities. The Funds’ maximum exposure under these arrangements is unknown, as this would involve future claims that may be made against the Funds that have not yet occurred. However, based on experience, the Funds expect the risk of loss due to these warranties and indemnities to be remote.
| | J. | DISTRIBUTIONS TO SHAREHOLDERS |
Distributions to shareholders, which are determined in accordance with income tax regulations, are recorded on the ex-dividend date. The treatment for financial reporting purposes of distributions made to shareholders during the period from net investment income or net realized capital gains may differ from their ultimate treatment for federal income tax purposes. These differences are caused primarily by differences in the timing of the recognition of certain components of income, expense or realized capital gain for federal income tax purposes. Where such differences are permanent in nature, they are reclassified in the components of net assets based on their ultimate characterization for federal income tax purposes. Any such reclassifications will have no effect on net assets, results of operations, or Net Asset Values (NAVs) per share of the Funds. Reclassifications for the fiscal year ended September 30, 2014 are as follows:
113
Notes to Financial Statements
September 30, 2014
Timothy Plan Family of Funds
| | | | | | | | | | | | |
| Fund | | Paid In Capital | | | Undistributed
Ordinary
Income (Loss) | | | Undistributed Long-
Term Gains (Loss) | |
Aggressive Growth Fund | | $ | - | | | $ | 479,095 | | | $ | (479,095 | ) |
International Fund | | | (93,192 | ) | | | 117,353 | | | | (24,161 | ) |
Large/Mid Cap Growth Fund | | | - | | | | 152,300 | | | | (152,300 | ) |
Small Cap Value Fund | | | - | | | | 278,303 | | | | (278,303 | ) |
Large/Mid Cap Value Fund | | | 24,511 | | | | 185,080 | | | | (209,591 | ) |
Fixed Income Fund | | | - | | | | 220,543 | | | | (220,543 | ) |
Israel Common Values Fund | | | - | | | | 25,397 | | | | (25,397 | ) |
Defensive Strategies Fund | | | (8,409 | ) | | | 14,427 | | | | (6,018 | ) |
Emerging Markets Fund | | | - | | | | 16,296 | | | | (16,296 | ) |
Growth & Income Fund | | | (17,286 | ) | | | 17,286 | | | | - | |
Note 2 | Security Valuation and Fair Value Measurements
Fair value is defined as the price that a Fund would receive upon selling an investment in a timely transaction to an independent buyer in the principal or most advantageous market of the investment. GAAP established a three-tier hierarchy to maximize the use of observable market data and minimize the use of unobservable inputs and to establish classification of fair value measurements for disclosure purposes.
Inputs refer broadly to the assumptions that market participants would use in pricing the asset or liability, including assumptions about risk (the risk inherent in a particular valuation technique used to measure fair value including such a pricing model and/or the risk inherent in the inputs to the valuation technique). Inputs may be observable or unobservable. Observable inputs are inputs that reflect the assumptions market participants would use in pricing the asset or liability developed based on market data obtained from sources independent of the reporting entity. Unobservable inputs are inputs that reflect the reporting entity’s own assumptions about the assumptions market participants would use in pricing the asset or liability developed based on the best information available in the circumstances.
VALUATION OF FUND OF FUNDS
A Fund may invest in portfolios of open-end or closed-end investment companies (the “Underlying Funds”). The Underlying Funds value securities in their portfolios for which market quotations are readily available at their market values (generally the last reported sale price) and all other securities and assets at their fair value based upon methods established by the board of directors of the Underlying Funds.
Open-ended funds are valued at their respective net asset values as reported by such investment companies. The shares of many closed-end investment companies, after their initial public offering, frequently trade at a price per share, which is different than the net asset value per share. The difference represents a market premium or market discount of such shares. There can be no assurances that the market discount or market premium on shares of any closed-end investment company purchased by the Fund will not change.
The Trust utilizes various methods to measure the fair value of all of its investments on a recurring basis. GAAP establishes a hierarchy that prioritizes inputs to valuation methods. The three levels of input are:
ŸLevel 1 – Unadjusted quoted prices in active markets for identical assets and liabilities that the Fund has the ability to access.
ŸLevel 2 – Observable inputs other than quoted prices included in Level 1 that are observable for the asset or liability, either directly or indirectly. These inputs may include quoted prices for the identical instrument in an inactive market, prices for similar instruments, interest rates, prepayment speeds, credit risk, yield curves, default rates and similar data.
114
Notes to Financial Statements
September 30, 2014
Timothy Plan Family of Funds
ŸLevel 3 – Unobservable inputs for the asset or liability, to the extent relevant observable inputs are not available, representing the Fund’s own assumptions about the assumptions a market participant would use in valuing the asset or liability, and would be based on the best information available.
The inputs used to measure fair value may fall into different levels of the fair value hierarchy. In such cases, for disclosure purposes, the level in the fair value hierarchy within which the fair value measurement falls in its entirety is determined based on the lowest level input that is significant to the fair value measurement in its entirety.
Each Fund generally determines the total value of each class of its shares by using market prices for the securities comprising its portfolio. Equity securities, including common stock, ADRs, REITs, MLPs, ETFs and warrants are generally valued by using market quotations, but may be valued on the basis of prices furnished by a pricing service when the Advisor or Sub-Advisor believes such prices more accurately reflect the fair value of such securities. Securities that are traded on any stock exchange are generally valued by the pricing service at the last quoted sale price. Lacking a last sale price, an exchange traded security is generally valued by the pricing service at its last bid price. Securities traded in the NASDAQ over-the-counter market are generally valued by the pricing service at the NASDAQ Official Closing Price. When using the market quotations or close prices provided by the pricing service and when the market is considered active, the security will be classified as a Level 1 security. Equity securities traded on inactive markets or valued by reference to similar instruments are categorized as a Level 2. When market quotations are not readily available, when the Advisor or Sub-Advisor determines that the market quotation or the price provided by the pricing service does not accurately reflect the current fair value, or when restricted or illiquid securities are being valued, such securities are valued as determined in good faith by the Advisor or Sub-Advisor, in conformity with guidelines adopted by and subject to review by the Board. These securities will generally be categorized as Level 3 securities.
Investments in mutual funds, including money market mutual funds, are generally priced at the ending NAV provided by the service agent of the funds. These securities will be categorized as Level 1 securities.
Fixed income securities such as corporate bonds, restricted corporate bonds, asset-backed securities, mortgage-backed securities, U.S. government securities, U.S. government agency securities and treasury inflation protected securities, when valued using market quotations in an active market, will be categorized as Level 1 securities. However, they may be valued on the basis of prices furnished by a pricing service when the Advisor or Sub-Advisor believes such prices more accurately reflect the fair value of such securities. A pricing service utilizes electronic data processing techniques based on yield spreads relating to securities with similar characteristics to determine prices for normal institutional-size trading units of debt securities without regard to sale or bid prices. These securities will generally be categorized as Level 2 securities. If the Advisor or Sub-Advisor decides that a price provided by the pricing service does not accurately reflect the fair value of the securities, when prices are not readily available from a pricing service, or when restricted or illiquid securities are being valued, securities are valued at fair value as determined in good faith by the Advisor or Sub-Advisor, in conformity with guidelines adopted by and subject to review of the Board. These securities will be categorized as Level 3 securities.
Short-term investments in fixed income securities (those with maturities of less than 60 days when acquired, or which subsequently are within 60 days of maturity) may be valued by using the amortized cost method of valuation, which the Board has determined will represent fair value. These securities will be classified as Level 2 securities.
The Board has delegated to the Advisor and/or Sub-Advisors responsibility for determining the value of Fund portfolio securities under certain circumstances. Under such circumstances, the Advisor or Sub-Advisor will use its best efforts to arrive at the fair value of a security held by the Fund under all reasonably ascertainable facts and circumstances. The Advisor must prepare a report for the Board not less than quarterly containing a complete listing of any securities for which fair value pricing was employed and detailing the specific reasons for such fair value pricing. The Board has adopted written policies and procedures to guide the Advisor and Sub-Advisors with respect to the circumstances under which, and the methods to be used, in fair valuing securities.
115
Notes to Financial Statements
September 30, 2014
Timothy Plan Family of Funds
The following is a summary of the inputs used to value each Fund’s assets as of September 30, 2014:
Aggressive Growth Fund
| | | | | | | | | | | | | | | | |
Assets | | | Level 1 | | | | Level 2 | | | | Level 3 | | | | Total | |
Common Stock | | $ | 21,986,557 | | | $ | - | | | $ | - | | | $ | 21,986,557 | |
Master Limited Partnerships | | | 452,498 | | | | - | | | | - | | | | 452,498 | |
REITs | | | 89,334 | | | | - | | | | - | | | | 89,334 | |
Money Market Fund | | | 377,838 | | | | - | | | | - | | | | 377,838 | |
Total | | $ | 22,906,227 | | | $ | - | | | $ | - | | | $ | 22,906,227 | |
| | | | |
International Fund | | | | | | | | | | | | | | | | |
| | | | |
Assets | | | Level 1 | | | | Level 2 | | | | Level 3 | | | | Total | |
Common Stock | | $ | 55,291,628 | | | $ | - | | | $ | - | | | $ | 55,291,628 | |
Money Market Fund | | | 2,972,365 | | | | - | | | | - | | | | 2,972,365 | |
Total | | $ | 58,263,993 | | | $ | - | | | $ | - | | | $ | 58,263,993 | |
| | | | |
Large/Mid Cap Growth Fund | | | | | | | | | | | | | | | | |
| | | | |
Assets | | | Level 1 | | | | Level 2 | | | | Level 3 | | | | Total | |
Common Stock | | $ | 59,039,471 | | | $ | - | | | $ | - | | | $ | 59,039,471 | |
Master Limited Partnerships | | | 986,369 | | | | - | | | | - | | | | 986,369 | |
Money Market Fund | | | 2,017,276 | | | | - | | | | - | | | | 2,017,276 | |
Total | | $ | 62,043,116 | | | $ | - | | | $ | - | | | $ | 62,043,116 | |
| | | | |
Small Cap Value Fund | | | | | | | | | | | | | | | | |
| | | | |
Assets | | | Level 1 | | | | Level 2 | | | | Level 3 | | | | Total | |
Common Stock | | $ | 71,592,951 | | | $ | - | | | $ | - | | | $ | 71,592,951 | |
Master Limited Partnerships | | | 1,444,312 | | | | | | | | | | | | 1,444,312 | |
REITs | | | 7,196,034 | | | | - | | | | - | | | | 7,196,034 | |
Money Market Fund | | | 411,973 | | | | - | | | | - | | | | 411,973 | |
Total | | $ | 80,645,270 | | | $ | - | | | $ | - | | | $ | 80,645,270 | |
| | | | |
Large/Mid Cap Value Fund | | | | | | | | | | | | | | | | |
| | | | |
Assets | | | Level 1 | | | | Level 2 | | | | Level 3 | | | | Total | |
Common Stock | | $ | 142,849,027 | | | $ | - | | | $ | - | | | $ | 142,849,027 | |
Master Limited Partnerships | | | 3,072,420 | | | | - | | | | - | | | | 3,072,420 | |
REITs | | | 3,383,303 | | | | - | | | | - | | | | 3,383,303 | |
Money Market Fund | | | 8,000,633 | | | | - | | | | - | | | | 8,000,633 | |
Total | | $ | 157,305,383 | | | $ | - | | | $ | - | | | $ | 157,305,383 | |
116
Notes to Financial Statements
September 30, 2014
Timothy Plan Family of Funds
| | | | | | | | | | | | | | | | |
Fixed Income Fund | | | | | | | | | | | | | | | | |
| | | | |
Assets | | | Level 1 | | | | Level 2 | | | | Level 3 | | | | Total | |
Corporate Bonds | | $ | - | | | $ | 30,016,374 | | | $ | - | | | $ | 30,016,374 | |
U.S. Government Notes & Bonds | | | - | | | | 20,641,044 | | | | - | | | | 20,641,044 | |
Government Mortgage-Backed Securities | | | - | | | | 21,739,105 | | | | - | | | | 21,739,105 | |
Money Market Fund | | | 2,777,823 | | | | - | | | | - | | | | 2,777,823 | |
Total | | $ | 2,777,823 | | | $ | 72,396,523 | | | $ | - | | | $ | 75,174,346 | |
| | | | |
High Yield Bond Fund | | | | | | | | | | | | | | | | |
| | | | |
Assets | | | Level 1 | | | | Level 2 | | | | Level 3 | | | | Total | |
Corporate Bonds | | $ | - | | | $ | 42,907,891 | | | $ | - | | | $ | 42,907,891 | |
Money Market Fund | | | 676,549 | | | | - | | | | - | | | | 676,549 | |
Total | | $ | 676,549 | | | $ | 42,907,891 | | | $ | - | | | $ | 43,584,440 | |
| | | | |
Israel Common Values Fund | | | | | | | | | | | | | | | | |
| | | | |
Assets | | | Level 1 | | | | Level 2 | | | | Level 3 | | | | Total | |
Common Stock | | $ | 15,186,602 | | | $ | - | | | $ | - | | | $ | 15,186,602 | |
REITs | | | 324,910 | | | | - | | | | - | | | | 324,910 | |
Money Market Fund | | | 676,183 | | | | - | | | | - | | | | 676,183 | |
Total | | $ | 16,187,695 | | | $ | - | | | $ | - | | | $ | 16,187,695 | |
| | | | |
Defensive Strategies Fund | | | | | | | | | | | | | | | | |
| | | | |
Assets | | | Level 1 | | | | Level 2 | | | | Level 3 | | | | Total | |
Common Stock | | $ | 17,848,355 | | | $ | - | | | $ | - | | | $ | 17,848,355 | |
REITs | | | 20,072,368 | | | | - | | | | - | | | | 20,072,368 | |
Exchange Traded Funds | | | 5,753,294 | | | | - | | | | - | | | | 5,753,294 | |
Government Mortgage-Backed Securities | | | - | | | | 1,948,052 | | | | - | | | | 1,948,052 | |
Corporate Bonds | | | - | | | | 2,281,352 | | | | - | | | | 2,281,352 | |
Treasury Inflation Protected Securities (TIPS) | | | - | | | | 17,287,648 | | | | - | | | | 17,287,648 | |
Money Market Fund | | | 3,262,240 | | | | - | | | | - | | | | 3,262,240 | |
Total | | $ | 46,936,257 | | | $ | 21,517,052 | | | $ | - | | | $ | 68,453,309 | |
| | | | |
Strategic Growth Fund | | | | | | | | | | | | | | | | |
| | | | |
Assets | | | Level 1 | | | | Level 2 | | | | Level 3 | | | | Total | |
Mutual Funds | | $ | 45,946,095 | | | $ | - | | | $ | - | | | $ | 45,946,095 | |
Total | | $ | 45,946,095 | | | $ | - | | | $ | - | | | $ | 45,946,095 | |
| | | | |
Conservative Growth Fund | | | | | | | | | | | | | | | | |
| | | | |
Assets | | | Level 1 | | | | Level 2 | | | | Level 3 | | | | Total | |
Mutual Funds | | $ | 59,716,969 | | | $ | - | | | $ | - | | | $ | 59,716,969 | |
Money Market Fund | | | 162,747 | | | | - | | | | - | | | | 162,747 | |
Total | | $ | 59,879,716 | | | $ | - | | | $ | - | | | $ | 59,879,716 | |
117
Notes to Financial Statements
September 30, 2014
Timothy Plan Family of Funds
| | | | | | | | | | | | | | | | |
Emerging Markets Fund | | | | | | | | | | | | | | | | |
| | | | |
Assets | | | Level 1 | | | | Level 2 | | | | Level 3 | | | | Total | |
Common Stock | | $ | 10,014,493 | | | $ | 305,336 | | | $ | - | | | $ | 10,319,829 | |
Preferred Stock | | | 563,884 | | | | - | | | | - | | | | 563,884 | |
REITs | | | 479,389 | | | | - | | | | - | | | | 479,389 | |
Money Market Fund | | | 350,124 | | | | - | | | | - | | | | 350,124 | |
Total | | $ | 11,407,890 | | | $ | 305,336 | | | $ | - | | | $ | 11,713,226 | |
| | | | |
Growth & Income Fund | | | | | | | | | | | | | | | | |
| | | | |
Assets | | | Level 1 | | | | Level 2 | | | | Level 3 | | | | Total | |
Common Stock | | $ | 12,378,297 | | | $ | - | | | $ | - | | | $ | 12,378,297 | |
Government Notes & Bonds | | | - | | | | 13,644,075 | | | | - | | | | 13,644,075 | |
Money Market Fund | | | 1,819,491 | | | | - | | | | - | | | | 1,819,491 | |
Total | | $ | 14,197,788 | | | $ | 13,644,075 | | | $ | - | | | $ | 27,841,863 | |
Refer to the Schedules of Investments for industry classifications.
The Funds did not hold any assets at any time during the reporting year end in which significant unobservable inputs were used in determining fair value; therefore, no reconciliation of Level 3 securities is included for this reporting year end. The Funds did not hold any derivative instruments during the reporting period. During the year ended September 30, 2014, transfers into and out of Level 1 and Level 2 are listed in the table below. The Funds’ policy is to recognize transfers at the end of the reporting period.
The following amounts were transfers in/(out) of Level 1/Level 2 assets:
| | | | | | | | | | | | | | |
| | Emerging Markets Fund | |
| | | |
| Common Stock -
Desarrolladora Homex
SAB de CV |
| |
| Common Stock -
Lifestyle International
Holdings Ltd |
| | | Total | |
| | Transfers into Level 2 from Level 1 | | | $ 24,041 | | | | $ 255,702 | | | | $ 279,743 | |
| | Transfers from Level 2 into Level 1 | | | - | | | | - | | | | - | |
| | Net Transfers in/(Out) of Level 2 | | | $ 24,041 | | | | $ 255,702 | | | | $ 279,743 | |
There were no transfers from Level 2 to Level 1. Transfers that were made into Level 2 represent securities being fair valued using observable inputs. A quoted price was not available at the time of valuation; therefore a fair valued price using observable inputs was used. It is the Funds’ policy to recognize transfers into or out of Level 1 and Level 2 at the end of the reporting period.
118
Notes to Financial Statements
September 30, 2014
Timothy Plan Family of Funds
Note 3 | Purchases and Sales of Securities
The following is a summary of the cost of purchases and proceeds from the sale of securities, other than short-term investments, for the year ended September 30, 2014:
| | | | | | | | | | |
| | | Purchases | | Sales | | |
| | | U.S. Gov’t | | | | U.S. Gov’t | | | |
| Fund | | Obligations | | Other | | Obligations | | Other | |
Aggressive Growth | | $ - | | $20,804,342 | | $ - | | $19,911,004 | |
International | | - | | 29,631,565 | | - | | 14,715,190 | |
Large/Mid Cap Growth | | - | | 35,755,373 | | - | | 34,666,459 | |
Small Cap Value | | - | | 59,524,427 | | - | | 56,057,763 | |
Large/Mid Cap Value | | - | | 56,553,173 | | - | | 52,180,528 | |
Fixed Income | | 4,008,008 | | 8,361,680 | | 6,200,654 | | 6,466,279 | |
High Yield Bond | | - | | 28,264,621 | | - | | 21,509,267 | |
Israel Common Values | | - | | 6,176,420 | | - | | 1,547,271 | |
Defensive Strategies | | 3,827,018 | | 11,288,254 | | 5,357,923 | | 12,294,564 | |
Strategic Growth | | - | | 11,142,305 | | - | | 6,447,005 | |
Conservative Growth | | - | | 17,738,054 | | - | | 11,184,686 | |
Emerging Markets | | - | | 6,533,155 | | - | | 3,941,902 | |
Growth & Income | | 14,149,575 | | 14,422,931 | | 664,385 | | 3,002,661 | |
Note 4 | Payments by Affiliates
As a result of a trade error, the Small Cap Value Fund experienced a loss of $17 for the year ended September 30, 2014, which was reimbursed by the Advisor.
Note 5 | Investment Management Fee and Other Transactions with Affiliates
Timothy Partners, Ltd., (“TPL”) is the investment advisor for the Funds pursuant to an investment advisory agreement (the “Agreement”) that was renewed by the Board on February 28, 2014. TPL supervises the investment of the assets of each Fund in accordance with the objectives, policies and restrictions of the Trust. Under the terms of the Agreement, as amended, TPL receives a fee, accrued daily and paid monthly, at an annual rate of 1.20% of the average daily net assets of the Timothy Plan Emerging Markets Fund; 1.00% of the average daily net assets of the Timothy Plan International Fund and Timothy Plan Israel Common Values Fund; 0.85% of the average daily net assets of the Timothy Plan Aggressive Growth, the Timothy Plan Small Cap Value, the Timothy Plan Large/Mid Cap Growth, Timothy Plan Growth & Income, and the Timothy Plan Large/Mid Cap Value Funds; 0.60% of the average daily net assets of the Timothy Plan Fixed Income, the Timothy Plan High Yield Bond, and the Timothy Plan Defensive Strategies Funds; and 0.65% of the average daily net assets of the Timothy Plan Conservative Growth and the Timothy Plan Strategic Growth Funds. TPL has voluntarily agreed to reduce the fee it receives from the Emerging Markets Fund to 1.15%; from the International Fund to 0.95%; from the Small Cap Value Fund, the Large/Mid Cap Growth Fund, the Growth & Income Fund, and the Large/Mid Cap Value Fund to 0.80%; from the Aggressive Growth Fund to 0.75%; from the High Yield Bond Fund and the Defensive Strategies Fund to 0.55%; and from the Fixed Income Fund to 0.40% . Such voluntary fee reductions/reimbursements may be authorized by TPL at any time, but such action shall not obligate TPL to waive any fees in the near future. Such voluntary fee reductions/reimbursements are not subject to future recoupment. An officer and trustee of the Funds is also an officer and owner of the Advisor.
119
Notes to Financial Statements
September 30, 2014
Timothy Plan Family of Funds
For the year ended September 30, 2014, TPL waived and reimbursed the Funds as follows:
| | | | |
| | | Year Ended | | |
| Fund | | September 30, 2014 | |
Aggressive Growth Fund | | $ 2,076 | |
International Fund | | 2,607 | |
Large/Mid Cap Growth Fund | | 2,794 | |
Small Cap Value Fund | | 3,669 | |
Large/Mid Cap Value Fund | | 7,079 | |
Fixed Income Fund | | 113,094 | |
High Yield Bond Fund | | 1,964 | |
Defensive Strategies Fund | | 3,066 | |
Emerging Markets Fund | | 541 | |
Growth & Income Fund | | 1,200 | |
Gemini Fund Services, LLC (“GFS”) provides administrative, fund accounting, and transfer agency services to the Funds pursuant to agreements with the Trust, for which it receives from each Fund: (i) basis points in decreasing amounts as assets reach certain breakpoints; and (ii) any related out-of-pocket expenses. Fees are billed monthly as follows:
Fund Accounting and Fund Administration Fees:
Fund Complex Base annual fee:
25 basis points (0.25%) on the first $200 million of net assets
15 basis points (0.15%) on the next $200 million of net assets;
8 basis points (0.08%) on the next $600 million of net assets; and
6 basis points (0.06%) on net assets greater than $1 billion.
Transfer agency fees for the Funds are combined with the Fund Accounting and Fund Administration fees under the Trust’s agreement with GFS. Therefore, there is no separate base annual fee per Fund or share class.
An officer of the Trust is also an employee of GFS, and is not paid any fees directly by the Trust for serving in such capacity.
The Timothy Plan Aggressive Growth, Timothy Plan International, Timothy Plan Large/Mid Cap Growth, Timothy Plan Small Cap Value, Timothy Plan Large/Mid Cap Value, Timothy Plan Fixed Income, Timothy Plan High Yield Bond, Timothy Plan Defensive Strategies, Timothy Plan Israel Common Values, Timothy Plan Emerging Markets, and Timothy Plan Growth & Income Funds have adopted shareholder services plans (the “Plans”) pursuant to Rule 12b-1 under the Investment Company Act of 1940, as amended. The Plans provide that the Funds will pay TPL or others for expenses that relate to the promotion or distribution of shares. Under the Class A Plan, the Funds will pay TPL a fee at an annual rate of 0.25%, payable monthly, of the average daily net assets attributable to such class of shares. Under the Class C Plan, the Funds will pay TPL a fee at an annual rate of 1.00%, payable monthly, of which, 0.25% may be a service fee and 0.75% may be payable to outside broker/dealers, of the average daily net assets attributable to such class of shares. Class I shares are not subject to the shareholder services plan.
The Timothy Plan Conservative Growth and Timothy Plan Strategic Growth Funds have adopted shareholder services plans (the “Plans”) pursuant to Rule 12b-1 under the Investment Company Act of 1940, as amended. The Plans provide that the Funds will pay TPL or others for expenses that relate to the promotion or distribution of shares. Class A shares of the Funds do not impose a service fee. Under the Class C Plan, the Funds will pay TPL a fee at an annual rate of 0.75%, payable monthly to outside broker/dealers, of the average daily net assets attributable to such class of shares.
120
Notes to Financial Statements
September 30, 2014
Timothy Plan Family of Funds
For the year ended September 30, 2014, the Funds paid TPL under the terms of the Plans as follows:
| | | | |
| | |
| Fund | | 12b-1 Fees | | |
| | |
| | | Year Ended | | |
| | | September 30, 2014 | | |
Aggressive Growth | | $80,997 | | |
International | | 148,599 | | |
Large/Mid Cap Growth | | 188,952 | | |
Small Cap Value | | 260,766 | | |
Large/Mid Cap Value | | 483,161 | | |
Fixed Income | | 237,959 | | |
High Yield Bond | | 125,006 | | |
Israel Common Values | | 50,013 | | |
Defensive Strategies | | 282,265 | | |
Strategic Growth | | 64,014 | | |
Conservative Growth | | 85,548 | | |
Emerging Markets | | 29,926 | | |
Growth & Income | | 51,410 | | |
TPL also serves as the principal underwriter of the Funds’ shares. An officer and trustee of the Funds is also an officer of the principal underwriter. For the year ended September 30, 2014, TPL received sales charges deducted from the proceeds of sales of Class A capital shares and CDSC fees deducted from the redemption of Class C capital shares as follows:
| | | | | | | | |
| Fund | | (Class A) | | | (Class C) | | |
Aggressive Growth | | | $10,513 | | | $389 | |
International | | | 17,889 | | | 99 | |
Large/Mid Cap Growth | | | 22,777 | | | 1,488 | |
Small Cap Value | | | 32,286 | | | 520 | |
Large/Mid Cap Value | | | 57,688 | | | 757 | |
Fixed Income | | | 26,220 | | | 991 | |
High Yield Bond | | | 16,296 | | | 1,135 | |
Israel Common Values | | | 11,812 | | | 221 | |
Defensive Strategies | | | 25,654 | | | 1,050 | |
Strategic Growth | | | 25,426 | | | 709 | |
Conservative Growth | | | 37,496 | | | 1,940 | |
Emerging Markets | | | 4,183 | | | 6 | |
Growth & Income * | | | 21,952 | | | 24 | |
* The Growth & Income Fund commenced operations on October 1, 2013.
121
Notes to Financial Statements
September 30, 2014
Timothy Plan Family of Funds
Note 6 | Control Ownership
The beneficial ownership, either directly or indirectly, of more than 25% of the voting securities of a Fund creates the presumption of control of the Fund under Section 2(a) 9 of the Investment Company Act of 1940. At September 30, 2014, there were no shareholders with ownership, either directly or indirectly, of more than 25% of the voting securities of a Fund.
Certain Timothy Plan Funds own shares of other Timothy Plan Funds. U.S. Bank, N.A., custodian of the Timothy Plan Funds, holds these shares in omnibus accounts, some of which are controlled by National Financial Services, Inc. The following shows the percentage of each Timothy Plan Fund that is held by U.S. Bank, N.A., as custodian of the Timothy Plan Funds. These accounts can be considered affiliated to the Timothy Plan.
| | | | |
| | | |
| | | % of Fund Owned by Other Timothy | | |
| Fund - Class A | | Plan Funds | | |
Aggressive Growth | | 27.91% | | |
International | | 35.51% | | |
Large/Mid Cap Growth | | 28.40% | | |
Small Cap Value | | 11.55% | | |
Large/Mid Cap Value | | 10.69% | | |
Fixed Income | | 34.98% | | |
High Yield Bond | | 40.42% | | |
Israel Common Values | | 46.46% | | |
Defensive Strategies | | 29.78% | | |
Emerging Markets | | 60.59% | | |
Growth & Income | | 60.24% | | |
Note 7 | Distributions to Shareholders
The tax character of distributions paid during the fiscal year ended September 30, 2014 and the fiscal year ended September 30, 2013 were as follows:
| | | | | | | | | | | | | | | | | | |
| | | | | | |
| | | Aggressive Growth | | | International * | | | Large/Mid Cap Growth | | | Small Cap Value | | | |
| | | | | | |
Year ended September 30, 2014 | | | | | | | | | | | | | | | | | | |
Ordinary Income | | $ | - | | | $ | 1,012,067 | | | $ | 2,876,614 | | | $ | 3,326,167 | | | |
Long-term Capital Gains | | | 1,247,804 | | | | - | | | | 2,470,222 | | | | 4,215,693 | | | |
Return of Capital | | | - | | | | - | | | | - | | | | - | | | |
| | | | | | |
| | $ | 1,247,804 | | | $ | 1,012,067 | | | $ | 5,346,836 | | | $ | 7,541,860 | | | |
| | | | | | |
Year ended September 30, 2013 | | | | | | | | | | | | | | | | | | |
Ordinary Income | | $ | - | | | $ | 340,389 | | | $ | 1,453,446 | | | $ | 88,849 | | | |
Long-term Capital Gains | | | - | | | | - | | | | 1,289,229 | | | | - | | | |
Return of Capital | | | - | | | | - | | | | - | | | | - | | | |
| | | | | | |
| | $ | - | | | $ | 340,389 | | | $ | 2,742,675 | | | $ | 88,849 | | | |
| | | | | | |
122
Notes to Financial Statements
September 30, 2014
Timothy Plan Family of Funds
| | | | | | | | | | | | | | | | | | |
| | | | | | |
| | | Large/Mid Cap Value | | | Fixed Income | | | High Yield Bond | | | Israel Common Values* | | | |
| | | | | | |
Year ended September 30, 2014 | | | | | | | | | | | | | | | | | | |
Ordinary Income | | $ | 575,850 | | | $ | 1,715,115 | | | $ | 1,928,998 | | | $ | 683,503 | | | |
Long-term Capital Gains | | | 9,110,156 | | | | 166,274 | | | | - | | | | 8,066 | | | |
Return of Capital | | | - | | | | - | | | | - | | | | - | | | |
| | | | | | |
| | $ | 9,686,006 | | | $ | 1,881,389 | | | $ | 1,928,998 | | | $ | 691,569 | | | |
| | | | | | |
Year ended September 30, 2013 | | | | | | | | | | | | | | | | | | |
Ordinary Income | | $ | 358,626 | | | $ | 958,092 | | | $ | 1,871,417 | | | $ | - | | | |
Long-term Capital Gains | | | - | | | | - | | | | - | | | | - | | | |
Return of Capital | | | - | | | | - | | | | - | | | | - | | | |
| | | | | | |
| | $ | 358,626 | | | $ | 958,092 | | | $ | 1,871,417 | | | $ | - | | | |
| | | | | | |
| | |
| | | | | | |
| | | Defensive Strategies | | | Strategic Growth | | | Conservative Growth | | | Emerging Markets* | | | |
| | | | | | |
Year ended September 30, 2014 | | | | | | | | | | | | | | | | | | |
Ordinary Income | | $ | 375,871 | | | $ | 35,399 | | | $ | 207,808 | | | $ | 363,300 | | | |
Long-term Capital Gains | | | - | | | | - | | | | - | | | | - | | | |
Return of Capital | | | - | | | | - | | | | - | | | | - | | | |
| | | | | | |
| | $ | 375,871 | | | $ | 35,399 | | | $ | 207,808 | | | $ | 363,300 | | | |
| | | | | | |
Year ended September 30, 2013 | | | | | | | | | | | | | | | | | | |
Ordinary Income | | $ | 132,486 | | | $ | 190,631 | | | $ | 306,954 | | | $ | - | | | |
Long-term Capital Gains | | | - | | | | - | | | | - | | | | - | | | |
Return of Capital | | | - | | | | - | | | | - | | | | - | | | |
| | | | | | |
| | $ | 132,486 | | | $ | 190,631 | | | $ | 306,954 | | | $ | - | | | |
| | | | | | |
* The difference between ordinary distributions paid from book and ordinary distributions paid from tax relates to $186,200 and $109,637 of allowable foreign tax credits from fiscal years ended September 30, 2014 and September 30, 2013, respectively, for the International Fund and $56,302 and $28,397 for the Israel Common Values Fund and Emerging Markets Fund for the fiscal year ended September 30, 2014 which have been passed through to the Funds’ underlying shareholders.
123
Notes to Financial Statements
September 30, 2014
Timothy Plan Family of Funds
As of September 30, 2014, the components of distributable earnings on a tax basis were as follows:
| | | | | | | | | | | | | | | | | | |
| | | | | | |
| | | Aggressive Growth | | | International | | | Large/Mid Cap Growth | | | Small Cap Value | | | |
| | | | | | |
Undistributed Ordinary Income | | $ | 197,089 | | | $ | - | | | $ | 1,104,440 | | | $ | 4,376,314 | | | |
Long-Term Capital Gains | | | 2,397,419 | | | | - | | | | 5,151,902 | | | | 10,462,415 | | | |
Capital Loss Carry Forward | | | - | | | | (13,139,242) | | | | - | | | | - | | | |
Post October and Other Losses | | | - | | | | (351,107) | | | | - | | | | - | | | |
Unrealized Appreciation (Depreciation) | | | 2,473,283 | | | | 6,540,463 | | | | 8,569,800 | | | | 5,428,534 | | | |
| | | | | | |
| | $ | 5,067,791 | | | $ | (6,949,886) | | | $ | 14,826,142 | | | $ | 20,267,263 | | | |
| | | | | | |
| | |
| | | | | | |
| | | Large/Mid Cap Value | | | | Fixed Income | | | | High Yield Bond | | | | Israel Common Values | | | |
| | | | | | |
Undistributed Ordinary Income | | $ | 1,373,623 | | | $ | 505,149 | | | $ | 63,801 | | | $ | - | | | |
Long-Term Capital Gains | | | 13,456,989 | | | | 160,551 | | | | - | | | | - | | | |
Capital Loss Carry Forward | | | - | | | | - | | | | (776,982) | | | | - | | | |
Post October and Other Losses | | | - | | | | - | | | | - | | | | (170,357) | | | |
Unrealized Appreciation (Depreciation) | | | 32,723,280 | | | | 590,904 | | | | 212,414 | | | | 1,562,942 | | | |
| | | | | | |
| | $ | 47,553,892 | | | $ | 1,256,604 | | | $ | (500,767) | | | $ | 1,392,585 | | | |
| | | | | | |
| | |
| | | | | | |
| | | Defensive Strategies | | | | Strategic Growth | | | | Conservative Growth | | | | Emerging Markets | | | |
| | | | | | |
Undistributed Ordinary Income | | $ | 394,856 | | | $ | 534,610 | | | $ | 448,836 | | | $ | 135,308 | | | |
Long-Term Capital Gains | | | 72,087 | | | | - | | | | 1,521,658 | | | | 535,959 | | | |
Capital Loss Carry Forward | | | - | | | | - | | | | - | | | | - | | | |
Post October and Other Losses | | | - | | | | (5,814,245) | | | | - | | | | - | | | |
Unrealized Appreciation (Depreciation) | | | 353,635 | | | | 4,629,423 | | | | 2,900,693 | | | | (662,019) | | | |
| | | | | | |
| | $ | 820,578 | | | $ | (650,212) | | | $ | 4,871,187 | | | $ | 9,248 | | | |
| | | | | | |
| | | | | |
| | | | | | | | | | | | | | | | | | |
| | | Growth & Income | | | | | | | | | | | | |
| | | | | | | | | | | | | | | | | | |
Undistributed Ordinary Income | | $ | - | | | | | | | | | | | | | | | |
Long-Term Capital Gains | | | - | | | | | | | | | | | | | | | |
Capital Loss Carry Forward | | | - | | | | | | | | | | | | | | | |
Post October and Other Losses | | | (40,690) | | | | | | | | | | | | | | | |
Unrealized Appreciation (Depreciation) | | | 1,195,825 | | | | | | | | | | | | | | | |
| | | | | | | | | | | | | | | | | | |
| | $ | 1,155,135 | | | | | | | | | | | | | | | |
| | | | | | | | | | | | | | | | | | |
The difference between book basis and tax basis unrealized appreciation (depreciation), undistributed net investment income (loss) and accumulated net realized gain (loss) from investments are primarily attributable to the tax deferral of losses on wash sales, mark-to-market on passive foreign investment companies, and adjustments for grantor trusts, partnerships and C Corporation return of capital distributions.
124
Notes to Financial Statements
September 30, 2014
Timothy Plan Family of Funds
Note 8 | Capital Loss Carryforwards, Post October and Other Losses
At September 30, 2014, the following capital loss carryforwards are available to offset future capital gains.
| | | | | | | | | | | | | | | | |
| | | Capital Loss Carry Forward | | | Year | | CLCF | | | |
| Fund | | Short-Term | | | Long-Term | | | Expiring | | Utilized | | | |
International Fund | | $ | 2,868,555 | | | $ | - | | | 2016 | | $ | 2,412,363 | | | |
| | | 8,833,573 | | | | - | | | 2017 | | | - | | | |
| | | 592,985 | | | | - | | | 2018 | | | - | | | |
| | | 844,129 | | | | - | | | 2019 | | | - | | | |
| | | |
High Yield Bond Fund | | | 776,982 | | | | - | | | 2017 | | | 594,758 | | | |
| | | |
Strategic Growth Fund | | | 1,855,585 | | | | - | | | 2017 | | | 1,490,367 | | | |
| | | 125,171 | | | | - | | | 2018 | | | | | | |
| | | 3,833,489 | | | | - | | | 2019 | | | | | | |
| | | |
To the extent these loss carryforwards are used to offset future capital gains, it is probable that the amount, which is offset, will not be distributed to shareholders.
Late year losses incurred after December 31 within the fiscal year are deemed to arise on the first business day of the following fiscal year for tax purposes. The Growth & Income Fund incurred and elected to defer such late year losses of $22,909.
Late year losses incurred after October 31 within the fiscal year are deemed to arise on the first business day of the following fiscal year for tax purposes. The following Funds incurred and elected to defer such late year losses as follows:
| | | | | | | | |
| | | | | | | | | |
Fund | | | | Post October Losses | | | |
International Fund | | | | $ | 351,107 | | | |
Israel Common Values Fund | | | | | 170,357 | | | |
Growth & Income Fund | | | | | 17,781 | | | |
Note 9 | SUBSEQUENT EVENTS
Subsequent events after the date of the Statements of Assets and Liabilities have been evaluated through the date the financial statements were issued. Management has concluded that there is no impact requiring adjustment or disclosure in the financial statements.
125
REPORT OF INDEPENDENT REGISTERED PUBLIC ACCOUNTING FIRM
To the Shareholders and Board of Trustees of
The Timothy Plan
We have audited the accompanying statements of assets and liabilities, including the schedules of investments, of The Timothy Plan, comprising Timothy Plan Aggressive Growth Fund, Timothy Plan International Fund, Timothy Plan Large/Mid Cap Growth Fund, Timothy Plan Small Cap Value Fund, Timothy Plan Large/Mid Cap Value Fund, Timothy Plan Fixed Income Fund, Timothy Plan High Yield Bond Fund, Timothy Plan Israel Common Values Fund, Timothy Plan Defensive Strategies Fund, Timothy Plan Strategic Growth Fund, Timothy Plan Conservative Growth Fund, Timothy Plan Emerging Markets Fund and Timothy Plan Growth & Income Fund (the “Funds”), as of September 30, 2014, and the related statements of operations for the year or period then ended, the statements of changes in net assets for each of the years or periods then ended, and the financial highlights for each of the years or periods indicated. These financial statements and financial highlights are the responsibility of the Funds’ management. Our responsibility is to express an opinion on these financial statements and financial highlights based on our audits.
We conducted our audits in accordance with the standards of the Public Company Accounting Oversight Board (United States). Those standards require that we plan and perform the audit to obtain reasonable assurance about whether the financial statements and financial highlights are free of material misstatement. An audit includes examining, on a test basis, evidence supporting the amounts and disclosures in the financial statements. Our procedures included confirmation of securities owned as of September 30, 2014, by correspondence with the custodian and brokers or by other appropriate auditing procedures where replies from brokers or counterparties were not received. An audit also includes assessing the accounting principles used and significant estimates made by management, as well as evaluating the overall financial statement presentation. We believe that our audits provide a reasonable basis for our opinion.
In our opinion, the financial statements and financial highlights referred to above present fairly, in all material respects, the financial position of Timothy Plan Aggressive Growth Fund, Timothy Plan International Fund, Timothy Plan Large/Mid Cap Growth Fund, Timothy Plan Small Cap Value Fund, Timothy Plan Large/Mid Cap Value Fund, Timothy Plan Fixed Income Fund, Timothy Plan High Yield Bond Fund, Timothy Plan Israel Common Values Fund, Timothy Plan Defensive Strategies Fund, Timothy Plan
126
REPORT OF INDEPENDENT REGISTERED PUBLIC ACCOUNTING FIRM (cont.)
Strategic Growth Fund, Timothy Plan Conservative Growth Fund, Timothy Plan Emerging Markets Fund and Timothy Plan Growth & Income Fund as of September 30, 2014, the results of their operations for the year or period then ended, the changes in their net assets and the financial highlights for each of the years or periods indicated in conformity with accounting principles generally accepted in the United States of America.
COHEN FUND AUDIT SERVICES, LTD.
Cleveland, Ohio
December 1, 2014
127
Expense Examples – (Unaudited)
September 30, 2014
As a shareholder of a Fund, you incur two types of costs: direct costs, such as wire fees and low balance fees; and indirect costs, including management fees, and other Fund operating expenses. This example is intended to help you understand your indirect costs, also referred to as “ongoing costs”, (in dollars) of investing in each Fund, and to compare these costs with the ongoing costs of investing in other mutual funds.
This example is based on an investment of $1,000 invested at the beginning of the period and held for the entire six-month period of April 1, 2014, through September 30, 2014.
Actual Expenses
The first line of the following tables provides information about actual account values and actual expenses. You may use the information in this line, together with the amount you invested at the beginning of the period, to estimate the expenses that you paid over the period. Simply divide your account value by $1,000 (for example, an $8,600 account value divided by $1,000 = 8.6), then multiply the result by the number in the first line under the heading “Expenses Paid During Period” to estimate the expenses you paid on your account during this period.
Hypothetical Example for Comparison Purposes
The second line of the tables provides information about hypothetical account values and hypothetical expenses based on each Fund’s actual expense ratio and an assumed rate of return of 5% per year before expenses, which is not the Fund’s actual return. The hypothetical account values and expenses may not be used to estimate the actual ending account balance or expenses you paid for the period. You may use this information to compare ongoing costs of investing in each Fund and other funds. To do so, compare this 5% hypothetical example with the 5% hypothetical examples that appear in the shareholder reports of other funds.
Please note that the expenses shown in the tables are meant to highlight your ongoing costs only and do not reflect any direct costs, such as wire fees or low balance fees. Therefore, the second line of the table is useful in comparing ongoing costs only, and will not help you determine the relative total costs of owning different funds. In addition, if these direct costs were included, your costs would be higher.
| | | | | | | | | | |
| AGGRESSIVE GROWTH FUND | | | | | | | | | | |
| | | Beginning Account | | | | Ending Account | | | | Expenses Paid |
| | | Value | | | | Value | | | | During Period |
| | | | | | | | | | | 4/1/2014 through |
| | | 4/1/2014 | | | | 9/30/2014 | | | | 9/30/2014 |
Actual - Class A * | | $1,000.00 | | | | $ 986.00 | | | | $ 8.31 |
Hypothetical - Class A ** | | $1,000.00 | | | | $1,016.70 | | | | $ 8.44 |
Actual - Class C * | | $1,000.00 | | | | $ 981.90 | | | | $12.01 |
Hypothetical - Class C ** | | $1,000.00 | | | | $1,012.95 | | | | $12.20 |
Actual - Class I * | | $1,000.00 | | | | $ 986.10 | | | | $ 7.05 |
Hypothetical - Class I ** | | $1,000.00 | | | | $1,012.95 | | | | $12.20 |
| * | Expenses are equal to the Fund’s annualized expense ratio of 1.67% for Class A, 2.42% for Class C and 1.42% for Class I, which is net of any expenses paid indirectly, multiplied by the average account value over the period, multiplied by 183 days/365 days (to reflect the partial year period). The Aggressive Growth Fund’s ending account value on the first line of each share class in the table is based on its actual total return of (1.40)% for Class A,(1.81)% for Class C and (1.39)% for Class I for the period of April 1, 2014, to September 30, 2014. |
| ** | Assumes a 5% return before expenses. |
128
Expense Examples – (Unaudited)(Continued)
September 30, 2014
| | | | | | | | | | |
| INTERNATIONAL FUND | | | | | | | | | | |
| | | Beginning Account | | | | Ending Account | | | | Expenses Paid |
| | | Value | | | | Value | | | | During Period |
| | | | | | | | | | | 4/1/2014 through |
| | | 4/1/2014 | | | | 9/30/2014 | | | | 9/30/2014 |
Actual - Class A * | | $1,000.00 | | | | $ 985.60 | | | | $ 8.09 |
Hypothetical - Class A ** | | $1,000.00 | | | | $1,016.92 | | | | $ 8.21 |
Actual - Class C * | | $1,000.00 | | | | $ 980.80 | | | | $11.78 |
Hypothetical - Class C ** | | $1,000.00 | | | | $1,013.17 | | | | $11.97 |
Actual - Class I * | | $1,000.00 | | | | $ 985.60 | | | | $ 6.83 |
Hypothetical - Class I ** | | $1,000.00 | | | | $1,012.95 | | | | $12.20 |
| * | Expenses are equal to the Fund’s annualized expense ratio of 1.62% for Class A, 2.37% for Class C and 1.37% for Class I, which is net of any expenses paid indirectly, multiplied by the average account value over the period, multiplied by 183 days/365 days (to reflect the partial year period). The International Fund’s ending account value on the first line of each share class in the table is based on its actual total return of (1.44)% for Class A, (1.92)% for Class C, and (1.44)% for Class I for the period of April 1, 2014, to September 30, 2014. |
| ** | Assumes a 5% return before expenses. |
| | | | | | | | | | |
| LARGE/MID CAP GROWTH FUND | | | | | | | | | | |
| | | Beginning Account | | | | Ending Account | | | | Expenses Paid |
| | | Value | | | | Value | | | | During Period |
| | | | | | | | | | | 4/1/2014 through |
| | | 4/1/2014 | | | | 9/30/2014 | | | | 9/30/2014 |
Actual - Class A * | | $1,000.00 | | | | $1,028.50 | | | | $ 7.76 |
Hypothetical - Class A ** | | $1,000.00 | | | | $1,017.41 | | | | $ 7.72 |
Actual - Class C * | | $1,000.00 | | | | $1,024.30 | | | | $11.56 |
Hypothetical - Class C ** | | $1,000.00 | | | | $1,013.65 | | | | $11.50 |
Actual - Class I * | | $1,000.00 | | | | $1,029.60 | | | | $ 6.50 |
Hypothetical - Class I ** | | $1,000.00 | | | | $1,013.65 | | | | $ 6.45 |
| * | Expenses are equal to the Fund’s annualized expense ratio of 1.53% for Class A, 2.28% for Class C and 1.28% for Class I, which is net of any expenses paid indirectly, multiplied by the average account value over the period, multiplied by 183 days/365 days (to reflect the partial year period). The Large/Mid Cap Growth Fund’s ending account value on the first line of each share class in the table is based on its actual total return of 2.85% for Class A, 2.43% for Class C, and 2.96% for Class I for the period of April 1, 2014, to September 30, 2014. |
| ** | Assumes a 5% return before expenses. |
| | | | | | | | | | |
| SMALL CAP VALUE FUND | | | | | | | | | | |
| | | Beginning Account | | | | Ending Account | | | | Expenses Paid |
| | | Value | | | | Value | | | | During Period |
| | | | | | | | | | | 4/1/2014 through |
| | | 4/1/2014 | | | | 9/30/2014 | | | | 9/30/2014 |
Actual - Class A * | | $1,000.00 | | | | $ 961.60 | | | | $ 7.43 |
Hypothetical - Class A ** | | $1,000.00 | | | | $1,017.50 | | | | $ 7.64 |
Actual - Class C * | | $1,000.00 | | | | $ 958.00 | | | | $11.10 |
Hypothetical - Class C ** | | $1,000.00 | | | | $1,013.74 | | | | $11.41 |
Actual - Class I * | | $1,000.00 | | | | $ 963.10 | | | | $ 6.19 |
Hypothetical - Class I ** | | $1,000.00 | | | | $1,013.74 | | | | $11.41 |
| * | Expenses are equal to the Fund’s annualized expense ratio of 1.51% for Class A, 2.26% for Class C, and 1.26% for Class I which is net of any expenses paid indirectly, multiplied by the average account value over the period, multiplied by 183 days/365 days (to reflect the partial year period). The Small Cap Value Fund’s ending account value on the first line of each share class in the table is based on its actual total return of (3.84)% for Class A, (4.20)% for Class C and (3.69)% for the period of April 1, 2014, to September 30, 2014. |
| ** | Assumes a 5% return before expenses. |
129
Expense Examples – (Unaudited)(Continued)
September 30, 2014
| | | | | | | | | | |
| LARGE/MID CAP VALUE FUND | | | | | | | | | | |
| | | Beginning Account | | | | Ending Account | | | | Expenses Paid |
| | | Value | | | | Value | | | | During Period |
| | | | | | | | | | | 4/1/2014 through |
| | | 4/1/2014 | | | | 9/30/2014 | | | | 9/30/2014 |
Actual - Class A * | | $1,000.00 | | | | $1,027.80 | | | | $ 7.45 |
Hypothetical - Class A ** | | $1,000.00 | | | | $1,017.72 | | | | $ 7.41 |
Actual - Class C * | | $1,000.00 | | | | $1,023.80 | | | | $11.24 |
Hypothetical - Class C ** | | $1,000.00 | | | | $1,013.97 | | | | $11.18 |
Actual - Class I * | | $1,000.00 | | | | $1,029.40 | | | | $ 6.18 |
Hypothetical - Class I ** | | $1,000.00 | | | | $1,013.97 | | | | $11.18 |
| * | Expenses are equal to the Fund’s annualized expense ratio of 1.47% for Class A, 2.21% for Class C, and 1.21% for Class I which is net of any expenses paid indirectly, multiplied by the average account value over the period, multiplied by 183 days/365 days (to reflect the partial year period). The Large/Mid Cap Value Fund’s ending account value on the first line of each share class in the table is based on its actual total return of 2.78% for Class A, 2.38% for Class C, and 2.94% for Class I for the period of April 1, 2014, to September 30, 2014. |
| ** | Assumes a 5% return before expenses. |
| | | | | | | | | | |
| FIXED INCOME FUND | | | | | | | | | | |
| | | Beginning Account | | | | Ending Account | | | | Expenses Paid |
| | | Value | | | | Value | | | | During Period |
| | | | | | | | | | | 4/1/2014 through |
| | | 4/1/2014 | | | | 9/30/2014 | | | | 9/30/2014 |
Actual - Class A * | | $1,000.00 | | | | $1,017.10 | | | | $5.35 |
Hypothetical - Class A ** | | $1,000.00 | | | | $1,019.76 | | | | $5.36 |
Actual - Class C * | | $1,000.00 | | | | $1,013.90 | | | | $9.12 |
Hypothetical - Class C ** | | $1,000.00 | | | | $1,016.01 | | | | $9.13 |
Actual - Class I * | | $1,000.00 | | | | $1,019.70 | | | | $4.08 |
Hypothetical - Class I ** | | $1,000.00 | | | | $1,021.03 | | | | $9.15 |
| * | Expenses are equal to the Fund’s annualized expense ratio of 1.06% for Class A, 1.81% for Class C, and 0.81% for Class I which is net of any expenses paid indirectly, multiplied by the average account value over the period, multiplied by 183 days/365 days (to reflect the partial year period). The Fixed Income Fund’s ending account value on the first line of each share class in the table is based on its actual total return of 1.71% for Class A, 1.39% for Class C, and 1.97% for Class I for the period of April 1, 2014, to September 30, 2014. |
| ** | Assumes a 5% return before expenses. |
| | | | | | | | | | |
| HIGH YIELD BOND FUND | | | | | | | | | | |
| | | Beginning Account | | | | Ending Account | | | | Expenses Paid |
| | | Value | | | | Value | | | | During Period |
| | | | | | | | | | | 4/1/2014 through |
| | | 4/1/2014 | | | | 9/30/2014 | | | | 9/30/2014 |
Actual - Class A * | | $1,000.00 | | | | $1,002.00 | | | | $6.04 |
Hypothetical - Class A ** | | $1,000.00 | | | | $1,019.04 | | | | $6.09 |
Actual - Class C * | | $1,000.00 | | | | $ 997.20 | | | | $9.77 |
Hypothetical - Class C ** | | $1,000.00 | | | | $1,015.28 | | | | $9.86 |
Actual - Class I * | | $1,000.00 | | | | $1,003.20 | | | | $4.78 |
Hypothetical - Class I ** | | $1,000.00 | | | | $1,015.28 | | | | $9.86 |
| * | Expenses are equal to the Fund’s annualized expense ratio of 1.20% for Class A, 1.95% for Class C, and 0.95% for Class I which is net of any expenses paid indirectly, multiplied by the average account value over the period, multiplied by 183 days/365 days (to reflect the partial year period). The High Yield Bond Fund’s ending account value on the first line of each share class in the table is based on its actual total return of 0.20% for Class A, (0.28)% for Class C, and 0.32% for Class I for the period of April 1, 2014, to September 30, 2014. |
| ** | Assumes a 5% return before expenses. |
130
Expense Examples – (Unaudited)(Continued)
September 30, 2014
| | | | | | | | | | |
| DEFENSIVE STRATEGIES FUND | | | | | | | | | | |
| | | Beginning Account | | | | Ending Account | | | | Expenses Paid |
| | | Value | | | | Value | | | | During Period |
| | | | | | | | | | | 4/1/2014 through |
| | | 4/1/2014 | | | | 9/30/2014 | | | | 9/30/2014 |
Actual - Class A * | | $1,000.00 | | | | $ 998.20 | | | | $5.97 |
Hypothetical - Class A ** | | $1,000.00 | | | | $1,019.09 | | | | $6.04 |
Actual - Class C * | | $1,000.00 | | | | $ 994.60 | | | | $9.70 |
Hypothetical - Class C ** | | $1,000.00 | | | | $1,015.34 | | | | $9.80 |
Actual - Class I * | | $1,000.00 | | | | $ 999.10 | | | | $4.71 |
Hypothetical - Class I ** | | $1,000.00 | | | | $1,020.35 | | | | $4.76 |
| * | Expenses are equal to the Fund’s annualized expense ratio of 1.19% for Class A, 1.94% for Class C and 0.94% for Class I, which is net of any expenses paid indirectly, multiplied by the average account value over the period, multiplied by 183 days/365 days (to reflect the partial year period). The Defensive Strategies Fund’s ending account value on the first line of each share class in the table is based on its actual total return of (0.18)% for Class A, (0.54)% for Class C and (0.09)% for Class I for the period of April 1, 2014, to September 30, 2014. |
| ** | Assumes a 5% return before expenses. |
| | | | | | | | | | |
| STRATEGIC GROWTH FUND | | | | | | | | | | |
| | | Beginning Account | | | | Ending Account | | | | Expenses Paid |
| | | Value | | | | Value | | | | During Period |
| | | | | | | | | | | 4/1/2014 through |
| | | 4/1/2014 | | | | 9/30/2014 | | | | 9/30/2014 |
Actual - Class A * | | $1,000.00 | | | | $ 995.50 | | | | $5.00 |
Hypothetical - Class A ** | | $1,000.00 | | | | $1,020.06 | | | | $5.06 |
Actual - Class C * | | $1,000.00 | | | | $ 991.50 | | | | $8.72 |
Hypothetical - Class C ** | | $1,000.00 | | | | $1,016.31 | | | | $8.83 |
| * | Expenses are equal to the Fund’s annualized expense ratio of 1.00% for Class A and 1.75% for Class C, which is net of any expenses paid indirectly, multiplied by the average account value over the period, multiplied by 183 days/365 days (to reflect the partial year period). The Strategic Growth Fund’s ending account value on the first line of each share class in the table is based on its actual total return of (0.45)% for Class A and (0.85)% for Class C for the six-month period of April 1, 2014, to September 30, 2014. |
| ** | Assumes a 5% return before expenses. |
| | | | | | | | | | |
| CONSERVATIVE GROWTH FUND | | | | | | | | | | |
| | | Beginning Account | | | | Ending Account | | | | Expenses Paid |
| | | Value | | | | Value | | | | During Period |
| | | | | | | | | | | 4/1/2014 through |
| | | 4/1/2014 | | | | 9/30/2014 | | | | 9/30/2014 |
Actual - Class A * | | $1,000.00 | | | | $ 998.20 | | | | $4.95 |
Hypothetical - Class A ** | | $1,000.00 | | | | $1,020.11 | | | | $5.01 |
Actual - Class C * | | $1,000.00 | | | | $ 994.20 | | | | $8.68 |
Hypothetical - Class C ** | | $1,000.00 | | | | $1,016.37 | | | | $8.77 |
| * | Expenses are equal to the Fund’s annualized expense ratio of 0.99% for Class A and 1.74% for Class C, which is net of any expenses paid indirectly, multiplied by the average account value over the period, multiplied by 183 days/365 days (to reflect the partial year period). The Conservative Growth Fund’s ending account value on the first line of each share class in the table is based on its actual total return of (0.18)% for Class A and (0.58)% for Class C for the six-month period of April 1, 2014, to September 30, 2014. |
| ** | Assumes a 5% return before expenses. |
131
Expense Examples – (Unaudited)(Continued)
September 30, 2014
| | | | | | | | | | |
| ISRAEL COMMON VALUES FUND | | | | | | | | | | |
| | | Beginning Account | | | | Ending Account | | | | Expenses Paid |
| | | Value | | | | Value | | | | During Period |
| | | | | | | | | | | 4/1/2014 through |
| | | 4/1/2014 | | | | 9/30/2014 | | | | 9/30/2014 |
Actual - Class A * | | $1,000.00 | | | | $ 920.00 | | | | $10.12 |
Hypothetical - Class A ** | | $1,000.00 | | | | $1,014.53 | | | | $10.62 |
Actual - Class C * | | $1,000.00 | | | | $ 915.70 | | | | $13.64 |
Hypothetical - Class C ** | | $1,000.00 | | | | $1,010.83 | | | | $14.32 |
Actual - Class I * | | $1,000.00 | | | | $ 920.60 | | | | $ 8.86 |
Hypothetical - Class I ** | | $1,000.00 | | | | $1,010.83 | | | | $14.32 |
| * | Expenses are equal to the Fund’s annualized expense ratio of 2.10% for Class A, 2.84% for Class C and 1.84% for Class I, which is net of any expenses paid indirectly, multiplied by the average account value over the period, multiplied by 183 days/365 days (to reflect the partial year period). The Israel Common Values Fund’s ending account value on the first line of each share class in the table is based on its actual total return of (8.00)% for Class A, (8.43)% for Class C and (7.94)% for the period of April 1, 2014, to September 30, 2014. |
| ** | Assumes a 5% return before expenses. |
| | | | | | | | | | |
| EMERGING MARKETS FUND | | | | | | | | | | |
| | | Beginning Account | | | | Ending Account | | | | Expenses Paid |
| | | Value | | | | Value | | | | During Period |
| | | | | | | | | | | 4/1/2014 through |
| | | 4/1/2014 | | | | 9/30/2014 | | | | 9/30/2014 |
Actual - Class A * | | $1,000.00 | | | | $1,014.90 | | | | $12.26 |
Hypothetical - Class A ** | | $1,000.00 | | | | $1,012.89 | | | | $12.25 |
Actual - Class C * | | $1,000.00 | | | | $1,010.00 | | | | $16.03 |
Hypothetical - Class C ** | | $1,000.00 | | | | $1,009.12 | | | | $16.02 |
Actual - Class I * | | $1,000.00 | | | | $1,015.90 | | | | $11.02 |
Hypothetical - Class I ** | | $1,000.00 | | | | $1,014.13 | | | | $11.01 |
| * | Expenses are equal to the Fund’s annualized expense ratio of 2.43% for Class A, 3.18% for Class C and 2.18% for Class I, which is net of any expenses paid indirectly, multiplied by the average account value over the period, multiplied by 183 days/365 days (to reflect the partial year period). The Emerging Markets Fund’s ending account value on the first line of each share class in the table is based on its actual total return of 1.49% for Class A, 1.00% for Class C and 1.59% for Class I for the period of April 1, 2014, to September 30, 2014. |
| ** | Assumes a 5% return before expenses. |
| | | | | | | | | | |
| GROWTH & INCOME FUND | | | | | | | | | | |
| | | Beginning Account | | | | Ending Account | | | | Expenses Paid |
| | | Value | | | | Value | | | | During Period |
| | | | | | | | | | | 4/1/2014 through |
| | | 4/1/2014 | | | | 9/30/2014 | | | | 9/30/2014 |
Actual - Class A * | | $1,000.00 | | | | $ 993.40 | | | | $4.75 |
Hypothetical - Class A ** | | $1,000.00 | | | | $1,004.21 | | | | $4.02 |
Actual - Class C * | | $1,000.00 | | | | $ 989.60 | | | | $6.73 |
Hypothetical - Class C ** | | $1,000.00 | | | | $1,003.02 | | | | $5.20 |
Actual - Class I *** | | $1,000.00 | | | | $1,057.20 | | | | $3.67 |
Hypothetical - Class I ** | | $1,000.00 | | | | $1,004.66 | | | | $3.57 |
| * | Expenses are equal to the Fund’s annualized expense ratio of 1.50% for Class A, 2.25% for Class C and 1.25% for Class I , which is net of any expenses paid indirectly, multiplied by the average account value over the period, multiplied by 183 days/365 days (to reflect the partial year period). The Emerging Markets Fund’s ending account value on the first line of each share class in the table is based on its actual total return of 0.00%% for Class A, (0.46)% for Class C and 0.09% for Class I, for the period of April 1, 2014, to September 30, 2014. |
| ** | Assumes a 5% return before expenses. |
132
SUPPLEMENTAL INFORMATION – (Unaudited)
September 30, 2014
PROXY VOTING
At a Special Meeting of Shareholders on Friday, December 6, 2013, Trust shareholders of record as of the close of business on September 30, 2013 voted to approve the following proposal:
Proposal 1: Approval of a new investment sub-advisory agreement for the Timothy Plan Defensive Strategies Fund
| | | | | | | | | | |
| FOR | | | | AGAINST | | | | ABSTAIN | | |
| 2,671,593 | | | | 12,337 | | | | 36,746 | |
At a Special Meeting of Shareholders on Tuesday, May 27, 2014, Trust shareholders of record as of the close of business on April 11, 2014 voted to approve the following proposal:
Proposal 1: Approval of a new investment sub-advisory agreement for the Timothy Plan Aggressive Growth Fund
| | | | | | | | | | |
| FOR | | | | AGAINST | | | | ABSTAIN | | |
| 1,152,968 | | | | 31,358 | | | | 79,424 | |
Proposal 2: Approval of a new investment sub-advisory agreement for the Timothy Plan Large/Mid Cap Growth Fund
| | | | | | | | | | |
| FOR | | | | AGAINST | | | | ABSTAIN | | |
| 3,568,185 | | | | 3,261 | | | | 110,186 | |
133
Officers and Trustees of the Trust
As of September 30, 2014 (Unaudited)
Timothy Plan Family of Funds
| | | | | | |
Name, Age and Address | | Position(s) Held With Trust | | Term of Office and Length of Time Served | | Number of Portfolios in Fund Complex Overseen by Trustee |
Arthur D. Ally* 1055 Maitland Center Commons Maitland, FL | | Chairman, President and Treasurer | | Indefinite; Trustee and President since 1994 | | 13 |
| | Principal Occupation During Past 5 Years | | Other Directorships Held by Trustee |
Born: 1942 | | President and controlling shareholder of Covenant Funds, Inc. (“CFI”), a holding company. President and general partner of Timothy Partners, Ltd. (“TPL”), the investment advisor and principal underwriter to each Fund. CFI is also the managing general partner of TPL. | | None |
| | | | | | |
Name, Age and Address | | Position(s) Held With Trust | | Term of Office and Length of Time Served | | Number of Portfolios in Fund Complex Overseen by Trustee |
Kenneth Blackwell 1055 Maitland Center Commons Maitland, FL | | Trustee | | Indefinite; Trustee since 2011 | | 13 |
| | Principal Occupation During Past 5 Years | | Other Directorships Held by Trustee |
Born: 1948 | | Secretary of State for the State of Ohio. Currently serving as an independent consultant or Fellow with the Family Research Council and the American Civil Rights Union, and is a Visiting Professor at Liberty University, Lynchburg, VA. | | None |
| | | | | | |
Name, Age and Address | | Position(s) Held With Trust | | Term of Office and Length of Time Served | | Number of Portfolios in Fund Complex Overseen by Trustee |
Joseph E. Boatwright** 1055 Maitland Center Commons Maitland, FL | | Trustee, Secretary | | Indefinite; Trustee and Secretary since 1995 | | 13 |
| | Principal Occupation During Past 5 Years | | Other Directorships Held by Trustee |
Born: 1930 | | Retired Minister. Currently serves as a consultant to the Greater Orlando Baptist Association. Served as Senior Pastor to Aloma Baptist Church from 1970-1996. | | None |
* Mr. Ally is an “interested” Trustee, as that term is defined in the 1940 Act, because of his positions with and financial interests in CFI and TPL.
** Messrs. Boatwright and Staver are “interested” Trustees, as that term is defined in the 1940 Act, because each has a limited partnership intereset in TPL.
134
Officers and Trustees of the Trust (Continued)
As of September 30, 2014 (Unaudited)
Timothy Plan Family of Funds
| | | | | | |
Name, Age and Address | | Position(s) Held With Trust | | Term of Office and Length of Time Served | | Number of Portfolios in Fund Complex Overseen by Trustee |
Richard W. Copeland 1055 Maitland Center Commons Maitland, FL | | Trustee | | Indefinite; Trustee since 2005 | | 13 |
| | Principal Occupation During Past 5 Years | | Other Directorships Held by Trustee |
Born: 1947 | | Principal of Copeland & Covert, Attorneys at Law; specializing in tax and estate planning. B.A. from Mississippi College, JD from University of Florida and LLM Taxation from University of Miami. Associate Professor Stetson University for past 35 years. | | None |
| | | | | | |
Name, Age and Address | | Position(s) Held With Trust | | Term of Office and Length of Time Served | | Number of Portfolios in Fund Complex Overseen by Trustee |
Deborah Honeycutt 1055 Maitland Center Commons Maitland, FL | | Trustee | | Indefinite; Trustee since 2010 | | 13 |
| | Principal Occupation During Past 5 Years | | Other Directorships Held by Trustee |
Born: 1947 | | Dr. Honeycutt is a licensed physician currently serving as Medical Director of Clayton State University Health Services in Morrow, GA, CEO of Minority Health Services in Atlanta, and as a volunteer at Good Shepherd Clinic. Dr. Honeycutt received her B.A. and M.D. at the University of Illinois. | | None |
| | | | | | |
Name, Age and Address | | Position(s) Held With Trust | | Term of Office and Length of Time Served | | Number of Portfolios in Fund Complex Overseen by Trustee |
Bill Johnson 1055 Maitland Center Commons Maitland, FL | | Trustee | | Indefinite; Trustee since 2005 | | 13 |
| | Principal Occupation During Past 5 Years | | Other Directorships Held by Trustee |
Born: 1946 | | President (and Founder) of American Decency Association, Freemont, MI since 1999. Previously served as Michigan State Director for American Family Association (1987-1999). Previously a public school teacher for 18 years. B.S. from Michigan State University and a Masters of Religious Education from Grand Rapids Baptist Seminary. | | None |
135
Officers and Trustees of the Trust (Continued)
As of September 30, 2014 (Unaudited)
Timothy Plan Family of Funds
| | | | | | |
| Name, Age and Address | | Position(s) Held With Trust | | Term of Office and Length of Time Served | | Number of Portfolios in Fund Complex Overseen by Trustee |
John C. Mulder 1055 Maitland Center Commons Maitland, FL | | Trustee | | Indefinite; Trustee since 2005 | | 13 |
| | Principal Occupation During Past 5 Years | | Other Directorships Held by Trustee |
| Born: 1950 | | President of WaterStone (formerly the Christian Community Foundation and National Foundation) since 2001. Prior: 22 years of executive experience for a group of banks and a trust company. B.A. in Economics from Wheaton College and MBA from University of Chicago. | | None |
| | | | | | |
| Name, Age and Address | | Position(s) Held With Trust | | Term of Office and Length of Time Served | | Number of Portfolios in Fund Complex Overseen by Trustee |
Charles E. Nelson 1055 Maitland Center Commons Maitland, FL | | Trustee | | Indefinite; Trustee since 2000 | | 13 |
| | Principal Occupation During Past 5 Years | | Other Directorships Held by Trustee |
Born: 1934 | | Certified Public Accountant, semi-retired. Former non-profit industry accounting officer. Former financial executive with commercial bank. Former partner national accounting firm. | | None |
| | | | | | |
| Name, Age and Address | | Position(s) Held With Trust | | Term of Office and Length of Time Served | | Number of Portfolios in Fund Complex Overseen by Trustee |
Scott Preissler, Ph.D. 1055 Maitland Center Commons Maitland, FL | | Trustee | | Indefinite; Trustee since 2004 | | 13 |
| | Principal Occupation During Past 5 Years | | Other Directorships Held by Trustee |
Born: 1960 | | Chairman of Stewardship Studies at Southwestern Baptist Theological Seminary, Ft. Worth, TX. Also serves as Founder and Chairman of the International Center for Biblical Stewardship. Previously, President and CEO of Christian Stewardship Association where he was affiliated for 14 years. | | None |
136
Officers and Trustees of the Trust (Continued)
As of September 30, 2014 (Unaudited)
Timothy Plan Family of Funds
| | | | | | |
| Name, Age and Address | | Position(s) Held With Trust | | Term of Office and Length of Time Served | | Number of Portfolios in Fund Complex Overseen by Trustee |
Alan M. Ross 1055 Maitland Center Commons Maitland, FL Born: 1951 | | Trustee, Vice Chairman | | Indefinite; Trustee since 2004 | | 13 |
| | Principal Occupation During Past 5 Years | | | | Other Directorships Held by Trustee |
| | Founder and CEO of Corporate Development Institute which he founded in 2000. Previously he served as President and CEO of Fellowship of Companies for Christ and has authored three books: Beyond World Class, Unconditional Excellence, Breaking Through to Prosperity. | | None |
| | | | | | |
| Name, Age and Address | | Position(s) Held With Trust | | Term of Office and Length of Time Served | | Number of Portfolios in Fund Complex Overseen by Trustee |
Mathew D. Staver** 1055 Maitland Center Commons Maitland, FL Born: 1956 | | Trustee | | Indefinite; Trustee since 2000 | | 13 |
| | Principal Occupation During Past 5 Years | | Other Directorships Held by Trustee |
| | Attorney specializing in free speech, appellate practice and religious liberty constitutional law. Founder of Liberty Counsel, a religious civil liberties education and legal defense organization. Host of two radio programs devoted to religious freedom issues. Editor of a monthly newsletter devoted to religious liberty topics. Mr. Staver has argued before the United States Supreme Court and has published numerous legal articles. | | None |
| | | | | | |
| Name, Age and Address | | Position(s) Held With Trust | | Term of Office and Length of Time Served | | Number of Portfolios in Fund Complex Overseen by Trustee |
Patrice Tsague 1055 Maitland Center Commons Maitland, FL Born: 1973 | | Trustee | | Indefinite; Trustee since 2011 | | 13 |
| | Principal Occupation During Past 5 Years | | Other Directorships Held by Trustee |
| | President and Chief Servant Officer of the Nehemiah Project International Ministries Inc. since 1999. | | None |
137
Officers and Trustees of the Trust (Continued)
As of September 30, 2011 (Unaudited)
Timothy Plan Family of Funds
OFFICERS WHO ARE NOT TRUSTEES
| | | | | | |
| Name, Age and Address | | Position(s) Held With Trust | | Term of Office and Length of Time Served | | Number of Portfolios in Fund Complex Overseen by Trustee |
David D. Jones, Esq. 422 Felming Street, Sute 7 Key West, FL 33040 | | Chief Compliance Officer | | Indefinite: since 2004 | | 13 |
| | Principal Occupation During Past 5 Years | | Other Directorships Held by Trustee |
| Born: 1957 | | Managing Member of Drake Compliance, LLC, a compliance consulting firm, Since 2004. B.A. From Univiersity of Texas at Austin in Economics- 1983. Juris Doctorate, with honors, from Saint Mary’s University School of Law in San Antonio, TX- 1994. | | None |
The Fund’s Statement of Additional Information includes additional information about the Trustees and is available free of charge, upon request, by calling toll-free at 1-800-846-7526.
138
Privacy Notice
| | |
FACTS | | WHAT DOES THE TIMOTHY PLAN DO WITH YOUR PERSONAL INFORMATION? |
| | |
WHY? | | Financial companies choose how they share your personal information. Federal law gives consumers the right to limit some, but not all information sharing. Federal law also requires us to tell you how we collect, share, and protect your personal information. Please read this Notice carefully to understand what we do. |
| | |
WHAT? | | The types of information we collect and share depend on the product or service you have with us. This information can include: |
| | | Ÿ Social Security Number |
| | | Ÿ Assets |
| | | Ÿ Retirement Assets |
| | | Ÿ Transaction History |
| | | Ÿ Checking Account History |
| | | Ÿ Purchase History |
| | | Ÿ Account Balances |
| | | Ÿ Account Transactions |
| | | Ÿ Wire Transfer Instructions |
| | | When you are no longer our customer, we continue to share your information as described in this Notice. |
| | |
HOW? | | All financial companies need to share your personal information to run their everyday business. In the section below, we list the reasons financial companies can share their customers’ personal information; the reasons The Timothy Plan chooses to share; and whether you can limit this sharing. |
| | | | |
| Reasons we can share your personal information. | | Does The Timothy Plan share? | | Can you limit this sharing? |
For our everyday business purposes- Such as to process your transactions, maintain your account(s), respond to court orders and legal investigations, or report to credit bureaus. | | Yes | | No |
For our marketing purposes- to offer our products and services to you. | | No | | We don’t share |
| For joint marketing with other financial companies | | No | | We don’t share |
For our affiliates’ everyday business purposes- information about your transactions and experiences. | | Yes | | No |
For our affiliates’ everyday business purposes- information about your creditworthiness | | No | | We don’t share |
| For non-affiliates to market to you | | No | | We don’t share |
| | | | |
Questions? | | Call 800-662-0201 |
139
| | |
Who we are | | |
Who is providing this Notice? | | Timothy Plan Family of Mutual Funds Timothy Partners, Ltd. |
What we do | | |
How does The Timothy Plan protect your personal information? | | To protect your personal information from unauthorized access and use, we use security measures that comply with federal law. These measures include computer safeguards and secured files and buildings. Our service providers are held accountable for adhering to strict policies and procedures to prevent any misuse or your nonpublic personal information. |
How does The Timothy Plan collect your personal information? | | We collect your personal information, for example, when you |
| | Ÿ Open an account |
| | Ÿ Provide account information |
| | | Ÿ Give us your contact information |
| | | Ÿ Make deposits or withdrawals from your account |
| | | Ÿ Make a wire transfer |
| | | Ÿ Tell us where to send the money |
| | | Ÿ Tell us who receives the money |
| | | Ÿ Show your government-issued ID |
| | | Ÿ Show your drivers’ license |
| | | We also collect your personal information from other companies. |
| Why can’t I limit all sharing? | | Federal law gives you the right to limit only: |
| | | Ÿ Sharing for affiliates’ everyday business purposes-information about your creditworthiness. |
| | | Ÿ Affiliates from using your information to market to you. |
| | | Ÿ Sharing for non-affiliates to market to you |
| | | State laws and individual companies may give you additional rights to limit sharing. |
| | |
| Definitions | | |
| Affiliates | | Companies related by common ownership or control. They can be financial and non-financial companies. Timothy Partners, Ltd. is an affiliate of The Timothy Plan |
| Non-affiliates | | Companies not related by common ownership or control. They can be financial and non-financial companies. Ÿ The Timothy Plan does not share with non-affiliates so they can market to you. |
| Joint marketing | | A formal agreement between non-affiliated financial companies that together market financial products to you. Ÿ The Timothy Plan does not jointly market. |
Customer Identification Program
The Board of Trustees of the Trust has approved procedures designed to prevent and detect attempts to launder money as required under the USA PATRIOT Act. The day-to-day responsibility for monitoring and reporting any such activities has been delegated to the transfer agent, subject to the oversight and supervision of the Board.
140
Disclosures
HOW TO OBTAIN PROXY VOTING INFORMATION
Information regarding how the Funds voted proxies relating to Fund securities during the period ended June 30 as well as a description of the policies and procedures that the Funds use to determine how to vote proxies is available without charge, upon request, by calling 1-800-732-0330 or by referring to the Security and Exchange Commission’s (“SEC”) website at http://www.sec.gov.
HOW TO OBTAIN 1ST AND 3RD FISCAL QUARTER PORTFOLIO HOLDINGS
Each Fund files its complete schedule of portfolio holdings with the SEC for the first and third quarters of each fiscal year on Form N-Q. Form N-Q is available on the SEC’s website at http://www.sec.gov and may be reviewed and copied at the SEC’s Public Reference Room in Washington, DC (1-800-SEC-0330). The information on Form N-Q is available without charge, upon request, by calling 1-800-732-0330.
141
BOARD OF TRUSTEES
Arthur D. Ally
Kenneth Blackwell
Joseph E. Boatwright
Rick Copeland
Deborah Honeycutt
Bill Johnson
John C. Mulder
Charles E. Nelson
Scott Preissler
Alan Ross
Mathew D. Staver
Patrice Tsague
OFFICERS
Arthur D. Ally, President
Joseph E. Boatwright, Secretary
INVESTMENT ADVISOR
Timothy Partners, Ltd.
1055 Maitland Center Commons
Maitland, FL 32751
| | |
DISTRIBUTOR Timothy Partners, Ltd. 1055 Maitland Center Commons Maitland, FL 32751 TRANSFER AGENT Gemini Fund Services, LLC 17605 Wright St., Suite 2 Omaha, NE 68130 INDEPENDENT REGISTERED PUBLIC ACCOUNTING FIRM Cohen Fund Audit Services, Ltd. 1350 Euclid Ave., Suite 800 Cleveland, OH 44115 LEGAL COUNSEL David Jones & Assoc., P.C. 422 Fleming St. Key West, FL 33040 | |  |
| |
| | HEADQUARTERS |
| | The Timothy Plan |
| | 1055 Maitland Center Commons |
| | Maitland, Florida 32751 |
For additional information or a prospectus, please call: 1-800-846-7526 Visit the Timothy Plan web site on the internet at: www.timothyplan.com | | (800) 846-7526 |
| | www.timothyplan.com |
| | invest@timothyplan.com |
This report is submitted for the general information of the shareholders of the Funds. It is not authorized for distribution to prospective investors in the Funds unless preceded or accompanied by an effective Prospectus which includes details regarding the Funds’ objectives, policies, expenses and other information. Distributed by Timothy Partners, Ltd. | | |
| | SHAREHOLDER SERVICES |
| | Gemini Fund Services, LLC |
| | 17605 Wright St., Suite 2 |
| | Omaha, NE 68130 |
| | (800) 662-0201 |
Item 2. Code of Ethics.
(a) As of the end of the period covered by this report, the registrant has adopted a code of ethics that applies to the registrant’s principal executive officer, principal financial officer, principal accounting officer or controller, or persons performing similar functions, regardless of whether these individuals are employed by the registrant or a third party.
(b) For purposes of this item, “code of ethics” means written standards that are reasonably designed to deter wrongdoing and to promote:
| | (1) | Honest and ethical conduct, including the ethical handling of actual or apparent conflicts of interest between personal and professional relationships; |
| | (2) | Full, fair, accurate, timely, and understandable disclosure in reports and documents that a registrant files with, or submits to, the Commission and in other public communications made by the registrant; |
| | (3) | Compliance with applicable governmental laws, rules, and regulations; |
| | (4) | The prompt internal reporting of violations of the code to an appropriate person or persons identified in the code; and |
| | (5) | Accountability for adherence to the code. |
(c) Amendments: During the period covered by the report, there have not been any amendments to the provisions of the code of ethics.
(d) Waivers: During the period covered by the report, the registrant has not granted any express or implicit waivers from the provisions of the code of ethics.
(e) Posting: We do not intend to post the Code of Ethics for the Officers or any amendments or waivers on a website.
(f) Availability: The Code of Ethics for the Officers can be obtained, free of charge by calling the toll free number for the appropriate Fund.
Item 3. Audit Committee Financial Expert.
(a) The registrant has an Audit committee currently composed of three independent Trustees, Mr. Wesley Pennington, Mr. John Mulder and Mr. Charles Nelson. The registrant’s board of trustees has determined that Mr. Charles Nelson is qualified to serve as an Audit Committee Financial Expert, and has designated him as such.
Item 4. Principal Accountant Fees and Services.
| | | | |
| The Timothy Plan | |
FY 2014 | | $ | 166,400 | |
FY 2013 | | $ | 142,700 | |
FY 2012 | | $ | 142,700 | |
-2-
| | | | | | | | | | | | |
The Timothy Plan | | | | | | Registrant | | | | | | Adviser |
FY 2014 | | $ | 0 | | | | | $ | 0 | | | |
FY 2013 | | $ | 0 | | | | | $ | 0 | | | |
FY 2012 | | $ | 0 | | | | | $ | 0 | | | |
Nature of the fees:
| | | | |
| The Timothy Plan | |
FY 2014 | | $ | 0 | |
FY 2013 | | $ | 0 | |
FY 2012 | | $ | 0 | |
Nature of the preparation of the 1120 RIC
fees:
Registrant
| | | | |
| The Timothy Plan | |
FY 2014 | | $ | 0 | |
FY 2013 | | $ | 0 | |
FY 2012 | | $ | 0 | |
(e) (1) Audit Committee’s Pre-Approval Policies
The Audit Committee Charter requires the Audit Committee to be responsible for the selection, retention or termination of auditors and, in connection therewith, to (i) evaluate the proposed fees and other compensation, if any, to be paid to the auditors, (ii) evaluate the independence of the auditors, (iii) pre-approve all audit services and, when appropriate, any non-audit services provided by the independent auditors to the Trust, (iv) pre-approve, when appropriate, any non-audit services provided by the independent auditors to the Trust’s investment adviser, or any entity controlling, controlled by, or under common control with the investment adviser and that provides ongoing services to the Trust if the engagement relates directly to the operations and financial reporting of the Trust, and (v) receive the auditors’ specific representations as to their independence;
(2) Percentages of Services Approved by the Audit Committee
Registrant
| | | | | | |
| | | | | | |
| | Audit-Related Fees: | | | 0 | % |
| | Tax Fees: | | | 0 | % |
| | All Other Fees: | | | 0 | % |
(f) During audit of registrant’s financial statements for the most recent fiscal year, less than 50 percent of the hours expended on the principal accountant’s engagement were attributed to work performed by persons other than the principal accountant’s full-time, permanent employees.
-3-
(g) The aggregate non-audit fees billed by the registrant’s accountant for services rendered to the registrant, and rendered to the registrant’s investment adviser (not including any sub-adviser whose role is primarily portfolio management and is subcontracted with or overseen by another investment adviser), and any entity controlling, controlled by, or under common control with the adviser that provides ongoing services to the registrant:
Registrant Adviser
| | | | | | | | | | |
FY 2014 | | $ | 0 | | | | | $ | 0 | |
FY 2013 | | $ | 0 | | | | | $ | 0 | |
FY 2012 | | $ | 0 | | | | | $ | 0 | |
(h) Not applicable. The auditor performed no services for the registrant’s investment adviser or any entity controlling, controlled by, or under common control with the investment adviser that provides ongoing services to the registrant.
Item 5. Audit Committee of Listed Companies. Not applicable.
Item 6. Schedule of Investments. Not applicable – schedule filed with Item 1.
Item 7. Disclosure of Proxy Voting Policies and Procedures for Closed-End Funds. Not applicable.
Item 8. Portfolio Managers of Closed-End Management Investment Companies. Not applicable.
Item 9. Purchases of Equity Securities by Closed-End Management Investment Company and Affiliated Purchasers. Not applicable.
Item 10. Submission of Matters to a Vote of Security Holders
The registrant has not adopted procedures by which shareholders may recommend nominees to the registrant’s board of trustees.
Item 11. Controls and Procedures.
(a) Based on an evaluation of the registrant’s disclosure controls and procedures as of November 19, 2010, the disclosure controls and procedures are reasonably designed to ensure that the information required in filings on Forms N-CSR is recorded, processed, summarized, and reported on a timely basis.
(b) There were no significant changes in the registrant’s internal control over financial reporting that occurred during the registrant’s second fiscal quarter of the period covered by this report that has materially affected, or is reasonably likely to materially affect, the registrant’s internal control over financial reporting.
Item 12. Exhibits.
| (a)(1) | Code is filed herewith |
| (a)(2) | Certifications by the registrant’s principal executive officer and principal financial officer, pursuant to Section 302 of the Sarbanes- Oxley Act of 2002 and required by Rule 30a-2 under the Investment Company Act of 1940 are filed herewith. |
| (b) | Certification pursuant to 18 U.S.C. Section 1350, as adopted pursuant to Section 906 of the Sarbanes-Oxley Act of 2002 is filed herewith. |
-4-
SIGNATURES
Pursuant to the requirements of the Securities Exchange Act of 1934 and the Investment Company Act of 1940, the registrant has duly caused this report to be signed on its behalf by the undersigned, thereunto duly authorized.
(Registrant) The Timothy Plan
| | | | |
By | | /s/ Arthur D. Ally | | |
| | Arthur D. Ally, President |
| | |
Date | | 12/9/14 | | |
Pursuant to the requirements of the Securities Exchange Act of 1934 and the Investment Company Act of 1940, this report has been signed below by the following persons on behalf of the registrant and in the capacities and on the dates indicated.
| | | | |
By | | /s/ Arthur D. Ally | | |
| | Arthur D. Ally, President |
| | |
Date | | 12/9/14 | | |
-5-