UNITED STATES
SECURITIES AND EXCHANGE COMMISSION
WASHINGTON, D.C. 20549
FORM N-CSR
CERTIFIED SHAREHOLDER REPORT OF REGISTERED MANAGEMENT
INVESTMENT COMPANIES
Investment Company Act file number 811-08228
The Timothy Plan
(Exact name of registrant as specified in charter)
| | |
1055 Maitland Center Commons, Maitland, FL 32751 |
| (Address of principal executive offices) | | (Zip code) |
Art Ally, The Timothy Plan
1055 Maitland Center Commons, Maitland, FL 32751
(Name and address of agent for service)
Registrant’s telephone number, including area code: 800-846-7526
Date of fiscal year end: 9/30
Date of reporting period: 9/30/17
Form N-CSR is to be used by management investment companies to file reports with the Commission not later than 10 days after the transmission to stockholders of any report that is required to be transmitted to stockholders under Rule 30e-1 under the Investment Company Act of 1940 (17 CFR 270.30e-1). The Commission may use the information provided on Form N-CSR in its regulatory, disclosure review, inspection and policymaking roles.
A registrant is required to disclose the information specified by Form N-CSR, and the Commission will make this information public. A registrant is not required to respond to the collection of information contained in Form N-CSR unless the Form displays a currently valid Office of Management and Budget (“OMB”) control number. Please direct comments concerning the accuracy of the information collection burden estimate and any suggestions for reducing the burden to Secretary, Securities and Exchange Commission, 450 Fifth Street, NW, Washington, DC 20549-0609. The OMB has reviewed this collection of information under the clearance requirements of 44 U.S.C. § 3507.
Item 1. Reports to Stockholders.
The Registrant’s audited annual financial reports transmitted to shareholders pursuant to Rule 30e-1 under the Investment Company Act of 1940 are as follows:
September 30, 2017
Dear Shareholder,
As you review the details on the following pages, you will see that most of our funds experienced very good performance over the past fiscal year (10-1-16 thru 9-30-17). Although our performance trailed many of our benchmark indexes over the period, it was mostly due to the impact that a couple of very large companies (ones we screen out) had on the various indexes during this period.
The positive returns we experienced are, we believe, in large part the result of our country’s leadership changes in Washington, DC, and the positive pro-business agenda they are pursuing. These changes gave us a positive long-term view of our economy and, therefore the equity markets. Even though we experienced periodic short-term volatility, we fully expect the market trend to continue. Nevertheless, Timothy Partners, Ltd, (the “Advisor”) continued (and will continue) to take a conservative approach to the markets as we believe our shareholders prefer a preservation of principal course to that of chasing returns. I do need to reiterate, however, that, in the capital markets in general and our funds in particular, returns can never be guaranteed.
For more complete information about the individual Funds, please read each of the sub-advisors’ annual review letters in the pages that follow. They more fully detail the various factors that impacted this fiscal year’s performance along with their economic outlook for the coming year.
Although we cannot guarantee any actual outcome, I remain confident that all our sub-advisors are, in our opinion, among the best in the industry and they each continue to honor our overall policy to manage their respective funds both in accordance with our screening restrictions and with a continued conservative bias.
Finally, I would once again like to thank you for your moral convictions that led you to becoming part of the Timothy Plan Family.
Yours in Christ,
Arthur D. Ally
President
1
| | |
Timothy Plan Aggressive Growth Fund Letter from the Manager – September 30, 2017 | | 
|
| | | |
The economic advances that started several years ago have continued throughout 2017, driving the equity markets to new highs. The unemployment rate which has been declining rapidly since 2013 has continued to decline, with the most recent unemployment rate of 4.2 percent reflecting a healthy job market. Other macro data points continue to be strong, and most importantly quite stable. We are entering the fifth year of consistent US CPI reports [ex food and energy]; the August report of 1.7 percent is at the bottom of the 5 year range of 1.7 – 2.2 percent. Meanwhile, the US GDP is also remarkably stable over the past several years, reflecting a steadily improving economic environment, with Q2 2017 GDP growth of 2.2 percent. This low level of macroeconomic volatility can explain why US equity valuations are moving to all-time highs. Equity investors are willing to pay a premium for consistent and healthy growth, be it for individual stocks or overall equity markets.
Timothy Plan Aggressive Growth Fund (the “Fund’) enjoyed strong returns for the year ended September 30, 2017, gaining 6.36% in the September 2017 quarter, 17.06% year to date, and 19.16% over the last 12 months for Class I. This compares favorably to the Russell Midcap Growth Index that returned 5.28% in the past quarter, 17.28% year to date, and 17.82% over the last 12 months.
The outperformance over the past 12 months was driven by strong stock selection in the consumer discretionary and the industrial sectors. Our largest stock outperformer in the consumer discretionary sector was Vail Resorts [MTN], as they continue to be a leading consolidator of ski resorts, most recently acquiring Whistler in Vancouver. The company is benefiting from network effects as more skiers are purchasing season passes that can be used in any one of their 19 resorts. In the industrial sector, the Fund’s strong performance was driven by its investments in Chemours [CC] and Albemarle [ALB]. Chemours is benefiting from strong titanium dioxide pricing and utilization trends. Albemarle is experiencing fantastic growth in lithium utilization and pricing, which has a promising multi-year outlook given the rapid adoption of electric vehicles on a global scale.
Regarding the underperformance within the portfolio, our investments in the energy and oil service industries proved to be disappointing. Given the high level of commodity volatility, as well as unfavorable supply / demand metrics, we have sold those underperforming securities, and instead we will look to generate alpha in other sectors.
Looking forward, we are optimistic that the healthcare sector in particular will generate strong returns, as there are several exciting medical advances occurring in the biotech industry, particularly in the treatment of various cancers and orphan diseases. We continue to find unique, attractive investment opportunities in many sectors, particularly in the healthcare and industrial sectors.
Chartwell Investment Partners, LLC
2
Letter From The Manager
Timothy Plan International Fund
September 30, 2017
International stocks joined the equity bull market over the last twelve months ended September 30, 2017 with Timothy Plan International Fund (the “Fund”) participating nicely.
The Fund had a strong absolute return over this period while its return relative to the MSCI EAFE Index closely matched the solid index performance. Sector allocation versus the benchmark index was a slight positive. An underweight to the underperforming Real Estate and Consumer Staples sectors and an overweight to the outperforming Technology sector were positive while holding any cash over the year was negative in this strong equity market. Good stock selection in the Health Care and Consumer Discretionary sectors helped performance and outweighed tough stock selection in the Financials sector. Stock selection in Belgium and France provided positive alpha while selection in the United Kingdom (UK) and Germany was challenging over the year. Positive returns from Ipsen SA (Health Care-France), KBC Groupe SA (Financials-Belgium), and Techtronic Industries (Consumer Discretionary-Hong Kong) helped absolute and relative performance while Shire PLC (Health Care-UK) was the most challenging for the portfolio during this period.
Equity markets were hesitant post the Brexit vote and prior to the US presidential elections but gained confidence after the election of President Trump. While UK Prime Minister Theresa May did trigger Article 50 of the EU Constitution to formally begin the exit of the UK from the European Union, this was more than offset by the very positive result of the French election. New French president Emmanuel Macron was welcomed by a positive response from European equity markets. The combination of reduced political risks as well as very accommodative monetary policy in the Eurozone area led to a strong pick up in business and consumer confidence. Inflation remains subdued and while interest rates have risen some, they remain at very low levels. The Eurozone economy appears to be firing on all cylinders and investor optimism has followed the strong earnings momentum. Corporate Japan’s further improvement in returns on equity and shareholder remuneration continues to unveil more investment opportunities there. Equity volatility remains at very low levels globally causing some concern that markets are too complacent but positive economic momentum remains. The dollar depreciated, even after its strong knee-jerk move post the Trump election, leading to strong international currencies helping the Fund’s performance.
While valuations have risen across the globe with the rise in the equity markets we continue to find attractive investment opportunities in Europe, Asia, and the emerging markets. Economic momentum remains positive and monetary policies across the globe remain very accommodative providing a substantial tailwind to asset prices. We remain committed to a consistent investment approach dedicated to finding long-term investments for the Fund. We thank you for your continued investment in the Fund.
Eagle Global Advisors, LLC
3
| | |
Timothy Plan Large/Mid Cap Growth Fund Letter from the Manager – September 30, 2017 | |
|
| | | |
We wrote in this letter last year that the market – in that trailing 12-month period – had defied the expectations of many market strategists and investors by climbing all four quarters for a gain of 14-15% on both the S&P500 and the Russell 1000 Growth index. Well, here we are a year later, the market has risen all four quarters again, and the total return on the S&P500 was 18.6% while large-cap growth stocks powered the Russell 1000 Growth to a whopping 22%! This year’s impressive rally began after the presidential election, which brought along with it expectations for: 1) a return to strong economic growth, 2) regulatory relief, and 3) a business-friendly environment that includes lower corporate and individual taxes. Even though most of these are still in the “hoped-for” category, the market has powered higher. This is likely due to corporate earnings up a higher-than-expected 11% year-to-date, and the Fed’s movement toward “normalization” of interest rates – and the attendant implication that the economy is now doing well enough to no longer need Q.E. (quantitative easing).
When large-cap growth stocks have the kind of historic gains that we’ve seen of late, it is very difficult for Timothy Plan Large/Mid Growth Fund (the “Fund”) to stay close to these eye-popping numbers. The Fund is significantly smaller than the benchmark (though this did not have an impact in the period) and also not as “growthy” — by virtue of the restriction of not being able to own many of the bellwether growth stocks. This less-growthy headwind is compounded when Technology leads the market (as we essentially have a “structural” underweight there); Tech was the best-performing sector in the R1G, up 31.6% over the twelve months.
The Fund advanced 17% for the 12 months ended September 30, 2017 for Class I, while the return of the benchmark, the Russell 1000 Growth Index, was +22%. Beyond the headwinds mentioned above, our performance was held back by poor selection in the Consumer Discretionary sector (AutoZone and Foot Locker); we also had an average 3.8% weight in the Energy sector (vs. the R1G’s almost non-existent weight of 0.6%), and since this was the worst-performing sector (-12.1%), that was a detractor. Additionally, in such a strong market, any amount of cash acts as ballast, thus our average 11% cash holding was a negative. On the positive side, we were able to offset some of the hit from being underweight Technology with good stock selection: chip-maker NVIDIA had another great year, up 162%, and security-software company Check Point Software rose 47%. Healthcare was also a good area for us, as our holdings were up 35%, vs. the benchmark sector’s +20%.
For the portfolio, there has been no change to our time-tested, bottom up fundamental approach to managing large and mid-cap growth investments. As an overview, the portfolio remains well diversified by issuers and by sectors as all areas of the economy are impacted by broad macroeconomic trends. We continue to find attractive investments at reasonable valuations. Looking forward, with the economy on solid footing, we are optimistic that economically-sensitive sectors (like Materials and Industrials) will generate strong returns. And with the Fed likely to continue on a pace of measured rate increases, the Financial sector is also where we expect to find compelling investment opportunities.
Chartwell Investment Partners, LLC
4
LETTER FROM THE MANAGER
September 30, 2017
TIMOTHY PLAN SMALL CAP VALUE FUND
We are pleased to provide you with our report for Timothy Plan Small Cap Value Fund (the “Fund”) for the twelve months ended September 30, 2017 and would like to thank you for entrusting your assets with us.
Looking back, the last year has seen regime change unfold across the investing landscape as the equity markets marched higher. While the election last November stands out, there were already forces underway to normalize the post-financial crisis monetary policy after interest rates posted their lowest levels in the last 5,000 years and trillions of dollars of debt had negative yields. The Federal Reserve hiked rates three times so far and began the process of reducing their balance sheet at the most recent meeting. The bump in the markets from the victory by Donald Trump further helped shift sentiment on the potential for fiscal policies to be a tailwind in the coming years for businesses. Although legislative changes to health care or corporate taxes remained elusive so far, there have been tangible efforts to reduce the regulatory burdens and that easing is starting to be seen at the company-level. Growth domestically remained positive while overseas, Europe appeared to improve and a global growth belief started to gain traction with investors. Other equity trends reversed from last year, as growth stocks outpaced value stocks and large caps topped small caps.
For the twelve months ended September 30, 2017, Timothy Plan Small Cap Value Fund produced a net return of 21.89% for Class I, while the Russell 2000 Index produced a return of 20.74%. Security selection was resoundingly positive during the period in Information Technology with Health Care and Financials also contributing positively. In such a strong absolute period, the Fund’s higher cash allocation resulted in a negative drag on performance.
Both Consumer sectors saw challenges in terms of stock selection and detracted from relative performance. In Consumer Discretionary, fears over changing consumer behaviors for retail and apparel companies as well as restaurants weighed on performance. Similar fears pressured one of our holdings in Consumer Staples though the sector itself struggled to try and keep pace with the torrid gains seen overall in the small cap space. A modest overweight in Energy, the only sector to post a loss for the last twelve months, also negatively impacted relative performance.
The Small Cap Value team is focused on seeking well-run companies with growth prospects that are underappreciated by the marketplace. We look for companies with above average growth and strong balance sheets that generate positive cash flows. As economic growth continues, we feel our companies are well positioned to achieve higher earnings and have the potential to provide superior relative returns.
We thank you for your continued confidence in the Westwood process and investment teams and we look forward to serving your investment needs through the years ahead.
Westwood Management Corporation
5
LETTER FROM THE MANAGER
September 30, 2017
TIMOTHY PLAN LARGE/MID CAP VALUE FUND
We are pleased to provide you with our report for Timothy Plan Large/Mid Cap Value Fund (the “Fund”) for the twelve months ended September 30, 2017 and would like to thank you for entrusting your assets with us.
Looking back, the last year has seen regime change unfold across the investing landscape as the equity markets marched higher. While the election last November stands out, there were already forces underway to normalize the post-financial crisis monetary policy after interest rates posted their lowest levels in the last 5,000 years and trillions of dollars of debt had negative yields. The Federal Reserve hiked rates three times so far and began the process of reducing their balance sheet at the most recent meeting. The bump in the markets from the victory by Donald Trump further helped shift sentiment on the potential for fiscal policies to be a tailwind in the coming years for businesses. Although legislative changes to health care or corporate taxes remained elusive so far, there have been tangible efforts to reduce the regulatory burdens and that easing is starting to be seen at the company-level. Growth domestically remained positive while overseas, Europe appeared to improve and a global growth belief started to gain traction with investors. Other equity trends reversed from last year, as growth stocks outpaced value stocks and large caps topped small caps. Financials were the best performing sector in the S&P 500. The sector saw several drivers arise including a more favorable regulatory environment and a positive interest rate environment. Since the financial crisis, banks in particular have seen increased costs for back office and compliance personnel to keep up with new regulations. In contrast, lower commodity prices weighed on the Energy sector, the worst performer during the past year.
For the twelve months ended September 30, 2017, Timothy Plan Large/Mid Cap Value Fund produced a net return of 13.36% for Class I, while the S&P 500 Index produced a return of 18.61%. While absolute returns remained strong, the relative performance faced headwinds. Notable positives included better stock selection within Information Technology and avoiding exposure to the Telecommunication Services sector which actually posted a loss.
The Information Technology sector saw several contributors as global growth improving in conjunction with secular trends expanding the markets for semiconductors saw strong flow-through to spending on semiconductor equipment. Both KLA-Tencor and Lam Research were top performers as the increasing number of chips in a variety of non-traditional end markets, like automobiles, and an increasing demand for memory were powerful tailwinds. Also, in Information Technology, Broadcom saw positive momentum in their acquired segments in addition to their classic wired markets as better results in the cellphone segment boosted their wireless results. With leverage to Silicon Valley and the broader tech space, SVB Financial moved higher. In addition, a more favorable yield curve and easing regulatory burdens were incremental positives that developed for SVB Financial. C.R. Bard agreed to be taken out at a substantial premium by Becton Dickinson to create a powerhouse in medical devices.
The Fund’s high cash position created a negative drag on relative performance as the S&P 500 saw strong appreciation, largely driven by multiple expansion, as did an underweight to Financials, the top performing sector for the period. Further, security selection in Consumer Discretionary detracted from relative performance as changing dynamics in the auto parts industry weighed on shares of Advanced Auto Parts. Similarly, fears over the secular pressures on retail tenants pressured Simon Property Group. J.M. Smucker faced challenges in their coffee and pet businesses, though management responded with additional cost take outs to help offset the impact to earnings. Patterson Companies decided to not renew an exclusive relationship with Sirona, causing investor concerns and compounding the weakness seen in trends in their dental consumable and animal health segments. RSP Permian suffered from volatile crude oil prices and concerns surrounding the ratio of natural gas to crude oil in the Permian basin from results at a competitor.
6
The Westwood team remains focused on seeking high-quality companies trading at a discount to intrinsic value. While market returns have most recently been bolstered by unprecedented monetary stimulus rather than fundamentals, we believe we may have reached the tipping point as regime change unfolds. The impact is on a number of fronts including monetary policy, at least domestically, shifting to be less accommodative with the Federal Reserve hiking rates and proceeding to reduce their balance sheet. On the fiscal front, easing regulatory burdens is beginning to be seen by corporations with the potential for legislative efforts in health care and corporate tax reform to come in the future. While the likelihood can be debated, the impact to corporate earnings would likely be very positive, though with some businesses winning and some losing. In total, the overall impact to the investing landscape should provide additional opportunities to active managers as dispersion of returns increases and correlations between stocks decrease. We continue to leverage our intensive research-driven process to identify securities with company-specific opportunities and visible earnings growth. As has always been our practice, we look to invest in companies with conservative balance sheets, robust free cash flow generation, and high returns as we believe those characteristics among others help provide attractive risk-adjusted returns for the portfolio. Given the above-average market returns over the past few years, we are mindful of the potential for downside risk and are focusing on opportunities which we feel have measurable and limited potential for loss should volatility rise.
We thank you for your continued confidence in the Westwood process and investment teams and we look forward to serving your investment needs through the years ahead.
Westwood Management Corporation
7
Letter from the Manager
September 30, 2017
Timothy Plan Fixed Income Fund
The fiscal year ended September 30, 2017 saw a modest increase in interest rates in part due to the “risk off” bond market response to Brexit having created a low starting point in rates. Timothy Plan Fixed Income Fund invests in the broad U.S. investment grade bond market benchmarked by the Barclays Capital U.S. Aggregate Bond Index which began the last 12 months with a 1.97% yield and ended at 2.55%.
The U.S. Treasury (UST) 10 year rate rose a little faster starting at 1.60%, peaking at 2.63% in March, and ending at 2.33%. The rise in U.S. Treasury (UST) rates began after the Presidential election. Investors began to anticipate higher economic growth from the new administration’s policies which supported a hawkish forecast of multiple Federal Reserve rate hikes. Post-election improvement of consumer and business sentiment (i.e., soft data) supported the Federal Reserve raising the Fed Funds rate 0.25% at the December 2016 and March 2017 meetings. However, the “hard” economic data did not keep pace with soft data expectations which led to a less hawkish view of future Fed actions along with lower inflation expectations. While short rates moved higher with the Federal Reserve actions, longer rates drifted lower in the last half of the fiscal year being influenced by modest economic growth and low inflation rates. This resulted in a flattening of the UST curve.
Corporate bonds remained the bond market’s bright spot as continued investor demand for yield drove credit spreads tighter by 0.35% by September 30th. Merger & Acquisition activity as well as shareholder friendly actions, which have been negative for the credit sector, slowed somewhat during the period. Energy credits reversed course and performed better as prices of oil and other types of commodity oriented companies improved. The Mortgage Backed Securities (“MBS”) sector struggled a bit during the period as the Fed floated ideas on how they would taper their $4.5 trillion balance sheet. We are keeping a close watch on the timing of the Fed’s policy to unwind their balance sheet.
Timothy Plan Fixed Income Fund A shares returned -0.81% over the 12 months ended September 30, 2017 slightly below the Barclays Capital U.S. Aggregate Bond Index at 0.07%. The overweight to Energy and Basic Industry holdings added value as these subsectors performed better than the overall index. Security selection in Consumer Non-cyclicals, Capital Goods and Transportation also added to results. The portfolio’s MBS holdings generated returns above their counterparts in the index. Detracting from results were our underweight to Financials, as the sector posted the best return for the period. The portfolio is positioned with modestly less interest rate risk than the market, an over-weight in corporate bonds and GNMA MBS for yield. We remain focused on generating income consistent with a prudent level of risk.
BARROW, HANLEY, MEWHINNEY & STRAUSS
8
Letter from the Manager
September 30, 2017
Timothy Plan High Yield Bond Fund
The fiscal year ended September 30, 2017 saw a modest decrease in high yield rates as Investor demand for yield remained strong. Timothy Plan High Yield Bond Fund invests primarily in BB and B rated high yield (HY) bonds with a benchmark of the Barclays Ba/B High Yield Index which began the last 12 months yielding 5.54% and ended at 5.16%. The HY market posted a return of 14.1% in calendar year 2016 which was the strongest calendar year return since 2009. Performance was led by lower rated credits and an outsized recovery in the energy and Basic Industry (including Metals & Mining) sectors. The momentum continued into early 2017, but lower oil prices in March and the uncertainty of tax reform caused HY spreads to widen in 2Q17. By June 30, 2017 negative Investor flows and higher issuance caused the HY market to reverse a four-quarter trend with total returns lagging the Investment Grade Credit sector. However, 3Q17 saw significant outperformance in HY as the market posted a total return of 1.89% and the highest excess return of any major bond market sector.
Returns have been fueled both by Investor demand and the expectation of declining default rates. In September 2017, Fitch reported that U.S. HY default rates are currently at 1.8% and have remained below 2.0% for the second consecutive month. Two top performing sectors were Basic Industry (Metals & Mining) and Energy where default rates have moderated significantly from 2016. Although not as significant as last year, HY market yields are still skewed higher by just a few industry groups. For example, the HY Energy sector yield spread above U.S. Treasury bonds was 675 basis points (bps) compared to 582bps for the entire HY market ex-energy.
Timothy High Yield Bond Fund A shares generated a total return of 6.94% over the 12 months ended September 30, 2017 while the Barclays Ba/B High Yield Index returned 7.74%. The portfolio’s overweight in Energy and Basic Industries benefitted results. We continue to hold Energy names especially MLP issues that we believe are less impacted by the price of the oil. Holdings in Communications, Consumer Cyclicals and Non-Cyclicals were also additive to returns. Detracting from performance was our underweight to Financials which posted the highest return in the index. The portfolio remains focused on generating a higher level of carry income consistent with a reasonable level of risk.
BARROW, HANLEY, MEWHINNEY & STRAUSS
9
September 30, 2017
Dear Shareholder,
Timothy Plan Defensive Strategies Fund (the “Fund”) was designed and is managed to do what its name implies, hedge against a possible scenario of hyper-inflation which could result from our Congress’s proven unwillingness to address our core problems of too much spending and too many onerous government regulations. The Fund was also designed with built-in flexibility that allows it to be adjusted to address a possible risk of extreme deflation, with the ability to convert the inflation sensitive assets to cash and fixed income securities during a deflationary environment, and to be adjusted to a more normal, traditional investment strategy.
The Fund’s portfolio is comprised of four inflation sensitive investment sleeves: commodities (commodity company stocks and ETF’s), real estate (in the form of REITs), precious metals (primarily gold and silver bullion), and TIPs (Treasury Inflation Protected Bonds), with the balance in cash. Timothy Partners, Ltd. (the “Advisor”) is responsible for setting the percentages of the Fund that will be allocated to each investment sleeve. Different sub-advisors manage the holdings in each sleeve. As a result of continued low inflation and the general weakness in the commodities market over the past year, the Fund experienced a -0.54% total return for the fiscal year ended September 30, 2017 for Class I. For a more complete description of the elements that impacted Fund performance and the outlook for the future, please read the sub-advisors’ reports in the pages that follow.
I would like to point out that, since there does not exist an appropriate benchmark index with which to compare our performance, we have created a blended index comprised of roughly 1/3 each of U.S. Government TIPs, FTSE NAREIT Equity Index and Dow Jones UBS Commodity Index. We believe the blend offers a fairly accurate reflection and comparison of the composition of the Fund. For the fiscal year ended September 30, 2017, the blended index had a total return of -0.48%.
While no one can predict future events, I remain confident that our sub-advisors (i.e. money management firms that manage the various sleeves of this Fund) are, in our opinion, among the best in the industry, and they each continue to honor our overall policy that they manage their respective Fund sleeve both in accordance with our screening restrictions and with a conservative bias. As I stated in last year’s report, although we will do our very best to be successful, we cannot guarantee results in any of these scenarios.
Finally, I would once again like to thank you for your moral convictions that led you to become part of the Timothy Plan Family.
Yours in Christ,
Arthur D. Ally
Fund Advisor
10
| | |
| |  |
| |
Annual Letter from the Manager | | September 30, 2017 |
We are pleased to provide you with our annual report for Timothy Plan Defensive Strategies Fund (the “Fund”) Commodity Sleeve for the twelve months ended September 30, 2017. The CoreCommodity sleeve of the Timothy Defensive Fund rose 6.6% on a net basis. Commodities were mixed over these twelve months with the broad Bloomberg Commodity Total Return Index falling (0.3%). Overall, the strongest performing sectors were industrial metals miners and agricultural producers, while energy producers and precious metal miners lagged.
Metals & Mining
Industrial metal commodities rose for the period, as the Bloomberg Industrial Metals Subindex Total Return Index rallied 24%. The Fund’s industrial metal holdings performed better than their underlying commodities returning almost 30% for the period. Copper and Zinc futures rallied over 30% over this year while aluminum rallied over 25%. Timothy Plan Defensive Strategies Fund Commodity Sleeve’s largest industrial metal holdings as of September 30, 2017 were MMC Norilsk Nickel, Lundin Mining, and Teck Resources.
Precious metal futures finished a choppy year down, with the Bloomberg Precious Metals Subindex Total Return falling (7%). After material outperformance last year, precious metal miners underperformed this year, with the Fund’s precious metal miners falling (17%) over the same time period. Holding a smaller allocation, on average less than 8% of the portfolio, in precious metal miners aided performance. Timothy Plan Defensive Strategies Fund Commodity Sleeve’s largest precious metal holdings as of September 30th were Gold Fields Ltd, Agnico Eagle Mines, and Tahoe Resources.
Energy
Energy prices had a mixed year with the Bloomberg Commodity Energy SubIndex Total Return ending down (3%). Coming off a strong year from the 12 months prior, the Fund’s energy companies fell a little more than futures, finishing down (5%). While the Fund’s Oil & Gas Exploration and Production holdings fell over (11%) this was somewhat offset by Integrated Oil & Gas companies rallying nearly 10%. Timothy Plan Defensive Strategies Fund Commodity Sleeve’s largest energy holdings as of September 30th were Lukoil, Schlumberger, and Pioneer Natural Resources.
Agriculture
Over the past year agricultural commodities fell (7%) as proxied by the Bloomberg Commodity Agriculture and Livestock Total Return Index. Over the same period the Fund’s agricultural holdings rallied over 20%. Strong results from livestock producers and fertilizer companies led to the Fund’s outperformance in the agriculture sector. Timothy Plan Defensive Strategies Fund Commodity Sleeve’s largest agriculture holdings as of September 30th were Potash Corp of Saskatchewan, Sanderson Farms, and Deere & Co.
Past performance is not indicative of future results. “Bloomberg®” and “Bloomberg Commodity IndexSM” are service marks of Bloomberg L.P. (“Bloomberg”) as the case may be. Source for all Index data: Bloomberg L.P. Global. Commodity prices are determined using the most relevant futures contract. This document does not constitute an offer of any commodities, securities or investment advisory services. Any such offer may be made only by means of a disclosure document or similar materials which contain a description of material terms and risks. Performance results shown here, including attribution across component positions and sectors and aggregate data derived there from, are indicative results based on estimation. These results may differ from the actual aggregate returns for reasons including that results attributed to each component position are not compounded and are gross of fees. The absence of deduction of fees has a compounding effect on performance. All expressions of opinion are subject to change without notice in reaction to shifting market conditions. Data contained herein from third-party providers is obtained from what are considered reliable sources. However, its accuracy, completeness or reliability cannot be guaranteed. The economic statistics presented herein are subject to revision by the agencies that issue them. Any indices and other financial benchmarks shown are provided for illustrative purposes only, are unmanaged, reflect reinvestment of income and do not reflect the impact of advisory fees. Investors cannot invest directly in an index. All investments are subject to risk.
11
Letter from the Manager
September 30, 2017
Timothy Plan Defensive Strategies Fund – TIPS
Over the past 12 months ended September 30, 2017, U.S. global economic growth gained momentum while inflation remained tepid but volatile. The Timothy Plan Defensive Strategies Fund has an allocation of U.S. Treasury Inflation Protected Securities (TIPS) designed to help protect assets from higher rates of inflation.
Investors’ future inflation expectations began to rise in late 2016 and early 2017 but subsequently declined. We measure investors’ inflation expectations as the difference between the U.S. Treasury 10 year and the U.S. TIPS 10 year. This “breakeven rate” of inflation is what would be required to make these two securities have the same yield. The “breakeven rate” of inflation started the period at 1.54%, climbed to 1.97% by the end of 1Q17, fell to 1.72% by June 30th, and eventually settled at 1.85% by September 30th. As a result, TIPS securities generated a return of -0.73%, as reported by Bloomberg Barclays U.S. TIPS Index, for the 12 months ended September 30th.
The TIPS allocation we manage held 5 to 10% in investment grade corporate bonds and a modest allocation to GNMA mortgages for their higher nominal yield. Although inflation has remained relatively subdued, going forward we are concerned about the potential impact on inflation from Global central banks engaging in massive monetary stimulus and the potential of higher wages as the unemployment rate remains low. The primary goal of the TIPS allocation continues to be protection from rising inflation rates.
BARROW, HANLEY, MEWHINNEY & STRAUSS
12
| | |
 | | 2005 Market St. |
| | Philadelphia, PA 19103-7094 |
Timothy Plan Defensive Strategies Fund
Real Estate Investment Trust Sleeve (the “Portfolio”)
Annual Manager Letter: 12 months ended September 30, 2017
The market can be described as before and after November 8, 2016. With Trump winning the U.S. Presidential election, the market changed course, interpreting the election results as pro-growth. With both the Executive Branch and Congress controlled by Republicans, the expectation was that investor and business friendly legislation would be passed. Ten months later, the market still favored pro-growth, cyclicals and pure price momentum investments, although no major policies have been enacted. The market has also been driven by an improving global economy which continues to rise. Earnings have rebounded from the downdraft of 2015/2016, and multiples on earnings have risen even further. The root cause for this expansion is easy money across the globe from China, Europe, Japan, and the U.S. The central bankers have succeeded by inflating assets across the globe from equities, bonds, real estate, commodities, and now even bitcoin. Notably, Gross Domestic Product (GDP) in developed nations is still averaging about 2%. With the U.S. now unwinding quantitative easing (QE) and Europe signaling that their balance sheet reduction could begin next year, risk assets are on notice.
As the U.S. Federal Reserve became more hawkish and with the pro-business policies of a newly elected President, Real Estate Investment Trust (“REIT’) came under relative pressure as markets pushed up yields and favored growth and cyclicals. REITs were up .79% while the S&P 500® Index was up over 18% for the year ended September 30, 2017. Clearly, the market believes that cyclical growth and rising yields will not portend well for REITs. Interestingly, REITs historically have performed well in rising rates as that has meant a strong economy and thus a demand for space. Many REITs have imbedded annual rent increases tied to Consumer Price Index (CPI) or 2%, whichever is higher. Even better, hotels, self-storage and apartments have leases under one year so they are positively correlated with rising rates. However, the 2009 to 2015 period of QE distorted many yield securities and so called “renters” bought the space based on yield and not fundamentals. Thus, those investors who blindly believe that rising rates are negative for real estate are selling REITs and other yield oriented securities.
For the twelve months ended September 30, 2017, the Timothy Plan Defensive Strategies Fund Real Estate Sleeve generated a gross return of -3.08% versus the FTSE NAREIT Equity REITs Index return of 0.67%. Sub-optimal security selection in Healthcare, Specialty, Technology and Diversified hindered performance. Brookdale Senior Living, an owner and operator of senior living facilities, saw weak performance with shares declining 25% over the past quarter as cyclical supply hurt occupancies and rent growth. However, the company is undergoing a strategic review and we believe that recent transactions would value the company 50% to 60% or more from current share price. This was a big reason for our recent underperformance. Stock selection in Technology (data centers) hurt performance as we avoided a high valuation group, but the market has continued to reward price momentum. These stocks are trading 2.5 standard deviations above historical valuations. Lastly, our retail weight hurt performance as we continue to believe that the discounts to underlying real estate value range from -15% to -40%, whereas the above mentioned data centers are trading at a 20% to 40% premium to underlying intrinsic value.
13
After reviewing the sectors in which the portfolio underperformed, we believe that the data centers sector is overvalued, while certain retail areas are significantly undervalued. The areas that could see outsize returns are high quality shopping centers with grocery anchors and senior housing REITS given the attractive valuations and favorable demographics. REITs have significantly underperformed the S&P 500 year to date through October by 12.5% and thus even on a relative basis they are attractive as well. To adjust for and take advantage of these situations, we have increased concentration in some of our highest-conviction ideas. These changes may result in some short-term underperformance. Many investors have continued to flock to exchange-traded funds (ETFs), especially those investing in the FANGs — Facebook, Amazon, Netflix, and Alphabet (Google). We believe that one way to combat passive investing is to take a long-term approach that allows value to emerge over time. If experience has taught us anything, it is that this fascination with FANGs and price momentum should reverse and that value, as it has often done before, will emerge.
14
September 30, 2017
Dear Strategic Growth Fund Shareholder:
Timothy Plan Strategic Growth Fund (the “Fund”) is an asset allocation fund that invests in Timothy Plan underlying funds. The allocation percentages vary from time to time due to Timothy Partners, Ltd.’s (the “Advisor”) observations and perceptions of changing economic conditions. As of September 30, 2017, the allocation was as follows:
| | | | | | | | | | | | |
| ● | | Large/Mid-Cap Growth Fund | | 9.50% | | | | ● | | Small-Cap Value Fund | | 5.50% |
| | | | | | |
| ● | | Large/Mid-Cap Value Fund | | 10.50% | | | | ● | | Aggressive Growth Fund | | 5.00% |
| | | | | | |
| ● | | International | | 19.00% | | | | ● | | High-Yield Bond Fund | | 6.00% |
| | | | | | |
| ● | | Defensive Strategies Fund | | 12.00% | | | | ● | | Israel Common Values | | 5.00% |
| | | | | | |
| ● | | Emerging markets Fund | | 7.00% | | | | ● | | Growth & Income | | 9.50% |
| | | | | | |
| ● | | Fixed Income | | 5.00% | | | | ● | | Cash | | 6.00% |
Due to our more positive long-term outlook on the economy and the markets in general, the Fund’s allocation was adjusted to be a little more aggressive than we were in 2016 when we were concerned about the uncertain impact the political environment might have on the nation’s economy. At fiscal year end, the Fund’s overall allocation resulted in approximately 61.5% invested in Timothy Plan’s underlying domestic and international equity funds, 23.0% in Timothy Plan’s underlying bond and Defensive Strategies funds, 9.5% in Growth & Income, which also incorporates a relatively significant bond portfolio, and 6.0% in cash. While the Strategic Growth Fund’s performance was a positive 8.59% for Class A for the fiscal year ending 9-30-17, detailed descriptions of events that contributed to this past year’s performance of the underlying Funds is contained in each sub-advisor’s letter, found within the pages of this Annual Report.
We realize the volatility and uncertainty of the markets over the past couple of years may have been unsettling for many investors; however, as mentioned above, we believe the outlook for the capital markets for 2018 and beyond should be fairly bright long-term; nevertheless, we are committed to manage our funds with a definite conservative bias.
As you know, no one can guarantee future performance. However, the one thing that I can assure you of is that every one of our sub-advisors is doing their very best and our team here at Timothy is working very hard to provide you an investment with which you can feel comfortable.
Sincerely,
Arthur D. Ally
Fund Advisor
15
September 30, 2017
Dear Conservative Growth Fund Shareholder:
The Timothy Plan Conservative Growth Fund (the “Fund”) is an asset allocation fund that invests in Timothy Plan underlying funds. The allocation percentages vary from time to time due to Timothy Partners Ltd.’s (the “Advisor”) observations and perceptions of changing economic conditions; the allocation on September 30, 2017 was as follows:
| | | | | | | | | | | | |
| ● | | Large/Mid-Cap Growth Fund | | 7.00% | | | | ● | | Small-Cap Value Fund | | 4.50% |
| | | | | | |
| ● | | Large/Mid-Cap Value Fund | | 7.50% | | | | ● | | Aggressive Growth Fund | | 4.00% |
| | | | | | |
| ● | | International | | 10.00% | | | | ● | | High-Yield Bond Fund | | 6.00% |
| | | | | | |
| ● | | Defensive Strategies Fund | | 11.00% | | | | ● | | Israel Common Values | | 3.00% |
| | | | | | |
| ● | | Emerging markets Fund | | 4.50% | | | | ● | | Growth & Income | | 9.50% |
| | | | | | |
| ● | | Fixed Income | | 24.00% | | | | ● | | Cash | | 9.00% |
Due to our more positive long-term outlook on the economy and the markets in general, the Fund’s allocation was adjusted to be a little more aggressive than we were in 2016 when we were concerned about the uncertain impact the political environment might have on the nation’s economy. At fiscal year end, the Fund’s overall allocation resulted in approximately 40.5% invested in Timothy Plan’s underlying domestic and international equity funds, 41.0% in Timothy Plan’s underlying bond and Defensive Strategies funds, 9.5% in Growth & Income, which also incorporates a relatively significant bond portfolio, and 9.0% in cash. While the Conservative Growth Fund’s performance was a positive 6.06% for Class A for the fiscal year ending 9-30-17, detailed descriptions of events that contributed to this past year’s performance of the underlying Funds is contained in each sub-advisor’s letter, found within the pages of this Annual Report.
We realize the volatility and uncertainty of the markets over the past couple of years may have been unsettling for many investors; however, as mentioned above, we believe the outlook for the capital markets for 2018 and beyond should be fairly bright long-term; nevertheless, we are committed to manage our funds with a definite conservative bias.
As you know, no one can guarantee future performance. However, the one thing that I can assure you of is that every one of our sub-advisors is doing their very best and our team here at Timothy is working very hard to provide you an investment with which you can feel comfortable.
Yours in Christ,
Arthur D. Ally
Fund Advisor
16
Letter From The Manager
Timothy Plan Israel Common Values Fund
September 30, 2017
Timothy Plan Israel Common Values Fund (the “Fund”) performed remarkably well on an absolute basis and relative to the benchmark Israel Tel Aviv 100 Index (“benchmark index”) index in the year ended September 30, 2017. On an absolute basis, the best performing sectors over the last twelve months were Consumer Staples, Financials, and Technology. While relative to the benchmark index, underweights to the underperforming Health Care and Telecom Services sectors while an overweight to the outperforming IT sector provided significant positive alpha for the Fund. Good stock selection in the Financials and Telecom Services sectors was also a positive contributor to relative performance. Strong individual contributors to performance included Nova Measuring Systems (Technology), Checkpoint Software (Technology), and Shufersal (Consumer Staples). The Fund also benefited from M&A activity as Israeli companies remain an attractive acquisition target to domestic and foreign companies desiring a foothold into leading edge technologies and innovations. The biggest M&A contributor to the Fund was Intel’s $15 billion acquisition of Fund holding Mobileye during the period. With leading edge companies in various technologies in Israel, the Fund’s largest sector overweight relative to the benchmark remains the IT sector. Any significant pullback in the IT sector would be a headwind to performance.
Israel’s economy remains one of the best performing developed economies in the world with above 3% annual GDP growth expected for 2017 and 2018. Underpinning this strong growth is continued strength in domestic consumption. While the housing market appears to have hit a softer patch, demographic and immigration trends in the country argue for continued long-term growth in housing. The Bank of Israel remained in the sidelines over the last 12 months with occasional participation in the foreign exchange market, trying to slow the appreciation of the shekel. Interest rates are likely to remain lower for longer as the central bank requires much higher inflation than the less than 1% that dominated over the recent period. Global trade has improved with the strength in emerging and European economies providing a near term boost to the export sector in spite of the headwinds from the strong shekel.
The Fund continues to invest alongside the innovative spirit of Israeli companies providing ample attractive investment opportunities. Strong domestic and global economic momentum should continue to support earnings growth. We remain committed to a consistent investment approach dedicated to finding long-term investments for the Fund. We thank you for your continued investment in the Fund.
Eagle Global Advisors, LLC
17
LETTER FROM THE MANAGER
September 30, 2017
Timothy Plan Emerging Markets Fund
The net asset value of the Timothy Plan Emerging Markets Fund (the “Fund”) increased 21.52% in the 12 months ended September 30, 2017 for Class I. For the same period, the Fund’s benchmark, the MSCI Emerging Markets Index (the “Index”), gained 19.73%.
The Markets
Nearly all equity markets advanced in the third quarter, adding to year-to-date gains, as investor optimism outweighed geopolitical worries on both sides of the Atlantic and in Asia.
Emerging markets continued to outperform developed markets for the year, led by gains in China, South Korea and Brazil. The rise in China’s equity market (as measured by the Shanghai Composite Index) was attributed to better-than-expected growth in the world’s second-largest economy and to the strong performance of financial stocks.
The Fund
Holdings in financials (especially banks), telecommunication services and industrials contributed positively to performance. From a country perspective, allocations to Brazil, Russia and Hong Kong helped returns. At the company level, notable contributors included banks Sberbank (Russia) and Erste Group (Austria), Brazil-based educational services provider Estacio Participacoes and South Korean technology company Samsung Electronics.
Additionally, Hong Kong-based luxury goods companies Luk Fook Holdings and Chow Tai Fook Jewellery aided performance, increasing over 70% each. These retailers benefited from the Chinese demand for luxury goods, which, after a couple of years of stagnation, have grown substantially in recent quarters amid China’s improved economic environment.
A significant underweight to information technology (IT), in which our holdings rose but not as much as those in the benchmark, hurt relative returns.
Contributions to the MSCI Emerging Markets Index’s return were extremely concentrated for the period. The top five performing stocks were IT companies and the IT sector accounted for 40% of Index performance. The disproportionate contributions to the Index’s return highlight, in our view, the importance of being selective when investing in emerging markets. The elevated prices—and valuations—of many emerging market IT businesses were the main reason we have been significantly underweight the sector.
Other detractors included holdings in real estate and our meaningful underweight to China, as well as positions in Turkey and South Korea.
18
At the security level, Turkish real estate investment trust (REIT) Emlak Konut and Chinese textile company, Weiqiao Textile weighed on performance. Moreover, South Korean automotive-related companies KIA Motors and Hyundai Mobis declined.
In a relatively busy period, the Emerging Markets Investment Committee initiated positions in financial services firms Barclays Africa (South Africa) and Siam Commercial Bank (Thailand). Another new purchase included Mexican REIT Fibra Uno.
Other activities included the full sale of Brazilian wireless telecommunication services provider TIM Participacoes and Panamanian airline Copa Holdings. Additionally, the investment committee exited the Fund’s position in Argentina-based Arcos Dorados, McDonald’s largest franchisee that operates in 20 countries across Latin America and the Caribbean, and counts Brazil as its biggest market.
Outlook
While the return of investor optimism and the resulting strong performance of emerging markets over the past 18+ months have driven up equity valuations, we are yet to witness material improvements in company earnings or returns on equity, leading us to believe there is still ample opportunity to uncover value.
Valuations for emerging market equities remain attractive compared to those for developed markets (as represented by the MSCI World Index). Within the asset class itself, the valuations for value stocks (as represented by the MSCI Emerging Markets Value Index) continue to look attractive to us. After a solid performance in the second half of 2016, value stocks meaningfully underperformed growth stocks (as represented by the MSCI Emerging Markets Growth Index) by 16% over the last nine months. As of September 30, 2017, value stocks traded in line with their 10-year price-to-book average, while growth stocks traded significantly above their 10-year price-to-book average.
While emerging markets’ strong performance in the last several quarters can be perceived as good news, a deeper look into the MSCI Emerging Markets Index’s performance (i.e., how concentrated its return contribution has been) reveals, in our opinion, how investors may be best served by applying an active, opportunity-focused investment approach. At Brandes, our stock selection relies on a careful, bottom-up research, instead of assigning capital based on companies’ market-capitalization sizes without regard to business fundamentals.
We remain optimistic about the prospects for the Timothy Plan Emerging Markets Fund and thank you for your continued trust.
This material is intended for informational purposes only. The information provided in this material should not be considered a recommendation to purchase or sell any particular security. It should not be assumed that any security transactions, holdings, or sectors discussed were or will be profitable, or that the investment recommendations or decisions we make in the future will be profitable or will equal the investment performance discussed herein. Portfolio holdings and allocations are subject to change at any time. Strategies discussed herein are subject to change at any time by the investment manager in its discretion due to market conditions or opportunities. Market conditions may impact performance.
19
International and emerging markets investing is subject to certain risks such as currency fluctuation and social and political changes, differences in financial reporting standards and less stringent regulation of securities markets which may result in greater share price volatility; such risks are increased when investing in emerging markets. Additional risks associated with emerging markets investing include smaller-sized markets, liquidity risks, and less established legal, political, social, and business systems to support securities markets. Some emerging markets countries may have fixed or managed currencies that are not free-floating against the U.S. dollar. Certain of these currencies have experienced, and may experience in the future, substantial fluctuations or a steady devaluation relative to the U.S. dollar. The foregoing reflects the thoughts and opinions of Brandes Investment Partners® exclusively and is subject to change without notice.
Brandes Investment Partners® is a registered trademark of Brandes Investment Partners, L.P. in the United States and Canada.
Index Guide
The MSCI Emerging Markets Index with gross dividends measures equity market performance of emerging markets.
Brandes Investment Partners, L.P.
11988 El Camino Real | Suite 600 | P.O. Box 919048 | San Diego, CA 92191-9048
858.755.0239 | 800.237.7119 | Fax 858.755.0916
www.brandes.com | info@brandes.com
20
LETTER FROM THE MANAGER
September 30, 2017
Timothy Plan Growth and Income Fund
We are pleased to provide you our annual report for Timothy Plan Growth and Income Fund (the “Fund”) for the year ended September 30, 2017. Like you, our company and some officers continue to hold corporate retirement and personal assets in the Fund. We certainly thank you for entrusting your assets with us.
For the year starting 1 October 2016 through 30 September 2017, the Fund returned 5.19% for Class I. During the past year, every stock sector in the portfolio positively contributed to performance. The Finance and Technology sectors were the top performers while the Basic Materials and Energy sectors didn’t perform as well. Two top stock contributors were Insight Enterprises, which provides IT solutions, and Credit Acceptance Corp, which offers financing programs to automobile dealers.
We continue to see divergences in the indices and underlying stock returns. Stocks with earnings have underperformed stocks without earnings so far in 2017. Bargain stocks, those with inexpensive valuation ratios, positive and growing earnings, and relative price strength, underperformed stocks with the opposite characteristics. This is not normal and we expect this to reverse as it has in the past.
Bonds provided ballast to the portfolio and helped reduce volatility during the past year. This is one reason why we continue to advocate a balanced portfolio approach. We are also continuing to favor high quality bonds over lower quality bonds. They tend to hold up better in times of uncertainty and credit spreads on corporate bonds are near the lowest levels of this credit cycle.
This Fund has two main objectives, growth and income but also preserving capital in declining markets. We have been managing similar assets for over 40 years. We will adjust equity and fixed income levels according to our risk analysis. We do this on a weekly basis. We continue to see opportunities for small capitalization value stocks going forward as they typically have less exposure to international economies and more opportunities for growth.
21
Due to the lackluster U.S. economy, interest rates have remained subdued, but we think the best returns in bonds are probably behind us. However, when stocks suffer another setback, having bonds in the portfolio should help. We think volatility will continue but if our research works well, this actually could give us opportunities to take advantage of these moves.
We thank you for your trust in the James Investment Research Inc., we are grateful for the opportunity to serve you.
James Investment Research, Inc.
22
Fund Performance - (Unaudited)
September 30, 2017
Aggressive Growth Fund
| | | | | | | | |
| Fund/Index | | 1 Year Total Return | | 5 Year Average Annual Return | | 10 Year Average Annual Return | |
Timothy Aggressive Growth Fund - Class A (With Sales Charge) | | 12.33% | | 8.28% | | | 3.99% | |
Russell Mid-Cap Growth Index | | 17.82% | | 14.18% | | | 8.20% | |
Timothy Aggressive Growth Fund - Class C * | | 16.86% | | 8.68% | | | 3.80% | |
Russell Mid-Cap Growth Index | | 17.82% | | 14.18% | | | 8.20% | |
Timothy Aggressive Growth Fund - Class I | | 19.16% | | N/A | | | 6.01% (a) | |
Russell Mid-Cap Growth Index | | 17.82% | | 14.18% | | | 10.88% (a) | |
| | (a) | For the period August 1, 2013 (commencement of investment in accordance with objective) to September 30, 2017. |
| | * | With Maximum Deferred Sales Charge |
Timothy Plan Aggressive Growth Fund vs. Russell Mid-Cap Growth Index
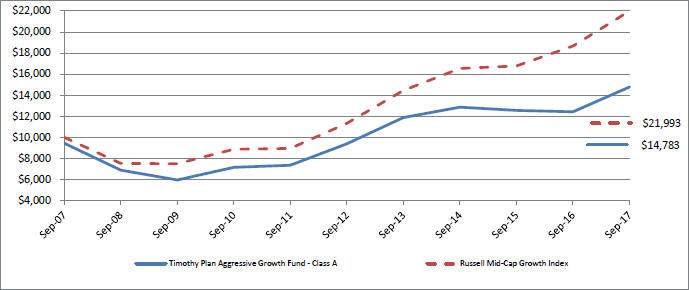
The chart shows the value of a hypothetical initial investment of $10,000 in the Fund’s Class A shares and the Russell Mid-Cap Growth Index on September 30, 2007 and held through September 30, 2017. The Russell Mid-Cap Growth Index is a widely recognized, unmanaged index of common stock prices. Performance figures include the change in value of the stocks in the index and the reinvestment of dividends. The index return does not reflect expenses, which have been deducted from the Fund’s return. The returns shown do not reflect deduction of taxes that a shareholder would pay on Fund distributions or the redemption of Fund shares. THE FUND’S RETURN REPRESENTS PAST PERFORMANCE AND IS NOT PREDICTIVE OF FUTURE RESULTS.
23
Fund Performance - (Unaudited)
September 30, 2017
International Fund
| | | | | | | | |
| Fund/Index | | 1 Year Total Return | | 5 Year Average Annual Return | | 10 Year Average Annual Return | |
Timothy International Fund - Class A (With Sales Charge) | | 10.43% | | 6.00% | | | (0.42)% | |
MSCI EAFE Index | | 15.99% | | 5.49% | | | (1.52)% | |
Timothy International Fund - Class C * | | 14.93% | | 6.40% | | | (0.60)% | |
MSCI EAFE Index | | 15.99% | | 5.49% | | | (1.52)% | |
Timothy International Fund - Class I | | 17.18% | | N/A | | | 5.01% (a) | |
MSCI EAFE Index | | 15.99% | | 5.49% | | | 3.05% (a) | |
| | (a) | For the period August 1, 2013 (commencement of investment in accordance with objective) to September 30, 2017. |
| | * | With Maximum Deferred Sales Charge |
Timothy Plan International Fund vs. MSCI EAFE Index
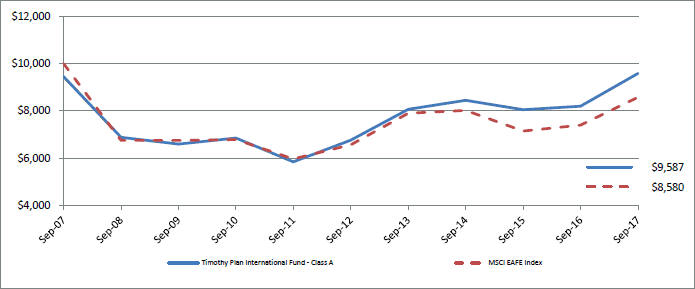
The chart shows the value of a hypothetical initial investment of $10,000 in the Fund’s Class A shares and the MSCI EAFE Index on September 30, 2007 and held through September 30, 2017. The MSCI EAFE Index is a widely recognized unmanaged index of equity prices and is representative of equity market performance of developed countries, excluding the U.S. and Canada. Performance figures include the change in value of the stocks in the index and the reinvestment of dividends. The index return does not reflect expenses, which have been deducted from the Fund’s return. The returns shown do not reflect deduction of taxes that a shareholder would pay on Fund distributions or the redemption of Fund shares. THE FUND’S RETURN REPRESENTS PAST PERFORMANCE AND IS NOT PREDICTIVE OF FUTURE RESULTS.
24
Fund Performance - (Unaudited)
September 30, 2017
Large/Mid Cap Growth Fund
| | | | | | | | |
| Fund/Index | | 1 Year Total Return | | 5 Year Average Annual Return | | 10 Year Average Annual Return | |
Timothy Large/Mid Cap Growth Fund - Class A (With Sales Charge) | | 10.18% | | 10.26% | | | 5.43% | |
Russell 1000 Growth Index | | 21.94% | | 15.26% | | | 9.08% | |
Timothy Large/Mid Cap Growth Fund - Class C * | | 14.58% | | 10.67% | | | 5.24% | |
Russell 1000 Growth Index | | 21.94% | | 15.26% | | | 9.08% | |
Timothy Large/Mid Cap Growth Fund - Class I | | 16.75% | | N/A | | | 9.18% (a) | |
Russell 1000 Growth Index | | 21.94% | | 15.26% | | | 14.01% (a) | |
| | (a) | For the period August 1, 2013 (commencement of investment in accordance with objective) to September 30, 2017. |
| | * | With Maximum Deferred Sales Charge |
Timothy Plan Large/Mid Cap Growth Fund vs. Russell 1000 Growth Index
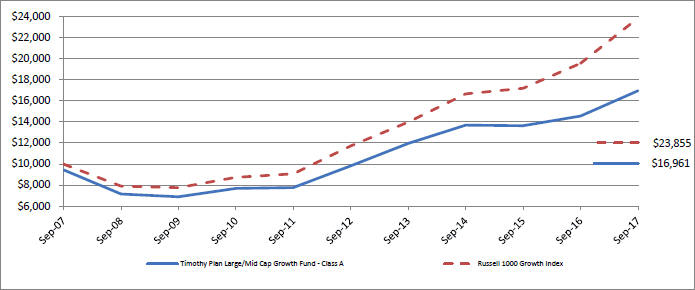
The chart shows the value of a hypothetical initial investment of $10,000 in the Fund’s Class A shares and the Russell 1000 Growth Index on September 30, 2007 and held through September 30, 2017. The Russell 1000 Growth Index is a widely recognized, unmanaged index of common stock prices. Performance figures include the change in value of the stocks in the index and the reinvestment of dividends. The index return does not reflect expenses, which have been deducted from the Fund’s return. The returns shown do not reflect deduction of taxes that a shareholder would pay on Fund distributions or the redemption of Fund shares. THE FUND’S RETURN REPRESENTS PAST PERFORMANCE AND IS NOT PREDICTIVE OF FUTURE RESULTS.
25
Fund Performance - (Unaudited)
September 30, 2017
Small Cap Value Fund
| | | | | | | | |
| Fund/Index | | 1 Year Total Return | | 5 Year Average Annual Return | | 10 Year Average Annual Return | |
Timothy Small Cap Value Fund - Class A (With Sales Charge) | | 14.89% | | 13.92% | | | 7.43% | |
Russell 2000 Index | | 20.74% | | 13.79% | | | 7.85% | |
Timothy Small Cap Value Fund - Class C * | | 19.70% | | 14.38% | | | 7.24% | |
Russell 2000 Index | | 20.74% | | 13.79% | | | 7.85% | |
Timothy Small Cap Value Fund - Class I | | 21.89% | | N/A | | | 10.82% (a) | |
Russell 2000 Index | | 20.74% | | 13.79% | | | 10.05% (a) | |
| | (a) | For the period August 1, 2013 (commencement of investment in accordance with objective) to September 30, 2017. |
| | * | With Maximum Deferred Sales Charge |
Timothy Plan Small Cap Value Fund vs. Russell 2000 Index
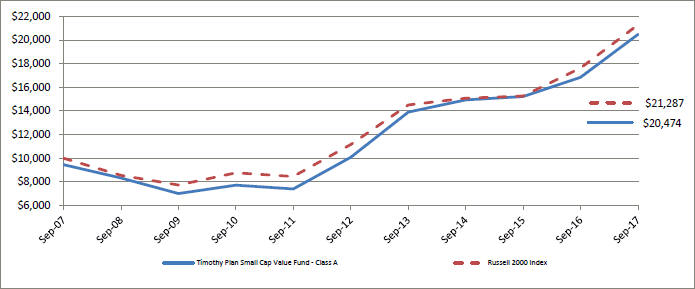
The chart shows the value of a hypothetical initial investment of $10,000 in the Fund’s Class A shares and the Russell 2000 Index on September 30, 2007 and held through September 30, 2017. The Russell 2000 Index is a widely recognized, unmanaged index of common stock prices. Performance figures include the change in value of the stocks in the index and the reinvestment of dividends. The index return does not reflect expenses, which have been deducted from the Fund’s return. The returns shown do not reflect deduction of taxes that a shareholder would pay on Fund distributions or the redemption of Fund shares. THE FUND’S RETURN REPRESENTS PAST PERFORMANCE AND IS NOT PREDICTIVE OF FUTURE RESULTS.
26
Fund Performance - (Unaudited)
September 30, 2017
Large/Mid Cap Value Fund
| | | | | | | | |
| Fund/Index | | 1 Year Total Return | | 5 Year Average Annual Return | | 10 Year Average Annual Return | |
Timothy Large/Mid Cap Value Fund - Class A (With Sales Charge) | | 6.87% | | 10.53% | | | 5.05% | |
S&P 500 Index | | 18.61% | | 14.22% | | | 7.44% | |
Timothy Large/Mid Cap Value Fund - Class C * | | 11.27% | | 10.96% | | | 4.86% | |
S&P 500 Index | | 18.61% | | 14.22% | | | 7.44% | |
Timothy Large/Mid Cap Value Fund - Class I | | 13.36% | | N/A | | | 8.96% (a) | |
S&P 500 Index | | 18.61% | | 14.22% | | | 12.14% (a) | |
| | (a) | For the period August 1, 2013 (commencement of investment in accordance with objective) to September 30, 2017. |
| | * | With Maximum Deferred Sales Charge |
Timothy Plan Large/Mid Cap Value Fund vs. S&P 500 Index
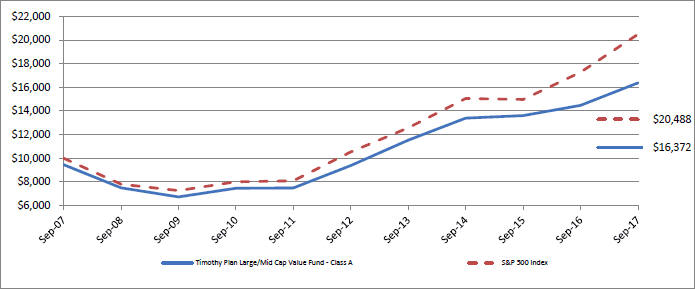
The chart shows the value of a hypothetical initial investment of $10,000 in the Fund’s Class A shares and the S&P 500 Index on September 30, 2007 and held through September 30, 2017. The S&P 500 Index is a widely recognized, unmanaged index of common stock prices. Performance figures include the change in value of the stocks in the index and the reinvestment of dividends. The index return does not reflect expenses, which have been deducted from the Fund’s return. The returns shown do not reflect deduction of taxes that a shareholder would pay on Fund distributions or the redemption of Fund shares. THE FUND’S RETURN REPRESENTS PAST PERFORMANCE AND IS NOT PREDICTIVE OF FUTURE RESULTS.
27
Fund Performance - (Unaudited)
September 30, 2017
Fixed Income Fund
| | | | | | | | |
| Fund/Index | | 1 Year Total Return | | 5 Year Average Annual Return | | 10 Year Average Annual Return | |
Timothy Fixed Income Fund - Class A (With Sales Charge) | | (5.24)% | | (0.22)% | | | 2.35% | |
Barclays Capital U.S. Aggregate Bond Index | | 0.07% | | 2.06% | | | 4.27% | |
Timothy Fixed Income Fund - Class C * | | (2.46)% | | (0.03)% | | | 2.18% | |
Barclays Capital U.S. Aggregate Bond Index | | 0.07% | | 2.06% | | | 4.27% | |
Timothy Fixed Income Fund - Class I | | (0.64)% | | N/A | | | 2.05% (a) | |
Barclays Capital U.S. Aggregate Bond Index | | 0.07% | | 2.06% | | | 3.14% (a) | |
| | (a) | For the period August 1, 2013 (commencement of investment in accordance with objective) to September 30, 2017. |
| | * | With Maximum Deferred Sales Charge |
Timothy Plan Fixed Income Fund vs. Barclays Capital U.S. Aggregate Bond Index
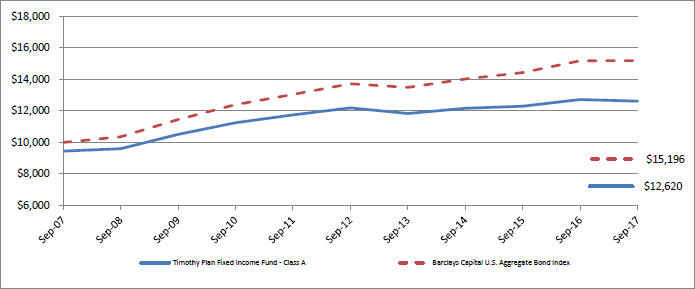
The chart shows the value of a hypothetical initial investment of $10,000 in the Fund’s Class A shares and the Barclays Capital U.S. Aggregate Bond Index on September 30, 2007 and held through September 30, 2017. The Barclays Capital U.S. Aggregate Bond Index is a widely recognized, unmanaged index of bond prices. Performance figures include the change in value of the bonds in the index and the reinvestment of interest. The index return does not reflect expenses, which have been deducted from the Fund’s return. The returns shown do not reflect deduction of taxes that a shareholder would pay on Fund distributions or the redemption of Fund shares. THE FUND’S RETURN REPRESENTS PAST PERFORMANCE AND IS NOT PREDICTIVE OF FUTURE RESULTS.
28
Fund Performance - (Unaudited)
September 30, 2017
High Yield Bond Fund
| | | | | | | | |
| Fund/Index | | 1 Year Total Return | | 5 Year Average Annual Return | | 10 Year Average Annual Return | |
Timothy High Yield Bond Fund - Class A (With Sales Charge) | | 2.12% | | 3.31% | | | 4.73% | |
Barclays Ba/B High Yield Index | | 7.74% | | 6.04% | | | 7.37% | |
Timothy High Yield Bond Fund - Class C * | | 5.04% | | 3.47% | | | 4.51% | |
Barclays Ba/B High Yield Index | | 7.74% | | 6.04% | | | 7.37% | |
Timothy High Yield Bond Fund - Class I | | 7.21% | | N/A | | | 4.40% (a) | |
Barclays Ba/B High Yield Index | | 7.74% | | 6.04% | | | 5.86% (a) | |
| | (a) | For the period August 1, 2013 (commencement of investment in accordance with objective) to September 30, 2017. |
| | * | With Maximum Deferred Sales Charge |
Timothy Plan High Yield Bond Fund vs. Barclays Ba/B High Yield Index

The chart shows the value of a hypothetical initial investment of $10,000 in the Fund’s Class A shares and the Barclays Ba/B High Yield Index on September 30, 2007 and held through September 30, 2017. The Barclays Ba/B High Yield Index measures the performance of bonds with Ba or B ratings. Performance figures include the change in value of the bonds in the index and the reinvestment of interest. The index return does not reflect expenses, which have been deducted from the Fund’s return. The returns shown do not reflect deduction of taxes that a shareholder would pay on Fund distributions or the redemption of Fund shares. THE FUND’S RETURN REPRESENTS PAST PERFORMANCE AND IS NOT PREDICTIVE OF FUTURE RESULTS.
29
Fund Performance - (Unaudited)
September 30, 2017
Israel Common Values Fund
| | | | | | | | |
| Fund/Index | | 1 Year Total Return | | 5 Year Average Annual Return | | Average Annual Return Since Inception | |
Timothy Israel Common Values Fund - Class A (With Sales Charge) | | 14.97% | | 8.18% | | | 7.13% (a) | |
Israel Tel Aviv 100 Index | | 2.43% | | 4.15% | | | 4.72% (a) | |
Timothy Israel Common Values Fund - Class C * | | 19.60% | | 8.57% | | | 7.31% (a) | |
Israel Tel Aviv 100 Index | | 2.43% | | 4.15% | | | 4.72% (a) | |
Timothy Israel Common Values Fund - Class I | | 21.87% | | N/A | | | 6.85% (b) | |
Israel Tel Aviv 100 Index | | 2.43% | | 4.15% | | | 3.97% (b) | |
| | (a) | For the period October 12, 2011 (commencement of investment in accordance with objective) to September 30, 2017. |
| | (b) | For the period August 1, 2013 (commencement of investment in accordance with objective) to September 30, 2017. |
| | * | With Maximum Deferred Sales Charge |
Timothy Plan Israel Common Values Fund vs. Israel Tel Aviv 100 Index
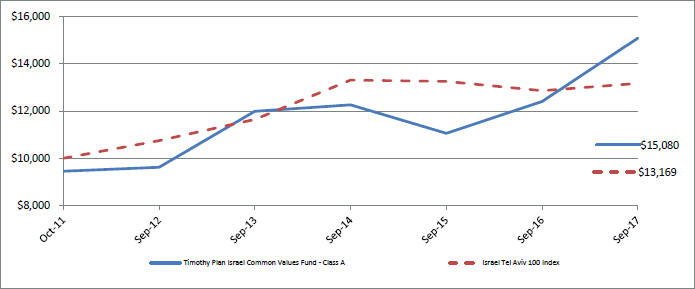
The chart shows the value of a hypothetical initial investment of $10,000 in the Fund’s Class A shares and the Israel Tel Aviv 100 Index on October 12, 2011 and held through September 30, 2017. The Israel Tel Aviv 100 Index is an unmanaged index of equity prices representing the 100 most highly capitalized companies listed on the Tel Aviv Stock Exchange . Performance figures include the change in value of the stocks in the index and the reinvestment of dividends. The index return does not reflect expenses, which have been deducted from the Fund’s return. The returns shown do not reflect deduction of taxes that a shareholder would pay on Fund distributions or the redemption of Fund shares. THE FUND’S RETURN REPRESENTS PAST PERFORMANCE AND IS NOT PREDICTIVE OF FUTURE RESULTS.
30
Fund Performance - (Unaudited)
September 30, 2017
Defensive Strategies Fund
| | | | | | | | |
| Fund/Index | | 1 Year Total Return | | 5 Year Total Return | | Average Annual Return Since Inception | |
Timothy Defensive Strategies Fund - Class A (With Sales Charge) | | (5.95)% | | (1.87)% | | | 2.60% (a) | |
Dow Jones Moderately Conservative U.S. Portfolio Index | | 10.46% | | 9.38% | | | 10.31% (a) | |
Timothy Defensive Strategies Fund Blended Index (c) | | (0.47)% | | (5.19)% | | | (0.96)% (a) | |
Timothy Defensive Strategies Fund - Class C * | | (2.34)% | | (1.51)% | | | 2.60% (a) | |
Dow Jones Moderately Conservative U.S. Portfolio Index | | 10.46% | | 9.38% | | | 10.31% (a) | |
Timothy Defensive Strategies Fund Blended Index (c) | | (0.47)% | | (5.19)% | | | (0.96)% (a) | |
Timothy Defensive Strategies Fund - Class I | | (0.54)% | | N/A | | | 1.39% (b) | |
Dow Jones Moderately Conservative U.S. Portfolio Index | | 10.46% | | 9.38% | | | 7.90% (b) | |
Timothy Defensive Strategies Fund Blended Index (c) | | (0.47)% | | (5.19)% | | | (3.59)% (b) | |
| | (a) | For the period November 4, 2009 (commencement of investment in accordance with objective) to September 30, 2017. |
| | (b) | For the period August 1, 2013 (commencement of investment in accordance with objective) to September 30, 2017. |
| | (c) | The Timothy Defensive Strategies Fund Blended Index reflects an unmanaged portfolio of 33% of the Barclays U.S. TIPs Index, 33% of the FTSE NAREIT ALL REITs Index and 34% of the Dow Jones Commodity Total Return Index. |
| | * | With Maximum Deferred Sales Charge |
Timothy Plan Defensive Strategies Fund vs. Dow Jones Moderately Conservative U.S. Portfolio Index vs. The Timothy Defensive Strategies Fund Blended Index (c)
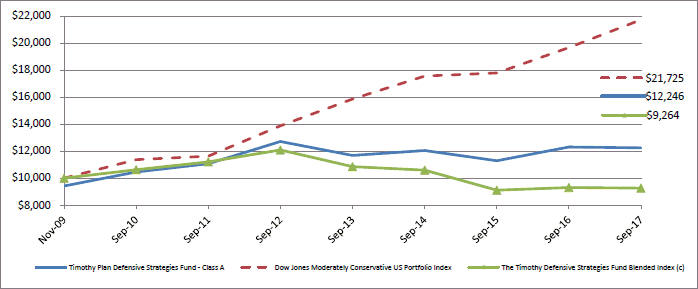
The chart shows the value of a hypothetical initial investment of $10,000 in the Fund’s Class A shares, Dow Jones Moderately Conservative U.S. Portfolio Index and the Timothy Defensive Strategies Fund Blended Index (c) on November 4, 2009 and held through September 30, 2017. The Dow Jones Moderately Conservative U.S. Portfolio Index is a widely recognized unmanaged index of stocks, bonds and cash. Performance figures include the change in value of the asset classes in the index and the reinvestment of dividends. The index return does not reflect expenses, which have been deducted from the Fund’s return. The returns shown do not reflect deduction of taxes that a shareholder would pay on Fund distributions or the redemption of Fund shares. THE FUND’S RETURN REPRESENTS PAST PERFORMANCE AND IS NOT PREDICTIVE OF FUTURE RESULTS.
31
Fund Performance - (Unaudited)
September 30, 2017
Strategic Growth Fund
| | | | | | |
| Fund/Index | | 1 Year Total Return | | 5 Year Average Annual Return | | 10 Year Average Annual Return |
Timothy Strategic Growth Fund - Class A (With Sales Charge) | | 2.60% | | 4.28% | | 1.02% |
Dow Jones Global Moderately Aggressive Portfolio Index | | 14.37% | | 9.70% | | 5.67% |
Timothy Strategic Growth Fund - Class C * | | 6.80% | | 4.66% | | 0.81% |
Dow Jones Global Moderately Aggressive Portfolio Index | | 14.37% | | 9.70% | | 5.67% |
| | * | With Maximum Deferred Sales Charge |
Timothy Plan Strategic Growth Fund vs. Dow Jones Global Moderately Aggressive Portfolio Index
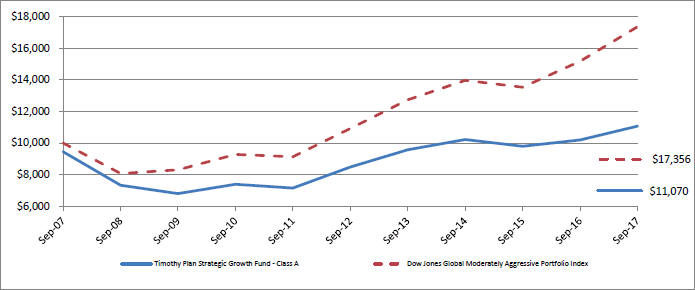
The chart shows the value of a hypothetical initial investment of $10,000 in the Fund’s Class A shares and the Dow Jones Global Moderately Aggressive Portfolio Index on September 30, 2007 and held through September 30, 2017. The Dow Jones Global Moderately Aggressive Portfolio Index is a widely recognized index that measures global stocks, bonds and cash which are in turn represented by multiple sub-indexes. Performance figures include the change in value of the investments in the index and the reinvestment of dividends. The index return does not reflect expenses, which have been deducted from the Fund’s return. The returns shown do not reflect deduction of taxes that a shareholder would pay on Fund distributions or the redemption of Fund shares. THE FUND’S RETURN REPRESENTS PAST PERFORMANCE AND IS NOT PREDICTIVE OF FUTURE RESULTS.
32
Fund Performance - (Unaudited)
September 30, 2017
Conservative Growth Fund
| | | | | | |
| Fund/Index | | 1 Year Total Return | | 5 Year Average Annual Return | | 10 Year Average Annual Return |
Timothy Conservative Growth Fund - Class A (With Sales Charge) | | 0.19% | | 2.68% | | 1.70% |
Dow Jones Global Moderate Portfolio Index | | 10.09% | | 7.61% | | 5.29% |
Timothy Conservative Growth Fund - Class C * | | 4.39% | | 3.07% | | 1.52% |
Dow Jones Global Moderate Portfolio Index | | 10.09% | | 7.61% | | 5.29% |
| | * | With Maximum Deferred Sales Charge |
Timothy Plan Conservative Growth Fund vs. Dow Jones Global Moderate Portfolio Index
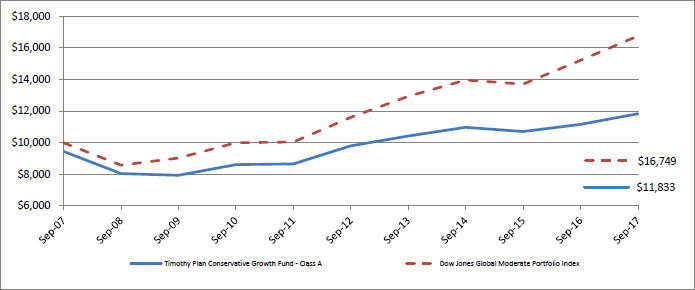
The chart shows the value of a hypothetical initial investment of $10,000 in the Fund’s Class A shares and the Dow Jones Global Moderate Portfolio Index on September 30, 2007 and held through September 30, 2017. The Dow Jones Global Moderate Portfolio Index is a widely recognized index that measures global stocks, bonds and cash which are in turn represented by multiple sub-indexes. Performance figures include the change in value of the investments in the index and the reinvestment of dividends. The index return does not reflect expenses, which have been deducted from the Fund’s return. The returns shown do not reflect deduction of taxes that a shareholder would pay on Fund distributions or the redemption of Fund shares. THE FUND’S RETURN REPRESENTS PAST PERFORMANCE AND IS NOT PREDICTIVE OF FUTURE RESULTS.
33
Fund Performance - (Unaudited)
September 30, 2017
Emerging Markets Fund
| | | | | | |
| Fund/Index | | 1 Year Total Return | | Average Annual Return Since Inception | |
Timothy Emerging Markets Fund - Class A (With Sales Charge) | | 14.61% | | | 0.46% (a) | |
MSCI Emerging Markets Index | | 19.73% | | | 1.48% (a) | |
Timothy Emerging Markets Fund - Class C * | | 19.46% | | | 0.92% (a) | |
MSCI Emerging Markets Index | | 19.73% | | | 1.48% (a) | |
Timothy Emerging Markets Fund - Class I | | 21.52% | | | 2.26% (b) | |
MSCI Emerging Markets Index | | 19.73% | | | 3.06% (b) | |
| | (a) | For the period December 3, 2012 (commencement of investment in accordance with objective) to September 30, 2017. |
| | (b) | For the period August 1, 2013 (commencement of investment in accordance with objective) to September 30, 2017. |
| | * | With Maximum Deferred Sales Charge |
Timothy Plan Emerging Markets Fund vs. MSCI Emerging Markets Index
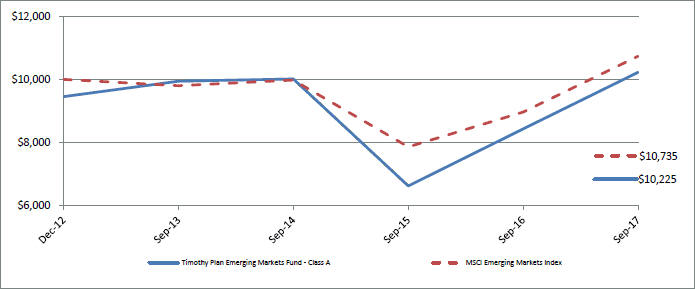
The chart shows the value of a hypothetical initial investment of $10,000 in the Fund’s Class A shares and the MSCI Emerging Markets Index on December 3, 2012 and held through September 30, 2017. The MSCI Emerging Markets Index is a free float-adjusted market capitalization index that is designed to measure equity market performance of emerging markets. The MSCI Emerging Markets Index consists of the following 21 emerging market country indices: Brazil, Chile, China, Colombia, Czech Republic, Egypt, Hungary, India, Indonesia, Korea, Malaysia, Mexico, Morocco, Peru, Philippines, Poland, Russia, South Africa, Taiwan, Thailand, and Turkey. Performance figures include the change in value of the stocks in the index and the reinvestment of dividends. The index return does not reflect expenses, which have been deducted from the Fund’s return. The returns shown do not reflect deduction of taxes that a shareholder would pay on Fund distributions or the redemption of Fund shares. THE FUND’S RETURN REPRESENTS PAST PERFORMANCE AND IS NOT PREDICTIVE OF FUTURE RESULTS.
34
Fund Performance - (Unaudited)
September 30, 2017
Growth & Income Fund
| | | | | | |
| Fund/Index | | 1 Year Total Return | | Average Annual Return Since Inception | |
Timothy Growth & Income Fund - Class A (With Sales Charge) | | (0.90)% | | | 1.70% (a) | |
Timothy Growth & Income Fund Blended Index (b) | | 9.17% | | | 7.22% (a) | |
Timothy Growth & Income Fund - Class C * | | 3.17% | | | 2.39% (a) | |
Timothy Growth & Income Fund Blended Index (b) | | 9.17% | | | 7.22% (a) | |
Timothy Growth & Income Fund - Class I | | 5.19% | | | 3.37% (a) | |
Timothy Growth & Income Fund Blended Index (b) | | 9.17% | | | 7.22% (a) | |
| | (a) | For the period October 1, 2013 (commencement of investment in accordance with objective) to September 30, 2017. |
| | (b) | The Timothy Growth & Income Fund Blended Index reflects an unmanaged portfolio of 50% of the Barclays Intermediate Government/Credit Index and 50% of the Russell 3000 Total Return Index. |
| | * | With Maximum Deferred Sales Charge |
Timothy Growth & Income Fund vs. Timothy Growth & Income Fund Blended Index (b)
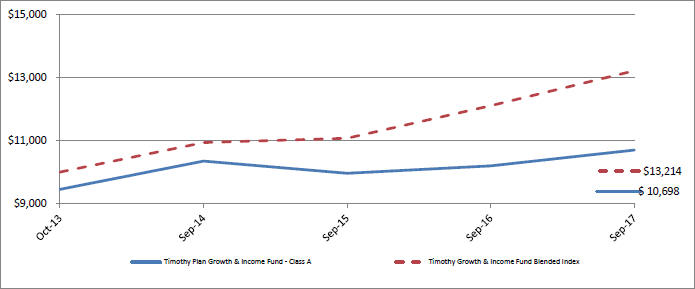
The chart shows the value of a hypothetical initial investment of $10,000 in the Fund’s Class A shares and the Timothy Growth & Income Fund Blended Index on October 1, 2013 and held through September 30, 2017. The Timothy Growth & Income Fund Blended Index reflects an unmanaged portfolio of 50% of the Barclays Intermediate Government/Credit Index and 50% of the Russell 3000 Total Return Index. Performance figures include the change in value of the stocks in the index and the reinvestment of dividends. The index return does not reflect expenses, which have been deducted from the Fund’s return. The returns shown do not reflect deduction of taxes that a shareholder would pay on Fund distributions or the redemption of Fund shares. THE FUND’S RETURN REPRESENTS PAST PERFORMANCE AND IS NOT PREDICTIVE OF FUTURE RESULTS.
35
Schedule of Investments | Aggressive Growth Fund
As of September 30, 2017
| | | | | | | | |
| | |
| Shares | | | | | Fair Value | |
| | |
| | |
| | | | COMMON STOCK - 96.5 % | | | | |
| | | | AEROSPACE/DEFENSE - 2.1 % | | | | |
| | 6,262 | | | HEICO Corp. | | $ | 562,390 | |
| | | | | | | | |
| | |
| | | | AIRLINES - 2.4 % | | | | |
| | 4,079 | | | Copa Holdings SA - Class A | | | 507,958 | |
| | 4,100 | | | Spirit Airlines, Inc. * | | | 136,981 | |
| | | | | | | | |
| | | | | | | 644,939 | |
| | | | | | | | |
| | | | AUTO PARTS & EQUIPMENT - 2.4 % | | | | |
| | 6,480 | | | Delphi Automotive PLC | | | 637,632 | |
| | | | | | | | |
| | |
| | | | BANKS - 2.8 % | | | | |
| | 10,855 | | | CenterState Banks, Inc. | | | 290,914 | |
| | 8,861 | | | Western Alliance Bancorp * | | | 470,342 | |
| | | | | | | | |
| | | | | | | 761,256 | |
| | | | | | | | |
| | | | BIOTECHNOLOGY - 5.8 % | | | | |
| | 4,019 | | | Charles River Laboratories International, Inc. * | | | 434,132 | |
| | 7,987 | | | Insmed, Inc. * | | | 249,274 | |
| | 2,224 | | | Puma Biotechnology, Inc. * | | | 266,324 | |
| | 1,263 | | | Spark Therapeutics, Inc. * | | | 112,609 | |
| | 3,295 | | | Vertex Pharmaceuticals, Inc. * | | | 500,972 | |
| | | | | | | | |
| | | | | | | 1,563,311 | |
| | | | | | | | |
| | | | CHEMICALS - 8.1 % | | | | |
| | 7,750 | | | Ablemarle Corp. | | | 1,056,402 | |
| | 22,560 | | | Chemours Co. | | | 1,141,762 | |
| | | | | | | | |
| | | | | | | 2,198,164 | |
| | | | | | | | |
| | | | COMMERCIAL SERVICES - 4.5 % | | | | |
| | 3,165 | | | Grand Canyon Education, Inc. * | | | 287,445 | |
| | 10,745 | | | On Assignment, Inc. * | | | 576,792 | |
| | 2,985 | | | WEX, Inc. * | | | 334,977 | |
| | | | | | | | |
| | | | | | | 1,199,214 | |
| | | | | | | | |
| | | | COMPUTERS - 1.9 % | | | | |
| | 9,572 | | | Mercury Systems, Inc. * | | | 496,595 | |
| | | | | | | | |
| | |
| | | | DIVERSIFIED FINANCIAL SERVICES - 2.2 % | | | | |
| | 33,330 | | | SLM Corp. * | | | 382,295 | |
| | 3,465 | | | WageWorks, Inc. * | | | 210,325 | |
| | | | | | | | |
| | | | | | | 592,620 | |
| | | | | | | | |
| | | | ELECTRICAL COMPONENTS & EQUIPMENT - 2.7 % | | | | |
| | 6,020 | | | Belden, Inc. | | | 484,791 | |
| | 1,866 | | | Universal Display Corp. | | | 240,434 | |
| | | | | | | | |
| | | | | | | 725,225 | |
| | | | | | | | |
| | | | ELECTRONICS - 12.8 % | | | | |
| | 6,700 | | | Agilent Technologies, Inc. | | | 430,140 | |
| | 4,712 | | | Coherent, Inc. * | | | 1,108,121 | |
| | 7,415 | | | Fortive Corp. | | | 524,908 | |
| | 4,104 | | | II-VI, Inc. * | | | 168,880 | |
| | 7,685 | | | Keysight Technologies, Inc. * | | | 320,157 | |
| | 875 | | | Mettler-Toledo International, Inc. * | | | 547,890 | |
| | 8,795 | | | Trimble, Inc. * | | | 345,204 | |
| | | | | | | | |
| | | | | | | 3,445,300 | |
| | | | | | | | |
| | | | ENGINEERING & CONSTRUCTION - 3.8 % | | | | |
| | 10,250 | | | MasTec, Inc. * | | | 475,600 | |
| | 5,140 | | | NV5 Global, Inc. * | | | 280,901 | |
| | 4,216 | | | TopBuild Corp. * | | | 274,757 | |
| | | | | | | | |
| | | | | | | 1,031,258 | |
| | | | | | | | |
| | | | ENTERTAINMENT - 3.2 % | | | | |
| | 3,781 | | | Vail Resorts, Inc. | | | 862,522 | |
| | | | | | | | |
The accompanying notes are an integral part of these financial statements.
36
Schedule of Investments | Aggressive Growth Fund
As of September 30, 2017 (Continued)
| | | | | | | | |
| | |
| Shares | | | | | Fair Value | |
| | |
| | |
| | | | HEALTHCARE - PRODUCTS - 4.9 % | | | | |
| | 5,547 | | | Integra LifeSciences Holdings Corp. * | | $ | 280,013 | |
| | 450 | | | Intuitive Surgical, Inc. * | | | 470,646 | |
| | 2,378 | | | Teleflex, Inc. | | | 575,405 | |
| | | | | | | | |
| | | | | | | 1,326,064 | |
| | | | | | | | |
| | | | HEALTHCARE - SERVICES - 2.5 % | | | | |
| | 8,423 | | | Acadia Healthcare Co., Inc. * | | | 402,282 | |
| | 6,100 | | | HealthSouth Corp. | | | 282,735 | |
| | | | | | | | |
| | | | | | | 685,017 | |
| | | | | | | | |
| | | | HOME BUILDERS - 2.1 % | | | | |
| | 1,803 | | | Thor Industries, Inc. | | | 227,016 | |
| | 8,120 | | | Toll Brothers, Inc. | | | 336,736 | |
| | | | | | | | |
| | | | | | | 563,752 | |
| | | | | | | | |
| | | | INSURANCE - 1.0 % | | | | |
| | 6,995 | | | Assured Guaranty Ltd. | | | 264,061 | |
| | | | | | | | |
| | |
| | | | INTERNET - 2.4 % | | | | |
| | 2,095 | | | Proofpoint, Inc. * | | | 182,726 | |
| | 10,985 | | | RingCentral, Inc. - Class A * | | | 458,624 | |
| | | | | | | | |
| | | | | | | 641,350 | |
| | | | | | | | |
| | | | LODGING - 1.0 % | | | | |
| | 9,790 | | | ILG, Inc. | | | 261,687 | |
| | | | | | | | |
| | |
| | | | OIL & GAS - 1.0 % | | | | |
| | 2,080 | | | Concho Resources, Inc. * | | | 273,978 | |
| | | | | | | | |
| | |
| | | | PACKAGING & CONTAINERS - 2.4 % | | | | |
| | 9,420 | | | Ball Corp. | | | 389,046 | |
| | 4,551 | | | Berry Global Group, Inc. * | | | 257,814 | |
| | | | | | | | |
| | | | | | | 646,860 | |
| | | | | | | | |
| | | | PHARMACEUTICALS - 3.8 % | | | | |
| | 2,495 | | | Clovis Oncology, Inc. * | | | 205,588 | |
| | 4,108 | | | Neurocrine Biosciences, Inc. * | | | 251,738 | |
| | 2,502 | | | PRA Health Sciences, Inc. * | | | 190,577 | |
| | 8,439 | | | Sarepta Therapeutics, Inc. * | | | 382,793 | |
| | | | | | | | |
| | | | | | | 1,030,696 | |
| | | | | | | | |
| | | | RETAIL - 6.1 % | | | | |
| | 2,274 | | | Burlington Stores, Inc. * | | | 217,076 | |
| | 3,875 | | | Children’s Place, Inc. | | | 457,831 | |
| | 18,734 | | | Lumber Liquidators Holdings, Inc. * | | | 730,251 | |
| | 5,150 | | | Texas Roadhouse, Inc. | | | 253,071 | |
| | | | | | | | |
| | | | | | | 1,658,229 | |
| | | | | | | | |
| | | | SAVINGS & LOANS - 1.0 % | | | | |
| | 6,995 | | | Pacific Premier Bancorp, Inc. * | | | | |
| | | | | | | 264,061 | |
| | | | | | | | |
| | | | SEMICONDUCTORS - 6.7 % | | | | |
| | 27,225 | | | Advanced Micro Devices, Inc. * | | | 347,119 | |
| | 3,955 | | | Cavium, Inc. * | | | 260,793 | |
| | 3,865 | | | Lam Research Corp. | | | 715,180 | |
| | 2,777 | | | MKS Instruments, Inc. | | | 262,288 | |
| | 2,559 | | | Monolithic Power System, Inc. | | | 272,661 | |
| | | | | | | | |
| | | | | | | 1,858,041 | |
| | | | | | | | |
| | | | SOFTWARE - 3.9 % | | | | |
| | 10,170 | | | Callidus Software, Inc. * | | | 250,690 | |
| | 6,969 | | | Fidelity National Information Services, Inc. | | | 650,835 | |
| | 3,132 | | | InterXion Holding NV * | | | 159,513 | |
| | | | | | | | |
| | | | | | | 1,061,038 | |
| | | | | | | | |
The accompanying notes are an integral part of these financial statements.
37
Schedule of Investments | Aggressive Growth Fund
As of September 30, 2017 (Continued)
| | | | | | | | |
| | |
| Shares | | | | | Fair Value | |
| | |
| | |
| | | | TELECOMMUNICATIONS - 2.2 % | | | | |
| | 4,200 | | | LogMeIn, Inc. | | $ | 462,210 | |
| | 12,525 | | | Viavi Solutions, Inc. * | | | 118,486 | |
| | | | | | | | |
| | | | | | | 580,696 | |
| | | | | | | | |
| | | | TRANSPORTATION - 0.8 % | | | | |
| | 3,058 | | | Genesee & Wyoming, Inc. - Class A * | | | 226,323 | |
| | | | | | | | |
| | |
| | | | TOTAL COMMON STOCK (Cost $22,015,632) | | | 26,062,279 | |
| | | | | | | | |
| | |
| | | | REITs - 0.8 % | | | | |
| | 10,425 | | | Easterly Government Properties, Inc. (Cost $204,117) | | | 215,485 | |
| | | | | | | | |
| | |
| | | | MONEY MARKET FUND - 3.8 % | | | | |
| | 1,032,475 | | | Fidelity Institutional Money Market Funds - Government Portfolio, 0.91% (A) (Cost $1,032,475) | | | 1,032,475 | |
| | | | | | | | |
| | |
| | | | TOTAL INVESTMENTS - 101.1 % (Cost $23,252,224) | | $ | 27,310,239 | |
| | | | OTHER ASSETS IN EXCESS OF LIABILITIES - NET - (1.1) % | | | (290,040) | |
| | | | | | | | |
| | | | NET ASSETS - 100.0 % | | $ | 27,020,199 | |
| | | | | | | | |
* Non-income producing securities.
REITs - Real Estate Investment Trust.
(A) Variable rate security; the rate shown represents the yield at September 30, 2017.
The accompanying notes are an integral part of these financial statements.
38
Schedule of Investments | International Fund
As of September 30, 2017
| | | | | | | | |
| | |
| Shares | | | | | Fair Value | |
| | |
| | |
| | | | COMMON STOCK - 95.1 % | | | | |
| | | | AIRLINES - 1.2 % | | | | |
| | 73,100 | | | Japan Airlines Co. Ltd. (ADR) * | | $ | 1,230,273 | |
| | | | | | | | |
| | |
| | | | AUTO PARTS & EQUIPMENT - 9.0 % | | | | |
| | 41,400 | | | Continental AG (ADR) | | | 2,107,674 | |
| | 63,500 | | | Magna International, Inc. - Class A | | | 3,389,630 | |
| | 91,800 | | | Valeo SA (ADR) | | | 3,416,796 | |
| | | | | | | | |
| | | | | | | 8,914,100 | |
| | | | | | | | |
| | | | BANKS - 11.7 % | | | | |
| | 14,000 | | | Banco Macro SA - Cl. B (ADR) | | | 1,642,900 | |
| | 40,339 | | | DBS Group Holdings Ltd. (ADR) | | | 2,484,479 | |
| | 112,000 | | | DNB ASA (ADR) | | | 2,263,520 | |
| | 63,000 | | | KBC Group NV (ADR) | | | 2,674,350 | |
| | 349,000 | | | Mizuho Financial Group, Inc. (ADR) | | | 1,238,950 | |
| | 44,100 | | | Swedbank AB (ADR) | | | 1,222,452 | |
| | | | | | | | |
| | | | | | | 11,526,651 | |
| | | | | | | | |
| | | | BUILDING MATERIALS - 3.7 % | | | | |
| | 175,000 | | | Asahi Glass Co. Ltd. (ADR) | | | 1,291,500 | |
| | 150,080 | | | Cemex SAB de CV (ADR) * | | | 1,362,726 | |
| | 52,600 | | | Xinyi Glass Holdings Ltd. (ADR) | | | 1,039,902 | |
| | | | | | | | |
| | | | | | | 3,694,128 | |
| | | | | | | | |
| | | | CHEMICALS - 3.6 % | | | | |
| | 22,700 | | | Arkema SA (ADR) | | | 2,768,719 | |
| | 71,000 | | | Brenntag AG (ADR) * | | | 792,360 | |
| | | | | | | | |
| | | | | | | 3,561,079 | |
| | | | | | | | |
| | | | COMMERCIAL SERVICES - 1.1 % | | | | |
| | 21,000 | | | AerCap Holdings NV * | | | 1,073,310 | |
| | | | | | | | |
| | |
| | | | DIVERSIFIED FINANCIAL SERVICES - 4.6 % | | | | |
| | 175,500 | | | Daiwa Securities Group, Inc. (ADR) | | | 1,000,350 | |
| | 43,800 | | | ORIX Corp. (ADR) | | | 3,545,172 | |
| | | | | | | | |
| | | | | | | 4,545,522 | |
| | | | | | | | |
| | | | ELECTRIC - 0.8 % | | | | |
| | 93,900 | | | Power Assets Holdings Ltd. (ADR) | | | 826,320 | |
| | | | | | | | |
| | |
| | | | ELECTRONICS - 1.9 % | | | | |
| | 13,600 | | | Alps Electric Co. Ltd. (ADR) | | | 715,632 | |
| | 27,000 | | | Orbotech Ltd. * | | | 1,139,670 | |
| | | | | | | | |
| | | | | | | 1,855,302 | |
| | | | | | | | |
| | | | ENGINEERING & CONSTRUCTION - 3.0 % | | | | |
| | 127,000 | | | Vinci SA (ADR) | | | 3,013,710 | |
| | | | | | | | |
| | |
| | | | FOOD - 5.3 % | | | | |
| | 243,000 | | | First Pacific Co. Ltd. (ADR) | | | 959,850 | |
| | 18,000 | | | Kerry Group PLC (ADR) | | | 1,796,940 | |
| | 125,000 | | | Marine Harvest ASA (ADR) | | | 2,480,000 | |
| | | | | | | | |
| | | | | | | 5,236,790 | |
| | | | | | | | |
| | | | FOREST PRODUCTS & PAPER - 0.9 % | | | | |
| | 16,000 | | | Mondi PLC (ADR) | | | 899,040 | |
| | | | | | | | |
| | |
| | | | HAND/MACHINE TOOLS - 2.8 % | | | | |
| | 101,650 | | | Techtronic Industries Co. (ADR) | | | 2,734,385 | |
| | | | | | | | |
| | |
| | | | HEALTHCARE - PRODUCTS - 2.6 % | | | | |
| | 70,000 | | | Smith & Nephew PLC (ADR) | | | 2,548,000 | |
| | | | | | | | |
| | |
| | | | HEALTHCARE - SERVICES - 2.8 % | | | | |
| | 57,000 | | | Fresenius Medical Care AG & Co. (ADR) | | | 2,786,730 | |
| | | | | | | | |
The accompanying notes are an integral part of these financial statements.
39
Schedule of Investments | International Fund
As of September 30, 2017 (Continued)
| | | | | | | | |
| | |
| Shares | | | | | Fair Value | |
| | |
| | |
| | | | HOME BUILDERS - 1.0 % | | | | |
| | 58,000 | | | Sekisui House Ltd. (ADR) | | $ | 977,880 | |
| | | | | | | | |
| | |
| | | | INSURANCE - 6.6 % | | | | |
| | 36,000 | | | AIA Group Ltd. (ADR) | | | 1,070,640 | |
| | 57,100 | | | Ageas (ADR) | | | 2,684,842 | |
| | 57,200 | | | Muenchener Rueckversicherungs AG (ADR) | | | 1,222,936 | |
| | 51,900 | | | Zurich Insurance Group AG (ADR) | | | 1,588,270 | |
| | | | | | | | |
| | | | | | | 6,566,688 | |
| | | | | | | | |
| | | | INTERNET - 3.7 % | | | | |
| | 20,600 | | | SINA Corp. * | | | 2,361,790 | |
| | 29,300 | | | Tencent Holdings Ltd. (ADR) | | | 1,286,709 | |
| | | | | | | | |
| | | | | | | 3,648,499 | |
| | | | | | | | |
| | | | MACHINERY - CONSTRUCTION & MINING - 1.8 % | | | | |
| | 46,000 | | | Atlas Copco AB (ADR) | | | 1,789,395 | |
| | | | | | | | |
| | |
| | | | MACHINERY - DIVERSIFIED - 0.6 % | | | | |
| | 50,000 | | | CNH Industrial NV | | | 600,500 | |
| | | | | | | | |
| | |
| | | | MINING - 1.0 % | | | | |
| | 21,000 | | | Rio Tinto PLC (ADR) | | | 990,990 | |
| | | | | | | | |
| | |
| | | | MISCELLANEOUS MANUFACTURING - 1.4 % | | | | |
| | 35,538 | | | FUJIFILM Holdings Corp. (ADR) | | | 1,378,874 | |
| | | | | | | | |
| | |
| | | | OIL & GAS - 4.1 % | | | | |
| | 49,100 | | | Eni SpA (ADR) | | | 1,623,737 | |
| | 120,000 | | | Statoil ASA (ADR) | | | 2,410,800 | |
| | | | | | | | |
| | | | | | | 4,034,537 | |
| | | | | | | | |
| | | | OIL & GAS SERVICES - 0.9 % | | | | |
| | 32,100 | | | Technip SA * | | | 896,232 | |
| | | | | | | | |
| | |
| | | | PHARMACEUTICALS - 4.1 % | | | | |
| | 47,000 | | | Ipsen SA (ADR) | | | 1,559,930 | |
| | 16,100 | | | Shire PLC (ADR) | | | 2,465,554 | |
| | | | | | | | |
| | | | | | | 4,025,484 | |
| | | | | | | | |
| | | | RETAIL - 1.1 % | | | | |
| | 133,600 | | | Kingfisher PLC (ADR) | | | 1,087,504 | |
| | | | | | | | |
| | |
| | | | SEMICONDUCTORS - 2.5 % | | | | |
| | 21,000 | | | Infineon Technologies AG (ADR) * | | | 529,620 | |
| | 17,000 | | | NXP Semiconductors NV * | | | 1,922,530 | |
| | | | | | | | |
| | | | | | | 2,452,150 | |
| | | | | | | | |
| | | | SOFTWARE - 3.7 % | | | | |
| | 31,000 | | | Amadeus IT Holdings SA (ADR) | | | 2,018,100 | |
| | 49,940 | | | Open Text Corp. | | | 1,612,563 | |
| | | | | | | | |
| | | | | | | 3,630,663 | |
| | | | | | | | |
| | | | TELECOMMUNICATIONS - 4.2 % | | | | |
| | 18,600 | | | Nice Ltd. (ADR) | | | 1,512,366 | |
| | 58,000 | | | Nippon Telegraph & Telephone Corp. (ADR) | | | 2,651,760 | |
| | | | | | | | |
| | | | | | | 4,164,126 | |
| | | | | | | | |
| | | | TRANSPORTATION - 1.9 % | | | | |
| | 6,500 | | | Canadian Pacific Railway Ltd. | | | 1,092,195 | |
| | 52,000 | | | East Japan Railway Co. (ADR) | | | 797,160 | |
| | | | | | | | |
| | | | | | | 1,889,355 | |
| | | | | | | | |
| | | | WATER - 1.5 % | | | | |
| | 141,000 | | | Cia de Saneamento Basico do Estado de Sao Paulo (ADR) | | | 1,474,860 | |
| | | | | | | | |
| | |
| | | | TOTAL COMMON STOCK (Cost $80,825,722) | | | 94,053,077 | |
| | | | | | | | |
The accompanying notes are an integral part of these financial statements.
40
Schedule of Investments | International Fund
As of September 30, 2017 (Continued)
| | | | | | | | |
| | |
| Shares | | | | | Fair Value | |
| | |
| | |
| | | | MONEY MARKET FUND - 4.8 % | | | | |
| | 4,695,880 | | | Fidelity Institutional Money Market Funds - Government Portfolio, 0.91% (A) | | $ | 4,695,880 | |
| | | | | | | | |
| | | | (Cost $4,695,880) | | | | |
| | |
| | | | TOTAL INVESTMENTS - 99.9 % (Cost $85,521,602) | | $ | 98,748,957 | |
| | | | OTHER ASSETS IN EXCESS OF LIABILITIES - NET - 0.1 % | | | 107,225 | |
| | | | | | | | |
| | | | NET ASSETS - 100.0 % | | $ | 98,856,182 | |
| | | | | | | | |
*Non-income producing securities.
ADR - American Depositary Receipt.
(A) Variable rate security; the rate shown represents the yield at September 30, 2017.
| | | | |
| Diversification of Assets | | | |
| |
| Country | | % of Net Assets | |
| |
| Japan | | | 15.0% | |
| France | | | 10.9% | |
| Germany | | | 7.5% | |
| Norway | | | 7.2% | |
| Hong Kong | | | 6.7% | |
| Britain | | | 6.2% | |
| Canada | | | 6.2% | |
| Belgium | | | 5.4% | |
| China | | | 3.7% | |
| Sweden | | | 3.1% | |
| Ireland | | | 2.9% | |
| Israel | | | 2.7% | |
| Singapore | | | 2.5% | |
| United States | | | 2.5% | |
| Spain | | | 2.0% | |
| Netherlands | | | 1.9% | |
| Argentina | | | 1.7% | |
| Italy | | | 1.6% | |
| Switzerland | | | 1.6% | |
| Brazil | | | 1.5% | |
| Mexico | | | 1.4% | |
| South Africa | | | 0.9% | |
| | | | |
| Total | | | 95.1% | |
| Money Market Fund | | | 4.8% | |
| Other Assets Less Liabilities - Net | | | 0.1% | |
| | | | |
| Grand Total | | | 100.0% | |
| | | | |
The accompanying notes are an integral part of these financial statements.
41
Schedule of Investments | Large/Mid Cap Growth Fund
As of September 30, 2017
| | | | | | | | |
| | |
| Shares | | | | | Fair Value | |
| | |
| | |
| | | | COMMON STOCK - 93.4 % | | | | |
| | | | AEROSPACE/DEFENSE - 2.4 % | | | | |
| | 9,596 | | | General Dynamics Corp. | | $ | 1,972,746 | |
| | | | | | | | |
| | |
| | | | AIRLINES - 0.9 % | | | | |
| | 5,590 | | | Copa Holdings SA - Class A | | | 696,123 | |
| | | | | | | | |
| | |
| | | | AUTO PARTS & EQUIPMENT - 0.9 % | | | | |
| | 7,615 | | | Delphi Automotive PLC | | | 749,316 | |
| | | | | | | | |
| | |
| | | | BANKS - 2.7 % | | | | |
| | 34,494 | | | PacWest Bancorp | | | 1,742,292 | |
| | 9,058 | | | Western Alliance Bancorp * | | | 480,799 | |
| | | | | | | | |
| | | | | | | 2,223,091 | |
| | | | | | | | |
| | | | BIOTECHNOLOGY - 7.8 % | | | | |
| | 23,620 | | | Celgene Corp. * | | | 3,444,268 | |
| | 5,921 | | | Charles River Laboratories International, Inc. * | | | 639,586 | |
| | 3,210 | | | Incyte Corp. * | | | 374,735 | |
| | 3,764 | | | Puma Biotechnology, Inc. * | | | 450,739 | |
| | 6,086 | | | Sage Therapeutics, Inc. * | | | 379,158 | |
| | 7,322 | | | Vertex Pharmaceuticals, Inc. * | | | 1,113,237 | |
| | | | | | | | |
| | | | | | | 6,401,723 | |
| | | | | | | | |
| | | | CHEMICALS - 6.0 % | | | | |
| | 9,505 | | | Albemarle Corp. | | | 1,295,627 | |
| | 19,937 | | | Chemours Co. | | | 1,009,012 | |
| | 8,965 | | | FMC Corp. | | | 800,664 | |
| | 11,161 | | | LyondellBasell Industries NV | | | 1,105,497 | |
| | 2,128 | | | Sherwin-Williams Co. | | | 761,909 | |
| | | | | | | | |
| | | | | | | 4,972,709 | |
| | | | | | | | |
| | | | COMMERCIAL SERVICES - 0.9 % | | | | |
| | 2,273 | | | MarketAxess Holdings, Inc. | | | 419,391 | |
| | 2,651 | | | WEX, Inc. * | | | 297,495 | |
| | | | | | | | |
| | | | | | | 716,886 | |
| | | | | | | | |
| | | | COMPUTERS - 3.7 % | | | | |
| | 20,717 | | | Check Point Software Technologies Ltd. * | | | 2,362,152 | |
| | 13,534 | | | Mercury Systems, Inc. * | | | 702,144 | |
| | | | | | | | |
| | | | | | | 3,064,296 | |
| | | | | | | | |
| | | | DIVERSIFIED FINANCIAL SERVICES - 4.4 % | | | | |
| | 19,724 | | | Intercontinental Exchange, Inc. | | | 1,355,039 | |
| | 50,725 | | | Invesco Ltd. | | | 1,777,404 | |
| | 41,813 | | | SLM Corp. * | | | 479,595 | |
| | | | | | | | |
| | | | | | | 3,612,038 | |
| | | | | | | | |
| | | | ELECTRICAL COMPONENTS & EQUIPMENT - 0.5 % | | | | |
| | 5,472 | | | Belden, Inc. | | | 440,660 | |
| | | | | | | | |
| | |
| | | | ELECTRONICS - 13.3 % | | | | |
| | 13,302 | | | Agilent Technologies, Inc. - Class A | | | 853,988 | |
| | 18,298 | | | Amphenol Corp. - Cl. A | | | 1,548,743 | |
| | 5,950 | | | Coherent, Inc. * | | | 1,399,261 | |
| | 9,543 | | | Fortive Corp. | | | 675,549 | |
| | 22,814 | | | Honeywell International, Inc. | | | 3,233,656 | |
| | 1,164 | | | Mettler-Toledo International, Inc. * | | | 728,850 | |
| | 24,695 | | | TE Connectivity Ltd. | | | 2,051,167 | |
| | 11,762 | | | Trimble, Inc. * | | | 461,659 | |
| | | | | | | | |
| | | | | | | 10,952,873 | |
| | | | | | | | |
| | | | ENGINEERING & CONSTRUCTION - 0.8 % | | | | |
| | 14,826 | | | MasTec, Inc. * | | | 687,926 | |
| | | | | | | | |
| | |
| | | | ENTERTAINMENT - 1.9 % | | | | |
| | 6,749 | | | Vail Resorts, Inc. | | | 1,539,582 | |
| | | | | | | | |
The accompanying notes are an integral part of these financial statements.
42
Schedule of Investments | Large/Mid Cap Growth Fund
As of September 30, 2017 (Continued)
| | | | | | | | |
| | |
| Shares | | | | | Fair Value | |
| | |
| | |
| | | | FOOD - 2.9 % | | | | |
| | 23,083 | | | McCormick & Co., Inc. | | $ | 2,369,239 | |
| | | | | | | | |
| | |
| | | | HEALTHCARE - PRODUCTS - 2.5 % | | | | |
| | 4,680 | | | Edwards Lifesciences Corp. * | | | 511,571 | |
| | 2,718 | | | Henry Schein, Inc. * | | | 222,849 | |
| | 592 | | | Intuitive Surgical, Inc. * | | | 619,161 | |
| | 2,854 | | | Teleflex, Inc. | | | 690,582 | |
| | | | | | | | |
| | | | | | | 2,044,163 | |
| | | | | | | | |
| | | | HEALTHCARE - SERVICES - 0.6 % | | | | |
| | 4,752 | | | Centene Corp. * | | | 459,851 | |
| | | | | | | | |
| | |
| | | | HOME BUILDERS - 1.6 % | | | | |
| | 16,005 | | | PulteGroup, Inc. | | | 437,417 | |
| | 2,750 | | | Thor Industries, Inc. | | | 346,252 | |
| | 13,031 | | | Toll Brothers, Inc. | | | 540,396 | |
| | | | | | | | |
| | | | | | | 1,324,065 | |
| | | | | | | | |
| | | | INSURANCE - 0.5 % | | | | |
| | 10,743 | | | Assured Guaranty, Ltd. | | | 405,548 | |
| | | | | | | | |
| | |
| | | | INTERNET - 1.2 % | | | | |
| | 14,889 | | | CDW Corp. | | | 982,674 | |
| | | | | | | | |
| | |
| | | | MACHINERY - CONSTRUCTION & MINING - 1.3 % | | | | |
| | 8,287 | | | Caterpillar, Inc. | | | 1,033,472 | |
| | | | | | | | |
| | |
| | | | MISCELLANEOUS MANUFACTURER - 2.5 % | | | | |
| | 14,049 | | | Illinois Tool Works, Inc. | | | 2,078,690 | |
| | | | | | | | |
| | |
| | | | OIL & GAS - 3.2 % | | | | |
| | 3,172 | | | Concho Resources, Inc. * | | | 417,816 | |
| | 32,071 | | | ConocoPhillips | | | 1,605,154 | |
| | 5,956 | | | Diamondback Energy, Inc. * | | | 583,450 | |
| | | | | | | | |
| | | | | | | 2,606,420 | |
| | | | | | | | |
| | | | PACKAGING & CONTAINERS - 1.8 % | | | | |
| | 20,745 | | | Ball Corp. | | | 856,768 | |
| | 11,267 | | | Berry Global Group, Inc. * | | | 638,276 | |
| | | | | | | | |
| | | | | | | 1,495,044 | |
| | | | | | | | |
| | | | PHARMACEUTICALS - 4.7 % | | | | |
| | 34,265 | | | AbbVie, Inc. | | | 3,044,788 | |
| | 4,020 | | | Clovis Oncology, Inc. * | | | 331,248 | |
| | 7,694 | | | Neurocrine Biosciences, Inc. * | | | 471,488 | |
| | | | | | | | |
| | | | | | | 3,847,524 | |
| | | | | | | | |
| | | | RETAIL - 9.0 % | | | | |
| | 6,770 | | | Burlington Stores, Inc. * | | | 646,264 | |
| | 14,814 | | | Costco Wholesale Corp. | | | 2,433,792 | |
| | 34,599 | | | Foot Locker, Inc. | | | 1,218,577 | |
| | 33,261 | | | Lowe’s Cos, Inc. | | | 2,658,884 | |
| | 8,541 | | | Texas Roadhouse, Inc. | | | 419,705 | |
| | | | | | | | |
| | | | | | | 7,377,222 | |
| | | | | | | | |
| | | | SEMICONDUCTORS - 10.9 % | | | | |
| | 44,985 | | | Advanced Micro Devices, Inc. * | | | 573,559 | |
| | 8,172 | | | Broadcom Ltd. | | | 1,982,037 | |
| | 10,448 | | | Cavium, Inc. * | | | 688,941 | |
| | 2,243 | | | IPG Photonics Corp. * | | | 415,090 | |
| | 2,860 | | | Lam Research Corp. | | | 529,214 | |
| | 44,641 | | | Maxim Integrated Products, Inc. | | | 2,129,822 | |
| | 5,929 | | | Monolithic Power Systems, Inc. | | | 631,735 | |
| | 11,415 | | | NVIDIA Corp. | | | 2,040,660 | |
| | | | | | | | |
| | | | | | | 8,991,058 | |
| | | | | | | | |
The accompanying notes are an integral part of these financial statements.
43
Schedule of Investments | Large/Mid Cap Growth Fund
As of September 30, 2017 (Continued)
| | | | | | | | |
| | |
| Shares | | | | | Fair Value | |
| | |
| | |
| | | | SOFTWARE - 3.9 % | | | | |
| | 19,711 | | | Callidus Software, Inc. * | | $ | 485,876 | |
| | 10,619 | | | Fidelity National Information Services, Inc. | | | 991,708 | |
| | 6,307 | | | InterXion Holding NV * | | | 321,216 | |
| | 8,062 | | | PTC, Inc. * | | | 453,729 | |
| | 7,868 | | | ServiceNow, Inc. * | | | 924,726 | |
| | | | | | | | |
| | | | | | | 3,177,255 | |
| | | | | | | | |
| | | | TELECOMMUNICATIONS - 0.6 % | | | | |
| | 4,298 | | | LogMeIn, Inc. | | | 472,995 | |
| | | | | | | | |
| | |
| | | | TOTAL COMMON STOCK (Cost $63,049,616) | | | 76,695,189 | |
| | | | | | | | |
| | |
| | | | MONEY MARKET FUND - 7.0 % | | | | |
| | 5,765,626 | | | Fidelity Institutional Money Market Funds - Government Portfolio, 0.91% (A) | | | 5,765,626 | |
| | | | | | | | |
| | | | (Cost $5,765,626) | | | | |
| | |
| | | | TOTAL INVESTMENTS - 100.4 % (Cost $68,815,242) | | $ | 82,460,815 | |
| | | | OTHER ASSETS IN EXCESS OF LIABILITIES - NET - (0.4) % | | | (325,162 | ) |
| | | | | | | | |
| | | | NET ASSETS - 100.0 % | | $ | 82,135,653 | |
| | | | | | | | |
*Non-income producing securities.
(A) Variable rate security; the rate shown represents the yield at September 30, 2017.
The accompanying notes are an integral part of these financial statements.
44
Schedule of Investments | Small Cap Value Fund
As of September 30, 2017
| | | | | | | | |
| | |
| Shares | | | | | Fair Value | |
| | |
| | |
| | | | COMMON STOCK - 85.9 % | | | | |
| | | | AEROSPACE/DEFENSE - 3.9 % | | | | |
| | 29,760 | | | Esterline Technologies Corp. * | | $ | 2,682,864 | |
| | 53,500 | | | Kaman Corp. | | | 2,984,230 | |
| | | | | | | | |
| | | | | | | 5,667,094 | |
| | | | | | | | |
| | | | APPAREL - 2.1 % | | | | |
| | 47,313 | | | Oxford Industries, Inc. | | | 3,006,268 | |
| | | | | | | | |
| | |
| | | | AUTO PARTS & EQUIPMENT - 2.0 % | | | | |
| | 73,811 | | | Douglas Dynamics, Inc. | | | 2,908,153 | |
| | | | | | | | |
| | |
| | | | BANKS - 18.4 % | | | | |
| | 54,017 | | | Chemical Financial Corp. | | | 2,822,928 | |
| | 68,063 | | | Columbia Banking System, Inc. | | | 2,866,133 | |
| | 79,525 | | | Glacier Bancorp, Inc. | | | 3,002,864 | |
| | 70,380 | | | Great Western Bancorp, Inc. | | | 2,905,286 | |
| | 95,900 | | | Hanmi Financial Corp. | | | 2,968,105 | |
| | 135,644 | | | Heritage Commerce Corp. | | | 1,930,214 | |
| | 72,404 | | | Legacy Texas Financial Group, Inc. | | | 2,890,368 | |
| | 66,900 | | | Renasant Corp. | | | 2,870,010 | |
| | 39,300 | | | ServisFirst Bancshares, Inc. | | | 1,526,805 | |
| | 33,600 | | | South State Corp. | | | 3,025,680 | |
| | | | | | | | |
| | | | | | | 26,808,393 | |
| | | | | | | | |
| | | | BUILDING MATERIALS - 11.5 % | | | | |
| | 66,986 | | | Apogee Enterprises, Inc. | | | 3,232,744 | |
| | 119,696 | | | Continental Building Products, Inc. * | | | 3,112,096 | |
| | 46,820 | | | Gibraltar Industries, Inc. * | | | 1,458,443 | |
| | 91,710 | | | Summit Materials, Inc. * - Class A | | | 2,937,471 | |
| | 33,551 | | | Trex Co., Inc. * | | | 3,021,939 | |
| | 29,525 | | | Universal Forest Products, Inc. | | | 2,898,174 | |
| | | | | | | | |
| | | | | | | 16,660,867 | |
| | | | | | | | |
| | | | CHEMICALS - 1.2 % | | | | |
| | 27,350 | | | Innospec, Inc. | | | 1,686,127 | |
| | | | | | | | |
| | |
| | | | COMMERCIAL SERVICES - 1.1 % | | | | |
| | 62,785 | | | Carriage Services, Inc. | | | 1,607,296 | |
| | | | | | | | |
| | |
| | | | ELECTRIC - 1.9 % | | | | |
| | 35,310 | | | ALLETE, Inc. | | | 2,729,110 | |
| | | | | | | | |
| | |
| | | | ELECTRICAL COMPONENTS & EQUIPMENT - 2.2 % | | | | |
| | 74,286 | | | Novanta, Inc. * | | | 3,238,870 | |
| | | | | | | | |
| | |
| | | | ELECTRONICS - 2.5 % | | | | |
| | 47,100 | | | Methode Electronics, Inc. | | | 1,994,685 | |
| | 18,025 | | | OSI Systems, Inc. * | | | 1,646,944 | |
| | | | | | | | |
| | | | | | | 3,641,629 | |
| | | | | | | | |
| | | | ENGINEERING & CONSTRUCTION - 2.1 % | | | | |
| | 83,700 | | | Comfort Systems USA, Inc. | | | 2,988,090 | |
| | | | | | | | |
| | |
| | | | ENTERTAINMENT - 0.9 % | | | | |
| | 37,342 | | | International Speedway Corp. | | | 1,344,312 | |
| | | | | | | | |
| | |
| | | | FOOD - 5.3 % | | | | |
| | 216,950 | | | Hostess Brands, Inc. * | | | 2,963,537 | |
| | 24,033 | | | J & J Snack Foods Corp. | | | 3,155,533 | |
| | 104,100 | | | Nomad Foods Ltd. * | | | 1,516,737 | |
| | | | | | | | |
| | | | | | | 7,635,807 | |
| | | | | | | | |
The accompanying notes are an integral part of these financial statements.
45
Schedule of Investments | Small Cap Value Fund
As of September 30, 2017 (Continued)
| | | | | | | | |
| | |
| Shares | | | | | Fair Value | |
| | |
| | |
| | | | HEALTHCARE - PRODUCTS - 1.5 % | | | | |
| | 42,231 | | | CONMED Corp. | | $ | 2,215,861 | |
| | | | | | | | |
| | |
| | | | INSURANCE - 5.1 % | | | | |
| | 67,029 | | | Employers Holdings, Inc. | | | 3,046,468 | |
| | 57,647 | | | Kemper Corp. | | | 3,055,291 | |
| | 17,897 | | | Safety Insurance Group, Inc. | | | 1,365,541 | |
| | | | | | | | |
| | | | | | | 7,467,300 | |
| | | | | | | | |
| | | | MACHINERY - 3.4 % | | | | |
| | 17,462 | | | Alamo Group, Inc. | | | 1,874,895 | |
| | 53,049 | | | Albany International Corp. - Class A | | | 3,045,013 | |
| | | | | | | | |
| | | | | | | 4,919,908 | |
| | | | | | | | |
| | | | MISCELLANEOUS MANUFACTURER - 1.2 % | | | | |
| | 29,869 | | | Lydall, Inc. * | | | 1,711,494 | |
| | | | | | | | |
| | |
| | | | OFFICE FURNISHINGS - 2.0 % | | | | |
| | 133,645 | | | Interface, Inc. | | | 2,926,826 | |
| | | | | | | | |
| | |
| | | | OIL & GAS - 6.4 % | | | | |
| | 256,140 | | | Callon Petroleum Co. * | | | 2,879,014 | |
| | 98,575 | | | Resolute Energy Corp. * | | | 2,926,692 | |
| | 41,000 | | | Rosehill Resources, Inc. * | | | 337,430 | |
| | 325,007 | | | SRC Energy, Inc. * | | | 3,142,818 | |
| | | | | | | | |
| | | | | | | 9,285,954 | |
| | | | | | | | |
| | | | PACKAGING & CONTAINERS - 1.6 % | | | | |
| | 109,190 | | | KapStone Paper and Packaging Corp. | | | 2,346,493 | |
| | | | | | | | |
| | |
| | | | RETAIL - 4.2 % | | | | |
| | 25,610 | | | Lithia Motors, Inc. - Class A | | | 3,081,139 | |
| | 121,425 | | | Sonic Corp. | | | 3,090,266 | |
| | | | | | | | |
| | | | | | | 6,171,405 | |
| | | | | | | | |
| | | | SAVINGS & LOANS - 1.0 % | | | | |
| | 37,023 | | | Berkshire Hills Bancorp, Inc. | | | 1,434,641 | |
| | | | | | | | |
| | |
| | | | SEMICONDUCTORS - 1.3 % | | | | |
| | 62,400 | | | Brooks Automation, Inc. | | | 1,894,464 | |
| | | | | | | | |
| | |
| | | | SOFTWARE - 1.9 % | | | | |
| | 54,393 | | | Omnicell, Inc. * | | | 2,776,763 | |
| | | | | | | | |
| | |
| | | | WATER - 1.2 % | | | | |
| | 28,315 | | | Connecticut Water Service, Inc. | | | 1,679,080 | |
| | | | | | | | |
| | |
| | | | TOTAL COMMON STOCK (Cost $103,945,194) | | | 124,752,205 | |
| | | | | | | | |
| | |
| | | | REITs - 11.0 % | | | | |
| | 136,644 | | | Easterly Government Properties, Inc. | | | 2,824,431 | |
| | 46,650 | | | Potlatch Corp. | | | 2,379,150 | |
| | 172,725 | | | Ramco-Gershenson Properties Trust | | | 2,247,152 | |
| | 96,805 | | | STAG Industrial, Inc. | | | 2,659,233 | |
| | 187,297 | | | Summit Hotel Properties, Inc. | | | 2,994,879 | |
| | 80,958 | | | Terreno Realty Corp. | | | 2,929,061 | |
| | | | | | | | |
| | | | TOTAL REITs (Cost $13,836,909) | | | 16,033,906 | |
| | | | | | | | |
The accompanying notes are an integral part of these financial statements.
46
Schedule of Investments | Small Cap Value Fund
As of September 30, 2017 (Continued)
| | | | | | | | |
| | |
| Shares | | | | | Fair Value | |
| | |
| | |
| | | | MONEY MARKET FUND - 2.9 % | | | | |
| | 4,254,758 | | | Fidelity Institutional Money Market Funds - Government Portfolio, 0.91% (A) | | $ | 4,254,758 | |
| | | | | | | | |
| | | | (Cost $4,254,758) | | | | |
| | |
| | | | TOTAL INVESTMENTS - 99.8 % (Cost $122,036,861) | | $ | 145,040,869 | |
| | | | OTHER ASSETS IN EXCESS OF LIABILITIES - NET - 0.2 % | | | 225,187 | |
| | | | | | | | |
| | | | NET ASSETS - 100.0 % | | $ | 145,266,056 | |
| | | | | | | | |
* Non-income producing securities.
REITs - Real Estate Investment Trust.
(A) Variable rate security; the rate shown represents the yield at September 30, 2017.
The accompanying notes are an integral part of these financial statements.
47
Schedule of Investments | Large/Mid Cap Value Fund
As of September 30, 2017
| | | | | | | | |
| | |
| Shares | | | | | Fair Value | |
| | |
| | |
| | | | COMMON STOCK - 92.4 % | | | | |
| | | | AEROSPACE/DEFENSE - 5.4 % | | | | |
| | 54,300 | | | Curtiss-Wright Corp. | | $ | 5,676,522 | |
| | 27,300 | | | General Dynamics Corp. | | | 5,612,334 | |
| | | | | | | | |
| | | | | | | 11,288,856 | |
| | | | | | | | |
| | | | APPAREL - 2.9 % | | | | |
| | 94,665 | | | VF Corp. | | | 6,017,854 | |
| | | | | | | | |
| | |
| | | | BANKS - 4.3 % | | | | |
| | 53,900 | | | East West Bancorp, Inc. | | | 3,222,142 | |
| | 16,986 | | | SVB Financial Group * | | | 3,177,911 | |
| | 48,315 | | | Western Alliance Bancorp * | | | 2,564,560 | |
| | | | | | | | |
| | | | | | | 8,964,613 | |
| | | | | | | | |
| | | | BEVERAGES - 2.2 % | | | | |
| | 52,460 | | | Dr. Pepper Snapple Group, Inc. | | | 4,641,136 | |
| | | | | | | | |
| | |
| | | | CHEMICALS - 2.9 % | | | | |
| | 17,350 | | | Sherwin-Williams Co. | | | 6,211,994 | |
| | | | | | | | |
| | |
| | | | COMPUTERS - 2.5 % | | | | |
| | 80,785 | | | Amdocs Ltd. | | | 5,196,091 | |
| | | | | | | | |
| | |
| | | | DIVERSIFIED FINANCIAL SERVICES - 2.8 % | | | | |
| | 84,870 | | | Intercontinental Exchange, Inc. | | | 5,830,569 | |
| | | | | | | | |
| | |
| | | | ELECTRIC - 3.6 % | | | | |
| | 48,050 | | | DTE Energy Co. | | | 5,158,648 | |
| | 41,465 | | | NorthWestern Corp. | | | 2,361,017 | |
| | | | | | | | |
| | | | | | | 7,519,665 | |
| | | | | | | | |
| | | | ELECTRIC COMPONENTS & EQUIPMENT - 2.2 % | | | | |
| | 40,500 | | | Hubbell, Inc. | | | 4,698,810 | |
| | | | | | | | |
| | |
| | | | ELECTRONICS - 15.2 % | | | | |
| | 70,740 | | | Amphenol Corp. - Cl. A | | | 5,987,434 | |
| | 96,800 | | | Avnet, Inc. | | | 3,804,240 | |
| | 126,300 | | | FLIR Systems, Inc. | | | 4,914,333 | |
| | 39,300 | | | Honeywell International, Inc. | | | 5,570,382 | |
| | 88,200 | | | PerkinElmer, Inc. | | | 6,083,154 | |
| | 68,300 | | | TE Connectivity, Ltd. | | | 5,672,998 | |
| | | | | | | | |
| | | | | | | 32,032,541 | |
| | | | | | | | |
| | | | FOOD - 6.3 % | | | | |
| | 140,500 | | | Flowers Foods, Inc. | | | 2,642,805 | |
| | 49,990 | | | JM Smucker Co. | | | 5,245,451 | |
| | 52,300 | | | McCormick & Co., Inc. | | | 5,368,072 | |
| | | | | | | | |
| | | | | | | 13,256,328 | |
| | | | | | | | |
| | | | HEALTHCARE - PRODUCTS - 7.2 % | | | | |
| | 79,800 | | | DENTSPLY SIRONA, Inc. | | | 4,772,838 | |
| | 114,800 | | | Patterson Companies, Inc. | | | 4,437,020 | |
| | 67,400 | | | STERIS PLC | | | 5,958,160 | |
| | | | | | | | |
| | | | | | | 15,168,018 | |
| | | | | | | | |
| | | | INSURANCE 4.8 % | | | | |
| | 86,500 | | | Arthur J. Gallagher & Co. | | | 5,324,075 | |
| | 120,100 | | | XL Group Ltd. | | | 4,737,945 | |
| | | | | | | | |
| | | | | | | 10,062,020 | |
| | | | | | | | |
| | | | MEDIA - 2.3 % | | | | |
| | 6,682 | | | Cable One, Inc. | | | 4,825,206 | |
| | | | | | | | |
| | |
| | | | MISCELLANEOUS MANUFACTURING - 2.5 % | | | | |
| | 78,500 | | | Pentair PLC | | | 5,334,860 | |
| | | | | | | | |
The accompanying notes are an integral part of these financial statements.
48
Schedule of Investments | Large/Mid Cap Value Fund
As of September 30, 2017 (Continued)
| | | | | | | | |
| | |
| Shares | | | | | Fair Value | |
| | |
| | |
| | | | OIL & NATURAL GAS - 4.8 % | | | | |
| | 50,585 | | | EOG Resources, Inc. | | $ | 4,893,593 | |
| | 52,200 | | | Marathon Petroleum Corp. | | | 2,927,376 | |
| | 63,140 | | | RSP Permian, Inc. * | | | 2,184,012 | |
| | | | | | | | |
| | | | | | | 10,004,981 | |
| | | | | | | | |
| | | | OIL & GAS SERVICES - 1.0 % | | | | |
| | 46,305 | | | Halliburton Co. | | | 2,131,419 | |
| | | | | | | | |
| | |
| | | | PHARMACEUTICALS - 2.6 % | | | | |
| | 85,500 | | | Express Scripts Holding Co. * | | | 5,413,860 | |
| | | | | | | | |
| | |
| | | | RETAIL - 3.8 % | | | | |
| | 31,875 | | | Advance Auto Parts, Inc. | | | 3,162,000 | |
| | 49,900 | | | Genuine Parts Co. | | | 4,772,935 | |
| | | | | | | | |
| | | | | | | 7,934,935 | |
| | | | | | | | |
| | | | SEMICONDUCTORS - 6.6 % | | | | |
| | 22,600 | | | Broadcom Ltd. | | | 5,481,404 | |
| | 51,200 | | | KLA - Tencor Corp. | | | 5,427,200 | |
| | 16,500 | | | Lam Research Corp. | | | 3,053,160 | |
| | | | | | | | |
| | | | | | | 13,961,764 | |
| | | | | | | | |
| | | | SOFTWARE - 1.4 % | | | | |
| | 36,350 | | | Broadridge Financial Solutions, Inc. | | | 2,937,807 | |
| | | | | | | | |
| | |
| | | | TEXTILES - 2.5 % | | | | |
| | 21,600 | | | Mohawk Industries, Inc. * | | | 5,346,216 | |
| | | | | | | | |
| | |
| | | | TRANSPORTATION - 2.6 % | | | | |
| | 47,900 | | | Union Pacific Corp. | | | 5,554,963 | |
| | | | | | | | |
| | |
| | | | TOTAL COMMON STOCK (Cost $158,957,745) | | | 194,334,506 | |
| | | | | | | | |
| | |
| | | | REITs - 4.4 % | | | | |
| | 21,900 | | | Public Storage | | | 4,686,381 | |
| | 27,800 | | | Simon Property Group, Inc. | | | 4,476,078 | |
| | | | | | | | |
| | | | TOTAL REITs (Cost $10,697,386) | | | 9,162,459 | |
| | | | | | | | |
| | |
| | | | MONEY MARKET FUND - 4.0 % | | | | |
| | 8,445,763 | | | Fidelity Institutional Money Market Funds - Government Portfolio, 0.91% (A) | | | 8,445,763 | |
| | | | | | | | |
| | | | (Cost $8,445,763) | | | | |
| | |
| | | | TOTAL INVESTMENTS - 100.8 % (Cost $178,100,894) | | $ | 211,942,728 | |
| | | | OTHER ASSETS IN EXCESS OF LIABILITIES - NET - (0.8) % | | | (1,699,315 | ) |
| | | | | | | | |
| | | | NET ASSETS - 100.0 % | | $ | 210,243,413 | |
| | | | | | | | |
* Non-income producing securities.
REITs - Real Estate Investment Trust.
(A) Variable rate security; the rate shown represents the yield at September 30, 2017.
The accompanying notes are an integral part of these financial statements.
49
Schedule of Investments | Fixed Income Fund
As of September 30, 2017
| | | | | | | | | | | | | | | | |
| | |
| Par Value | | | | | Coupon Rate (%) | | | Maturity | | | Fair Value | |
| | |
| | | | |
| | | | BONDS & NOTES - 96.5 % | | | | | | | | | | | | |
| | | | CORPORATE BONDS - 30.0 % | | | | | | | | | | | | |
| | $ 1,000,000 | | | ABB Finance USA, Inc. | | | 2.875 | | | | 5/8/2022 | | | $ | 1,020,309 | |
| | 500,000 | | | Abbvie, Inc. | | | 3.200 | | | | 5/14/2026 | | | | 501,926 | |
| | 1,000,000 | | | Boardwalk Pipelines LP | | | 5.750 | | | | 9/15/2019 | | | | 1,060,452 | |
| | 1,000,000 | | | Broadridge Financial Solutions, Inc. | | | 3.400 | | | | 6/27/2026 | | | | 992,761 | |
| | 1,000,000 | | | Buckeye Partners LP | | | 3.950 | | | | 12/1/2026 | | | | 988,422 | |
| | 1,000,000 | | | Canadian Pacific RR Co. | | | 2.900 | | | | 2/1/2025 | | | | 996,754 | |
| | 1,000,000 | | | CBOE Holdings, Inc. | | | 3.650 | | | | 1/12/2027 | | | | 1,025,947 | |
| | 1,000,000 | | | Celgene Corp. | | | 3.875 | | | | 8/15/2025 | | | | 1,056,860 | |
| | 500,000 | | | CSX Corp. | | | 3.250 | | | | 6/1/2027 | | | | 500,594 | |
| | 1,000,000 | | | Delphi Automotive Systems Corp. | | | 4.150 | | | | 3/15/2024 | | | | 1,062,362 | |
| | 325,000 | | | Eaton Corp. | | | 5.600 | | | | 5/15/2018 | | | | 332,812 | |
| | 750,000 | | | Eaton Corp. | | | 2.750 | | | | 11/2/2022 | | | | 756,082 | |
| | 1,000,000 | | | Enable Midstream Partners LP | | | 3.900 | | | | 5/15/2024 | | | | 1,006,800 | |
| | 1,000,000 | | | Energy Transfer Partners LP | | | 6.700 | | | | 7/1/2018 | | | | 1,034,761 | |
| | 500,000 | | | Enterprise Products Operating, LLC | | | 6.125 | | | | 10/15/2039 | | | | 608,103 | |
| | 750,000 | | | Husky Energy, Inc. | | | 3.950 | | | | 4/15/2022 | | | | 783,850 | |
| | 922,361 | | | John Sevier Combined Cycle Generation LLC | | | 4.626 | | | | 1/15/2042 | | | | 1,013,706 | |
| | 750,000 | | | Johnson Controls, Inc. | | | 5.000 | | | | 3/30/2020 | | | | 799,156 | |
| | 1,000,000 | | | Kennametal, Inc. | | | 3.875 | | | | 2/15/2022 | | | | 1,016,919 | |
| | 800,000 | | | LYB International Finance BV | | | 4.000 | | | | 7/15/2023 | | | | 845,008 | |
| | 1,500,000 | | | NiSource Finance Corp. | | | 3.490 | | | | 5/15/2027 | | | | 1,521,319 | |
| | 1,000,000 | | | Phillips 66 | | | 3.605 | | | | 2/15/2025 | | | | 999,499 | |
| | 1,000,000 | | | Potash Corp. | | | 4.000 | | | | 12/15/2026 | | | | 1,044,882 | |
| | 128,000 | | | Rio Tinto Finance USA PLC | | | 2.875 | | | | 8/21/2022 | | | | 130,202 | |
| | 1,000,000 | | | Stanley Black & Decker, Inc. | | | 2.900 | | | | 11/1/2022 | | | | 1,014,481 | |
| | 1,200,000 | | | Sunoco Logistics Partners LP | | | 4.250 | | | | 4/1/2024 | | | | 1,239,910 | |
| | 750,000 | | | Tyco Electronics Group SA | | | 6.550 | | | | 10/1/2017 | | | | 750,000 | |
| | 1,200,000 | | | Ventas Realty LP/CAP Corp. | | | 3.250 | | | | 8/15/2022 | | | | 1,221,956 | |
| | 1,000,000 | | | Zimmer Biomet Holdings, Inc. | | | 2.700 | | | | 4/1/2020 | | | | 1,010,568 | |
| | | | | | | | | | | | | | | | |
| | | | TOTAL CORPORATE BONDS (Cost $25,831,122) | | | | | | | | | | | 26,336,401 | |
| | | | | | | | | | | | | | | | |
| | | | |
| | | | U.S. GOVERNMENT & AGENCY OBLIGATIONS - 66.5 % | | | | | | | | | | | | |
| | | | GOVERNMENT NOTES & BONDS - 38.1 % | | | | | | | | | | | | |
| | 7,000,000 | | | United States Treasury Note | | | 3.125 | | | | 5/15/2021 | | | | 7,342,617 | |
| | 10,605,000 | | | United States Treasury Note | | | 2.125 | | | | 6/30/2022 | | | | 10,708,565 | |
| | 6,750,000 | | | United States Treasury Note | | | 2.250 | | | | 11/15/2024 | | | | 6,784,541 | |
| | 3,000,000 | | | United States Treasury Note | | | 2.000 | | | | 8/15/2025 | | | | 2,949,199 | |
| | 2,500,000 | | | United States Treasury Note | | | 1.625 | | | | 2/15/2026 | | | | 2,377,393 | |
| | 2,500,000 | | | United States Treasury Note | | | 4.500 | | | | 2/15/2036 | | | | 3,216,601 | |
| | | | | | | | | | | | | | | | |
| | | | TOTAL GOVERNMENT NOTES & BONDS (Cost $33,536,279) | | | | | | | | | | | 33,378,916 | |
| | | | | | | | | | | | | | | | |
| | | | |
| | | | GOVERNMENT MORTGAGE-BACKED SECURITIES - 28.4 % | | | | | | | | | | | | |
| | 208 | | | GNMA Pool 585163 | | | 5.000 | | | | 2/15/2018 | | | | 210 | |
| | 304 | | | GNMA Pool 585180 | | | 5.000 | | | | 2/15/2018 | | | | 307 | |
| | 255 | | | GNMA Pool 592492 | | | 5.000 | | | | 3/15/2018 | | | | 258 | |
| | 182 | | | GNMA Pool 599821 | | | 5.000 | | | | 1/15/2018 | | | | 183 | |
| | 663,212 | | | GNMA Pool 783060 | | | 4.000 | | | | 8/15/2040 | | | | 703,448 | |
| | 327,307 | | | GNMA Pool 783403 | | | 3.500 | | | | 9/15/2041 | | | | 341,022 | |
| | 2,865,762 | | | GNMA Pool AD 8801 | | | 3.500 | | | | 3/15/2043 | | | | 2,999,260 | |
| | 417,352 | | | GNMA Pool G2 4520 | | | 5.000 | | | | 8/20/2039 | | | | 456,333 | |
| | 508,598 | | | GNMA Pool G2 4947 | | | 5.000 | | | | 2/20/2041 | | | | 556,071 | |
| | 1,353,415 | | | GNMA Pool G2 AL 9364 | | | 3.500 | | | | 3/20/2045 | | | | 1,413,693 | |
| | 1,234,075 | | | GNMA Pool G2 MA0220 | | | 3.500 | | | | 7/20/2042 | | | | 1,290,214 | |
| | 1,353,180 | | | GNMA Pool G2 MA3376 | | | 3.500 | | | | 1/20/2046 | | | | 1,409,130 | |
| | 2,430,417 | | | GNMA Pool G2 MA3663 | | | 3.500 | | | | 5/20/2046 | | | | 2,530,348 | |
The accompanying notes are an integral part of these financial statements.
50
Schedule of Investments | Fixed Income Fund
As of September 30, 2017 (Continued)
| | | | | | | | | | | | | | | | |
| | |
| Par Value | | | | | Coupon Rate (%) | | | Maturity | | | Fair Value | |
| | |
| | | |
| | | | GOVERNMENT MORTGAGE-BACKED SECURITIES - 28.4 % (Cont.) | | | | | | | | | |
| | $ 1,087,082 | | | GNMA Pool G2 MA3735 | | | 3.000 | | | | 6/20/2046 | | | $ | 1,103,805 | |
| | 883,536 | | | GNMA Pool G2 MA3736 | | | 3.500 | | | | 6/20/2046 | | | | 919,808 | |
| | 1,456,703 | | | GNMA Pool G2 MA3803 | | | 3.500 | | | | 7/20/2046 | | | | 1,516,505 | |
| | 1,432,677 | | | GNMA Pool G2 MA4004 | | | 3.500 | | | | 10/20/2046 | | | | 1,491,494 | |
| | 1,303,852 | | | GNMA Pool G2 MA4322 | | | 4.000 | | | | 3/20/2047 | | | | 1,377,125 | |
| | 1,593,588 | | | GNMA Pool G2 MA4453 | | | 4.500 | | | | 5/20/2047 | | | | 1,703,752 | |
| | 926,771 | | | GNMA Pool G2 MA4509 | | | 3.000 | | | | 6/20/2047 | | | | 941,028 | |
| | 1,536,919 | | | GNMA Pool G2 MA4587 | | | 4.000 | | | | 7/20/2047 | | | | 1,625,330 | |
| | 479,022 | | | GNMA Pool G2 MA4652 | | | 3.500 | | | | 8/20/2047 | | | | 498,687 | |
| | 1,885,813 | | | GNMA Pool G2 MA4653 | | | 4.000 | | | | 8/20/2047 | | | | 1,996,086 | |
| | | | | | | | | | | | | | | | |
| | | | TOTAL GOVERNMENT MORTGAGE-BACKED SECURITIES (Cost $25,096,866) | | | | 24,874,097 | |
| | | | | | | | | | | | | | | | |
| | |
| | | | TOTAL U.S. GOVERNMENT & AGENCY OBLIGATIONS (Cost $58,633,145) | | | | 58,253,013 | |
| | | | | | | | | | | | | | | | |
| | | | |
| | | | TOTAL BONDS AND NOTES (Cost $84,464,267) | | | | | | | | | | | 84,589,414 | |
| | | | | | | | | | | | | | | | |
| | | | |
| Shares | | | | | | | | | | | | |
| | | | MONEY MARKET FUND - 4.6 % | | | | | | | | | | | | |
| | 4,016,232 | | | Fidelity Institutional Money Market Funds - Government Portfolio, 0.91% (A) | | | | 4,016,232 | |
| | | | | | | | | | | | | | | | |
| | | | (Cost $4,016,232) | | | | | | | | | | | | |
| | | | |
| | | | TOTAL INVESTMENTS - 101.1 % (Cost $88,480,499) | | | | | | | | | | $ | 88,605,646 | |
| | | | OTHER ASSETS IN EXCESS OF LIABILITIES - NET - (1.1) % | | | | | | | | (977,363) | |
| | | | | | | | | | | | | | | | |
| | | | NET ASSETS - 100.0 % | | | | | | | | | | $ | 87,628,283 | |
| | | | | | | | | | | | | | | | |
GNMA - Government National Mortgage Association.
(A) Variable rate security; the rate shown represents the yield at September 30, 2017.
The accompanying notes are an integral part of these financial statements.
51
Schedule of Investments | High Yield Bond Fund
As of September 30, 2017
| | | | | | | | | | | | | | |
| | |
| Par Value | | | | | Coupon Rate (%) | | Maturity | | | Fair Value | |
| | |
| | | | |
| | | | CORPORATE BONDS - 97.3 % | | | | | | | | | | |
| | $ 1,250,000 | | | AerCap Ireland Capital Ltd. | | 4.625 | | | 7/1/2022 | | | $ | 1,341,225 | |
| | 1,000,000 | | | Alliance Resource Finance Corp. (A) | | 7.500 | | | 5/1/2025 | | | | 1,041,250 | |
| | 500,000 | | | Amsted Industries, Inc. (A) | | 5.000 | | | 3/15/2022 | | | | 518,750 | |
| | 500,000 | | | Amsted Industries, Inc. (A) | | 5.375 | �� | | 9/15/2024 | | | | 528,125 | |
| | 500,000 | | | Anixter, Inc. | | 5.625 | | | 5/1/2019 | | | | 526,875 | |
| | 500,000 | | | ArcelorMittal | | 6.750 | | | 2/25/2022 | | | | 575,625 | |
| | 1,000,000 | | | Ashtead Capital, Inc. (A) | | 4.125 | | | 8/15/2025 | | | | 1,031,250 | |
| | 950,000 | | | B&G Foods, Inc. | | 5.250 | | | 4/1/2025 | | | | 976,125 | |
| | 1,000,000 | | | Berry Plastics Corp. | | 5.125 | | | 7/15/2023 | | | | 1,048,750 | |
| | 750,000 | | | Bombardier, Inc. (A) | | 6.125 | | | 1/15/2023 | | | | 730,875 | |
| | 500,000 | | | Braskem Finance, Ltd. | | 6.450 | | | 2/3/2024 | | | | 566,000 | |
| | 250,000 | | | Calpine Corp. | | 5.750 | | | 1/15/2025 | | | | 237,188 | |
| | 500,000 | | | Cascades, Inc. (A) | | 5.500 | | | 7/15/2022 | | | | 521,250 | |
| | 500,000 | | | Cemex Finance LLC (A) | | 6.000 | | | 4/1/2024 | | | | 532,505 | |
| | 500,000 | | | Centene Corp. | | 4.750 | | | 1/15/2025 | | | | 520,000 | |
| | 750,000 | | | CommScope, Inc. (A) | | 5.000 | | | 6/15/2021 | | | | 771,563 | |
| | 600,000 | | | Community Health Systems, Inc. | | 6.250 | | | 3/31/2023 | | | | 591,750 | |
| | 750,000 | | | Covanta Holding Corp. | | 5.875 | | | 3/1/2024 | | | | 746,250 | |
| | 250,000 | | | Crestwood Midstream Finance Corp. | | 5.750 | | | 4/1/2025 | | | | 256,250 | |
| | 500,000 | | | CyrusOne Finance Corp. (A) | | 5.000 | | | 3/15/2024 | | | | 527,500 | |
| | 1,000,000 | | | Dana, Inc. | | 5.500 | | | 12/15/2024 | | | | 1,055,000 | |
| | 750,000 | | | DaVita HealthCare Partners, Inc. | | 5.000 | | | 5/1/2025 | | | | 741,780 | |
| | 500,000 | | | DCP Midstream, LLC (A) (B) | | 5.850 | | | 5/21/2043 | | | | 468,750 | |
| | 1,000,000 | | | Delphi Jersey Holdings PLC (A) | | 5.000 | | | 10/1/2025 | | | | 1,020,000 | |
| | 500,000 | | | Dollar Tree, Inc. | | 5.750 | | | 3/1/2023 | | | | 530,000 | |
| | 500,000 | | | DR Horton, Inc. | | 4.750 | | | 2/15/2023 | | | | 542,490 | |
| | 1,000,000 | | | Eagle Materials, Inc. | | 4.500 | | | 8/1/2026 | | | | 1,047,500 | |
| | 500,000 | | | Eldorado Gold Corp. (A) | | 6.125 | | | 12/15/2020 | | | | 510,625 | |
| | 1,000,000 | | | Energy Transfer Equity LP | | 5.875 | | | 1/15/2024 | | | | 1,078,750 | |
| | 1,000,000 | | | Equinix, Inc. | | 5.375 | | | 5/15/2027 | | | | 1,088,750 | |
| | 500,000 | | | Ferrellgas LP | | 6.750 | | | 1/15/2022 | | | | 487,500 | |
| | 750,000 | | | FMG Resources (A) | | 5.125 | | | 5/15/2024 | | | | 762,188 | |
| | 500,000 | | | FTI Consulting, Inc. | | 6.000 | | | 11/15/2022 | | | | 518,125 | |
| | 750,000 | | | Gartner, Inc. (A) | | 5.125 | | | 4/1/2025 | | | | 793,125 | |
| | 500,000 | | | General Cable Corp. | | 5.750 | | | 10/1/2022 | | | | 504,700 | |
| | 250,000 | | | Genesis Energy LP | | 5.750 | | | 2/15/2021 | | | | 252,188 | |
| | 500,000 | | | Genesis Energy LP | | 6.750 | | | 8/1/2022 | | | | 513,750 | |
| | 500,000 | | | Geo Group, Inc. | | 5.125 | | | 4/1/2023 | | | | 508,750 | |
| | 500,000 | | | Gibraltar Industries, Inc. | | 6.250 | | | 2/1/2021 | | | | 514,625 | |
| | 500,000 | | | Global Partners LP/ Global Finance Corp. | | 6.250 | | | 7/15/2022 | | | | 508,750 | |
| | 1,000,000 | | | Goodyear Tire & Rubber Co. | | 4.875 | | | 3/15/2027 | | | | 1,031,980 | |
| | 500,000 | | | Group 1 Automotive, Inc. | | 5.000 | | | 6/1/2022 | | | | 520,625 | |
| | 750,000 | | | HCA, Inc. | | 5.250 | | | 4/15/2025 | | | | 812,812 | |
| | 500,000 | | | IHS Markit Ltd. (A) | | 4.750 | | | 2/15/2025 | | | | 536,250 | |
| | 500,000 | | | Kaiser Aluminum Corp. | | 5.875 | | | 5/15/2024 | | | | 536,250 | |
| | 1,000,000 | | | Koppers, Inc. (A) | | 6.000 | | | 2/15/2025 | | | | 1,077,500 | |
| | 500,000 | | | Land O’ Lakes, Inc. (A) | | 6.000 | | | 11/15/2022 | | | | 566,250 | |
| | 625,000 | | | LKQ Corp. | | 4.750 | | | 5/15/2023 | | | | 648,506 | |
| | 500,000 | | | Mednax, Inc. (A) | | 5.250 | | | 12/1/2023 | | | | 525,000 | |
| | 1,000,000 | | | Millicom International Cellular SA (A) | | 5.125 | | | 1/15/2028 | | | | 1,013,500 | |
| | 1,000,000 | | | MPT Operating Partnership LP | | 5.250 | | | 8/1/2026 | | | | 1,037,500 | |
| | 750,000 | | | Navient Corp. | | 4.875 | | | 6/17/2019 | | | | 778,125 | |
| | 500,000 | | | New Gold, Inc. (A) | | 6.375 | | | 5/15/2025 | | | | 530,000 | |
| | 500,000 | | | NGL Energy Partners LP | | 6.875 | | | 10/15/2021 | | | | 502,500 | |
| | 500,000 | | | NGL Energy Partners LP | | 6.125 | | | 3/1/2025 | | | | 467,500 | |
| | 1,000,000 | | | Nova Chemicals Corp. (A) | | 5.250 | | | 6/1/2027 | | | | 1,012,500 | |
| | 250,000 | | | NRG Energy, Inc. | | 7.250 | | | 5/15/2026 | | | | 269,375 | |
| | 1,000,000 | | | NuStar Logistics LP | | 5.625 | | | 4/28/2027 | | | | 1,057,500 | |
| | 500,000 | | | NXP BV / NXP Funding, LLC (A) | | 4.625 | | | 6/1/2023 | | | | 538,750 | |
| | 850,000 | | | Olin Corp. | | 5.125 | | | 9/15/2027 | | | | 890,375 | |
| | 500,000 | | | Omega Healthcare Investors, Inc. | | 4.375 | | | 8/1/2023 | | | | 516,021 | |
| | 500,000 | | | Oshkosh Corp. | | 5.375 | | | 3/1/2025 | | | | 532,500 | |
The accompanying notes are an integral part of these financial statements.
52
Schedule of Investments | High Yield Bond Fund
As of September 30, 2017 (Continued)
| | | | | | | | | | | | | | | | |
| | |
| Par Value | | | | | Coupon Rate (%) | | | Maturity | | | Fair Value | |
| | |
| | | | |
| | | | CORPORATE BONDS - 97.3 % (Cont.) | | | | | | | | | | | | |
| $ | 250,000 | | | Parker Drilling Co. | | | 7.500 | | | | 8/1/2020 | | | $ | 223,125 | |
| | 250,000 | | | Parker Drilling Co. | | | 6.750 | | | | 7/15/2022 | | | | 200,625 | |
| | 500,000 | | | Parsley Finance Corp. (A) | | | 5.250 | | | | 8/15/2025 | | | | 510,625 | |
| | 1,000,000 | | | PBF Finance Corp. (A) | | | 7.250 | | | | 6/15/2025 | | | | 1,025,000 | |
| | 1,000,000 | | | Reynolds Group Issuer, Inc. (A) | | | 5.125 | | | | 7/15/2023 | | | | 1,044,850 | |
| | 500,000 | | | Rose Rock Midstream LP | | | 5.625 | | | | 7/15/2022 | | | | 491,250 | |
| | 500,000 | | | RSP Permian, Inc. (A) | | | 5.250 | | | | 1/15/2025 | | | | 510,000 | |
| | 750,000 | | | Scotts Miracle-Gro Co. | | | 5.250 | | | | 12/15/2026 | | | | 793,125 | |
| | 1,000,000 | | | Sealed Air Corp. (A) | | | 5.250 | | | | 4/1/2023 | | | | 1,082,500 | |
| | 500,000 | | | SemGroup LP (A) | | | 6.375 | | | | 3/15/2025 | | | | 492,500 | |
| | 1,000,000 | | | Standard Industries, Inc. (A) | | | 5.000 | | | | 2/15/2027 | | | | 1,045,000 | |
| | 500,000 | | | Steel Dynamics, Inc. | | | 5.250 | | | | 4/15/2023 | | | | 522,500 | |
| | 1,000,000 | | | Suburban Propane Partners LP | | | 5.875 | | | | 3/1/2027 | | | | 995,000 | |
| | 1,000,000 | | | Summit Midstream Holdings LLC | | | 5.750 | | | | 4/15/2025 | | | | 1,020,000 | |
| | 100,000 | | | Sunoco LP Finance Corp. | | | 6.375 | | | | 4/1/2023 | | | | 106,750 | |
| | 1,000,000 | | | Tallgrass Energy Finance Corp. (A) | | | 5.500 | | | | 1/15/2028 | | | | 1,017,500 | |
| | 500,000 | | | Targa Resources Partners LP | | | 4.250 | | | | 11/15/2023 | | | | 498,125 | |
| | 500,000 | | | Targa Resources Partners LP | | | 5.375 | | | | 2/1/2027 | | | | 523,125 | |
| | 500,000 | | | Teleflex, Inc. | | | 4.875 | | | | 6/1/2026 | | | | 521,250 | |
| | 500,000 | | | Tempur Sealy International, Inc. | | | 5.625 | | | | 10/15/2023 | | | | 528,125 | |
| | 750,000 | | | Tenet Healthcare Corp. | | | 4.375 | | | | 10/1/2021 | | | | 764,062 | |
| | 1,000,000 | | | Tim Technologies, Inc. (A) | | | 5.625 | | | | 10/1/2025 | | | | 1,014,375 | |
| | 750,000 | | | Toll Brothers Finance Corp. | | | 4.875 | | | | 11/15/2025 | | | | 783,000 | |
| | 500,000 | | | TreeHouse Foods, Inc. (A) | | | 6.000 | | | | 2/15/2024 | | | | 536,875 | |
| | 750,000 | | | TRI Pointe Group, Inc. | | | 5.875 | | | | 6/15/2024 | | | | 806,250 | |
| | 500,000 | | | Tullow Oil PLC (A) | | | 6.000 | | | | 11/1/2020 | | | | 498,750 | |
| | 500,000 | | | United Rentals North America, Inc. | | | 4.625 | | | | 7/15/2023 | | | | 523,750 | |
| | 500,000 | | | United Rentals North America, Inc. | | | 4.875 | | | | 1/15/2028 | | | | 503,750 | |
| | 500,000 | | | Valvoline, Inc. (A) | | | 5.500 | | | | 7/15/2024 | | | | 535,000 | |
| | 500,000 | | | Valvoline, Inc. (A) | | | 4.375 | | | | 8/15/2025 | | | | 510,000 | |
| | 1,000,000 | | | VeriSign, Inc. | | | 4.625 | | | | 5/1/2023 | | | | 1,037,500 | |
| | 500,000 | | | WPX Energy, Inc. | | | 5.250 | | | | 9/15/2024 | | | | 503,750 | |
| | 750,000 | | | WR Grace & Co. (A) | | | 5.125 | | | | 10/1/2021 | | | | 815,625 | |
| | | | | | | | | | | | | | | | |
| | | | TOTAL BONDS (Cost $62,685,817) | | | | | | | | | | | 64,421,433 | |
| | | | | | | | | | | | | | | | |
| | | | |
| Shares | | | | | | | | | | | | |
| | | | MONEY MARKET FUND - 1.5 % | | | | | | | | | | | | |
| | 962,355 | | | Fidelity Institutional Money Market Funds - Government Portfolio, 0.91% (B) | | | | | |
| | | | (Cost $962,355) | | | | | | | | | | | 962,355 | |
| | | | | | | | | | | | | | | | |
| | | | |
| | | | TOTAL INVESTMENTS - 98.8 % (Cost $63,648,172) | | | | | | | | | | $ | 65,383,788 | |
| | | | OTHER ASSETS IN EXCESS OF LIABILITIES - NET - 1.2 % | | | | | | | | 821,687 | |
| | | | | | | | | | | | | | | | |
| | | | NET ASSETS - 100.0 % | | | | | | | | | | $ | 66,205,475 | |
| | | | | | | | | | | | | | | | |
(A) 144A Security - Security exempt from registration under Rule 144A of the Securities Act of 1933. The 144A securities represent 39.6% of total net assets. The securities may be resold in transactions exempt from registration typically only to qualified institutional buyers. Unless otherwise indicated, these securities are not considered to be illiquid.
(B) Variable rate security; the rate shown represents the yield at September 30, 2017.
The accompanying notes are an integral part of these financial statements.
53
Schedule of Investments | Israel Common Values Fund
As of September 30, 2017
| | | | | | | | |
| | |
| Shares | | | | | Fair Value | |
| | |
| | |
| | | | COMMON STOCK - 95.0 % | | | | |
| | | | AEROSPACE/DEFENSE - 3.5 % | | | | |
| | 10,701 | | | Elbit Systems Ltd. | | $ | 1,573,903 | |
| | | | | | | | |
| | |
| | | | APPAREL - 1.4 % | | | | |
| | 19,500 | | | Delta-Galil Industries Ltd. | | | 615,481 | |
| | | | | | | | |
| | |
| | | | BANKS - 12.6 % | | | | |
| | 39,500 | | | Bank Hapoalim BM (ADR) | | | 1,356,825 | |
| | 263,000 | | | Bank Leumi Le-Israel BM | | | 1,395,927 | |
| | 44,300 | | | First International Bank Of Israel Ltd. | | | 827,537 | |
| | 377,000 | | | Israel Discount Bank Ltd. * | | | 950,878 | |
| | 64,000 | | | Mizrahi Tefahot Bank Ltd. | | | 1,147,348 | |
| | | | | | | | |
| | | | | | | 5,678,515 | |
| | | | | | | | |
| | | | BUILDING MATERIALS - 0.7 % | | | | |
| | 10,500 | | | CaesarStone Ltd. * | | | 312,900 | |
| | | | | | | | |
| | |
| | | | CHEMICALS - 1.1 % | | | | |
| | 116,000 | | | Israel Chemicals Ltd. | | | 515,040 | |
| | | | | | | | |
| | |
| | | | COMPUTERS - 5.7 % | | | | |
| | 12,100 | | | Check Point Software Technologies Ltd. * | | | 1,379,642 | |
| | 42,266 | | | Kornit Digital Ltd. * | | | 646,670 | |
| | 49,210 | | | Matrix IT Ltd. | | | 517,648 | |
| | | | | | | | |
| | | | | | | 2,543,960 | |
| | | | | | | | |
| | | | ELECTRIC - 2.0 % | | | | |
| | 14,900 | | | Ormat Technologies, Inc. | | | 909,667 | |
| | | | | | | | |
| | |
| | | | ELECTRONICS - 4.4 % | | | | |
| | 27,896 | | | Ituran Location and Control Ltd. | | | 1,005,651 | |
| | 23,400 | | | Orbotech Ltd. * | | | 987,714 | |
| | | | | | | | |
| | | | | | | 1,993,365 | |
| | | | | | | | |
| | | | ENERGY-ALTERNATE SOURCES - 0.0 % | | | | |
| | 6,360 | | | Energix-Renewable Energies Ltd. | | | 5,635 | |
| | | | | | | | |
| | |
| | | | ENGINEERING & CONSTRUCTION - 1.0 % | | | | |
| | 190,000 | | | Shikun & Binui Ltd. * | | | 465,238 | |
| | | | | | | | |
| | |
| | | | FOOD - 9.5 % | | | | |
| | 21,000 | | | Frutarom Industries Ltd. | | | 1,616,345 | |
| | 15,700 | | | Rami Levi Chain Stores Hashikma Marketing 2006 Ltd. | | | 802,199 | |
| | 160,000 | | | Shufersal Ltd. | | | 940,271 | |
| | 47,500 | | | Strauss Group Ltd. | | | 892,154 | |
| | | | | | | | |
| | | | | | | 4,250,969 | |
| | | | | | | | |
| | | | HEALTHCARE - PRODUCTS - 0.9 % | | | | |
| | 62,000 | | | OPKO Health, Inc. * | | | 425,320 | |
| | | | | | | | |
| | |
| | | | HOLDING COMPANIES - DIVERSIFIED - 1.5 % | | | | |
| | 159,400 | | | Inrom Construction Industries Ltd. | | | 691,278 | |
| | | | | | | | |
| | |
| | | | HOME BUILDERS - 1.5 % | | | | |
| | 1,500 | | | Bayside Land Corp. | | | 689,577 | |
| | | | | | | | |
| | |
| | | | INSURANCE - 5.9 % | | | | |
| | 47,600 | | | Clal Insurance Enterprises Holdings Ltd. * | | | 803,349 | |
| | 147,000 | | | Harel Insurance Investments & Financial Services Ltd. | | | 919,634 | |
| | 880,000 | | | Migdal Insurance & Financial Holding Ltd. | | | 917,715 | |
| | | | | | | | |
| | | | | | | 2,640,698 | |
| | | | | | | | |
The accompanying notes are an integral part of these financial statements.
54
Schedule of Investments | Israel Common Values Fund
As of September 30, 2017 (Continued)
| | | | | | | | |
| | |
| Shares | | | | | Fair Value | |
| | |
| | |
| | | | OIL & NATURAL GAS - 8.0 % | | | | |
| | 245,541 | | | Delek Drilling LP | | $ | 760,409 | |
| | 1,900 | | | Israel Corp. Ltd. * | | | 378,914 | |
| | 2,961,664 | | | Isramco Negev 2 LP | | | 411,645 | |
| | 24,700 | | | Noble Energy, Inc. | | | 700,492 | |
| | 895,000 | | | Oil Refineries Ltd. | | | 448,184 | |
| | 2,500 | | | Paz Oil Co. Ltd. | | | 411,949 | |
| | 737,500 | | | Ratio Oil Exploration 1992 LP * | | | 469,314 | |
| | | | | | | | |
| | | | | | | 3,580,907 | |
| | | | | | | | |
| | | | PHARMACEUTICALS - 1.4 % | | | | |
| | 5,500 | | | Taro Pharmaceutical Industries Ltd. * | | | 619,795 | |
| | | | | | | | |
| | |
| | | | REAL ESTATE - 9.4 % | | | | |
| | 80,000 | | | Alony Hetz Properties & Investments Ltd. | | | 849,233 | |
| | 136,000 | | | Amot Investments Ltd. | | | 756,112 | |
| | 16,000 | | | Azrieli Group Ltd. | | | 888,637 | |
| | 40,000 | | | Gazit-Globe Ltd. | | | 385,099 | |
| | 332,522 | | | Jerusalem Economy Ltd. * | | | 822,127 | |
| | 11,366 | | | Melisron Ltd. | | | 549,841 | |
| | | | | | | | |
| | | | | | | 4,251,049 | |
| | | | | | | | |
| | | | RETAIL - 1.6 % | | | | |
| | 27,300 | | | Tadiran Holdings Ltd. | | | 726,511 | |
| | | | | | | | |
| | |
| | | | SEMICONDUCTORS - 4.1 % | | | | |
| | 9,500 | | | Mellanox Technologies Ltd. * | | | 447,925 | |
| | 27,800 | | | Nova Measuring Instruments Ltd. * | | | 781,458 | |
| | 1 | | | Tower Semiconductor Ltd. * | | | 19 | |
| | 20,100 | | | Tower Semiconductor Ltd. * | | | 618,075 | |
| | | | | | | | |
| | | | | | | 1,847,477 | |
| | | | | | | | |
| | | | SOFTWARE - 5.9 % | | | | |
| | 14,000 | | | CyberArk Software Ltd. * | | | 574,000 | |
| | 79,783 | | | Magic Software Enterprises Ltd. | | | 698,101 | |
| | 14,455 | | | Pointer Telocation Ltd. * | | | 245,012 | |
| | 22,500 | | | Radware Ltd. * | | | 379,350 | |
| | 56,600 | | | Sapiens International Corp. NV * | | | 747,120 | |
| | | | | | | | |
| | | | | | | 2,643,583 | |
| | | | | | | | |
| | | | TELECOMMUNICATIONS - 9.5 % | | | | |
| | 86,000 | | | AudioCodes Ltd. * | | | 614,040 | |
| | 75,000 | | | Cellcom Israel Ltd. * | | | 693,750 | |
| | 98,000 | | | Ceragon Networks Ltd. * | | | 203,840 | |
| | 20,300 | | | Nice Ltd. (ADR) | | | 1,650,593 | |
| | 73,600 | | | Partner Communications Co. Ltd. * | | | 395,647 | |
| | 12,117 | | | Silicom Ltd. | | | 708,966 | |
| | | | | | | | |
| | | | | | | 4,266,836 | |
| | | | | | | | |
| | | | TEXTILES - 1.9 % | | | | |
| | 42,300 | | | Fox Wizel Ltd. | | | 850,287 | |
| | | | | | | | |
| | |
| | | | TRANSPORTATION - 1.5 % | | | | |
| | 1,490,000 | | | Novolog Ltd. | | | 689,198 | |
| | | | | | | | |
| | |
| | | | TOTAL COMMON STOCK (Cost $33,271,338) | | | 42,787,189 | |
| | | | | | | | |
The accompanying notes are an integral part of these financial statements.
55
Schedule of Investments | Israel Common Values Fund
As of September 30, 2017 (Continued)
| | | | | | | | |
| | |
| Shares | | | | | Fair Value | |
| | |
| | |
| | | | MONEY MARKET FUND - 5.2 % | | | | |
| | 2,355,743 | | | Fidelity Institutional Money Market Funds - Government Portfolio, 0.91% (A) | | $ | 2,355,743 | |
| | | | | | | | |
| | | | (Cost $2,355,743) | | | | |
| | |
| | | | TOTAL INVESTMENTS - 100.2 % (Cost $35,627,081) | | $ | 45,142,932 | |
| | | | OTHER ASSETS IN EXCESS OF LIABILITIES - NET - (0.2) % | | | (91,317) | |
| | | | | | | | |
| | | | NET ASSETS - 100.0 % | | $ | 45,051,615 | |
| | | | | | | | |
*Non-income producing securities.
ADR American Depositary Receipt.
(A) Variable rate security; the rate shown represents the yield at September 30, 2017.
| | | | |
| Diversification of Assets | | | |
| |
| Country | | % of Net Assets | |
| |
Israel | | | 90.5% | |
United States | | | 4.5% | |
| | | | |
Total | | | 95.0% | |
Money Market Fund | | | 5.2% | |
Other Assets Less Liabilities - Net | | | (0.2)% | |
| | | | |
Grand Total | | | 100.0% | |
| | | | |
The accompanying notes are an integral part of these financial statements.
56
Schedule of Investments | Defensive Strategies Fund
As of September 30, 2017
| | | | | | | | |
| | |
| Shares | | | | | Fair Value | |
| | |
| | |
| | | | COMMON STOCK - 23.8 % | | | | |
| | | | AGRICULTURE - 0.7 % | | | | |
| | 559 | | | Andersons, Inc. | | $ | 19,146 | |
| | 5,348 | | | Bunge Ltd. | | | 371,472 | |
| | | | | | | | |
| | | | | | | 390,618 | |
| | | | | | | | |
| | | | CHEMICALS - 2.7 % | | | | |
| | 2,733 | | | Agrium, Inc. | | | 293,005 | |
| | 2,295 | | | CF Industries Holdings, Inc. | | | 80,692 | |
| | 1,067 | | | FMC Corp. | | | 95,294 | |
| | 264 | | | K+S AG | | | 7,194 | |
| | 16,150 | | | Mosaic Co. | | | 348,678 | |
| | 33,343 | | | Potash Corp. of Saskatchewan, Inc. | | | 641,519 | |
| | 2,969 | | | Sociedad Quimica Y Minera de Chile, SA (ADR) | | | 165,255 | |
| | | | | | | | |
| | | | | | | 1,631,637 | |
| | | | | | | | |
| | | | ENVIRONMENTAL CONTROL - 0.1 % | | | | |
| | 1,300 | | | Kurita Water Industries Ltd. | | | 37,534 | |
| | | | | | | | |
| | |
| | | | FOOD - 1.8 % | | | | |
| | 5,133 | | | BRF SA (ADR) * | | | 73,967 | |
| | 403 | | | Darling Ingredients, Inc. * | | | 7,061 | |
| | 2,509 | | | Ingredion, Inc. | | | 302,686 | |
| | 1,900 | | | Megmilk Snow Brand Co. Ltd. | | | 51,650 | |
| | 12,300 | | | Nippon Suisan Kaisha Ltd. | | | 68,731 | |
| | 2,091 | | | Pilgrim’s Pride Corp. * | | | 59,405 | |
| | 3,197 | | | Sanderson Farms, Inc. | | | 516,379 | |
| | | | | | | | |
| | | | | | | 1,079,879 | |
| | | | | | | | |
| | | | HEALTHCARE - SERVICES - 0.6 % | | | | |
| | 32,900 | | | Brookdale Senior Living, Inc. * | | | 348,740 | |
| | | | | | | | |
| | |
| | | | IRON/STEEL - 1.5 % | | | | |
| | 7,056 | | | AK Steel Holding Corp. * | | | 39,443 | |
| | 1,178 | | | Allegheny Technologies, Inc. * | | | 28,154 | |
| | 1,052 | | | ArcelorMittal (ADR) * | | | 27,100 | |
| | 7,145 | | | Cleveland-Cliffs, Inc. * | | | 51,087 | |
| | 5,045 | | | Commercial Metals Co. | | | 96,006 | |
| | 49,728 | | | Gerdau SA (ADR) | | | 170,567 | |
| | 4,300 | | | Hitachi Metals Ltd. | | | 59,821 | |
| | 1,381 | | | POSCO (ADR) | | | 95,841 | |
| | 3,654 | | | Severstal PAO (GDR) | | | 54,627 | |
| | 3,790 | | | Steel Dynamics, Inc. | | | 130,641 | |
| | 7,000 | | | Tokyo Steel Manufacturing Co. Ltd. | | | 57,647 | |
| | 760 | | | United States Steel Corp. | | | 19,502 | |
| | 4,079 | | | Vale SA (ADR) | | | 41,076 | |
| | | | | | | | |
| | | | | | | 871,512 | |
| | | | | | | | |
| | | | MACHINERY - DIVERSIFIED - 1.6 % | | | | |
| | 3,310 | | | AGCO Corp. | | | 244,179 | |
| | 3,295 | | | Deere & Co. | | | 413,819 | |
| | 15,900 | | | Kubota Corp. | | | 288,930 | |
| | | | | | | | |
| | | | | | | 946,928 | |
| | | | | | | | |
| | | | METAL FABRICATE/HARDWARE - 0.1 % | | | | |
| | 2,119 | | | Tenaris SA (ADR) | | | 59,989 | |
| | | | | | | | |
| | |
| | | | MINING - 5.9 % | | | | |
| | 3,452 | | | Agnico Eagle Mines Ltd. | | | 156,065 | |
| | 2,967 | | | Alamos Gold, Inc. | | | 20,057 | |
| | 5,540 | | | Anglo American PLC | | | 99,562 | |
| | 8,595 | | | AngloGold Ashanti Ltd. (ADR) | | | 79,848 | |
| | 318 | | | BHP Billiton Ltd. (ADR) | | | 12,889 | |
| | 234 | | | BHP Billiton PLC (ADR) | | | 8,295 | |
| | 451 | | | Cameco Corp. | | | 4,361 | |
| | 3,247 | | | Cia De Minas Buenaventura (ADR) | | | 41,529 | |
| | 1,877 | | | Coeur Mining, Inc. * | | | 17,250 | |
The accompanying notes are an integral part of these financial statements.
57
Schedule of Investments | Defensive Strategies Fund
As of September 30, 2017 (Continued)
| | | | | | | | |
| | |
| Shares | | | | | Fair Value | |
| | |
| | |
| | | | MINING - 5.9 % (Continued) | | | | |
| | 3,000 | | | Detour Gold Corp. * | | $ | 33,007 | |
| | 23,391 | | | Eldorado Gold Corp. | | | 51,460 | |
| | 19,098 | | | First Quantum Minerals Ltd. | | | 213,939 | |
| | 1,932 | | | Franco-Nevada Corp. | | | 149,691 | |
| | 11,555 | | | Freeport-McMoRan, Inc. * | | | 162,232 | |
| | 7,494 | | | Glencore PLC | | | 34,386 | |
| | 56,836 | | | Gold Fields Ltd. (ADR) | | | 244,963 | |
| | 2,494 | | | Goldcorp, Inc. | | | 32,322 | |
| | 664 | | | Kaiser Aluminum Corp. | | | 68,485 | |
| | 1,139 | | | Kinross Gold Corp. * | | | 4,829 | |
| | 47,800 | | | Lundin Mining Corp. | | | 327,164 | |
| | 3,400 | | | Mitsubishi Materials Corp. | | | 117,497 | |
| | 24,510 | | | MMC Norilsk Nickel PJSC (ADR) | | | 421,940 | |
| | 276 | | | Pan American Silver Corp. | | | 4,706 | |
| | 1,163 | | | Randgold Resources Ltd. (ADR) | | | 113,579 | |
| | 6,667 | | | Rio Tinto PLC (ADR) | | | 314,616 | |
| | 145 | | | Royal Gold, Inc. | | | 12,476 | |
| | 2,824 | | | Southern Copper Corp. | | | 112,282 | |
| | 4,500 | | | Sumitomo Metal Mining Co. Ltd. | | | 144,477 | |
| | 28,700 | | | Tahoe Resources, Inc. | | | 150,539 | |
| | 15,143 | | | Teck Resources Ltd. | | | 318,080 | |
| | 15,894 | | | Turquoise Hill Resources Ltd. * | | | 49,271 | |
| | 556 | | | Wheaton Precious Metals Corp. | | | 10,614 | |
| | | | | | | | |
| | | | | | | 3,532,411 | |
| | | | | | | | |
| | |
| | | | OIL & GAS - 7.4 % | | | | |
| | 268 | | | Anadarko Petroleum Corp. | | | 13,092 | |
| | 331 | | | Apache Corp. | | | 15,160 | |
| | 7,000 | | | ARC Resources Ltd | | | 96,214 | |
| | 2,514 | | | Cabot Oil & Gas Corp. | | | 67,250 | |
| | 2,358 | | | Callon Petroleum Co. * | | | 26,504 | |
| | 797 | | | Canadian Natural Resources Ltd. | | | 26,692 | |
| | 3,701 | | | Carrizo Oil & Gas, Inc. * | | | 63,398 | |
| | 13,966 | | | Cenovus Energy, Inc. | | | 139,699 | |
| | 901 | | | Chesapeake Energy Corp. * | | | 3,874 | |
| | 132 | | | Cimarex Energy Co. | | | 15,004 | |
| | 268 | | | ConocoPhillips | | | 13,413 | |
| | 4,255 | | | Continental Resources, Inc. * | | | 164,286 | |
| | 25,200 | | | Crescent Point Energy Corp. | | | 201,898 | |
| | 543 | | | Devon Energy Corp. | | | 19,934 | |
| | 499 | | | Diamondback Energy, Inc. * | | | 48,882 | |
| | 1,026 | | | Ecopetrol SA (ADR) * | | | 9,737 | |
| | 1,870 | | | Encana Corp. | | | 22,029 | |
| | 236 | | | Energen Corp. * | | | 12,904 | |
| | 9,700 | | | Enerplus Corp. | | | 95,476 | |
| | 1,233 | | | Ensco PLC - Cl. A | | | 7,361 | |
| | 239 | | | EOG Resources, Inc. | | | 23,121 | |
| | 2,438 | | | EQT Corp. | | | 159,055 | |
| | 1,280 | | | Gulfport Energy Corp. * | | | 18,355 | |
| | 587 | | | Helmerich & Payne, Inc. | | | 30,589 | |
| | 628 | | | Hess Corp. | | | 29,447 | |
| | 7,200 | | | Husky Energy, Inc. * | | | 89,924 | |
| | 17,000 | | | Inpex Corp. | | | 180,549 | |
| | 9,247 | | | Lukoil PJSC (ADR) | | | 489,444 | |
| | 1,577 | | | Marathon Oil Corp. | | | 21,384 | |
| | 2,350 | | | Matador Resources Co. * | | | 63,802 | |
| | 484 | | | Murphy Oil Corp. | | | 12,855 | |
| | 889 | | | Newfield Exploration Co. * | | | 26,377 | |
| | 4,564 | | | Noble Energy, Inc. | | | 129,435 | |
| | 1,311 | | | Novatek OJSC (GDR) | | | 153,780 | |
| | 13,089 | | | Oasis Petroleum, Inc. * | | | 119,372 | |
| | 435 | | | Occidental Petroleum Corp. | | | 27,931 | |
The accompanying notes are an integral part of these financial statements.
58
Schedule of Investments | Defensive Strategies Fund
As of September 30, 2017 (Continued)
| | | | | | | | |
| | |
| Shares | | | | | Fair Value | |
| | |
| | |
| | | | OIL & GAS - 7.4 % (Continued) | | | | |
| | 656 | | | Parsley Energy, Inc. * | | $ | 17,279 | |
| | 1,939 | | | PDC Energy, Inc. * | | | 95,069 | |
| | 3,018 | | | Petroleo Brasileiro SA (ADR) * | | | 30,301 | |
| | 4,600 | | | Peyto Exploration & Development Corp. | | | 75,033 | |
| | 1,450 | | | Pioneer Natural Resources Co. | | | 213,933 | |
| | 3,059 | | | PrairieSky Royalty Ltd. | | | 78,098 | |
| | 2,659 | | | QEP Resources, Inc. * | | | 22,788 | |
| | 3,069 | | | Range Resources Corp. | | | 60,060 | |
| | 33,810 | | | Rosneft Oil Company (GDR) * | | | 187,815 | |
| | 3,678 | | | Rowan Cos PLC * | | | 47,262 | |
| | 2,417 | | | RSP Permian, Inc. * | | | 83,604 | |
| | 1,463 | | | Sasol Ltd. (ADR) | | | 40,276 | |
| | 7,200 | | | Seven Generations Energy Ltd. * | | | 113,643 | |
| | 1,829 | | | Southwestern Energy Co. * | | | 11,175 | |
| | 107 | | | Statoil ASA (ADR) | | | 2,150 | |
| | 6,100 | | | Suncor Energy, Inc. | | | 213,291 | |
| | 4,900 | | | Tourmaline Oil Corp. * | | | 99,399 | |
| | 5,810 | | | Transocean Ltd. * | | | 62,516 | |
| | 2,400 | | | Vermillion Energy, Inc. | | | 85,108 | |
| | 25,800 | | | Whitecap Resources, Inc. | | | 200,104 | |
| | 1,925 | | | WPX Energy, Inc. * | | | 22,137 | |
| | 504 | | | YPF SA (ADR) | | | 11,229 | |
| | | | | | | | |
| | | | | | | 4,410,497 | |
| | | | | | | | |
| | | | OIL & GAS SERVICES - 1.1 % | | | | |
| | 648 | | | Baker Hughes, Inc. | | | 23,730 | |
| | 682 | | | Core Laboratories NV | | | 67,313 | |
| | 1,006 | | | Dril-Quip, Inc. * | | | 44,415 | |
| | 294 | | | Halliburton Co. | | | 13,533 | |
| | 409 | | | National Oilwell Varco, Inc. | | | 14,614 | |
| | 3,327 | | | Oceaneering International, Inc. | | | 87,400 | |
| | 1,315 | | | Oil States International, Inc. * | | | 33,335 | |
| | 3,541 | | | Schlumberger Ltd. | | | 247,020 | |
| | 733 | | | TechnipFMC PLC (France) * | | | 20,290 | |
| | 3,683 | | | TechnipFMC PLC * | | | 102,829 | |
| | | | | | | | |
| | | | | | | 654,479 | |
| | | | | | | | |
| | | | WATER - 0.3 % | | | | |
| | 821 | | | American Water Works Co. | | | 66,427 | |
| | 8,680 | | | Cia de Saneamento Basico do Estado de Sao Paulo (ADR) | | | 90,793 | |
| | | | | | | | |
| | | | | | | 157,220 | |
| | | | | | | | |
| | |
| | | | TOTAL COMMON STOCK (Cost $13,927,691) | | | 14,121,444 | |
| | | | | | | | |
| | |
| | | | REITs - 20.2 % | | | | |
| | 2,700 | | | Alexandria Real Estate Equities, Inc. | | | 321,219 | |
| | 7,200 | | | Apartment Investment & Management Co. - Class A | | | 315,792 | |
| | 2,850 | | | AvalonBay Communities, Inc. | | | 508,497 | |
| | 2,500 | | | Boston Properties, Inc. | | | 307,200 | |
| | 9,000 | | | Brandywine Realty Trust | | | 157,410 | |
| | 10,600 | | | Brixmor Property Group, Inc. | | | 199,280 | |
| | 5,300 | | | Columbia Property Trust, Inc. | | | 115,381 | |
| | 2,800 | | | Crown Castle International Corp. | | | 279,944 | |
| | 8,200 | | | CubeSmart | | | 212,872 | |
| | 7,200 | | | DCT Industrial Trust, Inc. | | | 417,024 | |
| | 17,300 | | | DDR Corp. | | | 158,468 | |
| | 4,100 | | | Douglas Emmett, Inc. | | | 161,622 | |
| | 2,700 | | | EPR Properties | | | 188,298 | |
| | 1,500 | | | Equinix, Inc. | | | 669,450 | |
| | 2,800 | | | Equity Lifestyle Properties, Inc. | | | 238,224 | |
| | 7,500 | | | Equity Residential | | | 494,475 | |
| | 1,054 | | | Essex Property Trust, Inc. | | | 267,748 | |
| | 2,200 | | | Federal Realty Investment Trust | | | 273,262 | |
The accompanying notes are an integral part of these financial statements.
59
Schedule of Investments | Defensive Strategies Fund
As of September 30, 2017 (Continued)
| | | | | | | | | | | | | | |
| | |
| Shares | | | | | | | | | | Fair Value | |
| | |
| | | | |
| | | | REITs - 20.2 % (Continued) | | | | | | | | | | |
| | 16,400 | | | HCP, Inc. | | | | | | | | $ | 456,412 | |
| | 8,800 | | | Hospitality Properties Trust | | | | | | | | | 250,712 | |
| | 5,100 | | | Invitation Homes, Inc. * | | | | | | | | | 115,515 | |
| | 3,500 | | | Kilroy Realty Corp. | | | | | | | | | 248,920 | |
| | 3,863 | | | Macerich Co. | | | | | | | | | 212,349 | |
| | 1,308 | | | Mid-America Apartment Communities, Inc. | | | | | | | | | 139,799 | |
| | 1,600 | | | National Health Investors, Inc. | | | | | | | | | 123,664 | |
| | 4,500 | | | National Retail Properties, Inc. | | | | | | | | | 187,470 | |
| | 8,794 | | | Prologis, Inc. | | | | | | | | | 558,067 | |
| | 2,400 | | | PS Business Parks, Inc. | | | | | | | | | 320,400 | |
| | 2,100 | | | Public Storage | | | | | | | | | 449,379 | |
| | 2,233 | | | Rayonier, Inc. | | | | | | | | | 64,511 | |
| | 5,100 | | | Regency Centers Corp. | | | | | | | | | 316,404 | |
| | 12,453 | | | RLJ Lodging Trust | | | | | | | | | 273,962 | |
| | 7,229 | | | Simon Property Group, Inc. | | | | | | | | | 1,163,941 | |
| | 1,950 | | | SL Green Realty Corp. | | | | | | | | | 197,574 | |
| | 15,200 | | | Spirit Realty Capital, Inc. | | | | | | | | | 130,264 | |
| | 8,600 | | | Store Capital Corp. | | | | | | | | | 213,882 | |
| | 3,200 | | | Taubman Centers, Inc. | | | | | | | | | 159,040 | |
| | 11,000 | | | UDR, Inc. | | | | | | | | | 418,330 | |
| | 6,700 | | | Weingarten Realty Investors | | | | | | | | | 212,658 | |
| | 6,300 | | | Welltower, Inc. | | | | | | | | | 442,764 | |
| | 1,726 | | | Weyerhaeuser Co. | | | | | | | | | 58,736 | |
| | | | | | | | | | | | | | |
| | | | TOTAL REITS (Cost $10,914,193) | | | | | | | | | 12,000,919 | |
| | | | | | | | | | | | | | |
| Par Value | | | | | Coupon Rate % | | Maturity | | | | |
| | | | BONDS & NOTES - 33.0 % | | | | | | | | | | |
| | | | COPORATE BONDS - 2.3 % | | | | | | | | | | |
| | $ 400,000 | | | Energy Transfer Partners LP | | 6.700 | | | 7/1/2018 | | | | 413,905 | |
| | 400,000 | | | LYB International Finance BV | | 4.000 | | | 7/15/2023 | | | | 422,504 | |
| | 500,000 | | | Welltower, Inc. | | 3.750 | | | 3/15/2023 | | | | 521,066 | |
| | | | | | | | | | | | | | |
| | | | TOTAL CORPORATE BONDS (Cost $1,303,312) | | | | | | | | | 1,357,475 | |
| | | | | | | | | | | | | | |
| | |
| | | | TREASURY INFLATION PROTECTED SECURITIES (TIPS) - 30.7 % | | | | | |
| | 1,650,000 | | | TIPS | | 0.125 | | | 4/15/2019 | | | | 1,728,619 | |
| | 895,000 | | | TIPS | | 1.375 | | | 1/15/2020 | | | | 926,334 | |
| | 2,000,000 | | | TIPS | | 0.125 | | | 4/15/2021 | | | | 2,070,553 | |
| | 2,630,000 | | | TIPS | | 0.625 | | | 1/15/2024 | | | | 2,815,942 | |
| | 1,460,000 | | | TIPS | | 2.375 | | | 1/15/2025 | | | | 2,164,848 | |
| | 1,550,000 | | | TIPS | | 2.000 | | | 1/15/2026 | | | | 2,148,993 | |
| | 1,285,000 | | | TIPS | | 2.375 | | | 1/15/2027 | | | | 1,822,664 | |
| | 950,000 | | | TIPS | | 1.750 | | | 1/15/2028 | | | | 1,242,306 | |
| | 850,000 | | | TIPS | | 2.500 | | | 1/15/2029 | | | | 1,169,704 | |
| | 1,535,000 | | | TIPS | | 2.125 | | | 2/15/2041 | | | | 2,171,645 | |
| | | | | | | | | | | | | | |
| | | | TOTAL TREASURY INFLATION PROTECTED SECURITIES (TIPS) (Cost $18,389,462) | | | | 18,261,608 | |
| | | | | | | | | | | | | | |
| | | | |
| | | | TOTAL BONDS AND NOTES (Cost $19,692,774) | | | | | | | | | 19,619,083 | |
| | | | | | | | | | | | | | |
| | | | |
| Shares | | | | | | | | | | | |
| | | | WARRANTS - 0.0 % | | | | | | | | | | |
| | 312 | | | Hycroft Mining Corp. * (Cost $54,161) | | | | | | | | | 34 | |
| | | | | | | | | | | | | | |
| Ounces | | | | | | | | | | | |
| | | | ALTERNATIVE INVESTMENTS - 16.1 % | | | | | | | | | | |
| | 6,743 | | | Gold Bars * | | | | | | | | | 8,630,285 | |
| | 57,827 | | | Silver Bars * | | | | | | | | | 963,105 | |
| | | | | | | | | | | | | | |
| | | | TOTAL ALTERNATIVE INVESTMENTS (Cost $8,900,255) | | | | | | | | | 9,593,390 | |
| | | | | | | | | | | | | | |
The accompanying notes are an integral part of these financial statements.
60
Schedule of Investments | Defensive Strategies Fund
As of September 30, 2017 (Continued)
| | | | | | | | |
| | |
| Shares | | | | | Fair Value | |
| | |
| | |
| | | | MONEY MARKET FUND - 7.1 % | | | | |
| | 4,193,154 | | | Fidelity Institutional Money Market Funds - Government Portfolio, 0.91% (A) | | $ | 4,193,154 | |
| | | | | | | | |
| | | | (Cost $4,193,154) | | | | |
| | |
| | | | TOTAL INVESTMENTS - 100.2 % (Cost $57,682,228) | | $ | 59,528,024 | |
| | | | OTHER ASSETS IN EXCESS OF LIABILITIES - NET - (0.2) % | | | (104,017) | |
| | | | | | | | |
| | | | NET ASSETS - 100.0 % | | $ | 59,424,007 | |
| | | | | | | | |
ADR - American Depositary Receipt.
REITs - Real Estate Investment Trust.
GDR - Global Depositary Receipt.
* Non-income producing securities/investments.
(A) Variable rate security; the rate shown represents the yield at September 30, 2017.
The accompanying notes are an integral part of these financial statements.
61
Schedule of Investments | Strategic Growth Fund
As of September 30, 2017
| | | | | | | | |
| | |
| Shares | | | | | Fair Value | |
| | |
| | |
| | | | MUTUAL FUNDS - 96.6 % (A) | | | | |
| | 251,575 | | | Timothy Plan Aggressive Growth Fund * | | $ | 2,040,274 | |
| | 427,333 | | | Timothy Plan Defensive Strategies Fund | | | 4,871,601 | |
| | 301,703 | | | Timothy Plan Emerging Markets Fund | | | 2,935,569 | |
| | 191,919 | | | Timothy Plan Fixed Income Fund | | | 1,961,410 | |
| | 342,210 | | | Timothy Plan Growth & Income Fund | | | 3,860,131 | |
| | 254,641 | | | Timothy Plan High Yield Bond Fund | | | 2,393,626 | |
| | 800,146 | | | Timothy Plan International Fund | | | 7,897,440 | |
| | 134,511 | | | Timothy Plan Israel Common Values Fund | | | 2,005,551 | |
| | 454,109 | | | Timothy Plan Large/Mid Cap Growth Fund | | | 3,900,798 | |
| | 220,076 | | | Timothy Plan Large/Mid Cap Value Fund | | | 4,216,653 | |
| | 112,155 | | | Timothy Plan Small Cap Value Fund | | | 2,299,187 | |
| | | | | | | | |
| | | | TOTAL MUTUAL FUNDS (Cost $35,258,624) | | | 38,382,240 | |
| | | | | | | | |
| | |
| | | | MONEY MARKET FUND - 3.5 % | | | | |
| | 1,389,014 | | | Fidelity Institutional Money Market Funds - Government Portfolio, 0.91% (B) | | | 1,389,014 | |
| | | | | | | | |
| | | | (Cost $1,389,014) | | | | |
| | |
| | | | TOTAL INVESTMENTS - 100.1 % (Cost $36,647,638) | | $ | 39,771,254 | |
| | | | OTHER ASSETS IN EXCESS OF LIABILITIES - NET - (0.1) % | | | (38,196) | |
| | | | | | | | |
| | | | NET ASSETS - 100.0 % | | $ | 39,733,058 | |
| | | | | | | | |
* Non-income producing securities.
(A) Affiliated Funds - Class A.
(B) Variable rate security; the rate shown represents the yield at September 30, 2017.
The accompanying notes are an integral part of these financial statements.
62
Schedule of Investments | Conservative Growth Fund
As of September 30, 2017
| | | | | | | | |
| | |
| Shares | | | | | Fair Value | |
| | |
| | |
| | | | MUTUAL FUNDS - 92.2 % (A) | | | | |
| | 278,007 | | | Timothy Plan Aggressive Growth Fund * | | $ | 2,254,637 | |
| | 541,035 | | | Timothy Plan Defensive Strategies Fund | | | 6,167,799 | |
| | 268,021 | | | Timothy Plan Emerging Markets Fund | | | 2,607,844 | |
| | 1,273,040 | | | Timothy Plan Fixed Income Fund | | | 13,010,465 | |
| | 472,649 | | | Timothy Plan Growth & Income Fund | | | 5,331,481 | |
| | 351,495 | | | Timothy Plan High Yield Bond Fund | | | 3,304,054 | |
| | 581,691 | | | Timothy Plan International Fund | | | 5,741,292 | |
| | 111,482 | | | Timothy Plan Israel Common Values Fund | | | 1,662,196 | |
| | 462,595 | | | Timothy Plan Large/Mid Cap Growth Fund | | | 3,973,690 | |
| | 217,150 | | | Timothy Plan Large/Mid Cap Value Fund | | | 4,160,595 | |
| | 126,775 | | | Timothy Plan Small Cap Value Fund | | | 2,598,881 | |
| | | | | | | | |
| | | | TOTAL MUTUAL FUNDS (Cost $47,579,942) | | | 50,812,934 | |
| | | | | | | | |
| | |
| | | | MONEY MARKET FUND - 7.9 % | | | | |
| | 4,323,713 | | | Fidelity Institutional Money Market Funds - Government Portfolio, 0.91% (B) | | | 4,323,713 | |
| | | | | | | | |
| | | | (Cost $4,323,713) | | | | |
| | |
| | | | TOTAL INVESTMENTS - 100.1 % (Cost $51,903,655) | | $ | 55,136,647 | |
| | | | OTHER ASSETS IN EXCESS OF LIABILITIES - NET - (0.1) % | | | (45,884) | |
| | | | | | | | |
| | | | NET ASSETS - 100.0 % | | $ | 55,090,763 | |
| | | | | | | | |
* Non-income producing securities.
(A) Affiliated Funds - Class A.
(B) Variable rate security; the rate shown represents the yield at September 30, 2017.
The accompanying notes are an integral part of these financial statements.
63
Schedule of Investments | Emerging Markets Fund
As of September 30, 2017
| | | | | | | | |
| | |
| Shares | | | | | Fair Value | |
| | |
| | |
| | | | COMMON STOCK - 67.9 % | | | | |
| | | | AEROSPACE/DEFENSE - 3.2 % | | | | |
| | 29,917 | | | Embraer SA (ADR) | | $ | 676,423 | |
| | | | | | | | |
| | |
| | | | AGRICULTURE - 0.5 % | | | | |
| | 9,259 | | | Adecoagro SA * | | | 99,997 | |
| | | | | | | | |
| | |
| | | | APPAREL - 1.0 % | | | | |
| | 54,000 | | | Yue Yuen Industrial Holdings Ltd. | | | 205,334 | |
| | | | | | | | |
| | |
| | | | AUTO MANUFACTURERS - 1.7 % | | | | |
| | 12,870 | | | Kia Motors Corp. | | | 355,643 | |
| | | | | | | | |
| | |
| | | | AUTO PARTS & EQUIPMENT - 2.6 % | | | | |
| | 2,268 | | | China Tuchai International Ltd. | | | 50,486 | |
| | 2,345 | | | Hyundai Mobis Co. Ltd. | | | 491,378 | |
| | | | | | | | |
| | | | | | | 541,864 | |
| | | | | | | | |
| | | | BANKS - 16.5 % | | | | |
| | 84,064 | | | AkBank TAS * | | | 222,210 | |
| | 96,366 | | | Banco del Bajio SA * | | | 185,417 | |
| | 25,600 | | | Banco do Brasil SA * | | | 282,857 | |
| | 63,300 | | | Bangkok Bank PCL (ADR) | | | 353,987 | |
| | 51,369 | | | Barclays Africa Group Ltd. | | | 528,813 | |
| | 6,735 | | | Erste Group Bank AG | | | 290,976 | |
| | 18,990 | | | Grupo Aval Acciones y Valores SA (ADR) | | | 170,340 | |
| | 43,122 | | | Sberbank of Russia (ADR) * | | | 615,351 | |
| | 41,500 | | | Siam Commercial Bank Public Company Limited | | | 190,390 | |
| | 12,061 | | | TBC Bank Group PLC | | | 268,615 | |
| | 72,989 | | | Turkiye Garanti Bankasi AS | | | 198,682 | |
| | 95,818 | | | Turkiye Vakiflar Bankasi Tao * | | | 168,943 | |
| | | | | | | | |
| | | | | | | 3,476,581 | |
| | | | | | | | |
| | | | BUILDING MATERIALS - 2.6 % | | | | |
| | 57,466 | | | Cemex SAB de CV (ADR) | | | 521,791 | |
| | 85,571 | | | Urbi Desarrollos Urbanos SAB de CV * | | | 35,106 | |
| | | | | | | | |
| | | | | | | 556,897 | |
| | | | | | | | |
| | | | COMMERCIAL SERVICES - 6.9 % | | | | |
| | 50,800 | | | Estacio Participacoes SA * | | | 497,376 | |
| | 108,526 | | | ITE Group PLC | | | 261,723 | |
| | 55,800 | | | Kroton Educacional SA | | | 352,284 | |
| | 55,500 | | | Mills Estruturas e Servicos de Engenharia SA * | | | 81,413 | |
| | 3,364 | | | S-1 Corp. * | | | 261,989 | |
| | | | | | | | |
| | | | | | | 1,454,785 | |
| | | | | | | | |
| | | | COMPUTERS - 2.3 % | | | | |
| | 19,197 | | | DataTec Ltd. | | | 81,423 | |
| | 27,002 | | | Infosys Ltd. (ADR) | | | 393,959 | |
| | | | | | | | |
| | | | | | | 475,382 | |
| | | | | | | | |
| | | | DIVERSIFIED FINANCIAL SERVICES - 1.2 % | | | | |
| | 3,081 | | | Hana Financial Group, Inc. | | | 127,372 | |
| | 2,939 | | | Shinhan Financial Group Co. Ltd. * | | | 129,071 | |
| | | | | | | | |
| | | | | | | 256,443 | |
| | | | | | | | |
| | | | ELECTRIC - 4.9 % | | | | |
| | 40,900 | | | AES Tiete Energia SA | | | 184,384 | |
| | 8,600 | | | Cia Paranaense de Energia | | | 63,321 | |
| | 3,260,992 | | | Enel Chile SA | | | 398,178 | |
| | 17,912 | | | Reliance Infrastructure Ltd. (GDR) | | | 392,273 | |
| | | | | | | | |
| | | | | | | 1,038,156 | |
| | | | | | | | |
| | | | FOOD - 4.0 % | | | | |
| | 3,323 | | | Binggrae Co. Ltd. * | | | 174,078 | |
| | 460,000 | | | First Pacific Co. Ltd. | | | 366,907 | |
| | 149,200 | | | Marfrig Global Foods SA * | | | 304,235 | |
| | | | | | | | |
| | | | | | | 845,220 | |
| | | | | | | | |
| | | | HOLDING COMPANIES - 0.9 % | | | | |
| | 549,800 | | | Jasmine Broadband Internet Infrastructure Fund | | | 189,586 | |
| | | | | | | | |
The accompanying notes are an integral part of these financial statements.
64
Schedule of Investments | Emerging Markets Fund
As of September 30, 2017 (Continued)
| | | | | | | | |
| | |
| Shares | | | | | Fair Value | |
| | |
| | |
| | | | IRON/STEEL - 1.2 % | | | | |
| | 939 | | | POSCO | | $ | 259,888 | |
| | | | | | | | |
| | |
| | | | MULTI-NATIONAL - 1.9 % | | | | |
| | 13,587 | | | Banco Latinoamericano de Comercio Exterior SA | | | 400,001 | |
| | | | | | | | |
| | |
| | | | OIL & GAS - 6.2 % | | | | |
| | 12,316 | | | Lukoil PJSC (ADR) | | | 653,117 | |
| | 8,501 | | | Petroleo Brasileiro SA (ADR) * | | | 82,120 | |
| | 25,621 | | | YPF SA (ADR) | | | 570,836 | |
| | | | | | | | |
| | | | | | | 1,306,073 | |
| | | | | | | | |
| | | | RETAIL - 4.3 % | | | | |
| | 1,828,000 | | | Bosideng International Holdings Ltd. | | | 168,507 | |
| | 157,500 | | | Lifestyle China Group Ltd. * | | | 55,453 | |
| | 186,500 | | | Lifestyle International Holdings Ltd. | | | 261,220 | |
| | 103,000 | | | Luk Fook Holdings International Ltd. | | | 416,051 | |
| | | | | | | | |
| | | | | | | 901,231 | |
| | | | | | | | |
| | | | SEMICONDUCTORS - 0.8 % | | | | |
| | 79 | | | Samsung Electronics Co., Ltd. | | | 176,851 | |
| | | | | | | | |
| | |
| | | | TELECOMMUNICATIONS - 4.9 % | | | | |
| | 15,708 | | | Empresa Nacional de Telecomunicaciones SA | | | 162,696 | |
| | 1,404 | | | Mobile TeleSystems PJSC (ADR) | | | 14,658 | |
| | 97,017 | | | Mobile TeleSystems PJSC * | | | 475,414 | |
| | 1,368,675 | | | XL Axiata TBK PT * | | | 380,046 | |
| | | | | | | | |
| | | | | | | 1,032,814 | |
| | | | | | | | |
| | | | TEXTILES - 0.3 % | | | | |
| | 119,500 | | | Weiqiao Textile Co. * | | | 63,493 | |
| | | | | | | | |
| | |
| | | | TOTAL COMMON STOCK (Cost $13,367,984) | | | 14,312,662 | |
| | | | | | | | |
| | |
| | | | PREFERRED STOCK - 10.8 % | | | | |
| | 22,630 | | | Banco Bradesco SA | | | 251,687 | |
| | 27,300 | | | Cia Brasileira de Distribuicao * | | | 648,075 | |
| | 22,481 | | | Cia Paranaense de Energia * | | | 199,356 | |
| | 464,063 | | | Grupo Aval Acciones y Valores SA | | | 209,377 | |
| | 3,737 | | | Hyundai Motor Co. | | | 305,394 | |
| | 73,200 | | | Petroleo Brasileiro SA * | | | 354,990 | |
| | 586,463 | | | Surgutneftegas OJSC * | | | 301,586 | |
| | | | | | | | |
| | | | TOTAL PREFERRED STOCK (Cost $1,906,399) | | | 2,270,465 | |
| | | | | | | | |
| | |
| | | | REITs - 8.1 % | | | | |
| | 686,303 | | | Emlak Konut Gayrimenkul Yatirim Ortakligi AS * | | | 517,222 | |
| | 129,574 | | | Fibra Uno Administracion SA de CV | | | 219,200 | |
| | 310,193 | | | Macquarie Mexico Real Estate Management SA de CV | | | 411,501 | |
| | 326,511 | | | PLA Administradora Industrial S de RL de CV | | | 563,686 | |
| | | | | | | | |
| | | | TOTAL REITs (Cost $1,703,403) | | | 1,711,609 | |
| | | | | | | | |
| | |
| | | | MONEY MARKET FUND - 14.5 % | | | | |
| | 3,048,351 | | | Fidelity Institutional Money Market Funds - Government Portfolio, 0.91% (A) | | | | |
| | | | (Cost $3,048,351) | | | 3,048,351 | |
| | | | | | | | |
| | |
| | | | TOTAL INVESTMENTS - 101.3 % (Cost $20,026,137) | | $ | 21,343,087 | |
| | | | OTHER ASSETS IN EXCESS OF LIABILITIES - NET - (1.3) % | | | (277,926) | |
| | | | | | | | |
| | | | NET ASSETS - 100.0 % | | $ | 21,065,161 | |
| | | | | | | | |
* Non-income producing securities.
ADR-American Depositary Receipt
GDR-Global Depositary Receipt
REITs - Real Estate Investment Trust
(A) Variable rate security; the rate shown represents the yield at September 30, 2017.
The accompanying notes are an integral part of these financial statements.
65
Schedule of Investments | Emerging Markets Fund
As of September 30, 2017 (Continued)
| | | | |
| Diversification of Assets | | | |
| |
| Country | | % of Net Assets | |
| |
| Brazil | | | 18.9% | |
| South Korea | | | 10.8% | |
| Russia | | | 9.8% | |
| Mexico | | | 9.2% | |
| Hong Kong | | | 7.0% | |
| Turkey | | | 5.2% | |
| India | | | 3.7% | |
| Thailand | | | 3.5% | |
| Argentina | | | 3.2% | |
| South Africa | | | 2.9% | |
| Chile | | | 2.7% | |
| Panama | | | 1.9% | |
| Colombia | | | 1.8% | |
| Indonesia | | | 1.8% | |
| Austria | | | 1.4% | |
| Georgia | | | 1.3% | |
| Britain | | | 1.2% | |
| China | | | 0.3% | |
| Singapore | | | 0.2% | |
| | | | |
| Total | | | 86.8% | |
| Money Market Fund | | | 14.5% | |
| Other Assets in Excess of Liabilities - Net | | | (1.30)% | |
| | | | |
| Grand Total | | | 100.0% | |
| | | | |
The accompanying notes are an integral part of these financial statements.
66
Schedule of Investments | Growth & Income Fund
As of September 30, 2017
| | | | | | | | |
| | |
| Shares | | | | | Fair Value | |
| | |
| | |
| | | | COMMON STOCK - 46.5 % | | | | |
| | | | AEROSPACE/DEFENSE - 1.0 % | | | | |
| | 2,130 | | | Moog, Inc. - Class A * | | $ | 177,706 | |
| | 2,325 | | | Spirit AeroSystems Holdings, Inc. - Class A | | | 180,699 | |
| | | | | | | | |
| | | | | | | 358,405 | |
| | | | | | | | |
| | | | AIRLINES - 0.9 % | | | | |
| | 4,000 | | | Hawaiian Holdings, Inc. * | | | 150,200 | |
| | 4,180 | | | SkyWest, Inc. | | | 183,502 | |
| | | | | | | | |
| | | | | | | 333,702 | |
| | | | | | | | |
| | | | AUTO PARTS & EQUIPMENT - 4.3 % | | | | |
| �� | 11,310 | | | American Axle & Manufacturing Holdings, Inc. * | | | 198,830 | |
| | 3,560 | | | BorgWarner, Inc. | | | 182,379 | |
| | 6,740 | | | Dana, Inc. | | | 188,450 | |
| | 1,755 | | | Delphi Automotive PLC | | | 172,692 | |
| | 1,125 | | | Lear Corp. | | | 194,715 | |
| | 8,565 | | | Meritor, Inc. * | | | 222,776 | |
| | 3,000 | | | Tenneco, Inc. | | | 182,010 | |
| | 1,410 | | | Visteon Corp. * | | | 174,516 | |
| | | | | | | | |
| | | | | | | 1,516,368 | |
| | | | | | | | |
| | | | BANKS - 1.4 % | | | | |
| | 3,445 | | | CIT Group, Inc. | | | 168,977 | |
| | 28,665 | | | First BanCorp.* | | | 146,765 | |
| | 3,460 | | | Walker & Dunlop, Inc. * | | | 181,062 | |
| | | | | | | | |
| | | | | | | 496,804 | |
| | | | | | | | |
| | | | BIOTECHNOLOGY - 0.5 % | | | | |
| | 13,090 | | | Innoviva, Inc. * | | | 184,831 | |
| | | | | | | | |
| | |
| | | | BUILDING MATERIALS - 1.0 % | | | | |
| | 9,905 | | | Builders FirstSource, Inc. * | | | 178,191 | |
| | 6,665 | | | Louisiana-Pacific Corp. * | | | 180,488 | |
| | | | | | | | |
| | | | | | | 358,679 | |
| | | | | | | | |
| | | | CHEMICALS - 3.0 % | | | | |
| | 1,665 | | | Celanese Corp. | | | 173,610 | |
| | 1,920 | | | Eastman Chemical Co. | | | 173,741 | |
| | 8,565 | | | Ferro Corp. * | | | 191,000 | |
| | 6,365 | | | Huntsman Corp. | | | 174,528 | |
| | 8,825 | | | Kronos Worldwide, Inc. | | | 201,475 | |
| | 12,565 | | | Platform Specialty Products Corp. * | | | 140,100 | |
| | | | | | | | |
| | | | | | | 1,054,454 | |
| | | | | | | | |
| | | | COMMERCIAL SERVICES - 4.6 % | | | | |
| | 3,570 | | | Aaron’s, Inc. | | | 155,759 | |
| | 4,890 | | | Adtalem Global Education, Inc. | | | 175,307 | |
| | 3,265 | | | AerCap Holdings NV * | | | 166,874 | |
| | 2,135 | | | Brink’s Co. | | | 179,874 | |
| | 8,790 | | | Evertec, Inc. | | | 139,322 | |
| | 5,220 | | | H&R Block, Inc. | | | 138,226 | |
| | 11,295 | | | Travelport Worldwide Ltd. | | | 177,332 | |
| | 4,300 | | | TriNet Group, Inc. * | | | 144,566 | |
| | 1,435 | | | United Rentals, Inc. * | | | 199,092 | |
| | 8,460 | | | Western Union Co. | | | 162,432 | |
| | | | | | | | |
| | | | | | | 1,638,784 | |
| | | | | | | | |
| | | | COMPUTERS - 1.0 % | | | | |
| | 3,805 | | | Insight Enterprises, Inc. * | | | 174,726 | |
| | 2,020 | | | Western Digital Corp. | | | 174,528 | |
| | | | | | | | |
| | | | | | | 349,254 | |
| | | | | | | | |
| | | | DIVERSIFIED FINANCIAL SERVICES - 2.9 % | | | | |
| | 585 | | | Credit Acceptance Corp. * | | | 163,899 | |
| | 3,750 | | | Franklin Resources, Inc. | �� | | 166,912 | |
| | 4,585 | | | Houlihan Lokey, Inc. | | | 179,411 | |
| | 4,265 | | | Legg Mason, Inc. | | | 167,657 | |
| | 3,520 | | | LPL Financial Holdings, Inc. | | | 181,526 | |
| | 3,225 | | | Stifel Financial Corp. | | | 172,408 | |
| | | | | | | | |
| | | | | | | 1,031,813 | |
| | | | | | | | |
The accompanying notes are an integral part of these financial statements.
67
Schedule of Investments | Growth & Income Fund
As of September 30, 2017 (Continued)
| | | | | | | | |
| | |
| Shares | | | | | Fair Value | |
| | |
| | |
| | | | ELECTRIC - 1.4 % | | | | |
| | 2,080 | | | Entergy Corp. | | $ | 158,829 | |
| | 6,560 | | | NRG Energy, Inc. | | | 167,870 | |
| | 3,865 | | | PNM Resources, Inc. | | | 155,759 | |
| | | | | | | | |
| | | | | | | 482,458 | |
| | | | | | | | |
| | | | ELECTRONICS - 2.9 % | | | | |
| | 2,515 | | | Applied Optoelectronics, Inc. * | | | 162,645 | |
| | 2,120 | | | Arrow Electronics, Inc. * | | | 170,469 | |
| | 1,375 | | | Synnex Corp. | | | 173,951 | |
| | 2,030 | | | TE Connectivity Ltd. | | | 168,612 | |
| | 11,980 | | | TTM Technologies, Inc. * | | | 184,133 | |
| | 9,325 | | | Vishay Intertechnology, Inc. | | | 175,310 | |
| | | | | | | | |
| | | | | | | 1,035,120 | |
| | | | | | | | |
| | | | ENERGY - ALTERNATE SOURCES - 0.4 % | | | | |
| | 3,420 | | | First Solar, Inc. * | | | 156,910 | |
| | | | | | | | |
| | |
| | | | ENGINEERING & CONSTRUCTION - 0.5 % | | | | |
| | 3,890 | | | MasTec, Inc. * | | | 180,496 | |
| | | | | | | | |
| | |
| | | | FOOD - 0.5 % | | | | |
| | 1,145 | | | Sanderson Farms, Inc. | | | 184,940 | |
| | | | | | | | |
| | |
| | | | HAND/MACHINE TOOLS - 0.5 % | | | | |
| | 10,115 | | | Milacron Holdings Corp. * | | | 170,539 | |
| | | | | | | | |
| | |
| | | | HOME BUILDERS - 1.0 % | | | | |
| | 3,770 | | | Meritage Homes Corp. * | | | 167,388 | |
| | 60 | | | NVR, Inc. * | | | 171,300 | |
| | | | | | | | |
| | | | | | | 338,688 | |
| | | | | | | | |
| | | | HOUSEHOLD PRODUCTS/WARES - 0.5 % | | | | |
| | 2,765 | | | SodaStream International Ltd. * | | | 183,734 | |
| | | | | | | | |
| | |
| | | | INSURANCE - 4.1 % | | | | |
| | 1,980 | | | Aflac, Inc. | | | 161,152 | |
| | 5,835 | | | American Equity Investment Life Holding Co. | | | 169,682 | |
| | 1,535 | | | American Financial Group, Inc. | | | 158,796 | |
| | 3,680 | | | Assured Guaranty Ltd. | | | 138,920 | |
| | 6,795 | | | CNO Financial Group, Inc. | | | 158,595 | |
| | 595 | | | Everest Re Group Ltd. | | | 135,892 | |
| | 14,055 | | | MGIC Investment Corp. * | | | 176,109 | |
| | 11,000 | | | Radian Group, Inc. | | | 205,590 | |
| | 3,205 | | | Unum Group | | | 163,872 | |
| | | | | | | | |
| | | | | | | 1,468,608 | |
| | | | | | | | |
| | | | INTERNET - 0.4 % | | | | |
| | 2,640 | | | Liberty Ventures * | | | 151,932 | |
| | | | | | | | |
| | |
| | | | INVESTMENT COMPANIES - 0.4 % | | | | |
| | 7,525 | | | TPG Specialty Lending, Inc. | | | 157,724 | |
| | | | | | | | |
| | |
| | | | IRON/STEEL - 0.9 % | | | | |
| | 30,010 | | | AK Steel Holding Corp. * | | | 167,756 | |
| | 4,958 | | | Steel Dynamics, Inc. | | | 170,902 | |
| | | | | | | | |
| | | | | | | 338,658 | |
| | | | | | | | |
| | | | MACHINERY - CONSTRUCTION & MINING - 1.0 % | | | | |
| | 1,415 | | | Caterpillar, Inc. | | | 176,465 | |
| | 2,160 | | | Oshkosh Corp. | | | 178,286 | |
| | | | | | | | |
| | | | | | | 354,751 | |
| | | | | | | | |
| | | | MACHINERY - DIVERSIFIED - 0.5 % | | | | |
| | 1,560 | | | Zebra Technologies Corp. - Class A * | | | 169,385 | |
| | | | | | | | |
| | |
| | | | MINING - 0.5 % | | | | |
| | 1,670 | | | Kaiser Aluminum Corp. | | | 172,244 | |
| | | | | | | | |
The accompanying notes are an integral part of these financial statements.
68
Schedule of Investments | Growth & Income Fund
As of September 30, 2017 (Continued)
| | | | | | | | | | | | | | | | |
| | |
| Shares | | | | | | | | | | | Fair Value | |
| | |
| | | | |
| | | | MISCELLANEOUS MANUFACTURER - 1.1 % | | | | | | | | | | | | |
| | 2,700 | | | Barnes Group, Inc. | | | | | | | | | | $ | 190,188 | |
| | 9,905 | | | Harsco Corp. * | | | | | | | | | | | 207,014 | |
| | | | | | | | | | | | | | | | |
| | | | | | | | | | | | | | | 397,202 | |
| | | | | | | | | | | | | | | | |
| | | | OIL & GAS - 1.0 % | | | | | | | | | | | | |
| | 38,635 | | | Chesapeake Energy Corp. * | | | | | | | | | | | 166,130 | |
| | 14,345 | | | Diamond Offshores Drilling, Inc. * | | | | | | | | | | | 208,002 | |
| | | | | | | | | | | | | | | | |
| | | | | | | | | | | | | | | 374,132 | |
| | | | | | | | | | | | | | | | |
| | | | PACKAGING & CONTAINERS - 0.5 % | | | | | | | | | | | | |
| | 6,820 | | | Owens-Illinois, Inc. * | | | | | | | | | | | 171,591 | |
| | | | | | | | | | | | | | | | |
| | | | |
| | | | PHARMACEUTICALS - 0.5 % | | | | | | | | | | | | |
| | 2,650 | | | Express Scripts Holding Co. * | | | | | | | | | | | 167,798 | |
| | | | | | | | | | | | | | | | |
| | | | |
| | | | RETAIL - 1.5 % | | | | | | | | | | | | |
| | 4,050 | | | Kohl’s Corp. | | | | | | | | | | | 184,882 | |
| | 4,085 | | | Rush Enterprises, Inc. * | | | | | | | | | | | 189,095 | |
| | 8,125 | | | Sally Beauty Holdings, Inc. * | | | | | | | | | | | 159,087 | |
| | | | | | | | | | | | | | | | |
| | | | | | | | | | | | | | | 533,064 | |
| | | | | | | | | | | | | | | | |
| | | | SEMICONDUCTORS - 3.9 % | | | | | | | | | | | | |
| | 18,750 | | | Amkor Technology, Inc. * | | | | | | | | | | | 197,812 | |
| | 6,670 | | | Brooks Automation, Inc. | | | | | | | | | | | 202,501 | |
| | 1,070 | | | Lam Research Corp. | | | | | | | | | | | 197,993 | |
| | 5,820 | | | Micron Technology, Inc. * | | | | | | | | | | | 228,901 | |
| | 3,235 | | | Microsemi Corp. * | | | | | | | | | | | 166,538 | |
| | 2,070 | | | MKS Instruments, Inc. | | | | | | | | | | | 195,511 | |
| | 5,000 | | | Teradyne, Inc. | | | | | | | | | | | 186,450 | |
| | | | | | | | | | | | | | | | |
| | | | | | | | | | | | | | | 1,375,706 | |
| | | | | | | | | | | | | | | | |
| | | | TELECOMMUNICATIONS - 1.4 % | | | | | | | | | | | | |
| | 2,200 | | | InterDigital, Inc. | | | | | | | | | | | 162,250 | |
| | 5,830 | | | Juniper Networks, Inc. | | | | | | | | | | | 162,249 | |
| | 19,225 | | | Oclaro, Inc. * | | | | | | | | | | | 165,912 | |
| | | | | | | | | | | | | | | | |
| | | | | | | | | | | | | | | 490,411 | |
| | | | | | | | | | | | | | | | |
| | | | TRANSPORTATION - 0.5 % | | | | | | | | | | | | |
| | 2,595 | | | Atlas Air Worldwide Holdings, Inc. * | | | | | | | | | | | 170,751 | |
| | | | | | | | | | | | | | | | |
| | | | |
| | | | TOTAL COMMON STOCK (Cost $15,002,526) | | | | | | | | | | | 16,549,936 | |
| | | | | | | | | | | | | | | | |
| | | | |
| | | | REITs - 1.0 % | | | | | | | | | | | | |
| | 3,420 | | | Potlatch Corp. | | | | | | | | | | | 174,420 | |
| | 8,185 | | | Xenia Hotels & Resorts, Inc. | | | | | | | | | | | 172,294 | |
| | | | | | | | | | | | | | | | |
| | | | TOTAL REITs (Cost $322,790) | | | | | | | | | | | 346,714 | |
| | | | | | | | | | | | | | | | |
|
| | |
| Par Value | | | | | Coupon Rate (%) | | | Maturity | | | | |
| | |
| | | | |
| | | | BONDS & NOTES - 50.3 % | | | | | | | | | | | | |
| | | | CORPORATE BONDS - 0.7 % | | | | | | | | | | | | |
| $ | 250,000 | | | ConocoPhillips Co. (Cost $254,599) | | | 3.350 | | | | 11/15/2024 | | | | 257,495 | |
| | | | | | | | | | | | | | | | |
| | | | |
| | | | GOVERNMENT NOTES, BONDS & AGENCIES - 41.6 % | | | | | | | | | | | | |
| | 314,815 | | | Federal Home Loan Banks | | | 3.000 | | | | 4/18/2031 | | | | 314,171 | |
| | 3,000,000 | | | United States Treasury Note | | | 1.000 | | | | 3/15/2018 | | | | 2,997,316 | |
| | 1,500,000 | | | United States Treasury Note | | | 1.250 | | | | 10/31/2018 | | | | 1,497,891 | |
| | 3,000,000 | | | United States Treasury Note | | | 1.193 | | | | 1/31/2019 | | | | 3,005,215 | |
| | 1,000,000 | | | United States Treasury Note | | | 1.250 | | | | 4/30/2019 | | | | 997,246 | |
| | 1,500,000 | | | United States Treasury Note | | | 1.625 | | | | 8/15/2022 | | | | 1,481,103 | |
| | 3,000,000 | | | United States Treasury Note | | | 1.750 | | | | 5/15/2023 | | | | 2,956,875 | |
| | 1,500,000 | | | United States Treasury Note | | | 3.125 | | | | 2/15/2042 | | | | 1,586,719 | |
| | | | | | | | | | | | | | | | |
| | | | TOTAL GOVERNMENT NOTES, BONDS & AGENCIES (Cost $14,804,966) | | | | | | | | 14,836,536 | |
| | | | | | | | | | | | | | | | |
The accompanying notes are an integral part of these financial statements.
69
Schedule of Investments | Growth & Income Fund
As of September 30, 2017 (Continued)
| | | | | | | | | | | | | | | | |
| | |
| Par Value | | | | | Coupon Rate (%) | | | Maturity | | | Fair Value | |
| | |
| | | |
| | | | TREASURY INFLATION PROTECTED SECURITIES (TIPS) - 8.0 % | | | | | | | | | |
| | $ 2,000,000 | | | United States Treasury Note TIPS (Cost $2,847,136) | | | 2.375 | | | | 1/15/2027 | | | $ | 2,836,832 | |
| | | | | | | | | | | | | | | | |
| | | | |
| | | | TOTAL BONDS & NOTES (Cost $17,906,701) | | | | | | | | | | | 17,930,863 | |
| | | | | | | | | | | | | | | | |
| Shares | | | | | | | | | | | | |
| | | | MONEY MARKET FUND - 3.5 % | | | | | | | | | | | | |
| | 1,256,883 | | | Fidelity Institutional Money Market Funds - Government Portfolio, 0.91% (A) | | | | | | | | 1,256,883 | |
| | | | | | | | | | | | | | | | |
| | | | (Cost $1,256,883) | | | | | | | | | | | | |
| | | | |
| | | | TOTAL INVESTMENTS - 101.3 % (Cost $34,488,900) | | | | | | | | | | $ | 36,084,396 | |
| | | | OTHER ASSETS IN EXCESS OF LIABILITIES - NET - 1.3 % | | | | | | | | (454,624) | |
| | | | | | | | | | | | | | | | |
| | | | NET ASSETS - 100.0 % | | | | | | | | | | $ | 35,629,772 | |
| | | | | | | | | | | | | | | | |
REITs - Real Estate Investment Trust.
* Non-income producing securities.
(A) Variable rate security; the rate shown represents the yield at September 30, 2017.
The accompanying notes are an integral part of these financial statements.
70
Timothy Plan Funds
Statements of Assets and Liabilities
September 30, 2017
| | | | | | | | | | | | | | | | | | | | | | | | |
| |
| | | | | | |
| | | Aggressive Growth Fund | | | International Fund | | | Large/Mid Cap Growth Fund | | | Small Cap Value Fund | | | Large/Mid Cap Value Fund | | | Fixed Income Fund | |
| | | | | | | | | | | | | | | | | | | | | | | | |
| |
ASSETS: | | | | | | | | | | | | | | | | | | | | | | | | |
Investments, at cost | | $ | 23,252,224 | | | $ | 85,521,602 | | | $ | 68,815,242 | | | $ | 122,036,861 | | | $ | 178,100,894 | | | $ | 88,480,499 | |
| | | | | | | | | | | | | | | | | | | | | | | | |
Investments, at value | | $ | 27,310,239 | | | $ | 98,748,957 | | | $ | 82,460,815 | | | $ | 145,040,869 | | | $ | 211,942,728 | | | $ | 88,605,646 | |
Cash | | | - | | | | - | | | | 8,335 | | | | 23,857 | | | | 23,052 | | | | - | |
Dividends and interest receivable | | | 9,921 | | | | 122,798 | | | | 22,392 | | | | 101,635 | | | | 197,895 | | | | 580,569 | |
Receivable for fund shares sold | | | 349 | | | | 86,226 | | | | 71,848 | | | | 117,942 | | | | 133,641 | | | | 41,655 | |
Receivable for securities sold | | | - | | | | - | | | | - | | | | 648,331 | | | | - | | | | - | |
Receivable for foreign tax reclaims | | | - | | | | 133,630 | | | | - | | | | - | | | | - | | | | - | |
Prepaid expenses and other assets | | | 22,681 | | | | 28,463 | | | | 25,794 | | | | 25,191 | | | | 26,005 | | | | 12,475 | |
| | | | | | | | | | | | | | | | | | | | | | | | |
Total Assets | | | 27,343,190 | | | | 99,120,074 | | | | 82,589,184 | | | | 145,957,825 | | | | 212,323,321 | | | | 89,240,345 | |
| | | | | | | | | | | | | | | | | | | | | | | | |
| | | | | | |
LIABILITIES: | | | | | | | | | | | | | | | | | | | | | | | | |
Payable to custodian | | | - | | | | 2,487 | | | | - | | | | - | | | | - | | | | - | |
Payable for fund shares redeemed | | | 46,579 | | | | 50,062 | | | | 11,414 | | | | 77,798 | | | | 296,973 | | | | 11,175 | |
Payable to related parties | | | 4,221 | | | | 13,105 | | | | 13,119 | | | | - | | | | 35,188 | | | | 13,843 | |
Accrued advisory fees | | | 16,294 | | | | 75,724 | | | | 52,496 | | | | 90,130 | | | | 127,445 | | | | 28,232 | |
Accrued 12b-1 fees | | | 7,255 | | | | 20,120 | | | | 21,224 | | | | 31,839 | | | | 51,491 | | | | 23,062 | |
Payable for securities purchased | | | 224,049 | | | | 80,604 | | | | 332,574 | | | | 468,063 | | | | 1,525,706 | | | | 1,512,890 | |
Accrued expenses and other liabilities | | | 24,593 | | | | 21,790 | | | | 22,704 | | | | 23,939 | | | | 43,105 | | | | 22,860 | |
| | | | | | | | | | | | | | | | | | | | | | | | |
Total Liabilities | | | 322,991 | | | | 263,892 | | | | 453,531 | | | | 691,769 | | | | 2,079,908 | | | | 1,612,062 | |
| | | | | | | | | | | | | | | | | | | | | | | | |
| | | | | | |
Net Assets | | $ | 27,020,199 | | | $ | 98,856,182 | | | $ | 82,135,653 | | | $ | 145,266,056 | | | $ | 210,243,413 | | | $ | 87,628,283 | |
| | | | | | | | | | | | | | | | | | | | | | | | |
| | | | | | |
NET ASSETS CONSIST OF: | | | | | | | | | | | | | | | | | | | | | | | | |
Paid in capital ($0 par value, unlimited shares authorized) | | $ | 23,648,755 | | | $ | 86,977,267 | | | $ | 66,772,771 | | | $ | 113,012,457 | | | $ | 162,178,532 | | | $ | 88,093,617 | |
Accumulated net investment income (loss) | | | (227,414 | ) | | | 88,682 | | | | (85,093 | ) | | | 71,470 | | | | 296,232 | | | | 340,631 | |
Accumulated net realized gain (loss) from investment | | | (459,157 | ) | | | (1,437,114 | ) | | | 1,802,402 | | | | 9,178,121 | | | | 13,926,815 | | | | (931,112 | ) |
Net unrealized appreciation (depreciation) on investments | | | 4,058,015 | | | | 13,227,347 | | | | 13,645,573 | | | | 23,004,008 | | | | 33,841,834 | | | | 125,147 | |
| | | | | | | | | | | | | | | | | | | | | | | | |
Net Assets | | $ | 27,020,199 | | | $ | 98,856,182 | | | $ | 82,135,653 | | | $ | 145,266,056 | | | $ | 210,243,413 | | | $ | 87,628,283 | |
| | | | | | | | | | | | | | | | | | | | | | | | |
| | | | | | |
Class A | | | | | | | | | | | | | | | | | | | | | | | | |
Net Assets | | $ | 22,549,073 | | | $ | 81,152,815 | | | $ | 68,290,568 | | | $ | 112,953,112 | | | $ | 167,056,046 | | | $ | 75,858,028 | |
Shares of beneficial interest outstanding ($0 par value, unlimited shares authorized) | | | 2,782,332 | | | | 8,226,433 | | | | 7,953,437 | | | | 5,509,274 | | | | 8,719,810 | | | | 7,420,031 | |
Net Asset Value, offering price and redemption price per share | | $ | 8.10 | | | $ | 9.86 | | | $ | 8.59 | | | $ | 20.50 | | | $ | 19.16 | | | $ | 10.22 | |
| | | | | | | | | | | | | | | | | | | | | | | | |
Offering Price Per Share (NAV / 0.945) *(NAV / 0.955) | | $ | 8.58 | | | $ | 10.44 | | | $ | 9.09 | | | $ | 21.69 | | | $ | 20.28 | | | $ | 10.70 | * |
| | | | | | | | | | | | | | | | | | | | | | | | |
| | | | | | |
Class C | | | | | | | | | | | | | | | | | | | | | | | | |
Net Assets | | $ | 3,584,372 | | | $ | 4,619,986 | | | $ | 9,909,411 | | | $ | 13,209,817 | | | $ | 23,803,165 | | | $ | 9,636,680 | |
Shares of beneficial interest outstanding ($0 par value, unlimited shares authorized) | | | 532,261 | | | | 483,759 | | | | 1,394,433 | | | | 850,120 | | | | 1,504,739 | | | | 978,679 | |
Net Asset Value, offering price and redemption price per share | | $ | 6.73 | | | $ | 9.55 | | | $ | 7.11 | | | $ | 15.54 | | | $ | 15.82 | | | $ | 9.85 | |
| | | | | | | | | | | | | | | | | | | | | | | | |
Minimum Redemption Price Per Share (NAV * 0.99) | | $ | 6.66 | | | $ | 9.45 | | | $ | 7.04 | | | $ | 15.38 | | | $ | 15.66 | | | $ | 9.75 | |
| | | | | | | | | | | | | | | | | | | | | | | | |
| | | | | | |
Class I | | | | | | | | | | | | | | | | | | | | | | | | |
Net Assets | | $ | 886,754 | | | $ | 13,083,381 | | | $ | 3,935,674 | | | $ | 19,103,127 | | | $ | 19,384,202 | | | $ | 2,133,575 | |
Shares of beneficial interest outstanding ($0 par value, unlimited shares authorized) | | | 108,050 | | | | 1,323,041 | | | | 452,537 | | | | 921,175 | | | | 1,002,445 | | | | 210,114 | |
Net Asset Value, offering price and redemption price per share | | $ | 8.21 | | | $ | 9.89 | | | $ | 8.70 | | | $ | 20.74 | | | $ | 19.34 | | | $ | 10.15 | |
| | | | | | | | | | | | | | | | | | | | | | | | |
The accompanying notes are an integral part of these financial statements.
71
Timothy Plan Funds
Statements of Assets and Liabilities (Continued)
September 30, 2017
| | | | | | | | | | | | | | | | | | | | | | | | | | | | |
| |
| | | | | | | |
| | | High Yield Bond Fund | | | Israel Common Values Fund | | | Defensive Strategies Fund | | | Strategic Growth Fund | | | Conservative Growth Fund | | | Emerging Markets Fund | | | Growth & Income Fund | |
| | | | | | | | | | | | | | | | | | | | | | | | | | | | |
| |
ASSETS: | | | | | | | | | | | | | | | | | | | | | | | | | | | | |
Investments, at cost | | $ | 63,648,172 | | | $ | 35,627,081 | | | $ | 48,781,973 | | | $ | 1,389,014 | | | $ | 4,323,713 | | | $ | 20,026,137 | | | $ | 34,488,900 | |
Investments in affiliates, at cost | | | - | | | | - | | | | - | | | | 35,258,624 | | | | 47,579,942 | | | | - | | | | - | |
| | | | | | | | | | | | | | | | | | | | | | | | | | | | |
Investments, at value | | $ | 65,383,788 | | | $ | 45,142,932 | | | $ | 49,934,634 | | | $ | 1,389,014 | | | $ | 4,323,713 | | | $ | 21,343,087 | | | $ | 36,084,396 | |
Investments in affiliates, at value | | | - | | | | - | | | | - | | | | 38,382,240 | | | | 50,812,934 | | | | - | | | | - | |
Gold and Silver Investments, at fair value (Cost $8,900,255) | | | - | | | | - | | | | 9,593,390 | | | | - | | | | - | | | | - | | | | - | |
Cash | | | - | | | | 2,487 | | | | - | | | | - | | | | - | | | | - | | | | - | |
Brazilian Real (BRL)(Cost $7,223) | | | - | | | | - | | | | - | | | | - | | | | - | | | | 7,161 | | | | - | |
Hong Kong Dollar (HKD)(Cost $4,712) | | | - | | | | - | | | | - | | | | - | | | | - | | | | 4,712 | | | | - | |
Thai Bhat (THB)(Cost $131,573) | | | - | | | | - | | | | - | | | | - | | | | - | | | | 131,682 | | | | - | |
Dividends and interest receivable | | | 895,274 | | | | 9,970 | | | | 123,577 | | | | 1,033 | | | | 3,028 | | | | 47,287 | | | | 80,169 | |
Receivable for fund shares sold | | | 31,402 | | | | 55,487 | | | | 725 | | | | 6,515 | | | | 7,893 | | | | 11,496 | | | | 24,206 | |
Deposit with broker | | | - | | | | - | | | | 39,745 | | | | - | | | | - | | | | - | | | | - | |
Receivable for foreign tax reclaims | | | - | | | | - | | | | 7,485 | | | | - | | | | - | | | | - | | | | 308 | |
Prepaid expenses and other assets | | | 36,836 | | | | 33,179 | | | | 24,168 | | | | 15,152 | | | | 16,943 | | | | 62,889 | | | | 21,991 | |
| | | | | | | | | | | | | | | | | | | | | | | | | | | | |
Total Assets | | | 66,347,300 | | | | 45,244,055 | | | | 59,723,724 | | | | 39,793,954 | | | | 55,164,511 | | | | 21,608,314 | | | | 36,211,070 | |
| | | | | | | | | | | | | | | | | | | | | | | | | | | | |
| | | | | | | |
LIABILITIES: | | | | | | | | | | | | | | | | | | | | | | | | | | | | |
Payable to custodian | | | - | | | | - | | | | 768 | | | | - | | | | - | | | | - | | | | - | |
Payable for securities purchased | | | - | | | | 115,056 | | | | 167,556 | | | | - | | | | - | | | | 442,318 | | | | 499,355 | |
Payable for fund shares redeemed | | | 67,606 | | | | 515 | | | | 23,753 | | | | 6,245 | | | | 11,572 | | | | 51,462 | | | | 25,708 | |
Payable to related parties | | | 7,332 | | | | 4,524 | | | | 20,491 | | | | 12,240 | | | | 13,645 | | | | 2,422 | | | | 6,784 | |
Accrued advisory fees | | | 29,539 | | | | 36,214 | | | | 26,630 | | | | 18,880 | | | | 26,309 | | | | 18,090 | | | | 23,040 | |
Accrued 12b-1 fees | | | 13,623 | | | | 13,407 | | | | 13,023 | | | | 3,741 | | | | 5,596 | | | | 5,293 | | | | 8,609 | |
Accrued expenses and other liabilities | | | 23,725 | | | | 22,724 | | | | 47,496 | | | | 19,790 | | | | 16,626 | | | | 23,568 | | | | 17,802 | |
| | | | | | | | | | | | | | | | | | | | | | | | | | | | |
Total Liabilities | | | 141,825 | | | | 192,440 | | | | 299,717 | | | | 60,896 | | | | 73,748 | | | | 543,153 | | | | 581,298 | |
| | | | | | | | | | | | | | | | | | | | | | | | | | | | |
| | | | | | | |
Net Assets | | $ | 66,205,475 | | | $ | 45,051,615 | | | $ | 59,424,007 | | | $ | 39,733,058 | | | $ | 55,090,763 | | | $ | 21,065,161 | | | $ | 35,629,772 | |
| | | | | | | | | | | | | | | | | | | | | | | | | | | | |
| | | | | | | |
NET ASSETS CONSIST OF: | | | | | | | | | | | | | | | | | | | | | | | | | | | | |
Paid in capital ($0 par value, unlimited shares authorized) | | $ | 65,785,768 | | | $ | 37,265,211 | | | $ | 58,326,870 | | | $ | 37,941,889 | | | $ | 52,051,024 | | | $ | 20,904,821 | | | $ | 33,173,433 | |
Accumulated net investment income (loss) | | | 113,120 | | | | (1,027,201 | ) | | | (12,867 | ) | | | (260,506 | ) | | | (236,547 | ) | | | 46,816 | | | | - | |
Accumulated net realized gain (loss) from investments | | | (1,429,029 | ) | | | (702,224 | ) | | | (734,148 | ) | | | (1,071,941 | ) | | | 43,294 | | | | (1,204,411 | ) | | | 860,843 | |
Net unrealized appreciation on investments | | | 1,735,616 | | | | 9,515,829 | | | | 1,844,152 | | | | 3,123,616 | | | | 3,232,992 | | | | 1,317,935 | | | | 1,595,496 | |
| | | | | | | | | | | | | | | | | | | | | | | | | | | | |
Net Assets | | $ | 66,205,475 | | | $ | 45,051,615 | | | $ | 59,424,007 | | | $ | 39,733,058 | | | $ | 55,090,763 | | | $ | 21,065,161 | | | $ | 35,629,772 | |
| | | | | | | | | | | | | | | | | | | | | | | | | | | | |
| | | | | | | |
Class A | | | | | | | | | | | | | | | | | | | | | | | | | | | | |
Net Assets | | $ | 52,950,112 | | | $ | 34,957,661 | | | $ | 50,079,776 | | | $ | 32,766,845 | | | $ | 45,109,735 | | | $ | 16,889,272 | | | $ | 30,426,334 | |
Shares of beneficial interest outstanding ($0 par value, unlimited shares authorized) | | | 5,632,787 | | | | 2,344,749 | | | | 4,403,520 | | | | 3,457,575 | | | | 4,227,272 | | | | 1,735,310 | | | | 2,696,769 | |
Net Asset Value, offering price and redemption price per share | | $ | 9.40 | | | $ | 14.91 | | | $ | 11.37 | | | $ | 9.48 | | | $ | 10.67 | | | $ | 9.73 | | | $ | 11.28 | |
| | | | | | | | | | | | | | | | | | | | | | | | | | | | |
Offering Price Per Share (NAV / 0.945) *(NAV / 0.955) | | $ | 9.84 | * | | $ | 15.78 | | | $ | 12.03 | | | $ | 10.03 | | | $ | 11.29 | | | $ | 10.30 | | | $ | 11.94 | |
| | | | | | | | | | | | | | | | | | | | | | | | | | | | |
| | | | | | | |
Class C | | | | | | | | | | | | | | | | | | | | | | | | | | | | |
Net Assets | | $ | 3,538,609 | | | $ | 7,904,792 | | | $ | 6,683,306 | | | $ | 6,966,213 | | | $ | 9,981,028 | | | $ | 2,413,400 | | | $ | 3,006,348 | |
Shares of beneficial interest outstanding ($0 par value, unlimited shares authorized) | | | 371,905 | | | | 551,486 | | | | 613,273 | | | | 813,254 | | | | 1,022,149 | | | | 254,549 | | | | 273,483 | |
Net Asset Value, offering price and redemption price per share | | $ | 9.51 | | | $ | 14.33 | | | $ | 10.90 | | | $ | 8.57 | | | $ | 9.76 | | | $ | 9.48 | | | $ | 10.99 | |
| | | | | | | | | | | | | | | | | | | | | | | | | | | | |
Minimum Redemption Price Per Share (NAV * 0.99) | | $ | 9.41 | | | $ | 14.19 | | | $ | 10.79 | | | $ | 8.48 | | | $ | 9.66 | | | $ | 9.39 | | | $ | 10.88 | |
| | | | | | | | | | | | | | | | | | | | | | | | | | | | |
| | | | | | | |
Class I | | | | | | | | | | | | | | | | | | | | | | | | | | | | |
Net Assets | | $ | 9,716,754 | | | $ | 2,189,162 | | | $ | 2,660,925 | | | $ | - | | | $ | - | | | $ | 1,762,489 | | | $ | 2,197,090 | |
Shares of beneficial interest outstanding ($0 par value, unlimited shares authorized) | | | 1,032,970 | | | | 146,259 | | | | 233,804 | | | | - | | | | - | | | | 179,973 | | | | 193,727 | |
Net Asset Value, offering price and redemption price per share | | $ | 9.41 | | | $ | 14.97 | | | $ | 11.38 | | | $ | - | | | $ | - | | | $ | 9.79 | | | $ | 11.34 | |
| | | | | | | | | | | | | | | | | | | | | | | | | | | | |
The accompanying notes are an integral part of these financial statements.
72
Timothy Plan Funds
Statements of Operations
For the Year Ended September 30, 2017
| | | | | | | | | | | | | | | | | | | | | | | | |
| |
| | | | | | |
| | | Aggressive Growth Fund | | | International Fund | | | Large/Mid Cap Growth Fund | | | Small Cap Value Fund | | | Large/Mid Cap Value Fund | | | Fixed Income Fund | |
| | | | | | | | | | | | | | | | | | | | | | | | |
| |
Investment Income: | | | | | | | | | | | | | | | | | | | | | | | | |
Interest income | | $ | 10,459 | | | $ | 50,564 | | | $ | 38,609 | | | $ | 30,006 | | | $ | 55,650 | | | $ | 2,163,029 | |
Dividend Income | | | 135,972 | | | | 1,860,517 | | | | 926,633 | | | | 1,996,460 | | | | 3,180,856 | | | | - | |
Foreign tax withheld | | | (260 | ) | | | (224,148 | ) | | | (2,804 | ) | | | - | | | | - | | | | - | |
| | | | | | | | | | | | | | | | | | | | | | | | |
Total Investment Income | | | 146,171 | | | | 1,686,933 | | | | 962,438 | | | | 2,026,466 | | | | 3,236,506 | | | | 2,163,029 | |
| | | | | | | | | | | | | | | | | | | | | | | | |
| | | | | | |
Operating Expenses: | | | | | | | | | | | | | | | | | | | | | | | | |
Investment advisory fees | | | 220,714 | | | | 824,867 | | | | 617,664 | | | | 1,083,226 | | | | 1,657,100 | | | | 553,591 | |
12b-1 Fees: | | | | | | | | | | | | | | | | | | | | | | | | |
Class A | | | 55,212 | | | | 174,966 | | | | 154,670 | | | | 259,325 | | | | 400,691 | | | | 202,936 | |
Class C | | | 32,795 | | | | 41,609 | | | | 85,829 | | | | 117,170 | | | | 222,179 | | | | 96,556 | |
Administration fees | | | 57,965 | | | | 167,100 | | | | 146,175 | | | | 235,000 | | | | 395,600 | | | | 199,580 | |
Registration fees | | | 28,835 | | | | 25,550 | | | | 29,200 | | | | 35,285 | | | | 34,675 | | | | 45,625 | |
Custody fees | | | 15,352 | | | | 12,045 | | | | 16,140 | | | | 20,440 | | | | 31,137 | | | | 18,118 | |
Non 12b-1 shareholder servicing fees | | | 20,250 | | | | 84,285 | | | | 49,202 | | | | 70,139 | | | | 146,000 | | | | 76,880 | |
Audit fees | | | 13,118 | | | | 12,494 | | | | 13,304 | | | | 9,855 | | | | 13,304 | | | | 13,220 | |
Printing expenses | | | 11,112 | | | | 34,014 | | | | 30,864 | | | | 55,025 | | | | 78,112 | | | | 33,502 | |
Trustees’ fees | | | 2,548 | | | | 6,723 | | | | 5,307 | | | | 9,676 | | | | 18,130 | | | | 9,030 | |
Insurance expenses | | | 730 | | | | 3,650 | | | | 1,460 | | | | 2,920 | | | | 4,015 | | | | 2,920 | |
Compliance officer fees | | | 365 | | | | 7,457 | | | | 6,198 | | | | 10,979 | | | | 18,184 | | | | 8,741 | |
Miscellaneous expenses | | | 1,365 | | | | 2,770 | | | | 2,456 | | | | 6,935 | | | | 6,410 | | | | 5,475 | |
| | | | | | | | | | | | | | | | | | | | | | | | |
Total Operating Expenses | | | 460,361 | | | | 1,397,530 | | | | 1,158,469 | | | | 1,915,975 | | | | 3,025,537 | | | | 1,266,174 | |
Less: Expenses waived by Advisor | | | (25,966 | ) | | | (41,243 | ) | | | (36,333 | ) | | | (63,719 | ) | | | (155,727 | ) | | | (184,531 | ) |
| | | | | | | | | | | | | | | | | | | | | | | | |
Net Operating Expenses | | | 434,395 | | | | 1,356,287 | | | | 1,122,136 | | | | 1,852,256 | | | | 2,869,810 | | | | 1,081,643 | |
| | | | | | | | | | | | | | | | | | | | | | | | |
| | | | | | |
Net Investment Income (Loss) | | | (288,224 | ) | | | 330,646 | | | | (159,698 | ) | | | 174,210 | | | | 366,696 | | | | 1,081,386 | |
| | | | | | | | | | | | | | | | | | | | | | | | |
| | | | | | |
Realized and Unrealized Gain (Loss) on Investments: | | | | | | | | | | | | | | | | | | | | | | | | |
Net realized gain (loss) on investments | | | 1,503,387 | | | | 9,963,787 | | | | 2,495,324 | | | | 9,445,306 | | | | 13,916,946 | | | | (40,306 | ) |
and foreign currency translations | | | - | | | | 113 | | | | - | | | | - | | | | (822 | ) | | | 323 | |
Capital gain dividends from REITs | | | - | | | | - | | | | - | | | | 102,356 | | | | 12,498 | | | | - | |
Net change in unrealized appreciation (depreciation) on investments | | | 3,127,978 | | | | 3,000,900 | | | | 8,627,675 | | | | 15,135,696 | | | | 9,552,826 | | | | (2,031,650 | ) |
and foreign currency transactions | | | - | | | | (8 | ) | | | - | | | | - | | | | 780 | | | | - | |
| | | | | | | | | | | | | | | | | | | | | | | | |
Net Realized and Unrealized Gain (Loss) on Investments | | | 4,631,365 | | | | 12,964,792 | | | | 11,122,999 | | | | 24,683,358 | | | | 23,482,228 | | | | (2,071,633 | ) |
| | | | | | | | | | | | | | | | | | | | | | | | |
| | | | | | |
Net Increase (Decrease) in Net Assets Resulting From Operations | | $ | 4,343,141 | | | $ | 13,295,438 | | | $ | 10,963,301 | | | $ | 24,857,568 | | | $ | 23,848,924 | | | $ | (990,247 | ) |
| | | | | | | | | | | | | | | | | | | | | | | | |
| | | | | | | | | | | | | | | | | | | | | | | | |
| |
The accompanying notes are an integral part of these financial statements.
73
Timothy Plan Funds
Statements of Operations (Continued)
For the Year Ended September 30, 2017
| | | | | | | | | | | | | | | | | | | | | | | | | | | | |
| |
| | | | | | | |
| | | High Yield Bond Fund | | | Israel Common Values Fund | | | Defensive Strategies Fund | | | Strategic Growth Fund | | | Conservative Growth Fund | | | Emerging Markets Fund | | | Growth & Income Fund | |
| | | | | | | | | | | | | | | | | | | | | | | | | | | | |
| |
Investment Income: | | | | | | | | | | | | | | | | | | | | | | | | | | | | |
Interest income | | $ | 2,727,704 | | | $ | 18,801 | | | $ | 402,285 | | | $ | 8,598 | | | $ | 18,410 | | | $ | 11,622 | | | $ | 279,349 | |
Dividend Income | | | - | | | | 899,052 | | | | 542,428 | | | | - | | | | - | | | | 451,905 | | | | 330,151 | |
Dividend income from affiliated funds | | | - | | | | - | | | | - | | | | 234,581 | | | | 438,587 | | | | - | | | | - | |
Foreign tax withheld | | | - | | | | (152,490 | ) | | | (30,242 | ) | | | - | | | | - | | | | (31,696 | ) | | | (535 | ) |
| | | | | | | | | | | | | | | | | | | | | | | | | | | | |
Total Investment Income | | | 2,727,704 | | | | 765,363 | | | | 914,471 | | | | 243,179 | | | | 456,997 | | | | 431,831 | | | | 608,965 | |
| | | | | | | | | | | | | | | | | | | | | | | | | | | | |
| | | | | | | |
Operating Expenses: | | | | | | | | | | | | | | | | | | | | | | | | | | | | |
Investment advisory fees | | | 329,126 | | | | 326,028 | | | | 393,491 | | | | 253,694 | | | | 352,262 | | | | 175,578 | | | | 320,979 | |
12b-1 fees: | | | | | | | | | | | | | | | | | | | | | | | | | | | | |
Class A | | | 114,748 | | | | 63,265 | | | | 140,664 | | | | - | | | | - | | | | 29,476 | | | | 82,025 | |
Class C | | | 32,995 | | | | 61,551 | | | | 78,678 | | | | 52,577 | | | | 78,169 | | | | 16,764 | | | | 30,082 | |
Administration fees | | | 127,000 | | | | 64,670 | | | | 160,055 | | | | 87,750 | | | | 116,925 | | | | 38,195 | | | | 84,800 | |
Non 12b-1 shareholder servicing fees | | | 48,755 | | | | 26,535 | | | | 77,490 | | | | 12,118 | | | | 18,365 | | | | 18,275 | | | | 27,000 | |
Registration fees | | | 24,999 | | | | 25,550 | | | | 31,025 | | | | 23,725 | | | | 29,930 | | | | - | | | | 27,375 | |
Printing expenses | | | 22,637 | | | | 14,375 | | | | 31,092 | | | | 15,284 | | | | 19,614 | | | | 6,615 | | | | 9,865 | |
Audit fees | | | 14,520 | | | | 14,965 | | | | 15,210 | | | | 12,775 | | | | 12,315 | | | | 12,950 | | | | 12,410 | |
Compliance officer fees | | | 4,045 | | | | 2,584 | | | | 6,490 | | | | 3,102 | | | | 3,964 | | | | 365 | | | | 4,380 | |
Custody fees | | | 6,884 | | | | 26,294 | | | | 47,550 | | | | 5,789 | | | | 8,030 | | | | 41,560 | | | | 7,950 | |
Trustees’ fees | | | 4,376 | | | | 3,708 | | | | 6,460 | | | | 2,639 | | | | 3,446 | | | | 1,194 | | | | 7,340 | |
Insurance expenses | | | 1,464 | | | | 365 | | | | 1,460 | | | | 1,460 | | | | 1,277 | | | | - | | | | 438 | |
Miscellaneous expenses | | | 2,599 | | | | 1,735 | | | | 6,540 | | | | 2,365 | | | | 365 | | | | 365 | | | | 2,365 | |
| | | | | | | | | | | | | | | | | | | | | | | | | | | | |
Total Operating Expenses | | | 734,148 | | | | 631,625 | | | | 996,205 | | | | 473,278 | | | | 644,662 | | | | 341,337 | | | | 617,009 | |
Less: Expenses waived by Advisor | | | (27,427 | ) | | | - | | | | (32,791 | ) | | | - | | | | - | | | | (7,316 | ) | | | (18,881 | ) |
| | | | | | | | | | | | | | | | | | | | | | | | | | | | |
Net Operating Expenses | | | 706,721 | | | | 631,625 | | | | 963,414 | | | | 473,278 | | | | 644,662 | | | | 334,021 | | | | 598,128 | |
| | | | | | | | | | | | | | | | | | | | | | | | | | | | |
| | | | | | | |
Net Investment Income (Loss) | | | 2,020,983 | | | | 133,738 | | | | (48,943 | ) | | | (230,099 | ) | | | (187,665 | ) | | | 97,810 | | | | 10,837 | |
| | | | | | | | | | | | | | | | | | | | | | | | | | | | |
| | | | | | | |
Realized and Unrealized Gain (Loss) on Investments: | | | | | | | | | | | | | | | | | | | | | | | | | | | | |
Net realized gain (loss) on | | | | | | | | | | | | | | | | | | | | | | | | | | | | |
investments | | | 422,511 | | | | 690,154 | | | | 273,314 | | | | - | | | | - | | | | 423,986 | | | | 3,128,758 | |
and foreign currency translations | | | - | | | | (1,107 | ) | | | (1,195 | ) | | | - | | | | - | | | | (6,120 | ) | | | - | |
affiliated investments | | | - | | | | - | | | | - | | | | 338,897 | | | | 170,419 | | | | - | | | | - | |
Capital gain distributions from affiliated funds | | | - | | | | - | | | | - | | | | 109,062 | | | | 126,976 | | | | - | | | | - | |
Capital gain dividends from REITs | | | - | | | | - | | | | 94,148 | | | | - | | | | - | | | | - | | | | 13,128 | |
Net change in unrealized appreciation (depreciation) on investments | | | 1,248,316 | | | | 5,289,596 | | | | (972,968 | ) | | | - | | | | - | | | | 2,388,196 | | | | (1,372,106 | ) |
affiliated funds | | | - | | | | - | | | | - | | | | 2,933,572 | | | | 3,046,851 | | | | - | | | | - | |
alternative investments | | | - | | | | - | | | | (403,910 | ) | | | - | | | | - | | | | - | | | | - | |
and foreign currency translations | | | - | | | | (34 | ) | | | (860 | ) | | | - | | | | - | | | | 84 | | | | - | |
| | | | | | | | | | | | | | | | | | | | | | | | | | | | |
Net Realized and Unrealized Gain (Loss) on Investments | | | 1,670,827 | | | | 5,978,609 | | | | (1,011,471 | ) | | | 3,381,531 | | | | 3,344,246 | | | | 2,806,146 | | | | 1,769,780 | |
| | | | | | | | | | | | | | | | | | | | | | | | | | | | |
| | | | | | | |
Net Increase (Decrease) in Net Assets Resulting From Operations | | $ | 3,691,810 | | | $ | 6,112,347 | | | $ | (1,060,414 | ) | | $ | 3,151,432 | | | $ | 3,156,581 | | | $ | 2,903,956 | | | $ | 1,780,617 | |
| | | | | | | | | | | | | | | | | | | | | | | | | | | | |
The accompanying notes are an integral part of these financial statements.
74
Timothy Plan Funds
Statements of Changes in Net Assets
| | | | | | | | | | | | | | | | | | | | | | | | |
| | | Aggressive Growth Fund | | | International Fund | | | Large/Mid Cap Growth Fund | |
| | | | | | |
| | | Year Ended
September 30,
2017 | | | Year Ended
September 30,
2016 | | | Year Ended
September 30,
2017 | | | Year Ended
September 30,
2016 | | | Year Ended
September 30,
2017 | | | Year Ended
September 30,
2016 | |
Operations: | | | | | | | | | | | | | | | | | | | | | | | | |
Net investment income (loss) | | $ | (288,224 | ) | | $ | (166,982 | ) | | $ | 330,646 | | | $ | (12,777 | ) | | $ | (159,698 | ) | | $ | (257,005 | ) |
Net realized gain (loss) from investments and foreign currency translations | | | 1,503,387 | | | | (1,831,106 | ) | | | 9,963,900 | | | | (2,914,476 | ) | | | 2,495,324 | | | | 228,818 | |
Capital gain dividends from REITs | | | - | | | | 1,828 | | | | - | | | | - | | | | - | | | | - | |
Net change in unrealized appreciation (depreciation) on investments and foreign currency translations | | | 3,127,978 | | | | 1,888,501 | | | | 3,000,892 | | | | 4,233,491 | | | | 8,627,675 | | | | 3,836,975 | |
| | | | | | | | | | | | | | | | | | | | | | | | |
Net increase (decrease) in net assets resulting from operations | | | 4,343,141 | | | | (107,759 | ) | | | 13,295,438 | | | | 1,306,238 | | | | 10,963,301 | | | | 3,808,788 | |
| | | | | | | | | | | | | | | | | | | | | | | | |
| | | | | | |
Distributions to Shareholders: | | | | | | | | | | | | | | | | | | | | | | | | |
Net investment income | | | | | | | | | | | | | | | | | | | | | | | | |
Class A | | | - | | | | - | | | | (651,323 | ) | | | (726,253 | ) | | | - | | | | - | |
Class C | | | - | | | | - | | | | (6,005 | ) | | | (28,008 | ) | | | - | | | | - | |
Class I | | | - | | | | - | | | | (72,240 | ) | | | (24,306 | ) | | | - | | | | - | |
Net realized gains | | | | | | | | | | | | | | | | | | | | | | | | |
Class A | | | - | | | | (2,544,026 | ) | | | - | | | | - | | | | (696,373 | ) | | | (5,603,259 | ) |
Class C | | | - | | | | (552,804 | ) | | | - | | | | - | | | | (108,931 | ) | | | (794,628 | ) |
Class I | | | - | | | | (41,648 | ) | | | - | | | | - | | | | (13,562 | ) | | | (112,991 | ) |
| | | | | | | | | | | | | | | | | | | | | | | | |
Total dividends and distributions to shareholders | | | - | | | | (3,138,478 | ) | | | (729,568 | ) | | | (778,567 | ) | | | (818,866 | ) | | | (6,510,878 | ) |
| | | | | | | | | | | | | | | | | | | | | | | | |
| | | | | | |
Share Transactions of Beneficial Interest: | | | | | | | | | | | | | | | | | | | | | | | | |
Net proceeds from shares sold | | | | | | | | | | | | | | | | | | | | | | | | |
Class A | | | 10,276,076 | | | | 9,757,605 | | | | 29,924,470 | | | | 31,091,113 | | | | 28,163,409 | | | | 14,842,125 | |
Class C | | | 664,926 | | | | 669,961 | | | | 1,063,169 | | | | 2,411,129 | | | | 2,761,483 | | | | 1,922,691 | |
Class I | | | 410,807 | | | | 302,342 | | | | 10,148,632 | | | | 1,489,273 | | | | 2,705,137 | | | | 810,899 | |
Reinvestment of dividends and distributions | | | | | | | | | | | | | | | | | | | | | | | | |
Class A | | | - | | | | 2,452,543 | | | | 555,955 | | | | 642,669 | | | | 671,056 | | | | 5,193,825 | |
Class C | | | - | | | | 515,399 | | | | 5,464 | | | | 25,560 | | | | 95,918 | | | | 687,062 | |
Class I | | | - | | | | 41,648 | | | | 39,506 | | | | 4,463 | | | | 13,516 | | | | 113,034 | |
Cost of shares redeemed | | | | | | | | | | | | | | | | | | | | | | | | |
Class A | | | (12,638,423 | ) | | | (4,695,428 | ) | | | (29,726,519 | ) | | | (15,678,562 | ) | | | (23,071,818 | ) | | | (16,613,778 | ) |
Class C | | | (1,040,253 | ) | | | (608,765 | ) | | | (1,543,450 | ) | | | (1,426,663 | ) | | | (1,701,660 | ) | | | (1,091,308 | ) |
Class I | | | (25,304 | ) | | | (210,850 | ) | | | (1,564,989 | ) | | | (235,857 | ) | | | (196,871 | ) | | | (985,318 | ) |
| | | | | | | | | | | | | | | | | | | | | | | | |
Net increase (decrease) in net assets from share transactions of beneficial interest | | | (2,352,171 | ) | | | 8,224,455 | | | | 8,902,238 | | | | 18,323,125 | | | | 9,440,170 | | | | 4,879,232 | |
| | | | | | | | | | | | | | | | | | | | | | | | |
| | | | | | |
Total Increase in Net Assets | | | 1,990,970 | | | | 4,978,218 | | | | 21,468,108 | | | | 18,850,796 | | | | 19,584,605 | | | | 2,177,142 | |
| | | | | | |
Net Assets: | | | | | | | | | | | | | | | | | | | | | | | | |
Beginning of period | | | 25,029,229 | | | | 20,051,011 | | | | 77,388,074 | | | | 58,537,278 | | | | 62,551,048 | | | | 60,373,906 | |
| | | | | | | | | | | | | | | | | | | | | | | | |
End of period* | | $ | 27,020,199 | | | $ | 25,029,229 | | | $ | 98,856,182 | | | $ | 77,388,074 | | | $ | 82,135,653 | | | $ | 62,551,048 | |
| | | | | | | | | | | | | | | | | | | | | | | | |
* Includes accumulated net investment income (loss) at end of period | | $ | (227,414 | ) | | $ | (112,683 | ) | | $ | 88,682 | | | $ | (274,483 | ) | | $ | (85,093 | ) | | $ | (214,045 | ) |
| | | | | | | | | | | | | | | | | | | | | | | | |
| | | | | | |
Share Activity: | | | | | | | | | | | | | | | | | | | | | | | | |
Shares Sold | | | | | | | | | | | | | | | | | | | | | | | | |
Class A | | | 1,412,044 | | | | 1,423,889 | | | | 3,344,583 | | | | 3,711,299 | | | | 3,551,281 | | | | 2,009,044 | |
Class C | | | 107,222 | | | | 114,375 | | | | 122,174 | | | | 292,735 | | | | 414,212 | | | | 314,086 | |
Class I | | | 54,291 | | | | 44,337 | | | | 1,157,000 | | | | 178,098 | | | | 330,898 | | | | 110,605 | |
Shares Reinvested | | | | | | | | | | | | | | | | | | | | | | | | |
Class A | | | - | | | | 350,864 | | | | 65,793 | | | | 76,966 | | | | 86,812 | | | | 718,371 | |
Class C | | | - | | | | 87,504 | | | | 664 | | | | 3,148 | | | | 14,894 | | | | 113,004 | |
Class I | | | - | | | | 5,907 | | | | 4,675 | | | | 534 | | | | 1,730 | | | | 15,505 | |
Shares Redeemed | | | | | | | | | | | | | | | | | | | | | | | | |
Class A | | | (1,741,621 | ) | | | (706,090 | ) | | | (3,390,201 | ) | | | (1,893,709 | ) | | | (2,895,329 | ) | | | (2,317,721 | ) |
Class C | | | (175,323 | ) | | | (100,152 | ) | | | (184,030 | ) | | | (177,184 | ) | | | (258,305 | ) | | | (180,263 | ) |
Class I | | | (3,580 | ) | | | (30,623 | ) | | | (175,352 | ) | | | (28,138 | ) | | | (24,333 | ) | | | (136,022 | ) |
| | | | | | | | | | | | | | | | | | | | | | | | |
Net increase (decrease) in shares of beneficial interest outstanding | | | (346,967 | ) | | | 1,190,011 | | | | 945,306 | | | | 2,163,749 | | | | 1,221,860 | | | | 646,609 | |
| | | | | | | | | | | | | | | | | | | | | | | | |
| | | | | | | | | | | | | | | | | | | | | | | | |
| |
The accompanying notes are an integral part of these financial statements.
75
Timothy Plan Funds
Statements of Changes in Net Assets (Continued)
| | | | | | | | | | | | | | | | | | | | | | | | |
| | | Small Cap Value Fund | | | Large/Mid Cap Value Fund | | | Fixed Income Fund | |
| | | | | | |
| | | Year Ended
September 30,
2017 | | | Year Ended
September 30,
2016 | | | Year Ended
September 30,
2017 | | | Year Ended
September 30,
2016 | | | Year Ended
September 30,
2017 | | | Year Ended
September 30,
2016 | |
Operations: | | | | | | | | | | | | | | | | | | | | | | | | |
Net investment income (loss) | | $ | 174,210 | | | $ | (102,494 | ) | | $ | 366,696 | | | $ | (63,043 | ) | | $ | 1,081,386 | | | $ | 1,132,812 | |
Net realized gain (loss) from investments and foreign currency translations | | | 9,445,306 | | | | 1,403,949 | | | | 13,916,124 | | | | 2,267,246 | | | | (39,983 | ) | | | 70,867 | |
Capital gain dividends from REITs | | | 102,356 | | | | 9,918 | | | | 12,498 | | | | 65,206 | | | | - | | | | - | |
Net change in unrealized appreciation (depreciation) on investments and foreign currency translations | | | 15,135,696 | | | | 8,551,910 | | | | 9,553,606 | | | | 8,267,200 | | | | (2,031,650 | ) | | | 1,854,779 | |
| | | | | | | | | | | | | | | | | | | | | | | | |
Net increase (decrease) in net assets resulting from operations | | | 24,857,568 | | | | 9,863,283 | | | | 23,848,924 | | | | 10,536,609 | | | | (990,247 | ) | | | 3,058,458 | |
| | | | | | | | | | | | | | | | | | | | | | | | |
| | | | | | |
Distributions to Shareholders: | | | | | | | | | | | | | | | | | | | | | | | | |
Net investment income | | | | | | | | | | | | | | | | | | | | | | | | |
Class A | | | - | | | | - | | | | - | | | | - | | | | (1,274,991 | ) | | | (1,177,146 | ) |
Class C | | | - | | | | - | | | | - | | | | - | | | | (87,395 | ) | | | (58,563 | ) |
Class I | | | - | | | | - | | | | - | | | | - | | | | (28,822 | ) | | | (5,499 | ) |
Net realized gains | | | | | | | | | | | | | | | | | | | | | | | | |
Class A | | | (1,379,261 | ) | | | (6,897,842 | ) | | | (1,940,987 | ) | | | (16,483,862 | ) | | | - | | | | - | |
Class C | | | (197,580 | ) | | | (1,028,884 | ) | | | (312,832 | ) | | | (2,525,475 | ) | | | - | | | | - | |
Class I | | | (95,030 | ) | | | (137,683 | ) | | | (78,954 | ) | | | (420,027 | ) | | | - | | | | - | |
| | | | | | | | | | | | | | | | | | | | | | | | |
Total dividends and distributions to shareholders | | | (1,671,871 | ) | | | (8,064,409 | ) | | | (2,332,773 | ) | | | (19,429,364 | ) | | | (1,391,208 | ) | | | (1,241,208 | ) |
| | | | | | | | | | | | | | | | | | | | | | | | |
| | | | | | |
Share Transactions of Beneficial Interest: | | | | | | | | | | | | | | | | | | | | | | | | |
Net proceeds from shares sold | | | | | | | | | | | | | | | | | | | | | | | | |
Class A | | | 34,063,961 | | | | 30,092,717 | | | | 44,668,663 | | | | 48,007,995 | | | | 29,145,764 | | | | 32,750,066 | |
Class C | | | 3,051,009 | | | | 1,930,487 | | | | 5,127,515 | | | | 4,416,018 | | | | 3,385,129 | | | | 3,152,958 | |
Class I | | | 15,600,425 | | | | 1,688,930 | | | | 15,746,538 | | | | 2,533,303 | | | | 2,319,134 | | | | 683,578 | |
Reinvestment of dividends and distributions | | | | | | | | | | | | | | | | | | | | | | | | |
Class A | | | 1,332,783 | | | | 6,620,002 | | | | 1,782,051 | | | | 15,246,790 | | | | 1,137,339 | | | | 1,029,560 | |
Class C | | | 189,394 | | | | 966,913 | | | | 278,290 | | | | 2,183,543 | | | | 74,448 | | | | 49,825 | |
Class I | | | 79,726 | | | | 129,683 | | | | 74,220 | | | | 358,505 | | | | 25,178 | | | | 5,499 | |
Cost of shares redeemed | | | | | | | | | | | | | | | | | | | | | | | | |
Class A | | | (36,134,908 | ) | | | (15,559,182 | ) | | | (51,593,275 | ) | | | (36,698,931 | ) | | | (38,428,316 | ) | | | (15,357,156 | ) |
Class C | | | (2,277,120 | ) | | | (1,495,014 | ) | | | (4,692,501 | ) | | | (2,801,607 | ) | | | (3,243,896 | ) | | | (2,254,369 | ) |
Class I | | | (1,277,488 | ) | | | (412,706 | ) | | | (3,161,750 | ) | | | (828,259 | ) | | | (771,465 | ) | | | (610,256 | ) |
| | | | | | | | | | | | | | | | | | | | | | | | |
Net increase (decrease) in net assets from share transactions of beneficial interest | | | 14,627,782 | | | | 23,961,830 | | | | 8,229,751 | | | | 32,417,357 | | | | (6,356,685 | ) | | | 19,449,705 | |
| | | | | | | | | | | | | | | | | | | | | | | | |
| | | | | | |
Total Increase (Decrease) in Net Assets | | | 37,813,479 | | | | 25,760,704 | | | | 29,745,902 | | | | 23,524,602 | | | | (8,738,140 | ) | | | 21,266,955 | |
| | | | | | |
Net Assets: | | | | | | | | | | | | | | | | | | | | | | | | |
Beginning of period | | | 107,452,577 | | | | 81,691,873 | | | | 180,497,511 | | | | 156,972,909 | | | | 96,366,423 | | | | 75,099,468 | |
| | | | | | | | | | | | | | | | | | | | | | | | |
End of period* | | $ | 145,266,056 | | | $ | 107,452,577 | | | $ | 210,243,413 | | | $ | 180,497,511 | | | $ | 87,628,283 | | | $ | 96,366,423 | |
| | | | | | | | | | | | | | | | | | | | | | | | |
* Includes accumulated net investment income (loss) at end of period | | $ | 71,470 | | | $ | (102,740 | ) | | $ | 296,232 | | | $ | (69,271 | ) | | $ | 340,631 | | | $ | 324,438 | |
| | | | | | | | | | | | | | | | | | | | | | | | |
| | | | | | |
| Share Activity: | | | | | | | | | | | | | | | | | | | | | | | | |
Shares Sold | | | | | | | | | | | | | | | | | | | | | | | | |
Class A | | | 1,841,275 | | | | 1,882,925 | | | | 2,470,843 | | | | 2,835,690 | | | | 2,846,241 | | | | 3,173,802 | |
Class C | | | 213,742 | | | | 156,174 | | | | 341,567 | | | | 314,051 | | | | 343,433 | | | | 317,784 | |
Class I | | | 849,133 | | | | 100,485 | | | | 856,447 | | | | 150,827 | | | | 229,120 | | | | 66,251 | |
Shares Reinvested | | | | | | | | | | | | | | | | | | | | | | | | |
Class A | | | 70,705 | | | | 430,150 | | | | 100,624 | | | | 939,420 | | | | 111,777 | | | | 99,386 | |
Class C | | | 13,180 | | | | 81,459 | | | | 18,918 | | | | 160,319 | | | | 7,594 | | | | 4,987 | |
Class I | | | 4,189 | | | | 8,371 | | | | 4,160 | | | | 21,981 | | | | 2,487 | | | | 533 | |
Shares Redeemed | | | | | | | | | | | | | | | | | | | | | | | | |
Class A | | | (1,954,274 | ) | | | (1,004,301 | ) | | | (2,845,566 | ) | | | (2,204,996 | ) | | | (3,761,593 | ) | | | (1,487,222 | ) |
Class C | | | (159,590 | ) | | | (124,194 | ) | | | (313,752 | ) | | | (197,741 | ) | | | (329,334 | ) | | | (226,631 | ) |
Class I | | | (66,949 | ) | | | (25,157 | ) | | | (169,874 | ) | | | (48,600 | ) | | | (75,731 | ) | | | (59,905 | ) |
| | | | | | | | | | | | | | | | | | | | | | | | |
Net increase (decrease) in shares of beneficial interest outstanding | | | 811,411 | | | | 1,505,912 | | | | 463,367 | | | | 1,970,951 | | | | (626,006 | ) | | | 1,888,985 | |
| | | | | | | | | | | | | | | | | | | | | | | | |
The accompanying notes are an integral part of these financial statements.
76
Timothy Plan Funds
Statements of Changes in Net Assets (Continued)
| | | | | | | | | | | | | | | | | | | | | | | | |
| | | High Yield Bond Fund | | | Israel Common Values Fund | | | Defensive Strategies Fund | |
| | | | | | |
| | | Year Ended
September 30,
2017 | | | Year Ended
September 30,
2016 | | | Year Ended
September 30,
2017 | | | Year Ended
September 30,
2016 | | | Year Ended
September 30,
2017 | | | Year Ended
September 30,
2016 | |
Operations: | | | | | | | | | | | | | | | | | | | | | | | | |
Net investment income (loss) | | $ | 2,020,983 | | | $ | 1,935,693 | | | $ | 133,738 | | | $ | (176,879 | ) | | $ | (48,943 | ) | | $ | 237,014 | |
Net realized gain (loss) from investments and foreign currency translations | | | 422,511 | | | | (935,586 | ) | | | 689,047 | | | | (324,559 | ) | | | 272,119 | | | | (1,915,896 | ) |
Capital gain dividends from REITs | | | - | | | | - | | | | - | | | | - | | | | 94,148 | | | | 206,920 | |
Net change in unrealized appreciation (depreciation) on investments and foreign currency translations | | | 1,248,316 | | | | 3,461,231 | | | | 5,289,562 | | | | 2,645,020 | | | | (1,377,738 | ) | | | 8,550,989 | |
| | | | | | | | | | | | | | | | | | | | | | | | |
Net increase (decrease) in net assets resulting from operations | | | 3,691,810 | | | | 4,461,338 | | | | 6,112,347 | | | | 2,143,582 | | | | (1,060,414 | ) | | | 7,079,027 | |
| | | | | | | | | | | | | | | | | | | | | | | | |
| | | | | | |
Distributions to Shareholders: | | | | | | | | | | | | | | | | | | | | | | | | |
Net investment income | | | | | | | | | | | | | | | | | | | | | | | | |
Class A | | | (1,652,789 | ) | | | (1,790,913 | ) | | | (265,667 | ) | | | - | | | | (208,348 | ) | | | - | |
Class C | | | (92,483 | ) | | | (87,942 | ) | | | (49,930 | ) | | | - | | | | - | | | | - | |
Class I | | | (248,296 | ) | | | (45,400 | ) | | | (10,636 | ) | | | - | | | | (2,838 | ) | | | - | |
From net realized gains | | | | | | | | | | | | | | | | | | | | | | | | |
Class A | | | - | | | | - | | | | - | | | | - | | | | - | | | | - | |
Class C | | | - | | | | - | | | | - | | | | - | | | | - | | | | - | |
Class I | | | - | | | | - | | | | - | | | | - | | | | - | | | | - | |
| | | | | | | | | | | | | | | | | | | | | | | | |
Total dividends and distributions to shareholders | | | (1,993,568 | ) | | | (1,924,255 | ) | | | (326,233 | ) | | | - | | | | (211,186 | ) | | | - | |
| | | | | | | | | | | | | | | | | | | | | | | | |
| | | | | | |
Share Transactions of Beneficial Interest: | | | | | | | | | | | | | | | | | | | | | | | | |
Net proceeds from shares sold | | | | | | | | | | | | | | | | | | | | | | | | |
Class A | | | 31,183,806 | | | | 24,017,263 | | | | 24,717,238 | | | | 5,321,650 | | | | 12,582,965 | | | | 21,058,691 | |
Class C | | | 806,793 | | | | 525,354 | | | | 3,951,474 | | | | 1,814,336 | | | | 1,389,434 | | | | 1,397,370 | |
Class I | | | 11,795,627 | | | | 845,583 | | | | 1,727,826 | | | | 270,177 | | | | 2,620,051 | | | | 327,197 | |
Reinvestment of dividends and distributions | | | | | | | | | | | | | | | | | | | | | | | | |
Class A | | | 1,432,008 | | | | 1,544,213 | | | | 245,204 | | | | - | | | | 196,408 | | | | - | |
Class C | | | 83,410 | | | | 79,858 | | | | 43,283 | | | | - | | | | - | | | | - | |
Class I | | | 153,646 | | | | 14,011 | | | | 8,532 | | | | - | | | | 2,381 | | | | - | |
Cost of shares redeemed | | | | | | | | | | | | | | | | | | | | | | | | |
Class A | | | (30,260,787 | ) | | | (15,001,868 | ) | | | (10,511,012 | ) | | | (2,750,868 | ) | | | (30,288,144 | ) | | | (30,050,425 | ) |
Class C | | | (563,008 | ) | | | (377,771 | ) | | | (1,335,601 | ) | | | (794,156 | ) | | | (4,160,352 | ) | | | (7,357,766 | ) |
Class I | | | (3,979,380 | ) | | | (2,079,004 | ) | | | (275,995 | ) | | | (24,354 | ) | | | (381,311 | ) | | | (123,433 | ) |
| | | | | | | | | | | | | | | | | | | | | | | | |
Net increase (decrease) in net assets from share transactions of beneficial interest | | | 10,652,115 | | | | 9,567,639 | | | | 18,570,949 | | | | 3,836,785 | | | | (18,038,568 | ) | | | (14,748,366 | ) |
| | | | | | | | | | | | | | | | | | | | | | | | |
| | | | | | |
Total Increase (Decrease) in Net Assets | | | 12,350,357 | | | | 12,104,722 | | | | 24,357,063 | | | | 5,980,367 | | | | (19,310,168 | ) | | | (7,669,339 | ) |
| | | | | | |
Net Assets: | | | | | | | | | | | | | | | | | | | | | | | | |
Beginning of period | | | 53,855,118 | | | | 41,750,396 | | | | 20,694,552 | | | | 14,714,185 | | | | 78,734,175 | | | | 86,403,514 | |
| | | | | | | | | | | | | | | | | | | | | | | | |
End of period* | | $ | 66,205,475 | | | $ | 53,855,118 | | | $ | 45,051,615 | | | $ | 20,694,552 | | | $ | 59,424,007 | | | $ | 78,734,175 | |
| | | | | | | | | | | | | | | | | | | | | | | | |
* Includes accumulated net investment income (loss) at end of period | | $ | 113,120 | | | $ | 85,705 | | | $ | (1,027,201 | ) | | $ | (895,856 | ) | | $ | (12,867 | ) | | $ | 2,970,065 | |
| | | | | | | | | | | | | | | | | | | | | | | | |
| | | | | | |
| Share Activity: | | | | | | | | | | | | | | | | | | | | | | | | |
Shares Sold | | | | | | | | | | | | | | | | | | | | | | | | |
Class A | | | 3,356,207 | | | | 2,742,134 | | | | 1,786,768 | | | | 461,537 | | | | 1,108,876 | | | | 1,934,784 | |
Class C | | | 86,106 | | | | 59,795 | | | | 302,596 | | | | 163,402 | | | | 128,104 | | | | 132,615 | |
Class I | | | 1,273,172 | | | | 94,126 | | | | 123,082 | | | | 22,627 | | | | 232,834 | | | | 29,889 | |
Shares Reinvested | | | | | | | | | | | | | | | | | | | | | | | | |
Class A | | | 154,827 | | | | 177,482 | | | | 19,538 | | | | - | | | | 17,351 | | | | - | |
Class C | | | 8,921 | | | | 9,081 | | | | 3,568 | | | | - | | | | - | | | | - | |
Class I | | | 16,553 | | | | 1,599 | | | | 679 | | | | - | | | | 211 | | | | - | |
Shares Redeemed | | | | | | | | | | | | | | | | | | | | | | | | |
Class A | | | (3,278,174 | ) | | | (1,718,478 | ) | | | (748,818 | ) | | | (233,549 | ) | | | (2,701,606 | ) | | | (2,748,219 | ) |
Class C | | | (60,370 | ) | | | (42,767 | ) | | | (99,863 | ) | | | (70,715 | ) | | | (384,962 | ) | | | (697,585 | ) |
Class I | | | (427,863 | ) | | | (243,426 | ) | | | (19,084 | ) | | | (2,247 | ) | | | (33,852 | ) | | | (10,792 | ) |
| | | | | | | | | | | | | | | | | | | | | | | | |
Net increase (decrease) in shares of beneficial interest outstanding | | | 1,129,379 | | | | 1,079,546 | | | | 1,368,466 | | | | 341,055 | | | | (1,633,044 | ) | | | (1,359,308 | ) |
| | | | | | | | | | | | | | | | | | | | | | | | |
The accompanying notes are an integral part of these financial statements.
77
Timothy Plan Funds
Statements of Changes in Net Assets (Continued)
| | | | | | | | | | | | | | | | | | | | | | | | |
| | | Strategic Growth Fund | | | Conservative Growth Fund | | | Emerging Markets Fund | |
| | | | | | |
| | | Year Ended
September 30,
2017 | | | Year Ended
September 30,
2016 | | | Year Ended
September 30,
2017 | | | Year Ended
September 30,
2016 | | | Year Ended
September 30,
2017 | | | Year Ended
September 30,
2016 | |
Operations: | | | | | | | | | | | | | | | | | | | | | | | | |
Net investment income (loss) | | $ | (230,099 | ) | | $ | (209,030 | ) | | $ | (187,665 | ) | | $ | (224,509 | ) | | $ | 97,810 | | | $ | 30,501 | |
Net realized gain (loss) from investments and foreign currency translations | | | 338,897 | | | | (448,605 | ) | | | 170,419 | | | | (1,151,302 | ) | | | 417,866 | | | | (754,177 | ) |
Capital gain distributions from affiliated funds | | | 109,062 | | | | 1,314,297 | | | | 126,976 | | | | 1,035,661 | | | | - | | | | - | |
Net change in unrealized appreciation (depreciation) on investments, affiliated funds and foreign currency translations | | | 2,933,572 | | | | 937,576 | | | | 3,046,851 | | | | 2,479,474 | | | | 2,388,280 | | | | 2,655,529 | |
| | | | | | | | | | | | | | | | | | | | | | | | |
Net increase in net assets resulting from operations | | | 3,151,432 | | | | 1,594,238 | | | | 3,156,581 | | | | 2,139,324 | | | | 2,903,956 | | | | 1,931,853 | |
| | | | | | | | | | | | | | | | | | | | | | | | |
| | | | | | |
Distributions to Shareholders: | | | | | | | | | | | | | | | | | | | | | | | | |
Net Investment Income | | | | | | | | | | | | | | | | | | | | | | | | |
Class A | | | - | | | | (112,223 | ) | | | - | | | | (236,640 | ) | | | (43,769 | ) | | | - | |
Class C | | | - | | | | - | | | | - | | | | - | | | | - | | | | - | |
Class I | | | - | | | | - | | | | - | | | | - | | | | (4,732 | ) | | | - | |
From net realized gains | | | | | | | | | | | | | | | | | | | | | | | | |
Class A | | | - | | | | - | | | | - | | | | (2,639,009 | ) | | | - | | | | - | |
Class C | | | - | | | | - | | | | - | | | | (682,167 | ) | | | - | | | | - | |
Class I | | | - | | | | - | | | | - | | | | - | | | | - | | | | - | |
| | | | | | | | | | | | | | | | | | | | | | | | |
Total dividends and distributions to shareholders | | | - | | | | (112,223 | ) | | | - | | | | (3,557,816 | ) | | | (48,501 | ) | | | - | |
| | | | | | | | | | | | | | | | | | | | | | | | |
| | | | | | |
Share Transactions of Beneficial Interest: | | | | | | | | | | | | | | | | | | | | | | | | |
Net proceeds from shares sold | | | | | | | | | | | | | | | | | | | | | | | | |
Class A | | | 4,166,453 | | | | 4,032,536 | | | | 6,702,813 | | | | 5,470,344 | | | | 11,239,828 | | | | 2,572,036 | |
Class C | | | 785,628 | | | | 787,803 | | | | 1,695,154 | | | | 1,602,781 | | | | 1,505,369 | | | | 365,496 | |
Class I | | | - | | | | - | | | | - | | | | - | | | | 952,797 | | | | 507,804 | |
Reinvestment of dividends and distributions | | | | | | | | | | | | | | | | | | | | | | | | |
Class A | | | - | | | | 109,450 | | | | - | | | | 2,757,111 | | | | 41,696 | | | | - | |
Class C | | | - | | | | - | | | | - | | | | 646,209 | | | | - | | | | - | |
Class I | | | - | | | | - | | | | - | | | | - | | | | 4,324 | | | | - | |
Cost of shares redeemed | | | | | | | | | | | | | | | | | | | | | | | | |
Class A | | | (6,834,735 | ) | | | (5,652,166 | ) | | | (8,654,305 | ) | | | (7,421,419 | ) | | | (3,799,619 | ) | | | (3,118,821 | ) |
Class C | | | (1,715,590 | ) | | | (1,364,045 | ) | | | (2,943,388 | ) | | | (2,343,151 | ) | | | (316,701 | ) | | | (134,303 | ) |
Class I | | | - | | | | - | | | | - | | | | - | | | | (135,941 | ) | | | (214,533 | ) |
| | | | | | | | | | | | | | | | | | | | | | | | |
Net increase (decrease) in net assets from share transactions of beneficial interest | | | (3,598,244 | ) | | | (2,086,422 | ) | | | (3,199,726 | ) | | | 711,875 | | | | 9,491,753 | | | | (22,321 | ) |
| | | | | | | | | | | | | | | | | | | | | | | | |
| | | | | | |
Total Increase (Decrease) in Net Assets | | | (446,812 | ) | | | (604,407 | ) | | | (43,145 | ) | | | (706,617 | ) | | | 12,347,208 | | | | 1,909,532 | |
| | | | | | |
Net Assets: | | | | | | | | | | | | | | | | | | | | | | | | |
Beginning of period | | | 40,179,870 | | | | 40,784,277 | | | | 55,133,908 | | | | 55,840,525 | | | | 8,717,953 | | | | 6,808,421 | |
| | | | | | | | | | | | | | | | | | | | | | | | |
End of period* | | $ | 39,733,058 | | | $ | 40,179,870 | | | $ | 55,090,763 | | | $ | 55,133,908 | | | $ | 21,065,161 | | | $ | 8,717,953 | |
| | | | | | | | | | | | | | | | | | | | | | | | |
* Includes accumulated net investment income (loss) at end of period | | $ | (260,506 | ) | | $ | (210,011 | ) | | $ | (236,547 | ) | | $ | (226,602 | ) | | $ | 46,816 | | | $ | 3,627 | |
| | | | | | | | | | | | | | | | | | | | | | | | |
| | | | | | |
| Share Activity: | | | | | | | | | | | | | | | | | | | | | | | | |
Shares Sold | | | | | | | | | | | | | | | | | | | | | | | | |
Class A | | | 464,147 | | | | 480,831 | | | | 655,267 | | | | 554,370 | | | | 1,274,463 | | | | 363,891 | |
Class C | | | 96,618 | | | | 102,532 | | | | 180,953 | | | | 175,034 | | | | 176,963 | | | | 53,058 | |
Class I | | | - | | | | - | | | | - | | | | - | | | | 107,396 | | | | 65,927 | |
Shares Reinvested | | | | | | | | | | | | | | | | | | | | | | | | |
Class A | | | - | | | | 13,045 | | | | - | | | | 287,499 | | | | 5,122 | | | | - | |
Class C | | | - | | | | - | | | | - | | | | 72,689 | | | | - | | | | - | |
Class I | | | - | | | | - | | | | - | | | | - | | | | 529 | | | | - | |
Shares Redeemed | | | | | | | | | | | | | | | | | | | | | | | | |
Class A | | | (762,256 | ) | | | (667,629 | ) | | | (845,604 | ) | | | (755,679 | ) | | | (426,808 | ) | | | (425,373 | ) |
Class C | | | (211,295 | ) | | | (176,799 | ) | | | (312,252 | ) | | | (256,362 | ) | | | (36,280 | ) | | | (19,113 | ) |
Class I | | | - | | | | - | | | | - | | | | - | | | | (14,747 | ) | | | (31,018 | ) |
| | | | | | | | | | | | | | | | | | | | | | | | |
Net increase (decrease) in shares of beneficial interest outstanding | | | (412,786 | ) | | | (248,020 | ) | | | (321,636 | ) | | | 77,551 | | | | 1,086,638 | | | | 7,372 | |
| | | | | | | | | | | | | | | | | | | | | | | | |
The accompanying notes are an integral part of these financial statements.
78
Timothy Plan Funds
Statements of Changes in Net Assets (Continued)
| | | | | | | | |
| | | Growth & Income Fund | |
| | |
| | | Year Ended
September 30,
2017 | | | Year Ended
September 30,
2016 | |
Operations: | | | | | | | | |
Net investment income | | $ | 10,837 | | | $ | 68,916 | |
Net realized gain (loss) from investments | | | 3,128,758 | | | | (1,285,364 | ) |
Capital gain dividends from REITs | | | 13,128 | | | | 4,777 | |
Net change in unrealized appreciation (depreciation) on investments | | | (1,372,106 | ) | | | 2,103,587 | |
| | | | | | | | |
Net increase in net assets resulting from operations | | | 1,780,617 | | | | 891,916 | |
| | | | | | | | |
| | |
Distributions to Shareholders: | | | | | | | | |
Net Investment Income | | | | | | | | |
Class A | | | (21,156 | ) | | | (63,627 | ) |
Class I | | | (5,642 | ) | | | (3,765 | ) |
| | | | | | | | |
Total dividends and distributions to shareholders | | | (26,798 | ) | | | (67,392 | ) |
| | | | | | | | |
| | |
Share Transactions of Beneficial Interest: | | | | | | | | |
Net proceeds from shares sold | | | | | | | | |
Class A | | | 6,564,420 | | | | 15,061,831 | |
Class C | | | 928,371 | | | | 694,150 | |
Class I | | | 775,543 | | | | 314,655 | |
Reinvestment of dividends and distributions | | | | | | | | |
Class A | | | 20,338 | | | | 62,209 | |
Class I | | | 5,224 | | | | 3,498 | |
Cost of shares redeemed | | | | | | | | |
Class A | | | (14,180,161 | ) | | | (5,764,625 | ) |
Class C | | | (1,069,371 | ) | | | (1,040,757 | ) |
Class I | | | (275,644 | ) | | | (329,849 | ) |
| | | | | | | | |
Net increase (decrease) in net assets from share transactions of beneficial interest | | | (7,231,280 | ) | | | 9,001,112 | |
| | | | | | | | |
| | |
Total Increase (Decrease) in Net Assets | | | (5,477,461 | ) | | | 9,825,636 | |
| | |
Net Assets: | | | | | | | | |
Beginning of period | | | 41,107,233 | | | | 31,281,597 | |
| | | | | | | | |
End of period* | | $ | 35,629,772 | | | $ | 41,107,233 | |
| | | | | | | | |
* Includes accumulated net investment income (loss) at end of period | | $ | - | | | $ | 1,949 | |
| | | | | | | | |
| | |
Share Activity: | | | | | | | | |
Shares Sold | | | | | | | | |
Class A | | | 604,205 | | | | 1,423,716 | |
Class C | | | 87,468 | | | | 66,702 | |
Class I | | | 71,030 | | | | 29,170 | |
Shares Reinvested | | | | | | | | |
Class A | | | 1,881 | | | | 5,792 | |
Class I | | | 480 | | | | 324 | |
Shares Redeemed | | | | | | | | |
Class A | | | (1,299,652 | ) | | | (543,935 | ) |
Class C | | | (100,879 | ) | | | (100,357 | ) |
Class I | | | (25,176 | ) | | | (31,110 | ) |
| | | | | | | | |
Net increase (decrease) in shares of beneficial interest outstanding | | | (660,643 | ) | | | 850,302 | |
| | | | | | | | |
The accompanying notes are an integral part of these financial statements.
79
Timothy Aggressive Growth Fund (Class A Shares)
Selected data based on a share outstanding throughout each period
| | | | | | | | | | | | | | | | | | | | |
| | | For the Year
ended
September 30,
2017 | | | For the Year
ended
September 30,
2016 | | | For the Year
ended
September 30,
2015 | | | For the Year
ended
September 30,
2014 | | | For the Year
ended
September 30,
2013 | |
| | | | | |
Net asset value, beginning of year | | $ | 6.82 | | | $ | 7.98 | | | $ | 9.18 | | | $ | 9.00 | | | $ | 7.10 | |
| | | | | | | | | | | | | | | | | | | | |
| | | | | |
INCOME FROM INVESTMENT OPERATIONS: | | | | | | | | | | | | | | | | | | | | |
Net investment loss (A) | | | (0.08 | ) | | | (0.04 | ) | | | (0.08 | ) | | | (0.11 | ) | | | (0.09 | ) |
Net realized and unrealized gain (loss) on investments | | | 1.36 | | | | (0.02 | ) (B) | | | (0.05 | ) | | | 0.84 | | | | 1.99 | |
| | | | | | | | | | | | | | | | | | | | |
Total from investment operations | | | 1.28 | | | | (0.06 | ) | | | (0.13 | ) | | | 0.73 | | | | 1.90 | |
| | | | | | | | | | | | | | | | | | | | |
| | | | | |
LESS DISTRIBUTIONS: | | | | | | | | | | | | | | | | | | | | |
From net realized gains on investments | | | - | | | | (1.10 | ) | | | (1.07 | ) | | | (0.55 | ) | | | - | |
| | | | | | | | | | | | | | | | | | | | |
Total distributions | | | - | | | | (1.10 | ) | | | (1.07 | ) | | | (0.55 | ) | | | - | |
| | | | | | | | | | | | | | | | | | | | |
| | | | | |
Net asset value, end of year | | $ | 8.10 | | | $ | 6.82 | | | $ | 7.98 | | | $ | 9.18 | | | $ | 9.00 | |
| | | | | | | | | | | | | | | | | | | | |
| | | | | |
Total return (C)(D) | | | 18.77% | | | | (1.03)% | | | | (2.35)% | | | | 8.22% | | | | 26.76% | |
| | | | | |
RATIOS/SUPPLEMENTAL DATA: | | | | | | | | | | | | | | | | | | | | |
Net assets, end of year (in 000’s) | | $ | 22,549 | | | $ | 21,209 | | | $ | 16,306 | | | $ | 19,268 | | | $ | 17,727 | |
Ratios to average net assets | | | | | | | | | | | | | | | | | | | | |
Expenses, before waiver and reimbursement | | | 1.69% | | | | 1.69% | | | | 1.77% | | | | 1.74% | | | | - | |
Expenses, net waiver and reimbursement | | | 1.59% | | | | 1.59% | | | | 1.67% | | | | 1.73% | | | | 1.86% | |
Net investment loss, before waiver and reimbursement | | | (1.12)% | | | | (0.73)% | | | | (1.04)% | | | | (1.19)% | | | | - | |
Net investment loss, net waiver and reimbursement | | | (1.02)% | | | | (0.63)% | | | | (0.94)% | | | | (1.18)% | | | | (1.20)% | |
Portfolio turnover rate | | | 151% | | | | 124% | | | | 144% | | | | 91% | | | | 120% | |
| (A) | Per share amounts calculated using average shares method, which more appropriately presents the per share data for the period. |
| (B) | Realized and unrealized gains per share in this caption are balancing amounts necessary to reconcile the change in net asset value per share for the period, and may not reconcile with the aggregate gains and losses in the Statements of Operations due to share transactions for the period. |
| (C) | Total return calculation does not reflect sales load. |
| (D) | Total return in the above table represents the rate that the investor would have earned or lost on an investment in the Fund assuming reinvestment of dividends. |
| | Total return would have been higher or lower if certain expenses had not been reimbursed, waived or recouped. |
The accompanying notes are an integral part of these financial statements.
80
Timothy Aggressive Growth Fund (Class C Shares)
Selected data based on a share outstanding throughout each period
| | | | | | | | | | | | | | | | | | | | |
| | | For the Year
ended
September 30,
2017 | | | For the Year
ended
September 30,
2016 | | | For the Year
ended
September 30,
2015 | | | For the Year
ended
September 30,
2014 | | | For the Year
ended
September 30,
2013 | |
| | | | | |
Net asset value, beginning of year | | $ | 5.71 | | | $ | 6.90 | | | $ | 8.13 | | | $ | 8.09 | | | $ | 6.43 | |
| | | | | | | | | | | | | | | | | | | | |
| | | | | |
INCOME FROM INVESTMENT OPERATIONS: | | | | | | | | | | | | | | | | | | | | |
Net investment loss (A) | | | (0.11 | ) | | | (0.08 | ) | | | (0.13 | ) | | | (0.16 | ) | | | (0.14 | ) |
Net realized and unrealized gain (loss) on investments | | | 1.13 | | | | (0.01 | ) (B) | | | (0.03 | ) | | | 0.75 | | | | 1.80 | |
| | | | | | | | | | | | | | | | | | | | |
Total from investment operations | | | 1.02 | | | | (0.09 | ) | | | (0.16 | ) | | | 0.59 | | | | 1.66 | |
| | | | | | | | | | | | | | | | | | | | |
| | | | | |
LESS DISTRIBUTIONS: | | | | | | | | | | | | | | | | | | | | |
From net realized gains on investments | | | - | | | | (1.10 | ) | | | (1.07 | ) | | | (0.55 | ) | | | - | |
| | | | | | | | | | | | | | | | | | | | |
Total distributions | | | - | | | | (1.10 | ) | | | (1.07 | ) | | | (0.55 | ) | | | - | |
| | | | | | | | | | | | | | | | | | | | |
| | | | | |
Net asset value, end of year | | $ | 6.73 | | | $ | 5.71 | | | $ | 6.90 | | | $ | 8.13 | | | $ | 8.09 | |
| | | | | | | | | | | | | | | | | | | | |
| | | | | |
Total return (C)(D) | | | 17.86% | | | | (1.73)% | | | | (3.10)% | | | | 7.37% | | | | 25.82% | |
| | | | | |
RATIOS/SUPPLEMENTAL DATA: | | | | | | | | | | | | | | | | | | | | |
Net assets, end of year (in 000’s) | | $ | 3,584 | | | $ | 3,426 | | | $ | 3,442 | | | $ | 3,458 | | | $ | 2,892 | |
Ratios to average net assets | | | | | | | | | | | | | | | | | | | | |
Expenses, before waiver and reimbursement | | | 2.44% | | | | 2.44% | | | | 2.52% | | | | 2.49% | | | | - | |
Expenses, net waiver and reimbursement | | | 2.34% | | | | 2.34% | | | | 2.42% | | | | 2.48% | | | | 2.60% | |
Net investment loss, before waiver and reimbursement | | | (1.88)% | | | | (1.47)% | | | | (1.78)% | | | | (1.94)% | | | | - | |
Net investment loss, net waiver and reimbursement | | | (1.78)% | | | | (1.37)% | | | | (1.69)% | | | | (1.93)% | | | | (1.94)% | |
Portfolio turnover rate | | | 151% | | | | 124% | | | | 144% | | | | 91% | | | | 120% | |
| (A) | Per share amounts calculated using average shares method, which more appropriately presents the per share data for the period. |
| (B) | Realized and unrealized gains per share in this caption are balancing amounts necessary to reconcile the change in net asset value per share for the period, and may not reconcile with the aggregate gains and losses in the Statements of Operations due to share transactions for the period. |
| (C) | Total return calculation does not reflect redemption fee. |
| (D) | Total return in the above table represents the rate that the investor would have earned or lost on an investment in the Fund assuming reinvestment of dividends. |
| | Total return would have been higher or lower if certain expenses had not been reimbursed, waived or recouped. |
The accompanying notes are an integral part of these financial statements.
81
Timothy Aggressive Growth Fund (Class I Shares)
Selected data based on a share outstanding throughout each period
| | | | | | | | | | | | | | | | | | | | |
| | | For the Year
ended
September 30,
2017 | | | For the Year
ended
September 30,
2016 | | | For the Year
ended
September 30,
2015 | | | For the Year
ended
September 30,
2014 | | | For the
Period ended
September 30,
2013 (A) | |
| | | | | |
Net asset value, beginning of period | | $ | 6.89 | | | $ | 8.03 | | | $ | 9.21 | | | $ | 9.01 | | | $ | 8.87 | |
| | | | | | | | | | | | | | | | | | | | |
| | | | | |
INCOME FROM INVESTMENT OPERATIONS: | | | | | | | | | | | | | | | | | | | | |
Net investment income (loss) (B) | | | (0.06 | ) | | | (0.03 | ) | | | (0.06 | ) | | | (0.07 | ) | | | - | * |
Net realized and unrealized gain (loss) on investments | | | 1.38 | | | | (0.01 | ) (C) | | | (0.05 | ) | | | 0.82 | | | | 0.14 | |
| | | | | | | | | | | | | | | | | | | | |
Total from investment operations | | | 1.32 | | | | (0.04 | ) | | | (0.11 | ) | | | 0.75 | | | | 0.14 | |
| | | | | | | | | | | | | | | | | | | | |
| | | | | |
LESS DISTRIBUTIONS: | | | | | | | | | | | | | | | | | | | | |
From net realized gains on investments | | | - | | | | (1.10 | ) | | | (1.07 | ) | | | (0.55 | ) | | | - | |
| | | | | | | | | | | | | | | | | | | | |
Total distributions | | | - | | | | (1.10 | ) | | | (1.07 | ) | | | (0.55 | ) | | | - | |
| | | | | | | | | | | | | | | | | | | | |
| | | | | |
Net asset value, end of period | | $ | 8.21 | | | $ | 6.89 | | | $ | 8.03 | | | $ | 9.21 | | | $ | 9.01 | |
| | | | | | | | | | | | | | | | | | | | |
| | | | | |
Total return (D) | | | 19.16% | | | | (0.75)% | | | | (2.10)% | | | | 8.43% | | | | 1.58% | (E) |
| | | | | |
RATIOS/SUPPLEMENTAL DATA: | | | | | | | | | | | | | | | | | | | | |
Net assets, end of period (in 000’s) | | $ | 887 | | | $ | 395 | | | $ | 303 | | | $ | 140 | | | $ | 102 | + |
Ratios to average net assets | | | | | | | | | | | | | | | | | | | | |
Expenses, before waiver and reimbursement | | | 1.44% | | | | 1.44% | | | | 1.52% | | | | 1.33% | | | | - | |
Expenses, net waiver and reimbursement | | | 1.34% | | | | 1.34% | | | | 1.42% | | | | 1.28% | | | | 1.61% | (F) |
Net investment income (loss), before waiver and reimbursement | | | (0.88)% | | | | (0.48)% | | | | (0.74)% | | | | (0.78)% | | | | - | |
Net investment loss, net waiver and reimbursement | | | (0.78)% | | | | (0.38)% | | | | (0.69)% | | | | (0.73)% | | | | (0.95)% | (F) |
Portfolio turnover rate | | | 151% | | | | 124% | | | | 144% | | | | 91% | | | | 120% | (E) |
*Amount is less than $0.005 per share.
+Actual net assets not truncated.
| (A) | For the period August 1, 2013 (Commencement of Operations) to September 30, 2013. |
| (B) | Per share amounts calculated using average shares method, which more appropriately presents the per share data for the period. |
| (C) | Realized and unrealized gains per share in this caption are balancing amounts necessary to reconcile the change in net asset value per share for the period, and may not reconcile with the aggregate gains and losses in the Statements of Operations due to share transactions for the period. |
| (D) | Total return in the above table represents the rate that the investor would have earned or lost on an investment in the Fund assuming reinvestment of dividends. |
| | Total return would have been higher or lower if certain expenses had not been reimbursed, waived or recouped. |
| (E) | For periods of less than one full year, total return and turnover are not annualized. |
The accompanying notes are an integral part of these financial statements.
82
Timothy International Fund (Class A Shares)
Selected data based on a share outstanding throughout each period
| | | | | | | | | | | | | | | | | | | | |
| | | For the Year
ended
September 30,
2017 | | | For the Year
ended
September 30,
2016 | | | For the Year
ended
September 30,
2015 | | | For the Year
ended
September 30,
2014 | | | For the Year
ended
September 30,
2013 | |
| | | | | |
Net asset value, beginning of year | | $ | 8.53 | | | $ | 8.47 | | | $ | 8.89 | | | $ | 8.65 | | | $ | 7.31 | |
| | | | | | | | | | | | | | | | | | | | |
| | | | | |
INCOME (LOSS) FROM INVESTMENT OPERATIONS: | | | | | | | | | | | | | | | | | | | | |
Net investment income (loss) (A) | | | 0.04 | | | | 0.00 | * | | | 0.08 | | | | 0.05 | | | | 0.06 | |
Net realized and unrealized gain (loss) on investments | | | 1.38 | | | | 0.15 | | | | (0.50 | ) | | | 0.36 | | | | 1.34 | |
| | | | | | | | | | | | | | | | | | | | |
Total from investment operations | | | 1.42 | | | | 0.15 | | | | (0.42 | ) | | | 0.41 | | | | 1.40 | |
| | | | | | | | | | | | | | | | | | | | |
| | | | | |
LESS DISTRIBUTIONS: | | | | | | | | | | | | | | | | | | | | |
From net investment income | | | (0.09 | ) | | | (0.09 | ) | | | - | | | | (0.17 | ) | | | (0.06 | ) |
| | | | | | | | | | | | | | | | | | | | |
Total distributions | | | (0.09 | ) | | | (0.09 | ) | | | - | | | | (0.17 | ) | | | (0.06 | ) |
| | | | | | | | | | | | | | | | | | | | |
| | | | | |
Net asset value, end of year | | $ | 9.86 | | | $ | 8.53 | | | $ | 8.47 | | | $ | 8.89 | | | $ | 8.65 | |
| | | | | | | | | | | | | | | | | | | | |
| | | | | |
Total return (B)(C) | | | 16.78% | | | | 1.85% | | | | (4.72)% | (D) | | | 4.74% | | | | 19.25% | |
| | | | | |
RATIOS/SUPPLEMENTAL DATA: | | | | | | | | | | | | | | | | | | | | |
Net assets, end of year (in 000’s) | | $ | 81,153 | | | $ | 70,013 | | | $ | 53,458 | | | $ | 54,709 | | | $ | 38,432 | |
Ratios to average net assets | | | | | | | | | | | | | | | | | | | | |
Expenses, before waiver and reimbursement | | | 1.69% | | | | 1.68% | | | | 1.67% | | | | 1.69% | | | | - | |
Expenses, net waiver and reimbursement | | | 1.64% | | | | 1.63% | | | | 1.62% | | | | 1.68% | | | | 1.73% | |
Net investment income (loss) before waiver and reimbursement | | | 0.35% | | | | (0.03)% | | | | 0.88% | | | | 0.52% | | | | - | |
Net investment income (loss), net waiver and reimbursement | | | 0.40% | | | | 0.02% | | | | 0.93% | | | | 0.52% | | | | 0.70% | |
Portfolio turnover rate | | | 42% | | | | 28% | | | | 30% | | | | 31% | | | | 29% | |
*Amount is less than $0.005 per share.
| (A) | Per share amounts calculated using average shares method, which more appropriately presents the per share data for the period. |
| (B) | Total return calculation does not reflect sales load. |
| (C) | Total return in the above table represents the rate that the investor would have earned or lost on an investment in the Fund assuming reinvestment of dividends. |
| | Total return would have been higher or lower if certain expenses had not been reimbursed, waived or recouped. |
| (D) | As a result of a trade error, the Fund experienced a loss totaling $4,927.83 for the year ended September 30, 2015, all of which was reimbursed by the Advisor; there was no effect on total return due to trade error. |
The accompanying notes are an integral part of these financial statements.
83
Timothy International Fund (Class C Shares)
Selected data based on a share outstanding throughout each period
| | | | | | | | | | | | | | | | | | | | |
| | | For the Year
ended
September 30,
2017 | | | For the Year
ended
September 30,
2016 | | | For the Year
ended
September 30,
2015 | | | For the Year
ended
September 30,
2014 | | | For the Year
ended
September 30,
2013 | |
| | | | | |
Net asset value, beginning of year | | $ | 8.25 | | | $ | 8.21 | | | $ | 8.67 | | | $ | 8.46 | | | $ | 7.15 | |
| | | | | | | | | | | | | | | | | | | | |
| | | | | |
INCOME (LOSS) FROM INVESTMENT OPERATIONS: | | | | | | | | | | | | | | | | | | | | |
Net investment income (loss) (A) | | | (0.03 | ) | | | (0.06 | ) | | | 0.02 | | | | (0.02 | ) | | | - | |
Net realized and unrealized gain (loss) on investments | | | 1.34 | | | | 0.15 | | | | (0.48 | ) | | | 0.35 | (B) | | | 1.31 | |
| | | | | | | | | | | | | | | | | | | | |
Total from investment operations | | | 1.31 | | | | 0.09 | | | | (0.46 | ) | | | 0.33 | | | | 1.31 | |
| | | | | | | | | | | | | | | | | | | | |
| | | | | |
LESS DISTRIBUTIONS: | | | | | | | | | | | | | | | | | | | | |
From net investment income | | | (0.01 | ) | | | (0.05 | ) | | | - | | | | (0.12 | ) | | | - | |
| | | | | | | | | | | | | | | | | | | | |
Total distributions | | | (0.01 | ) | | | (0.05 | ) | | | - | | | | (0.12 | ) | | | - | |
| | | | | | | | | | | | | | | | | | | | |
| | | | | |
Net asset value, end of year | | $ | 9.55 | | | $ | 8.25 | | | $ | 8.21 | | | $ | 8.67 | | | $ | 8.46 | |
| | | | | | | | | | | | | | | | | | | | |
| | | | | |
Total return (C)(D) | | | 15.93% | | | | 1.09% | | | | (5.31)% | (E) | | | 3.87% | | | | 18.32% | |
| | | | | |
RATIOS/SUPPLEMENTAL DATA: | | | | | | | | | | | | | | | | | | | | |
Net assets, end of year (in 000’s) | | $ | 4,620 | | | $ | 4,495 | | | $ | 3,498 | | | $ | 3,336 | | | $ | 2,446 | |
Ratios to average net assets | | | | | | | | | | | | | | | | | | | | |
Expenses, before waiver and reimbursement | | | 2.44% | | | | 2.43% | | | | 2.41% | | | | 2.44% | | | | - | |
Expenses, net waiver and reimbursement | | | 2.39% | | | | 2.38% | | | | 2.36% | | | | 2.44% | | | | 2.47% | |
Net investment income (loss) before waiver and reimbursement | | | (0.41)% | | | | (0.74)% | | | | 0.17% | | | | (0.21)% | | | | - | |
Net investment income (loss), net waiver and reimbursement | | | (0.36)% | | | | (0.69)% | | | | 0.18% | | | | (0.20)% | | | | (0.01)% | |
Portfolio turnover rate | | | 42% | | | | 28% | | | | 30% | | | | 31% | | | | 29% | |
| (A) | Per share amounts calculated using average shares method, which more appropriately presents the per share data for the period. |
| (B) | Realized and unrealized gains per share in this caption are balancing amounts necessary to reconcile the change in net asset value per share for the period, and may not reconcile with the aggregate gains and losses in the Statements of Operations due to share transactions for the period. |
| (C) | Total return calculation does not reflect redemption fee. |
| (D) | Total return in the above table represents the rate that the investor would have earned or lost on an investment in the Fund assuming reinvestment of dividends. |
| | Total return would have been higher or lower if certain expenses had not been reimbursed, waived or recouped. |
| (E) | As a result of a trade error, the Fund experienced a loss totaling $4,927.83 for the year ended September 30, 2015, all of which was reimbursed by the Advisor; there was no effect on total return due to trade error. |
The accompanying notes are an integral part of these financial statements.
84
Timothy International Fund (Class I Shares)
Selected data based on a share outstanding throughout each period
| | | | | | | | | | | | | | | | | | | | |
| | | For the Year
ended
September 30,
2017 | | | For the Year
ended
September 30,
2016 | | | For the Year
ended
September 30,
2015 | | | For the Year
ended
September 30,
2014 | | | For the Period ended
September 30,
2013 (A) | |
| | | | | |
Net asset value, beginning of period | | $ | 8.55 | | | $ | 8.49 | | | $ | 8.88 | | | $ | 8.65 | | | $ | 8.46 | |
| | | | | | | | | | | | | | | | | | | | |
| | | | | |
INCOME (LOSS) FROM INVESTMENT OPERATIONS: | | | | | | | | | | | | | | | | | | | | |
Net investment income (B) | | | 0.07 | | | | 0.02 | | | | 0.15 | | | | 0.08 | | | | 0.02 | |
Net realized and unrealized gain (loss) on investments | | | 1.38 | | | | 0.15 | (C) | | | (0.54 | ) | | | 0.34 | | | | 0.17 | |
| | | | | | | | | | | | | | | | | | | | |
Total from investment operations | | | 1.45 | | | | 0.17 | | | | (0.39 | ) | | | 0.42 | | | | 0.19 | |
| | | | | | | | | | | | | | | | | | | | |
| | | | | |
LESS DISTRIBUTIONS: | | | | | | | | | | | | | | | | | | | | |
From net investment income | | | (0.11 | ) | | | (0.11 | ) | | | - | | | | (0.19 | ) | | | - | |
| | | | | | | | | | | | | | | | | | | | |
Total distributions | | | (0.11 | ) | | | (0.11 | ) | | | - | | | | (0.19 | ) | | | - | |
| | | | | | | | | | | | | | | | | | | | |
| | | | | |
Net asset value, end of period | | $ | 9.89 | | | $ | 8.55 | | | $ | 8.49 | | | $ | 8.88 | | | $ | 8.65 | |
| | | | | | | | | | | | | | | | | | | | |
| | | | | |
Total return (D) | | | 17.18% | | | | 2.08% | | | | (4.39)% | (E) | | | 4.85% | | | | 2.25% | (F) |
| | | | | |
RATIOS/SUPPLEMENTAL DATA: | | | | | | | | | | | | | | | | | | | | |
Net assets, end of period (in 000’s) | | $ | 13,083 | | | $ | 2,880 | | | $ | 1,581 | | | $ | 461 | | | $ | 102 | + |
Ratios to average net assets | | | | | | | | | | | | | | | | | | | | |
Expenses, before waiver and reimbursement | | | 1.43% | | | | 1.45% | | | | 1.42% | | | | 1.38% | | | | - | |
Expenses, net waiver and reimbursement | | | 1.38% | | | | 1.39% | | | | 1.37% | | | | 1.38% | | | | 1.48% | (G) |
Net investment income, before waiver and reimbursement | | | 0.74% | | | | 0.22% | | | | 1.13% | | | | 0.85% | | | | - | |
Net investment income, net waiver and reimbursement | | | 0.79% | | | | 0.29% | | | | 1.18% | | | | 0.86% | | | | 0.95% | (G) |
Portfolio turnover rate | | | 42% | | | | 28% | | | | 30% | | | | 31% | | | | 29% | (F) |
+ Actual net assets not truncated.
| (A) | For the period August 1, 2013 (Commencement of Operations) to September 30, 2013. |
| (B) | Per share amounts calculated using average shares method, which more appropriately presents the per share data for the period. |
| (C) | Realized and unrealized gains per share in this caption are balancing amounts necessary to reconcile the change in net asset value per share for the period, and may not reconcile with the aggregate gains and losses in the Statements of Operations due to share transactions for the period. |
| (D) | Total return in the above table represents the rate that the investor would have earned or lost on an investment in the Fund assuming reinvestment of dividends. |
| | Total return would have been higher or lower if certain expenses had not been reimbursed, waived or recouped. |
| (E) | As a result of a trade error, the Fund experienced a loss totaling $4,927.83 for the year ended September 30, 2015, all of which was reimbursed by the Advisor; there was no effect on total return due to trade error. |
| (F) | For periods of less than one full year, total return and turnover are not annualized. |
The accompanying notes are an integral part of these financial statements.
85
Timothy Large/Mid Cap Growth Fund (Class A Shares)
Selected data based on a share outstanding throughout each period
| | | | | | | | | | | | | | | | | | | | |
| | | For the Year
ended
September 30,
2017 | | | For the Year
ended
September 30,
2016 | | | For the Year
ended
September 30,
2015 | | | For the Year
ended
September 30,
2014 | | | For the Year
ended
September 30,
2013 | |
| | | | | |
Net asset value, beginning of year | | $ | 7.46 | | | $ | 7.75 | | | $ | 8.66 | | | $ | 8.36 | | | $ | 7.30 | |
| | | | | | | | | | | | | | | | | | | | |
| | | | | |
INCOME FROM INVESTMENT OPERATIONS: | | | | | | | | | | | | | | | | | | | | |
Net investment loss (A) | | | (0.01 | ) | | | (0.02 | ) | | | (0.01 | ) | | | (0.01 | ) | | | (0.02 | ) |
Net realized and unrealized gain on investments | | | 1.23 | | | | 0.51 | | | | 0.03 | (B) | | | 1.15 | | | | 1.51 | |
| | | | | | | | | | | | | | | | | | | | |
Total from investment operations | | | 1.22 | | | | 0.49 | | | | 0.02 | | | | 1.14 | | | | 1.49 | |
| | | | | | | | | | | | | | | | | | | | |
| | | | | |
LESS DISTRIBUTIONS: | | | | | | | | | | | | | | | | | | | | |
From net realized gains on investments | | | (0.09 | ) | | | (0.78 | ) | | | (0.93 | ) | | | (0.84 | ) | | | (0.43 | ) |
| | | | | | | | | | | | | | | | | | | | |
Total distributions | | | (0.09 | ) | | | (0.78 | ) | | | (0.93 | ) | | | (0.84 | ) | | | (0.43 | ) |
| | | | | | | | | | | | | | | | | | | | |
| | | | | |
Net asset value, end of year | | $ | 8.59 | | | $ | 7.46 | | | $ | 7.75 | | | $ | 8.66 | | | $ | 8.36 | |
| | | | | | | | | | | | | | | | | | | | |
| | | | | |
Total return (C)(D) | | | 16.53% | | | | 6.65% | | | | (0.35)% | | | | 14.70% | | | | 21.62% | |
| | | | | |
RATIOS/SUPPLEMENTAL DATA: | | | | | | | | | | | | | | | | | | | | |
Net assets, end of year (in 000’s) | | $ | 68,291 | | | $ | 53,827 | | | $ | 52,682 | | | $ | 56,073 | | | $ | 48,411 | |
Ratios to average net assets | | | | | | | | | | | | | | | | | | | | |
Expenses, before waiver and reimbursement | | | 1.52% | | | | 1.54% | | | | 1.56% | | | | 1.57% | | | | - | |
Expenses, net waiver and reimbursement | | | 1.47% | | | | 1.49% | | | | 1.51% | | | | 1.57% | | | | 1.59% | |
Net investment loss, before waiver and reimbursement | | | (0.19)% | | | | (0.38)% | | | | (0.14)% | | | | (0.18)% | | | | - | |
Net investment loss, net waiver and reimbursement | | | (0.14)% | | | | (0.33)% | | | | (0.09)% | | | | (0.17)% | | | | (0.24)% | |
Portfolio turnover rate | | | 76% | | | | 71% | | | | 73% | | | | 61% | | | | 91% | |
| (A) | Per share amounts calculated using average shares method, which more appropriately presents the per share data for the period. |
| (B) | Realized and unrealized gains per share in this caption are balancing amounts necessary to reconcile the change in net asset value per share for the period, and may not reconcile with the aggregate gains and losses in the Statements of Operations due to share transactions for the period. |
| (C) | Total return calculation does not reflect sales load. |
| (D) | Total return in the above table represents the rate that the investor would have earned or lost on an investment in the Fund assuming reinvestment of dividends. |
| | Total return would have been higher or lower if certain expenses had not been reimbursed, waived or recouped. |
The accompanying notes are an integral part of these financial statements.
86
Timothy Large/Mid Cap Growth Fund (Class C Shares)
Selected data based on a share outstanding throughout each period
| | | | | | | | | | | | | | | | | | | | |
| | | For the Year
ended
September 30,
2017 | | | For the Year
ended
September 30,
2016 | | | For the Year
ended
September 30,
2015 | | | For the Year
ended
September 30,
2014 | | | For the Year
ended
September 30,
2013 | |
| | | | | |
Net asset value, beginning of year | | $ | 6.24 | | | $ | 6.64 | | | $ | 7.60 | | | $ | 7.49 | | | $ | 6.63 | |
| | | | | | | | | | | | | | | | | | | | |
| | | | | |
INCOME (LOSS) FROM INVESTMENT OPERATIONS: | | | | | | | | | | | | | | | | | | | | |
Net investment loss (A) | | | (0.06 | ) | | | (0.07 | ) | | | (0.06 | ) | | | (0.07 | ) | | | (0.07 | ) |
Net realized and unrealized gain on investments | | | 1.02 | | | | 0.45 | | | | 0.03 | (B) | | | 1.02 | | | | 1.36 | |
| | | | | | | | | | | | | | | | | | | | |
Total from investment operations | | | 0.96 | | | | 0.38 | | | | (0.03 | ) | | | 0.95 | | | | 1.29 | |
| | | | | | | | | | | | | | | | | | | | |
| | | | | |
LESS DISTRIBUTIONS: | | | | | | | | | | | | | | | | | | | | |
From net realized gains on investments | | | (0.09 | ) | | | (0.78 | ) | | | (0.93 | ) | | | (0.84 | ) | | | (0.43 | ) |
| | | | | | | | | | | | | | | | | | | | |
Total distributions | | | (0.09 | ) | | | (0.78 | ) | | | (0.93 | ) | | | (0.84 | ) | | | (0.43 | ) |
| | | | | | | | | | | | | | | | | | | | |
| | | | | |
Net asset value, end of year | | $ | 7.11 | | | $ | 6.24 | | | $ | 6.64 | | | $ | 7.60 | | | $ | 7.49 | |
| | | | | | | | | | | | | | | | | | | | |
| | | | | |
Total return (C)(D) | | | 15.58% | | | | 6.04% | | | | (1.14)% | | | | 13.84% | | | | 20.74% | |
| | | | | |
RATIOS/SUPPLEMENTAL DATA: | | | | | | | | | | | | | | | | | | | | |
Net assets, end of year (in 000’s) | | $ | 9,909 | | | $ | 7,636 | | | $ | 6,490 | | | $ | 5,929 | | | $ | 5,041 | |
Ratios to average net assets | | | | | | | | | | | | | | | | | | | | |
Expenses, before waiver and reimbursement | | | 2.27% | | | | 2.30% | | | | 2.31% | | | | 2.32% | | | | - | |
Expenses, net waiver and reimbursement | | | 2.22% | | | | 2.24% | | | | 2.26% | | | | 2.32% | | | | 2.34% | |
Net investment loss, before waiver and reimbursement | | | (0.94)% | | | | (1.14)% | | | | (0.88)% | | | | (0.93)% | | | | - | |
Net investment loss, net waiver and reimbursement | | | (0.89)% | | | | (1.08)% | | | | (0.84)% | | | | (0.93)% | | | | (0.99)% | |
Portfolio turnover rate | | | 76% | | | | 71% | | | | 73% | | | | 61% | | | | 91% | |
| (A) | Per share amounts calculated using average shares method, which more appropriately presents the per share data for the period. |
| (B) | Realized and unrealized gains per share in this caption are balancing amounts necessary to reconcile the change in net asset value per share for the period, and may not reconcile with the aggregate gains and losses in the Statements of Operations due to share transactions for the period. |
| (C) | Total return calculation does not reflect redemption fee. |
| (D) | Total return in the above table represents the rate that the investor would have earned or lost on an investment in the Fund assuming reinvestment of dividends. |
| | Total return would have been higher or lower if certain expenses had not been reimbursed, waived or recouped. |
The accompanying notes are an integral part of these financial statements.
87
Timothy Large/Mid Cap Growth Fund (Class I Shares)
Selected data based on a share outstanding throughout each period
| | | | | | | | | | | | | | | | | | | | |
| | | For the Year
ended
September 30,
2017 | | | For the Year
ended
September 30,
2016 | | | For the Year
ended
September 30,
2015 | | | For the Year
ended
September 30,
2014 | | | For the
Period ended
September 30,
2013 (A) | |
| | | | | |
Net asset value, beginning of period | | $ | 7.54 | | | $ | 7.80 | | | $ | 8.69 | | | $ | 8.37 | | | $ | 8.31 | |
| | | | | | | | | | | | | | | | | | | | |
| | | | | |
INCOME (LOSS) FROM INVESTMENT OPERATIONS: | | | | | | | | | | | | | | | | | | | | |
Net investment income (loss) (B) | | | 0.01 | | | | (0.01 | ) | | | 0.02 | | | | 0.01 | | | | 0.01 | |
Net realized and unrealized gain on investments | | | 1.24 | | | | 0.53 | | | | 0.02 | (C) | | | 1.15 | (C) | | | 0.05 | |
| | | | | | | | | | | | | | | | | | | | |
Total from investment operations | | | 1.25 | | | | 0.52 | | | | 0.04 | | | | 1.16 | | | | 0.06 | |
| | | | | | | | | | | | | | | | | | | | |
| | | | | |
LESS DISTRIBUTIONS: | | | | | | | | | | | | | | | | | | | | |
From net realized gains on investments | | | (0.09 | ) | | | (0.78 | ) | | | (0.93 | ) | | | (0.84 | ) | | | - | |
| | | | | | | | | | | | | | | | | | | | |
Total distributions | | | (0.09 | ) | | | (0.78 | ) | | | (0.93 | ) | | | (0.84 | ) | | | - | |
| | | | | | | | | | | | | | | | | | | | |
| | | | | |
Net asset value, end of period | | $ | 8.70 | | | $ | 7.54 | | | $ | 7.80 | | | $ | 8.69 | | | $ | 8.37 | |
| | | | | | | | | | | | | | | | | | | | |
| | | | | |
Total return (D) | | | 16.75% | | | | 7.01% | | | | (0.10)% | | | | 14.94% | | | | 0.72% | (E) |
| | | | | |
RATIOS/SUPPLEMENTAL DATA: | | | | | | | | | | | | | | | | | | | | |
Net assets, end of period (in 000’s) | | $ | 3,936 | | | $ | 1,088 | | | $ | 1,202 | | | $ | 190 | | | $ | 101 | + |
Ratios to average net assets | | | | | | | | | | | | | | | | | | | | |
Expenses, before waiver and reimbursement | | | 1.26% | | | | 1.29% | | | | 1.31% | | | | 1.30% | | | | - | |
Expenses, net waiver and reimbursement | | | 1.21% | | | | 1.24% | | | | 1.26% | | | | 1.29% | | | | 1.34% | (F) |
Net investment income (loss), before waiver and reimbursement | | | 0.10% | | | | (0.12)% | | | | 0.13% | | | | 0.13% | | | | - | |
Net investment income (loss), net waiver and reimbursement | | | 0.15% | | | | (0.08)% | | | | 0.16% | | | | 0.14% | | | | 0.01% | (F) |
Portfolio turnover rate | | | 76% | | | | 71% | | | | 73% | | | | 61% | | | | 91% | (E) |
+ Actual net assets not truncated.
| (A) | For the period August 1, 2013 (Commencement of Operations) to September 30, 2013. |
| (B) | Per share amounts calculated using average shares method, which more appropriately presents the per share data for the period. |
| (C) | Realized and unrealized gains per share in this caption are balancing amounts necessary to reconcile the change in net asset value per share for the period, and may not reconcile with the aggregate gains and losses in the Statements of Operations due to share transactions for the period. |
| (D) | Total return in the above table represents the rate that the investor would have earned or lost on an investment in the Fund assuming reinvestment of dividends. |
| | Total return would have been higher or lower if certain expenses had not been reimbursed, waived or recouped. |
| (E) | For periods of less than one full year, total return and turnover are not annualized. |
The accompanying notes are an integral part of these financial statements.
88
Timothy Small Cap Value Fund (Class A Shares)
Selected data based on a share outstanding throughout each period
| | | | | | | | | | | | | | | | | | | | |
| | | For the Year
ended
September 30,
2017 | | | For the Year
ended
September 30,
2016 | | | For the Year
ended
September 30,
2015 | | | For the Year
ended
September 30,
2014 | | | For the Year
ended
September 30,
2013 | |
| | | | | |
Net asset value, beginning of year | | $ | 17.09 | | | $ | 16.93 | | | $ | 19.79 | | | $ | 20.30 | | | $ | 14.74 | |
| | | | | | | | | | | | | | | | | | | | |
| | | | | |
INCOME (LOSS) FROM INVESTMENT OPERATIONS: | | | | | | | | | | | | | | | | | | | | |
Net investment income (loss) (A) | | | 0.03 | | | | (0.01 | ) | | | (0.07 | ) | | | (0.04 | ) | | | 0.02 | |
Net realized and unrealized gain on investments | | | 3.63 | | | | 1.65 | | | | 0.64 | | | | 1.57 | | | | 5.57 | |
| | | | | | | | | | | | | | | | | | | | |
Total from investment operations | | | 3.66 | | | | 1.64 | | | | 0.57 | | | | 1.53 | | | | 5.59 | |
| | | | | | | | | | | | | | | | | | | | |
| | | | | |
LESS DISTRIBUTIONS: | | | | | | | | | | | | | | | | | | | | |
From net investment income | | | - | | | | - | | | | - | | | | - | | | | (0.03 | ) |
From net realized gains on investments | | | (0.25 | ) | | | (1.48 | ) | | | (3.43 | ) | | | (2.04 | ) | | | - | |
| | | | | | | | | | | | | | | | | | | | |
Total distributions | | | (0.25 | ) | | | (1.48 | ) | | | (3.43 | ) | | | (2.04 | ) | | | (0.03 | ) |
| | | | | | | | | | | | | | | | | | | | |
| | | | | |
Net asset value, end of year | | $ | 20.50 | | | $ | 17.09 | | | $ | 16.93 | | | $ | 19.79 | | | $ | 20.30 | |
| | | | | | | | | | | | | | | | | | | | |
| | | | | |
Total return (B)(C) | | | 21.55% | | | | 10.67% | | | | 1.90% | | | | 7.61% | | | | 37.97% | |
| | | | | |
RATIOS/SUPPLEMENTAL DATA: | | | | | | | | | | | | | | | | | | | | |
Net assets, end of year (in 000’s) | | $ | 112,953 | | | $ | 94,871 | | | $ | 71,840 | | | $ | 71,997 | | | $ | 64,972 | |
Ratios to average net assets | | | | | | | | | | | | | | | | | | | | |
Expenses, before waiver and reimbursement | | | 1.46% | | | | 1.48% | | | | 1.53% | | | | 1.53% | | | | - | |
Expenses, net waiver and reimbursement | | | 1.41% | | | | 1.44% | | | | 1.48% | | | | 1.52% | | | | 1.55% | |
Net investment income (loss), before waiver and reimbursement | | | 0.13% | | | | (0.09)% | | | | (0.45)% | | | | (0.25)% | | | | - | |
Net investment income (loss), net waiver and reimbursement | | | 0.18% | | | | (0.04)% | | | | (0.40)% | | | | (0.25)% | | | | 0.11% | |
Portfolio turnover rate | | | 57% | | | | 73% | | | | 30% | | | | 71% | | | | 73% | |
| (A) | Per share amounts calculated using average shares method, which more appropriately presents the per share data for the period. |
| (B) | Total return calculation does not reflect sales load. |
| (C) | Total return in the above table represents the rate that the investor would have earned or lost on an investment in the Fund assuming reinvestment of dividends. |
| | Total return would have been higher or lower if certain expenses had not been reimbursed, waived or recouped. |
The accompanying notes are an integral part of these financial statements.
89
Timothy Small Cap Value Fund (Class C Shares)
Selected data based on a share outstanding throughout each period
| | | | | | | | | | | | | | | | | | | | |
| | | For the Year
ended
September 30,
2017 | | | For the Year
ended
September 30,
2016 | | | For the Year
ended
September 30,
2015 | | | For the Year
ended
September 30,
2014 | | | For the Year
ended
September 30,
2013 | |
| | | | | |
Net asset value, beginning of year | | $ | 13.10 | | | $ | 13.42 | | | $ | 16.45 | | | $ | 17.30 | | | $ | 12.63 | |
| | | | | | | | | | | | | | | | | | | | |
| | | | | |
INCOME (LOSS) FROM INVESTMENT OPERATIONS: | | | | | | | | | | | | | | | | | | | | |
Net investment loss (A) | | | (0.08 | ) | | | (0.10 | ) | | | (0.17 | ) | | | (0.17 | ) | | | (0.10 | ) |
Net realized and unrealized gain on investments | | | 2.77 | | | | 1.26 | | | | 0.57 | | | | 1.36 | | | | 4.77 | |
| | | | | | | | | | | | | | | | | | | | |
Total from investment operations | | | 2.69 | | | | 1.16 | | | | 0.40 | | | | 1.19 | | | | 4.67 | |
| | | | | | | | | | | | | | | | | | | | |
| | | | | |
LESS DISTRIBUTIONS: | | | | | | | | | | | | | | | | | | | | |
From net realized gains on investments | | | (0.25 | ) | | | (1.48 | ) | | | (3.43 | ) | | | (2.04 | ) | | | - | |
| | | | | | | | | | | | | | | | | | | | |
Total distributions | | | (0.25 | ) | | | (1.48 | ) | | | (3.43 | ) | | | (2.04 | ) | | | - | |
| | | | | | | | | | | | | | | | | | | | |
| | | | | |
Net asset value, end of year | | $ | 15.54 | | | $ | 13.10 | | | $ | 13.42 | | | $ | 16.45 | | | $ | 17.30 | |
| | | | | | | | | | | | | | | | | | | | |
| | | | | |
Total return (B)(C) | | | 20.70% | | | | 9.81% | | | | 1.14% | | | | 6.96% | | | | 36.98% | |
| | | | | |
RATIOS/SUPPLEMENTAL DATA: | | | | | | | | | | | | | | | | | | | | |
Net assets, end of year (in 000’s) | | $ | 13,210 | | | $ | 10,257 | | | $ | 8,981 | | | $ | 8,135 | | | $ | 7,539 | |
Ratios to average net assets | | | | | | | | | | | | | | | | | | | | |
Expenses, before waiver and reimbursement | | | 2.21% | | | | 2.23% | | | | 2.28% | | | | 2.28% | | | | - | |
Expenses, net waiver and reimbursement | | | 2.16% | | | | 2.18% | | | | 2.23% | | | | 2.27% | | | | 2.30% | |
Net investment loss, before waiver and reimbursement | | | (0.62)% | | | | (0.84)% | | | | (1.19)% | | | | (1.01)% | | | | - | |
Net investment loss, net waiver and reimbursement | | | (0.57)% | | | | (0.78)% | | | | (1.14)% | | | | (1.01)% | | | | (0.65)% | |
Portfolio turnover rate | | | 57% | | | | 73% | | | | 30% | | | | 71% | | | | 73% | |
| (A) | Per share amounts calculated using average shares method, which more appropriately presents the per share data for the period. |
| (B) | Total return calculation does not reflect redemption fee. |
| (C) | Total return in the above table represents the rate that the investor would have earned or lost on an investment in the Fund assuming reinvestment of dividends. |
| | Total return would have been higher or lower if certain expenses had not been reimbursed, waived or recouped. |
The accompanying notes are an integral part of these financial statements.
90
Timothy Small Cap Value Fund (Class I Shares)
Selected data based on a share outstanding throughout each period
| | | | | | | | | | | | | | | | | | | | |
| | | For the Year
ended
September 30,
2017 | | | For the Year
ended
September 30,
2016 | | | For the Year
ended
September 30,
2015 | | | For the Year
ended
September 30,
2014 | | | For the
Period ended
September 30,
2013(A) | |
| | | | | |
Net asset value, beginning of period | | $ | 17.24 | | | $ | 17.03 | | | $ | 19.84 | | | $ | 20.29 | | | $ | 19.68 | |
| | | | | | | | | | | | | | | | | | | | |
| | | | | |
INCOME (LOSS) FROM INVESTMENT OPERATIONS: | | | | | | | | | | | | | | | | | | | | |
Net investment income (loss) (B) | | | 0.08 | | | | 0.04 | | | | (0.03 | ) | | | 0.02 | | | | (0.01 | ) |
Net realized and unrealized gain on investments | | | 3.67 | | | | 1.65 | | | | 0.65 | | | | 1.57 | (C) | | | 0.62 | |
| | | | | | | | | | | | | | | | | | | | |
Total from investment operations | | | 3.75 | | | | 1.69 | | | | 0.62 | | | | 1.59 | | | | 0.61 | |
| | | | | | | | | | | | | | | | | | | | |
| | | | | |
LESS DISTRIBUTIONS: | | | | | | | | | | | | | | | | | | | | |
From net realized gains on investments | | | (0.25 | ) | | | (1.48 | ) | | | (3.43 | ) | | | (2.04 | ) | | | - | |
| | | | | | | | | | | | | | | | | | | | |
Total distributions | | | (0.25 | ) | | | (1.48 | ) | | | (3.43 | ) | | | (2.04 | ) | | | - | |
| | | | | | | | | | | | | | | | | | | | |
| | | | | |
Net asset value, end of period | | $ | 20.74 | | | $ | 17.24 | | | $ | 17.03 | | | $ | 19.84 | | | $ | 20.29 | |
| | | | | | | | | | | | | | | | | | | | |
| | | | | |
Total return (D) | | | 21.89% | | | | 10.92% | | | | 2.18% | | | | 7.93% | | | | 3.10% | (E) |
| | | | | |
RATIOS/SUPPLEMENTAL DATA: | | | | | | | | | | | | | | | | | | | | |
Net assets, end of period (in 000’s) | | $ | 19,103 | | | $ | 2,324 | | | $ | 870 | | | $ | 532 | | | $ | 103 | + |
Ratios to average net assets | | | | | | | | | | | | | | | | | | | | |
Expenses, before waiver and reimbursement | | | 1.21% | | | | 1.26% | | | | 1.28% | | | | 1.27% | | | | - | |
Expenses, net waiver and reimbursement | | | 1.16% | | | | 1.20% | | | | 1.23% | | | | 1.27% | | | | 1.30% | (F) |
Net investment income (loss), before waiver and reimbursement | | | 0.38% | | | | 0.18% | | | | (0.19)% | | | | 0.06% | | | | - | |
Net investment income (loss), net waiver and reimbursement | | | 0.43% | | | | 0.23% | | | | (0.14)% | | | | 0.07% | | | | 0.36% | (F) |
Portfolio turnover rate | | | 57% | | | | 73% | | | | 30% | | | | 71% | | | | 73% | (E) |
+Actual net assets not truncated.
| (A) | For the period August 1, 2013 (Commencement of Operations) to September 30, 2013. |
| (B) | Per share amounts calculated using average shares method, which more appropriately presents the per share data for the period. |
| (C) | Realized and unrealized gains per share in this caption are balancing amounts necessary to reconcile the change in net asset value per share for the period, and may not reconcile with the aggregate gains and losses in the Statements of Operations due to share transactions for the period. |
| (D) | Total return in the above table represents the rate that the investor would have earned or lost on an investment in the Fund assuming reinvestment of dividends. |
| | Total return would have been higher or lower if certain expenses had not been reimbursed, waived or recouped. |
| (E) | For periods of less than one full year, total return and turnover are not annualized. (F) Annualized. |
The accompanying notes are an integral part of these financial statements.
91
Timothy Large/Mid Cap Value Fund (Class A Shares)
Selected data based on a share outstanding throughout each period
| | | | | | | | | | | | | | | | | | | | |
| | | For the Year
ended
September 30,
2017 | | | For the Year
ended
September 30,
2016 | | | For the Year
ended
September 30,
2015 | | | For the Year
ended
September 30,
2014 | | | For the Year
ended
September 30,
2013 | |
| | | | | |
Net asset value, beginning of year | | $ | 17.15 | | | $ | 18.20 | | | $ | 19.61 | | | $ | 18.14 | | | $ | 14.80 | |
| | | | | | | | | | | | | | | | | | | | |
| | | | | |
INCOME (LOSS) FROM INVESTMENT OPERATIONS: | | | | | | | | | | | | | | | | | | | | |
Net investment income (loss) (A) | | | 0.05 | | | | 0.01 | | | | (0.01 | ) | | | (0.01 | ) | | | 0.09 | |
Net realized and unrealized gain on investments (B) | | | 2.18 | | | | 1.04 | | | | 0.38 | | | | 2.83 | | | | 3.30 | |
| | | | | | | | | | | | | | | | | | | | |
Total from investment operations | | | 2.23 | | | | 1.05 | | | | 0.37 | | | | 2.82 | | | | 3.39 | |
| | | | | | | | | | | | | | | | | | | | |
| | | | | |
LESS DISTRIBUTIONS: | | | | | | | | | | | | | | | | | | | | |
From net investment income | | | - | | | | - | | | | - | | | | (0.09 | ) | | | (0.05 | ) |
From net realized gains on investments | | | (0.22 | ) | | | (2.10 | ) | | | (1.78 | ) | | | (1.26 | ) | | | - | |
| | | | | | | | | | | | | | | | | | | | |
Total distributions | | | (0.22 | ) | | | (2.10 | ) | | | (1.78 | ) | | | (1.35 | ) | | | (0.05 | ) |
| | | | | | | | | | | | | | | | | | | | |
| | | | | |
Net asset value, end of year | | $ | 19.16 | | | $ | 17.15 | | | $ | 18.20 | | | $ | 19.61 | | | $ | 18.14 | |
| | | | | | | | | | | | | | | | | | | | |
| | | | | |
Total return (C)(D) | | | 13.10% | | | | 6.40% | | | | 1.59% | | | | 16.13% | | | | 23.00% | |
| | | | | |
RATIOS/SUPPLEMENTAL DATA: | | | | | | | | | | | | | | | | | | | | |
Net assets, end of year (in 000’s) | | $ | 167,056 | | | $ | 154,260 | | | $ | 135,091 | | | $ | 138,821 | | | $ | 114,657 | |
Ratios to average net assets | | | | | | | | | | | | | | | | | | | | |
Expenses, before waiver and reimbursement | | | 1.49% | | | | 1.48% | | | | 1.48% | | | | 1.50% | | | | - | |
Expenses, net waiver and reimbursement | | | 1.41% | | | | 1.43% | | | | 1.43% | | | | 1.49% | | | | 1.49% | |
Net investment income (loss), before waiver and reimbursement | | | 0.18% | | | | (0.01)% | | | | (0.13)% | | | | (0.03)% | | | | - | |
Net investment income (loss), net waiver and reimbursement | | | 0.26% | | | | 0.04% | | | | (0.08)% | | | | (0.03)% | | | | 0.55% | |
Portfolio turnover rate | | | 39% | | | | 45% | | | | 11% | | | | 37% | | | | 64% | |
| (A) | Per share amounts calculated using average shares method, which more appropriately presents the per share data for the period. |
| (B) | Realized and unrealized gains and losses per share in this caption are balancing amounts necessary to reconcile the change in net asset value per share for the period, and may not agree to the aggregate gains and losses in the Statement of Operations due to the fluctuations in share transactions. |
| (C) | Total return calculation does not reflect sales load. |
| (D) | Total return in the above table represents the rate that the investor would have earned or lost on an investment in the Fund assuming reinvestment of dividends. |
| | Total return would have been higher or lower if certain expenses had not been reimbursed, waived or recouped. |
The accompanying notes are an integral part of these financial statements.
92
Timothy Large/Mid Cap Value Fund (Class C Shares)
Selected data based on a share outstanding throughout each period
| | | | | | | | | | | | | | | | | | | | |
| | | For the Year
ended
September 30,
2017 | | | For the Year
ended
September 30,
2016 | | | For the Year
ended
September 30,
2015 | | | For the Year
ended
September 30,
2014 | | | For the Year
ended
September 30,
2013 | |
| | | | | |
Net asset value, beginning of year | | $ | 14.30 | | | $ | 15.62 | | | $ | 17.19 | | | $ | 16.12 | | | $ | 13.20 | |
| | | | | | | | | | | | | | | | | | | | |
| | | | | |
INCOME (LOSS) FROM INVESTMENT OPERATIONS: | | | | | | | | | | | | | | | | | | | | |
Net investment loss (A) | | | (0.07 | ) | | | (0.10 | ) | | | (0.14 | ) | | | (0.13 | ) | | | (0.03 | ) |
Net realized and unrealized gain on investments | | | 1.81 | | | | 0.88 | | | | 0.35 | | | | 2.49 | | | | 2.95 | |
| | | | | | | | | | | | | | | | | | | | |
Total from investment operations | | | 1.74 | | | | 0.78 | | | | 0.21 | | | | 2.36 | | | | 2.92 | |
| | | | | | | | | | | | | | | | | | | | |
| | | | | |
LESS DISTRIBUTIONS: | | | | | | | | | | | | | | | | | | | | |
From net investment income | | | - | | | | - | | | | - | | | | (0.03 | ) | | | - | |
From net realized gains on investments | | | (0.22 | ) | | | (2.10 | ) | | | (1.78 | ) | | | (1.26 | ) | | | - | |
| | | | | | | | | | | | | | | | | | | | |
Total distributions | | | (0.22 | ) | | | (2.10 | ) | | | (1.78 | ) | | | (1.29 | ) | | | - | |
| | | | | | | | | | | | | | | | | | | | |
| | | | | |
Net asset value, end of year | | $ | 15.82 | | | $ | 14.30 | | | $ | 15.62 | | | $ | 17.19 | | | $ | 16.12 | |
| | | | | | | | | | | | | | | | | | | | |
| | | | | |
Total return (B)(C) | | | 12.27% | | | | 5.64% | | | | 0.82% | | | | 15.21% | | | | 22.12% | |
| | | | | |
RATIOS/SUPPLEMENTAL DATA: | | | | | | | | | | | | | | | | | | | | |
Net assets, end of year (in 000’s) | | $ | 23,803 | | | $ | 20,855 | | | $ | 18,458 | | | $ | 16,778 | | | $ | 13,649 | |
Ratios to average net assets | | | | | | | | | | | | | | | | | | | | |
Expenses, before waiver and reimbursement | | | 2.24% | | | | 2.23% | | | | 2.23% | | | | 2.25% | | | | - | |
Expenses, net waiver and reimbursement | | | 2.16% | | | | 2.18% | | | | 2.18% | | | | 2.24% | | | | 2.23% | |
Net investment loss, before waiver and reimbursement | | | (0.57)% | | | | (0.76)% | | | | (0.88)% | | | | (0.78)% | | | | - | |
Net investment loss, net waiver and reimbursement | | | (0.49)% | | | | (0.70)% | | | | (0.83)% | | | | (0.77)% | | | | (0.19)% | |
Portfolio turnover rate | | | 39% | | | | 45% | | | | 11% | | | | 37% | | | | 64% | |
| (A) | Per share amounts calculated using average shares method, which more appropriately presents the per share data for the period. |
| (B) | Total return calculation does not reflect redemption fee. |
| (C) | Total return in the above table represents the rate that the investor would have earned or lost on an investment in the Fund assuming reinvestment of dividends. |
| | Total return would have been higher or lower if certain expenses had not been reimbursed, waived or recouped. |
The accompanying notes are an integral part of these financial statements.
93
Timothy Large/Mid Cap Value Fund (Class I Shares)
Selected data based on a share outstanding throughout each period
| | | | | | | | | | | | | | | | | | | | |
| | | For the Year
ended
September 30,
2017 | | | For the Year
ended
September 30,
2016 | | | For the Year
ended
September 30,
2015 | | | For the Year
ended
September 30,
2014 | | | For the
Period ended
September 30,
2013 (A) | |
| | | | | |
Net asset value, beginning of period | | $ | 17.27 | | | $ | 18.26 | | | $ | 19.63 | | | $ | 18.13 | | | $ | 18.19 | |
| | | | | | | | | | | | | | | | | | | | |
| | | | | |
INCOME (LOSS) FROM INVESTMENT OPERATIONS: | | | | | | | | | | | | | | | | | | | | |
Net investment income (B) | | | 0.10 | | | | 0.05 | | | | 0.03 | | | | 0.05 | | | | 0.03 | |
Net realized and unrealized gain (loss) on investments | | | 2.19 | | | | 1.06 | (C) | | | 0.38 | | | | 2.82 | (C) | | | (0.09 | ) |
| | | | | | | | | | | | | | | | | | | | |
Total from investment operations | | | 2.29 | | | | 1.11 | | | | 0.41 | | | | 2.87 | | | | (0.06 | ) |
| | | | | | | | | | | | | | | | | | | | |
| | | | | |
LESS DISTRIBUTIONS: | | | | | | | | | | | | | | | | | | | | |
From net investment income | | | - | | | | - | | | | - | | | | (0.11 | ) | | | - | |
From net realized gains on investments | | | (0.22 | ) | | | (2.10 | ) | | | (1.78 | ) | | | (1.26 | ) | | | - | |
| | | | | | | | | | | | | | | | | | | | |
Total distributions | | | (0.22 | ) | | | (2.10 | ) | | | (1.78 | ) | | | (1.37 | ) | | | - | |
| | | | | | | | | | | | | | | | | | | | |
| | | | | |
Net asset value, end of period | | $ | 19.34 | | | $ | 17.27 | | | $ | 18.26 | | | $ | 19.63 | | | $ | 18.13 | |
| | | | | | | | | | | | | | | | | | | | |
| | | | | |
Total return (D) | | | 13.36% | | | | 6.74% | | | | 1.81% | | | | 16.09% | | | | (0.33)% | (E) |
| | | | | |
RATIOS/SUPPLEMENTAL DATA: | | | | | | | | | | | | | | | | | | | | |
Net assets, end of period (in 000’s) | | $ | 19,384 | | | $ | 5,382 | | | $ | 3,424 | | | $ | 1,442 | | | $ | 100 | + |
Ratios to average net assets | | | | | | | | | | | | | | | | | | | | |
Expenses, before waiver and reimbursement | | | 1.23% | | | | 1.25% | | | | 1.23% | | | | 1.23% | | | | - | |
Expenses, net waiver and reimbursement | | | 1.14% | | | | 1.19% | | | | 1.18% | | | | 1.23% | | | | 1.24% | (F) |
Net investment income, before waiver and reimbursement | | | 0.46% | | | | 0.24% | | | | 0.12% | | | | 0.25% | | | | - | |
Net investment income, net waiver and reimbursement | | | 0.55% | | | | 0.30% | | | | 0.18% | | | | 0.26% | | | | 0.80% | (F) |
Portfolio turnover rate | | | 39% | | | | 45% | | | | 11% | | | | 37% | | | | 64% | (E) |
+ Actual net assets not truncated.
| (A) | For the period August 1, 2013 (Commencement of Operations) to September 30, 2013. |
| (B) | Per share amounts calculated using average shares method, which more appropriately presents the per share data for the period. |
| (C) | Realized and unrealized gains per share in this caption are balancing amounts necessary to reconcile the change in net asset value per share for the period, and may not reconcile with the aggregate gains and losses in the Statements of Operations due to share transactions for the period. |
| (D) | Total return in the above table represents the rate that the investor would have earned or lost on an investment in the Fund assuming reinvestment of dividends. |
| | Total return would have been higher or lower if certain expenses had not been reimbursed, waived or recouped. |
| (E) | For periods of less than one full year, total return and turnover are not annualized. |
The accompanying notes are an integral part of these financial statements.
94
Timothy Fixed Income Fund (Class A Shares)
Selected data based on a share outstanding throughout each period
| | | | | | | | | | | | | | | | | | | | |
| | | For the Year
ended
September 30,
2017 | | | For the Year
ended
September 30,
2016 | | | For the Year
ended
September 30,
2015 | | | For the Year
ended
September 30,
2014 | | | For the Year
ended
September 30,
2013 | |
| | | | | |
Net asset value, beginning of year | | $ | 10.47 | | | $ | 10.27 | | | $ | 10.43 | | | $ | 10.43 | | | $ | 10.87 | |
| | | | | | | | | | | | | | | | | | | | |
| | | | | |
INCOME (LOSS) FROM INVESTMENT OPERATIONS: | | | | | | | | | | | | | | | | | | | | |
Net investment income (A) | | | 0.13 | | | | 0.14 | | | | 0.15 | | | | 0.18 | | | | 0.18 | |
Net realized and unrealized gain (loss) on investments | | | (0.22 | ) | | | 0.21 | | | | (0.04 | ) | | | 0.10 | | | | (0.49 | ) |
| | | | | | | | | | | | | | | | | | | | |
Total from investment operations | | | (0.09 | ) | | | 0.35 | | | | 0.11 | | | | 0.28 | | | | (0.31 | ) |
| | | | | | | | | | | | | | | | | | | | |
| | | | | |
LESS DISTRIBUTIONS: | | | | | | | | | | | | | | | | | | | | |
From net investment income | | | (0.16 | ) | | | (0.15 | ) | | | (0.25 | ) | | | (0.25 | ) | | | (0.13 | ) |
From net realized gains on investments | | | - | | | | - | | | | (0.02 | ) | | | (0.03 | ) | | | - | |
| | | | | | | | | | | | | | | | | | | | |
Total distributions | | | (0.16 | ) | | | (0.15 | ) | | | (0.27 | ) | | | (0.28 | ) | | | (0.13 | ) |
| | | | | | | | | | | | | | | | | | | | |
| | | | | |
Net asset value, end of year | | $ | 10.22 | | | $ | 10.47 | | | $ | 10.27 | | | $ | 10.43 | | | $ | 10.43 | |
| | | | | | | | | | | | | | | | | | | | |
| | | | | |
Total return (B)(C) | | | (0.81)% | | | | 3.47% | | | | 1.08% | | | | 2.64% | | | | (2.82)% | |
| | | | | |
RATIOS/SUPPLEMENTAL DATA: | | | | | | | | | | | | | | | | | | | | |
Net assets, end of year (in 000’s) | | $ | 75,858 | | | $ | 86,142 | | | $ | 66,107 | | | $ | 68,274 | | | $ | 67,558 | |
Ratios to average net assets | | | | | | | | | | | | | | | | | | | | |
Expenses, before waiver and reimbursement | | | 1.30% | | | | 1.24% | | | | 1.28% | | | | 1.30% | | | | 1.27% | |
Expenses, net waiver and reimbursement | | | 1.10% | | | | 1.04% | | | | 1.11% | | | | 1.14% | | | | 1.12% | |
Net investment income, before waiver and reimbursement | | | 1.05% | | | | 1.19% | | | | 1.29% | | | | 1.60% | | | | 1.54% | |
Net investment income, net waiver and reimbursement | | | 1.25% | | | | 1.39% | | | | 1.48% | | | | 1.75% | | | | 1.69% | |
Portfolio turnover rate | | | 43% | | | | 40% | | | | 28% | | | | 18% | | | | 25% | |
| (A) | Per share amounts calculated using average shares method, which more appropriately presents the per share data for the period. |
| (B) | Total return calculation does not reflect sales load. |
| (C) | Total return in the above table represents the rate that the investor would have earned or lost on an investment in the Fund assuming reinvestment of dividends. |
| | Total return would have been higher or lower if certain expenses had not been reimbursed, waived or recouped. |
The accompanying notes are an integral part of these financial statements.
95
Timothy Fixed Income Fund (Class C Shares)
Selected data based on a share outstanding throughout each period
| | | | | | | | | | | | | | | | | | | | |
| | | For the Year
ended
September 30,
2017 | | | For the Year
ended
September 30,
2016 | | | For the Year
ended
September 30,
2015 | | | For the Year
ended
September 30,
2014 | | | For the Year
ended
September 30,
2013 | |
| | | | | |
Net asset value, beginning of year | | $ | 10.09 | | | $ | 9.89 | | | $ | 10.07 | | | $ | 10.07 | | | $ | 10.51 | |
| | | | | | | | | | | | | | | | | | | | |
| | | | | |
INCOME (LOSS) FROM INVESTMENT OPERATIONS: | | | | | | | | | | | | | | | | | | | | |
Net investment income (A) | | | 0.05 | | | | 0.07 | | | | 0.08 | | | | 0.10 | | | | 0.10 | |
Net realized and unrealized gain (loss) on investments | | | (0.20 | ) | | | 0.19 | | | | (0.04 | ) | | | 0.11 | | | | (0.48 | ) |
| | | | | | | | | | | | | | | | | | | | |
Total from investment operations | | | (0.15 | ) | | | 0.26 | | | | 0.04 | | | | 0.21 | | | | (0.38 | ) |
| | | | | | | | | | | | | | | | | | | | |
| | | | | |
LESS DISTRIBUTIONS: | | | | | | | | | | | | | | | | | | | | |
From net investment income | | | (0.09 | ) | | | (0.06 | ) | | | (0.20 | ) | | | (0.18 | ) | | | (0.06 | ) |
From net realized gains on investments | | | - | | | | - | | | | (0.02 | ) | | | (0.03 | ) | | | - | |
| | | | | | | | | | | | | | | | | | | | |
Total distributions | | | (0.09 | ) | | | (0.06 | ) | | | (0.22 | ) | | | (0.21 | ) | | | (0.06 | ) |
| | | | | | | | | | | | | | | | | | | | |
| | | | | |
Net asset value, end of year | | $ | 9.85 | | | $ | 10.09 | | | $ | 9.89 | | | $ | 10.07 | | | $ | 10.07 | |
| | | | | | | | | | | | | | | | | | | | |
| | | | | |
Total return (B)(C) | | | (1.49)% | | | | 2.66% | | | | 0.36% | | | | 2.02% | | | | (3.57)% | |
| | | | | |
RATIOS/SUPPLEMENTAL DATA: | | | | | | | | | | | | | | | | | | | | |
Net assets, end of year (in 000’s) | | $ | 9,637 | | | $ | 9,660 | | | $ | 8,510 | | | $ | 7,120 | | | $ | 7,958 | |
Ratios to average net assets | | | | | | | | | | | | | | | | | | | | |
Expenses, before waiver and reimbursement | | | 2.06% | | | | 1.99% | | | | 2.03% | | | | 2.05% | | | | 2.03% | |
Expenses, net waiver and reimbursement | | | 1.86% | | | | 1.79% | | | | 1.86% | | | | 1.90% | | | | 1.88% | |
Net investment income, before waiver and reimbursement | | | 0.30% | | | | 0.46% | | | | 0.56% | | | | 0.85% | | | | 0.79% | |
Net investment income, net waiver and reimbursement | | | 0.50% | | | | 0.65% | | | | 0.73% | | | | 1.00% | | | | 0.94% | |
Portfolio turnover rate | | | 43% | | | | 40% | | | | 28% | | | | 18% | | | | 25% | |
| (A) | Per share amounts calculated using average shares method, which more appropriately presents the per share data for the period. |
| (B) | Total return calculation does not reflect redemption fee. |
| (C) | Total return in the above table represents the rate that the investor would have earned or lost on an investment in the Fund assuming reinvestment of dividends. |
| | Total return would have been higher or lower if certain expenses had not been reimbursed, waived or recouped. |
The accompanying notes are an integral part of these financial statements.
96
Timothy Fixed Income Fund (Class I Shares)
Selected data based on a share outstanding throughout each period
| | | | | | | | | | | | | | | | | | | | |
| | | For the Year
ended
September 30,
2017 | | | For the Year
ended
September 30,
2016 | | | For the Year
ended
September 30,
2015 | | | For the Year
ended
September 30,
2014 | | | For the
Period ended
September 30,
2013 (A) | |
| | | | | |
Net asset value, beginning of period | | $ | 10.41 | | | $ | 10.20 | | | $ | 10.36 | | | $ | 10.34 | | | $ | 10.35 | |
| | | | | | | | | | | | | | | | | | | | |
| | | | | |
INCOME (LOSS) FROM INVESTMENT OPERATIONS: | | | | | | | | | | | | | | | | | | | | |
Net investment income (B) | | | 0.16 | | | | 0.17 | | | | 0.18 | | | | 0.41 | | | | 0.04 | |
Net realized and unrealized gain (loss) on investments | | | (0.23 | ) | | | 0.22 | | | | (0.05 | ) | | | (0.08 | ) (C) | | | 0.05 | |
| | | | | | | | | | | | | | | | | | | | |
Total from investment operations | | | (0.07 | ) | | | 0.39 | | | | 0.13 | | | | 0.33 | | | | 0.09 | |
| | | | | | | | | | | | | | | | | | | | |
| | | | | |
LESS DISTRIBUTIONS: | | | | | | | | | | | | | | | | | | | | |
From net investment income | | | (0.19 | ) | | | (0.18 | ) | | | (0.27 | ) | | | (0.28 | ) | | | (0.10 | ) |
From net realized gains on investments | | | - | | | | - | | | | (0.02 | ) | | | (0.03 | ) | | | - | |
| | | | | | | | | | | | | | | | | | | | |
Total distributions | | | (0.19 | ) | | | (0.18 | ) | | | (0.29 | ) | | | (0.31 | ) | | | (0.10 | ) |
| | | | | | | | | | | | | | | | | | | | |
| | | | | |
Net asset value, end of period | | $ | 10.15 | | | $ | 10.41 | | | $ | 10.20 | | | $ | 10.36 | | | $ | 10.34 | |
| | | | | | | | | | | | | | | | | | | | |
| | | | | |
Total return (D) | | | (0.64)% | | | | 3.91% | | | | 1.28% | | | | 3.16% | | | | 0.90% | (E) |
| | | | | |
RATIOS/SUPPLEMENTAL DATA: | | | | | | | | | | | | | | | | | | | | |
Net assets, end of period (in 000’s) | | $ | 2,134 | | | $ | 564 | | | $ | 483 | | | $ | 103 | | | $ | 101 | + |
Ratios to average net assets | | | | | | | | | | | | | | | | | | | | |
Expenses, before waiver and reimbursement | | | 1.08% | | | | 0.96% | | | | 1.03% | | | | (0.44)% | | | | 1.02% | (F) |
Expenses, net waiver and reimbursement | | | 0.88% | | | | 0.78% | | | | 0.87% | | | | (0.64)% | | | | 0.87% | (F) |
Net investment income, before waiver and reimbursement | | | 1.37% | | | | 1.45% | | | | 1.58% | | | | 3.72% | | | | 1.79% | (F) |
Net investment income, net waiver and reimbursement | | | 1.57% | | | | 1.63% | | | | 1.73% | | | | 3.92% | | | | 1.94% | (F) |
Portfolio turnover rate | | | 43% | | | | 40% | | | | 28% | | | | 18% | | | | 25% | (E) |
+ Actual net assets not truncated.
| (A) | For the period August 1, 2013 (Commencement of Operations) to September 30, 2013. |
| (B) | Per share amounts calculated using average shares method, which more appropriately presents the per share data for the period. |
| (C) | Realized and unrealized gains per share in this caption are balancing amounts necessary to reconcile the change in net asset value per share for the period, and may not reconcile with the aggregate gains and losses in the Statements of Operations due to share transactions for the period. |
| (D) | Total return in the above table represents the rate that the investor would have earned or lost on an investment in the Fund assuming reinvestment of dividends. |
| | Total return would have been higher or lower if certain expenses had not been reimbursed, waived or recouped. |
| (E) | For periods of less than one full year, total return and turnover are not annualized. |
The accompanying notes are an integral part of these financial statements.
97
Timothy High Yield Bond Fund (Class A Shares)
Selected data based on a share outstanding throughout each period
| | | | | | | | | | | | | | | | | | | | |
| | | For the Year
ended
September 30,
2017 | | | For the Year
ended
September 30,
2016 | | | For the Year
ended
September 30,
2015 | | | For the Year
ended
September 30,
2014 | | | For the Year
ended
September 30,
2013 | |
| | | | | |
Net asset value, beginning of year | | $ | 9.11 | | | $ | 8.64 | | | $ | 9.49 | | | $ | 9.40 | | | $ | 9.46 | |
| | | | | | | | | | | | | | | | | | | | |
| | | | | |
INCOME (LOSS) FROM INVESTMENT OPERATIONS: | | | | | | | | | | | | | | | | | | | | |
Net investment income (A) | | | 0.34 | | | | 0.36 | | | | 0.40 | | | | 0.44 | | | | 0.49 | |
Net realized and unrealized gain (loss) on investments | | | 0.28 | | | | 0.46 | | | | (0.85 | ) | | | 0.09 | | | | (0.08 | ) |
| | | | | | | | | | | | | | | | | | | | |
Total from investment operations | | | 0.62 | | | | 0.82 | | | | (0.45 | ) | | | 0.53 | | | | 0.41 | |
| | | | | | | | | | | | | | | | | | | | |
| | | | | |
LESS DISTRIBUTIONS: | | | | | | | | | | | | | | | | | | | | |
From net investment income | | | (0.33 | ) | | | (0.35 | ) | | | (0.40 | ) | | | (0.44 | ) | | | (0.47 | ) |
| | | | | | | | | | | | | | | | | | | | |
Total distributions | | | (0.33 | ) | | | (0.35 | ) | | | (0.40 | ) | | | (0.44 | ) | | | (0.47 | ) |
| | | | | | | | | | | | | | | | | | | | |
| | | | | |
Net asset value, end of year | | $ | 9.40 | | | $ | 9.11 | | | $ | 8.64 | | | $ | 9.49 | | | $ | 9.40 | |
| | | | | | | | | | | | | | | | | | | | |
Total return (B)(C) | | | 6.94% | | | | 9.80% | | | | (4.88)% | | | | 5.71% | | | | 4.42% | |
| | | | | |
RATIOS/SUPPLEMENTAL DATA: | | | | | | | | | | | | | | | | | | | | |
Net assets, end of year (in 000’s) | | $ | 52,950 | | | $ | 49,187 | | | $ | 36,279 | | | $ | 41,038 | | | $ | 35,578 | |
Ratios to average net assets | | | | | | | | | | | | | | | | | | | | |
Expenses, before waiver and reimbursement | | | 1.32% | | | | 1.29% | | | | 1.30% | | | | 1.28% | | | | - | |
Expenses, net waiver and reimbursement | | | 1.27% | | | | 1.24% | | | | 1.25% | | | | 1.28% | | | | 1.33% | |
Net investment income, before waiver and reimbursement | | | 3.66% | | | | 4.03% | | | | 4.28% | | | | 4.53% | | | | - | |
Net investment income, net waiver and reimbursement | | | 3.71% | | | | 4.08% | | | | 4.33% | | | �� | 4.53% | | | | 5.13% | |
Portfolio turnover rate | | | 45% | | | | 27% | | | | 39% | | | | 53% | | | | 56% | |
| (A) | Per share amounts calculated using average shares method, which more appropriately presents the per share data for the period. |
| (B) | Total return calculation does not reflect sales load. |
| (C) | Total return in the above table represents the rate that the investor would have earned or lost on an investment in the Fund assuming reinvestment of dividends. |
| | Total return would have been higher or lower if certain expenses had not been reimbursed, waived or recouped. |
The accompanying notes are an integral part of these financial statements.
98
Timothy High Yield Bond Fund (Class C Shares)
Selected data based on a share outstanding throughout each period
| | | | | | | | | | | | | | | | | | | | |
| | | For the Year
ended
September 30,
2017 | | | For the Year
ended
September 30,
2016 | | | For the Year
ended
September 30,
2015 | | | For the Year
ended
September 30,
2014 | | | For the Year
ended
September 30,
2013 | |
| | | | | |
Net asset value, beginning of year | | $ | 9.22 | | | $ | 8.72 | | | $ | 9.57 | | | $ | 9.48 | | | $ | 9.55 | |
| | | | | | | | | | | | | | | | | | | | |
| | | | | |
INCOME (LOSS) FROM INVESTMENT OPERATIONS: | | | | | | | | | | | | | | | | | | | | |
Net investment income (A) | | | 0.28 | | | | 0.30 | | | | 0.33 | | | | 0.37 | | | | 0.43 | |
Net realized and unrealized gain (loss) on investments | | | 0.27 | | | | 0.47 | | | | (0.86 | ) | | | 0.09 | | | | (0.09 | ) |
| | | | | | | | | | | | | | | | | | | | |
Total from investment operations | | | 0.55 | | | | 0.77 | | | | (0.53 | ) | | | 0.46 | | | | 0.34 | |
| | | | | | | | | | | | | | | | | | | | |
| | | | | |
LESS DISTRIBUTIONS: | | | | | | | | | | | | | | | | | | | | |
From net investment income | | | (0.26 | ) | | | (0.27 | ) | | | (0.32 | ) | | | (0.37 | ) | | | (0.41 | ) |
| | | | | | | | | | | | | | | | | | | | |
Total distributions | | | (0.26 | ) | | | (0.27 | ) | | | (0.32 | ) | | | (0.37 | ) | | | (0.41 | ) |
| | | | | | | | | | | | | | | | | | | | |
| | | | | |
Net asset value, end of year | | $ | 9.51 | | | $ | 9.22 | | | $ | 8.72 | | | $ | 9.57 | | | $ | 9.48 | |
| | | | | | | | | | | | | | | | | | | | |
| | | | | |
Total return (B)(C) | | | 6.04% | | | | 9.04% | | | | (5.58)% | | | | 4.89% | | | | 3.54% | |
| | | | | |
RATIOS/SUPPLEMENTAL DATA: | | | | | | | | | | | | | | | | | | | | |
Net assets, end of year (in 000’s) | | $ | 3,539 | | | $ | 3,108 | | | $ | 2,714 | | | $ | 2,771 | | | $ | 2,236 | |
Ratios to average net assets | | | | | | | | | | | | | | | | | | | | |
Expenses, before waiver and reimbursement | | | 2.07% | | | | 2.03% | | | | 2.05% | | | | 2.03% | | | | - | |
Expenses, net waiver and reimbursement | | | 2.02% | | | | 1.98% | | | | 2.00% | | | | 2.03% | | | | 2.07% | |
Net investment income, before waiver and reimbursement | | | 2.91% | | | | 3.30% | | | | 3.53% | | | | 3.78% | | | | - | |
Net investment income, net waiver and reimbursement | | | 2.96% | | | | 3.35% | | | | 3.57% | | | | 3.79% | | | | 4.39% | |
Portfolio turnover rate | | | 45% | | | | 27% | | | | 39% | | | | 53% | | | | 56% | |
| (A) | Per share amounts calculated using average shares method, which more appropriately presents the per share data for the period. |
| (B) | Total return calculation does not reflect redemption fee. |
| (C) | Total return in the above table represents the rate that the investor would have earned or lost on an investment in the Fund assuming reinvestment of dividends. |
| | Total return would have been higher or lower if certain expenses had not been reimbursed, waived or recouped. |
The accompanying notes are an integral part of these financial statements.
99
Timothy High Yield Bond Fund (Class I Shares)
Selected data based on a share outstanding throughout each period
| | | | | | | | | | | | | | | | | | | | |
| | | For the Year
ended
September 30,
2017 | | | For the Year
ended
September 30,
2016 | | | For the Year
ended
September 30,
2015 | | | For the Year
ended
September 30,
2014 | | | For the Period ended
September 30,
2013 (A) | |
| | | | | |
Net asset value, beginning of period | | $ | 9.12 | | | $ | 8.65 | | | $ | 9.50 | | | $ | 9.40 | | | $ | 9.48 | |
| | | | | | | | | | | | | | | | | | | | |
| | | | | |
INCOME (LOSS) FROM INVESTMENT OPERATIONS: | | | | | | | | | | | | | | | | | | | | |
Net investment income (B) | | | 0.37 | | | | 0.39 | | | | 0.43 | | | | 0.47 | | | | 0.07 | |
Net realized and unrealized gain (loss) on investments | | | 0.28 | | | | 0.46 | | | | (0.86 | ) | | | 0.10 | | | | (0.06 | ) |
| | | | | | | | | | | | | | | | | | | | |
Total from investment operations | | | 0.65 | | | | 0.85 | | | | (0.43 | ) | | | 0.57 | | | | 0.01 | |
| | | | | | | | | | | | | | | | | | | | |
| | | | | |
LESS DISTRIBUTIONS: | | | | | | | | | | | | | | | | | | | | |
From net investment income | | | (0.36 | ) | | | (0.38 | ) | | | (0.42 | ) | | | (0.47 | ) | | | (0.09 | ) |
| | | | | | | | | | | | | | | | | | | | |
Total distributions | | | (0.36 | ) | | | (0.38 | ) | | | (0.42 | ) | | | (0.47 | ) | | | (0.09 | ) |
| | | | | | | | | | | | | | | | | | | | |
| | | | | |
Net asset value, end of period | | $ | 9.41 | | | $ | 9.12 | | | $ | 8.65 | | | $ | 9.50 | | | $ | 9.40 | |
| | | | | | | | | | | | | | | | | | | | |
| | | | | |
Total return (C) | | | 7.21% | | | | 10.12% | | | | (4.62)% | | | | 6.07% | | | | 0.15% | (D) |
| | | | | |
RATIOS/SUPPLEMENTAL DATA: | | | | | | | | | | | | | | | | | | | | |
Net assets, end of period (in 000’s) | | $ | 9,717 | | | $ | 1,560 | | | $ | 2,758 | | | $ | 241 | | | $ | 100 | + |
Ratios to average net assets | | | | | | | | | | | | | | | | | | | | |
Expenses, before waiver and reimbursement | | | 1.06% | | | | 0.96% | | | | 1.06% | | | | 0.90% | | | | - | |
Expenses, net waiver and reimbursement | | | 1.01% | | | | 0.92% | | | | 1.00% | | | | 0.89% | | | | 1.08% | (E) |
Net investment income, before waiver and reimbursement | | | 3.89% | | | | 4.38% | | | | 4.55% | | | | 4.77% | | | | - | |
Net investment income, net waiver and reimbursement | | | 3.94% | | | | 4.42% | | | | 4.58% | | | | 4.78% | | | | 5.38% | (E) |
Portfolio turnover rate | | | 45% | | | | 27% | | | | 39% | | | | 53% | | | | 56% | (D) |
+ Actual net assets not truncated.
| (A) | For the period August 1, 2013 (Commencement of Operations) to September 30, 2013. |
| (B) | Per share amounts calculated using average shares method, which more appropriately presents the per share data for the period. |
| (C) | Total return in the above table represents the rate that the investor would have earned or lost on an investment in the Fund assuming reinvestment of dividends. |
| | Total return would have been higher or lower if certain expenses had not been reimbursed, waived or recouped. |
| (D) | For periods of less than one full year, total return and turnover are not annualized. |
The accompanying notes are an integral part of these financial statements.
100
Timothy Israel Common Values Fund (Class A Shares)
Selected data based on a share outstanding throughout each period
| | | | | | | | | | | | | | | | | | | | |
| | | For the Year
ended
September 30,
2017 | | | For the Year
ended
September 30,
2016 | | | For the Year
ended
September 30,
2015 | | | For the Year
ended
September 30,
2014 | | | For the Year
ended
September 30,
2013 | |
| | | | | |
Net asset value, beginning of year | | $ | 12.45 | | | $ | 11.10 | | | $ | 12.31 | | | $ | 12.69 | | | $ | 10.17 | |
| | | | | | | | | | | | | | | | | | | | |
| | | | | |
INCOME (LOSS) FROM INVESTMENT OPERATIONS: | | | | | | | | | | | | | | | | | | | | |
Net investment income (loss)(A) | | | 0.07 | | | | (0.09 | ) | | | (0.10 | ) | | | (0.08 | ) | | | (0.06 | ) |
Net realized and unrealized gain (loss) on investments | | | 2.58 | | | | 1.44 | | | | (1.11 | ) | | | 0.37 | | | | 2.58 | |
| | | | | | | | | | | | | | | | | | | | |
Total from investment operations | | | 2.65 | | | | 1.35 | | | | (1.21 | ) | | | 0.29 | | | | 2.52 | |
| | | | | | | | | | | | | | | | | | | | |
| | | | | |
LESS DISTRIBUTIONS: | | | | | | | | | | | | | | | | | | | | |
From net investment income | | | (0.19 | ) | | | - | | | | - | | | | (0.67 | ) | | | - | |
| | | | | | | | | | | | | | | | | | | | |
Total distributions | | | (0.19 | ) | | | - | | | | - | | | | (0.67 | ) | | | - | |
| | | | | | | | | | | | | | | | | | | | |
| | | | | |
Net asset value, end of year | | $ | 14.91 | | | $ | 12.45 | | | $ | 11.10 | | | $ | 12.31 | | | $ | 12.69 | |
| | | | | | | | | | | | | | | | | | | | |
| | | | | |
Total return (B)(C) | | | 21.62% | | | | 12.16% | | | | (9.83)% | | | | 2.21% | | | | 24.78% | |
| | | | | |
RATIOS/SUPPLEMENTAL DATA: | | | | | | | | | | | | | | | | | | | | |
Net assets, end of year (in 000’s) | | $ | 34,958 | | | $ | 16,030 | | | $ | 11,756 | | | $ | 13,792 | | | $ | 10,295 | |
Ratio of expenses to average net assets | | | 1.80% | | | | 1.96% | | | | 1.93% | | | | 1.98% | | | | 2.24% | |
Ratio of net investment income (loss) to average net assets | | | 0.54% | | | | (0.82)% | | | | (0.83)% | | | | (0.64)% | | | | (0.57)% | |
Portfolio turnover rate | | | 10% | | | | 38% | | | | 24% | | | | 11% | | | | 30% | |
| (A) | Per share amounts calculated using average shares method, which more appropriately presents the per share data for the period. |
| (B) | Total return calculation does not reflect sales load. |
| (C) | Total return in the above table represents the rate that the investor would have earned or lost on an investment in the Fund assuming reinvestment of dividends. |
The accompanying notes are an integral part of these financial statements.
101
Timothy Israel Common Values Fund (Class C Shares)
Selected data based on a share outstanding throughout each period
| | | | | | | | | | | | | | | | | | | | |
| | | For the Year
ended
September 30,
2017 | | | For the Year
ended
September 30,
2016 | | | For the Year
ended
September 30,
2015 | | | For the Year
ended
September 30,
2014 | | | For the Year
ended
September 30,
2013 | |
| | | | | |
Net asset value, beginning of year | | $ | 12.01 | | | $ | 10.78 | | | $ | 12.05 | | | $ | 12.50 | | | $ | 10.09 | |
| | | | | | | | | | | | | | | | | | | | |
| | | | | |
INCOME (LOSS) FROM INVESTMENT OPERATIONS: | | | | | | | | | | | | | | | | | | | | |
Net investment loss (A) | | | (0.03 | ) | | | (0.18 | ) | | | (0.18 | ) | | | (0.18 | ) | | | (0.13 | ) |
Net realized and unrealized gain (loss) on investments | | | 2.48 | | | | 1.41 | | | | (1.09 | ) | | | 0.37 | | | | 2.54 | |
| | | | | | | | | | | | | | | | | | | | |
Total from investment operations | | | 2.45 | | | | 1.23 | | | | (1.27 | ) | | | 0.19 | | | | 2.41 | |
| | | | | | | | | | | | | | | | | | | | |
| | | | | |
LESS DISTRIBUTIONS: | | | | | | | | | | | | | | | | | | | | |
From net investment income | | | (0.13 | ) | | | - | | | | - | | | | (0.64 | ) | | | - | |
| | | | | | | | | | | | | | | | | | | | |
Total distributions | | | (0.13 | ) | | | - | | | | - | | | | (0.64 | ) | | | - | |
| | | | | | | | | | | | | | | | | | | | |
| | | | | |
Net asset value, end of year | | $ | 14.33 | | | $ | 12.01 | | | $ | 10.78 | | | $ | 12.05 | | | $ | 12.50 | |
| | | | | | | | | | | | | | | | | | | | |
| | | | | |
Total return (B)(C) | | | 20.60% | | | | 11.41% | | | | (10.54)% | | | | 1.40% | | | | 23.89% | |
| | | | | |
RATIOS/SUPPLEMENTAL DATA: | | | | | | | | | | | | | | | | | | | | |
Net assets, end of year (in 000’s) | | $ | 7,905 | | | $ | 4,144 | | | $ | 2,722 | | | $ | 2,342 | | | $ | 943 | |
Ratio of expenses to average net assets | | | 2.56% | | | | 2.71% | | | | 2.68% | | | | 2.74% | | | | 2.99% | |
Ratio of net investment loss to average net assets | | | (0.21)% | | | | (1.57)% | | | | (1.59)% | | | | (1.38)% | | | | (1.32)% | |
Portfolio turnover rate | | | 10% | | | | 38% | | | | 24% | | | | 11% | | | | 30% | |
| (A) | Per share amounts calculated using average shares method, which more appropriately presents the per share data for the period. |
| (B) | Total return calculation does not reflect redemption fee. |
| (C) | Total return in the above table represents the rate that the investor would have earned or lost on an investment in the Fund assuming reinvestment of dividends. |
The accompanying notes are an integral part of these financial statements.
102
Timothy Israel Common Values Fund (Class I Shares)
Selected data based on a share outstanding throughout each period
| | | | | | | | | | | | | | | | | | | | |
| | | For the Year
ended
September 30,
2017 | | | For the Year
ended
September 30,
2016 | | | For the Year
ended
September 30,
2015 | | | For the Year
ended
September 30,
2014 | | | For the Period ended
September 30,
2013 (A) | |
| | | | | |
Net asset value, beginning of period | | $ | 12.50 | | | $ | 11.11 | | | $ | 12.29 | | | $ | 12.67 | | | $ | 12.21 | |
| | | | | | | | | | | | | | | | | | | | |
| | | | | |
INCOME (LOSS) FROM INVESTMENT OPERATIONS: | | | | | | | | | | | | | | | | | | | | |
Net investment income (loss) (B) | | | 0.12 | | | | (0.08 | ) | | | (0.03 | ) | | | (0.05 | ) | | | 0.01 | |
Net realized and unrealized gain (loss) on investments | | | 2.57 | | | | 1.47 | | | | (1.15 | ) | | | 0.37 | | | | 0.45 | |
| | | | | | | | | | | | | | | | | | | | |
Total from investment operations | | | 2.69 | | | | 1.39 | | | | (1.18 | ) | | | 0.32 | | | | 0.46 | |
| | | | | | | | | | | | | | | | | | | | |
| | | | | |
LESS DISTRIBUTIONS: | | | | | | | | | | | | | | | | | | | | |
From net investment income | | | (0.22 | ) | | | - | | | | - | | | | (0.70 | ) | | | - | |
| | | | | | | | | | | | | | | | | | | | |
Total distributions | | | (0.22 | ) | | | - | | | | - | | | | (0.70 | ) | | | - | |
| | | | | | | | | | | | | | | | | | | | |
| | | | | |
Net asset value, end of period | | $ | 14.97 | | | $ | 12.50 | | | $ | 11.11 | | | $ | 12.29 | | | $ | 12.67 | |
| | | | | | | | | | | | | | | | | | | | |
| | | | | |
Total return (C) | | | 21.87% | | | | 12.51% | | | | (9.60)% | | | | 2.36% | | | | 3.77% | (D) |
| | | | | |
RATIOS/SUPPLEMENTAL DATA: | | | | | | | | | | | | | | | | | | | | |
Net assets, end of period (in 000’s) | | $ | 2,189 | | | $ | 520 | | | $ | 236 | | | $ | 13 | | | $ | 104 | + |
Ratio of expenses to average net assets | | | 1.56% | | | | 1.72% | | | | 1.68% | | | | 1.78% | | | | 1.99% | (E) |
Ratio of net investment income (loss) to average net assets | | | 0.83% | | | | (0.58)% | | | | (0.58)% | | | | (0.36)% | | | | (0.32)% | (E) |
Portfolio turnover rate | | | 10% | | | | 38% | | | | 24% | | | | 11% | | | | 30% | (D) |
+ Actual net assets not truncated.
| (A) | For the period August 1, 2013 (Commencement of Operations) to September 30, 2013. |
| (B) | Per share amounts calculated using average shares method, which more appropriately presents the per share data for the period. |
| (C) | Total return in the above table represents the rate that the investor would have earned or lost on an investment in the Fund assuming reinvestment of dividends. |
| (D) | For periods of less than one full year, total return and turnover are not annualized. |
The accompanying notes are an integral part of these financial statements.
103
Timothy Defensive Strategies Fund (Class A Shares)
Selected data based on a share outstanding throughout each period
| | | | | | | | | | | | | | | | | | | | |
| | | For the Year
ended
September 30,
2017 | | | For the Year
ended
September 30,
2016 | | | For the Year
ended
September 30,
2015 | | | For the Year
ended
September 30,
2014 | | | For the Year
ended
September 30,
2013 | |
| | | | | |
Net asset value, beginning of year | | $ | 11.49 | | | $ | 10.54 | | | $ | 11.38 | | | $ | 11.12 | | | $ | 12.12 | |
| | | | | | | | | | | | | | | | | | | | |
| | | | | |
INCOME (LOSS) FROM INVESTMENT OPERATIONS: | | | | | | | | | | | | | | | | | | | | |
Net investment income (A) | | | 0.00 | * | | | 0.04 | | | | 0.02 | | | | 0.09 | | | | 0.06 | |
Net realized and unrealized gain (loss) on investments | | | (0.08 | ) | | | 0.91 | | | | (0.73 | ) | | | 0.25 | | | | (1.04 | ) |
| | | | | | | | | | | | | | | | | | | | |
Total from investment operations | | | (0.08 | ) | | | 0.95 | | | | (0.71 | ) | | | 0.34 | | | | (0.98 | ) |
| | | | | | | | | | | | | | | | | | | | |
| | | | | |
LESS DISTRIBUTIONS: | | | | | | | | | | | | | | | | | | | | |
From net investment income | | | (0.04 | ) | | | - | | | | (0.12 | ) | | | (0.05 | ) | | | - | |
From net realized gains on investments | | | - | | | | - | | | | (0.01 | ) | | | (0.03 | ) | | | (0.02 | ) |
| | | | | | | | | | | | | | | | | | | | |
Total distributions | | | (0.04 | ) | | | - | | | | (0.13 | ) | | | (0.08 | ) | | | (0.02 | ) |
| | | | | | | | | | | | | | | | | | | | |
| | | | | |
Net asset value, end of year | | $ | 11.37 | | | $ | 11.49 | | | $ | 10.54 | | | $ | 11.38 | | | $ | 11.12 | |
| | | | | | | | | | | | | | | | | | | | |
| | | | | |
Total return (B)(C) | | | (0.72)% | | | | 9.01% | | | | (6.30)% | | | | 3.06% | | | | (8.09)% | |
| | | | | |
RATIOS/SUPPLEMENTAL DATA: | | | | | | | | | | | | | | | | | | | | |
Net assets, end of year (in 000’s) | | $ | 50,080 | | | $ | 68,706 | | | $ | 71,569 | | | $ | 54,054 | | | $ | 51,859 | |
Ratios to average net assets | | | | | | | | | | | | | | | | | | | | |
Expenses, before waiver and reimbursement | | | 1.44% | | | | 1.35% | | | | 1.26% | | | | 1.28% | | | | - | |
Expenses, net waiver and reimbursement | | | 1.39% | | | | 1.30% | | | | 1.21% | | | | 1.28% | | | | 1.26% | |
Net investment income, before waiver and reimbursement | | | (0.05)% | | | | 0.35% | | | | 0.11% | | | | 0.78% | | | | - | |
Net investment income, net waiver and reimbursement | | | 0.00% | | | | 0.40% | | | | 0.16% | | | | 0.78% | | | | 0.52% | |
Portfolio turnover rate | | | 51% | | | | 58% | | | | 42% | | | | 24% | | | | 56% | |
| * | Amount is less than $0.005 per share. |
| (A) | Per share amounts calculated using average shares method, which more appropriately presents the per share data for the period. |
| (B) | Total return calculation does not reflect sales load. |
| (C) | Total return in the above table represents the rate that the investor would have earned or lost on an investment in the Fund assuming reinvestment of dividends. |
| | Total return would have been higher or lower if certain expenses had not been reimbursed, waived or recouped. |
The accompanying notes are an integral part of these financial statements.
104
Timothy Defensive Strategies Fund (Class C Shares)
Selected data based on a share outstanding throughout each period
| | | | | | | | | | | | | | | | | | | | |
| | | For the Year
ended
September 30,
2017 | | | For the Year
ended
September 30,
2016 | | | For the Year
ended
September 30,
2015 | | | For the Year
ended
September 30,
2014 | | | For the Year
ended
September 30,
2013 | |
| | | | | |
Net asset value, beginning of year | | $ | 11.07 | | | $ | 10.22 | | | $ | 11.04 | | | $ | 10.82 | | | $ | 11.88 | |
| | | | | | | | | | | | | | | | | | | | |
| | | | | |
INCOME (LOSS) FROM INVESTMENT OPERATIONS: | | | | | | | | | | | | | | | | | | | | |
Net investment income (loss) (A) | | | (0.08 | ) | | | (0.04 | ) | | | (0.07 | ) | | | - | | | | (0.03 | ) |
Net realized and unrealized gain (loss) on investments | | | (0.09 | ) | | | 0.89 | (B) | | | (0.71 | ) | | | 0.25 | | | | (1.01 | ) |
| | | | | | | | | | | | | | | | | | | | |
Total from investment operations | | | (0.17 | ) | | | 0.85 | | | | (0.78 | ) | | | 0.25 | | | | (1.04 | ) |
| | | | | | | | | | | | | | | | | | | | |
| | | | | |
LESS DISTRIBUTIONS: | | | | | | | | | | | | | | | | | | | | |
From net investment income | | | - | | | | - | | | | (0.03 | ) | | | - | | | | - | |
From net realized gains on investments | | | - | | | | - | | | | (0.01 | ) | | | (0.03 | ) | | | (0.02 | ) |
| | | | | | | | | | | | | | | | | | | | |
Total distributions | | | - | | | | - | | | | (0.04 | ) | | | (0.03 | ) | | | (0.02 | ) |
| | | | | | | | | | | | | | | | | | | | |
| | | | | |
Net asset value, end of year | | $ | 10.90 | | | $ | 11.07 | | | $ | 10.22 | | | $ | 11.04 | | | $ | 10.82 | |
| | | | | | | | | | | | | | | | | | | | |
| | | | | |
Total return (C)(D) | | | (1.54)% | | | | 8.32% | | | | (7.06)% | | | | 2.27% | | | | (8.75)% | |
| | | | | |
RATIOS/SUPPLEMENTAL DATA: | | | | | | | | | | | | | | | | | | | | |
Net assets, end of year (in 000’s) | | $ | 6,683 | | | $ | 9,630 | | | $ | 14,671 | | | $ | 14,461 | | | $ | 16,718 | |
Ratios to average net assets | | | | | | | | | | | | | | | | | | | | |
Expenses, before waiver and reimbursement | | | 2.21% | | | | 2.07% | | | | 2.01% | | | | 2.04% | | | | - | |
Expenses, net waiver and reimbursement | | | 2.16% | | | | 2.02% | | | | 1.96% | | | | 2.03% | | | | 2.02% | |
Net investment loss, before waiver and reimbursement | | | (0.79)% | | | | (0.46)% | | | | (0.67)% | | | | (0.02)% | | | | - | |
Net investment loss, net waiver and reimbursement | | | (0.74)% | | | | (0.41)% | | | | (0.62)% | | | | (0.01)% | | | | (0.25)% | |
Portfolio turnover rate | | | 51% | | | | 58% | | | | 42% | | | | 24% | | | | 56% | |
| (A) | Per share amounts calculated using average shares method, which more appropriately presents the per share data for the period. |
| (B) | Realized and unrealized gains per share in this caption are balancing amounts necessary to reconcile the change in net asset value per share for the period, and may not reconcile with the aggregate gains and losses in the Statements of Operations due to share transactions for the period. |
| (C) | Total return calculation does not reflect redemption fee. |
| (D) | Total return in the above table represents the rate that the investor would have earned or lost on an investment in the Fund assuming reinvestment of dividends. |
| | Total return would have been higher or lower if certain expenses had not been reimbursed, waived or recouped. |
The accompanying notes are an integral part of these financial statements.
105
Timothy Defensive Strategies Fund (Class I Shares)
Selected data based on a share outstanding throughout each period
| | | | | | | | | | | | | | | | | | | | |
| | | For the Year
ended
September 30,
2017 | | | For the Year
ended
September 30,
2016 | | | For the Year
ended
September 30,
2015 | | | For the Year
ended
September 30,
2014 | | | For the
Period ended
September 30,
2013 (A) | |
| | | | | |
Net asset value, beginning of period | | $ | 11.51 | | | $ | 10.52 | | | $ | 11.36 | | | $ | 11.11 | | | $ | 11.11 | |
| | | | | | | | | | | | | | | | | | | | |
| | | | | |
INCOME (LOSS) FROM INVESTMENT OPERATIONS: | | | | | | | | | | | | | | | | | | | | |
Net investment income (B) | | | 0.06 | | | | 0.09 | | | | 0.05 | | | | 0.18 | | | | 0.01 | |
Net realized and unrealized gain (loss) on investments | | | (0.12 | ) | | | 0.90 | | | | (0.73 | ) | | | 0.20 | | | | (0.01 | ) |
| | | | | | | | | | | | | | | | | | | | |
Total from investment operations | | | (0.06 | ) | | | 0.99 | | | | (0.68 | ) | | | 0.38 | | | | 0.00 | |
| | | | | | | | | | | | | | | | | | | | |
| | | | | |
LESS DISTRIBUTIONS: | | | | | | | | | | | | | | | | | | | | |
From net investment income | | | (0.07 | ) | | | - | | | | (0.15 | ) | | | (0.10 | ) | | | - | |
From net realized gains on investments | | | - | | | | - | | | | (0.01 | ) | | | (0.03 | ) | | | - | |
| | | | | | | | | | | | | | | | | | | | |
Total distributions | | | (0.07 | ) | | | - | | | | (0.16 | ) | | | (0.13 | ) | | | - | |
| | | | | | | | | | | | | | | | | | | | |
| | | | | |
Net asset value, end of period | | $ | 11.38 | | | $ | 11.51 | | | $ | 10.52 | | | $ | 11.36 | | | $ | 11.11 | |
| | | | | | | | | | | | | | | | | | | | |
| | | | | |
Total return (C) | | | (0.54)% | | | | 9.41% | | | | (6.09)% | | | | 3.39% | | | | 0.00% | (D) |
RATIOS/SUPPLEMENTAL DATA: | | | | | | | | | | | | | | | | | | | | |
Net assets, end of period (in 000’s) | | $ | 2,661 | | | $ | 398 | | | $ | 163 | | | $ | 97 | | | $ | 100 | + |
Ratios to average net assets | | | | | | | | | | | | | | | | | | | | |
Expenses, before waiver and reimbursement | | | 1.14% | | | | 1.18% | | | | 1.01% | | | | 0.74% | | | | - | |
Expenses, net waiver and reimbursement | | | 1.09% | | | | 1.12% | | | | 0.96% | | | | 0.72% | | | | 1.01% | (E) |
Net investment income, before waiver and reimbursement | | | 0.44% | | | | 0.73% | | | | 0.42% | | | | 1.50% | | | | - | |
Net investment income, net waiver and reimbursement | | | 0.49% | | | | 0.79% | | | | 0.47% | | | | 1.52% | | | | 0.77% | (E) |
Portfolio turnover rate | | | 51% | | | | 58% | | | | 42% | | | | 24% | | | | 56% | (D) |
| + | Actual net assets not truncated. |
| (A) | For the period August 1, 2013 (Commencement of Operations) to September 30, 2013. |
| (B) | Per share amounts calculated using average shares method, which more appropriately presents the per share data for the period. |
| (C) | Total return in the above table represents the rate that the investor would have earned or lost on an investment in the Fund assuming reinvestment of dividends. |
| | Total return would have been higher or lower if certain expenses had not been reimbursed, waived or recouped. |
| (D) | For periods of less than one full year, total return and turnover are not annualized. |
The accompanying notes are an integral part of these financial statements.
106
Timothy Strategic Growth Fund (Class A Shares)
Selected data based on a share outstanding throughout each period
| | | | | | | | | | | | | | | | | | | | |
| | | For the Year
ended
September 30,
2017 | | | For the Year
ended
September 30,
2016 | | | For the Year
ended
September 30,
2015 | | | For the Year
ended
September 30,
2014 | | | For the Year
ended
September 30,
2013 | |
| | | | | |
Net asset value, beginning of year | | $ | 8.73 | | | $ | 8.42 | | | $ | 8.90 | | | $ | 8.34 | | | $ | 7.44 | |
| | | | | | | | | | | | | | | | | | | | |
| | | | | |
INCOME (LOSS) FROM INVESTMENT OPERATIONS: | | | | | | | | | | | | | | | | | | | | |
Net investment income (loss) (A) | | | (0.04 | ) | | | (0.03 | ) | | | 0.03 | | | | 0.12 | | | | 0.02 | |
Net realized and unrealized gain (loss) on investments | | | 0.79 | | | | 0.37 | | | | (0.40 | ) | | | 0.45 | | | | 0.93 | |
| | | | | | | | | | | | | | | | | | | | |
Total from investment operations | | | 0.75 | | | | 0.34 | | | | (0.37 | ) | | | 0.57 | | | | 0.95 | |
| | | | | | | | | | | | | | | | | | | | |
| | | | | |
LESS DISTRIBUTIONS: | | | | | | | | | | | | | | | | | | | | |
From net investment income | | | - | | | | (0.03 | ) | | | (0.11 | ) | | | (0.01 | ) | | | (0.05 | ) |
| | | | | | | | | | | | | | | | | | | | |
Total distributions | | | - | | | | (0.03 | ) | | | (0.11 | ) | | | (0.01 | ) | | | (0.05 | ) |
| | | | | | | | | | | | | | | | | | | | |
| | | | | |
Net asset value, end of year | | $ | 9.48 | | | $ | 8.73 | | | $ | 8.42 | | | $ | 8.90 | | | $ | 8.34 | |
| | | | | | | | | | | | | | | | | | | | |
| | | | | |
Total return (B)(C) | | | 8.59% | | | | 4.03% | | | | (4.16)% | | | | 6.82% | | | | 12.78% | |
| | | | | |
RATIOS/SUPPLEMENTAL DATA: | | | | | | | | | | | | | | | | | | | | |
Net assets, end of year (in 000’s) | | $ | 32,767 | | | $ | 32,800 | | | $ | 33,071 | | | $ | 36,951 | | | $ | 34,466 | |
Ratio of expenses to average net assets (D) | | | 1.07% | | | | 1.05% | | | | 1.08% | | | | 1.07% | | | | 1.08% | |
Ratio of net investment income (loss), to average net assets (D)(E) | | | (0.45)% | | | | (0.38)% | | | | 0.37% | | | | 1.34% | | | | 0.24% | |
Portfolio turnover rate | | | 36% | | | | 37% | | | | 24% | | | | 14% | | | | 19% | |
| (A) | Per share amounts calculated using average shares method, which more appropriately presents the per share data for the period. |
| (B) | Total return calculation does not reflect sales load. |
| (C) | Total return in the above table represents the rate that the investor would have earned or lost on an investment in the Fund assuming reinvestment of dividends. |
| (D) | These ratios exclude the impact of expenses of the underlying security holdings as represented in the Schedule of Investments. |
| (E) | Recognition of net investment income (loss) by the Fund is affected by the timing of the declaration of dividends by the underlying investment companies in which the Fund invests. |
The accompanying notes are an integral part of these financial statements.
107
Timothy Strategic Growth Fund (Class C Shares)
Selected data based on a share outstanding throughout each period
| | | | | | | | | | | | | | | | | | | | |
| | | For the Year
ended
September 30,
2017 | | | For the Year
ended
September 30,
2016 | | | For the Year
ended
September 30,
2015 | | | For the Year
ended
September 30,
2014 | | | For the Year
ended
September 30,
2013 | |
| | | | | |
Net asset value, beginning of year | | $ | 7.95 | | | $ | 7.70 | | | $ | 8.15 | | | $ | 7.69 | | | $ | 6.87 | |
| | | | | | | | | | | | | | | | | | | | |
| | | | | |
INCOME (LOSS) FROM INVESTMENT OPERATIONS: | | | | | | | | | | | | | | | | | | | | |
Net investment income (loss) (A) | | | (0.10 | ) | | | (0.08 | ) | | | (0.02 | ) | | | 0.03 | | | | (0.04 | ) |
Net realized and unrealized gain (loss) on investments | | | 0.72 | | | | 0.33 | | | | (0.38 | ) | | | 0.43 | | | | 0.86 | |
| | | | | | | | | | | | | | | | | | | | |
Total from investment operations | | | 0.62 | | | | 0.25 | | | | (0.40 | ) | | | 0.46 | | | | 0.82 | |
| | | | | | | | | | | | | | | | | | | | |
| | | | | |
LESS DISTRIBUTIONS: | | | | | | | | | | | | | | | | | | | | |
From net investment income | | | - | | | | - | | | | (0.05 | ) | | | - | | | | - | |
| | | | | | | | | | | | | | | | | | | | |
Total distributions | | | - | | | | - | | | | (0.05 | ) | | | - | | | | - | |
| | | | | | | | | | | | | | | | | | | | |
| | | | | |
Net asset value, end of year | | $ | 8.57 | | | $ | 7.95 | | | $ | 7.70 | | | $ | 8.15 | | | $ | 7.69 | |
| | | | | | | | | | | | | | | | | | | | |
| | | | | |
Total return (B)(C) | | | 7.80% | | | | 3.25% | | | | (4.89)% | | | | 5.98% | | | | 11.94% | |
| | | | | |
RATIOS/SUPPLEMENTAL DATA: | | | | | | | | | | | | | | | | | | | | |
Net assets, end of year (in 000’s) | | $ | 6,966 | | | $ | 7,380 | | | $ | 7,713 | | | $ | 8,842 | | | $ | 7,668 | |
Ratio of expenses to average net assets (D) | | | 1.82% | | | | 1.80% | | | | 1.84% | | | | 1.82% | | | | 1.83% | |
Ratio of net investment income (loss), to average net assets (D)(E) | | | (1.18)% | | | | (1.09)% | | | | (0.29)% | | | | 0.50% | | | | (0.52)% | |
Portfolio turnover rate | | | 36% | | | | 37% | | | | 24% | | | | 14% | | | | 19% | |
| (A) | Per share amounts calculated using average shares method, which more appropriately presents the per share data for the period. |
| (B) | Total return calculation does not reflect redemption fee. |
| (C) | Total return in the above table represents the rate that the investor would have earned or lost on an investment in the Fund assuming reinvestment of dividends. |
| (D) | These ratios exclude the impact of expenses of the underlying security holdings as represented in the Schedule of Investments. |
| (E) | Recognition of net investment income (loss) by the Fund is affected by the timing of the declaration of dividends by the underlying investment companies in which the Fund invests. |
The accompanying notes are an integral part of these financial statements.
108
Timothy Conservative Growth Fund (Class A Shares)
Selected data based on a share outstanding throughout each period
| | | | | | | | | | | | | | | | | | | | |
| | | For the Year
ended
September 30,
2017 | | | For the Year
ended
September 30,
2016 | | | For the Year
ended
September 30,
2015 | | | For the Year
ended
September 30,
2014 | | | For the Year
ended
September 30,
2013 | |
| | | | | |
Net asset value, beginning of year | | $ | 10.06 | | | $ | 10.32 | | | $ | 11.01 | | | $ | 10.51 | | | $ | 9.95 | |
| | | | | | | | | | | | | | | | | | | | |
| | | | | |
INCOME (LOSS) FROM INVESTMENT OPERATIONS: | | | | | | | | | | | | | | | | | | | | |
Net investment income (loss) (A) | | | (0.02 | ) | | | (0.03 | ) | | | 0.06 | | | | 0.14 | | | | 0.03 | |
Net realized and unrealized gain (loss) on investments | | | 0.63 | | | | 0.43 | | | | (0.32 | ) | | | 0.41 | | | | 0.61 | |
| | | | | | | | | | | | | | | | | | | | |
Total from investment operations | | | 0.61 | | | | 0.40 | | | | (0.26 | ) | | | 0.55 | | | | 0.64 | |
| | | | | | | | | | | | | | | | | | | | |
| | | | | |
LESS DISTRIBUTIONS: | | | | | | | | | | | | | | | | | | | | |
From net investment income | | | - | | | | (0.05 | ) | | | (0.10 | ) | | | (0.05 | ) | | | (0.08 | ) |
From net realized gains on investments | | | - | | | | (0.61 | ) | | | (0.33 | ) | | | - | | | | - | |
| | | | | | | | | | | | | | | | | | | | |
Total distributions | | | - | | | | (0.66 | ) | | | (0.43 | ) | | | (0.05 | ) | | | (0.08 | ) |
| | | | | | | | | | | | | | | | | | | | |
| | | | | |
Net asset value, end of year | | $ | 10.67 | | | $ | 10.06 | | | $ | 10.32 | | | $ | 11.01 | | | $ | 10.51 | |
| | | | | | | | | | | | | | | | | | | | |
| | | | | |
Total return (B)(C) | | | 6.06% | | | | 4.22% | | | | (2.47)% | | | | 5.23% | | | | 6.44% | |
| | | | | |
RATIOS/SUPPLEMENTAL DATA: | | | | | | | | | | | | | | | | | | | | |
Net assets, end of year (in 000’s) | | $ | 45,110 | | | $ | 44,437 | | | $ | 44,706 | | | $ | 47,543 | | | $ | 44,238 | |
Ratio of expenses to average net assets (D) | | | 1.04% | | | | 1.02% | | | | 1.07% | | | | 1.05% | | | | 1.05% | |
Ratio of net investment income (loss) to average net assets (D)(E) | | | (0.20)% | | | | (0.27)% | | | | 0.53% | | | | 1.26% | | | | 0.25% | |
Portfolio turnover rate | | | 27% | | | | 27% | | | | 25% | | | | 19% | | | | 22% | |
| (A) | Per share amounts calculated using average shares method, which more appropriately presents the per share data for the period. |
| (B) | Total return calculation does not reflect sales load. |
| (C) | Total return in the above table represents the rate that the investor would have earned or lost on an investment in the Fund assuming reinvestment of dividends. |
| (D) | These ratios exclude the impact of expenses of the underlying security holdings as represented in the Schedule of Investments. |
| (E) | Recognition of net investment income (loss) by the Fund is affected by the timing of the declaration of dividends by the underlying investment companies in which the Fund invests. |
The accompanying notes are an integral part of these financial statements.
109
Timothy Conservative Growth Fund (Class C Shares)
Selected data based on a share outstanding throughout each period
| | | | | | | | | | | | | | | | | | | | |
| | | For the Year
ended
September 30,
2017 | | | For the Year
ended
September 30,
2016 | | | For the Year
ended
September 30,
2015 | | | For the Year
ended
September 30,
2014 | | | For the Year
ended
September 30,
2013 | |
| | | | | |
Net asset value, beginning of year | | $ | 9.27 | | | $ | 9.58 | | | $ | 10.22 | | | $ | 9.79 | | | $ | 9.27 | |
| | | | | | | | | | | | | | | | | | | | |
| | | | | |
INCOME (LOSS) FROM INVESTMENT OPERATIONS: | | | | | | | | | | | | | | | | | | | | |
Net investment income (loss) (A) | | | (0.09 | ) | | | (0.09 | ) | | | (0.01 | ) | | | 0.03 | | | | (0.05 | ) |
Net realized and unrealized gain (loss) on investments | | | 0.58 | | | | 0.39 | | | | (0.30 | ) | | | 0.40 | | | | 0.57 | |
| | | | | | | | | | | | | | | | | | | | |
Total from investment operations | | | 0.49 | | | | 0.30 | | | | (0.31 | ) | | | 0.43 | | | | 0.52 | |
| | | | | | | | | | | | | | | | | | | | |
| | | | | |
LESS DISTRIBUTIONS: | | | | | | | | | | | | | | | | | | | | |
From net realized gains on investments | | | - | | | | (0.61 | ) | | | (0.33 | ) | | | - | | | | - | |
| | | | | | | | | | | | | | | | | | | | |
Total distributions | | | - | | | | (0.61 | ) | | | (0.33 | ) | | | - | | | | - | |
| | | | | | | | | | | | | | | | | | | | |
| | | | | |
Net asset value, end of year | | $ | 9.76 | | | $ | 9.27 | | | $ | 9.58 | | | $ | 10.22 | | | $ | 9.79 | |
| | | | | | | | | | | | | | | | | | | | |
| | | | | |
Total return (B)(C) | | | 5.29% | | | | 3.39% | | | | (3.19)% | | | | 4.39% | | | | 5.61% | |
| | | | | |
RATIOS/SUPPLEMENTAL DATA: | | | | | | | | | | | | | | | | | | | | |
Net assets, end of year (in 000’s) | | $ | 9,981 | | | $ | 10,697 | | | $ | 11,135 | | | $ | 12,359 | | | $ | 10,419 | |
Ratio of expenses to average net assets (D) | | | 1.79% | | | | 1.77% | | | | 1.82% | | | | 1.79% | | | | 1.80% | |
Ratio of net investment income (loss), to average net assets (D)(E) | | | (0.96)% | | | | (1.01)% | | | | (0.14)% | | | | 0.41% | | | | (0.50)% | |
Portfolio turnover rate | | | 27% | | | | 27% | | | | 25% | | | | 19% | | | | 22% | |
| (A) | Per share amounts calculated using average shares method, which more appropriately presents the per share data for the period. |
| (B) | Total return calculation does not reflect redemption fees. |
| (C) | Total return in the above table represents the rate that the investor would have earned or lost on an investment in the Fund assuming reinvestment of dividends. |
| (D) | These ratios exclude the impact of expenses of the underlying security holdings as represented in the Schedule of Investments. |
| (E) | Recognition of net investment income (loss) by the Fund is affected by the timing of the declaration of dividends by the underlying investment companies in which the Fund invests. |
The accompanying notes are an integral part of these financial statements.
110
Timothy Emerging Markets Fund (Class A Shares)
Selected data based on a share outstanding throughout each period
| | | | | | | | | | | | | | | | | | | | |
| | | For the Year
ended
September 30,
2017 | | | For the Year
ended
September 30,
2016 | | | For the Year
ended
September 30,
2015 | | | For the Year
ended
September 30,
2014 | | | For the
Period ended
September 30,
2013 (A) | |
| | | | | |
Net asset value, beginning of period | | $ | 8.06 | | | $ | 6.34 | | | $ | 10.23 | | | $ | 10.53 | | | $ | 10.00 | |
| | | | | | | | | | | | | | | | | | | | |
| | | | | |
INCOME (LOSS) FROM INVESTMENT OPERATIONS: | | | | | | | | | | | | | | | | | | | | |
Net investment income (loss) (B) | | | 0.06 | | | | 0.03 | | | | 0.04 | | | | (0.02 | ) | | | (0.08 | ) |
Net realized and unrealized gain (loss) on investments | | | 1.65 | | | | 1.69 | | | | (3.35 | ) | | | 0.08 | | | | 0.61 | |
| | | | | | | | | | | | | | | | | | | | |
Total from investment operations | | | 1.71 | | | | 1.72 | | | | (3.31 | ) | | | 0.06 | | | | 0.53 | |
| | | | | | | | | | | | | | | | | | | | |
| | | | | |
LESS DISTRIBUTIONS: | | | | | | | | | | | | | | | | | | | | |
From net investment income | | | (0.04 | ) | | | - | | | | (0.04 | ) | | | - | | | | - | |
From net realized gains on investments | | | - | | | | - | | | | (0.54 | ) | | | (0.36 | ) | | | - | |
| | | | | | | | | | | | | | | | | | | | |
Total distributions | | | (0.04 | ) | | | - | | | | (0.58 | ) | | | (0.36 | ) | | | - | |
| | | | | | | | | | | | | | | | | | | | |
| | | | | |
Net asset value, end of period | | $ | 9.73 | | | $ | 8.06 | | | $ | 6.34 | | | $ | 10.23 | | | $ | 10.53 | |
| | | | | | | | | | | | | | | | | | | | |
| | | | | |
Total return (C)(D) | | | 21.29% | | | | 27.13% | | | | (33.78)% | | | | 0.61% | | | | 5.30% | (E) |
| | | | | |
RATIOS/SUPPLEMENTAL DATA: | | | | | | | | | | | | | | | | | | | | |
Net assets, end of period (in 000’s) | | $ | 16,889 | | | $ | 7,118 | | | $ | 5,981 | | | $ | 10,803 | | | $ | 8,675 | |
Ratios to average net assets | | | | | | | | | | | | | | | | | | | | |
Expenses, before waiver and reimbursement | | | 2.27% | | | | 2.58% | | | | 2.50% | | | | 2.55% | | | | - | |
Expenses, net waiver and reimbursement | | | 2.22% | | | | 2.53% | | | | 2.45% | | | | 2.55% | | | | 3.03% | (F) |
Net investment income (loss), before waiver and reimbursement | | | 0.68% | | | | 0.39% | | | | 0.36% | | | | (0.19)% | | | | - | |
Net investment income (loss), net waiver and reimbursement | | | 0.73% | | | | 0.44% | | | | 0.41% | | | | (0.19)% | | | | (0.95)% | (F) |
Portfolio turnover rate | | | 31% | | | | 24% | | | | 37% | | | | 39% | | | | 19% | (E) |
| (A) | For the period December 3, 2012 (Commencement of Operations) to September 30, 2013. |
| (B) | Per share amounts calculated using average shares method, which more appropriately presents the per share data for the period. |
| (C) | Total return calculation does not reflect sales load. |
| (D) | Total return in the above table represents the rate that the investor would have earned or lost on an investment in the Fund assuming reinvestment of dividends. |
| | Total return would have been higher or lower if certain expenses had not been reimbursed, waived or recouped. |
| (E) | For periods of less than one full year, total return and turnover are not annualized. |
The accompanying notes are an integral part of these financial statements.
111
Timothy Emerging Markets Fund (Class C Shares)
Selected data based on a share outstanding throughout each period
| | | | | | | | | | | | | | | | | | | | |
| | | For the Year
ended
September 30,
2017 | | | For the Year
ended
September 30,
2016 | | | For the Year
ended
September 30,
2015 | | | For the Year
ended
September 30,
2014 | | | For the Period ended
September 30,
2013 (A) | |
| | | | | |
Net asset value, beginning of period | | $ | 7.88 | | | $ | 6.23 | | | $ | 10.09 | | | $ | 10.48 | | | $ | 10.00 | |
| | | | | | | | | | | | | | | | | | | | |
| | | | | |
INCOME (LOSS) FROM INVESTMENT OPERATIONS: | | | | | | | | | | | | | | | | | | | | |
Net investment loss(B) | | | 0.00 | * | | | (0.02 | ) | | | (0.02 | ) | | | (0.09 | ) | | | (0.12 | ) |
Net realized and unrealized gain (loss) on investments | | | 1.60 | | | | 1.67 | (C) | | | (3.30 | ) | | | 0.06 | | | | 0.60 | |
| | | | | | | | | | | | | | | | | | | | |
Total from investment operations | | | 1.60 | | | | 1.65 | | | | (3.32 | ) | | | (0.03 | ) | | | 0.48 | |
| | | | | | | | | | | | | | | | | | | | |
| | | | | |
LESS DISTRIBUTIONS: | | | | | | | | | | | | | | | | | | | | |
From net realized gains on investments | | | - | | | | - | | | | (0.54 | ) | | | (0.36 | ) | | | - | |
| | | | | | | | | | | | | | | | | | | | |
Total distributions | | | - | | | | - | | | | (0.54 | ) | | | (0.36 | ) | | | - | |
| | | | | | | | | | | | | | | | | | | | |
| | | | | |
Net asset value, end of period | | $ | 9.48 | | | $ | 7.88 | | | $ | 6.23 | | | $ | 10.09 | | | $ | 10.48 | |
| | | | | | | | | | | | | | | | | | | | |
| | | | | |
Total return (D)(E) | | | 20.30% | | | | 26.48% | | | | (34.29)% | | | | (0.27)% | | | | 4.80% | (F) |
| | | | | |
RATIOS/SUPPLEMENTAL DATA: | | | | | | | | | | | | | | | | | | | | |
Net assets, end of period (in 000’s) | | $ | 2,413 | | | $ | 897 | | | $ | 498 | | | $ | 883 | | | $ | 291 | |
Ratios to average net assets | | | | | | | | | | | | | | | | | | | | |
Expenses, before waiver and reimbursement | | | 3.02% | | | | 3.36% | | | | 3.26% | | | | 3.25% | | | | - | |
Expenses, net waiver and reimbursement | | | 2.97% | | | | 3.28% | | | | 3.21% | | | | 3.25% | | | | 3.76% | (G) |
Net investment loss, before waiver and reimbursement | | | (0.04)% | | | | (0.29)% | | | | (0.39)% | | | | (0.83)% | | | | - | |
Net investment income (loss), net waiver and reimbursement | | | 0.01% | | | | (0.24)% | | | | (0.34)% | | | | (0.83)% | | | | (1.39)% | (G) |
Portfolio turnover rate | | | 31% | | | | 24% | | | | 37% | | | | 39% | | | | 19% | (F) |
| * | Amount is less than $0.005 per share |
| (A) | For the period December 3, 2012 (Commencement of Operations) to September 30, 2013. |
| (B) | Per share amounts calculated using average shares method, which more appropriately presents the per share data for the period. |
| (C) | Realized and unrealized gains per share in this caption are balancing amounts necessary to reconcile the change in net asset value per share for the period, and may not reconcile with the aggregate gains and losses in the Statements of Operations due to share transactions for the period. |
| (D) | Total return calculation does not reflect redemption fee. |
| (E) | Total return in the above table represents the rate that the investor would have earned or lost on an investment in the Fund assuming reinvestment of dividends. |
| | Total return would have been higher or lower if certain expenses had not been reimbursed, waived or recouped. |
| (F) | For periods of less than one full year, total return and turnover are not annualized. |
The accompanying notes are an integral part of these financial statements.
112
Timothy Emerging Markets Fund (Class I Shares)
Selected data based on a share outstanding throughout each period
| | | | | | | | | | | | | | | | | | | | |
| | | For the Year
ended
September 30,
2017 | | | For the Year
ended
September 30,
2016 | | | For the Year
ended
September 30,
2015 | | | For the Year
ended
September 30,
2014 | | | For the Period ended
September 30,
2013 (A) | |
| | | | | |
Net asset value, beginning of period | | $ | 8.11 | | | $ | 6.35 | | | $ | 10.25 | | | $ | 10.53 | | | $ | 9.96 | |
| | | | | | | | | | | | | | | | | | | | |
| | | | | |
INCOME (LOSS) FROM INVESTMENT OPERATIONS: | | | | | | | | | | | | | | | | | | | | |
Net investment income (loss) (B) | | | 0.09 | | | | 0.05 | | | | 0.08 | | | | 0.03 | | | | 0.00 | * |
Net realized and unrealized gain (loss) on investments | | | 1.64 | | | | 1.71 | | | | (3.38 | ) | | | 0.05 | (C) | | | 0.57 | |
| | | | | | | | | | | | | | | | | | | | |
Total from investment operations | | | 1.73 | | | | 1.76 | | | | (3.30 | ) | | | 0.08 | | | | 0.57 | |
| | | | | | | | | | | | | | | | | | | | |
| | | | | |
LESS DISTRIBUTIONS: | | | | | | | | | | | | | | | | | | | | |
From net investment income | | | (0.05 | ) | | | - | | | | (0.06 | ) | | | - | | | | - | |
From net realized gains on investments | | | - | | | | - | | | | (0.54 | ) | | | (0.36 | ) | | | - | |
| | | | | | | | | | | | | | | | | | | | |
Total distributions | | | (0.05 | ) | | | - | | | | (0.60 | ) | | | (0.36 | ) | | | - | |
| | | | | | | | | | | | | | | | | | | | |
| | | | | |
Net asset value, end of period | | $ | 9.79 | | | $ | 8.11 | | | $ | 6.35 | | | $ | 10.25 | | | $ | 10.53 | |
| | | | | | | | | | | | | | | | | | | | |
| | | | | |
Total return (D) | | | 21.52% | | | | 27.72% | | | | (33.04)% | | | | 0.81% | | | | 5.72% | (E) |
| | | | | |
RATIOS/SUPPLEMENTAL DATA: | | | | | | | | | | | | | | | | | | | | |
Net assets, end of period (in 000’s) | | $ | 1,762 | | | $ | 703 | | | $ | 329 | | | $ | 333 | | | $ | 106 | + |
Ratios to average net assets | | | | | | | | | | | | | | | | | | | | |
Expenses, before waiver and reimbursement | | | 2.02% | | | | 2.42% | | | | 2.26% | | | | 2.25% | | | | - | |
Expenses, net waiver and reimbursement | | | 1.97% | | | | 2.38% | | | | 2.21% | | | | 2.25% | | | | 2.78% | (F) |
Net investment income (loss), before waiver and reimbursement | | | 0.97% | | | | 0.61% | | | | 0.90% | | | | 0.25% | | | | - | |
Net investment income (loss), net waiver and reimbursement | | | 1.02% | | | | 0.66% | | | | 0.95% | | | | 0.26% | | | | (0.70%) | (F) |
Portfolio turnover rate | | | 31% | | | | 24% | | | | 37% | | | | 39% | | | | 19% | (E) |
*Amount is less than $0.005 per share.
+ Actual net assets not truncated.
| (A) | For the period August 1, 2013 (Commencement of Operations) to September 30, 2013. |
| (B) | Per share amounts calculated using average shares method, which more appropriately presents the per share data for the period. |
| (C) | Realized and unrealized gains per share in this caption are balancing amounts necessary to reconcile the change in net asset value per share for the period, and may not reconcile with the aggregate gains and losses in the Statements of Operations due to share transactions for the period. |
| (D) | Total return in the above table represents the rate that the investor would have earned or lost on an investment in the Fund assuming reinvestment of dividends. |
| | Total return would have been higher or lower if certain expenses had not been reimbursed, waived or recouped. |
| (E) | For periods of less than one full year, total return and turnover are not annualized. |
The accompanying notes are an integral part of these financial statements.
113
Timothy Growth & Income Fund (Class A Shares)
Selected data based on a share outstanding throughout each period
| | | | | | | | | | | | | | | | |
| | | For the Year
ended
September 30,
2017 | | | For the Year
ended
September 30,
2016 | | | For the Year
ended
September 30,
2015 | | | For the Period ended
September 30,
2014 (A) | |
| | | | |
Net asset value, beginning of period | | $ | 10.76 | | | $ | 10.53 | | | $ | 10.95 | | | $ | 10.00 | |
| | | | | | | | | | | | | | | | |
| | | | |
INCOME (LOSS) FROM INVESTMENT OPERATIONS: | | | | | | | | | | | | | | | | |
Net investment income (loss) (B) | | | 0.01 | | | | 0.03 | | | | 0.01 | | | | (0.02) | |
Net realized and unrealized gain (loss) on investments | | | 0.52 | | | | 0.22 | | | | (0.42) | | | | 0.97 | |
| | | | | | | | | | | | | | | | |
Total from investment operations | | | 0.53 | | | | 0.25 | | | | (0.41) | | | | 0.95 | |
| | | | | | | | | | | | | | | | |
| | | | |
LESS DISTRIBUTIONS: | | | | | | | | | | | | | | | | |
From net investment income | | | (0.01) | | | | (0.02) | | | | (0.01) | | | | - | |
| | | | | | | | | | | | | | | | |
Total distributions | | | (0.01) | | | | (0.02) | | | | (0.01) | | | | - | |
| | | | | | | | | | | | | | | | |
| | | | |
Net asset value, end of period | | $ | 11.28 | | | $ | 10.76 | | | $ | 10.53 | | | $ | 10.95 | |
| | | | | | | | | | | | | | | | |
| | | | |
Total return (C)(D) | | | 4.91% | | | | 2.36% | | | | (3.75)% | | | | 9.50% | (E) |
| | | | |
RATIOS/SUPPLEMENTAL DATA: | | | | | | | | | | | | | | | | |
Net assets, end of period (in 000’s) | | $ | 30,426 | | | $ | 36,486 | | | $ | 26,378 | | | $ | 24,272 | |
Ratios to average net assets | | | | | | | | | | | | | | | | |
Expenses, before waiver and reimbursement | | | 1.59% | | | | 1.59% | | | | 1.56% | | | | 1.68% | (F) |
Expenses, net waiver and reimbursement | | | 1.54% | | | | 1.54% | | | | 1.51% | | | | 1.67% | (F) |
Net investment income (loss), before waiver and reimbursement | | | 0.03% | | | | 0.20% | | | | 0.08% | | | | (0.21%) | (F) |
Net investment income (loss), net waiver and reimbursement | | | 0.08% | | | | 0.25% | | | | 0.13% | | | | (0.21%) | (F) |
Portfolio turnover rate | | | 118% | | | | 45% | | | | 75% | | | | 21% | (E) |
| (A) | For the period October 1, 2013 (Commencement of Operations) to September 30, 2014. |
| (B) | Per share amounts calculated using average shares method, which more appropriately presents the per share data for the period. |
| (C) | Total return calculation does not reflect sales load. |
| (D) | Total return in the above table represents the rate that the investor would have earned or lost on an investment in the Fund assuming reinvestment of dividends. Total return would have been higher or lower if certain expenses had not been reimbursed, waived or recouped. |
| (E) | For periods of less than one full year, total return and turnover are not annualized. |
The accompanying notes are an integral part of these financial statements.
114
Timothy Growth & Income Fund (Class C Shares)
Selected data based on a share outstanding throughout each period
| | | | | | | | | | | | | | | | |
| | | For the Year
ended
September 30,
2017 | | | For the Year
ended
September 30,
2016 | | | For the Year
ended
September 30,
2015 | | | For the Period ended
September 30,
2014 (A) | |
| | | | |
Net asset value, beginning of period | | $ | 10.55 | | | $ | 10.39 | | | $ | 10.87 | | | $ | 10.00 | |
| | | | | | | | | | | | | | | | |
| | | | |
INCOME (LOSS) FROM INVESTMENT OPERATIONS: | | | | | | | | | | | | | | | | |
Net investment loss (B) | | | (0.07) | | | | (0.06) | | | | (0.06) | | | | (0.08) | |
Net realized and unrealized gain (loss) on investments | | | 0.51 | | | | 0.22 | (C) | | | (0.42) | | | | 0.95 | |
| | | | | | | | | | | | | | | | |
Total from investment operations | | | 0.44 | | | | 0.16 | | | | (0.48) | | | | 0.87 | |
| | | | | | | | | | | | | | | | |
| | | | |
Net asset value, end of period | | $ | 10.99 | | | $ | 10.55 | | | $ | 10.39 | | | $ | 10.87 | |
| | | | | | | | | | | | | | | | |
| | | | |
Total return (D)(E) | | | 4.17% | | | | 1.54% | | | | (4.42)% | | | | 8.70% | (F) |
| | | | |
RATIOS/SUPPLEMENTAL DATA: | | | | | | | | | | | | | | | | |
Net assets, end of period (in 000’s) | | $ | 3,006 | | | $ | 3,028 | | | $ | 3,330 | | | $ | 2,081 | |
Ratios to average net assets | | | | | | | | | | | | | | | | |
Expenses, before waiver and reimbursement | | | 2.34% | | | | 2.32% | | | | 2.30% | | | | 2.20% | (G) |
Expenses, net waiver and reimbursement | | | 2.29% | | | | 2.28% | | | | 2.25% | | | | 2.19% | (G) |
Net investment loss, before waiver and reimbursement | | | (0.73%) | | | | (0.61%) | | | | (0.60%) | | | | (0.72%) | (G) |
Net investment loss, net waiver and reimbursement | | | (0.68%) | | | | (0.56%) | | | | (0.55%) | | | | (0.70%) | (G) |
Portfolio turnover rate | | | 118% | | | | 45% | | | | 75% | | | | 21% | (F) |
| (A) | For the period October 1, 2013 (Commencement of Operations) to September 30, 2014. |
| (B) | Per share amounts calculated using average shares method, which more appropriately presents the per share data for the period. |
| (C) | Realized and unrealized gains per share in this caption are balancing amounts necessary to reconcile the change in net asset value per share for the period, and may not reconcile with the aggregate gains and losses in the Statements of Operations due to share transactions for the period. |
| (D) | Total return calculation does not reflect redemption fee. |
| (E) | Total return in the above table represents the rate that the investor would have earned or lost on an investment in the Fund assuming reinvestment of dividends. Total return would have been higher or lower if certain expenses had not been reimbursed, waived or recouped. |
| (F) | For periods of less than one full year, total return and turnover are not annualized. |
The accompanying notes are an integral part of these financial statements.
115
Timothy Growth & Income Fund (Class I Shares)
Selected data based on a share outstanding throughout each period
| | | | | | | | | | | | | | | | |
| | | For the Year
ended
September 30,
2017 | | | For the Year
ended
September 30,
2016 | | | For the Year
ended
September 30,
2015 | | | For the
Period ended
September 30,
2014 (A) | |
| | | | |
Net asset value, beginning of period | | $ | 10.81 | | | $ | 10.56 | | | $ | 10.96 | | | $ | 10.00 | |
| | | | | | | | | | | | | | | | |
| | | | |
INCOME (LOSS) FROM INVESTMENT OPERATIONS: | | | | | | | | | | | | | | | | |
Net investment income (B) | | | 0.03 | | | | 0.05 | | | | 0.04 | | | | 0.04 | |
Net realized and unrealized gain (loss) on investments | | | 0.53 | | | | 0.23 | | | | (0.42 | ) | | | 0.92 | (C) |
| | | | | | | | | | | | | | | | |
Total from investment operations | | | 0.56 | | | | 0.28 | | | | (0.38 | ) | | | 0.96 | |
| | | | | | | | | | | | | | | | |
| | | | |
LESS DISTRIBUTIONS: | | | | | | | | | | | | | | | | |
From net investment income | | | (0.03 | ) | | | (0.03 | ) | | | (0.02 | ) | | | - | |
| | | | | | | | | | | | | | | | |
Total distributions | | | (0.03 | ) | | | (0.03 | ) | | | (0.02 | ) | | | - | |
| | | | | | | | | | | | | | | | |
| | | | |
Net asset value, end of period | | $ | 11.34 | | | $ | 10.81 | | | $ | 10.56 | | | $ | 10.96 | |
| | | | | | | | | | | | | | | | |
| | | | |
Total return (D) | | | 5.19% | | | | 2.61% | | | | (3.50)% | | | | 9.60% | (E) |
| | | | |
RATIOS/SUPPLEMENTAL DATA: | | | | | | | | | | | | | | | | |
Net assets, end of period (in 000’s) | | $ | 2,197 | | | $ | 1,593 | | | $ | 1,573 | | | $ | 1,507 | |
Ratios to average net assets | | | | | | | | | | | | | | | | |
Expenses, before waiver and reimbursement | | | 1.34% | | | | 1.32% | | | | 1.31% | | | | 1.18% | (F) |
Expenses, net waiver and reimbursement | | | 1.29% | | | | 1.28% | | | | 1.26% | | | | 1.16% | (F) |
Net investment income, before waiver and reimbursement | | | 0.27% | | | | 0.41% | | | | 0.32% | | | | 0.30% | (F) |
Net investment income, net waiver and reimbursement | | | 0.32% | | | | 0.46% | | | | 0.38% | | | | 0.31% | (F) |
Portfolio turnover rate | | | 118% | | | | 45% | | | | 75% | | | | 21% | (E) |
| (A) | For the period October 1, 2013 (Commencement of Operations) to September 30, 2014. |
| (B) | Per share amounts calculated using average shares method, which more appropriately presents the per share data for the period. |
| (C) | Realized and unrealized gains per share in this caption are balancing amounts necessary to reconcile the change in net asset value per share for the period, and may not reconcile with the aggregate gains and losses in the Statements of Operations due to share transactions for the period. |
| (D) | Total return in the above table represents the rate that the investor would have earned or lost on an investment in the Fund assuming reinvestment of dividends. |
Total return would have been higher or lower if certain expenses had not been reimbursed, waived or recouped.
| (E) | For periods of less than one full year, total return and turnover are not annualized. |
The accompanying notes are an integral part of these financial statements.
116
Notes to Financial Statements
September 30, 2017
Timothy Plan Family of Funds
Note 1 | Significant Accounting Policies
The Timothy Plan (the “Trust”) is organized as a series of a Delaware business trust pursuant to a trust agreement dated December 16, 1993. The Trust is registered under the Investment Company Act of 1940, as amended, as an open-end management investment company. As of September 30, 2017, the Trust consisted of fifteen series. These financial statements include the following thirteen series: Timothy Plan Aggressive Growth Fund, Timothy Plan International Fund, Timothy Plan Large/Mid Cap Growth Fund, Timothy Plan Small Cap Value Fund, Timothy Plan Large/Mid Cap Value Fund, Timothy Plan Fixed Income Fund, Timothy Plan High Yield Bond Fund, Timothy Plan Israel Common Values Fund, Timothy Plan Defensive Strategies Fund, Timothy Plan Strategic Growth Fund, Timothy Plan Conservative Growth Fund, Timothy Plan Emerging Markets Fund and Timothy Plan Growth & Income Fund (the “Funds”). The Funds are diversified funds except for the Timothy Plan Defensive Strategy Fund which is a non-diversified fund.
The Timothy Plan Aggressive Growth Fund’s investment objective is long-term growth of capital. The Fund seeks to achieve its investment objective by normally investing at least 80% of the Fund’s total assets in U.S. common stocks without regard to market capitalizations and investing in the securities of a limited number of companies which the Fund’s Advisor believes show a high probability for superior growth.
The Timothy Plan International Fund’s investment objective is long-term growth of capital. The Fund seeks to achieve its investment objective by normally investing at least 80% of the Fund’s total assets in the common stock and similar securities of foreign companies through the purchase of American Depositary Receipts (“ADRs”) without regard to market capitalization, investing its assets in the ADRs of companies which the Fund’s Advisor believes show a high probability for superior growth, and allocating investments across countries and regions considering the size of the market in each country and region relative to the size of the international market as a whole. Although the Fund maintains a diversified investment portfolio, the political or economic developments within a particular country or region may have an adverse effect on the ability of domiciled issuers to meet their obligations. Additionally, political or economic developments may have an effect on the liquidity and volatility of portfolio securities and currency holdings.
The Timothy Plan Large/Mid Cap Growth Fund’s investment objective is long-term growth of capital. Current income is not a significant investment consideration and any such income realized will be considered incidental to the Fund’s investment objective. The Fund seeks to achieve its investment objective by normally investing at least 80% of the Fund’s total assets in U.S. common stocks with market capitalizations in excess of $2 billion.
The Timothy Plan Small Cap Value Fund’s primary objective is long-term capital growth, with a secondary objective of current income. The Fund seeks to achieve its investment objective by primarily investing at least 80% of the Fund’s total assets in U.S. stocks with market capitalizations that fall within the range of companies included in the Russell 2000 Index.
The Timothy Plan Large/Mid Cap Value Fund’s investment objective is long-term capital growth, with a secondary objective of current income. The Fund seeks to achieve its investment objective by primarily investing in U.S. common stocks. The Fund will invest at least 80% of its assets in the common stock of companies whose total market capitalization generally exceeds $2 billion.
The Timothy Plan Fixed Income Fund seeks to generate a high level of current income consistent with prudent investment risk. To achieve its investment objective, the Fund normally invests in a diversified portfolio of debt securities. These include corporate bonds, U.S. Government and agency securities, convertible securities and preferred securities. The Fund will generally only purchase high quality securities.
The Timothy Plan High Yield Bond Fund’s investment objective is to generate a high level of current income. To achieve its investment objective, the Fund normally invests in a diversified portfolio of debt securities. These include corporate bonds, U.S. Government and agency securities, convertible securities and preferred securities. The Fund will generally purchase securities that are not investment-grade, meaning securities with a rating of “BBB” or lower as rated by Standard and Poor’s or a comparable rating by another nationally recognized rating agency. Investments in these higher yielding securities are generally accompanied by a greater degree of credit risk than higher rated securities. Additionally, lower rated securities may be more susceptible to adverse economic and competitive industry conditions than investment-grade securities.
The Timothy Plan Israel Common Values Fund seeks to provide long-term growth of capital. This Fund seeks to achieve its investment objectives by normally investing at least 80% of the Fund’s total assets in the common stock of companies domiciled and/or headquartered in Israel through the purchase of American Depositary Receipts (ADRs) and direct investments in such companies on foreign stock exchanges, without regard to market capitalizations.
The Timothy Plan Defensive Strategies Fund’s investment objective is the protection of principal through aggressive, proactive reactions to prevailing economic conditions. To achieve its investment objective, the Fund normally invests in Real Estate Investment Trusts (“REITs”), commodities based Exchange-Traded Funds (“ETFs”), Treasury Inflation Protected Securities (“TIPS”), and currently holds gold and silver bullion.
The Timothy Plan Strategic Growth Fund seeks to generate medium to high levels of long-term capital growth. The Fund seeks to achieve its investment objective by normally investing at least 75% of its net assets in the following Funds which are other series of the Trust: approximately 2-10% of its net assets in the Timothy Plan Small Cap Value Fund; approximately 10-20% of its net assets in the Timothy Plan Large/Mid Cap Value Fund; approximately 10-20% of its net assets in the Timothy Plan Large/Mid Cap Growth Fund; approximately 6-18% of its net assets in the Timothy Plan High Yield Bond Fund; approximately 10-20% of its net assets in the Timothy Plan International Fund; approximately 2-10% of its net assets in the Timothy Plan Aggressive Growth Fund; approximately 10-30% of its net assets in the Timothy Plan Defensive Strategies Fund; approximately 0-10% of its net assets in the Timothy Plan Israel Common Values Fund; approximately 0-10% of its net assets in the Timothy Plan Emerging Markets Fund; approximately 5-20% of its net assets in the Timothy Plan Growth & Income Fund; and approximately 0-15% of its net assets in the Timothy Fixed Income Fund.
117
Notes to Financial Statements
September 30, 2017 (Continued)
Timothy Plan Family of Funds
The Timothy Plan Conservative Growth Fund seeks to generate moderate levels of long-term capital growth with a secondary objective of current income. The Fund seeks to achieve its investment objective by normally investing at least 75% of its net assets in the following Funds which are other series of the Trust: approximately 2-10% of its net assets in the Timothy Plan Small Cap Value Fund; approximately 5-15% of its net assets in the Timothy Plan Large/Mid Cap Value Fund; approximately 5-15% of its net assets in the Timothy Plan Large/Mid Cap Growth Fund; approximately 2-5% of its net assets in the Timothy Plan Aggressive Growth Fund; approximately 6-15% of its net assets in the Timothy Plan High Yield Bond Fund; approximately 0-10% of its net assets in the Timothy Plan International Fund; approximately 20%-40% of its net assets in the Timothy Plan Fixed Income Fund; approximately 10-30% of its net assets in the Timothy Plan Defensive Strategies Fund; approximately 0-10% of its net assets in the Timothy Plan Israel Common Values Fund; approximately 0-10% of its net assets in the Timothy Plan Emerging Markets Fund; and approximately 5-20% of its net assets in the Timothy Plan Growth & Income Fund.
The Timothy Plan Emerging Markets Fund commenced operations on December 3, 2012. The Fund’s investment objective is long-term growth of capital. The Fund seeks to achieve its investment objectives by normally investing at least 80% of the Fund’s total assets in the common stock of companies domiciled and/or headquartered in countries that the Fund’s Advisor/Sub-Advisor believes are experiencing rapid or above average growth or industrialization through the purchase of American Depositary Receipts (ADRs) and direct investments in such companies on foreign stock exchanges, without regard to market capitalizations.
The Timothy Plan Growth & Income Fund commenced operations on October 1, 2013. The Fund’s investment objective is to provide total return through a combination of growth and income and preservation of capital in declining markets. The Fund seeks to achieve its investment objectives by employing a proprietary investment model to select equity securities for the Fund that the Fund’s Advisor/Sub-Advisor believes are undervalued and more likely to appreciate. The Fund’s Advisor/Sub-Advisor focuses on characteristics such as management commitment, value and neglect, and on equity securities that are underrepresented by institutional investors. The Fund’s Advisor/Sub-Advisor also assesses a number of fundamental factors such as earnings, earnings trends, price earnings multiples, return on assets and other financial statement data, as well as other proprietary calculations. The model evaluates over 8,500 companies of all capitalization ranges. For the Fund, the Fund’s Advisor/Sub-Advisor refines the model by using a capitalization screen and evaluates thousands of companies within the appropriate capitalization range. The Fund’s Advisor normally will sell a security when the investment no longer meets the Funds Advisor’s/Sub-Advisor’s investment criteria.
The following is a summary of significant accounting policies consistently followed by the Funds in the preparation of their financial statements. The policies are in conformity with accounting principles generally accepted in the United States of America (“GAAP”) for investment companies. The Fund is an investment company and accordingly follows the investment company accounting and reporting guidance of the Financial Accounting Standards Board (FASB) Accounting Standard Codification Topic 946 “Financial Services – Investment Companies” including FASB Accounting Standard Update ASU 2013-08.
| | A. | SECURITY VALUATION AND FAIR VALUE MEASUREMENTS |
All investments in securities are recorded at their estimated fair value as described in Note 2.
| | B. | INVESTMENT INCOME AND SECURITIES TRANSACTIONS |
Security transactions are accounted for on the date the securities are purchased or sold (trade date). The costing method for the Timothy Plan Funds is FIFO (first-in-first-out). Dividend income is recognized on the ex-dividend date. Interest income and expenses are recognized on an accrual basis. The Timothy Plan Aggressive Growth Fund, Large/Mid Cap Growth Fund, Large/Mid Cap Value Fund, Small Cap Value Fund, Israel Common Values Fund, Defensive Strategies Fund and Emerging Markets Fund have made certain investments in REITs and Master Limited Partnerships (“MLPs”). Dividend income from REITs and MLPs is recognized on the ex-dividend date. It is common for distributions from REITs and MLPs to exceed taxable earnings and profits, resulting in the excess portion of such dividends being designated as a return of capital. Income or loss from the MLPs is reclassified upon receipt of the MLPs’ K-1. The calendar year-end amounts of ordinary income, capital gains, and return of capital included in distributions received from the Funds’ investments in REITS are reported to the Funds after the end of the calendar year; accordingly, the Funds estimate these amounts for accounting purposes until the characterization of REIT distributions is reported to the Funds after the end of the calendar year. Estimates are based on the most recent REIT distribution information available. Withholding taxes on foreign dividends have been provided for in accordance with the Funds’ understanding of the applicable country’s tax rules and rates. Discounts and premiums on securities purchased are amortized over the lives of the respective securities. The ability of issuers of debt securities held by the Funds to meet their obligations may be affected by economic and political developments in a specific country or region.
Investment securities denominated in foreign currencies are translated into U.S. dollar amounts at the date of valuation. Purchases and sales of investment securities and income and expense items denominated in foreign currencies are translated into U.S. dollar amounts on the respective dates of such transactions. The Funds do not isolate that portion of the results of operations resulting from changes in foreign exchange rates on investments from the fluctuations arising from changes in market prices of securities held. Such fluctuations are included in the net realized and unrealized gain or loss from investments. Reported net realized foreign exchange gains or losses arise from sales of foreign currencies, currency gains or losses realized between the trade and settlement dates on securities transactions, and the difference between the amounts of dividends, interest and foreign withholding taxes recorded on the Funds’ books and the U.S. dollar equivalent of the amounts actually received or paid. Net unrealized foreign exchange gains and losses arise from changes in the fair values of assets and liabilities, other than investments in securities at fiscal period end, resulting from changes in exchange rates.
118
Notes to Financial Statements
September 30, 2017 (Continued)
Timothy Plan Family of Funds
| | D. | GOLD/SILVER RISK FACTORS |
There is a risk that some or all of the Trust’s gold and silver bars held by the custodian or any sub-custodian on behalf of the Trust could be lost, damaged or stolen. Access to the Trust’s gold bars could be restricted by natural events (such as an earthquake) or human actions (such as a terrorist attack). Any of these events may adversely affect the operations of the Trust and, consequently, an investment in the fund shares.
Several factors may affect the price of gold and silver, including but not limited to:
| | • | | Global or regional political, economic or financial events and situations; |
| | • | | Investors’ expectations with respect to the rate of inflation; |
| | • | | Currency exchange rates; |
| | • | | Investment and trading activities of hedge funds and commodity funds. |
| | E. | NET ASSET VALUE PER SHARE |
The Net Asset Value (“NAV”) per share of the capital stock of the Funds is determined daily as of the close of trading on the New York Stock Exchange by dividing the value of its net assets by the number of Fund shares outstanding. The NAV is calculated separately for each class of each Fund in the Trust. The net asset value of the classes may differ because of different fees and expenses charged to each class.
Expenses incurred by the Trust that do not relate to a specific Fund of the Trust are allocated to the individual Funds based on each Fund’s relative net assets or another appropriate basis as determined by the Board of Trustees (the “Board”).
There are three classes of shares currently offered by all Funds in the Trust, except Strategic Growth Fund and Conservative Growth Fund: Class A shares are offered with a front-end sales charge and ongoing service/distribution fees; Class C shares are offered with a contingent deferred sales charge (“CDSC”) that ends after the first year and ongoing service and distribution fees; Class I shares, which commenced operations on August 1, 2013, are offered without any sales charges or ongoing service distribution fees.
Class specific expenses are borne by each specific class. Income, expenses, and realized and unrealized gains/losses are allocated to the respective classes on the basis of relative daily net assets.
In the preparation of financial statements in conformity with GAAP, management makes estimates and assumptions that affect the reported amounts of assets and liabilities and disclosure of contingent assets and liabilities at the date of the financial statements, as well as the reported amounts of revenues and expenses during the year ended. Actual results could differ from those estimates.
It is the policy of each Fund to continue to comply with all requirements under subchapter M of the Internal Revenue Code applicable to regulated investment companies and to distribute substantially all of its taxable income to its shareholders. Each Fund also intends to distribute sufficient net investment income and net capital gains, if any, so that it will not be subject to excise tax on undistributed income or gains. Therefore, no federal income tax or excise provision is required.
As of September 30, 2017, the Funds did not have a liability for any unrecognized tax benefits. The Funds recognize interest and penalties, if any, related to unrecognized tax benefits as income tax expense in the Statements of Operations. During the year ended September 30, 2017, the Funds did not incur any interest or penalties. The Funds are not aware of any tax positions for which it is reasonably possible that the total amounts of unrecognized tax benefits will change materially within the next twelve months.
The Trust indemnifies its officers and trustees for certain liabilities that may arise from the performance of their duties to the Trust. Additionally, in the normal course of business, the Funds enter into contracts that contain a variety of representations and warranties and which provide general indemnities. The Funds’ maximum exposure under these arrangements is unknown, as this would involve future claims that may be made against the Funds that have not yet occurred. However, based on experience, the Funds expect the risk of loss due to these warranties and indemnities to be remote.
| | K. | DISTRIBUTIONS TO SHAREHOLDERS |
Distributions to shareholders, which are determined in accordance with income tax regulations, are recorded on the ex-dividend date. The treatment for financial reporting purposes of distributions made to shareholders during the period from net investment income or net realized capital gains may differ from their ultimate treatment for federal income tax purposes. These differences are caused primarily by differences in the timing of the recognition of certain components of income, expense or realized capital gain for federal income tax purposes. Where such differences are permanent in nature, they are reclassified in the components of net assets based on their ultimate characterization for federal income tax purposes. Any such reclassifications will have no effect on net assets, results of operations, or Net Asset Values (NAVs) per share of the Funds.
119
Notes to Financial Statements
September 30, 2017 (Continued)
Timothy Plan Family of Funds
Permanent book and tax differences, primarily attributable to the book/tax treatment of foreign currency gains/(losses), PFIC gains/(losses), net operating losses and short-term capital gains, the expiration of capital loss carry forwards, adjustments for paydowns, C-Corporation return of capital distributions, grantor trusts, and partnerships, resulted in reclassifications for the Funds for the fiscal year ended September 30, 2017:
| | | | | | | | | | | | | | |
| Fund | | Paid In Capital | | | Accumulated
Net Investment
Income (Loss) | | | Accumulated Net
Realized Gains
(Loss) | | | |
Aggressive Growth Fund | | $ | (191,245 | ) | | $ | 173,493 | | | $ | 17,752 | | |
International Fund | | | (5,935,936 | ) | | | 762,087 | | | | 5,173,849 | | |
Large/Mid Cap Growth Fund | | | (289,056 | ) | | | 288,650 | | | | 406 | | |
Small Cap Value Fund | | | (2,870 | ) | | | - | | | | 2,870 | | |
Large/Mid Cap Value Fund | | | - | | | | (1,193 | ) | | | 1,193 | | |
Fixed Income Fund | | | - | | | | 326,015 | | | | (326,015 | ) | |
High Yield Bond Fund | | | (776,982 | ) | | | - | | | | 776,982 | | |
Israel Common Values Fund | | | - | | | | 61,150 | | | | (61,150 | ) | |
Defensive Strategies Fund | | | (107,851 | ) | | | (2,722,803 | ) | | | 2,830,654 | | |
Strategic Growth Fund | | | (179,604 | ) | | | 179,604 | | | | - | | |
Conservative Growth Fund | | | (177,678 | ) | | | 177,720 | | | | (42 | ) | |
Emerging Markets Fund | | | - | | | | (6,120 | ) | | | 6,120 | | |
Growth & Income Fund | | | (2,237 | ) | | | 14,012 | | | | (11,775 | ) | |
Effective May 22, 2015, the Timothy Plan Family of Funds entered into a precious metals storage agreement with Brink’s Global Services U.S.A., Inc. to maintain the custody of the gold and silver held in the Timothy Plan Defensive Strategies Fund.
Note 2 | Security Valuation and Fair Value Measurements
Fair value is defined as the price that a Fund would receive upon selling an investment in a timely transaction to an independent buyer in the principal or most advantageous market of the investment. GAAP established a three-tier hierarchy to maximize the use of observable market data and minimize the use of unobservable inputs and to establish classification of fair value measurements for disclosure purposes.
Inputs refer broadly to the assumptions that market participants would use in pricing the asset or liability, including assumptions about risk (the risk inherent in a particular valuation technique used to measure fair value including such a pricing model and/or the risk inherent in the inputs to the valuation technique). Inputs may be observable or unobservable. Observable inputs are inputs that reflect the assumptions market participants would use in pricing the asset or liability developed based on market data obtained from sources independent of the reporting entity. Unobservable inputs are inputs that reflect the reporting entity’s own assumptions about the assumptions market participants would use in pricing the asset or liability developed based on the best information available in the circumstances.
VALUATION OF FUND OF FUNDS
A Fund may invest in portfolios of open-end or closed-end investment companies (the “Underlying Funds”). The Underlying Funds value securities in their portfolios for which market quotations are readily available at their market values (generally the last reported sale price) and all other securities and assets at their fair value based upon methods established by the Board of Directors of the Underlying Funds.
Open-ended funds are valued at their respective net asset values as reported by such investment companies. The shares of many closed-end investment companies, after their initial public offering, frequently trade at a price per share, which is different than the net asset value per share. The difference represents a market premium or market discount of such shares. There can be no assurances that the market discount or market premium on shares of any closed-end investment company purchased by the Fund will not change.
OPTIONS TRANSACTIONS –The Funds are subject to equity price risk in the normal course of pursuing their investment objectives and may purchase or sell options to help hedge against this risk.
Each Fund may write call options only if it (i) owns an offsetting position in the underlying security or (ii) has an absolute or immediate right to acquire that security without additional cash consideration or exchange of other securities held in its portfolio.
When the Funds write a call option, an amount equal to the premium received is included in the statement of assets and liabilities as a liability. The amount of the liability is subsequently marked-to-market to reflect the current market value of the option. If an option expires on its stipulated expiration date or if the Funds enter into a closing purchase transaction, a gain or loss is realized. If a written call option is exercised, a gain or loss is realized for the sale of the underlying security and the proceeds from the sale are increased by the premium originally received. As writer of an option, the Funds have no control over whether the option will be exercised and, as a result, retain the market risk of an unfavorable change in the price of the security underlying the written option.
The Funds may purchase put and call options. Call options are purchased to hedge against an increase in the value of securities held in a Fund’s portfolio. If such an increase occurs, the call options will permit the Fund to purchase the securities underlying such options at the exercise price, not at the current market price. Put options are purchased to hedge against a decline in the value of securities held in a Fund’s portfolio. If such a
120
Notes to Financial Statements
September 30, 2017 (Continued)
Timothy Plan Family of Funds
decline occurs, the put options will permit the Fund to sell the securities underlying such options at the exercise price, or to close out the options at a profit. The premium paid for a put or call option plus any transaction costs will reduce the benefit, if any, realized by the Fund upon exercise of the option, and, unless the price of the underlying security rises or declines sufficiently, the option may expire worthless to the Fund. In addition, in the event that the price of the security in connection with which an option was purchased moves in a direction favorable to a Fund, the benefits realized by the Fund as a result of such favorable movement will be reduced by the amount of the premium paid for the option and related transaction costs. Written and purchased options are non-income producing securities. With purchased options, there is minimal counterparty credit risk to the Funds since these options are exchange traded and the exchange’s clearinghouse, as counterparty to all exchange traded options, guarantees against a possible default.
There were no options held at September 30, 2017, and there were no options transactions for the year ended September 30, 2017.
The Trust utilizes various methods to measure the fair value of all of its investments on a recurring basis. GAAP establishes a hierarchy that prioritizes inputs to valuation methods. The three levels of input are:
•Level 1 – Unadjusted quoted prices in active markets for identical assets and liabilities that the Fund has the ability to access.
•Level 2 – Observable inputs other than quoted prices included in Level 1 that are observable for the asset or liability, either directly or indirectly. These inputs may include quoted prices for the identical instrument in an inactive market, prices for similar instruments, interest rates, prepayment speeds, credit risk, yield curves, default rates and similar data.
•Level 3 – Unobservable inputs for the asset or liability, to the extent relevant observable inputs are not available, representing the Fund’s own assumptions about the assumptions a market participant would use in valuing the asset or liability, and would be based on the best information available.
The inputs used to measure fair value may fall into different levels of the fair value hierarchy. In such cases, for disclosure purposes, the level in the fair value hierarchy within which the fair value measurement falls in its entirety is determined based on the lowest level input that is significant to the fair value measurement in its entirety.
Each Fund generally determines the total value of each class of its shares by using market prices for the securities comprising its portfolio. Equity securities, including common stock, ADRs, REITs, MLPs, ETFs and warrants are generally valued by using market quotations, but may be valued on the basis of prices furnished by a pricing service when the Advisor or Sub-Advisor believes such prices more accurately reflect the fair value of such securities. Securities that are traded on any stock exchange are generally valued by the pricing service at the last quoted sale price. Lacking a last sale price, an exchange traded security is generally valued by the pricing service at its last bid price. Securities traded in the NASDAQ over-the-counter market are generally valued by the pricing service at the NASDAQ Official Closing Price. When using the market quotations or close prices provided by the pricing service and when the market is considered active, the security will be classified as a Level 1 security. Equity securities traded on inactive markets or valued by reference to similar instruments are categorized as a Level 2. When market quotations are not readily available, when the Advisor or Sub-Advisor determines that the market quotation or the price provided by the pricing service does not accurately reflect the current fair value, or when restricted or illiquid securities are being valued, such securities are valued as determined in good faith by the Advisor or Sub-Advisor, in conformity with guidelines adopted by and subject to review by the Board. These securities will generally be categorized as Level 3 securities.
Investments in commodities are valued at the spot rate at 4:00 p.m. Eastern time each business day and are categorized as Level 1 in the hierarchy.
Investments in mutual funds, including money market mutual funds, are generally priced at the ending NAV provided by the service agent of the funds. These securities will be categorized as Level 1 securities.
Fixed income securities such as corporate bonds, restricted corporate bonds, asset-backed securities, mortgage-backed securities, U.S. government securities, U.S. government agency securities and treasury inflation protected securities, when valued using market quotations in an active market, will be categorized as Level 1 securities. However, they may be valued on the basis of prices furnished by a pricing service when the Advisor or Sub-Advisor believes such prices more accurately reflect the fair value of such securities. A pricing service utilizes electronic data processing techniques based on yield spreads relating to securities with similar characteristics to determine prices for normal institutional-size trading units of debt securities without regard to sale or bid prices. These securities will generally be categorized as Level 2 securities. If the Advisor or Sub-Advisor decides that a price provided by the pricing service does not accurately reflect the fair value of the securities, when prices are not readily available from a pricing service, or when restricted or illiquid securities are being valued, securities are valued at fair value as determined in good faith by the Advisor or Sub-Advisor, in conformity with guidelines adopted by and subject to review of the Board. These securities will be categorized as Level 3 securities.
Short-term investments in fixed income securities (those with maturities of less than 60 days when acquired, or which subsequently are within 60 days of maturity) may be valued by using the amortized cost method of valuation, which the Board has determined will represent fair value. These securities will be classified as Level 2 securities.
The Board has delegated to the Advisor and/or Sub-Advisors responsibility for determining the value of Fund portfolio securities under certain circumstances. Under such circumstances, the Advisor or Sub-Advisor will use its best efforts to arrive at the fair value of a security held by the Fund under all reasonably ascertainable facts and circumstances. The Advisor must prepare a report for the Board not less than quarterly containing a complete listing of any securities for which fair value pricing was employed and detailing the specific reasons for such fair value pricing. The Board has adopted written policies and procedures to guide the Advisor and Sub-Advisors with respect to the circumstances under which, and the methods to be used, in fair valuing securities.
121
Notes to Financial Statements
September 30, 2017 (Continued)
Timothy Plan Family of Funds
The following is a summary of the inputs used to value each Fund’s assets as of September 30, 2017:
| | | | | | | | | | | | | | | | | | | | |
Aggressive Growth Fund | | | | | | | | | | | | | | | | | | | | |
| | | | | |
| Assets | | Level 1 | | | Level 2 | | | Level 3 | | | Total | | | | |
Common Stock | | $ | 26,062,279 | | | $ | - | | | $ | - | | | $ | 26,062,279 | | | | | |
REITs | | | 215,485 | | | | - | | | | - | | | | 215,485 | | | | | |
Money Market Fund | | | 1,032,475 | | | | - | | | | - | | | | 1,032,475 | | | | | |
Total | | $ | 27,310,239 | | | $ | - | | | $ | - | | | $ | 27,310,239 | | | | | |
| | | | | |
International Fund | | | | | | | | | | | | | | | | | | | | |
| | | | | |
Assets | | | Level 1 | | | | Level 2 | | | | Level 3 | | | | Total | | | | | |
Common Stock | | $ | 94,053,077 | | | $ | - | | | $ | - | | | $ | 94,053,077 | | | | | |
Money Market Fund | | | 4,695,880 | | | | - | | | | - | | | | 4,695,880 | | | | | |
Total | | $ | 98,748,957 | | | $ | - | | | $ | - | | | $ | 98,748,957 | | | | | |
| | | | | |
Large/Mid Cap Growth Fund | | | | | | | | | | | | | | | | | | | | |
| | | | | |
Assets | | | Level 1 | | | | Level 2 | | | | Level 3 | | | | Total | | | | | |
Common Stock | | $ | 76,695,189 | | | $ | - | | | $ | - | | | $ | 76,695,189 | | | | | |
Money Market Fund | | | 5,765,626 | | | | - | | | | - | | | | 5,765,626 | | | | | |
Total | | $ | 82,460,815 | | | $ | - | | | $ | - | | | $ | 82,460,815 | | | | | |
| | | | | |
Small Cap Value Fund | | | | | | | | | | | | | | | | | | | | |
| | | | | |
Assets | | | Level 1 | | | | Level 2 | | | | Level 3 | | | | Total | | | | | |
Common Stock | | $ | 124,752,205 | | | $ | - | | | $ | - | | | $ | 124,752,205 | | | | | |
REITs | | | 16,033,906 | | | | - | | | | - | | | | 16,033,906 | | | | | |
Money Market Fund | | | 4,254,758 | | | | - | | | | - | | | | 4,254,758 | | | | | |
Total | | $ | 145,040,869 | | | $ | - | | | $ | - | | | $ | 145,040,869 | | | | | |
| | | | | |
Large/Mid Cap Value Fund | | | | | | | | | | | | | | | | | | | | |
| | | | | |
Assets | | | Level 1 | | | | Level 2 | | | | Level 3 | | | | Total | | | | | |
Common Stock | | $ | 194,334,506 | | | $ | - | | | $ | - | | | $ | 194,334,506 | | | | | |
REITs | | | 9,162,459 | | | | - | | | | - | | | | 9,162,459 | | | | | |
Money Market Fund | | | 8,445,763 | | | | - | | | | - | | | | 8,445,763 | | | | | |
Total | | $ | 211,942,728 | | | $ | - | | | $ | - | | | $ | 211,942,728 | | | | | |
| | | | | |
Fixed Income Fund | | | | | | | | | | | | | | | | | | | | |
| | | | | |
Assets | | | Level 1 | | | | Level 2 | | | | Level 3 | | | | Total | | | | | |
Corporate Bonds | | $ | - | | | $ | 26,336,401 | | | $ | - | | | $ | 26,336,401 | | | | | |
Government Notes & Bonds | | | - | | | | 33,378,916 | | | | - | | | | 33,378,916 | | | | | |
Government Mortgage-Backed Securities | | | - | | | | 24,874,097 | | | | - | | | | 24,874,097 | | | | | |
Money Market Fund | | | 4,016,232 | | | | - | | | | - | | | | 4,016,232 | | | | | |
Total | | $ | 4,016,232 | | | $ | 84,589,414 | | | $ | - | | | $ | 88,605,646 | | | | | |
| | | | | |
High Yield Bond Fund | | | | | | | | | | | | | | | | | | | | |
| | | | | |
Assets | | | Level 1 | | | | Level 2 | | | | Level 3 | | | | Total | | | | | |
Corporate Bonds | | $ | - | | | $ | 64,421,433 | | | $ | - | | | $ | 64,421,433 | | | | | |
Money Market Fund | | | 962,355 | | | | - | | | | - | | | | 962,355 | | | | | |
Total | | $ | 962,355 | | | $ | 64,421,433 | | | $ | - | | | $ | 65,383,788 | | | | | |
| | | | | |
Israel Common Values Fund | | | | | | | | | | | | | | | | | | | | |
| | | | | |
Assets | | | Level 1 | | | | Level 2 | | | | Level 3 | | | | Total | | | | | |
Common Stock | | $ | 42,787,189 | | | $ | - | | | $ | - | | | $ | 42,787,189 | | | | | |
Money Market Fund | | | 2,355,743 | | | | - | | | | - | | | | 2,355,743 | | | | | |
Total | | $ | 45,142,932 | | | $ | - | | | $ | - | | | $ | 45,142,932 | | | | | |
122
Notes to Financial Statements
September 30, 2017 (Continued)
Timothy Plan Family of Funds
| | | | | | | | | | | | | | | | | | |
Defensive Strategies Fund | | | |
| | | | | |
| Assets | | Level 1 | | | Level 2 | | | Level 3 | | | Total | | | |
Common Stock | | $ | 14,121,444 | | | $ | - | | | $ | - | | | $ | 14,121,444 | | | |
REITs | | | 12,000,919 | | | | - | | | | - | | | | 12,000,919 | | | |
Corporate Bonds | | | - | | | | 1,357,475 | | | | - | | | | 1,357,475 | | | |
Treasury Inflation Protected Securities (TIPS) | | | - | | | | 18,261,608 | | | | - | | | | 18,261,608 | | | |
Warrants | | | 34 | | | | - | | | | - | | | | 34 | | | |
Alternative Investments | | | 9,593,390 | | | | - | | | | - | | | | 9,593,390 | | | |
Money Market Fund | | | 4,193,154 | | | | - | | | | - | | | | 4,193,154 | | | |
Total | | $ | 39,908,941 | | | $ | 19,619,083 | | | $ | �� - | | | $ | 59,528,024 | | | |
| | | | | | | | | | | | | | | | | | |
Strategic Growth Fund | | | |
| | | | | |
| Assets | | Level 1 | | | Level 2 | | | Level 3 | | | Total | | | |
Mutual Funds | | $ | 38,382,240 | | | $ | - | | | $ | - | | | $ | 38,382,240 | | | |
Money Market Fund | | | 1,389,014 | | | | - | | | | - | | | | 1,389,014 | | | |
Total | | $ | 39,771,254 | | | $ | - | | | $ | - | | | $ | 39,771,254 | | | |
| | | | | | | | | | | | | | | | | | |
Conservative Growth Fund | | | |
| | | | | |
| Assets | | Level 1 | | | Level 2 | | | Level 3 | | | Total | | | |
Mutual Funds | | $ | 50,812,934 | | | $ | - | | | $ | - | | | $ | 50,812,934 | | | |
Money Market Fund | | | 4,323,713 | | | | - | | | | - | | | | 4,323,713 | | | |
Total | | $ | 55,136,647 | | | $ | - | | | $ | - | | | $ | 55,136,647 | | | |
| | | | | | | | | | | | | | | | | | |
Emerging Markets Fund | | | |
| | | | | |
| Assets | | Level 1 | | | Level 2 | | | Level 3 | | | Total | | | |
Common Stock | | $ | 14,312,662 | | | $ | - | | | $ | - | | | $ | 14,312,662 | | | |
Preferred Stock | | | 2,270,465 | | | | - | | | | - | | | | 2,270,465 | | | |
REITs | | | 1,711,609 | | | | - | | | | - | | | | 1,711,609 | | | |
Money Market Fund | | | 3,048,351 | | | | - | | | | - | | | | 3,048,351 | | | |
Total | | $ | 21,343,087 | | | $ | - | | | $ | - | | | $ | 21,343,087 | | | |
| | | | | | | | | | | | | | | | | | |
Growth & Income Fund | | | |
| | | | | |
| Assets | | Level 1 | | | Level 2 | | | Level 3 | | | Total | | | |
Common Stock | | $ | 16,549,936 | | | $ | - | | | $ | - | | | $ | 16,549,936 | | | |
REITs | | | 346,714 | | | | - | | | | - | | | | 346,714 | | | |
Corporate Bonds | | | - | | | | 257,495 | | | | - | | | | 257,495 | | | |
Government Notes, Bonds & Agencies | | | - | | | | 14,836,536 | | | | - | | | | 14,836,536 | | | |
Treasury Inflation Protected Securities (TIPS) | | | - | | | | 2,836,832 | | | | - | | | | 2,836,832 | | | |
Money Market Fund | | | 1,256,883 | | | | - | | | | - | | | | 1,256,883 | | | |
Total | | $ | 18,153,533 | | | $ | 17,930,863 | | | $ | - | | | $ | 36,084,396 | | | |
Refer to the Schedules of Investments for industry classifications.
The Funds did not hold any Level 3 securities during the period presented. There were transfers into Level 1 during the current period presented. It is the Trust’s policy to record transfers between Level 1 and Level 2 at the end of the reporting period.
| | | | | | | | | | |
| Emerging Markets Fund | | | | | | | | | | |
| | | Common Stock | | | Total | | | |
Transfer into Level 1 from Level 2 | | $ | 35,106 | | | $ | 35,106 | | | |
Transfer was due to the availability of pricing from an approved pricing source.
123
Notes to Financial Statements
September 30, 2017 (Continued)
Timothy Plan Family of Funds
Note 3 | Purchases and Sales of Securities
The following is a summary of the cost of purchases and proceeds from the sale of securities, other than short-term investments, for the year ended September 30, 2017:
| | | | | | | | | | | | | | | | | | |
| | | Purchases | | | Sales | | | |
| Fund | | U.S. Gov’t
Obligations | | | Other | | | U.S. Gov’t
Obligations | | | Other | | | |
Aggressive Growth | | | $ - | | | | $39,536,783 | | | | $ - | | | | $35,336,114 | | | |
International | | | - | | | | 50,943,160 | | | | - | | | | 30,741,244 | | | |
Large/Mid Cap Growth | | | - | | | | 70,757,198 | | | | - | | | | 49,231,323 | | | |
Small Cap Value | | | - | | | | 103,273,903 | | | | - | | | | 68,122,969 | | | |
Large/Mid Cap Value | | | - | | | | 114,106,339 | | | | - | | | | 70,620,083 | | | |
Fixed Income | | | 29,630,744 | | | | 7,559,280 | | | | 34,335,406 | | | | 5,321,471 | | | |
High Yield Bond | | | - | | | | 34,740,247 | | | | - | | | | 23,529,274 | | | |
Israel Common Values | | | - | | | | 23,182,746 | | | | - | | | | 2,927,940 | | | |
Defensive Strategies | | | - | | | | 27,266,567 | | | | 1,127,375 | | | | 41,799,707 | | | |
Strategic Growth * | | | - | | | | 13,748,301 | | | | - | | | | 15,470,852 | | | |
Conservative Growth * | | | - | | | | 13,948,241 | | | | - | | | | 14,956,671 | | | |
Emerging Markets | | | - | | | | 11,308,555 | | | | - | | | | 3,905,093 | | | |
Growth & Income | | | 10,573,927 | | | | 31,685,397 | | | | 13,698,594 | | | | 34,584,246 | | | |
* The security transactions are purchases and sales of affiliated funds.
Note 4 | Investment Management Fee and Other Transactions with Related Parties
Timothy Partners, Ltd., (“TPL”) is the investment advisor for the Funds pursuant to an investment advisory agreement (the “Agreement”) that was renewed by the Board on February 26, 2017. TPL supervises the investment of the assets of each Fund in accordance with the objectives, policies and restrictions of the Trust. Under the terms of the Agreement, as amended, TPL receives a fee, accrued daily and paid monthly, at an annual rate of 1.20% of the average daily net assets of the Timothy Plan Emerging Markets Fund; 1.00% of the average daily net assets of the Timothy Plan International Fund and Timothy Plan Israel Common Values Fund; 0.85% of the average daily net assets of the Timothy Plan Aggressive Growth, the Timothy Plan Small Cap Value, the Timothy Plan Large/Mid Cap Growth, the Timothy Plan Growth & Income and the Timothy Plan Large/Mid Cap Value Funds; 0.60% of the average daily net assets of the Timothy Plan Fixed Income, the Timothy Plan High Yield Bond, and the Timothy Plan Defensive Strategies Funds; and 0.65% of the average daily net assets of the Timothy Plan Conservative Growth and the Timothy Plan Strategic Growth Funds. TPL has voluntarily agreed to reduce the fee it receives from the Emerging Markets Fund to 1.15%; from the International Fund to 0.95%; from the Small Cap Value Fund, the Large/Mid Cap Growth Fund and the Growth & Income Fund to 0.80%; from the Aggressive Growth Fund to 0.75%; from the High Yield Bond Fund and the Defensive Strategies Fund to 0.55%; and from the Fixed Income Fund to 0.40%. Effective March 1, 2017, the Large/Mid Cap Value Fund reduced the fee it receives to 0.75% from 0.80%. Such voluntary fee reductions/reimbursements may be authorized by TPL at any time, but such action shall not obligate TPL to waive any fees in the near future. Such voluntary fee reductions/reimbursements are not subject to future recoupment. An officer and trustee of the Funds is also an officer and owner of the Advisor.
For the year ended September 30, 2017, TPL waived and reimbursed the Funds as follows:
| | | | | | |
| Fund | | Year Ended
September 30, 2017 | | | |
Aggressive Growth Fund | | $ | 25,966 | | | |
International Fund | | | 41,243 | | | |
Large/Mid Cap Growth Fund | | | 36,333 | | | |
Small Cap Value Fund | | | 63,719 | | | |
Large/Mid Cap Value Fund | | | 155,727 | | | |
Fixed Income Fund | | | 184,531 | | | |
High Yield Bond Fund | | | 27,427 | | | |
Defensive Strategies Fund | | | 32,791 | | | |
Emerging Markets Fund | | | 7,316 | | | |
Growth & Income Fund | | | 18,881 | | | |
Gemini Fund Services, LLC (“GFS”) provides administrative, fund accounting, and transfer agency services to the Funds pursuant to agreements with the Trust, for which it receives from each Fund: (i) basis points in decreasing amounts as assets reach certain breakpoints; and (ii) any related out-of-pocket expenses. Fees are billed monthly as follows:
Fund Accounting and Fund Administration Fees:
Fund Complex Base annual fee:
25 basis points (0.25%) on the first $200 million of net assets
15 basis points (0.15%) on the next $200 million of net assets;
8 basis points (0.08%) on the next $600 million of net assets; and
6 basis points (0.06%) on net assets greater than $1 billion.
124
Notes to Financial Statements
September 30, 2017 (Continued)
Timothy Plan Family of Funds
Transfer agency fees for the Funds are combined with the Fund Accounting and Fund Administration fees under the Trust’s agreement with GFS. Therefore, there is no separate base annual fee per Fund or share class.
An officer of the Trust is also an employee of GFS, and is not paid any fees directly by the Trust for serving in such capacity.
The Timothy Plan Aggressive Growth, Timothy Plan International, Timothy Plan Large/Mid Cap Growth, Timothy Plan Small Cap Value, Timothy Plan Large/Mid Cap Value, Timothy Plan Fixed Income, Timothy Plan High Yield Bond, Timothy Plan Defensive Strategies, Timothy Plan Israel Common Values, Timothy Plan Emerging Markets, and Timothy Plan Growth & Income Funds have adopted shareholder services plans (the “Plans”) pursuant to Rule 12b-1 under the Investment Company Act of 1940, as amended. The Plans provide that the Funds will pay TPL or others for expenses that relate to the promotion or distribution of shares. Under the Class A Plan, the Funds will pay TPL a fee at an annual rate of 0.25%, payable monthly, of the average daily net assets attributable to such class of shares. Under the Class C Plan, the Funds will pay TPL a fee at an annual rate of 1.00%, payable monthly, of which, 0.25% may be a service fee and 0.75% may be payable to outside broker/dealers, of the average daily net assets attributable to such class of shares. Class I shares are not subject to the shareholder services plan.
The Timothy Plan Conservative Growth and Timothy Plan Strategic Growth Funds have adopted shareholder services plans (the “Plans”) pursuant to Rule 12b-1 under the Investment Company Act of 1940, as amended. The Plans provide that the Funds will pay TPL or others for expenses that relate to the promotion or distribution of shares. Class A shares of the Funds do not impose a service fee. Under the Class C Plan, the Funds will pay TPL a fee at an annual rate of 0.75%, payable monthly to outside broker/dealers, of the average daily net assets attributable to such class of shares.
For the year ended September 30, 2017, the Funds paid TPL under the terms of the Plans as follows:
| | | | | | |
| Fund | | 12b-1 Fees | | | |
| | |
| | | Year Ended
September 30, 2017 | | | |
Aggressive Growth | | $ | 88,007 | | | |
International | | | 216,575 | | | |
Large/Mid Cap Growth | | | 240,499 | | | |
Small Cap Value | | | 376,495 | | | |
Large/Mid Cap Value | | | 622,870 | | | |
Fixed Income | | | 299,492 | | | |
High Yield Bond | | | 147,743 | | | |
Israel Common Values | | | 124,816 | | | |
Defensive Strategies | | | 219,342 | | | |
Strategic Growth | | | 52,577 | | | |
Conservative Growth | | | 78,169 | | | |
Emerging Markets | | | 46,240 | | | |
Growth & Income | | | 112,107 | | | |
TPL also serves as the principal underwriter of the Funds’ shares. An officer and trustee of the Funds is also an officer of the principal underwriter. For the year ended September 30, 2017, TPL received sales charges deducted from the proceeds of sales of Class A capital shares and CDSC fees deducted from the redemption of Class C capital shares as follows:
| | | | | | | | | | |
| Fund | | Sales Charges
(Class A) | | | CDSC Fees
(Class C) | | | |
Aggressive Growth | | | $8,689 | | | | $989 | | | |
International | | | 18,354 | | | | 415 | | | |
Large/Mid Cap Growth | | | 45,247 | | | | 1,530 | | | |
Small Cap Value | | | 41,615 | | | | 1,638 | | | |
Large/Mid Cap Value | | | 69,146 | | | | 2,815 | | | |
Fixed Income | | | 43,304 | | | | 4,442 | | | |
High Yield Bond | | | 19,995 | | | | 285 | | | |
Israel Common Values | | | 31,055 | | | | 3,836 | | | |
Defensive Strategies | | | 17,466 | | | | 465 | | | |
Strategic Growth | | | 13,750 | | | | 436 | | | |
Conservative Growth | | | 26,517 | | | | 2,020 | | | |
Emerging Markets | | | 10,661 | | | | 721 | | | |
Growth & Income | | | 22,142 | | | | 1,430 | | | |
125
Notes to Financial Statements
September 30, 2017 (Continued)
Timothy Plan Family of Funds
Note 5 | Control Ownership
The beneficial ownership, either directly or indirectly, of more than 25% of the voting securities of a Fund creates the presumption of control of the Fund under Section 2(a) 9 of the Investment Company Act of 1940. At September 30, 2017, there were no shareholders with ownership, either directly or indirectly, of more than 25% of the voting securities of a Fund.
Certain Timothy Plan Funds own shares of other Timothy Plan Funds. U.S. Bank, N.A., custodian of the Timothy Plan Funds, holds these shares in omnibus accounts, some of which are controlled by National Financial Services, Inc. The following shows the percentage of each Timothy Plan Fund that is held by U.S. Bank, N.A., as custodian of the Timothy Plan Funds. These accounts can be considered affiliated to the Timothy Plan.
| | | | |
| Fund - Class A | | % of Fund Owned by Other Timothy
Plan Funds | | |
Aggressive Growth | | 27.72% | | |
International | | 24.76% | | |
Large/Mid Cap Growth | | 16.82% | | |
Small Cap Value | | 6.31% | | |
Large/Mid Cap Value | | 7.33% | | |
Fixed Income | | 27.57% | | |
High Yield Bond | | 15.57% | | |
Israel Common Values | | 15.41% | | |
Defensive Strategies | | 31.89% | | |
Emerging Markets | | 48.12% | | |
Growth & Income | | 43.71% | | |
Note 6 | Underlying Investment in Other Investment Companies
The Funds’ transactions with affiliates represent holdings for which the respective Fund and the underlying investee fund have the same investment advisor or where the investee fund’s investment advisor is under common control with the Fund’s investment advisor.
The Timothy Plan Strategic Growth Fund and Conservative Growth Fund had the following transactions during the year ended September 30, 2017, with affiliates:
| | | | | | | | | | | | | | | | | | | | | | | | | | | | | | | | | | |
| Strategic Growth | | Share Activity | | | Year Ended September 30, 2017 | | | |
| Fund | | Balance
September 30,
2016 | | | Purchases | | | Sales | | | Balance
September 30,
2017 | | | Fair Value | | | Net Change in
Unrealized
Appreciation
(Depreciation) | | | Dividends
Credited to
Income | | | Amount of Gain
(Loss) Realized on
Sale of Shares* | | | |
Aggressive Growth | | | 135,983 | | | | 198,685 | | | | 83,093 | | | | 251,575 | | | $ | 2,040,274 | | | $ | 385,668 | | | $ | - | | | $ | (74,921 | ) | | |
International | | | 514,732 | | | | 391,819 | | | | 106,405 | | | | 800,146 | | | | 7,897,440 | | | | 873,692 | | | | 43,206 | | | | 144,382 | | | |
Large/Mid Cap Growth | | | 340,307 | | | | 173,758 | | | | 59,956 | | | | 454,109 | | | | 3,900,798 | | | | 464,567 | | | | - | | | | 45,428 | | | |
Small Cap Value | | | 79,114 | | | | 80,880 | | | | 47,839 | | | | 112,155 | | | | 2,299,187 | | | | 334,501 | | | | - | | | | 87,250 | | | |
Large/Mid Cap Value | | | 161,372 | | | | 86,265 | | | | 27,561 | | | | 220,076 | | | | 4,216,653 | | | | 277,067 | | | | - | | | | 155,381 | | | |
Fixed Income | | | 493,062 | | | | 93,289 | | | | 394,432 | | | | 191,919 | | | | 1,961,410 | | | | (92,535 | ) | | | 41,766 | | | | (53,633 | ) | | |
High Yield Bond | | | 273,492 | | | | 55,269 | | | | 74,120 | | | | 254,641 | | | | 2,393,626 | | | | 94,587 | | | | 91,091 | | | | (13,382 | ) | | |
Israel Common Values | | | 90,290 | | | | 55,761 | | | | 11,540 | | | | 134,511 | | | | 2,005,551 | | | | 284,596 | | | | 21,668 | | | | 19,136 | | | |
Defensive Strategies | | | 785,176 | | | | 16,154 | | | | 373,997 | | | | 427,333 | | | | 4,871,601 | | | | (136,406 | ) | | | 28,127 | | | | (18,635 | ) | | |
Emerging Markets | | | 114,951 | | | | 238,664 | | | | 51,912 | | | | 301,703 | | | | 2,935,569 | | | | 401,211 | | | | 5,921 | | | | (17,398 | ) | | |
Growth & Income | | | 569,346 | | | | 2,009 | | | | 229,145 | | | | 342,210 | | | | 3,860,131 | | | | 50,286 | | | | 2,802 | | | | 170,689 | | | |
| | | | | | | | | |
| | | | | | | | | | | | | | | | | | | | | | | | | | | | | | | | | | |
| Conservative Growth | | Share Activity | | | Year Ended September 30, 2017 | | | |
| Fund | | Balance
September 30,
2016 | | | Purchases | | | Sales | | | Balance
September 30,
2017 | | | Fair Value | | | Net Change in
Unrealized
Appreciation
(Depreciation) | | | Dividends
Credited to
Income | | | Amount of Gain
(Loss) Realized on
Sale of Shares* | | | |
Aggressive Growth | | | 122,318 | | | | 187,245 | | | | 31,556 | | | | 278,007 | | | $ | 2,254,637 | | | $ | 356,172 | | | $ | - | | | $ | (29,269 | ) | | |
International | | | 545,728 | | | | 174,419 | | | | 138,456 | | | | 581,691 | | | | 5,741,292 | | | | 779,057 | | | | 47,108 | | | | 23,956 | | | |
Large/Mid Cap Growth | | | 275,570 | | | | 293,419 | | | | 106,394 | | | | 462,595 | | | | 3,973,690 | | | | 491,310 | | | | - | | | | 35,355 | | | |
Small Cap Value | | | 98,534 | | | | 67,916 | | | | 39,675 | | | | 126,775 | | | | 2,598,881 | | | | 446,080 | | | | - | | | | 96,002 | | | |
Large/Mid Cap Value | | | 137,102 | | | | 114,833 | | | | 34,785 | | | | 217,150 | | | | 4,160,595 | | | | 432,791 | | | | - | | | | 53,816 | | | |
Fixed Income | | | 1,330,529 | | | | 140,258 | | | | 197,747 | | | | 1,273,040 | | | | 13,010,465 | | | | (205,463 | ) | | | 207,080 | | | | (114,010 | ) | | |
High Yield Bond | | | 261,362 | | | | 178,677 | | | | 88,544 | | | | 351,495 | | | | 3,304,054 | | | | 134,775 | | | | 110,849 | | | | (26,647 | ) | | |
Israel Common Values | | | 121,824 | | | | 52,963 | | | | 63,305 | | | | 111,482 | | | | 1,662,196 | | | | 242,114 | | | | 30,069 | | | | 93,501 | | | |
Defensive Strategies | | | 866,321 | | | | 10,846 | | | | 336,132 | | | | 541,035 | | | | 6,167,799 | | | | (131,740 | ) | | | 31,939 | | | | (27,074 | ) | | |
Emerging Markets | | | 120,632 | | | | 184,210 | | | | 36,821 | | | | 268,021 | | | | 2,607,844 | | | | 391,048 | | | | 7,604 | | | | (7,776 | ) | | |
Growth & Income | | | 768,193 | | | | 13,456 | | | | 309,000 | | | | 472,649 | | | | 5,331,481 | | | | 114,107 | | | | 3,938 | | | | 196,142 | | | |
*Includes capital gain distributions from affiliated funds
126
Notes to Financial Statements
September 30, 2017 (Continued)
Timothy Plan Family of Funds
Note 7 | Aggregate Unrealized Appreciation and Depreciation
The identified cost of investments in securities (including written options and short sales) owned by each Fund for federal income tax purposes, and their respective gross unrealized appreciation and depreciation at September 30 2017, were as follows:
| | | | | | | | | | | | | | | | | | | | |
| Fund | | Tax Cost | | | Gross Unrealized
Appreciation | | | Gross Unrealized
Depreciation | | | Net Unrealized
Appreciation/
(Depreciation) | | | | |
Aggressive Growth | | $ | 23,265,114 | | | $ | 4,260,316 | | | $ | (215,191 | ) | | $ | 4,045,125 | | | | | |
International | | | 87,418,733 | | | | 14,036,675 | | | | (2,706,451 | ) | | | 11,330,224 | | | | | |
Large/Mid Cap Growth | | | 68,824,626 | | | | 14,725,711 | | | | (1,089,522 | ) | | | 13,636,189 | | | | | |
Small Cap Value | | | 122,951,138 | | | | 25,056,923 | | | | (2,967,192 | ) | | | 22,089,731 | | | | | |
Large/Mid Cap Value | | | 178,103,420 | | | | 39,963,954 | | | | (6,124,646 | ) | | | 33,839,308 | | | | | |
Fixed Income | | | 88,480,499 | | | | 728,464 | | | | (603,317 | ) | | | 125,147 | | | | | |
High Yield Bond | | | 63,648,172 | | | | 1,973,691 | | | | (238,075 | ) | | | 1,735,616 | | | | | |
Israel Common Values | | | 37,252,761 | | | | 10,394,594 | | | | (2,504,423 | ) | | | 7,890,171 | | | | | |
Defensive Strategies | | | 57,770,843 | | | | 3,988,813 | | | | (2,231,632 | ) | | | 1,757,181 | | | | | |
Strategic Growth | | | 36,753,300 | | | | 3,146,917 | | | | (128,963 | ) | | | 3,017,954 | | | | | |
Conservative Growth | | | 52,029,211 | | | | 3,567,155 | | | | (459,719 | ) | | | 3,107,436 | | | | | |
Emerging Markets | | | 20,148,990 | | | | 2,208,347 | | | | (1,014,250 | ) | | | 1,194,097 | | | | | |
Growth & Income | | | 34,488,900 | | | | 1,936,611 | | | | (341,115 | ) | | | 1,595,496 | | | | | |
Note 8 | Distributions to Shareholders and Tax Components of Capital
The tax character of distributions paid during the fiscal year ended September 30, 2017 and the fiscal year ended September 30, 2016 were as follows:
| | | | | | | | | | | | | | | | | | |
| | | | | | |
| | | Aggressive Growth | | | International * | | | Large/Mid Cap Growth | | | Small Cap Value | | | |
| | | | | | |
Year ended September 30, 2017 | | | | | | | | | | | | | | | | | | |
Ordinary Income | | $ | - | | | $ | 921,956 | | | $ | - | | | $ | - | | | |
Long-term Capital Gains | | | - | | | | - | | | | 818,866 | | | | 1,671,871 | | | |
Return of Capital | | | - | | | | - | | | | - | | | | - | | | |
| | | | | | |
| | $ | - | | | $ | 921,956 | | | $ | 818,866 | | | $ | 1,671,871 | | | |
| | | | | | |
| | | | | |
Year ended September 30, 2016 | | | | | | | | | | | | | | | | | | |
Ordinary Income | | $ | 78,956 | | | $ | 987,038 | | | $ | 84,166 | | | $ | - | | | |
Long-term Capital Gains | | | 3,059,522 | | | | - | | | | 6,426,712 | | | | 8,064,409 | | | |
Return of Capital | | | - | | | | - | | | | - | | | | - | | | |
| | | | | | |
| | $ | 3,138,478 | | | $ | 987,038 | | | $ | 6,510,878 | | | $ | 8,064,409 | | | |
| | | | | | |
| | | | | | | | | | | | | | | | | | | | |
| | | | |
| | | Large/Mid Cap Value | | | Fixed Income | | | High Yield Bond | | | Israel Common Values* | | | Defensive Strategies | |
| | | | |
Year ended September 30, 2017 | | | | | | | | | | | | | | | | | | | | |
Ordinary Income | | $ | - | | | $ | 1,391,208 | | | $ | 1,993,568 | | | $ | 478,723 | | | $ | 211,186 | |
Long-term Capital Gains | | | 2,332,773 | | | | - | | | | - | | | | - | | | | - | |
Return of Capital | | | - | | | | - | | | | - | | | | - | | | | - | |
| | | | |
| | $ | 2,332,773 | | | $ | 1,391,208 | | | $ | 1,993,568 | | | $ | 478,723 | | | $ | 211,186 | |
| | | | |
| | | | | |
Year ended September 30, 2016 | | | | | | | | | | | | | | | | | | | | |
Ordinary Income | | $ | - | | | $ | 1,241,208 | | | $ | 1,924,255 | | | $ | 58,926 | | | $ | - | |
Long-term Capital Gains | | | 19,429,364 | | | | - | | | | - | | | | - | | | | - | |
Return of Capital | | | - | | | | - | | | | - | | | | - | | | | - | |
| | | | |
| | $ | 19,429,364 | | | $ | 1,241,208 | | | $ | 1,924,255 | | | $ | 58,926 | | | $ | - | |
| | | | |
| | | | | | | | | | | | | | | | | | | | |
| | | | | | | | |
| | | Strategic Growth | | | Conservative Growth | | | Emerging Markets* | | | Growth & Income Fund | | | | |
| | | | | | | | |
Year ended September 30, 2017 | | | | | | | | | | | | | | | | | | | | |
Ordinary Income | | $ | - | | | $ | - | | | $ | 67,208 | | | $ | 9,747 | | | | | |
Long-term Capital Gains | | | - | | | | - | | | | - | | | | 17,051 | | | | | |
Return of Capital | | | - | | | | - | | | | - | | | | - | | | | | |
| | | | | | | | |
| | $ | - | | | $ | - | | | $ | 67,208 | | | $ | 26,798 | | | | | |
| | | | | | | | |
Year ended September 30, 2016 | | | | | | | | | | | | | | | | | | | | |
Ordinary Income | | $ | 112,223 | | | $ | 236,705 | | | $ | 23,441 | | | $ | 67,392 | | | | | |
Long-term Capital Gains | | | - | | | | 3,321,111 | | | | - | | | | - | | | | | |
Return of Capital | | | - | | | | - | | | | - | | | | - | | | | | |
| | | | | | | | |
| | $ | 112,223 | | | $ | 3,557,816 | | | $ | 23,441 | | | $ | 67,392 | | | | | |
| | | | | | | | |
127
Notes to Financial Statements
September 30, 2017 (Continued)
Timothy Plan Family of Funds
* The difference between ordinary distributions paid from book and ordinary distributions paid from tax relates to allowable foreign tax credits of $18,707, $152,490, and $192,388 for fiscal year ended September 30, 2017 for the Emerging Markets, Israel Common Values, and International Funds, respectively, and $23,441, $58,926, and $208,471 for the fiscal year ended September 30, 2016 for the Emerging Markets, Israel Common Values, and International Funds, which have been passed through to the Funds’ underlying shareholders and are deemed dividends for tax purposes.
As of September 30, 2017, the components of distributable earnings on a tax basis were as follows:
| | | | | | | | | | | | | | | | | | |
| | | | | | |
| | | Aggressive Growth
Fund | | | International
Fund | | | Large/Mid Cap
Growth Fund | | | Small Cap Value Fund | | | |
| | | | | | |
Undistributed Ordinary Income | | $ | - | | | $ | 1,985,813 | | | $ | - | | | $ | 1,218,765 | | | |
Long-Term Capital Gains | | | - | | | | - | | | | 1,811,786 | | | | 8,945,103 | | | |
Capital Loss Carry Forward | | | (446,267 | ) | | | (1,437,114 | ) | | | - | | | | - | | | |
Post October and Other Losses | | | (227,414 | ) | | | - | | | | (85,093 | ) | | | - | | | |
Unrealized Appreciation (Depreciation) | | | 4,045,125 | | | | 11,330,216 | | | | 13,636,189 | | | | 22,089,731 | | | |
| | | | | | |
| | $ | 3,371,444 | | | $ | 11,878,915 | | | $ | 15,362,882 | | | $ | 32,253,599 | | | |
| | | | | | |
| | | | | | | | | | | | | | | | | | |
| | | | | | |
| | | Large/Mid Cap
Value Fund | | | Fixed Income
Fund | | | High Yield Bond Fund | | | Israel Common
Values Fund | | | |
| | | | | | |
Undistributed Ordinary Income | | $ | 2,004,025 | | | $ | 340,631 | | | $ | 113,120 | | | $ | 598,479 | | | |
Long-Term Capital Gains | | | 12,221,548 | | | | - | | | | - | | | | - | | | |
Capital Loss Carry Forward | | | - | | | | (596,694 | ) | | | (1,429,029 | ) | | | (702,224 | ) | | |
Post October and Other Losses | | | - | | | | (334,418 | ) | | | - | | | | - | | | |
Unrealized Appreciation (Depreciation) | | | 33,839,308 | | | | 125,147 | | | | 1,735,616 | | | | 7,890,149 | | | |
| | | | | | |
| | $ | 48,064,881 | | | $ | (465,334 | ) | | $ | 419,707 | | | $ | 7,786,404 | | | |
| | | | | | |
| | | | | | | | | | | | | | | | | | |
| | | | | | |
| | | Defensive Strategies Fund | | | Strategic Growth
Fund | | | Conservative Growth Fund | | | Emerging Markets
Fund | | | |
| | | | | | |
Undistributed Ordinary Income | | $ | - | | | $ | - | | | $ | - | | | $ | 132,392 | | | |
Long-Term Capital Gains | | | - | | | | - | | | | 168,851 | | | | - | | | |
Capital Loss Carry Forward | | | (658,400 | ) | | | (952,821 | ) | | | - | | | | (1,167,134 | ) | | |
Post October and Other Losses | | | - | | | | (273,964 | ) | | | (236,547 | ) | | | - | | | |
Unrealized Appreciation (Depreciation) | | | 1,755,537 | | | | 3,017,954 | | | | 3,107,436 | | | | 1,195,082 | | | |
| | | | | | |
| | $ | 1,097,137 | | | $ | 1,791,169 | | | $ | 3,039,740 | | | $ | 160,340 | | | |
| | | | | | |
| | | | | | | | | | | | | | | | | | |
| | | | | | | | | | | | | | | | | | |
| | | Growth & Income
Fund | | | | | | | | | | | | |
| | | | | | | | | | | | | | | | | | |
Undistributed Ordinary Income | | $ | - | | | | | | | | | | | | | | | |
Long-Term Capital Gains | | | 860,843 | | | | | | | | | | | | | | | |
Capital Loss Carry Forward | | | - | | | | | | | | | | | | | | | |
Post October and Other Losses | | | - | | | | | | | | | | | | | | | |
Unrealized Appreciation (Depreciation) | | | 1,595,496 | | | | | | | | | | | | | | | |
| | | | | | | | | | | | | | | | | | |
| | $ | 2,456,339 | | | | | | | | | | | | | | | |
| | | | | | | | | | | | | | | | | | |
The difference between book basis and tax basis unrealized appreciation (depreciation), undistributed net investment income (loss) and accumulated net realized gain (loss) from investments are primarily attributable to the tax deferral of losses on wash sales, mark-to-market on passive foreign investment companies, and C-Corporation return of capital distributions. The unrealized appreciation (depreciation) in the table above includes unrealized foreign currency gains (losses) of ($22), ($8), ($822), and $985 for the Israel Common Values, International, Defensive Strategies, and Emerging Markets Funds, respectively.
Note 9 | Capital Loss Carryforwards, Post October and Other Losses
Late year losses incurred after December 31 within the fiscal year are deemed to arise on the first business day of the following fiscal year for tax purposes. The following Funds incurred and elected to defer such late year losses as follows:
| | | | | | |
Fund | | Late Year Losses | | | |
Aggressive Growth Fund | | $ | 227,414 | | | |
Large/Mid Cap Growth Fund | | | 85,093 | | | |
Strategic Growth Fund | | | 260,506 | | | |
Conservative Growth Fund | | | 236,547 | | | |
Capital losses incurred after October 31 within the fiscal year are deemed to arise on the first business day of the following fiscal year for tax purposes. The following Funds incurred and elected to defer such capital losses as follows:
| | | | | | |
Fund | | Post October Losses | | | |
Fixed Income Fund | | | 334,418 | | | |
Strategic Growth Fund | | | 13,458 | | | |
128
Notes to Financial Statements
September 30, 2017 (Continued)
Timothy Plan Family of Funds
At September 30, 2017, the following capital loss carryforwards are available to offset future capital gains.
| | | | | | | | | | | | | | | | | | | | | | |
| | | Capital Loss Carry Forward | | | Year | | | | | CLCF | | | CLCF | |
| Fund | | Short-Term | | | Long-Term | | | Expiring | | Total | | | Utilized | | | Expired | |
Aggressive Growth Fund | | $ | 446,267 | | | $ | - | | | Unlimited | | $ | 446,267 | | | $ | - | | | $ | - | |
International Fund | | | - | | | | - | | | 2017 | | | - | | | | 6,217,932 | | | | 5,935,936 | |
| | | | 592,985 | | | | - | | | 2018 | | | 592,985 | | | | - | | | | - | |
| | | | 844,129 | | | | - | | | 2019 | | | 844,129 | | | | - | | | | - | |
Fixed Income Fund | | | 161,289 | | | | 435,405 | | | Unlimited | | | 596,694 | | | | - | | | | - | |
High Yield Bond Fund | | | - | | | | - | | | 2017 | | | - | | | | - | | | | 776,982 | |
| | | | 181,677 | | | | 1,247,352 | | | Unlimited | | | 1,429,029 | | | | - | | | | - | |
Israel Common Values Fund | | | 495,405 | | | | 206,819 | | | Unlimited | | | 702,224 | | | | 307,196 | | | | - | |
Defensive Strategies Fund | | | 105,418 | | | | 552,982 | | | Unlimited | | | 658,400 | | | | - | | | | - | |
Strategic Growth Fund | | | 952,821 | | | | - | | | 2019 | | | 952,821 | | | | 327,891 | | | | - | |
Conservative Growth Fund | | | - | | | | - | | | Unlimited | | | - | | | | 23,142 | | | | - | |
Emerging Markets Fund | | | - | | | | 1,167,134 | | | Unlimited | | | 1,167,134 | | | | - | | | | - | |
Growth & Income Fund | | | - | | | | - | | | Unlimited | | | - | | | | 961,211 | | | | - | |
To the extent these loss carryforwards are used to offset future capital gains, it is probable that the amount, which is offset, will not be distributed to shareholders.
Note 10 | SUBSEQUENT EVENTS
Subsequent events after the date of the Statements of Assets and Liabilities have been evaluated through the date the financial statements were issued. Management has concluded that there is no impact requiring adjustment or disclosure in the financial statements
Note 11 | TAX INFORMATION (Unaudited)
The Strategic and Conservative Growth Funds designate the following for federal income tax purposes for the year ended September 30, 2017.
| | | | | | | | | | |
Strategic Growth Fund | | Foreign Taxes paid | | | Foreign Source Income | | | |
| | | | | | |
Timothy Israel Common Values Fund | | | 6,742 | | | $ | 39,502 | | | |
Timothy Emerging Markets Fund | | | 2,601 | | | | 62,835 | | | |
Timothy International Fund | | | 15,343 | | | | 148,375 | | | |
| | | |
Conservative Growth Fund | | Foreign Taxes paid | | | Foreign Source Income | | | |
| | | | | | |
Timothy Israel Common Values Fund | | $ | 5,588 | | | $ | 32,739 | | | |
Timothy Emerging Markets Fund | | | 2,311 | | | | 55,820 | | | |
Timothy International Fund | | | 11,154 | | | | 107,866 | | | |
Board Annual Approval/Renewals of Advisory and Sub-Advisory Agreements (Unaudited)
Timothy Partners, Ltd; Investment Advisor to all Funds.
The continuance of the Investment Advisory Agreement (the “IA Agreement”) on behalf of each series of the Trust between the Trust and Timothy Partners, Ltd. (“TPL”) was last approved by the Board of Trustees (“the Board”), including a majority of the Trustees who are not interested persons of the Trust or any person who is a party to the Agreement, at an in-person meeting held on February 17, 2017. The Trust’s Board considered, among others, the factors described below prior to approving the Agreement.
The Trustees, including the Independent Trustees, noted the Advisor’s experience in incorporating and implementing the unique, biblically-based management style that is a stated objective as set forth in the Funds’ prospectus.
To further assist the Board in making its determination as to whether the IA Agreement should be renewed, the Board requested and received the following information: a description of TPL’s business and any personnel changes, a description of the compensation received by TPL from the Funds, information relating to the Advisor’s compliance and operational policies and procedures, and a description of any material legal proceedings or securities enforcement proceedings regarding TPL or its personnel (there were none of either). In addition, the Board requested and received financial statements of TPL for its fiscal year ended December 31, 2016.
The Board also received a report from TPL relating to the fees charged by TPL, both as an aggregate and in relation to fees charged by other advisors to similar funds. The materials prepared by TPL were provided to the Board in advance of the meeting. The Board considered the fees charged by TPL in light of the services provided to the Funds by TPL, the unique nature of the Funds and their moral screening requirements, which are maintained by TPL, and TPL’s role as a manager of managers. After full and careful consideration, the Board, with the independent trustees separately concurring, agreed that the fees charged by TPL were fair and reasonable in light of the services provided to the Funds.
129
Notes to Financial Statements
September 30, 2017 (Continued)
Timothy Plan Family of Funds
The Board also discussed the nature, extent and quality of TPL’s services to the Funds. In particular, the Board noted with approval TPL’s commitment to maintaining certain targeted expense ratios for the Funds, its efforts in providing comprehensive and consistent moral screens to the investment managers, its efforts in maintaining appropriate oversight of the investment managers to each Fund, and its efforts to maintain ongoing regulatory compliance for the Funds. The Board also discussed TPL’s current fee structure and whether such structure would allow the Funds to realize economies of scale as they grow. The Board next considered the investment performance of each Fund and the Advisor’s performance in monitoring the investment managers of the underlying funds. The Board generally approved of each Fund’s performance, noting that the Funds invested in a manner that did not rely exclusively on investment performance. Further, the Board noted with approval that the investment managers of each Fund did not succumb to “style drift” in their management of each Fund’s assets, and that each Fund was committed to maintain its investment mandate, even if that meant under performance during periods when that style was out of favor. The Board noted with approval the Advisor’s ongoing efforts to maintain such consistent investment discipline. The Board also noted with approval that the Advisor’s business was devoted exclusively to serving the Funds, and that the Advisor did not realize any ancillary benefits or profits deriving from its relationship with the Funds. The Board further noted with approval the Advisor’s past activities on monitoring the performance of the underlying Funds’ various investment managers and the promptness and efficiency with which problems were brought to the Board’s attention and responsible remedies offered and executed. After careful discussion and consideration, the Board, including the separate concurrence of the independent Trustees, unanimously cast an affirmative vote, and determined that the renewal of the IA Agreement for another one-year period would be in the best interests of the Funds’ shareholders. In approving the renewal of the IA Agreement for an additional one year period, the Board did not place specific emphasis on any one factor discussed above, but considered all factors in equal light. Further, the Board had available and availed itself of the assistance of legal counsel at all times during its consideration of the IA Agreement renewal.
Barrow, Hanley, Mewhinney & Strauss; Sub-Advisor for the Fixed Income, High Yield Bond, and Defensive Strategies TIPS sleeve.
The Sub-Advisory Agreement between the Trust, TPL and Barrow, Hanley, Mewhinney & Strauss (“BHM&S”), on behalf of the Timothy Plan Fixed Income, High Yield Bond and Defensive Strategies TIPS sleeve Funds, was last renewed by the Board at a meeting held for that purpose, among others, on February 17, 2017. The Board considered the following factors in arriving at its conclusions to renew the BHM&S Sub-Advisory Agreement for an additional year. First, the Board considered the fees charged by BHM&S in light of the services provided by BHM&S. After full and careful consideration, the Board, with the independent trustees separately concurring, agreed that the fees charged by BHM&S and paid out of the fees received by TPL were fair and reasonable in light of the services provided by BHM&S. In reaching that determination, the Board relied on reports describing the fees paid to BHM&S and comparing those fees against fees paid to other investment advisors operating under similar circumstances. Next, the Board discussed the nature, extent and quality of BHM&S’s services to each Fund, including the investment performance of the Funds under BHM&S’s investment management. The Board generally approved of BHM&S’s performance, noting that the Funds managed by BHM&S invested in a manner that did not rely exclusively on investment performance. Further, the Board noted with approval that BHM&S did not succumb to “style drift” in its management of each Fund’s assets, and that BHM&S was committed to maintain its investment mandate, even if that meant under performance during periods when that style was out of favor. The Board noted with approval BHM&S’s ongoing efforts to maintain such consistent investment discipline. Next, the Board considered whether BHM&S’s current fee structure would allow the Funds to realize economies of scale as they grow. The Board decided that this particular factor was moot with respect to the BHM&S Sub-Advisory Agreement because BHM&S was paid out of the fees paid to TPL. After careful discussion and consideration, the Board, including the independent Trustees separately concurring, unanimously determined that the renewal of the BHM&S Sub-Advisory Agreement for another one-year period would be in the best interests of the Funds’ shareholders. In approving the renewal of the BHM&S Sub-Advisory Agreement for an additional one year period, the Board did not place specific emphasis on any one factor discussed above, but considered all factors in equal light. Further, the Board had available and availed itself of the assistance of legal counsel at all times during its consideration of the BHM&S Sub-Advisory Agreement renewal.
Westwood Management Corporation; Sub-Advisor to the Large/Mid Cap Value and the Small Cap Value Funds.
The Sub-Advisory Agreement between the Trust, TPL and Westwood Management Corporation (“Westwood”), on behalf of the Timothy Plan Small Cap Value and Large/Mid Cap Value Funds, was last renewed by the Board at a meeting held for that purpose, among others, on February 17, 2017. The Board considered the following factors in arriving at its conclusions to renew the Westwood Sub-Advisory Agreement for an additional year. First, the Board considered the fees charged by Westwood in light of the services provided by Westwood. After full and careful consideration, the Board, with the independent trustees separately concurring, agreed that the fees charged by Westwood and paid out of the fees received by TPL were fair and reasonable in light of the services provided by Westwood. In reaching that determination, the Board relied on reports describing the fees paid to Westwood and comparing those fees against fees paid to other investment advisors operating under similar circumstances. Next, the Board discussed the nature, extent and quality of Westwood’s services to each Fund, including the investment performance of the Funds under Westwood’s investment management. The Board generally approved of Westwood’s performance, noting that the Funds managed by Westwood invested in a manner that did not rely exclusively on investment performance. Further, the Board noted with approval that Westwood did not succumb to “style drift” in its management of each Fund’s assets, and that Westwood was committed to maintain its investment mandate, even if that meant under performance during periods when that style was out of favor. The Board noted with approval Westwood’s ongoing efforts to maintain such consistent investment discipline. Next, the Board considered whether Westwood’s current fee structure would allow the Funds to realize economies of scale as they grow. The Board decided that this particular factor was moot with respect to the Westwood Sub-Advisory Agreement because Westwood was paid out of the fees paid to TPL. After careful discussion and consideration, the Board, including the independent Trustees separately concurring, unanimously determined that the renewal of the Westwood Sub-Advisory Agreement for another one-year period would be in the best interests of the Funds’ shareholders. In approving the renewal of the Westwood Sub-Advisory Agreement for an additional one year period, the Board did not place specific emphasis on any one factor discussed above, but considered all factors in equal light. Further, the Board had available and availed itself of the assistance of legal counsel at all times during its consideration of the Westwood Sub-Advisory Agreement renewal.
130
Notes to Financial Statements
September 30, 2017 (Continued)
Timothy Plan Family of Funds
Chartwell Investment Partners; Sub-Advisor to the Aggressive Growth and Large/Mid Cap Growth Funds.
The Sub-Advisory Agreement between the Trust, TPL and Chartwell Investment Partners (“Chartwell”), on behalf of the Timothy Plan Aggressive Growth and Large/Mid Cap Growth Funds, was last renewed by the Board at a meeting held for that purpose, among others, on February 17, 2017. The Board considered the following factors in arriving at its conclusions to renew the Chartwell Sub-Advisory Agreement for an additional year. First, the Board considered the fees charged by Chartwell in light of the services provided by Chartwell. After full and careful consideration, the Board, with the independent trustees separately concurring, agreed that the fees charged by Chartwell and paid out of the fees received by TPL were fair and reasonable in light of the services provided by Chartwell. In reaching that determination, the Board relied on reports describing the fees paid to Chartwell and comparing those fees against fees paid to other investment advisors operating under similar circumstances. Next, the Board discussed the nature, extent and quality of Chartwell’s services to each Fund, including the investment performance of the Funds under Chartwell’s investment management. The Board generally approved of Chartwell’s performance, noting that the Funds managed by Chartwell invested in a manner that did not rely exclusively on investment performance. Further, the Board noted with approval that Chartwell did not succumb to “style drift” in its management of each Fund’s assets, and that Chartwell was committed to maintain its investment mandate, even if that meant under performance during periods when that style was out of favor. The Board noted with approval Chartwell’s ongoing efforts to maintain such consistent investment discipline. Next, the Board considered whether Chartwell’s current fee structure would allow the Funds to realize economies of scale as they grow. The Board decided that this particular factor was moot with respect to the Chartwell Sub-Advisory Agreement because Chartwell was paid out of the fees paid to TPL. After careful discussion and consideration, the Board, including the independent Trustees separately concurring, unanimously determined that the renewal of the Chartwell Sub-Advisory Agreement for another one-year period would be in the best interests of the Funds’ shareholders. In approving the renewal of the Chartwell Sub-Advisory Agreement for an additional one year period, the Board did not place specific emphasis on any one factor discussed above, but considered all factors in equal light. Further, the Board had available and availed itself of the assistance of legal counsel at all times during its consideration of the Chartwell Sub-Advisory Agreement renewal.
Eagle Global Advisors; Sub-Advisor to the International Fund and Israel Common Values Fund.
The Sub-Advisory Agreement between the Trust, TPL and Eagle Global Advisors (“Eagle”), on behalf of the Timothy Plan International Fund and Israel Common Values Fund, was last renewed by the Board at a meeting held for that purpose, among others, on February 17, 2017. The Board considered the following factors in arriving at its conclusions to renew the Eagle Sub-Advisory Agreement for an additional year. First, the Board considered the fees charged by Eagle in light of the services provided by Eagle. After full and careful consideration, the Board, with the independent trustees separately concurring, agreed that the fees charged by Eagle and paid out of the fees received by TPL were fair and reasonable in light of the services provided by Eagle. In reaching that determination, the Board relied on reports describing the fees paid to Eagle and comparing those fees against fees paid to other investment advisors operating under similar circumstances. Next, the Board discussed the nature, extent and quality of Eagle’s services to the Funds, including the investment performance of the Funds under Eagle’s investment management. The Board generally approved of Eagle’s performance, noting that the Funds managed by Eagle invested in a manner that did not rely exclusively on investment performance. Further, the Board noted with approval that Eagle did not succumb to “style drift” in its management of the Funds’ assets, and that Eagle was committed to maintain its investment mandate, even if that meant under performance during periods when that style was out of favor. The Board noted with approval Eagle’s ongoing efforts to maintain such consistent investment discipline. Next, the Board considered whether Eagle’s current fee structure would allow the Funds to realize economies of scale as they grow. The Board decided that this particular factor was moot with respect to the Eagle Sub-Advisory Agreement because Eagle was paid out of the fees paid to TPL. After careful discussion and consideration, the Board, including the independent Trustees separately concurring, unanimously determined that the renewal of the Eagle Sub-Advisory Agreement for another one-year period would be in the best interests of the Funds’ shareholders. In approving the renewal of the Eagle Sub-Advisory Agreement for an additional one year period, the Board did not place specific emphasis on any one factor discussed above, but considered all factors in equal light. Further, the Board had available and availed itself of the assistance of legal counsel at all times during its consideration of the Eagle Sub-Advisory Agreement renewal.
Brandes Investment Partners; Sub-Advisor to the Emerging Markets Fund.
The Sub-Advisory Agreement between the Trust, TPL and Brandes Investment Partners (“Brandes”), on behalf of the Timothy Plan Emerging Market Fund, was last renewed by the Board at a meeting held for that purpose, among others, on February 17, 2017. The Board considered the following factors in arriving at its conclusions to renew the Brandes Sub-Advisory Agreement for an additional year. First, the Board considered the fees charged by Brandes in light of the services provided by Brandes. After full and careful consideration, the Board, with the independent trustees separately concurring, agreed that the fees charged by Brandes and paid out of the fees received by TPL were fair and reasonable in light of the services provided by Brandes. In reaching that determination, the Board relied on reports describing the fees paid to Brandes and comparing those fees against fees paid to other investment advisors operating under similar circumstances. Next, the Board discussed the nature, extent and quality of Brandes’s services to the Fund, including the investment performance of the Fund under Brandes’s investment management. The Board generally approved of Brandes’s performance, noting that the Fund managed by Brandes invested in a manner that did not rely exclusively on investment performance. Further, the Board noted with approval that Brandes did not succumb to “style drift” in its management of the Funds’ assets, and that Brandes was committed to maintain its investment mandate, even if that meant under performance during periods when that style was out of favor. The Board noted with approval Brandes’s ongoing efforts to maintain such consistent investment discipline. Next, the Board considered whether Brandes’s current fee structure would allow the Fund to realize economies of scale as it grows. The Board decided that this particular factor was moot with respect to the Brandes Sub-Advisory Agreement because Brandes was paid out of the fees paid to TPL. After careful discussion and consideration, the Board, including the independent Trustees separately concurring, unanimously determined that the renewal of the Brandes Sub-Advisory Agreement for another one-year period would be in the best interests of the Fund’s shareholders. In approving the renewal of the Eagle Sub-Advisory Agreement for an additional one year period, the Board did not place specific emphasis on any one factor discussed above, but considered all factors in equal light. Further, the Board had available and availed itself of the assistance of legal counsel at all times during its consideration of the Brandes Sub-Advisory Agreement renewal.
131
Notes to Financial Statements
September 30, 2017 (Continued)
Timothy Plan Family of Funds
Macquarie Investment Management; Sub-Advisor to the Defensive Strategies Fund REITs sleeve.
The Sub-Advisory Agreement between the Trust, TPL and Macquarie Investment Management (“Macquarie”), on behalf of the Timothy Plan Defensive Strategies Fund REITs sleeve, was last renewed by the Board at a meeting held for that purpose, among others, on February 17, 2017. The Board considered the following factors in arriving at its conclusions to renew the Macquarie Sub-Advisory Agreement for an additional year. First, the Board considered the fees charged by Macquarie in light of the services provided by Macquarie. After full and careful consideration, the Board, with the independent trustees separately concurring, agreed that the fees charged by Macquarie and paid out of the fees received by TPL were fair and reasonable in light of the services provided by Macquarie. In reaching that determination, the Board relied on reports describing the fees paid to Macquarie and comparing those fees against fees paid to other investment advisors operating under similar circumstances. Next, the Board discussed the nature, extent and quality of Macquarie’s services to the Fund, including the investment performance of the Fund under Macquarie’s investment management. The Board generally approved of Macquarie’s performance, noting that the Fund managed by Macquarie invested in a manner that did not rely exclusively on investment performance. Further, the Board noted with approval that Macquarie did not succumb to “style drift” in its management of the Fund’s assets, and that Macquarie was committed to maintain its investment mandate, even if that meant under performance during periods when that style was out of favor. The Board noted with approval Macquarie’s ongoing efforts to maintain such consistent investment discipline. Next, the Board considered whether Macquarie’s current fee structure would allow the Fund to realize economies of scale as it grows. The Board decided that this particular factor was moot with respect to the Macquarie Sub-Advisory Agreement because Macquarie was paid out of the fees paid to TPL. After careful discussion and consideration, the Board, including the independent Trustees separately concurring, unanimously determined that the renewal of the Macquarie Sub-Advisory Agreement for another one-year period would be in the best interests of the Fund’s shareholders. In approving the renewal of the Macquarie Sub-Advisory Agreement for an additional one year period, the Board did not place specific emphasis on any one factor discussed above, but considered all factors in equal light. Further, the Board had available and availed itself of the assistance of legal counsel at all times during its consideration of the Macquarie Sub-Advisory Agreement renewal.
CoreCommodity Management, LLC; Sub-Advisor to the Defensive Strategies Fund commodities sleeve.
The Sub-Advisory Agreement between the Trust, TPL and CoreCommodity Management, LLC (“Core”), on behalf of the Timothy Plan Defensive Strategies Fund commodity sleeve, was last renewed by the Board at a meeting held for that purpose, among others, on February 17, 2017. The Board considered the following factors in arriving at its conclusions to renew the Core Sub-Advisory Agreement for an additional year. First, the Board considered the fees charged by Core in light of the services provided by Core. After full and careful consideration, the Board, with the independent trustees separately concurring, agreed that the fees charged by Core and paid out of the fees received by TPL were fair and reasonable in light of the services provided by Core. In reaching that determination, the Board relied on reports describing the fees paid to Core and comparing those fees against fees paid to other investment advisors operating under similar circumstances. Next, the Board discussed the nature, extent and quality of Core’s services to the Fund, including the investment performance of the Fund under Core’s investment management. The Board generally approved of Core’s performance, noting that the Fund managed by Core invested in a manner that did not rely exclusively on investment performance. Further, the Board noted with approval that Core did not succumb to “style drift” in its management of the Fund’s assets, and that Core was committed to maintain its investment mandate, even if that meant under performance during periods when that style was out of favor. The Board noted with approval Core’s ongoing efforts to maintain such consistent investment discipline. Next, the Board considered whether Core’s current fee structure would allow the Fund to realize economies of scale as it grows. The Board decided that this particular factor was moot with respect to the Core Sub-Advisory Agreement because Core was paid out of the fees paid to TPL. After careful discussion and consideration, the Board, including the independent Trustees separately concurring, unanimously determined that the renewal of the Core Sub-Advisory Agreement for another one-year period would be in the best interests of the Fund’s shareholders. In approving the renewal of the Core Sub-Advisory Agreement for an additional one year period, the Board did not place specific emphasis on any one factor discussed above, but considered all factors in equal light. Further, the Board had available and availed itself of the assistance of legal counsel at all times during its consideration of the Core Sub-Advisory Agreement renewal.
James Investment Partners; Sub-Advisor to the Growth and Income Fund.
The Sub-Advisory Agreement between the Trust, TPL and James Investment Research, Inc. (“James”), on behalf of the Timothy Plan Growth and Income Fund, was last renewed by the Board at a meeting held for that purpose, among others, on February 17, 2017. The Board considered the following factors in arriving at its conclusions to renew the James Sub-Advisory Agreement for an additional year. First, the Board considered the fees charged by James in light of the services provided by James. After full and careful consideration, the Board, with the independent trustees separately concurring, agreed that the fees charged by James and paid out of the fees received by TPL were fair and reasonable in light of the services provided by James. In reaching that determination, the Board relied on reports describing the fees paid to James and comparing those fees against fees paid to other investment advisors operating under similar circumstances. Next, the Board discussed the nature, extent and quality of James’s services to the Fund, including the investment performance of the Fund under James’s investment management. The Board generally approved of James’s performance, noting that the Fund managed by James invested in a manner that did not rely exclusively on investment performance. Further, the Board noted with approval that James did not succumb to “style drift” in its management of the Fund’s assets, and that James was committed to maintain its investment mandate, even if that meant under performance during periods when that style was out of favor. The Board noted with approval James’s ongoing efforts to maintain such consistent investment discipline. Next, the Board considered whether James’s current fee structure would allow the Fund to realize economies of scale as it grows. The Board decided that this particular factor was moot with respect to the James Sub-Advisory Agreement because James was paid out of the fees paid to TPL. After careful discussion and consideration, the Board, including the independent Trustees separately concurring, unanimously determined that the renewal of the James Sub-Advisory Agreement for another one-year period would be in the best interests of the Fund’s shareholders. In approving the renewal of the James Sub-Advisory Agreement for an additional one year period, the Board did not place specific emphasis on any one factor discussed above, but considered all factors in equal light. Further, the Board had available and availed itself of the assistance of legal counsel at all times during its consideration of the James Sub-Advisory Agreement renewal.
132
REPORT OF INDEPENDENT REGISTERED PUBLIC ACCOUNTING FIRM
To the Shareholders and Board of Trustees of
The Timothy Plan
We have audited the accompanying statements of assets and liabilities, including the schedules of investments, of The Timothy Plan, comprising Timothy Plan Aggressive Growth Fund, Timothy Plan International Fund, Timothy Plan Large/Mid Cap Growth Fund, Timothy Plan Small Cap Value Fund, Timothy Plan Large/Mid Cap Value Fund, Timothy Plan Fixed Income Fund, Timothy Plan High Yield Bond Fund, Timothy Plan Israel Common Values Fund, Timothy Plan Defensive Strategies Fund, Timothy Plan Strategic Growth Fund, Timothy Plan Conservative Growth Fund, Timothy Plan Emerging Markets Fund, and Timothy Plan Growth & Income Fund (the “Funds”), as of September 30, 2017, and the related statements of operations for the year then ended, the statements of changes in net assets for each of the two years in the period then ended, and the financial highlights for each of the five years or periods indicated. These financial statements and financial highlights are the responsibility of the Funds’ management. Our responsibility is to express an opinion on these financial statements and financial highlights based on our audits.
We conducted our audits in accordance with the standards of the Public Company Accounting Oversight Board (United States). Those standards require that we plan and perform the audit to obtain reasonable assurance about whether the financial statements and financial highlights are free of material misstatement. An audit includes examining, on a test basis, evidence supporting the amounts and disclosures in the financial statements. Our procedures included confirmation of securities owned as of September 30, 2017, including physical observation of precious metals, by correspondence with the custodian and brokers or by other appropriate auditing procedures where replies from brokers or counterparties were not received. An audit also includes assessing the accounting principles used and significant estimates made by management, as well as evaluating the overall financial statement presentation. We believe that our audits provide a reasonable basis for our opinion.
In our opinion, the financial statements and financial highlights referred to above present fairly, in all material respects, the financial position of Timothy Plan Aggressive Growth Fund, Timothy Plan International Fund, Timothy Plan Large/Mid Cap Growth Fund, Timothy Plan Small Cap Value Fund, Timothy Plan Large/Mid Cap Value Fund, Timothy Plan Fixed Income Fund, Timothy Plan High Yield Bond Fund, Timothy Plan Israel Common Values Fund, Timothy Plan Defensive Strategies Fund, Timothy Plan Strategic Growth Fund, Timothy Plan Conservative Growth Fund, Timothy Plan Emerging Markets Fund, and Timothy Plan Growth & Income Fund as of September 30, 2017, the results of their operations for the year then ended, the changes in their net assets for each of the two years in the period then ended, and the financial highlights for each of the years or periods indicated, in conformity with accounting principles generally accepted in the United States of America.
COHEN & COMPANY, LTD.
Cleveland, Ohio
November 29, 2017
133
Expense Examples – (Unaudited)
September 30, 2017
As a shareholder of a Fund, you incur two types of costs: direct costs, such as wire fees and low balance fees; and indirect costs, including management fees, and other Fund operating expenses. This example is intended to help you understand your indirect costs, also referred to as “ongoing costs”, (in dollars) of investing in each Fund, and to compare these costs with the ongoing costs of investing in other mutual funds.
This example is based on an investment of $1,000 invested at the beginning of the period and held for the entire six-month period of April 1, 2017, through September 30, 2017.
Actual Expenses
The first line of the following tables provides information about actual account values and actual expenses. You may use the information in this line, together with the amount you invested at the beginning of the period, to estimate the expenses that you paid over the period. Simply divide your account value by $1,000 (for example, an $8,600 account value divided by $1,000 = 8.6), then multiply the result by the number in the first line under the heading “Expenses Paid During Period” to estimate the expenses you paid on your account during this period.
Hypothetical Example for Comparison Purposes
The second line of the tables provides information about hypothetical account values and hypothetical expenses based on each Fund’s actual expense ratio and an assumed rate of return of 5% per year before expenses, which is not the Fund’s actual return. The hypothetical account values and expenses may not be used to estimate the actual ending account balance or expenses you paid for the period. You may use this information to compare ongoing costs of investing in each Fund and other funds. To do so, compare this 5% hypothetical example with the 5% hypothetical examples that appear in the shareholder reports of other funds.
Please note that the expenses shown in the tables are meant to highlight your ongoing costs only and do not reflect any direct costs, such as wire fees or low balance fees. Therefore, the second line of the table is useful in comparing ongoing costs only, and will not help you determine the relative total costs of owning different funds. In addition, if these direct costs were included, your costs would be higher.
AGGRESSIVE GROWTH FUND
| | | | | | | | | | |
| | | Beginning Account
Value | | | | Ending Account
Value | | | | Expenses Paid
During Period |
| | | | | |
| | | 4/1/2017 | | | | 9/30/2017 | | | | 4/1/2017 through
9/30/2017 |
Actual - Class A * | | $1,000.00 | | | | $1,075.60 | | | | $ 8.17 |
Hypothetical - Class A ** | | $1,000.00 | | | | $1,017.20 | | | | $ 7.94 |
Actual - Class C * | | $1,000.00 | | | | $1,070.00 | | | | $12.04 |
Hypothetical - Class C ** | | $1,000.00 | | | | $1,013.44 | | | | $11.71 |
Actual - Class I * | | $1,000.00 | | | | $1,076.00 | | | | $ 6.87 |
Hypothetical - Class I ** | | $1,000.00 | | | | $1,018.45 | | | | $ 6.68 |
| * | Expenses are equal to the Fund’s annualized expense ratio of 1.57% for Class A, 2.32% for Class C and 1.32% for Class I, which is net of any expenses paid indirectly, multiplied by the average account value over the period, multiplied by 183 days/365 days (to reflect the partial year period). The Aggressive Growth Fund’s ending account value on the first line of each share class in the table is based on its actual total return of 7.56% for Class A, 7.00% for Class C and 7.60% for Class I for the period of April 1, 2017, to September 30, 2017. |
| ** | Assumes a 5% return before expenses. |
134
Expense Examples – (Unaudited)(Continued)
September 30, 2017
INTERNATIONAL FUND
| | | | | | | | | | |
| | | Beginning Account
Value | | | | Ending Account
Value | | | | Expenses Paid
During Period |
| | | | | |
| | | 4/1/2017 | | | | 9/30/2017 | | | | 4/1/2017 through
9/30/2017 |
Actual - Class A * | | $1,000.00 | | | | $1,128.00 | | | | $ 8.54 |
Hypothetical - Class A ** | | $1,000.00 | | | | $1,017.05 | | | | $ 8.09 |
Actual - Class C * | | $1,000.00 | | | | $1,122.20 | | | | $ 12.50 |
Hypothetical - Class C ** | | $1,000.00 | | | | $1,013.29 | | | | $ 11.86 |
Actual - Class I * | | $1,000.00 | | | | $1,129.00 | | | | $ 7.21 |
Hypothetical - Class I ** | | $1,000.00 | | | | $1,018.30 | | | | $ 6.83 |
| * | Expenses are equal to the Fund’s annualized expense ratio of 1.60% for Class A, 2.35% for Class C and 1.35% for Class I, which is net of any expenses paid indirectly, multiplied by the average account value over the period, multiplied by 183 days/365 days (to reflect the partial year period). The International Fund’s ending account value on the first line of each share class in the table is based on its actual total return of 12.80% for Class A, 12.22% for Class C, and 12.90% for Class I for the period of April 1, 2017, to September 30, 2017. |
| ** | Assumes a 5% return before expenses. |
LARGE/MID CAP GROWTH FUND
| | | | | | | | | | |
| | | Beginning Account
Value | | | | Ending Account
Value | | | | Expenses Paid
During Period |
| | | | | |
| | | 4/1/2017 | | | | 9/30/2017 | | | | 4/1/2017 through
9/30/2017 |
Actual - Class A * | | $1,000.00 | | | | $1,065.80 | | | | $ 7.46 |
Hypothetical - Class A ** | | $1,000.00 | | | | $1,017.85 | | | | $ 7.28 |
Actual - Class C * | | $1,000.00 | | | | $1,061.20 | | | | $11.26 |
Hypothetical - Class C ** | | $1,000.00 | | | | $1,014.14 | | | | $11.01 |
Actual - Class I * | | $1,000.00 | | | | $1,066.20 | | | | $ 6.16 |
Hypothetical - Class I ** | | $1,000.00 | | | | $1,019.10 | | | | $ 6.02 |
| * | Expenses are equal to the Fund’s annualized expense ratio of 1.44% for Class A, 2.18% for Class C and 1.19% for Class I, which is net of any expenses paid indirectly, multiplied by the average account value over the period, multiplied by 183 days/365 days (to reflect the partial year period). The Large/Mid Cap Growth Fund’s ending account value on the first line of each share class in the table is based on its actual total return of 6.58% for Class A, 6.12% for Class C, and 6.62% for Class I for the period of April 1, 2017, to September 30, 2017. |
| ** | Assumes a 5% return before expenses. |
SMALL CAP VALUE FUND
| | | | | | | | | | |
| | | Beginning Account
Value | | | | Ending Account
Value | | | | Expenses Paid
During Period |
| | | | | |
| | | 4/1/2017 | | | | 9/30/2017 | | | | 4/1/2017 through
9/30/2017 |
Actual - Class A * | | $1,000.00 | | | | $1,091.00 | | | | $ 7.29 |
Hypothetical - Class A ** | | $1,000.00 | | | | $1,018.10 | | | | $ 7.03 |
Actual - Class C * | | $1,000.00 | | | | $1,087.50 | | | | $11.20 |
Hypothetical - Class C ** | | $1,000.00 | | | | $1,014.34 | | | | $10.81 |
Actual - Class I * | | $1,000.00 | | | | $1,092.70 | | | | $ 5.88 |
Hypothetical - Class I ** | | $1,000.00 | | | | $1,019.45 | | | | $ 5.67 |
| * | Expenses are equal to the Fund’s annualized expense ratio of 1.39% for Class A, 2.14% for Class C and 1.12% for Class I, which is net of any expenses paid indirectly, multiplied by the average account value over the period, multiplied by 183 days/365 days (to reflect the partial year period). The Large/Mid Cap Growth Fund’s ending account value on the first line of each share class in the table is based on its actual total return of 9.10% for Class A, 8.75% for Class C, and 9.27% for Class I for the period of April 1, 2017, to September 30, 2017. |
| ** | Assumes a 5% return before expenses. |
135
Expense Examples – (Unaudited)(Continued)
September 30, 2017
LARGE/MID CAP VALUE FUND
| | | | | | | | | | |
| | | Beginning Account
Value | | | | Ending Account
Value | | | | Expenses Paid
During Period |
| | | | | |
| | | 4/1/2017 | | | | 9/30/2017 | | | | 4/1/2017 through
9/30/2017 |
Actual - Class A * | | $1,000.00 | | | | $1,049.30 | | | | $ 6.99 |
Hypothetical - Class A ** | | $1,000.00 | | | | $1,018.25 | | | | $ 6.88 |
Actual - Class C * | | $1,000.00 | | | | $1,044.90 | | | | $10.82 |
Hypothetical - Class C ** | | $1,000.00 | | | | $1,014.49 | | | | $10.66 |
Actual - Class I * | | $1,000.00 | | | | $1,050.50 | | | | $ 5.71 |
Hypothetical - Class I ** | | $1,000.00 | | | | $1,019.50 | | | | $ 5.62 |
| * | Expenses are equal to the Fund’s annualized expense ratio of 1.36% for Class A, 2.11% for Class C, and 1.11% for Class I which is net of any expenses paid indirectly, multiplied by the average account value over the period, multiplied by 183 days/365 days (to reflect the partial year period). The Large/Mid Cap Value Fund’s ending account value on the first line of each share class in the table is based on its actual total return of 4.93% for Class A, 4.49 % for Class C, and 5.05% for Class I for the period of April 1, 2017, to September 30, 2017. |
| ** | Assumes a 5% return before expenses. |
FIXED INCOME FUND
| | | | | | | | | | |
| | | Beginning Account
Value | | | | Ending Account
Value | | | | Expenses Paid
During Period |
| | | | | |
| | | 4/1/2017 | | | | 9/30/2017 | | | | 4/1/2017 through
9/30/2017 |
Actual - Class A * | | $1,000.00 | | | | $1,013.90 | | | | $5.60 |
Hypothetical - Class A ** | | $1,000.00 | | | | $1,019.50 | | | | $5.62 |
Actual - Class C * | | $1,000.00 | | | | $1,010.70 | | | | $9.38 |
Hypothetical - Class C ** | | $1,000.00 | | | | $1,015.74 | | | | $9.40 |
Actual - Class I * | | $1,000.00 | | | | $1,015.20 | | | | $4.34 |
Hypothetical - Class I ** | | $1,000.00 | | | | $1,020.76 | | | | $4.36 |
| * | Expenses are equal to the Fund’s annualized expense ratio of 1.11% for Class A, 1.86% for Class C, and 0.86% for Class I which is net of any expenses paid indirectly, multiplied by the average account value over the period, multiplied by 183 days/365 days (to reflect the partial year period). The Fixed Income Fund’s ending account value on the first line of each share class in the table is based on its actual total return of 1.39% for Class A, 1.07% for Class C, and 1.52% for Class I for the period of April 1, 2017, to September 30, 2017. |
| ** | Assumes a 5% return before expenses. |
HIGH YIELD BOND FUND
| | | | | | | | | | |
| | | Beginning Account
Value | | | | Ending Account
Value | | | | Expenses Paid
During Period |
| | | | | |
| | | 4/1/2017 | | | | 9/30/2017 | | | | 4/1/2017 through
9/30/2017 |
Actual - Class A * | | $1,000.00 | | | | $1,039.70 | | | | $ 6.19 |
Hypothetical - Class A ** | | $1,000.00 | | | | $1,019.00 | | | | $ 6.12 |
Actual - Class C * | | $1,000.00 | | | | $1,034.30 | | | | $10.00 |
Hypothetical - Class C ** | | $1,000.00 | | | | $1,015.24 | | | | $ 9.90 |
Actual - Class I * | | $1,000.00 | | | | $1,040.90 | | | | $ 4.91 |
Hypothetical - Class I ** | | $1,000.00 | | | | $1,020.26 | | | | $ 4.86 |
| ** | Expenses are equal to the Fund’s annualized expense ratio of 1.21% for Class A, 1.96% for Class C, and 0.96% for Class I which is net of any expenses paid indirectly, multiplied by the average account value over the period, multiplied by 183 days/365 days (to reflect the partial year period). The High Yield Bond Fund’s ending account value on the first line of each share class in the table is based on its actual total return of 3.97% for Class A, 3.43% for Class C, and 4.09% for Class I for the period of April 1, 2017, to September 30, 2017. |
| ** | Assumes a 5% return before expenses. |
136
Expense Examples – (Unaudited)(Continued)
September 30, 2017
DEFENSIVE STRATEGIES FUND
| | | | | | | | | | |
| | | Beginning Account
Value | | | | Ending Account
Value | | | | Expenses Paid
During Period |
| | | | | |
| | | 4/1/2017 | | | | 9/30/2017 | | | | 4/1/2017 through
9/30/2017 |
Actual - Class A * | | $1,000.00 | | | | $1,008.80 | | | | $ 6.70 |
Hypothetical - Class A ** | | $1,000.00 | | | | $1,018.40 | | | | $ 6.73 |
Actual - Class C * | | $1,000.00 | | | | $1,003.70 | | | | $10.50 |
Hypothetical - Class C ** | | $1,000.00 | | | | $1,014.59 | | | | $10.56 |
Actual - Class I * | | $1,000.00 | | | | $1,009.70 | | | | $ 5.34 |
Hypothetical - Class I ** | | $1,000.00 | | | | $1,019.75 | | | | $ 5.37 |
| * | Expenses are equal to the Fund’s annualized expense ratio of 1.33% for Class A, 2.09% for Class C and 1.06% for Class I, which is net of any expenses paid indirectly, multiplied by the average account value over the period, multiplied by 183 days/365 days (to reflect the partial year period). The Defensive Strategies Fund’s ending account value on the first line of each share class in the table is based on its actual total return of 0.88% for Class A, 0.37% for Class C and 0.97% for Class I for the period of April 1, 2017, to September 30, 2017. |
| ** | Assumes a 5% return before expenses. |
STRATEGIC GROWTH FUND
| | | | | | | | | | |
| | | Beginning Account
Value | | | | Ending Account
Value | | | | Expenses Paid
During Period |
| | | | | |
| | | 4/1/2017 | | | | 9/30/2017 | | | | 4/1/2017 through
9/30/2017 |
Actual - Class A * | | $1,000.00 | | | | $1,056.90 | | | | $5.47 |
Hypothetical - Class A ** | | $1,000.00 | | | | $1,019.75 | | | | $5.37 |
Actual - Class C * | | $1,000.00 | | | | $1,052.80 | | | | $9.31 |
Hypothetical - Class C ** | | $1,000.00 | | | | $1,015.99 | | | | $9.15 |
| * | Expenses are equal to the Fund’s annualized expense ratio of 1.06% for Class A and 1.81% for Class C, which is net of any expenses paid indirectly, multiplied by the average account value over the period, multiplied by 183 days/365 days (to reflect the partial year period). The Strategic Growth Fund’s ending account value on the first line of each share class in the table is based on its actual total return of 5.69% for Class A and 5.28% for Class C for the six-month period of April 1, 2017, to September 30, 2017. |
| ** | Assumes a 5% return before expenses. |
CONSERVATIVE GROWTH FUND
| | | | | | | | | | |
| | | Beginning Account
Value | | | | Ending Account
Value | | | | Expenses Paid
During Period |
| | | | | |
| | | 4/1/2017 | | | | 9/30/2017 | | | | 4/1/2017 through
9/30/2017 |
Actual - Class A * | | $1,000.00 | | | | $1,040.00 | | | | $5.22 |
Hypothetical - Class A ** | | $1,000.00 | | | | $1,019.95 | | | | $5.17 |
Actual - Class C * | | $1,000.00 | | | | $1,036.10 | | | | $9.03 |
Hypothetical - Class C ** | | $1,000.00 | | | | $1,016.19 | | | | $8.95 |
| * | Expenses are equal to the Fund’s annualized expense ratio of 1.02% for Class A and 1.77% for Class C, which is net of any expenses paid indirectly, multiplied by the average account value over the period, multiplied by 183 days/365 days (to reflect the partial year period). The Conservative Growth Fund’s ending account value on the first line of each share class in the table is based on its actual total return of 4.00% for Class A and 3.61% for Class C for the six-month period of April 1, 2017, to September 30, 2017. |
| ** | Assumes a 5% return before expenses. |
137
Expense Examples – (Unaudited)(Continued)
September 30, 2017
ISRAEL COMMON VALUES FUND
| | | | | | | | | | |
| | | Beginning Account
Value | | | | Ending Account
Value | | | | Expenses Paid
During Period |
| | | | | |
| | | 4/1/2017 | | | | 9/30/2017 | | | | 4/1/2017 through
9/30/2017 |
Actual - Class A * | | $1,000.00 | | | | $1,074.20 | | | | $ 9.10 |
Hypothetical - Class A ** | | $1,000.00 | | | | $1,016.29 | | | | $ 8.85 |
Actual - Class C * | | $1,000.00 | | | | $1,070.20 | | | | $12.97 |
Hypothetical - Class C ** | | $1,000.00 | | | | $1,012.53 | | | | $12.61 |
Actual - Class I * | | $1,000.00 | | | | $1,076.20 | | | | $ 7.96 |
Hypothetical - Class I ** | | $1,000.00 | | | | $1,017.40 | | | | $ 7.74 |
| * | Expenses are equal to the Fund’s annualized expense ratio of 1.75% for Class A, 2.50% for Class C and 1.53% for Class I, which is net of any expenses paid indirectly, multiplied by the average account value over the period, multiplied by 183 days/365 days (to reflect the partial year period). The Israel Common Values Fund’s ending account value on the first line of each share class in the table is based on its actual total return of 7.42% for Class A, 7.02% for Class C and 7.62% for Class I for the period of April 1, 2017, to September 30, 2017. |
| ** | Assumes a 5% return before expenses. |
EMERGING MARKETS FUND
| | | | | | | | | | |
| | | Beginning Account
Value | | | | Ending Account
Value | | | | Expenses Paid
During Period |
| | | | | |
| | | 4/1/2017 | | | | 9/30/2017 | | | | 4/1/2017 through
9/30/2017 |
Actual - Class A * | | $1,000.00 | | | | $1,103.20 | | | | $11.70 |
Hypothetical - Class A ** | | $1,000.00 | | | | $1,013.94 | | | | $11.21 |
Actual - Class C * | | $1,000.00 | | | | $1,099.80 | | | | $15.63 |
Hypothetical - Class C ** | | $1,000.00 | | | | $1,010.18 | | | | $14.97 |
Actual - Class I * | | $1,000.00 | | | | $1,105.00 | | | | $10.45 |
Hypothetical - Class I ** | | $1,000.00 | | | | $1,015.14 | | | | $10.00 |
| * | Expenses are equal to the Fund’s annualized expense ratio of 2.22% for Class A, 2.97% for Class C and 1.98% for Class I, which is net of any expenses paid indirectly, multiplied by the average account value over the period, multiplied by 183 days/365 days to reflect the partial year period). The Emerging Markets Fund’s ending account value on the first line of each share class in the table is based on its actual total return of 10.32% for Class A, 9.98% for Class C and 10.50% for Class I for the period of April 1, 2017, to September 30, 2017. |
| ** | Assumes a 5% return before expenses. |
GROWTH & INCOME FUND
| | | | | | | | | | |
| | | Beginning Account
Value | | | | Ending Account
Value | | | | Expenses Paid
During Period |
| | | | | |
| | | 4/1/2017 | | | | 9/30/2017 | | | | 4/1/2017 through
9/30/2017 |
Actual - Class A * | | $1,000.00 | | | | $1,032.70 | | | | $ 7.69 |
Hypothetical - Class A ** | | $1,000.00 | | | | $1,017.50 | | | | $ 7.64 |
Actual - Class C * | | $1,000.00 | | | | $1,029.00 | | | | $11.50 |
Hypothetical - Class C ** | | $1,000.00 | | | | $1,013.74 | | | | $11.41 |
Actual - Class I *** | | $1,000.00 | | | | $1,034.10 | | | | $ 6.42 |
Hypothetical - Class I ** | | $1,000.00 | | | | $1,018.75 | | | | $ 6.38 |
| * | Expenses are equal to the Fund’s annualized expense ratio of 1.51% for Class A, 2.26% for Class C and 1.26% for Class I, which is net of any expenses paid indirectly, multiplied by the average account value over the period, multiplied by 183 days/365 days (to reflect the partial year period). The Growth & Income Fund’s ending account value on the first line of each share class in the table is based on its actual total return of 3.27% for Class A, 2.90% for Class C and 3.41% for Class I for the period of April 1, 2017, to September 30, 2017. |
| ** | Assumes a 5% return before expenses. |
138
Officers and Trustees of the Trust (Unaudited)
The Trustees and principal executive officers of the Trust and their principal occupations for the past five years are listed as follows:
INTERESTED TRUSTEES
| | | | | | |
| Name, Age and Address | | Position(s) Held With Trust | | Term of Office and Length of Time Served | | Number of Portfolios in Fund Complex Overseen by Trustee |
Arthur D. Ally* | | Chairman and President | | Indefinite; Trustee and President since 1994 | | 13 |
1055 Maitland Center Commons | | | | | | |
Maitland, FL | | | | | | Other Directorships |
| | Principal Occupation During Past 5 Years | | Held by Trustee |
Born: 1942 | | President and controlling shareholder of Covenant Funds, Inc. (“CFI”), a holding company. President and general partner of Timothy Partners, Ltd. (“TPL”), the investment Advisor and principal underwriter to each Fund. CFI is also the managing general partner of TPL. | | None |
| | | | | | |
| Name, Age and Address | | Position(s) Held With Trust | | Term of Office and Length of Time Served | | Number of Portfolios in Fund Complex Overseen by Trustee |
Joseph E. Boatwright** | | Trustee, Secretary | | Indefinite; Trustee and Secretary since 1995 | | 13 |
1055 Maitland Center Commons | | | | | | Other Directorships |
Maitland, FL | | Principal Occupation During Past 5 Years | | Held by Trustee |
Born: 1930 | | Retired Minister. Currently serves as a consultant to the Greater Orlando Baptist Association. Served as Senior Pastor to Aloma Baptist Church from 1970-1996. | | None |
| | | | | | |
| Name, Age and Address | | Position(s) Held With Trust | | Term of Office and Length of Time Served | | Number of Portfolios in Fund Complex Overseen by Trustee |
Mathew D. Staver** | | Trustee | | Indefinite; Trustee since 2000 | | 13 |
1055 Maitland Center Commons | | | | | | Other Directorships |
Maitland, FL | | Principal Occupation During Past 5 Years | | Held by Trustee |
Born: 1956 | | Attorney specializing in free speech, appellate practice and religious liberty constitutional law. Founder of Liberty Counsel, a religious civil liberties education and legal defense organization. Host of two radio programs devoted to religious freedom issues. Editor of a monthly newsletter devoted to religious liberty topics. Mr. Staver has argued before the United States Supreme Court and has published numerous legal articles. | | None |
* Mr. Ally is an “interested” Trustee, as that term is defined in the 1940 Act, because of his positions with and financial interests in CFI and TPL.
** Messrs. Boatwright and Staver are “interested” Trustees, as that term is defined in the 1940 Act, because each has a limited partnership interest in TPL.
139
Officers and Trustees of the Trust
(Unaudited)(Continued)
INDEPENDENT TRUSTEES
| | | | | | |
| Name, Age and Address | | Position(s) Held With Trust | | Term of Office and Length of Time Served | | Number of Portfolios in Fund Complex Overseen by Trustee |
Kenneth Blackwell | | Trustee | | Indefinite; Trustee since 2011 | | 13 |
1055 Maitland Center Commons Maitland, FL | | | | Other Directorships |
| | Principal Occupation During Past 5 Years | | Held by Trustee |
Born: 1948 | | Currently serving as an independent consultant or Fellow with the Family Research Council and the American Civil Rights Union, and is a Visiting Professor at Liberty University, Lynchburg, VA. Former Secretary of State for the State of Ohio. | | None |
| | | | | | |
| Name, Age and Address | | Position(s) Held With Trust | | Term of Office and Length of Time Served | | Number of Portfolios in Fund Complex Overseen by Trustee |
Richard W. Copeland | | Trustee | | Indefinite; Trustee since 2005 | | 13 |
1055 Maitland Center Commons Maitland, FL | | | | Other Directorships |
| | Principal Occupation During Past 5 Years | | Held by Trustee |
Born: 1947 | | Retired founder of Copeland & Covert, Attorneys at Law; B.A. from Mississippi College, JD from University of Florida and LLM Taxation from University of Miami. Associate Professor Stetson University for past 40 years. | | None |
| | | | | | |
| Name, Age and Address | | Position(s) Held With Trust | | Term of Office and Length of Time Served | | Number of Portfolios in Fund Complex Overseen by Trustee |
Deborah Honeycutt | | Trustee | | Indefinite; Trustee since 2010 | | 13 |
1055 Maitland Center Commons Maitland, FL | | | | Other Directorships |
| | Principal Occupation During Past 5 Years | | Held by Trustee |
Born: 1947 | | Dr. Honeycutt is a licensed physician currently serving as Medical Director of Clayton State University Health Services in Morrow, GA, CEO of Minority Health Services in Atlanta, and as a volunteer at Good Shepherd Clinic. Dr. Honeycutt received her B.A. and M.D. at the University of Illinois. | | None |
| | | | | | |
| Name, Age and Address | | Position(s) Held With Trust | | Term of Office and Length of Time Served | | Number of Portfolios in Fund Complex Overseen by Trustee |
Bill Johnson | | Trustee | | Indefinite; Trustee since 2005 | | 13 |
1055 Maitland Center Commons Maitland, FL | | | | Other Directorships |
| | Principal Occupation During Past 5 Years | | Held by Trustee |
Born: 1946 | | President (and Founder) of American Decency Association, Freemont, MI since 1999. Previously served as Michigan State Director for American Family Association (1987-1999). Previously a public school teacher for 18 years. B.S. from Michigan State University and a Masters of Religious Education from Grand Rapids Baptist Seminary. | | None |
140
Officers and Trustees of the Trust
(Unaudited)(Continued)
| | | | | | |
| Name, Age and Address | | Position(s)
Held With Trust | | Term of Office
and Length of Time Served | | Number of Portfolios
in Fund Complex Overseen by Trustee |
John C. Mulder | | Trustee | | Indefinite; Trustee since 2005 | | 13 |
1055 Maitland Center Commons | | | | | | Other Directorships |
Maitland, FL | | Principal Occupation During Past 5 Years | | Held by Trustee |
Born: 1950 | | President of WaterStone (formerly the Christian Community Foundation and National Foundation) since 2001. Prior: 22 years of executive experience for a group of banks and a trust company. B.A. in Economics from Wheaton College and MBA from University of Chicago. | | None |
141
Officers and Trustees of the Trust
(Unaudited)(Continued)
| | | | | | |
| Name, Age and Address | | Position(s)
Held With Trust | | Term of Office
and Length of Time Served | | Number of Portfolios
in Fund Complex Overseen by Trustee |
Charles E. Nelson | | Trustee | | Indefinite; Trustee since 2000 | | 13 |
1055 Maitland Center Commons | | | | | | Other Directorships |
Maitland, FL | | Principal Occupation During Past 5 Years | | Held by Trustee |
Born: 1934 | | Certified Public Accountant, semi-retired. Former non-profit industry accounting officer. Former financial executive with commercial bank. Former partner national accounting firm. | | None |
| | | | | | |
| Name, Age and Address | | Position(s)
Held With Trust | | Term of Office
and Length of Time Served | | Number of Portfolios
in Fund Complex Overseen by Trustee |
Scott Preissler, Ph.D. | | Trustee | | Indefinite; Trustee since 2004 | | 13 |
1055 Maitland Center Commons | | | | | | Other Directorships |
Maitland, FL | | Principal Occupation During Past 5 Years | | Held by Trustee |
Born: 1960 | | Director of Steward Leadership and Professor in Residence at Shorter University. Former Chairman of Stewardship Studies at Southwestern Baptist Theological Seminary, Ft. Worth, TX. Also serves as Founder and Chairman of the International Center for Biblical Stewardship. | | None |
| | | | | | |
| Name, Age and Address | | Position(s)
Held With Trust | | Term of Office
and Length of Time Served | | Number of Portfolios
in Fund Complex Overseen by Trustee |
Alan M. Ross | | Trustee, Vice
Chairman | | Indefinite; Trustee since 2004 | | 13 |
1055 Maitland Center Commons | | | | | | Other Directorships |
Maitland, FL | | Principal Occupation During Past 5 Years | | Held by Trustee |
Born: 1951 | | Founder and CEO of Corporate Development Institute which he founded in 2000. Previously he served as President and CEO of Fellowship of Companies for Christ and has authored three books: Beyond World Class, Unconditional Excellence, Breaking Through to Prosperity. | | None |
| | | | | | |
| Name, Age and Address | | Position(s)
Held With
Trust | | Term of Office
and Length of Time Served | | Number of Portfolios
in Fund Complex
Overseen by Trustee |
Patrice Tsague | | Trustee | | Indefinite; Trustee since 2011 | | 13 |
1055 Maitland Center Commons | | | | | | Other Directorships |
Maitland, FL | | Principal Occupation During Past 5 Years | | Held by Trustee |
Born: 1973 | | President and Chief Servant Officer of the Nehemiah Project International Ministries Inc. since 1999. | | None |
142
Privacy Notice
| | |
FACTS | | WHAT DOES THE TIMOTHY PLAN DO WITH YOUR PERSONAL INFORMATION? |
| | |
| WHY? | | Financial companies choose how they share your personal information. Federal law gives consumers the right to limit some, but not all information sharing. Federal law also requires us to tell you how we collect, share, and protect your personal information. Please read this Notice carefully to understand what we do. |
| | |
WHAT? | | The types of information we collect and share depend on the product or service you have with us. This information can include: |
| | | • Social Security Number |
| | | • Assets |
| | | • Retirement Assets |
| | | • Transaction History |
| | | • Checking Account History |
| | | • Purchase History |
| | | • Account Balances |
| | | • Account Transactions |
| | | • Wire Transfer Instructions |
| | | When you are no longer our customer, we continue to share your information as described in this Notice. |
| | |
| HOW? | | All financial companies need to share your personal information to run their everyday business. In the section below, we list the reasons financial companies can share their customers’ personal information; the reasons The Timothy Plan chooses to share; and whether you can limit this sharing. |
| | | | |
Reasons we can share your personal information. | | Does The Timothy Plan share? | | Can you limit this sharing? |
For our everyday business purposes- Such as to process your transactions, maintain your account(s), respond to court orders and legal investigations, or report to credit bureaus. | | Yes | | No |
For our marketing purposes- to offer our products and services to you. | | No | | We don’t share |
For joint marketing with other financial companies | | No | | We don’t share |
For our affiliates’ everyday business purposes- information about your transactions and experiences. | | Yes | | No |
For our affiliates’ everyday business purposes- information about your creditworthiness | | No | | We don’t share |
For non-affiliates to market to you | | No | | We don’t share |
| | | | |
Questions? | | Call 800-662-0201 | | |
143
| | |
Who we are | | |
| Who is providing this Notice? | | Timothy Plan Family of Mutual Funds Timothy Partners, Ltd. |
What we do | | |
| How does The Timothy Plan protect your personal information? | | To protect your personal information from unauthorized access and use, we use security measures that comply with federal law. These measures include computer safeguards and secured files and buildings. Our service providers are held accountable for adhering to strict policies and procedures to prevent any misuse of your nonpublic personal information. |
How does The Timothy Plan collect your personal information? | | We collect your personal information, for example, when you • Open an account |
| | | • Provide account information |
| | | • Give us your contact information |
| | | • Make deposits or withdrawals from your account |
| | | • Make a wire transfer |
| | | • Tell us where to send the money |
| | | • Tell us who receives the money |
| | | • Show your government-issued ID |
| | | • Show your driver’s license |
| | | We also collect your personal information from other companies. |
Why can’t I limit all sharing? | | Federal law gives you the right to limit only: |
| | | • Sharing for affiliates’ everyday business purposes- |
| | | information about your creditworthiness. |
| | | • Affiliates from using your information to market to you. |
| | | • Sharing for non-affiliates to market to you |
| | | State laws and individual companies may give you additional rights to limit sharing. |
Definitions
| | |
Affiliates | | Companies related by common ownership or control. They can be financial and non-financial companies. Timothy Partners, Ltd. is an affiliate of The Timothy Plan |
Non-affiliates | | Companies not related by common ownership or control. They can be financial and non-financial companies. • The Timothy Plan does not share with non-affiliates so they can market to you. |
Joint marketing | | A formal agreement between non-affiliated financial companies that together market financial products to you. • The Timothy Plan does not jointly market. |
Customer Identification Program
The Board of Trustees of the Trust has approved procedures designed to prevent and detect attempts to launder money as required under the USA PATRIOT Act. The day-to-day responsibility for monitoring and reporting any such activities has been delegated to the transfer agent, subject to the oversight and supervision of the Board.
144
Disclosures
HOW TO OBTAIN PROXY VOTING INFORMATION
Information regarding how the Funds voted proxies relating to Fund securities during the period ended June 30 of well as a description of the policies and procedures that the Funds use to determine how to vote proxies is available without charge, upon request, by calling 1-800-732-0330 or by referring to the Security and Exchange Commission’s (“SEC”) website at http://www.sec.gov
HOW TO OBTAIN 1ST AND 3RD FISCAL QUARTER PORTFOLIO HOLDINGS
Each Fund files its complete schedule of portfolio holdings with the SEC for the first and third quarters of each fiscal year on Form N-Q. Form N-Q is available on the SEC’s website at http://www.sec.gov and may be reviewed and copied at the SEC’s Public Reference Room in Washington, DC (1-800-SEC-0330). The information on Form N-Q is available without charge, upon request, by calling 1-800-732-0330.
145
| | |
| BOARD OF TRUSTEES | | |
| Arthur D. Ally | | |
| Kenneth Blackwell | | |
| Joseph E. Boatwright | | |
| Rick Copeland | | |
| Deborah Honeycutt | | |
| Bill Johnson | | |
| John C. Mulder | | |
| Charles E. Nelson | | |
| Scott Preissler | | |
| Alan Ross | | |
| Mathew D. Staver | | |
| Patrice Tsague | | |
OFFICERS | | |
| Arthur D. Ally, President | | |
| Joseph E. Boatwright, Secretary | | |
INVESTMENT ADVISOR | | |
| Timothy Partners, Ltd. | | |
| 1055 Maitland Center Commons | | |
| Maitland, FL 32751 | | |
DISTRIBUTOR | | |
| Timothy Partners, Ltd. | | |
| 1055 Maitland Center Commons | | |
| Maitland, FL 32751 | | |
TRANSFER AGENT | | |
| Gemini Fund Services, LLC | | |
| 17605 Wright St., Suite 2 | | |
| Omaha, NE 68130 | | |
INDEPENDENT REGISTERED PUBLIC ACCOUNTING FIRM | | |
| Cohen & Company, Ltd. | | |
| 1350 Euclid Ave., Suite 800 | | |
| Cleveland, OH 44115 | | |
LEGAL COUNSEL | |  |
| David Jones & Assoc., P.C. | |
18630 Crosstimber | |
| San Antonio, TX 78258 | |
| | |
| | HEADQUARTERS |
| | The Timothy Plan |
| | 1055 Maitland Center Commons |
| | Maitland, Florida 32751 |
For additional information or a prospectus, please call: 1-800-846-7526 Visit the Timothy Plan web site on the internet at: www.timothyplan.com This report is submitted for the general information of the shareholders of the Funds. It is not authorized for distribution to prospective investors in the Funds unless preceded or accompanied by an effective Prospectus which includes details regarding the Funds’ objectives, policies, expenses and other information. Distributed by Timothy Partners, Ltd. | | (800) 846-7526 www.timothyplan.com invest@timothyplan.com SHAREHOLDER SERVICES Gemini Fund Services, LLC 17605 Wright St., Suite 2 Omaha, NE 68130 (800) 662-0201 |
| |
| |
| |
| |
| |
| |
| |
| |
| |
Item 2. Code of Ethics.
(a) As of the end of the period covered by this report, the registrant has adopted a code of ethics that applies to the registrant’s principal executive officer, principal financial officer, principal accounting officer or controller, or persons performing similar functions, regardless of whether these individuals are employed by the registrant or a third party.
(b) For purposes of this item, “code of ethics” means written standards that are reasonably designed to deter wrongdoing and to promote:
| | (1) | Honest and ethical conduct, including the ethical handling of actual or apparent conflicts of interest between personal and professional relationships; |
| | (2) | Full, fair, accurate, timely, and understandable disclosure in reports and documents that a registrant files with, or submits to, the Commission and in other public communications made by the registrant; |
| | (3) | Compliance with applicable governmental laws, rules, and regulations; |
| | (4) | The prompt internal reporting of violations of the code to an appropriate person or persons identified in the code; and |
| | (5) | Accountability for adherence to the code. |
(c) Amendments: During the period covered by the report, there have not been any amendments to the provisions of the code of ethics.
(d) Waivers: During the period covered by the report, the registrant has not granted any express or implicit waivers from the provisions of the code of ethics.
(e) Posting: We do not intend to post the Code of Ethics for the Officers or any amendments or waivers on a website.
(f) Availability: The Code of Ethics for the Officers can be obtained, free of charge by calling the toll free number for the appropriate Fund.
Item 3. Audit Committee Financial Expert.
(a) The registrant has an Audit committee currently composed of three independent Trustees, Mr. Wesley Pennington, Mr. John Mulder and Mr. Charles Nelson. The registrant’s board of trustees has determined that Mr. Charles Nelson is qualified to serve as an Audit Committee Financial Expert, and has designated him as such.
Item 4. Principal Accountant Fees and Services.
| | | | |
The Timothy Plan | |
FY 2017 | | $ | 175,500 | |
FY 2016 | | $ | 170,900 | |
FY 2015 | | $ | 168,900 | |
FY 2014 | | $ | 168,400 | |
-2-
| | | | | | | | | | |
The Timothy Plan | | | Registrant | | | | | | Adviser | |
FY 2017 | | | $0 | | | | | | $0 | |
FY 2016 | | | $0 | | | | | | $0 | |
FY 2014 | | | $0 | | | | | | $0 | |
FY 2015 | | | $0 | | | | | | $0 | |
| | |
FY 2017 | | $0 |
FY 2016 | | $0 |
FY 2015 | | $0 |
FY 2014 | | $0 |
| | |
| Nature of the fees: | | preparation of the 1120 RIC |
Registrant
| | | | |
| The Timothy Plan | |
FY 2017 | | | $0 | |
FY 2016 | | | $0 | |
FY 2015 | | | $0 | |
FY 2014 | | | $0 | |
(e) (1) Audit Committee’s Pre-Approval Policies
The Audit Committee Charter requires the Audit Committee to be responsible for the selection, retention or termination of auditors and, in connection therewith, to (i) evaluate the proposed fees and other compensation, if any, to be paid to the auditors, (ii) evaluate the independence of the auditors, (iii) pre-approve all audit services and, when appropriate, any non-audit services provided by the independent auditors to the Trust, (iv) pre-approve, when appropriate, any non-audit services provided by the independent auditors to the Trust’s investment adviser, or any entity controlling, controlled by, or under common control with the investment adviser and that provides ongoing services to the Trust if the engagement relates directly to the operations and financial reporting of the Trust, and (v) receive the auditors’ specific representations as to their independence;
| | (2) | Percentages of Services Approved by the Audit Committee |
Registrant
| | | | |
| | | | | |
| | Audit-Related Fees: | | 0% |
| | Tax Fees: | | 0% |
| | All Other Fees: | | 0% |
-3-
(f) During audit of registrant’s financial statements for the most recent fiscal year, less than 50 percent of the hours expended on the principal accountant’s engagement were attributed to work performed by persons other than the principal accountant’s full-time, permanent employees.
(g) The aggregate non-audit fees billed by the registrant’s accountant for services rendered to the registrant, and rendered to the registrant’s investment adviser (not including any sub-adviser whose role is primarily portfolio management and is subcontracted with or overseen by another investment adviser), and any entity controlling, controlled by, or under common control with the adviser that provides ongoing services to the registrant:
Registrant Adviser
| | | | | | |
FY 2017 | | $0 | | $ | 0 | |
FY 2016 | | $0 | | $ | 0 | |
FY 2015 | | $0 | | $ | 0 | |
FY 2014 | | $0 | | $ | 0 | |
(h) Not applicable. The auditor performed no services for the registrant’s investment adviser or any entity controlling, controlled by, or under common control with the investment adviser that provides ongoing services to the registrant.
Item 5. Audit Committee of Listed Companies. Not applicable.
Item 6. Schedule of Investments. Not applicable – schedule filed with Item 1.
Item 7. Disclosure of Proxy Voting Policies and Procedures for Closed-End Funds. Not applicable.
Item 8. Portfolio Managers of Closed-End Management Investment Companies. Not applicable.
Item 9. Purchases of Equity Securities by Closed-End Management Investment Company and Affiliated Purchasers. Not applicable.
Item 10. Submission of Matters to a Vote of Security Holders
The registrant has not adopted procedures by which shareholders may recommend nominees to the registrant’s board of trustees.
Item 11. Controls and Procedures.
(a) Based on an evaluation of the registrant’s disclosure controls and procedures as of November 19, 2010, the disclosure controls and procedures are reasonably designed to ensure that the information required in filings on Forms N-CSR is recorded, processed, summarized, and reported on a timely basis.
(b) There were no significant changes in the registrant’s internal control over financial reporting that occurred during the registrant’s second fiscal quarter of the period covered by this report that has materially affected, or is reasonably likely to materially affect, the registrant’s internal control over financial reporting.
Item 12. Exhibits.
(a)(1) Code is filed herewith
| (a)(2) | Certifications by the registrant’s principal executive officer and principal financial officer, pursuant to Section 302 of the Sarbanes- Oxley Act of 2002 and required by Rule 30a-2 under the Investment Company Act of 1940 are filed herewith. |
(a)(3) Not Applicable
| (b) | Certification pursuant to 18 U.S.C. Section 1350, as adopted pursuant to Section 906 of the Sarbanes-Oxley Act of 2002 is filed herewith. |
-4-
SIGNATURES
Pursuant to the requirements of the Securities Exchange Act of 1934 and the Investment Company Act of 1940, the registrant has duly caused this report to be signed on its behalf by the undersigned, thereunto duly authorized.
(Registrant) The Timothy Plan
| | | | |
By | | /s/ Arthur D. Ally | | |
| | Arthur D. Ally, President/Principle Executive Officer & Treasurer/Principle Financial Officer |
| | |
Date | | 12/6/17 | | |
Pursuant to the requirements of the Securities Exchange Act of 1934 and the Investment Company Act of 1940, this report has been signed below by the following persons on behalf of the registrant and in the capacities and on the dates indicated.
| | | | |
By | | /s/ Arthur D. Ally | | |
| | Arthur D. Ally, President/Principle Executive Officer & Treasurer/Principle Financial Officer |
| | |
Date | | 12/6/17 | | |
-5-