UNITED STATES
SECURITIES AND EXCHANGE COMMISSION
WASHINGTON, D.C. 20549
FORM N-CSR
CERTIFIED SHAREHOLDER REPORT OF REGISTERED MANAGEMENT
INVESTMENT COMPANIES
Investment Company Act file number 811-08228
The Timothy Plan
(Exact name of registrant as specified in charter)
1055 Maitland Center Commons, Maitland, FL 32751
(Address of principal executive offices) (Zip code)
Art Ally, The Timothy Plan
1055 Maitland Center Commons, Maitland, FL 32751
(Name and address of agent for service)
Registrant’s telephone number, including area code: 800-846-7526
Date of fiscal year end: 9/30
Date of reporting period: 9/30/18
Form N-CSR is to be used by management investment companies to file reports with the Commission not later than 10 days after the transmission to stockholders of any report that is required to be transmitted to stockholders under Rule 30e-1 under the Investment Company Act of 1940 (17 CFR 270.30e-1). The Commission may use the information provided on Form N-CSR in its regulatory, disclosure review, inspection and policymaking roles.
A registrant is required to disclose the information specified by Form N-CSR, and the Commission will make this information public. A registrant is not required to respond to the collection of information contained in Form N-CSR unless the Form displays a currently valid Office of Management and Budget (“OMB”) control number. Please direct comments concerning the accuracy of the information collection burden estimate and any suggestions for reducing the burden to Secretary, Securities and Exchange Commission, 450 Fifth Street, NW, Washington, DC 20549-0609. The OMB has reviewed this collection of information under the clearance requirements of 44 U.S.C. § 3507.
Item 1. Reports to Stockholders.
The Registrant’s audited annual financial reports transmitted to shareholders pursuant to Rule 30e-1 under the Investment Company Act of 1940 are as follows:
September 30, 2018
Dear Shareholder,
As you review the details on the following pages, you will see that most of our funds experienced excellent performance over the past fiscal year (10-1-17 thru 9-30-18). Our fixed-income oriented funds were slightly down for the past 12 months due to weakness in the bond markets. Our only fund that was down fairly significantly was Emerging Markets (down nearly 10%) but that was due to the cyclical nature of that market. All of that simply underscores the wisdom of asset allocation since different market segments perform differently over differing periods.
The positive returns we experienced are, we believe, in large part the result of our country’s leadership changes in Washington, DC, and the positive pro-business agenda they are pursuing. These changes gave us a positive long-term view of our economy and, therefore the equity markets. Even though we experienced periodic short-term volatility, we fully expect the market trend to continue. Nevertheless, Timothy Partners, Ltd, (the “Advisor”) continued (and will continue) to take a conservative approach to the markets as we believe our shareholders prefer a preservation of principal course to that of chasing returns. I do need to reiterate, however, that, in the capital markets in general and our funds in particular, returns can never be guaranteed.
For more complete information about the individual Funds, please read each of the sub-advisors’ annual review letters in the pages that follow. They more fully detail the various factors that impacted this fiscal year’s performance along with their economic outlook for the coming year.
Although we cannot guarantee any actual outcome, I remain confident that all our sub-advisors are, in our opinion, among the best in the industry and they each continue to honor our overall policy to manage their respective funds both in accordance with our screening restrictions and with a continued conservative bias.
Finally, I would once again like to thank you for your moral convictions that led you to becoming part of the Timothy Plan Family.
Yours in Christ,
Arthur D. Ally
President
1
| | |
| |
Timothy Plan Aggressive Growth Fund Letter from the Manager – September 30, 2018 | | 
|
| | | |
The growth rate of the U.S. economy accelerated over the past year, with the Commerce Department reporting that GDP grew 3.05 percent over the past twelve months, compared to 2.35 percent growth over the twelve-month period ending September 2017. Unemployment is now at a 50-year low at 3.83 percent, compared to 4.3 percent unemployment as of September 2017. Consumer Confidence, as measured by the University of Michigan Consumer Sentiment Survey, is nearing record high readings not seen since 1999. Not surprisingly, this high economic activity is leading to higher inflation across several indices: CPI less Food & Energy is now at 2.2 pct, compared to 1.7 pct a year ago; PPI less Food & Energy is at 2.7 pct, compared to 1.7 pct a year ago. Federal government spending, following the adoption in mid-March of a $1.3 trillion spending plan for the fiscal year ending September 30, 2018, also added to aggregate U.S. growth. The federal budget is estimated to have led to half of the increased growth over the past year. Given that we are entering the ninth year of economic expansion, paired with sharply rising inflationary pressures, investors are closely watching the Federal Reserve. The next round of tariffs scheduled to be implemented at year end will only add to inflationary pressures. That will keep the Federal Reserve in the hot seat as it tries to manage inflation expectations while at the same time allowing this economic expansion to continue as long as possible. The above-trend growth in the second and third quarters is likely unsustainable and we would expect some softening as rising prices and rising interest rates start to have an impact.
The Fund enjoyed strong returns in 2018, gaining 6.69 percent in the September 2018 quarter, 11.23 percent year to date, and 14.62 percent for Class I over the last 12 months. This compares to the Russell Midcap Growth Index that returned 7.57 percent in the past quarter, 13.38 percent year to date, and 21.1 percent over the last 12 months.
The underperformance over the past 12 months was driven by weak stock selection in the consumer discretionary and the industrial sectors. Our largest stock underperformer in the consumer discretionary sector was Lumber Liquidators [LL], which suffered from tougher competition in the flooring markets from big box retailers. They also disappointed investors by not improving their margin structure. Within the industrial sector, our investment in Oshkosh [OSK] proved to be disappointing. While Oshkosh never reported subpar earnings, its valuation contracted significantly as investors moved away from nearly all industrial stocks; investors worried that higher raw material costs driven by tariffs, and higher freight costs would negatively impact the operating margins for those companies.
The largest outperformers over the past 12 months were primarily investments in the healthcare sector, specifically biotech companies. Sarepta [SRPT] had significant gains after they reported incredibly strong clinical data in their first gene therapy program to treat Duchennes Muscular Dystrophy. Also, the company made a strong strategic move in partnering with Myonexus, another biotechnology company with a compelling gene therapy program for the treatment of Limb-Girdle muscular dystrophies. Another top performer was Ignyta [RXDX]. Ignyta agreed to be acquired at a 74% premium by Roche Holding, in a $1.7 billion transaction. Ignyta has an exciting late stage oncology program that targets ROS1 and TRK mutations across several different cancers. Initial clinical results are very promising, leading to interest from Roche in acquiring the company.
Looking forward, we continue to emphasize the healthcare and technology sectors within the portfolio, as they do not face many of the headwinds seen in other sectors of the economy. Specifically, we believe that many companies in the industrial sectors will find it difficult to fully pass on higher costs to their end customers. Also, the likelihood of higher interest rates will continue to depress several industries, specifically the homebuilding and auto industries. Conversely, there are many attractive midcap healthcare and technology companies that largely are focused on the US market, and are relatively sheltered from cost pressures seen in other sectors. We thank you for your continuing support and investment.
Chartwell Investment Partners, LLC
2
Letter from The Manager
The Timothy Plan International Fund
September 30, 2018
International equities continued to perform well as strong corporate earnings supported equities up until volatility came back to the markets in early 2018. The markets were spooked earlier this year when U.S. wage growth accelerated, and inflation pressures entered the conversation. Despite increased global concerns, The Timothy Plan International Fund rose in absolute terms slightly outperforming the MSCI EAFE index for the twelve-month period. Good stock selection in the Financials, Consumer Staples and Industrials sectors more than offset negative selection in Consumer Discretionary, Materials, and Utilities sectors. An overweight to the Technology sector helped performance but stock selection there was challenged. Country allocation was tough as any allocation to emerging market countries was negative while stock selection was positive. Selection in Norway and Spain was good while that in Japan and France and emerging markets was less favorable. Strong returns from individual stocks included Equinor ASA (Norway-Energy), Amadeus IT (Spain-Technology), and DBS Group (Financials-Singapore). The Fund was hurt from poor performance in auto parts including Valeo (France-Consumer Discretionary) and Continental (Germany-Consumer Discretionary), and from technology exposure in China.
While this twelve-month period started on a solid footing of global economic acceleration, it ended on a wall of worries related to central bank policies, Brexit, Italian election outcomes, China growth slowdown, trade wars, and emerging market contagions. This affected stock prices over the second half of the period as volatility increased. President Trump stepped up his trade battles which rattled equity markets on concerns of effect on global growth and rising input prices. The U.S. dollar bounced back, supported by rising rates and strong growth in the U.S., all placing more pressures on emerging market currencies. The IMF came to the rescue in Argentina while contagion gripped Brazil, South Africa, Turkey and others. Oil prices rose as the U.S. backed away from the Iran nuclear pact while tariffs were placed on Chinese goods. The European Central bank is scheduled to end its bond buying program at the end of 2018 while uncertainty remains on Brexit negotiation outcomes. U.S. economic growth remains strong while European and Japanese economic growth has decelerated but remains well above trend.
Relative and absolute valuations have improved for international equities over the last twelve months. Equity price volatility is likely to remain in the near term as the market climbs a wall of worries which may provide good buying opportunities for long term investors. We remain committed to a consistent investment approach dedicated to finding long-term investments for the Fund. We thank you for your continued investment in the Fund.
Eagle Global Advisors, LLC
3
| | |
Timothy Plan Large/Mid Cap Growth Fund Letter from the Manager – September 30, 2018 | | |
The growth rate of the U.S. economy accelerated over the past year, with the Commerce Department reporting that GDP grew 3.05 percent over the past twelve months, compared to 2.35 percent growth over the twelve-month period ending September 2017. Unemployment is now at a 50-year low at 3.83 percent, compared to 4.3 percent unemployment as of September 2017. Consumer Confidence, as measured by the University of Michigan Consumer Sentiment Survey, is nearing record high readings not seen since 1999. Not surprisingly, this high economic activity is leading to higher inflation across several indices: CPI less Food & Energy is now at 2.2 pct, compared to 1.7 pct a year ago; PPI less Food & Energy is at 2.7 pct, compared to 1.7 pct a year ago. Federal government spending, following the adoption in mid-March of a $1.3 trillion spending plan for the fiscal year ending September 30, 2018, also added to aggregate U.S. growth. The federal budget is estimated to have led to half of the increased growth over the past year. Given that we are entering the ninth year of economic expansion, paired with sharply rising inflationary pressures, investors are closely watching the Federal Reserve. The next round of tariffs scheduled to be implemented at year end will only add to inflationary pressures. That will keep the Federal Reserve in the hot seat as it tries to manage inflation expectations while at the same time allowing this economic expansion to continue as long as possible. The above-trend growth in the second and third quarters is likely unsustainable and we would expect some softening as rising prices and rising interest rates start to have an impact.
The bull market in growth stocks continued unabated over the last twelve months, in fact, it was even more pronounced than last year: the Russell 1000 Growth Index was up 26.3%, vs. +22% the prior year. As we wrote in last year’s letter, while this is a good environment for the absolute return of the fund, it provides a significant headwind for our returns relative to the benchmark – due to the restrictions on what we can own (the Fund was up 11.69% for Class I). Not being able to hold the “bellwether” growth/tech stocks that have been the market leaders leaves us with a portfolio – on average – of much smaller market capitalization companies and with a lower growth profile compared to the benchmark. In the past year, that positioning was a liability, given that large growth was the place to be. One way to quantify this is that the portion of the R1G Index that is not restricted was up about 20%, or 6.3 percentage points short of the full index. Another reference point is to look at the returns for the period of some of the large R1G stocks that are restricted: Amazon was up 108%; Microsoft +56%; and Apple +48% (not owning just those 3 stocks in their index weights was a “cost” of 4.8 percentage points). Finally, the Tech sector as a whole – which we were underweight by 8 percentage points on average - was up 41%, and it was one of only two sectors that meaningfully outperformed the benchmark (Consumer Discretionary being the other).
Turning to stock selection, we had two great performers in Health Care – Neurocrine Biosciences (+101%), which had an exceptional commercial launch for its drug Ingrezza, and Sarepta Therapeutics (+71%), which presented promising gene therapy data for the treatment of Duchenne Muscular Dystrophy. Home-improvement retailer Lowe’s was also a big winner (+46%), and energy company ConocoPhillips vastly outperformed its sector’s return with a gain of 58%. Negative selection was most pronounced in the Tech sector, where some of the stocks that we owned as substitutes for the restricted stocks fared poorly: Western Digital fell 31%; Mercury Systems dropped 28%; and IPG Photonics was down 16%. A partial offset, however, came from semiconductor company, NVIDIA, a multi-year strong performer for us, which came through again with a 58% gain. Its solid results in data-center and growing potential in leading-edge technologies like artificial intelligence have continued to propel the stock. In Health Care, biotech company Celgene lowered near-term growth expectations, and the market punished it with a 39% drop. In Financials, asset-manager Invesco was a drag on our performance, falling 25%, and in the Materials sector, chemical-company Albemarle (one of last year’s big winners) sold off by 26%.
For the portfolio, there has been no change to our time-tested, bottom up fundamental approach to managing large and mid-cap growth investments. As an overview, the portfolio remains well diversified by issuers and
4
sectors, as all areas of the economy are impacted by broad macroeconomic trends. We continue to find attractive investments at reasonable valuations. However, with the recent above-trend earnings resulting from tax reform, comparisons for earnings growth will become more difficult in 2019. This, along with input-cost pressures and tariff-related challenges will create a more uneven playing field. We will be vigilant in orienting the portfolio toward industries and companies that are best-positioned for this environment. Healthcare is a sector that we currently favor, and Industrials and Materials are “under review” as we move through the current earnings season. We thank you for your continuing support and investment.
Chartwell Investment Partners, LLC
5
LETTER FROM THE MANAGER
September 30, 2018
TIMOTHY PLAN SMALL CAP VALUE FUND
We are pleased to provide you with our report for the Timothy Plan Small Cap Value Fund for the twelve months ending September 30, 2018 and would like to thank you for entrusting your assets with us.
Looking back, equity markets have marched higher with only a small blip from a short-lived spike in volatility. While headline noise remains deafening, the normalization of post-crisis monetary policy and the pick up in economic growth remain key drivers for markets going forward. The Federal Reserve again hiked rates, with the fed funds rate now sitting at 2.00-2.25 percent, and the reductions of the balance sheet continuing as expected. Supporting their actions, the most recent GDP figure showed an acceleration to 4.2 percent growth in the second quarter of 2018. This tailwind has driven strong topline growth and, in conjunction with the reduction in tax rates, produced very strong earnings growth to underpin the move higher by the equity markets. Stronger cash balances have been a driver for incremental spending on capital expenditures as well as returning additional cash to shareholders. Margins for many companies have held up well despite input cost pressures, whether labor or raw material, as pricing power has returned after being absent for a number of years. In contrast to the strength in the U.S., the rest of the world has been more mixed with varying impacts from the stronger dollar and trade policies. There remains a high degree of concern regarding the potential for further disruptions and impacts in the future.
For the twelve months ending September 30, 2018, the Timothy Plan Small Cap Value Fund produced a net return of
10.37% for Class I, while the Russell 2000 Index produced a return of 15.24%. Positive stock selection was offset by unfavorable allocation, as the more growth-oriented areas of the market produced strong absolute returns. Strong selection was seen in Industrials and Materials while less favorable selection in Consumer Discretionary and an overweight in Financials were headwinds to relative performance.
Sonic Corp. moved up after agreeing to be acquired at a significant premium by Inspire Brands. Our domestically-focused cyclicals, including Novanta, rallied strongly on better economic data points that translated into sales and earnings growth, even as the rest of world was more mixed in terms of underlying growth trends. Comfort Systems, an installer of heating and air conditioning systems saw a strong rise in their backlog on continued strength in the commercial construction market. Additionally, KapStone Paper and Packaging, a containerboard company, was taken out at a significant premium by a competitor as the industry consolidation theme marched forward. Oxford Industries rallied as their lifestyle brands of Tommy Bahama and Lilly Pulitzer continue to resonate well with the consumer and their sales exceeded expectations.
Concerns over the housing cycle and rising input pressures weighed heavily on Installed Building Products. Wet weather caused volumes and pricing realizations to fall short of expectations for Summit Materials. The recent rise in rates has captured the headlines and coincided with a seasonally slower time of the year which has raised concerns regarding both the residential and non-residential cycles. Lithia Motors saw topline trends remain strong, underpinned by low unemployment and rising wages, but faced cost pressures from the rising wages and incremental marketing expenses that weighed on shares. Consumers looking for higher interest rates on their deposits compressed net interest margins, which caused a decline in the shares of Hanmi Financial. OSI Systems moved lower on investor concerns regarding the profitability of their turn key business in two areas, Albania and Mexico.
The Small Cap Value team is focused on seeking well-run companies with growth prospects that are underappreciated by the marketplace. We look for companies with above average growth and strong balance sheets that generate positive cash flows. As economic growth continues, we feel our companies are well positioned to achieve higher earnings and have the potential to provide superior relative returns.
We thank you for your continued confidence in the Westwood process and investment teams and we look forward to serving your investment needs through the years ahead.
Westwood Management Corporation
6
LETTER FROM THE MANAGER
September 30, 2018
TIMOTHY PLAN LARGE/MID CAP VALUE FUND
We are pleased to provide you with our report for the Timothy Plan Large/Mid Cap Value Fund for the twelve months ending September 30, 2018 and would like to thank you for entrusting your assets with us.
Looking back, equity markets have marched higher with only a small blip from a short-lived spike in volatility. While headline noise remains deafening, the normalization of post-crisis monetary policy and the pick up in economic growth remain key drivers for markets going forward. The Federal Reserve again hiked rates, with the fed funds rate now sitting at 2.00-2.25 percent, and the reductions of the balance sheet continuing as expected. Supporting their actions, the most recent GDP figure showed an acceleration to 4.2 percent growth in the second quarter of 2018. This tailwind has driven strong topline growth and, in conjunction with the reduction in tax rates, produced very strong earnings growth to underpin the move higher by the equity markets. Stronger cash balances have been a driver for incremental spending on capital expenditures as well as returning additional cash to shareholders. Margins for many companies have held up well despite input cost pressures, whether labor or raw material, as pricing power has returned after being absent for a number of years. In contrast to the strength in the U.S., the rest of the world has been more mixed with varying impacts from the stronger dollar and trade policies. There remains a high degree of concern regarding the potential for further disruptions and impacts in the future.
For the twelve months ending September 30, 2018, the Timothy Plan Large/Mid Cap Value Fund produced a net return of 13.83% for Class I, while the S&P 500 Index produced a return of 17.91%. While absolute returns remained strong, the relative performance faced headwinds. Notable positives included better stock selection within Consumer Staples and Industrials while our underweight to more growth-oriented parts of the market, namely Information Technology, Consumer Discretionary, and Health Care, weighed on relative performance.
Several areas saw strong stock selection, particularly in Consumer Staples which benefitted from the acquisition of a carbonated beverage company at a significant premium. This created a powerhouse in the beverage category combing single-serve coffee with a variety of carbonated and non-carbonated drinks. Strong economic growth boosted several industrials with broad exposures, notably Union Pacific where better pricing and solid volumes contributed to strong earnings growth. Management at Union Pacific also announced a recent long-term plan to further expand margins as they focus on precision railroading. FLIR Systems benefitted as well from incremental defense spending and a refocused management team under the helm of a new CEO on expanding their gross margins. SVB Financial saw both strong asset growth and better sensitivity to rising rates which pushed earnings up materially higher than expected and shares followed. Their exposure to technology lending has allowed them to avoid some of the headwinds such as commercial real estate that have weighed on other banks. PerkinElmer gained as they continued to see management’s strategy to shift towards higher growth markets pay off as topline growth accelerated to double-digits in both their segments. Continued strength in the housing market and housing turnover pushed shares of Sherwin-Williams higher as they delivered on their synergies from their recent acquisition of Valspar.
The Fund’s under-exposure to high growth areas of the market were a notable headwind, though offset somewhat by more favorable stock selection elsewhere. DENTSPLY closed on their acquisition of Sirona, however, dental consumable volume trends have been disappointing and weighed on shares and recent softness in equipment has been met with lowering of prices to stimulate demand. Patterson Companies shared many of the same headwinds as DENTSPLY, including the loss of their exclusive arrangement with Sirona. Eagle Materials suffered from higher than usual rainfall, limiting cement volumes, and leading to less pricing realizations than anticipated. The consolidation thesis for the industry remains intact and should lead to better pricing in the future. Mohawk Industries faced a number of expense headwinds in their flooring businesses and management had a rare earnings miss as a result. Price increases are being enacted to restore margins, though their impact will come over time as they flow through their various products. Lam
7
Research declined as a lull in spending in the semiconductor industry pressured their sales and earnings. While management expects a rebound, the market remains uncertain despite secular growth trends in several end-markets for chips.
The Westwood team remains focused on seeking high-quality companies trading at a discount to intrinsic value. While market returns have most recently been bolstered by unprecedented monetary stimulus rather than fundamentals, the continued rise in interest rates has begun shifting the focus back to company-specific drivers. These normalizations are occurring across a number of areas including monetary policy, where the Federal Reserve continues to hike rates and reduce their balance sheet. Fiscal policies, particularly the tax cuts, serve as a replacement to the stimulus and should continue to have a positive impact despite the potential trade headwinds into the following year. These benefits, as well as other fiscal changes, will benefit companies in disproportionate ways and is expected to further create dispersion in returns. In total, the overall impact to the investing landscape should provide additional opportunities to active managers as dispersion of returns increases and correlations between stocks decrease. We continue to leverage our intensive research-driven process to identify securities with company-specific opportunities and visible earnings growth. As has always been our practice, we look to invest in companies with conservative balance sheets, robust free cash flow generation, and high returns as we believe those characteristics among others help provide attractive risk-adjusted returns for the portfolio. Given the above-average market returns over the past few years, we are mindful of the potential for downside risk and are focusing on opportunities which we feel have measurable and limited potential for loss should volatility rise.
We thank you for your continued confidence in the Westwood process and investment teams and we look forward to serving your investment needs through the years ahead.
Westwood Management Corporation
8
Letter from the Manager
September 30, 2018
Timothy Plan Fixed Income Fund
The fiscal year ended September 30, 2018 saw an increase in interest rates as the Federal Reserve (Fed) maintained its rate normalization policy and economic growth continued to surprise to the upside. The Timothy Plan Fixed Income Fund invests in the broad U.S. investment grade bond market benchmarked to the Bloomberg Barclays Aggregate index which began the last 12 months with a 2.55% yield and ended at 3.46%.
The U.S. Treasury (UST) 10-year rate rose after starting the fiscal period at 2.33%, peaking at 3.11% in May, and ending at 3.06%. By comparison, the 2-year rate rose even higher starting at 1.48% and ending the last 12 months at 2.82% or 1.34% higher. This rise resulted in the UST yield curve flattening to levels not seen since September of 2007. Low volatility in UST rates was also a bellwether event in late 2017 and early 2018. The markets shrugged off global geopolitical events, natural disasters, and the North Korean nuclear threat to register the lowest volatility in 25 years. The U.S. economy continued to evidence low unemployment and solid job creation and in May 2018 the Fed’s 2.0% Core Personal Consumption Expenditure target was attained for the first time since April 2012. Consequently, the Fed continues to telegraph and maintain its hawkish quantitative tightening actions.
Corporate bond spreads started the last 12 months at 96 basis points (bps), widened to a high of 116 and finished at 100bps. The widening was a result of supply/demand dynamics that included new issue supply to fund accelerated M&A activity, diminished foreign buying, and repatriation of foreign cash holdings of U.S. corporations. The Mortgage Backed Securities (MBS) sector struggled during the period as the Fed announced its balance sheet reduction plan. For the first time in nearly a decade, the Fed will no longer be the primary buyer of MBS.
The Timothy Fixed Income Fund A shares returned -2.31% (Class A shares) over the 12 months ended September 30, 2018 which was below the Bloomberg Barclays Aggregate index at -1.22%. The overweight to Industrials added value as the sector performed better than the overall index. Security selection in Energy, Capital Goods and Technology also added to results. Detracting from results was our underweight to Financials, as the sector posted the second-best return for the period. The portfolio’s MBS holdings generated returns below their counterparts in the index which also hurt performance. The portfolio is positioned with modestly less interest rate risk than the market, an over-weight in corporate bonds and GNMA MBS for yield. We remain focused on generating income consistent with a prudent level of risk.
BARROW, HANLEY, MEWHINNEY & STRAUSS
9
Letter from the Manager
September 30, 2018
Timothy Plan High Yield Fund
The fiscal year ended September 30, 2018 saw an increase in High Yield rates as investor demand for yield remained modestly healthy. The Timothy Plan High Yield Fund invests primarily in BB and B rated High Yield (HY) bonds with a benchmark of the Bloomberg Barclays BA/B HY index which began the last 12 months yielding 4.68% and ended at 5.78%. Over the period, the HY market posted a return of 2.18% and generated an excess return of 3.29%, the highest of any major bond market sector. Performance was led by lower rated credits and continued recovery in the Energy and Basic Industry (including Metals & Mining) sectors.
The primary influence on performance has been favorable technicals, particularly a lack of supply, and improvement of credit fundamentals. During the first nine-months of 2018, net new issuance totaled $11.5B which was significantly lower than the $55.4B issued in 2017. Favorable economic growth and improving earnings will support HY companies and help to contain defaults. On a trailing 1-year basis, the HY default rate was 2.57% (latest available data as of 8/31/18).
The Timothy High Yield Fund A shares generated a total return of -0.17% (Class A shares) over the 12 months ended September 30, 2018 while the Barclays Capital U.S. Corporate High Yield Bond index returned 3.05% and the Bloomberg Barclays Ba/B index returned 0.37%. The portfolio’s overweight in Energy benefitted results. We continue to hold Energy names especially MLP issues that we believe are less correlated with the price of oil. Holdings in Technology and REITS were also additive to returns. Detracting from performance was our underweight to Financials which posted the second highest return in the index. The portfolio remains focused on generating a higher level of carry income consistent with a reasonable level of risk.
BARROW, HANLEY, MEWHINNEY & STRAUSS
10
September 30, 2018
Dear Shareholder,
The Defensive Strategies Fund was designed and is managed to do what its name implies, hedge against a possible scenario of hyper-inflation which could result from our Congress’s proven unwillingness to address our core problems of too much spending and too much debt. The Fund was also designed with built-in flexibility that allows it to be adjusted to address a possible risk of extreme deflation, with the ability to convert the inflation sensitive assets to cash and fixed income securities during a deflationary environment, and to be adjusted to a more normal, traditional investment strategy.
The Fund’s portfolio is comprised of four inflation sensitive investment sleeves: commodities (commodity company stocks and ETF’s), real estate (in the form of REITs), precious metals (primarily gold and silver bullion), and TIPs (Treasury Inflation Protected Bonds), with the balance in cash. Timothy Partners, Ltd. (the “Advisor”) is responsible for setting the percentages of the Fund that will be allocated to each investment sleeve. Different sub-advisors manage the holdings in each sleeve. As a result of continued low inflation and the general weakness in the commodities market over the past year, the Fund experienced a fairly weak 0.75% total return for Class A for the fiscal year ended September 30, 2018. For a more complete description of the elements that impacted Fund performance and the outlook for the future, please read the sub-advisors’ reports in the pages that follow.
I would like to point out that, since there does not exist an appropriate benchmark index with which to compare our performance, we have created a blended index comprised of roughly 1/3 each of U.S. Government TIPs, FTSE NAREIT Equity Index and Dow Jones UBS Commodity Index. We believe the blend offers a fairly accurate reflection and comparison of the composition of the Fund. For the fiscal year ended September 30, 2018, the blended index had a total return of 1.34%. The primary reason the index slightly beat our fund’s performance has a lot to do with the weakness of the gold and silver markets over the past year (initially 10% of the portfolio but with fairly significant appreciation now comprise 17.5% of the portfolio).
While no one can predict future events, I remain confident that our sub-advisors (i.e. money management firms that manage the various sleeves of this Fund) are, in our opinion, among the best in the industry, and they each continue to honor our overall policy that they manage their respective Fund sleeve both in accordance with our screening restrictions and with a conservative bias. As I stated in last year’s report, although we will do our very best to be successful, we cannot guarantee results in any of these scenarios.
Finally, I would once again like to thank you for your moral convictions that led you to become part of the Timothy Plan Family.
Yours in Christ,
Arthur D. Ally
Fund Advisor
11
| | |
| |  |
| |
Annual Letter from the Manager | | September 30, 2018 |
We are pleased to provide you with our annual report for the Timothy Plan Defensive Strategies Fund Commodity Sleeve (the Portfolio) for the twelve months ending September 30, 2018. The CoreCommodity sleeve of the Timothy Defensive Fund rose 7.35% on a net basis. Commodities broadly rose over these twelve months with the Bloomberg Commodity Total Return Index rising 2.6%. The Portfolio had positive contributions to performance from all sectors (energy, industrial metals, and agriculture) except for precious metals over the period.
Metals & Mining
Industrial metal commodity futures were modestly down for the period with the Bloomberg Industrial Metals Total Return Subindex falling (2.4%). The best performing base metal was Nickel, rising more than 20% over the period. Zinc fell nearly (17%) and was the worst performing base metal over the period, giving back most of its strong performance in the year prior. The Portfolio’s industrial metal holdings performed substantially better than the commodity futures, returning over 11% for the period. While most industries in the base metals sleeve of the portfolio performed positively, steel companies (up over 13%) and iron mining companies (up roughly 25%, the primary input to the steel-making process) combined constituted over half of the base metals outperformance. It’s important to note that the portfolio benefitted from exposure to these globally important commodities for which no highly liquid futures contracts exist. The Portfolio’s largest industrial metal holdings as of September 30th were Rio Tinto (RIO US), Vale (VALE US), and Freeport-McMoran (FCX US).
Precious metal futures struggled again this year with the Bloomberg Precious Metals Total Return Subindex falling nearly (9%). The Portfolio’s precious metals miners also struggled, falling nearly (27%). Holding a smaller allocation to precious metals miners than other sectors helped curb the underperformance from this sector for the period. The Portfolio’s largest precious metal holdings as of September 30th were Newmont Mining (NEM US), Franco-Nevada Corp (FNV US), and Agnico Eagle Mines (AEM US).
Energy
Energy was the best performing sector for the prior year, with the Bloomberg Energy Total Return Subindex rising over 28%. The Portfolio’s energy holdings were also the best performing sector, returning over 16% for the period. The Portfolio’s higher allocation to energy (averaging 42% over the period) significantly helped performance. While the Portfolio’s Oil & Gas Exploration and Production holdings did not keep pace with the futures (only rising about 12%) the Integrated Oil & Gas companies significantly outperformed (rising over 37%) which helped offset some of the difference. The Portfolio’s largest energy holdings as of September 30th were Lukoil (LKOD LI), EOG Resources (EOG US), and Concho Resources (CXO US).
Agriculture
Over the past year agricultural commodities, as proxied by the Bloomberg Commodity Agriculture and Livestock Total Return Subindex, fell nearly (11%). Over the same period the Portfolio’s agricultural holdings rallied roughly 2.5%, providing additional outperformance. The Portfolio had strong performance from the Fertilizer industry, which was (on average) the largest agriculture industry, as well as from Fisheries and Forestry companies. The decision to hold less weight in the animal producers than in the past year helped performance, as those industries generated significant losses this year after strong returns in the prior year. The Portfolio’s largest agriculture holdings as of September 30th were CF Industries (CF US), The Mosaic Company (MOS US), and Deere & Company (DE US).
Market Outlook
12
The Timothy Plan Defensive Strategy Fund Commodity Sleeve currently utilizes a diversified portfolio of natural resource equities that is intended to capture commodity price movements. To the extent commodities rally in the coming year we would expect the Portfolio to perform positively. We believe commodities may rally if global economic growth remains healthy. If industry demand falls off then commodities may not continue to rally, in which case we would not expect the Portfolio to perform positively.
13
Letter from the Manager
September 30, 2018
Timothy Plan Defensive Fund – TIPS
Over the past 12 months ended September 30th, the U.S. experienced moderately stronger economic growth and slightly higher inflation. The Timothy Defensive Fund has an allocation of U.S. Treasury Inflation Protected Securities (TIPS) designed to help protect assets from higher rates of inflation.
Investors’ future inflation expectations reached a low in late 2017 but subsequently climbed during the 12 month period. We measure investors’ inflation expectations as the difference between the U.S. Treasury 10 year and the U.S. TIPS 10 year. This “breakeven rate” of inflation is what would be required to make these two securities have the same yield. The “breakeven rate” of inflation fell to a low of 1.83% in October 2017, climbed to a high of 2.20% by May 2018, and eventually settled at 2.14% by September 30th. As a result, TIPS securities generated a return of 0.37%, as reported by Bloomberg Barclays, for the 12 months ended September 30th.
The TIPS allocation we manage held 5 to 10% in investment grade corporate bonds for their higher nominal yield. Although inflation has ticked up it remains relatively subdued. Going forward the potential of higher inflation exists as global central banks have engaged in massive monetary stimulus and the unemployment rate remains low which could potentially trigger higher wages. The primary goal of the TIPS allocation continues to be protection from rising inflation rates.
BARROW, HANLEY, MEWHINNEY & STRAUSS
14
| | |
 | | 2005 Market St. |
| | Philadelphia, PA 19103-7094 |
The Timothy Plan Defensive Strategies Fund
Real Estate Sleeve (the “Portfolio”)
Annual Manager Letter: 12 months ended September 30, 2018
The strong market returns of the S&P 500 continued over the past year providing investors with a 17.91% return. Solid earnings and a still accommodative credit backdrop drove the markets higher. However, as good as earnings have been, the P/E multiple has compressed by 3 points as the Federal Reserve’s rate increases are beginning to signal a slowdown is potentially ahead. The US continues to be the strongest market globally, but investors can already see the effects of a more hawkish Federal Reserve. Emerging markets, China, Europe, Asia and US housing have been in negative territory over much of 2018. Generally, when the Federal Reserve begins to tighten, bad things tend to occur and as we write this letter, US equities are beginning to play catch up with global markets.
REITs underperformed but were able to provide a positive 3.47% return during a rising rate environment. We have always contended that REITs can still provide positive returns even in a rising rate period if the economy is improving. Initially, investors will sell yield but if GDP is rising that is generally good for all sectors, including real estate. Obviously, growth and cyclical areas of the economy benefit more than REITs however, it proves that REITS should always be apart of any portfolio. Again, since quarter end, the growth, tech and cyclical areas of the market have vastly underperformed the REITs. Interestingly, REITs have outperformed FANG’s since the end of February 2018.
For the twelve months ended September 30, 2018, the Timothy Plan Defensive Fund Real Estate Sleeve generated a gross return of 4.59% versus the FTSE NAREIT Equity REITs Index return of 3.47%. Strong stock selection drove performance while sector allocation was moderately negative. Diversified, Freestanding, Industrial and Healthcare drove positive performance while Lodging, Self-Storage and Mixed sectors detracted from performance. At times, avoiding stocks is more beneficial than owning them and thus within the Diversified sector, Colony Capital dropped 50% during this period and we did not own the stock. A merger gone bad was mostly the cause for their decline. As ironic as it seems, Freestanding stocks performed well and are leading the way in 2018 even with long leases in a rising rate environment. Logic says that short duration with growth should work better than long duration but, in this case, cap rates in triple net properties have proven resilient given their lack of credit issues and higher going in yield. Industrial stocks performed well as the expanding economy and e-commerce are driving higher rents and based on most recent quarter, this momentum should continue. The demand for e-commerce is changing the supply chain and new technologically efficient buildings are needed for the future of on-line economy. Healthcare REITs were strong performers for the portfolio as skilled nursing company Sabra Health Care had improved returns as occupancies stabilized. On the negative side, Lodging was the largest underperformer as we lost 56 basis points. Our underweight and stock selection hurt performance. As the economy improves, business and transient travel benefits hotels. Self-storage stocks were a detractor to performance as we maintained an underweight given slowing
15
cash flow growth from excessive supply. Although fundamentally we were right, the hurricanes in late 2017 temporarily increased demand in Houston and Florida.
Lastly, real estate stocks continue to deliver on their merits of higher than average yield and good dividend growth. Importantly, some sectors should see trough fundamentals in 2019 which will set up for a stronger 2020. We believe retail should see less bankruptcies and thus FFO growth should improve as the year progresses. Senior housing has been through a difficult period but with construction starts moving lower and deliveries also peaking, this sector should also begin to attract investor attention in the 2nd to 3rd quarter of 2019. We continue to position for a turn in senior housing with our Brookdale Senior Living investment while waiting for a better entry in the retail sectors.
For Institutional Client Use Only
(675219)
16
Important Information:
Investing involves risk, including possible loss of principal.
The FTSE NAREIT Equity REITs Index measures the performance of all publicly traded equity real estate investment trusts (REITs) traded on U.S. exchanges, excluding timber and infrastructure REITs.
All third-party trademarks are the property of their respective owners.
Index performance returns do not reflect any management fees, transaction costs or expenses. Indices are unmanaged and one cannot invest directly in an index.
The views expressed represent the Investment Manager’s assessment of the account and market environment as of September 30, 2018 and should not be considered a recommendation to buy, hold, or sell any security, and should not be relied on as research or investment advice. Holdings are as of September 30, 2018 and subject to change.
Past performance is no guarantee of future results.
Unless otherwise noted, the source of statistical information used in this document was FactSet.
Because this Strategy expects to hold a concentrated fund of a limited number of securities, the fund’s risk is increased because each investment has a greater effect on the Strategy’s overall performance.
REIT investments are subject to many of the risks associated with direct real estate ownership, including changes in economic conditions, credit risk, and interest rate fluctuations.
International investments entail risks not ordinarily associated with U.S. investments including fluctuation in currency values, differences in accounting principles, or economic or political instability in other nations.
Additional information regarding the firm’s policies and procedures for calculating and reporting performance results is available upon request. A complete list and description of composites managed is available upon request. The above information is not intended and should not be construed as a presentation of information regarding any mutual fund.
Macquarie Investment Management (MIM) is the marketing name for the following registered investment advisers: Macquarie Investment Management Business Trust, Macquarie Funds Management Hong Kong Limited, Macquarie Investment Management Austria Kapitalanlage AG, Macquarie Investment Management Global Limited, Macquarie Investment Management Europe Limited, and Macquarie Capital Investment Management LLC.
Other than Macquarie Bank Limited (MBL), none of the entities noted are authorised deposit-taking institutions for the purposes of the Banking Act 1959 (Commonwealth of Australia). The obligations of these entities do not represent deposits or other liabilities of MBL. MBL does not guarantee or otherwise provide assurance in respect of the obligations of these entities, unless noted otherwise
© 2018 Macquarie Group Limited
For Institutional Client Use Only
(675219)
17
September 30, 2018
Dear Strategic Growth Fund Shareholder:
The Timothy Plan Strategic Growth Fund is an asset allocation fund that invests in ten of Timothy Plan’s underlying funds. The allocation percentages vary from time to time due to Timothy Partners, Ltd.’s (the “Advisor”) observations and perceptions of changing economic conditions. As of September 30, 2018, the allocation was as follows:
| | | | | | | | | | | | |
| • | | Large/Mid-Cap Growth Fund | | 10.00% | | | | * | | Small-Cap Value Fund | | 6.00% |
| | | | | | |
| • | | Large/Mid-Cap Value Fund | | 11.00% | | | | * | | Aggressive Growth Fund | | 5.50% |
| | | | | | |
| • | | International Fund | | 19.50% | | | | * | | High-Yield Bond Fund | | 6.50% |
| | | | | | |
| • | | Defensive Strategies Fund | | 12.00% | | | | * | | Israel Common Values | | 5.00% |
| | | | | | |
| • | | Emerging Markets Fund | | 7.00% | | | | * | | Growth & Income | | 9.50% |
| | | | | | |
| • | | Fixed Income | | 5.00% | | | | * | | Cash | | 3.00% |
At fiscal year end, the Fund’s overall allocation resulted in approximately 64.0% invested in Timothy Plan’s underlying domestic and international equity funds, 23.5% in Timothy Plan’s underlying bond and Defensive Strategies funds, 9.5% in Growth & Income, which also incorporates a relatively significant bond portfolio, and 3.0% in cash. The Strategic Growth Fund’s performance was a positive 2.32% for Class A for the fiscal year ending 9-30-18 even with the weakness in international equities and commodities (which comprise a significant portion of our Defensive Strategies Fund). Detailed descriptions of events that contributed to this past year’s performance of the underlying Funds is contained in each sub-advisor’s letter, found within the pages of this Annual Report.
We realize the volatility and uncertainty of the markets over the past couple of years may have been unsettling for many investors; however, as mentioned above, we believe the outlook for the capital markets for the remainder of 2018 and beyond should be fairly bright long-term; nevertheless, we are committed to manage our funds with a definite conservative bias.
As you know, no one can guarantee future performance. However, the one thing that I can assure you of is that every one of our sub-advisors is doing their very best and our team here at Timothy is working very hard to provide you an investment with which you can feel comfortable.
Sincerely,
Arthur D. Ally
Fund Advisor
18
September 30, 2018
Dear Conservative Growth Fund Shareholder:
The Timothy Plan Conservative Growth Fund is an asset allocation fund that invests in Timothy Plan underlying funds. The allocation percentages vary from time to time due to Timothy Partners Ltd.‘s (the “Advisor”) observations and perceptions of changing economic conditions; the allocation on September 30, 2018 was as follows:
| | | | | | | | | | | | |
| • | | Large/Mid-Cap Growth Fund | | 7.50% | | | | * | | Small-Cap Value Fund | | 5.00% |
| | | | | | |
| • | | Large/Mid-Cap Value Fund | | 8.50% | | | | * | | Aggressive Growth Fund | | 4.00% |
| | | | | | |
| • | | International Fund | | 10.50% | | | | * | | High-Yield Bond Fund | | 6.50% |
| | | | | | |
| • | | Defensive Strategies Fund | | 11.00% | | | | * | | Israel Common Values | | 3.50% |
| | | | | | |
| • | | Emerging Markets Fund | | 4.50% | | | | * | | Growth & Income | | 9.50% |
| | | | | | |
| • | | Fixed Income | | 24.50% | | | | * | | Cash | | 5.00% |
At fiscal year end, the Fund’s overall allocation resulted in approximately 43.5% invested in Timothy Plan’s underlying domestic and international equity funds, 42.0% in Timothy Plan’s underlying bond and Defensive Strategies funds, 9.5% in Growth & Income, which also incorporates a relatively significant bond portfolio, and 5.0% in cash. The Conservative Growth Fund’s performance was a positive 1.06% for Class A for the fiscal year ending 9-30-18 even with the weakness in international equities and commodities (which comprise a significant portion of our Defensive Strategies Fund). Detailed descriptions of events that contributed to this past year’s performance of the underlying Funds is contained in each sub-advisor’s letter, found within the pages of this Annual Report.
We realize the volatility and uncertainty of the markets over the past couple of years may have been unsettling for many investors; however, as mentioned above, we believe the outlook for the capital markets for the remainder of 2018 and beyond should be fairly bright long-term; nevertheless, we are committed to manage our funds with a definite conservative bias.
As you know, no one can guarantee future performance. However, the one thing that I can assure you of is that every one of our sub-advisors is doing their very best and our team here at Timothy is working very hard to provide you an investment with which you can feel comfortable.
Yours in Christ,
Arthur D. Ally
Fund Advisor
19
Letter from The Manager
The Timothy Plan Israel Common Values Fund
September 30, 2018
The Timothy Plan Israel Common Values Fund performed well on an absolute basis but trailed the TA-125 index over the twelve-month period. Strong absolute performance in the Technology, Financials, and Materials sectors led the way. Sector allocation was positive for the last twelve months while stock selection proved negative. The main culprit in the negative selection was detrimental stock selection in the Consumer Discretionary and Health Care sectors. The negative relative performance was more a story of what the Fund did not own rather than what it did own. Not owning some of the pharmaceutical names that came back strong in the year as well as Consumer Discretionary company Sodastream, which was acquired by Pepsi, were detrimental to relative performance versus the index. On the positive front, the Fund’s exposure to cyber security companies, where Israel is a world leader in innovation, was helpful to the Fund with names such as CyberArk Software performing well. In addition, Fund holding Orbotech was acquired by a U.S. company following on the trend of global companies acquiring innovative Israeli firms. The Fund’s overweight to the Technology sector provided good opportunities to the leading-edge technologies in cloud computing, data centers, and cyber security.
The Israeli economy remains strong and most economists forecast GDP growth to remain above 3% for the foreseeable future. Household spending remains robust on the back of strong wage growth and a historically low unemployment rate and historically high labor participation rate. The Bank of Israel (BoI) remained on the sidelines during this period and most analysts do not expect the BoI to raise interest rates until later in 2019. Inflation has bounced back a bit given the strong wage growth but remains at the low end of the central bank’s desired range. The energy sector continues to invest in infrastructure as new natural gas export deals are struck with Israel’s neighbors. Export growth improved over this period as global growth rebounded while some depreciation of the strong Israeli shekel helped the export economy as well.
The Fund continues to invest alongside the innovate spirit of Israeli companies providing ample attractive investment opportunities. Strong domestic consumption should continue to support corporate earnings into next year. We remain committed to a consistent investment approach dedicated to finding long-term investments for the Fund. We thank you for your continued investment in the Fund.
Eagle Global Advisors, LLC
20

Brandes Investment Partners, L.P.
Emerging Markets Fund
Equity Strategy Notes
Third Quarter 2018 (July 1 – September 30, 2018)
The Brandes Emerging Markets Equity Strategy slightly outperformed its benchmark, the MSCI Emerging Markets Index, which fell 1.1%.
Positive Contributors
Highlighting how volatility is often part and parcel of emerging markets investing, two of this period’s major positive contributors were detractors to returns in the second quarter. Brazilian Petrobras and Argentinian YPF rebounded sharply as short-term concerns that weighed on their shares last quarter abated. As with our other oil & gas holdings, both companies continued to benefit from improved earnings and cash flows in a higher oil-price environment.
Holdings in Mexico also aided returns, led by real estate investment trusts (REITs) PLA Administradora Industrial (Terrafina) and Macquarie Mexico Real Estate Management. Investors seemed to welcome the prospect of the new trade deal between the United States and Mexico, which lifted some uncertainty regarding future relations between the two countries.
Additionally, our underweight to China helped relative performance.
Performance Detractors
The strategy’s exposure to Turkey, most notably our commercial bank holdings, hurt performance amid the country’s currency crisis. President Erdogan’s interference in monetary policy and the appointment of his son-in-law as treasury and finance minister shook investor confidence. Furthermore, weakened diplomatic relations with western partners added fuel to the lira’s tumbling. While fears of contagion momentarily spread throughout emerging markets, they have since dissipated.
As the risks of investing in the country intensified, we exited our position in bank Vakif Bankasi, especially given the company’s direct government control. We continuously monitor the situation in Turkey and maintain measured positions in Akbank, Garanti Bankasi and REIT Emlak Konut.
Holdings in Brazil also declined as the country’s upcoming election led to increased volatility. Notable detractors included food producer Marfrig Global Foods, regional jet manufacturer Embraer, health insurer Hapvida Participacoes and payment processor Cielo.
In early July, Boeing and Embraer released a non-binding agreement to establish a new joint venture (JV) for commercial aircraft. The deal values Embraer’s commercial aircraft business unit, which will be fully transferred to the new JV, at $4.75bn. Based on the proposed terms, Boeing will own an 80% stake in the JV, while Embraer will hold the remaining 20%. Embraer will also retain control of its defense and business jet operations. The deal is expected to close by the end of 2019, subject to regulatory clearance.
Embraer’s shares fell as many investors appeared unsatisfied with the offered price. However, in our opinion, the price was adequate, especially considering the other terms outlined in the agreement. Through its 20% stake, Embraer will be able to participate in the potential synergies that may materialize within the JV. Additionally, as the commercial aviation segment has faced increased competition, particularly from Chinese, Russian and Japanese newcomers, we believe the deal actually “neutralizes” a major long-term business threat for Embraer.
In August, Marfrig announced that it would sell about 90% of its stake in Keystone, a fully owned subsidiary, to Tyson Foods. Keystone supplies protein to fast food chains mostly in the United States and Asia. The deal is expected to close by year-end at an enterprise value of $2.4bn, which was below the market’s initial expectations. Nevertheless, we believe Marfrig remains undervalued. We are encouraged by the company’s continued balance sheet improvements and its efforts to streamline its business model.
Select Activity in the Third Quarter
The investment committee added X5 Retail Group to the strategy.
X5 is Russia’s largest food retailer by revenue, with an approximately 9% market share in food retailing and a strong footprint in big cities such as Moscow and St. Petersburg. The company operates in three retail formats, namely proximity/convenience stores (78% of 2017 sales), supermarkets (15% of sales) and hypermarkets (7% of sales). The company has a vertically integrated supply chain and delivers over 90% of the items sold in its stores from internal distribution centers.
A number of factors have weighed on X5’s shares, including an increasing pressure on margins (an industry-wide challenge), a recent move of management personnel to a main competitor and the potential impact of further sanctions against Russia. We believe these concerns have been more than reflected in the current share price. Despite the pressure on margins, the food retailing industry in Russia is still underpenetrated relative to developed countries, with fewer grocery stores per 1,000 inhabitants.
Trading at less than 10x forward earnings and offering a dividend yield of 5.5% as of September 30, X5 represents an appealing investment opportunity to us.
Year-to-Date 2018 Briefing
The Brandes Emerging Markets Equity Strategy underperformed the MSCI Emerging Markets Index, which fell 7.7% for the nine months ended September 30, 2018.
Similar to what happened in the quarter, holdings in Turkey and Brazil detracted from year-to-date returns. Turkish Akbank, Vakif Bankasi and Emlak Konut performed poorly, as did Brazil’s Marfrig Global Foods and Embraer.
Other detractors included Indian electric utility Reliance Infrastructure and Argentinian oil & gas firm YPF.
We saw positive contributions from our oil & gas holdings, specifically Lukoil, Surgutneftegas and Petrobras. Retailers with exposure to China—namely Lifestyle International, Bosideng and Luk Fook Holdings—also helped performance. Additionally, Indian technology company Infosys aided returns.
Current Positioning
We have increasingly found investment opportunities in China amid the country’s trade war with the United States, coupled with increased market volatility.
The strategy’s exposures have been relatively unchanged, as Brazil, Russia and Mexico continue to represent overweight positions. We also maintained higher allocations to consumer discretionary and telecommunication services companies than the benchmark.
China remained one of our largest underweights at quarter end, along with Taiwan. From a sector perspective, we held material underweight allocations to information technology and financials.
We remain convinced that the current positioning of the Brandes Emerging Markets Equity Strategy, which results from our careful bottom-up stock selection, bodes well for the long term.
Thank you for your continued trust.
Cash Flow: The amount of cash generated minus the amount of cash used by a company in a given period.
Dividend Yield: Dividends per share divided by price per share.
Enterprise value: Market capitalization plus debt, minority interest and preferred shares, minus total cash and cash equivalents.
Forward Earnings: Sell-side analysts’ consensus earnings estimates for the next fiscal year.
Forward Price/ Earnings: Price per share divided by earnings estimates for the next fiscal year.
The declaration and payment of shareholder dividends are solely at the discretion of the issuer and are subject to change at any time.
The MSCI Emerging Markets Index with net dividends captures large and mid cap representation of emerging market countries. Data prior to 2001 is gross dividend and linked to the net dividend returns.
MSCI has not approved, reviewed or produced this report, makes no express or implied warranties or representations and is not liable whatsoever for any data in the report. You may not redistribute the MSCI data or use it as a basis for other indices or investment products.
The foregoing Quarterly Commentary reflects the thoughts and opinions of Brandes Investment Partners® exclusively and is subject to change without notice. The information provided in the commentary should not be considered a recommendation to purchase or sell any particular security. It should not be assumed that any security transactions, holdings or sectors discussed were or will be profitable, or that the investment recommendations or decisions we make in the future will be profitable or will equal the investment performance discussed herein. International and emerging markets investi ng is subject to certain risks such as currency fluctuation and social and political changes; such risks may result in greater share price volatility. There is no assurance that any securities discussed herein will remain in an account’s portfolio at the time you receive this report or that the securities sold have not been repurchased. The actual characteristics with respect to any particular account will vary based on a number of factors including but not limited to: (i) the size of the account; (ii) investment restrictions applicable to the account, if any; and (iii) market exigencies at the time of investment. Unlike bonds issued or guaranteed by the U.S. government or its agencies, stocks and other bonds are not backed by the full faith and credit of the United States. Stock and bond prices will experience market fluctuations. Please note that the value of government securities and bonds in general have an inverse relationship to interest rates. Bonds carry the risk of default, or the risk that an issuer will be unable to make income or principal payment. There is no assurance that private guarantors or insurers will meet their obligations. The credit quality of the investments in the portfolio is not a guarantee of the safety or stability of the portfolio. Investments in Asset Backed and Mortgage Backed Securities include additional risks that investors should be aware of such as credit risk, prepayment risk, possible illiquidity and default, as well as increased susceptibility to adverse economic developments. Securities of small companies generally experience more volatility than mid and large sized companies. Although the statements of fact and data in this report have been obtained from, and are based upon, sources that are believed to be reliable, we cannot guarantee their accuracy, and any such information may be incomplete or condensed. Strategies discussed are subject to change at any time by the investment manager in its discretion due to market conditions or opportunities. The Brandes investment approach tends to result in portfolios that are materially different than their benchmarks with regard to characteristics such as risk, volatility, diversification, and concentration. Please note that all indices are unmanaged and are not available for direct investment. Past performance is not a guarantee of future results. No investment strategy can assure a profit or protect against loss. Market conditions may impact performance. The performance results presented were achieved in particular market conditions which may not be repeated. Moreover, the current market volatility and uncertain regulatory environment may have a negative impact on future performance. The margin of safety for any security is defined as the discount of its market price to what the firm believes is the intrinsic value of that security. The declaration and payment of shareholder dividends are solely at the discretion of the issuer and are subject to change at any time.
United States: Issued by Brandes Investment Partners, L.P., 11988 El Camino Real, Suite 600, San Diego, CA 92130.
LETTER FROM THE MANAGER
September 30, 2018
Timothy Plan Growth and Income Fund
We are pleased to provide you our annual report for the Timothy Plan Growth and Income Fund for the period ending September 30, 2018. Like you, our company continues to hold corporate and retirement assets in the fund and some officers have additional personal assets in the fund. We certainly thank you for entrusting your assets with us.
For the period starting 1 October 2017 through 30 September 2018, the fund returned -1.22% for Class A shares. The Energy and Industrial sectors contributed the most to performance. Two top stock contributors were Sodastream International Ltd and Cleveland-Cliffs Inc.
We continue to see divergences in the indices and underlying stock returns. Stocks with earnings have underperformed stocks without earnings so far in 2018. Bargain stocks, those with inexpensive valuation ratios, positive and growing earnings, and relative price strength, underperformed stocks with the opposite characteristics. This is not normal and we expect this to reverse as it has in the past.
Bonds helped reduce volatility during the past year. This is one reason why we continue to advocate a balanced portfolio approach. We continue to favor high quality bonds over lower quality bonds. They tend to hold up better in times of uncertainty and the extra compensation earned on lower quality bonds is near the lowest levels of this credit cycle.
We think the best returns in bonds are probably behind us. However, when stocks suffer another setback, having bonds in the portfolio should help. We think volatility will continue but if our research works well, this actually could give us opportunities to take advantage of these moves.
This fund has two main objectives, growth and income but also preserving capital in declining markets. We have been managing similar assets for over 40 years. We will adjust equity and fixed income levels according to our risk analysis. We do this on a weekly basis. We continue to see opportunities for small capitalization value stocks going forward as they typically have less exposure to international economies and more opportunities for growth.
We thank you for your trust in the James Investment Research Inc., we are grateful for the opportunity to serve you.
James Investment Research, Inc.
24
Fund Performance - (Unaudited)
September 30, 2018
Aggressive Growth Fund
| | | | | | | | |
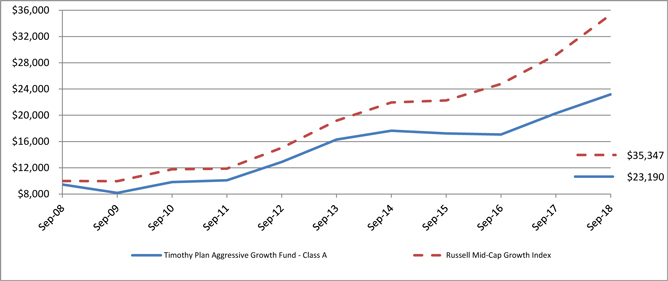
| Fund/Index | | 1 Year Total Return | | 5 Year Average Annual Return | | 10 Year Average Annual Return | |
Timothy Aggressive Growth Fund - Class A (With Sales Charge) | | 8.04% | | 6.09% | | | 8.78% | |
Russell Mid-Cap Growth Index | | 21.10% | | 13.00% | | | 13.46% | |
Timothy Aggressive Growth Fund - Class C * | | 12.67% | | 6.52% | | | 8.61% | |
Russell Mid-Cap Growth Index | | 21.10% | | 13.00% | | | 13.46% | |
Timothy Aggressive Growth Fund - Class I | | 14.62% | | 7.55% | | | 7.62% (a) | |
Russell Mid-Cap Growth Index | | 21.10% | | 13.00% | | | 12.79% (a) | |
| | (a) | For the period August 1, 2013 (commencement of investment in accordance with objective) to September 30, 2018. |
| | * | With Maximum Deferred Sales Charge |
Timothy Plan Aggressive Growth Fund vs. Russell Mid-Cap Growth Index
The chart shows the value of a hypothetical initial investment of $10,000 in the Fund’s Class A shares and the Russell Mid-Cap Growth Index on September 30, 2008 and held through September 30, 2018. The Russell Mid-Cap Growth Index is a widely recognized, unmanaged index of common stock prices. Performance figures include the change in value of the stocks in the index and the reinvestment of dividends. The index return does not reflect expenses, which have been deducted from the Fund’s return. The returns shown do not reflect deduction of taxes that a shareholder would pay on Fund distributions or the redemption of Fund shares. THE FUND’S RETURN REPRESENTS PAST PERFORMANCE AND IS NOT PREDICTIVE OF FUTURE RESULTS.
25
Fund Performance - (Unaudited)
September 30, 2018
International Fund
| | | | | | | | |
| Fund/Index | | 1 Year Total Return | | 5 Year Average Annual Return | | 10 Year Average Annual Return | |
Timothy International Fund - Class A (With Sales Charge) | | (4.69)% | | 2.52% | | | 2.87% | |
MSCI EAFE Index | | (0.01)% | | 1.65% | | | 2.42% | |
Timothy International Fund - Class C * | | (0.87)% | | 2.91% | | | 2.69% | |
MSCI EAFE Index | | (0.01)% | | 1.65% | | | 2.42% | |
Timothy International Fund - Class I | | 1.04% | | 3.91% | | | 4.23% (a) | |
MSCI EAFE Index | | (0.01)% | | 1.65% | | | 2.45% (a) | |
| | (a) | For the period August 1, 2013 (commencement of investment in accordance with objective) to September 30, 2018. |
| | * | With Maximum Deferred Sales Charge |
Timothy Plan International Fund vs. MSCI EAFE Index
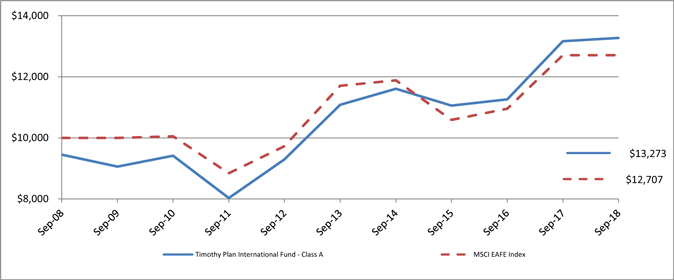
The chart shows the value of a hypothetical initial investment of $10,000 in the Fund’s Class A shares and the MSCI EAFE Index on September 30, 2008 and held through September 30, 2018. The MSCI EAFE Index is a widely recognized unmanaged index of equity prices and is representative of equity market performance of developed countries, excluding the U.S. and Canada. Performance figures include the change in value of the stocks in the index and the reinvestment of dividends. The index return does not reflect expenses, which have been deducted from the Fund’s return. The returns shown do not reflect deduction of taxes that a shareholder would pay on Fund distributions or the redemption of Fund shares. THE FUND’S RETURN REPRESENTS PAST PERFORMANCE AND IS NOT PREDICTIVE OF FUTURE RESULTS.
26
Fund Performance - (Unaudited)
September 30, 2018
Large/Mid Cap Growth Fund
| | | | | | | | |
| Fund/Index | | 1 Year Total Return | | 5 Year Average Annual Return | | 10 Year Average Annual Return | |
Timothy Large/Mid Cap Growth Fund - Class A (With Sales Charge) | | 5.36% | | 8.34% | | | 9.57% | |
Russell 1000 Growth Index | | 26.30% | | 16.58% | | | 14.31% | |
Timothy Large/Mid Cap Growth Fund - Class C * | | 9.63% | | 8.75% | | | 9.35% | |
Russell 1000 Growth Index | | 26.30% | | 16.58% | | | 14.31% | |
Timothy Large/Mid Cap Growth Fund - Class I | | 11.69% | | 9.84% | | | 9.66% (a) | |
Russell 1000 Growth Index | | 26.30% | | 16.58% | | | 16.29% (a) | |
| | (a) | For the period August 1, 2013 (commencement of investment in accordance with objective) to September 30, 2018. |
| | * | With Maximum Deferred Sales Charge |
Timothy Plan Large/Mid Cap Growth Fund vs. Russell 1000 Growth Index
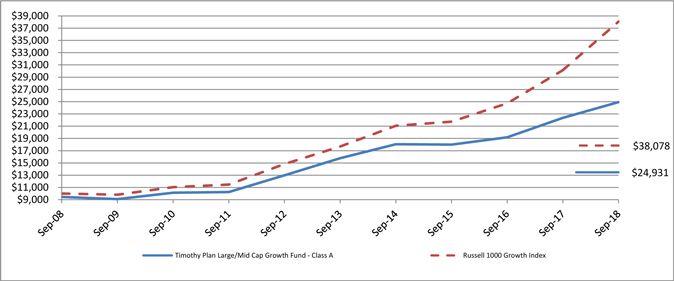
The chart shows the value of a hypothetical initial investment of $10,000 in the Fund’s Class A shares and the Russell 1000 Growth Index on September 30, 2008 and held through September 30, 2018. The Russell 1000 Growth Index is a widely recognized, unmanaged index of common stock prices. Performance figures include the change in value of the stocks in the index and the reinvestment of dividends. The index return does not reflect expenses, which have been deducted from the Fund’s return. The returns shown do not reflect deduction of taxes that a shareholder would pay on Fund distributions or the redemption of Fund shares. THE FUND’S RETURN REPRESENTS PAST PERFORMANCE AND IS NOT PREDICTIVE OF FUTURE RESULTS.
27
Fund Performance - (Unaudited)
September 30, 2018
Small Cap Value Fund
| | | | | | | | |
| Fund/Index | | 1 Year Total Return | | 5 Year Average Annual Return | | 10 Year Average Annual Return | |
Timothy Small Cap Value Fund - Class A (With Sales Charge) | | 4.07% | | 8.91% | | | 9.86% | |
Russell 2000 Index | | 15.24% | | 11.07% | | | 11.11% | |
Timothy Small Cap Value Fund - Class C * | | 8.27% | | 9.33% | | | 9.66% | |
Russell 2000 Index | | 15.24% | | 11.07% | | | 11.11% | |
Timothy Small Cap Value Fund - Class I | | 10.37% | | 10.42% | | | 10.73% (a) | |
Russell 2000 Index | | 15.24% | | 11.07% | | | 11.04% (a) | |
| | (a) | For the period August 1, 2013 (commencement of investment in accordance with objective) to September 30, 2018. |
| | * | With Maximum Deferred Sales Charge |
Timothy Plan Small Cap Value Fund vs. Russell 2000 Index
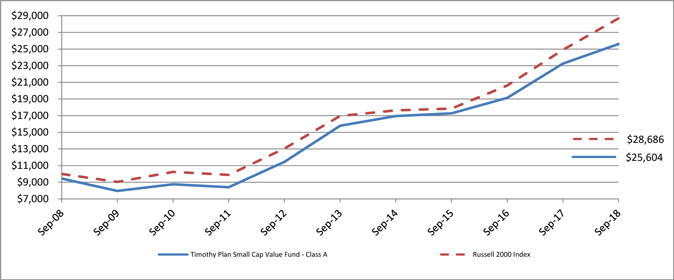
The chart shows the value of a hypothetical initial investment of $10,000 in the Fund’s Class A shares and the Russell 2000 Index on September 30, 2008 and held through September 30, 2018. The Russell 2000 Index is a widely recognized, unmanaged index of common stock prices. Performance figures include the change in value of the stocks in the index and the reinvestment of dividends. The index return does not reflect expenses, which have been deducted from the Fund’s return. The returns shown do not reflect deduction of taxes that a shareholder would pay on Fund distributions or the redemption of Fund shares. THE FUND’S RETURN REPRESENTS PAST PERFORMANCE AND IS NOT PREDICTIVE OF FUTURE RESULTS.
28
Fund Performance - (Unaudited)
September 30, 2018
Large/Mid Cap Value Fund
| | | | | | | | |
| Fund/Index | | 1 Year Total Return | | 5 Year Average Annual Return | | 10 Year Average Annual Return | |
Timothy Large/Mid Cap Value Fund - Class A (With Sales Charge) | | 7.31% | | 8.79% | | | 8.89% | |
S&P 500 Index | | 17.91% | | 13.95% | | | 11.97% | |
Timothy Large/Mid Cap Value Fund - Class C * | | 11.75% | | 9.22% | | | 8.69% | |
S&P 500 Index | | 17.91% | | 13.95% | | | 11.97% | |
Timothy Large/Mid Cap Value Fund - Class I | | 13.83% | | 10.30% | | | 9.89% (a) | |
S&P 500 Index | | 17.91% | | 13.95% | | | 13.23% (a) | |
| | (a) | For the period August 1, 2013 (commencement of investment in accordance with objective) to September 30, 2018. |
| | * | With Maximum Deferred Sales Charge |
Timothy Plan Large/Mid Cap Value Fund vs. S&P 500 Index
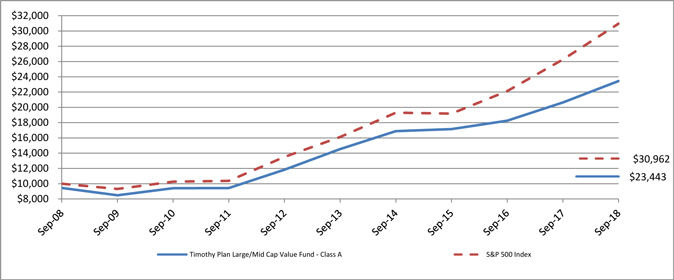
The chart shows the value of a hypothetical initial investment of $10,000 in the Fund’s Class A shares and the S&P 500 Index on September 30, 2008 and held through September 30, 2018. The S&P 500 Index is a widely recognized, unmanaged index of common stock prices. Performance figures include the change in value of the stocks in the index and the reinvestment of dividends. The index return does not reflect expenses, which have been deducted from the Fund’s return. The returns shown do not reflect deduction of taxes that a shareholder would pay on Fund distributions or the redemption of Fund shares. THE FUND’S RETURN REPRESENTS PAST PERFORMANCE AND IS NOT PREDICTIVE OF FUTURE RESULTS.
29
Fund Performance - (Unaudited)
September 30, 2018
Fixed Income Fund
| | | | | | | | |
| Fund/Index | | 1 Year Total Return | | 5 Year Average Annual Return | | 10 Year Average Annual Return | |
Timothy Fixed Income Fund - Class A (With Sales Charge) | | (6.69)% | | (0.10)% | | | 1.95% | |
Barclays Capital U.S. Aggregate Bond Index | | (1.22)% | | 2.16% | | | 3.77% | |
Timothy Fixed Income Fund - Class C * | | (4.10)% | | 0.06% | | | 1.76% | |
Barclays Capital U.S. Aggregate Bond Index | | (1.22)% | | 2.16% | | | 3.77% | |
Timothy Fixed Income Fund - Class I | | (2.06)% | | 1.07% | | | 1.25% (a) | |
Barclays Capital U.S. Aggregate Bond Index | | (1.22)% | | 2.16% | | | 2.28% (a) | |
| | (a) | For the period August 1, 2013 (commencement of investment in accordance with objective) to September 30, 2018. |
| | * | With Maximum Deferred Sales Charge |
Timothy Plan Fixed Income Fund vs. Barclays Capital U.S. Aggregate Bond Index
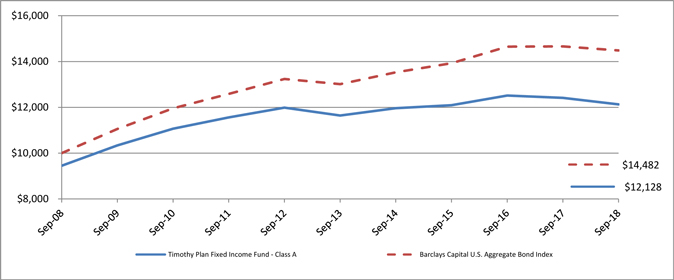
The chart shows the value of a hypothetical initial investment of $10,000 in the Fund’s Class A shares and the Barclays Capital U.S. Aggregate Bond Index on September 30, 2008 and held through September 30, 2018. The Barclays Capital U.S. Aggregate Bond Index is a widely recognized, unmanaged index of bond prices. Performance figures include the change in value of the bonds in the index and the reinvestment of interest. The index return does not reflect expenses, which have been deducted from the Fund’s return. The returns shown do not reflect deduction of taxes that a shareholder would pay on Fund distributions or the redemption of Fund shares. THE FUND’S RETURN REPRESENTS PAST PERFORMANCE AND IS NOT PREDICTIVE OF FUTURE RESULTS.
30
Fund Performance - (Unaudited)
September 30, 2018
High Yield Bond Fund
| | | | | | | | |
| Fund/Index | | 1 Year Total Return | | 5 Year Average Annual Return | | 10 Year Average Annual Return | |
Timothy High Yield Bond Fund - Class A (With Sales Charge) | | (4.63)% | | 2.42% | | | 5.93% | |
Barclays Capital U.S. Corporate High Yield Bond Index | | 3.05% | | 5.54% | | | 9.46% | |
Timothy High Yield Bond Fund - Class C * | | (1.81)% | | 2.60% | | | 5.73% | |
Barclays Capital U.S. Corporate High Yield Bond Index | | 3.05% | | 5.54% | | | 9.46% | |
Timothy High Yield Bond Fund - Class I | | 0.00% | | 3.62% | | | 3.53% (a) | |
Barclays Capital U.S. Corporate High Yield Bond Index | | 3.05% | | 5.54% | | | 5.44% (a) | |
| | (a) | For the period August 1, 2013 (commencement of investment in accordance with objective) to September 30, 2018. |
| | * | With Maximum Deferred Sales Charge |
Timothy Plan High Yield Bond Fund vs. Barclays Capital U.S. Corporate High Yield Bond Index
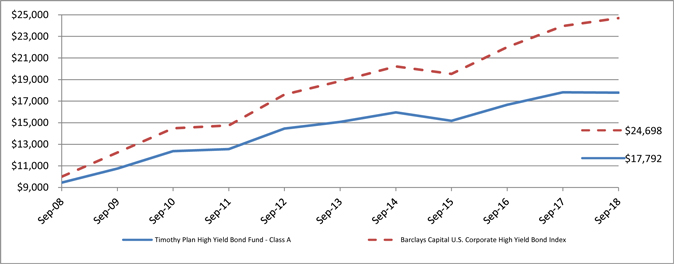
The chart shows the value of a hypothetical initial investment of $10,000 in the Fund’s Class A shares and the Barclays Capital U.S. Corporate High Yield Bond Index on September 30, 2008 and held through September 30, 2018. The Barclays Capital U.S. Corporate High Yield Bond Index measures the performance of bonds with Ba or B ratings. Performance figures include the change in value of the bonds in the index and the reinvestment of interest. The index return does not reflect expenses, which have been deducted from the Fund’s return. The returns shown do not reflect deduction of taxes that a shareholder would pay on Fund distributions or the redemption of Fund shares. THE FUND’S RETURN REPRESENTS PAST PERFORMANCE AND IS NOT PREDICTIVE OF FUTURE RESULTS.
31
Fund Performance - (Unaudited)
September 30, 2018
Israel Common Values Fund
| | | | | | | | |
| Fund/Index | | 1 Year Total Return | | 5 Year Average Annual Return | | Average Annual Return Since Inception | |
Timothy Israel Common Values Fund - Class A (With Sales Charge) | | 1.10% | | 4.93% | | | 7.11% (a) | |
Israel Tel Aviv 100 Index | | 12.46% | | 4.89% | | | 6.45% (a) | |
Timothy Israel Common Values Fund - Class C * | | 5.20% | | 5.31% | | | 7.15% (a) | |
Israel Tel Aviv 100 Index | | 12.46% | | 4.89% | | | 6.45% (a) | |
Timothy Israel Common Values Fund - Class I | | 7.22% | | 6.37% | | | 6.92% (b) | |
Israel Tel Aviv 100 Index | | 12.46% | | 4.89% | | | 5.75% (b) | |
| | (a) | For the period October 12, 2011 (commencement of investment in accordance with objective) to September 30, 2018. |
| | (b) | For the period August 1, 2013 (commencement of investment in accordance with objective) to September 30, 2018. |
| | * | With Maximum Deferred Sales Charge |
Timothy Plan Israel Common Values Fund vs. Israel Tel Aviv 100 Index
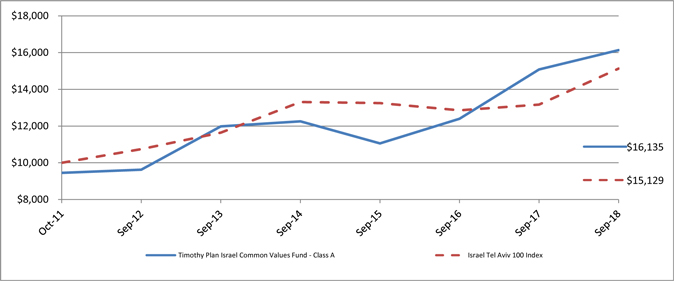
The chart shows the value of a hypothetical initial investment of $10,000 in the Fund’s Class A shares and the Israel Tel Aviv 100 Index on October 12, 2011 and held through September 30, 2018. The Israel Tel Aviv 100 Index is an unmanaged index of equity prices representing the 100 most highly capitalized companies listed on the Tel Aviv Stock Exchange . Performance figures include the change in value of the stocks in the index and the reinvestment of dividends. The index return does not reflect expenses, which have been deducted from the Fund’s return. The returns shown do not reflect deduction of taxes that a shareholder would pay on Fund distributions or the redemption of Fund shares. THE FUND’S RETURN REPRESENTS PAST PERFORMANCE AND IS NOT PREDICTIVE OF FUTURE RESULTS.
32
Fund Performance - (Unaudited)
September 30, 2018
Defensive Strategies Fund
| | | | | | | | |
| Fund/Index | | 1 Year Total Return | | 5 Year Total Return | | Average Annual Return Since Inception | |
Timothy Defensive Strategies Fund - Class A (With Sales Charge) | | (5.01)% | | (0.11)% | | | 2.36% (a) | |
Dow Jones Moderately Conservative U.S. Portfolio Index | | 9.63% | | 8.48% | | | 10.24% (a) | |
Timothy Defensive Strategies Fund Blended Index (c) | | 1.57% | | (2.82)% | | | (0.68)% (a) | |
Timothy Defensive Strategies Fund - Class C * | | (1.18)% | | 0.27% | | | 2.28% (a) | |
Dow Jones Moderately Conservative U.S. Portfolio Index | | 9.63% | | 8.48% | | | 10.24% (a) | |
Timothy Defensive Strategies Fund Blended Index (c) | | 1.57% | | (2.82)% | | | (0.68)% (a) | |
Timothy Defensive Strategies Fund - Class I | | 1.04% | | 1.32% | | | 1.27% (b) | |
Dow Jones Moderately Conservative U.S. Portfolio Index | | 9.63% | | 8.48% | | | 8.24% (b) | |
Timothy Defensive Strategies Fund Blended Index (c) | | 1.57% | | (2.82)% | | | (2.61)% (b) | |
| | (a) | For the period November 4, 2009 (commencement of investment in accordance with objective) to September 30, 2018. |
| | (b) | For the period August 1, 2013 (commencement of investment in accordance with objective) to September 30, 2018. |
| | (c) | The Timothy Defensive Strategies Fund Blended Index reflects an unmanaged portfolio of 33% of the Barclays U.S. TIPs Index, 33% of the FTSE NAREIT ALL REITs Index and 34% of the Dow Jones Commodity Total Return Index. |
| | * | With Maximum Deferred Sales Charge |
Timothy Plan Defensive Strategies Fund vs. Dow Jones Moderately Conservative U.S. Portfolio Index vs. The Timothy Defensive Strategies Fund Blended Index (c)
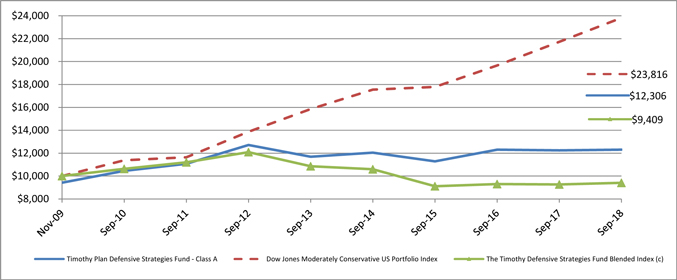
The chart shows the value of a hypothetical initial investment of $10,000 in the Fund’s Class A shares, Dow Jones Moderately Conservative U.S. Portfolio Index and the Timothy Defensive Strategies Fund Blended Index (c) on November 4, 2009 and held through September 30, 2018. The Dow Jones Moderately Conservative U.S. Portfolio Index is a widely recognized unmanaged index of stocks, bonds and cash. Performance figures include the change in value of the asset classes in the index and the reinvestment of dividends. The index return does not reflect expenses, which have been deducted from the Fund’s return. The returns shown do not reflect deduction of taxes that a shareholder would pay on Fund distributions or the redemption of Fund shares. THE FUND’S RETURN REPRESENTS PAST PERFORMANCE AND IS NOT PREDICTIVE OF FUTURE RESULTS.
33
Fund Performance - (Unaudited)
September 30, 2018
Strategic Growth Fund
| | | | | | |
| Fund/Index | | 1 Year Total Return | | 5 Year Average Annual Return | | 10 Year Average Annual Return |
Timothy Strategic Growth Fund - Class A (With Sales Charge) | | (3.29)% | | 2.25% | | 3.87% |
Dow Jones Global Moderately Aggressive Portfolio Index | | 9.39% | | 8.32% | | 8.93% |
Timothy Strategic Growth Fund - Class C * | | 0.52% | | 2.66% | | 3.63% |
Dow Jones Global Moderately Aggressive Portfolio Index | | 9.39% | | 8.32% | | 8.93% |
| | * | With Maximum Deferred Sales Charge |
Timothy Plan Strategic Growth Fund vs. Dow Jones Global Moderately Aggressive Portfolio Index
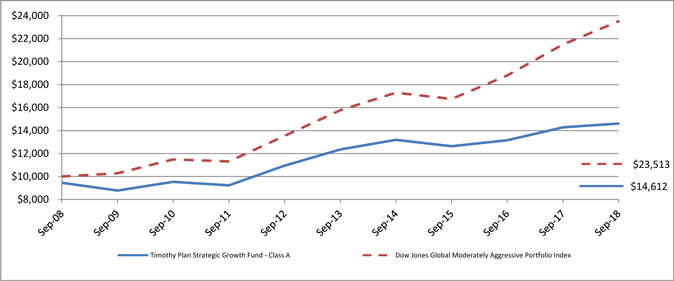
The chart shows the value of a hypothetical initial investment of $10,000 in the Fund’s Class A shares and the Dow Jones Global Moderately Aggressive Portfolio Index on September 30, 2008 and held through September 30, 2018. The Dow Jones Global Moderately Aggressive Portfolio Index is a widely recognized index that measures global stocks, bonds and cash which are in turn represented by multiple sub-indexes. Performance figures include the change in value of the investments in the index and the reinvestment of dividends. The index return does not reflect expenses, which have been deducted from the Fund’s return. The returns shown do not reflect deduction of taxes that a shareholder would pay on Fund distributions or the redemption of Fund shares. THE FUND’S RETURN REPRESENTS PAST PERFORMANCE AND IS NOT PREDICTIVE OF FUTURE RESULTS.
34
Fund Performance - (Unaudited)
September 30, 2018
Conservative Growth Fund
| | | | | | |
| Fund/Index | | 1 Year Total Return | | 5 Year Average Annual Return | | 10 Year Average Annual Return |
Timothy Conservative Growth Fund - Class A (With Sales Charge) | | (4.49)% | | 1.64% | | 3.45% |
Dow Jones Global Moderate Portfolio Index | | 6.73% | | 6.68% | | 7.62% |
Timothy Conservative Growth Fund - Class C * | | (0.77)% | | 2.02% | | 3.27% |
Dow Jones Global Moderate Portfolio Index | | 6.73% | | 6.68% | | 7.62% |
| | * | With Maximum Deferred Sales Charge |
Timothy Plan Conservative Growth Fund vs. Dow Jones Global Moderate Portfolio Index
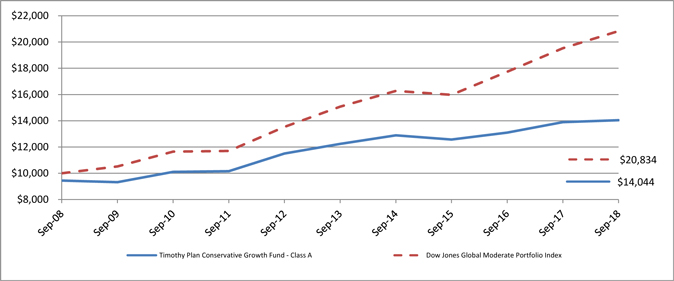
The chart shows the value of a hypothetical initial investment of $10,000 in the Fund’s Class A shares and the Dow Jones Global Moderate Portfolio Index on September 30, 2008 and held through September 30, 2018. The Dow Jones Global Moderate Portfolio Index is a widely recognized index that measures global stocks, bonds and cash which are in turn represented by multiple sub-indexes. Performance figures include the change in value of the investments in the index and the reinvestment of dividends. The index return does not reflect expenses, which have been deducted from the Fund’s return. The returns shown do not reflect deduction of taxes that a shareholder would pay on Fund distributions or the redemption of Fund shares. THE FUND’S RETURN REPRESENTS PAST PERFORMANCE AND IS NOT PREDICTIVE OF FUTURE RESULTS.
35
Fund Performance - (Unaudited)
September 30, 2018
Emerging Markets Fund
| | | | | | | | |
| Fund/Index | | 1 Year Total Return | | 5 Year Average Annual Return | | Average Annual Return Since Inception | |
Timothy Emerging Markets Fund - Class A (With Sales Charge) | | (15.74)% | | (2.81)% | | | (1.57)% (a) | |
MSCI Emerging Markets Index | | (3.13)% | | 1.20% | | | 0.67% (a) | |
Timothy Emerging Markets Fund - Class C * | | (12.41)% | | (2.46)% | | | (1.34)% (a) | |
MSCI Emerging Markets Index | | (3.13)% | | 1.20% | | | 0.67% (a) | |
Timothy Emerging Markets Fund - Class I | | (10.58)% | | (1.47)% | | | (0.36)% (b) | |
MSCI Emerging Markets Index | | (3.13)% | | 1.20% | | | 1.83% (b) | |
| | (a) | For the period December 3, 2012 (commencement of investment in accordance with objective) to September 30, 2018. |
| | (b) | For the period August 1, 2013 (commencement of investment in accordance with objective) to September 30, 2018. |
| | * | With Maximum Deferred Sales Charge |
Timothy Plan Emerging Markets Fund vs. MSCI Emerging Markets Index
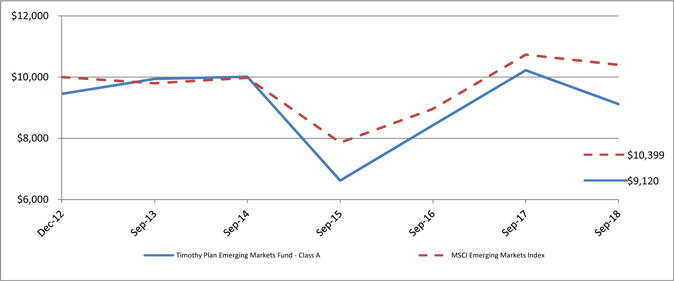
The chart shows the value of a hypothetical initial investment of $10,000 in the Fund’s Class A shares and the MSCI Emerging Markets Index on December 3, 2012 and held through September 30, 2018. The MSCI Emerging Markets Index is a free float-adjusted market capitalization index that is designed to measure equity market performance of emerging markets. The MSCI Emerging Markets Index consists of the following 21 emerging market country indices: Brazil, Chile, China, Colombia, Czech Republic, Egypt, Hungary, India, Indonesia, Korea, Malaysia, Mexico, Morocco, Peru, Philippines, Poland, Russia, South Africa, Taiwan, Thailand, and Turkey. Performance figures include the change in value of the stocks in the index and the reinvestment of dividends. The index return does not reflect expenses, which have been deducted from the Fund’s return. The returns shown do not reflect deduction of taxes that a shareholder would pay on Fund distributions or the redemption of Fund shares. THE FUND’S RETURN REPRESENTS PAST PERFORMANCE AND IS NOT PREDICTIVE OF FUTURE RESULTS.
36
Fund Performance - (Unaudited)
September 30, 2018
Growth & Income Fund
| | | | | | | | |
| Fund/Index | | 1 Year Total Return | | 5 Year Total Return | | Average Annual Return Since Inception | |
Timothy Growth & Income Fund - Class A (With Sales Charge) | | (6.68)% | | (6.68)% | | | 1.11% (a) | |
Timothy Growth & Income Fund Blended Index (b) | | 8.04% | | 8.04% | | | 7.38% (a) | |
Timothy Growth & Income Fund - Class C * | | (2.93)% | | (2.93)% | | | 1.50% (a) | |
Timothy Growth & Income Fund Blended Index (b) | | 8.04% | | 8.04% | | | 7.38% (a) | |
Timothy Growth & Income Fund - Class I | | (1.00)% | | (1.00)% | | | 2.48% (a) | |
Timothy Growth & Income Fund Blended Index (b) | | 8.04% | | 8.04% | | | 7.38% (a) | |
| | (a) | For the period October 1, 2013 (commencement of investment in accordance with objective) to September 30, 2018. |
| | (b) | The Timothy Growth & Income Fund Blended Index reflects an unmanaged portfolio of 50% of the Barclays Intermediate Government/Credit Index and 50% of the Russell 3000 Total Return Index. |
| | * | With Maximum Deferred Sales Charge |
Timothy Growth & Income Fund vs. Timothy Growth & Income Fund Blended Index (b)
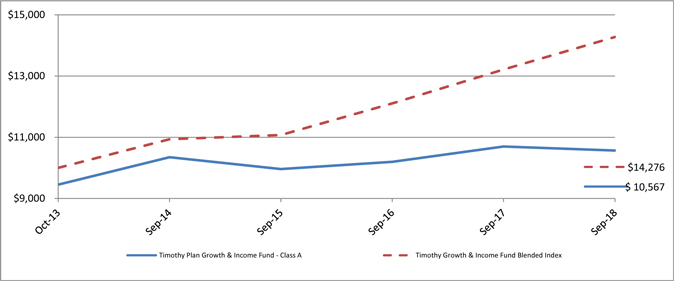
The chart shows the value of a hypothetical initial investment of $10,000 in the Fund’s Class A shares and the Timothy Growth & Income Fund Blended Index on October 1, 2013 and held through September 30, 2018. The Timothy Growth & Income Fund Blended Index reflects an unmanaged portfolio of 50% of the Barclays Intermediate Government/Credit Index and 50% of the Russell 3000 Total Return Index. Performance figures include the change in value of the stocks in the index and the reinvestment of dividends. The index return does not reflect expenses, which have been deducted from the Fund’s return. The returns shown do not reflect deduction of taxes that a shareholder would pay on Fund distributions or the redemption of Fund shares. THE FUND’S RETURN REPRESENTS PAST PERFORMANCE AND IS NOT PREDICTIVE OF FUTURE RESULTS.
37
Schedule of Investments | Aggressive Growth Fund
As of September 30, 2018
| | | | | | | | |
| | |
| Shares | | | | | Fair Value | |
| | |
| | |
| | | | COMMON STOCK - 94.2 % | | | | |
| | | | AEROSPACE/DEFENSE - 2.9 % | | | | |
| | 9,783 | | | HEICO Corp. | | $ | 906,004 | |
| | | | | | | | |
| | |
| | | | APPAREL - 1.6 % | | | | |
| | 5,500 | | | VF Corp. | | | 513,975 | |
| | | | | | | | |
| | |
| | | | AUTO PARTS & EQUIPMENT - 1.7 % | | | | |
| | 6,480 | | | Aptiv PLC | | | 543,672 | |
| | | | | | | | |
| | |
| | | | BANKS - 5.3 % | | | | |
| | 10,855 | | | CenterState Banks, Inc. | | | 304,483 | |
| | 6,602 | | | East West Bancorp, Inc. | | | 398,563 | |
| | 1,482 | | | SVB Financial Group * | | | 460,650 | |
| | 8,861 | | | Western Alliance Bancorp * | | | 504,102 | |
| | | | | | | | |
| | | | | | | 1,667,798 | |
| | | | | | | | |
| | | | BIOTECHNOLOGY - 3.0 % | | | | |
| | 2,746 | | | Sage Therapeutics, Inc. * | | | 387,873 | |
| | 2,852 | | | Vertex Pharmaceuticals, Inc. * | | | 549,694 | |
| | | | | | | | |
| | | | | | | 937,567 | |
| | | | | | | | |
| | | | CHEMICALS - 5.9 % | | | | |
| | 7,750 | | | Albemarle Corp. | | | 773,295 | |
| | 5,411 | | | Ingevity Corp. * | | | 551,273 | |
| | 2,700 | | | Quaker Chemical Corp. | | | 545,967 | |
| | | | | | | | |
| | | | | | | 1,870,535 | |
| | | | | | | | |
| | | | COMMERCIAL SERVICES - 12.3 % | | | | |
| | 7,833 | | | ASGN, Inc. * | | | 618,259 | |
| | 1,918 | | | FleetCor Technologies, Inc. * | | | 436,997 | |
| | 6,681 | | | Grand Canyon Education, Inc. * | | | 753,617 | |
| | 2,664 | | | Medifast, Inc. | | | 590,209 | |
| | 2,338 | | | Strategic Education, Inc. | | | 320,376 | |
| | 16,541 | | | Travelport Worldwide Ltd. | | | 279,047 | |
| | 4,419 | | | WEX, Inc. * | | | 887,158 | |
| | | | | | | | |
| | | | | | | 3,885,663 | |
| | | | | | | | |
| | | | COMPUTERS - 1.2 % | | | | |
| | 4,999 | | | Varonis Systems, Inc. * | | | 366,177 | |
| | | | | | | | |
| | |
| | | | ELECTRONICS - 3.2 % | | | | |
| | 7,415 | | | Fortive Corp. | | | 624,343 | |
| | 8,795 | | | Trimble, Inc. * | | | 382,231 | |
| | | | | | | | |
| | | | | | | 1,006,574 | |
| | | | | | | | |
| | | | ENGINEERING & CONSTRUCTION - 0.8 % | | | | |
| | 4,216 | | | TopBuild Corp. * | | | 239,553 | |
| | | | | | | | |
| | |
| | | | ENTERTAINMENT - 0.9 % | | | | |
| | 983 | | | Vail Resorts, Inc. | | | 269,755 | |
| | | | | | | | |
| | |
| | | | HEALTHCARE - PRODUCTS - 12.2 % | | | | |
| | 1,407 | | | ICU Medical, Inc. * | | | 397,829 | |
| | 2,179 | | | Inogen, Inc. * | | | 531,937 | |
| | 12,804 | | | Insulet Corp. * | | | 1,356,584 | |
| | 3,881 | | | Integra LifeSciences Holdings Corp. * | | | 255,641 | |
| | 8,871 | | | Quidel Corp. * | | | 578,123 | |
| | 2,743 | | | Teleflex, Inc. | | | 729,885 | |
| | | | | | | | |
| | | | | | | 3,849,999 | |
| | | | | | | | |
| | | | HEALTHCARE - SERVICES - 1.1 % | | | | |
| | 4,260 | | | Encompass Health Corp. | | | 332,067 | |
| | | | | | | | |
| | |
| | | | INSURANCE - 1.1 % | | | | |
| | 9,974 | | | American Equity Investment Life Holding Co. | | | 352,681 | |
| | | | | | | | |
| | |
| | | | INTERNET - 9.2 % | | | | |
| | 4,013 | | | GoDaddy, Inc. * | | | 334,644 | |
| | 2,843 | | | GrubHub, Inc. * | | | 394,097 | |
| | 4,098 | | | Palo Alto Networks, Inc. * | | | 923,115 | |
The accompanying notes are an integral part of these financial statements.
38
Schedule of Investments | Aggressive Growth Fund
As of September 30, 2017 (Continued)
| | | | | | | | |
| | |
| Shares | | | | | Fair Value | |
| | |
| | |
| | | | INTERNET (continued) - 9.2 % | | | | |
| | 2,095 | | | Proofpoint, Inc. * | | $ | 222,761 | |
| | 10,985 | | | RingCentral, Inc. - Class A * | | | 1,022,154 | |
| | | | | | | | |
| | | | | | | 2,896,771 | |
| | | | | | | | |
| | | | MACHINERY - CONSTRUCTION & MINING - 2.3 % | | | | |
| | 10,239 | | | Oshkosh Corp. | | | 729,426 | |
| | | | | | | | |
| | |
| | | | MACHINERY - DIVERSIFIED - 1.1 % | | | | |
| | 3,247 | | | Kadant, Inc. | | | 350,189 | |
| | | | | | | | |
| | |
| | | | OIL & GAS - 1.0 % | | | | |
| | 2,080 | | | Concho Resources, Inc. * | | | 317,720 | |
| | | | | | | | |
| | |
| | | | PACKAGING & CONTAINERS - 1.5 % | | | | |
| | 4,398 | | | Packaging Corporation of America | | | 482,417 | |
| | | | | | | | |
| | |
| | | | PHARMACEUTICALS - 3.8 % | | | | |
| | 4,033 | | | PRA Health Sciences, Inc. * | | | 444,396 | |
| | 3,469 | | | Sarepta Therapeutics, Inc. * | | | 560,278 | |
| | 3,966 | | | Zogenix, Inc. * | | | 196,714 | |
| | | | | | | | |
| | | | | | | 1,201,388 | |
| | | | | | | | |
| | | | RETAIL - 5.5% | | | | |
| | 2,274 | | | Burlington Stores, Inc. * | | | 370,480 | |
| | 1,670 | | | Children’s Place, Inc. | | | 213,426 | |
| | 6,746 | | | Ollie’s Bargain Outlet Holdings, Inc. * | | | 648,291 | |
| | 7,250 | | | Texas Roadhouse, Inc. | | | 502,353 | |
| | | | | | | | |
| | | | | | | 1,734,550 | |
| | | | | | | | |
| | | | SAVINGS & LOANS - 1.2 % | | | | |
| | 10,437 | | | Pacific Premier Bancorp, Inc. * | | | 388,256 | |
| | | | | | | | |
| | |
| | | | SEMICONDUCTORS - 4.8 % | | | | |
| | 18,641 | | | Advanced Micro Devices, Inc. * | | | 575,820 | |
| | 4,108 | | | Monolithic Power System, Inc. | | | 515,677 | |
| | 4,782 | | | NXP Semiconductors NV | | | 408,861 | |
| | | | | | | | |
| | | | | | | 1,500,358 | |
| | | | | | | | |
| | | | SOFTWARE - 6.9 % | | | | |
| | 6,969 | | | Fidelity National Information Services, Inc. | | | 760,109 | |
| | 6,132 | | | InterXion Holding NV * | | | 412,684 | |
| | 1,643 | | | MSCI, Inc. | | | 291,485 | |
| | 19,033 | | | Rapid7, Inc. * | | | 702,698 | |
| | | | | | | | |
| | | | | | | 2,166,976 | |
| | | | | | | | |
| | | | TELECOMMUNICATIONS - 1.5 % | | | | |
| | 35,485 | | | Vonage Holdings Corp. * | | | 502,468 | |
| | | | | | | | |
| | |
| | | | TRANSPORTATION - 2.2 % | | | | |
| | 6,307 | | | XPO Logistics, Inc. * | | | 720,070 | |
| | | | | | | | |
| | |
| | | | TOTAL COMMON STOCK (Cost $24,050,218) | | | 29,732,609 | |
| | | | | | | | |
The accompanying notes are an integral part of these financial statements.
39
Schedule of Investments | Aggressive Growth Fund
As of September 30, 2018 (Continued)
| | | | | | | | |
| | |
| Shares | | | | | Fair Value | |
| | |
| | |
| | | | REITs - 1.7 % | | | | |
| | 5,210 | | | CyrusOne, Inc. | | $ | 330,314 | |
| | 10,425 | | | Easterly Government Properties, Inc. | | | 201,932 | |
| | | | | | | | |
| | | | TOTAL REITS (Cost $477,566) | | | 532,246 | |
| | | | | | | | |
| | |
| | | | MONEY MARKET FUND - 4.7 % | | | | |
| | 1,473,315 | | | Fidelity Institutional Money Market Funds - Government Portfolio - Class I, 1.95% (A) (Cost $1,473,315) | | | 1,473,315 | |
| | | | | | | | |
| | |
| | | | TOTAL INVESTMENTS - 100.6 % (Cost $26,001,099) | | $ | 31,738,170 | |
| | | | OTHER ASSETS IN EXCESS OF LIABILITIES - NET - (0.6) % | | | (181,011) | |
| | | | | | | | |
| | | | NET ASSETS - 100.0 % | | $ | 31,557,159 | |
| | | | | | | | |
* Non-income producing securities.
PLC - Public Limited Co.
REITs - Real Estate Investment Trust.
(A) Variable rate security; the rate shown represents the yield at September 30, 2018.
The accompanying notes are an integral part of these financial statements.
40
Schedule of Investments | International Fund
As of September 30, 2018
| | | | | | | | |
| | |
| Shares | | | | | Fair Value | |
| | |
| | |
| | | | COMMON STOCK - 98.2 % | | | | |
| | | | AIRLINES - 1.0 % | | | | |
| | 58,100 | | | Japan Airlines Co. Ltd. (ADR) | | $ | 1,038,247 | |
| | | | | | | | |
| | |
| | | | APPAREL - 1.7 % | | | | |
| | 187,360 | | | Prada SpA (ADR) | | | 1,809,898 | |
| | | | | | | | |
| | |
| | | | AUTO PARTS & EQUIPMENT - 5.2 % | | | | |
| | 30,100 | | | Continental AG (ADR) | | | 1,045,223 | |
| | 51,200 | | | Magna International, Inc. - Class A | | | 2,689,536 | |
| | 85,800 | | | Valeo SA (ADR) | | | 1,855,425 | |
| | | | | | | | |
| | | | | | | 5,590,184 | |
| | | | | | | | |
| | | | BANKS - 10.4 % | | | | |
| | 41,839 | | | DBS Group Holdings Ltd. (ADR) | | | 3,188,341 | |
| | 124,000 | | | DNB ASA (ADR) | | | 2,605,860 | |
| | 38,000 | | | Intesa Sanpaola SpA (ADR) | | | 582,540 | |
| | 82,600 | | | KBC Group NV (ADR) | | | 3,066,112 | |
| | 462,000 | | | Mizuho Financial Group, Inc. (ADR) | | | 1,617,000 | |
| | | | | | | | |
| | | | | | | 11,059,853 | |
| | | | | | | | |
| | | | BIOTECHNOLOGY - 1.9 % | | | | |
| | 11,000 | | | Shire PLC (ADR) | | | 1,993,970 | |
| | | | | | | | |
| | |
| | | | BUILDING MATERIALS - 2.8 % | | | | |
| | 200,000 | | | AGC, Inc. (ADR) | | | 1,652,000 | |
| | 52,600 | | | Xinyi Glass Holdings Ltd. (ADR) | | | 1,325,257 | |
| | | | | | | | |
| | | | | | | 2,977,257 | |
| | | | | | | | |
| | | | CHEMICALS - 2.8 % | | | | |
| | 24,600 | | | Arkema SA (ADR) | | | 3,039,330 | |
| | | | | | | | |
| | |
| | | | COMMERCIAL SERVICES - 2.0 % | | | | |
| | 16,600 | | | Ashtead Group PLC (ADR) | | | 2,125,879 | |
| | | | | | | | |
| | |
| | | | COSMETICS - 0.9 % | | | | |
| | 12,000 | | | Shiseido Co. Ltd. (ADR) | | | 929,940 | |
| | | | | | | | |
| | |
| | | | DIVERSIFIED FINANCIAL SERVICES - 3.3 % | | | | |
| | 44,100 | | | ORIX Corp. (ADR) | | | 3,573,423 | |
| | | | | | | | |
| | |
| | | | ELECTRIC - 0.4 % | | | | |
| | 68,900 | | | Power Assets Holdings Ltd. (ADR) | | | 473,343 | |
| | | | | | | | |
| | |
| | | | ELECTRONICS - 1.6 % | | | | |
| | 28,700 | | | Orbotech Ltd. * | | | 1,705,928 | |
| | | | | | | | |
| | |
| | | | ENGINEERING & CONSTRUCTION - 3.0 % | | | | |
| | 137,000 | | | Vinci SA (ADR) | | | 3,248,955 | |
| | | | | | | | |
| | |
| | | | FOOD - 4.6 % | | | | |
| | 18,000 | | | Kerry Group PLC (ADR) | | | 2,066,940 | |
| | 125,000 | | | Marine Harvest ASA (ADR) | | | 2,893,750 | |
| | | | | | | | |
| | | | | | | 4,960,690 | |
| | | | | | | | |
| | | | FOREST PRODUCTS & PAPER - 0.5 % | | | | |
| | 10,000 | | | Mondi PLC (ADR) | | | 563,150 | |
| | | | | | | | |
| | |
| | | | HAND/MACHINE TOOLS - 3.4 % | | | | |
| | 114,650 | | | Techtronic Industries Co. (ADR) | | | 3,650,456 | |
| | | | | | | | |
| | |
| | | | HEALTHCARE - PRODUCTS - 2.0 % | | | | |
| | 58,000 | | | Smith & Nephew PLC (ADR) | | | 2,151,220 | |
| | | | | | | | |
| | |
| | | | HEALTHCARE - SERVICES - 2.8 % | | | | |
| | 58,000 | | | Fresenius Medical Care AG & Co. (ADR) | | | 2,982,360 | |
| | | | | | | | |
| | |
| | | | HOME BUILDERS - 0.8 % | | | | |
| | 58,000 | | | Sekisui House Ltd. (ADR) | | | 887,400 | |
| | | | | | | | |
The accompanying notes are an integral part of these financial statements.
41
Schedule of Investments | International Fund
As of September 30, 2018 (Continued)
| | | | | | | | |
| | |
| Shares | | | | | Fair Value | |
| | |
| | |
| | | | INSURANCE - 6.4 % | | | | |
| | 60,300 | | | Ageas (ADR) | | $ | 3,236,904 | |
| | 75,000 | | | AIA Group Ltd. (ADR) | | | 2,670,000 | |
| | 44,200 | | | Muenchener Rueckversicherungs AG (ADR) | | | 973,505 | |
| | | | | | | | |
| | | | | | | 6,880,409 | |
| | | | | | | | |
| | | | INTERNET - 6.6 % | | | | |
| | 35,700 | | | SINA Corp. * | | | 2,480,436 | |
| | 64,800 | | | Tencent Holdings Ltd. (ADR) | | | 2,646,432 | |
| | 58,700 | | | Yandex NV * | | | 1,930,643 | |
| | | | | | | | |
| | | | | | | 7,057,511 | |
| | | | | | | | |
| | | | MACHINERY - CONSTRUCTION & MINING - 3.3 % | | | | |
| | 53,500 | | | Atlas Copco AB (ADR) | | | 1,424,170 | |
| | 70,600 | | | Komatsu Ltd. (ADR) | | | 2,150,123 | |
| | | | | | | | |
| | | | | | | 3,574,293 | |
| | | | | | | | |
| | | | MACHINERY - DIVERSIFIED - 1.5 % | | | | |
| | 135,000 | | | CNH Industrial NV | | | 1,621,350 | |
| | | | | | | | |
| | |
| | | | MINING - 1.4 % | | | | |
| | 29,000 | | | Rio Tinto PLC (ADR) | | | 1,479,580 | |
| | | | | | | | |
| | |
| | | | MISCELLANEOUS MANUFACTURING - 1.7 % | | | | |
| | 41,138 | | | FUJIFILM Holdings Corp. (ADR) | | | 1,860,260 | |
| | | | | | | | |
| | |
| | | | OIL & GAS - 5.2 % | | | | |
| | 48,100 | | | Eni SpA (ADR) | | | 1,811,446 | |
| | 131,000 | | | EQUINOR ASA (ADR) | | | 3,694,200 | |
| | | | | | | | |
| | | | | | | 5,505,646 | |
| | | | | | | | |
| | | | OIL & GAS SERVICES - 1.4 % | | | | |
| | 47,600 | | | Technip SA * | | | 1,487,500 | |
| | | | | | | | |
| | |
| | | | PHARMACEUTICALS - 2.2 % | | | | |
| | 55,500 | | | Ipsen SA (ADR) | | | 2,344,875 | |
| | | | | | | | |
| | |
| | | | RETAIL - 1.6 % | | | | |
| | 152,400 | | | Arcos Dorados Holdings, Inc. | | | 952,500 | |
| | 100,600 | | | Kingfisher PLC (ADR) | | | 683,074 | |
| | | | | | | | |
| | | | | | | 1,635,574 | |
| | | | | | | | |
| | | | SEMICONDUCTORS - 1.7 % | | | | |
| | 41,300 | | | Infineon Technologies AG (ADR) | | | 938,336 | |
| | 10,500 | | | NXP Semiconductors NV | | | 897,750 | |
| | | | | | | | |
| | | | | | | 1,836,086 | |
| | | | | | | | |
| | | | SOFTWARE - 4.8 % | | | | |
| | 34,200 | | | Amadeus IT Holdings SA (ADR) | | | 3,169,656 | |
| | 50,140 | | | Open Text Corp. | | | 1,907,326 | |
| | | | | | | | |
| | | | | | | 5,076,982 | |
| | | | | | | | |
| | | | TELECOMMUNICATIONS - 4.7 % | | | | |
| | 18,600 | | | Nice Ltd. (ADR) * | | | 2,129,142 | |
| | 63,900 | | | Nippon Telegraph & Telephone Corp. (ADR) | | | 2,878,376 | |
| | | | | | | | |
| | | | | | | 5,007,518 | |
| | | | | | | | |
| | | | TRANSPORTATION - 2.5 % | | | | |
| | 12,800 | | | Canadian Pacific Railway Ltd. | | | 2,712,831 | |
| | | | | | | | |
| | |
| | | | TRUCKING & LEASING - 2.1 % | | | | |
| | 36,600 | | | AerCap Holdings NV * | | | 2,105,231 | |
| | | | | | | | |
| | |
| | | | TOTAL COMMON STOCK (Cost $92,529,179) | | | 104,947,129 | |
| | | | | | | | |
| | |
| | | | MONEY MARKET FUND - 1.3 % | | | | |
| | 1,366,888 | | | Fidelity Institutional Money Market Funds - Government Portfolio - Class I, 1.95% (A) (Cost $1,366,888) | | | 1,366,888 | |
| | | | | | | | |
| | |
| | | | TOTAL INVESTMENTS - 99.5 % (Cost $93,896,067) | | $ | 106,314,017 | |
| | | | OTHER ASSETS IN EXCESS OF LIABILITIES - NET - 0.5 % | | | 541,152 | |
| | | | | | | | |
| | | | NET ASSETS - 100.0 % | | $ | 106,855,169 | |
| | | | | | | | |
The accompanying notes are an integral part of these financial statements.
42
Schedule of Investments | International Fund
As of September 30, 2018 (Continued)
*Non-income producing securities.
ADR - American Depositary Receipt.
PLC - Public Limited Co.
(A) Variable rate security; the rate shown represents the yield at September 30, 2018.
| | | | |
| Diversification of Assets | | | |
| |
| Country | | | % of Net Assets | |
| |
| Japan | | | 15.5% | |
| France | | | 9.8% | |
| Britain | | | 9.5% | |
| Norway | | | 8.6% | |
| Hong Kong | | | 7.6% | |
| Canada | | | 6.8% | |
| Belgium | | | 5.9% | |
| Germany | | | 5.6% | |
| China | | | 4.8% | |
| Ireland | | | 3.9% | |
| Italy | | | 3.9% | |
| Israel | | | 3.6% | |
| Singapore | | | 3.0% | |
| Spain | | | 3.0% | |
| Russia | | | 1.9% | |
| United States | | | 1.7% | |
| Sweden | | | 1.3% | |
| Uruguay | | | 0.9% | |
| Netherlands | | | 0.9% | |
| Total | | | 98.2% | |
| | | | |
| Money Market Fund | | | 1.3% | |
| Other Assets Less Liabilities - Net | | | 0.5% | |
| | | | |
| Grand Total | | | 100.0% | |
| | | | |
The accompanying notes are an integral part of these financial statements.
43
Schedule of Investments | Large/Mid Cap Growth Fund
As of September 30, 2018
| | | | | | | | |
| Shares | | | | | Fair Value | |
| | |
| | |
| | | | COMMON STOCK - 95.4 % | | | | |
| | | | AEROSPACE/DEFENSE - 1.9 % | | | | |
| | 9,596 | | | General Dynamics Corp. | | $ | �� 1,964,493 | |
| | | | | | | | |
| | |
| | | | APPAREL - 1.0 % | | | | |
| | 10,753 | | | VF Corp. | | | 1,004,868 | |
| | | | | | | | |
| | |
| | | | AUTO PARTS & EQUIPMENT - 0.6 % | | | | |
| | 7,615 | | | Aptiv PLC | | | 638,899 | |
| | | | | | | | |
| | |
| | | | BANKS - 4.1 % | | | | |
| | 27,603 | | | East West Bancorp, Inc. | | | 1,666,393 | |
| | 5,701 | | | SVB Financial Group * | | | 1,772,042 | |
| | 13,298 | | | Western Alliance Bancorp * | | | 756,523 | |
| | | | | | | | |
| | | | | | | 4,194,958 | |
| | | | | | | | |
| | | | BIOTECHNOLOGY - 3.1 % | | | | |
| | 23,031 | | | Celgene Corp. * | | | 2,061,044 | |
| | 2,791 | | | Sage Therapeutics, Inc. * | | | 394,229 | |
| | 3,542 | | | Vertex Pharmaceuticals, Inc. * | | | 682,685 | |
| | | | | | | | |
| | | | | | | 3,137,958 | |
| | | | | | | | |
| | | | CHEMICALS - 5.1 % | | | | |
| | 11,822 | | | Albemarle Corp. | | | 1,179,599 | |
| | 8,965 | | | FMC Corp. | | | 781,569 | |
| | 11,161 | | | LyondellBasell Industries NV | | | 1,144,114 | |
| | 4,637 | | | Sherwin-Williams Co. | | | 2,110,809 | |
| | | | | | | | |
| | | | | | | 5,216,091 | |
| | | | | | | | |
| | | | COMMERCIAL SERVICES - 2.1 % | | | | |
| | 6,277 | | | Grand Canyon Education, Inc. * | | | 708,046 | |
| | 2,273 | | | MarketAxess Holdings, Inc. | | | 405,708 | |
| | 5,013 | | | WEX, Inc. * | | | 1,006,410 | |
| | | | | | | | |
| | | | | | | 2,120,164 | |
| | | | | | | | |
| | | | COMPUTERS - 3.1 % | | | | |
| | 11,090 | | | Nutanix, Inc. * | | | 473,765 | |
| | 17,329 | | | Varonis Systems, Inc. * | | | 1,269,349 | |
| | 24,462 | | | Western Digital Corp. | | | 1,432,005 | |
| | | | | | | | |
| | | | | | | 3,175,119 | |
| | | | | | | | |
| | | | DIVERSIFIED FINANCIAL SERVICES - 1.9 % | | | | |
| | 26,415 | | | Intercontinental Exchange, Inc. | | | 1,978,219 | |
| | | | | | | | |
| | |
| | | | ELECTRICAL COMPONENTS & EQUIPMENT - 1.2 % | | | | |
| | 15,311 | | | Emerson Electric Co. | | | 1,172,516 | |
| | | | | | | | |
| | |
| | | | ELECTRONICS - 8.7 % | | | | |
| | 18,298 | | | Amphenol Corp. - Class A | | | 1,720,378 | |
| | 12,459 | | | Fortive Corp. | | | 1,049,048 | |
| | 17,459 | | | Honeywell International, Inc. | | | 2,905,178 | |
| | 6,795 | | | Keysight Technologies, Inc. * | | | 450,373 | |
| | 24,695 | | | TE Connectivity Ltd. | | | 2,171,431 | |
| | 11,762 | | | Trimble, Inc. * | | | 511,177 | |
| | | | | | | | |
| | | | | | | 8,807,585 | |
| | | | | | | | |
| | | | ENTERTAINMENT - 0.6 % | | | | |
| | 2,147 | | | Vail Resorts, Inc. | | | 589,180 | |
| | | | | | | | |
| | |
| | | | FOOD - 3.0 % | | | | |
| | 23,083 | | | McCormick & Co., Inc. | | | 3,041,185 | |
| | | | | | | | |
| | |
| | | | HAND/MACHINE TOOLS - 1.1 % | | | | |
| | 7,683 | | | Stanley Black & Decker, Inc. | | | 1,125,099 | |
| | | | | | | | |
| | |
| | | | HEALTHCARE - PRODUCTS - 4.4 % | | | | |
| | 1,167 | | | ABIOMED, Inc. * | | | 524,858 | |
| | 4,680 | | | Edwards Lifesciences Corp. * | | | 814,788 | |
| | 6,323 | | | Henry Schein, Inc. * | | | 537,645 | |
| | 13,287 | | | Insulet Corp. * | | | 1,407,758 | |
| | 4,647 | | | Teleflex, Inc. | | | 1,236,520 | |
| | | | | | | | |
| | | | | | | 4,521,569 | |
| | | | | | | | |
The accompanying notes are an integral part of these financial statements.
44
Schedule of Investments | Large/Mid Cap Growth Fund
As of September 30, 2018 (Continued)
| | | | | | | | |
| | |
| Shares | | | | | Fair Value | |
| | |
| | |
| | | | HEALTHCARE - SERVICES - 0.9 % | | | | |
| | 6,305 | | | Centene Corp. * | | $ | 912,838 | |
| | | | | | | | |
| | |
| | | | INSURANCE - 1.8 % | | | | |
| | 24,487 | | | Arthur J. Gallagher & Co. | | | 1,822,812 | |
| | | | | | | | |
| | |
| | | | INTERNET - 4.7 % | | | | |
| | 28,267 | | | CDW Corp. | | | 2,513,502 | |
| | 4,337 | | | GrubHub, Inc. * | | | 601,195 | |
| | 7,535 | | | Palo Alto Networks, Inc. * | | | 1,697,334 | |
| | | | | | | | |
| | | | | | | 4,812,031 | |
| | | | | | | | |
| | | | MACHINERY - CONSTRUCTION & MINING - 3.6 % | | | | |
| | 8,938 | | | BWX Technologies, Inc. | | | 558,983 | |
| | 15,131 | | | Caterpillar, Inc. | | | 2,307,326 | |
| | 10,772 | | | Oshkosh Corp. | | | 767,397 | |
| | | | | | | | |
| | | | | | | 3,633,706 | |
| | | | | | | | |
| | | | OIL & GAS - 3.7 % | | | | |
| | 3,172 | | | Concho Resources, Inc. * | | | 484,523 | |
| | 32,071 | | | ConocoPhillips | | | 2,482,295 | |
| | 5,956 | | | Diamondback Energy, Inc. | | | 805,192 | |
| | | | | | | | |
| | | | | | | 3,772,010 | |
| | | | | | | | |
| | | | PACKAGING & CONTAINERS - 0.8 % | | | | |
| | 7,814 | | | Packaging Corporation of America | | | 857,118 | |
| | | | | | | | |
| | |
| | | | PHARMACEUTICALS - 6.4 % | | | | |
| | 25,669 | | | AbbVie, Inc. | | | 2,427,774 | |
| | 7,694 | | | Neurocrine Biosciences, Inc. * | | | 945,977 | |
| | 6,992 | | | Sarepta Therapeutics, Inc. * | | | 1,129,278 | |
| | 21,888 | | | Zoetis, Inc. | | | 2,004,065 | |
| | | | | | | | |
| | | | | | | 6,507,094 | |
| | | | | | | | |
| | | | RETAIL - 11.7 % | | | | |
| | 6,770 | | | Burlington Stores, Inc. * | | | 1,102,968 | |
| | 8,452 | | | Costco Wholesale Corp. | | | 1,985,206 | |
| | 38,298 | | | Lowe’s Cos, Inc. | | | 4,397,376 | |
| | 2,855 | | | Lululemon Athletica, Inc. * | | | 463,909 | |
| | 5,009 | | | O’Reilly Automotive, Inc. * | | | 1,739,726 | |
| | 22,635 | | | Restaurant Brands International, Inc. | | | 1,341,803 | |
| | 12,708 | | | Texas Roadhouse, Inc. | | | 880,537 | |
| | | | | | | | |
| | | | | | | 11,911,525 | |
| | | | | | | | |
| | | | SEMICONDUCTORS - 9.3 % | | | | |
| | 24,109 | | | Advanced Micro Devices, Inc. * | | | 744,727 | |
| | 6,568 | | | Broadcom Ltd. | | | 1,620,523 | |
| | 23,480 | | | Maxim Integrated Products, Inc. | | | 1,324,037 | |
| | 32,208 | | | Micron Technology, Inc. * | | | 1,456,768 | |
| | 5,929 | | | Monolithic Power Systems, Inc. | | | 744,267 | |
| | 7,660 | | | NVIDIA Corp. | | | 2,152,613 | |
| | 16,628 | | | NXP Semiconductors NV | | | 1,421,694 | |
| | | | | | | | |
| | | | | | | 9,464,629 | |
| | | | | | | | |
| | | | SOFTWARE - 7.2 % | | | | |
| | 10,619 | | | Fidelity National Information Services, Inc. | | | 1,158,214 | |
| | 22,426 | | | InterXion Holding NV * | | | 1,509,270 | |
| | 14,442 | | | PTC, Inc. * | | | 1,533,596 | |
| | 47,853 | | | Rapid7, Inc. * | | | 1,766,733 | |
| | 1,608 | | | ServiceNow, Inc. * | | | 314,573 | |
| | 3,243 | | | Ultimate Software Group, Inc. * | | | 1,044,862 | |
| | | | | | | | |
| | | | | | | 7,327,248 | |
| | | | | | | | |
| | | | TELECOMMUNICATIONS - 1.2 % | | | | |
| | 75,864 | | | Vonage Holdings Corp. * | | | 1,074,234 | |
| | | | | | | | |
The accompanying notes are an integral part of these financial statements.
45
Schedule of Investments | Large/Mid Cap Growth Fund
As of September 30, 2018 (Continued)
| | | | | | | | |
| | |
| Shares | | | | | Fair Value | |
| | |
| | |
| | | | TRANSPORTATION - 2.2 % | | | | |
| | 12,675 | | | JB Hunt Transport Services, Inc. | | $ | 1,507,565 | |
| | 6,766 | | | XPO Logistics, Inc. * | | | 772,473 | |
| | | | | | | | |
| | | | | | | 2,280,038 | |
| | | | | | | | |
| | |
| | | | TOTAL COMMON STOCK (Cost $78,265,125) | | | 97,063,186 | |
| | | | | | | | |
| | |
| | | | MONEY MARKET FUND - 4.6 % | | | | |
| | 4,731,497 | | | Fidelity Institutional Money Market Funds - Government Portfolio - Class I, 1.95% (A) (Cost $4,731,497) | | | 4,731,497 | |
| | | | | | | | |
| | |
| | | | TOTAL INVESTMENTS - 100.0 % (Cost $82,996,622) | | $ | 101,794,683 | |
| | | | OTHER ASSETS IN EXCESS OF LIABILITIES - NET - 0.0 % | | | 8,609 | |
| | | | | | | | |
| | | | NET ASSETS - 100.0 % | | $ | 101,803,292 | |
| | | | | | | | |
*Non-income producing securities.
PLC - Public Limited Co.
(A) Variable rate security; the rate shown represents the yield at September 30, 2018.
The accompanying notes are an integral part of these financial statements.
46
Schedule of Investments | Small Cap Value Fund
As of September 30, 2018
| | | | | | | | |
| | |
| Shares | | | | | Fair Value | |
| | |
| | |
| | | | COMMON STOCK - 86.5 % | | | | |
| | | | AEROSPACE/DEFENSE - 3.2 % | | | | |
| | 18,645 | | | Esterline Technologies Corp. * | | $ | 1,695,763 | |
| | 53,890 | | | Kaman Corp. | | | 3,598,774 | |
| | | | | | | | |
| | | | | | | 5,294,537 | |
| | | | | | | | |
| | | | APPAREL - 2.0 % | | | | |
| | 36,751 | | | Oxford Industries, Inc. | | | 3,314,940 | |
| | | | | | | | |
| | |
| | | | AUTO PARTS & EQUIPMENT - 5.0 % | | | | |
| | 80,420 | | | Douglas Dynamics, Inc. | | | 3,530,438 | |
| | 35,145 | | | Gentherm, Inc. * | | | 1,597,340 | |
| | 87,344 | | | Methode Electronics, Inc. | | | 3,161,853 | |
| | | | | | | | |
| | | | | | | 8,289,631 | |
| | | | | | | | |
| | | | BANKS - 15.9 % | | | | |
| | 85,914 | | | Columbia Banking System, Inc. | | | 3,330,886 | |
| | 37,935 | | | Glacier Bancorp, Inc. | | | 1,634,619 | |
| | 81,230 | | | Great Western Bancorp, Inc. | | | 3,427,094 | |
| | 128,350 | | | Hanmi Financial Corp. | | | 3,195,915 | |
| | 99,244 | | | Heritage Commerce Corp. | | | 1,480,720 | |
| | 73,434 | | | Legacy Texas Financial Group, Inc. | | | 3,128,288 | |
| | 78,000 | | | Renasant Corp. | | | 3,214,380 | |
| | 85,245 | | | ServisFirst Bancshares, Inc. | | | 3,337,342 | |
| | 42,415 | | | South State Corp. | | | 3,478,030 | |
| | | | | | | | |
| | | | | | | 26,227,274 | |
| | | | | | | | |
| | | | BUILDING MATERIALS - 7.3 % | | | | |
| | 36,161 | | | Apogee Enterprises, Inc. | | | 1,494,173 | |
| | 95,271 | | | Continental Building Products, Inc. * | | | 3,577,426 | |
| | 194,219 | | | Summit Materials, Inc. - Class A * | | | 3,530,901 | |
| | 96,925 | | | Universal Forest Products, Inc. | | | 3,424,360 | |
| | | | | | | | |
| | | | | | | 12,026,860 | |
| | | | | | | | |
| | | | CHEMICALS - 2.2 % | | | | |
| | 47,091 | | | Innospec, Inc. | | | 3,614,234 | |
| | | | | | | | |
| | |
| | | | COMMERCIAL SERVICES - 1.0 % | | | | |
| | 73,555 | | | Carriage Services, Inc. | | | 1,585,110 | |
| | | | | | | | |
| | |
| | | | ELECTRICAL COMPONENTS & EQUIPMENT - 2.1 % | | | | |
| | 51,356 | | | Novanta, Inc. * | | | 3,512,750 | |
| | | | | | | | |
| | |
| | | | ELECTRONICS - 1.0 % | | | | |
| | 20,765 | | | OSI Systems, Inc. * | | | 1,584,577 | |
| | | | | | | | |
| | |
| | | | ENGINEERING & CONSTRUCTION - 2.0 % | | | | |
| | 59,105 | | | Comfort Systems USA, Inc. | | | 3,333,522 | |
| | | | | | | | |
| | |
| | | | FOOD - 5.2 % | | | | |
| | 290,380 | | | Hostess Brands, Inc. * | | | 3,214,507 | |
| | 23,003 | | | J & J Snack Foods Corp. | | | 3,470,923 | |
| | 90,975 | | | Nomad Foods Ltd. * | | | 1,843,154 | |
| | | | | | | | |
| | | | | | | 8,528,584 | |
| | | | | | | | |
| | | | GAS - 1.1 % | | | | |
| | 49,910 | | | South Jersey Industries, Inc. | | | 1,760,326 | |
| | | | | | | | |
| | |
| | | | HEALTHCARE - PRODUCTS - 1.6 % | | | | |
| | 32,531 | | | CONMED Corp. | | | 2,577,106 | |
| | | | | | | | |
| | |
| | | | HOME BUILDERS - 1.9 % | | | | |
| | 81,089 | | | Installed Building Products, Inc. * | | | 3,162,471 | |
| | | | | | | | |
| | |
| | | | INSURANCE - 5.1 % | | | | |
| | 45,425 | | | Aspen Insurance Holdings Ltd. | | | 1,898,765 | |
| | 71,852 | | | Employers Holdings, Inc. | | | 3,254,896 | |
| | 32,460 | | | Mercury General Corp. | | | 1,628,194 | |
| | 17,897 | | | Safety Insurance Group, Inc. | | | 1,603,571 | |
| | | | | | | | |
| | | | | | | 8,385,426 | |
| | | | | | | | |
The accompanying notes are an integral part of these financial statements.
47
Schedule of Investments | Small Cap Value Fund
As of September 30, 2018 (Continued)
| | | | | | | | |
| | |
| Shares | | | | | Fair Value | |
| | |
| | |
| | | | MACHINERY - 4.4 % | | | | |
| | 20,537 | | | Alamo Group, Inc. | | $ | 1,881,395 | |
| | 43,629 | | | Albany International Corp. - Class A | | | 3,468,506 | |
| | 47,900 | | | Columbus McKinnon Corp. | | | 1,893,966 | |
| | | | | | | | |
| | | | | | | 7,243,867 | |
| | | | | | | | |
| | | | MISCELLANEOUS MANUFACTURER - 1.1 % | | | | |
| | 41,024 | | | Lydall, Inc. * | | | 1,768,134 | |
| | | | | | | | |
| | |
| | | | OFFICE FURNISHINGS - 3.8 % | | | | |
| | 145,855 | | | Interface, Inc. | | | 3,405,714 | |
| | 118,345 | | | Knoll, Inc. | | | 2,775,190 | |
| | | | | | | | |
| | | | | | | 6,180,904 | |
| | | | | | | | |
| | | | OIL & GAS - 8.3 % | | | | |
| | 292,645 | | | Callon Petroleum Co. * | | | 3,508,814 | |
| | 130,201 | | | Jagged Peak Energy, Inc. * | | | 1,800,680 | |
| | 34,142 | | | Penn Virginia Corp. * | | | 2,749,797 | |
| | 55,886 | | | Resolute Energy Corp. * | | | 2,113,050 | |
| | 389,337 | | | SRC Energy, Inc. * | | | 3,461,206 | |
| | | | | | | | |
| | | | | | | 13,633,547 | |
| | | | | | | | |
| | | | OIL & GAS SERVICES - 1.5 % | | | | |
| | 158,580 | | | ProPetro Holding Corp. * | | | 2,614,984 | |
| | | | | | | | |
| | |
| | | | RETAIL - 3.8 % | | | | |
| | 60,323 | | | BJ’s Wholesale Club Holdings, Inc. * | | | 1,615,450 | |
| | 35,820 | | | Lithia Motors, Inc. | | | 2,925,061 | |
| | 39,079 | | | Sonic Corp. | | | 1,693,684 | |
| | | | | | | | |
| | | | | | | 6,234,195 | |
| | | | | | | | |
| | | | SAVINGS & LOANS - 3.0 % | | | | |
| | 90,915 | | | Banc of California, Inc. | | | 1,718,294 | |
| | 81,928 | | | Berkshire Hills Bancorp, Inc. | | | 3,334,470 | |
| | | | | | | | |
| | | | | | | 5,052,764 | |
| | | | | | | | |
| | | | SEMICONDUCTORS - 1.8 % | | | | |
| | 83,025 | | | Brooks Automation, Inc. | | | 2,908,365 | |
| | | | | | | | |
| | |
| | | | SOFTWARE - 2.2 % | | | | |
| | 50,785 | | | Omnicell, Inc. * | | | 3,651,441 | |
| | | | | | | | |
| | |
| | | | TOTAL COMMON STOCK (Cost $126,894,380) | | | 142,485,549 | |
| | | | | | | | |
| | |
| | | | REITs - 12.9 % | | | | |
| | 118,208 | | | Americold Realty Trust | | | 2,957,564 | |
| | 78,625 | | | Columbia Property Trust, Inc. | | | 1,858,695 | |
| | 170,109 | | | Easterly Government Properties, Inc. | | | 3,295,011 | |
| | 53,245 | | | Potlatch Corp. | | | 2,180,383 | |
| | 182,375 | | | Ramco-Gershenson Properties Trust | | | 2,480,300 | |
| | 124,360 | | | STAG Industrial, Inc. | | | 3,419,900 | |
| | 254,007 | | | Summit Hotel Properties, Inc. | | | 3,436,715 | |
| | 45,003 | | | Terreno Realty Corp. | | | 1,696,611 | |
| | | | | | | | |
| | | | TOTAL REITs (Cost $20,239,896) | | | 21,325,179 | |
| | | | | | | | |
The accompanying notes are an integral part of these financial statements.
48
Schedule of Investments | Small Cap Value Fund
As of September 30, 2018 (Continued)
| | | | | | | | |
| | |
| Shares | | | | | Fair Value | |
| | |
| | |
| | | | MONEY MARKET FUND - 2.0 % | | | | |
| | 3,288,923 | | | Fidelity Institutional Money Market Funds - Government Portfolio - Class I, 1.95% (A) | | $ | 3,288,923 | |
| | | | | | | | |
| | | | (Cost $3,288,923) | | | | |
| | |
| | | | TOTAL INVESTMENTS - 101.4 % (Cost $150,423,199) | | $ | 167,099,651 | |
| | | | OTHER ASSETS IN EXCESS OF LIABILITIES - NET - (1.4) % | | | (2,371,801) | |
| | | | | | | | |
| | | | NET ASSETS - 100.0 % | | $ | 164,727,850 | |
| | | | | | | | |
* Non-income producing securities.
REITs - Real Estate Investment Trust.
(A) Variable rate security; the rate shown represents the yield at September 30, 2018.
The accompanying notes are an integral part of these financial statements.
49
Schedule of Investments | Large/Mid Cap Value Fund
As of September 30, 2018
| | | | | | | | |
| | |
| Shares | | | | | Fair Value | |
| | |
| | |
| | | | COMMON STOCK - 90.8 % | | | | |
| | | | AEROSPACE/DEFENSE - 5.1 % | | | | |
| | 44,050 | | | Curtiss-Wright Corp. | | $ | 6,053,351 | |
| | 28,780 | | | General Dynamics Corp. | | | 5,891,842 | |
| | | | | | | | |
| | | | | | | 11,945,193 | |
| | | | | | | | |
| | | | BANKS - 7.2 % | | | | |
| | 97,650 | | | Chemical Financial Corp. | | | 5,214,510 | |
| | 53,900 | | | East West Bancorp, Inc. | | | 3,253,943 | |
| | 8,736 | | | SVB Financial Group * | | | 2,715,411 | |
| | 98,815 | | | Western Alliance Bancorp * | | | 5,621,585 | |
| | | | | | | | |
| | | | | | | 16,805,449 | |
| | | | | | | | |
| | | | BUILDING MATERIALS - 1.9 % | | | | |
| | 51,900 | | | Eagle Materials, Inc. | | | 4,423,956 | |
| | | | | | | | |
| | |
| | | | CHEMICALS - 3.2 % | | | | |
| | 16,300 | | | Sherwin-Williams Co. | | | 7,419,923 | |
| | | | | | | | |
| | |
| | | | COMPUTERS - 2.3 % | | | | |
| | 80,785 | | | Amdocs Ltd. | | | 5,330,194 | |
| | | | | | | | |
| | |
| | | | DIVERSIFIED FINANCIAL SERVICES - 2.7 % | | | | |
| | 84,870 | | | Intercontinental Exchange, Inc. | | | 6,355,914 | |
| | | | | | | | |
| | |
| | | | ELECTRIC - 5.2 % | | | | |
| | 122,300 | | | CMS Energy Corp. | | | 5,992,700 | |
| | 55,800 | | | DTE Energy Co. | | | 6,089,454 | |
| | | | | | | | |
| | | | | | | 12,082,154 | |
| | | | | | | | |
| | | | ELECTRIC COMPONENTS & EQUIPMENT - 3.5 % | | | | |
| | 48,530 | | | Energizer Holdings, Inc. | | | 2,846,285 | |
| | 40,500 | | | Hubbell, Inc. | | | 5,409,585 | |
| | | | | | | | |
| | | | | | | 8,255,870 | |
| | | | | | | | |
| | | | ELECTRONICS - 14.6 % | | | | |
| | 70,740 | | | Amphenol Corp. - Class A | | | 6,650,975 | |
| | 96,800 | | | Avnet, Inc. | | | 4,333,736 | |
| | 102,450 | | | FLIR Systems, Inc. | | | 6,297,602 | |
| | 36,245 | | | Honeywell International, Inc. | | | 6,031,168 | |
| | 121,500 | | | nVent Electric PLC * | | | 3,299,940 | |
| | 75,900 | | | PerkinElmer, Inc. | | | 7,382,793 | |
| | | | | | | | |
| | | | | | | 33,996,214 | |
| | | | | | | | |
| | | | ENVIRONMENTAL CONTROL - 1.5 % | | | | |
| | 78,500 | | | Pentair PLC | | | 3,402,975 | |
| | | | | | | | |
| | |
| | | | FOOD - 6.3 % | | | | |
| | 140,500 | | | Flowers Foods, Inc. | | | 2,621,730 | |
| | 49,990 | | | JM Smucker Co. | | | 5,129,474 | |
| | 52,300 | | | McCormick & Co., Inc. | | | 6,890,525 | |
| | | | | | | | |
| | | | | | | 14,641,729 | |
| | | | | | | | |
| | | | HEALTHCARE - PRODUCTS - 4.9 % | | | | |
| | 79,800 | | | Dentsply Sirona, Inc. | | | 3,011,652 | |
| | 114,800 | | | Patterson Companies, Inc. | | | 2,806,860 | |
| | 49,730 | | | STERIS PLC | | | 5,689,112 | |
| | | | | | | | |
| | | | | | | 11,507,624 | |
| | | | | | | | |
| | | | INSURANCE - 5.4 % | | | | |
| | 86,500 | | | Arthur J. Gallagher & Co. | | | 6,439,060 | |
| | 27,220 | | | Everest Re Group Ltd. | | | 6,218,953 | |
| | | | | | | | |
| | | | | | | 12,658,013 | |
| | | | | | | | |
| | | | MEDIA - 2.5 % | | | | |
| | 6,682 | | | Cable One, Inc. | | | 5,904,282 | |
| | | | | | | | |
| | |
| | | | MISCELLANEOUS MANUFACTURING - 1.3 % | | | | |
| | 34,750 | | | Eaton Corp. PLC | | | 3,013,868 | |
| | | | | | | | |
The accompanying notes are an integral part of these financial statements.
50
Schedule of Investments | Large/Mid Cap Value Fund
As of September 30, 2018 (Continued)
| | | | | | | | |
| | |
| Shares | | | | | Fair Value | |
| | |
| | |
| | | | OIL & GAS - 6.8 % | | | | |
| | 45,500 | | | Diamondback Energy, Inc. | | $ | 6,151,145 | |
| | 50,585 | | | EOG Resources, Inc. | | | 6,453,128 | |
| | 42,100 | | | Marathon Petroleum Corp. | | | 3,366,737 | |
| | | | | | | | |
| | | | | | | 15,971,010 | |
| | | | | | | | |
| | | | OIL & GAS SERVICES - 0.8 % | | | | |
| | 46,305 | | | Halliburton Co. | | | 1,876,742 | |
| | | | | | | | |
| | |
| | | | RETAIL - 3.5 % | | | | |
| | 19,425 | | | Advance Auto Parts, Inc. | | | 3,269,810 | |
| | 49,900 | | | Genuine Parts Co. | | | 4,960,060 | |
| | | | | | | | |
| | | | | | | 8,229,870 | |
| | | | | | | | |
| | | | SEMICONDUCTORS - 5.7 % | | | | |
| | 51,200 | | | KLA - Tencor Corp. | | | 5,207,552 | |
| | 16,500 | | | Lam Research Corp. | | | 2,503,050 | |
| | 100,800 | | | Maxim Integrated Products, Inc. | | | 5,684,112 | |
| | | | | | | | |
| | | | | | | 13,394,714 | |
| | | | | | | | |
| | | | SOFTWARE - 1.7 % | | | | |
| | 29,650 | | | Broadridge Financial Solutions, Inc. | | | 3,912,318 | |
| | | | | | | | |
| | |
| | | | TEXTILES - 1.4 % | | | | |
| | 18,800 | | | Mohawk Industries, Inc. * | | | 3,296,580 | |
| | | | | | | | |
| | |
| | | | TRANSPORTATION - 3.3 % | | | | |
| | 47,900 | | | Union Pacific Corp. | | | 7,799,556 | |
| | | | | | | | |
| | |
| | | | TOTAL COMMON STOCK (Cost $169,436,912) | | | 212,224,148 | |
| | | | | | | | |
| | |
| | | | REITs - 5.3 % | | | | |
| | 28,825 | | | Public Storage | | | 5,811,985 | |
| | 36,925 | | | Simon Property Group, Inc. | | | 6,526,494 | |
| | | | | | | | |
| | | | TOTAL REITs (Cost $13,477,918) | | | 12,338,479 | |
| | | | | | | | |
| | |
| | | | MONEY MARKET FUND - 3.1 % | | | | |
| | 7,176,332 | | | Fidelity Institutional Money Market Funds - Government Portfolio - Class I, 1.95% (A) | | | 7,176,332 | |
| | | | | | | | |
| | | | (Cost $7,176,332) | | | | |
| | |
| | | | TOTAL INVESTMENTS - 99.2 % (Cost $190,091,162) | | $ | 231,738,959 | |
| | | | OTHER ASSETS IN EXCESS OF LIABILITIES - NET - 0.8 % | | | 1,849,601 | |
| | | | | | | | |
| | | | NET ASSETS - 100.0 % | | $ | 233,588,560 | |
| | | | | | | | |
* Non-income producing securities.
PLC - Public Limited Co.
REITs - Real Estate Investment Trust.
(A) Variable rate security; the rate shown represents the yield at September 30, 2018.
The accompanying notes are an integral part of these financial statements.
51
Schedule of Investments | Fixed Income Fund
As of September 30, 2018
| | | | | | | | | | | | | | | | |
| | |
| Par Value | | | | | Coupon Rate (%) | | | Maturity | | | Fair Value | |
| | |
| | | | |
| | | | BONDS & NOTES - 96.5 % | | | | | | | | | | | | |
| | | | CORPORATE BONDS - 33.3 % | | | | | | | | | | | | |
| | $ 1,000,000 | | | ABB Finance USA, Inc. | | | 2.875 | | | | 5/8/2022 | | | $ | 981,942 | |
| | 1,000,000 | | | Abbvie, Inc. | | | 3.200 | | | | 5/14/2026 | | | | 932,682 | |
| | 1,000,000 | | | American Electric Power | | | 3.200 | | | | 11/13/2027 | | | | 938,641 | |
| | 500,000 | | | Analog Devices, Inc. | | | 3.900 | | | | 12/15/2025 | | | | 491,526 | |
| | 1,000,000 | | | Boardwalk Pipelines LP | | | 5.750 | | | | 9/15/2019 | | | | 1,024,655 | |
| | 1,000,000 | | | Broadridge Financial Solutions, Inc. | | | 3.400 | | | | 6/27/2026 | | | | 949,168 | |
| | 1,000,000 | | | Buckeye Partners LP | | | 3.950 | | | | 12/1/2026 | | | | 923,567 | |
| | 1,000,000 | | | Canadian Pacific RR Co. | | | 2.900 | | | | 2/1/2025 | | | | 952,063 | |
| | 1,000,000 | | | CBOE Holdings, Inc. | | | 3.650 | | | | 1/12/2027 | | | | 959,588 | |
| | 1,000,000 | | | Celgene Corp. | | | 3.875 | | | | 8/15/2025 | | | | 986,607 | |
| | 1,000,000 | | | Columbia Pipeline Group, Inc. | | | 4.500 | | | | 6/1/2025 | | | | 1,012,394 | |
| | 1,000,000 | | | CSX Corp. | | | 3.250 | | | | 6/1/2027 | | | | 949,446 | |
| | 1,000,000 | | | Delphi Automotive Systems Corp. | | | 4.150 | | | | 3/15/2024 | | | | 1,003,142 | |
| | 500,000 | | | Digital Realty Trust LP | | | 3.700 | | | | 8/15/2027 | | | | 475,885 | |
| | 500,000 | | | Dollar General Corp. | | | 4.125 | | | | 5/1/2028 | | | | 494,063 | |
| | 750,000 | | | Eaton Corp. | | | 2.750 | | | | 11/2/2022 | | | | 728,569 | |
| | 1,000,000 | | | Enable Midstream Partners LP | | | 3.900 | | | | 5/15/2024 | | | | 968,872 | |
| | 750,000 | | | Husky Energy, Inc. | | | 3.950 | | | | 4/15/2022 | | | | 756,790 | |
| | 906,076 | | | John Sevier Combined Cycle Generation LLC | | | 4.626 | | | | 1/15/2042 | | | | 970,320 | |
| | 750,000 | | | Johnson Controls, Inc. | | | 5.000 | | | | 3/30/2020 | | | | 765,326 | |
| | 1,000,000 | | | Kennametal, Inc. | | | 3.875 | | | | 2/15/2022 | | | | 992,546 | |
| | 800,000 | | | LYB International Finance BV | | | 4.000 | | | | 7/15/2023 | | | | 801,578 | |
| | 1,500,000 | | | NiSource Finance Corp. | | | 3.490 | | | | 5/15/2027 | | | | 1,425,212 | |
| | 1,000,000 | | | Nutrien Ltd. | | | 4.000 | | | | 12/15/2026 | | | | 968,465 | |
| | 1,000,000 | | | Phillips 66 | | | 3.605 | | | | 2/15/2025 | | | | 965,845 | |
| | 1,000,000 | | | Stanley Black & Decker, Inc. | | | 2.900 | | | | 11/1/2022 | | | | 979,044 | |
| | 700,000 | | | Sunoco Logistics Partners LP | | | 4.250 | | | | 4/1/2024 | | | | 698,543 | |
| | 1,200,000 | | | Ventas Realty LP/CAP Corp. | | | 3.250 | | | | 8/15/2022 | | | | 1,178,331 | |
| | 1,000,000 | | | Zimmer Biomet Holdings, Inc. | | | 2.700 | | | | 4/1/2020 | | | | 990,640 | |
| | | | | | | | | | | | | | | | |
| | | | TOTAL CORPORATE BONDS (Cost $27,042,343) | | | | | | | | | | | 26,265,450 | |
| | | | | | | | | | | | | | | | |
| | | | |
| | | | U.S. GOVERNMENT & AGENCY OBLIGATIONS - 63.2 % | | | | | | | | | | | | |
| | | | GOVERNMENT NOTES & BONDS - 37.3 % | | | | | | | | | | | | |
| | 6,400,000 | | | United States Treasury Note | | | 3.125 | | | | 5/15/2021 | | | | 6,442,000 | |
| | 10,915,000 | | | United States Treasury Note | | | 2.125 | | | | 6/30/2022 | | | | 10,609,721 | |
| | 5,935,000 | | | United States Treasury Note | | | 2.250 | | | | 11/15/2024 | | | | 5,688,906 | |
| | 3,000,000 | | | United States Treasury Note | | | 2.000 | | | | 8/15/2025 | | | | 2,811,914 | |
| | 1,000,000 | | | United States Treasury Note | | | 1.625 | | | | 2/15/2026 | | | | 907,617 | |
| | 2,500,000 | | | United States Treasury Note | | | 4.500 | | | | 2/15/2036 | | | | 2,967,041 | |
| | | | | | | | | | | | | | | | |
| | | | TOTAL GOVERNMENT NOTES & BONDS (Cost $30,717,302) | | | | | | | | | | | 29,427,199 | |
| | | | | | | | | | | | | | | | |
| | | | |
| | | | GOVERNMENT MORTGAGE-BACKED SECURITIES - 25.9 % | | | | | | | | | | | | |
| | 596,040 | | | GNMA Pool 783060 | | | 4.000 | | | | 8/15/2040 | | | | 610,398 | |
| | 274,405 | | | GNMA Pool 783403 | | | 3.500 | | | | 9/15/2041 | | | | 274,189 | |
| | 335,086 | | | GNMA Pool G2 4520 | | | 5.000 | | | | 8/20/2039 | | | | 357,185 | |
| | 413,490 | | | GNMA Pool G2 4947 | | | 5.000 | | | | 2/20/2041 | | | | 439,006 | |
| | 1,118,529 | | | GNMA Pool G2 MA3376 | | | 3.500 | | | | 1/20/2046 | | | | 1,115,310 | |
| | 787,941 | | | GNMA Pool G2 MA3596 | | | 3.000 | | | | 4/20/2046 | | | | 765,379 | |
| | 2,027,925 | | | GNMA Pool G2 MA3663 | | | 3.500 | | | | 5/20/2046 | | | | 2,020,839 | |
| | 940,422 | | | GNMA Pool G2 MA3735 | | | 3.000 | | | | 6/20/2046 | | | | 912,915 | |
| | 744,179 | | | GNMA Pool G2 MA3736 | | | 3.500 | | | | 6/20/2046 | | | | 741,349 | |
| | 1,205,196 | | | GNMA Pool G2 MA4004 | | | 3.500 | | | | 10/20/2046 | | | | 1,200,056 | |
| | |
The accompanying notes are an integral part of these financial statements.
52
Schedule of Investments | Fixed Income Fund
As of September 30, 2018 (Continued)
| | | | | | | | | | | | | | | | |
| Par Value | | | | | Coupon Rate (%) | | | Maturity | | | Fair Value | |
| | |
| | | |
| | | | GOVERNMENT MORTGAGE-BACKED SECURITIES - 25.9 % (Cont.) | | | | | | | | | |
| | $ 827,821 | | | GNMA Pool G2 MA4509 | | | 3.000 | | | | 6/20/2047 | | | $ | 802,921 | |
| | 1,126,085 | | | GNMA Pool G2 MA4652 | | | 3.500 | | | | 8/20/2047 | | | | 1,120,918 | |
| | 1,535,360 | | | GNMA Pool G2 MA4719 | | | 3.500 | | | | 9/20/2047 | | | | 1,528,315 | |
| | 1,549,866 | | | GNMA Pool G2 MA4778 | | | 3.500 | | | | 10/20/2047 | | | | 1,542,751 | |
| | 1,381,172 | | | GNMA Pool G2 MA4901 | | | 4.000 | | | | 12/20/2047 | | | | 1,406,366 | |
| | 1,292,848 | | | GNMA Pool G2 MA4963 | | | 4.000 | | | | 1/20/2048 | | | | 1,316,436 | |
| | 1,049,612 | | | GNMA Pool G2 MA4964 | | | 4.500 | | | | 1/20/2048 | | | | 1,086,281 | |
| | 1,702,384 | | | GNMA Pool G2 MA5021 | | | 4.500 | | | | 2/20/2048 | | | | 1,761,858 | |
| | 1,466,226 | | | GNMA Pool G2 MA5138 | | | 4.500 | | | | 4/20/2048 | | | | 1,517,450 | |
| | | | | | | | | | | | | | | | |
| | | | TOTAL GOVERNMENT MORTGAGE-BACKED SECURITIES (Cost $21,242,391) | | | | 20,519,922 | |
| | | | | | | | | | | | | | | | |
| | |
| | | | TOTAL U.S. GOVERNMENT & AGENCY OBLIGATIONS (Cost $51,959,693) | | | | 49,947,121 | |
| | | | | | | | | | | | | | | | |
| | |
| | | | TOTAL BONDS AND NOTES (Cost $79,002,036) | | | | 76,212,571 | |
| | | | | | | | | | | | | | | | |
| | | | |
| Shares | | | | | | | | | | | | |
| | | | MONEY MARKET FUND - 2.9 % | | | | | |
| | 2,255,083 | | | Fidelity Institutional Money Market Funds - Government Portfolio - Class I, 1.95% (A) | | | | | | | | 2,255,083 | |
| | | | | | | | | | | | | | | | |
| | | | (Cost $2,255,083) | | | | | | | | | | | | |
| | | | |
| | | | TOTAL INVESTMENTS - 99.4 % (Cost $81,257,119) | | | | | | | | | | $ | 78,467,654 | |
| | | | OTHER ASSETS IN EXCESS OF LIABILITIES - NET - 0.6 % | | | | | | | | | | | 512,827 | |
| | | | | | | | | | | | | | | | |
| | | | NET ASSETS - 100.0 % | | | | | | | | | | $ | 78,980,481 | |
| | | | | | | | | | | | | | | | |
GNMA - Government National Mortgage Association.
LLC - Limited Liability Company.
LP - Limited Partnership.
(A) Variable rate security; the rate shown represents the yield at September 30, 2018.
The accompanying notes are an integral part of these financial statements.
53
Schedule of Investments | High Yield Bond Fund
As of September 30, 2018
| | | | | | | | | | | | | | |
| | |
| Par Value | | | | | Coupon Rate (%) | | Maturity | | | Fair Value | |
| | |
| | | | |
| | | | CORPORATE BONDS - 93.9 % | | | | | | | | | | |
| | $ 1,000,000 | | | Adient Global Holdings Ltd. (A) | | 4.875 | | | 8/15/2026 | | | $ | 893,750 | |
| | 1,000,000 | | | Alliance Resource Finance Corp. (A) | | 7.500 | | | 5/1/2025 | | | | 1,068,750 | |
| | 500,000 | | | Amsted Industries, Inc. (A) | | 5.000 | | | 3/15/2022 | | | | 502,500 | |
| | 500,000 | | | Amsted Industries, Inc. (A) | | 5.375 | | | 9/15/2024 | | | | 497,500 | |
| | 1,000,000 | | | Ashtead Capital, Inc. (A) | | 4.125 | | | 8/15/2025 | | | | 955,000 | |
| | 950,000 | | | B&G Foods, Inc. | | 5.250 | | | 4/1/2025 | | | | 910,813 | |
| | 750,000 | | | BBA US Holdings, Inc. (A) | | 5.375 | | | 5/1/2026 | | | | 752,813 | |
| | 1,000,000 | | | Berry Plastics Corp. | | 5.125 | | | 7/15/2023 | | | | 1,008,750 | |
| | 500,000 | | | Braskem Finance, Ltd. | | 6.450 | | | 2/3/2024 | | | | 535,000 | |
| | 500,000 | | | BWX Technologies, Inc. (A) | | 5.375 | | | 7/15/2026 | | | | 503,125 | |
| | 250,000 | | | Calpine Corp. | | 5.750 | | | 1/15/2025 | | | | 222,188 | |
| | 500,000 | | | Cascades, Inc. (A) | | 5.500 | | | 7/15/2022 | | | | 506,250 | |
| | 500,000 | | | Cemex Finance LLC (A) | | 6.000 | | | 4/1/2024 | | | | 516,265 | |
| | 500,000 | | | Centene Corp. | | 4.750 | | | 1/15/2025 | | | | 500,000 | |
| | 600,000 | | | Community Health Systems, Inc. | | 6.250 | | | 3/31/2023 | | | | 571,320 | |
| | 750,000 | | | Covanta Holding Corp. | | 5.875 | | | 3/1/2024 | | | | 767,588 | |
| | 250,000 | | | Crestwood Midstream Finance Corp. | | 5.750 | | | 4/1/2025 | | | | 256,250 | |
| | 1,000,000 | | | CyrusOne Finance Corp. | | 5.000 | | | 3/15/2024 | | | | 1,021,250 | |
| | 1,000,000 | | | Dana, Inc. | | 5.500 | | | 12/15/2024 | | | | 994,000 | |
| | 750,000 | | | DaVita HealthCare Partners, Inc. | | 5.000 | | | 5/1/2025 | | | | 719,063 | |
| | 500,000 | | | DCP Midstream, LLC, 3 mo. LIBOR + 3.85% (A) (B) | | 6.250 | | | 5/21/2043 | | | | 465,000 | |
| | 1,000,000 | | | Delphi Jersey Holdings PLC (A) | | 5.000 | | | 10/1/2025 | | | | 943,750 | |
| | 500,000 | | | Eldorado Gold Corp. (A) | | 6.125 | | | 12/15/2020 | | | | 476,250 | |
| | 1,000,000 | | | Energy Transfer Equity LP | | 5.875 | | | 1/15/2024 | | | | 1,055,000 | |
| | 1,000,000 | | | Equinix, Inc. | | 5.375 | | | 5/15/2027 | | | | 1,002,500 | |
| | 500,000 | | | Ferrellgas LP | | 6.750 | | | 1/15/2022 | | | | 438,750 | |
| | 750,000 | | | FMG Resources (A) | | 5.125 | | | 5/15/2024 | | | | 732,188 | |
| | 500,000 | | | FTI Consulting, Inc. | | 6.000 | | | 11/15/2022 | | | | 512,800 | |
| | 750,000 | | | Gartner, Inc. (A) | | 5.125 | | | 4/1/2025 | | | | 757,058 | |
| | 500,000 | | | Genesis Energy LP | | 6.750 | | | 8/1/2022 | | | | 512,500 | |
| | 500,000 | | | Geo Group, Inc. | | 5.125 | | | 4/1/2023 | | | | 481,250 | |
| | 500,000 | | | Gibraltar Industries, Inc. | | 6.250 | | | 2/1/2021 | | | | 503,750 | |
| | 500,000 | | | Global Partners LP/ Global Finance Corp. | | 6.250 | | | 7/15/2022 | | | | 500,000 | |
| | 1,000,000 | | | Goodyear Tire & Rubber Co. | | 4.875 | | | 3/15/2027 | | | | 921,250 | |
| | 500,000 | | | IHS Markit Ltd. (A) | | 4.750 | | | 2/15/2025 | | | | 508,515 | |
| | 600,000 | | | Ingevity Corp. (A) | | 4.500 | | | 2/1/2026 | | | | 573,570 | |
| | 100,000 | | | Itron, Inc. (A) | | 5.000 | | | 1/15/2026 | | | | 96,249 | |
| | 250,000 | | | Jagged Peak Energy LLC (A) | | 5.875 | | | 5/1/2026 | | | | 249,374 | |
| | 500,000 | | | Kaiser Aluminum Corp. | | 5.875 | | | 5/15/2024 | | | | 512,350 | |
| | 1,000,000 | | | Koppers, Inc. (A) | | 6.000 | | | 2/15/2025 | | | | 1,002,500 | |
| | 500,000 | | | Magnolia Oil Gas (A) | | 6.000 | | | 8/1/2026 | | | | 500,000 | |
| | 1,000,000 | | | Millicom International Cellular SA (A) | | 5.125 | | | 1/15/2028 | | | | 923,750 | |
| | 1,000,000 | | | MPT Operating Partnership LP | | 5.250 | | | 8/1/2026 | | | | 998,750 | |
| | 500,000 | | | MSCI, Inc. (A) | | 5.375 | | | 5/15/2027 | | | | 511,250 | |
| | 500,000 | | | NGL Energy Partners LP | | 6.875 | | | 10/15/2021 | | | | 509,377 | |
| | 500,000 | | | NGL Energy Partners LP | | 6.125 | | | 3/1/2025 | | | | 471,250 | |
| | 1,000,000 | | | Nova Chemicals Corp. (A) | | 5.250 | | | 6/1/2027 | | | | 933,750 | |
| | 250,000 | | | NRG Energy, Inc. | | 7.250 | | | 5/15/2026 | | | | 272,500 | |
| | 1,000,000 | | | NuStar Logistics LP | | 5.625 | | | 4/28/2027 | | | | 992,500 | |
| | 850,000 | | | Olin Corp. | | 5.125 | | | 9/15/2027 | | | | 824,500 | |
| | 500,000 | | | Parsley Finance Corp. (A) | | 5.250 | | | 8/15/2025 | | | | 500,000 | |
| | 1,000,000 | | | PBF Finance Corp. | | 7.250 | | | 6/15/2025 | | | | 1,052,500 | |
| | 500,000 | | | QTS LP (A) | | 4.750 | | | 11/15/2025 | | | | 481,343 | |
| | 1,000,000 | | | Reynolds Group Issuer, Inc. (A) | | 5.125 | | | 7/15/2023 | | | | 996,250 | |
| | 750,000 | | | Scotts Miracle-Gro Co. | | 5.250 | | | 12/15/2026 | | | | 721,875 | |
| | 1,000,000 | | | Sealed Air Corp. (A) | | 5.250 | | | 4/1/2023 | | | | 1,022,500 | |
| | 500,000 | | | SemGroup LP | | 5.625 | | | 7/15/2022 | | | | 498,750 | |
| | 500,000 | | | SemGroup LP | | 6.375 | | | 3/15/2025 | | | | 493,750 | |
| | 1,000,000 | | | Standard Industries, Inc. (A) | | 5.000 | | | 2/15/2027 | | | | 943,750 | |
| | 500,000 | | | Steel Dynamics, Inc. | | 5.250 | | | 4/15/2023 | | | | 509,275 | |
| | 1,000,000 | | | Suburban Propane Partners LP | | 5.875 | | | 3/1/2027 | | | | 955,000 | |
| | 1,000,000 | | | Summit Midstream Holdings LLC | | 5.750 | | | 4/15/2025 | | | | 967,500 | |
The accompanying notes are an integral part of these financial statements.
54
Schedule of Investments | High Yield Bond Fund
As of September 30, 2018 (Continued)
| | | | | | | | | | | | | | |
| | |
| Par Value | | | | | Coupon Rate (%) | | Maturity | | | Fair Value | |
| | |
| | | | |
| | | | CORPORATE BONDS - 93.9 % (Cont.) | | | | | | | | | | |
| $ | 1,000,000 | | | Tallgrass Energy Finance Corp. (A) | | 5.500 | | | 1/15/2028 | | | $ | 1,011,250 | |
| | 500,000 | | | Targa Resources Partners LP | | 4.250 | | | 11/15/2023 | | | | 490,625 | |
| | 500,000 | | | Targa Resources Partners LP | | 5.375 | | | 2/1/2027 | | | | 502,500 | |
| | 500,000 | | | Teleflex, Inc. | | 4.875 | | | 6/1/2026 | | | | 497,500 | |
| | 500,000 | | �� | Tempur Sealy International, Inc. | | 5.625 | | | 10/15/2023 | | | | 501,250 | |
| | 750,000 | | | Tenet Healthcare Corp. | | 4.375 | | | 10/1/2021 | | | | 750,503 | |
| | 750,000 | | | Toll Brothers Finance Corp. | | 4.875 | | | 11/15/2025 | | | | 738,750 | |
| | 500,000 | | | TreeHouse Foods, Inc. (A) | | 6.000 | | | 2/15/2024 | | | | 518,125 | |
| | 750,000 | | | TRI Pointe Group, Inc. | | 5.875 | | | 6/15/2024 | | | | 747,188 | |
| | 1,000,000 | | | TTM Technologies, Inc. (A) | | 5.625 | | | 10/1/2025 | | | | 1,005,000 | |
| | 750,000 | | | United Rentals North America, Inc. | | 4.875 | | | 1/15/2028 | | | | 705,000 | |
| | 500,000 | | | Valvoline, Inc. | | 4.375 | | | 8/15/2025 | | | | 465,625 | |
| | 500,000 | | | Valvoline, Inc. | | 5.500 | | | 7/15/2024 | | | | 502,500 | |
| | 1,000,000 | | | VeriSign, Inc. | | 4.625 | | | 5/1/2023 | | | | 1,019,660 | |
| | 500,000 | | | Weekley Finance Corp. | | 6.625 | | | 8/15/2025 | | | | 478,750 | |
| | 325,000 | | | Weekley Finance Corp. | | 6.000 | | | 2/1/2023 | | | | 316,062 | |
| | 250,000 | | | Whiting Petroleum Corp. | | 6.625 | | | 1/15/2026 | | | | 260,938 | |
| | 500,000 | | | WPX Energy, Inc. | | 5.250 | | | 9/15/2024 | | | | 505,000 | |
| | 250,000 | | | WPX Energy, Inc. | | 5.750 | | | 6/1/2026 | | | | 254,062 | |
| | | | | | | | | | | | | | |
| | | | TOTAL CORPORATE BONDS (Cost $54,204,546) | | | | | | | | | 53,297,187 | |
| | | | | | | | | | | | | | |
| | | | |
| Shares | | | | | | | | | | | |
| | | | MONEY MARKET FUND - 3.6 % | | | | | | | | | | |
| | 2,043,608 | | | Fidelity Institutional Money Market Funds - Government Portfolio - Class I, 1.95% (C) | | | | | |
| | | | (Cost $2,043,608) | | | | | | | | | 2,043,608 | |
| | | | | | | | | | | | | | |
| | | | |
| | | | TOTAL INVESTMENTS - 97.5 % (Cost $56,248,154) | | | | | | | | $ | 55,340,795 | |
| | | | OTHER ASSETS IN EXCESS OF LIABILITIES - NET - 2.5 % | | | | | | | 1,446,632 | |
| | | | | | | | | | | | | | |
| | | | NET ASSETS - 100.0 % | | | | | | | | $ | 56,787,427 | |
| | | | | | | | | | | | | | |
LIBOR - London Interbank Offered Rate.
LLC - Limited Liability Company.
LP - Limited Partnership.
PLC - Public Limited Co.
(A) 144A Security - Security exempt from registration under Rule 144A of the Securities Act of 1933. The 144A securities had a fair value of $21,347,375 and represent 37.6% of total net assets. The securities may be resold in transactions exempt from registration typically only to qualified institutional buyers. Unless otherwise indicated, these securities are not considered to be illiquid.
(B) Variable rate security; the interest rate shown reflects the effective rate at September 30, 2018.
(C) Variable rate security; the rate shown represents the yield at September 30, 2018.
The accompanying notes are an integral part of these financial statements.
55
Schedule of Investments | Israel Common Values Fund
As of September 30, 2018
| | | | | | | | |
| | |
| Shares | | | | | Fair Value | |
| | |
| | |
| | | | COMMON STOCK - 92.6 % | | | | |
| | | | AEROSPACE/DEFENSE - 3.0% | | | | |
| | 14,601 | | | Elbit Systems Ltd. | | $ | 1,832,718 | |
| | | | | | | | |
| | |
| | | | APPAREL - 1.0 % | | | | |
| | 19,500 | | | Delta-Galil Industries Ltd. | | | 574,886 | |
| | | | | | | | |
| | |
| | | | BANKS - 14.3 % | | | | |
| | 54,500 | | | Bank Hapoalim BM (ADR) | | | 1,963,635 | |
| | 388,000 | | | Bank Leumi Le-Israel BM | | | 2,559,848 | |
| | 55,300 | | | First International Bank Of Israel Ltd. | | | 1,248,440 | |
| | 497,000 | | | Israel Discount Bank Ltd. | | | 1,657,942 | |
| | 69,000 | | | Mizrahi Tefahot Bank Ltd. * | | | 1,209,141 | |
| | | | | | | | |
| | | | | | | 8,639,006 | |
| | | | | | | | |
| | | | CHEMICALS - 2.1 % | | | | |
| | 214,000 | | | Israel Chemicals Ltd. | | | 1,290,420 | |
| | | | | | | | |
| | |
| | | | COMPUTERS - 6.0 % | | | | |
| | 11,000 | | | Check Point Software Technologies Ltd. * | | | 1,294,370 | |
| | 15,000 | | | CyberArk Software Ltd. * | | | 1,197,600 | |
| | 24,266 | | | Kornit Digital Ltd. * | | | 531,425 | |
| | 49,210 | | | Matrix IT Ltd. | | | 589,378 | |
| | | | | | | | |
| | | | | | | 3,612,773 | |
| | | | | | | | |
| | | | ELECTRIC - 2.0 % | | | | |
| | 22,500 | | | Ormat Technologies, Inc. | | | 1,217,494 | |
| | | | | | | | |
| | |
| | | | ELECTRONICS - 3.9 % | | | | |
| | 27,896 | | | Ituran Location and Control Ltd. | | | 959,622 | |
| | 23,400 | | | Orbotech Ltd. * | | | 1,390,896 | |
| | | | | | | | |
| | | | | | | 2,350,518 | |
| | | | | | | | |
| | | | ENERGY-ALTERNATE SOURCES - 0.0 % ** | | | | |
| | 6,360 | | | Energix-Renewable Energies Ltd. * | | | 7,332 | |
| | | | | | | | |
| | |
| | | | ENGINEERING & CONSTRUCTION - 0.3 % | | | | |
| | 86,211 | | | Shikun & Binui Ltd. * | | | 177,107 | |
| | | | | | | | |
| | |
| | | | FOOD - 9.4 % | | | | |
| | 24,100 | | | Frutarom Industries Ltd. | | | 2,495,366 | |
| | 21,700 | | | Rami Levi Chain Stores Hashikma Marketing 2006 Ltd. | | | 1,026,456 | |
| | 160,000 | | | Shufersal Ltd. | | | 1,025,246 | |
| | 52,500 | | | Strauss Group Ltd. | | | 1,154,908 | |
| | | | | | | | |
| | | | | | | 5,701,976 | |
| | | | | | | | |
| | | | HEALTHCARE - PRODUCTS - 1.8 % | | | | |
| | 19,000 | | | Mazor Robotics Ltd. (ADR) * | | | 1,108,080 | |
| | | | | | | | |
| | |
| | | | HOLDING COMPANIES - DIVERSIFIED - 2.7 % | | | | |
| | 45,000 | | | Elco Ltd. | | | 858,987 | |
| | 209,400 | | | Inrom Construction Industries Ltd. | | | 791,829 | |
| | | | | | | | |
| | | | | | | 1,650,816 | |
| | | | | | | | |
| | | | HOME BUILDERS - 1.4 % | | | | |
| | 1,800 | | | Bayside Land Corp. | | | 837,578 | |
| | | | | | | | |
| | |
| | | | INSURANCE - 6.8 % | | | | |
| | 54,600 | | | Clal Insurance Enterprises Holdings Ltd. * | | | 1,028,574 | |
| | 147,000 | | | Harel Insurance Investments & Financial Services Ltd. | | | 1,130,334 | |
| | 1,080,000 | | | Migdal Insurance & Financial Holding Ltd. * | | | 1,198,746 | |
| | 121,000 | | | Phoenix Holdings Ltd. * | | | 731,417 | |
| | | | | | | | |
| | | | | | | 4,089,071 | |
| | | | | | | | |
| | | | LEISURE TIME - 0.7 % | | | | |
| | 68,000 | | | Maytronics Ltd. | | | 441,714 | |
| | | | | | | | |
The accompanying notes are an integral part of these financial statements.
56
Schedule of Investments | Israel Common Values Fund
As of September 30, 2018 (Continued)
| | | | | | | | |
| | |
| Shares | | | | | Fair Value | |
| | |
| | |
| | | | OIL & NATURAL GAS - 8.1 % | | | | |
| | 295,541 | | | Delek Drilling LP | | $ | 876,985 | |
| | 3,000 | | | Israel Corp. Ltd. | | | 964,468 | |
| | 24,700 | | | Noble Energy, Inc. | | | 770,393 | |
| | 1,595,000 | | | Oil Refineries Ltd. | | | 794,824 | |
| | 5,900 | | | Paz Oil Co. Ltd. | | | 925,678 | |
| | 737,500 | | | Ratio Oil Exploration 1992 LP * | | | 550,255 | |
| | | | | | | | |
| | | | | | | 4,882,603 | |
| | | | | | | | |
| | | | PHARMACEUTICALS - 1.4 % | | | | |
| | 1,575,013 | | | Novolog Ltd. | | | 583,017 | |
| | 2,200 | | | Taro Pharmaceutical Industries Ltd. * | | | 216,260 | |
| | | | | | | | |
| | | | | | | 799,277 | |
| | | | | | | | |
| | | | REAL ESTATE - 6.8 % | | | | |
| | 80,000 | | | Alony Hetz Properties & Investments Ltd. | | | 841,318 | |
| | 176,000 | | | Amot Investments Ltd. | | | 929,322 | |
| | 11,000 | | | Azrieli Group Ltd. | | | 565,095 | |
| | 40,000 | | | Gazit-Globe Ltd. | | | 364,666 | |
| | 332,522 | | | Jerusalem Economy Ltd. * | | | 932,766 | |
| | 11,366 | | | Melisron Ltd. | | | 494,167 | |
| | | | | | | | |
| | | | | | | 4,127,334 | |
| | | | | | | | |
| | | | RETAIL - 2.3 % | | | | |
| | 84,909 | | | Delek Automotive Systems Ltd. * | | | 460,949 | |
| | 34,300 | | | Tadiran Holdings Ltd. | | | 943,292 | |
| | | | | | | | |
| | | | | | | 1,404,241 | |
| | | | | | | | |
| | | | SEMICONDUCTORS - 5.3 % | | | | |
| | 14,700 | | | Mellanox Technologies Ltd. * | | | 1,079,715 | |
| | 41,300 | | | Nova Measuring Instruments Ltd. * | | | 1,086,603 | |
| | 1 | | | Tower Semiconductor Ltd. * | | | 14 | |
| | 46,900 | | | Tower Semiconductor Ltd. * | | | 1,020,544 | |
| | | | | | | | |
| | | | | | | 3,186,876 | |
| | | | | | | | |
| | | | SOFTWARE - 4.3 % | | | | |
| | 95,783 | | | Magic Software Enterprises Ltd. | | | 814,156 | |
| | 27,455 | | | Pointer Telocation Ltd. * | | | 356,915 | |
| | 29,500 | | | Radware Ltd. * | | | 780,865 | |
| | 48,600 | | | Sapiens International Corp. NV | | | 642,006 | |
| | | | | | | | |
| | | | | | | 2,593,942 | |
| | | | | | | | |
| | | | TELECOMMUNICATIONS - 7.9 % | | | | |
| | 81,000 | | | AudioCodes Ltd. | | | 814,860 | |
| | 69,800 | | | Cellcom Israel Ltd. * | | | 473,942 | |
| | 22,600 | | | Nice Ltd. (ADR) * | | | 2,587,022 | |
| | 73,600 | | | Partner Communications Co. Ltd. * | | | 387,008 | |
| | 13,117 | | | Silicom Ltd. * | | | 532,026 | |
| | | | | | | | |
| | | | | | | 4,794,858 | |
| | | | | | | | |
| | | | TEXTILES - 1.1 % | | | | |
| | 30,300 | | | Fox Wizel Ltd. | | | 620,883 | |
| | | | | | | | |
| | |
| | | | TOTAL COMMON STOCK (Cost $42,187,052) | | | 55,941,503 | |
| | | | | | | | |
The accompanying notes are an integral part of these financial statements.
57
Schedule of Investments | Israel Common Values Fund
As of September 30, 2018 (Continued)
| | | | | | | | |
| | |
| Shares | | | | | Fair Value | |
| | |
| | |
| | | | MONEY MARKET FUND - 2.2 % | | | | |
| | 1,358,738 | | | Fidelity Institutional Money Market Funds - Government Portfolio - Class I, 1.95% (A) | | $ | 1,358,738 | |
| | | | | | | | |
| | | | (Cost $1,358,738) | | | | |
| | |
| | | | TOTAL INVESTMENTS - 94.8 % (Cost $43,545,790) | | $ | 57,300,241 | |
| | | | OTHER ASSETS IN EXCESS OF LIABILITIES - NET - 5.2 % | | | 3,141,894 | |
| | | | | | | | |
| | | | NET ASSETS - 100.0 % | | $ | 60,442,135 | |
| | | | | | | | |
* Non-income producing securities.
** Less than 0.05%.
ADR - American Depositary Receipt.
LP - Limited Partnership.
(A) Variable rate security; the rate shown represents the yield at September 30, 2018.
| | | | |
| Diversification of Assets | | | |
| |
| Country | | % of Net Assets | |
| |
Israel | | | 89.3% | |
United States | | | 3.3% | |
| | | | |
Total | | | 92.6% | |
Money Market Fund | | | 2.2% | |
Other Assets Less Liabilities - Net | | | 5.2% | |
| | | | |
Grand Total | | | 100.0% | |
| | | | |
The accompanying notes are an integral part of these financial statements.
58
Schedule of Investments | Defensive Strategies Fund
As of September 30, 2018
| | | | | | | | |
| | |
| Shares | | | | | Fair Value | |
| | |
| | |
| | | | COMMON STOCK - 26.6 % | | | | |
| | | | AGRICULTURE - 0.7 % | | | | |
| | 1,709 | | | Adecoagro SA * | | $ | 12,561 | |
| | 3,336 | | | Bunge Ltd. | | | 229,217 | |
| | 1,502 | | | Nutrien Ltd. * | | | 86,665 | |
| | | | | | | | |
| | | | | | | 328,443 | |
| | | | | | | | |
| | |
| | | | CHEMICALS - 2.8 % | | | | |
| | 8,718 | | | CF Industries Holdings, Inc. | | | 474,608 | |
| | 2,969 | | | FMC Corp. | | | 258,837 | |
| | 1,952 | | | K+S AG | | | 40,992 | |
| | 11,619 | | | Mosaic Co. | | | 377,385 | |
| | 1,463 | | | Sasol Ltd. (ADR) | | | 56,530 | |
| | 3,811 | | | Sociedad Quimica Y Minera de Chile, SA (ADR) | | | 174,239 | |
| | | | | | | | |
| | | | | | | 1,382,591 | |
| | | | | | | | |
| | | | COAL - 0.0 % ** | | | | |
| | 1,167 | | | SunCoke Energy, Inc. * | | | 13,561 | |
| | | | | | | | |
| | |
| | | | ENVIRONMENTAL CONTROL - 0.1 % | | | | |
| | 1,300 | | | Kurita Water Industries Ltd. | | | 37,884 | |
| | | | | | | | |
| | |
| | | | FOOD - 1.1 % | | | | |
| | 5,133 | | | BRF SA (ADR) * | | | 28,129 | |
| | 680 | | | Cal-Maine Foods, Inc. | | | 32,844 | |
| | 3,205 | | | Darling Ingredients, Inc. * | | | 61,921 | |
| | 269 | | | Fresh Del Monte Produce, Inc. | | | 9,116 | |
| | 1,040 | | | Ingredion, Inc. | | | 109,158 | |
| | 1,900 | | | Megmilk Snow Brand Co. Ltd. | | | 48,828 | |
| | 12,300 | | | Nippon Suisan Kaisha Ltd. | | | 80,134 | |
| | 4,054 | | | Pilgrim’s Pride Corp. * | | | 73,337 | |
| | 890 | | | Sanderson Farms, Inc. | | | 91,999 | |
| | | | | | | | |
| | | | | | | 535,466 | |
| | | | | | | | |
| | | | FOREST PRODUCTS & PAPER - 0.0 % ** | | | | |
| | 900 | | | Sumitomo Forestry Co. Ltd. | | | 15,649 | |
| | | | | | | | |
| | |
| | | | HEALTHCARE - SERVICES - 1.2 % | | | | |
| | 61,100 | | | Brookdale Senior Living, Inc. * | | | 600,613 | |
| | | | | | | | |
| | |
| | | | IRON/STEEL - 1.9 % | | | | |
| | 1,178 | | | Allegheny Technologies, Inc. * | | | 34,810 | |
| | 1,052 | | | ArcelorMittal (ADR) * | | | 32,465 | |
| | 300 | | | Daido Steel Co. Ltd. | | | 14,579 | |
| | 32,999 | | | Gerdau SA (ADR) | | | 138,926 | |
| | 4,300 | | | Hitachi Metals Ltd. | | | 53,265 | |
| | 4,100 | | | JFE Holdings Inc | | | 94,103 | |
| | 5,600 | | | Kobe Steel Ltd. | | | 49,795 | |
| | 2,000 | | | Nippon Steel & Sumitomo Metal Corp. | | | 42,321 | |
| | 762 | | | POSCO (ADR) | | | 50,292 | |
| | 588 | | | Salzgitter AG | | | 29,402 | |
| | 3,654 | | | Severstal PAO (GDR) | | | 60,839 | |
| | 841 | | | Ternium SA (ADR) | | | 25,474 | |
| | 7,000 | | | Tokyo Steel Manufacturing Co. Ltd. | | | 51,274 | |
| | 1,503 | | | United States Steel Corp. | | | 45,811 | |
| | 15,495 | | | Vale SA (ADR) | | | 229,946 | |
| | | | | | | | |
| | | | | | | 953,302 | |
| | | | | | | | |
| | | | MACHINERY - DIVERSIFIED - 1.1 % | | | | |
| | 1,442 | | | AGCO Corp. | | | 87,659 | |
| | 4,046 | | | CNH Industrial NV | | | 48,592 | |
| | 2,144 | | | Deere & Co. | | | 322,308 | |
| | 6,100 | | | Kubota Corp. | | | 103,703 | |
| | | | | | | | |
| | | | | | | 562,262 | |
| | | | | | | | |
| | | | METAL FABRICATE/HARDWARE - 0.1 % | | | | |
| | 500 | | | Maruichi Steel Tube Ltd. * | | | 16,309 | |
| | 942 | | | Tenaris SA (ADR) | | | 31,576 | |
| | | | | | | | |
| | | | | | | 47,885 | |
| | | | | | | | |
| | | | MINING - 5.5 % | | | | |
| | 3,452 | | | Agnico Eagle Mines Ltd. | | | 118,058 | |
| | 2,967 | | | Alamos Gold, Inc. | | | 13,678 | |
The accompanying notes are an integral part of these financial statements.
59
Schedule of Investments | Defensive Strategies Fund
As of September 30, 2018 (Continued)
| | | | | | | | |
| | |
| Shares | | | | | Fair Value | |
| | |
| | |
| | | | MINING - 5.5 % (Continued) | | | | |
| | 3,064 | | | Anglo American PLC | | $ | 68,844 | |
| | 5,945 | | | AngloGold Ashanti Ltd. (ADR) | | | 51,008 | |
| | 1,391 | | | Antofagasta PLC | | | 15,509 | |
| | 2,974 | | | BHP Billiton Ltd. (ADR) | | | 148,224 | |
| | 234 | | | BHP Billiton PLC (ADR) | | | 10,291 | |
| | 2,352 | | | Cameco Corp. * | | | 26,813 | |
| | 3,247 | | | Cia De Minas Buenaventura (ADR) | | | 43,542 | |
| | 817 | | | Compass Minerals International, Inc. | | | 54,902 | |
| | 3,000 | | | Detour Gold Corp. * | | | 24,230 | |
| | 145 | | | Eramet | | | 15,334 | |
| | 298 | | | First Quantum Minerals Ltd. | | | 3,391 | |
| | 1,932 | | | Franco-Nevada Corp. | | | 120,847 | |
| | 14,950 | | | Freeport-McMoRan, Inc. | | | 208,104 | |
| | 24,174 | | | Glencore PLC | | | 104,566 | |
| | 25,830 | | | Gold Fields Ltd. (ADR) | | | 62,509 | |
| | 2,494 | | | Goldcorp, Inc. * | | | 25,439 | |
| | 21,521 | | | Hecla Mining Co. | | | 60,044 | |
| | 9,900 | | | Hudbay Minerals, Inc. | | | 50,090 | |
| | 15,889 | | | IAMGOLD Corp. * | | | 58,472 | |
| | 1,412 | | | KAZ Minerals PLC | | | 10,120 | |
| | 36,641 | | | Kinross Gold Corp. * | | | 98,931 | |
| | 16,700 | | | Lundin Mining Corp. | | | 88,371 | |
| | 3,400 | | | Mitsubishi Materials Corp. | | | 101,624 | |
| | 1,594 | | | MMC Norilsk Nickel PJSC (ADR) | | | 27,576 | |
| | 4,437 | | | Newmont Mining Corp. | | | 133,997 | |
| | 6,360 | | | Pan American Silver Corp. | | | 93,874 | |
| | 1,552 | | | Randgold Resources Ltd. (ADR) | | | 109,494 | |
| | 5,622 | | | Rio Tinto PLC (ADR) | | | 286,834 | |
| | 117 | | | Royal Gold, Inc. | | | 9,016 | |
| | 1,948 | | | Southern Copper Corp. | | | 84,037 | |
| | 900 | | | Sumitomo Metal Mining Co. Ltd. | | | 31,583 | |
| | 14,900 | | | Tahoe Resources, Inc. * | | | 41,152 | |
| | 7,443 | | | Teck Resources Ltd. | | | 179,252 | |
| | 15,894 | | | Turquoise Hill Resources Ltd. * | | | 33,695 | |
| | 1,249 | | | Vedanta Ltd. (ADR) | | | 15,987 | |
| | 4,563 | | | Wheaton Precious Metals Corp. * | | | 79,853 | |
| | | | | | | | |
| | | | | | | 2,709,291 | |
| | | | | | | | |
| | | | MISCELLANEOUS MANUFACTURER - 0.1 % | | | | |
| | 1,043 | | | Harsco Corp. * | | | 29,778 | |
| | | | | | | | |
| | |
| | | | OIL & GAS - 9.6% | | | | |
| | 268 | | | Anadarko Petroleum Corp. | | | 18,066 | |
| | 4,506 | | | Antero Resources Corp. * | | | 79,801 | |
| | 2,136 | | | Apache Corp. | | | 101,823 | |
| | 9,800 | | | ARC Resources Ltd. | | | 109,175 | |
| | 2,514 | | | Cabot Oil & Gas Corp. | | | 56,615 | |
| | 4,417 | | | Callon Petroleum Co. * | | | 52,960 | |
| | 5,407 | | | Canadian Natural Resources Ltd. | | | 176,593 | |
| | 1,437 | | | Carrizo Oil & Gas, Inc. * | | | 36,212 | |
| | 13,966 | | | Cenovus Energy, Inc. | | | 140,135 | |
| | 1,323 | | | Centennial Resource Development, Inc. * | | | 28,908 | |
| | 901 | | | Chesapeake Energy Corp. * | | | 4,045 | |
| | 370 | | | Cimarex Energy Co. | | | 34,388 | |
| | 1,521 | | | Concho Resources, Inc. * | | | 232,333 | |
| | 876 | | | ConocoPhillips | | | 67,802 | |
| | 994 | | | Continental Resources, Inc. * | | | 67,870 | |
| | 20,700 | | | Crescent Point Energy Corp. | | | 131,637 | |
| | 3,890 | | | Devon Energy Corp. | | | 155,367 | |
| | 272 | | | Diamondback Energy, Inc. | | | 36,772 | |
| | 1,026 | | | Ecopetrol SA (ADR) | | | 27,630 | |
| | 1,870 | | | Encana Corp. | | | 24,516 | |
| | 1,997 | | | Energen Corp. * | | | 172,081 | |
| | 9,700 | | | Enerplus Corp. | | | 119,693 | |
| | 1,233 | | | Ensco PLC - Class A | | | 10,407 | |
The accompanying notes are an integral part of these financial statements.
60
Schedule of Investments | Defensive Strategies Fund
As of September 30, 2018 (Continued)
| | | | | | | | |
| | |
| Shares | | | | | Fair Value | |
| | |
| | |
| | | | OIL & GAS - 9.6 % (Continued) | | | | |
| | 1,962 | | | EOG Resources, Inc. | | $ | 250,292 | |
| | 127 | | | EQT Corp. | | | 5,617 | |
| | 1,865 | | | Equinor ASA (ADR) | | | 52,593 | |
| | 587 | | | Helmerich & Payne, Inc. | | | 40,368 | |
| | 628 | | | Hess Corp. | | | 44,952 | |
| | 3,600 | | | Husky Energy, Inc. | | | 63,166 | |
| | 15,200 | | | Inpex Corp. | | | 189,624 | |
| | 3,940 | | | Lukoil PJSC (ADR) | | | 302,198 | |
| | 894 | | | Marathon Oil Corp. | | | 20,812 | |
| | 2,350 | | | Matador Resources Co. * | | | 77,668 | |
| | 4,881 | | | Murphy Oil Corp. | | | 162,733 | |
| | 4,377 | | | Nabors Industries Ltd. | | | 26,962 | |
| | 393 | | | Newfield Exploration Co. * | | | 11,330 | |
| | 2,548 | | | Noble Energy, Inc. | | | 79,472 | |
| | 392 | | | Novatek OJSC (GDR) | | | 72,128 | |
| | 361 | | | Oasis Petroleum, Inc. * | | | 5,119 | |
| | 435 | | | Occidental Petroleum Corp. | | | 35,744 | |
| | 800 | | | Parex Resources, Inc. * | | | 13,585 | |
| | 1,293 | | | Parsley Energy, Inc. * | | | 37,820 | |
| | 861 | | | Patterson-UTI Energy, Inc. | | | 14,732 | |
| | 1,939 | | | PDC Energy, Inc. * | | | 94,933 | |
| | 3,018 | | | Petroleo Brasileiro SA (ADR) | | | 36,427 | |
| | 12,300 | | | Peyto Exploration & Development Corp. | | | 105,910 | |
| | 530 | | | Pioneer Natural Resources Co. | | | 92,321 | |
| | 3,059 | | | PrairieSky Royalty Ltd. | | | 53,697 | |
| | 2,659 | | | QEP Resources, Inc. * | | | 30,100 | |
| | 3,069 | | | Range Resources Corp. | | | 52,142 | |
| | 14,357 | | | Rosneft Oil Company (GDR) * | | | 107,792 | |
| | 4,859 | | | Rowan Cos PLC * | | | 91,495 | |
| | 9,000 | | | Seven Generations Energy Ltd. * | | | 107,226 | |
| | 1,829 | | | Southwestern Energy Co. * | | | 9,346 | |
| | 5,600 | | | Suncor Energy, Inc. | | | 216,531 | |
| | 4,900 | | | Tourmaline Oil Corp. * | | | 86,203 | |
| | 2,400 | | | Vermillion Energy, Inc. | | | 79,022 | |
| | 14,500 | | | Whitecap Resources, Inc. | | | 87,947 | |
| | 1,925 | | | WPX Energy, Inc. * | | | 38,731 | |
| | 504 | | | YPF SA (ADR) * | | | 7,787 | |
| | | | | | | | |
| | | | | | | 4,689,354 | |
| | | | | | | | |
| | | | OIL & GAS SERVICES - 1.6 % | | | | |
| | 1,569 | | | Baker Hughes, Inc. | | | 53,079 | |
| | 682 | | | Core Laboratories NV | | | 78,996 | |
| | 1,006 | | | Dril-Quip, Inc. * | | | 52,564 | |
| | 2,336 | | | Halliburton Co. | | | 94,678 | |
| | 3,420 | | | McDermott International, Inc. * | | | 63,031 | |
| | 409 | | | National Oilwell Varco, Inc. | | | 17,620 | |
| | 3,327 | | | Oceaneering International, Inc. * | | | 91,825 | |
| | 1,315 | | | Oil States International, Inc. * | | | 43,658 | |
| | 2,616 | | | Schlumberger Ltd. | | | 159,367 | |
| | 733 | | | TechnipFMC PLC (France) | | | 23,072 | |
| | 3,683 | | | TechnipFMC PLC * | | | 115,094 | |
| | | | | | | | |
| | | | | | | 792,984 | |
| | | | | | | | |
| | | | WATER - 0.8 % | | | | |
| | 459 | | | American States Water Co. | | | 28,063 | |
| | 1,356 | | | American Water Works Co., Inc. | | | 119,287 | |
| | 818 | | | Aqua America, Inc. | | | 30,184 | |
| | 437 | | | California Water Service Group | | | 18,747 | |
| | 8,680 | | | Cia de Saneamento Basico do Estado de Sao Paulo (ADR) | | | 51,212 | |
| | 1,505 | | | United Utilities Group PLC | | | 13,817 | |
| | 5,651 | | | Veolia Environnement SA | | | 112,829 | |
| | | | | | | | |
| | | | | | | 374,139 | |
| | | | | | | | |
| | |
| | | | TOTAL COMMON STOCK (Cost $13,221,718) | | | 13,073,202 | |
| | | | | | | | |
The accompanying notes are an integral part of these financial statements.
61
Schedule of Investments | Defensive Strategies Fund
As of September 30, 2018 (Continued)
| | | | | | | | | | | | | | |
| | |
| Shares | | | | | | | | | | Fair Value | |
| | |
| | | | |
| | | | REITs - 21.1 % | | | | | | | | | | |
| | 900 | | | Alexandria Real Estate Equities, Inc. | | | | | | | | $ | 113,211 | |
| | 6,700 | | | Apartment Investment & Management Co. - Class A | | | | | | | | | 295,671 | |
| | 2,650 | | | AvalonBay Communities, Inc. | | | | | | | | | 480,048 | |
| | 1,700 | | | Boston Properties, Inc. | | | | | | | | | 209,253 | |
| | 3,200 | | | Brandywine Realty Trust | | | | | | | | | 50,304 | |
| | 4,500 | | | Brixmor Property Group, Inc. | | | | | | | | | 78,795 | |
| | 8,400 | | | Columbia Property Trust, Inc. | | | | | | | | | 198,576 | |
| | 2,300 | | | Crown Castle International Corp. | | | | | | | | | 256,059 | |
| | 9,900 | | | CubeSmart | | | | | | | | | 282,447 | |
| | 11,600 | | | Duke Realty Corp. | | | | | | | | | 329,092 | |
| | 2,500 | | | EPR Properties | | | | | | | | | 171,025 | |
| | 1,200 | | | Equinix, Inc. | | | | | | | | | 519,468 | |
| | 2,700 | | | Equity Lifestyle Properties, Inc. | | | | | | | | | 260,415 | |
| | 6,800 | | | Equity Residential | | | | | | | | | 450,568 | |
| | 1,154 | | | Essex Property Trust, Inc. | | | | | | | | | 284,703 | |
| | 2,000 | | | Federal Realty Investment Trust | | | | | | | | | 252,940 | |
| | 15,100 | | | HCP, Inc. | | | | | | | | | 397,432 | |
| | 8,000 | | | Hospitality Properties Trust | | | | | | | | | 230,720 | |
| | 3,800 | | | Hudson Pacific Properties, Inc. | | | | | | | | | 124,336 | |
| | 8,700 | | | Invitation Homes, Inc. | | | | | | | | | 199,317 | |
| | 3,300 | | | Kilroy Realty Corp. | | | | | | | | | 236,577 | |
| | 1,208 | | | Mid-America Apartment Communities, Inc. | | | | | | | | | 121,017 | |
| | 1,600 | | | National Health Investors, Inc. | | | | | | | | | 120,944 | |
| | 4,200 | | | National Retail Properties, Inc. | | | | | | | | | 188,244 | |
| | 935 | | | PotlatchDeltic Corp. | | | | | | | | | 38,288 | |
| | 12,266 | | | Prologis, Inc. | | | | | | | | | 831,512 | |
| | 2,100 | | | PS Business Parks, Inc. | | | | | | | | | 266,889 | |
| | 800 | | | Public Storage | | | | | | | | | 161,304 | |
| | 2,233 | | | Rayonier, Inc. | | | | | | | | | 75,498 | |
| | 3,200 | | | Regency Centers Corp. | | | | | | | | | 206,944 | |
| | 11,252 | | | RLJ Lodging Trust | | | | | | | | | 247,882 | |
| | 4,200 | | | Sabra Health Care REIT, Inc. | | | | | | | | | 97,104 | |
| | 3,929 | | | Simon Property Group, Inc. | | | | | | | | | 694,451 | |
| | 2,250 | | | SL Green Realty Corp. | | | | | | | | | 219,443 | |
| | 1,380 | | | Spirit MTA REIT | | | | | | | | | 15,898 | |
| | 14,000 | | | Spirit Realty Capital, Inc. | | | | | | | | | 112,840 | |
| | 8,400 | | | Store Capital Corp. | | | | | | | | | 233,436 | |
| | 10,200 | | | UDR, Inc. | | | | | | | | | 412,386 | |
| | 4,300 | | | Vornado Realty Trust | | | | | | | | | 313,900 | |
| | 6,200 | | | Weingarten Realty Investors | | | | | | | | | 184,512 | |
| | 5,400 | | | Welltower, Inc. | | | | | | | | | 347,328 | |
| | 1,726 | | | Weyerhaeuser Co. | | | | | | | | | 55,697 | |
| | | | | | | | | | | | | | |
| | | | TOTAL REITS (Cost $9,436,331) | | | | | | | | | 10,366,474 | |
| | | | | | | | | | | | | | |
| | | | |
| Principal | | | | | Coupon Rate % | | Maturity | | | | |
| | | | BONDS & NOTES - 33.6 % | | | | | | | | | | |
| | | | COPORATE BONDS - 1.9 % | | | | | | | | | | |
| | $ 400,000 | | | LYB International Finance BV | | 4.000 | | | 7/15/2023 | | | | 400,789 | |
| | 500,000 | | | Welltower, Inc. | | 3.750 | | | 3/15/2023 | | | | 496,972 | |
| | | | | | | | | | | | | | |
| | | | TOTAL CORPORATE BONDS (Cost $893,393) | | | | | | | | | 897,761 | |
| | | | | | | | | | | | | | |
| | |
| | | | TREASURY INFLATION PROTECTED SECURITIES (TIPS) - 31.7 % | | | | | |
| | 1,806,806 | | | TIPS | | 0.125 | | | 4/15/2019 | | | | 1,795,620 | |
| | 2,663,111 | | | TIPS | | 0.125 | | | 4/15/2022 | | | | 2,588,003 | |
| | 1,922,471 | | | TIPS | | 0.625 | | | 1/15/2024 | | | | 1,897,163 | |
| | 1,316,866 | | | TIPS | | 2.375 | | | 1/15/2025 | | | | 1,435,041 | |
| | 1,580,764 | | | TIPS | | 2.000 | | | 1/15/2026 | | | | 1,700,742 | |
| | 1,312,112 | | | TIPS | | 2.375 | | | 1/15/2027 | | | | 1,462,015 | |
| | 1,142,764 | | | TIPS | | 1.750 | | | 1/15/2028 | | | | 1,223,703 | |
| | 1,144,416 | | | TIPS | | 2.500 | | | 1/15/2029 | | | | 1,316,213 | |
| | 1,766,417 | | | TIPS | | 2.125 | | | 2/15/2041 | | | | 2,152,821 | |
| | | | | | | | | | | | | | |
| | | | TOTAL TREASURY INFLATION PROTECTED SECURITIES (TIPS) (Cost $15,958,012) | | | | | | | 15,571,321 | |
| | | | | | | | | | | | | | |
| | |
| | | | TOTAL BONDS AND NOTES (Cost $16,851,405) | | | | 16,469,082 | |
| | | | | | | | | | | | | | |
The accompanying notes are an integral part of these financial statements.
62
Schedule of Investments | Defensive Strategies Fund
As of September 30, 2018 (Continued)
| | | | | | | | |
| | |
| | | | | | Fair Value | |
| | |
| Ounces | | | | | | |
| | | | ALTERNATIVE INVESTMENTS - 18.1 % | | | | |
| | 6,743 | | | Gold Bars * | | $ | 8,034,139 | |
| | 57,827 | | | Silver Bars * | | | 846,700 | |
| | | | | | | | |
| | | | TOTAL ALTERNATIVE INVESTMENTS (Cost $8,900,255) | | | 8,880,839 | |
| | | | | | | | |
| | |
| Shares | | | MONEY MARKET FUND - 3.5 % | | | |
| | 1,700,606 | | | Fidelity Institutional Money Market Funds - Government Portfolio - Class I, 1.95% (A) | | | 1,700,606 | |
| | | | | | | | |
| | | | (Cost $1,700,606) | | | | |
| | |
| | | | TOTAL INVESTMENTS - 102.9 % (Cost $50,110,315) | | $ | 50,490,203 | |
| | | | OTHER ASSETS IN EXCESS OF LIABILITIES - NET - (2.9) % | | | (1,414,575) | |
| | | | | | | | |
| | | | NET ASSETS - 100.0 % | | $ | 49,075,628 | |
| | | | | | | | |
* Non-income producing securities/investments.
** Less than 0.05%.
ADR - American Depositary Receipt.
GDR - Global Depositary Receipt.
REITs - Real Estate Investment Trust.
(A) Variable rate security; the rate shown represents the yield at September 30, 2018.
The accompanying notes are an integral part of these financial statements.
63
Schedule of Investments | Strategic Growth Fund
As of September 30, 2018
| | | | | | | | |
| | |
| Shares | | | | | Fair Value | |
| | |
| | |
| | | | MUTUAL FUNDS - 97.7 % (A) | | | | |
| | 229,083 | | | Timothy Plan Aggressive Growth Fund * | | $ | 2,123,602 | |
| | 408,480 | | | Timothy Plan Defensive Strategies Fund | | | 4,673,014 | |
| | 317,409 | | | Timothy Plan Emerging Markets Fund | | | 2,736,063 | |
| | 198,820 | | | Timothy Plan Fixed Income Fund | | | 1,950,425 | |
| | 336,155 | | | Timothy Plan Growth & Income Fund | | | 3,654,003 | |
| | 280,181 | | | Timothy Plan High Yield Bond Fund | | | 2,527,231 | |
| | 773,432 | | | Timothy Plan International Fund | | | 7,533,228 | |
| | 121,906 | | | Timothy Plan Israel Common Values Fund | | | 1,918,799 | |
| | 414,327 | | | Timothy Plan Large/Mid Cap Growth Fund | | | 3,869,816 | |
| | 206,561 | | | Timothy Plan Large/Mid Cap Value Fund | | | 4,209,704 | |
| | 110,900 | | | Timothy Plan Small Cap Value Fund | | | 2,292,304 | |
| | | | | | | | |
| | | | TOTAL MUTUAL FUNDS (Cost $34,529,733) | | | 37,488,189 | |
| | | | | | | | |
| | |
| | | | MONEY MARKET FUND - 2.7 % | | | | |
| | 1,041,790 | | | Fidelity Institutional Money Market Funds - Government Portfolio - Class I, 1.95% (B) | | | 1,041,790 | |
| | | | | | | | |
| | | | (Cost $1,041,790) | | | | |
| | |
| | | | TOTAL INVESTMENTS - 100.4 % (Cost $35,571,523) | | $ | 38,529,979 | |
| | | | OTHER ASSETS IN EXCESS OF LIABILITIES - NET - (0.4) % | | | (139,007) | |
| | | | | | | | |
| | | | NET ASSETS - 100.0 % | | $ | 38,390,972 | |
| | | | | | | | |
* Non-income producing securities.
(A) Affiliated Funds - Class A.
(B) Variable rate security; the rate shown represents the yield at September 30, 2018.
The accompanying notes are an integral part of these financial statements.
64
Schedule of Investments | Conservative Growth Fund
As of September 30, 2018
| | | | | | | | |
| | |
| Shares | | | | | Fair Value | |
| | |
| | |
| | | | MUTUAL FUNDS - 95.1 % (A) | | | | |
| | 220,788 | | | Timothy Plan Aggressive Growth Fund * | | $ | 2,046,709 | |
| | 496,240 | | | Timothy Plan Defensive Strategies Fund | | | 5,676,984 | |
| | 270,433 | | | Timothy Plan Emerging Markets Fund | | | 2,331,129 | |
| | 1,291,118 | | | Timothy Plan Fixed Income Fund | | | 12,665,871 | |
| | 445,493 | | | Timothy Plan Growth & Income Fund | | | 4,842,505 | |
| | 371,312 | | | Timothy Plan High Yield Bond Fund | | | 3,349,233 | |
| | 551,945 | | | Timothy Plan International Fund | | | 5,375,945 | |
| | 113,093 | | | Timothy Plan Israel Common Values Fund | | | 1,780,089 | |
| | 411,813 | | | Timothy Plan Large/Mid Cap Growth Fund | | | 3,846,334 | |
| | 211,534 | | | Timothy Plan Large/Mid Cap Value Fund | | | 4,311,072 | |
| | 122,474 | | | Timothy Plan Small Cap Value Fund | | | 2,531,545 | |
| | | | | | | | |
| | | | TOTAL MUTUAL FUNDS (Cost $46,133,963) | | | 48,757,416 | |
| | | | | | | | |
| | |
| | | | MONEY MARKET FUND - 5.1 % | | | | |
| | 2,622,149 | | | Fidelity Institutional Money Market Funds - Government Portfolio - Class I, 1.95% (B) | | | 2,622,149 | |
| | | | | | | | |
| | | | (Cost $2,622,149) | | | | |
| | |
| | | | TOTAL INVESTMENTS - 100.2 % (Cost $48,756,112) | | $ | 51,379,565 | |
| | | | OTHER ASSETS IN EXCESS OF LIABILITIES - NET - (0.2) % | | | (121,649) | |
| | | | | | | | |
| | | | NET ASSETS - 100.0 % | | $ | 51,257,916 | |
| | | | | | | | |
* Non-income producing securities.
(A) Affiliated Funds - Class A.
(B) Variable rate security; the rate shown represents the yield at September 30, 2018.
The accompanying notes are an integral part of these financial statements.
65
Schedule of Investments | Emerging Markets Fund
As of September 30, 2018
| | | | | | | | |
| | |
| Shares | | | | | Fair Value | |
| | |
| | |
| | | | COMMON STOCK - 67.6 % | | | | |
| | | | AEROSPACE/DEFENSE - 3.1 % | | | | |
| | 33,706 | | | Embraer SA (ADR) | | $ | 660,301 | |
| | | | | | | | |
| | |
| | | | AGRICULTURE - 1.6 % | | | | |
| | 42,566 | | | Adecoagro SA * | | | 312,860 | |
| | | | | | | | |
| | |
| | | | APPAREL - 1.6 % | | | | |
| | 111,500 | | | Yue Yuen Industrial Holdings Ltd. | | | 309,924 | |
| | | | | | | | |
| | |
| | | | AUTO MANUFACTURERS - 2.5 % | | | | |
| | 16,724 | | | Kia Motors Corp. | | | 529,198 | |
| | | | | | | | |
| | |
| | | | AUTO PARTS & EQUIPMENT - 3.0 % | | | | |
| | 2,268 | | | China Yuchai International Ltd. | | | 39,168 | |
| | 2,852 | | | Hyundai Mobis Co. Ltd. | | | 586,212 | |
| | | | | | | | |
| | | | | | | 625,380 | |
| | | | | | | | |
| | | | BANKS - 12.3 % | | | | |
| | 18,455 | | | Absa Group Ltd. | | | 198,071 | |
| | 146,301 | | | AkBank TAS * | | | 168,529 | |
| | 65,501 | | | Banco del Bajio SA (A) | | | 161,832 | |
| | 58,400 | | | Bangkok Bank PCL (NVDR) | | | 379,221 | |
| | 1,529,900 | | | Bank Rakyat Indonesia Persero Tbk PT | | | 323,403 | |
| | 21,200 | | | Hapvida Participacoes E Investimentos SA * | | | 127,405 | |
| | 120,993 | | | Sberbank of Russia | | | 375,513 | |
| | 111,100 | | | Siam Commercial Bank Public Company Limited | | | 511,871 | |
| | 11,134 | | | TBC Bank Group PLC | | | 244,505 | |
| | 67,379 | | | Turkiye Garanti Bankasi AS | | | 86,477 | |
| | | | | | | | |
| | | | | | | 2,576,827 | |
| | | | | | | | |
| | | | BUILDING MATERIALS - 5.0 % | | | | |
| | 147,702 | | | Cemex SAB de CV (ADR) * | | | 1,039,822 | |
| | 85,571 | | | Urbi Desarrollos Urbanos SAB de CV * | | | 16,474 | |
| | | | | | | | |
| | | | | | | 1,056,296 | |
| | | | | | | | |
| | | | COMMERCIAL SERVICES - 6.8 % | | | | |
| | 51,200 | | | Cielo SA | | | 156,412 | |
| | 60,300 | | | Estacio Participacoes SA | | | 377,484 | |
| | 275,506 | | | ITE Group PLC | | | 258,677 | |
| | 88,700 | | | Kroton Educacional SA | | | 251,426 | |
| | 73,700 | | | Mills Estruturas e Servicos de Engenharia SA * | | | 34,326 | |
| | 4,675 | | | S-1 Corp. * | | | 385,211 | |
| | | | | | | | |
| | | | | | | 1,463,536 | |
| | | | | | | | |
| | | | COMPUTERS - 2.9 % | | | | |
| | 54,000 | | | Asustek Computer, Inc. | | | 466,905 | |
| | 14,862 | | | Infosys Ltd. (ADR) | | | 151,147 | |
| | | | | | | | |
| | | | | | | 618,052 | |
| | | | | | | | |
| | | | ELECTRIC - 2.7 % | | | | |
| | 89,500 | | | AES Tiete Energia SA | | | 214,026 | |
| | 7,900 | | | Cia Paranaense de Energia * | | | 39,959 | |
| | 25,801 | | | Reliance Infrastructure Ltd. (GDR) | | | 317,352 | |
| | | | | | | | |
| | | | | | | 571,337 | |
| | | | | | | | |
| | | | ENGINEERING & CONSTRUCTION - 1.5 % | | | | |
| | 988,400 | | | Jasmine Broadband Internet Infrastructure Fund | | | 320,909 | |
| | | | | | | | |
| | |
| | | | FOOD - 3.6 % | | | | |
| | 1,450 | | | Binggrae Co. Ltd. * | | | 98,562 | |
| | 502,000 | | | First Pacific Co. Ltd. | | | 247,635 | |
| | 164,900 | | | Marfrig Global Foods SA * | | | 217,607 | |
| | 8,933 | | | X5 Retail Group NV (GDR) | | | 201,886 | |
| | | | | | | | |
| | | | | | | 765,690 | |
| | | | | | | | |
The accompanying notes are an integral part of these financial statements.
66
Schedule of Investments | Emerging Markets Fund
As of September 30, 2018 (Continued)
| | | | | | | | |
| | |
| Shares | | | | | Fair Value | |
| | |
| | |
| | | | INSURANCE - 1.4 % | | | | |
| | 30,867 | | | Korean Reinsurance Company * | | $ | 290,791 | |
| | | | | | | | |
| | |
| | | | IRON/STEEL - 1.4 % | | | | |
| | 1,074 | | | POSCO | | | 285,141 | |
| | | | | | | | |
| | |
| | | | MULTI-NATIONAL - 1.8 % | | | | |
| | 17,612 | | | Banco Latinoamericano de Comercio Exterior SA | | | 368,443 | |
| | | | | | | | |
| | |
| | | | OIL & GAS - 6.4 % | | | | |
| | 3,198 | | | Lukoil PJSC (ADR) | | | 244,455 | |
| | 44,500 | | | Petrobras Distribuidora SA | | | 216,954 | |
| | 8,501 | | | Petroleo Brasileiro SA (ADR) | | | 88,920 | |
| | 178,852 | | | Vivo Energy PLC (A) * | | | 301,056 | |
| | 32,117 | | | YPF SA (ADR) * | | | 496,208 | |
| | | | | | | | |
| | | | | | | 1,347,593 | |
| | | | | | | | |
| | | | RETAIL - 2.7 % | | | | |
| | 872,000 | | | Bosideng International Holdings Ltd. | | | 122,583 | |
| | 138,500 | | | Lifestyle International Holdings Ltd. | | | 271,871 | |
| | 47,000 | | | Luk Fook Holdings International Ltd. | | | 163,676 | |
| | | | | | | | |
| | | | | | | 558,130 | |
| | | | | | | | |
| | | | SEMICONDUCTORS - 1.3 % | | | | |
| | 6,739 | | | Samsung Electronics Co., Ltd. | | | 282,197 | |
| | | | | | | | |
| | |
| | | | SOFTWARE - 1.0 % | | | | |
| | 302,000 | | | Chinasoft International Ltd. * | | | 201,465 | |
| | | | | | | | |
| | |
| | | | TELECOMMUNICATIONS - 4.8 % | | | | |
| | 24,111 | | | Empresa Nacional de Telecomunicaciones SA * | | | 204,410 | |
| | 55,991 | | | Mobile TeleSystems PJSC * | | | 232,957 | |
| | 3,074,175 | | | XL Axiata TBK PT * | | | 569,387 | |
| | | | | | | | |
| | | | | | | 1,006,754 | |
| | | | | | | | |
| | | | TEXTILES - 0.2 % | | | | |
| | 110,500 | | | Weiqiao Textile Co. | | | 38,975 | |
| | | | | | | | |
| | |
| | | | TOTAL COMMON STOCK (Cost $16,206,235) | | | 14,189,799 | |
| | | | | | | | |
| | |
| | | | PREFERRED STOCK - 10.6 % | | | | |
| | 29,500 | | | Cia Brasileira de Distribuicao | | | 642,587 | |
| | 61,481 | | | Cia Paranaense de Energia * | | | 329,609 | |
| | 734,638 | | | Grupo Aval Acciones y Valores SA | | | 288,225 | |
| | 92,400 | | | Petroleo Brasileiro SA * | | | 488,197 | |
| | 836,971 | | | Surgutneftegas OJSC * | | | 486,382 | |
| | | | | | | | |
| | | | TOTAL PREFERRED STOCK (Cost $2,195,204) | | | 2,235,000 | |
| | | | | | | | |
| | |
| | | | REITs - 9.1 % | | | | |
| | 1,102,377 | | | Emlak Konut Gayrimenkul Yatirim Ortakligi AS | | | 328,476 | |
| | 443,043 | | | Fibra Uno Administracion SA de CV | | | 586,404 | |
| | 286,350 | | | Macquarie Mexico Real Estate Management SA de CV (A) | | | 343,481 | |
| | 420,201 | | | PLA Administradora Industrial S de RL de CV | | | 645,832 | |
| | | | | | | | |
| | | | TOTAL REITs (Cost $2,553,956) | | | 1,904,193 | |
| | | | | | | | |
| | |
| | | | MONEY MARKET FUND - 11.8 % | | | | |
| | 2,486,393 | | | Fidelity Institutional Money Market Funds - Government Portfolio - Class I, 1.95% (B) | | | | |
| | | | (Cost $2,486,393) | | | 2,486,393 | |
| | | | | | | | |
| | |
| | | | TOTAL INVESTMENTS - 99.1 % (Cost $23,441,788) | | $ | 20,815,385 | |
| | | | OTHER ASSETS IN EXCESS OF LIABILITIES - NET - 0.9 % | | | 182,522 | |
| | | | | | | | |
| | | | NET ASSETS - 100.0 % | | $ | 20,997,907 | |
| | | | | | | | |
The accompanying notes are an integral part of these financial statements.
67
Schedule of Investments | Emerging Markets Fund
As of September 30, 2018 (Continued)
* Non-income producing securities.
ADR - American Depositary Receipt.
GDR - Global Depositary Receipt.
NVDR - Non-Voting Depositary Receipt.
PLC - Public Limited Co.
REITs - Real Estate Investment Trust.
(A) 144A Security - Security exempt from registration under Rule 144A of the Securities Act of 1933. The 144A securities had a fair value of $806,369 and represent 3.8% of total net assets. The securities may be resold in transactions exempt from registration typically only to qualified institutional buyers. Unless otherwise indicated, these securities are not considered to be illiquid.
(B) Variable rate security; the rate shown represents the yield at September 30, 2018.
| | | | |
| Diversification of Assets | | | |
| |
| Country | | % of Net Assets | |
| |
| Brazil | | | 18.2% | |
| Mexico | | | 13.3% | |
| South Korea | | | 11.7% | |
| Russia | | | 7.3% | |
| Thailand | | | 5.8% | |
| Hong Kong | | | 5.3% | |
| Indonesia | | | 4.3% | |
| Argentina | | | 3.9% | |
| Turkey | | | 2.8% | |
| Britain | | | 2.7% | |
| India | | | 2.2% | |
| Taiwan | | | 2.2% | |
| Panama | | | 1.8% | |
| Colombia | | | 1.4% | |
| Georgia | | | 1.2% | |
| China | | | 1.1% | |
| Chile | | | 1.0% | |
| South Africa | | | 0.9% | |
| Singapore | | | 0.2% | |
| | | | |
| Total | | | 87.3% | |
| Money Market Fund | | | 11.8% | |
| Other Assets in Excess of Liabilities - Net | | | 0.9% | |
| | | | |
| Grand Total | | | 100.0% | |
| | | | |
The accompanying notes are an integral part of these financial statements.
68
Schedule of Investments | Growth & Income Fund
As of September 30, 2018
| | | | | | | | |
| | |
| Shares | | | | | Fair Value | |
| | |
| | |
| | | | COMMON STOCK - 43.9 % | | | | |
| | | | AIRLINES - 0.6 % | | | | |
| | 3,475 | | | SkyWest, Inc. | | $ | 204,678 | |
| | | | | | | | |
| | |
| | | | APPAREL - 0.8 % | | | | |
| | 2,410 | | | Deckers Outdoor Corp. * | | | 285,778 | |
| | | | | | | | |
| | |
| | | | AUTO PARTS & EQUIPMENT - 3.2 % | | | | |
| | 4,160 | | | Allison Transmission Holdings, Inc. | | | 216,362 | |
| | 10,880 | | | American Axle & Manufacturing Holdings, Inc. * | | | 189,747 | |
| | 3,230 | | | BorgWarner, Inc. | | | 138,179 | |
| | 6,635 | | | Dana, Inc. | | | 123,875 | |
| | 920 | | | Lear Corp. | | | 133,400 | |
| | 8,135 | | | Meritor, Inc. * | | | 157,494 | |
| | 3,345 | | | Tenneco, Inc. | | | 140,958 | |
| | | | | | | | |
| | | | | | | 1,100,015 | |
| | | | | | | | |
| | | | BANKS - 0.6 % | | | | |
| | 23,315 | | | First BanCorp. * | | | 212,167 | |
| | | | | | | | |
| | |
| | | | BIOTECHNOLOGY - 0.4 % | | | | |
| | 6,175 | | | Exelixis, Inc. * | | | 109,421 | |
| | | | | | | | |
| | |
| | | | BUILDING MATERIALS - 1.8 % | | | | |
| | 4,410 | | | Boise Cascade Co. | | | 162,288 | |
| | 9,395 | | | Builders FirstSource, Inc. * | | | 137,919 | |
| | 6,045 | | | Louisiana-Pacific Corp. | | | 160,132 | |
| | 4,500 | | | Norbord, Inc. | | | 149,265 | |
| | | | | | | | |
| | | | | | | 609,604 | |
| | | | | | | | |
| | | | CHEMICALS - 0.9 % | | | | |
| | 5,415 | | | Huntsman Corp. | | | 147,450 | |
| | 3,405 | | | Kraton Corp. * | | | 160,546 | |
| | | | | | | | |
| | | | | | | 307,996 | |
| | | | | | | | |
| | | | COMMERCIAL SERVICES - 2.3 % | | | | |
| | 2,770 | | | ASGN, Inc. * | | | 218,636 | |
| | 2,960 | | | FTI Consulting, Inc. * | | | 216,642 | |
| | 1,070 | | | United Rentals, Inc. * | | | 175,052 | |
| | 8,560 | | | Western Union Co. | | | 163,154 | |
| | | | | | | | |
| | | | | | | 773,484 | |
| | | | | | | | |
| | | | COMPUTERS - 2.3 % | | | | |
| | 1,745 | | | DXC Technology Co. | | | 163,192 | |
| | 872 | | | Perspecta, Inc. | | | 22,428 | |
| | 4,250 | | | Seagate Technology PLC | | | 201,238 | |
| | 6,910 | | | Syntel, Inc. * | | | 283,172 | |
| | 2,060 | | | Western Digital Corp. | | | 120,592 | |
| | | | | | | | |
| | | | | | | 790,622 | |
| | | | | | | | |
| | | | DISTRIBUTION/WHOLESALE - 0.5 % | | | | |
| | 4,990 | | | Triton International Ltd. | | | 166,017 | |
| | | | | | | | |
| | |
| | | | DIVERSIFIED FINANCIAL SERVICES - 2.4 % | | | | |
| | 12,770 | | | BGC Partners, Inc. | | | 150,941 | |
| | 3,980 | | | Encore Capital Group, Inc. * | | | 142,683 | |
| | 4,535 | | | Legg Mason, Inc. | | | 141,628 | |
| | 5,295 | | | OneMain Holdings, Inc. * | | | 177,965 | |
| | 10,000 | | | Santander Consumer USA Holdings, Inc. | | | 200,400 | |
| | | | | | | | |
| | | | | | | 813,617 | |
| | | | | | | | |
| | | | ELECTRIC - 1.4 % | | | | |
| | 2,680 | | | Entergy Corp. | | | 217,428 | |
| | 7,260 | | | NRG Energy, Inc. | | | 271,524 | |
| | | | | | | | |
| | | | | | | 488,952 | |
| | | | | | | | |
| | | | ELECTRICAL COMPONENTS & EQUIPMENT - 1.1 % | | | | |
| | 3,395 | | | Generac Holdings, Inc. * | | | 191,512 | |
| | 5,425 | | | SPX Corp. * | | | 180,707 | |
| | | | | | | | |
| | | | | | | 372,219 | |
| | | | | | | | |
The accompanying notes are an integral part of these financial statements.
69
Schedule of Investments | Growth & Income Fund
As of September 30, 2018 (Continued)
| | | | | | | | |
| | |
| Shares | | | | | Fair Value | |
| | |
| | |
| | | | ELECTRONICS - 1.0 % | | | | |
| | 1,735 | | | TE Connectivity Ltd. | | $ | 152,559 | |
| | 9,455 | | | Vishay Intertechnology, Inc. | | | 192,409 | |
| | | | | | | | |
| | | | | | | 344,968 | |
| | | | | | | | |
| | | | FOOD - 0.5 % | | | | |
| | 7,490 | | | Pilgrim’s Pride Corp. * | | | 135,494 | |
| | | | | | | | |
| | |
| | | | HAND/MACHINE TOOLS - 0.5 % | | | | |
| | 3,650 | | | Kennametal, Inc. | | | 158,994 | |
| | | | | | | | |
| | |
| | | | HEALTHCARE - SERVICES - 0.9 % | | | | |
| | 2,020 | | | Magellan Health, Inc. * | | | 145,541 | |
| | 5,420 | | | Tenet Healthcare Corp. * | | | 154,253 | |
| | | | | | | | |
| | | | | | | 299,794 | |
| | | | | | | | |
| | | | HOME BUILDERS - 2.7 % | | | | |
| | 2,495 | | | LGI Homes, Inc. * | | | 118,363 | |
| | 5,668 | | | MDC Holdings, Inc. | | | 167,659 | |
| | 5,570 | | | PulteGroup, Inc. | | | 137,969 | |
| | 1,415 | | | Thor Industries, Inc. | | | 118,436 | |
| | 4,050 | | | Toll Brothers, Inc. | | | 133,772 | |
| | 10,165 | | | TRI Pointe Group, Inc. * | | | 126,046 | |
| | 3,520 | | | Winnebago Industries, Inc. | | | 116,688 | |
| | | | | | | | |
| | | | | | | 918,933 | |
| | | | | | | | |
| | | | HOME FURNISHINGS - 1.1 % | | | | |
| | 2,555 | | | SodaStream International Ltd. * | | | 365,569 | |
| | | | | | | | |
| | |
| | | | HOUSEHOLD PRODUCTS/WARES - 0.4 % | | | | |
| | 13,420 | | | ACCO Brands Corp. | | | 151,646 | |
| | | | | | | | |
| | |
| | | | INSURANCE - 2.8 % | | | | |
| | 5,545 | | | American Equity Investment Life Holding Co. | | | 196,071 | |
| | 7,805 | | | CNO Financial Group, Inc. | | | 165,622 | |
| | 16,720 | | | MGIC Investment Corp. * | | | 222,543 | |
| | 11,435 | | | Radian Group, Inc. | | | 236,361 | |
| | 3,110 | | | Unum Group | | | 121,508 | |
| | | | | | | | |
| | | | | | | 942,105 | |
| | | | | | | | |
| | | | IRON/STEEL - 1.5 % | | | | |
| | 26,225 | | | Cleveland-Cliffs, Inc. * | | | 332,009 | |
| | 5,805 | | | United States Steel Corp. | | | 176,936 | |
| | | | | | | | |
| | | | | | | 508,945 | |
| | | | | | | | |
| | | | MACHINERY - CONSTRUCTION & MINING - 0.9 % | | | | |
| | 1,130 | | | Caterpillar, Inc. | | | 172,314 | |
| | 1,935 | | | Oshkosh Corp. | | | 137,849 | |
| | | | | | | | |
| | | | | | | 310,163 | |
| | | | | | | | |
| | | | MINING - 0.8 % | | | | |
| | 10,925 | | | Freeport-McMoRan, Inc. | | | 152,076 | |
| | 21,375 | | | Hudbay Minerals, Inc. * | | | 107,944 | |
| | | | | | | | |
| | | | | | | 260,020 | |
| | | | | | | | |
| | | | MISCELLANEOUS MANUFACTURER - 1.0 % | | | | |
| | 4,445 | | | Trinity Industries, Inc. | | | 162,865 | |
| | 2,305 | | | Trinseo SA | | | 180,482 | |
| | | | | | | | |
| | | | | | | 343,347 | |
| | | | | | | | |
The accompanying notes are an integral part of these financial statements.
70
Schedule of Investments | Growth & Income Fund
As of September 30, 2018 (Continued)
| | | | | | | | | | | | | | | | |
| | |
| Shares | | | | | | | | | | | Fair Value | |
| | |
| | | | |
| | | | OIL & GAS - 2.9 % | | | | | | | | | | | | |
| | 64,300 | | | Chesapeake Energy Corp. * | | | | | | | | | | $ | 288,707 | |
| | 3,875 | | | HollyFrontier Corp. | | | | | | | | | | | 270,863 | |
| | 2,665 | | | Marathon Petroleum Corp. | | | | | | | | | | | 213,120 | |
| | 1,945 | | | Valero Energy Corp. | | | | | | | | | | | 221,244 | |
| | | | | | | | | | | | | | | | |
| | | | | | | | | | | | | | | 993,934 | |
| | | | | | | | | | | | | | | | |
| | | | OIL & GAS SERVICES - 0.5 % | | | | | | | | | | | | |
| | 9,351 | | | McDermott International, Inc. * | | | | | | | | | | | 172,339 | |
| | | | | | | | | | | | | | | | |
| | | | |
| | | | PACKAGING & CONTAINERS - 0.5 % | | | | | | | | | | | | |
| | 8,090 | | | Owens-Illinois, Inc. * | | | | | | | | | | | 152,011 | |
| | | | | | | | | | | | | | | | |
| | | | |
| | | | PHARMACEUTICALS - 0.9 % | | | | | | | | | | | | |
| | 3,260 | | | Express Scripts Holding Co. * | | | | | | | | | | | 309,732 | |
| | | | | | | | | | | | | | | | |
| | | | |
| | | | PRIVATE EQUITY - 0.5 % | | | | | | | | | | | | |
| | 7,850 | | | Carlyle Group LP | | | | | | | | | | | 177,017 | |
| | | | | | | | | | | | | | | | |
| | | | |
| | | | RETAIL - 3.3 % | | | | | | | | | | | | |
| | 4,050 | | | Big Lots, Inc. | | | | | | | | | | | 169,250 | |
| | 1,490 | | | Children’s Place, Inc. | | | | | | | | | | | 190,422 | |
| | 2,705 | | | Group 1 Automotive, Inc. | | | | | | | | | | | 175,555 | |
| | 8,745 | | | Michaels Companies, Inc. * | | | | | | | | | | | 141,931 | |
| | 7,185 | | | Qurate Retail Group, Inc. * | | | | | | | | | | | 159,579 | |
| | 3,535 | | | Rush Enterprises, Inc. * | | | | | | | | | | | 138,961 | |
| | 5,605 | | | Tailored Brands, Inc. | | | | | | | | | | | 141,190 | |
| | | | | | | | | | | | | | | | |
| | | | | | | | | | | | | | | 1,116,888 | |
| | | | | | | | | | | | | | | | |
| | | | SEMICONDUCTORS - 1.8 % | | | | | | | | | | | | |
| | 1,530 | | | KLA-Tencor Corp. | | | | | | | | | | | 155,616 | |
| | 985 | | | Lam Research Corp. | | | | | | | | | | | 149,425 | |
| | 3,750 | | | Micron Technology, Inc. * | | | | | | | | | | | 169,613 | |
| | 1,540 | | | MKS Instruments, Inc. | | | | | | | | | | | 123,430 | |
| | | | | | | | | | | | | | | | |
| | | | | | | | | | | | | | | 598,084 | |
| | | | | | | | | | | | | | | | |
| | | | TRUCKING & LEASING - 1.1 % | | | | | | | | | | | | |
| | 3,140 | | | AerCap Holdings NV * | | | | | | | | | | | 180,613 | |
| | 3,240 | | | Greenbrier Companies, Inc. | | | | | | | | | | | 194,723 | |
| | | | | | | | | | | | | | | 375,336 | |
| | | | | | | | | | | | | | | | |
| | | | |
| | | | TOTAL COMMON STOCK (Cost $14,061,361) | | | | | | | | | | | 14,869,889 | |
| | | | | | | | | | | | | | | | |
| | | | |
| | | | EXCHANGE TRADED FUNDS - 0.3 % | | | | | | | | | | | | |
| | 4,490 | | | James Biblically Responsible Investment ETF * (A) (Cost $112,195) | | | | | | | | 113,310 | |
| | | | | | | | | | | | | | | | |
| | | | |
| | | | REITs - 1.0 % | | | | | | | | | | | | |
| | 8,150 | | | New Residential Investment Corp. | | | | | | | | | | | 145,233 | |
| | 7,830 | | | Xenia Hotels & Resorts, Inc. | | | | | | | | | | | 185,571 | |
| | | | | | | | | | | | | | | | |
| | | | TOTAL REITs (Cost $291,798) | | | | | | | | | | | 330,804 | |
| | | | | | | | | | | | | | | | |
|
| | |
| Par Value | | | | | Coupon Rate (%) | | | Maturity | | | | |
| | |
| | | | |
| | | | BONDS & NOTES - 52.5 % | | | | | | | | | | | | |
| | | | GOVERNMENT NOTES, BONDS & AGENCIES - 44.3 % | | | | | | | | | | | | |
| $ | 314,815 | | | Federal Home Loan Banks | | | 3.000 | | | | 4/18/2031 | | | | 288,414 | |
| | 500,000 | | | Federal Home Loan Mortgage Corp. | | | 3.100 | | | | 3/29/2023 | | | | 493,910 | |
| | 2,000,000 | | | United States Treasury Note | | | 1.250 | | | | 10/31/2018 | | | | 1,998,697 | |
| | 500,000 | | | United States Treasury Note | | | 1.250 | | | | 1/31/2019 | | | | 498,248 | |
| | 3,000,000 | | | United States Treasury Note | | | 2.327 | | | | 1/31/2019 | | | | 3,002,194 | |
| | 1,500,000 | | | United States Treasury Note | | | 1.250 | | | | 4/30/2019 | | | | 1,489,805 | |
| | 2,000,000 | | | United States Treasury Note | | | 2.625 | | | | 11/15/2020 | | | | 1,991,133 | |
| | 1,500,000 | | | United States Treasury Note | | | 1.625 | | | | 8/15/2022 | | | | 1,428,926 | |
| | 3,000,000 | | | United States Treasury Note | | | 1.750 | | | | 5/15/2023 | | | | 2,846,133 | |
| | 1,000,000 | | | United States Treasury Note | | | 3.125 | | | | 2/15/2042 | | | | 990,038 | |
| | | | | | | | | | | | | | | | |
| | | | TOTAL GOVERNMENT NOTES, BONDS & AGENCIES (Cost $15,280,792) | | | | | | | | 15,027,498 | |
| | | | | | | | | | | | | | | | |
The accompanying notes are an integral part of these financial statements.
71
Schedule of Investments | Growth & Income Fund
As of September 30, 2018 (Continued)
| | | | | | | | | | | | | | | | |
| | |
| Principal | | | | | Coupon Rate (%) | | | Maturity | | | Fair Value | |
| | |
| | | |
| | | | TREASURY INFLATION PROTECTED SECURITIES (TIPS) - 8.2 % | | | | | | | | | |
| | $ 2,499,260 | | | United States Treasury Note TIPS (Cost $2,876,733) | | | 2.375 | | | | 1/15/2027 | | | $ | 2,784,791 | |
| | | | | | | | | | | | | | | | |
| | | | |
| | | | TOTAL BONDS & NOTES (Cost $18,157,525) | | | | | | | | | | | 17,812,289 | |
| | | | | | | | | | | | | | | | |
| | | | |
| Shares | | | | | | | | | | | | |
| | | | MONEY MARKET FUND - 2.3 % | | | | | | | | | | | | |
| | 765,958 | | | Fidelity Institutional Money Market Funds - Government Portfolio - Class I, 1.95% (B) | | | | | | | | 765,958 | |
| | | | | | | | | | | | | | | | |
| | | | (Cost $765,958) | | | | | | | | | | | | |
| | | | |
| | | | TOTAL INVESTMENTS - 100.0 % (Cost $33,388,837) | | | | | | | | | | $ | 33,892,250 | |
| | | | OTHER ASSETS IN EXCESS OF LIABILITIES - NET - 0.0 % | | | | | | | | 11,991 | |
| | | | | | | | | | | | | | | | |
| | | | NET ASSETS - 100.0 % | | | | | | | | | | $ | 33,904,241 | |
| | | | | | | | | | | | | | | | |
* Non-income producing securities.
LP - Limited Partnerships.
PLC - Public Limited Company.
REITs - Real Estate Investment Trust.
(A) Affiliated issuer.
(B) Variable rate security; the rate shown represents the yield at September 30, 2018.
The accompanying notes are an integral part of these financial statements.
72
Timothy Plan Funds
Statements of Assets and Liabilities
September 30, 2018
| | | | | | | | | | | | | | | | | | | | | | | | |
| |
| | | | | | |
| | | Aggressive Growth Fund | | | International Fund | | | Large/Mid Cap Growth Fund | | | Small Cap Value Fund | | | Large/Mid Cap Value Fund | | | Fixed Income Fund | |
| | | | | | | | | | | | | | | | | | | |
| |
ASSETS: | | | | | | | | | | | | | | | | | | | | | | | | |
Investments, at cost | | $ | 26,001,099 | | | $ | 93,896,067 | | | $ | 82,996,622 | | | $ | 150,423,199 | | | $ | 190,091,162 | | | $ | 81,257,119 | |
| | | | | | | | | | | | | | | | | | | | | | | | |
Investments, at value | | $ | 31,738,170 | | | $ | 106,314,017 | | | $ | 101,794,683 | | | $ | 167,099,651 | | | $ | 231,738,959 | | | $ | 78,467,654 | |
Dividends and interest receivable | | | 16,119 | | | | 183,962 | | | | 47,724 | | | | 339,143 | | | | 159,231 | | | | 558,190 | |
Receivable for fund shares sold | | | 70,767 | | | | 406,528 | | | | 124,379 | | | | 243,057 | | | | 2,052,146 | | | | 109,715 | |
Receivable for securities sold | | | - | | | | - | | | | - | | | | 229,535 | | | | - | | | | - | |
Receivable for foreign tax reclaims | | | - | | | | 133,630 | | | | - | | | | - | | | | - | | | | - | |
Prepaid expenses and other assets | | | 18,281 | | | | 20,711 | | | | 21,805 | | | | 28,509 | | | | 35,045 | | | | 15,875 | |
| | | | | | | | | | | | | | | | | | | | | | | | |
Total Assets | | | 31,843,337 | | | | 107,058,848 | | | | 101,988,591 | | | | 167,939,895 | | | | 233,985,381 | | | | 79,151,434 | |
| | | | | | | | | | | | | | | | | | | | | | | | |
| | | | | | |
LIABILITIES: | | | | | | | | | | | | | | | | | | | | | | | | |
Payable for fund shares redeemed | | | 206,949 | | | | 43,530 | | | | 46,630 | | | | 2,229,545 | | | | 123,435 | | | | 69,102 | |
Payable to service providers | | | 14,215 | | | | 24,502 | | | | 19,316 | | | | 35,413 | | | | 42,336 | | | | 22,170 | |
Accrued advisory fees | | | 19,713 | | | | 81,982 | | | | 66,619 | | | | 103,588 | | | | 135,046 | | | | 25,061 | |
Accrued 12b-1 fees | | | 8,808 | | | | 18,133 | | | | 25,257 | | | | 36,286 | | | | 55,593 | | | | 20,839 | |
Payable for securities purchased | | | - | | | | - | | | | - | | | | 766,755 | | | | - | | | | - | |
Accrued expenses and other liabilities | | | 36,493 | | | | 35,532 | | | | 27,477 | | | | 40,458 | | | | 40,411 | | | | 33,781 | |
| | | | | | | | | | | | | | | | | | | | | | | | |
Total Liabilities | | | 286,178 | | | | 203,679 | | | | 185,299 | | | | 3,212,045 | | | | 396,821 | | | | 170,953 | |
| | | | | | | | | | | | | | | | | | | | | | | | |
| | | | | | |
Net Assets | | $ | 31,557,159 | | | $ | 106,855,169 | | | $ | 101,803,292 | | | $ | 164,727,850 | | | $ | 233,588,560 | | | $ | 78,980,481 | |
| | | | | | | | | | | | | | | | | | | | | | | | |
| | | | | | |
NET ASSETS CONSIST OF: | | | | | | | | | | | | | | | | | | | | | | | | |
Paid in capital ($0 par value, unlimited shares authorized) | | $ | 24,229,629 | | | $ | 96,552,146 | | | $ | 78,778,629 | | | $ | 130,705,654 | | | $ | 172,216,330 | | | $ | 82,900,648 | |
Accumulated net investment income (loss) | | | (267,521) | | | | (548,573) | | | | (229,905) | | | | - | | | | 722,928 | | | | 366,969 | |
Accumulated net realized gain (loss) from investment | | | 1,857,980 | | | | (1,566,412) | | | | 4,456,507 | | | | 17,345,744 | | | | 19,001,505 | | | | (1,497,671) | |
Net unrealized appreciation (depreciation) on investments | | | 5,737,071 | | | | 12,418,008 | | | | 18,798,061 | | | | 16,676,452 | | | | 41,647,797 | | | | (2,789,465) | |
| | | | | | | | | | | | | | | | | | | | | | | | |
Net Assets | | $ | 31,557,159 | | | $ | 106,855,169 | | | $ | 101,803,292 | | | $ | 164,727,850 | | | $ | 233,588,560 | | | $ | 78,980,481 | |
| | | | | | | | | | | | | | | | | | | | | | | | |
| | | | | | |
Class A | | | | | | | | | | | | | | | | | | | | | | | | |
Net Assets | | $ | 25,926,058 | | | $ | 70,790,181 | | | $ | 79,896,912 | | | $ | 114,984,878 | | | $ | 172,163,170 | | | $ | 66,119,108 | |
Shares of beneficial interest outstanding ($0 par value, unlimited shares authorized) | | | 2,796,682 | | | | 7,269,544 | | | | 8,557,034 | | | | 5,563,332 | | | | 8,448,354 | | | | 6,741,929 | |
Net Asset Value, offering price and redemption price per share | | $ | 9.27 | | | $ | 9.74 | | | $ | 9.34 | | | $ | 20.67 | | | $ | 20.38 | | | $ | 9.81 | |
| | | | | | | | | | | | | | | | | | | | | | | | |
Offering Price Per Share (NAV / 0.945) *(NAV / 0.955) | | $ | 9.81 | | | $ | 10.31 | | | $ | 9.88 | | | $ | 21.87 | | | $ | 21.57 | | | $ | 10.27 | * |
| | | | | | | | | | | | | | | | | | | | | | | | |
| | | | | | |
Class C | | | | | | | | | | | | | | | | | | | | | | | | |
Net Assets | | $ | 4,357,636 | | | $ | 4,778,823 | | | $ | 11,355,023 | | | $ | 14,602,717 | | | $ | 25,851,907 | | | $ | 9,653,259 | |
Shares of beneficial interest outstanding ($0 par value, unlimited shares authorized) | | | 570,009 | | | | 508,003 | | | | 1,488,374 | | | | 967,582 | | | | 1,568,022 | | | | 1,022,396 | |
Net Asset Value, offering price and redemption price per share | | $ | 7.64 | | | $ | 9.41 | | | $ | 7.63 | | | $ | 15.09 | | | $ | 16.49 | | | $ | 9.44 | |
| | | | | | | | | | | | | | | | | | | | | | | | |
Minimum Redemption Price Per Share (NAV * 0.99) | | $ | 7.56 | | | $ | 9.32 | | | $ | 7.55 | | | $ | 14.94 | | | $ | 16.33 | | | $ | 9.35 | |
| | | | | | | | | | | | | | | | | | | | | | | | |
| | | | | | |
Class I | | | | | | | | | | | | | | | | | | | | | | | | |
Net Assets | | $ | 1,273,465 | | | $ | 31,286,165 | | | $ | 10,551,357 | | | $ | 35,140,255 | | | $ | 35,573,483 | | | $ | 3,208,114 | |
Shares of beneficial interest outstanding ($0 par value, unlimited shares authorized) | | | 135,298 | | | | 3,204,530 | | | | 1,112,518 | | | | 1,679,127 | | | | 1,728,252 | | | | 329,466 | |
Net Asset Value, offering price and redemption price per share | | $ | 9.41 | | | $ | 9.76 | | | $ | 9.48 | | | $ | 20.93 | | | $ | 20.58 | | | $ | 9.74 | |
| | | | | | | | | | | | | | | | | | | | | | | | |
The accompanying notes are an integral part of these financial statements.
73
Timothy Plan Funds
Statements of Assets and Liabilities (Continued)
September 30, 2017
| | | | | | | | | | | | | | | | | | | | | | | | | | | | |
| |
| | | | | | | |
| | | High Yield Bond Fund | | | Israel Common
Values Fund | | | Defensive Strategies Fund | | | Strategic Growth Fund | | | Conservative
Growth Fund | | | Emerging Markets Fund | | | Growth & Income
Fund | |
| | | | | | | | | | | | | | | | | | | | | | | | | | | | |
| |
ASSETS: | | | | | | | | | | | | | | | | | | | | | | | | | | | | |
Investments, at cost | | $ | 56,248,154 | | | $ | 43,545,790 | | | $ | 41,210,060 | | | $ | 1,041,790 | | | $ | 2,622,149 | | | $ | 23,441,788 | | | $ | 33,276,642 | |
Investments in affiliates, at cost | | | - | | | | - | | | | - | | | | 34,529,733 | | | | 46,133,963 | | | | - | | | | 112,195 | |
| | | | | | | | | | | | | | | | | | | | | | | | | | | | |
Investments, at value | | $ | 55,340,795 | | | $ | 57,300,241 | | | $ | 41,609,364 | | | $ | 1,041,790 | | | $ | 2,622,149 | | | $ | 20,815,385 | | | $ | 33,778,940 | |
Investments in affiliates, at value | | | - | | | | - | | | | - | | | | 37,488,189 | | | | 48,757,416 | | | | - | | | | 113,310 | |
Gold and Silver Investments, at fair value (Cost $8,900,255) | | | - | | | | - | | | | 8,880,839 | | | | - | | | | - | | | | - | | | | - | |
Cash | | | - | | | | - | | | | - | | | | - | | | | - | | | | - | | | | 140 | |
Hong Kong Dollar (HKD)(Cost $17,046) | | | - | | | | - | | | | - | | | | - | | | | - | | | | 17,040 | | | | - | |
Brazilian Real (BRL)(Cost $8,045) | | | - | | | | - | | | | - | | | | - | | | | - | | | | 8,045 | | | | - | |
Dividends and interest receivable | | | 810,920 | | | | 36,009 | | | | 104,882 | | | | 1,187 | | | | 2,681 | | | | 33,501 | | | | 116,945 | |
Receivable for fund shares sold | | | 767,001 | | | | 3,214,163 | | | | 15,998 | | | | 465 | | | | 3,880 | | | | 12,872 | | | | 360 | |
Receivable for securities sold | | | - | | | | - | | | | - | | | | - | | | | - | | | | 184,488 | | | | - | |
Deposit with broker | | | - | | | | - | | | | 39,745 | | | | - | | | | - | | | | - | | | | - | |
Receivable for foreign tax reclaims | | | - | | | | - | | | | 6,293 | | | | - | | | | - | | | | - | | | | 1,897 | |
Prepaid expenses and other assets | | | 17,743 | | | | 19,903 | | | | 20,822 | | | | 12,972 | | | | 15,089 | | | | 24,616 | | | | 18,320 | |
| | | | | | | | | | | | | | | | | | | | | | | | | | | | |
Total Assets | | | 56,936,459 | | | | 60,570,316 | | | | 50,677,943 | | | | 38,544,603 | | | | 51,401,215 | | | | 21,095,947 | | | | 34,029,912 | |
| | | | | | | | | | | | | | | | | | | | | | | | | | | | |
| | | | | | | |
LIABILITIES: | | | | | | | | | | | | | | | | | | | | | | | | | | | | |
Due to Custodian | | | - | | | | - | | | | 3,967 | | | | - | | | | - | | | | - | | | | - | |
Payable for securities purchased | | | - | | | | - | | | | - | | | | - | | | | - | | | | 12,575 | | | | - | |
Payable for fund shares redeemed | | | 53,334 | | | | 13,780 | | | | 1,492,425 | | | | 90,494 | | | | 65,998 | | | | 9,693 | | | | 48,522 | |
Payable to service providers | | | 19,143 | | | | 15,927 | | | | 20,425 | | | | 13,916 | | | | 15,866 | | | | 8,641 | | | | 11,413 | |
Accrued advisory fees | | | 25,346 | | | | 47,238 | | | | 22,853 | | | | 17,111 | | | | 25,472 | | | | 18,297 | | | | 22,501 | |
Accrued 12b-1 fees | | | 11,007 | | | | 15,409 | | | | 10,415 | | | | 3,420 | | | | 5,228 | | | | 5,167 | | | | 8,421 | |
Accrued expenses and other liabilities | | | 40,202 | | | | 35,827 | | | | 52,230 | | | | 28,690 | | | | 30,735 | | | | 43,667 | | | | 34,814 | |
| | | | | | | | | | | | | | | | | | | | | | | | | | | | |
Total Liabilities | | | 149,032 | | | | 128,181 | | | | 1,602,315 | | | | 153,631 | | | | 143,299 | | | | 98,040 | | | | 125,671 | |
| | | | | | | | | | | | | | | | | | | | | | | | | | | | |
| | | | | | | |
Net Assets | | $ | 56,787,427 | | | $ | 60,442,135 | | | $ | 49,075,628 | | | $ | 38,390,972 | | | $ | 51,257,916 | | | $ | 20,997,907 | | | $ | 33,904,241 | |
| | | | | | | | | | | | | | | | | | | | | | | | | | | | |
| | | | | | | |
NET ASSETS CONSIST OF: | | | | | | | | | | | | | | | | | | | | | | | | | | | | |
Paid in capital ($0 par value, unlimited shares authorized) | | $ | 58,870,530 | | | $ | 49,677,602 | | | $ | 47,676,103 | | | $ | 35,680,794 | | | $ | 47,835,581 | | | $ | 23,829,787 | | | $ | 32,808,575 | |
Accumulated net investment income (loss) | | | 34,306 | | | | (1,500,349) | | | | 368,580 | | | | (262,904) | | | | (198,280) | | | | 85,297 | | | | 10,026 | |
Accumulated net realized gain (loss) from investments | | | (1,210,050) | | | | (1,489,213) | | | | 651,046 | | | | 14,626 | | | | 997,162 | | | | (290,752) | | | | 582,227 | |
Net unrealized appreciation (depreciation) on investments | | | (907,359) | | | | 13,754,095 | | | | 379,899 | | | | 2,958,456 | | | | 2,623,453 | | | | (2,626,425) | | | | 503,413 | |
| | | | | | | | | | | | | | | | | | | | | | | | | | | | |
Net Assets | | $ | 56,787,427 | | | $ | 60,442,135 | | | $ | 49,075,628 | | | $ | 38,390,972 | | | $ | 51,257,916 | | | $ | 20,997,907 | | | $ | 33,904,241 | |
| | | | | | | | | | | | | | | | | | | | | | | | | | | | |
| | | | | | | |
Class A | | | | | | | | | | | | | | | | | | | | | | | | | | | | |
Net Assets | | $ | 41,990,743 | | | $ | 41,137,194 | | | $ | 40,573,012 | | | $ | 32,077,770 | | | $ | 42,040,141 | | | $ | 16,941,187 | | | $ | 27,715,982 | |
Shares of beneficial interest outstanding ($0 par value, unlimited shares authorized) | | | 4,654,976 | | | | 2,614,000 | | | | 3,545,723 | | | | 3,306,363 | | | | 3,909,314 | | | | 1,966,002 | | | | 2,550,157 | |
Net Asset Value, offering price and redemption price per share | | $ | 9.02 | | | $ | 15.74 | | | $ | 11.44 | | | $ | 9.70 | | | $ | 10.75 | | | $ | 8.62 | | | $ | 10.87 | |
| | | | | | | | | | | | | | | | | | | | | | | | | | | | |
Offering Price Per Share (NAV / 0.945) *(NAV / 0.955) | | $ | 9.45 | * | | $ | 16.66 | | | $ | 12.11 | | | $ | 10.26 | | | $ | 11.38 | | | $ | 9.12 | | | $ | 11.50 | |
| | | | | | | | | | | | | | | | | | | | | | | | | | | | |
| | | | | | | |
Class C | | | | | | | | | | | | | | | | | | | | | | | | | | | | |
Net Assets | | $ | 3,219,102 | | | $ | 9,220,462 | | | $ | 5,431,737 | | | $ | 6,313,202 | | | $ | 9,217,775 | | | $ | 2,192,183 | | | $ | 3,176,382 | |
Shares of beneficial interest outstanding ($0 par value, unlimited shares authorized) | | | 352,266 | | | | 610,950 | | | | 498,463 | | | | 725,347 | | | | 944,075 | | | | 261,871 | | | | 302,238 | |
Net Asset Value, offering price and redemption price per share | | $ | 9.14 | | | $ | 15.09 | | | $ | 10.90 | | | $ | 8.70 | | | $ | 9.76 | | | $ | 8.37 | | | $ | 10.51 | |
| | | | | | | | | | | | | | | | | | | | | | | | | | | | |
Minimum Redemption Price Per Share (NAV * 0.99) | | $ | 9.05 | | | $ | 14.94 | | | $ | 10.79 | | | $ | 8.61 | | | $ | 9.66 | | | $ | 8.29 | | | $ | 10.41 | |
| | | | | | | | | | | | | | | | | | | | | | | | | | | | |
| | | | | | | |
Class I | | | | | | | | | | | | | | | | | | | | | | | | | | | | |
Net Assets | | $ | 11,577,582 | | | $ | 10,084,479 | | | $ | 3,070,879 | | | $ | - | | | $ | - | | | $ | 1,864,537 | | | $ | 3,011,877 | |
Shares of beneficial interest outstanding ($0 par value, unlimited shares authorized) | | | 1,283,207 | | | | 637,718 | | | | 268,288 | | | | - | | | | - | | | | 214,767 | | | | 275,333 | |
Net Asset Value, offering price and redemption price per share | | $ | 9.02 | | | $ | 15.81 | | | $ | 11.45 | | | $ | - | | | $ | - | | | $ | 8.68 | | | $ | 10.94 | |
| | | | | | | | | | | | | | | | | | | | | | | | | | | | |
The accompanying notes are an integral part of these financial statements.
74
Timothy Plan Funds
Statements of Operations
For the Year Ended September 30, 2018
| | | | | | | | | | | | | | | | | | | | | | | | |
| |
| | | Aggressive Growth Fund | | | International Fund | | | Large/Mid Cap
Growth Fund | | | Small Cap Value
Fund | | | Large/Mid Cap Value Fund | | | Fixed Income Fund | |
| | | | | | | | | | | | | | | | | | | | | | | | |
| |
Investment Income: | | | | | | | | | | | | | | | | | | | | | | | | |
Interest income | | $ | 20,795 | | | $ | 36,764 | | | $ | 82,423 | | | $ | 34,247 | | | $ | 84,156 | | | $ | 2,223,222 | |
Dividend Income | | | 146,350 | | | | 3,259,633 | | | | 1,094,944 | | | | 2,165,958 | | | | 3,782,668 | | | | - | |
Foreign tax withheld | | | - | | | | (334,794) | | | | - | | | | - | | | | - | | | | - | |
| | | | | | | | | | | | | | | | | | | | | | | | |
Total Investment Income | | | 167,145 | | | | 2,961,603 | | | | 1,177,367 | | | | 2,200,205 | | | | 3,866,824 | | | | 2,223,222 | |
| | | | | | | | | | | | | | | | | | | | | | | | |
| | | | | | |
Operating Expenses: | | | | | | | | | | | | | | | | | | | | | | | | |
Investment advisory fees | | | 248,801 | | | | 1,049,025 | | | | 788,593 | | | | 1,305,824 | | | | 1,892,693 | | | | 494,359 | |
12b-1 Fees: | | | | | | | | | | | | | | | | | | | | | | | | |
Class A | | | 60,647 | | | | 195,188 | | | | 185,658 | | | | 285,740 | | | | 428,602 | | | | 175,723 | |
Class C | | | 39,547 | | | | 49,819 | | | | 106,529 | | | | 140,024 | | | | 251,468 | | | | 96,371 | |
Administration fees | | | 72,226 | | | | 221,435 | | | | 190,965 | | | | 319,825 | | | | 446,020 | | | | 172,220 | |
Registration fees | | | 34,614 | | | | 46,934 | | | | 41,285 | | | | 42,384 | | | | 42,431 | | | | 30,306 | |
Non 12b-1 shareholder service fees | | | 28,208 | | | | 104,440 | | | | 65,223 | | | | 111,528 | | | | 147,156 | | | | 79,266 | |
Custody fees | | | 6,253 | | | | 22,228 | | | | 16,559 | | | | 33,619 | | | | 30,260 | | | | 18,581 | |
Audit fees | | | 13,643 | | | | 14,475 | | | | 13,700 | | | | 16,803 | | | | 13,954 | | | | 13,674 | |
Printing expenses | | | 19,231 | | | | 47,247 | | | | 40,967 | | | | 68,240 | | | | 87,575 | | | | 34,806 | |
Trustees’ fees | | | 2,548 | | | | 10,523 | | | | 9,150 | | | | 14,176 | | | | 18,830 | | | | 8,030 | |
Compliance officer fees | | | 3,350 | | | | 9,931 | | | | 7,718 | | | | 13,362 | | | | 20,031 | | | | 7,596 | |
Insurance expenses | | | 730 | | | | 3,650 | | | | 1,460 | | | | 2,920 | | | | 4,015 | | | | 2,920 | |
Miscellaneous expenses | | | 3,865 | | | | 4,720 | | | | 4,656 | | | | 2,345 | | | | 1,110 | | | | 5,475 | |
| | | | | | | | | | | | | | | | | | | | | | | | |
Total Operating Expenses | | | 533,663 | | | | 1,779,615 | | | | 1,472,463 | | | | 2,356,790 | | | | 3,384,145 | | | | 1,139,327 | |
Less: Expenses waived by Advisor | | | (29,271) | | | | (52,451) | | | | (46,388) | | | | (90,874) | | | | (241,198) | | | | (164,786) | |
| | | | | | | | | | | | | | | | | | | | | | | | |
Net Operating Expenses | | | 504,392 | | | | 1,727,164 | | | | 1,426,075 | | | | 2,265,916 | | | | 3,142,947 | | | | 974,541 | |
| | | | | | | | | | | | | | | | | | | | | | | | |
| | | | | | |
Net Investment Income (Loss) | | | (337,247) | | | | 1,234,439 | | | | (248,708) | | | | (65,711) | | | | 723,877 | | | | 1,248,681 | |
| | | | | | | | | | | | | | | | | | | | | | | | |
| | | | | | |
Realized and Unrealized Gain (Loss) on Investments: | | | | | | | | | | | | | | | | | | | | | | | | |
Net realized gain (loss) on investments | | | 2,614,277 | | | | (306,315) | | | | 4,948,472 | | | | 20,589,359 | | | | 19,004,936 | | | | (414,217) | |
and foreign currency translations | | | - | | | | 354 | | | | - | | | | - | | | | - | | | | - | |
Capital gain dividends from REITs | | | - | | | | - | | | | - | | | | 279,942 | | | | 352 | | | | - | |
Net change in unrealized appreciation (depreciation) on investments | | | 1,679,056 | | | | (809,405) | | | | 5,152,488 | | | | (6,327,556) | | | | 7,805,963 | | | | (2,914,612) | |
and foreign currency transactions | | | - | | | | 66 | | | | - | | | | - | | | | - | | | | - | |
| | | | | | | | | | | | | | | | | | | | | | | | |
Net Realized and Unrealized Gain (Loss) on Investments | | | 4,293,333 | | | | (1,115,300) | | | | 10,100,960 | | | | 14,541,745 | | | | 26,811,251 | | | | (3,328,829) | |
| | | | | | | | | | | | | | | | | | | | | | | | |
| | | | | | |
Net Increase (Decrease) in Net Assets Resulting From Operations | | $ | 3,956,086 | | | $ | 119,139 | | | $ | 9,852,252 | | | $ | 14,476,034 | | | $ | 27,535,128 | | | $ | (2,080,148) | |
| | | | | | | | | | | | | | | | | | | | | | | | |
The accompanying notes are an integral part of these financial statements.
75
Timothy Plan Funds
Statements of Operations (Continued)
For the Year Ended September 30, 2018
| | | | | | | | | | | | | | | | | | | | | | | | | | | | |
| |
| | | | | | | |
| | | High Yield Bond Fund | | | Israel Common
Values Fund | | | Defensive
Strategies Fund | | | Strategic Growth
Fund | | | Conservative
Growth Fund | | | Emerging Markets Fund | | | Growth & Income
Fund | |
| | | | | | | | | | | | | | | | | | | | | | | | | | | | |
| |
Investment Income: | | | | | | | | | | | | | | | | | | | | | | | | | | | | |
Interest income | | $ | 3,052,323 | | | $ | 25,978 | | | $ | 604,470 | | | $ | 14,503 | | | $ | 35,772 | | | $ | 37,597 | | | $ | 403,525 | |
Dividend Income | | | - | | | | 1,010,048 | | | | 648,577 | | | | - | | | | - | | | | 742,442 | | | | 228,852 | |
Dividend income from affiliated funds | | | - | | | | - | | | | - | | | | 430,824 | | | | 617,787 | | | | - | | | | - | |
Foreign tax withheld | | | - | | | | (243,253) | | | | (22,928) | | | | - | | | | - | | | | (67,769) | | | | (1,857) | |
| | | | | | | | | | | | | | | | | | | | | | | | | | | | |
Total Investment Income | | | 3,052,323 | | | | 792,773 | | | | 1,230,119 | | | | 445,327 | | | | 653,559 | | | | 712,270 | | | | 630,520 | |
| | | | | | | | | | | | | | | | | | | | | | | | | | | | |
| | | | | | | |
Operating Expenses: | | | | | | | | | | | | | | | | | | | | | | | | | | | | |
Investment advisory fees | | | 359,090 | | | | 497,192 | | | | 325,371 | | | | 257,651 | | | | 348,384 | | | | 276,012 | | | | 302,346 | |
12b-1 fees: | | | | | | | | | | | | | | | | | | | | | | | | | | | | |
Class A | | | 115,537 | | | | 88,776 | | | | 113,611 | | | | - | | | | - | | | | 46,933 | | | | 74,008 | |
Class C | | | 33,430 | | | | 86,083 | | | | 60,122 | | | | 51,302 | | | | 69,833 | | | | 24,325 | | | | 31,451 | |
Administration fees | | | 152,080 | | | | 109,020 | | | | 122,514 | | | | 84,615 | | | | 112,807 | | | | 61,368 | | | | 84,880 | |
Non 12b-1 shareholder service fees | | | 70,090 | | | | 49,047 | | | | 56,698 | | | | 18,410 | | | | 23,266 | | | | 33,644 | | | | 34,491 | |
Registration fees | | | 51,533 | | | | 38,521 | | | | 29,898 | | | | 26,325 | | | | 26,839 | | | | 67,004 | | | | 28,695 | |
Printing expenses | | | 29,059 | | | | 25,952 | | | | 16,876 | | | | 20,472 | | | | 25,843 | | | | 15,545 | | | | 19,903 | |
Audit fees | | | 13,515 | | | | 12,235 | | | | 12,210 | | | | 13,795 | | | | 14,710 | | | | 15,699 | | | | 14,705 | |
Custody fees | | | 13,023 | | | | 51,096 | | | | 47,512 | | | | 6,565 | | | | 10,326 | | | | 60,564 | | | | 10,713 | |
Compliance officer fees | | | 8,316 | | | | 5,067 | | | | 6,547 | | | | 3,740 | | | | 5,780 | | | | 2,706 | | | | 3,966 | |
Trustees’ fees | | | 5,376 | | | | 4,308 | | | | 7,460 | | | | 4,139 | | | | 5,255 | | | | 1,194 | | | | 5,840 | |
Insurance expenses | | | 1,464 | | | | 365 | | | | 1,460 | | | | 1,460 | | | | 1,281 | | | | - | | | | 438 | |
Miscellaneous expenses | | | 4,799 | | | | 5,735 | | | | 3,755 | | | | 3,165 | | | | 3,866 | | | | 8,970 | | | | 7,865 | |
| | | | | | | | | | | | | | | | | | | | | | | | | | | | |
Total Operating Expenses | | | 857,312 | | | | 973,397 | | | | 804,034 | | | | 491,639 | | | | 648,190 | | | | 613,964 | | | | 619,301 | |
Less: Expenses waived by Advisor | | | (29,924) | | | | - | | | | (27,114) | | | | - | | | | - | | | | (11,501) | | | | (17,785) | |
| | | | | | | | | | | | | | | | | | | | | | | | | | | | |
Net Operating Expenses | | | 827,388 | | | | 973,397 | | | | 776,920 | | | | 491,639 | | | | 648,190 | | | | 602,463 | | | | 601,516 | |
| | | | | | | | | | | | | | | | | | | | | | | | | | | | |
| | | | | | | |
Net Investment Income (Loss) | | | 2,224,935 | | | | (180,624) | | | | 453,199 | | | | (46,312) | | | | 5,369 | | | | 109,807 | | | | 29,004 | |
| | | | | | | | | | | | | | | | | | | | | | | | | | | | |
| | | | | | | |
Realized and Unrealized Gain (Loss) on Investments: | | | | | | | | | | | | | | | | | | | | | | | | | | | | |
Net realized gain (loss) on investments | | | 218,979 | | | | (674,702) | | | | 1,333,977 | | | | - | | | | - | | | | 1,003,240 | | | | 586,758 | |
foreign currency translations | | | - | | | | 3,028 | | | | (6,004) | | | | - | | | | - | | | | (28,339) | | | | 63 | |
and affiliated investments | | | - | | | | - | | | | - | | | | 480,513 | | | | 449,831 | | | | - | | | | (554) | |
Capital gain distributions from affiliated funds | | | - | | | | - | | | | - | | | | 606,054 | | | | 673,012 | | | | - | | | | - | |
Capital gain dividends from REITs | | | - | | | | - | | | | 73,608 | | | | - | | | | - | | | | - | | | | 1,275 | |
Net change in unrealized appreciation (depreciation) on investments | | | (2,642,975) | | | | 4,238,600 | | | | (753,357) | | | | - | | | | - | | | | (3,943,353) | | | | (1,093,198) | |
affiliated investments | | | - | | | | - | | | | - | | | | (165,160) | | | | (609,539) | | | | - | | | | 1,115 | |
alternative investments | | | - | | | | - | | | | (712,551) | | | | - | | | | - | | | | - | | | | - | |
and foreign currency translations | | | - | | | | (340) | | | | 49 | | | | - | | | | - | | | | (69) | | | | - | |
| | | | | | | | | | | | | | | | | | | | | | | | | | | | |
Net Realized and Unrealized Gain (Loss) on Investments | | | (2,423,996) | | | | 3,566,586 | | | | (64,278) | | | | 921,407 | | | | 513,304 | | | | (2,968,521) | | | | (504,541) | |
| | | | | | | | | | | | | | | | | | | | | | | | | | | | |
| | | | | | | |
Net Increase (Decrease) in Net Assets Resulting From Operations | | $ | (199,061) | | | $ | 3,385,962 | | | $ | 388,921 | | | $ | 875,095 | | | $ | 518,673 | | | $ | (2,858,714) | | | $ | (475,537) | |
| | | | | | | | | | | | | | | | | | | | | | | | | | | | |
The accompanying notes are an integral part of these financial statements.
76
Timothy Plan Funds
Statements of Changes in Net Assets
| | | | | | | | | | | | | | | | | | | | | | | | |
| | | Aggressive Growth Fund | | | International Fund | | | Large/Mid Cap Growth Fund | |
| | | | | | |
| | | Year Ended September 30, 2018 | | | Year Ended September 30, 2017 | | | Year Ended September 30, 2018 | | | Year Ended September 30, 2017 | | | Year Ended September 30, 2018 | | | Year Ended September 30, 2017 | |
Operations: | | | | | | | | | | | | | | | | | | | | | | | | |
Net investment income (loss) | | $ | (337,247) | | | $ | (288,224) | | | $ | 1,234,439 | | | $ | 330,646 | | | $ | (248,708) | | | $ | (159,698) | |
Net realized gain (loss) from investments and foreign currency translations | | | 2,614,277 | | | | 1,503,387 | | | | (305,961) | | | | 9,963,900 | | | | 4,948,472 | | | | 2,495,324 | |
Net change in unrealized appreciation (depreciation) on investments and foreign currency translations | | | 1,679,056 | | | | 3,127,978 | | | | (809,339) | | | | 3,000,892 | | | | 5,152,488 | | | | 8,627,675 | |
| | | | | | | | | | | | | | | | | | | | | | | | |
Net increase in net assets resulting from operations | | | 3,956,086 | | | | 4,343,141 | | | | 119,139 | | | | 13,295,438 | | | | 9,852,252 | | | | 10,963,301 | |
| | | | | | | | | | | | | | | | | | | | | | | | |
| | | | | | |
Distributions to Shareholders: | | | | | | | | | | | | | | | | | | | | | | | | |
Net investment income | | | | | | | | | | | | | | | | | | | | | | | | |
Class A | | | - | | | | - | | | | (1,590,599) | | | | (651,323) | | | | - | | | | - | |
Class C | | | - | | | | - | | | | (78,049) | | | | (6,005) | | | | - | | | | - | |
Class I | | | - | | | | - | | | | (317,870) | | | | (72,240) | | | | - | | | | - | |
Net realized gains | | | | | | | | | | | | | | | | | | | | | | | | |
Class A | | | - | | | | - | | | | - | | | | - | | | | (1,847,919) | | | | (696,373) | |
Class C | | | - | | | | - | | | | - | | | | - | | | | (315,112) | | | | (108,931) | |
Class I | | | - | | | | - | | | | - | | | | - | | | | (131,374) | | | | (13,562) | |
| | | | | | | | | | | | | | | | | | | | | | | | |
Total dividends and distributions to shareholders | | | - | | | | - | | | | (1,986,518) | | | | (729,568) | | | | (2,294,405) | | | | (818,866) | |
| | | | | | | | | | | | | | | | | | | | | | | | |
| | | | | | |
Share Transactions of Beneficial Interest: | | | | | | | | | | | | | | | | | | | | | | | | |
Net proceeds from shares sold | | | | | | | | | | | | | | | | | | | | | | | | |
Class A | | | 6,109,332 | | | | 10,276,076 | | | | 26,340,958 | | | | 29,924,470 | | | | 26,743,917 | | | | 28,163,409 | |
Class C | | | 936,704 | | | | 664,926 | | | | 1,087,173 | | | | 1,063,169 | | | | 2,228,727 | | | | 2,761,483 | |
Class I | | | 481,847 | | | | 410,807 | | | | 23,288,714 | | | | 10,148,632 | | | | 7,874,524 | | | | 2,705,137 | |
Reinvestment of dividends and distributions | | | | | | | | | | | | | | | | | | | | | | | | |
Class A | | | - | | | | - | | | | 1,371,884 | | | | 555,955 | | | | 1,776,200 | | | | 671,056 | |
Class C | | | - | | | | - | | | | 67,879 | | | | 5,464 | | | | 286,578 | | | | 95,918 | |
Class I | | | - | | | | - | | | | 195,978 | | | | 39,506 | | | | 114,736 | | | | 13,516 | |
Cost of shares redeemed | | | | | | | | | | | | | | | | | | | | | | | | |
Class A | | | (6,037,901) | | | | (12,638,423) | | | | (37,345,703) | | | | (29,726,519) | | | | (23,051,846) | | | | (23,071,818) | |
Class C | | | (660,781) | | | | (1,040,253) | | | | (915,581) | | | | (1,543,450) | | | | (1,800,801) | | | | (1,701,660) | |
Class I | | | (248,327) | | | | (25,304) | | | | (4,224,936) | | | | (1,564,989) | | | | (2,062,243) | | | | (196,871) | |
| | | | | | | | | | | | | | | | | | | | | | | | |
Net increase (decrease) in net assets from share transactions of beneficial interest | | | 580,874 | | | | (2,352,171) | | | | 9,866,366 | | | | 8,902,238 | | | | 12,109,792 | | | | 9,440,170 | |
| | | | | | | | | | | | | | | | | | | | | | | | |
| | | | | | |
Total Increase in Net Assets | | | 4,536,960 | | | | 1,990,970 | | | | 7,998,987 | | | | 21,468,108 | | | | 19,667,639 | | | | 19,584,605 | |
| | | | | | |
Net Assets: | | | | | | | | | | | | | | | | | | | | | | | | |
Beginning of year | | | 27,020,199 | | | | 25,029,229 | | | | 98,856,182 | | | | 77,388,074 | | | | 82,135,653 | | | | 62,551,048 | |
| | | | | | | | | | | | | | | | | | | | | | | | |
End of year* | | $ | 31,557,159 | | | $ | 27,020,199 | | | $ | 106,855,169 | | | $ | 98,856,182 | | | $ | 101,803,292 | | | $ | 82,135,653 | |
| | | | | | | | | | | | | | | | | | | | | | | | |
* Includes accumulated net investment income (loss) at end of period | | $ | (267,521) | | | $ | (227,414) | | | $ | (548,573) | | | $ | 88,682 | | | $ | (229,905) | | | $ | (85,093) | |
| | | | | | | | | | | | | | | | | | | | | | | | |
| | | | | | |
Share Activity: | | | | | | | | | | | | | | | | | | | | | | | | |
Shares Sold | | | | | | | | | | | | | | | | | | | | | | | | |
Class A | | | 710,533 | | | | 1,412,044 | | | | 2,594,394 | | | | 3,344,583 | | | | 2,994,799 | | | | 3,551,281 | |
Class C | | | 130,147 | | | | 107,222 | | | | 110,883 | | | | 122,174 | | | | 302,780 | | | | 414,212 | |
Class I | | | 55,163 | | | | 54,291 | | | | 2,284,264 | | | | 1,157,000 | | | | 872,751 | | | | 330,898 | |
Shares Reinvested | | | | | | | | | | | | | | | | | | | | | | | | |
Class A | | | - | | | | - | | | | 138,017 | | | | 65,793 | | | | 203,693 | | | | 86,812 | |
Class C | | | - | | | | - | | | | 7,027 | | | | 664 | | | | 39,969 | | | | 14,894 | |
Class I | | | - | | | | - | | | | 19,696 | | | | 4,675 | | | | 12,979 | | | | 1,730 | |
Shares Redeemed | | | | | | | | | | | | | | | | | | | | | | | | |
Class A | | | (696,184) | | | | (1,741,621) | | | | (3,689,300) | | | | (3,390,201) | | | | (2,594,895) | | | | (2,895,329) | |
Class C | | | (92,398) | | | | (175,323) | | | | (93,666) | | | | (184,030) | | | | (248,808) | | | | (258,305) | |
Class I | | | (27,915) | | | | (3,580) | | | | (422,471) | | | | (175,352) | | | | (225,749) | | | | (24,333) | |
| | | | | | | | | | | | | | | | | | | | | | | | |
Net increase (decrease) in shares of beneficial interest outstanding | | | 79,346 | | | | (346,967) | | | | 948,844 | | | | 945,306 | | | | 1,357,519 | | | | 1,221,860 | |
| | | | | | | | | | | | | | | | | | | | | | | | |
| | | | | | |
| | | | | | | | | | | | | | | | | | | | | | | | | |
The accompanying notes are an integral part of these financial statements.
77
Timothy Plan Funds
Statements of Changes in Net Assets (Continued)
| | | | | | | | | | | | | | | | | | | | | | | | |
| | | Small Cap Value Fund | | | Large/Mid Cap Value Fund | | | Fixed Income Fund | |
| | | | | | |
| | | Year Ended | | | Year Ended | | | Year Ended | | | Year Ended | | | Year Ended | | | Year Ended | |
| | | | | | |
| | | September 30, 2018 | | | September 30, 2017 | | | September 30, 2018 | | | September 30, 2017 | | | September 30, 2018 | | | September 30, 2017 | |
Operations: | | | | | | | | | | | | | | | | | | | | | | | | |
Net investment income (loss) | | $ | (65,711) | | | $ | 174,210 | | | $ | 723,877 | | | $ | 366,696 | | | $ | 1,248,681 | | | $ | 1,081,386 | |
Net realized gain (loss) from investments and foreign currency translations | | | 20,589,359 | | | | 9,445,306 | | | | 19,004,936 | | | | 13,916,124 | | | | (414,217) | | | | (39,983) | |
Capital gain dividends from REITs | | | 279,942 | | | | 102,356 | | | | 352 | | | | 12,498 | | | | - | | | | - | |
Net change in unrealized appreciation (depreciation) on investments and foreign currency translations | | | (6,327,556) | | | | 15,135,696 | | | | 7,805,963 | | | | 9,553,606 | | | | (2,914,612) | | | | (2,031,650) | |
| | | | | | | | | | | | | | | | | | | | | | | | |
Net increase (decrease) in net assets resulting from operations | | | 14,476,034 | | | | 24,857,568 | | | | 27,535,128 | | | | 23,848,924 | | | | (2,080,148) | | | | (990,247) | |
| | | | | | | | | | | | | | | | | | | | | | | | |
| | | | | | |
Distributions to Shareholders: | | | | | | | | | | | | | | | | | | | | | | | | |
Net investment income | | | | | | | | | | | | | | | | | | | | | | | | |
Class A | | | (22,710) | | | | - | | | | (220,445) | | | | - | | | | (1,218,734) | | | | (1,274,991) | |
Class C | | | - | | | | - | | | | - | | | | - | | | | (101,803) | | | | (87,395) | |
Class I | | | (52,883) | | | | - | | | | (76,736) | | | | - | | | | (54,148) | | | | (28,822) | |
Net realized gains | | | | | | | | | | | | | | | | | | | | | | | | |
Class A | | | (9,388,636) | | | | (1,379,261) | | | | (10,710,030) | | | | (1,940,987) | | | | - | | | | - | |
Class C | | | (1,526,616) | | | | (197,580) | | | | (1,896,292) | | | | (312,832) | | | | - | | | | - | |
Class I | | | (1,716,592) | | | | (95,030) | | | | (1,324,276) | | | | (78,954) | | | | - | | | | - | |
| | | | | | | | | | | | | | | | | | | | | | | | |
Total dividends and distributions to shareholders | | | (12,707,437) | | | | (1,671,871) | | | | (14,227,779) | | | | (2,332,773) | | | | (1,374,685) | | | | (1,391,208) | |
| | | | | | | | | | | | | | | | | | | | | | | | |
| | | | | | |
Share Transactions of Beneficial Interest: | | | | | | | | | | | | | | | | | | | | | | | | |
Net proceeds from shares sold | | | | | | | | | | | | | | | | | | | | | | | | |
Class A | | | 29,520,528 | | | | 34,063,961 | | | | 42,017,010 | | | | 44,668,663 | | | | 13,394,512 | | | | 29,145,764 | |
Class C | | | 1,993,048 | | | | 3,051,009 | | | | 3,682,182 | | | | 5,127,515 | | | | 3,335,525 | | | | 3,385,129 | |
Class I | | | 17,485,340 | | | | 15,600,425 | | | | 20,485,063 | | | | 15,746,538 | | | | 1,810,955 | | | | 2,319,134 | |
Reinvestment of dividends and distributions | | | | | | | | | | | | | | | | | | | | | | | | |
Class A | | | 8,933,806 | | | | 1,332,783 | | | | 10,092,852 | | | | 1,782,051 | | | | 1,067,151 | | | | 1,137,339 | |
Class C | | | 1,478,389 | | | | 189,394 | | | | 1,738,242 | | | | 278,290 | | | | 87,551 | | | | 74,448 | |
Class I | | | 1,609,352 | | | | 79,726 | | | | 1,175,132 | | | | 74,220 | | | | 46,244 | | | | 25,178 | |
Cost of shares redeemed | | | | | | | | | | | | | | | | | | | | | | | | |
Class A | | | (37,994,067) | | | | (36,134,908) | | | | (57,481,324) | | | | (51,593,275) | | | | (21,251,623) | | | | (38,428,316) | |
Class C | | | (1,771,734) | | | | (2,277,120) | | | | (4,442,696) | | | | (4,692,501) | | | | (3,003,371) | | | | (3,243,896) | |
Class I | | | (3,561,465) | | | | (1,277,488) | | | | (7,228,663) | | | | (3,161,750) | | | | (679,913) | | | | (771,465) | |
| | | | | | | | | | | | | | | | | | | | | | | | |
Net increase (decrease) in net assets from share transactions of beneficial interest | | | 17,693,197 | | | | 14,627,782 | | | | 10,037,798 | | | | 8,229,751 | | | | (5,192,969) | | | | (6,356,685) | |
| | | | | | | | | | | | | | | | | | | | | | | | |
| | | | | | |
Total Increase (Decrease) in Net Assets | | | 19,461,794 | | | | 37,813,479 | | | | 23,345,147 | | | | 29,745,902 | | | | (8,647,802) | | | | (8,738,140) | |
| | | | | | |
Net Assets: | | | | | | | | | | | | | | | | | | | | | | | | |
Beginning of year | | | 145,266,056 | | | | 107,452,577 | | | | 210,243,413 | | | | 180,497,511 | | | | 87,628,283 | | | | 96,366,423 | |
| | | | | | | | | | | | | | | | | | | | | | | | |
End of year* | | $ | 164,727,850 | | | $ | 145,266,056 | | | $ | 233,588,560 | | | $ | 210,243,413 | | | $ | 78,980,481 | | | $ | 87,628,283 | |
| | | | | | | | | | | | | | | | | | | | | | | | |
* Includes accumulated net investment income (loss) at end of period | | $ | - | | | $ | 71,470 | | | $ | 722,928 | | | $ | 296,232 | | | $ | 366,969 | | | $ | 340,631 | |
| | | | | | | | | | | | | | | | | | | | | | | | |
| | | | | | |
Share Activity: | | | | | | | | | | | | | | | | | | | | | | | | |
Shares Sold | | | | | | | | | | | | | | | | | | | | | | | | |
Class A | | | 1,453,270 | | | | 1,841,275 | | | | 2,121,546 | | | | 2,470,843 | | | | 1,337,781 | | | | 2,846,241 | |
Class C | | | 132,775 | | | | 213,742 | | | | 230,041 | | | | 341,567 | | | | 347,652 | | | | 343,433 | |
Class I | | | 849,056 | | | | 849,133 | | | | 1,027,556 | | | | 856,447 | | | | 182,832 | | | | 229,120 | |
Shares Reinvested | | | | | | | | | | | | | | | | | | | | | | | | |
Class A | | | 459,560 | | | | 70,705 | | | | 526,767 | | | | 100,624 | | | | 107,477 | | | | 111,777 | |
Class C | | | 103,525 | | | | 13,180 | | | | 111,426 | | | | 18,918 | | | | 9,157 | | | | 7,594 | |
Class I | | | 81,901 | | | | 4,189 | | | | 60,825 | | | | 4,160 | | | | 4,701 | | | | 2,487 | |
Shares Redeemed | | | | | | | | | | | | | | | | | | | | | | | | |
Class A | | | (1,858,772) | | | | (1,954,274) | | | | (2,919,770) | | | | (2,845,566) | | | | (2,123,360) | | | | (3,761,593) | |
Class C | | | (118,838) | | | | (159,590) | | | | (278,184) | | | | (313,752) | | | | (313,092) | | | | (329,334) | |
Class I | | | (173,006) | | | | (66,949) | | | | (362,574) | | | | (169,874) | | | | (68,181) | | | | (75,731) | |
| | | | | | | | | | | | | | | | | | | | | | | | |
Net increase (decrease) in shares of beneficial interest outstanding | | | 929,471 | | | | 811,411 | | | | 517,633 | | | | 463,367 | | | | (515,033) | | | | (626,006) | |
| | | | | | | | | | | | | | | | | | | | | | | | |
| | | | | | | | | | | | | | | | | | | | | | | | |
| |
The accompanying notes are an integral part of these financial statements.
78
Timothy Plan Funds
Statements of Changes in Net Assets (Continued)
| | | | | | | | | | | | | | | | | | | | | | | | |
| | | High Yield Bond Fund | | | Israel Common Values Fund | | | Defensive Strategies Fund | |
| | | | | | |
| | | Year Ended | | | Year Ended | | | Year Ended | | | Year Ended | | | Year Ended | | | Year Ended | |
| | | | | | |
| | | September 30, 2018 | | | September 30, 2017 | | | September 30, 2018 | | | September 30, 2017 | | | September 30, 2018 | | | September 30, 2017 | |
Operations: | | | | | | | | | | | | | | | | | | | | | | | | |
Net investment income (loss) | | $ | 2,224,935 | | | $ | 2,020,983 | | | $ | (180,624) | | | $ | 133,738 | | | $ | 453,199 | | | $ | (48,943) | |
Net realized gain (loss) from investments and foreign currency translations | | | 218,979 | | | | 422,511 | | | | (671,674) | | | | 689,047 | | | | 1,327,973 | | | | 272,119 | |
Capital gain dividends from REITs | | | - | | | | - | | | | - | | | | - | | | | 73,608 | | | | 94,148 | |
Net change in unrealized appreciation (depreciation) on investments and foreign currency translations | | | (2,642,975) | | | | 1,248,316 | | | | 4,238,260 | | | | 5,289,562 | | | | (1,465,859) | | | | (1,377,738) | |
| | | | | | | | | | | | | | | | | | | | | | | | |
Net increase (decrease) in net assets resulting from operations | | | (199,061) | | | | 3,691,810 | | | | 3,385,962 | | | | 6,112,347 | | | | 388,921 | | | | (1,060,414) | |
| | | | | | | | | | | | | | | | | | | | | | | | |
| | | | | | |
Distributions to Shareholders: | | | | | | | | | | | | | | | | | | | | | | | | |
Net investment income | | | | | | | | | | | | | | | | | | | | | | | | |
Class A | | | (1,768,397) | | | | (1,652,789) | | | | (359,503) | | | | (265,667) | | | | (60,700) | | | | (208,348) | |
Class C | | | (102,963) | | | | (92,483) | | | | (42,642) | | | | (49,930) | | | | - | | | | - | |
Class I | | | (432,389) | | | | (248,296) | | | | (5,694) | | | | (10,636) | | | | (11,149) | | | | (2,838) | |
Return of Capital | | | | | | | | | | | | | | | | | | | | | | | | |
Class A | | | - | | | | - | | | | (129,767) | | | | - | | | | - | | | | - | |
Class C | | | - | | | | - | | | | (29,086) | | | | - | | | | - | | | | - | |
Class I | | | - | | | | - | | | | (31,812) | | | | - | | | | - | | | | - | |
| | | | | | | | | | | | | | | | | | | | | | | | |
Total dividends and distributions to shareholders | | | (2,303,749) | | | | (1,993,568) | | | | (598,504) | | | | (326,233) | | | | (71,849) | | | | (211,186) | |
| | | | | | | | | | | | | | | | | | | | | | | | |
| | | | | | |
Share Transactions of Beneficial Interest: | | | | | | | | | | | | | | | | | | | | | | | | |
Net proceeds from shares sold | | | | | | | | | | | | | | | | | | | | | | | | |
Class A | | | 15,559,524 | | | | 31,183,806 | | | | 20,164,685 | | | | 24,717,238 | | | | 7,809,456 | | | | 12,582,965 | |
Class C | | | 554,200 | | | | 806,793 | | | | 2,149,433 | | | | 3,951,474 | | | | 541,442 | | | | 1,389,434 | |
Class I | | | 8,399,536 | | | | 11,795,627 | | | | 8,130,495 | | | | 1,727,826 | | | | 1,070,040 | | | | 2,620,051 | |
Reinvestment of dividends and distributions | | | | | | | | | | | | | | | | | | | | | | | | |
Class A | | | 1,555,166 | | | | 1,432,008 | | | | 449,425 | | | | 245,204 | | | | 57,373 | | | | 196,408 | |
Class C | | | 92,585 | | | | 83,410 | | | | 61,406 | | | | 43,283 | | | | - | | | | - | |
Class I | | | 315,949 | | | | 153,646 | | | | 31,555 | | | | 8,532 | | | | 8,471 | | | | 2,381 | |
Cost of shares redeemed | | | | | | | | | | | | | | | | | | | | | | | | |
Class A | | | (26,107,974) | | | | (30,260,787) | | | | (16,303,706) | | | | (10,511,012) | | | | (17,672,282) | | | | (30,288,144) | |
Class C | | | (828,446) | | | | (563,008) | | | | (1,345,224) | | | | (1,335,601) | | | | (1,796,160) | | | | (4,160,352) | |
Class I | | | (6,455,778) | | | | (3,979,380) | | | | (735,007) | | | | (275,995) | | | | (683,791) | | | | (381,311) | |
| | | | | | | | | | | | | | | | | | | | | | | | |
Net increase (decrease) in net assets from share transactions of beneficial interest | | | (6,915,238) | | | | 10,652,115 | | | | 12,603,062 | | | | 18,570,949 | | | | (10,665,451) | | | | (18,038,568) | |
| | | | | | | | | | | | | | | | | | | | | | | | |
| | | | | | |
Total Increase (Decrease) in Net Assets | | | (9,418,048) | | | | 12,350,357 | | | | 15,390,520 | | | | 24,357,063 | | | | (10,348,379) | | | | (19,310,168) | |
| | | | | | |
Net Assets: | | | | | | | | | | | | | | | | | | | | | | | | |
Beginning of year | | | 66,205,475 | | | | 53,855,118 | | | | 45,051,615 | | | | 20,694,552 | | | | 59,424,007 | | | | 78,734,175 | |
| | | | | | | | | | | | | | | | | | | | | | | | |
End of year* | | $ | 56,787,427 | | | $ | 66,205,475 | | | $ | 60,442,135 | | | $ | 45,051,615 | | | $ | 49,075,628 | | | $ | 59,424,007 | |
| | | | | | | | | | | | | | | | | | | | | | | | |
* Includes accumulated net investment income (loss) at end of period | | $ | 34,306 | | | $ | 113,120 | | | $ | (1,500,349) | | | $ | (1,027,201) | | | $ | 368,580 | | | $ | (12,867) | |
| | | | | | | | | | | | | | | | | | | | | | | | |
| | | | | | |
Share Activity: | | | | | | | | | | | | | | | | | | | | | | | | |
Shares Sold | | | | | | | | | | | | | | | | | | | | | | | | |
Class A | | | 1,683,808 | | | | 3,356,207 | | | | 1,308,467 | | | | 1,786,768 | | | | 680,848 | | | | 1,108,876 | |
Class C | | | 59,502 | | | | 86,106 | | | | 146,910 | | | | 302,596 | | | | 49,408 | | | | 128,104 | |
Class I | | | 916,697 | | | | 1,273,172 | | | | 537,915 | | | | 123,082 | | | | 93,378 | | | | 232,834 | |
Shares Reinvested | | | | | | | | | | | | | | | | | | | | | | | | |
Class A | | | 170,795 | | | | 154,827�� | | | | 29,744 | | | | 19,538 | | | | 5,019 | | | | 17,351 | |
Class C | | | 10,053 | | | | 8,921 | | | | 4,212 | | | | 3,568 | | | | - | | | | - | |
Class I | | | 34,809 | | | | 16,553 | | | | 2,081 | | | | 679 | | | | 742 | | | | 211 | |
Shares Redeemed | | | | | | | | | | | | | | | | | | | | | | | | |
Class A | | | (2,832,414) | | | | (3,278,174) | | | | (1,068,959) | | | | (748,818) | | | | (1,543,665) | | | | (2,701,606) | |
Class C | | | (89,194) | | | | (60,370) | | | | (91,658) | | | | (99,863) | | | | (164,218) | | | | (384,962) | |
Class I | | | (701,269) | | | | (427,863) | | | | (48,538) | | | | (19,084) | | | | (59,636) | | | | (33,852) | |
| | | | | | | | | | | | | | | | | | | | | | | | |
Net increase (decrease) in shares of beneficial interest outstanding | | | (747,213) | | | | 1,129,379 | | | | 820,174 | | | | 1,368,466 | | | | (938,124) | | | | (1,633,044) | |
| | | | | | | | | | | | | | | | | | | | | | | | |
| | | | | | | | | | | | | | | | | | | | | | | | |
| |
The accompanying notes are an integral part of these financial statements.
79
Timothy Plan Funds
Statements of Changes in Net Assets (Continued)
| | | | | | | | | | | | | | | | | | | | | | | | |
| | | Strategic Growth Fund | | | Conservative Growth Fund | | | Emerging Markets Fund | |
| | | | | | |
| | | Year Ended
September 30, 2018 | | | Year Ended
September 30, 2017 | | | Year Ended
September 30, 2018 | | | Year Ended
September 30, 2017 | | | Year Ended
September 30, 2018 | | | Year Ended
September 30, 2017 | |
Operations: | | | | | | | | | | | | | | | | | | | | | | | | |
Net investment income (loss) | | $ | (46,312) | | | $ | (230,099) | | | $ | 5,369 | | | $ | (187,665) | | | $ | 109,807 | | | $ | 97,810 | |
Net realized gain from investments and foreign currency translations | | | 480,513 | | | | 338,897 | | | | 449,831 | | | | 170,419 | | | | 974,901 | | | | 417,866 | |
Capital gain distributions from affiliated funds | | | 606,054 | | | | 109,062 | | | | 673,012 | | | | 126,976 | | | | - | | | | - | |
Net change in unrealized appreciation (depreciation) on investments, affiliated funds and foreign currency translations | | | (165,160) | | | | 2,933,572 | | | | (609,539) | | | | 3,046,851 | | | | (3,943,422) | | | | 2,388,280 | |
| | | | | | | | | | | | | | | | | | | | | | | | |
Net increase (decrease) in net assets resulting from operations | | | 875,095 | | | | 3,151,432 | | | | 518,673 | | | | 3,156,581 | | | | (2,858,714) | | | | 2,903,956 | |
| | | | | | | | | | | | | | | | | | | | | | | | |
| | | | | | |
Distributions to Shareholders: | | | | | | | | | | | | | | | | | | | | | | | | |
Net Investment Income | | | | | | | | | | | | | | | | | | | | | | | | |
Class A | | | - | | | | - | | | | - | | | | - | | | | (113,234) | | | | (43,769) | |
Class C | | | - | | | | - | | | | - | | | | - | | | | (5,091) | | | | - | |
Class I | | | - | | | | - | | | | - | | | | - | | | | (14,243) | | | | (4,732) | |
From net realized gains | | | | | | | | | | | | | | | | | | | | | | | | |
Class A | | | - | | | | - | | | | (137,622) | | | | - | | | | - | | | | - | |
Class C | | | - | | | | - | | | | (31,354) | | | | - | | | | - | | | | - | |
| | | | | | | | | | | | | | | | | | | | | | | | |
Total dividends and distributions to shareholders | | | - | | | | - | | | | (168,976) | | | | - | | | | (132,568) | | | | (48,501) | |
| | | | | | | | | | | | | | | | | | | | | | | | |
| | | | | | |
Share Transactions of Beneficial Interest: | | | | | | | | | | | | | | | | | | | | | | | | |
Net proceeds from shares sold | | | | | | | | | | | | | | | | | | | | | | | | |
Class A | | | 3,962,826 | | | | 4,166,453 | | | | 4,287,330 | | | | 6,702,813 | | | | 11,859,076 | | | | 11,239,828 | |
Class C | | | 695,858 | | | | 785,628 | | | | 1,689,015 | | | | 1,695,154 | | | | 789,603 | | | | 1,505,369 | |
Class I | | | - | | | | - | | | | - | | | | - | | | | 847,810 | | | | 952,797 | |
Reinvestment of dividends and distributions | | | | | | | | | | | | | | | | | | | | | | | | |
Class A | | | - | | | | - | | | | 131,649 | | | | - | | | | 105,541 | | | | 41,696 | |
Class C | | | - | | | | - | | | | 30,014 | | | | - | | | | 4,430 | | | | - | |
Class I | | | - | | | | - | | | | - | | | | - | | | | 12,412 | | | | 4,324 | |
Cost of shares redeemed | | | | | | | | | | | | | | | | | | | | | | | | |
Class A | | | (5,414,758) | | | | (6,834,735) | | | | (7,840,182) | | | | (8,654,305) | | | | (9,432,142) | | | | (3,799,619) | |
Class C | | | (1,461,107) | | | | (1,715,590) | | | | (2,480,370) | | | | (2,943,388) | | | | (723,848) | | | | (316,701) | |
Class I | | | - | | | | - | | | | - | | | | - | | | | (538,854) | | | | (135,941) | |
| | | | | | | | | | | | | | | | | | | | | | | | |
Net increase (decrease) in net assets from share transactions of beneficial interest | | | (2,217,181) | | | | (3,598,244) | | | | (4,182,544) | | | | (3,199,726) | | | | 2,924,028 | | | | 9,491,753 | |
| | | | | | | | | | | | | | | | | | | | | | | | |
| | | | | | |
Total Increase (Decrease) in Net Assets | | | (1,342,086) | | | | (446,812) | | | | (3,832,847) | | | | (43,145) | | | | (67,254) | | | | 12,347,208 | |
| | | | | | |
Net Assets: | | | | | | | | | | | | | | | | | | | | | | | | |
Beginning of year | | | 39,733,058 | | | | 40,179,870 | | | | 55,090,763 | | | | 55,133,908 | | | | 21,065,161 | | | | 8,717,953 | |
| | | | | | | | | | | | | | | | | | | | | | | | |
End of year* | | $ | 38,390,972 | | | $ | 39,733,058 | | | $ | 51,257,916 | | | $ | 55,090,763 | | | $ | 20,997,907 | | | $ | 21,065,161 | |
| | | | | | | | | | | | | | | | | | | | | | | | |
* Includes accumulated net investment income (loss) at end of period | | $ | (262,904) | | | $ | (260,506) | | | $ | (198,280) | | | $ | (236,547) | | | $ | 85,297 | | | $ | 46,816 | |
| | | | | | | | | | | | | | | | | | | | | | | | |
| | | | | | |
| Share Activity: | | | | | | | | | | | | | | | | | | | | | | | | |
Shares Sold | | | | | | | | | | | | | | | | | | | | | | | | |
Class A | | | 406,432 | | | | 464,147 | | | | 396,929 | | | | 655,267 | | | | 1,212,100 | | | | 1,274,463 | |
Class C | | | 79,661 | | | | 96,618 | | | | 171,926 | | | | 180,953 | | | | 84,433 | | | | 176,963 | |
Class I | | | - | | | | - | | | | - | | | | - | | | | 90,646 | | | | 107,396 | |
Shares Reinvested | | | | | | | | | | | | | | | | | | | | | | | | |
Class A | | | - | | | | - | | | | 12,201 | | | | - | | | | 11,017 | | | | 5,122 | |
Class C | | | - | | | | - | | | | 3,047 | | | | - | | | | 473 | | | | - | |
Class I | | | - | | | | - | | | | - | | | | - | | | | 1,289 | | | | 529 | |
Shares Redeemed | | | | | | | | | | | | | | | | | | | | | | | | |
Class A | | | (557,644) | | | | (762,256) | | | | (727,089) | | | | (845,604) | | | | (992,425) | | | | (426,808) | |
Class C | | | (167,568) | | | | (211,295) | | | | (253,047) | | | | (312,252) | | | | (77,584) | | | | (36,280) | |
Class I | | | - | | | | - | | | | - | | | | - | | | | (57,141) | | | | (14,747) | |
| | | | | | | | | | | | | | | | | | | | | | | | |
Net increase (decrease) in shares of beneficial interest outstanding | | | (239,119) | | | | (412,786) | | | | (396,033) | | | | (321,636) | | | | 272,808 | | | | 1,086,638 | |
| | | | | | | | | | | | | | | | | | | | | | | | |
| | | | | | | | | | | | | | | | | | | | | | | | |
| |
The accompanying notes are an integral part of these financial statements.
80
Timothy Plan Funds
Statements of Changes in Net Assets (Continued)
| | | | | | | | |
| | | Growth & Income Fund | |
| | |
| | | Year Ended
September 30, 2018 | | | Year Ended
September 30, 2017 | |
Operations: | | | | | | | | |
Net investment income | | $ | 29,004 | | | $ | 10,837 | |
Net realized gain from investments and foreign currency translations | | | 586,267 | | | | 3,128,758 | |
Capital gain dividends from REITs | | | 1,275 | | | | 13,128 | |
Net change in unrealized appreciation (depreciation) on investments | | | (1,092,083) | | | | (1,372,106) | |
| | | | | | | | |
Net increase (decrease) in net assets resulting from operations | | | (475,537) | | | | 1,780,617 | |
| | | | | | | | |
| | |
Distributions to Shareholders: | | | | | | | | |
Net Investment Income | | | | | | | | |
Class A | | | (18,351) | | | | (21,156) | |
Class I | | | (5,651) | | | | (5,642) | |
From net realized gains | | | | | | | | |
Class A | | | (721,257) | | | | - | |
Class C | | | (74,717) | | | | - | |
Class I | | | (65,160) | | | | - | |
| | | | | | | | |
Total dividends and distributions to shareholders | | | (885,136) | | | | (26,798) | |
| | | | | | | | |
| | |
Share Transactions of Beneficial Interest: | | | | | | | | |
Net proceeds from shares sold | | | | | | | | |
Class A | | | 3,785,740 | | | | 6,564,420 | |
Class C | | | 770,706 | | | | 928,371 | |
Class I | | | 1,229,539 | | | | 775,543 | |
Reinvestment of dividends and distributions | | | | | | | | |
Class A | | | 710,191 | | | | 20,338 | |
Class C | | | 68,477 | | | | - | |
Class I | | | 69,743 | | | | 5,224 | |
Cost of shares redeemed | | | | | | | | |
Class A | | | (6,094,471) | | | | (14,180,161) | |
Class C | | | (528,346) | | | | (1,069,371) | |
Class I | | | (376,437) | | | | (275,644) | |
| | | | | | | | |
Net decrease in net assets from share transactions of beneficial interest | | | (364,858) | | | | (7,231,280) | |
| | | | | | | | |
| | |
Total Decrease in Net Assets | | | (1,725,531) | | | | (5,477,461) | |
| | |
Net Assets: | | | | | | | | |
Beginning of year | | | 35,629,772 | | | | 41,107,233 | |
| | | | | | | | |
End of year* | | $ | 33,904,241 | | | $ | 35,629,772 | |
| | | | | | | | |
* Includes accumulated net investment income (loss) at end of period | | $ | 10,026 | | | $ | - | |
| | | | | | | | |
| | |
Share Activity: | | | | | | | | |
Shares Sold | | | | | | | | |
Class A | | | 338,559 | | | | 604,205 | |
Class C | | | 71,395 | | | | 87,468 | |
Class I | | | 108,880 | | | | 71,030 | |
Shares Reinvested | | | | | | | | |
Class A | | | 63,566 | | | | 1,881 | |
Class C | | | 6,305 | | | | - | |
Class I | | | 6,217 | | | | 480 | |
Shares Redeemed | | | | | | | | |
Class A | | | (548,737) | | | | (1,299,652) | |
Class C | | | (48,945) | | | | (100,879) | |
Class I | | | (33,491) | | | | (25,176) | |
| | | | | | | | |
Net decrease in shares of beneficial interest outstanding | | | (36,251) | | | | (660,643) | |
| | | | | | | | |
| | |
| | | | | | | | |
| |
The accompanying notes are an integral part of these financial statements.
81
Timothy Aggressive Growth Fund (Class A Shares)
Selected data based on a share outstanding throughout each year
| | | | | | | | | | | | | | | | | | | | |
| | | For the Year
ended
September 30,
2018 | | | For the Year
ended
September 30,
2017 | | | For the Year
ended
September 30,
2016 | | | For the Year
ended
September 30,
2015 | | | For the Year
ended
September 30,
2014 | |
| | | | | |
Net asset value, beginning of year | | $ | 8.10 | | | $ | 6.82 | | | $ | 7.98 | | | $ | 9.18 | | | $ | 9.00 | |
| | | | | | | | | | | | | | | | | | | | |
| | | | | |
INCOME FROM INVESTMENT OPERATIONS: | | | | | | | | | | | | | | | | | | | | |
Net investment loss (A) | | | (0.09) | | | | (0.08) | | | | (0.04) | | | | (0.08) | | | | (0.11) | |
Net realized and unrealized gain (loss) on investments | | | 1.26 | | | | 1.36 | | | | (0.02) | (B) | | | (0.05) | | | | 0.84 | |
| | | | | | | | | | | | | | | | | | | | |
Total from investment operations | | | 1.17 | | | | 1.28 | | | | (0.06) | | | | (0.13) | | | | 0.73 | |
| | | | | | | | | | | | | | | | | | | | |
| | | | | |
LESS DISTRIBUTIONS: | | | | | | | | | | | | | | | | | | | | |
From net realized gains on investments | | | - | | | | - | | | | (1.10) | | | | (1.07) | | | | (0.55) | |
| | | | | | | | | | | | | | | | | | | | |
Total distributions | | | - | | | | - | | | | (1.10) | | | | (1.07) | | | | (0.55) | |
| | | | | | | | | | | | | | | | | | | | |
| | | | | |
Net asset value, end of year | | $ | 9.27 | | | $ | 8.10 | | | $ | 6.82 | | | $ | 7.98 | | | $ | 9.18 | |
| | | | | | | | | | | | | | | | | | | | |
| | | | | |
Total return (C)(D) | | | 14.44% | | | | 18.77% | | | | (1.03)% | | | | (2.35)% | | | | 8.22% | |
| | | | | |
RATIOS/SUPPLEMENTAL DATA: | | | | | | | | | | | | | | | | | | | | |
Net assets, end of year (in 000’s) | | $ | 25,926 | | | $ | 22,549 | | | $ | 21,209 | | | $ | 16,306 | | | $ | 19,268 | |
Ratios to average net assets | | | | | | | | | | | | | | | | | | | | |
Expenses, before waiver and reimbursement | | | 1.73% | | | | 1.69% | | | | 1.69% | | | | 1.77% | | | | 1.74% | |
Expenses, net waiver and reimbursement (E) | | | 1.63% | | | | 1.59% | | | | 1.59% | | | | 1.67% | | | | 1.73% | |
Net investment loss, before waiver and reimbursement | | | (1.16)% | | | | (1.12)% | | | | (0.73)% | | | | (1.04)% | | | | (1.19)% | |
Net investment loss, net waiver and reimbursement (E) | | | (1.06)% | | | | (1.02)% | | | | (0.63)% | | | | (0.94)% | | | | (1.18)% | |
Portfolio turnover rate | | | 85% | | | | 151% | | | | 124% | | | | 144% | | | | 91% | |
| (A) | Per share amounts calculated using average shares method, which more appropriately presents the per share data for the period. |
| (B) | Realized and unrealized gains per share in this caption are balancing amounts necessary to reconcile the change in net asset value per share for the period, and may not reconcile with the aggregate gains and losses in the Statements of Operations due to share transactions for the period. |
| (C) | Total return calculation does not reflect sales load. Total return represents aggregate total return based on Net Asset Value. |
| (D) | Total return in the above table represents the rate that the investor would have earned or lost on an investment in the Fund assuming reinvestment of dividends. |
| | Total return would have been higher or lower if certain expenses had not been reimbursed, waived or recouped. |
| (E) | This expense decrease from the voluntary waiver is reflected in both the net expense and the net investment income ratios shown. |
The accompanying notes are an integral part of these financial statements.
82
Timothy Aggressive Growth Fund (Class C Shares)
Selected data based on a share outstanding throughout each year
| | | | | | | | | | | | | | | | | | | | |
| | | For the Year
ended
September 30,
2018 | | | For the Year
ended
September 30,
2017 | | | For the Year
ended
September 30,
2016 | | | For the Year
ended
September 30,
2015 | | | For the Year
ended
September 30,
2014 | |
| | | | | |
Net asset value, beginning of year | | $ | 6.73 | | | $ | 5.71 | | | $ | 6.90 | | | $ | 8.13 | | | $ | 8.09 | |
| | | | | | | | | | | | | | | | | | | | |
| | | | | |
INCOME FROM INVESTMENT OPERATIONS: | | | | | | | | | | | | | | | | | | | | |
Net investment loss (A) | | | (0.13) | | | | (0.11) | | | | (0.08) | | | | (0.13) | | | | (0.16) | |
Net realized and unrealized gain (loss) on investments | | | 1.04 | | | | 1.13 | | | | (0.01) (B) | | | | (0.03) | | | | 0.75 | |
| | | | | | | | | | | | | | | | | | | | |
Total from investment operations | | | 0.91 | | | | 1.02 | | | | (0.09) | | | | (0.16) | | | | 0.59 | |
| | | | | | | | | | | | | | | | | | | | |
| | | | | |
LESS DISTRIBUTIONS: | | | | | | | | | | | | | | | | | | | | |
From net realized gains on investments | | | - | | | | - | | | | (1.10) | | | | (1.07) | | | | (0.55) | |
| | | | | | | | | | | | | | | | | | | | |
Total distributions | | | - | | | | - | | | | (1.10) | | | | (1.07) | | | | (0.55) | |
| | | | | | | | | | | | | | | | | | | | |
| | | | | |
Net asset value, end of year | | $ | 7.64 | | | $ | 6.73 | | | $ | 5.71 | | | $ | 6.90 | | | $ | 8.13 | |
| | | | | | | | | | | | | | | | | | | | |
| | | | | |
Total return (C)(D) | | | 13.52% | | | | 17.86% | | | | (1.73)% | | | | (3.10)% | | | | 7.37% | |
| | | | | |
RATIOS/SUPPLEMENTAL DATA: | | | | | | | | | | | | | | | | | | | | |
Net assets, end of year (in 000’s) | | $ | 4,358 | | | $ | 3,584 | | | $ | 3,426 | | | $ | 3,442 | | | $ | 3,458 | |
Ratios to average net assets | | | | | | | | | | | | | | | | | | | | |
Expenses, before waiver and reimbursement | | | 2.48% | | | | 2.44% | | | | 2.44% | | | | 2.52% | | | | 2.49% | |
Expenses, net waiver and reimbursement (E) | | | 2.38% | | | | 2.34% | | | | 2.34% | | | | 2.42% | | | | 2.48% | |
Net investment loss, before waiver and reimbursement | | | (1.91)% | | | | (1.88)% | | | | (1.47)% | | | | (1.78)% | | | | (1.94)% | |
Net investment loss, net waiver and reimbursement (E) | | | (1.81)% | | | | (1.78)% | | | | (1.37)% | | | | (1.69)% | | | | (1.93)% | |
Portfolio turnover rate | | | 85% | | | | 151% | | | | 124% | | | | 144% | | | | 91% | |
| (A) | Per share amounts calculated using average shares method, which more appropriately presents the per share data for the period. |
| (B) | Realized and unrealized gains per share in this caption are balancing amounts necessary to reconcile the change in net asset value per share for the period, and may not reconcile with the aggregate gains and losses in the Statements of Operations due to share transactions for the period. |
| (C) | Total return calculation does not reflect redemption fee. Total return represents aggregate total return based on Net Asset Value. |
| (D) | Total return in the above table represents the rate that the investor would have earned or lost on an investment in the Fund assuming reinvestment of dividends. Total return would have been higher or lower if certain expenses had not been reimbursed, waived or recouped. |
| (E) | This expense decrease from the voluntary waiver is reflected in both the net expense and the net investment income ratios shown. |
The accompanying notes are an integral part of these financial statements.
83
Timothy Aggressive Growth Fund (Class I Shares)
Selected data based on a share outstanding throughout each year
| | | | | | | | | | | | | | | | | | | | |
| | | For the Year
ended
September 30,
2018 | | | For the Year
ended
September 30,
2017 | | | For the Year
ended
September 30,
2016 | | | For the Year
ended
September 30,
2015 | | | For the Year
ended
September 30,
2014 | |
| | | | | |
Net asset value, beginning of year | | $ | 8.21 | | | $ | 6.89 | | | $ | 8.03 | | | $ | 9.21 | | | $ | 9.01 | |
| | | | | | | | | | | | | | | | | | | | |
| | | | | |
INCOME FROM INVESTMENT OPERATIONS: | | | | | | | | | | | | | | | | | | | | |
Net investment loss (A) | | | (0.07) | | | | (0.06) | | | | (0.03) | | | | (0.06) | | | | (0.07) | |
Net realized and unrealized gain (loss) on investments | | | 1.27 | | | | 1.38 | | | | (0.01) (B) | | | | (0.05) | | | | 0.82 | |
| | | | | | | | | | | | | | | | | | | | |
Total from investment operations | | | 1.20 | | | | 1.32 | | | | (0.04) | | | | (0.11) | | | | 0.75 | |
| | | | | | | | | | | | | | | | | | | | |
| | | | | |
LESS DISTRIBUTIONS: | | | | | | | | | | | | | | | | | | | | |
From net realized gains on investments | | | - | | | | - | | | | (1.10) | | | | (1.07) | | | | (0.55) | |
| | | | | | | | | | | | | | | | | | | | |
Total distributions | | | - | | | | - | | | | (1.10) | | | | (1.07) | | | | (0.55) | |
| | | | | | | | | | | | | | | | | | | | |
| | | | | |
Net asset value, end of year | | $ | 9.41 | | | $ | 8.21 | | | $ | 6.89 | | | $ | 8.03 | | | $ | 9.21 | |
| | | | | | | | | | | | | | | | | | | | |
| | | | | |
Total return (C) | | | 14.62% | | | | 19.16% | | | | (0.75)% | | | | (2.10)% | | | | 8.43% | |
| | | | | |
RATIOS/SUPPLEMENTAL DATA: | | | | | | | | | | | | | | | | | | | | |
Net assets, end of year (in 000’s) | | $ | 1,273 | | | $ | 887 | | | $ | 395 | | | $ | 303 | | | $ | 140 | |
Ratios to average net assets | | | | | | | | | | | | | | | | | | | | |
Expenses, before waiver and reimbursement | | | 1.48% | | | | 1.44% | | | | 1.44% | | | | 1.52% | | | | 1.33% | |
Expenses, net waiver and reimbursement (D) | | | 1.38% | | | | 1.34% | | | | 1.34% | | | | 1.42% | | | | 1.28% | |
Net investment loss, before waiver and reimbursement | | | (0.91)% | | | | (0.88)% | | | | (0.48)% | | | | (0.74)% | | | | (0.78)% | |
Net investment loss, net waiver and reimbursement (D) | | | (0.81)% | | | | (0.78)% | | | | (0.38)% | | | | (0.69)% | | | | (0.73)% | |
Portfolio turnover rate | | | 85% | | | | 151% | | | | 124% | | | | 144% | | | | 91% | |
| (A) | Per share amounts calculated using average shares method, which more appropriately presents the per share data for the period. |
| (B) | Realized and unrealized gains per share in this caption are balancing amounts necessary to reconcile the change in net asset value per share for the period, and may not reconcile with the aggregate gains and losses in the Statements of Operations due to share transactions for the period. |
| (C) | Total return in the above table represents the rate that the investor would have earned or lost on an investment in the Fund assuming reinvestment of dividends. |
| | Total return would have been higher or lower if certain expenses had not been reimbursed, waived or recouped. |
| (D) | This expense decrease from the voluntary waiver is reflected in both the net expense and the net investment income ratios shown. |
The accompanying notes are an integral part of these financial statements.
84
Timothy International Fund (Class A Shares)
Selected data based on a share outstanding throughout each year
| | | | | | | | | | | | | | | | | | | | |
| | | For the Year
ended
September 30,
2018 | | | For the Year
ended
September 30,
2017 | | | For the Year
ended
September 30,
2016 | | | For the Year
ended
September 30,
2015 | | | For the Year
ended
September 30,
2014 | |
| | | | | |
Net asset value, beginning of year | | $ | 9.86 | | | $ | 8.53 | | | $ | 8.47 | | | $ | 8.89 | | | $ | 8.65 | |
| | | | | | | | | | | | | | | | | | | | |
| | | | | |
INCOME (LOSS) FROM INVESTMENT OPERATIONS: | | | | | | | | | | | | | | | | | | | | |
Net investment income (loss) (A) | | | 0.11 | | | | 0.04 | | | | 0.00 | * | | | 0.08 | | | | 0.05 | |
Net realized and unrealized gain (loss) on investments | | | (0.02) | | | | 1.38 | | | | 0.15 | | | | (0.50) | | | | 0.36 | |
| | | | | | | | | | | | | | | | | | | | |
Total from investment operations | | | 0.09 | | | | 1.42 | | | | 0.15 | | | | (0.42) | | | | 0.41 | |
| | | | | | | | | | | | | | | | | | | | |
| | | | | |
LESS DISTRIBUTIONS: | | | | | | | | | | | | | | | | | | | | |
From net investment income | | | (0.21) | | | | (0.09) | | | | (0.09) | | | | - | | | | (0.17) | |
| | | | | | | | | | | | | | | | | | | | |
Total distributions | | | (0.21) | | | | (0.09) | | | | (0.09) | | | | - | | | | (0.17) | |
| | | | | | | | | | | | | | | | | | | | |
| | | | | |
Net asset value, end of year | | $ | 9.74 | | | $ | 9.86 | | | $ | 8.53 | | | $ | 8.47 | | | $ | 8.89 | |
| | | | | | | | | | | | | | | | | | | | |
| | | | | |
Total return (B)(C) | | | 0.91% | | | | 16.78% | | | | 1.85% | | | | (4.72)% | (D) | | | 4.74% | |
| | | | | |
RATIOS/SUPPLEMENTAL DATA: | | | | | | | | | | | | | | | | | | | | |
Net assets, end of year (in 000’s) | | $ | 70,790 | | | $ | 81,153 | | | $ | 70,013 | | | $ | 53,458 | | | $ | 54,709 | |
Ratios to average net assets | | | | | | | | | | | | | | | | | | | | |
Expenses, before waiver and reimbursement | | | 1.71% | | | | 1.69% | | | | 1.68% | | | | 1.67% | | | | 1.69% | |
Expenses, net waiver and reimbursement (E) | | | 1.66% | | | | 1.64% | | | | 1.63% | | | | 1.62% | | | | 1.68% | |
Net investment income (loss) before waiver and reimbursement | | | 1.05% | | | | 0.35% | | | | (0.03)% | | | | 0.88% | | | | 0.52% | |
Net investment income (loss), net waiver and reimbursement (E) | | | 1.10% | | | | 0.40% | | | | 0.02% | | | | 0.93% | | | | 0.52% | |
Portfolio turnover rate | | | 19% | | | | 42% | | | | 28% | | | | 30% | | | | 31% | |
| * | Amount is less than $0.005 per share. |
| (A) | Per share amounts calculated using average shares method, which more appropriately presents the per share data for the period. |
| (B) | Total return calculation does not reflect sales load. Total return represents aggregate total return based on Net Asset Value. |
| (C) | Total return in the above table represents the rate that the investor would have earned or lost on an investment in the Fund assuming reinvestment of dividends. Total return would have been higher or lower if certain expenses had not been reimbursed, waived or recouped. |
| (D) | As a result of a trade error, the Fund experienced a loss totaling $4,927.83 for the year ended September 30, 2015, all of which was reimbursed by the Advisor; there was no effect on total return due to trade error. |
| (E) | This expense decrease from the voluntary waiver is reflected in both the net expense and the net investment income ratios shown. |
The accompanying notes are an integral part of these financial statements.
85
Timothy International Fund (Class C Shares)
Selected data based on a share outstanding throughout each year
| | | | | | | | | | | | | | | | | | | | |
| | | For the Year
ended
September 30,
2018 | | | For the Year
ended
September 30,
2017 | | | For the Year
ended
September 30,
2016 | | | For the Year
ended
September 30,
2015 | | | For the Year
ended
September 30,
2014 | |
| | | | | |
Net asset value, beginning of year | | $ | 9.55 | | | $ | 8.25 | | | $ | 8.21 | | | $ | 8.67 | | | $ | 8.46 | |
| | | | | | | | | | | | | | | | | | | | |
| | | | | |
INCOME (LOSS) FROM INVESTMENT OPERATIONS: | | | | | | | | | | | | | | | | | | | | |
Net investment income (loss) (A) | | | 0.03 | | | | (0.03) | | | | (0.06) | | | | 0.02 | | | | (0.02) | |
Net realized and unrealized gain (loss) on investments | | | (0.01) | | | | 1.34 | | | | 0.15 | | | | (0.48) | | | | 0.35 | (B) |
| | | | | | | | | | | | | | | | | | | | |
Total from investment operations | | | 0.02 | | | | 1.31 | | | | 0.09 | | | | (0.46) | | | | 0.33 | |
| | | | | | | | | | | | | | | | | | | | |
| | | | | |
LESS DISTRIBUTIONS: | | | | | | | | | | | | | | | | | | | | |
From net investment income | | | (0.16) | | | | (0.01) | | | | (0.05) | | | | - | | | | (0.12) | |
| | | | | | | | | | | | | | | | | | | | |
Total distributions | | | (0.16) | | | | (0.01) | | | | (0.05) | | | | - | | | | (0.12) | |
| | | | | | | | | | | | | | | | | | | | |
| | | | | |
Net asset value, end of year | | $ | 9.41 | | | $ | 9.55 | | | $ | 8.25 | | | $ | 8.21 | | | $ | 8.67 | |
| | | | | | | | | | | | | | | | | | | | |
| | | | | |
Total return (C)(D) | | | 0.12% | | | | 15.93% | | | | 1.09% | | | | (5.31)% | (E) | | | 3.87% | |
| | | | | |
RATIOS/SUPPLEMENTAL DATA: | | | | | | | | | | | | | | | | | | | | |
Net assets, end of year (in 000’s) | | $ | 4,779 | | | $ | 4,620 | | | $ | 4,495 | | | $ | 3,498 | | | $ | 3,336 | |
Ratios to average net assets | | | | | | | | | | | | | | | | | | | | |
Expenses, before waiver and reimbursement | | | 2.46% | | | | 2.44% | | | | 2.43% | | | | 2.41% | | | | 2.44% | |
Expenses, net waiver and reimbursement (F) | | | 2.41% | | | | 2.39% | | | | 2.38% | | | | 2.36% | | | | 2.44% | |
Net investment income (loss) before waiver and reimbursement | | | 0.28% | | | | (0.41)% | | | | (0.74)% | | | | 0.17% | | | | (0.21)% | |
Net investment income (loss), net waiver and reimbursement (F) | | | 0.33% | | | | (0.36)% | | | | (0.69)% | | | | 0.18% | | | | (0.20)% | |
Portfolio turnover rate | | | 19% | | | | 42% | | | | 28% | | | | 30% | | | | 31% | |
| (A) | Per share amounts calculated using average shares method, which more appropriately presents the per share data for the period. |
| (B) | Realized and unrealized gains per share in this caption are balancing amounts necessary to reconcile the change in net asset value per share for the period, and may not reconcile with the aggregate gains and losses in the Statements of Operations due to share transactions for the period. |
| (C) | Total return calculation does not reflect redemption fee. |
| (D) | Total return in the above table represents the rate that the investor would have earned or lost on an investment in the Fund assuming reinvestment of dividends. Total return would have been higher or lower if certain expenses had not been reimbursed, waived or recouped. |
| (E) | As a result of a trade error, the Fund experienced a loss totaling $4,927.83 for the year ended September 30, 2015, all of which was reimbursed by the Advisor; there was no effect on total return due to trade error. |
| (F) | This expense decrease from the voluntary waiver is reflected in both the net expense and the net investment income ratios shown. |
The accompanying notes are an integral part of these financial statements.
86
Timothy International Fund (Class I Shares)
Selected data based on a share outstanding throughout each year
| | | | | | | | | | | | | | | | | | | | |
| | | For the Year
ended
September 30,
2018 | | | For the Year
ended
September 30,
2017 | | | For the Year
ended
September 30,
2016 | | | For the Year
ended
September 30,
2015 | | | For the Year
ended
September 30,
2014 | |
| | | | | |
Net asset value, beginning of year | | $ | 9.89 | | | $ | 8.55 | | | $ | 8.49 | | | $ | 8.88 | | | $ | 8.65 | |
| | | | | | | | | | | | | | | | | | | | |
| | | | | |
INCOME (LOSS) FROM INVESTMENT OPERATIONS: | | | | | | | | | | | | | | | | | | | | |
Net investment income (A) | | | 0.17 | | | | 0.07 | | | | 0.02 | | | | 0.15 | | | | 0.08 | |
Net realized and unrealized gain (loss) on investments | | | (0.06) | | | | 1.38 | | | | 0.15 | (B) | | | (0.54) | | | | 0.34 | |
| | | | | | | | | | | | | | | | | | | | |
Total from investment operations | | | 0.11 | | | | 1.45 | | | | 0.17 | | | | (0.39) | | | | 0.42 | |
| | | | | | | | | | | | | | | | | | | | |
| | | | | |
LESS DISTRIBUTIONS: | | | | | | | | | | | | | | | | | | | | |
From net investment income | | | (0.24) | | | | (0.11) | | | | (0.11) | | | | - | | | | (0.19) | |
| | | | | | | | | | | | | | | | | | | | |
Total distributions | | | (0.24) | | | | (0.11) | | | | (0.11) | | | | - | | | | (0.19) | |
| | | | | | | | | | | | | | | | | | | | |
| | | | | |
Net asset value, end of year | | $ | 9.76 | | | $ | 9.89 | | | $ | 8.55 | | | $ | 8.49 | | | $ | 8.88 | |
| | | | | | | | | | | | | | | | | | | | |
| | | | | |
Total return (C) | | | 1.04% | | | | 17.18% | | | | 2.08% | | | | (4.39)% | (D) | | | 4.85% | |
| | | | | |
RATIOS/SUPPLEMENTAL DATA: | | | | | | | | | | | | | | | | | | | | |
Net assets, end of year (in 000’s) | | $ | 31,286 | | | $ | 13,083 | | | $ | 2,880 | | | $ | 1,581 | | | $ | 461 | |
Ratios to average net assets | | | | | | | | | | | | | | | | | | | | |
Expenses, before waiver and reimbursement | | | 1.45% | | | | 1.43% | | | | 1.45% | | | | 1.42% | | | | 1.38% | |
Expenses, net waiver and reimbursement (E) | | | 1.41% | | | | 1.38% | | | | 1.39% | | | | 1.37% | | | | 1.38% | |
Net investment income, before waiver and reimbursement | | | 1.60% | | | | 0.74% | | | | 0.22% | | | | 1.13% | | | | 0.85% | |
Net investment income, net waiver and reimbursement (E) | | | 1.65% | | | | 0.79% | | | | 0.29% | | | | 1.18% | | | | 0.86% | |
Portfolio turnover rate | | | 19% | | | | 42% | | | | 28% | | | | 30% | | | | 31% | |
| (A) | Per share amounts calculated using average shares method, which more appropriately presents the per share data for the period. |
| (B) | Realized and unrealized gains per share in this caption are balancing amounts necessary to reconcile the change in net asset value per share for the period, and may not reconcile with the aggregate gains and losses in the Statements of Operations due to share transactions for the period. |
| (C) | Total return in the above table represents the rate that the investor would have earned or lost on an investment in the Fund assuming reinvestment of dividends. |
| | Total return would have been higher or lower if certain expenses had not been reimbursed, waived or recouped. |
| (D) | As a result of a trade error, the Fund experienced a loss totaling $4,927.83 for the year ended September 30, 2015, all of which was reimbursed by the Advisor; there was no effect on total return due to trade error. |
| (E) | This expense decrease from the voluntary waiver is reflected in both the net expense and the net investment income ratios shown. |
The accompanying notes are an integral part of these financial statements.
87
Timothy Large/Mid Cap Growth Fund (Class A Shares)
Selected data based on a share outstanding throughout each year
| | | | | | | | | | | | | | | | | | | | |
| | | For the Year
ended
September 30,
2018 | | | For the Year
ended
September 30,
2017 | | | For the Year
ended
September 30,
2016 | | | For the Year
ended
September 30,
2015 | | | For the Year
ended
September 30,
2014 | |
| | | | | |
Net asset value, beginning of year | | $ | 8.59 | | | $ | 7.46 | | | $ | 7.75 | | | $ | 8.66 | | | $ | 8.36 | |
| | | | | | | | | | | | | | | | | | | | |
| | | | | |
INCOME FROM INVESTMENT OPERATIONS: | | | | | | | | | | | | | | | | | | | | |
Net investment loss (A) | | | (0.02) | | | | (0.01) | | | | (0.02) | | | | (0.01) | | | | (0.01) | |
Net realized and unrealized gain on investments | | | 0.99 | | | | 1.23 | | | | 0.51 | | | | 0.03 | (B) | | | 1.15 | |
| | | | | | | | | | | | | | | | | | | | |
Total from investment operations | | | 0.97 | | | | 1.22 | | | | 0.49 | | | | 0.02 | | | | 1.14 | |
| | | | | | | | | | | | | | | | | | | | |
| | | | | |
LESS DISTRIBUTIONS: | | | | | | | | | | | | | | | | | | | | |
From net realized gains on investments | | | (0.22) | | | | (0.09) | | | | (0.78) | | | | (0.93) | | | | (0.84) | |
| | | | | | | | | | | | | | | | | | | | |
Total distributions | | | (0.22) | | | | (0.09) | | | | (0.78) | | | | (0.93) | | | | (0.84) | |
| | | | | | | | | | | | | | | | | | | | |
| | | | | |
Net asset value, end of year | | $ | 9.34 | | | $ | 8.59 | | | $ | 7.46 | | | $ | 7.75 | | | $ | 8.66 | |
| | | | | | | | | | | | | | | | | | | | |
| | | | | |
Total return (C)(D) | | | 11.49% | | | | 16.53% | | | | 6.65% | | | | (0.35)% | | | | 14.70% | |
| | | | | |
RATIOS/SUPPLEMENTAL DATA: | | | | | | | | | | | | | | | | | | | | |
Net assets, end of year (in 000’s) | | $ | 79,897 | | | $ | 68,291 | | | $ | 53,827 | | | $ | 52,682 | | | $ | 56,073 | |
Ratios to average net assets | | | | | | | | | | | | | | | | | | | | |
Expenses, before waiver and reimbursement | | | 1.52% | | | | 1.52% | | | | 1.54% | | | | 1.56% | | | | 1.57% | |
Expenses, net waiver and reimbursement (E) | | | 1.47% | | | | 1.47% | | | | 1.49% | | | | 1.51% | | | | 1.57% | |
Net investment loss, before waiver and reimbursement | | | (0.25)% | | | | (0.19)% | | | | (0.38)% | | | | (0.14)% | | | | (0.18)% | |
Net investment loss, net waiver and reimbursement (E) | | | (0.20)% | | | | (0.14)% | | | | (0.33)% | | | | (0.09)% | | | | (0.17)% | |
Portfolio turnover rate | | | 57% | | | | 76% | | | | 71% | | | | 73% | | | | 61% | |
| (A) | Per share amounts calculated using average shares method, which more appropriately presents the per share data for the period. |
| (B) | Realized and unrealized gains per share in this caption are balancing amounts necessary to reconcile the change in net asset value per share for the period, and may not reconcile with the aggregate gains and losses in the Statements of Operations due to share transactions for the period. |
| (C) | Total return calculation does not reflect sales load. |
| (D) | Total return in the above table represents the rate that the investor would have earned or lost on an investment in the Fund assuming reinvestment of dividends. |
| | Total return would have been higher or lower if certain expenses had not been reimbursed, waived or recouped. |
| (E) | This expense decrease from the voluntary waiver is reflected in both the net expense and the net investment income ratios shown. |
The accompanying notes are an integral part of these financial statements.
88
Timothy Large/Mid Cap Growth Fund (Class C Shares)
Selected data based on a share outstanding throughout each year
| | | | | | | | | | | | | | | | | | | | |
| | | For the Year
ended
September 30,
2018 | | | For the Year
ended
September 30,
2017 | | | For the Year
ended
September 30,
2016 | | | For the Year
ended
September 30,
2015 | | | For the Year
ended
September 30,
2014 | |
| | | | | |
Net asset value, beginning of year | | $ | 7.11 | | | $ | 6.24 | | | $ | 6.64 | | | $ | 7.60 | | | $ | 7.49 | |
| | | | | | | | | | | | | | | | | | | | |
| | | | | |
INCOME (LOSS) FROM INVESTMENT OPERATIONS: | | | | | | | | | | | | | | | | | | | | |
Net investment loss (A) | | | (0.07) | | | | (0.06) | | | | (0.07) | | | | (0.06) | | | | (0.07) | |
Net realized and unrealized gain on investments | | | 0.81 | | | | 1.02 | | | | 0.45 | | | | 0.03 | (B) | | | 1.02 | |
| | | | | | | | | | | | | | | | | | | | |
Total from investment operations | | | 0.74 | | | | 0.96 | | | | 0.38 | | | | (0.03) | | | | 0.95 | |
| | | | | | | | | | | | | | | | | | | | |
| | | | | |
LESS DISTRIBUTIONS: | | | | | | | | | | | | | | | | | | | | |
From net realized gains on investments | | | (0.22) | | | | (0.09) | | | | (0.78) | | | | (0.93) | | | | (0.84) | |
| | | | | | | | | | | | | | | | | | | | |
Total distributions | | | (0.22) | | | | (0.09) | | | | (0.78) | | | | (0.93) | | | | (0.84) | |
| | | | | | | | | | | | | | | | | | | | |
| | | | | |
Net asset value, end of year | | $ | 7.63 | | | $ | 7.11 | | | $ | 6.24 | | | $ | 6.64 | | | $ | 7.60 | |
| | | | | | | | | | | | | | | | | | | | |
| | | | | |
Total return (C)(D) | | | 10.63% | | | | 15.58% | | | | 6.04% | | | | (1.14)% | | | | 13.84% | |
| | | | | |
RATIOS/SUPPLEMENTAL DATA: | | | | | | | | | | | | | | | | | | | | |
Net assets, end of year (in 000’s) | | $ | 11,355 | | | $ | 9,909 | | | $ | 7,636 | | | $ | 6,490 | | | $ | 5,929 | |
Ratios to average net assets | | | | | | | | | | | | | | | | | | | | |
Expenses, before waiver and reimbursement | | | 2.27% | | | | 2.27% | | | | 2.30% | | | | 2.31% | | | | 2.32% | |
Expenses, net waiver and reimbursement (E) | | | 2.22% | | | | 2.22% | | | | 2.24% | | | | 2.26% | | | | 2.32% | |
Net investment loss, before waiver and reimbursement | | | (1.00)% | | | | (0.94)% | | | | (1.14)% | | | | (0.88)% | | | | (0.93)% | |
Net investment loss, net waiver and reimbursement (E) | | | (0.95)% | | | | (0.89)% | | | | (1.08)% | | | | (0.84)% | | | | (0.93)% | |
Portfolio turnover rate | | | 57% | | | | 76% | | | | 71% | | | | 73% | | | | 61% | |
| (A) | Per share amounts calculated using average shares method, which more appropriately presents the per share data for the period. |
| (B) | Realized and unrealized gains per share in this caption are balancing amounts necessary to reconcile the change in net asset value per share for the period, and may not reconcile with the aggregate gains and losses in the Statements of Operations due to share transactions for the period. |
| (C) | Total return calculation does not reflect redemption fee. |
| (D) | Total return in the above table represents the rate that the investor would have earned or lost on an investment in the Fund assuming reinvestment of dividends. |
| | Total return would have been higher or lower if certain expenses had not been reimbursed, waived or recouped. |
| (E) | This expense decrease from the voluntary waiver is reflected in both the net expense and the net investment income ratios shown. |
The accompanying notes are an integral part of these financial statements.
89
Timothy Large/Mid Cap Growth Fund (Class I Shares)
Selected data based on a share outstanding throughout each year
| | | | | | | | | | | | | | | | | | | | |
| | | For the Year
ended
September 30,
2018 | | | For the Year
ended
September 30,
2017 | | | For the Year
ended
September 30,
2016 | | | For the Year
ended
September 30,
2015 | | | For the Year
ended
September 30,
2014 | |
| | | | | |
Net asset value, beginning of year | | $ | 8.70 | | | $ | 7.54 | | | $ | 7.80 | | | $ | 8.69 | | | $ | 8.37 | |
| | | | | | | | | | | | | | | | | | | | |
| | | | | |
INCOME (LOSS) FROM INVESTMENT OPERATIONS: | | | | | | | | | | | | | | | | | | | | |
Net investment income (loss) (A) | | | 0.00 | * | | | 0.01 | | | | (0.01) | | | | 0.02 | | | | 0.01 | |
Net realized and unrealized gain on investments | | | 1.00 | | | | 1.24 | | | | 0.53 | | | | 0.02 | (B) | | | 1.15 | (B) |
| | | | | | | | | | | | | | | | | | | | |
Total from investment operations | | | 1.00 | | | | 1.25 | | | | 0.52 | | | | 0.04 | | | | 1.16 | |
| | | | | | | | | | | | | | | | | | | | |
| | | | | |
LESS DISTRIBUTIONS: | | | | | | | | | | | | | | | | | | | | |
From net realized gains on investments | | | (0.22) | | | | (0.09) | | | | (0.78) | | | | (0.93) | | | | (0.84) | |
| | | | | | | | | | | | | | | | | | | | |
Total distributions | | | (0.22) | | | | (0.09) | | | | (0.78) | | | | (0.93) | | | | (0.84) | |
| | | | | | | | | | | | | | | | | | | | |
| | | | | |
Net asset value, end of year | | $ | 9.48 | | | $ | 8.70 | | | $ | 7.54 | | | $ | 7.80 | | | $ | 8.69 | |
| | | | | | | | | | | | | | | | | | | | |
| | | | | |
Total return (C) | | | 11.69% | | | | 16.75% | | | | 7.01% | | | | (0.10)% | | | | 14.94% | |
| | | | | |
RATIOS/SUPPLEMENTAL DATA: | | | | | | | | | | | | | | | | | | | | |
Net assets, end of year (in 000’s) | | $ | 10,551 | | | $ | 3,936 | | | $ | 1,088 | | | $ | 1,202 | | | $ | 190 | |
Ratios to average net assets | | | | | | | | | | | | | | | | | | | | |
Expenses, before waiver and reimbursement | | | 1.27% | | | | 1.26% | | | | 1.29% | | | | 1.31% | | | | 1.30% | |
Expenses, net waiver and reimbursement (D) | | | 1.22% | | | | 1.21% | | | | 1.24% | | | | 1.26% | | | | 1.29% | |
Net investment income (loss), before waiver and reimbursement | | | (0.03)% | | | | 0.10% | | | | (0.12)% | | | | 0.13% | | | | 0.13% | |
Net investment income (loss), net waiver and reimbursement (D) | | | 0.02% | | | | 0.15% | | | | (0.08)% | | | | 0.16% | | | | 0.14% | |
Portfolio turnover rate | | | 57% | | | | 76% | | | | 71% | | | | 73% | | | | 61% | |
| * | Amount is less than $0.005 per share. |
| (A) | Per share amounts calculated using average shares method, which more appropriately presents the per share data for the period. |
| (B) | Realized and unrealized gains per share in this caption are balancing amounts necessary to reconcile the change in net asset value per share for the period, and may not reconcile with the aggregate gains and losses in the Statements of Operations due to share transactions for the period. |
| (C) | Total return in the above table represents the rate that the investor would have earned or lost on an investment in the Fund assuming reinvestment of dividends. |
| | Total return would have been higher or lower if certain expenses had not been reimbursed, waived or recouped. |
| (D) | This expense decrease from the voluntary waiver is reflected in both the net expense and the net investment income ratios shown. |
The accompanying notes are an integral part of these financial statements.
90
Timothy Small Cap Value Fund (Class A Shares)
Selected data based on a share outstanding throughout each year
| | | | | | | | | | | | | | | | | | | | |
| | | For the Year
ended
September 30,
2018 | | | For the Year
ended
September 30,
2017 | | | For the Year
ended
September 30,
2016 | | | For the Year
ended
September 30,
2015 | | | For the Year
ended
September 30,
2014 | |
| | | | | |
Net asset value, beginning of year | | $ | 20.50 | | | $ | 17.09 | | | $ | 16.93 | | | $ | 19.79 | | | $ | 20.30 | |
| | | | | | | | | | | | | | | | | | | | |
| | | | | |
INCOME (LOSS) FROM INVESTMENT OPERATIONS: | | | | | | | | | | | | | | | | | | | | |
Net investment income (loss) (A) | | | 0.00 | * | | | 0.03 | | | | (0.01) | | | | (0.07) | | | | (0.04) | |
Net realized and unrealized gain on investments | | | 1.96 | | | | 3.63 | | | | 1.65 | | | | 0.64 | | | | 1.57 | |
| | | | | | | | | | | | | | | | | | | | |
Total from investment operations | | | 1.96 | | | | 3.66 | | | | 1.64 | | | | 0.57 | | | | 1.53 | |
| | | | | | | | | | | | | | | | | | | | |
| | | | | |
LESS DISTRIBUTIONS: | | | | | | | | | | | | | | | | | | | | |
From net investment income | | | (0.00) | * | | | - | | | | - | | | | - | | | | - | |
From net realized gains on investments | | | (1.79) | | | | (0.25) | | | | (1.48) | | | | (3.43) | | | | (2.04) | |
| | | | | | | | | | | | | | | | | | | | |
Total distributions | | | (1.79) | | | | (0.25) | | | | (1.48) | | | | (3.43) | | | | (2.04) | |
| | | | | | | | | | | | | | | | | | | | |
| | | | | |
Net asset value, end of year | | $ | 20.67 | | | $ | 20.50 | | | $ | 17.09 | | | $ | 16.93 | | | $ | 19.79 | |
| | | | | | | | | | | | | | | | | | | | |
| | | | | |
Total return (B)(C) | | | 10.11% | | | | 21.55% | | | | 10.67% | | | | 1.90% | | | | 7.61% | |
| | | | | |
RATIOS/SUPPLEMENTAL DATA: | | | | | | | | | | | | | | | | | | | | |
Net assets, end of year (in 000’s) | | $ | 114,985 | | | $ | 112,953 | | | $ | 94,871 | | | $ | 71,840 | | | $ | 71,997 | |
Ratios to average net assets | | | | | | | | | | | | | | | | | | | | |
Expenses, before waiver and reimbursement | | | 1.50% | | | | 1.46% | | | | 1.48% | | | | 1.53% | | | | 1.53% | |
Expenses, net waiver and reimbursement (D) | | | 1.44% | | | | 1.41% | | | | 1.44% | | | | 1.48% | | | | 1.52% | |
Net investment income (loss), before waiver and reimbursement | | | (0.08)% | | | | 0.13% | | | | (0.09)% | | | | (0.45)% | | | | (0.25)% | |
Net investment income (loss), net waiver and reimbursement (D) | | | (0.02)% | | | | 0.18% | | | | (0.04)% | | | | (0.40)% | | | | (0.25)% | |
Portfolio turnover rate | | | 58% | | | | 57% | | | | 73% | | | | 30% | | | | 71% | |
| * | Amount is less than $0.005 per share. |
| (A) | Per share amounts calculated using average shares method, which more appropriately presents the per share data for the period. |
| (B) | Total return calculation does not reflect sales load. |
| (C) | Total return in the above table represents the rate that the investor would have earned or lost on an investment in the Fund assuming reinvestment of dividends. Total return would have been higher or lower if certain expenses had not been reimbursed, waived or recouped. |
| (D) | This expense decrease from the voluntary waiver is reflected in both the net expense and the net investment income ratios shown. |
The accompanying notes are an integral part of these financial statements.
91
Timothy Small Cap Value Fund (Class C Shares)
Selected data based on a share outstanding throughout each year
| | | | | | | | | | | | | | | | | | | | | | | | |
| | | For the Year
ended
September 30,
2018 | | | For the Year
ended
September 30,
2017 | | | For the Year
ended
September 30,
2016 | | | For the Year
ended
September 30,
2015 | | | For the Year
ended
September 30,
2014 | | | | |
| | | | | | |
Net asset value, beginning of year | | $ | 15.54 | | | $ | 13.10 | | | $ | 13.42 | | | $ | 16.45 | | | $ | 17.30 | | | | | |
| | | | | | | | | | | | | | | | | | | | | | | | |
| | | | | | |
INCOME (LOSS) FROM INVESTMENT OPERATIONS: | | | | | | | | | | | | | | | | | | | | | | | | |
Net investment loss (A) | | | (0.11) | | | | (0.08) | | | | (0.10) | | | | (0.17) | | | | (0.17) | | | | | |
Net realized and unrealized gain on investments | | | 1.45 | | | | 2.77 | | | | 1.26 | | | | 0.57 | | | | 1.36 | | | | | |
| | | | | | | | | | | | | | | | | | | | | | | | |
Total from investment operations | | | 1.34 | | | | 2.69 | | | | 1.16 | | | | 0.40 | | | | 1.19 | | | | | |
| | | | | | | | | | | | | | | | | | | | | | | | |
| | | | | | |
LESS DISTRIBUTIONS: | | | | | | | | | | | | | | | | | | | | | | | | |
From net realized gains on investments | | | (1.79) | | | | (0.25) | | | | (1.48) | | | | (3.43) | | | | (2.04) | | | | | |
| | | | | | | | | | | | | | | | | | | | | | | | |
Total distributions | | | (1.79) | | | | (0.25) | | | | (1.48) | | | | (3.43) | | | | (2.04) | | | | | |
| | | | | | | | | | | | | | | | | | | | | | | | |
| | | | | | |
Net asset value, end of year | | $ | 15.09 | | | $ | 15.54 | | | $ | 13.10 | | | $ | 13.42 | | | $ | 16.45 | | | | | |
| | | | | | | | | | | | | | | | | | | | | | | | |
| | | | | | |
Total return (B)(C) | | | 9.24% | | | | 20.70% | | | | 9.81% | | | | 1.14% | | | | 6.96% | | | | | |
| | | | | | |
RATIOS/SUPPLEMENTAL DATA: | | | | | | | | | | | | | | | | | | | | | | | | |
Net assets, end of year (in 000’s) | | $ | 14,603 | | | $ | 13,210 | | | $ | 10,257 | | | $ | 8,981 | | | $ | 8,135 | | | | | |
Ratios to average net assets | | | | | | | | | | | | | | | | | | | | | | | | |
Expenses, before waiver and reimbursement | | | 2.25% | | | | 2.21% | | | | 2.23% | | | | 2.28% | | | | 2.28% | | | | | |
Expenses, net waiver and reimbursement (D) | | | 2.19% | | | | 2.16% | | | | 2.18% | | | | 2.23% | | | | 2.27% | | | | | |
Net investment loss, before waiver and reimbursement | | | (0.82)% | | | | (0.62)% | | | | (0.84)% | | | | (1.19)% | | | | (1.01)% | | | | | |
Net investment loss, net waiver and reimbursement (D) | | | (0.76)% | | | | (0.57)% | | | | (0.78)% | | | | (1.14)% | | | | (1.01)% | | | | | |
Portfolio turnover rate | | | 58% | | | | 57% | | | | 73% | | | | 30% | | | | 71% | | | | | |
| (A) | Per share amounts calculated using average shares method, which more appropriately presents the per share data for the period. |
| (B) | Total return calculation does not reflect redemption fee. |
| (C) | Total return in the above table represents the rate that the investor would have earned or lost on an investment in the Fund assuming reinvestment of dividends. |
| | Total return would have been higher or lower if certain expenses had not been reimbursed, waived or recouped. |
| (D) | This expense decrease from the voluntary waiver is reflected in both the net expense and the net investment income ratios shown. |
The accompanying notes are an integral part of these financial statements.
92
Timothy Small Cap Value Fund (Class I Shares)
Selected data based on a share outstanding throughout each year
| | | | | | | | | | | | | | | | | | | | |
| | | For the Year
ended
September 30,
2018 | | | For the Year
ended
September 30,
2017 | | | For the Year
ended
September 30,
2016 | | | For the Year
ended
September 30,
2015 | | | For the Year
ended
September 30,
2014 | |
| | | | | |
Net asset value, beginning of year | | $ | 20.74 | | | $ | 17.24 | | | $ | 17.03 | | | $ | 19.84 | | | $ | 20.29 | |
| | | | | | | | | | | | | | | | | | | | |
| | | | | |
INCOME (LOSS) FROM INVESTMENT OPERATIONS: | | | | | | | | | | | | | | | | | | | | |
Net investment income (loss) (A) | | | 0.06 | | | | 0.08 | | | | 0.04 | | | | (0.03) | | | | 0.02 | |
Net realized and unrealized gain on investments | | | 1.97 | | | | 3.67 | | | | 1.65 | | | | 0.65 | | | | 1.57 | (B) |
| | | | | | | | | | | | | | | | | | | | |
Total from investment operations | | | 2.03 | | | | 3.75 | | | | 1.69 | | | | 0.62 | | | | 1.59 | |
| | | | | | | | | | | | | | | | | | | | |
| | | | | |
LESS DISTRIBUTIONS: | | | | | | | | | | | | | | | | | | | | |
From net investment income | | | (0.05) | | | | - | | | | - | | | | - | | | | - | |
From net realized gains on investments | | | (1.79) | | | | (0.25) | | | | (1.48) | | | | (3.43) | | | | (2.04) | |
| | | | | | | | | | | | | | | | | | | | |
Total distributions | | | (1.84) | | | | (0.25) | | | | (1.48) | | | | (3.43) | | | | (2.04) | |
| | | | | | | | | | | | | | | | | | | | |
| | | | | |
Net asset value, end of year | | $ | 20.93 | | | $ | 20.74 | | | $ | 17.24 | | | $ | 17.03 | | | $ | 19.84 | |
| | | | | | | | | | | | | | | | | | | | |
| | | | | |
Total return (C) | | | 10.37% | | | | 21.89% | | | | 10.92% | | | | 2.18% | | | | 7.93% | |
| | | | | |
RATIOS/SUPPLEMENTAL DATA: | | | | | | | | | | | | | | | | | | | | |
Net assets, end of year (in 000’s) | | $ | 35,140 | | | $ | 19,103 | | | $ | 2,324 | | | $ | 870 | | | $ | 532 | |
Ratios to average net assets | | | | | | | | | | | | | | | | | | | | |
Expenses, before waiver and reimbursement | | | 1.25% | | | | 1.21% | | | | 1.26% | | | | 1.28% | | | | 1.27% | |
Expenses, net waiver and reimbursement (D) | | | 1.19% | | | | 1.16% | | | | 1.20% | | | | 1.23% | | | | 1.27% | |
Net investment income (loss), before waiver and reimbursement | | | 0.21% | | | | 0.38% | | | | 0.18% | | | | (0.19)% | | | | 0.06% | |
Net investment income (loss), net waiver and reimbursement (D) | | | 0.27% | | | | 0.43% | | | | 0.23% | | | | (0.14)% | | | | 0.07% | |
Portfolio turnover rate | | | 58% | | | | 57% | | | | 73% | | | | 30% | | | | 71% | |
| (A) | Per share amounts calculated using average shares method, which more appropriately presents the per share data for the period. |
| (B) | Realized and unrealized gains per share in this caption are balancing amounts necessary to reconcile the change in net asset value per share for the period, and may not reconcile with the aggregate gains and losses in the Statements of Operations due to share transactions for the period. |
| (C) | Total return in the above table represents the rate that the investor would have earned or lost on an investment in the Fund assuming reinvestment of dividends. |
| | Total return would have been higher or lower if certain expenses had not been reimbursed, waived or recouped. |
| (D) | This expense decrease from the voluntary waiver is reflected in both the net expense and the net investment income ratios shown. |
The accompanying notes are an integral part of these financial statements.
93
Timothy Large/Mid Cap Value Fund (Class A Shares)
Selected data based on a share outstanding throughout each year
| | | | | | | | | | | | | | | | | | | | | | | | |
| | | For the Year
ended
September 30,
2018 | | | For the Year
ended
September 30,
2017 | | | For the Year
ended
September 30,
2016 | | | For the Year
ended
September 30,
2015 | | | For the Year
ended
September 30,
2014 | | | | |
| | | | | | |
Net asset value, beginning of year | | $ | 19.16 | | | $ | 17.15 | | | $ | 18.20 | | | $ | 19.61 | | | $ | 18.14 | | | | | |
| | | | | | | | | | | | | | | | | | | | | | | | |
| | | | | | |
INCOME (LOSS) FROM INVESTMENT OPERATIONS: | | | | | | | | | | | | | | | | | | | | | | | | |
Net investment income (loss) (A) | | | 0.07 | | | | 0.05 | | | | 0.01 | | | | (0.01) | | | | (0.01) | | | | | |
Net realized and unrealized gain on investments (B) | | | 2.45 | | | | 2.18 | | | | 1.04 | | | | 0.38 | | | | 2.83 | | | | | |
| | | | | | | | | | | | | | | | | | | | | | | | |
Total from investment operations | | | 2.52 | | | | 2.23 | | | | 1.05 | | | | 0.37 | | | | 2.82 | | | | | |
| | | | | | | | | | | | | | | | | | | | | | | | |
| | | | | | |
LESS DISTRIBUTIONS: | | | | | | | | | | | | | | | | | | | | | | | | |
From net investment income | | | (0.03) | | | | - | | | | - | | | | - | | | | (0.09) | | | | | |
From net realized gains on investments | | | (1.27) | | | | (0.22) | | | | (2.10) | | | | (1.78) | | | | (1.26) | | | | | |
| | | | | | | | | | | | | | | | | | | | | | | | |
Total distributions | | | (1.30) | | | | (0.22) | | | | (2.10) | | | | (1.78) | | | | (1.35) | | | | | |
| | | | | | | | | | | | | | | | | | | | | | | | |
| | | | | | |
Net asset value, end of year | | $ | 20.38 | | | $ | 19.16 | | | $ | 17.15 | | | $ | 18.20 | | | $ | 19.61 | | | | | |
| | | | | | | | | | | | | | | | | | | | | | | | |
| | | | | | |
Total return (C)(D) | | | 13.58% | | | | 13.10% | | | | 6.40% | | | | 1.59% | | | | 16.13% | | | | | |
| | | | | | |
RATIOS/SUPPLEMENTAL DATA: | | | | | | | | | | | | | | | | | | | | | | | | |
Net assets, end of year (in 000’s) | | $ | 172,163 | | | $ | 167,056 | | | $ | 154,260 | | | $ | 135,091 | | | $ | 138,821 | | | | | |
Ratios to average net assets | | | | | | | | | | | | | | | | | | | | | | | | |
Expenses, before waiver and reimbursement | | | 1.46% | | | | 1.49% | | | | 1.48% | | | | 1.48% | | | | 1.50% | | | | | |
Expenses, net waiver and reimbursement (E) | | | 1.35% | | | | 1.41% | | | | 1.43% | | | | 1.43% | | | | 1.49% | | | | | |
Net investment income (loss), before waiver and reimbursement | | | 0.27% | | | | 0.18% | | | | (0.01)% | | | | (0.13)% | | | | (0.03)% | | | | | |
Net investment income (loss), net waiver and reimbursement (E) | | | 0.38% | | | | 0.26% | | | | 0.04% | | | | (0.08)% | | | | (0.03)% | | | | | |
Portfolio turnover rate | | | 24% | | | | 39% | | | | 45% | | | | 11% | | | | 37% | | | | | |
| (A) | Per share amounts calculated using average shares method, which more appropriately presents the per share data for the period. |
| (B) | Realized and unrealized gains and losses per share in this caption are balancing amounts necessary to reconcile the change in net asset value per share for the period, and may not reconcile with the aggregate gains and losses in the Statement of Operations due to the fluctuations in share transactions. |
| (C) | Total return calculation does not reflect sales load. |
| (D) | Total return in the above table represents the rate that the investor would have earned or lost on an investment in the Fund assuming reinvestment of dividends. |
| | Total return would have been higher or lower if certain expenses had not been reimbursed, waived or recouped. |
| (E) | This expense decrease from the voluntary waiver is reflected in both the net expense and the net investment income ratios shown. |
The accompanying notes are an integral part of these financial statements.
94
Timothy Large/Mid Cap Value Fund (Class C Shares)
Selected data based on a share outstanding throughout each year
| | | | | | | | | | | | | | | | | | | | | | | | |
| | | For the Year
ended
September 30,
2018 | | | For the Year
ended
September 30,
2017 | | | For the Year
ended
September 30,
2016 | | | For the Year
ended
September 30,
2015 | | | For the Year
ended
September 30,
2014 | | | | |
| | | | | | |
Net asset value, beginning of year | | $ | 15.82 | | | $ | 14.30 | | | $ | 15.62 | | | $ | 17.19 | | | $ | 16.12 | | | | | |
| | | | | | | | | | | | | | | | | | | | | | | | |
| | | | | | |
INCOME (LOSS) FROM INVESTMENT OPERATIONS: | | | | | | | | | | | | | | | | | | | | | | | | |
Net investment loss (A) | | | (0.06) | | | | (0.07) | | | | (0.10) | | | | (0.14) | | | | (0.13) | | | | | |
Net realized and unrealized gain on investments (B) | | | 2.00 | | | | 1.81 | | | | 0.88 | | | | 0.35 | | | | 2.49 | | | | | |
| | | | | | | | | | | | | | | | | | | | | | | | |
Total from investment operations | | | 1.94 | | | | 1.74 | | | | 0.78 | | | | 0.21 | | | | 2.36 | | | | | |
| | | | | | | | | | | | | | | | | | | | | | | | |
| | | | | | |
LESS DISTRIBUTIONS: | | | | | | | | | | | | | | | | | | | | | | | | |
From net investment income | | | - | | | | - | | | | - | | | | - | | | | (0.03) | | | | | |
From net realized gains on investments | | | (1.27) | | | | (0.22) | | | | (2.10) | | | | (1.78) | | | | (1.26) | | | | | |
| | | | | | | | | | | | | | | | | | | | | | | | |
Total distributions | | | (1.27) | | | | (0.22) | | | | (2.10) | | | | (1.78) | | | | (1.29) | | | | | |
| | | | | | | | | | | | | | | | | | | | | | | | |
| | | | | | |
Net asset value, end of year | | $ | 16.49 | | | $ | 15.82 | | | $ | 14.30 | | | $ | 15.62 | | | $ | 17.19 | | | | | |
| | | | | | | | | | | | | | | | | | | | | | | | |
| | | | | | |
Total return (C)(D) | | | 12.75% | | | | 12.27% | | | | 5.64% | | | | 0.82% | | | | 15.21% | | | | | |
| | | | | | |
RATIOS/SUPPLEMENTAL DATA: | | | | | | | | | | | | | | | | | | | | | | | | |
Net assets, end of year (in 000’s) | | $ | 25,852 | | | $ | 23,803 | | | $ | 20,855 | | | $ | 18,458 | | | $ | 16,778 | | | | | |
Ratios to average net assets | | | | | | | | | | | | | | | | | | | | | | | | |
Expenses, before waiver and reimbursement | | | 2.21% | | | | 2.24% | | | | 2.23% | | | | 2.23% | | | | 2.25% | | | | | |
Expenses, net waiver and reimbursement (E) | | | 2.10% | | | | 2.16% | | | | 2.18% | | | | 2.18% | | | | 2.24% | | | | | |
Net investment loss, before waiver and reimbursement | | | (0.48)% | | | | (0.57)% | | | | (0.76)% | | | | (0.88)% | | | | (0.78)% | | | | | |
Net investment loss, net waiver and reimbursement (E) | | | (0.37)% | | | | (0.49)% | | | | (0.70)% | | | | (0.83)% | | | | (0.77)% | | | | | |
Portfolio turnover rate | | | 24% | | | | 39% | | | | 45% | | | | 11% | | | | 37% | | | | | |
| (A) | Per share amounts calculated using average shares method, which more appropriately presents the per share data for the period. |
| (B) | Realized and unrealized gains per share in this caption are balancing amounts necessary to reconcile the change in net asset value per share for the period, and may not reconcile with aggregate gains and losses in the Statement of Operations due to the timing of share transactions for the period. |
| (C) | Total return calculation does not reflect redemption fee. |
| (D) | Total return in the above table represents the rate that the investor would have earned or lost on an investment in the Fund assuming reinvestment of dividends. |
| | Total return would have been higher or lower if certain expenses had not been reimbursed, waived or recouped. |
| (E) | This expense decrease from the voluntary waiver is reflected in both the net expense and the net investment income ratios shown. |
The accompanying notes are an integral part of these financial statements.
95
Timothy Large/Mid Cap Value Fund (Class I Shares)
Selected data based on a share outstanding throughout each year
| | | | | | | | | | | | | | | | | | | | | | | | |
| | | For the Year
ended
September 30,
2018 | | | For the Year
ended
September 30,
2017 | | | For the Year
ended
September 30,
2016 | | | For the Year
ended
September 30,
2015 | | | For the Year
ended
September 30,
2014 | | | | |
| | | | | | |
Net asset value, beginning of year | | $ | 19.34 | | | $ | 17.27 | | | $ | 18.26 | | | $ | 19.63 | | | $ | 18.13 | | | | | |
| | | | | | | | | | | | | | | | | | | | | | | | |
| | | | | | |
INCOME (LOSS) FROM INVESTMENT OPERATIONS: | | | | | | | | | | | | | | | | | | | | | | | | |
Net investment income (A) | | | 0.13 | | | | 0.10 | | | | 0.05 | | | | 0.03 | | | | 0.05 | | | | | |
Net realized and unrealized gain on investments | | | 2.45 | | | | 2.19 | | | | 1.06 | (B) | | | 0.38 | | | | 2.82 | (B) | | | | |
| | | | | | | | | | | | | | | | | | | | | | | | |
Total from investment operations | | | 2.58 | | | | 2.29 | | | | 1.11 | | | | 0.41 | | | | 2.87 | | | | | |
| | | | | | | | | | | | | | | | | | | | | | | | |
| | | | | | |
LESS DISTRIBUTIONS: | | | | | | | | | | | | | | | | | | | | | | | | |
From net investment income | | | (0.07) | | | | - | | | | - | | | | - | | | | (0.11) | | | | | |
From net realized gains on investments | | | (1.27) | | | | (0.22) | | | | (2.10) | | | | (1.78) | | | | (1.26) | | | | | |
| | | | | | | | | | | | | | | | | | | | | | | | |
Total distributions | | | (1.34) | | | | (0.22) | | | | (2.10) | | | | (1.78) | | | | (1.37) | | | | | |
| | | | | | | | | | | | | | | | | | | | | | | | |
| | | | | | |
Net asset value, end of year | | $ | 20.58 | | | $ | 19.34 | | | $ | 17.27 | | | $ | 18.26 | | | $ | 19.63 | | | | | |
| | | | | | | | | | | | | | | | | | | | | | | | |
| | | | | | |
Total return (C) | | | 13.83% | | | | 13.36% | | | | 6.74% | | | | 1.81% | | | | 16.09% | | | | | |
| | | | | | |
RATIOS/SUPPLEMENTAL DATA: | | | | | | | | | | | | | | | | | | | | | | | | |
Net assets, end of year (in 000’s) | | $ | 35,573 | | | $ | 19,384 | | | $ | 5,382 | | | $ | 3,424 | | | $ | 1,442 | | | | | |
Ratios to average net assets | | | | | | | | | | | | | | | | | | | | | | | | |
Expenses, before waiver and reimbursement | | | 1.21% | | | | 1.23% | | | | 1.25% | | | | 1.23% | | | | 1.23% | | | | | |
Expenses, net waiver and reimbursement (D) | | | 1.10% | | | | 1.14% | | | | 1.19% | | | | 1.18% | | | | 1.23% | | | | | |
Net investment income, before waiver and reimbursement | | | 0.54% | | | | 0.46% | | | | 0.24% | | | | 0.12% | | | | 0.25% | | | | | |
Net investment income, net waiver and reimbursement (D) | | | 0.65% | | | | 0.55% | | | | 0.30% | | | | 0.18% | | | | 0.26% | | | | | |
Portfolio turnover rate | | | 24% | | | | 39% | | | | 45% | | | | 11% | | | | 37% | | | | | |
| (A) | Per share amounts calculated using average shares method, which more appropriately presents the per share data for the period. |
| (B) | Realized and unrealized gains per share in this caption are balancing amounts necessary to reconcile the change in net asset value per share for the period, and may not reconcile with the aggregate gains and losses in the Statements of Operations due to share transactions for the period. |
| (C) | Total return in the above table represents the rate that the investor would have earned or lost on an investment in the Fund assuming reinvestment of dividends. |
| | Total return would have been higher or lower if certain expenses had not been reimbursed, waived or recouped. |
| (D) | This expense decrease from the voluntary waiver is reflected in both the net expense and the net investment income ratios shown. |
The accompanying notes are an integral part of these financial statements.
96
Timothy Fixed Income Fund (Class A Shares)
Selected data based on a share outstanding throughout each year
| | | | | | | | | | | | | | | | | | | | | | | | |
| | | For the Year
ended
September 30,
2018 | | | For the Year
ended
September 30,
2017 | | | For the Year
ended
September 30,
2016 | | | For the Year
ended
September 30,
2015 | | | For the Year
ended
September 30,
2014 | | | | |
| | | | | | |
Net asset value, beginning of year | | $ | 10.22 | | | $ | 10.47 | | | $ | 10.27 | | | $ | 10.43 | | | $ | 10.43 | | | | | |
| | | | | | | | | | | | | | | | | | | | | | | | |
| | | | | | |
INCOME (LOSS) FROM INVESTMENT OPERATIONS: | | | | | | | | | | | | | | | | | | | | | | | | |
Net investment income (A) | | | 0.16 | | | | 0.13 | | | | 0.14 | | | | 0.15 | | | | 0.18 | | | | | |
Net realized and unrealized gain (loss) on investments | | | (0.39) | | | | (0.22) | | | | 0.21 | | | | (0.04) | | | | 0.10 | | | | | |
| | | | | | | | | | | | | | | | | | | | | | | | |
Total from investment operations | | | (0.23) | | | | (0.09) | | | | 0.35 | | | | 0.11 | | | | 0.28 | | | | | |
| | | | | | | | | | | | | | | | | | | | | | | | |
| | | | | | |
LESS DISTRIBUTIONS: | | | | | | | | | | | | | | | | | | | | | | | | |
From net investment income | | | (0.18) | | | | (0.16) | | | | (0.15) | | | | (0.25) | | | | (0.25) | | | | | |
From net realized gains on investments | | | - | | | | - | | | | - | | | | (0.02) | | | | (0.03) | | | | | |
| | | | | | | | | | | | | | | | | | | | | | | | |
Total distributions | | | (0.18) | | | | (0.16) | | | | (0.15) | | | | (0.27) | | | | (0.28) | | | | | |
| | | | | | | | | | | | | | | | | | | | | | | | |
| | | | | | |
Net asset value, end of year | | $ | 9.81 | | | $ | 10.22 | | | $ | 10.47 | | | $ | 10.27 | | | $ | 10.43 | | | | | |
| | | | | | | | | | | | | | | | | | | | | | | | |
| | | | | | |
Total return (B)(C) | | | (2.31)% | | | | (0.81)% | | | | 3.47% | | | | 1.08% | | | | 2.64% | | | | | |
| | | | | | |
RATIOS/SUPPLEMENTAL DATA: | | | | | | | | | | | | | | | | | | | | | | | | |
Net assets, end of year (in 000’s) | | $ | 66,119 | | | $ | 75,858 | | | $ | 86,142 | | | $ | 66,107 | | | $ | 68,274 | | | | | |
Ratios to average net assets | | | | | | | | | | | | | | | | | | | | | | | | |
Expenses, before waiver and reimbursement | | | 1.30% | | | | 1.30% | | | | 1.24% | | | | 1.28% | | | | 1.30% | | | | | |
Expenses, net waiver and reimbursement (D) | | | 1.10% | | | | 1.10% | | | | 1.04% | | | | 1.11% | | | | 1.14% | | | | | |
Net investment income, before waiver and reimbursement | | | 1.40% | | | | 1.05% | | | | 1.19% | | | | 1.29% | | | | 1.60% | | | | | |
Net investment income, net waiver and reimbursement (D) | | | 1.60% | | | | 1.25% | | | | 1.39% | | | | 1.48% | | | | 1.75% | | | | | |
Portfolio turnover rate | | | 30% | | | | 43% | | | | 40% | | | | 28% | | | | 18% | | | | | |
| (A) | Per share amounts calculated using average shares method, which more appropriately presents the per share data for the period. |
| (B) | Total return calculation does not reflect sales load. |
| (C) | Total return in the above table represents the rate that the investor would have earned or lost on an investment in the Fund assuming reinvestment of dividends. |
| | Total return would have been higher or lower if certain expenses had not been reimbursed, waived or recouped. |
| (D) | This expense decrease from the voluntary waiver is reflected in both the net expense and the net investment income ratios shown. |
The accompanying notes are an integral part of these financial statements.
97
Timothy Fixed Income Fund (Class C Shares)
Selected data based on a share outstanding throughout each year
| | | | | | | | | | | | | | | | | | | | | | | | |
| | | For the Year
ended
September 30,
2018 | | | For the Year
ended
September 30,
2017 | | | For the Year
ended
September 30,
2016 | | | For the Year
ended
September 30,
2015 | | | For the Year
ended
September 30,
2014 | | | | |
| | | | | | |
Net asset value, beginning of year | | $ | 9.85 | | | $ | 10.09 | | | $ | 9.89 | | | $ | 10.07 | | | $ | 10.07 | | | | | |
| | | | | | | | | | | | | | | | | | | | | | | | |
| | | | | | |
INCOME (LOSS) FROM INVESTMENT OPERATIONS: | | | | | | | | | | | | | | | | | | | | | | | | |
Net investment income (A) | | | 0.08 | | | | 0.05 | | | | 0.07 | | | | 0.08 | | | | 0.10 | | | | | |
Net realized and unrealized gain (loss) on investments | | | (0.39) | | | | (0.20) | | | | 0.19 | | | | (0.04) | | | | 0.11 | | | | | |
| | | | | | | | | | | | | | | | | | | | | | | | |
Total from investment operations | | | (0.31) | | | | (0.15) | | | | 0.26 | | | | 0.04 | | | | 0.21 | | | | | |
| | | | | | | | | | | | | | | | | | | | | | | | |
| | | | | | |
LESS DISTRIBUTIONS: | | | | | | | | | | | | | | | | | | | | | | | | |
From net investment income | | | (0.10) | | | | (0.09) | | | | (0.06) | | | | (0.20) | | | | (0.18) | | | | | |
From net realized gains on investments | | | - | | | | - | | | | - | | | | (0.02) | | | | (0.03) | | | | | |
| | | | | | | | | | | | | | | | | | | | | | | | |
Total distributions | | | (0.10) | | | | (0.09) | | | | (0.06) | | | | (0.22) | | | | (0.21) | | | | | |
| | | | | | | | | | | | | | | | | | | | | | | | |
| | | | | | |
Net asset value, end of year | | $ | 9.44 | | | $ | 9.85 | | | $ | 10.09 | | | $ | 9.89 | | | $ | 10.07 | | | | | |
| | | | | | | | | | | | | | | | | | | | | | | | |
| | | | | | |
Total return (B)(C) | | | (3.15)% | | | | (1.49)% | | | | 2.66% | | | | 0.36% | | | | 2.02% | | | | | |
| | | | | | |
RATIOS/SUPPLEMENTAL DATA: | | | | | | | | | | | | | | | | | | | | | | | | |
Net assets, end of year (in 000’s) | | $ | 9,653 | | | $ | 9,637 | | | $ | 9,660 | | | $ | 8,510 | | | $ | 7,120 | | | | | |
Ratios to average net assets | | | | | | | | | | | | | | | | | | | | | | | | |
Expenses, before waiver and reimbursement | | | 2.05% | | | | 2.06% | | | | 1.99% | | | | 2.03% | | | | 2.05% | | | | | |
Expenses, net waiver and reimbursement (D) | | | 1.85% | | | | 1.86% | | | | 1.79% | | | | 1.86% | | | | 1.90% | | | | | |
Net investment income, before waiver and reimbursement | | | 0.65% | | | | 0.30% | | | | 0.46% | | | | 0.56% | | | | 0.85% | | | | | |
Net investment income, net waiver and reimbursement (D) | | | 0.85% | | | | 0.50% | | | | 0.65% | | | | 0.73% | | | | 1.00% | | | | | |
Portfolio turnover rate | | | 30% | | | | 43% | | | | 40% | | | | 28% | | | | 18% | | | | | |
| (A) | Per share amounts calculated using average shares method, which more appropriately presents the per share data for the period. |
| (B) | Total return calculation does not reflect redemption fee. |
| (C) | Total return in the above table represents the rate that the investor would have earned or lost on an investment in the Fund assuming reinvestment of dividends. |
| | Total return would have been higher or lower if certain expenses had not been reimbursed, waived or recouped. |
| (D) | This expense decrease from the voluntary waiver is reflected in both the net expense and the net investment income ratios shown. |
The accompanying notes are an integral part of these financial statements.
98
Timothy Fixed Income Fund (Class I Shares)
Selected data based on a share outstanding throughout each year
| | | | | | | | | | | | | | | | | | | | |
| | | For the Year
ended
September 30,
2018 | | | For the Year
ended
September 30,
2017 | | | For the Year
ended
September 30,
2016 | | | For the Year
ended
September 30,
2015 | | | For the Year
ended
September 30,
2014 | |
| | | | | |
Net asset value, beginning of year | | $ | 10.15 | | | $ | 10.41 | | | $ | 10.20 | | | $ | 10.36 | | | $ | 10.34 | |
| | | | | | | | | | | | | | | | | | | | |
| | | | | |
INCOME (LOSS) FROM INVESTMENT OPERATIONS: | | | | | | | | | | | | | | | | | | | | |
Net investment income (A) | | | 0.18 | | | | 0.16 | | | | 0.17 | | | | 0.18 | | | | 0.41 | |
Net realized and unrealized gain (loss) on investments | | | (0.39) | | | | (0.23) | | | | 0.22 | | | | (0.05) | | | | (0.08) | (B) |
| | | | | | | | | | | | | | | | | | | | |
Total from investment operations | | | (0.21) | | | | (0.07) | | | | 0.39 | | | | 0.13 | | | | 0.33 | |
| | | | | | | | | | | | | | | | | | | | |
| | | | | |
LESS DISTRIBUTIONS: | | | | | | | | | | | | | | | | | | | | |
From net investment income | | | (0.20) | | | | (0.19) | | | | (0.18) | | | | (0.27) | | | | (0.28) | |
From net realized gains on investments | | | - | | | | - | | | | - | | | | (0.02) | | | | (0.03) | |
| | | | | | | | | | | | | | | | | | | | |
Total distributions | | | (0.20) | | | | (0.19) | | | | (0.18) | | | | (0.29) | | | | (0.31) | |
| | | | | | | | | | | | | | | | | | | | |
Net asset value, end of year | | $ | 9.74 | | | $ | 10.15 | | | $ | 10.41 | | | $ | 10.20 | | | $ | 10.36 | |
| | | | | | | | | | | | | | | | | | | | |
Total return (C) | | | (2.06)% | | | | (0.64)% | | | | 3.91% | | | | 1.28% | | | | 3.16% | |
| | | | | |
RATIOS/SUPPLEMENTAL DATA: | | | | | | | | | | | | | | | | | | | | |
Net assets, end of year (in 000’s) | | $ | 3,208 | | | $ | 2,134 | | | $ | 564 | | | $ | 483 | | | $ | 103 | |
Ratios to average net assets | | | | | | | | | | | | | | | | | | | | |
Expenses, before waiver and reimbursement | | | 1.05% | | | | 1.08% | | | | 0.96% | | | | 1.03% | | | | (0.44)% | |
Expenses, net waiver and reimbursement (D) | | | 0.85% | | | | 0.88% | | | | 0.78% | | | | 0.87% | | | | (0.64)% | |
Net investment income, before waiver and reimbursement | | | 1.66% | | | | 1.37% | | | | 1.45% | | | | 1.58% | | | | 3.72% | |
Net investment income, net waiver and reimbursement (D) | | | 1.86% | | | | 1.57% | | | | 1.63% | | | | 1.73% | | | | 3.92% | |
Portfolio turnover rate | | | 30% | | | | 43% | | | | 40% | | | | 28% | | | | 18% | |
| (A) | Per share amounts calculated using average shares method, which more appropriately presents the per share data for the period. |
| (B) | Realized and unrealized gains per share in this caption are balancing amounts necessary to reconcile the change in net asset value per share for the period, and may not reconcile with the aggregate gains and losses in the Statements of Operations due to share transactions for the period. |
| (C) | Total return in the above table represents the rate that the investor would have earned or lost on an investment in the Fund assuming reinvestment of dividends. |
| | Total return would have been higher or lower if certain expenses had not been reimbursed, waived or recouped. |
| (D) | This expense decrease from the voluntary waiver is reflected in both the net expense and the net investment income ratios shown. |
The accompanying notes are an integral part of these financial statements.
99
Timothy High Yield Bond Fund (Class A Shares)
Selected data based on a share outstanding throughout each year
| | | | | | | | | | | | | | | | | | | | | | | | |
| | | For the Year
ended
September 30,
2018 | | | For the Year
ended
September 30,
2017 | | | For the Year
ended
September 30,
2016 | | | For the Year
ended
September 30,
2015 | | | For the Year
ended
September 30,
2014 | | | | |
| | | | | | |
Net asset value, beginning of year | | $ | 9.40 | | | $ | 9.11 | | | $ | 8.64 | | | $ | 9.49 | | | $ | 9.40 | | | | | |
| | | | | | | | | | | | | | | | | | | | | | | | |
| | | | | | |
INCOME (LOSS) FROM INVESTMENT OPERATIONS: | | | | | | | | | | | | | | | | | | | | | | | | |
Net investment income (A) | | | 0.34 | | | | 0.34 | | | | 0.36 | | | | 0.40 | | | | 0.44 | | | | | |
Net realized and unrealized gain (loss) on investments | | | (0.36) | | | | 0.28 | | | | 0.46 | | | | (0.85) | | | | 0.09 | | | | | |
| | | | | | | | | | | | | | | | | | | | | | | | |
Total from investment operations | | | (0.02) | | | | 0.62 | | | | 0.82 | | | | (0.45) | | | | 0.53 | | | | | |
| | | | | | | | | | | | | | | | | | | | | | | | |
| | | | | | |
LESS DISTRIBUTIONS: | | | | | | | | | | | | | | | | | | | | | | | | |
From net investment income | | | (0.36) | | | | (0.33) | | | | (0.35) | | | | (0.40) | | | | (0.44) | | | | | |
| | | | | | | | | | | | | | | | | | | | | | | | |
Total distributions | | | (0.36) | | | | (0.33) | | | | (0.35) | | | | (0.40) | | | | (0.44) | | | | | |
| | | | | | | | | | | | | | | | | | | | | | | | |
| | | | | | |
Net asset value, end of year | | $ | 9.02 | | | $ | 9.40 | | | $ | 9.11 | | | $ | 8.64 | | | $ | 9.49 | | | | | |
| | | | | | | | | | | | | | | | | | | | | | | | |
| | | | | | |
Total return (B)(C) | | | (0.17)% | | | | 6.94% | | | | 9.80% | | | | (4.88)% | | | | 5.71% | | | | | |
| | | | | | |
RATIOS/SUPPLEMENTAL DATA: | | | | | | | | | | | | | | | | | | | | | | | | |
Net assets, end of year (in 000’s) | | $ | 41,991 | | | $ | 52,950 | | | $ | 49,187 | | | $ | 36,279 | | | $ | 41,038 | | | | | |
Ratios to average net assets | | | | | | | | | | | | | | | | | | | | | | | | |
Expenses, before waiver and reimbursement | | | 1.44% | | | | 1.32% | | | | 1.29% | | | | 1.30% | | | | 1.28% | | | | | |
Expenses, net waiver and reimbursement (D) | | | 1.39% | | | | 1.27% | | | | 1.24% | | | | 1.25% | | | | 1.28% | | | | | |
Net investment income, before waiver and reimbursement | | | 3.67% | | | | 3.66% | | | | 4.03% | | | | 4.28% | | | | 4.53% | | | | | |
Net investment income, net waiver and reimbursement (D) | | | 3.72% | | | | 3.71% | | | | 4.08% | | | | 4.33% | | | | 4.53% | | | | | |
Portfolio turnover rate | | | 12% | | | | 45% | | | | 27% | | | | 39% | | | | 53% | | | | | |
| (A) | Per share amounts calculated using average shares method, which more appropriately presents the per share data for the period. |
| (B) | Total return calculation does not reflect sales load. |
| (C) | Total return in the above table represents the rate that the investor would have earned or lost on an investment in the Fund assuming reinvestment of dividends. |
| | Total return would have been higher or lower if certain expenses had not been reimbursed, waived or recouped. |
| (D) | This expense decrease from the voluntary waiver is reflected in both the net expense and the net investment income ratios shown. |
The accompanying notes are an integral part of these financial statements.
100
Timothy High Yield Bond Fund (Class C Shares)
Selected data based on a share outstanding throughout each year
| | | | | | | | | | | | | | | | | | | | | | | | |
| | | For the Year
ended
September 30,
2018 | | | For the Year
ended
September 30,
2017 | | | For the Year
ended
September 30,
2016 | | | For the Year
ended
September 30,
2015 | | | For the Year
ended
September 30,
2014 | | | | |
| | | | | | |
Net asset value, beginning of year | | $ | 9.51 | | | $ | 9.22 | | | $ | 8.72 | | | $ | 9.57 | | | $ | 9.48 | | | | | |
| | | | | | | | | | | | | | | | | | | | | | | | |
| | | | | | |
INCOME (LOSS) FROM INVESTMENT OPERATIONS: | | | | | | | | | | | | | | | | | | | | | | | | |
Net investment income (A) | | | 0.28 | | | | 0.28 | | | | 0.30 | | | | 0.33 | | | | 0.37 | | | | | |
Net realized and unrealized gain (loss) on investments | | | (0.36) | | | | 0.27 | | | | 0.47 | | | | (0.86) | | | | 0.09 | | | | | |
| | | | | | | | | | | | | | | | | | | | | | | | |
Total from investment operations | | | (0.08) | | | | 0.55 | | | | 0.77 | | | | (0.53) | | | | 0.46 | | | | | |
| | | | | | | | | | | | | | | | | | | | | | | | |
| | | | | | |
LESS DISTRIBUTIONS: | | | | | | | | | | | | | | | | | | | | | | | | |
From net investment income | | | (0.29) | | | | (0.26) | | | | (0.27) | | | | (0.32) | | | | (0.37) | | | | | |
| | | | | | | | | | | | | | | | | | | | | | | | |
Total distributions | | | (0.29) | | | | (0.26) | | | | (0.27) | | | | (0.32) | | | | (0.37) | | | | | |
| | | | | | | | | | | | | | | | | | | | | | | | |
| | | | | | |
Net asset value, end of year | | $ | 9.14 | | | $ | 9.51 | | | $ | 9.22 | | | $ | 8.72 | | | $ | 9.57 | | | | | |
| | | | | | | | | | | | | | | | | | | | | | | | |
| | | | | | |
Total return (B)(C) | | | (0.85)% | | | | 6.04% | | | | 9.04% | | | | (5.58)% | | | | 4.89% | | | | | |
| | | | | | |
RATIOS/SUPPLEMENTAL DATA: | | | | | | | | | | | | | | | | | | | | | | | | |
Net assets, end of year (in 000’s) | | $ | 3,219 | | | $ | 3,539 | | | $ | 3,108 | | | $ | 2,714 | | | $ | 2,771 | | | | | |
Ratios to average net assets | | | | | | | | | | | | | | | | | | | | | | | | |
Expenses, before waiver and reimbursement | | | 2.19% | | | | 2.07% | | | | 2.03% | | | | 2.05% | | | | 2.03% | | | | | |
Expenses, net waiver and reimbursement (D) | | | 2.14% | | | | 2.02% | | | | 1.98% | | | | 2.00% | | | | 2.03% | | | | | |
Net investment income, before waiver and reimbursement | | | 2.92% | | | | 2.91% | | | | 3.30% | | | | 3.53% | | | | 3.78% | | | | | |
Net investment income, net waiver and reimbursement (D) | | | 2.97% | | | | 2.96% | | | | 3.35% | | | | 3.57% | | | | 3.79% | | | | | |
Portfolio turnover rate | | | 12% | | | | 45% | | | | 27% | | | | 39% | | | | 53% | | | | | |
| (A) | Per share amounts calculated using average shares method, which more appropriately presents the per share data for the period. |
| (B) | Total return calculation does not reflect redemption fee. |
| (C) | Total return in the above table represents the rate that the investor would have earned or lost on an investment in the Fund assuming reinvestment of dividends. |
| | Total return would have been higher or lower if certain expenses had not been reimbursed, waived or recouped. |
| (D) | This expense decrease from the voluntary waiver is reflected in both the net expense and the net investment income ratios shown. |
The accompanying notes are an integral part of these financial statements.
101
Timothy High Yield Bond Fund (Class I Shares)
Selected data based on a share outstanding throughout each year
| | | | | | | | | | | | | | | | | | | | | | | | |
| | | For the Year
ended
September 30,
2018 | | | For the Year
ended
September 30,
2017 | | | For the Year
ended
September 30,
2016 | | | For the Year
ended
September 30,
2015 | | | For the Year
ended
September 30,
2014 | | | | |
| | | | | | |
Net asset value, beginning of year | | $ | 9.41 | | | $ | 9.12 | | | $ | 8.65 | | | $ | 9.50 | | | $ | 9.40 | | | | | |
| | | | | | | | | | | | | | | | | | | | | | | | |
| | | | | | |
INCOME (LOSS) FROM INVESTMENT OPERATIONS: | | | | | | | | | | | | | | | | | | | | | | | | |
Net investment income (A) | | | 0.36 | | | | 0.37 | | | | 0.39 | | | | 0.43 | | | | 0.47 | | | | | |
Net realized and unrealized gain (loss) on investments | | | (0.36) | | | | 0.28 | | | | 0.46 | | | | (0.86) | | | | 0.10 | | | | | |
| | | | | | | | | | | | | | | | | | | | | | | | |
Total from investment operations | | | 0.00 | | | | 0.65 | | | | 0.85 | | | | (0.43) | | | | 0.57 | | | | | |
| | | | | | | | | | | | | | | | | | | | | | | | |
| | | | | | |
LESS DISTRIBUTIONS: | | | | | | | | | | | | | | | | | | | | | | | | |
From net investment income | | | (0.39) | | | | (0.36) | | | | (0.38) | | | | (0.42) | | | | (0.47) | | | | | |
| | | | | | | | | | | | | | | | | | | | | | | | |
Total distributions | | | (0.39) | | | | (0.36) | | | | (0.38) | | | | (0.42) | | | | (0.47) | | | | | |
| | | | | | | | | | | | | | | | | | | | | | | | |
| | | | | | |
Net asset value, end of year | | $ | 9.02 | | | $ | 9.41 | | | $ | 9.12 | | | $ | 8.65 | | | $ | 9.50 | | | | | |
| | | | | | | | | | | | | | | | | | | | | | | | |
| | | | | | |
Total return (B) | | | 0.00% | | | | 7.21% | | | | 10.12% | | | | (4.62)% | | | | 6.07% | | | | | |
| | | | | | |
RATIOS/SUPPLEMENTAL DATA: | | | | | | | | | | | | | | | | | | | | | | | | |
Net assets, end of year (in 000’s) | | $ | 11,578 | | | $ | 9,717 | | | $ | 1,560 | | | $ | 2,758 | | | $ | 241 | | | | | |
Ratios to average net assets | | | | | | | | | | | | | | | | | | | | | | | | |
Expenses, before waiver and reimbursement | | | 1.19% | | | | 1.06% | | | | 0.96% | | | | 1.06% | | | | 0.90% | | | | | |
Expenses, net waiver and reimbursement (C) | | | 1.14% | | | | 1.01% | | | | 0.92% | | | | 1.00% | | | | 0.89% | | | | | |
Net investment income, before waiver and reimbursement | | | 3.92% | | | | 3.89% | | | | 4.38% | | | | 4.55% | | | | 4.77% | | | | | |
Net investment income, net waiver and reimbursement (C) | | | 3.97% | | | | 3.94% | | | | 4.42% | | | | 4.58% | | | | 4.78% | | | | | |
Portfolio turnover rate | | | 12% | | | | 45% | | | | 27% | | | | 39% | | | | 53% | | | | | |
| (A) | Per share amounts calculated using average shares method, which more appropriately presents the per share data for the period. |
| (B) | Total return in the above table represents the rate that the investor would have earned or lost on an investment in the Fund assuming reinvestment of dividends. |
| | Total return would have been higher or lower if certain expenses had not been reimbursed, waived or recouped. |
| (C) | This expense decrease from the voluntary waiver is reflected in both the net expense and the net investment income ratios shown. |
The accompanying notes are an integral part of these financial statements.
102
Timothy Israel Common Values Fund (Class A Shares)
Selected data based on a share outstanding throughout each year
| | | | | | | | | | | | | | | | | | | | | | | | |
| | | For the Year
ended
September 30,
2018 | | | For the Year
ended
September 30,
2017 | | | For the Year
ended
September 30,
2016 | | | For the Year
ended
September 30,
2015 | | | For the Year
ended
September 30,
2014 | | | | |
| | | | | | |
Net asset value, beginning of year | | $ | 14.91 | | | $ | 12.45 | | | $ | 11.10 | | | $ | 12.31 | | | $ | 12.69 | | | | | |
| | | | | | | | | | | | | | | | | | | | | | | | |
| | | | | | |
INCOME (LOSS) FROM INVESTMENT OPERATIONS: | | | | | | | | | | | | | | | | | | | | | | | | |
Net investment income (loss)(A) | | | (0.04) | | | | 0.07 | | | | (0.09) | | | | (0.10) | | | | (0.08) | | | | | |
Net realized and unrealized gain (loss) on investments | | | 1.07 | | | | 2.58 | | | | 1.44 | | | | (1.11) | | | | 0.37 | | | | | |
| | | | | | | | | | | | | | | | | | | | | | | | |
Total from investment operations | | | 1.03 | | | | 2.65 | | | | 1.35 | | | | (1.21) | | | | 0.29 | | | | | |
| | | | | | | | | | | | | | | | | | | | | | | | |
| | | | | | |
LESS DISTRIBUTIONS: | | | | | | | | | | | | | | | | | | | | | | | | |
From net investment income | | | (0.14) | | | | (0.19) | | | | - | | | | - | | | | (0.67) | | | | | |
Return of Capital | | | (0.06) | | | | - | | | | - | | | | - | | | | - | | | | | |
| | | | | | | | | | | | | | | | | | | | | | | | |
Total distributions | | | (0.20) | | | | (0.19) | | | | - | | | | - | | | | (0.67) | | | | | |
| | | | | | | | | | | | | | | | | | | | | | | | |
| | | | | | |
Net asset value, end of year | | $ | 15.74 | | | $ | 14.91 | | | $ | 12.45 | | | $ | 11.10 | | | $ | 12.31 | | | | | |
| | | | | | | | | | | | | | | | | | | | | | | | |
| | | | | | |
Total return (B)(C) | | | 7.00% | | | | 21.62% | | | | 12.16% | | | | (9.83)% | | | | 2.21% | | | | | |
| | | | | | |
RATIOS/SUPPLEMENTAL DATA: | | | | | | | | | | | | | | | | | | | | | | | | |
Net assets, end of year (in 000’s) | | $ | 41,137 | | | $ | 34,958 | | | $ | 16,030 | | | $ | 11,756 | | | $ | 13,792 | | | | | |
Ratio of expenses to average net assets | | | 1.84% | | | | 1.80% | | | | 1.96% | | | | 1.93% | | | | 1.98% | | | | | |
Ratio of net investment income (loss) to average net assets | | | (0.27)% | | | | 0.54% | | | | (0.82)% | | | | (0.83)% | | | | (0.64)% | | | | | |
Portfolio turnover rate | | | 9% | | | | 10% | | | | 38% | | | | 24% | | | | 11% | | | | | |
| (A) | Per share amounts calculated using average shares method, which more appropriately presents the per share data for the period. |
| (B) | Total return calculation does not reflect sales load. |
| (C) | Total return in the above table represents the rate that the investor would have earned or lost on an investment in the Fund assuming reinvestment of dividends. |
The accompanying notes are an integral part of these financial statements.
103
Timothy Israel Common Values Fund (Class C Shares)
Selected data based on a share outstanding throughout each year
| | | | | | | | | | | | | | | | | | | | | | | | |
| | | For the Year
ended
September 30,
2018 | | | For the Year
ended
September 30,
2017 | | | For the Year
ended
September 30,
2016 | | | For the Year
ended
September 30,
2015 | | | For the Year
ended
September 30,
2014 | | | | |
| | | | | | |
Net asset value, beginning of year | | $ | 14.33 | | | $ | 12.01 | | | $ | 10.78 | | | $ | 12.05 | | | $ | 12.50 | | | | | |
| | | | | | | | | | | | | | | | | | | | | | | | |
| | | | | | |
INCOME (LOSS) FROM INVESTMENT OPERATIONS: | | | | | | | | | | | | | | | | | | | | | | | | |
Net investment loss (A) | | | (0.15) | | | | (0.03) | | | | (0.18) | | | | (0.18) | | | | (0.18) | | | | | |
Net realized and unrealized gain (loss) on investments | | | 1.03 | | | | 2.48 | | | | 1.41 | | | | (1.09) | | | | 0.37 | | | | | |
| | | | | | | | | | | | | | | | | | | | | | | | |
Total from investment operations | | | 0.88 | | | | 2.45 | | | | 1.23 | | | | (1.27) | | | | 0.19 | | | | | |
| | | | | | | | | | | | | | | | | | | | | | | | |
| | | | | | |
LESS DISTRIBUTIONS: | | | | | | | | | | | | | | | | | | | | | | | | |
From net investment income | | | (0.07) | | | | (0.13) | | | | - | | | | - | | | | (0.64) | | | | | |
Return of Capital | | | (0.05) | | | | - | | | | - | | | | - | | | | - | | | | | |
| | | | | | | | | | | | | | | | | | | | | | | | |
Total distributions | | | (0.12) | | | | (0.13) | | | | - | | | | - | | | | (0.64) | | | | | |
| | | | | | | | | | | | | | | | | | | | | | | | |
| | | | | | |
Net asset value, end of year | | $ | 15.09 | | | $ | 14.33 | | | $ | 12.01 | | | $ | 10.78 | | | $ | 12.05 | | | | | |
| | | | | | | | | | | | | | | | | | | | | | | | |
| | | | | | |
Total return (B)(C) | | | 6.20% | | | | 20.60% | | | | 11.41% | | | | (10.54)% | | | | 1.40% | | | | | |
| | | | | | |
RATIOS/SUPPLEMENTAL DATA: | | | | | | | | | | | | | | | | | | | | | | | | |
Net assets, end of year (in 000’s) | | $ | 9,220 | | | $ | 7,905 | | | $ | 4,144 | | | $ | 2,722 | | | $ | 2,342 | | | | | |
Ratio of expenses to average net assets | | | 2.59% | | | | 2.56% | | | | 2.71% | | | | 2.68% | | | | 2.74% | | | | | |
Ratio of net investment loss to average net assets | | | (1.01)% | | | | (0.21)% | | | | (1.57)% | | | | (1.59)% | | | | (1.38)% | | | | | |
Portfolio turnover rate | | | 9% | | | | 10% | | | | 38% | | | | 24% | | | | 11% | | | | | |
| (A) | Per share amounts calculated using average shares method, which more appropriately presents the per share data for the period. |
| (B) | Total return calculation does not reflect redemption fee. |
| (C) | Total return in the above table represents the rate that the investor would have earned or lost on an investment in the Fund assuming reinvestment of dividends. |
The accompanying notes are an integral part of these financial statements.
104
Timothy Israel Common Values Fund (Class I Shares)
Selected data based on a share outstanding throughout each year
| | | | | | | | | | | | | | | | | | | | | | | | |
| | | For the Year
ended
September 30,
2018 | | | For the Year
ended
September 30,
2017 | | | For the Year
ended
September 30,
2016 | | | For the Year
ended
September 30,
2015 | | | For the Year
ended
September 30,
2014 | | | | |
| | | | | | |
Net asset value, beginning of year | | $ | 14.97 | | | $ | 12.50 | | | $ | 11.11 | | | $ | 12.29 | | | $ | 12.67 | | | | | |
| | | | | | | | | | | | | | | | | | | | | | | | |
| | | | | | |
INCOME (LOSS) FROM INVESTMENT OPERATIONS: | | | | | | | | | | | | | | | | | | | | | | | | |
Net investment income (loss) (A) | | | 0.01 | | | | 0.12 | | | | (0.08) | | | | (0.03) | | | | (0.05) | | | | | |
Net realized and unrealized gain (loss) on investments (B) | | | 1.06 | | | | 2.57 | | | | 1.47 | | | | (1.15) | | | | 0.37 | | | | | |
| | | | | | | | | | | | | | | | | | | | | | | | |
Total from investment operations | | | 1.07 | | | | 2.69 | | | | 1.39 | | | | (1.18) | | | | 0.32 | | | | | |
| | | | | | | | | | | | | | | | | | | | | | | | |
| | | | | | |
LESS DISTRIBUTIONS: | | | | | | | | | | | | | | | | | | | | | | | | |
From net investment income | | | (0.04) | | | | (0.22) | | | | - | | | | - | | | | (0.70) | | | | | |
Return of Capital | | | (0.19) | | | | - | | | | - | | | | - | | | | - | | | | | |
| | | | | | | | | | | | | | | | | | | | | | | | |
Total distributions | | | (0.23) | | | | (0.22) | | | | - | | | | - | | | | (0.70) | | | | | |
| | | | | | | | | | | | | | | | | | | | | | | | |
| | | | | | |
Net asset value, end of year | | $ | 15.81 | | | $ | 14.97 | | | $ | 12.50 | | | $ | 11.11 | | | $ | 12.29 | | | | | |
| | | | | | | | | | | | | | | | | | | | | | | | |
| | | | | | |
Total return (C) | | | 7.22% | | | | 21.87% | | | | 12.51% | | | | (9.60)% | | | | 2.36% | | | | | |
| | | | | | |
RATIOS/SUPPLEMENTAL DATA: | | | | | | | | | | | | | | | | | | | | | | | | |
Net assets, end of year (in 000’s) | | $ | 10,084 | | | $ | 2,189 | | | $ | 520 | | | $ | 236 | | | $ | 13 | | | | | |
Ratio of expenses to average net assets | | | 1.69% | | | | 1.56% | | | | 1.72% | | | | 1.68% | | | | 1.78% | | | | | |
Ratio of net investment income (loss) to average net assets | | | 0.05% | | | | 0.83% | | | | (0.58)% | | | | (0.58)% | | | | (0.36)% | | | | | |
Portfolio turnover rate | | | 9% | | | | 10% | | | | 38% | | | | 24% | | | | 11% | | | | | |
| (A) | Per share amounts calculated using average shares method, which more appropriately presents the per share data for the period. |
| (B) | Realized and unrealized gains per share in this caption are balancing amounts necessary to reconcile the change in net asset value per share for the period, and may not reconcile with aggregate gains and losses in the Statement of Operations due to the timing of share transactions for the period. |
| (C) | Total return in the above table represents the rate that the investor would have earned or lost on an investment in the Fund assuming reinvestment of dividends. |
The accompanying notes are an integral part of these financial statements.
105
Timothy Defensive Strategies Fund (Class A Shares)
Selected data based on a share outstanding throughout each year
| | | | | | | | | | | | | | | | | | | | | | | | |
| | | For the Year
ended
September 30,
2018 | | | For the Year
ended
September 30,
2017 | | | For the Year
ended
September 30,
2016 | | | For the Year
ended
September 30,
2015 | | | For the Year
ended
September 30,
2014 | | | | |
| | | | | | |
Net asset value, beginning of year | | $ | 11.37 | | | $ | 11.49 | | | $ | 10.54 | | | $ | 11.38 | | | $ | 11.12 | | | | | |
| | | | | | | | | | | | | | | | | | | | | | | | |
| | | | | | |
INCOME (LOSS) FROM INVESTMENT OPERATIONS: | | | | | | | | | | | | | | | | | | | | | | | | |
Net investment income (A) | | | 0.10 | | | | 0.00 | * | | | 0.04 | | | | 0.02 | | | | 0.09 | | | | | |
Net realized and unrealized gain (loss) on investments | | | (0.01) | | | | (0.08) | | | | 0.91 | | | | (0.73) | | | | 0.25 | | | | | |
| | | | | | | | | | | | | | | | | | | | | | | | |
Total from investment operations | | | 0.09 | | | | (0.08) | | | | 0.95 | | | | (0.71) | | | | 0.34 | | | | | |
| | | | | | | | | | | | | | | | | | | | | | | | |
| | | | | | |
LESS DISTRIBUTIONS: | | | | | | | | | | | | | | | | | | | | | | | | |
From net investment income | | | (0.02) | | | | (0.04) | | | | - | | | | (0.12) | | | | (0.05) | | | | | |
From net realized gains on investments | | | - | | | | - | | | | - | | | | (0.01) | | | | (0.03) | | | | | |
| | | | | | | | | | | | | | | | | | | | | | | | |
Total distributions | | | (0.02) | | | | (0.04) | | | | - | | | | (0.13) | | | | (0.08) | | | | | |
| | | | | | | | | | | | | | | | | | | | | | | | |
| | | | | | |
Net asset value, end of year | | $ | 11.44 | | | $ | 11.37 | | | $ | 11.49 | | | $ | 10.54 | | | $ | 11.38 | | | | | |
| | | | | | | | | | | | | | | | | | | | | | | | |
| | | | | | |
Total return (B)(C) | | | 0.75% | | | | (0.72)% | | | | 9.01% | | | | (6.30)% | | | | 3.06% | | | | | |
| | | | | | |
RATIOS/SUPPLEMENTAL DATA: | | | | | | | | | | | | | | | | | | | | | | | | |
Net assets, end of year (in 000’s) | | $ | 40,573 | | | $ | 50,080 | | | $ | 68,706 | | | $ | 71,569 | | | $ | 54,054 | | | | | |
Ratios to average net assets | | | | | | | | | | | | | | | | | | | | | | | | |
Expenses, before waiver and reimbursement | | | 1.41% | | | | 1.44% | | | | 1.35% | | | | 1.26% | | | | 1.28% | | | | | |
Expenses, net waiver and reimbursement (D) | | | 1.36% | | | | 1.39% | | | | 1.30% | | | | 1.21% | | | | 1.28% | | | | | |
Net investment income, before waiver and reimbursement | | | 0.86% | | | | (0.05)% | | | | 0.35% | | | | 0.11% | | | | 0.78% | | | | | |
Net investment income, net waiver and reimbursement (D) | | | 0.91% | | | | 0.00% | | | | 0.40% | | | | 0.16% | | | | 0.78% | | | | | |
Portfolio turnover rate | | | 35% | | | | 51% | | | | 58% | | | | 42% | | | | 24% | | | | | |
| * | Amount is less than $0.005 per share. |
| (A) | Per share amounts calculated using average shares method, which more appropriately presents the per share data for the period. |
| (B) | Total return calculation does not reflect sales load. Total return represents aggregate total return based on Net Asset Value. |
| (C) | Total return in the above table represents the rate that the investor would have earned or lost on an investment in the Fund assuming reinvestment of dividends. |
| | Total return would have been higher or lower if certain expenses had not been reimbursed, waived or recouped. |
| (D) | This expense decrease from the voluntary waiver is reflected in both the net expense and the net investment income ratios shown. |
The accompanying notes are an integral part of these financial statements.
106
Timothy Defensive Strategies Fund (Class C Shares)
Selected data based on a share outstanding throughout each year
| | | | | | | | | | | | | | | | | | | | | | | | |
| | | For the Year
ended
September 30,
2018 | | | For the Year
ended
September 30,
2017 | | | For the Year
ended
September 30,
2016 | | | For the Year
ended
September 30,
2015 | | | For the Year
ended
September 30,
2014 | | | | |
| | | | | | |
Net asset value, beginning of year | | $ | 10.90 | | | $ | 11.07 | | | $ | 10.22 | | | $ | 11.04 | | | $ | 10.82 | | | | | |
| | | | | | | | | | | | | | | | | | | | | | | | |
| | | | | | |
INCOME (LOSS) FROM INVESTMENT OPERATIONS: | | | | | | | | | | | | | | | | | | | | | | | | |
Net investment income (loss) (A) | | | 0.02 | | | | (0.08) | | | | (0.04) | | | | (0.07) | | | | - | | | | | |
Net realized and unrealized gain (loss) on investments | | | (0.02) | | | | (0.09) | | | | 0.89 | (B) | | | (0.71) | | | | 0.25 | | | | | |
| | | | | | | | | | | | | | | | | | | | | | | | |
Total from investment operations | | | 0.00 | | | | (0.17) | | | | 0.85 | | | | (0.78) | | | | 0.25 | | | | | |
| | | | | | | | | | | | | | | | | | | | | | | | |
| | | | | | |
LESS DISTRIBUTIONS: | | | | | | | | | | | | | | | | | | | | | | | | |
From net investment income | | | - | | | | - | | | | - | | | | (0.03) | | | | - | | | | | |
From net realized gains on investments | | | - | | | | - | | | | - | | | | (0.01) | | | | (0.03) | | | | | |
| | | | | | | | | | | | | | | | | | | | | | | | |
Total distributions | | | - | | | | - | | | | - | | | | (0.04) | | | | (0.03) | | | | | |
| | | | | | | | | | | | | | | | | | | | | | | | |
| | | | | | |
Net asset value, end of year | | $ | 10.90 | | | $ | 10.90 | | | $ | 11.07 | | | $ | 10.22 | | | $ | 11.04 | | | | | |
| | | | | | | | | | | | | | | | | | | | | | | | |
| | | | | | |
Total return (C)(D) | | | 0.00% | | | | (1.54)% | | | | 8.32% | | | | (7.06)% | | | | 2.27% | | | | | |
| | | | | | |
RATIOS/SUPPLEMENTAL DATA: | | | | | | | | | | | | | | | | | | | | | | | | |
Net assets, end of year (in 000’s) | | $ | 5,432 | | | $ | 6,683 | | | $ | 9,630 | | | $ | 14,671 | | | $ | 14,461 | | | | | |
Ratios to average net assets | | | | | | | | | | | | | | | | | | | | | | | | |
Expenses, before waiver and reimbursement | | | 2.16% | | | | 2.21% | | | | 2.07% | | | | 2.01% | | | | 2.04% | | | | | |
Expenses, net waiver and reimbursement (E) | | | 2.11% | | | | 2.16% | | | | 2.02% | | | | 1.96% | | | | 2.03% | | | | | |
Net investment income (loss), before waiver and reimbursement | | | 0.09% | | | | (0.79)% | | | | (0.46)% | | | | (0.67)% | | | | (0.02)% | | | | | |
Net investment income (loss), net waiver and reimbursement (E) | | | 0.14% | | | | (0.74)% | | | | (0.41)% | | | | (0.62)% | | | | (0.01)% | | | | | |
Portfolio turnover rate | | | 35% | | | | 51% | | | | 58% | | | | 42% | | | | 24% | | | | | |
| (A) | Per share amounts calculated using average shares method, which more appropriately presents the per share data for the period. |
| (B) | Realized and unrealized gains per share in this caption are balancing amounts necessary to reconcile the change in net asset value per share for the period, and may not reconcile with the aggregate gains and losses in the Statements of Operations due to share transactions for the period. |
| (C) | Total return calculation does not reflect redemption fee. Total return represents aggregate total return based on Net Asset Value. |
| (D) | Total return in the above table represents the rate that the investor would have earned or lost on an investment in the Fund assuming reinvestment of dividends. |
| | Total return would have been higher or lower if certain expenses had not been reimbursed, waived or recouped. |
| (E) | This expense decrease from the voluntary waiver is reflected in both the net expense and the net investment income ratios shown. |
The accompanying notes are an integral part of these financial statements.
107
Timothy Defensive Strategies Fund (Class I Shares)
Selected data based on a share outstanding throughout each year
| | | | | | | | | | | | | | | | | | | | | | | | |
| | | For the Year
ended
September 30,
2018 | | | For the Year
ended
September 30,
2017 | | | For the Year
ended
September 30,
2016 | | | For the Year
ended
September 30,
2015 | | | For the Year
ended
September 30,
2014 | | | | |
| | | | | | |
Net asset value, beginning of year | | $ | 11.38 | | | $ | 11.51 | | | $ | 10.52 | | | $ | 11.36 | | | $ | 11.11 | | | | | |
| | | | | | | | | | | | | | | | | | | | | | | | |
| | | | | | |
INCOME (LOSS) FROM INVESTMENT OPERATIONS: | | | | | | | | | | | | | | | | | | | | | | | | |
Net investment income (A) | | | 0.14 | | | | 0.06 | | | | 0.09 | | | | 0.05 | | | | 0.18 | | | | | |
Net realized and unrealized gain (loss) on investments | | | (0.02) | | | | (0.12) | | | | 0.90 | | | | (0.73) | | | | 0.20 | | | | | |
| | | | | | | | | | | | | | | | | | | | | | | | |
Total from investment operations | | | 0.12 | | | | (0.06) | | | | 0.99 | | | | (0.68) | | | | 0.38 | | | | | |
| | | | | | | | | | | | | | | | | | | | | | | | |
| | | | | | |
LESS DISTRIBUTIONS: | | | | | | | | | | | | | | | | | | | | | | | | |
From net investment income | | | (0.05)�� | | | | (0.07) | | | | - | | | | (0.15) | | | | (0.10) | | | | | |
From net realized gains on investments | | | - | | | | - | | | | - | | | | (0.01) | | | | (0.03) | | | | | |
| | | | | | | | | | | | | | | | | | | | | | | | |
Total distributions | | | (0.05) | | | | (0.07) | | | | - | | | | (0.16) | | | | (0.13) | | | | | |
| | | | | | | | | | | | | | | | | | | | | | | | |
| | | | | | |
Net asset value, end of year | | $ | 11.45 | | | $ | 11.38 | | | $ | 11.51 | | | $ | 10.52 | | | $ | 11.36 | | | | | |
| | | | | | | | | | | | | | | | | | | | | | | | |
| | | | | | |
Total return (B,C) | | | 1.04% | | | | (0.54)% | | | | 9.41% | | | | (6.09)% | | | | 3.39% | | | | | |
| | | | | | |
RATIOS/SUPPLEMENTAL DATA: | | | | | | | | | | | | | | | | | | | | | | | | |
Net assets, end of year (in 000’s) | | $ | 3,071 | | | $ | 2,661 | | | $ | 398 | | | $ | 163 | | | $ | 97 | | | | | |
Ratios to average net assets | | | | | | | | | | | | | | | | | | | | | | | | |
Expenses, before waiver and reimbursement | | | 1.16% | | | | 1.14% | | | | 1.18% | | | | 1.01% | | | | 0.74% | | | | | |
Expenses, net waiver and reimbursement (D) | | | 1.11% | | | | 1.09% | | | | 1.12% | | | | 0.96% | | | | 0.72% | | | | | |
Net investment income, before waiver and reimbursement | | | 1.14% | | | | 0.44% | | | | 0.73% | | | | 0.42% | | | | 1.50% | | | | | |
Net investment income, net waiver and reimbursement (D) | | | 1.19% | | | | 0.49% | | | | 0.79% | | | | 0.47% | | | | 1.52% | | | | | |
Portfolio turnover rate | | | 35% | | | | 51% | | | | 58% | | | | 42% | | | | 24% | | | | | |
| (A) | Per share amounts calculated using average shares method, which more appropriately presents the per share data for the period. |
| (B) | Total return represents aggregate total return based on Net Asset Value. |
| (C) | Total return in the above table represents the rate that the investor would have earned or lost on an investment in the Fund assuming reinvestment of dividends. |
| | Total return would have been higher or lower if certain expenses had not been reimbursed, waived or recouped. |
| (D) | This expense decrease from the voluntary waiver is reflected in both the net expense and the net investment income ratios shown. |
The accompanying notes are an integral part of these financial statements.
108
Timothy Strategic Growth Fund (Class A Shares)
Selected data based on a share outstanding throughout each year
| | | | | | | | | | | | | | | | | | | | | | | | |
| | | For the Year
ended
September 30,
2018 | | | For the Year
ended
September 30,
2017 | | | For the Year
ended
September 30,
2016 | | | For the Year
ended
September 30,
2015 | | | For the Year
ended
September 30,
2014 | | | | |
| | | | | | |
Net asset value, beginning of year | | $ | 9.48 | | | $ | 8.73 | | | $ | 8.42 | | | $ | 8.90 | | | $ | 8.34 | | | | | |
| | | | | | | | | | | | | | | | | | | | | | | | |
| | | | | | |
INCOME (LOSS) FROM INVESTMENT OPERATIONS: | | | | | | | | | | | | | | | | | | | | | | | | |
Net investment income (loss) (A) | | | 0.00 | * | | | (0.04) | | | | (0.03) | | | | 0.03 | | | | 0.12 | | | | | |
Net realized and unrealized gain (loss) on investments | | | 0.22 | | | | 0.79 | | | | 0.37 | | | | (0.40) | | | | 0.45 | | | | | |
| | | | | | | | | | | | | | | | | | | | | | | | |
Total from investment operations | | | 0.22 | | | | 0.75 | | | | 0.34 | | | | (0.37) | | | | 0.57 | | | | | |
| | | | | | | | | | | | | | | | | | | | | | | | |
| | | | | | |
LESS DISTRIBUTIONS: | | | | | | | | | | | | | | | | | | | | | | | | |
From net investment income | | | - | | | | - | | | | (0.03) | | | | (0.11) | | | | (0.01) | | | | | |
| | | | | | | | | | | | | | | | | | | | | | | | |
Total distributions | | | - | | | | - | | | | (0.03) | | | | (0.11) | | | | (0.01) | | | | | |
| | | | | | | | | | | | | | | | | | | | | | | | |
| | | | | | |
Net asset value, end of year | | $ | 9.70 | | | $ | 9.48 | | | $ | 8.73 | | | $ | 8.42 | | | $ | 8.90 | | | | | |
| | | | | | | | | | | | | | | | | | | | | | | | |
| | | | | | |
Total return (B)(C) | | | 2.32% | | | | 8.59% | | | | 4.03% | | | | (4.16)% | | | | 6.82% | | | | | |
| | | | | | |
RATIOS/SUPPLEMENTAL DATA: | | | | | | | | | | | | | | | | | | | | | | | | |
Net assets, end of year (in 000’s) | | $ | 32,078 | | | $ | 32,767 | | | $ | 32,800 | | | $ | 33,071 | | | $ | 36,951 | | | | | |
Ratio of expenses to average net assets (D) | | | 1.10% | | | | 1.07% | | | | 1.05% | | | | 1.08% | | | | 1.07% | | | | | |
Ratio of net investment income (loss), to average net assets (D)(E) | | | 0.00% | | | | (0.45)% | | | | (0.38)% | | | | 0.37% | | | | 1.34% | | | | | |
Portfolio turnover rate | | | 8% | | | | 36% | | | | 37% | | | | 24% | | | | 14% | | | | | |
| * | Amount is less than $0.005 per share. |
| (A) | Per share amounts calculated using average shares method, which more appropriately presents the per share data for the period. |
| (B) | Total return calculation does not reflect sales load. |
| (C) | Total return in the above table represents the rate that the investor would have earned or lost on an investment in the Fund assuming reinvestment of dividends. |
| (D) | These ratios exclude the impact of expenses of the underlying security holdings as represented in the Schedule of Investments. |
| (E) | Recognition of net investment income (loss) by the Fund is affected by the timing of the declaration of dividends by the underlying investment companies in which the Fund invests. |
The accompanying notes are an integral part of these financial statements.
109
Timothy Strategic Growth Fund (Class C Shares)
Selected data based on a share outstanding throughout each year
| | | | | | | | | | | | | | | | | | | | | | | | |
| | | For the Year
ended
September 30,
2018 | | | For the Year
ended
September 30,
2017 | | | For the Year
ended
September 30,
2016 | | | For the Year
ended
September 30,
2015 | | | For the Year
ended
September 30,
2014 | | | | |
| | | | | | |
Net asset value, beginning of year | | $ | 8.57 | | | $ | 7.95 | | | $ | 7.70 | | | $ | 8.15 | | | $ | 7.69 | | | | | |
| | | | | | | | | | | | | | | | | | | | | | | | |
| | | | | | |
INCOME (LOSS) FROM INVESTMENT OPERATIONS: | | | | | | | | | | | | | | | | | | | | | | | | |
Net investment income (loss) (A) | | | (0.06) | | | | (0.10) | | | | (0.08) | | | | (0.02) | | | | 0.03 | | | | | |
Net realized and unrealized gain (loss) on investments | | | 0.19 | | | | 0.72 | | | | 0.33 | | | | (0.38) | | | | 0.43 | | | | | |
| | | | | | | | | | | | | | | | | | | | | | | | |
Total from investment operations | | | 0.13 | | | | 0.62 | | | | 0.25 | | | | (0.40) | | | | 0.46 | | | | | |
| | | | | | | | | | | | | | | | | | | | | | | | |
| | | | | | |
LESS DISTRIBUTIONS: | | | | | | | | | | | | | | | | | | | | | | | | |
From net investment income | | | - | | | | - | | | | - | | | | (0.05) | | | | - | | | | | |
| | | | | | | | | | | | | | | | | | | | | | | | |
Total distributions | | | - | | | | - | | | | - | | | | (0.05) | | | | - | | | | | |
| | | | | | | | | | | | | | | | | | | | | | | | |
| | | | | | |
Net asset value, end of year | | $ | 8.70 | | | $ | 8.57 | | | $ | 7.95 | | | $ | 7.70 | | | $ | 8.15 | | | | | |
| | | | | | | | | | | | | | | | | | | | | | | | |
| | | | | | |
Total return (B)(C) | | | 1.52% | | | | 7.80% | | | | 3.25% | | | | (4.89)% | | | | 5.98% | | | | | |
| | | | | | |
RATIOS/SUPPLEMENTAL DATA: | | | | | | | | | | | | | | | | | | | | | | | | |
Net assets, end of year (in 000’s) | | $ | 6,313 | | | $ | 6,966 | | | $ | 7,380 | | | $ | 7,713 | | | $ | 8,842 | | | | | |
Ratio of expenses to average net assets (D) | | | 1.85% | | | | 1.82% | | | | 1.80% | | | | 1.84% | | | | 1.82% | | | | | |
Ratio of net investment income (loss), to average net assets (D)(E) | | | (0.70)% | | | | (1.18)% | | | | (1.09)% | | | | (0.29)% | | | | 0.50% | | | | | |
Portfolio turnover rate | | | 8% | | | | 36% | | | | 37% | | | | 24% | | | | 14% | | | | | |
| (A) | Per share amounts calculated using average shares method, which more appropriately presents the per share data for the period. |
| (B) | Total return calculation does not reflect redemption fee. |
| (C) | Total return in the above table represents the rate that the investor would have earned or lost on an investment in the Fund assuming reinvestment of dividends. |
| (D) | These ratios exclude the impact of expenses of the underlying security holdings as represented in the Schedule of Investments. |
| (E) | Recognition of net investment income (loss) by the Fund is affected by the timing of the declaration of dividends by the underlying investment companies in which the Fund invests. |
The accompanying notes are an integral part of these financial statements.
110
Timothy Conservative Growth Fund (Class A Shares)
Selected data based on a share outstanding throughout each year
| | | | | | | | | | | | | | | | | | | | | | | | |
| | | For the Year
ended
September 30,
2018 | | | For the Year
ended
September 30,
2017 | | | For the Year
ended
September 30,
2016 | | | For the Year
ended
September 30,
2015 | | | For the Year
ended
September 30,
2014 | | | | |
| | | | | | |
Net asset value, beginning of year | | $ | 10.67 | | | $ | 10.06 | | | $ | 10.32 | | | $ | 11.01 | | | $ | 10.51 | | | | | |
| | | | | | | | | | | | | | | | | | | | | | | | |
| | | | | | |
INCOME (LOSS) FROM INVESTMENT OPERATIONS: | | | | | | | | | | | | | | | | | | | | | | | | |
Net investment income (loss) (A) | | | 0.02 | | | | (0.02) | | | | (0.03) | | | | 0.06 | | | | 0.14 | | | | | |
Net realized and unrealized gain (loss) on investments | | | 0.09 | | | | 0.63 | | | | 0.43 | | | | (0.32) | | | | 0.41 | | | | | |
| | | | | | | | | | | | | | | | | | | | | | | | |
Total from investment operations | | | 0.11 | | | | 0.61 | | | | 0.40 | | | | (0.26) | | | | 0.55 | | | | | |
| | | | | | | | | | | | | | | | | | | | | | | | |
| | | | | | |
LESS DISTRIBUTIONS: | | | | | | | | | | | | | | | | | | | | | | | | |
From net investment income | | | - | | | | - | | | | (0.05) | | | | (0.10) | | | | (0.05) | | | | | |
From net realized gains on investments | | | (0.03) | | | | - | | | | (0.61) | | | | (0.33) | | | | - | | | | | |
| | | | | | | | | | | | | | | | | | | | | | | | |
Total distributions | | | (0.03) | | | | - | | | | (0.66) | | | | (0.43) | | | | (0.05) | | | | | |
| | | | | | | | | | | | | | | | | | | | | | | | |
| | | | | | |
Net asset value, end of year | | $ | 10.75 | | | $ | 10.67 | | | $ | 10.06 | | | $ | 10.32 | | | $ | 11.01 | | | | | |
| | | | | | | | | | | | | | | | | | | | | | | | |
| | | | | | |
Total return (B)(C) | | | 1.06% | | | | 6.06% | | | | 4.22% | | | | (2.47)% | | | | 5.23% | | | | | |
| | | | | | |
RATIOS/SUPPLEMENTAL DATA: | | | | | | | | | | | | | | | | | | | | | | | | |
Net assets, end of year (in 000’s) | | $ | 42,040 | | | $ | 45,110 | | | $ | 44,437 | | | $ | 44,706 | | | $ | 47,543 | | | | | |
Ratio of expenses to average net assets (D) | | | 1.08% | | | | 1.04% | | | | 1.02% | | | | 1.07% | | | | 1.05% | | | | | |
Ratio of net investment income (loss) to average net assets (D)(E) | | | 0.14% | | | | (0.20)% | | | | (0.27)% | | | | 0.53% | | | | 1.26% | | | | | |
Portfolio turnover rate | | | 7% | | | | 27% | | | | 27% | | | | 25% | | | | 19% | | | | | |
| (A) | Per share amounts calculated using average shares method, which more appropriately presents the per share data for the period. |
| (B) | Total return calculation does not reflect sales load. |
| (C) | Total return in the above table represents the rate that the investor would have earned or lost on an investment in the Fund assuming reinvestment of dividends. |
| (D) | These ratios exclude the impact of expenses of the underlying security holdings as represented in the Schedule of Investments. |
| (E) | Recognition of net investment income (loss) by the Fund is affected by the timing of the declaration of dividends by the underlying investment companies in which the Fund invests. |
The accompanying notes are an integral part of these financial statements.
111
Timothy Conservative Growth Fund (Class C Shares)
Selected data based on a share outstanding throughout each year
| | | | | | | | | | | | | | | | | | | | | | | | |
| | | For the Year
ended
September 30,
2018 | | | For the Year
ended
September 30,
2017 | | | For the Year
ended
September 30,
2016 | | | For the Year
ended
September 30,
2015 | | | For the Year
ended
September 30,
2014 | | | | |
| | | | | | |
Net asset value, beginning of year | | $ | 9.76 | | | $ | 9.27 | | | $ | 9.58 | | | $ | 10.22 | | | $ | 9.79 | | | | | |
| | | | | | | | | | | | | | | | | | | | | | | | |
| | | | | | |
INCOME (LOSS) FROM INVESTMENT OPERATIONS: | | | | | | | | | | | | | | | | | | | | | | | | |
Net investment income (loss) (A) | | | (0.06) | | | | (0.09) | | | | (0.09) | | | | (0.01) | | | | 0.03 | | | | | |
Net realized and unrealized gain (loss) on investments (B) | | | 0.09 | | | | 0.58 | | | | 0.39 | | | | (0.30) | | | | 0.40 | | | | | |
| | | | | | | | | | | | | | | | | | | | | | | | |
Total from investment operations | | | 0.03 | | | | 0.49 | | | | 0.30 | | | | (0.31) | | | | 0.43 | | | | | |
| | | | | | | | | | | | | | | | | | | | | | | | |
| | | | | | |
LESS DISTRIBUTIONS: | | | | | | | | | | | | | | | | | | | | | | | | |
From net realized gains on investments | | | (0.03) | | | | - | | | | (0.61) | | | | (0.33) | | | | - | | | | | |
| | | | | | | | | | | | | | | | | | | | | | | | |
Total distributions | | | (0.03) | | | | - | | | | (0.61) | | | | (0.33) | | | | - | | | | | |
| | | | | | | | | | | | | | | | | | | | | | | | |
| | | | | | |
Net asset value, end of year | | $ | 9.76 | | | $ | 9.76 | | | $ | 9.27 | | | $ | 9.58 | | | $ | 10.22 | | | | | |
| | | | | | | | | | | | | | | | | | | | | | | | |
| | | | | | |
Total return (C)(D) | | | 0.34% | | | | 5.29% | | | | 3.39% | | | | (3.19)% | | | | 4.39% | | | | | |
| | | | | | |
RATIOS/SUPPLEMENTAL DATA: | | | | | | | | | | | | | | | | | | | | | | | | |
Net assets, end of year (in 000’s) | | $ | 9,218 | | | $ | 9,981 | | | $ | 10,697 | | | $ | 11,135 | | | $ | 12,359 | | | | | |
Ratio of expenses to average net assets (E) | | | 1.83% | | | | 1.79% | | | | 1.77% | | | | 1.82% | | | | 1.79% | | | | | |
Ratio of net investment income (loss), to average net assets (E)(F) | | | (0.63)% | | | | (0.96)% | | | | (1.01)% | | | | (0.14)% | | | | 0.41% | | | | | |
Portfolio turnover rate | | | 7% | | | | 27% | | | | 27% | | | | 25% | | | | 19% | | | | | |
| (A) | Per share amounts calculated using average shares method, which more appropriately presents the per share data for the period. |
| (B) | Realized and unrealized gains per share in this caption are balancing amounts necessary to reconcile the change in net asset value per share for the period, and may not reconcile with aggregate gains and losses in the Statement of Operations due to the timing of share transactions for the period. |
| (C) | Total return calculation does not reflect redemption fees. Total return represents aggregate total return based on Net Asset Value. |
| (D) | Total return in the above table represents the rate that the investor would have earned or lost on an investment in the Fund assuming reinvestment of dividends. |
| (E) | These ratios exclude the impact of expenses of the underlying security holdings as represented in the Schedule of Investments. |
| (F) | Recognition of net investment income (loss) by the Fund is affected by the timing of the declaration of dividends by the underlying investment companies in which the Fund invests. |
The accompanying notes are an integral part of these financial statements.
112
Timothy Emerging Markets Fund (Class A Shares)
Selected data based on a share outstanding throughout each year
| | | | | | | | | | | | | | | | | | | | | | | | |
| | | For the Year
ended
September 30,
2018 | | | For the Year
ended
September 30,
2017 | | | For the Year
ended
September 30,
2016 | | | For the Year
ended
September 30,
2015 | | | For the Year
ended
September 30,
2014 | | | | |
| | | | | | |
Net asset value, beginning of year | | $ | 9.73 | | | $ | 8.06 | | | $ | 6.34 | | | $ | 10.23 | | | $ | 10.53 | | | | | |
| | | | | | | | | | | | | | | | | | | | | | | | |
| | | | | | |
INCOME (LOSS) FROM INVESTMENT OPERATIONS: | | | | | | | | | | | | | | | | | | | | | | | | |
Net investment income (loss) (A) | | | 0.05 | | | | 0.06 | | | | 0.03 | | | | 0.04 | | | | (0.02) | | | | | |
Net realized and unrealized gain (loss) on investments | | | (1.09) | | | | 1.65 | | | | 1.69 | | | | (3.35) | | | | 0.08 | | | | | |
| | | | | | | | | | | | | | | | | | | | | | | | |
Total from investment operations | | | (1.04) | | | | 1.71 | | | | 1.72 | | | | (3.31) | | | | 0.06 | | | | | |
| | | | | | | | | | | | | | | | | | | | | | | | |
| | | | | | |
LESS DISTRIBUTIONS: | | | | | | | | | | | | | | | | | | | | | | | | |
From net investment income | | | (0.07) | | | | (0.04) | | | | - | | | | (0.04) | | | | - | | | | | |
From net realized gains on investments | | | - | | | | - | | | | - | | | | (0.54) | | | | (0.36) | | | | | |
| | | | | | | | | | | | | | | | | | | | | | | | |
Total distributions | | | (0.07) | | | | (0.04) | | | | - | | | | (0.58) | | | | (0.36) | | | | | |
| | | | | | | | | | | | | | | | | | | | | | | | |
| | | | | | |
Net asset value, end of year | | $ | 8.62 | | | $ | 9.73 | | | $ | 8.06 | | | $ | 6.34 | | | $ | 10.23 | | | | | |
| | | | | | | | | | | | | | | | | | | | | | | | |
| | | | | | |
Total return (B)(C) | | | (10.81)% | | | | 21.29% | | | | 27.13% | | | | (33.78)% | | | | 0.61% | | | | | |
| | | | | | |
RATIOS/SUPPLEMENTAL DATA: | | | | | | | | | | | | | | | | | | | | | | | | |
Net assets, end of year (in 000’s) | | $ | 16,941 | | | $ | 16,889 | | | $ | 7,118 | | | $ | 5,981 | | | $ | 10,803 | | | | | |
Ratios to average net assets | | | | | | | | | | | | | | | | | | | | | | | | |
Expenses, before waiver and reimbursement | | | 2.60% | | | | 2.27% | | | | 2.58% | | | | 2.50% | | | | 2.55% | | | | | |
Expenses, net waiver and reimbursement (D) | | | 2.55% | | | | 2.22% | | | | 2.53% | | | | 2.45% | | | | 2.55% | | | | | |
Net investment income (loss), before waiver and reimbursement | | | 0.48% | | | | 0.68% | | | | 0.39% | | | | 0.36% | | | | (0.19)% | | | | | |
Net investment income (loss), net waiver and reimbursement (D) | | | 0.53% | | | | 0.73% | | | | 0.44% | | | | 0.41% | | | | (0.19)% | | | | | |
Portfolio turnover rate | | | 51% | | | | 31% | | | | 24% | | | | 37% | | | | 39% | | | | | |
| (A) | Per share amounts calculated using average shares method, which more appropriately presents the per share data for the period. |
| (B) | Total return calculation does not reflect sales load. |
| (C) | Total return in the above table represents the rate that the investor would have earned or lost on an investment in the Fund assuming reinvestment of dividends. |
| | Total return would have been higher or lower if certain expenses had not been reimbursed, waived or recouped. |
| (D) | This expense decrease from the voluntary waiver is reflected in both the net expense and the net investment income ratios shown. |
The accompanying notes are an integral part of these financial statements.
113
Timothy Emerging Markets Fund (Class C Shares)
Selected data based on a share outstanding throughout each year
| | | | | | | | | | | | | | | | | | | | | | | | |
| | | For the Year
ended
September 30,
2018 | | | For the Year
ended
September 30,
2017 | | | For the Year
ended
September 30,
2016 | | | For the Year
ended
September 30,
2015 | | | For the Year
ended
September 30,
2014 | | | | |
| | | | | | |
Net asset value, beginning of year | | $ | 9.48 | | | $ | 7.88 | | | $ | 6.23 | | | $ | 10.09 | | | $ | 10.48 | | | | | |
| | | | | | | | | | | | | | | | | | | | | | | | |
| | | | | | |
INCOME (LOSS) FROM INVESTMENT OPERATIONS: | | | | | | | | | | | | | | | | | | | | | | | | |
Net investment loss (A) | | | (0.02) | | | | 0.00 | * | | | (0.02) | | | | (0.02) | | | | (0.09) | | | | | |
Net realized and unrealized gain (loss) on investments | | | (1.07) | | | | 1.60 | | | | 1.67 | (B) | | | (3.30) | | | | 0.06 | | | | | |
| | | | | | | | | | | | | | | | | | | | | | | | |
Total from investment operations | | | (1.09) | | | | 1.60 | | | | 1.65 | | | | (3.32) | | | | (0.03) | | | | | |
| | | | | | | | | | | | | | | | | | | | | | | | |
| | | | | | |
LESS DISTRIBUTIONS: | | | | | | | | | | | | | | | | | | | | | | | | |
From net investment income | | | (0.02) | | | | - | | | | - | | | | - | | | | - | | | | | |
From net realized gains on investments | | | - | | | | - | | | | - | | | | (0.54) | | | | (0.36) | | | | | |
| | | | | | | | | | | | | | | | | | | | | | | | |
Total distributions | | | (0.02) | | | | - | | | | - | | | | (0.54) | | | | (0.36) | | | | | |
| | | | | | | | | | | | | | | | | | | | | | | | |
| | | | | | |
Net asset value, end of year | | $ | 8.37 | | | $ | 9.48 | | | $ | 7.88 | | | $ | 6.23 | | | $ | 10.09 | | | | | |
| | | | | | | | | | | | | | | | | | | | | | | | |
| | | | | | |
Total return (C)(D) | | | (11.53)% | | | | 20.30% | | | | 26.48% | | | | (34.29)% | | | | (0.27)% | | | | | |
| | | | | | |
RATIOS/SUPPLEMENTAL DATA: | | | | | | | | | | | | | | | | | | | | | | | | |
Net assets, end of year (in 000’s) | | $ | 2,192 | | | $ | 2,413 | | | $ | 897 | | | $ | 498 | | | $ | 883 | | | | | |
Ratios to average net assets | | | | | | | | | | | | | | | | | | | | | | | | |
Expenses, before waiver and reimbursement | | | 3.35% | | | | 3.02% | | | | 3.36% | | | | 3.26% | | | | 3.25% | | | | | |
Expenses, net waiver and reimbursement (E) | | | 3.30% | | | | 2.97% | | | | 3.28% | | | | 3.21% | | | | 3.25% | | | | | |
Net investment loss, before waiver and reimbursement | | | (0.25)% | | | | (0.04)% | | | | (0.29)% | | | | (0.39)% | | | | (0.83)% | | | | | |
Net investment income (loss), net waiver and reimbursement (E) | | | (0.20)% | | | | 0.01% | | | | (0.24)% | | | | (0.34)% | | | | (0.83)% | | | | | |
Portfolio turnover rate | | | 51% | | | | 31% | | | | 24% | | | | 37% | | | | 39% | | | | | |
| * | Amount is less than $0.005 per share |
| (A) | Per share amounts calculated using average shares method, which more appropriately presents the per share data for the period. |
| (B) | Realized and unrealized gains per share in this caption are balancing amounts necessary to reconcile the change in net asset value per share for the period, and may not reconcile with the aggregate gains and losses in the Statements of Operations due to share transactions for the period. |
| (C) | Total return calculation does not reflect redemption fee. |
| (D) | Total return in the above table represents the rate that the investor would have earned or lost on an investment in the Fund assuming reinvestment of dividends. |
| | Total return would have been higher or lower if certain expenses had not been reimbursed, waived or recouped. |
| (E) | This expense decrease from the voluntary waiver is reflected in both the net expense and the net investment income ratios shown. |
The accompanying notes are an integral part of these financial statements.
114
Timothy Emerging Markets Fund (Class I Shares)
Selected data based on a share outstanding throughout each year
| | | | | | | | | | | | | | | | | | | | |
| | | For the Year
ended
September 30,
2018 | | | For the Year
ended
September 30,
2017 | | | For the Year
ended
September 30,
2016 | | | For the Year
ended
September 30,
2015 | | | For the Year
ended
September 30,
2014 | |
| | | | | |
Net asset value, beginning of year | | $ | 9.79 | | | $ | 8.11 | | | $ | 6.35 | | | $ | 10.25 | | | $ | 10.53 | |
| | | | | | | | | | | | | | | | | | | | |
| | | | | |
INCOME (LOSS) FROM INVESTMENT OPERATIONS: | | | | | | | | | | | | | | | | | | | | |
Net investment income (A) | | | 0.08 | | | | 0.09 | | | | 0.05 | | | | 0.08 | | | | 0.03 | |
Net realized and unrealized gain (loss) on investments | | | (1.11) | | | | 1.64 | | | | 1.71 | | | | (3.38) | | | | 0.05 | (B) |
| | | | | | | | | | | | | | | | | | | | |
Total from investment operations | | | (1.03) | | | | 1.73 | | | | 1.76 | | | | (3.30) | | | | 0.08 | |
| | | | | | | | | | | | | | | | | | | | |
| | | | | |
LESS DISTRIBUTIONS: | | | | | | | | | | | | | | | | | | | | |
From net investment income | | | (0.08) | | | | (0.05) | | | | - | | | | (0.06) | | | | - | |
From net realized gains on investments | | | - | | | | - | | | | - | | | | (0.54) | | | | (0.36) | |
| | | | | | | | | | | | | | | | | | | | |
Total distributions | | | (0.08) | | | | (0.05) | | | | - | | | | (0.60) | | | | (0.36) | |
| | | | | | | | | | | | | | | | | | | | |
| | | | | |
Net asset value, end of year | | $ | 8.68 | | | $ | 9.79 | | | $ | 8.11 | | | $ | 6.35 | | | $ | 10.25 | |
| | | | | | | | | | | | | | | | | | | | |
| | | | | |
Total return (C) | | | (10.58)% | | | | 21.52% | | | | 27.72% | | | | (33.04)% | | | | 0.81% | |
| | | | | |
RATIOS/SUPPLEMENTAL DATA: | | | | | | | | | | | | | | | | | | | | |
Net assets, end of year (in 000’s) | | $ | 1,865 | | | $ | 1,762 | | | $ | 703 | | | $ | 329 | | | $ | 333 | |
Ratios to average net assets | | | | | | | | | | | | | | | | | | | | |
Expenses, before waiver and reimbursement | | | 2.35% | | | | 2.02% | | | | 2.42% | | | | 2.26% | | | | 2.25% | |
Expenses, net waiver and reimbursement (D) | | | 2.30% | | | | 1.97% | | | | 2.38% | | | | 2.21% | | | | 2.25% | |
Net investment income, before waiver and reimbursement | | | 0.74% | | | | 0.97% | | | | 0.61% | | | | 0.90% | | | | 0.25% | |
Net investment income, net waiver and reimbursement (D) | | | 0.79% | | | | 1.02% | | | | 0.66% | | | | 0.95% | | | | 0.26% | |
Portfolio turnover rate | | | 51% | | | | 31% | | | | 24% | | | | 37% | | | | 39% | |
| (A) | Per share amounts calculated using average shares method, which more appropriately presents the per share data for the period. |
| (B) | Realized and unrealized gains per share in this caption are balancing amounts necessary to reconcile the change in net asset value per share for the period, and may not reconcile with the aggregate gains and losses in the Statements of Operations due to share transactions for the period. |
| (C) | Total return in the above table represents the rate that the investor would have earned or lost on an investment in the Fund assuming reinvestment of dividends. |
| | Total return would have been higher or lower if certain expenses had not been reimbursed, waived or recouped. |
| (D) | This expense decrease from the voluntary waiver is reflected in both the net expense and the net investment income ratios shown. |
The accompanying notes are an integral part of these financial statements.
115
Timothy Growth & Income Fund (Class A Shares)
Selected data based on a share outstanding throughout each period
| | | | | | | | | | | | | | | | | | | | |
| | | For the Year
ended
September 30,
2018 | | | For the Year
ended
September 30,
2017 | | | For the Year
ended
September 30,
2016 | | | For the Year
ended
September 30,
2015 | | | For the Period ended
September 30,
2014 (A) | |
| | | | | |
Net asset value, beginning of period | | $ | 11.28 | | | $ | 10.76 | | | $ | 10.53 | | | $ | 10.95 | | | $ | 10.00 | |
| | | | | | | | | | | | | | | | | | | | |
| | | | | |
INCOME (LOSS) FROM INVESTMENT OPERATIONS: | | | | | | | | | | | | | | | | | | | | |
Net investment income (loss) (B) | | | 0.01 | | | | 0.01 | | | | 0.03 | | | | 0.01 | | | | (0.02) | |
Net realized and unrealized gain (loss) on investments | | | (0.14) | | | | 0.52 | | | | 0.22 | | | | (0.42) | | | | 0.97 | |
| | | | | | | | | | | | | | | | | | | | |
Total from investment operations | | | (0.13) | | | | 0.53 | | | | 0.25 | | | | (0.41) | | | | 0.95 | |
| | | | | | | | | | | | | | | | | | | | |
| | | | | |
LESS DISTRIBUTIONS: | | | | | | | | | | | | | | | | | | | | |
From net investment income | | | (0.01) | | | | (0.01) | | | | (0.02) | | | | (0.01) | | | | - | |
From net realized gains on investments | | | (0.27) | | | | - | | | | - | | | | - | | | | - | |
| | | | | | | | | | | | | | | | | | | | |
Total distributions | | | (0.28) | | | | (0.01) | | | | (0.02) | | | | (0.01) | | | | - | |
| | | | | | | | | | | | | | | | | | | | |
| | | | | |
Net asset value, end of period | | $ | 10.87 | | | $ | 11.28 | | | $ | 10.76 | | | $ | 10.53 | | | $ | 10.95 | |
| | | | | | | | | | | | | | | | | | | | |
| | | | | |
Total return (C)(D) | | | (1.22)% | | | | 4.91% | | | | 2.36% | | | | (3.75)% | | | | 9.50% | (E) |
| | | | | |
RATIOS/SUPPLEMENTAL DATA: | | | | | | | | | | | | | | | | | | | | |
Net assets, end of period (in 000’s) | | $ | 27,716 | | | $ | 30,426 | | | $ | 36,486 | | | $ | 26,378 | | | $ | 24,272 | |
Ratios to average net assets | | | | | | | | | | | | | | | | | | | | |
Expenses, before waiver and reimbursement | | | 1.70% | | | | 1.59% | | | | 1.59% | | | | 1.56% | | | | 1.68% | (F) |
Expenses, net waiver and reimbursement (G) | | | 1.65% | | | | 1.54% | | | | 1.54% | | | | 1.51% | | | | 1.67% | (F) |
Net investment income (loss), before waiver and reimbursement | | | 0.08% | | | | 0.03% | | | | 0.20% | | | | 0.08% | | | | (0.21%) | (F) |
Net investment income (loss), net waiver and reimbursement (G) | | | 0.13% | | | | 0.08% | | | | 0.25% | | | | 0.13% | | | | (0.21%) | (F) |
Portfolio turnover rate | | | 56% | | | | 118% | | | | 45% | | | | 75% | | | | 21% | (E) |
| (A) | For the period October 1, 2013 (Commencement of Operations) to September 30, 2014. |
| (B) | Per share amounts calculated using average shares method, which more appropriately presents the per share data for the period. |
| (C) | Total return calculation does not reflect sales load. |
| (D) | Total return in the above table represents the rate that the investor would have earned or lost on an investment in the Fund assuming reinvestment of dividends. |
| | Total return would have been higher or lower if certain expenses had not been reimbursed, waived or recouped. |
| (E) | For periods of less than one full year, total return and turnover are not annualized. |
| (G) | This expense decrease from the voluntary waiver is reflected in both the net expense and the net investment income ratios shown. |
The accompanying notes are an integral part of these financial statements.
116
Timothy Growth & Income Fund (Class C Shares)
Selected data based on a share outstanding throughout each period
| | | | | | | | | | | | | | | | | | | | |
| | | For the Year
ended
September 30,
2018 | | | For the Year
ended
September 30,
2017 | | | For the Year
ended
September 30,
2016 | | | For the Year
ended
September 30,
2015 | | | For the Period
ended
September 30,
2014 (A) | |
| | | | | |
Net asset value, beginning of period | | $ | 10.99 | | | $ | 10.55 | | | $ | 10.39 | | | $ | 10.87 | | | $ | 10.00 | |
| | | | | | | | | | | | | | | | | | | | |
| | | | | |
INCOME (LOSS) FROM INVESTMENT OPERATIONS: | | | | | | | | | | | | | | | | | | | | |
Net investment loss (B) | | | (0.07) | | | | (0.07) | | | | (0.06) | | | | (0.06) | | | | (0.08) | |
Net realized and unrealized gain (loss) on investments | | | (0.14) | | | | 0.51 | | | | 0.22 | (C) | | | (0.42) | | | | 0.95 | |
| | | | | | | | | | | | | | | | | | | | |
Total from investment operations | | | (0.21) | | | | 0.44 | | | | 0.16 | | | | (0.48) | | | | 0.87 | |
| | | | | | | | | | | | | | | | | | | | |
| | | | | |
LESS DISTRIBUTIONS: | | | | | | | | | | | | | | | | | | | | |
From net realized gains on investments | | | (0.27) | | | | - | | | | - | | | | - | | | | - | |
| | | | | | | | | | | | | | | | | | | | |
Total distributions | | | (0.27) | | | | - | | | | - | | | | - | | | | - | |
| | | | | | | | | | | | | | | | | | | | |
| | | | | |
Net asset value, end of period | | $ | 10.51 | | | $ | 10.99 | | | $ | 10.55 | | | $ | 10.39 | | | $ | 10.87 | |
| | | | | | | | | | | | | | | | | | | | |
| | | | | |
Total return (D)(E) | | | (1.97)% | | | | 4.17% | | | | 1.54% | | | | (4.42)% | | | | 8.70% | (F) |
| | | | | |
RATIOS/SUPPLEMENTAL DATA: | | | | | | | | | | | | | | | | | | | | |
Net assets, end of period (in 000’s) | | $ | 3,176 | | | $ | 3,006 | | | $ | 3,028 | | | $ | 3,330 | | | $ | 2,081 | |
Ratios to average net assets | | | | | | | | | | | | | | | | | | | | |
Expenses, before waiver and reimbursement | | | 2.45% | | | | 2.34% | | | | 2.32% | | | | 2.30% | | | | 2.20% | (G) |
Expenses, net waiver and reimbursement (H) | | | 2.40% | | | | 2.29% | | | | 2.28% | | | | 2.25% | | | | 2.19% | (G) |
Net investment loss, before waiver and reimbursement | | | (0.67%) | | | | (0.73%) | | | | (0.61%) | | | | (0.60%) | | | | (0.72%) | (G) |
Net investment loss, net waiver and reimbursement (H) | | | (0.62%) | | | | (0.68%) | | | | (0.56%) | | | | (0.55%) | | | | (0.70%) | (G) |
Portfolio turnover rate | | | 56% | | | | 118% | | | | 45% | | | | 75% | | | | 21% | (F) |
| (A) | For the period October 1, 2013 (Commencement of Operations) to September 30, 2014. |
| (B) | Per share amounts calculated using average shares method, which more appropriately presents the per share data for the period. |
| (C) | Realized and unrealized gains per share in this caption are balancing amounts necessary to reconcile the change in net asset value per share for the period, and may not reconcile with the aggregate gains and losses in the Statements of Operations due to share transactions for the period. |
| (D) | Total return calculation does not reflect redemption fee. |
| (E) | Total return in the above table represents the rate that the investor would have earned or lost on an investment in the Fund assuming reinvestment of dividends. |
| | Total return would have been higher or lower if certain expenses had not been reimbursed, waived or recouped. |
| (F) | For periods of less than one full year, total return and turnover are not annualized. |
| (H) | This expense decrease from the voluntary waiver is reflected in both the net expense and the net investment income ratios shown. |
The accompanying notes are an integral part of these financial statements.
117
Timothy Growth & Income Fund (Class I Shares)
Selected data based on a share outstanding throughout each period
| | | | | | | | | | | | | | | | | | | | |
| | | For the Year
ended
September 30,
2018 | | | For the Year
ended
September 30,
2017 | | | For the Year
ended
September 30,
2016 | | | For the Year
ended
September 30,
2015 | | | For the Period ended
September 30,
2014 (A) | |
| | | | | |
Net asset value, beginning of period | | $ | 11.34 | | | $ | 10.81 | | | $ | 10.56 | | | $ | 10.96 | | | $ | 10.00 | |
| | | | | | | | | | | | | | | | | | | | |
| | | | | |
INCOME (LOSS) FROM INVESTMENT OPERATIONS: | | | | | | | | | | | | | | | | | | | | |
Net investment income (B) | | | 0.04 | | | | 0.03 | | | | 0.05 | | | | 0.04 | | | | 0.04 | |
Net realized and unrealized gain (loss) on investments | | | (0.15) | | | | 0.53 | | | | 0.23 | | | | (0.42) | | | | 0.92 | (C) |
| | | | | | | | | | | | | | | | | | | | |
Total from investment operations | | | (0.11) | | | | 0.56 | | | | 0.28 | | | | (0.38) | | | | 0.96 | |
| | | | | | | | | | | | | | | | | | | | |
| | | | | |
LESS DISTRIBUTIONS: | | | | | | | | | | | | | | | | | | | | |
From net investment income | | | (0.02) | | | | (0.03) | | | | (0.03) | | | | (0.02) | | | | - | |
From net realized gains on investments | | | (0.27) | | | | - | | | | - | | | | - | | | | - | |
| | | | | | | | | | | | | | | | | | | | |
Total distributions | | | (0.29) | | | | (0.03) | | | | (0.03) | | | | (0.02) | | | | - | |
| | | | | | | | | | | | | | | | | | | | |
| | | | | |
Net asset value, end of period | | $ | 10.94 | | | $ | 11.34 | | | $ | 10.81 | | | $ | 10.56 | | | $ | 10.96 | |
| | | | | | | | | | | | | | | | | | | | |
| | | | | |
Total return (D,E) | | | (0.96)% | | | | 5.19% | | | | 2.61% | | | | (3.50)% | | | | 9.60% | (F) |
| | | | | |
RATIOS/SUPPLEMENTAL DATA: | | | | | | | | | | | | | | | | | | | | |
Net assets, end of period (in 000’s) | | $ | 3,012 | | | $ | 2,197 | | | $ | 1,593 | | | $ | 1,573 | | | $ | 1,507 | |
Ratios to average net assets | | | | | | | | | | | | | | | | | | | | |
Expenses, before waiver and reimbursement | | | 1.45% | | | | 1.34% | | | | 1.32% | | | | 1.31% | | | | 1.18% | (G) |
Expenses, net waiver and reimbursement (H) | | | 1.40% | | | | 1.29% | | | | 1.28% | | | | 1.26% | | | | 1.16% | (G) |
Net investment income, before waiver and reimbursement | | | 0.33% | | | | 0.27% | | | | 0.41% | | | | 0.32% | | | | 0.30% | (G) |
Net investment income, net waiver and reimbursement (H) | | | 0.38% | | | | 0.32% | | | | 0.46% | | | | 0.38% | | | | 0.31% | (G) |
Portfolio turnover rate | | | 56% | | | | 118% | | | | 45% | | | | 75% | | | | 21% | (F) |
| (A) | For the period October 1, 2013 (Commencement of Operations) to September 30, 2014. |
| (B) | Per share amounts calculated using average shares method, which more appropriately presents the per share data for the period. |
| (C) | Realized and unrealized gains per share in this caption are balancing amounts necessary to reconcile the change in net asset value per share for the period, and may not reconcile with the aggregate gains and losses in the Statements of Operations due to share transactions for the period. |
| (D) | Total return represents aggregate total return based on Net Asset Value. |
| (E) | Total return in the above table represents the rate that the investor would have earned or lost on an investment in the Fund assuming reinvestment of dividends. |
| | Total return would have been higher or lower if certain expenses had not been reimbursed, waived or recouped. |
| (F) | For periods of less than one full year, total return and turnover are not annualized. |
| (H) | This expense decrease from the voluntary waiver is reflected in both the net expense and the net investment income ratios shown. |
The accompanying notes are an integral part of these financial statements.
118
Notes to Financial Statements
September 30, 2018
Timothy Plan Family of Funds
Note 1 | Significant Accounting Policies
The Timothy Plan (the “Trust”) is organized as a series of a Delaware business trust pursuant to a trust agreement dated December 16, 1993. The Trust is registered under the Investment Company Act of 1940, as amended, as an open-end management investment company. As of September 30, 2018, the Trust consisted of fifteen series. These financial statements include the following thirteen series: Timothy Plan Aggressive Growth Fund, Timothy Plan International Fund, Timothy Plan Large/Mid Cap Growth Fund, Timothy Plan Small Cap Value Fund, Timothy Plan Large/Mid Cap Value Fund, Timothy Plan Fixed Income Fund, Timothy Plan High Yield Bond Fund, Timothy Plan Israel Common Values Fund, Timothy Plan Defensive Strategies Fund, Timothy Plan Strategic Growth Fund, Timothy Plan Conservative Growth Fund, Timothy Plan Emerging Markets Fund and Timothy Plan Growth & Income Fund (the “Funds”). The Funds are diversified funds except for the Timothy Plan Defensive Strategy Fund which is a non-diversified fund.
The Timothy Plan Aggressive Growth Fund’s investment objective is long-term growth of capital. The Fund seeks to achieve its investment objective by normally investing at least 80% of the Fund’s total assets in U.S. common stocks without regard to market capitalizations and investing in the securities of a limited number of companies which the Fund’s Advisor believes show a high probability for superior growth.
The Timothy Plan International Fund’s investment objective is long-term growth of capital. The Fund seeks to achieve its investment objective by normally investing at least 80% of the Fund’s total assets in the common stock and similar securities of foreign companies through the purchase of American Depositary Receipts (“ADRs”) without regard to market capitalization, investing its assets in the ADRs of companies which the Fund’s Advisor believes show a high probability for superior growth, and allocating investments across countries and regions considering the size of the market in each country and region relative to the size of the international market as a whole. Although the Fund maintains a diversified investment portfolio, the political or economic developments within a particular country or region may have an adverse effect on the ability of domiciled issuers to meet their obligations. Additionally, political or economic developments may have an effect on the liquidity and volatility of portfolio securities and currency holdings.
The Timothy Plan Large/Mid Cap Growth Fund’s investment objective is long-term growth of capital. Current income is not a significant investment consideration and any such income realized will be considered incidental to the Fund’s investment objective. The Fund seeks to achieve its investment objective by normally investing at least 80% of the Fund’s total assets in U.S. common stocks with market capitalizations in excess of $2 billion.
The Timothy Plan Small Cap Value Fund’s primary objective is long-term capital growth, with a secondary objective of current income. The Fund seeks to achieve its investment objective by primarily investing at least 80% of the Fund’s total assets in U.S. stocks with market capitalizations that fall within the range of companies included in the Russell 2000 Index.
The Timothy Plan Large/Mid Cap Value Fund’s investment objective is long-term capital growth, with a secondary objective of current income. The Fund seeks to achieve its investment objective by primarily investing in U.S. common stocks. The Fund will invest at least 80% of its assets in the common stock of companies whose total market capitalization generally exceeds $2 billion.
The Timothy Plan Fixed Income Fund seeks to generate a high level of current income consistent with prudent investment risk. To achieve its investment objective, the Fund normally invests in a diversified portfolio of debt securities. These include corporate bonds, U.S. Government and agency securities, convertible securities and preferred securities. The Fund will generally only purchase high quality securities.
The Timothy Plan High Yield Bond Fund’s investment objective is to generate a high level of current income. To achieve its investment objective, the Fund normally invests in a diversified portfolio of debt securities. These include corporate bonds, U.S. Government and agency securities, convertible securities and preferred securities. The Fund will generally purchase securities that are not investment-grade, meaning securities with a rating of “BBB” or lower as rated by Standard and Poor’s or a comparable rating by another nationally recognized rating agency. Investments in these higher yielding securities are generally accompanied by a greater degree of credit risk than higher rated securities. Additionally, lower rated securities may be more susceptible to adverse economic and competitive industry conditions than investment-grade securities.
The Timothy Plan Israel Common Values Fund seeks to provide long-term growth of capital. This Fund seeks to achieve its investment objectives by normally investing at least 80% of the Fund’s total assets in the common stock of companies domiciled and/or headquartered in Israel through the purchase of American Depositary Receipts (ADRs) and direct investments in such companies on foreign stock exchanges, without regard to market capitalizations.
The Timothy Plan Defensive Strategies Fund’s investment objective is the protection of principal through aggressive, proactive reactions to prevailing economic conditions. To achieve its investment objective, the Fund normally invests in Real Estate Investment Trusts (“REITs”), commodities based Exchange-Traded Funds (“ETFs”), Treasury Inflation Protected Securities (“TIPS”), and currently holds gold and silver bullion.
The Timothy Plan Strategic Growth Fund seeks to generate medium to high levels of long-term capital growth. The Fund seeks to achieve its investment objective by normally investing at least 75% of its net assets in the following Funds which are other series of the Trust: approximately 2-10% of its net assets in the Timothy Plan Small Cap Value Fund; approximately 10-20% of its net assets in the Timothy Plan Large/Mid Cap Value Fund; approximately 10-20% of its net assets in the Timothy Plan Large/Mid Cap Growth Fund; approximately 6-18% of its net assets in the Timothy Plan High Yield Bond Fund; approximately 10-20% of its net assets in the Timothy Plan International Fund; approximately 2-10% of its net assets in the Timothy Plan Aggressive Growth Fund; approximately 10-30% of its net assets in the Timothy Plan Defensive Strategies Fund; approximately 0-10% of its net assets in the Timothy Plan Israel Common Values Fund; approximately 0-10% of its net assets in the Timothy Plan Emerging Markets Fund; approximately 5-20% of its net assets in the Timothy Plan Growth & Income Fund; and approximately 0-15% of its net assets in the Timothy Fixed Income Fund.
119
Notes to Financial Statements
September 30, 2018 (Continued)
Timothy Plan Family of Funds
The Timothy Plan Conservative Growth Fund seeks to generate moderate levels of long-term capital growth with a secondary objective of current income. The Fund seeks to achieve its investment objective by normally investing at least 75% of its net assets in the following Funds which are other series of the Trust: approximately 2-10% of its net assets in the Timothy Plan Small Cap Value Fund; approximately 5-15% of its net assets in the Timothy Plan Large/Mid Cap Value Fund; approximately 5-15% of its net assets in the Timothy Plan Large/Mid Cap Growth Fund; approximately 2-5% of its net assets in the Timothy Plan Aggressive Growth Fund; approximately 6-15% of its net assets in the Timothy Plan High Yield Bond Fund; approximately 0-10% of its net assets in the Timothy Plan International Fund; approximately 20%-40% of its net assets in the Timothy Plan Fixed Income Fund; approximately 10-30% of its net assets in the Timothy Plan Defensive Strategies Fund; approximately 0-10% of its net assets in the Timothy Plan Israel Common Values Fund; approximately 0-10% of its net assets in the Timothy Plan Emerging Markets Fund; and approximately 5-20% of its net assets in the Timothy Plan Growth & Income Fund.
The Timothy Plan Emerging Markets Fund commenced operations on December 3, 2012. The Fund’s investment objective is long-term growth of capital. The Fund seeks to achieve its investment objectives by normally investing at least 80% of the Fund’s total assets in the common stock of companies domiciled and/or headquartered in countries that the Fund’s Advisor/Sub-Advisor believes are experiencing rapid or above average growth or industrialization through the purchase of American Depositary Receipts (ADRs) and direct investments in such companies on foreign stock exchanges, without regard to market capitalizations.
The Timothy Plan Growth & Income Fund commenced operations on October 1, 2013. The Fund’s investment objective is to provide total return through a combination of growth and income and preservation of capital in declining markets. The Fund seeks to achieve its investment objectives by employing a proprietary investment model to select equity securities for the Fund that the Fund’s Advisor/Sub-Advisor believes are undervalued and more likely to appreciate. The Fund’s Advisor/Sub-Advisor focuses on characteristics such as management commitment, value and neglect, and on equity securities that are underrepresented by institutional investors. The Fund’s Advisor/Sub-Advisor also assesses a number of fundamental factors such as earnings, earnings trends, price earnings multiples, return on assets and other financial statement data, as well as other proprietary calculations. The model evaluates over 8,500 companies of all capitalization ranges. For the Fund, the Fund’s Advisor/Sub-Advisor refines the model by using a capitalization screen and evaluates thousands of companies within the appropriate capitalization range. The Fund’s Advisor normally will sell a security when the investment no longer meets the Funds Advisor’s/Sub-Advisor’s investment criteria.
The following is a summary of significant accounting policies consistently followed by the Funds in the preparation of their financial statements. The policies are in conformity with accounting principles generally accepted in the United States of America (“GAAP”) for investment companies. The Fund is an investment company and accordingly follows the investment company accounting and reporting guidance of the Financial Accounting Standards Board (FASB) Accounting Standard Codification Topic 946 “Financial Services – Investment Companies” including FASB Accounting Standard Update ASU 2013-08.
A. SECURITY VALUATION AND FAIR VALUE MEASUREMENTS
All investments in securities are recorded at their estimated fair value as described in Note 2.
B. INVESTMENT INCOME AND SECURITIES TRANSACTIONS
Security transactions are accounted for on the date the securities are purchased or sold (trade date). The costing method for the Timothy Plan Funds is specific identification. Dividend income is recognized on the ex-dividend date. Interest income and expenses are recognized on an accrual basis. The Timothy Plan Aggressive Growth Fund, Large/Mid Cap Value Fund, Small Cap Value Fund, Defensive Strategies Fund, Emerging Markets Fund and Growth & Income Fund have made certain investments in REITs. Dividend income from REITs is recognized on the ex-dividend date. It is common for distributions from REITs to exceed taxable earnings and profits, resulting in the excess portion of such dividends being designated as a return of capital. The calendar year-end amounts of ordinary income, capital gains, and return of capital included in distributions received from the Funds’ investments in REITS are reported to the Funds after the end of the calendar year; accordingly, the Funds estimate these amounts for accounting purposes until the characterization of REIT distributions is reported to the Funds after the end of the calendar year. Estimates are based on the most recent REIT distribution information available. Withholding taxes on foreign dividends have been provided for in accordance with the Funds’ understanding of the applicable country’s tax rules and rates. Discounts and premiums on securities purchased are amortized over the lives of the respective securities. The ability of issuers of debt securities held by the Funds to meet their obligations may be affected by economic and political developments in a specific country or region.
C. FOREIGN TAXES
The Funds may be subject to foreign taxes related to foreign income received (a portion of which may be reclaimable), capital gains on the sale of securities and certain foreign currency transactions. All foreign taxes are recorded in accordance with the applicable regulations and rates that exist in the foreign jurisdictions in which the Funds invest.
D. FOREIGN CURRENCY
Investment securities denominated in foreign currencies are translated into U.S. dollar amounts at the date of valuation. Purchases and sales of investment securities and income and expense items denominated in foreign currencies are translated into U.S. dollar amounts on the respective dates of such transactions. The Funds do not isolate that portion of the results of operations resulting from changes in foreign exchange rates on investments from the fluctuations arising from changes in market prices of securities held. Such fluctuations are included in the net realized and unrealized gain or loss from investments. Reported net realized foreign exchange gains or losses arise from sales of foreign currencies, currency gains or losses realized between the trade and settlement dates on securities transactions, and the difference between the amounts of dividends, interest and foreign withholding taxes recorded on the Funds’ books and the U.S. dollar equivalent of the amounts actually received or paid. Net unrealized foreign exchange gains and losses arise from changes in the fair values of assets and liabilities, other than investments in securities at fiscal period end, resulting from changes in exchange rates.
120
Notes to Financial Statements
September 30, 2018 (Continued)
Timothy Plan Family of Funds
E. GOLD/SILVER RISK FACTORS
There is a risk that some or all of the Trust’s gold and silver bars held by the custodian or any sub-custodian on behalf of the Trust could be lost, damaged or stolen. Access to the Trust’s gold and silver bars could be restricted by natural events (such as an earthquake) or human actions (such as a terrorist attack). Any of these events may adversely affect the operations of the Trust and, consequently, an investment in the fund shares.
Several factors may affect the price of gold and silver, including but not limited to:
• Global or regional political, economic or financial events and situations;
• Investors’ expectations with respect to the rate of inflation;
• Currency exchange rates;
• Interest rates; and
• Investment and trading activities of hedge funds and commodity funds.
F. NET ASSET VALUE PER SHARE
The Net Asset Value (“NAV”) per share of the capital stock of the Funds is determined daily as of the close of trading on the New York Stock Exchange by dividing the value of its net assets by the number of Fund shares outstanding. The NAV is calculated separately for each class of each Fund in the Trust. The net asset value of the classes may differ because of different fees and expenses charged to each class.
G. EXPENSES
Expenses incurred by the Trust that do not relate to a specific Fund of the Trust are allocated to the individual Funds based on each Fund’s relative net assets or another appropriate basis as determined by the Board of Trustees (the “Board”).
H. CLASSES
There are three classes of shares currently offered by all Funds in the Trust, except Strategic Growth Fund and Conservative Growth Fund: Class A shares are offered with a front-end sales charge and ongoing service/distribution fees; Class C shares are offered with a contingent deferred sales charge (“CDSC”) that ends after the first year and ongoing service and distribution fees; Class I shares, which commenced operations on August 1, 2013, are offered without any sales charges or ongoing service distribution fees.
Class specific expenses are borne by each specific class. Income, expenses, and realized and unrealized gains/losses are allocated to the respective classes on the basis of relative daily net assets.
I. USE OF ESTIMATES
In the preparation of financial statements in conformity with GAAP, management makes estimates and assumptions that affect the reported amounts of assets and liabilities and disclosure of contingent assets and liabilities at the date of the financial statements, as well as the reported amounts of revenues and expenses during the year ended. Actual results could differ from those estimates.
J. FEDERAL INCOME TAXES
It is the policy of each Fund to continue to comply with all requirements under subchapter M of the Internal Revenue Code applicable to regulated investment companies and to distribute substantially all of its taxable income to its shareholders. Each Fund also intends to distribute sufficient net investment income and net capital gains, if any, so that it will not be subject to excise tax on undistributed income or gains. Therefore, no federal income tax or excise provision is required.
As of September 30, 2018, the Funds did not have a liability for any unrecognized tax benefits. The Funds recognize interest and penalties, if any, related to unrecognized tax benefits as income tax expense in the Statements of Operations. During the year ended September 30, 2018, the Funds did not incur any interest or penalties. The Funds are not aware of any tax positions for which it is reasonably possible that the total amounts of unrecognized tax benefits will change materially within the next twelve months.
K. INDEMNIFICATION
The Trust indemnifies its officers and trustees for certain liabilities that may arise from the performance of their duties to the Trust. Additionally, in the normal course of business, the Funds enter into contracts that contain a variety of representations and warranties and which provide general indemnities. The Funds’ maximum exposure under these arrangements is unknown, as this would involve future claims that may be made against the Funds that have not yet occurred. However, based on experience, the Funds expect the risk of loss due to these warranties and indemnities to be remote.
L. DISTRIBUTIONS TO SHAREHOLDERS
Distributions to shareholders, which are determined in accordance with income tax regulations, are recorded on the ex-dividend date. The treatment for financial reporting purposes of distributions made to shareholders during the period from net investment income or net realized capital gains may differ from their ultimate treatment for federal income tax purposes. These differences are caused primarily by differences in the timing of the recognition of certain components of income, expense or realized capital gain for federal income tax purposes. Where such differences are permanent in nature, they are reclassified in the components of net assets based on their ultimate characterization for federal income tax purposes. Any such reclassifications will have no effect on net assets, results of operations, or Net Asset Values (NAVs) per share of the Funds.
121
Notes to Financial Statements
September 30, 2018 (Continued)
Timothy Plan Family of Funds
Permanent book and tax differences, primarily attributable to the book/tax treatment of foreign currency gains/(losses), net operating losses and short-term capital gains, the expiration of capital loss carry forwards, adjustments for paydowns, passive foreign investment corporations, C-Corporation return of capital distributions, grantor trusts, and partnerships, and the reclassification of Fund distributions resulted in reclassifications for the Funds for the fiscal year ended September 30, 2018 as follows:
| | | | | | | | | | | | | | | | |
Fund | | Paid In Capital | | | Accumulated
Net Investment Income (Loss) | | | Accumulated Net
Realized Gains (Loss) | | | Net Unrealized
Appreciation/
(Depreciation) | |
Aggressive Growth Fund | | $ | - | | | $ | 297,140 | | | $ | (297,140 | ) | | $ | - | |
International Fund | | | (291,487 | ) | | | 114,824 | | | | 176,663 | | | | - | |
Large/Mid Cap Growth Fund | | | (103,934 | ) | | | 103,896 | | | | 38 | | | | - | |
Small Cap Value Fund | | | - | | | | 69,834 | | | | (69,834 | ) | | | - | |
Large/Mid Cap Value Fund | | | - | | | | - | | | | - | | | | - | |
Fixed Income Fund | | | - | | | | 152,342 | | | | (152,342 | ) | | | - | |
High Yield Bond Fund | | | - | | | | - | | | | - | | | | - | |
Israel Common Values Fund | | | (6 | ) | | | 115,315 | | | | (115,315 | ) | | | 6 | |
Defensive Strategies Fund | | | 14,684 | | | | 97 | | | | (16,387 | ) | | | 1,606 | |
Strategic Growth Fund | | | (43,914 | ) | | | 43,914 | | | | - | | | | - | |
Conservative Growth Fund | | | (32,899 | ) | | | 32,898 | | | | 1 | | | | - | |
Emerging Markets Fund | | | 938 | | | | 61,242 | | | | (61,242 | ) | | | (938 | ) |
Growth & Income Fund | | | - | | | | 5,024 | | | | (5,024 | ) | | | - | |
M. SUB-CUSTODIAN
Effective May 22, 2015, the Timothy Plan Family of Funds entered into a precious metals storage agreement with Brink’s Global Services U.S.A., Inc. to maintain the custody of the gold and silver held in the Timothy Plan Defensive Strategies Fund.
Note 2 | Security Valuation and Fair Value Measurements
Fair value is defined as the price that a Fund would receive upon selling an investment in a timely transaction to an independent buyer in the principal or most advantageous market of the investment. GAAP established a three-tier hierarchy to maximize the use of observable market data and minimize the use of unobservable inputs and to establish classification of fair value measurements for disclosure purposes.
Inputs refer broadly to the assumptions that market participants would use in pricing the asset or liability, including assumptions about risk (the risk inherent in a particular valuation technique used to measure fair value including such a pricing model and/or the risk inherent in the inputs to the valuation technique). Inputs may be observable or unobservable. Observable inputs are inputs that reflect the assumptions market participants would use in pricing the asset or liability developed based on market data obtained from sources independent of the reporting entity. Unobservable inputs are inputs that reflect the reporting entity’s own assumptions about the assumptions market participants would use in pricing the asset or liability developed based on the best information available in the circumstances.
VALUATION OF FUND OF FUNDS
A Fund may invest in portfolios of open-end or closed-end investment companies (the “Underlying Funds”). The Underlying Funds value securities in their portfolios for which market quotations are readily available at their market values (generally the last reported sale price) and all other securities and assets at their fair value based upon methods established by the Board of Trustees of the Underlying Funds.
Open-ended funds are valued at their respective net asset values as reported by such investment companies. The shares of many closed-end investment companies, after their initial public offering, frequently trade at a price per share, which is different than the net asset value per share. The difference represents a market premium or market discount of such shares. There can be no assurances that the market discount or market premium on shares of any closed-end investment company purchased by the Fund will not change.
OPTIONS TRANSACTIONS –The Funds are subject to equity price risk in the normal course of pursuing their investment objectives and may purchase or sell options to help hedge against this risk.
Each Fund may write call options only if it (i) owns an offsetting position in the underlying security or (ii) has an absolute or immediate right to acquire that security without additional cash consideration or exchange of other securities held in its portfolio.
When the Funds write a call option, an amount equal to the premium received is included in the statement of assets and liabilities as a liability. The amount of the liability is subsequently marked-to-market to reflect the current market value of the option. If an option expires on its stipulated expiration date or if the Funds enter into a closing purchase transaction, a gain or loss is realized. If a written call option is exercised, a gain or loss is realized for the sale of the underlying security and the proceeds from the sale are increased by the premium originally received. As writer of an option, the Funds have no control over whether the option will be exercised and, as a result, retain the market risk of an unfavorable change in the price of the security underlying the written option.
The Funds may purchase put and call options. Call options are purchased to hedge against an increase in the value of securities held in a Funds’ portfolio. If such an increase occurs, the call options will permit the Fund to purchase the securities underlying such options at the exercise price, not
122
Notes to Financial Statements
September 30, 2018 (Continued)
Timothy Plan Family of Funds
at the current market price. Put options are purchased to hedge against a decline in the value of securities held in a Fund’s portfolio. If such a decline occurs, the put options will permit the Fund to sell the securities underlying such options at the exercise price, or to close out the options at a profit. The premium paid for a put or call option plus any transaction costs will reduce the benefit, if any, realized by the Fund upon exercise of the option, and, unless the price of the underlying security rises or declines sufficiently, the option may expire worthless to the Fund. In addition, in the event that the price of the security in connection with which an option was purchased moves in a direction favorable to a Fund, the benefits realized by the Fund as a result of such favorable movement will be reduced by the amount of the premium paid for the option and related transaction costs. Written and purchased options are non-income producing securities. With purchased options, there is minimal counterparty credit risk to the Funds since these options are exchange traded and the exchange’s clearinghouse, as counterparty to all exchange traded options, guarantees against a possible default.
There were no options held at September 30, 2018, and there were no options transactions for the year ended September 30, 2018.
The Trust utilizes various methods to measure the fair value of all of its investments on a recurring basis. GAAP establishes a hierarchy that prioritizes inputs to valuation methods. The three levels of input are:
| | ●Level | 1 – Unadjusted quoted prices in active markets for identical assets and liabilities that the Fund has the ability to access. |
| | ●Level | 2 – Observable inputs other than quoted prices included in Level 1 that are observable for the asset or liability, either directly or indirectly. These inputs may include quoted prices for the identical instrument in an inactive market, prices for similar instruments, interest rates, prepayment speeds, credit risk, yield curves, default rates and similar data. |
| | ●Level | 3 – Unobservable inputs for the asset or liability, to the extent relevant observable inputs are not available, representing the Fund’s own assumptions about the assumptions a market participant would use in valuing the asset or liability, and would be based on the best information available. |
The inputs used to measure fair value may fall into different levels of the fair value hierarchy. In such cases, for disclosure purposes, the level in the fair value hierarchy within which the fair value measurement falls in its entirety is determined based on the lowest level input that is significant to the fair value measurement in its entirety.
Each Fund generally determines the total value of each class of its shares by using market prices for the securities comprising its portfolio. Equity securities, including common stock, ADRs, REITs, LPs, GDRs, NVDRs, ETFs and warrants are generally valued by using market quotations, but may be valued on the basis of prices furnished by a pricing service when the Advisor or Sub-Advisor believes such prices more accurately reflect the fair value of such securities. Securities that are traded on any stock exchange are generally valued by the pricing service at the last quoted sale price. Lacking a last sale price, an exchange traded security is generally valued by the pricing service at its last bid price. Securities traded in the NASDAQ over-the-counter market are generally valued by the pricing service at the NASDAQ Official Closing Price. When using the market quotations or close prices provided by the pricing service and when the market is considered active, the security will be classified as a Level 1 security. Equity securities traded on inactive markets or valued by reference to similar instruments are categorized as a Level 2. When market quotations are not readily available, when the Advisor or Sub-Advisor determines that the market quotation or the price provided by the pricing service does not accurately reflect the current fair value, or when restricted or illiquid securities are being valued, such securities are valued as determined in good faith by the Advisor or Sub-Advisor, in conformity with guidelines adopted by and subject to review by the Board of Trustees (“Board”). These securities will generally be categorized as Level 3 securities. Foreign investments are not fair valued using fair value triggers.
Investments in alternative investments, such as gold and silver bars, are valued at the spot rate at 4:00 p.m. Eastern time each business day and are categorized as Level 1 in the hierarchy.
Investments in mutual funds, including money market mutual funds, are generally priced at the ending NAV provided by the service agent of the funds. These securities will be categorized as Level 1 securities.
Fixed income securities such as corporate bonds, government mortgage-backed securities, U.S. government notes and bonds, U.S. government agency securities and treasury inflation protected securities, when valued using market quotations in an active market, will be categorized as Level 1 securities. However, they may be valued on the basis of prices furnished by a pricing service when the Advisor or Sub-Advisor believes such prices more accurately reflect the fair value of such securities. A pricing service utilizes electronic data processing techniques based on yield spreads relating to securities with similar characteristics to determine prices for normal institutional-size trading units of debt securities without regard to sale or bid prices. These securities will generally be categorized as Level 2 securities. If the Advisor or Sub-Advisor decides that a price provided by the pricing service does not accurately reflect the fair value of the securities, when prices are not readily available from a pricing service, or when restricted or illiquid securities are being valued, securities are valued at fair value as determined in good faith by the Advisor or Sub-Advisor, in conformity with guidelines adopted by and subject to review of the Board. These securities will be categorized as Level 3 securities.
Short-term investments in fixed income securities (those with maturities of less than 60 days when acquired, or which subsequently are within 60 days of maturity) may be valued by using the amortized cost method of valuation, which the Board has determined will represent fair value. These securities will be classified as Level 2 securities.
The Board has delegated to the Advisor and/or Sub-Advisors responsibility for determining the value of Fund portfolio securities under certain circumstances. Under such circumstances, the Advisor or Sub-Advisor will use its best efforts to arrive at the fair value of a security held by the Fund under all reasonably ascertainable facts and circumstances. The Advisor must prepare a report for the Board not less than quarterly containing a complete listing of any securities for which fair value pricing was employed and detailing the specific reasons for such fair value pricing. The Board has adopted written policies and procedures to guide the Advisor and Sub-Advisors with respect to the circumstances under which, and the methods to be used, in fair valuing securities.
123
Notes to Financial Statements
September 30, 2018 (Continued)
Timothy Plan Family of Funds
The following is a summary of the inputs used to value each Fund’s investments as of September 30, 2018:
| | | | | | | | | | | | | | | | |
Aggressive Growth Fund | | | | | | | | | | | | | | | | |
| | | | |
| Assets | | Level 1 | | | Level 2 | | | Level 3 | | | Total | |
Common Stock | | $ | 29,732,609 | | | $ | - | | | $ | - | | | $ | 29,732,609 | |
REITs | | | 532,246 | | | | - | | | | - | | | | 532,246 | |
Money Market Fund | | | 1,473,315 | | | | - | | | | - | | | | 1,473,315 | |
Total | | $ | 31,738,170 | | | $ | - | | | $ | - | | | $ | 31,738,170 | |
| | | | |
International Fund | | | | | | | | | | | | | | | | |
| | | | |
Assets | | | Level 1 | | | | Level 2 | | | | Level 3 | | | | Total | |
Common Stock | | $ | 104,947,129 | | | $ | - | | | $ | - | | | $ | 104,947,129 | |
Money Market Fund | | | 1,366,888 | | | | - | | | | - | | | | 1,366,888 | |
Total | | $ | 106,314,017 | | | $ | - | | | $ | - | | | $ | 106,314,017 | |
| | | | |
Large/Mid Cap Growth Fund | | | | | | | | | | | | | | | | |
| | | | |
Assets | | | Level 1 | | | | Level 2 | | | | Level 3 | | | | Total | |
Common Stock | | $ | 97,063,186 | | | $ | - | | | $ | - | | | $ | 97,063,186 | |
Money Market Fund | | | 4,731,497 | | | | - | | | | - | | | | 4,731,497 | |
Total | | $ | 101,794,683 | | | $ | - | | | $ | - | | | $ | 101,794,683 | |
| | | | |
Small Cap Value Fund | | | | | | | | | | | | | | | | |
| | | | |
Assets | | | Level 1 | | | | Level 2 | | | | Level 3 | | | | Total | |
Common Stock | | $ | 142,485,549 | | | $ | - | | | $ | - | | | $ | 142,485,549 | |
REITs | | | 21,325,179 | | | | - | | | | - | | | | 21,325,179 | |
Money Market Fund | | | 3,288,923 | | | | - | | | | - | | | | 3,288,923 | |
Total | | $ | 167,099,651 | | | $ | - | | | $ | - | | | $ | 167,099,651 | |
| | | | |
Large/Mid Cap Value Fund | | | | | | | | | | | | | | | | |
| | | | |
Assets | | | Level 1 | | | | Level 2 | | | | Level 3 | | | | Total | |
Common Stock | | $ | 212,224,148 | | | $ | - | | | $ | - | | | $ | 212,224,148 | |
REITs | | | 12,338,479 | | | | - | | | | - | | | | 12,338,479 | |
Money Market Fund | | | 7,176,332 | | | | - | | | | - | | | | 7,176,332 | |
Total | | $ | 231,738,959 | | | $ | - | | | $ | - | | | $ | 231,738,959 | |
| | | | |
Fixed Income Fund | | | | | | | | | | | | | | | | |
| | | | |
Assets | | | Level 1 | | | | Level 2 | | | | Level 3 | | | | Total | |
Corporate Bonds | | $ | - | | | $ | 26,265,450 | | | $ | - | | | $ | 26,265,450 | |
Government Notes & Bonds | | | - | | | | 29,427,199 | | | | - | | | | 29,427,199 | |
Government Mortgage-Backed Securities | | | - | | | | 20,519,922 | | | | - | | | | 20,519,922 | |
Money Market Fund | | | 2,255,083 | | | | - | | | | - | | | | 2,255,083 | |
Total | | $ | 2,255,083 | | | $ | 76,212,571 | | | $ | - | | | $ | 78,467,654 | |
| | | | |
High Yield Bond Fund | | | | | | | | | | | | | | | | |
| | | | |
Assets | | | Level 1 | | | | Level 2 | | | | Level 3 | | | | Total | |
Corporate Bonds | | $ | - | | | $ | 53,297,187 | | | $ | - | | | $ | 53,297,187 | |
Money Market Fund | | | 2,043,608 | | | | - | | | | - | | | | 2,043,608 | |
Total | | $ | 2,043,608 | | | $ | 53,297,187 | | | $ | - | | | $ | 55,340,795 | |
| | | | |
Israel Common Values Fund | | | | | | | | | | | | | | | | |
| | | | |
Assets | | | Level 1 | | | | Level 2 | | | | Level 3 | | | | Total | |
Common Stock | | $ | 55,941,503 | | | $ | - | | | $ | - | | | $ | 55,941,503 | |
Money Market Fund | | | 1,358,738 | | | | - | | | | - | | | | 1,358,738 | |
Total | | $ | 57,300,241 | | | $ | - | | | $ | - | | | $ | 57,300,241 | |
124
Notes to Financial Statements
September 30, 2018 (Continued)
Timothy Plan Family of Funds
| | | | | | | | | | | | | | | | | | |
Defensive Strategies Fund | | | | | | | | | | | | | | | | | | |
| | | | | |
| Assets | | Level 1 | | | Level 2 | | | Level 3 | | | Total | | | |
Common Stock | | $ | 13,073,202 | | | $ | - | | | $ | - | | | $ | 13,073,202 | | | |
REITs | | | 10,366,474 | | | | - | | | | - | | | | 10,366,474 | | | |
Corporate Bonds | | | - | | | | 897,761 | | | | - | | | | 897,761 | | | |
Treasury Inflation Protected Securities (TIPS) | | | - | | | | 15,571,321 | | | | - | | | | 15,571,321 | | | |
Alternative Investments | | | 8,880,839 | | | | - | | | | - | | | | 8,880,839 | | | |
Money Market Fund | | | 1,700,606 | | | | - | | | | - | | | | 1,700,606 | | | |
Total | | $ | 34,021,121 | | | $ | 16,469,082 | | | $ | - | | | $ | 50,490,203 | | | |
| | | | | | | | | | | | | | | | | | |
Strategic Growth Fund | | | | | | | | | | | | | | | | | | |
| | | | | |
| Assets | | Level 1 | | | Level 2 | | | Level 3 | | | Total | | | |
Mutual Funds | | $ | 37,488,189 | | | $ | - | | | $ | - | | | $ | 37,488,189 | | | |
Money Market Fund | | | 1,041,790 | | | | - | | | | - | | | | 1,041,790 | | | |
Total | | $ | 38,529,979 | | | $ | - | | | $ | - | | | $ | 38,529,979 | | | |
Conservative Growth Fund | | | | | | | | | | | | | | | | | | |
| | | | | |
Assets | | | Level 1 | | | | Level 2 | | | | Level 3 | | | | Total | | | |
Mutual Funds | | $ | 48,757,416 | | | $ | - | | | $ | - | | | $ | 48,757,416 | | | |
Money Market Fund | | | 2,622,149 | | | | - | | | | - | | | | 2,622,149 | | | |
Total | | $ | 51,379,565 | | | $ | - | | | $ | - | | | $ | 51,379,565 | | | |
| | | | | | | | | | | | | | | | | | |
Emerging Markets Fund | | | | | | | | | | | | | | | | | | |
| | | | | |
| Assets | | Level 1 | | | Level 2 | | | Level 3 | | | Total | | | |
Common Stock | | $ | 12,981,506 | | | $ | 1,208,293 | | | $ | - | | | $ | 14,189,799 | | | |
Preferred Stock | | | 1,748,618 | | | | 486,382 | | | | - | | | | 2,235,000 | | | |
REITs | | | 1,904,193 | | | | - | | | | - | | | | 1,904,193 | | | |
Money Market Fund | | | 2,486,393 | | | | - | | | | - | | | | 2,486,393 | | | |
Total | | $ | 19,120,710 | | | $ | 1,694,675 | | | $ | - | | | $ | 20,815,385 | | | |
| | | | | | | | | | | | | | | | | | |
Growth & Income Fund | | | | | | | | | | | | | | | | | | |
| | | | | |
| Assets | | Level 1 | | | Level 2 | | | Level 3 | | | Total | | | |
Common Stock | | $ | 14,869,889 | | | $ | - | | | $ | - | | | $ | 14,869,889 | | | |
Exchange Traded Funds | | | 113,310 | | | | - | | | | - | | | | 113,310 | | | |
REITs | | | 330,804 | | | | - | | | | - | | | | 330,804 | | | |
Government Notes, Bonds & Agencies | | | - | | | | 15,027,498 | | | | - | | | | 15,027,498 | | | |
Treasury Inflation Protected Securities (TIPS) | | | - | | | | 2,784,791 | | | | - | | | | 2,784,791 | | | |
Money Market Fund | | | 765,958 | | | | - | | | | - | | | | 765,958 | | | |
Total | | $ | 16,079,961 | | | $ | 17,812,289 | | | $ | - | | | $ | 33,892,250 | | | |
Refer to the Schedules of Investments for industry classifications.
The Funds did not hold any Level 3 securities during the period presented. There were transfers into Level 2 during the current period presented. It is the Trust’s policy to record transfers between Level 1 and Level 2 at the end of the reporting period.
| | | | | | | | | | |
| Emerging Markets Fund | | | | | | | | | | |
| | | Common Stock | | | Total | | | |
Transfer into Level 2 from Level 1 | | $ | 1,694,675 | | | $ | 1,694,675 | | | |
Transfer was due to the lack of availability of pricing from an approved pricing source.
Note 3 | Purchases and Sales of Securities
The following is a summary of the cost of purchases and proceeds from the sale of securities, other than short-term investments, for the year ended September 30, 2018:
125
Notes to Financial Statements
September 30, 2018 (Continued)
Timothy Plan Family of Funds
| | | | | | | | | | | | | | | | | | |
| | | Purchases | | | Sales | | | |
| Fund | | U.S. Gov’t
Obligations | | | Other | | | U.S. Gov’t
Obligations | | | Other | | | |
Aggressive Growth | | $ | - | | | $ | 23,514,650 | | | $ | - | | | $ | 23,809,750 | | | |
International | | | - | | | | 31,823,706 | | | | - | | | | 19,813,934 | | | |
Large/Mid Cap Growth | | | - | | | | 59,969,081 | | | | - | | | | 49,702,044 | | | |
Small Cap Value | | | - | | | | 96,309,670 | | | | - | | | | 87,772,961 | | | |
Large/Mid Cap Value | | | - | | | | 50,943,665 | | | | - | | | | 56,689,107 | | | |
Fixed Income | | | 18,373,016 | | | | 5,520,102 | | | | 24,180,355 | | | | 4,372,863 | | | |
High Yield Bond | | | - | | | | 7,204,336 | | | | - | | | | 15,812,440 | | | |
Israel Common Values | | | - | | | | 13,831,043 | | | | - | | | | 4,240,627 | | | |
Defensive Strategies | | | - | | | | 14,651,981 | | | | - | | | | 21,381,350 | | | |
Strategic Growth * | | | - | | | | 3,002,784 | | | | - | | | | 4,212,188 | | | |
Conservative Growth * | | | - | | | | 3,714,889 | | | | - | | | | 5,610,699 | | | |
Emerging Markets | | | - | | | | 13,275,959 | | | | - | | | | 10,301,591 | | | |
Growth & Income | | | 5,228,535 | | | | 13,659,116 | | | | 5,169,287 | | | | 14,959,507 | | | |
* The security transactions are purchases and sales of affiliated funds.
Note 4 | Investment Advisory Agreement and Transactions with Service Providers
Timothy Partners, Ltd., (“TPL”) is the investment advisor for the Funds pursuant to an investment advisory agreement (the “Agreement”) that was renewed by the Board on February 26, 2017. TPL supervises the investment of the assets of each Fund in accordance with the objectives, policies and restrictions of the Trust. Under the terms of the Agreement, as amended, TPL receives a fee, accrued daily and paid monthly, at an annual rate of 1.20% of the average daily net assets of the Timothy Plan Emerging Markets Fund; 1.00% of the average daily net assets of the Timothy Plan International Fund and Timothy Plan Israel Common Values Fund; 0.85% of the average daily net assets of the Timothy Plan Aggressive Growth, the Timothy Plan Small Cap Value, the Timothy Plan Large/Mid Cap Growth, the Timothy Plan Growth & Income and the Timothy Plan Large/Mid Cap Value Funds; 0.60% of the average daily net assets of the Timothy Plan Fixed Income, the Timothy Plan High Yield Bond, and the Timothy Plan Defensive Strategies Funds; and 0.65% of the average daily net assets of the Timothy Plan Conservative Growth and the Timothy Plan Strategic Growth Funds. TPL has voluntarily agreed to reduce the fee it receives from the Emerging Markets Fund to 1.15%; from the International Fund to 0.95%; from the Small Cap Value Fund, the Large/Mid Cap Growth Fund and the Growth & Income Fund to 0.80%; from the Aggressive Growth Fund and Large/Mid Cap Value Fund to 0.75%; from the High Yield Bond Fund and the Defensive Strategies Fund to 0.55%; and from the Fixed Income Fund to 0.40%. Effective August 1, 2018, Timothy Plan Large/Mid Cap Value Fund agreed to voluntarily reduce the fee from 0.75% to 0.70% and Timothy Plan Small Cap Value Fund agreed to voluntarily reduce the fee from 0.80% to 0.75%. Such voluntary fee reductions/reimbursements may be authorized by TPL at any time, but such action shall not obligate TPL to waive any fees in the near future. Such voluntary fee reductions/reimbursements are not subject to future recoupment. An officer and trustees of the Funds is also an officer and owner of the Advisor.
For the year ended September 30, 2018, TPL waived and reimbursed the Funds as follows:
| | | | | | |
| Fund | | Year Ended
September 30, 2018 | | | |
Aggressive Growth Fund | | $ | 29,271 | | | |
International Fund | | | 52,451 | | | |
Large/Mid Cap Growth Fund | | | 46,388 | | | |
Small Cap Value Fund | | | 90,874 | | | |
Large/Mid Cap Value Fund | | | 241,198 | | | |
Fixed Income Fund | | | 164,786 | | | |
High Yield Bond Fund | | | 29,924 | | | |
Defensive Strategies Fund | | | 27,114 | | | |
Emerging Markets Fund | | | 11,501 | | | |
Growth & Income Fund | | | 17,785 | | | |
Gemini Fund Services, LLC (“GFS”) provides administrative, fund accounting, and transfer agency services to the Funds pursuant to agreements with the Trust, for which it receives from each Fund: (i) basis points in decreasing amounts as assets reach certain breakpoints; and (ii) any related out-of-pocket expenses. Fees are billed monthly as follows:
Fund Accounting and Fund Administration Fees:
Fund Complex Base annual fee:
25 basis points (0.25%) on the first $200 million of net assets
15 basis points (0.15%) on the next $200 million of net assets;
8 basis points (0.08%) on the next $600 million of net assets; and
6 basis points (0.06%) on net assets greater than $1 billion.
Transfer agency fees for the Funds are combined with the Fund Accounting and Fund Administration fees under the Trust’s agreement with GFS. Therefore, there is no separate base annual fee per Fund or share class.
126
Notes to Financial Statements
September 30, 2018 (Continued)
Timothy Plan Family of Funds
The Timothy Plan Aggressive Growth, Timothy Plan International, Timothy Plan Large/Mid Cap Growth, Timothy Plan Small Cap Value, Timothy Plan Large/Mid Cap Value, Timothy Plan Fixed Income, Timothy Plan High Yield Bond, Timothy Plan Defensive Strategies, Timothy Plan Israel Common Values, Timothy Plan Emerging Markets, and Timothy Plan Growth & Income Funds have adopted shareholder services plans (the “Plans”) pursuant to Rule 12b-1 under the Investment Company Act of 1940, as amended. The Plans provide that the Funds will pay TPL or others for expenses that relate to the promotion or distribution of shares. Under the Class A Plan, the Funds will pay TPL a fee at an annual rate of 0.25%, payable monthly, of the average daily net assets attributable to such class of shares. Under the Class C Plan, the Funds will pay TPL a fee at an annual rate of 1.00%, payable monthly, of which, 0.25% may be a service fee and 0.75% may be payable to outside broker/dealers, of the average daily net assets attributable to such class of shares. Class I shares are not subject to the shareholder services plan.
The Timothy Plan Conservative Growth and Timothy Plan Strategic Growth Funds have adopted shareholder services plans (the “Plans”) pursuant to Rule 12b-1 under the Investment Company Act of 1940, as amended. The Plans provide that the Funds will pay TPL or others for expenses that relate to the promotion or distribution of shares. Class A shares of the Funds do not impose a service fee. Under the Class C Plan, the Funds will pay TPL a fee at an annual rate of 0.75%, payable monthly to outside broker/dealers, of the average daily net assets attributable to such class of shares.
For the year ended September 30, 2018, the Funds paid TPL under the terms of the Plans as follows:
| | | | | | | | | | |
| Fund | | | | | 12b-1 Fees | | | |
| | | |
| | | | | | Year Ended
September 30, 2018 | | | |
Aggressive Growth | | | | | | $ | 100,194 | | | |
International | | | | | | | 245,007 | | | |
Large/Mid Cap Growth | | | | | | | 292,187 | | | |
Small Cap Value | | | | | | | 425,764 | | | |
Large/Mid Cap Value | | | | | | | 680,070 | | | |
Fixed Income | | | | | | | 272,094 | | | |
High Yield Bond | | | | | | | 148,967 | | | |
Israel Common Values | | | | | | | 174,859 | | | |
Defensive Strategies | | | | | | | 173,733 | | | |
Strategic Growth | | | | | | | 51,302 | | | |
Conservative Growth | | | | | | | 69,833 | | | |
Emerging Markets | | | | | | | 71,258 | | | |
Growth & Income | | | | | | | 105,459 | | | |
TPL also serves as the principal underwriter of the Funds’ shares. An officer and trustees of the Funds are also officers of the principal underwriter. For the year ended September 30, 2018, TPL received sales charges deducted from the proceeds of sales of Class A capital shares and CDSC fees deducted from the redemption of Class C capital shares as follows:
| | | | | | | | | | |
| Fund | | Sales Charges
(Class A) | | | CDSC Fees
(Class C) | | | |
Aggressive Growth | | | $11,698 | | | | $584 | | | |
International | | | 19,109 | | | | 816 | | | |
Large/Mid Cap Growth | | | 33,707 | | | | 1,751 | | | |
Small Cap Value | | | 49,018 | | | | 2,053 | | | |
Large/Mid Cap Value | | | 55,903 | | | | 2,397 | | | |
Fixed Income | | | 26,575 | | | | 2,950 | | | |
High Yield Bond | | | 14,975 | | | | 757 | | | |
Israel Common Values | | | 31,485 | | | | 4,313 | | | |
Defensive Strategies | | | 11,761 | | | | 526 | | | |
Strategic Growth | | | 15,718 | | | | 368 | | | |
Conservative Growth | | | 14,456 | | | | 983 | | | |
Emerging Markets | | | 10,606 | | | | 2,669 | | | |
Growth & Income | | | 10,142 | | | | 661 | | | |
Note 5 | Control Ownership
The beneficial ownership, either directly or indirectly, of more than 25% of the voting securities of a Fund creates the presumption of control of the Fund under Section 2(a) 9 of the Investment Company Act of 1940. At September 30, 2018, there were no shareholders with ownership, either directly or indirectly, of more than 25% of the voting securities of a Fund.
Certain Timothy Plan Funds own shares of other Timothy Plan Funds. U.S. Bank, N.A., custodian of the Timothy Plan Funds, holds these shares in omnibus accounts, some of which are controlled by National Financial Services, Inc. The following shows the percentage of each Timothy Plan Fund that is held by U.S. Bank, N.A., as custodian of the Timothy Plan Funds. These accounts can be considered affiliated to the Timothy Plan.
127
Notes to Financial Statements
September 30, 2018 (Continued)
Timothy Plan Family of Funds
| | | | |
| Fund - Class A | | % of Fund Owned by Other Timothy
Plan Funds | | |
Aggressive Growth | | 22.68% | | |
International | | 25.95% | | |
Large/Mid Cap Growth | | 13.60% | | |
Small Cap Value | | 5.89% | | |
Large/Mid Cap Value | | 6.96% | | |
Fixed Income | | 29.68% | | |
High Yield Bond | | 19.54% | | |
Israel Common Values | | 12.69% | | |
Defensive Strategies | | 35.71% | | |
Emerging Markets | | 42.32% | | |
Growth & Income | | 42.78% | | |
Note 6 | Underlying Investment in Other Investment Companies
The Conservative Growth Fund currently seeks to achieve its investment objectives by investing a portion of its assets in the Timothy Plan Fixed Income Fund (the “Security”). The Fund may redeem its investments from the Security at any time if the Advisor determines that it is in the best interest of the Fund and its shareholders to do so.
The performance of the Fund will be directly affected by the performance of the Security. The annual report of the Security, along with the report of the independent registered public accounting firm is included in the Security’s N-CSRs available at www.sec.gov. As of September 30, 2018, 24.7% of the Conservative Growth Fund’s net assets were invested in the Timothy Plan Fixed Income Fund.
Note 7 | Investments in Affiliated Companies
The Funds’ transactions with affiliates represent holdings for which the respective Fund and the underlying investee fund have the same investment advisor or where the investee fund’s investment advisor is under common control with the Fund’s investment advisor.
James Investment Partners is the sponsor to the James Biblically Responsible Investment ETF and, as such, is an affiliate.
The Timothy Plan Strategic Growth Fund, Conservative Growth Fund and Growth & Income Fund had the following transactions during the year ended September 30, 2018, with affiliates:
| | | | | | | | | | | | | | | | | | | | | | | | | | | | | | | | | | |
| Strategic Growth | | Share Activity | | | Year Ended September 30, 2018 | | | |
| Fund | | Balance
September 30,
2017 | | | Purchases | | | Sales | | | Balance
September 30,
2018 | | | Fair Value | | | Net Change in
Unrealized
Appreciation
(Depreciation) | | | Dividends
Credited to
Income | | | Amount of Gain
(Loss) Realized on
Sale of Shares* | | | |
Aggressive Growth | | | 251,575 | | | | 26,614 | | | | 49,106 | | | | 229,083 | | | $ | 2,123,602 | | | $ | 222,243 | | | $ | - | | | $ | 66,917 | | | |
International | | | 800,146 | | | | 62,558 | | | | 89,272 | | | | 773,432 | | | | 7,533,228 | | | | (181,844 | ) | | | 166,088 | | | | 107,468 | | | |
Large/Mid Cap Growth | | | 454,109 | | | | 27,171 | | | | 66,953 | | | | 414,327 | | | | 3,869,816 | | | | 267,217 | | | | - | | | | 158,094 | | | |
Small Cap Value | | | 112,155 | | | | 20,688 | | | | 21,943 | | | | 110,900 | | | | 2,292,304 | | | | (75,267 | ) | | | 35,030 | | | | 270,235 | | | |
Large/Mid Cap Value | | | 220,076 | | | | 19,106 | | | | 32,621 | | | | 206,561 | | | | 4,209,704 | | | | 207,157 | | | | 39,842 | | | | 303,076 | | | |
Fixed Income | | | 191,919 | | | | 15,871 | | | | 8,970 | | | | 198,820 | | | | 1,950,425 | | | | (76,321 | ) | | | 34,497 | | | | (3,739 | ) | | |
High Yield Bond | | | 254,641 | | | | 37,442 | | | | 11,902 | | | | 280,181 | | | | 2,527,231 | | | | (100,779 | ) | | | 100,461 | | | | (4,956 | ) | | |
Israel Common Values | | | 134,511 | | | | 3,818 | | | | 16,423 | | | | 121,906 | | | | 1,918,799 | | | | 63,122 | | | | 27,002 | | | | 46,474 | | | |
Defensive Strategies | | | 427,333 | | | | 4,251 | | | | 23,104 | | | | 408,480 | | | | 4,673,014 | | | | 7,864 | | | | 6,410 | | | | 10,231 | | | |
Emerging Markets | | | 301,703 | | | | 36,133 | | | | 20,427 | | | | 317,409 | | | | 2,736,063 | | | | (346,328 | ) | | | 19,099 | | | | 27,841 | | | |
Growth & Income | | | 342,210 | | | | 19,049 | | | | 25,104 | | | | 336,155 | | | | 3,654,003 | | | | (152,224 | ) | | | 2,395 | | | | 104,926 | | | |
| | | | | | | | | |
| | | | | | | | | | | | | | | | | | | | | | | | | | | | | | | | | | |
| Conservative Growth | | Share Activity | | | Year Ended September 30, 2018 | | | |
| Fund | | Balance
September 30,
2017 | | | Purchases | | | Sales | | | Balance
September 30,
2018 | | | Fair Value | | | Net Change in
Unrealized
Appreciation
(Depreciation) | | | Dividends
Credited to
Income | | | Amount of Gain
(Loss) Realized on
Sale of Shares* | | | |
Aggressive Growth | | | 278,007 | | | | 510 | | | | 57,729 | | | | 220,788 | | | $ | 2,046,709 | | | $ | 242,247 | | | $ | - | | | $ | 44,103 | | | |
International | | | 581,691 | | | | 60,318 | | | | 90,064 | | | | 551,945 | | | | 5,375,945 | | | | (167,449 | ) | | | 121,151 | | | | 121,540 | | | |
Large/Mid Cap Growth | | | 462,595 | | | | 31,779 | | | | 82,561 | | | | 411,813 | | | | 3,846,334 | | | | 260,660 | | | | - | | | | 166,861 | | | |
Small Cap Value | | | 126,775 | | | | 24,514 | | | | 28,815 | | | | 122,474 | | | | 2,531,545 | | | | (62,951 | ) | | | 39,539 | | | | 281,079 | | | |
Large/Mid Cap Value | | | 217,150 | | | | 35,065 | | | | 40,681 | | | | 211,534 | | | | 4,311,072 | | | | 220,187 | | | | 41,674 | | | | 293,928 | | | |
Fixed Income | | | 1,273,040 | | | | 55,740 | | | | 37,662 | | | | 1,291,118 | | | | 12,665,871 | | | | (494,888 | ) | | | 227,002 | | | | (36,585 | ) | | |
High Yield Bond | | | 351,495 | | | | 40,278 | | | | 20,461 | | | | 371,312 | | | | 3,349,233 | | | | (132,891 | ) | | | 135,049 | | | | (9,787 | ) | | |
Israel Common Values | | | 111,482 | | | | 19,173 | | | | 17,562 | | | | 113,093 | | | | 1,780,089 | | | | 28,235 | | | | 25,591 | | | | 70,305 | | | |
Defensive Strategies | | | 541,035 | | | | 696 | | | | 45,491 | | | | 496,240 | | | | 5,676,984 | | | | 3,447 | | | | 7,960 | | | | 19,255 | | | |
Emerging Markets | | | 268,021 | | | | 30,558 | | | | 28,146 | | | | 270,433 | | | | 2,331,129 | | | | (304,466 | ) | | | 16,633 | | | | 32,763 | | | |
Growth & Income | | | 472,649 | | | | 12,829 | | | | 39,985 | | | | 445,493 | | | | 4,842,505 | | | | (201,670 | ) | | | 3,188 | | | | 139,381 | | | |
*Includes capital gain distributions from affiliated funds
128
Notes to Financial Statements
September 30, 2018 (Continued)
Timothy Plan Family of Funds
| | | | | | | | | | | | | | | | | | | | | | | | | | | | | | | | | | |
| Growth & Income | | Share Activity | | | Year Ended September 30, 2018 | | | |
| Fund | | Balance
September 30,
2017 | | | Purchases | | | Sales | | | Balance
September
30, 2018 | | | Fair Value | | | Net Change in
Unrealized
Appreciation
(Depreciation) | | | Dividends
Credited to
Income | | | Amount of Gain
(Loss) Realized on
Sale of Shares* | | | |
James Biblically Responsible Investment ETF | | | - | | | | 6,000 | | | | 1,510 | | | | 4,490 | | | $ | 113,310 | | | $ | 1,115 | | | $ | - | | | $ | | (554) | | |
Note 8 | Aggregate Unrealized Appreciation and Depreciation
The identified cost of investments in securities owned by each Fund for federal income tax purposes, and their respective gross unrealized appreciation and depreciation at September 30, 2018, were as follows:
| | | | | | | | | | | | | | | | | | | | | | | | | | | | |
| Fund | | Tax Cost | | | Gross Unrealized
Appreciation | | | Gross Unrealized
Depreciation | | | Net Unrealized
Appreciation/
(Depreciation) | | | | | | | | | | |
Aggressive Growth | | $ | 26,004,852 | | | $ | 6,262,129 | | | $ | (528,811 | ) | | $ | 5,733,318 | | | | | | | | | | | | | |
International | | | 95,544,805 | | | | 16,966,071 | | | | (6,196,859 | ) | | | 10,769,212 | | | | | | | | | | | | | |
Large/Mid Cap Growth | | | 83,004,948 | | | | 20,964,315 | | | | (2,174,580 | ) | | | 18,789,735 | | | | | | | | | | | | | |
Small Cap Value | | | 150,987,026 | | | | 23,328,245 | | | | (7,215,620 | ) | | | 16,112,625 | | | | | | | | | | | | | |
Large/Mid Cap Value | | | 190,022,357 | | | | 50,647,921 | | | | (8,931,319 | ) | | | 41,716,602 | | | | | | | | | | | | | |
Fixed Income | | | 81,257,119 | | | | 88,161 | | | | (2,877,626 | ) | | | (2,789,465 | ) | | | | | | | | | | | | |
High Yield Bond | | | 56,248,154 | | | | 357,589 | | | | (1,264,948 | ) | | | (907,359 | ) | | | | | | | | | | | | |
Israel Common Values | | | 45,045,218 | | | | 14,729,784 | | | | (2,474,761 | ) | | | 12,255,023 | | | | | | | | | | | | | |
Defensive Strategies | | | 50,196,798 | | | | 2,386,908 | | | | (2,093,503 | ) | | | 293,405 | | | | | | | | | | | | | |
Strategic Growth | | | 35,679,056 | | | | 3,126,165 | | | | (275,242 | ) | | | 2,850,923 | | | | | | | | | | | | | |
Conservative Growth | | | 48,872,335 | | | | 3,522,020 | | | | (1,014,790 | ) | | | 2,507,230 | | | | | | | | | | | | | |
Emerging Markets | | | 23,545,327 | | | | 806,988 | | | | (3,536,930 | ) | | | (2,729,942 | ) | | | | | | | | | | | | |
Growth & Income | | | 33,379,365 | | | | 2,083,251 | | | | (1,570,366 | ) | | | 512,885 | | | | | | | | | | | | | |
Note 9 | Distributions to Shareholders and Tax Components of Capital
The tax character of distributions paid during the fiscal year ended September 30, 2018 and the fiscal year ended September 30, 2017 were as follows:
| | | | | | | | | | | | | | | | | | |
| | | | | | |
| | | Aggressive Growth | | | International * | | | Large/Mid Cap Growth | | | Small Cap Value | | | |
| | | | | | |
Year ended September 30, 2018 | | | | | | | | | | | | | | | | | | |
Ordinary Income | | $ | - | | | $ | 2,275,886 | | | $ | - | | | $ | 2,201,065 | | | |
Long-term Capital Gains | | | - | | | | - | | | | 2,294,405 | | | | 10,506,372 | | | |
| | | | | | |
| | $ | - | | | $ | 2,275,886 | | | $ | 2,294,405 | | | $ | 12,707,437 | | | |
| | | | | | |
| | | | | |
Year ended September 30, 2017 | | | | | | | | | | | | | | | | | | |
Ordinary Income | | $ | - | | | $ | 921,956 | | | $ | - | | | $ | - | | | |
Long-term Capital Gains | | | - | | | | - | | | | 818,866 | | | | 1,671,871 | | | |
| | | | | | |
| | $ | - | | | $ | 921,956 | | | $ | 818,866 | | | $ | 1,671,871 | | | |
| | | | | | |
129
Notes to Financial Statements
September 30, 2018 (Continued)
Timothy Plan Family of Funds
| | | | | | | | | | | | | | | | | | | | |
| | | | |
| | | Large/Mid Cap Value | | | Fixed Income | | | High Yield Bond | | | Israel Common Values* | | | Defensive Strategies | |
| | | | |
Year ended September 30, 2018 | | | | | | | | | | | | | | | | | | | | |
Ordinary Income | | $ | 2,005,692 | | | $ | 1,374,685 | | | $ | 2,303,749 | | | $ | 651,092 | | | $ | 71,849 | |
Long-term Capital Gains | | | 12,222,087 | | | | - | | | | - | | | | - | | | | - | |
Return of Capital | | | - | | | | - | | | | - | | | | 190,665 | | | | - | |
| | | | |
| | $ | 14,227,779 | | | $ | 1,374,685 | | | $ | 2,303,749 | | | $ | 841,757 | | | $ | 71,849 | |
| | | | |
| | | | | |
Year ended September 30, 2017 | | | | | | | | | | | | | | | | | | | | |
Ordinary Income | | $ | - | | | $ | 1,391,208 | | | $ | 1,993,568 | | | $ | 478,723 | | | $ | 211,186 | |
Long-term Capital Gains | | | 2,332,773 | | | | - | | | | - | | | | - | | | | - | |
| | | | |
| | $ | 2,332,773 | | | $ | 1,391,208 | | | $ | 1,993,568 | | | $ | 478,723 | | | $ | 211,186 | |
| | | | |
| | | | | |
| | | | | | | | | | | | | | | | | | | | |
| | | | | | | | |
| | | Strategic Growth | | | Conservative Growth | | | Emerging Markets* | | | Growth & Income Fund | | | | |
| | | | | | | | |
Year ended September 30, 2018 | | | | | | | | | | | | | | | | | | | | |
Ordinary Income | | $ | - | | | $ | - | | | $ | 189,144 | | | $ | 24,002 | | | | | |
Long-term Capital Gains | | | - | | | | 168,976 | | | | - | | | | 861,134 | | | | | |
| | | | | | | | |
| | $ | - | | | $ | 168,976 | | | $ | 189,144 | | | $ | 885,136 | | | | | |
| | | | | | | | |
Year ended September 30, 2018 | | | | | | | | | | | | | | | | | | | | |
Ordinary Income | | $ | - | | | $ | - | | | $ | 67,208 | | | $ | 9,747 | | | | | |
Long-term Capital Gains | | | - | | | | - | | | | - | | | | 17,051 | | | | | |
| | | | | | | | |
| | $ | - | | | $ | - | | | $ | 67,208 | | | $ | 26,798 | | | | | |
| | | | | | | | |
* The difference between ordinary distributions paid from book and ordinary distributions paid from tax relates to allowable foreign tax credits of $56,576, $243,253, and $289,368 for fiscal year ended September 30, 2018 for the Emerging Markets, Israel Common Values, and International Funds, respectively, and $18,707, $152,490, and $192,388 for the fiscal year ended September 30, 2017 for the Emerging Markets, Israel Common Values and International Funds, which have been passed through to the Funds’ underlying shareholders and are deemed dividends for tax purposes. As of September 30, 2018, the components of distributable earnings on a tax basis were as follows:
| | | | | | | | | | | | | | | | | | |
| | | | | | |
| | | Aggressive Growth
Fund | | | International
Fund | | | Large/Mid Cap Growth Fund | | | Small Cap Value Fund | | | |
| | | | | | |
Undistributed Ordinary Income | | $ | 43,174 | | | $ | 1,100,165 | | | $ | - | | | $ | 4,406,131 | | | |
Long-Term Capital Gains | | | 1,818,559 | | | | - | | | | 4,464,833 | | | | 13,503,440 | | | |
Capital Loss Carry Forward | | | - | | | | (844,129 | ) | | | - | | | | - | | | |
Post October and Other Losses | | | (267,521 | ) | | | (722,283 | ) | | | (229,905 | ) | | | - | | | |
Unrealized Appreciation (Depreciation) | | | 5,733,318 | | | | 10,769,270 | | | | 18,789,735 | | | | 16,112,625 | | | |
| | | | | | |
| | $ | 7,327,530 | | | $ | 10,303,023 | | | $ | 23,024,663 | | | $ | 34,022,196 | | | |
| | | | | | |
| | | | | | | | | | | | | | | | | | |
| | | | | | |
| | | Large/Mid Cap Value Fund | | | Fixed Income
Fund | | | High Yield Bond Fund | | | Israel Common
Values Fund | | | |
| | | | | | |
Undistributed Ordinary Income | | $ | 1,666,241 | | | $ | 366,969 | | | $ | 34,306 | | | $ | - | | | |
Long-Term Capital Gains | | | 17,989,387 | | | | - | | | | - | | | | - | | | |
Capital Loss Carry Forward | | | - | | | | (901,235 | ) | | | (1,210,050 | ) | | | (702,224) | | | |
Post October and Other Losses | | | - | | | | (596,436 | ) | | | - | | | | (787,910) | | | |
Unrealized Appreciation (Depreciation) | | | 41,716,602 | | | | (2,789,465 | ) | | | (907,359 | ) | | | 12,254,667 | | | |
| | | | | | |
| | $ | 61,372,230 | | | $ | (3,920,167 | ) | | $ | (2,083,103 | ) | | $ | 10,764,533 | | | |
| | | | | | |
| | | | | | | | | | | | | | | | | | |
| | | | | | |
| | | Defensive Strategies Fund | | | Strategic Growth
Fund | | | Conservative Growth Fund | | | Emerging Markets
Fund | | | |
| | | | | | |
Undistributed Ordinary Income | | $ | 662,202 | | | $ | - | | | $ | - | | | $ | 152,756 | | | |
Long-Term Capital Gains | | | 443,907 | | | | 122,159 | | | | 1,113,385 | | | | - | | | |
Capital Loss Carry Forward | | | - | | | | - | | | | - | | | | (254,672) | | | |
Post October and Other Losses | | | - | | | | (262,904 | ) | | | (198,280 | ) | | | - | | | |
Unrealized Appreciation (Depreciation) | | | 293,416 | | | | 2,850,923 | | | | 2,507,230 | | | | (2,729,964) | | | |
| | | | | | |
| | $ | 1,399,525 | | | $ | 2,710,178 | | | $ | 3,422,335 | | | $ | (2,831,880) | | | |
| | | | | | |
| | | | | | | | | | | | | | | | | | |
| | | | | | | | | | | | | | | | | | |
| | | Growth & Income
Fund | | | | | | | | | | | | |
| | | | | | | | | | | | | | | | | | |
Undistributed Ordinary Income | | $ | 217,974 | | | | | | | | | | | | | | | |
Long-Term Capital Gains | | | 364,807 | | | | | | | | | | | | | | | |
Capital Loss Carry Forward | | | - | | | | | | | | | | | | | | | |
Post October and Other Losses | | | - | | | | | | | | | | | | | | | |
Unrealized Appreciation (Depreciation) | | | 512,885 | | | | | | | | | | | | | | | |
| | | | | | | | | | | | | | | | | | |
| | $ | 1,095,666 | | | | | | | | | | | | | | | |
| | | | | | | | | | | | | | | | | | |
The difference between book basis and tax basis unrealized appreciation (depreciation), undistributed net investment income (loss) and accumulated net realized gain (loss) from investments are primarily attributable to the tax deferral of losses on wash sales, mark-to-market on passive foreign investment companies, adjustments for partnerships, and C-Corporation return of capital distributions. The unrealized appreciation (depreciation) in the table above includes unrealized foreign currency gains (losses) of ($356), $58, $11 and $(22) for the Israel Common Values, International, Defensive Strategies, and Emerging Markets Funds, respectively.
130
Notes to Financial Statements
September 30, 2018 (Continued)
Timothy Plan Family of Funds
Note 10 | Capital Loss Carryforwards, Post October and Other Losses
Late year losses incurred after December 31 within the fiscal year are deemed to arise on the first business day of the following fiscal year for tax purposes. The following Funds incurred and elected to defer such late year losses as follows:
| | | | | | | | |
Fund | | Late Year Losses | | | | | |
Aggressive Growth Fund | | $ | 267,521 | | | | | |
Large/Mid Cap Growth Fund | | | 229,905 | | | | | |
Israel Common Values Fund | | | 921 | | | | | |
Strategic Growth Fund | | | 262,904 | | | | | |
Conservative Growth Fund | | | 198,280 | | | | | |
Capital losses incurred after October 31 within the fiscal year are deemed to arise on the first business day of the following fiscal year for tax purposes. The following Funds incurred and elected to defer such capital losses as follows:
| | | | | | | | |
Fund | | Post October Losses | | | | | |
International Fund | | $ | 722,283 | | | | | |
Fixed Income Fund | | | 596,436 | | | | | |
Israel Common Values Fund | | | 786,989 | | | | | |
At September 30, 2018, the Funds had capital loss carry forwards for federal income tax purposes available to offset future capital gains, utilized capital loss carryforwards and had capital loss carryforwards subject to expiration as follows:
| | | | | | | | | | | | | | | | | | | | | | | | |
| | | Capital Loss Carry Forward | | | Year | | | | | | CLCF | | | CLCF | |
| Fund | | Short-Term | | | Long-Term | | | Expiring | | | Total | | | Utilized | | | Expired | |
| Aggressive Growth Fund | | $ | - | | | $ | - | | | | - | | | $ | - | | | $ | 441,455 | | | $ | - | |
| International Fund | | | 844,129 | | | | - | | | | 2019 | | | | 844,129 | | | | 301,498 | | | | 291,487 | |
| Fixed Income Fund | | | 639,064 | | | | 262,171 | | | | Unlimited | | | | 901,235 | | | | - | | | | - | |
| High Yield Bond Fund | | | 190,727 | | | | 1,019,323 | | | | Unlimited | | | | 1,210,050 | | | | 218,979 | | | | - | |
| Israel Common Values Fund | | | 495,405 | | | | 206,819 | | | | Unlimited | | | | 702,224 | | | | - | | | | - | |
| Defensive Strategies Fund | | | - | | | | - | | | | - | | | | - | | | | 659,361 | | | | - | |
| Strategic Growth Fund | | | - | | | | - | | | | - | | | | - | | | | 952,821 | | | | - | |
| Emerging Markets Fund | | | - | | | | 254,672 | | | | Unlimited | | | | 254,672 | | | | 912,462 | | | | - | |
To the extent these loss carryforwards are used to offset future capital gains, it is probable that the amount, which is offset, will not be distributed to shareholders.
Note 11| NEW ACCOUNTING PRONOUNCEMENTS
In August 2018, the FASB issued Accounting Standards Update (“ASU”) No. 2018-13, which changes certain fair value measurement disclosure requirements. The new ASU, in addition to other modifications and additions, removes the requirement to disclose the amount and reasons for transfers between Level 1 and Level 2 of the fair value hierarchy, and the policy for the timing of transfers between levels. For investment companies, the amendments are effective for financial statements issued for fiscal years beginning after December 15, 2019, and interim periods within those fiscal years. Early adoption is allowed. At this time, management is evaluating the implications of the ASU and any impact on the financial statement disclosures.
In September 2018, the Securities and Exchange Commission released Final Rule 33-10532 captioned “Disclosure Update and Simplification” which is intended to amend certain disclosure requirements that have become redundant, duplicative, overlapping, outdated or superseded, in light of other Commission disclosure requirements, GAAP, or changes in the information environment. These changes will be effective November 5, 2018. Management is currently evaluating the impact that this release will have on the Fund’s financial statements and related disclosures.
Note 12 | SUBSEQUENT EVENTS
Subsequent events after the date of the Statements of Assets and Liabilities have been evaluated through the date the financial statements were issued. Management has determined that no events or transactions occurred requiring adjustment or disclosure in the financial statements
Note 13 | TAX INFORMATION (Unaudited)
The Strategic and Conservative Growth Funds designate the following for federal income tax purposes for the year ended September 30, 2018:
| | | | | | | | | | |
Strategic Growth Fund | | Foreign Taxes paid | | | Foreign Source Income | | | |
| | | | | | |
Timothy Israel Common Values Fund | | $ | 7,677 | | | $ | 31,220 | | | |
Timothy Emerging Markets Fund | | | 7,352 | | | | 96,477 | | | |
Timothy International Fund | | | 20,379 | | | | 229,565 | | | |
131
Notes to Financial Statements
September 30, 2018 (Continued)
Timothy Plan Family of Funds
| | | | | | | | | | |
Conservative Growth Fund | | Foreign Taxes paid | | | Foreign Source Income | | | |
| | | | | | |
Timothy Israel Common Values Fund | | $ | 7,122 | | | $ | 28,963 | | | |
Timothy Emerging Markets Fund | | | 6,264 | | | | 82,198 | | | |
Timothy International Fund | | | 14,543 | | | | 163,825 | | | |
Board Annual Approval/Renewals of Advisory and Sub-Advisory Agreements (Unaudited)
Timothy Partners, Ltd; Investment Advisor to all Funds.
The continuance of the Investment Advisory Agreement (the “IA Agreement”) on behalf of each series of the Trust between the Trust and Timothy Partners, Ltd. (“TPL”) was last approved by the Board of Trustees (“the Board”), including a majority of the Trustees who are not interested persons of the Trust or any person who is a party to the Agreement, at an in-person meeting held on February 23, 2018. A description of the factors considered by the Board in renewing the IA Agreement are set forth below.
The Trustees, including the Independent Trustees, noted with approval the Advisor’s experience and consistency in incorporating and implementing the unique, biblically-based management style that is a stated objective of all the Funds, as set forth in the Funds’ prospectus.
The Board also received and reviewed a description of TPL’s business and any personnel changes, a description of the compensation received by TPL from the Funds, information relating to the Advisor’s compliance and operational policies and procedures, and a description of any material legal proceedings or securities enforcement proceedings regarding TPL or its personnel (there were none of either). In addition, the Board requested and received financial statements of TPL for its fiscal year ended December 31, 2017, and noted that updated financial statements were provided at each Board Meeting.
The Board also received a report from TPL relating to the fees charged by TPL, both as an aggregate and in relation to fees charged by other advisors to similar funds. The materials prepared by TPL were provided to the Board in advance of the meeting. The Board considered the fees charged by TPL in light of the services provided to the Funds by TPL, the unique nature of the Funds and their moral screening requirements, which are maintained by TPL, and TPL’s role as a manager of managers. After full and careful consideration, the Board, with the independent trustees separately concurring, agreed that the fees charged by TPL were fair and reasonable in light of the services provided to the Funds.
The Board also discussed the nature, extent and quality of TPL’s services to the Funds. In particular, the Board noted with approval TPL’s commitment to maintaining certain targeted expense ratios for the Funds, its efforts in providing comprehensive and consistent moral screens to the investment managers, its efforts in maintaining appropriate oversight of the investment managers to each Fund, and its efforts to maintain ongoing regulatory compliance for the Funds. The Board also discussed TPL’s current fee structure and whether such structure would allow the Funds to realize economies of scale as they grow. The Board next considered the investment performance of each Fund and the Advisor’s performance in monitoring the investment managers of the underlying funds. The Board generally approved of each Fund’s performance, noting that the Funds invested in a manner that did not rely exclusively on investment performance. Further, the Board noted with approval that the investment managers of each Fund did not succumb to “style drift” in their management of each Fund’s assets, and that each Fund was committed to maintain its investment mandate, even if that meant under performance during periods when that style was out of favor. The Board noted with approval the Advisor’s ongoing efforts to maintain such consistent investment discipline. The Board also noted with approval that the Advisor’s business was devoted exclusively to serving the Funds, and that the Advisor did not realize any ancillary benefits or profits deriving from its relationship with the Funds. The Board further noted with approval the Advisor’s past activities on monitoring the performance of the underlying Funds’ various investment managers and the promptness and efficiency with which problems were brought to the Board’s attention and responsible remedies offered and executed. After careful discussion and consideration, the Board, including the separate concurrence of the independent Trustees, unanimously cast an affirmative vote, and determined that the renewal of the IA Agreement for another one-year period would be in the best interests of the Funds’ shareholders. In approving the renewal of the IA Agreement for an additional one year period, the Board did not place specific emphasis on any one factor discussed above, but considered all factors in equal light. Further, the Board had available and availed itself of the assistance of legal counsel at all times during its consideration of the IA Agreement renewal.
Barrow, Hanley, Mewhinney & Strauss; Sub-Advisor for the Fixed Income, High Yield Bond, and Defensive Strategies TIPS sleeve.
The Sub-Advisory Agreement between the Trust, TPL and Barrow, Hanley, Mewhinney & Strauss (“BHM&S”), on behalf of the Timothy Plan Fixed Income, High Yield Bond and Defensive Strategies TIPS sleeve Funds, was last renewed by the Board at a meeting held for that purpose, among others, on February 23, 2018. The Board considered the following factors in arriving at its conclusions to renew the BHM&S Sub-Advisory Agreement for an additional year. First, the Board considered the fees charged by BHM&S in light of the services provided by BHM&S to other similar clients. After full and careful consideration, the Board, with the independent trustees separately concurring, agreed that the fees charged by BHM&S and paid out of the fees received by TPL were fair and reasonable in light of the services provided by BHM&S. In reaching that determination, the Board relied on reports describing the fees paid to BHM&S. Next, the Board discussed the nature, extent and quality of BHM&S’s services to each Fund, including the investment performance of the Funds under BHM&S’s investment management. The Board generally approved of BHM&S’s performance, noting that the Funds managed by BHM&S invested in a manner that did not rely exclusively on investment performance. Further, the Board noted with approval that BHM&S did not succumb to “style drift” in its management of each Fund’s assets, and that BHM&S was committed to maintain its investment mandate, even if that meant under performance during periods when that style was out of favor. The Board noted with approval BHM&S’s ongoing efforts to maintain such consistent investment discipline. Next, the Board considered whether BHM&S’s current fee structure would allow the Funds to realize economies of scale as they grow. The Board decided that this particular factor was moot with respect to the BHM&S Sub-Advisory Agreement because BHM&S was paid out of the fees paid to TPL. After careful discussion and consideration, the Board, including the independent Trustees separately concurring, unanimously determined that the renewal of the BHM&S Sub-Advisory Agreement for
132
Notes to Financial Statements
September 30, 2018 (Continued)
Timothy Plan Family of Funds
another one-year period would be in the best interests of the Funds’ shareholders. In approving the renewal of the BHM&S Sub-Advisory Agreement for an additional one year period, the Board did not place specific emphasis on any one factor discussed above, but considered all factors in equal light. Further, the Board had available and availed itself of the assistance of legal counsel at all times during its consideration of the BHM&S Sub-Advisory Agreement renewal.
Westwood Management Corporation; Sub-Advisor to the Large/Mid Cap Value and the Small Cap Value Funds.
The Sub-Advisory Agreement between the Trust, TPL and Westwood Management Corporation (“Westwood”), on behalf of the Timothy Plan Small Cap Value and Large/Mid Cap Value Funds, was last renewed by the Board at a meeting held for that purpose, among others, on February 23, 2018. The Board considered the following factors in arriving at its conclusions to renew the Westwood Sub-Advisory Agreement for an additional year. First, the Board considered the fees charged by Westwood in light of the services provided by Westwood. After full and careful consideration, the Board, with the independent trustees separately concurring, agreed that the fees charged by Westwood and paid out of the fees received by TPL were fair and reasonable in light of the services provided by Westwood. Next, the Board discussed the nature, extent and quality of Westwood’s services to each Fund, including the investment performance of the Funds under Westwood’s investment management. The Board generally approved of Westwood’s performance, noting that the Funds managed by Westwood invested in a manner that did not rely exclusively on investment performance. Further, the Board noted with approval that Westwood did not succumb to “style drift” in its management of each Fund’s assets, and that Westwood was committed to maintain its investment mandate, even if that meant under performance during periods when that style was out of favor. The Board noted with approval Westwood’s ongoing efforts to maintain such consistent investment discipline. Next, the Board considered whether Westwood’s current fee structure would allow the Funds to realize economies of scale as they grow. The Board decided that this particular factor was moot with respect to the Westwood Sub-Advisory Agreement because Westwood was paid out of the fees paid to TPL. After careful discussion and consideration, the Board, including the independent Trustees separately concurring, unanimously determined that the renewal of the Westwood Sub-Advisory Agreement for another one-year period would be in the best interests of the Funds’ shareholders. In approving the renewal of the Westwood Sub-Advisory Agreement for an additional one year period, the Board did not place specific emphasis on any one factor discussed above, but considered all factors in equal light. Further, the Board had available and availed itself of the assistance of legal counsel at all times during its consideration of the Westwood Sub-Advisory Agreement renewal.
Chartwell Investment Partners; Sub-Advisor to the Aggressive Growth and Large/Mid Cap Growth Funds.
The Sub-Advisory Agreement between the Trust, TPL and Chartwell Investment Partners (“Chartwell”), on behalf of the Timothy Plan Aggressive Growth and Large/Mid Cap Growth Funds, was last renewed by the Board at a meeting held for that purpose, among others, on February 23, 2018. The Board considered the following factors in arriving at its conclusions to renew the Chartwell Sub-Advisory Agreement for an additional year. First, the Board considered the fees charged by Chartwell in light of the services provided by Chartwell. After full and careful consideration, the Board, with the independent trustees separately concurring, agreed that the fees charged by Chartwell and paid out of the fees received by TPL were fair and reasonable in light of the services provided by Chartwell. Next, the Board discussed the nature, extent and quality of Chartwell’s services to each Fund, including the investment performance of the Funds under Chartwell’s investment management. The Board generally approved of Chartwell’s performance, noting that the Funds managed by Chartwell invested in a manner that did not rely exclusively on investment performance. Further, the Board noted with approval that Chartwell did not succumb to “style drift” in its management of each Fund’s assets, and that Chartwell was committed to maintain its investment mandate, even if that meant under performance during periods when that style was out of favor. The Board noted with approval Chartwell’s ongoing efforts to maintain such consistent investment discipline. Next, the Board considered whether Chartwell’s current fee structure would allow the Funds to realize economies of scale as they grow. The Board decided that this particular factor was moot with respect to the Chartwell Sub-Advisory Agreement because Chartwell was paid out of the fees paid to TPL. After careful discussion and consideration, the Board, including the independent Trustees separately concurring, unanimously determined that the renewal of the Chartwell Sub-Advisory Agreement for another one-year period would be in the best interests of the Funds’ shareholders. In approving the renewal of the Chartwell Sub-Advisory Agreement for an additional one year period, the Board did not place specific emphasis on any one factor discussed above, but considered all factors in equal light. Further, the Board had available and availed itself of the assistance of legal counsel at all times during its consideration of the Chartwell Sub-Advisory Agreement renewal.
Eagle Global Advisors; Sub-Advisor to the International Fund and Israel Common Values Fund.
The Sub-Advisory Agreement between the Trust, TPL and Eagle Global Advisors (“Eagle”), on behalf of the Timothy Plan International Fund and Israel Common Values Fund, was last renewed by the Board at a meeting held for that purpose, among others, on February 23, 2018. The Board considered the following factors in arriving at its conclusions to renew the Eagle Sub-Advisory Agreement for an additional year. First, the Board considered the fees charged by Eagle in light of the services provided by Eagle. After full and careful consideration, the Board, with the independent trustees separately concurring, agreed that the fees charged by Eagle and paid out of the fees received by TPL were fair and reasonable in light of the services provided by Eagle. Next, the Board discussed the nature, extent and quality of Eagle’s services to the Funds, including the investment performance of the Funds under Eagle’s investment management. The Board generally approved of Eagle’s performance, noting that the Funds managed by Eagle invested in a manner that did not rely exclusively on investment performance. Further, the Board noted with approval that Eagle did not succumb to “style drift” in its management of the Funds’ assets, and that Eagle was committed to maintain its investment mandate, even if that meant under performance during periods when that style was out of favor. The Board noted with approval Eagle’s ongoing efforts to maintain such consistent investment discipline. Next, the Board considered whether Eagle’s current fee structure would allow the Funds to realize economies of scale as they grow. The Board decided that this particular factor was moot with respect to the Eagle Sub-Advisory Agreement because Eagle was paid out of the fees paid to TPL. After careful discussion and consideration, the Board, including the independent Trustees separately concurring, unanimously determined that the renewal of the Eagle Sub-Advisory Agreement for another one-year period would be in the best interests of the Funds’ shareholders. In approving the renewal of the Eagle Sub-Advisory Agreement for an additional one year period, the Board did not place specific emphasis on any one factor discussed above, but considered all factors in equal light. Further, the Board had available and availed itself of the assistance of legal counsel at all times during its consideration of the Eagle Sub-Advisory Agreement renewal.
133
Notes to Financial Statements
September 30, 2018 (Continued)
Timothy Plan Family of Funds
Brandes Investment Partners; Sub-Advisor to the Emerging Markets Fund.
The Sub-Advisory Agreement between the Trust, TPL and Brandes Investment Partners (“Brandes”), on behalf of the Timothy Plan Emerging Market Fund, was last renewed by the Board at a meeting held for that purpose, among others, on February 23, 2018. The Board considered the following factors in arriving at its conclusions to renew the Brandes Sub-Advisory Agreement for an additional year. First, the Board considered the fees charged by Brandes in light of the services provided by Brandes. After full and careful consideration, the Board, with the independent trustees separately concurring, agreed that the fees charged by Brandes and paid out of the fees received by TPL were fair and reasonable in light of the services provided by Brandes. Next, the Board discussed the nature, extent and quality of Brandes’s services to the Fund, including the investment performance of the Fund under Brandes’s investment management. The Board generally approved of Brandes’s performance, noting that the Fund managed by Brandes invested in a manner that did not rely exclusively on investment performance. Further, the Board noted with approval that Brandes did not succumb to “style drift” in its management of the Funds’ assets, and that Brandes was committed to maintain its investment mandate, even if that meant under performance during periods when that style was out of favor. The Board noted with approval Brandes’s ongoing efforts to maintain such consistent investment discipline. Next, the Board considered whether Brandes’s current fee structure would allow the Fund to realize economies of scale as it grows. The Board decided that this particular factor was moot with respect to the Brandes Sub-Advisory Agreement because Brandes was paid out of the fees paid to TPL. After careful discussion and consideration, the Board, including the independent Trustees separately concurring, unanimously determined that the renewal of the Brandes Sub-Advisory Agreement for another one-year period would be in the best interests of the Fund’s shareholders. In approving the renewal of the Eagle Sub-Advisory Agreement for an additional one year period, the Board did not place specific emphasis on any one factor discussed above, but considered all factors in equal light. Further, the Board had available and availed itself of the assistance of legal counsel at all times during its consideration of the Brandes Sub-Advisory Agreement renewal.
Macquarie Investment Management; Sub-Advisor to the Defensive Strategies Fund REITs sleeve.
The Sub-Advisory Agreement between the Trust, TPL and Macquarie Investment Management (“Macquarie”), on behalf of the Timothy Plan Defensive Strategies Fund REITs sleeve, was last renewed by the Board at a meeting held for that purpose, among others, on February 23, 2018. The Board considered the following factors in arriving at its conclusions to renew the Macquarie Sub-Advisory Agreement for an additional year. First, the Board considered the fees charged by Macquarie in light of the services provided by Macquarie. After full and careful consideration, the Board, with the independent trustees separately concurring, agreed that the fees charged by Macquarie and paid out of the fees received by TPL were fair and reasonable in light of the services provided by Macquarie. In reaching that determination, the Board relied on reports describing the fees paid to Macquarie and comparing those fees against fees paid to other investment advisors operating under similar circumstances. Next, the Board discussed the nature, extent and quality of Macquarie’s services to the Fund, including the investment performance of the Fund under Macquarie’s investment management. The Board generally approved of Macquarie’s performance, noting that the Fund managed by Macquarie invested in a manner that did not rely exclusively on investment performance. Further, the Board noted with approval that Macquarie did not succumb to “style drift” in its management of the Fund’s assets, and that Macquarie was committed to maintain its investment mandate, even if that meant under performance during periods when that style was out of favor. The Board noted with approval Macquarie’s ongoing efforts to maintain such consistent investment discipline. Next, the Board considered whether Macquarie’s current fee structure would allow the Fund to realize economies of scale as it grows. The Board decided that this particular factor was moot with respect to the Macquarie Sub-Advisory Agreement because Macquarie was paid out of the fees paid to TPL. After careful discussion and consideration, the Board, including the independent Trustees separately concurring, unanimously determined that the renewal of the Macquarie Sub-Advisory Agreement for another one-year period would be in the best interests of the Fund’s shareholders. In approving the renewal of the Macquarie Sub-Advisory Agreement for an additional one year period, the Board did not place specific emphasis on any one factor discussed above, but considered all factors in equal light. Further, the Board had available and availed itself of the assistance of legal counsel at all times during its consideration of the Macquarie Sub-Advisory Agreement renewal.
CoreCommodity Management, LLC; Sub-Advisor to the Defensive Strategies Fund commodities sleeve.
The Sub-Advisory Agreement between the Trust, TPL and CoreCommodity Management, LLC (“Core”), on behalf of the Timothy Plan Defensive Strategies Fund commodity sleeve, was last renewed by the Board at a meeting held for that purpose, among others, on February 23, 2018. The Board considered the following factors in arriving at its conclusions to renew the Core Sub-Advisory Agreement. First, the Board considered the fees charged by Core in light of the services provided by Core. After full and careful consideration, the Board, with the independent trustees separately concurring, agreed that the fees charged by Core and paid out of the fees received by TPL were fair and reasonable in light of the services provided by Core. Next, the Board discussed the nature, extent and quality of Core’s services to the Fund, including the investment performance of the Fund under Core’s investment management. The Board generally approved of Core’s performance, noting that the Fund managed by Core invested in a manner that did not rely exclusively on investment performance. Further, the Board noted with approval that Core did not succumb to “style drift” in its management of the Fund’s assets, and that Core was committed to maintain its investment mandate, even if that meant under performance during periods when that style was out of favor. The Board noted with approval Core’s ongoing efforts to maintain such consistent investment discipline. Next, the Board considered whether Core’s current fee structure would allow the Fund to realize economies of scale as it grows. The Board decided that this particular factor was moot with respect to the Core Sub-Advisory Agreement because Core was paid out of the fees paid to TPL. After careful discussion and consideration, the Board, including the independent Trustees separately concurring, unanimously determined that the renewal of the Core Sub-Advisory Agreement would be in the best interests of the Fund’s shareholders. However, the Board requested that additional information be provided by Core at the next Meeting in May, 2018. Accordingly, the Board approved the reneal of the Core Sub-IA Agreement through May 31, 2018. In approving the renewal of the Core Sub-Advisory Agreement, the Board did not place specific emphasis on any one factor discussed above, but considered all factors in equal light. Further, the Board had available and availed itself of the assistance of legal counsel at all times during its consideration of the Core Sub-Advisory Agreement renewal.
134
Notes to Financial Statements
September 30, 2018 (Continued)
Timothy Plan Family of Funds
James Investment Partners; Sub-Advisor to the Growth and Income Fund.
The Sub-Advisory Agreement between the Trust, TPL and James Investment Research, Inc. (“James”), on behalf of the Timothy Plan Growth and Income Fund, was last renewed by the Board at a meeting held for that purpose, among others, on February 23, 2018. The Board considered the following factors in arriving at its conclusions to renew the James Sub-Advisory Agreement for an additional year. First, the Board considered the fees charged by James in light of the services provided by James. After full and careful consideration, the Board, with the independent trustees separately concurring, agreed that the fees charged by James and paid out of the fees received by TPL were fair and reasonable in light of the services provided by James. Next, the Board discussed the nature, extent and quality of James’s services to the Fund, including the investment performance of the Fund under James’s investment management. The Board generally approved of James’s performance, noting that the Fund managed by James invested in a manner that did not rely exclusively on investment performance. Further, the Board noted with approval that James did not succumb to “style drift” in its management of the Fund’s assets, and that James was committed to maintain its investment mandate, even if that meant under performance during periods when that style was out of favor. The Board noted with approval James’s ongoing efforts to maintain such consistent investment discipline. Next, the Board considered whether James’s current fee structure would allow the Fund to realize economies of scale as it grows. The Board decided that this particular factor was moot with respect to the James Sub-Advisory Agreement because James was paid out of the fees paid to TPL. After careful discussion and consideration, the Board, including the independent Trustees separately concurring, unanimously determined that the renewal of the James Sub-Advisory Agreement for another one-year period would be in the best interests of the Fund’s shareholders. In approving the renewal of the James Sub-Advisory Agreement for an additional one year period, the Board did not place specific emphasis on any one factor discussed above, but considered all factors in equal light. Further, the Board had available and availed itself of the assistance of legal counsel at all times during its consideration of the James Sub-Advisory Agreement renewal.
135
REPORT OF INDEPENDENT REGISTERED PUBLIC ACCOUNTING FIRM
To the Shareholders and Board of Trustees of
The Timothy Plan
Opinion on the Financial Statements
We have audited the accompanying statements of assets and liabilities, including the schedules of investments, of The Timothy Plan, comprising Timothy Plan Aggressive Growth Fund, Timothy Plan International Fund, Timothy Plan Large/Mid Cap Growth Fund, Timothy Plan Small Cap Value Fund, Timothy Plan Large/Mid Cap Value Fund, Timothy Plan Fixed Income Fund, Timothy Plan High Yield Bond Fund, Timothy Plan Israel Common Values Fund, Timothy Plan Defensive Strategies Fund, Timothy Plan Strategic Growth Fund, Timothy Plan Conservative Growth Fund, Timothy Plan Emerging Markets Fund, and Timothy Plan Growth & Income Fund (the “Funds”), as of September 30, 2018, and the related statements of operations for the year then ended, the statements of changes in net assets for each of the two years in the period then ended, including the related notes, and the financial highlights for each of the five periods in the period then ended (collectively referred to as the “financial statements”). In our opinion, the financial statements present fairly, in all material respects, the financial position of each of the Funds as of September 30, 2018, the results of their operations for the year then ended, the changes in their net assets for each of the two years in the period then ended, and the financial highlights for each of the five periods in the period then ended, in conformity with accounting principles generally accepted in the United States of America.
Basis for Opinion
These financial statements are the responsibility of the Funds’ management. Our responsibility is to express an opinion on the Funds’ financial statements based on our audits. We are a public accounting firm registered with the Public Company Accounting Oversight Board (United States) (“PCAOB”) and are required to be independent with respect to the Funds in accordance with the U.S. federal securities laws and the applicable rules and regulations of the Securities and Exchange Commission and the PCAOB.
We conducted our audits in accordance with the standards of the PCAOB. Those standards require that we plan and perform the audit to obtain reasonable assurance about whether the financial statements are free of material misstatement, whether due to error or fraud.
Our audits include performing procedures to assess the risks of material misstatement of the financial statements, whether due to error or fraud, and performing procedures that respond to those risks. Such procedures include examining, on a test basis, evidence regarding the amounts and disclosures in the financial statements and confirmation of securities owned as of September 30, 2018, including physical observation of precious metals, by correspondence with the custodian and brokers or by other appropriate auditing procedures where replies from brokers or counterparties were not received. Our audits also included evaluating the accounting principles used and significant estimates made by management, as well as evaluating the overall presentation of the financial statements. We believe that our audits provide a reasonable basis for our opinion.
We have served as the auditor of one or more investment companies advised by Timothy Partners, Ltd., since 2005.
COHEN & COMPANY, LTD.
Cleveland, Ohio
November 28, 2018
136
Expense Examples – (Unaudited)
September 30, 2018
As a shareholder of a Fund, you incur two types of costs: direct costs, such as wire fees and low balance fees; and indirect costs, including management fees, and other Fund operating expenses. This example is intended to help you understand your indirect costs, also referred to as “ongoing costs”, (in dollars) of investing in each Fund, and to compare these costs with the ongoing costs of investing in other mutual funds.
This example is based on an investment of $1,000 invested at the beginning of the period and held for the entire six-month period of April 1, 2018, through September 30, 2018.
Actual Expenses
The first line of the following tables provides information about actual account values and actual expenses. You may use the information in this line, together with the amount you invested at the beginning of the period, to estimate the expenses that you paid over the period. Simply divide your account value by $1,000 (for example, an $8,600 account value divided by $1,000 = 8.6), then multiply the result by the number in the first line under the heading “Expenses Paid During Period” to estimate the expenses you paid on your account during this period.
Hypothetical Example for Comparison Purposes
The second line of the tables provides information about hypothetical account values and hypothetical expenses based on each Fund’s actual expense ratio and an assumed rate of return of 5% per year before expenses, which is not the Fund’s actual return. The hypothetical account values and expenses may not be used to estimate the actual ending account balance or expenses you paid for the period. You may use this information to compare ongoing costs of investing in each Fund and other funds. To do so, compare this 5% hypothetical example with the 5% hypothetical examples that appear in the shareholder reports of other funds.
Please note that the expenses shown in the tables are meant to highlight your ongoing costs only and do not reflect any direct costs, such as wire fees or low balance fees. Therefore, the second line of the table is useful in comparing ongoing costs only, and will not help you determine the relative total costs of owning different funds. In addition, if these direct costs were included, your costs would be higher.
AGGRESSIVE GROWTH FUND
| | | | | | | | | | |
| | | Beginning Account
Value | | | | Ending Account
Value | | | | Expenses Paid
During Period |
| | | | | |
| | | 4/1/2018 | | | | 9/30/2018 | | | | 4/1/2018 through
9/30/2018 |
Actual - Class A * | | $1,000.00 | | | | $1,107.50 | | | | $ 9.25 |
Hypothetical - Class A ** | | $1,000.00 | | | | $1,016.29 | | | | $ 8.85 |
Actual - Class C * | | $1,000.00 | | | | $1,103.90 | | | | $13.19 |
Hypothetical - Class C ** | | $1,000.00 | | | | $1,012.53 | | | | $12.61 |
Actual - Class I * | | $1,000.00 | | | | $1,108.40 | | | | $ 7.93 |
Hypothetical - Class I ** | | $1,000.00 | | | | $1,017.55 | | | | $ 7.59 |
| * | Expenses are equal to the Fund’s annualized expense ratio of 1.75% for Class A, 2.50% for Class C and 1.50% for Class I, which is net of any expenses paid indirectly, multiplied by the average account value over the period, multiplied by 183 days/365 days (to reflect the partial year period). The Aggressive Growth Fund’s ending account value on the first line of each share class in the table is based on its actual total return of 10.75% for Class A, 10.39% for Class C and 10.84% for Class I for the period of April 1, 2018, to September 30, 2018. |
| ** | Assumes a 5% return before expenses. |
137
Expense Examples – (Unaudited)(Continued)
September 30, 2018
INTERNATIONAL FUND
| | | | | | | | | | |
| | | Beginning Account
Value | | | | Ending Account
Value | | | | Expenses Paid
During Period |
| | | | | |
| | | 4/1/2018 | | | | 9/30/2018 | | | | 4/1/2018 through
9/30/2018 |
Actual - Class A * | | $1,000.00 | | | | $ 951.20 | | | | $ 8.41 |
Hypothetical - Class A ** | | $1,000.00 | | | | $1,016.44 | | | | $ 8.69 |
Actual - Class C * | | $1,000.00 | | | | $ 947.60 | | | | $12.06 |
Hypothetical - Class C ** | | $1,000.00 | | | | $1,012.68 | | | | $12.46 |
Actual - Class I * | | $1,000.00 | | | | $ 952.20 | | | | $ 7.19 |
Hypothetical - Class I ** | | $1,000.00 | | | | $1,017.70 | | | | $ 7.44 |
| * | Expenses are equal to the Fund’s annualized expense ratio of 1.72% for Class A, 2.47% for Class C and 1.47% for Class I, which is net of any expenses paid indirectly, multiplied by the average account value over the period, multiplied by 183 days/365 days (to reflect the partial year period). The International Fund’s ending account value on the first line of each share class in the table is based on its actual total return of (4.88)% for Class A, (5.24)% for Class C, and (4.78)% for Class I for the period of April 1, 2018, to September 30, 2018. |
| ** | Assumes a 5% return before expenses. |
LARGE/MID CAP GROWTH FUND
| | | | | | | | | | |
| | | Beginning Account Value | | | | Ending Account Value | | | | Expenses Paid During Period |
| | | | | |
| | | 4/1/2018 | | | | 9/30/2018 | | | | 4/1/2018 through
9/30/2018 |
Actual - Class A * | | $1,000.00 | | | | $1,072.30 | | | | $ 8.00 |
Hypothetical - Class A ** | | $1,000.00 | | | | $1,017.35 | | | | $ 7.79 |
Actual - Class C * | | $1,000.00 | | | | $1,067.10 | | | | $11.87 |
Hypothetical - Class C ** | | $1,000.00 | | | | $1,013.59 | | | | $11.56 |
Actual - Class I * | | $1,000.00 | | | | $1,072.40 | | | | $ 6.65 |
Hypothetical - Class I ** | | $1,000.00 | | | | $1,018.65 | | | | $ 6.48 |
| * | Expenses are equal to the Fund’s annualized expense ratio of 1.54% for Class A, 2.29% for Class C and 1.28% for Class I, which is net of any expenses paid indirectly, multiplied by the average account value over the period, multiplied by 183 days/365 days (to reflect the partial year period). The Large/Mid Cap Growth Fund’s ending account value on the first line of each share class in the table is based on its actual total return of 7.23% for Class A, 6.71% for Class C, and 7.24% for Class I for the period of April 1, 2018, to September 30, 2018. |
| ** | Assumes a 5% return before expenses. |
SMALL CAP VALUE FUND
| | | | | | | | | | |
| | | Beginning Account
Value | | | | Ending Account
Value | | | | Expenses Paid
During Period |
| | | | | |
| | | 4/1/2018 | | | | 9/30/2018 | | | | 4/1/2018 through
9/30/2018 |
Actual - Class A * | | $1,000.00 | | | | $1,064.40 | | | | $ 8.02 |
Hypothetical - Class A ** | | $1,000.00 | | | | $1,017.30 | | | | $ 7.84 |
Actual - Class C * | | $1,000.00 | | | | $1,060.40 | | | | $11.88 |
Hypothetical - Class C ** | | $1,000.00 | | | | $1,013.54 | | | | $11.61 |
Actual - Class I * | | $1,000.00 | | | | $1,065.70 | | | | $ 6.84 |
Hypothetical - Class I ** | | $1,000.00 | | | | $1,018.45 | | | | $ 6.68 |
| * | Expenses are equal to the Fund’s annualized expense ratio of 1.55% for Class A, 2.30% for Class C and 1.32% for Class I, which is net of any expenses paid indirectly, multiplied by the average account value over the period, multiplied by 183 days/365 days (to reflect the partial year period). The Large/Mid Cap Growth Fund’s ending account value on the first line of each share class in the table is based on its actual total return of 6.44% for Class A, 6.04% for Class C, and 6.57% for Class I for the period of April 1, 2018, to September 30, 2018. |
| ** | Assumes a 5% return before expenses. |
138
Expense Examples – (Unaudited)(Continued)
September 30, 2018
LARGE/MID CAP VALUE FUND
| | | | | | | | | | |
| | | Beginning Account
Value | | | | Ending Account
Value | | | | Expenses Paid
During Period |
| | | | | |
| | | 4/1/2018 | | | | 9/30/2018 | | | | 4/1/2018 through
9/30/2018 |
Actual - Class A * | | $1,000.00 | | | | $1,054.30 | | | | $ 7.11 |
Hypothetical - Class A ** | | $1,000.00 | | | | $1,018.15 | | | | $ 6.98 |
Actual - Class C * | | $1,000.00 | | | | $1,050.30 | | | | $10.95 |
Hypothetical - Class C ** | | $1,000.00 | | | | $1,014.39 | | | | $10.76 |
Actual - Class I * | | $1,000.00 | | | | $1,055.40 | | | | $ 5.82 |
Hypothetical - Class I ** | | $1,000.00 | | | | $1,019.40 | | | | $ 5.72 |
| * | Expenses are equal to the Fund’s annualized expense ratio of 1.38% for Class A, 2.13% for Class C, and 1.13% for Class I which is net of any expenses paid indirectly, multiplied by the average account value over the period, multiplied by 183 days/365 days (to reflect the partial year period). The Large/Mid Cap Value Fund’s ending account value on the first line of each share class in the table is based on its actual total return of 5.43% for Class A, 5.03% for Class C, and 5.54% for Class I for the period of April 1, 2018, to September 30, 2018. |
| ** | Assumes a 5% return before expenses. |
FIXED INCOME FUND
| | | | | | | | | | |
| | | Beginning Account
Value | | | | Ending Account
Value | | | | Expenses Paid
During Period |
| | | | | |
| | | 4/1/2018 | | | | 9/30/2018 | | | | 4/1/2018 through
9/30/2018 |
Actual - Class A * | | $1,000.00 | | | | $ 997.00 | | | | $ 5.61 |
Hypothetical - Class A ** | | $1,000.00 | | | | $1,019.45 | | | | $ 5.67 |
Actual - Class C * | | $1,000.00 | | | | $ 992.10 | | | | $ 9.34 |
Hypothetical - Class C ** | | $1,000.00 | | | | $1,015.69 | | | | $ 9.45 |
Actual - Class I * | | $1,000.00 | | | | $ 998.20 | | | | $ 4.26 |
Hypothetical - Class I ** | | $1,000.00 | | | | $1,020.81 | | | | $ 4.31 |
| * | Expenses are equal to the Fund’s annualized expense ratio of 1.12% for Class A, 1.87% for Class C, and 0.85% for Class I which is net of any expenses paid indirectly, multiplied by the average account value over the period, multiplied by 183 days/365 days (to reflect the partial year period). The Fixed Income Fund’s ending account value on the first line of each share class in the table is based on its actual total return of (0.30)% for Class A, (0.79)% for Class C, and (0.18)% for Class I for the period of April 1, 2018, to September 30, 2018. |
| ** | Assumes a 5% return before expenses. |
HIGH YIELD BOND FUND
| | | | | | | | | | |
| | | Beginning Account
Value | | | | Ending Account
Value | | | | Expenses Paid
During Period |
| | | | | |
| | | 4/1/2018 | | | | 9/30/2018 | | | | 4/1/2018 through
9/30/2018 |
Actual - Class A * | | $1,000.00 | | | | $1,015.30 | | | | $ 7.73 |
Hypothetical - Class A ** | | $1,000.00 | | | | $1,017.40 | | | | $ 7.74 |
Actual - Class C * | | $1,000.00 | | | | $1,011.30 | | | | $ 11.45 |
Hypothetical - Class C ** | | $1,000.00 | | | | $1,013.69 | | | | $ 11.46 |
Actual - Class I * | | $1,000.00 | | | | $1,016.60 | | | | $ 6.42 |
Hypothetical - Class I ** | | $1,000.00 | | | | $1,018.70 | | | | $ 6.43 |
| ** | Expenses are equal to the Fund’s annualized expense ratio of 1.53% for Class A, 2.27% for Class C, and 1.27% for Class I which is net of any expenses paid indirectly, multiplied by the average account value over the period, multiplied by 183 days/365 days (to reflect the partial year period). The High Yield Bond Fund’s ending account value on the first line of each share class in the table is based on its actual total return of 1.53% for Class A, 1.13% for Class C, and 1.66% for Class I for the period of April 1, 2018, to September 30, 2018. |
| ** | Assumes a 5% return before expenses. |
139
Expense Examples – (Unaudited)(Continued)
September 30, 2018
DEFENSIVE STRATEGIES FUND
| | | | | | | | | | |
| | | Beginning Account
Value | | | | Ending Account
Value | | | | Expenses Paid
During Period |
| | | | | |
| | | 4/1/2018 | | | | 9/30/2018 | | | | 4/1/2018 through
9/30/2018 |
Actual - Class A * | | $1,000.00 | | | | $1,008.80 | | | | $ 6.19 |
Hypothetical - Class A ** | | $1,000.00 | | | | $1,018.90 | | | | $ 6.23 |
Actual - Class C * | | $1,000.00 | | | | $1,005.50 | | | | $ 9.95 |
Hypothetical - Class C ** | | $1,000.00 | | | | $1,015.14 | | | | $10.00 |
Actual - Class I * | | $1,000.00 | | | | $1,010.60 | | | | $ 4.99 |
Hypothetical - Class I ** | | $1,000.00 | | | | $1,020.10 | | | | $ 5.01 |
| * | Expenses are equal to the Fund’s annualized expense ratio of 1.23% for Class A, 1.98% for Class C and 0.99% for Class I, which is net of any expenses paid indirectly, multiplied by the average account value over the period, multiplied by 183 days/365 days (to reflect the partial year period). The Defensive Strategies Fund’s ending account value on the first line of each share class in the table is based on its actual total return of 0.88% for Class A, 0.55% for Class C and 1.06% for Class I for the period of April 1, 2018, to September 30, 2018. |
| ** | Assumes a 5% return before expenses. |
STRATEGIC GROWTH FUND
| | | | | | | | | | |
| | | Beginning Account
Value | | | | Ending Account
Value | | | | Expenses Paid
During Period |
| | | | | |
| | | 4/1/2018 | | | | 9/30/2018 | | | | 4/1/2018 through
9/30/2018 |
Actual - Class A * | | $1,000.00 | | | | $1,003.10 | | | | $ 5.77 |
Hypothetical - Class A ** | | $1,000.00 | | | | $1,019.30 | | | | $ 5.82 |
Actual - Class C * | | $1,000.00 | | | | $ 998.90 | | | | $ 9.52 |
Hypothetical - Class C ** | | $1,000.00 | | | | $1,015.54 | | | | $ 9.60 |
| * | Expenses are equal to the Fund’s annualized expense ratio of 1.15% for Class A and 1.90% for Class C, which is net of any expenses paid indirectly, multiplied by the average account value over the period, multiplied by 183 days/365 days (to reflect the partial year period). The Strategic Growth Fund’s ending account value on the first line of each share class in the table is based on its actual total return of 0.31% for Class A and (0.11)% for Class C for the six-month period of April 1, 2018, to September 30, 2018. |
| ** | Assumes a 5% return before expenses. |
CONSERVATIVE GROWTH FUND
| | | | | | | | | | |
| | | Beginning Account
Value | | | | Ending Account
Value | | | | Expenses Paid
During Period |
| | | | | |
| | | 4/1/2018 | | | | 9/30/2018 | | | | 4/1/2018 through
9/30/2018 |
Actual - Class A * | | $1,000.00 | | | | $1,0003.70 | | | | $ 5.68 |
Hypothetical - Class A ** | | $1,000.00 | | | | $1,019.40 | | | | $ 5.72 |
Actual - Class C * | | $1,000.00 | | | | $1,000.00 | | | | $ 9.38 |
Hypothetical - Class C ** | | $1,000.00 | | | | $1,015.69 | | | | $ 9.45 |
| * | Expenses are equal to the Fund’s annualized expense ratio of 1.13% for Class A and 1.87% for Class C, which is net of any expenses paid indirectly, multiplied by the average account value over the period, multiplied by 183 days/365 days (to reflect the partial year period). The Conservative Growth Fund’s ending account value on the first line of each share class in the table is based on its actual total return of 0.37% for Class A and 0.00% for Class C for the six-month period of April 1, 2018, to September 30, 2018. |
| ** | Assumes a 5% return before expenses. |
140
Expense Examples – (Unaudited)(Continued)
September 30, 2018
ISRAEL COMMON VALUES FUND
| | | | | | | | | | |
| | | Beginning Account
Value | | | | Ending Account
Value | | | | Expenses Paid
During Period |
| | | | | |
| | | 4/1/2018 | | | | 9/30/2018 | | | | 4/1/2018 through
9/30/2018 |
Actual - Class A * | | $1,000.00 | | | | $1,066.40 | | | | $10.41 |
Hypothetical - Class A ** | | $1,000.00 | | | | $1,014.99 | | | | $10.15 |
Actual - Class C * | | $1,000.00 | | | | $1,061.90 | | | | $14.32 |
Hypothetical - Class C ** | | $1,000.00 | | | | $1,011.18 | | | | $13.97 |
Actual - Class I * | | $1,000.00 | | | | $1,067.50 | | | | $ 9.23 |
Hypothetical - Class I ** | | $1,000.00 | | | | $1,016.14 | | | | $ 9.00 |
| * | Expenses are equal to the Fund’s annualized expense ratio of 2.01% for Class A, 2.77% for Class C and 1.78% for Class I, which is net of any expenses paid indirectly, multiplied by the average account value over the period, multiplied by 183 days/365 days (to reflect the partial year period). The Israel Common Values Fund’s ending account value on the first line of each share class in the table is based on its actual total return of 6.64% for Class A, 6.19% for Class C and 6.75% for Class I for the period of April 1, 2018, to September 30, 2018. |
| ** | Assumes a 5% return before expenses. |
EMERGING MARKETS FUND
| | | | | | | | | | |
| | | Beginning Account
Value | | | | Ending Account
Value | | | | Expenses Paid
During Period |
| | | | | |
| | | 4/1/2018 | | | | 9/30/2018 | | | | 4/1/2018 through
9/30/2018 |
Actual - Class A * | | $1,000.00 | | | | $ 875.10 | | | | $14.05 |
Hypothetical - Class A ** | | $1,000.00 | | | | $1,010.08 | | | | $15.07 |
Actual - Class C * | | $1,000.00 | | | | $ 871.90 | | | | $17.83 |
Hypothetical - Class C ** | | $1,000.00 | | | | $1,006.02 | | | | $19.11 |
Actual - Class I * | | $1,000.00 | | | | $ 876.80 | | | | $13.08 |
Hypothetical - Class I ** | | $1,000.00 | | | | $1,011.13 | | | | $14.02 |
| * | Expenses are equal to the Fund’s annualized expense ratio of 2.99% for Class A, 3.80% for Class C and 2.78% for Class I, which is net of any expenses paid indirectly, multiplied by the average account value over the period, multiplied by 183 days/365 days to reflect the partial year period). The Emerging Markets Fund’s ending account value on the first line of each share class in the table is based on its actual total return of (12.49)% for Class A, (12.81)% for Class C and (12.32)% for Class I for the period of April 1, 2018, to September 30, 2018. |
| ** | Assumes a 5% return before expenses. |
GROWTH & INCOME FUND
| | | | | | | | | | |
| | | Beginning Account
Value | | | | Ending Account
Value | | | | Expenses Paid
During Period |
| | | | | |
| | | 4/1/2018 | | | | 9/30/2018 | | | | 4/1/2018 through
9/30/2018 |
Actual - Class A * | | $1,000.00 | | | | $ 994.20 | | | | $ 8.75 |
Hypothetical - Class A ** | | $1,000.00 | | | | $1,016.29 | | | | $ 8.85 |
Actual - Class C * | | $1,000.00 | | | | $ 990.60 | | | | $12.48 |
Hypothetical - Class C ** | | $1,000.00 | | | | $1,012.53 | | | | $12.61 |
Actual - Class I *** | | $1,000.00 | | | | $ 995.60 | | | | $ 7.50 |
Hypothetical - Class I ** | | $1,000.00 | | | | $1,017.55 | | | | $ 7.59 |
| * | Expenses are equal to the Fund’s annualized expense ratio of 1.75% for Class A, 2.50% for Class C and 1.50% for Class I, which is net of any expenses paid indirectly, multiplied by the average account value over the period, multiplied by 183 days/365 days (to reflect the partial year period). The Growth & Income Fund’s ending account value on the first line of each share class in the table is based on its actual total return of (0.58)% for Class A, (0.94)% for Class C and (0.44)% for Class I for the period of April 1, 2018, to September 30, 2018. |
| ** | Assumes a 5% return before expenses. |
141
Officers and Trustees of the Trust (Unaudited)
The Trustees and principal executive officers of the Trust and their principal occupations for the past five years are listed as follows:
INTERESTED TRUSTEES
| | | | | | |
| Name, Age and Address | | Position(s) Held With Trust | | Term of Office and Length of Time Served | | Number of Portfolios in Fund Complex Overseen by Trustee |
Arthur D. Ally* | | Chairman and President | | Indefinite; Trustee and President since 1994 | | 13 |
1055 Maitland Center Commons | | | | | | |
Maitland, FL | | | | | | Other Directorships |
| | Principal Occupation During Past 5 Years | | Held by Trustee |
Born: 1942 | | President and controlling shareholder of Covenant Funds, Inc. (“CFI”), a holding company. President and general partner of Timothy Partners, Ltd. (“TPL”), the investment Advisor and principal underwriter to each Fund. CFI is also the managing general partner of TPL. | | None |
| | | | | | |
| Name, Age and Address | | Position(s) Held With Trust | | Term of Office and Length of Time Served | | Number of Portfolios in Fund Complex Overseen by Trustee |
Joseph E. Boatwright** | | Trustee, Secretary | | Indefinite; Trustee and Secretary since 1995 | | 13 |
1055 Maitland Center Commons | | | | | | Other Directorships |
Maitland, FL | | Principal Occupation During Past 5 Years | | Held by Trustee |
Born: 1930 | | Retired Minister. Currently serves as a consultant to the Greater Orlando Baptist Association. Served as Senior Pastor to Aloma Baptist Church from 1970-1996. | | None |
| | | | | | |
| Name, Age and Address | | Position(s) Held With Trust | | Term of Office and Length of Time Served | | Number of Portfolios in Fund Complex Overseen by Trustee |
Mathew D. Staver** | | Trustee | | Indefinite; Trustee since 2000 | | 13 |
1055 Maitland Center Commons | | | | | | Other Directorships |
Maitland, FL | | Principal Occupation During Past 5 Years | | Held by Trustee |
Born: 1956 | | Attorney specializing in free speech, appellate practice and religious liberty constitutional law. Founder of Liberty Counsel, a religious civil liberties education and legal defense organization. Host of two radio programs devoted to religious freedom issues. Editor of a monthly newsletter devoted to religious liberty topics. Mr. Staver has argued before the United States Supreme Court and has published numerous legal articles. | | None |
| | | | | | |
| Name, Age and Address | | Position(s) Held With Trust | | Term of Office and Length of Time Served | | Number of Portfolios in Fund Complex Overseen by Trustee |
Charles E. Nelson*** | | Trustee | | Indefinite; Trustee since 2000 | | 13 |
1055 Maitland Center Commons | | | | | | Other Directorships |
Maitland, FL | | Principal Occupation During Past 5 Years | | Held by Trustee |
Born: 1934 | | Certified Public Accountant, semi-retired. Former non-profit industry accounting officer. Former financial executive with commercial bank. Former partner national accounting firm. | | None |
* Mr. Ally is an “interested” Trustee, as that term is defined in the 1940 Act, because of his positions with and financial interests in CFI and TPL.
** Messrs. Boatwright and Staver are “interested” Trustees, as that term is defined in the 1940 Act, because each has a limited partnership interest in TPL.
***Mr. Nelson is an “interested” Trustee, as that term is defined in the 1940 Act, because he is employed by an affiliate of the Advisor.
142
Officers and Trustees of the Trust (Unaudited)
(Continued)
INDEPENDENT TRUSTEES
| | | | | | |
| Name, Age and Address | | Position(s) Held With Trust | | Term of Office and Length of Time Served | | Number of Portfolios in Fund Complex Overseen by Trustee |
Kenneth Blackwell | | Trustee | | Indefinite; Trustee since 2011 | | 13 |
1055 Maitland Center Commons | | | | | | Other Directorships |
Maitland, FL | | Principal Occupation During Past 5 Years | | Held by Trustee |
Born: 1948 | | Currently serving as an independent consultant or Fellow with the Family Research Council and the American Civil Rights Union, and is a Visiting Professor at Liberty University, Lynchburg, VA. Former Secretary of State for the State of Ohio. | | None |
| | | | | | |
| Name, Age and Address | | Position(s) Held With Trust | | Term of Office and Length of Time Served | | Number of Portfolios in Fund Complex Overseen by Trustee |
Richard W. Copeland | | Trustee | | Indefinite; Trustee since 2005 | | 13 |
1055 Maitland Center Commons | | | | | | Other Directorships |
| | |
Maitland, FL | | Principal Occupation During Past 5 Years | | Held by Trustee |
Born: 1947 | | Associate Professor Stetson University for past 40 years. Retired Principal of Copeland & Covert, Attorneys at Law; specializing in tax and estate planning. B.A. from Mississippi College, JD from University of Florida and LLM Taxation from University of Miami. | | None |
| | | | | | |
| Name, Age and Address | | Position(s) Held With Trust | | Term of Office and Length of Time Served | | Number of Portfolios in Fund Complex Overseen by Trustee |
Deborah Honeycutt | | Trustee | | Indefinite; Trustee since 2010 | | 13 |
1055 Maitland Center Commons | | | | | | Other Directorships |
Maitland, FL | | Principal Occupation During Past 5 Years | | Held by Trustee |
Born: 1947 | | Dr. Honeycutt is a licensed physician currently serving as Medical Director of Clayton State University Health Services in Morrow, GA, CEO of Minority Health Services in Atlanta, and as a volunteer at Good Shepherd Clinic. Dr. Honeycutt received her B.A. and M.D. at the University of Illinois. | | None |
| | | | | | |
| Name, Age and Address | | Position(s) Held With Trust | | Term of Office and Length of Time Served | | Number of Portfolios in Fund Complex Overseen by Trustee |
Bill Johnson | | Trustee | | Indefinite; Trustee since 2005 | | 13 |
1055 Maitland Center Commons | | | | | | Other Directorships |
Maitland, FL | | Principal Occupation During Past 5 Years | | Held by Trustee |
Born: 1946 | | President (and Founder) of American Decency Association, Freemont, MI since 1999. Previously served as Michigan State Director for American Family Association (1987-1999). Previously a public school teacher for 18 years. B.S. from Michigan State University and a Masters of Religious Education from Grand Rapids Baptist Seminary. | | None |
143
Officers and Trustees of the Trust (Unaudited)
(Continued)
| | | | | | |
| Name, Age and Address | | Position(s) Held With Trust | | Term of Office and Length of Time Served | | Number of Portfolios in Fund Complex Overseen by Trustee |
John C. Mulder | | Trustee | | Indefinite; Trustee since 2005 | | 13 |
1055 Maitland Center Commons | | | | | | Other Directorships |
Maitland, FL | | Principal Occupation During Past 5 Years | | Held by Trustee |
Born: 1950 | | President of WaterStone (formerly the Christian Community Foundation and National Foundation) since 2001. Prior: 22 years of executive experience for a group of banks and a trust company. B.A. in Economics from Wheaton College and MBA from University of Chicago. | | None |
| | | | | | |
| Name, Age and Address | | Position(s) Held With Trust | | Term of Office and Length of Time Served | | Number of Portfolios in Fund Complex Overseen by Trustee |
Scott Preissler, Ph.D. | | Trustee | | Indefinite; Trustee since 2004 | | 13 |
1055 Maitland Center Commons | | | | | | Other Directorships |
Maitland, FL | | Principal Occupation During Past 5 Years | | Held by Trustee |
Born: 1960 | | Director of Steward Leadership and Professor in Residence at Shorter University. Former Chairman of Stewardship Studies at Southwestern Baptist Theological Seminary, Ft. Worth, TX. Also serves as Founder and Chairman of the International Center for Biblical Stewardship. | | None |
| | | | | | |
| Name, Age and Address | | Position(s) Held With Trust | | Term of Office and Length of Time Served | | Number of Portfolios in Fund Complex Overseen by Trustee |
Alan M. Ross | | Trustee, Vice Chairman | | Indefinite; Trustee since 2004 | | 13 |
1055 Maitland Center Commons | | | | | | Other Directorships |
Maitland, FL | | Principal Occupation During Past 5 Years | | Held by Trustee |
Born: 1951 | | Founder and CEO of Corporate Development Institute which he founded in 2000. Previously he served as President and CEO of Fellowship of Companies for Christ and has authored three books: Beyond World Class, Unconditional Excellence, Breaking Through to Prosperity. | | None |
| | | | | | |
| Name, Age and Address | | Position(s) Held With Trust | | Term of Office and Length of Time Served | | Number of Portfolios in Fund Complex Overseen by Trustee |
Patrice Tsague | | Trustee | | Indefinite; Trustee since 2011 | | 13 |
1055 Maitland Center Commons | | | | | | Other Directorships |
Maitland, FL | | Principal Occupation During Past 5 Years | | Held by Trustee |
Born: 1973 | | President and Chief Servant Officer of the Nehemiah Project International Ministries Inc. since 1999. | | None |
The Fund’s Statement of Additional Information includes additional information about the Trustees and is available free of charge, upon request, by calling toll-free at 1-800-846-7526.
144
Privacy Notice
| | |
FACTS | | WHAT DOES THE TIMOTHY PLAN DO WITH YOUR PERSONAL INFORMATION? |
| | |
WHY? | | Financial companies choose how they share your personal information. Federal law gives consumers the right to limit some, but not all information sharing. Federal law also requires us to tell you how we collect, share, and protect your personal information. Please read this Notice carefully to understand what we do. |
| | |
|
|
|
WHAT? | | The types of information we collect and share depend on the product or service you have with us. This information can include: |
| | | • Social Security Number |
| | | • Assets |
| | | • Retirement Assets |
| | | • Transaction History |
| | | • Checking Account History |
| | | • Purchase History |
| | | • Account Balances |
| | | • Account Transactions |
| | | • Wire Transfer Instructions |
| | | When you are no longer our customer, we continue to share your information as described in this Notice. |
| | |
| HOW? | | All financial companies need to share your personal information to run their everyday business. In the section below, we list the reasons financial companies can share their customers’ personal information; the reasons The Timothy Plan chooses to share; and whether you can limit this sharing. |
| | | | |
Reasons we can share your personal information. | | Does The Timothy Plan share? | | Can you limit this sharing? |
For our everyday business purposes- Such as to process your transactions, maintain your account(s), respond to court orders and legal investigations, or report to credit bureaus. | | Yes | | No |
For our marketing purposes- to offer our products and services to you. | | No | | We don’t share |
For joint marketing with other financial companies | | No | | We don’t share |
For our affiliates’ everyday business purposes- information about your transactions and experiences. | | Yes | | No |
For our affiliates’ everyday business purposes- information about your creditworthiness | | No | | We don’t share |
For non-affiliates to market to you | | No | | We don’t share |
| | | | |
Questions? | | Call 800-662-0201 | | |
145
| | |
Who we are | | |
Who is providing this Notice? | | Timothy Plan Family of Mutual Funds Timothy Partners, Ltd. |
| What we do | | |
How does The Timothy Plan protect your personal information? | | To protect your personal information from unauthorized access and use, we use security measures that comply with federal law. These measures include computer safeguards and secured files and buildings. Our service providers are held accountable for adhering to strict policies and procedures to prevent any misuse of your nonpublic personal information. |
How does The Timothy Plan collect your personal information? | | We collect your personal information, for example, when you |
| | | • Open an account |
| | | • Provide account information |
| | | • Give us your contact information |
| | | • Make deposits or withdrawals from your account |
| | | • Make a wire transfer |
| | | • Tell us where to send the money |
| | | • Tell us who receives the money |
| | | • Show your government-issued ID |
| | | • Show your driver’s license |
| | | We also collect your personal information from other companies. |
Why can’t I limit all sharing? | | Federal law gives you the right to limit only: |
| | | • Sharing for affiliates’ everyday business purposes- |
| | | information about your creditworthiness. |
| | | • Affiliates from using your information to market to you. |
| | | • Sharing for non-affiliates to market to you |
| | | State laws and individual companies may give you additional rights to limit sharing. |
Definitions
| | |
Affiliates | | Companies related by common ownership or control. They can be financial and non-financial companies. Timothy Partners, Ltd. is an affiliate of The Timothy Plan |
Non-affiliates | | Companies not related by common ownership or control. They can be financial and non-financial companies. • The Timothy Plan does not share with non-affiliates so they can market to you. |
Joint marketing | | A formal agreement between non-affiliated financial companies that together market financial products to you. • The Timothy Plan does not jointly market. |
Customer Identification Program
The Board of Trustees of the Trust has approved procedures designed to prevent and detect attempts to launder money as required under the USA PATRIOT Act. The day-to-day responsibility for monitoring and reporting any such activities has been delegated to the transfer agent, subject to the oversight and supervision of the Board.
146
Disclosures
HOW TO OBTAIN PROXY VOTING INFORMATION
Information regarding how the Funds voted proxies relating to Fund securities during the period ended June 30 of well as a description of the policies and procedures that the Funds use to determine how to vote proxies is available without charge, upon request, by calling 1-800-732-0330 or by referring to the Security and Exchange Commission’s (“SEC”) website at http://www.sec.gov
HOW TO OBTAIN 1ST AND 3RD FISCAL QUARTER PORTFOLIO HOLDINGS
Each Fund files its complete schedule of portfolio holdings with the SEC for the first and third quarters of each fiscal year on Form N-Q. Form N-Q is available on the SEC’s website at http://www.sec.gov and may be reviewed and copied at the SEC’s Public Reference Room in Washington, DC (1-800-SEC-0330). The information on Form N-Q is available without charge, upon request, by calling 1-800-732-0330.
147
This Page Intentionally Left Blank.
| | |
| BOARD OF TRUSTEES | | |
| Arthur D. Ally | | |
| Kenneth Blackwell | | |
| Joseph E. Boatwright | | |
| Rick Copeland | | |
| Deborah Honeycutt | | |
| Bill Johnson | | |
| John C. Mulder | | |
| Charles E. Nelson | | |
| Scott Preissler | | |
| Alan Ross | | |
| Mathew D. Staver | | |
| Patrice Tsague | | |
OFFICERS | | |
| Arthur D. Ally, President | | |
| Joseph E. Boatwright, Secretary | | |
INVESTMENT ADVISOR | | |
| Timothy Partners, Ltd. | | |
| 1055 Maitland Center Commons | | |
| Maitland, FL 32751 | | |
DISTRIBUTOR | | |
| Timothy Partners, Ltd. | | |
| 1055 Maitland Center Commons | | |
| Maitland, FL 32751 | | |
TRANSFER AGENT | | |
| Gemini Fund Services, LLC | | |
| 17605 Wright St., Suite 2 | | |
| Omaha, NE 68130 | | |
INDEPENDENT REGISTERED PUBLIC ACCOUNTING FIRM | | |
| Cohen & Company, Ltd. | | |
| 1350 Euclid Ave., Suite 800 | | |
| Cleveland, OH 44115 | | |
LEGAL COUNSEL | |  |
| David Jones & Assoc., P.C. |
| 18630 Crosstimber |
| San Antonio, TX 78258 | | |
| | |
| | HEADQUARTERS |
| | The Timothy Plan |
| | 1055 Maitland Center Commons |
| | Maitland, Florida 32751 |
For additional information or a prospectus, please call: 1-800-846-7526 Visit the Timothy Plan web site on the internet at: www.timothyplan.com This report is submitted for the general information of the shareholders of the Funds. It is not authorized for distribution to prospective investors in the Funds unless preceded or accompanied by an effective Prospectus which includes details regarding the Funds’ objectives, policies, expenses and other information. Distributed by Timothy Partners, Ltd. | | (800) 846-7526 www.timothyplan.com invest@timothyplan.com SHAREHOLDER SERVICES Gemini Fund Services, LLC 17605 Wright St., Suite 2 Omaha, NE 68130 (800) 662-0201 |
Item 2. Code of Ethics.
(a) As of the end of the period covered by this report, the registrant has adopted a code of ethics that applies to the registrant’s principal executive officer, principal financial officer, principal accounting officer or controller, or persons performing similar functions, regardless of whether these individuals are employed by the registrant or a third party.
(b) For purposes of this item, “code of ethics” means written standards that are reasonably designed to deter wrongdoing and to promote:
| | (1) | Honest and ethical conduct, including the ethical handling of actual or apparent conflicts of interest between personal and professional relationships; |
| | (2) | Full, fair, accurate, timely, and understandable disclosure in reports and documents that a registrant files with, or submits to, the Commission and in other public communications made by the registrant; |
| | (3) | Compliance with applicable governmental laws, rules, and regulations; |
| | (4) | The prompt internal reporting of violations of the code to an appropriate person or persons identified in the code; and |
| | (5) | Accountability for adherence to the code. |
(c) Amendments: During the period covered by the report, there have not been any amendments to the provisions of the code of ethics.
(d) Waivers: During the period covered by the report, the registrant has not granted any express or implicit waivers from the provisions of the code of ethics.
(e) Posting: We do not intend to post the Code of Ethics for the Officers or any amendments or waivers on a website.
(f) Availability: The Code of Ethics for the Officers can be obtained, free of charge by calling the toll free number for the appropriate Fund.
Item 3. Audit Committee Financial Expert.
(a) The registrant has an Audit committee currently composed of three independent Trustees, Mr. Alan Ross, Mr. John Mulder and Mr. Richard Copeland. The registrant’s board of trustees has determined that Mr. Alan Ross is qualified to serve as an Audit Committee Financial Expert, and has designated him as such.
Item 4. Principal Accountant Fees and Services.
| | | | |
| The Timothy Plan | |
FY 2018 | | $ | 175,500 | |
FY 2017 | | $ | 175,500 | |
FY 2016 | | $ | 170,900 | |
FY 2015 | | $ | 168,900 | |
FY 2014 | | $ | 168,400 | |
-2-
| | | | | | |
The Timothy Plan | | Registrant | | | | Adviser |
FY 2018 | | $ 0 | | | | $ 0 |
FY 2017 | | $ 0 | | | | $ 0 |
FY 2016 | | $ 0 | | | | $ 0 |
FY 2014 | | $ 0 | | | | $ 0 |
FY 2015 | | $ 0 | | | | $ 0 |
| | |
| The Timothy Plan |
FY 2018 | | $ 0 |
FY 2017 | | $ 0 |
FY 2016 | | $ 0 |
FY 2015 | | $ 0 |
FY 2014 | | $ 0 |
Nature of the preparation of the 1120 RIC
fees:
Registrant
| | | | |
| The Timothy Plan | |
FY 2018 | | | $ 0 | |
FY 2017 | | | $ 0 | |
FY 2016 | | | $ 0 | |
FY 2015 | | | $ 0 | |
FY 2014 | | | $ 0 | |
(e) (1) Audit Committee’s Pre-Approval Policies
The Audit Committee Charter requires the Audit Committee to be responsible for the selection, retention or termination of auditors and, in connection therewith, to (i) evaluate the proposed fees and other compensation, if any, to be paid to the auditors, (ii) evaluate the independence of the auditors, (iii) pre-approve all audit services and, when appropriate, any non-audit services provided by the independent auditors to the Trust, (iv) pre-approve, when appropriate, any non-audit services provided by the independent auditors to the Trust’s investment adviser, or any entity controlling, controlled by, or under common control with the investment adviser and that provides ongoing services to the Trust if the engagement relates directly to the operations and financial reporting of the Trust, and (v) receive the auditors’ specific representations as to their independence;
| | (2) | Percentages of Services Approved by the Audit Committee |
Registrant
-3-
| | | | |
Tax Fees: | | | 0 | % |
All Other Fees: | | | 0 | % |
(f) During audit of registrant’s financial statements for the most recent fiscal year, less than 50 percent of the hours expended on the principal accountant’s engagement were attributed to work performed by persons other than the principal accountant’s full-time, permanent employees.
(g) The aggregate non-audit fees billed by the registrant’s accountant for services rendered to the registrant, and rendered to the registrant’s investment adviser (not including any sub-adviser whose role is primarily portfolio management and is subcontracted with or overseen by another investment adviser), and any entity controlling, controlled by, or under common control with the adviser that provides ongoing services to the registrant:
Registrant Adviser
| | | | | | |
FY 2018 | | $ 0 | | $ | 0 | |
FY 2017 | | $ 0 | | $ | 0 | |
FY 2016 | | $ 0 | | $ | 0 | |
FY 2015 | | $ 0 | | $ | 0 | |
FY 2014 | | $ 0 | | $ | 0 | |
(h) Not applicable. The auditor performed no services for the registrant’s investment adviser or any entity controlling, controlled by, or under common control with the investment adviser that provides ongoing services to the registrant.
Item 5. Audit Committee of Listed Companies. Not applicable.
Item 6. Schedule of Investments. Not applicable – schedule filed with Item 1.
Item 7. Disclosure of Proxy Voting Policies and Procedures for Closed-End Funds. Not applicable.
Item 8. Portfolio Managers of Closed-End Management Investment Companies. Not applicable.
Item 9. Purchases of Equity Securities by Closed-End Management Investment Company and Affiliated Purchasers. Not applicable.
Item 10. Submission of Matters to a Vote of Security Holders
The registrant has not adopted procedures by which shareholders may recommend nominees to the registrant’s board of trustees.
Item 11. Controls and Procedures.
(a) Based on an evaluation of the registrant’s disclosure controls and procedures as of November 19, 2010, the disclosure controls and procedures are reasonably designed to ensure that the information required in filings on Forms N-CSR is recorded, processed, summarized, and reported on a timely basis.
(b) There were no significant changes in the registrant’s internal control over financial reporting that occurred during the registrant’s second fiscal quarter of the period covered by this report that has materially affected, or is reasonably likely to materially affect, the registrant’s internal control over financial reporting.
-4-
Item 12. Exhibits.
| (a)(1) | Code is filed herewith |
| (a)(2) | Certifications by the registrant’s principal executive officer and principal financial officer, pursuant to Section 302 of the Sarbanes- Oxley Act of 2002 and required by Rule 30a-2 under the Investment Company Act of 1940 are filed herewith. |
| (b) | Certification pursuant to 18 U.S.C. Section 1350, as adopted pursuant to Section 906 of the Sarbanes-Oxley Act of 2002 is filed herewith. |
-5-
SIGNATURES
Pursuant to the requirements of the Securities Exchange Act of 1934 and the Investment Company Act of 1940, the registrant has duly caused this report to be signed on its behalf by the undersigned, thereunto duly authorized.
(Registrant) The Timothy Plan
| | | | |
By | | /s/ Arthur D. Ally | | |
| | Arthur D. Ally, President/Principle Executive Officer & Treasurer/Principle Financial Officer |
| | |
Date | | 11/30/18 | | |
Pursuant to the requirements of the Securities Exchange Act of 1934 and the Investment Company Act of 1940, this report has been signed below by the following persons on behalf of the registrant and in the capacities and on the dates indicated.
| | | | |
By | | /s/ Arthur D. Ally | | |
| | Arthur D. Ally, President/Principle Executive Officer & Treasurer/Principle Financial Officer |
| | |
Date | | 11/30/18 | | |
-6-