united states
securities and exchange commission
washington, d.c. 20549
form n-csr
certified shareholder report of registered management
investment companies
Investment Company Act file number 811-08228
The Timothy Plan
(Exact name of registrant as specified in charter)
1055 Maitland Center Commons, Maitland, FL 32751
(Address of principal executive offices) (Zip code)
Art Ally, The Timothy Plan
1055 Maitland Center Commons, Maitland, FL 32751
(Name and address of agent for service)
Registrant's telephone number, including area code: 800-846-7526
Date of fiscal year end: 9/30
Date of reporting period: 9/30/21
Form N-CSR is to be used by management investment companies to file reports with the Commission not later than 10 days after the transmission to stockholders of any report that is required to be transmitted to stockholders under Rule 30e-1 under the Investment Company Act of 1940 (17 CFR 270.30e-1). The Commission may use the information provided on Form N-CSR in its regulatory, disclosure review, inspection and policymaking roles.
A registrant is required to disclose the information specified by Form N-CSR, and the Commission will make this information public. A registrant is not required to respond to the collection of information contained in Form N-CSR unless the Form displays a currently valid Office of Management and Budget ("OMB") control number. Please direct comments concerning the accuracy of the information collection burden estimate and any suggestions for reducing the burden to Secretary, Securities and Exchange Commission, 450 Fifth Street, NW, Washington, DC 20549-0609. The OMB has reviewed this collection of information under the clearance requirements of 44 U.S.C. § 3507.
Item 1. Reports to Stockholders.
The Registrant’s audited annual financial reports transmitted to shareholders pursuant to Rule 30e-1 under the Investment Company Act of 1940 are as follows:
September 30, 2021
Dear Shareholder,
As you review the details of our various funds on the following pages, you may not recall the substantial negative effect the Covid-19 pandemic and resultant economic shutdown had on the capital markets in the middle months of 2020 (i.e., February thru September). I am pleased to report, however, that we recovered nicely during this current fiscal year. Hence, although our performance (10-1-20 thru 9-30-21) varies among our funds, nearly all were strongly up. Among our better performers were our domestic equity funds (i.e. Small-Cap Value, Large/Mid-Cap Value, Aggressive Growth and Large/Mid-Cap Growth) along with our International and Israel Common Values Funds while our weakest performer was Fixed Income. All of that simply underscores the wisdom of asset allocation since different market segments perform differently over differing periods.
The positive returns we experienced in fiscal 2021 are, we believe, in large part the result the momentum created by our country’s prior leadership during this period and the positive pro-business agenda President Trump was pursuing. With the new administration in place, we are maintaining a more cautious outlook for our economy and, therefore the equity markets. Timothy Partners, Ltd, (the “Advisor”) has always attempted to take a conservative approach to the markets as we believe our shareholders prefer a preservation of principal course to that of chasing returns. I do need to reiterate, however, that, in the capital markets in general and our funds in particular, returns can never be guaranteed.
For more complete information about the individual funds, please read each of the sub-advisor’s annual review letters in the pages that follow. They more fully detail the various factors that impacted this fiscal year’s performance along with their economic outlook for the coming year.
Although we cannot guarantee any actual outcome, I remain confident that all our sub-advisors are, in our opinion, among the best in the industry and they each continue to honor our overall policy to manage their respective funds both in accordance with our screening restrictions and with a continued conservative bias.
Finally, I would once again like to thank you for your moral convictions that led you to becoming part of the Timothy Plan Family.
Yours in Christ,
Arthur D. Ally
President
Timothy Plan Aggressive Growth Fund
Letter from the Manager – September 30, 2021 |  |
At this this time last year we wrote that the 12-month period ending 9/30/20 was “unlike any other witnessed in U.S. history” — the onset of COVID (with U.S. deaths peaking at over 23,000 per week), a 31% contraction in GDP in the second quarter, 21.4 million jobs lost in just March/April ’20, the S&P500 down 34% in 5 weeks. It can’t be overstated how much better the subsequent 12 months were. COVID vaccines came to market in record time with effectiveness beyond almost anyone’s expectations; close to 80% of the U.S. population has received at least one dose. This, along with trillions of dollars of monetary and fiscal stimulus has brought about a strong economic and labor-market recovery (real GDP growth over 6%, and the unemployment rate down to 5.2%). And, in response, the stock market – which had already bounced back very nicely last spring & summer, was up another 30% (S&P500) in the year ending this September. This is not to say that everything has been smooth sailing: the transition to a new presidency was marred by the riot at the Capitol, the Delta variant brought about another spike in COVID cases and deaths, supply chain issues have led to shortages in key areas of the economy, and Biden’s proposed budget & tax plan has led to another political stalemate, as of this writing. The supply chain issues, in particular, have created risk for the upcoming earnings season; we will be watching very closely to see which companies are vulnerable and which are navigating the environment the best.
The Fund returned 0.7% in the September 2021 quarter, 12.2% year to date, and 34.2% for Class I over the last 12 months. This compares to the Russell Midcap Growth Index that returned -0.8% in the past quarter, 9.6% year to date, and 30.4% over the last 12 months.
The 530 basis point outperformance over the past 12 months was broad-based, with every major sector outperforming its respective benchmark. The greatest relative outperformance was seen in the healthcare, industrials, and consumer discretionary sectors. The healthcare sector had the strongest performance, as both a modest overweighting as well as superior stock selection generating notable alpha.
The Fund’s top overall contributor on a relative basis over the last 12 months was Rapid7 (3.3% avg. weight), which returned 85%. Rapid7 is a cybersecurity software company whose focused on enterprise’s Vulnerability Management. The continued rise of cybersecurity crime has led to a strong tailwind for the entire industry. Another strong performer within the tech sector was Lam Research (1.7%), which returned 98% over the past 12 months. Lam Research is one of the leading global semiconductor equipment manufacturers that is experiencing tremendous growth as the semiconductor industry is rapidly expanding to meet extraordinarily high demand levels. Lastly, Monolithic Power Systems (3.5%) was another standout performer, returning 74%. Monolithic Power Systems is a semiconductor company that designs and manufacturers power management systems utilized in the telecom, cloud computing, and industrial applications.
In general, we didn’t have too many dramatic underperformers. Our largest relative underperformer was down a modest 9% over the past twelve months. While Fidelity National (0.9%) met all of its revenue and earnings targets, the stock was a lackluster performer as investors rotated away from the merchant payment processors
industries into other industries that are experiencing higher organic growth rates. Another underperformer was Sunrun (0.9%), which was down 43% over the year. Sunrun is a leading national solar panel and energy storage residential system provider. While the company continues to execute well, in hindsight the stock along with the entire solar industry complex was overvalued post the election last year, leading to the underperformance over the past year. We continue to be excited about the long-term potential for Sunrun, and we are retaining our position in the security.
We are cautious in our near-term earnings outlook for the overall market given the many headwinds being seen currently. Whereas earlier this year most managements’ concerns were related to passing on price increases, those concerns are now being replaced by supply chain interruptions. The most recent wave of COVID19 has led to significant interruptions in manufacturing and transport in Southeast Asia, and that is having a significant ripple effect throughout the world. We are all witnessing the downside of a globally interconnected supply chain, which will only further accelerate the nascent trend of onshoring. The most significant interruptions are still being seen in the semiconductor industry, with lead times for nearly all chips doubling over the past few months; that is leading auto manufacturers to forecast a much slower production cadence for 2022. Other supply chain issues are leading to a slowdown in the homebuilding industry. All these factors are leading us to focus the portfolio on sectors that do not face these pressures, sectors such as the pharma/biotech sector and the software sector. We remain focused on generating alpha and producing the strongest investment results over the long run. We thank you for your continuing support and investment.
Chartwell Investment Partners, LLC
| The Timothy Plan International Fund |
| Letter from The Manager - September 30, 2021 |
Global equity markets had a strong performance during the fiscal year as vaccines and re-opening momentum boosted markets and the Fund participated nicely. The Fund continued its positive outperformance trend and handily beat its benchmark MSCI All Country World ex. US Index this year with a combination of great sector allocation and stock selection. From a sector standpoint, an overweight to outperforming Technology sector and underweights to underperforming Consumer Staples, Communications Services, and Real Estate helped the relative performance. From a stock standpoint, great stock selection in Industrials, Technology, and Health Care led the outperformance. The Fund’s outperformance was driven by companies such as Hong Kong-based power tools manufacturer Techtronic Industries, owner of popular power tools brands Ryobi and Milwaukee. Moreover, notable performers for the Fund included equipment rentals company Ashtead Group that owns the Sunbelt brand, Norwegian energy leader Equinor, and semiconductor technology leader ASML Holding. From a country standpoint, an underweight to China and overweight to Norway and the Netherlands was helpful. Positive country stock selection was led by Hong Kong, Japan, Belgium while stock selection in Germany, Italy and France was more challenging.
2020 was a momentous year not to be forgotten. TIME magazine put it best on its cover: “2020: The Worst Year Ever.” It was a tough period on all fronts as the global pandemic took the lives of hundreds of thousands and triggered a global recession. While 2020 was a bear market for humans, global equities rallied sharply, particularly during the last quarter of 2020 as visions of vaccine stocking stuffers danced in investor’s heads. The positive momentum carried into 2021 and equity markets followed along as corporate earnings were revised upwards throughout the year as re-opening momentum and pricing power led to robust corporate results. The Fund benefitted from being well positioned with structural growth stories and re-opening plays during the fiscal year.
Economic growth across Europe and parts of Asia accelerated in 2021 and remains well supported by strong consumer spending. Growth is likely to remain above trend over the coming quarters. Inflation is the major debate of the day with most central bankers arguing that elevated inflation is transitory while consumers suffer much higher prices and shortages of autos, groceries, furniture, housing, and many other items. Despite the elevated inflation levels, global central banks are likely to keep accommodative policies for longer even though they may begin to taper their bond buying in the coming months.
While volatility in equity markets has increased with higher inflation and shifting central bank policies, earnings results should remain well underpinned by robust re-opening momentum, strong consumer spending, and pricing power. We remain committed to a disciplined and consistent investment approach dedicated to finding long-term investments for shareholders and we thank you for your continued investment in the Fund.
Eagle Global Advisors, LLC
September 30, 2021
Dear Timothy Plan Large/Mid-Cap Growth Fund Shareholder:
In 2019, Timothy Plan added four new Exchange Traded Funds to our diversified product line: Timothy Plan Large/Mid-Cap Core (TPLC), Timothy Plan High Dividend Stock (TPHD), Timothy Plan International Equity Fund (TPIF), and Timothy Plan Small Cap Core (TPSC). Also, in July, 2020 we added two new ETFs that contained a structured partial move to cash in the event of a substantial market decline: Timothy Plan Large-Mid Cap Core Enhanced (TPLE) and Timothy Plan High Dividend Stock Enhanced (TPHE). These are all smart beta index funds traded on the New York Stock Exchange. Since TPLC and TPLE fit nicely into the into the investment objective of our Large/Mid-Cap Growth Fund, we incorporated these two particular ETFs into the holdings of this fund so that:
| ● | Approximately 20% of the fund is now invested in a combination of TPLC and TPLE |
| ● | And the remainder of the fund continues to be actively managed by our long-time sub-advisor, Chartwell Investment Partners. |
In addition to greatly increasing the diversification of the holdings in this fund, we believe this addition should have the positive effect of lowering our expense ratio over both the near and longer term.
For past performance of this fund and future market outlook, please read Chartwell’s Sub-Advisor’s letter.
As you know, no one can guarantee future performance. However, the one thing that I can assure you of is every one of our sub-advisors is doing their very best and our team here at Timothy is working very hard to provide you an investment in which you can feel comfortable.
Sincerely,
Arthur D. Ally
President
Timothy Plan Large/Mid Cap Growth Fund
Letter from the Manager – September 30, 2021 | |
At this time last year, we wrote that the 12-month period ending 9/30/20 was “unlike any other witnessed in U.S. history” — the onset of COVID (with U.S. deaths peaking at over 23,000 per week), a 31% contraction in GDP in the second quarter, 21.4 million jobs lost in just March/April ’20, the S&P500 down 34% in 5 weeks. It can’t be overstated how much better the subsequent 12 months were. COVID vaccines came to market in record time with effectiveness beyond almost anyone’s expectations; over two-thirds of the U.S. population has received at least one dose. This, along with trillions of dollars of monetary and fiscal stimulus has brought about a strong economic and labor-market recovery (real GDP growth over 6%, and the unemployment rate down to 5.2%). And, in response, the stock market – which had already bounced back very nicely last spring & summer, was up another 30% (S&P500) in the year ending this September. This is not to say that everything has been smooth sailing: the transition to a new presidency was marred by the riot at the Capitol, the Delta variant brought about another spike in COVID cases and deaths, inflation is running higher than it has in over a decade (at 5%+), supply-chain issues have led to shortages in key areas of the economy, and Biden’s proposed budget & tax plan has led to another political stalemate, as of this writing. The supply -chain issues, in particular, have created risk for the upcoming earnings season; we will be watching very closely to see which companies are vulnerable and which are navigating the environment the best.
In stark contrast to last year, value stocks outperformed growth stocks in the 12- month period: Russell 1000 Value +35.0%; Russell 1000 Growth +27.3%. It was the first half of this period, however, that value led the charge. When the vaccine announcements from Pfizer and Moderna came out in November, the market took it as an “all-clear” signal for economic reopening, and as often occurs coming out of recessions, value took the baton from growth (R1V up 29.3% in the 6-month period, vs. R1G up 12.4%). This helped the Fund’s relative performance, as it is usually challenging when growth leads, as we can’t own many of the largest growth stocks in the benchmark index. Similarly, it is a tailwind for the fund if small stocks outperform large stocks, as also occurred during the past year (Russell 2000 +47.7% vs. S&P500 +30.0%).
The fund’s gross return was 33.6%, ahead of the 27.3% return of the benchmark Russell 1000 Growth Index. All of the outperformance came from stock selection, as sector allocation was a net negative (especially the underweight of Communication Services, which rose 46.2%). Technology was far and away the largest contributor from a stock standpoint, accounting for nearly 700 basis points. In software, Rapid7 (2.7%) gained 84.4%, EPAM Systems (2.6%) was up 76.4%, and Palo Alto Networks (2.2%) rose 95.8%. In semiconductors, Micron Technology (0%) and NXP Semiconductors (1.8%) rose 68.3% and 58.7% respectively. And in hardware, CDW (3.3%) gained 53.7%, and Western Digital (1.7%) was up 54.1%. These results in technology were especially encouraging, as we had to make up for 270 basis points of headwinds for not owning Alphabet (Google) and Microsoft (restricted). After Technology, the next-best selection was sourced from our holdings in Industrials, particularly Capital Goods. The strong economic recovery benefitted the likes of Honeywell (1.2%), up 30.7%, Trane Technologies (1.3%) +44.2%, and Emerson Electric (1.4%) +47.0%. The Fund’s largest shortfall came in the Health Care sector. Not owning some of the high-flyer Biotech stocks like Moderna (up 444%) was part of it, but we also had self-inflicted “misses” in Vertex Pharmaceutical (0.9%), down 33.3%, and Sarepta Therapeutics (0%), which fell 43.4%.
For the portfolio, there has been no change to our time -tested, bottom-up fundamental approach to managing large and mid-cap growth investments. As an overview, the Fund remains well diversified by issuers and sectors, as all areas of the economy are impacted by broad macroeconomic trends. We have made some trades in Technology to reduce higher-valuation exposures. We have added to Consumer Discretionary, an area of underweight, as the recovery and reopening became more certain. Health Care remains an area of overweight, as we like the combination of secular growth and defensiveness. We remain focused on generating alpha and producing the strongest investment results over the long run. We thank you for your continuing support and investment.
Chartwell Investment Partners, LLC
September 30, 2021
Dear Timothy Plan Small-Cap Value Fund Shareholder:
In 2019, Timothy Plan added four new Exchange Traded Funds to our diversified product line: Timothy Plan Large/Mid-Cap Core (TPLC), Timothy Plan High Dividend Stock (TPHD), Timothy Plan International Equity Fund (TPIF), and Timothy Plan Small Cap Core (TPSC). These are all smart beta index funds traded on the New York Stock Exchange. Since TPSC fits nicely into the into the investment objective of our Small-Cap Value Fund, we incorporated this ETF into the holdings of this fund so that:
| ● | Approximately 10% of the fund is now invested in TPSC. |
| ● | And the remainder of the fund continues to be actively managed by our long-time sub-advisor, Westwood Capital Management. |
In addition to greatly increasing the diversification of the holdings in this fund, we believe this addition should have the positive effect of lowering our expense ratio over both the near and longer term.
For past performance of this fund and future market outlook, please read Westwood’s Sub-Advisor’s letter.
As you know, no one can guarantee future performance. However, the one thing that I can assure you of is every one of our sub-advisors is doing their very best and our team here at Timothy is working very hard to provide you an investment in which you can feel comfortable.
Sincerely,
Arthur D. Ally
President

LETTER FROM THE MANAGER
September 30, 2021
TIMOTHY PLAN SMALL CAP VALUE FUND
We are pleased to provide you with our report for the Timothy Plan Small Cap Value Fund for the twelve months ending September 30, 2021 and would like to thank you for entrusting your assets with us.
Looking back, the past twelve months have witnessed an incredible recovery unfold. From the initial announcement, equity markets have embraced the hope that vaccines, and now therapeutics, could see the end of the global pandemic that has ravaged the world. The rally that unfolded in November of 2020 was historic in magnitude with the S&P 500 Index gaining nearly 11% as not one but three prospective vaccine solutions emerged. The logistical challenges of deploying them across the U.S., given the requirements for transport and storage, appeared daunting as 2021 began. With the largest mobilization effort since the great World Wars, vaccinations across the U.S. began to pick up steam through the spring and caseloads began to fall as consumers and corporations were set free to go back into their world. Spending by both resumed in earnest, leading to supply shortages that persist today. Consumer confidence has rebounded and remained resilient as variants have emerged, bolstered by rising wages from a tight labor market and the wealth effect from increasing investments. This resurgence in spending and demand sparked inflation fears as prices for goods, like used cars, components, like semiconductors, and even commodities, like copper, spiked higher. Supply chain issues have expanded beyond the initial shortages and may persist for quite some time. This has led to some moderation of the economic growth projections; however, the backdrop remains optimistic for further recovery in corporate profits.
For the twelve months ending September 30, 2021, the Timothy Plan Small Cap Value Fund produced a net return of 51.33% for Class I while the Russell 2000 Index produced a return of 47.68%. Both stock selection and allocation tailwinds aided relative performance, overcoming continued headwinds from low quality and high beta securities. Many of these firms were facing financial distress prior to the optimism sparked by the vaccine announcements last November. Combined with the unprecedented stimulus efforts from central banks and governments, many firms heavily impacted with higher leverage or impaired business models were able to stave off financial distress and boost their equity prices dramatically from their lows. As has been the case before, these periods of market preference for loss-making stocks can persist over the short -term and early signs have emerged that leadership is returning to companies with strong fundamentals and higher quality attributes. This was notable in Health Care, where an underweight given a lack of exposure to biotechnology stocks, was a significant contributor to relative performance. Other areas saw more modest benefits, including Financials where banks and capital markets far outpaced gains seen elsewhere coupled with being overweight. Industrials and Consumer Staples were headwinds given strong absolute performance but with less favorable selections than some of the more cyclical areas.
Great Western Bancorp moved higher as the company agreed to be acquired at a premium and merge with another regional bank. PDC Energy rallied, as did crude oil prices, with management focused on generating cashflow and returns over higher levels of production given the current environment. Amkor Technology gained as the semiconductor cycle, particular for consumer devices including cellphones, served as a strong tailwind for demand for their products as operating leverage emerged to boost their margin profile. Oxford Industries rose as the company was well-positioned with their lifestyle brands, Tommy Bahama and Lilly Pulitzer, to capitalize on a consumer flush with cash as well as benefitting from a resumption of domestic travel. Sandy Spring Bancorp reported continued strong results, outpacing rivals, as their loan growth came with better net interest margins, not just better credit, which pushed shares higher.
Aveanna HealthCare Holdings posted solid results but investor concerns over nursing shortages and labor costs
Net returns are net of the sub-adviser’s fees, not the mutual fund fees.
Past performance is not indicative of future results. Portfolio returns reflect the reinvestment of dividend and interest income. All information provided is for informational purposes only and is not intended to be, and should not be interpreted as, an offer, solicitation, or recommendation to buy or sell or otherwise invest in any of the securities/sectors/countries that may be mentioned. A description of the methodology used to calculate the attribution analysis or a complete list of each holding’s contribution to overall performance during the measurement period may be obtained by contacting info@westwoodgroup.com. Benchmark Data Source: © 2021 FactSet Research Systems Inc. All Rights Reserved. Russell Investment Group is the owner of the trademarks, service marks, and copyrights related to its indexes, which have been licensed for use by Westwood.
| 3 Investing Where It Counts | |  |
sent shares downward. Chuy’s Holdings moved lower despite admirable margin performance as same-store comparisons fell below expectations as varied policies created uneven restaurant hours as they worked back to full capacity. Avanos Medical, a recent purchase, faced challenging gross margin pressures leading to a reduction in forward guidance even as some dynamics should abate later this year. Healthcare Services Group declined as results have been impacted more than expected and their nursing home customers remain challenged by the pandemic. James River Group Holdings fell as the company had to raise equity capital to offset the losses as they worked to run-off the last part of their Uber liability from insuring their drivers in prior years.
The Small Cap Value team is focused on seeking well-run companies with growth prospects that are underappreciated by the marketplace. We look for companies with above average growth and strong balance sheets that generate positive cash flows. Against the current backdrop, we feel our companies are well-positioned for superior relative returns in a post-pandemic world while weathering any volatility that may arise.
We thank you for your continued confidence in the Westwood process and investment teams and we look forward to serving your investment needs through the years ahead.
Westwood Management Corp.
Net returns are net of the sub-adviser’s fees, not the mutual fund fees.
Past performance is not indicative of future results. Portfolio returns reflect the reinvestment of dividend and interest income. All information provided is for informational purposes only and is not intended to be, and should not be interpreted as, an offer, solicitation, or recommendation to buy or sell or otherwise invest in any of the securities/sectors/countries that may be mentioned. A description of the methodology used to calculate the attribution analysis or a complete list of each holding’s contribution to overall performance during the measurement period may be obtained by contacting info@westwoodgroup.com. Benchmark Data Source: © 2021 FactSet Research Systems Inc. All Rights Reserved. Russell Investment Group is the owner of the trademarks, service marks, and copyrights related to its indexes, which have been licensed for use by Westwood.
| 4 Investing Where It Counts | | |
September 30, 2021
Dear Timothy Plan Large/Mid-Cap Value Fund Shareholder:
In 2019, Timothy Plan added four new Exchange Traded Funds to our diversified product line: Timothy Plan Large/Mid-Cap Core (TPLC), Timothy Plan High Dividend Stock (TPHD), Timothy Plan International Equity Fund (TPIF), and Timothy Plan Small Cap Core (TPSC). Also, in July, 2020 we added two new ETFs that contained a structured partial move to cash in the event of a substantial market decline: Timothy Plan Large-Mid Cap Core Enhanced (TPLE) and Timothy Plan High Dividend Stock Enhanced (TPHE). These are all smart beta index funds traded on the New York Stock Exchange. Since TPLC, TPLE, TPHE and TPHE fit nicely into the investment objective of our Large/Mid-Cap Value Fund we incorporated them into the holdings of this fund so that approximately:
| ● | Approximately 10% of the fund is invested in a combination of TPLC and TPLE |
| ● | Approximately 10% of the fund is invested in a combination of TPHD and TPHE |
| ● | The remaining 80% of the fund continues to be actively managed by our long-time sub-advisor, Westwood Capital Management. |
In addition to greatly increasing the diversification of the holdings in this fund, we believe this addition should have the positive effect of lowering our expense ratio over both the near and longer term.
For past performance of this fund and future market outlook, please read Westwood’s Sub-Advisor’s letter.
As you know, no one can guarantee future performance. However, the one thing that I can assure you of is every one of our sub-advisors is doing their very best and our team here at Timothy is working very hard to provide you an investment in which you can feel comfortable.
Sincerely,
Arthur D. Ally
President
LETTER FROM THE MANAGER
September 30, 2021
TIMOTHY PLAN LARGE/MID CAP VALUE FUND
We are pleased to provide you with our report for the Timothy Plan Large/Mid Cap Value Fund for the twelve months ending September 30, 2021 and would like to thank you for entrusting your assets with us.
Looking back, the past twelve months have witnessed an incredible recovery unfold. From the initial announcement, equity markets have embraced the hope that vaccines, and now therapeutics, could see the end of the global pandemic that has ravaged the world. The rally that unfolded in November of 2020 was historic in magnitude with the S&P 500 Index gaining nearly 11% as not one but three prospective vaccine solutions emerged. The logistical challenges of deploying them across the U.S., given the requirements for transport and storage, appeared daunting as 2021 began. With the largest mobilization effort since the great World Wars, vaccinations across the U.S. began to pick up steam through the spring and caseloads began to fall as consumers and corporations were set free to go back into their world. Spending by both resumed in earnest, leading to supply shortages that persist today. Consumer confidence has rebounded and remained resilient as variants have emerged, bolstered by rising wages from a tight labor market and the wealth effect from increasing investments. This resurgence in spending and demand sparked inflation fears as prices for goods, like used cars, components, like semiconductors, and even commodities, like copper, spiked higher. Supply chain issues have expanded beyond the initial shortages and may persist for quite some time. This has led to some moderation of the economic growth projections; however, the backdrop remains optimistic for further recovery in corporate profits.
For the twelve months ending September 30, 2021, the Timothy Plan Large/Mid Cap Value Fund produced a net return of 30.20% for Class I, while the S&P 500 Index produced a return of 30.00%. Absolute returns are notably positive, bolstered by the recovery that unfolded after the drawdown early in 2020. Relative performance was modestly positive on strong stock selection, led by Information Technology. Exposures to the semiconductor industry, through chip designers and producers, was the largest contributor to relative performance. Financials also experienced strong performance, as banks collectively benefitted from the stimulus efforts to limit potential defaults and delinquencies, in addition to the need for capital to invest in acquisitions and equipment. Communication Services and Utilities both faced challenges from selections, as some of the more pandemic impacted areas saw far stronger recoveries.
Several of the strongest individual performers in the portfolio resided in Information Technology. Shares of NVIDIA remain extremely well positioned to continue to grow given their exposure to semiconductor chips used for gaming to automobiles. Micron Technology similarly remains well situated as the consolidation that has occurred in the memory market has helped reduce the volatility and structurally improved the industry amidst high levels of current demand. Monolithic Power Systems posted strong results on better margins and growth as their power management solutions remain critical to shrinking device sizes and the need for longer battery life. Western Alliance Bancorp, a regional bank, saw stronger loan growth and unlike some peers, strong net interest margins as well, leading to better earnings and favorable outlooks. EOG Resources moved higher, as oil prices rallied over 80 percent over the last twelve months, with strong cash generation leading to further deleveraging.
The Fund’s performance was impacted by the Communication Services sector, where more stable franchises in the cable industry failed to keep pace with the appreciation seen by some higher growth areas like digital advertising and search. Similar headwinds in the Utilities sector were seen as well. McCormick & Company faced difficult comparisons after the surge in eating at home last year, as well as some pressures on their input costs that weighed on their results. Freeport-McMoRan declined in sympathy with falling copper prices, despite their
Net returns are net of the sub-adviser’s fees, not the mutual fund fees.
Past performance is not indicative of future results. Portfolio returns reflect the reinvestment of dividend and interest income. All information provided is for informational purposes only and is not intended to be, and should not be interpreted as, an offer, solicitation, or recommendation to buy or sell or otherwise invest in any of the securities/sectors/countries that may be mentioned. A description of the methodology used to calculate the attribution analysis or a complete list of each holding’s contribution to overall performance during the measurement period may be obtained by contacting info@westwoodgroup.com. Benchmark Data Source: © 2021 FactSet Research Systems Inc. All Rights Reserved. Russell Investment Group is the owner of the trademarks, service marks, and copyrights related to its indexes, which have been licensed for use by Westwood.
| 1 Investing Where It Counts | | |
improving capital profile, given the challenges in China with Evergrande and the potential impact on copper demand in the coming periods. Ross Stores also posted strong results but faced investor concerns over whether near-term headwinds from lean inventories and rising freight costs would disrupt their growth trajectory. Valero Energy saw improvement in their second quarter results but short-term disruptions from weather events and power outages pressured their operations. WEC Energy Group faced investor rotation into more risk-on oriented areas of the markets as results remained solid and execution was good across their utility operations.
The Westwood team remains focused on seeking high-quality companies trading at a discount to intrinsic value. Optimism has surged, leaving valuations elevated even as uncertainty persists. The likely removal of monetary stimulus by the Federal Reserve and the dysfunction in Washington limiting additional fiscal spending could create choppy trends ahead for the economy and businesses alike. Should volatility rise further as a result, the market is likely to maintain a preference for businesses with greater stability and future growth prospects. The team believes those firms with stronger balance sheets and cash generation remain well-positioned to capitalize on opportunities to deploy that capital in the coming periods to augment their growth trajectories, something often overlooked in valuations. Interest rates remaining low should help to finance such ambitions for corporations as well as consumers looking to move or improve their housing situation. Employment remains a bright spot for many, as wages are rising in this tight labor market, but further job gains have slowed highlighting a potential disconnect between current job seekers and open positions. Resolving this and lowering unemployment will be important to maintain consumer confidence and spending. In total, the overall impact to the investing landscape should provide additional opportunities to active managers as dispersion of returns increases and correlations between stocks decrease. We continue to leverage our intensive research -driven process to identify securities with company-specific opportunities and visible earnings growth. As has always been our practice, we look to invest in companies with conservative balance sheets, robust free cash flow generation, and high returns as we believe those characteristics among others help provide attractive risk-adjusted returns for the portfolio. Given the speed and magnitude of the unprecedented market recovery, we remain mindful that markets may continue to experience significant bouts of volatility and are focused on protecting client capital by investing in opportunities which we feel have measurable and limited potential for loss.
We thank you for your continued confidence in the Westwood process and investment teams and we look forward to serving your investment needs through the years ahead.
Westwood Management Corp.
Net returns are net of the sub-adviser’s fees, not the mutual fund fees.
Past performance is not indicative of future results. Portfolio returns reflect the reinvestment of dividend and interest income. All information provided is for informational purposes only and is not intended to be, and should not be interpreted as, an offer, solicitation, or recommendation to buy or sell or otherwise invest in any of the securities/sectors/countries that may be mentioned. A description of the methodology used to calculate the attribution analysis or a complete list of each holding’s contribution to overall performance during the measurement period may be obtained by contacting info@westwoodgroup.com. Benchmark Data Source: © 2021 FactSet Research Systems Inc. All Rights Reserved. Russell Investment Group is the owner of the trademarks, service marks, and copyrights related to its indexes, which have been licensed for use by Westwood.
| 2 Investing Where It Counts | | |

Letter from the Manager
September 30, 2021
Timothy Plan Fixed Income Fund
The fiscal year ending September 30, 2021 saw an increase in U.S. Treasury (UST) yields as the Federal Reserve (Fed) announced they would likely begin tapering their quantitative easing (QE) purchases in November 2021 due to heightened inflation concerns. The Timothy Plan Fixed Income Fund invests in the broad U.S. investment grade bond market benchmarked to the Bloomberg Barclays Aggregate index which began the last 12 months with a yield of 1.18% and ended at 1.37%.
The 10-year UST yield rose after starting the fiscal period at 0.69%, peaking at 1.74% at the end of March 2021, and ending September 2021 at 1.49%. By comparison, the 2-year rate more than doubled after starting at 0.13% and ending the last 12 months at 0.28%. The U.S. and global economies saw significant recovery from the pandemic recessions experienced during the last fiscal period. Fiscal and monetary stimulus, the rollout of vaccines and pent-up demand gave way to an expanding economy. These factors also led to potential risks as we neared September 30, 2021. The risk of inflation became evident due to the largest fiscal deficits and money supply growth experienced since World War II. U.S. CPI accelerated at a greater than 5.0% year/year pace in all three of 3Q21’s monthly data releases, more than double the 2021 forecast issued by the Fed at its Dec. 2020 meeting.
Investment Grade (IG) Credit spreads started the last 12 months at 128 basis points (bps), narrowed to 77 by June 2021 and ended at 80 by September 2021. IG Credit bond funds continued to receive net inflows and achieved a calendar year record by September. Strong investor demand offset the impact of year-to-date issuance which reached $1.35T by the end of the fiscal period. The Mortgage- Backed Securities (MBS) sector generated nominal returns ahead of the Bloomberg Barclays Aggregate Index but suffered negative excess returns. MBS investors will continue to focus on the Fed’s QE-taper plans going forward.
The Timothy Fixed Income Fund A shares returned -2.07% for Class I, over the 12-month period ending September 30, 2021 which was below the Bloomberg Barclays Aggregate index at -0.90%. The underweight allocation to Financials detracted from relative performance as the sector generated the second highest nominal return of all other major sectors and the overall index. Security selection in MBS also hurt relative performance. Our GNMA holdings generated returns below the counterparts in the index. Our overweight to Industrials and Utilities added value as these two sectors posted higher nominal and excess returns than the Bloomberg Barclays Aggregate Index. We remain focused on generating income consistent with a prudent level of risk.
| |
| BARROW HANLEY GLOBAL INVESTORS |
| 2200 Ross Avenue, 31st Floor | Dallas, TX 75201 | (214) 665-1900 |
Letter from the Manager
September 30, 2021
Timothy Plan High Yield Fund
During the fiscal year ending September 30, 2021, High Yield (HY) spreads started at 441 basis points (bps), declined to 236bps by June 30th, and finished the year slightly higher at 251bps. The Timothy Plan High Yield Fund invests primarily in BB and B rated HY bonds with a benchmark of the Bloomberg Barclays Ba/B HY* index. The benchmark began the last 12 months with a Yield to Worst (YTW) of 5.01%, fell to 3.43% by June 30th 2021, and ended slightly higher at 3.68%. Over the period, the HY market posted a return of 9.84% which surpassed the return of investment grade credit bonds of 1.45%. Performance of the index was led by lower quality ‘B’ rated credits.
Approaching the end of 2020, investors’ risk appetites increased following the positive vaccine news. HY spreads continued to tighten as unprecedented monetary and fiscal policies were unleashed to stimulate both consumer and business spending. Through September, the HY market posted its 10th consecutive month of positive returns and is now 3.89% higher on a calendar year-to-date basis. HY gross issuance leapt 59% year/year in 2020 with a record-high $418B of deals priced.
The Timothy High Yield Fund A shares generated a total return of 11.71% for Class I, over the 12 months ending September 30, 2021 while the Bloomberg Barclays Ba/B HY* index returned 9.84%. Security selection in Basic Industry and Consumer Cyclicals benefited performance. Within Financials, our Insurance and Finance Companies generated returns ahead of their counterparts in the index, positively contributing to performance. Detracting from performance was our security selection in Energy and an underweight allocation to Banks. The portfolio remains focused on generating a higher level of carry income consistent with a reasonable level of risk.
| * | Bloomberg Barclays U.S. HY Ba/B 3% |
| |
| BARROW HANLEY GLOBAL INVESTORS |
| 2200 Ross Avenue, 31st Floor | Dallas, TX 75201 | (214) 665-1900 |
September 30, 2021
Dear Shareholder,
The Defensive Strategies Fund was designed and is managed to do what its name implies, hedge against a possible scenario of hyper-inflation which could result from our Congress’s proven unwillingness to address our core problems of too much spending and too much debt. The Fund was also designed with built-in flexibility that allows it to be adjusted to address a possible risk of extreme deflation, with the ability to convert the inflation sensitive assets to cash and fixed income securities during a deflationary environment, and to be adjusted to a more normal, traditional investment strategy.
The Fund’s portfolio is primarily comprised of several inflation sensitive investment sleeves: commodities (commodity company stocks and ETF’s), real estate (in the form of REITs), precious metals (primarily gold bullion) and silver ETFs, TIPs (Treasury Inflation Protected Bonds), with the balance in cash. Timothy Partners, Ltd. (the “Advisor”) is responsible for setting the percentages of the Fund that will be allocated to each investment sleeve. Different sub-advisors manage the holdings in each sleeve. Even after the negative effects on the economic shutdown produced by the Covid-19 pandemic, the Fund experienced a respectable 14.34% total return for the fiscal year ended September 30, 2021. For a more complete description of the elements that impacted Fund performance and the outlook for the future, please read the various sub-advisors’ reports in the pages that follow.
I would like to point out that, since there does not exist an appropriate benchmark index with which to compare our performance, we have created a blended index comprised of roughly 33% each of U.S. Government TIPs, FTSE NAREIT Equity Index and Bloomberg Commodity Index. We believe the blend offers a fairly accurate reflection and comparison of the composition of the Fund. For the fiscal year ended September 30, 2021, the blended index had a total return of 25.60%. The difference between the fund’s performance and the blended index was due mainly to the drag the gold bullion position had on the fund while it is not reflected in the index.
While no one can predict future events, I remain confident that our sub-advisors (i.e. money management firms that manage the various sleeves of this Fund) are, in our opinion, among the best in the industry, and they each continue to honor our overall policy that they manage their respective Fund sleeve both in accordance with our screening restrictions and with a conservative bias. As I stated in last year’s report, although we will do our very best to be successful, we cannot guarantee results in any of these scenarios.
Finally, I would once again like to thank you for your moral convictions that led you to become part of the Timothy Plan Family.
Yours in Christ,
Arthur D. Ally
Fund Advisor
Letter from the Manager
September 30, 2021
Timothy Plan Defensive Fund – Treasury Inflation Protected Securities (TIPS)
The unprecedented fiscal and monetary stimulus, initiated during the pandemic, has resulted in the largest fiscal deficit and money supply growth since World War II. These factors have also heightened fears of accelerating inflation. The Fed’s insistence that inflation will prove transitory faced an ongoing rebuttal from inflation in consumer and durable goods, such as automobiles, where production remained disrupted by supply chain issues. U.S. CPI accelerated at a greater than 5.0% year/year pace in all three of 3Q21’s monthly data releases, more than double the 2021 forecast issued by the Fed at its Dec. 2020 meeting. The Timothy Defensive Fund has an allocation of U.S. Treasury Inflation Protected Securities (TIPS) designed to help protect assets from higher rates of inflation.
In August 2021, Cleveland Fed President Loretta Mester admitted the inflation hurdle for a Fed rate hike had already been cleared, but that the second requirement, full employment, was likely to remain unachieved until year-end 2022. The U-3 unemployment rate fell 110bps to 4.8% in 3Q, but the number of businesses struggling to fill vacancies was indicative of a tighter labor market. The Bureau of Labor Statistics’ Job Openings Index (JOLT) registered 10.9mm openings, 47% above the pre-COVID high of Dec. 2018, and larger than the 8.3mm Americans who remained unemployed.
Energy markets lifted costs for producers and consumers and by the end of the fiscal period Brent Crude reached $78.52 per-barrel, its highest level in three years. Natural gas prices also rose, climbing 60% in the U.S. Meanwhile, portions of the U.S. CPI basket lagged the levels implied by market prices. Home prices, as reported by the S&P Case-Shiller home price index, had jumped 20.0% year/year by July. However, the “shelter” component of CPI had only climbed 2.8% year/year due to its survey reporting method’s tie to the rental market.
Over the previous 12-month period, investors’ future inflation expectations climbed dramatically. We measure investors’ inflation expectations as the difference between the U.S. Treasury 10-year and the U.S. TIPS 10-year. This “breakeven rate” of inflation is what would be required to make these two securities have the same yield. The “breakeven rate” of inflation started the fiscal period at 1.64%, reached a 12-month high of 2.57% in May 2021 but subsequently declined to 2.36% by the end of September. TIPS securities generated a 12-month return of 5.19%, as reported by Bloomberg Barclays. The Timothy Plan’s TIPS portfolio, within the Defensive Fund, ended the fiscal year-end period with an underweight to the 1 to 4.99-year maturity segment, overweight to the 5 to 9.99-year, and underweight to 20+ year securities. The primary goal of the TIPS allocation continues to be protection from rising inflation rates.
| |
| BARROW HANLEY GLOBAL INVESTORS |
| 2200 Ross Avenue, 31st Floor | Dallas, TX 75201 | (214) 665-1900 |

The Timothy Plan Defensive Strategies Fund
Real Estate Sleeve (the “Portfolio”)
Annual Manager Letter: 12 months ended September 30, 2021
In the 12 months ending September 30, 2021, the US REIT market has surged based on positive headlines on the Pfizer COVID vaccine and the resulting momentum in consumer spending, leading to higher rent collection and rising occupancy and rents, albeit off of a low base. The combination of loose monetary policy and stimulus created a ‘perfect storm’ of rising GDP and low interest rates, which flowed from the consumer to businesses, enabling wages to rise significantly.
We believe Commercial real estate is a beneficiary of inflation, as shown by the +37.2% total return in the one year period ending September 30, 2021, in the MSCI US REIT Index (Bloomberg: RMZ). The rising demand via job growth and consumer spending was matched with low supply growth, at first due to the sheer inability to be on a construction site during a pandemic, then due to the inability to get financing from banks, and finally due to the rising construction costs from inflation. We believe these conditions should persist for a few years as the construction pipelines begin to refill and occupancy and rents catch up.
The top performing property types over the period were Regional Malls, Lodging, and Shopping Centers, while the lowest total returns were in the data center, cell tower, and triple net sectors. Chilton took over management of the portfolio on November 30, 2020, and has produced a total return of +25.5% (gross of fees) through September 30, 2021, which compares to +27.1% for the RMZ over the same period. The top contributors to relative performance were stock selection in the diversified sector, an underweight allocation to the data center sector, and stock selection in the healthcare sector. The top detractors from relative performance over the same period were an overweight allocation to the cell tower sector, and an underweight allocation to the shopping center and regional mall sectors.
Sector performance was particularly impacted by the Pfizer vaccine announcement in November 2020, which began a five month surge in the most downtrodden sectors such as regional malls, shopping centers, and lodging. However, following the 1Q21 earnings season, the market has become more focused on earnings growth and dividend growth, which we believe should continue. While the portfolio remains underweight to regional malls, lodging, and shopping centers as of September 30, 2021, we have been adding exposure to the ‘reopening’ trade by investing in healthcare and diversified REITs, which we believe provide a better risk-adjusted reward given lower valuation multiples.
An investment cannot be made directly in an index. The information contained herein should be considered to be current only as of the date indicated, and we do not undertake any obligation to update the information contained herein in light of later circumstances or events. This publication may contain forward looking statements and projections that are based on the current beliefs and assumptions of Chilton Capital Management and on information currently available that we believe to be reasonable, however, such statements necessarily involve risks, uncertainties and assumptions, and prospective investors may not put undue reliance on any of these statements. This communication is provided for informational purposes only and does not constitute an offer or a solicitation to buy, hold, or sell an interest in any Chilton investment or any other security. Past performance does not guarantee future results.
| The Timothy Plan Defensive Strategies Fund Commodity Sleeve (the “Portfolio”) |  |
Annual Letter from the Manager (September 30, 2021)
We are pleased to provide you with our annual report for the Timothy Plan Defensive Strategies Fund Commodity Sleeve (the “Portfolio”) for the twelve months ending September 30, 2021. The Portfolio rose 69.1% on a gross basis. Commodities broadly posted strong gains during these twelve months with the Bloomberg Commodity Index Total Return (the “BCOM”) gaining 42.3%. The Portfolio generated 26.8% of outperformance versus the BCOM benchmark with positive contributions from energy, agriculture, and industrial metals, though underperformance in precious metals modestly detracted from this overall relative outperformance.
Energy
Energy was the best performing sector for the prior year, with the Bloomberg Energy Subindex Total Return rising 78.8%. The Portfolio’s energy holdings were also the best performing sector, gaining 109.3% for the period and generating roughly half of the Portfolio’s overall relative outperformance versus the BCOM. WTI crude oil prices jumped approximately 86.6% during the period as demand rose with pandemic travel restrictions easing, while US crude oil production remained well below pre-COVID levels. Natural gas prices more than doubled over the period rising from $2.53 per MMBTU to nearly $5.90. Upstream E&P companies held in the Portfolio benefited the most from these increasing prices, rising nearly 150% over the period. The Portfolio’s largest energy holdings as of September 30th were EOG Resources (EOG US), ConocoPhillips (COP US), and Inpex Corp (1605 JP).
Agriculture
Over the past year agricultural commodities, as proxied by the Bloomberg Commodity Agriculture and Livestock Subindex Total Return, rose by 39.1%. Over the same period the Portfolio’s agricultural holdings outperformed, rising 51.6% and providing some additional relative outperformance. The Portfolio’s largest agriculture holdings as of September 30th were Nutrien Ltd (NTR US), Deere & Co (DE US), and Coreteva Inc (CTVA US).
Metals & Mining
Industrial metal commodity futures were up strongly for the period with the Bloomberg Industrial Metals Subindex Total Return rising 37.1%. The Portfolio’s industrial metal holdings performed better than their respective commodity futures, rising 78.1% over the same period and contributing greatly to the Portfolio’s overall outperformance. The Portfolio’s exposure to steel – a commodity not included in the BCOM benchmark – was particularly beneficial as holdings in that industry appreciated more than 100% during the period. The Portfolio’s largest industrial metal holdings as of September 30th were Rio Tinto (RIO US), Vale SA (VALE US), and Teck Resources (TECK/B CN).
Precious metal futures were the only sector to finish down over the prior year with the Bloomberg Precious Metals Subindex Total Return falling (7.8%) for the twelve months ended September 30, 2021. Timothy’s precious metal miners underperformed, falling (24.2%) over the same time period as falling prices and rising fuel costs weighed on these miners. The Portfolio’s largest precious metal holdings as of September 30th were Newmont Goldcorp (NEM US), Kirkland Lake Gold (KL CN), and Kinross Gold (KGC US).
Market Outlook
The Timothy Plan Defensive Strategy Fund Commodity Sleeve currently utilizes a diversified portfolio of natural resource equities that is intended to capture commodity price movements. We believe that the supply of many global commodities has not kept pace with the demand increases resulting from the continued re-opening efforts in the wake of the pandemic. Though demand remains below pre-pandemic levels, to the extent this continues to normalize and commodity prices continue to rally, we expect the Portfolio to perform positively.
CoreCommodity Management, LLC 680 Washington Boulevard Stamford, CT 06901 Tel: 203.708.6500 www.CoreCommodityllc.com
Past performance is not indicative of future results. STANDARD & POOR’S, and S&P are registered trademarks of Standard & Poor’s Financial Services LLC. “Bloomberg®,” “Bloomberg Commodity IndexSM” and the names of the other indexes and sub-indexes that are part of the Bloomberg Commodity Index family are service marks of Bloomberg Finance L.P. and its affiliates. Source for all Index data: Bloomberg L.P. Commodity Sectors are represented by the Bloomberg Commodity Sector Sub-Indices. This document does not constitute an offer of any commodities, securities or investment advisory services. Any such offer may be made only by means of a disclosure document or similar materials which contain a description of material terms and risks. All expressions of opinion are subject to change without notice in reaction to shifting market conditions. Data contained herein from third-party providers is obtained from what are considered reliable sources. However, its accuracy, completeness or reliability cannot be guaranteed. The economic statistics presented herein are subject to revision by the agencies that issue them. This information is accurate only as of the date hereof, or as of historical dates otherwise indicated herein, and we do not undertake any obligation to update this material Any indices and other financial benchmarks shown are provided for illustrative purposes only, are unmanaged, reflect reinvestment of income and do not reflect the impact of advisory fees. Investors cannot invest directly in an index. All investments are subject to risk.
CoreCommodity Management, LLC 680 Washington Boulevard Stamford, CT 06901 Tel: 203.708.6500 www.CoreCommodityllc.com
September 30, 2021
Dear Timothy Plan Strategic Growth and Conservative Growth Fund Shareholder:
Asset allocation has normally been, and we believe it continues to be, a very prudent approach to investing. As a review, your Timothy Plan investment is a compilation of many of Timothy’s underlying funds (including six of our more recent ETF’s) and, as such, your performance is directly related to the performance of those underlying funds. Although the second and third quarters of 2020 experienced very negative returns as a result of the economic shutdown due to the Covid-19 pandemic, fiscal year 2021 (October, 2020 thru September, 2021) was a very different story as we experienced excellent performance in nearly all our underlying funds and we ended the fiscal year with very respectable returns of (17.98%) for Strategic Growth and (12.25%) for Conservative Growth. Having said that, we intend to participate in this strong market while maintaining a more cautious outlook for the economy in the year ahead. As a result, we have adjusted our positions in the underlying funds to the allocations shown below:
| | | | Conservative Growth | | Strategic Growth |
| ● | Large/Mid-Cap Core ETF | | 8.00 % | | 9.50% |
| ● | Large/Mid-Cap Core Enhanced ETF | | 6.00 % | | 7.50% |
| ● | High Dividend Stock ETF | | 2.00 % | | 4.50% |
| ● | High Dividend Stock Enhanced ETF | | 1.50 % | | 3.00% |
| ● | Small-Cap Core ETF | | 7.00 % | | 9.00% |
| ● | International ETF | | 14.00 % | | 23.00% |
| ● | International Fund | | 6.50 % | | 10.00% |
| ● | High-Yield Bond Fund | | 5.50 % | | 5.00% |
| ● | Defensive Strategies Fund | | 6.00 % | | 7.00% |
| ● | Fixed Income Fund | | 39.50 % | | 18.50% |
| ● | Cash | | 4.00 % | | 3.00% |
Even though the Portfolios have been designed to be conservatively allocated, we understand that recent market gyrations may be unsettling for some investors. Please understand that our #1 concern is preservation of principal, and, even though we do want to participate in the markets’ strong upward trend, we will attempt to adjust our allocation above to changing market conditions.
As you know, no one can guarantee future performance. However, the one thing that I can assure you of is every one of our sub-advisors is doing their very best and our team here at Timothy is working very hard to provide you an investment in which you can feel comfortable.
Sincerely,
Arthur D. Ally
President
| The Timothy Plan Israel Common Values Fund |
| Letter from The Manager - September 30, 2021 |
The Israeli market came roaring back during this fiscal year as news of a Covid-19 vaccine breakthrough sent global markets soaring on hopes of ending global lockdowns. The Fund again handily beat its benchmark TA-125 index with a combination of good sector allocation and stock selection. Sector allocation was aided from an overweight to a strong performing Consumer Discretionary sector as well as underweight to underperforming Health Care, Communications Services, and Utilities sectors. These outweighed poor allocation to Consumer Staples and Real Estate. From a stock selection standpoint, the Fund did very well in the Industrials, Technology, and Materials sectors. Individual companies contributing to the strong relative performance included leading retailer Fox-Wizel (Consumer Discretionary), semiconductor metrology leader Nova Ltd (Technology), textile printing solutions leader Kornit Digital (Industrials), and insurance company Migdal Insurance (Financials). The Israeli market continues to provide the Fund ample investment opportunities.
After multiple lockdowns in Israeli cities related to the Covid-19 pandemic, the Israeli economy has come back strong. The country also became a global leader in its drive to vaccinate a major portion of its population. Both the International Monetary Fund (IMF) and the Bank of Israel (BoI) expect Israeli GDP growth to hover around 7% in calendar year 2021 while the BoI expects further growth of over 5% in 2022. This strong growth backdrop should lead to robust consumer demand with strong job creation and lower unemployment levels. While inflation at 2.2% is above recent trend, it remains within the central bank’s target range and well below the elevated levels of many other developed economies. The BoI expects inflation to moderate over the next twelve months signaling tapering of its quantitative easing measures is likely to start in the coming months.
On the political front, after four elections in two years, a new government was finally formed with the ousting of Israel’s longest serving prime minister Benjamin Netanyahu. A coalition government headed by Naftali Bennett of Yamina party and Yair Lipid of Yesh Atid party was able to get enough votes to move forward with Bennett serving as prime minister. We do not expect significant changes in policy from this new government that would materially affect the capital markets.
The Fund continues to invest alongside the innovate spirit of Israeli companies providing ample attractive investment opportunities. The economic backdrop remains supportive of continued positive earnings momentum over the coming quarters. We remain committed to a consistent investment approach dedicated to finding long-term investments for shareholders and we thank you for your continued investment in the Fund.
Eagle Global Advisors, LLC
September 30, 2021
Dear Timothy Plan Growth and Income Fund Shareholder:
In 2019, Timothy Plan added four new Exchange Traded Funds to our diversified product line: Timothy Plan Large/Mid-Cap Core (TPLC), Timothy Plan High Dividend Stock (TPHD), Timothy Plan International Equity Fund (TPIF), and Timothy Plan Small Cap Core (TPSC). Also, in July, 2020 we added two new ETFs that contained a structured partial move to cash in the event of a substantial market decline: Timothy Plan Large-Mid Cap Core Enhanced (TPLE) and Timothy Plan High Dividend Stock Enhanced (TPHE). These are all smart beta index funds traded on the New York Stock Exchange. Since TPHD and TPHE fits nicely into the into the investment objective of our Growth and Income Fund, we incorporated these two particular ETFs into the holdings of this fund so that:
| ● | Approximately 60% of the fund is now invested in a combination of TPHD and TPHE. |
| ● | While the remaining fixed income portion of the fund is actively managed by our long-time fixed income sub-advisor, Barrow Hanley. |
It is our belief that this dual managed arrangement will result in both better performance and a reduction of this fund’s expense ratio.
For future market outlook for this fund, please read Barrow Hanley’s Sub-Advisor’s letter in this Annual Report.
As you know, no one can guarantee future performance. However, the one thing that I can assure you of is, for every one of our Timothy Plan Funds, all our sub-advisors are doing their very best and our team here at Timothy is working very hard to provide you an investment in which you can feel comfortable.
Sincerely,
Arthur D. Ally
President
Letter from the Manager
September 30, 2021
Timothy Growth and Income Fund – Fixed Income Allocation
The fiscal year ending September 30, 2021 saw an increase in U.S. Treasury (UST) yields as the Federal Reserve (Fed) announced they would likely begin tapering their quantitative easing (QE) purchases in November 2021 due to heightened inflation concerns. The fixed income allocation of the Timothy Plan Growth & Income Fund invests in the broad U.S. investment grade bond market benchmarked to the Bloomberg Barclays Aggregate index which began the last 12 months with a yield of 1.18% and ended at 1.37%.
The 10-year UST yield rose after starting the fiscal period at 0.69%, peaking at 1.74% at the end of March 2021, and ending September 2021 at 1.49%. By comparison, the 2-year rate more than doubled after starting at 0.13% and ending the last 12 months at 0.28%. The U.S. and global economies saw significant recovery from the pandemic recessions experienced during the last fiscal period. Fiscal and monetary stimulus, the rollout of vaccines and pent-up demand gave way to an expanding economy. These factors also led to potential risks as we neared September 30, 2021. The risk of inflation became evident due to the largest fiscal deficits and money supply growth experienced since World War II. U.S. CPI accelerated at a greater than 5.0% year/year pace in all three of 3Q21’s monthly data releases, more than double the 2021 forecast issued by the Fed at its Dec. 2020 meeting.
Investment Grade (IG) Credit spreads started the last 12 months at 128 basis points (bps), narrowed to 77 by June 2021 and ended slightly higher at 80 by September 2021. IG Credit bond funds continued to receive net inflows and achieved a calendar year record by September. Strong investor demand offset the impact of year-to-date issuance which reached $1.35T by the end of the fiscal period. The Mortgage- Backed Securities (MBS) sector generated nominal returns ahead of the Bloomberg Barclays Aggregate Index but suffered negative excess returns. MBS investors will continue to focus on the Fed’s QE-taper plans going forward.
Over the 12 months ended September 30th, security selection in MBS hurt relative performance. Our GNMA holdings generated returns below the counterparts in the index. Our overweight to Industrials and Utilities added value as these two sectors posted higher nominal and excess returns than the Bloomberg Barclays Aggregate Index. We remain focused on generating income consistent with a prudent level of risk.
| |
| BARROW HANLEY GLOBAL INVESTORS |
| 2200 Ross Avenue, 31st Floor | Dallas, TX 75201 | (214) 665-1900 |
Fund Performance - (Unaudited)
September 30, 2021
Aggressive Growth Fund
| | | 5 Year | 10 Year | |
| | 1 Year | Average | Average | |
| Fund/Index | Total Return | Annual Return | Annual Return | |
| Timothy Aggressive Growth Fund - Class A (With Sales Charge) | 26.49% | 14.61% | 12.84% | |
| Russell Mid-Cap Growth Index | 30.45% | 19.27% | 17.54% | |
| Timothy Aggressive Growth Fund - Class C * | 31.87% | 15.06% | 12.62% | |
| Russell Mid-Cap Growth Index | 30.45% | 19.27% | 17.54% | |
| Timothy Aggressive Growth Fund - Class I | 34.19% | 16.20% | 10.55% | (a) |
| Russell Mid-Cap Growth Index | 30.45% | 19.27% | 15.09% | (a) |
| (a) | For the period August 1, 2013 (commencement of investment in accordance with objective) to September 30, 2021. |
| * | With Maximum Deferred Sales Charge |
Timothy Plan Aggressive Growth Fund vs. Russell Mid-Cap Growth Index
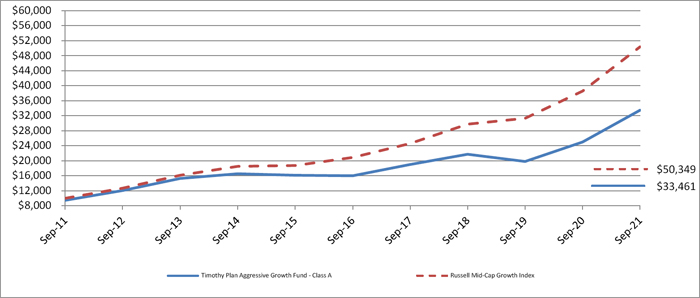
The chart shows the value of a hypothetical initial investment of $10,000 in the Fund’s Class A shares and the Russell Mid-Cap Growth Index on September 30, 2011 and held through September 30, 2021. The Russell Mid-Cap Growth Index is a widely recognized, unmanaged index of common stock prices. Performance figures include the change in value of the stocks in the index and the reinvestment of dividends. The index return does not reflect expenses, which have been deducted from the Fund’s return. The returns shown do not reflect deduction of taxes that a shareholder would pay on Fund distributions or the redemption of Fund shares. THE FUND’S RETURN REPRESENTS PAST PERFORMANCE AND IS NOT PREDICTIVE OF FUTURE RESULTS.
Fund Performance - (Unaudited)
September 30, 2021
International Fund
| | | 5 Year | 10 Year | |
| | 1 Year | Average | Average | |
| Fund/Index | Total Return | Annual Return | Annual Return | |
| Timothy International Fund - Class A (With Sales Charge) | 22.29% | 8.41% | 7.71% | |
| MSCI EAFE Index | 22.96% | 6.04% | 5.21% | |
| MSCI AC World Index ex USA Net (USD) | 23.91% | 8.94% | 7.48% | |
| Timothy International Fund - Class C * | 27.38% | 8.82% | 7.51% | |
| MSCI EAFE Index | 22.96% | 6.04% | 5.21% | |
| MSCI AC World Index ex USA Net (USD) | 23.91% | 8.94% | 7.48% | |
| Timothy International Fund - Class I | 29.68% | 9.93% | 6.55% | (a) |
| MSCI EAFE Index | 22.96% | 6.04% | 3.36% | (a) |
| MSCI AC World Index ex USA Net (USD) | 23.91% | 8.94% | 6.03% | (a) |
| (a) | For the period August 1, 2013 (commencement of investment in accordance with objective) to September 30, 2021. |
| * | With Maximum Deferred Sales Charge |
Timothy Plan International Fund vs. MSCI EAFE Index vs. MSCI AC World Index ex USA Net (USD)
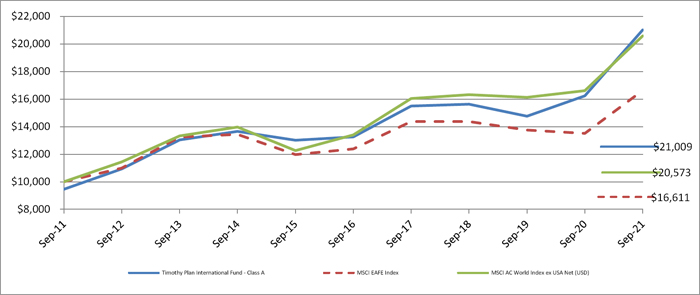
The chart shows the value of a hypothetical initial investment of $10,000 in the Fund’s Class A shares, the MSCI EAFE Index and the MSCI AC World Index ex USA Net (USD) on September 30, 2011 and held through September 30, 2021. The MSCI EAFE Index is a widely recognized unmanaged index of equity prices and is representative of equity market performance of developed countries, excluding the U.S. and Canada. The MSCI ACWI ex USA Index captures large and mid cap representation across 22 of 23 Developed Markets (DM) countries (excluding the US) and 26 Emerging Markets (EM) countries. With 2,377 constituents, the index covers approximately 85% of the global equity opportunity set outside the US. Performance figures include the change in value of the stocks in the index and the reinvestment of dividends. The index return does not reflect expenses, which have been deducted from the Fund’s return. The returns shown do not reflect deduction of taxes that a shareholder would pay on Fund distributions or the redemption of Fund shares. THE FUND’S RETURN REPRESENTS PAST PERFORMANCE AND IS NOT PREDICTIVE OF FUTURE RESULTS.
Fund Performance - (Unaudited)
September 30, 2021
Large/Mid Cap Growth Fund
| | | 5 Year | 10 Year | |
| | 1 Year | Average | Average | |
| Fund/Index | Total Return | Annual Return | Annual Return | |
| Timothy Large/Mid Cap Growth Fund - Class A (With Sales Charge) | 24.08% | 13.20% | 13.28% | |
| Russell 1000 Growth Total Return Index | 27.32% | 22.84% | 19.68% | |
| Timothy Large/Mid Cap Growth Fund - Class C * | 29.32% | 13.59% | 13.05% | |
| Russell 1000 Growth Total Return Index | 27.32% | 22.84% | 19.68% | |
| Timothy Large/Mid Cap Growth Fund - Class I | 31.64% | 14.74% | 11.63% | (a) |
| Russell 1000 Growth Total Return Index | 27.32% | 22.84% | 18.36% | (a) |
| (a) | For the period August 1, 2013 (commencement of investment in accordance with objective) to September 30, 2021. |
| * | With Maximum Deferred Sales Charge |
Timothy Plan Large/Mid Cap Growth Fund vs. Russell 1000 Growth Total Return Index
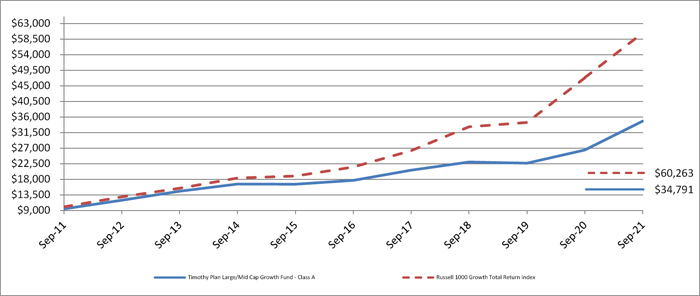
The chart shows the value of a hypothetical initial investment of $10,000 in the Fund’s Class A shares and the Russell 1000 Growth Total Return Index on September 30, 2011 and held through September 30, 2021. The Russell 1000 Growth Index is a widely recognized, unmanaged index of common stock prices. Performance figures include the change in value of the stocks in the index and the reinvestment of dividends. The index return does not reflect expenses, which have been deducted from the Fund’s return. The returns shown do not reflect deduction of taxes that a shareholder would pay on Fund distributions or the redemption of Fund shares. THE FUND’S RETURN REPRESENTS PAST PERFORMANCE AND IS NOT PREDICTIVE OF FUTURE RESULTS.
Fund Performance - (Unaudited)
September 30, 2021
Small Cap Value Fund
| | | 5 Year | 10 Year | |
| | 1 Year | Average | Average | |
| Fund/Index | Total Return | Annual Return | Annual Return | |
| Timothy Small Cap Value Fund - Class A (With Sales Charge) | 42.76% | 9.50% | 13.61% | |
| Russell 2000 Index | 47.68% | 13.45% | 14.63% | |
| Timothy Small Cap Value Fund - Class C * | 48.84% | 9.91% | 13.39% | |
| Russell 2000 Index | 47.68% | 13.45% | 14.63% | |
| Timothy Small Cap Value Fund - Class I | 51.33% | 11.02% | 9.65% | (a) |
| Russell 2000 Index | 47.68% | 13.45% | 10.86% | (a) |
| (a) | For the period August 1, 2013 (commencement of investment in accordance with objective) to September 30, 2021. |
| * | With Maximum Deferred Sales Charge |
Timothy Plan Small Cap Value Fund vs. Russell 2000 Index
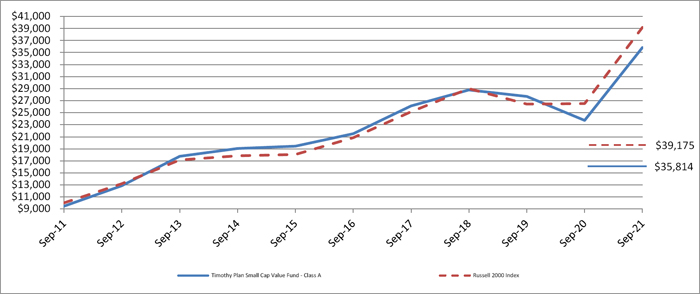
The chart shows the value of a hypothetical initial investment of $10,000 in the Fund’s Class A shares and the Russell 2000 Index on September 30, 2011 and held through September 30, 2021. The Russell 2000 Index is a widely recognized, unmanaged index of common stock prices. Performance figures include the change in value of the stocks in the index and the reinvestment of dividends. The index return does not reflect expenses, which have been deducted from the Fund’s return. The returns shown do not reflect deduction of taxes that a shareholder would pay on Fund distributions or the redemption of Fund shares. THE FUND’S RETURN REPRESENTS PAST PERFORMANCE AND IS NOT PREDICTIVE OF FUTURE RESULTS.
Fund Performance - (Unaudited)
September 30, 2021
Large/Mid Cap Value Fund
| | | 5 Year | 10 Year | |
| | 1 Year | Average | Average | |
| Fund/Index | Total Return | Annual Return | Annual Return | |
| Timothy Large/Mid Cap Value Fund - Class A (With Sales Charge) | 22.78% | 10.94% | 12.52% | |
| S&P 500 Index | 30.00% | 16.90% | 16.63% | |
| Timothy Large/Mid Cap Value Fund - Class C * | 27.91% | 11.36% | 12.31% | |
| S&P 500 Index | 30.00% | 16.90% | 16.63% | |
| Timothy Large/Mid Cap Value Fund - Class I | 30.20% | 12.47% | 10.56% | (a) |
| S&P 500 Index | 30.00% | 16.90% | 14.24% | (a) |
| (a) | For the period August 1, 2013 (commencement of investment in accordance with objective) to September 30, 2021. |
| * | With Maximum Deferred Sales Charge |
Timothy Plan Large/Mid Cap Value Fund vs. S&P 500 Index
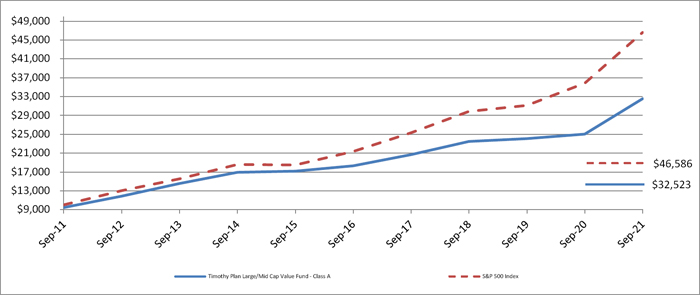
The chart shows the value of a hypothetical initial investment of $10,000 in the Fund’s Class A shares and the S&P 500 Index on September 30, 2011 and held through September 30, 2021. The S&P 500 Index is a widely recognized, unmanaged index of common stock prices. Performance figures include the change in value of the stocks in the index and the reinvestment of dividends. The index return does not reflect expenses, which have been deducted from the Fund’s return. The returns shown do not reflect deduction of taxes that a shareholder would pay on Fund distributions or the redemption of Fund shares. THE FUND’S RETURN REPRESENTS PAST PERFORMANCE AND IS NOT PREDICTIVE OF FUTURE RESULTS.
Fund Performance - (Unaudited)
September 30, 2021
Fixed Income Fund
| | | 5 Year | 10 Year | |
| | 1 Year | Average | Average | |
| Fund/Index | Total Return | Annual Return | Annual Return | |
| Timothy Fixed Income Fund - Class A (With Sales Charge) | (6.61)% | 0.56% | 1.07% | |
| Bloomberg U.S. Aggregate Bond Index | (0.90)% | 2.94% | 3.01% | |
| Timothy Fixed Income Fund - Class C * | (3.95)% | 0.72% | 0.78% | |
| Bloomberg U.S. Aggregate Bond Index | (0.90)% | 2.94% | 3.01% | |
| Timothy Fixed Income Fund - Class I | (2.07)% | 1.71% | 2.18% | (a) |
| Bloomberg U.S. Aggregate Bond Index | (0.90)% | 2.94% | 3.40% | (a) |
| (a) | For the period August 1, 2013 (commencement of investment in accordance with objective) to September 30, 2021. |
| * | With Maximum Deferred Sales Charge |
Timothy Plan Fixed Income Fund vs. Bloomberg U.S. Aggregate Bond Index
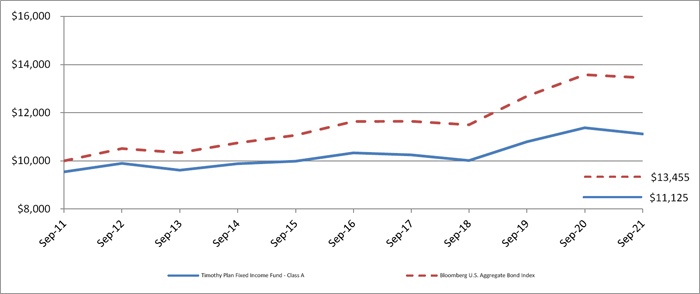
The chart shows the value of a hypothetical initial investment of $10,000 in the Fund’s Class A shares and the Bloomberg U.S. Aggregate Bond Index on September 30, 2011 and held through September 30, 2021. The Bloomberg U.S. Aggregate Bond Index is a widely recognized, unmanaged index of bond prices. Performance figures include the change in value of the bonds in the index and the reinvestment of interest. The index return does not reflect expenses, which have been deducted from the Fund’s return. The returns shown do not reflect deduction of taxes that a shareholder would pay on Fund distributions or the redemption of Fund shares. THE FUND’S RETURN REPRESENTS PAST PERFORMANCE AND IS NOT PREDICTIVE OF FUTURE RESULTS.
Fund Performance - (Unaudited)
September 30, 2021
High Yield Bond Fund
| | | 5 Year | 10 Year | |
| | 1 Year | Average | Average | |
| Fund/Index | Total Return | Annual Return | Annual Return | |
| Timothy High Yield Bond Fund - Class A (With Sales Charge) | 6.37% | 4.94% | 5.39% | |
| Bloomberg U.S. High Yield Ba/B 3% Index | 9.84% | 6.47% | 7.24% | |
| Timothy High Yield Bond Fund - Class C * | 9.71% | 5.12% | 5.08% | |
| Bloomberg U.S. High Yield Ba/B 3% Index | 9.84% | 6.47% | 7.24% | |
| Timothy High Yield Bond Fund - Class I | 11.71% | 6.17% | 5.13% | (a) |
| Bloomberg U.S. High Yield Ba/B 3% Index | 9.84% | 6.47% | 6.00% | (a) |
| (a) | For the period August 1, 2013 (commencement of investment in accordance with objective) to September 30, 2021. |
| * | With Maximum Deferred Sales Charge |
Timothy Plan High Yield Bond Fund vs. Bloomberg U.S. High Yield Ba/B 3% Index
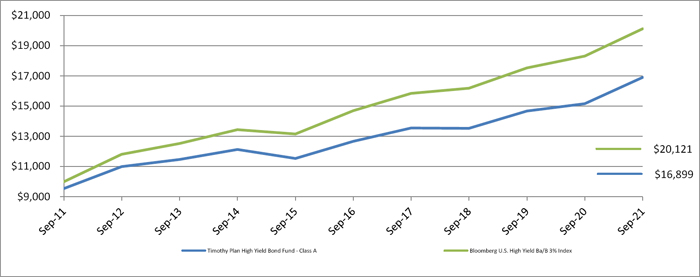
The chart shows the value of a hypothetical initial investment of $10,000 in the Fund’s Class A shares and Bloomberg U.S. High Yield Ba/B 3% Index on September 30, 2011 and held through September 30, 2021. The Bloomberg U.S. High Yield Ba/B 3% Index is an issuer-constrained version of the flagship U.S. Corporate High Yield Index, which measures the USD-denominated, high yield, fixed-rate corporate bond market. Performance figures include the change in value of the bonds in the index and the reinvestment of interest. The index return does not reflect expenses, which have been deducted from the Fund’s return. The returns shown do not reflect deduction of taxes that a shareholder would pay on Fund distributions or the redemption of Fund shares. THE FUND’S RETURN REPRESENTS PAST PERFORMANCE AND IS NOT PREDICTIVE OF FUTURE RESULTS.
Fund Performance - (Unaudited)
September 30, 2021
Israel Common Values Fund
| | | 5 Year | Average | |
| | 1 Year | Average | Annual Return | |
| Fund/Index | Total Return | Annual Return | Since Inception | |
| Timothy Israel Common Values Fund - Class A (With Sales Charge) | 41.06% | 14.43% | 9.95% | (a) |
| TA - 125 Index | 46.67% | 11.36% | 8.04% | (a) |
| Timothy Israel Common Values Fund - Class C * | 47.06% | 14.84% | 9.73% | (a) |
| TA - 125 Index | 46.67% | 11.36% | 8.04% | (a) |
| Timothy Israel Common Values Fund - Class I | 49.58% | 16.01% | 10.57% | (b) |
| TA - 125 Index | 46.67% | 11.36% | 7.95% | (b) |
| (a) | For the period October 12, 2011 (commencement of investment in accordance with objective) to September 30, 2021. |
| (b) | For the period August 1, 2013 (commencement of investment in accordance with objective) to September 30, 2021. |
| * | With Maximum Deferred Sales Charge |
Timothy Plan Israel Common Values Fund vs. TA - 125 Index
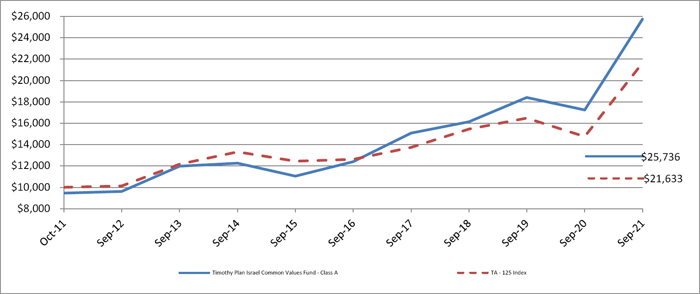
The chart shows the value of a hypothetical initial investment of $10,000 in the Fund’s Class A shares and the TA - 125 Index on October 12, 2011 and held through September 30, 2021. The TA - 125 Index is an unmanaged index of equity prices representing the 125 most highly capitalized companies listed on the Tel Aviv Stock Exchange . Performance figures include the change in value of the stocks in the index and the reinvestment of dividends. The index return does not reflect expenses, which have been deducted from the Fund’s return. The returns shown do not reflect deduction of taxes that a shareholder would pay on Fund distributions or the redemption of Fund shares. THE FUND’S RETURN REPRESENTS PAST PERFORMANCE AND IS NOT PREDICTIVE OF FUTURE RESULTS.
Fund Performance - (Unaudited)
September 30, 2021
Defensive Strategies Fund
| | | | 10 Year | |
| | 1 Year | 5 Year | Average | |
| Fund/Index | Total Return | Total Return | Annual Return | |
| Timothy Defensive Strategies Fund - Class A (With Sales Charge) | 8.42% | 3.38% | 2.75% | |
| Timothy Defensive Strategies Fund Blended Index | 25.59% | 4.75% | 3.61% | |
| Timothy Defensive Strategies Fund - Class C * | 12.95% | 3.76% | 2.56% | |
| Timothy Defensive Strategies Fund Blended Index | 25.59% | 4.75% | 3.61% | |
| Timothy Defensive Strategies Fund - Class I | 15.12% | 4.81% | 3.68% | (a) |
| Timothy Defensive Strategies Fund Blended Index | 25.59% | 4.75% | 3.14% | (a) |
| (a) | For the period August 1, 2013 (commencement of investment in accordance with objective) to September 30, 2021. |
| * | With Maximum Deferred Sales Charge |
Timothy Plan Defensive Strategies Fund vs. The Timothy Defensive Strategies Fund Blended Index
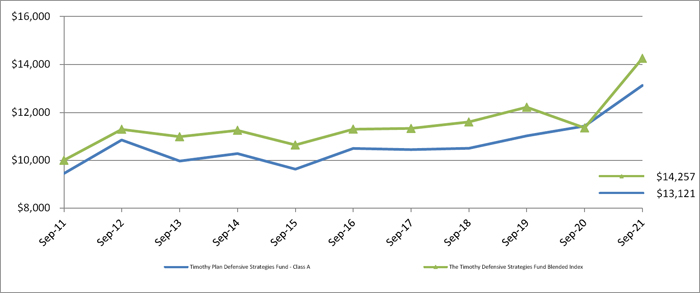
The chart shows the value of a hypothetical initial investment of $10,000 in the Fund’s Class A shares and the Timothy Defensive Strategies Fund Blended Index on September 30, 2011 and held through September 30, 2021. The Timothy Defensive Strategies Fund Blended Index reflects an unmanaged portfolio of 33% of the Bloomberg Barclays U.S. Treasury: 1-3 years Index, 33% of the Bloomberg Commodity Index Total Return and 34% of the MSCI U.S. REIT Gross (USD) Index. Performance figures include the change in value of the asset classes in the index and the reinvestment of dividends. The index return does not reflect expenses, which have been deducted from the Fund’s return. The returns shown do not reflect deduction of taxes that a shareholder would pay on Fund distributions or the redemption of Fund shares. THE FUND’S RETURN REPRESENTS PAST PERFORMANCE AND IS NOT PREDICTIVE OF FUTURE RESULTS.
Fund Performance - (Unaudited)
September 30, 2021
Strategic Growth Fund
| | | 5 Year | 10 Year |
| | 1 Year | Average | Average |
| Fund/Index | Total Return | Annual Return | Annual Return |
| Timothy Strategic Growth Fund - Class A (With Sales Charge) | 12.62% | 4.94% | 6.15% |
| Dow Jones Moderately Aggressive Portfolio Index | 25.50% | 11.34% | 11.02% |
| Timothy Strategic Growth Fund - Class C * | 17.19% | 5.35% | 5.96% |
| Dow Jones Moderately Aggressive Portfolio Index | 25.50% | 11.34% | 11.02% |
| * | With Maximum Deferred Sales Charge |
Timothy Plan Strategic Growth Fund vs. Dow Jones Moderately Aggressive Portfolio Index
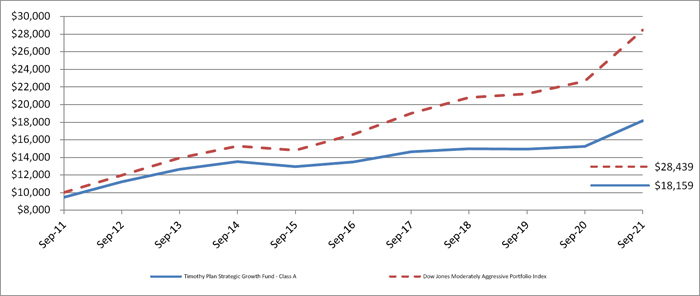
The chart shows the value of a hypothetical initial investment of $10,000 in the Fund’s Class A shares and the Dow Jones Moderately Aggressive Portfolio Index on September 30, 2011 and held through September 30, 2021. The Dow Jones Moderately Aggressive Portfolio Index is a widely recognized index that measures global stocks, bonds and cash which are in turn represented by multiple sub-indexes. Performance figures include the change in value of the investments in the index and the reinvestment of dividends. The index return does not reflect expenses, which have been deducted from the Fund’s return. The returns shown do not reflect deduction of taxes that a shareholder would pay on Fund distributions or the redemption of Fund shares. THE FUND’S RETURN REPRESENTS PAST PERFORMANCE AND IS NOT PREDICTIVE OF FUTURE RESULTS.
Fund Performance - (Unaudited)
September 30, 2021
Conservative Growth Fund
| | | 5 Year | 10 Year |
| | 1 Year | Average | Average |
| Fund/Index | Total Return | Annual Return | Annual Return |
| Timothy Conservative Growth Fund - Class A (With Sales Charge) | 6.41% | 3.66% | 4.44% |
| Dow Jones Moderate Portfolio Index | 18.18% | 8.96% | 8.81% |
| Timothy Conservative Growth Fund - Class C * | 10.84% | 4.07% | 4.25% |
| Dow Jones Moderate Portfolio Index | 18.18% | 8.96% | 8.81% |
| * | With Maximum Deferred Sales Charge |
Timothy Plan Conservative Growth Fund vs. Dow Jones Moderate Portfolio Index
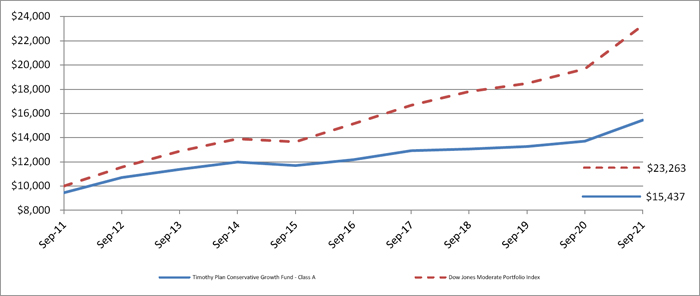
The chart shows the value of a hypothetical initial investment of $10,000 in the Fund’s Class A shares and the Dow Jones Moderate Portfolio Index on September 30, 2011 and held through September 30, 2021. The Dow Jones Moderate Portfolio Index is a widely recognized index that measures global stocks, bonds and cash which are in turn represented by multiple sub-indexes. Performance figures include the change in value of the investments in the index and the reinvestment of dividends. The index return does not reflect expenses, which have been deducted from the Fund’s return. The returns shown do not reflect deduction of taxes that a shareholder would pay on Fund distributions or the redemption of Fund shares. THE FUND’S RETURN REPRESENTS PAST PERFORMANCE AND IS NOT PREDICTIVE OF FUTURE RESULTS.
Fund Performance - (Unaudited)
September 30, 2021
Growth & Income Fund
| | | | Average | |
| | 1 Year | 5 Year | Annual Return | |
| Fund/Index | Total Return | Total Return | Since Inception | |
| Timothy Growth & Income Fund - Class A (With Sales Charge) | 10.72% | 2.04% | 2.24% | (a) |
| Timothy Growth & Income Fund Blended Index | 19.71% | 8.05% | 7.81% | (a) |
| Timothy Growth & Income Fund - Class C * | 15.25% | 2.44% | 2.20% | (a) |
| Timothy Growth & Income Fund Blended Index | 19.71% | 8.05% | 7.81% | (a) |
| Timothy Growth & Income Fund - Class I | 17.44% | 3.46% | 3.20% | (a) |
| Timothy Growth & Income Fund Blended Index | 19.71% | 8.05% | 7.81% | (a) |
| (a) | For the period October 1, 2013 (commencement of investment in accordance with objective) to September 30, 2021. |
| * | With Maximum Deferred Sales Charge |
Timothy Growth & Income Fund vs. Timothy Growth & Income Fund Blended Index
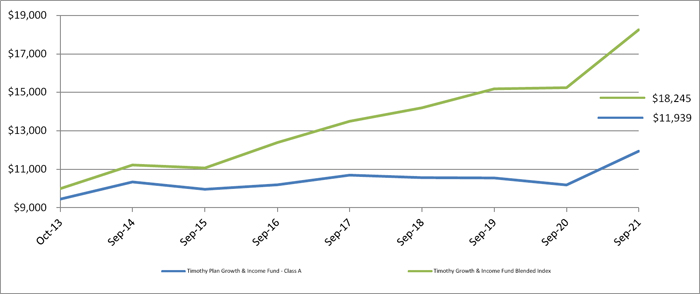
The chart shows the value of a hypothetical initial investment of $10,000 in the Fund’s Class A shares and the Timothy Growth & Income Fund Blended Index on October 1, 2013 and held through September 30, 2021. The Timothy Growth & Income Fund Blended Index reflects an unmanaged portfolio of 40% of the Barclays U.S. Aggregate Bond Index and 60% of the Russell 1000 Value Index. Performance figures include the change in value of the stocks in the index and the reinvestment of dividends. The index return does not reflect expenses, which have been deducted from the Fund’s return. The returns shown do not reflect deduction of taxes that a shareholder would pay on Fund distributions or the redemption of Fund shares. THE FUND’S RETURN REPRESENTS PAST PERFORMANCE AND IS NOT PREDICTIVE OF FUTURE RESULTS.
| Schedule of Investments | Aggressive Growth Fund |
| As of September 30, 2021 |
| Shares | | | | | Fair Value | |
| | | | | COMMON STOCK - 92.9% | | | | |
| | | | | ADVERTISING & MARKETING - 0.8% | | | | |
| | 6,092 | | | Trade Desk, Inc. * | | $ | 428,268 | |
| | | | | | | | | |
| | | | | AEROSPACE & DEFENSE - 0.8% | | | | |
| | 639 | | | TransDigm Group, Inc. * | | | 399,100 | |
| | | | | | | | | |
| | | | | APPAREL & TEXTILE PRODUCTS - 3.8% | | | | |
| | 2,579 | | �� | Deckers Outdoor Corp. * | | | 928,956 | |
| | 29,749 | | | Tapestry, Inc. | | | 1,101,308 | |
| | | | | | | | 2,030,264 | |
| | | | | BANKING - 2.7% | | | | |
| | 5,236 | | | Signature Bank | | | 1,425,658 | |
| | | | | | | | | |
| | | | | BIOTECH & PHARMA - 11.0% | | | | |
| | 1,834 | | | Argenx SE - ADR * | | | 553,868 | |
| | 20,294 | | | Horizon Therapeutics PLC * | | | 2,223,005 | |
| | 22,500 | | | Maravai LifeSciences Holdings, Inc. * | | | 1,104,300 | |
| | 10,549 | | | United Therapeutics Corp. * | | | 1,947,134 | |
| | | | | | | | 5,828,307 | |
| | | | | CHEMICALS - 1.4% | | | | |
| | 3,481 | | | Albemarle Corp. | | | 762,235 | |
| | | | | | | | | |
| | | | | CONTAINERS & PACKAGING - 2.1% | | | | |
| | 10,961 | | | Crown Holdings, Inc. | | | 1,104,650 | |
| | | | | | | | | |
| | | | | ELECTRICAL EQUIPMENT - 6.2% | | | | |
| | 11,434 | | | Fortive Corp. | | | 806,897 | |
| | 4,506 | | | Generac Holdings, Inc. * | | | 1,841,467 | |
| | 3,671 | | | Trane Technologies PLC | | | 633,798 | |
| | | | | | | | 3,282,162 | |
| | | | | ENGINEERING & CONSTRUCTION - 1.4% | | | | |
| | 6,411 | | | Quanta Services, Inc. | | | 729,700 | |
| | | | | | | | | |
| | | | | FOOD - 1.4% | | | | |
| | 10,181 | | | Darling Ingredients, Inc. * | | | 732,014 | |
| | | | | | | | | |
| | | | | FORESTRY, PAPER & WOOD PRODUCTS - 0.9% | | | | |
| | 4,816 | | | Trex Company, Inc. * | | | 490,895 | |
| | | | | | | | | |
| | | | | HEALTH CARE FACILITIES & SERVICES - 3.6% | | | | |
| | 6,460 | | | Catalent, Inc. * | | | 859,632 | |
| | 4,047 | | | ICON PLC * | | | 1,060,395 | |
| | | | | | | | 1,920,027 | |
| | | | | INDUSTRIAL SUPPORT SERVICES - 4.1% | | | | |
| | 6,126 | | | United Rentals, Inc. * | | | 2,149,797 | |
| | | | | | | | | |
| | | | | LEISURE FACILITIES & SERVICES - 1.9% | | | | |
| | 40,303 | | | Bloomin’ Brands, Inc. * | | | 1,007,575 | |
| | | | | | | | | |
| | | | | MACHINERY - 3.8% | | | | |
| | 4,991 | | | Lincoln Electric Holdings, Inc. | | | 642,791 | |
| | 9,435 | | | Oshkosh Corp. | | | 965,861 | |
| | 1,376 | | | Parker-Hannifin Corp. | | | 384,757 | |
| | | | | | | | 1,993,409 | |
| | | | | MEDICAL EQUIPMENT & DEVICES - 13.0% | | | | |
| | 46,042 | | | Avantor, Inc. * | | | 1,883,118 | |
| | 1,061 | | | DexCom, Inc. * | | | 580,218 | |
| | 1,694 | | | Insulet Corp. * | | | 481,486 | |
| | 14,484 | | | Natera, Inc. * | | | 1,614,097 | |
| | 2,963 | | | Novocure Ltd. * | | | 344,212 | |
| | 3,713 | | | Repligen Corp. * | | | 1,073,020 | |
| | 1,774 | | | STERIS PLC | | | 362,392 | |
| | 1,375 | | | Teleflex, Inc. | | | 517,756 | |
| | | | | | | | 6,856,299 | |
The accompanying notes are an integral part of these financial statements.
| Schedule of Investments | Aggressive Growth Fund |
| As of September 30, 2021 (Continued) |
| Shares | | | | | Fair Value | |
| | | | | RENEWABLE ENERGY - 1.8% | | | | |
| | 4,359 | | | Enphase Energy, Inc. * | | $ | 653,719 | |
| | 7,369 | | | Sunrun, Inc. * | | | 324,236 | |
| | | | | | | | 977,955 | |
| | | | | RETAIL - DISCRETIONARY - 2.8% | | | | |
| | 5,294 | | | Burlington Stores, Inc. * | | | 1,501,220 | |
| | | | | | | | | |
| | | | | SEMICONDUCTORS - 11.1% | | | | |
| | 1,932 | | | KLA Corp. | | | 646,273 | |
| | 35,907 | | | Marvell Technology Group Ltd. | | | 2,165,551 | |
| | 4,239 | | | Monolithic Power System, Inc. | | | 2,054,559 | |
| | 3,217 | | | Skyworks Solutions, Inc. | | | 530,097 | |
| | 4,539 | | | Teradyne, Inc. | | | 495,523 | |
| | | | | | | | 5,892,003 | |
| | | | | SOFTWARE - 10.6% | | | | |
| | 1,161 | | | ANSYS, Inc. * | | | 395,262 | |
| | 498 | | | HubSpot, Inc. * | | | 336,693 | |
| | 2,900 | | | Palo Alto Networks, Inc. * | | | 1,389,100 | |
| | 17,373 | | | Rapid7, Inc. * | | | 1,963,496 | |
| | 3,787 | | | RingCentral, Inc. * | | | 823,672 | |
| | 11,082 | | | Varonis Systems, Inc. * | | | 674,340 | |
| | | | | | | | 5,582,563 | |
| | | | | TECHNOLOGY HARDWARE - 2.8% | | | | |
| | 17,773 | | | Seagate Technology Holdings PLC | | | 1,466,628 | |
| | | | | | | | | |
| | | | | TECHNOLOGY SERVICES - 4.9% | | | | |
| | 1,940 | | | EPAM Systems, Inc. * | | | 1,106,731 | |
| | 1,678 | | | MSCI, Inc. | | | 1,020,795 | |
| | 4,020 | | | TransUnion | | | 451,486 | |
| | | | | | | | 2,579,012 | |
| | | | | | | | | |
| | | | | TOTAL COMMON STOCK (Cost $33,928,040) | | | 49,139,741 | |
| | | | | | | | | |
| | | | | REITs - 1.0% | | | | |
| | 6,960 | | | CyrusOne, Inc. (Cost $533,208) | | | 538,774 | |
| | | | | | | | | |
| | | | | MONEY MARKET FUND - 6.2% | | | | |
| | 3,258,766 | | | Fidelity Institutional Money Market Funds - Government Portfolio - Class I, 0.01% (A) (Cost $3,258,766) | | | 3,258,766 | |
| | | | | | | | | |
| | | | | TOTAL INVESTMENTS - 100.1% (Cost $37,720,014) | | $ | 52,937,281 | |
| | | | | OTHER ASSETS IN EXCESS OF LIABILITIES - NET - (0.1)% | | | (39,636 | ) |
| | | | | NET ASSETS - 100.0% | | $ | 52,897,645 | |
| * | Non-income producing securities. |
ADR - American Depositary Receipt.
PLC - Public Limited Co.
REITs - Real Estate Investment Trusts.
| (A) | Variable rate security; the rate shown represents the yield at September 30, 2021. |
The accompanying notes are an integral part of these financial statements.
| Schedule of Investments | International Fund |
| As of September 30, 2021 |
| Shares | | | | | Fair Value | |
| | | | | COMMON STOCK - 95.9% | | | | |
| | | | | AEROSPACE & DEFENSE - 1.7% | | | | |
| | 73,000 | | | Safran SA (ADR) | | $ | 2,313,370 | |
| | | | | | | | | |
| | | | | AUTOMOTIVE - 3.0% | | | | |
| | 55,300 | | | Magna International, Inc. - Class A | | | 4,160,772 | |
| | | | | | | | | |
| | | | | BANKING - 10.6% | | | | |
| | 41,539 | | | DBS Group Holdings Ltd. (ADR) | | | 3,684,509 | |
| | 99,000 | | | DNB ASA (ADR) * | | | 2,271,060 | |
| | 30,700 | | | HDFC Bank Ltd. (ADR) | | | 2,243,863 | |
| | 104,100 | | | ICICI Bank Ltd. (ADR) | | | 1,964,367 | |
| | 263,000 | | | Itau Unibanco Holding SA (ADR) | | | 1,386,010 | |
| | 66,100 | | | KBC Group NV (ADR) | | | 2,981,110 | |
| | | | | | | | 14,530,919 | |
| | | | | CHEMICALS - 3.2% | | | | |
| | 31,000 | | | Air Liquide SA (ADR) | | | 996,650 | |
| | 13,400 | | | Arkema SA (ADR) | | | 1,747,226 | |
| | 82,000 | | | BASF SE (ADR) | | | 1,561,280 | |
| | | | | | | | 4,305,156 | |
| | | | | CONSTRUCTION MATERIALS - 1.2% | | | | |
| | 27,500 | | | Xinyi Glass Holdings Ltd. (ADR) | | | 1,610,950 | |
| | | | | | | | | |
| | | | | ELECTRIC UTILITIES - 1.6% | | | | |
| | 283,000 | | | Enel SpA (ADR) | | | 2,162,120 | |
| | | | | | | | | |
| | | | | ELECTRICAL EQUIPMENT - 2.0% | | | | |
| | 80,400 | | | Schneider Electric SE (ADR) | | | 2,671,250 | |
| | | | | | | | | |
| | | | | ENGINEERING & CONSTRUCTION - 3.0% | | | | |
| | 155,000 | | | Vinci SA (ADR) | | | 4,031,550 | |
| | | | | | | | | |
| | | | | FOOD - 3.0% | | | | |
| | 22,700 | | | Kerry Group PLC (ADR) | | | 3,108,992 | |
| | 40,000 | | | Mowi ASA (ADR) | | | 1,012,000 | |
| | | | | | | | 4,120,992 | |
| | | | | HEALTH CARE FACILITIES & SERVICES - 2.2% | | | | |
| | 11,500 | | | ICON PLC * | | | 3,013,230 | |
| | | | | | | | | |
| | | | | HOUSEHOLD PRODUCTS - 0.6% | | | | |
| | 38,000 | | | Beiersdorf AG (ADR) | | | 826,500 | |
| | | | | | | | | |
| | | | | INDUSTRIAL SUPPORT SERVICES - 1.8% | | | | |
| | 8,100 | | | Ashtead Group PLC (ADR) | | | 2,471,148 | |
| | | | | | | | | |
| | | | | INSTITUTIONAL FINANCIAL SERVICES - 1.9% | | | | |
| | 156,500 | | | Deutsche Boerse AG (ADR) | | | 2,532,170 | |
| | | | | | | | | |
| | | | | INSURANCE - 7.0% | | | | |
| | 49,200 | | | Ageas SA/NV (ADR) | | | 2,453,112 | |
| | 62,500 | | | AIA Group Ltd. (ADR) | | | 2,875,625 | |
| | 57,400 | | | Muenchener Rueckversicherungs AG (ADR) | | | 1,571,612 | |
| | 108,600 | | | Sampo Oyj (ADR) | | | 2,686,221 | |
| | | | | | | | 9,586,570 | |
The accompanying notes are an integral part of these financial statements.
| Schedule of Investments | International Fund |
| As of September 30, 2021 (Continued) |
| Shares | | | | | Fair Value | |
| | | | | INTERNET MEDIA & SERVICES - 4.5% | | | | |
| | 38,700 | | | Naspers Ltd. (ADR) | | $ | 1,287,162 | |
| | 108,000 | | | Prosus NV (ADR) | | | 1,732,320 | |
| | 39,600 | | | Yandex NV * | | | 3,155,724 | |
| | | | | | | | 6,175,206 | |
| | | | | LEISURE PRODUCTS - 1.5% | | | | |
| | 71,000 | | | Shimano, Inc. (ADR) | | | 2,079,590 | |
| | | | | | | | | |
| | | | | MACHINERY - 7.8% | | | | |
| | 58,500 | | | Atlas Copco AB (ADR) | | | 2,983,500 | |
| | 70,000 | | | FANUC Corp. (ADR) | | | 1,543,500 | |
| | 60,850 | | | Techtronic Industries Co. (ADR) | | | 6,063,398 | |
| | | | | | | | 10,590,398 | |
| | | | | MEDICAL EQUIPMENT & DEVICES - 6.9% | | | | |
| | 41,200 | | | Alcon, Inc. | | | 3,315,364 | |
| | 26,800 | | | Hoya Corp. (ADR) | | | 4,202,789 | |
| | 53,900 | | | Smith & Nephew PLC (ADR) | | | 1,850,926 | |
| | | | | | | | 9,369,079 | |
| | | | | METALS & MINING - 1.2% | | | | |
| | 23,800 | | | Rio Tinto PLC (ADR) | | | 1,590,316 | |
| | | | | | | | | |
| | | | | OIL & GAS PRODUCERS - 4.6% | | | | |
| | 151,000 | | | Equinor ASA (ADR) | | | 3,850,500 | |
| | 438,000 | | | Galp Energia SGPS SA (ADR) | | | 2,452,800 | |
| | | | | | | | 6,303,300 | |
| | | | | RETAIL - CONSUMER STAPLES - 0.7% | | | | |
| | 45,948 | | | Pan Pacific International Holdings Corp. (ADR) | | | 954,800 | |
| | | | | | | | | |
| | | | | SEMICONDUCTORS - 7.2% | | | | |
| | 5,950 | | | ASML Holding NV (ADR) | | | 4,433,405 | |
| | 13,000 | | | NXP Semiconductors NV | | | 2,546,310 | |
| | 25,900 | | | Taiwan Semiconductor Manufacturing Co. Ltd. (ADR) | | | 2,891,735 | |
| | | | | | | | 9,871,450 | |
| | | | | SOFTWARE - 4.9% | | | | |
| | 13,800 | | | Nice Ltd. (ADR) * | | | 3,919,752 | |
| | 34,640 | | | Open Text Corp. | | | 1,688,354 | |
| | 850 | | | Shopify, Inc. * | | | 1,152,413 | |
| | | | | | | | 6,760,519 | |
| | | | | SPECIALTY FINANCE - 1.8% | | | | |
| | 26,700 | | | ORIX Corp. (ADR) | | | 2,523,684 | |
| | | | | | | | | |
| | | | | TECHNOLOGY HARDWARE - 1.4% | | | | |
| | 21,438 | | | FUJIFILM Holdings Corp. (ADR) | | | 1,846,455 | |
| | | | | | | | | |
| | | | | TECHNOLOGY SERVICES - 5.9% | | | | |
| | 14,800 | | | Adyen NV (ADR) * | | | 414,992 | |
| | 51,000 | | | Amadeus IT Group SA (ADR) * | | | 3,358,350 | |
| | 89,000 | | | Infosys Ltd. (ADR) | | | 1,980,250 | |
| | 43,700 | | | Pagseguro Digital Ltd. * | | | 2,260,164 | |
| | | | | | | | 8,013,756 | |
| | | | | TELECOMMUNICATIONS - 1.9% | | | | |
| | 95,300 | | | Nippon Telegraph & Telephone Corp. (ADR) | | | 2,645,528 | |
| | | | | | | | | |
| | | | | TRANSPORTATION & LOGISTICS - 2.8% | | | | |
| | 59,300 | | | Canadian Pacific Railway Ltd. | | | 3,858,651 | |
| | | | | | | | | |
| | | | | TOTAL COMMON STOCK (Cost $93,189,127) | | | 130,919,429 | |
The accompanying notes are an integral part of these financial statements.
| Schedule of Investments | International Fund |
| As of September 30, 2021 (Continued) |
| Shares | | | | | Fair Value | |
| | | | | MONEY MARKET FUND - 4.0% | | | | |
| | 5,466,035 | | | Fidelity Institutional Money Market Funds - Government Portfolio - Class I, 0.01% (A) (Cost $5,466,035) | | $ | 5,466,035 | |
| | | | | | | | | |
| | | | | TOTAL INVESTMENTS - 99.9% (Cost $98,655,162) | | $ | 136,385,464 | |
| | | | | OTHER ASSETS IN EXCESS OF LIABILITIES - NET - 0.1% | | | 128,073 | |
| | | | | NET ASSETS - 100.0% | | $ | 136,513,537 | |
| * | Non-income producing securities. |
ADR - American Depositary Receipt.
PLC - Public Limited Co.
| (A) | Variable rate security; the rate shown represents the yield at September 30, 2021. |
| Diversification of Assets | | | |
| Country | | % of Net Assets | |
| Japan | | | 11.6 | % |
| France | | | 8.6 | % |
| Canada | | | 8.0 | % |
| Hong Kong | | | 7.7 | % |
| Netherlands | | | 6.7 | % |
| Norway | | | 5.2 | % |
| Germany | | | 4.7 | % |
| India | | | 4.5 | % |
| Ireland | | | 4.5 | % |
| United Kingdom | | | 4.3 | % |
| Belgium | | | 4.0 | % |
| Israel | | | 2.9 | % |
| Singapore | | | 2.7 | % |
| Brazil | | | 2.7 | % |
| Spain | | | 2.5 | % |
| Switzerland | | | 2.4 | % |
| Russia | | | 2.3 | % |
| Sweden | | | 2.2 | % |
| Taiwan | | | 2.1 | % |
| Finland | | | 2.0 | % |
| Portugal | | | 1.8 | % |
| Italy | | | 1.6 | % |
| South Africa | | | 0.9 | % |
| Total | | | 95.9 | % |
| Money Market Fund | | | 4.0 | % |
| Other Assets Less Liabilities - Net | | | 0.1 | % |
| Grand Total | | | 100.0 | % |
The accompanying notes are an integral part of these financial statements.
| Schedule of Investments | Large/Mid Cap Growth Fund |
| As of September 30, 2021 |
| Shares | | | | | Fair Value | |
| | | | | COMMON STOCK - 76.4% | | | | |
| | | | | BANKING - 0.9% | | | | |
| | 10,774 | | | Western Alliance Bancorp | | $ | 1,172,427 | |
| | | | | | | | | |
| | | | | BIOTECH & PHARMA - 5.4% | | | | |
| | 18,734 | | | Horizon Therapeutics PLC * | | | 2,052,122 | |
| | 6,572 | | | Neurocrine Biosciences, Inc. * | | | 630,320 | |
| | 5,401 | | | Vertex Pharmaceuticals, Inc. * | | | 979,687 | |
| | 18,691 | | | Zoetis, Inc. | | | 3,628,671 | |
| | | | | | | | 7,290,800 | |
| | | | | CABLE & SATELLITE - 1.3% | | | | |
| | 954 | | | Cable One, Inc. | | | 1,729,726 | |
| | | | | | | | | |
| | | | | CHEMICALS - 2.2% | | | | |
| | 16,730 | | | FMC Corp. | | | 1,531,799 | |
| | 4,997 | | | Linde PLC | | | 1,466,020 | |
| | | | | | | | 2,997,819 | |
| | | | | CONSTRUCTION MATERIALS - 0.8% | | | | |
| | 12,695 | | | Owens Corning | | | 1,085,422 | |
| | | | | | | | | |
| | | | | DIVERSIFIED INDUSTRIALS - 2.1% | | | | |
| | 16,353 | | | Emerson Electric Co. | | | 1,540,453 | |
| | 6,258 | | | Honeywell International, Inc. | | | 1,328,448 | |
| | | | | | | | 2,868,901 | |
| | | | | ELECTRIC UTILITIES - 1.2% | | | | |
| | 21,347 | | | NextEra Energy, Inc. | | | 1,676,166 | |
| | | | | | | | | |
| | | | | ELECTRICAL EQUIPMENT - 3.2% | | | | |
| | 26,732 | | | Amphenol Corp. - Class A | | | 1,957,584 | |
| | 13,796 | | | Fortive Corp. | | | 973,584 | |
| | 8,164 | | | Trane Technologies PLC | | | 1,409,515 | |
| | | | | | | | 4,340,683 | |
| | | | | HEALTH CARE FACILITIES & SERVICES - 1.3% | | | | |
| | 7,400 | | | IQVIA Holdings, Inc. * | | | 1,772,596 | |
| | | | | | | | | |
| | | | | INSTITUTIONAL FINANCIAL SERVICES - 1.2% | | | | |
| | 14,572 | | | Intercontinental Exchange, Inc. | | | 1,673,157 | |
| | | | | | | | | |
| | | | | INSURANCE - 2.7% | | | | |
| | 15,754 | | | Arthur J. Gallagher & Co. | | | 2,341,832 | |
| | 41,628 | | | Equitable Holdings, Inc. | | | 1,233,854 | |
| | | | | | | | 3,575,686 | |
| | | | | LEISURE FACILITIES & SERVICES - 1.6% | | | | |
| | 1,160 | | | Chipotle Mexican Grill, Inc. * | | | 2,108,323 | |
| | | | | | | | | |
| | | | | MACHINERY - 1.9% | | | | |
| | 5,527 | | | Caterpillar, Inc. | | | 1,061,018 | |
| | 14,366 | | | Oshkosh Corp. | | | 1,470,647 | |
| | | | | | | | 2,531,665 | |
| | | | | MEDICAL EQUIPMENT & DEVICES - 7.3% | | | | |
| | 10,988 | | | Baxter International, Inc. | | | 883,765 | |
| | 5,002 | | | Danaher Corp. | | | 1,522,809 | |
| | 16,458 | | | Edwards Lifesciences Corp. * | | | 1,863,210 | |
| | 5,934 | | | Insulet Corp. * | | | 1,686,621 | |
| | 2,364 | | | Intuitive Surgical, Inc. * | | | 2,350,171 | |
| | 3,963 | | | Teleflex, Inc. | | | 1,492,268 | |
| | | | | | | | 9,798,844 | |
| | | | | OIL & GAS PRODUCERS - 0.7% | | | | |
| | 13,284 | | | ConocoPhillips | | | 900,257 | |
The accompanying notes are an integral part of these financial statements.
| Schedule of Investments | Large/Mid Cap Growth Fund |
| As of September 30, 2021 (Continued) |
| Shares | | | | | Fair Value | |
| | | | | RETAIL - CONSUMER STAPLES - 3.7% | | | | |
| | 6,208 | | | Costco Wholesale Corp. | | $ | 2,789,565 | |
| | 10,119 | | | Dollar General Corp. | | | 2,146,645 | |
| | | | | | | | 4,936,210 | |
| | | | | RETAIL - DISCRETIONARY - 6.5% | | | | |
| | 5,781 | | | Burlington Stores, Inc. * | | | 1,639,318 | |
| | 36,621 | | | Foot Locker, Inc. | | | 1,672,115 | |
| | 9,092 | | | Lowe’s Cos, Inc. | | | 1,844,403 | |
| | 3,742 | | | Lululemon Athletica, Inc. * | | | 1,514,387 | |
| | 3,364 | | | O’Reilly Automotive, Inc. * | | | 2,055,606 | |
| | | | | | | | 8,725,829 | |
| | | | | SEMICONDUCTORS - 12.9% | | | | |
| | 33,315 | | | Advanced Micro Devices, Inc. * | | | 3,428,113 | |
| | 7,318 | | | Analog Devices, Inc. | | | 1,225,619 | |
| | 5,155 | | | Broadcom Ltd. | | | 2,499,814 | |
| | 1,672 | | | Lam Research Corporation | | | 951,619 | |
| | 5,067 | | | Monolithic Power Systems, Inc. | | | 2,455,874 | |
| | 22,888 | | | NVIDIA Corp. | | | 4,741,478 | |
| | 10,302 | | | NXP Semiconductors NV | | | 2,017,853 | |
| | | | | | | | 17,320,370 | |
| | | | | SOFTWARE - 9.2% | | | | |
| | 2,285 | | | HubSpot, Inc. * | | | 1,544,866 | |
| | 5,008 | | | Palo Alto Networks, Inc. * | | | 2,398,832 | |
| | 25,788 | | | Rapid7, Inc. * | | | 2,914,560 | |
| | 4,306 | | | ServiceNow, Inc. * | | | 2,679,495 | |
| | 9,354 | | | Synopsys, Inc. * | | | 2,800,681 | |
| | | | | | | | 12,338,434 | |
| | | | | TECHNOLOGY HARDWARE - 2.5% | | | | |
| | 17,643 | | | Seagate Technology Holdings PLC | | | 1,455,900 | |
| | 33,942 | | | Western Digital Corp. * | | | 1,915,686 | |
| | | | | | | | 3,371,586 | |
| | | | | TECHNOLOGY SERVICES - 6.0% | | | | |
| | 20,164 | | | CDW Corp. | | | 3,670,251 | |
| | 5,066 | | | EPAM Systems, Inc. * | | | 2,890,052 | |
| | 12,608 | | | Fidelity National Information Services, Inc. | | | 1,534,141 | |
| | | | | | | | 8,094,444 | |
| | | | | | | | | |
| | | | | TRANSPORTATION & LOGISTICS - 1.1% | | | | |
| | 21,625 | | | Canadian Pacific Railway Ltd. | | | 1,407,139 | |
| | | | | | | | | |
| | | | | TRANSPORTATION & EQUIPMENT - 0.7% | | | | |
| | 12,086 | | | PACCAR, Inc. | | | 953,827 | |
| | | | | | | | | |
| | | | | TOTAL COMMON STOCK (Cost $61,932,189) | | | 102,670,311 | |
| | | | | | | | | |
| | | | | EXCHANGE TRADED FUNDS (A) - 18.6% | | | | |
| | 77,000 | | | Timothy Plan US Large/Mid Cap Core Enhanced ETF | | | 1,885,976 | |
| | 665,000 | | | Timothy Plan US Large/Mid Cap Core ETF | | | 23,152,773 | |
| | | | | TOTAL EXCHANGE TRADED FUNDS (Cost $18,644,500) | | | 25,038,749 | |
| | | | | | | | | |
| | | | | MONEY MARKET FUND - 5.1% | | | | |
| | 6,917,122 | | | Fidelity Institutional Money Market Funds - Government Portfolio - Class I, 0.01% (B) (Cost $6,917,122) | | | 6,917,122 | |
| | | | | | | | | |
| | | | | TOTAL INVESTMENTS - 100.1% (Cost $87,493,811) | | $ | 134,626,182 | |
| | | | | OTHER ASSETS IN EXCESS OF LIABILITIES - NET - (0.1)% | | | (183,962 | ) |
| | | | | NET ASSETS - 100.0% | | $ | 134,442,220 | |
| * | Non-income producing securities. |
ETF - Exchange Traded Fund.
PLC - Public Limited Co.
| (B) | Variable rate security; the rate shown represents the yield at September 30, 2021. |
The accompanying notes are an integral part of these financial statements.
| Schedule of Investments | Small Cap Value Fund |
| As of September 30, 2021 |
| Shares | | | | | Fair Value | |
| | | | | COMMON STOCK - 79.9% | | | | |
| | | | | AEROSPACE/DEFENSE - 1.7% | | | | |
| | 38,745 | | | Moog, Inc. | | $ | 2,953,531 | |
| | | | | | | | | |
| | | | | BANKING - 13.9% | | | | |
| | 80,008 | | | Columbia Banking System, Inc. | | | 3,039,504 | |
| | 98,580 | | | Great Western Bancorp, Inc. | | | 3,227,509 | |
| | 44,834 | | | Hilltop Holdings, Inc. | | | 1,464,727 | |
| | 73,500 | | | Provident Financial Services, Inc. | | | 1,725,045 | |
| | 83,635 | | | Renasant Corp. | | | 3,015,042 | |
| | 69,196 | | | Sandy Spring Bancorp, Inc. | | | 3,170,561 | |
| | 109,290 | | | Simmons First National Corp. | | | 3,230,612 | |
| | 49,754 | | | Trustmark Corp. | | | 1,603,074 | |
| | 78,810 | | | Veritex Holdings, Inc. | | | 3,101,962 | |
| | | | | | | | 23,578,036 | |
| | | | | CHEMICALS - 5.3% | | | | |
| | 64,719 | | | Avient Corp. | | | 2,999,726 | |
| | 124,960 | | | Ecovyst, Inc. | | | 1,457,034 | |
| | 17,731 | | | Innospec, Inc. | | | 1,493,305 | |
| | 27,024 | | | Stepan Co. | | | 3,052,090 | |
| | | | | | | | 9,002,155 | |
| | | | | ELECTRIC UTILITIES - 3.2% | | | | |
| | 73,193 | | | Avista Corp. | | | 2,863,310 | |
| | 45,351 | | | NorthWestern Corp. | | | 2,598,612 | |
| | | | | | | | 5,461,922 | |
| | | | | ENGINEERING & CONSTRUCTION - 1.7% | | | | |
| | 39,744 | | | Comfort Systems USA, Inc. | | | 2,834,542 | |
| | | | | | | | | |
| | | | | FOOD - 3.5% | | | | |
| | 180,915 | | | Hostess Brands, Inc. * | | | 3,142,494 | |
| | 18,681 | | | J & J Snack Foods Corp. | | | 2,854,830 | |
| | | | | | | | 5,997,324 | |
| | | | | FORESTRY, PAPER & WOOD PRODUCTS - 1.6% | | | | |
| | 39,253 | | | UFP Industries, Inc. | | | 2,668,419 | |
| | | | | | | | | |
| | | | | GAS & WATER UTILITIES - 0.7% | | | | |
| | 57,055 | | | South Jersey Industries, Inc. | | | 1,212,989 | |
| | | | | | | | | |
| | | | | HEALTH CARE FACILITIES & SERVICES - 1.6% | | | | |
| | 139,003 | | | Aveanna Healthcare Holdings, Inc. * | | | 1,114,804 | |
| | 51,347 | | | Patterson Companies, Inc. | | | 1,547,599 | |
| | | | | | | | 2,662,403 | |
| | | | | HOME CONSTRUCTION - 4.5% | | | | |
| | 47,990 | | | Century Communities, Inc. | | | 2,948,985 | |
| | 70,575 | | | Griffon Corp. | | | 1,736,145 | |
| | 27,198 | | | Masonite International Corp. * | | | 2,886,524 | |
| | | | | | | | 7,571,654 | |
| | | | | HOUSEHOLD PRODUCTS - 1.8% | | | | |
| | 71,154 | | | Central Garden & Pet Co. * | | | 3,059,622 | |
| | | | | | | | | |
| | | | | INDUSTRIAL INTERMEDIATE PRODUCTS - 0.9% | | | | |
| | 28,208 | | | AZZ, Inc. | | | 1,500,666 | |
| | | | | | | | | |
| | | | | INSTITUTIONAL FINANCIAL SERVICES - 4.4% | | | | |
| | 49,550 | | | Moelis & Co. | | | 3,065,658 | |
| | 108,059 | | | Perella Weinberg Partners | | | 1,431,782 | |
| | 20,853 | | | Piper Sandler Companies | | | 2,887,306 | |
| | | | | | | | 7,384,746 | |
| | | | | INSURANCE - 3.2% | | | | |
| | 55,251 | | | Argo Group International Holdings Ltd. | | | 2,885,207 | |
| | 66,781 | | | James River Group Holdings Ltd. | | | 2,519,647 | |
| | | | | | | | 5,404,854 | |
The accompanying notes are an integral part of these financial statements.
| Schedule of Investments | Small Cap Value Fund |
| As of September 30, 2021 (Continued) |
| Shares | | | | | Fair Value | |
| | | | | LEISURE FACILITIES & SERVICES - 4.4% | | | | |
| | 59,804 | | | Bloomin’ Brands, Inc. * | | $ | 1,495,100 | |
| | 48,678 | | | Chuy’s Holdings, Inc. * | | | 1,534,817 | |
| | 29,322 | | | Jack in the Box, Inc. | | | 2,853,910 | |
| | 12,182 | | | Papa John’s International, Inc. | | | 1,546,992 | |
| | | | | | | | 7,430,819 | |
| | | | | MACHINERY - 5.2% | | | | |
| | 9,604 | | | Alamo Group, Inc. | | | 1,340,046 | |
| | 49,782 | | | Altra Industrial Motion Corp. | | | 2,755,434 | |
| | 34,776 | | | Columbus McKinnon Corp. | | | 1,681,420 | |
| | 76,718 | | | Federal Signal Corp. | | | 2,962,849 | |
| | | | | | | | 8,739,749 | |
| | | | | MEDICAL EQUIPMENT & DEVICES - 4.4% | | | | |
| | 46,540 | | | Avanos Medical, Inc. * | | | 1,452,048 | |
| | 23,431 | | | CONMED Corp. | | | 3,065,478 | |
| | 41,581 | | | Merit Medical Systems, Inc. * | | | 2,985,516 | |
| | | | | | | | 7,503,042 | |
| | | | | METALS & MINING - 1.9% | | | | |
| | 19,412 | | | Encore Wire Corp. | | | 1,840,840 | |
| | 62,629 | | | Livent Corporation * | | | 1,447,356 | |
| | | | | | | | 3,288,196 | |
| | | | | OIL & GAS PRODUCERS - 3.6% | | | | |
| | 76,736 | | | Brigham Minerals, Inc. | | | 1,470,262 | |
| | 66,060 | | | PDC Energy, Inc. | | | 3,130,583 | |
| | 26,820 | | | Whiting Petroleum Corporation * | | | 1,566,556 | |
| | | | | | | | 6,167,401 | |
| | | | | REAL ESTATE OWNERS & DEVELOPERS - 1.7% | | | | |
| | 173,333 | | | Radius Global Infrastructure, Inc. * | | | 2,830,528 | |
| | | | | | | | | |
| | | | | RETAIL - DISCRETIONARY - 4.6% | | | | |
| | 39,680 | | | Academy Sports & Outdoors, Inc. * | | | 1,587,994 | |
| | 53,145 | | | Monro, Inc. | | | 3,056,369 | |
| | 59,649 | | | Sonic Automotive, Inc. | | | 3,133,958 | |
| | | | | | | | 7,778,321 | |
| | | | | SEMICONDUCTORS - 1.6% | | | | |
| | 110,360 | | | Amkor Technology, Inc. | | | 2,753,482 | |
| | | | | | | | | |
| | | | | TECHNOLOGY HARDWARE - 2.7% | | | | |
| | 80,957 | | | ADTRAN, Inc. | | | 1,518,753 | |
| | 191,447 | | | Viavi Solutions, Inc. * | | | 3,013,376 | |
| | | | | | | | 4,532,129 | |
| | | | | TECHNOLOGY SERVICES - 1.8% | | | | |
| | 132,726 | | | Repay Holdings Corp. * | | | 3,056,680 | |
| | | | | | | | | |
| | | | | TOTAL COMMON STOCK (Cost $113,911,202) | | | 135,373,210 | |
| | | | | | | | | |
| | | | | EXCHANGE TRADED FUND (A) - 11.3% | | | | |
| | 580,000 | | | Timothy Plan US Small Cap Core ETF (Cost $14,834,080) | | | 19,173,988 | |
| | | | | | | | | |
| | | | | REITs - 7.8% | | | | |
| | 62,475 | | | Community Healthcare Trust Inc | | | 2,823,246 | |
| | 52,511 | | | National Storage Affiliates Trust | | | 2,772,056 | |
| | 131,547 | | | Plymouth Industrial REIT, Inc. | | | 2,992,694 | |
| | 29,571 | | | PotlatchDeltic Corp. | | | 1,525,272 | |
| | 171,467 | | | Summit Hotel Properties, Inc. * | | | 1,651,227 | |
| | 79,481 | | | Urban Edge Properties | | | 1,455,297 | |
| | | | | TOTAL REITs (Cost $12,140,216) | | | 13,219,792 | |
The accompanying notes are an integral part of these financial statements.
| Schedule of Investments | Small Cap Value Fund |
| As of September 30, 2021 (Continued) |
| Shares | | | | | Fair Value | |
| | | | | MONEY MARKET FUND - 0.9% | | | | |
| | 1,489,069 | | | Fidelity Institutional Money Market Funds - Government Portfolio - Class I, 0.01% (B) (Cost $1,489,069) | | $ | 1,489,069 | |
| | | | | | | | | |
| | | | | TOTAL INVESTMENTS - 99.9% (Cost $142,374,567) | | $ | 169,256,059 | |
| | | | | OTHER ASSETS IN EXCESS OF LIABILITIES - NET - 0.1% | | | 136,530 | |
| | | | | NET ASSETS - 100.0% | | $ | 169,392,589 | |
| * | Non-income producing securities. |
ETF - Exchange Traded Fund.
REITs - Real Estate Investment Trusts.
| (B) | Variable rate security; the rate shown represents the yield at September 30, 2021. |
The accompanying notes are an integral part of these financial statements.
| Schedule of Investments | Large/Mid Cap Value Fund |
| As of September 30, 2021 |
| Shares | | | | | Fair Value | |
| | | | | COMMON STOCK - 66.6% | | | | |
| | | | | AEROSPACE/DEFENSE - 1.8% | | | | |
| | 23,063 | | | General Dynamics Corp. | | $ | 4,521,040 | |
| | | | | | | | | |
| | | | | ASSET MANAGEMENT - 1.7% | | | | |
| | 61,114 | | | Charles Schwab Corp. | | | 4,451,544 | |
| | | | | | | | | |
| | | | | BANKING - 3.6% | | | | |
| | 49,718 | | | BOK Financial Corp. | | | 4,452,247 | |
| | 42,473 | | | Western Alliance Bancorp | | | 4,621,912 | |
| | | | | | | | 9,074,159 | |
| | | | | CABLE & SATELLITE - 1.7% | | | | |
| | 2,330 | | | Cable One, Inc. | | | 4,224,593 | |
| | | | | | | | | |
| | | | | CHEMICALS - 1.9% | | | | |
| | 17,211 | | | Sherwin-Williams Co. | | | 4,814,433 | |
| | | | | | | | | |
| | | | | DIVERSIFIED INDUSTRIALS - 3.4% | | | | |
| | 29,061 | | | Eaton Corp. PLC | | | 4,339,098 | |
| | 20,741 | | | Honeywell International, Inc. | | | 4,402,900 | |
| | | | | | | | 8,741,998 | |
| | | | | ELECTRIC UTILITIES - 3.2% | | | | |
| | 66,757 | | | CMS Energy Corp. | | | 3,987,396 | |
| | 47,840 | | | WEC Energy Group, Inc. | | | 4,219,488 | |
| | | | | | | | 8,206,884 | |
| | | | | ELECTRICAL EQUIPMENT - 0.8% | | | | |
| | 11,559 | | | Hubbell, Inc. | | | 2,088,365 | |
| | | | | | | | | |
| | | | | FOOD - 2.9% | | | | |
| | 30,466 | | | JM Smucker Co. | | | 3,656,834 | |
| | 47,305 | | | McCormick & Co., Inc. | | | 3,833,124 | |
| | | | | | | | 7,489,958 | |
| | | | | INSTITUTIONAL FINANCIAL SERVICES - 1.7% | | | | |
| | 37,499 | | | Intercontinental Exchange, Inc. | | | 4,305,635 | |
| | | | | | | | | |
| | | | | INSURANCE - 1.7% | | | | |
| | 29,413 | | | Arthur J. Gallagher & Co. | | | 4,372,242 | |
| | | | | | | | | |
| | | | | MACHINERY - 3.4% | | | | |
| | 34,530 | | | Curtiss-Wright Corp. | | | 4,356,995 | |
| | 24,437 | | | Middleby Corp. * | | | 4,166,753 | |
| | | | | | | | 8,523,748 | |
| | | | | MEDICAL EQUIPMENT & DEVICES - 5.2% | | | | |
| | 28,845 | | | PerkinElmer, Inc. | | | 4,998,550 | |
| | 21,065 | | | STERIS PLC | | | 4,303,158 | |
| | 26,329 | | | Zimmer Biomet Holdings, Inc. | | | 3,853,512 | |
| | | | | | | | 13,155,220 | |
| | | | | METALS & MINING - 1.6% | | | | |
| | 124,975 | | | Freeport-McMoRan, Inc. | | | 4,065,437 | |
| | | | | | | | | |
| | | | | OIL & GAS PRODUCERS - 2.9% | | | | |
| | 44,205 | | | EOG Resources, Inc. | | | 3,548,335 | |
| | 54,685 | | | Valero Energy Corp. | | | 3,859,120 | |
| | | | | | | | 7,407,455 | |
| | | | | RETAIL - CONSUMER STAPLES - 1.8% | | | | |
| | 21,164 | | | Dollar General Corp. | | | 4,489,731 | |
| | | | | | | | | |
| | | | | RETAIL - DISCRETIONARY - 5.4% | | | | |
| | 7,830 | | | O’Reilly Automotive, Inc. * | | | 4,784,600 | |
| | 35,895 | | | Ross Stores, Inc. | | | 3,907,171 | |
| | 24,858 | | | Tractor Supply Co. | | | 5,036,479 | |
| | | | | | | | 13,728,250 | |
The accompanying notes are an integral part of these financial statements.
| Schedule of Investments | Large/Mid Cap Value Fund |
| As of September 30, 2021 (Continued) |
| Shares | | | | | Fair Value | |
| | | | | SEMICONDUCTORS - 10.6% | | | | |
| | 6,385 | | | ASML Holding N.V. (ADR) | | $ | 4,757,527 | |
| | 9,957 | | | Broadcom, Inc. | | | 4,828,448 | |
| | 30,061 | | | Microchip Technology, Inc. | | | 4,614,063 | |
| | 13,515 | | | Monolithic Power Systems, Inc. | | | 6,550,450 | |
| | 29,036 | | | NVIDIA Corp. | | | 6,015,098 | |
| | | | | | | | 26,765,586 | |
| | | | | SOFTWARE - 6.2% | | | | |
| | 34,505 | | | Cadence Design Systems, Inc. * | | | 5,225,437 | |
| | 18,155 | | | Synopsys, Inc. * | | | 5,435,789 | |
| | 10,793 | | | Tyler Technologies, Inc. * | | | 4,950,209 | |
| | | | | | | | 15,611,435 | |
| | | | | TECHNOLOGY SERVICES - 1.7% | | | | |
| | 16,536 | | | CACI International, Inc. * | | | 4,334,086 | |
| | | | | | | | | |
| | | | | TRANSPORTATION & LOGISTICS - 1.6% | | | | |
| | 20,188 | | | Union Pacific Corp. | | | 3,957,050 | |
| | | | | | | | | |
| | | | | TRANSPORTATION EQUIPMENT - 1.8% | | | | |
| | 53,361 | | | Westinghouse Air Brake Technologies Corp. | | | 4,600,252 | |
| | | | | | | | | |
| | | | | TOTAL COMMON STOCK (Cost $120,085,096) | | | 168,929,101 | |
| | | | | | | | | |
| | | | | EXCHANGE TRADED FUNDS (A) - 23.3% | | | | |
| | 33,000 | | | Timothy Plan High Dividend Stock Enhanced ETF | | | 802,943 | |
| | 892,500 | | | Timothy Plan High Dividend Stock ETF | | | 26,150,161 | |
| | 77,000 | | | Timothy Plan US Large/Mid Cap Core Enhanced ETF | | | 1,885,976 | |
| | 865,000 | | | Timothy Plan US Large/Mid Cap Core ETF | | | 30,116,013 | |
| | | | | TOTAL EXCHANGE TRADED FUNDS (Cost $46,799,749) | | | 58,955,093 | |
| | | | | | | | | |
| | | | | REITs - 3.5% | | | | |
| | 22,044 | | | Crown Castle International Corp. | | | 3,820,666 | |
| | 16,913 | | | Public Storage | | | 5,024,852 | |
| | | | | TOTAL REITs (Cost $6,729,326) | | | 8,845,518 | |
| | | | | | | | | |
| | | | | MONEY MARKET FUND - 6.7% | | | | |
| | 16,927,368 | | | Fidelity Institutional Money Market Funds - Government Portfolio - Class I, 0.01% (B) (Cost $16,927,368) | | | 16,927,368 | |
| | | | | | | | | |
| | | | | TOTAL INVESTMENTS - 100.1% (Cost $190,541,539) | | $ | 253,657,080 | |
| | | | | OTHER ASSETS IN EXCESS OF LIABILITIES - NET - ( 0.1)% | | | (159,043 | ) |
| | | | | NET ASSETS - 100.0% | | $ | 253,498,037 | |
| * | Non-income producing securities. |
ADR - American Depositary Receipt
ETF - Exchange Traded Fund.
PLC - Public Limited Co.
REITs - Real Estate Investment Trusts.
| (B) | Variable rate security; the rate shown represents the yield at September 30, 2021. |
The accompanying notes are an integral part of these financial statements.
| Schedule of Investments | Fixed Income Fund |
| As of September 30, 2021 |
| Par Value | | | | | Coupon Rate (%) | | | Maturity | | | Fair Value | |
| | | | | BONDS & NOTES - 97.5% | | | | | | | | | | | | |
| | | | | CORPORATE BONDS - 31.4% | | | | | | | | | | | | |
| $ | 1,000,000 | | | ABB Finance USA, Inc. | | | 2.875 | | | | 5/8/2022 | | | $ | 1,015,746 | |
| | 2,205,000 | | | American Electric Power, Inc. | | | 3.200 | | | | 11/13/2027 | | | | 2,371,240 | |
| | 2,210,000 | | | Aptiv Corp. | | | 4.150 | | | | 3/15/2024 | | | | 2,374,008 | |
| | 1,000,000 | | | Canadian Pacific Railway Co. | | | 2.900 | | | | 2/1/2025 | | | | 1,056,230 | |
| | 1,000,000 | | | CBOE Global Markets, Inc. | | | 3.650 | | | | 1/12/2027 | | | | 1,101,960 | |
| | 1,580,000 | | | Columbia Pipeline Group, Inc. | | | 4.500 | | | | 6/1/2025 | | | | 1,754,008 | |
| | 2,190,000 | | | CSX Corp. | | | 3.250 | | | | 6/1/2027 | | | | 2,387,122 | |
| | 1,520,000 | | | Digital Realty Trust LP | | | 3.700 | | | | 8/15/2027 | | | | 1,689,865 | |
| | 1,575,000 | | | Dollar General Corp. | | | 4.125 | | | | 5/1/2028 | | | | 1,788,382 | |
| | 750,000 | | | Eaton Corp. | | | 2.750 | | | | 11/2/2022 | | | | 769,500 | |
| | 1,000,000 | | | Enable Midstream Partners LP | | | 3.900 | | | | 5/15/2024 | | | | 1,062,304 | |
| | 855,000 | | | European Investment Bank | | | 2.375 | | | | 6/15/2022 | | | | 868,564 | |
| | 2,200,000 | | | Healthpeak Properties, Inc. | | | 3.500 | | | | 7/15/2029 | | | | 2,406,602 | |
| | 852,508 | | | John Sevier Combined Cycle Generation LLC | | | 4.626 | | | | 1/15/2042 | | | | 1,043,312 | |
| | 865,000 | | | Kreditanstalt fuer Wiederaufbau | | | 2.125 | | | | 6/15/2022 | | | | 877,229 | |
| | 1,212,000 | | | LYB International Finance BV | | | 4.000 | | | | 7/15/2023 | | | | 1,286,200 | |
| | 855,000 | | | National Rural Utilities Cooperative Finance Corp. | | | 2.950 | | | | 2/7/2024 | | | | 898,982 | |
| | 2,185,000 | | | NiSource, Inc. | | | 3.490 | | | | 5/15/2027 | | | | 2,394,758 | |
| | 1,570,000 | | | Nutrien Ltd. | | | 4.000 | | | | 12/15/2026 | | | | 1,752,763 | |
| | 2,240,000 | | | Phillips 66 Partners LP | | | 3.605 | | | | 2/15/2025 | | | | 2,396,797 | |
| | 2,235,000 | | | Province of Ontario Canada | | | 2.500 | | | | 4/27/2026 | | | | 2,378,985 | |
| | 865,000 | | | Province of Quebec Canada | | | 2.375 | | | | 1/31/2022 | | | | 871,094 | |
| | 2,235,000 | | | Sunoco Logistics Partners LP | | | 4.250 | | | | 4/1/2024 | | | | 2,393,173 | |
| | 1,577,000 | | | WEC Energy Group, Inc. | | | 3.550 | | | | 6/15/2025 | | | | 1,705,705 | |
| | 1,000,000 | | | Zimmer Biomet Holdings, Inc. | | | 3.700 | | | | 3/19/2023 | | | | 1,043,652 | |
| | | | | TOTAL CORPORATE BONDS (Cost $38,159,765) | | 39,688,181 | |
| | | | | | | | | | | | | | | | | |
| | | | | U.S. GOVERNMENT & AGENCY OBLIGATIONS - 66.1% | |
| | | | | GOVERNMENT MORTGAGE-BACKED SECURITIES - 25.1% | |
| | 1,612,689 | | | FNMA Pool CA8997 | | | 3.000 | | | | 2/1/2051 | | | | 1,728,918 | |
| | 1,089,052 | | | FNMA Pool CB0855 | | | 3.000 | | | | 6/1/2051 | | | | 1,161,443 | |
| | 1,057,546 | | | FNMA Pool CB0867 | | | 3.500 | | | | 6/1/2051 | | | | 1,130,649 | |
| | 1,104,927 | | | FNMA Pool FM4053 | | | 2.500 | | | | 8/1/2050 | | | | 1,143,135 | |
| | 1,663,037 | | | FNMA Pool FM5537 | | | 2.000 | | | | 1/1/2036 | | | | 1,714,065 | |
| | 1,293,989 | | | FNMA Pool MA4258 | | | 3.500 | | | | 2/1/2051 | | | | 1,377,766 | |
| | 1,342,348 | | | FNMA Pool MA4316 | | | 2.500 | | | | 4/1/2036 | | | | 1,402,166 | |
| | 1,398,396 | | | FNMA Pool MA4329 | | | 2.000 | | | | 5/1/2036 | | | | 1,441,304 | |
| | 1,728,459 | | | FNMA Pool MA4333 | | | 2.000 | | | | 5/1/2041 | | | | 1,755,140 | |
| | 856,554 | | | FNMA Pool MA4366 | | | 2.500 | | | | 6/1/2041 | | | | 886,802 | |
| | 150,621 | | | GNMA Pool G2 4520 | | | 5.000 | | | | 8/20/2039 | | | | 171,955 | |
| | 199,303 | | | GNMA Pool G2 4947 | | | 5.000 | | | | 2/20/2041 | | | | 227,540 | |
| | 820,181 | | | GNMA Pool G2 BN2662 | | | 3.000 | | | | 10/20/2049 | | | | 858,421 | |
| | 1,472,568 | | | GNMA Pool G2 CE1974 | | | 3.000 | | | | 8/20/1951 | | | | 1,555,847 | |
| | 382,228 | | | GNMA Pool G2 MA3376 | | | 3.500 | | | | 1/20/2046 | | | | 407,815 | |
| | 247,728 | | | GNMA Pool G2 MA3596 | | | 3.000 | | | | 4/20/2046 | | | | 260,880 | |
| | 674,318 | | | GNMA Pool G2 MA3663 | | | 3.500 | | | | 5/20/2046 | | | | 716,629 | |
| | 245,298 | | | GNMA Pool G2 MA3736 | | | 3.500 | | | | 6/20/2046 | | | | 260,893 | |
| | 416,434 | | | GNMA Pool G2 MA4004 | | | 3.500 | | | | 10/20/2046 | | | | 443,197 | |
| | 271,367 | | | GNMA Pool G2 MA4509 | | | 3.000 | | | | 6/20/2047 | | | | 287,225 | |
| | 344,225 | | | GNMA Pool G2 MA4652 | | | 3.500 | | | | 8/20/2047 | | | | 365,033 | |
| | 434,705 | | | GNMA Pool G2 MA4719 | | | 3.500 | | | | 9/20/2047 | | | | 460,906 | |
| | 442,078 | | | GNMA Pool G2 MA4778 | | | 3.500 | | | | 10/20/2047 | | | | 470,971 | |
| | 360,798 | | | GNMA Pool G2 MA4901 | | | 4.000 | | | | 12/20/2047 | | | | 386,610 | |
| | 318,267 | | | GNMA Pool G2 MA4963 | | | 4.000 | | | | 1/20/2048 | | | | 341,037 | |
| | 338,118 | | | GNMA Pool G2 MA6092 | | | 4.500 | | | | 8/20/2049 | | | | 360,922 | |
| | 380,760 | | | GNMA Pool G2 MA6156 | | | 4.500 | | | | 9/20/2049 | | | | 405,782 | |
| | 338,150 | | | GNMA Pool G2 MA6221 | | | 4.500 | | | | 10/20/2049 | | | | 361,120 | |
| | 621,765 | | | GNMA Pool G2 MA6338 | | | 3.000 | | | | 12/20/2049 | | | | 650,342 | |
| | 348,408 | | | GNMA Pool G2 MA6477 | | | 4.500 | | | | 2/20/2050 | | | | 372,390 | |
| | 525,769 | | | GNMA Pool G2 MA6478 | | | 5.000 | | | | 2/20/2050 | | | | 571,433 | |
| | 562,683 | | | GNMA Pool G2 MA6544 | | | 4.500 | | | | 3/20/2050 | | | | 598,998 | |
| | 397,367 | | | GNMA Pool G2 MA6545 | | | 5.000 | | | | 3/20/2050 | | | | 430,614 | |
| | 494,435 | | | GNMA Pool G2 MA6600 | | | 3.500 | | | | 4/20/2050 | | | | 520,169 | |
The accompanying notes are an integral part of these financial statements.
| Schedule of Investments | Fixed Income Fund |
| As of September 30, 2021 (Continued) |
| Par Value | | | | | Coupon Rate (%) | | Maturity | | | Fair Value | |
| | | | | GOVERNMENT MORTGAGE-BACKED SECURITIES (Continued) - 25.1% | |
| $ | 430,706 | | | GNMA Pool G2 MA6601 | | | 4.000 | | | | 4/20/2050 | | | $ | 458,793 | |
| | 421,751 | | | GNMA Pool G2 MA6603 | | | 5.000 | | | | 4/20/2050 | | | | 456,335 | |
| | 1,391,177 | | | GNMA Pool G2 MA7255 | | | 2.500 | | | | 3/20/2051 | | | | 1,436,907 | |
| | 737,229 | | | GNMA Pool G2 MA7370 | | | 4.000 | | | | 5/20/2051 | | | | 786,031 | |
| | 932,701 | | | GNMA Pool G2 MA7418 | | | 2.500 | | | | 6/20/2051 | | | | 963,004 | |
| | 1,742,119 | | | GNMA Pool G2 MA7419 | | | 3.000 | | | | 6/20/2051 | | | | 1,822,658 | |
| | 25,736 | | | GNMA Pool GN 723248 | | | 5.000 | | | | 10/15/2039 | | | | 30,053 | |
| | 316,261 | | | GNMA Pool GN 783060 | | | 4.000 | | | | 8/15/2040 | | | | 345,135 | |
| | 119,539 | | | GNMA Pool GN 783403 | | | 3.500 | | | | 9/15/2041 | | | | 128,417 | |
| | | | | TOTAL GOVERNMENT MORTGAGE-BACKED SECURITIES (Cost $31,517,797) | | 31,655,450 | |
| | | | | | | | | | | | | | | | | |
| | | | | GOVERNMENT NOTES & BONDS - 41.0% | | | |
| | 2,165,000 | | | United States Treasury Note | | | 2.250 | | | | 11/15/2024 | | | | 2,279,085 | |
| | 13,070,000 | | | United States Treasury Note | | | 2.000 | | | | 8/15/2025 | | | | 13,685,720 | |
| | 8,260,000 | | | United States Treasury Note | | | 1.625 | | | | 2/15/2026 | | | | 8,522,319 | |
| | 4,250,000 | | | United States Treasury Note | | | 0.625 | | | | 7/31/2026 | | | | 4,180,605 | |
| | 9,635,000 | | | United States Treasury Note | | | 1.500 | | | | 2/15/2030 | | | | 9,689,009 | |
| | 3,285,000 | | | United States Treasury Note | | | 1.250 | | | | 8/15/2031 | | | | 3,201,592 | |
| | 4,540,000 | | | United States Treasury Note | | | 4.500 | | | | 2/15/2036 | | | | 6,196,036 | |
| | 2,150,000 | | | United States Treasury Note | | | 2.250 | | | | 5/15/2041 | | | | 2,231,297 | |
| | 1,560,000 | | | United States Treasury Note | | | 3.000 | | | | 2/15/2049 | | | | 1,860,605 | |
| | | | | TOTAL GOVERNMENT NOTES & BONDS (Cost $51,425,158) | | | 51,846,268 | |
| | | | | | | | | | | | | | | | | |
| | | | | TOTAL U.S. GOVERNMENT & AGENCY OBLIGATIONS (Cost $82,942,955) | | | 83,501,718 | |
| | | | | | | | | | | | | | | | | |
| | | | | TOTAL BONDS AND NOTES (Cost $121,102,720) | | 123,189,899 | |
| | | | | | | | | | | | | | | | |
| Shares | | | | | | | | | | | | | | | |
| | | | | MONEY MARKET FUND - 3.3% | | | | | |
| | 4,209,551 | | | Fidelity Institutional Money Market Funds - Government Portfolio - Class I, 0.01% (A) (Cost $4,209,551) | | | | 4,209,551 | |
| | | | | | | | | | | | | | | | | |
| | | | | TOTAL INVESTMENTS - 100.8% (Cost $125,312,271) | | $ | 127,399,450 | |
| | | | | OTHER ASSETS IN EXCESS OF LIABILITIES - NET - (0.8)% | | (1,055,758 | ) |
| | | | | NET ASSETS - 100.0% | | | | | $ | 126,343,692 | |
FNMA - Federal National Mortgage Association.
GNMA - Government National Mortgage Association.
LLC - Limited Liability Company.
LP - Limited Partnership.
| (A) | Variable rate security; the rate shown represents the yield at September 30, 2021. |
The accompanying notes are an integral part of these financial statements.
| Schedule of Investments | High Yield Bond Fund |
| As of September 30, 2021 |
| Par Value | | | | | Coupon Rate (%) | | | Maturity | | | Fair Value | |
| | | | | CORPORATE BONDS - 91.6% | | | | | | | | | | | | |
| $ | 500,000 | | | Adient Global Holdings Ltd. (A) | | | 4.875 | | | | 8/15/2026 | | | $ | 512,725 | |
| | 500,000 | | | AerCap Global Aviation Trust, 3 mo. LIBOR + 4.30% (A)(B) | | | 4.430 | | | | 6/15/2045 | | | | 542,785 | |
| | 3,000,000 | | | Air Lease Corp. (B) | | | 4.650 | | | | 6/15/2170 | | | | 3,146,250 | |
| | 1,500,000 | | | Allegheny Technologies, Inc. | | | 5.125 | | | | 10/1/2031 | | | | 1,513,672 | |
| | 1,000,000 | | | Alliance Data Systems Corp. (A) | | | 7.000 | | | | 1/15/2026 | | | | 1,073,185 | |
| | 1,125,000 | | | Allied Universal Holdco LLC (A) | | | 4.625 | | | | 6/1/2028 | | | | 1,124,662 | |
| | 1,391,000 | | | Ardent Health Services, Inc. (A) | | | 5.750 | | | | 7/15/2029 | | | | 1,406,697 | |
| | 293,000 | | | Ashton Woods Finance Co. (A) | | | 9.875 | | | | 4/1/2027 | | | | 328,526 | |
| | 500,000 | | | Ashton Woods Finance Co. (A) | | | 6.625 | | | | 1/15/2028 | | | | 532,317 | |
| | 1,500,000 | | | Ashton Woods Finance Co. (A) | | | 4.625 | | | | 8/1/2029 | | | | 1,516,470 | |
| | 1,250,000 | | | Ashton Woods Finance Co. (A) | | | 4.625 | | | | 4/1/2030 | | | | 1,259,375 | |
| | 125,000 | | | Atlas LuxCompany (A) | | | 4.625 | | | | 6/1/2028 | | | | 125,000 | |
| | 250,000 | | | Bausch Health Cos, Inc. (A) | | | 5.000 | | | | 1/30/2028 | | | | 237,554 | |
| | 750,000 | | | Bausch Health Cos, Inc. (A) | | | 4.875 | | | | 6/1/2028 | | | | 778,125 | |
| | 125,000 | | | Bausch Health Cos, Inc. (A) | | | 5.000 | | | | 2/15/2029 | | | | 116,596 | |
| | 1,000,000 | | | Bausch Health Cos, Inc. (A) | | | 5.250 | | | | 1/30/2030 | | | | 934,020 | |
| | 50,000 | | | Bausch Health Cos, Inc. (A) | | | 5.250 | | | | 2/15/2031 | | | | 46,053 | |
| | 250,000 | | | BCPE Empire Holdings, Inc. (A) | | | 7.625 | | | | 5/1/2027 | | | | 249,062 | |
| | 1,550,000 | | | Beacon Roofing Supply, Inc. (A) | | | 4.125 | | | | 5/15/2029 | | | | 1,542,250 | |
| | 2,500,000 | | | Burford Capital Global Finance LLC (A) | | | 6.250 | | | | 4/15/2028 | | | | 2,652,700 | |
| | 500,000 | | | BWX Technologies, Inc. (A) | | | 4.125 | | | | 6/30/2028 | | | | 513,750 | |
| | 500,000 | | | BWX Technologies, Inc. (A) | | | 4.125 | | | | 4/15/2029 | | | | 512,500 | |
| | 500,000 | | | Cascades, Inc. (A) | | | 5.125 | | | | 1/15/2026 | | | | 532,440 | |
| | 500,000 | | | Catalent Pharma Solutions, Inc. (A) | | | 3.125 | | | | 2/15/2029 | | | | 491,600 | |
| | 250,000 | | | Cemex SAB de CV (A) | | | 3.875 | | | | 7/11/2031 | | | | 250,462 | |
| | 1,000,000 | | | Central Garden & Pet Co. (A) | | | 4.125 | | | | 4/30/2031 | | | | 1,016,776 | |
| | 3,000,000 | | | Chemours Co. (A) | | | 4.625 | | | | 11/15/2029 | | | | 2,933,400 | |
| | 522,000 | | | Clarios Global LP (A) | | | 6.250 | | | | 5/15/2026 | | | | 549,103 | |
| | 1,000,000 | | | Clarios Global LP (A) | | | 8.500 | | | | 5/15/2027 | | | | 1,065,000 | |
| | 1,500,000 | | | Colgate Energy Partners III, LLC (A) | | | 5.875 | | | | 7/1/2029 | | | | 1,513,155 | |
| | 1,000,000 | | | CommScope, Inc. (A) | | | 8.250 | | | | 3/1/2027 | | | | 1,046,250 | |
| | 750,000 | | | CommScope, Inc. (A) | | | 7.125 | | | | 7/1/2028 | | | | 768,000 | |
| | 1,000,000 | | | Compass Minerals International, Inc. (A) | | | 6.750 | | | | 12/1/2027 | | | | 1,062,875 | |
| | 1,072,000 | | | CQP Holdco, LP (A) | | | 5.500 | | | | 6/15/2031 | | | | 1,141,466 | |
| | 250,000 | | | Crestwood Midstream Finance Corp. | | | 5.750 | | | | 4/1/2025 | | | | 255,625 | |
| | 1,500,000 | | | Crestwood Midstream Finance Corp. (A) | | | 5.625 | | | | 5/1/2027 | | | | 1,545,675 | |
| | 1,000,000 | | | Crowdstrike Holdings, Inc. | | | 3.000 | | | | 2/15/2029 | | | | 997,900 | |
| | 500,000 | | | DCP Midstream, LLC, 3 mo. LIBOR + 3.85% (A)(B) | | | 3.980 | | | | 5/21/2043 | | | | 466,217 | |
| | 500,000 | | | Diamond BC BV (A) | | | 4.625 | | | | 10/1/2029 | | | | 508,132 | |
| | 350,000 | | | Diamond Sports Finance Co. (A) | | | 5.375 | | | | 8/15/2026 | | | | 231,437 | |
| | 1,000,000 | | | Diversified Healthcare Trust | | | 9.750 | | | | 6/15/2025 | | | | 1,091,250 | |
| | 250,000 | | | DT Midstream, Inc. (A) | | | 4.125 | | | | 6/15/2029 | | | | 253,828 | |
| | 750,000 | | | DT Midstream, Inc. (A) | | | 4.375 | | | | 6/15/2031 | | | | 773,437 | |
| | 1,694,000 | | | Dycom Industries, Inc. (A) | | | 4.500 | | | | 4/15/2029 | | | | 1,706,197 | |
| | 1,500,000 | | | Emergent BioSolutions, Inc. (A) | | | 3.875 | | | | 8/15/2028 | | | | 1,464,630 | |
| | 1,250,000 | | | First Student Bidco, Inc. / First Transit Parent, Inc. (A) | | | 4.000 | | | | 7/31/2029 | | | | 1,234,375 | |
| | 115,000 | | | Freedom Mortgage Corp. (A) | | | 8.125 | | | | 11/15/2024 | | | | 116,945 | |
| | 786,000 | | | Freedom Mortgage Corp. (A) | | | 8.250 | | | | 4/15/2025 | | | | 802,919 | |
| | 500,000 | | | Freedom Mortgage Corp. (A) | | | 7.625 | | | | 5/1/2026 | | | | 510,050 | |
| | 1,000,000 | | | Freedom Mortgage Corp. (A) | | | 6.625 | | | | 1/15/2027 | | | | 973,750 | |
| | 500,000 | | | Genesis Energy LP | | | 7.750 | | | | 2/1/2028 | | | | 501,875 | |
| | 2,125,000 | | | Geo Group, Inc. | | | 5.125 | | | | 4/1/2023 | | | | 2,005,394 | |
| | 2,550,000 | | | GFL Environmental, Inc. (A) | | | 4.000 | | | | 8/1/2028 | | | | 2,534,062 | |
| | 50,000 | | | GFL Environmental, Inc. (A) | | | 4.750 | | | | 6/15/2029 | | | | 51,250 | |
| | 250,000 | | | GFL Environmental, Inc. (A) | | | 4.375 | | | | 8/15/2029 | | | | 252,813 | |
| | 1,000,000 | | | Global Partners LP | | | 7.000 | | | | 8/1/2027 | | | | 1,045,160 | |
| | 1,000,000 | | | Goodyear Tire & Rubber Co. | | | 5.625 | | | | 4/30/2033 | | | | 1,091,250 | |
| | 500,000 | | | Graham Packaging Co., Inc. (A) | | | 7.125 | | | | 8/15/2028 | | | | 526,350 | |
| | 500,000 | | | Gray Television, Inc. (A) | | | 7.000 | | | | 5/15/2027 | | | | 536,875 | |
| | 1,750,000 | | | Gray Television, Inc. (A) | | | 4.750 | | | | 10/15/2030 | | | | 1,721,947 | |
| | 125,000 | | | HealthEquity, Inc. (A) | | | 4.500 | | | | 10/1/2029 | | | | 127,362 | |
| | 3,749,000 | | | Howard Hughes Corp. (A) | | | 4.375 | | | | 2/1/2031 | | | | 3,775,843 | |
| | 250,000 | | | Icahn Enterprises Finance Corp. | | | 4.750 | | | | 9/15/2024 | | | | 260,313 | |
| | 1,000,000 | | | Icahn Enterprises Finance Corp. | | | 6.250 | | | | 5/15/2026 | | | | 1,046,250 | |
| | 1,000,000 | | | Icahn Enterprises Finance Corp. | | | 4.375 | | | | 2/1/2029 | | | | 1,000,000 | |
| | 2,955,000 | | | ILFC E-Capital Trust I, 3 mo. LIBOR + 1.55% (A)(B) | | | 3.460 | | | | 12/21/2065 | | | | 2,394,230 | |
| | 1,500,000 | | | ILFC E-Capital Trust II, 3 mo. LIBOR + 1.80% (A)(B) | | | 3.710 | | | | 12/21/2065 | | | | 1,252,500 | |
| | 100,000 | | | Ingles Markets, Inc. (A) | | | 4.000 | | | | 6/15/2031 | | | | 101,414 | |
| | 1,500,000 | | | iStar, Inc. | | | 5.500 | | | | 2/15/2026 | | | | 1,569,375 | |
The accompanying notes are an integral part of these financial statements.
| Schedule of Investments | High Yield Bond Fund |
| As of September 30, 2021 (Continued) |
| Par Value | | | | | Coupon Rate (%) | | | Maturity | | | Fair Value | |
| | | | | CORPORATE BONDS - 91.6% (Cont.) | | | | | | | | | | | | |
| $ | 1,000,000 | | | ITT Holdings, LLC (A) | | | 6.500 | | | | 8/1/2029 | | | $ | 1,010,000 | |
| | 250,000 | | | Jazz Securities (A) | | | 4.375 | | | | 1/15/2029 | | | | 259,388 | |
| | 750,000 | | | Kaiser Aluminum Corp. (A) | | | 4.500 | | | | 6/1/2031 | | | | 769,688 | |
| | 500,000 | | | Ken Garff Automotive LLC (A) | | | 4.875 | | | | 9/15/2028 | | | | 514,620 | |
| | 1,500,000 | | | Koppers, Inc. (A) | | | 6.000 | | | | 2/15/2025 | | | | 1,535,745 | |
| | 750,000 | | | Ladder Capital Finance Corp. (A) | | | 4.250 | | | | 2/1/2027 | | | | 743,438 | |
| | 750,000 | | | Legacy LifePoint Health LLC (A) | | | 4.375 | | | | 2/15/2027 | | | | 747,038 | |
| | 700,000 | | | LFS Topco, LLC (A) | | | 5.875 | | | | 10/15/2026 | | | | 721,921 | |
| | 250,000 | | | LifePoint Health, Inc. (A) | | | 5.375 | | | | 1/15/2029 | | | | 243,571 | |
| | 250,000 | | | Lithia Motors, Inc. (A) | | | 3.875 | | | | 6/1/2029 | | | | 259,803 | |
| | 1,000,000 | | | Lithia Motors, Inc. (A) | | | 4.375 | | | | 1/15/2031 | | | | 1,068,750 | |
| | 1,750,000 | | | LPL Holdings, Inc. (A) | | | 4.000 | | | | 3/15/2029 | | | | 1,799,613 | |
| | 500,000 | | | LPL Holdings, Inc. (A) | | | 4.375 | | | | 5/15/2031 | | | | 522,698 | |
| | 250,000 | | | Madison IAQ, LLC (A) | | | 4.125 | | | | 6/30/2028 | | | | 250,316 | |
| | 1,750,000 | | | Mercer International, Inc. | | | 5.125 | | | | 2/1/2029 | | | | 1,789,375 | |
| | 1,000,000 | | | MGIC Investment Corp. | | | 5.250 | | | | 8/15/2028 | | | | 1,068,300 | |
| | 2,000,000 | | | Midwest Connector Capital Co. LLC (A) | | | 4.625 | | | | 4/1/2029 | | | | 2,152,638 | |
| | 500,000 | | | Mozart Debt Merger Sub, Inc. (A) | | | 3.875 | | | | 4/1/2029 | | | | 500,000 | |
| | 500,000 | | | Mozart Debt Merger Sub, Inc. (A) | | | 5.250 | | | | 10/1/2029 | | | | 500,000 | |
| | 500,000 | | | MSCI, Inc. (A) | | | 3.625 | | | | 11/1/2031 | | | | 520,938 | |
| | 250,000 | | | MSCI, Inc. (A) | | | 3.250 | | | | 8/15/2033 | | | | 253,178 | |
| | 500,000 | | | Nationstar Mortgage Holdings, Inc. (A) | | | 6.000 | | | | 1/15/2027 | | | | 522,500 | |
| | 750,000 | | | Nationstar Mortgage Holdings, Inc. (A) | | | 5.500 | | | | 8/15/2028 | | | | 773,516 | |
| | 500,000 | | | Navient Corp. | | | 7.250 | | | | 9/25/2023 | | | | 545,885 | |
| | 3,000,000 | | | New Residential Investment Corp. (A) | | | 6.250 | | | | 10/15/2025 | | | | 3,027,150 | |
| | 250,000 | | | NRG Energy, Inc. (A) | | | 3.375 | | | | 2/15/2029 | | | | 247,045 | |
| | 250,000 | | | NRG Energy, Inc. (A) | | | 3.625 | | | | 2/15/2031 | | | | 245,875 | |
| | 1,000,000 | | | NuStar Logistics LP | | | 5.625 | | | | 4/28/2027 | | | | 1,066,970 | |
| | 1,000,000 | | | Olin Corp. | | | 5.625 | | | | 8/1/2029 | | | | 1,100,620 | |
| | 1,250,000 | | | Pactiv Evergreen Group Issuer, Inc. (A) | | | 4.375 | | | | 10/15/2028 | | | | 1,256,250 | |
| | 500,000 | | | Papa John’s International, Inc. (A) | | | 3.875 | | | | 9/15/2029 | | | | 496,815 | |
| | 1,000,000 | | | PBF Holding Co. LLC (A) | | | 9.250 | | | | 5/15/2025 | | | | 948,865 | |
| | 775,000 | | | PBF Holding Co. LLC | | | 7.250 | | | | 6/15/2025 | | | | 522,893 | |
| | 500,000 | | | PBF Holding Co. LLC | | | 6.000 | | | | 2/15/2028 | | | | 320,000 | |
| | 125,000 | | | PHH Mortgage Corp. (A) | | | 7.875 | | | | 3/15/2026 | | | | 127,382 | |
| | 1,500,000 | | | Plastipak Holdings, Inc. (A) | | | 6.250 | | | | 10/15/2025 | | | | 1,528,575 | |
| | 2,000,000 | | | Polar US Borrower, LLC (A) | | | 6.750 | | | | 5/15/2026 | | | | 2,015,030 | |
| | 1,500,000 | | | Rent-A-Center, Inc. (A) | | | 6.375 | | | | 2/15/2029 | | | | 1,620,000 | |
| | 125,000 | | | Roller Bearing Company of America, Inc. (A) | | | 4.375 | | | | 10/15/2029 | | | | 128,281 | |
| | 500,000 | | | Scotts Miracle-Gro Co. (A) | | | 4.000 | | | | 4/1/2031 | | | | 499,685 | |
| | 500,000 | | | Scotts Miracle-Gro Co. (A) | | | 4.375 | | | | 2/1/2032 | | | | 504,688 | |
| | 1,250,000 | | | Service Properties Trust | | | 7.500 | | | | 9/15/2025 | | | | 1,405,328 | |
| | 500,000 | | | Service Properties Trust | | | 5.500 | | | | 12/15/2027 | | | | 533,021 | |
| | 500,000 | | | Sotheby’s/Bidfair Holdings, Inc. (A) | | | 5.875 | | | | 6/1/2029 | | | | 515,005 | |
| | 500,000 | | | Spirit AeroSystems, Inc. (A) | | | 5.500 | | | | 1/15/2025 | | | | 529,375 | |
| | 1,000,000 | | | Standard Industries, Inc. (A) | | | 5.000 | | | | 2/15/2027 | | | | 1,032,500 | |
| | 1,500,000 | | | STL Holding Co. LLC (A) | | | 7.500 | | | | 2/15/2026 | | | | 1,586,250 | |
| | 1,000,000 | | | Suburban Propane Partners LP | | | 5.875 | | | | 3/1/2027 | | | | 1,045,765 | |
| | 125,000 | | | Tap Rock Resources, LLC (A) | | | 7.000 | | | | 10/1/2026 | | | | 128,594 | |
| | 1,250,000 | | | Targa Resources Partners LP | | | 5.500 | | | | 3/1/2030 | | | | 1,368,359 | |
| | 390,000 | | | Tenet Healthcare Corp. (A) | | | 4.625 | | | | 9/1/2024 | | | | 399,263 | |
| | 1,000,000 | | | Tenet Healthcare Corp. (A) | | | 6.250 | | | | 2/1/2027 | | | | 1,038,750 | |
| | 1,759,000 | | | TMS International Holding Corp. (A) | | | 6.250 | | | | 4/15/2029 | | | | 1,840,354 | |
| | 1,250,000 | | | TriMas Corp. (A) | | | 4.125 | | | | 4/15/2029 | | | | 1,280,913 | |
| | 500,000 | | | Trinity Industries, Inc. | | | 4.550 | | | | 10/1/2024 | | | | 530,695 | |
| | 500,000 | | | TTM Technologies, Inc. (A) | | | 4.000 | | | | 3/1/2029 | | | | 501,475 | |
| | 1,000,000 | | | Twilio, Inc. | | | 3.625 | | | | 3/15/2029 | | | | 1,024,250 | |
| | 1,500,000 | | | United Natural Foods, Inc. (A) | | | 6.750 | | | | 10/15/2028 | | | | 1,625,625 | |
| | 500,000 | | | Vista Outdoor, Inc. (A) | | | 4.500 | | | | 3/15/2029 | | | | 507,660 | |
| | 750,000 | | | Vistra Operations Co. LLC (A) | | | 5.625 | | | | 2/15/2027 | | | | 777,232 | |
| | 250,000 | | | Vistra Operations Co. LLC (A) | | | 4.375 | | | | 5/1/2029 | | | | 250,937 | |
| | 1,185,000 | | | Vizient, Inc. (A) | | | 6.250 | | | | 5/15/2027 | | | | 1,241,400 | |
| | 125,000 | | | Wabash National Corporation (A) | | | 4.500 | | | | 10/15/2028 | | | | 125,000 | |
| | 2,200,000 | | | Waste Pro USA, Inc. (A) | | | 5.500 | | | | 2/15/2026 | | | | 2,225,058 | |
| | 500,000 | | | Weekley Finance Corp. (A) | | | 4.875 | | | | 9/15/2028 | | | | 520,625 | |
| | 500,000 | | | WR Grace Holdings, LLC (A) | | | 5.625 | | | | 8/15/2029 | | | | 516,255 | |
| | | | | TOTAL CORPORATE BONDS (Cost $121,432,695) | | 125,040,163 | |
The accompanying notes are an integral part of these financial statements.
| Schedule of Investments | High Yield Bond Fund |
| As of September 30, 2021 (Continued) |
| Par Value | | | | | Coupon Rate (%) | | | Maturity | | | Fair Value | |
| | | | | CONVERTIBLE BONDS - 4.7% | | | | | | | | | | | | |
| | | | | OIL & GAS PRODUCERS - 2.4% | | | | | | | | | | | | |
| $ | 3,775,000 | | | Cheniere Energy, Inc. | | | 4.250 | | | | 3/15/2045 | | | $ | 3,276,498 | |
| | | | | | | | | | | | | | | | | |
| | | | | SPECIALTY FINANCE - 2.3% | | | | | | | | | | | | |
| | 2,275,000 | | | MGIC Investment Corp. (A) | | | 9.000 | | | | 4/1/2063 | | | | 3,042,812 | |
| | | | | | | | | | | | | | | | | |
| | | | | TOTAL CONVERTIBLE BONDS (Cost $5,680,341) | | | | | | 6,319,310 | |
| | | | | | | | | | | | | | | | | |
| Shares | | | | | | | | | | | | | | | |
| | | | | PREFERRED STOCK - 0.4% | | | | | | | | |
| | | | | INDUSTRIAL SUPPORT SERVICES - 0.4% | | | | | | | | |
| | 17,500 | | | WESCO International, Inc., 0.625% (Cost $463,059) | | 549,150 | |
| | | | | | | | | | | | | | | | | |
| | | | | MONEY MARKET FUND - 3.2% | | | | | | | | | | | | |
| | 4,398,611 | | | Fidelity Institutional Money Market Funds - Government Portfolio - Class I, 0.01% (C) (Cost $4,398,611) | | 4,398,611 | |
| | | | | | | | | | | | | | | | | |
| | | | | TOTAL INVESTMENTS - 99.9% (Cost $131,974,706) | | | $ | 136,307,234 | |
| | | | | OTHER ASSETS IN EXCESS OF LIABILITIES - NET - 0.1% | | | | 196,211 | |
| | | | | NET ASSETS - 100.0% | | | | | | $ | 136,503,445 | |
LIBOR - London Interbank Offered Rate. The 3 month U.S. LIBOR rate as of September 30, 2021 is 0.13%
LLC - Limited Liability Company.
LP - Limited Partnership.
| (A) | 144A Security - Security exempt from registration under Rule 144A of the Securities Act of 1933. The 144A securities had a fair value of $100,237,200 and represent 73.43% of total net assets. The securities may be resold in transactions exempt from registration typically only to qualified institutional buyers. Unless otherwise indicated, these securities are not considered to be illiquid. |
| (B) | Variable rate security; the interest rate shown reflects the effective rate at September 30, 2021 |
| (C) | Variable rate security; the rate shown represents the yield at September 30, 2021. |
The accompanying notes are an integral part of these financial statements.
| Schedule of Investments | Israel Common Values Fund |
| As of September 30, 2021 |
| Shares | | | | | Fair Value | |
| | | | | COMMON STOCK - 93.5% | | | | |
| | | | | ADVERTISING & MARKETING - 0.3% | | | | |
| | 17,000 | | | Tremor International Ltd. (ADR) * | | $ | 313,990 | |
| | | | | | | | | |
| | | | | AEROSPACE & DEFENSE - 2.5% | | | | |
| | 18,001 | | | Elbit Systems Ltd. | | | 2,607,265 | |
| | 31,000 | | | RADA Electronic Industries Ltd. * | | | 329,840 | |
| | | | | | | | 2,937,105 | |
| | | | | APPAREL & TEXTILE PRODUCTS - 3.4% | | | | |
| | 24,063 | | | Delta Galil Industries Ltd. | | | 1,200,856 | |
| | 21,392 | | | Fox Wizel Ltd. | | | 2,698,078 | |
| | | | | | | | 3,898,934 | |
| | | | | BANKING - 16.4% | | | | |
| | 108,000 | | | Bank Hapoalim BM (ADR) | | | 4,592,160 | |
| | 629,000 | | | Bank Leumi Le-Israel BM | | | 5,359,704 | |
| | 58,300 | | | First International Bank Of Israel Ltd. | | | 2,136,001 | |
| | 602,000 | | | Israel Discount Bank Ltd. * | | | 3,194,594 | |
| | 105,000 | | | Mizrahi Tefahot Bank Ltd. | | | 3,547,572 | |
| | | | | | | | 18,830,031 | |
| | | | | BIOTECH & PHARMA - 0.8% | | | | |
| | 450,000 | | | Enlight Renewable Energy Ltd. * | | | 978,767 | |
| | | | | | | | | |
| | | | | CHEMICALS - 2.0% | | | | |
| | 319,902 | | | ICL Group Ltd. | | | 2,325,688 | |
| | | | | | | | | |
| | | | | CONSTRUCTION MATERIALS - 0.8% | | | | |
| | 178,000 | | | Inrom Construction Industries Ltd. | | | 882,786 | |
| | | | | | | | | |
| | | | | E-COMMERCE DISCRETIONARY - 0.6% | | | | |
| | 9,900 | | | Global-e Online Ltd. * | | | 710,820 | |
| | | | | | | | | |
| | | | | ELECTRIC UTILITIES - 1.7% | | | | |
| | 28,700 | | | Ormat Technologies, Inc. | | | 1,911,731 | |
| | | | | | | | | |
| | | | | FOOD - 1.3% | | | | |
| | 50,500 | | | Strauss Group Ltd. | | | 1,477,831 | |
| | | | | | | | | |
| | | | | HEALTH CARE FACILITIES & SERVICES - 3.4% | | | | |
| | 12,769 | | | Danel Adir Yeoshua Ltd. | | | 2,493,520 | |
| | 1,575,013 | | | Novolog Ltd. | | | 1,425,550 | |
| | | | | | | | 3,919,070 | |
| | | | | HOME & OFFICE PRODUCTS - 2.4% | | | | |
| | 116,585 | | | Maytronics Ltd. | | | 2,755,846 | |
| | | | | | | | | |
| | | | | INSTITUTIONAL FINANCIAL SERVICES - 2.1% | | | | |
| | 453,685 | | | Tel Aviv Stock Exchange Ltd. | | | 2,414,572 | |
| | | | | | | | | |
| | | | | INSURANCE - 4.9% | | | | |
| | 184,000 | | | Harel Insurance Investments & Financial Services Ltd. | | | 1,903,792 | |
| | 1,230,000 | | | Migdal Insurance & Financial Holding Ltd. * | | | 1,807,170 | |
| | 167,400 | | | Phoenix Holdings Ltd. | | | 1,913,128 | |
| | | | | | | | 5,624,090 | |
| | | | | INTERNET MEDIA & SERVICES - 0.9% | | | | |
| | 5,800 | | | Fiverr International Ltd. * | | | 1,059,544 | |
| | | | | | | | | |
| | | | | LEISURE FACILITIES & SERVICES - 1.3% | | | | |
| | 15,800 | | | Fattal Holdings 1998 Ltd. * | | | 1,424,187 | |
| | | | | | | | | |
| | | | | MEDICAL EQUIPMENT & DEVICES - 0.9% | | | | |
| | 1,200 | | | Inmode Ltd. * | | | 191,340 | |
| | 7,100 | | | Novocure Ltd. * | | | 824,807 | |
| | | | | | | | 1,016,147 | |
The accompanying notes are an integral part of these financial statements.
| Schedule of Investments | Israel Common Values Fund |
| As of September 30, 2021 (Continued) |
| Shares | | | | | Fair Value | |
| | | | | OIL & GAS PRODUCERS - 4.1% | | | | |
| | 62,968 | | | Energean PLC * | | $ | 750,542 | |
| | 40,000 | | | Energean PLC * | | | 469,414 | |
| | 5,600 | | | Israel Corp. Ltd. * | | | 1,742,932 | |
| | 2,000,000 | | | Oil Refineries Ltd. * | | | 453,172 | |
| | 7,000 | | | Paz Oil Co. Ltd. * | | | 761,589 | |
| | 1,175,000 | | | Ratio Oil Exploration 1992 LP * | | | 516,087 | |
| | | | | | | | 4,693,736 | |
| | | | | REAL ESTATE OWNERS & DEVELOPERS - 12.2% | | | | |
| | 105,000 | | | Alony Hetz Properties & Investments Ltd. | | | 1,614,308 | |
| | 176,000 | | | Amot Investments Ltd. | | | 1,245,472 | |
| | 31,000 | | | Azrieli Group Ltd. | | | 2,799,095 | |
| | 40,000 | | | Elco Ltd. | | | 2,477,256 | |
| | 160,000 | | | Gav-Yam Lands Corp Ltd. | | | 1,628,691 | |
| | 125,000 | | | Gazit-Globe Ltd. | | | 885,731 | |
| | 16,380 | | | Melisron Ltd. * | | | 1,313,449 | |
| | 593,430 | | | Mivne Real Estate KD Ltd. | | | 2,087,761 | |
| | | | | | | | 14,051,763 | |
| | | | | RENEWABLE ENERGY - 1.6% | | | | |
| | 216,360 | | | Energix-Renewable Energies Ltd. | | | 916,770 | |
| | 3,600 | | | SolarEdge Technologies, Inc. * | | | 954,792 | |
| | | | | | | | 1,871,562 | |
| | | | | RETAIL - CONSUMER STAPLES - 3.0% | | | | |
| | 16,700 | | | Rami Levy Chain Stores Hashikma Marketing 2006 Ltd. | | | 1,199,901 | |
| | 210,000 | | | Shufersal Ltd. | | | 1,705,438 | |
| | 27,315 | | | Victory Supermarket Chain Ltd. | | | 568,966 | |
| | | | | | | | 3,474,305 | |
| | | | | SEMICONDUCTORS - 5.4% | | | | |
| | 39,000 | | | Nova Measuring Instruments Ltd. * | | | 3,989,310 | |
| | 74,423 | | | Tower Semiconductor Ltd. * | | | 2,225,248 | |
| | | | | | | | 6,214,558 | |
| | | | | SOFTWARE - 14.1% | | | | |
| | 15,000 | | | Cognyte Software Ltd. * | | | 308,250 | |
| | 13,100 | | | CyberArk Software Ltd. * | | | 2,067,442 | |
| | 33,435 | | | Hilan Ltd. | | | 1,886,202 | |
| | 1,200 | | | Monday.com Ltd. * | | | 391,440 | |
| | 21,100 | | | Nice Ltd. (ADR) * | | | 5,993,244 | |
| | 60,000 | | | One Software Technologies Ltd. | | | 968,771 | |
| | 45,300 | | | Sapiens International Corp. NV | | | 1,303,734 | |
| | 35,800 | | | Varonis Systems, Inc. * | | | 2,178,430 | |
| | 25,500 | | | Verint Systems, Inc. * | | | 1,142,145 | |
| | | | | | | | 16,239,658 | |
| | | | | TECHNOLOGY HARDWARE - 2.5% | | | | |
| | 17,800 | | | AudioCodes Ltd. | | | 579,212 | |
| | 15,800 | | | Kornit Digital Ltd. * | | | 2,286,892 | |
| | | | | | | | 2,866,104 | |
| | | | | TECHNOLOGY SERVICES - 2.8% | | | | |
| | 86,783 | | | Magic Software Enterprises Ltd. | | | 1,735,660 | |
| | 56,210 | | | Matrix IT Ltd. | | | 1,498,573 | |
| | | | | | | | 3,234,233 | |
| | | | | WHOLESALE - DISCRETIONARY - 2.1% | | | | |
| | 20,300 | | | Tadiran Holdings Ltd. | | | 2,468,481 | |
| | | | | | | | | |
| | | | | TOTAL COMMON STOCK (Cost $54,830,055) | | | 107,595,539 | |
The accompanying notes are an integral part of these financial statements.
| Schedule of Investments | Israel Common Values Fund |
| As of September 30, 2021 (Continued) |
| Shares | | | | | Fair Value | |
| | | | | REITs - 1.3% | | | | |
| | 259,000 | | | Reit 1 Ltd. * (Cost $1,256,747) | | $ | 1,530,967 | |
| | | | | | | | | |
| | | | | MONEY MARKET FUND - 5.6% | | | | |
| | 6,382,650 | | | Fidelity Institutional Money Market Funds - Government Portfolio - Class I, 0.01% (A) (Cost $6,382,650) | | | 6,382,650 | |
| | | | | | | | | |
| | | | | TOTAL INVESTMENTS - 100.4% (Cost $62,469,452) | | $ | 115,509,156 | |
| | | | | OTHER ASSETS IN EXCESS OF LIABILITIES - NET - (0.4)% | | | (486,051 | ) |
| | | | | NET ASSETS - 100.0% | | $ | 115,023,105 | |
| * | Non-income producing securities. |
ADR - American Depositary Receipt.
LP - Limited Partnership.
PLC - Public Limited Co.
REITs - Real Estate Investment Trusts.
| (A) | Variable rate security; the rate shown represents the yield at September 30, 2021. |
| Diversification of Assets | | | |
| Country | | % of Net Assets | |
| Israel | | | 88.5 | % |
| United States | | | 4.5 | % |
| United Kingdom | | | 1.1 | % |
| Jersey | | | 0.7 | % |
| Total | | | 94.8 | % |
| Money Market Fund | | | 5.6 | % |
| Other Assets Less Liabilities - Net | | | (0.4 | )% |
| Grand Total | | | 100.0 | % |
The accompanying notes are an integral part of these financial statements.
| Schedule of Investments | Defensive Strategies Fund |
| As of September 30, 2021 |
| Shares | | | | | Fair Value | |
| | | | | COMMON STOCK - 22.0% | | | | |
| | | | | AEROSPACE & DEFENSE - 0.1% | | | | |
| | 1,863 | | | Suez S.A. * | | $ | 42,502 | |
| | | | | | | | | |
| | | | | AUTOMOTIVE - 0.1% | | | | |
| | 2,400 | | | NGK Insulators Ltd. | | | 40,934 | |
| | | | | | | | | |
| | | | | CHEMICALS - 2.9% | | | | |
| | 4,993 | | | CF Industries Holdings, Inc. | | | 278,709 | |
| | 1,297 | | | Chemours Co. | | | 37,691 | |
| | 6,651 | | | Corteva, Inc. | | | 279,874 | |
| | 1,605 | | | FMC Corp. | | | 146,954 | |
| | 3,251 | | | K+S AG * | | | 52,579 | |
| | 7,110 | | | Mosaic Co. | | | 253,969 | |
| | 5,505 | | | Nutrien Ltd | | | 356,889 | |
| | 682 | | | OCI N.V. * | | | 20,171 | |
| | 1,463 | | | Sasol Ltd. (ADR) * | | | 27,563 | |
| | 4,104 | | | Sociedad Quimica Y Minera de Chile, SA (ADR) | | | 220,467 | |
| | | | | | | | 1,674,866 | |
| | | | | CONSTRUCTION MATERIALS - 0.3% | | | | |
| | 3,200 | | | AGC, Inc. | | | 165,772 | |
| | | | | | | | | |
| | | | | DIVERSIFIED INDUSTRIALS - 0.1% | | | | |
| | 638 | | | Pentair PLC | | | 46,338 | |
| | | | | | | | | |
| | | | | ELECTRIC UTILITIES - 0.1% | | | | |
| | 865 | | | Neoen SA * | | | 34,907 | |
| | 503 | | | Ormat Technologies, Inc. | | | 33,505 | |
| | | | | | | | 68,412 | |
| | | | | FOOD - 1.1% | | | | |
| | 428 | | | Bakkafrost P/F | | | 35,498 | |
| | 1,762 | | | Beyond Meat, Inc. * | | | 185,468 | |
| | 8,982 | | | BRF SA (ADR) * | | | 45,090 | |
| | 545 | | | Cal-Maine Foods, Inc. | | | 19,707 | |
| | 948 | | | Darling Ingredients, Inc. * | | | 68,161 | |
| | 815 | | | Ingredion, Inc. | | | 72,543 | |
| | 1,100 | | | Maple Leaf Foods, Inc. | | | 22,350 | |
| | 600 | | | Morinaga Milk Industry Co. Ltd. | | | 37,643 | |
| | 4,700 | | | Nippon Suisan Kaisha Ltd. | | | 27,423 | |
| | 1,279 | | | Pilgrim’s Pride Corp. * | | | 37,193 | |
| | 554 | | | Sanderson Farms, Inc. | | | 104,263 | |
| | | | | | | | 655,339 | |
| | | | | FORESTRY, PAPER & WOOD PRODUCTS - 0.0% ** | | | | |
| | 600 | | | Canfor Corp. * | | | 13,176 | |
| | 900 | | | Sumitomo Forestry Co. Ltd. | | | 17,294 | |
| | | | | | | | 30,470 | |
| | | | | | | | | |
| | | | | GAS & WATER UTILITIES - 0.9% | | | | |
| | 403 | | | American States Water Co. | | | 34,465 | |
| | 671 | | | American Water Works Co., Inc. | | | 113,426 | |
| | 437 | | | California Water Service Group | | | 25,752 | |
| | 5,672 | | | Cia de Saneamento Basico do Estado de Sao Paulo (ADR) | | | 40,158 | |
| | 539 | | | Essential Utilities, Inc. | | | 24,837 | |
| | 885 | | | Pennon Group PLC | | | 13,520 | |
| | 1,154 | | | Severn Trent PLC | | | 40,518 | |
| | 1,944 | | | United Utilities Group PLC | | | 25,384 | |
| | 6,518 | | | Veolia Environnement SA | | | 199,880 | |
| | | | | | | | 517,940 | |
| | | | | HEALTH CARE FACILITIES & SERVICES - 0.5% | | | | |
| | 48,754 | | | Brookdale Senior Living, Inc. * | | | 307,150 | |
| | | | | | | | | |
| | | | | INTERNET MEDIA & SERVICES - 0.0% ** | | | | |
| | 944 | | | PhosAgro (ADR) | | | 21,032 | |
| | | | | | | | | |
| | | | | MACHINERY - 1.6% | | | | |
| | 1,110 | | | AGCO Corp. | | | 136,008 | |
| | 7,592 | | | CNH Industrial NV | | | 126,103 | |
| | 906 | | | Deere & Co. | | | 303,573 | |
| | 3,026 | | | Evoqua Water Technologies Corp. * | | | 113,657 | |
| | 11,700 | | | Kubota Corp. | | | 250,516 | |
| | 700 | | | Kurita Water Industries Ltd. | | | 33,879 | |
| | | | | | | | 963,736 | |
The accompanying notes are an integral part of these financial statements.
| Schedule of Investments | Defensive Strategies Fund |
| As of September 30, 2021 (Continued) |
| Shares | | | | | Fair Value | |
| | | | | METALS & MINING - 4.2% | | | | |
| | 1,501 | | | Agnico Eagle Mines Ltd. | | $ | 77,827 | |
| | 8,525 | | | Alamos Gold, Inc. | | | 61,380 | |
| | 2,243 | | | Anglo American PLC | | | 79,314 | |
| | 2,708 | | | AngloGold Ashanti Ltd. (ADR) | | | 43,301 | |
| | 1,391 | | | Antofagasta PLC | | | 25,545 | |
| | 22,898 | | | B2Gold Corp. | | | 78,311 | |
| | 1,550 | | | BHP Group Ltd. (ADR) | | | 82,956 | |
| | 234 | | | BHP Group PLC (ADR) | | | 11,861 | |
| | 2,352 | | | Cameco Corp. | | | 51,109 | |
| | 3,247 | | | Cia De Minas Buenaventura (ADR) * | | | 21,950 | |
| | 964 | | | Cleveland-Cliffs, Inc. * | | | 19,097 | |
| | 413 | | | Compass Minerals International, Inc. | | | 26,597 | |
| | 3,700 | | | Endeavour Mining PLC | | | 83,267 | |
| | 137 | | | First Majestic Silver Corp. | | | 1,548 | |
| | 2,600 | | | First Quantum Minerals Ltd. | | | 48,127 | |
| | 542 | | | Franco-Nevada Corp. | | | 70,411 | |
| | 2,135 | | | Freeport-McMoRan, Inc. | | | 69,452 | |
| | 8,858 | | | Gold Fields Ltd. (ADR) | | | 71,927 | |
| | 2,400 | | | Hudbay Minerals, Inc. | | | 14,966 | |
| | 21,177 | | | Kinross Gold Corp. | | | 113,509 | |
| | 2,802 | | | Kirkland Lake Gold Ltd. | | | 116,694 | |
| | 1,334 | | | Lithium Americas Corp. * | | | 29,788 | |
| | 3,123 | | | Livent Corp. * | | | 72,173 | |
| | 300 | | | Lundin Mining Corp. | | | 2,157 | |
| | 4,231 | | | MMC Norilsk Nickel PJSC (ADR) | | | 126,634 | |
| | 2,632 | | | Newmont Corp. | | | 142,918 | |
| | 3,416 | | | Pan American Silver Corp. | | | 79,490 | |
| | 3,028 | | | Rio Tinto PLC (ADR) | | | 202,331 | |
| | 730 | | | Royal Gold, Inc. | | | 69,708 | |
| | 1,144 | | | Southern Copper Corp. | | | 64,224 | |
| | 5,543 | | | SSR Mining, Inc. | | | 80,651 | |
| | 2,300 | | | Sumitomo Metal Mining Co. Ltd. | | | 83,796 | |
| | 5,243 | | | Teck Resources Ltd. | | | 130,490 | |
| | 10,403 | | | Vale SA (ADR) | | | 145,121 | |
| | 1,249 | | | Vedanta Ltd. (ADR) | | | 19,085 | |
| | 98 | | | Wheaton Precious Metals Corp. | | | 3,683 | |
| | 8,737 | | | Yamana Gold, Inc. | | | 34,599 | |
| | | | | | | | 2,455,997 | |
| | | | | OIL & GAS PRODUCERS - 6.7% | | | | |
| | 4,673 | | | APA Corp. | | | 100,142 | |
| | 20,300 | | | ARC Resources Ltd | | | 190,205 | |
| | 2,009 | | | Canadian Natural Resources Ltd. | | | 73,409 | |
| | 14,090 | | | Cenovus Energy, Inc. | | | 142,029 | |
| | 561 | | | Cimarex Energy Company | | | 48,919 | |
| | 1,701 | | | CNX Resources Corp. * | | | 21,467 | |
| | 4,626 | | | ConocoPhillips | | | 313,504 | |
| | 4,251 | | | Continental Resources, Inc. | | | 196,184 | |
| | 8,106 | | | Coterra Energy, Inc. | | | 176,387 | |
| | 475 | | | Devon Energy Corp. | | | 16,867 | |
| | 2,248 | | | Diamondback Energy, Inc. | | | 212,818 | |
| | 1,026 | | | Ecopetrol SA (ADR) | | | 14,723 | |
| | 5,060 | | | EOG Resources, Inc. | | | 406,166 | |
| | 127 | | | EQT Corp. * | | | 2,598 | |
| | 1,411 | | | Hess Corp. | | | 110,213 | |
| | 34,900 | | | Inpex Corp. | | | 274,008 | |
| | 2,222 | | | Lukoil PJSC (ADR) | | | 212,912 | |
| | 1,380 | | | Magnolia Oil & Gas Corp. | | | 24,550 | |
| | 6,109 | | | Marathon Oil Corp. | | | 83,510 | |
| | 711 | | | Murphy Oil Corp. | | | 17,754 | |
| | 306 | | | Novatek OJSC (GDR) | | | 80,815 | |
| | 7,365 | | | Occidental Petroleum Corp. | | | 217,857 | |
| | 1,141 | | | Ovintiv, Inc. | | | 37,516 | |
| | 2,800 | | | Parex Resources, Inc. | | | 50,923 | |
| | 2,370 | | | PDC Energy, Inc. | | | 112,314 | |
| | 3,018 | | | Petroleo Brasileiro SA (ADR) | | | 31,206 | |
| | 927 | | | Pioneer Natural Resources Co. | | | 154,355 | |
| | 2,695 | | | Range Resources Corporation * | | | 60,988 | |
| | 8,242 | | | Rosneft Oil Company (GDR) | | | 69,645 | |
| | 2,126 | | | SM Energy Co. | | | 56,084 | |
| | 9,131 | | | Southwestern Energy Co. * | | | 50,586 | |
| | 7,600 | | | Suncor Energy, Inc. | | | 157,537 | |
| | 5,400 | | | Tourmaline Oil Corp. | | | 188,617 | |
| | 504 | | | YPF SA (ADR) * | | | 2,349 | |
| | | | | | | | 3,909,157 | |
The accompanying notes are an integral part of these financial statements.
| Schedule of Investments | Defensive Strategies Fund |
| As of September 30, 2021 (Continued) |
| Shares | | | | | Fair Value | |
| | | | | OIL & GAS SERVICES & EQUIPMENT - 1.1% | | | | |
| | 4,502 | | | Baker Hughes, Inc. | | $ | 111,334 | |
| | 2,561 | | | ChampionX Corp. * | | | 57,264 | |
| | 6,953 | | | Halliburton Co. | | | 150,324 | |
| | 3,172 | | | Helmerich & Payne, Inc. | | | 86,945 | |
| | 2,874 | | | NOV, Inc. * | | | 37,678 | |
| | 3,391 | | | Patterson-UTI Energy, Inc. | | | 30,519 | |
| | 4,683 | | | Schlumberger Ltd. | | | 138,804 | |
| | 733 | | | TechnipFMC PLC (France) * | | | 5,566 | |
| | 5,132 | | | TechnipFMC PLC * | | | 38,644 | |
| | | | | | | | 657,078 | |
| | | | | RENEWABLE ENERGY- 0.8% | | | | |
| | 975 | | | Atlantica Sustainable Infrastructure PLC | | | 33,647 | |
| | 1,878 | | | Ballard Power Systems, Inc. * | | | 26,386 | |
| | 535 | | | Daqo New Energy Corporation * | | | 30,495 | |
| | 501 | | | Enphase Energy, Inc. * | | | 75,135 | |
| | 438 | | | First Solar, Inc. * | | | 41,811 | |
| | 1,733 | | | Green Plains, Inc. * | | | 56,582 | |
| | 1,300 | | | GS Yuasa Corp. | | | 29,618 | |
| | 2,163 | | | Plug Power, Inc. * | | | 55,243 | |
| | 476 | | | Renewable Energy Group, Inc. * | | | 23,895 | |
| | 183 | | | SolarEdge Technologies, Inc. * | | | 48,535 | |
| | 259 | | | Varta AG | | | 35,060 | |
| | | | | | | | 456,407 | |
| | | | | STEEL - 1.0% | | | | |
| | 365 | | | Allegheny Technologies, Inc. * | | | 6,070 | |
| | 1,575 | | | ArcelorMittal (ADR) | | | 47,502 | |
| | 12,813 | | | Cia Siderurgica Nacional SA (ADR) | | | 67,396 | |
| | 15,931 | | | Gerdau SA (ADR) | | | 78,381 | |
| | 2,300 | | | Hitachi Metals Ltd. * | | | 44,464 | |
| | 3,900 | | | JFE Holdings, Inc. | | | 59,317 | |
| | 3,100 | | | Kobe Steel Ltd. | | | 19,032 | |
| | 6,400 | | | Nippon Steel & Sumitomo Metal Corp. | | | 116,671 | |
| | 475 | | | Novolipetskiy Metallurgicheskiy Kombinat PAO (ADR) | | | 14,127 | |
| | 782 | | | Severstal (ADR) | | | 16,469 | |
| | 841 | | | Ternium S.A. (ADR) | | | 35,574 | |
| | 2,893 | | | United States Steel Corp. | | | 63,559 | |
| | | | | | | | 568,562 | |
| | | | | TELECOMMUNICATIONS - 0.3% | | | | |
| | 7,020 | | | Switch, Inc. | | | 178,238 | |
| | | | | | | | | |
| | | | | WHOLESALE - CONSUMER STAPLES - 0.2% | | | | |
| | 1,360 | | | Bunge Ltd. | | | 110,595 | |
| | | | | | | | | |
| | | | | TOTAL COMMON STOCK (Cost $10,475,075) | | | 12,870,525 | |
| | | | | | | | | |
| | | | | EXCHANGE TRADED FUND - 2.0% | | | | |
| | 56,000 | | | Invesco DB US Dollar Index Bearish Fund * (Cost - $1,207,768) | | | 1,154,720 | |
| | | | | | | | | |
| | | | | REITs - 20.0% | | | | |
| | 11,400 | | | Alexander & Baldwin, Inc. | | | 267,216 | |
| | 7,500 | | | American Assets Trust, Inc. | | | 280,650 | |
| | 4,600 | | | American Campus Communities, Inc. | | | 222,870 | |
| | 13,000 | | | American Homes 4 Rent | | | 495,560 | |
| | 1,645 | | | American Tower Corp. | | | 436,600 | |
| | 15,000 | | | Americold Realty Trust | | | 435,750 | |
| | 17,950 | | | Armada Hoffler Properties, Inc. | | | 239,991 | |
| | 1,500 | | | AvalonBay Communities, Inc. | | | 332,460 | |
| | 3,200 | | | Camden Property Trust | | | 471,904 | |
| | 11,000 | | | Cousins Properties, Inc. | | | 410,190 | |
| | 4,550 | | | Crown Castle International Corp. | | | 788,606 | |
| | 4,400 | | | CTO Realty Growth, Inc. | | | 236,544 | |
| | 1,500 | | | Digital Realty Trust, Inc. | | | 216,675 | |
| | 1,030 | | | Equinix, Inc. | | | 813,834 | |
| | 800 | | | Essex Property Trust, Inc. | | | 255,792 | |
| | 14,400 | | | Getty Realty Corp. | | | 422,064 | |
| | 7,900 | | | Healthcare Realty Trust, Inc. | | | 235,262 | |
| | 13,000 | | | Invitation Homes, Inc. | | | 498,290 | |
| | 4,000 | | | Life Storage, Inc. | | | 458,960 | |
| | 13,000 | | | Plymouth Industrial REIT, Inc. | | | 295,750 | |
| | 2,332 | | | PotlatchDeltic Corp. | | | 120,285 | |
| | 7,600 | | | Prologis, Inc. | | | 953,268 | |
| | 1,600 | | | Public Storage | | | 475,360 | |
| | 690 | | | Rayonier, Inc. | | | 24,619 | |
The accompanying notes are an integral part of these financial statements.
| Schedule of Investments | Defensive Strategies Fund |
| As of September 30, 2021 (Continued) |
| Shares | | | | | Coupon Rate% | | | Maturity | | | Fair Value | |
| | | | | REITs (Continued)- 20.0% | | | | | | | | | | | | |
| | 16,000 | | | Sabra Health Care REIT, Inc. | | | | | | | | | | $ | 235,520 | |
| | 2,030 | | | SBA Communications Corp. | | | | | | | | | | | 671,057 | |
| | 1,500 | | | Sun Communities, Inc. | | | | | | | | | | | 277,650 | |
| | 9,400 | | | Ventas, Inc. | | | | | | | | | | | 518,974 | |
| | 7,000 | | | Welltower, Inc. | | | | | | | | | | | 576,800 | |
| | 1,726 | | | Weyerhaeuser Co. | | | | | | | | | | | 61,394 | |
| | | | | TOTAL REITS (Cost $9,907,574) | | | | | | | | | | | 11,729,895 | |
| | | | | | | | | | | | | | | | | |
| Principal | | | | Coupon Rate% | | | Maturity | | | | | |
| | | | | TREASURY INFLATION PROTECTED SECURITIES (TIPS) - 26.3% | | | | | | |
| $ | 1,140,779 | | | TIPS | | | 0.625 | | | | 1/15/2024 | | | | 1,217,349 | |
| | 1,013,824 | | | TIPS | | | 2.375 | | | | 1/15/2025 | | | | 1,164,161 | |
| | 887,191 | | | TIPS | | | 2.000 | | | | 1/15/2026 | | | | 1,034,900 | |
| | 1,089,769 | | | TIPS | | | 2.375 | | | | 1/15/2027 | | | | 1,326,125 | |
| | 1,264,046 | | | TIPS | | | 1.750 | | | | 1/15/2028 | | | | 1,521,183 | |
| | 1,272,786 | | | TIPS | | | 0.500 | | | | 1/15/2028 | | | | 1,425,084 | |
| | 1,029,964 | | | TIPS | | | 2.500 | | | | 1/15/2029 | | | | 1,319,067 | |
| | 1,946,142 | | | TIPS | | | 0.875 | | | | 1/15/2029 | | | | 2,248,384 | |
| | 2,265,278 | | | TIPS | | | 0.125 | | | | 1/15/2031 | | | | 2,485,737 | |
| | 1,097,043 | | | TIPS | | | 2.125 | | | | 2/15/2041 | | | | 1,649,142 | |
| | | | | TOTAL TREASURY INFLATION PROTECTED SECURITIES (TIPS) (Cost $14,489,292) | | 15,391,132 | |
| | | | | | | | | | | | | | | | | |
| Shares | | | | | | | | | | | | | | | |
| | | | | CLOSED END FUND - 4.8% | | | | | | |
| | 369,000 | | | Sprott Physical Silver Trust * (Cost $3,475,241) | | | | 2,833,920 | |
| | | | | | | | | | |
| Ounces | | | | | | | | | | | | | | | |
| | | | | ALTERNATIVE INVESTMENTS - 18.6% | | | | | | | | | |
| | 6,143 | | | Gold Bars * (Cost $7,240,876) | | | | | | | 10,796,704 | |
| | | | | | | | | | | | | | | | | |
| Shares | | | | | | | | | | | | | | | |
| | | | | MONEY MARKET FUND - 6.1% | | | | | | | |
| | 3,579,858 | | | Fidelity Institutional Money Market Funds - Government Portfolio - Class I, 0.01% (A) (Cost $3,579,858) | | 3,579,858 | |
| | | | | | | | | | | | | | | | | |
| | | | | | | | | | | | | | | | | |
| | | | | TOTAL INVESTMENTS - 99.8% (Cost $50,375,684) | | | $ | 58,356,754 | |
| | | | | OTHER ASSETS IN EXCESS OF LIABILITIES - NET - 0.2% | | 122,865 | |
| | | | | NET ASSETS - 100.0% | | | $ | 58,479,619 | |
| * | Non-income producing securities/investments. |
ADR - American Depositary Receipt.
GDR - Global Depositary Receipt.
PLC - Public Limited Co.
REITs - Real Estate Investment Trusts.
| (A) | Variable rate security; the rate shown represents the yield at September 30, 2021. |
The accompanying notes are an integral part of these financial statements.
| Schedule of Investments | Strategic Growth Fund |
| As of September 30, 2021 |
| Shares | | | | | Fair Value | |
| | | | | EXCHANGE TRADED FUNDS (A) - 55.7% | | | | |
| | 49,100 | | | Timothy Plan High Dividend Stock Enhanced ETF | | $ | 1,194,681 | |
| | 61,033 | | | Timothy Plan High Dividend Stock ETF | | | 1,788,261 | |
| | 322,561 | | | Timothy Plan International ETF | | | 9,157,507 | |
| | 122,800 | | | Timothy Plan US Large/Mid Cap Core Enhanced ETF | | | 3,007,765 | |
| | 108,969 | | | Timothy Plan US Large/Mid Cap Core ETF | | | 3,793,886 | |
| | 111,831 | | | Timothy Plan US Small Cap Core ETF | | | 3,696,976 | |
| | | | | TOTAL EXCHANGE TRADED FUNDS (Cost $19,134,687) | | | 22,639,076 | |
| | | | | | | | | |
| | | | | MUTUAL FUNDS - 41.3% (B) | | | | |
| | 213,323 | | | Timothy Plan Defensive Strategies Fund * | | | 2,884,121 | |
| | 745,351 | | | Timothy Plan Fixed Income Fund | | | 7,781,458 | |
| | 213,862 | | | Timothy Plan High Yield Bond Fund | | | 2,119,374 | |
| | 313,562 | | | Timothy Plan International Fund * | | | 4,026,138 | |
| | | | | TOTAL MUTUAL FUNDS (Cost $15,329,723) | | | 16,811,091 | |
| | | | | | | | | |
| | | | | MONEY MARKET FUND - 3.2% | | | | |
| | 1,320,403 | | | Fidelity Institutional Money Market Funds - Government Portfolio - Class I, 0.01% (C) (Cost $1,320,403) | | | 1,320,403 | |
| | | | | | | | | |
| | | | | | | | | |
| | | | | TOTAL INVESTMENTS - 100.2% (Cost $35,784,813) | | $ | 40,770,570 | |
| | | | | OTHER ASSETS IN EXCESS OF LIABILITIES - NET - (0.2)% | | | (72,983 | ) |
| | | | | NET ASSETS - 100.0% | | $ | 40,697,587 | |
| * | Non-income producing securities. |
ETF - Exchange Traded Fund.
| (B) | Affiliated Funds - Class A. |
| (C) | Variable rate security; the rate shown represents the yield at September 30, 2021. |
The accompanying notes are an integral part of these financial statements.
| Schedule of Investments | Conservative Growth Fund |
| As of September 30, 2021 |
| Shares | | | | | Fair Value | |
| | | | | EXCHANGE TRADED FUNDS (A) - 37.9% | | | | |
| | 31,200 | | | Timothy Plan High Dividend Stock Enhanced ETF | | $ | 759,146 | |
| | 34,612 | | | Timothy Plan High Dividend Stock ETF | | | 1,014,128 | |
| | 249,544 | | | Timothy Plan International ETF | | | 7,084,554 | |
| | 124,300 | | | Timothy Plan US Large/Mid Cap Core Enhanced ETF | | | 3,044,505 | |
| | 116,721 | | | Timothy Plan US Large/Mid Cap Core ETF | | | 4,063,782 | |
| | 110,523 | | | Timothy Plan US Small Cap Core ETF | | | 3,653,736 | |
| | | | | TOTAL EXCHANGE FUNDS (Cost $16,284,708) | | | 19,619,851 | |
| | | | | | | | | |
| | | | | MUTUAL FUNDS - 59.2% (B) | | | | |
| | 232,427 | | | Timothy Plan Defensive Strategies Fund * | | | 3,142,415 | |
| | 2,022,768 | | | Timothy Plan Fixed Income Fund | | | 21,117,696 | |
| | 299,003 | | | Timothy Plan High Yield Bond Fund | | | 2,963,127 | |
| | 259,063 | | | Timothy Plan International Fund * | | | 3,326,366 | |
| | | | | TOTAL MUTUAL FUNDS (Cost $28,963,410) | | | 30,549,604 | |
| | | | | | | | | |
| | | | | MONEY MARKET FUND - 3.0% | | | | |
| | 1,537,435 | | | Fidelity Institutional Money Market Funds - Government Portfolio - Class I, 0.01% (C) (Cost $1,537,435) | | | 1,537,435 | |
| | | | | | | | | |
| | | | | TOTAL INVESTMENTS - 100.1% (Cost $46,785,553) | | $ | 51,706,890 | |
| | | | | OTHER ASSETS IN EXCESS OF LIABILITIES - NET - 0.1% | | | (59,467 | ) |
| | | | | NET ASSETS - 100.0% | | $ | 51,647,423 | |
| * | Non-income producing securities. |
ETF - Exchange Traded Fund.
| (B) | Affiliated Funds - Class A. |
| (C) | Variable rate security; the rate shown represents the yield at September 30, 2021. |
The accompanying notes are an integral part of these financial statements.
| Schedule of Investments | Growth & Income Fund |
| As of September 30, 2021 |
| Par Value | | | | | Coupon Rate (%) | | | Maturity | | | Fair Value | |
| | | | | BONDS & NOTES - 34.3% | | | | | | | | | | | | |
| | | | | CORPORATE BONDS - 13.9% | | | | | | | | | | | | |
| $ | 60,000 | | | ABB Finance USA, Inc. | | | 2.875 | | | | 5/8/2022 | | | $ | 60,937 | |
| | 160,000 | | | American Electric Power Company, Inc. | | | 3.200 | | | | 11/13/2027 | | | | 171,879 | |
| | 160,000 | | | Aptiv Corp. | | | 4.150 | | | | 3/15/2024 | | | | 171,820 | |
| | 55,000 | | | Canadian Pacific Railway Co. | | | 2.900 | | | | 2/1/2025 | | | | 58,065 | |
| | 55,000 | | | CBOE Global Markets, Inc. | | | 3.650 | | | | 1/12/2027 | | | | 60,573 | |
| | 85,000 | | | Columbia Pipeline Group, Inc. | | | 4.500 | | | | 6/1/2025 | | | | 94,324 | |
| | 160,000 | | | CSX Corp. | | | 3.250 | | | | 6/1/2027 | | | | 174,230 | |
| | 135,000 | | | Digital Realty Trust LP | | | 3.700 | | | | 8/15/2027 | | | | 149,986 | |
| | 80,000 | | | Dollar General Corp. | | | 4.125 | | | | 5/1/2028 | | | | 90,715 | |
| | 120,000 | | | Eaton Corp. | | | 2.750 | | | | 11/2/2022 | | | | 123,093 | |
| | 45,000 | | | European Investment Bank | | | 2.375 | | | | 6/15/2022 | | | | 45,705 | |
| | 120,000 | | | Healthpeak Properties, Inc. | | | 3.500 | | | | 7/15/2029 | | | | 131,189 | |
| | 45,000 | | | Kreditanstalt fuer Wiederaufbau | | | 2.125 | | | | 6/15/2022 | | | | 45,630 | |
| | 114,000 | | | LYB International Finance BV | | | 4.000 | | | | 7/15/2023 | | | | 120,925 | |
| | 120,000 | | | National Rural Utilities Cooperative Finance Corp. | | | 2.950 | | | | 2/7/2024 | | | | 126,126 | |
| | 110,000 | | | NiSource, Inc. | | | 3.490 | | | | 5/15/2027 | | | | 120,484 | |
| | 85,000 | | | Nutrien Ltd. | | | 4.000 | | | | 12/15/2026 | | | | 94,823 | |
| | 160,000 | | | Phillips 66 Partners LP | | | 3.605 | | | | 2/15/2025 | | | | 171,099 | |
| | 120,000 | | | Province of Ontario Canada | | | 2.500 | | | | 4/27/2026 | | | | 127,586 | |
| | 45,000 | | | Province of Quebec Canada | | | 2.375 | | | | 1/31/2022 | | | | 45,314 | |
| | 110,000 | | | Sunoco Logistics Partners Operations LP | | | 4.250 | | | | 4/1/2024 | | | | 117,730 | |
| | 142,000 | | | WEC Energy Group, Inc. | | | 3.550 | | | | 6/15/2025 | | | | 153,434 | |
| | 60,000 | | | Zimmer Biomet Holdings, Inc. | | | 3.700 | | | | 3/19/2023 | | | | 62,589 | |
| | | | | TOTAL CORPORATE BONDS (Cost $2,390,773) | | 2,518,256 | |
| | | | | | | | | | | | | | | | | |
| | | | | U.S. GOVERNMENT & AGENCY OBLIGATIONS - 20.4% | | |
| | | | | GOVERNMENT MORTGAGE-BACKED SECURITIES - 9.0% | | | | |
| | 65,824 | | | FNMA FN CA8897 | | | 3.000 | | | | 2/1/2051 | | | | 70,548 | |
| | 53,480 | | | FNMA FN CB0855 | | | 3.000 | | | | 6/1/2051 | | | | 57,018 | |
| | 52,166 | | | FNMA FN CB0867 | | | 3.500 | | | | 6/1/2051 | | | | 55,756 | |
| | 69,293 | | | FNMA FN FM5537 | | | 2.000 | | | | 1/1/2036 | | | | 71,398 | |
| | 12,030 | | | FNMA FN MA4258 | | | 3.500 | | | | 2/1/2051 | | | | 12,805 | |
| | 51,629 | | | FNMA FN MA4316 | | | 2.500 | | | | 4/1/2036 | | | | 53,913 | |
| | 23,945 | | | FNMA FN MA4329 | | | 2.000 | | | | 5/1/2036 | | | | 24,672 | |
| | 73,033 | | | FNMA FN MA4333 | | | 2.000 | | | | 5/1/2041 | | | | 74,138 | |
| | 57,413 | | | GNMA Pool G2 BN2662 | | | 3.000 | | | | 10/20/2049 | | | | 60,071 | |
| | 74,876 | | | GNMA Pool G2 CE1974 | | | 3.000 | | | | 8/20/2051 | | | | 79,087 | |
| | 67,996 | | | GNMA Pool G2 MA3376 | | | 3.500 | | | | 1/20/2046 | | | | 72,527 | |
| | 51,519 | | | GNMA Pool G2 MA3596 | | | 3.000 | | | | 4/20/2046 | | | | 54,238 | |
| | 44,955 | | | GNMA Pool G2 MA3663 | | | 3.500 | | | | 5/20/2046 | | | | 47,761 | |
| | 59,058 | | | GNMA Pool G2 MA3736 | | | 3.500 | | | | 6/20/2046 | | | | 62,794 | |
| | 19,235 | | | GNMA Pool G2 MA4509 | | | 3.000 | | | | 6/20/2047 | | | | 20,353 | |
| | 57,144 | | | GNMA Pool G2 MA4652 | | | 3.500 | | | | 8/20/2047 | | | | 60,580 | |
| | 55,326 | | | GNMA Pool G2 MA4719 | | | 3.500 | | | | 9/20/2047 | | | | 58,643 | |
| | 46,437 | | | GNMA Pool G2 MA6092 | | | 4.500 | | | | 8/20/2049 | | | | 49,540 | |
| | 37,466 | | | GNMA Pool G2 MA6156 | | | 4.500 | | | | 9/20/2049 | | | | 39,905 | |
| | 39,075 | | | GNMA Pool G2 MA6221 | | | 4.500 | | | | 10/20/2049 | | | | 41,705 | |
| | 53,980 | | | GNMA Pool G2 MA6338 | | | 3.000 | | | | 12/20/2049 | | | | 56,444 | |
| | 33,978 | | | GNMA Pool G2 MA6478 | | | 5.000 | | | | 2/20/2050 | | | | 36,898 | |
| | 43,563 | | | GNMA Pool G2 MA6544 | | | 4.500 | | | | 3/20/2050 | | | | 46,347 | |
| | 28,008 | | | GNMA Pool G2 MA6545 | | | 5.000 | | | | 3/20/2050 | | | | 30,325 | |
| | 38,403 | | | GNMA Pool G2 MA6600 | | | 3.500 | | | | 4/20/2050 | | | | 40,389 | |
| | 35,892 | | | GNMA Pool G2 MA6601 | | | 4.000 | | | | 4/20/2050 | | | | 38,210 | |
| | 50,358 | | | GNMA Pool G2 MA6603 | | | 5.000 | | | | 4/20/2050 | | | | 54,441 | |
| | 66,929 | | | GNMA Pool G2 MA7255 | | | 2.500 | | | | 3/20/2051 | | | | 69,109 | |
| | 51,984 | | | GNMA Pool G2 MA7370 | | | 4.000 | | | | 5/20/2051 | | | | 55,393 | |
| | 49,349 | | | GNMA Pool G2 MA7418 | | | 2.500 | | | | 6/20/2051 | | | | 50,937 | |
| | 83,425 | | | GNMA Pool G2 MA7419 | | | 3.000 | | | | 6/20/2051 | | | | 87,256 | |
| | 4,151 | | | GNMA Pool GN 723248 | | | 5.000 | | | | 10/15/2039 | | | | 4,843 | |
| | | | | TOTAL GOVERNMENT MORTGAGE-BACKED SECURITIES (Cost $1,624,720) | | | | 1,638,044 | |
The accompanying notes are an integral part of these financial statements.
| Schedule of Investments | Growth & Income Fund |
| As of September 30, 2021 (Continued) |
| Par Value | | | | | Coupon Rate (%) | | | Maturity | | | Fair Value | |
| | | | | GOVERNMENT NOTES, BONDS & AGENCIES - 11.4% | | | | | | | | | | | | |
| $ | 325,000 | | | United States Treasury Note | | | 0.125 | | | | 7/31/2023 | | | $ | 324,289 | |
| | 150,000 | | | United States Treasury Note | | | 0.375 | | | | 8/15/2024 | | | | 149,438 | |
| | 225,000 | | | United States Treasury Note | | | 0.375 | | | | 12/31/2025 | | | | 220,386 | |
| | 160,000 | | | United States Treasury Note | | | 1.625 | | | | 2/15/2026 | | | | 165,031 | |
| | 270,000 | | | United States Treasury Note | | | 0.625 | | | | 7/31/2026 | | | | 265,570 | |
| | 265,000 | | | United States Treasury Note | | | 1.500 | | | | 2/15/2030 | | | | 266,418 | |
| | 160,000 | | | United States Treasury Note | | | 1.250 | | | | 8/15/2031 | | | | 155,925 | |
| | 80,000 | | | United States Treasury Note | | | 4.500 | | | | 2/15/2036 | | | | 109,156 | |
| | 100,000 | | | United States Treasury Note | | | 2.250 | | | | 5/15/2041 | | | | 103,750 | |
| | 130,000 | | | United States Treasury Note | | | 3.000 | | | | 2/15/2049 | | | | 155,010 | |
| | 190,000 | | | United States Treasury Note | | | 1.375 | | | | 8/15/2050 | | | | 159,867 | |
| | | | | TOTAL GOVERNMENT NOTES, BONDS & AGENCIES (Cost $2,089,589) | | | | 2,074,840 | |
| | | | | | | | | | | | | | | | | |
| | | | | TOTAL U.S. GOVERNMENT & AGENCY OBLIGATIONS (Cost $3,714,309) | | | 3,712,884 | |
| | | | | | | | | | | | | | | | | |
| | | | | TOTAL BONDS & NOTES (Cost $6,105,082) | | | | | | | 6,231,140 | |
| | | | | | | | | | | | | | | | | |
| Shares | | | | | | | | | | | | | | | |
| | | | | EXCHANGE TRADED FUNDS (A) - 65.2% | | | | | | | | |
| | 100,000 | | | Timothy Plan High Dividend Stock Enhanced ETF | | | 2,433,160 | |
| | 322,000 | | | Timothy Plan High Dividend Stock ETF | | | 9,434,568 | |
| | | | | TOTAL EXCHANGE TRADED FUNDS (Cost $10,398,701) | | 11,867,728 | |
| | | | | | | | | | | | | | | | | |
| | | | | MONEY MARKET FUND - 0.7% | | | | | | | |
| | 129,532 | | | Fidelity Institutional Money Market Funds - Government Portfolio - Class I, 0.01% (B) (Cost $129,532) | | 129,532 | |
| | | | | | | | | | | | | | | | | |
| | | | | TOTAL INVESTMENTS - 100.2% (Cost $16,633,315) | $ | 18,228,400 | |
| | | | | OTHER ASSETS IN EXCESS OF LIABILITIES - NET - (0.2)% | | (29,366 | ) |
| | | | | NET ASSETS - 100.0% | | | $ | 18,199,034 | |
ETF - Exchange Traded Fund.
FNMA - Federal National Mortgage Association.
GNMA - Government National Mortgage Association.
LP - Limited Partnership.
| (B) | Variable rate security; the rate shown represents the yield at September 30, 2021. |
The accompanying notes are an integral part of these financial statements.
| Timothy Plan Funds |
| Statements of Assets and Liabilities |
| September 30, 2021 |
| | | Aggressive | | | | | | Large/Mid Cap | | | | | | Large/Mid Cap | | | | |
| | | Growth | | | International | | | Growth | | | Small Cap Value | | | Value | | | Fixed Income | |
| | | Fund | | | Fund | | | Fund | | | Fund | | | Fund | | | Fund | |
| ASSETS: | | | | | | | | | | | | | | | | | | |
| Investments, at cost | | $ | 37,720,014 | | | $ | 98,655,162 | | | $ | 68,849,311 | | | $ | 127,540,487 | | | $ | 143,741,790 | | | $ | 125,312,271 | |
| Investments in affiliates, at cost | | | — | | | | — | | | | 18,644,500 | | | | 14,834,080 | | | | 46,799,749 | | | | — | |
| Investments, at value | | $ | 52,937,281 | | | $ | 136,385,464 | | | $ | 109,587,433 | | | $ | 150,082,071 | | | $ | 194,701,987 | | | $ | 127,399,450 | |
| Investments in affiliates, at value | | | — | | | | — | | | | 25,038,749 | | | | 19,173,988 | | | | 58,955,093 | | | | — | |
| Dividends and interest receivable | | | 19,823 | | | | 209,381 | | | | 41,184 | | | | 104,894 | | | | 24,040 | | | | 584,768 | |
| Receivable for fund shares sold | | | 14,191 | | | | 62,988 | | | | 114,479 | | | | 443,982 | | | | 112,459 | | | | 400,278 | |
| Receivable for securities sold | | | — | | | | 114,179 | | | | — | | | | 401,846 | | | | — | | | | — | |
| Receivable for foreign tax reclaims | | | — | | | | 219,334 | | | | — | | | | — | | | | — | | | | — | |
| Prepaid expenses and other assets | | | 17,093 | | | | 23,809 | | | | 16,583 | | | | 29,780 | | | | 27,656 | | | | 10,632 | |
| Total Assets | | | 52,988,388 | | | | 137,015,155 | | | | 134,798,428 | | | | 170,236,561 | | | | 253,821,235 | | | | 128,395,128 | |
| | | | | | | | | | | | | | | | | | | | | | | | | |
| LIABILITIES: | | | | | | | | | | | | | | | | | | | | | | | | |
| Payable for securities purchased | | | — | | | | 281,749 | | | | — | | | | 582,846 | | | | — | | | | 1,660,111 | |
| Payable for fund shares redeemed | | | 4,441 | | | | 38,249 | | | | 198,886 | | | | 49,467 | | | | 22,041 | | | | 208,395 | |
| Payable to service providers | | | 25,656 | | | | 36,855 | | | | 50,562 | | | | 58,445 | | | | 93,209 | | | | 72,026 | |
| Accrued advisory fees | | | 33,946 | | | | 110,259 | | | | 63,475 | | | | 104,134 | | | | 144,797 | | | | 43,102 | |
| Accrued 12b-1 fees | | | 10,436 | | | | 14,760 | | | | 29,299 | | | | 27,357 | | | | 45,621 | | | | 28,574 | |
| Accrued expenses and other liabilities | | | 16,264 | | | | 19,746 | | | | 13,986 | | | | 21,723 | | | | 17,530 | | | | 39,228 | |
| Total Liabilities | | | 90,743 | | | | 501,618 | | | | 356,208 | | | | 843,972 | | | | 323,198 | | | | 2,051,436 | |
| | | | | | | | | | | | | | | | | | | | | | | | | |
| Net Assets | | $ | 52,897,645 | | | $ | 136,513,537 | | | $ | 134,442,220 | | | $ | 169,392,589 | | | $ | 253,498,037 | | | $ | 126,343,692 | |
| | | | | | | | | | | | | | | | | | | | | | | | | |
| NET ASSETS CONSIST OF: | | | | | | | | | | | | | | | | | | | | | | | | |
| Paid in capital ($0 par value, unlimited shares authorized) | | $ | 34,226,759 | | | $ | 98,759,299 | | | $ | 79,239,056 | | | $ | 129,129,411 | | | $ | 179,064,961 | | | $ | 125,478,317 | |
| Accumulated earnings | | | 18,670,886 | | | | 37,754,238 | | | | 55,203,164 | | | | 40,263,178 | | | | 74,433,076 | | | | 865,375 | |
| Net Assets | | $ | 52,897,645 | | | $ | 136,513,537 | | | $ | 134,442,220 | | | $ | 169,392,589 | | | $ | 253,498,037 | | | $ | 126,343,692 | |
| | | | | | | | | | | | | | | | | | | | | | | | | |
| Class A | | | | | | | | | | | | | | | | | | | | | | | | |
| Net Assets | | $ | 37,917,061 | | | $ | 61,220,107 | | | $ | 96,377,721 | | | $ | 105,800,401 | | | $ | 160,559,933 | | | $ | 96,585,790 | |
| Shares of beneficial interest outstanding ($0 par value, unlimited shares authorized) | | | 3,026,347 | | | | 4,767,081 | | | | 7,642,432 | | | | 4,955,212 | | | | 7,339,571 | | | | 9,254,309 | |
| Net Asset Value, offering price and redemption price per share | | $ | 12.53 | | | $ | 12.84 | | | $ | 12.61 | | | $ | 21.35 | | | $ | 21.88 | | | $ | 10.44 | |
| Offering Price Per Share (NAV / 0.945) *(NAV / 0.955) | | $ | 13.26 | | | $ | 13.59 | | | $ | 13.34 | | | $ | 22.59 | | | $ | 23.15 | | | $ | 10.93 | * |
| | | | | | | | | | | | | | | | | | | | | | | | | |
| Class C | | | | | | | | | | | | | | | | | | | | | | | | |
| Net Assets | | $ | 2,876,927 | | | $ | 2,336,927 | | | $ | 10,844,767 | | | $ | 7,292,960 | | | $ | 15,161,817 | | | $ | 11,369,393 | |
| Shares of beneficial interest outstanding ($0 par value, unlimited shares authorized) | | | 293,860 | | | | 189,187 | | | | 1,107,409 | | | | 514,884 | | | | 929,457 | | | | 1,132,517 | |
| Net Asset Value, offering price and redemption price per share | | $ | 9.79 | | | $ | 12.35 | | | $ | 9.79 | | | $ | 14.16 | | | $ | 16.31 | | | $ | 10.04 | |
| Minimum Redemption Price Per Share (NAV * 0.99) | | $ | 9.69 | | | $ | 12.23 | | | $ | 9.69 | | | $ | 14.02 | | | $ | 16.15 | | | $ | 9.94 | |
| | | | | | | | | | | | | | | | | | | | | | | | | |
| Class I | | | | | | | | | | | | | | | | | | | | | | | | |
| Net Assets | | $ | 12,103,657 | | | $ | 72,956,503 | | | $ | 27,219,732 | | | $ | 56,299,228 | | | $ | 77,776,287 | | | $ | 18,388,509 | |
| Shares of beneficial interest outstanding ($0 par value, unlimited shares authorized) | | | 942,496 | | | | 5,658,220 | | | | 2,105,264 | | | | 2,593,278 | | | | 3,513,323 | | | | 1,778,092 | |
| Net Asset Value, offering price and redemption price per share | | $ | 12.84 | | | $ | 12.89 | | | $ | 12.93 | | | $ | 21.71 | | | $ | 22.14 | | | $ | 10.34 | |
The accompanying notes are an integral part of these financial statements.
| Timothy Plan Funds |
| Statements of Assets and Liabilities (Continued) |
| September 30, 2021 |
| | | High Yield | | | Israel Common | | | Defensive | | | | | | Conservative | | | | |
| | | Bond | | | Values | | | Strategies | | | Strategic Growth | | | Growth | | | Growth & Income | |
| | | Fund | | | Fund | | | Fund | | | Fund | | | Fund | | | Fund | |
| ASSETS: | | | | | | | | | | | | | | | | | | |
| Investments, at cost | | $ | 131,974,706 | | | $ | 62,469,452 | | | $ | 43,134,808 | | | $ | 1,320,403 | | | $ | 1,537,435 | | | $ | 6,234,614 | |
| Investments in affiliates, at cost | | | — | | | | — | | | | — | | | | 34,464,410 | | | | 45,248,118 | | | | 10,398,701 | |
| Investments, at value | | $ | 136,307,234 | | | $ | 115,509,156 | | | $ | 47,560,050 | | | $ | 1,320,403 | | | $ | 1,537,435 | | | $ | 6,360,672 | |
| Investments in affiliates, at value | | | — | | | | — | | | | — | | | | 39,450,167 | | | | 50,169,455 | | | | 11,867,728 | |
| Gold Investments, at fair value (Cost $7,240,876) | | | — | | | | — | | | | 10,796,704 | | | | — | | | | — | | | | — | |
| Foreign Cash | | | | | | | | | | | | | | | | | | | | | | | | |
| Canadian Dollar (CAD)(Cost $146) | | | — | | | | — | | | | 146 | | | | — | | | | — | | | | — | |
| Euro (EUR)(Cost $83) | | | — | | | | — | | | | 82 | | | | — | | | | — | | | | — | |
| Great British Pound (GBP)(Cost $125) | | | — | | | | — | | | | 122 | | | | — | | | | — | | | | — | |
| Dividends and interest receivable | | | 1,739,606 | | | | 8,993 | | | | 102,883 | | | | 10 | | | | 13 | | | | 32,750 | |
| Receivable for fund shares sold | | | 225,679 | | | | 332,638 | | | | 306,135 | | | | 6,514 | | | | 42,879 | | | | 1,873 | |
| Receivable for securities sold | | | 746,250 | | | | — | | | | — | | | | — | | | | — | | | | — | |
| Receivable for foreign tax reclaims | | | — | | | | — | | | | 1,321 | | | | — | | | | — | | | | — | |
| Prepaid expenses and other assets | | | 13,312 | | | | 22,454 | | | | 25,542 | | | | 4,879 | | | | 7,348 | | | | 11,777 | |
| Total Assets | | | 139,032,081 | | | | 115,873,241 | | | | 58,792,985 | | | | 40,781,973 | | | | 51,757,130 | | | | 18,274,800 | |
| | | | | | | | | | | | | | | | | | | | | | | | | |
| LIABILITIES: | | | | | | | | | | | | | | | | | | | | | | | | |
| Payable for securities purchased | | | 2,127,500 | | | | 638,793 | | | | 195,796 | | | | — | | | | — | | | | — | |
| Payable for fund shares redeemed | | | 254,332 | | | | 34,063 | | | | 31,083 | | | | 25,238 | | | | 36,364 | | | | 29,996 | |
| Payable to service providers | | | 34,033 | | | | 28,312 | | | | 24,461 | | | | 20,533 | | | | 25,904 | | | | 11,634 | |
| Accrued advisory fees | | | 61,228 | | | | 94,273 | | | | 26,530 | | | | 18,770 | | | | 24,464 | | | | 7,716 | |
| Accrued 12b-1 fees | | | 15,483 | | | | 22,184 | | | | 8,426 | | | | 1,340 | | | | 3,120 | | | | 4,687 | |
| Accrued expenses and other liabilities | | | 36,060 | | | | 32,511 | | | | 27,070 | | | | 18,505 | | | | 19,855 | | | | 21,733 | |
| Total Liabilities | | | 2,528,636 | | | | 850,136 | | | | 313,366 | | | | 84,386 | | | | 109,707 | | | | 75,766 | |
| | | | | | | | | | | | | | | | | | | | | | | | | |
| Net Assets | | $ | 136,503,445 | | | $ | 115,023,105 | | | $ | 58,479,619 | | | $ | 40,697,587 | | | $ | 51,647,423 | | | $ | 18,199,034 | |
| | | | | | | | | | | | | | | | | | | | | | | | | |
| NET ASSETS CONSIST OF: | | | | | | | | | | | | | | | | | | | | | | | | |
| Paid in capital ($0 par value, unlimited shares authorized) | | $ | 132,008,624 | | | $ | 65,455,179 | | | $ | 50,694,671 | | | $ | 33,839,490 | | | $ | 44,752,789 | | | $ | 16,547,020 | |
| Accumulated earnings | | | 4,494,821 | | | | 49,567,926 | | | | 7,784,948 | | | | 6,858,097 | | | | 6,894,634 | | | | 1,652,014 | |
| Net Assets | | $ | 136,503,445 | | | $ | 115,023,105 | | | $ | 58,479,619 | | | $ | 40,697,587 | | | $ | 51,647,423 | | | $ | 18,199,034 | |
| | | | | | | | | | | | | | | | | | | | | | | | | |
| Class A | | | | | | | | | | | | | | | | | | | | | | | | |
| Net Assets | | $ | 64,215,901 | | | $ | 57,666,592 | | | $ | 40,341,713 | | | $ | 37,730,597 | | | $ | 46,151,141 | | | $ | 14,190,526 | |
| Shares of beneficial interest outstanding ($0 par value, unlimited shares authorized) | | | 6,479,114 | | | | 2,334,894 | | | | 2,983,208 | | | | 3,456,631 | | | | 3,959,081 | | | | 1,208,070 | |
| Net Asset Value, offering price and redemption price per share | | $ | 9.91 | | | $ | 24.70 | | | $ | 13.52 | | | $ | 10.92 | | | $ | 11.66 | | | $ | 11.75 | |
| Offering Price Per Share (NAV / 0.945) *(NAV / 0.955) | | $ | 10.38 | * | | $ | 26.14 | | | $ | 14.31 | | | $ | 11.56 | | | $ | 12.34 | | | $ | 12.43 | |
| | | | | | | | | | | | | | | | | | | | | | | | | |
| Class C | | | | | | | | | | | | | | | | | | | | | | | | |
| Net Assets | | $ | 3,137,930 | | | $ | 12,293,235 | | | $ | 3,387,760 | | | $ | 2,966,990 | | | $ | 5,496,282 | | | $ | 1,938,195 | |
| Shares of beneficial interest outstanding ($0 par value, unlimited shares authorized) | | | 311,377 | | | | 527,748 | | | | 265,976 | | | | 312,413 | | | | 534,251 | | | | 171,413 | |
| Net Asset Value, offering price and redemption price per share | | $ | 10.08 | | | $ | 23.29 | | | $ | 12.74 | | | $ | 9.50 | | | $ | 10.29 | | | $ | 11.31 | |
| Minimum Redemption Price Per Share (NAV * 0.99) | | $ | 9.98 | | | $ | 23.06 | | | $ | 12.61 | | | $ | 9.41 | | | $ | 10.19 | | | $ | 11.20 | |
| | | | | | | | | | | | | | | | | | | | | | | | | |
| Class I | | | | | | | | | | | | | | | | | | | | | | | | |
| Net Assets | | $ | 69,149,614 | | | $ | 45,063,278 | | | $ | 14,750,146 | | | $ | — | | | $ | — | | | $ | 2,070,313 | |
| Shares of beneficial interest outstanding ($0 par value, unlimited shares authorized) | | | 6,975,434 | | | | 1,806,266 | | | | 1,088,837 | | | | — | | | | — | | | | 174,986 | |
| Net Asset Value, offering price and redemption price per share | | $ | 9.91 | | | $ | 24.95 | | | $ | 13.55 | | | $ | — | | | $ | — | | | $ | 11.83 | |
The accompanying notes are an integral part of these financial statements.
| Timothy Plan Funds |
| Statements of Operations |
| For the Year Ended September 30, 2021 |
| | | Aggressive | | | | | | Large/Mid Cap | | | | | | Large/Mid Cap | | | | |
| | | Growth | | | International | | | Growth | | | Small Cap Value | | | Value | | | Fixed Income | |
| | | Fund | | | Fund | | | Fund | | | Fund | | | Fund | | | Fund | |
| Investment Income: | | | | | | | | | | | | | | | | | | | | | | | | |
| Interest income | | $ | 211 | | | $ | 471 | | | $ | 328 | | | $ | 213 | | | $ | 452 | | | $ | 1,749,452 | |
| Dividend Income | | | 139,237 | | | | 2,477,831 | | | | 772,100 | | | | 2,432,610 | | | | 1,999,139 | | | | — | |
| Dividend income from affiliated investments | | | — | | | | — | | | | 178,901 | | | | 230,391 | | | | 821,007 | | | | — | |
| Foreign tax withheld | | | — | | | | (375,492 | ) | | | (5,622 | ) | | | — | | | | — | | | | — | |
| Total Investment Income | | | 139,448 | | | | 2,102,810 | | | | 945,707 | | | | 2,663,214 | | | | 2,820,598 | | | | 1,749,452 | |
| | | | | | | | | | | | | | | | | | | | | | | | | |
| Operating Expenses: | | | | | | | | | | | | | | | | | | | | | | | | |
| Investment advisory fees | | | 389,531 | | | | 1,169,259 | | | | 1,020,225 | | | | 1,324,981 | | | | 1,893,455 | | | | 724,310 | |
| 12b-1 Fees: | | | | | | | | | | | | | | | | | | | | | | | | |
| Class A | | | 86,240 | | | | 141,918 | | | | 213,917 | | | | 248,929 | | | | 376,264 | | | | 234,520 | |
| Class C | | | 26,777 | | | | 22,991 | | | | 98,392 | | | | 68,273 | | | | 148,425 | | | | 99,787 | |
| Administration fees | | | 119,755 | | | | 236,375 | | | | 264,700 | | | | 291,456 | | | | 438,414 | | | | 301,170 | |
| Registration fees | | | 36,810 | | | | 42,700 | | | | 51,800 | | | | 55,669 | | | | 54,321 | | | | 61,150 | |
| Printing expenses | | | 18,155 | | | | 44,425 | | | | 50,760 | | | | 64,186 | | | | 82,907 | | | | 52,300 | |
| Non 12b-1 shareholder service fees | | | 15,650 | | | | 74,185 | | | | 44,140 | | | | 53,049 | | | | 85,128 | | | | 106,790 | |
| Audit fees | | | 13,490 | | | | 13,490 | | | | 12,980 | | | | 13,539 | | | | 13,140 | | | | 13,490 | |
| Custody fees | | | 10,861 | | | | 16,600 | | | | 19,082 | | | | 24,783 | | | | 25,580 | | | | 22,030 | |
| Compliance officer fees | | | 5,270 | | | | 11,505 | | | | 12,905 | | | | 15,186 | | | | 22,210 | | | | 14,190 | |
| Trustees’ fees | | | 3,125 | | | | 2,260 | | | | 4,150 | | | | 6,949 | | | | 6,651 | | | | 6,790 | |
| Insurance expenses | | | 1,415 | | | | 4,055 | | | | 5,280 | | | | 5,950 | | | | 10,822 | | | | 5,675 | |
| Miscellaneous expenses | | | 7,620 | | | | 995 | | | | 7,620 | | | | 7,172 | | | | 5,454 | | | | 2,835 | |
| Total Operating Expenses | | | 734,699 | | | | 1,780,758 | | | | 1,805,951 | | | | 2,180,122 | | | | 3,162,771 | | | | 1,645,037 | |
| Less: Expenses waived by Advisor | | | (45,827 | ) | | | (54,433 | ) | | | (128,092 | ) | | | (166,945 | ) | | | (299,330 | ) | | | (235,823 | ) |
| Net Operating Expenses | | | 688,872 | | | | 1,726,325 | | | | 1,677,859 | | | | 2,013,177 | | | | 2,863,441 | | | | 1,409,214 | |
| | | | | | | | | | | | | | | | | | | | | | | | | |
| Net Investment Income (Loss) | | | (549,424 | ) | | | 376,485 | | | | (732,152 | ) | | | 650,037 | | | | (42,843 | ) | | | 340,238 | |
| | | | | | | | | | | | | | | | | | | | | | | | | |
| Realized and Unrealized Gain (Loss) on Investments: | | | | | | | | | | | | | | | | | | | | | | | | |
| Net realized gain on | | | | | | | | | | | | | | | | | | | | | | | | |
| investments | | | 4,965,183 | | | | 3,800,478 | | | | 8,888,843 | | | | 20,016,550 | | | | 17,145,584 | | | | 724,416 | |
| foreign currency transactions | | | — | | | | 90 | | | | 53 | | | | — | | | | — | | | | — | |
| and affiliated investments | | | — | | | | — | | | | 608,796 | | | | — | | | | 763,816 | | | | — | |
| Capital gain dividends from REITs | | | 762 | | | | — | | | | — | | | | 68,869 | | | | 13,632 | | | | — | |
| Net change in unrealized appreciation (depreciation) on investments | | | 7,354,050 | | | | 21,845,442 | | | | 16,956,388 | | | | 29,606,336 | | | | 23,947,507 | | | | (3,838,709 | ) |
| affiliated investments | | | — | | | | — | | | | 5,148,793 | | | | 6,843,594 | | | | 12,463,820 | | | | — | |
| and foreign currency translations | | | — | | | | (37 | ) | | | (15 | ) | | | — | | | | — | | | | — | |
| Net Realized and Unrealized Gain (Loss) on Investments | | | 12,319,995 | | | | 25,645,973 | | | | 31,602,858 | | | | 56,535,349 | | | | 54,334,359 | | | | (3,114,293 | ) |
| | | | | | | | | | | | | | | | | | | | | | | | | |
| Net Increase (Decrease) in Net Assets Resulting From Operations | | $ | 11,770,571 | | | $ | 26,022,458 | | | $ | 30,870,706 | | | $ | 57,185,386 | | | $ | 54,291,516 | | | $ | (2,774,055 | ) |
| | | | | | | | | | | | | | | | | | | | | | | | | |
The accompanying notes are an integral part of these financial statements.
| Timothy Plan Funds |
| Statements of Operations (Continued) |
| For the Year Ended September 30, 2021 |
| | | High Yield | | | Israel Common | | | Defensive | | | | | | Conservative | | | | |
| | | Bond | | | Values | | | Strategies | | | Strategic Growth | | | Growth | | | Growth & Income | |
| | | Fund | | | Fund | | | Fund | | | Fund | | | Fund | | | Fund | |
| Investment Income: | | | | | | | | | | | | | | | | | | | | | | | | |
| Interest income | | $ | 5,711,453 | | | $ | 239 | | | $ | 600,660 | | | $ | 93 | | | $ | 187 | | | $ | 106,485 | |
| Dividend Income | | | 46,484 | | | | 1,553,501 | | | | 481,869 | | | | — | | | | — | | | | — | |
| Dividend income from affiliated investments | | | — | | | | — | | | | — | | | | 541,419 | | | | 665,669 | | | | 272,824 | |
| Foreign tax withheld | | | (37,233 | ) | | | (383,005 | ) | | | (19,690 | ) | | | — | | | | — | | | | — | |
| Total Investment Income | | | 5,720,704 | | | | 1,170,735 | | | | 1,062,839 | | | | 541,512 | | | | 665,856 | | | | 379,309 | |
| | | | | | | | | | | | | | | | | | | | | | | | | |
| Operating Expenses: | | | | | | | | | | | | | | | | | | | | | | | | |
| Investment advisory fees | | | 621,647 | | | | 940,658 | | | | 282,666 | | | | 255,783 | | | | 330,796 | | | | 154,947 | |
| 12b-1 fees: | | | | | | | | | | | | | | | | | | | | | | | | |
| Class A | | | 134,789 | | | | 120,379 | | | | 87,334 | | | | — | | | | — | | | | 35,346 | |
| Class C | | | 27,589 | | | | 108,478 | | | | 28,473 | | | | 21,506 | | | | 40,744 | | | | 18,803 | |
| Administration fees | | | 239,500 | | | | 197,650 | | | | 122,644 | | | | 99,330 | | | | 124,492 | | | | 73,690 | |
| Non 12b-1 shareholder service fees | | | 98,010 | | | | 28,053 | | | | 31,140 | | | | 8,174 | | | | 16,169 | | | | 6,367 | |
| Printing expenses | | | 72,450 | | | | 51,300 | | | | 38,052 | | | | 16,799 | | | | 21,408 | | | | 9,715 | |
| Registration fees | | | 68,750 | | | | 45,771 | | | | 29,467 | | | | 24,425 | | | | 36,088 | | | | 26,280 | |
| Custody fees | | | 18,710 | | | | 89,349 | | | | 46,550 | | | | 4,308 | | | | 7,340 | | | | 5,604 | |
| Audit fees | | | 13,505 | | | | 13,189 | | | | 13,140 | | | | 13,157 | | | | 13,358 | | | | 13,554 | |
| Compliance officer fees | | | 12,450 | | | | 10,162 | | | | 5,144 | | | | 5,144 | | | | 6,334 | | | | 2,506 | |
| Trustees’ fees | | | 5,825 | | | | 5,586 | | | | 1,893 | | | | 3,612 | | | | 3,009 | | | | 1,727 | |
| Miscellaneous expenses | | | 2,875 | | | | 3,236 | | | | 2,466 | | | | 2,224 | | | | 2,279 | | | | 5,328 | |
| Insurance expenses | | | 4,800 | | | | 3,343 | | | | 1,774 | | | | 1,583 | | | | 2,110 | | | | 592 | |
| Total Operating Expenses | | | 1,320,900 | | | | 1,617,154 | | | | 690,743 | | | | 456,045 | | | | 604,127 | | | | 354,459 | |
| Less: Expenses waived by Advisor | | | (51,804 | ) | | | — | | | | (23,556 | ) | | | — | | | | — | | | | (68,011 | ) |
| Net Operating Expenses | | | 1,269,096 | | | | 1,617,154 | | | | 667,187 | | | | 456,045 | | | | 604,127 | | | | 286,448 | |
| | | | | | | | | | | | | | | | | | | | | | | | | |
| Net Investment Income (Loss) | | | 4,451,608 | | | | (446,419 | ) | | | 395,652 | | | | 85,467 | | | | 61,729 | | | | 92,861 | |
| | | | | | | | | | | | | | | | | | | | | | | | | |
| Realized and Unrealized Gain (Loss) on Investments: | | | | | | | | | | | | | | | | | | | | | | | | |
| Net realized gain (loss) on | | | | | | | | | | | | | | | | | | | | | | | | |
| investments | | | 1,339,672 | | | | 770,111 | | | | 1,567,138 | | | | — | | | | — | | | | 76,893 | |
| foreign currency transactions | | | — | | | | 9,414 | | | | (1,760 | ) | | | — | | | | — | | | | — | |
| and affiliated investments | | | — | | | | — | | | | — | | | | 1,998,299 | | | | 2,207,288 | | | | 590,568 | |
| Capital gain dividends from REITs | | | — | | | | — | | | | 38,438 | | | | — | | | | — | | | | — | |
| Net change in unrealized appreciation (depreciation) on investments | | | 4,545,311 | | | | 34,790,495 | | | | 4,416,771 | | | | — | | | | — | | | | (232,602 | ) |
| affiliated investments | | | — | | | | — | | | | — | | | | 4,426,668 | | | | 3,541,820 | | | | 2,247,199 | |
| alternative investments | | | — | | | | — | | | | (791,725 | ) | | | — | | | | — | | | | — | |
| and foreign currency translations | | | — | | | | (206 | ) | | | (19 | ) | | | — | | | | — | | | | — | |
| Net Realized and Unrealized Gain on Investments | | | 5,884,983 | | | | 35,569,814 | | | | 5,228,843 | | | | 6,424,967 | | | | 5,749,108 | | | | 2,682,058 | |
| | | | | | | | | | | | | | | | | | | | | | | | | |
| Net Increase in Net Assets Resulting From Operations | | $ | 10,336,591 | | | $ | 35,123,395 | | | $ | 5,624,495 | | | $ | 6,510,434 | | | $ | 5,810,837 | | | $ | 2,774,919 | |
The accompanying notes are an integral part of these financial statements.
| Timothy Plan Funds |
| Statements of Changes in Net Assets |
| | | Aggressive Growth Fund | | | International Fund | | | Large/Mid Cap Growth Fund | |
| | | Year Ended | | | Year Ended | | | Year Ended | | | Year Ended | | | Year Ended | | | Year Ended | |
| | | September 30, 2021 | | | September 30, 2020 | | | September 30, 2021 | | | September 30, 2020 | | | September 30, 2021 | | | September 30, 2020 | |
| Operations: | | | | | | | | | | | | | | | | | | |
| Net investment income (loss) | | $ | (549,424 | ) | | $ | (313,451 | ) | | $ | 376,485 | | | $ | (232,277 | ) | | $ | (732,152 | ) | | $ | (401,853 | ) |
| Net realized gain from investments and foreign currency transactions | | | 4,965,183 | | | | 2,881,501 | | | | 3,800,568 | | | | 1,477,398 | | | | 9,497,692 | | | | 1,895,276 | |
| Capital gain dividends from REITs | | | 762 | | | | — | | | | — | | | | — | | | | — | | | | — | |
| Net change in unrealized appreciation (depreciation) on investments, affiliated investments and foreign currency translations | | | 7,354,050 | | | | 4,488,748 | | | | 21,845,405 | | | | 7,128,189 | | | | 22,105,166 | | | | 12,093,448 | |
| Net increase in net assets resulting from operations | | | 11,770,571 | | | | 7,056,798 | | | | 26,022,458 | | | | 8,373,310 | | | | 30,870,706 | | | | 13,586,871 | |
| | | | | | | | | | | | | | | | | | | | | | | | | |
| Distributions to Shareholders: | | | | | | | | | | | | | | | | | | | | | | | | |
| Return of Capital | | | | | | | | | | | | | | | | | | | | | | | | |
| Class A | | | — | | | | — | | | | — | | | | (272 | ) | | | — | | | | — | |
| Class C | | | — | | | | — | | | | — | | | | — | | | | — | | | | — | |
| Class I | | | — | | | | — | | | | — | | | | (154 | ) | | | — | | | | — | |
| Total distributions paid | | | | | | | | | | | | | | | | | | | | | | | | |
| Class A | | | (1,759,027 | ) | | | — | | | | — | | | | (414,996 | ) | | | (1,333,781 | ) | | | (2,645,457 | ) |
| Class C | | | (179,742 | ) | | | — | | | | — | | | | — | | | | (201,076 | ) | | | (411,753 | ) |
| Class I | | | (311,960 | ) | | | — | | | | — | | | | (304,044 | ) | | | (437,156 | ) | | | (662,464 | ) |
| Total dividends and distributions to shareholders | | | (2,250,729 | ) | | | — | | | | — | | | | (719,466 | ) | | | (1,972,013 | ) | | | (3,719,674 | ) |
| | | | | | | | | | | | | | | | | | | | | | | | | |
| Share Transactions of Beneficial Interest: | | | | | | | | | | | | | | | | | | | | | | | | |
| Net proceeds from shares sold | | | | | | | | | | | | | | | | | | | | | | | | |
| Class A | | | 10,261,986 | | | | 10,263,766 | | | | 15,219,293 | | | | 15,515,619 | | | | 19,629,181 | | | | 16,068,610 | |
| Class C | | | 822,801 | | | | 420,318 | | | | 399,937 | | | | 674,959 | | | | 2,201,953 | | | | 1,333,528 | |
| Class I | | | 11,257,925 | | | | 2,930,563 | | | | 43,620,770 | | | | 19,860,676 | | | | 15,853,873 | | | | 18,044,926 | |
| Reinvestment of dividends and distributions | | | | | | | | | | | | | | | | | | | | | | | | |
| Class A | | | 1,710,650 | | | | — | | | | — | | | | 339,337 | | | | 1,294,897 | | | | 2,530,212 | |
| Class C | | | 177,642 | | | | — | | | | — | | | | — | | | | 196,543 | | | | 392,575 | |
| Class I | | | 292,104 | | | | — | | | | — | | | | 188,255 | | | | 406,909 | | | | 626,060 | |
| Cost of shares redeemed | | | | | | | | | | | | | | | | | | | | | | | | |
| Class A | | | (11,786,611 | ) | | | (7,336,933 | ) | | | (16,161,405 | ) | | | (30,058,546 | ) | | | (16,164,437 | ) | | | (19,245,020 | ) |
| Class C | | | (891,732 | ) | | | (1,111,752 | ) | | | (746,545 | ) | | | (1,353,244 | ) | | | (2,014,066 | ) | | | (2,236,862 | ) |
| Class I | | | (4,771,795 | ) | | | (1,386,692 | ) | | | (19,797,614 | ) | | | (14,445,090 | ) | | | (14,322,410 | ) | | | (15,036,610 | ) |
| Net increase (decrease) in net assets from share transactions of beneficial interest | | | 7,072,970 | | | | 3,779,270 | | | | 22,534,436 | | | | (9,278,034 | ) | | | 7,082,443 | | | | 2,477,419 | |
| | | | | | | | | | | | | | | | | | | | | | | | | |
| Total Increase (Decrease) in Net Assets | | | 16,592,812 | | | | 10,836,068 | | | | 48,556,894 | | | | (1,624,190 | ) | | | 35,981,136 | | | | 12,344,616 | |
| | | | | | | | | | | | | | | | | | | | | | | | | |
| Net Assets: | | | | | | | | | | | | | | | | | | | | | | | | |
| Beginning of year | | | 36,304,833 | | | | 25,468,765 | | | | 87,956,643 | | | | 89,580,833 | | | | 98,461,084 | | | | 86,116,468 | |
| End of year | | $ | 52,897,645 | | | $ | 36,304,833 | | | $ | 136,513,537 | | | $ | 87,956,643 | | | $ | 134,442,220 | | | $ | 98,461,084 | |
| | | | | | | | | | | | | | | | | | | | | | | | | |
| Share Activity: | | | | | | | | | | | | | | | | | | | | | | | | |
| Shares Sold | | | | | | | | | | | | | | | | | | | | | | | | |
| Class A | | | 878,326 | | | | 1,144,605 | | | | 1,230,383 | | | | 1,669,718 | | | | 1,701,127 | | | | 1,824,223 | |
| Class C | | | 88,276 | | | | 61,079 | | | | 33,623 | | | | 74,198 | | | | 247,285 | | | | 196,651 | |
| Class I | | | 932,116 | | | | 370,655 | | | | 3,540,045 | | | | 2,165,480 | | | | 1,385,905 | | | | 2,018,098 | |
| Shares Reinvested | | | | | | | | | | | | | | | | | | | | | | | | |
| Class A | | | 159,724 | | | | — | | | | — | | | | 35,127 | | | | 122,045 | | | | 282,705 | |
| Class C | | | 21,098 | | | | — | | | | — | | | | — | | | | 23,708 | | | | 55,448 | |
| Class I | | | 26,676 | | | | — | | | | — | | | | 19,488 | | | | 37,469 | | | | 68,497 | |
| Shares Redeemed | | | | | | | | | | | | | | | | | | | | | | | | |
| Class A | | | (1,066,906 | ) | | | (860,806 | ) | | | (1,361,302 | ) | | | (3,232,658 | ) | | | (1,433,860 | ) | | | (2,231,377 | ) |
| Class C | | | (96,564 | ) | | | (163,949 | ) | | | (65,127 | ) | | | (153,554 | ) | | | (229,790 | ) | | | (328,373 | ) |
| Class I | | | (387,181 | ) | | | (153,601 | ) | | | (1,627,542 | ) | | | (1,574,142 | ) | | | (1,257,328 | ) | | | (1,728,840 | ) |
| Net increase (decrease) in shares of beneficial interest outstanding | | | 555,565 | | | | 397,983 | | | | 1,750,080 | | | | (996,343 | ) | | | 596,561 | | | | 157,032 | |
| | | | | | | | | | | | | | | | | | | | | | | | | |
The accompanying notes are an integral part of these financial statements.
| Timothy Plan Funds |
| Statements of Changes in Net Assets (Continued) |
| | | Small Cap Value Fund | | | Large/Mid Cap Value Fund | | | Fixed Income Fund | |
| | | Year Ended | | | Year Ended | | | Year Ended | | | Year Ended | | | Year Ended | | | Year Ended | |
| | | September 30, 2021 | | | September 30, 2020 | | | September 30, 2021 | | | September 30, 2020 | | | September 30, 2021 | | | September 30, 2020 | |
| Operations: | | | | | | | | | | | | | | | | | | |
| Net investment income (loss) | | $ | 650,037 | | | $ | 404,327 | | | $ | (42,843 | ) | | $ | 320,779 | | | $ | 340,238 | | | $ | 1,114,655 | |
| Net realized gain (loss) from investments and foreign currency transactions | | | 20,016,550 | | | | (3,126,054 | ) | | | 17,909,400 | | | | 803,689 | | | | 724,416 | | | | 719,937 | |
| Capital gain dividends from REITs | | | 68,869 | | | | 112,588 | | | | 13,632 | | | | 1,535 | | | | — | | | | — | |
| Net change in unrealized appreciation (depreciation) on investments, affiliated investments and foreign currency translations | | | 36,449,930 | | | | (15,946,373 | ) | | | 36,411,327 | | | | 5,706,882 | | | | (3,838,709 | ) | | | 3,514,629 | |
| Net increase (decrease) in net assets resulting from operations | | | 57,185,386 | | | | (18,555,512 | ) | | | 54,291,516 | | | | 6,832,885 | | | | (2,774,055 | ) | | | 5,349,221 | |
| | | | | | | | | | | | | | | | | | | | | | | | | |
| Distributions to Shareholders: | | | | | | | | | | | | | | | | | | | | | | | | |
| Total distributions paid | | | | | | | | | | | | | | | | | | | | | | | | |
| Class A | | | (145,591 | ) | | | (3,484,745 | ) | | | (4,723,162 | ) | | | (16,241,793 | ) | | | (1,095,468 | ) | | | (1,185,130 | ) |
| Class C | | | — | | | | (444,256 | ) | | | (629,087 | ) | | | (2,284,461 | ) | | | (31,078 | ) | | | (59,229 | ) |
| Class I | | | (235,809 | ) | | | (1,608,471 | ) | | | (1,718,701 | ) | | | (5,910,352 | ) | | | (272,172 | ) | | | (163,819 | ) |
| Total dividends and distributions to shareholders | | | (381,400 | ) | | | (5,537,472 | ) | | | (7,070,950 | ) | | | (24,436,606 | ) | | | (1,398,718 | ) | | | (1,408,178 | ) |
| | | | | | | | | | | | | | | | | | | | | | | | | |
| Share Transactions of Beneficial Interest: | | | | | | | | | | | | | | | | | | | | | | | | |
| Net proceeds from shares sold | | | | | | | | | | | | | | | | | | | | | | | | |
| Class A | | | 14,073,350 | | | | 11,772,086 | | | | 22,929,759 | | | | 24,478,552 | | | | 26,437,486 | | | | 27,874,703 | |
| Class C | | | 1,321,147 | | | | 1,037,946 | | | | 2,286,681 | | | | 2,089,087 | | | | 4,820,492 | | | | 3,457,109 | |
| Class I | | | 24,763,371 | | | | 21,243,639 | | | | 37,132,392 | | | | 32,183,968 | | | | 15,917,543 | | | | 12,132,019 | |
| Reinvestment of dividends and distributions | | | | | | | | | | | | | | | | | | | | | | | | |
| Class A | | | 139,050 | | | | 3,340,385 | | | | 4,496,466 | | | | 15,085,002 | | | | 1,002,964 | | | | 1,074,093 | |
| Class C | | | — | | | | 428,980 | | | | 603,732 | | | | 2,150,333 | | | | 23,671 | | | | 46,467 | |
| Class I | | | 189,231 | | | | 1,504,962 | | | | 1,579,911 | | | | 5,493,549 | | | | 231,009 | | | | 140,391 | |
| Cost of shares redeemed | | | | | | | | | | | | | | | | | | | | | | | | |
| Class A | | | (19,125,740 | ) | | | (23,672,886 | ) | | | (29,756,516 | ) | | | (39,660,804 | ) | | | (19,027,079 | ) | | | (26,199,346 | ) |
| Class C | | | (2,250,567 | ) | | | (3,087,087 | ) | | | (4,891,508 | ) | | | (4,917,130 | ) | | | (2,466,111 | ) | | | (3,029,571 | ) |
| Class I | | | (21,788,455 | ) | | | (18,239,807 | ) | | | (19,841,245 | ) | | | (34,084,778 | ) | | | (10,362,221 | ) | | | (7,470,668 | ) |
| Net increase (decrease) in net assets from share transactions of beneficial interest | | | (2,678,613 | ) | | | (5,671,782 | ) | | | 14,539,672 | | | | 2,817,779 | | | | 16,577,754 | | | | 8,025,197 | |
| | | | | | | | | | | | | | | | | | | | | | | | | |
| Total Increase (Decrease) in Net Assets | | | 54,125,373 | | | | (29,764,766 | ) | | | 61,760,238 | | | | (14,785,942 | ) | | | 12,404,981 | | | | 11,966,240 | |
| | | | | | | | | | | | | | | | | | | | | | | | | |
| Net Assets: | | | | | | | | | | | | | | | | | | | | | | | | |
| Beginning of year | | | 115,267,216 | | | | 145,031,982 | | | | 191,737,799 | | | | 206,523,741 | | | | 113,938,711 | | | | 101,972,471 | |
| End of year | | $ | 169,392,589 | | | $ | 115,267,216 | | | $ | 253,498,037 | | | $ | 191,737,799 | | | $ | 126,343,692 | | | $ | 113,938,711 | |
| | | | | | | | | | | | | | | | | | | | | | | | | |
| Share Activity: | | | | | | | | | | | | | | | | | | | | | | | | |
| Shares Sold | | | | | | | | | | | | | | | | | | | | | | | | |
| Class A | | | 705,641 | | | | 785,701 | | | | 1,118,061 | | | | 1,455,831 | | | | 2,484,863 | | | | 2,610,965 | |
| Class C | | | 99,030 | | | | 104,450 | | | | 146,472 | | | | 166,081 | | | | 473,801 | | | | 340,891 | |
| Class I | | | 1,236,880 | | | | 1,406,282 | | | | 1,743,744 | | | | 1,875,536 | | | | 1,511,851 | | | | 1,144,700 | |
| Shares Reinvested | | | | | | | | | | | | | | | | | | | | | | | | |
| Class A | | | 8,089 | | | | 191,647 | | | | 237,030 | | | | 859,544 | | | | 95,205 | | | | 101,469 | |
| Class C | | | — | | | | 36,664 | | | | 42,427 | | | | 160,592 | | | | 2,355 | | | | 4,594 | |
| Class I | | | 10,183 | | | | 85,026 | | | | 82,459 | | | | 310,020 | | | | 22,100 | | | | 13,307 | |
| Shares Redeemed | | | | | | | | | | | | | | | | | | | | | | | | |
| Class A | | | (992,273 | ) | | | (1,519,667 | ) | | | (1,492,161 | ) | | | (2,392,013 | ) | | | (1,786,331 | ) | | | (2,465,061 | ) |
| Class C | | | (183,375 | ) | | | (308,384 | ) | | | (326,823 | ) | | | (381,304 | ) | | | (241,630 | ) | | | (298,562 | ) |
| Class I | | | (1,114,591 | ) | | | (1,150,668 | ) | | | (998,773 | ) | | | (1,991,566 | ) | | | (987,793 | ) | | | (710,241 | ) |
| Net increase (decrease) in shares of beneficial interest outstanding | | | (230,416 | ) | | | (368,949 | ) | | | 552,436 | | | | 62,721 | | | | 1,574,421 | | | | 742,062 | |
| | | | | | | | | | | | | | | | | | | | | | | | | |
The accompanying notes are an integral part of these financial statements.
| Timothy Plan Funds |
| Statements of Changes in Net Assets (Continued) |
| | | High Yield Bond Fund | | | Israel Common Values Fund | | | Defensive Strategies Fund | |
| | | Year Ended | | | Year Ended | | | Year Ended | | | Year Ended | | | Year Ended | | | Year Ended | |
| | | September 30, 2021 | | | September 30, 2020 | | | September 30, 2021 | | | September 30, 2020 | | | September 30, 2021 | | | September 30, 2020 | |
| Operations: | | | | | | | | | | | | | | | | | | |
| Net investment income (loss) | | $ | 4,451,608 | | | $ | 3,415,148 | | | $ | (446,419 | ) | | $ | (471,877 | ) | | $ | 395,652 | | | $ | (39,904 | ) |
| Net realized gain (loss) from investments and foreign currency transactions | | | 1,339,672 | | | | 233,510 | | | | 779,525 | | | | (1,142,847 | ) | | | 1,565,378 | | | | (1,948,581 | ) |
| Capital gain dividends from REITs | | | — | | | | — | | | | — | | | | — | | | | 38,438 | | | | 33,316 | |
| Net change in unrealized appreciation (depreciation) on investments and foreign currency translations | | | 4,545,311 | | | | (1,331,098 | ) | | | 34,790,289 | | | | (3,276,125 | ) | | | 3,625,027 | | | | 3,186,489 | |
| Net increase (decrease) in net assets resulting from operations | | | 10,336,591 | | | | 2,317,560 | | | | 35,123,395 | | | | (4,890,849 | ) | | | 5,624,495 | | | | 1,231,320 | |
| | | | | | | | | | | | | | | | | | | | | | | | | |
| Distributions to Shareholders: | | | | | | | | | | | | | | | | | | | | | | | | |
| Return of Capital | | | | | | | | | | | | | | | | | | | | | | | | |
| Class A | | | — | | | | — | | | | — | | | | (9,977 | ) | | | — | | | | (3,881 | ) |
| Class C | | | — | | | | — | | | | — | | | | (2,414 | ) | | | — | | | | (365 | ) |
| Class I | | | — | | | | — | | | | — | | | | (5,833 | ) | | | — | | | | (565 | ) |
| Total distributions paid | | | | | | | | | | | | | | | | | | | | | | | | |
| Class A | | | (2,251,965 | ) | | | (2,035,084 | ) | | | — | | | | (440,041 | ) | | | — | | | | (919,259 | ) |
| Class C | | | (89,077 | ) | | | (91,711 | ) | | | — | | | | (31,435 | ) | | | — | | | | (75,547 | ) |
| Class I | | | (2,180,847 | ) | | | (1,241,948 | ) | | | — | | | | (306,642 | ) | | | — | | | | (130,298 | ) |
| Total dividends and distributions to shareholders | | | (4,521,889 | ) | | | (3,368,743 | ) | | | — | | | | (796,342 | ) | | | — | | | | (1,129,915 | ) |
| | | | | | | | | | | | | | | | | | | | | | | | | |
| Share Transactions of Beneficial Interest: | | | | | | | | | | | | | | | | | | | | | | | | |
| Net proceeds from shares sold | | | | | | | | | | | | | | | | | | | | | | | | |
| Class A | | | 26,411,790 | | | | 28,629,454 | | | | 12,218,199 | | | | 14,258,338 | | | | 13,192,053 | | | | 4,811,338 | |
| Class C | | | 1,212,283 | | | | 623,382 | | | | 1,648,189 | | | | 2,211,779 | | | | 1,269,492 | | | | 447,075 | |
| Class I | | | 50,130,344 | | | | 24,381,412 | | | | 17,632,057 | | | | 15,841,843 | | | | 12,525,965 | | | | 3,190,306 | |
| Reinvestment of dividends and distributions | | | | | | | | | | | | | | | | | | | | | | | | |
| Class A | | | 2,008,049 | | | | 1,768,156 | | | | — | | | | 406,728 | | | | — | | | | 880,163 | |
| Class C | | | 86,707 | | | | 86,725 | | | | — | | | | 29,270 | | | | — | | | | 70,252 | |
| Class I | | | 1,658,971 | | | | 947,104 | | | | — | | | | 286,984 | | | | — | | | | 120,968 | |
| Cost of shares redeemed | | | | | | | | | | | | | | | | | | | | | | | | |
| Class A | | | (13,406,616 | ) | | | (23,219,760 | ) | | | (9,390,476 | ) | | | (24,660,411 | ) | | | (6,804,176 | ) | | | (10,161,774 | ) |
| Class C | | | (761,780 | ) | | | (904,620 | ) | | | (2,519,410 | ) | | | (2,091,301 | ) | | | (663,983 | ) | | | (1,141,669 | ) |
| Class I | | | (15,941,614 | ) | | | (12,770,412 | ) | | | (9,491,711 | ) | | | (11,198,744 | ) | | | (3,917,640 | ) | | | (1,792,048 | ) |
| Net increase (decrease) in net assets from share transactions of beneficial interest | | | 51,398,134 | | | | 19,541,441 | | | | 10,096,848 | | | | (4,915,514 | ) | | | 15,601,711 | | | | (3,575,389 | ) |
| | | | | | | | | | | | | | | | | | | | | | | | | |
| Total Increase (Decrease) in Net Assets | | | 57,212,836 | | | | 18,490,258 | | | | 45,220,243 | | | | (10,602,705 | ) | | | 21,226,206 | | | | (3,473,984 | ) |
| | | | | | | | | | | | | | | | | | | | | | | | | |
| Net Assets: | | | | | | | | | | | | | | | | | | | | | | | | |
| Beginning of year | | | 79,290,609 | | | | 60,800,351 | | | | 69,802,862 | | | | 80,405,567 | | | | 37,253,413 | | | | 40,727,397 | |
| End of year | | $ | 136,503,445 | | | $ | 79,290,609 | | | $ | 115,023,105 | | | $ | 69,802,862 | | | $ | 58,479,619 | | | $ | 37,253,413 | |
| | | | | | | | | | | | | | | | | | | | | | | | | |
| Share Activity: | | | | | | | | | | | | | | | | | | | | | | | | |
| Shares Sold | | | | | | | | | | | | | | | | | | | | | | | | |
| Class A | | | 2,690,563 | | | | 3,115,231 | | | | 551,098 | | | | 864,480 | | | | 1,001,465 | | | | 422,649 | |
| Class C | | | 121,685 | | | | 67,258 | | | | 77,687 | | | | 135,571 | | | | 99,773 | | | | 41,663 | |
| Class I | | | 5,082,748 | | | | 2,646,886 | | | | 799,074 | | | | 922,156 | | | | 950,790 | | | | 277,728 | |
| Shares Reinvested | | | | | | | | | | | | | | | | | | | | | | | | |
| Class A | | | 204,598 | | | | 199,079 | | | | — | | | | 21,973 | | | | — | | | | 77,138 | |
| Class C | | | 8,691 | | | | 9,553 | | | | — | | | | 1,654 | | | | — | | | | 6,451 | |
| Class I | | | 168,803 | | | | 106,165 | | | | — | | | | 15,421 | | | | — | | | | 10,630 | |
| Shares Redeemed | | | | | | | | | | | | | | | | | | | | | | | | |
| Class A | | | (1,379,460 | ) | | | (2,586,721 | ) | | | (439,335 | ) | | | (1,417,448 | ) | | | (528,846 | ) | | | (890,593 | ) |
| Class C | | | (77,099 | ) | | | (98,041 | ) | | | (126,867 | ) | | | (134,779 | ) | | | (54,213 | ) | | | (106,998 | ) |
| Class I | | | (1,616,588 | ) | | | (1,367,605 | ) | | | (427,214 | ) | | | (701,466 | ) | | | (304,722 | ) | | | (161,469 | ) |
| Net increase (decrease) in shares of beneficial interest outstanding | | | 5,203,941 | | | | 2,091,805 | | | | 434,443 | | | | (292,438 | ) | | | 1,164,247 | | | | (322,801 | ) |
| | | | | | | | | | | | | | | | | | | | | | | | | |
The accompanying notes are an integral part of these financial statements.
| Timothy Plan Funds |
| Statements of Changes in Net Assets (Continued) |
| | | Strategic Growth Fund | | | Conservative Growth Fund | | | Growth & Income Fund | |
| | | Year Ended | | | Year Ended | | | Year Ended | | | Year Ended | | | Year Ended | | | Year Ended | |
| | | September 30, 2021 | | | September 30, 2020 | | | September 30, 2021 | | | September 30, 2020 | | | September 30, 2021 | | | September 30, 2020 | |
| Operations: | | | | | | | | | | | | | | | | | | |
| Net investment income | | $ | 85,467 | | | $ | 122,767 | | | $ | 61,729 | | | $ | 156,341 | | | $ | 92,861 | | | $ | 161,784 | |
| Net realized gain (loss) from investments, affiliated investments and foreign currency transactions | | | 1,998,299 | | | | 1,231,878 | | | | 2,207,288 | | | | 1,062,914 | | | | 667,461 | | | | (111,175 | ) |
| Capital gain distributions from affiliated investments | | | — | | | | 38,287 | | | | — | | | | 42,133 | | | | — | | | | — | |
| Net change in unrealized appreciation (depreciation) on investments, affiliated investments and foreign currency translations | | | 4,426,668 | | | | (652,306 | ) | | | 3,541,820 | | | | 112,552 | | | | 2,014,597 | | | | (873,565 | ) |
| Net increase (decrease) in net assets resulting from operations | | | 6,510,434 | | | | 740,626 | | | | 5,810,837 | | | | 1,373,940 | | | | 2,774,919 | | | | (822,956 | ) |
| | | | | | | | | | | | | | | | | | | | | | | | | |
| Distributions to Shareholders: | | | | | | | | | | | | | | | | | | | | | | | | |
| Return of Capital | | | | | | | | | | | | | | | | | | | | | | | | |
| Class A | | | — | | | | — | | | | — | | | | — | | | | — | | | | (1,185 | ) |
| Class C | | | — | | | | — | | | | — | | | | — | | | | — | | | | (193 | ) |
| Class I | | | — | | | | — | | | | — | | | | — | | | | — | | | | (242 | ) |
| Total distributions paid | | | | | | | | | | | | | | | | | | | | | | | | |
| Class A | | | (1,165,888 | ) | | | (1,199,081 | ) | | | (1,105,678 | ) | | | (1,464,847 | ) | | | (116,254 | ) | | | (146,081 | ) |
| Class C | | | (98,452 | ) | | | (137,411 | ) | | | (119,253 | ) | | | (221,058 | ) | | | (2,105 | ) | | | (8,076 | ) |
| Class I | | | — | | | | — | | | | — | | | | — | | | | (23,691 | ) | | | (32,030 | ) |
| Total dividends and distributions to shareholders | | | (1,264,340 | ) | | | (1,336,492 | ) | | | (1,224,931 | ) | | | (1,685,905 | ) | | | (142,050 | ) | | | (187,807 | ) |
| | | | | | | | | | | | | | | | | | | | | | | | | |
| Share Transactions of Beneficial Interest: | | | | | | | | | | | | | | | | | | | | | | | | |
| Net proceeds from shares sold | | | | | | | | | | | | | | | | | | | | | | | | |
| Class A | | | 4,181,203 | | | | 4,394,265 | | | | 6,236,902 | | | | 7,217,924 | | | | 1,972,327 | | | | 3,255,251 | |
| Class C | | | 625,855 | | | | 425,625 | | | | 1,394,069 | | | | 1,069,767 | | | | 467,983 | | | | 225,817 | |
| Class I | | | — | | | | — | | | | — | | | | — | | | | 1,060,966 | | | | 2,174,045 | |
| Reinvestment of dividends and distributions | | | | | | | | | | | | | | | | | | | | | | | | |
| Class A | | | 1,140,481 | | | | 1,178,596 | | | | 1,064,304 | | | | 1,391,939 | | | | 107,423 | | | | 135,567 | |
| Class C | | | 98,074 | | | | 134,395 | | | | 115,430 | | | | 211,609 | | | | 2,043 | | | | 8,053 | |
| Class I | | | — | | | | — | | | | — | | | | — | | | | 21,449 | | | | 29,055 | |
| Cost of shares redeemed | | | | | | | | | | | | | | | | | | | | | | | | |
| Class A | | | (4,732,445 | ) | | | (5,157,240 | ) | | | (6,830,283 | ) | | | (7,446,765 | ) | | | (3,211,912 | ) | | | (3,965,676 | ) |
| Class C | | | (865,233 | ) | | | (941,279 | ) | | | (1,177,101 | ) | | | (1,968,448 | ) | | | (522,375 | ) | | | (771,341 | ) |
| Class I | | | — | | | | — | | | | — | | | | — | | | | (1,448,464 | ) | | | (3,032,452 | ) |
| Net increase (decrease) in net assets from share transactions of beneficial interest | | | 447,935 | | | | 34,362 | | | | 803,321 | | | | 476,026 | | | | (1,550,560 | ) | | | (1,941,681 | ) |
| | | | | | | | | | | | | | | | | | | | | | | | | |
| Total Increase (Decrease) in Net Assets | | | 5,694,029 | | | | (561,504 | ) | | | 5,389,227 | | | | 164,061 | | | | 1,082,309 | | | | (2,952,444 | ) |
| | | | | | | | | | | | | | | | | | | | | | | | | |
| Net Assets: | | | | | | | | | | | | | | | | | | | | | | | | |
| Beginning of year | | | 35,003,558 | | | | 35,565,062 | | | | 46,258,196 | | | | 46,094,135 | | | | 17,116,725 | | | | 20,069,169 | |
| End of year | | $ | 40,697,587 | | | $ | 35,003,558 | | | $ | 51,647,423 | | | $ | 46,258,196 | | | | 18,199,034 | | | $ | 17,116,725 | |
| | | | | | | | | | | | | | | | | | | | | | | | | |
| Share Activity: | | | | | | | | | | | | | | | | | | | | | | | | |
| Shares Sold | | | | | | | | | | | | | | | | | | | | | | | | |
| Class A | | | 388,876 | | | | 484,704 | | | | 542,123 | | | | 698,747 | | | | 169,337 | | | | 316,144 | |
| Class C | | | 66,790 | | | | 52,144 | | | | 138,897 | | | | 119,741 | | | | 42,191 | | | | 23,088 | |
| Class I | | | — | | | | — | | | | — | | | | — | | | | 91,596 | | | | 208,374 | |
| Shares Reinvested | | | | | | | | | | | | | | | | | | | | | | | | |
| Class A | | | 112,807 | | | | 121,757 | | | | 95,883 | | | | 131,563 | | | | 9,139 | | | | 14,206 | |
| Class C | | | 11,082 | | | | 15,700 | | | | 11,719 | | | | 22,392 | | | | 181 | | | | 875 | |
| Class I | | | — | | | | — | | | | — | | | | — | | | | 1,813 | | | | 3,022 | |
| Shares Redeemed | | | | | | | | | | | | | | | | | | | | | | | | |
| Class A | | | (446,881 | ) | | | (557,809 | ) | | | (592,797 | ) | | | (722,433 | ) | | | (285,347 | ) | | | (383,312 | ) |
| Class C | | | (94,445 | ) | | | (117,307 | ) | | | (116,026 | ) | | | (216,599 | ) | | | (47,530 | ) | | | (81,328 | ) |
| Class I | | | — | | | | — | | | | — | | | | — | | | | (124,851 | ) | | | (303,039 | ) |
| Net increase (decrease) in shares of beneficial interest outstanding | | | 38,229 | | | | (811 | ) | | | 79,799 | | | | 33,411 | | | | (143,471 | ) | | | (201,970 | ) |
| | | | | | | | | | | | | | | | | | | | | | | | | |
The accompanying notes are an integral part of these financial statements.
| Timothy Aggressive Growth Fund (Class A Shares) |
Selected data based on a share outstanding throughout each year
| | | For the Year | | | For the Year | | | For the Year | | | For the Year | | | For the Year | |
| | | ended | | | ended | | | ended | | | ended | | | ended | |
| | | September 30, | | | September 30, | | | September 30, | | | September 30, | | | September 30, | |
| | | 2021 | | | 2020 | | | 2019 | | | 2018 | | | 2017 | |
| Net asset value, beginning of year | | $ | 9.92 | | | $ | 7.87 | | | $ | 9.27 | | | $ | 8.10 | | | $ | 6.82 | |
| INCOME (LOSS) FROM INVESTMENT OPERATIONS: | | | | | | | | | | | | | | | | | | | | |
| Net investment loss (A) | | | (0.14 | ) | | | (0.09 | ) | | | (0.07 | ) | | | (0.09 | ) | | | (0.08 | ) |
| Net realized and unrealized gain (loss) on investments | | | 3.39 | | | | 2.14 | | | | (0.81 | ) | | | 1.26 | | | | 1.36 | |
| Total from investment operations | | | 3.25 | | | | 2.05 | | | | (0.88 | ) | | | 1.17 | | | | 1.28 | |
| LESS DISTRIBUTIONS: | | | | | | | | | | | | | | | | | | | | |
| From net realized gains on investments | | | (0.64 | ) | | | — | | | | (0.52 | ) | | | — | | | | — | |
| Return of Capital | | | — | | | | — | | | | (0.00 | ) * | | | — | | | | — | |
| Total distributions | | | (0.64 | ) | | | — | | | | (0.52 | ) | | | — | | | | — | |
| Net asset value, end of year | | $ | 12.53 | | | $ | 9.92 | | | $ | 7.87 | | | $ | 9.27 | | | $ | 8.10 | |
| Total return (B)(C) | | | 33.89 | % | | | 26.05 | % | | | (8.72 | )% | | | 14.44 | % | | | 18.77 | % |
| RATIOS/SUPPLEMENTAL DATA: | | | | | | | | | | | | | | | | | | | | |
| Net assets, end of year (in 000’s) | | $ | 37,917 | | | $ | 30,316 | | | $ | 21,802 | | | $ | 25,926 | | | $ | 22,549 | |
| Ratios to average net assets | | | | | | | | | | | | | | | | | | | | |
| Expenses, before waiver and reimbursement | | | 1.60 | % | | | 1.71 | % | | | 1.64 | % | | | 1.73 | % | | | 1.69 | % |
| Expenses, net waiver and reimbursement (D) | | | 1.50 | % | | | 1.61 | % | | | 1.56 | % | | | 1.63 | % | | | 1.59 | % |
| Net investment loss, before waiver and reimbursement | | | (1.30 | )% | | | (1.19 | )% | | | (0.91 | )% | | | (1.16 | )% | | | (1.12 | )% |
| Net investment loss, net waiver and reimbursement (D) | | | (1.20 | )% | | | (1.09 | )% | | | (0.82 | )% | | | (1.06 | )% | | | (1.02 | )% |
| Portfolio turnover rate | | | 56 | % | | | 96 | % | | | 77 | % | | | 85 | % | | | 151 | % |
| * | Amount is less than $0.005 per share. |
| (A) | Per share amounts calculated using average shares method, which more appropriately presents the per share data for the period. |
| (B) | Total return calculation does not reflect sales load. Total return represents aggregate total return based on Net Asset Value. |
| (C) | Total return in the above table represents the rate that the investor would have earned or lost on an investment in the Fund assuming reinvestment of dividends. Total return would have been higher or lower if certain expenses had not been reimbursed, waived or recouped. |
| (D) | This expense decrease from the voluntary waiver is reflected in both the net expense and the net investment income ratios shown. |
The accompanying notes are an integral part of these financial statements.
| Timothy Aggressive Growth Fund (Class C Shares) |
Selected data based on a share outstanding throughout each year
| | | For the Year | | | For the Year | | | For the Year | | | For the Year | | | For the Year | |
| | | ended | | | ended | | | ended | | | ended | | | ended | |
| | | September 30, | | | September 30, | | | September 30, | | | September 30, | | | September 30, | |
| | | 2021 | | | 2020 | | | 2019 | | | 2018 | | | 2017 | |
| Net asset value, beginning of year | | $ | 7.93 | | | $ | 6.34 | | | $ | 7.64 | | | $ | 6.73 | | | $ | 5.71 | |
| INCOME (LOSS) FROM INVESTMENT OPERATIONS: | | | | | | | | | | | | | | | | | | | | |
| Net investment loss (A) | | | (0.18 | ) | | | (0.12 | ) | | | (0.11 | ) | | | (0.13 | ) | | | (0.11 | ) |
| Net realized and unrealized gain (loss) on investments | | | 2.68 | | | | 1.71 | | | | (0.67 | ) | | | 1.04 | | | | 1.13 | |
| Total from investment operations | | | 2.50 | | | | 1.59 | | | | (0.78 | ) | | | 0.91 | | | | 1.02 | |
| LESS DISTRIBUTIONS: | | | | | | | | | | | | | | | | | | | | |
| From net realized gains on investments | | | (0.64 | ) | | | — | | | | (0.52 | ) | | | — | | | | — | |
| Return of Capital | | | — | | | | — | | | | (0.00 | ) * | | | — | | | | — | |
| Total distributions | | | (0.64 | ) | | | — | | | | (0.52 | ) | | | — | | | | — | |
| Net asset value, end of year | | $ | 9.79 | | | $ | 7.93 | | | $ | 6.34 | | | $ | 7.64 | | | $ | 6.73 | |
| Total return (B)(C) | | | 32.87 | % | | | 25.08 | % | | | (9.33 | )% | | | 13.52 | % | | | 17.86 | % |
| RATIOS/SUPPLEMENTAL DATA: | | | | | | | | | | | | | | | | | | | | |
| Net assets, end of year (in 000’s) | | $ | 2,877 | | | $ | 2,230 | | | $ | 2,433 | | | $ | 4,358 | | | $ | 3,584 | |
| Ratios to average net assets | | | | | | | | | | | | | | | | | | | | |
| Expenses, before waiver and reimbursement | | | 2.35 | % | | | 2.46 | % | | | 2.39 | % | | | 2.48 | % | | | 2.44 | % |
| Expenses, net waiver and reimbursement (D) | | | 2.25 | % | | | 2.36 | % | | | 2.31 | % | | | 2.38 | % | | | 2.34 | % |
| Net investment loss, before waiver and reimbursement | | | (2.05 | )% | | | (1.92 | )% | | | (1.73 | )% | | | (1.91 | )% | | | (1.88 | )% |
| Net investment loss, net waiver and reimbursement (D) | | | (1.95 | )% | | | (1.82 | )% | | | (1.64 | )% | | | (1.81 | )% | | | (1.78 | )% |
| Portfolio turnover rate | | | 56 | % | | | 96 | % | | | 77 | % | | | 85 | % | | | 151 | % |
| * | Amount is less than $0.005 per share. |
| (A) | Per share amounts calculated using average shares method, which more appropriately presents the per share data for the period. |
| (B) | Total return calculation does not reflect redemption fee. Total return represents aggregate total return based on Net Asset Value. |
| (C) | Total return in the above table represents the rate that the investor would have earned or lost on an investment in the Fund assuming reinvestment of dividends Total return would have been higher or lower if certain expenses had not been reimbursed, waived or recouped. |
| (D) | This expense decrease from the voluntary waiver is reflected in both the net expense and the net investment income ratios shown. |
The accompanying notes are an integral part of these financial statements.
| Timothy Aggressive Growth Fund (Class I Shares) |
Selected data based on a share outstanding throughout each year
| | | For the Year | | | For the Year | | | For the Year | | | For the Year | | | For the Year | |
| | | ended | | | ended | | | ended | | | ended | | | ended | |
| | | September 30, | | | September 30, | | | September 30, | | | September 30, | | | September 30, | |
| | | 2021 | | | 2020 | | | 2019 | | | 2018 | | | 2017 | |
| Net asset value, beginning of year | | $ | 10.13 | | | $ | 8.02 | | | $ | 9.41 | | | $ | 8.21 | | | $ | 6.89 | |
| INCOME (LOSS) FROM INVESTMENT OPERATIONS: | | | | | | | | | | | | | | | | | | | | |
| Net investment loss (A) | | | (0.12 | ) | | | (0.08 | ) | | | (0.05 | ) | | | (0.07 | ) | | | (0.06 | ) |
| Net realized and unrealized gain (loss) on investments | | | 3.47 | | | | 2.19 | | | | (0.82 | ) | | | 1.27 | | | | 1.38 | |
| Total from investment operations | | | 3.35 | | | | 2.11 | | | | (0.87 | ) | | | 1.20 | | | | 1.32 | |
| LESS DISTRIBUTIONS: | | | | | | | | | | | | | | | | | | | | |
| From net realized gains on investments | | | (0.64 | ) | | | — | | | | (0.52 | ) | | | — | | | | — | |
| Return of Capital | | | — | | | | — | | | | (0.00 | ) * | | | — | | | | — | |
| Total distributions | | | (0.64 | ) | | | — | | | | (0.52 | ) | | | — | | | | — | |
| Net asset value, end of year | | $ | 12.84 | | | $ | 10.13 | | | $ | 8.02 | | | $ | 9.41 | | | $ | 8.21 | |
| Total return (B) | | | 34.19 | % | | | 26.31 | % | | | (8.48 | )% | | | 14.62 | % | | | 19.16 | % |
| RATIOS/SUPPLEMENTAL DATA: | | | | | | | | | | | | | | | | | | | | |
| Net assets, end of year (in 000’s) | | $ | 12,104 | | | $ | 3,759 | | | $ | 1,233 | | | $ | 1,273 | | | $ | 887 | |
| Ratios to average net assets | | | | | | | | | | | | | | | | | | | | |
| Expenses, before waiver and reimbursement | | | 1.35 | % | | | 1.46 | % | | | 1.39 | % | | | 1.48 | % | | | 1.44 | % |
| Expenses, net waiver and reimbursement (C) | | | 1.25 | % | | | 1.36 | % | | | 1.31 | % | | | 1.38 | % | | | 1.34 | % |
| Net investment loss, before waiver and reimbursement | | | (1.05 | )% | | | (1.02 | )% | | | (0.67 | )% | | | (0.91 | )% | | | (0.88 | )% |
| Net investment loss, net waiver and reimbursement (C) | | | (0.95 | )% | | | (0.92 | )% | | | (0.57 | )% | | | (0.81 | )% | | | (0.78 | )% |
| Portfolio turnover rate | | | 56 | % | | | 96 | % | | | 77 | % | | | 85 | % | | | 151 | % |
| * | Amount is less than $0.005 per share. |
| (A) | Per share amounts calculated using average shares method, which more appropriately presents the per share data for the period. |
| (B) | Total return in the above table represents the rate that the investor would have earned or lost on an investment in the Fund assuming reinvestment of dividends. Total return would have been higher or lower if certain expenses had not been reimbursed, waived or recouped. |
| (C) | This expense decrease from the voluntary waiver is reflected in both the net expense and the net investment income ratios shown. |
The accompanying notes are an integral part of these financial statements.
| Timothy International Fund (Class A Shares) |
Selected data based on a share outstanding throughout each year
| | | For the Year | | | For the Year | | | For the Year | | | For the Year | | | For the Year | |
| | | ended | | | ended | | | ended | | | ended | | | ended | |
| | | September 30, | | | September 30, | | | September 30, | | | September 30, | | | September 30, | |
| | | 2021 | | | 2020 | | | 2019 | | | 2018 | | | 2017 | |
| Net asset value, beginning of year | | $ | 9.92 | | | $ | 9.09 | | | $ | 9.74 | | | $ | 9.86 | | | $ | 8.53 | |
| INCOME (LOSS) FROM INVESTMENT OPERATIONS: | | | | | | | | | | | | | | | | | | | | |
| Net investment income (loss) (A) | | | 0.02 | | | | (0.03 | ) | | | 0.09 | | | | 0.11 | | | | 0.04 | |
| Net realized and unrealized gain (loss) on | | | 2.90 | | | | 0.94 | | | | (0.64 | ) | | | (0.02 | ) | | | 1.38 | |
| investments Total from investment operations | | | 2.92 | | | | 0.91 | | | | (0.55 | ) | | | 0.09 | | | | 1.42 | |
| LESS DISTRIBUTIONS: | | | | | | | | | | | | | | | | | | | | |
| From net investment income | | | — | | | | (0.08 | ) | | | (0.10 | ) | | | (0.21 | ) | | | (0.09 | ) |
| Return of Capital | | | — | | | | 0.00 | * | | | — | | | | — | | | | — | |
| Total distributions | | | — | | | | (0.08 | ) | | | (0.10 | ) | | | (0.21 | ) | | | (0.09 | ) |
| Net asset value, end of year | | $ | 12.84 | | | $ | 9.92 | | | $ | 9.09 | | | $ | 9.74 | | | $ | 9.86 | |
| Total return (B)(C) | | | 29.44 | % | | | 10.00 | % | | | (5.55 | )% | | | 0.91 | % | | | 16.78 | % |
| RATIOS/SUPPLEMENTAL DATA: | | | | | | | | | | | | | | | | | | | | |
| Net assets, end of year (in 000’s) | | $ | 61,220 | | | $ | 48,608 | | | $ | 58,397 | | | $ | 70,790 | | | $ | 81,153 | |
| Ratios to average net assets | | | | | | | | | | | | | | | | | | | | |
| Expenses, before waiver and reimbursement | | | 1.63 | % | | | 1.76 | % | | | 1.71 | % | | | 1.71 | % | | | 1.69 | % |
| Expenses, net waiver and reimbursement (D) | | | 1.58 | % | | | 1.71 | % | | | 1.67 | % | | | 1.66 | % | | | 1.64 | % |
| Net investment income (loss) before waiver and reimbursement | | | 0.13 | % | | | (0.38 | )% | | | 0.96 | % | | | 1.05 | % | | | 0.35 | % |
| Net investment income (loss), net waiver and reimbursement (D) | | | 0.18 | % | | | (0.33 | )% | | | 1.01 | % | | | 1.10 | % | | | 0.40 | % |
| Portfolio turnover rate | | | 17 | % | | | 25 | % | | | 27 | % | | | 19 | % | | | 42 | % |
| * | Amount is less than $0.005 per share. |
| (A) | Per share amounts calculated using average shares method, which more appropriately presents the per share data for the period. |
| (B) | Total return calculation does not reflect sales load. Total return represents aggregate total return based on Net Asset Value. |
| (C) | Total return in the above table represents the rate that the investor would have earned or lost on an investment in the Fund assuming reinvestment of dividends. Total return would have been higher or lower if certain expenses had not been reimbursed, waived or recouped. |
| (D) | This expense decrease from the voluntary waiver is reflected in both the net expense and the net investment income ratios shown. |
The accompanying notes are an integral part of these financial statements.
| Timothy International Fund (Class C Shares) |
Selected data based on a share outstanding throughout each year
| | | For the Year | | | For the Year | | | For the Year | | | For the Year | | | For the Year | |
| | | ended | | | ended | | | ended | | | ended | | | ended | |
| | | September 30, | | | September 30, | | | September 30, | | | September 30, | | | September 30, | |
| | | 2021 | | | 2020 | | | 2019 | | | 2018 | | | 2017 | |
| Net asset value, beginning of year | | $ | 9.62 | | | $ | 8.80 | | | $ | 9.41 | | | $ | 9.55 | | | $ | 8.25 | |
| INCOME (LOSS) FROM INVESTMENT OPERATIONS: | | | | | | | | | | | | | | | | | | | | |
| Net investment income (loss) (A) | | | (0.07 | ) | | | (0.10 | ) | | | 0.01 | | | | 0.03 | | | | (0.03 | ) |
| Net realized and unrealized gain (loss) on | | | 2.80 | | | | 0.92 | | | | (0.61 | ) | | | (0.01 | ) | | | 1.34 | |
| investments Total from investment operations | | | 2.73 | | | | 0.82 | | | | (0.60 | ) | | | 0.02 | | | | 1.31 | |
| LESS DISTRIBUTIONS: | | | | | | | | | | | | | | | | | | | | |
| From net investment income | | | — | | | | — | | | | (0.01 | ) | | | (0.16 | ) | | | (0.01 | ) |
| Total distributions | | | — | | | | — | | | | (0.01 | ) | | | (0.16 | ) | | | (0.01 | ) |
| Net asset value, end of year | | $ | 12.35 | | | $ | 9.62 | | | $ | 8.80 | | | $ | 9.41 | | | $ | 9.55 | |
| Total return (B)(C) | | | 28.38 | % | | | 9.32 | % | | | (6.31 | )% | | | 0.12 | % | | | 15.93 | % |
| RATIOS/SUPPLEMENTAL DATA: | | | | | | | | | | | | | | | | | | | | |
| Net assets, end of year (in 000’s) | | $ | 2,337 | | | $ | 2,122 | | | $ | 2,641 | | | $ | 4,779 | | | $ | 4,620 | |
| Ratios to average net assets | | | | | | | | | | | | | | | | | | | | |
| Expenses, before waiver and reimbursement | | | 2.38 | % | | | 2.51 | % | | | 2.46 | % | | | 2.46 | % | | | 2.44 | % |
| Expenses, net waiver and reimbursement (D) | | | 2.33 | % | | | 2.46 | % | | | 2.42 | % | | | 2.41 | % | | | 2.39 | % |
| Net investment income (loss) before waiver and reimbursement | | | (0.65 | )% | | | (1.17 | )% | | | 0.09 | % | | | 0.28 | % | | | (0.41 | )% |
| Net investment income (loss), net waiver and reimbursement (D) | | | (0.60 | )% | | | (1.12 | )% | | | 0.12 | % | | | 0.33 | % | | | (0.36 | )% |
| Portfolio turnover rate | | | 17 | % | | | 25 | % | | | 27 | % | | | 19 | % | | | 42 | % |
| (A) | Per share amounts calculated using average shares method, which more appropriately presents the per share data for the period |
| (B) | Total return calculation does not reflect redemption fee. |
| (C) | Total return in the above table represents the rate that the investor would have earned or lost on an investment in the Fund assuming reinvestment of dividends. Total return would have been higher or lower if certain expenses had not been reimbursed, waived or recouped. |
| (D) | This expense decrease from the voluntary waiver is reflected in both the net expense and the net investment income ratios shown. |
The accompanying notes are an integral part of these financial statements.
| Timothy International Fund (Class I Shares) |
Selected data based on a share outstanding throughout each year
| | | For the Year | | | For the Year | | | For the Year | | | For the Year | | | For the Year | |
| | | ended | | | ended | | | ended | | | ended | | | ended | |
| | | September 30, | | | September 30, | | | September 30, | | | September 30, | | | September 30, | |
| | | 2021 | | | 2020 | | | 2019 | | | 2018 | | | 2017 | |
| Net asset value, beginning of year | | $ | 9.94 | | | $ | 9.10 | | | $ | 9.76 | | | $ | 9.89 | | | $ | 8.55 | |
| INCOME (LOSS) FROM INVESTMENT OPERATIONS: | | | | | | | | | | | | | | | | | | | | |
| Net investment income (loss) (A) | | | 0.06 | | | | (0.01 | ) | | | 0.11 | | | | 0.17 | | | | 0.07 | |
| Net realized and unrealized gain (loss) on investments | | | 2.89 | | | | 0.96 | | | | (0.64 | ) | | | (0.06 | ) | | | 1.38 | |
| Total from investment operations | | | 2.95 | | | | 0.95 | | | | (0.53 | ) | | | 0.11 | | | | 1.45 | |
| LESS DISTRIBUTIONS: | | | | | | | | | | | | | | | | | | | | |
| From net investment income | | | — | | | | (0.11 | ) | | | (0.13 | ) | | | (0.24 | ) | | | (0.11 | ) |
| Return of Capital | | | — | | | | 0.00 | * | | | — | | | | — | | | | — | |
| Total distributions | | | — | | | | (0.11 | ) | | | (0.13 | ) | | | (0.24 | ) | | | (0.11 | ) |
| Net asset value, end of year | | $ | 12.89 | | | $ | 9.94 | | | $ | 9.10 | | | $ | 9.76 | | | $ | 9.89 | |
| Total return (B) | | | 29.68 | % | | | 10.42 | % | | | (5.33 | )% | | | 1.04 | % | | | 17.18 | % |
| RATIOS/SUPPLEMENTAL DATA: | | | | | | | | | | | | | | | | | | | | |
| Net assets, end of year (in 000’s) | | $ | 72,957 | | | $ | 37,226 | | | $ | 28,542 | | | $ | 31,286 | | | $ | 13,083 | |
| Ratios to average net assets | | | | | | | | | | | | | | | | | | | | |
| Expenses, before waiver and reimbursement | | | 1.38 | % | | | 1.51 | % | | | 1.46 | % | | | 1.45 | % | | | 1.43 | % |
| Expenses, net waiver and reimbursement (C) | | | 1.33 | % | | | 1.46 | % | | | 1.42 | % | | | 1.41 | % | | | 1.38 | % |
| Net investment income (loss), before waiver and reimbursement | | | 0.45 | % | | | (0.16 | )% | | | 1.24 | % | | | 1.60 | % | | | 0.74 | % |
| Net investment income (loss), net waiver and reimbursement (C) | | | 0.50 | % | | | (0.11 | )% | | | 1.28 | % | | | 1.65 | % | | | 0.79 | % |
| Portfolio turnover rate | | | 17 | % | | | 25 | % | | | 27 | % | | | 19 | % | | | 42 | % |
| * | Amount is less than $0.005 per share. |
| (A) | Per share amounts calculated using average shares method, which more appropriately presents the per share data for the period. |
| (B) | Total return in the above table represents the rate that the investor would have earned or lost on an investment in the Fund assuming reinvestment of dividends. Total return would have been higher or lower if certain expenses had not been reimbursed, waived or recouped. |
| (C) | This expense decrease from the voluntary waiver is reflected in both the net expense and the net investment income ratios shown. |
The accompanying notes are an integral part of these financial statements.
| Timothy Large/Mid Cap Growth Fund (Class A Shares) |
Selected data based on a share outstanding throughout each year
| | | For the Year | | | For the Year | | | For the Year | | | For the Year | | | For the Year | |
| | | ended | | | ended | | | ended | | | ended | | | ended | |
| | | September 30, | | | September 30, | | | September 30, | | | September 30, | | | September 30, | |
| | | 2021 | | | 2020 | | | 2019 | | | 2018 | | | 2017 | |
| Net asset value, beginning of year | | $ | 9.77 | | | $ | 8.70 | | | $ | 9.34 | | | $ | 8.59 | | | $ | 7.46 | |
| INCOME (LOSS) FROM INVESTMENT OPERATIONS: | | | | | | | | | | | | | | | | | | | | |
| Net investment loss (A) | | | (0.07 | ) | | | (0.04 | ) | | | (0.03 | ) | | | (0.02 | ) | | | (0.01 | ) |
| Net realized and unrealized gain (loss) on investments | | | 3.10 | | | | 1.48 | | | | (0.19 | ) | | | 0.99 | | | | 1.23 | |
| Total from investment operations | | | 3.03 | | | | 1.44 | | | | (0.22 | ) | | | 0.97 | | | | 1.22 | |
| LESS DISTRIBUTIONS: | | | | | | | | | | | | | | | | | | | | |
| From net realized gains on investments | | | (0.19 | ) | | | (0.37 | ) | | | (0.42 | ) | | | (0.22 | ) | | | (0.09 | ) |
| Total distributions | | | (0.19 | ) | | | (0.37 | ) | | | (0.42 | ) | | | (0.22 | ) | | | (0.09 | ) |
| Net asset value, end of year | | $ | 12.61 | | | $ | 9.77 | | | $ | 8.70 | | | $ | 9.34 | | | $ | 8.59 | |
| Total return (B)(C) | | | 31.32 | % | | | 16.93 | % | | | (1.48 | )% | | | 11.49 | % | | | 16.53 | % |
| RATIOS/SUPPLEMENTAL DATA: | | | | | | | | | | | | | | | | | | | | |
| Net assets, end of year (in 000’s) | | $ | 96,378 | | | $ | 70,891 | | | $ | 64,150 | | | $ | 79,897 | | | $ | 68,291 | |
| Ratios to average net assets | | | | | | | | | | | | | | | | | | | | |
| Expenses, before waiver and reimbursement | | | 1.50 | % | | | 1.54 | % | | | 1.56 | % | | | 1.52 | % | | | 1.52 | % |
| Expenses, net waiver and reimbursement (D) | | | 1.39 | % | | | 1.49 | % | | | 1.52 | % | | | 1.47 | % | | | 1.47 | % |
| Net investment loss, before waiver and reimbursement | | | (0.71 | )% | | | (0.48 | )% | | | (0.35 | )% | | | (0.25 | )% | | | (0.19 | )% |
| Net investment loss, net waiver and reimbursement (D)(E) | | | (0.60 | )% | | | (0.43 | )% | | | (0.31 | )% | | | (0.20 | )% | | | (0.14 | )% |
| Portfolio turnover rate | | | 22 | % | | | 23 | % | | | 44 | % | | | 57 | % | | | 76 | % |
| (A) | Per share amounts calculated using average shares method, which more appropriately presents the per share data for the period. |
| (B) | Total return calculation does not reflect sales load. |
| (C) | Total return in the above table represents the rate that the investor would have earned or lost on an investment in the Fund assuming reinvestment of dividends Total return would have been higher or lower if certain expenses had not been reimbursed, waived or recouped. |
| (D) | This expense decrease from the voluntary waiver is reflected in both the net expense and the net investment income ratios shown. |
| (E) | Recognition of net investment income (loss) by the Fund is affected by the timing of the declaration of dividends by the underlying investment companies in which the Fund invests. |
The accompanying notes are an integral part of these financial statements.
| Timothy Large/Mid Cap Growth Fund (Class C Shares) |
Selected data based on a share outstanding throughout each year
| | | For the Year | | | For the Year | | | For the Year | | | For the Year | | | For the Year | |
| | | ended | | | ended | | | ended | | | ended | | | ended | |
| | | September 30, | | | September 30, | | | September 30, | | | September 30, | | | September 30, | |
| | | 2021 | | | 2020 | | | 2019 | | | 2018 | | | 2017 | |
| Net asset value, beginning of year | | $ | 7.68 | | | $ | 6.96 | | | $ | 7.63 | | | $ | 7.11 | | | $ | 6.24 | |
| INCOME (LOSS) FROM INVESTMENT OPERATIONS: | | | | | | | | | | | | | | | | | | | | |
| Net investment loss (A) | | | (0.12 | ) | | | (0.08 | ) | | | (0.07 | ) | | | (0.07 | ) | | | (0.06 | ) |
| Net realized and unrealized gain (loss) on investments | | | 2.42 | | | | 1.17 | | | | (0.18 | ) | | | 0.81 | | | | 1.02 | |
| Total from investment operations | | | 2.30 | | | | 1.09 | | | | (0.25 | ) | | | 0.74 | | | | 0.96 | |
| LESS DISTRIBUTIONS: | | | | | | | | | | | | | | | | | | | | |
| From net realized gains on investments | | | (0.19 | ) | | | (0.37 | ) | | | (0.42 | ) | | | (0.22 | ) | | | (0.09 | ) |
| Total distributions | | | (0.19 | ) | | | (0.37 | ) | | | (0.42 | ) | | | (0.22 | ) | | | (0.09 | ) |
| Net asset value, end of year | | $ | 9.79 | | | $ | 7.68 | | | $ | 6.96 | | | $ | 7.63 | | | $ | 7.11 | |
| Total return (B)(C) | | | 30.32 | % | | | 16.09 | % | | | (2.24 | )% | | | 10.63 | % | | | 15.58 | % |
| RATIOS/SUPPLEMENTAL DATA: | | | | | | | | | | | | | | | | | | | | |
| Net assets, end of year (in 000’s) | | $ | 10,845 | | | $ | 8,192 | | | $ | 7,950 | | | $ | 11,355 | | | $ | 9,909 | |
| Ratios to average net assets | | | | | | | | | | | | | | | | | | | | |
| Expenses, before waiver and reimbursement | | | 2.25 | % | | | 2.29 | % | | | 2.31 | % | | | 2.27 | % | | | 2.27 | % |
| Expenses, net waiver and reimbursement (D) | | | 2.14 | % | | | 2.24 | % | | | 2.27 | % | | | 2.22 | % | | | 2.22 | % |
| Net investment loss, before waiver and reimbursement | | | (1.46 | )% | | | (1.23 | )% | | | (1.10 | )% | | | (1.00 | )% | | | (0.94 | )% |
| Net investment loss, net waiver and reimbursement (D)(E) | | | (1.35 | )% | | | (1.18 | )% | | | (1.06 | )% | | | (0.95 | )% | | | (0.89 | )% |
| Portfolio turnover rate | | | 22 | % | | | 23 | % | | | 44 | % | | | 57 | % | | | 76 | % |
| (A) | Per share amounts calculated using average shares method, which more appropriately presents the per share data for the period. |
| (B) | Total return calculation does not reflect redemption fee. |
| (C) | Total return in the above table represents the rate that the investor would have earned or lost on an investment in the Fund assuming reinvestment of dividends Total return would have been higher or lower if certain expenses had not been reimbursed, waived or recouped. |
| (D) | This expense decrease from the voluntary waiver is reflected in both the net expense and the net investment income ratios shown. |
| (E) | Recognition of net investment income (loss) by the Fund is affected by the timing of the declaration of dividends by the underlying investment companies in which the Fund invests. |
The accompanying notes are an integral part of these financial statements.
| Timothy Large/Mid Cap Growth Fund (Class I Shares) |
Selected data based on a share outstanding throughout each year
| | | For the Year | | | For the Year | | | For the Year | | | For the Year | | | For the Year | |
| | | ended | | | ended | | | ended | | | ended | | | ended | |
| | | September 30, | | | September 30, | | | September 30, | | | September 30, | | | September 30, | |
| | | 2021 | | | 2020 | | | 2019 | | | 2018 | | | 2017 | |
| Net asset value, beginning of year | | $ | 9.99 | | | $ | 8.86 | | | $ | 9.48 | | | $ | 8.70 | | | $ | 7.54 | |
| INCOME (LOSS) FROM INVESTMENT OPERATIONS: | | | | | | | | | | | | | | | | | | | | |
| Net investment income (loss) (A) | | | (0.04 | ) | | | (0.02 | ) | | | (0.01 | ) | | | 0.00 | * | | | 0.01 | |
| Net realized and unrealized gain (loss) on investments | | | 3.17 | | | | 1.52 | | | | (0.19 | ) | | | 1.00 | | | | 1.24 | |
| Total from investment operations | | | 3.13 | | | | 1.50 | | | | (0.20 | ) | | | 1.00 | | | | 1.25 | |
| LESS DISTRIBUTIONS: | | | | | | | | | | | | | | | | | | | | |
| From net realized gains on investments | | | (0.19 | ) | | | (0.37 | ) | | | (0.42 | ) | | | (0.22 | ) | | | (0.09 | ) |
| Total distributions | | | (0.19 | ) | | | (0.37 | ) | | | (0.42 | ) | | | (0.22 | ) | | | (0.09 | ) |
| Net asset value, end of year | | $ | 12.93 | | | $ | 9.99 | | | $ | 8.86 | | | $ | 9.48 | | | $ | 8.70 | |
| Total return (B) | | | 31.64 | % | | | 17.30 | % | | | (1.24 | )% | | | 11.69 | % | | | 16.75 | % |
| RATIOS/SUPPLEMENTAL DATA: | | | | | | | | | | | | | | | | | | | | |
| Net assets, end of year (in 000’s) | | $ | 27,220 | | | $ | 19,378 | | | $ | 14,016 | | | $ | 10,551 | | | $ | 3,936 | |
| Ratios to average net assets | | | | | | | | | | | | | | | | | | | | |
| Expenses, before waiver and reimbursement | | | 1.25 | % | | | 1.29 | % | | | 1.31 | % | | | 1.27 | % | | | 1.26 | % |
| Expenses, net waiver and reimbursement (C) | | | 1.14 | % | | | 1.24 | % | | | 1.27 | % | | | 1.22 | % | | | 1.21 | % |
| Net investment income (loss), before waiver and reimbursement | | | (0.45 | )% | | | (0.22 | )% | | | (0.09 | )% | | | (0.03 | )% | | | 0.10 | % |
| Net investment income (loss), net waiver and reimbursement (C)(D) | | | (0.34 | )% | | | (0.17 | )% | | | (0.06 | )% | | | 0.02 | % | | | 0.15 | % |
| Portfolio turnover rate | | | 22 | % | | | 23 | % | | | 44 | % | | | 57 | % | | | 76 | % |
| * | Amount is less than $0.005 per share. |
| (A) | Per share amounts calculated using average shares method, which more appropriately presents the per share data for the period. |
| (B) | Total return in the above table represents the rate that the investor would have earned or lost on an investment in the Fund assuming reinvestment of dividends Total return would have been higher or lower if certain expenses had not been reimbursed, waived or recouped. |
| (C) | This expense decrease from the voluntary waiver is reflected in both the net expense and the net investment income ratios shown. |
| (D) | Recognition of net investment income (loss) by the Fund is affected by the timing of the declaration of dividends by the underlying investment companies in which the Fund invests. |
The accompanying notes are an integral part of these financial statements.
| Timothy Small Cap Value Fund (Class A Shares) |
Selected data based on a share outstanding throughout each year
| | | For the Year | | | For the Year | | | For the Year | | | For the Year | | | For the Year | |
| | | ended | | | ended | | | ended | | | ended | | | ended | |
| | | September 30, | | | September 30, | | | September 30, | | | September 30, | | | September 30, | |
| | | 2021 | | | 2020 | | | 2019 | | | 2018 | | | 2017 | |
| Net asset value, beginning of year | | $ | 14.16 | | | $ | 17.15 | | | $ | 20.67 | | | $ | 20.50 | | | $ | 17.09 | |
| INCOME (LOSS) FROM INVESTMENT OPERATIONS: | | | | | | | | | | | | | | | | | | | | |
| Net investment income (loss) (A) | | | 0.12 | | | | 0.04 | | | | 0.06 | | | | 0.00 | * | | | 0.03 | |
| Net realized and unrealized gain (loss) on investments | | | 7.10 | | | | (2.39 | ) | | | (1.28 | ) | | | 1.96 | | | | 3.63 | |
| Total from investment operations | | | 7.22 | | | | (2.35 | ) | | | (1.22 | ) | | | 1.96 | | | | 3.66 | |
| LESS DISTRIBUTIONS: | | | | | | | | | | | | | | | | | | | | |
| From net investment income | | | (0.03 | ) | | | (0.04 | ) | | | — | | | | (0.00 | ) * | | | — | |
| From net realized gains on investments | | | — | | | | (0.60 | ) | | | (2.30 | ) | | | (1.79 | ) | | | (0.25 | ) |
| Total distributions | | | (0.03 | ) | | | (0.64 | ) | | | (2.30 | ) | | | (1.79 | ) | | | (0.25 | ) |
| Net asset value, end of year | | $ | 21.35 | | | $ | 14.16 | | | $ | 17.15 | | | $ | 20.67 | | | $ | 20.50 | |
| Total return (B)(C) | | | 51.03 | % | | | (14.38 | )% | | | (3.77 | )% | | | 10.11 | % | | | 21.55 | % |
| RATIOS/SUPPLEMENTAL DATA: | | | | | | | | | | | | | | | | | | | | |
| Net assets, end of year (in 000’s) | | $ | 105,800 | | | $ | 74,130 | | | $ | 99,077 | | | $ | 114,985 | | | $ | 112,953 | |
| Ratios to average net assets | | | | | | | | | | | | | | | | | | | | |
| Expenses, before waiver and reimbursement | | | 1.46 | % | | | 1.57 | % | | | 1.52 | % | | | 1.50 | % | | | 1.46 | % |
| Expenses, net waiver and reimbursement (D) | | | 1.34 | % | | | 1.47 | % | | | 1.43 | % | | | 1.44 | % | | | 1.41 | % |
| Net investment income (loss), before waiver and reimbursement | | | 0.50 | % | | | 0.19 | % | | | 0.29 | % | | | (0.08 | )% | | | 0.13 | % |
| Net investment income (loss), net waiver and reimbursement (D)(E) | | | 0.62 | % | | | 0.29 | % | | | 0.38 | % | | | (0.02 | )% | | | 0.18 | % |
| Portfolio turnover rate | | | 61 | % | | | 73 | % | | | 63 | % | | | 58 | % | | | 57 | % |
| * | Amount is less than $0.005 per share. |
| (A) | Per share amounts calculated using average shares method, which more appropriately presents the per share data for the period. |
| (B) | Total return calculation does not reflect sales load. |
| (C) | Total return in the above table represents the rate that the investor would have earned or lost on an investment in the Fund assuming reinvestment of dividends Total return would have been higher or lower if certain expenses had not been reimbursed, waived or recouped. |
| (D) | This expense decrease from the voluntary waiver is reflected in both the net expense and the net investment income ratios shown. |
| (E) | Recognition of net investment income (loss) by the Fund is affected by the timing of the declaration of dividends by the underlying investment companies in which the Fund invests. |
The accompanying notes are an integral part of these financial statements.
| Timothy Small Cap Value Fund (Class C Shares) |
Selected data based on a share outstanding throughout each year
| | | For the Year | | | For the Year | | | For the Year | | | For the Year | | | For the Year | |
| | | ended | | | ended | | | ended | | | ended | | | ended | |
| | | September 30, | | | September 30, | | | September 30, | | | September 30, | | | September 30, | |
| | | 2021 | | | 2020 | | | 2019 | | | 2018 | | | 2017 | |
| Net asset value, beginning of year | | $ | 9.45 | | | $ | 11.69 | | | $ | 15.09 | | | $ | 15.54 | | | $ | 13.10 | |
| INCOME (LOSS) FROM INVESTMENT OPERATIONS: | | | | | | | | | | | | | | | | | | | | |
| Net investment loss (A) | | | (0.02 | ) | | | (0.05 | ) | | | (0.05 | ) | | | (0.11 | ) | | | (0.08 | ) |
| Net realized and unrealized gain (loss) on investments | | | 4.73 | | | | (1.59 | ) | | | (1.05 | ) | | | 1.45 | | | | 2.77 | |
| Total from investment operations | | | 4.71 | | | | (1.64 | ) | | | (1.10 | ) | | | 1.34 | | | | 2.69 | |
| LESS DISTRIBUTIONS: | | | | | | | | | | | | | | | | | | | | |
| From net realized gains on investments | | | — | | | | (0.60 | ) | | | (2.30 | ) | | | (1.79 | ) | | | (0.25 | ) |
| Total distributions | | | — | | | | (0.60 | ) | | | (2.30 | ) | | | (1.79 | ) | | | (0.25 | ) |
| Net asset value, end of year | | $ | 14.16 | | | $ | 9.45 | | | $ | 11.69 | | | $ | 15.09 | | | $ | 15.54 | |
| Total return (B)(C) | | | 49.84 | % | | | (15.01 | )% | | | (4.49 | )% | | | 9.24 | % | | | 20.70 | % |
| RATIOS/SUPPLEMENTAL DATA: | | | | | | | | | | | | | | | | | | | | |
| Net assets, end of year (in 000’s) | | $ | 7,293 | | | $ | 5,663 | | | $ | 8,963 | | | $ | 14,603 | | | $ | 13,210 | |
| Ratios to average net assets | | | | | | | | | | | | | | | | | | | | |
| Expenses, before waiver and reimbursement | | | 2.21 | % | | | 2.32 | % | | | 2.27 | % | | | 2.25 | % | | | 2.21 | % |
| Expenses, net waiver and reimbursement (D) | | | 2.09 | % | | | 2.22 | % | | | 2.18 | % | | | 2.19 | % | | | 2.16 | % |
| Net investment loss, before waiver and reimbursement | | | (0.26 | )% | | | (0.55 | )% | | | (0.50 | )% | | | (0.82 | )% | | | (0.62 | )% |
| Net investment loss, net waiver and reimbursement (D)(E) | | | (0.14 | )% | | | (0.45 | )% | | | (0.42 | )% | | | (0.76 | )% | | | (0.57 | )% |
| Portfolio turnover rate | | | 61 | % | | | 73 | % | | | 63 | % | | | 58 | % | | | 57 | % |
| (A) | Per share amounts calculated using average shares method, which more appropriately presents the per share data for the period. |
| (B) | Total return calculation does not reflect redemption fee. |
| (C) | Total return in the above table represents the rate that the investor would have earned or lost on an investment in the Fund assuming reinvestment of dividends Total return would have been higher or lower if certain expenses had not been reimbursed, waived or recouped. |
| (D) | This expense decrease from the voluntary waiver is reflected in both the net expense and the net investment income ratios shown. |
| (E) | Recognition of net investment income (loss) by the Fund is affected by the timing of the declaration of dividends by the underlying investment companies in which the Fund invests. |
The accompanying notes are an integral part of these financial statements.
| Timothy Small Cap Value Fund (Class I Shares) |
Selected data based on a share outstanding throughout each year
| | | For the Year | | | For the Year | | | For the Year | | | For the Year | | | For the Year | |
| | | ended | | | ended | | | ended | | | ended | | | ended | |
| | | September 30, | | | September 30, | | | September 30, | | | September 30, | | | September 30, | |
| | | 2021 | | | 2020 | | | 2019 | | | 2018 | | | 2017 | |
| Net asset value, beginning of year | | $ | 14.42 | | | $ | 17.45 | | | $ | 20.93 | | | $ | 20.74 | | | $ | 17.24 | |
| INCOME (LOSS) FROM INVESTMENT OPERATIONS: | | | | | | | | | | | | | | | | | | | | |
| Net investment income (A) | | | 0.17 | | | | 0.08 | | | | 0.11 | | | | 0.06 | | | | 0.08 | |
| Net realized and unrealized gain (loss) on investments | | | 7.21 | | | | (2.42 | ) | | | (1.29 | ) | | | 1.97 | | | | 3.67 | |
| Total from investment operations | | | 7.38 | | | | (2.34 | ) | | | (1.18 | ) | | | 2.03 | | | | 3.75 | |
| LESS DISTRIBUTIONS: | | | | | | | | | | | | | | | | | | | | |
| From net investment income | | | (0.09 | ) | | | (0.09 | ) | | | — | | | | (0.05 | ) | | | — | |
| From net realized gains on investments | | | — | | | | (0.60 | ) | | | (2.30 | ) | | | (1.79 | ) | | | (0.25 | ) |
| Total distributions | | | (0.09 | ) | | | (0.69 | ) | | | (2.30 | ) | | | (1.84 | ) | | | (0.25 | ) |
| Net asset value, end of year | | $ | 21.71 | | | $ | 14.42 | | | $ | 17.45 | | | $ | 20.93 | | | $ | 20.74 | |
| Total return (B) | | | 51.33 | % | | | (14.14 | )% | | | (3.51 | )% | | | 10.37 | % | | | 21.89 | % |
| RATIOS/SUPPLEMENTAL DATA: | | | | | | | | | | | | | | | | | | | | |
| Net assets, end of year (in 000’s) | | $ | 56,299 | | | $ | 35,473 | | | $ | 36,993 | | | $ | 35,140 | | | $ | 19,103 | |
| Ratios to average net assets | | | | | | | | | | | | | | | | | | | | |
| Expenses, before waiver and reimbursement | | | 1.21 | % | | | 1.32 | % | | | 1.27 | % | | | 1.25 | % | | | 1.21 | % |
| Expenses, net waiver and reimbursement (C) | | | 1.09 | % | | | 1.22 | % | | | 1.18 | % | | | 1.19 | % | | | 1.16 | % |
| Net investment income, before waiver and reimbursement | | | 0.75 | % | | | 0.44 | % | | | 0.56 | % | | | 0.21 | % | | | 0.38 | % |
| Net investment income, net waiver and reimbursement (C)(D) | | | 0.87 | % | | | 0.54 | % | | | 0.64 | % | | | 0.27 | % | | | 0.43 | % |
| Portfolio turnover rate | | | 61 | % | | | 73 | % | | | 63 | % | | | 58 | % | | | 57 | % |
| (A) | Per share amounts calculated using average shares method, which more appropriately presents the per share data for the period. |
| (B) | Total return in the above table represents the rate that the investor would have earned or lost on an investment in the Fund assuming reinvestment of dividends Total return would have been higher or lower if certain expenses had not been reimbursed, waived or recouped. |
| (C) | This expense decrease from the voluntary waiver is reflected in both the net expense and the net investment income ratios shown. |
| (D) | Recognition of net investment income (loss) by the Fund is affected by the timing of the declaration of dividends by the underlying investment companies in which the Fund invests. |
The accompanying notes are an integral part of these financial statements.
| Timothy Large/Mid Cap Value Fund (Class A Shares) |
Selected data based on a share outstanding throughout each year
| | | For the Year | | | For the Year | | | For the Year | | | For the Year | | | For the Year | |
| | | ended | | | ended | | | ended | | | ended | | | ended | |
| | | September 30, | | | September 30, | | | September 30, | | | September 30, | | | September 30, | |
| | | 2021 | | | 2020 | | | 2019 | | | 2018 | | | 2017 | |
| Net asset value, beginning of year | | $ | 17.43 | | | $ | 18.86 | | | $ | 20.38 | | | $ | 19.16 | | | $ | 17.15 | |
| INCOME FROM INVESTMENT OPERATIONS: | | | | | | | | | | | | | | | | | | | | |
| Net investment income (A) | | | (0.01 | ) | | | 0.03 | | | | 0.09 | | | | 0.07 | | | | 0.05 | |
| Net realized and unrealized gain on investments (B) | | | 5.12 | | | | 0.72 | | | | 0.12 | | | | 2.45 | | | | 2.18 | |
| Total from investment operations | | | 5.11 | | | | 0.75 | | | | 0.21 | | | | 2.52 | | | | 2.23 | |
| LESS DISTRIBUTIONS: | | | | | | | | | | | | | | | | | | | | |
| From net investment income | | | (0.03 | ) | | | (0.08 | ) | | | (0.06 | ) | | | (0.03 | ) | | | — | |
| From net realized gains on investments | | | (0.63 | ) | | | (2.10 | ) | | | (1.67 | ) | | | (1.27 | ) | | | (0.22 | ) |
| Total distributions | | | (0.66 | ) | | | (2.18 | ) | | | (1.73 | ) | | | (1.30 | ) | | | (0.22 | ) |
| Net asset value, end of year | | $ | 21.88 | | | $ | 17.43 | | | $ | 18.86 | | | $ | 20.38 | | | $ | 19.16 | |
| Total return (C)(D) | | | 29.89 | % | | | 3.93 | % | | | 2.54 | % | | | 13.58 | % | | | 13.10 | % |
| RATIOS/SUPPLEMENTAL DATA: | | | | | | | | | | | | | | | | | | | | |
| Net assets, end of year (in 000’s) | | $ | 160,560 | | | $ | 130,296 | | | $ | 142,420 | | | $ | 172,163 | | | $ | 167,056 | |
| Ratios to average net assets | | | | | | | | | | | | | | | | | | | | |
| Expenses, before waiver and reimbursement | | | 1.45 | % | | | 1.51 | % | | | 1.51 | % | | | 1.46 | % | | | 1.49 | % |
| Expenses, net waiver and reimbursement (E) | | | 1.30 | % | | | 1.41 | % | | | 1.41 | % | | | 1.35 | % | | | 1.41 | % |
| Net investment income, before waiver and reimbursement | | | (0.17 | )% | | | 0.06 | % | | | 0.42 | % | | | 0.27 | % | | | 0.18 | % |
| Net investment income, net waiver and reimbursement (E)(F) | | | (0.02 | )% | | | 0.16 | % | | | 0.52 | % | | | 0.38 | % | | | 0.26 | % |
| Portfolio turnover rate | | | 33 | % | | | 26 | % | | | 51 | % | | | 24 | % | | | 39 | % |
| (A) | Per share amounts calculated using average shares method, which more appropriately presents the per share data for the period. |
| (B) | Realized and unrealized gains and losses per share in this caption are balancing amounts necessary to reconcile the change in net asset value per share for the period, and may not agree to the aggregate gains and losses in the Statement of Operations due to the fluctuations in share transactions. |
| (C) | Total return calculation does not reflect sales load. |
| (D) | Total return in the above table represents the rate that the investor would have earned or lost on an investment in the Fund assuming reinvestment of dividends Total return would have been higher or lower if certain expenses had not been reimbursed, waived or recouped. |
| (E) | This expense decrease from the voluntary waiver is reflected in both the net expense and the net investment income ratios shown. |
| (F) | Recognition of net investment income (loss) by the Fund is affected by the timing of the declaration of dividends by the underlying investment companies in which the Fund invests. |
The accompanying notes are an integral part of these financial statements.
| Timothy Large/Mid Cap Value Fund (Class C Shares) |
Selected data based on a share outstanding throughout each year
| | | For the Year | | | For the Year | | | For the Year | | | For the Year | | | For the Year | |
| | | ended | | | ended | | | ended | | | ended | | | ended | |
| | | September 30, | | | September 30, | | | September 30, | | | September 30, | | | September 30, | |
| | | 2021 | | | 2020 | | | 2019 | | | 2018 | | | 2017 | |
| Net asset value, beginning of year | | $ | 13.21 | | | $ | 14.82 | | | $ | 16.49 | | | $ | 15.82 | | | $ | 14.30 | |
| INCOME (LOSS) FROM INVESTMENT OPERATIONS: | | | | | | | | | | | | | | | | | | | | |
| Net investment loss (A) | | | (0.12 | ) | | | (0.08 | ) | | | (0.03 | ) | | | (0.06 | ) | | | (0.07 | ) |
| Net realized and unrealized gain on investments (B) | | | 3.85 | | | | 0.57 | | | | 0.03 | | | | 2.00 | | | | 1.81 | |
| Total from investment operations | | | 3.73 | | | | 0.49 | | | | 0.00 | | | | 1.94 | | | | 1.74 | |
| LESS DISTRIBUTIONS: | | | | | | | | | | | | | | | | | | | | |
| From net realized gains on investments | | | (0.63 | ) | | | (2.10 | ) | | | (1.67 | ) | | | (1.27 | ) | | | (0.22 | ) |
| Total distributions | | | (0.63 | ) | | | (2.10 | ) | | | (1.67 | ) | | | (1.27 | ) | | | (0.22 | ) |
| Net asset value, end of year | | $ | 16.31 | | | $ | 13.21 | | | $ | 14.82 | | | $ | 16.49 | | | $ | 15.82 | |
| Total return (C)(D) | | | 28.91 | % | | | 3.14 | % | | | 1.74 | % | | | 12.75 | % | | | 12.27 | % |
| RATIOS/SUPPLEMENTAL DATA: | | | | | | | | | | | | | | | | | | | | |
| Net assets, end of year (in 000’s) | | $ | 15,162 | | | $ | 14,102 | | | $ | 16,627 | | | $ | 25,852 | | | $ | 23,803 | |
| Ratios to average net assets | | | | | | | | | | | | | | | | | | | | |
| Expenses, before waiver and reimbursement | | | 2.20 | % | | | 2.26 | % | | | 2.26 | % | | | 2.21 | % | | | 2.24 | % |
| Expenses, net waiver and reimbursement (E) | | | 2.05 | % | | | 2.16 | % | | | 2.16 | % | | | 2.10 | % | | | 2.16 | % |
| Net investment loss, before waiver and reimbursement | | | (0.92 | )% | | | (0.69 | )% | | | (0.32 | )% | | | (0.48 | )% | | | (0.57 | )% |
| Net investment loss, net waiver and reimbursement (E)(F) | | | (0.77 | )% | | | (0.59 | )% | | | (0.22 | )% | | | (0.37 | )% | | | (0.49 | )% |
| Portfolio turnover rate | | | 33 | % | | | 26 | % | | | 51 | % | | | 24 | % | | | 39 | % |
| (A) | Per share amounts calculated using average shares method, which more appropriately presents the per share data for the period. |
| (B) | Realized and unrealized gains per share in this caption are balancing amounts necessary to reconcile the change in net asset value per share for the period and may not reconcile with aggregate gains and losses in the Statement of Operations due to the timing of share transactions for the period. |
| (C) | Total return calculation does not reflect redemption fee. |
| (D) | Total return in the above table represents the rate that the investor would have earned or lost on an investment in the Fund assuming reinvestment of dividends Total return would have been higher or lower if certain expenses had not been reimbursed, waived or recouped. |
| (E) | This expense decrease from the voluntary waiver is reflected in both the net expense and the net investment income ratios shown. |
| (F) | Recognition of net investment income (loss) by the Fund is affected by the timing of the declaration of dividends by the underlying investment companies in which the Fund invests. |
The accompanying notes are an integral part of these financial statements.
| Timothy Large/Mid Cap Value Fund (Class I Shares) |
Selected data based on a share outstanding throughout each year
| | | For the Year | | | For the Year | | | For the Year | | | For the Year | | | For the Year | |
| | | ended | | | ended | | | ended | | | ended | | | ended | |
| | | September 30, | | | September 30, | | | September 30, | | | September 30, | | | September 30, | |
| | | 2021 | | | 2020 | | | 2019 | | | 2018 | | | 2017 | |
| Net asset value, beginning of year | | $ | 17.63 | | | $ | 19.05 | | | $ | 20.58 | | | $ | 19.34 | | | $ | 17.27 | |
| INCOME FROM INVESTMENT OPERATIONS: | | | | | | | | | | | | | | | | | | | | |
| Net investment income (A) | | | 0.04 | | | | 0.07 | | | | 0.14 | | | | 0.13 | | | | 0.10 | |
| Net realized and unrealized gain on | | | 5.18 | | | | 0.74 | | | | 0.11 | | | | 2.45 | | | | 2.19 | |
| investments Total from investment operations | | | 5.22 | | | | 0.81 | | | | 0.25 | | | | 2.58 | | | | 2.29 | |
| LESS DISTRIBUTIONS: | | | | | | | | | | | | | | | | | | | | |
| From net investment income | | | (0.08 | ) | | | (0.13 | ) | | | (0.11 | ) | | | (0.07 | ) | | | — | |
| From net realized gains on investments | | | (0.63 | ) | | | (2.10 | ) | | | (1.67 | ) | | | (1.27 | ) | | | (0.22 | ) |
| Total distributions | | | (0.71 | ) | | | (2.23 | ) | | | (1.78 | ) | | | (1.34 | ) | | | (0.22 | ) |
| Net asset value, end of year | | $ | 22.14 | | | $ | 17.63 | | | $ | 19.05 | | | $ | 20.58 | | | $ | 19.34 | |
| Total return (B) | | | 30.20 | % | | | 4.24 | % | | | 2.78 | % | | | 13.83 | % | | | 13.36 | % |
| RATIOS/SUPPLEMENTAL DATA: | | | | | | | | | | | | | | | | | | | | |
| Net assets, end of year (in 000’s) | | $ | 77,776 | | | $ | 47,340 | | | $ | 47,477 | | | $ | 35,573 | | | $ | 19,384 | |
| Ratios to average net assets | | | | | | | | | | | | | | | | | | | | |
| Expenses, before waiver and reimbursement | | | 1.20 | % | | | 1.26 | % | | | 1.26 | % | | | 1.21 | % | | | 1.23 | % |
| Expenses, net waiver and reimbursement (C) | | | 1.05 | % | | | 1.16 | % | | | 1.16 | % | | | 1.10 | % | | | 1.14 | % |
| Net investment income, before waiver and reimbursement | | | 0.08 | % | | | 0.31 | % | | | 0.66 | % | | | 0.54 | % | | | 0.46 | % |
| Net investment income, net waiver and reimbursement (C)(D) | | | 0.23 | % | | | 0.41 | % | | | 0.77 | % | | | 0.65 | % | | | 0.55 | % |
| Portfolio turnover rate | | | 33 | % | | | 26 | % | | | 51 | % | | | 24 | % | | | 39 | % |
| (A) | Per share amounts calculated using average shares method, which more appropriately presents the per share data for the period. |
| (B) | Total return in the above table represents the rate that the investor would have earned or lost on an investment in the Fund assuming reinvestment of dividends Total return would have been higher or lower if certain expenses had not been reimbursed, waived or recouped. |
| (C) | This expense decrease from the voluntary waiver is reflected in both the net expense and the net investment income ratios shown. |
| (D) | Recognition of net investment income (loss) by the Fund is affected by the timing of the declaration of dividends by the underlying investment companies in which the Fund invests. |
The accompanying notes are an integral part of these financial statements.
| Timothy Fixed Income Fund (Class A Shares) |
Selected data based on a share outstanding throughout each year
| | | For the Year | | | For the Year | | | For the Year | | | For the Year | | | For the Year | |
| | | ended | | | ended | | | ended | | | ended | | | ended | |
| | | September 30, | | | September 30, | | | September 30, | | | September 30, | | | September 30, | |
| | | 2021 | | | 2020 | | | 2019 | | | 2018 | | | 2017 | |
| Net asset value, beginning of year | | $ | 10.80 | | | $ | 10.39 | | | $ | 9.81 | | | $ | 10.22 | | | $ | 10.47 | |
| INCOME (LOSS) FROM INVESTMENT OPERATIONS: | | | | | | | | | | | | | | | | | | | | |
| Net investment income (A) | | | 0.03 | | | | 0.12 | | | | 0.16 | | | | 0.16 | | | | 0.13 | |
| Net realized and unrealized gain (loss) on investments | | | (0.27 | ) | | | 0.44 | | | | 0.60 | | | | (0.39 | ) | | | (0.22 | ) |
| Total from investment operations | | | (0.24 | ) | | | 0.56 | | | | 0.76 | | | | (0.23 | ) | | | (0.09 | ) |
| LESS DISTRIBUTIONS: | | | | | | | | | | | | | | | | | | | | |
| From net investment income | | | (0.12 | ) | | | (0.15 | ) | | | (0.18 | ) | | | (0.18 | ) | | | (0.16 | ) |
| From net realized gains on investments | | | — | | | | — | | | | — | | | | — | | | | — | |
| Total distributions | | | (0.12 | ) | | | (0.15 | ) | | | (0.18 | ) | | | (0.18 | ) | | | (0.16 | ) |
| Net asset value, end of year | | $ | 10.44 | | | $ | 10.80 | | | $ | 10.39 | | | $ | 9.81 | | | $ | 10.22 | |
| Total return (B)(C) | | | (2.20 | )% | | | 5.39 | % | | | 7.76 | % | | | (2.31 | )% | | | (0.81 | )% |
| RATIOS/SUPPLEMENTAL DATA: | | | | | | | | | | | | | | | | | | | | |
| Net assets, end of year (in 000’s) | | $ | 96,586 | | | $ | 91,403 | | | $ | 85,375 | | | $ | 66,119 | | | $ | 75,858 | |
| Ratios to average net assets | | | | | | | | | | | | | | | | | | | | |
| Expenses, before waiver and reimbursement | | | 1.34 | % | | | 1.30 | % | | | 1.30 | % | | | 1.30 | % | | | 1.30 | % |
| Expenses, net waiver and reimbursement (D) | | | 1.14 | % | | | 1.10 | % | | | 1.13 | % | | | 1.10 | % | | | 1.10 | % |
| Net investment income, before waiver and reimbursement | | | 0.11 | % | | | 0.90 | % | | | 1.46 | % | | | 1.40 | % | | | 1.05 | % |
| Net investment income, net waiver and reimbursement (D) | | | 0.31 | % | | | 1.10 | % | | | 1.62 | % | | | 1.60 | % | | | 1.25 | % |
| Portfolio turnover rate | | | 45 | % | | | 32 | % | | | 53 | % | | | 30 | % | | | 43 | % |
| (A) | Per share amounts calculated using average shares method, which more appropriately presents the per share data for the period. |
| (B) | Total return calculation does not reflect sales load. |
| (C) | Total return in the above table represents the rate that the investor would have earned or lost on an investment in the Fund assuming reinvestment of dividends. Total return would have been higher or lower if certain expenses had not been reimbursed, waived or recouped. |
| (D) | This expense decrease from the voluntary waiver is reflected in both the net expense and the net investment income ratios shown. |
The accompanying notes are an integral part of these financial statements.
| Timothy Fixed Income Fund (Class C Shares) |
Selected data based on a share outstanding throughout each year
| | | For the Year | | | For the Year | | | For the Year | | | For the Year | | | For the Year | |
| | | ended | | | ended | | | ended | | | ended | | | ended | |
| | | September 30, | | | September 30, | | | September 30, | | | September 30, | | | September 30, | |
| | | 2021 | | | 2020 | | | 2019 | | | 2018 | | | 2017 | |
| Net asset value, beginning of year | | $ | 10.38 | | | $ | 9.99 | | | $ | 9.44 | | | $ | 9.85 | | | $ | 10.09 | |
| INCOME (LOSS) FROM INVESTMENT OPERATIONS: | | | | | | | | | | | | | | | | | | | | |
| Net investment income (loss)(A) | | | (0.04 | ) | | | 0.04 | | | | 0.09 | | | | 0.08 | | | | 0.05 | |
| Net realized and unrealized gain (loss) on investments | | | (0.27 | ) | | | 0.42 | | | | 0.57 | | | | (0.39 | ) | | | (0.20 | ) |
| Total from investment operations | | | (0.31 | ) | | | 0.46 | | | | 0.66 | | | | (0.31 | ) | | | (0.15 | ) |
| LESS DISTRIBUTIONS: | | | | | | | | | | | | | | | | | | | | |
| From net investment income | | | (0.03 | ) | | | (0.07 | ) | | | (0.11 | ) | | | (0.10 | ) | | | (0.09 | ) |
| From net realized gains on investments | | | — | | | | — | | | | — | | | | — | | | | — | |
| Total distributions | | | (0.03 | ) | | | (0.07 | ) | | | (0.11 | ) | | | (0.10 | ) | | | (0.09 | ) |
| Net asset value, end of year | | $ | 10.04 | | | $ | 10.38 | | | $ | 9.99 | | | $ | 9.44 | | | $ | 9.85 | |
| Total return (B)(C) | | | (2.99 | )% | | | 4.59 | % | | | 7.06 | % | | | (3.15 | )% | | | (1.49 | )% |
| RATIOS/SUPPLEMENTAL DATA: | | | | | | | | | | | | | | | | | | | | |
| Net assets, end of year (in 000’s) | | $ | 11,369 | | | $ | 9,320 | | | $ | 8,502 | | | $ | 9,653 | | | $ | 9,637 | |
| Ratios to average net assets | | | | | | | | | | | | | | | | | | | | |
| Expenses, before waiver and reimbursement | | | 2.09 | % | | | 2.05 | % | | | 2.05 | % | | | 2.05 | % | | | 2.06 | % |
| Expenses, net waiver and reimbursement (D) | | | 1.89 | % | | | 1.85 | % | | | 1.88 | % | | | 1.85 | % | | | 1.86 | % |
| Net investment income (loss), before waiver and reimbursement | | | (0.64 | )% | | | 0.15 | % | | | 0.72 | % | | | 0.65 | % | | | 0.30 | % |
| Net investment income (loss), net waiver and reimbursement (D) | | | (0.44 | )% | | | 0.35 | % | | | 0.89 | % | | | 0.85 | % | | | 0.50 | % |
| Portfolio turnover rate | | | 45 | % | | | 32 | % | | | 53 | % | | | 30 | % | | | 43 | % |
| (A) | Per share amounts calculated using average shares method, which more appropriately presents the per share data for the period. |
| (B) | Total return calculation does not reflect redemption fee. |
| (C) | Total return in the above table represents the rate that the investor would have earned or lost on an investment in the Fund assuming reinvestment of dividends Total return would have been higher or lower if certain expenses had not been reimbursed, waived or recouped. |
| (D) | This expense decrease from the voluntary waiver is reflected in both the net expense and the net investment income ratios shown. |
The accompanying notes are an integral part of these financial statements.
| Timothy Fixed Income Fund (Class I Shares) |
| |
Selected data based on a share outstanding throughout each year
| | | For the Year | | | For the Year | | | For the Year | | | For the Year | | | For the Year | |
| | | ended | | | ended | | | ended | | | ended | | | ended | |
| | | September 30, | | | September 30, | | | September 30, | | | September 30, | | | September 30, | |
| | | 2021 | | | 2020 | | | 2019 | | | 2018 | | | 2017 | |
| Net asset value, beginning of year | | $ | 10.73 | | | $ | 10.32 | | | $ | 9.74 | | | $ | 10.15 | | | $ | 10.41 | |
| INCOME (LOSS) FROM INVESTMENT OPERATIONS: | | | | | | | | | | | | | | | | | | | | |
| Net investment income (A) | | | 0.06 | | | | 0.14 | | | | 0.19 | | | | 0.18 | | | | 0.16 | |
| Net realized and unrealized gain (loss) on investments | | | (0.28 | ) | | | 0.44 | | | | 0.59 | | | | (0.39 | ) | | | (0.23 | ) |
| Total from investment operations | | | (0.22 | ) | | | 0.58 | | | | 0.78 | | | | (0.21 | ) | | | (0.07 | ) |
| LESS DISTRIBUTIONS: | | | | | | | | | | | | | | | | | | | | |
| From net investment income | | | (0.17 | ) | | | (0.17 | ) | | | (0.20 | ) | | | (0.20 | ) | | | (0.19 | ) |
| From net realized gains on investments | | | — | | | | — | | | | — | | | | — | | | | — | |
| Total distributions | | | (0.17 | ) | | | (0.17 | ) | | | (0.20 | ) | | | (0.20 | ) | | | (0.19 | ) |
| Net asset value, end of year | | $ | 10.34 | | | $ | 10.73 | | | $ | 10.32 | | | $ | 9.74 | | | $ | 10.15 | |
| Total return (B) | | | (2.07 | )% | | | 5.70 | % | | | 8.05 | % | | | (2.06 | )% | | | (0.64 | )% |
| RATIOS/SUPPLEMENTAL DATA: | | | | | | | | | | | | | | | | | | | | |
| Net assets, end of year (in 000’s) | | $ | 18,389 | | | $ | 13,215 | | | $ | 8,095 | | | $ | 3,208 | | | $ | 2,134 | |
| Ratios to average net assets | | | | | | | | | | | | | | | | | | | | |
| Expenses, before waiver and reimbursement | | | 1.09 | % | | | 1.05 | % | | | 1.05 | % | | | 1.05 | % | | | 1.08 | % |
| Expenses, net waiver and reimbursement (C) | | | 0.89 | % | | | 0.85 | % | | | 0.88 | % | | | 0.85 | % | | | 0.88 | % |
| Net investment income, before waiver and reimbursement | | | 0.36 | % | | | 1.12 | % | | | 1.68 | % | | | 1.66 | % | | | 1.37 | % |
| Net investment income, net waiver and reimbursement (C) | | | 0.56 | % | | | 1.32 | % | | | 1.86 | % | | | 1.86 | % | | | 1.57 | % |
| Portfolio turnover rate | | | 45 | % | | | 32 | % | | | 53 | % | | | 30 | % | | | 43 | % |
| | | | | | | | | | | | | | | | | | | | | |
| (A) | Per share amounts calculated using average shares method, which more appropriately presents the per share data for the period. |
| (B) | Total return in the above table represents the rate that the investor would have earned or lost on an investment in the Fund assuming reinvestment of dividends Total return would have been higher or lower if certain expenses had not been reimbursed, waived or recouped. |
| (C) | This expense decrease from the voluntary waiver is reflected in both the net expense and the net investment income ratios shown |
The accompanying notes are an integral part of these financial statements.
| Timothy High Yield Bond Fund (Class A Shares) |
| |
Selected data based on a share outstanding throughout each year
| | | For the Year | | | For the Year | | | For the Year | | | For the Year | | | For the Year | |
| | | ended | | | ended | | | ended | | | ended | | | ended | |
| | | September 30, | | | September 30, | | | September 30, | | | September 30, | | | September 30, | |
| | | 2021 | | | 2020 | | | 2019 | | | 2018 | | | 2017 | |
| Net asset value, beginning of year | | $ | 9.26 | | | $ | 9.39 | | | $ | 9.02 | | | $ | 9.40 | | | $ | 9.11 | |
| INCOME (LOSS) FROM INVESTMENT OPERATIONS: | | | | | | | | | | | | | | | | | | | | |
| Net investment income (A) | | | 0.41 | | | | 0.43 | | | | 0.39 | | | | 0.34 | | | | 0.34 | |
| Net realized and unrealized gain (loss) on investments | | | 0.64 | | | | (0.15 | ) | | | 0.36 | | | | (0.36 | ) | | | 0.28 | |
| Total from investment operations | | | 1.05 | | | | 0.28 | | | | 0.75 | | | | (0.02 | ) | | | 0.62 | |
| LESS DISTRIBUTIONS: | | | | | | | | | | | | | | | | | | | | |
| From net investment income | | | (0.40 | ) | | | (0.41 | ) | | | (0.38 | ) | | | (0.36 | ) | | | (0.33 | ) |
| Total distributions | | | (0.40 | ) | | | (0.41 | ) | | | (0.38 | ) | | | (0.36 | ) | | | (0.33 | ) |
| Net asset value, end of year | | $ | 9.91 | | | $ | 9.26 | | | $ | 9.39 | | | $ | 9.02 | | | $ | 9.40 | |
| Total return (B)(C) | | | 11.42 | % | | | 3.26 | % | | | 8.50 | % | | | (0.17 | )% | | | 6.94 | % |
| RATIOS/SUPPLEMENTAL DATA: | | | | | | | | | | | | | | | | | | | | |
| Net assets, end of year (in 000’s) | | $ | 64,216 | | | $ | 45,940 | | | $ | 39,777 | | | $ | 41,991 | | | $ | 52,950 | |
| Ratios to average net assets | | | | | | | | | | | | | | | | | | | | |
| Expenses, before waiver and reimbursement | | | 1.38 | % | | | 1.34 | % | | | 1.35 | % | | | 1.44 | % | | | 1.32 | % |
| Expenses, net waiver and reimbursement (D) | | | 1.33 | % | | | 1.29 | % | | | 1.31 | % | | | 1.39 | % | | | 1.27 | % |
| Net investment income, before waiver and reimbursement | | | 4.15 | % | | | 4.61 | % | | | 4.24 | % | | | 3.67 | % | | | 3.66 | % |
| Net investment income, net waiver and reimbursement (D) | | | 4.20 | % | | | 4.66 | % | | | 4.28 | % | | | 3.72 | % | | | 3.71 | % |
| Portfolio turnover rate | | | 57 | % | | | 91 | % | | | 75 | % | | | 12 | % | | | 45 | % |
| | | | | | | | | | | | | | | | | | | | | |
| (A) | Per share amounts calculated using average shares method, which more appropriately presents the per share data for the period. |
| (B) | Total return calculation does not reflect sales load. |
| (C) | Total return in the above table represents the rate that the investor would have earned or lost on an investment in the Fund assuming reinvestment of dividends Total return would have been higher or lower if certain expenses had not been reimbursed, waived or recouped. |
| (D) | This expense decrease from the voluntary waiver is reflected in both the net expense and the net investment income ratios shown |
The accompanying notes are an integral part of these financial statements.
| Timothy High Yield Bond Fund (Class C Shares) |
| |
Selected data based on a share outstanding throughout each year
| | | For the Year | | | For the Year | | | For the Year | | | For the Year | | | For the Year | |
| | | ended | | | ended | | | ended | | | ended | | | ended | |
| | | September 30, | | | September 30, | | | September 30, | | | September 30, | | | September 30, | |
| | | 2021 | | | 2020 | | | 2019 | | | 2018 | | | 2017 | |
| Net asset value, beginning of year | | $ | 9.40 | | | $ | 9.52 | | | $ | 9.14 | | | $ | 9.51 | | | $ | 9.22 | |
| INCOME (LOSS) FROM INVESTMENT OPERATIONS: | | | | | | | | | | | | | | | | | | | | |
| Net investment income (A) | | | 0.34 | | | | 0.36 | | | | 0.32 | | | | 0.28 | | | | 0.28 | |
| Net realized and unrealized gain (loss) on investments | | | 0.66 | | | | (0.14 | ) | | | 0.36 | | | | (0.36 | ) | | | 0.27 | |
| Total from investment operations | | | 1.00 | | | | 0.22 | | | | 0.68 | | | | (0.08 | ) | | | 0.55 | |
| LESS DISTRIBUTIONS: | | | | | | | | | | | | | | | | | | | | |
| From net investment income | | | (0.32 | ) | | | (0.34 | ) | | | (0.30 | ) | | | (0.29 | ) | | | (0.26 | ) |
| Total distributions | | | (0.32 | ) | | | (0.34 | ) | | | (0.30 | ) | | | (0.29 | ) | | | (0.26 | ) |
| Net asset value, end of year | | $ | 10.08 | | | $ | 9.40 | | | $ | 9.52 | | | $ | 9.14 | | | $ | 9.51 | |
| Total return (B)(C) | | | 10.71 | % | | | 2.45 | % | | | 7.63 | % | | | (0.85 | )% | | | 6.04 | % |
| RATIOS/SUPPLEMENTAL DATA: | | | | | | | | | | | | | | | | | | | | |
| Net assets, end of year (in 000’s) | | $ | 3,138 | | | $ | 2,427 | | | $ | 2,660 | | | $ | 3,219 | | | $ | 3,539 | |
| Ratios to average net assets | | | | | | | | | | | | | | | | | | | | |
| Expenses, before waiver and reimbursement | | | 2.13 | % | | | 2.09 | % | | | 2.10 | % | | | 2.19 | % | | | 2.07 | % |
| Expenses, net waiver and reimbursement (D) | | | 2.08 | % | | | 2.04 | % | | | 2.06 | % | | | 2.14 | % | | | 2.02 | % |
| Net investment income, before waiver and reimbursement | | | 3.40 | % | | | 3.84 | % | | | 3.46 | % | | | 2.92 | % | | | 2.91 | % |
| Net investment income, net waiver and reimbursement (D) | | | 3.45 | % | | | 3.89 | % | | | 3.50 | % | | | 2.97 | % | | | 2.96 | % |
| Portfolio turnover rate | | | 57 | % | | | 91 | % | | | 75 | % | | | 12 | % | | | 45 | % |
| | | | | | | | | | | | | | | | | | | | | |
| (A) | Per share amounts calculated using average shares method, which more appropriately presents the per share data for the period. |
| (B) | Total return calculation does not reflect redemption fee. |
| (C) | Total return in the above table represents the rate that the investor would have earned or lost on an investment in the Fund assuming reinvestment of dividends Total return would have been higher or lower if certain expenses had not been reimbursed, waived or recouped. |
| (D) | This expense decrease from the voluntary waiver is reflected in both the net expense and the net investment income ratios shown |
The accompanying notes are an integral part of these financial statements.
| Timothy High Yield Bond Fund (Class I Shares) |
| |
Selected data based on a share outstanding throughout each year
| | | For the Year | | | For the Year | | | For the Year | | | For the Year | | | For the Year | |
| | | ended | | | ended | | | ended | | | ended | | | ended | |
| | | September 30, | | | September 30, | | | September 30, | | | September 30, | | | September 30, | |
| | | 2021 | | | 2020 | | | 2019 | | | 2018 | | | 2017 | |
| Net asset value, beginning of year | | $ | 9.26 | | | $ | 9.39 | | | $ | 9.02 | | | $ | 9.41 | | | $ | 9.12 | |
| INCOME (LOSS) FROM INVESTMENT OPERATIONS: | | | | | | | | | | | | | | | | | | | | |
| Net investment income (A) | | | 0.44 | | | | 0.45 | | | | 0.42 | | | | 0.36 | | | | 0.37 | |
| Net realized and unrealized gain (loss) on investments | | | 0.63 | | | | (0.14 | ) | | | 0.35 | | | | (0.36 | ) | | | 0.28 | |
| Total from investment operations | | | 1.07 | | | | 0.31 | | | | 0.77 | | | | 0.00 | | | | 0.65 | |
| LESS DISTRIBUTIONS: | | | | | | | | | | | | | | | | | | | | |
| From net investment income | | | (0.42 | ) | | | (0.44 | ) | | | (0.40 | ) | | | (0.39 | ) | | | (0.36 | ) |
| Total distributions | | | (0.42 | ) | | | (0.44 | ) | | | (0.40 | ) | | | (0.39 | ) | | | (0.36 | ) |
| Net asset value, end of year | | $ | 9.91 | | | $ | 9.26 | | | $ | 9.39 | | | $ | 9.02 | | | $ | 9.41 | |
| Total return (B) | | | 11.71 | % | | | 3.53 | % | | | 8.78 | % | | | 0.00 | % | | | 7.21 | % |
| RATIOS/SUPPLEMENTAL DATA: | | | | | | | | | | | | | | | | | | | | |
| Net assets, end of year (in 000’s) | | $ | 69,150 | | | $ | 30,924 | | | $ | 18,363 | | | $ | 11,578 | | | $ | 9,717 | |
| Ratios to average net assets | | | | | | | | | | | | | | | | | | | | |
| Expenses, before waiver and reimbursement | | | 1.13 | % | | | 1.09 | % | | | 1.10 | % | | | 1.19 | % | | | 1.06 | % |
| Expenses, net waiver and reimbursement (C) | | | 1.08 | % | | | 1.04 | % | | | 1.06 | % | | | 1.14 | % | | | 1.01 | % |
| Net investment income, before waiver and reimbursement | | | 4.40 | % | | | 4.86 | % | | | 4.52 | % | | | 3.92 | % | | | 3.89 | % |
| Net investment income, net waiver and reimbursement (C) | | | 4.45 | % | | | 4.91 | % | | | 4.56 | % | | | 3.97 | % | | | 3.94 | % |
| Portfolio turnover rate | | | 57 | % | | | 91 | % | | | 75 | % | | | 12 | % | | | 45 | % |
| | | | | | | | | | | | | | | | | | | | | |
| (A) | Per share amounts calculated using average shares method, which more appropriately presents the per share data for the period. |
| (B) | Total return in the above table represents the rate that the investor would have earned or lost on an investment in the Fund assuming reinvestment of dividends Total return would have been higher or lower if certain expenses had not been reimbursed, waived or recouped. |
| (C) | This expense decrease from the voluntary waiver is reflected in both the net expense and the net investment income ratios shown |
The accompanying notes are an integral part of these financial statements.
| Timothy Israel Common Values Fund (Class A Shares) |
| |
Selected data based on a share outstanding throughout each year
| | | For the Year | | | For the Year | | | For the Year | | | For the Year | | | For the Year | |
| | | ended | | | ended | | | ended | | | ended | | | ended | |
| | | September 30, | | | September 30, | | | September 30, | | | September 30, | | | September 30, | |
| | | 2021 | | | 2020 | | | 2019 | | | 2018 | | | 2017 | |
| Net asset value, beginning of year | | $ | 16.55 | | | $ | 17.84 | | | $ | 15.74 | | | $ | 14.91 | | | $ | 12.45 | |
| INCOME (LOSS) FROM INVESTMENT OPERATIONS: | | | | | | | | | | | | | | | | | | | | |
| Net investment income (loss)(A) | | | (0.10 | ) | | | (0.10 | ) | | | 0.00 | * | | | (0.04 | ) | | | 0.07 | |
| Net realized and unrealized gain (loss) on investments | | | 8.25 | | | | (1.01 | ) | | | 2.20 | | | | 1.07 | | | | 2.58 | |
| Total from investment operations | | | 8.15 | | | | (1.11 | ) | | | 2.20 | | | | 1.03 | | | | 2.65 | |
| LESS DISTRIBUTIONS: | | | | | | | | | | | | | | | | | | | | |
| From net investment income | | | — | | | | (0.18 | ) | | | — | | | | (0.14 | ) | | | (0.19 | ) |
| From net realized gains on investments | | | — | | | | — | | | | (0.10 | ) | | | — | | | | — | |
| Return of Capital | | | — | | | | 0.00 | * | | | — | | | | (0.06 | ) | | | — | |
| Total distributions | | | — | | | | (0.18 | ) | | | (0.10 | ) | | | (0.20 | ) | | | (0.19 | ) |
| Net asset value, end of year | | $ | 24.70 | | | $ | 16.55 | | | $ | 17.84 | | | $ | 15.74 | | | $ | 14.91 | |
| Total return (B)(C) | | | 49.24 | % | | | (6.35 | )% | | | 14.12 | % | | | 7.00 | % | | | 21.62 | % |
| RATIOS/SUPPLEMENTAL DATA: | | | | | | | | | | | | | | | | | | | | |
| Net assets, end of year (in 000’s) | | $ | 57,667 | | | $ | 36,800 | | | $ | 49,123 | | | $ | 41,137 | | | $ | 34,958 | |
| Ratio of expenses to average net assets | | | 1.72 | % | | | 1.84 | % | | | 1.76 | % | | | 1.84 | % | | | 1.80 | % |
| Ratio of net investment income (loss) to average net assets | | | (0.48 | )% | | | (0.62 | )% | | | 0.02 | % | | | (0.27 | )% | | | 0.54 | % |
| Portfolio turnover rate | | | 12 | % | | | 16 | % | | | 23 | % | | | 9 | % | | | 10 | % |
| | | | | | | | | | | | | | | | | | | | | |
| * | Amount is less than $0.005 per share. |
| (A) | Per share amounts calculated using average shares method, which more appropriately presents the per share data for the period. |
| (B) | Total return calculation does not reflect sales load. |
| (C) | Total return in the above table represents the rate that the investor would have earned or lost on an investment in the Fund assuming reinvestment of dividends. |
The accompanying notes are an integral part of these financial statements.
| Timothy Israel Common Values Fund (Class C Shares) |
| |
Selected data based on a share outstanding throughout each year
| | | For the Year | | | For the Year | | | For the Year | | | For the Year | | | For the Year | |
| | | ended | | | ended | | | ended | | | ended | | | ended | |
| | | September 30, | | | September 30, | | | September 30, | | | September 30, | | | September 30, | |
| | | 2021 | | | 2020 | | | 2019 | | | 2018 | | | 2017 | |
| Net asset value, beginning of year | | $ | 15.73 | | | $ | 16.97 | | | $ | 15.09 | | | $ | 14.33 | | | $ | 12.01 | |
| INCOME (LOSS) FROM INVESTMENT OPERATIONS: | | | | | | | | | | | | | | | | | | | | |
| Net investment loss (A) | | | (0.26 | ) | | | (0.22 | ) | | | (0.12 | ) | | | (0.15 | ) | | | (0.03 | ) |
| Net realized and unrealized gain (loss) on investments | | | 7.82 | | | | (0.96 | ) | | | 2.10 | | | | 1.03 | | | | 2.48 | |
| Total from investment operations | | | 7.56 | | | | (1.18 | ) | | | 1.98 | | | | 0.88 | | | | 2.45 | |
| LESS DISTRIBUTIONS: | | | | | | | | | | | | | | | | | | | | |
| From net investment income | | | — | | | | (0.06 | ) | | | — | | | | (0.07 | ) | | | (0.13 | ) |
| From net realized gains on investments | | | — | | | | — | | | | (0.10 | ) | | | — | | | | — | |
| Return of Capital | | | — | | | | 0.00 | * | | | — | | | | (0.05 | ) | | | — | |
| Total distributions | | | — | | | | (0.06 | ) | | | (0.10 | ) | | | (0.12 | ) | | | (0.13 | ) |
| Net asset value, end of year | | $ | 23.29 | | | $ | 15.73 | | | $ | 16.97 | | | $ | 15.09 | | | $ | 14.33 | |
| Total return (B)(C) | | | 48.06 | % | | | (7.00 | )% | | | 13.26 | % | | | 6.20 | % | | | 20.60 | % |
| RATIOS/SUPPLEMENTAL DATA: | | | | | | | | | | | | | | | | | | | | |
| Net assets, end of year (in 000’s) | | $ | 12,293 | | | $ | 9,076 | | | $ | 9,750 | | | $ | 9,220 | | | $ | 7,905 | |
| Ratio of expenses to average net assets | | | 2.47 | % | | | 2.59 | % | | | 2.51 | % | | | 2.59 | % | | | 2.56 | % |
| Ratio of net investment loss to average net assets | | | (1.27 | )% | | | (1.37 | )% | | | (0.75 | )% | | | (1.01 | )% | | | (0.21 | )% |
| Portfolio turnover rate | | | 12 | % | | | 16 | % | | | 23 | % | | | 9 | % | | | 10 | % |
| | | | | | | | | | | | | | | | | | | | | |
| * | Amount is less than $0.005 per share. |
| (A) | Per share amounts calculated using average shares method, which more appropriately presents the per share data for the period. |
| (B) | Total return calculation does not reflect redemption fee. |
| (C) | Total return in the above table represents the rate that the investor would have earned or lost on an investment in the Fund assuming reinvestment of dividends. |
The accompanying notes are an integral part of these financial statements.
| Timothy Israel Common Values Fund (Class I Shares) |
| |
Selected data based on a share outstanding throughout each year
| | | For the Year | | | For the Year | | | For the Year | | | For the Year | | | For the Year | |
| | | ended | | | ended | | | ended | | | ended | | | ended | |
| | | September 30, | | | September 30, | | | September 30, | | | September 30, | | | September 30, | |
| | | 2021 | | | 2020 | | | 2019 | | | 2018 | | | 2017 | |
| Net asset value, beginning of year | | $ | 16.68 | | | $ | 17.97 | | | $ | 15.81 | | | $ | 14.97 | | | $ | 12.50 | |
| INCOME (LOSS) FROM INVESTMENT OPERATIONS: | | | | | | | | | | | | | | | | | | | | |
| Net investment income (loss) (A) | | | (0.05 | ) | | | (0.06 | ) | | | 0.06 | | | | 0.01 | | | | 0.12 | |
| Net realized and unrealized gain (loss) on investments | | | 8.32 | | | | (1.01 | ) | | | 2.20 | | | | 1.06 | (B) | | | 2.57 | (B) |
| Total from investment operations | | | 8.27 | | | | (1.07 | ) | | | 2.26 | | | | 1.07 | | | | 2.69 | |
| LESS DISTRIBUTIONS: | | | | | | | | | | | | | | | | | | | | |
| From net investment income | | | — | | | | (0.22 | ) | | | — | | | | (0.04 | ) | | | (0.22 | ) |
| From net realized gains on investments | | | — | | | | — | | | | (0.10 | ) | | | — | | | | — | |
| Return of Capital | | | — | | | | 0.00 | * | | | — | | | | (0.19 | ) | | | — | |
| Total distributions | | | — | | | | (0.22 | ) | | | (0.10 | ) | | | (0.23 | ) | | | (0.22 | ) |
| Net asset value, end of year | | $ | 24.95 | | | $ | 16.68 | | | $ | 17.97 | | | $ | 15.81 | | | $ | 14.97 | |
| Total return (C) | | | 49.58 | % | | | (6.08 | )% | | | 14.44 | % | | | 7.22 | % | | | 21.87 | % |
| RATIOS/SUPPLEMENTAL DATA: | | | | | | | | | | | | | | | | | | | | |
| Net assets, end of year (in 000’s) | | $ | 45,063 | | | $ | 23,928 | | | $ | 21,533 | | | $ | 10,084 | | | $ | 2,189 | |
| Ratio of expenses to average net assets | | | 1.47 | % | | | 1.59 | % | | | 1.51 | % | | | 1.69 | % | | | 1.56 | % |
| Ratio of net investment income (loss) to average net assets | | | (0.22 | )% | | | (0.37 | )% | | | 0.38 | % | | | 0.05 | % | | | 0.83 | % |
| Portfolio turnover rate | | | 12 | % | | | 16 | % | | | 23 | % | | | 9 | % | | | 10 | % |
| | | | | | | | | | | | | | | | | | | | | |
| * | Amount is less than $0.005 per share. |
| (A) | Per share amounts calculated using average shares method, which more appropriately presents the per share data for the period. |
| (B) | Realized and unrealized gains per share in this caption are balancing amounts necessary to reconcile the change in net asset value per share for the period, and may not reconcile with aggregate gains and losses in the Statement of Operations due to the timing of share transactions for the period. |
| (C) | Total return in the above table represents the rate that the investor would have earned or lost on an investment in the Fund assuming reinvestment of dividends. |
The accompanying notes are an integral part of these financial statements.
| Timothy Defensive Strategies Fund (Class A Shares) |
| |
Selected data based on a share outstanding throughout each year
| | | For the Year | | | For the Year | | | For the Year | | | For the Year | | | For the Year | |
| | | ended | | | ended | | | ended | | | ended | | | ended | |
| | | September 30, | | | September 30, | | | September 30, | | | September 30, | | | September 30, | |
| | | 2021 | | | 2020 | | | 2019 | | | 2018 | | | 2017 | |
| Net asset value, beginning of year | | $ | 11.78 | | | $ | 11.69 | | | $ | 11.44 | | | $ | 11.37 | | | $ | 11.49 | |
| INCOME (LOSS) FROM INVESTMENT OPERATIONS: | | | | | | | | | | | | | | | | | | | | |
| Net investment income (loss) (A) | | | 0.10 | | | | (0.01 | ) | | | 0.06 | | | | 0.10 | | | | 0.00 | * |
| Net realized and unrealized gain (loss) on investments | | | 1.64 | | | | 0.44 | | | | 0.48 | | | | (0.01 | ) | | | (0.08 | ) |
| Total from investment operations | | | 1.74 | | | | 0.43 | | | | 0.54 | | | | 0.09 | | | | (0.08 | ) |
| LESS DISTRIBUTIONS: | | | | | | | | | | | | | | | | | | | | |
| From net investment income | | | — | | | | (0.06 | ) | | | (0.11 | ) | | | (0.02 | ) | | | (0.04 | ) |
| From net realized gains on investments | | | — | | | | (0.28 | ) | | | (0.18 | ) | | | — | | | | — | |
| Return of capital | | | — | | | | 0.00 | * | | | — | | | | — | | | | — | |
| Total distributions | | | — | | | | (0.34 | ) | | | (0.29 | ) | | | (0.02 | ) | | | (0.04 | ) |
| Net asset value, end of year | | $ | 13.52 | | | $ | 11.78 | | | $ | 11.69 | | | $ | 11.44 | | | $ | 11.37 | |
| Total return (B)(C) | | | 14.77 | % | | | 3.75 | % | | | 4.92 | % | | | 0.75 | % | | | (0.72 | )% |
| RATIOS/SUPPLEMENTAL DATA: | | | | | | | | | | | | | | | | | | | | |
| Net assets, end of year (in 000’s) | | $ | 40,342 | | | $ | 29,577 | | | $ | 33,926 | | | $ | 40,573 | | | $ | 50,080 | |
| Ratios to average net assets | | | | | | | | | | | | | | | | | | | | |
| Expenses, before waiver and reimbursement | | | 1.48 | % | | | 1.54 | % | | | 1.45 | % | | | 1.41 | % | | | 1.44 | % |
| Expenses, net waiver and reimbursement (D) | | | 1.43 | % | | | 1.49 | % | | | 1.41 | % | | | 1.36 | % | | | 1.39 | % |
| Net investment income (loss), before waiver and reimbursement | | | 0.74 | % | | | (0.13 | )% | | | 0.52 | % | | | 0.86 | % | | | (0.05 | )% |
| Net investment income (loss), net waiver and reimbursement (D) | | | 0.79 | % | | | (0.08 | )% | | | 0.56 | % | | | 0.91 | % | | | 0.00 | % |
| Portfolio turnover rate | | | 34 | % | | | 49 | % | | | 34 | % | | | 35 | % | | | 51 | % |
| | | | | | | | | | | | | | | | | | | | | |
| * | Amount is less than $0.005 per share. |
| (A) | Per share amounts calculated using average shares method, which more appropriately presents the per share data for the period. |
| (B) | Total return calculation does not reflect sales load. Total return represents aggregate total return based on Net Asset Value. |
| (C) | Total return in the above table represents the rate that the investor would have earned or lost on an investment in the Fund assuming reinvestment of dividends. Total return would have been higher or lower if certain expenses had not been reimbursed, waived or recouped. |
| (D) | This expense decrease from the voluntary waiver is reflected in both the net expense and the net investment income ratios shown. |
The accompanying notes are an integral part of these financial statements.
| Timothy Defensive Strategies Fund (Class C Shares) |
| |
Selected data based on a share outstanding throughout each year
| | | For the Year | | | For the Year | | | For the Year | | | For the Year | | | For the Year | |
| | | ended | | | ended | | | ended | | | ended | | | ended | |
| | | September 30, | | | September 30, | | | September 30, | | | September 30, | | | September 30, | |
| | | 2021 | | | 2020 | | | 2019 | | | 2018 | | | 2017 | |
| Net asset value, beginning of year | | $ | 11.18 | | | $ | 11.13 | | | $ | 10.90 | | | $ | 10.90 | | | $ | 11.07 | |
| INCOME (LOSS) FROM INVESTMENT OPERATIONS: | | | | | | | | | | | | | | | | | | | | |
| Net investment income (loss) (A) | | | 0.01 | | | | (0.09 | ) | | | (0.03 | ) | | | 0.02 | | | | (0.08 | ) |
| Net realized and unrealized gain (loss) on investments | | | 1.55 | | | | 0.42 | | | | 0.46 | | | | (0.02 | ) | | | (0.09 | ) |
| Total from investment operations | | | 1.56 | | | | 0.33 | | | | 0.43 | | | | 0.00 | | | | (0.17 | ) |
| LESS DISTRIBUTIONS: | | | | | | | | | | | | | | | | | | | | |
| From net investment income | | | — | | | | — | | | | (0.02 | ) | | | — | | | | — | |
| From net realized gains on investments | | | — | | | | (0.28 | ) | | | (0.18 | ) | | | — | | | | — | |
| From return of capital | | | — | | | | 0.00 | * | | | — | | | | — | | | | — | |
| Total distributions | | | — | | | | (0.28 | ) | | | (0.20 | ) | | | — | | | | — | |
| Net asset value, end of year | | $ | 12.74 | | | $ | 11.18 | | | $ | 11.13 | | | $ | 10.90 | | | $ | 10.90 | |
| Total return (B)(C) | | | 13.95 | % | | | 3.01 | % | | | 4.06 | % | | | 0.00 | % | | | (1.54 | )% |
| RATIOS/SUPPLEMENTAL DATA: | | | | | | | | | | | | | | | | | | | | |
| Net assets, end of year (in 000’s) | | $ | 3,388 | | | $ | 2,464 | | | $ | 3,110 | | | $ | 5,432 | | | $ | 6,683 | |
| Ratios to average net assets | | | | | | | | | | | | | | | | | | | | |
| Expenses, before waiver and reimbursement | | | 2.23 | % | | | 2.29 | % | | | 2.20 | % | | | 2.16 | % | | | 2.21 | % |
| Expenses, net waiver and reimbursement (D) | | | 2.18 | % | | | 2.24 | % | | | 2.16 | % | | | 2.11 | % | | | 2.16 | % |
| Net investment income (loss), before waiver and reimbursement | | | (0.01 | )% | | | (0.89 | )% | | | (0.31 | )% | | | 0.09 | % | | | (0.79 | )% |
| Net investment income (loss), net waiver and reimbursement (D) | | | 0.04 | % | | | (0.84 | )% | | | (0.27 | )% | | | 0.14 | % | | | (0.74 | )% |
| Portfolio turnover rate | | | 34 | % | | | 49 | % | | | 34 | % | | | 35 | % | | | 51 | % |
| | | | | | | | | | | | | | | | | | | | | |
| * | Amount is less than $0.005 per share. |
| (A) | Per share amounts calculated using average shares method, which more appropriately presents the per share data for the period. |
| (B) | Total return calculation does not reflect redemption fee. Total return represents aggregate total return based on Net Asset Value. |
| (C) | Total return in the above table represents the rate that the investor would have earned or lost on an investment in the Fund assuming reinvestment of dividends. Total return would have been higher or lower if certain expenses had not been reimbursed, waived or recouped. |
| (D) | This expense decrease from the voluntary waiver is reflected in both the net expense and the net investment income ratios shown. |
The accompanying notes are an integral part of these financial statements.
| Timothy Defensive Strategies Fund (Class I Shares) |
| |
Selected data based on a share outstanding throughout each year
| | | For the Year | | | For the Year | | | For the Year | | | For the Year | | | For the Year | |
| | | ended | | | ended | | | ended | | | ended | | | ended | |
| | | September 30, | | | September 30, | | | September 30, | | | September 30, | | | September 30, | |
| | | 2021 | | | 2020 | | | 2019 | | | 2018 | | | 2017 | |
| Net asset value, beginning of year | | $ | 11.77 | | | $ | 11.69 | | | $ | 11.45 | | | $ | 11.38 | | | $ | 11.51 | |
| INCOME (LOSS) FROM INVESTMENT OPERATIONS: | | | | | | | | | | | | | | | | | | | | |
| Net investment income (A) | | | 0.17 | | | | 0.02 | | | | 0.09 | | | | 0.14 | | | | 0.06 | |
| Net realized and unrealized gain (loss) on investments | | | 1.61 | | | | 0.43 | | | | 0.47 | | | | (0.02 | ) | | | (0.12 | ) |
| Total from investment operations | | | 1.78 | | | | 0.45 | | | | 0.56 | | | | 0.12 | | | | (0.06 | ) |
| LESS DISTRIBUTIONS: | | | | | | | | | | | | | | | | | | | | |
| From net investment income | | | — | | | | (0.09 | ) | | | (0.14 | ) | | | (0.05 | ) | | | (0.07 | ) |
| From net realized gains on investments | | | — | | | | (0.28 | ) | | | (0.18 | ) | | | — | | | | — | |
| From return of capital | | | — | | | | 0.00 | * | | | — | | | | — | | | | — | |
| Total distributions | | | — | | | | (0.37 | ) | | | (0.32 | ) | | | (0.05 | ) | | | (0.07 | ) |
| Net asset value, end of year | | $ | 13.55 | | | $ | 11.77 | | | $ | 11.69 | | | $ | 11.45 | | | $ | 11.38 | |
| Total return (B)(C) | | | 15.12 | % | | | 3.96 | % | | | 5.17 | % | | | 1.04 | % | | | (0.54 | )% |
| RATIOS/SUPPLEMENTAL DATA: | | | | | | | | | | | | | | | | | | | | |
| Net assets, end of year (in 000’s) | | $ | 14,750 | | | $ | 5,212 | | | $ | 3,692 | | | $ | 3,071 | | | $ | 2,661 | |
| Ratios to average net assets | | | | | | | | | | | | | | | | | | | | |
| Expenses, before waiver and reimbursement | | | 1.23 | % | | | 1.29 | % | | | 1.20 | % | | | 1.16 | % | | | 1.14 | % |
| Expenses, net waiver and reimbursement (D) | | | 1.18 | % | | | 1.24 | % | | | 1.16 | % | | | 1.11 | % | | | 1.09 | % |
| Net investment income, before waiver and reimbursement | | | 1.21 | % | | | 0.16 | % | | | 0.78 | % | | | 1.14 | % | | | 0.44 | % |
| Net investment income, net waiver and reimbursement (D) | | | 1.26 | % | | | 0.21 | % | | | 0.82 | % | | | 1.19 | % | | | 0.49 | % |
| Portfolio turnover rate | | | 34 | % | | | 49 | % | | | 34 | % | | | 35 | % | | | 51 | % |
| | | | | | | | | | | | | | | | | | | | | |
| * | Amount is less than $0.005 per share. |
| (A) | Per share amounts calculated using average shares method, which more appropriately presents the per share data for the period. |
| (B) | Total return represents aggregate total return based on Net Asset Value. |
| (C) | Total return in the above table represents the rate that the investor would have earned or lost on an investment in the Fund assuming reinvestment of dividends. Total return would have been higher or lower if certain expenses had not been reimbursed, waived or recouped. |
| (D) | This expense decrease from the voluntary waiver is reflected in both the net expense and the net investment income ratios shown. |
The accompanying notes are an integral part of these financial statements.
| Timothy Strategic Growth Fund (Class A Shares) |
| |
Selected data based on a share outstanding throughout each year
| | | For the Year | | | For the Year | | | For the Year | | | For the Year | | | For the Year | |
| | | ended | | | ended | | | ended | | | ended | | | ended | |
| | | September 30, | | | September 30, | | | September 30, | | | September 30, | | | September 30, | |
| | | 2021 | | | 2020 | | | 2019 | | | 2018 | | | 2017 | |
| Net asset value, beginning of year | | $ | 9.48 | | | $ | 9.64 | | | $ | 9.70 | | | $ | 9.48 | | | $ | 8.73 | |
| INCOME (LOSS) FROM INVESTMENT OPERATIONS: | | | | | | | | | | | | | | | | | | | | |
| Net investment income (loss) (A) | | | 0.03 | | | | 0.04 | | | | 0.01 | | | | 0.00 | * | | | (0.04 | ) |
| Net realized and unrealized gain (loss) on investments | | | 1.75 | | | | 0.16 | | | | (0.04 | ) | | | 0.22 | | | | 0.79 | |
| Total from investment operations | | | 1.78 | | | | 0.20 | | | | (0.03 | ) | | | 0.22 | | | | 0.75 | |
| LESS DISTRIBUTIONS: | | | | | | | | | | | | | | | | | | | | |
| From net investment income | | | (0.01 | ) | | | — | | | | — | | | | — | | | | — | |
| From net realized gains on investments | | | (0.33 | ) | | | (0.36 | ) | | | (0.03 | ) | | | — | | | | — | |
| Total distributions | | | (0.34 | ) | | | (0.36 | ) | | | (0.03 | ) | | | — | | | | — | |
| Net asset value, end of year | | $ | 10.92 | | | $ | 9.48 | | | $ | 9.64 | | | $ | 9.70 | | | $ | 9.48 | |
| Total return (B)(C) | | | 19.15 | % | | | 2.03 | % | | | (0.26 | )% | | | 2.32 | % | | | 8.59 | % |
| RATIOS/SUPPLEMENTAL DATA: | | | | | | | | | | | | | | | | | | | | |
| Net assets, end of year (in 000’s) | | $ | 37,731 | | | $ | 32,260 | | | $ | 32,318 | | | $ | 32,078 | | | $ | 32,767 | |
| Ratio of expenses to average net assets (D) | | | 1.10 | % | | | 1.15 | % | | | 1.12 | % | | | 1.10 | % | | | 1.07 | % |
| Ratio of net investment income (loss), to average net assets (D)(E) | | | 0.27 | % | | | 0.42 | % | | | 0.16 | % | | | 0.00 | % | | | (0.45 | )% |
| Portfolio turnover rate | | | 22 | % | | | 47 | % | | | 50 | % | | | 8 | % | | | 36 | % |
| | | | | | | | | | | | | | | | | | | | | |
| * | Amount is less than $0.005 per share. |
| (A) | Per share amounts calculated using average shares method, which more appropriately presents the per share data for the period. |
| (B) | Total return calculation does not reflect sales load. |
| (C) | Total return in the above table represents the rate that the investor would have earned or lost on an investment in the Fund assuming reinvestment of dividends. Total return would have been higher or lower if certain expenses had not been reimbursed, waived or recouped. |
| (D) | These ratios exclude the impact of expenses of the underlying security holdings as represented in the Schedule of Investments. |
| (E) | Recognition of net investment income (loss) by the Fund is affected by the timing of the declaration of dividends by the underlying investment companies in which the Fund invests. |
The accompanying notes are an integral part of these financial statements.
| Timothy Strategic Growth Fund (Class C Shares) |
| |
Selected data based on a share outstanding throughout each year
| | | For the Year | | | For the Year | | | For the Year | | | For the Year | | | For the Year | |
| | | ended | | | ended | | | ended | | | ended | | | ended | |
| | | September 30, | | | September 30, | | | September 30, | | | September 30, | | | September 30, | |
| | | 2021 | | | 2020 | | | 2019 | | | 2018 | | | 2017 | |
| Net asset value, beginning of year | | $ | 8.34 | | | $ | 8.58 | | | $ | 8.70 | | | $ | 8.57 | | | $ | 7.95 | |
| INCOME (LOSS) FROM INVESTMENT OPERATIONS: | | | | | | | | | | | | | | | | | | | | |
| Net investment income (loss) (A) | | | (0.05 | ) | | | (0.03 | ) | | | 0.03 | | | | (0.06 | ) | | | (0.10 | ) |
| Net realized and unrealized gain (loss) on | | | 1.54 | | | | 0.15 | | | | (0.12 | ) | | | 0.19 | | | | 0.72 | |
| investments Total from investment operations | | | 1.49 | | | | 0.12 | | | | (0.09 | ) | | | 0.13 | | | | 0.62 | |
| LESS DISTRIBUTIONS: | | | | | | | | | | | | | | | | | | | | |
| From net realized gains on investments | | | (0.33 | ) | | | (0.36 | ) | | | (0.03 | ) | | | — | | | | — | |
| Total distributions | | | (0.33 | ) | | | (0.36 | ) | | | (0.03 | ) | | | — | | | | — | |
| Net asset value, end of year | | $ | 9.50 | | | $ | 8.34 | | | $ | 8.58 | | | $ | 8.70 | | | $ | 8.57 | |
| Total return (B)(C) | | | 18.19 | % | | | 1.33 | % | | | (0.99 | )% | | | 1.52 | % | | | 7.80 | % |
| RATIOS/SUPPLEMENTAL DATA: | | | | | | | | | | | | | | | | | | | | |
| Net assets, end of year (in 000’s) | | $ | 2,967 | | | $ | 2,743 | | | $ | 3,247 | | | $ | 6,313 | | | $ | 6,966 | |
| Ratio of expenses to average net assets (D) | | | 1.85 | % | | | 1.90 | % | | | 1.87 | % | | | 1.85 | % | | | 1.82 | % |
| Ratio of net investment income (loss), to average net assets (D)(E) | | | (0.48 | )% | | | (0.32 | )% | | | 0.35 | % | | | (0.70 | )% | | | (1.18 | )% |
| Portfolio turnover rate | | | 22 | % | | | 47 | % | | | 50 | % | | | 8 | % | | | 36 | % |
| | | | | | | | | | | | | | | | | | | | | |
| (A) | Per share amounts calculated using average shares method, which more appropriately presents the per share data for the period. |
| (B) | Total return calculation does not reflect redemption fee. |
| (C) | Total return in the above table represents the rate that the investor would have earned or lost on an investment in the Fund assuming reinvestment of dividends Total return would have been higher or lower if certain expenses had not been reimbursed, waived or recouped. |
| (D) | These ratios exclude the impact of expenses of the underlying security holdings as represented in the Schedule of Investments. |
| (E) | Recognition of net investment income (loss) by the Fund is affected by the timing of the declaration of dividends by the underlying investment companies in which the Fund invests. |
The accompanying notes are an integral part of these financial statements.
| Timothy Conservative Growth Fund (Class A Shares) |
| |
Selected data based on a share outstanding throughout each year
| | | For the Year | | | For the Year | | | For the Year | | | For the Year | | | For the Year | |
| | | ended | | | ended | | | ended | | | ended | | | ended | |
| | | September 30, | | | September 30, | | | September 30, | | | September 30, | | | September 30, | |
| | | 2021 | | | 2020 | | | 2019 | | | 2018 | | | 2017 | |
| Net asset value, beginning of year | | $ | 10.62 | | | $ | 10.66 | | | $ | 10.75 | | | $ | 10.67 | | | $ | 10.06 | |
| INCOME (LOSS) FROM INVESTMENT OPERATIONS: | | | | | | | | | | | | | | | | | | | | |
| Net investment income (loss) (A) | | | 0.02 | | | | 0.05 | | | | 0.05 | | | | 0.02 | | | | (0.02 | ) |
| Net realized and unrealized gain on | | | 1.31 | | | | 0.30 | | | | 0.10 | | | | 0.09 | | | | 0.63 | |
| investments Total from investment operations | | | 1.33 | | | | 0.35 | | | | 0.15 | | | | 0.11 | | | | 0.61 | |
| LESS DISTRIBUTIONS: | | | | | | | | | | | | | | | | | | | | |
| From net investment income | | | (0.04 | ) | | | — | | | | — | | | | — | | | | — | |
| From net realized gains on investments | | | (0.25 | ) | | | (0.39 | ) | | | (0.24 | ) | | | (0.03 | ) | | | — | |
| Total distributions | | | (0.29 | ) | | | (0.39 | ) | | | (0.24 | ) | | | (0.03 | ) | | | — | |
| Net asset value, end of year | | $ | 11.66 | | | $ | 10.62 | | | $ | 10.66 | | | $ | 10.75 | | | $ | 10.67 | |
| Total return (B)(C) | | | 12.63 | % | | | 3.27 | % | | | 1.61 | % | | | 1.06 | % | | | 6.06 | % |
| RATIOS/SUPPLEMENTAL DATA: | | | | | | | | | | | | | | | | | | | | |
| Net assets, end of year (in 000’s) | | $ | 46,151 | | | $ | 41,546 | | | $ | 40,590 | | | $ | 42,040 | | | $ | 45,110 | |
| Ratio of expenses to average net assets (D) | | | 1.10 | % | | | 1.12 | % | | | 1.08 | % | | | 1.08 | % | | | 1.04 | % |
| Ratio of net investment income (loss) to average net assets (D)(E) | | | 0.20 | % | | | 0.43 | % | | | 0.44 | % | | | 0.14 | % | | | (0.20 | )% |
| Portfolio turnover rate | | | 21 | % | | | 37 | % | | | 42 | % | | | 7 | % | | | 27 | % |
| | | | | | | | | | | | | | | | | | | | | |
| (A) | Per share amounts calculated using average shares method, which more appropriately presents the per share data for the period. |
| (B) | Total return calculation does not reflect sales load. |
| (C) | Total return in the above table represents the rate that the investor would have earned or lost on an investment in the Fund assuming reinvestment of dividends Total return would have been higher or lower if certain expenses had not been reimbursed, waived or recouped. |
| (D) | These ratios exclude the impact of expenses of the underlying security holdings as represented in the Schedule of Investments. |
| (E) | Recognition of net investment income (loss) by the Fund is affected by the timing of the declaration of dividends by the underlying investment companies in which the Fund invests. |
The accompanying notes are an integral part of these financial statements.
| Timothy Conservative Growth Fund (Class C Shares) |
| |
Selected data based on a share outstanding throughout each year
| | | For the Year | | | For the Year | | | For the Year | | | For the Year | | | For the Year | |
| | | ended | | | ended | | | ended | | | ended | | | ended | |
| | | September 30, | | | September 30, | | | September 30, | | | September 30, | | | September 30, | |
| | | 2021 | | | 2020 | | | 2019 | | | 2018 | | | 2017 | |
| Net asset value, beginning of year | | $ | 9.43 | | | $ | 9.59 | | | $ | 9.76 | | | $ | 9.76 | | | $ | 9.27 | |
| INCOME (LOSS) FROM INVESTMENT OPERATIONS: | | | | | | | | | | | | | | | | | | | | |
| Net investment income (loss) (A) | | | (0.06 | ) | | | (0.03 | ) | | | 0.01 | | | | (0.06 | ) | | | (0.09 | ) |
| Net realized and unrealized gain on | | | 1.17 | | | | 0.26 | | | | 0.06 | | | | 0.09 | (B) | | | 0.58 | (B) |
| investments Total from investment operations | | | 1.11 | | | | 0.23 | | | | 0.07 | | | | 0.03 | | | | 0.49 | |
| LESS DISTRIBUTIONS: | | | | | | | | | | | | | | | | | | | | |
| From net realized gains on investments | | | (0.25 | ) | | | (0.39 | ) | | | (0.24 | ) | | | (0.03 | ) | | | — | |
| Total distributions | | | (0.25 | ) | | | (0.39 | ) | | | (0.24 | ) | | | (0.03 | ) | | | — | |
| Net asset value, end of year | | $ | 10.29 | | | $ | 9.43 | | | $ | 9.59 | | | $ | 9.76 | | | $ | 9.76 | |
| Total return (C)(D) | | | 11.84 | % | | | 2.36 | % | | | 0.94 | % | | | 0.34 | % | | | 5.29 | % |
| RATIOS/SUPPLEMENTAL DATA: | | | | | | | | | | | | | | | | | | | | |
| Net assets, end of year (in 000’s) | | $ | 5,496 | | | $ | 4,712 | | | $ | 5,504 | | | $ | 9,218 | | | $ | 9,981 | |
| Ratio of expenses to average net assets (E) | | | 1.85 | % | | | 1.87 | % | | | 1.83 | % | | | 1.83 | % | | | 1.79 | % |
| Ratio of net investment income (loss), to average net assets (E)(F) | | | (0.56 | )% | | | (0.31 | )% | | | 0.14 | % | | | (0.63 | )% | | | (0.96 | )% |
| Portfolio turnover rate | | | 21 | % | | | 37 | % | | | 42 | % | | | 7 | % | | | 27 | % |
| | | | | | | | | | | | | | | | | | | | | |
| (A) | Per share amounts calculated using average shares method, which more appropriately presents the per share data for the period. |
| (B) | Realized and unrealized gains per share in this caption are balancing amounts necessary to reconcile the change in net asset value per share for the period and may not reconcile with aggregate gains and losses in the Statement of Operations due to the timing of share transactions for the period. |
| (C) | Total return calculation does not reflect redemption fees. Total return represents aggregate total return based on Net Asset Value. |
| (D) | Total return in the above table represents the rate that the investor would have earned or lost on an investment in the Fund assuming reinvestment of dividends Total return would have been higher or lower if certain expenses had not been reimbursed, waived or recouped. |
| (E) | These ratios exclude the impact of expenses of the underlying security holdings as represented in the Schedule of Investments. |
| (F) | Recognition of net investment income (loss) by the Fund is affected by the timing of the declaration of dividends by the underlying investment companies in which the Fund invests. |
The accompanying notes are an integral part of these financial statements.
| Timothy Growth & Income Fund (Class A Shares) |
| |
Selected data based on a share outstanding throughout each year
| | | For the Year | | | For the Year | | | For the Year | | | For the Year | | | For the Year | |
| | | ended | | | ended | | | ended | | | ended | | | ended | |
| | | September 30, | | | September 30, | | | September 30, | | | September 30, | | | September 30, | |
| | | 2021 | | | 2020 | | | 2019 | | | 2018 | | | 2017 | |
| Net asset value, beginning of year | | $ | 10.11 | | | $ | 10.60 | | | $ | 10.87 | | | $ | 11.28 | | | $ | 10.76 | |
| INCOME (LOSS) FROM INVESTMENT OPERATIONS: | | | | | | | | | | | | | | | | | | | | |
| Net investment income (A) | | | 0.06 | | | | 0.09 | | | | 0.04 | | | | 0.01 | | | | 0.01 | |
| Net realized and unrealized gain (loss) on | | | 1.68 | | | | (0.47 | ) | | | (0.07 | ) | | | (0.14 | ) | | | 0.52 | |
| investments Total from investment operations | | | 1.74 | | | | (0.38 | ) | | | (0.03 | ) | | | (0.13 | ) | | | 0.53 | |
| LESS DISTRIBUTIONS: | | | | | | | | | | | | | | | | | | | | |
| From net investment income | | | (0.10 | ) | | | (0.11 | ) | | | (0.05 | ) | | | (0.01 | ) | | | (0.01 | ) |
| From net realized gains on investments | | | — | | | | — | | | | (0.19 | ) | | | (0.27 | ) | | | — | |
| Return of Capital | | | — | | | | 0.00 | * | | | (0.00 | ) * | | | — | | | | — | |
| Total distributions | | | (0.10 | ) | | | (0.11 | ) | | | (0.24 | ) | | | (0.28 | ) | | | (0.01 | ) |
| Net asset value, end of year | | $ | 11.75 | | | $ | 10.11 | | | $ | 10.60 | | | $ | 10.87 | | | $ | 11.28 | |
| Total return (B)(C) | | | 17.18 | % | | | (3.48 | )% | | | (0.10 | )% | | | (1.22 | )% | | | 4.91 | % |
| RATIOS/SUPPLEMENTAL DATA: | | | | | | | | | | | | | | | | | | | | |
| Net assets, end of year (in 000’s) | | $ | 14,191 | | | $ | 13,295 | | | $ | 14,500 | | | $ | 27,716 | | | $ | 30,426 | |
| Ratios to average net assets | | | | | | | | | | | | | | | | | | | | |
| Expenses, before waiver and reimbursement | | | 1.90 | % | | | 1.85 | % | | | 1.69 | % | | | 1.70 | % | | | 1.59 | % |
| Expenses, net waiver and reimbursement (D) | | | 1.52 | % | | | 1.50 | % | | | 1.65 | % | | | 1.65 | % | | | 1.54 | % |
| Net investment income, before waiver and reimbursement | | | 0.18 | % | | | 0.55 | % | | | 0.37 | % | | | 0.08 | % | | | 0.03 | % |
| Net investment income, net waiver and reimbursement (D)(E) | | | 0.56 | % | | | 0.90 | % | | | 0.42 | % | | | 0.13 | % | | | 0.08 | % |
| Portfolio turnover rate | | | 43 | % | | | 39 | % | | | 167 | % | | | 56 | % | | | 118 | % |
| | | | | | | | | | | | | | | | | | | | | |
| * | Amount is less than $0.005 per share |
| (A) | Per share amounts calculated using average shares method, which more appropriately presents the per share data for the period. |
| (B) | Total return calculation does not reflect sales load. |
| (C) | Total return in the above table represents the rate that the investor would have earned or lost on an investment in the Fund assuming reinvestment of dividends. Total return would have been higher or lower if certain expenses had not been reimbursed, waived or recouped. |
| (D) | This expense decrease from the voluntary waiver is reflected in both the net expense and the net investment income ratios shown. |
| (E) | Recognition of net investment income (loss) by the Fund is affected by the timing of the declaration of dividends by the underlying investment companies in which the Fund invests. |
The accompanying notes are an integral part of these financial statements.
| Timothy Growth & Income Fund (Class C Shares) |
| |
Selected data based on a share outstanding throughout each year
| | | For the Year | | | For the Year | | | For the Year | | | For the Year | | | For the Year | |
| | | ended | | | ended | | | ended | | | ended | | | ended | |
| | | September 30, | | | September 30, | | | September 30, | | | September 30, | | | September 30, | |
| | | 2021 | | | 2020 | | | 2019 | | | 2018 | | | 2017 | |
| Net asset value, beginning of year | | $ | 9.74 | | | $ | 10.21 | | | $ | 10.51 | | | $ | 10.99 | | | $ | 10.55 | |
| INCOME (LOSS) FROM INVESTMENT OPERATIONS: | | | | | | | | | | | | | | | | | | | | |
| Net investment income (loss) (A) | | | (0.02 | ) | | | 0.02 | | | | (0.03 | ) | | | (0.07 | ) | | | (0.07 | ) |
| Net realized and unrealized gain (loss) on | | | 1.60 | | | | (0.45 | ) | | | (0.07 | ) | | | (0.14 | ) | | | 0.51 | |
| investments Total from investment operations | | | 1.58 | | | | (0.43 | ) | | | (0.10 | ) | | | (0.21 | ) | | | 0.44 | |
| LESS DISTRIBUTIONS: | | | | | | | | | | | | | | | | | | | | |
| From net investment income | | | (0.01 | ) | | | (0.04 | ) | | | (0.01 | ) | | | — | | | | — | |
| From net realized gains on investments | | | — | | | | — | | | | (0.19 | ) | | | (0.27 | ) | | | — | |
| Return of Capital | | | — | | | | 0.00 | * | | | (0.00 | ) * | | | — | | | | — | |
| Total distributions | | | (0.01 | ) | | | (0.04 | ) | | | (0.20 | ) | | | (0.27 | ) | | | — | |
| Net asset value, end of year | | $ | 11.31 | | | $ | 9.74 | | | $ | 10.21 | | | $ | 10.51 | | | $ | 10.99 | |
| Total return (B)(C) | | | 16.25 | % | | | (4.20 | )% | | | (0.82 | )% | | | (1.97 | )% | | | 4.17 | % |
| RATIOS/SUPPLEMENTAL DATA: | | | | | | | | | | | | | | | | | | | | |
| Net assets, end of year (in 000’s) | | $ | 1,938 | | | $ | 1,719 | | | $ | 2,388 | | | $ | 3,176 | | | $ | 3,006 | |
| Ratios to average net assets | | | | | | | | | | | | | | | | | | | | |
| Expenses, before waiver and reimbursement | | | 2.65 | % | | | 2.60 | % | | | 2.44 | % | | | 2.45 | % | | | 2.34 | % |
| Expenses, net waiver and reimbursement (D) | | | 2.27 | % | | | 2.25 | % | | | 2.40 | % | | | 2.40 | % | | | 2.29 | % |
| Net investment income (loss), before waiver and reimbursement | | | (0.57 | %) | | | (0.19 | %) | | | (0.34 | %) | | | (0.67 | %) | | | (0.73 | %) |
| Net investment income (loss), net waiver and reimbursement (D)(E) | | | (0.19 | %) | | | 0.16 | % | | | (0.29 | %) | | | (0.62 | %) | | | (0.68 | %) |
| Portfolio turnover rate | | | 43 | % | | | 39 | % | | | 167 | % | | | 56 | % | | | 118 | % |
| | | | | | | | | | | | | | | | | | | | | |
| * | Amount is less than $0.005 per share |
| (A) | Per share amounts calculated using average shares method, which more appropriately presents the per share data for the period. |
| (B) | Total return calculation does not reflect redemption fee. |
| (C) | Total return in the above table represents the rate that the investor would have earned or lost on an investment in the Fund assuming reinvestment of dividends. Total return would have been higher or lower if certain expenses had not been reimbursed, waived or recouped. |
| (D) | This expense decrease from the voluntary waiver is reflected in both the net expense and the net investment income ratios shown. |
| (E) | Recognition of net investment income (loss) by the Fund is affected by the timing of the declaration of dividends by the underlying investment companies in which the Fund invests. |
The accompanying notes are an integral part of these financial statements.
| Timothy Growth & Income Fund (Class I Shares) |
| |
Selected data based on a share outstanding throughout each year
| | | For the Year | | | For the Year | | | For the Year | | | For the Year | | | For the Year | |
| | | ended | | | ended | | | ended | | | ended | | | ended | |
| | | September 30, | | | September 30, | | | September 30, | | | September 30, | | | September 30, | |
| | | 2021 | | | 2020 | | | 2019 | | | 2018 | | | 2017 | |
| Net asset value, beginning of year | | $ | 10.18 | | | $ | 10.67 | | | $ | 10.94 | | | $ | 11.34 | | | $ | 10.81 | |
| INCOME (LOSS) FROM INVESTMENT OPERATIONS: | | | | | | | | | | | | | | | | | | | | |
| Net investment income (A) | | | 0.09 | | | | 0.12 | | | | 0.08 | | | | 0.04 | | | | 0.03 | |
| Net realized and unrealized gain (loss) on investments | | | 1.69 | | | | (0.47 | ) | | | (0.09 | ) | | | (0.15 | ) | | | 0.53 | |
| Total from investment operations | | | 1.78 | | | | (0.35 | ) | | | (0.01 | ) | | | (0.11 | ) | | | 0.56 | |
| LESS DISTRIBUTIONS: | | | | | | | | | | | | | | | | | | | | |
| From net investment income | | | (0.13 | ) | | | (0.14 | ) | | | (0.07 | ) | | | (0.02 | ) | | | (0.03 | ) |
| From net realized gains on investments | | | — | | | | — | | | | (0.19 | ) | | | (0.27 | ) | | | — | |
| Return of Capital | | | — | | | | 0.00 | * | | | (0.00 | ) * | | | — | | | | — | |
| Total distributions | | | (0.13 | ) | | | (0.14 | ) | | | (0.26 | ) | | | (0.29 | ) | | | (0.03 | ) |
| Net asset value, end of year | | $ | 11.83 | | | $ | 10.18 | | | $ | 10.67 | | | $ | 10.94 | | | $ | 11.34 | |
| Total return (B)(C) | | | 17.44 | % | | | (3.20 | )% | | | 0.11 | % | | | (0.96 | )% | | | 5.19 | % |
| RATIOS/SUPPLEMENTAL DATA: | | | | | | | | | | | | | | | | | | | | |
| Net assets, end of year (in 000’s) | | $ | 2,070 | | | $ | 2,102 | | | $ | 3,182 | | | $ | 3,012 | | | $ | 2,197 | |
| Ratios to average net assets | | | | | | | | | | | | | | | | | | | | |
| Expenses, before waiver and reimbursement | | | 1.65 | % | | | 1.60 | % | | | 1.44 | % | | | 1.45 | % | | | 1.34 | % |
| Expenses, net waiver and reimbursement (D) | | | 1.27 | % | | | 1.25 | % | | | 1.40 | % | | | 1.40 | % | | | 1.29 | % |
| Net investment income, before waiver and reimbursement | | | 0.43 | % | | | 0.86 | % | | | 0.70 | % | | | 0.33 | % | | | 0.27 | % |
| Net investment income, net waiver and reimbursement (D)(E) | | | 0.81 | % | | | 1.21 | % | | | 0.75 | % | | | 0.38 | % | | | 0.32 | % |
| Portfolio turnover rate | | | 43 | % | | | 39 | % | | | 167 | % | | | 56 | % | | | 118 | % |
| | | | | | | | | | | | | | | | | | | | | |
| * | Amount is less than $0.005 per share. |
| (A) | Per share amounts calculated using average shares method, which more appropriately presents the per share data for the period. |
| (B) | Total return represents aggregate total return based on Net Asset Value. |
| (C) | Total return in the above table represents the rate that the investor would have earned or lost on an investment in the Fund assuming reinvestment of dividends. Total return would have been higher or lower if certain expenses had not been reimbursed, waived or recouped. |
| (D) | This expense decrease from the voluntary waiver is reflected in both the net expense and the net investment income ratios shown. |
| (E) | Recognition of net investment income (loss) by the Fund is affected by the timing of the declaration of dividends by the underlying investment companies in which the Fund invests. |
The accompanying notes are an integral part of these financial statements.
| Notes to Financial Statements |
| September 30, 2021 |
| Timothy Plan Family of Funds |
Note 1 | Significant Accounting Policies
The Timothy Plan (the “Trust”) is organized as a series of a Delaware business trust pursuant to a trust agreement dated December 16, 1993. The Trust is registered under the Investment Company Act of 1940, as amended, as an open-end management investment company. As of September 30, 2021, the Trust consisted of eighteen series. These financial statements include the following twelve series: Timothy Plan Aggressive Growth Fund, Timothy Plan International Fund, Timothy Plan Large/Mid Cap Growth Fund, Timothy Plan Small Cap Value Fund, Timothy Plan Large/Mid Cap Value Fund, Timothy Plan Fixed Income Fund, Timothy Plan High Yield Bond Fund, Timothy Plan Israel Common Values Fund, Timothy Plan Defensive Strategies Fund, Timothy Plan Strategic Growth Fund, Timothy Plan Conservative Growth Fund and Timothy Plan Growth & Income Fund (the “Funds”). The Funds are diversified funds except for the Timothy Plan Defensive Strategy Fund which is a non-diversified fund.
The Timothy Plan Aggressive Growth Fund’s investment objective is long-term growth of capital. The Fund seeks to achieve its investment objective by normally investing at least 80% of the Fund’s total assets in U.S. common stocks without regard to market capitalizations and investing in the securities of a limited number of companies which the Fund’s Advisor believes show a high probability for superior growth.
The Timothy Plan International Fund’s investment objective is long-term growth of capital. The Fund seeks to achieve its investment objective by normally investing at least 80% of the Fund’s total assets in the common stock and similar securities of foreign companies through the purchase of American Depositary Receipts (“ADRs”) without regard to market capitalization, investing its assets in the ADRs of companies which the Fund’s Advisor believes show a high probability for superior growth, and allocating investments across countries and regions considering the size of the market in each country and region relative to the size of the international market as a whole. Although the Fund maintains a diversified investment portfolio, the political or economic developments within a particular country or region may have an adverse effect on the ability of domiciled issuers to meet their obligations. Additionally, political or economic developments may have an effect on the liquidity and volatility of portfolio securities and currency holdings.
The Timothy Plan Large/Mid Cap Growth Fund’s investment objective is long-term growth of capital. Current income is not a significant investment consideration and any such income realized will be considered incidental to the Fund’s investment objective. The Fund seeks to achieve its investment objective by normally investing at least 80% of the Fund’s total assets in U.S. common stocks with market capitalizations in excess of $2 billion.
The Timothy Plan Small Cap Value Fund’s primary objective is long-term capital growth, with a secondary objective of current income. The Fund seeks to achieve its investment objective by primarily investing at least 80% of the Fund’s total assets in U.S. stocks with market capitalizations that fall within the range of companies included in the Russell 2000 Index.
The Timothy Plan Large/Mid Cap Value Fund’s investment objective is long-term capital growth, with a secondary objective of current income. The Fund seeks to achieve its investment objective by primarily investing in U.S. common stocks. The Fund will invest at least 80% of its assets in the common stock of companies whose total market capitalization generally exceeds $2 billion.
The Timothy Plan Fixed Income Fund seeks to generate a high level of current income consistent with prudent investment risk. To achieve its investment objective, the Fund normally invests in a diversified portfolio of debt securities. These include corporate bonds, U.S. Government and agency securities, convertible securities and preferred securities.
The Timothy Plan High Yield Bond Fund’s investment objective is to generate a high level of current income. To achieve its investment objective, the Fund normally invests in a diversified portfolio of high yield fixed income securities. These include corporate bonds, U.S. Government and agency securities, convertible securities and preferred securities. The Fund will generally purchase securities that are not investment-grade, meaning securities with a rating of “BBB” or lower as rated by Standard and Poor’s or a comparable rating by another nationally recognized rating agency. Investments in these higher yielding securities are generally accompanied by a greater degree of credit risk than higher rated securities. Additionally, lower rated securities may be more susceptible to adverse economic and competitive industry conditions than investment-grade securities.
The Timothy Plan Israel Common Values Fund seeks to provide long-term growth of capital. This Fund seeks to achieve its investment objectives by normally investing at least 80% of the Fund’s total assets in the common stock of companies domiciled and/or headquartered in Israel through the purchase of American Depositary Receipts (ADRs) and direct investments in such companies on foreign stock exchanges, without regard to market capitalizations.
The Timothy Plan Defensive Strategies Fund’s investment objective is the protection of principal through aggressive, proactive reactions to prevailing economic conditions. To achieve its investment objective, the Fund normally invests in Real Estate Investment Trusts (“REITs”), commodities based Exchange-Traded Funds (“ETFs”), Treasury Inflation Protected Securities (“TIPS”), and currently holds gold bullion.
The Timothy Plan Strategic Growth Fund seeks to generate medium to high levels of long-term capital growth. The Fund seeks to achieve its investment objective by normally investing at least 75% of its net assets in the following Funds which are other series of the Trust: approximately 0-10% of its net assets in the Timothy Plan Small Cap Value Fund; approximately 0-20% of its net assets in the Timothy Plan Large/Mid Cap Value Fund; approximately 0-20% of its net assets in the Timothy Plan Large/Mid Cap Growth Fund; approximately 5-15% of its net assets in the Timothy Plan High Yield Bond Fund; approximately 0-20% of its net assets in the Timothy Plan International Fund; approximately 0-10% of its net assets in the Timothy Plan Aggressive Growth Fund; approximately 5-30% of its net assets in the Timothy Plan Defensive Strategies Fund; approximately 0-10% of its net assets in the Timothy Plan Israel Common Values Fund; approximately 0-20% of its net assets in the Timothy Fixed Income Fund; approximately 0-40% of its net assets in the Timothy Plan U.S. Large/Mid Cap Core ETF; approximately 0-20% of its net assets in the Timothy Plan High Dividend Stock ETF; approximately 0-30% of its net assets in the Timothy Plan International ETF; and approximately 0-20% of its net assets in the Timothy Plan Small Cap Core ETF.
| Notes to Financial Statements |
| September 30, 2021 (Continued) |
| Timothy Plan Family of Funds |
The Timothy Plan Conservative Growth Fund seeks to generate moderate levels of long-term capital growth with a secondary objective of current income. The Fund seeks to achieve its investment objective by normally investing at least 75% of its net assets in the following Funds which are other series of the Trust: approximately 0-10% of its net assets in the Timothy Plan Small Cap Value Fund; approximately 0-15% of its net assets in the Timothy Plan Large/Mid Cap Value Fund; approximately 0-15% of its net assets in the Timothy Plan Large/Mid Cap Growth Fund; approximately 0-5% of its net assets in the Timothy Plan Aggressive Growth Fund; approximately 5-15% of its net assets in the Timothy Plan High Yield Bond Fund; approximately 0-20% of its net assets in the Timothy Plan International Fund; approximately 20%-40% of its net assets in the Timothy Plan Fixed Income Fund; approximately 5-30% of its net assets in the Timothy Plan Defensive Strategies Fund; approximately 0-10% of its net assets in the Timothy Plan Israel Common Values Fund; approximately 0-30% of its net assets in the Timothy Plan U.S. Large/Mid Cap Core ETF; approximately 0-25% of its net assets in the Timothy Plan High Dividend Stock ETF; approximately 0-25% of its net assets in the Timothy Plan International ETF; and approximately 0- 15% of its net assets in the Timothy Plan Small Cap Core ETF.
The Timothy Plan Growth & Income Fund’s investment objective is to provide total return through a combination of growth and income and preservation of capital in declining markets. To achieve its goals, the Fund primarily invests in equity securities of foreign and domestic companies that the Advisor believes are undervalued, and in fixed income securities. The Fund will normally hold both equity securities and fixed income securities, with at least 25% of its assets in equity securities and at least 25% of its assets in fixed income securities.
The following is a summary of significant accounting policies consistently followed by the Funds in the preparation of their financial statements. The policies are in conformity with accounting principles generally accepted in the United States of America (“GAAP”) for investment companies. The Funds are an investment company and accordingly follows the investment company accounting and reporting guidance of the Financial Accounting Standards Board (FASB) Accounting Standard Codification Topic 946 “Financial Services – Investment Companies”.
| A. | SECURITY VALUATION AND FAIR VALUE MEASUREMENTS |
All investments in securities are recorded at their estimated fair value as described in Note 2.
| B. | INVESTMENT INCOME AND SECURITIES TRANSACTIONS |
Security transactions are accounted for on the date the securities are purchased or sold (trade date). The costing method for the Timothy Plan Funds is specific identification. Dividend income is recognized on the ex-dividend date. Interest income and expenses are recognized on an accrual basis. The Timothy Plan Aggressive Growth Fund, Large/Mid Cap Value Fund, Israel Common Values Fund, Small Cap Value Fund and Defensive Strategies Fund have made certain investments in REITs. Dividend income from REITs is recognized on the ex-dividend date. It is common for distributions from REITs to exceed taxable earnings and profits, resulting in the excess portion of such dividends being designated as a return of capital. The calendar year-end amounts of ordinary income, capital gains, and return of capital included in distributions received from the Funds’ investments in REITS are reported to the Funds after the end of the calendar year; accordingly, the Funds estimate these amounts for accounting purposes until the characterization of REIT distributions is reported to the Funds after the end of the calendar year. Estimates are based on the most recent REIT distribution information available. Withholding taxes on foreign dividends have been provided for in accordance with the Funds’ understanding of the applicable country’s tax rules and rates. Discounts and premiums on securities purchased are amortized over the lives of the respective securities. The ability of issuers of debt securities held by the Funds to meet their obligations may be affected by economic and political developments in a specific country or region.
The Funds may be subject to foreign taxes related to foreign income received (a portion of which may be reclaimable), capital gains on the sale of securities and certain foreign currency transactions. All foreign taxes are recorded in accordance with the applicable regulations and rates that exist in the foreign jurisdictions in which the Funds invest.
Investment securities denominated in foreign currencies are translated into U.S. dollar amounts at the date of valuation. Purchases and sales of investment securities and income and expense items denominated in foreign currencies are translated into U.S. dollar amounts on the respective dates of such transactions. The Funds do not isolate that portion of the results of operations resulting from changes in foreign exchange rates on investments from the fluctuations arising from changes in market prices of securities held. Such fluctuations are included in the net realized and unrealized gain or loss from investments. Reported net realized foreign exchange gains or losses arise from sales of foreign currencies, currency gains or losses realized between the trade and settlement dates on securities transactions, and the difference between the amounts of dividends, interest and foreign withholding taxes recorded on the Funds’ books and the U.S. dollar equivalent of the amounts actually received or paid. Net unrealized foreign exchange gains and losses arise from changes in the fair values of assets and liabilities, other than investments in securities at fiscal period end, resulting from changes in exchange rates.
There is a risk that some or all of the Trust’s gold bars held by the custodian or any sub-custodian on behalf of the Trust could be lost, damaged or stolen. Access to the Trust’s gold bars could be restricted by natural events (such as an earthquake) or human actions (such as a terrorist attack). Any of these events may adversely affect the operations of the Trust and, consequently, an investment in the fund shares.
| Notes to Financial Statements |
| September 30, 2021 (Continued) |
| Timothy Plan Family of Funds |
Several factors may affect the price of gold, including but not limited to:
| ● | Global or regional political, economic or financial events and situations; |
| ● | Investors’ expectations with respect to the rate of inflation; |
| ● | Currency exchange rates; |
| ● | Investment and trading activities of hedge funds and commodity funds. |
| F. | NET ASSET VALUE PER SHARE |
The Net Asset Value (“NAV”) per share of the capital stock of the Funds is determined daily as of the close of trading on the New York Stock Exchange by dividing the value of its net assets by the number of Fund shares outstanding. The NAV is calculated separately for each class of each Fund in the Trust. The net asset value of the classes may differ because of different fees and expenses charged to each class.
Expenses incurred by the Trust that do not relate to a specific Fund of the Trust are allocated to the individual Funds based on each Fund’s relative net assets or another appropriate basis as determined by the Board of Trustees (the “Board”).
There are three classes of shares currently offered by all Funds in the Trust, except Strategic Growth Fund and Conservative Growth Fund: Class A shares are offered with a front-end sales charge and ongoing service/distribution fees; Class C shares are offered with a contingent deferred sales charge (“CDSC”) that ends after the first year and ongoing service and distribution fees; Class I shares, which commenced operations on August 1, 2013, are offered without any sales charges or ongoing service distribution fees.
Class specific expenses are borne by each specific class. Income, expenses, and realized and unrealized gains/losses are allocated to the respective classes on the basis of relative daily net assets.
In the preparation of financial statements in conformity with GAAP, management makes estimates and assumptions that affect the reported amounts of assets and liabilities and disclosure of contingent assets and liabilities at the date of the financial statements, as well as the reported amounts of revenues and expenses during the year ended. Actual results could differ from those estimates.
It is the policy of each Fund to continue to comply with all requirements under subchapter M of the Internal Revenue Code applicable to regulated investment companies and to distribute substantially all of its taxable income to its shareholders. Each Fund also intends to distribute sufficient net investment income and net capital gains, if any, so that it will not be subject to excise tax on undistributed income or gains. Therefore, no federal income tax or excise provision is required.
As of September 30, 2021, the Funds did not have a liability for any unrecognized tax benefits. The Funds recognize interest and penalties, if any, related to unrecognized tax benefits as income tax expense in the Statements of Operations. During the year ended September 30, 2021, the Funds did not incur any interest or penalties. The Funds are not aware of any tax positions for which it is reasonably possible that the total amounts of unrecognized tax benefits will change materially within the next twelve months.
The Trust indemnifies its officers and trustees for certain liabilities that may arise from the performance of their duties to the Trust. Additionally, in the normal course of business, the Funds enter into contracts that contain a variety of representations and warranties and which provide general indemnities. The Funds’ maximum exposure under these arrangements is unknown, as this would involve future claims that may be made against the Funds that have not yet occurred. However, based on experience, the Funds expect the risk of loss due to these warranties and indemnities to be remote.
| L. | DISTRIBUTIONS TO SHAREHOLDERS |
Distributions to shareholders, which are determined in accordance with income tax regulations, are recorded on the ex-dividend date. The treatment for financial reporting purposes of distributions made to shareholders during the period from net investment income or net realized capital gains may differ from their ultimate treatment for federal income tax purposes. These differences are caused primarily by differences in the timing of the recognition of certain components of income, expense or realized capital gain for federal income tax purposes. Where such differences are permanent in nature, they are reclassified in the components of net assets based on their ultimate characterization for federal income tax purposes. Any such reclassifications will have no effect on net assets, results of operations, or Net Asset Values (NAVs) per share of the Funds.
Permanent book and tax differences, primarily attributable to the book/tax treatment of net operating losses, the adjustments for equalization debits, and the reclassification of Fund distributions resulted in reclassifications for the Funds for the fiscal year ended September 30, 2021 as follows:
| Notes to Financial Statements |
| September 30, 2021 (Continued) |
| Timothy Plan Family of Funds |
| | | | | | Accumulated | |
| Fund | | Paid In Capital | | | Earnings (Losses) | |
| Aggressive Growth Fund | | $ | 668,260 | | | $ | (668,260 | ) |
| International Fund | | | 10,555 | | | | (10,555 | ) |
| Large/Mid Cap Growth Fund | | | 201,147 | | | | (201,147 | ) |
| Small Cap Value Fund | | | 873,410 | | | | (873,410 | ) |
| Large/Mid Cap Value Fund | | | 705,356 | | | | (705,356 | ) |
| Fixed Income Fund | | | — | | | | — | |
| High Yield Bond Fund | | | 128,597 | | | | (128,597 | ) |
| Israel Common Values Fund | | | (815,379 | ) | | | 815,379 | |
| Defensive Strategies Fund | | | 4,550 | | | | (4,550 | ) |
| Strategic Growth Fund | | | 158,440 | | | | (158,440 | ) |
| Conservative Growth Fund | | | 190,284 | | | | (190,284 | ) |
| Growth & Income Fund | | | 4,356 | | | | (4,356 | ) |
Effective May 22, 2015, the Timothy Plan Family of Funds entered into a precious metals storage agreement with Brink’s Global Services U.S.A., Inc. to maintain the custody of the gold held in the Timothy Plan Defensive Strategies Fund.
Note 2 | Security Valuation and Fair Value Measurements
The Funds’ securities are valued at fair value. Fair value is defined as the price that a Fund would receive upon selling an investment in a timely transaction to an independent buyer in the principal or most advantageous market of the investment. GAAP established a three-tier hierarchy to maximize the use of observable market data and minimize the use of unobservable inputs and to establish classification of fair value measurements for disclosure purposes.
Inputs refer broadly to the assumptions that market participants would use in pricing the asset or liability, including assumptions about risk (the risk inherent in a particular valuation technique used to measure fair value including such a pricing model and/or the risk inherent in the inputs to the valuation technique). Inputs may be observable or unobservable. Observable inputs are inputs that reflect the assumptions market participants would use in pricing the asset or liability developed based on market data obtained from sources independent of the reporting entity. Unobservable inputs are inputs that reflect the reporting entity’s own assumptions about the assumptions market participants would use in pricing the asset or liability developed based on the best information available in the circumstances.
VALUATION OF FUND OF FUNDS
A Fund may invest in portfolios of open-end or closed-end investment companies (the “Underlying Funds”). The Underlying Funds value securities in their portfolios for which market quotations are readily available at their market values (generally the last reported sale price) and all other securities and assets at their fair value based upon methods established by the Board of Trustees of the Underlying Funds.
Open-ended funds are valued at their respective net asset values as reported by such investment companies. The shares of many closed-end investment companies, after their initial public offering, frequently trade at a price per share, which is different than the net asset value per share. The difference represents a market premium or market discount of such shares. There can be no assurances that the market discount or market premium on shares of any closed-end investment company purchased by the Fund will not change.
EXCHANGE TRADED FUNDS
The Funds may invest in exchange traded funds (“ETFs”). ETFs are a type of index fund bought and sold on a securities exchange. An ETF trades like common stock and may be actively traded or represent a fixed portfolio of securities designed to track the performance and dividend yield of a particular domestic or foreign market index. The risks of owning an ETF generally reflect the risks of owning the underlying securities they are designed to track, although the lack of liquidity on an ETF could result in it being more volatile. Each ETF is subject to specific risks, depending on the nature of the ETF. Additionally, ETFs have fees and expenses that reduce their value.
OPTIONS TRANSACTIONS –The Funds are subject to equity price risk in the normal course of pursuing their investment objectives and may purchase or sell options to help hedge against this risk.
Each Fund may write call options only if it (i) owns an offsetting position in the underlying security or (ii) has an absolute or immediate right to acquire that security without additional cash consideration or exchange of other securities held in its portfolio.
When the Funds write a call option, an amount equal to the premium received is included in the statement of assets and liabilities as a liability. The amount of the liability is subsequently marked-to-market to reflect the current market value of the option. If an option expires on its stipulated expiration date or if the Funds enter into a closing purchase transaction, a gain or loss is realized. If a written call option is exercised, a gain or loss is realized for the sale of the underlying security and the proceeds from the sale are increased by the premium originally received. As writer of an option, the Funds have no control over whether the option will be exercised and, as a result, retain the market risk of an unfavorable change in the price of the security underlying the written option.
| Notes to Financial Statements |
| September 30, 2021 (Continued) |
| Timothy Plan Family of Funds |
The Funds may purchase put and call options. Call options are purchased to hedge against an increase in the value of securities held in a Funds’ portfolio. If such an increase occurs, the call options will permit the Fund to purchase the securities underlying such options at the exercise price, not at the current market price. Put options are purchased to hedge against a decline in the value of securities held in a Fund’s portfolio. If such a decline occurs, the put options will permit the Fund to sell the securities underlying such options at the exercise price, or to close out the options at a profit. The premium paid for a put or call option plus any transaction costs will reduce the benefit, if any, realized by the Fund upon exercise of the option, and, unless the price of the underlying security rises or declines sufficiently, the option may expire worthless to the Fund. In addition, in the event that the price of the security in connection with which an option was purchased moves in a direction favorable to a Fund, the benefits realized by the Fund as a result of such favorable movement will be reduced by the amount of the premium paid for the option and related transaction costs. Written and purchased options are non-income producing securities. With purchased options, there is minimal counterparty credit risk to the Funds since these options are exchange traded and the exchange’s clearinghouse, as counterparty to all exchange traded options, guarantees against a possible default.
There were no options held at September 30, 2021, and there were no options transactions for the year ended September 30, 2021.
The Trust utilizes various methods to measure the fair value of all of its investments on a recurring basis. GAAP establishes a hierarchy that prioritizes inputs to valuation methods. The three levels of input are:
| ● | Level 1 – Unadjusted quoted prices in active markets for identical assets and liabilities that the Fund has the ability to access. |
| ● | Level 2 – Observable inputs other than quoted prices included in Level 1 that are observable for the asset or liability, either directly or indirectly. These inputs may include quoted prices for the identical instrument in an inactive market, prices for similar instruments, interest rates, prepayment speeds, credit risk, yield curves, default rates and similar data. |
| ● | Level 3 – Unobservable inputs for the asset or liability, to the extent relevant observable inputs are not available, representing the Fund’s own assumptions about the assumptions a market participant would use in valuing the asset or liability, and would be based on the best information available. |
The inputs used to measure fair value may fall into different levels of the fair value hierarchy. In such cases, for disclosure purposes, the level in the fair value hierarchy within which the fair value measurement falls in its entirety is determined based on the lowest level input that is significant to the fair value measurement in its entirety.
Each Fund generally determines the total value of each class of its shares by using market prices for the securities comprising its portfolio. Equity securities, including common stock, preferred stock, ADRs, REITs, LPs, LLCs, PLCs, GDRs and NVDRs are generally valued by using market quotations, but may be valued on the basis of prices furnished by a pricing service when the Advisor or Sub-Advisor believes such prices more accurately reflect the fair value of such securities. Securities including ETFs, that are traded on any stock exchange are generally valued by the pricing service at the last quoted sale price. Lacking a last sale price, an exchange traded security is generally valued by the pricing service at its last bid price. Securities traded in the NASDAQ over-the-counter market are generally valued by the pricing service at the NASDAQ Official Closing Price. When using the market quotations or close prices provided by the pricing service and when the market is considered active, the security will be classified as a Level 1 security. Equity securities traded on inactive markets or valued by reference to similar instruments are categorized as a Level 2. When market quotations are not readily available, when the Advisor or Sub-Advisor determines that the market quotation or the price provided by the pricing service does not accurately reflect the current fair value, or when restricted or illiquid securities are being valued, such securities are valued as determined in good faith by the Advisor or Sub-Advisor, in conformity with guidelines adopted by and subject to review by the Board. These securities will generally be categorized as Level 3 securities. Foreign investments are not fair valued using fair value triggers.
Investments in alternative investments, such as gold bars, are valued at the spot rate at 4:00 p.m. Eastern time each business day and are categorized as Level 1 in the hierarchy.
Investments in mutual funds, including money market mutual funds, are generally priced at the ending NAV provided by the service agent of the funds.
These securities will be categorized as Level 1 securities.
Fixed income securities such as corporate bonds, convertible bonds, government mortgage-backed securities, government notes and bonds, U.S. government agency securities and treasury inflation protected securities, when valued using market quotations in an active market, will be categorized as Level 1 securities. However, they may be valued on the basis of prices furnished by a pricing service when the Advisor or Sub-Advisor believes such prices more accurately reflect the fair value of such securities. A pricing service utilizes electronic data processing techniques based on yield spreads relating to securities with similar characteristics to determine prices for normal institutional-size trading units of debt securities without regard to sale or bid prices. These securities will generally be categorized as Level 2 securities. If the Advisor or Sub-Advisor decides that a price provided by the pricing service does not accurately reflect the fair value of the securities, when prices are not readily available from a pricing service, or when restricted or illiquid securities are being valued, securities are valued at fair value as determined in good faith by the Advisor or Sub-Advisor, in conformity with guidelines adopted by and subject to review of the Board. These securities will be categorized as Level 3 securities.
Short-term investments in fixed income securities (those with maturities of less than 60 days when acquired, or which subsequently are within 60 days of maturity) may be valued by using the amortized cost method of valuation, which the Board has determined will represent fair value. These securities will be classified as Level 2 securities.
The Board has delegated to the Advisor and/or Sub-Advisors responsibility for determining the value of Fund portfolio securities under certain circumstances. Under such circumstances, the Advisor or Sub-Advisor will use its best efforts to arrive at the fair value of a security held by the Fund under all reasonably ascertainable facts and circumstances. The Advisor must prepare a report for the Board not less than quarterly containing a complete listing of any securities for which fair value pricing was employed and detailing the specific reasons for such fair value pricing. The Board has adopted written policies and procedures to guide the Advisor and Sub-Advisors with respect to the circumstances under which, and the methods to be used, in fair valuing securities.
| Notes to Financial Statements |
| September 30, 2021 (Continued) |
| Timothy Plan Family of Funds |
The following is a summary of the inputs used to value each Fund’s investments as of September 30, 2021:
| Aggressive Growth Fund | |
| | | | | | | | | | | | | |
| Assets | | Level 1 | | | Level 2 | | | Level 3 | | | Total | |
| Common Stock | | $ | 49,139,741 | | | $ | — | | | $ | — | | | $ | 49,139,741 | |
| REITs | | | 538,774 | | | | — | | | | — | | | | 538,774 | |
| Money Market Fund | | | 3,258,766 | | | | — | | | | — | | | | 3,258,766 | |
| Total | | $ | 52,937,281 | | | $ | — | | | $ | — | | | $ | 52,937,281 | |
| | | | | | | | | | | | | | | | | |
| International Fund | |
| | | | | | | | | | | | | |
| Assets | | Level 1 | | | Level 2 | | | Level 3 | | | Total | |
| Common Stock | | $ | 130,919,429 | | | $ | — | | | $ | — | | | $ | 130,919,429 | |
| Money Market Fund | | | 5,466,035 | | | | — | | | | — | | | | 5,466,035 | |
| Total | | $ | 136,385,464 | | | $ | — | | | $ | — | | | $ | 136,385,464 | |
| | | | | | | | | | | | | | | | | |
| Large/Mid Cap Growth Fund | |
| | | | | | | | | | | | | |
| Assets | | Level 1 | | | Level 2 | | | Level 3 | | | Total | |
| Common Stock | | $ | 102,670,311 | | | $ | — | | | $ | — | | | $ | 102,670,311 | |
| Exchange Traded Funds | | | 25,038,749 | | | | — | | | | — | | | | 25,038,749 | |
| Money Market Fund | | | 6,917,122 | | | | — | | | | — | | | | 6,917,122 | |
| Total | | $ | 134,626,182 | | | $ | — | | | $ | — | | | $ | 134,626,182 | |
| | | | | | | | | | | | | | | | | |
| Small Cap Value Fund | |
| | | | | | | | | | | | | |
| Assets | | Level 1 | | | Level 2 | | | Level 3 | | | Total | |
| Common Stock | | $ | 135,373,210 | | | $ | — | | | $ | — | | | $ | 135,373,210 | |
| Exchange Traded Fund | | | 19,173,988 | | | | — | | | | — | | | | 19,173,988 | |
| REITs | | | 13,219,792 | | | | — | | | | — | | | | 13,219,792 | |
| Money Market Fund | | | 1,489,069 | | | | — | | | | — | | | | 1,489,069 | |
| Total | | $ | 169,256,059 | | | $ | — | | | $ | — | | | $ | 169,256,059 | |
| | | | | | | | | | | | | | | | �� | |
| Large/Mid Cap Value Fund | |
| | | | | | | | | | | | | |
| Assets | | Level 1 | | | Level 2 | | | Level 3 | | | Total | |
| Common Stock | | $ | 168,929,101 | | | $ | — | | | $ | — | | | $ | 168,929,101 | |
| Exchange Traded Funds | | | 58,955,093 | | | | — | | | | — | | | | 58,955,093 | |
| REITs | | | 8,845,518 | | | | — | | | | — | | | | 8,845,518 | |
| Money Market Fund | | | 16,927,368 | | | | — | | | | — | | | | 16,927,368 | |
| Total | | $ | 253,657,080 | | | $ | — | | | $ | — | | | $ | 253,657,080 | |
| | | | | | | | | | | | | | | | | |
| Fixed Income Fund | |
| | | | | | | | | | | | | |
| Assets | | Level 1 | | | Level 2 | | | Level 3 | | | Total | |
| Corporate Bonds | | $ | — | | | $ | 39,688,181 | | | $ | — | | | $ | 39,688,181 | |
| Government Mortgage-Backed Securities | | | — | | | | 31,655,450 | | | | — | | | | 31,655,450 | |
| Government Notes & Bonds | | | — | | | | 51,846,268 | | | | — | | | | 51,846,268 | |
| Money Market Fund | | | 4,209,551 | | | | — | | | | — | | | | 4,209,551 | |
| Total | | $ | 4,209,551 | | | $ | 123,189,899 | | | $ | — | | | $ | 127,399,450 | |
| | | | | | | | | | | | | | | | | |
| High Yield Bond Fund | |
| | | | | | | | | | | | | |
| Assets | | Level 1 | | | Level 2 | | | Level 3 | | | Total | |
| Corporate Bonds | | $ | — | | | $ | 125,040,163 | | | $ | — | | | | 125,040,163 | |
| Convertible Bonds | | | — | | | | 6,319,310 | | | | — | | | | 6,319,310 | |
| Preferred Stock | | | 549,150 | | | | — | | | | — | | | | 549,150 | |
| Money Market Fund | | | 4,398,611 | | | | — | | | | — | | | | 4,398,611 | |
| Total | | $ | 4,947,761 | | | $ | 131,359,473 | | | $ | — | | | $ | 136,307,234 | |
| Notes to Financial Statements |
| September 30, 2021 (Continued) |
| Timothy Plan Family of Funds |
| Israel Common Values Fund | |
| | | | | | | | | | | | | |
| Assets | | Level 1 | | | Level 2 | | | Level 3 | | | Total | |
| Common Stock | | $ | 107,595,539 | | | $ | — | | | $ | — | | | $ | 107,595,539 | |
| REITs | | | 1,530,967 | | | | — | | | | — | | | | 1,530,967 | |
| Money Market Fund | | | 6,382,650 | | | | — | | | | — | | | | 6,382,650 | |
| Total | | $ | 115,509,156 | | | $ | — | | | $ | — | | | $ | 115,509,156 | |
| | | | | | | | | | | | | | | | | |
| Defensive Strategies Fund | |
| | | | | | | | | | | | | |
| Assets | | Level 1 | | | Level 2 | | | Level 3 | | | Total | |
| Common Stock | | $ | 12,870,525 | | | $ | — | | | $ | — | | | $ | 12,870,525 | |
| Exchange Traded Fund | | | 1,154,720 | | | | — | | | | — | | | | 1,154,720 | |
| REITs | | | 11,729,895 | | | | — | | | | — | | | | 11,729,895 | |
| Treasury Inflation Protected Securities (TIPS) | | | — | | | | 15,391,132 | | | | — | | | | 15,391,132 | |
| Closed End Fund | | | 2,833,920 | | | | — | | | | — | | | | 2,833,920 | |
| Alternative Investments | | | 10,796,704 | | | | — | | | | — | | | | 10,796,704 | |
| Money Market Fund | | | 3,579,858 | | | | — | | | | — | | | | 3,579,858 | |
| Total | | $ | 42,965,622 | | | $ | 15,391,132 | | | $ | — | | | $ | 58,356,754 | |
| | | | | | | | | | | | | | | | | |
| Strategic Growth Fund | |
| | | | | | | | | | | | | |
| Assets | | Level 1 | | | Level 2 | | | Level 3 | | | Total | |
| Exchange Traded Funds | | $ | 22,639,076 | | | $ | — | | | $ | — | | | $ | 22,639,076 | |
| Mutual Funds | | | 16,811,091 | | | | — | | | | — | | | | 16,811,091 | |
| Money Market Fund | | | 1,320,403 | | | | — | | | | — | | | | 1,320,403 | |
| Total | | $ | 40,770,570 | | | $ | — | | | $ | — | | | $ | 40,770,570 | |
| | | | | | | | | | | | | | | | | |
| Conservative Growth Fund | |
| | | | | | | | | | | | | |
| Assets | | Level 1 | | | Level 2 | | | Level 3 | | | Total | |
| Exchange Traded Funds | | $ | 19,619,851 | | | $ | — | | | $ | — | | | $ | 19,619,851 | |
| Mutual Funds | | | 30,549,604 | | | | — | | | | — | | | | 30,549,604 | |
| Money Market Fund | | | 1,537,435 | | | | — | | | | — | | | | 1,537,435 | |
| Total | | $ | 51,706,890 | | | $ | — | | | $ | — | | | $ | 51,706,890 | |
| | | | | | | | | | | | | | | | | |
| Growth & Income Fund | |
| | | | | | | | | | | | | |
| Assets | | Level 1 | | | Level 2 | | | Level 3 | | | Total | |
| Corporate Bonds | | $ | — | | | $ | 2,518,256 | | | $ | — | | | $ | 2,518,256 | |
| Government Mortgage-Backed Securities | | | — | | | | 1,638,044 | | | | — | | | | 1,638,044 | |
| Government Notes, Bonds & Agencies | | | — | | | | 2,074,840 | | | | — | | | | 2,074,840 | |
| Exchange Traded Funds | | | 11,867,728 | | | | — | | | | — | | | | 11,867,728 | |
| Money Market Fund | | | 129,532 | | | | — | | | | — | | | | 129,532 | |
| Total | | $ | 11,997,260 | | | $ | 6,231,140 | | | $ | — | | | $ | 18,228,400 | |
Refer to the Schedules of Investments for industry classifications.
The Funds did not hold any Level 3 securities during the year presented.
| Notes to Financial Statements |
| September 30, 2021 (Continued) |
| Timothy Plan Family of Funds |
Note 3 | Purchases and Sales of Securities
The following is a summary of the cost of purchases and proceeds from the sale of securities, other than short-term investments, for the year ended September 30, 2021:
| | | Purchases | | | Sales | |
| | | U.S. Gov’t | | | | | | U.S. Gov’t | | | | |
| Fund | | Obligations | | | Other | | | Obligations | | | Other | |
| Aggressive Growth | | $ | — | | | $ | 27,129,194 | | | $ | — | | | $ | 24,591,401 | |
| International | | | — | | | | 37,993,233 | | | | — | | | | 18,911,775 | |
| Large/Mid Cap Growth * | | | — | | | | 25,574,249 | | | | — | | | | 25,490,473 | |
| Small Cap Value * | | | — | | | | 91,794,118 | | | | — | | | | 92,193,912 | |
| Large/Mid Cap Value * | | | — | | | | 70,894,193 | | | | — | | | | 78,636,608 | |
| Fixed Income | | | 52,439,654 | | | | 16,035,230 | | | | 48,704,020 | | | | 3,365,101 | |
| High Yield Bond | | | — | | | | 105,704,701 | | | | — | | | | 57,228,441 | |
| Israel Common Values | | | — | | | | 15,319,146 | | | | — | | | | 11,105,899 | |
| Defensive Strategies | | | — | | | | 28,955,325 | | | | — | | | | 14,924,012 | |
| Strategic Growth * | | | — | | | | 8,299,045 | | | | — | | | | 9,258,005 | |
| Conservative Growth * | | | — | | | | 10,110,685 | | | | — | | | | 10,196,050 | |
| Growth & Income * | | | 4,801,346 | | | | 2,879,102 | | | | 4,071,602 | | | | 5,098,708 | |
| * | The security transactions are inclusive of purchases and sales of affiliated funds. |
Note 4 | Investment Advisory Agreement and Transactions with Service Providers
Timothy Partners, Ltd., (“TPL”) is the investment advisor for the Funds pursuant to an investment advisory agreement (the “Agreement”) that was renewed by the Board on February 25-26, 2021. TPL supervises the investment of the assets of each Fund in accordance with the objectives, policies and restrictions of the Trust. Under the terms of the Agreement, as amended, TPL receives a fee, accrued daily and paid monthly, at an annual rate of 1.00% of the average daily net assets of the Timothy Plan International Fund and Timothy Plan Israel Common Values Fund; 0.85% of the average daily net assets of the Timothy Plan Aggressive Growth, the Timothy Plan Small Cap Value, the Timothy Plan Large/Mid Cap Growth, the Timothy Plan Growth & Income and the Timothy Plan Large/Mid Cap Value Funds; 0.60% of the average daily net assets of the Timothy Plan Fixed Income, the Timothy Plan High Yield Bond, and the Timothy Plan Defensive Strategies Funds; and 0.65% of the average daily net assets of the Timothy Plan Conservative Growth and the Timothy Plan Strategic Growth Funds. TPL has voluntarily agreed to reduce the fee it receives from the International Fund to 0.95%; from the Large/Mid Cap Growth Fund to 0.80%; from the Small Cap Value Fund, the Aggressive Growth Fund and the Large/Mid Cap Value Fund to 0.75%; from the High Yield Bond Fund and the Defensive Strategies Fund to 0.55%; from the Growth & Income Fund to 0.50%; and from the Fixed Income Fund to 0.40%. From August 1, 2021 through August 31, 2021 TPL voluntarily reduced the fee it receives from the Small Cap Value Fund to 0.60%; from the Large/Mid Cap Value Fund to 0.50% and the Growth & Income Fund to 0.25%. From August 1, 2021 through September 30, 2021 TPL voluntarily reduced the fee it receives from the Large/Mid Cap Growth Fund to 0.55%. Such voluntary fee reductions/reimbursements may be authorized by TPL at any time, but such action shall not obligate TPL to waive any fees in the near future. Such voluntary fee reductions/reimbursements are not subject to future recoupment. An officer and trustees of the Funds is also an officer and owner of the Advisor.
For the year ended September 30, 2021, TPL waived advisory fees for the Funds as follows:
| | | Year Ended | |
| Fund | | September 30, 2021 | |
| Aggressive Growth Fund | | $ | 45,827 | |
| International Fund | | | 54,433 | |
| Large/Mid Cap Growth Fund | | | 128,092 | |
| Small Cap Value Fund | | | 166,945 | |
| Large/Mid Cap Value Fund | | | 299,330 | |
| Fixed Income Fund | | | 235,823 | |
| High Yield Bond Fund | | | 51,804 | |
| Defensive Strategies Fund | | | 23,556 | |
| Growth & Income Fund | | | 68,011 | |
Gemini Fund Services, LLC (“GFS”) provides administrative, fund accounting, and transfer agency services to the Funds pursuant to agreements with the Trust, for which it receives from each Fund: (i) basis points in decreasing amounts as assets reach certain breakpoints; and (ii) any related out-of-pocket expenses. Fees are billed monthly as follows:
Fund Accounting and Fund Administration Fees:
Fund Complex Base annual fee:
25 basis points (0.25%) on the first $200 million of net assets
15 basis points (0.15%) on the next $200 million of net assets;
8 basis points (0.08%) on the next $600 million of net assets; and
6 basis points (0.06%) on net assets greater than $1 billion.
Transfer agency fees for the Funds are combined with the Fund Accounting and Fund Administration fees under the Trust’s agreement with GFS.
Therefore, there is no separate base annual fee per Fund or share class.
The Timothy Plan Aggressive Growth, Timothy Plan International, Timothy Plan Large/Mid Cap Growth, Timothy Plan Small Cap Value, Timothy Plan Large/Mid Cap Value, Timothy Plan Fixed Income, Timothy Plan High Yield Bond, Timothy Plan Defensive Strategies, Timothy Plan Israel Common Values and Timothy Plan Growth & Income Funds have adopted shareholder services plans (the “Plans”) pursuant to Rule 12b-1 under the Investment Company Act of 1940, as amended. The Plans provide that the Funds will pay TPL or others for expenses that relate to the promotion or distribution of shares. Under the Class A Plan, the Funds will pay TPL a fee at an annual rate of 0.25%, payable monthly, of the average daily net assets attributable
| Notes to Financial Statements |
| September 30, 2021 (Continued) |
| Timothy Plan Family of Funds |
to such class of shares. Under the Class C Plan, the Funds will pay TPL a fee at an annual rate of 1.00%, payable monthly, of which, 0.25% may be a service fee and 0.75% may be payable to outside broker/dealers, of the average daily net assets attributable to such class of shares. Class I shares are not subject to the shareholder services plan.
The Timothy Plan Conservative Growth and Timothy Plan Strategic Growth Funds have adopted shareholder services plans (the “Plans”) pursuant to Rule 12b-1 under the Investment Company Act of 1940, as amended. The Plans provide that the Funds will pay TPL or others for expenses that relate to the promotion or distribution of shares. Class A shares of the Funds do not impose a service fee. Under the Class C Plan, the Funds will pay TPL a fee at an annual rate of 0.75%, payable monthly to outside broker/dealers, of the average daily net assets attributable to such class of shares.
For the year ended September 30, 2021, the Funds paid TPL under the terms of the Plans as follows:
| Fund | | 12b-1 Fees | |
| | | Year Ended | |
| | | September 30, 2021 | |
| Aggressive Growth | | $ | 113,017 | |
| International | | | 164,909 | |
| Large/Mid Cap Growth | | | 312,309 | |
| Small Cap Value | | | 317,202 | |
| Large/Mid Cap Value | | | 524,689 | |
| Fixed Income | | | 334,307 | |
| High Yield Bond | | | 162,378 | |
| Israel Common Values | | | 228,857 | |
| Defensive Strategies | | | 115,807 | |
| Strategic Growth | | | 21,506 | |
| Conservative Growth | | | 40,744 | |
| Growth & Income | | | 54,149 | |
TPL also serves as the principal underwriter of the Funds’ shares. An officer and trustees of the Funds are also officers of the principal underwriter. For the year ended September 30, 2021, TPL received sales charges deducted from the proceeds of sales of Class A capital shares and CDSC fees deducted from the redemption of Class C capital shares as follows:
| | | Sales Charges | | | CDSC Fees | |
| Fund | | (Class A) | | | (Class C) | |
| Aggressive Growth | | $ | 22,827 | | | $ | 942 | |
| International | | | 26,508 | | | | 172 | |
| Large/Mid Cap Growth | | | 55,088 | | | | 904 | |
| Small Cap Value | | | 26,209 | | | | 783 | |
| Large/Mid Cap Value | | | 58,183 | | | | 2,570 | |
| Fixed Income | | | 41,157 | | | | 3,998 | |
| High Yield Bond | | | 32,174 | | | | 1,376 | |
| Israel Common Values | | | 26,517 | | | | 1,820 | |
| Defensive Strategies | | | 32,097 | | | | 442 | |
| Strategic Growth | | | 12,338 | | | | 475 | |
| Conservative Growth | | | 16,748 | | | | 989 | |
| Growth & Income | | | 6,209 | | | | 440 | |
Note 5 | Control Ownership
The beneficial ownership, either directly or indirectly, of more than 25% of the voting securities of a Fund creates the presumption of control of the Fund under Section 2(a) 9 of the Investment Company Act of 1940. At September 30, 2021, there were no shareholders with ownership, either directly or indirectly, of more than 25% of the voting securities of a Fund.
Certain Timothy Plan Funds own shares of other Timothy Plan Funds. U.S. Bank, N.A., custodian of the Timothy Plan Funds, holds these shares in omnibus accounts, some of which are controlled by National Financial Services, Inc. The following shows the percentage of each Timothy Plan Fund that is held by U.S. Bank, N.A., as custodian of the Timothy Plan Funds. These accounts can be considered affiliated to the Timothy Plan.
| | | % of Fund Owned by Other Timothy |
| Fund - Class A | | Plan Funds |
| International | | 16.15% |
| Fixed Income | | 38.59% |
| High Yield Bond | | 10.42% |
| Defensive Strategies | | 19.90% |
Note 6 | Underlying Investment in Other Investment Companies
The Conservative Growth Fund currently seeks to achieve its investment objectives by investing a portion of its assets in the Timothy Plan Fixed Income Fund (the “Security”). The Fund may redeem its investments from the Security at any time if the Advisor determines that it is in the best interest of the Fund and its shareholders to do so.
| Notes to Financial Statements |
| September 30, 2021 (Continued) |
| Timothy Plan Family of Funds |
The performance of the Fund will be directly affected by the performance of the Security. The annual report of the Security, along with the report of the independent registered public accounting firm is included in the Security’s N-CSRs available at www.sec.gov. As of September 30, 2021, 40.8% of the Conservative Growth Fund’s net assets were invested in the Timothy Plan Fixed Income Fund.
The Growth & Income Fund currently seeks to achieve its investment objectives by investing a portion of its assets in the Timothy Plan High Dividend Stock ETF (the “ETF”). The Fund may redeem its investments from the ETF at any time if the Advisor determines that it is in the best interest of the Fund and its shareholders to do so.
The performance of the Fund will be directly affected by the performance of the ETF. The annual report of the ETF, along with the report of the independent registered public accounting firm is included in the Security’s N-CSRs available at www.sec.gov. As of September 30, 2021, 51.8% of the Growth & Income Fund’s net assets were invested in the Timothy Plan High Dividend Stock ETF.
Note 7 | Investments in Affiliated Companies
The Funds’ transactions with affiliates represent holdings for which the respective Fund and the underlying investee fund have the same investment advisor or where the investee fund’s investment advisor is under common control with the Fund’s investment advisor.
The Timothy Plan Large/Mid Cap Growth Fund, Small Cap Value Fund, Large/Mid Cap Value Fund, Strategic Growth Fund, Conservative Growth Fund and Growth & Income Fund had the following transactions during the year ended September 30, 2021, with affiliates:
| Large/Mid Cap Growth | | Year Ended September 30, 2021 | |
| | | | | | | | | | | | | | | | | | Net Change in | | | | |
| | | Balance | | | | | | | | | | | | Amount of Gain | | | Unrealized | | | Fair Value | |
| | | September 30, | | | | | | | | | Dividends Credited | | | (Loss) Realized on | | | Appreciation | | | September 30, | |
| Fund | | 2020 | | | Purchases | | | Sales | | | to Income | | | Sale of Shares | | | (Depreciation) | | | 2021 | |
| Timothy Plan US Large/Mid Cap Core Enhanced ETF | | $ | — | | | $ | 1,962,975 | | | $ | — | | | $ | 938 | | | $ | — | | | $ | (76,999 | ) | | $ | 1,885,976 | |
| Timothy Plan US Large/Mid Cap Core ETF | | | 19,306,656 | | | | — | | | | 1,988,471 | | | | 177,963 | | | | 608,796 | | | | 5,225,792 | | | | 23,152,773 | |
| Total | | $ | 19,306,656 | | | | — | | | | — | | | $ | 178,901 | | | $ | 608,796 | | | $ | 5,148,793 | | | $ | 25,038,749 | |
| | | | | | | | | | | | | | | | | | | | | | | | | | | | | |
| Small Cap Value | | Year Ended September 30, 2021 | |
| | | | | | | | | | | | | | | | | | Net Change in | | | | |
| | | Balance | | | | | | | | | | | | Amount of Gain | | | Unrealized | | | Fair Value | |
| | | September 30, | | | | | | | | | Dividends Credited | | | (Loss) Realized on | | | Appreciation | | | September 30, | |
| Fund | | 2020 | | | Purchases | | | Sales | | | to Income | | | Sale of Shares | | | (Depreciation) | | | 2021 | |
| Timothy Plan US Small Cap Core ETF | | $ | 12,330,394 | | | $ | — | | | $ | — | | | $ | 230,391 | | | $ | — | | | $ | 6,843,594 | | | $ | 19,173,988 | |
| | | | | | | | | | | | | | | | | | | | | | | | | | | | | |
| Large/Mid Cap Value | | Year Ended September 30, 2021 | |
| | | | | | | | | | | | | | | | | | Net Change in | | | | |
| | | Balance | | | | | | | | | | | | Amount of Gain | | | Unrealized | | | Fair Value | |
| | | September 30, | | | | | | | | | Dividends Credited | | | (Loss) Realized on | | | Appreciation | | | September 30, | |
| Fund | | 2020 | | | Purchases | | | Sales | | | to Income | | | Sale of Shares | | | (Depreciation) | | | 2021 | |
| Timothy Plan High Dividend Stock Enhanced ETF | | $ | — | | | $ | 840,677 | | | $ | — | | | $ | 1,172 | | | $ | — | | | $ | (37,734 | ) | | $ | 802,943 | |
| Timothy Plan High Dividend Stock ETF | | | 21,086,308 | | | | — | | | | 843,658 | | | | 590,996 | | | | 156,571 | | | | 5,750,940 | | | | 26,150,161 | |
| Timothy Plan US Large/Mid Cap Core Enhanced ETF | | | — | | | | 1,961,434 | | | | — | | | | 953 | | | | — | | | | (75,458 | ) | | | 1,885,976 | |
| Timothy Plan US Large/Mid Cap Core ETF | | | 24,669,616 | | | | — | | | | 1,986,920 | | | | 227,886 | | | | 607,245 | | | | 6,826,072 | | | | 30,116,013 | |
| Total | | $ | 45,755,924 | | | | — | | | | — | | | $ | 821,007 | | | $ | 763,816 | | | $ | 12,463,820 | | | $ | 58,955,093 | |
| | | | | | | | | | | | | | | | | | | | | | | | | | | | | |
| Strategic Growth | | Year Ended September 30, 2021 | |
| | | | | | | | | | | | | | | | | | Net Change in | | | | |
| | | Balance | | | | | | | | | Dividends | | | Amount of Gain | | | Unrealized | | | Fair Value | |
| | | September 30, | | | | | | | | | Credited | | | (Loss) Realized on | | | Appreciation | | | September 30, | |
| Fund | | 2020 | | | Purchases | | | Sales | | | to Income | | | Sale of Shares* | | | (Depreciation) | | | 2021 | |
| International | | $ | 2,462,011 | | | $ | 1,281,273 | | | $ | 403,240 | | | $ | — | | | $ | 106,663 | | | $ | 579,431 | | | $ | 4,026,138 | |
| Fixed Income | | | 6,916,817 | | | | 1,374,536 | | | | 252,483 | | | | 88,152 | | | | 14,214 | | | | (271,626 | ) | | | 7,781,458 | |
| High Yield Bond | | | 1,916,780 | | | | 250,659 | | | | 186,106 | | | | 84,125 | | | | 15,857 | | | | 122,184 | | | | 2,119,374 | |
| Defensive Strategies | | | 2,442,481 | | | | 144,096 | | | | 71,406 | | | | — | | | | 16,102 | | | | 352,848 | | | | 2,884,121 | |
| Timothy Plan High Dividend Stock Enhanced ETF | | | — | | | | 1,252,524 | | | | — | | | | 1,732 | | | | — | | | | (57,843 | ) | | | 1,194,681 | |
| Timothy Plan High Dividend Stock ETF | | | 3,679,400 | | | | — | | | | 2,970,104 | | | | 82,650 | | | | 468,446 | | | | 610,519 | | | | 1,788,261 | |
| Timothy Plan International ETF | | | 8,078,257 | | | | 143,988 | | | | 554,514 | | | | 191,701 | | | | 53,820 | | | | 1,435,956 | | | | 9,157,507 | |
| Timothy Plan US Large/Mid Cap Core Enhanced ETF | | | — | | | | 3,258,731 | | | | 129,799 | | | | 1,502 | | | | 3,974 | | | | (125,141 | ) | | | 3,007,765 | |
| Timothy Plan US Large/Mid Cap Core ETF | | | 6,011,047 | | | | — | | | | 4,061,756 | | | | 48,874 | | | | 1,247,150 | | | | 597,445 | | | | 3,793,886 | |
| Timothy Plan US Small Cap Core ETF | | | 2,477,367 | | | | 593,239 | | | | 628,598 | | | | 42,683 | | | | 72,073 | | | | 1,182,895 | | | �� | 3,696,976 | |
| Total | | $ | 33,984,160 | | | | — | | | | — | | | $ | 541,419 | | | $ | 1,998,299 | | | $ | 4,426,668 | | | $ | 39,450,167 | |
| Notes to Financial Statements |
| September 30, 2021 (Continued) |
| Timothy Plan Family of Funds |
| Conservative Growth | | Year Ended September 30, 2021 | |
| | | | | | | | | | | | | | | | | | Net Change in | | | | |
| | | Balance | | | | | | | | | Dividends | | | Amount of Gain | | | Unrealized | | | Fair Value | |
| | | September 30, | | | | | | | | | Credited to | | | (Loss) Realized on | | | Appreciation | | | September 30, | |
| Fund | | 2020 | | | Purchases | | | Sales | | | Income | | | Sale of Shares* | | | (Depreciation) | | | 2021 | |
| International | | $ | 2,100,853 | | | $ | 1,119,300 | | | $ | 476,707 | | | $ | — | | | $ | 118,633 | | | $ | 464,287 | | | $ | 3,326,366 | |
| Fixed Income | | | 18,136,503 | | | | 3,644,575 | | | | — | | | | 233,484 | | | | — | | | | (663,382 | ) | | | 21,117,696 | |
| High Yield Bond | | | 2,544,601 | | | | 249,678 | | | | 13,091 | | | | 114,494 | | | | 2,126 | | | | 179,813 | | | | 2,963,127 | |
| Defensive Strategies | | | 2,778,571 | | | | 43,928 | | | | 96,395 | | | | — | | | | 22,035 | | | | 394,276 | | | | 3,142,415 | |
| Timothy Plan High Dividend Stock Enhanced ETF | | | — | | | | 795,929 | | | | — | | | | 1,100 | | | | — | | | | (36,783 | ) | | | 759,146 | |
| Timothy Plan High Dividend Stock ETF | | | 3,498,998 | | | | — | | | | 3,493,690 | | | | 68,992 | | | | 512,922 | | | | 495,898 | | | | 1,014,128 | |
| Timothy Plan International ETF | | | 6,528,482 | | | | 172,785 | | | | 823,281 | | | | 152,175 | | | | 95,672 | | | | 1,110,896 | | | | 7,084,554 | |
| Timothy Plan US Large/Mid Cap Core Enhanced ETF | | | — | | | | 3,211,110 | | | | 44,174 | | | | 1,521 | | | | 1,394 | | | | (123,825 | ) | | | 3,044,505 | |
| Timothy Plan US Large/Mid Cap Core ETF | | | 6,570,189 | | | | — | | | | 4,500,629 | | | | 52,696 | | | | 1,353,659 | | | | 640,563 | | | | 4,063,782 | |
| Timothy Plan US Small Cap Core ETF | | | 2,347,515 | | | | 873,380 | | | | 748,083 | | | | 41,207 | | | | 100,847 | | | | 1,080,077 | | | | 3,653,736 | |
| Total | | $ | 44,505,712 | | | | — | | | | — | | | $ | 665,669 | | | $ | 2,207,288 | | | $ | 3,541,820 | | | $ | 50,169,455 | |
| | | | | | | | | | | | | | | | | | | | | | | | | | | | | |
| Growth & Income | | Year Months Ended September 30, 2021 | |
| | | | | | | | | | | | | | | | | | Net Change in | | | | |
| | | Balance | | | | | | | | | | | | Amount of Gain | | | Unrealized | | | Fair Value | |
| | | September 30, | | | | | | | | | Dividends Credited | | | (Loss) Realized on | | | Appreciation | | | September 30, | |
| Fund | | 2020 | | | Purchases | | | Sales | | | to Income | | | Sale of Shares | | | (Depreciation) | | | 2021 | |
| Timothy Plan High Dividend Stock Enhanced ETF | | $ | — | | | $ | 2,531,500 | | | $ | — | | | $ | 3,899 | | | $ | — | | | $ | (98,340 | ) | | $ | 2,433,160 | |
| Timothy Plan High Dividend Stock ETF | | | 10,611,914 | | | | — | | | | 4,113,453 | | | | 268,925 | | | | 590,568 | | | | 2,345,539 | | | | 9,434,568 | |
| Total | | $ | 10,611,914 | | | | — | | | | — | | | $ | 272,824 | | | $ | 590,568 | | | $ | 2,247,199 | | | $ | 11,867,728 | |
Note 8 | Aggregate Unrealized Appreciation and Depreciation
The identified cost of investments in securities owned by each Fund for federal income tax purposes, and their respective gross unrealized appreciation and depreciation at September 30, 2021, were as follows:
| | | | | | | | | | | | | |
| | | | | | | | | | | | Net Unrealized | |
| | | | | | Gross Unrealized | | | Gross Unrealized | | | Appreciation/ | |
| Fund | | Tax Cost | | | Appreciation | | | Depreciation | | | (Depreciation) | |
| Aggressive Growth | | $ | 37,720,014 | | | $ | 16,066,437 | | | $ | (849,170 | ) | | $ | 15,217,267 | |
| International | | | 99,249,652 | | | | 39,006,193 | | | | (1,870,381 | ) | | | 37,135,812 | |
| Large/Mid Cap Growth | | | 87,609,853 | | | | 48,635,265 | | | | (1,618,936 | ) | | | 47,016,329 | |
| Small Cap Value | | | 143,191,853 | | | | 30,644,886 | | | | (4,580,680 | ) | | | 26,064,206 | |
| Large/Mid Cap Value | | | 190,463,087 | | | | 65,170,094 | | | | (1,976,101 | ) | | | 63,193,993 | |
| Fixed Income | | | 125,451,681 | | | | 2,630,272 | | | | (682,503 | ) | | | 1,947,769 | |
| High Yield Bond | | | 132,213,574 | | | | 4,844,971 | | | | (751,311 | ) | | | 4,093,660 | |
| Israel Common Values | | | 65,040,809 | | | | 53,532,478 | | | | (3,064,131 | ) | | | 50,468,347 | |
| Defensive Strategies | | | 50,757,621 | | | | 9,395,506 | | | | (1,796,373 | ) | | | 7,599,133 | |
| Strategic Growth | | | 35,830,915 | | | | 5,168,742 | | | | (229,087 | ) | | | 4,939,655 | |
| Conservative Growth | | | 46,878,682 | | | | 5,081,945 | | | | (253,737 | ) | | | 4,828,208 | |
| Growth & Income | | | 16,651,390 | | | | 1,716,052 | | | | (139,042 | ) | | | 1,577,010 | |
Note 9 | Distributions to Shareholders and Tax Components of Capital
The tax character of distributions paid during the fiscal year ended September 30, 2021 and the fiscal year ended September 30, 2020 were as follows:
| | | Aggressive Growth | | | International * | | | Large/Mid Cap Growth | | | Small Cap Value | |
| Year ended September 30, 2021 | |
| Ordinary Income | | $ | — | | | $ | 322,810 | | | $ | — | | | $ | 381,400 | |
| Long-term Capital Gains | | | 2,250,728 | | | | — | | | | 1,972,013 | | | | — | |
| | | $ | 2,250,728 | | | $ | 322,810 | | | $ | 1,972,013 | | | $ | 381,400 | |
| | | | | | | | | | | | | | | | | |
| Year ended September 30, 2020 | |
| Ordinary Income | | $ | — | | | $ | 719,040 | | | $ | — | | | $ | 401,399 | |
| Long-term Capital Gains | | | — | | | | — | | | | 3,719,674 | | | | 5,136,073 | |
| Return of Capital | | | — | | | | 426 | | | | — | | | | — | |
| | | $ | — | | | $ | 719,466 | | | $ | 3,719,674 | | | $ | 5,537,472 | |
| Notes to Financial Statements |
| September 30, 2021 (Continued) |
| Timothy Plan Family of Funds |
| | | Large/Mid Cap Value | | | Fixed Income | | | High Yield Bond | | | Israel Common Values* | | | Defensive Strategies | |
| Year ended September 30, 2021 | |
| Ordinary Income | | $ | 4,829,716 | | | $ | 1,398,718 | | | $ | 4,521,889 | | | $ | — | | | $ | — | |
| Long-term Capital Gains | | | 2,241,234 | | | | — | | | | — | | | | — | | | | — | |
| | | $ | 7,070,950 | | | $ | 1,398,718 | | | $ | 4,521,889 | | | $ | — | | | $ | — | |
| | | | | | | | | | | | | | | | | | | | | |
| Year ended September 30, 2020 | |
| Ordinary Income | | $ | 980,213 | | | $ | 1,408,178 | | | $ | 3,368,743 | | | $ | 876,698 | | | $ | 538,485 | |
| Long-term Capital Gains | | | 23,456,393 | | | | — | | | | — | | | | 3,222 | | | | 586,619 | |
| Return of Capital | | | — | | | | — | | | | — | | | | 18,224 | | | | 4,811 | |
| | | $ | 24,436,606 | | | $ | 1,408,178 | | | $ | 3,368,743 | | | $ | 898,144 | | | $ | 1,129,915 | |
| | | | | | | | | | | | | | | | | | | | | |
| | | Strategic Growth | | | Conservative Growth | | | Growth & Income Fund | | | | | | | |
| Year ended September 30, 2021 | |
| Ordinary Income | | $ | 78,822 | | | $ | 173,742 | | | $ | 137,308 | | | | | | | | | |
| Long-term Capital Gains | | | 1,207,004 | | | | 1,068,245 | | | | 4,742 | | | | | | | | | |
| | | $ | 1,285,826 | | | $ | 1,241,987 | | | $ | 142,050 | | | | | | | | | |
| | | | | | | | | | | | | | | | | | | | | |
| Year ended September 30, 2020 | |
| Ordinary Income | | $ | — | | | $ | 96,249 | | | $ | 186,187 | | | | | | | | | |
| Long-term Capital Gains | | | 1,336,492 | | | | 1,589,656 | | | | — | | | | | | | | | |
| Return of Capital | | | — | | | | — | | | | 1,620 | | | | | | | | | |
| | | $ | 1,336,492 | | | $ | 1,685,905 | | | $ | 187,807 | | | | | | | | | |
| * | The difference between ordinary distributions paid from book and ordinary distributions paid from tax relates to allowable foreign tax credits of $322,810 for the fiscal year ended September 30, 2021 for the International Fund, and $101,802 for fiscal year ended September 30, 2020 for Israel Common Values Fund, which has been passed through to the Funds’ underlying shareholders and are deemed dividends for tax purposes. Strategic Growth Fund had $21,486 of foreign taxes paid and Conservative Growth Fund had $17,056 included with distributions as well. |
As of September 30, 2021, the components of distributable earnings on a tax basis were as follows:
| | | Aggressive Growth | | | International | | | Large/Mid Cap | | | Small Cap Value | |
| | | Fund | | | Fund | | | Growth Fund | | | Fund | |
| Undistributed Ordinary Income | | $ | 140,857 | | | $ | 780,414 | | | $ | — | | | $ | 10,878,081 | |
| Long-Term Capital Gains | | | 3,312,762 | | | | — | | | | 8,186,840 | | | | 3,320,891 | |
| Capital Loss Carry Forward | | | — | | | | (161,975 | ) | | | — | | | | — | |
| Unrealized Appreciation (Depreciation) | | | 15,217,267 | | | | 37,135,799 | | | | 47,016,324 | | | | 26,064,206 | |
| | | $ | 18,670,886 | | | $ | 37,754,238 | | | $ | 55,203,164 | | | $ | 40,263,178 | |
| | | | | | | | | | | | | | | | | |
| | | Large/Mid Cap | | | Fixed Income | | | High Yield Bond | | | Israel Common | |
| | | Value Fund | | | Fund | | | Fund | | | Values Fund | |
| Undistributed Ordinary Income | | $ | 104,458 | | | $ | 14,609 | | | $ | 401,161 | | | $ | — | |
| Long-Term Capital Gains | | | 11,134,625 | | | | — | | | | — | | | | — | |
| Capital Loss Carry Forward | | | — | | | | (1,097,003 | ) | | | — | | | | (900,215 | ) |
| Unrealized Appreciation (Depreciation) | | | 63,193,993 | | | | 1,947,769 | | | | 4,093,660 | | | | 50,468,141 | |
| | | $ | 74,433,076 | | | $ | 865,375 | | | $ | 4,494,821 | | | $ | 49,567,926 | |
| | | | | | | | | | | | | | | | | |
| | | Defensive | | | Strategic Growth | | | Conservative | | | Growth & Income | |
| | | Strategies Fund | | | Fund | | | Growth Fund | | | Fund | |
| Undistributed Ordinary Income | | $ | 338,983 | | | $ | 90,570 | | | $ | 67,682 | | | $ | — | |
| Long-Term Capital Gains | | | — | | | | 1,827,872 | | | | 1,998,744 | | | | 75,004 | |
| Capital Loss Carry Forward | | | (153,204 | ) | | | — | | | | — | | | | — | |
| Unrealized Appreciation (Depreciation) | | | 7,599,169 | | | | 4,939,655 | | | | 4,828,208 | | | | 1,577,010 | |
| | | $ | 7,784,948 | | | $ | 6,858,097 | | | $ | 6,894,634 | | | $ | 1,652,014 | |
The difference between book basis and tax basis unrealized appreciation (depreciation), undistributed net investment income (loss) and accumulated net realized gain (loss) from investments are primarily attributable to the tax deferral of losses on wash sales, mark-to-market on passive foreign investment companies, and adjustments for C-Corporation return of capital distributions and perpetual bonds. The unrealized appreciation (depreciation) in the table above includes unrealized foreign currency gains (losses) of $(13), $36, $(5), $(206) for the International, Defensive Strategies, Large-Mid Cap Growth, and Israel Common Values Funds, respectively.
| Notes to Financial Statements |
| September 30, 2021 (Continued) |
| Timothy Plan Family of Funds |
Note 10 | Capital Loss Carryforwards, Post October and Other Losses
At September 30, 2021, the Funds had capital loss carry forwards for federal income tax purposes available to offset future capital gains, and utilized capital loss carryforwards as follows:
| | | Capital Loss Carry Forward | |
| Fund | | Short-Term | | | Long-Term | | | Total | | | Utilized | |
| International Fund | | $ | 161,975 | | | $ | — | | | $ | 161,975 | | | $ | 3,794,230 | |
| Small Cap Value Fund | | | — | | | | — | | | | — | | | | 5,073,326 | |
| Fixed Income Fund | | | 1,097,003 | | | | — | | | | 1,097,003 | | | | 138,088 | |
| High Yield Bond Fund | | | — | | | | — | | | | — | | | | 1,097,080 | |
| Israel Common Values Fund | | | 900,215 | | | | — | | | | 900,215 | | | | — | |
| Defensive Strategies Fund | | | — | | | | 153,204 | | | | 153,204 | | | | 1,302,749 | |
| Growth & Income Fund | | | — | | | | — | | | | — | | | | 421,773 | |
To the extent these loss carryforwards are used to offset future capital gains, it is probable that the amount, which is offset, will not be distributed to shareholders.
Note 11 | NEW ACCOUNTING PRONOUNCEMENTS
In March 2020, FASB issued ASU 2020-04, Reference Rate Reform (Topic 848): Facilitation of the Effects of Reference Rate Reform on Financial Reporting (’‘ASU 2020-04’’). The amendments in ASU 2020-04 provide optional temporary financial reporting relief from the effect of certain types of contract modifications due to the planned discontinuation of LIBOR and other interbank-offered based reference rates as of the end of 2021. ASU 2020-04 is effective for certain reference rate-related contract modifications that occur during the period March 12, 2020 through December 31, 2022. Management is currently evaluating the impact, if any of applying this ASU.
Note 12 | SUBSEQUENT EVENTS
Subsequent events after the date of the Statement of Assets and Liabilities have been evaluated through the date the financial issues were issued.
Management has determined that no events or transactions occurred requiring adjustment or disclosure in the financial statements.
Note 13 | TAX INFORMATION (Unaudited)
The Strategic Growth and Conservative Growth Funds designate the following for federal income tax purposes for the year ended September 30, 2021:
| | | Foreign Taxes paid | | | Foreign Source Income | |
| Strategic Growth Fund | | $ | 21,486 | | | $ | 191,414 | |
| Conservative Growth Fund | | | 17,056 | | | | 151,947 | |
| Notes to Financial Statements |
| September 30, 2021 (Continued) |
| Timothy Plan Family of Funds |
Board Annual Approval/Renewals of Advisory and Sub-Advisory Agreements (Unaudited)
Timothy Partners, Ltd; Investment Advisor to all Funds.
The continuance of the Investment Advisory Agreement (the “IA Agreement”) on behalf of each series of the Trust between the Trust and Timothy Partners, Ltd. (“TPL”) was last approved by the Board of Trustees (“the Board”), including a majority of the trustees who are not interested persons of the Trust or any person who is a party to the Agreement, at a meeting held on February 25-26, 2021. A description of the factors considered by the Board in renewing the IA Agreement are set forth below.
The Trustees, including the Independent Trustees, noted with approval the Advisor’s experience and consistency in incorporating and implementing the unique, Biblically-based management style that is a stated objective of all the Funds, as set forth in the Funds’ prospectus.
The Board also received and reviewed a description of TPL’s business and any personnel changes, a description of the compensation received by TPL from the Funds, information relating to the Advisor’s compliance and operational policies and procedures. In addition, the Board requested and received financial statements of TPL for its fiscal year ended December 31, 2020, and noted that updated financial statements were provided at each Board Meeting.
The Board also received a report from TPL relating to the fees charged by TPL, both as an aggregate and in relation to fees charged by other advisors to similar funds. The materials prepared by TPL were provided to the Board in advance of the meeting.
The Board considered the fees charged by TPL in light of the services provided to the Funds by TPL, the unique nature of the Funds and their moral screening requirements, which TPL maintains, and TPL’s role as a manager of managers. After full and careful consideration, the Board, with the independent trustees separately concurring, agreed that the fees charged by TPL were fair and reasonable in light of the services provided to the Funds.
The Board also discussed the nature, extent, and quality of TPL’s services to the Funds. In particular, the Board noted with approval TPL’s commitment to maintaining certain targeted expense ratios for the Funds, its efforts in providing comprehensive and consistent moral screens to the investment managers, its efforts in maintaining appropriate oversight of the investment managers to each Fund, and its efforts to maintain ongoing regulatory compliance for the Funds.
The Board also discussed TPL’s current fee structure and whether such structure would allow the Funds to realize economies of scale as they grow. The Board noted with approval that TPL was voluntarily waiving a portion of its fees for certain Funds in order to lower overall expenses. The Board next considered the investment performance of each Fund and the Advisor’s performance in monitoring the investment managers of the underlying funds. The Board generally approved of each Fund’s performance, noting that the Funds invested in a manner that did not rely exclusively on investment performance.
Further, the Board noted with approval that the investment managers of each Fund did not succumb to “style drift” in their management of each Fund’s assets and that each Fund was committed to maintain its investment mandate, even if that meant underperformance during periods when that style was out of favor. The Board noted with approval the Advisor’s ongoing efforts to maintain such consistent investment discipline. The Board also noted with approval that the Advisor’s business was devoted exclusively to serving the Funds, and that the Advisor did not realize any ancillary benefits or profits deriving from its relationship with the Funds. The Board further noted with approval the Advisor’s past activities on monitoring the performance of the underlying Funds’ various investment managers and the promptness and efficiency with which problems were brought to the Board’s attention and responsible remedies offered and executed. After careful discussion and consideration, the Board, including the separate concurrence of the independent Trustees, unanimously cast an affirmative vote and determined that the renewal of the IA Agreement for another one-year period would be in the best interests of the Funds’ shareholders. In approving the renewal of the IA Agreement for an additional one-year period, the Board did not place specific emphasis on any one factor discussed above, but considered all factors in equal light. Further, the Board had available and availed itself of the assistance of legal counsel at all times during its consideration of the IA Agreement renewal.
Westwood Management Corporation; Sub-Advisor to the Large/Mid Cap Value and the Small Cap Value Funds.
The Sub-Advisory Agreement between the Trust, TPL, and Westwood Management Corporation (“Westwood”), on behalf of the Timothy Plan Small Cap Value and Large/Mid Cap Value Funds, was last renewed by the Board at a meeting held for that purpose, among others, on February 26, 2021. The Board considered the following factors in arriving at its conclusions to renew the Westwood Sub-Advisory Agreement for an additional year. First, the Board considered the fees charged by Westwood in light of the services provided by Westwood. After full and careful consideration, the Board, with the independent trustees separately concurring, agreed that the fees charged by Westwood and paid out of the fees received by TPL were fair and reasonable in light of the services provided by Westwood. Next, the Board discussed the nature, extent, and quality of Westwood’s services to each Fund, including the investment performance of the Funds under Westwood’s investment management. The Board generally approved of Westwood’s performance, noting that the Funds managed by Westwood invested in a manner that did not rely exclusively on investment performance. Further, the Board noted with approval that Westwood did not succumb to “style drift” in its management of each Fund’s assets and that Westwood was committed to maintain its investment mandate, even if that meant underperformance during periods when that style was out of favor. The Board noted with approval Westwood’s ongoing efforts to maintain such consistent investment discipline. Next, the Board considered whether Westwood’s current fee structure would allow the Funds to realize economies of scale as they grow. The Board decided that this particular factor was moot with respect to the Westwood Sub-Advisory Agreement because Westwood was paid out of the fees paid to TPL. After careful discussion and consideration, the Board, including the independent Trustees separately concurring, unanimously determined that the renewal of the Westwood Sub-Advisory Agreement for another one-year period would be in the best interests of the Fund’s shareholders. In approving the renewal of the Westwood Sub- Advisory Agreement for an additional one-year period, the Board did not place specific emphasis on any one factor discussed above but considered all
| Notes to Financial Statements |
| September 30, 2021 (Continued) |
| Timothy Plan Family of Funds |
factors in equal light. Further, the Board had available and availed itself of the assistance of legal counsel at all times during its consideration of the Westwood Sub-Advisory Agreement renewal.
Barrow, Hanley, Mewhinney & Strauss; Sub-Advisor for the Fixed Income, High Yield Bond, and Defensive Strategies TIPS sleeve.
The Sub-Advisory Agreement between the Trust, TPL and Barrow, Hanley, Mewhinney & Strauss (“BHM&S”), on behalf of the Timothy Plan Fixed Income, High Yield Bond and Defensive Strategies TIPS sleeve Funds, was last renewed by the Board at a meeting held for that purpose, among others, on February 26, 2021. The Board considered the following factors in arriving at its conclusions to renew the BHM&S Sub-Advisory Agreement for an additional year. First, the Board considered the fees charged by BHM&S in light of the services provided by BHM&S to other similar clients. After full and careful consideration, the Board, with the independent trustees separately concurring, agreed that the fees charged by BHM&S and paid out of the fees received by TPL were fair and reasonable in light of the services provided by BHM&S. In reaching that determination, the Board relied on reports describing the fees paid to BHM&S. Next, the Board discussed the nature, extent, and quality of BHM&S’s services to each Fund, including the investment performance of the Funds under BHM&S’s investment management. The Board generally approved of BHM&S’s performance, noting that the Funds managed by BHM&S invested in a manner that did not rely exclusively on investment performance. Further, the Board noted with approval that BHM&S did not succumb to “style drift” in its management of each Fund’s assets and that BHM&S was committed to maintain its investment mandate, even if that meant underperformance during periods when that style was out of favor. The Board noted with approval BHM&S’s ongoing efforts to maintain such consistent investment discipline. Next, the Board considered whether BHM&S’s current fee structure would allow the Funds to realize economies of scale as they grow. The Board decided that this particular factor was moot with respect to the BHM&S Sub-Advisory Agreement because BHM&S was paid out of the fees paid to TPL. After careful discussion and consideration, the Board, including the independent Trustees separately concurring, unanimously determined that the renewal of the BHM&S Sub-Advisory Agreement for another one-year period would be in the best interests of the Funds’ shareholders. In approving the renewal of the BHM&S Sub-Advisory Agreement for an additional one-year period, the Board did not place specific emphasis on any one factor discussed above but considered all factors in equal light. Further, the Board had available and availed itself of the assistance of legal counsel at all times during its consideration of the BHM&S Sub-Advisory Agreement renewal.
Chartwell Investment Partners; Sub-Advisor to the Aggressive Growth and Large/Mid Cap Growth Funds.
The Sub-Advisory Agreement between the Trust, TPL, and Chartwell Investment Partners (“Chartwell”), on behalf of the Timothy Plan Aggressive Growth and Large/Mid Cap Growth Funds, was last renewed by the Board at a meeting held for that purpose, among others, on February 26, 2021. The Board considered the following factors in arriving at its conclusions to renew the Chartwell Sub-Advisory Agreement for an additional year. First, the Board considered the fees charged by Chartwell in light of the services provided by Chartwell. After full and careful consideration, the Board, with the independent trustees separately concurring, agreed that the fees charged by Chartwell and paid out of the fees received by TPL were fair and reasonable in light of the services provided by Chartwell. Next, the Board discussed the nature, extent, and quality of Chartwell’s services to each Fund, including the investment performance of the Funds under Chartwell’s investment management. The Board generally approved of Chartwell’s performance, noting that the Funds managed by Chartwell invested in a manner that did not rely exclusively on investment performance. Further, the Board noted with approval that Chartwell did not succumb to “style drift” in its management of each Fund’s assets and that Chartwell was committed to maintain its investment mandate, even if that meant underperformance during periods when that style was out of favor. The Board noted with approval Chartwell’s ongoing efforts to maintain such consistent investment discipline. Next, the Board considered whether Chartwell’s current fee structure would allow the Funds to realize economies of scale as they grow. The Board decided that this particular factor was moot with respect to the Chartwell Sub-Advisory Agreement because Chartwell was paid out of the fees paid to TPL. After careful discussion and consideration, the Board, including the independent Trustees separately concurring, unanimously determined that the renewal of the Chartwell Sub-Advisory Agreement for another one-year period would be in the best interests of the Funds’ shareholders. In approving the renewal of the Chartwell Sub-Advisory Agreement for an additional one-year period, the Board did not place specific emphasis on any one factor discussed above but considered all factors in equal light. Further, the Board had available and availed itself of the assistance of legal counsel at all times during its consideration of the Chartwell Sub-Advisory Agreement renewal.
CoreCommodity Management, LLC; Sub-Advisor to the Defensive Strategies Fund commodities sleeve.
The Sub-Advisory Agreement between the Trust, TPL, and CoreCommodity Management, LLC (“Core”), on behalf of the Timothy Plan Defensive Strategies Fund commodity sleeve, was last renewed by the Board at a meeting held for that purpose, among others, on February 26, 2021. The Board considered the following factors in arriving at its conclusions to renew the Core Sub-Advisory Agreement. First, the Board considered the fees charged by Core in light of the services provided by Core. After full and careful consideration, the Board, with the independent trustees separately concurring, agreed that the fees charged by Core and paid out of the fees received by TPL were fair and reasonable in light of the services provided by Core. Next, the Board discussed the nature, extent, and quality of Core’s services to the Fund, including the investment performance of the Fund under Core’s investment management. The Board generally approved of Core’s performance, noting that the Fund managed by Core invested in a manner that did not rely exclusively on investment performance. Further, the Board noted with approval that Core did not succumb to “style drift” in its management of the Fund’s assets and that Core was committed to maintain its investment mandate, even if that meant underperformance during periods when that style was out of favor. The Board noted with approval Core’s ongoing efforts to maintain such consistent investment discipline. Next, the Board considered whether Core’s current fee structure would allow the Fund to realize economies of scale as it grows. The Board decided that this particular factor was moot with respect to the Core Sub-Advisory Agreement because Core was paid out of the fees paid to TPL. After careful discussion and consideration, the Board, including the independent Trustees separately concurring, unanimously determined that the renewal of the Core Sub- Advisory Agreement would be in the best interests of the Fund’s shareholders. In approving the renewal of the Core Sub-Advisory Agreement, the Board did not place specific emphasis on any one factor discussed above but considered all factors in equal light. Further, the Board had available and availed itself of the assistance of legal counsel at all times during its consideration of the Core Sub-Advisory Agreement renewal.
| Notes to Financial Statements |
| September 30, 2021 (Continued) |
| Timothy Plan Family of Funds |
Eagle Global Advisors; Sub-Advisor to the International Fund and Israel Common Values Fund.
The Sub-Advisory Agreement between the Trust, TPL, and Eagle Global Advisors (“Eagle”), on behalf of the Timothy Plan International Fund and Israel Common Values Fund, was last renewed by the Board at a meeting held for that purpose, among others, on February 26, 2021. The Board considered the following factors in arriving at its conclusions to renew the Eagle Sub-Advisory Agreement for an additional year. First, the Board considered the fees charged by Eagle in light of the services provided by Eagle. After full and careful consideration, the Board, with the independent trustees separately concurring, agreed that the fees charged by Eagle and paid out of the fees received by TPL were fair and reasonable in light of the services provided by Eagle. Next, the Board discussed the nature, extent, and quality of Eagle’s services to the Funds, including the investment performance of the Funds under Eagle’s investment management. The Board generally approved of Eagle’s performance, noting that the Funds managed by Eagle invested in a manner that did not rely exclusively on investment performance. Further, the Board noted with approval that Eagle did not succumb to “style drift” in its management of the Funds’ assets and that Eagle was committed to maintain its investment mandate, even if that meant underperformance during periods when that style was out of favor. The Board noted with approval Eagle’s ongoing efforts to maintain such consistent investment discipline. Next, the Board considered whether Eagle’s current fee structure would allow the Funds to realize economies of scale as they grow. The Board decided that this particular factor was moot with respect to the Eagle Sub-Advisory Agreement because Eagle was paid out of the fees paid to TPL. After careful discussion and consideration, the Board, including the independent Trustees separately concurring, unanimously determined that the renewal of the Eagle Sub-Advisory Agreement for another one-year period would be in the best interests of the Funds’ shareholders. In approving the renewal of the Eagle Sub-Advisory Agreement for an additional one-year period, the Board did not place specific emphasis on any one factor discussed above but considered all factors in equal light. Further, the Board had available and availed itself of the assistance of legal counsel at all times during its consideration of the Eagle Sub-Advisory Agreement renewal.

REPORT OF INDEPENDENT REGISTERED PUBLIC ACCOUNTING FIRM
To the Shareholders and Board of Trustees of
The Timothy Plan
Opinion on the Financial Statements
We have audited the accompanying statements of assets and liabilities, including the schedules of investments, of Timothy Plan Aggressive Growth Fund, Timothy Plan International Fund, Timothy Plan Large/Mid Cap Growth Fund, Timothy Plan Small Cap Value Fund, Timothy Plan Large/Mid Cap Value Fund, Timothy Plan Fixed Income Fund, Timothy Plan High Yield Bond Fund, Timothy Plan Israel Common Values Fund, Timothy Plan Defensive Strategies Fund, Timothy Plan Strategic Growth Fund, Timothy Plan Conservative Growth Fund, and Timothy Plan Growth & Income Fund (the “Funds”), twelve of the portfolios constituting The Timothy Plan, as of September 30, 2021, the related statements of operations for the year then ended, the statements of changes in net assets for each of the two years in the period then ended, the related notes, and the financial highlights for each of the five years in the period then ended (collectively referred to as the “financial statements”). In our opinion, the financial statements present fairly, in all material respects, the financial position of the Funds as of September 30, 2021, the results of their operations for the year then ended, the changes in net assets for each of the two years in the period then ended, and the financial highlights for each of the five years in the period then ended, in conformity with accounting principles generally accepted in the United States of America.
Basis for Opinion
These financial statements are the responsibility of the Funds’ management. Our responsibility is to express an opinion on the Funds’ financial statements based on our audits. We are a public accounting firm registered with the Public Company Accounting Oversight Board (United States) (“PCAOB”) and are required to be independent with respect to the Funds in accordance with the U.S. federal securities laws and the applicable rules and regulations of the Securities and Exchange Commission and the PCAOB.
We conducted our audits in accordance with the standards of the PCAOB. Those standards require that we plan and perform the audit to obtain reasonable assurance about whether the financial statements are free of material misstatement whether due to error or fraud.
Our audits included performing procedures to assess the risks of material misstatement of the financial statements, whether due to error or fraud, and performing procedures that respond to those risks. Such procedures included examining, on a test basis, evidence regarding the amounts and disclosures in the financial statements. Our procedures included confirmation of securities owned as of September 30, 2021, including observation of precious metals, by correspondence with the custodian and brokers; when replies were not received from brokers, we performed other auditing procedures. Our audits also included evaluating the accounting principles used and significant estimates made by management, as well as evaluating the overall presentation of the financial statements. We believe that our audits provide a reasonable basis for our opinion.
We have served as the auditor of one or more investment companies advised by Timothy Partners, Ltd., since 2005.

COHEN & COMPANY, LTD.
Cleveland, Ohio
November 24, 2021
COHEN & COMPANY, LTD.
800.229.1099 | 866.818.4538 fax | cohencpa.com
Registered with the Public Company Accounting Oversight Board
| Expense Examples – (Unaudited) |
| September 30, 2021 |
As a shareholder of a Fund, you incur two types of costs: direct costs, such as wire fees and low balance fees; and indirect costs, including management fees, and other Fund operating expenses. This example is intended to help you understand your indirect costs, also referred to as “ongoing costs”, (in dollars) of investing in each Fund, and to compare these costs with the ongoing costs of investing in other mutual funds.
This example is based on an investment of $1,000 invested at the beginning of the period and held for the entire six-month period of April 1, 2021, through September 30, 2021.
Actual Expenses
The first line of the following tables provides information about actual account values and actual expenses. You may use the information in this line, together with the amount you invested at the beginning of the period, to estimate the expenses that you paid over the period. Simply divide your account value by $1,000 (for example, an $8,600 account value divided by $1,000 = 8.6), then multiply the result by the number in the first line under the heading “Expenses Paid During Period” to estimate the expenses you paid on your account during this period.
Hypothetical Example for Comparison Purposes
The second line of the tables provides information about hypothetical account values and hypothetical expenses based on each Fund’s actual expense ratio and an assumed rate of return of 5% per year before expenses, which is not the Fund’s actual return. The hypothetical account values and expenses may not be used to estimate the actual ending account balance or expenses you paid for the period. You may use this information to compare ongoing costs of investing in each Fund and other funds. To do so, compare this 5% hypothetical example with the 5% hypothetical examples that appear in the shareholder reports of other funds.
Please note that the expenses shown in the tables are meant to highlight your ongoing costs only and do not reflect any direct costs, such as wire fees or low balance fees. Therefore, the second line of the table is useful in comparing ongoing costs only, and will not help you determine the relative total costs of owning different funds. In addition, if these direct costs were included, your costs would be higher.
AGGRESSIVE GROWTH FUND
| | | Beginning Account | | Ending Account | | Expenses Paid |
| | | Value | | Value | | During Period |
| | | | | | | 4/1/2021 through |
| | | 4/1/2021 | | 9/30/2021 | | 9/30/2021 |
| Actual - Class A * | | $1,000.00 | | $1,089.60 | | $7.96 |
| Hypothetical - Class A ** | | $1,000.00 | | $1,017.45 | | $7.69 |
| Actual - Class C * | | $1,000.00 | | $1,085.40 | | $11.87 |
| Hypothetical - Class C ** | | $1,000.00 | | $1,013.69 | | $11.46 |
| Actual - Class I * | | $1,000.00 | | $1,090.00 | | $6.65 |
| Hypothetical - Class I ** | | $1,000.00 | | $1,018.70 | | $6.43 |
| * | Expenses are equal to the Fund’s annualized expense ratio of 1.52% for Class A, 2.27% for Class C and 1.27% for Class I, which is net of any expenses paid indirectly, multiplied by the average account value over the period, multiplied by 183 days/365 days (to reflect the partial year period). The Aggressive Growth Fund’s ending account value on the first line of each share class in the table is based on its actual total return of 8.96% for Class A, 8.54% for Class C and 9.00% for Class I for the period of April 1, 2021, to September 30, 2021. |
| ** | Assumes a 5% return before expenses. |
| Expense Examples – (Unaudited)(Continued) |
| September 30, 2021 |
INTERNATIONAL FUND
| | | Beginning Account | | Ending Account | | Expenses Paid |
| | | Value | | Value | | During Period |
| | | | | | | 4/1/2021 through |
| | | 4/1/2021 | | 9/30/2021 | | 9/30/2021 |
| Actual - Class A * | | $1,000.00 | | $1,034.60 | | $8.06 |
| Hypothetical - Class A ** | | $1,000.00 | | $1,017.15 | | $7.99 |
| Actual - Class C * | | $1,000.00 | | $1,030.90 | | $11.86 |
| Hypothetical - Class C ** | | $1,000.00 | | $1,013.39 | | $11.76 |
| Actual - Class I * | | $1,000.00 | | $1,035.30 | | $6.79 |
| Hypothetical - Class I ** | | $1,000.00 | | $1,018.40 | | $6.73 |
| * | Expenses are equal to the Fund’s annualized expense ratio of 1.58% for Class A, 2.33% for Class C and 1.33% for Class I, which is net of any expenses paid indirectly, multiplied by the average account value over the period, multiplied by 183 days/365 days (to reflect the partial year period). The International Fund’s ending account value on the first line of each share class in the table is based on its actual total return of 3.46% for Class A, 3.09% for Class C, and 3.53% for Class I for the period of April 1, 2021, to September 30, 2021. |
| ** | Assumes a 5% return before expenses. |
LARGE/MID CAP GROWTH FUND
| | | Beginning Account | | Ending Account | | Expenses Paid |
| | | Value | | Value | | During Period |
| | | | | | | 4/1/2021 through |
| | | 4/1/2021 | | 9/30/2021 | | 9/30/2021 |
| Actual - Class A * | | $1,000.00 | | $1,107.10 | | $6.92 |
| Hypothetical - Class A ** | | $1,000.00 | | $1,018.50 | | $6.63 |
| Actual - Class C * | | $1,000.00 | | $1,102.50 | | $10.86 |
| Hypothetical - Class C ** | | $1,000.00 | | $1,014.74 | | $10.40 |
| Actual - Class I * | | $1,000.00 | | $1,108.90 | | $5.60 |
| Hypothetical - Class I ** | | $1,000.00 | | $1,019.75 | | $5.37 |
| * | Expenses are equal to the Fund’s annualized expense ratio of 1.31% for Class A, 2.06% for Class C and 1.06% for Class I, which is net of any expenses paid indirectly, multiplied by the average account value over the period, multiplied by 183 days/365 days (to reflect the partial year period). The Large/Mid Cap Growth Fund’s ending account value on the first line of each share class in the table is based on its actual total return of 10.71% for Class A, 10.25% for Class C, and 10.89% for Class I for the period of April 1, 2021, to September 30, 2021. |
| ** | Assumes a 5% return before expenses. |
SMALL CAP VALUE FUND
| | | Beginning Account | | Ending Account | | Expenses Paid |
| | | Value | | Value | | During Period |
| | | | | | | 4/1/2021 through |
| | | 4/1/2021 | | 9/30/2021 | | 9/30/2021 |
| Actual - Class A * | | $1,000.00 | | $1,023.00 | | $6.74 |
| Hypothetical - Class A ** | | $1,000.00 | | $1,018.40 | | $6.73 |
| Actual - Class C * | | $1,000.00 | | $1,018.70 | | $10.53 |
| Hypothetical - Class C ** | | $1,000.00 | | $1,014.64 | | $10.50 |
| Actual - Class I * | | $1,000.00 | | $1,024.30 | | $5.48 |
| Hypothetical - Class I ** | | $1,000.00 | | $1,019.65 | | $5.47 |
| * | Expenses are equal to the Fund’s annualized expense ratio of 1.33% for Class A, 2.08% for Class C and 1.08% for Class I, which is net of any expenses paid indirectly, multiplied by the average account value over the period, multiplied by 183 days/365 days (to reflect the partial year period). The Large/Mid Cap Growth Fund’s ending account value on the first line of each share class in the table is based on its actual total return of 2.30% for Class A, 1.87% for Class C, and 2.43% for Class I for the period of April 1, 2021, to September 30, 2021. |
| ** | Assumes a 5% return before expenses. |
| Expense Examples – (Unaudited)(Continued) |
| September 30, 2021 |
LARGE/MID CAP VALUE FUND
| | | Beginning Account | | Ending Account | | Expenses Paid |
| | | Value | | Value | | During Period |
| | | | | | | 4/1/2021 through |
| | | 4/1/2021 | | 9/30/2021 | | 9/30/2021 |
| Actual - Class A * | | $1,000.00 | | $1,061.60 | | $6.82 |
| Hypothetical - Class A ** | | $1,000.00 | | $1,018.45 | | $6.68 |
| Actual - Class C * | | $1,000.00 | | $1,057.00 | | $10.67 |
| Hypothetical - Class C ** | | $1,000.00 | | $1,014.69 | | $10.45 |
| Actual - Class I * | | $1,000.00 | | $1,062.90 | | $5.53 |
| Hypothetical - Class I ** | | $1,000.00 | | $1,019.70 | | $5.42 |
| * | Expenses are equal to the Fund’s annualized expense ratio of 1.32% for Class A, 2.07% for Class C, and 1.07% for Class I which is net of any expenses paid indirectly, multiplied by the average account value over the period, multiplied by 183 days/365 days (to reflect the partial year period). The Large/Mid Cap Value Fund’s ending account value on the first line of each share class in the table is based on its actual total return of 6.16% for Class A, 5.70% for Class C, and 6.29% for Class I for the period of April 1, 2021, to September 30, 2021. |
| ** | Assumes a 5% return before expenses. |
FIXED INCOME FUND
| | | Beginning Account | | Ending Account | | Expenses Paid |
| | | Value | | Value | | During Period |
| | | | | | | 4/1/2021 through |
| | | 4/1/2021 | | 9/30/2021 | | 9/30/2021 |
| Actual - Class A * | | $1,000.00 | | $1,005.00 | | $4.67 |
| Hypothetical - Class A ** | | $1,000.00 | | $1,020.41 | | $4.71 |
| Actual - Class C * | | $1,000.00 | | $1,000.60 | | $8.43 |
| Hypothetical - Class C ** | | $1,000.00 | | $1,016.65 | | $8.49 |
| Actual - Class I * | | $1,000.00 | | $1,005.30 | | $3.42 |
| Hypothetical - Class I ** | | $1,000.00 | | $1,021.66 | | $3.45 |
| * | Expenses are equal to the Fund’s annualized expense ratio of 0.93% for Class A, 1.68% for Class C, and 0.68% for Class I which is net of any expenses paid indirectly, multiplied by the average account value over the period, multiplied by 183 days/365 days (to reflect the partial year period). The Fixed Income Fund’s ending account value on the first line of each share class in the table is based on its actual total return of 0.50% for Class A, 0.06% for Class C, and 0.53% for Class I for the period of April 1, 2021, to September 30, 2021. |
| ** | Assumes a 5% return before expenses. |
HIGH YIELD BOND FUND
| | | Beginning Account | | Ending Account | | Expenses Paid |
| | | Value | | Value | | During Period |
| | | | | | | 4/1/2021 through |
| | | 4/1/2021 | | 9/30/2021 | | 9/30/2021 |
| Actual - Class A * | | $1,000.00 | | $1,033.10 | | $4.89 |
| Hypothetical - Class A ** | | $1,000.00 | | $1,020.26 | | $4.86 |
| Actual - Class C * | | $1,000.00 | | $1,029.70 | | $8.70 |
| Hypothetical - Class C ** | | $1,000.00 | | $1,016.50 | | $8.64 |
| Actual - Class I * | | $1,000.00 | | $1,034.30 | | $3.62 |
| Hypothetical - Class I ** | | $1,000.00 | | $1,021.51 | | $3.60 |
| ** | Expenses are equal to the Fund’s annualized expense ratio of 0.96% for Class A, 1.71% for Class C, and 0.71% for Class I which is net of any expenses paid indirectly, multiplied by the average account value over the period, multiplied by 183 days/365 days (to reflect the partial year period). The High Yield Bond Fund’s ending account value on the first line of each share class in the table is based on its actual total return of 3.31% for Class A, 2.97% for Class C, and 3.43% for Class I for the period of April 1, 2021, to September 30, 2021. |
| ** | Assumes a 5% return before expenses. |
| Expense Examples – (Unaudited)(Continued) |
| September 30, 2021 |
DEFENSIVE STRATEGIES FUND
| | | Beginning Account | | Ending Account | | Expenses Paid |
| | | Value | | Value | | During Period |
| | | | | | | 4/1/2021 through |
| | | 4/1/2021 | | 9/30/2021 | | 9/30/2021 |
| Actual - Class A * | | $1,000.00 | | $1,050.50 | | $6.63 |
| Hypothetical - Class A ** | | $1,000.00 | | $1,018.60 | | $6.53 |
| Actual - Class C * | | $1,000.00 | | $1,046.80 | | $10.47 |
| Hypothetical - Class C ** | | $1,000.00 | | $1,014.84 | | $10.30 |
| Actual - Class I * | | $1,000.00 | | $1,052.00 | | $5.35 |
| Hypothetical - Class I ** | | $1,000.00 | | $1,019.85 | | $5.27 |
| * | Expenses are equal to the Fund’s annualized expense ratio of 1.29% for Class A, 2.04% for Class C and 1.04% for Class I, which is net of any expenses paid indirectly, multiplied by the average account value over the period, multiplied by 183 days/365 days (to reflect the partial year period). The Defensive Strategies Fund’s ending account value on the first line of each share class in the table is based on its actual total return of 5.05% for Class A, 4.68% for Class C and 5.20% for Class I for the period of April 1, 2021, to September 30, 2021. |
| ** | Assumes a 5% return before expenses. |
STRATEGIC GROWTH FUND
| | | Beginning Account | | Ending Account | | Expenses Paid |
| | | Value | | Value | | During Period |
| | | | | | | 4/1/2021 through |
| | | 4/1/2021 | | 9/30/2021 | | 9/30/2021 |
| Actual - Class A * | | $1,000.00 | | $1,027.30 | | $4.83 |
| Hypothetical - Class A ** | | $1,000.00 | | $1,020.31 | | $4.81 |
| Actual - Class C * | | $1,000.00 | | $1,023.70 | | $8.62 |
| Hypothetical - Class C ** | | $1,000.00 | | $1,016.55 | | $8.59 |
| * | Expenses are equal to the Fund’s annualized expense ratio of 0.95% for Class A and 1.70% for Class C, which is net of any expenses paid indirectly, multiplied by the average account value over the period, multiplied by 183 days/365 days (to reflect the partial year period). The Strategic Growth Fund’s ending account value on the first line of each share class in the table is based on its actual total return of 2.73% for Class A and 2.37% for Class C for the six-month period of April 1, 2021, to September 30, 2021. |
| ** | Assumes a 5% return before expenses. |
CONSERVATIVE GROWTH FUND
| | | Beginning Account | | Ending Account | | Expenses Paid |
| | | Value | | Value | | During Period |
| | | | | | | 4/1/2021 through |
| | | 4/1/2021 | | 9/30/2021 | | 9/30/2021 |
| Actual - Class A * | | $1,000.00 | | $1,020.10 | | $5.17 |
| Hypothetical - Class A ** | | $1,000.00 | | $1,019.95 | | $5.16 |
| Actual - Class C * | | $1,000.00 | | $1,016.80 | | $8.95 |
| Hypothetical - Class C ** | | $1,000.00 | | $1,016.19 | | $8.95 |
| * | Expenses are equal to the Fund’s annualized expense ratio of 1.02% for Class A and 1.77% for Class C, which is net of any expenses paid indirectly, multiplied by the average account value over the period, multiplied by 183 days/365 days (to reflect the partial year period). The Conservative Growth Fund’s ending account value on the first line of each share class in the table is based on its actual total return of 2.01% for Class A and 1.68% for Class C for the six-month period of April 1, 2021, to September 30, 2021. |
| ** | Assumes a 5% return before expenses. |
| Expense Examples – (Unaudited)(Continued) |
| September 30, 2021 |
ISRAEL COMMON VALUES FUND
| | | Beginning Account | | Ending Account | | Expenses Paid |
| | | Value | | Value | | During Period |
| | | | | | | 4/1/2021 through |
| | | 4/1/2021 | | 9/30/2021 | | 9/30/2021 |
| Actual - Class A * | | $1,000.00 | | $1,158.50 | | $8.55 |
| Hypothetical - Class A ** | | $1,000.00 | | $1,017.15 | | $7.99 |
| Actual - Class C * | | $1,000.00 | | $1,153.50 | | $12.58 |
| Hypothetical - Class C ** | | $1,000.00 | | $1,013.39 | | $11.76 |
| Actual - Class I * | | $1,000.00 | | $1,159.90 | | $7.20 |
| Hypothetical - Class I ** | | $1,000.00 | | $1,018.40 | | $6.73 |
| * | Expenses are equal to the Fund’s annualized expense ratio of 1.58% for Class A, 2.33% for Class C and 1.33% for Class I, which is net of any expenses paid indirectly, multiplied by the average account value over the period, multiplied by 183 days/365 days (to reflect the partial year period). The Israel Common Values Fund’s ending account value on the first line of each share class in the table is based on its actual total return of 15.85% for Class A, 15.35% for Class C and 15.99% for Class I for the period of April 1, 2021, to September 30, 2021. |
| ** | Assumes a 5% return before expenses. |
GROWTH & INCOME FUND
| | | Beginning Account | | Ending Account | | Expenses Paid |
| | | Value | | Value | | During Period |
| | | | | | | 4/1/2021 through |
| | | 4/1/2021 | | 9/30/2021 | | 9/30/2021 |
| Actual - Class A * | | $1,000.00 | | $1,012.70 | | $7.32 |
| Hypothetical - Class A ** | | $1,000.00 | | $1,017.80 | | $7.33 |
| Actual - Class C * | | $1,000.00 | | $1,008.40 | | $11.08 |
| Hypothetical - Class C ** | | $1,000.00 | | $1,014.04 | | $11.11 |
| Actual - Class I *** | | $1,000.00 | | $1,013.00 | | $6.06 |
| Hypothetical - Class I ** | | $1,000.00 | | $1,019.05 | | $6.07 |
| * | Expenses are equal to the Fund’s annualized expense ratio of 1.45% for Class A, 2.20% for Class C and 1.20% for Class I, which is net of any expenses paid indirectly, multiplied by the average account value over the period, multiplied by 183 days/365 days (to reflect the partial year period). The Growth & Income Fund’s ending account value on the first line of each share class in the table is based on its actual total return of 1.27% for Class A, 0.84% for Class C and 1.30% for Class I for the period of April 1, 2021, to September 30, 2021. |
| ** | Assumes a 5% return before expenses. |
| Officers and Trustees of the Trust (Unaudited) |
The Trustees and principal executive officers of the Trust and their principal occupations for the past five years are listed as follows:
INTERESTED TRUSTEES
| Name, Age and Address | Position(s)
Held With Trust | Term of Office
and Length of Time Served | Number of Portfolios
in Fund Complex
Overseen by Trustee |
Arthur D. Ally*
1055 Maitland Center Commons
Maitland, FL
Born: 1942 | Trustee, Chairman, President, and Treasurer | Indefinite; Trustee and President since 1994 | 18 |
| Principal Occupation During Past 5 Years | Other Directorships
Held by Trustee |
| President and controlling shareholder of Covenant Funds, Inc. (“CFI”), a holding company. President and general partner of Timothy Partners, Ltd. (“TPL”), the investment Advisor and principal underwriter to each Fund. CFI is also the managing general partner of TPL. | None |
| Name, Age and Address | Position(s)
Held With Trust | Term of Office
and Length of Time Served | Number of Portfolios
in Fund Complex
Overseen by Trustee |
Joseph E. Boatwright**
1055 Maitland Center Commons
Maitland, FL
Born: 1930 | Trustee Emeritus and Secretary | Indefinite; Trustee and Secretary since 1995, Trustee Emeritus as of 2020 | 18 |
| Principal Occupation During Past 5 Years | Other Directorships
Held by Trustee |
| Retired Minister. Currently serves as a consultant to the Greater Orlando Baptist Association. Served as Senior Pastor to Aloma Baptist Church from 1970-1996. | None |
| Name, Age and Address | Position(s)
Held With Trust | Term of Office
and Length of Time Served | Number of Portfolios
in Fund Complex
Overseen by Trustee |
Mathew D. Staver**
1055 Maitland Center Commons
Maitland, FL
Born: 1956 | Trustee | Indefinite; Trustee since 2000 | 18 |
| Principal Occupation During Past 5 Years | Other Directorships
Held by Trustee |
| Attorney specializing in free speech, appellate practice and religious liberty constitutional law. Founder of Liberty Counsel, a religious civil liberties education and legal defense organization. Host of two radio programs devoted to religious freedom issues. Editor of a monthly newsletter devoted to religious liberty topics. Mr. Staver has argued before the United States Supreme Court and has published numerous legal articles. | None |
| * | Mr. Ally is an “interested” Trustee, as that term is defined in the 1940 Act, because of his positions with and financial interests in CFI and TPL. |
| ** | Messrs. Boatwright and Staver are “interested” Trustees, as that term is defined in the 1940 Act, because each has a limited partnership interest in TPL. |
| Officers and Trustees of the Trust (Unaudited) |
| (Continued) |
INDEPENDENT TRUSTEES
| Name, Age and Address | Position(s)
Held With Trust | Term of Office
and Length of Time Served | Number of Portfolios
in Fund Complex
Overseen by Trustee |
Richard W. Copeland
1055 Maitland Center Commons
Maitland, FL
Born: 1947 | Trustee | Indefinite; Trustee since 2005 | 18 |
| Principal Occupation During Past 5 Years | Other Directorships
Held by Trustee |
| Retired. Associate Professor Stetson University for the past 40 years. Retired Principal of Copeland & Covert, Attorneys at Law; specializing in tax and estate planning. B.A. from Mississippi College, JD from University of Florida and LLM Taxation from University of Miami. | None |
| Name, Age and Address | Position(s)
Held With Trust | Term of Office
and Length of Time Served | Number of Portfolios
in Fund Complex
Overseen by Trustee |
Deborah Honeycutt
1055 Maitland Center Commons
Maitland, FL
Born: 1947 | Trustee | Indefinite; Trustee since 2010 | 18 |
| Principal Occupation During Past 5 Years | Other Directorships
Held by Trustee |
| Dr. Honeycutt is a licensed physician currently serving as Medical Director of Clayton State University Health Services in Morrow, GA, CEO of Minority Health Services in Atlanta, and as a volunteer at Good Shepherd Clinic. Dr. Honeycutt received her B.A. and M.D. at the University of Illinois. | None |
| Name, Age and Address | Position(s)
Held With Trust | Term of Office
and Length of Time Served | Number of Portfolios
in Fund Complex
Overseen by Trustee |
Bill Johnson
1055 Maitland Center Commons
Maitland, FL
Born: 1946 | Trustee | Indefinite; Trustee since 2005 | 18 |
| Principal Occupation During Past 5 Years | Other Directorships
Held by Trustee |
| President (and Founder) of American Decency Association, Freemont, MI since 1999. Previously served as Michigan State Director for American Family Association (1987-1999). Previously a public school teacher for 18 years. B.S. from Michigan State University and a Masters of Religious Education from Grand Rapids Baptist Seminary. | None |
| Officers and Trustees of the Trust (Unaudited) |
| (Continued) |
| Name, Age and Address | Position(s)
Held With Trust | Term of Office
and Length of Time Served | Number of Portfolios
in Fund Complex
Overseen by Trustee |
John C. Mulder
1055 Maitland Center Commons
Maitland, FL
Born: 1950 | Trustee | Indefinite; Trustee since 2005 | 18 |
| Principal Occupation During Past 5 Years | Other Directorships
Held by Trustee |
| President of WaterStone (formerly the Christian Community Foundation and National Foundation) since 2001. Prior: 22 years of executive experience for a group of banks and a trust company. B.A. in Economics from Wheaton College and MBA from University of Chicago. | None |
| Name, Age and Address | Position(s)
Held With Trust | Term of Office
and Length of Time Served | Number of Portfolios
in Fund Complex
Overseen by Trustee |
Scott Preissler, Ph.D.
1055 Maitland Center Commons
Maitland, FL
Born: 1960 | Trustee | Indefinite; Trustee since 2004 | 18 |
| Principal Occupation During Past 5 Years | Other Directorships
Held by Trustee |
| Scott Preissler, Ph.D. is the Executive Director of The National Center for Stewardship& Generosity. He is a former professor and past President and CEO of The Christian Stewardship Association (CSA) and Southern Baptist state headquarters in Texas and Georgia | None |
| Name, Age and Address | Position(s)
Held With Trust | Term of Office
and Length of Time Served | Number of Portfolios
in Fund Complex
Overseen by Trustee |
Alan M. Ross
1055 Maitland Center Commons
Maitland, FL
Born: 1951 | Trustee, Vice Chairman | Indefinite; Trustee since 2004 | 18 |
| Principal Occupation During Past 5 Years | Other Directorships
Held by Trustee |
| Founder and CEO of Corporate Development Institute which he founded in 2000. Previously he served as President and CEO of Fellowship of Companies for Christ and has authored three books: Beyond World Class, Unconditional Excellence, Breaking Through to Prosperity. | None |
| Name, Age and Address | Position(s)
Held With Trust | Term of Office
and Length of Time Served | Number of Portfolios
in Fund Complex
Overseen by Trustee |
Patrice Tsague
1055 Maitland Center Commons
Maitland, FL
Born: 1973 | Trustee | Indefinite; Trustee since 2011 | 18 |
| Principal Occupation During Past 5 Years | Other Directorships
Held by Trustee |
| President and Chief Servant Officer of the Nehemiah Project International Ministries Inc. since 1999. | None |
| Officers and Trustees of the Trust (Unaudited) |
| (Continued) |
| Name, Age and Address | Position(s)
Held With Trust | Term of Office
and Length of Time Served | Number of Portfolios
in Fund Complex
Overseen by Trustee |
Abraham M. Rivera
1055 Maitland Center Commons
Maitland, FL
Born: 1969 | Trustee | Indefinite; Trustee since 2020 | 18 |
| Principal Occupation During Past 5 Years | Other Directorships
Held by Trustee |
| Pastor / President / Director, for La Puerta Life Center, Inc., a Florida corporation. | 1 |
| Name, Age and Address | Position(s)
Held With Trust | Term of Office
and Length of Time Served | Number of Portfolios
in Fund Complex
Overseen by Trustee |
Dale A. Bissonette
1055 Maitland Center Commons
Maitland, FL
Born: 1958 | Trustee | Indefinite; Trustee since 2020 | 18 |
| Principal Occupation During Past 5 Years | Other Directorships
Held by Trustee |
| President, Good Place Holdings, a Christian Centered Business Holding Company. | None |
EXECUTIVE OFFICERS
| Name, Address & Age | Position(s)
Held with the
Trust | Length of Time
Served and Term of
Office | Number of Portfolios
in Fund Complex
Overseen by Trustee |
Terry Covert
1055 Maitland Center Commons
Maitland, FL
Born: 1947 | Executive Officer, Vice President | Officer since 2019 Indefinite Term | N/A |
| Principal Occupation During Past 5 Years | Other Directorships
Held by Trustee |
Chief Compliance Officer and General Counsel for the Advisor, Timothy Partners, Ltd. | N/A |
| | | | |
| Name, Address & Age | Position(s)
Held with the
Trust | Length of Time
Served and Term of
Office | Number of Portfolios
in Fund Complex
Overseen by Trustee |
Cheryl Mumbert
1055 Maitland Center Commons
Maitland, FL
Born: 1970 | Executive Officer, Vice President | Officer since 2019 Indefinite Term | N/A |
| Principal Occupation During Past 5 Years | Other Directorships
Held by Trustee |
| Chief Marketing Officer for Advisor, Timothy Partners, Ltd. | N/A |
| | | | |
| Name, Address & Age | Position(s)
Held with the Trust | Length of Time
Served and Term of Office | Number of Portfolios
in Fund Complex
Overseen by Trustee |
David D. Jones
1055 Maitland Center Commons
Maitland, FL
Born: 1957 | Chief Compliance Officer | Since 2004, Indefinite Term | N/A |
| Principal Occupation During Past 5 Years | Other Directorships Held by Trustee |
| Co-founder and Managing Member, Drake Compliance, LLC (compliance consulting); founder and controlling shareholder, David Jones & Associates (law firm), 1998 to 2015. | N/A |
The Fund’s Statement of Additional Information includes additional information about the Trustees and is available free of charge, upon request, by calling toll-free at 1-800-846-7526.
Privacy Notice
| | | |
FACTS | | WHAT DOES THE TIMOTHY PLAN DO WITH YOUR PERSONAL INFORMATION? |
| | | |
| WHY? | | Financial companies choose how they share your personal information. Federal law gives consumers the right to limit some, but not all information sharing. Federal law also requires us to tell you how we collect, share, and protect your personal information. Please read this Notice carefully to understand what we do. |
| | | |
| WHAT? | | The types of information we collect and share depend on the product or service you have with us. This information can include: |
| | | |
| | | ● Social Security Number |
| | | |
| | | ● Assets |
| | | |
| | | ● Retirement Assets |
| | | |
| | | ● Transaction History |
| | | |
| | | ● Checking Account History |
| | | |
| | | ● Purchase History |
| | | |
| | | ● Account Balances |
| | | |
| | | ● Account Transactions |
| | | |
| | | ● Wire Transfer Instructions |
| | | |
| | | When you are no longer our customer, we continue to share your information as described in this Notice. |
| | | |
| HOW? | | All financial companies need to share your personal information to run their everyday business. In the section below, we list the reasons financial companies can share their customers’ personal information; the reasons The Timothy Plan chooses to share; and whether you can limit this sharing. |
| | | | | |
| Reasons we can share your personal information. | | Does The Timothy Plan share? | | Can you limit this sharing? |
For our everyday business purposes- Such as to process your transactions, maintain your account(s), respond to court orders and legal investigations, or report to credit bureaus. | | Yes | | No |
For our marketing purposes- to offer our products and services to you. | | No | | We don’t share |
| For joint marketing with other financial companies | | No | | We don’t share |
For our affiliates’ everyday business purposes- information about your transactions and experiences. | | Yes | | No |
For our affiliates’ everyday business purposes- information about your creditworthiness | | No | | We don’t share |
| For non-affiliates to market to you | | No | | We don’t share |
| | | | | |
| Questions? | | Call 800-662-0201 |
| Who we are | | |
| Who is providing this Notice? | | Timothy Plan Family of Mutual Funds Timothy Partners, Ltd. |
What we do | | |
How does The Timothy Plan protect your personal information? | | To protect your personal information from unauthorized access and use, we use security measures that comply with federal law. These measures include computer safeguards and secured files and buildings. Our service providers are held accountable for adhering to strict policies and procedures to prevent any misuse or your nonpublic personal information. |
How does The Timothy Plan collect your personal information? | | We collect your personal information, for example, when you
|
| | ● Open an account
|
| | ● Provide account information
|
| | | ● Give us your contact information
|
| | | ● Make deposits or withdrawals from your account
|
| | | ● Make a wire transfer
|
| | | ● Tell us where to send the money
|
| | | ● Tell us who receives the money
|
| | | ● Show your government-issued ID
|
| | | ● Show your driver’s license
|
| | | We also collect your personal information from other companies. |
| Why can’t I limit all sharing? | | Federal law gives you the right to limit only: |
| | | |
| | | ● Sharing for affiliates’ everyday business purposes-information about your creditworthiness. |
| | | |
| | | ● Affiliates from using your information to market to you. |
| | | |
| | | ● Sharing for non-affiliates to market to you |
| | | |
| | | State laws and individual companies may give you additional rights to limit sharing. |
| Definitions | | |
| Affiliates | | Companies related by common ownership or control. They can be financial and non-financial companies. ● Timothy Partners, Ltd. is an affiliate of The Timothy Plan |
| Non-affiliates | | Companies not related by common ownership or control. They can be financial and non-financial companies. ● The Timothy Plan does not share with non-affiliates so they can market to you. |
| Joint marketing | | A formal agreement between non-affiliated financial companies that together market financial products to you. ● The Timothy Plan does not jointly market. |
Customer Identification Program
The Board of Trustees of the Trust has approved procedures designed to prevent and detect attempts to launder money as required under the USA PATRIOT Act. The day-to-day responsibility for monitoring and reporting any such activities has been delegated to the transfer agent, subject to the oversight and supervision of the Board.
Disclosures
HOW TO OBTAIN PROXY VOTING INFORMATION
Information regarding how the Funds voted proxies relating to Fund securities during the period ended June 30 of well as a description of the policies and procedures that the Funds use to determine how to vote proxies is available without charge, upon request, by calling 1-800-732-0330 or by referring to the Security and Exchange Commission’s (“SEC”) website at http://www.sec.gov.
HOW TO OBTAIN 1ST AND 3RD FISCAL QUARTER PORTFOLIO HOLDINGS
The Trust files a complete listing of the Fund’s portfolio holdings with the SEC as of the end of the first and third quarters of each fiscal year on Form N-Q or as an exhibit to its reports on Form N-Q’s successor form, Form N-PORT. The filings are available free of charge, upon request, by calling the Trust toll-free at 1-800-662-0201. Furthermore, you may obtain a copy of these filings on the SEC’s website at www.sec.gov.
| BOARD OF TRUSTEES | | | |
| Arthur D. Ally | | | |
| Rick Copeland | | | |
| Deborah Honeycutt | | | |
| Bill Johnson | | | |
| John C. Mulder | | | |
| Scott Preissler | | | |
| Alan Ross | | | |
| Mathew D. Staver | | | |
| Patrice Tsague | | | |
| Abraham M. Rivera | | | |
| Dale A. Bissonette | | | |
| | | | |
| OFFICERS | | | |
| Arthur D. Ally, President | | | |
| Joseph E. Boatwright, Secretary | | | |
| Terry Covert, Vice President | | | |
| Cheryl Mumbert, Vice President | | | |
| David D. Jones, Chief Compliance Officer | | | |
| | | | |
| INVESTMENT ADVISOR | | | |
| Timothy Partners, Ltd. | | | |
| 1055 Maitland Center Commons | | | |
| Maitland, FL 32751 | | | |
| | | | |
| DISTRIBUTOR | | | |
| Timothy Partners, Ltd. | | | |
| 1055 Maitland Center Commons | | | |
| Maitland, FL 32751 | | | |
| | | | |
| TRANSFER AGENT | | | |
| Ultimus Fund Solutions, LLC | | | |
| 4221 N. 203rd St, Suite 100 | | | |
| Elkhorn, NE 68022-3474 | | | |
| | | | |
INDEPENDENT REGISTERED PUBLIC ACCOUNTING FIRM
Cohen & Company, Ltd.
1350 Euclid Ave., Suite 800
Cleveland, OH 44115 | |
| | | | |
LEGAL COUNSEL
David D Jones, Esq.
20770 Hwy 281 N., Suite 108-619
San Antonio, TX 78258 | |  |
| | | | |
| For additional information or a prospectus, please call: 1-800-846-7526 Visit the Timothy Plan web site on the internet at: www.timothyplan.com | HEADQUARTERS
The Timothy Plan
1055 Maitland Center Commons
Maitland, Florida 32751
(800) 846-7526
www.timothyplan.com
invest@timothyplan.com |
| | | | |
| This report is submitted for the general information of the shareholders of the Funds. It is not authorized for distribution to prospective investors in the Funds unless preceded or accompanied by an effective Prospectus which includes details regarding the Funds’ objectives, policies, expenses and other information. Distributed by Timothy Partners, Ltd. | SHAREHOLDER SERVICES
Ultimus Fund Solutions, LLC
4221 N. 203rd St, Suite 100
Elkhorn, NE 68022-3474
(800) 662-0201 |
TP-AR21
(a) Include a copy of the report transmitted to stockholders pursuant to Rule 30e-1 under the Act (17 CFR 270.30e-1).
(b) Include a copy of each notice transmitted to stockholders in reliance on Rule 30e-3 under the Act (17 CFR 270.30e-3) that contains disclosures specified by paragraph (c)(3) of that rule. Not applicable
Item 2. Code of Ethics.
(a) As of the end of the period covered by this report, the registrant has adopted a code of ethics that applies to the registrant's principal executive officer, principal financial officer, principal accounting officer or controller, or persons performing similar functions, regardless of whether these individuals are employed by the registrant or a third party.
(b) For purposes of this item, “code of ethics” means written standards that are reasonably designed to deter wrongdoing and to promote:
| | (1) | Honest and ethical conduct, including the ethical handling of actual or apparent conflicts of interest between personal and professional relationships; |
| | (2) | Full, fair, accurate, timely, and understandable disclosure in reports and documents that a registrant files with, or submits to, the Commission and in other public communications made by the registrant; |
(3) Compliance with applicable governmental laws, rules, and regulations;
| | (4) | The prompt internal reporting of violations of the code to an appropriate person or persons identified in the code; and |
(5) Accountability for adherence to the code.
(c) Amendments: During the period covered by the report, there have not been any amendments to the provisions of the code of ethics.
(d) Waivers: During the period covered by the report, the registrant has not granted any express or implicit waivers from the provisions of the code of ethics.
(e) Posting: We do not intend to post the Code of Ethics for the Officers or any amendments or waivers on a website.
(f) Availability: The Code of Ethics for the Officers can be obtained, free of charge by calling the toll free number for the appropriate Fund.
Item 3. Audit Committee Financial Expert.
(a) The registrant has an Audit committee currently composed of three independent Trustees, Mr. Alan Ross, Mr. John Mulder and Mr. Richard Copeland. The registrant’s board of trustees has determined that Mr. Alan Ross is qualified to serve as an Audit Committee Financial Expert, and has designated him as such.
Item 4. Principal Accountant Fees and Services.
FY 2021 FY 2020 FY 2019 FY 2018 FY 2017 | $ 158,250 $ 158,250 $ 175,500 $ 175,500 $ 175,500 |
| FY 2016 | $ 170,900 |
| FY 2015 | $ 168,900 |
| FY 2014 | $ 168,400 |
The Timothy Plan Registrant Adviser
FY 2021 FY 2020 FY 2019 FY 2018 FY 2017 | | $ 0 $ 0 $ 0 $ 0 $ 0 | $ 0 $ 0 $ 0 $ 0 $ 0 |
| FY 2016 | | $ 0 | $ 0 |
FY 2014 | | $ 0 | $ 0 |
| FY 2015 | $ 0 | $ 0 |
| The Timothy Plan |
FY 2021 FY 2020 FY 2019 FY 2018 FY 2017 | $ 0 $ 0 $ 0 $ 0 $ 0 |
| FY 2016 | $ 0 |
| FY 2015 | $ 0 |
| FY 2014 | | $0 |
Nature of the fees: | preparation of the 1120 RIC |
Registrant
| The Timothy Plan |
FY 2021 FY 2020 FY 2019 FY 2018 FY 2017 | $ 0 $ 0 $ 0 $ 0 $ 0 |
| FY 2016 | $ 0 |
| FY 2015 | $ 0 |
| FY 2014 | $0 |
| | | |
| (e) | (1) | Audit Committee’s Pre-Approval Policies |
The Audit Committee Charter requires the Audit Committee to be responsible for the selection, retention or termination of auditors and, in connection therewith, to (i) evaluate the proposed fees and other compensation, if any, to be paid to the auditors, (ii) evaluate the independence of the auditors, (iii) pre-approve all audit services and, when appropriate, any non-audit services provided by the independent auditors to the Trust, (iv) pre-approve, when appropriate, any non-audit services provided by the independent auditors to the Trust's investment adviser, or any entity controlling, controlled by, or under common control with the investment adviser and that provides ongoing services to the Trust if the engagement relates directly to the operations and financial reporting of the Trust, and (v) receive the auditors’ specific representations as to their independence;
| | (2) | Percentages of Services Approved by the Audit Committee |
Audit-Related Fees: 0 %
Tax Fees: 0 %
All Other Fees: 0 %
(f) During audit of registrant's financial statements for the most recent fiscal year, less than 50 percent of the hours expended on the principal accountant's engagement were attributed to work performed by persons other than the principal accountant's full-time, permanent employees.
(g) The aggregate non-audit fees billed by the registrant's accountant for services rendered to the registrant, and rendered to the registrant's investment adviser (not including any sub-adviser whose role is primarily portfolio management and is subcontracted with or overseen by another investment adviser), and any entity controlling, controlled by, or under common control with the adviser that provides ongoing services to the registrant:
FY 2021 FY 2020 FY 2019 FY 2018 FY 2017 | $ 0 $ 0 $ 0 $ 0 $ 0 | $0 $0 $0 $0 $0 |
| FY 2016 | $ 0 | $0 |
| FY 2015 | $ 0 | $0 |
| FY 2014 | $ 0 | $0 |
(h) Not applicable. The auditor performed no services for the registrant’s investment adviser or any entity controlling, controlled by, or under common control with the investment adviser that provides ongoing services to the registrant.
Item 5. Audit Committee of Listed Companies. Not applicable.
Item 6. Schedule of Investments. Not applicable – schedule filed with Item 1.
Item 7. Disclosure of Proxy Voting Policies and Procedures for Closed-End Funds. Not applicable.
Item 8. Portfolio Managers of Closed-End Management Investment Companies. Not applicable.
Item 9. Purchases of Equity Securities by Closed-End Management Investment Company and Affiliated Purchasers. Not applicable.
Item 10. Submission of Matters to a Vote of Security Holders
The registrant has not adopted procedures by which shareholders may recommend nominees to the registrant’s board of trustees.
Item 11. Controls and Procedures.
(a) Based on an evaluation of the registrant’s disclosure controls and procedures as of November 19, 2010, the disclosure controls and procedures are reasonably designed to ensure that the information required in filings on Forms N-CSR is recorded, processed, summarized, and reported on a timely basis.
(b) There were no significant changes in the registrant’s internal control over financial reporting that occurred during the registrant’s second fiscal quarter of the period covered by this report that has materially affected, or is reasonably likely to materially affect, the registrant’s internal control over financial reporting.
Item 12. Disclosure of Securities Lending Activities for Closed-End Management Investment Companies. Not applicable.
Item 13. Exhibits.
(a)(1) Code is filed herewith
(a)(2) Certifications by the registrant's principal executive officer and principal financial officer, pursuant to Section 302 of the Sarbanes- Oxley Act of 2002 and required by Rule 30a-2 under the Investment Company Act of 1940 are filed herewith.
(a)(3) Not Applicable
(b) Certification pursuant to 18 U.S.C. Section 1350, as adopted pursuant to Section 906 of the Sarbanes-Oxley Act of 2002 is filed herewith.
SIGNATURES
Pursuant to the requirements of the Securities Exchange Act of 1934 and the Investment Company Act of 1940, the registrant has duly caused this report to be signed on its behalf by the undersigned, thereunto duly authorized.
(Registrant) The Timothy Plan
| | Arthur D. Ally, President/Principle Executive Officer & Treasurer/Principle Financial Officer |
| | |
| Date | 11/30/21 | |
Pursuant to the requirements of the Securities Exchange Act of 1934 and the Investment Company Act of 1940, this report has been signed below by the following persons on behalf of the registrant and in the capacities and on the dates indicated.
| By | /s/ Arthur D. Ally | |
| | Arthur D. Ally, President/Principle Executive Officer & Treasurer/Principle Financial Officer |
| | |
| Date | 11/30/21 | |