
North America’s oldest, largest and most innovative recycling solutions company serving the nation’s food industry 2012 Farm to Market Conference BMO Capital Markets May 16, 2012 Exhibit 99.1

Forward-Looking Statements This presentation contains forward-looking statements regarding the business, operations and prospects of Darling and industry factors affecting it. These statements are identified by words such as “may,” “will,” “ begin,” “ look forward,” “expect,” “believe,” “intend,” “anticipate,” “should,” “potential,” “estimate,” “continue,” “momentum” and other words referring to events to occur in the future. These statements reflect Darling's current view of future events and are based on its assessment of, and are subject to, a variety of risks and uncertainties beyond its control, including disturbances in world financial, credit, commodities and stock markets; unanticipated changes in national and international regulations affecting the company’s products; a decline in consumer confidence and discretionary spending; the general performance of the U.S. and global economies; global demands for bio-fuels and grain and oilseed commodities, which have exhibited volatility, and can impact the cost of feed for cattle, hogs, and poultry, thus affecting available rendering feedstock; risks, including future expenditure, relating to Darling’s joint venture with Valero Energy Corporation to construct and complete a renewable diesel plant in Norco, Louisiana and possible difficulties completing and obtaining operational viability with the plant; economic disruptions resulting from the European debt crisis; and continued or escalated conflict in the Middle East, each of which could cause actual results to differ materially from those projected in the forward-looking statements. Other risks and uncertainties regarding Darling, its business and the industry in which it operates are referenced from time to time in the Company’s filings with the Securities and Exchange Commission. Darling is under no obligation to (and expressly disclaims any such obligation to) update or alter its forward-looking statements whether as a result of new information, future events or otherwise. This presentation also contains information about Darling’s adjusted EBITDA, adjusted net income and adjusted earnings per share, which are not measures derived in accordance with GAAP and which exclude components that are important to understanding Darling’s financial performance. Investors should recognize that these non-GAAP measures might not be comparable to similarly titled measures of other companies. These measures should be considered in addition to, and not as a substitute for or superior to, any measure of performance, cash flows or liquidity prepared in accordance with accounting principles generally accepted in the United States. 2 DAR Inv_v Spr12
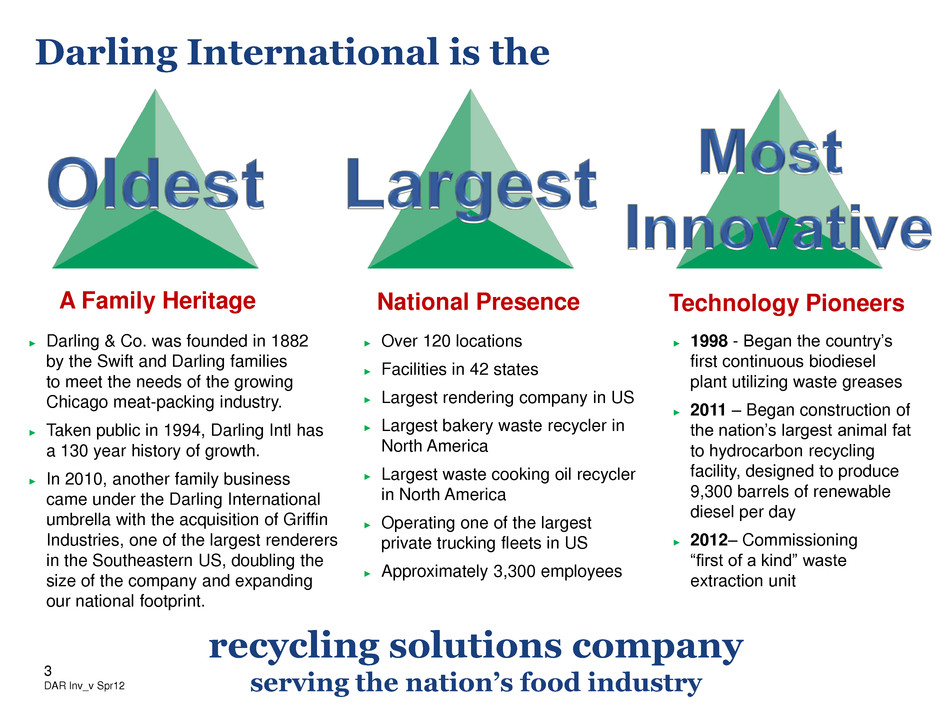
recycling solutions company serving the nation’s food industry Darling International is the A Family Heritage ► Darling & Co. was founded in 1882 by the Swift and Darling families to meet the needs of the growing Chicago meat-packing industry. ► Taken public in 1994, Darling Intl has a 130 year history of growth. ► In 2010, another family business came under the Darling International umbrella with the acquisition of Griffin Industries, one of the largest renderers in the Southeastern US, doubling the size of the company and expanding our national footprint. National Presence Technology Pioneers ► Over 120 locations ► Facilities in 42 states ► Largest rendering company in US ► Largest bakery waste recycler in North America ► Largest waste cooking oil recycler in North America ► Operating one of the largest private trucking fleets in US ► Approximately 3,300 employees ► 1998 - Began the country’s first continuous biodiesel plant utilizing waste greases ► 2011 – Began construction of the nation’s largest animal fat to hydrocarbon recycling facility, designed to produce 9,300 barrels of renewable diesel per day ► 2012– Commissioning “first of a kind” waste extraction unit 3 DAR Inv_v Spr12

We are North America’s oldest, largest and most innovative recycling solutions company serving our nation’s food industry Our Model Recycling Waste Streams into “Value-Added” Ingredients for Feed and Fuel Darling International Route- based Service Provider Feed Ingredients Specialty Ingredients Renewable Fuels Food Industry Recycler 4 DAR Inv_v Spr12

Darling International Our Lines of Business Darling Bio-Energy ? New Line Nature Safe Fertilizers Bakery Feeds DAR PRO Solutions Introducing… TM 5 DAR Inv_v Spr12
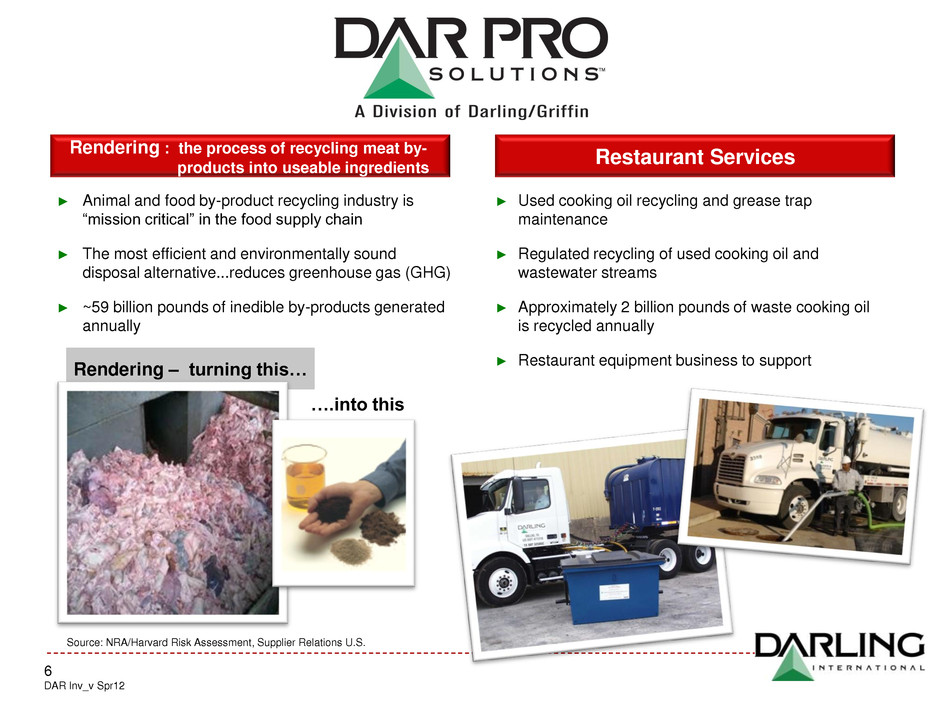
Source: NRA/Harvard Risk Assessment, Supplier Relations U.S. ► Used cooking oil recycling and grease trap maintenance ► Regulated recycling of used cooking oil and wastewater streams ► Approximately 2 billion pounds of waste cooking oil is recycled annually ► Restaurant equipment business to support ► Animal and food by-product recycling industry is “mission critical” in the food supply chain ► The most efficient and environmentally sound disposal alternative...reduces greenhouse gas (GHG) ► ~59 billion pounds of inedible by-products generated annually Rendering : the process of recycling meat by- products into useable ingredients Restaurant Services Rendering – turning this… ….into this 6 DAR Inv_v Spr12

Bakery Recycling Bakery Industry ► 9 plants, primarily east of the Mississippi river ► Value-added nutrition approach producing animal feed for the poultry industry ► Creates an additional linkage to our raw material suppliers ► DAR real estate allows for new growth opportunities … new Dallas transfer station ► Approximately 3.0 million tons of bakery waste is created annually ► Servicing commercial baking, snacks, cookies and crackers producers ► Additional food safety regulations and traceability should help “scrape” rates grow Our Presence -4% -3% -2% -1% 0% 1% 2% 3% 4% Year-over-year changes in measured channel retail sales volume for bakery-related products Y -o -Y C hang e i n B a k e ry -r e la te d P roduc t V o lu m e S a le s i n M e a s ur e d C hann e ls Bakery Volume Source: IRI 7 DAR Inv_v Spr12
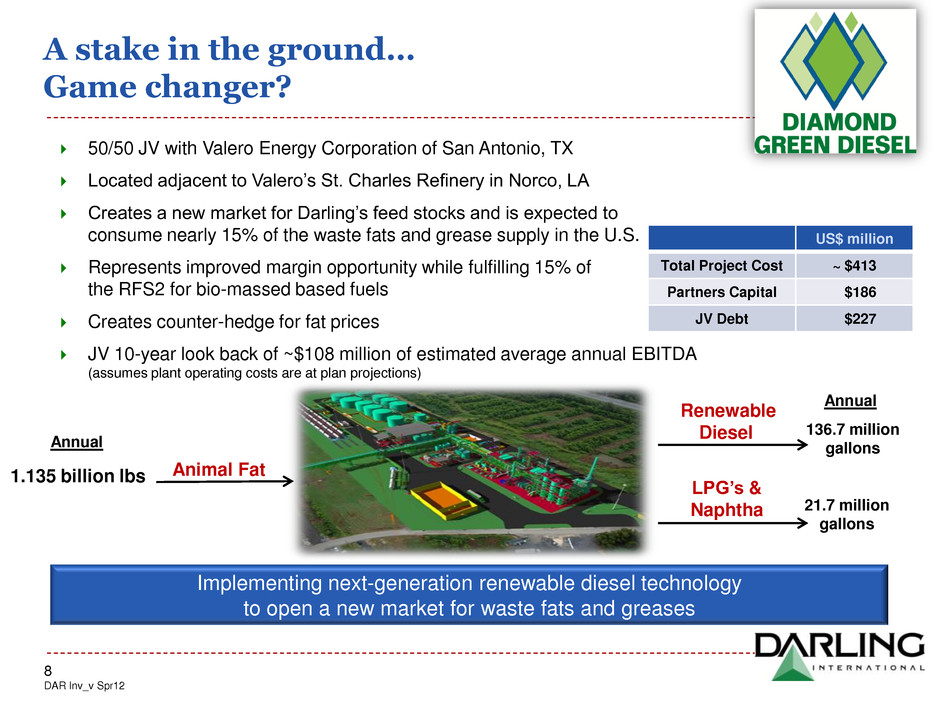
A stake in the ground… Game changer? 50/50 JV with Valero Energy Corporation of San Antonio, TX Located adjacent to Valero’s St. Charles Refinery in Norco, LA Creates a new market for Darling’s feed stocks and is expected to consume nearly 15% of the waste fats and grease supply in the U.S. Represents improved margin opportunity while fulfilling 15% of the RFS2 for bio-massed based fuels Creates counter-hedge for fat prices JV 10-year look back of ~$108 million of estimated average annual EBITDA (assumes plant operating costs are at plan projections) Implementing next-generation renewable diesel technology to open a new market for waste fats and greases Animal Fat 1.135 billion lbs Renewable Diesel LPG’s & Naphtha 136.7 million gallons 21.7 million gallons Annual Annual US$ million Total Project Cost ~ $413 Partners Capital $186 JV Debt $227 8 DAR Inv_v Spr12
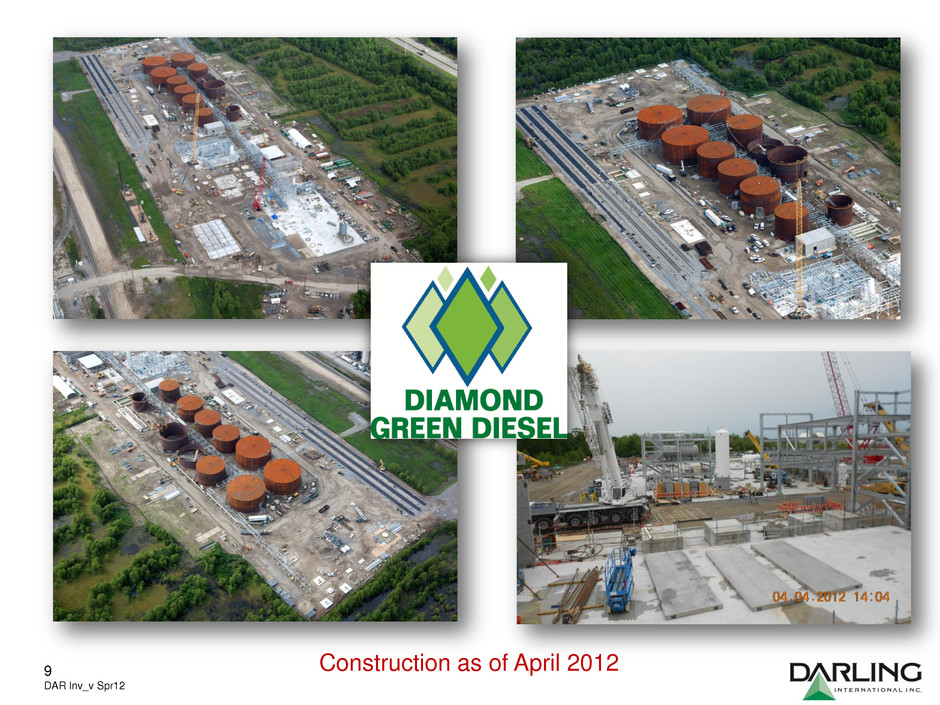
Construction as of April 2012 9 DAR Inv_v Spr12
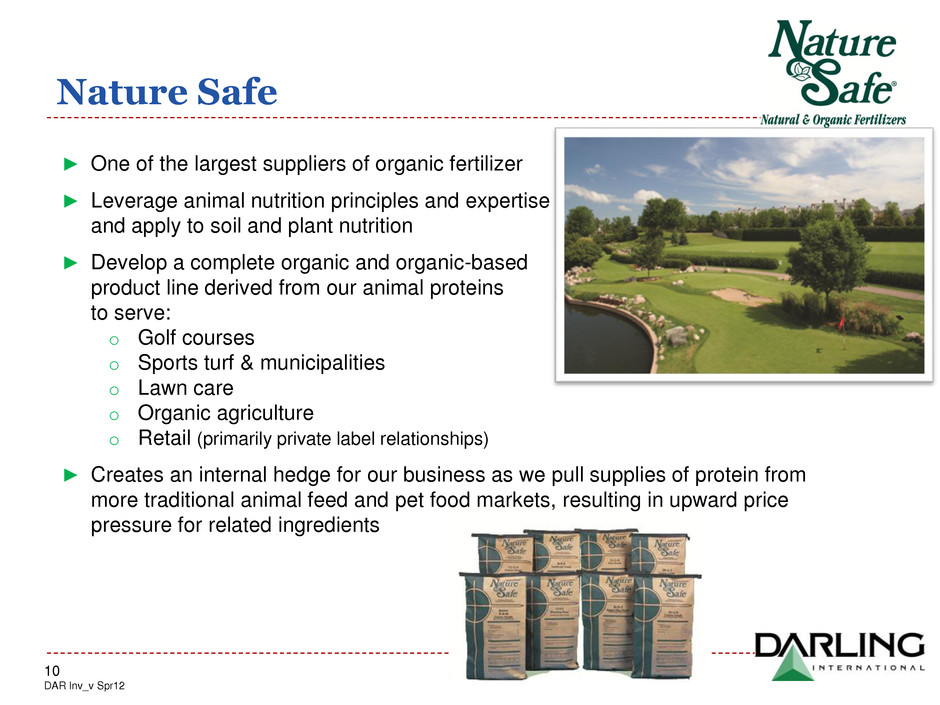
Nature Safe ► One of the largest suppliers of organic fertilizer ► Leverage animal nutrition principles and expertise and apply to soil and plant nutrition ► Develop a complete organic and organic-based product line derived from our animal proteins to serve: o Golf courses o Sports turf & municipalities o Lawn care o Organic agriculture o Retail (primarily private label relationships) ► Creates an internal hedge for our business as we pull supplies of protein from more traditional animal feed and pet food markets, resulting in upward price pressure for related ingredients 10 DAR Inv_v Spr12

Vortex of Value….. Positive industry fundamentals Innovators of value and technology; passionate about growth Robust financial performance & cash flow generation Business model reduces risk and protects margins “Best in Class” across the food recycling spectrum 1 2 3 4 5 11 DAR Inv_v Spr12
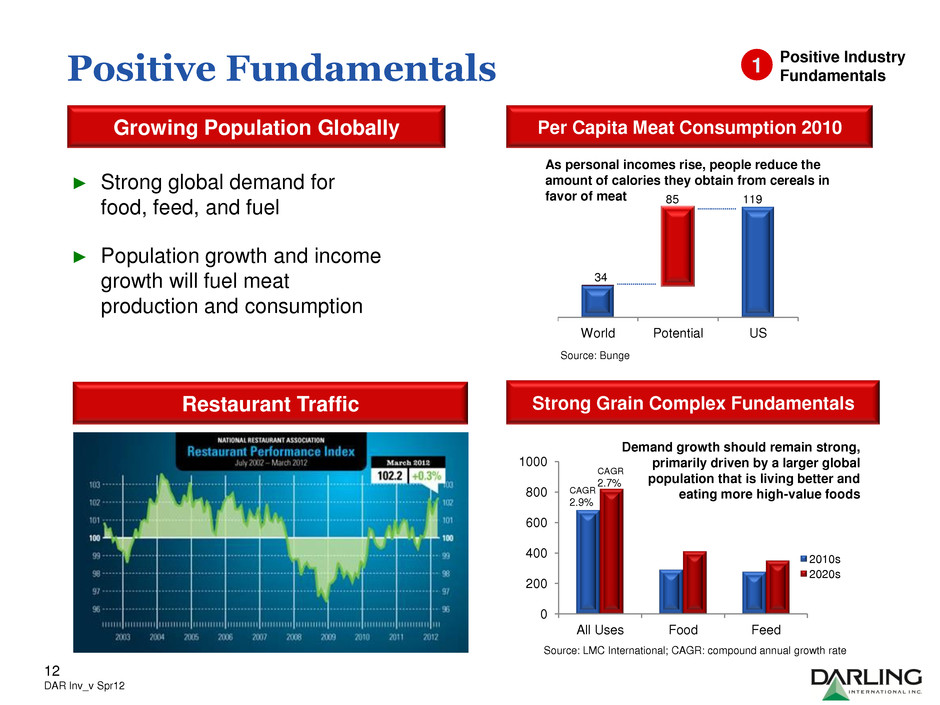
Demand growth should remain strong, primarily driven by a larger global population that is living better and eating more high-value foods As personal incomes rise, people reduce the amount of calories they obtain from cereals in favor of meat Positive Fundamentals Growing Population Globally Restaurant Traffic World Potential US 85 119 34 Source: Bunge Per Capita Meat Consumption 2010 0 200 400 600 800 1000 All Uses Food Feed 2010s 2020s CAGR 2.9% CAGR 2.7% Source: LMC International; CAGR: compound annual growth rate Strong Grain Complex Fundamentals Positive Industry Fundamentals 1 ► Strong global demand for food, feed, and fuel ► Population growth and income growth will fuel meat production and consumption 12 DAR Inv_v Spr12
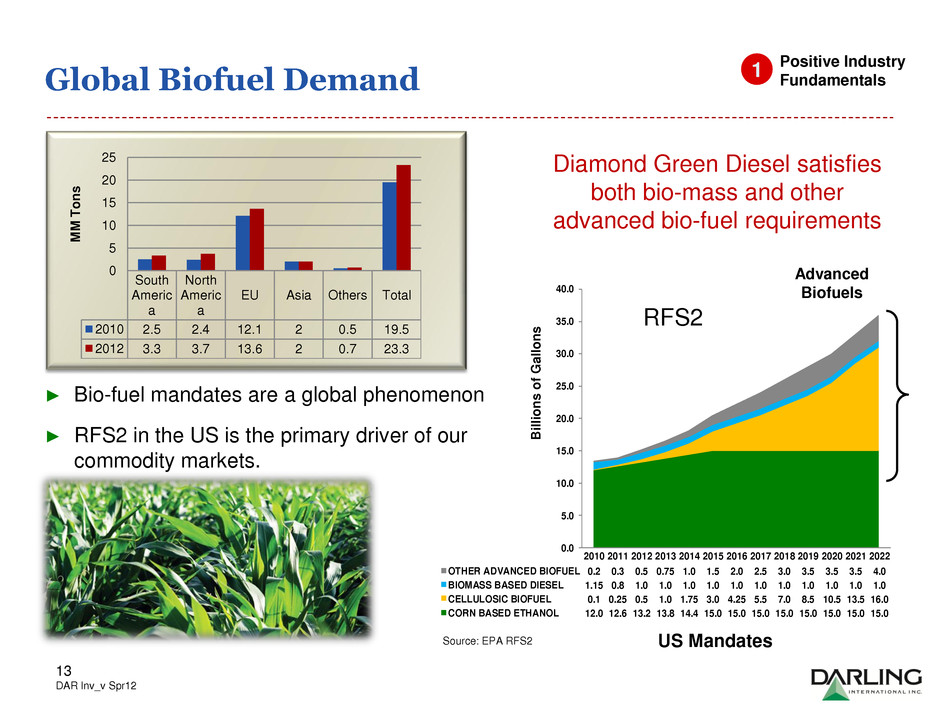
Global Biofuel Demand Positive Industry Fundamentals 2010 2011 2012 2013 2014 2015 2016 2017 2018 2019 2020 2021 2022 OTHER ADVANCED BIOFUEL 0.2 0.3 0.5 0.75 1.0 1.5 2.0 2.5 3.0 3.5 3.5 3.5 4.0 BIOMASS BASED DIESEL 1.15 0.8 1.0 1.0 1.0 1.0 1.0 1.0 1.0 1.0 1.0 1.0 1.0 CELLULOSIC BIOFUEL 0.1 0.25 0.5 1.0 1.75 3.0 4.25 5.5 7.0 8.5 10.5 13.5 16.0 CORN BASED ETHANOL 12.0 12.6 13.2 13.8 14.4 15.0 15.0 15.0 15.0 15.0 15.0 15.0 15.0 0.0 5.0 10.0 15.0 20.0 25.0 30.0 35.0 40.0 Advanced Biofuels Billio n s o f G al lo n s Diamond Green Diesel satisfies both bio-mass and other advanced bio-fuel requirements RFS2 South Americ a North Americ a EU Asia Others Total 2010 2.5 2.4 12.1 2 0.5 19.5 2012 3.3 3.7 13.6 2 0.7 23.3 0 5 10 15 20 25 M M T o n s Source: EPA RFS2 1 ► Bio-fuel mandates are a global phenomenon ► RFS2 in the US is the primary driver of our commodity markets. US Mandates 13 DAR Inv_v Spr12
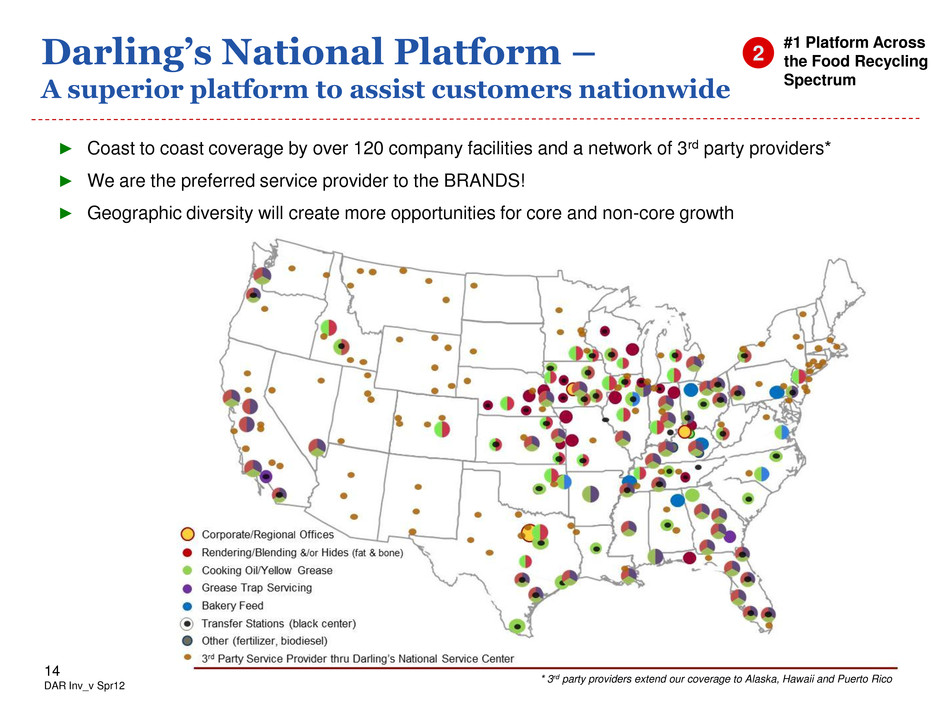
Darling’s National Platform – A superior platform to assist customers nationwide ► Coast to coast coverage by over 120 company facilities and a network of 3rd party providers* ► We are the preferred service provider to the BRANDS! ► Geographic diversity will create more opportunities for core and non-core growth #1 Platform Across the Food Recycling Spectrum 2 * 3rd party providers extend our coverage to Alaska, Hawaii and Puerto Rico 14 DAR Inv_v Spr12
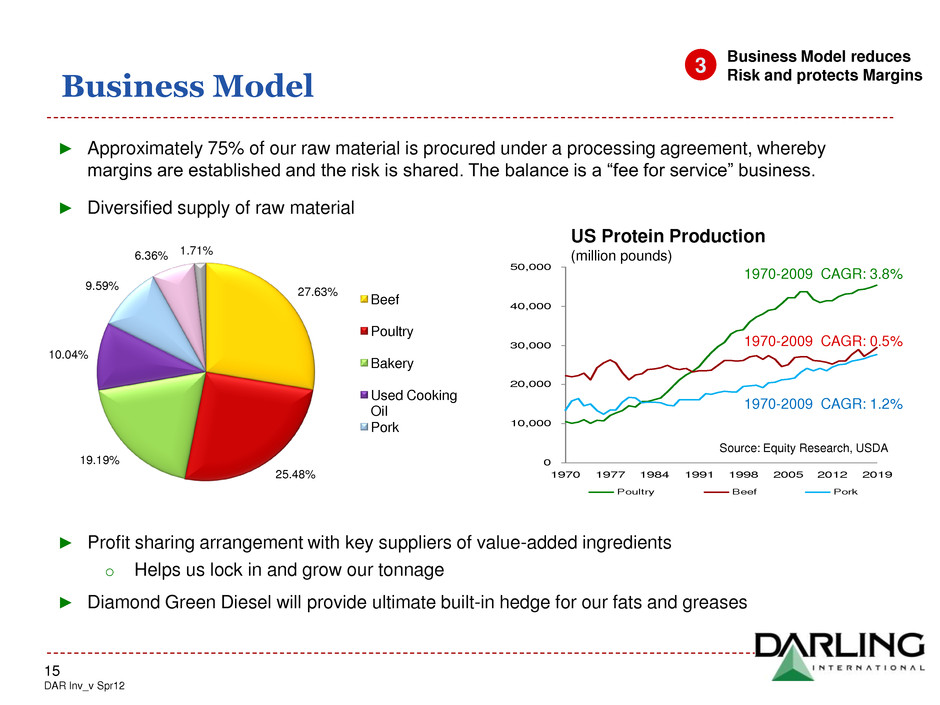
0 10,000 20,000 30,000 40,000 50,000 1970 1977 1984 1991 1998 2005 2012 2019 Poultry Beef Pork 1 70-2009 CAGR: 3.8% 1970-2009 CAGR: 0.5% 1970-2009 CAGR: 1.2% ► Approximately 75% of our raw material is procured under a processing agreement, whereby margins are established and the risk is shared. The balance is a “fee for service” business. ► Diversified supply of raw material ► Profit sharing arrangement with key suppliers of value-added ingredients o Helps us lock in and grow our tonnage ► Diamond Green Diesel will provide ultimate built-in hedge for our fats and greases Business Model Business Model reduces Risk and protects Margins 3 US Protein Production (million pounds) Source: Equity Research, USDA 27.63% 25.48% 19.19% 10.04% 9.59% 6.36% 1.71% Beef Poultry Bakery Used Cooking Oil Pork 15 DAR Inv_v Spr12
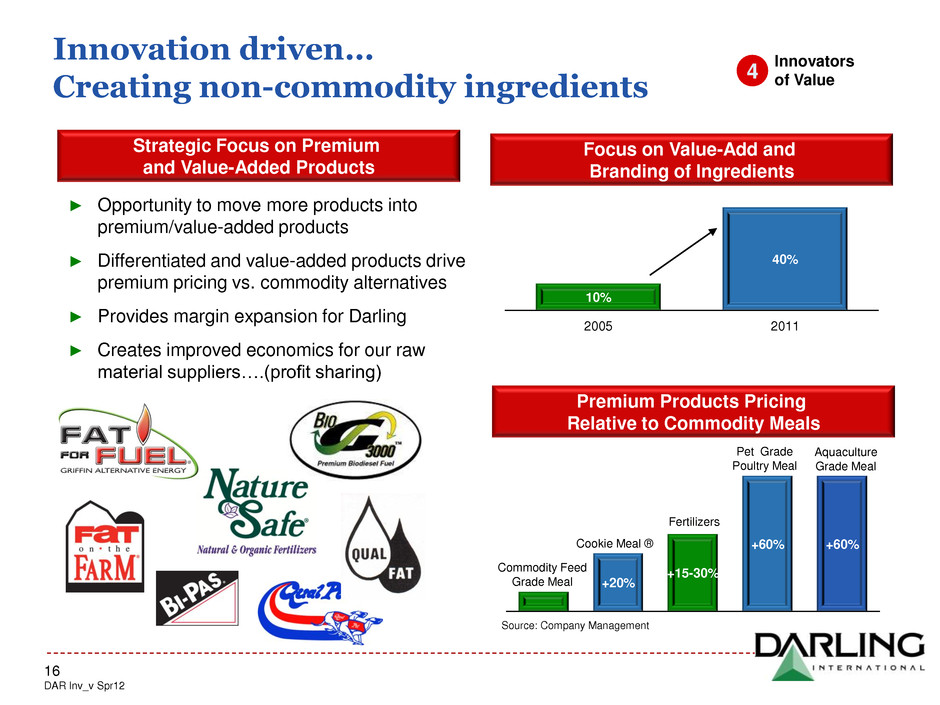
Innovation driven… Creating non-commodity ingredients Strategic Focus on Premium and Value-Added Products Premium Products Pricing Relative to Commodity Meals Focus on Value-Add and Branding of Ingredients ► Opportunity to move more products into premium/value-added products ► Differentiated and value-added products drive premium pricing vs. commodity alternatives ► Provides margin expansion for Darling ► Creates improved economics for our raw material suppliers….(profit sharing) 10% 40% 2005 2011 Innovators of Value 4 +20% +15-30% +60% +60% Commodity Feed Grade Meal Fertilizers Pet Grade Poultry Meal Aquaculture Grade Meal Source: Company Management Cookie Meal ® 16 DAR Inv_v Spr12
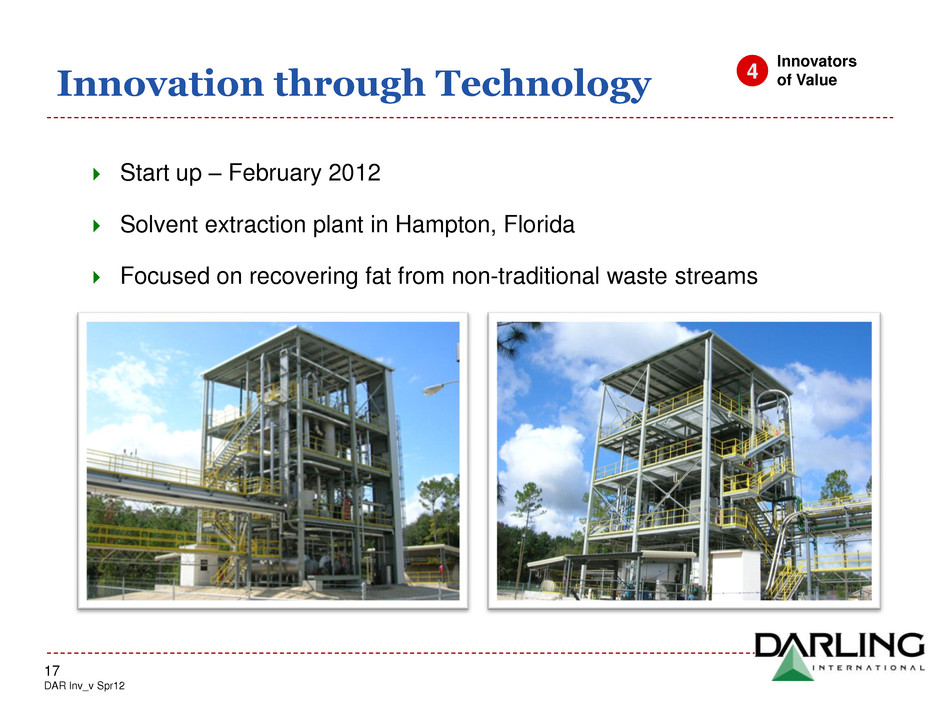
Innovation through Technology Start up – February 2012 Solvent extraction plant in Hampton, Florida Focused on recovering fat from non-traditional waste streams Innovators of Value 4 17 DAR Inv_v Spr12
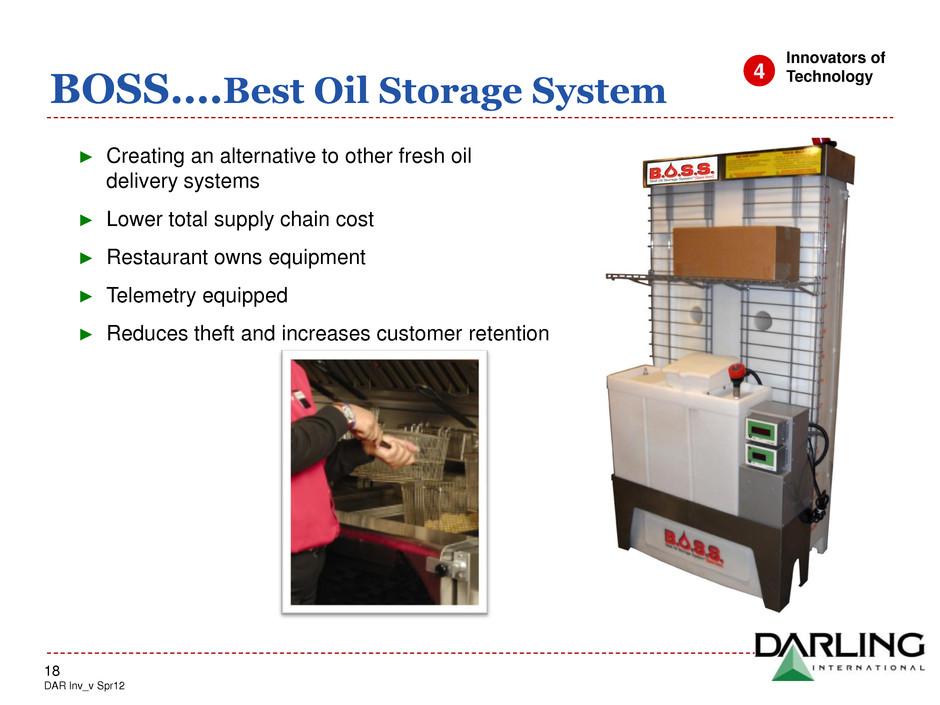
BOSS….Best Oil Storage System ► Creating an alternative to other fresh oil delivery systems ► Lower total supply chain cost ► Restaurant owns equipment ► Telemetry equipped ► Reduces theft and increases customer retention Innovators of Technology 4 18 DAR Inv_v Spr12
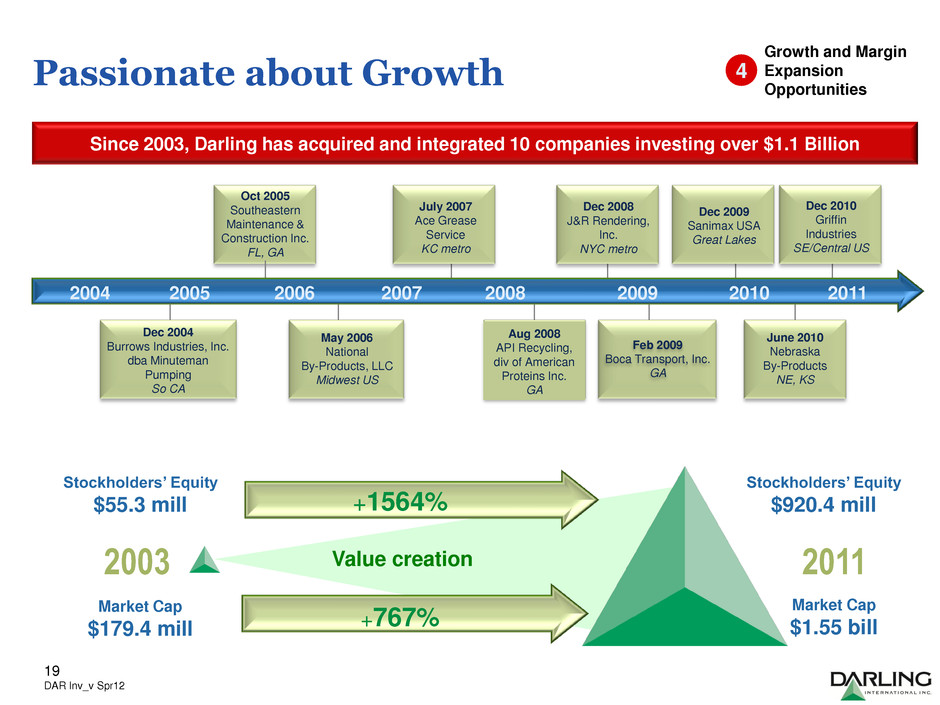
Aug 2008 API Recycling, div of American Proteins Inc. GA Oct 2005 Southeastern Maintenance & Construction Inc. FL, GA Feb 2009 Boca Transport, Inc. GA Dec 2009 Sanimax USA Great Lakes Dec 2010 Griffin Industries SE/Central US Passionate about Growth Dec 2004 Burrows Industries, Inc. dba Minuteman Pumping So CA Since 2003, Darling has acquired and integrated 10 companies investing over $1.1 Billion May 2006 National By-Products, LLC Midwest US 2004 2005 2006 2007 2008 2009 2010 Dec 2008 J&R Rendering, Inc. NYC metro June 2010 Nebraska By-Products NE, KS Growth and Margin Expansion Opportunities 4 July 2007 Ace Grease Service KC metro 2011 2003 2011 Stockholders’ Equity $55.3 mill Value creation Market Cap $1.55 bill Market Cap $179.4 mill Stockholders’ Equity $920.4 mill +1564% +767% 19 DAR Inv_v Spr12
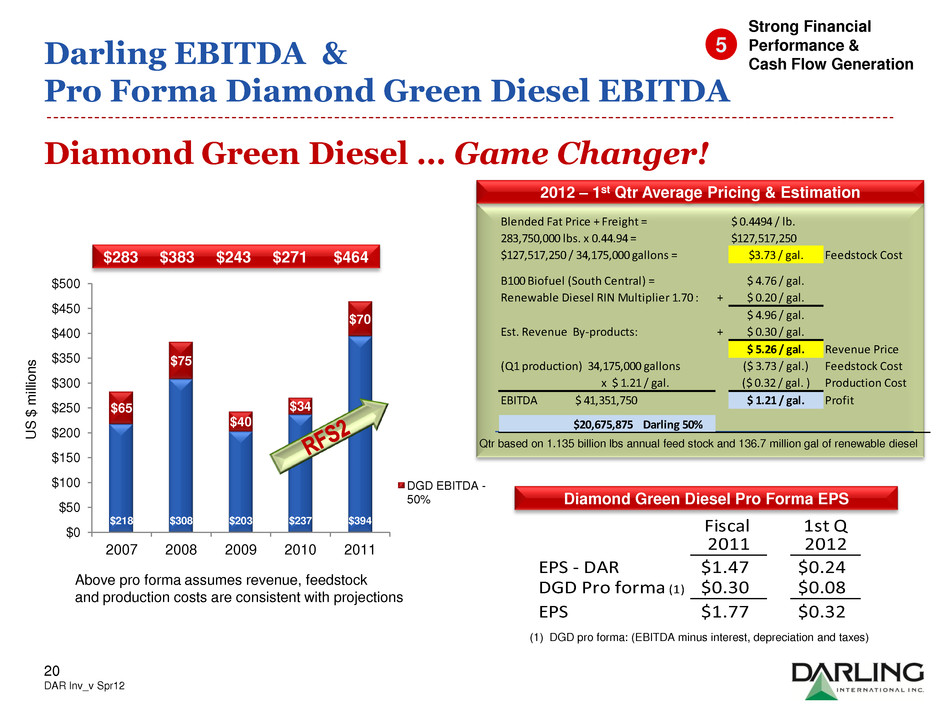
$218 $308 $203 $237 $394 $65 $75 $40 $34 $70 $0 $50 $100 $150 $200 $250 $300 $350 $400 $450 $500 2007 2008 2009 2010 2011 DGD EBITDA - 50% Darling EBITDA & Pro Forma Diamond Green Diesel EBITDA Strong Financial Performance & Cash Flow Generation 5 U S $ m ill ion s $283 $383 $243 $271 $464 2012 – 1st Qtr Average Pricing & Estimation Diamond Green Diesel … Game Changer! Diamond Green Diesel Pro Forma EPS Above pro forma assumes revenue, feedstock and production costs are consistent with projections Qtr based on 1.135 billion lbs annual feed stock and 136.7 million gal of renewable diesel (1) DGD pro forma: (EBITDA minus interest, depreciation and taxes) 20 DAR Inv_v Spr12 Blended Fat Price + Freight = $ 0.4494 / lb. 283,750,000 lbs. x 0.44.94 = $127,517,250 $127,517,250 / 34,175,000 gallons = $3.73 / gal. Feedstock Cost B100 Biofuel (South Central) = $ 4.76 / gal. Renewable Diesel RIN Multiplier 1.70 : + $ 0.20 / gal. $ 4.96 / gal. Est. Revenue By-products: + $ 0.30 / gal. $ 5.26 / gal. Revenue Price (Q1 production) 34,175,000 gallons ($ 3.73 / gal.) Feedstock Cost x $ 1.21 / gal. ($ 0.32 / gal. ) Production Cost EBITDA $ 41,351,750 $ 1.21 / gal. Profit $20,675,875 Darling 50% Fiscal 1st Q 2011 2012 EPS - DAR $1.47 $0.24 DGD Pro forma (1) $0.30 $0.08 EPS $1.77 $0.32
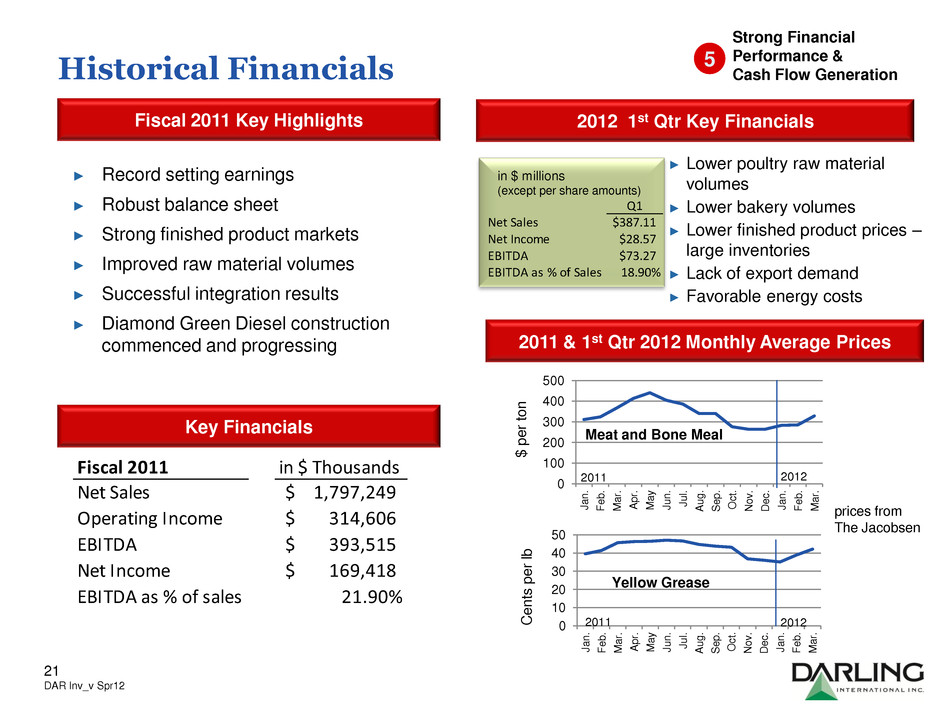
Historical Financials Fiscal 2011 Key Highlights Key Financials 2012 1st Qtr Key Financials Strong Financial Performance & Cash Flow Generation 5 ► Record setting earnings ► Robust balance sheet ► Strong finished product markets ► Improved raw material volumes ► Successful integration results ► Diamond Green Diesel construction commenced and progressing in $ millions (except per share amounts) prices from The Jacobsen 2011 & 1st Qtr 2012 Monthly Average Prices 21 DAR Inv_v Spr12 ► Lower poultry raw material volumes ► Lower bakery volumes ► Lower finished product prices – large inventories ► Lack of export demand ► Favorable energy costs Yellow Grease 0 10 20 30 40 50 J an . Fe b . M a r. A p r. M a y J un . J u l. A u g . S e p . O c t. N o v . D e c . J an . Fe b . M a r. C e n ts p e r lb 2012 2011 Meat and Bone Meal 0 100 200 300 400 500 J a n . Fe b . M a r. A p r. M a y J u n . J u l. A u g . S e p . O c t. N o v . D e c . J a n . Fe b . M a r. $ p e r to n 2012 2011 Q1 Net Sales $387.11 Net Income $28.57 EBITDA $73.27 EBITDA as % of S les 18.90% Fiscal 2011 in $ Thousands Net Sale 1,797,249$ Operating Income 314,606$ EBITDA 393,515$ Net Income 169,418$ EBITDA as % of sales 21.90%

Historical Financials Revenue (US$ millions) Capex (US$ millions) EBITDA - Capex (US$ millions) EBITDA (US$ millions) Source: Company Management NOTE: 2007-2010 includes combined proforma of Griffin Industries. Strong Financial Performance & Cash Flow Generation 5 22 DAR Inv_v Spr12 0 200 400 600 800 1000 1200 1400 1600 1800 2000 2008 2009 2010 2011 LTM 2012 $1,489 $1,123 $1,340 $1,797 $1,744 0 50 100 150 200 250 300 350 400 2008 2009 2010 2011 LTM 2012 $308 $203 $237 $394 $359 0 10 20 30 40 50 60 70 2008 2009 2010 2011 LTM 2012 $71 $69 $61 $60 $72 0 50 100 150 200 250 300 350 2008 2009 2010 2011 LTM 2012 $237 $133 $176 $334 $287
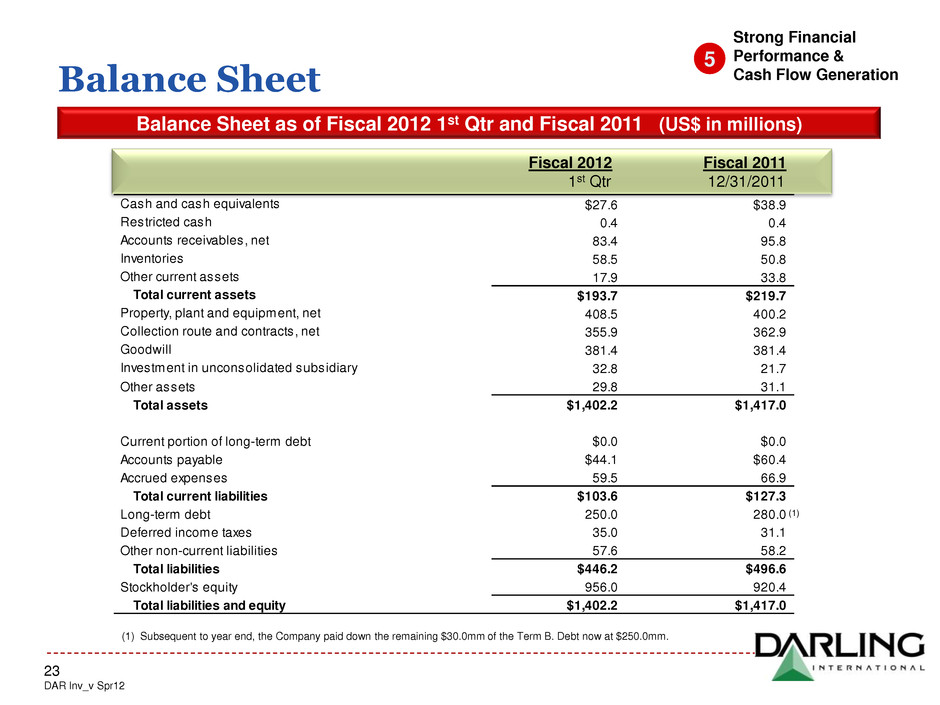
Balance Sheet Balance Sheet as of Fiscal 2012 1st Qtr and Fiscal 2011 (US$ in millions) Fiscal 2011 1st Qtr 12/31/2011 Cash and cash equivalents $27.6 $38.9 Restricted cash 0.4 0.4 Accounts receivables, net 83.4 95.8 Inventories 58.5 50.8 Other current assets 17.9 33.8 Total current assets $193.7 $219.7 Property, plant and equipment, net 408.5 400.2 Collection route and contracts, net 355.9 362.9 Goodwill 381.4 381.4 Investment in unconsolidated subsidiary 32.8 21.7 Other assets 29.8 31.1 Total assets $1,402.2 $1,417.0 Current portion of long-term debt $0.0 $0.0 Accounts payable $44.1 $60.4 Accrued expenses 59.5 66.9 Total current liabilities $103.6 $127.3 Long-term debt 250.0 280.0 Deferred income taxes 35.0 31.1 Other non-current liabilities 57.6 58.2 Total liabilities $446.2 $496.6 Stockholder's equity 956.0 920.4 Total liabilities and equity $1,402.2 $1,417.0 2012 Strong Financial Performance & Cash Flow Generation Fiscal 2012 Fiscal 2011 1st Qtr 12/31/2011 5 23 DAR Inv_v Spr12 (1) (1) Subsequent to year end, the Company paid down the remaining $30.0mm of the Term B. Debt now at $250.0mm.
North America’s oldest, largest and most innovative recycling solutions company serving the nation’s food industry Q&A 24 DAR Inv_v Spr12


