EXHIBIT 99.1 Randall C. Stuewe, Chairman and CEO Brad Phillips, EVP Chief Financial Officer Melissa A. Gaither, VP IR and Global Communications
Safe Harbor Statement 2 This presentation contains “forward-looking” statements regarding the business operations and prospects of Darling Ingredients Inc., including its Diamond Green Diesel joint venture, and industry factors affecting it. These statements are identified by words such as “believe,” “anticipate,” “expect,” “estimate,” “intend,” “could,” “may,” “will,” “should,” “planned,” “potential,” “continue,” “momentum,” “assumption,” and other words referring to events that may occur in the future. These statements reflect Darling Ingredient’s current view of future events and are based on its assessment of, and are subject to, a variety of risks and uncertainties beyond its control, each of which could cause actual results to differ materially from those indicated in the forward-looking statements. These factors include, among others, existing and unknown future limitations on the ability of the Company's direct and indirect subsidiaries to make their cash flow available to the Company for payments on the Company's indebtedness or other purposes; global demands for bio-fuels and grain and oilseed commodities, which have exhibited volatility, and can impact the cost of feed for cattle, hogs and poultry, thus affecting available rendering feedstock and selling prices for the Company’s products; reductions in raw material volumes available to the Company due to weak margins in the meat production industry as a result of higher feed costs, reduced consumer demand or other factors, reduced volume from food service establishments, or otherwise; reduced demand for animal feed; reduced finished product prices, including a decline in fat and used cooking oil finished product prices; changes to worldwide government policies relating to renewable fuels and greenhouse gas emissions that adversely affect programs like the Renewable Fuel Standards Program (RFS2), low carbon fuel standards (LCFS) and tax credits for biofuels both in the Unites States and abroad; possible product recall resulting from developments relating to the discovery of unauthorized adulterations to food or food additives; the occurrence of 2009 H1N1 flu (initially known as “Swine Flu”, highly pathogenic strains of avian influenza (collectively known as “Bird Flu”), bovine spongiform encephalopathy (or "BSE"), porcine epidemic diarrhea ("PED") or other diseases associated with animal origin in the United States or elsewhere; unanticipated costs and/or reductions in raw material volumes related to the Company’s compliance with the existing or unforeseen new U.S. or foreign regulations (including, without limitation, China) affecting the industries in which the Company operates or its value added products (including new or modified animal feed, Bird Flu, PED or BSE or similar or unanticipated regulations); risks associated with the renewable diesel plant in Norco, Louisiana owned and operated by a joint venture between Darling Ingredients and Valero Energy Corporation, including possible unanticipated operating disruptions and issues related to the announced expansion project; risks and uncertainties relating to international sales and operations, including imposition of tariffs, quotas, trade barriers and other trade protection measures imposed by foreign countries; difficulties or a significant disruption in our information systems or failure to implement new systems and software successfully, including our ongoing enterprise resource planning project; risks relating to possible third party claims of intellectual property infringement; increased contributions to the Company’s pension and benefit plans, including multiemployer and employer-sponsored defined benefit pension plans as required by legislation, regulation or other applicable U.S. or foreign law or resulting from a U.S. mass withdrawal event; bad debt write-offs; loss of or failure to obtain necessary permits and registrations; continued or escalated conflict in the Middle East, North Korea, Ukraine or elsewhere; uncertainty regarding the likely exit of the U.K. from the European Union; and/or unfavorable export or import markets. These factors, coupled with volatile prices for natural gas and diesel fuel, climate conditions, currency exchange fluctuations, general performance of the U.S. and global economies, disturbances in world financial, credit, commodities and stock markets, and any decline in consumer confidence and discretionary spending, including the inability of consumers and companies to obtain credit due to lack of liquidity in the financial markets, among others, could negatively impact the Company's results of operations. Among other things, future profitability may be affected by the Company’s ability to grow its business, which faces competition from companies that may have substantially greater resources than the Company. The Company’s announced share repurchase program may be suspended or discontinued at any time and purchases of shares under the program are subject to market conditions and other factors, which are likely to change from time to time. Other risks and uncertainties regarding Darling Ingredients Inc., its business and the industries in which it operates are referenced from time to time in the Company’s filings with the Securities and Exchange Commission. Darling Ingredients Inc. is under no obligation to (and expressly disclaims any such obligation to) update or alter its forward-looking statements whether as a result of new information, future events or otherwise.

3 touches the lives of families around the world… every day!
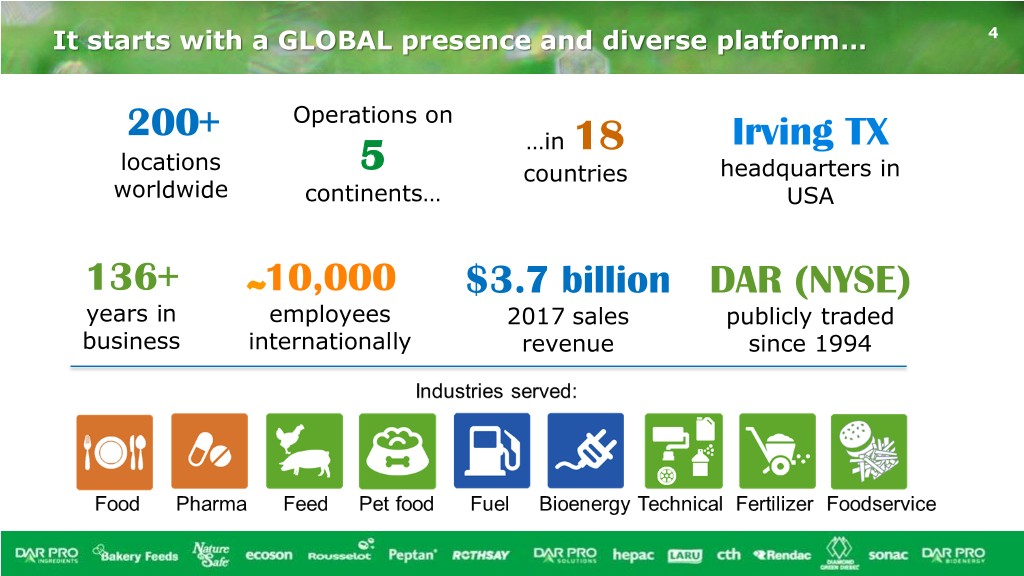
It starts with a GLOBAL presence and diverse platform… 4 200+ Operations on …in 18 Irving TX locations 5 countries headquarters in worldwide continents… USA 136+ 10,000 $3.7 billion DAR (NYSE) years in ~ employees 2017 sales publicly traded business internationally revenue since 1994

5
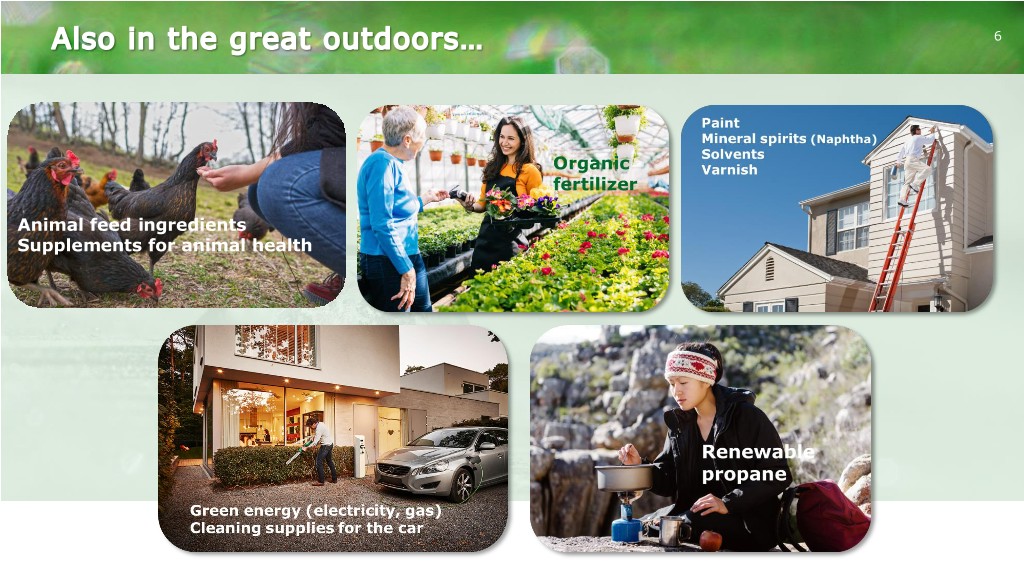
6 Animal feed ingredients Supplements for animal health

7 Cellular concrete Energy bar Metal mold release Sunscreen lotions Surgical sponge X-ray film coating Soaps, cleansers Antiseptics Textiles Insulin
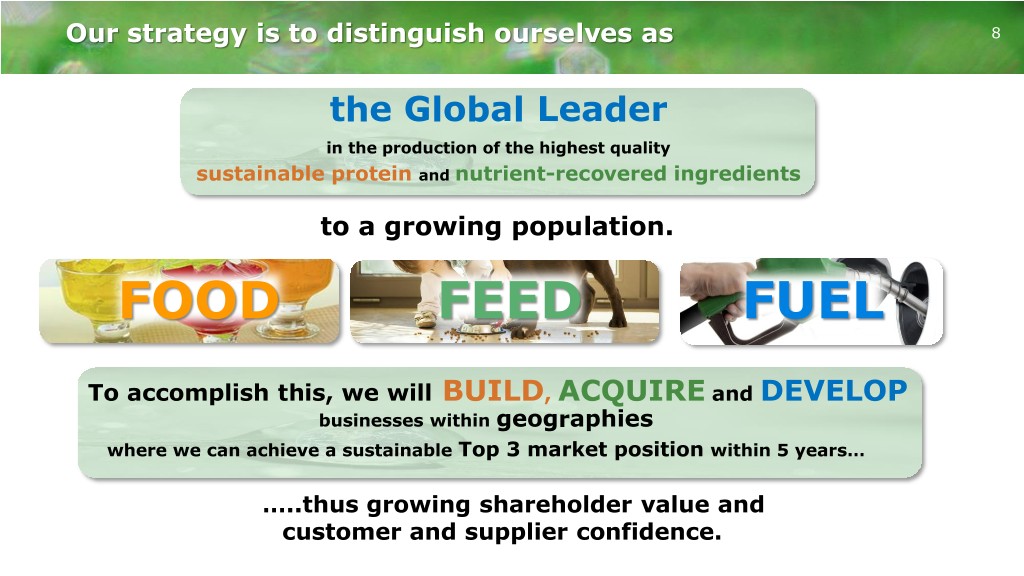
Our strategy is to distinguish ourselves as 8 the Global Leader in the production of the highest quality sustainable protein and nutrient-recovered ingredients to a growing population. FOOD FEED FUEL To accomplish this, we will BUILD, ACQUIRE and DEVELOP businesses within geographies where we can achieve a sustainable Top 3 market position within 5 years… TH…..thus growing shareholder value and customer and supplier confidence.
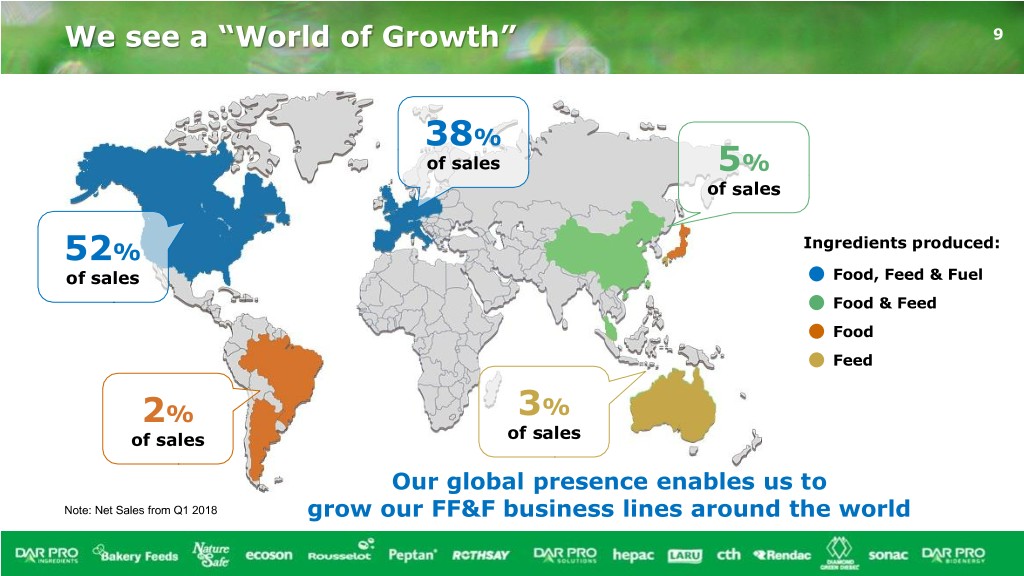
We see a “World of Growth” 9 38% of sales 5% of sales 52% Ingredients produced: of sales Food, Feed & Fuel Food & Feed Food Feed 2% 3% of sales of sales Our global presence enables us to Note: Net Sales from Q1 2018 grow our FF&F business lines around the world
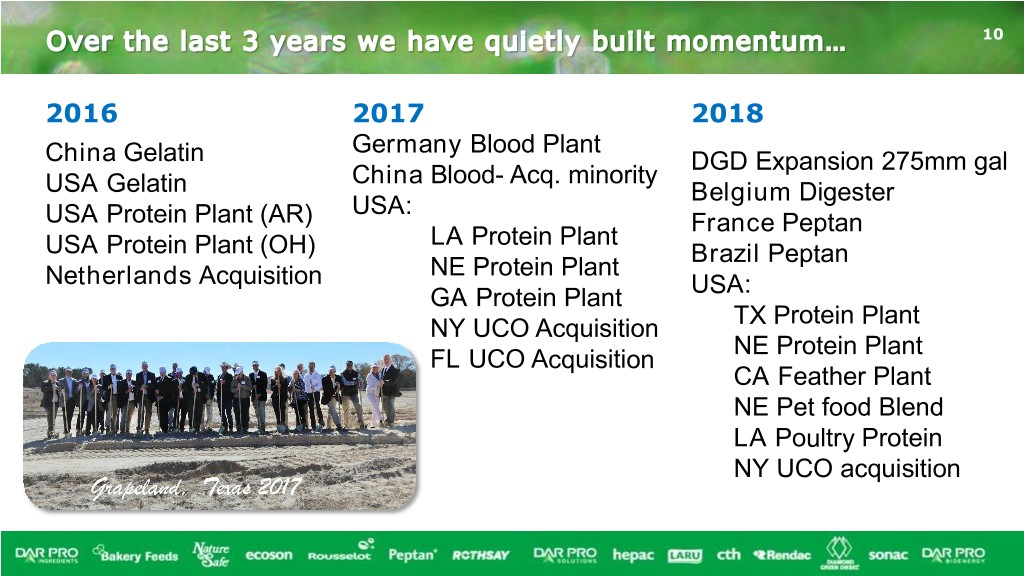
10 2016 2017 2018 Germany Blood Plant China Gelatin DGD Expansion 275mm gal China Blood- Acq. minority USA Gelatin Belgium Digester USA: USA Protein Plant (AR) France Peptan LA Protein Plant USA Protein Plant (OH) Brazil Peptan NE Protein Plant Netherlands Acquisition USA: GA Protein Plant TX Protein Plant NY UCO Acquisition NE Protein Plant FL UCO Acquisition CA Feather Plant NE Pet food Blend LA Poultry Protein NY UCO acquisition
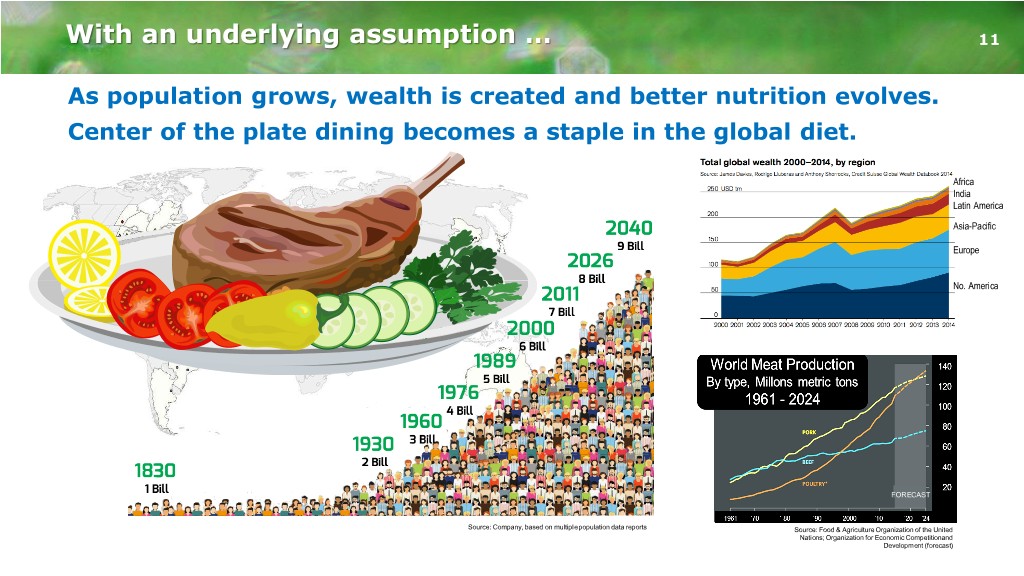
With an underlying assumption … 11 As population grows, wealth is created and better nutrition evolves. Center of the plate dining becomes a staple in the global diet. Africa India Latin America Asia-Pacific Europe No. America FORECAST Source: Company, based on multiple population data reports Source: Food & Agriculture Organization of the United Nations; Organization for Economic Competitionand Development (forecast)
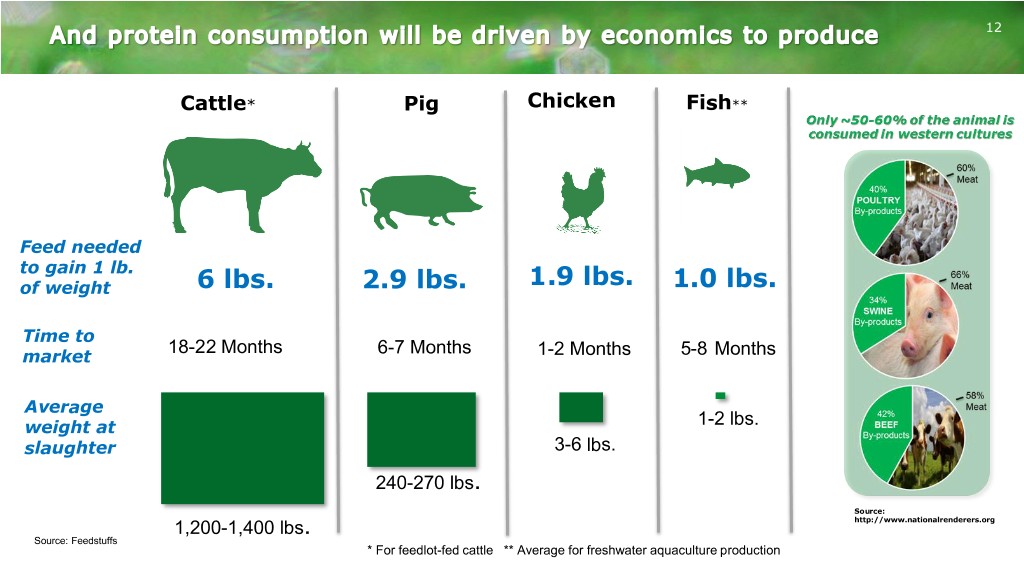
12 Cattle* Pig Chicken Fish** Feed needed to gain 1 lb. of weight 6 lbs. 2.9 lbs. 1.9 lbs. 1.0 lbs. Time to 18-22 Months 6-7 Months market 1-2 Months 5-8 Months Average weight at 1-2 lbs. slaughter 3-6 lbs. 240-270 lbs. Source: 1,200-1,400 lbs. http://www.nationalrenderers.org Source: Feedstuffs * For feedlot-fed cattle ** Average for freshwater aquaculture production
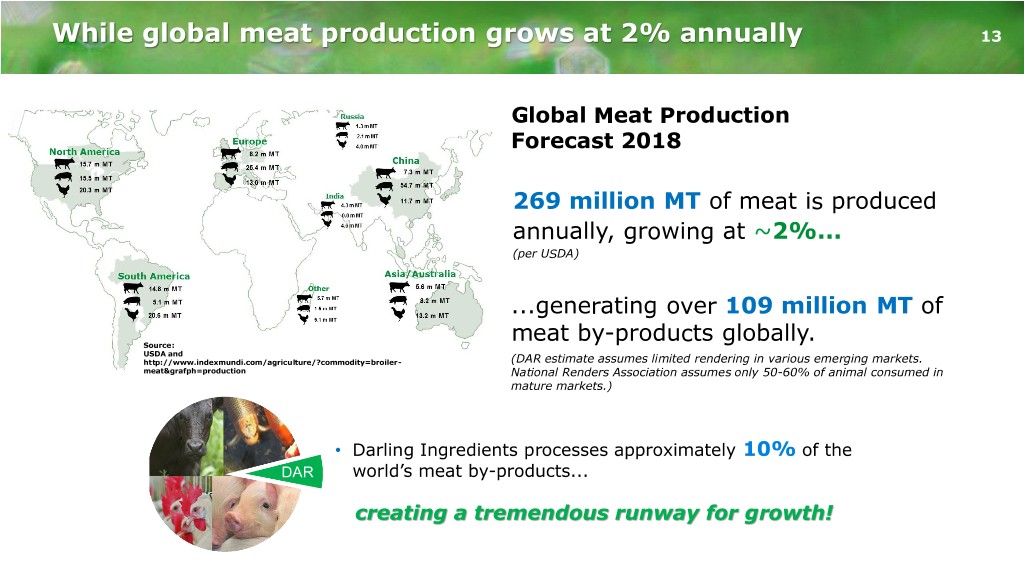
While global meat production grows at 2% annually 13 Global Meat Production Forecast 2018 269 million MT of meat is produced annually, growing at ~2%... (per USDA) ...generating over 109 million MT of meat by-products globally. Source: USDA and http://www.indexmundi.com/agriculture/?commodity=broiler- (DAR estimate assumes limited rendering in various emerging markets. meat&grafph=production National Renders Association assumes only 50-60% of animal consumed in mature markets.) • Darling Ingredients processes approximately 10% of the DAR world’s meat by-products... creating a tremendous runway for growth!

Supplying raw materials to create a portfolio of 14 diverse ingredients… Processed Processed Processed 1.12 million MT 8.24 million MT 1.19 million* MT ~$1 billion ~$2 billion ~$580 million FOOD FEED FUEL company company company Note: Includes DGD Revenues Note: Processed amounts are for raw material in 2017 Represents revenues in U.S. $ * Does not include Diamond Green Diesel volumes
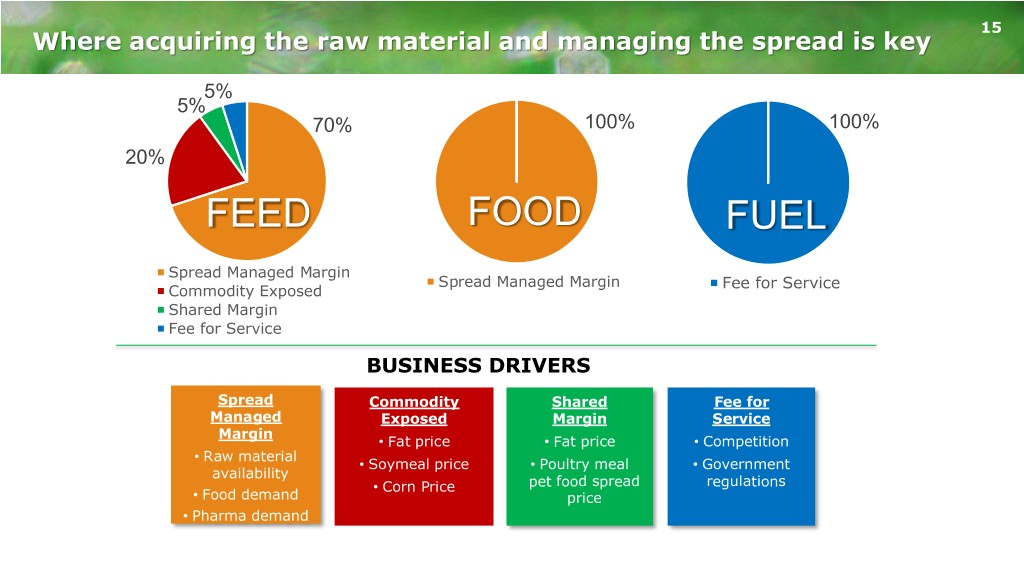
15 Where acquiring the raw material and managing the spread is key 5% 5% 70% 100% 100% 20% FEED FOOD FUEL Spread Managed Margin Spread Managed Margin Fee for Service Commodity Exposed Shared Margin Fee for Service BUSINESS DRIVERS Spread Commodity Shared Fee for Managed Exposed Margin Service Margin • Fat price • Fat price • Competition • Raw material • Soymeal price • Poultry meal • Government availability • Corn Price pet food spread regulations • Food demand price • Pharma demand
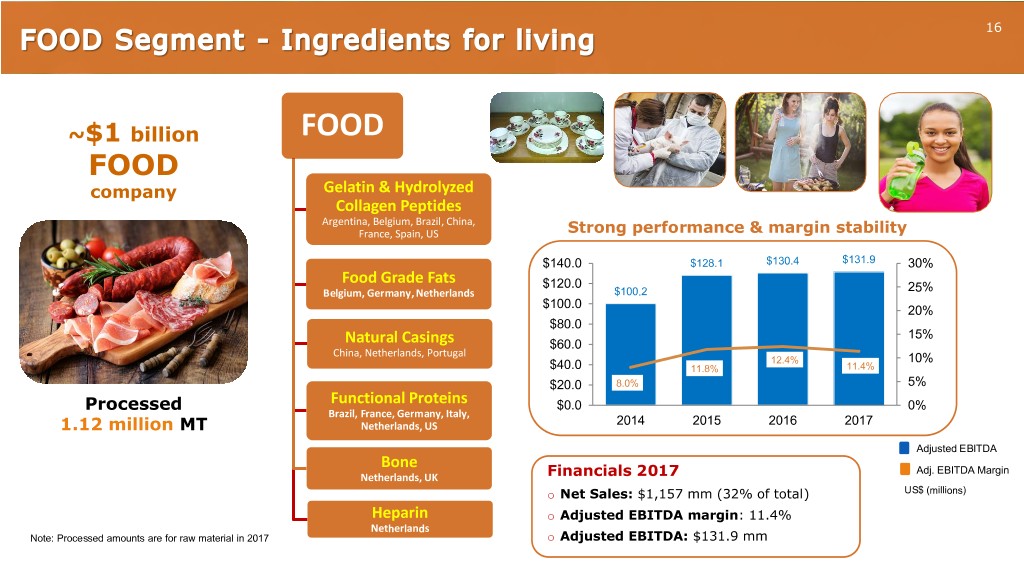
16 ~$1 billion FOOD FOOD company Gelatin & Hydrolyzed Collagen Peptides Argentina, Belgium, Brazil, China, France, Spain, US Strong performance & margin stability $140.0 $128.1 $130.4 $131.9 30% Food Grade Fats $120.0 25% Belgium, Germany, Netherlands $100.2 $100.0 20% $80.0 15% Natural Casings $60.0 China, Netherlands, Portugal 12.4% 10% $40.0 11.8% 11.4% $20.0 8.0% 5% Processed Functional Proteins $0.0 0% Brazil, France, Germany, Italy, 2014 2015 2016 2017 1.12 million MT Netherlands, US Adjusted EBITDA Bone Adj. EBITDA Margin Netherlands, UK Financials 2017 o Net Sales: $1,157 mm (32% of total) US$ (millions) Heparin o Adjusted EBITDA margin: 11.4% Netherlands Note: Processed amounts are for raw material in 2017 o Adjusted EBITDA: $131.9 mm

FEED segment – Nutrients for growth 17 ~$2 billion FEED FEED Fats company Canada, Belgium, Germany, Netherlands, Poland, USA Proteins Strong performance & margin stability Canada, Belgium, Germany, Netherlands, Poland, USA $400.0 30% $351.3 $316.5 $297.1 25% UCO Services $300.0 $282.3 Canada, USA 20% Blood Products $200.0 15% USA, Australia, China, Germany, 14.5% 14.1% Italy, Netherlands, Poland 13.6% 14.2% 10% $100.0 5% Pet Food Ingredients Processed Netherlands, USA $0.0 0% 8.24 million MT 2014 2015 2016 2017 Organic Fertilizers Netherlands & USA Adjusted EBITDA Financials 2017 Adj. EBITDA Margin Bakery Feeds US$ (millions) USA o Net Sales: $2,239.5 mm (61% of total) o Adjusted EBITDA margin: 14.1% Insect Fats & Proteins o Adjusted EBITDA: $316.5 mm USA Note: Processed amounts are for raw material in 2017
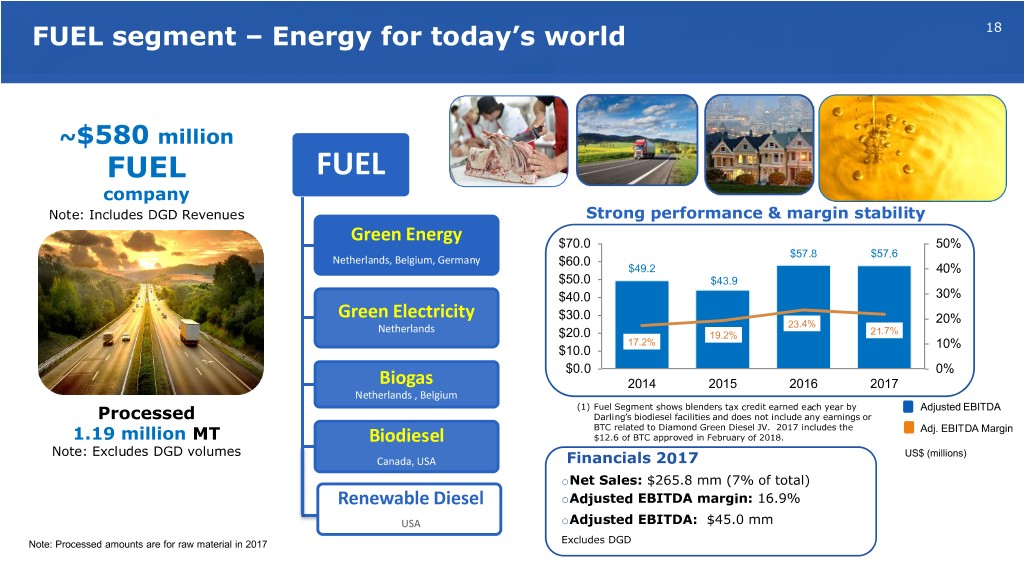
FUEL segment – Energy for today’s world 18 ~$580 million FUEL FUEL company Note: Includes DGD Revenues Strong performance & margin stability Green Energy $70.0 50% $57.8 $57.6 Netherlands, Belgium, Germany $60.0 $49.2 40% $50.0 $43.9 $40.0 30% Green Electricity $30.0 20% Netherlands 23.4% $20.0 19.2% 21.7% 17.2% 10% $10.0 $0.0 0% Biogas 2014 2015 2016 2017 Netherlands , Belgium (1) Fuel Segment shows blenders tax credit earned each year by Adjusted EBITDA Processed Darling’s biodiesel facilities and does not include any earnings or BTC related to Diamond Green Diesel JV. 2017 includes the Adj. EBITDA Margin 1.19 million MT Biodiesel $12.6 of BTC approved in February of 2018. Note: Excludes DGD volumes US$ (millions) Canada, USA Financials 2017 oNet Sales: $265.8 mm (7% of total) Renewable Diesel oAdjusted EBITDA margin: 16.9% USA oAdjusted EBITDA: $45.0 mm Note: Processed amounts are for raw material in 2017 Excludes DGD
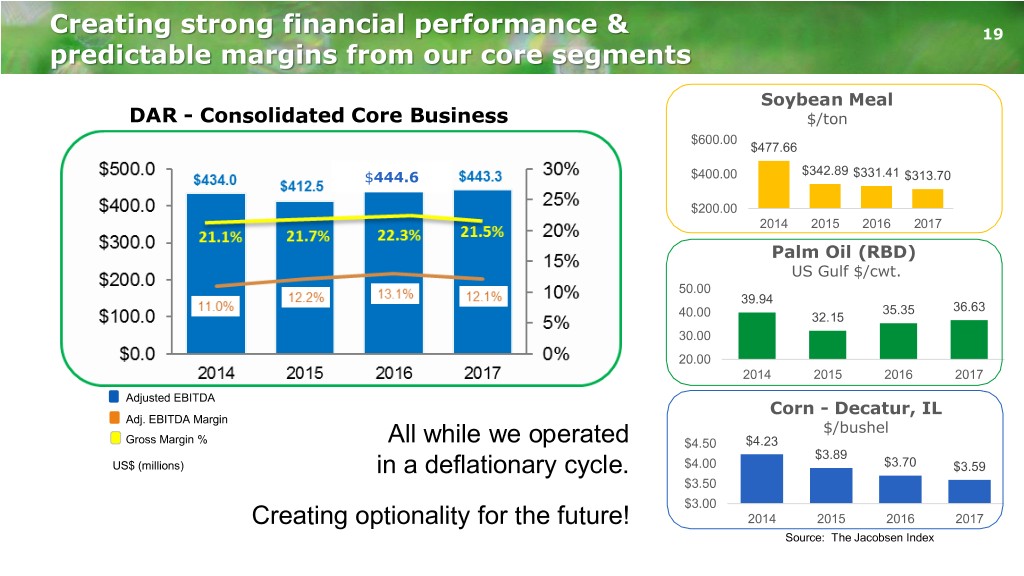
Creating strong financial performance & 19 predictable margins from our core segments Soybean Meal DAR - Consolidated Core Business $/ton $600.00 $477.66 $444.6 $400.00 $342.89 $331.41 $313.70 $200.00 2014 2015 2016 2017 Palm Oil (RBD) US Gulf $/cwt. 50.00 39.94 35.35 36.63 40.00 32.15 30.00 20.00 2014 2015 2016 2017 Adjusted EBITDA Corn - Decatur, IL Adj. EBITDA Margin $/bushel Gross Margin % All while we operated $4.50 $4.23 $3.89 US$ (millions) in a deflationary cycle. $4.00 $3.70 $3.59 $3.50 $3.00 Creating optionality for the future! 2014 2015 2016 2017 Source: The Jacobsen Index
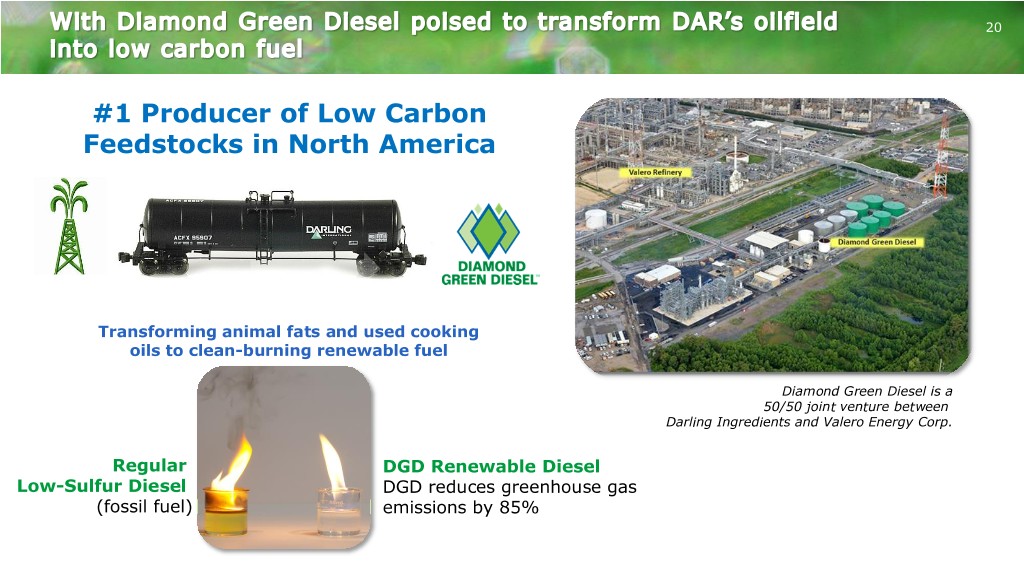
20 #1 Producer of Low Carbon Feedstocks in North America Transforming animal fats and used cooking oils to clean-burning renewable fuel Diamond Green Diesel is a 50/50 joint venture between Darling Ingredients and Valero Energy Corp. Regular DGD Renewable Diesel Low-Sulfur Diesel DGD reduces greenhouse gas (fossil fuel) emissions by 85%
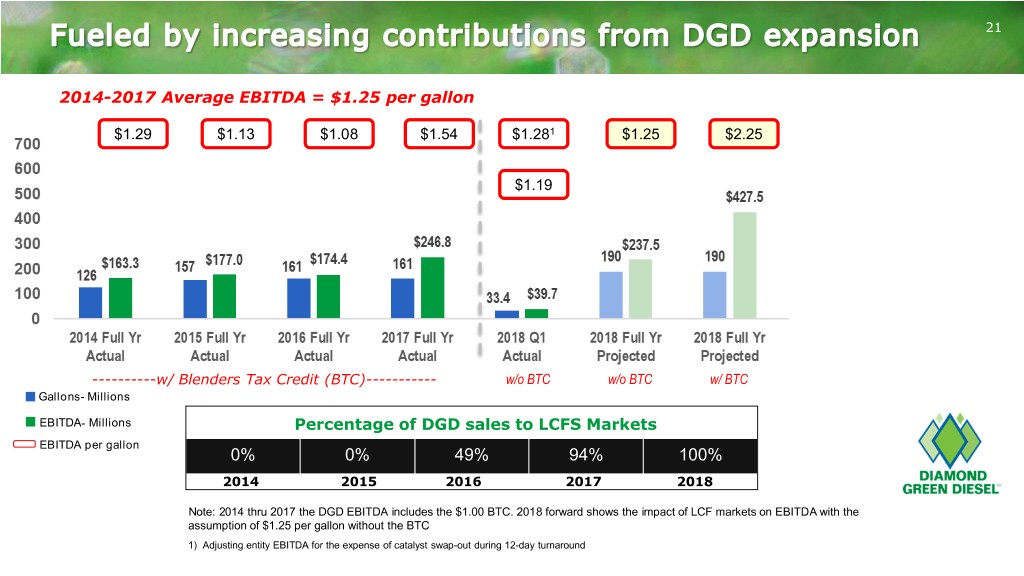
21 2014-2017 Average EBITDA = $1.25 per gallon $1.29 $1.13 $1.08 $1.54 $1.281 $1.25 $2.25 $1.19 ----------w/ Blenders Tax Credit (BTC)----------- w/o BTC w/o BTC w/ BTC Gallons- Millions EBITDA- Millions Percentage of DGD sales to LCFS Markets EBITDA per gallon 0% 0% 49% 94% 100% 2014 2015 2016 2017 2018 Note: 2014 thru 2017 the DGD EBITDA includes the $1.00 BTC. 2018 forward shows the impact of LCF markets on EBITDA with the assumption of $1.25 per gallon without the BTC 1) Adjusting entity EBITDA for the expense of catalyst swap-out during 12-day turnaround

22 2014-2017 Average EBITDA = $1.25 per gallon $1.29 $1.13 $1.08 $1.54 $1.281 $1.25 $2.25 $1.25 $2.25 700 $618.8 600 $1.19 500 $427.5 400 $343.8 275 275 300 $246.8 $237.5 190 190 $163.3 157 $177.0 161 $174.4 161 200 126 100 33.4 $39.7 0 2014 Full Yr 2015 Full Yr 2016 Full Yr 2017 Full Yr 2018 Q1 2018 Full Yr 2018 Full Yr 2019 Full Yr 2019 Full Yr Actual Actual Actual Actual Actual Projected Projected Projected Projected ----------w/ Blenders Tax Credit (BTC)----------- wo/BTCw/o BTC wo/BTCw/o BTC w/w/BTC BTC wo/BTC w/o BTC w/w/BTC BTC Gallons- Millions Percentage of DGD sales to LCFS Markets EBITDA- Millions EBITDA per gallon 0% 0% 49% 94% 100% 2014 2015 2016 2017 2018 Note: 2014 thru 2017 the DGD EBITDA includes the $1.00 BTC. 2018 forward shows the impact of LCF markets on EBITDA with the assumption of $1.25 per gallon without the BTC 1) Adjusting entity EBITDA for the expense of catalyst swap-out during 12-day turnaround

23 California is driving the expansion of global LCF market California Average Spot price Carbon Price in May 2018 Carbon Reduction Mandate – State of CA $1.54 25.00% 20.00% $.88 18.75% 20.00% 16.25%17.30% 15.00% $.99 13.75% 12.50% 15.00% 11.25% 10.00% $.51 8.80% 7.50% 10.00% 6.30% 5.00% 5.00% 3.50% 1.00% 2.00% 0.00% 2015 2016 2017 2018 2019 2020 2021 2022 2023 2024 2025 2026 2027 2028 2029 2030 Source: California Air Resources Board (CASB); The Jacobsen • LCF is a global phenomenon • USA (California, Oregon, Washington, New York, Canada, Scandinavia and potentially the UK) • Renewable Diesel made from UCO and Animal Fats is the preferred low carbon fuel • The world is pricing carbon off California

24 Encouraging us to expand the capacity of DGD by 2021 • Final cost estimate and detailed engineering funded DGD JV in Final Engineering for phase three • 28 acre site adjacent to expansion to 600 million current DGD facility gallons • Additional rail access • Water access • Decision time – this fall • Start up late 2021
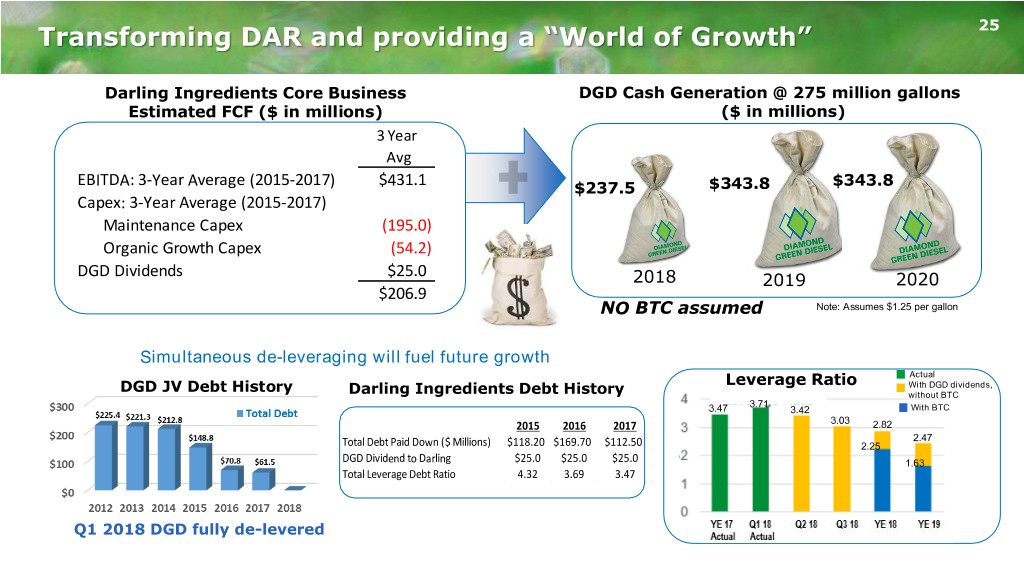
Transforming DAR and providing a “World of Growth” 25 Darling Ingredients Core Business DGD Cash Generation @ 275 million gallons Estimated FCF ($ in millions) ($ in millions) 3 Year Avg $343.8 EBITDA: 3-Year Average (2015-2017) $431.1 $237.5 $343.8 Capex: 3-Year Average (2015-2017) Maintenance Capex (195.0) Organic Growth Capex (54.2) DGD Dividends $25.0 2018 2019 2020 $206.9 NO BTC assumed Note: Assumes $1.25 per gallon Simultaneous de-leveraging will fuel future growth Actual DGD JV Debt History Leverage Ratio With DGD dividends, Darling Ingredients Debt History without BTC 3.71 3.47 3.42 With BTC 2015 2016 2017 3.03 2.82 2.47 Total Debt Paid Down ($ Millions) $118.20 $169.70 $112.50 2.25 DGD Dividend to Darling $25.0 $25.0 $25.0 1.63 Total Leverage Debt Ratio 4.32 3.69 3.47 Q1 2018 DGD fully de-levered

26 ENERGY RENEWABLE DIESEL AVOIDED GHG EMISSIONS METRICS PRODUCTION FROM FOSSIL FUEL CONSUMPTION (Used) CONTRIBUTION (Produced) (Bio) Energy Production Energy Consumption 161 million gallons 1.9 million MT CO2e (Bio) Fuel Production 2017 production Mln metric tons fewer GHG emissions GHG Raw Material 1.9 Emissions Carbon Capture (RD emits 85% less than fossil diesel) = a CO2 equivalent of removing Fresh Water Water 450,000 Consumption Production cars from the road for a year Note: One gallon of fossil diesel emits 10.21 kg CO2 Source: EPA Metric figures are for Diamond Green Diesel renewable diesel production in 2017.
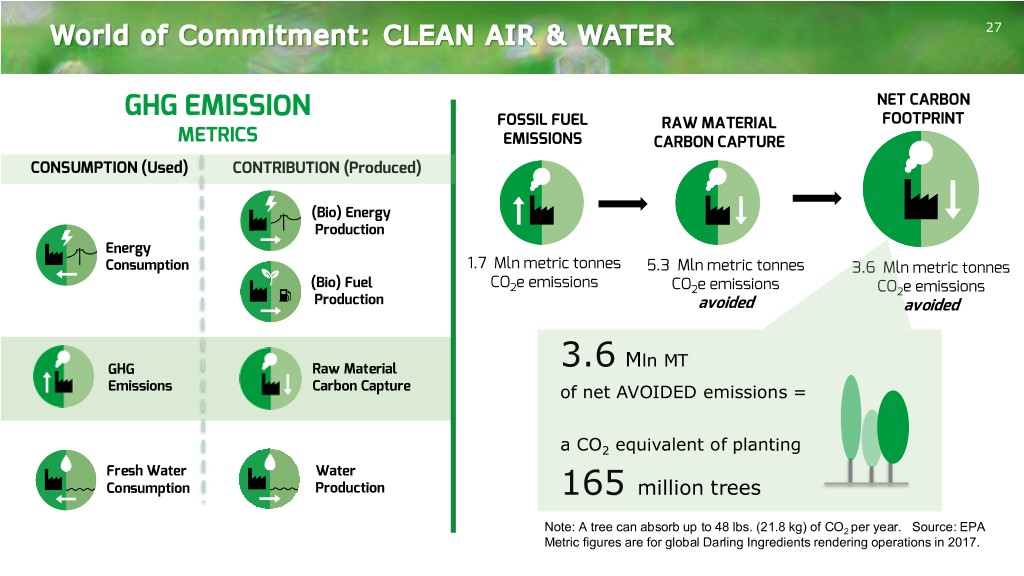
27 GHG EMISSION NET CARBON FOSSIL FUEL RAW MATERIAL FOOTPRINT METRICS EMISSIONS CARBON CAPTURE CONSUMPTION (Used) CONTRIBUTION (Produced) (Bio) Energy Production Energy Consumption 1.7 Mln metric tonnes 5.3 Mln metric tonnes 3.6 Mln metric tonnes (Bio) Fuel CO e emissions 2 CO2e emissions CO2e emissions Production avoided avoided Mln MT GHG Raw Material 3.6 Emissions Carbon Capture of net AVOIDED emissions = a CO2 equivalent of planting Fresh Water Water Consumption Production 165 million trees Note: A tree can absorb up to 48 lbs. (21.8 kg) of CO2 per year. Source: EPA Metric figures are for global Darling Ingredients rendering operations in 2017.
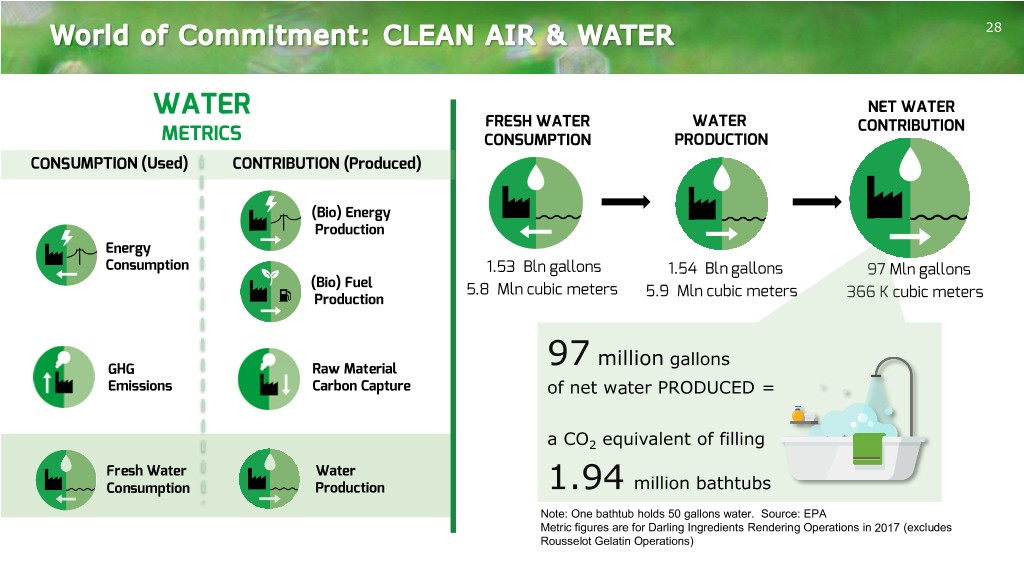
28 WATER NET WATER FRESH WATER WATER CONTRIBUTION METRICS CONSUMPTION PRODUCTION CONSUMPTION (Used) CONTRIBUTION (Produced) (Bio) Energy Production Energy Consumption 1.53 Bln gallons 1.54 Bln gallons 97 Mln gallons (Bio) Fuel 5.8 Mln cubic meters 5.9 Mln cubic meters Production 366 K cubic meters million gallons GHG Raw Material 97 Emissions Carbon Capture of net water PRODUCED = a CO2 equivalent of filling Fresh Water Water Consumption Production 1.94 million bathtubs Note: One bathtub holds 50 gallons water. Source: EPA Metric figures are for Darling Ingredients Rendering Operations in 2017 (excludes Rousselot Gelatin Operations)
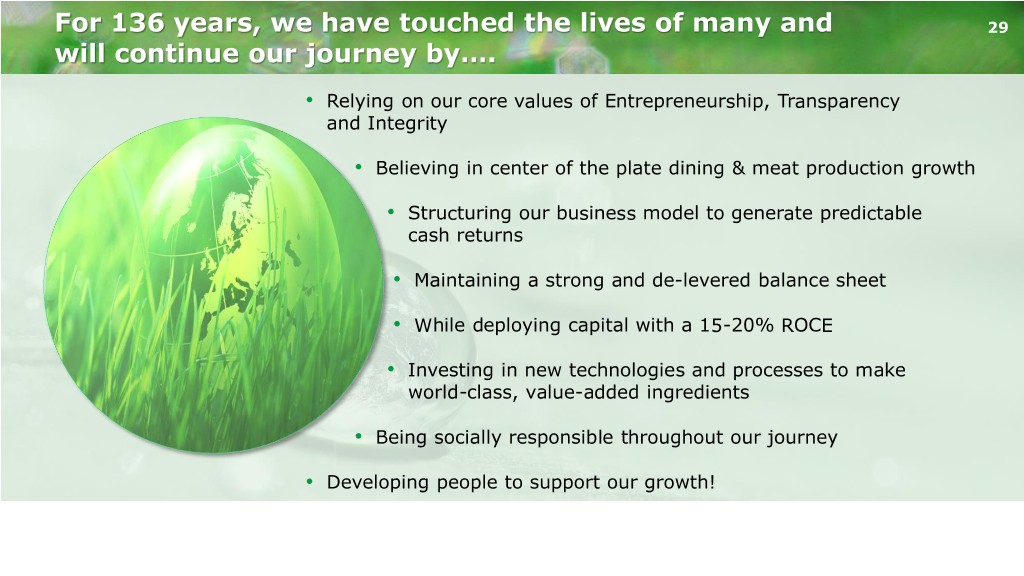
For 136 years, we have touched the lives of many and 29 will continue our journey by…. • Relying on our core values of Entrepreneurship, Transparency and Integrity • Believing in center of the plate dining & meat production growth • Structuring our business model to generate predictable cash returns • Maintaining a strong and de-levered balance sheet • While deploying capital with a 15-20% ROCE • Investing in new technologies and processes to make world-class, value-added ingredients • Being socially responsible throughout our journey • Developing people to support our growth!

30 DAR— A GLOBAL GROWTH Touching PLATFORM your life FOR every day GENERATIONS TO COME Creating sustainable food, feed and fuel ingredients for a growing population

31

Consolidated Earnings 32 Total Total Q1 Q2 Q3 Q4 Total Q1 Q1 2018 Overview US$ (millions) except per share price 2015 2016 2017 2017 2017 2017 2017 2018 • Harsh winter weather in N. America impacted Revenue $ 3,391.3 $ 3,391.9 $ 878.5 $ 894.9 $ 936.3 $ 952.6 $ 3,662.3 $ 875.4 performance Gross Margin 737.3 756.6 190.5 195.7 193.8 206.8 786.8 197.3 Gross Margin % 21.7% 22.3% 21.7% 21.9% 20.7% 21.7% 21.5% 22.5% • Deflationary fat prices affected Feed segment. SG&A 316.4 311.6 86.9 84.5 82.1 90.0 343.5 86.9 Formulas playing catch up while DGD benefits. SG&A Margin % 9.3% 9.2% 9.9% 9.4% 8.8% 9.4% 9.4% 9.9% • Sales volumes grew globally Operating Income 142.6 154.7 32.5 38.2 34.4 36.1 141.2 31.8 Adj. EBITDA (2) 412.5 445.0 103.6 111.2 111.6 116.9 443.3 110.4 • Earnings reflect impact of retroactive 2017 blenders Adj. EBITDA Margin % 12.2% 13.1% 11.8% 12.4% 11.9% 12.3% 12.1% 12.6% tax credit (BTC) in both the Fuel Segment and equity Interest Expense (105.5) (94.2) (21.7) (22.4) (22.5) (22.3) (88.9) (23.1) in unconsolidated subsidiaries Foreign Currency gain/(loss) (4.9) (1.9) (0.3) (2.1) (2.1) (2.4) (6.9) (1.5) • DGD delivers solid quarter and pays off $53.7M of long Other Expense (3) (6.9) (6.5) (2.0) (4.0) (2.5) (1.3) (9.7) (2.6) term debt Equity in net income of unconsolidated 73.4 70.4 0.7 8.3 7.7 11.8 28.5 97.2 subsidiaries • Euro Bonds refinanced in April reducing interest rate to Income Tax (Expense)/Benefit (13.5) (15.3) (1.8) (7.7) (6.3) 85.0 69.2 (3.7) 3.625% from 4.750% and extending maturity from Net income attributable to noncontrolling (6.7) (4.9) (1.6) (1.2) (0.9) (1.2) (4.9) (0.8) 2022 to 2026 interests Net income attributable to Darling $ 78.5 $ 102.3 $ 5.8 $ 9.1 $ 7.8 $ 105.7 $ 128.5 $ 97.3 • Q1 2018 includes revenue recognition reclass for Earnings per share (fully diluted) $ 0.48 $ 0.62 $ 0.04 $ 0.05 $ 0.05 $ 0.63 $ 0.77 $ 0.58 billed freight moved to cost of sales per new revenue standard (1) Includes $12.6M of 2017 BTC and revenue recognition for Q1 2018 (2) Does not inlcude Unconsolidated Subsidiaries EBITDA. (3) Rounding captured in Other Expense. • SG&A reflects performance compensation and retirement provisions 32
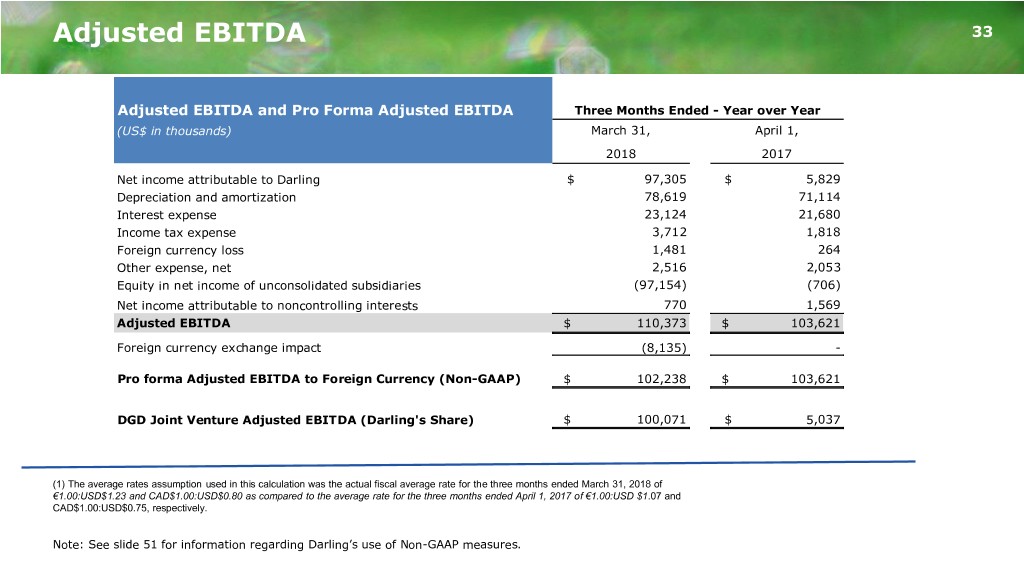
Adjusted EBITDA 33 Adjusted EBITDA and Pro Forma Adjusted EBITDA Three Months Ended - Year over Year (US$ in thousands) March 31, April 1, 2018 2017 Net income attributable to Darling $ 97,305 $ 5,829 Depreciation and amortization 78,619 71,114 Interest expense 23,124 21,680 Income tax expense 3,712 1,818 Foreign currency loss 1,481 264 Other expense, net 2,516 2,053 Equity in net income of unconsolidated subsidiaries (97,154) (706) Net income attributable to noncontrolling interests 770 1,569 Adjusted EBITDA $ 110,373 $ 103,621 Foreign currency exchange impact (8,135) - Pro forma Adjusted EBITDA to Foreign Currency (Non-GAAP) $ 102,238 $ 103,621 DGD Joint Venture Adjusted EBITDA (Darling's Share) $ 100,071 $ 5,037 (1) The average rates assumption used in this calculation was the actual fiscal average rate for the three months ended March 31, 2018 of €1.00:USD$1.23 and CAD$1.00:USD$0.80 as compared to the average rate for the three months ended April 1, 2017 of €1.00:USD $1.07 and CAD$1.00:USD$0.75, respectively. Note: See slide 51 for information regarding Darling’s use of Non-GAAP measures.
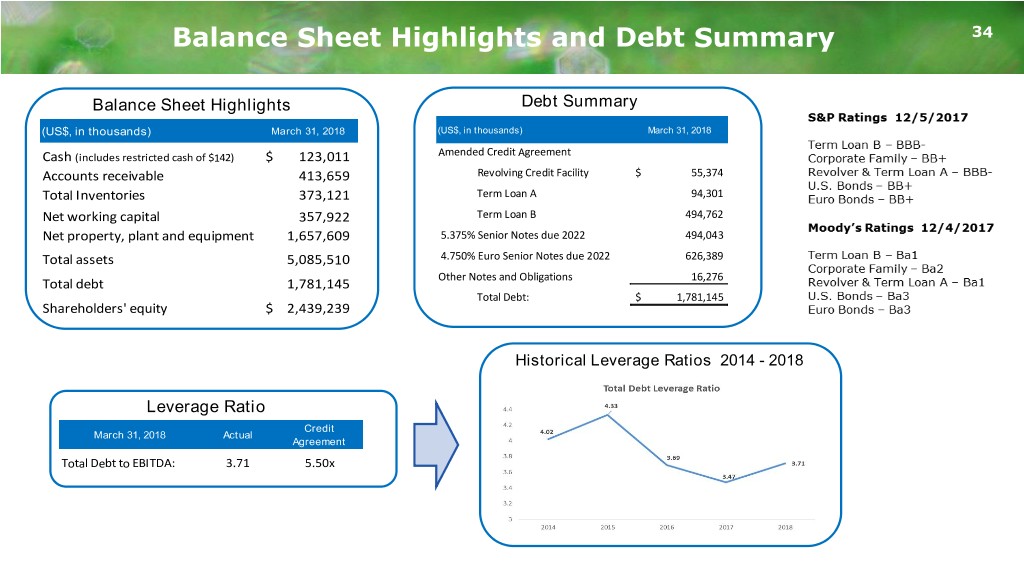
Balance Sheet Highlights and Debt Summary 34 Balance Sheet Highlights Debt Summary (US$, in thousands) March 31, 2018 (US$, in thousands) March 31, 2018 Amended Credit Agreement Cash (includes restricted cash of $142) $ 123,011 Accounts receivable 413,659 Revolving Credit Facility $ 55,374 Total Inventories 373,121 Term Loan A 94,301 Net working capital 357,922 Term Loan B 494,762 Net property, plant and equipment 1,657,609 5.375% Senior Notes due 2022 494,043 Total assets 5,085,510 4.750% Euro Senior Notes due 2022 626,389 Other Notes and Obligations 16,276 Total debt 1,781,145 Total Debt: $ 1,781,145 Shareholders' equity $ 2,439,239 Historical Leverage Ratios 2014 - 2018 Leverage Ratio Credit March 31, 2018 Actual Agreement Total Debt to EBITDA: 3.71 5.50x
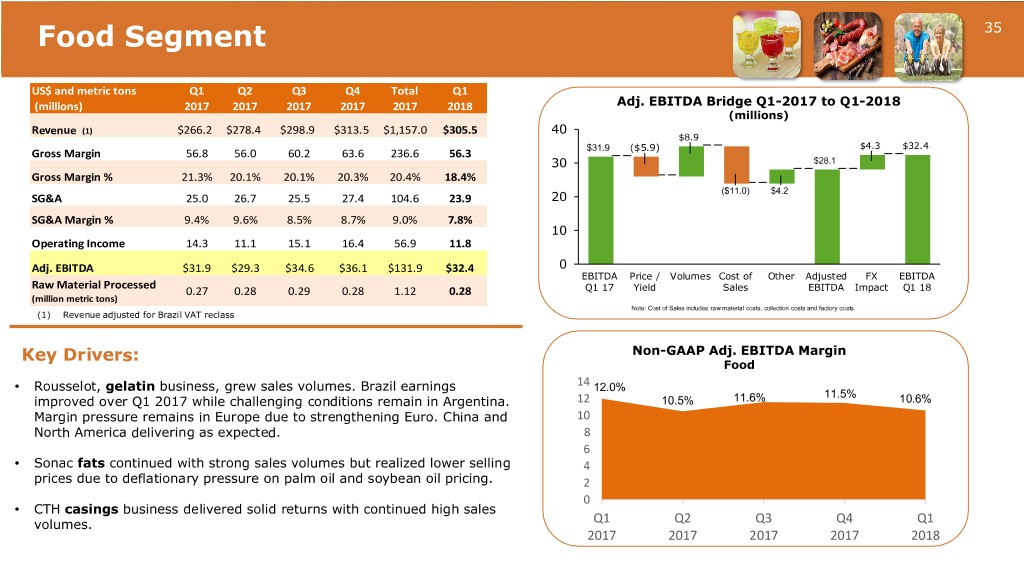
Food Segment 35 US$ and metric tons Q1 Q2 Q3 Q4 Total Q1 (millions) 2017 2017 2017 2017 2017 2018 Adj. EBITDA Bridge Q1-2017 to Q1-2018 (millions) Revenue (1) $266.2 $278.4 $298.9 $313.5 $1,157.0 $305.5 40 $8.9 $31.9 ($5.9) $4.3 $32.4 Gross Margin 56.8 56.0 60.2 63.6 236.6 56.3 30 $28.1 Gross Margin % 21.3% 20.1% 20.1% 20.3% 20.4% 18.4% ($11.0) $4.2 SG&A 25.0 26.7 25.5 27.4 104.6 23.9 20 SG&A Margin % 9.4% 9.6% 8.5% 8.7% 9.0% 7.8% 10 Operating Income 14.3 11.1 15.1 16.4 56.9 11.8 Adj. EBITDA $31.9 $29.3 $34.6 $36.1 $131.9 $32.4 0 EBITDA Price / Volumes Cost of Other Adjusted FX EBITDA Raw Material Processed 0.27 0.28 0.29 0.28 1.12 0.28 Q1 17 Yield Sales EBITDA Impact Q1 18 (million metric tons) Note: Cost of Sales includes raw material costs, collection costs and factory costs. (1) Revenue adjusted for Brazil VAT reclass Key Drivers: Non-GAAP Adj. EBITDA Margin Food • Rousselot, gelatin business, grew sales volumes. Brazil earnings 14 12.0% 11.5% improved over Q1 2017 while challenging conditions remain in Argentina. 12 10.5% 11.6% 10.6% Margin pressure remains in Europe due to strengthening Euro. China and 10 North America delivering as expected. 8 6 • Sonac fats continued with strong sales volumes but realized lower selling 4 prices due to deflationary pressure on palm oil and soybean oil pricing. 2 0 • CTH casings business delivered solid returns with continued high sales volumes. Q1 Q2 Q3 Q4 Q1 2017 2017 2017 2017 2018
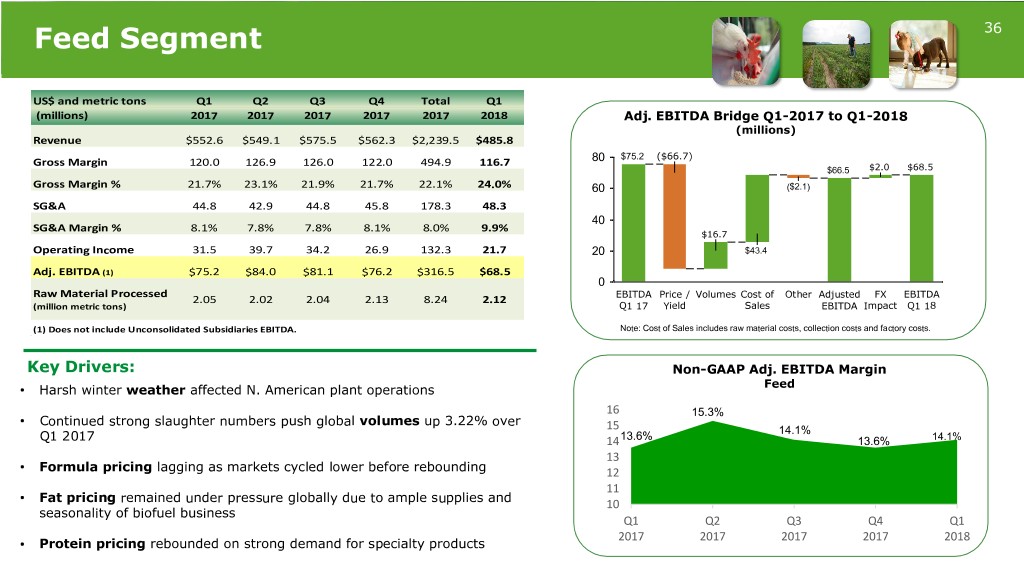
Feed Segment 36 US$ and metric tons Q1 Q2 Q3 Q4 Total Q1 (millions) 2017 2017 2017 2017 2017 2018 Adj. EBITDA Bridge Q1-2017 to Q1-2018 (millions) Revenue $552.6 $549.1 $575.5 $562.3 $2,239.5 $485.8 $75.2 ($66.7) Gross Margin 120.0 126.9 126.0 122.0 494.9 116.7 80 $66.5 $2.0 $68.5 Gross Margin % 21.7% 23.1% 21.9% 21.7% 22.1% 24.0% 60 ($2.1) SG&A 44.8 42.9 44.8 45.8 178.3 48.3 40 SG&A Margin % 8.1% 7.8% 7.8% 8.1% 8.0% 9.9% $16.7 Operating Income 31.5 39.7 34.2 26.9 132.3 21.7 20 $43.4 Adj. EBITDA (1) $75.2 $84.0 $81.1 $76.2 $316.5 $68.5 0 Raw Material Processed EBITDA Price / Volumes Cost of Other Adjusted FX EBITDA 2.05 2.02 2.04 2.13 8.24 2.12 (million metric tons) Q1 17 Yield Sales EBITDA Impact Q1 18 (1) Does not include Unconsolidated Subsidiaries EBITDA. Note: Cost of Sales includes raw material costs, collection costs and factory costs. Key Drivers: Non-GAAP Adj. EBITDA Margin Feed • Harsh winter weather affected N. American plant operations 16 15.3% • Continued strong slaughter numbers push global volumes up 3.22% over 15 14.1% Q1 2017 1413.6% 13.6% 14.1% 13 • Formula pricing lagging as markets cycled lower before rebounding 12 11 • Fat pricing remained under pressure globally due to ample supplies and 10 seasonality of biofuel business Q1 Q2 Q3 Q4 Q1 2017 2017 2017 2017 2018 • Protein pricing rebounded on strong demand for specialty products

37 Fuel Segment (Does not include Diamond Green Diesel JV) US$ and metric tons Q1 Q2 Q3 Q4 Total Q1 (millions) 2017 2017 2017 2017 2017 2018 Adj. EBITDA Bridge Q1-2017 to Q1-2018 (millions) Revenue $59.7 $67.4 $61.9 $76.8 $265.8 $84.1 Gross Margin 13.7 12.7 7.6 21.4 55.4 24.2 80 $25.6 Gross Margin % 22.9% 18.8% 12.3% 27.9% 20.8% 28.8% 60 $23.8 $1.8 SG&A 3.3 2.9 (0.5) 4.7 10.4 (1.4) 40 SG&A Margin % 5.5% 4.3% -0.8% 6.1% 3.9% -1.7% $12.6 $5.2 20 $10.4 Operating Income 3.6 2.1 0.2 8.1 14.0 17.2 ($8.1) $4.4 ($0.7) Adj. EBITDA (1) $10.4 $9.9 $8.1 $16.6 $45.0 $25.6 0 Raw Material Processed * EBITDA Price / Volumes 2017 Cost of Other Adjusted FX EBITDA 0.30 0.29 0.28 0.32 1.19 0.30 (million metric tons) Q1 17 Yield BTC Sales EBITDA Impact Q1 18 (1) Does not include DGD EBITDA. * Excludes raw material processed at the DGD joint venture. Note: Cost of Sales includes raw material costs, collection costs and factory costs. Key Drivers: 35 Non-GAAP Adj. EBITDA Margin 30.4% • Fuel segment Q1 2018 includes full year 2017 BTC of $12.6M 30 Fuel passed retro active in February of 2018 25 21.6% • North American biodiesel operating at breakeven without the 20 17.4% 14.7% BTC for 2018. 15 13.1% 10 • Ecoson, European bioenergy business, delivered strong results related to high sales volumes 5 0 • Rendac, European disposal rendering business, continued with Q1 Q2 Q3 Q4 Q1 strong supply volumes producing consistent results over Q1 2017 2017 2017 2017 2017 2018

38 DGD - ENTITY LEVEL ➢ DGD JV Long term debt of $53.7M has been paid off, total cash of exploring phase $41.0M at March 31, 2018 plus $160.4M of blenders tax credit (BTC) receivable expected Q2 2018 three expansion to 600 million ➢ Entity EBITDA of $1.19 per gallon on 33.4M gallons of gallons sales. When adjusted for expensed catalyst swap out, adjusted EBITDA was $1.28 per gallon ➢ Q1 2018 EBITDA – DGD Entity $200.1M (including the 2017 retroactive BTC) $39.7M (excluding the 2017 retroactive BTC) ➢ 130,000 barrel boat loaded last day of March and will be reflected in Q2 2018 ➢ Turn around for expansion tie-in scheduled for 45 days beginning in mid June Diamond Green Diesel (50% Joint Venture) DGD - DARLING’S SHARE Q1 US$ (millions) 2014 2015 2016 2017 ➢ BTC approved retroactively Feb. 2018 added $0.48 per share 2018 in 1Q 2018 to Darling’s EPS EBITDA (Entity) $163.3 $177.0 $174.4 * $246.8 $39.7 EBITDA (Darling's share) 81.6 88.5 87.2 * 123.4 19.9 ➢ Q1 2018 EBITDA – Darling’s Share Gallons Produced 127.3 158.8 158.1 161.3 37.1 $100.1M (including the 2017 retroactive BTC) *Includes 2017 retroactive blenders tax credit of $160.4 million that was approved in February 2018 and $19.9M (excluding the 2017 retroactive BTC) recorded in Q1 2018
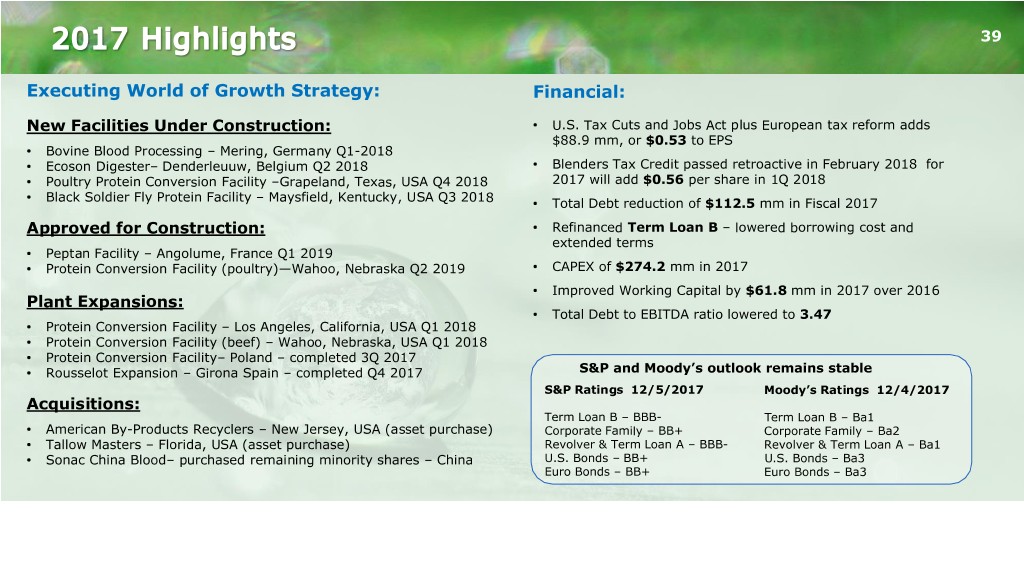
39 Executing World of Growth Strategy: Financial: New Facilities Under Construction: • U.S. Tax Cuts and Jobs Act plus European tax reform adds $88.9 mm, or $0.53 to EPS • Bovine Blood Processing – Mering, Germany Q1-2018 • Ecoson Digester– Denderleuuw, Belgium Q2 2018 • Blenders Tax Credit passed retroactive in February 2018 for • Poultry Protein Conversion Facility –Grapeland, Texas, USA Q4 2018 2017 will add $0.56 per share in 1Q 2018 • Black Soldier Fly Protein Facility – Maysfield, Kentucky, USA Q3 2018 • Total Debt reduction of $112.5 mm in Fiscal 2017 Approved for Construction: • Refinanced Term Loan B – lowered borrowing cost and extended terms • Peptan Facility – Angolume, France Q1 2019 • Protein Conversion Facility (poultry)—Wahoo, Nebraska Q2 2019 • CAPEX of $274.2 mm in 2017 • Improved Working Capital by $61.8 mm in 2017 over 2016 Plant Expansions: • Total Debt to EBITDA ratio lowered to 3.47 • Protein Conversion Facility – Los Angeles, California, USA Q1 2018 • Protein Conversion Facility (beef) – Wahoo, Nebraska, USA Q1 2018 • Protein Conversion Facility– Poland – completed 3Q 2017 • Rousselot Expansion – Girona Spain – completed Q4 2017 S&P and Moody’s outlook remains stable S&P Ratings 12/5/2017 Moody’s Ratings 12/4/2017 Acquisitions: Term Loan B – BBB- Term Loan B – Ba1 • American By-Products Recyclers – New Jersey, USA (asset purchase) Corporate Family – BB+ Corporate Family – Ba2 • Tallow Masters – Florida, USA (asset purchase) Revolver & Term Loan A – BBB- Revolver & Term Loan A – Ba1 • Sonac China Blood– purchased remaining minority shares – China U.S. Bonds – BB+ U.S. Bonds – Ba3 Euro Bonds – BB+ Euro Bonds – Ba3
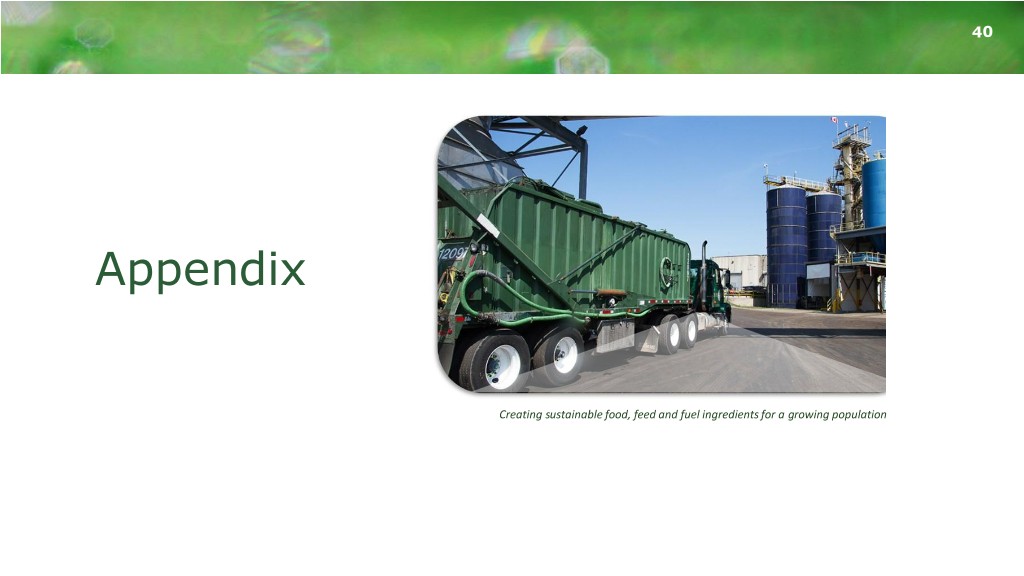
40 Appendix Creating sustainable food, feed and fuel ingredients for a growing population
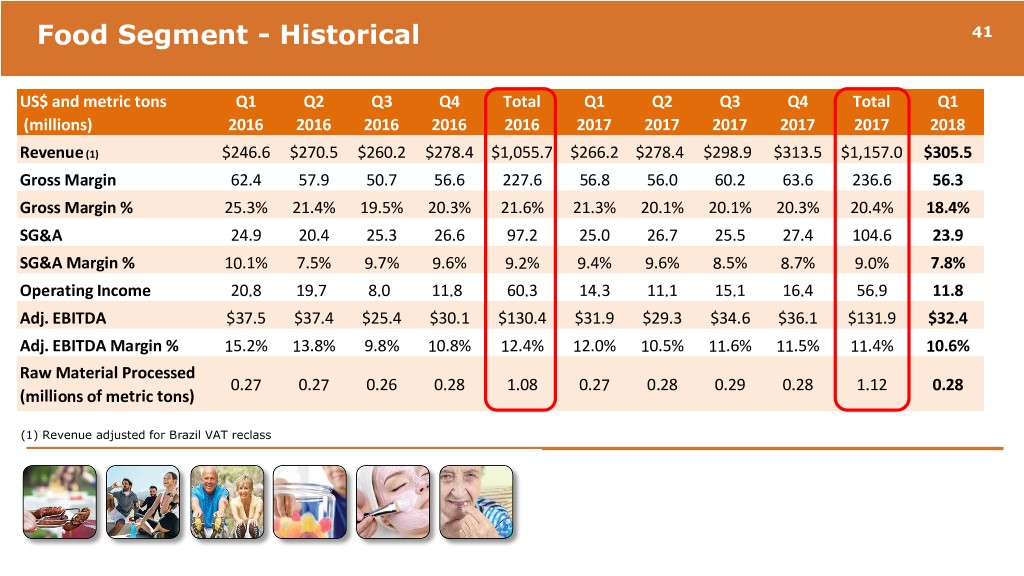
Food Segment - Historical 41 US$ and metric tons Q1 Q2 Q3 Q4 Total Q1 Q2 Q3 Q4 Total Q1 (millions) 2016 2016 2016 2016 2016 2017 2017 2017 2017 2017 2018 Revenue (1) $246.6 $270.5 $260.2 $278.4 $1,055.7 $266.2 $278.4 $298.9 $313.5 $1,157.0 $305.5 Gross Margin 62.4 57.9 50.7 56.6 227.6 56.8 56.0 60.2 63.6 236.6 56.3 Gross Margin % 25.3% 21.4% 19.5% 20.3% 21.6% 21.3% 20.1% 20.1% 20.3% 20.4% 18.4% SG&A 24.9 20.4 25.3 26.6 97.2 25.0 26.7 25.5 27.4 104.6 23.9 SG&A Margin % 10.1% 7.5% 9.7% 9.6% 9.2% 9.4% 9.6% 8.5% 8.7% 9.0% 7.8% Operating Income 20.8 19.7 8.0 11.8 60.3 14.3 11.1 15.1 16.4 56.9 11.8 Adj. EBITDA $37.5 $37.4 $25.4 $30.1 $130.4 $31.9 $29.3 $34.6 $36.1 $131.9 $32.4 Adj. EBITDA Margin % 15.2% 13.8% 9.8% 10.8% 12.4% 12.0% 10.5% 11.6% 11.5% 11.4% 10.6% Raw Material Processed 0.27 0.27 0.26 0.28 1.08 0.27 0.28 0.29 0.28 1.12 0.28 (millions of metric tons) (1) Revenue adjusted for Brazil VAT reclass
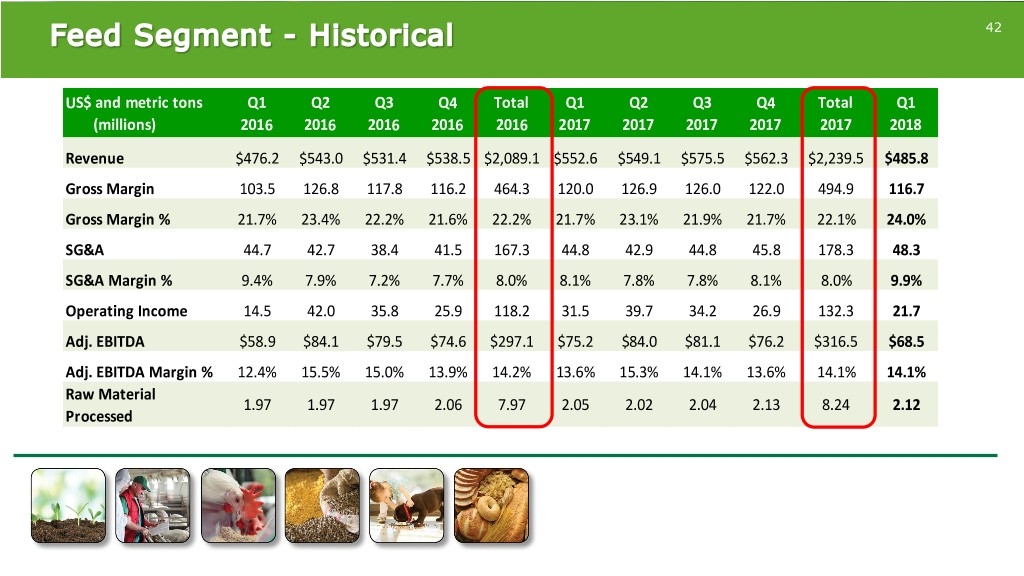
42 US$ and metric tons Q1 Q2 Q3 Q4 Total Q1 Q2 Q3 Q4 Total Q1 (millions) 2016 2016 2016 2016 2016 2017 2017 2017 2017 2017 2018 Revenue $476.2 $543.0 $531.4 $538.5 $2,089.1 $552.6 $549.1 $575.5 $562.3 $2,239.5 $485.8 Gross Margin 103.5 126.8 117.8 116.2 464.3 120.0 126.9 126.0 122.0 494.9 116.7 Gross Margin % 21.7% 23.4% 22.2% 21.6% 22.2% 21.7% 23.1% 21.9% 21.7% 22.1% 24.0% SG&A 44.7 42.7 38.4 41.5 167.3 44.8 42.9 44.8 45.8 178.3 48.3 SG&A Margin % 9.4% 7.9% 7.2% 7.7% 8.0% 8.1% 7.8% 7.8% 8.1% 8.0% 9.9% Operating Income 14.5 42.0 35.8 25.9 118.2 31.5 39.7 34.2 26.9 132.3 21.7 Adj. EBITDA $58.9 $84.1 $79.5 $74.6 $297.1 $75.2 $84.0 $81.1 $76.2 $316.5 $68.5 Adj. EBITDA Margin % 12.4% 15.5% 15.0% 13.9% 14.2% 13.6% 15.3% 14.1% 13.6% 14.1% 14.1% Raw Material 1.97 1.97 1.97 2.06 7.97 2.05 2.02 2.04 2.13 8.24 2.12 Processed
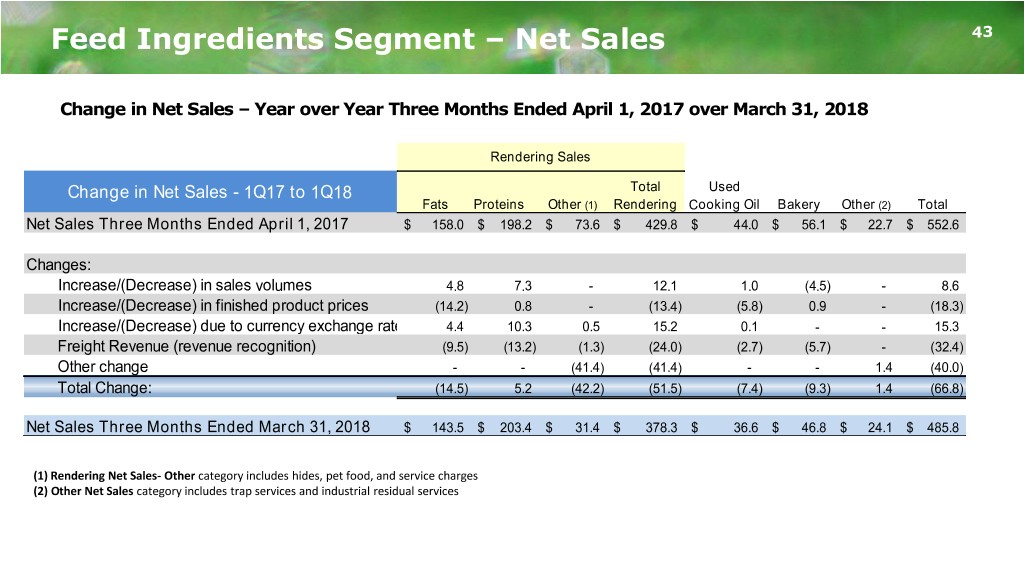
Feed Ingredients Segment – Net Sales 43 Change in Net Sales – Year over Year Three Months Ended April 1, 2017 over March 31, 2018 Rendering Sales Change in Net Sales - 1Q17 to 1Q18 Total Used Fats Proteins Other (1) Rendering Cooking Oil Bakery Other (2) Total Net Sales Three Months Ended April 1, 2017 $ 158.0 $ 198.2 $ 73.6 $ 429.8 $ 44.0 $ 56.1 $ 22.7 $ 552.6 Changes: Increase/(Decrease) in sales volumes 4.8 7.3 - 12.1 1.0 (4.5) - 8.6 Increase/(Decrease) in finished product prices (14.2) 0.8 - (13.4) (5.8) 0.9 - (18.3) Increase/(Decrease) due to currency exchange rates 4.4 10.3 0.5 15.2 0.1 - - 15.3 Freight Revenue (revenue recognition) (9.5) (13.2) (1.3) (24.0) (2.7) (5.7) - (32.4) Other change - - (41.4) (41.4) - - 1.4 (40.0) Total Change: (14.5) 5.2 (42.2) (51.5) (7.4) (9.3) 1.4 (66.8) Net Sales Three Months Ended March 31, 2018 $ 143.5 $ 203.4 $ 31.4 $ 378.3 $ 36.6 $ 46.8 $ 24.1 $ 485.8 (1) Rendering Net Sales- Other category includes hides, pet food, and service charges (2) Other Net Sales category includes trap services and industrial residual services
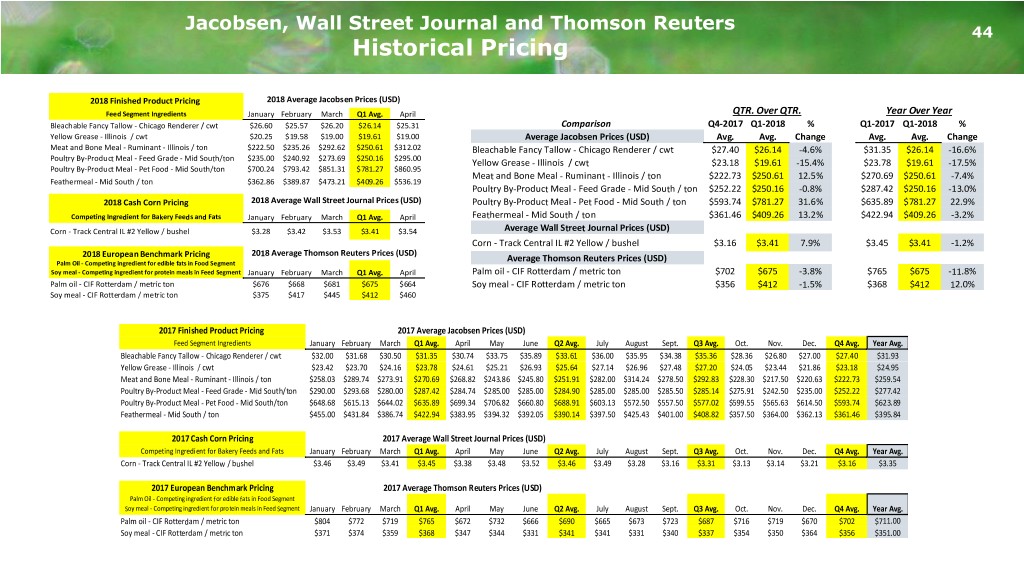
Jacobsen, Wall Street Journal and Thomson Reuters 44 Historical Pricing 2018 Finished Product Pricing 2018 Average Jacobsen Prices (USD) Feed Segment Ingredients January February March Q1 Avg. April QTR. Over QTR. Year Over Year Bleachable Fancy Tallow - Chicago Renderer / cwt $26.60 $25.57 $26.20 $26.14 $25.31 Comparison Q4-2017 Q1-2018 % Q1-2017 Q1-2018 % Yellow Grease - Illinois / cwt $20.25 $19.58 $19.00 $19.61 $19.00 Average Jacobsen Prices (USD) Avg. Avg. Change Avg. Avg. Change Meat and Bone Meal - Ruminant - Illinois / ton $222.50 $235.26 $292.62 $250.61 $312.02 Bleachable Fancy Tallow - Chicago Renderer / cwt $27.40 $26.14 -4.6% $31.35 $26.14 -16.6% Poultry By-Product Meal - Feed Grade - Mid South/ton $235.00 $240.92 $273.69 $250.16 $295.00 Yellow Grease - Illinois / cwt $23.18 $19.61 -15.4% $23.78 $19.61 -17.5% Poultry By-Product Meal - Pet Food - Mid South/ton $700.24 $793.42 $851.31 $781.27 $860.95 Meat and Bone Meal - Ruminant - Illinois / ton $222.73 $250.61 12.5% $270.69 $250.61 -7.4% Feathermeal - Mid South / ton $362.86 $389.87 $473.21 $409.26 $536.19 Poultry By-Product Meal - Feed Grade - Mid South / ton $252.22 $250.16 -0.8% $287.42 $250.16 -13.0% 2018 Cash Corn Pricing 2018 Average Wall Street Journal Prices (USD) Poultry By-Product Meal - Pet Food - Mid South / ton $593.74 $781.27 31.6% $635.89 $781.27 22.9% Competing Ingredient for Bakery Feeds and Fats January February March Q1 Avg. April Feathermeal - Mid South / ton $361.46 $409.26 13.2% $422.94 $409.26 -3.2% Corn - Track Central IL #2 Yellow / bushel $3.28 $3.42 $3.53 $3.41 $3.54 Average Wall Street Journal Prices (USD) Corn - Track Central IL #2 Yellow / bushel $3.16 $3.41 7.9% $3.45 $3.41 -1.2% 2018 European Benchmark Pricing 2018 Average Thomson Reuters Prices (USD) Palm Oil - Competing ingredient for edible fats in Food Segment Average Thomson Reuters Prices (USD) Soy meal - Competing ingredient for protein meals in Feed Segment January February March Q1 Avg. April Palm oil - CIF Rotterdam / metric ton $702 $675 -3.8% $765 $675 -11.8% Palm oil - CIF Rotterdam / metric ton $676 $668 $681 $675 $664 Soy meal - CIF Rotterdam / metric ton $356 $412 -1.5% $368 $412 12.0% Soy meal - CIF Rotterdam / metric ton $375 $417 $445 $412 $460 2017 Finished Product Pricing 2017 Average Jacobsen Prices (USD) Feed Segment Ingredients January February March Q1 Avg. April May June Q2 Avg. July August Sept. Q3 Avg. Oct. Nov. Dec. Q4 Avg. Year Avg. Bleachable Fancy Tallow - Chicago Renderer / cwt $32.00 $31.68 $30.50 $31.35 $30.74 $33.75 $35.89 $33.61 $36.00 $35.95 $34.38 $35.36 $28.36 $26.80 $27.00 $27.40 $31.93 Yellow Grease - Illinois / cwt $23.42 $23.70 $24.16 $23.78 $24.61 $25.21 $26.93 $25.64 $27.14 $26.96 $27.48 $27.20 $24.05 $23.44 $21.86 $23.18 $24.95 Meat and Bone Meal - Ruminant - Illinois / ton $258.03 $289.74 $273.91 $270.69 $268.82 $243.86 $245.80 $251.91 $282.00 $314.24 $278.50 $292.83 $228.30 $217.50 $220.63 $222.73 $259.54 Poultry By-Product Meal - Feed Grade - Mid South/ton $290.00 $293.68 $280.00 $287.42 $284.74 $285.00 $285.00 $284.90 $285.00 $285.00 $285.50 $285.14 $275.91 $242.50 $235.00 $252.22 $277.42 Poultry By-Product Meal - Pet Food - Mid South/ton $648.68 $615.13 $644.02 $635.89 $699.34 $706.82 $660.80 $688.91 $603.13 $572.50 $557.50 $577.02 $599.55 $565.63 $614.50 $593.74 $623.89 Feathermeal - Mid South / ton $455.00 $431.84 $386.74 $422.94 $383.95 $394.32 $392.05 $390.14 $397.50 $425.43 $401.00 $408.82 $357.50 $364.00 $362.13 $361.46 $395.84 2017 Cash Corn Pricing 2017 Average Wall Street Journal Prices (USD) Competing Ingredient for Bakery Feeds and Fats January February March Q1 Avg. April May June Q2 Avg. July August Sept. Q3 Avg. Oct. Nov. Dec. Q4 Avg. Year Avg. Corn - Track Central IL #2 Yellow / bushel $3.46 $3.49 $3.41 $3.45 $3.38 $3.48 $3.52 $3.46 $3.49 $3.28 $3.16 $3.31 $3.13 $3.14 $3.21 $3.16 $3.35 2017 European Benchmark Pricing 2017 Average Thomson Reuters Prices (USD) Palm Oil - Competing ingredient for edible fats in Food Segment Soy meal - Competing ingredient for protein meals in Feed Segment January February March Q1 Avg. April May June Q2 Avg. July August Sept. Q3 Avg. Oct. Nov. Dec. Q4 Avg. Year Avg. Palm oil - CIF Rotterdam / metric ton $804 $772 $719 $765 $672 $732 $666 $690 $665 $673 $723 $687 $716 $719 $670 $702 $711.00 Soy meal - CIF Rotterdam / metric ton $371 $374 $359 $368 $347 $344 $331 $341 $341 $331 $340 $337 $354 $350 $364 $356 $351.00
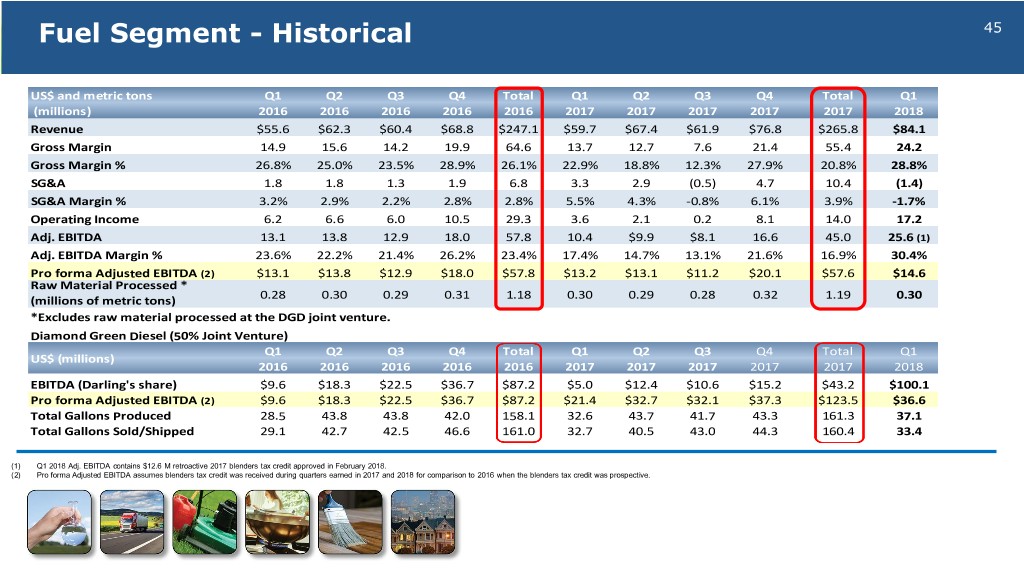
Fuel Segment - Historical 45 US$ and metric tons Q1 Q2 Q3 Q4 Total Q1 Q2 Q3 Q4 Total Q1 (millions) 2016 2016 2016 2016 2016 2017 2017 2017 2017 2017 2018 Revenue $55.6 $62.3 $60.4 $68.8 $247.1 $59.7 $67.4 $61.9 $76.8 $265.8 $84.1 Gross Margin 14.9 15.6 14.2 19.9 64.6 13.7 12.7 7.6 21.4 55.4 24.2 Gross Margin % 26.8% 25.0% 23.5% 28.9% 26.1% 22.9% 18.8% 12.3% 27.9% 20.8% 28.8% SG&A 1.8 1.8 1.3 1.9 6.8 3.3 2.9 (0.5) 4.7 10.4 (1.4) SG&A Margin % 3.2% 2.9% 2.2% 2.8% 2.8% 5.5% 4.3% -0.8% 6.1% 3.9% -1.7% Operating Income 6.2 6.6 6.0 10.5 29.3 3.6 2.1 0.2 8.1 14.0 17.2 Adj. EBITDA 13.1 13.8 12.9 18.0 57.8 10.4 $9.9 $8.1 16.6 45.0 25.6 (1) Adj. EBITDA Margin % 23.6% 22.2% 21.4% 26.2% 23.4% 17.4% 14.7% 13.1% 21.6% 16.9% 30.4% Pro forma Adjusted EBITDA (2) $13.1 $13.8 $12.9 $18.0 $57.8 $13.2 $13.1 $11.2 $20.1 $57.6 $14.6 Raw Material Processed * 0.28 0.30 0.29 0.31 1.18 0.30 0.29 0.28 0.32 1.19 0.30 (millions of metric tons) *Excludes raw material processed at the DGD joint venture. Diamond Green Diesel (50% Joint Venture) Q1 Q2 Q3 Q4 Total Q1 Q2 Q3 Q4 Total Q1 US$ (millions) 2016 2016 2016 2016 2016 2017 2017 2017 2017 2017 2018 EBITDA (Darling's share) $9.6 $18.3 $22.5 $36.7 $87.2 $5.0 $12.4 $10.6 $15.2 $43.2 $100.1 Pro forma Adjusted EBITDA (2) $9.6 $18.3 $22.5 $36.7 $87.2 $21.4 $32.7 $32.1 $37.3 $123.5 $36.6 Total Gallons Produced 28.5 43.8 43.8 42.0 158.1 32.6 43.7 41.7 43.3 161.3 37.1 Total Gallons Sold/Shipped 29.1 42.7 42.5 46.6 161.0 32.7 40.5 43.0 44.3 160.4 33.4 (1) Q1 2018 Adj. EBITDA contains $12.6 M retroactive 2017 blenders tax credit approved in February 2018. (2) Pro forma Adjusted EBITDA assumes blenders tax credit was received during quarters earned in 2017 and 2018 for comparison to 2016 when the blenders tax credit was prospective.
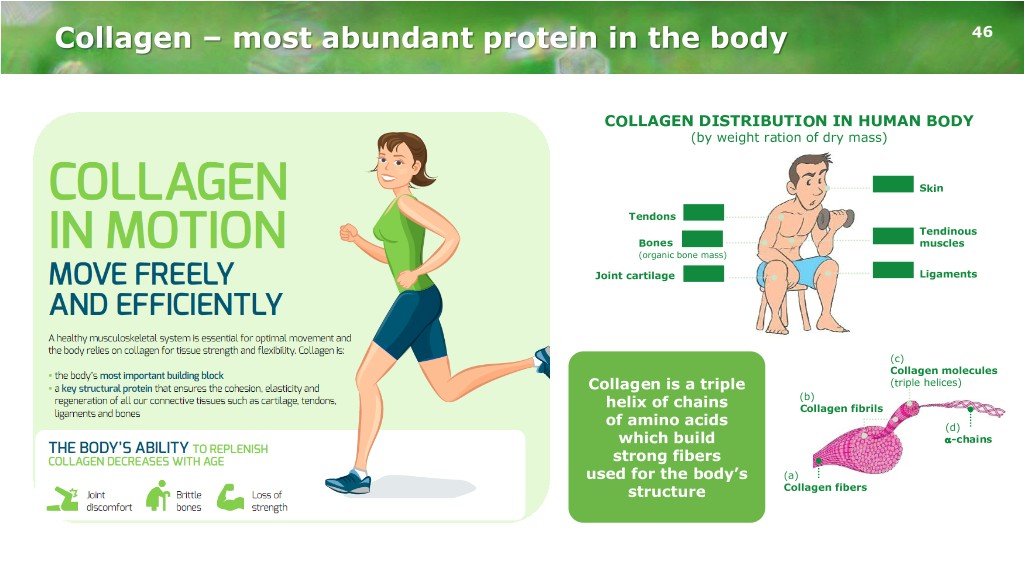
Collagen – most abundant protein in the body 46 COLLAGEN DISTRIBUTION IN HUMAN BODY (by weight ration of dry mass) 75% Skin Tendons 85% Tendinous 6% Bones 90% muscles (organic bone mass) 70% Joint cartilage 70% Ligaments (c) Collagen molecules Collagen is a triple (triple helices) (b) helix of chains Collagen fibrils of amino acids (d) which build -chains strong fibers used for the body’s (a) structure Collagen fibers
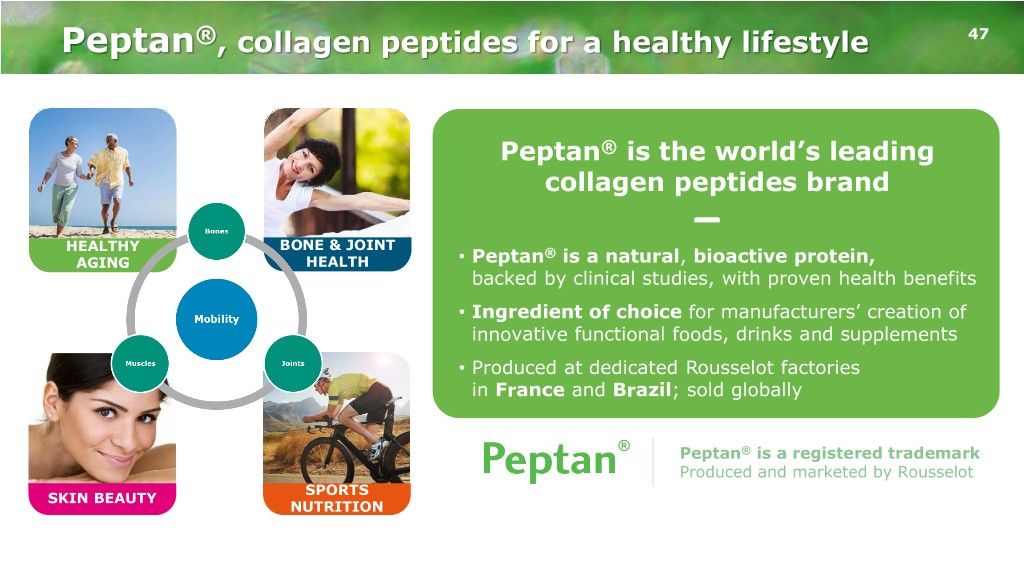
Peptan®, collagen peptides for a healthy lifestyle 47 Peptan® is the world’s leading collagen peptides brand BONE & JOINT HEALTHY ® AGING HEALTH • Peptan is a natural, bioactive protein, backed by clinical studies, with proven health benefits • Ingredient of choice for manufacturers’ creation of innovative functional foods, drinks and supplements • Produced at dedicated Rousselot factories in France and Brazil; sold globally Peptan® is a registered trademark Produced and marketed by Rousselot SPORTS SKIN BEAUTY NUTRITION
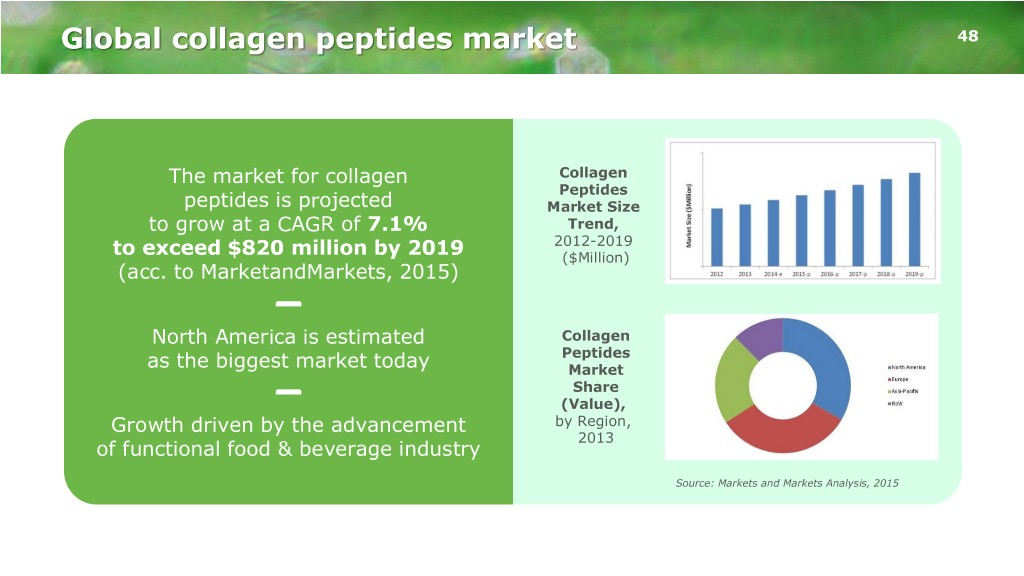
Global collagen peptides market 48 The market for collagen Collagen Peptides peptides is projected Market Size to grow at a CAGR of 7.1% Trend, 2012-2019 to exceed $820 million by 2019 ($Million) (acc. to MarketandMarkets, 2015) North America is estimated Collagen Peptides as the biggest market today Market Share (Value), Growth driven by the advancement by Region, 2013 of functional food & beverage industry Source: Markets and Markets Analysis, 2015
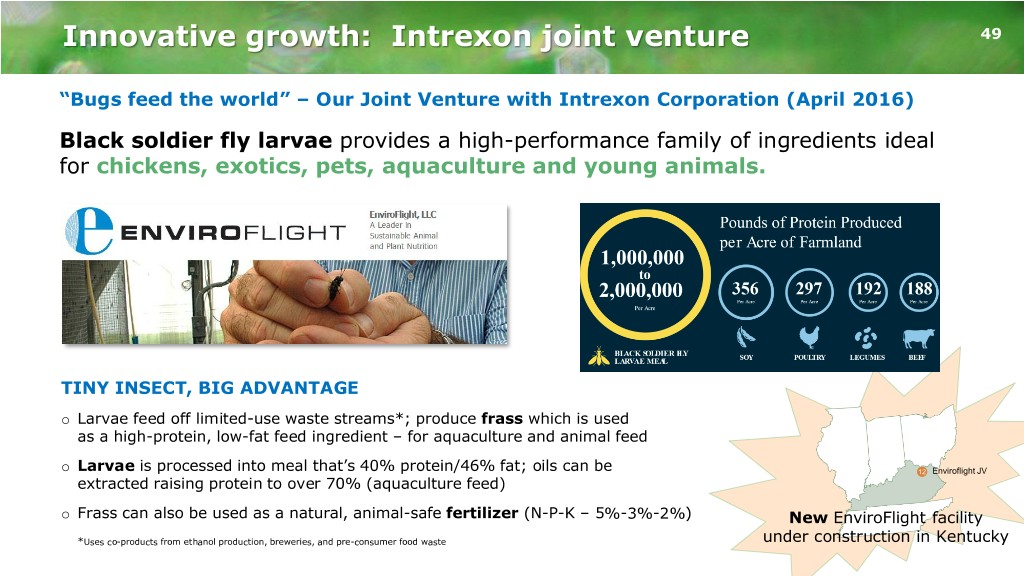
Innovative growth: Intrexon joint venture 49 “Bugs feed the world” – Our Joint Venture with Intrexon Corporation (April 2016) Black soldier fly larvae provides a high-performance family of ingredients ideal for chickens, exotics, pets, aquaculture and young animals. TINY INSECT, BIG ADVANTAGE o Larvae feed off limited-use waste streams*; produce frass which is used as a high-protein, low-fat feed ingredient – for aquaculture and animal feed o Larvae is processed into meal that’s 40% protein/46% fat; oils can be 12 Enviroflight JV extracted raising protein to over 70% (aquaculture feed) o Frass can also be used as a natural, animal-safe fertilizer (N-P-K – 5%-3%-2%) New EnviroFlight facility *Uses co-products from ethanol production, breweries, and pre-consumer food waste under construction in Kentucky
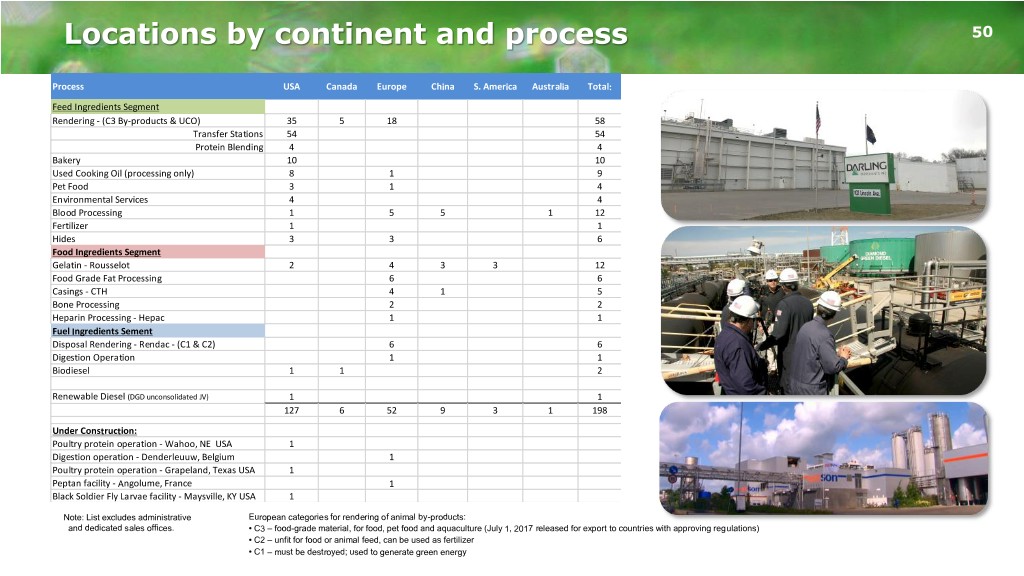
Locations by continent and process 50 Process USA Canada Europe China S. America Australia Total: Feed Ingredients Segment Rendering - (C3 By-products & UCO) 35 5 18 58 Transfer Stations 54 54 Protein Blending 4 4 Bakery 10 10 Used Cooking Oil (processing only) 8 1 9 Pet Food 3 1 4 Environmental Services 4 4 Blood Processing 1 5 5 1 12 Fertilizer 1 1 Hides 3 3 6 Food Ingredients Segment Gelatin - Rousselot 2 4 3 3 12 Food Grade Fat Processing 6 6 Casings - CTH 4 1 5 Bone Processing 2 2 Heparin Processing - Hepac 1 1 Fuel Ingredients Sement Disposal Rendering - Rendac - (C1 & C2) 6 6 Digestion Operation 1 1 Biodiesel 1 1 2 Renewable Diesel (DGD unconsolidated JV) 1 1 127 6 52 9 3 1 198 Under Construction: Poultry protein operation - Wahoo, NE USA 1 Digestion operation - Denderleuuw, Belgium 1 Poultry protein operation - Grapeland, Texas USA 1 Peptan facility - Angolume, France 1 Black Soldier Fly Larvae facility - Maysville, KY USA 1 Note: List excludes administrative European categories for rendering of animal by-products: and dedicated sales offices. • C3 – food-grade material, for food, pet food and aquaculture (July 1, 2017 released for export to countries with approving regulations) • C2 – unfit for food or animal feed, can be used as fertilizer • C1 – must be destroyed; used to generate green energy
Non-U.S. GAAP Measures 51 Adjusted EBITDA is presented here not as an alternative to net income, but rather as a measure of the Company’s operating performance and is not intended to be a presentation in accordance with GAAP. Since EBITDA (generally, net income plus interest expenses, taxes, depreciation and amortization) is not calculated identically by all companies, this presentation may not be comparable to EBITDA or adjusted EBITDA presentations disclosed by other companies. Adjusted EBITDA is calculated in this presentation and represents, for any relevant period, net income/(loss) plus depreciation and amortization, goodwill and long-lived asset impairment, interest expense, (income)/loss from discontinued operations, net of tax, income tax provision, other income/(expense) and equity in net loss of unconsolidated subsidiary. Management believes that Adjusted EBITDA is useful in evaluating the Company’s operating performance compared to that of other companies in its industry because the calculation of Adjusted EBITDA generally eliminates the effects of financing income taxes and certain non-cash and other items that may vary for different companies for reasons unrelated to overall operating performance. As a result, the Company’s management uses Adjusted EBITDA as a measure to evaluate performance and for other discretionary purposes. However, Adjusted EBITDA is not a recognized measurement under GAAP, should not be considered as an alternative to net income as a measure of operating results or to cash flow as a measure of liquidity, and is not intended to be a presentation in accordance with GAAP. In addition to the foregoing, management also uses or will use Adjusted EBITDA to measure compliance with certain financial covenants under the Company’s Senior Secured Credit Facilities and 5.375% Notes and 4.75% Notes that were outstanding at March 31, 2018. However, the amounts shown in this presentation for Adjusted EBITDA differ from the amounts calculated under similarly titled definitions in the Company’s Senior Secured Credit Facilities and 5.375% Notes and 4.75% Notes, as those definitions permit further adjustments to reflect certain other non-recurring costs and non-cash charges and cash dividends from the DGD Joint Venture. Additionally, the Company evaluates the impact of foreign exchange on operating cash flow, which is defined as segment operating income (loss) plus depreciation and amortization.


