UNITED STATES SECURITIES AND EXCHANGE COMMISSION
Washington, D.C. 20549
FORM N-CSR
CERTIFIED SHAREHOLDER REPORT OF REGISTERED MANAGEMENT
INVESTMENT COMPANIES
Investment Company Act file number: 811-08246
Exact name of registrant as specified in charter:
Delaware Investments® Global Dividend and Income Fund, Inc.
Address of principal executive offices:
2005 Market Street
Philadelphia, PA 19103
Name and address of agent for service:
David F. Connor, Esq.
2005 Market Street
Philadelphia, PA 19103
Registrant’s telephone number, including area code: (800) 523-1918
Date of fiscal year end: November 30
Date of reporting period: November 30, 2008
Item 1. Reports to Stockholders
| Annual Report | Delaware |
November 30, 2008 | |
The figures in the annual report for Delaware Investments Global | |
 | Closed-end fund |
Table of contents
| > Portfolio management review | 1 |
| > Performance summary | 4 |
| > Sector and country allocations | 6 |
| > Statement of net assets | 8 |
| > Statement of operations | 19 |
| > Statements of changes in net assets | 20 |
| > Statement of cash flows | 21 |
| > Financial highlights | 22 |
| > Notes to financial statements | 23 |
| > Report of independent registered public accounting firm | 29 |
| > Other Fund information | 30 |
| > Board of trustees/directors and officers addendum | 36 |
| > About the organization | 39 |
Funds are not FDIC insured and are not guaranteed. It is possible to lose the principal amount invested.
Mutual fund advisory services provided by Delaware Management Company, a series of Delaware Management
Business Trust, which is a registered investment advisor.
© 2009 Delaware Distributors, L.P.
All third-party trademarks cited are the property of their respective owners.
Portfolio management review
Delaware Investments® Global Dividend and Income Fund, Inc.
Dec. 9, 2008
The managers of Delaware Investments Global Dividend and Income Fund, Inc. provided answers to the questions below as a review of the Fund’s activities for the fiscal year that ended Nov. 30, 2008.
How did the Fund perform during the 12 months ended Nov. 30, 2008?
Delaware Investments Global Dividend and Income Fund, Inc. returned -47.68% at net asset value and -54.54% at market price (both figures reflect all distributions reinvested) for the fiscal year ended Nov. 30, 2008. By comparison, the Fund’s all-equity benchmark, the S&P 500 Index, declined by 38.09%. Complete annualized performance for Delaware Investments Global Dividend and Income Fund, Inc. is shown in the table on page 4.
How would you describe the investment environment during the year ended Nov. 30, 2008?
The annual period presented an especially challenging investment environment, as fixed income and equity investors contended with the dual threats posed by declining economic conditions coupled with a credit crisis that grew in intensity as the period progressed.
Early during the fiscal year, declining economic conditions dominated most investors’ attention. Unemployment figures rose, reflecting a deteriorating job market, and inflationary pressures mounted primarily because of higher oil and food prices. Oil prices peaked at more than $140 a barrel before finally declining during the summer months. In our opinion, most investors then focused their attention on the drop in home prices, which had begun to overshadow most other economic indicators.
Lower home prices caused a general loss of confidence that, in our view, effectively crippled the global credit markets, making credit extremely difficult to obtain for individuals or corporations. One result was pressure on financial institutions that set off a series of events beginning with the March 2008 bailout of Bear Stearns by J.P. Morgan (with assistance from the Federal Reserve).
Similar strains led Lehman Brothers to file for bankruptcy. Merrill Lynch was sold to Bank of America, while Fannie Mae and Freddie Mac were converted from independent entities to a conservatorship run by the Federal Housing Finance Agency. Each of these events had roots in the credit markets, and contributed to significant weakness across the vast majority of equity markets around the world, in our opinion.
The Federal Reserve took an array of steps to stem the financial crisis during the period, lowering the fed funds rate on a total of seven separate occasions, and establishing a plan for biweekly emergency auctions of loans to banks. Along with central banks around the world, the Fed also provided certain markets with significantly increased liquidity early in the fiscal year. In a dramatic departure from its normal operations, the Fed (in coordination with the Treasury Department) facilitated a number of mergers and acquisitions, and took the unprecedented step of injecting capital directly into certain banks and other financial institutions, as liquidity deteriorated.
What factors influenced the Fund’s fiscal year performance?
The Fund’s objective is to seek current income, with a secondary objective of capital appreciation. In managing the Fund, we pursue these objectives by investing broadly, in a diverse range of income-generating securities from around the globe. Many of the asset types held in the Fund have traditionally not moved in lock step with each other. This approach generally provides the Fund with a measure of diversification. (Diversification does not assure a profit or protect against loss in a declining market.) That is, many asset classes that tend to rise or fall independently, faced declines together during the period.
The views expressed are current as of the date of this report and are subject to change.
Data for this portfolio management review were provided by Bloomberg unless otherwise noted.
(continues) 1
Portfolio management review
Delaware Investments® Global Dividend and Income Fund, Inc.
Although certain sectors of the fixed income markets experienced declines during the year, the Fund’s exposure to fixed income securities generally anchored its performance. For example, exposure to Treasurys and agency securities, one area that performed well, buoyed the Fund amid the massive flight toward higher-quality investments. Even high yield bonds, traditionally a more volatile asset class among fixed-income securities, fared better than equity assets on a total return basis. High yield bonds declined on the year, but did help the Fund’s total return performance when comparing it to equity market indices.
Unfortunately, the Fund’s position in convertible bonds, international value equities, and domestic and global real estate investment trusts (REITs) performed worse than the all-domestic-equity S&P 500 Index. Domestic REITs and international value equities declined by nearly 50% during the year. REITs held up quite nicely throughout much of the period, but fell precipitously during the last several months, mostly because of the ongoing credit crisis and the unwinding of leverage by REITs (that is, the reduction of debt by investors rapidly selling assets).
Broadly speaking, international stocks were overcome by many of the same issues that affected the U.S. equity markets. For U.S.-based investors, a late rally in the U.S. dollar had a detrimental effect on international equity markets, when non-U.S.-derived returns were converted into U.S. dollars.
The Fund’s worst-performing sector during the year was global REITs. Like the U.S. REIT market, global real estate markets faced a massive period of deleveraging, which took its toll on both real estate values and business models, and severely impacted the global REIT sector.
What was your strategy during the fiscal year?
Overall, we maintained a defensive positioning in the Fund, reflecting our cautious outlook for the global economy. For example, within large-cap value equities, the largest portion of the Fund, we emphasized sectors such as healthcare and consumer staples. Both of these sectors tend to generate relatively predictable earnings, and therefore have traditionally held up well in challenging economic conditions. For similar reasons, we sought individual stocks with what we believed to be resilient balance sheets and stable cash flows.
Within the international value equity space, our allocation to the poor-performing financials sector was reduced over the course of the year via declining security prices. This sector, which dominates the value-oriented portion of the MSCI EAFE Index, was the worst-performing sector during the period. (The EAFE Index measures equity market performance across developed market countries in Europe, Australasia, and the Far East.) The materials sector was also hit hard during the period, and we believed that, despite attractive fundamentals, many materials-sector stocks did not justify their expensive valuations. We therefore maintained an underweight position.
Our general strategy across all fixed income sectors from the start of the fiscal period involved increasing Fund positions in high quality, defensive securities in an effort to avoid the most treacherous market conditions. We increased the Fund’s position in government securities, including Treasurys and agency mortgage-backed securities (MBS). We also gradually increased the Fund’s position in high-grade corporate bonds during the year. We raised our positions in such holdings by paring back the Fund’s exposure to lower-quality bond holdings.
Although our overall strategy involved moving toward a more conservative posture, we also cautiously added lower-quality credit exposure after the market reached a level at which we felt certain long-term value opportunities existed.
Within the high yield market, we implemented a number of strategies to help mitigate the risky environment. For example, we increased the Fund’s positions in asset-rich industries such as utilities, energy, and telecommunications. We began to favor corporations with more tangible assets, positive free cash flow, and adequate liquidity. We also favored senior bonds — those with income streams that take priority over other securities that the company issues — and reduced the Fund’s exposure to lower-rated bonds (such as those rated CCC by a nationally recognized statistical rating
2
organization). We increased the Fund’s weighting in secured bank debt and, given our view of extremely difficult market conditions, actively sold certain positions in an attempt to protect the Fund’s yield.
Within the REIT sector (both global and domestic), we maintained a greater emphasis on companies with long-term contractual leases, as well as those that derived more of their income from leasing activity, an approach we believe inherently provides real estate companies the potential to generate more stable income than does the development of new real estate projects. Our defensive strategy included limiting the Fund’s overall exposure to REITs. We also avoided companies with too much development in their pipelines and those with significant near-term debt maturities.
Lastly, we added to our convertible bond positions early in the fiscal year. Convertible bonds can be converted into a predetermined amount of a company’s equity; we consider these securities to generally be less volatile than stocks, but we also believe they can provide gains similar to equities in the event of a market rebound. However, we did not anticipate that hedge funds, which came under pressure from lenders for more collateral and from investors seeking to withdraw funds, would begin selling convertible bonds in earnest during October. With hedge funds accounting for a large part of demand, and relatively few other buyers focused on the market, price swings were particularly volatile, in our opinion.
3
Performance summary
Delaware Investments® Global Dividend and Income Fund, Inc.
The performance data quoted represent past performance; past performance does not guarantee future results. Investment return and principal value will fluctuate so your shares, when sold, may be worth more or less than their original cost. Current performance may be lower or higher than the performance data quoted. Funds that invest in bonds can lose their value as interest rates rise, and an investor can lose principal. Please obtain the performance data for the most recent month end by calling 800 523-1918.
A rise or fall in interest rates can have a significant impact on bond prices and the net asset value (NAV) of the Fund.
| Fund performance | ||||||||
| Average annual total returns | ||||||||
| Through Nov. 30, 2008 | 1 year | 5 years | 10 years | Lifetime | ||||
| At market price | -54.54% | -7.43% | -0.99% | 2.81% | ||||
| At net asset value | -47.68% | -3.08% | 1.49% | 4.96% |
Diversification does not assure a profit or protect against loss in a declining market.
High yielding noninvestment grade bonds (junk bonds) involve higher risk than investment grade bonds. Adverse conditions may affect the issuer’s ability to pay interest and principal on these securities.
Funds that invest in REITs are subject to many of the risks associated with direct real estate ownership and, as such, may be adversely affected by declines in real-estate values and general and local economic conditions.
Foreign investments are subject to risks not ordinarily associated with domestic investments, such as currency, economic and political risks, and different accounting standards.
The “Fund performance” table and the “Performance of a $10,000 investment” graph do not reflect the deduction of taxes the shareholder would pay on Fund distributions or redemptions of Fund shares.
Returns reflect the reinvestment of all distributions. Dividends and distributions, if any, are assumed, for the purpose of this calculation to be reinvested at prices obtained under the Fund’s dividend reinvestment policy. Shares of the Fund were initially offered with a sales charge of 6%. Performance since inception does not include the sales charge or any other brokerage commission for purchases made since inception. Past performance is not a guarantee of future results.
Fund basics
As of Nov. 30, 2008
| Fund objectives |
The Fund seeks to achieve high current income. Capital appreciation is a secondary objective. |
| Total Fund net assets |
$28 million |
| Number of holdings |
418 |
| Fund start date |
March 4, 1994 |
| NYSE symbol |
DGF |
4
Market price versus net asset value (see notes below)
Nov. 30, 2007, through Nov. 30, 2008

| Starting value (Nov. 30, 2007) | Ending value (Nov. 30, 2008) | |||||
| Delaware Investments® Global Dividend and Income Fund, Inc. @ NAV | $11.59 | $5.36 | ||||
| Delaware Investments Global Dividend and Income Fund, Inc. @ Market price | $10.55 | $4.24 | ||||
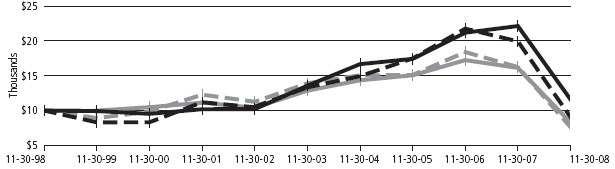
Performance of a $10,000 investment
Nov. 30, 1998, through Nov. 30, 2008
| Starting value | Ending value | ||||
| (Nov. 30, 1998) | (Nov. 30, 2008) | ||||
| Delaware Investments Global Dividend and Income Fund, Inc. @ NAV | $10,000 | $11,599 | |||
| Delaware Investments Global Dividend and Income Fund, Inc. @ Market Price | $10,000 | $9,057 | |||
| Lipper Closed-End Income and Preferred Stock Funds Average @ NAV | $10,000 | $8,277 | |||
| Lipper Closed-End Income and Preferred Stock Funds Average @ Market price | $10,000 | $7,638 |
The chart assumes $10,000 invested in the Fund on Nov. 30, 1998 and includes the reinvestment of all distributions at market value.
The chart assumes $10,000 invested in the Lipper Closed-end Income and Preferred Stock Funds Average at market price and at NAV. Performance of the Fund and the Lipper class at market value is based on market performance during the period. Performance of the Fund and Lipper class at NAV is based on the fluctuations in NAV during the period. Delaware Investments Global Dividend and Income Fund, Inc. was initially offered with a sales charge of 6%. Performance shown in both charts above does not include fees, the initial sales charge, or any brokerage commissions for purchases. Investments in the Fund are not available at NAV.
The Lipper Closed-End Income and Preferred Stock Funds Average represents the average return of closed-end income and preferred funds tracked by Lipper.
Market price is the price an investor would pay for shares of the Fund on the secondary market. NAV is the total value of one fund share, generally equal to a fund’s net assets divided by the number of shares outstanding.
Past performance is not a guarantee of future results.
5
Sector and country allocations
Delaware Investments® Global Dividend and Income Fund, Inc.
As of November 30, 2008
Sector designations may be different than the sector designations presented in other Fund materials. The sector designations may represent the investment manager’s internal sector classifications, which may result in the sector designations for one Fund being different than another Fund’s sector designations.
| Percentage | ||
| Sector | of Net Assets | |
| Common Stock | 67.19 | % |
| Consumer Discretionary | 7.52 | % |
| Consumer Staples | 8.38 | % |
| Diversified REITs | 0.67 | % |
| Energy | 6.05 | % |
| Financials | 5.96 | % |
| Health Care | 10.55 | % |
| Health Care REITs | 0.56 | % |
| Hotel REITs | 0.23 | % |
| Industrial REIT | 0.11 | % |
| Industrials | 6.53 | % |
| Information Technology | 7.66 | % |
| Mall REITs | 0.63 | % |
| Materials | 1.88 | % |
| Multifamily REITs | 0.70 | % |
| Office REITs | 0.80 | % |
| Self-Storage REIT | 0.19 | % |
| Shopping Center REITs | 0.40 | % |
| Specialty REITs | 0.63 | % |
| Telecommunications | 5.60 | % |
| Utilities | 2.14 | % |
| Convertible Preferred Stock | 2.56 | % |
| Banking, Finance & Insurance | 0.73 | % |
| Basic Materials | 0.09 | % |
| Cable, Media & Publishing | 0.20 | % |
| Energy | 0.47 | % |
| Health Care & Pharmaceuticals | 0.49 | % |
| Telecommunications | 0.13 | % |
| Utilities | 0.45 | % |
| Preferred Stock | 1.45 | % |
| Banking, Finance & Insurance | 0.04 | % |
| Industrial | 0.02 | % |
| Leisure, Lodging & Entertainment | 0.43 | % |
| Real Estate | 0.96 | % |
| Agency Mortgage-Backed Securities | 0.98 | % |
| Convertible Bonds | 8.80 | % |
| Aerospace & Defense | 0.61 | % |
| Banking, Finance & Insurance | 0.47 | % |
| Basic Materials | 0.54 | % |
| Cable, Media & Publishing | 0.34 | % |
| Computers & Technology | 1.67 | % |
| Energy | 0.28 | % |
| Environmental Services | 0.23 | % |
| Health Care & Pharmaceuticals | 2.63 | % |
| Real Estate | 0.31 | % |
| Retail | 0.25 | % |
| Telecommunications | 0.94 | % |
| Transportation | 0.13 | % |
| Utilities | 0.40 | % |
| Corporate Bonds | 24.40 | % |
| Banking | 1.09 | % |
| Basic Industry | 2.57 | % |
| Brokerage | 0.51 | % |
| Capital Goods | 1.96 | % |
| Consumer Cyclical | 1.87 | % |
| Consumer Non-Cyclical | 1.21 | % |
| Energy | 3.25 | % |
| Finance & Investments | 2.13 | % |
| Media | 1.06 | % |
| Real Estate | 0.14 | % |
| Services Cyclical | 2.20 | % |
| Services Non-Cyclical | 1.48 | % |
| Technology & Electronics | 1.22 | % |
| Telecommunications | 2.58 | % |
| Utilities | 1.13 | % |
| Foreign Agencies | 3.34 | % |
| Regional Agency | 0.93 | % |
| Senior Secured Loans | 0.42 | % |
| Sovereign Agencies | 1.01 | % |
| Sovereign Debt | 15.46 | % |
| Supranational Banks | 4.54 | % |
| Exchange Traded Fund | 0.05 | % |
| Limited Partnership | 0.14 | % |
| Right | 0.07 | % |
| Warrants | 0.00 | % |
6
| Percentage | ||
| Sector | of Net Assets | |
| Repurchase Agreement | 4.74 | % |
| Securities Lending Collateral | 10.69 | % |
| Total Value of Securities | 146.77 | % |
| Obligation to Return Securities Lending Collateral | (11.24 | %) |
| Borrowing Under Line of Credit | (38.57 | %) |
| Receivables and Other Assets Net of Liabilities | 3.04 | % |
| Total Net Assets | 100.00 | % |
| Percentage | ||
| Country | of Net Assets | |
| Australia | 2.74 | % |
| Austria | 1.83 | % |
| Bermuda | 0.89 | % |
| Canada | 3.30 | % |
| Cayman Islands | 0.23 | % |
| Denmark | 0.76 | % |
| Finland | 0.76 | % |
| France | 8.59 | % |
| Germany | 7.74 | % |
| Hong Kong | 0.33 | % |
| Ireland | 0.52 | % |
| Italy | 0.69 | % |
| Japan | 9.04 | % |
| Luxembourg | 0.16 | % |
| Mexico | 0.39 | % |
| Netherlands | 0.93 | % |
| Norway | 1.23 | % |
| Republic of Korea | 1.06 | % |
| Singapore | 0.57 | % |
| Supranational | 4.54 | % |
| Sweden | 1.40 | % |
| Switzerland | 0.92 | % |
| Taiwan | 0.95 | % |
| United Kingdom | 10.81 | % |
| United States | 75.70 | % |
| Total | 136.08 | % |
7
Statement of net assets
Delaware Investments® Global Dividend and Income Fund, Inc.
November 30, 2008
| Number of | Value | |||
| Shares | (U.S. $) | ||||
| Common Stock – 67.19%v | |||||
| Consumer Discretionary – 7.52% | |||||
| ∏@=† | Avado Brands | 272 | $ | 0 | |
| Bayerische Motoren Werke | 5,242 | 131,022 | |||
| Don Quijote | 12,200 | 262,455 | |||
| Gap | 24,800 | 322,895 | |||
| Lagardere | 3,578 | 130,511 | |||
| Limited Brands | 29,300 | 272,783 | |||
| Mattel | 20,600 | 281,601 | |||
| * | NGK Spark Plug | 15,000 | 125,622 | ||
| * | PPR | 845 | 40,084 | ||
| Publicis Groupe | 4,917 | 114,031 | |||
| * | Round One | 179 | 84,417 | ||
| * | Techtronic Industries | 300,500 | 91,890 | ||
| *† | Time Warner Cable Class A | 2 | 41 | ||
| Toyota Motor | 3,721 | 116,859 | |||
| † | WPP Group | 20,902 | 116,098 | ||
| 2,090,309 | |||||
| Consumer Staples – 8.38% | |||||
| Archer-Daniels-Midland | 10,800 | 295,704 | |||
| Coca-Cola Amatil | 51,173 | 289,734 | |||
| CVS Caremark | 8,800 | 254,584 | |||
| * | Greggs | 2,362 | 116,638 | ||
| Heinz (H.J.) | 6,200 | 240,808 | |||
| Kimberly-Clark | 4,400 | 254,276 | |||
| Kraft Foods Class A | 9,500 | 258,495 | |||
| Metro | 4,641 | 142,053 | |||
| Parmalat | 118,730 | 191,507 | |||
| Safeway | 13,100 | 285,580 | |||
| 2,329,379 | |||||
| Diversified REITs – 0.67% | |||||
| Ascendas Real Estate | |||||
| Investment Trust | 27,200 | 26,602 | |||
| * | Digital Realty Trust | 1,200 | 32,832 | ||
| Liberty Property Trust | 2,800 | 53,536 | |||
| * | Vornado Realty Trust | 1,370 | 73,227 | ||
| 186,197 | |||||
| Energy – 6.05% | |||||
| BP | 50,489 | 409,958 | |||
| Chevron | 3,900 | 308,139 | |||
| ConocoPhillips | 5,800 | 304,616 | |||
| Marathon Oil | 11,400 | 298,452 | |||
| † | Petroleum Geo-Services | 13,150 | 58,733 | ||
| * | Total | 5,823 | 303,585 | ||
| 1,683,483 | |||||
| Financials – 5.96% | |||||
| Allstate | 13,100 | 333,265 | |||
| * | AXA | 8,309 | 157,765 | ||
| Bank of New York Mellon | 9,700 | 293,037 | |||
| ING Groep CVA | 11,135 | 93,337 | |||
| Mitsubishi UFJ Financial Group | 37,539 | 204,740 | |||
| Nordea Bank FDR | 22,155 | 157,854 | |||
| Standard Chartered | 9,225 | 120,032 | |||
| Travelers | 6,800 | 296,820 | |||
| Wachovia | 0 | 2 | |||
| 1,656,852 | |||||
| Health Care – 10.55% | |||||
| AstraZeneca | 6,370 | 239,770 | |||
| Bristol-Myers Squibb | 12,200 | 252,540 | |||
| Cardinal Health | 8,300 | 269,916 | |||
| Johnson & Johnson | 4,200 | 246,036 | |||
| Merck | 10,000 | 267,200 | |||
| Novartis | 5,514 | 256,676 | |||
| Novo-Nordisk Class B | 4,106 | 210,036 | |||
| Ono Pharmaceutical | 4,000 | 176,289 | |||
| Pfizer | 16,300 | 267,809 | |||
| Quest Diagnostics | 6,300 | 293,391 | |||
| Sanofi-Aventis | 3,388 | 186,962 | |||
| Wyeth | 7,400 | 266,474 | |||
| 2,933,099 | |||||
| Health Care REITs – 0.56% | |||||
| HCP | 2,000 | 41,340 | |||
| Health Care REIT | 2,175 | 82,650 | |||
| Ventas | 1,325 | 30,449 | |||
| 154,439 | |||||
| Hotel REITs – 0.23% | |||||
| Hersha Hospitality Trust | 5,450 | 19,184 | |||
| Host Hotels & Resorts | 5,950 | 44,744 | |||
| 63,928 | |||||
| Industrial REIT – 0.11% | |||||
| AMB Property | 1,785 | 30,738 | |||
| 30,738 | |||||
| Industrials – 6.53% | |||||
| * | Asahi Glass | 23,000 | 129,055 | ||
| † | BWAY Holding | 470 | 2,261 | ||
| Cie de Saint-Gobain | 3,783 | 151,009 | |||
| *† | Delta Air Lines | 23 | 198 | ||
| Deutsche Post | 19,126 | 272,909 | |||
| Donnelley (R.R.) & Sons | 19,500 | 248,819 | |||
| Grupo Aeroportuario del | |||||
| Centro Norte ADR | 1,200 | 9,984 | |||
| Koninklijke Philips Electronics | 10,244 | 166,013 | |||
| ∏@=† | Port Townsend | 100 | 1 | ||
| Singapore Airlines | 16,550 | 113,742 | |||
| Teleperformance | 7,945 | 189,500 | |||
| Tomkins | 108,720 | 183,424 | |||
| Vallourec | 1,054 | 111,716 | |||
| * | Waste Management | 8,100 | 236,520 | ||
| 1,815,151 | |||||
8
| Number of | Value | ||||
| Shares | (U.S. $) | ||||
| Common Stock (continued) | |||||
| Information Technology – 7.66% | |||||
| Canon | 6,500 | $ | 192,227 | ||
| † | CGI Group Class A | 37,874 | 299,437 | ||
| * | Ericsson LM Class B | 26,400 | 187,869 | ||
| Intel | 19,300 | 266,340 | |||
| International Business Machines | 3,300 | 269,280 | |||
| Motorola | 61,400 | 264,634 | |||
| Nokia | 15,009 | 211,400 | |||
| Samsung Electronics | 536 | 177,330 | |||
| Xerox | 37,500 | 262,125 | |||
| 2,130,642 | |||||
| Mall REITs – 0.63% | |||||
| * | Macerich | 2,140 | 28,804 | ||
| * | Simon Property Group | 3,100 | 147,250 | ||
| 176,054 | |||||
| Materials – 1.88% | |||||
| duPont (E.I.) deNemours | 10,500 | 263,130 | |||
| * | Lafarge | 1,943 | 106,617 | ||
| Linde | 2,123 | 153,825 | |||
| 523,572 | |||||
| Multifamily REITs – 0.70% | |||||
| American Campus | |||||
| Communities | 2,020 | 45,228 | |||
| * | Apartment Investment & | ||||
| Management | 2,192 | 25,142 | |||
| Camden Property Trust | 1,440 | 38,117 | |||
| Equity Residential | 2,800 | 85,204 | |||
| 193,691 | |||||
| Office REITs – 0.80% | |||||
| Alexandria Real Estate Equities | 700 | 30,996 | |||
| Highwoods Properties | 2,200 | 52,536 | |||
| * | Kilroy Realty | 800 | 24,376 | ||
| Mack-Cali Realty | 5,700 | 108,129 | |||
| SL Green Realty | 400 | 7,584 | |||
| 223,621 | |||||
| Self-Storage REIT – 0.19% | |||||
| Public Storage | 750 | 52,418 | |||
| 52,418 | |||||
| Shopping Center REITs – 0.40% | |||||
| Kimco Realty | 6,400 | 90,560 | |||
| Kite Realty Group Trust | 3,100 | 12,121 | |||
| Ramco-Gershenson Properties | 2,100 | 10,353 | |||
| 113,034 | |||||
| Specialty REITs – 0.63% | |||||
| Entertainment Properties Trust | 2,600 | 63,778 | |||
| * | Plum Creek Timber | 1,820 | 64,774 | ||
| * | Potlatch | 1,730 | 46,156 | ||
| 174,708 | |||||
| Telecommunications – 5.60% | |||||
| AT&T | 9,600 | 274,176 | |||
| † | Century Communications | 125,000 | 0 | ||
| Chunghwa Telecom ADR | 16,809 | 262,900 | |||
| France Telecom | 11,000 | 282,485 | |||
| Telstra | 80,294 | 213,379 | |||
| Verizon Communications | 8,900 | 290,584 | |||
| * | Vodafone Group | 119,230 | 233,579 | ||
| 1,557,103 | |||||
| Utilities – 2.14% | |||||
| *† | Mirant | 53 | 913 | ||
| National Grid | 31,338 | 326,641 | |||
| *† | NRG Energy | 250 | 5,923 | ||
| Progress Energy | 6,600 | 261,954 | |||
| 595,431 | |||||
| Total Common Stock | |||||
| (cost $27,502,830) | 18,683,849 | ||||
| Convertible Preferred Stock – 2.56% | |||||
| Banking, Finance & Insurance – 0.73% | |||||
| Aspen Insurance Holdings | |||||
| 5.625% exercise price | |||||
| $29.28, expiration | |||||
| date 12/31/49 | 3,400 | 110,499 | |||
| Fannie Mae 8.75% exercise | |||||
| price $32.45, expiration | |||||
| date 5/13/11 | 1,500 | 2,760 | |||
| # | Morgan Stanley 144A | ||||
| 11.00% exercise price | |||||
| $94.64, expiration | |||||
| date 1/7/09 | 1,700 | 85,026 | |||
| XL Capital 7.00% exercise | |||||
| price $80.59, expiration | |||||
| date 2/15/09 | 3,000 | 6,120 | |||
| 204,405 | |||||
| Basic Materials – 0.09% | |||||
| Freeport-McMoRan Copper | |||||
| & Gold 6.75% exercise | |||||
| price $73.24, expiration | |||||
| date 5/1/10 | 600 | 25,200 | |||
| 25,200 | |||||
| Cable, Media & Publishing – 0.20% | |||||
| # | Interpublic Group 144A | ||||
| 5.25% exercise price | |||||
| $13.66, expiration | |||||
| date 12/31/49 | 140 | 55,510 | |||
| 55,510 | |||||
| Energy – 0.47% | |||||
| * | Chesapeake Energy | ||||
| 4.50% exercise price | |||||
| $44.15, expiration | |||||
| date 12/31/49 | 1,275 | 81,281 | |||
| El Paso Energy Capital Trust I | |||||
| 4.75% exercise price | |||||
| $41.59, expiration | |||||
| date 3/31/28 | 1,950 | 48,848 | |||
| 130,129 | |||||
(continues) 9
Statement of net assets
Delaware Investments® Global Dividend and Income Fund, Inc.
| Number of | Value | ||||||
| Shares | (U.S. $) | ||||||
| Convertible Preferred Stock (continued) | |||||||
| Health Care & Pharmaceuticals – 0.49% | |||||||
| Mylan 6.50% exercise price | |||||||
| $17.08, expiration | |||||||
| date 11/15/10 | 100 | $ | 59,000 | ||||
| Schering-Plough | |||||||
| 6.00% exercise price | |||||||
| $33.69, expiration | |||||||
| date 8/13/10 | 500 | 77,469 | |||||
| 136,469 | |||||||
| Telecommunications – 0.13% | |||||||
| Lucent Technologies Capital | |||||||
| Trust I 7.75% exercise | |||||||
| price $24.80, expiration | |||||||
| date 3/15/17 | 120 | 34,830 | |||||
| 34,830 | |||||||
| Utilities – 0.45% | |||||||
| Entergy 7.625% exercise | |||||||
| price $86.58, expiration | |||||||
| date 2/17/09 | 2,500 | 124,375 | |||||
| 124,375 | |||||||
| Total Convertible Preferred Stock | |||||||
| (cost $1,390,696) | 710,918 | ||||||
| Preferred Stock – 1.45% | |||||||
| Banking, Finance & Insurance – 0.04% | |||||||
| · | JPMorgan Chase 7.90% | 15,000 | 11,772 | ||||
| 11,772 | |||||||
| Industrial – 0.02% | |||||||
| @= | Port Townsend | 20 | 4,871 | ||||
| 4,871 | |||||||
| Leisure, Lodging & Entertainment – 0.43% | |||||||
| Red Lion Hotels Capital | |||||||
| Trust 9.50% | 10,226 | 119,286 | |||||
| 119,286 | |||||||
| Real Estate – 0.96% | |||||||
| SL Green Realty 7.625% | 22,000 | 242,000 | |||||
| W2007 Grace | |||||||
| Acquisitions 8.75% | 10,000 | 25,000 | |||||
| 267,000 | |||||||
| Total Preferred Stock | |||||||
| (cost $1,087,923) | 402,929 | ||||||
| Principal | |||||||
| Amount° | |||||||
| Agency Mortgage-Backed Securities – 0.98% | |||||||
| Fannie Mae S.F. 30 yr | |||||||
| 5.00% 12/1/36 | USD | 135,926 | 136,970 | ||||
| Freddie Mac S.F. 30 yr | |||||||
| 5.50% 1/1/35 | 133,661 | 135,832 | |||||
| Total Agency Mortgage-Backed | |||||||
| Securities (cost $266,652) | 272,802 | ||||||
| Convertible Bonds – 8.80% | |||||||
| Aerospace & Defense – 0.61% | |||||||
| # | AAR 144A 1.75% 2/1/26 | ||||||
| exercise price $29.43, | |||||||
| expiration date 1/1/26 | 90,000 | 66,488 | |||||
| # | L-3 Communications | ||||||
| Holdings 144A | |||||||
| 3.00% 8/01/35 | |||||||
| exercise price $101.13, | |||||||
| expiration date 8/1/35 | 110,000 | 102,162 | |||||
| 168,650 | |||||||
| Banking, Finance & Insurance – 0.47% | |||||||
| CommScope 1.00% 3/15/24 | |||||||
| exercise price $21.75, | |||||||
| expiration date 3/15/24 | 85,000 | 81,388 | |||||
| · | Prudential Financial | ||||||
| 0.419% 12/12/36 | |||||||
| exercise price $104.21, | |||||||
| expiration date 12/12/36 | 50,000 | 49,505 | |||||
| 130,893 | |||||||
| Basic Materials – 0.54% | |||||||
| * | Rayonier TRS Holdings | ||||||
| 3.75% 10/15/12 | |||||||
| exercise price $54.82, | |||||||
| expiration date 10/15/12 | 135,000 | 114,075 | |||||
| # | Sino-Forest 144A | ||||||
| 5.00% 8/1/13 exercise | |||||||
| price $20.29 expiration | |||||||
| date 8/1/13 | 65,000 | 35,506 | |||||
| 149,581 | |||||||
| Cable, Media & Publishing – 0.34% | |||||||
| # | Playboy Enterprises 144A | ||||||
| 3.00% 3/15/25 exercise | |||||||
| price $17.02, expiration | |||||||
| date 3/15/25 | 160,000 | 93,600 | |||||
| 93,600 | |||||||
| Computers & Technology – 1.67% | |||||||
| Advanced Micro Devices | |||||||
| 6.00% 5/1/15 | |||||||
| exercise price $28.08, | |||||||
| expiration date 5/1/15 | 70,000 | 20,913 | |||||
| #144A 6.00% 5/1/15 | |||||||
| exercise price $28.08, | |||||||
| expiration date 5/1/15 | 165,000 | 49,294 | |||||
| Euronet Worldwide | |||||||
| 3.50% 10/15/25 | |||||||
| exercise price $40.48, | |||||||
| expiration date 10/15/25 | 165,000 | 101,887 | |||||
| Hutchinson Technology | |||||||
| 3.25% 1/15/26 | |||||||
| exercise price $36.43, | |||||||
| expiration date 1/14/26 | 120,000 | 38,400 | |||||
| # | Intel 144A 2.95% 12/15/35 | ||||||
| exercise price $31.53, | |||||||
| expiration date 12/15/35 | 105,000 | 79,537 | |||||
10
| Principal | Value | ||||||
| Amount° | (U.S. $) | ||||||
| Convertible Bonds (continued) | |||||||
| Computers & Technology (continued) | |||||||
| Linear Technology 3.125% | |||||||
| 5/1/27 exercise price | |||||||
| $48.24 expiration | |||||||
| date 5/1/27 | USD | 70,000 | $ | 62,650 | |||
| Red Hat 0.50% 1/15/24 | |||||||
| exercise price $25.59, | |||||||
| expiration date 1/15/24 | 70,000 | 69,474 | |||||
| SanDisk 1.00% 5/15/13 | |||||||
| exercise price $82.36, | |||||||
| expiration date 5/15/13 | 100,000 | 43,125 | |||||
| 465,280 | |||||||
| Energy – 0.28% | |||||||
| Peabody Energy | |||||||
| 4.75% 12/15/41 | |||||||
| exercise price $58.45, | |||||||
| expiration date 12/15/41 | 35,000 | 20,606 | |||||
| Transocean | |||||||
| 1.50% 12/15/37 | |||||||
| exercise price $168.61, | |||||||
| expiration date 12/15/37 | 35,000 | 27,475 | |||||
| 1.625% 12/15/37 | |||||||
| exercise price $168.61, | |||||||
| expiration date 12/15/37 | 35,000 | 29,794 | |||||
| 77,875 | |||||||
| Environmental Services – 0.23% | |||||||
| Allied Waste Industries | |||||||
| 4.25% 4/15/34 exercise | |||||||
| price $20.43, expiration | |||||||
| date 4/15/34 | 71,000 | 63,634 | |||||
| 63,634 | |||||||
| Health Care & Pharmaceuticals – 2.63% | |||||||
| Advanced Medical Optics | |||||||
| 3.25% 8/1/26 exercise | |||||||
| price $59.61, expiration | |||||||
| date 8/1/26 | 180,000 | 69,300 | |||||
| # | Allergan 144A 1.50% 4/1/26 | ||||||
| exercise price $63.33, | |||||||
| expiration date 4/1/26 | 150,000 | 140,625 | |||||
| Amgen | |||||||
| 0.375% 2/1/13 exercise | |||||||
| price $79.48, expiration | |||||||
| date 2/1/13 | 85,000 | 73,738 | |||||
| #144A 0.375% 2/1/13 | |||||||
| exercise price $79.48, | |||||||
| expiration date 2/1/13 | 60,000 | 52,050 | |||||
| CV Therapeutics | |||||||
| 3.25% 8/16/13 | |||||||
| exercise price $27.00, | |||||||
| expiration date 8/16/13 | 45,000 | 28,800 | |||||
| Φ | Hologic 2.00% 12/15/37 | ||||||
| exercise price $38.59, | |||||||
| expiration date 12/15/37 | 85,000 | 48,556 | |||||
| LifePoint Hospitals | |||||||
| 3.50% 5/15/14 exercise | |||||||
| price $51.79, expiration | |||||||
| date 5/14/14 | 40,000 | 22,500 | |||||
| Mentor 2.75% 1/1/24 | |||||||
| exercise price $28.81, | |||||||
| expiration date 12/31/08 | 100,000 | 98,250 | |||||
| · | Wyeth 2.621% 1/15/24 | ||||||
| exercise price $60.09, | |||||||
| expiration date 1/15/24 | 200,000 | 198,419 | |||||
| 732,238 | |||||||
| Real Estate – 0.31% | |||||||
| MeriStar Hospitality | |||||||
| 9.50% 4/1/10 exercise | |||||||
| price $10.18, expiration | |||||||
| date 4/1/10 | 85,000 | 87,253 | |||||
| 87,253 | |||||||
| Retail – 0.25% | |||||||
| Pantry 3.00% 11/15/12 | |||||||
| exercise price $50.10, | |||||||
| expiration date 11/15/12 | 65,000 | 37,213 | |||||
| # | Saks 144A 2.00% 3/15/24 | ||||||
| exercise price $11.97, | |||||||
| expiration date 3/15/24 | 55,000 | 32,106 | |||||
| 69,319 | |||||||
| Telecommunications – 0.94% | |||||||
| Level 3 Communications | |||||||
| 3.50% 6/15/12 exercise | |||||||
| price $5.46, expiration | |||||||
| date 6/15/12 | 110,000 | 42,488 | |||||
| NII Holdings 3.125% 6/15/12 | |||||||
| exercise price $118.32, | |||||||
| expiration date 6/15/12 | 155,000 | 86,605 | |||||
| # | Nortel Networks 144A | ||||||
| 1.75% 4/15/12 exercise | |||||||
| price $32.00, expiration | |||||||
| date 4/15/12 | 40,000 | 5,800 | |||||
| 2.125% 4/15/14 exercise | |||||||
| price $32.00, expiration | |||||||
| date 4/15/14 | 40,000 | 5,800 | |||||
| Qwest Communications | |||||||
| International 3.50% | |||||||
| 11/15/25 exercise price | |||||||
| $5.46, expiration | |||||||
| date 11/15/25 | 70,000 | 56,875 | |||||
| # | Virgin Media 144A | ||||||
| 6.50% 11/15/16 exercise | |||||||
| price $19.22, expiration | |||||||
| date 11/15/16 | 150,000 | 63,188 | |||||
| 260,756 | |||||||
| Transportation – 0.13% | |||||||
| Bristow Group 3.00% | |||||||
| 6/15/38 exercise price | |||||||
| $77.34 expiration | |||||||
| date 6/15/38 | 70,000 | 36,138 | |||||
| 36,138 | |||||||
(continues) 11
Statement of net assets
Delaware Investments® Global Dividend and Income Fund, Inc.
| Principal | Value | ||||||
| Amount° | (U.S. $) | ||||||
| Convertible Bonds (continued) | |||||||
| Utilities – 0.40% | |||||||
| Dominion Resources | |||||||
| 2.125% 12/15/23 | |||||||
| exercise price $36.14, | |||||||
| expiration date 12/15/23 | USD | 110,000 | $ | 112,613 | |||
| 112,613 | |||||||
| Total Convertible Bonds | |||||||
| (cost $3,629,183) | 2,447,830 | ||||||
| Corporate Bonds – 24.40% | |||||||
| Banking – 1.09% | |||||||
| ·@ | Capital One FSB | ||||||
| 2.919% 3/13/09 | 165,000 | 164,752 | |||||
| @ | JPMorgan Chase Capital XXV | ||||||
| 6.80% 10/1/37 | 187,000 | 137,791 | |||||
| 302,543 | |||||||
| Basic Industry – 2.57% | |||||||
| California Steel Industries | |||||||
| 6.125% 3/15/14 | 30,000 | 18,450 | |||||
| Domtar 7.125% 8/15/15 | 50,000 | 34,250 | |||||
| @# | Evraz Group 144A | ||||||
| 9.50% 4/24/18 | 100,000 | 43,500 | |||||
| Freeport McMoRan Copper | |||||||
| & Gold 8.25% 4/1/15 | 61,000 | 44,274 | |||||
| Georgia-Pacific | |||||||
| 7.70% 6/15/15 | 15,000 | 11,475 | |||||
| 8.875% 5/15/31 | 32,000 | 20,160 | |||||
| Innophos 8.875% 8/15/14 | 45,000 | 38,475 | |||||
| @# | Innophos Holding 144A | ||||||
| 9.50% 4/15/12 | 30,000 | 22,350 | |||||
| International Coal Group | |||||||
| 10.25% 7/15/14 | 55,000 | 41,800 | |||||
| # | MacDermid 144A | ||||||
| 9.50% 4/15/17 | 78,000 | 42,510 | |||||
| Momentive Performance | |||||||
| Materials 9.75% 12/1/14 | 50,000 | 19,625 | |||||
| NewPage 10.00% 5/1/12 | 60,000 | 32,700 | |||||
| · | Noranda Aluminum Acquisition | ||||||
| 6.595% 5/15/15 | 40,000 | 13,200 | |||||
| @ | Norske Skog Canada | ||||||
| 8.625% 6/15/11 | 40,000 | 22,800 | |||||
| @= | Port Townsend | ||||||
| 12.431% 8/27/12 | 28,000 | 27,720 | |||||
| @ | Potlatch 13.00% 12/1/09 | 88,000 | 95,304 | ||||
| # | Rock-Tenn 144A | ||||||
| 9.25% 3/15/16 | 35,000 | 30,275 | |||||
| @ | Rockwood Specialties Group | ||||||
| 7.50% 11/15/14 | 50,000 | 41,250 | |||||
| *·# | Ryerson 144A | ||||||
| 10.568% 11/1/14 | 25,000 | 16,625 | |||||
| @# | Sappi Papier Holding 144A | ||||||
| 6.75% 6/15/12 | 75,000 | 55,209 | |||||
| # | Steel Dynamics 144A | ||||||
| 7.75% 4/15/16 | 50,000 | 30,750 | |||||
| · | Verso Paper Holdings | ||||||
| 6.943% 8/1/14 | 20,000 | 10,900 | |||||
| 713,602 | |||||||
| Brokerage – 0.51% | |||||||
| @ | Goldman Sachs Group | ||||||
| 6.75% 10/1/37 | 185,000 | 118,877 | |||||
| LaBranche 11.00% 5/15/12 | 27,000 | 22,545 | |||||
| 141,422 | |||||||
| Capital Goods – 1.96% | |||||||
| Allied Waste North America | |||||||
| 6.875% 6/1/17 | 25,000 | 21,875 | |||||
| 7.125% 5/15/16 | 10,000 | 8,850 | |||||
| *@ | Associated Materials | ||||||
| 9.75% 4/15/12 | 50,000 | 43,000 | |||||
| @ | BWAY 10.00% 10/15/10 | 85,000 | 73,525 | ||||
| @ | CPG International I | ||||||
| 10.50% 7/1/13 | 32,000 | 18,080 | |||||
| * | Graham Packaging | ||||||
| 9.875% 10/15/14 | 60,000 | 38,100 | |||||
| Graphic Packaging International | |||||||
| 9.50% 8/15/13 | 75,000 | 52,125 | |||||
| Greenbrier 8.375% 5/15/15 | 60,000 | 44,700 | |||||
| @ | Intertape Polymer 8.50% 8/1/14 | 26,000 | 19,890 | ||||
| # | Moog 144A 7.25% 6/15/18 | 30,000 | 23,250 | ||||
| Owens Brockway Glass | |||||||
| Container 6.75% 12/1/14 | 110,000 | 96,250 | |||||
| Thermadyne Holdings | |||||||
| 9.50% 2/1/14 | 55,000 | 43,725 | |||||
| @ | Vitro 11.75% 11/1/13 | 55,000 | 15,675 | ||||
| Vought Aircraft Industries | |||||||
| 8.00% 7/15/11 | 65,000 | 45,175 | |||||
| 544,220 | |||||||
| Consumer Cyclical – 1.87% | |||||||
| Centex | |||||||
| 4.55% 11/1/10 | 30,000 | 24,900 | |||||
| 5.125% 10/1/13 | 10,000 | 6,050 | |||||
| @ | Denny’s Holdings | ||||||
| 10.00% 10/1/12 | 15,000 | 10,350 | |||||
| * | Dollar General | ||||||
| 10.625% 7/15/15 | 35,000 | 31,675 | |||||
| DR Horton | |||||||
| 6.00% 4/15/11 | 15,000 | 11,775 | |||||
| 7.875% 8/15/11 | 50,000 | 41,250 | |||||
| @# | Expedia 144A 8.50% 7/1/16 | 25,000 | 15,375 | ||||
| * | Ford Motor 7.45% 7/16/31 | 29,000 | 7,395 | ||||
| Ford Motor Credit | |||||||
| 7.80% 6/1/12 | 100,000 | 43,157 | |||||
| GMAC | |||||||
| 5.625% 5/15/09 | 20,000 | 13,782 | |||||
| 6.625% 5/15/12 | 20,000 | 7,016 | |||||
| 6.875% 8/28/12 | 15,000 | 5,254 | |||||
| * | Goodyear Tire & Rubber | ||||||
| 9.00% 7/1/15 | 15,000 | 11,250 | |||||
12
| Principal | Value | ||||||
| Amount° | (U.S. $) | ||||||
| Corporate Bonds (continued) | |||||||
| Consumer Cyclical (continued) | |||||||
| # | Invista 144A 9.25% 5/1/12 | USD | 20,000 | $ | 14,700 | ||
| Lear 8.75% 12/1/16 | 114,000 | 25,080 | |||||
| Levi Strauss 9.75% 1/15/15 | 28,000 | 16,940 | |||||
| M/I Homes 6.875% 4/1/12 | 20,000 | 10,700 | |||||
| @ | Mobile Mini 6.875% 5/1/15 | 30,000 | 21,450 | ||||
| * | Neiman Marcus Group | ||||||
| 10.375% 10/15/15 | 60,000 | 22,800 | |||||
| Ryland Group | |||||||
| 6.875% 6/15/13 | 55,000 | 38,225 | |||||
| Sally Holdings | |||||||
| 10.50% 11/15/16 | 50,000 | 29,250 | |||||
| * | Tenneco Automotive | ||||||
| 8.625% 11/15/14 | 110,000 | 41,250 | |||||
| Toll | |||||||
| 8.25% 2/1/11 | 70,000 | 58,100 | |||||
| 8.25% 12/1/11 | 15,000 | 12,375 | |||||
| 520,099 | |||||||
| Consumer Non-Cyclical – 1.21% | |||||||
| @ | ACCO Brands | ||||||
| 7.625% 8/15/15 | 30,000 | 15,750 | |||||
| * | Chiquita Brands International | ||||||
| 8.875% 12/1/15 | 35,000 | 25,025 | |||||
| * | Constellation Brands | ||||||
| 8.125% 1/15/12 | 85,000 | 74,375 | |||||
| Cornell 10.75% 7/1/12 | 15,000 | 13,425 | |||||
| Del Monte | |||||||
| 6.75% 2/15/15 | 15,000 | 12,300 | |||||
| 8.625% 12/15/12 | 10,000 | 9,100 | |||||
| Iron Mountain | |||||||
| *6.625% 1/1/16 | 30,000 | 23,550 | |||||
| 8.00% 6/15/20 | 30,000 | 23,250 | |||||
| * | Jarden 7.50% 5/1/17 | 31,000 | 20,305 | ||||
| JohnsonDiversey Holdings | |||||||
| 10.67% 5/15/13 | 5,000 | 3,575 | |||||
| LVB Acquisition | |||||||
| 10.00% 10/15/17 | 50,000 | 45,250 | |||||
| @ | National Beef Packing | ||||||
| 10.50% 8/1/11 | 32,000 | 23,600 | |||||
| Tyson Foods 7.35% 4/1/16 | 25,000 | 15,733 | |||||
| Visant Holding | |||||||
| 8.75% 12/1/13 | 45,000 | 32,625 | |||||
| 337,863 | |||||||
| Energy – 3.25% | |||||||
| AmeriGas Partners | |||||||
| 7.125% 5/20/16 | 57,000 | 40,185 | |||||
| Chesapeake Energy | |||||||
| 6.375% 6/15/15 | 48,000 | 33,840 | |||||
| Complete Production Service | |||||||
| 8.00% 12/15/16 | 25,000 | 15,875 | |||||
| Compton Petroleum Finance | |||||||
| 7.625% 12/1/13 | 83,000 | 34,445 | |||||
| @# | Connacher Oil & Gas 144A | ||||||
| 10.25% 12/15/15 | 75,000 | 39,375 | |||||
| # | Copano Energy 144A | ||||||
| 7.75% 6/1/18 | 30,000 | 19,800 | |||||
| Dynergy Holdings | |||||||
| 7.75% 6/1/19 | 45,000 | 30,150 | |||||
| El Paso | |||||||
| 6.875% 6/15/14 | 21,000 | 15,672 | |||||
| 7.00% 6/15/17 | 5,000 | 3,585 | |||||
| # | El Paso Performance-Linked | ||||||
| Trust 144A | |||||||
| 7.75% 7/15/11 | 46,000 | 38,386 | |||||
| Energy Partners | |||||||
| 9.75% 4/15/14 | 27,000 | 12,555 | |||||
| Frontier Oil 8.50% 9/15/16 | 20,000 | 16,900 | |||||
| @ | Geophysique-Veritas | ||||||
| 7.50% 5/15/15 | 13,000 | 8,515 | |||||
| 7.75% 5/15/17 | 36,000 | 22,275 | |||||
| # | Helix Energy Solutions Group | ||||||
| 144A 9.50% 1/15/16 | 60,000 | 31,800 | |||||
| # | Hilcorp Energy I 144A | ||||||
| 7.75% 11/1/15 | 7,000 | 5,040 | |||||
| 9.00% 6/1/16 | 52,000 | 37,440 | |||||
| Inergy Finance | |||||||
| 6.875% 12/15/14 | 52,000 | 38,090 | |||||
| 8.25% 3/1/16 | 20,000 | 14,800 | |||||
| Key Energy Services | |||||||
| 8.375% 12/1/14 | 40,000 | 28,100 | |||||
| Mariner Energy | |||||||
| 8.00% 5/15/17 | 60,000 | 32,400 | |||||
| MarkWest Energy Partners | |||||||
| 8.75% 4/15/18 | 60,000 | 38,100 | |||||
| Massey Energy | |||||||
| 6.875% 12/15/13 | 62,000 | 42,315 | |||||
| OPTI Canada | |||||||
| 7.875% 12/15/14 | 25,000 | 9,625 | |||||
| 8.25% 12/15/14 | 73,000 | 28,835 | |||||
| PetroHawk Energy | |||||||
| 9.125% 7/15/13 | 62,000 | 47,740 | |||||
| #144A 7.875% 6/1/15 | 15,000 | 10,650 | |||||
| @ | Petroleum Development | ||||||
| 12.00% 2/15/18 | 30,000 | 20,700 | |||||
| Plains Exploration & Production | |||||||
| 7.00% 3/15/17 | 46,000 | 31,050 | |||||
| Range Resources | |||||||
| 7.25% 5/1/18 | 30,000 | 23,963 | |||||
| Regency Energy Partners | |||||||
| 8.375% 12/15/13 | 48,000 | 34,200 | |||||
| Reliant Energy | |||||||
| 7.625% 6/15/14 | 20,000 | 15,400 | |||||
| Whiting Petroleum | |||||||
| 7.25% 5/1/13 | 97,000 | 69,355 | |||||
| Williams 7.50% 1/15/31 | 18,000 | 11,814 | |||||
| 902,975 | |||||||
(continues) 13
Statement of net assets
Delaware Investments® Global Dividend and Income Fund, Inc.
| Principal | Value | ||||||
| Amount° | (U.S. $) | ||||||
| Corporate Bonds (continued) | |||||||
| Finance & Investments – 2.13% | |||||||
| @ | GE Capital UK Funding | ||||||
| 4.625% 1/18/16 | GBP | 114,000 | $ | 143,524 | |||
| @ | General Electric Capital | ||||||
| 5.125% 1/28/14 | SEK | 1,000,000 | 115,804 | ||||
| ·6.78% 2/2/11 | NOK | 1,000,000 | 138,643 | ||||
| · | Hartford Financial Services | ||||||
| Group 8.125% 6/15/38 | USD | 25,000 | 11,580 | ||||
| Hexion US Finance | |||||||
| 9.75% 11/15/14 | 25,000 | 13,125 | |||||
| ·@ | HSBC Financial | ||||||
| 2.846% 4/24/10 | CAD | 101,000 | 80,127 | ||||
| Lender Processing Services | |||||||
| 8.125% 7/1/16 | USD | 25,000 | 21,125 | ||||
| Leucadia National | |||||||
| 8.125% 9/15/15 | 29,000 | 25,303 | |||||
| @# | Nuveen Investments 144A | ||||||
| 10.50% 11/15/15 | 77,000 | 23,966 | |||||
| · | USB Capital IX | ||||||
| 6.189% 4/15/49 | 15,000 | 7,804 | |||||
| · | Wells Fargo Capital XIII | ||||||
| 7.70% 12/29/49 | 15,000 | 12,179 | |||||
| 593,180 | |||||||
| Media – 1.06% | |||||||
| * | CCO Holdings Capital | ||||||
| 8.75% 11/15/13 | 45,000 | 25,875 | |||||
| # | Charter Communications | ||||||
| Operating 144A | |||||||
| 10.875% 9/15/14 | 80,000 | 57,800 | |||||
| # | CSC Holdings 144A | ||||||
| 8.50% 6/15/15 | 30,000 | 24,375 | |||||
| Dex Media West | |||||||
| 9.875% 8/15/13 | 77,000 | 17,133 | |||||
| * | Lamar Media | ||||||
| 6.625% 8/15/15 | 60,000 | 43,800 | |||||
| # | LBI Media 144A | ||||||
| 8.50% 8/1/17 | 25,000 | 8,875 | |||||
| LIN Television 6.50% 5/15/13 | 25,000 | 11,750 | |||||
| Mediacom Capital | |||||||
| 9.50% 1/15/13 | 20,000 | 16,500 | |||||
| Quebecor Media | |||||||
| 7.75% 3/15/16 | 47,000 | 31,725 | |||||
| # | Rainbow National Services | ||||||
| 144A 10.375% 9/1/14 | 10,000 | 8,700 | |||||
| # | Videotron 144A | ||||||
| 9.125% 4/15/18 | 55,000 | 48,675 | |||||
| 295,208 | |||||||
| Real Estate – 0.14% | |||||||
| Host Hotels & Resorts | |||||||
| 7.125% 11/1/13 | 55,000 | 40,288 | |||||
| 40,288 | |||||||
| Services Cyclical – 2.20% | |||||||
| ARAMARK Services | |||||||
| 8.50% 2/1/15 | 58,000 | 48,430 | |||||
| @ | Cardtronics 9.25% 8/15/13 | 67,000 | 49,999 | ||||
| Corrections Corporation | |||||||
| of America 6.25% 3/15/13 | 25,000 | 22,125 | |||||
| FTI Consulting | |||||||
| 7.625% 6/15/13 | 99,000 | 88,604 | |||||
| Gaylord Entertainment | |||||||
| 6.75% 11/15/14 | 20,000 | 10,900 | |||||
| 8.00% 11/15/13 | 62,000 | 37,123 | |||||
| @ | Global Cash Access | ||||||
| 8.75% 3/15/12 | 40,000 | 31,400 | |||||
| Hertz 8.875% 1/1/14 | 39,000 | 20,329 | |||||
| Kansas City Southern | |||||||
| de Mexico 9.375% 5/1/12 | 103,000 | 82,400 | |||||
| * | MGM MIRAGE | ||||||
| 7.50% 6/1/16 | 35,000 | 18,200 | |||||
| #144A 13.00% 11/15/13 | 10,000 | 8,400 | |||||
| ‡@ | Northwest Airlines | ||||||
| 10.00% 2/1/09 | 15,000 | 56 | |||||
| Pinnacle Entertainment | |||||||
| 8.25% 3/15/12 | 20,000 | 14,700 | |||||
| *8.75% 10/1/13 | 40,000 | 30,600 | |||||
| @# | Pokagon Gaming Authority | ||||||
| 144A 10.375% 6/15/14 | 66,000 | 56,100 | |||||
| RSC Equipment Rental | |||||||
| 9.50% 12/1/14 | 25,000 | 12,375 | |||||
| Seabulk International | |||||||
| 9.50% 8/15/13 | 30,000 | 27,225 | |||||
| @# | Seminole Indian Tribe | ||||||
| of Florida 144A | |||||||
| 7.804% 10/1/20 | 40,000 | 35,038 | |||||
| 8.03% 10/1/20 | 20,000 | 17,737 | |||||
| 611,741 | |||||||
| Services Non-Cyclical – 1.48% | |||||||
| Advanced Medical Optics | |||||||
| 7.50% 5/1/17 | 55,000 | 30,525 | |||||
| Alliance Imaging | |||||||
| 7.25% 12/15/12 | 30,000 | 25,125 | |||||
| *# | Bausch & Lomb 144A | ||||||
| 9.875% 11/1/15 | 90,000 | 69,524 | |||||
| @ | Casella Waste Systems | ||||||
| 9.75% 2/1/13 | 73,000 | 63,875 | |||||
| Community Health Systems | |||||||
| 8.875% 7/15/15 | 55,000 | 44,413 | |||||
| HCA | |||||||
| 6.50% 2/15/16 | 25,000 | 14,125 | |||||
| 9.25% 11/15/16 | 25,000 | 20,375 | |||||
| PIK 9.625% 11/15/16 | 75,000 | 54,188 | |||||
| · | HealthSouth | ||||||
| 9.133% 6/15/14 | 60,000 | 50,100 | |||||
| Select Medical | |||||||
| 7.625% 2/1/15 | 65,000 | 38,675 | |||||
| 410,925 | |||||||
14
| Principal | Value | ||||||
| Amount° | (U.S. $) | ||||||
| Corporate Bonds (continued) | |||||||
| Technology & Electronics – 1.22% | |||||||
| Celestica | |||||||
| 7.625% 7/1/13 | USD | 5,000 | $ | 3,725 | |||
| 7.875% 7/1/11 | 15,000 | 12,825 | |||||
| Flextronics International | |||||||
| 6.25% 11/15/14 | 25,000 | 18,625 | |||||
| · | Freescale Semiconductor | ||||||
| 6.694% 12/15/14 | 45,000 | 11,250 | |||||
| @ | International Business Machines | ||||||
| 4.00% 11/11/11 | EUR | 200,000 | 247,638 | ||||
| Sungard Data Systems | |||||||
| 9.125% 8/15/13 | USD | 32,000 | 24,960 | ||||
| 10.25% 8/15/15 | 35,000 | 20,475 | |||||
| 339,498 | |||||||
| Telecommunications – 2.58% | |||||||
| · | Centennial Communications | ||||||
| 9.633% 1/1/13 | 14,000 | 13,160 | |||||
| Cincinnati Bell | |||||||
| 7.00% 2/15/15 | 25,000 | 17,938 | |||||
| 7.25% 7/15/13 | 15,000 | 12,375 | |||||
| Cricket Communications | |||||||
| 9.375% 11/1/14 | 72,000 | 57,510 | |||||
| @# | Digicel 144A 9.25% 9/1/12 | 100,000 | 74,499 | ||||
| @ | GCI 7.25% 2/15/14 | 15,000 | 12,113 | ||||
| Hughes Network Systems | |||||||
| 9.50% 4/15/14 | 52,000 | 43,160 | |||||
| Inmarsat Finance | |||||||
| 10.375% 11/15/12 | 95,000 | 83,837 | |||||
| Intelsat Jackson Holdings | |||||||
| 11.25% 6/15/16 | 62,000 | 50,220 | |||||
| # | Intelsat Subsidiary Holding | ||||||
| 144A 8.875% 1/15/15 | 15,000 | 12,600 | |||||
| Lucent Technologies | |||||||
| 6.45% 3/15/29 | 42,000 | 17,010 | |||||
| MetroPCS Wireless | |||||||
| 9.25% 11/1/14 | 87,000 | 71,775 | |||||
| Nortel Networks | |||||||
| ·9.003% 7/15/11 | 17,000 | 5,610 | |||||
| 10.75% 7/15/16 | 38,000 | 11,210 | |||||
| * | PAETEC Holding | ||||||
| 9.50% 7/15/15 | 30,000 | 16,875 | |||||
| Qwest Capital Funding | |||||||
| 7.25% 2/15/11 | 67,000 | 51,925 | |||||
| * | Sprint Nextel 6.00% 12/1/16 | 110,000 | 61,132 | ||||
| Time Warner Telecom | |||||||
| Holdings 9.25% 2/15/14 | 40,000 | 31,800 | |||||
| Virgin Media Finance | |||||||
| 8.75% 4/15/14 | 65,000 | 47,288 | |||||
| Windstream 8.125% 8/1/13 | 32,000 | 26,560 | |||||
| 718,597 | |||||||
| Utilities – 1.13% | |||||||
| AES | |||||||
| 8.00% 10/15/17 | 41,000 | 28,495 | |||||
| #144A 8.00% 6/1/20 | 15,000 | 9,675 | |||||
| #144A 8.75% 5/15/13 | 16,000 | 14,160 | |||||
| Edison Mission Energy | |||||||
| 7.625% 5/15/27 | 25,000 | 17,125 | |||||
| Elwood Energy | |||||||
| 8.159% 7/5/26 | 92,051 | 67,835 | |||||
| Midwest Generation | |||||||
| 8.30% 7/2/09 | 35,781 | 34,260 | |||||
| Mirant North America | |||||||
| 7.375% 12/31/13 | 32,000 | 27,840 | |||||
| NRG Energy 7.375% 2/1/16 | 48,000 | 39,120 | |||||
| Orion Power Holdings | |||||||
| 12.00% 5/1/10 | 50,000 | 48,750 | |||||
| # | Texas Competitive Electric | ||||||
| Holdings 144A | |||||||
| 10.50% 11/1/15 | 40,000 | 25,800 | |||||
| 313,060 | |||||||
| Total Corporate Bonds | |||||||
| (cost $9,360,133) | 6,785,221 | ||||||
| Foreign Agencies – 3.34% | |||||||
| Germany – 3.34% | |||||||
| KFW | |||||||
| 3.50% 7/4/21 | EUR | 228,000 | 266,997 | ||||
| 4.125% 7/4/17 | EUR | 323,000 | 417,080 | ||||
| 8.00% 12/21/12 | NZD | 160,000 | 96,662 | ||||
| Rentenbank | |||||||
| 1.375% 4/25/13 | JPY | 14,000,000 | 148,119 | ||||
| Total Foreign Agencies | |||||||
| (cost $948,550) | 928,858 | ||||||
| Regional Agency – 0.93% | |||||||
| Australia – 0.93% | |||||||
| New South Wales Treasury | |||||||
| 6.00% 5/1/12 | AUD | 377,000 | 257,472 | ||||
| Total Regional Agency | |||||||
| (cost $312,381) | 257,472 | ||||||
| «Senior Secured Loans – 0.42% | |||||||
| Energy Futures Holdings | |||||||
| 5.634% 10/10/14 | USD | 50,000 | 34,306 | ||||
| Ford Motor Term B | |||||||
| 4.423% 11/29/13 | 55,000 | 23,100 | |||||
| General Motors Term B | |||||||
| 5.795% 11/17/13 | 25,000 | 10,161 | |||||
| Talecris Biotherapeutics 2nd | |||||||
| Lien 8.64% 12/6/14 | 55,000 | 48,675 | |||||
| Total Senior Secured Loans | |||||||
| (cost $137,075) | 116,242 | ||||||
(continues) 15
Statement of net assets
Delaware Investments® Global Dividend and Income Fund, Inc.
| Principal | Value | ||||||
| Amount° | (U.S. $) | ||||||
| Sovereign Agencies – 1.01% | |||||||
| Norway – 1.01% | |||||||
| Kommunalbanken | |||||||
| 4.25% 10/24/11 | USD | 940,000 | $ | 137,000 | |||
| 8.00% 10/19/10 | 250,000 | 144,795 | |||||
| Total Sovereign Agencies | |||||||
| (cost $336,735) | 281,795 | ||||||
| Sovereign Debt – 15.46% | |||||||
| Austria – 1.63% | |||||||
| # | Republic of Austria 144A | ||||||
| 4.00% 9/15/16 | EUR | 350,000 | 452,980 | ||||
| 452,980 | |||||||
| Canada – 0.87% | |||||||
| Canadian Government | |||||||
| 3.50% 6/1/13 | CAD | 148,000 | 125,125 | ||||
| 4.25% 6/1/18 | CAD | 135,000 | 117,444 | ||||
| 242,569 | |||||||
| France – 2.10% | |||||||
| France Government O.A.T. | |||||||
| 4.00% 10/25/38 | EUR | 30,000 | 38,630 | ||||
| 4.00% 4/25/55 | EUR | 420,000 | 545,858 | ||||
| 584,488 | |||||||
| Germany – 1.88% | |||||||
| Bundesobligation | |||||||
| 3.50% 4/12/13 | EUR | 22,100 | 29,010 | ||||
| Deutschland Republic | |||||||
| 4.25% 7/4/18 | EUR | 105,400 | 144,759 | ||||
| 5.625% 1/4/28 | EUR | 226,000 | 349,593 | ||||
| 523,362 | |||||||
| Japan – 4.40% | |||||||
| Japan Government | |||||||
| 10 yr Bond 1.70% 3/20/17 | JPY | 17,200,000 | 187,877 | ||||
| 20 yr Bond 2.30% 6/20/26 | JPY | 78,000,000 | 843,904 | ||||
| 30 yr Bond 2.40% 3/20/37 | JPY | 17,550,000 | 191,154 | ||||
| 1,222,935 | |||||||
| Republic of Korea – 0.43% | |||||||
| Government of South Korea | |||||||
| 4.25% 12/7/21 | EUR | 140,000 | 118,242 | ||||
| 118,242 | |||||||
| Sweden – 0.16% | |||||||
| Sweden Government | |||||||
| 5.50% 10/8/12 | SEK | 330,000 | 45,300 | ||||
| 45,300 | |||||||
| United Kingdom – 3.99% | |||||||
| U.K. Treasury | |||||||
| 4.50% 3/7/13 | GBP | 559,000 | 901,046 | ||||
| 5.00% 3/7/18 | GBP | 123,300 | 208,092 | ||||
| 1,109,138 | |||||||
| Total Sovereign Debt | |||||||
| (cost $4,377,882) | 4,299,014 | ||||||
| Supranational Banks – 4.54% | |||||||
| Asia Development Bank | |||||||
| 0.50% 10/9/12 | AUD | 199,000 | 112,404 | ||||
| European Investment Bank | |||||||
| 1.40% 6/20/17 | JPY | 18,100,000 | 189,140 | ||||
| 4.75% 10/15/17 | EUR | 287,000 | 385,941 | ||||
| 5.75% 9/15/09 | AUD | 260,000 | 172,638 | ||||
| 6.00% 8/14/13 | AUD | 78,000 | 53,309 | ||||
| 6.125% 1/23/17 | AUD | 73,000 | 50,591 | ||||
| Inter-American Development | |||||||
| Bank 7.25% 5/24/12 | NZD | 378,000 | 214,453 | ||||
| International Bank | |||||||
| for Reconstruction | |||||||
| & Development | |||||||
| 12.25% 8/4/10 | BRL | 200,000 | 84,732 | ||||
| Total Supranational Banks | |||||||
| (cost $1,400,683) | 1,263,208 | ||||||
| Number of | |||||||
| Shares | |||||||
| Exchange Traded Fund – 0.05% | |||||||
| UltraShort Real Estate Proshares | 100 | 12,187 | |||||
| Total Exchange Traded Fund | |||||||
| (cost $14,448) | 12,187 | ||||||
| Limited Partnership – 0.14% | |||||||
| * | Brookfield Infrastructure Partners | 3,300 | 38,775 | ||||
| Total Limited Partnership | |||||||
| (cost $62,715) | 38,775 | ||||||
| Right – 0.07% | |||||||
| Standard Chartered | 3,041 | 19,036 | |||||
| Total Right (cost $0) | 19,036 | ||||||
| Warrants – 0.00% | |||||||
| Õ@=† | Port Townsend | 20 | 0 | ||||
| †# | Solutia 144A, exercise price | ||||||
| $7.59, expiration | |||||||
| date 7/15/09 | 130 | 0 | |||||
| Total Warrants (cost $11,539) | 0 | ||||||
16
| Principal | Value | ||||||
| Amount° | (U.S. $) | ||||||
| Repurchase Agreement** – 4.74% | |||||||
| BNP Paribas 0.20%, | |||||||
| dated 11/28/08, to | |||||||
| be repurchased on | |||||||
| 12/1/08, repurchase price | |||||||
| $1,319,022 (collateralized | |||||||
| by U.S. Government | |||||||
| obligations, 6/4/09; | |||||||
| market value $1,362,751) | USD | 1,319,000 | $ | 1,319,000 | |||
| Total Repurchase Agreement | |||||||
| (cost $1,319,000) | 1,319,000 | ||||||
| Total Value of Securities Before Securities | |||||||
| Lending Collateral – 136.08% | |||||||
| (cost $52,158,425) | 37,839,136 | ||||||
| Number of | |||||||
| Shares | |||||||
| Securities Lending Collateral*** – 10.69% | |||||||
| Investment Companies | |||||||
| Mellon GSL DBT II | |||||||
| Collateral Fund | 3,047,141 | 2,966,087 | |||||
| =Mellon GSL DBT II | |||||||
| Liquidation Trust | 78,121 | 6,406 | |||||
| Total Securities Lending Collateral | |||||||
| (cost $3,125,262) | 2,972,493 | ||||||
| Total Value of Securities – 146.77% | |||||||
| (cost $55,283,687) | 40,811,629 | © | |||||
| Obligation to Return Securities | |||||||
| Lending Collateral*** – (11.24%) | (3,125,262 | ) | |||||
| Borrowing Under Line of Credit – (38.57%) | (10,725,000 | ) | |||||
| Receivables and Other Assets | |||||||
| Net of Liabilities – 3.04% | 846,233 | ||||||
| Net Assets Applicable to 5,190,559 | |||||||
| Shares Outstanding; Equivalent to | |||||||
| $5.36 Per Share – 100.00% | $ | 27,807,600 | |||||
| Components of Net Assets at November 30, 2008: | |||||||
| Common stock, $0.01 par value, 500,000,000 | |||||||
| shares authorized to the Fund | $ | 49,148,381 | |||||
| Distributions in excess of net investment income | (279,992 | ) | |||||
| Accumulated net realized loss on investments | (6,726,549 | ) | |||||
| Net unrealized depreciation of investments, | |||||||
| foreign currencies, and swap contracts | (14,334,240 | ) | |||||
| Total net assets | $ | 27,807,600 | |||||
°Principal amount shown is stated in the currency in which each security is denominated.
AUD — Australian Dollar
BRL — Brazilian Real
CAD — Canadian Dollar
CHF — Swiss Franc
EUR — European Monetary Unit
GBP — British Pound Sterling
JPY — Japanese Yen
NOK — Norwegian Kroner
NZD — New Zealand Dollar
SEK — Swedish Krona
USD — United States Dollar
| = | Security is being fair valued in accordance with the Fund’s fair valuation policy. At November 30, 2008, the aggregate amount of fair valued securities was $38,998, which represented 0.14% of the Fund’s net assets. See Note 1 in “Notes to financial statements.” |
| @ | Illiquid security. At November 30, 2008, the aggregate amount of illiquid securities was $2,172,504, which represented 7.81% of the Fund’s net assets. See Note 11 in “Notes to financial statements.” |
| † | Non income producing security. |
| Õ | Restricted security. These investments are in securities not registered under the Securities Act of 1933, and have certain restrictions on resale which may limit their liquidity. At November 30, 2008, the aggregate amount of the restricted securities was $1 or 0.00% of the Fund’s net assets. See Note 11 in “Notes to financial statements.” |
| · | Variable rate security. The rate shown is the rate as of November 30, 2008. |
| # | Security exempt from registration under Rule 144A of the Securities Act of 1933, as amended. At November 30, 2008, the aggregate amount of Rule 144A securities was $2,292,631, which represented 8.24% of the Fund’s net assets. See Note 11 in “Notes to financial statements.” |
| ‡ | Non income producing security. Security is currently in default. |
| Φ | Step coupon bond. Coupon increases periodically based on a predetermined schedule. Stated rate in effect at November 30, 2008. |
| v | Securities have been classified by type of business. Classification by country of origin has been presented in Sector and country allocations on page 7. |
| « | Senior Secured Loans in which the Fund invests generally pay interest at rates which are periodically redetermined by reference to a base lending rate plus a premium. These base lending rates are generally (i) the prime rate offered by one or more United States banks, (ii) the lending rate offered by one or more European banks such as the London Inter-Bank Offered Rate (LIBOR), and (iii) the certificate of deposit rate. Senior Secured Loans may be subject to restrictions on resale. |
| * | Fully or partially on loan. |
| ** | See Note 1 in “Notes to financial statements.” |
| *** | See Note 10 in “Notes to financial statements.” |
| © | Includes $2,918,623 of securities loaned. |
(continues) 17
Statement of net assets
Delaware Investments® Global Dividend and Income Fund, Inc.
| Summary of Abbreviations: ADR — American Depositary Receipt CDS — Credit Default Swap CVA — Dutch Certificate FDR — Foreign Depositary Receipt O.A.T. — Obligation Assimilable au Tresor (Treasury Obligation) PIK — Payment-in-kind REIT — Real Estate Investment Trust S.F. — Single Family yr — Year |
The following foreign currency exchange contracts, foreign cross currency exchange contracts and swap contracts were outstanding at November 30, 2008: |
Foreign Currency Exchange Contracts1
| Unrealized | |||||||||||||
| Contracts to | Settlement | Appreciation | |||||||||||
| Receive (Deliver) | In Exchange For | Date | (Depreciation) | ||||||||||
| AUD | (889,120 | ) | USD | 614,542 | 12/5/08 | $ | 32,723 | ||||||
| BRL | (187,506 | ) | USD | 87,172 | 12/5/08 | 5,769 | |||||||
| CAD | (242,809 | ) | USD | 204,419 | 12/5/08 | 7,929 | |||||||
| CHF | 90,432 | USD | (76,999 | ) | 12/5/08 | (2,467 | ) | ||||||
| EUR | (374,043 | ) | USD | 479,972 | 12/5/08 | 4,943 | |||||||
| EUR | 1,866,830 | USD | (2,384,546 | ) | 12/5/08 | (13,698 | ) | ||||||
| EUR | (631,822 | ) | USD | 808,733 | 12/5/08 | 6,327 | |||||||
| GBP | (595,290 | ) | USD | 879,167 | 12/5/08 | (38,055 | ) | ||||||
| JPY | 6,976,560 | GBP | (48,000 | ) | 12/5/08 | (904 | ) | ||||||
| JPY | 71,458,063 | USD | (724,932 | ) | 12/5/08 | 23,329 | |||||||
| JPY | 214,525,362 | USD | (2,171,309 | ) | 12/5/08 | 75,056 | |||||||
| NOK | (1,690,481 | ) | USD | 248,527 | 12/5/08 | 7,777 | |||||||
| NZD | (821,790 | ) | USD | 490,609 | 12/5/08 | 39,393 | |||||||
| SEK | (812,039 | ) | USD | 103,857 | 12/5/08 | 3,538 | |||||||
| $ | 151,660 | ||||||||||||
| Swap Contracts2 Credit Default Swap Contracts | ||||||||||||
| Annual | ||||||||||||
| Swap Counterparty & | Notional | Protection | Termination | Unrealized | ||||||||
| Referenced Obligation | Value | Payments | Date | Appreciation | ||||||||
| Protection Purchased: | ||||||||||||
| Citigroup | ||||||||||||
| Global Markets | ||||||||||||
| Hartford | ||||||||||||
| Financial CDS | $ | 8,050 | 4.95% | 12/20/13 | $ | 676 | ||||||
| JPMorgan Chase Bank, | ||||||||||||
| National Association | ||||||||||||
| Hartford | ||||||||||||
| Financial CDS | 8,050 | 5.20% | 12/20/13 | 745 | ||||||||
| Hartford | ||||||||||||
| Financial CDS | 8,050 | 7.00% | 12/20/13 | 175 | ||||||||
| Total | $ | 24,150 | $ | 1,596 | ||||||||
| The use of foreign currency exchange contracts, foreign cross currency exchange contracts and swap contracts involves elements of market risk and risks in excess of the amounts recognized in the financial statements. The notional values presented above represent the Fund’s total exposure in such contracts, whereas only the net unrealized appreciation (depreciation) is reflected in the Fund’s net assets. |
1 See Note 8 in “Notes to financial statements.”
2 See Note 9 in “Notes to financial statements.”
See accompanying notes
18
Statement of operations
Delaware Investments® Global Dividend and Income Fund, Inc.
Year Ended November 30, 2008
| Investment Income: | |||||||
| Dividends | $ | 1,747,532 | |||||
| Interest | 1,659,174 | ||||||
| Securities lending income | 64,567 | ||||||
| Foreign tax withheld | (64,072 | ) | $ | 3,407,201 | |||
| Expenses: | |||||||
| Management fees | $ | 502,602 | |||||
| Reports to shareholders | 93,285 | ||||||
| Legal fees | 78,525 | ||||||
| Transfer agent fees | 60,507 | ||||||
| Custodian fees | 37,741 | ||||||
| Accounting and administration expenses | 28,734 | ||||||
| Pricing fees | 22,766 | ||||||
| NYSE fees | 22,500 | ||||||
| Audit and tax | 16,843 | ||||||
| Taxes (other than taxes on income) | 8,000 | ||||||
| Dues and services | 7,961 | ||||||
| Leverage expenses | 3,505 | ||||||
| Directors’ fees | 3,073 | ||||||
| Insurance fees | 1,322 | ||||||
| Consulting fees | 773 | ||||||
| Registration fees | 643 | ||||||
| Directors’ expenses | 213 | 888,993 | |||||
| Less expense paid indirectly | (5,880 | ) | |||||
| Total operating expenses (before interest expense) | 883,113 | ||||||
| Interest expense | 571,493 | ||||||
| Total operating expenses | 1,454,606 | ||||||
| Net Investment Income | 1,952,595 | ||||||
| Net Realized and Unrealized Gain (Loss) on Investments and Foreign Currencies: | |||||||
| Net realized gain (loss) on: | |||||||
| Investments | (6,208,589 | ) | |||||
| Foreign currencies | 946,269 | ||||||
| Net realized loss | (5,262,320 | ) | |||||
| Net change in unrealized appreciation/depreciation of investments, foreign currencies, and swap contracts | (24,502,899 | ) | |||||
| Net Realized and Unrealized Loss on Investments and Foreign Currencies | (29,765,219 | ) | |||||
| Net Decrease in Net Assets Resulting from Operations | $ | (27,812,624 | ) | ||||
See accompanying notes
19
Statements of changes in net assets
Delaware Investments® Global Dividend and Income Fund, Inc.
| Year Ended | |||||||
| 11/30/08 | 11/30/07 | ||||||
| Increase (Decrease) in Net Assets from Operations: | |||||||
| Net investment income | $ | 1,952,595 | $ | 1,457,575 | |||
| Net realized gain (loss) on investments and foreign currencies | (5,262,320 | ) | 3,909,365 | ||||
| Net change in unrealized appreciation/depreciation of investments, foreign currencies, and swap contracts: | (24,502,899 | ) | (2,820,437 | ) | |||
| Net increase (decrease) in net assets resulting from operations | (27,812,624 | ) | 2,546,503 | ||||
| Dividends and Distributions to Shareholders from:1 | |||||||
| Net investment income | (3,065,302 | ) | (2,193,842 | ) | |||
| Net realized gains | — | (4,717,455 | ) | ||||
| Tax return of capital | (2,070,619 | ) | (4,895,858 | ) | |||
| (5,135,921 | ) | (11,807,155 | ) | ||||
| Capital Share Transactions:2 | |||||||
| Cost of shares repurchased | (2,573,422 | ) | — | ||||
| Decrease in net assets derived from capital share transactions | (2,573,422 | ) | — | ||||
| Net Decrease in Net Assets | (35,521,967 | ) | (9,260,652 | ) | |||
| Net Assets: | |||||||
| Beginning of year | 63,329,567 | 72,590,219 | |||||
| End of year (including distributions in excess of net investment income of $279,992 | |||||||
| and $349,505, respectively) | $ | 27,807,600 | $ | 63,329,567 | |||
1 See Note 4 in ”Notes to financial statements.”
2 See Note 6 in ”Notes to financial statements.”
See accompanying notes
20
Statement of cash flows
Delaware Investments® Global Dividend and Income Fund, Inc.
Year Ended November 30, 2008
| Net Cash (Including Foreign Currency) Provided by Operating Activities: | |||
| Net decrease in net assets resulting from operations | $ | (27,812,624 | ) |
| Adjustments to reconcile net decrease in net assets from operations to cash provided by operating activities: | |||
| Amortization of premium and discount on investments purchased | 91 | ||
| Purchase of investment securities | (40,403,585 | ) | |
| Purchase of short-term investment securities, net | (1,373,216 | ) | |
| Proceeds from disposition of investment securities | 55,889,137 | ||
| Net realized loss on investment transactions | 6,336,532 | ||
| Net change in unrealized appreciation/depreciation of investments and foreign currencies | 24,502,899 | ||
| Decrease in receivable for investments sold | 2,993,880 | ||
| Decrease in interest and dividends receivable | 215,802 | ||
| Decrease in payable for investments purchased | (413,408 | ) | |
| Decrease in interest payable | (168,299 | ) | |
| Decrease in accrued expenses and other liabilities | (59,138 | ) | |
| Total adjustments | 47,520,695 | ||
| Net cash provided by operating activities | 19,708,071 | ||
| Cash Flows Used in Financing Activities: | |||
| Repayment of line of credit, net | (12,275,000 | ) | |
| Cash dividends and distributions paid | (5,135,921 | ) | |
| Purchase of fund shares (tender offer) | (2,573,422 | ) | |
| Net cash used in financing activities | (19,984,343 | ) | |
| Effect of exchange rates on cash | (407,151 | ) | |
| Net decrease in cash | (683,423 | ) | |
| Cash at beginning of year | 1,088,557 | ||
| Cash at end of year | $ | 405,134 | |
| Interest paid for borrowings during the year | $ | 739,792 | |
See accompanying notes
21
Financial highlights
Delaware Investments® Global Dividend and Income Fund, Inc.
Selected data for each share of the Fund outstanding throughout each period were as follows:
| Year Ended | |||||||||||||||
| 11/30/08 | 11/30/07 | 11/30/06 | 11/30/05 | 11/30/04 | |||||||||||
| Net asset value, beginning of period | $11.590 | $13.290 | $13.190 | $13.590 | $11.980 | ||||||||||
| Income (loss) from investment operations: | |||||||||||||||
| Net investment income1 | 0.365 | 0.269 | 0.273 | 0.384 | 0.416 | ||||||||||
| Net realized and unrealized gain (loss) | |||||||||||||||
| on investments and foreign currencies | (5.635 | ) | 0.192 | 2.437 | 0.176 | 2.154 | |||||||||
| Total from investment operations | (5.270 | ) | 0.461 | 2.710 | 0.560 | 2.570 | |||||||||
| Less dividends and distributions from: | |||||||||||||||
| Net investment income | (0.573 | ) | (0.402 | ) | (0.316 | ) | (0.398 | ) | (0.815 | ) | |||||
| Net realized gain on investments | — | (0.863 | ) | (2.294 | ) | (0.562 | ) | (0.145 | ) | ||||||
| Return of capital | (0.387 | ) | (0.896 | ) | — | — | — | ||||||||
| Total dividends and distributions | (0.960 | ) | (2.161 | ) | (2.610 | ) | (0.960 | ) | (0.960 | ) | |||||
| Net asset value, end of period | $5.360 | $11.590 | $13.290 | $13.190 | $13.590 | ||||||||||
| Market value, end of period | $4.240 | $10.550 | $13.800 | $13.400 | $12.300 | ||||||||||
| Total return based on:2 | |||||||||||||||
| Market value | (54.54% | ) | (8.46% | ) | 24.39% | 17.22% | 12.01% | ||||||||
| Net asset value | (47.68% | ) | 4.43% | 21.61% | 4.43% | 22.92% | |||||||||
| Ratios and supplemental data: | |||||||||||||||
| Net assets, end of period (000 omitted) | $27,808 | $63,330 | $72,590 | $72,082 | $81,321 | ||||||||||
| Ratio of expenses to average net assets | 2.90% | 3.13% | 3.24% | 2.59% | 1.92% | ||||||||||
| Ratio of expenses to adjusted average net assets | |||||||||||||||
| (before interest expense)3 | 1.23% | 0.98% | 1.01% | 1.13% | 0.98% | ||||||||||
| Ratio of interest expense to adjusted average net assets3 | 0.79% | 1.40% | 1.40% | 0.87% | 0.46% | ||||||||||
| Ratio of net investment income to average net assets | 3.90% | 2.01% | 2.21% | 2.84% | 3.31% | ||||||||||
| Ratio of net investment income to adjusted average net assets3 | 2.71% | 1.52% | 1.65% | 2.19% | 2.48% | ||||||||||
| Portfolio turnover | 60% | 46% | 76% | 121% | 78% | ||||||||||
| Leverage Analysis: | |||||||||||||||
| Debt outstanding at end of period at par (000 omitted) | $10,725 | $23,000 | $23,000 | $23,000 | $25,000 | ||||||||||
| Asset coverage per $1,000 of debt outstanding at end of period | $3,593 | $3,753 | $4,156 | $4,134 | $4,253 | ||||||||||
| 1 The average shares outstanding method has been applied for per share information. | |
| 2 Total investment return is calculated assuming a purchase of common stock on the opening of the first day and a sale on the closing of the last day of each period reported. Dividends and distributions, if any, are assumed for the purpose of this calculation, to be reinvested at prices obtained under the Fund’s dividend reinvestment plan. Generally, total investment return based on net asset value will be higher than total investment return based on market value in periods where there is an increase in the discount or decrease in the premium of the market value to the net asset value from the beginning to the end of such periods. Conversely, total investment return based on net asset value will be lower than total investment return based on market value in periods where there is a decrease in the discount or an increase in the premium of the market value to the net asset value from the beginning to the end of such periods. | |
| 3 Adjusted average net assets excludes debt outstanding. |
See accompanying notes
22
Notes to financial statements
Delaware Investments® Global Dividend and Income Fund, Inc.
November 30, 2008
Delaware Investments Global Dividend and Income Fund, Inc. (Fund) is organized as a Maryland corporation and is a diversified closed-end management investment company under the Investment Company Act of 1940, as amended. The Fund’s shares trade on the New York Stock Exchange (NYSE) under the symbol DGF.
The investment objective of the Fund is to seek high current income. Capital appreciation is a secondary objective.
1. Significant Accounting Policies
The following accounting policies are in accordance with U.S. generally accepted accounting principles and are consistently followed by the Fund.
Security Valuation — Equity securities, except those traded on the Nasdaq Stock Market, Inc. (Nasdaq), are valued at the last quoted sales price as of the time of the regular close of the NYSE on the valuation date. Securities traded on the Nasdaq are valued in accordance with the Nasdaq Official Closing Price, which may not be the last sales price. If on a particular day an equity security does not trade, then the mean between the bid and ask prices will be used. Securities listed on a foreign exchange are valued at the last quoted sales price on the valuation date. U.S. Government and agency securities are valued at the mean between the bid and ask prices. Other long-term debt securities, credit default swap (CDS) contracts and interest rate swap contracts are valued by an independent pricing service or broker. To the extent current market prices are not available, the pricing service may take into account developments related to the specific security, as well as transactions in comparable securities. Short-term debt securities having less than 60 days to maturity are valued at amortized cost, which approximates market value. Investment companies are valued at net asset value per share. Foreign currency exchange contracts and forward foreign cross currency exchange contracts are valued at the mean between the bid and ask prices. Interpolated values are derived when the settlement date of the contract is an interim date for which quotations are not available. Financial futures contracts and options on futures contracts are valued at the daily quoted settlement prices. Exchange-traded options are valued at the last reported sale price or, if no sales are reported, at the mean between the last reported bid and ask prices. Generally, index swap contracts, spread swap contracts and other securities and assets for which market quotations are not readily available are valued at fair value as determined in good faith under the direction of the Fund’s Board of Directors (Board). In determining whether market quotations are readily available or fair valuation will be used, various factors will be taken into consideration, such as market closures or suspension of trading in a security. The Fund may use fair value pricing more frequently for securities traded primarily in non-U.S. markets because, among other things, most foreign markets close well before the Fund values its securities at 4:00 p.m. Eastern Time. The earlier close of these foreign markets gives rise to the possibility that significant events, including broad market moves, government actions or pronouncements, aftermarket trading or new events, may have occurred in the interim. To account for this, the Fund may frequently value foreign securities using fair value prices based on third-party vendor modeling tools (“international fair value pricing”).
Federal Income Taxes — The Fund intends to continue to qualify for federal income tax purposes as a regulated investment company under Subchapter M of the Internal Revenue Code of 1986, as amended, and make the requisite distributions to shareholders. Accordingly, no provision for federal income taxes has been made in the financial statements. Effective May 30, 2008, the Fund adopted FASB Interpretation No. 48 “Accounting for Uncertainty in Income Taxes” (FIN 48). FIN 48 provides guidance for how uncertain tax positions should be recognized, measured, presented, and disclosed in the financial statements. FIN 48 requires the evaluation of tax positions taken or expected to be taken in the course of preparing the Fund’s tax returns to determine whether the tax positions are “more-likely-than-not” of being sustained by the applicable tax authority. Tax positions not deemed to meet the more-likely-than-not threshold would be recorded as a tax benefit or expense in the current year. The adoption of FIN 48 did not result in the recording of any tax benefit or expense in the current period.
Distributions — The Fund has a managed distribution policy. Under the policy, the Fund declares and pays monthly distributions and is managed with a goal of generating as much of the distribution as possible from ordinary income (net investment income and short-term capital gains). The balance of the distribution then comes from long-term capital gains to the extent permitted and, if necessary, a return of capital.
Repurchase Agreements — The Fund may invest in a pooled cash account along with other members of the Delaware Investments Family of Funds pursuant to an exemptive order issued by the Securities and Exchange Commission. The aggregate daily balance of the pooled cash account is invested in repurchase agreements secured by obligations of the U.S. government. The respective collateral is held by the Fund’s custodian bank until the maturity of the respective repurchase agreements. Each repurchase agreement is at least 102% collateralized. However, in the event of default or bankruptcy by the counterparty to the agreement, realization of the collateral may be subject to legal proceedings.
Foreign Currency Transactions — Transactions denominated in foreign currencies are recorded at the prevailing exchange rates on the valuation date. The value of all assets and liabilities denominated in foreign currencies is translated into U.S. dollars at the exchange rate of such currencies against the U.S. dollar daily. Transaction gains or losses resulting from changes in exchange rates during the reporting period or upon settlement of the foreign currency transaction are reported in operations for the current period. The Fund isolates that portion of realized gains and losses on investments in debt securities, which is due to changes in foreign exchange rates from that which are due to changes in market prices of debt securities. For foreign equity securities, these changes are included in realized gains (losses) on investments. The Fund reports certain foreign currency related transactions as components of realized gains (losses) for financial reporting purposes, whereas such components are treated as ordinary income (loss) for federal income tax purposes.
Use of Estimates — The preparation of financial statements in conformity with U.S. generally accepted accounting principles requires management to make estimates and assumptions that affect the reported amounts of assets and liabilities at the date of the financial statements and the reported amounts of revenues and expenses during the reporting period. Actual results could differ from those estimates.
Other — Expenses directly attributable to the Fund are charged directly to the Fund. Other expenses common to various funds within the Delaware Investments Family of Funds are generally allocated amongst such funds on the basis of average net assets. Management fees and some other expenses are paid monthly. Security transactions are recorded on the date the securities are purchased or sold (trade date) for financial reporting
(continues) 23
Notes to financial statements
Delaware Investments® Global Dividend and Income Fund, Inc.
1. Significant Accounting Policies (continued)
purposes. Costs used in calculating realized gains and losses on the sale of investment securities are those of the specific securities sold. Dividend income is recorded on the ex-dividend date and interest income is recorded on the accrual basis. Discounts and premiums on non-convertible bonds are amortized to interest income over the lives of the respective securities. Realized gains (losses) on paydowns of mortgage and asset-backed securities are classified as interest income. Foreign dividends are also recorded on the ex-dividend date or as soon after the ex-dividend date that the Fund is aware of such dividends, net of all non-rebatable tax withholdings. Withholding taxes on foreign dividends and interest have been provided for in accordance with the Fund’s understanding of the applicable country’s tax rules and rates. Distributions received from investments in Real Estate Investment Trusts (REITs) are recorded as dividend income on the ex-dividend date, subject to reclassification upon notice of the character of such distributions by the issuer. The financial statements reflect an estimate of the reclassification of the distribution character.
Subject to seeking best execution, the Fund may direct certain security trades to brokers who have agreed to rebate a portion of the related brokerage commission to the Fund in cash. Such commission rebates are included in realized gain on investments in the accompanying financial statements and totaled $353 for the year ended November 30, 2008. In general, best execution refers to many factors, including the price paid or received for a security, the commission charged, the promptness and reliability of execution, the confidentiality and placement accorded the order, and other factors affecting the overall benefit obtained by the Fund on the transaction. DMC, as defined below, and its affiliates have previously and may in the future act as an investment advisor to mutual funds or separate accounts affiliated with the administrator of the commission recapture program described above. In addition, affiliates of the administrator act as consultants in helping institutional clients choose investment advisors and may also participate in other types of business and provide other services in the investment management industry.
The Fund receives earnings credits from its custodian when positive cash balances are maintained, which are used to offset custody fees. The expense paid under this arrangement is included in custodian fees on the statement of operations with the corresponding expense offset shown as “expense paid indirectly.”
2. Investment Management, Administration Agreements and Other Transactions with Affiliates
In accordance with the terms of its Investment Management Agreement, the Fund pays Delaware Management Company (DMC), a series of Delaware Management Business Trust and the investment manager, an annual fee of 0.70% (calculated daily) of the adjusted average weekly net assets of the Fund. For purposes of the calculation of investment management fees, adjusted average weekly net assets excludes the line of credit liability.
Delaware Service Company, Inc. (DSC), an affiliate of DMC, provides fund accounting and financial administration oversight services to the Fund. For these services, the Fund pays DSC fees based on the aggregate daily net assets of the Delaware Investments Family of Funds at the following annual rate: 0.0050% of the first $30 billion; 0.0045% of the next $10 billion; 0.0040% of the next $10 billion; and 0.0025% of aggregate average daily net assets in excess of $50 billion. The fees payable to DSC under the service agreement described above are allocated among all Funds in the Delaware Investments Family of Funds on a relative net asset value basis. For the year ended November 30, 2008, the Fund was charged $3,592 for these services.
At November 30, 2008, the Fund had liabilities payable to affiliates as follows:
| Investment management fee payable to DMC | $ | 24,089 |
| Fees and other expenses payable to DSC | 170 | |
| Other expenses payable to DMC and affiliates* | 6,353 |
*DMC, as part of its administrative services, pays operating expenses on behalf of the Fund and is reimbursed on a periodic basis. Such expenses include items such as printing of shareholder reports, fees for audit, legal and tax services, stock exchange fees, custodian fees and Directors’ fees.
As provided in the investment management agreement, the Fund bears the cost of certain legal and tax services, including internal legal and tax services provided to the Fund by DMC and/or its affiliates’ employees. For the year ended November 30, 2008, the Fund was charged $3,418 for internal legal and tax services provided by DMC and/or its affiliates’ employees.
Directors’ fees include expenses accrued by the Fund for each Directors’ retainer and meeting fees. Certain officers of DMC and DSC are officers and/or directors of the Fund. These officers and Directors are paid no compensation by the Fund.
3. Investments
For the year ended November 30, 2008, the Fund made purchases of $40,403,585 and sales of $55,889,137 of investment securities other than short-term investments.
At November 30, 2008, the cost of investments for federal income tax purposes was $55,845,364. At November 30, 2008, net unrealized depreciation was $15,033,735, of which $810,074 related to unrealized appreciation of investments and $15,843,809 related to unrealized depreciation of investments.
Effective December 1, 2007, the Fund adopted Financial Accounting Standards No. 157, Fair Value Measurements (FAS 157). FAS 157 defines fair value as the price that the Fund would receive to sell an asset or pay to transfer a liability in an orderly transaction between market participants at the measurement date. FAS 157 also establishes a framework for measuring fair value, and a three level hierarchy for fair value measurements based upon the transparency of inputs to the valuation of an asset or liability. Inputs may be observable or unobservable and refer broadly to the assumptions that market participants would use in pricing the asset or liability. Observable inputs reflect the assumptions market participants would use in pricing the asset or liability based on market data obtained from sources independent of the reporting entity. Unobservable inputs reflect the reporting entity’s own assumptions about the assumptions that market participants
24
3. Investments (continued)
would use in pricing the asset or liability developed based on the best information available under the circumstances. The Fund’s investment in its entirety is assigned a level based upon the observability of the inputs which are significant to the overall valuation. The three-tier hierarchy of inputs is summarized below.
Level 1 – inputs are quoted prices in active markets
Level 2 – inputs are observable, directly or indirectly
Level 3 – inputs are unobservable and reflect assumptions on the part of the reporting entity
The following table summarizes the valuation of the Fund’s investments by the above FAS 157 fair value hierarchy levels as of November 30, 2008:
| Securities | Derivatives | ||||
| Level 1 | $ | 20,072,845 | $ | — | |
| Level 2 | 20,171,289 | 153,256 | |||
| Level 3 | 567,495 | — | |||
| Total | $ | 40,811,629 | $ | 153,256 | |
The following is a reconciliation of investments in which significant unobservable inputs (Level 3) were used in determining fair value:
| Securities | ||||
| Balance as of 11/30/07 | $ | 834,625 | ||
| Net realized loss | (49,844 | ) | ||
| Net change in unrealized | ||||
| appreciation/depreciation | (672,523 | ) | ||
| Net purchases, sales and settlements | (43,194 | ) | ||
| Net transfers in and/or out of Level 3 | 498,431 | |||
| Balance as of 11/30/08 | $ | 567,495 | ||
| Net change in unrealized | ||||
| appreciation/depreciation on | ||||
| investments still held as of 11/30/08 | $ | (701,626 | ) | |
4. Dividend and Distribution Information
Income and long-term capital gain distributions are determined in accordance with federal income tax regulations, which may differ from U.S. generally accepted accounting principles. Additionally, distributions from net gains on foreign currency transactions and net short-term gains on sales of investment securities are treated as ordinary income for federal income tax purposes. The tax character of dividends and distributions paid during the years ended November 30, 2008 and 2007 was as follows:
| Year Ended | ||||||
| 11/30/08 | 11/30/07 | |||||
| Ordinary income | $ | 3,065,302 | $ | 2,426,014 | ||
| Long-term capital gains | — | 4,485,283 | ||||
| Return of capital | 2,070,619 | 4,895,858 | ||||
| Total | $ | 5,135,921 | $ | 11,807,155 | ||
5. Components of Net Assets on a Tax Basis
As of November 30, 2008, the components of net assets on a tax basis were as follows:
| Shares of beneficial interest | $ | 49,148,381 | |
| Capital loss carrryforwards | (6,164,872 | ) | |
| Other temporary differences | (126,965 | ) | |
| Unrealized depreciation of investments, | |||
| foreign currencies, and swap contracts | (15,048,944 | ) | |
| Net assets | $ | 27,807,600 |
The differences between book basis and tax basis components of net assets are primarily attributable to tax deferral of losses on wash sales, tax deferral of losses on straddles, contingent payment debt instruments, partnership income, mark-to-market of foreign currency contracts, tax treatment of CDS contracts, and market discount and premium on debt instruments.
For financial reporting purposes, capital accounts are adjusted to reflect the tax character of permanent book/tax differences. Reclassifications are primarily due to tax treatment of gain (loss) on foreign currency transactions, dividends and distributions, partnership income, market discount and premium on certain debt instruments, paydowns of mortgage- and asset-backed securities. Results of operations and net assets were not affected by these reclassifications. For the year ended November 30, 2008, the Fund recorded the following reclassifications:
| Distributions in excess of net investment income | $ | 1,182,220 | |
| Accumulated net realized loss | (1,176,966 | ) | |
| Paid-in Capital | (5,254 | ) |
For federal income tax purposes, capital loss carryforwards may be carried forward and applied against future capital gains. Capital loss carryforward remaining at November 30, 2008 was $6,164,872 and expires in 2016.
6. Capital Stock
Shares obtained under the Fund’s dividend reinvestment plan are purchased by the Fund’s transfer agent, BNY Mellon Shareowner Services, in the open market. There were no shares issued under the Fund’s dividend reinvestment plan for the years ended November 30, 2008 and 2007.
On May 22, 2008, the Fund’s Board approved a tender offer for shares of the Fund’s common stock. The tender offer authorized the Fund to purchase up to 5% of its issued and outstanding shares at a price equal to the Fund’s net asset value at the close of business on the NYSE on June 30, 2008, the first business day following the expiration of the offer.
The tender offer commenced on May 30, 2008 and expired on June 27, 2008. In connection with the tender offer, the Fund purchased 273,187 shares of capital stock at a total cost of $2,573,422.
Notes to financial statements
Delaware Investments® Global Dividend and Income Fund, Inc.
7. Line of Credit
For the year ended November 30, 2008, the Fund borrowed money pursuant to a $25,000,000 Credit Agreement with The Bank of New York Mellon (BNY Mellon) that expires on November 30, 2009. During the year ended November 30, 2008, the Fund reduced the amount borrowed pursuant to the Credit Agreement from $23,000,000 to $10,725,000. The reduction was a result of the unprecedented volatility in the securities markets. Depending on market conditions, the amount borrowed by the Fund pursuant to the Credit Agreement may be reduced or possibly increased in the future.
At November 30, 2008, the par value of loans outstanding was $10,725,000 at a variable interest rate of 1.42%. During the year ended November 30, 2008, the average daily balance of loans outstanding was $21,805,601 at a weighted average interest rate of approximately 2.62%. Interest on borrowings is based on a variable short-term rate plus an applicable margin. The commitment fee is computed at a rate of 0.10% per annum on the unused balance. The loan is collateralized by the Fund’s portfolio.
8. Foreign Currency Exchange Contracts
The Fund may enter into foreign currency exchange contracts as a way of managing foreign exchange rate risk. The Fund may enter into these contracts to fix the U.S. dollar value of a security that it has agreed to buy or sell for the period between the date the trade was entered into and the date the security is delivered and paid for. The Fund may also use these contracts to hedge the U.S. dollar value of securities it already owns that are denominated in foreign currencies. The change in value is recorded as an unrealized gain or loss. When the contract is closed, a realized gain or loss is recorded equal to the difference between the value of the contract at the time it was opened and the value at the time it was closed.
The use of foreign currency exchange contracts does not eliminate fluctuations in the underlying prices of the securities, but does establish a rate of exchange that can be achieved in the future. Although foreign currency exchange contracts limit the risk of loss due to a decline in the value of the hedged currency, they also limit any potential gain that might result should the value of the currency increase. In addition, the Fund could be exposed to risks if the counterparties to the contracts are unable to meet the terms of their contracts.
9. Swap Contracts
The Fund may enter into interest rate swap contracts, index swap contracts and CDS contracts in accordance with its investment objectives. The Fund may use interest rate swaps to adjust the Fund’s sensitivity to interest rates or to hedge against changes in interest rates. Index swaps may be used to gain exposure to markets that the Fund invests in, such as the corporate bond market. The Fund may also use index swaps as a substitute for futures or options contracts if such contracts are not directly available to the Fund on favorable terms. The Fund may enter into CDS contracts in order to hedge against a credit event, to enhance total return or to gain exposure to certain securities or markets.
An interest rate swap involves payments received by the Fund from another party based on a variable or floating interest rate, in return for making payments based on a fixed interest rate. An interest rate swap can also work in reverse with the Fund receiving payments based on a fixed interest rate and making payments based on a variable or floating interest rate. Interest rate swaps may be used to adjust the Fund’s sensitivity to interest rates or to hedge against changes in interest rates. Periodic payments on such contracts are accrued daily and recorded as unrealized appreciation/depreciation on swap contracts. Upon periodic payment/ receipt or termination of the contract, such amounts are recorded as realized gains or losses on swap contracts.
Index swaps involve commitments to pay interest in exchange for a market-linked return based on a notional amount. To the extent the total return of the security, instrument or basket of instruments underlying the transaction exceeds the offsetting interest obligation, the Fund will receive a payment from the counterparty. To the extent the total return of the security, instrument or basket of instruments underlying the transaction falls short of the offsetting interest obligation, the Fund will make a payment to the counterparty. The change in value of swap contracts outstanding, if any, is recorded as unrealized appreciation or depreciation daily. A realized gain or loss is recorded at maturity or termination of the swap contract.
A CDS contract is a risk-transfer instrument through which one party (purchaser of protection) transfers to another party (seller of protection) the financial risk of a credit event (as defined in the CDS agreement), as it relates to a particular referenced security or basket of securities (such as an index). In exchange for the protection offered by the seller of protection, the purchaser of protection agrees to pay the seller of protection a periodic amount at a stated rate that is applied to the notional amount of the CDS contract. In addition, an upfront payment may be made or received by the Fund in connection with an unwinding or assignment of a CDS contract. Upon the occurrence of a credit event, the seller of protection would pay the par (or other agreed-upon) value of the referenced security (or basket of securities) to the counterparty.
During the year ended November 30, 2008, the Fund entered into CDS contracts as a purchaser of protection. Periodic payments on such contracts are accrued daily and recorded as unrealized losses on swap contracts. Upon payment, such amounts are recorded as realized losses on swap contracts. Upfront payments made or received in connection with CDS contracts are amortized over the expected life of the CDS contracts as unrealized losses (gains) on swap contracts. The change in value of CDS contracts is recorded as unrealized appreciation or depreciation daily. A realized gain or loss is recorded upon a credit event (as defined in the CDS agreement) or the maturity or termination of the agreement. For the year ended November 30, 2008, the Fund did not enter into any CDS contracts as a seller of protection.
CDS may involve greater risks than if the Fund had invested in the referenced obligation directly. Credit default swaps are subject to general market risk, liquidity risk, counterparty risk and credit risk. If the Fund enters into a CDS contract as a purchaser of protection and no credit event occurs, its exposure is limited to the periodic payments previously made to the counterparty.
Because there is no organized market for swap contracts, the value of open swaps may differ from that which would be realized in the event the Fund terminated its position in the agreement. Risks of entering into these contracts include the potential inability of the counterparty to meet the terms of the contracts. This type of risk is generally limited to the amount of favorable movement in the value of the underlying security, instrument
26
or basket of instruments, if any, at the day of default. Risks also arise from potential losses from adverse market movements and such losses could exceed the unrealized amounts shown on the statements of net assets.
10. Securities Lending
The Fund, along with other funds in the Delaware Investments® Family of Funds, may lend its securities pursuant to a security lending agreement (Lending Agreement) with BNY Mellon. With respect to each loan, if the aggregate market value of securities collateral held plus cash collateral received on any business day is less than the aggregate market value of the securities which are the subject of such loan, the borrower will be notified to provide additional collateral not less than the applicable collateral requirements. Cash collateral received is generally invested in the Mellon GSL DBT II Collateral Fund (the “Collective Trust”) established by BNY Mellon for the purpose of investment on behalf of clients participating in its securities lending programs. The Collective Trust invests in fixed income securities, with a weighted average maturity not to exceed 90 days, rated in one of the top three tiers by Standard & Poor’s Ratings Group or Moody’s Investors Service, Inc. or repurchase agreements collateralized by such securities. The Collective Trust seeks to maintain a net asset value per unit of $1.00, but there can be no assurance that it will always be able to do so. The Fund may incur investment losses as a result of investing securities lending collateral in the Collective Trust. This could occur if an investment in the Collective Trust defaulted or if it were necessary to liquidate assets in the Collective Trust to meet returns on outstanding security loans at a time when the Collective Trust’s net asset value per unit was less than $1.00. Under those circumstances, the Fund may not receive an amount from the Collective Trust that is equal in amount to the collateral the Fund would be required to return to the borrower of the securities and the Fund would be required to make up for this shortfall. During the year ended November 30, 2008, BNY Mellon transferred certain distressed securities from the Collective Trust into the Mellon GSL DBT II Liquidation Trust. The Fund can also accept U.S. government securities and letters of credit (non-cash collateral) in connection with securities loans. In the event of default or bankruptcy by the lending agent, realization and/or retention of the collateral may be subject to legal proceedings. In the event the borrower fails to return loaned securities and the collateral received is insufficient to cover the value of the loaned securities and provided such collateral shortfall is not the result of investment losses, the lending agent has agreed to pay the amount of the shortfall to the Fund, or at the discretion of the lending agent, replace the loaned securities. The Fund continues to record dividends or interest, as applicable, on the securities loaned and is subject to change in value of the securities loaned that may occur during the term of the loan. The Fund has the right under the Lending Agreement to recover the securities from the borrower on demand. With respect to security loans collateralized by non-cash collateral, the Fund receives loan premiums paid by the borrower. With respect to security loans collateralized by cash collateral, the earnings from the collateral investments are shared among the Fund, the security lending agent and the borrower. The Fund records security lending income net of allocations to the security lending agent and the borrower.
At November 30, 2008, the value of the securities on loan was $2,918,623, for which the cash collateral was received and invested in accordance with the Lending Agreement. Such investments are presented on the statement of net assets under the caption “Securities Lending Collateral.”
11. Credit and Market Risk
The Fund borrows through its line of credit for purposes of leveraging. Leveraging may result in higher degrees of volatility because the Fund’s net asset value could be subject to fluctuations in short-term interest rates and changes in market value of portfolio securities attributable to the leverage.
Some countries in which the Fund may invest require governmental approval for the repatriation of investment income, capital or the proceeds of sales of securities by foreign investors. In addition, if there is deterioration in a country’s balance of payments or for other reasons, a country may impose temporary restrictions on foreign capital remittances abroad.
The securities exchanges of certain foreign markets are substantially smaller, less liquid and more volatile than the major securities markets in the United States. Consequently, acquisition and disposition of securities by the Fund may be inhibited. In addition, a significant portion of the aggregate market value of equity securities listed on the major securities exchanges in emerging markets is held by a smaller number of investors. This may limit the number of shares available for acquisition or disposition by the Fund.
The Fund invests a portion of its assets in high yield fixed income securities, which carry ratings of BB or lower by Standard & Poor’s Ratings Group and/or Ba or lower by Moody’s Investors Service, Inc. Investments in these higher yielding securities are generally accompanied by a greater degree of credit risk than higher rated securities. Additionally, lower rated securities may be more susceptible to adverse economic and competitive industry conditions than investment grade securities.
The Fund invests in REITs and is subject to the risks associated with that industry. If the Fund holds real estate directly as a result of defaults or receives rental income directly from real estate holdings, its tax status as a regulated investment company may be jeopardized. There were no direct real estate holdings during the year ended November 30, 2008. The Fund’s REIT holdings are also affected by interest rate changes, particularly if the REITs it holds use floating rate debt to finance their ongoing operations.
The Fund may invest up to 10% of its net assets in illiquid securities, which may include securities with contractual restrictions on resale, securities exempt from registration under Rule 144A of the Securities Act of 1933, as amended, and other securities which may not be readily marketable. The relative illiquidity of these securities may impair the Fund from disposing of them in a timely manner and at a fair price when it is necessary or desirable to do so. While maintaining oversight, the Fund’s Board has delegated to DMC the day-to-day functions of determining whether individual securities are liquid for purposes of the Fund’s limitation on investments in illiquid assets. Securities eligible for resale pursuant to Rule 144A, which are determined to be liquid, are not subject to the Fund’s 10% limit on investments in illiquid securities. Rule 144A and illiquid securities have been identified on the statement of net assets.
(continues) 27
Notes to financial statements
Delaware Investments® Global Dividend and Income Fund, Inc.
12. Contractual Obligations
The Fund enters into contracts in the normal course of business that contain a variety of indemnifications. The Fund’s maximum exposure under these arrangements is unknown. However, the Fund has not had prior claims or losses pursuant to these contracts. Management has reviewed the Fund’s existing contracts and expects the risk of loss to be remote.
13. Tax Information (Unaudited)
The information set forth below is for the Fund’s fiscal year as required by federal income tax laws. Shareholders, however, must report distributions on a calendar year basis for income tax purposes, which may include distributions for portions of two fiscal years of a fund. Accordingly, the information needed by shareholders for income tax purposes will be sent to them in January of each year. Please consult your tax advisor for proper treatment of this information.
For the fiscal year ended November 30, 2008, the Fund designates distributions paid during the year as follows:
| (A) | (B) | |||||||
| Long-Term | Ordinary | (C) | ||||||
| Capital Gain | Income | Return | Total | (D) | ||||
| Distributions | Distributions* | of Capital | Distributions | Qualifying | ||||
| (Tax Basis) | (Tax Basis) | (Tax Basis) | (Tax Basis) | Dividends1 | ||||
| — | 59.68% | 40.32% | 100% | 28.75% |
(A), (B), and (C) are based on a percentage of the Fund’s total distributions.
(D) is based on percentage of ordinary income distributions of the Fund.
1Qualifying dividends represent dividends, which qualify for the corporate dividends received deduction.
*For the fiscal year ended November 30, 2008, certain dividends paid by the Fund may be subject to a maximum tax rate of 15%, as provided for by the Jobs and Growth Tax Relief Reconciliation Act of 2003. The Fund intends to designate up to a maximum amount of $ 960,507 to be taxed at a maximum rate of 15%.Complete information will be computed and reported in conjunction with your 2008 Form 1099-DIV.
28
Report of independent
registered public accounting firm
To the Shareholders and Board of Directors
Delaware Investments® Global Dividend
and Income Fund, Inc.
We have audited the accompanying statement of net assets of Delaware Investments Global Dividend and Income Fund, Inc. (the “Fund”) as of November 30, 2008, and the related statements of operations and cash flows for the year then ended, the statements of changes in net assets for each of the two years in the period then ended, and the financial highlights for each of the five years in the period then ended. These financial statements and financial highlights are the responsibility of the Fund’s management. Our responsibility is to express an opinion on these financial statements and financial highlights based on our audits.
We conducted our audits in accordance with the standards of the Public Company Accounting Oversight Board (United States). Those standards require that we plan and perform the audit to obtain reasonable assurance about whether the financial statements and financial highlights are free of material misstatement. We were not engaged to perform an audit of the Fund’s internal control over financial reporting. Our audits included consideration of internal control over financial reporting as a basis for designing audit procedures that are appropriate in the circumstances, but not for the purpose of expressing an opinion on the effectiveness of the Fund’s internal control over financial reporting. Accordingly, we express no such opinion. An audit also includes examining, on a test basis, evidence supporting the amounts and disclosures in the financial statements and financial highlights, assessing the accounting principles used and significant estimates made by management, and evaluating the overall financial statement presentation. Our procedures included confirmation of securities owned as of November 30, 2008 by correspondence with the custodian and brokers or by other appropriate auditing procedures where replies from brokers were not received. We believe that our audits provide a reasonable basis for our opinion.
In our opinion, the financial statements and financial highlights referred to above present fairly, in all material respects, the financial position of the Delaware Investments Global Dividend and Income Fund, Inc. at November 30, 2008, the results of its operations and cash flows for the year then ended, the changes in its net assets for each of the two years in the period then ended, and its financial highlights for each of the five years in the period then ended, in conformity with U.S. generally accepted accounting principles.

Philadelphia, Pennsylvania
January 16, 2009
29
Other Fund information
(Unaudited)
Delaware Investments® Global Dividend and Income Fund, Inc.
Proxy Results
The Fund held its Annual Meeting of Shareholders on Aug. 20, 2008. At the Annual Meeting, the Fund’s shareholders elected nine Directors. The results of the voting at the meeting were as follows:
| Shares Voted | |||||||
| Against or | No Vote | ||||||
| Nominee | Shares Voted For | Withheld | Received | ||||
| Patrick P. Coyne | 4,757,172.54 | 183,099.40 | 523,473.06 | ||||
| Thomas L. Bennett | 4,758,182.54 | 182,089.40 | 523,473.06 | ||||
| John A. Fry | 4,758,672.54 | 181,599.40 | 523,473.06 | ||||
| Anthony D. Knerr | 4,756,029.54 | 184,242.40 | 523,473.06 | ||||
| Lucinda S. Landreth | 4,757,397.54 | 182,874.40 | 523,473.06 | ||||
| Ann R. Leven | 4,756,904.54 | 183,367.40 | 523,473.06 | ||||
| Thomas F. Madison | 4,752,784.54 | 187,487.40 | 523,473.06 | ||||
| Janet L. Yeomans | 4,756,772.54 | 183,499.40 | 523,473.06 | ||||
| J. Richard Zecher | 4,758,272.54 | 181,999.40 | 523,473.06 | ||||
Corporate Governance
The Fund’s audit committee charter is available on its web site at www.delawareinvestments.com, and the charter is also available in print to any shareholder who requests it. The Fund submitted its Annual CEO certification for 2008 to the New York Stock Exchange (“NYSE”) on September 19, 2008 stating that the CEO was not aware of any violation by the Fund of the NYSE’s corporate governance listing standards. In addition, the Fund had filed the required CEO/CFO certifications regarding the quality of the Fund’s public disclosure as exhibits to the Forms N-CSR and Forms N-Q filed by the Fund over the past fiscal year. The Fund’s Form N-CSR and Form N-Q filings are available on the Commission’s web site at www.sec.gov.
Changes to Portfolio Management Team
Roger A. Early and Kristen E. Bartholdson were appointed co-portfolio managers of the Fund on Jan. 14, 2008, and Dec. 8, 2008, respectively. Mr. Early and Ms. Bartholdson joined Anthony A. Lombardi, Babak Zenouzi, Nikhil G. Lalvani, Robert A. Vogel Jr., Nashira S. Wynn, Philip R. Perkins, Damon J. Andres, Edward Gray, Thomas H. Chow, D. Tysen Nutt Jr., Kevin P. Loome, and Todd A. Bassion in making day-to-day decisions for the Fund.
Fund management
Anthony A. Lombardi, CFA
Vice President, Senior Portfolio Manager
Anthony A. Lombardi joined Delaware Investments in 2004 as a vice president and senior portfolio manager for the firm’s Large-Cap Value Focus strategy. Previously, Lombardi worked at Merrill Lynch Investment Managers from 1998 to 2004, where he rose to the position of director and portfolio manager for the U.S. Active Large-Cap Value team, managing mutual funds and separate accounts for institutions and private clients. Prior to that, he worked at Dean Witter Reynolds for seven years as a sell-side equity research analyst, and he began his career as an investment analyst with Crossland Savings in 1989. Lombardi graduated from Hofstra University, receiving a bachelor’s degree in finance and an MBA with a concentration in finance. He is a member of the New York Society of Security Analysts and the CFA Institute.
30
Babak (Bob) Zenouzi
Senior Vice President, Senior Portfolio Manager
Bob Zenouzi is the lead manager for the domestic and global REIT effort at Delaware Investments, which includes the team, its process, and its institutional and retail products, which he created during his prior time with the firm. He also focuses on opportunities in Japan, Singapore, and Malaysia for the firm’s global REIT product. Additionally, he serves as lead portfolio manager for the firm’s Dividend Income products, which he helped to create in the 1990s. He rejoined Delaware Investments in May 2006. In his first term with the firm, he spent seven years as an analyst and portfolio manager, leaving in 1999 to work at Chartwell Investment Partners, where from 1999 to 2006 he was a partner and senior portfolio manager on Chartwell’s Small-Cap Value portfolio. He began his career with The Boston Company, where he held several positions in accounting and financial analysis. Zenouzi earned a master’s degree in finance from Boston College and a bachelor’s degree from Babson College. He is a member of the National Association of Real Estate Investment Trusts and the Urban Land Institute.
Nikhil G. Lalvani, CFA
Vice President, Portfolio Manager
Nikhil G. Lalvani is a portfolio manager with the firm’s Large-Cap Value Focus team. At Delaware Investments, Lalvani has served as both a fundamental and quantitative analyst. Prior to joining the firm in 1997, he was a research associate with Bloomberg. Lalvani holds a bachelor’s degree in finance from The Pennsylvania State University and is a member of the CFA Society of Philadelphia.
Robert A. Vogel Jr., CFA
Vice President, Senior Portfolio Manager
Robert A. Vogel Jr. joined Delaware Investments in 2004 as a vice president, senior portfolio manager for the firm’s Large-Cap Value Focus strategy. He previously worked at Merrill Lynch Investment Managers for more than seven years, where he rose to the position of director and portfolio manager within the U.S. Active Large-Cap Value team. He began his career in 1992 as a financial consultant at Merrill Lynch. Vogel graduated from Loyola College in Maryland, earning both bachelor’s and master’s degrees in finance. He also earned an MBA with a concentration in finance from The Wharton School of the University of Pennsylvania, and he is a member of the New York Society of Security Analysts and the CFA Society of Philadelphia.
Nashira S. Wynn
Vice President, Portfolio Manager
Nashira S. Wynn is a portfolio manager with the firm’s Large-Cap Value Focus team. Prior to joining Delaware Investments in 2004, she was an equity research analyst for Merrill Lynch Investment Managers, starting there in July 2001. Wynn earned a bachelor’s degree in finance, with a minor in economics, from The College of New Jersey, and she attended England’s Oxford University as a Presidential Scholar.
Kristen E. Bartholdson
Vice President, Portfolio Manager
Kristen E. Bartholdson is a portfolio manager with the firm’s Large-Cap Value Focus team. Prior to joining the firm in 2006, she worked at Susquehanna International Group from 2004 to 2006, where she was an equity research salesperson. From 2000 to 2004 she worked in equity research at Credit Suisse, most recently as an associate analyst in investment strategy. Bartholdson earned her bachelor’s degree in economics from Princeton University.
(continues) 31
Other Fund information
(Unaudited)
Delaware Investments® Global Dividend and Income Fund, Inc.
Philip R. Perkins
Senior Vice President, Senior Portfolio Manager
Philip R. Perkins is a member of the firm’s taxable fixed income portfolio management team with primary responsibility for portfolio construction and strategic asset allocation. He leads the firm’s international bond team, where his responsibilities include managing global bond assets across the product matrix. Prior to joining Delaware Investments in 2003, he worked at Deutsche Bank for five years. He served as a managing director in global markets from 2001 to 2003, during that same time he was the chief operating officer for the Bank’s emerging markets division in London, and from 1998 to 2001 he was responsible for local markets trading in Moscow. Prior to that, Perkins was chief executive officer of Dinner Key Advisors, a registered broker/dealer founded to trade derivative mortgage-backed bonds with institutional clients. He began his career at Salomon Brothers, where he was a mortgage/CMO trader from 1985 to 1990. Perkins holds a bachelor’s degree in international studies with a minor in computer science from the University of Notre Dame.
Damon J. Andres, CFA
Vice President, Senior Portfolio Manager
Damon J. Andres, who joined Delaware Investments in 1994, currently serves as a portfolio manager for REIT investments and convertibles. He also serves as a portfolio manager for the firm’s Dividend Income products. From 1991 to 1994, he performed investment-consulting services as a consulting associate with Cambridge Associates. Andres earned a bachelor’s degree in business administration with an emphasis in finance and accounting from the University of Richmond.
Edward A. “Ned” Gray, CFA
Senior Vice President, Senior Portfolio Manager
Ned Gray joined Delaware Investments in June 2005 to develop the firm’s International Value Equity team, from Arborway Capital, which he co-founded in January 2005. He previously worked in the investment management business at Thomas Weisel Asset Management, and ValueQuest, which was acquired by TWAM in 2002. At ValueQuest, which he joined in 1987, Gray served as a senior investment professional with responsibilities for portfolio management, security analysis, quantitative research, performance analysis, global research, back office/investment information systems integration, trading, and client and consultant relations. Prior to ValueQuest, he was a research analyst at the Center for Competitive Analysis. Gray received his bachelor’s degree in history from Reed College and a master of arts in law and diplomacy, in international economics, business and law from Tufts University’s Fletcher School of Law and Diplomacy.
Thomas H. Chow, CFA
Senior Vice President, Senior Portfolio Manager
Thomas H. Chow is a member of the firm’s taxable fixed income portfolio management team with primary responsibility for portfolio construction and strategic asset allocation. His experience includes significant exposure to asset liability management strategies and credit risk opportunities. Prior to joining Delaware Investments in 2001, he was a trader of high grade and high yield securities, and was involved in the portfolio management of collateralized bond obligations (CBOs) and insurance portfolios at SunAmerica/AIG from 1997 to 2001. Before that, he was an analyst, trader, and portfolio manager at Conseco Capital Management from 1989 to 1997. Chow received a bachelor’s degree in business analysis from Indiana University, and he is a Fellow of Life Management Institute.
D. Tysen Nutt Jr.
Senior Vice President, Senior Portfolio Manager, Team Leader – Large-Cap Value Focus Equity
D. Tysen Nutt Jr. joined Delaware Investments in 2004 as senior vice president and senior portfolio manager for the firm’s Large-Cap Value Focus strategy. Before joining the firm, Nutt led the U.S. Active Large-Cap Value team within Merrill Lynch Investment Managers (MLIM), where he managed mutual funds and separate accounts for institutions and private clients. He departed MLIM as a managing director. Prior to joining MLIM in 1994, Nutt was with Van Deventer & Hoch (V&H) where he managed large-cap value portfolios for institutions and private clients. He began his investment career at Dean Witter Reynolds, where he eventually became vice president, investments. Nutt earned his bachelor’s degree from Dartmouth College, and he is a member of the New York Society of Security Analysts and the CFA Institute.
32
Kevin P. Loome, CFA
Senior Vice President, Senior Portfolio Manager, Head of High Yield Investments
Kevin P. Loome is head of the High Yield fixed income team, responsible for portfolio construction and strategic asset allocation of all high yield fixed income assets. Prior to joining Delaware Investments in August 2007, Loome spent 11 years at T. Rowe Price, starting as an analyst and leaving the firm as a portfolio manager. He began his career with Morgan Stanley as a corporate finance analyst in the New York and London offices. Loome received his bachelor’s degree in commerce from the University of Virginia and earned an MBA from the Tuck School of Business at Dartmouth.
Roger A. Early, CPA, CFA, CFP
Senior Vice President, Senior Portfolio Manager
Roger A. Early is a member of the firm’s taxable fixed income portfolio management team with primary responsibility for portfolio construction and strategic asset allocation. He rejoined Delaware Investments in March 2007. During his previous tenure at the firm, from 1994 to 2001, he was a senior portfolio manager in the same area, and he left Delaware Investments as head of its U.S. investment grade fixed income group. Early most recently worked at Chartwell Investment Partners, where he served as a senior portfolio manager in fixed income from 2003 to 2007. He also worked at Turner Investments from 2002 to 2003, where he served as chief investment officer for fixed income, and Rittenhouse Financial from 2001 to 2002. He started his career in Pittsburgh, leaving to join Delaware Investments in 1994 after 10 years at Federated Investors. Early earned his bachelor’s degree in economics from The Wharton School of the University of Pennsylvania and an MBA with concentrations in finance and accounting from the University of Pittsburgh, and he is a member of the CFA Society of Philadelphia.
Todd A. Bassion, CFA
Vice President, Portfolio Manager
Todd A. Bassion joined Delaware Investments in June 2005 as a senior analyst on the firm’s International Value Equity team. He takes a lead role in generating and researching new companies for the portfolios as well as providing input on ongoing portfolio management. Bassion previously worked at Arborway Capital, where he was a key part of the team that started at ValueQuest/TA and moved to Thomas Weisel Asset Management with its acquisition of ValueQuest/TA in 2002. Bassion, who joined ValueQuest/TA in 2000, served as a research associate there. Bassion earned a bachelor’s degree in economics from Colorado College.
Distribution Information
Shareholders were sent monthly notices from the Fund that set forth estimates, on a book basis, of the source or sources from which monthly distributions were paid. Subsequently, certain of these estimates have been corrected in part. Listed below is a written statement of the sources of these monthly distributions on a book basis.
| Net Investment | Return of | Long Term | Total | |||||||||||||
| Income | Capital | Capital Gain | Distribution | |||||||||||||
| per share | per share | per share | Amount | |||||||||||||
| 12/07 | $0.017 | $0.063 | $— | $0.080 | ||||||||||||
| 1/08 | 0.014 | 0.066 | — | 0.080 | ||||||||||||
| 2/08 | 0.025 | 0.055 | — | 0.080 | ||||||||||||
| 3/08 | 0.043 | 0.037 | — | 0.080 | ||||||||||||
| 4/08 | 0.031 | 0.049 | — | 0.080 | ||||||||||||
| 5/08 | 0.049 | 0.031 | — | 0.080 | ||||||||||||
| 6/08 | 0.032 | 0.048 | — | 0.080 | ||||||||||||
| 7/08 | 0.032 | 0.048 | — | 0.080 | ||||||||||||
| 8/08 | 0.043 | 0.037 | — | 0.080 | ||||||||||||
| 9/08 | 0.026 | 0.054 | — | 0.080 | ||||||||||||
| 10/08 | 0.032 | 0.048 | — | 0.080 | ||||||||||||
| 11/08 | 0.029 | 0.051 | — | 0.080 | ||||||||||||
| Total | $0.373 | $0.587 | $— | $0.960 | ||||||||||||
Please note that the information in the preceding chart is for book purposes only. Shareholders should be aware the tax treatment of distributions may differ from their book treatment. The tax treatment of distributions will be set forth in a Form 1099-DIV.
In January 2009, the Fund reduced the monthly distribution amount from $0.08 per share to $0.575 per share. The Fund continues to evaluate its monthly distribution in light of ongoing economic and market conditions and may change the amount of the monthly distributions in the future.
(continues) 33
Other Fund information
(Unaudited)
Delaware Investments Global Dividend and Income Fund, Inc.
Tender Offer
As described in Note 6 to the Financial Statements, the Fund conducted a tender offer in 2008. There can be no assurance that a tender offer will reduce or eliminate any spread between market price and the net asset value of the Fund’s shares. The market price of the shares will, among other things, be determined by the relative demand for and supply of shares in the market, the Fund’s investment performance, the Fund’s dividends and yields, and investor perception of the Fund’s overall attractiveness as an investment as compared with other investment alternatives. Nevertheless, the fact that a tender offer may be conducted may result in more of a reduction in the spread between market price and net asset value than might otherwise be the case. The Fund’s Board of Directors, consistent with its fiduciary obligations, may explore alternatives to a tender offer to reduce or eliminate the Fund’s potential market value discount from net asset value. Therefore, the Fund cannot provide assurance that it will make tender offers in the future.
Since the Fund’s organization in 1994, the Fund has consummated three tender offers, including tender offers in 2000, 2005, and 2008.
Dividend Reinvestment Plan
The Fund offers an automatic dividend reinvestment program (“Plan”). Shareholders who have shares registered in their own names are eligible to elect to participate in the Plan by contacting BNY Mellon Shareowner Services at 800 851-9677. Shareholders who hold their shares through a bank, broker, or other nominee should request the bank, broker, or nominee to participate in the Plan on their behalf. This can be done as long as the bank, broker, or nominee provides a dividend reinvestment service for the Fund. If the bank, broker, or nominee does not provide this service, such shareholders must have their shares taken out of “street” or nominee name and re-registered in their own name in order to participate in the Plan. Shareholders will receive their Distributions (as defined below) in cash unless they notify BNY Mellon Shareowner Services or their bank, broker, or nominee of their desire to enroll in the Plan.
BNY Mellon Shareowner Services will apply all cash dividends, capital gains and other distributions (collectively, “Distributions”) on the Fund’s shares of common stock which become payable to each Plan participant to the purchase of outstanding shares of the Fund’s common stock for such participant. These purchases may be made on a securities exchange or in the over-the-counter market, and may be subject to such terms of price, delivery, and related matters to which BNY Mellon Shareowner Services may agree. The Fund will not issue new shares in connection with the Plan.
Distributions reinvested for participants are subject to income taxes just as if they had been paid directly to the shareholder in cash. Participants will receive a year-end statement showing distributions reinvested, and any brokerage commissions paid on such participant’s behalf.
Shareholders holding shares of the Fund in their own names who wish to terminate their participation in the Plan may do so by sending written instruction to BNY Mellon Shareowner Services so that BNY Mellon Shareowner Services receives such instructions at least 10 days prior to the Distribution record date. Shareholders with shares held in account by a bank, broker, or other nominee should contact such bank, broker, or other nominee to determine the procedure for withdrawal from the Plan.
If written instructions are not received by BNY Mellon Shareowner Services at least 10 days prior to the record date for a particular Distribution, that Distribution may be reinvested at the sole discretion of BNY Mellon Shareowner Services. After a shareholder’s instructions to terminate participation in the Plan become effective, Distributions will be paid to shareholders in cash. Upon termination, a shareholder may elect to receive either stock or cash for all the full shares in the account. If cash is elected, BNY Mellon Shareowner Services will sell such shares at the then current market value and then send the net proceeds to the shareholder, after deducting brokerage commissions and related expenses. Any fractional shares at the time of termination will be paid in cash at the current market price, less brokerage commissions and related expenses, if any. Shareholders may at any time request a full or partial withdrawal of shares from the Plan, without terminating participation in the Plan. When shares outside of the Plan are liquidated, Distributions on shares held under the Plan will continue to be reinvested unless BNY Mellon Shareowner Services is notified of the shareholder’s withdrawal from the Plan.
An investor holding shares that participate in the Plan in a brokerage account may not be able to transfer the shares to another broker and continue to participate in the Plan. Please contact your broker/dealer for additional details.
34
BNY Mellon Shareowner Services will charge participants their proportional share of brokerage commissions on market purchases. Participants may obtain a certificate or certificates for all or part of the full shares credited to their accounts at any time by making a request in writing to BNY Mellon Shareowner Services. A fee may be charged to the participant for each certificate issuance.
If you have any questions and shares are registered in your name, contact BNY Mellon Shareowner Services at 800 851-9677. If you have any questions and shares are registered in “street” name, contact the broker/dealer holding the shares or your financial advisor.
Effective August 1, 2008, the Dividend Reinvestment Plan may be amended by the Fund upon twenty days written notice to the Plan’s participants.
(continues) 35
Board of trustees/directors
and officers addendum
Delaware Investments® Family of Funds
A fund is governed by a Board of Trustees/Directors (“Trustees”), which has oversight responsibility for the management of a fund’s business affairs. Trustees establish procedures and oversee and review the performance of the investment manager, and others who perform services for the fund. The independent fund trustees, in particular, are advocates for shareholder interests. Each trustee has served in that capacity since he or she was elected to or appointed to the Board of Trustees, and will continue to serve until his or her retirement or the election of a new trustee in his or her place. The following is a list of the Trustees and Officers with certain background and related information.
| Number of | |||||
| Portfolios in Fund | Other | ||||
| Name, | Complex Overseen | Directorships | |||
| Address, | Position(s) | Length of | Principal Occupation(s) | by Trustee | Held by |
| and Birth Date | Held with Fund(s) | Time Served | During Past 5 Years | or Officer | Trustee or Officer |
| Interested Trustees | |||||
| Patrick P. Coyne1 | Chairman, | Chairman and Trustee | Patrick P. Coyne has served in | 85 | Director — |
| 2005 Market Street | President, | since August 16, 2006 | various executive capacities | Kaydon Corp. | |
| Philadelphia, PA | Chief Executive | at different times at | |||
| 19103 | Officer, and | President and | Delaware Investments.2 | Board of Governors | |
| Trustee | Chief Executive Officer | Member — Investment | |||
| April 1963 | since August 1, 2006 | Company Institute (ICI) | |||
| (2007–Present) | |||||
| Member of Investment | |||||
| Committee — Cradle | |||||
| of Liberty Council, BSA | |||||
| (November | |||||
| 2007–Present) | |||||
| Finance Committee | |||||
| Member — St. John | |||||
| Vianney Roman | |||||
| Catholic Church | |||||
| (2007–Present) | |||||
| Independent Trustees | |||||
| Thomas L. Bennett | Trustee | Since | Private Investor — | 85 | Director — |
| 2005 Market Street | March 2005 | (March 2004–Present) | Bryn Mawr | ||
| Philadelphia, PA | Bank Corp. (BMTC) | ||||
| 19103 | Investment Manager — | (April 2007–Present) | |||
| Morgan Stanley & Co. | |||||
| October 1947 | (January 1984–March 2004) | Chairman of | |||
| Investment Committee | |||||
| — Pennsylvania | |||||
| Academy of Fine Arts | |||||
| (2007–Present) | |||||
| Trustee (2004–Present) | |||||
| Investment Committee | |||||
| and Governance | |||||
| Committee Member | |||||
| — Pennsylvania | |||||
| Horticultural Society | |||||
| (February | |||||
| 2006–Present) | |||||
36
| Number of | |||||
| Portfolios in Fund | Other | ||||
| Name, | Complex Overseen | Directorships | |||
| Address, | Position(s) | Length of | Principal Occupation(s) | by Trustee | Held by |
| and Birth Date | Held with Fund(s) | Time Served | During Past 5 Years | or Officer | Trustee or Officer |
| Independent Trustees (continued) | |||||
| John A. Fry | Trustee | Since | President — | 85 | Director — |
| 2005 Market Street | January 2001 | Franklin & Marshall College | Community Health | ||
| Philadelphia, PA | (June 2002–Present) | Systems | |||
| 19103 | |||||
| Executive Vice President — | |||||
| May 1960 | University of Pennsylvania | ||||
| (April 1995–June 2002) | |||||
| Anthony D. Knerr | Trustee | Since | Founder and Managing Director — | 85 | None |
| 2005 Market Street | April 1990 | Anthony Knerr & Associates | |||
| Philadelphia, PA | (Strategic Consulting) | ||||
| 19103 | (1990–Present) | ||||
| December 1938 | |||||
| Lucinda S. Landreth | Trustee | Since | Chief Investment Officer — | 85 | None |
| 2005 Market Street | March 2005 | Assurant, Inc. | |||
| Philadelphia, PA | (Insurance) | ||||
| 19103 | (2002–2004) | ||||
| June 1947 | |||||
| Ann R. Leven | Trustee | Since | Consultant — | 85 | Director and Audita |
| 2005 Market Street | October 1989 | ARL Associates | Committee Chair — | ||
| Philadelphia, PA | (Financial Planning) | Systemax, Inc. | |||
| 19103 | (1983–Present) | ||||
| November 1940 | |||||
| Thomas F. Madison | Trustee | Since | President and Chief | 85 | Director and Chair of |
| 2005 Market Street | May 19973 | Executive Officer — | Compensation | ||
| Philadelphia, PA | MLM Partners, Inc. | Committee, | |||
| 19103 | (Small Business Investing | Governance Committee | |||
| and Consulting) | Member | ||||
| February 1936 | (January 1993–Present) | — CenterPoint Energy | |||
| Lead Director and Chair | |||||
| of Audit | |||||
| and Governance | |||||
| Committees, | |||||
| Member of | |||||
| Compensation | |||||
| Committee — Digital | |||||
| River, Inc. | |||||
| Director and Chair of | |||||
| Governance | |||||
| Committee, Audit | |||||
| Committee Member — | |||||
| Rimage Corporation | |||||
| Director and Chair of | |||||
| the Compensation | |||||
| Committee — Spanlink | |||||
| Communications | |||||
| Lead Director and Chair | |||||
| of Compensation and | |||||
| Governance | |||||
| Committees — | |||||
| Valmont Industries, Inc. | |||||
| Janet L. Yeomans | Trustee | Since | Vice President and Treasurer | 85 | None |
| 2005 Market Street | April 1999 | (January 2006–Present) | |||
| Philadelphia, PA | Vice President — Mergers & Acquisitions | ||||
| 19103 | (January 2003–January 2006), and | ||||
| Vice President | |||||
| July 1948 | (July 1995–January 2003) | ||||
| 3M Corporation | |||||
37
| Number of | |||||
| Portfolios in Fund | Other | ||||
| Name, | Complex Overseen | Directorships | |||
| Address, | Position(s) | Length of | Principal Occupation(s) | by Trustee | Held by |
| and Birth Date | Held with Fund(s) | Time Served | During Past 5 Years | or Officer | Trustee or Officer |
| Independent Trustees (continued) | |||||
| J. Richard Zecher | Trustee | Since | Founder — | 85 | Director and Audit |
| 2005 Market Street | March 2005 | Investor Analytics | Committee Member — | ||
| Philadelphia, PA | (Risk Management) | Investor Analytics | |||
| 19103 | (May 1999–Present) | ||||
| July 1940 | Founder — | ||||
| Sutton Asset Management | |||||
| (Hedge Fund) | |||||
| (September 1996–Present) | |||||
| Officers | |||||
| David F. Connor | Vice President, | Vice President since | David F. Connor has served as | 85 | None4 |
| 2005 Market Street | Deputy General | September 2000 | Vice President and Deputy | ||
| Philadelphia, PA | Counsel, and Secretary | and Secretary | General Counsel of | ||
| 19103 | since | Delaware Investments | |||
| October 2005 | since 2000. | ||||
| December 1963 | |||||
| Daniel V. Geatens | Vice President | Treasurer | Daniel V. Geatens has served | 85 | None4 |
| 2005 Market Street | and Treasurer | since | in various capacities at | ||
| Philadelphia, PA | October 25, 2007 | different times at | |||
| 19103 | Delaware Investments. | ||||
| October 1972 | |||||
| David P. O’Connor | Senior Vice | Senior Vice President, | David P. O’Connor has served in | 85 | None4 |
| 2005 Market Street | President, | General Counsel, and | various executive and legal | ||
| Philadelphia, PA | General Counsel, | Chief Legal Officer | capacities at different times | ||
| 19103 | and Chief | since | at Delaware Investments. | ||
| Legal Officer | October 2005 | ||||
| February 1966 | |||||
| Richard Salus | Senior | Chief Financial | Richard Salus has served in | 85 | None4 |
| 2005 Market Street | Vice President | Officer since | various executive capacities | ||
| Philadelphia, PA | and | November 2006 | at different times at | ||
| 19103 | Chief Financial | Delaware Investments. | |||
| Officer | |||||
| October 1963 | |||||
38
About the organization
This annual report is for the information of Delaware Investments® Global Dividend and Income Fund, Inc. shareholders. The figures in this report represent past results that are not a guarantee of future results. The return and principal value of an investment in the Fund will fluctuate so that shares, when sold, may be worth more or less than their original cost.
Notice is hereby given in accordance with Section 23(c) of the Investment Company Act of 1940 that the Fund may, from time to time, purchase shares of its Common Stock on the open market at market prices. Your Fund’s Board of Directors approved a share repurchase program in 1994 that authorizes the Fund to purchase up to 10% of its outstanding shares on the floor of the New York Stock Exchange.
Board of Directors Patrick P. Coyne Thomas L. Bennett† John A. Fry Anthony D. Knerr Lucinda S. Landreth Ann R. Leven Thomas F. Madison† Janet L. Yeomans† J. Richard Zecher† †Audit committee member | Affiliated officers David F. Connor Daniel V. Geatens David P. O’Connor Richard Salus The Fund files its complete schedule of portfolio holdings with the Securities and Exchange Commission for the first and third quarters of each fiscal year on Form N-Q. The Fund’s Forms N-Q, as well as a description of the policies and procedures that the Fund uses to determine how to vote proxies (if any) relating to portfolio securities is available without charge (i) upon request, by calling 800 523-1918; (ii) on the Fund’s Web site at http://www.delawareinvestments.com; and (iii) on the Commission’s Web site at http://www.sec.gov. The Fund’s Forms N-Q may be reviewed and copied at the Commission’s Public Reference Room in Washington, D.C.; information on the operation of the Public Reference Room may be obtained by calling 800 SEC-0330. Information (if any) regarding how the Fund voted proxies relating to portfolio securities during the most recently disclosed 12-month period ended June 30 is available without charge (i) through the Fund’s Web site at http://www.delawareinvestments.com; and (ii) on the Commission’s Web site at http://www.sec.gov. | Contact information Investment manager Principal office of the Fund Independent registered public accounting firm Registrar and stock transfer agent For securities dealers Web site Your reinvestment options |
39
Item 2. Code of Ethics
The registrant has adopted a code of ethics that applies to the registrant’s principal executive officer, principal financial officer, principal accounting officer or controller, or persons performing similar functions, regardless of whether these individuals are employed by the registrant or a third party. A copy of the registrant’s Code of Business Ethics has been posted on the Delaware Investments Internet Web site at www.delawareinvestments.com. Any amendments to the Code of Business Ethics, and information on any waiver from its provisions granted by the registrant, will also be posted on this Web site within five business days of such amendment or waiver and will remain on the Web site for at least 12 months.
Item 3. Audit Committee Financial Expert
The registrant’s Board of Trustees/Directors has determined that each member of the registrant’s Audit Committee is an audit committee financial expert, as defined below. For purposes of this item, an “audit committee financial expert” is a person who has the following attributes:
a. An understanding of generally accepted accounting principles and financial statements;
b. The ability to assess the general application of such principles in connection with the accounting for estimates, accruals, and reserves;
c. Experience preparing, auditing, analyzing, or evaluating financial statements that present a breadth and level of complexity of accounting issues that are generally comparable to the breadth and complexity of issues that can reasonably be expected to be raised by the registrant’s financial statements, or experience actively supervising one or more persons engaged in such activities;
d. An understanding of internal controls and procedures for financial reporting; and
e. An understanding of audit committee functions.
An “audit committee financial expert” shall have acquired such attributes through:
a. Education and experience as a principal financial officer, principal accounting officer, controller, public accountant, or auditor or experience in one or more positions that involve the performance of similar functions;
b. Experience actively supervising a principal financial officer, principal accounting officer, controller, public accountant, auditor, or person performing similar functions;
c. Experience overseeing or assessing the performance of companies or public accountants with respect to the preparation, auditing, or evaluation of financial statements; or
d. Other relevant experience.
The registrant’s Board of Trustees/Directors has also determined that each member of the registrant’s Audit Committee is independent. In order to be “independent” for purposes of this item, the Audit Committee member may not: (i) other than in his or her capacity as a member of the Board of Trustees/Directors or any committee thereof, accept directly or indirectly any consulting, advisory or other compensatory fee from the issuer; or (ii) be an “interested person” of the registrant as defined in Section 2(a)(19) of the Investment Company Act of 1940.
The names of the audit committee financial experts on the registrant’s Audit Committee are set forth below:
Thomas L. Bennett 1
Thomas F. Madison
Janet L. Yeomans 1
J. Richard Zecher
Item 4. Principal Accountant Fees and Services
(a) Audit fees.
The aggregate fees billed for services provided to the registrant by its independent auditors for the audit of the registrant’s annual financial statements and for services normally provided by the independent auditors in connection with statutory and regulatory filings or engagements were $11,200 for the fiscal year ended November 30, 2008.
____________________
1 The instructions to Form N-CSR require disclosure on the relevant experience of persons who qualify as audit committee financial experts based on “other relevant experience.” The Board of Trustees/Directors has determined that Mr. Bennett qualifies as an audit committee financial expert by virtue of his education, Chartered Financial Analyst designation, and his experience as a credit analyst, portfolio manager and the manager of other credit analysts and portfolio managers. The Board of Trustees/Directors has determined that Ms. Yeomans qualifies as an audit committee financial expert by virtue of her education and experience as the Treasurer of a large global corporation.
The aggregate fees billed for services provided to the registrant by its independent auditors for the audit of the registrant’s annual financial statements and for services normally provided by the independent auditors in connection with statutory and regulatory filings or engagements were $11,700 for the fiscal year ended November 30, 2007.
(b) Audit-related fees.
The aggregate fees billed by the registrant’s independent auditors for services relating to the performance of the audit of the registrant’s financial statements and not reported under paragraph (a) of this Item were $0 for the fiscal year ended November 30, 2008.
The aggregate fees billed by the registrant’s independent auditors for services relating to the performance of the audit of the financial statements of the registrant’s investment adviser and other service providers under common control with the adviser and that relate directly to the operations or financial reporting of the registrant were $0 for the registrant’s fiscal year ended November 30, 2008.
The aggregate fees billed by the registrant’s independent auditors for services relating to the performance of the audit of the registrant’s financial statements and not reported under paragraph (a) of this Item were $0 for the fiscal year ended November 30, 2007.
The aggregate fees billed by the registrant’s independent auditors for services relating to the performance of the audit of the financial statements of the registrant’s investment adviser and other service providers under common control with the adviser and that relate directly to the operations or financial reporting of the registrant were $0 for the registrant’s fiscal year ended November 30, 2007.
(c) Tax fees.
The aggregate fees billed by the registrant’s independent auditors for tax-related services provided to the registrant were $2,567 for the fiscal year ended November 30, 2008. The percentage of these fees relating to services approved by the registrant’s Audit Committee pursuant to the de minimis exception from the pre-approval requirement in Rule 2-01(c)(7)(i)(C) of Regulation S-X was 0%. These tax-related services were as follows: review of income tax returns and review of annual excise distribution calculations, and tax compliance services relating to investments in foreign securities.
The aggregate fees billed by the registrant’s independent auditors for tax-related services provided to the registrant’s investment adviser and other service providers under common control with the adviser and that relate directly to the operations or financial reporting of the registrant were $0 for the registrant’s fiscal year ended November 30, 2008.
The aggregate fees billed by the registrant’s independent auditors for tax-related services provided to the registrant were $3,250 for the fiscal year ended November 30, 2007. The percentage of these fees relating to services approved by the registrant’s Audit Committee pursuant to the de minimis exception from the pre-approval requirement in Rule 2-01(c)(7)(i)(C) of Regulation S-X was 0%. These tax-related services were as follows: review of income tax returns and review of annual excise distribution calculations, and tax compliance services relating to investments in foreign securities.
The aggregate fees billed by the registrant’s independent auditors for tax-related services provided to the registrant’s adviser and other service providers under common control with the adviser and that relate directly to the operations or financial reporting of the registrant were $0 for the registrant’s fiscal year ended November 30, 2007.
(d) All other fees.
The aggregate fees billed for all services provided by the independent auditors to the registrant other than those set forth in paragraphs (a), (b) and (c) of this Item were $0 for the fiscal year ended November 30, 2008.
The aggregate fees billed for all services other than those set forth in paragraphs (b) and (c) of this Item provided by the registrant’s independent auditors to the registrant’s adviser and other service providers under common control with the adviser and that relate directly to the operations or financial reporting of the registrant were $0 for the registrant’s fiscal year ended November 30, 2008.
The aggregate fees billed for all services provided by the independent auditors to the registrant other than those set forth in paragraphs (a), (b) and (c) of this Item were $0 for the fiscal year ended November 30, 2007.
The aggregate fees billed for all services other than those set forth in paragraphs (b) and (c) of this Item provided by the registrant’s independent auditors to the registrant’s adviser and other service providers under common control with the adviser and that relate directly to the operations or financial reporting of the registrant were $0 for the registrant’s fiscal year ended November 30, 2007.
(e) The registrant’s Audit Committee has established pre-approval policies and procedures as permitted by Rule 2-01(c)(7)(i)(B) of Regulation S-X (the “Pre-Approval Policy”) with respect to services provided by the registrant’s independent auditors. Pursuant to the Pre-Approval Policy, the Audit Committee has pre-approved the services set forth in the table below with respect to the registrant up to the specified fee limits. Certain fee limits are based on aggregate fees to the registrant and other registrants within the Delaware Investments® Family of Funds.
Service | Range of Fees |
| Audit Services | |
| Statutory audits or financial audits for new Funds | up to $25,000 per Fund |
| Services associated with SEC registration statements (e.g., Form N-1A, Form N-14, etc.), periodic reports and other documents filed with the SEC or other documents issued in connection with securities offerings (e.g., comfort letters for closed-end Fund offerings, consents), and assistance in responding to SEC comment letters | up to $10,000 per Fund |
| Consultations by Fund management as to the accounting or disclosure treatment of transactions or events and/or the actual or potential impact of final or proposed rules, standards or interpretations by the SEC, FASB, or other regulatory or standard-setting bodies (Note: Under SEC rules, some consultations may be considered “audit-related services” rather than “audit services”) | up to $25,000 in the aggregate |
| Audit-Related Services | |
| Consultations by Fund management as to the accounting or disclosure treatment of transactions or events and /or the actual or potential impact of final or proposed rules, standards or interpretations by the SEC, FASB, or other regulatory or standard-setting bodies (Note: Under SEC rules, some consultations may be considered “audit services” rather than “audit-related services”) | up to $25,000 in the aggregate |
| Tax Services | |
| U.S. federal, state and local and international tax planning and advice (e.g., consulting on statutory, regulatory or administrative developments, evaluation of Funds’ tax compliance function, etc.) | up to $25,000 in the aggregate |
| U.S. federal, state and local tax compliance (e.g., excise distribution reviews, etc.) | up to $5,000 per Fund |
| Review of federal, state, local and international income, franchise and other tax returns | up to $5,000 per Fund |
Under the Pre-Approval Policy, the Audit Committee has also pre-approved the services set forth in the table below with respect to the registrant’s investment adviser and other entities controlling, controlled by or under common control with the investment adviser that provide ongoing services to the registrant (the “Control Affiliates”) up to the specified fee limit. This fee limit is based on aggregate fees to the investment adviser and its Control Affiliates.
| Service | Range of Fees |
| Non-Audit Services | |
| Services associated with periodic reports and other documents filed with the SEC and assistance in responding to SEC comment letters | up to $10,000 in the aggregate |
The Pre-Approval Policy requires the registrant’s independent auditors to report to the Audit Committee at each of its regular meetings regarding all services initiated since the last such report was rendered, including those services authorized by the Pre-Approval Policy.
(f) Not applicable.
(g) The aggregate non-audit fees billed by the registrant’s independent auditors for services rendered to the registrant and to its investment adviser and other service providers under common control with the adviser were $256,569 and $251,938 for the registrant’s fiscal years ended November 30, 2008 and November 30, 2007, respectively.
(h) In connection with its selection of the independent auditors, the registrant’s Audit Committee has considered the independent auditors’ provision of non-audit services to the registrant’s investment adviser and other service providers under common control with the adviser that were not required to be pre-approved pursuant to Rule 2-01(c)(7)(ii) of Regulation S-X. The Audit Committee has determined that the independent auditors’ provision of these services is compatible with maintaining the auditors’ independence.
Item 5. Audit Committee of Listed Registrants
The registrant has a separately-designated standing Audit Committee established in accordance with Section 3(a)(58)(A) of the Securities Exchange Act of 1934. The members of the registrant’s Audit Committee are Thomas L. Bennett, Thomas F. Madison, Janet L. Yeomans and J. Richard Zecher.
Item 6. Investments
(a) Included as part of report to shareholders filed under Item 1 of this Form N-CSR.
(b) Divestment of securities in accordance with Section 13(c) of the Investment Company Act of 1940.
Not applicable.
Item 7. Disclosure of Proxy Voting Policies and Procedures for Closed-End Management Investment Companies
The registrant has formally delegated to its investment adviser(s) (the “Adviser”) the ability to make all proxy voting decisions in relation to portfolio securities held by the registrant. If and when proxies need to be voted on behalf of the registrant, the Adviser will vote such proxies pursuant to its Proxy Voting Policies and Procedures (the “Procedures”). The Adviser has established a Proxy Voting Committee (the “Committee”) which is responsible for overseeing the Adviser’s proxy voting process for the registrant. One of the main responsibilities of the Committee is to review and approve the Procedures to ensure that the Procedures are designed to allow the Adviser to vote proxies in a manner consistent with the goal of voting in the best interests of the registrant.
In order to facilitate the actual process of voting proxies, the Adviser has contracted with Institutional Shareholder Services (“ISS/RiskMetrics”), a wholly owned subsidiary of RiskMetrics Group ("RiskMetrics"), to analyze proxy statements on behalf of its clients and vote proxies generally in accordance with the Procedures.) to analyze proxy statements on behalf of the registrant and other Adviser clients and vote proxies generally in accordance with the Procedures. The Committee is responsible for overseeing ISS/RiskMetrics’s proxy voting activities. If a proxy has been voted for the registrant, ISS//RiskMetrics will create a record of the vote. By no later than August 31 of each year, information (if any) regarding how the registrant voted proxies relating to portfolio securities during the most recently disclosed 12-month period ended June 30 is available without charge (i) through the registrant’s website at http://www.delawareinvestments.com; and (ii) on the Commission’s website at http://www.sec.gov.
The Procedures contain a general guideline that recommendations of company management on an issue (particularly routine issues) should be given a fair amount of weight in determining how proxy issues should be voted. However, the Adviser will normally vote against management’s position when it runs counter to its specific Proxy Voting Guidelines (the “Guidelines”), and the Adviser will also vote against management’s recommendation when it believes that such position is not in the best interests of the registrant.
As stated above, the Procedures also list specific Guidelines on how to vote proxies on behalf of the registrant. Some examples of the Guidelines are as follows: (i) generally vote for shareholder proposals asking that a majority or more of directors be independent; (ii) generally vote against proposals to require a supermajority shareholder vote; (iii) votes on mergers and acquisitions should be considered on a case-by-case basis, determining whether the transaction enhances shareholder value; (iv) generally vote against proposals to create a new class of common stock with superior voting rights; (v) generally vote re-incorporation proposals on a case-by-case basis; (vi) votes with respect to equity-based compensation plans are generally determined on a case-by-case basis; and (vii) generally vote for proposals requesting reports on the level of greenhouse gas emissions from a company’s operations and products.
Because the registrant has delegated proxy voting to the Adviser, the registrant is not expected to encounter any conflict of interest issues regarding proxy voting and therefore does not have procedures regarding this matter. However, the Adviser does have a section in its Procedures that addresses the possibility of conflicts of interest. Most proxies which the Adviser receives on behalf of the registrant are voted by ISS/RiskMetrics in accordance with the Procedures. Because almost all registrant proxies are voted by ISS/RiskMetrics pursuant to the pre-determined Procedures, it normally will not be necessary for the Adviser to make an actual determination of how to vote a particular proxy, thereby largely eliminating conflicts of interest for the Adviser during the proxy voting process. In the very limited instances where the Adviser is considering voting a proxy contrary to ISS/RiskMetrics’s recommendation, the Committee will first assess the issue to see if there is any possible conflict of interest involving the Adviser or affiliated persons of the Adviser. If a member of the Committee has actual knowledge of a conflict of interest, the Committee will normally use another independent third party to do additional research on the particular proxy issue in order to make a recommendation to the Committee on how to vote the proxy in the best interests of the registrant. The Committee will then review the proxy voting materials and recommendation provided by ISS/RiskMetrics and the independent third party to determine how to vote the issue in a manner which the Committee believes is consistent with the Procedures and in the best interests of the registrant.
Item 8. Portfolio Managers of Closed-End Management Investment Companies
The following chart lists certain information about types of other accounts for which the portfolio managers are primarily responsible as of November 30, 2008. Any accounts managed in a personal capacity appear under “Other Accounts” along with other accounts managed on a professional basis. The personal account information is current as of the most recent calendar quarter-end for which account statements are available.
| Total Assets | ||||
| in Accounts with | ||||
| No. of Accounts with | Performance- | |||
| No. of | Total Assets | Performance-Based | Based | |
| Accounts | in Accounts Fee | Fees | Fee | |
| Damon J. Andres | ||||
| Registered | 14 | $625.0 million | 0 | $0 |
| Investment | ||||
| Companies | ||||
| Other pooled | 0 | $0 | 0 | $0 |
| Investment Vehicles | ||||
| Other Accounts | 3 | $32.1 million | 0 | $0 |
| Kristen E. | ||||
| Bartholdson | ||||
| Registered | 16 | $1.7 billion | 0 | $0 |
| Investment | ||||
| Companies | ||||
| Other pooled | 0 | $0 | 0 | $0 |
| Investment Vehicles | ||||
| Other Accounts | 19 | $1.4 billion | 2 | $545.0 million |
| Todd A. Bassion | ||||
| Registered | 10 | $658.0 million | 0 | $0 |
| Investment | ||||
| Companies | ||||
| Other pooled | 0 | $0 | 0 | $0 |
| Investment Vehicles | ||||
| Other Accounts | 14 | $429.7 million | 0 | $0 |
| Thomas H. Chow | ||||
| Registered | 19 | $7.7 billion | 0 | $0 |
| Investment | ||||
| Companies | ||||
| Other pooled | 0 | $0 | 0 | $0 |
| Investment Vehicles | ||||
| Other Accounts | 10 | $1.2 billion | 0 | $0 |
| Roger A. Early | ||||
| Registered | 26 | $5.1 billion | 0 | $0 |
| Investment | ||||
| Companies | ||||
| Other pooled | 0 | $0 | 0 | $0 |
| Investment Vehicles | ||||
| Other Accounts | 18 | $2.8 billion | 0 | $0 |
| Edward A. Gray | ||||
| Registered | 10 | $658.0 million | 0 | $0 |
| Investment | ||||
| Companies | ||||
| Other pooled | 0 | $0 | 0 | $0 |
| Investment Vehicles | ||||
| Other Accounts | 8 | $429.0 million | 0 | $0 |
| Nikhil G. Lalvani | ||||
| Registered | 16 | $1.7 billion | 0 | $0 |
| Investment | ||||
| Companies |
| Other pooled | 0 | $0 | 0 | $0 |
| Investment Vehicles | ||||
| Other Accounts | 22 | $1.4 billion | 2 | $545.0 million |
| Anthony A. | ||||
| Lombardi | ||||
| Registered | 16 | $1.7 billion | 0 | $0 |
| Investment | ||||
| Companies | ||||
| Other pooled | 0 | $0 | 0 | $0 |
| Investment Vehicles | ||||
| Other Accounts | 25 | $1.4 billion | 2 | $545.0 million |
| Kevin P. Loome | ||||
| Registered | 21 | $6.3 billion | 0 | $0 |
| Investment | ||||
| Companies | ||||
| Other pooled | 0 | $0 | 0 | $0 |
| Investment Vehicles | ||||
| Other Accounts | 6 | $478.7 million | 0 | $0 |
| D. Tysen Nutt, Jr. | ||||
| Registered | 16 | $1.7 billion | 0 | $0 |
| Investment | ||||
| Companies | ||||
| Other pooled | 0 | $0 | 0 | $0 |
| Investment Vehicles | ||||
| Other Accounts | 29 | $1.4 billion | 2 | $545.0 million |
| Philip R. Perkins | ||||
| Registered | 13 | $4.6 billion | 0 | $0 |
| Investment | ||||
| Companies | ||||
| Other pooled | 0 | $0 | 0 | $0 |
| Investment Vehicles | ||||
| Other Accounts | 6 | $763.9 million | 0 | $0 |
| Robert A. Vogel, Jr. | ||||
| Registered | 16 | $1.7 billion | 0 | $0 |
| Investment | ||||
| Companies | ||||
| Other pooled | 0 | $0 | 0 | $0 |
| Investment Vehicles | ||||
| Other Accounts | 30 | $1.4 billion | 2 | $545.0 million |
| Nashira Wynn | ||||
| Registered | 16 | $1.7 billion | 0 | $0 |
| Investment | ||||
| Companies | ||||
| Other pooled | 0 | $0 | 0 | $0 |
| Investment Vehicles | ||||
| Other Accounts | 19 | $1.4 billion | 2 | $545.0 million |
| Babak Zenouzi | ||||
| Registered | 14 | $625.0 million | 0 | $0 |
| Investment | ||||
| Companies | ||||
| Other pooled | 0 | $0 | 0 | $0 |
| Investment Vehicles | ||||
| Other Accounts | 2 | $32.0 million | 0 | $0 |
DESCRIPTION OF MATERIAL CONFLICTS OF INTEREST
Individual portfolio managers may perform investment management services for other funds or accounts similar to those provided to the Funds and the investment action for such other fund or account and the Funds may differ. For example, an account or fund may be selling a security, while another account or Fund may be purchasing or holding the same security. As a result, transactions executed for one fund or account may adversely affect the value of securities held by another fund, account or Fund. Additionally, the management of multiple other funds or accounts and the Funds may give rise to potential conflicts of interest, as a portfolio manager must allocate time and effort to multiple funds or accounts and the Funds. A portfolio manager may discover an investment opportunity that may be suitable for more than one account or fund. The investment opportunity may be limited, however, so that all funds or accounts for which the investment would be suitable may not be able to participate. The Manager has adopted procedures designed to allocate investments fairly across multiple funds or accounts.
Two of the accounts managed by the portfolio managers have a performance-based fee. This compensation structure presents a potential conflict of interest. The portfolio manager has an incentive to manage this account so as to enhance its performance, to the possible detriment of other accounts for which the investment manager does not receive a performance-based fee.
A portfolio manager’s management of personal accounts also may present certain conflicts of interest. While Delaware’s code of ethics is designed to address these potential conflicts, there is no guarantee that it will do so.
COMPENSATION STRUCTURE
Each portfolio’s manager’s compensation consists of the following:
BASE SALARY – Each named portfolio manager receives a fixed base salary. Salaries are determined by a comparison to industry data prepared by third parties to ensure that portfolio manager salaries are in line with salaries paid at peer investment advisory firms.
BONUS – (Mr. Nutt, Ms. Bartholdson, Mr. Lalvani, Mr. Lombardi, Mr. Vogel and Ms. Wynn only) Each named portfolio manager is eligible to receive an annual cash bonus. The bonus pool is determined by the revenues associated with the products a portfolio manager manages. Delaware keeps a percentage of the revenues and the remaining percentage of revenues (minus appropriate expenses associated with relevant product and the investment management team) create the "bonus pool" for the product. Various members of the team have the ability to earn a percentage of the bonus pool with the most senior contributor having the largest share. The pool is allotted based on subjective factors and objective factors. The primary objective factor is the performance of the funds managed relative to the performance of the appropriate Lipper peer groups and the performance of institutional composites relative to the appropriate indices. Performance is measured as the result of one's standing in the Lipper peer groups on a one-year, three-year and five-year basis. Three-year and five-year performance is weighted more heavily and there is no objective award for a fund whose performance falls below the 50th percentile for a given time period.
Individual allocations of the bonus pool are based on individual performance measurements, both objective and subjective, as determined by senior management.
(Mr. Andres and Mr. Zenouzi only) Each named portfolio manager is eligible to receive an annual cash bonus. The bonus pool is determined by the revenues associated with the products a portfolio manager manages. Delaware keeps a percentage of the revenues and the remaining percentage of revenues (minus appropriate expenses associated with relevant product and the investment management team) create the "bonus pool" for the product. Various members of the team have the ability to earn a percentage of the bonus pool with the most senior contributor having the largest share. The pool is allotted based on subjective factors (50%) and objective factors (50%). The primary objective factor is the performance of the funds managed relative to the performance of the appropriate Lipper peer groups and the performance of institutional composites relative to the appropriate indices. Performance is measured as the result of one’s standing in the Lipper peer groups on a one-year, three-year and five-year basis. Three-year and five-year performance is weighed more heavily and there is no objective award for a fund whose performance falls below the 50th percentile for a given time period.
Individual allocations of the bonus pool are based on individual performance measurements, both objective and subjective, as determined by senior management.
(Mr. Bassion and Mr. Gray only) Each named portfolio manager is eligible to receive an annual cash bonus. The bonus pool is determined by the revenues associated with the products a portfolio manager manages. Delaware keeps a percentage of the revenues and the remaining percentage of revenues (minus appropriate expenses associated with relevant product and the investment management team) create the "bonus pool" for the product. Various members of the team have the ability to earn a percentage of the bonus pool with the most senior contributor having the largest share. The pool is allotted based on subjective factors (50%) and objective factors (50%). The primary objective factor is the performance of the funds managed relative to the performance of the appropriate Lipper peer groups and the performance of institutional composites relative to the appropriate indices. Performance is measured as the result of one’s standing in the Lipper peer groups on a one-year, three-year and five-year basis. Three-year and five-year performance are weighted more heavily and there is no objective award for a fund whose performance falls below the 50th percentile for a given time period.
Individual allocations of the bonus pool are based on individual performance measurements, both objective and subjective, as determined by senior management.
(Mr. Chow and Mr. Perkins only) Each portfolio manager is eligible to receive an annual cash bonus, which is based on quantitative and qualitative factors. There is one pool for bonus payments for the fixed income department. The amount of the pool for bonus payments is first determined by mathematical equation based on all assets managed (including investment companies, insurance product-related accounts and other separate accounts), management fees and related expenses (including fund waiver expenses) for registered investment companies, pooled vehicles, and managed separate accounts. Generally, 50%-70% of the bonus is quantitatively determined. For more senior portfolio managers, a higher percentage of the bonus is quantitatively determined. For investment companies, each manager is compensated according the Fund’s Lipper peer group percentile ranking on a one-year and three-year basis, equally weighted. For managed separate accounts the portfolio managers are compensated according to the composite percentile ranking against the Frank Russell and Callan Associates databases on a one-year and three-year basis, with three-year performance more heavily weighted. There is no objective award for a fund that falls below the 50th percentile over the three-year period. There is a sliding scale for investment companies that are ranked above the 50th percentile. The remaining 30%-50% portion of the bonus is discretionary as determined by Delaware Investments and takes into account subjective factors.
(Mr. Early and Mr. Loome only) Due to transitioning of responsibilities of these managers, the managers’ bonuses for the past year were guaranteed. It is anticipated that going forward an objective component will be added that is reflective of account performance relative to an appropriate peer group or database.
DEFERRED COMPENSATION – Each named portfolio manager is eligible to participate in the Lincoln National Corporation Executive Deferred Compensation Plan, which is available to all employees whose income exceeds a designated threshold. The Plan is a non-qualified unfunded deferred compensation plan that permits participating employees to defer the receipt of a portion of their cash compensation.
STOCK OPTION INCENTIVE PLAN/EQUITY COMPENSATION PLAN - Portfolio managers may be awarded options, stock appreciation rights, restricted stock awards and restricted stock units relating to the underlying shares of common stock of Delaware Investments U.S., Inc. pursuant to the terms the Amended and Restated Delaware Investments U.S., Inc. Incentive Compensation Plan. In addition, certain managers may be awarded restricted stock units, or “performance shares,” in Lincoln National Corporation. Delaware Investments U.S., Inc., is an indirect subsidiary of Delaware Management Holdings, Inc. Delaware Management Holdings, Inc., is in turn an indirect, wholly-owned subsidiary of Lincoln National Corporation.
The Amended and Restated Delaware Investments U.S., Inc. Incentive Compensation Plan was established in 2001 in order to provide certain employees of the Manager with a more direct means of participating in the growth of the Manager. Under the terms of the plan, stock options typically vest in 25% increments on a four-year schedule and expire ten years after issuance.
Subject to the terms of the plan, restricted stock units typically vest in 25% increments on a four-year schedule, and shares of common stock underlying the restricted stock awards will be issued after vesting. Awards are granted under the plan from time to time by the investment manager in its full discretion. Awards may be based in part on seniority. The fair market value of the shares of Delaware Investments U.S., Inc., is normally determined as of each March 31, June 30, September 30 and December 31. Shares issued upon the exercise of such options or vesting of restricted stock units must be held for six months and one day, after which time the shareholder may put them back to the issuer or the shares may be called back from the shareholder from time to time, as the case may be.
Portfolio managers who do not participate in the Delaware Investments U.S., Inc. Stock Option Plan are eligible to participate in Lincoln’s Long-Term Incentive Plan, which is designed to provide a long-term incentive to officers of Lincoln. Under the plan, a specified number of performance shares are allocated to each unit and are awarded to participants in the discretion of their managers in accordance with recommended targets related to the number of employees in a unit that may receive an award and the number of shares to be awarded. The performance shares have a three year vesting schedule and, at the end of the three years, the actual number of shares distributed to those who received awards may be equal to, greater than or less than the amount of the award based on Lincoln’s achievement of certain performance goals relative to a predetermined peer group.
OTHER COMPENSATION - Portfolio managers may also participate in benefit plans and programs available generally to all employees.
OWNERSHIP OF SECURITIES
As of November 30, 2008, the portfolio managers of the Fund did not own any shares of the Fund.
Item 9. Purchases of Equity Securities by Closed-End Management Investment Companies and Affiliated Purchasers
Not applicable.
Item 10. Submission of Matters to a Vote of Security Holders
Not applicable.
Item 11. Controls and Procedures
The registrant’s principal executive officer and principal financial officer have evaluated the registrant’s disclosure controls and procedures within 90 days of the filing of this report and have concluded that they are effective in providing reasonable assurance that the information required to be disclosed by the registrant in its reports or statements filed under the Securities Exchange Act of 1934 is recorded, processed, summarized and reported within the time periods specified in the rules and forms of the Securities and Exchange Commission.
There were no significant changes in the registrant’s internal control over financial reporting that occurred during the second fiscal quarter of the period covered by the report to stockholders included herein (i.e., the registrant’s fourth fiscal quarter) that have materially affected, or are reasonably likely to materially affect, the registrant’s internal control over financial reporting.
Item 12. Exhibits
| (a) | (1) | Code of Ethics | |
Not applicable. | |||
| (2) | Certifications of Principal Executive Officer and Principal Financial Officer pursuant to Rule 30a-2 under the Investment Company Act of 1940 are attached hereto as Exhibit 99.CERT. | ||
| (3) | Written solicitations to purchase securities pursuant to Rule 23c-1 under the Securities Exchange Act of 1934. | ||
Not applicable. | |||
| (b) | Certifications pursuant to Section 906 of the Sarbanes-Oxley Act of 2002 are furnished herewith as Exhibit 99.906CERT. |
SIGNATURES
Pursuant to the requirements of the Securities Exchange Act of 1934 and the Investment Company Act of 1940, the registrant has duly caused this report to be signed on its behalf, by the undersigned, thereunto duly authorized.
Name of Registrant: Delaware Investments® Global Dividend and Income Fund, Inc.
| PATRICK P. COYNE |
| By: Patrick P. Coyne |
| Title: Chief Executive Officer |
| Date: January 30, 2009 |
Pursuant to the requirements of the Securities Exchange Act of 1934 and the Investment Company Act of 1940, this report has been signed below by the following persons on behalf of the registrant and in the capacities and on the dates indicated.
| PATRICK P. COYNE |
| By: Patrick P. Coyne |
| Title: Chief Executive Officer |
| Date: January 30, 2009 |
| RICHARD SALUS |
| By: Richard Salus |
| Title: Chief Financial Officer |
| Date: January 30, 2009 |