Project Baseball TM Capital Corp. December 23, 2009 |
Table of Contents |
| Tab | Page | |||
| I | Transaction Overview | |||
| Situation Overview | 1 | |||
| Proposed Transaction Rationale | 2 | |||
| TM Capital’s Procedures | 4 | |||
| II | Baseball Company Overview | |||
| Baseball Company Overview | 5 | |||
| Work Gloves and Protective Wear Company Overview | 6 | |||
| Promotional and Specialty Products Company Overview | 7 | |||
| Pet Supplies Company Overview | 8 | |||
| Stock Ownership Summary | 9 | |||
| Historical Financial Information | 10 | |||
| Projected Financial Information | 17 | |||
| III | Valuation Analyses | |||
| Valuation Approaches | 26 | |||
| Trading Profile | 27 | |||
| Analysis of Selected Public Companies | 32 | |||
| Analysis of Comparable “Go Dark” Transactions | 42 | |||
| Discounted Cash Flow Analysis | 44 | |||
| Liquidation Analysis | 45 | |||
| IV | Summary Valuation | |||
| Summary Valuation | 46 |
 |
TAB I:
Transaction Overview
|
Situation Overview |
| – | Proposed Transaction | |||
| v | Baseball (the “Company”) plans to effect a reverse split of the Company’s common stock at a ratio of 1 for 100, followed immediately by a forward 100 for 1 split of the common stock, and to provide for payment of $7.65 in cash (the “Consideration”) to those stockholders (the “Fractional Shareholders”) holding, prior to the reverse stock split, fewer than 100 shares of common stock (the “Transaction”) | |||
| v | The Company estimates that 1,241 of the approximate 1,415 stockholders of record own fewer than 100 shares | |||
| v | After the reverse and forward split, with fractional share repurchases, the Company estimates it will have approximately 174 stockholders of record | |||
| v | Once the Company has fewer than 300 stockholders of record, it can terminate its public company reporting status | |||
| v | The Company estimates that the Transaction will result in the purchase of approximately 40,000 shares | |||
| v | The Company has asked TM Capital to provide an opinion as to whether the Consideration to be received by the Fractional Shareholders, pursuant to the Transaction, is fair to such holders from a financial point of view | |||
| 1 | |
Proposed Transaction Rationale |
| – | Public company costs are high and increasing | |||
| v | The costs of complying with the Sarbanes-Oxley Act, increased D&O insurance expenses, audit costs and implementation of related corporate governance reforms have become significant | |||
| v | The costs associated with retaining public status, servicing stockholders and continuing public communications remain high | |||
| – | The time demands on management and employees associated with public company status are significant | |||
| v | Preparing public reports, filings, press releases and Regulation FD compliance | |||
| v | Since the Company has relatively few executive personnel, these costs can be material | |||
| v | Investor relations and communications with stockholders take management time | |||
| – | Stockholders are unable to benefit fully from public company status due to limited liquidity and the Company’s micro-cap classification | |||
| v | Stockholders are not able to move into, or out of, stock positions without materially impacting the market price | |||
| v | The Company is not able to raise capital conventionally in public markets | |||
| v | The Company has not been able to attract any significant institutional investor interest in the public equity | |||
| v | The Company is not able to effectively use shares for acquisitions | |||
| – | Reduced competitive risks with increased focus | |||
| v | Management can focus more time on long-term financial results and goals rather than short-term market concerns | |||
| v | The Company no longer has to disclose competitive business or other sensitive information | |||
| 2 | |
Proposed Transaction Rationale |
| – | A go dark transaction effected via a reverse and then immediate stock split provides multiple benefits | |||
| v | Reduces direct and indirect costs | |||
| v | Saves management and employee time | |||
| v | Small stockholders are able to sell without a commission | |||
| v | The cash demands on the Company to accomplish the reverse split are predictable | |||
| – | Several negative ramifications affecting shareholders in a “go dark” transaction include: | |||
| v | Small shareholders who might want to retain ownership will have their common shares converted into the right to receive cash | |||
| v | Liquidity for continuing shareholders will be reduced | |||
| v | The Company will cease filing required SEC financial reports resulting in less information available to shareholders | |||
| 3 | |
TM Capital’s Procedures |
| – | In performing our analyses, TM Capital has, among other things: | |||
| v | Reviewed the Company’s Annual Reports on Form 10-K and related financial information for the years ended December 2004 through 2008 | |||
| v | Reviewed the Company’s Quarterly Reports on Form 10-Q and the related unaudited financial information for the periods ended March 28, 2009, June 27, 2009 and September 26, 2009 | |||
| v | Reviewed the Company’s Amendment No. 1 to its Annual Report on Form 10-K for the year ended December 27, 2008 on Form 10-K/A | |||
| v | Reviewed a draft of the Company’s proxy statement prepared in connection with the Transaction | |||
| v | Reviewed certain information, including historical financial data and financial forecasts, relating to the business, earnings, cash flow, assets and prospects of the Company, furnished to us by the Company or publicly available | |||
| v | Visited the Company, toured certain facilities and conducted discussions with members of senior management of the Company concerning its business and prospects | |||
| v | Reviewed the historical market prices and trading activity of the Company’s common stock | |||
| v | Compared certain financial and market information for the Company with that of selected publicly traded companies which we deemed to be relevant | |||
| v | Compared the financial terms of the Transaction with those of certain other transactions which we deemed to be relevant | |||
| v | Reviewed a liquidation analysis of the Company prepared by management | |||
| v | Reviewed such other financial studies and analyses and performed such other investigations and took into account such other matters as we deemed necessary, including our assessment of general economic, market and monetary conditions | |||
| 4 | |
TAB II:
Baseball Company Overview
|
Baseball Company Overview |
    | – | Baseball was founded in 1893 in Kewanee, Illinois and engages in the import, marketing and distribution of work gloves, boots, rainwear, pet supplies and promotional and specialty products | ||||
| – | Listed on the Over the Counter (OTC) Bulletin Board; market capitalization as of December 18, 2009: $12.4 million | |||||
| – | Company conducts operations in three segments: | |||||
| v | Work Gloves and Protective Wear | |||||
| v | Promotional and Specialty Products | |||||
| v | Pet Supplies | |||||
| – | Customers include a broad range of retailers: | |||||
| v | Convenience stores, mass merchandisers, hardware and grocery stores | |||||
| – | Services a diverse group of industries: | |||||
| v | Agricultural, automotive, energy, lumber, mining, construction, consumer, entertainment, banking, real estate and education | |||||
 | ||||||
| 5 | |
Work Gloves and Protective Wear Segment Overview |
| – | The Work Gloves and Protective Wear segment imports, markets and distributes gloves, boots and rainwear products | ||||||
| – | This segment has operations in Kewanee, IL, serving its US customers and Concord, Canada serving its Canadian customers | ||||||
| – | Company serves two primary markets: | ||||||
| v | Consumer: comprised of retailers ranging from convenience stores to mass merchandisers as well as hardware and grocery stores | ||||||
| v | Industrial: comprised of various industrial and commercial users of gloves and protective wear | ||||||
| – | Trademark licensing agreement with Caterpillar, Inc. | ||||||
| v | Markets work gloves, safety items and other products under the CAT® trademark to both the consumer and industrial market | ||||||
| v | Represents approximately 8% of 2008 domestic sales in this segment | ||||||
| – | Boss brand is a recognized and trusted name | ||||||
| v | Represents quality, value, and good customer service | ||||||
| – | Annually designs and sources new products from low cost manufacturing locations | ||||||
| v | Malaysia, China, Sri Lanka, Vietnam, Pakistan, India, etc. | ||||||
| 6 | |
Promotional and Specialty Products Segment Overview |
| – | The Promotional and Specialty Products segment, operating as Galaxy Balloons, Inc., imports and custom imprints inflatable products such as balloons, mini-sport balls, signature balls, exercise balls and beach balls and non-inflatable products including yo-yos, juggle balls, sport horns, fan-ta-sticks, holiday candles and ornaments | |||||
| – | Based in Cleveland, Ohio | |||||
| v | Products distributed under the Galactic Fun Time brand name | |||||
| – | Products are sold exclusively through authorized distributors to the promotional products industry | |||||
| v | Over the past two years, the Company has sold products to approximately 10,000 different distributors | |||||
| – | Company serves a broad based group of end-users looking to get their name in front of potential customers for maximum exposure at a relatively small advertising cost: | |||||
| v | Banks, real estate brokers, automobile dealers, hotels and schools | |||||
| 7 | |
Pet Supplies Segment Overview |
| – | Pet Supplies, operating as Boss Pet Products, Inc., imports, markets and distributes pet cable restraints, collars and leads, pet toys, rawhide chews, shampoos and other pet specialty products | |||||
| – | Based in Maple Heights, OH | |||||
| – | Boss Pet sells its products primarily to pet supply specialty, hardware and discount retailers under various branded and private label brands | |||||
| v | Pet Therapy, PDQ, Prestige, Digger’s, HiLo and Aloe Care | |||||
| – | Products are sourced primarily from Asian manufacturers, with minor assembly and repackaging done in the Ohio facility | |||||
| – | Due to its patented connecting device, Boss Pet is one of the leading provider of pet cable restraints in the United States | |||||
| 8 | |
Current Ownership |
| % of | ||||||
| Total | ||||||
| Shareholders | Shares Owned | Outstanding* | Ownership Summary | |||
| Officers & Directors: |  | |||||
| Louis Graziadio III Family | ||||||
| G. Louis Graziadio III, Chairman, President and CEO | 153,000 | 7.2% | ||||
| Ginarra Partners, LLC | 576,388 | 27.2% | ||||
| Graziadio Family Trust | 410,519 | 19.4% | ||||
| Total - Louis Graziadio III Family (a) | 1,139,907 | 53.9% | ||||
| Paul A. Novelly | ||||||
| Paul A. Novelly, Director | 12,000 | 0.6% | ||||
| St. Albans Global Management LLLP | 87,283 | 4.1% | ||||
| Total - Paul A. Novelly (b) | 99,283 | 4.7% | ||||
| Other Officers & Directors | ||||||
| Perry A. Lerner, Director | 51,504 | 2.4% | ||||
| Lee E. Mikles, Director | 12,000 | 0.6% | ||||
| Richard Bern, Operational Consultant | 8,500 | 0.4% | ||||
| James F. Sanders, Secretary and General Counsel | 6,000 | 0.3% | ||||
| Total - Other Officers & Directors | 78,004 | 3.7% | ||||
| Total Officers & Directors | 1,317,194 | 62.2% | ||||
| Institutions: | ||||||
| Advisory Research | 138,150 | 6.5% | ||||
| Total Institutional Investors | 138,150 | 6.5% | ||||
| Implied Retail | 660,703 | 31.2% | ||||
| Total Shares Outstanding (c) | 2,116,047 | 100.0% | ||||
* Excludes 231,000 stock options with a weighted average exercise price of $3.92 per share.
(a) Includes shares owned by (i) G. Louis Graziadio, (ii) Ginarra Partners and (iii) Graziadio Family Trust.
(b) Includes shares owned by Paul A. Novelly and St. Albans Global Management.
(c) Total shares outstanding as of October 27, 2009 per Form 10-Q filed on November 10, 2009.
(a) Includes shares owned by (i) G. Louis Graziadio, (ii) Ginarra Partners and (iii) Graziadio Family Trust.
(b) Includes shares owned by Paul A. Novelly and St. Albans Global Management.
(c) Total shares outstanding as of October 27, 2009 per Form 10-Q filed on November 10, 2009.
| 9 | |
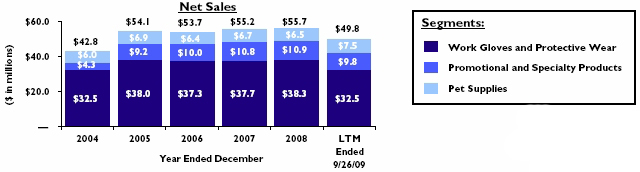
Historical Consolidated Income Statement Data |
Net Sales (% Growth) | Gross Profit (% Margin) | |
 |  | |
EBITDA (% Margin) | Operating Income (% Margin) | |
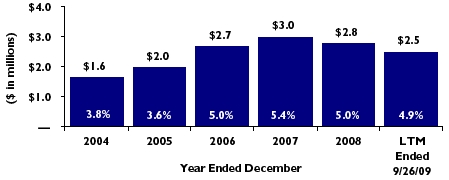 | 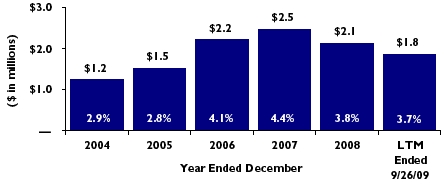 |
| 10 | |
Historical Consolidated Income Statements |
| ($s and shares in thousands, except per share data) | |||||||||||||||||
| Year Ended December | Nine Months Ended | LTM Ended | |||||||||||||||
| 2004 | 2005 | 2006 | 2007 | 2008 | 9/27/2008 | 9/26/2009 | 9/26/2009 | ||||||||||
| Net Sales | $42,832 | $54,150 | $53,663 | $55,197 | $55,732 | $40,711 | $34,729 | $49,750 | |||||||||
| Cost of Goods Sold | 32,107 | 40,600 | 40,112 | 40,817 | 41,962 | 30,951 | 26,192 | 37,203 | |||||||||
| Gross Profit | 10,724 | 13,550 | 13,551 | 14,380 | 13,771 | 9,760 | 8,537 | 12,548 | |||||||||
| Operating Expenses | 9,497 | 12,029 | 11,348 | 11,924 | 11,658 | 8,640 | 7,685 | 10,702 | |||||||||
| Operating Income | 1,227 | 1,521 | 2,203 | 2,456 | 2,112 | 1,120 | 852 | 1,844 | |||||||||
| Interest Income | 28 | 17 | 4 | 110 | 40 | 36 | 14 | 19 | |||||||||
| Interest Expense | (267) | (428) | (416) | (309) | (313) | (229) | (201) | (285) | |||||||||
| Other Income (Expense) | 48 | 29 | 42 | 20 | (770) | * | 4 | 40 | (733) | * | |||||||
| Income before Provision for Taxes | 1,035 | 1,139 | 1,832 | 2,277 | 1,069 | 931 | 705 | 845 | |||||||||
| Income Tax (Benefit) Expense | 439 | 449 | 668 | 911 | 531 | 378 | 275 | 427 | |||||||||
| Net Income before NOL Valuation Allowance Adjustment | 596 | 690 | 1,164 | 1,366 | 539 | 553 | 430 | 417 | |||||||||
| NOL Valuation Allowance Adjustment | 3,127 | — | 2,730 | — | — | — | (134) | (134) | |||||||||
| Net Income | $3,723 | $690 | $3,894 | $1,366 | $539 | $553 | $296 | $283 | |||||||||
| Net Income before NOL Valuation Allowance | |||||||||||||||||
| Adjustment per Common Share: | |||||||||||||||||
| Diluted Earnings Per Share | $0.28 | $0.31 | $0.53 | $0.62 | $0.24 | $0.25 | $0.20 | $0.19 | |||||||||
| Weighted Average Shares Outstanding | 2,163 | 2,206 | 2,194 | 2,205 | 2,206 | 2,212 | 2,201 | 2,198 | |||||||||
| EBITDA Calculation: | |||||||||||||||||
| Operating Income | $1,227 | $1,521 | $2,203 | $2,456 | $2,112 | $1,120 | $852 | $1,844 | |||||||||
| Plus: Depreciation & Amortization | 405 | 447 | 467 | 534 | 653 | 491 | 454 | 616 | |||||||||
| EBITDA | $1,631 | $1,968 | $2,670 | $2,990 | $2,765 | $1,611 | $1,306 | $2,461 | |||||||||
| Segment Operating Income and EBITDA: | |||||||||||||||||
| Corporate Expenses | ($920) | ($1,029) | ($976) | ($1,005) | ($897) | ($780) | ($820) | ($937) | |||||||||
| Operating Income Before Corporate Expenses | 2,147 | 2,550 | 3,179 | 3,461 | 3,010 | 1,900 | 1,672 | 2,782 | |||||||||
| EBITDA Before Corporate Expenses | 2,551 | 2,997 | 3,646 | 3,995 | 3,664 | 2,391 | 2,126 | 3,398 | |||||||||
| Net Sales Growth | 20.3% | 26.4% | (0.9%) | 2.9% | 1.0% | — | (14.7%) | — | |||||||||
| Gross Margin | 25.0% | 25.0% | 25.3% | 26.1% | 24.7% | 24.0% | 24.6% | 25.2% | |||||||||
| Operating Expenses as a % of Net Sales | 22.2% | 22.2% | 21.1% | 21.6% | 20.9% | 21.2% | 22.1% | 21.5% | |||||||||
| Operating Margin | 2.9% | 2.8% | 4.1% | 4.4% | 3.8% | 2.8% | 2.5% | 3.7% | |||||||||
| EBITDA Margin | 3.8% | 3.6% | 5.0% | 5.4% | 5.0% | 4.0% | 3.8% | 4.9% | |||||||||
| Net Margin before NOL Valuation Allowance Adjustment | 1.4% | 1.3% | 2.2% | 2.5% | 1.0% | 1.4% | 1.2% | 0.8% | |||||||||
* Includes a non-cash goodwill impairment loss of $757,000 and a $35,000 patent impairment loss at the work gloves and protective wear segment.
| 11 | |
LTM Net Sales and EBITDA by Segment |
($ in thousands)
| LTM Net Sales by Segment | LTM EBITDA before Corporate Expenses | |
 |  |
Segments: | |
| n | Work Gloves and Protective Wear |
| n | Promotional and Specialty Products |
| n | Pet Supplies |
| 12 | |
Historical Income Statement Data by Segment |
| ($ in thousands) | ||||||||||||||||||
| Year Ended December | Nine Months Ended | LTM Ended | ||||||||||||||||
| 2003 | 2004 | 2005 | 2006 | 2007 | 2008 | 9/27/2008 | 9/26/2009 | 9/26/2009 | ||||||||||
| Net Sales | ||||||||||||||||||
| Work Gloves and Protective Wear | $29,764 | $32,535 | $38,045 | $37,258 | $37,689 | $38,283 | $27,646 | $21,857 | $32,494 | |||||||||
| Promotional and Specialty Products | 720 | 4,270 | 9,165 | 9,992 | 10,815 | 10,924 | 8,059 | 6,888 | 9,754 | |||||||||
| Pet Supplies | 5,127 | 6,027 | 6,940 | 6,414 | 6,693 | 6,525 | 5,006 | 5,983 | 7,502 | |||||||||
| Total Net Sales | $35,611 | $42,832 | $54,150 | $53,663 | $55,197 | $55,732 | $40,711 | $34,729 | $49,750 | |||||||||
| Gross Profit | ||||||||||||||||||
| Work Gloves and Protective Wear | $7,445 | $7,864 | $8,877 | $9,019 | $9,337 | $9,020 | $6,247 | $4,893 | $7,666 | |||||||||
| Promotional and Specialty Products | 285 | 1,535 | 3,104 | 3,393 | 3,425 | 3,418 | 2,464 | 2,132 | 3,087 | |||||||||
| Pet Supplies | 1,274 | 1,324 | 1,569 | 1,139 | 1,618 | 1,332 | 1,049 | 1,512 | 1,795 | |||||||||
| Total Gross Profit | $9,004 | $10,724 | $13,550 | $13,551 | $14,380 | $13,771 | $9,760 | $8,537 | $12,548 | |||||||||
| Operating Income | ||||||||||||||||||
| Work Gloves and Protective Wear | $1,094 | $1,308 | $1,002 | $1,568 | $1,598 | $1,403 | $740 | $361 | $1,023 | |||||||||
| Promotional and Specialty Products | 48 | 628 | 1,192 | 1,485 | 1,228 | 1,148 | 780 | 727 | 1,095 | |||||||||
| Pet Supplies | 183 | 211 | 356 | 126 | 635 | 460 | 379 | 584 | 665 | |||||||||
| Corporate | (968) | (920) | (1,029) | (976) | (1,005) | (897) | (780) | (820) | (937) | |||||||||
| Total Operating Income | $357 | $1,227 | $1,521 | $2,203 | $2,456 | $2,113 | $1,120 | $852 | $1,844 | |||||||||
| EBITDA | ||||||||||||||||||
| Work Gloves and Protective Wear | $1,391 | $1,607 | $1,286 | $1,854 | $1,942 | $1,788 | $1,010 | $606 | $1,384 | |||||||||
| Promotional and Specialty Products | 56 | 715 | 1,337 | 1,647 | 1,377 | 1,369 | 963 | 908 | 1,314 | |||||||||
| Pet Supplies | 200 | 229 | 374 | 144 | 677 | 506 | 418 | 612 | 701 | |||||||||
| Corporate | (968) | (920) | (1,029) | (976) | (1,005) | (897) | (780) | (820) | (937) | |||||||||
| Total EBITDA | $679 | $1,631 | $1,968 | $2,670 | $2,990 | $2,766 | $1,611 | $1,306 | $2,461 | |||||||||
| Net Sales Growth | ||||||||||||||||||
| Work Gloves and Protective Wear | — | 9.3% | 16.9% | (2.1%) | 1.2% | 1.6% | — | (20.9%) | — | |||||||||
| Promotional and Specialty Products | — | NM | 114.6% | 9.0% | 8.2% | 1.0% | — | (14.5%) | — | |||||||||
| Pet Supplies | — | 17.6% | 15.1% | (7.6%) | 4.4% | (2.5%) | — | 19.5% | — | |||||||||
| Total | — | 20.3% | 26.4% | (0.9%) | 2.9% | 1.0% | — | (14.7%) | — | |||||||||
| Gross Margin | ||||||||||||||||||
| Work Gloves and Protective Wear | 25.0% | 24.2% | 23.3% | 24.2% | 24.8% | 23.6% | 22.6% | 22.4% | 23.6% | |||||||||
| Promotional and Specialty Products | 39.6% | 36.0% | 33.9% | 34.0% | 31.7% | 31.3% | 30.6% | 31.0% | 31.6% | |||||||||
| Pet Supplies | 24.9% | 22.0% | 22.6% | 17.8% | 24.2% | 20.4% | 21.0% | 25.3% | 23.9% | |||||||||
| Total | 25.3% | 25.0% | 25.0% | 25.3% | 26.1% | 24.7% | 24.0% | 24.6% | 25.2% | |||||||||
| Operating Margin | ||||||||||||||||||
| Work Gloves and Protective Wear | 3.7% | 4.0% | 2.6% | 4.2% | 4.2% | 3.7% | 2.7% | 1.7% | 3.1% | |||||||||
| Promotional and Specialty Products | 6.6% | 14.7% | 13.0% | 14.9% | 11.4% | 10.5% | 9.7% | 10.6% | 11.2% | |||||||||
| Pet Supplies | 3.6% | 3.5% | 5.1% | 2.0% | 9.5% | 7.0% | 7.6% | 9.8% | 8.9% | |||||||||
| Total | 1.0% | 2.9% | 2.8% | 4.1% | 4.4% | 3.8% | 2.8% | 2.5% | 3.7% | |||||||||
| EBITDA Margin | ||||||||||||||||||
| Work Gloves and Protective Wear | 4.7% | 4.9% | 3.4% | 5.0% | 5.2% | 4.7% | 3.7% | 2.8% | 4.3% | |||||||||
| Promotional and Specialty Products | 7.8% | 16.8% | 14.6% | 16.5% | 12.7% | 12.5% | 11.9% | 13.2% | 13.5% | |||||||||
| Pet Supplies | 3.9% | 3.8% | 5.4% | 2.3% | 10.1% | 7.8% | 8.4% | 10.2% | 9.3% | |||||||||
| Total | 1.9% | 3.8% | 3.6% | 5.0% | 5.4% | 5.0% | 4.0% | 3.8% | 4.9% | |||||||||
| 13 | |
Historical Consolidated Balance Sheets |
| ($s in thousands, except per share data) | ||||||||||||
| As of December | As of | |||||||||||
| 2004 | 2005 | 2006 | 2007 | 2008 | 9/26/2009 | |||||||
| Assets: | ||||||||||||
| Cash & Equivalents | $1,056 | — | $1,002 | $2,557 | $803 | $5,641 | ||||||
| Accounts Receivable, net | 7,251 | $8,373 | 8,155 | 8,278 | 8,256 | 7,537 | ||||||
| Inventories | 14,124 | 16,728 | 14,838 | 15,984 | 18,929 | 15,367 | ||||||
| Other Current Assets | 484 | 554 | 619 | 579 | 523 | 393 | ||||||
| Total Current Assets | 22,915 | 25,656 | 24,614 | 27,397 | 28,511 | 28,938 | ||||||
| Property, Plant & Equipment, net | 3,829 | 3,799 | 3,656 | 3,528 | 3,340 | 3,174 | ||||||
| Goodwill | 2,453 | 3,180 | 3,380 | 3,666 | 2,853 | 2,853 | ||||||
| Deferred Taxes | 2,533 | 2,211 | 4,343 | 3,616 | 3,219 | 2,873 | ||||||
| Other Assets | 449 | 596 | 586 | 780 | 505 | 502 | ||||||
| Total Assets | $32,180 | $35,441 | $36,579 | $38,988 | $38,428 | $38,340 | ||||||
| Liabilities & Stockholders' Equity: | ||||||||||||
| Current Portion of Long-Term Debt | $762 | $817 | $481 | $511 | $495 | $1,136 | ||||||
| Accounts Payable | 1,173 | 1,270 | 1,540 | 2,370 | 1,860 | 1,839 | ||||||
| Accrued Wages and Commission | 853 | 1,006 | 766 | 1,191 | 1,123 | 871 | ||||||
| Other Accrued Liabilities | 1,306 | 1,460 | 1,641 | 1,260 | 1,486 | 1,438 | ||||||
| Total Current Liabilities | 4,094 | 4,553 | 4,428 | 5,331 | 4,965 | 5,284 | ||||||
| Long-Term Debt | 3,258 | 4,889 | 2,106 | 2,054 | 1,607 | 605 | ||||||
| Deferred Compensation | 222 | 321 | 349 | 201 | 146 | 202 | ||||||
| Total Liabilities | 7,574 | 9,762 | 6,883 | 7,586 | 6,718 | 6,091 | ||||||
| Total Stockholders' Equity | 24,606 | 25,679 | 29,696 | 31,402 | 31,710 | 32,249 | ||||||
| Total Liabilities & Stockholders' Equity | $32,180 | $35,441 | $36,579 | $38,988 | $38,428 | $38,340 | ||||||
| Book Value Per Share | $12.65 | $12.96 | $14.99 | $15.56 | $15.57 | $15.24 | ||||||
| Shares Outstanding | 1,946 | 1,981 | 1,981 | 2,018 | 2,036 | 2,116 | ||||||
| 14 | |
Historical Consolidated Statement of Cash Flows |
| ($s in thousands) | ||||||||||||||||
| Year Ended December | Nine Months Ended | LTM Ended | ||||||||||||||
| 2004 | 2005 | 2006 | 2007 | 2008 | 9/27/2008 | 9/26/2009 | 9/26/2009 | |||||||||
| Cash Flows from Operating Activities: | ||||||||||||||||
| Net Income | $3,723 | $690 | $3,894 | $1,366 | $538 | $553 | $296 | $281 | ||||||||
| Depreciation & Amortization | 404 | 448 | 467 | 534 | 654 | 491 | 454 | 617 | ||||||||
| Goodwill and Patent Impairment | — | — | — | — | 792 | — | — | 792 | ||||||||
| Adjustments to Reconcile Net Income to | ||||||||||||||||
| Cash Flow from Operations: | ||||||||||||||||
| (Gain) Loss from Sale of Assets | (32) | — | — | — | — | — | — | — | ||||||||
| Stock Compensation Expense | 74 | 178 | 128 | 36 | 8 | 6 | 4 | 6 | ||||||||
| Other Operating Activities | (2,712) | 304 | (2,132) | 772 | 587 | 267 | 339 | 659 | ||||||||
| Changes in Working Capital: | ||||||||||||||||
| (Increase) Decrease in Accounts Receivable | (225) | (1,047) | 218 | 48 | (84) | 207 | 765 | 474 | ||||||||
| (Increase) Decrease in Inventory | (2,686) | (2,363) | 1,890 | (1,100) | (3,156) | (2,931) | 3,663 | 3,438 | ||||||||
| Increase (Decrease) in Accounts Payable | 5 | (81) | 271 | 579 | (206) | 65 | (177) | (448) | ||||||||
| Increase (Decrease) in Accrued Liabilities | 76 | 101 | (60) | 246 | 116 | (117) | (253) | (20) | ||||||||
| Change in Other Net Operating Assets | (28) | (70) | (70) | 52 | 71 | 288 | 71 | (146) | ||||||||
| Net Cash Provided (Used) By Continuing Operations | (1,401) | (1,840) | 4,606 | 2,533 | (680) | (1,171) | 5,162 | 5,653 | ||||||||
| Cash Flows from Investing Activities: | ||||||||||||||||
| Capital Expenditures | (147) | (371) | (281) | (343) | (380) | (333) | (200) | (247) | ||||||||
| Proceeds from Sale of Property, Plant & Equipment | 1,712 | — | — | — | — | — | — | — | ||||||||
| Cash for Acquisitions | (3,418) | (709) | (200) | (887) | — | — | — | — | ||||||||
| Net Cash Provided (Used) By Investing Activities | (1,853) | (1,080) | (481) | (1,230) | (380) | (333) | (200) | (247) | ||||||||
| Cash Flows From Financing Activities: | ||||||||||||||||
| Net Payments on Revolving Line of Credit | 98 | 2,204 | (2,302) | — | — | — | (23) | (23) | ||||||||
| Borrowing on Long-Term Obligations | 1,750 | 250 | — | 405 | — | — | — | — | ||||||||
| Repayment of Long-Term Obligations | (1,969) | (768) | (817) | (427) | (477) | (368) | (374) | (483) | ||||||||
| Purchase and Retirement of Stock | (135) | — | — | — | — | — | — | — | ||||||||
| Proceeds from Exercise of Stock Options | 33 | 87 | — | 86 | 51 | — | 140 | 191 | ||||||||
| Net Cash Provided (Used) By Financing Activities | (223) | 1,773 | (3,119) | 64 | (426) | (368) | (257) | (315) | ||||||||
| Effect of Exchange Rate Changes on Cash | 54 | 91 | (4) | 188 | (268) | (254) | 133 | 119 | ||||||||
| Net Increase (Decrease) In Cash And Cash Equivalents | (3,423) | (1,056) | 1,002 | 1,555 | (1,754) | (2,126) | 4,838 | 5,210 | ||||||||
| Cash And Cash Equivalents, Beginning | 4,479 | $1,056 | — | 1,002 | 2,557 | 2,557 | 803 | 431 | ||||||||
| Cash And Cash Equivalents, Ending | $1,056 | — | $1,002 | $2,557 | $803 | $431 | $5,641 | $5,641 | ||||||||
| 15 | |
Historical Orders Per Day and Backlog |
n Previous Twelve Months n Latest Twelve Months |
| ($ in thousands) | Orders Per Day |

| ($ in thousands) | Backlog |

____________________
* As of December 7, 2008 and 2009.
| 16 | |
2008 and 2009 Quarterly Sales and EBITDA Data by Segment |
n Work Gloves and Protective Wear n Promotional and Specialty Products n Pet Supplies |
Segment Quarterly Net Sales
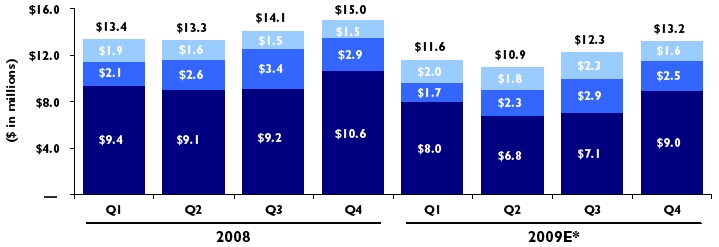
Segment Quarterly EBITDA (a)

____________________
* Q4 2009 based on management’s assumptions.
(a) Excludes corporate expenses.
(a) Excludes corporate expenses.
| 17 | |
Projected 2009 Quarterly Consolidated Income Statements |
| ($s and shares in thousands, except per share data) | ||||||||||
| Year Ending December 2009 | ||||||||||
| Q1 A | Q2 A | Q3 A | Q4 E | Total | ||||||
| Net Sales | $11,582 | $10,890 | $12,258 | $13,180 | $47,909 | |||||
| Cost of Goods Sold | 8,859 | 8,384 | 8,949 | 9,688 | 35,880 | |||||
| Gross Profit | 2,723 | 2,506 | 3,308 | 3,492 | 12,029 | |||||
| Operating Expenses | 2,745 | 2,341 | 2,599 | 2,788 | 10,473 | |||||
| Operating Income | (22) | 165 | 709 | 704 | 1,556 | |||||
| Interest Income | 5 | 4 | 5 | 0 | 14 | |||||
| Interest Expense | (67) | (67) | (68) | (72) | (273) | |||||
| Other Income (Expense) | 1 | (1) | 40 | (20) | 20 | |||||
| Income before Provision for Taxes | (83) | 102 | 686 | 612 | 1,317 | |||||
| Income Tax (Benefit) Expense | (32) | 39 | 268 | 244 | 519 | |||||
| Net Income before NOL Valuation Allowance Adjustment | (51) | 63 | 418 | 368 | 798 | |||||
| NOL Valuation Allowance Adjustment | — | (376) | 242 | — | (134) | |||||
| Net Income | ($51) | ($313) | $660 | $368 | $664 | |||||
| Net Income before NOL Valuation Allowance | ||||||||||
| Adjustment per Common Share: | ||||||||||
| Diluted Earnings Per Share | ($0.02) | $0.03 | $0.20 | $0.17 | $0.37 | |||||
| Weighted Average Shares Outstanding | 2,201 | 2,116 | 2,116 | 2,116 | 2,137 | |||||
| EBITDA Calculation: | ||||||||||
| Operating Income | ($22) | $165 | $709 | $704 | $1,556 | |||||
| Plus: Depreciation & Amortization | 146 | 163 | 145 | 137 | 591 | |||||
| EBITDA | $124 | $328 | $855 | $841 | $2,147 | |||||
| Segment Operating Income and EBITDA: | ||||||||||
| Corporate Expenses | ($312) | ($260) | ($249) | ($259) | ($1,079) | |||||
| Operating Income Before Corporate Expenses | 290 | 425 | 958 | 963 | 2,635 | |||||
| EBITDA Before Corporate Expenses | 436 | 588 | 1,104 | 1,100 | 3,226 | |||||
| Net Sales Growth | (13.3%) | (18.0%) | (12.9%) | (12.3%) | (14.0%) | |||||
| Gross Margin | 23.5% | 23.0% | 27.0% | 26.5% | 25.1% | |||||
| Operating Expenses as a % of Net Sales | 23.7% | 21.5% | 21.2% | 21.2% | 21.9% | |||||
| Operating Margin | (0.2%) | 1.5% | 5.8% | 5.3% | 3.2% | |||||
| EBITDA Margin | 1.1% | 3.0% | 7.0% | 6.4% | 4.5% | |||||
| Net Margin before NOL Valuation Allowance Adjustment | (0.4%) | 0.6% | 3.4% | 2.8% | 1.7% | |||||
| 18 | |
Projected Consolidated Income Statement Data* |
Net Sales (% Growth) | Gross Profit (% Margin) | |
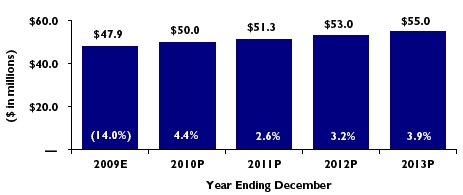 |  | |
EBITDA (% Margin) | Operating Income (% Margin) | |
 | 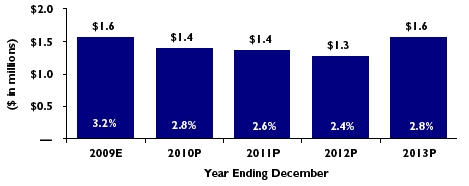 |
____________________
* Based on management’s assumptions.
| 19 | |
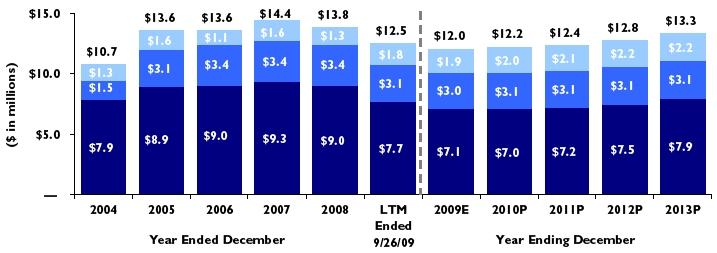
Historical & Projected Income Statement Data by Segment* |
n Work Gloves and Protective Wear n Promotional and Specialty Products n Pet Supplies |
Segment Net Sales

Segment Gross Profit
____________________
* 2009E-2013P based on management’s assumptions.
| 20 | |
Historical & Projected Income Statement Data by Segment* |
n Work Gloves and Protective Wear n Promotional and Specialty Products n Pet Supplies |
Segment EBITDA*

Segment Operating Income*

____________________
* Excludes corporate expenses.
| 21 | |
Projected Consolidated Income Statements* |
| ($s and shares in thousands, except per share data) | ||||||||||
| Year Ending December | ||||||||||
| 2009E | 2010P | 2011P | 2012P | 2013P | ||||||
| Net Sales | $47,909 | $50,016 | $51,314 | $52,966 | $55,010 | |||||
| Cost of Goods Sold | 35,880 | 37,852 | 38,946 | 40,209 | 41,694 | |||||
| Gross Profit | 12,029 | 12,164 | 12,367 | 12,757 | 13,316 | |||||
| Operating Expenses | 10,473 | 10,774 | 11,015 | 11,491 | 11,764 | |||||
| Operating Income | 1,556 | 1,390 | 1,353 | 1,266 | 1,552 | |||||
| Interest Income | 14 | — | — | — | — | |||||
| Interest Expense | (273) | — | — | — | — | |||||
| Other Income (Expense) | 20 | — | — | — | — | |||||
| Income before Provision for Taxes | 1,317 | 1,390 | 1,353 | 1,266 | 1,552 | |||||
| Income Tax (Benefit) Expense (a) | 519 | 556 | 541 | 507 | 621 | |||||
| Net Income before NOL Valuation Allowance Adjustment | 798 | 834 | 812 | 760 | 931 | |||||
| NOL Valuation Allowance Adjustment | (134) | — | — | — | — | |||||
| Net Income | $664 | $834 | $812 | $760 | $931 | |||||
| Net Income before NOL Valuation Allowance | ||||||||||
| Adjustment per Common Share: | ||||||||||
| Diluted Earnings Per Share | $0.37 | $0.39 | $0.38 | $0.36 | $0.44 | |||||
| Weighted Average Shares Outstanding | 2,137 | 2,116 | 2,116 | 2,116 | 2,116 | |||||
| EBITDA Calculation: | ||||||||||
| Operating Income | $1,556 | $1,390 | $1,353 | $1,266 | $1,552 | |||||
| Plus: Depreciation & Amortization | 591 | 661 | 695 | 649 | 657 | |||||
| EBITDA | $2,147 | $2,051 | $2,048 | $1,915 | $2,209 | |||||
| Segment Operating Income and EBITDA: | ||||||||||
| Corporate Expenses | ($1,079) | ($969) | ($1,037) | ($1,237) | ($1,237) | |||||
| Operating Income Before Corporate Expenses | 2,635 | 2,359 | 2,390 | 2,503 | 2,789 | |||||
| EBITDA Before Corporate Expenses | 3,226 | 3,020 | 3,085 | 3,152 | 3,446 | |||||
| Net Sales Growth | (14.0%) | 4.4% | 2.6% | 3.2% | 3.9% | |||||
| Gross Margin | 25.1% | 24.3% | 24.1% | 24.1% | 24.2% | |||||
| Operating Expenses as a % of Net Sales | 21.9% | 21.5% | 21.5% | 21.7% | 21.4% | |||||
| Operating Margin | 3.2% | 2.8% | 2.6% | 2.4% | 2.8% | |||||
| EBITDA Margin | 4.5% | 4.1% | 4.0% | 3.6% | 4.0% | |||||
| Net Margin before NOL Valuation Allowance Adjustment | 1.7% | 1.7% | 1.6% | 1.4% | 1.7% | |||||
* Based on management’s assumptions.
(a) Assumes a 40% tax rate in 2010 - 2013.
(a) Assumes a 40% tax rate in 2010 - 2013.
| 22 | |
Projected Income Statements by Segment* |
| ($ in thousands) | ||||||||||
| Year Ending December | ||||||||||
| 2009E | 2010P | 2011P | 2012P | 2013P | ||||||
| Net Sales | ||||||||||
| Work Gloves and Protective Wear | $30,865 | $30,906 | $31,833 | $33,106 | $34,761 | |||||
| Promotional and Specialty Products | 9,428 | 10,163 | 10,264 | 10,367 | 10,471 | |||||
| Pet Supplies | 7,616 | 8,948 | 9,216 | 9,493 | 9,778 | |||||
| Total Net Sales | $47,909 | $50,016 | $51,314 | $52,966 | $55,010 | |||||
| Gross Profit | ||||||||||
| Work Gloves and Protective Wear | $7,133 | $7,044 | $7,205 | $7,485 | $7,931 | |||||
| Promotional and Specialty Products | 2,992 | 3,098 | 3,074 | 3,106 | 3,139 | |||||
| Pet Supplies | 1,905 | 2,022 | 2,088 | 2,166 | 2,246 | |||||
| Total Gross Profit | $12,029 | $12,164 | $12,367 | $12,757 | $13,316 | |||||
| Operating Income | ||||||||||
| Work Gloves and Protective Wear | $897 | $669 | $707 | $687 | $909 | |||||
| Promotional and Specialty Products | 1,014 | 975 | 951 | 1,031 | 1,040 | |||||
| Pet Supplies | 724 | 715 | 732 | 785 | 840 | |||||
| Corporate | (1,079) | (969) | (1,037) | (1,237) | (1,237) | |||||
| Total Operating Income | $1,556 | $1,390 | $1,353 | $1,266 | $1,552 | |||||
| EBITDA | ||||||||||
| Work Gloves and Protective Wear | $1,221 | $994 | $1,094 | $1,082 | $1,325 | |||||
| Promotional and Specialty Products | 1,244 | 1,287 | 1,224 | 1,244 | 1,234 | |||||
| Pet Supplies | 761 | 739 | 767 | 826 | 887 | |||||
| Corporate | (1,079) | (969) | (1,037) | (1,237) | (1,237) | |||||
| Total EBITDA | $2,147 | $2,051 | $2,048 | $1,915 | $2,209 | |||||
| Net Sales Growth | ||||||||||
| Work Gloves and Protective Wear | (19.4%) | 0.1% | 3.0% | 4.0% | 5.0% | |||||
| Promotional and Specialty Products | (13.7%) | 7.8% | 1.0% | 1.0% | 1.0% | |||||
| Pet Supplies | 16.7% | 17.5% | 3.0% | 3.0% | 3.0% | |||||
| Total | (14.0%) | 4.4% | 2.6% | 3.2% | 3.9% | |||||
| Gross Margin | ||||||||||
| Work Gloves and Protective Wear | 23.1% | 22.8% | 22.6% | 22.6% | 22.8% | |||||
| Promotional and Specialty Products | 31.7% | 30.5% | 29.9% | 30.0% | 30.0% | |||||
| Pet Supplies | 25.0% | 22.6% | 22.7% | 22.8% | 23.0% | |||||
| Total | 25.1% | 24.3% | 24.1% | 24.1% | 24.2% | |||||
| Operating Margin | ||||||||||
| Work Gloves and Protective Wear | 2.9% | 2.2% | 2.2% | 2.1% | 2.6% | |||||
| Promotional and Specialty Products | 10.8% | 9.6% | 9.3% | 9.9% | 9.9% | |||||
| Pet Supplies | 9.5% | 8.0% | 7.9% | 8.3% | 8.6% | |||||
| Total | 3.2% | 2.8% | 2.6% | 2.4% | 2.8% | |||||
| EBITDA Margin | ||||||||||
| Work Gloves and Protective Wear | 4.0% | 3.2% | 3.4% | 3.3% | 3.8% | |||||
| Promotional and Specialty Products | 13.2% | 12.7% | 11.9% | 12.0% | 11.8% | |||||
| Pet Supplies | 10.0% | 8.3% | 8.3% | 8.7% | 9.1% | |||||
| Total | 4.5% | 4.1% | 4.0% | 3.6% | 4.0% | |||||
* Based on management’s assumptions.
| 23 | |
Projected Consolidated Balance Sheets* |
| ($s in thousands, except per share data) | ||||||||||
| As of December | ||||||||||
| 2009E | 2010P | 2011P | 2012P | 2013P | ||||||
| Assets: | ||||||||||
| Cash & Equivalents | $5,137 | $4,008 | $4,175 | $4,641 | $5,234 | |||||
| Accounts Receivable, net | 6,933 | 7,122 | 7,322 | 7,585 | 7,917 | |||||
| Inventories | 14,519 | 16,350 | 16,846 | 17,443 | 18,151 | |||||
| Other Current Assets | 408 | 429 | 448 | 479 | 547 | |||||
| Total Current Assets | 26,998 | 27,909 | 28,791 | 30,147 | 31,850 | |||||
| Property, Plant & Equipment, net | 2,934 | 3,118 | 3,323 | 3,159 | 2,987 | |||||
| Goodwill | 2,853 | 2,853 | 2,853 | 2,853 | 2,853 | |||||
| Deferred Taxes | 2,843 | 2,726 | 2,549 | 2,239 | 1,789 | |||||
| Other Assets | 505 | 505 | 505 | 505 | 505 | |||||
| Total Assets | $36,133 | $37,111 | $38,021 | $38,903 | $39,984 | |||||
| Liabilities & Stockholders' Equity: | ||||||||||
| Accounts Payable | $1,460 | $1,537 | $1,580 | $1,630 | $1,689 | |||||
| Accrued Wages and Commission | 937 | 978 | 1,002 | 1,032 | 1,070 | |||||
| Other Accrued Liabilities | 1,215 | 1,241 | 1,272 | 1,314 | 1,368 | |||||
| Total Current Liabilities | 3,612 | 3,756 | 3,855 | 3,977 | 4,127 | |||||
| Long-Term Debt | — | — | — | — | — | |||||
| Deferred Compensation | 146 | 146 | 146 | 146 | 146 | |||||
| Total Liabilities | 3,758 | 3,902 | 4,001 | 4,123 | 4,273 | |||||
| Total Stockholders' Equity | 32,375 | 33,209 | 34,020 | 34,780 | 35,711 | |||||
| Total Liabilities & Stockholders' Equity | $36,133 | $37,111 | $38,021 | $38,903 | $39,984 | |||||
| Book Value Per Share (a) | $15.30 | $15.69 | $16.08 | $16.44 | $16.88 | |||||
____________________
* Based on management’s assumptions.
(a) Based on 2,116,047 shares outstanding.
(a) Based on 2,116,047 shares outstanding.
| 24 | |
Projected Consolidated Cash Flow Statements* |
| ($s in thousands) | ||||||||||
| Year Ending December | ||||||||||
| 2009E | 2010P | 2011P | 2012P | 2013P | ||||||
| Cash Flows from Operating Activities: | ||||||||||
| Net Income (Loss) | $664 | $834 | $812 | $760 | $931 | |||||
| Adjustments to Reconcile Net Income to | ||||||||||
| Cash Flow from Operations: | ||||||||||
| Depreciation & Amortization | 591 | 661 | 695 | 649 | 657 | |||||
| Deferred Taxes | 376 | 117 | 177 | 310 | 450 | |||||
| Changes in Working Capital: | ||||||||||
| (Increase) Decrease in Accounts Receivable | 1,323 | (189) | (200) | (263) | (333) | |||||
| (Increase) Decrease in Inventory | 4,410 | (1,831) | (496) | (597) | (708) | |||||
| (Increase) Decrease in Other Current Assets | 115 | (21) | (19) | (31) | (69) | |||||
| Increase (Decrease) in Accounts Payable | (400) | 78 | 43 | 50 | 59 | |||||
| Increase (Decrease) in Accrued Liabilities | (457) | 67 | 55 | 72 | 91 | |||||
| Net Cash Provided (Used) By Continuing Operations | 6,622 | (285) | 1,067 | 950 | 1,079 | |||||
| Cash Flows from Investing Activities: | ||||||||||
| Capital Expenditures | (185) | (845) | (900) | (485) | (485) | |||||
| Net Cash Provided (Used) By Investing Activities | (185) | (845) | (900) | (485) | (485) | |||||
| Cash Flows From Financing Activities: | ||||||||||
| Repayment of Current Portion of Long-Term Debt | (495) | — | — | — | — | |||||
| Repayment of Long-Term Debt | (1,607) | — | — | — | — | |||||
| Other Proceeds / (Payments) | — | — | — | — | — | |||||
| Net Cash Provided (Used) By Financing Activities | (2,102) | — | — | — | — | |||||
| Net Increase (Decrease) In Cash And Cash Equivalents | 4,334 | (1,130) | 167 | 465 | 594 | |||||
| Cash And Cash Equivalents, Beginning | 803 | 5,137 | 4,008 | 4,175 | 4,641 | |||||
| Cash And Cash Equivalents, Ending | $5,137 | $4,008 | $4,175 | $4,641 | $5,234 | |||||
____________________
* Based on management’s assumptions.
| 25 | |
TAB III:
Valuation Analyses
|
Valuation Approaches |

– Review of current and historical trading prices and volume of Baseball’s common stock | – “Public Market” valuation –Value based on public market trading multiples of similar micro-cap companies | – “Transaction Specific” valuation – Analyzes the premiums paid in other reverse/forward split transactions resulting in the company “going dark” | – Present value of projected free cash flows – Incorporates time value and cost of capital considerations – Relies on management’s projections | – Value that could hypothetically be derived from the liquidation (sale) of assets and the satisfaction of liabilities – Based on recent balance sheet – Relies on management’s estimates |
| 26 | |
Summary Market Data – Baseball |
| Market Data (As of 12/18/09) (a) | ||||||||||
| ($s and shares in millions, except per share data) | Earnings per Share | $0.19 | ||||||||
| Price/Earnings Ratio | 30.8x | |||||||||
| Ticker Symbol | BSHI | |||||||||
| Stock Exchange | OTCBB | Book Value per Share | $15.24 | |||||||
| Price/Book Value | 0.4x | |||||||||
| Closing Price | $5.85 | |||||||||
| Market Capitalization | $12.4 | |||||||||
| 52-Week High | $6.90 | Plus: Total Debt | 1.7 | |||||||
| 52-Week Low | $5.10 | Less: Cash & Equivalents | 5.6 | |||||||
| Enterprise Value | $8.5 | |||||||||
| Current as a % of 52-Week High | 84.8% | |||||||||
| Enterprise Value/LTM Operating Income | 4.6x | |||||||||
| Market Capitalization | $12.4 | Enterprise Value/2009E Operating Income | 5.4x | |||||||
| Common Shares Outstanding | 2.1 | Enterprise Value/LTM EBITDA | 3.4x | |||||||
| Enterprise Value/2009E EBITDA | 3.9x | |||||||||
| Market Data (As of 12/18/09) – Pro Forma for the Transaction (a) (b) | ||||||||||
| ($s and shares in millions, except per share data) | Earnings per Share | $0.19 | ||||||||
| Price/Earnings Ratio | 40.3x | |||||||||
| Ticker Symbol | BSHI | |||||||||
| Stock Exchange | OTCBB | Book Value per Share | $15.24 | |||||||
| Price/Book Value | 0.5x | |||||||||
| Closing Price | $7.65 | |||||||||
| Market Capitalization | $16.2 | |||||||||
| 52-Week High | $6.90 | Plus: Total Debt | 1.7 | |||||||
| 52-Week Low | $5.10 | Less: Cash & Equivalents | 5.6 | |||||||
| Enterprise Value | $12.3 | |||||||||
| Current as a % of 52-Week High | 110.9% | |||||||||
| Enterprise Value/LTM Operating Income | 6.7x | |||||||||
| Market Capitalization | $16.2 | Enterprise Value/2009E Operating Income | 7.9x | |||||||
| Common Shares Outstanding | 2.1 | Enterprise Value/LTM EBITDA | 5.0x | |||||||
| Enterprise Value/2009E EBITDA | 5.7x | |||||||||
____________________
Source: Capital IQ and Baseball.
Note: On August 27, 2009, the Company announced the Transaction. The closing stock price the day prior was $6.20.
(a) Balance sheet and income statement data as of the LTM ended September 26, 2009.
(b) Pro forma for the proposed $7.65 cash consideration per share pursuant to the Transaction.
Note: On August 27, 2009, the Company announced the Transaction. The closing stock price the day prior was $6.20.
(a) Balance sheet and income statement data as of the LTM ended September 26, 2009.
(b) Pro forma for the proposed $7.65 cash consideration per share pursuant to the Transaction.
| 27 | |
One Year Stock Price and Trading Volume History |
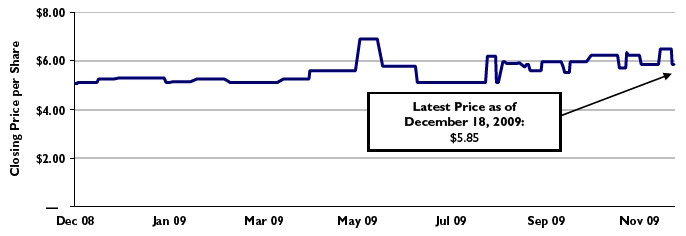

| Stock Trading History | |
| Closing stock price (12/18/09) | $5.85 |
| Market capitalization (in millions) | $12.4 |
| 52-week high | $6.90 |
| 52-week low | $5.10 |
| Average stock price: | |
| 30 day | $6.13 |
| 60 day | $6.13 |
| 90 day | $6.04 |
| 120 day | $5.98 |
| One Year | $5.60 |
| Volume weighted average stock price: | |
| 30 day | $6.08 |
| 60 day | $6.22 |
| 90 day | $5.99 |
| 120 day | $5.86 |
| One Year | $5.71 |
| Average daily trading volume: | |
| 30 day | 41 |
| 60 day | 152 |
| 90 day | 247 |
| 120 day | 657 |
| One Year | 319 |
____________________
Source: Capital IQ.
Note: On August 27, 2009, the Company announced the Transaction. The closing stock price the day prior was $6.20.
Note: On August 27, 2009, the Company announced the Transaction. The closing stock price the day prior was $6.20.
| 28 | |
Three Year Stock Price and Trading Volume History |


| Stock Trading History | |
| Closing stock price (12/18/09) | $5.85 |
| Market capitalization (in millions) | $12.4 |
| 52-week high | $6.90 |
| 52-week low | $5.10 |
| Average stock price: | |
| 30 day | $6.13 |
| 60 day | $6.13 |
| 90 day | $6.04 |
| 120 day | $5.98 |
| One Year | $5.60 |
| Three Year | $6.80 |
| Volume weighted average stock price: | |
| 30 day | $6.08 |
| 60 day | $6.22 |
| 90 day | $5.99 |
| 120 day | $5.86 |
| One Year | $5.71 |
| Three Year | $7.23 |
| Average daily trading volume: | |
| 30 day | 41 |
| 60 day | 152 |
| 90 day | 247 |
| 120 day | 657 |
| One Year | 319 |
| Three Year | 542 |
____________________
Source: Capital IQ.
Note: On August 27, 2009, the Company announced the Transaction. The closing stock price the day prior was $6.20.
Note: On August 27, 2009, the Company announced the Transaction. The closing stock price the day prior was $6.20.
| 29 | |
Shares of Baseball Traded at or Below Analysis – One Year |

Price per Share
| Total Shares Traded | 81,401 | Price Summary | ||||
| % of Shares Outstanding (a) | 3.8% | Low | $5.10 | |||
| Mean | $5.60 | |||||
| Avg. Daily Volume | 319 | High | $6.90 | |||
____________________
Source: Bloomberg.
Note: On August 27, 2009, the Company announced the Transaction. The closing stock price the day prior was $6.20.
Note: Represents common stock traded from December 19, 2008 to December 18, 2009.
(a) Shares outstanding of 2,116,047 as of October 27, 2009. Does not include shares issuable upon exercise of stock options.
| 30 | |
Shares of Baseball Traded at or Below Analysis – Three Year |

Price per Share
| Total Shares Traded | 412,785 | Price Summary | ||||
| % of Shares Outstanding (a) | 19.5% | Low | $5.05 | |||
| Mean | $6.80 | |||||
| Avg. Daily Volume | 542 | High | $9.03 | |||
____________________
Source: Bloomberg.
Note: On August 27, 2009, the Company announced the Transaction. The closing stock price the day prior was $6.20.
Note: Represents common stock traded from December 19, 2006 to December 18, 2009.
(a) Shares outstanding of 2,116,047 as of October 27, 2009. Does not include shares issuable upon exercise of stock options.
| 31 | |
Selected Public Companies Criteria |
| u | TM Capital analyzed 10 selected public companies’ operating and valuation statistics in comparison to that of Baseball | ||||
| u | To be included in this analysis, each company had to meet the following criteria: | ||||
| v | Headquartered in the United States | ||||
| v | Traded on a United States exchange | ||||
| v | Market capitalization less than $350 million | ||||
| v | Enterprise value greater than $10 million | ||||
| v | Primarily distributors, importing products used in a consumer or industrial end-user application | ||||
| v | Sourced products from third party manufacturers based primarily in the far east (i.e. Asia) | ||||
| 32 | |
Analysis of Selected Publicly Traded Companies* |
Enterprise Value / 2009E EBIT & EBITDA Multiples (a) (b)

| Ticker | Company | ||||||
| BOOT | Lacrosse Footwear Inc. | EV / 2009E EBIT | |||||
| RCRC | RC2 Corp. | EV / 2009E EBITDA | |||||
| RBI | Sport Supply Group, Inc | EV / 2009E EBIT | |||||
| SUMR | Summer Infant, Inc. | EV / 2009E EBITDA |
____________________
Source: Capital IQ and company filings. Only includes companies with publically available 2009 EBITDA projections.
* Stock data as of December 18, 2009.
(a) Adjusts for non-recurring and unusual items.
(b) 2009E EBIT calculated by subtracting depreciation and amortization for the latest twelve months from 2009 EBITDA estimates.
| 33 | |
Analysis of Selected Publicly Traded Companies* |
Enterprise Value / Historical EBITDA Multiples (a)

| Ticker | Company | Ticker | Company | |||||||||
| CRWS | Crown Crafts Inc. | RCRC | RC2 Corp. | EV / Historical Average EBITDA | ||||||||
| CSS | CSS Industries Inc. | RBI | Sport Supply Group, Inc | EV / LTM EBITDA | ||||||||
| CTIB | CTI Industries Corp. | SUMR | Summer Infant, Inc. | EV / Historical Average EBITDA | ||||||||
| KID | Kid Brands, Inc. | SNKI | Swank Inc. | EV / LTM EBITDA | ||||||||
| BOOT | Lacrosse Footwear Inc. | UUU | Universal Security Instruments Inc. | |||||||||
____________________
Source: Capital IQ and company filings.
Note: Historical Average includes latest three fiscal years and LTM.
NM – Not Meaningful.
* Stock data as of December 18, 2009.
(a) Adjusts for non-recurring and unusual items.
Note: Historical Average includes latest three fiscal years and LTM.
NM – Not Meaningful.
* Stock data as of December 18, 2009.
(a) Adjusts for non-recurring and unusual items.
| 34 | |
Analysis of Selected Publicly Traded Companies* |
Enterprise Value / Historical EBIT Multiples (a)

| Ticker | Company | Ticker | Company | |||||||||
| CRWS | Crown Crafts Inc. | RCRC | RC2 Corp. | EV / Historical Average EBIT | ||||||||
| CSS | CSS Industries Inc. | RBI | Sport Supply Group, Inc | EV / LTM EBIT | ||||||||
| CTIB | CTI Industries Corp. | SUMR | Summer Infant, Inc. | EV / Historical Average EBIT | ||||||||
| KID | Kid Brands, Inc. | SNKI | Swank Inc. | EV / LTM EBIT | ||||||||
| BOOT | Lacrosse Footwear Inc. | UUU | Universal Security Instruments Inc. | |||||||||
____________________
Source: Capital IQ and company filings.
Note: Historical Average includes latest three fiscal years and LTM.
* Stock data as of December 18, 2009.
(a) Adjusts for non-recurring and unusual items.
Source: Capital IQ and company filings.
Note: Historical Average includes latest three fiscal years and LTM.
* Stock data as of December 18, 2009.
(a) Adjusts for non-recurring and unusual items.
| 35 | |
Analysis of Selected Publicly Traded Companies |
| ($s in million) | |||||||||||
| LTM Sales | 3 Year* Sales Compounded Annual Growth Rate | ||||||||||
| Rank | Company | Sales | Rank | Company | CAGR | ||||||
| 1 | CSS Industries Inc. | $467.6 | 1 | Summer Infant, Inc. | 55.0% | ||||||
| 2 | RC2 Corp. | $421.5 | 2 | Russ Berrie & Co., Inc. | 20.3% | ||||||
| 3 | Sport Supply Group, Inc | $254.1 | 3 | CTI Industries Corp. | 15.5% | ||||||
| 4 | Kid Brands, Inc. | $231.9 | 4 | Lacrosse Footwear Inc. | 8.8% | ||||||
| 5 | Summer Infant, Inc. | $148.6 | 5 | Sport Supply Group, Inc | 6.6% | ||||||
| 6 | Lacrosse Footwear Inc. | $131.8 | 6 | Crown Crafts Inc. | 6.4% | ||||||
| 7 | Swank Inc. | $113.9 | 7 | Swank Inc. | 5.2% | ||||||
| 8 | Crown Crafts Inc. | $83.3 | 8 | Baseball (a) | 1.0% | ||||||
| 9 | Baseball (a) | $49.8 | 9 | CSS Industries Inc. | (2.8%) | ||||||
| 10 | CTI Industries Corp. | $40.4 | 10 | Universal Security Instruments Inc. | (3.3%) | ||||||
| 11 | Universal Security Instruments Inc. | $25.3 | 11 | RC2 Corp. | (3.9%) | ||||||
| LTM Gross Margin | LTM EBITDA Margin | ||||||||||
| Rank | Company | Margin | Rank | Company | Margin | ||||||
| 1 | RC2 Corp. | 42.6% | 1 | RC2 Corp. | 14.7% | ||||||
| 2 | Lacrosse Footwear Inc. | 39.0% | 2 | Crown Crafts Inc. | 13.4% | ||||||
| 3 | Sport Supply Group, Inc | 35.7% | 3 | Kid Brands, Inc. | 10.5% | ||||||
| 4 | Summer Infant, Inc. | 35.2% | 4 | Sport Supply Group, Inc | 9.7% | ||||||
| 5 | Swank Inc. | 30.9% | 5 | Summer Infant, Inc. | 9.1% | ||||||
| 6 | Kid Brands, Inc. | 29.9% | 6 | CSS Industries Inc. | 9.1% | ||||||
| 7 | CSS Industries Inc. | 25.6% | 7 | CTI Industries Corp. | 9.0% | ||||||
| 8 | Baseball (a) | 25.2% | 8 | Lacrosse Footwear Inc. | 7.7% | ||||||
| 9 | Crown Crafts Inc. | 22.0% | 9 | Baseball (a) | 4.9% | ||||||
| 10 | CTI Industries Corp. | 21.8% | 10 | Swank Inc. | 3.8% | ||||||
| 11 | Universal Security Instruments Inc. | 21.5% | 11 | Universal Security Instruments Inc. | (0.1%) | ||||||
____________________
Source: Capital IQ and company filings.
Note: Adjusts for non-recurring and unusual items
* Based on the latest three fiscal years.
(a) Income statement data for the LTM ended September 26, 2009.
Source: Capital IQ and company filings.
Note: Adjusts for non-recurring and unusual items
* Based on the latest three fiscal years.
(a) Income statement data for the LTM ended September 26, 2009.
| 36 | |
Analysis of Selected Publicly Traded Companies – Valuation Data |
| (in millions, except per share data) | ||||||||||||||||||||||
| Price | Enterprise Value Calculation | |||||||||||||||||||||
| Per Share | % of 52- | Shares | Market | Total | Enterprise | Book Value | ||||||||||||||||
| Company | Latest FY | Ticker | 12/18/2009 | Week High | Out | Cap | Debt | Cash | Value | Per Share | Multiple | |||||||||||
| Crown Crafts Inc. | 3/29/2009 | CRWS | $2.60 | 68.9% | 9.2 | $23.8 | $23.1 | $12.0 | $34.9 | $2.62 | 1.0x | |||||||||||
| CSS Industries Inc. | 3/31/2009 | CSS | 18.55 | 68.0% | 9.6 | 178.8 | 79.8 | 2.8 | 255.8 | 27.23 | 0.7 | |||||||||||
| CTI Industries Corp. | 12/31/2008 | CTIB | 2.24 | 78.9% | 2.7 | 6.1 | 15.2 | 0.4 | 21.0 | 3.12 | 0.7 | |||||||||||
| Kid Brands, Inc. | 12/31/2008 | KID | 3.64 | 48.3% | 21.5 | 78.2 | 89.6 | 2.0 | 165.8 | 3.64 | 1.0 | |||||||||||
| Lacrosse Footwear Inc. | 12/31/2008 | BOOT | 13.63 | 90.3% | 6.3 | 86.3 | — | 3.5 | 82.8 | 10.02 | 1.4 | |||||||||||
| RC2 Corp. | 12/31/2008 | RCRC | 14.81 | 83.6% | 21.4 | 316.7 | 60.0 | 86.8 | 289.9 | 10.99 | 1.3 | |||||||||||
| Sport Supply Group, Inc | 6/30/2009 | RBI | 11.70 | 95.7% | 12.4 | 145.4 | 28.9 | 16.7 | 157.5 | 7.84 | 1.5 | |||||||||||
| Summer Infant, Inc. | 12/31/2008 | SUMR | 4.20 | 79.2% | 15.6 | 65.5 | 39.1 | 2.7 | 101.9 | 4.32 | 1.0 | |||||||||||
| Swank Inc. | 12/31/2008 | SNKI | 2.90 | 96.7% | 5.7 | 16.4 | 11.5 | 0.5 | 27.5 | 5.01 | 0.6 | |||||||||||
| Universal Security Instruments Inc. | 3/31/2009 | UUU | 7.60 | 97.1% | 2.4 | 18.1 | 3.4 | 6.0 | 15.6 | 10.64 | 0.7 | |||||||||||
| Median | 81.4% | 9.4 | $71.9 | $26.0 | $3.2 | $92.3 | $6.42 | 1.0x | ||||||||||||||
| High | 97.1% | 21.5 | 316.7 | 89.6 | 86.8 | 289.9 | 27.2 | 1.5 | ||||||||||||||
| Low | 48.3% | 2.4 | 6.1 | — | 0.4 | 15.6 | 2.6 | 0.6 | ||||||||||||||
| Baseball | 12/27/2008 | — | $5.85 | 84.8% | 2.1 | $12.4 | $1.7 | $5.6 | $8.5 | $15.24 | 0.4x | |||||||||||
| Baseball - Pursuant to Transaction | 12/27/2008 | — | $7.65 | 110.9% | 2.1 | $16.2 | $1.7 | $5.6 | $12.3 | $15.24 | 0.5x | |||||||||||
| Enterprise Value Multiples | |||||||||||||||||||||||||
| Sales | EBIT | EBITDA | |||||||||||||||||||||||
| Historical | Latest | Historical | Latest | Historical | Latest | ||||||||||||||||||||
| Company | Average (a) | FY | LTM | 2009E | Average (a) | FY | LTM | 2009E (b) | Average (a) | FY | LTM | 2009E | |||||||||||||
| Crown Crafts Inc. | 0.44x | 0.40x | 0.42x | NA | 3.9x | 3.9x | 4.1x | NA | 3.3x | 3.2x | 3.1x | NA | |||||||||||||
| CSS Industries Inc. | 0.52 | 0.53 | 0.55 | NA | 6.8 | 7.9 | 8.7 | NA | 5.0 | 5.6 | 6.0 | NA | |||||||||||||
| CTI Industries Corp. | 0.53 | 0.47 | 0.52 | 0.51x | 10.8 | 8.6 | 11.9 | NA | 6.0 | 5.2 | 5.8 | NA | |||||||||||||
| Kid Brands, Inc. | 0.86 | 0.72 | 0.72 | NA | 6.1 | 7.1 | 8.2 | NA | 5.1 | 5.7 | 6.8 | NA | |||||||||||||
| Lacrosse Footwear Inc. | 0.68 | 0.65 | 0.63 | 0.62 | 8.5 | 7.7 | 10.9 | 11.6x | 7.0 | 6.6 | 8.1 | 8.5x | |||||||||||||
| RC2 Corp. | 0.62 | 0.66 | 0.69 | 0.68 | 4.8 | 6.5 | 6.2 | 6.3 | 3.8 | 4.7 | 4.7 | 4.7 | |||||||||||||
| Sport Supply Group, Inc | 0.63 | 0.63 | 0.62 | 0.62 | 8.4 | 7.4 | 7.2 | 8.4 | 7.1 | 6.5 | 6.4 | 7.3 | |||||||||||||
| Summer Infant, Inc. | 0.99 | 0.77 | 0.69 | 0.66 | 13.4 | 10.3 | 10.8 | 9.7 | 10.4 | 7.9 | 7.6 | 7.0 | |||||||||||||
| Swank Inc. | 0.23 | 0.24 | 0.24 | NA | 3.9 | 10.8 | 7.1 | NA | 3.7 | 9.2 | 6.4 | NA | |||||||||||||
| Universal Security Instruments Inc. | 0.53 | 0.60 | 0.61 | NA | 11.7 | 41.2 | NM | NA | 11.3 | 36.5 | NM | NA | |||||||||||||
| Median | 0.58x | 0.61x | 0.62x | 0.62x | 7.6x | 7.8x | 8.2x | 9.1x | 5.5x | 6.1x | 6.4x | 7.2x | |||||||||||||
| High | 0.99 | 0.77 | 0.72 | 0.68 | 13.4 | 41.2 | 11.9 | 11.6 | 11.3 | 36.5 | 8.1 | 8.5 | |||||||||||||
| Low | 0.23 | 0.24 | 0.24 | 0.51 | 3.9 | 3.9 | 4.1 | 6.3 | 3.3 | 3.2 | 3.1 | 4.7 | |||||||||||||
| Baseball | 0.16x | 0.15x | 0.17x | 0.18x | 3.9x | 4.0x | 4.6x | 5.4x | 3.1x | 3.1x | 3.4x | 3.9x | |||||||||||||
| Baseball - Pursuant to Transaction | 0.23x | 0.22x | 0.25x | 0.26x | 5.7x | 5.8x | 6.7x | 7.9x | 4.5x | 4.4x | 5.0x | 5.7x | |||||||||||||
____________________
Source: Capital IQ and company filings.
Note: Adjusts for non-recurring and unusual items.
NA – Not Available.
NM – Not Meaningful.
(a) Historical Average includes latest three fiscal years and LTM.
(b) 2009E EBIT calculated by subtracting depreciation and amortization for the latest twelve months from 2009 EBITDA estimates.
| 37 | |
Analysis of Selected Publicly Traded Companies – Operating Data |
| ($ in millions) | |||||||||||||||||||||||||||||
| Sales | Gross Profit | EBIT | |||||||||||||||||||||||||||
| Company | FY-2 | FY-1 | Latest FY | LTM | 2009E | FY-2 | FY-1 | Latest FY | LTM | FY-2 | FY-1 | Latest FY | LTM | 2009E (a) | |||||||||||||||
| Crown Crafts Inc. | $69.3 | $74.9 | $87.4 | $83.3 | NA | $18.1 | $18.8 | $18.9 | $18.3 | $9.2 | $9.2 | $8.9 | $8.6 | NA | |||||||||||||||
| CSS Industries Inc. | 530.7 | 498.3 | 482.4 | 467.6 | NA | 137.3 | 137.5 | 126.3 | 119.9 | 44.0 | 44.6 | 32.2 | 29.5 | NA | |||||||||||||||
| CTI Industries Corp. | 35.4 | 36.5 | 45.0 | 40.4 | $41.5 | 8.9 | 8.7 | 10.3 | 8.8 | 2.3 | 1.3 | 2.4 | 1.8 | NA | |||||||||||||||
| Kid Brands, Inc. | 147.1 | 163.1 | 229.2 | 231.9 | NA | 62.8 | 61.7 | 73.1 | 69.4 | 34.3 | 31.6 | 23.3 | 20.1 | NA | |||||||||||||||
| Lacrosse Footwear Inc. | 107.8 | 118.2 | 128.0 | 131.8 | 133.1 | 42.3 | 46.9 | 50.7 | 51.3 | 9.3 | 11.5 | 10.7 | 7.6 | $7.1 | |||||||||||||||
| RC2 Corp. | 518.8 | 489.0 | 437.0 | 421.5 | 424.7 | 243.1 | 218.9 | 193.6 | 179.4 | 90.6 | 61.2 | 44.9 | 46.8 | 46.1 | |||||||||||||||
| Sport Supply Group, Inc | 236.9 | 251.4 | 250.2 | 254.1 | 253.3 | 83.6 | 91.1 | 89.7 | 90.7 | 12.7 | 19.7 | 21.3 | 21.8 | 18.8 | |||||||||||||||
| Summer Infant, Inc. | 52.2 | 80.5 | 132.4 | 148.6 | 153.3 | 20.3 | 30.5 | 46.9 | 52.3 | 4.4 | 6.6 | 9.9 | 9.4 | 10.5 | |||||||||||||||
| Swank Inc. | 119.1 | 128.6 | 114.0 | 113.9 | NA | 41.4 | 42.8 | 35.8 | 35.2 | 11.4 | 10.2 | 2.5 | 3.9 | NA | |||||||||||||||
| Universal Security Instruments Inc. | 32.9 | 33.9 | 26.1 | 25.3 | NA | 10.4 | 7.9 | 6.1 | 5.4 | 3.6 | 1.4 | 0.4 | (0.1) | NA | |||||||||||||||
| Median | $113.4 | $123.4 | $130.2 | $140.2 | $153.3 | $41.8 | $44.9 | $48.8 | $51.8 | $10.4 | $10.9 | $10.3 | $9.0 | $14.6 | |||||||||||||||
| High | 530.7 | 498.3 | 482.4 | 467.6 | 424.7 | 243.1 | 218.9 | 193.6 | 179.4 | 90.6 | 61.2 | 44.9 | 46.8 | 46.1 | |||||||||||||||
| Low | 32.9 | 33.9 | 26.1 | 25.3 | 41.5 | 8.9 | 7.9 | 6.1 | 5.4 | 2.3 | 1.3 | 0.4 | (0.1) | 7.1 | |||||||||||||||
| Baseball | $53.7 | $55.2 | $55.7 | $49.8 | $47.9 | $13.6 | $14.4 | $13.8 | $12.5 | $2.2 | $2.5 | $2.1 | $1.8 | $1.6 | |||||||||||||||
| Sales Growth | Gross Margin | EBIT Margin | |||||||||||||||||||||||||||
| Company | FY-2 | FY-1 | Latest FY | CAGR* | FY-2 | FY-1 | Latest FY | LTM | FY-2 | FY-1 | Latest FY | LTM | 2009E (a) | ||||||||||||||||
| Crown Crafts Inc. | (4.7%) | 8.1% | 16.7% | 6.4% | 26.1% | 25.1% | 21.6% | 22.0% | 13.3% | 12.3% | 10.1% | 10.3% | NA | ||||||||||||||||
| CSS Industries Inc. | 1.0% | (6.1%) | (3.2%) | (2.8%) | 25.9% | 27.6% | 26.2% | 25.6% | 8.3% | 8.9% | 6.7% | 6.3% | NA | ||||||||||||||||
| CTI Industries Corp. | 21.4% | 3.1% | 23.2% | 15.5% | 25.1% | 23.8% | 22.9% | 21.8% | 6.5% | 3.4% | 5.4% | 4.4% | NA | ||||||||||||||||
| Kid Brands, Inc. | 11.8% | 10.9% | 40.6% | 20.3% | 42.7% | 37.8% | 31.9% | 29.9% | 23.3% | 19.4% | 10.2% | 8.7% | NA | ||||||||||||||||
| Lacrosse Footwear Inc. | 8.5% | 9.6% | 8.3% | 8.8% | 39.2% | 39.7% | 39.6% | 39.0% | 8.7% | 9.8% | 8.4% | 5.8% | 5.4% | ||||||||||||||||
| RC2 Corp. | 5.3% | (5.7%) | (10.6%) | (3.9%) | 46.9% | 44.8% | 44.3% | 42.6% | 17.5% | 12.5% | 10.3% | 11.1% | 10.9% | ||||||||||||||||
| Sport Supply Group, Inc | 14.7% | 6.1% | (0.5%) | 6.6% | 35.3% | 36.2% | 35.8% | 35.7% | 5.4% | 7.8% | 8.5% | 8.6% | 7.4% | ||||||||||||||||
| Summer Infant, Inc. | 46.9% | 54.3% | 64.4% | 55.0% | 38.9% | 37.9% | 35.4% | 35.2% | 8.4% | 8.3% | 7.5% | 6.3% | 6.8% | ||||||||||||||||
| Swank Inc. | 21.6% | 8.0% | (11.4%) | 5.2% | 34.8% | 33.3% | 31.4% | 30.9% | 9.6% | 7.9% | 2.2% | 3.4% | NA | ||||||||||||||||
| Universal Security Instruments Inc. | 14.0% | 2.8% | (23.0%) | (3.3%) | 31.7% | 23.2% | 23.4% | 21.5% | 11.0% | 4.1% | 1.4% | (0.3%) | NA | ||||||||||||||||
| Median | 12.9% | 7.1% | 3.9% | 6.5% | 35.0% | 34.8% | 31.7% | 30.4% | 9.1% | 8.6% | 7.9% | 6.3% | 7.1% | ||||||||||||||||
| High | 46.9% | 54.3% | 64.4% | 55.0% | 46.9% | 44.8% | 44.3% | 42.6% | 23.3% | 19.4% | 10.3% | 11.1% | 10.9% | ||||||||||||||||
| Low | (4.7%) | (6.1%) | (23.0%) | (3.9%) | 25.1% | 23.2% | 21.6% | 21.5% | 5.4% | 3.4% | 1.4% | (0.3%) | 5.4% | ||||||||||||||||
| Baseball | (0.9%) | 2.9% | 1.0% | 1.0% | 25.3% | 26.1% | 24.7% | 25.2% | 4.1% | 4.4% | 3.8% | 3.7% | 3.2% | ||||||||||||||||
____________________
Source: Capital IQ and company filings.
Note: Adjusts for non-recurring and unusual items.
* Latest three fiscal years sales compounded annual growth rate.
(a) 2009E EBIT calculated by subtracting depreciation and amortization for the latest twelve months from 2009 EBITDA estimates.
Source: Capital IQ and company filings.
Note: Adjusts for non-recurring and unusual items.
* Latest three fiscal years sales compounded annual growth rate.
(a) 2009E EBIT calculated by subtracting depreciation and amortization for the latest twelve months from 2009 EBITDA estimates.
| 38 | |
Analysis of Selected Publicly Traded Companies – Operating Data |
| ($ in millions) | |||||||||||||||||||||
| EBITDA | Earnings Per Share | ||||||||||||||||||||
| Company | FY-2 | FY-1 | Latest FY | LTM | 2009E | FY-2 | FY-1 | Latest FY | LTM | 2009E | |||||||||||
| Crown Crafts Inc. | $9.7 | $10.3 | $10.9 | $11.2 | NA | $0.79 | $0.44 | ($1.83) | ($1.89) | NA | |||||||||||
| CSS Industries Inc. | 58.4 | 57.8 | 45.4 | 42.4 | NA | 2.19 | 2.31 | 1.70 | 1.59 | NA | |||||||||||
| CTI Industries Corp. | 3.7 | 2.7 | 4.0 | 3.6 | NA | 0.85 | 0.03 | 0.40 | 0.16 | $0.34 | |||||||||||
| Kid Brands, Inc. | 39.6 | 37.5 | 29.2 | 24.3 | NA | 0.67 | 0.43 | (4.65) | (5.26) | NA | |||||||||||
| Lacrosse Footwear Inc. | 11.0 | 13.3 | 12.6 | 10.2 | $9.7 | 1.02 | 1.15 | 0.96 | 0.69 | 0.78 | |||||||||||
| RC2 Corp. | 105.8 | 76.0 | 61.2 | 62.2 | 61.5 | 2.05 | 1.04 | (11.82) | (10.76) | 1.43 | |||||||||||
| Sport Supply Group, Inc | 16.2 | 23.4 | 24.1 | 24.5 | 21.5 | 0.37 | 0.76 | 0.80 | 0.82 | 0.87 | |||||||||||
| Summer Infant, Inc. | 5.1 | 8.0 | 12.8 | 13.5 | 14.6 | 0.17 | 0.23 | 0.33 | 0.32 | 0.36 | |||||||||||
| Swank Inc. | 11.6 | 10.4 | 3.0 | 4.3 | NA | 2.36 | 0.81 | 0.35 | 0.54 | NA | |||||||||||
| Universal Security Instruments Inc. | 3.7 | 1.4 | 0.4 | (0.0) | NA | 2.45 | 1.13 | 0.58 | 0.77 | NA | |||||||||||
| Median | $11.3 | $11.9 | $12.7 | $12.3 | $18.0 | $0.93 | $0.79 | $0.37 | $0.43 | $0.78 | |||||||||||
| High | 105.8 | 76.0 | 61.2 | 62.2 | 61.5 | 2.45 | 2.31 | 1.70 | 1.59 | 1.43 | |||||||||||
| Low | 3.7 | 1.4 | 0.4 | (0.0) | 9.7 | 0.17 | 0.03 | (11.82) | (10.76) | 0.34 | |||||||||||
| Baseball (a) | $2.7 | $3.0 | $2.8 | $2.5 | $2.1 | $0.53 | $0.62 | $0.24 | $0.19 | $0.37 | |||||||||||
| EBITDA Margin | |||||||||||||||||||||
| Company | FY-2 | FY-1 | Latest FY | LTM | 2009E | ||||||||||||||||
| Crown Crafts Inc. | 13.9% | 13.8% | 12.5% | 13.4% | NA | ||||||||||||||||
| CSS Industries Inc. | 11.0% | 11.6% | 9.4% | 9.1% | NA | ||||||||||||||||
| CTI Industries Corp. | 10.5% | 7.5% | 9.0% | 9.0% | NA | ||||||||||||||||
| Kid Brands, Inc. | 26.9% | 23.0% | 12.8% | 10.5% | NA | ||||||||||||||||
| Lacrosse Footwear Inc. | 10.2% | 11.2% | 9.8% | 7.7% | 7.3% | ||||||||||||||||
| RC2 Corp. | 20.4% | 15.5% | 14.0% | 14.7% | 14.5% | ||||||||||||||||
| Sport Supply Group, Inc | 6.8% | 9.3% | 9.6% | 9.7% | 8.5% | ||||||||||||||||
| Summer Infant, Inc. | 9.7% | 10.0% | 9.7% | 9.1% | 9.5% | ||||||||||||||||
| Swank Inc. | 9.8% | 8.1% | 2.6% | 3.8% | NA | ||||||||||||||||
| Universal Security Instruments Inc. | 11.1% | 4.3% | 1.6% | (0.1%) | NA | ||||||||||||||||
| Median | 10.7% | 10.6% | 9.6% | 9.1% | 9.0% | ||||||||||||||||
| High | 26.9% | 23.0% | 14.0% | 14.7% | 14.5% | ||||||||||||||||
| Low | 6.8% | 4.3% | 1.6% | (0.1%) | 7.3% | ||||||||||||||||
| Baseball (a) | 5.0% | 5.4% | 5.0% | 4.9% | 4.5% | ||||||||||||||||
Source: Capital IQ and company filings.
Note: Adjusts for non-recurring and unusual items.
(a) FY -2, LTM and 2009E EPS stated before NOL Valuation Allowance Adjustment.
Note: Adjusts for non-recurring and unusual items.
(a) FY -2, LTM and 2009E EPS stated before NOL Valuation Allowance Adjustment.
| 39 | |
Analysis of Selected Publicly Traded Companies |
| Company Name | Company Description | |
 | Crown Crafts, Inc. engages in the design, marketing and distribution of infant and toddler products in the United States and internationally. Its infant products include crib bedding, blankets, nursery accessories, room decor, bibs, burp cloths, bathing accessories, and other infant soft goods. Its customers include mass merchants, chain stores, juvenile specialty stores, Internet accounts, wholesale clubs, and catalogue and direct mail houses. Products are manufactured primarily in China and marketed under a variety of company-owned trademarks. Crown Crafts sells its products through its sales force, independent commissioned sales representatives and distributors. The company was founded in 1957 and is headquartered in Gonzales, Louisiana. | |
 | CSS Industries, Inc. engages in the design, manufacture, procurement, distribution and sale of seasonal and social expression products. Its products include gift wrap, gift bags, gift boxes, boxed greeting cards, gift tags, decorative tissue paper, decorations, classroom exchange Valentines, decorative ribbons and bows, halloween masks, costumes and other gift items. The company sells its products through national and regional account managers, product specialists, and a network of independent manufacturers’ representatives to mass market retailers, discount department stores, specialty chains, warehouse clubs, drug and food chains, dollar stores, independent card, gift and floral shops, and retail teachers’ stores in the United States, Canada, and Hong Kong. The company operates 11 manufacturing and distribution centers in the United States. Approximately 47% of the company's 2008 sales were related to products sourced from foreign suppliers. CSS Industries was founded in 1923 and is headquartered in Philadelphia, Pennsylvania. | |
 | CTI Industries Corporation engages in the development, production, marketing and sale of novelty products, specialty and printed films and flexible containers in the United States and internationally. The company’s products include foil balloons, latex balloons, punch balls and other inflatable toy items (accounted for approximately 57.5% of 2008 revenue); specialty and printed films for food packaging, specialized consumer uses and various commercial applications (accounted for approximately 18.3% of 2008 revenue); and flexible containers for home and consumer use for the storage and preservation of food and personal items (accounted for approximately 24.2% of 2008 revenue). It markets its products primarily through distributors, wholesalers, independent sales representatives and retail outlets. CTI Industries Corporation was founded in 1975 and is headquartered in Barrington, Illinois. | |
 | Kid Brands, Inc. designs, imports, markets and distributes infant and juvenile consumer products. It offers infant bedding and related nursery accessories and decor. Substantially all the company's products are produced by independent manufacturers in Eastern Asia. The company offers its products to retailers, including national retail accounts, and independent retailers, as well as to military post exchanges. It sells products through its direct sales force and independent manufacturers’ representatives and distributors in the United States, the United Kingdom and Australia. The company was formerly known as Russ Berrie and Company, Inc. and changed its name to Kid Brands, Inc. on September 22, 2009. The company was founded in 1963 and is based in Wayne, New Jersey. | |
 | LaCrosse Footwear, Inc. engages in the design, development, manufacture and marketing of footwear and apparel for the work and outdoor markets. The company offers work and outdoor boots under the ‘DANNER’ brand name; and rubber and leather footwear, and rainwear and protective clothing under the ‘LACROSSE’ brand name. The company sources approximately 75% of the products it sells through a network of international contract manufacturers, primarily in China, with the remaining 25% manufactured domestically in the company's facility. The company offers its products through a network of specialty retailers and distributors in the United States, Asia, Europe, and Canada, as well as through the Internet. It also operates a retail outlet store, which sells slow-moving merchandise, factory seconds and other products for ‘DANNER’ and ‘LACROSSE’ brands. The company sells its products directly to sporting goods and outdoor retailers, general merchandise and independent shoe stores, wholesalers, and distributors. LaCrosse Footwear, Inc. was founded in 1897 and is based in Portland, Oregon. |
| 40 | |
Analysis of Selected Publicly Traded Companies |
| Company Name | Company Description | |
RC2 Corporation designs, produces, and markets toys, collectibles and infant and toddler products. It offers mother, infant and toddler category products that include a range of products related to infant and toddler feeding, gear, care, and play, which are marketed under The First Years and Lamaze brands. The company’s product line includes Take & Toss toddler self-feeding system, Lamaze infant development products, and American Red Cross health and wellness products. It also provides preschool, youth, and adult category products under the Learning Curve, Johnny Lightning and Ertl brands. The company also offers its products under the Thomas & Friends, John Deere and Take Along Thomas brand names. The company sources approximately 90% of the products it purchased in 2008 from China. RC2 Corporation sells its products through chain retailers, specialty retailers, wholesalers, and OEM dealers in North America, Europe, Australia, the Asia Pacific and South America. The company was founded in 1996 and is headquartered in Oak Brook, Illinois. | ||
 | Sport Supply Group, Inc. manufacturers, markets and distributes sporting goods equipment, physical education, and recreational and leisure products, as well as markets and distributes soft good athletic apparel and footwear products primarily to the institutional market in the United States. The company principally offers equipment and soft goods for various sports comprising football, baseball, softball, basketball, volleyball, soccer, tennis and other racquet sports. Its line of equipment for these sports includes inflatable balls, nets, batting cages, scoreboards, bleachers, weight lifting equipment, standards and goals. Its customers include various public and private schools, colleges, government agencies, military facilities, athletic teams and team dealers. The company operates two manufacturing facilities but imports a significant amount of its goods from foreign suppliers, primarily in the Far East. Sport Supply Group sells its products through catalogs and fliers, sales professionals, telemarketers, Internet, trade shows, and other sales events under its own and third party-owned brands. The company, formerly known as Collegiate Pacific, Inc., was founded in 1997 and is headquartered in Farmers Branch, Texas. | |
 | Summer Infant, Inc. designs, markets and distributes branded juvenile health, safety, and wellness products to retailers primarily in North America and the United Kingdom. It offers products in various product categories, including nursery audio/video monitors, safety gates, durable bath products, bed rails, related health and safety products, booster and potty seats, bouncers, a line of soft goods/bedding, infant sleep positioners, head supports and portable changing pads, as well as nursery and feeding accessories. Substantially all of the company’s products are manufactured in southern China. The company sells its products through various distribution channels comprising chain retailers, specialty retailers and direct to consumers. Summer Infant, Inc. is headquartered in Woonsocket, Rhode Island. | |
 | Swank, Inc. imports and distributes men's leather accessories including belts, wallets, billfolds, key cases, and card holders and other small leather goods under licensed brand names in the United States. The company offers its products under various brands, including Kenneth Cole, Tommy Hilfiger, Nautica, Geoffrey Beene, Claiborne, Guess, Ted Baker, Donald Trump, Tumi, Chaps, Steve Harvey and Pierre Cardin. Swank sells its merchandise to various retailers, including department stores, national chain stores, specialty stores, mass merchandisers, catalog retailers, the United States military retail exchanges and labels for less retailers. The company sources all of its products from third party vendors, who are primarily based in India. As of December 31, 2008, it operated four factory outlet stores in four states primarily to distribute excess and out of line merchandise. The company was founded in 1897 and is based in New York, New York. | |
 | Universal Security Instruments Inc. designs and markets various safety products primarily in the United States. Its products principally include smoke alarms, carbon monoxide alarms, and related products. The company markets outdoor floodlights under the name Lite Aide. Universal Security Instruments also owns a 50% interest in the Hong Kong Joint Venture that manufactures certain of its electronic and electrical products. The company imports all of its products from various foreign suppliers (80% of purchases in 2008 were from China). The company offers its products to various retailers, including wholesale distributors; chains and discount retailers; as well as home center stores, catalog and mail order companies, and other distributors/retailers. Universal Security Instruments also sells its products through the electrical distribution trade, including electrical and lighting distributors and manufactured housing companies, as well as to home improvement retailers. In addition, it markets its products through its own sales catalogs, brochures, and the internet. The company was founded in 1969 and is based in Owings Mills, Maryland. |
| 41 | |
Analysis of Selected Recent Reverse/Forward Split “Go Dark” Transactions |
| u | TM Capital analyzed historical reverse/forward stock splits announced by publicly traded companies from November 2005 to December 2009 | ||||
| u | To be included in this analysis, each company had to meet the following criteria: | ||||
| v | Headquartered in the United States | ||||
| v | Traded on a United States exchange | ||||
| v | Announced a reverse stock split immediately followed by a forward stock split | ||||
| v | Purpose of the stock split was to reduce the number of stockholders of record to under 300 in order to terminate its public company reporting status and “go dark” | ||||
| v | Market capitalization 1 day prior to announcement greater than $5 million | ||||
| v | Takeout payment price per share greater than $1.00 | ||||
| 42 | |
Analysis of Selected Recent Reverse/Forward Split “Go Dark” Transactions |
| ($ in millions, except per share amounts) | ||||||||||||||||||||||||||
| Date Split | ||||||||||||||||||||||||||
| Announced | Reverse | Market Cap | ||||||||||||||||||||||||
| Intention to | Split | Payment | % Premium vs Stock Price Prior to Announcement of Intention | 1 Day Prior to | ||||||||||||||||||||||
| Shareholders | Company | Ticker | Industry | Amount | Per Share | 1 Day | 7 Day | 30 Day | 60 Day | 90 Day | 120 Day | Announcement | LTM Revenue* | |||||||||||||
| 9/28/2009 | Gander Mountain Co. | GMTN | Specialty Retail | 1:30,000 | $5.15 | 57.0% | 32.1% | (4.8%) | (13.9%) | (14.2%) | (12.6%) | $92.4 | $1,080.1 | |||||||||||||
| 8/12/2009 | Zareba Systems, Inc. | ZRBA | Electrical Equipment | 1:250 | $5.20 | 147.6% | 147.6% | 160.0% | 94.0% | 160.0% | 244.4% | 5.2 | 32.2 | |||||||||||||
| 5/27/2009 | Cuisine Solutions Inc. | CUSI | Food Products | 1:5,000 | $1.30 | 36.8% | 38.3% | 85.7% | 132.1% | 120.3% | 100.0% | 16.7 | 80.5 | |||||||||||||
| 5/5/2009 | CallWave Inc. | CALL | Software | 1:5,000 | $1.15 | 43.8% | 38.6% | 74.2% | 27.8% | 64.3% | 94.9% | 16.9 | 16.3 | |||||||||||||
| 4/3/2009 | New Horizons Worldwide Inc. | NWRZ | Professional Services | 1:25 | $1.85 | 208.3% | 146.7% | 208.3% | 208.3% | 164.3% | 76.2% | 6.9 | 35.7 | |||||||||||||
| 2/5/2009 | Grill Concepts Inc. | GLLC | Hotels, Restaurants and Leisure | 1:35 | $1.50 | 130.8% | 130.8% | 226.1% | 130.8% | 87.5% | 31.6% | 5.7 | 96.6 | |||||||||||||
| 9/19/2008 | China Direct, Inc. | CDII | Metals and Mining | 1:100 | $5.07 | 16.0% | 3.9% | (22.4%) | (30.5%) | (37.1%) | (38.6%) | 102.7 | 235.1 | |||||||||||||
| 12/21/2007 | Jaclyn Inc. | JCLY | Textiles, Apparel and Luxury Goods | 1:250 | $10.21 | 70.2% | 53.0% | 70.2% | 60.8% | 6.9% | 7.9% | 14.8 | 151.3 | |||||||||||||
| 10/4/2007 | MedAire Inc. | MEDRF | Healthcare Providers and Services | 1:5,000 | $1.20 | 30.1% | 30.1% | 16.2% | 16.2% | 38.3% | 62.8% | 54.0 | 30.4 | |||||||||||||
| 9/28/2007 | Lazare Kaplan International Inc. | LKI | Textiles, Apparel and Luxury Goods | 1:101 | $8.06 | 11.8% | 8.9% | 0.9% | 4.3% | 1.8% | (6.3%) | 59.5 | 398.1 | |||||||||||||
| 2/12/2007 | BNS Holding Inc. | BNSS.A | Machinery | 1:200 | $13.62 | 0.0% | 0.1% | 2.8% | 18.4% | 47.2% | 112.8% | 41.3 | 304.3 | |||||||||||||
| 8/21/2006 | American Education Corp. | AECC | Software | 1:2,000 | $11.00 | 1.9% | 1.9% | 22.2% | 12.2% | 12.2% | 2.8% | 5.8 | 9.4 | |||||||||||||
| 8/21/2006 | Meritage Hospitality Group Inc. | MHGU | Hotels, Restaurants and Leisure | 1:300 | $5.25 | 21.0% | 21.0% | 22.4% | 25.9% | 28.0% | 19.3% | 23.6 | 55.4 | |||||||||||||
| 2/10/2006 | Major Automotive Companies Inc. | MJRC | Specialty Retail | 1:1,000 | $1.90 | 8.0% | 12.4% | 18.8% | 11.8% | 7.3% | 35.7% | 16.2 | 470.8 | |||||||||||||
| 11/2/2005 | Collins Industries, Inc. | CNSI | Machinery | 1:300 | $7.70 | 14.1% | 13.2% | 10.8% | 24.6% | 23.2% | 40.0% | 44.7 | 269.4 | |||||||||||||
| Median | 30.1% | 30.1% | 22.2% | 24.6% | 28.0% | 35.7% | $16.9 | $96.6 | ||||||||||||||||||
| High | 208.3% | 147.6% | 226.1% | 208.3% | 164.3% | 244.4% | $102.7 | $1,080.1 | ||||||||||||||||||
| Low | 0.0% | 0.1% | (22.4%) | (30.5%) | (37.1%) | (38.6%) | $5.2 | $9.4 | ||||||||||||||||||
| 8/27/2009 | Baseball | – | Distributors | 1:100 | $7.65 | 23.4% | 49.7% | 49.7% | 32.4% | 36.6% | 45.7% | $13.1 | $51.6 | |||||||||||||
Stock split and pricing data per Bloomberg. LTM revenue per Capital IQ.
Note: Excludes utilities, real estate, financials and special purpose acquisition corporations.
* As of announcement day.
Note: Excludes utilities, real estate, financials and special purpose acquisition corporations.
* As of announcement day.
| 43 | |
Discounted Cash Flow Analysis |
| ($ in thousands) | ||||||||||
| 3 Months Ending | Year Ending December | |||||||||
| 12/31/09E | 2010P | 2011P | 2012P | 2013P | ||||||
| After-Tax Free Cash Flow Calculation (a) | ||||||||||
| EBIT | $704 | $1,390 | $1,353 | $1,266 | $1,552 | |||||
| Less: Provision for Income Taxes (b) | (282) | (556) | (541) | (507) | (621) | |||||
| Plus: Depreciation and Amortization | 137 | 661 | 695 | 649 | 657 | |||||
| Plus: (Increase) / Decrease in Working Capital | 901 | (1,897) | (616) | (768) | (959) | |||||
| Less: Capital Expenditures | 24 | (845) | (900) | (485) | (485) | |||||
| Plus: Increase in Deferred Taxes | 30 | 117 | 177 | 310 | 450 | |||||
| Unlevered After-Tax Free Cash Flow | $1,514 | ($1,130) | $167 | $465 | $594 | |||||
| EBITDA | $841 | $2,051 | $2,048 | $1,915 | $2,209 | |||||
| Enterprise Value | ||||||
| NPV of Cash Flow and Terminal Value | ||||||
| Discount | Terminal Value Multiple of EBITDA | |||||
| Rate (c) | 4.5x | 5.5x | 6.5x | |||
| 9.0% | $8,252 | $9,782 | $11,311 | |||
| 10.0% | $7,968 | $9,440 | $10,911 | |||
| 11.0% | $7,698 | $9,113 | $10,529 | |||
| Per Share Equity Value (d) | ||||||
| NPV of Cash Flow and Terminal Value | ||||||
| Discount | Terminal Value Multiple of EBITDA | |||||
| Rate | 4.5x | 5.5x | 6.5x | |||
| 9.0% | $5.74 | $6.47 | $7.19 | |||
| 10.0% | $5.61 | $6.30 | $7.00 | |||
| 11.0% | $5.48 | $6.15 | $6.82 | |||
| Working Capital Calculation: | |||||||||||||
| As of | As of December | ||||||||||||
| Current Assets: | 9/26/2009 | 2009E | 2010P | 2011P | 2012P | 2013P | |||||||
| Accounts Receivable | $7,537 | $6,933 | $7,122 | $7,322 | $7,585 | $7,917 | |||||||
| Inventory | 15,367 | 14,519 | 16,350 | 16,846 | 17,443 | 18,151 | |||||||
| Other Current Assets | 393 | 408 | 429 | 448 | 479 | 547 | |||||||
| Total Current Assets (excluding cash) | $23,297 | $21,860 | $23,901 | $24,616 | $25,507 | $26,616 | |||||||
| Total Current Liabilities (excluding debt) | $4,148 | $3,612 | $3,756 | $3,855 | $3,977 | $4,127 | |||||||
| Working Capital | $19,149 | $18,248 | $20,145 | $20,761 | $21,530 | $22,489 | |||||||
(a) Discounted to September 26, 2009.
(b) Assumes a 40.0% tax rate.
(c) Calculated based on the weighted average cost of capital of selected public companies, adjusted to reflect Baseball’s smaller size.
(d) Calculated by adding net cash of $3,900 (as of September 26, 2009) to the enterprise value and dividing by 2,116,047 shares outstanding.
| 44 | |
Liquidation Analysis |
| ($ in thousands) | Estimated | |||
| As of | Liquidation | |||
| 9/26/2009 | Value | |||
| Assets: | ||||
| Cash & Equivalents | $5,641 | $5,641 | ||
| Accounts Receivable, net (a) | 7,537 | 6,224 | ||
| Inventories (b) | 15,367 | 5,897 | ||
| Other Current Assets | 393 | — | ||
| Total Current Assets | 28,938 | 17,762 | ||
| Property, Plant & Equipment, net (c) | 3,174 | 1,168 | ||
| Goodwill | 2,853 | — | ||
| Deferred Taxes | 2,873 | — | ||
| Other Assets | 502 | — | ||
| Total Assets | $38,340 | $18,930 | ||
| Liabilities: | ||||
| Current Portion of Long-Term Debt | $1,136 | $1,136 | ||
| Accounts Payable | 1,839 | 1,839 | ||
| Accrued Wages and Commission | 871 | 871 | ||
| Other Accrued Liabilities | 1,438 | 1,438 | ||
| Total Current Liabilities | 5,284 | 5,284 | ||
| Long-Term Debt | 605 | 605 | ||
| Deferred Compensation | 202 | 202 | ||
| Total Liabilities | $6,091 | $6,091 | ||
| Other Estimated Liquidation Costs: | ||||
| Severance | $778 | |||
| Leases | 903 | |||
| Closedown / Reserve (d) | 1,350 | |||
| Tail Insurance | 250 | |||
| Total Other Liquidation Costs | $3,281 | |||
| Net Liquidation Value | $9,558 | |||
| Net Liquidation Value Per Share (e) | $4.52 | |||
(a) Based on 80% of accounts receivable. Excludes certain receivables management does not expect to collect.
(b) Assumes no cash value for raw materials and a liquidation value of approximately 40% of book value, on average, for finished goods.
(c) Assumes Bas eball can realize $850 for owned land and buildings and 30% of book value on all machinery, equipment, furniture and fixtures.
(d) Includes expected litigation costs, consulting fees, facility closedown expenses, management costs, tax filing costs and accounting services fees.
(e) Based on 2,116,047 shares outstanding.
| 45 | |
TAB IV:
Summary Valuation
|
Summary Valuation |
| Valuation Ranges |

____________________
| Note: | Represents the current stock price of Baseball of $5.85 as of December 18, 2009. | |||
| Represents the proposed $7.65 cash consideration per share pursuant to the Transaction. | ||||
On August 27, 2009, the Company announced the Transaction. The closing stock price the day prior was $6.20. * 2009E EBIT for the comparable companies calculated by subtracting depreciation and amortization for the latest twelve months from 2009 EBITDA estimates. | ||||
| 46 | |
Summary Valuation (a) |
| ($ in millions) | |||||||||||
| Baseball Statistic | Low | Mean | High | ||||||||
| Selected Public Companies Analysis | |||||||||||
| Historical Average EBITDA Multiple | 4.0x | 4.8x | 5.5x | ||||||||
| Implied Enterprise Value - Historical Average EBITDA | $2.7 | $10.9 | $12.9 | $15.0 | |||||||
| Equity Value | 14.8 | 16.8 | 18.9 | ||||||||
| Price Per Share | $6.99 | $7.95 | $8.92 | ||||||||
| Premium / (Discount) to Current (b) | 19.4% | 35.9% | 52.4% | ||||||||
| LTM EBITDA Multiple | 4.5x | 5.3x | 6.0x | ||||||||
| Implied Enterprise Value - LTM EBITDA | $2.5 | $11.1 | $12.9 | $14.8 | |||||||
| Equity Value | 15.0 | 16.8 | 18.7 | ||||||||
| Price Per Share | $7.08 | $7.95 | $8.82 | ||||||||
| Premium / (Discount) to Current (b) | 21.0% | 35.9% | 50.8% | ||||||||
| 2009E EBITDA Multiple | 5.5x | 6.3x | 7.0x | ||||||||
| Implied Enterprise Value - 2009E EBITDA | $2.1 | $11.8 | $13.4 | $15.0 | |||||||
| Equity Value | 15.7 | 17.3 | 18.9 | ||||||||
| Price Per Share | $7.42 | $8.19 | $8.95 | ||||||||
| Premium / (Discount) to Current (b) | 26.9% | 39.9% | 52.9% | ||||||||
| Historical Average EBIT Multiple | 5.0x | 5.8x | 6.5x | ||||||||
| Implied Enterprise Value - Historical Average EBIT | $2.2 | $10.8 | $12.4 | $14.0 | |||||||
| Equity Value | 14.7 | 16.3 | 17.9 | ||||||||
| Price Per Share | $6.93 | $7.70 | $8.46 | ||||||||
| Premium / (Discount) to Current (b) | 18.5% | 31.5% | 44.6% | ||||||||
| LTM EBIT Multiple (b) | 6.0x | 6.5x | 7.0x | ||||||||
| Implied Enterprise Value - LTM EBIT | $1.8 | $11.1 | $12.0 | $12.9 | |||||||
| Equity Value | 15.0 | 15.9 | 16.8 | ||||||||
| Price Per Share | $7.07 | $7.51 | $7.94 | ||||||||
| Premium / (Discount) to Current (b) | 20.9% | 28.4% | 35.8% | ||||||||
| 2009E EBIT Multiple (c) | 7.0x | 7.5x | 8.0x | ||||||||
| Implied Value - 2009E Adjusted EBIT | $1.6 | $10.9 | $11.7 | $12.4 | |||||||
| Equity Value | 14.8 | 15.6 | 16.3 | ||||||||
| Price Per Share | $6.99 | $7.36 | $7.73 | ||||||||
| Premium / (Discount) to Current (b) | 19.5% | 25.8% | 32.1% | ||||||||
(a) Multiple ranges based on selected public companies and TM Capital’s judgment.
(b) Based on a current stock price of $5.85 as of December 18, 2009.
(c) 2009E EBIT for the comparable companies calculated by subtracting depreciation and amortization for the latest twelve months from 2009 EBITDA estimates.
(b) Based on a current stock price of $5.85 as of December 18, 2009.
(c) 2009E EBIT for the comparable companies calculated by subtracting depreciation and amortization for the latest twelve months from 2009 EBITDA estimates.
| 47 | |
Summary Valuation |
| Discounted Cash Flow Analysis |
| Enterprise Value | Per Share Equity Value | |||||||||||||
| NPV of Cash Flow and Terminal Value | NPV of Cash Flow and Terminal Value | |||||||||||||
| Discount | Terminal Value Multiple of EBITDA | Discount | Terminal Value Multiple of EBITDA | |||||||||||
| Rate | 4.5x | 5.5x | 6.5x | Rate | 4.5x | 5.5x | 6.5x | |||||||
| 9.0% | $8,252 | $9,782 | $11,311 | 9.0% | $5.74 | $6.47 | $7.19 | |||||||
| 10.0% | $7,968 | $9,440 | $10,911 | 10.0% | $5.61 | $6.30 | $7.00 | |||||||
| 11.0% | $7,698 | $9,113 | $10,529 | 11.0% | $5.48 | $6.15 | $6.82 | |||||||
| “Go Dark” Transactions |
| % Premium vs Stock Price Prior to Announcement of Intention | ||||||||||||
| 1 Day | 7 Day | 30 Day | 60 Day | 90 Day | 120 Day | |||||||
| Median | 30.1% | 30.1% | 22.2% | 24.6% | 28.0% | 35.7% | ||||||
| Implied Stock Price Based on Current | $7.61 | $7.61 | $7.15 | $7.29 | $7.49 | $7.94 | ||||||
| Liquidation Analysis |
| Estimated Liquidation Value of Assets | $18,930 | ||
| Value of Liabilities | (6,091) | ||
| Other Estimated Liquidation Costs | (3,281) | ||
| Net Liquidation Value | $9,558 | ||
| Net Liquidation Value Per Share | $4.52 | ||
| 48 | |