
| > CORPORATE PROFILE < | |||||||
Southern Missouri Bancorp, Inc. (NASDAQ: SMBC) is the holding company for Southern Missouri Bank & Trust Company (Southern Missouri Bank). This year, the company celebrated its 120th anniversary by reporting strong asset growth and record earnings. The Company's management team believes that its success this year in core business growth has laid the groundwork for even better results in future periods. | |||||||
| > TABLE of CONTENTS < | |||||||
| Letter to Shareholders | 2 | ||||||
| Common Share Data | 8 | ||||||
| Financial Review | 9 | ||||||
| Report from Independent Registered Public Accounting Firm | 20 | ||||||
| Consolidated Financial Statements | 21 | ||||||
| Notes to Consolidated Financial Statements | 26 | ||||||
| Corporate and Investor Information | 48 | ||||||
| Directors and Officers | 49 | ||||||
> FINANCIAL SUMMARY < | ||||||||
| 2007 | 2006 | CHANGE(%) | ||||||
| EARNINGS (dollars in thousands) | ||||||||
| Net interest income | $ 9,929 | $ 9,600 | 3.4 | |||||
| Provision for possible loan losses | 605 | 555 | 9.0 | |||||
| Other income | 2,207 | 2,144 | 2.9 | |||||
| Other expense | 7,458 | 7,028 | 6.1 | |||||
| Income taxes | 1,145 | 1,377 | (16.9 | ) | ||||
| Net income | 2,928 | 2,784 | 5.2 | |||||
| PER COMMON SHARE | ||||||||
| Net income: | ||||||||
| Basic | $ 1.32 | $ 1.25 | 5.6 | |||||
| Diluted | 1.29 | 1.24 | 4.0 | |||||
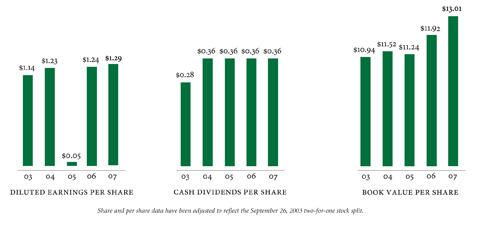
| Tangible book value | 12.06 | 10.86 | 11.1 | |||||
| Closing market price | 14.95 | 13.00 | 15.0 | |||||
| Cash dividends declared | .36 | .36 | - | |||||
| AT YEAR-END (dollars in thousands) | ||||||||
| Total assets | $379,927 | $350,684 | 8.3 | |||||
| Loans, net of allowance | 312,063 | 280,931 | 11.1 | |||||
| Reserves as a percent of nonperforming loans | 9,845.43 | % | 3,888.50 | % | ||||
| Deposits | $270,088 | $258,069 | 4.7 | |||||
| Stockholders' equity | 28,714 | 26,554 | 8.1 | |||||
| FINANCIAL RATIOS | ||||||||
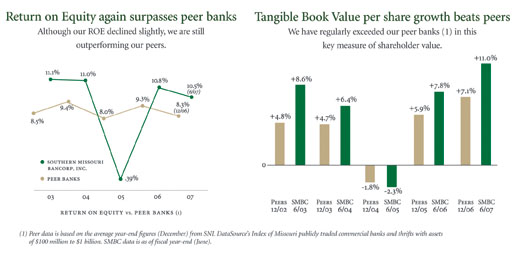
| Return on average stockholders' equity | 10.49 | % | 10.83 | % | ||||
| Return on average assets | .80 | .80 | ||||||
| Net interest margin | 2.90 | 2.96 | ||||||
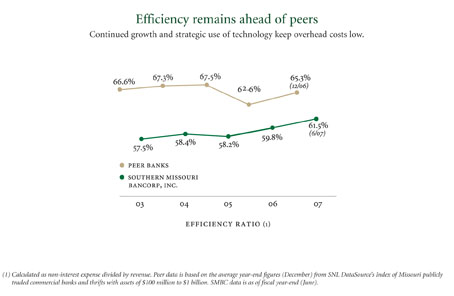
| Efficiency ratio | 61.45 | 59.84 | ||||||
| Allowance for possible loan losses to net loans | .81 | .73 | ||||||
| Equity to average assets at year-end | 7.88 | 7.67 | ||||||
| OTHER DATA(1) | ||||||||
| Common shares outstanding | 2,213,976 | 2,236,331 | ||||||
| Average common and dilutive shares outstanding | 2,264,236 | 2,276,071 | ||||||
| Stockholders of record | 276 | 282 | ||||||
| Full-time equivalent employees | 95 | 96 | ||||||
| Assets per employee (in thousands) | $ 3,999 | $ 3,653 | ||||||
| Banking offices | 9 | 9 | ||||||
| (1)Other data is as of year-end, except for average shares. | ||||||||
 | ||||||||
| 1 | | ||||||||
> LETTER to SHAREHOLDERS <
| In 2007, Southern Missouri Bancorp realized record net income and earnings per share, experienced strong loan and deposit growth, and positioned itself for even better results in the future. |
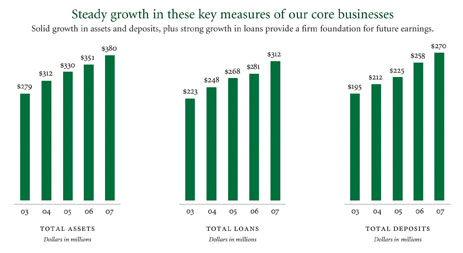
| Despite a challenging interest rate environment, we expanded our core business and grew earnings. We realized strong asset growth – our total loan portfolio grew by 11%, most of it in commercial and commercial real estate loans, meeting our strategic objectives of diversifying our loan portfolio. We achieved strong growth in retail and public unit deposits - up a combined 10% - and reduced |  |
| higher-cost, brokered deposit balances from $13.5 million to less than $100,000. We increased Book Value per share by 9%, to $13.01, and Tangible Book Value per share by 11%, to $12.06, reflecting the growth in our Company's value to shareholders. Diluted earnings per share were $1.29, a record, up from $1.24 in the previous fiscal year. Total earnings rose from $2,784,000 in 2006 to $2,928,000 in 2007, a 5% increase. |
| 2 |
Overcoming Challenges
| While our earnings increased this year, they declined as a percentage of average assets and equity. This was due to a balance sheet that grew more quickly than earnings. To help improve these key measures, the Company completed its share repurchase plan and announced a new one in June 2007, and in the first quarter | of our liabilities have already repriced to current market rates. We saw evidence of this in the last two quarters of the fiscal year, when our CD portfolio repriced upwards by an average of just seven basis points, less than a fourth of the average 29 basis point increase over the previous six quarters. |
| of fiscal 2008 announced an 11% increase in the quarterly dividend. Meanwhile, the Bank's capital levels remain strong. As a result of an inverted yield curve for much of the year, the Company, like many in the industry, experienced interest rate spread contraction. | 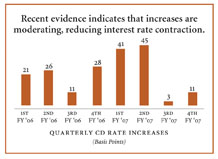 | Over the last five years, our deposits increased at a 7.5% compounded annual growth rate. Using the most recent data available, we can tell that overall deposits in our market area have grown 5.0%, by comparison. We've been able to grow faster than our market area by increasing |
| We were able to overcome this contraction and increase net interest income by growing our interest-earning asset balances. We are optimistic that the worst of the margin contraction is behind us, as many | our market share, and we are poised to establish a leadership position. A key ingredient in this success is our formal program to expand relationships with our current customers and reach out to new ones. |
| 3 |

Deeper Roots for
Stronger
Growth
We took a number of steps that
we feel have prepared the Bank
for future growth:
| > | We improved and diversified the Company's asset mix. Our commercial and commercial real estate portfolios grew by a combined 18%, or $23.3 million, including agricultural loan growth of 44%, or $7.6 million. These loans, while carrying specific additional risks, earn higher yields, and generally reprice at terms more favorable than the Bank's traditional residential real estate loans. |
 |
| 4 |
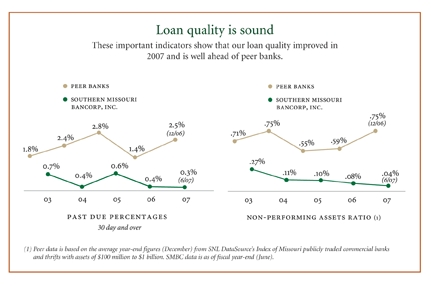
| > | We maintained strong asset quality. The Bank's percentage of loans past due 30 days or more, at 0.3%, compares favorably to peers. At the same time, the Company increased its Allowance for Loan Losses, as a percentage of net loans, to 0.81% at June 30, 2007, from 0.73% at June 30, 2006. The increase was in response to the changing portfolio components – which require additional allowances – and management recognition of the potential for challenges in the future. Traditionally, the Bank's loan portfolio has been more concentrated in residential real estate, and has required a relatively small loan loss allowance. |
 | |
| > | Our Sikeston branch, opened in January 2006, achieved profitability in less than 18 months, ahead of projections. We continue to look at several acquisition opportunities each year and we will proceed cautiously, insisting that any acquisition be both affordable and capable of adding significant long-term value to the Company. In the meantime, our primary focus has moved to de novo branching, since this process is more completely under our control. |
| 5 |
> LETTER to SHAREHOLDERS <
Technology continues to enhance efficiency
| By implementing a new, more efficient loan platform system, we eliminated repetitive data-entry, which reduced processing time | the Bank electronically, without sending an employee to the Bank, or even requiring a teller to process the deposit. This has pushed the "business day" cut-off | |||
| and improved our employees' ability to serve our customers. Many paper files have been replaced by image files, allowing access to documents from both headquarters and the originating branch. We were among the first in the area to introduce our commercial depositors to remote deposit capture. We now offer them the option of submitting deposits to |  | from 3:00 pm to 4:00 pm, improved the availability of funds for both the customers and the Bank, and reduced our courier costs. | ||
| 6 |

In Summary
| This year marked Southern Missouri Bank's 120th year of operations. For a company to persevere for such a long period of time it must provide a solid return to its shareholders. Market valuations fluctuate and share prices over shorter periods of time can be volatile, but we are optimistic that measures within our control - diluted earnings per share, Book Value per share - will continue to |  | show the same positive, improving results. I would note that every eligible Southern Missouri employee is also an owner through our employee stock ownership plan; their exemplary work here demonstrates the value they hold in the Company. I appreciate their efforts more than a mere letter can convey. Finally, we are also grateful to our customers for the opportunity to earn their business. |
PRESIDENT, SOUTHERN MISSOURI BANCORP, INC.
PLEASE JOIN US
at our 2007 Annual Meeting where shareholders and those considering
investing in Southern Missouri Bancorp, Inc. will hear management cover
this year's performance in detail and discuss our plans for continued growth.
ANNUAL MEETING
MONDAY, OCTOBER 15 AT 9 AM - CHAMBER OF COMMERCE BUILDING, POPLAR BLUFF
| 7 |
> COMMON SHARE DATA <
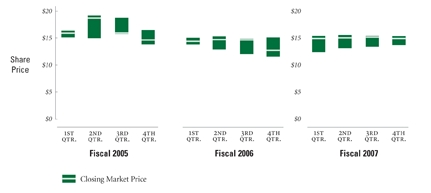
The common stock of the Company is listed on the Nasdaq Stock Market under the symbol "SMBC." The following bar graph sets forth the high, low and closing market prices of the common stock, cash dividends and other information for the last three years.
The following table sets forth per share market price and dividend information for the Company's common stock. As of June 30, 2007, there were approximately 276 stockholders of record. This does not reflect the number of persons or entities who hold stock in nominee or "street name."
| Fiscal 2007 | High | Low | Close | Book Value At End Of Period | Market Price To Book Value | Dividends Declared |
| 4th Quarter (6-30-07) | $15.49 | $14.00 | $14.95 | $13.01 | 114.91% | $0.09 |
| 3rd Quarter (3-31-07) | $15.50 | $14.50 | $15.48 | $12.83 | 120.65% | $0.09 |
| 2nd Quarter (12-31-06) | $15.73 | $14.06 | $15.19 | $12.59 | 120.65% | $0.09 |
| 1st Quarter (9-30-06) | $15.55 | $12.29 | $15.00 | $12.29 | 122.05% | $0.09 |
| Fiscal 2006 | ||||||
| 4th Quarter (6-30-06) | $15.07 | $11.80 | $13.00 | $11.92 | 109.06% | $0.09 |
| 3rd Quarter (3-31-06) | $14.95 | $12.02 | $14.77 | $11.77 | 125.49% | $0.09 |
| 2nd Quarter (12-31-05) | $15.47 | $13.00 | $14.70 | $11.57 | 127.05% | $0.09 |
| 1st Quarter (9-30-05) | $15.06 | $13.90 | $14.35 | $11.42 | 125.66% | $0.09 |
| Fiscal 2005 | ||||||
| 4th Quarter (6-30-05) | $16.43 | $13.85 | $14.50 | $11.24 | 129.00% | $0.09 |
| 3rd Quarter (3-31-05) | $18.48 | $15.80 | $15.85 | $11.57 | 136.99% | $0.09 |
| 2nd Quarter (12-31-04) | $19.00 | $14.81 | $18.49 | $12.19 | 151.68% | $0.09 |
| 1st Quarter (9-30-04) | $16.29 | $15.01 | $15.90 | $11.96 | 132.94% | $0.09 |
Any future dividend declarations and payments are subject to the discretion of the Board of Directors of the Company. The ability of the Company to pay dividends depends primarily on the ability of the Bank to pay dividends to the Company. For a discussion of the restrictions on the Bank's ability to pay dividends, see Note 12 of Notes to Consolidated Financial Statements included elsewhere in this report.
| 8 |
> FINANCIAL REVIEW <
| BUSINESS OF THE COMPANY AND THE BANK Southern Missouri Bancorp, Inc. (Southern Missouri or Company) is a Missouri corporation and owns all of the outstanding stock of Southern Missouri Bank & Trust Co. (SMBT or the Bank). The Company's earnings are primarily dependent on the operations of the Bank. As a result, the following discussion relates primarily to the operations of the Bank. The Bank was originally chartered by the State of Missouri in 1887 and converted from a state-chartered stock savings and loan association to a Federally-chartered stock savings bank effective June 1995. Then, effective February 1998, the Bank converted its charter to a state-chartered stock savings bank. On June 4, 2004, the Bank converted to a state chartered trust company with banking powers. The Bank's deposit accounts are generally insured up to a maximum of $100,000 (some retirement accounts are insured up to $250,000) by the Deposit Insurance Fund (DIF), which is administered by the Federal Deposit Insurance Corporation (FDIC). The Bank's primary business consists of attracting deposits from the communities it serves and investing those funds in permanent | loans secured by one- to four-family residences, commercial real estate, commercial business and consumer loans. The Company's results of operations are primarily dependent on its net interest margin, which is the difference between the average yield on loans, mortgage-related securities and investments and the average rate paid on deposits, securities sold under agreements to repurchase and borrowings. The net interest margin is affected by economic, regulatory and competitive factors that influence interest rates, loan demand and deposits. Lending activities are funded through the attraction of deposit accounts consisting of checking accounts, passbook accounts, money market deposit accounts, certificate of deposit accounts with terms of 60 months or less, securities sold under agreements to repurchase, advances from the Federal Home Loan Bank of Des Moines, and to a lesser extent brokered deposits. The Bank currently conducts its business through its home office located in Poplar Bluff and eight full service branch facilities in Poplar Bluff (2), Van Buren, Dexter, Kennett, Doniphan, Sikeston and Qulin, Missouri. |
| (dollars in thousands) | |||||||||||||
| At June 30 | |||||||||||||
| Financial Condition Data: | 2007 | 2006 | 2005 | 2004 | 2003 | ||||||||
| Total assets | $ 379,927 | $ 350,684 | $ 330,360 | $ 311,703 | $ 279,455 | ||||||||
| Loans receivable, net | 312,063 | 280,931 | 267,568 | 248,355 | 222,840 | ||||||||
| Mortgage-backed securities | 10,723 | 14,440 | 17,243 | 20,994 | 25,019 | ||||||||
| Cash, interest-bearing deposits and investment securities | 31,492 | 30,328 | 21,344 | 23,794 | 13,602 | ||||||||
| Deposits | 270,088 | 258,069 | 224,666 | 211,959 | 194,532 | ||||||||
| Borrowings | 71,758 | 57,296 | 72,257 | 65,698 | 58,734 | ||||||||
| Subordinated debt | 7,217 | 7,217 | 7,217 | 7,217 | - | ||||||||
| Stockholders' equity | 28,714 | 26,554 | 25,003 | 25,952 | 25,108 | ||||||||
| (dollars in thousands) | |||||||||||||
| For The Year Ended June 30 | |||||||||||||
| Operating Data: | 2007 | 2006 | 2005 | 2004 | 2003 | ||||||||
| Interest income | $ 23,550 | $ 20,363 | $ 17,284 | $ 15,700 | $ 16,404 | ||||||||
| Interest expense | 13,621 | 10,763 | 8,032 | 6,545 | 7,120 | ||||||||
| Net interest income | 9,929 | 9,600 | 9,252 | 9,155 | 9,284 | ||||||||
| Provision for loan losses | 605 | 555 | 4,815 | 275 | 330 | ||||||||
| Net interest income after provision for loan losses | 9,324 | 9,045 | 4,437 | 8,880 | 8,954 | ||||||||
| Noninterest income | 2,207 | 2,144 | 2,313 | 1,875 | 1,415 | ||||||||
| Noninterest expense | 7,458 | 7,028 | 6,728 | 6,445 | 6,165 | ||||||||
| Income before income taxes | 4,073 | 4,161 | 22 | 4,310 | 4,204 | ||||||||
| Income tax (benefit) expense | 1,145 | 1,377 | (82 | ) | 1,427 | 1,466 | |||||||
| Net income | $ 2,928 | $ 2,784 | $ 104 | $ 2,883 | $ 2,738 | ||||||||
| Basic earnings per common share | $ 1.32 | $ 1.25 | $ .05 | $ 1.27 | $ 1.17 | ||||||||
| Diluted earnings per common share | $ 1.29 | $ 1.24 | $ .05 | $ 1.23 | $ 1.14 | ||||||||
| Dividends per share | $ .36 | $ .36 | $ .36 | $ .36 | $ .28 | ||||||||
| 9 |
> FINANCIAL REVIEW (continued) <
| At June 30 | ||||||||||||||
| Other Data: | 2007 | 2006 | 2005 | 2004 | 2003 | |||||||||
| Number of: | ||||||||||||||
| Real estate loans | 2,795 | 2,808 | 2,850 | 2,877 | 2,842 | |||||||||
| Deposit accounts | 19,978 | 18,845 | 17,336 | 16,995 | 16,455 | |||||||||
| Full service offices | 9 | 9 | 8 | 8 | 8 | |||||||||
| At Or For The Year Ended June 30 | ||||||||||||||
| Key Operating Ratios: | 2007 | 2006 | 2005 | 2004 | 2003 | |||||||||
| Return on assets (net income divided by average assets) | .80 | % | .80 | % | .03 | % | .98 | % | 1.00 | % | ||||
| Return on average equity (net income divided by average equity) | 10.49 | 10.83 | .39 | 11.09 | 11.08 | |||||||||
| Average equity to average assets | 7.66 | 7.43 | 8.18 | 8.82 | 9.02 | |||||||||
| Interest rate spread (spread between weighted average rate on all interest-earning assets and all interest-bearing liabilities) | 2.57 | 2.69 | 2.84 | 3.06 | 3.29 | |||||||||
| Net interest margin (net interest income as a percentage of average interest-earning assets) | 2.90 | 2.96 | 3.06 | 3.28 | 3.57 | |||||||||
| Noninterest expense to average assets | 2.05 | 2.03 | 2.07 | 2.19 | 2.25 | |||||||||
| Average interest-earning assets to average interest-bearing liabilities | 108.29 | 108.15 | 108.10 | 109.42 | 110.67 | |||||||||
| Allowance for loan losses to total loans (1) | .81 | .73 | .75 | .80 | .81 | |||||||||
| Allowance for loan losses to nonperforming loans (1) | 9,845.43 | 3,888.50 | 353.36 | 1,460.14 | 2,062.59 | |||||||||
| Net charge-offs to average out- standing loans during the period | .04 | .19 | 1.85 | .06 | .03 | |||||||||
| Ratio of nonperforming assets to total assets (1) | .04 | .08 | .20 | .10 | .11 | |||||||||
| Dividend payout ratio | 27.50 | 28.80 | 776.14 | 28.50 | 23.97 | |||||||||
(1) At end of period
| 10 |
> FINANCIAL REVIEW (continued) <
Management's Discussion and Analysis of Financial Condition and Results of Operations
| OVERVIEW Southern Missouri Bancorp, Inc. is a Missouri corporation originally organized for the principal purpose of becoming the holding company of Southern Missouri Savings Bank. The Bank converted from a Federally-chartered stock savings bank to a state-chartered stock savings bank effective February 17, 1998, and subsequently changed its name to Southern Missouri Bank & Trust Co. The Company's state of incorporation changed from Delaware to Missouri effective April 1, 1999. On June 4, 2004, the Bank converted to a state chartered trust company with banking powers, and the Company became a bank holding company supervised by the Federal Reserve. The principal business of SMBT consists of attracting deposits from the general public and using such deposits along with wholesale funding from the Federal Home Loan Bank of Des Moines (FHLB) to finance mortgage loans secured by one- to four-family residences, commercial real estate loans and commercial business loans. These funds have also been used to purchase investment securities, mortgage-backed securities (MBS), U.S. government and federal agency obligations and other permissible securities. Southern Missouri's results of operations are primarily dependent on the levels of its net interest margin and noninterest income, and its ability to control operating expenses. Net interest margin is dependent primarily on the difference or spread between the average yield earned on interest-earning assets and the average rate paid on interest-bearing liabilities, as well as the relative amounts of these assets and liabilities. Southern Missouri is subject to interest rate risk to the degree that its interest-earning assets mature or reprice at different times, or on a varying basis, from its interest-bearing liabilities. Southern Missouri's noninterest income consists primarily of fees charged on transaction and loan accounts and increased cash surrender value of bank owned life insurance ("BOLI"). Southern Missouri's operating expenses include: employee compensation and benefits, occupancy expenses, legal and professional fees, federal deposit insurance premiums, amortization of intangible assets and other general and administrative expenses. Southern Missouri's operations are significantly influenced by general economic conditions including monetary and fiscal policies of the U.S. government and the Federal Reserve Board. Additionally, Southern Missouri is subject to policies and regulations issued by financial institution regulatory agencies, including the Federal Deposit Insurance Corporation, the Federal Reserve and the Missouri Division of Finance. Each of these factors may influence interest rates, loan demand, prepayment rates and deposit flows. Interest rates available on competing investments as well as general market interest rates influence the Bank's cost of funds. Lending activities are affected by the demand for financing real estate and other types of loans, which in turn is affected by the interest rates at which such financing may be offered. The Bank intends to continue to focus on its lending programs for one- to four-family residential real estate, commercial real estate, commercial business and consumer financing on loans sec ured by properties or collateral located primarily in Southeastern Missouri. FORWARD-LOOKING STATEMENTS This document, including information incorporated by reference, contains forward-looking statements about the Company and its subsidiaries which we believe are within the meaning of the Private Securities Litigation Reform Act of 1995. These forward-looking statements include, without limitation, statements with respect to anticipated future operating and financial performance, growth | opportunities, interest rates, cost savings and funding advantages expected or anticipated to be realized by management. Words such as "may," "could," "should," "would," "believe," "anticipate," "estimate," "expect," "intend," "plan" and similar expressions are intended to identify these forward looking statements. Forward-looking statements by the Company and its management are based on beliefs, plans, objectives, goals, expectations, anticipations, estimates and the intentions of management and are not guarantees of future performance. The important factors we discuss below, as well as other factors discussed under the caption "Management's Discussion and Analysis of Financial Condition and Results of Operations" and identified in our filings with the SEC and those presented elsewhere by our management from time to time, could cause actual results to differ materially from those indicated by the forward-looking statements made in this document:
CRITICAL ACCOUNTING POLICIES The Company has established various accounting policies, which govern the application of accounting principles generally accepted in the United States of America in the preparation of our financial statements. Our significant accounting policies are described in the footnotes to the Consolidated Financial Statements. Certain accounting policies involve significant judgments and assumptions by management that have a material impact on the carrying value of certain assets and liabilities; management considers such accounting policies to be critical accounting policies. The judgments and assumptions used by management are based on historical experience and other factors, which are believed to be reasonable under the circumstances. Because of the nature of the judgments and assumptions made by management, actual results could differ from these judgments and estimates that could have a material impact on the carrying values of assets and liabilities and the results of operations of the Company. The allowance for losses on loans represents management's best estimate of probable losses in the existing loan portfolio. The allowance for losses on loans is increased by the provision for losses on loans charged to expense and reduced by loans charged off, net of recoveries. |
| 11 |
> FINANCIAL REVIEW (continued) <
| The provision for losses on loans is determined based on management's assessment of several factors: reviews and evaluations of specific loans, changes in the nature and volume of the loan portfolio, current economic conditions and the related impact on specific borrowers and industry groups, historical loan loss experience, the level of classified and nonperforming loans and the results of regulatory examinations. Integral to the methodology for determining the adequacy of the allowance for loan losses is portfolio segmentation and impairment measurement. Under the Company's methodology, loans are first segmented into 1) those comprising large groups of smaller-balance homogeneous loans, including single-family mortgages and installment loans, which are collectively evaluated for impairment and 2) all other loans which are individually evaluated. Those loans in the second category are further segmented utilizing a defined grading system which involves categorizing loans by severity of risk based on conditions that may affect the ability of the borrowers to repay their debt, such as current financial information, collateral valuations, historical payment experience, credit documentation, public information, and current trends. The loans subject to credit classification represent the portion of the portfolio subject to the greatest credit risk and where adjustments to the allowance for losses on loans as a result of pro visions and charge-offs are most likely to have a significant impact on operations. A periodic review of selected credits (based on loan size and type) is conducted to identify loans with heightened risk or probable losses and to assign risk grades. The primary responsibility for this review rests with the loan administration personnel. This review is supplemented with periodic examinations of both selected credits and the credit review process by applicable regulatory agencies. The information from these reviews assists management in the timely identification of problems and potential problems and provides a basis for deciding whether the credit represents a probable loss or risk that should be recognized. Loans are considered impaired if, based on current information and events, it is probable that Southern Missouri will be unable to collect the scheduled payments of principal or interest when due according to the contractual terms of the loan agreement. The measurement of impaired loans is generally based on the fair value of the collateral for collateral-dependent loans. If the loan is not collateral-dependent, the measurement of impairment is based on the present value of expected future cash flows discounted at the historical effective interest rate or the observable market price of the loan. In measuring the fair value of the collateral, management uses the assumptions (i.e., discount rates) and methodologies (i.e., comparison to the recent selling price of similar assets) consistent with those that would be utilized by unrelated third parties. Impairment identified through this evaluation process is a component of the allowance for loan losses. If a loan that is individually evaluated for impairment is found to have none, it is grouped together with loans having similar characteristics (i.e., the same risk grade), and an allowance for loan losses is based upon historical average charge-offs for similar loans over the past five years, the historical average charge-off rate for developing trends in the economy, in industries and other factors. For portfolio loans that are evaluated for impairment as part of homogenous pools, an allowance is maintained based upon the average charge-offs for the past five years. Changes in the financial condition of individual borrowers, in economic conditions, in historical loss experience and in the conditions of the various markets in which collateral may be sold may all affect the required level of the allowance for losses on loans and the associated provision for losses on loans. | FINANCIAL CONDITION General. The Company's total assets increased $29.2 million, or 8.3%, to $379.9 million at June 30, 2007, when compared to $350.7 million at June 30, 2006. The growth was primarily due to growth in the loan portfolio of $31.1 million, or 11.1%, and was partially offset by a reduction in investment balances of $3.5 million, or 9.2%. Asset growth was primarily funded by growth in deposit balances of $12.0 million, or 4.7%, FHLB advances of $8.0 million, or 17.4%, and repurchase agreements of $6.5 million, or 57.2%. Loans. Loans increased $31.1 million, or 11.1%, to $312.0 million at June 30, 2007, from $280.9 million at June 30, 2006. The growth in the loan portfolio was comprised principally of commercial real estate and commercial business loans of $12.3 million and $10.9 million, respectively, while multi-family real estate loans increased $4.5 million, and one- to four-family real estate loans increased $3.6 million. Allowance for Loan Losses. The allowance for loan losses increased $480,000, or 23.3%, from $2.1 million at June 30, 2006, to $2.5 million at June 30, 2007. The allowance for loan losses represented 0.81% of gross loans receivable at June 30, 2007, as compared to 0.73% at June 30, 2006. At June 30, 2007, nonperforming loans, which included loans past due greater than 90 days and nonaccruing loans, were $26,000, compared to $53,000 at June 30, 2006 (see Provision for Loan Losses, under Comparison of Years Ended June 30, 2007 and 2006). Investments. The investment portfolio decreased $3.5 million, or 9.2%, to $34.9 million at June 30, 2007, from $38.4 million at June 30, 2006. The decrease in the investment portfolio was primarily due to the Company's strategic decision to reduce investment balances due to the lower returns available, compared to loans and cost of funding. Premises and Equipment. Premises and equipment decreased $281,000 to $8.6 million at June 30, 2007, from $8.9 million at June 30, 2006. The decrease was due to depreciation expense for the fiscal year, partially offset by equipment and software purchases. Bank Owned Life Insurance. The Bank purchased "key person" life insurance policies on six employees for a cash surrender value of $4.0 million in February, 2003. In addition, in October, 2004, the Bank purchased "key person" life insurance policies on 20 employees for $2.0 million. At June 30, 2007, the cash surrender value had increased to $7.0 million. Intangible Assets. Intangible assets generated through branch acquisitions in 2000 decreased $255,000 to $2.1 million as of June 30, 2007, and will continue to be amortized in accordance with Statement of Financial Accounting Standards (SFAS) No. 142. Deposits. Deposits increased $12.0 million, or 4.7%, to $270.1 million at June 30, 2007, from $258.1 million at June 30, 2006. The deposit growth was primarily comprised of increases in retail and public CDs, savings, and checking accounts of $18.5 million, $9.6 million, and $4.5 million, respectively, partially offset by decreases in brokered CDs of $13.5 million and money market deposit and passbook accounts of $6.2 million. At June 30, 2007, brokered deposits totaled less than $100,000. Management's decision to reduce the level of brokered deposits was based on the availability of other funding sources at more attractive terms. |
| 12 |
> FINANCIAL REVIEW (continued) <
| Borrowings. FHLB advances increased $8.0 million, or 17.4%, to $54.0 million at June 30, 2007, from $46.0 million at June 30, 2006, mostly as a result of the Company's use of advances in place of brokered deposits, to fund asset growth. Of the outstanding advances, $7.0 million were short term borrowings, compared to no short term borrowings at June 30, 2006. Of the remaining $47.0 million in long-term advances, the entire amount carries fixed interest rates, and $44.0 million is subject to early redemption by the issuer. At June 30, 2007, the long-term advances had a weighted average maturity of 4.2 years, compared to 3.2 years at June 30, 2006. At June 30, 2007, all FHLB advances had a weighted-average cost of 5.42%, as compared to 5.41% at June 30, 2006. Subordinated Debt. In March, 2004, the Company issued $7.0 million of Floating Rate Capital Securities of Southern Missouri Statutory Trust I with a liquidation value of $1,000 per share. The securities are due in 30 years, redeemable after five years and bear interest at a floating rate based on three month LIBOR. Stockholders' Equity. The Company's stockholders' equity increased by $2.1 million, or 8.1%, to $28.7 million at June 30, 2007, from $26.6 million at June 30, 2006. This increase was primarily due to net income of $2.9 million, and a $342,000 increase in the market value of the investment portfolio, net of tax, partially offset by dividend payments of $805,000. The Company announced its current stock repurchase program of approximately 110,000 shares on June 21, 2007. As of June 30, 2007, no activity had yet occurred under the program. COMPARISON OF THE YEARS ENDED JUNE 30, 2007 AND 2006 Net Income. Southern Missouri's net income was $2.9 million for the fiscal year ended June 30, 2007, an increase of $144,000, or 5.2%, when compared to the results of the prior fiscal year. The increase in net income was primarily due to a $329,000 increase in net interest income, a reduction in income tax provisions of $232,000, and an increase in non-interest income of $63,000, partially offset by a $430,000 increase in non-interest expenses, and a $50,000 increase in loan loss provisions, compared to the prior fiscal year. Net Interest Income. Net interest income increased $329,000, or 3.4%, to $9.9 million for fiscal 2007, when compared to the prior fiscal year. The increase was primarily due to a $17.9 million increase in average interest-earning assets, partially offset by a 12 basis point decrease in the average interest rate spread. The decrease in interest rate spread was a result of a yield curve which remained relatively flat during the fiscal year. For fiscal 2007, the average interest rate spread was 2.57%, compared to 2.69% for fiscal year 2006. At June 30, 2007, our spread was 2.55%. Interest Income. Interest income increased $3.2 million, or 15.6%, to $23.5 million for fiscal 2007, when compared to the prior fiscal year. The increase was primarily due to the 60 basis point increase in average yield earned on interest-earning assets from 6.27% in fiscal 2006 to 6.87% in fiscal 2007. Interest income also increased due to the $17.9 million increase in the average balance of interest-earning assets. Interest income on loans receivable increased by $3.1 million, or 16.9%, to $21.7 million for fiscal 2007 when compared to the prior fiscal year. The increase was primarily due to a 59 basis point increase in the average yield earned on loans receivable. Interest income on loans also increased due to the $20.5 million increase in average loans receivable. | Interest income on the investment portfolio and other interest-earning assets increased $49,000 or 2.7%, to $1.9 million for fiscal 2007 when compared to the prior fiscal year. The increase was due to a 33 basis point increase in the average yield earned on these assets, and was partially offset by a $2.6 million decrease in the average balance outstanding. Interest Expense. Interest expense increased $2.9 million, or 26.5%, to $13.6 million for fiscal 2007 when compared to the prior fiscal year. The increase was primarily due to the 72 basis point increase in the average rate paid on interest-bearing liabilities from 3.58% in fiscal 2006 to 4.30% in fiscal 2007. Interest expense also increased due to the $16.1 million increase in the average balance of interest-bearing liabilities. Interest expense on deposits increased $2.1 million, or 29.9%, to $9.1 million for fiscal 2007 when compared to the prior fiscal year. The increase was primarily due to an 80 basis point increase in the average rate paid on deposits. Interest expense on deposits also increased due to the $6.4 million increase in average deposits outstanding. Interest expense on FHLB advances increased $514,000, or 17.8%, to $3.4 million for fiscal 2007 when compared to the prior fiscal year. The increase was primarily due to the $8.3 million increase in the average balance of FHLB advances for fiscal 2007, and the 12 basis point increase in the average rate paid on advances. The Company issued $7.0 million of Floating Rate Capital Securities in March, 2004, with an interest rate of three month LIBOR plus 275 basis points, repricing quarterly. Interest expense on these securities was $594,000 for fiscal 2007 as compared to $512,000 for the prior fiscal year. This increase was due to the average rate paid increasing by 114 basis points. Provision for Loan Losses. A provision for loan losses is charged to earnings to bring the total allowance for loan losses to a level considered adequate by management to provide for probable loan losses based on prior loss experience, type and amount of loans in the portfolio, adverse situations that may affect the borrower's ability to repay, the estimated value of any underlying collateral and current economic conditions. Management also considers other factors relating to the collectibility of the loan portfolio. The provision for loan losses was $605,000 for fiscal 2007, compared to $555,000 for the prior fiscal year. The increase in provision was primarily due to strong loan growth and additions made in anticipation of a declining credit quality environment. In fiscal 2007 net charge offs were $125,000 compared to $513,000 for the prior year. At June 30, 2007, classified assets totaled $1.3 million, roughly equal to the total of classified assets at June 30, 2006. The above provision was made based on management's analysis of the various factors which affect the loan portfolio and management's desire to maintain the allowance at a level considered adequate. Management performed a detailed analysis of the loan portfolio, including types of loans, the charge-off history, and an analysis of the allowance for loan losses. Management also considered the continued origination of loans secured by commercial businesses and commercial real estate, which bear an inherently higher level of credit risk. While management believes the allowance for loan losses at June 30, 2007, is adequate to cover all losses inherent in the portfolio, there can be no assurance that, in the future, the Bank's regulators will not require further increases in the allowance, or that actual losses will not exceed the allowance. |
| 13 |
> FINANCIAL REVIEW (continued) <
| Noninterest Income. Noninterest income increased $63,000, or 3.0%, to $2.2 million for fiscal 2007, compared to $2.1 million in fiscal 2006. The increase was primarily due to a $102,000 increase in miscellaneous income collected (including ATM and debit card transaction income, and income from sales of loans on the secondary market), and was offset by a $61,000 decrease in non-sufficient funds charges. Noninterest Expense. Noninterest expense increased $430,000, or 6.1%, to $7.5 million for fiscal 2007, compared to the $7.0 million expensed during fiscal 2006. The increase resulted primarily from higher compensation, legal and occupancy expenses. Expenses for compensation and benefits increased $322,000, or 8.7%, for fiscal 2007 when compared to the prior year. The increase was due to the mid-fiscal 2006 addition of employees attributable to the opening of a new branch facility, increased salaries, and other compensation-related expenditures. Occupancy expenses increased $57,000, or 4.1%, primarily due to the cost of acquiring and operating a new facility for the full fiscal year. Professional fees increased $73,000, or 41.8%, primarily due to an increase in legal expenses to obtain a recovery on a large loan loss reported in fiscal 2005. Provision for Income Taxes. The Company expensed an income tax provision of $1.1 million for fiscal 2007, compared to $1.4 million in fiscal 2006. The decrease was due to recognition of benefits from acquired tax credits, the Company's investment in additional tax-exempt securities, a reduction in pre-tax income, and adjustments related to compliance with new accounting standards. COMPARISON OF THE YEARS ENDED JUNE 30, 2006 AND 2005 Net Income. Southern Missouri's net income was $2.8 million for the fiscal year ended June 30, 2006, an increase of $2.7 million when compared to the results of the prior fiscal year. The increase in net income was primarily due to a $4.3 million decrease in the provision for loan losses. Of the prior period's provision for loan losses, $4.5 million was due to alleged fraudulent activities undertaken by a credit relationship totaling $4.9 million. Partially offsetting the impact of the reduced loan loss provision was the reversal from the accrual of an income tax benefit of $82,000 during the fiscal year ended June 30, 2005, to an income tax provision of $1.4 million during the fiscal year ended June 30, 2006. Net Interest Income. Net interest income increased $348,000, or 3.8%, to $9.6 million for fiscal 2006, when compared to the prior fiscal year. The increase was primarily due to a 7.3% increase in average interest-earning assets, partially offset by a 15 basis point decrease in the average interest rate spread. The decrease in interest rate spread was a result of a flattening yield curve, in which short term interest rates increased, while long term interest rates remained relatively unchanged, during the fiscal year. An example of this was the prime rate which increased 200 basis points over the year (from 6.25% to 8.25%), while the 10-year treasury rate increased by only 121 basis points (from 3.94% to 5.15%). For fiscal 2006, the average interest rate spread was 2.69%, compared to 2.84% for fiscal year 2005. | Interest Income. Interest income increased $3.1 million, or 17.8%, to $20.4 million for fiscal 2006, when compared to the prior fiscal year. The increase was primarily due to the 56 basis point increase in average yield earned on interest-earning assets from 5.71% to 6.27%; additionally, interest income increased due to the $22.2 million increase in the average balance of interest-earning assets. Interest income on loans receivable increased by $2.8 million, or 17.5%, to $18.6 million for fiscal 2006 when compared to the prior fiscal year. The increase was primarily due to a 63 basis point increase in average yield earned on loans receivable; additionally, interest income increased due to the $17.0 million increase in average loans receivable. Interest income on the investment portfolio and other interest-earning assets increased $316,000, or 21.1%, to $1.8 million for fiscal 2006 when compared to the prior fiscal year. The increase was primarily due to a $5.1 million increase in the average balance outstanding; additionally, interest income increased due to a 28 basis point increase in the average yield on these investments. Interest Expense. Interest expense increased $2.7 million, or 34.0%, to $10.8 million for fiscal 2006 when compared to the prior fiscal year. The increase was primarily due to the 71 basis point increase in the average rate paid on interest-bearing liabilities from 2.87% in fiscal 2005 to 3.58% in fiscal 2006; additionally, interest expense increased due to the $20.4 million increase in the average balance of interest-bearing liabilities. Interest expense on deposits increased $2.5 million, or 54.7%, to $7.0 million for fiscal 2006 when compared to the prior fiscal year. The increase in interest expense was primarily due to an increase in the average rate paid on interest-bearing deposits to 3.06% for fiscal 2006 from 2.21% for fiscal 2005; the higher rates paid were the result of upward pricing of deposits in line with higher short-term interest rates. Additionally, interest expense on deposits increased as the average balance of deposits increased by $24.4 million for fiscal 2006 as compared to fiscal 2005. The increase was primarily due to growth in the CD portfolio. Interest expense on FHLB advances decreased $88,000, or 2.9%, to $2.9 million for fiscal 2006 when compared to the prior fiscal year. The decrease in interest expense was primarily due to the $5.6 million decrease in the average balance of FHLB advances for fiscal 2006, partially offset by the 35 basis point increase in the average rate paid on advances. The decrease in average balances was attributed to a reduced need for advances due to an increase in deposits during fiscal 2006. The Company issued $7.0 million of Floating Rate Capital Securities in March, 2004, with an interest rate of three month LIBOR plus 275 basis points, repricing quarterly. Interest expense on these securities was $512,000 for fiscal 2006 as compared to $370,000 for the prior fiscal year. Interest expense increased in fiscal 2006 as compared to the prior fiscal year as the average rate paid increased by 198 basis points. Provision for Loan Losses. A provision for loan losses is charged to earnings to bring the total allowance for loan losses to a level considered adequate by management to provide for probable loan losses based on prior loss experience, type and amount of loans in the portfolio, adverse situations that may affect the borrower's ability to repay, the estimated value of any underlying collateral and current economic conditions. Management also considers other factors relating to the collectibility of the loan portfolio. |
| 14 |
> FINANCIAL REVIEW (continued) <
| The provision for loan losses was $555,000 for fiscal 2006, compared to $4.8 million for the prior fiscal year. The decrease in the loan loss provision was primarily due to the aforementioned problem credit relationship which came to light during fiscal 2005. At June 30, 2006, classified assets totaled $1.3 million, compared to $1.8 million at June 30, 2005. The decrease in classified assets was primarily due to the improvement in the status of several relationships, as well as the charge off of others. The above provision was made based on management's analysis of the various factors which affect the loan portfolio and management's desire to maintain the allowance at a level considered adequate. Management performed a detailed analysis of the loan portfolio, including types of loans, the charge-off history and an analysis of the allowance for loan losses. Management also considered the continued origination of loans secured by commercial businesses and commercial real estate. These loans bear an inherently higher level of credit risk than one- to four-family residential real estate loans. While management believes the allowance for loan losses at June 30, 2006, is adequate to cover all losses inherent in the portfolio, there can be no assurance that, in the future, the Bank's regulators will not require further increases in the allowance, or that actual losses will not exceed the allowance. Noninterest Income. Noninterest income decreased $170,000, or 7.3%, to $2.1 million for fiscal 2006, when compared to the $2.3 million earned during fiscal 2005. The decrease was primarily due to inclusion in the results of the same period of the prior year of $352,000 in gains realized on the sale of equity investments and $41,000 in dividend income received on those equities, partially offset by an increase in bank service charges of $193,000, or 18.9%, for fiscal 2006 when compared to the prior year. The increase in bank service charges was primarily due to the inclusion in the prior period's results of a $210,000 deposit loss related to the aforementioned problem credit relationship identified in fiscal 2005. Noninterest Expense. Noninterest expense increased $300,000, or 4.5%, to $7.0 million for fiscal 2006, compared to the $6.7 million expensed during fiscal 2005. The increase resulted primarily from higher compensation and occupancy expenses. Expenses for compensation and benefits increased $175,000, or 5.0%, for fiscal 2006 when compared to the prior year. The increase was due to the addition of employees attributable to the opening of the new branch facility, increased salaries, and other compensation-related expenditures. Occupancy expenses increased $113,000, or 8.9%, primarily due to the costs of acquiring and operating the new facility. Provision for Income Taxes. The Company expensed an income tax provision of $1.4 million for fiscal 2006, compared to the accrual of a benefit of $82,000 in fiscal 2005. The reversal was due to the improvement in earnings. | QUANTITATIVE AND QUALITATIVE DISCLOSURES ABOUT MARKET RISK The goal of the Company's asset/liability management strategy is to manage the interest rate sensitivity of both interest-earning assets and interest-bearing liabilities in order to maximize net interest income without exposing the Company to an excessive level of interest rate risk. The Company employs various strategies intended to manage the potential effect that changing interest rates may have on future operating results. The primary asset/liability management strategy has been to focus on matching the anticipated repricing intervals of interest-earning assets and interest-bearing liabilities. At times, however, depending on the level of general interest rates, the relationship between long- and short-term interest rates, market conditions and competitive factors, the Company may increase its interest rate risk position in order to maintain its net interest margin. In an effort to manage the interest rate risk resulting from fixed rate lending, the Company has utilized longer term (up to 10 year maturities) FHLB advances, which are subject to early redemption and fixed terms to offset interest rate risk. Other elements of the Company's current asset/liability strategy include: (i) increasing originations of commercial real estate, commercial business loans, agricultural real estate, and agricultural operating lines, which typically provide higher yields and shorter repricing periods, but inherently increase credit risk, (ii) limiting the price volatility of the investment portfolio by maintaining a weighted average maturity of less than five years, (iii) actively soliciting less rate-sensitive deposits, and (iv) offering competitively priced money market accounts and CDs with maturities of up to five years. The degree to which each segment of the strategy is achieved will affect profitability and exposure to interest rate risk. The Company continues to generate long-term, fixed-rate residential loans. During the year ended June 30, 2007, fixed rate residential loan originations totaled $20.1 million compared to $21.3 million during the same period of the prior year. At June 30, 2007, the fixed-rate residential loan portfolio totaled $91.2 million with a weighted average maturity of 200 months compared to $88.2 million at June 30, 2006, with a weighted average maturity of 196 months. At June 30, 2007, fixed rate loans with remaining maturities in excess of 10 years totaled $78.0 million, or 24.8%, of loans receivable compared to $74.1 million, or 26.4%, of loans receivable at June 30, 2006. The Company originated $63.3 million in fixed rate commercial and commercial real estate loans during the year ended June 30, 2007, compared to $43.4 million during the prior fiscal year. The Company also originated $45.3 million in adjustable rate commercial loans during the year ended June 30, 2007, compared to $74.0 million during the prior ye ar. The Company originated $6.8 million in adjustable rate residential loans during the year ended June 30, 2007, compared to $9.3 million during the prior year. At June 30, 2007, home equity loans had decreased to $6.5 million as compared to $7.0 million as of June 30, 2006. Over the last several years, the Company has maintained a weighted average life of its investment portfolio of less than four years. At June 30, 2007, CDs with original terms of two years or more totaled $18.4 million compared to $32.7 million at June 30, 2006. |
| 15 |
> FINANCIAL REVIEW (continued) <
| INTEREST RATE SENSITIVITY ANALYSIS The following table sets forth as of June 30, 2007, and 2006, management's estimates of the projected changes in net portfolio value and net interest income in the event of 1%, 2% and 3%, instantaneous, permanent increases or decreases in market interest rates. Computations in the table below are based on prospective effects of hypothetical changes in interest rates and are based on an internally generated model using the actual maturity and repricing schedules for Southern Missouri's loans and deposits, adjusted by management's assumptions for prepayment rates and deposit runoff. Further, the computations do not consider any reactions that the Bank may undertake in response to changes in interest rates. These projected changes should not be relied upon as indicative of actual results in any of the aforementioned interest rate changes. Management cannot accurately predict future interest rates or their effect on the Company's NPV and net interest income in the future. Certain shortcomings are inherent in the method of analysis presented in the computation of NPV and net interest income. For example, although certain assets and liabilities may have similar maturities or periods of repricing, they may react in different degrees to changes in market interest rates. Also, the interest rates on certain types of assets and liabilities may fluctuate in advance of changes in market interest rates, while interest rates on other types of assets and liabilities may lag behind changes in market interest rates. Additionally, most of Southern Missouri's loans have features which restrict changes in interest rates on a short-term basis and over the life of the asset. Further, in the event of a change in interest rates, prepayment and early withdrawal levels would likely deviate significantly from those assumed in calculating the foregoing table. Finally, the ability of many borrowers to service their debt may decrease in the event of an interest rate increase. | AVERAGE BALANCE, INTEREST AND AVERAGE YIELDS AND RATES The table on the following page sets forth certain information relating to the Company's average interest-earning assets and interest-bearing liabilities and reflects the average yield on assets and the average cost of liabilities for the periods indicated. These yields and costs are derived by dividing income or expense by the average month-end balance of assets or liabilities, respectively, for the years indicated. Nonaccrual loans are included in the net loan category. The table also presents information with respect to the difference between the weighted-average yield earned on interest-earning assets and the weighted-average rate paid on interest-bearing liabilities, or interest rate spread, which financial institutions have traditionally used as an indicator of profitability. Another indicator of an institution's net interest income is its net yield on interest-earning assets, which is its net interest income divided by the average balance of interest-earning assets. Net interest income is affected by the interest rate spread and by the relative amounts of interest-earning assets and interest-bearing liabilities. When interest-earning assets approximate or exceed interest-bearing liabilities, any positive interest rate spread will generate net interest income. |
| June 30, 2007 | |||||||||
| Net Portfolio | NPV as % of PV of Assets | ||||||||
| $ Amount | $ Change | % Change | NPV Ratio | Change | |||||
| Change in Rates | (dollars in thousands) | ||||||||
| +300 bp | $ 16,862 | (16,526 | ) | (49 | ) | 4.73 | -4.15 | ||
| +200 bp | 22,897 | (10,491 | ) | (31 | ) | 6.31 | -2.57 | ||
| +100 bp | 28,458 | (4,930 | ) | (15 | ) | 7.70 | -1.18 | ||
| 0 bp | 33,388 | - | - | 8.88 | - | ||||
| -100 bp | 37,139 | 3,751 | 11 | 9.74 | 0.86 | ||||
| -200 bp | 39,307 | 5,919 | 18 | 10.19 | 1.31 | ||||
| -300 bp | 40,593 | 7,205 | 22 | 10.42 | 1.54 | ||||
| June 30, 2007 | |||||||||
| Net Portfolio | NPV as % of PV of Assets | ||||||||
| $ Amount | $ Change | % Change | NPV Ratio | Change | |||||
| Change in Rates | (dollars in thousands) | ||||||||
| +300 bp | $ 14,966 | (15,129 | ) | (50 | ) | 4.54 | -4.15 | ||
| +200 bp | 20,409 | (9,686 | ) | (32 | ) | 6.08 | -2.61 | ||
| +100 bp | 25,592 | (4,503 | ) | (15 | ) | 7.51 | -1.18 | ||
| 0 bp | 30,095 | - | - | 8.69 | - | ||||
| -100 bp | 33,265 | 3,170 | 11 | 9.49 | .80 | ||||
| -200 bp | 35,080 | 4,985 | 17 | 9.91 | 1.22 | ||||
| -300 bp | 36,172 | 6,077 | 20 | 10.13 | 1.44 | ||||
| 16 |
> FINANCIAL REVIEW (continued) <
(dollars in thousands)
| 2007 | 2006 | 2005 | ||||||||||||||||||||
| Year Ended June 30 | Average Balance | Interest and Dividends | Yield/ Cost | Average Balance | Interest and Dividends | Yield/ Cost | Average Balance | Interest and Dividends | Yield/ Cost | |||||||||||||
| Interest-earning assets: | ||||||||||||||||||||||
| Mortgage loans (1) | $ 211,203 | $ 14,726 | 6.97 | % | $ 192,191 | $ 12,781 | 6.65 | % | $ 181,368 | $ 11,206 | 6.18 | % | ||||||||||
| Other loans (1) | 86,352 | 6,966 | 8.07 | 84,838 | 5,773 | 6.81 | 78,613 | 4,585 | 5.83 | |||||||||||||
| Total net loans | 297,555 | 21,692 | 7.29 | 277,029 | 18,554 | 6.70 | 259,981 | 15,791 | 6.07 | |||||||||||||
| Mortgage-backed securities | 13,082 | 556 | 4.25 | 15,648 | 596 | 3.81 | 19,521 | 720 | 3.69 | |||||||||||||
| Investment securities (2) | 28,234 | 1,256 | 4.45 | 25,067 | 1,020 | 4.07 | 19,462 | 747 | 3.84 | |||||||||||||
| Other interest-earning assets | 3,780 | 46 | 1.22 | 6,989 | 193 | 2.77 | 3,585 | 26 | 0.73 | |||||||||||||
| TOTAL INTEREST- EARNING ASSETS (1) | 342,651 | 23,550 | 6.87 | 324,733 | 20,363 | 6.27 | 302,549 | 17,284 | 5.71 | |||||||||||||
| Other noninterest-earning assets (3) | 21,563 | - | - | 21,281 | - | - | 22,000 | - | - | |||||||||||||
| TOTAL ASSETS | $ 364,214 | $ 23,550 | - | $ 346,014 | $ 20,363 | - | $ 324,549 | $ 17,284 | - | |||||||||||||
| Interest-bearing liabilities: | ||||||||||||||||||||||
| Savings accounts | $ 71,211 | $ 2,660 | 3.74 | % | $ 70,704 | $ 2,259 | 3.19 | % | $ 68,640 | $ 1,407 | 2.05 | % | ||||||||||
| Now accounts | 30,742 | 402 | 1.31 | 29,619 | 362 | 1.22 | 30,308 | 341 | 1.13 | |||||||||||||
| Money market accounts | 7,321 | 142 | 1.94 | 11,333 | 206 | 1.82 | 14,867 | 206 | 1.38 | |||||||||||||
| Certificates of deposit | 125,149 | 5,849 | 4.67 | 116,330 | 4,140 | 3.56 | 89,728 | 2,550 | 2.84 | |||||||||||||
| TOTAL INTEREST- BEARING DEPOSITS | 234,423 | 9,053 | 3.86 | 227,986 | 6,967 | 3.06 | 203,543 | 4,504 | 2.21 | |||||||||||||
| Borrowings: | ||||||||||||||||||||||
| Securities sold under agreements to repurchase | 11,863 | 575 | 4.84 | 10,420 | 400 | 3.84 | 8,847 | 186 | 2.11 | |||||||||||||
| FHLB advances | 62,906 | 3,399 | 5.40 | 54,642 | 2,884 | 5.28 | 60,263 | 2,972 | 4.93 | |||||||||||||
| Junior subordinated debt | 7,217 | 594 | 8.24 | 7,217 | 512 | 7.10 | 7,217 | 370 | 5.12 | |||||||||||||
| TOTAL INTEREST- BEARING LIABILITIES | 316,409 | 13,621 | 4.30 | 300,265 | 10,763 | 3.58 | 279,870 | 8,032 | 2.87 | |||||||||||||
| Noninterest-bearing demand deposits | 17,850 | - | - | 17,745 | - | - | 15,439 | - | - | |||||||||||||
| Other liabilities | 2,041 | - | - | 2,286 | - | - | 2,678 | - | - | |||||||||||||
| TOTAL LIABILITIES | 336,300 | 13,621 | - | 320,296 | 10,763 | - | 297,987 | 8,032 | - | |||||||||||||
| Stockholders' equity | 27,914 | - | 25,718 | - | - | 26,562 | - | - | ||||||||||||||
| TOTAL LIABILITIES AND STOCKHOLDERS' EQUITY | $ 364,214 | $ 13,621 | - | $ 346,014 | $ 10,763 | - | $ 324,549 | $ 8,032 | - | |||||||||||||
| Net interest income | $ 9,929 | $ 9,600 | $ 9,252 | |||||||||||||||||||
| Interest rate spread (4) | 2.57 | % | 2.69 | % | 2.84 | % | ||||||||||||||||
| Net interest margin (5) | 2.90 | % | 2.96 | % | 3.06 | % | ||||||||||||||||
| Ratio of average interest-earning assets to average interest- bearing liabilities | 108.29 | % | 108.15 | % | 108.10 | % | ||||||||||||||||
(1) Calculated net of deferred loan fees, loan discounts and loans-in-process. Nonaccrual loans are included in average loans.
(2) Includes FHLB stock and related cash dividends.
(3) Includes equity securities and related cash dividends.
(4) Net interest spread represents the difference between the average rate on interest-earning assets and the average cost of interest-bearing liabilities.
(5) Net yield on average interest-earning assets represents net interest income divided by average interest-earning assets.
| 17 |
> FINANCIAL REVIEW (continued) <
YIELDS EARNED AND RATES PAID
The following table sets forth for the periods and at the dates indicated, the weighted average yields earned on the Company's assets, the weighted average interest rates paid on the Company's liabilities, together with the net yield on interest-earning assets.
| At June 30, | For The Year Ended June 30, | |||||||||||
| 2007 | 2007 | 2006 | 2005 | |||||||||
| Weighted-average yield on loan portfolio | 7.41 | % | 7.29 | % | 6.70 | % | 6.07 | % | ||||
| Weighted-average yield on mortgage-backed securities | 4.28 | 4.25 | 3.81 | 3.69 | ||||||||
| Weighted-average yield on investment securities (1) | 4.16 | 4.45 | 4.07 | 3.84 | ||||||||
| Weighted-average yield on other interest-earning assets | 1.10 | 1.22 | 2.77 | .73 | ||||||||
| Weighted-average yield on all interest-earning assets | 6.98 | 6.87 | 6.27 | 5.71 | ||||||||
| Weighted-average rate paid on deposits | 4.08 | 3.86 | 3.06 | 2.21 | ||||||||
| Weighted-average rate paid on securities sold under agreements to repurchase | 4.90 | 4.84 | 3.84 | 2.11 | ||||||||
| Weighted-average rate paid on FHLB advances | 5.42 | 5.40 | 5.28 | 4.93 | ||||||||
| Weighted-average rate paid on subordinated debt | 8.11 | 8.24 | 7.10 | 5.12 | ||||||||
| Weighted-average rate paid on all interest-bearing liabilities | 4.44 | 4.30 | 3.58 | 2.87 | ||||||||
| Interest rate spread (spread between weighted average rate on all interest-earning assets and all interest-bearing liabilities) | 2.55 | 2.57 | 2.69 | 2.84 | ||||||||
| Net interest margin (net interest income as a percentage of average interest-earning assets) | 2.93 | 2.90 | 2.96 | 3.06 | ||||||||
(1) Includes Federal Home Loan Bank stock.
RATE/VOLUME ANALYSIS
The following table sets forth the effects of changing rates and volumes on net interest income of the Company. Information is provided with respect to (i) effects on interest income attributable to changes in volume (changes in volume multiplied by prior rate), (ii) effects on interest income attributable to changes in rate (changes in rate multiplied by prior volume), and (iii) changes in rate/volume (change in rate multiplied by change in volume).
| Years Ended June 30, 2007 Compared to 2006 Increase (Decrease) Due to | Years Ended June 30, 2006 Compared to 2005 Increase (Decrease) Due to | |||||||||||||||||
| (dollars in thousands) | Rate | Volume | Rate/ Volume | Net | Rate | Volume | Rate/ Volume | Net | ||||||||||
| Interest-earning assets: | ||||||||||||||||||
| Loans receivable (1) | 1,634 | 1,375 | 129 | 3,138 | 1,622 | 1,030 | 111 | 2,763 | ||||||||||
| Mortgage-backed securities | 69 | (98 | ) | (11 | ) | (40 | ) | 24 | (143 | ) | (5 | ) | (124 | ) | ||||
| Investment securities (2) | 95 | 129 | 12 | 236 | 45 | 214 | 14 | 273 | ||||||||||
| Other interest-earning deposits | (108 | ) | (89 | ) | 50 | (147 | ) | 73 | 25 | 69 | 167 | |||||||
| Total net change in income on interest-earning assets | 1,690 | 1,317 | 180 | 3,187 | 1,764 | 1,126 | 189 | 3,079 | ||||||||||
| Interest-bearing liabilities: | ||||||||||||||||||
| Deposits | 1,721 | 271 | 94 | 2,086 | 1,523 | 741 | 199 | 2,463 | ||||||||||
| Securities sold under agreements to repurchase | 104 | 55 | 16 | 175 | 154 | 33 | 27 | 214 | ||||||||||
| Subordinated debt | 82 | 0 | 0 | 82 | 142 | 0 | 0 | 142 | ||||||||||
| FHLB advances | 66 | 436 | 13 | 515 | 210 | (277 | ) | (21 | ) | (88 | ) | |||||||
| Total net change in expense on interest-bearing liabilities | 1,973 | 762 | 123 | 2,858 | 2,029 | 497 | 205 | 2,731 | ||||||||||
| Net change in net interest income | (283 | ) | 555 | 57 | 329 | (265 | ) | 629 | (16 | ) | 348 | |||||||
(2) Does not include dividends earned on equity securities.
| 18 |
> FINANCIAL REVIEW (continued) <
| LIQUIDITY AND CAPITAL RESOURCES Southern Missouri's primary potential sources of funds include deposit growth, securities sold under agreements to repurchase, FHLB advances, amortization and prepayment of loan principal, investment maturities and sales, and ongoing operating results. While scheduled repayments on loans and securities as well as the maturity of short-term investments are a relatively predictable source of funding, deposit flows, FHLB advance redemptions and loan and security prepayment rates are significantly influenced by factors outside of the Bank's control, including general economic conditions and market competition. The Bank has relied on FHLB advances as a source for funding cash or liquidity needs. Southern Missouri uses its liquid assets as well as other funding sources to meet ongoing commitments, to fund loan commitments, to repay maturing certificates of deposit and FHLB advances, to make investments, to fund other deposit withdrawals and to meet operating expenses. At June 30, 2007, the Bank had outstanding commitments to extend credit of $36.7 million (including $30.6 million in unused lines of credit). Total commitments to originate fixed-rate loans with terms in excess of one year were $2.9 million at interest rates ranging from 6.875% to 8.75%. Management anticipates that current funding sources will be adequate to meet foreseeable liquidity needs. The primary sources of funding for the Company are deposits, securities sold under agreements to repurchase and FHLB advances. For the year ended June 30, 2007, Southern Missouri increased deposits, securities sold under agreements to repurchase, and FHLB advances by $12.0 million, $6.5 million, and $8.0 million, respectively. During the prior year, Southern Missouri increased deposits and securities sold under agreements to repurchase by $33.4 million and $538,000, respectively, while decreasing FHLB advances by $15.5 million. At June 30, 2007, the Bank had additional borrowing capacity from the FHLB of $42.4 million as compared to $51.2 million at June 30, 2007. In addition to the $42.4 million, the Bank has the ability to pledge additional loan portfolios including commercial real estate, home equity and commercial business, which could provide additional borrowing capacity of approximately $84.0 million at June 30, 2007. Liquidity management is an ongoing responsibility of the Bank's management. The Bank adjusts its investment in liquid assets based upon a variety of factors including (i) expected loan demand and deposit flows, (ii) anticipated investment and FHLB advance maturities, (iii) the impact on profitability, and (iv) asset/liability management objectives. At June 30, 2007, the Bank had $117.1 million in CDs maturing within one year and $157.3 million in other deposits and securities sold under agreements to repurchase without a specified maturity as compared to the prior year of $113.1 million in CDs maturing within one year and $143.8 million in other deposits and securities sold under agreements to repurchase. Management believes that most maturing interest-bearing liabilities will be retained or replaced by new interest-bearing liabilities. Also at June 30, 2007, the Bank had $39.0 million in FHLB advances eligible for early redemption by the lender within one year. | REGULATORY CAPITAL Federally insured financial institutions are required to maintain minimum levels of regulatory capital. FDIC regulations establish capital requirements, including a leverage (or core capital) requirement and a risk-based capital requirement. The FDIC is also authorized to impose capital requirements in excess of these standards on individual institutions on a case-by-case basis. At June 30, 2007, the Bank exceeded regulatory capital requirements with core and total risk-based capital of $29.9 million and $32.4 million, or 8.1% and 11.8% of adjusted total assets and risk-weighted assets, respectively. These capital levels exceeded minimum requirements of 4.0% and 8.0% for adjusted total assets and risk-weighted assets. (See Note 12 - Stockholders' Equity and Regulatory Capital.) IMPACT OF INFLATION The consolidated financial statements and related data presented herein have been prepared in accordance with U.S. generally accepted accounting principles, which require the measurement of financial position and operating results in historical dollars without considering changes in the relative purchasing power of money over time due to inflation. The primary impact of inflation on the operations of the Company is reflected in increased operating costs. Unlike most industrial companies, virtually all of the assets and liabilities of a financial institution are monetary in nature. As a result, changes in interest rates generally have a more significant impact on a financial institution's performance than does inflation. Interest rates do not necessarily move in the same direction or to the same extent as the prices of goods and services. In the current interest rate environment, liquidity and maturity structure of the Company's assets and liabilities are critical to the maintenance of acceptable performance levels. |
| 19 |
> REPORT OF INDEPENDENT REGISTERED PUBLIC ACCOUNTING FIRM <
| 20 |
> CONSOLIDATED BALANCE SHEETS <
JUNE 30, 2007 AND 2006
Southern Missouri Bancorp, Inc.
| Assets | 2007 | 2006 | |||
| Cash and cash equivalents | $ 7,330,966 | $ 6,366,608 | |||
| Available for sale securities (Note 2) | 34,883,588 | 38,401,508 | |||
| Stock in FHLB of Des Moines | 3,070,600 | 2,641,300 | |||
| Loans, net of allowance for loan losses of $2,537,659 and $2,058,144 at June 30, 2007 and 2006, respectively (Note 3) | 312,062,967 | 280,930,991 | |||
| Accrued interest receivable | 2,248,064 | 1,955,345 | |||
| Premises and equipment, net (Note 4) | 8,650,673 | 8,931,178 | |||
| Bank owned life insurance - cash surrender value | 6,998,565 | 6,735,355 | |||
| Intangible assets, net | 2,093,160 | 2,348,418 | |||
| Prepaid expenses and other assets | 2,588,212 | 2,373,025 | |||
| TOTAL ASSETS | $ 379,926,795 | $ 350,683,728 | |||
| Liabilities and Stockholders' Equity | |||||
| Deposits (Note 5) | $ 270,088,096 | $ 258,069,019 | |||
| Securities sold under agreements to repurchase (Note 6) | 17,758,364 | 11,295,611 | |||
| Advances from FHLB of Des Moines (Note 7) | 54,000,000 | 46,000,000 | |||
| Accounts payable and other liabilities | 742,816 | 803,725 | |||
| Accrued interest payable | 1,406,280 | 744,146 | |||
| Subordinated debt (Note 8) | 7,217,000 | 7,217,000 | |||
| TOTAL LIABILITIES | 351,212,556 | 324,129,501 | |||
| Commitments and contingencies (Note 13) | - | - | |||
| Preferred stock, $.01 par value; 500,000 shares authorized; none issued or outstanding | - | - | |||
| Common stock, $.01 par value; 4,000,000 shares authorized; 2,957,226 shares issued | 29,572 | 29,572 | |||
| Additional paid-in capital | 17,389,156 | 17,354,621 | |||
| Retained earnings | 24,634,854 | 22,511,880 | |||
| Treasury stock of 743,250 shares in 2007 and 720,895 shares in 2006, at cost | (12,990,541 | ) | (12,651,521 | ) | |
| Accumulated other comprehensive loss | (348,802 | ) | (690,325 | ) | |
| TOTAL STOCKHOLDERS' EQUITY | 28,714,239 | 26,554,227 | |||
| TOTAL LIABILITIES AND STOCKHOLDERS' EQUITY | $ 379,926,795 | $ 350,683,728 | |||
See accompanying notes to consolidated financial statements.
| 21 |
> CONSOLIDATED STATEMENTS OF INCOME <
YEARS ENDED JUNE 30, 2007, 2006 AND 2005
Southern Missouri Bancorp, Inc.
| Interest income: | 2007 | 2006 | 2005 | |||||
| Loans | $ 21,691,579 | $ 18,554,139 | $ 15,790,675 | |||||
| Investment securities | 1,255,676 | 1,020,140 | 747,378 | |||||
| Mortgage-backed securities | 556,235 | 596,065 | 720,104 | |||||
| Other interest-earning assets | 46,144 | 193,301 | 26,175 | |||||
| TOTAL INTEREST INCOME | 23,549,634 | 20,363,645 | 17,284,332 | |||||
| Interest expense: | ||||||||
| Deposits | 9,052,748 | 6,966,798 | 4,504,594 | |||||
| Securities sold under agreements to repurchase | 574,570 | 400,097 | 186,224 | |||||
| Advances from FHLB of Des Moines | 3,398,868 | 2,884,426 | 2,971,936 | |||||
| Subordinated debt | 594,357 | 512,074 | 369,733 | |||||
| TOTAL INTEREST EXPENSE | 13,620,543 | 10,763,395 | 8,032,487 | |||||
| NET INTEREST INCOME | 9,929,091 | 9,600,250 | 9,251,845 | |||||
| Provision for loan losses (Note 3) | 605,000 | 555,000 | 4,815,000 | |||||
| NET INTEREST INCOME AFTER | ||||||||
| PROVISION FOR LOAN LOSSES | 9,324,091 | 9,045,250 | 4,436,845 | |||||
| Noninterest income: | ||||||||
| Net gains (losses) on sales of available for sale securities | - | - | 351,508 | |||||
| Customer service charges | 1,140,474 | 1,211,084 | 1,018,337 | |||||
| Loan late charges | 124,076 | 119,762 | 147,704 | |||||
| Increase in cash surrender value of bank owned life insurance | 263,210 | 249,598 | 225,291 | |||||
| Other | 679,038 | 563,047 | 570,640 | |||||
| TOTAL NONINTEREST INCOME | 2,206,798 | 2,143,491 | 2,313,480 | |||||
| Noninterest expense: | ||||||||
| Compensation and benefits | 4,006,971 | 3,685,388 | 3,510,841 | |||||
| Occupancy and equipment | 1,432,659 | 1,375,670 | 1,263,055 | |||||
| SAIF deposit insurance premium | 31,022 | 30,583 | 30,282 | |||||
| Professional fees | 246,271 | 173,685 | 276,587 | |||||
| Advertising | 224,438 | 187,632 | 164,169 | |||||
| Postage and office supplies | 298,440 | 294,888 | 254,440 | |||||
| Amortization of intangible assets | 255,258 | 255,258 | 255,258 | |||||
| Other | 962,959 | 1,024,826 | 973,334 | |||||
| TOTAL NONINTEREST EXPENSE | 7,458,018 | 7,027,930 | 6,727,966 | |||||
| INCOME BEFORE INCOME TAXES | 4,072,871 | 4,160,811 | 22,359 | |||||
| Income taxes (Note 10) | ||||||||
| Current | 1,307,458 | 1,673,184 | 9,000 | |||||
| Deferred | (163,000 | ) | (296,539 | ) | (90,900 | ) | ||
| 1,144,458 | 1,376,645 | (81,900 | ) | |||||
| NET INCOME | $ 2,928,413 | $ 2,784,166 | $ 104,259 | |||||
| Basic earnings per common share | $ 1.32 | $ 1.25 | $ 0.05 | |||||
| Diluted earnings per common share | $ 1.29 | $ 1.24 | $ 0.05 | |||||
See accompanying notes to consolidated financial statements.
| 22 |
> CONSOLIDATED STATEMENTS OF STOCKHOLDERS' EQUITY <
YEARS ENDED JUNE 30, 2007, 2006 AND 2005
Southern Missouri Bancorp, Inc.
| Common Stock | Additional Paid-in Capital | Retained Earnings | Treasury Stock | Unearned Employee Benefits | Accumulated Other Comprehensive Income (Loss) | Total Stockholders' Equity | ||||||||
| BALANCE AT JUNE 30, 2004 | $ 29,572 | $ 17,287,099 | $ 21,236,686 | $ (12,253,732 | ) | $ (109,051 | ) | $ (238,156 | ) | $ 25,952,418 | ||||
| Net income | 104,259 | 104,259 | ||||||||||||
| Change in unrealized gain (loss) | ||||||||||||||
| on available for sale securities | 65,041 | 65,041 | ||||||||||||
| TOTAL COMPREHENSIVE INCOME | 169,300 | |||||||||||||
| Purchases of treasury stock | (585,884 | ) | (585,884 | ) | ||||||||||
| Dividends paid ($.36 per share) | (809,193 | ) | (809,193 | ) | ||||||||||
| Release of ESOP awards | 132,638 | 59,140 | 191,778 | |||||||||||
| MRP expense | 11,083 | 4,148 | 15,231 | |||||||||||
| Tax benefit of MRP | 3,887 | 3,887 | ||||||||||||
| Exercise of stock options | (71,165 | ) | 137,127 | 65,962 | ||||||||||
| BALANCE AT JUNE 30, 2005 | $ 29,572 | $ 17,363,542 | $ 20,531,752 | $ (12,702,489 | ) | $ (45,763 | ) | $ (173,115 | ) | $ 25,003,499 | ||||
| Net income | 2,784,166 | 2,784,166 | ||||||||||||
| Change in unrealized gain (loss) | ||||||||||||||
| on available for sale securities | (517,210 | ) | (517,210 | ) | ||||||||||
| TOTAL COMPREHENSIVE INCOME | 2,266,956 | |||||||||||||
| Reclassification of unearned compensation in accordance with adoption of SFAS No. 123R | (45,763 | ) | 45,763 | - | ||||||||||
| Dividends paid ($.36 per share) | (804,038 | ) | (804,038 | ) | ||||||||||
| SOP expense | 51,473 | 51,473 | ||||||||||||
| MRP expense | 10,890 | 10,890 | ||||||||||||
| Tax benefit of MRP | 2,599 | 2,599 | ||||||||||||
| Exercise of stock options | (28,120 | ) | 50,968 | 22,848 | ||||||||||
| BALANCE AT JUNE 30, 2006 | $ 29,572 | $ 17,354,621 | $ 22,511,880 | $ (12,651,521 | ) | $ - | $ (690,325 | ) | $ 26,554,227 | |||||
| Net income | 2,928,413 | 2,928,413 | ||||||||||||
| Change in unrealized gain (loss) | ||||||||||||||
| on available for sale securities | 341,523 | 341,523 | ||||||||||||
| TOTAL COMPREHENSIVE INCOME | 3,269,936 | |||||||||||||
| Purchases of treasury stock | (397,020 | ) | (397,020 | ) | ||||||||||
| Dividends paid ($.36 per share) | (805,439 | ) | (805,439 | ) | ||||||||||
| SOP Expense | 50,067 | 50,067 | ||||||||||||
| MRP expense | 13,147 | 13,147 | ||||||||||||
| Tax benefit of MRP | 3,321 | 3,321 | ||||||||||||
| Exercise of stock options | (32,000 | ) | 58,000 | 26,000 | ||||||||||
| BALANCE AT JUNE 30, 2007 | $ 29,572 | $ 17,389,156 | $ 24,634,854 | $ (12,990,541 | ) | $ - | $ (348,802 | ) | $ 28,714,239 | |||||
See accompanying notes to consolidated financial statements.
| 23 |
> CONSOLIDATED STATEMENTS OF CASH FLOWS <
YEARS ENDED JUNE 30, 2007, 2006 AND 2005
Southern Missouri Bancorp, Inc.
| Cash flows from operating activities: | 2007 | 2006 | 2005 | |||||
| Net income | $ 2,928,413 | $ 2,784,166 | $ 104,259 | |||||
| Items not requiring (providing) cash: | ||||||||
| Depreciation | 713,774 | 642,449 | 535,433 | |||||
| SOP, MRP expense and ESOP expense | 66,535 | 62,364 | 207,008 | |||||
| Net realized losses (gains) on sale of available for sale securities | - | - | (351,508 | ) | ||||
| (Gain) Loss on sale of foreclosed assets | (1,035 | ) | 29,938 | 14,977 | ||||
| Amortization of intangible assets | 255,258 | 255,258 | 255,258 | |||||
| Increase in cash surrender value of bank owned life insurance | (263,210 | ) | (249,598 | ) | (225,291 | ) | ||
| Provision for loan losses | 605,000 | 555,000 | 4,815,000 | |||||
| Amortization of premiums and discounts on securities | (9,373 | ) | 36,598 | 81,630 | ||||
| Deferred income taxes | (163,000 | ) | (296,539 | ) | (90,900 | ) | ||
| Changes in: | ||||||||
| Accrued interest receivable | (346,437 | ) | (561,225 | ) | (73,453 | ) | ||
| Prepaid expenses and other assets | (346,378 | ) | (52,073 | ) | (1,891,167 | ) | ||
| Accounts payable and other liabilities | 160,803 | 1,194,227 | 177,620 | |||||
| Accrued interest payable | 440,422 | 246,905 | 161,218 | |||||
| NET CASH PROVIDED BY OPERATING ACTIVITIES | $ 4,040,772 | $ 4,647,470 | $ 3,720,084 | |||||
| Cash flows from investing activities: | ||||||||
| Net increase in loans | $ (31,877,876 | ) | $ (14,094,508 | ) | $ (23,995,293 | ) | ||
| Proceeds from sales of available for sale securities | - | - | 7,017,287 | |||||
| Proceeds from maturities of available for sale securities | 8,919,334 | 5,007,756 | 8,907,916 | |||||
| Purchases of available for sale securities | (4,849,941 | ) | (9,566,422 | ) | (10,046,587 | ) | ||
| Sale (purchase) of Federal Home Loan Bank stock | (429,300 | ) | 479,800 | 49,900 | ||||
| Purchase of premises and equipment | (347,815 | ) | (1,689,261 | ) | (310,422 | ) | ||
| Purchase of land | - | - | (5,537,842 | ) | ||||
| Proceeds from sale of land | - | - | 3,497,971 | |||||
| Proceeds from sale of vehicle | 1,867 | - | - | |||||
| Purchase of bank owned life insurance | - | - | (2,000,000 | ) | ||||
| Proceeds from sale of foreclosed real estate | 201,946 | 34,269 | 64,355 | |||||
| NET CASH USED IN INVESTING ACTIVITIES | $ (28,381,785 | ) | $ (19,828,366 | ) | $ (22,352,715 | ) | ||
See accompanying notes to consolidated financial statements.
| 24 |
> CONSOLIDATED STATEMENTS OF CASH FLOWS (continued) <
YEARS ENDED JUNE 30, 2007, 2006 AND 2005
Southern Missouri Bancorp, Inc.
| Cash flows from financing activities: | 2007 | 2006 | 2005 | |||||
| Net increase (decrease) in demand deposits and savings accounts | $ 7,025,174 | $ 7,741,339 | $ (4,627,461 | ) | ||||
| Net increase in certificates of deposit | 4,993,903 | 25,661,983 | 17,334,562 | |||||
| Net increase in securities sold under agreements to repurchase | 6,462,753 | 538,411 | 4,309,381 | |||||
| Proceeds from Federal Home Loan Bank advances | 388,475,000 | 36,250,000 | 83,050,000 | |||||
| Repayments of Federal Home Loan Bank advances | (380,475,000 | ) | (51,750,000 | ) | (80,800,000 | ) | ||
| Dividends paid on common stock | (805,439 | ) | (804,038 | ) | (809,193 | ) | ||
| Exercise of stock options | 26,000 | 22,848 | 65,962 | |||||
| Purchases of treasury stock | (397,020 | ) | - | (585,884 | ) | |||
| NET CASH PROVIDED BY FINANCING ACTIVITIES | $25,305,371 | $ 17,660,543 | $ 17,937,367 | |||||
| Increase (Decrease) in cash and cash equivalents | 964,358 | 2,479,647 | (695,264 | ) | ||||
| Cash and cash equivalents at beginning of year | 6,366,608 | 3,886,961 | 4,582,225 | |||||
| CASH AND CASH EQUIVALENTS AT END OF YEAR | $ 7,330,966 | $ 6,366,608 | $ 3,886,961 | |||||
| Supplemental disclosures of cash flow information: | ||||||||
| Noncash investing and financing activities | ||||||||
| Conversion of loans to foreclosed real estate | $ 288,577 | $ 221,447 | $ 4,000 | |||||
| Conversion of foreclosed real estate to loans | 52,611 | 45,000 | - | |||||
| Cash paid during the period for | ||||||||
| Interest (net of interest credited) | 5,223,263 | 4,602,987 | 3,871,180 | |||||
| Income taxes | 1,472,391 | 1,090,000 | 1,204,884 | |||||
See accompanying notes to consolidated financial statements.
| 25 |
> NOTES TO CONSOLIDATED FINANCIAL STATEMENTS <
Southern Missouri Bancorp, Inc.
| NOTE 1: Organization and Summary of Significant Accounting Policies Organization. Southern Missouri Bancorp, Inc., a Missouri corporation (the Company) was organized in 1994 and is the parent company of Southern Missouri Bank & Trust (the Bank). Substantially all of the Company's consolidated revenues are derived from the operations of the Bank, and the Bank represents substantially all of the Company's consolidated assets and liabilities. Basis of Financial Statement Presentation. The financial statements of the Company have been prepared in conformity with U.S. generally accepted accounting principles and general practices within the banking industry. In the normal course of business, the Company encounters two significant types of risk: economic and regulatory. Economic risk is comprised of interest rate risk, credit risk, and market risk. The Company is subject to interest rate risk to the degree that its interest-bearing liabilities reprice on a different basis than its interest-earning assets. Credit risk is the risk of default on the Company's loan portfolio that results from the borrowers' inability or unwillingness to make contractually required payments. Market risk reflects changes in the value of collateral underlying loans receivable and the value of the Company's investment in real estate. Principles of Consolidation. The consolidated financial statements include the accounts of the Company and its wholly-owned subsidiary, the Bank. All significant intercompany accounts and transactions have been eliminated. Use of Estimates. The preparation of financial statements in conformity with accounting principles generally accepted in the United States of America requires management to make estimates and assumptions that affect the reported amounts of assets and liabilities and disclosures of contingent assets and liabilities at the date of the financial statements and the reported amounts of revenues and expenses during the reporting period. Actual results could differ from those estimates. Material estimates that are particularly susceptible to significant change relate to the determination of the allowance for loan losses. In connection with the determination of the allowance for loan losses, management obtains independent appraisals for significant properties. Cash and Cash Equivalents. For purposes of reporting cash flows, cash and cash equivalents includes cash due from depository institutions and interest-bearing deposits in other depository institutions with original maturities of three months or less. Interest-bearing deposits in other depository institutions were $4,394,010 and $3,907,302 at June 30, 2007 and 2006, respectively. | Available for Sale Securities. Available for sale securities, which include any security for which the Company has no immediate plan to sell but which may be sold in the future are carried at fair value. Unrealized gains and losses, net of tax, are reported in accumulated other comprehensive loss, a component of stockholders' equity. All securities have been classified as available for sale. Premiums and discounts on debt securities are amortized or accreted as adjustments to income over the estimated life of the security using the level yield method. Realized gains or losses on the sale of securities is based on the specific identification method. The fair value of securities is based on quoted market prices or dealer quotes. If a quoted market price is not available, fair value is estimated using quoted market prices for similar securities. The Company does not invest in collateralized mortgage obligations that are considered high risk. Federal Home Loan Bank Stock. The Bank is a member of the Federal Home Loan Bank (FHLB) system. Capital stock of the FHLB is a required investment based upon a predetermined formula and is carried at cost. Loans. Loans are stated at unpaid principal balances, less the allowance for loan losses and net deferred loan origination fees. Interest on loans is accrued based upon the principal amount outstanding. The accrual of interest on loans is discontinued when, in management's judgment, the collectibility of interest or principal in the normal course of business is doubtful. A loan is considered delinquent when a payment has not been made by the contractual due date. Interest income previously accrued but not collected at the date a loan is placed on nonaccrual status is reversed against interest income. Cash receipts on a nonaccrual loan are applied to principal and interest in accordance with its contractual terms unless full payment of principal is not expected, in which case cash receipts, whether designated as principal or interest, are applied as a reduction of the carrying value of the loan. A nonaccrual loan is generally returned to accrual status when principal and interest payments are current, full collectibility of principal and interest is reasonably assured and a consistent record of performance has been demonstrated. The allowance for losses on loans represents management's best estimate of losses probable in the existing loan portfolio. The allowance for losses on loans is increased by the provision for losses on loans charged to expense and reduced by loans charged off, net of recoveries. Loans are charged off in the period deemed uncollectible. Recoveries of loans previously charged off are recorded when received. The provision for losses on loans is determined based on management's assessment of several factors: reviews and evaluations of specific loans, changes in the nature and volume of the loan portfolio, current economic conditions and the related impact on specific borrowers and industry groups, historical loan loss experience, the level of classified and nonperforming loans and the results of regulatory examinations. |
| 26 |
> NOTES TO CONSOLIDATED FINANCIAL STATEMENTS (continued) <
Southern Missouri Bancorp, Inc.
| Valuation allowances are established for impaired loans for the difference between the loan amount and fair value of collateral less estimated selling costs. Impairment losses are recognized through an increase in the allowance for loan losses. Loans are considered impaired if, based on current information and events, it is probable that the Company will be unable to collect the scheduled payments of principal or interest when due according to the contractual terms of the loan agreement. Loan fees and certain direct loan origination costs are deferred, and the net fee or cost is recognized as an adjustment to interest income using the interest method over the contractual life of the loans. Foreclosed Real Estate. Real estate acquired by foreclosure or by deed in lieu of foreclosure is initially recorded at the lower of cost or fair value less estimated selling costs. Costs for development and improvement of the property are capitalized. Valuations are periodically performed by management, and an allowance for losses is established by a charge to operations if the carrying value of a property exceeds its estimated fair value, less estimated selling costs. Loans to facilitate the sale of real estate acquired in foreclosure are discounted if made at less than market rates. Discounts are amortized over the fixed interest period of each loan using the interest method. Premises and Equipment. Premises and equipment are stated at cost less accumulated depreciation and include expenditures for major betterments and renewals. Maintenance, repairs, and minor renewals are expensed as incurred. When property is retired or sold, the retired asset and related accumulated depreciation are removed from the accounts and the resulting gain or loss taken into income. The Company reviews property and equipment for impairment whenever events or changes in circumstances indicate that the carrying amount of an asset may not be recoverable. If such assets are considered to be impaired, the impairment loss recognized is measured by the amount by which the carrying amount exceeds the fair value of the assets. Depreciation is computed by use of straight-line and accelerated methods over the estimated useful lives of the assets. Estimated lives are generally 20 to 40 years for premises, and five to seven years for equipment. Intangible Assets. The Bank adopted the provisions of Statement of Financial Accounting Standards (SFAS) No. 142, Goodwill and Other Intangible Assets, effective July 1, 2002. Intangible assets acquired through the purchase of branches were excluded from the scope of SFAS 142. In October 2002, the Financial Accounting Standards Board (FASB) issued SFAS No. 147, Acquisitions of Certain Financial Institutions. SFAS 147 clarified that the carrying amount of an unidentified intangible asset should continue to be amortized. The Bank's gross amount of this intangible asset at June 30, 2007 and 2006 was $3,837,416 and $3,837,416, respectively, with accumulated amortization of $1,744,256 and $1,488,998, respectively. The intangible asset is being amortized over 15 years with amortization expense over the next five years expected to be $255,258 per year. | Income Taxes. The Company and its subsidiary file consolidated income tax returns. Deferred assets and liabilities are recognized for the tax effects of differences between the financial reporting bases and income tax bases of the Company's assets and liabilities. Incentive Plans. The Company accounts for its management and recognition plan (MRP) in accordance with Statement of Financial Accounting Standards (SFAS) No. 123 (revised 2004), "Share-Based Payment". The aggregate purchase price of all shares owned by the incentive plan is reflected as a reduction of stockholder's equity. Compensation expense is based on the market price of the Company's stock on the date the shares are granted and is recorded over the vesting period. The difference between the aggregate purchase price and the fair value on the date the shares are considered earned is recorded as an adjustment to additional paid in capital. Outside Directors' Retirement. The Bank adopted a directors' retirement plan in April 1994 for outside directors. The directors' retirement plan provides that each non-employee director (participant) shall receive, upon termination of service on the Board on or after age 60, other than termination for cause, a benefit in equal annual installments over a five year period. The benefit will be based upon the product of the participant's vesting percentage and the total Board fees paid to the participant during the calendar year preceding termination of service on the Board. The vesting percentage shall be determined based upon the participant's years of service on the Board, whether before or after the reorganization date. In the event that the participant dies before collecting any or all of the benefits, the Bank shall pay the participant's beneficiary. No benefits shall be payable to anyone other than the beneficiary, and shall terminate on the death of the beneficiary. Stock Options. In December 2004, the Financial Accounting Standards Board (FASB) issued Statement of Financial Accounting Standards (SFAS) No. 123 (revised 2004), "Share-Based Payment," which requires the compensation costs related to share-based payment transactions to be recognized in financial statements. With limited exceptions, the amount of compensation cost is measured based on the grant-date fair value of the equity instruments issued. Compensation cost is recognized over the vesting period during which an employee provides service in exchange for the award. SFAS No. 123R was adopted during the first quarter of fiscal 2006 for the Company primarily due to the transition from a small business filer to a full filer; stock-based compensation has been recognized for all stock options granted or modified after July 1, 2005. In addition, stock options not vested on July 1, 2005, are being recognized in expense over the remaining vesting period. Because of the July 1, 2005, adoption of SFAS No. 123 R, the table on the following page only shows pro forma compensation expense for fiscal year 2005. In the table, net income and earnings per share are displayed as if the Company had applied the fair value recognition provisions of SFAS No. 123R. |
| 27 |
> NOTES TO CONSOLIDATED FINANCIAL STATEMENTS (continued) <
Southern Missouri Bancorp, Inc.
| June 30, 2005 | |||
| Net income as reported | $ 104,259 | ||
| Add: Stock-based employee compensation expense included in reported income, net of related tax effects | 207,008 | ||
| Deduct: Total stock-based employee compensation expense determined under fair-value-based method for all awards, | |||
| net of related tax effects | (243,469 | ) | |
| Pro forma net income | $ 67,798 | ||
| Earnings per share | |||
| Basic as reported | $ .05 | ||
| Basic pro forma | .03 | ||
| Diluted as reported | .05 | ||
| Diluted pro forma | .03 |
| Employee Stock Ownership Plan. The Company accounts for its employee stock ownership plan (ESOP) in accordance with American Institute of Certified Public Accountants (AICPA) Statement of Position 93-6. As of June 30, 2005, the ESOP shares were fully distributed and the Bank began purchasing additional shares under the ESOP plan. Earnings Per Share. Basic income per share is computed using the weighted-average number of common shares outstanding. Diluted income per share includes the effect of all dilutive potential common shares (primarily stock options) outstanding during each year. Treasury Stock. Treasury stock is stated at cost. Cost is determined by the first-in, first-out method. Reclassification.Certain amounts included in the 2006 and 2005 consolidated financial statements have been reclassified to conform to the 2007 presentation. These reclassifications had no effect on net income. The following paragraphs summarize the impact of new accounting pronouncements: In July 2006, the FASB issued Interpretation No. 48 (FIN 48), Accounting for Uncertainty in Income Taxes - an Interpretation of FASB Statement 109, which provides guidance on the measurement, recognition, and disclosure of tax positions taken or expected to be taken in a tax return. The Interpretation also provides guidance on derecognition, classification, interest and penalties, and disclosure. FIN 48 prescribes that a tax position should only be recognized if it is more-likely-than-not that the position will be sustained upon examination by the appropriate taxing authority. A tax position that meets this | threshold is measured as the largest amount of benefit that is greater than 50 percent likely of being realized upon ultimate settlement. The cumulative effect of applying the provisions of FIN 48 is to be reported as an adjustment to the beginning balance of retained earnings in the period of adoption. FIN 48 is effective for fiscal years beginning after December 15, 2006. The Company plans to adopt the statement on July 1, 2007, and believes the impact of the adoption of this statement on the financial results will be minimal. �� In September 2006, FASB issued SFAS No. 157, Fair Value Measurements, which provides enhanced guidance for using fair value to measure assets and liabilities. SFAS 157 establishes a common definition of fair value, provides a framework for measuring fair value under U.S. GAAP, and expands disclosure requirements about fair value measurements. SFAS 157 is effective for financial statements issued in fiscal years beginning after November 15, 2007, and interim periods within those fiscal years. We are currently evaluating the impact, if any, the adoption of SFAS 157 will have on our financial reporting and disclosures. In September 2006, FASB issued SFAS No. 158, Employers' Accounting for Defined Benefit Pension and Other Postretirement Plans – an amendment of FASB Statements No. 87, 88, 106, and 132(R). SFAS 158 requires an employer to recognize the overfunded or underfunded status of a defined benefit postretirement plan (other than a multiemployer plan) as an asset or liability in its statement of financial position and to recognize changes in the funded status in the year in which the changes occur through comprehensive income of a business entity or changes in unrestricted net assets of a not-for-profit organization. This statement also requires an employer to measure the funded status of a plan as of the date of its year-end statement of financial position, with limited exceptions. SFAS No. 158 became effective for and was adopted by our Company for the fiscal year ended June 30, 2007. The impact on our Company's financial statements at June 30, 2007, from the adoption of SFAS No. 158 is immaterial. |
| 28 |
> NOTES TO CONSOLIDATED FINANCIAL STATEMENTS (continued) <
Southern Missouri Bancorp, Inc.
| In September, 2006, the Securities and Exchange Commission issued Staff Accounting Bulletin No. 108, Considering the Effects of Prior year Misstatements when Quantifying Misstatements in Current Year Financial Statements. SAB 108 requires an entity to consider the effects of prior year misstatements when quantifying misstatements in current year financial statements for purposes of determining materiality. SAB 108 was effective for our Company beginning July 1, 2006. Adoption of SAB 108 has not resulted in a material impact on our Company's financial position or results of operations. In February 2007, FASB issued SFAS No. 159, The Fair Value Option for Financial Assets and Liabilities, which permits companies to choose to measure many financial instruments and certain other items at fair value. The objective of the new pronouncement is to improve financial reporting by providing companies with the opportunity to mitigate volatility in reported earnings caused by measuring assets and liabilities differently without having to apply complex hedge accounting provisions. SFAS 159 is effective for the Company beginning in fiscal 2008. The Company has not yet made a determination if it will elect to apply any of the options available in SFAS 159. In September 2006, the Emerging Issues Task Force Issue 06-4, Accounting for Deferred Compensation and Postretirement Benefit Aspects of Endorsement | Split-Dollar Life Insurance Arrangements, was ratified. This EITF Issue addresses accounting for separate agreements which split life insurance policy benefits between an employer and employee. The Issue requires the employer to recognize a liability for future benefits payable to the employee under these agreements. The effects of applying this Issue must be recognized through either a change in accounting principle through an adjustment to equity or through the retrospective application to all prior periods. The Issue is effective for the Company beginning in fiscal 2009. The Company is currently reviewing the impact the adoption of the Issue will have on the Company's financial results. Effective November 17, 2006, the FDIC implemented a one-time credit of $4.7 billion to eligible institutions. The purpose of the credit is to recognize contributions made by certain institutions to capitalize the Bank Insurance Fund and Savings Association Insurance Fund, which have now been merged into the Deposit Insurance Fund. The Bank is an eligible institution and has received notice from the FDIC that its share of the credit is $169,000. This amount is not reflected in the accompanying financial statements as it represents contingent future credits against future insurance assessment payments. As such, the timing and ultimate recoverability of the one-time credit may change. |
| 29 |
> NOTES TO CONSOLIDATED FINANCIAL STATEMENTS (continued) <
Southern Missouri Bancorp, Inc.
| NOTE 2: Securities The amortized cost, gross unrealized gains, gross unrealized losses and estimated fair value of securities available for sale consisted of the following: |
| June 30, 2007 | |||||||||||
| Amortized Cost | Gross Unrealized Gains | Gross Unrealized Losses | Estimated Fair Value | ||||||||
| Investment securities: | |||||||||||
| U.S. government and Federal agency obligations | $ 21,709,953 | $ - | $ (220,616 | ) | $ 21,489,337 | ||||||
| Obligations of states and political subdivisions | 2,015,783 | 24,276 | (24,550 | ) | 2,015,509 | ||||||
| Other securities | 661,025 | - | (5,000 | ) | 656,025 | ||||||
| TOTAL INVESTMENT SECURITIES | 24,386,761 | 24,276 | (250,166 | ) | 24,160,871 | ||||||
| Mortgage-backed securities: | |||||||||||
| FHLMC certificates | 1,229,108 | 210 | (46,939 | ) | 1,182,379 | ||||||
| GNMA certificates | 155,726 | 722 | (104 | ) | 156,344 | ||||||
| FNMA certificates | 4,386,823 | 2,913 | (176,449 | ) | 4,213,287 | ||||||
| CMOs issued by government agencies | 5,278,853 | - | (108,146 | ) | 5,170,707 | ||||||
| TOTAL MORTGAGE-BACKED SECURITIES | 11,050,510 | 3,845 | (331,638 | ) | 10,722,717 | ||||||
| TOTAL | $ 35,437,271 | $ 28,121 | $ (581,804 | ) | $ 34,883,588 | ||||||
| June 30, 2006 | |||||||||||
| Amortized Cost | Gross Unrealized Gains | Gross Unrealized Losses | Estimated Fair Value | ||||||||
| Investment securities: | |||||||||||
| U.S. government and Federal agency obligations | $ 20,672,506 | $ - | $ (508,951 | ) | $ 20,163,555 | ||||||
| Obligations of states and political subdivisions | 851,758 | 10,635 | (12,371 | ) | 850,022 | ||||||
| FNMA preferred stock | 1,000,000 | - | - | 1,000,000 | |||||||
| Other securities | 1,950,000 | - | (2,344 | ) | 1,947,656 | ||||||
| TOTAL INVESTMENT SECURITIES | 24,474,264 | 10,635 | (523,666 | ) | 23,961,233 | ||||||
| Mortgage-backed securities: | |||||||||||
| FHLMC certificates | 1,853,852 | 580 | (83,299 | ) | 1,771,133 | ||||||
| GNMA certificates | 193,545 | - | (1,385 | ) | 192,160 | ||||||
| FNMA certificates | 5,624,398 | 920 | (290,070 | ) | 5,335,248 | ||||||
| CMOs issued by government agencies | 7,351,232 | - | (209,498 | ) | 7,141,734 | ||||||
| TOTAL MORTGAGE-BACKED SECURITIES | 15,023,027 | 1,500 | (584,252 | ) | 14,440,275 | ||||||
| TOTAL | $ 39,497,291 | $ 12,135 | $ (1,107,918 | ) | $ 38,401,508 | ||||||
| 30 |
> NOTES TO CONSOLIDATED FINANCIAL STATEMENTS (continued) <
Southern Missouri Bancorp, Inc.
| The amortized cost and estimated fair value of investment and mortgage-backed securities, by contractual maturity, are shown below. Expected maturities will differ from contractual maturities because borrowers may have the right to call or prepay obligations with or without call or prepayment penalties. |
| June 30, 2007 | ||||||
| Available for Sale | Amortized Cost | Estimated Fair Value | ||||
| Within one year | $ 9,490,386 | $ 9,424,582 | ||||
| After one but less than five years | 11,993,329 | 11,852,114 | ||||
| After five but less than 10 years | 998,626 | 983,226 | ||||
| After 10 years | 1,904,420 | 1,900,949 | ||||
| Total investment securities | 24,386,761 | 24,160,871 | ||||
| Mortgage-backed securities | 11,050,510 | 10,722,717 | ||||
| TOTAL | $ 35,437,271 | $ 34,883,588 | ||||
| The carrying value of investment and mortgage-backed securities pledged as collateral to secure public deposits and securities sold under agreements to repurchase amounted to $33,455,667 and $28,395,994 at June 30, 2007 and 2006, respectively. Certain investments in debt and marketable equity securities are reported in the financial statements at an amount less than their historical cost. Total fair | value of these investments at June 30, 2007 was $33 million, which is approximately 94.9% of the Bank's available for sale investment portfolio, as compared to $35 million or approximately 91.1% of the Bank's available for sale investment portfolio at June 30, 2006. These declines primarily resulted from recent increases in market interest rates. |
| Based on evaluation of available evidence, including recent changes in market interest rates, credit rating information and information obtained from regulatory filings, management believes the declines in fair value for these securities are temporary. Should the impairment of any of these securities become other than temporary, the cost basis of the investment will be reduced and the resulting | loss recognized in net income in the period the other-than-temporary impairment is identified. The following tables show our investments' gross unrealized losses and fair value, aggregated by investment category and length of time that individual securities have been in a continuous unrealized loss position at June 30, 2007 and 2006. |
| Less than 12 months | 12 months or more | Total | |||||||||||||||
| Description of Securities | Fair Value | Unrealized Losses | Fair Value | Unrealized Losses | Fair Value | Unrealized Losses | |||||||||||
| For the year ended June 30, 2007 | |||||||||||||||||
| U.S. Treasury | $ - | $ - | $ 500,938 | $ 890 | $ 500,938 | $ 890 | |||||||||||
| U.S. government agencies | 2,949,308 | 27,978 | 18,039,092 | 191,748 | 20,988,400 | 219,726 | |||||||||||
| Mortgage-backed securities | 2,125,963 | 27,702 | 7,760,000 | 303,936 | 9,885,963 | 331,638 | |||||||||||
| Other securities | 1,483,269 | 21,152 | 253,913 | 8,398 | 1,737,182 | 29,550 | |||||||||||
| Total temporarily impaired securities | $ 6,558,540 | $ 76,832 | $ 26,553,943 | $ 504,972 | $ 33,112,483 | $ 581,804 | |||||||||||
| 31 |
> NOTES TO CONSOLIDATED FINANCIAL STATEMENTS (continued) <
Southern Missouri Bancorp, Inc.
| Less than 12 months | 12 months or more | Total | |||||||||||||||
| Description of Securities | Fair Value | Unrealized Losses | Fair Value | Unrealized Losses | Fair Value | Unrealized Losses | |||||||||||
| For the year ended June 30, 2006 | |||||||||||||||||
| U.S. Treasury | $ - | $ - | $ 504,532 | $ 12,119 | $ 504,532 | $ 12,119 | |||||||||||
| U.S. government agencies | 7,776,078 | 165,814 | 11,882,946 | 331,018 | 19,659,024 | 496,832 | |||||||||||
| Mortgage-backed securities | 2,434,689 | 39,379 | 11,296,394 | 544,873 | 13,731,083 | 584,252 | |||||||||||
| Other securities | 497,656 | 2,344 | 591,007 | 12,371 | 1,088,663 | 14,715 | |||||||||||
| Total temporarily impaired securities | $ 10,708,423 | $ 207,537 | $ 24,274,879 | $ 900,381 | $ 34,983,302 | $ 1,107,918 | |||||||||||
| NOTE 3: Loans Loans are summarized as follows: |
| June 30, | ||||||
| 2007 | 2006 | |||||
| Real estate loans: | ||||||
| Conventional | $ 135,287,992 | $ 127,205,201 | ||||
| Construction | 7,981,390 | 10,868,078 | ||||
| Commercial | 77,723,332 | 65,373,576 | ||||
| Consumer loans | 19,416,309 | 20,105,818 | ||||
| Commercial | 76,053,308 | 65,108,884 | ||||
| 316,462,331 | 288,661,557 | |||||
| Loans in process | (1,913,191 | ) | (5,737,933 | ) | ||
| Deferred loan fees, net | 51,486 | 65,511 | ||||
| Allowance for loan losses | (2,537,659 | ) | (2,058,144 | ) | ||
| TOTAL | $ 312,062,967 | $ 280,930,991 | ||||
| Adjustable rate loans included in the loan portfolio amounted to $113,874,188 and $126,484,100 at June 30, 2007 and 2006, respectively. One- to four-family residential real estate loans amounted to $129,920,634 and $126,349,770 at June 30, 2007 and 2006, respectively. | Real estate construction loans are secured principally by single and multi-family dwelling units. Commercial real estate loans are secured principally by commercial buildings, motels, medical centers, churches, restaurants and farmland. |
| 32 |
> NOTES TO CONSOLIDATED FINANCIAL STATEMENTS (continued) <
Southern Missouri Bancorp, Inc.
| Following is a summary of activity in the allowance for loan losses: |
| June 30, | |||||||||
| 2007 | 2006 | 2005 | |||||||
| Balance, beginning of period | $ 2,058,144 | $ 2,016,514 | $ 1,978,491 | ||||||
| Loans charged-off | (162,719 | ) | (577,938 | ) | (4,821,112 | ) | |||
| Recoveries of loans previously charged-off | 37,234 | 64,568 | 44,135 | ||||||
| Net charge-offs | (125,485 | ) | (513,370 | ) | (4,776,977 | ) | |||
| Provision charged to expense | 605,000 | 555,000 | 4,815,000 | ||||||
| Balance, end of period | $ 2,537,659 | $ 2,058,144 | $ 2,016,514 | ||||||
| Total loans past due 90 days or more and still accruing interest amounted to $24,000 and $2,000 at June 30, 2007 and 2006, respectively. The Company had ceased recognition of interest income on loans with a book value of $2,000 and $51,000, at June 30, 2007 and 2006, respectively. The average balance of nonaccrual loans for the years ended June 30, 2007 and 2006 was $47,000 and $272,000, respectively. Allowance for losses on nonaccrual loans amounted to $0 and $0, at June 30, 2007 and 2006. Interest income recognized on these loans for the years ended June 30, 2007 and 2006, was considered nominal. Gross interest income would have been nominal for the years ended June 30, 2007 and 2006, if the interest payments had been received in accordance with the original terms. The Company is not committed to lend additional funds to customers whose loans have been placed on nonaccrual status. Of the above nonaccrual loans at June 30, 2007 and 2006, none were considered to be impaired. There were no impaired loans during the years ended June 30, 2007 and 2006. |
| Following is a summary of loans to directors, executive officers and loans to corporations in which executive officers and directors have a substantial interest: | ||
| Balance, June 30, 2006 | $ 6,868,342 | |
| Additions | 1,388,216 | |
| Repayments | (212,835 | ) |
| Balance, June 30, 2007 | $ 8,043,723 | |
These loans were made on substantially the same terms as those prevailing at the time for comparable transactions with unaffiliated persons. | ||
| 33 |
> NOTES TO CONSOLIDATED FINANCIAL STATEMENTS (continued) <
Southern Missouri Bancorp, Inc.
| NOTE 4: Premises and Equipment Following is a summary of premises and equipment: |
| June 30, | ||||||
| 2007 | 2006 | |||||
| Land | $ 3,418,074 | $ 3,328,783 | ||||
| Buildings and improvements | 5,884,266 | 5,857,147 | ||||
| Furniture, fixtures and equipment | 4,567,267 | 4,274,139 | ||||
| Automobiles | 32,376 | 48,376 | ||||
| 13,901,983 | 13,508,445 | |||||
| Less accumulated depreciation | (5,251,310 | ) | (4,577,267 | ) | ||
| TOTAL | $ 8,650,673 | $ 8,931,178 | ||||
| 34 |
> NOTES TO CONSOLIDATED FINANCIAL STATEMENTS (continued) <
Southern Missouri Bancorp, Inc.
| NOTE 5: Deposits Deposits are summarized as follows: |
| June 30, | ||||||
| 2007 | 2006 | |||||
| Noninterest-bearing accounts | $ 22,275,977 | $ 18,710,087 | ||||
| NOW accounts | 31,122,878 | 31,037,038 | ||||
| Money market deposit accounts | 7,211,517 | 8,907,715 | ||||
| Savings accounts | 78,908,351 | 73,824,996 | ||||
| TOTAL TRANSACTION ACCOUNTS | $139,518,723 | $132,479,836 | ||||
| Certificates: | ||||||
| 0.00 - 0.99% | $ - | $ - | ||||
| 1.00 - 1.99% | - | - | ||||
| 2.00 - 2.99% | 1,086,670 | 9,474,913 | ||||
| 3.00 - 3.99% | 6,557,958 | 56,044,666 | ||||
| 4.00 - 4.99% | 27,805,696 | 49,634,850 | ||||
| 5.00 - 5.99% | 95,119,049 | 10,434,754 | ||||
| 6.00 - 6.99% | - | - | ||||
| Total certificates, 4.94% | ||||||
| and 4.06%, respectively | 130,569,373 | 125,589,183 | ||||
| TOTAL DEPOSITS | $ 270,088,096 | $ 258,069,019 | ||||
| The aggregate amount of certificates of deposit with a minimum denomination of $100,000 was $41,448,245 and $47,509,029 at June 30, 2007 and 2006, respectively. | ||||||
| Certificate maturities at June 30, 2007 are summarized as follows: | ||||||
| July 1, 2007 to June 30, 2008 | $ 117,082,454 | |||||
| July 1, 2008 to June 30, 2009 | 4,989,240 | |||||
| July 1, 2009 to June 30, 2010 | 3,903,426 | |||||
| July 1, 2010 to June 30, 2011 | 1,803,393 | |||||
| July 1, 2011 to June 30, 2012 | 2,790,860 | |||||
| Thereafter | - | |||||
| TOTAL | $ 130,569,373 | |||||
| 35 |
> NOTES TO CONSOLIDATED FINANCIAL STATEMENTS (continued) <
Southern Missouri Bancorp, Inc.
| NOTE 6: Securities Sold Under Agreements to Repurchase Securities sold under agreements to repurchase, which are classified as borrowings, generally mature within one to four days. The following table presents balance and interest rate information on the securities sold under agreements to repurchase. The market value of the securities underlying the agreements at June 30, 2007 and 2006, was $18,307,912 and $12,469,129, respectively. The securities sold under agreements to repurchase are under the Company's control. |
| June 30, | ||||||
| 2007 | 2006 | |||||
| Year-end balance | $ 17,758,364 | $ 11,295,611 | ||||
| Average balance during the year | 11,862,732 | 10,420,045 | ||||
| Maximum month-end balance during the year | 17,758,364 | 12,588,949 | ||||
| Average interest during the year | 4.84 | % | 3.84 | % | ||
| Year-end interest rate | 4.90 | % | 4.69 | % | ||
| NOTE 7: Advances from Federal Home Loan Bank Advances from Federal Home Loan Bank are summarized as follows: |
| Call Date or Quarterly | Interest | June 30 | ||||||||||
| Maturity | Thereafter | Rate | 2007 | 2006 | ||||||||
| Overnight borrowings and short-term | ||||||||||||
| repurchase agreements | - | 5.48 | % | $ 7,000,000 | $ 0 | |||||||
| 12-18-06 | - | 3.05 | % | - | 2,000,000 | |||||||
| 01-08-07 | - | 2.69 | % | - | 2,000,000 | |||||||
| 06-11-07 | - | 4.96 | % | - | 1,000,000 | |||||||
| 06-19-07 | - | 4.69 | % | - | 1,000,000 | |||||||
| 08-30-07 | - | 3.96 | % | 1,000,000 | 1,000,000 | |||||||
| 10-17-07 | - | 4.91 | % | 2,000,000 | 2,000,000 | |||||||
| 02-06-08 | 08-06-03 | 5.24 | % | - | 3,000,000 | |||||||
| 10-26-09 | 09-01-03 | 5.58 | % | 10,000,000 | 10,000,000 | |||||||
| 01-20-10 | 07-20-03 | 5.85 | % | 5,000,000 | 5,000,000 | |||||||
| 10-27-10 | 10-27-03 | 5.94 | % | 9,000,000 | 9,000,000 | |||||||
| 12-09-10 | 12-09-05 | 6.01 | % | 10,000,000 | 10,000,000 | |||||||
| 11-29-16 | 11-29-07 | 3.93 | % | 5,000,000 | - | |||||||
| 11-29-16 | 11-29-11 | 4.42 | % | 5,000,000 | - | |||||||
| TOTAL | $ 54,000,000 | $ 46,000,000 | ||||||||||
| Weighted-average rate | 5.42 | % | 5.41 | % | ||||||||
| In addition to the above advances, the Bank had an available line of credit amounting to $42,384,625 and $51,211,125, with FHLB at June 30, 2007 and 2006, respectively. Advances from FHLB of Des Moines are secured by FHLB stock and one- to four-family mortgage loans of $64,800,000 and $55,200,000 at June 30, 2007 and 2006, respectively. The principal maturities of FHLB advances at June 30, 2007, are at right: |
| FHLB Advance Maturities | |
| July 1, 2007 to June 30, 2008 | $ 10,000,000 |
| July 1, 2008 to June 30, 2009 | - |
| July 1, 2009 to June 30, 2010 | 15,000,000 |
| July 1, 2010 to June 30, 2011 | 19,000,000 |
| July 1, 2011 to June 30, 2012 | - |
| July 1, 2012 and thereafter | 10,000,000 |
| TOTAL | $ 54,000,000 |
| 36 |
> NOTES TO CONSOLIDATED FINANCIAL STATEMENTS (continued) <
Southern Missouri Bancorp, Inc.
| NOTE 8: Subordinated Debt Southern Missouri Statutory Trust I issued $7.0 million of Floating Rate Capital Securities (the "Trust Preferred Securities") with a liquidation value of $1,000 per share in March 2004. The securities are due in 30 years, redeemable after five years and bear interest at a floating rate based on LIBOR. At June 30, 2007, the current rate was 8.11%. The securities represent undivided beneficial interests in the trust, which was established by Southern Missouri for the purpose of issuing the securities. The Trust Preferred Securities were sold in a private transaction exempt from registration under the Securities Act of 1933, | as amended (the "Act") and have not been registered under the Act. The securities may not be offered or sold in the United States absent registration or an applicable exemption from registration requirements. Southern Missouri Statutory Trust I used the proceeds from the sale of the Trust Preferred Securities to purchase Junior Subordinated Debentures of Southern Missouri Bancorp. Southern Missouri Bancorp, Inc. used its net proceeds for working capital and investment in its subsidiaries. |
| NOTE 9: Employee Benefits 401(k). The Bank has a 401(k) profit sharing plan that covers substantially all eligible employees. Contributions to the plan are at the discretion of the Board of Directors of the Bank. During 2007, 2006, and 2005, there were no contributions made to the plan. Employee Stock Ownership Plan (ESOP). The Bank established a tax-qualified ESOP in April 1994. The plan covers substantially all employees who have attained the age of 21 and completed one year of service. Benefits are vested over five years. Forfeitures are allocated on the same basis as other contributions. Benefits are payable upon a participant's retirement, death, disability or separation of service. The Bank makes discretionary contributions to the ESOP. The ESOP expense for 2007, 2006, and 2005 was $190,000, $180,000, and $191,777, respectively. The number of ESOP shares at June 30, 2007 and 2006 were as follows: | ||||
| 2007 | 2006 | |||
| Allocated shares | 160,270 | 139,131 | ||
| Unreleased shares | - | - | ||
| TOTAL ESOP SHARES | 160,270 | 139,131 | ||
| Management Recognition Plan (MRP). The Bank adopted an MRP for the benefit of non-employee directors and two MRPs for officers and key employees (who may also be directors) in April 1994. During 2004, the Bank granted 5,000 MRP shares to employees. During 2007, an additional 1,000 shares were granted. The shares granted are in the form of restricted stock payable at the rate of 20% of such shares per year. During 2007, 900 MRP shares vested, which had been awarded in 2004 and 2007. Compensation expense, in the amount of the fair market value of the common stock at the date of grant, will be recognized pro-rata over the five years during which the shares are payable. | ||||
| The Board of Directors can terminate the MRPs at any time, and if it does so, any shares not allocated will revert to the Company. The MRP expense for 2007, 2006, and 2005, was $13,147, $10,890, and $15,231, respectively. Stock Option Plan. The Company adopted a stock option plan in April 1994. The purpose of the plan was to provide additional incentive to certain directors, officers and key employees of the Bank. In October 1999, the stockholders voted to increase the number of shares reserved for options by 67,932 shares. The stock options were granted at the fair market value of the common stock on the date of the grant. Through June 30, 1999, all options granted were 100% vested at the grant date. For shares granted after June 30, 1999, the vesting period ranged from the grant date up to a five year period. All options expire ten years from the date of the grant. The 1994 stock option plan expired in April 2004. In October 2003, a new stock option and incentive plan was adopted ("2003 Plan"). Under the 2003 Plan, the Company has granted 72,500 options to employees and directors. In December, 2004, the Financial Accounting Standards Board issued Statement of Financial Accounting Standards (SFAS) No. 123R, "Share-Based Payment" (SFAS 123R). SFAS 123R requires companies to recognize the cost of employee services received in exchange for awards of equity instruments, such as stock options and restricted stock, based on the fair value of those awards at the date of grant, and eliminates the choice to account for employee stock options under Accounting Principles Board Opinion No. 25, "Accounting for Stock Issued to Employees" (APB 25), which is how the Company previously accounted for its stock options. The Company adopted SFAS 123R effective July 1, 2005. As a result of adopting SFAS 123R, incremental stock-based compensation expense recognized during fiscal 2006 was $53,106. As of June 30, 2007, there was $107,000 in remaining unrecognized compensation expense related to nonvested stock options, which will be recognized over the remaining weighted average vesting period. The aggregate intrinsic value of stock options outstanding at June 30, 2007, was $764,000. The aggregate intrinsic value of stock options exercisable at June 30, 2007, was $761,000. |
| 37 |
> NOTES TO CONSOLIDATED FINANCIAL STATEMENTS (continued) <
Southern Missouri Bancorp, Inc.
Changes in options outstanding were as follows:
| Year Ended June 30 | ||||||||||||||||||
| 2007 | 2006 | 2005 | ||||||||||||||||
| Weighted Average Price | Number | Weighted Average Price | Number | Weighted Average Price | Number | |||||||||||||
| Outstanding at beginning of year | $ 10.64 | 180,500 | $ 10.70 | 188,515 | $ 10.24 | 186,972 | ||||||||||||
| Granted | - | - | 14.26 | 5,000 | 15.30 | 15,000 | ||||||||||||
| Exercised | 6.50 | 4,000 | 6.50 | (3,515 | ) | 6.97 | (9,457 | ) | ||||||||||
| Forfeited | - | - | 15.23 | (9,500 | ) | 15.23 | (4,000 | ) | ||||||||||
| Outstanding at year-end | $ 10.73 | 176,500 | $ 10.64 | 180,500 | $ 10.70 | 188,515 | ||||||||||||
| Options exercisable at year-end | $ 9.75 | 144,100 | $ 9.10 | 134,400 | $ 8.37 | 123,915 | ||||||||||||
| The following is a summary of the assumptions used in the Black-Scholes pricing model in determining the fair values of options granted during fiscal years 2007, 2006, and 2005 (no options were granted in fiscal 2007): |
| 2007 | 2006 | 2005 | |||||||
| Assumptions: | |||||||||
| Expected dividend yield | - | 2.52 | % | 2.35 | % | ||||
| Expected volatility | - | 18.89 | % | 18.74 | % | ||||
| Risk-free interest rate | - | 3.98 | % | 3.31 | % | ||||
| Weighted-average expected life | - | 5 years | 5 years | ||||||
| Weighted-average fair value of options granted during the year | - | $ 3.43 | $ 3.55 |
| The following table summarizes information about stock options under the plan outstanding at June 30, 2007: |
| Options Outstanding | Options Exercisable | ||||||||||||||
| Exercise Price | Number Outstanding | Weighted Average Remaining Contractual Life | Weighted Average Exercise Price | Number Exercisable | Weighted Average Exercise Price | ||||||||||
| $ 6.5000 | 14,000 | 34.5 mo. | $ 6.5000 | 14,000 | $ 6.5000 | ||||||||||
| 6.7500 | 60,000 | 26.0 mo. | 6.7500 | 60,000 | 6.7500 | ||||||||||
| 9.9375 | 30,000 | 7.1 mo. | 9.9375 | 30,000 | 9.9375 | ||||||||||
| 15.2300 | 52,500 | 82.7 mo. | 15.2300 | 33,100 | 15.2300 | ||||||||||
| 15.3000 | 15,000 | 87.7 mo. | 15.3000 | 6,000 | 15.3000 | ||||||||||
| 14.2600 | 5,000 | 98.5 mo. | 14.2600 | 1,000 | 14.2600 | ||||||||||
| 38 |
> NOTES TO CONSOLIDATED FINANCIAL STATEMENTS (continued) <
Southern Missouri Bancorp, Inc.
| NOTE 10: Income Taxes The components of net deferred tax assets (liabilities) are summarized as follows: |
| 2007 | 2006 | ||||||||
| Deferred tax assets: | |||||||||
| Provision for losses on loans | $ 900,049 | $ 792,385 | |||||||
| Unrealized loss of available for sale securities | 204,851 | 405,429 | |||||||
| Accrued compensation and benefits | 154,965 | 140,185 | |||||||
| Other | 65,698 | 56,810 | |||||||
| Total deferred tax assets | 1,325,563 | 1,394,809 | |||||||
| Deferred tax liabilities: | |||||||||
| FHLB stock dividends | 188,612 | 188,612 | |||||||
| Purchase accounting adjustments | 63,694 | 60,175 | |||||||
| Depreciation | 284,405 | 319,593 | |||||||
| Total deferred tax liabilities | 536,711 | 568,380 | |||||||
| NET DEFERRED TAX ASSET | $ 788,852 | $ 826,429 | |||||||
| A reconciliation of income tax expense at the statutory rate to the Company's actual income tax expense is shown below: |
| Year Ended June 30 | |||||||||
| 2007 | 2006 | 2005 | |||||||
| Tax at statutory Federal rate | $ 1,384,776 | $ 1,414,675 | $ 7,602 | ||||||
| Increase (reduction) in taxes resulting from: | |||||||||
| Nontaxable municipal income | (31,983 | ) | (17,879 | ) | (20,695 | ) | |||
| State tax, net of Federal benefit | 52,006 | 106,194 | (12,138 | ) | |||||
| Nondeductible ESOP expenses | - | - | 45,097 | ||||||
| Cash surrender value of bank owned life insurance | (89,491 | ) | (84,863 | ) | (76,599 | ) | |||
| Other, net | (170,850 | ) | (41,482 | ) | (25,167 | ) | |||
| ACTUAL PROVISION | $ 1,144,458 | $ 1,376,645 | $ (81,900 | ) | |||||
| 39 |
> NOTES TO CONSOLIDATED FINANCIAL STATEMENTS (continued) <
Southern Missouri Bancorp, Inc.
| NOTE 11: Other Comprehensive Income (Loss) Other comprehensive income (loss) components are as follows: |
| Year Ended June 30 | |||||||||
| 2007 | 2006 | 2005 | |||||||
| Unrealized gains (losses) on available for sale securities: | |||||||||
| Unrealized holding gains (losses) arising during period | $ 542,101 | $ (820,968 | ) | $ 454,748 | |||||
| Less: reclassification adjustments for (gains) losses realized in net income | - | - | (351,508 | ) | |||||
| Total unrealized gains (losses) on securities | 542,101 | (820,968 | ) | 103,240 | |||||
| Income tax (expense) benefit | (200,578 | ) | 303,758 | (38,199 | ) | ||||
| Other comprehensive income (loss) | $ 341,523 | $ (517,210 | ) | $ 65,041 | |||||
| 40 |
> NOTES TO CONSOLIDATED FINANCIAL STATEMENTS (continued) <
Southern Missouri Bancorp, Inc.
| NOTE 12: Stockholders' Equity and Regulatory Capital The Bank is subject to various regulatory capital requirements administered by the Federal banking agencies. Failure to meet minimum capital requirements can result in certain mandatory – and possibly additional discretionary – actions by regulators that, if undertaken, could have a direct material effect on the Company's financial statements. Under capital adequacy guidelines and the regulatory framework for prompt corrective action, the Bank must meet specific capital guidelines that involve quantitative measures of the Bank's assets, liabilities, and certain off-balance-sheet items as calculated under regulatory accounting practices. The Bank's capital amounts and classification are also subject to qualitative judgments by the regulators about components, risk weightings, and other factors. Quantitative measures established by regulation to ensure capital adequacy require the Bank to maintain minimum amounts and ratios (set forth in the table below) of total capital and Tier I capital (as defined in the regulations) to | risk-weighted assets (as defined) and of Tier I capital (as defined) to average total assets (as defined). Management believes, as of June 30, 2007, that the Bank meets all capital adequacy requirements to which it is subject. As of June 30, 2007, the most recent notification from the Federal Deposit Insurance Corporation categorized the Bank as well capitalized under the regulatory framework for prompt corrective action. To be categorized as well capitalized the Bank must maintain minimum total risk-based, Tier I risk-based, and Tier I leverage ratios as set forth in the table. There are no conditions or events since that notification that management believes have changed the Bank's category. The Company's only significant activity is ownership of the Bank, and, therefore, its capital, capital ratios, and minimum required levels of capital are materially the same as the Bank's. The following table summarizes the Bank's actual and required regulatory capital: |
| (dollars in thousands) | Actual | For Capital Adequacy Purposes | To Be Well Capitalized Under Prompt Corrective Action Provisions | |||||||||||||||
| As of June 30, 2007 | Amount | Ratio | Amount | Ratio | Amount | Ratio | ||||||||||||
| Total Capital (to Risk-Weighted Assets) | $ 32,420 | 11.81 | % | $ 21,954 | >8.00 | % | $ 27,443 | >10.00 | % | |||||||||
| Tier I Capital (to Risk-Weighted Assets) | 29,882 | 10.89 | % | 10,977 | >4.00 | % | 16,466 | >6.00 | % | |||||||||
| Tier I Capital (to Average Assets) | 29,882 | 8.10 | % | 14,756 | >4.00 | % | 18,445 | >5.00 | % | |||||||||
| As of June 30, 2006 | ||||||||||||||||||
| Total Capital (to Risk-Weighted Assets) | $ 29,372 | 11.73 | % | $ 20,035 | >8.00 | % | $ 25,044 | >10.00 | % | |||||||||
| Tier I Capital (to Risk-Weighted Assets) | 27,314 | 10.91 | % | 10,018 | >4.00 | % | 15,026 | >6.00 | % | |||||||||
| Tier I Capital (to Average Assets) | 27,314 | 7.92 | % | 13,794 | >4.00 | % | 17,242 | >5.00 | % | |||||||||
The Bank's ability to pay dividends on its common stock to the Company is restricted to maintain adequate capital as shown in the table above.
| 41 |
> NOTES TO CONSOLIDATED FINANCIAL STATEMENTS (continued) <
Southern Missouri Bancorp, Inc.
| NOTE 13: Commitments and Credit Risk Standby Letters of Credit. In the normal course of business, the Bank issues various financial standby, performance standby and commercial letters of credit for its customers. As consideration for the letters of credit, the institution charges letter of credit fees based on the face amount of the letters and the creditworthiness of the counterparties. These letters of credit are stand-alone agreements, and are unrelated to any obligation the depositor has to the Bank. Standby letters of credit are irrevocable conditional commitments issued by the Bank to guarantee the performance of a customer to a third party. Financial standby letters of credit are primarily issued to support public and private borrowing arrangements, including commercial paper, bond financing and similar transactions. Performance standby letters of credit are issued to guarantee performance of certain customers under non-financial contractual obligations. The credit risk involved in issuing standby letters of credit is essentially the same as that involved in extending loans to customers. The Bank had total outstanding standby letters of credit amounting to $696,000 and $1,270,000 at June 30, 2007 and 2006, respectively, with terms ranging from 12 to 24 months. At June 30, 2007, the Bank's deferred revenue under standby letters of credit agreements was nominal. Off-balance-sheet and Credit Risk. The Company's Consolidated Financial Statements do not reflect various financial instruments to extend credit to meet the financing needs of its customers. These financial instruments include commitments to extend credit. These instruments involve, to varying degrees, elements of credit and interest-rate risk in excess of the amount recognized in the statements of financial condition. Lines of credit are agreements to lend to a customer as long as there | is no violation of any condition established in the contract. Lines of credit generally have fixed expiration dates. Since a portion of the line may expire without being drawn upon, the total unused lines do not necessarily represent future cash requirements. Each customer's creditworthiness is evaluated on a case-by-case basis. The amount of collateral obtained, if deemed necessary, is based on management's credit evaluation of the counterparty. Collateral held varies but may include accounts receivable, inventory, property, plant and equipment, commercial real estate and residential real estate. Management uses the same credit policies in granting lines of credit as it does for on-balance-sheet instruments. The Company had $36.0 million in commitments to extend credit at June 30, 2007, and $39.3million at June 30, 2006. At June 30, 2007, total commitments to originate fixed-rate loans with terms in excess of one year were $2.9 million at interest rates ranging from 6.875% to 8.75%. Commitments to extend credit and standby letters of credit include exposure to some credit loss in the event of nonperformance of the customer. The Company's policies for credit commitments and financial guarantees are the same as those for extension of credit that are recorded in the statements of financial condition. The commitments extend over varying periods of time with the majority being disbursed within a thirty-day period. The Company grants collateralized commercial, real estate, and consumer loans to customers in Southeast Missouri. Although the Company has a diversified portfolio, loans aggregating $135,288,000 at June 30, 2007, are secured by single and multi-family residential real estate in the Company's primary lending area. |
| 42 |
> NOTES TO CONSOLIDATED FINANCIAL STATEMENTS (continued) <
Southern Missouri Bancorp, Inc.
| NOTE 14: Earnings Per Share The following table sets forth the computations of basic and diluted earnings per common share: |
| Year Ended June 30 | |||||||||
| 2007 | 2006 | 2005 | |||||||
| Net income | $ 2,928,413 | $ 2,784,166 | $ 104,259 | ||||||
| Denominator for basic earnings per share - | |||||||||
| Weighted-average shares outstanding | 2,225,658 | 2,224,409 | 2,225,493 | ||||||
| Effect of dilutive securities Stock options | 38,578 | 27,852 | 64,255 | ||||||
| Denominator for diluted earnings per share | 2,264,236 | 2,252,261 | 2,289,748 | ||||||
| Basic earnings per common share | $ 1.32 | $ 1.25 | $ .05 | ||||||
| Diluted earnings per common share | $ 1.29 | $ 1.24 | $ .05 | ||||||
| 43 |
> NOTES TO CONSOLIDATED FINANCIAL STATEMENTS (continued) <
Southern Missouri Bancorp, Inc.
| NOTE 15: Disclosures About Fair Value of Financial Instruments The following table presents estimated fair values of the Company's financial instruments. The fair values of certain of these instruments were calculated by discounting expected cash flows, which involves significant judgments by management and uncertainties. Fair value is the estimated amount at which financial assets or liabilities could be exchanged in a current transaction between willing parties, other than in a forced or liquidation sale. | Because no market exists for certain of these financial instruments and because management does not intend to sell these financial instruments, the Company does not know whether the fair values shown below represent values at which the respective financial instruments could be sold individually or in the aggregate. |
| 2007 | 2006 | |||||||||||
| Carrying Amount | Fair Value | Carrying Amount | Fair Value | |||||||||
| (in thousands) | (in thousands) | |||||||||||
| Financial Assets | ||||||||||||
| Cash and cash equivalents | $ 7,331 | $ 7,331 | $ 6,367 | $ 6,367 | ||||||||
| Investment and mortgage- backed securities available for sale | 34,884 | 34,884 | 38,402 | 38,402 | ||||||||
| Stock in FHLB | 3,071 | 3,071 | 2,641 | 2,641 | ||||||||
| Loans receivable, net | 312,063 | 311,240 | 280,931 | 280,784 | ||||||||
| Bank owned life insurance | 6,999 | 6,999 | 6,735 | 6,735 | ||||||||
| Accrued interest receivable | 2,248 | 2,248 | 1,955 | 1,955 | ||||||||
| Financial Liabilities | ||||||||||||
| Deposits | 270,088 | 268,236 | 258,069 | 256,772 | ||||||||
| Securities sold under agreements to repurchase | 17,758 | 17,758 | 11,296 | 11,296 | ||||||||
| Advances from FHLB | 54,000 | 54,366 | 46,000 | 46,499 | ||||||||
| Subordinated Debt | 7,217 | 7,217 | 7,217 | 7,217 | ||||||||
| Accrued interest payable | 1,406 | 1,406 | 744 | 744 | ||||||||
| Unrecognized financial instruments (net of contract amount) | ||||||||||||
| Letters of Credit | - | - | - | - | ||||||||
| Lines of Credit | - | - | - | - | ||||||||
| The following methods and assumptions were used in estimating the fair values of financial instruments: Cash and cash equivalents are valued at their carrying amounts which approximates fair value. Fair values of investment and mortgage-backed securities are based on quoted market prices or, if unavailable, quoted market prices of similar securities. Stock in FHLB is valued at cost which approximates fair value. Fair value of loans is estimated by discounting the future cash flows using the current rates at which similar loans would be made to borrowers with similar credit ratings and for the same remaining maturities. Loans with similar characteristics are aggregated for purposes of the calculations. Fair value of Bank owned life insurance is equal to the cash surrender value of the underlying life insurance policies. The carrying amounts of accrued interest approximate their fair values. | Deposits with no defined maturities, such as NOW accounts, savings accounts and money market deposit accounts, are valued at their carrying amount which approximates fair value. The fair value of fixed-maturity time deposits is estimated using a discounted cash flow calculation that applies the rates currently offered for deposits of similar remaining maturities. The carrying amounts of securities sold under agreements to repurchase approximate fair value. Fair value of advances from the FHLB is estimated by discounting maturities using an estimate of the current market for similar instruments. The fair value of subordinated debt is estimated using rates currently available to the Company for debt with similar terms and maturities. |
| 44 |
> NOTES TO CONSOLIDATED FINANCIAL STATEMENTS (continued) <
Southern Missouri Bancorp, Inc.
| NOTE 16: Condensed Parent Company Only Financial Statements The following condensed balance sheets, statements of income and cash flows for Southern Missouri Bancorp, Inc. should be read in conjunction with the consolidated financial statements and the notes thereto. |
| June 30 | ||||||
| Condensed Balance Sheets | 2007 | 2006 | ||||
| Assets | ||||||
| Cash and cash equivalents | $ 1,870,317 | $ 1,043,992 | ||||
| Premise and equipment | 2,079,658 | 2,079,658 | ||||
| Other assets | 433,122 | 1,745,972 | ||||
| Investment in common stock of Bank | 31,626,094 | 28,970,952 | ||||
| TOTAL ASSETS | $ 36,009,191 | $ 33,840,574 | ||||
| Liabilities and Stockholders' Equity | ||||||
| Accrued expenses and other liabilities | $ 77,952 | $ 69,347 | ||||
| Subordinated debt | 7,217,000 | 7,217,000 | ||||
| TOTAL LIABILITIES | 7,294,952 | 7,286,347 | ||||
| Stockholders' equity | 28,714,239 | 26,554,227 | ||||
| TOTAL LIABILITIES AND STOCKHOLDERS' EQUITY | $ 36,009,191 | $ 33,840,574 | ||||
| Year Ended June 30 | |||||||||
| Condensed Statements of Income | 2007 | 2006 | 2005 | ||||||
| Interest income | $ 61,165 | $ 85,272 | $ 96,653 | ||||||
| Interest expense | 594,357 | 512,074 | 369,733 | ||||||
| Net interest income | (533,192 | ) | (426,802 | ) | (273,080 | ) | |||
| Dividends from Bank | 1,200,000 | 1,200,000 | 1,200,000 | ||||||
| Gain on sales of securities | - | - | 351,508 | ||||||
| Operating expenses | 294,479 | 301,372 | 272,643 | ||||||
| Income before income taxes and equity in undistributed income of the Bank | 372,329 | 471,826 | 1,005,785 | ||||||
| Income tax benefit | 309,000 | 279,300 | 79,900 | ||||||
| Income before equity in undistributed income of the Bank; | 681,329 | 751,126 | 1,085,685 | ||||||
| Equity in undistributed (loss) income of the Bank | 2,247,084 | 2,033,040 | (981,426 | ) | |||||
| NET INCOME | $ 2,928,413 | $ 2,784,166 | $ 104,259 | ||||||
| 45 |
> NOTES TO CONSOLIDATED FINANCIAL STATEMENTS (continued) <
Southern Missouri Bancorp, Inc.
| Year Ended June 30 | |||||||||
| Condensed Statements | 2007 | 2006 | 2005 | ||||||
| Cash flows from operating activities: | |||||||||
| Net income | $ 2,928,413 | $ 2,784,166 | $ 104,259 | ||||||
| Changes in: | |||||||||
| Equity in undistributed income of the Bank | (2,247,084 | ) | (2,033,040 | ) | 981,426 | ||||
| Other adjustments, net | 32,480 | 58,329 | 37,355 | ||||||
| NET CASH PROVIDED BY OPERATING ACTIVITIES | 713,809 | 809,455 | 1,123,040 | ||||||
| Cash flows from investing activities: | |||||||||
| Principal collected on loan to ESOP | - | - | 70,566 | ||||||
| Purchase of available for sale securities | (1,330,000 | ) | (1,450,000 | ) | (1,099,000 | ) | |||
| Investment in real estate | - | (69,327 | ) | (5,537,842 | ) | ||||
| Sale of investment real estate | - | - | 3,497,971 | ||||||
| Depreciation | - | - | 39,916 | ||||||
| Proceeds from sales and maturities of available for sale securities | 2,618,975 | - | 6,668,949 | ||||||
| Capital contributed to Bank | - | - | (2,000,000 | ) | |||||
| NET CASH PROVIDED BY OR (USED IN) INVESTING ACTIVITIES | 1,288,975 | (1,519,327 | ) | 1,640,560 | |||||
| Cash flows from financing activities: | |||||||||
| Dividends on common stock | (805,439 | ) | (804,038 | ) | (809,193 | ) | |||
| Exercise of stock options | 26,000 | 22,848 | 65,962 | ||||||
| Payments to acquire treasury stock | (397,020 | ) | - | (585,884 | ) | ||||
| NET CASH (USED IN) OR PROVIDED BY FINANCING ACTIVITIES | (1,176,459 | ) | (781,190 | ) | (1,329,115 | ) | |||
| Net increase (decrease) in cash and cash equivalents | 826,325 | (1,491,062 | ) | 1,434,485 | |||||
| Cash and cash equivalents at beginning of year | 1,043,992 | 2,535,054 | 1,100,569 | ||||||
| CASH AND CASH EQUIVALENTS AT END OF YEAR | $ 1,870,317 | $ 1,043,992 | $ 2,535,054 | ||||||
| 46 |
> NOTES TO CONSOLIDATED FINANCIAL STATEMENTS (continued) <
Southern Missouri Bancorp, Inc.
| NOTE 17: Quarterly Financial Data (Unaudited) Quarterly operating data is summarized as follows (in thousands): |
| June 30, 2007 | ||||||||||||
| First Quarter | Second Quarter | Third Quarter | Fourth Quarter | |||||||||
| Interest income | $ 5,686 | $ 5,802 | $ 5,920 | $ 6,141 | ||||||||
| Interest expense | 3,197 | 3,388 | 3,465 | 3,570 | ||||||||
| Net interest income | 2,489 | 2,414 | 2,455 | 2,571 | ||||||||
| Provision for loan losses | 125 | 95 | 100 | 285 | ||||||||
| Noninterest income | 577 | 548 | 516 | 565 | ||||||||
| Noninterest expense | 1,797 | 1,803 | 1,889 | 1,969 | ||||||||
| Income before income taxes | 1,144 | 1,064 | 982 | 882 | ||||||||
| Income tax expense | 404 | 341 | 330 | 69 | ||||||||
| NET INCOME | $ 740 | $ 723 | $ 652 | $ 813 | ||||||||
| June 30, 2006 | ||||||||||||
| First Quarter | Second Quarter | Third Quarter | Fourth Quarter | |||||||||
| Interest income | $ 4,750 | $ 5,016 | $ 5,187 | $ 5,410 | ||||||||
| Interest expense | 2,401 | 2,690 | 2,782 | 2,890 | ||||||||
| Net interest income | 2,349 | 2,326 | 2,405 | 2,520 | ||||||||
| Provision for loan losses | 120 | 85 | 80 | 270 | ||||||||
| Noninterest income | 540 | 533 | 505 | 566 | ||||||||
| Noninterest expense | 1,732 | 1,729 | 1,833 | 1,734 | ||||||||
| Income before income taxes | 1,037 | 1,045 | 997 | 1,082 | ||||||||
| Income tax expense | 356 | 366 | 352 | 303 | ||||||||
| NET INCOME | $ 681 | $ 679 | $ 645 | $ 779 | ||||||||
| June 30, 2005 | ||||||||||||
| First Quarter | Second Quarter | Third Quarter | Fourth Quarter | |||||||||
| Interest income | $ 4,171 | $ 4,312 | $ 4,325 | $ 4,476 | ||||||||
| Interest expense | 1,848 | 1,928 | 2,050 | 2,206 | ||||||||
| Net interest income | 2,323 | 2,384 | 2,275 | 2,270 | ||||||||
| Provision for loan losses | 150 | 95 | 2,610 | 1,960 | ||||||||
| Noninterest income | 691 | 764 | 322 | 536 | ||||||||
| Noninterest expense | 1,643 | 1,605 | 1,664 | 1,816 | ||||||||
| Income (loss) before income taxes | 1,221 | 1,448 | (1,677 | ) | (970 | ) | ||||||
| Income tax expense (benefit) | 428 | 574 | (701 | ) | (383 | ) | ||||||
| NET INCOME (LOSS) | $ 793 | $ 874 | $ (976 | ) | $ (587 | ) | ||||||
| 47 |
> CORPORATE INFORMATION <
| CORPORATE HEADQUARTERS 531 Vine Street Poplar Bluff, Missouri 63901 COMPANY WEBSITE www.smbtonline.com SPECIAL COUNSEL Silver, Freedman & Taff, LLP Washington, D.C. 20007 | INDEPENDENT REGISTERED PUBLIC ACCOUNTING FIRM BKD, LLP St. Louis, Missouri 63102 COMMON STOCK Nasdaq Stock Market Nasdaq Symbol: SMBC | |
| TRANSFER AGENT Stockholders should report lost stock certificates or direct inquiries concerning dividend payments, change of name, address, or ownership, or consolidation of accounts, to the Company's transfer agent: Registrar and Transfer Company 10 Commerce Drive Cranford, New Jersey 07016 (800) 368-5948 ANNUAL MEETING The Annual Meeting of Stockholders will be held Monday, October 15, 2007, at 9:00 a.m., Central Time, at the Greater Poplar Bluff Area Chamber of Commerce Building, 1111 West Pine, Poplar Bluff, Missouri 63901. ANNUAL REPORT ON FORM 10-K AND OTHER REPORTS A copy of the Company's annual report on Form 10-K, including financial statement schedules and our quarterly reports as filed with the Securities and Exchange Commission, will be furnished without charge to stockholders as of the record date upon written request to the Secretary, Southern Missouri Bancorp, Inc., 531 Vine Street, Poplar Bluff, Missouri 63901. These documents also may be accessed through the SEC's website at www.sec.gov. | ||
| 48 |
> DIRECTORS and OFFICERS <
 |
SOUTHERN MISSOURI BANCORP, INC.
| Directors | ||||
| James W. Tatum Chairman of the Board, Retired Certified Public Accountant | Ronnie D. Black Executive Director, General Association of General Baptists | Charles R. Love Certified Public Accountant, Kraft, Miles and Tatum | ||
| Samuel H. Smith Vice-Chairman of the Board, Engineer and Majority Owner, S.H. Smith and Company, Inc. | Sammy A. Schalk President, Gamblin Lumber Company | Charles R. Moffitt Agency Manager, Morse Harwell Jiles Insurance Agency | ||
| L. Douglas Bagby City Manager, Poplar Bluff General Manager, Municipal Utilities of Poplar Bluff | Greg A. Steffens President and Chief Executive Officer, Southern Missouri Bancorp, Inc. Rebecca M. Brooks Financial Manager, McLane Transport | Leonard W. Ehlers Director Emeritus, Retired Court Reporter, 36th Judicial Circuit |
SOUTHERN MISSOURI BANK AND TRUST
| Directors | Senior Officers | |||
| Samuel H. Smith Chairman of the Board, Engineer and Majority Owner, S.H. Smith and Company, Inc. L. Douglas Bagby Vice-Chairman of the Board, City Manager, Poplar Bluff General Manager, Municipal Utilities of Poplar Bluff Ronnie D. Black Executive Director, General Association of General Baptists James W. Tatum Retired Certified Public Accountant | Sammy A. Schalk President, Gamblin Lumber Company Greg A. Steffens President and Chief Executive Officer, Southern Missouri Bancorp, Inc. Rebecca M. Brooks Financial Manager, McLane Transport Charles R. Love Certified Public Accountant, Kraft, Miles and Tatum Charles R. Moffitt Agency Manager, Morse Harwell Jiles Insurance Agency | Greg A. Steffens President and Chief Executive Officer Kimberly A. Capps Chief Operations Officer William D. Hribovsek Chief Lending Officer Matthew T. Funke Chief Financial Officer Lora L. Daves Chief of Credit Administration Valerie E. Yates Head of Internal Audit |
| 49 |