| Weathering the Storm
SOUTHERN MISSOURI BANCORP, INC. | 2009 ANNUAL REPORT |
> CORPORATE PROFILE <
Southern Missouri Bancorp, Inc. (NASDAQ: SMBC) is the holding company for Southern Bank. The last twelve months have seen an historic upheaval in the financial industry, but the Company reported solid results and took steps to provide for continued growth. |
> TABLE of CONTENTS <
| Letter to Shareholders | 2 |
| Common Share Data | 8 |
| Financial Review | 9 |
| Report of Independent | |
| Registered Public Accounting Firm | 20 |
| Consolidated Financial Statements | 21 |
| Notes to Consolidated Financial Statements | 26 |
| Corporate and Investor Information | 48 |
| Directors and Officers | 49 |
> FINANCIAL SUMMARY <
| | | 2009 | | | 2008 | | | CHANGE(%) | |
EARNINGS (dollars in thousands) | | | | | | | | | |
| Net interest income | | $ | 14,097 | | | $ | 11,780 | | | | 19.7 | |
| Provision for possible loan losses | | | 1,220 | | | | 940 | | | | 29.8 | |
| Other income | | | 1,820 | | | | 2,412 | | | | -24.5 | |
| Other expense | | | 9,150 | | | | 7,864 | | | | 16.4 | |
| Income taxes | | | 1,712 | | | | 1,775 | | | | -3.5 | |
| Net income | | | 3,835 | | | | 3,613 | | | | 6.1 | |
| Effective dividend on preferred shares | | | 289 | | | | --- | | | | N/A | |
| Net income available to common stockholders | | | 3,546 | | | | 3,613 | | | | -1.9 | |
| | | | | | | | | | | | | |
| PER COMMON SHARE | | | | | | | | | | | | |
| Net income: | | | | | | | | | | | | |
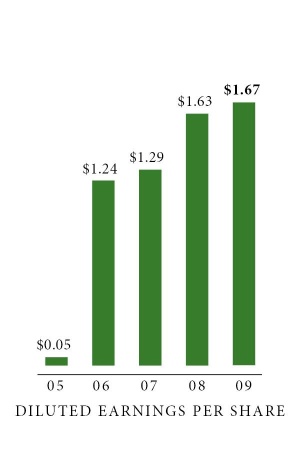
| Basic | | $ | 1.67 | | | $ | 1.64 | | | | 1.8 | |
| Diluted | | | 1.67 | | | | 1.63 | | | | 2.5 | |
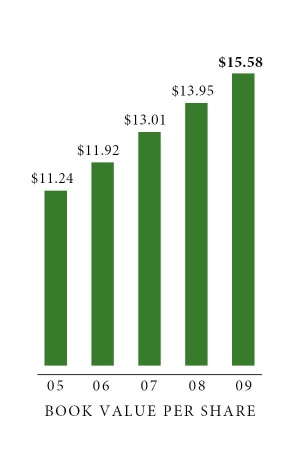
| Tangible book value | | | 14.82 | | | | 13.11 | | | | 13.0 | |
| Closing market price | | | 9.95 | | | | 15.49 | | | | -35.8 | |
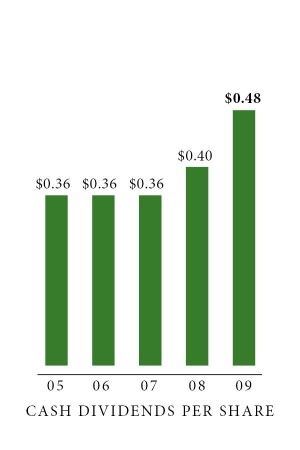
| Cash dividends declared | | | .48 | | | | .40 | | | | 20.0 | |
| | | | | | | | | | | | | |
AT YEAR-END (dollars in thousands) | | | | | | | | | | | | |
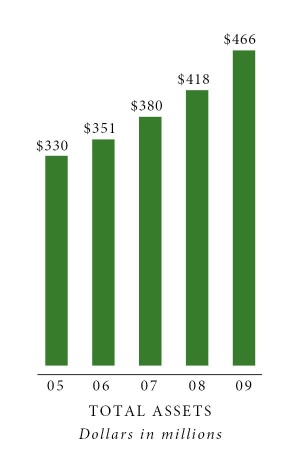
| Total assets | | $ | 465,897 | | | $ | 417,820 | | | | 11.5 | |
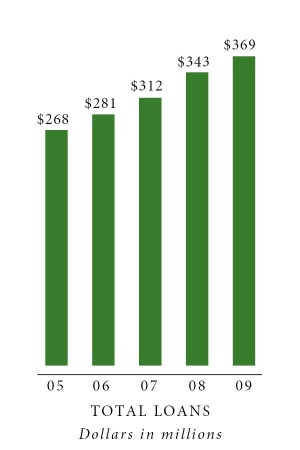
| Loans, net of allowance | | | 368,556 | | | | 343,070 | | | | 7.4 | |
| Reserves as a percent of nonperforming loans | | | 556.78 | % | | | 58,865 | % | | | | |
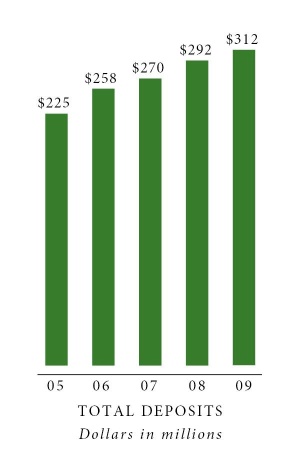
| Deposits | | $ | 311,955 | | | $ | 292,257 | | | | 6.7 | |
| Stockholders’ equity | | | 42,008 | | | | 30,472 | | | | 37.9 | |
| | | | | | | | | | | | | |
| FINANCIAL RATIOS | | | | | | | | | | | | |
| Return on average common stockholders’ equity | | | 11.38 | % | | | 12.06 | % | | | | |
| Return on average assets | | | .87 | | | | .92 | | | | | |
| Net interest margin | | | 3.37 | | | | 3.17 | | | | | |
| Efficiency ratio | | | 57.49 | | | | 55.41 | | | | | |
| Allowance for possible loan losses to net loans | | | 1.20 | | | | 1.04 | | | | | |
| Equity to average assets at year-end | | | 9.51 | | | | 7.73 | | | | | |
| | | | | | | | | | | | | |
OTHER DATA(1) | | | | | | | | | | | | |
| Common shares outstanding | | | 2,087,976 | | | | 2,190,833 | | | | | |
| Average common and dilutive | | | | | | | | | | | | |
| shares outstanding | | | 2,124,369 | | | | 2,212,132 | | | | | |
| Common stockholders of record | | | 283 | | | | 276 | | | | | |
| Full-time equivalent employees | | | 108 | | | | 100 | | | | | |
| Assets per employee (in thousands) | | $ | 4,314 | | | $ | 4,178 | | | | | |
| Banking offices | | | 10 | | | | 9 | | | | | |
(1) Other data is as of year-end, except for average shares.
> LETTER to SHAREHOLDERS <
 | Southern Missouri Bancorp weathered the financial market storm, continuing to generate strong returns, and taking steps to grow the company for the future. |
In last year’s report, we announced outstanding earnings growth, and noted that the economy had
soured. Since then, we’ve seen the recession plunge to depths that would have been nearly unimaginable
twelve months ago. But our results have held up remarkably well. Earnings per diluted common share
were $1.67 for fiscal 2009, up from $1.63 in 2008. The Company generated a return on average common
equity of 11.4% and a return on average assets of 0.87% in fiscal 2009.
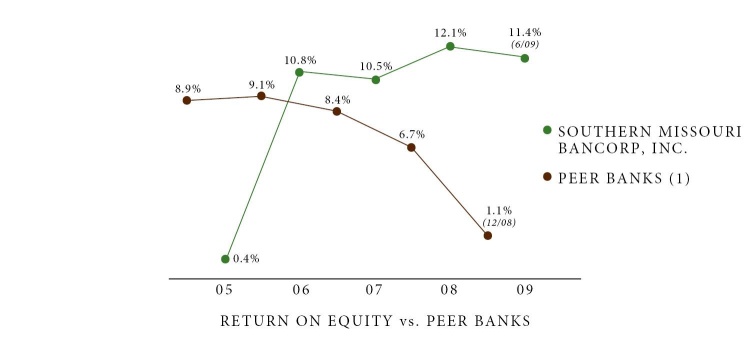
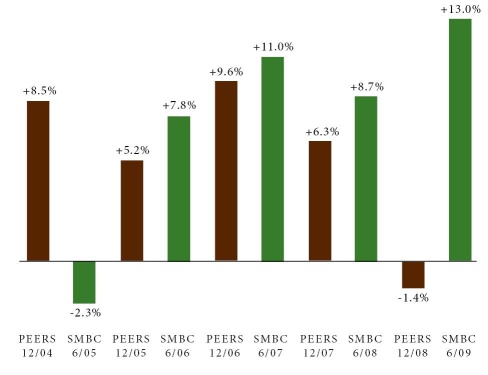
Return on common equity again surpasses peer banks
Our ROE was down slightly, but well ahead of peer banks in a troubled banking environment.
| | (1) | Peer data is based on the average year-end figures (December) from SNL DataSource’s Index of publicly traded commercial banks and thrifts with assets of $100 million to $1 billion, headquartered in Missouri, Arkansas, Illinois, Iowa, Kansas, Kentucky, Nebraska, Oklahoma, and Tennessee. SMBC data is as of fiscal year-end (June). |
Net income available to common shareholders totaled $3.5 million in fiscal 2009, down slightly from $3.6 million in the prior year. Our net interest income was up 19.7% in 2009, as we expanded our net interest margin by 20 basis points, and grew our average interest earning assets by 12.1%. Non-interest expense grew – up 16.4% – as we geared up operations to position ourselves for future opportunities, and as we paid higher deposit insurance premiums resulting from industry-wide base assessment rate increases and a special assessment from the FDIC. Non-interest income was down – off 24.6% – due to charges the bank recorded to reflect the other-than-temporary impairment of two investments.
Our net interest income was up 19.7% in 2009 |
Our net loan portfolio grew 7.4% in 2009, while our commercial and commercial real estate loans continued to account for much of that growth, up a combined 11.2%. Deposits increased 6.7% as we introduced a successful new rewards checking product, now marketed nationally under the “Kasasa” brand. Repurchase agreements, all of which are with local governments and businesses, were up 8.9%, even before accounting for a significant new public unit relationship which did not fund until early July.
Continued steady growth in our core business
Asset growth was above-trend due to the leveraging of additional capital.
The Company’s book value per common share increased by 11.7%, and tangible book value per common share increased by 13.0%. While our stock price did not perform well over the last year, it roughly mirrored the industry, down 35.8%, compared to a decline of 32.3% for the SNL bank index, and a decline of 38.4% for SNL micro cap banks. Earnings and increases in book value, however, outperformed the industry, and we believe that those results should bode well for our stock performance as the markets return to normal functioning over time. The Company also repurchased 5.8% of shares that were outstanding at July 1, 2008, increasing each remaining shareholder's percentage of ownership.
Tangible Book Value per share growth beats peers We have regularly exceeded our peer banks (1) in this key measure of shareholder value. | |
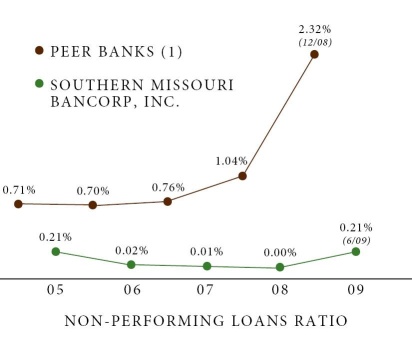
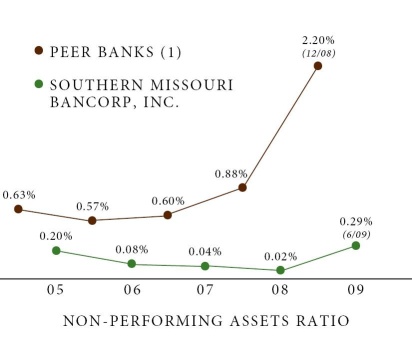
Asset quality at Southern Missouri has always been important, and we are benefitting from that focus today. Net charge-offs were up, but are still far below peers; non-performing assets have increased, but, again, remain at very manageable levels. However, we have continued to grow loan loss reserves in these uncertain economic times, increasing our allowance from 1.03% of total loans at June 30, 2008, to 1.19% at June 30, 2009.
Loan quality is sound
Problem loans and assets increased, but credit quality remained relatively strong.
| | (1) | Peer data is based on the average year-end figures (December) from SNL DataSource’s Index of publicly traded commercial banks and thrifts with assets of $100 million to $1 billion, headquartered in Missouri, Arkansas, Illinois, Iowa, Kansas, Kentucky, Nebraska, Oklahoma, and Tennessee. SMBC data is as of fiscal year-end (June). |
| In April 2009, Southern Missouri announced that it was acquiring a small financial institution, Southern Bank of Commerce, located in northeast Arkansas. The transaction closed in July 2009, and the Company is working diligently to implement its successful business model in these attractive new markets. The bank acquired was a |
| troubled financial institution, and the acquisition is expected to have a relatively small negative impact on our near-term earnings. However, we believe entry to these markets will provide a framework for us to deliver consistent growth in the future as the available potential customer base for us will nearly double. |
The Company also announced, in December 2008, that it received an investment of $9.6 million from the U.S. Treasury under the terms of its Capital Purchase Program (CPP), whereby the Company sold shares of fixed-rate, cumulative preferred stock and issued warrants to purchase 114,000 shares of common stock. The Company accepted the investment due to the uncertainty in the economic environment at the time, the relatively attractive cost of capital compared to the market at the time, and the strategic opportunities the Company foresaw regarding the potential uses of the capital.
While the program has become highly politicized, we believe we have put it to good uses that have helped accomplish Treasury's objectives: increasing the flow of financing to U.S. businesses and consumers, and to support the U.S. economy. Provided not a handout, but capital - an investment to be repaid, plus interest - the Company has increased its loan and investment portfolios - collectively, our investment in the credit markets - by more than we would have been likely to do, otherwise. Additionally, the Company utilized the additional capital when it made the aforementioned acquisition of Southern Bank of Commerce, a troubled financial institution, thereby improving credit availability in markets where it operated.
We will strongly consider our opportunities to raise capital and repay the Treasury investment at the earliest possible time, subject to consideration of the best possible uses of the capital. But we will not be pressured into raising capital at an inopportune time, or into reducing capital levels in a time of economic turbulence, if needed to maintain the safe and sound operation of the Company.
We look forward with great anticipation to 2010.
Our goals include:
| | Ø | First and foremost, continuing growth in core shareholder value - these can be disappointing |
| | | times for investors who check the ticker daily. We hope that our solid results in key measures |
| | | of shareholder value translate to an improved stock price in coming periods. |
| | | |
| | Ø | Second, building our retail deposit base – especially in our new markets, where we think our |
| | | products will be well received. |
| | | |
| | Ø | Third, resolving problem assets at our newly-acquired Arkansas operations, and generating |
| | | sound asset growth in those markets to build profitability. |
| | | |
| | Ø | And fourth, due to our expansion into new Arkansas markets, accomplishing a complicated |
| | | re-branding of Southern Missouri Bank as simply |
Next year's results will be hampered by the northeast Arkansas integration. We know the return to profitability for these branches will not be easy. But we also know they represent an impressive opportunity for the future of our Company.
Moreover, we don’t expect this economy to turn around overnight, and that means we must remain committed to operating at the highest efficiency and with strong asset quality. We will continue to bring the best products to our markets, do so at reasonable costs, and ensure that our customers
receive outstanding support from our employees.
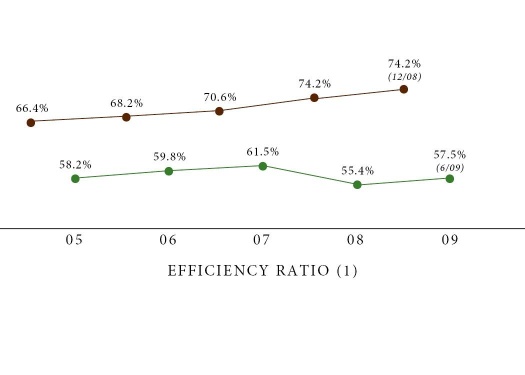
Efficiency remains ahead of peers
We again outperformed peer banks in this key measure.
| (1) | Peer data is based on the average year-end figures (December) from SNL DataSource’s Index of publicly traded commercial banks and thrifts with assets of $100 million to $1 billion, headquartered in Missouri, Arkansas, Illinois, Iowa, Kansas, Kentucky, Nebraska, Oklahoma, and Tennessee. SMBC data is as of fiscal year-end (June). |
| In these trying times, we could hardly | In these trying times, we could hardly be prouder of our solid results in 2009. |
| be prouder of our solid results in 2009. |
| Our institution is well-positioned for the |
| coming year due to the diligence of our |
| management team, the hard work of our |
| employees, and the loyalty of our valued |
| customers. I want to take this opportunity |
| to thank them all. |
I would also like to take this opportunity to thank our board of directors for the steady hand of leadership they have provided over the years, and, especially, our former Chairman, James W. Tatum, who retired from the board in October 2008. Mr. Tatum served our Company on the board for over 25 years, and I am happy to note that he continues to serve in the role of Director Emeritus.
And finally, I thank you for your investment in Southern Missouri, and consider myself fortunate to hold your trust. I am pleased to issue this positive report on your investment. |
/s/ Greg Steffens
GREG STEFFENS
PRESIDENT and CHIEF EXECUTIVE OFFICER
SOUTHERN MISSOURI BANCORP, INC.
PLEASE JOIN US
at our 2009 Annual Meeting, where shareholders and those considering invest-
ing in Southern Missouri Bancorp, Inc. will hear management review this year’s
performance in detail and discuss our plans to achieve continued superior results.
ANNUAL MEETING
MONDAY, OCTOBER 19, 2009 AT 9:00 AM
CHAMBER OF COMMERCE BUILDING
1111 WEST PINE, POPLAR BLUFF, MISSOURI
> COMMON SHARE DATA <
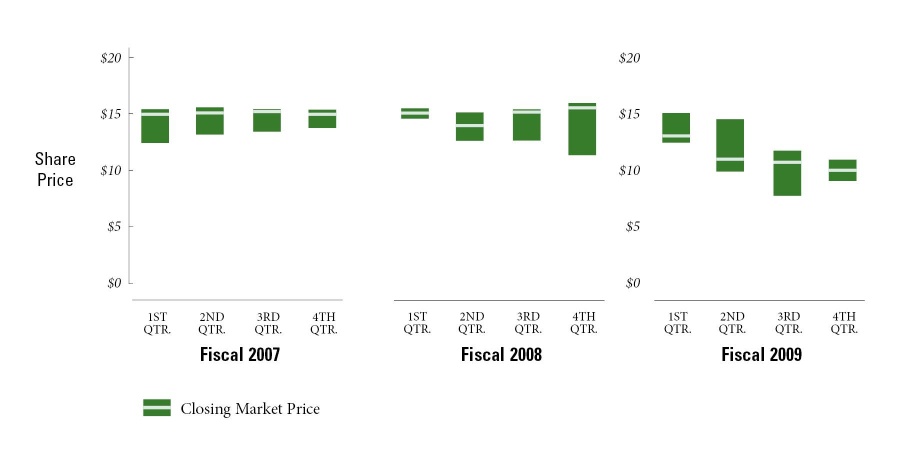
The common stock of the Company is listed on the NASDAQ Stock Market under the symbol “SMBC.” The following bar graph sets forth the high, low and closing market prices of the common stock for the last three fiscal years. |
The following table sets forth per share market price and dividend information for the Company’s common stock. As of June 30, 2009, there were approximately 283 common stockholders of record. This does not reflect the number of persons or entities who hold common stock in nominee or “street name.”
| Fiscal 2009 | | High | | | Low | | | Close | | | Book Value At End Of Period | | | Market Price To Book Value | | | Dividends Declared | |
4th Quarter (6-30-09) | | $ | 11.00 | | | $ | 8.99 | | | $ | 9.95 | | | $ | 15.58 | | | | 63.86 | % | | $ | 0.12 | |
3rd Quarter (3-31-09) | | $ | 11.70 | | | $ | 7.63 | | | $ | 10.80 | | | $ | 15.16 | | | | 71.24 | % | | $ | 0.12 | |
2nd Quarter (12-31-08) | | $ | 14.91 | | | $ | 9.87 | | | $ | 11.09 | | | $ | 14.75 | | | | 75.19 | % | | $ | 0.12 | |
1st Quarter (9-30-08) | | $ | 15.01 | | | $ | 12.36 | | | $ | 13.05 | | | $ | 14.23 | | | | 91.71 | % | | $ | 0.12 | |
| Fiscal 2008 | | | | | | | | | | | | | | | | | | | | | | | | |
4th Quarter (6-30-08) | | $ | 15.89 | | | $ | 11.21 | | | $ | 15.49 | | | $ | 13.95 | | | | 111.04 | % | | $ | 0.10 | |
3rd Quarter (3-31-08) | | $ | 15.10 | | | $ | 12.75 | | | $ | 15.10 | | | $ | 13.95 | | | | 108.24 | % | | $ | 0.10 | |
2nd Quarter (12-31-07) | | $ | 15.02 | | | $ | 12.75 | | | $ | 13.99 | | | $ | 13.76 | | | | 101.67 | % | | $ | 0.10 | |
1st Quarter (9-30-07) | | $ | 15.25 | | | $ | 14.45 | | | $ | 14.96 | | | $ | 13.35 | | | | 112.06 | % | | $ | 0.10 | |
| Fiscal 2007 | | | | | | | | | | | | | | | | | | | | | | | | |
4th Quarter (6-30-07) | | $ | 15.49 | | | $ | 14.00 | | | $ | 14.95 | | | $ | 13.01 | | | | 114.91 | % | | $ | 0.09 | |
3rd Quarter (3-31-07) | | $ | 15.50 | | | $ | 14.50 | | | $ | 15.48 | | | $ | 12.83 | | | | 120.65 | % | | $ | 0.09 | |
2nd Quarter (12-31-06) | | $ | 15.73 | | | $ | 14.06 | | | $ | 15.19 | | | $ | 12.59 | | | | 120.65 | % | | $ | 0.09 | |
1st Quarter (9-30-06) | | $ | 15.55 | | | $ | 12.29 | | | $ | 15.00 | | | $ | 12.29 | | | | 122.05 | % | | $ | 0.09 | |
Any future dividend declarations and payments are subject to the discretion of the Board of Directors of the Company. The ability of the Company to pay dividends on its common stock depends primarily on the ability of the Bank to pay dividends to the Company. For a discussion of the restrictions on the Bank’s ability to pay dividends, see Note 12 of Notes to Consolidated Financial Statements included elsewhere in this report.
> FINANCIAL REVIEW <
BUSINESS OF THE COMPANY AND THE BANK Southern Missouri Bancorp, Inc. (Southern Missouri or Company) is a Missouri corporation and owns all of the outstanding stock of Southern Bank (the Bank). The Company’s earnings are primarily dependent on the operations of the Bank. As a result, the following discussion relates primarily to the operations of the Bank. The Bank was originally chartered by the State of Missouri in 1887 and converted from a state-chartered stock savings and loan association to a Federally-chartered stock savings bank effective June 1995. Then, effective February 1998, the Bank converted its charter to a state-chartered stock savings bank. On June 4, 2004, the Bank converted to a state chartered trust company with banking powers. The Bank’s deposit accounts are generally insured up to a maximum of $250,000 under current law by the Deposit Insurance Fund (DIF), which is administered by the Federal Deposit Insurance Corporation (FDIC). The Bank’s primary business consists of attracting deposits from the communities it serves and investing those funds in loans secured by one- to four-family residences, commercial real estate, commercial business and consumer loans. The Company’s results of operations are primarily dependent on its net interest margin, which | | is the difference between the average yield on loans, mortgage-related securities and investments and the average rate paid on deposits, securities sold under agreements to repurchase and borrowings. The net interest margin is affected by economic, regulatory and competitive factors that influence interest rates, loan demand and deposits. Lending activities are funded through the attraction of deposit accounts consisting of checking accounts, passbook accounts, money market deposit accounts, certificate of deposit accounts with terms of 60 months or less, securities sold under agreements to repurchase, advances from the Federal Home Loan Bank of Des Moines, and, to a lesser extent, brokered deposits. As of June 30, 2009, the Bank conducted its business through its home office located in Poplar Bluff and nine full service branch facilities in Poplar Bluff (2), Van Buren, Dexter, Kennett, Doniphan, Sikeston, Matthews, and Qulin, Missouri. Subsequent to June 30, 2009, the Company added four branches through its acquisition of Southern Bank of Commerce. Those branches are located in Paragould, Jonesboro, Leachville, and Brookland, Arkansas. |
| (dollars in thousands) | | At June 30 | |
| Financial Condition Data: | | 2009 | | | 2008 | | | 2007 | | | 2006 | | | 2005 | |
| Total assets | | $ | 465,897 | | | $ | 417,820 | | | $ | 379,927 | | | $ | 350,684 | | | $ | 330,360 | |
| Loans receivable, net | | | 368,556 | | | | 343,070 | | | | 312,063 | | | | 280,931 | | | | 267,568 | |
| Mortgage-backed securities | | | 40,269 | | | | 28,006 | | | | 10,723 | | | | 14,440 | | | | 17,243 | |
| Cash, interest-bearing deposits | | | | | | | | | | | | | | | | | | | | |
| and investment securities | | | 27,983 | | | | 19,931 | | | | 31,492 | | | | 30,328 | | | | 21,344 | |
| Deposits | | | 311,955 | | | | 292,257 | | | | 270,088 | | | | 258,069 | | | | 224,666 | |
| Borrowings | | | 102,498 | | | | 85,854 | | | | 71,758 | | | | 57,296 | | | | 72,257 | |
| Subordinated debt | | | 7,217 | | | | 7,217 | | | | 7,217 | | | | 7,217 | | | | 7,217 | |
| Stockholders’ equity | | | 42,008 | | | | 30,472 | | | | 28,714 | | | | 26,554 | | | | 25,003 | |
| | | | | | | | | | | | | | | | | | | | | |
(dollars in thousands, except per share data) | | For The Year Ended June 30 | |
| Operating Data: | | | 2009 | | | | 2008 | | | | 2007 | | | | 2006 | | | | 2005 | |
| Interest income | | $ | 25,301 | | | $ | 25,327 | | | $ | 23,550 | | | $ | 20,363 | | | $ | 17,284 | |
| Interest expense | | | 11,204 | | | | 13,547 | | | | 13,621 | | | | 10,763 | | | | 8,032 | |
| | | | | | | | | | | | | | | | | | | | | |
| Net interest income | | | 14,097 | | | | 11,780 | | | | 9,929 | | | | 9,600 | | | | 9,252 | |
| Provision for loan losses | | | 1,220 | | | | 940 | | | | 605 | | | | 555 | | | | 4,815 | |
| | | | | | | | | | | | | | | | | | | | | |
| Net interest income after | | | | | | | | | | | | | | | | | | | | |
| provision for loan losses | | | 12,877 | | | | 10,840 | | | | 9,324 | | | | 9,045 | | | | 4,437 | |
| | | | | | | | | | | | | | | | | | | | | |
| Noninterest income | | | 1,820 | | | | 2,412 | | | | 2,207 | | | | 2,144 | | | | 2,313 | |
| Noninterest expense | | | 9,150 | | | | 7,864 | | | | 7,458 | | | | 7,028 | | | | 6,728 | |
| | | | | | | | | | | | | | | | | | | | | |
| Income before income taxes | | | 5,547 | | | | 5,388 | | | | 4,073 | | | | 4,161 | | | | 22 | |
| Income tax (benefit) expense | | | 1,712 | | | | 1,775 | | | | 1,145 | | | | 1,377 | | | | (82 | ) |
| Net income | | $ | 3,835 | | | $ | 3,613 | | | $ | 2,928 | | | $ | 2,784 | | | $ | 104 | |
| | | | | | | | | | | | | | | | | | | | | |
| Less: effective dividend on preferred stock | | | 289 | | | | - | | | | - | | | | - | | | | - | |
| Net income available to common stockholders | | $ | 3,546 | | | $ | 3,613 | | | $ | 2,928 | | | $ | 2,784 | | | $ | 104 | |
| | | | | | | | | | | | | | | | | | | | | |
| Basic earnings per share available to | | | | | | | | | | | | | | | | | | | | |
| common stockholders | | $ | 1.67 | | | $ | 1.64 | | | $ | 1.32 | | | $ | 1.25 | | | $ | .05 | |
| Diluted earnings per share available to | | | | | | | | | | | | | | | | | | | | |
| common stockholders | | $ | 1.67 | | | $ | 1.63 | | | $ | 1.29 | | | $ | 1.24 | | | $ | .05 | |
| Dividends per share | | $ | .48 | | | $ | .40 | | | $ | .36 | | | $ | .36 | | | $ | .36 | |
> FINANCIAL REVIEW (continued) <
| | At June 30 |
| Other Data: | 2009 | 2008 | 2007 | 2006 | 2005 |
| Number of: | | | | | |
| Real estate loans | 2,957 | 2,868 | 2,795 | 2,808 | 2,850 |
| Deposit accounts | 22,069 | 20,560 | 19,978 | 18,845 | 17,336 |
| Full service offices | 10 | 9 | 9 | 9 | 8 |
| | | | | | |
| | At Or For The Year Ended June 30 |
| Key Operating Ratios: | 2009 | 2008 | 2007 | 2006 | 2005 |
| Return on assets (net income | | | | | |
| divided by average assets) | .87% | .92% | .80% | .80% | .03% |
| | | | | | |
| Return on average common equity (net | | | | | |
| income available to common stockholders | | | | | |
| divided by average common equity) | 11.38 | 12.06 | 10.49 | 10.83 | .39 |
| | | | | | |
| Average equity to average assets | 8.29 | 7.60 | 7.66 | 7.43 | 8.18 |
| | | | | | |
| Interest rate spread (spread | | | | | |
| between weighted average rate on | | | | | |
| all interest-earning assets and all | | | | | |
| interest-bearing liabilities) | 3.11 | 2.86 | 2.57 | 2.69 | 2.84 |
| | | | | | |
| Net interest margin (net interest | | | | | |
| income as a percentage of average | | | | | |
| interest-earning assets) | 3.37 | 3.17 | 2.90 | 2.96 | 3.06 |
| | | | | | |
| Noninterest expense to average assets | 2.07 | 2.00 | 2.05 | 2.03 | 2.07 |
| | | | | | |
| Average interest-earning assets to | | | | | |
| average interest-bearing liabilities | 109.77 | 108.60 | 108.29 | 108.15 | 108.10 |
| | | | | | |
| Allowance for loan losses to gross | | | | | |
| loans (1) | 1.19 | 1.03 | .81 | .73 | .75 |
| | | | | | |
| Allowance for loan losses to | | | | | |
| nonperforming loans (1) | 556.78 | 58,864.74 | 9,845.43 | 3,888.50 | 353.36 |
| | | | | | |
| Net charge-offs (recoveries) to average | | | | | |
| outstanding loans during the period | .10 | (0.03) | .04 | .19 | 1.85 |
| | | | | | |
| Ratio of nonperforming assets | | | | | |
| to total assets (1) | .29 | .02 | .04 | .08 | .20 |
| | | | | | |
| Common shareholder dividend | | | | | |
| payout ratio (common dividends as a | | | | | |
| percentage of earnings available to | | | | | |
| common shareholders) | 28.27 | 24.49 | 27.50 | 28.80 | 776.14 |
(1) At end of period
> FINANCIAL REVIEW (continued) <
Management’s Discussion and Analysis of Financial Condition and Results of Operations
OVERVIEW Southern Missouri Bancorp, Inc. is a Missouri corporation originally organized for the principal purpose of becoming the holding company of Southern Missouri Savings Bank. The Bank converted from a Federally-chartered stock savings bank to a state-chartered stock savings bank effective February 17, 1998. The Company’s state of incorporation changed from Delaware to Missouri effective April 1, 1999. On June 4, 2004, the Bank converted to a state chartered trust company with banking powers, and the Company became a bank holding company supervised by the Federal Reserve. On June 1, 2009, the Bank changed its name to Southern Bank. The principal business of Southern Bank consists of attracting deposits from the general public and using such deposits along with advances from the Federal Home Loan Bank of Des Moines (FHLB) to finance mortgage loans secured by one- to four-family residences, commercial real estate loans and commercial business loans. These funds have also been used to purchase investment securities, mortgage-backed securities (MBS), U.S. government and federal agency obligations and other permissible securities. Southern Bank’s results of operations are primarily dependent on the levels of its net interest margin and noninterest income, and its ability to control operating expenses. Net interest margin is dependent primarily on the difference or spread between the average yield earned on interest-earning assets and the average rate paid on interest-bearing liabilities, as well as the relative amounts of these assets and liabilities. Southern Bank is subject to interest rate risk to the degree that its interest-earning assets mature or reprice at different times, or on a varying basis, from its interest-bearing liabilities. Southern Bank’s noninterest income consists primarily of fees charged on transaction and loan accounts and increased cash surrender value of bank owned life insurance (“BOLI”). Southern Bank’s operating expenses include: employee compensation and benefits, occupancy expenses, legal and professional fees, federal deposit insurance premiums, amortization of intangible assets and other general and administrative expenses. Southern Bank’s operations are significantly influenced by general economic conditions including monetary and fiscal policies of the U.S. government and the Federal Reserve Board. Additionally, Southern Bank is subject to policies and regulations issued by financial institution regulatory agencies, including the Federal Deposit Insurance Corporation, the Federal Reserve and the Missouri Division of Finance. Each of these factors may influence interest rates, loan demand, prepayment rates and deposit flows. Interest rates available on competing investments as well as general market interest rates influence the Bank’s cost of funds. Lending activities are affected by the demand for real estate and other types of loans, which in turn is affected by the interest rates at which such financing may be offered. The Bank intends to continue to focus on its lending programs for one- to four-family residential real estate, commercial real estate, commercial business and consumer financing on loans secured by properties or collateral located primarily in southeast Missouri and northeast Arkansas. FORWARD-LOOKING STATEMENTS This document, including information incorporated by reference, contains forward-looking statements about the Company and its subsidiaries which we believe are within the meaning of the Private Securities Litigation Reform Act of 1995. These forward-looking statements include, without limitation, statements with respect to anticipated future operating and financial | | performance, growth opportunities, interest rates, cost savings and funding advantages expected or anticipated to be realized by management. Words such as “may,” “could,” “should,” “would,” “believe,” “anticipate,” “estimate,” “expect,” “intend,” “plan” and similar expressions are intended to identify these forward looking statements. Forward-looking statements by the Company and its management are based on beliefs, plans, objectives, goals, expectations, anticipations, estimates and the intentions of management and are not guarantees of future performance. The important factors we discuss below, as well as other factors discussed under the caption “Management’s Discussion and Analysis of Financial Condition and Results of Operations” and identified in our filings with the SEC and those presented elsewhere by our management from time to time, could cause actual results to differ materially from those indicated by the forward-looking statements made in this document: the strength of the United States economy in general and the strength of the local economies in which we conduct operations; the effects of, and changes in, trade, monetary and fiscal policies and laws, including interest rate policies of the Federal Reserve Board; inflation, interest rate, market and monetary fluctuations; the timely development and acceptance of our new products and services and the perceived overall value of these products and services by users, including the features, pricing and quality compared to competitors’ products and services; the willingness of users to substitute our products and services for products and services of our competitors; the impact of changes in financial services’ laws and regulations (including laws concerning taxes, banking, securities and insurance); the impact of technological changes; acquisitions; changes in consumer spending and saving habits; and our success at managing the risks involved in the foregoing.
The Company disclaims any obligation to update or revise any forward-looking statements based on the occurrence of future events, the receipt of new information, or otherwise. CRITICAL ACCOUNTING POLICIES The Company has established various accounting policies, which govern the application of accounting principles generally accepted in the United States of America in the preparation of our financial statements. Our significant accounting policies are described in the footnotes to the Consolidated Financial Statements. Certain accounting policies involve significant judgments and assumptions by management that have a material impact on the carrying value of certain assets and liabilities; management considers such accounting policies to be critical accounting policies. The judgments and assumptions used by management are based on historical experience and other factors, which are believed to be reasonable under the circumstances. Because of the nature of the judgments and assumptions made by management, actual results could differ from these judgments and estimates that could have a material impact on the carrying values of assets and liabilities and the results of operations of the Company. The allowance for losses on loans represents management’s best estimate of probable losses in the existing loan portfolio. The allowance for losses on loans is increased by the provision for losses on loans charged to expense and reduced by loans charged off, net of recoveries. |
> FINANCIAL REVIEW (continued) <
The provision for losses on loans is determined based on management’s assessment of several factors: reviews and evaluations of specific loans, changes in the nature and volume of the loan portfolio, current economic conditions and the related impact on specific borrowers and industry groups, historical loan loss experience, the level of classified and nonperforming loans and the results of regulatory examinations. Integral to the methodology for determining the adequacy of the allowance for loan losses is portfolio segmentation and impairment measurement. Under the Company’s methodology, loans are first segmented into 1) those comprising large groups of smaller-balance homogeneous loans, including single-family mortgages and installment loans, which are collectively evaluated for impairment and 2) all other loans which are individually evaluated. Those loans in the second category are further segmented utilizing a defined grading system which involves categorizing loans by severity of risk based on conditions that may affect the ability of the borrowers to repay their debt, such as current financial information, collateral valuations, historical payment experience, credit documentation, public information, and current trends. The loans subject to credit classification represent the portion of the portfolio subject to the greatest credit risk and where adjustments to the allowance for losses on loans as a result of provisions and charge-offs are most likely to have a significant impact on operations. A periodic review of selected credits (based on loan size and type) is conducted to identify loans with heightened risk or probable losses and to assign risk grades. The primary responsibility for this review rests with the loan administration personnel. This review is supplemented with periodic examinations of both selected credits and the credit review process by applicable regulatory agencies. The information from these reviews assists management in the timely identification of problems and potential problems and provides a basis for deciding whether the credit represents a probable loss or risk that should be recognized. Loans are considered impaired if, based on current information and events, it is probable that Southern Bank will be unable to collect the scheduled payments of principal or interest when due according to the contractual terms of the loan agreement. The measurement of impaired loans is generally based on the fair value of the collateral for collateral-dependent loans. If the loan is not collateral-dependent, the measurement of impairment is based on the present value of expected future cash flows discounted at the historical effective interest rate or the observable market price of the loan. In measuring the fair value of the collateral, management uses the assumptions (i.e., discount rates) and methodologies (i.e., comparison to the recent selling price of similar assets) consistent with those that would be utilized by unrelated third parties. Impairment identified through this evaluation process is a component of the allowance for loan losses. If a loan that is individually evaluated for impairment is found to have none, it is grouped together with loans having similar characteristics (i.e., the same risk grade), and an allowance for loan losses is based upon historical average charge-offs for similar loans over the past five years, the historical average charge-off rate for developing trends in the economy, in industries and other factors. For portfolio loans that are evaluated for impairment as part of homogenous pools, an allowance is maintained based upon the average charge-offs for the past five years. Changes in the financial condition of individual borrowers, in economic conditions, in historical loss experience and in the conditions of the various markets in which collateral may be sold may all affect the required level of the allowance for losses on loans and the associated provision for losses on loans. | | FINANCIAL CONDITION General. The Company’s total assets increased $48.1 million, or 11.5%, to $465.9 million at June 30, 2009, when compared to $417.8 million at June 30, 2008. The growth was primarily due to growth in the net loan portfolio of $25.5 million, or 7.4%, as well as growth in available for sale investments of $20.3 million, or 50.8%. Asset growth was primarily funded by growth in deposit balances of $19.7 million, or 6.7%, FHLB advances of $14.7 million, or 23.0%, total equity of $11.5 million, or 37.9%, and repurchase agreements of $1.9 million, or 8.9%. Loans. Loans increased $25.5 million, or 7.4%, to $368.6 million at June 30, 2009, from $343.1 million at June 30, 2008. The growth in the loan portfolio was comprised principally of commercial real estate loans of $11.3 million, commercial loans of $7.5 million, and residential real estate loans of $6.2 million. Allowance for Loan Losses. The allowance for loan losses increased $863,000, or 24.2%, from $3.6 million at June 30, 2008, to $4.4 million at June 30, 2009. The allowance for loan losses represented 1.19% of gross loans receivable at June 30, 2009, as compared to 1.03% at June 30, 2008. At June 30, 2009, nonperforming loans, which included loans past due greater than 90 days and nonaccruing loans, were $796,000, compared to $6,000 at June 30, 2008 (see also, Provision for Loan Losses, under Comparison of Operating Results for the Years Ended June 30, 2009 and 2008). Investments. The investment portfolio increased $20.3 million, or 50.8%, to $60.2 million at June 30, 2009, from $39.9 million at June 30, 2008. The increase in the investment portfolio was primarily due to the Company’s leveraged deployment of $9.6 million in capital raised from the U.S. Treasury under the terms of its Capital Purchase Program. Investment growth was comprised primarily of collateralized mortgage obligations (CMOs) issued by U.S. government agencies and obligations of state and political subdivisions. Premises and Equipment. Premises and equipment decreased $70,000 to $8.1 million at June 30, 2009, from $8.2 million at June 30, 2008. The decrease was due to an increase in accumulated depreciation for the fiscal year, partially offset by investments in buildings, equipment and software. Bank Owned Life Insurance. The Bank purchased “key person” life insurance policies on six employees with a cash surrender value of $4.0 million in February, 2003. In addition, in October, 2004, the Bank purchased “key person” life insurance policies on 20 employees for $2.0 million. At June 30, 2009, the cash surrender value had increased to $7.6 million. Intangible Assets. Intangible assets generated through branch acquisitions in 2000 decreased $255,000 to $1.6 million as of June 30, 2009, and will continue to be amortized in accordance with Statement of Financial Accounting Standards (SFAS) No. 142. Deposits. Deposits increased $19.7 million, or 6.7%, to $312.0 million at June 30, 2009, from $292.3 million at June 30, 2008. The deposit growth was primarily comprised of increases in interest checking accounts of $28.0 million and certificate of deposit balances of $9.9 million, partially offset by decreases in money market passbook and statement savings accounts of $14.8 million, and money market deposit accounts of $5.5 million. The increase in interest checking balances was attributed to the success of the Bank’s rewards checking product, and the increase in certificates was attributed to customers’ seeking higher rates, as well as a $5.7 million increase in brokered CDs, which were added due to advantageous pricing and to help manage interest rate risk. Brokered CDs totaled $5.8 million at June 30, 2009, compared to less than $100,000 at June 30, 2008. Decreases in money market passbook and statement |
> FINANCIAL REVIEW (continued) <
savings, as well as money market deposit accounts were attributed primarily to a decrease in public unit deposits in those products, as well as customers shifting from those products to our rewards checking product, or to CDs. During fiscal 2009, public unit deposits decreased by $15.4 million. Total retail, non-public deposits increased by $29.3 million during the fiscal year. Borrowings. FHLB advances increased $14.7 million, or 23.0%, to $78.8 million at June 30, 2009, from $64.1 million at June 30, 2008. The increase was primarily attributed to the use of borrowings to leverage the $9.6 million investment by the U.S. Treasury to purchase investments and grow loan balances. Of the outstanding advances, $6.3 million was in overnight and short term borrowings at June 30, 2009, compared to $5.6 million in overnight and short term borrowings at June 30, 2008. Of the remaining $72.5 million in long-term advances, the entire amount carries fixed interest rates, and $58.5 million is subject to early redemption by the issuer. At June 30, 2009, the long-term advances had a weighted average maturity of 3.8 years, compared to 4.3 years at June 30, 2008. At June 30, 2009, all FHLB advances had a weighted-average cost of 4.31%, as compared to 4.91% at June 30, 2008. Subordinated Debt. In March 2004, $7.0 million of Floating Rate Capital Securities of Southern Missouri Statutory Trust I with a liquidation value of $1,000 per share were issued. The securities are due in 30 years, redeemable after five years and bear interest at a floating rate based on three month LIBOR. Stockholders’ Equity. The Company’s stockholders’ equity increased by $11.5 million, or 37.9%, to $42.0 million at June 30, 2009, from $30.5 million at June 30, 2008. This increase was primarily due to the investment by the U.S. Treasury of $9.6 million pursuant to the terms of its Capital Purchase Program (CPP). Additionally, net income of $3.8 million, a $733,000 increase in the market value of the investment portfolio, net of tax, and stock options exercised for $161,000, were partially offset by treasury stock purchases of $1.5 million, and common and preferred dividend payments of $1.3 million. The Company completed its most recently announced share repurchase program on November 19, 2008, and has not announced a new repurchase plan. Due to the Company’s participation in the CPP, new repurchase activity is restricted. COMPARISON OF OPERATING RESULTS FOR THE YEARS ENDED JUNE 30, 2009 AND 2008 Net Income. The Company’s net income available to common stockholders for the fiscal year ended June 30, 2009, was $3.5 million, a decrease of $67,000, or 1.9%, from the $3.6 million net income available to common stockholders for the prior fiscal year. Before an effective dividend on preferred shares of $289,000, net income was $3.8 million for the 2009 fiscal year, an increase of $222,000, or 6.1%, compared to the $3.6 million in net income for the prior fiscal year. The increase in net income was primarily due to a $2.3 million increase in net interest income, partially offset by a $1.3 million increase in non-interest expense, a $592,000 decrease in non-interest income, and a $280,000 increase in loan loss provisions. Net Interest Income. Net interest income increased $2.3 million, or 19.7%, to $14.1 million for fiscal 2009, when compared to the prior fiscal year. The increase was primarily due to a $47.0 million increase in average interest-earning assets, combined with a 25 basis point increase in the average interest rate spread. The increase in interest rate spread was primarily a result of decreasing short-term interest rates, prompted by actions of the Federal Reserve’s Federal Open Market Committee, as well as a steepened yield curve for most of the fiscal year. For fiscal 2009, the average interest rate spread was 3.11%, compared to 2.86% for fiscal year 2008. At June 30, 2009, the spread was 3.11%. | | Interest Income. Interest income decreased $26,000 or 0.1%, to $25.3 million for fiscal 2009, when compared to the prior fiscal year. The decrease was primarily due to the 78 basis point decrease in the average yield earned on interest-earning assets, from 6.82% in fiscal 2008 to 6.04% in fiscal 2009, mostly offset by the $47.0 million increase in the average balance of interest-earning assets. Interest income on loans receivable decreased by $455,000, or 2.0%, to $22.8 million for fiscal 2009 when compared to the prior fiscal year. The decrease was due to a 77 basis point decrease in the average yield earned on loans receivable, partially offset by a $32.2 million increase in the average balance of loans receivable. Interest income on the investment portfolio and other interest-earning assets increased $430,000 or 21.1%, to $2.5 million for fiscal 2009 when compared to the prior fiscal year. The increase was due to a $14.8 million increase in the average balance of these assets, partially offset by a 36 basis point decrease in the average yield earned on these assets. Interest Expense. Interest expense decreased $2.3 million, or 17.3%, to $11.2 million for fiscal 2009 when compared to the prior fiscal year. The decrease was due to the 103 basis point decrease in the average rate paid on interest-bearing liabilities, from 3.96% in fiscal 2008 to 2.93% in fiscal 2009, reflecting the decrease in market rates, partially offset by a $39.2 million increase in the average balance of interest-bearing liabilities. Interest expense on deposits decreased $2.1 million, or 22.6%, to $7.2 million for fiscal 2009 when compared to the prior fiscal year. The decrease was due to a 98 basis point decrease in the average rate paid on deposits, partially offset by a $16.0 million increase in average deposits outstanding. Interest expense on FHLB advances increased $378,000, or 12.3%, to $3.5 million for fiscal 2009 when compared to the prior fiscal year. The increase was due to the $19.4 million increase in the average balance of FHLB advances for fiscal 2009, partially offset by the 82 basis point decrease in the average rate paid on advances, reflecting the decrease in market rates. In March 2009, $7.0 million of Floating Rate Capital Securities were issued, with an interest rate of three month LIBOR plus 275 basis points, repricing quarterly. Interest expense on these securities was $357,000 for fiscal 2009 as compared to $539,000 for the prior fiscal year. This decrease was due to the average rate paid decreasing by 252 basis points. Provision for Loan Losses. A provision for loan losses is charged to earnings to bring the total allowance for loan losses to a level considered adequate by management to provide for probable loan losses based on prior loss experience, type and amount of loans in the portfolio, adverse situations that may affect the borrower’s ability to repay, the estimated value of any underlying collateral, and current economic conditions. Management also considers other factors relating to the collectability of the loan portfolio. The provision for loan losses was $1.2 million for fiscal 2009, compared to $940,000 for the prior fiscal year. The increase in provision was primarily due to loan growth, the deteriorating health of the national and regional economy, the potential for declining real estate collateral values, and increased non-performing asset levels experienced by the Company. In fiscal 2009, net charge offs were $357,000, compared to net recoveries of $90,000 for the prior year. At June 30, 2009, classified assets totaled $9.7 million, or 2.1% of total assets, compared to classified assets of $4.5 million, or 1.1% of total assets, at June 30, 2008. The increase is primarily due to the classification of two loans totaling $3.5 million outstanding to a bank holding company, as well as the classification of the Company’s investments in pooled trust preferred securities with a book value of $1.5 million (see Note 2 – Securities). Other classified assets were generally comprised of loans secured by commercial and agricultural real estate, or inventory and equipment. Two investments in pooled |
> FINANCIAL REVIEW (continued) <
trust preferred securities with a total book value of $559,000 (included in the total of $1.5 million, above) have deferred interest payments as of June 30, 2009; all other classified assets were performing in accordance with terms. All assets were classified due to concerns as to the borrowers’ ability to continue to generate sufficient cash flows to service the debt. The above provision was made based on management’s analysis of the various factors which affect the loan portfolio and management’s desire to maintain the allowance at a level considered adequate. Management performed a detailed analysis of the loan portfolio, including types of loans, the charge-off history, and an analysis of the allowance for loan losses. Management also considered the continued origination of loans secured by commercial businesses and commercial real estate, which bear an inherently higher level of credit risk. While management believes the allowance for loan losses at June 30, 2009, is adequate to cover all losses inherent in the portfolio, there can be no assurance that, in the future, increases in the allowance will not be necessary, or that actual losses will not exceed the allowance. Noninterest Income. Noninterest income decreased $592,000, or 24.6%, to $1.8 million for fiscal 2009, when compared to the prior fiscal year. The decrease was primarily due to charges of $679,000 incurred to recognize the other-than-temporary impairment of two investments held by the Company (see Note 2 – Securities). Exclusive of those charges, noninterest income would have increased 3.6% in fiscal 2009, attributable to increased debit and ATM card income, secondary market income, loan fees and late charges, partially offset by decreases in NSF and account service charges, miscellaneous customer fees, and smaller increases in the cash surrender value of BOLI. Noninterest Expense. Noninterest expense increased $1.3 million, or 16.4%, to $9.2 million for fiscal 2009, when compared to the prior fiscal year. The increase resulted primarily from higher deposit insurance assessments, compensation expenses, legal and professional fees, and electronic banking and other charges. These increases were partially offset by lower charges for correspondent banking services and insurance. Deposit insurance assessments were $536,000 for fiscal 2009, an increase of $506,000 when compared to the prior year, the result of base assessment rate increases and special assessments collected by the FDIC to rebuild depleted insurance fund balances. Compensation expenses were $4.8 million, an increase of $371,000, or 8.4%, when compared to the prior fiscal year. The increase was due to increased salaries, the addition of key personnel, and increased health care benefit costs. Legal expenses increased due primarily to work required for the acquisition of the Southern Bank of Commerce. Electronic banking and other charges increased due to the development and promotion of our popular new rewards checking product, as well as the additional costs of servicing those accounts. Provision for Income Taxes. The Company expensed an income tax provision of $1.7 million for fiscal 2009, a decrease of $63,000, or 3.6%, compared to $1.8 million in fiscal 2008. The decrease was primarily due to larger investments in tax-exempt securities and tax credits, partially offset by increased pre-tax income. COMPARISON OF OPERATING RESULTS FOR THE YEARS ENDED JUNE 30, 2008 AND 2007 Net Income. Southern Bank’s net income was $3.6 million for the fiscal year ended June 30, 2008, an increase of $685,000, or 23.4%, when compared to the results of the prior fiscal year. The increase in net income was primarily due to a $1.9 million increase in net interest income and an increase in non-interest income of $205,000, partially offset by a $630,000 increase in income tax provisions, a $406,000 increase in non-interest expenses, and a $335,000 increase in loan loss provisions. | | Net Interest Income. Net interest income increased $1.9 million, or 18.6%, to $11.8 million for fiscal 2008, when compared to the prior fiscal year. The increase was primarily due to a 29 basis point increase in the average interest rate spread, combined with a $29.0 million increase in average interest-earning assets. The increase in interest rate spread was primarily a result of decreasing short-term interest rates, prompted by actions of the Federal Reserve’s Federal Open Market Committee, as well as a steeper yield curve for most of the fiscal year. For fiscal 2008, the average interest rate spread was 2.86%, compared to 2.57% for fiscal year 2007. At June 30, 2008, the spread was 3.12%. Interest Income. Interest income increased $1.8 million, or 7.5%, to $25.3 million for fiscal 2008, when compared to the prior fiscal year. The increase was primarily due to the $29.0 million increase in the average balance of interest-earning assets, partially offset by a five basis point decrease in average yield earned on interest-earning assets, from 6.87% in fiscal 2007 to 6.82% in fiscal 2008. Interest income on loans receivable increased by $1.6 million, or 7.4%, to $23.3 million for fiscal 2008 when compared to the prior fiscal year. The increase was due to a $27.6 million increase in average balance of loans receivable, partially offset by a 13 basis point decrease in the average yield earned on loans receivable. Interest income on the investment portfolio and other interest-earning assets increased $183,000 or 9.8%, to $2.0 million for fiscal 2008 when compared to the prior fiscal year. The increase was due to a 27 basis point increase in the average yield earned on these assets, combined with a $1.4 million increase in the average balance of investments and other interest-earning assets. Interest Expense. Interest expense decreased $74,000, or 0.5%, to $13.5 million for fiscal 2008 when compared to the prior fiscal year. The decrease was due to the 34 basis point decrease in the average rate paid on interest-bearing liabilities, from 4.30% in fiscal 2007 to 3.96% in fiscal 2008, partially offset by a $25.8 million increase in the average balance of interest-bearing liabilities. Interest expense on deposits increased $199,000, or 2.2%, to $9.3 million for fiscal 2008 when compared to the prior fiscal year. The increase was due to a $21.4 million increase in average deposits outstanding, partially offset by a 24 basis point decrease in the average rate paid on deposits. Interest expense on FHLB advances decreased $324,000, or 9.5%, to $3.1 million for fiscal 2008 when compared to the prior fiscal year. The decrease was primarily due to the $4.4 million decrease in the average balance of FHLB advances for fiscal 2008, combined with the 15 basis point decrease in the average rate paid on advances. The Company issued $7.0 million of Floating Rate Capital Securities in March, 2004, with an interest rate of three month LIBOR plus 275 basis points, repricing quarterly. Interest expense on these securities was $539,000 for fiscal 2008 as compared to $594,000 for the prior fiscal year. This decrease was due to the average rate paid decreasing by 77 basis points. Provision for Loan Losses. A provision for loan losses is charged to earnings to bring the total allowance for loan losses to a level considered adequate by management to provide for probable loan losses based on prior loss experience, type and amount of loans in the portfolio, adverse situations that may affect the borrower’s ability to repay, the estimated value of any underlying collateral, and current economic conditions. Management also considers other factors relating to the collectibility of the loan portfolio. |
> FINANCIAL REVIEW (continued) <
The provision for loan losses was $940,000 for fiscal 2008, compared to $605,000 for the prior fiscal year. The increase in provision was primarily due to loan growth, the health of the national and regional economy, and the potential for declining real estate collateral values. In fiscal 2008, net recoveries were $90,000, compared to net charge offs of $125,000 for the prior year. At June 30, 2008, classified assets totaled $4.5 million, compared to classified assets of $1.3 million at June 30, 2007. The increase in classifications was due primarily to a single loan relationship with outstanding classified balances of $3.5 million, secured by commercial and agricultural real estate, and was performing according to terms at June 30, 2008. The relationship was classified due to concerns regarding the borrower’s ability to generate sufficient cash flow from operations to service the debt. The above provision was made based on management’s analysis of the various factors which affect the loan portfolio and management’s desire to maintain the allowance at a level considered adequate. Management performed a detailed analysis of the loan portfolio, including types of loans, the charge-off history, and an analysis of the allowance for loan losses. Management also considered the continued origination of loans secured by commercial businesses and commercial real estate, which bear an inherently higher level of credit risk. While management believes the allowance for loan losses at June 30, 2008, is adequate to cover all losses inherent in the portfolio, there can be no assurance that, in the future, increases in the allowance will not be necessary, or that actual losses will not exceed the allowance. Noninterest Income. Noninterest income increased $205,000, or 9.3%, to $2.4 million for fiscal 2008, when compared to the prior fiscal year. The increase was primarily due to increased collection of insufficient funds charges, increased debit and ATM card income, loan late charges, and increases in the cash surrender value of BOLI, partially offset by lower secondary market loan income. Noninterest Expense. Noninterest expense increased $406,000, or 5.4%, to $7.9 million for fiscal 2008, when compared to the prior fiscal year. The increase resulted primarily from higher compensation expenses, partially offset by lower professional, advertising, and miscellaneous expenses. Expenses for compensation and benefits increased $422,000, or 10.5%, for fiscal 2008 when compared to the prior year. The increase was due to increased salaries, addition of personnel, and the payment of additional bonuses based on the Company’s strong financial performance. Provision for Income Taxes. The Company expensed an income tax provision of $1.8 million for fiscal 2008, compared to $1.1 million in fiscal 2007. The increase was primarily due to increased pre-tax income, as well as the prior fiscal year’s adjustments related to compliance with new accounting standards. QUANTITATIVE AND QUALITATIVE DISCLOSURES ABOUT MARKET RISK The goal of the Company’s asset/liability management strategy is to manage the interest rate sensitivity of both interest-earning assets and interest-bearing liabilities in order to maximize net interest income without exposing the Company to an excessive level of interest rate risk. The Company employs various strategies intended to manage the potential effect that changing interest rates may have on future operating results. The primary asset/liability management strategy has been to focus on matching the anticipated repricing intervals of interest-earning assets and interest-bearing liabilities. At times, however, depending on the level of general interest rates, the relationship between long- and short-term interest rates, market conditions and competitive factors, the Company may increase its interest rate risk position in order to maintain its net interest margin. | | In an effort to manage the interest rate risk resulting from fixed rate lending, the Company has utilized longer term (up to 10 year maturities), fixed-rate FHLB advances, which may be subject to early redemption, to offset interest rate risk. Other elements of the Company’s current asset/liability strategy include: (i) increasing originations of commercial real estate, commercial business loans, agricultural real estate, and agricultural operating lines, which typically provide higher yields and shorter repricing periods, but inherently increase credit risk, (ii) limiting the price volatility of the investment portfolio by maintaining a weighted average maturity of five years or less, (iii) actively soliciting less rate-sensitive deposits, and (iv) offering competitively priced money market accounts and CDs with maturities of up to five years. The degree to which each segment of the strategy is achieved will affect profitability and exposure to interest rate risk. The Company continues to generate long-term, fixed-rate residential loans. During the year ended June 30, 2009, fixed rate residential loan originations totaled $23.1 million, compared to $22.0 million during the prior year. At June 30, 2009, the fixed-rate residential loan portfolio totaled $96.6 million with a weighted average maturity of 206 months, compared to $98.6 million at June 30, 2008, with a weighted average maturity of 207 months. At June 30, 2009, fixed rate loans with remaining maturities in excess of 10 years totaled $90.4 million, or 24.2%, of loans receivable, compared to $83.7 million, or 24.1%, of loans receivable, at June 30, 2008. The Company originated $57.7 million in fixed rate commercial and commercial real estate loans during the year ended June 30, 2009, compared to $58.3 million during the prior fiscal year. The Company also originated $74.0 million in adjustable rate commercial and commercial real estate loans during the year ended June 30, 2009, compared to $50.1 million during the prior year. The Company originated $14.3 million in adjustable rate residential loans during the year ended June 30, 2009, compared to $9.9 million during the prior year. At June 30, 2009, adjustable-rate home equity lines of credit had increased to $11.0 million as compared to $8.2 million as of June 30, 2008. At June 30, 2009, the Company’s weighted average life of its investment portfolio was 3.9 years, as compared to 5.9 years at June 30, 2008. At June 30, 2009, CDs with original terms of two years or more totaled $45.7 million compared to $20.8 million at June 30, 2008. |
> FINANCIAL REVIEW (continued) <
INTEREST RATE SENSITIVITY ANALYSIS The following table sets forth as of June 30, 2009, and 2008, management’s estimates of the projected changes in net portfolio value in the event of 1%, 2% and 3%, instantaneous, permanent increases or decreases in market interest rates. Computations in the table below are based on prospective effects of hypothetical changes in interest rates and are based on an internally generated model using the actual maturity and repricing schedules for Southern Bank’s loans and deposits, adjusted by management’s assumptions for prepayment rates and deposit runoff. Further, the computations do not consider any reactions that the Bank may undertake in response to changes in interest rates. These projected changes should not be relied upon as indicative of actual results in any of the aforementioned interest rate changes. Management cannot accurately predict future interest rates or their effect on the Company’s NPV and net interest income in the future. Certain shortcomings are inherent in the method of analysis presented in the computation of NPV and net interest income. For example, although certain assets and liabilities may have similar maturities or periods of repricing, they may react in different degrees to changes in market interest rates. Also, the interest rates on certain types of assets and liabilities may fluctuate in advance of changes in market interest rates, while interest rates on other types of assets and liabilities may lag behind changes in market interest rates. Additionally, most of Southern Bank’s loans have features which restrict changes in interest rates on a short-term basis and over the life of the asset. Further, in the event of a change in interest rates, prepayment and early withdrawal levels would likely deviate significantly from those assumed in calculating the foregoing table. Finally, the ability of many borrowers to service their debt may decrease in the event of an interest rate increase. | | LIQUIDITY AND CAPITAL RESOURCES Southern Missouri’s primary potential sources of funds include deposit growth, securities sold under agreements to repurchase, FHLB advances, amortization and prepayment of loan principal, investment maturities and sales, and ongoing operating results. While scheduled repayments on loans and securities as well as the maturity of short-term investments are a relatively predictable source of funding, deposit flows, FHLB advance redemptions and loan and security prepayment rates are significantly influenced by factors outside of the Bank’s control, including general economic conditions and market competition. The Bank has relied on FHLB advances as a source for funding cash or liquidity needs. Southern Missouri uses its liquid assets as well as other funding sources to meet ongoing commitments, to fund loan commitments, to repay maturing certificates of deposit and FHLB advances, to make investments, to fund other deposit withdrawals and to meet operating expenses. At June 30, 2009, the Bank had outstanding commitments to extend credit of $62.8 million (including $53.4 million in unused lines of credit). Total commitments to originate fixed-rate loans with terms in excess of one year were $6.6 million at rates ranging from 4.75% to 7.25%. Management anticipates that current funding sources will be adequate to meet foreseeable liquidity needs. For the year ended June 30, 2009, Southern Missouri increased deposits, securities sold under agreements to repurchase, and FHLB advances by $19.7 million, $1.9 million, and $14.7 million, respectively. During the prior year, Southern Missouri increased deposits, securities sold under agreements to repurchase, and FHLB advances by $22.2 million, $4.0 million, and $10.1 million, respectively. At June 30, 2009, the Bank had pledged $175.5 million of its residential and commercial real estate loan portfolios to the FHLB for available credit of approximately $131.3 million, of which $78.8 million had been advanced. In addition, the Bank has the ability to pledge several of its other loan portfolios, including, for example, its home equity and commercial business loans, which could provide collateral for an additional $34.3 million in borrowings at June 30, 2009. In total, FHLB borrowings are generally limited to 40% of Bank assets, or approximately $184.3 million, which means that an amount up to $105.5 million may still be eligible to be borrowed from the FHLB, subject to available collateral. Along with the ability to borrow from the FHLB, management believes its liquid resources will be sufficient to meet the Company’s liquidity needs. Liquidity management is an ongoing responsibility of the Bank’s management. The Bank adjusts its investment in liquid assets based upon a variety of factors including (i) expected loan demand and deposit flows, (ii) anticipated investment and FHLB advance maturities, (iii) the impact on profitability, and (iv) asset/liability management objectives. At June 30, 2009, the Bank had $112.8 million in CDs maturing within one year and $175.4 million in other deposits and securities sold under agreements to repurchase without a specified maturity, as compared to the prior year of $130.0 million in CDs maturing within one year and $163.7 million in other deposits and securities sold under agreements to repurchase without a specified maturity. Management believes that most maturing interest-bearing liabilities will be retained or replaced by new interest-bearing liabilities. Also at June 30, 2009, the Bank had $39.0 million in FHLB advances eligible for early redemption by the lender within one year. |
| |
| |
| | | | | | | | |
| June 30, 2009 | |
| | | Net Portfolio | NPV as % of PV of Assets | |
| | | $ Amount | $ Change | % Change | NPV Ratio | Change | |
| Change in Rates | (dollars in thousands) | | | |
| +300 bp | | $ 42,388 | $ (5,131) | (11) | 9.51 | -0.61 | |
| +200 bp | | 44,863 | (2,656) | (6) | 9.90 | -0.22 | |
| +100 bp | | 46,998 | (521) | (1) | 10.19 | 0.07 | |
| 0 bp | | 47,519 | - | - | 10.12 | - | |
| -100 bp | | 44,881 | (2,638) | (6) | 9.45 | -0.67 | |
| -200 bp | | 42,397 | (5,122) | (11) | 8.88 | -1.24 | |
| -300 bp | | 41,942 | (5,577) | (12) | 8.78 | -1.41 | |
| | | | | | | | |
| | | | | | | | |
| June 30, 2008 | |
| | | Net Portfolio | NPV as % of PV of Assets | |
| | | $ Amount | $ Change | % Change | NPV Ratio | Change | |
| Change in Rates | (dollars in thousands) | | | |
| +300 bp | | $ 20,957 | $ (15,791) | (43) | 5.33 | -3.51 | |
| +200 bp | | 26,442 | (10,306) | (28) | 6.60 | -2.24 | |
| +100 bp | | 31,816 | (4,932) | (13) | 7.79 | -1.05 | |
| 0 bp | | 36,748 | - | - | 8.84 | - | |
| -100 bp | | 39,471 | 2,723 | 7 | 9.36 | 0.52 | |
| -200 bp | | 42,133 | 5,385 | 15 | 9.85 | 1.01 | |
| -300 bp | | 43,892 | 7,144 | 19 | 10.15 | 1.31 | |
> FINANCIAL REVIEW (continued) <
REGULATORY CAPITAL Federally insured financial institutions are required to maintain minimum levels of regulatory capital. FDIC regulations establish capital requirements, including a leverage (or core capital) requirement and a risk-based capital requirement. The FDIC is also authorized to impose capital requirements in excess of these standards on individual institutions on a case-by-case basis. At June 30, 2009, the Bank exceeded regulatory capital requirements with core and total risk-based capital of $40.4 million and $44.7 million, or 8.87% and 12.98% of adjusted total assets and risk-weighted assets, respectively. These capital levels exceeded minimum requirements of 4.0% and 8.0%, respectively, and well-capitalized requirements of 5% and 10%, respectively for adjusted total assets and risk-weighted assets. (See Note 12 - Stockholders’ Equity and Regulatory Capital.) IMPACT OF INFLATION The consolidated financial statements and related data presented herein have been prepared in accordance with U.S. generally accepted accounting principles, which require the measurement of financial position and operating results in historical dollars without considering changes in the relative purchasing power of money over time due to inflation. The primary impact of inflation on the operations of the Company is reflected in increased operating costs. Unlike most industrial companies, virtually all of the assets and liabilities of a financial institution are monetary in nature. As a result, changes in interest rates generally have a more significant impact on a financial institution’s performance than does inflation. Interest rates do not necessarily move in the same direction or to the same extent as the prices of goods and services. In the current interest rate environment, liquidity and maturity structure of the Company’s assets and liabilities are critical to the maintenance of acceptable performance levels. AVERAGE BALANCE, INTEREST AND AVERAGE YIELDS AND RATES The table on the following page sets forth certain information relating to the Company’s average interest-earning assets and interest-bearing liabilities and reflects the average yield on assets and the average cost of liabilities for the periods indicated. These yields and costs are derived by dividing income or expense by the average balance of assets or liabilities, respectively, for the years indicated. Nonaccrual loans are included in the net loan category. The table also presents information with respect to the difference between the weighted-average yield earned on interest-earning assets and the weighted-average rate paid on interest-bearing liabilities, or interest rate spread, which financial institutions have traditionally used as an indicator of profitability. Another indicator of an institution’s net interest income is its net yield on interest-earning assets, which is its net interest income divided by the average balance of interest-earning assets. Net interest income is affected by the interest rate spread and by the relative amounts of interest-earning assets and interest-bearing liabilities. When interest-earning assets approximate or exceed interest-bearing liabilities, any positive interest rate spread will generate net interest income. |
| |
> FINANCIAL REVIEW (continued) <
| (dollars in thousands) | | | | | | | | | | | | | | | | | | | | | | | | | | | |
| | | 2009 | | | 2008 | | | 2007 | |
| Year Ended June 30 | | Average Balance | | | Interest and Dividends | | | Yield/ Cost | | | Average Balance | | | Interest and Dividends | | | Yield/ Cost | | | Average Balance | | | Interest and Dividends | | | Yield/ Cost | |
| Interest-earning assets: | | | | | | | | | | | | | | | | | | | | | | | | | | | |
| Mortgage loans (1) | | $ | 254,355 | | | $ | 16,781 | | | | 6.60 | % | | $ | 232,500 | | | $ | 16,541 | | | | 7.11 | % | | $ | 211,203 | | | $ | 14,726 | | | | 6.97 | % |
| Other loans (1) | | | 102,963 | | | | 6,050 | | | | 5.88 | | | | 92,614 | | | | 6,745 | | | | 7.28 | | | | 86,352 | | | | 6,966 | | | | 8.07 | |
| Total net loans | | | 357,318 | | | | 22,831 | | | | 6.39 | | | | 325,114 | | | | 23,286 | | | | 7.16 | | | | 297,555 | | | | 21,692 | | | | 7.29 | |
| Mortgage-backed securities | | | 35,714 | | | | 1,729 | | | | 4.84 | | | | 19,372 | | | | 923 | | | | 4.76 | | | | 13,082 | | | | 556 | | | | 4.25 | |
| Investment securities (2) | | | 20,487 | | | | 706 | | | | 3.45 | | | | 22,552 | | | | 1,059 | | | | 4.69 | | | | 28,234 | | | | 1,256 | | | | 4.45 | |
| Other interest-earning assets | | | 5,133 | | | | 35 | | | | 0.68 | | | | 4,567 | | | | 59 | | | | 1.29 | | | | 3,780 | | | | 46 | | | | 1.22 | |
TOTAL INTEREST- EARNING ASSETS (1) | | | 418,652 | | | | 25,301 | | | | 6.04 | | | | 371,605 | | | | 25,327 | | | | 6.82 | | | | 342,651 | | | | 23,550 | | | | 6.87 | |
| Other noninterest-earning | | | | | | | | | | | | | | | | | | | | | | | | | | | | | | | | | | | | |
| assets (3) | | | 23,045 | | | | - | | | | - | | | | 22,429 | | | | - | | | | - | | | | 21,563 | | | | - | | | | - | |
| TOTAL ASSETS | | $ | 441,697 | | | | 25,301 | | | | - | | | $ | 394,034 | | | $ | 25,327 | | | | - | | | $ | 364,214 | | | $ | 23,550 | | | | - | |
| Interest-bearing liabilities: | | | | | | | | | | | | | | | | | | | | | | | | | | | | | | | | | | | | |
| Savings accounts | | $ | 64,349 | | | $ | 1,155 | | | | 1.80 | | | $ | 76,126 | | | $ | 2,426 | | | | 3.19 | % | | $ | 71,211 | | | $ | 2,660 | | | | 3.74 | % |
| NOW accounts | | | 49,325 | | | | 1,015 | | | | 2.06 | | | | 32,461 | | | | 427 | | | | 1.31 | | | | 30,742 | | | | 402 | | | | 1.31 | |
| Money market accounts | | | 6,905 | | | | 99 | | | | 1.43 | | | | 6,319 | | | | 112 | | | | 1.77 | | | | 7,321 | | | | 142 | | | | 1.94 | |
| Certificates of deposit | | | 151,316 | | | | 4,896 | | | | 3.24 | | | | 140,955 | | | | 6,287 | | | | 4.46 | | | | 125,149 | | | | 5,849 | | | | 4.67 | |
TOTAL INTEREST- BEARING DEPOSITS | | | 271,895 | | | | 7,165 | | | | 2.64 | | | | 255,861 | | | | 9,252 | | | | 3.62 | | | | 234,423 | | | | 9,053 | | | | 3.86 | |
| Borrowings: | | | | | | | | | | | | | | | | | | | | | | | | | | | | | | | | | | | | |
| Securities sold under | | | | | | | | | | | | | | | | | | | | | | | | | | | | | | | | | | | | |
| agreements to repurchase | | | 24,345 | | | | 229 | | | | 0.94 | | | | 20,567 | | | | 682 | | | | 3.31 | | | | 11,863 | | | | 575 | | | | 4.84 | |
| FHLB advances | | | 77,923 | | | | 3,453 | | | | 4.43 | | | | 58,526 | | | | 3,074 | | | | 5.25 | | | | 62,906 | | | | 3,399 | | | | 5.40 | |
| Junior subordinated debt | | | 7,217 | | | | 357 | | | | 4.95 | | | | 7,217 | | | | 539 | | | | 7.47 | | | | 7,217 | | | | 594 | | | | 8.24 | |
| TOTAL INTEREST- | | | | | | | | | | | | | | | | | | | | | | | | | | | | | | | | | | | | |
| BEARING LIABILITIES | | | 381,380 | | | | 11,204 | | | | 2.93 | | | | 342,171 | | | | 13,547 | | | | 3.96 | | | | 316,409 | | | | 13,621 | | | | 4.30 | |
| Noninterest-bearing | | | | | | | | | | | | | | | | | | | | | | | | | | | | | | | | | | | | |
| demand deposits | | | 23,140 | | | | - | | | | - | | | | 20,055 | | | | - | | | | - | | | | 17,850 | | | | - | | | | - | |
| Other liabilities | | | 546 | | | | - | | | | - | | | | 1,848 | | | | - | | | | - | | | | 2,041 | | | | - | | | | - | |
| TOTAL LIABILITIES | | | 405,066 | | | | 11,204 | | | | | | | | 364,074 | | | | 13,547 | | | | - | | | | 336,300 | | | | 13,621 | | | | - | |
| Stockholders’ equity | | | 36,631 | | | | - | | | | - | | | | 29,960 | | | | - | | | | - | | | | 27,914 | | | | - | | | | - | |
| TOTAL LIABILITIES AND | | | | | | | | | | | | | | | | | | | | | | | | | | | | | | | | | | | | |
| STOCKHOLDERS’ EQUITY | | $ | 441,697 | | | $ | 11,204 | | | | - | | | $ | 394,034 | | | $ | 13,547 | | | | - | | | $ | 364,214 | | | $ | 13,621 | | | | - | |
| Net interest income | | | | | | $ | 14,097 | | | | | | | | | | | $ | 11,780 | | | | | | | | | | | $ | 9,929 | | | | | |
| Interest rate spread (4) | | | | | | | | | | | 3.11 | % | | | | | | | | | | | 2.86 | % | | | | | | | | | | | 2.57 | % |
| Net interest margin (5) | | | | | | | | | | | 3.37 | % | | | | | | | | | | | 3.17 | % | | | | | | | | | | | 2.90 | % |
| Ratio of average interest-earning | | | | | | | | | | | | | | | | | | | | | | | | | | | | | | | | | | | | |
| assets to average interest- | | | | | | | | | | | | | | | | | | | | | | | | | | | | | | | | | | | | |
| bearing liabilities | | | 109.77 | % | | | | | | | | | | | | | | | 108.60 | % | | | | | | | | | | | | | | | 108.29 | % |
(1) Calculated net of deferred loan fees, loan discounts and loans-in-process. Nonaccrual loans are included in average loans.
(2) Includes FHLB stock and related cash dividends.
(3) Includes equity securities and related cash dividends.
(4) Net interest spread represents the difference between the average rate on interest-earning assets and the average cost of interest-bearing liabilities.
(5) Net yield on average interest-earning assets represents net interest income divided by average interest-earning assets.
> FINANCIAL REVIEW (continued) <
YIELDS EARNED AND RATES PAID
The following table sets forth for the periods and at the dates indicated, the weighted average yields earned on the Company’s assets, the weighted average interest rates paid on the Company’s liabilities, together with the net yield on interest-earning assets.
| | | At | | | For | |
| | | June 30, | | | The Year Ended June 30, | |
| | | 2009 | | | 2009 | | | 2008 | | | 2007 | |
| | | | | | | | | | | | | |
| Weighted-average yield on loan portfolio | | | 6.13% | | | | 6.39% | | | | 7.16% | | | | 7.29% | |
| Weighted-average yield on mortgage-backed securities | | | 4.63 | | | | 4.84 | | | | 4.76 | | | | 4.25 | |
| Weighted-average yield on investment securities (1) | | | 3.35 | | | | 3.45 | | | | 4.69 | | | | 4.45 | |
| Weighted-average yield on other interest-earning assets | | | 0.00 | | | | 0.68 | | | | 1.29 | | | | 1.22 | |
| Weighted-average yield on all interest-earning assets | | | 5.76 | | | | 6.04 | | | | 6.82 | | | | 6.87 | |
| Weighted-average rate paid on deposits | | | 2.34 | | | | 2.64 | | | | 3.62 | | | | 3.86 | |
| Weighted-average rate paid on securities sold under | | | | | | | | | | | | | | | | |
| agreements to repurchase | | | 0.69 | | | | 0.94 | | | | 3.31 | | | | 4.84 | |
| Weighted-average rate paid on FHLB advances | | | 4.31 | | | | 4.43 | | | | 5.25 | | | | 5.40 | |
| Weighted-average rate paid on subordinated debt | | | 3.36 | | | | 4.95 | | | | 7.47 | | | | 8.24 | |
| Weighted-average rate paid on all interest-bearing liabilities | | | 2.65 | | | | 2.93 | | | | 3.96 | | | | 4.30 | |
| Interest rate spread (spread between weighted average rate on | | | | | | | | | | | | | | | | |
| all interest-earning assets and all interest-bearing liabilities) | | | 3.11 | | | | 3.11 | | | | 2.86 | | | | 2.57 | |
| Net interest margin (net interest income as a percentage of | | | | | | | | | | | | | | | | |
| average interest-earning assets) | | | 3.36 | | | | 3.37 | | | | 3.17 | | | | 2.90 | |
(1) Includes Federal Home Loan Bank stock.
RATE/VOLUME ANALYSIS
The following table sets forth the effects of changing rates and volumes on net interest income of the Company. Information is provided with respect to (i) effects on interest income attributable to changes in volume (changes in volume multiplied by prior rate), (ii) effects on interest income attributable to changes in rate (changes in rate multiplied by prior volume), and (iii) changes in rate/volume (change in rate multiplied by change in volume).
| | | Years Ended June 30, 2009 Compared to 2008 Increase (Decrease) Due to | | | Years Ended June 30, 2008 Compared to 2007 Increase (Decrease) Due to | |
| | | | | | | | | | | | | | | | | | | | | | | | | |
| (dollars in thousands) | | Rate | | | Volume | | | Rate/ Volume | | | Net | | | Rate | | | Volume | | | Rate/ Volume | | | Net | |
| Interest-earning assets: | | | | | | | | | | | | | | | | | | | | | | | | |
| Loans receivable (1) | | | (2,503 | ) | | | 2,306 | | | | (258 | ) | | | (455 | ) | | | (387 | ) | | | 2,009 | | | | (28 | ) | | | 1,594 | |
| Mortgage-backed securities | | | 15 | | | | 778 | | | | 13 | | | | 806 | | | | 67 | | | | 267 | | | | 33 | | | | 367 | |
| Investment securities (2) | | | (280 | ) | | | (97 | ) | | | 24 | | | | (353 | ) | | | 68 | | | | (253 | ) | | | (12 | ) | | | (197 | ) |
| Other interest-earning deposits | | | (28 | ) | | | 7 | | | | (3 | ) | | | (24 | ) | | | 3 | | | | 10 | | | | - | | | | 13 | |
| Total net change in income on | | | | | | | | | | | | | | | | | | | | | | | | | | | | | | | | |
| interest-earning assets | | | (2,796 | ) | | | 2,994 | | | | (224 | ) | | | (26 | ) | | | (249 | ) | | | 2,033 | | | | (7 | ) | | | 1,777 | |
| Interest-bearing liabilities: | | | | | | | | | | | | | | | | | | | | | | | | | | | | | | | | |
| Deposits | | | (2,556 | ) | | | 317 | | | | 152 | | | | (2,087 | ) | | | (667 | ) | | | 926 | | | | (60 | ) | | | 199 | |
| Securities sold under | | | | | | | | | | | | | | | | | | | | | | | | | | | | | | | | |
| agreements to repurchase | | | (487 | ) | | | 125 | | | | (91 | ) | | | (453 | ) | | | (182 | ) | | | 421 | | | | (132 | ) | | | 107 | |
| Subordinated debt | | | (182 | ) | | | - | | | | - | | | | (182 | ) | | | (56 | ) | | | - | | | | 1 | | | | (55 | ) |
| FHLB advances | | | (480 | ) | | | 1,018 | | | | (159 | ) | | | 379 | | | | (94 | ) | | | (237 | ) | | | 6 | | | | (325 | ) |
| Total net change in expense on | | | | | | | | | | | | | | | | | | | | | | | | | | | | | | | | |
| interest-bearing liabilities | | | (3,705 | ) | | | 1,460 | | | | (98 | ) | | | (2,343 | ) | | | (999 | ) | | | 1,110 | | | | (185 | ) | | | (74 | ) |
| Net change in net interest income | | | 909 | | | | 1,534 | | | | (126 | ) | | | 2,317 | | | | 750 | | | | 923 | | | | 178 | | | | 1,851 | |
(1) Does not include interest on loans placed on nonaccrual status.
(2) Does not include dividends earned on equity securities.
> REPORT OF INDEPENDENT REGISTERED PUBLIC ACCOUNTING FIRM <
> CONSOLIDATED BALANCE SHEETS <
JUNE 30, 2009 AND 2008
Southern Missouri Bancorp, Inc.
| Assets | | 2009 | | | 2008 | |
| Cash and cash equivalents | | $ | 8,074,465 | | | $ | 6,042,408 | |
| Interest-bearing time deposits | | | - | | | | 1,980,000 | |
| Available for sale securities (Note 2) | | | 60,177,992 | | | | 39,915,280 | |
| Stock in FHLB of Des Moines | | | 4,592,300 | | | | 3,323,700 | |
| Loans, net of allowance for loan losses of | | | | | | | | |
| $4,430,210 and $3,567,203 at | | | | | | | | |
| June 30, 2009 and 2008, respectively (Note 3) | | | 368,555,962 | | | | 343,069,775 | |
| Accrued interest receivable | | | 2,650,161 | | | | 3,011,777 | |
| Premises and equipment, net (Note 4) | | | 8,135,092 | | | | 8,204,631 | |
| Bank owned life insurance - cash surrender value | | | 7,563,855 | | | | 7,289,819 | |
| Intangible assets, net | | | 1,582,645 | | | | 1,837,903 | |
| Prepaid expenses and other assets | | | 4,564,164 | | | | 3,145,090 | |
| TOTAL ASSETS | | $ | 465,896,636 | | | $ | 417,820,383 | |
| Liabilities and Stockholders’ Equity | | | | | | |
| Deposits (Note 5) | | $ | 311,955,468 | | | $ | 292,257,045 | |
| Securities sold under agreements to repurchase (Note 6) | | | 23,747,557 | | | | 21,803,513 | |
| Advances from FHLB of Des Moines (Note 7) | | | 78,750,000 | | | | 64,050,000 | |
| Accounts payable and other liabilities | | | 1,229,187 | | | | 821,407 | |
| Accrued interest payable | | | 989,086 | | | | 1,199,769 | |
| Subordinated debt (Note 8) | | | 7,217,000 | | | | 7,217,000 | |
| TOTAL LIABILITIES | | | 423,888,298 | | | | 387,348,734 | |
| | | | | | | | | |
| Commitments and contingencies (Note 14) | | | - | | | | - | |
| | | | | | | | | |
| Preferred stock, $.01 par value; $1,000 liquidation value | | | | | | | | |
| 500,000 shares authorized; 9,550 issued and outstanding | | | 9,388,815 | | | | - | |
| Common stock, $.01 par value; 4,000,000 shares | | | | | | | | |
| authorized; 2,957,226 shares issued | | | 29,572 | | | | 29,572 | |
| Warrants to acquire common stock | | | 176,790 | | | | - | |
| Additional paid-in capital | | | 16,344,725 | | | | 16,675,839 | |
| Retained earnings | | | 29,947,297 | | | | 27,364,219 | |
| Treasury stock of 869,250 shares in 2009 | | | | | | | | |
| and 766,393 shares in 2008, at cost | | | (13,994,870 | ) | | | (13,002,803 | ) |
| Accumulated other comprehensive gain (loss) - AFS securities | | | 106,930 | | | | (626,673 | ) |
| Accumulated other comprehensive income - FAS 158 | | | 9,079 | | | | 31,495 | |
| TOTAL STOCKHOLDERS’ EQUITY | | | 42,008,338 | | | | 30,471,649 | |
TOTAL LIABILITIES AND STOCKHOLDERS’ EQUITY | | $ | 465,896,636 | | | $ | 417,820,383 | |
See accompanying notes to consolidated financial statements.
> CONSOLIDATED STATEMENTS OF INCOME <
YEARS ENDED JUNE 30, 2009, 2008 AND 2007
Southern Missouri Bancorp, Inc.
| Interest income: | | 2009 | | | 2008 | | | 2007 | |
| Loans | | $ | 22,830,730 | | | $ | 23,285,907 | | | $ | 21,691,579 | |
| Investment securities | | | 706,429 | | | | 1,058,742 | | | | 1,255,676 | |
| Mortgage-backed securities | | | 1,728,958 | | | | 923,039 | | | | 556,235 | |
| Other interest-earning assets | | | 35,010 | | | | 58,992 | | | | 46,144 | |
| TOTAL INTEREST INCOME | | | 25,301,127 | | | | 25,326,680 | | | | 23,549,634 | |
| Interest expense: | | | | | | | | | | | | |
| Deposits | | | 7,165,030 | | | | 9,251,569 | | | | 9,052,748 | |
| Securities sold under agreements | | | | | | | | | | | | |
| to repurchase | | | 228,893 | | | | 681,817 | | | | 574,570 | |
| Advances from FHLB of Des Moines | | | 3,452,840 | | | | 3,074,378 | | | | 3,398,868 | |
| Subordinated debt | | | 357,387 | | | | 539,017 | | | | 594,357 | |
| TOTAL INTEREST EXPENSE | | | 11,204,150 | | | | 13,546,781 | | | | 13,620,543 | |
| NET INTEREST INCOME | | | 14,096,977 | | | | 11,779,899 | | | | 9,929,091 | |
| Provision for loan losses (Note 3) | | | 1,220,000 | | | | 940,000 | | | | 605,000 | |
NET INTEREST INCOME AFTER PROVISION FOR LOAN LOSSES | | | 12,876,977 | | | | 10,839,899 | | | | 9,324,091 | |
| Noninterest income: | | | | | | | | | | | | |
| Net gains on sales of | | | | | | | | | | | | |
| available for sale securities | | | - | | | | 6,084 | | | | - | |
| AFS securities losses due to | | | | | | | | | | | | |
| other-than-temporary impairment | | | (678,973 | ) | | | - | | | | - | |
| Customer service charges | | | 1,223,449 | | | | 1,257,525 | | | | 1,140,474 | |
| Loan late charges | | | 155,454 | | | | 142,232 | | | | 124,076 | |
| Increase in cash surrender value | | | | | | | | | | | | |
| of bank owned life insurance | | | 274,036 | | | | 291,254 | | | | 263,210 | |
| Other | | | 845,778 | | | | 715,016 | | | | 679,038 | |
| TOTAL NONINTEREST INCOME | | | 1,819,744 | | | | 2,412,111 | | | | 2,206,798 | |
| Noninterest expense: | | | | | | | | | | | | |
| Compensation and benefits | | | 4,800,224 | | | | 4,428,909 | | | | 4,006,971 | |
| Occupancy and equipment | | | 1,528,850 | | | | 1,525,999 | | | | 1,432,659 | |
| Deposit insurance premium | | | 535,971 | | | | 30,393 | | | | 31,022 | |
| Professional fees | | | 311,461 | | | | 223,136 | | | | 246,271 | |
| Advertising | | | 217,295 | | | | 176,479 | | | | 224,438 | |
| Postage and office supplies | | | 317,844 | | | | 275,585 | | | | 298,440 | |
| Amortization of intangible assets | | | 255,258 | | | | 255,258 | | | | 255,258 | |
| Other | | | 1,183,241 | | | | 947,968 | | | | 962,959 | |
| TOTAL NONINTEREST EXPENSE | | | 9,150,144 | | | | 7,863,727 | | | | 7,458,018 | |
| INCOME BEFORE INCOME TAXES | | | 5,546,577 | | | | 5,388,283 | | | | 4,072,871 | |
| Income taxes (Note 10) | | | | | | | | | | | | |
| Current | | | 2,004,500 | | | | 2,278,803 | | | | 1,307,458 | |
| Deferred | | | (293,000 | ) | | | (504,000 | ) | | | (163,000 | ) |
| | | | 1,711,500 | | | | 1,774,803 | | | | 1,144,458 | |
| NET INCOME | | $ | 3,835,077 | | | $ | 3,613,480 | | | $ | 2,928,413 | |
| Less: effective dividend on preferred shares | | | 288,841 | | | | - | | | | - | |
NET INCOME AVAILABLE TO COMMON STOCKHOLDERS | | $ | 3,546,236 | | | $ | 3,613,480 | | | $ | 2,928,413 | |
| Basic earnings per share available to common stockholders | | $ | 1.67 | | | $ | 1.64 | | | $ | 1.32 | |
| Diluted earnings per share available to common stockholders | | $ | 1.67 | | | $ | 1.63 | | | $ | 1.29 | |
See accompanying notes to consolidated financial statements.
> CONSOLIDATED STATEMENTS OF STOCKHOLDERS’ EQUITY <
YEARS ENDED JUNE 30, 2009, 2008 AND 2007
Southern Missouri Bancorp, Inc.
| | | Preferred Stock | | | Common Stock | | | Warrants to Acquire Common Stock | | | Additional Paid-in Capital | | | Retained Earnings | | | Treasury Stock | | | Accumulated Other Comprehensive Income (Loss) | | | Total Stockholders’ Equity | |
| | | | | | | | | | | | | | | | | | | | | | | | | |
| BALANCE AT JUNE 30, 2006 | | $ | - | | | $ | 29,572 | | | $ | - | | | $ | 17,354,621 | | | $ | 22,511,880 | | | $ | (12,651,521 | ) | | $ | (690,325 | ) | | $ | 26,554,227 | |
| | | | | | | | | | | | | | | | | | | | | | | | | | | | | | | | | |
| Net income | | | | | | | | | | | | | | | | | | | 2,928,413 | | | | | | | | | | | | 2,928,413 | |
| Change in unrealized gain | | | | | | | | | | | | | | | | | | | | | | | | | | | | | | | | |
| on available for sale securities | | | | | | | | | | | | | | | | | | | | | | | | | | | 341,523 | | | | 341,523 | |
| TOTAL COMPREHENSIVE INCOME | | | | | | | | | | | | | | | | | | | | | | | | | | | | | | | 3,269,936 | |
| | | | | | | | | | | | | | | | | | | | | | | | | | | | | | | | | |
| Purchases of treasury stock | | | | | | | | | | | | | | | | | | | | | | | (397,020 | ) | | | | | | | (397,020 | ) |
| Dividends paid on common | | | | | | | | | | | | | | | | | | | | | | | | | | | | | | | | |
| stock ($.36 per share) | | | | | | | | | | | | | | | | | | | (805,439 | ) | | | | | | | | | | | (805,439 | ) |
| SOP Expense | | | | | | | | | | | | | | | 50,067 | | | | | | | | | | | | | | | | 50,067 | |
| MRP expense | | | | | | | | | | | | | | | 13,147 | | | | | | | | | | | | | | | | 13,147 | |
| Tax benefit of MRP | | | | | | | | | | | | | | | 3,321 | | | | | | | | | | | | | | | | 3,321 | |
| Exercise of stock options | | | | | | | | | | | | | | | (32,000 | ) | | | | | | | 58,000 | | | | | | | | 26,000 | |
| BALANCE AT JUNE 30, 2007 | | $ | - | | | $ | 29,572 | | | $ | - | | | $ | 17,389,156 | | | $ | 24,634,854 | | | $ | (12,990,541 | ) | | $ | (348,802 | ) | | $ | 28,714,239 | |
| | | | | | | | | | | | | | | | | | | | | | | | | | | | | | | | | |
| Net income | | | | | | | | | | | | | | | | | | | 3,613,480 | | | | | | | | | | | | 3,613,480 | |
| Change in unrealized loss | | | | | | | | | | | | | | | | | | | | | | | | | | | | | | | | |
| on available for sale securities | | | | | | | | | | | | | | | | | | | | | | | | | | | (277,871 | ) | | | (277,871 | ) |
| Defined benefit pension | | | | | | | | | | | | | | | | | | | | | | | | | | | | | | | | |
| plan net gain | | | | | | | | | | | | | | | | | | | | | | | | | | | 31,495 | | | | 31,495 | |
| TOTAL COMPREHENSIVE INCOME | | | | | | | | | | | | | | | | | | | | | | | | | | | | | | | 3,367,104 | |
| | | | | | | | | | | | | | | | | | | | | | | | | | | | | | | | | |
| Purchases of treasury stock | | | | | | | | | | | | | | | | | | | | | | | (1,364,279 | ) | | | | | | | (1,364,279 | ) |
| Dividends paid on common | | | | | | | | | | | | | | | | | | | | | | | | | | | | | | | | |
| stock ($.40 per share) | | | | | | | | | | | | | | | | | | | (884,115 | ) | | | | | | | | | | | (884,115 | ) |
| SOP Expense | | | | | | | | | | | | | | | 48,481 | | | | | | | | | | | | | | | | 48,481 | |
| MRP expense | | | | | | | | | | | | | | | 19,777 | | | | | | | | | | | | | | | | 19,777 | |
| Tax benefit of MRP | | | | | | | | | | | | | | | 4,817 | | | | | | | | | | | | | | | | 4,817 | |
| Exercise of stock options | | | | | | | | | | | | | | | (786,392 | ) | | | | | | | 1,352,017 | | | | | | | | 565,625 | |
| BALANCE AT JUNE 30, 2008 | | $ | - | | | $ | 29,572 | | | $ | - | | | $ | 16,675,839 | | | $ | 27,364,219 | | | $ | (13,002,803 | ) | | $ | (595,178 | ) | | $ | 30,471,649 | |
| | | | | | | | | | | | | | | | | | | | | | | | | | | | | | | | | |
| Net income | | | | | | | | | | | | | | | | | | $ | 3,835,077 | | | | | | | | | | | $ | 3,835,077 | |
| Change in unrealized gain | | | | | | | | | | | | | | | | | | | | | | | | | | | | | | | | |
| on available for sale securities | | | | | | | | | | | | | | | | | | | | | | | | | | | 733,603 | | | | 733,603 | |
| Defined benefit pension | | | | | | | | | | | | | | | | | | | | | | | | | | | | | | | | |
| plan net loss | | | | | | | | | | | | | | | | | | | | | | | | | | | (22,416 | ) | | | (22,416 | ) |
| TOTAL COMPREHENSIVE INCOME | | | | | | | | | | | | | | | | | | | | | | | | | | | | | | | 4,546,264 | |
| | | | | | | | | | | | | | | | | | | | | | | | | | | | | | | | | |
| Preferred stock issued | | | 9,373,210 | | | | | | | | 176,790 | | | | (38,871 | ) | | | | | | | | | | | | | | | 9,511,129 | |
| Purchases of treasury stock | | | | | | | | | | | | | | | | | | | | | | | (1,507,825 | ) | | | | | | | (1,507,825 | ) |
| Dividends paid on common | | | | | | | | | | | | | | | | | | | | | | | | | | | | | | | | |
| stock ($.48 per share) | | | | | | | | | | | | | | | | | | | (1,024,172 | ) | | | | | | | | | | | (1,024,172 | ) |
| Dividends paid on preferred stock | | | | | | | | | | | | | | | | | | | (212,222 | ) | | | | | | | | | | | (212,222 | ) |
| Accretion of discount on preferred stock | | | 15,605 | | | | | | | | | | | | | | | | (15,605 | ) | | | | | | | - | | | | | |
| SOP Expense | | | | | | | | | | | | | | | 47,215 | | | | | | | | | | | | | | | | 47,215 | |
| MRP expense | | | | | | | | | | | | | | | 12,809 | | | | | | | | | | | | | | | | 12,809 | |
| Tax benefit of MRP | | | | | | | | | | | | | | | 2,422 | | | | | | | | | | | | | | | | 2,422 | |
| Exercise of stock options | | | | | | | | | | | | | | | (354,689 | ) | | | | | | | 515,758 | | | | | | | | 161,069 | |
| BALANCE AT JUNE 30, 2009 | | $ | 9,388,815 | | | $ | 29,572 | | | $ | 176,790 | | | $ | 16,344,725 | | | $ | 29,947,297 | | | $ | (13,994,870 | ) | | $ | 116,009 | | | $ | 42,008,338 | |
See accompanying notes to consolidated financial statements.
> CONSOLIDATED STATEMENTS OF CASH FLOWS <
YEARS ENDED JUNE 30, 2009, 2008 AND 2007
Southern Missouri Bancorp, Inc.
| Cash flows from operating activities: | | 2009 | | | 2008 | | | 2007 | |
| Net income | | $ | 3,835,077 | | | $ | 3,613,480 | | | $ | 2,928,413 | |
| Items not requiring (providing) cash: | | | | | | | | | | | | |
| Depreciation | | | 625,582 | | | | 680,693 | | | | 713,774 | |
| SOP and MRP expense | | | 62,446 | | | | 73,075 | | | | 66,535 | |
| AFS securities losses due to other-than-temporary | | | | | | | | | | | | |
| impairment | | | 678,973 | | | | - | | | | - | |
| Net realized gains on available | | | | | | | | | | | | |
| for sale securities | | | - | | | | (6,084 | ) | | | - | |
| Gain on sale of foreclosed assets | | | (21,369 | ) | | | (18,455 | ) | | | (1,035 | ) |
| Amortization of intangible assets | | | 255,258 | | | | 255,258 | | | | 255,258 | |
| Increase in cash surrender value | | | | | | | | | | | | |
| of bank owned life insurance | | | (274,036 | ) | | | (291,254 | ) | | | (263,210 | ) |
| Provision for loan losses | | | 1,220,000 | | | | 940,000 | | | | 605,000 | |
| Amortization of premiums and discounts | | | | | | | | | | | | |
| on securities | | | 136,347 | | | | (52,965 | ) | | | (9,373 | ) |
| Deferred income taxes | | | (293,000 | ) | | | (504,000 | ) | | | (163,000 | ) |
| Changes in: | | | | | | | | | | | | |
| Accrued interest receivable | | | 361,616 | | | | (763,713 | ) | | | (346,437 | ) |
| Prepaid expenses and other assets | | | 95,720 | | | | 49,053 | | | | (346,378 | ) |
| Accounts payable and other liabilities | | | 385,364 | | | | 110,086 | | | | 160,803 | |
| Accrued interest payable | | | (210,683 | ) | | | (206,511 | ) | | | 440,422 | |
| NET CASH PROVIDED BY OPERATING ACTIVITIES | | $ | 6,857,295 | | | $ | 3,878,663 | | | $ | 4,040,772 | |
| | | | | | | | | | | | | |
| | | | | | | | | | | | | |
| Cash flows from investing activities: | | | | | | | | | | | | |
| Net change in interest-bearing deposits | | $ | 1,980,000 | | | $ | (1,980,000 | ) | | $ | - | |
| Net increase in loans | | | (27,425,708 | ) | | | (32,445,458 | ) | | | (31,877,876 | ) |
| Proceeds from sales of | | | | | | | | | | | | |
| available for sale securities | | | - | | | | 233,500 | | | | - | |
| Proceeds from maturities of | | | | | | | | | | | | |
| available for sale securities | | | 9,227,820 | | | | 24,698,058 | | | | 8,919,334 | |
| Purchases of available for | | | | | | | | | | | | |
| sale securities | | | (29,141,403 | ) | | | (30,345,266 | ) | | | (4,849,941 | ) |
| Investment in federal and state tax credits | | | (1,263,944 | ) | | | - | | | | - | |
| Purchase of Federal Home Loan Bank stock | | | (1,268,600 | ) | | | (253,100 | ) | | | (429,300 | ) |
| Purchase of premises and equipment | | | (556,043 | ) | | | (234,651 | ) | | | (347,815 | ) |
| Proceeds from sale of vehicle | | | - | | | | - | | | | 1,867 | |
| Proceeds from sale of foreclosed and repossessed property | | | 352,194 | | | | 578,367 | | | | 201,946 | |
| NET CASH USED IN INVESTING ACTIVITIES | | $ | (48,095,684 | ) | | $ | (39,748,550 | ) | | $ | (28,381,785 | ) |
See accompanying notes to consolidated financial statements.
> CONSOLIDATED STATEMENTS OF CASH FLOWS (continued) <
YEARS ENDED JUNE 30, 2009, 2008 AND 2007
Southern Missouri Bancorp, Inc.
| Cash flows from financing activities: | | 2009 | | | 2008 | | | 2007 | |
| Net increase in demand deposits and savings accounts | | $ | 9,750,488 | | | $ | 2,405,635 | | | $ | 7,025,174 | |
| Net increase in certificates of deposit | | | 9,947,935 | | | | 19,763,314 | | | | 4,993,903 | |
| Net increase in securities sold under | | | | | | | | | | | | |
| agreements to repurchase | | | 1,944,044 | | | | 4,045,149 | | | | 6,462,753 | |
| Proceeds from Federal Home Loan Bank advances | | | 212,675,000 | | | | 353,550,000 | | | | 388,475,000 | |
| Repayments of Federal Home Loan Bank advances | | | (197,975,000 | ) | | | (343,500,000 | ) | | | (380,475,000 | ) |
| Proceeds from issuance of preferred stock | | | 9,511,129 | ) | | | - | | | | - | |
| Dividends paid on preferred stock | | | (212,222 | ) | | | - | | | | - | |
| Dividends paid on common stock | | | (1,024,172 | ) | | | (884,115 | ) | | | (805,439 | ) |
| Exercise of stock options | | | 161,069 | | | | 565,625 | | | | 26,000 | |
| Purchases of treasury stock | | | (1,507,825 | ) | | | (1,364,279 | ) | | | (397,020 | ) |
| NET CASH PROVIDED BY FINANCING ACTIVITIES | | $ | 43,270,446 | | | $ | 34,581,329 | | | $ | 25,305,371 | |
| Increase (Decrease) in cash and cash equivalents | | | 2,032,057 | | | | (1,288,558 | ) | | | 964,358 | |
| Cash and cash equivalents at beginning of year | | | 6,042,408 | | | | 7,330,966 | | | | 6,366,608 | |
| CASH AND CASH EQUIVALENTS AT END OF YEAR | | $ | 8,074,465 | | | $ | 6,042,408 | | | $ | 7,330,966 | |
| | | | | | | | | | | | | |
| | | | | | | | | | | | | |
| Supplemental disclosures of cash flow information: | | | | | | | | | | | | |
| Noncash investing and financing activities | | | | | | | | | | | | |
| Conversion of loans to foreclosed real estate | | $ | 477,177 | | | $ | 654,369 | | | $ | 288,577 | |
| Conversion of foreclosed real estate to loans | | | 13,172 | | | | 235,000 | | | | 52,611 | |
| | | | | | | | | | | | | |
| Cash paid during the period for | | | | | | | | | | | | |
| Interest (net of interest credited) | | | 4,981,065 | | | | 5,050,895 | | | | 5,223,263 | |
| Income taxes | | | 1,886,405 | | | | 1,965,393 | | | | 1,472,391 | |
See accompanying notes to consolidated financial statements.
> NOTES TO CONSOLIDATED FINANCIAL STATEMENTS <
Southern Missouri Bancorp, Inc.
NOTE 1: Organization and Summary of Significant Accounting Policies Organization. Southern Missouri Bancorp, Inc., a Missouri corporation (the Company) was organized in 1994 and is the parent company of Southern Bank (the Bank). Substantially all of the Company’s consolidated revenues are derived from the operations of the Bank, and the Bank represents substantially all of the Company’s consolidated assets and liabilities. Basis of Financial Statement Presentation. The financial statements of the Company have been prepared in conformity with accounting principles generally accepted in the United States of America and general practices within the banking industry. In the normal course of business, the Company encounters two significant types of risk: economic and regulatory. Economic risk is comprised of interest rate risk, credit risk, and market risk. The Company is subject to interest rate risk to the degree that its interest-bearing liabilities reprice on a different basis than its interest-earning assets. Credit risk is the risk of default on the Company’s loan portfolio that results from the borrowers’ inability or unwillingness to make contractually required payments. Market risk reflects changes in the value of collateral underlying loans receivable and the value of the Company’s investment in real estate. Principles of Consolidation. The consolidated financial statements include the accounts of the Company and its wholly-owned subsidiary, the Bank. All significant intercompany accounts and transactions have been eliminated. Use of Estimates. The preparation of financial statements in conformity with accounting principles generally accepted in the United States of America requires management to make estimates and assumptions that affect the reported amounts of assets and liabilities and disclosures of contingent assets and liabilities at the date of the financial statements and the reported amounts of revenues and expenses during the reporting period. Actual results could differ from those estimates. Material estimates that are particularly susceptible to significant change relate to the determination of the allowance for loan losses. In connection with the determination of the allowance for loan losses, management obtains independent appraisals for significant properties. Cash and Cash Equivalents. For purposes of reporting cash flows, cash and cash equivalents includes cash, due from depository institutions and interest-bearing deposits in other depository institutions with original maturities of three months or less. Interest-bearing deposits in other depository institutions were $5,614,330 and $5,656,273 at June 30, 2009 and 2008, respectively. The deposits are held at the Federal Reserve and Federal Home Loan Bank of Des Moines. Available for Sale Securities. Available for sale securities, which include any security for which the Company has no immediate plan to sell but which may be sold in the future are carried at fair value. Unrealized gains and losses, net of tax, are reported in accumulated other comprehensive loss, a component of stockholders’ equity. All securities have been classified as available for sale. Premiums and discounts on debt securities are amortized or accreted as adjustments to income over the estimated life of the security using the level yield method. Realized gains or losses on the sale of securities is based on the specific identification method. The fair value of securities is based on quoted market prices or dealer quotes. If a quoted market price is not available, fair value is estimated using quoted market prices for similar securities. The Company does not invest in collateralized mortgage obligations that are considered high risk. | | Federal Home Loan Bank Stock. The Bank is a member of the Federal Home Loan Bank (FHLB) system. Capital stock of the FHLB is a required investment based upon a predetermined formula and is carried at cost. Loans. Loans are stated at unpaid principal balances, less the allowance for loan losses and net deferred loan origination fees. Interest on loans is accrued based upon the principal amount outstanding. The accrual of interest on loans is discontinued when, in management’s judgment, the collectibility of interest or principal in the normal course of business is doubtful. A loan is considered delinquent when a payment has not been made by the contractual due date. Interest income previously accrued but not collected at the date a loan is placed on nonaccrual status is reversed against interest income. Cash receipts on a nonaccrual loan are applied to principal and interest in accordance with its contractual terms unless full payment of principal is not expected, in which case cash receipts, whether designated as principal or interest, are applied as a reduction of the carrying value of the loan. A nonaccrual loan is generally returned to accrual status when principal and interest payments are current, full collectibility of principal and interest is reasonably assured and a consistent record of performance has been demonstrated. The allowance for losses on loans represents management’s best estimate of losses probable in the existing loan portfolio. The allowance for losses on loans is increased by the provision for losses on loans charged to expense and reduced by loans charged off, net of recoveries. Loans are charged off in the period deemed uncollectible. Recoveries of loans previously charged off are recorded when received. The provision for losses on loans is determined based on management’s assessment of several factors: reviews and evaluations of specific loans, changes in the nature and volume of the loan portfolio, current economic conditions and the related impact on specific borrowers and industry groups, historical loan loss experience, the level of classified and nonperforming loans and the results of regulatory examinations. Valuation allowances are established for impaired loans for the difference between the loan amount and fair value of collateral less estimated selling costs. Impairment losses are recognized through an increase in the allowance for loan losses. Loans are considered impaired if, based on current information and events, it is probable that the Company will be unable to collect the scheduled payments of principal or interest when due according to the contractual terms of the loan agreement. Loan fees and certain direct loan origination costs are deferred, and the net fee or cost is recognized as an adjustment to interest income using the interest method over the contractual life of the loans. Foreclosed Real Estate. Real estate acquired by foreclosure or by deed in lieu of foreclosure is initially recorded at the lower of cost or fair value less estimated selling costs. Costs for development and improvement of the property are capitalized. Valuations are periodically performed by management, and an allowance for losses is established by a charge to operations if the carrying value of a property exceeds its estimated fair value, less estimated selling costs. Loans to facilitate the sale of real estate acquired in foreclosure are discounted if made at less than market rates. Discounts are amortized over the fixed interest period of each loan using the interest method. |
> NOTES TO CONSOLIDATED FINANCIAL STATEMENTS (continued) <
Southern Missouri Bancorp, Inc.
Premises and Equipment. Premises and equipment are stated at cost less accumulated depreciation and include expenditures for major betterments and renewals. Maintenance, repairs, and minor renewals are expensed as incurred. When property is retired or sold, the retired asset and related accumulated depreciation are removed from the accounts and the resulting gain or loss taken into income. The Company reviews property and equipment for impairment whenever events or changes in circumstances indicate that the carrying amount of an asset may not be recoverable. If such assets are considered to be impaired, the impairment loss recognized is measured by the amount by which the carrying amount exceeds the fair value of the assets. Depreciation is computed by use of straight-line and accelerated methods over the estimated useful lives of the assets. Estimated lives are generally 20 to 40 years for premises, and five to seven years for equipment. Intangible Assets. The Bank adopted the provisions of Statement of Financial Accounting Standards (SFAS) No. 142, Goodwill and Other Intangible Assets, effective July 1, 2002. Intangible assets acquired through the purchase of branches were excluded from the scope of SFAS 142. In October 2002, the Financial Accounting Standards Board (FASB) issued SFAS No. 147, Acquisitions of Certain Financial Institutions. SFAS 147 clarified that the carrying amount of an unidentified intangible asset should continue to be amortized. The Bank’s gross amount of this intangible asset at June 30, 2009 and 2008 was $3,837,416 and $3,837,416, respectively, with accumulated amortization of $2,254,771 and $1,999,513, respectively. The intangible asset is being amortized over 15 years with amortization expense over the next five years expected to be $255,258 per year. Income Taxes. The Company and its subsidiary file consolidated income tax returns. Deferred assets and liabilities are recognized for the tax effects of differences between the financial reporting bases and income tax bases of the Company’s assets and liabilities. Incentive Plan. The Company accounts for its management and recognition plan (MRP) in accordance with Statement of Financial Accounting Standards (SFAS) No. 123 (revised 2004), “Share-Based Payment”. The aggregate purchase price of all shares owned by the incentive plan is reflected as a reduction of stockholders’ equity. Compensation expense is based on the market price of the Company’s stock on the date the shares are granted and is recorded over the vesting period. The difference between the aggregate purchase price and the fair value on the date the shares are considered earned is recorded as an adjustment to additional paid in capital. Outside Directors’ Retirement. The Bank adopted a directors’ retirement plan in April 1994 for outside directors. The directors’ retirement plan provides that each non-employee director (participant) shall receive, upon termination of service on the Board on or after age 60, other than termination for cause, a benefit in equal annual installments over a five year period. The benefit will be based upon the product of the participant’s vesting percentage and the total Board fees paid to the participant during the calendar year preceding termination of service on the Board. The vesting percentage shall be determined based upon the participant’s years of service on the Board, whether before or after the reorganization date. In the event that the participant dies before collecting any or all of the benefits, the Bank shall pay the participant’s beneficiary. No benefits shall be payable to anyone other than the beneficiary, and shall terminate on the death of the beneficiary. | | Stock Options. In December 2004, the Financial Accounting Standards Board (FASB) issued Statement of Financial Accounting Standards (SFAS) No. 123 (revised 2004), “Share-Based Payment,” which requires the compensation costs related to share-based payment transactions to be recognized in financial statements. With limited exceptions, the amount of compensation cost is measured based on the grant-date fair value of the equity instruments issued. Compensation cost is recognized over the vesting period during which an employee provides service in exchange for the award. SFAS No. 123R was adopted during the first quarter of fiscal 2006 for the Company primarily due to the transition from a small business filer to a full filer; stock-based compensation has been recognized for all stock options granted or modified after July 1, 2005. In addition, stock options not vested on July 1, 2005, are being recognized in expense over the remaining vesting period. Employee Stock Ownership Plan. The Company accounts for its employee stock ownership plan (ESOP) in accordance with American Institute of Certified Public Accountants (AICPA) Statement of Position 93-6. As of June 30, 2005, the ESOP shares reserved at the initial public offering were fully distributed and the Bank began purchasing additional shares under the ESOP plan. Earnings Per Share. Basic earnings per share available to common stockholders is computed using the weighted-average number of common shares outstanding. Diluted earnings per share available to common stockholders includes the effect of all dilutive potential common shares (primarily stock options) outstanding during each year. Treasury Stock. Treasury stock is stated at cost. Cost is determined by the first-in, first-out method. Reclassification. Certain amounts included in the 2008 and 2007 consolidated financial statements have been reclassified to conform to the 2009 presentation. These reclassifications had no effect on net income. The following paragraphs summarize the impact of new accounting pronouncements: In September 2006, the Financial Accounting Standards Board (FASB) issued Statement No. 157, “Fair Value Measurements” (“SFAS No. 157”), which defines fair value, establishes a framework for measuring fair value in generally accepted accounting standards, and expands disclosures about fair value measurements. SFAS No. 157 was effective for the Company for the fiscal year which began July 1, 2008. In March 2008, the FASB issued Staff Position No. FAS 157-2 (“FSP No. 157-2”), which delays the effective date of SFAS No. 157 for non-financial assets and liabilities, except for items that are recognized or disclosed at fair value in the financial statements on a recurring basis (at least annually), to fiscal years and interim periods beginning after November 15, 2008. The Company added the required footnote disclosures as a result of adopting this standard. In December 2007, the FASB issued Statement No. 141 (revised 2007), “Business Combinations—A Replacement of FASB Statement No. 141” (“SFAS No. 141(R)”) and Statement No. 160, “Noncontrolling Interests in Consolidated Financial Statements—An Amendment of ARB No. 51” (“SFAS No. 160”). SFAS No. 141(R) establishes principles and requirements for how an acquirer recognizes and measures certain items in a business combination, as well as disclosures about the nature and financial effects of a business combination. SFAS No. 160 establishes accounting and reporting standards surrounding noncontrolling interest, or minority interests, which are the |
> NOTES TO CONSOLIDATED FINANCIAL STATEMENTS (continued) <
Southern Missouri Bancorp, Inc.
portions of equity in a subsidiary not attributable, directly or indirectly, to a parent. The pronouncements will be effective for the Company beginning July 1, 2009. Presentation and disclosure requirements related to noncontrolling interests must be retrospectively applied. The Company will be impacted by the adoption of this standard with its July 2009 acquisition. The Company is in the process of determining the purchase accounting adjustments. In March 2008, the FASB issued Statement No. 161, “Disclosures about Derivative Instruments and Hedging Activities—An Amendment of FASB Statement No. 133” (“SFAS No. 161”). SFAS No. 161 requires enhanced qualitative disclosures about objectives and strategies for using derivatives, quantitative disclosures about fair value amounts of and gains and losses on derivative instruments, and disclosures about credit-risk-related contingent features in derivative agreements. SFAS No. 161 was effective for the Company for the interim period which began January 1, 2009, and did not have a significant effect on the Company’s consolidated financial statements. In October 2008, the FASB issued the FASB Staff Position on FAS 157-3, “Determining the Fair Value of a Financial Asset When the Market for That Asset is Not Active” (“FSP 157-3”). FSP 157-3 clarifies the application of SFAS No. 157, “Fair Value Measurements,” in a market that is not active and provides an example to illustrate key considerations in determining fair value of financial assets when the market for that financial asset is not active. FSP 157-3 applies to financial assets within the scope of accounting pronouncements that require or permit fair value measurements in accordance with FAS 157. FSP 157-3 was effective upon issuance and included prior periods for which financial statements had not been issued. The application of FSP 157-3 did not have a material impact on the Company’s consolidated financial statements. In April 2009, the FASB issued the FASB Staff Position on FAS 157-4, “Determining Fair Value When the Volume and Level of Activity For the Asset or Liability Have Significantly Decreased and Identifying Transactions That Are Not Orderly” (FSP 157-4). FSP 157-4 provides additional guidance for estimating fair value in accordance with SFAS 157 when the volume and level of activity for the asset or liability have decreased significantly. FSP 157-4 also provides guidance on identifying circumstances that indicate a transaction is not orderly. The provisions of FSP 157-4 were effective for the Company’s year ended June 30, 2009. Implementation of this standard had a minimal effect on the Company’s consolidated financial statements. In April 2009, the FASB issued the FASB Staff Position on FAS 115-2 and FAS 124-2, “Recognition and Presentation of Other-Than-Temporary Impairments” (the FSP). The FSP establishes a methodology of determining and recording other-than-temporary impairments of debt securities and expands disclosures about fair value measurements. The provisions of the FSP were effective for the Company’s year ended June 30, 2009. The Company has included the disclosure provisions from this FSP in the footnotes. On May 28, 2009, the FASB issued Statement No. 165, “Subsequent Events” (“SFAS No. 165”). Under SFAS No. 165, companies are required to evaluate events and transactions that occur after the balance sheet date but before the date the financial statements are issued, or available to be issued in the case of non-public entities. SFAS No. 165 requires entities to recognize in the financial statements the effect of all events or transactions that provide additional evidence of conditions that existed at the balance sheet date, including the estimates inherent in the financial preparation process. Entities shall not recognize the impact of events or transactions that provide evidence about conditions that did not exist at the balance sheet date, but arose after that date. SFAS No. 165 also requires entites to disclose the date through which subsequent events have been evaluated. SFAS No. 165 was effective for interim and annual periods ending after June 15, 2009. The Company | | adopted the provisions of SFAS No. 165 during the year ended June 30, 2009, and the adoption did not have a material impact on the Company’s financial statements. On June 12, 2009, the FASB issued Statement No. 166, “Accounting for Transfers of Financial Assets” (“SFAS No. 166”). SFAS No. 166 is a revision to SFAS No. 140, “Accounting for Transfers and Servicing of Financial Assets and Extinguishments of Liabilities,” and will require more information about transfers of financial assets, including securitization transactions, and where companies will have continuing exposure to the risks related to transferred financial assets. SFAS No. 166 also eliminates the concept of a “qualifying special-purpose entity,” changes the requirements for derecognizing financial assets, and requires additional disclosures. SFAS No. 166 will be effective as of the beginning of the Company’s first annual reporting period that begins after November 15, 2009, for interim periods within that first annual reporting period and for interim and annual reporting periods thereafter. Earlier application is prohibited. The recognition and measurement provisions of SFAS No. 166 shall be applied to transfers that occur on or after the effective date. The Company will adopt SFAS No. 166 on July 1, 2010, as required. Management has not determined the impact the adoption may have on the Company’s consolidated financial statements. On June 12, 2009, the FASB issued Statement No. 167, “Amendments to FASB Interpretation No. 46(R)” (“SFAS No. 167”). SFAS No. 167 is a revision to FASB Interpretation No. 46(R), “Consolidation of Variable Interest Entities,” and changes how a company determines when an entity that is insufficiently capitalized or is not controlled through voting (or similar rights) should be consolidated. The determination of whether a company is required to consolidate an entity is based on, among other things, an entity’s purpose and design, and a company’s ability to direct the activities of the entity that most significantly impact the entity’s economic performance. SFAS No. 167 will be effective as of the Company’s first annual reporting period that begins after November 15, 2009, for interim periods within that first annual reporting period, and annual reporting periods thereafter. Earlier application is prohibited. The Company will adopt SFAS No. 167 on July 1, 2010, as required. Management has not determined the impact the adoption may have on the Company’s consolidated financial statements. On June 29, 2009, the FASB issued Statement No. 168, “Accounting Standards Codification TM and the Hierarchy of Generally Accepted Accounting Principles” (“SFAS No. 168”), a replacement of FASB Statement No. 162. SFAS No. 168 establishes the FASB Accounting Standards Codification TM as the source of authoritative accounting principles recognized by the FASB to be applied by nongovernmental entities in the preparation of financial statements in conformity with US GAAP. SFAS No. 168 will be effective for financial statements issued for interim and annual periods ending after September 15, 2009, for most entities. On the effective date, all non-SEC accounting and reporting standards will be superseded. The Company will adopt SFAS No. 168 for the quarterly period ended September 30, 2009, as required, and the adoption is not expected to have a material impact on the Company’s consolidated financial statements. |
> NOTES TO CONSOLIDATED FINANCIAL STATEMENTS (continued) <
Southern Missouri Bancorp, Inc.
NOTE 2: Securities The amortized cost, gross unrealized gains, gross unrealized losses and estimated fair value of securities available for sale consisted of the following: | | |
| | | June 30, 2009 | |
| | | Amortized Cost | | | Gross Unrealized Gains | | | Gross Unrealized Losses | | | Estimated Fair Value | |
| Investment securities: | | | | | | | | | | | | |
| U.S. government and Federal | | | | | | | | | | | | |
| agency obligations | | $ | 3,216,975 | | | $ | 61,733 | | | $ | - | | | $ | 3,278,708 | |
| Obligations of states and | | | | | | | | | | | | | | | | |
| political subdivisions | | | 13,512,789 | | | | 212,308 | | | | (102,402 | ) | | | 13,622,695 | |
| FHLMC preferred stock | | | - | | | | 7,920 | | | | - | | | | 7,920 | |
| Other securities | | | 4,264,409 | | | | - | | | | (1,264,753 | ) | | | 2,999,656 | |
| TOTAL INVESTMENT SECURITIES | | | 20,994,173 | | | | 281,961 | | | | (1,367,155 | ) | | | 19,908,979 | |
| | | | | | | | | | | | | | | | | |
| Mortgage-backed securities: | | | | | | | | | | | | | | | | |
| FHLMC certificates | | | 10,163,401 | | | | 236,649 | | | | (1,839 | ) | | | 10,398,211 | |
| GNMA certificates | | | 113,986 | | | | 667 | | | | (153 | ) | | | 114,500 | |
| FNMA certificates | | | 9,811,522 | | | | 307,453 | | | | (6,795 | ) | | | 10,112,180 | |
| CMOs issued by government agencies | | | 18,925,210 | | | | 718,912 | | | | - | | | | 19,644,122 | |
| TOTAL MORTGAGE-BACKED SECURITIES | | | 39,014,119 | | | | 1,263,681 | | | | (8,787 | ) | | | 40,269,013 | |
| TOTAL | | $ | 60,008,292 | | | $ | 1,545,642 | | | $ | (1,375,942 | ) | | $ | 60,177,992 | |
| | | June 30, 2008 | |
| | | Amortized Cost | | | Gross Unrealized Gains | | | Gross Unrealized Losses | | | Estimated Fair Value | |
| Investment securities: | | | | | | | | | | | | |
| U.S. government and Federal | | | | | | | | | | | | |
| agency obligations | | $ | 3,992,999 | | | $ | 52,103 | | | $ | (25,660 | ) | | $ | 4,019,442 | |
| Obligations of states and | | | | | | | | | | | | | | | | |
| political subdivisions | | | 6,299,763 | | | | 7,195 | | | | (276,075 | ) | | | 6,030,883 | |
| FHLMC preferred stock | | | 304,125 | | | | - | | | | (8,925 | ) | | | 295,200 | |
| Other securities | | | 1,889,424 | | | | - | | | | (325,979 | ) | | | 1,563,445 | |
| TOTAL INVESTMENT SECURITIES | | | 12,486,311 | | | | 59,298 | | | | (636,639 | ) | | | 11,908,970 | |
| | | | | | | | | | | | | | | | | |
| Mortgage-backed securities: | | | | | | | | | | | | | | | | |
| FHLMC certificates | | | 13,114,487 | | | | 2,658 | | | | (291,529 | ) | | | 12,825,616 | |
| GNMA certificates | | | 127,583 | | | | 108 | | | | (807 | ) | | | 126,884 | |
| FNMA certificates | | | 11,247,033 | | | | 11,441 | | | | (165,909 | ) | | | 11,092,565 | |
| CMOs issued by government agencies | | | 3,934,614 | | | | 49,547 | | | | (22,916 | ) | | | 3,961,245 | |
| TOTAL MORTGAGE-BACKED SECURITIES | | | 28,423,717 | | | | 63,754 | | | | (481,161 | ) | | | 28,006,310 | |
| TOTAL | | $ | 40,910,028 | | | $ | 123,052 | | | $ | (1,117,800 | ) | | $ | 39,915,280 | |
> NOTES TO CONSOLIDATED FINANCIAL STATEMENTS (continued) <
Southern Missouri Bancorp, Inc.
The amortized cost and estimated fair value of investment and mortgage-backed securities, by contractual maturity, are shown below. Expected maturities will differ from contractual maturities because borrowers may have the right to call or prepay obligations with or without call or prepayment penalties. | | |
| | | June 30, 2009 | |
| Available for Sale | | Amortized Cost | | | Estimated Fair Value | |
| Within one year | | $ | 3,010,178 | | | $ | 3,010,333 | |
| After one but less than five years | | | 1,148,429 | | | | 1,209,380 | |
| After five but less than 10 years | | | 2,768,546 | | | | 2,791,532 | |
| After 10 years | | | 14,067,020 | | | | 12,897,734 | |
| Total investment securities | | | 20,994,173 | | | | 19,908,979 | |
| Mortgage-backed securities | | | 39,014,119 | | | | 40,269,013 | |
| TOTAL | | $ | 60,008,292 | | | $ | 60,177,992 | |
The carrying value of investment and mortgage-backed securities pledged as collateral to secure public deposits and securities sold under agreements to repurchase amounted to $46,361,060 and $37,886,510 at June 30, 2009 and 2008, respectively. No gains or losses resulted from sales of available-for-sale securities in 2009 or 2007. Gross gains of $6,084, and no gross losses resulted from sales of available-for-sale securities in 2008. With the exception of U.S. government agencies and corporations, the Company did not hold any securities of a single issuer, payable from and secured by the same source of revenue or taxing authority, the book value of which exceeded 10% of stockholders’ equity at June 30, 2009. | | Certain investments in debt and marketable equity securities are reported in the financial statements at an amount less than their historical cost. Total fair value of these investments at June 30, 2009 was $5.6 million, which is approximately 9.3% of the Bank’s available for sale investment portfolio, as compared to $31.7 million or approximately 79.5% of the Bank’s available for sale investment portfolio at June 30, 2008. Except as discussed below, management believes the declines in fair value for these securities to be temporary. The tables below show our investments’ gross unrealized losses and fair value, aggregated by investment category and length of time that individual securities have been in a continuous unrealized loss position at June 30, 2009 and 2008. |
| | | Less than 12 months | | | 12 months or more | | | Total | |
Description of Securities | | Fair Value | | | Unrealized Losses | | | Fair Value | | | Unrealized Losses | | | Fair Value | | | Unrealized Losses | |
| For the year ended June 30, 2009 | | | | | | | | | | | | | | | | | | |
| | | | | | | | | | | | | | | | | | | |
| U.S. government agencies | | $ | - | | | $ | - | | | $ | - | | | $ | - | | | $ | - | | | $ | - | |
| Mortgage-backed securities | | | 276,201 | | | | 1,992 | | | | 291,621 | | | | 6,795 | | | | 567,822 | | | | 8,787 | |
| Other securities | | | - | | | | - | | | | 249,656 | | | | 1,264,753 | | | | 249,656 | | | | 1,264,753 | |
| Obligations of state and political subdivisions | | | 3,243,030 | | | | 82,933 | | | | 1,547,675 | | | | 19,469 | | | | 4,790,705 | | | | 102,402 | |
| | | | | | | | | | | | | | | | | | | | | | | | | |
| Total temporarily impaired securities | | $ | 3,519,231 | | | $ | 84,925 | | | $ | 2,088,952 | | | $ | 1,291,017 | | | $ | 5,608,183 | | | $ | 1,375,942 | |
| | | | | | | | | | | | | | | | | | | | | | | | | |
| | | Less than 12 months | | | 12 months or more | | | Total | |
Description of Securities | | Fair Value | | | Unrealized Losses | | | Fair Value | | | Unrealized Losses | | | Fair Value | | | Unrealized Losses | |
| For the year ended June 30, 2008 | | | | | | | | | | | | | | | | | | | | | | | | |
| | | | | | | | | | | | | | | | | | | | | | | | | |
| U.S. government agencies | | $ | 1,971,482 | | | $ | 25,660 | | | $ | - | | | $ | - | | | $ | 1,971,482 | | | $ | 25,660 | |
| Mortgage-backed securities | | | 21,382,034 | | | | 449,610 | | | | 1,407,530 | | | | 31,551 | | | | 22,789,564 | | | | 481,161 | |
| Other securities | | | 1,858,645 | | | | 334,904 | | | | - | | | | - | | | | 1,858,645 | | | | 334,904 | |
| Obligations of state and political subdivisions | | | 5,117,601 | | | | 276,075 | | | | - | | | | - | | | | 5,117,601 | | | | 276,075 | |
| | | | | | | | | | | | | | | | | | | | | | | | | |
| Total temporarily impaired securities | | $ | 30,329,762 | | | $ | 1,086,249 | | | $ | 1,407,530 | | | $ | 31,551 | | | $ | 31,737,292 | | | $ | 1,117,800 | |
> NOTES TO CONSOLIDATED FINANCIAL STATEMENTS (continued) <
Southern Missouri Bancorp, Inc.
Mortgage-backed securities. At June 30, 2009, there were three mortgage-backed securities issued by Federal Home Loan Mortgage Corporation and Federal National Mortgage Association with a fair value of $292,000 and unrealized losses of $7,000 in a continuous unrealized loss position for twelve months or more. This position was due to intermediate rates increasing since the purchase of these securities, resulting in the market value of the securities being lower than book value. Because the decline in market value is attributable to changes in interest rates and not credit quality, and because the Company does not intend to sell these securities and it is not more-likely-than-not the Company will be required to sell these securities before recovery of their amortized cost basis, which may be maturity, the Company does not consider these investments to be other than temporarily impaired at June 30, 2009. Obligations of states and political subdivisions. At June 30, 2009, there were two obligations of states and political subdivisions issued by two municipalities with a fair value of $1.5 million and unrealized losses of $19,000 in a continuous unrealized loss position for twelve months or more. This position was due to municipal rates increasing since the purchase of the securities, resulting in the market value being lower than book value. The contractual terms of these investments do not permit the issuer to settle the securities at a price less than the amortized cost basis of the investments. Because the Company does not intend to sell these securities and it is not more-likely-than-not the Company will be required to sell these securities, before recovery of their amortized cost bases, which may be maturity, the Company does not consider these investments to be other than temporarily impaired at June 30, 2009. Other Securities. At June 30, 2009, there were four pooled trust preferred securities with a fair value of $250,000 and unrealized losses of $1.3 million in a continuous unrealized loss position for twelve months or more. These unrealized losses were primarily due to the long-term nature of the pooled trust preferred securities, a lack of demand or inactive market for these securities, and concerns regarding the financial institutions that have issued the underlying trust preferred securities. The June 30, 2009 cash flow analysis for three of these securities showed it is probable the Company will receive all contracted principal and related interest projected, though interest payments have been deferred on one of the three securities and are projected to be deferred on a second security. Because the Company does not intend to sell these securities and it is not more-likely-than-not that the Company will be required to sell these securities prior to recovery of their amortized cost bases, which may be maturity, the Company does not consider these investments to be other than temporarily impaired at June 30, 2009. At December 31, 2008, analysis of the fourth pooled trust preferred security indicated other-than-temporary impairment (OTTI) and the Company performed further analysis to determine the portion of the loss that was related to credit conditions of the underlying issuers. The credit loss was calculated by comparing expected discounted cash flows based on performance indicators of the underlying assets in the security to the carrying value of the investment. The discounted cash flow was based on anticipated default and recovery rates, and resulting projected cash flows were discounted based on the yield anticipated at the time the security was purchased. Based on this analysis, the Company recorded an impairment charge of $375,000 for the credit portion of the unrealized loss for this trust preferred security. This loss established a new, lower amortized cost basis of $125,000 for this security, and reduced non-interest income for the second quarter and the twelve months ended June 30, 2009. At June 30, 2009, cash flow analyses showed it is probable the Company will receive all of the remaining cost basis and related interest projected for the | | security. Because the Company does not intend to sell this security and it is not more-likely-than-not the Company will be required to sell this security before recovery of its new, lower amortized cost basis, which may be maturity, the Company does not consider the remainder of the investment in this security to be other-than-temporarily impaired at June 30, 2009. During the first quarter of fiscal 2009, the Company’s investments in Freddie Mac Preferred Stock was deemed other than temporarily impaired, based on quoted market prices which reflected market participants’ expectations regarding the likelihood of recovery of their investment following the placement of the firm into receivership by the U.S. Treasury Department. Accordingly, the Company recorded an impairment charge for the full amortized cost of the security, $304,000. The loss established a new, lower amortized cost basis of $0 for this security, and reduced non-interest income for the first quarter of fiscal 2009. The Company does not believe any other individual unrealized loss as of June 30, 2009 represents OTTI. However, given the continued disruption in the financial markets, the Company may be required to recognize OTTI losses in future periods with respect to its available for sale investment securities portfolio. The amount and timing of any additional OTTI will depend on the decline in the underlying cash flows of the securities. Should the impairment of any of these securities become other-than-temporary, the cost basis of the investment will be reduced and the resulting loss recognized in the period the other-than-temporary impairment is identified. Credit Losses Recognized on Investments. As described above, some of the Company’s investments in trust preferred securities have experienced fair value deterioration due to credit losses, but are not otherwise other-than-temporarily impaired. During 2009, the Company adopted FASB Staff Position 157-4, “Determining Fair Value when the Volume and Level of Activity For the Asset or Liability Have Significantly Decreased and Identifying Transactions That Are Not Orderly.” The following table provides information about the trust preferred security for which only a credit loss was recognized in income and other losses are recorded in other comprehensive income (loss) for the years ended June 30, 2009 and 2008. |
| | | | | | |
| | | | Accumulated Credit Losses Year Ended June 30 |
| | | | 2009 | | 2008 |
| | Credit losses on debt securities held | | | | |
| | Beginning of period | | $ - | | $ - |
| | Additions related to OTTI losses not previously recognized | | 375,000 | | - |
| | Reductions due to sales | | | | |
| | Reductions due to change in intent or likelihood of sale | | | | |
| | Additions related to increases in previously recognized OTTI losses | | | | |
| | Reductions due to increases in expected cash flows | | - | | - |
| | | | | | |
| | | | | | |
| | | | | | |
| | | | | | |
| | | | | | |
> NOTES TO CONSOLIDATED FINANCIAL STATEMENTS (continued) <
Southern Missouri Bancorp, Inc.
NOTE 3: Loans Loans are summarized as follows: | | |
| | | June 30 | |
| | | 2009 | | | 2008 | |
| Real estate loans: | | | | | | |
| Residential | | $ | 155,490,317 | | | $ | 149,340,248 | |
| Construction | | | 23,531,528 | | | | 13,945,027 | |
| Commercial | | | 97,160,828 | | | | 85,859,482 | |
| Consumer loans | | | 23,141,738 | | | | 21,524,166 | |
| Commercial | | | 89,065,652 | | | | 81,574,995 | |
| | | | 388,390,063 | | | | 352,243,918 | |
| Loans in process | | | (15,511,237 | ) | | | (5,667,898 | ) |
| Deferred loan fees, net | | | 107,346 | | | | 60,958 | |
| Allowance for loan losses | | | (4,430,210 | ) | | | (3,567,203 | ) |
| TOTAL | | $ | 368,555,962 | | | $ | 343,069,775 | |
Adjustable rate loans included in the loan portfolio amounted to $154,037,379 and $118,302,376 at June 30, 2009 and 2008, respectively. One- to four-family residential real estate loans amounted to $141,340,882 and $136,732,435 at June 30, 2009 and 2008, respectively. Following is a summary of activity in the allowance for loan losses: | | Real estate construction loans are secured principally by single and multi-family dwelling units. Commercial real estate loans are secured principally by commercial buildings, motels, medical centers, churches, restaurants and farmland. |
| | | June 30 | |
| | | 2009 | | | 2008 | | | 2007 | |
| Balance, beginning of period | | $ | 3,567,203 | | | $ | 2,537,659 | | | $ | 2,058,144 | |
| Loans charged-off | | | (382,542 | ) | | | (93,755 | ) | | | (162,719 | ) |
| Recoveries of loans previously charged-off | | | 25,549 | | | | 183,299 | | | | 37,234 | |
| Net recoveries (charge-offs) | | | (356,993 | ) | | | 89,544 | | | | (125,485 | ) |
| Provision charged to expense | | | 1,220,000 | | | | 940,000 | | | | 605,000 | |
| Balance, end of period | | $ | 4,430,210 | | | $ | 3,567,203 | | | $ | 2,537,659 | |
Total loans past due 90 days or more and still accruing interest amounted to $137,000 and $6,000 at June 30, 2009 and 2008, respectively. The Company had ceased recognition of interest income on loans with a book value of $659,000 and $0 at June 30, 2009 and 2008, respectively. The average balance of nonaccrual loans for the years ended June 30, 2009, 2008, and 2007 was $66,000, $28,000, and $47,000, respectively. The allowance for losses allocated to nonaccrual loans at June 30, 2009 and 2008 was approximately $67,000 and $0, respectively. Interest income recognized on these loans for the year ended June 30, 2009, was $25,000, while interest income recognized on these loans for the years ended June 30, 2008 and 2007 was immaterial. Gross interest income was $52,000 for the year ended June 30, 2009, and would have been immaterial for the years ended June 30, 2008 and 2007 if interest payments had been received in accordance with the original terms. The Company is not committed to lend additional funds to customers whose loans have been placed on nonaccrual status. Of the above nonaccrual loans at June 30, 2009 and 2008, none were considered to be impaired. There were no impaired loans during the years ended June 30, 2009 and 2008. | | Following is a summary of loans to directors, executive officers and loans to corporations in which executive officers and directors have a substantial interest: |
| | |
| Balance, June 30, 2008 | $8,460,333 |
| Additions | 1,196,839 |
| Repayments | (1,193,458) |
| Balance, June 30, 2009 | $8,463,714 |
| | |
These loans were made on substantially the same terms as those prevailing at the time for comparable transactions with unaffiliated persons. |
> NOTES TO CONSOLIDATED FINANCIAL STATEMENTS (continued) <
Southern Missouri Bancorp, Inc.
NOTE 4: Premises and Equipment Following is a summary of premises and equipment: | | |
| | | June 30 | |
| | | 2009 | | | 2008 | |
| Land | | $ | 3,487,898 | | | $ | 3,448,083 | |
| Buildings and improvements | | | 6,202,134 | | | | 6,016,459 | |
| Furniture, fixtures and equipment | | | 4,918,784 | | | | 4,598,236 | |
| Automobiles | | | 41,775 | | | | 32,376 | |
| | | | 14,650,591 | | | | 14,095,154 | |
| Less accumulated depreciation | | | 6,515,499 | | | | 5,890,523 | |
| TOTAL | | $ | 8,135,092 | | | $ | 8,204,631 | |
NOTE 5: Deposits Deposits are summarized as follows: | | |
| | | June 30 |
| | | 2009 | 2008 |
| Noninterest-bearing accounts | | $ 21,303,646 | $ 19,220,977 |
| NOW accounts | | 65,114,474 | 37,150,005 |
| Money market deposit accounts | | 6,632,987 | 12,104,527 |
| Savings accounts | | 58,598,085 | 73,423,195 |
| TOTAL TRANSACTION ACCOUNTS | | $ 151,649,192 | $ 141,898,704 |
| | | | |
| | | | |
| Certificates: | | | |
| 1.00 - 1.99% | | $ 45,305,667 | $ 7,134,672 |
| 2.00 - 2.99% | | 51,985,401 | 33,105,497 |
| 3.00 - 3.99% | | 47,719,837 | 50,555,205 |
| 4.00 - 4.99% | | 13,898,373 | 48,413,758 |
| 5.00 - 5.99% | | 1,396,998 | 11,149,209 |
| TOTAL CERTIFICATES | | 160,306,276 | 150,358,341 |
| TOTAL DEPOSITS | | $ 311,955,468 | $ 292,257,045 |
The aggregate amount of certificates of deposit with a minimum denomination of $100,000 was $62,698,514 and $58,181,336 at June 30, 2009 and 2008, respectively. Certificate maturities at June 30, 2009 are summarized as follows: | | |
| July 1, 2009 to June 30, 2010 | | $ | 112,810,093 | |
| July 1, 2010 to June 30, 2011 | | | 33,152,417 | |
| July 1, 2011 to June 30, 2012 | | | 4,477,766 | |
| July 1, 2012 to June 30, 2013 | | | 4,465,794 | |
| July 1, 2013 to June 30, 2014 | | | 5,394,425 | |
| Thereafter | | | 5,781 | |
| TOTAL | | $ | 160,306,276 | |
> NOTES TO CONSOLIDATED FINANCIAL STATEMENTS (continued) <
Southern Missouri Bancorp, Inc.
NOTE 6: Securities Sold Under Agreements to Repurchase Securities sold under agreements to repurchase, which are classified as borrowings, generally mature within one to four days. The following table presents balance and interest rate information on the securities sold under agreements to repurchase. | | The market value of the securities underlying the agreements at June 30, 2009 and 2008, was $24,832,415 and $24,854,028, respectively. The securities sold under agreements to repurchase are under the Company’s control. |
| | | June 30 | |
| | | 2009 | | | 2008 | |
| Year-end balance | | $ | 23,747,557 | | | $ | 21,803,513 | |
| Average balance during the year | | | 24,344,511 | | | | 20,567,605 | |
| Maximum month-end balance during the year | | | 27,819,186 | | | | 24,659,429 | |
| Average interest during the year | | | 0.94 | % | | | 3.31 | % |
| Year-end interest rate | | | 0.67 | % | | | 1.67 | % |
NOTE 7: Advances from Federal Home Loan Bank Advances from Federal Home Loan Bank are summarized as follows: | | |
| | | | June 30 |
| Maturity | Call Date or Quarterly Thereafter | Interest Rate | 2009 | | 2008 |
| Overnight borrowings and short-term | | | | | |
| repurchase agreements | - | 0.96% | $ 6,250,000 | | - |
| Overnight borrowings and short-term | | | | | |
| repurchase agreements | - | 2.81% | - | | $ 5,550,000 |
| 10-26-09 | 09-01-03 | 5.58% | 10,000,000 | | 10,000,000 |
| 01-08-10 | - | 1.43% | 5,000,000 | | - |
| 01-20-10 | 07-20-03 | 5.85% | 5,000,000 | | 5,000,000 |
| 10-27-10 | 10-27-03 | 5.94% | 9,000,000 | | 9,000,000 |
| 12-09-10 | 12-09-05 | 6.01% | 10,000,000 | | 10,000,000 |
| 10-30-12 | - | 4.87% | 3,000,000 | | 3,000,000 |
| 04-01-13 | - | 3.65% | 3,000,000 | | 3,000,000 |
| 01-30-15 | - | 3.75% | 3,000,000 | | 3,000,000 |
| 11-29-16 | 11-29-07 | 3.93% | 5,000,000 | | 5,000,000 |
| 11-29-16 | 11-29-11 | 4.42% | 5,000,000 | | 5,000,000 |
| 11-20-17 | 11-22-10 | 3.87% | 3,000,000 | | 3,000,000 |
| 11-29-17 | 11-29-12 | 4.07% | 2,500,000 | | 2,500,000 |
| 08-14-18 | 08-15-11 | 3.53% | 4,000,000 | | - |
| 08-14-18 | 08-14-13 | 4.04% | 5,000,000 | | - |
| | | TOTAL | $ 78,750,000 | | $ 64,050,000 |
| Weighted-average rate | | | 4.31% | | 4.91% |
In addition to the above advances, the Bank had an available line of credit amounting to $52,514,528 and $37,380,792, with FHLB at June 30, 2009 and 2008, respectively. Advances from FHLB of Des Moines were secured by FHLB stock, commercial real estate loans, and one- to four-family mortgage loans of $105,288,000 and $76,860,000 at June 30, 2009 and 2008, respectively. The principal maturities of FHLB advances at June 30, 2009, are at right: | | FHLB Advance Maturities | | |
| July 1, 2009 to June 30, 2010 | | $26,250,000 |
| July 1, 2010 to June 30, 2011 | | 19,000,000 |
| July 1, 2011 to June 30, 2012 | | - |
| July 1, 2012 to June 30, 2013 | | 6,000,000 |
| July 1, 2013 to June 30, 2014 | | - |
| July 1, 2014 and thereafter | | 27,500,000 |
| | total | $78,750,000 |
> NOTES TO CONSOLIDATED FINANCIAL STATEMENTS (continued) <
Southern Missouri Bancorp, Inc.
NOTE 8: Subordinated Debt Southern Missouri Statutory Trust I issued $7.0 million of Floating Rate Capital Securities (the “Trust Preferred Securities”) with a liquidation value of $1,000 per share in March 2004. The securities are due in 30 years, redeemable after five years and bear interest at a floating rate based on LIBOR. At June 30, 2009, the current rate was 3.36%. The securities represent undivided beneficial interests in the trust, which was established by Southern Missouri for the purpose of issuing the securities. The Trust Preferred Securities were sold in a private transaction exempt from registration under the Securities Act of 1933, | | as amended (the “Act”) and have not been registered under the Act. The securities may not be offered or sold in the United States absent registration or an applicable exemption from registration requirements. Southern Missouri Statutory Trust I used the proceeds from the sale of the Trust Preferred Securities to purchase Junior Subordinated Debentures of Southern Missouri Bancorp. Southern Missouri Bancorp, Inc. used its net proceeds for working capital and investment in its subsidiaries. |
NOTE 9: Employee Benefits 401(k). The Bank has a 401(k) profit sharing plan that covers substantially all eligible employees. Contributions to the plan are at the discretion of the Board of Directors of the Bank. During 2009, 2008, and 2007, there were no contributions made to the plan. Employee Stock Ownership Plan (ESOP). The Bank established a tax-qualified ESOP in April 1994. The plan covers substantially all employees who have attained the age of 21 and completed one year of service. Benefits are vested over five years. Forfeitures are allocated on the same basis as other contributions. Benefits are payable upon a participant’s retirement, death, disability or separation of service. The Bank makes discretionary contributions to the ESOP. The ESOP expense for 2009, 2008, and 2007 was $210,000, $200,000, and $190,000, respectively. The number of ESOP shares at June 30, 2009 and 2008 were as follows: | | The Board of Directors can terminate the MRPs at any time, and if it does so, any shares not allocated will revert to the Company. The MRP expense for 2009, 2008, and 2007, was $12,809, $19,777, and $13,147, respectively. Stock Option Plan. The Company adopted a stock option plan in April 1994. The purpose of the plan was to provide additional incentive to certain directors, officers and key employees of the Bank. In October 1999, the stockholders voted to increase the number of shares reserved for options by 67,932 shares. The stock options were granted at the fair market value of the common stock on the date of the grant. Through June 30, 1999, all options granted were 100% vested at the grant date. For shares granted after June 30, 1999, the vesting period ranged from the grant date up to a five year period. All options expire ten years from the date of the grant. The 1994 stock option plan expired in April 2004. In October 2003, a new stock option and incentive plan was adopted (“2003 Plan”). Under the 2003 Plan, the Company has granted 75,500 options to employees and directors. As of June 30, 2009, there was $15,000 in remaining unrecognized compensation expense related to nonvested stock options, which will be recognized over the remaining weighted average vesting period. The aggregate intrinsic value of stock options outstanding at June 30, 2009, was $32,000. The aggregate intrinsic value of stock options exercisable at June 30, 2009, was $32,000. The intrinsic value of options exercised in fiscal 2009 was $110,400. The intrinsic value of options vested in fiscal 2009 was $0. |
| | | | |
| | | 2009 | 2008 |
| Allocated shares | | 194,919 | 173,719 |
| | | | |
| Unreleased shares | | - | - |
| TOTAL ESOP SHARES | | 194,919 | 173,719 |
| | | | |
Management Recognition Plan (MRP). The Bank adopted an MRP for the benefit of non-employee directors and two MRPs for officers and key employees (who may also be directors) in April 1994. During 2004, the Bank granted 5,000 MRP shares to employees; during 2007, an additional 1,000 shares were granted; and during 2008, an additional 2,500 shares were awarded. The shares granted are in the form of restricted stock payable at the rate of 20% of such shares per year. During 2009, 1,300 MRP shares vested, which had been awarded in 2004, 2007, and 2008. Compensation expense, in the amount of the fair market value of the common stock at the date of grant, will be recognized pro-rata over the five years during which the shares are payable. |
> NOTES TO CONSOLIDATED FINANCIAL STATEMENTS (continued) <
Southern Missouri Bancorp, Inc.
Changes in options outstanding were as follows:
| | | Year Ended June 30 | |
| | | 2009 | | | 2008 | | | 2007 | |
| | | Weighted Average Price | | | Number | | | Weighted Average Price | | | Number | | | Weighted Average Price | | | Number | |
| Outstanding at beginning of year | | $ | 12.43 | | | | 104,500 | | | $ | 10.73 | | | | 176,500 | | | $ | 10.64 | | | | 180,500 | |
| Granted | | | 12.15 | | | | 5,000 | | | | - | | | | - | | | | - | | | | - | |
| Exercised | | | 6.71 | | | | (24,000 | ) | | | 8.08 | | | | (70,000 | ) | | | 6.50 | | | | (4,000 | ) |
| Forfeited | | | - | | | | - | | | | 15.23 | | | | (2,000 | ) | | | - | | | | | |
| Outstanding at year-end | | $ | 14.01 | | | | 85,500 | | | $ | 12.43 | | | | 104,500 | | | $ | 10.73 | | | | 176,500 | |
| Options exercisable at year-end | | $ | 14.08 | | | | 75,500 | | | $ | 11.88 | | | | 86,800 | | | $ | 9.75 | | | | 144,100 | |
The following is a summary of the assumptions used in the
Black-Scholes pricing model in determining the fair values of options
granted during fiscal years 2009, 2008, and 2007 (no options were granted
in fiscal 2008 or 2007):
| | | 2009 | | | 2008 | | | 2007 | |
| | | | | | | | | | |
| Assumptions: | | | | | | | | | |
| Expected dividend yield | | | 3.95 | % | | | - | | | | - | |
| Expected volatility | | | 17.85 | % | | | - | | | | - | |
| Risk-free interest rate | | | 3.68 | % | | | - | | | | - | |
| Weighted-average expected life | | | 10.0 | | | | - | | | | - | |
| Weighted-average fair value of | | | | | | | | | | | | |
| options granted during the year | | $ | 1.73 | | | | - | | | | - | |
The following table summarizes information about stock options under
the plan outstanding at June 30, 2009:
| | | | | | Options Outstanding | | | Options Exercisable | |
| Exercise Price | | | Number Outstanding | | Weighted Average Remaining Contractual Life | | Weighted Average Exercise Price | | | Number Exercisable | | | Weighted Average Exercise Price | |
| $ | 6.7500 | | | | 10,000 | | 17.3 mo. | | $ | 6.7500 | | | | 10,000 | | | $ | 6.7500 | |
| | 15.2300 | | | | 50,500 | | 70.6 mo. | | | 15.2300 | | | | 50,500 | | | | 15.2300 | |
| | 15.3000 | | | | 15,000 | | 75.7 mo. | | | 15.3000 | | | | 12,000 | | | | 15.3000 | |
| | 14.2600 | | | | 5,000 | | 86.5 mo. | | | 14.2600 | | | | 3,000 | | | | 14.2600 | |
| | 12.1500 | | | | 5,000 | | 112.7 mo. | | | 12.1500 | | | | - | | | | - | |
> NOTES TO CONSOLIDATED FINANCIAL STATEMENTS (continued) <
Southern Missouri Bancorp, Inc.
NOTE 10: Income Taxes
The components of net deferred tax assets (liabilities) are summarized
as follows:
| | | | 2009 | | | 2008 | |
| Deferred tax assets: | | | | | | | |
| Provision for losses on loans | | | $ | 1,671,156 | | | $ | 1,373,373 | |
| Unrealized loss on available for sale securities | | | | - | | | | 368,075 | |
| Accrued compensation and benefits | | | | 125,617 | | | | 121,319 | |
| Other-than-temporary impairment on available | | | | | | | | | |
| for sale securities | | | | 261,405 | | | | - | |
| Other | | | | - | | | | 64,503 | |
| Total deferred tax assets | | | | 2,058,178 | | | | 1,927,270 | |
| | | | | | | | | | |
| | | | | | | | | | |
| Deferred tax liabilities: | | | | | | | | | |
| FHLB stock dividends | | | | 188,612 | | | | 188,612 | |
| Purchase accounting adjustments | | | | 55,664 | | | | 71,062 | |
| Depreciation | | | | 271,362 | | | | 211,550 | |
| Prepaid expenses | | | | 125,361 | | | | - | |
| Unrealized gain on available for sale securities | | | | 62,770 | | | | - | |
| Other | | | | 36,209 | | | | - | |
| Total deferred tax liabilities | | | | 739,978 | | | | 471,224 | |
| | NET DEFERRED TAX ASSET | | $ | 1,318,200 | | | $ | 1,456,046 | |
A reconciliation of income tax expense at the statutory rate to the
Company’s actual income tax expense is shown below:
| | | | Year Ended June 30 | |
| | | | 2009 | | | 2008 | | | 2007 | |
| Tax at statutory rate | | | $ | 1,806,276 | | | $ | 1,832,016 | | | $ | 1,384,776 | |
| Increase (reduction) in taxes | | | | | | | | | | | | | |
| resulting from: | | | | | | | | | | | | | |
| Nontaxable municipal income | | | | (217,004 | ) | | | (56,886 | ) | | | (31,983 | ) |
| State tax, net of Federal benefit | | | | 181,500 | | | | 74,951 | | | | 52,006 | |
| Cash surrender value of bank | | | | | | | | | | | | | |
| owned life insurance | | | | (93,172 | ) | | | (99,026 | ) | | | (89,491 | ) |
| Other, net | | | | 33,900 | | | | 23,748 | | | | (170,850 | ) |
| | ACTUAL PROVISION | | $ | 1,711,500 | | | $ | 1,774,803 | | | $ | 1,144,458 | |
> NOTES TO CONSOLIDATED FINANCIAL STATEMENTS (continued) <
Southern Missouri Bancorp, Inc.
NOTE 11: Other Comprehensive (Loss) Income
Other comprehensive (loss) income components are as follows:
| | | Year Ended June 30 | |
| | | 2009 | | | 2008 | | | 2007 | |
| Unrealized gains (losses) on | | | | | | | | | |
| arising during period | | $ | 1,206,610 | | | $ | (434,981 | ) | | $ | 542,101 | |
| Unrealized losses on available- | | | | | | | | | | | | |
| impairment has been recognized | | | | | | | | | | | | |
| in income | | | (42,162 | ) | | | | | | | - | |
| net income | | | - | | | | (6,084 | ) | | | - | |
| on securities | | $ | 1,164,448 | | | | (441,065 | ) | | | 542,101 | |
| net (loss) gain | | | (22,416 | ) | | | 31,495 | | | | - | |
| Income tax (expense) benefit | | | (430,845 | ) | | | 163,194 | | | | (200,578 | ) |
| Other comprehensive income (loss) | | $ | 711,187 | | | $ | (246,376 | ) | | $ | 341,523 | |
The components of accumulated other comprehensive income (loss), included in stockholders’ equity, are as follows:
| | | June 30 | |
| | | 2009 | | | 2008 | |
| | | | | | | |
| Net unrealized gain (loss) on securities available-for-sale | | $ | 289,717 | | | $ | (994,748 | ) |
Net unrealized gain (loss) on securities available-for-sale securities for which a portion of an other-than-temporary impairment has been recognized in income | | | (120,017 | ) | | | - | |
| Unrealized gain (loss) from defined benefit pension plan | | | 9,079 | | | | 31,495 | |
| | | $ | 178,779 | | | | (963,253 | ) |
| Tax effect | | | (62,770 | ) | | | 368,075 | |
| Net of tax amount | | $ | 116,009 | | | $ | (595,178 | ) |
> NOTES TO CONSOLIDATED FINANCIAL STATEMENTS (continued) <
Southern Missouri Bancorp, Inc.
NOTE 12: Stockholders’ Equity and Regulatory Capital The Bank is subject to various regulatory capital requirements administered by the Federal banking agencies. Failure to meet minimum capital requirements can result in certain mandatory — and possibly additional discretionary — actions by regulators that, if undertaken, could have a direct material effect on the Company’s financial statements. Under capital adequacy guidelines and the regulatory framework for prompt corrective action, the Bank must meet specific capital guidelines that involve quantitative measures of the Bank’s assets, liabilities, and certain off-balance-sheet items as calculated under regulatory accounting practices. The Bank’s capital amounts and classification are also subject to qualitative judgments by the regulators about components, risk weightings, and other factors. Quantitative measures established by regulation to ensure capital adequacy require the Bank to maintain minimum amounts and ratios (set forth in the table below) of total capital and Tier I capital (as defined in the regulations) to | | risk-weighted assets (as defined) and of Tier I capital (as defined) to average total assets (as defined). Management believes, as of June 30, 2009, that the Bank meets all capital adequacy requirements to which it is subject. As of June 30, 2009, the most recent notification from the Federal Deposit Insurance Corporation categorized the Bank as well capitalized under the regulatory framework for prompt corrective action. To be categorized as well capitalized the Bank must maintain minimum total risk-based, Tier I risk-based, and Tier I leverage ratios as set forth in the table. There are no conditions or events since that notification that management believes have changed the Bank’s category. The Company’s only significant activity is ownership of the Bank, and, therefore, its capital, capital ratios, and minimum required levels of capital are materially the same as the Bank’s. The following table summarizes the Bank’s actual and required regulatory capital: |
(dollars in thousands) | | Actual | | | For Capital Adequacy Purposes | | To Be Well Capitalized Under Prompt Corrective Action Provisions |
| As of June 30, 2009 | | Amount | | | Ratio | | | Amount | | Ratio | | Amount | | Ratio |
| Total Capital (to Risk-Weighted Assets) | | $ | 44,699 | | | | 12.98 | % | | $ | 27,557 | | >8.00% | | $ | 34,446 | | >10.00% |
| Tier I Capital (to Risk-Weighted Assets) | | | 40,388 | | | | 11.72 | % | | | 13,779 | | >4.00% | | | 20,668 | | >6.00% |
| Tier I Capital (to Average Assets) | | | 40,388 | | | | 8.87 | % | | | 18,215 | | >4.00% | | | 22,769 | | >5.00% |
| | | | | | | | | | | | | | | | | | | |
| As of June 30, 2008 | | | | | | | | | | | | | | | | | | |
| Total Capital (to Risk-Weighted Assets) | | $ | 36,302 | | | | 11.79 | % | | $ | 24,631 | | >8.00% | | $ | 30,789 | | >10.00% |
| Tier I Capital (to Risk-Weighted Assets) | | | 32,735 | | | | 10.63 | % | | | 12,315 | | >4.00% | | | 18,473 | | >6.00% |
| Tier I Capital (to Average Assets) | | | 32,735 | | | | 8.08 | % | | | 16,214 | | >4.00% | | | 20,267 | | >5.00% |
The Bank’s ability to pay dividends on its common stock to the Company is restricted to maintain adequate capital as shown in the table above.
> NOTES TO CONSOLIDATED FINANCIAL STATEMENTS (continued) <
Southern Missouri Bancorp, Inc.
NOTE 13: Capital Purchase Program Implemented by the U.S. Treasury In December 2008, the Company received $9.6 million from the U.S. Treasury through the sale of 9,550 shares of the Company’s Fixed Rate Cumulative Perpetual Preferred Stock, Series A, as part of the Treasury’s Capital Purchase Program. The Company also issued to the U.S. Treasury a warrant to purchase 114,326 shares of common stock at $12.53 per share. The amount of preferred shares sold represented approximately 3% of the Company’s risk-weighted assets as of September 30, 2008. The transaction was part of the Treasury’s program to infuse capital into the nation’s healthiest and strongest banks for the purpose of stabilizing the US financial system and promoting economic activity. The Company elected to participate in the program given the uncertain economic outlook, the relatively | | attractive cost of capital compared to the current market, and the strategic opportunities the Company foresees regarding potential uses of the capital. The additional capital increased the Company’s already well-capitalized position. The Company used the proceeds of the issue for working capital and investment in its banking subsidiary. The preferred shares pay a cumulative dividend of 5% per year for the first five years and 9% per year thereafter. The preferred shares are callable after three years at 100% of the issue price, subject to the approval of the Company’s federal regulator. Earlier redemptions of the preferred shares also require that the Company complete an offering of at least $2,387,500. |
NOTE 14: Commitments and Credit Risk Standby Letters of Credit. In the normal course of business, the Bank issues various financial standby, performance standby, and commercial letters of credit for its customers. As consideration for the letters of credit, the institution charges letter of credit fees based on the face amount of the letters and the creditworthiness of the counterparties. These letters of credit are stand-alone agreements, and are unrelated to any obligation the depositor has to the Company. Standby letters of credit are irrevocable conditional commitments issued by the Company to guarantee the performance of a customer to a third party. Financial standby letters of credit are primarily issued to support public and private borrowing arrangements, including commercial paper, bond financing and similar transactions. Performance standby letters of credit are issued to guarantee performance of certain customers under non-financial contractual obligations. The credit risk involved in issuing standby letters of credit is essentially the same as that involved in extending loans to customers. The Company had total outstanding standby letters of credit amounting to $1.1 million at June 30, 2009 and 2008, with terms ranging from 12 to 24 months. At June 30, 2009, the Company’s deferred revenue under standby letters of credit agreements was nominal. Off-balance-sheet and Credit Risk. The Company’s Consolidated Financial Statements do not reflect various financial instruments to extend credit to meet the financing needs of its customers. These financial instruments include commitments to extend credit. These instruments involve, to varying degrees, elements of credit and interest-rate risk in excess of the amount recognized in the balance sheets. Lines of credit are agreements to lend to a customer as long as there is no violation | | of any condition established in the contract. Lines of credit generally have fixed expiration dates. Since a portion of the line may expire without being drawn upon, the total unused lines do not necessarily represent future cash requirements. Each customer’s creditworthiness is evaluated on a case-by-case basis. The amount of collateral obtained, if deemed necessary, is based on management’s credit evaluation of the counterparty. Collateral held varies but may include accounts receivable, inventory, property, plant and equipment, commercial real estate and residential real estate. Management uses the same credit policies in granting lines of credit as it does for on-balance-sheet instruments. The Company had $64.2 million in commitments to extend credit at June 30, 2009 and $50.4 million at June 30, 2008. At June 30, 2009, total commitments to originate fixed-rate loans with terms in excess of one year were $6.6 million at rates ranging from 4.75% to 7.25%. Commitments to extend credit and standby letters of credit include exposure to some credit loss in the event of nonperformance of the customer. The Company’s policies for credit commitments and financial guarantees are the same as those for extension of credit that are recorded in the balance sheet. The commitments extend over varying periods of time with the majority being disbursed within a thirty-day period. The Company grants collateralized commercial, real estate, and consumer loans to customers in Southeast Missouri. Although the Company has a diversified portfolio, loans aggregating $155,490,000 at June 30, 2009, are secured by single and multi-family residential real estate in the Company’s primary lending area. |
> NOTES TO CONSOLIDATED FINANCIAL STATEMENTS (continued) <
Southern Missouri Bancorp, Inc.
NOTE 15: Earnings Per Share
The following table sets forth the computations of basic and diluted
earnings per common share:
| | | Year Ended June 30 | |
| | | 2009 | | | 2008 | | | 2007 | |
| | | | | | | | | | |
| Net income | | $ | 3,835,077 | | | $ | 3,613,480 | | | $ | 2,928,413 | |
| Less: Effective dividend on preferred shares | | | 288,841 | | | | - | | | | - | |
| Net income available to common stockholders | | $ | 3,546,236 | | | $ | 3,613,480 | | | $ | 2,928,413 | |
| | | | | | | | | | | | | |
| Denominator for basic earnings per share - | | | | | | | | | | | | |
| Weighted-average shares outstanding | | | 2,123,144 | | | | 2,199,928 | | | | 2,225,658 | |
| Effect of dilutive securities stock options | | | 1,225 | | | | 12,204 | | | | 38,578 | |
| Denominator for diluted earnings per share | | | 2,124,369 | | | | 2,212,132 | | | | 2,264,236 | |
| | | | | | | | | | | | | |
| Basic earnings per share available to common stockholders | | $ | 1.67 | | | $ | 1.64 | | | $ | 1.32 | |
| Diluted earnings per share available to common stockholders | | $ | 1.67 | | | $ | 1.63 | | | $ | 1.29 | |
> NOTES TO CONSOLIDATED FINANCIAL STATEMENTS (continued) <
Southern Missouri Bancorp, Inc.
NOTE 16: Disclosures About Fair Value of Financial Instruments The following table presents estimated fair values of the Company’s financial instruments. The fair values of certain of these instruments were calculated by discounting expected cash flows, which involves significant judgments by management and uncertainties. Fair value is the estimated amount at which financial assets or liabilities could be exchanged in a current transaction between willing parties, other than in a forced or liquidation sale. Because no market exists for certain of these financial instruments and because management does not intend to sell these financial instruments, the Company does not know whether the fair values shown below represent values at which the respective financial instruments could be sold individually or in the aggregate. Effective July 1, 2008, the Company adopted Statement of Financial Accounting Standards No. 157, Fair Value Measurements (“SFAS No. 157”). SFAS No. 157 defines fair value, establishes a framework for measuring fair value and expands disclosures about fair value measurements. SFAS No. 157 has been applied prospectively as of the beginning of the year. SFAS No. 157 defines fair value as the price that would be received to sell an asset or paid to transfer a liability in an orderly transaction between market participants at the measurement date. SFAS No. 157 also establishes a fair value hierarchy which requires an entity to maximize the use of observable inputs and minimize the use of unobservable inputs when measuring fair value. The standard describes three levels of inputs that may be used to measure fair value: | | Level 1. Quoted prices in active markets for identical assets or liabilities Level 2. Observable inputs other than Level 1 prices, such as quoted prices for similar assets or liabilities; quoted prices in active markets that are not active; or other inputs that are observable or can be corroborated by observable market data for substantially the full term of the assets or liabilities Level 3. Unobservable inputs that are supported by little or no market activity and that are significant to the fair value of the assets or liabilities Following is a description of the valuation methodologies used for instruments measured at fair value on a recurring basis and recognized in the accompanying balance sheet, as well as the general classification of such instruments pursuant to the valuation hierarchy. Available-for-sale Securities. Available-for-sale securities are recorded at fair value on a recurring basis. Available-for-sale securities is the only balance sheet category our Company is required, in accordance with accounting principles generally accepted in the United States of America (US GAAP), to carry at fair value on a recurring basis. Securities classified as available for sale are reported at fair value utilizing Level 2 inputs. For these securities, our Company obtains fair value measurements from an independent pricing service. The fair value measurements consider observable data that may include dealer quotes, market spreads, cash flows, the U.S. Treasury yield curve, live trading levels, trade execution data, market consensus prepayment speeds, credit information and the bond’s terms and conditions, among other things. |
| | | Fair Value Measurements at June 30, 2009, Using: | |
| | | Fair Value at June 30, 2009 | | | Quoted Prices in Active Markets for Identical Assets (Level 1) | | | Significant Other Observable Inputs (Level 2) | | | Significant Unobservable Inputs (Level 3) | |
| | | | | | | | | | | | | |
| Available-for-sale securities | | $ | 60,177,992 | | | $ | - | | | $ | 60,177,992 | | | $ | - | |
> NOTES TO CONSOLIDATED FINANCIAL STATEMENTS (continued) <
Southern Missouri Bancorp, Inc.
| The following table presents estimated fair values of the Company’s financial instruments. The fair values of certain of these instruments were calculated by discounting expected cash flows, which involves significant judgments by management and uncertainties. Fair value is the estimated amount at which financial assets or liabilities could be exchanged in a current transaction between willing parties, other than in a forced or liquidation sale. | | Because no market exists for certain of these financial instruments and because management does not intend to sell these financial instruments, the Company does not know whether the fair values shown below represent values at which the respective financial instruments could be sold individually or in the aggregate. |
| | | 2009 | | | 2008 | |
| | | Carrying Amount | | | Fair Value | | | Carrying Amount | | | Fair Value | |
| | | (in thousands) | | | (in thousands) | |
| Financial Assets | | | | | | | | | | | | |
| Cash and cash equivalents | | $ | 8,074 | | | $ | 8,074 | | | $ | 6,042 | | | $ | 6,042 | |
| Interest-bearing time deposits | | | - | | | | - | | | | 1,980 | | | | 1,980 | |
| Investment and mortgage- | | | | | | | | | | | | | | | | |
| backed securities | | | | | | | | | | | | | | | | |
| available for sale | | | 60,178 | | | | 60,178 | | | | 39,915 | | | | 39,915 | |
| Stock in FHLB | | | 4,592 | | | | 4,592 | | | | 3,324 | | | | 3,324 | |
| Loans receivable, net | | | 368,556 | | | | 374,328 | | | | 343,070 | | | | 344,330 | |
| Accrued interest receivable | | | 2,650 | | | | 2,650 | | | | 3,012 | | | | 3,012 | |
| Bank owned life insurance | | | 7,564 | | | | 7,564 | | | | 7,290 | | | | 7,290 | |
| Financial Liabilities | | | | | | | | | | | | | | | | |
| Deposits | | | 311,955 | | | | 313,059 | | | | 292,257 | | | | 289,214 | |
| Securities sold under | | | | | | | | | | | | | | | | |
| agreements to repurchase | | | 23,748 | | | | 23,748 | | | | 21,804 | | | | 21,804 | |
| Advances from FHLB | | | 78,750 | | | | 82,510 | | | | 64,050 | | | | 65,968 | |
| Accrued interest payable | | | 989 | | | | 989 | | | | 1,200 | | | | 1,200 | |
| Subordinated Debt | | | 7,217 | | | | 7,217 | | | | 7,217 | | | | 7,217 | |
| Unrecognized financial instruments | | | | | | | | | | | | | | | | |
| (net of contract amount) | | | | | | | | | | | | | | | | |
| Commitments to originate loans | | | - | | | | - | | | | - | | | | - | |
| Letters of Credit | | | - | | | | - | | | | - | | | | - | |
| Lines of Credit | | | - | | | | - | | | | - | | | | - | |
The following methods and assumptions were used in estimating the fair values of financial instruments: Cash and cash equivalents and interest-bearing time deposits are valued at their carrying amounts which approximates fair value. Fair values of investment and mortgage-backed securities are based on quoted market prices or, if unavailable, quoted market prices of similar securities. Stock in FHLB is valued at cost which approximates fair value. Fair value of loans is estimated by discounting the future cash flows using the current rates at which similar loans would be made to borrowers with similar credit ratings and for the same remaining maturities. Loans with similar characteristics are aggregated for purposes of the calculations. Fair value of Bank owned life insurance is equal to the cash surrender value of the underlying life insurance policies. The carrying amounts of accrued interest approximate their fair values. Deposits with no defined maturities, such as NOW accounts, savings accounts and money market deposit accounts, are valued at their carrying amount which approximates fair value. | | The fair value of fixed-maturity time deposits is estimated using a discounted cash flow calculation that applies the rates currently offered for deposits of similar remaining maturities. The carrying amounts of securities sold under agreements to repurchase approximate fair value. Fair value of advances from the FHLB is estimated by discounting maturities using an estimate of the current market for similar instruments. The fair value of subordinated debt is estimated using rates currently available to the Company for debt with similar terms and maturities. The fair value of commitments to originate loans is estimated using the fees currently charged to enter into similar agreements, taking into account the remaining terms of the agreements and the present creditworthiness of the counterparties. For fixed-rate loan commitments, fair value also considers the difference between current levels of interest rates and committed rates. The fair value of letters of credit and lines of credit are based on fees currently charged for similar agreements or on the estimated cost to terminate or otherwise settle the obligations with the counterparties at the reporting date. |
> NOTES TO CONSOLIDATED FINANCIAL STATEMENTS (continued) <
Southern Missouri Bancorp, Inc.
NOTE 17: Significant Estimates Accounting principles generally accepted in the United States of America require disclosure of certain significant estimates and current vulnerabilities due to certain concentrations. Estimates related to the allowance for loan losses are described in Note 1. Current Economic Conditions. The current economic environment presents financial institutions with unprecedented circumstances and challenges which in some cases have resulted in large declines in the fair values of investments and other assets, constraints on liquidity and significant credit | | quality problems, including severe volatility in the valuation of real estate and other collateral supporting loans. The financial statements have been prepared using values and information currently available to the Company. Given the volatility of current economic conditions, the values of assets and liabilities recorded in the financial statements could change rapidly, resulting in material future adjustments in asset values, the allowance for loan losses, and capital that could negatively impact the Company’s ability to meet regulatory capital requirements and maintain sufficient liquidity. |
NOTE 18: Subsequent Events On July 17, 2009, the Company acquired 100% of the outstanding stock of Southern Bank of Commerce (SBOC), headquartered in Paragould, Arkansas. SBOC was merged into the Company’s existing banking subsidiary, Southern Bank, on July 20, 2009. The Company acquired SBOC primarily for the purpose of obtaining entry to markets where it believes the Company’s business model will perform well. The Company paid $600,000 in cash to acquire the target, of which $200,000 is held in escrow pending settlement of certain tax matters. An amount in excess of the amounts above may be paid based on the realization of additional tax benefits pursuant to recent changes in the tax code regarding net operating loss carryback. At acquisition, SBOC held assets of $29.9 million, including loans of $16.2 million, and held total deposits of $29.1 million. The initial accounting for the business combination was incomplete | | as of the date these financial statements were issued, due to work required to identify the fair value of the target’s assets and liabilities. The Company will determine any goodwill or bargain purchase gain when the fair values of the purchased assets and liabilities are determined. The Company expects fair value adjustments to loans, investments, deposits, and fixed assets. A core deposit intangible is also expected to be recognized from the acquisition. The Company will recognize all acquisition-related costs as an expense. The Company’s acquisition-related costs were $109,000 through June 30, 2009, and are reflected in professional fees. Subsequent events have been evaluated through August 25, 2009, which is the date the financial statements were issued. |
> NOTES TO CONSOLIDATED FINANCIAL STATEMENTS (continued) <
Southern Missouri Bancorp, Inc.
NOTE 19: Condensed Parent Company Only Financial Statements The following condensed balance sheets, statements of income and cash flows for Southern Missouri Bancorp, Inc. should be read in conjunction with the consolidated financial statements and the notes thereto. | | |
| | | | June 30 | |
| Condensed Balance Sheets | | | 2009 | | | 2008 | |
| | | | | | | | |
| Assets | | | | | | | |
| | | | | | | | |
| Cash and cash equivalents | | | $ | 1,606,209 | | | $ | 1,378,574 | |
| Premise and equipment | | | | 2,109,667 | | | | 2,109,667 | |
| Other assets | | | | 3,493,480 | | | | 251,752 | |
| Investment in common stock of Bank | | | | 42,086,832 | | | | 33,987,344 | |
| | TOTAL ASSETS | | $ | 49,296,188 | | | $ | 37,727,337 | |
| | | | | | | | | | |
| Liabilities and Stockholders’ Equity | | | | | | | | | |
| | | | | | | | | | |
| Accrued expenses and other liabilities | | | $ | 70,850 | | | $ | 38,688 | |
| Subordinated debt | | | | 7,217,000 | | | | 7,217,000 | |
| | TOTAL LIABILITIES | | | 7,287,850 | | | | 7,255,688 | |
| | | | | | | | | | |
| Stockholders’ equity | | | | 42,008,338 | | | | 30,471,649 | |
| | TOTAL LIABILITIES AND | | | | | | | | |
| | STOCKHOLDERS’ EQUITY | | $ | 49,296,188 | | | $ | 37,727,337 | |
| | | | Year Ended June 30 | |
| Condensed Statements of Income | | | 2009 | | | 2008 | | | 2007 | |
| | | | | | | | | | | |
| Interest income | | | $ | 37,908 | | | $ | 23,843 | | | $ | 61,165 | |
| Interest expense | | | | 357,387 | | | | 539,017 | | | | 594,357 | |
| Net interest income (expense) | | | | (319,479 | ) | | | (515,174 | ) | | | (533,192 | ) |
| Dividends from Bank | | | | 2,000,000 | | | | 1,600,000 | | | | 1,200,000 | |
| | | | | | | | | | | | | | |
| Operating expenses | | | | 464,801 | | | | 316,897 | | | | 294,479 | |
| | | | | | | | | | | | | | |
| Income before income taxes and | | | | | | | | | | | | | |
| equity in undistributed income | | | | | | | | | | | | | |
| of the Bank | | | | 1,215,720 | | | | 767,929 | | | | 372,329 | |
| | | | | | | | | | | | | | |
| Income tax benefit | | | | 293,500 | | | | 311,000 | | | | 309,000 | |
| | | | | | | | | | | | | | |
| Income before equity in undistributed | | | | | | | | | | | | | |
| income of the Bank | | | | 1,509,220 | | | | 1,078,929 | | | | 681,329 | |
| | | | | | | | | | | | | | |
| Equity in undistributed income | | | | | | | | | | | | | |
| of the Bank | | | | 2,325,857 | | | | 2,534,551 | | | | 2,247,084 | |
| | NET INCOME | | $ | 3,835,077 | | | $ | 3,613,480 | | | $ | 2,928,413 | |
> NOTES TO CONSOLIDATED FINANCIAL STATEMENTS (continued) <
Southern Missouri Bancorp, Inc.
| | | Year Ended June 30 | |
| Condensed Statements of Cash Flow | | 2009 | | | | | | 2008 | | | | | | 2007 | |
| Cash flows from operating activities: | | | | | | | | | | | | | | | |
| Net income | | $ | 3,835,077 | | | | | | $ | 3,613,480 | | | | | | $ | 2,928,413 | |
| Changes in: | | | | | | | | | | | | | | | | | | |
| Equity in undistributed income | | | | | | | | | | | | | | | | | | |
| of the Bank | | | (2,325,857 | ) | | | | | | (2,534,551 | ) | | | | | | (2,247,084 | ) |
| Other adjustments, net | | | (459,564 | ) | | | | | | (18,919 | ) | | | | | | 32,480 | |
NET CASH PROVIDED BY OPERATING ACTIVITIES | | | 1,049,656 | | | | | | | 1,060,010 | | | | | | | 713,809 | |
| | | | | | | | | | | | | | | | | | | |
| | | | | | | | | | | | | | | | | | | |
| Cash flows from investing activities: | | | | | | | | | | | | | | | | | | |
| Purchase of available for sale securities | | | (2,750,000 | ) | | | - | | | | | | | | | | | (1,330,000 | ) |
| Investment in real estate | | | - | | | | | | | | (30,009 | ) | | | - | | | | | |
| Proceeds from sales and maturities of | | | | | | | | | | | | | | | | | | | | |
| available for sale securities | | | - | | | | | | | | 161,025 | | | | | | | | 2,618,975 | |
| Investment in Bank subsidiary | | | (5,000,000 | ) | | | - | | | | | | | | | | | | - | |
NET CASH PROVIDED BY OR (USED IN) INVESTING ACTIVITIES | | | (7,750,000 | ) | | | | | | | 131,016 | | | | | | | | 1,288,975 | |
| | | | | | | | | | | | | | | | | | | | | |
| | | | | | | | | | | | | | | | | | | | | |
| Cash flows from financing activities: | | | | | | | | | | | | | | | | | | | | |
| Proceeds from issuance | | | | | | | | | | | | | | | | | | | | |
| of preferred stock | | | 9,511,129 | | | | | | | | - | | | | | | | | - | |
| Dividends on preferred stock | | | (212,222 | ) | | | | | | | - | | | | - | | | | | |
| Dividends on common stock | | | (1,024,172 | ) | | | | | | | (884,115 | ) | | | | | | | (805,439 | ) |
| Exercise of stock options | | | 161,069 | | | | | | | | 565,625 | | | | | | | | 26,000 | |
| Payments to acquire treasury stock | | | (1,507,825 | ) | | | | | | | (1,364,279 | ) | | | | | | | (397,020 | ) |
NET CASH PROVIDED BY OR (USED IN) FINANCING ACTIVITIES | | | 6,927,979 | | | | | | | | (1,682,769 | ) | | | | | | | (1,176,459 | ) |
Net increase (decrease) in cash and cash equivalents | | | 227,635 | | | | | | | | (491,743 | ) | | | | | | | 826,325 | |
Cash and cash equivalents at beginning of year | | | 1,378,574 | | | | | | | | 1,870,317 | | | | | | | | 1,043,992 | |
CASH AND CASH EQUIVALENTS AT END OF YEAR | | $ | 1,606,209 | | | | | | | $ | 1,378,574 | | | | | | | $ | 1,870,317 | |
> NOTES TO CONSOLIDATED FINANCIAL STATEMENTS (continued) <
Southern Missouri Bancorp, Inc.
NOTE 20: Quarterly Financial Data (Unaudited) Quarterly operating data is summarized as follows (in thousands): | | |
| | | June 30, 2009 | |
| | | | | | | | | | | | | |
| | | First Quarter | | | Second Quarter | | | Third Quarter | | | Fourth Quarter | |
| | | | | | | | | | | | | |
| Interest income | | $ | 6,342 | | | $ | 6,304 | | | $ | 6,290 | | | $ | 6,365 | |
| Interest expense | | | 2,889 | | | | 2,846 | | | | 2,714 | | | | 2,755 | |
| | | | | | | | | | | | | | | | | |
| Net interest income | | | 3,453 | | | | 3,458 | | | | 3,576 | | | | 3,610 | |
| | | | | | | | | | | | | | | | | |
| Provision for loan losses | | | 400 | | | | 200 | | | | 410 | | | | 210 | |
| Noninterest income | | | 336 | | | | 240 | | | | 582 | | | | 662 | |
| Noninterest expense | | | 2,037 | | | | 2,206 | | | | 2,341 | | | | 2,566 | |
| Income before income taxes | | | 1,352 | | | | 1,292 | | | | 1,407 | | | | 1,496 | |
| Income tax expense | | | 425 | | | | 404 | | | | 423 | | | | 460 | |
| NET INCOME | | $ | 927 | | | $ | 888 | | | $ | 984 | | | $ | 1,036 | |
| | | | | | | | | | | | | | | | | |
| | | June 30, 2008 | |
| | | First Quarter | | | Second Quarter | | | Third Quarter | | | Fourth Quarter | |
| | | | | | | | | | | | | | | | | |
| Interest income | | $ | 6,333 | | | $ | 6,377 | | | $ | 6,386 | | | $ | 6,231 | |
| Interest expense | | | 3,701 | | | | 3,606 | | | | 3,310 | | | | 2,930 | |
| | | | | | | | | | | | | | | | | |
| Net interest income | | | 2,632 | | | | 2,771 | | | | 3,076 | | | | 3,301 | |
| | | | | | | | | | | | | | | | | |
| Provision for loan losses | | | 110 | | | | 90 | | | | 350 | | | | 390 | |
| Noninterest income | | | 590 | | | | 602 | | | | 601 | | | | 621 | |
| Noninterest expense | | | 1,899 | | | | 1,978 | | | | 1,987 | | | | 2,003 | |
| Income before income taxes | | | 1,213 | | | | 1,305 | | | | 1,340 | | | | 1,529 | |
| Income tax expense | | | 400 | | | | 432 | | | | 442 | | | | 500 | |
| NET INCOME | | $ | 813 | | | $ | 873 | | | $ | 898 | | | $ | 1,029 | |
| | | | | | | | | | | | | | | | | |
| | | June 30, 2007 | |
| | | First Quarter | | | Second Quarter | | | Third Quarter | | | Fourth Quarter | |
| | | | | | | | | | | | | | | | | |
| Interest income | | $ | 5,686 | | | $ | 5,802 | | | $ | 5,920 | | | $ | 6,141 | |
| Interest expense | | | 3,197 | | | | 3,388 | | | | 3,465 | | | | 3,570 | |
| | | | | | | | | | | | | | | | | |
| Net interest income | | | 2,489 | | | | 2,414 | | | | 2,455 | | | | 2,571 | |
| | | | | | | | | | | | | | | | | |
| Provision for loan losses | | | 125 | | | | 95 | | | | 100 | | | | 285 | |
| Noninterest income | | | 577 | | | | 548 | | | | 516 | | | | 565 | |
| Noninterest expense | | | 1,797 | | | | 1,803 | | | | 1,889 | | | | 1,969 | |
| Income before income taxes | | | 1,144 | | | | 1,064 | | | | 982 | | | | 882 | |
| Income tax expense | | | 404 | | | | 341 | | | | 330 | | | | 69 | |
| NET INCOME | | $ | 740 | | | $ | 723 | | | $ | 652 | | | $ | 813 | |
> CORPORATE INFORMATION <
CORPORATE HEADQUARTERS 531 Vine Street Poplar Bluff, Missouri 63901 COMPANY WEBSITE www.bankwithsouthern.com SPECIAL COUNSEL Silver, Freedman & Taff, LLP Washington, D.C. 20007 | | INDEPENDENT REGISTERED PUBLIC ACCOUNTING FIRM BKD, LLP St. Louis, Missouri 63102 COMMON STOCK Nasdaq Stock Market Nasdaq Symbol: SMBC |
| | | |
TRANSFER AGENT Stockholders should report lost stock certificates or direct inquiries concerning dividend payments, change of name, address, or ownership, or consolidation of accounts, to the Company’s transfer agent: Registrar and Transfer Company 10 Commerce Drive Cranford, New Jersey 07016 (800) 368-5948 ANNUAL MEETING The Annual Meeting of Stockholders will be held Monday, October 19, 2009, at 9:00 a.m., Central Time, at the Greater Poplar Bluff Area Chamber of Commerce Building, 1111 West Pine, Poplar Bluff, Missouri 63901. ANNUAL REPORT ON FORM 10-K AND OTHER REPORTS A copy of the Company’s annual report on Form 10-K, including financial statement schedules and our quarterly reports as filed with the Securities and Exchange Commission, will be furnished without charge to stockholders as of the record date upon written request to the Secretary, Southern Missouri Bancorp, Inc., 531 Vine Street, Poplar Bluff, Missouri 63901. These documents also may be accessed through Southern Bank’s website at www.bankwithsouthern.com, under the Investor Relations tab. |
> DIRECTORS and OFFICERS <
| | | Standing: Sammy Schalk, Dennis Robison, Rebecca Brooks, Charles Moffitt, Charles Love, Ronnie Black Seated: Douglas Bagby, Samuel Smith, Greg Steffens |
SOUTHERN MISSOURI BANCORP, INC.
Directors Samuel H. Smith Chairman of the Board, Engineer and Majority Owner, S.H. Smith and Company, Inc. L. Douglas Bagby Vice-Chairman of the Board, City Manager, Poplar Bluff General Manager, Municipal Utilities of Poplar Bluff Ronnie D. Black Executive Director, General Association of General Baptists Sammy A. Schalk President, Gamblin Lumber Company | | Greg A. Steffens President and Chief Executive Officer, Southern Missouri Bancorp, Inc. Rebecca M. Brooks Financial Manager, McLane Transport Charles R. Love Certified Public Accountant, Kraft, Miles and Tatum Charles R. Moffitt Agency Manager, Morse Harwell Jiles Insurance Agency | | Dennis C. Robison President, Robison Farms, Inc. Leonard W. Ehlers Director Emeritus, Retired Court Reporter, 36th Judicial Circuit James W. Tatum Director Emeritus, Retired Certified Public Accountant |
| | | SOUTHERN BANK | | |
Directors L. Douglas Bagby Vice-Chairman of the Board, City Manager, Poplar Bluff General Manager, Municipal Utilities of Poplar Bluff Sammy A. Schalk President, Gamblin Lumber Company Samuel H. Smith Chairman of the Board, Engineer and Majority Owner, S.H. Smith and Company, Inc. Ronnie D. Black Executive Director, General Association of General Baptists | | Greg A. Steffens President and Chief Executive Officer, Southern Missouri Bancorp, Inc. Rebecca M. Brooks Financial Manager, McLane Transport Charles R. Love Certified Public Accountant, Kraft, Miles and Tatum Charles R. Moffitt Agency Manager, Morse Harwell Jiles Insurance Agency Dennis C. Robison President, Robison Farms, Inc. | | Senior Officers Greg A. Steffens President and Chief Executive Officer Kimberly A. Capps Chief Operations Officer William D. Hribovsek Chief Lending Officer Matthew T. Funke Chief Financial Officer Lora L. Daves Chief of Credit Administration |
SOUTHERN MISSOURI BANCORP, INC. is a single-bank holding company that has outperformed peers in this troubled economic environment. We are weathering the storm. Southern Missouri Bancorp, Inc. 531 Vine Street Poplar Bluff, Missouri 63901 (573) 778-1800 www.bankwithsouthern.com |