> CORPORATE PROFILE <
Southern Missouri Bancorp, Inc. (NASDAQ: SMBC) is the holding company for Southern Bank. The Company produced outstanding financial results and expanded its footprint in fiscal 2011, taking advantage of new opportunities. |
> TABLE of CONTENTS <
| Letter to Shareholders | 2 |
| Common Share Data | 8 |
| Financial Review | 9 |
| Report of Independent | |
| Registered Public Accounting Firm | 21 |
| Consolidated Financial Statements | 22 |
| Notes to Consolidated Financial Statements | 28 |
| Corporate and Investor Information | 64 |
| Directors and Officers | 65 |
> FINANCIAL SUMMARY <
| | | 2011 | | | 2010 | | | CHANGE(%) | |
EARNINGS (dollars in thousands) | | | | | | | | | |
| Net interest income | | $ | 23,763 | | | $ | 16,316 | | | | 45.6 | % |
| Provision for loan losses | | | 2,385 | | | | 925 | | | | 157.8 | |
| Noninterest income | | | 10,502 | | | | 3,094 | | | | 239.4 | |
| Noninterest expense | | | 14,459 | | | | 12,348 | | | | 17.1 | |
| Income taxes | | | 5,951 | | | | 1,511 | | | | 293.8 | |
| Net income | | | 11,470 | | | | 4,626 | | | | 147.9 | |
| Effective dividend on preferred shares | | | 512 | | | | 510 | | | | 0.4 | |
| Net income available to common stockholders | | | 10,958 | | | | 4,116 | | | | 166.2 | |
| | | | | | | | | | | | | |
| PER COMMON SHARE | | | | | | | | | | | | |
| Net income: | | | | | | | | | | | | |
| Basic | | $ | 5.25 | | | $ | 1.98 | | | | 165.2 | |
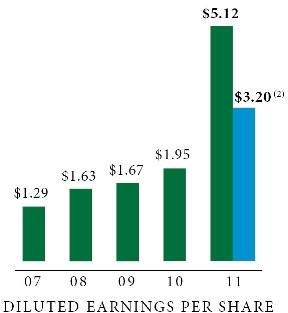
| Diluted | | | 5.12 | | | | 1.95 | | | | 162.6 | |
| Tangible book value | | | 21.19 | | | | 16.62 | | | | 27.5 | |
| Closing market price | | | 20.78 | | | | 15.01 | | | | 38.4 | |
| Cash dividends declared | | | .48 | | | | .48 | | | | | |
| | | | | | | | | | | | | |
AT YEAR-END (dollars in thousands) | | | | | | | | | | | | |
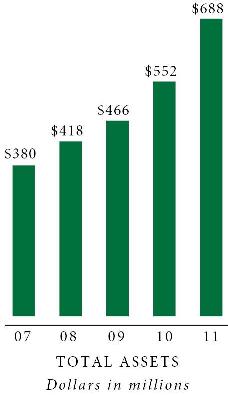
| Total assets | | $ | 688,200 | | | $ | 552,084 | | | | 24.7 | |
| Loans, net of allowance | | | 556,576 | | | | 418,683 | | | | 32.9 | |
| Reserves as a percent of nonperforming loans | | | 919 | % | | | 1,358 | % | | | | |
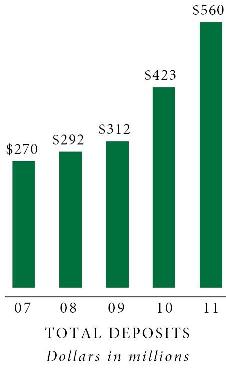
| Deposits | | $ | 560,151 | | | $ | 422,893 | | | | 32.5 | |
| Stockholders’ equity | | | 55,732 | | | | 45,649 | | | | 22.1 | |
| | | | | | | | | | | | | |
| FINANCIAL RATIOS | | | | | | | | | | | | |
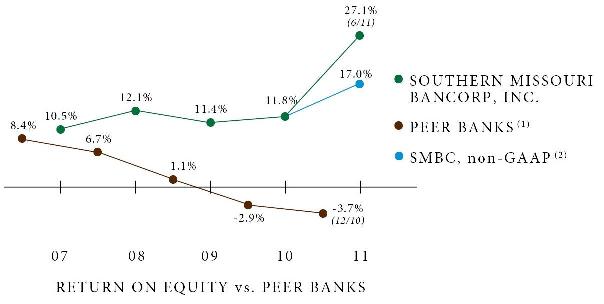
| Return on average common stockholders’ equity | | | 27.08 | % | | | 11.85 | % | | | | |
| Return on average assets | | | 1.81 | | | | 0.88 | | | | | |
| Net interest margin | | | 3.92 | | | | 3.27 | | | | | |
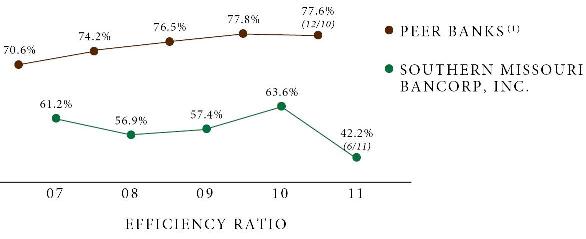
| Efficiency ratio | | | 42.20 | | | | 63.62 | | | | | |
| Allowance for loan losses to loans | | | 1.14 | | | | 1.06 | | | | | |
| Equity to average assets at year-end | | | 8.81 | | | | 8.68 | | | | | |
| | | | | | | | | | | | | |
OTHER DATA(1) | | | | | | | | | | | | |
| Common shares outstanding | | | 2,098,976 | | | | 2,087,976 | | | | | |
| Average common and dilutive | | | | | | | | | | | | |
| shares outstanding | | | 2,141,091 | | | | 2,105,292 | | | | | |
| Common stockholders of record | | | 252 | | | | 280 | | | | | |
| Full-time equivalent employees | | | 158 | | | | 133 | | | | | |
| Assets per employee (in thousands) | | $ | 4,356 | | | $ | 4,151 | | | | | |
| Banking offices | | | 16 | | | | 14 | | | | | |
(1) Other data is as of year-end, except for average shares.
(2) Diluted Earnings Per Share excluding impact of bargain
purchase gain on Acquisition and related transaction expenses.
> LETTER to SHAREHOLDERS <
Dear Shareholder,
| Southern Missouri Bancorp produced outstanding financial results in fiscal 2011, partially as a result of the gain on bargain purchase recognized from an FDIC-assisted acquisition. During 2011, we achieved earnings that far outpaced peers, expanded our footprint into attractive new markets, grew our deposit market share, and, as a result, improved long-term shareholder value. |
For fiscal 2011, net income available to common shareholders was $11.0 million, an increase of 166.3% from the $4.1 million earned in fiscal 2010; this equated to $5.12 per diluted share, up from $1.95 in the prior year. The Company generated a return on common equity of 27.1%, and a return on average assets of 1.81%, both up sharply from fiscal 2010 results. This improved performance was
| primarily the result of our December 2010 acquisition from the FDIC of the former First Southern Bank, Batesville, Arkansas (the Acquisition), which resulted in a $7.0 million bargain purchase gain. After taxes and related acquisition expenses, the impact of the transaction on income was approximately $4.1 million. Exclusive of the bargain purchase gain and transaction | Return on common equity remains ahead of peer banks ROE was significantly higher due to the bargain purchase gain realized on the Acquisition. |
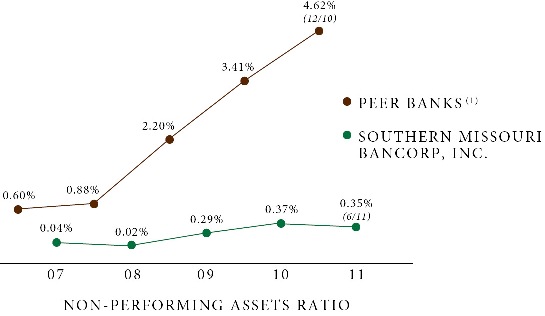
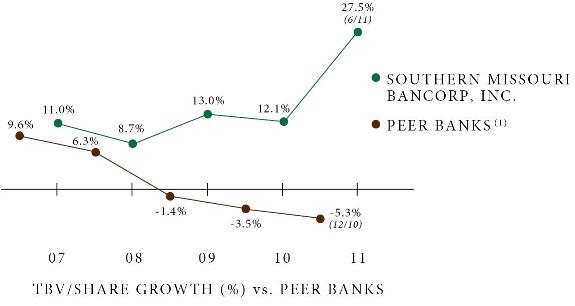
| (1) | Peer data is based on the average year-end figures (December) from SNL DataSource’s Index of publicly traded commercial banks and thrifts with assets of $100 million to $1 billion, headquartered in Missouri, Arkansas, Illinois, Iowa, Kansas, Kentucky, Nebraska, Oklahoma, and Tennessee. SMBC data is as of fiscal year-end (June). |
| (2) | SMBC, excluding bargain purchase gain and related transaction expenses. |
expenses related to the Acquisition, the Company estimates that it would have reported net income available to common shareholders for the fiscal year ended June 30, 2011, of $6.9 million, or $3.20
per diluted common share. Additionally, the acquired locations were immediately profitable and improved our net interest income. This was a result of the related growth in earning assets, the mix and pricing of the acquired loans and deposits, and the fair value discount applied to the acquired loan portfolio which resulted in an effective yield earned on the portfolio that was higher than our legacy earning assets.
Net interest income for the year improved 45.6%, as we grew earning assets by 21.7% and improved our net interest margin to 3.92%, as compared to 3.27% for the prior fiscal year. Noninterest income was up 239.4%, boosted by the one-time bargain purchase gain. (Exclusive of that item, noninterest income would have improved by 13.3%.)
| Noninterest expense increased 17.1% for fiscal 2011, a relatively limited amount considering the addition of two branch facilities for slightly more than half the year, a new loan production office in Springfield, Missouri, for most of the year, and a new loan production office in Little Rock, Arkansas, for a third of the year. The controlled increase in noninterest expense and higher noninterest income as a | Efficiency remains ahead of peers The 2011 improvement was due largely to the bargain purchase gain, but core efficiency also improved. |
result of the bargain purchase gain, along with the strong improvement in net interest income combined to produce an efficiency ratio of 42.2%, as compared to 63.6% in the prior year. |
For a second consecutive year, we grew deposits by more than $100 million. Last year’s growth was attributed primarily to growth of our checking accounts (including our Kasasa-branded rewards checking product); deposits obtained in the July 2009 acquisition of the Southern Bank of Commerce, Paragould, Arkansas; and growth of attractively-priced savings accounts in our new northeast Arkansas markets. With regard to this year’s growth of $137.3 million, or 32.5%, we can point to the December
2010 acquisition of First Southern Bank – deposits in the new Batesville and Searcy markets totaled $75.9 million at June 30, 2011 – and continued strong checking account growth. Checking accounts made up 38.5% of our deposit growth, most of it unrelated to the First Southern Bank acquisition.
Continued growth in our core business
The Acquisition contributed to significant balance sheet growth in 2011.
The loan portfolio, net, grew by $137.9 million, or 32.9%, in fiscal 2011. Loans outstanding at June 30, 2011, included $86.3 million from the new Batesville and Searcy markets. Including these acquired loans, we increased commercial real estate loans by $63.6 million, residential real estate loans by $41.4 million, and commercial operating and equipment loans by $28.8 million.
Credit quality is sound The level of problem assets was stable, despite the acquisition of a failed financial institution. | Asset quality remained stable, despite the acquisition of a failed financial institution. At June 30, 2011, non-performing loans were 0.12% of total loans, as compared to 0.08% of total loans at June 30, 2010. Non-performing assets totaled 0.35% of total assets at June 30, 2011, as compared to 0.37% of total assets at June 30, 2010. |
| Boosted by the gain from the First Southern Bank acquisition, earnings for the fiscal year contributed to an improvement of 27.0% in book value per common share as of June 30, 2011, compared to the previous year end; tangible book value per share improved 27.5% as of June 30, 2011, compared to the previous year end. Our stock price improved as well, up 38.4% as of June 30, 2011, compared to the previous year end. Over that | Tangible Book Value per share growth beats peers We have regularly exceeded peer banks (1) in this key measure of shareholder value. This year's results were boosted by the bargain purchase gain on the Acquisition. |
| same period, the SNL Bank Index improved 3.8%. Our dividend represented a 2.3% yield on our June 30, 2011, closing stock price, and a 2.6% yield on our average closing stock price for fiscal 2011. |
Recent Developments:
In July 2011, the Company announced a $20 million investment from the US Treasury in the form of
preferred stock issued under the terms of the Treasury’s Small Business Lending Fund (SBLF).
The SBLF was designed by Treasury to promote lending to small businesses: as the Company grows its qualified small business lending portfolio, the rate paid on the investment will decrease, making this an attractively-priced source of capital. Because our business model already emphasized lending to small businesses, we see the program as a good fit for the Company in the near term. Nearly half of the $20 million investment went to immediately repay the Treasury’s investment in our preferred stock under the Capital Purchase Program of the Troubled Asset Relief Program (TARP). The remainder is available to support the Company’s anticipated continued growth, with much of that growth expected to be in the form of small business lending.
| Also, in May 2011, the Company filed a preliminary registration statement with the SEC regarding a proposed public offering of up to $28.8 million of common stock. We continue to believe that a secondary offering of our common stock is in the Company’s long-term best interest. We expect our needs for capital - resulting from continued growth, opportunities for expansion, and the requirement for permanent capital to eventually replace the SBLF investment - will, in the near term, exceed our internally-generated capital growth. |
Our goals for 2012 include:
| • | Conversion of our loan production office in Springfield, Missouri, to a full-service branch. Our Springfield market accounted for $23.4 million of our loan portfolio at June 30, 2011. As this letter goes to press, we’re expanding our staff and preparing an exciting new service-delivery model for the Springfield branch. |
| • | Increased focus on branch profitability. Recent investments in profitability management software and additional personnel devoted to this function will allow more timely information to be reported to executive and branch management, and the Board of Directors. Employee goals for 2012 will be tweaked to better align strategic, profitability, and growth objectives at each of our locations. |
| | |
| • | Adoption of a new teller platform. This new technology will allow us to continue to improve efficiency. Additionally, the new teller platform is a key step in implementing the new service-delivery model we’re deploying at our Springfield branch. As we adopt the platform in additional locations throughout the coming year, we’ll consider adopting customer service changes tailored to each market. |
| | |
| • | Repositioning and adding branch locations. We believe several of our markets will require additional investments in facilities for Southern Bank to serve as a key provider of financial services in the local economy. Over the next several years, we anticipate new investments in fixed assets. You can be certain that we’ll keep a careful eye on the bottom line in order to ensure that we realize a sound return on your investment. |
| | |
| • | Finally, as always, we'll continue to work towards long-term improvement in shareholder value. We believe that our proposed secondary offering of common stock will help us meet this goal. Receipt of additional capital from the SBLF has provided us flexibility in our timing of the offering, in what has recently been a turbulent equity market. We'll continue to pursue opportunities for expansion as the industry consolidates, as well as for organic growth. |
I can say without a doubt that fiscal 2011 was the best year for Southern Missouri Bancorp since its formation. As we mark the 125th anniversary of Southern Bank in 2012, continued opportunities and challenges await us. I know that our excellent staff will be ready.
Thank you once again for your continued investment in this Company. I consider it a privilege to serve you, our staff, and our customers.
/s/ Greg Steffens
GREG STEFFENS
PRESIDENT and CHIEF EXECUTIVE OFFICER
SOUTHERN MISSOURI BANCORP, INC.
PLEASE JOIN US
at our 2011 Annual Meeting, where shareholders will hear
management review this year’s performance in detail.
ANNUAL MEETING
MONDAY, OCTOBER 17, 2011 AT 9:00 AM
CHAMBER OF COMMERCE BUILDING
1111 WEST PINE, POPLAR BLUFF, MISSOURI
> COMMON SHARE DATA <
The common stock of the Company is listed on the NASDAQ Global Market under the symbol “SMBC.” The following bar graph sets forth the high, low and closing market prices of the common stock for the last three fiscal years. |
|
The following table sets forth per share market price, book value, and dividend information for the Company’s common stock. As of June 30, 2011, there were approximately 252 common stockholders of record. This does not reflect the number of persons or entities who hold common stock in nominee or “street name.”
| | | | | Book | | |
| | | | | Value At | | |
| | | | | End Of | Market Price | Dividends |
| Fiscal 2011 | High | Low | Close | Period | To Book Value | Declared |
4th Quarter (6-30-11) | $28.00 | $19.97 | $20.78 | $22.08 | 94.11% | $0.12 |
3rd Quarter (3-31-11) | 24.10 | 17.00 | 22.32 | 20.74 | 107.62% | $0.12 |
2nd Quarter (12-31-10) | 17.70 | 14.65 | 17.25 | 19.95 | 86.47% | $0.12 |
1st Quarter (9-30-10) | 16.01 | 14.03 | 15.52 | 17.92 | 86.61% | $0.12 |
| | | | | | | |
| Fiscal 2010 | | | | | | |
4th Quarter (6-30-10) | $16.75 | $14.15 | $15.01 | $17.39 | 86.31% | $0.12 |
3rd Quarter (3-31-10) | 14.50 | 11.80 | 14.20 | 17.07 | 83.19% | 0.12 |
2nd Quarter (12-31-09) | 11.80 | 10.80 | 11.75 | 16.65 | 70.57% | 0.12 |
1st Quarter (9-30-09) | 12.15 | 9.39 | 10.80 | 16.40 | 65.85% | 0.12 |
| | | | | | | |
| Fiscal 2009 | | | | | | |
4th Quarter (6-30-09) | $11.00 | $ 8.99 | $ 9.95 | $15.58 | 63.86% | $0.12 |
3rd Quarter (3-31-09) | 11.70 | 7.63 | 10.80 | 15.16 | 71.24% | 0.12 |
2nd Quarter (12-31-08) | 14.91 | 9.87 | 11.09 | 14.75 | 75.19% | 0.12 |
1st Quarter (9-30-08) | 15.01 | 12.36 | 13.05 | 14.23 | 91.71% | 0.12 |
Any future dividend declarations and payments are subject to the discretion of the Board of Directors of the Company. The ability of the Company to pay dividends on its common stock depends primarily on the ability of the Bank to pay dividends to the Company. For a discussion of the restrictions on the Bank’s ability to pay dividends, see Note 13 of Notes to Consolidated Financial Statements included elsewhere in this report.
> FINANCIAL REVIEW <
BUSINESS OF THE COMPANY AND THE BANK Southern Missouri Bancorp, Inc. (Southern Missouri or Company) is a Missouri corporation and owns all of the outstanding stock of Southern Bank (the Bank). The Company’s earnings are primarily dependent on the operations of the Bank. As a result, the following discussion relates primarily to the operations of the Bank. The Bank was originally chartered by the State of Missouri in 1887 and converted from a state-chartered stock savings and loan association to a Federally chartered stock savings bank in 1995. In 1998, the Bank converted its charter to a state-chartered stock savings bank. Finally, in 2004, the Bank converted to a state chartered trust company with banking powers. The Bank’s deposit accounts are generally insured up to a maximum of $250,000 per | | depositor under current law by the Deposit Insurance Fund (DIF), which is administered by the Federal Deposit Insurance Corporation (FDIC). As of June 30, 2011, the Bank conducted its business through its home office located in Poplar Bluff, fifteen full service branch facilities in Poplar Bluff (2), Van Buren, Dexter, Kennett, Doniphan, Sikeston, Matthews, and Qulin, Missouri, and Paragould, Jonesboro, Leachville, Brookland, Batesville, and Searcy, Arkansas. Additionally, the bank operates two loan production offices in Springfield, Missouri, and Little Rock, Arkansas. |
| (dollars in thousands) | At June 30 |
| Financial Condition Data: | 2011 | 2010 | 2009 | 2008 | 2007 |
| Total assets | $ 688,200 | $ 552,084 | $ 466,334 | $ 418,188 | $ 380,106 |
| Loans receivable, net | 556,576 | 418,683 | 368,993 | 343,438 | 312,242 |
| Mortgage-backed securities | 24,536 | 34,334 | 40,269 | 28,006 | 10,723 |
| Cash, interest-bearing deposits | | | | | |
| and investment securities | 73,479 | 67,103 | 27,983 | 19,931 | 31,492 |
| Deposits | 560,151 | 422,893 | 311,955 | 292,257 | 270,088 |
| Borrowings | 58,730 | 73,869 | 102,498 | 85,854 | 71,758 |
| Subordinated debt | 7,217 | 7,217 | 7,217 | 7,217 | 7,217 |
| Stockholders’ equity | 55,732 | 45,649 | 42,008 | 30,472 | 28,714 |
| (dollars in thousands, except per share data) | For The Year Ended June 30 |
| Operating Data: | 2011 | 2010 | 2009 | 2008 | 2007 |
| Interest income | $ 35,048 | $ 27,541 | $ 25,301 | $ 25,327 | $ 23,550 |
| Interest expense | 11,285 | 11,225 | 11,204 | 13,547 | 13,621 |
| | | | | | |
| Net interest income | 23,763 | 16,316 | 14,097 | 11,780 | 9,929 |
| Provision for loan losses | 2,385 | 925 | 1,151 | 723 | 633 |
| | | | | | |
| Net interest income after | | | | | |
| provision for loan losses | 21,378 | 15,391 | 12,946 | 11,057 | 9,296 |
| | | | | | |
| Noninterest income | 10,502 | 3,094 | 1,820 | 2,412 | 2,207 |
| Noninterest expense | 14,459 | 12,348 | 9,134 | 8,081 | 7,430 |
| | | | | | |
| Income before income taxes | 17,422 | 6,137 | 5,632 | 5,388 | 4,073 |
| Income taxes | 5,952 | 1,511 | 1,797 | 1,775 | 1,145 |
| Net income | $ 11,470 | $ 4,626 | $ 3,835 | $ 3,613 | $ 2,928 |
| | | | | | |
| Less: effective dividend on preferred stock | 512 | 510 | 289 | - | - |
| Net income available to common stockholders | $ 10,958 | $ 4,116 | $ 3,546 | $ 3,613 | $ 2,928 |
| Basic earnings per share available to | | | | | |
| common stockholders | $ 5.25 | $ 1.98 | $ 1.67 | $ 1.64 | $ 1.32 |
| Diluted earnings per share available to | | | | | |
| common stockholders | $ 5.12 | $ 1.95 | $ 1.67 | $ 1.63 | $ 1.29 |
| Dividends per share | $ .48 | $ .48 | $ .48 | $ .40 | $ .36 |
> FINANCIAL REVIEW (continued) <
| | | At June 30 | |
| Other Data: | | 2011 | | | 2010 | | | 2009 | | | 2008 | | | 2007 | |
| Number of: | | | | | | | | | | | | | | | |
| Real estate loans | | | 3,758 | | | | 3,282 | | | | 2,957 | | | | 2,868 | | | | 2,795 | |
| Deposit accounts | | | 30,243 | | | | 25,353 | | | | 22,069 | | | | 20,560 | | | | 19,978 | |
| Full service offices | | | 16 | | | | 14 | | | | 10 | | | | 9 | | | | 9 | |
| Loan production offices | | | 2 | | | | - | | | | - | | | | - | | | | - | |
| | | | | | | | | | | | | | | | | | | | | |
| | | At Or For The Year Ended June 30 | |
| Key Operating Ratios: | | | 2011 | | | | 2010 | | | | 2009 | | | | 2008 | | | | 2007 | |
| Return on assets (net income | | | | | | | | | | | | | | | | | | | | |
| divided by average assets) | | | 1.81 | % | | | .88 | % | | | .87 | % | | | .92 | % | | | .80 | % |
| | | | | | | | | | | | | | | | | | | | | |
| Return on average common equity (net | | | | | | | | | | | | | | | | | | | | |
| income available to common stockholders | | | | | | | | | | | | | | | | | | | | |
| divided by average common equity) | | | 27.08 | | | | 11.85 | | | | 11.38 | | | | 12.06 | | | | 10.49 | |
| | | | | | | | | | | | | | | | | | | | | |
| Average equity to average assets | | | 7.89 | | | | 8.39 | | | | 8.29 | | | | 7.60 | | | | 7.66 | |
| | | | | | | | | | | | | | | | | | | | | |
| Interest rate spread (spread | | | | | | | | | | | | | | | | | | | | |
| between weighted average rate on | | | | | | | | | | | | | | | | | | | | |
| all interest-earning assets and all | | | | | | | | | | | | | | | | | | | | |
| interest-bearing liabilities) | | | 3.71 | | | | 3.06 | | | | 3.10 | | | | 2.86 | | | | 2.57 | |
| | | | | | | | | | | | | | | | | | | | | |
| Net interest margin (net interest | | | | | | | | | | | | | | | | | | | | |
| income as a percentage of average | | | | | | | | | | | | | | | | | | | | |
| interest-earning assets) | | | 3.92 | | | | 3.27 | | | | 3.37 | | | | 3.17 | | | | 2.90 | |
| | | | | | | | | | | | | | | | | | | | | |
| Noninterest expense to average assets | | | 2.28 | | | | 2.35 | | | | 2.07 | | | | 2.05 | | | | 2.05 | |
| | | | | | | | | | | | | | | | | | | | | |
| Average interest-earning assets to | | | | | | | | | | | | | | | | | | | | |
| average interest-bearing liabilities | | | 111.29 | | | | 109.57 | | | | 109.77 | | | | 108.60 | | | | 108.29 | |
| | | | | | | | | | | | | | | | | | | | | |
| Allowance for loan losses to gross | | | | | | | | | | | | | | | | | | | | |
| loans (1) | | | 1.14 | | | | 1.06 | | | | 1.07 | | | | .92 | | | | .76 | |
| | | | | | | | | | | | | | | | | | | | | |
| Allowance for loan losses to | | | | | | | | | | | | | | | | | | | | |
| nonperforming loans (1) | | | 918.84 | | | | 1,358.45 | | | | 501.63 | | | | 53,316.67 | | | | 9,180.77 | |
| | | | | | | | | | | | | | | | | | | | | |
| Net charge-offs (recoveries) to average | | | | | | | | | | | | | | | | | | | | |
| outstanding loans during the period | | | .09 | | | | .10 | | | | .10 | | | | (.03 | ) | | | .04 | |
| | | | | | | | | | | | | | | | | | | | | |
| Ratio of nonperforming assets | | | | | | | | | | | | | | | | | | | | |
| to total assets (1) | | | .35 | | | | .37 | | | | .29 | | | | .02 | | | | .04 | |
| | | | | | | | | | | | | | | | | | | | | |
| Common shareholder dividend | | | | | | | | | | | | | | | | | | | | |
| payout ratio (common dividends as a | | | | | | | | | | | | | | | | | | | | |
| percentage of earnings available to | | | | | | | | | | | | | | | | | | | | |
| common shareholders) | | | 9.17 | | | | 24.35 | | | | 28.88 | | | | 24.47 | | | | 27.50 | |
(1) At end of period
> FINANCIAL REVIEW (continued) <
Management’s Discussion and Analysis of Financial Condition and Results of Operations
OVERVIEW Southern Missouri Bancorp, Inc. is a Missouri corporation originally organized for the principal purpose of becoming the holding company of Southern Bank. The principal business of Southern Bank consists of attracting deposits from the communities it serves and investing those funds in loans secured by one- to four-family residences and commercial real estate, as well as commercial business and consumer loans. These funds have also been used to purchase investment securities, mortgage-backed securities (MBS), U.S. government and federal agency obligations and other permissible securities. Southern Bank’s results of operations are primarily dependent on the levels of its net interest margin and noninterest income, and its ability to control operating expenses. Net interest margin is dependent primarily on the difference or spread between the average yield earned on interest-earning assets (including loans, mortgage-related securities, and investments) and the average rate paid on interest-bearing liabilities (including deposits, securities sold under agreements to repurchase, and borrowings), as well as the relative amounts of these assets and liabilities. Southern Bank is subject to interest rate risk to the degree that its interest-earning assets mature or reprice at different times, or on a varying basis, from its interest-bearing liabilities. Southern Bank’s noninterest income consists primarily of fees charged on transaction and loan accounts, interchange income from customer debit and ATM card use, gains on sales of loans to the secondary market, and increased cash surrender value of bank owned life insurance (“BOLI”). Southern Bank’s operating expenses include: employee compensation and benefits, occupancy expenses, legal and professional fees, federal deposit insurance premiums, amortization of intangible assets, and other general and administrative expenses. Southern Bank’s operations are significantly influenced by general economic conditions including monetary and fiscal policies of the U.S. government and the Federal Reserve Board. Additionally, Southern Bank is subject to policies and regulations issued by financial institution regulatory agencies including the Federal Reserve, the Missouri Division of Finance, and the Federal Deposit Insurance Corporation. Each of these factors may influence interest rates, loan demand, prepayment rates and deposit flows. Interest rates available on competing investments as well as general market interest rates influence the Bank’s cost of funds. Lending activities are affected by the demand for real estate and other types of loans, which in turn is affected by the interest rates at which such financing may be offered. Lending activities are funded through the attraction of deposit accounts consisting of checking accounts, passbook and statement savings accounts, money market deposit accounts, certificate of deposit accounts with terms of 60 months or less, securities sold under agreements to repurchase, advances from the Federal Home Loan Bank of Des Moines, and, to a lesser extent, brokered deposits. The Bank intends to continue to focus on its lending programs for one- to four-family residential real estate, commercial real estate, commercial business and consumer financing on loans secured by properties or collateral located primarily in southeast Missouri and northeast and north central Arkansas. FORWARD-LOOKING STATEMENTS This document, including information incorporated by reference, contains forward-looking statements about the Company and its subsidiaries which we believe are within the meaning of the Private Securities Litigation Reform Act of 1995. These forward-looking statements include, without | | limitation, statements with respect to anticipated future operating and financial performance, growth opportunities, interest rates, cost savings and funding advantages expected or anticipated to be realized by management. Words such as “may,” “could,” “should,” “would,” “believe,” “anticipate,” “estimate,” “expect,” “intend,” “plan” and similar expressions are intended to identify these forward looking statements. Forward-looking statements by the Company and its management are based on beliefs, plans, objectives, goals, expectations, anticipations, estimates and the intentions of management and are not guarantees of future performance. The important factors we discuss below, as well as other factors discussed under the caption “Management’s Discussion and Analysis of Financial Condition and Results of Operations” and identified in our filings with the SEC and those presented elsewhere by our management from time to time, could cause actual results to differ materially from those indicated by the forward-looking statements made in this document: · the strength of the United States economy in general and the strength of the local economies in which we conduct operations; · fluctuations in interest rates and in real estate values; · monetary and fiscal policies of the Board of Governors of the Federal Reserve System (the “Federal Reserve Board”) and the U.S. Government and other governmental initiatives affecting the financial services industry; · the risks of lending and investing activities, including changes in the level and direction of loan delinquencies and write-offs and changes in estimates of the adequacy of the allowance for loan losses; · our ability to access cost-effective funding; · the timely development of and acceptance of our new products and services and the perceived overall value of these products and services by users, including the features, pricing and quality compared to competitors’ products and services; · expected cost savings, synergies and other benefits from the Company’s merger and acquisition activities might not be realized within the anticipated time frames or at all, and costs or difficulties relating to integration matters, including but not limited to customer and employee retention, might be greater than expected; · fluctuations in real estate values and both residential and commercial real estate market conditions; · demand for loans and deposits in our market area; · legislative or regulatory changes that adversely affect our business; · results of examinations of us by our regulators, including the possibility that our regulators may, among other things, require us to increase our · reserve for loan losses or to write-down assets; · the impact of technological changes; and · our success at managing the risks involved in the foregoing. The Company disclaims any obligation to update or revise any forward-looking statements based on the occurrence of future events, the receipt of new information, or otherwise. NON-GAAP FINANCIAL INFORMATION This annual report contains certain financial information determined by methods other than in accordance with accounting principles generally accepted in the United States of America (GAAP). These measures include net income available to common shareholders excluding bargain purchase gain and transaction expenses related to the Acquisition; net income available to common shareholders per diluted common share excluding bargain purchase gain and transaction expenses related to the Acquisition; net income excluding |
> FINANCIAL REVIEW (continued) <
bargain purchase gain and transaction expenses related to the Acquisition; and noninterest income excluding bargain purchase gain related to the Acquisition. Management believes that showing these amounts excluding the bargain purchase gain and transaction expenses related to the Acquisition is useful for investors because it better reflects our core operating results. | | The following table presents a reconciliation of the calculation of return on common equity excluding bargain purchase gain and transaction expenses related to the Acquisition: |
| The following table presents a reconciliation of the calculation of net available to common | | | For the twelve months |
shareholders excluding bargain purchase gain and transaction expenses related to the | | | ended June 30, 2011 |
| Acquisition: | | Net income available to common shareholders | $ 10,958,000 |
| | For the twelve months | | Less: Impact of bargain purchase gain and | |
| | ended June 30, 2011 | | transaction expenses related to the Acquisition, | |
| Net income available to common shareholders | $ 10,958,000 | | net of tax | 4,100,000 |
| Less: Impact of bargain purchase gain and | | | Net income available to common shareholders | |
| transaction expenses related to the Acquisition, | | | excluding bargain purchase gain and transaction | |
| net of tax | 4,100,000 | | expenses related to the Acquisition | $ 6,858,000 |
| Net income available to common shareholders | | | | |
| excluding bargain purchase gain and transaction | | | Divided by: average common equity | 40,455,000 |
| expenses related to the Acquisition | $ 6,858,000 | | Return on average common equity, excluding | |
| | | | bargain purchase gain and transaction expenses | |
| The following table presents a reconciliation of the calculation of diluted earnings per share available to common shareholders excluding bargain purchase gain and transaction expenses related to the Acquisition: | | related to the Acquisition | 17.0% |
| | For the twelve months | | The following table presents a reconciliation of the calculation of noninterest income excluding bargain purchase gain related to the Acquisition: |
| | ended June 30, 2011 | | | |
| Diluted earnings per share available to | | | | For the twelve months |
| common stockholders | $ 5.12 | | | ended June 30, 2011 |
| Less: Impact of bargain purchase gain and | | | Noninterest income | $ 10,502,000 |
| transaction expenses related to the Acquisition, | 1.92 | | Less: Impact of bargain purchase gain related | |
| net of tax | | | to the Acquisition | 6,997,000 |
| | | | Noninterest income excluding bargain purchase | |
| Diluted earnings per share available to common | | | gain related to the Acquisition | $ 3,505,000 |
| stockholders excluding bargain purchase gain and | | | | |
| transaction expenses related to the Acquisition | $ 3.20 | | The non-GAAP disclosures contained herein should not be viewed as |
| | | | substitutes for the results determined to be in accordance with GAAP, nor are |
| | | | they necessarily comparable to non-GAAP performance measures that may be |
| | | | presented by other companies. |
CRITICAL ACCOUNTING POLICIES The Company has established various accounting policies, which govern the application of accounting principles generally accepted in the United States of America in the preparation of our financial statements. Our significant accounting policies are described in the footnotes to the Consolidated Financial Statements. Certain accounting policies involve significant judgments and assumptions by management that have a material impact on the carrying value of certain assets and liabilities; management considers such accounting policies to be critical accounting policies. The judgments and assumptions used by management are based on historical experience and other factors, which are believed to be reasonable under the circumstances. Because of the nature of the judgments and assumptions made by management, actual results could differ from these judgments and estimates that could have a material impact on the carrying values of assets and liabilities and the results of operations of the Company. | | The allowance for losses on loans represents management’s best estimate of probable losses in the existing loan portfolio. The allowance for losses on loans is increased by the provision for losses on loans charged to expense and reduced by loans charged off, net of recoveries. The provision for losses on loans is determined based on management’s assessment of several factors: reviews and evaluations of specific loans, changes in the nature and volume of the loan portfolio, current economic conditions and the related impact on specific borrowers and industry groups, historical loan loss experience, the level of classified and nonperforming loans and the results of regulatory examinations. Integral to the methodology for determining the adequacy of the allowance for loan losses is portfolio segmentation and impairment measurement. Under the Company’s methodology, loans are first segmented into 1) those comprising large groups of smaller-balance homogeneous loans, including single-family mortgages and installment loans, which are collectively evaluated |
> FINANCIAL REVIEW (continued) <
for impairment and 2) all other loans which are individually evaluated. Those loans in the second category are further segmented utilizing a defined grading system which involves categorizing loans by severity of risk based on conditions that may affect the ability of the borrowers to repay their debt, such as current financial information, collateral valuations, historical payment experience, credit documentation, public information, and current trends. The loans subject to credit classification represent the portion of the portfolio subject to the greatest credit risk and where adjustments to the allowance for losses on loans as a result of provisions and charge-offs are most likely to have a significant impact on operations. A periodic review of selected credits (based on loan size and type) is conducted to identify loans with heightened risk or probable losses and to assign risk grades. The primary responsibility for this review rests with the loan administration personnel. This review is supplemented with periodic examinations of both selected credits and the credit review process by applicable regulatory agencies. The information from these reviews assists management in the timely identification of problems and potential problems and provides a basis for deciding whether the credit represents a probable loss or risk that should be recognized. Loans are considered impaired if, based on current information and events, it is probable that Southern Bank will be unable to collect the scheduled payments of principal or interest when due according to the contractual terms of the loan agreement. The measurement of impaired loans is generally based on the fair value of the collateral for collateral-dependent loans. If the loan is not collateral-dependent, the measurement of impairment is based on the present value of expected future cash flows discounted at the historical effective interest rate or the observable market price of the loan. In measuring the fair value of the collateral, management uses the assumptions (i.e., discount rates) and methodologies (i.e., comparison to the recent selling price of similar assets) consistent with those that would be utilized by unrelated third parties. Impairment identified through this evaluation process is a component of the allowance for loan losses. If a loan that is individually evaluated for impairment is found to have none, it is grouped together with loans having similar characteristics (i.e., the same risk grade), and an allowance for loan losses is based upon a quantitative factor (historical average charge-offs for similar loans over the past one to five years), and qualitative factors such as qualitative factors such as changes in lending policies; national, regional, and local economic conditions; changes in mix and volume of portfolio; experience, ability, and depth of lending management and staff; entry to new | | $137.9 million, partially offset by a decrease in available for sale investments of $3.6 million. Asset growth was funded by growth in deposit balances of $137.3 million and an increase in equity of $10.1 million; securities sold under agreements to repurchase declined by $5.1 million, and FHLB advances declined $10.0 million. Cash and equivalents. Cash and equivalents increased $215,000, or 0.6%, to $34.7 million at June 30, 2011, from $34.5 million at June 30, 2010. Loans. Loans increased $137.9 million, or 32.9%, to $556.6 million at June 30, 2011, from $418.7 million at June 30, 2010. This growth was attributed primarily to the Acquisition. The growth in the loan portfolio was comprised principally of commercial real estate loans of $63.6 million, residential real estate loans of $41.4 million, and commercial loans of $28.8 million. Allowance for Loan Losses. The allowance for loan losses increased $1.9 million, or 42.8%, from $4.5 million at June 30, 2010, to $6.4 million at June 30, 2011. The allowance for loan losses represented 1.14% of gross loans receivable at June 30, 2011, as compared to 1.06% of gross loans receivable at June 30, 2010. At June 30, 2011, nonperforming loans, which included loans past due greater than 90 days and nonaccruing loans, were $701,000, compared to $332,000 at June 30, 2010 (see also, Provision for Loan Losses, under Comparison of Operating Results for the Years Ended June 30, 2011 and 2010). In its quarterly evaluation of the adequacy of its allowance for loan losses, the Company employs historical data including past due percentages, charge offs, and recoveries for the previous five years for each loan category. During fiscal year 2011, the Company modified its allowance methodology to also consider the most recent twelve-month period’s average net charge offs and to use this information as one of the primary factors for evaluation of allowance adequacy. Average net charge offs are calculated as net charge offs by portfolio type for the period as a percentage of the average balance of respective portfolio type over the same period. As the Company and the industry have seen increases in loan defaults in the past several years, the Company believes that it is prudent to emphasize more recent historical factors in the allowance evaluation. As is illustrated in the table below, the impact of the modification has been minimal. The following table sets forth the Company’s historical net charge offs as of June 30, 2011: |
| markets; levels and trends of delinquent, nonaccrual, special mention, and | | | | Net charge offs - | | Net charge offs - |
| classified loans; concentrations of credit; changes in collateral values; | | Portfolio segment | | 1-year historical | | 5-year historical |
| agricultural economic conditions; and regulatory risk. For portfolio loans that are | | Real estate loans: | | | | |
| evaluated for impairment as part of homogenous pools, an allowance is | | Conventional | | .07% | | .06% |
| maintained based upon similar quantitative and qualitative factors. | | Construction | | .00 | | .00 |
| Changes in the financial condition of individual borrowers, in economic | | Commercial | | .13 | | .09 |
| conditions, in historical loss experience and in the conditions of the various | | Consumer loans | | .23 | | .43 |
| markets in which collateral may be sold may all affect the required level of the | | Commercial loans | | .08 | | .10 |
| allowance for losses on loans and the associated provision for losses on loans. | | | | | | |
FINANCIAL CONDITION General. The Company’s total assets increased $136.1 million, or 24.7%, to $688.2 million at June 30, 2011, when compared to $552.1 million at June 30, 2010. The increase was due primarily to the December 2010 acquisition of certain assets and assumption of certain liabilities of the former First Southern Bank, Batesville, Arkansas, from the FDIC in its role as receiver (the Acquisition). Asset growth consisted of an increase in the net loan portfolio of | | Additionally, in its quarterly evaluation of the adequacy of the allowance for loan losses, the Company evaluates changes in the financial condition of individual borrowers; changes in local, regional, and national economic conditions; the Company’s historical loss experience; and changes in market conditions for property pledged to the Company as collateral. The Company has identified specific qualitative factors that address these issues and subjectively assigns a percentage to each factor. Qualitative factors are reviewed quarterly and may be adjusted as necessary to reflect improving or declining trends. At June 30, 2011, these qualitative factors included: · Changes in lending policies |
> FINANCIAL REVIEW (continued) <
· National, regional, and local economic conditions · Changes in mix and volume of portfolio · Experience, ability, and depth of lending management and staff · Entry to new markets · Levels and trends of delinquent, nonaccrual, special mention and · classified loans · Concentrations of credit · Changes in collateral values · Agricultural economic conditions · Regulatory risk The qualitative factors are applied to the allowance for loan losses based upon the following percentages by loan type: | | Deposits. Deposits increased $137.3 million, or 32.5%, to $560.2 million at June 30, 2011, from $422.9 million at June 30, 2010. The deposit growth was primarily comprised of increases in certificate of deposit balances of $72.1 million, interest-bearing checking accounts of $48.8 million, and money market deposit accounts of $8.3 million. The growth was primarily due to the Acquisition. At June 30, 2011, deposits obtained from the acquired branches totaled approximately $75.9 million. These acquired deposits were primarily concentrated in certificate of deposit balances; the Company’s increase in interest-bearing checking accounts was primarily the result of organic growth. Borrowings. FHLB advances decreased $10.0 million, or 23.0%, to $33.5 million at June 30, 2011, from $43.5 million at June 30, 2010. At both June 30, 2011, and June 30, 2010, outstanding advances included no overnight or short term borrowings. Of the $33.5 million in advances at June 30, 2011, the entire amount carries fixed interest rates, and $24.5 million is subject to early redemption by the issuer. |
| | | Qualitative factor | | Qualitative factor | | At June 30, 2011, long-term FHLB advances had a weighted average |
| | | applied at | | applied at | | maturity of 5.2 years, compared to 4.8 years at June 30, 2010. At June 30, |
| Portfolio segment | | June 30, 2011 | | June 30, 2010 | | 2011, all FHLB advances had a weighted-average cost of 4.02%, as compared |
| Real estate loans: | | | | | | to 4.48% at June 30, 2010. |
| Conventional | | 0.88% | | 0.58% | | Subordinated Debt. In March 2004, $7.0 million of Floating Rate Capital |
| Construction | | 1.00 | | 1.03 | | Securities of Southern Missouri Statutory Trust I with a liquidation value of |
| Commercial | | 1.27 | | 1.08 | | $1,000 per share were issued. The securities mature in March 2034, were |
| Consumer loans | | 1.53 | | 1.44 | | redeemable beginning in March 2009, and bear interest at a floating rate of |
| Commercial loans | | 1.38 | | 1.18 | | three month LIBOR plus 275 basis points. |
| | | | | | | Stockholders’ Equity. The Company’s stockholders’ equity increased by |
| At June 30, 2011, the amount of our allowance for loan losses attributable | | $10.1million, or 22.1%, to $55.7 million at June 30, 2011, from $45.6 million |
to these qualitative factors was approximately $5.4 million, as compared to $3.8 million at June 30, 2010. The general increase in qualitative factors was attributable to entry to new markets and corresponding changes in the mix and volume of the portfolio and lending staff. Investments. The investment portfolio decreased $3.6 million, or 5.4%, to $63.3 million at June 30, 2011, from $67.0 million at June 30, 2010. The decrease was primarily the result of principal repayments on mortgage-backed securities (MBSs) and collateralized mortgage obligations (CMOs), partially offset by purchases of obligations of state and political subdivisions. Premises and Equipment. Premises and equipment increased $407,000, to $8.1 million at June 30, 2011, from $7.7 million at June 30, 2010. The increase was due to investments in building and equipment, partially offset by increases in accumulated depreciation. BOLI. The Bank purchased “key person” life insurance policies on six employees with a cash surrender value of $4.0 million in February, 2003. In addition, in October, 2004, the Bank purchased “key person” life insurance policies on 20 employees for $2.0 million. At June 30, 2011, the cash surrender value had increased to $8.1 million. Intangible Assets. Intangible assets generated through branch acquisitions in 2000 decreased $255,000 to $1.1 million as of June 30, 2011, and will continue to be amortized in accordance with ASC Topic 350. The July 2009 acquisition of the Southern Bank of Commerce resulted in goodwill of $126,000, which will not be amortized, but will be tested for impairment at least annually, and a $184,000 core deposit intangible, which is being amortized over a five-year period using the straight-line method. The December 2010 acquisition of the former First Southern Bank resulted in a bargain purchase gain, and a $625,000 core deposit intangible, which is being amortized over a five-year period using the straight-line method. | | at June 30, 2010. This increase was primarily due to net income of $11.5 million, partially offset by common and preferred dividend payments of $1.5 million. Due to the Company’s participation in the Capital Purchase Program under the U.S. Treasury’s Troubled Asset Relief Program, new repurchase activity was restricted through the Company’s July 2011 repurchase of those preferred shares (see Note 20: Subsequent Events). COMPARISON OF OPERATING RESULTS FOR THE YEARS ENDED JUNE 30, 2011 AND 2010 Net Income. The Company’s net income available to common stockholders for the fiscal year ended June 30, 2011, was $11.0 million, an increase of $6.8 million, or 166.3%, from the $4.1 million net income available to common stockholders for the prior fiscal year. Before an effective dividend on preferred shares of $512,000, net income was $11.5 million for the 2011 fiscal year, an increase of $6.8 million, or 148.0%, compared to the $4.6 million in net income for the prior fiscal year. The increase in net income was primarily due to a $7.4 million increase in net interest income and a $7.4 million increase in noninterest income, partially offset by a $4.4 million increase in income tax provision, a $2.1 million increase in noninterest expense, and a $1.5 million increase in loan loss provisions. Net Interest Income. Net interest income for fiscal 2011 was $23.8 million, an increase of $7.4 million, or 45.6%, when compared to the prior fiscal year. The increase was due to a $107.9 million increase in average interest-earning assets, combined with a 65 basis point increase in the average interest rate spread. The increase in interest rate spread was primarily a result of the Acquisition, through which the Company obtained assets marked at a discounted fair value resulting in an effective yield on the acquired assets that is higher than the Company’s legacy earning assets. For fiscal 2011, the average interest rate spread was 3.71%, compared to 3.06% for fiscal year 2010. At June 30, 2011, the spread was 4.00%. |
> FINANCIAL REVIEW (continued) <
Interest Income. Interest income for fiscal 2011 was $35.0 million, an increase of $7.5 million, or 27.3%, when compared to the prior fiscal year. The increase was due to the $107.9 million increase in the average balance of interest-earning assets, combined with a 25 basis point increase in the average yield earned on interest-earning assets, from 5.53% in fiscal 2010 to 5.78% in fiscal 2011. Interest income on loans receivable for fiscal 2011 was $32.3 million, an increase of $7.7 million, or 31.4%, when compared to the prior fiscal year. The increase was due to a $101.1 million increase in the average balance of loans receivable, combined with a 31 basis point increase in the average yield earned on loans receivable. The increase in average balances was attributed to both organic growth and the Acquisition. The increase in the average yield was attributable to the Acquisition and the resulting fair value discount on the loan portfolio accreted to income. Interest income on the investment portfolio and other interest-earning assets was $2.8 million for fiscal 2011, a decrease of $204,000, or 6.8%, when compared to the prior fiscal year. The decrease was due to a 41 basis point decrease in the average yield earned on these assets, partially offset by a $6.9 million increase in the average balance of these assets. The decreased yield was due primarily to lower available yields on investment securities, reflecting the low interest rate environment. Interest Expense. Interest expense was $11.3 million for fiscal 2011, an increase of $60,000, or 0.5%, when compared to the prior fiscal year. The increase was due to the $89.9 million increase in the average balance of interest-bearing liabilities, partially offset by a 40 basis point decrease in the average rate paid on interest-bearing liabilities, from 2.47% in fiscal 2010 to 2.07% in fiscal 2011. Interest expense on deposits was $9.2 million for fiscal 2011, an increase of $1.1 million, or 14.1%, when compared to the prior fiscal year. The increase was due to a $108.6 million increase in the average balance of interest-bearing deposits, partially offset by a 27 basis point decrease in the average rate paid on deposits outstanding, reflecting the decrease in market rates. Interest expense on FHLB advances was $1.6 million for fiscal 2011, a decrease of $1.1 million, or 42.2%, when compared to the prior fiscal year. The decrease was due to a $20.3 million decrease in the average balance of FHLB advances, combined with a 49 basis point decrease in the average rate paid on advances, reflecting the repayment of advances that carried higher rates than the average of the advances that remain outstanding. In March 2004, $7.0 million of Floating Rate Capital Securities were issued, with an interest rate of three month LIBOR plus 275 basis points, repricing quarterly. Interest expense on these securities was $227,000 for fiscal 2011, roughly equal to the prior fiscal year, as the average rate paid decreased by one basis point. Provision for Loan Losses. A provision for loan losses is charged to earnings to bring the total allowance for loan losses to a level considered adequate by management to provide for probable loan losses based on prior loss experience, type and amount of loans in the portfolio, adverse situations that may affect the borrower’s ability to repay, the estimated value of any underlying collateral, and current economic conditions. Management also considers other factors relating to the collectability of the loan portfolio. The provision for loan losses was $2.4 million for fiscal 2011, compared to $925,000 for the prior fiscal year. The increase in provision was attributed to provisions needed during the year to bring reserves to an appropriate level based on our continued analysis of the loan portfolio, the current fiscal year’s growth in the loan portfolio, and the increase in classified loans during the fiscal year. In fiscal 2011, net charge offs were $455,000, compared to $409,000 for the prior fiscal year. At June 30, 2011, classified loans totaled $8.5 million, or 1.52% of gross loans, as compared to $6.3 million, or 1.50% of gross loans at June 30, 2010. | | Classified loans were comprised primarily of loans secured by commercial and agricultural real estate. All loans so designated were classified due to concerns as to the borrowers’ ability to continue to generate sufficient cash flows to service the debt. The above provision was made based on management’s analysis of the various factors which affect the loan portfolio and management’s desire to maintain the allowance at a level considered adequate. Management performed a detailed analysis of the loan portfolio, including types of loans, the charge-off history, and an analysis of the allowance for loan losses. Management also considered the continued origination of loans secured by commercial businesses and commercial and agricultural real estate, which bear an inherently higher level of credit risk. While management believes the allowance for loan losses at June 30, 2011, is adequate to cover all losses inherent in the portfolio, there can be no assurance that, in the future, increases in the allowance will not be necessary, or that actual losses will not exceed the allowance. Noninterest Income. Noninterest income was $10.5 million for fiscal 2011, an increase of $7.4 million, or 239.4%, when compared to the prior fiscal year. The increase was primarily due to the bargain purchase gain of $7.0 million (pre-tax) recognized in the second quarter of fiscal 2011 as a result of the Acquisition. Excluding the bargain purchase gain related to the Acquisition, noninterest income would have been approximately $3.5 million for fiscal 2011, an increase of $411,000, or 13.3%, when compared to the prior fiscal year. That increase was attributable to income generated from ATM and debit card transactions, increased NSF activity, and loan late fee collections, and was also partially offset by lower secondary market loan sales. Noninterest Expense. Noninterest expense was $14.5 million for fiscal 2011, an increase of $2.1 million, or 17.1%, when compared to the prior fiscal year. The increase resulted primarily from higher compensation, occupancy, and legal and professional fees. Compensation expenses were $8.0 million for fiscal 2011, an increase of $1.7 million, or 27.0%, when compared to the prior fiscal year. The increase was due to the Acquisition, opening two new loan production offices, the addition of key personnel, increased salaries, and increased benefit expenses. Occupancy expenses were $2.2 million for fiscal 2011, an increase of $373,000, or 19.9%, as we added two new locations with the Acquisition, opened two loan production offices, and expanded our headquarters facility. Legal and professional fees were $530,000 in fiscal 2011, an increase of $224,000, or 73.2%, and increased primarily as a result of the Acquisition. Provision for Income Taxes. The Company recorded an income tax provision of $6.0 million for fiscal 2011, an increase of $4.4 million, compared to $1.5 million expensed for fiscal 2010. The effective tax rate for fiscal 2011 was 34.2%, as compared to 24.6% for fiscal 2010. The increase was primarily due to additional pre-tax income, and the inclusion in fiscal 2010 results of tax benefits associated with the July 2009 acquisition of the Southern Bank of Commerce with no corresponding benefits in fiscal 2011. COMPARISON OF OPERATING RESULTS FOR THE YEARS ENDED JUNE 30, 2010 AND 2009 Net Income. The Company’s net income available to common stockholders for the fiscal year ended June 30, 2010, was $4.1 million, an increase of $569,000, or 16.1%, from the $3.5 million net income available to common stockholders for the prior fiscal year. Before an effective dividend on preferred shares of $510,000, net income was $4.6 million for the 2010 fiscal year, an increase of $791,000, or 20.6%, compared to the $3.8 million in net income for the prior fiscal year. The increase in net income was primarily due to a $2.2 million increase in net interest income, a $1.3 million increase in noninterest income, |
> FINANCIAL REVIEW (continued) <
a $285,000 decrease in income tax provisions, and a $226,000 decrease in loan loss provisions, partially offset by a $3.2 million increase in noninterest expense. Net Interest Income. Net interest income for fiscal 2010 was $16.3 million, an increase of $2.2 million, or 15.7%, when compared to the prior fiscal year. The increase was due to a $79.7 million increase in average interest-earning assets, partially offset by a five basis point decrease in the average interest rate spread. The decrease in interest rate spread was primarily a result of our strong deposit growth, accomplished in part due to our rewards checking product and an above-market savings account special in our new Arkansas market, coupled with resulting higher average cash balances (which earn a lower rate of return than our average interest-earning assets) during the fiscal year. For fiscal 2010, the average interest rate spread was 3.06%, compared to 3.11% for fiscal year 2009. At June 30, 2010, the spread was 3.08%. Interest Income. Interest income for fiscal 2010 was $27.5 million, an increase of $2.2 million, or 8.9%, when compared to the prior fiscal year. The increase was due to the $79.7 million increase in the average balance of interest-earning assets, partially offset by a 51 basis point decrease in the average yield earned on interest-earning assets, from 6.04% in fiscal 2009 to 5.53% in fiscal 2010. Interest income on loans receivable for fiscal 2010 was $24.6 million, an increase of $1.7 million, or 7.6%, when compared to the prior fiscal year. The increase was due to a $45.1 million increase in the average balance of loans receivable, partially offset by a 29 basis point decrease in the average yield earned on loans receivable, reflecting the decrease in market rates. Interest income on the investment portfolio and other interest-earning assets was $3.0 million for fiscal 2010, an increase of $516,000, or 20.9%, when compared to the prior fiscal year. The increase was due to a $34.7 million increase in the average balance of these assets, partially offset by a 92 basis point decrease in the average yield earned on these assets. The decreased yield was due primarily to higher average cash balances. Interest Expense. Interest expense was $11.2 million for fiscal 2010, an increase of $21,000, or 0.2%, when compared to the prior fiscal year. The increase was due to the $73.5 million increase in the average balance of interest-bearing liabilities, partially offset by a 46 basis point decrease in the average rate paid on interest-bearing liabilities, from 2.93% in fiscal 2009 to 2.47% in fiscal 2010. Interest expense on deposits was $8.1 million for fiscal 2010, an increase of $911,000, or 12.7%, when compared to the prior fiscal year. The increase was due to a $90.7 million increase in the average balance of interest-bearing deposits, partially offset by a 41 basis point decrease in the average rate paid on deposits outstanding, reflecting the decrease in market rates, despite above-market rates paid in new markets. Interest expense on FHLB advances was $2.7 million for fiscal 2010, a decrease of $764,000, or 22.1%, when compared to the prior fiscal year. The decrease was due to a $20.5 million decrease in the average balance of FHLB advances, partially offset by a 25 basis point increase in the average rate paid on advances, reflecting the repayment of short-term borrowings while long-term advances remained outstanding. In March 2004, $7.0 million of Floating Rate Capital Securities were issued, with an interest rate of three month LIBOR plus 275 basis points, repricing quarterly. Interest expense on these securities was $227,000 for fiscal 2010, as compared to $357,000 for the prior fiscal year, as the average rate paid decreased by 180 basis points, due to the decrease in the index. Provision for Loan Losses. A provision for loan losses is charged to earnings to bring the total allowance for loan losses to a level considered adequate by management to provide for probable loan losses based on prior loss experience, type and amount of loans in the portfolio, adverse situations that may affect the | | borrower’s ability to repay, the estimated value of any underlying collateral, and current economic conditions. Management also considers other factors relating to the collectability of the loan portfolio. The provision for loan losses was $925,000 for fiscal 2010, compared to $1.2 million for the prior fiscal year. The decrease in provision was primarily due to less uncertainty in the regional economy and real estate market as compared to the prior fiscal year, while charge-offs and non-performing loans remained stable in the current fiscal year. Additionally, loans acquired through the July 2009 acquisition of the Southern Bank of Commerce performed slightly better than anticipated, and have not required significant further provisioning. In fiscal 2010, net charge offs were $409,000, compared to $357,000 for the prior year. At June 30, 2010, classified loans totaled $6.3 million, or 1.50% of gross loans, as compared to $8.2 million, or 2.08% of gross loans, at June 30, 2009. Classified loans were comprised primarily of loans secured by commercial and agricultural real estate, or inventory and equipment. All loans so designated were classified due to concerns as to the borrowers’ ability to continue to generate sufficient cash flows to service the debt. The above provision was made based on management’s analysis of the various factors which affect the loan portfolio and management’s desire to maintain the allowance at a level considered adequate. Management performed a detailed analysis of the loan portfolio, including types of loans, the charge-off history, and an analysis of the allowance for loan losses. Management also considered the continued origination of loans secured by commercial businesses and commercial real estate, which bear an inherently higher level of credit risk. While management believes the allowance for loan losses at June 30, 2010, is adequate to cover all losses inherent in the portfolio, there can be no assurance that, in the future, increases in the allowance will not be necessary, or that actual losses will not exceed the allowance. Noninterest Income. Noninterest income was $3.1 million for fiscal 2010, an increase of $1.3 million, or 70.0%, when compared to the prior fiscal year. The increase was due to increased NSF fee collection, additional ATM and debit card transaction fee income, and increased gains on sales of secondary market loans, as well as charges of $679,000 incurred during fiscal 2009 to recognize the other-than-temporary impairment (OTTI) of two investments held by the Company, with no corresponding charges in the current period. Noninterest Expense. Noninterest expense was $12.3 million for fiscal 2010, an increase of $3.2 million, or 35.2%, when compared to the prior fiscal year. The increase resulted primarily from higher compensation, occupancy, and electronic banking expenses, a prepayment penalty for the FHLB advance prepaid in March 2010, a charge to dispose of fixed assets, and charges to write down the carrying value of foreclosed real estate held for sale. Compensation expenses were $6.3 million for fiscal 2010, an increase of $1.5 million, or 31.1%, when compared to the prior fiscal year. The increase was due to the July 2009 acquisition of the Southern Bank of Commerce, the addition of key personnel, increased salaries, personnel, and increased benefit expenses. Occupancy expenses were $1.9 million for fiscal 2010, an increase of $341,000, or 22.3%, as we added four new locations with the July 2009 acquisition of the Southern Bank of Commerce. Electronic banking and other charges increased due to the development and promotion of our popular new rewards checking product, as well as the additional costs of servicing those accounts. Provision for Income Taxes. The Company expensed an income tax provision of $1.5 million for fiscal 2010, a decrease of $285,000, compared to $1.8 million expensed for fiscal 2009. The effective tax rate for fiscal 2010 was 24.6%, as compared to 31.9% for fiscal 2009. The decrease was primarily due to tax benefits associated with the July 2009 acquisition, partially offset by increased pre-tax income. |
> FINANCIAL REVIEW (continued) <
QUANTITATIVE AND QUALITATIVE DISCLOSURES ABOUT MARKET RISK The goal of the Company’s asset/liability management strategy is to manage the interest rate sensitivity of both interest-earning assets and interest-bearing liabilities in order to maximize net interest income without exposing the Company to an excessive level of interest rate risk. The Company employs various strategies intended to manage the potential effect that changing interest rates may have on future operating results. The primary asset/liability management strategy has been to focus on matching the anticipated repricing intervals of interest-earning assets and interest-bearing liabilities. At times, however, depending on the level of general interest rates, the relationship between long- and short-term interest rates, market conditions and competitive factors, the Company may increase its interest rate risk position in order to maintain its net interest margin. In an effort to manage the interest rate risk resulting from fixed rate lending, the Company has utilized longer term (up to 10 year maturities), fixed-rate FHLB advances, which may be subject to early redemption, to offset interest rate risk. Other elements of the Company’s current asset/liability strategy include: (i) increasing originations of commercial real estate, commercial | | rates and deposit runoff. Further, the computations do not consider any reactions that the Bank may undertake in response to changes in interest rates. These projected changes should not be relied upon as indicative of actual results in any of the aforementioned interest rate changes. Management cannot accurately predict future interest rates or their effect on the Company’s NPV and net interest income in the future. Certain shortcomings are inherent in the method of analysis presented in the computation of NPV and net interest income. For example, although certain assets and liabilities may have similar maturities or periods of repricing, they may react in different degrees to changes in market interest rates. Also, the interest rates on certain types of assets and liabilities may fluctuate in advance of changes in market interest rates, while interest rates on other types of assets and liabilities may lag behind changes in market interest rates. Additionally, most of Southern Bank’s loans have features which restrict changes in interest rates on a short-term basis and over the life of the asset. Further, in the event of a change in interest rates, prepayment and early withdrawal levels would likely deviate significantly from those assumed in calculating the foregoing table. Finally, the ability of many borrowers to service their debt may decrease in the event of an interest rate increase. |
| business loans, agricultural real estate, and agricultural operating lines, which | | June 30, 2011 |
| typically provide higher yields and shorter repricing periods, but inherently | | | | | | NPV as % of |
| increase credit risk, (ii) limiting the price volatility of the investment portfolio | | | Net Portfolio | PV of Assets |
| by maintaining a weighted average maturity of five years or less, (iii) actively | | | $ Amount | $ Change | % Change | NPV Ratio | Change |
| soliciting less rate-sensitive deposits, and (iv) offering competitively priced | | Change in Rates | (dollars in thousands) | | |
| money market accounts and CDs with maturities of up to five years. The degree | | +300 bp | $ 61,503 | $ 5,115 | 9 | 9.11 | 0.96 |
| to which each segment of the strategy is achieved will affect profitability and | | +200 bp | 61,759 | 5,371 | 10 | 9.08 | 0.92 |
| exposure to interest rate risk. | | +100 bp | 59,975 | 3,587 | 6 | 8.74 | 0.58 |
| The Company continues to generate long-term, fixed-rate residential loans. | | 0 bp | 56,388 | - | - | 8.16 | - |
| During the fiscal year ended June 30, 2011, fixed rate residential loan | | -100 bp | 50,216 | (6,172) | (11) | 7.23 | -0.92 |
| originations totaled $11.1 million, compared to $17.0 million during the prior | | -200 bp | 43,747 | (12,641) | (22) | 6.27 | -1.88 |
| year. At June 30, 2011, the fixed-rate residential loan portfolio totaled $117.5 | | -300 bp | 41,255 | (15,132) | (27) | 5.89 | -2.27 |
| million, with a weighted average maturity of 167 months, compared to $103.3 | | | | | | | |
| million with a weighted average maturity of 192 months at June 30, 2010. The | | June 30, 2010 |
| Company originated $17.4 million in adjustable rate residential loans during the | | | | | | NPV as % of |
| fiscal year ended June 30, 2011, compared to $11.9 million during the prior | | | Net Portfolio | PV of Assets |
| fiscal year. At June 30, 2011, fixed rate loans with remaining maturities in | | | $ Amount | $ Change | % Change | NPV Ratio | Change |
| excess of 10 years totaled $83.8 million, or 14.9%, of loans receivable, | | Change in Rates | (dollars in thousands) | | |
| compared to $99.5 million, or 23.5%, of loans receivable, at June 30, 2010. The | | +300 bp | $ 59,399 | $ 7,513 | 14 | 10.93 | 1.63 |
| Company originated $52.4 million in fixed rate commercial and commercial real | | +200 bp | 58,204 | 6,318 | 12 | 10.60 | 1.30 |
| estate loans during the year ended June 30, 2011, compared to $53.2 million | | +100 bp | 56,030 | 4,144 | 8 | 10.11 | 0.81 |
| during the prior fiscal year. The Company also originated $31.8 million in | | 0 bp | 51,886 | - | - | 9.30 | - |
| adjustable rate commercial and commercial real estate loans during the fiscal | | -100 bp | 46,599 | (5,287) | (10) | 8.30 | -1.00 |
| year ended June 30, 2011, compared to $68.4 million during the prior year. At | | -200 bp | 41,009 | (10,877) | (21) | 7.26 | -2.04 |
| June 30, 2011, adjustable-rate home equity lines of credit had increased to $14.0 | | -300 bp | 39,297 | (12,589) | (24) | 6.92 | -2.38 |
| million as compared to $12.9 million as of June 30, 2010. At June 30, 2011, the | | | | | | | |
Company’s weighted average life of its investment portfolio was 3.1 years, as compared to 2.9 years at June 30, 2010. At June 30, 2011, CDs with original terms of two years or more totaled $92.6 million compared to $66.8 million at June 30, 2010. INTEREST RATE SENSITIVITY ANALYSIS | | The Company has worked to limit its exposure to rising rates in the current historically low rate environment by (a) increasing the share of funding on its balance sheet obtained from non-maturity transaction accounts, (b) reducing FHLB borrowings and (c) limiting the duration of its available-for-sale investment portfolio. |
The following table sets forth as of June 30, 2011, and 2010, management’s estimates of the projected changes in net portfolio value in the event of 1%, 2% and 3%, instantaneous, permanent increases or decreases in market interest rates. Computations in the table below are based on prospective effects of hypothetical changes in interest rates and are based on an internally generated model using the actual maturity and repricing schedules for Southern Bank’s loans and deposits, adjusted by management’s assumptions for prepayment | | | | | | | |
> FINANCIAL REVIEW (continued) <
LIQUIDITY AND CAPITAL RESOURCES Southern Missouri’s primary potential sources of funds include deposit growth, securities sold under agreements to repurchase, FHLB advances, amortization and prepayment of loan principal, investment maturities and sales, and ongoing operating results. While scheduled repayments on loans and securities as well as the maturity of short-term investments are a relatively predictable source of funding, deposit flows, FHLB advance redemptions and loan and security prepayment rates are significantly influenced by factors outside of the Bank’s control, including general economic conditions and market competition. The Bank has relied on FHLB advances as a source for funding cash or liquidity needs. Southern Missouri uses its liquid assets as well as other funding sources to meet ongoing commitments, to fund loan commitments, to repay maturing certificates of deposit and FHLB advances, to make investments, to fund other deposit withdrawals and to meet operating expenses. At June 30, 2011, the Bank had outstanding commitments to extend credit of $73.6 million (including $64.6 million in unused lines of credit). Total commitments to originate fixed-rate loans with terms in excess of one year were $5.4 million at rates ranging from 5.0% to 7.5%, with a weighted-average rate of 5.99%. Management anticipates that current funding sources will be adequate to meet foreseeable liquidity needs. For the year ended June 30, 2011, Southern Missouri increased deposits by $137.3 million and decreased securities sold under agreements to repurchase and FHLB advances by $5.1 million and $10.0 million, respectively. During the prior year, Southern Missouri increased deposits and securities sold under agreements to repurchase by $110.9 million and $6.6 million, respectively, and decreased FHLB advances by $35.3 million. At June 30, 2011, the Bank had pledged $218.2 million of its residential and commercial real estate loan portfolios to the FHLB for available credit of approximately $148.9 million, of which $33.5 million had been advanced, and another $7.1 million had been used for the issuance of letters of credit to secure public unit deposits. The Bank had also pledged $88.4 of its agricultural real estate and agricultural operating and equipment loans to the Federal Reserve’s discount window for available credit of approximately $59.2, none of which had been advanced. In addition, the Bank has the ability to pledge several of its other loan portfolios, including, for example, its home equity and commercial business loans. In total, FHLB borrowings are generally limited to 40% of Bank assets, or approximately $275.1 million, which means that an amount up to $234.5 million may still be eligible to be borrowed from the FHLB, subject to available collateral. Along with the ability to borrow from the FHLB and Federal Reserve, management believes its liquid resources will be sufficient to meet the Company’s liquidity needs. Liquidity management is an ongoing responsibility of the Bank’s management. The Bank adjusts its investment in liquid assets based upon a variety of factors including (i) expected loan demand and deposit flows, (ii) anticipated investment and FHLB advance maturities, (iii) the impact on profitability, and (iv) asset/liability management objectives. At June 30, 2011, the Bank had $181.3 million in CDs maturing within one year and $320.7 million in other deposits and securities sold under agreements to repurchase without a specified maturity, as compared to the prior year of $147.9 million in CDs maturing within one year and $260.7 million in other deposits and securities sold under agreements to repurchase without a specified maturity. Management believes that most maturing interest-bearing liabilities will be retained or replaced by new interest-bearing liabilities. Also at June 30, 2011, the Bank had $17.0 million in FHLB advances eligible for early redemption by the lender within one year. | | REGULATORY CAPITAL Federally insured financial institutions are required to maintain minimum levels of regulatory capital. Federal Reserve regulations establish capital requirements, including a leverage (or core capital) requirement and a risk-based capital requirement. The Federal Reserve is also authorized to impose capital requirements in excess of these standards on individual institutions on a case-by-case basis. At June 30, 2011, the Bank exceeded regulatory capital requirements with core and total risk-based capital of $60.0 million and $66.2 million, or 8.66% and 12.52% of adjusted total assets and risk-weighted assets, respectively. These capital levels exceeded minimum requirements of 4.0% and 8.0%, respectively, and well-capitalized requirements of 5% and 10%, respectively for adjusted total assets and risk-weighted assets. The Company became subject to requirements to report regulatory capital ratios as of March 31, 2011. At June 30, 2011, the Company exceeded regulatory capital requirements with core and total risk based capital of $59.1 million and $65.5 million, or 8.60% and 12.40% of adjusted total assets and risk-weighted assets, respectively. These capital levels exceed minimum requirements of 4.0% and 8.0%, respectively. (See Note 13: Stockholders’ Equity and Regulatory Capital.) IMPACT OF INFLATION The consolidated financial statements and related data presented herein have been prepared in accordance with U.S. generally accepted accounting principles, which require the measurement of financial position and operating results in historical dollars without considering changes in the relative purchasing power of money over time due to inflation. The primary impact of inflation on the operations of the Company is reflected in increased operating costs. Unlike most industrial companies, virtually all of the assets and liabilities of a financial institution are monetary in nature. As a result, changes in interest rates generally have a more significant impact on a financial institution’s performance than does inflation. Interest rates do not necessarily move in the same direction or to the same extent as the prices of goods and services. In the current interest rate environment, liquidity and maturity structure of the Company’s assets and liabilities are critical to the maintenance of acceptable performance levels. AVERAGE BALANCE, INTEREST AND AVERAGE YIELDS AND RATES The table on the following page sets forth certain information relating to the Company’s average interest-earning assets and interest-bearing liabilities and reflects the average yield on assets and the average cost of liabilities for the periods indicated. These yields and costs are derived by dividing income or expense by the average balance of assets or liabilities, respectively, for the years indicated. Nonaccrual loans are included in the net loan category. The table also presents information with respect to the difference between the weighted-average yield earned on interest-earning assets and the weighted-average rate paid on interest-bearing liabilities, or interest rate spread, which financial institutions have traditionally used as an indicator of profitability. Another indicator of an institution’s net interest income is its net yield on interest-earning assets, which is its net interest income divided by the average balance of interest-earning assets. Net interest income is affected by the interest rate spread and by the relative amounts of interest-earning assets and interest-bearing liabilities. When interest-earning assets approximate or exceed interest-bearing liabilities, any positive interest rate spread will generate net interest income. |
> FINANCIAL REVIEW (continued) <
| (dollars in thousands) | | | | | | | | | | | | | | | | | | | | | | | | | | | |
| | | 2011 | | | 2010 | | | 2009 | |
| Year Ended June 30 | | Average Balance | | | Interest and Dividends | | | Yield/ Cost | | | Average Balance | | | Interest and Dividends | | | Yield/ Cost | | | Average Balance | | | Interest and Dividends | | | Yield/ Cost | |
| Interest-earning assets: | | | | | | | | | | | | | | | | | | | | | | | | | | | |
| Mortgage loans (1) | | $ | 366,368 | | | $ | 24,196 | | | | 6.60 | % | | $ | 287,216 | | | $ | 17,917 | | | | 6.24 | % | | $ | 254,355 | | | $ | 16,781 | | | | 6.60 | % |
| Other loans (1) | | | 137,057 | | | | 8,069 | | | | 5.89 | | | | 115,155 | | | | 6,638 | | | | 5.76 | | | | 102,963 | | | | 6,050 | | | | 5.88 | |
| Total net loans | | | 503,425 | | | | 32,265 | | | | 6.41 | | | | 402,371 | | | | 24,555 | | | | 6.10 | | | | 357,318 | | | | 22,831 | | | | 6.39 | |
| Mortgage-backed securities | | | 28,503 | | | | 1,377 | | | | 4.83 | | | | 35,862 | | | | 1,715 | | | | 4.78 | | | | 35,714 | | | | 1,729 | | | | 4.84 | |
| Investment securities (2) | | | 40,473 | | | | 1,287 | | | | 3.18 | | | | 30,878 | | | | 1,156 | | | | 3.74 | | | | 20,487 | | | | 706 | | | | 3.45 | |
| Other interest-earning assets | | | 33,901 | | | | 119 | | | | 0.35 | | | | 29,282 | | | | 115 | | | | 0.39 | | | | 5,133 | | | | 35 | | | | 0.68 | |
| TOTAL INTEREST- | | | | | | | | | | | | | | | | | | | | | | | | | | | | | | | | | | | | |
| EARNING ASSETS (1) | | | 606,302 | | | | 35,048 | | | | 5.78 | | | | 498,393 | | | | 27,541 | | | | 5.53 | | | | 418,652 | | | | 25,301 | | | | 6.04 | |
| Other noninterest-earning | | | | | | | | | | | | | | | | | | | | | | | | | | | | | | | | | | | | |
| assets (3) | | | 26,356 | | | | - | | | | - | | | | 27,741 | | | | - | | | | - | | | | 23,045 | | | | - | | | | - | |
| TOTAL ASSETS | | $ | 632,658 | | | | 35,048 | | | | - | | | $ | 526,134 | | | | 27,541 | | | | - | | | $ | 441,697 | | | $ | 25,301 | | | | - | |
| Interest-bearing liabilities: | | | | | | | | | | | | | | | | | | | | | | | | | | | | | | | | | | | | |
| Savings accounts | | $ | 89,699 | | | $ | 1,040 | | | | 1.16 | % | | $ | 79,512 | | | $ | 1,186 | | | | 1.49 | % | | $ | 64,349 | | | $ | 1,155 | | | | 1.79 | % |
| NOW accounts | | | 130,337 | | | | 3,273 | | | | 2.51 | | | | 85,911 | | | | 2,076 | | | | 2.42 | | | | 49,325 | | | | 1,015 | | | | 2.06 | |
| Money market accounts | | | 13,598 | | | | 176 | | | | 1.29 | | | | 6,951 | | | | 99 | | | | 1.42 | | | | 6,905 | | | | 99 | | | | 1.43 | |
| Certificates of deposit | | | 237,531 | | | | 4,725 | | | | 1.99 | | | | 190,190 | | | | 4,715 | | | | 2.48 | | | | 151,316 | | | | 4,896 | | | | 3.24 | |
| TOTAL INTEREST- | | | | | | | | | | | | | | | | | | | | | | | | | | | | | | | | | | | | |
| BEARING DEPOSITS | | | 471,165 | | | | 9,214 | | | | 1.96 | | | | 362,564 | | | | 8,076 | | | | 2.23 | | | | 271,895 | | | | 7,165 | | | | 2.64 | |
| Borrowings: | | | | | | | | | | | | | | | | | | | | | | | | | | | | | | | | | | | | |
| Securities sold under | | | | | | | | | | | | | | | | | | | | | | | | | | | | | | | | | | | | |
| agreements to repurchase | | | 29,285 | | | | 290 | | | | 0.99 | | | | 27,674 | | | | 233 | | | | 0.84 | | | | 24,345 | | | | 229 | | | | 0.94 | |
| FHLB advances | | | 37,114 | | | | 1,554 | | | | 4.19 | | | | 57,399 | | | | 2,689 | | | | 4.68 | | | | 77,923 | | | | 3,453 | | | | 4.43 | |
| Junior subordinated debt | | | 7,217 | | | | 227 | | | | 3.15 | | | | 7,217 | | | | 227 | | | | 3.15 | | | | 7,217 | | | | 357 | | | | 4.95 | |
| TOTAL INTEREST- | | | | | | | | | | | | | | | | | | | | | | | | | | | | | | | | | | | | |
| BEARING LIABILITIES | | | 544,781 | | | | 11,285 | | | | 2.07 | | | | 454,854 | | | | 11,225 | | | | 2.47 | | | | 381,380 | | | | 11,204 | | | | 2.94 | |
| Noninterest-bearing | | | | | | | | | | | | | | | | | | | | | | | | | | | | | | | | | | | | |
| demand deposits | | | 35,098 | | | | - | | | | - | | | | 25,701 | | | | - | | | | - | | | | 23,140 | | | | - | | | | - | |
| Other liabilities | | | 2,882 | | | | - | | | | - | | | | 1,438 | | | | - | | | | - | | | | 546 | | | | - | | | | - | |
| TOTAL LIABILITIES | | | 582,761 | | | | - | | | | - | | | | 481,993 | | | | 11,225 | | | | - | | | | 405,066 | | | | 11,204 | | | | - | |
| Stockholders’ equity | | | 49,897 | | | | - | | | | - | | | | 44,141 | | | | - | | | | - | | | | 36,631 | | | | - | | | | - | |
| TOTAL LIABILITIES AND | | | | | | | | | | | | | | | | | | | | | | | | | | | | | | | | | | | | |
| STOCKHOLDERS’ EQUITY | | $ | 632,658 | | | | 11,285 | | | | - | | | $ | 526,134 | | | | 11,225 | | | | - | | | $ | 441,697 | | | | 11,204 | | | | - | |
| Net interest income | | | | | | $ | 23,763 | | | | | | | | | | | $ | 16,316 | | | | | | | | | | | $ | 14,097 | | | | | |
| Interest rate spread (4) | | | | | | | | | | | 3.71 | % | | | | | | | | | | | 3.06 | % | | | | | | | | | | | 3.10 | % |
| Net interest margin (5) | | | | | | | | | | | 3.92 | % | | | | | | | | | | | 3.27 | % | | | | | | | | | | | 3.37 | % |
| Ratio of average interest-earning | | | | | | | | | | | | | | | | | | | | | | | | | | | | | | | | | | | | |
| assets to average interest- | | | | | | | | | | | | | | | | | | | | | | | | | | | | | | | | | | | | |
| bearing liabilities | | | 111.29 | % | | | | | | | | | | | | | | | 109.57 | % | | | | | | | | | | | | | | | 109.77 | % |
| (1) | Calculated net of deferred loan fees, loan discounts and loans-in-process. Nonaccrual loans are included in average loans. |
| (2) | Includes FHLB stock and related cash dividends. |
| (3) | Includes equity securities and related cash dividends. |
| (4) | Represents the difference between the average rate on interest-earning assets and the average cost of interest-bearing liabilities. |
| (5) | Represents net interest income divided by average interest-earning assets. |
> FINANCIAL REVIEW (continued) <
YIELDS EARNED AND RATES PAID
The following table sets forth for the periods and at the dates indicated, the weighted average yields earned on the Company’s assets, the weighted average interest rates paid on the Company’s liabilities, together with the net yield on interest-earning assets.
| | | At June 30, | | | For The Year Ended June 30, | |
| | | 2011 | | | 2011 | | | 2010 | | | 2009 | |
| Weighted-average yield on loan portfolio | | | 6.08 | % | | | 6.41 | % | | | 6.10 | % | | | 6.39 | % |
| Weighted-average yield on mortgage-backed securities | | | 4.85 | | | | 4.83 | | | | 4.78 | | | | 4.84 | |
| Weighted-average yield on investment securities (1) | | | 3.43 | | | | 3.18 | | | | 3.74 | | | | 3.45 | |
| Weighted-average yield on other interest-earning assets | | | 0.39 | | | | 0.35 | | | | 0.39 | | | | 0.68 | |
| Weighted-average yield on all interest-earning assets | | | 5.61 | | | | 5.78 | | | | 5.53 | | | | 6.04 | |
| Weighted-average rate paid on deposits | | | 1.47 | | | | 1.96 | | | | 2.23 | | | | 2.64 | |
| Weighted-average rate paid on securities sold under | | | | | | | | | | | | | | | | |
| agreements to repurchase | | | 0.86 | | | | 0.99 | | | | 0.84 | | | | 0.94 | |
| Weighted-average rate paid on FHLB advances | | | 4.02 | | | | 4.19 | | | | 4.68 | | | | 4.43 | |
| Weighted-average rate paid on subordinated debt | | | 3.00 | | | | 3.14 | | | | 3.15 | | | | 4.95 | |
| Weighted-average rate paid on all interest-bearing liabilities | | | 1.61 | | | | 2.07 | | | | 2.47 | | | | 2.93 | |
| Interest rate spread (spread between weighted average rate on | | | | | | | | | | | | | | | | |
| all interest-earning assets and all interest-bearing liabilities) | | | 4.00 | | | | 3.71 | | | | 3.06 | | | | 3.11 | |
| Net interest margin (net interest income as a percentage of | | | | | | | | | | | | | | | | |
| average interest-earning assets) | | | 4.16 | | | | 3.92 | | | | 3.27 | | | | 3.37 | |
(1) Includes Federal Home Loan Bank stock.
RATE/VOLUME ANALYSIS
The following table sets forth the effects of changing rates and volumes on net interest income of the Company. Information is provided with respect to (i) effects on interest income attributable to changes in volume (changes in volume multiplied by prior rate), (ii) effects on interest income attributable to changes in rate (changes in rate multiplied by prior volume), and (iii) changes in rate/volume (change in rate multiplied by change in volume).
| | | Years Ended June 30, 2011 Compared to 2010 Increase (Decrease) Due to | | | Years Ended June 30, 2010 Compared to 2009 Increase (Decrease) Due to | |
| (dollars in thousands) | | Rate | | | Volume | | | Rate/ Volume | | | Net | | | Rate | | | Volume | | | Rate/ Volume | | | Net | |
| Interest-earning assets: | | | | | | | | | | | | | | | | | | | | | | | | |
| Loans receivable (1) | | $ | 1,247 | | | $ | 6,164 | | | $ | 299 | | | $ | 7,710 | | | $ | (1,036 | ) | | $ | 2,879 | | | $ | (119 | ) | | $ | 1,724 | |
| Mortgage-backed securities | | | 18 | | | | (352 | ) | | | (4 | ) | | | (338 | ) | | | (21 | ) | | | 7 | | | | - | | | | (14 | ) |
| Investment securities (2) | | | (173 | ) | | | 359 | | | | (55 | ) | | | 131 | | | | 59 | | | | 358 | | | | 33 | | | | 450 | |
| Other interest-earning deposits | | | (12 | ) | | | 18 | | | | (3 | ) | | | 3 | | | | (15 | ) | | | 164 | | | | (69 | ) | | | 80 | |
| Total net change in income on | | | | | | | | | | | | | | | | | | | | | | | | | | | | | | | | |
| interest-earning assets | | | 1,080 | | | | 6,189 | | | | 237 | | | | 7,506 | | | | (1,013 | ) | | | 3,408 | | | | (155 | ) | | | 2,240 | |
| Interest-bearing liabilities: | | | | | | | | | | | | | | | | | | | | | | | | | | | | | | | | |
| Deposits | | | (1,125 | ) | | | 2,495 | | | | (233 | ) | | | 1,137 | | | | (1,172 | ) | | | 2,288 | | | | (205 | ) | | | 911 | |
| Securities sold under | | | | | | | | | | | | | | | | | | | | | | | | | | | | | | | | |
| agreements to repurchase | | | 42 | | | | 14 | | | | 1 | | | | 57 | | | | (24 | ) | | | 31 | | | | (3 | ) | | | 4 | |
| Subordinated debt | | | (1 | ) | | | - | | | | 1 | | | | - | | | | (130 | ) | | | - | | | | - | | | | (130 | ) |
| FHLB advances | | | (281 | ) | | | (949 | ) | | | 96 | | | | (1,134 | ) | | | 195 | | | | (909 | ) | | | (50 | ) | | | (764 | ) |
| Total net change in expense on | | | | | | | | | | | | | | | | | | | | | | | | | | | | | | | | |
| interest-bearing liabilities | | | (1,365 | ) | | | 1,560 | | | | (135 | ) | | | 60 | | | | (1,131 | ) | | | 1,410 | | | | (258 | ) | | | 21 | |
| Net change in net interest income | | $ | 2,445 | | | $ | 4,629 | | | $ | 372 | | | $ | 7,446 | | | $ | 118 | | | $ | 1,998 | | | $ | 103 | | | $ | 2,219 | |
(1) Does not include interest on loans placed on nonaccrual status.
(2) Does not include dividends earned on equity securities.
> REPORT OF INDEPENDENT REGISTERED PUBLIC ACCOUNTING FIRM <
Report of Independent Registered Public Accounting Firm
Audit Committee, Board of Directors
and Stockholders
Southern Missouri Bancorp, Inc.
Poplar Bluff, Missouri
We have audited the accompanying consolidated balance sheets of Southern Missouri Bancorp, Inc. (“Company”) as of June 30, 2011 and 2010, and the related consolidated statements of income, stockholders’ equity and cash flows for each of the years in the three-year period ended June 30, 2011. The Company’s management is responsible for these financial statements. Our responsibility is to express an opinion on these financial statements based on our audits.
We conducted our audits in accordance with the standards of the Public Company Accounting Oversight Board (United States). Those standards require that we plan and perform the audits to obtain reasonable assurance about whether the financial statements are free of material misstatement. The Company is not required to have, nor were we engaged to perform, an audit of its internal control over financial reporting. Our audits included consideration of internal control over financial reporting as a basis for designing auditing procedures that are appropriate in the circumstances, but not for the purpose of expressing an opinion on the effectiveness of the Company’s internal control over financial reporting. Accordingly, we express no such opinion. Our audits also included examining, on a test basis, evidence supporting the amounts and disclosures in the financial statements, assessing the accounting principles used and significant estimates made by management and evaluating the overall financial statement presentation. We believe that our audits provide a reasonable basis for our opinion.
In our opinion, the consolidated financial statements referred to above present fairly, in all material respects, the financial position of Southern Missouri Bancorp, Inc. as of June 30, 2011 and 2010, and the results of its operations and its cash flows for each of the years in the three-year period ended June 30, 2011, in conformity with accounting principles generally accepted in the United States of America.
/s/ BKD, LLP
Decatur, Illinois
September 21, 2011
> CONSOLIDATED BALANCE SHEETS <
JUNE 30, 2011 AND 2010
Southern Missouri Bancorp, Inc.
| Assets | | 2011 | | | 2010 | |
| Cash and cash equivalents | | $ | 33,895,706 | | | $ | 33,383,278 | |
| Interest-bearing time deposits | | | 792,000 | | | | 1,089,000 | |
| Available for sale securities (Note 2) | | | 63,327,201 | | | | 66,965,413 | |
| Stock in FHLB of Des Moines | | | 2,369,200 | | | | 2,621,600 | |
| Stock in Federal Reserve Bank of St. Louis | | | 718,750 | | | | 583,100 | |
| Loans, net of allowance for loan losses of | | | | | | | | |
| $6,438,451 and $4,508,611 at | | | | | | | | |
| June 30, 2011 and 2010, respectively (Notes 3 and 4) | | | 556,576,055 | | | | 418,682,927 | |
| Accrued interest receivable | | | 3,799,935 | | | | 3,043,324 | |
| Premises and equipment, net (Note 5) | | | 8,057,529 | | | | 7,650,244 | |
| Bank owned life insurance - cash surrender value | | | 8,114,469 | | | | 7,836,929 | |
| Intangible assets, net | | | 1,874,689 | | | | 1,604,372 | |
| Prepaid expenses and other assets | | | 8,674,848 | | | | 8,623,520 | |
| TOTAL ASSETS | | $ | 688,200,382 | | | $ | 552,083,707 | |
| | | | | | | | | |
| | | | | | | | | |
| Liabilities and Stockholders’ Equity | | | | | | | | |
| Deposits (Note 6) | | $ | 560,150,817 | | | $ | 422,892,907 | |
| Securities sold under agreements to repurchase (Note 7) | | | 25,230,051 | | | | 30,368,748 | |
| Advances from FHLB of Des Moines (Note 8) | | | 33,500,000 | | | | 43,500,000 | |
| Accounts payable and other liabilities | | | 5,536,062 | | | | 1,598,436 | |
| Accrued interest payable | | | 834,344 | | | | 857,418 | |
| Subordinated debt (Note 9) | | | 7,217,000 | | | | 7,217,000 | |
| TOTAL LIABILITIES | | | 632,468,274 | | | | 506,434,509 | |
| | | | | | | | | |
| Commitments and contingencies (Note 15) | | | - | | | | - | |
| | | | | | | | | |
| Preferred stock, $.01 par value; $1,000 liquidation value | | | | | | | | |
| 500,000 shares authorized; 9,550 issued and outstanding | | | 9,455,635 | | | | 9,421,321 | |
| Common stock, $.01 par value; 4,000,000 shares | | | | | | | | |
| authorized; 2,957,226 shares issued | | | 29,572 | | | | 29,572 | |
| Warrants to acquire common stock | | | 176,790 | | | | 176,790 | |
| Additional paid-in capital | | | 16,274,545 | | | | 16,367,698 | |
| Retained earnings | | | 43,014,191 | | | | 33,060,723 | |
| Treasury stock of 858,250 shares in 2011 and 869,250 in 2010, at cost | | | (13,754,245 | ) | | | (13,994,870 | ) |
| Accumulated other comprehensive income | | | 535,620 | | | | 587,964 | |
| TOTAL STOCKHOLDERS’ EQUITY | | | 55,732,108 | | | | 45,649,198 | |
| TOTAL LIABILITIES AND | | | | | | | | |
| STOCKHOLDERS’ EQUITY | | $ | 688,200,382 | | | $ | 552,083,707 | |
See accompanying notes to consolidated financial statements.
> CONSOLIDATED STATEMENTS OF INCOME <
YEARS ENDED JUNE 30, 2011, 2010 AND 2009
Southern Missouri Bancorp, Inc.
| Interest income: | | 2011 | | | 2010 | | | 2009 | |
| Loans | | $ | 32,265,395 | | | $ | 24,554,917 | | | $ | 22,830,730 | |
| Investment securities | | | 1,286,779 | | | | 1,155,795 | | | | 706,429 | |
| Mortgage-backed securities | | | 1,376,856 | | | | 1,715,309 | | | | 1,728,958 | |
| Other interest-earning assets | | | 118,627 | | | | 115,239 | | | | 35,010 | |
| TOTAL INTEREST INCOME | | | 35,047,657 | | | | 27,541,260 | | | | 25,301,127 | |
| Interest expense: | | | | | | | | | | | | |
| Deposits | | | 9,213,424 | | | | 8,076,400 | | | | 7,165,030 | |
| Securities sold under agreements | | | | | | | | | | | | |
| to repurchase | | | 290,203 | | | | 232,773 | | | | 228,893 | |
| Advances from FHLB of Des Moines | | | 1,554,344 | | | | 2,688,747 | | | | 3,452,840 | |
| Subordinated debt | | | 226,776 | | | | 227,019 | | | | 357,387 | |
| TOTAL INTEREST EXPENSE | | | 11,284,747 | | | | 11,224,939 | | | | 11,204,150 | |
| NET INTEREST INCOME | | | 23,762,910 | | | | 16,316,321 | | | | 14,096,977 | |
| Provision for loan losses (Note 3) | | | 2,384,799 | | | | 924,933 | | | | 1,150,985 | |
| NET INTEREST INCOME AFTER | | | | | | | | | | | | |
| PROVISION FOR LOAN LOSSES | | | 21,378,111 | | | | 15,391,388 | | | | 12,945,992 | |
| Noninterest income: | | | | | | | | | | | | |
| AFS securities losses due to | | | | | | | | | | | | |
| other-than-temporary impairment | | | - | | | | - | | | | (678,973 | ) |
| Customer service charges | | | 1,538,483 | | | | 1,360,526 | | | | 1,223,449 | |
| Loan late charges | | | 231,897 | | | | 214,444 | | | | 155,454 | |
| Increase in cash surrender value | | | | | | | | | | | | |
| of bank owned life insurance | | | 277,540 | | | | 273,074 | | | | 274,036 | |
| Bargain purchase gain on acquisition | | | 6,996,750 | | | | - | | | | - | |
| Other | | | 1,457,622 | | | | 1,246,088 | | | | 845,778 | |
| TOTAL NONINTEREST INCOME | | | 10,502,292 | | | | 3,094,132 | | | | 1,819,744 | |
| Noninterest expense: | | | | | | | | | | | | |
| Compensation and benefits | | | 7,987,470 | | | | 6,291,436 | | | | 4,800,224 | |
| Occupancy and equipment | | | 2,242,284 | | | | 1,869,597 | | | | 1,528,850 | |
| Deposit insurance premium | | | 563,751 | | | | 554,467 | | | | 535,971 | |
| Professional fees | | | 530,133 | | | | 306,069 | | | | 311,461 | |
| Advertising | | | 262,294 | | | | 252,404 | | | | 217,295 | |
| Postage and office supplies | | | 362,201 | | | | 417,699 | | | | 317,844 | |
| Amortization of intangible assets | | | 354,636 | | | | 289,066 | | | | 255,258 | |
| Other | | | 2,156,000 | | | | 2,368,089 | | | | 1,167,223 | |
| TOTAL NONINTEREST EXPENSE | | | 14,458,769 | | | | 12,348,827 | | | | 9,134,126 | |
| INCOME BEFORE INCOME TAXES | | | 17,421,634 | | | | 6,136,693 | | | | 5,631,610 | |
| Income taxes (Note 11) | | | | | | | | | | | | |
| Current | | | 4,443,982 | | | | 2,052,105 | | | | 2,089,533 | |
| Deferred | | | 1,507,621 | | | | (541,000 | ) | | | (293,000 | ) |
| | | | 5,951,603 | | | | 1,511,105 | | | | 1,796,533 | |
| NET INCOME | | $ | 11,470,031 | | | $ | 4,625,588 | | | $ | 3,835,077 | |
| Less: effective dividend on preferred shares | | | 511,814 | | | | 510,006 | | | | 288,841 | |
| NET INCOME AVAILABLE TO | | | | | | | | | | | | |
| COMMON STOCKHOLDERS | | $ | 10,958,217 | | | $ | 4,115,582 | | | $ | 3,546,236 | |
| Basic earnings per share available to common stockholders | | $ | 5.25 | | | $ | 1.98 | | | $ | 1.67 | |
| Diluted earnings per share available to common stockholders | | $ | 5.12 | | | $ | 1.95 | | | $ | 1.67 | |
| Dividends paid | | $ | .48 | | | $ | .48 | | | $ | .48 | |
See accompanying notes to consolidated financial statements.
> CONSOLIDATED STATEMENTS OF STOCKHOLDERS’ EQUITY <
YEARS ENDED JUNE 30, 2011, 2010 AND 2009
Southern Missouri Bancorp, Inc.
| | | | | | | | | Warrants to | | | | | | | | | | | | Accumulated | | | | |
| | | | | | | | | Acquire | | | Additional | | | | | | | | | Other | | | Total | |
| | | Preferred | | | Common | | | Common | | | Paid-in | | | Retained | | | Treasury | | | Comprehensive | | | Stockholders’ | |
| | | Stock | | | Stock | | | Stock | | | Capital | | | Earnings | | | Stock | | | Income (Loss) | | | Equity | |
| | | | | | | | | | | | | | | | | | | | | | | | | |
| BALANCE AT JUNE 30, 2008 | | $ | - | | | $ | 29,572 | | | $ | - | | | $ | 16,675,839 | | | $ | 27,364,219 | | | $ | (13,002,803 | ) | | $ | (595,178 | ) | | $ | 30,471,649 | |
| | | | | | | | | | | | | | | | | | | | | | | | | | | | | | | | | |
| Net income | | | | | | | | | | | | | | | | | | | 3,835,077 | | | | | | | | | | | | 3,835,077 | |
| Change in unrealized gain on available for sale securities | | | | | | | | | | | | | | | | | | | | | | | | | | | 733,603 | | | | 733,603 | |
| Defined benefit pension plan net loss | | | | | | | | | | | | | | | | | | | | | | | | | | | (22,416 | ) | | | (22,416 | ) |
| TOTAL COMPREHENSIVE INCOME | | | | | | | | | | | | | | | | | | | | | | | | | | | | | | | 4,546,264 | |
| | | | | | | | | | | | | | | | | | | | | | | | | | | | | | | | | |
| Preferred stock issued | | | 9,373,210 | | | | | | | | 176,790 | | | | (38,871 | ) | | | | | | | | | | | | | | | 9,511,129 | |
| Purchases of treasury stock | | | | | | | | | | | | | | | | | | | | | | | (1,507,825 | ) | | | | | | | (1,507,825 | ) |
| Dividends paid on common stock ($.48 per share) | | | | | | | | | | | | | | | | | | | (1,024,172 | ) | | | | | | | | | | | (1,024,172 | ) |
| Dividends paid on preferred stock | | | | | | | | | | | | | | | | | | | (212,222 | ) | | | | | | | | | | | (212,222 | ) |
| Accretion of discount on preferred stock | | | 15,605 | | | | | | | | | | | | | | | | (15,605 | ) | | | | | | | | | | | - | |
| SOP Expense | | | | | | | | | | | | | | | 47,215 | | | | | | | | | | | | | | | | 47,215 | |
| MRP expense | | | | | | | | | | | | | | | 12,809 | | | | | | | | | | | | | | | | 12,809 | |
| Tax benefit of MRP | | | | | | | | | | | | | | | 2,422 | | | | | | | | | | | | | | | | 2,422 | |
| Exercise of stock options | | | | | | | | | | | | | | | (354,689 | ) | | | | | | | 515,758 | | | | | | | | 161,069 | |
| BALANCE AT JUNE 30, 2009 | | $ | 9,388,815 | | | $ | 29,572 | | | $ | 176,790 | | | $ | 16,344,725 | | | $ | 29,947,297 | | | $ | (13,994,870 | ) | | $ | 116,009 | | | $ | 42,008,338 | |
| | | | | | | | | | | | | | | | | | | | | | | | | | | | | | | | | |
| Net income | | | | | | | | | | | | | | | | | | | 4,625,588 | | | | | | | | | | | | 4,625,588 | |
| Change in unrealized gain on available for sale securities | | | | | | | | | | | | | | | | | | | | | | | | | | | 469,737 | | | | 469,737 | |
| Defined benefit pension plan net gain | | | | | | | | | | | | | | | | | | | | | | | | | | | 2,218 | | | | 2,218 | |
| TOTAL COMPREHENSIVE INCOME | | | | | | | | | | | | | | | | | | | | | | | | | | | | | | | 5,097,543 | |
| | | | | | | | | | | | | | | | | | | | | | | | | | | | | | | | | |
| Dividends paid on common stock ($.48 per share) | | | | | | | | | | | | | | | | | | | (1,002,156 | ) | | | | | | | | | | | (1,002,156 | ) |
| Dividends paid on preferred stock | | | | | | | | | | | | | | | | | | | (477,500 | ) | | | | | | | | | | | (477,500 | ) |
| Accretion of discount on preferred stock | | | 32,506 | | | | | | | | | | | | | | | | (32,506 | ) | | | | | | | | | | | - | |
| SOP Expense | | | | | | | | | | | | | | | 11,072 | | | | | | | | | | | | | | | | 11,072 | |
| MRP expense | | | | | | | | | | | | | | | 11,901 | | | | | | | | | | | | | | | | 11,901 | |
| BALANCE AT JUNE 30, 2010 | | $ | 9,421,321 | | | $ | 29,572 | | | $ | 176,790 | | | $ | 16,367,698 | | | $ | 33,060,723 | | | $ | (13,994,870 | ) | | $ | 587,964 | | | $ | 45,649,198 | |
| | | | | | | | | | | | | | | | | | | | | | | | | | | | | | | | | |
| Net income | | | | | | | | | | | | | | | | | | | 11,470,031 | | | | | | | | | | | | 11,470,031 | |
| Change in unrealized gain on available for sale securities | | | | | | | | | | | | | | | | | | | | | | | | | | | (55,249 | ) | | | (55,249 | ) |
| Defined benefit pension plan net gain | | | | | | | | | | | | | | | | | | | | | | | | | | | 2,905 | | | | 2,905 | |
| TOTAL COMPREHENSIVE INCOME | | | | | | | | | | | | | | | | | | | | | | | | | | | | | | | 11,417,687 | |
| | | | | | | | | | | | | | | | | | | | | | | | | | | | | | | | | |
| Dividends paid on common stock ($.48 per share) | | | | | | | | | | | | | | | | | | | (1,004,749 | ) | | | | | | | | | | | (1,004,749 | ) |
| Dividends paid on preferred stock | | | | | | | | | | | | | | | | | | | (477,500 | ) | | | | | | | | | | | (477,500 | ) |
| Accretion of discount on preferred stock | | | 34,314 | | | | | | | | | | | | | | | | (34,314 | ) | | | | | | | | | | | - | |
| SOP Expense | | | | | | | | | | | | | | | 10,388 | | | | | | | | | | | | | | | | 10,388 | |
| MRP expense | | | | | | | | | | | | | | | 13,152 | | | | | | | | | | | | | | | | 13,152 | |
| Tax benefit of MRP | | | | | | | | | | | | | | | 6,860 | | | | | | | | | | | | | | | | 6,860 | |
| Exercise of stock options | | | | | | | | | | | | | | | (157,895 | ) | | | | | | | 240,625 | | | | | | | | 82,730 | |
| Tax benefit of stock options | | | | | | | | | | | | | | | 34,342 | | | | | | | | | | | | | | | | 34,342 | |
| BALANCE AT JUNE 30, 2011 | | $ | 9,455,635 | | | $ | 29,572 | | | $ | 176,790 | | | $ | 16,274,545 | | | $ | 43,014,191 | | | $ | (13,754,245 | ) | | $ | 535,620 | | | $ | 55,732,108 | |
See accompanying notes to consolidated financial statements.
> CONSOLIDATED STATEMENTS OF CASH FLOWS <
YEARS ENDED JUNE 30, 2011, 2010 AND 2009
Southern Missouri Bancorp, Inc.
| Cash flows from operating activities: | | 2011 | | | 2010 | | | 2009 | |
| Net income | | $ | 11,470,031 | | | $ | 4,625,588 | | | $ | 3,835,077 | |
| Items not requiring (providing) cash: | | | | | | | | | | | | |
| Depreciation | | | 733,131 | | | | 709,981 | | | | 625,582 | |
| Loss on disposal of fixed assets | | | - | | | | 280,521 | | | | - | |
| SOP and MRP expense | | | 64,742 | | | | 22,973 | | | | 62,446 | |
| AFS securities losses due to other-than-temporary | | | | | | | | | | | | |
| impairment | | | - | | | | - | | | | 678,973 | |
| Loss (gain) on sale of foreclosed assets | | | 71,964 | | | | 84,324 | | | | (21,369 | ) |
| Amortization of intangible assets | | | 323,387 | | | | 289,066 | | | | 255,258 | |
| Increase in cash surrender value | | | | | | | | | | | | |
| of bank owned life insurance | | | (277,540 | ) | | | (273,074 | ) | | | (274,036 | ) |
| Provision for loan losses | | | 2,384,799 | | | | 924,993 | | | | 1,150,985 | |
| Amortization of premiums and discounts | | | | | | | | | | | | |
| on securities | | | 258,606 | | | | 200,952 | | | | 136,347 | |
| Bargain purchase gain on acquisition | | | (6,996,750 | ) | | | - | | | | - | |
| Decrease (increase) deferred income taxes | | | 1,507,621 | | | | (541,000 | ) | | | (293,000 | ) |
| Changes in: | | | | | | | | | | | | |
| Accrued interest receivable | | | 100,525 | | | | (261,572 | ) | | | 361,616 | |
| Prepaid expenses and other assets | | | 693,289 | | | | (1,090,179 | ) | | | 95,720 | |
| Accounts payable and other liabilities | | | 4,248,091 | | | | (26,288 | ) | | | 454,379 | |
| Accrued interest payable | | | (107,241 | ) | | | (192,688 | ) | | | (210,683 | ) |
| NET CASH PROVIDED BY OPERATING ACTIVITIES | | | 14,474,655 | | | | 4,753,597 | | | | 6,857,295 | |
| | | | | | | | | | | | | |
| | | | | | | | | | | | | |
| Cash flows from investing activities: | | | | | | | | | | | | |
| Net cash received in acquisitions | | $ | 38,249,286 | | | $ | 9,713,304 | | | $ | - | |
| Net change in interest-bearing deposits | | | 297,000 | | | | (1,089,000 | ) | | | 1,980,000 | |
| Net increase in loans | | | (26,806,328 | ) | | | (37,503,820 | ) | | | (27,425,708 | ) |
| Proceeds from maturities of | | | | | | | | | | | | |
| available for sale securities | | | 26,595,224 | | | | 16,631,759 | | | | 9,227,820 | |
| Purchases of available for | | | | | | | | | | | | |
| sale securities | | | (23,303,316 | ) | | | (21,270,406 | ) | | | (29,141,403 | ) |
| Investment in federal and state tax credits | | | (2,138,984 | ) | | | (1,250,000 | ) | | | (1,263,944 | ) |
| Redemption (purchase) of Federal Home Loan Bank stock | | | 1,020,900 | | | | 1,970,700 | | | | (1,268,600 | ) |
| Purchase of Federal Reserve Bank of St. Louis stock | | | (135,650 | ) | | | (583,100 | ) | | | - | |
| Purchase of premises and equipment | | | (1,139,257 | ) | | | (1,131,254 | ) | | | (556,043 | ) |
| Proceeds from sale of fixed assets | | | - | | | | 2,006,263 | | | | - | |
| Proceeds from sale of foreclosed and repossessed property | | | 724,667 | | | | 1,296,410 | | | | 352,194 | |
| NET CASH PROVIDED BY (USED IN) | | | | | | | | | | | | |
| INVESTING ACTIVITIES | | | 13,363,542 | | | | (31,209,144 | ) | | | (48,095,684 | ) |
See accompanying notes to consolidated financial statements.
> CONSOLIDATED STATEMENTS OF CASH FLOWS (continued) <
YEARS ENDED JUNE 30, 2011, 2010 AND 2009
Southern Missouri Bancorp, Inc.
| Cash flows from financing activities: | | 2011 | | | 2010 | | | 2009 | |
| Net increase in demand deposits and savings accounts | | $ | 39,133,943 | | | $ | 74,540,768 | | | $ | 9,750,488 | |
| Net (decrease)/increase in certificates of deposit | | | (32,714,693 | ) | | | 7,332,057 | | | | 9,947,935 | |
| Net (decrease)/increase in securities sold under | | | | | | | | | | | | |
| agreements to repurchase | | | (5,138,697 | ) | | | 6,621,191 | | | | 1,944,044 | |
| Proceeds from Federal Home Loan Bank advances | | | - | | | | 30,950,000 | | | | 212,675,000 | |
| Repayments of Federal Home Loan Bank advances | | | (27,206,803 | ) | | | (66,200,000 | ) | | | (197,975,000 | ) |
| Proceeds from issuance of preferred stock | | | - | | | | - | | | | 9,511,129 | |
| Dividends paid on preferred stock | | | (477,500 | ) | | | (477,500 | ) | | | (212,222 | ) |
| Dividends paid on common stock | | | (1,004,749 | ) | | | (1,002,156 | ) | | | (1,024,172 | ) |
| Exercise of stock options | | | 82,730 | | | | - | | | | 161,069 | |
| Purchases of treasury stock | | | - | | | | - | | | | (1,507,825 | ) |
| NET CASH (USED IN) PROVIDED BY | | | | | | | | | | | | |
| FINANCING ACTIVITIES | | | (27,325,769 | ) | | | 51,764,360 | | | | 43,270,446 | |
| Increase in cash and cash equivalents | | | 512,428 | | | | 25,308,813 | | | | 2,032,057 | |
| Cash and cash equivalents at beginning of year | | | 33,383,278 | | | | 8,074,465 | | | | 6,042,408 | |
| CASH AND CASH EQUIVALENTS AT END OF YEAR | | $ | 33,895,706 | | | $ | 33,383,278 | | | $ | 8,074,465 | |
| | | | | | | | | | | | | |
| | | | | | | | | | | | | |
| Supplemental disclosures of cash flow information: | | | | | | | | | | | | |
| Noncash investing and financing activities | | | | | | | | | | | | |
| Conversion of loans to foreclosed real estate | | $ | 896,875 | | | $ | 1,925,854 | | | $ | 477,177 | |
| Conversion of foreclosed real estate to loans | | $ | 157,500 | | | $ | 196,944 | | | $ | 13,172 | |
| Conversion of loans to repossessed assets | | $ | 396,229 | | | $ | 255,620 | | | $ | 255,516 | |
| | | | | | | | | | | | | |
| Cash paid during the period for | | | | | | | | | | | | |
| Interest (net of interest credited) | | $ | 3,079,647 | | | $ | 4,142,105 | | | $ | 4,981,065 | |
| Income taxes | | $ | 1,947,171 | | | $ | 1,598,000 | | | $ | 1,886,405 | |
See accompanying notes to consolidated financial statements.
> NOTES TO CONSOLIDATED FINANCIAL STATEMENTS <
Southern Missouri Bancorp, Inc.
NOTE 1: Organization and Summary of Significant Accounting Policies Organization. Southern Missouri Bancorp, Inc., a Missouri corporation (the Company) was organized in 1994 and is the parent company of Southern Bank (the Bank). Substantially all of the Company’s consolidated revenues are derived from the operations of the Bank, and the Bank represents substantially all of the Company’s consolidated assets and liabilities. The Bank is primarily engaged in providing a full range of banking and financial services to individuals and corporate customers in its market areas. The Bank and Company are subject to competition from other financial institutions. The Bank and Company are subject to the regulation of certain federal and state agencies and undergo periodic examinations by those regulatory authorities. Basis of Financial Statement Presentation. The financial statements of the Company have been prepared in conformity with accounting principles generally accepted in the United States of America and general practices within the banking industry. In the normal course of business, the Company encounters two significant types of risk: economic and regulatory. Economic risk is comprised of interest rate risk, credit risk, and market risk. The Company is subject to interest rate risk to the degree that its interest-bearing liabilities reprice on a different basis than its interest-earning assets. Credit risk is the risk of default on the Company’s investment or loan portfolios resulting from the borrowers’ inability or unwillingness to make contractually required payments. Market risk reflects changes in the value of the investment portfolio, collateral underlying loans receivable, and the value of the Company’s investments in real estate. Principles of Consolidation. The consolidated financial statements include the accounts of the Company and its wholly-owned subsidiary, the Bank. All significant intercompany accounts and transactions have been eliminated. Use of Estimates. The preparation of financial statements in conformity with accounting principles generally accepted in the United States of America requires management to make estimates and assumptions that affect the reported amounts of assets and liabilities and disclosures of contingent assets and liabilities at the date of the financial statements and the reported amounts of revenues and expenses during the reporting period. Actual results could differ from those estimates. Material estimates that are particularly susceptible to significant change relate to the determination of the allowance for loan losses, estimated fair values of purchased loans, other-than-temporary impairments (OTTI), and fair value of financial instruments. Cash and Cash Equivalents. For purposes of reporting cash flows, cash and cash equivalents includes cash, due from depository institutions and interest-bearing deposits in other depository institutions with original maturities of three months or less. Interest-bearing deposits in other depository institutions were $30,690,109 and $31,246,703 at June 30, 2011 and 2010, respectively. The deposits are held in various commercial banks in amounts not exceeding the FDIC’s deposit insurance limits, as well as at the Federal Reserve, the Federal Home Loan Bank of Des Moines, and the Federal Home Loan Bank of Dallas. Available for Sale Securities. Available for sale securities, which include any security for which the Company has no immediate plan to sell but which may be sold in the future, are carried at fair value. Unrealized gains and losses, net of tax, are reported in accumulated other comprehensive income, a component of | | stockholders’ equity. All securities have been classified as available for sale. Premiums and discounts on debt securities are amortized or accreted as adjustments to income over the estimated life of the security using the level yield method. Realized gains or losses on the sale of securities is based on the specific identification method. The fair value of securities is based on quoted market prices or dealer quotes. If a quoted market price is not available, fair value is estimated using quoted market prices for similar securities. The Company does not invest in collateralized mortgage obligations that are considered high risk. Effective April 1, 2009, the Company adopted new accounting guidance related to recognition and presentation of other-than-temporary impairment (ASC 320-10). When the Company does not intend to sell a debt security, and it is more likely than not the Company will not have to sell the security before recovery of its cost basis, it recognizes the credit component of an other-than-temporary impairment of a debt security in earnings and the remaining portion in other comprehensive income. As a result of this guidance, the Company’s consolidated statement of income as of June 30, 2011, reflects the full impairment (that is, the difference between the security’s amortized cost basis and fair value) on debt securities that the Company intends to sell or would more likely than not be required to sell before the expected recovery of the amortized cost basis. For available-for-sale debt securities that management has no intent to sell and believes that it more likely than not will not be required to sell prior to recovery, only the credit loss component of the impairment is recognized in earnings, while the noncredit loss is recognized in accumulated other comprehensive income. The credit loss component recognized in earnings is identified as the amount of principal cash flows not expected to be received over the remaining term of the security as projected based on cash flow projections. Prior to the adoption of the recent accounting guidance on April 1, 2009, management considered, in determining whether other-than-temporary impairment exists, (1) the length of time and the extent to which the fair value has been less than cost, (2) the financial condition and near-term prospects of the issuer, and (3) the intent and ability of the company to retain its investment in the issuer for a period time sufficient to allow for any anticipated recovery in fair value. Federal Reserve Bank and Federal Home Loan Bank Stock. The Bank is a member of the Federal Reserve and the Federal Home Loan Bank (FHLB) systems. Capital stock of the Federal Reserve and the FHLB is a required investment based upon a predetermined formula and is carried at cost. Loans. Loans are generally stated at unpaid principal balances, less the allowance for loan losses and net deferred loan origination fees. Interest on loans is accrued based upon the principal amount outstanding. The accrual of interest on loans is discontinued when, in management’s judgment, the collectibility of interest or principal in the normal course of business is doubtful. The Company complies with regulatory guidance which indicates that loans should be placed in nonaccrual status when 90 days past due, unless the loan is both well-secured and in the process of collection. A loan that is “in the process of collection” may be subject to legal action or, in appropriate circumstances, through other collection efforts reasonably expected to result in repayment or restoration to current status in the near future. A loan is considered delinquent when a payment has not been made by the contractual due date. Interest income previously accrued but not collected at the date a loan is placed on nonaccrual status is reversed against interest income. Cash receipts on a nonaccrual loan are applied to principal and interest in accordance with |
> NOTES TO CONSOLIDATED FINANCIAL STATEMENTS (continued) <
Southern Missouri Bancorp, Inc.
its contractual terms unless full payment of principal is not expected, in which case cash receipts, whether designated as principal or interest, are applied as a reduction of the carrying value of the loan. A nonaccrual loan is generally returned to accrual status when principal and interest payments are current, full collectibility of principal and interest is reasonably assured, and a consistent record of performance has been demonstrated. The allowance for losses on loans represents management’s best estimate of losses probable in the existing loan portfolio. The allowance for losses on loans is increased by the provision for losses on loans charged to expense and reduced by loans charged off, net of recoveries. Loans are charged off in the period deemed uncollectible. Recoveries of loans previously charged off are recorded when received. The provision for losses on loans is determined based on management’s assessment of several factors: reviews and evaluations of specific loans, changes in the nature and volume of the loan portfolio, current economic conditions and the related impact on specific borrowers and industry groups, historical loan loss experience, the level of classified and nonperforming loans and the results of regulatory examinations. Loans are considered impaired if, based on current information and events, it is probable that the Company will be unable to collect the scheduled payments of principal or interest when due according to the contractual terms of the loan agreement. Depending on a particular loan’s circumstances, we measure impairment of a loan based upon either the present value of expected future cash flows discounted at the loans effective interest rate, the loan’s observable market price, or the fair value of the collateral less estimated costs to sell if the loan is collateral dependent. Valuation allowances are established for collateral-dependent impaired loans for the difference between the loan amount and fair value of collateral less estimated selling costs. For impaired loans that are not collateral dependent, a valuation allowance is established for the difference between the loan amount and the present value of expected future cash flows discounted at the historical effective interest rate or the observable market price of the loan. Impairment losses are recognized through an increase in the required allowance for loan losses. Cash receipts on loans deemed impaired are recorded based on the loan’s separate status as a nonaccrual loan or an accrual status loan. As a result of the acquisition of the former First Southern Bank, Batesville, Arkansas, the Company acquired certain loans with an outstanding principal balance of $14.2 million for which it was deemed probable that we would be unable to collect all contractually required payments. These loans are accounted for in accordance with ASC 310-30, Loans and Debt Securities Acquired with Deteriorated Credit Quality. The Company recorded a fair value discount of $3.9 million related to these loans acquired with deteriorated credit quality (“purchased credit impaired loans”), and began carrying them at a value of $10.3 million. For these loans, we determined the contractual amount and timing of undiscounted principal and interest payments (the “undiscounted contractual cash flows”), and estimated the amount and timing of undiscounted expected principal and interest payments, including expected prepayments (the “undiscounted expected cash flows”). Under acquired impaired loan accounting, the difference between the undiscounted contractual cash flows and the undiscounted expected cash flows is the nonaccretable difference. The nonaccretable difference is an estimate of the loss exposure of principal and interest related to the purchased credit impaired loans, and the amount is subject to change over time based on the performance of the loans. The carrying value of purchased credit impaired loans is initially determined as the discounted expected cash flows. The excess of expected cash flows at acquisition over the initial fair value of the purchased credit impaired loans is referred to as the “accretable yield” and is recorded as interest income over the | | estimated life of the acquired loans using the level-yield method, if the timing and amount of the future cash flows is reasonably estimable. The carrying value of purchased credit impaired loans is reduced by payments received, both principal and interest, and increased by the portion of the accretable yield recognized as interest income. Subsequent to acquisition, the Company evaluates the purchased credit impaired loans on a quarterly basis. Increases in expected cash flows compared to those previously estimated increase the accretable yield and are recognized as interest income prospectively. Decreases in expected cash flows compared to those previously estimated decrease the accretable yield and may result in the establishment of an allowance for loan losses and a provision for loan losses. Purchased credit impaired loans are generally considered accruing and performing loans, as the loans accrete interest income over the estimated life of the loan when expected cash flows are reasonably estimable. Accordingly, purchased credit impaired loans that are contractually past due are still considered to be accruing and performing as long as there is an expectation that the estimated cash flows will be received. If the timing and amount of cash flows is not reasonably estimable, the loans may be classified as nonaccrual loans. Loan fees and certain direct loan origination costs are deferred, and the net fee or cost is recognized as an adjustment to interest income using the interest method over the contractual life of the loans. Foreclosed Real Estate. Real estate acquired by foreclosure or by deed in lieu of foreclosure is initially recorded at fair value less estimated selling costs. Costs for development and improvement of the property are capitalized. Valuations are periodically performed by management, and an allowance for losses is established by a charge to operations if the carrying value of a property exceeds its estimated fair value, less estimated selling costs. Loans to facilitate the sale of real estate acquired in foreclosure are discounted if made at less than market rates. Discounts are amortized over the fixed interest period of each loan using the interest method. Premises and Equipment. Premises and equipment are stated at cost less accumulated depreciation and include expenditures for major betterments and renewals. Maintenance, repairs, and minor renewals are expensed as incurred. When property is retired or sold, the retired asset and related accumulated depreciation are removed from the accounts and the resulting gain or loss taken into income. The Company reviews property and equipment for impairment whenever events or changes in circumstances indicate that the carrying amount of an asset may not be recoverable. If such assets are considered to be impaired, the impairment loss recognized is measured by the amount by which the carrying amount exceeds the fair value of the assets. Depreciation is computed by use of straight-line and accelerated methods over the estimated useful lives of the assets. Estimated lives are generally 10 to 40 years for premises, and five to seven years for equipment. Intangible Assets. The Company’s gross amount of intangible assets at June 30, 2011 and 2010 was $4.7 million and $4.1 million, respectively, with accumulated amortization of $2.9 million and $2.5 million, respectively. The Company’s intangible assets are being amortized over periods ranging from five to fifteen years, with amortization expense expected to be approximately $417,000 per year over the next three years. Income Taxes. The Company accounts for income taxes in accordance with income tax accounting guidance (ASC 740, Income Taxes). The income tax accounting guidance results in two components of income tax expense: |
> NOTES TO CONSOLIDATED FINANCIAL STATEMENTS (continued) <
Southern Missouri Bancorp, Inc.
current and deferred. Current income tax expense reflects taxes to be paid or refunded for the current period by applying the provisions of the enacted tax law to the taxable income or excess of deductions over revenues. The Company determines deferred income taxes using the liability (or balance sheet) method. Under this method, the net deferred tax asset or liability is based on the tax effects of the differences between the book and tax bases of assets and liabilities, and enacted changes in tax rates and laws are recognized in the period in which they occur. Deferred income tax expense results from changes in deferred tax assets and liabilities between periods. Deferred tax assets are recognized if it is more likely than not, based on the technical merits, that the tax position will be realized or sustained upon examination. The term more likely than not means a likelihood of more than 50 percent; the terms examined and upon examination also include resolution of the related appeals or litigation processes, if any. A tax position that meets the more-likely-than-not recognition threshold is initially and subsequently measured as the largest amount of tax benefit that has a greater than 50 percent likelihood of being realized upon settlement with a taxing authority that has full knowledge of all relevant information. The determination of whether or not a tax position has met the more-likely-than-not recognition threshold considers the facts, circumstances, and information available at the reporting date and is subject to the management’s judgment. Deferred tax assets are reduced by a valuation allowance if, based on the weight of evidence available, it is more likely than not that some portion or all of a deferred tax asset will not be realized. The Company recognizes interest and penalties on income taxes as a component of income tax expense. The Company files consolidated income tax returns with its subsidiary. Incentive Plan. The Company accounts for its management and recognition plan (MRP) in accordance with ASC 718, “Share-Based Payment.” The aggregate purchase price of all shares owned by the incentive plan is reflected as a reduction of stockholders’ equity. Compensation expense is based on the market price of the Company’s stock on the date the shares are granted and is recorded over the vesting period. The difference between the aggregate purchase price and the fair value on the date the shares are considered earned is recorded as an adjustment to additional paid in capital. Outside Directors’ Retirement. The Bank adopted a directors’ retirement plan in April 1994 for outside directors. The directors’ retirement plan provides that each non-employee director (participant) shall receive, upon termination of service on the Board on or after age 60, other than termination for cause, a benefit in equal annual installments over a five year period. The benefit will be based upon the product of the participant’s vesting percentage and the total Board fees paid to the participant during the calendar year preceding termination of service on the Board. The vesting percentage shall be determined based upon the participant’s years of service on the Board, whether before or after the reorganization date. In the event that the participant dies before collecting any or all of the benefits, the Bank shall pay the participant’s beneficiary. No benefits shall be payable to anyone other than the beneficiary, and shall terminate on the death of the beneficiary. Stock Options. The Company adopted ASC 718, “Share-Based Payment,” which requires the compensation costs related to share-based payment | | transactions to be recognized in financial statements, in the first quarter of fiscal 2006, primarily due to the Company’s transition from a small business filer to a full filer. With limited exceptions, the amount of compensation cost is measured based on the grant-date fair value of the equity instruments issued. Compensation cost is recognized over the vesting period during which an employee provides service in exchange for the award. Stock-based compensation has been recognized for all stock options granted or modified after July 1, 2005. In addition, stock options not vested on July 1, 2005, were recognized in expense over their remaining vesting period. Earnings Per Share. Basic earnings per share available to common stockholders is computed using the weighted-average number of common shares outstanding. Diluted earnings per share available to common stockholders includes the effect of all dilutive potential common shares (stock options and warrants) outstanding during each year. Comprehensive Income. Comprehensive income consists of net income and other comprehensive income, net of applicable income taxes. Other comprehensive income includes unrealized appreciation (depreciation) on available-for-sale securities, unrealized appreciation (depreciation) on available-for-sale securities for which a portion of an other-than-temporary impairment has been recognized in income, and changes in the funded status of defined benefit pension plans. Treasury Stock. Treasury stock is stated at cost. Cost is determined by the first-in, first-out method. Reclassification. Certain amounts included in the 2010 and 2009 consolidated financial statements have been reclassified to conform to the 2011 presentation. These reclassifications had no effect on net income. The following paragraphs summarize the impact of new accounting pronouncements: In January 2010, the Financial Accounting Standards Board (FASB) issued Accounting Standards Update (ASU) No. 2010-06, “Fair Value Measurement and Disclosures (Topic 820) – Improving Disclosures about Fair Value Measurements.” ASU 2010-06 amends the fair value disclosure guidance. The amendments include new disclosures and changes to clarify existing disclosure requirements. ASU 2010-06 was effective for interim and annual reporting periods beginning after December 15, 2009, except for the disclosures about purchases, sales, issuances, and settlements of Level 3 fair value measurements. Those disclosures are effective for fiscal years beginning after December 15, 2010, and for interim periods within those fiscal years. Adoption of this update did not have a material effect on the Company’s financial statements. In July 2010, the FASB issued Accounting Standards Update ASU No. 2010-20, “Receivables (Topic 310) – Disclosures about the Credit Quality of Financing Receivables and the Allowance for Credit Losses,” which requires significant new disclosures about the allowance for credit losses and the credit quality of financing receivables. The requirements are intended to enhance transparency regarding credit losses and the credit quality of loan and lease receivables. Under this statement, allowance for credit losses and fair value are to be disclosed by portfolio segment, while credit quality information, impaired financing receivables and nonaccrual status are to be presented by class of financing receivable. Disclosure of the nature, extent, and financial impact |
> NOTES TO CONSOLIDATED FINANCIAL STATEMENTS (continued) <
Southern Missouri Bancorp, Inc.
and segment information concerning troubled debt restructurings will also be required. The disclosures are to be presented at the level of disaggregation that management uses when assessing and monitoring the portfolio’s risk and performance. ASU 2010-20 is effective for interim and annual reporting periods after December 15, 2010. The Company has adopted the provisions of ASU 2010-20 and has provided the required disclosure in this report. Adoption of the update did not have a material effect on the Company’s financial statements, but it has significantly expanded the disclosures the Company is required to provide. In April 2011, the FASB issued ASU No. 2011-02, “A Creditor’s Determination of Whether a Restructuring is a Troubled Debt Restructuring.” The provisions of ASU NO. 2011-02 provide additional guidance related to determining whether a creditor has granted a concession, include factors and examples for creditors to consider in evaluating whether a restructuring results in a delay in payment that is insignificant, prohibit creditors from using the borrower’s effective rate test to evaluate whether a concession has been granted to the borrower, and add factors for creditors to use in determining whether a borrower is experiencing financial difficulties. A provision in ASU No. 2011-02 also ends the FASB’s deferral of the additional disclosures about troubled debt restructurings as required by ASU No. 2010-20. The provisions of ASU No. 2011-02 are effective interim and annual periods beginning after June 15, 2011, and will be effective for the Company’s quarter ended September 30, 2011. The adoption of ASU 2011-02 is not expected to have a material impact on the Company’s financial statements. In April 2011, the FASB issued ASU No. 2011-03 to amend FASB ASC Topic 860, Transfers and Servicing. ASC 860 outlines when the transfer of financial assets under a repurchase agreement may or may not be accounted for as a sale. Whether the transferring entity maintains effective control over the transferred financial assets provides the basis for such a determination. The previous requirement that the transferor must have the ability to repurchase or redeem the financial assets before the maturity of the agreement is removed from the assessment of effective control by this Update. The Update is effective on a prospective basis for interim and annual reporting periods beginning on or after December 15, 2011, and is not expected to have a material impact on the Company’s financial position or results of operations. In May 2011, the FASB issued ASU No. 2011-04 to amend FASB ASC Topic 820, Fair Value Measurement: Amendments to Achieve Common Fair Value Measurements and Disclosure Requirements in U.S. GAAP and IFRSs. The Update amends the GAAP requirements for measuring fair value and for disclosures about fair value measurements to improve consistency between GAAP and IFRSs by changing some of the wording used to describe the requirements, clarifying the intended application of certain requirements and changing certain principles. The Update is effective on a prospective basis for interim and annual reporting periods beginning after December 15, 2011, and is not expected to have a material impact on the Company’s financial position or results of operations. In June 2011, the FASB issued Accounting Standards Update (ASU) No. 2011-05 to amend FASB ASC Topic 220, Comprehensive Income: Presentation of Comprehensive Income. The purpose of the Update is to improve the comparability, consistency and transparency of financial reporting related to other comprehensive income. It eliminates the option to present the components of other comprehensive income as part of the statement of changes in stockholders’ equity. Instead, the components of other comprehensive income must either be presented with net income in a single continuous | | statement of comprehensive income or as a separate but consecutive statement following the statement of operations. Regardless of which method is used, adjustments for items that are reclassified from other comprehensive income to net income must be presented on the face of the financial statements. The Update is effective on a retrospective basis for interim and annual reporting periods beginning after December 15, 2011, and is not expected to have a material impact on the Company’s financial position or results of operations. |
> NOTES TO CONSOLIDATED FINANCIAL STATEMENTS (continued) <
Southern Missouri Bancorp, Inc.
NOTE 2: Available-for-Sale Securities
The amortized cost, gross unrealized gains, gross unrealized losses and approximate fair value of securities available for sale consisted of the following:
| | | June 30, 2011 | |
| | | | | | Gross | | | Gross | | | | |
| | | Amortized | | | Unrealized | | | Unrealized | | | Fair | |
| | | Cost | | | Gains | | | Losses | | | Value | |
| Debt and equity securities: | | | | | | | | | | | | |
| U.S. government and Federal | | | | | | | | | | | | |
| agency obligations | | $ | 12,991,362 | | | $ | 28,805 | | | $ | (44,097 | ) | | $ | 12,976,070 | |
| Obligations of states and | | | | | | | | | | | | | | | | |
| political subdivisions | | | 24,232,364 | | | | 816,966 | | | | (67,876 | ) | | | 24,981,454 | |
| FHLMC preferred stock | | | - | | | | - | | | | - | | | | | |
| Other securities | | | 1,785,562 | | | | 18,717 | | | | (970,138 | ) | | | 834,141 | |
| TOTAL DEBT AND EQUITY SECURITIES | | | 39,009,288 | | | | 864,488 | | | | (1,082,111 | ) | | | 38,791,665 | |
| | | | | | | | | | | | | | | | | |
| Mortgage-backed securities: | | | | | | | | | | | | | | | | |
| FHLMC certificates | | | 4,829,996 | | | | 356,213 | | | | - | | | | 5,186,209 | |
| GNMA certificates | | | 89,126 | | | | 1,481 | | | | - | | | | 90,607 | |
| FNMA certificates | | | 4,632,854 | | | | 353,886 | | | | - | | | | 4,986,740 | |
| CMOs issued by government agencies | | | 13,938,320 | | | | 333,660 | | | | - | | | | 14,271,980 | |
| TOTAL MORTGAGE-BACKED SECURITIES | | | 23,490,296 | | | | 1,045,240 | | | | - | | | | 24,535,536 | |
| TOTAL | | $ | 62,499,584 | | | $ | 1,909,728 | | | $ | (1,082,111 | ) | | $ | 63,327,201 | |
| | | | | | | | | | | | | | | | | |
| | | June 30, 2010 | |
| | | | | | | Gross | | | Gross | | | | | |
| | | Amortized | | | Unrealized | | | Unrealized | | | Fair | |
| | | Cost | | | Gains | | | Losses | | | Value | |
| Debt and equity securities: | | | | | | | | | | | | | | | | |
| U.S. government and Federal | | | | | | | | | | | | | | | | |
| agency obligations | | $ | 12,345,409 | | | $ | 68,568 | | | $ | - | | | $ | 12,413,977 | |
| Obligations of states and | | | | | | | | | | | | | | | | |
| political subdivisions | | | 19,351,837 | | | | 454,941 | | | | (37,661 | ) | | | 19,769,117 | |
| FHLMC preferred stock | | | - | | | | 6,000 | | | | - | | | | 6,000 | |
| Other securities | | | 1,771,299 | | | | 4,306 | | | | (1,333,737 | ) | | | 441,868 | |
| TOTAL DEBT AND EQUITY SECURITIES | | | 33,468,545 | | | | 533,815 | | | | (1,371,398 | ) | | | 32,630,962 | |
| | | | | | | | | | | | | | | | | |
| Mortgage-backed securities: | | | | | | | | | | | | | | | | |
| FHLMC certificates | | | 7,316,562 | | | | 498,133 | | | | - | | | | 7,814,695 | |
| GNMA certificates | | | 99,148 | | | | 2,028 | | | | - | | | | 101,176 | |
| FNMA certificates | | | 7,101,611 | | | | 511,596 | | | | (148 | ) | | | 7,613,059 | |
| CMOs issued by government agencies | | | 18,064,231 | | | | 741,290 | | | | - | | | | 18,805,521 | |
| TOTAL MORTGAGE-BACKED SECURITIES | | | 32,581,552 | | | | 1,753,047 | | | | (148 | ) | | | 34,334,451 | |
| TOTAL | | $ | 66,050,097 | | | $ | 2,286,862 | | | $ | (1,371,546 | ) | | $ | 66,965,413 | |
> NOTES TO CONSOLIDATED FINANCIAL STATEMENTS (continued) <
Southern Missouri Bancorp, Inc.
The amortized cost and fair value of available-for-sale securities, by contractual maturity, are shown below. Expected maturities will differ from contractual maturities because borrowers may have the right to call or prepay obligations with or without call or prepayment penalties.
| | | June 30, 2011 | |
| | | | | | Estimated | |
| | | Amortized | | | Fair | |
| Available for Sale | | Cost | | | Value | |
| Within one year | | $ | - | | | $ | - | |
| After one but less than five years | | | 920,000 | | | | 925,925 | |
| After five but less than 10 years | | | 7,777,301 | | | | 7,920,957 | |
| After 10 years | | | 30,311,987 | | | | 29,944,783 | |
| Total investment securities | | | 39,009,288 | | | | 38,791,665 | |
| Mortgage-backed securities - GSE residential | | | 23,490,296 | | | | 24,535,536 | |
| TOTAL | | $ | 62,499,584 | | | $ | 63,327,201 | |
The carrying value of investment and mortgage-backed securities pledged as collateral to secure public deposits and securities sold under agreements to repurchase amounted to $57.1 million and $62.0 million at June 30, 2011 and 2010, respectively. No gains or losses resulted from sales of available-for-sale securities in 2011, 2010, or 2009. With the exception of U.S. government agencies and corporations, the Company did not hold any securities of a single issuer, payable from and secured by the same source of revenue or taxing authority, the book value of which exceeded 10% of stockholders’ equity at June 30, 2011. | | Certain investments in debt securities are reported in the financial statements at an amount less than their historical cost. Total fair value of these investments at June 30, 2011, was $10.8 million, which is approximately 17.0% of the Company’s available for sale investment portfolio, as compared to $4.9 million or approximately 7.3% of the Company’s available for sale investment portfolio at June 30, 2010. Except as discussed below, management believes the declines in fair value for these securities to be temporary. The tables below show our investments’ gross unrealized losses and fair value, aggregated by investment category and length of time that individual securities have been in a continuous unrealized loss position at June 30, 2011 and 2010. |
| | | Less than 12 months | | | 12 months or more | | | Total | |
| Description of | | | | | Unrealized | | | | | | Unrealized | | | | | | Unrealized | |
| Securities | | Fair Value | | | Losses | | | Fair Value | | | Losses | | | Fair Value | | | Losses | |
| For the year ended June 30, 2011 | | | | | | | | | | | | | | | | | | |
| | | | | | | | | | | | | | | | | | | |
| US Government and Federal Agency obligations | | $ | 5,955,903 | | | $ | 44,097 | | | $ | - | | | $ | - | | | $ | 5,955,903 | | | $ | 44,097 | |
| Other securities | | | - | | | | - | | | | 568,568 | | | | 970,138 | | | | 568,568 | | | | 970,138 | |
| Obligations of state and political subdivisions | | | 4,233,216 | | | | 67,876 | | | | - | | | | - | | | | 4,233,216 | | | | 67,876 | |
| | | | | | | | | | | | | | | | | | | | | | | | | |
| Total temporarily impaired securities | | $ | 10,189,119 | | | $ | 111,973 | | | $ | 568,568 | | | $ | 970,138 | | | $ | 10,757,687 | | | $ | 1,082,111 | |
| | | | | | | | | | | | | | | | | | | | | | | | | |
| | | Less than 12 months | | | 12 months or more | | | Total | |
| Description of | | | | | | Unrealized | | | | | | | Unrealized | | | | | | | Unrealized | |
| Securities | | Fair Value | | | Losses | | | Fair Value | | | Losses | | | Fair Value | | | Losses | |
| For the year ended June 30, 2010 | | | | | | | | | | | | | | | | | | | | | | | | |
| | | | | | | | | | | | | | | | | | | | | | | | | |
| Mortgage-backed securities - GSE residential | | $ | - | | | $ | - | | | $ | 27,349 | | | $ | 148 | | | $ | 27,349 | | | $ | 148 | |
| Other securities | | | - | | | | - | | | | 191,218 | | | | 1,333,737 | | | | 191,218 | | | | 1,333,737 | |
| Obligations of state and political subdivisions | | | 4,677,991 | | | | 37,661 | | | | - | | | | - | | | | 4,677,991 | | | | 37,661 | |
| | | | | | | | | | | | | | | | | | | | | | | | | |
| Total temporarily impaired securities | | $ | 4,677,991 | | | $ | 37,661 | | | $ | 218,567 | | | $ | 1,333,885 | | | $ | 4,896,558 | | | $ | 1,371,546 | |
> NOTES TO CONSOLIDATED FINANCIAL STATEMENTS (continued) <
Southern Missouri Bancorp, Inc.
Other Securities. At June 30, 2011, there were four pooled trust preferred securities with a fair value of $569,000 and unrealized losses of $1.0 million in a continuous unrealized loss position for twelve months or more. These unrealized losses were primarily due to the long-term nature of the pooled trust preferred securities, a lack of demand or inactive market for these securities, and concerns regarding the financial institutions that have issued the underlying trust preferred securities. The June 30, 2011, cash flow analysis for three of these securities showed it is probable the Company will receive all contracted principal and related interest projected. The cash flow analysis used in making this determination was based on anticipated default and recovery rates, amounts of prepayments, and the resulting cash flows were discounted based on the yield anticipated at the time the securities were purchased. Other inputs include the actual collateral attributes, which include credit ratings and other performance indicators of the underlying financial institutions, including profitability, capital ratios, and asset quality. Assumptions for these three securities included prepayments by all issuers of asset size greater than $15 billion, to account for the lack of favorable capital treatment under the Dodd-Frank regulatory reform bill; prepayments of 5% every five years thereafter, to account for isolated prepayments; no recoveries on issuers currently in default; recoveries of 34% to 40% on currently deferred issuers within the next two years; no new deferrals for the next two years; and annual defaults of 36 basis points (with 10% recoveries, lagged two years) thereafter. One of these three securities continues to receive cash interest payments in full and our cash flow analysis indicates that these payments are likely to continue. Because the Company does not intend to sell this security and it is not more-likely-than-not that the Company will be required to sell the security prior to recovery of its amortized cost basis, which may be maturity, the Company does not consider this investment to be other than temporarily impaired at June 30, 2011. For two of these three securities, the Company is receiving principal-in-kind (PIK), in lieu of cash interest. These securities all allow, under the terms of the issue, for issuers to defer interest for up to five consecutive years. After five years, if not cured, the securities are considered to be in default and the trustee may demand payment in full of principal and accrued interest. Issuers are also considered to be in default in the event of the failure of the issuer or a subsidiary. Both deferred and defaulted issuers are considered non-performing, and the trustee calculates, on a quarterly or semi-annual basis, certain coverage tests prior to the payment of cash interest to owners of the various tranches of the securities. The tests must show that performing collateral is sufficient to meet requirements for senior tranches, both in terms of cash flow and collateral value, before cash interest can be paid to subordinate tranches. If the tests are not met, available cash flow is diverted to pay down the principal balance of senior tranches until the coverage tests are met, before cash interest payments to subordinate tranches may resume. The Company’s investments in these two securities are receiving PIK due to failure of the required coverage tests described above at senior tranche levels of these securities. The risk to holders of a tranche of a security in PIK status is that the pool’s total cash flow will not be sufficient to repay all principal and accrued interest related to the investment. The impact of payment of PIK to subordinate tranches is to strengthen the position of senior tranches, by reducing the senior tranches’ principal balances relative to available collateral and cash flow, while increasing principal balances, decreasing cash flow, and increasing credit risk to the tranches receiving PIK. For our securities in receipt of PIK, the principal balance is increasing, cash flow has stopped, and, as a result, credit risk is increasing. The Company expects these securities to remain in PIK status for a | | period of three to seven years. Despite these facts, because the Company does not intend to sell these two securities and it is not more-likely-than-not that the Company will be required to sell these two securities prior to recovery of their amortized cost bases, which may be maturity, the Company does not consider these investments to be other than temporarily impaired at June 30, 2011. At December 31, 2008, analysis of the fourth pooled trust preferred security indicated other-than-temporary impairment (OTTI) and the Company performed further analysis to determine the portion of the loss that was related to credit conditions of the underlying issuers. The credit loss was calculated by comparing expected discounted cash flows based on performance indicators of the underlying assets in the security to the carrying value of the investment. The discounted cash flow was based on anticipated default and recovery rates, and resulting projected cash flows were discounted based on the yield anticipated at the time the security was purchased. Based on this analysis, the Company recorded an impairment charge of $375,000 for the credit portion of the unrealized loss for this trust preferred security. This loss established a new, lower amortized cost basis of $125,000 for this security, and reduced non-interest income for the second quarter and the twelve months ended June 30, 2009. At June 30, 2011, cash flow analyses showed it is probable the Company will receive all of the remaining cost basis and related interest projected for the security. The cash flow analysis used in making this determination was based similar inputs and factors as those described above. Assumptions for this security included prepayments by all issuers of asset size greater than $15 billion, to account for the lack of favorable capital treatment under the Dodd-Frank regulatory reform bill; prepayments of 5% every five years thereafter, to account for isolated prepayments; no recoveries on issuers currently in default; recoveries of 28% on currently deferred issuers within the next two years; no new deferrals for the next two years; and annual defaults of 36 basis points (with 10% recoveries, lagged two years) thereafter. This security is in PIK status due to similar criteria and factors as those described above, with similar impact to the Company. This security is projected to remain in PIK status for a period of three years. Because the Company does not intend to sell this security and it is not more-likely-than-not the Company will be required to sell this security before recovery of its new, lower amortized cost basis, which may be maturity, the Company does not consider the remainder of the investment in this security to be other-than-temporarily impaired at June 30, 2011. During the first quarter of fiscal 2009, the Company’s investments in Freddie Mac Preferred Stock was deemed other than temporarily impaired, based on quoted market prices which reflected market participants’ expectations regarding the likelihood of recovery of their investment following the placement of the firm into receivership by the U.S. Treasury Department. Accordingly, the Company recorded an impairment charge for the full amortized cost of the security, $304,000. The loss established a new, lower amortized cost basis of $0 for this security, and reduced non-interest income for the first quarter of fiscal 2009. The Company does not believe any other individual unrealized loss as of June 30, 2011, represents OTTI. However, given the continued disruption in the financial markets, the Company may be required to recognize OTTI losses in future periods with respect to its available for sale investment securities portfolio. The amount and timing of any additional OTTI will depend on the decline in the underlying cash flows of the securities. Should the impairment of any of these securities become other-than-temporary, the cost basis of the investment will be reduced and the resulting loss recognized in the period the other-than-temporary impairment is identified. |
> NOTES TO CONSOLIDATED FINANCIAL STATEMENTS (continued) <
Southern Missouri Bancorp, Inc.
Credit Losses Recognized on Investments. As described above, some of the Company’s investments in trust preferred securities have experienced fair value deterioration due to credit losses, but are not otherwise other-than-temporarily impaired. During fiscal 2009, the Company adopted ASC 820, formerly FASB Staff Position 157-4, “Determining Fair Value when the Volume and Level of Activity For the Asset or Liability Have Significantly Decreased and Identifying Transactions That Are Not Orderly.” The following table provides information about the trust preferred security for which only a credit loss was recognized in income and other losses are recorded in other comprehensive income (loss) for the years ended June 30, 2011 and 2010.
| | | Accumulated Credit Losses | |
| | | Year Ended June 30 | |
| | | 2011 | | | 2010 | |
| Credit losses on debt securities held | | | | | | |
| Beginning of period | | $ | 375,000 | | | $ | 375,000 | |
| Additions related to OTTI losses not previously recognized | | | - | | | | - | |
| Reductions due to sales | | | - | | | | - | |
| Reductions due to change in intent or likelihood of sale | | | - | | | | - | |
| Additions related to increases in previously recognized OTTI losses | | | | | | | | |
| Reductions due to increases in expected cash flows | | | - | | | | - | |
| End of period | | $ | 375,000 | | | $ | 375,000 | |
NOTE 3: Loans and Allowance for Loan Losses
Loans are summarized as follows:
| | | June 30 | |
| | | 2011 | | | 2010 | |
| Real estate loans: | | | | | | |
| Residential | | $ | 199,884,607 | | | $ | 158,494,230 | |
| Construction | | | 29,921,110 | | | | 27,951,418 | |
| Commercial | | | 185,158,763 | | | | 121,525,818 | |
| Consumer loans | | | 29,963,281 | | | | 26,323,936 | |
| Commercial | | | 126,290,143 | | | | 97,480,888 | |
| | | | 571,217,904 | | | | 431,776,290 | |
| Loans in process | | | (8,330,245 | ) | | | (8,705,521 | ) |
| Deferred loan fees, net | | | 126,847 | | | | 120,769 | |
| Allowance for loan losses | | | (6,438,451 | ) | | | (4,508,611 | ) |
| TOTAL | | $ | 556,576,055 | | | $ | 418,682,927 | |
The Company’s lending activities consist of origination of loans secured by mortgages on one- to four-family residences and commercial and agricultural real estate, construction loans on residential and commercial properties, commercial and agricultural business loans and consumer loans. The Company has also occasionally purchased loan participation interests originated by other lenders and secured by properties generally located in the states of Missouri and Arkansas. Supervision of the loan portfolio is the responsibility of our Chief Lending Officer. Loan officers have varying amounts of lending authority depending upon experience and types of loans. Loans beyond their authority are presented to the next level of authority, or to one of several lending committees, comprised of lenders and other officers with expertise in the type of loan the committee is authorized to approve. Loans to one borrower (or group of related borrowers), in aggregate, in excess of $1,000,000 require the approval of a majority of the Discount Committee, which consists of all Bank directors, prior to the closing of the loan. All loans are subject to ratification by the full Board of Directors. | | The aggregate amount of loans that the Company is permitted to make under applicable federal regulations to any one borrower, including related entities, or the aggregate amount that the Company could have invested in any one real estate project, is based on the Bank’s capital levels. Residential Mortgage Lending. The Company actively originates loans for the acquisition or refinance of one- to four-family residences. These loans are originated as a result of customer and real estate agent referrals, existing and walk-in customers and from responses to the Company’s marketing campaigns. The Company currently offers both fixed-rate and adjustable-rate mortgage (“ARM”) loans. Substantially all of the one- to four-family residential mortgage originations in the Company’s portfolio are located within the Company’s primary market area. The Company generally originates one- to four-family residential mortgage loans in amounts up to 90% of the lower of the purchase price or appraised value of residential property. For loans originated in excess of 80%, the Company charges an additional 50 basis points, but does not require private |
> NOTES TO CONSOLIDATED FINANCIAL STATEMENTS (continued) <
Southern Missouri Bancorp, Inc.
mortgage insurance. The majority of new residential mortgage loans originated by the Company conform to secondary market standards. The interest rates charged on these loans are competitively priced based on local market conditions, the availability of funding, and anticipated profit margins. Fixed and ARM loans originated by the Company are amortized over periods as long as 30 years, but typically are repaid over shorter periods. Fixed-rate loans secured by one- to four-family residences have contractual maturities up to 30 years, and are generally fully amortizing with payments due monthly. These loans normally remain outstanding for a substantially shorter period of time because of refinancing and other prepayments. A significant change in the interest rate environment can alter the average life of a residential loan portfolio. The one- to four-family fixed-rate loans do not contain prepayment penalties. Most are written using secondary market guidelines. The Company currently originates ARM loans, which adjust annually after an initial period of one, three or five years. Typically, originated ARM loans secured by owner occupied properties reprice at a margin of 2.75% to 3.00% over the weekly average yield on United States Treasury securities adjusted to a constant maturity of one year (“CMT”). Generally, ARM loans secured by non-owner occupied residential properties reprice at a margin of 3.75% over the CMT index. Current residential ARM loan originations are subject to annual and lifetime interest rate caps and floors. As a consequence of using interest rate caps, initial rates which may be at a premium or discount, and a “CMT” loan index, the interest earned on the Company’s ARMs will react differently to changing interest rates than the Company’s cost of funds. In underwriting one- to four-family residential real estate loans, the Company evaluates the borrower’s ability to meet debt service requirements at current as well as fully indexed rates for ARM loans, as well as the value of the property securing the loan. Most properties securing real estate loans made by the Company have appraisals performed on them by independent fee appraisers approved and qualified by the Board of Directors. The Company generally requires borrowers to obtain title insurance and fire, property and flood insurance (if indicated) in an amount not less than the amount of the loan. Real estate loans originated by the Company generally contain a “due on sale” clause allowing the Company to declare the unpaid principal balance due and payable upon the sale of the security property. The Company also originates loans secured by multi-family residential properties that are generally located in the Company’s primary market area. The majority of the multi-family residential loans that are originated by the Bank are amortized over periods generally up to 20 years, with balloon maturities up to five years. Both fixed and adjustable interest rates are offered and it is typical for the Company to include an interest rate “floor” in the loan agreement. Variable rate loans typically adjust daily, monthly, quarterly or annually based on the Wall Street prime interest rate. Generally, multi-family residential loans do not exceed 85% of the lower of the appraised value or purchase price of the secured property. The Company generally requires a Board-approved independent certified fee appraiser to be engaged in determining the collateral value. As a general rule, the Company requires the unlimited guaranty of all individuals (or entities) owning (directly or indirectly) 20% or more of the stock of the borrowing entity. The primary risk associated with multifamily loans is the ability of the income-producing property that collateralizes the loan to produce adequate cash flow to service the debt. High unemployment or generally weak economic conditions may result in borrowers having to provide rental rate concessions to achieve adequate occupancy rates. In an effort to reduce these risks, the Bank will evaluate the guarantor’s ability to inject personal funds as a tertiary source of repayment. | | Commercial Real Estate Lending. The Company actively originates loans secured by commercial real estate including land (improved, unimproved, and farmland), strip shopping centers, retail establishments and other businesses generally located in the Company’s primary market area. Most commercial real estate loans originated by the Company generally are based on amortization schedules of up to 20 years with monthly principal and interest payments. Generally, the interest rate received on these loans is fixed for a maturity for up to five years, with a balloon payment due at maturity. Alternatively, for some loans, the interest rate adjusts at least annually after an initial period up to five years, based upon the Wall Street Journal’s published prime rate. The Company typically includes an interest rate “floor” in the loan agreement. Variable rate commercial real estate originations typically adjust daily, monthly, quarterly or annually based on the Wall Street Journal’s published prime rate. Generally, improved commercial real estate loan amounts do not exceed 80% of the lower of the appraised value or the purchase price of the secured property. Agricultural real estate terms offered differ slightly, with amortization schedules of up to 25 years with an 80% loan-to-value ratio, or 30 years with a 75% loan-to-value ratio. Before credit is extended, the Company analyzes the financial condition of the borrower, the borrower’s credit history, and the reliability and predictability of the cash flow generated by the property and the value of the property itself. Generally, personal guarantees are obtained from the borrower in addition to obtaining the secured property as collateral for such loans. The Company also generally requires appraisals on properties securing commercial real estate to be performed by a Board-approved independent certified fee appraiser. Generally, loans secured by commercial real estate involve a greater degree of credit risk than one- to four-family residential mortgage loans. These loans typically involve large balances to single borrowers or groups of related borrowers. Because payments on loans secured by commercial real estate are often dependent on the successful operation or management of the secured property, repayment of such loans may be subject to adverse conditions in the real estate market or the economy. Construction Lending. The Company originates real estate loans secured by property or land that is under construction or development. Construction loans originated by the Company are generally secured by mortgage loans for the construction of owner occupied residential real estate or to finance speculative construction secured by residential real estate, land development, or owner-operated or non-owner occupied commercial real estate. During construction, these loans typically require monthly interest-only payments and have maturities ranging from 6 to 12 months. Once construction is completed, permanent construction loans may be converted to monthly payments using amortization schedules of up to 30 years on residential and generally up to 20 years on commercial real estate. Speculative construction and land development lending generally affords the Company an opportunity to receive higher interest rates and fees with shorter terms to maturity than those obtainable from residential lending. Nevertheless, construction and land development lending is generally considered to involve a higher level of credit risk than one- to four-family residential lending due to (i) the concentration of principal among relatively few borrowers and development projects, (ii) the increased difficulty at the time the loan is made of accurately estimating building or development costs and the selling price of the finished product, (iii) the increased difficulty and costs of monitoring and disbursing funds for the loan, (iv) the higher degree of sensitivity to increases in market rates of interest and changes in local economic conditions, and (v) the increased difficulty of working out problem |
> NOTES TO CONSOLIDATED FINANCIAL STATEMENTS (continued) <
Southern Missouri Bancorp, Inc.
loans. Due in part to these risk factors, the Company may be required from time to time to modify or extend the terms of some of these types of loans. In an effort to reduce these risks, the application process includes a submission to the Company of accurate plans, specifications and costs of the project to be constructed. These items are also used as a basis to determine the appraised value of the subject property. Loan amounts are generally limited to 80% of the lesser of current appraised value and/or the cost of construction. To closely monitor the inherent risks associated with construction loans, the Company will typically utilize maturity periods ranging from 6 to 12 months for these loans. Weather conditions, change orders, availability of materials and/or labor, and other factors may contribute to the lengthening of a project, thus necessitating the need to renew the construction loan at the balloon maturity. Such extensions are typically executed in incremental three month periods to facilitate project completion. The Company’s average term of construction loans is approximately 14 months. During construction, loans typically require monthly interest only payments which may allow the Company an opportunity to monitor for early signs of financial difficulty should the borrower fail to make a required monthly payment. Additionally, during the construction phase, the Company typically obtains interim inspections completed by an independent third party. This monitoring further allows the Company opportunity to assess risk. At June 30, 2011, construction loans outstanding included 24 loans, totaling $2.2 million, for which a modification had been agreed to; At June 30, 2010, construction loans outstanding included 18 loans, totaling $6.3 million, for which a modification had been agreed to. All modifications were solely for the purpose of extending the maturity date due to conditions described above. None of these modifications were executed due to financial difficulty on the part of the borrower and, therefore, were not accounted for as TDRs. Consumer Lending. The Company offers a variety of secured consumer loans, including home equity, direct and indirect automobile loans, second mortgages, mobile home loans and loans secured by deposits. The Company originates substantially all of its consumer loans in its primary market area. Usually, consumer loans are originated with fixed rates for terms of up to five years, with the exception of home equity lines of credit, which are variable, tied to the prime rate of interest and are for a period of ten years. Home equity lines of credit (HELOCs) are secured with a deed of trust and are issued up to 100% of the appraised or assessed value of the property securing the line of credit, less the outstanding balance on the first mortgage. Interest rates on the HELOCs are adjustable and are tied to the current prime interest rate. This rate is obtained from the Wall Street Journal and adjusts on a daily basis. Interest rates are based upon the loan-to-value ratio of the property with better rates given to borrowers with more equity. HELOCs, which are secured by residential properties, are secured by stronger collateral than automobile loans and because of the adjustable rate structure, contain less interest rate risk to the Company. Lending up to 100% of the value of the property presents greater credit risk to the Company. Consequently, the Company limits this product to customers with a favorable credit history. Automobile loans originated by the Company include both direct loans and a smaller amount of loans originated by auto dealers. The Company generally pays a negotiated fee back to the dealer for indirect loans. Typically, automobile loans are made for terms of up to 60 months for new and used vehicles. Loans secured by automobiles have fixed rates and are generally made in amounts up to 100% of the purchase price of the vehicle. Consumer loan terms vary according to the type and value of collateral, length of contract and creditworthiness of the borrower. The underwriting | | standards employed for consumer loans include employment stability, an application, a determination of the applicant’s payment history on other debts, and an assessment of ability to meet existing and proposed obligations. Although creditworthiness of the applicant is a primary consideration, the underwriting process also includes a comparison of the value of the security, if any, in relation to the proposed loan amount. Consumer loans may entail greater credit risk than do residential mortgage loans, because they are generally unsecured or are secured by rapidly depreciable or mobile assets, such as automobiles. In the event of repossession or default, there may be no secondary source of repayment or the underlying value of the collateral could be insufficient to repay the loan. In addition, consumer loan collections are dependent on the borrower’s continuing financial stability, and thus are more likely to be affected by adverse personal circumstances. Furthermore, the application of various federal and state laws, including bankruptcy and insolvency laws, may limit the amount which can be recovered on such loans. Commercial Business Lending. The Company’s commercial business lending activities encompass loans with a variety of purposes and security, including loans to finance accounts receivable, inventory, equipment and operating lines of credit, including agricultural production and equipment loans. The Company currently offers both fixed and adjustable rate commercial business loans. Adjustable rate business loans typically reprice daily, monthly, quarterly, or annually, in accordance with the Wall Street Journal’s prime rate of interest. The Company typically includes an interest rate “floor” in the loan agreement. Commercial business loan terms vary according to the type and value of collateral, length of contract and creditworthiness of the borrower. Generally, commercial loans secured by fixed assets are amortized over periods up to five years, while commercial operating lines of credit or agricultural production lines are generally for a one year period. The Company’s commercial business loans are evaluated based on the loan application, a determination of the applicant’s payment history on other debts, business stability and an assessment of ability to meet existing obligations and payments on the proposed loan. Although creditworthiness of the applicant is a primary consideration, the underwriting process also includes a comparison of the value of the security, if any, in relation to the proposed loan amount. Unlike residential mortgage loans, which generally are made on the basis of the borrower’s ability to make repayment from his or her employment and other income, and which are secured by real property whose value tends to be more easily ascertainable, commercial business loans are of higher risk and typically are made on the basis of the borrower’s ability to make repayment from the cash flow of the borrower’s business. As a result, the availability of funds for the repayment of commercial business loans may be substantially dependent on the success of the business itself. Further, the collateral securing the loans may depreciate over time, may be difficult to appraise and may fluctuate in value based on the success of the business. The tables on the following page present the balance in the allowance for loan losses and the recorded investment in loans (excluding loans in process and deferred loan fees) based on portfolio segment and impairment methods as of June 30, 2011 and 2010, and activity in the allowance for loan losses for the fiscal year ended June 30, 2011: |
> NOTES TO CONSOLIDATED FINANCIAL STATEMENTS (continued) <
Southern Missouri Bancorp, Inc.
| | | Conventional | | | Construction | | | Commercial | | | | | | | | | | | | | |
| June 30, 2011 | | Real Estate | | | Real Estate | | | Real Estate | | | Consumer | | | Commercial | | | Unallocated | | | Total | |
| Allowance for loan losses: | | | | | | | | | | | | | | | | | | | | | |
| Balance, beginning of period | | $ | 902,122 | | | $ | 198,027 | | | $ | 1,605,218 | | | $ | 473,064 | | | $ | 1,330,180 | | | $ | - | | | $ | 4,508,611 | |
| Provision charged to expense | | | 871,114 | | | | 127,312 | | | | 1,125,231 | | | | 15,761 | | | | 245,381 | | | $ | - | | | | 2,384,799 | |
| Losses charged off | | | (157,587 | ) | | | (157,711 | ) | | | (59,955 | ) | | | (66,250 | ) | | | (67,488 | ) | | $ | - | | | | (508,991 | ) |
| Recoveries | | | 2,636 | | | | 25,124 | | | | 988 | | | | 18,632 | | | | 6,652 | | | $ | - | | | | 54,032 | |
| Balance, end of period | | $ | 1,618,285 | | | $ | 192,752 | | | $ | 2,671,482 | | | $ | 441,207 | | | $ | 1,514,725 | | | $ | - | | | $ | 6,438,451 | |
| | | | | | | | | | | | | | | | | | | | | | | | | | | | | |
| Ending Balance: individually | | | | | | | | | | | | | | | | | | | | | | | | | | | | |
| evaluated for impairment | | $ | - | | | $ | - | | | $ | 477,517 | | | $ | - | | | $ | - | | | $ | - | | | $ | 477,517 | |
| | | | | | | | | | | | | | | | | | | | | | | | | | | | | |
| Ending Balance: collectively | | | | | | | | | | | | | | | | | | | | | | | | | | | | |
| evaluated for impairment | | $ | 1,618,285 | | | $ | 192,752 | | | $ | 2,072,595 | | | $ | 441,207 | | | $ | 1,514,725 | | | $ | - | | | $ | 5,839,564 | |
| | | | | | | | | | | | | | | | | | | | | | | | | | | | | |
| Ending Balance: loans | | | | | | | | | | | | | | | | | | | | | | | | | | | | |
| acquired with deteriorated | | | | | | | | | | | | | | | | | | | | | | | | | | | | |
| credit quality | | $ | - | | | $ | - | | | $ | 121,370 | | | $ | - | | | $ | - | | | $ | - | | | $ | 121,370 | |
| | | | | | | | | | | | | | | | | | | | | | | | | | | | | |
| Loans: | | | | | | | | | | | | | | | | | | | | | | | | | | | | |
| Ending Balance: individually | | | | | | | | | | | | | | | | | | | | | | | | | | | | |
| evaluated for impairment | | $ | - | | | $ | - | | | $ | 1,484,711 | | | $ | - | | | $ | - | | | $ | - | | | $ | 1,484,711 | |
| | | | | | | | | | | | | | | | | | | | | | | | | | | | | |
| Ending Balance: collectively | | | | | | | | | | | | | | | | | | | | | | | | | | | | |
| evaluated for impairment | | $ | 198,328,878 | | | $ | 21,590,865 | | | $ | 181,257,071 | | | $ | 29,963,281 | | | $ | 123,062,000 | | | $ | - | | | $ | 554,202,095 | |
| | | | | | | | | | | | | | | | | | | | | | | | | | | | | |
| Ending Balance: loans | | | | | | | | | | | | | | | | | | | | | | | | | | | | |
| acquired with deteriorated | | | | | | | | | | | | | | | | | | | | | | | | | | | | |
| credit quality | | $ | 1,555,729 | | | $ | - | | | $ | 2,416,981 | | | $ | - | | | $ | 3,228,143 | | | $ | - | | | $ | 7,200,853 | |
| | | Conventional | | | Construction | | | Commercial | | | | | | | | | | | | | |
June 30, 2010 | | Real Estate | | | Real Estate | | | Real Estate | | | Consumer | | | Commercial | | | Unallocated | | | Total | |
| Allowance for loan losses: | | | | | | | | | | | | | | | | | | | | | |
| Balance, end of period | | $ | 902,122 | | | $ | 198,027 | | | $ | 1,605,218 | | | $ | 473,064 | | | $ | 1,330,180 | | | $ | - | | | $ | 4,508,611 | |
| | | | | | | | | | | | | | | | | | | | | | | | | | | | | |
| Ending Balance: individually | | | | | | | | | | | | | | | | | | | | | | | | | | | | |
| evaluated for impairment | | $ | - | | | $ | - | | | $ | 394,211 | | | $ | - | | | $ | 19,699 | | | $ | - | | | $ | 413,910 | |
| | | | | | | | | | | | | | | | | | | | | | | | | | | | | |
| Ending Balance: collectively | | | | | | | | | | | | | | | | | | | | | | | | | | | | |
| evaluated for impairment | | $ | 902,122 | | | $ | 198,027 | | | $ | 1,211,007 | | | $ | 473,064 | | | $ | 1,310,481 | | | $ | - | | | $ | 4,094,701 | |
| | | | | | | | | | | | | | | | | | | | | | | | | | | | | |
| Ending Balance: loans | | | | | | | | | | | | | | | | | | | | | | | | | | | | |
| acquired with deteriorated | | | | | | | | | | | | | | | | | | | | | | | | | | | | |
| credit quality | | $ | - | | | $ | - | | | $ | - | | | $ | - | | | $ | - | | | $ | - | | | $ | - | |
| | | | | | | | | | | | | | | | | | | | | | | | | | | | | |
| Loans: | | | | | | | | | | | | | | | | | | | | | | | | | | | | |
| Ending Balance: individually | | | | | | | | | | | | | | | | | | | | | | | | | | | | |
| evaluated for impairment | | $ | - | | | $ | - | | | $ | 1,433,410 | | | $ | - | | | $ | 299,716 | | | $ | - | | | $ | 1,733,126 | |
| | | | | | | | | | | | | | | | | | | | | | | | | | | | | |
| Ending Balance: collectively | | | | | | | | | | | | | | | | | | | | | | | | | | | | |
| evaluated for impairment | | $ | 157,866,852 | | | $ | 19,245,897 | | | $ | 119,898,506 | | | $ | 26,152,658 | | | $ | 97,175,939 | | | $ | - | | | $ | 420,339,852 | |
| | | | | | | | | | | | | | | | | | | | | | | | | | | | | |
| Ending Balance: loans | | | | | | | | | | | | | | | | | | | | | | | | | | | | |
| acquired with deteriorated | | | | | | | | | | | | | | | | | | | | | | | | | | | | |
| credit quality | | $ | 627,378 | | | $ | - | | | $ | 193,902 | | | $ | 171,278 | | | $ | 5,233 | | | $ | - | | | $ | 997,791 | |
> NOTES TO CONSOLIDATED FINANCIAL STATEMENTS (continued) <
Southern Missouri Bancorp, Inc.
The following table presents the activity in the allowance for loan losses for the fiscal years ended June 30, 2010 and 2009:
| | | Fiscal 2010 | | | Fiscal 2009 | |
| Balance, beginning of period | | $ | 3,992,961 | | | $ | 3,198,969 | |
| Loans charged off: | | | | | | | | |
| Residential real estate | | | (156,980 | ) | | | (19,382 | ) |
| Commercial business | | | (117,957 | ) | | | (242,008 | ) |
| Commercial real estate | | | (75,780 | ) | | | (10,495 | ) |
| Consumer | | | (79,507 | ) | | | (110,657 | ) |
| Gross charged off loans | | | (430,224 | ) | | | (382,542 | ) |
| Recoveries of loans previously charged off: | | | | | | | | |
| Residential real estate | | | 7,994 | | | | 2,898 | |
| Commercial business | | | 4,986 | | | | 2,600 | |
| Commercial real estate | | | 2,464 | | | | 6,500 | |
| Consumer | | | 5,497 | | | | 13,551 | |
| Gross charged off loans | | | 20,941 | | | | 25,549 | |
| Net charge offs | | | (409,283 | ) | | | (356,993 | ) |
| Provision charged to expense | | | 924,933 | | | | 1,150,985 | |
| Balance, end of period | | $ | 4,508,611 | | | $ | 3,992,961 | |
Management’s opinion as to the ultimate collectability of loans is subject to estimates regarding future cash flows from operations and the value of property, real and personal, pledged as collateral. These estimates are affected by changing economic conditions and the economic prospects of borrowers. The allowance for loan losses is maintained at a level that, in management’s judgment, is adequate to cover probable credit losses inherent in the loan portfolio at the balance sheet date. The allowance for loan losses is established as losses are estimated to have occurred through a provision for loan losses charged to earnings. Loan losses are charged against the allowance when management believes the uncollectability of a loan balance is confirmed. Subsequent recoveries, if any, are credited to the allowance. The allowance for loan losses is evaluated on a regular basis by management and is based upon management’s periodic review of the collectability of the loans in light of historical experience, the nature and volume of the loan portfolio, adverse situations that may affect the borrower’s ability to repay, estimated value of any underlying collateral and prevailing economic conditions. This evaluation is inherently subjective as it requires estimates that are susceptible to significant revision as more information becomes available. The allowance consists of allocated and general components. The allocated component relates to loans that are classified as impaired. For those loans that are classified as impaired, an allowance is established when the discounted cash flows (or collateral value or observable market price) of the impaired loan is lower than the carrying value of that loan. A loan is considered impaired when, based on current information and events, it is probable that the scheduled payments of principal or interest will not be able to be collected when due according to the contractual terms of the loan agreement. Factors considered by management in determining impairment include payment status, collateral value and the probability of collecting scheduled principal and interest payments when due. Loans that | | experience insignificant payment delays and payment shortfalls generally are not classified as impaired. Management determines the significance of payment delays and payment shortfalls on a case-by-case basis, taking into consideration all of the circumstances surrounding the loan and the borrower, including the length of the delay, the reasons for the delay, the borrower’s prior payment record and the amount of the shortfall in relation to the principal and interest owed. Impairment is measured on a loan-by-loan basis for commercial and agricultural loans by either the present value of expected future cash flows discounted at the loan’s effective interest rate, the loan’s obtainable market price or the fair value of the collateral if the loan is collateral dependent. Groups of loans with similar risk characteristics are collectively evaluated for impairment based on the group’s historical loss experience adjusted for changes in trends, conditions and other relevant factors that affect repayment of the loans. Accordingly, individual consumer and residential loans are not separately identified for impairment measurements, unless such loans are the subject of a restructuring agreement due to financial difficulties of the borrower. The general component covers non-classified loans and is based on historical charge-off experience and expected loss given the internal risk rating process. The loan portfolio is stratified into homogeneous groups of loans that possess similar loss characteristics and an appropriate loss ratio adjusted for other qualitative factors is applied to the homogeneous pools of loans to estimate the incurred losses in the loan portfolio. During fiscal 2011, the Company changed its allowance methodology to consider, as the primary quantitative factor, average net charge offs over the most recent twelve-month period. The Company had previously considered average net charge offs over the most recent five-year period as the primary quantitative factor. The impact of the modification was minimal. |
> NOTES TO CONSOLIDATED FINANCIAL STATEMENTS (continued) <
Southern Missouri Bancorp, Inc.
Included in the Company’s loan portfolio are certain loans accounted for in accordance with ASC 310-30, Loans and Debt Securities Acquired with Deteriorated Credit Quality. These loans were written down at acquisition to an amount estimated to be collectible. As a result, certain ratios regarding the Company’s loan portfolio and credit quality cannot be used to compare the Company to peer companies or to compare the Company’s current credit quality to prior periods. The ratios particularly affected by accounting under ASC 310-30 include the allowance for loan losses as a percentage of loans, nonaccrual loans, and nonperforming assets, and nonaccrual loans and nonperforming loans as a percentage of total loans.
The following tables present the credit risk profile of the Company’s loan portfolio (excluding loans in process and deferred loan fees) based on rating category and payment activity as of June 30, 2011 and 2010. These tables include purchased credit impaired loans, which are reported according to risk categorization after acquisition based on the Company’s standards for such classification:
| | | Conventional | | | Construction | | | Commercial | | | | | | | |
| June 30, 2011 | | Real Estate | | | Real Estate | | | Real Estate | | | Consumer | | | Commercial | |
| | | | | | | | | | | | | | | | |
| Pass | | $ | 198,104,835 | | | $ | 21,590,865 | | | $ | 177,467,948 | | | $ | 29,951,645 | | | $ | 119,248,931 | |
| Special Mention | | | 1,478,676 | | | | - | | | | 1,005,338 | | | | - | | | | 5,499,249 | |
| Substandard | | | 215,702 | | | | - | | | | 6,685,477 | | | | 9,996 | | | | 1,541,963 | |
| Doubtful | | | 85,394 | | | | - | | | | - | | | | 1,640 | | | | - | |
| Total | | $ | 199,884,607 | | | $ | 21,590,865 | | | $ | 185,158,763 | | | $ | 29,963,281 | | | $ | 126,290,143 | |
| | | | | | | | | | | | | | | | | | | | | |
| | | | | | | | | | | | | | | | | | | | | |
| | | | | | | | | | | | | | | | | | | | | |
| | | Conventional | | | Construction | | | Commercial | | | | | | | | | |
| June 30, 2010 | | Real Estate | | | Real Estate | | | Real Estate | | | Consumer | | | Commercial | |
| | | | | | | | | | | | | | | | | | | | | |
| Pass | | $ | 158,407,780 | | | $ | 19,245,897 | | | $ | 115,891,426 | | | $ | 26,323,936 | | | $ | 90,941,003 | |
| Special Mention | | | - | | | | - | | | | 123,100 | | | | - | | | | 5,790,000 | |
| Substandard | | | 86,450 | | | | - | | | | 5,511,292 | | | | - | | | | 749,885 | |
| Doubtful | | | - | | | | - | | | | - | | | | - | | | | - | |
| Total | | $ | 158,494,230 | | | $ | 19,245,897 | | | $ | 121,525,818 | | | $ | 26,323,936 | | | $ | 97,480,888 | |
The above amounts include purchased credit impaired loans. At June 30, 2011, these loans comprised $2.1 of credits rated “Pass”; $2.4 of credits rated “Special Mention”; $2.7 of loans rated “Substandard”; and $0 of credits rated “Doubtful”. At June 30, 2010, these loans comprised $846,000 of credits rated “Pass”; $68,000 of credits rated “Special Mention”; $84,000 of loans rated “Substandard”; and $0 of credits rated “Doubtful”. Credit Quality Indicators. The Company categorizes loans into risk categories based on relevant information about the ability of borrowers to service their debt such as: current financial information, historical payment experience, credit documentation, public information, and current economic trends among other factors. The Company analyzes loans individually by classifying the loans as to credit risk. This analysis is performed on all loans at origination, and is updated on a quarterly basis for loans risk rated Special Mention, Substandard, or Doubtful. In addition, lending relationships over $250,000 are subject to an independent loan review following origination, and lending relationships in excess of $1,000,000 are subject to an independent loan review annually, in order to verify risk ratings. | | The Company uses the following definitions for risk ratings: Special Mention – Loans classified as special mention warrant more than usual monitoring. Issues may include deteriorating financial condition, payments made after the due date but within 30 days, adverse industry conditions, management problems, or other signs of deterioration that indicate a potential weakening of the institution’s credit position in the future. Substandard – Loans classified as substandard possess weaknesses that jeopardize the ultimate collection of the principal and interest outstanding. These loans exhibit continued financial losses, ongoing delinquency, overall poor financial condition, and insufficient collateral. They are characterized by the distinct possibility that the institution will sustain some loss if the deficiencies are not corrected. Doubtful – Loans classified as doubtful have all the weaknesses of substandard loans, and have deteriorated to the level that there is a high probability of substantial loss. Loans not meeting the criteria above that are analyzed individually as part of the above described process are considered to be Pass rated loans. |
> NOTES TO CONSOLIDATED FINANCIAL STATEMENTS (continued) <
Southern Missouri Bancorp, Inc.
The following tables present the Company’s loan portfolio aging analysis (excluding loans in process and deferred loan fees) as of June 30, 2011 and 2010. These tables include purchased credit impaired loans, which are reported according to aging analysis after acquisition based on the Company’s standards for such classification:
| | | | | | | | | | | | | | | | | | | | | Total Loans | |
| | | 30-59 Days | | | 60-89 Days | | | Greater than | | | Total | | | | | | Total Loans | | | > 90 Days | |
| June 30, 2011 | | Past Due | | | Past Due | | | 90 Days | | | Past Due | | | Current | | | Receivable | | | & Accruing | |
| Real Estate Loans: | | | | | | | | | | | | | | | | | | | | | |
| Conventional | | $ | 1,287,921 | | | $ | 997,076 | | | $ | 275,021 | | | $ | 2,560,018 | | | $ | 197,324,589 | | | $ | 199,884,607 | | | $ | 189,627 | |
| Construction | | | 800,198 | | | | 100,000 | | | | 151,699 | | | | 1,051,897 | | | | 20,538,968 | | | | 21,590,865 | | | | - | |
| Commercial | | | 338,484 | | | | - | | | | 124,825 | | | | 463,309 | | | | 184,695,454 | | | | 185,158,763 | | | | 124,824 | |
| Consumer loans | | | 433,468 | | | | 18,528 | | | | 121,934 | | | | 573,930 | | | | 29,389,351 | | | | 29,963,281 | | | | 121,934 | |
| Commercial loans | | | 1,153,498 | | | | 13,583 | | | | 1,841 | | | | 1,168,922 | | | | 125,121,221 | | | | 126,290,143 | | | | 1,840 | |
| Total Loans | | $ | 4,013,569 | | | $ | 1,129,187 | | | $ | 675,320 | | | $ | 5,818,076 | | | $ | 557,069,583 | | | $ | 562,887,659 | | | $ | 438,225 | |
| | | | | | | | | | | | | | | | | | | | | Total Loans | |
| | | 30-59 Days | | | 60-89 Days | | | Greater than | | | Total | | | | | | Total Loans | | | > 90 Days | |
| June 30, 2010 | | Past Due | | | Past Due | | | 90 Days | | | Past Due | | | Current | | | Receivable | | | & Accruing | |
| Real Estate Loans: | | | | | | | | | | | | | | | | | | | | | |
| Conventional | | $ | 212,708 | | | $ | 239,191 | | | $ | 162,731 | | | $ | 614,630 | | | $ | 157,879,600 | | | $ | 158,494,230 | | | $ | 8,170 | |
| Construction | | | - | | | | - | | | | - | | | | - | | | | 19,245,897 | | | | 19,245,897 | | | | - | |
| Commercial | | | 320,562 | | | | - | | | | 51,174 | | | | 371,736 | | | | 121,154,082 | | | | 121,525,818 | | | | - | |
| Consumer loans | | | 236,694 | | | | 20,202 | | | | 74,957 | | | | 331,853 | | | | 25,992,083 | | | | 26,323,936 | | | | 51,447 | |
| Commercial loans | | | 103,168 | | | | 22,997 | | | | 42,835 | | | | 169,000 | | | | 97,311,888 | | | | 97,480,888 | | | | 34,347 | |
| Total Loans | | $ | 873,132 | | | $ | 282,390 | | | $ | 331,697 | | | $ | 1,487,219 | | | $ | 421,583,550 | | | $ | 423,070,769 | | | $ | 93,964 | |
The above amounts include purchased credit impaired loans. At June 30, 2011, these loans comprised $1.8 million of credits 30-59 Days Past Due; $442,000 of credits 60-89 Days Past Due; $153,000 of credits Greater Than 90 Days Past Due; $2.4 million of Total Past Due credits; $4.7 million of credits Current; and $0 of Total Loans > 90 Days & Accruing. At June 30, 2010, these loans comprised $0 of credits 30-59 Days Past Due; $0 of credits 60-89 Days Past Due; $50,000 of credits Greater Than 90 Days Past Due; $50,000 of Total Past Due credits; $948,000 of credits Current; and $1,000 of Total Loans > 90 Days & Accruing. A loan is considered impaired, in accordance with the impairment accounting guidance (ASC 310-10-35-16), when based on current information and events, it is probable the Company will be unable to collect all amounts due from the borrower in accordance with the contractual terms of the loan. Impaired loans include nonperforming commercial loans but also include loans modified in troubled debt restructurings where concessions have been granted to borrowers experiencing financial difficulties. These concessions could include a reduction in the interest rate on the loan, payment extensions, forgiveness of principal, forbearance or other actions intended to maximize collection. | | The following tables present impaired loans (excluding loans in process and deferred loan fees) as of June 30, 2011, and June 30, 2010. These tables include purchased credit impaired loans. Purchased credit impaired loans are those for which it was deemed probable, at acquisition, that the Company would be unable to collect all contractually required payments receivable. In an instance where, subsequent to the acquisition, the Company determines it is probable, for a specific loan, that cash flows received will exceed the amount previously expected, the Company will recalculate the amount of accretable yield in order to recognize the improved cash flow expectation as additional interest income over the remaining life of the loan. These loans, however, will continue to be reported as impaired loans. In an instance where, subsequent to the acquisition, the Company determines it is probable that, for a specific loan, that cash flows received will be less than the amount previously expected, the Company will allocate a specific allowance under the terms of ASC 310-10-35. |
> NOTES TO CONSOLIDATED FINANCIAL STATEMENTS (continued) <
Southern Missouri Bancorp, Inc.
| | | June 30, 2011 | |
| | | Recorded | | | Unpaid Principal | | | Specific | |
| | | Balance | | | Balance | | | Allowance | |
| Loans without a specific valuation allowance: | | | | | | | | | |
| Conventional real estate | | $ | 1,555,729 | | | $ | 2,307,417 | | | $ | - | |
| Construction real estate | | | - | | | | - | | | | - | |
| Commercial real estate | | | 1,835,250 | | | | 3,228,059 | | | | - | |
| Consumer loans | | | - | | | | - | | | | - | |
| Commercial loans | | | 3,228,143 | | | | 4,728,158 | | | | - | |
| Loans with a specific valuation allowance: | | | | | | | | | | | | |
| Conventional real estate | | $ | - | | | $ | - | | | $ | - | |
| Construction real estate | | | - | | | | - | | | | - | |
| Commercial real estate | | | 2,066,442 | | | | 2,114,016 | | | | 598,887 | |
| Consumer loans | | | - | | | | - | | | | - | |
| Commercial loans | | | - | | | | - | | | | - | |
| Total | | | | | | | | | | | | |
| Conventional real estate | | $ | 1,555,729 | | | $ | 2,307,417 | | | $ | - | |
| Construction real estate | | $ | - | | | $ | - | | | $ | - | |
| Commercial real estate | | $ | 3,901,692 | | | $ | 5,342,075 | | | $ | 598,887 | |
| Consumer loans | | $ | - | | | $ | - | | | $ | - | |
| Commercial loans | | $ | 3,228,143 | | | $ | 4,728,158 | | | $ | - | |
| | | | | | | | | | | | | |
| | | June 30, 2010 | |
| | | Recorded | | | Unpaid Principal | | | Specific | |
| | | Balance | | | Balance | | | Allowance | |
| | | | | | | | | | | | | |
| Loans without a specific valuation allowance: | | | | | | | | | | | | |
| Conventional real estate | | $ | 627,378 | | | $ | 1,062,003 | | | $ | - | |
| Construction real estate | | | - | | | | - | | | | - | |
| Commercial real estate | | | 193,902 | | | | 273,308 | | | | - | |
| Consumer loans | | | 171,278 | | | | 305,882 | | | | - | |
| Commercial loans | | | 5,233 | | | | 15,037 | | | | - | |
| Loans with a specific valuation allowance: | | | | | | | | | | | | |
| Conventional real estate | | $ | - | | | $ | - | | | $ | - | |
| Construction real estate | | | - | | | | - | | | | - | |
| Commercial real estate | | | 1,433,410 | | | | 1,433,410 | | | | 394,211 | |
| Consumer loans | | | - | | | | - | | | | - | |
| Commercial loans | | | 299,716 | | | | 299,716 | | | | 19,699 | |
| Total | | | | | | | | | | | | |
| Conventional real estate | | $ | 627,378 | | | $ | 1,062,003 | | | $ | - | |
| Construction real estate | | $ | - | | | $ | - | | | $ | - | |
| Commercial real estate | | $ | 1,627,312 | | | $ | 1,706,718 | | | $ | 394,211 | |
| Consumer loans | | $ | 171,278 | | | $ | 305,882 | | | $ | - | |
| Commercial loans | | $ | 304,949 | | | $ | 314,753 | | | $ | 19,699 | |
The above amounts include purchased credit impaired loans. At June 30, 2011, these loans comprised $6.6 million of impaired loans without a specific valuation allowance; $582,000 of impaired loans with a specific valuation allowance, and $7.2 million of total impaired loans. At June 30, 2010, these loans comprised $1.0 million of impaired loans without a specific valuation allowance; $0 of impaired loans with a specific valuation allowance, and $1.0 million of total impaired loans.
> NOTES TO CONSOLIDATED FINANCIAL STATEMENTS (continued) <
Southern Missouri Bancorp, Inc.
The following tables present information regarding interest income recognized on impaired loans:
| | | Fiscal 2011 | | | Fiscal 2010 | |
| | | Average | | | | | | Average | | | | |
| | | Investment in | | | Interest Income | | | Investment in | | | Interest Income | |
| | | Impaired Loans | | | Recognized | | | Impaired Loans | | | Recognized | |
| | | | | | | | | | | | | |
| Conventional real estate | | $ | 981,000 | | | $ | 105,000 | | | $ | 802,000 | | | $ | 112,000 | |
| Construction real estate | | | - | | | | - | | | | - | | | | - | |
| Commercial real estate | | | 2,758,000 | | | | 220,000 | | | | 1,758,000 | | | | 116,000 | |
| Consumer loans | | | - | | | | | | | | 353,000 | | | | 57,000 | |
| Commercial loans | | | 2,283,000 | | | | 212,000 | | | | 393,000 | | | | 17,000 | |
| Total loans | | $ | 6,022,000 | | | $ | 537,000 | | | $ | 3,306,000 | | | $ | 302,000 | |
Interest income on impaired loans recognized on a cash basis in the fiscal years ended June 30, 2011 and 2010, was immaterial.
For the fiscal years ended June 30, 2011 and 2010, the amount of interest income recorded for impaired loans that represents a change in the present value of future cash flows attributable to the passage of time was approximately $95,000 and $46,000, respectively.
The following table presents the Company’s nonaccrual loans at June 30, 2011 and 2010. This table includes purchased credit impaired loans. Purchased credit impaired loans are placed on nonaccrual status in the event the Company cannot reasonably estimate cash flows expected to be collected. The table excludes performing troubled debt restructurings.
| | | June 30, 2011 | | | June 30, 2010 | |
| | | | | | | |
| Conventional real estate | | $ | 97,131 | | | $ | 154,508 | |
| Construction real estate | | | - | | | | - | |
| Commercial real estate | | | 151,701 | | | | 51,164 | |
| Consumer loans | | | 11,636 | | | | 23,649 | |
| Commercial loans | | | 2,022 | | | | 8,709 | |
| Total loans | | $ | 262,490 | | | $ | 238,030 | |
The above amounts include purchased credit impaired loans. At June 30, 2011, these loans comprised $153,000 of nonaccrual loans; at June 30, 2010, these loans comprised $93,000 of nonaccrual loans.
At June 30, 2011 and 2010, the Company held no loans recognized as a troubled debt restructuring.
> NOTES TO CONSOLIDATED FINANCIAL STATEMENTS (continued) <
Southern Missouri Bancorp, Inc.
NOTE 4: Accounting for Certain Loans Acquired in a Transfer The Company acquired loans in a transfer during the fiscal year ended June 30, | | Accretable yield, or income expected to be collected, is as follows: |
| 2011. At acquisition, certain transferred loans evidenced deterioration of credit quality | | Balance at June 30, 2010 | $ 13,525 | |
| since origination and it was probable, at acquisition, that all contractually required | | Additions | 600,788 | |
| payments would not be collected. | | Accretion | (233,530) | |
| | | Reclassification from nonaccretable difference | 12,159 | |
| Loans purchased with evidence of credit deterioration since origination and for | | Disposals | - | |
| which it is probable that all contractually required payments will not be collected are | | Balance at June 30, 2011 | $ 792,942 | |
| considered to be credit impaired. Evidence of credit quality deterioration as of the | | | | |
| purchase date may include information such as past-due and nonaccrual status, | | During the fiscal year ended June 30, 2011, the Company increased the |
| borrower credit scores and recent loan to value percentages. Purchased credit-impaired | | allowance for the loan losses by a charge to the income statement of $121,370. |
| loans are accounted for under the accounting guidance for loans and debt securities | | No allowance for loan losses was reversed in fiscal 2011. |
| acquired with deteriorated credit quality (ASC 310-30) and initially measured at fair | | | | |
| value, which includes estimated future credit losses expected to be incurred over the life | | Loans acquired during the fiscal year ended June 30, 2011, for which it was |
| of the loan. Accordingly, an allowance for credit losses related to these loans is not | | probable at acquisition that all contractually required payments would not be |
carried over and recorded at the acquisition date. Management estimated the cash flows expected to be collected at acquisition using our internal risk models, which incorporate | | collected are as follows: |
| the estimate of current key assumptions, such as default rates, severity and prepayment | | Contractually required payments receivable at acquisition: | |
| speeds. | | Conventional real estate | $ 3,164,199 | |
| The carrying amount of those loans is included in the balance sheet amounts of | | Construction real estate | 2,267,781 | |
loans receivable at June 30, 2011. The amounts of loans at June 30, 2011, are as: | | Commercial real estate | 4,669,215 | |
| follows | | Consumer loans | - | |
| | | Commercial loans | 6,844,624 | |
| | | | | | | Total required payments receivable | $ 16,945,819 | |
| | Real Estate Loans | | | | | | | |
| | Conventional | | $ 2,307,417 | | | Cash flows expected to be collected at acquisition | $ 11,543,172 | |
| | Construction | | - | | | Basis in acquired loans at acquisition | $ 10,301,650 | |
| | Commercial | | 3,857,364 | | | | | |
| | Consumer loans | | - | | | Certain of the loans acquired by the Company that are within the scope of |
| | Commercial loans | | 4,728,158 | | | this guidance (ASC 310-30) are not accounted for using the income recognition |
| | Outstanding balance | | $ 10,892,939 | | | model for loans and debt securities acquired with deteriorated credit quality |
| | Carrying amount, net of fair | | | | | because the Company cannot reasonably estimate cash flows expected to be |
| | value adjustment of $3,692,086 | | $ 7,200,853 | | | collected. The carrying amounts of such loans (which are included in the |
| | | | | | | carrying amount, net allowance, described above) are as follows: |
| | | | | | | | | |
| | | | | | | Loans purchased during the year | $ 622,114 | |
| | | | | | | Loans at end of period | $ 153,232 | |
NOTE 5: Premises and Equipment
Following is a summary of premises and equipment:
| | | June 30 |
| | | 2011 | | 2010 |
| Land | | $ 1,746,331 | | $ 1,488,697 |
| Buildings and improvements | | 7,977,484 | | 7,558,799 |
| Furniture, fixtures and equipment | | 6,158,890 | | 5,695,979 |
| Automobiles | | 74,080 | | 74,080 |
| | | 15,956,785 | | 14,817,555 |
| Less accumulated depreciation | | 7,899,256 | | 7,167,311 |
| TOTAL | | $ 8,057,529 | | $ 7,650,244 |
> NOTES TO CONSOLIDATED FINANCIAL STATEMENTS (continued) <
Southern Missouri Bancorp, Inc.
NOTE 6: Deposits
Deposits are summarized as follows:
| | June 30 |
| | 2011 | 2010 |
| Noninterest-bearing accounts | $ 32,848,037 | $ 28,795,215 |
| NOW accounts | 152,474,730 | 103,712,619 |
| Money market deposit accounts | 15,802,312 | 7,479,938 |
| Savings accounts | 94,378,370 | 90,384,521 |
| TOTAL NON-MATURITY DEPOSITS | 295,503,449 | 230,372,293 |
| | | |
| | | |
| Certificates: | | |
| 0.00 - 0.99% | $ 26,139,189 | $ 5,576,442 |
| 1.00 - 1.99% | 148,429,914 | 82,606,152 |
| 2.00 - 2.99% | 57,993,390 | 57,960,992 |
| 3.00 - 3.99% | 25,888,256 | 33,905,369 |
| 4.00 - 4.99% | 4,651,354 | 10,736,794 |
| 5.00 - 5.99% | 1,545,265 | 1,734,865 |
| TOTAL CERTIFICATES | 264,647,368 | 192,520,614 |
| TOTAL DEPOSITS | $ 560,150,817 | $ 422,892,907 |
The aggregate amount of deposits with a minimum denomination of $100,000 was $261,490,430 and $177,568,630 at June 30, 2011 and 2010, respectively.
Certificate maturities at June 30, 2011 are summarized as follows:
| July 1, 2011 to June 30, 2012 | $ 181,347,272 |
| July 1, 2012 to June 30, 2013 | 42,389,255 |
| July 1, 2013 to June 30, 2014 | 19,012,350 |
| July 1, 2014 to June 30, 2015 | 9,096,865 |
| July 1, 2015 to June 30, 2016 | 12,801,626 |
| Thereafter | - |
| TOTAL | $ 264,647,368 |
> NOTES TO CONSOLIDATED FINANCIAL STATEMENTS (continued) <
Southern Missouri Bancorp, Inc.
NOTE 7: Securities Sold Under Agreements to Repurchase
Securities sold under agreements to repurchase, which are classified as borrowings, generally mature within one to four days. The following table presents balance and interest rate information on the securities sold under agreements to repurchase.
The market value of the securities underlying the agreements at June 30, 2011 and 2010, was $27.5 million and $32.0 million, respectively. The securities sold under agreements to repurchase are under the Company’s control.
| | | June 30 |
| | | 2011 | | 2010 |
| Year-end balance | | $ 25,230,051 | | $ 30,368,748 |
| Average balance during the year | | 29,285,198 | | 27,673,908 |
| Maximum month-end balance during the year | | 34,916,762 | | 31,229,801 |
| Average interest during the year | | 0.99% | | 0.84% |
| Year-end interest rate | | 0.86% | | 0.85% |
NOTE 8: Advances from Federal Home Loan Bank
Advances from Federal Home Loan Bank are summarized as follows:
| | Call Date or | | | | | |
| | Quarterly | Interest | | June 30 |
| Maturity | Thereafter | Rate | | 2011 | | 2010 |
| 12-09-10 | 12-09-05 | 6.01% | | $ - | | $ 10,000,000 |
| 10-30-12 | - | 4.87% | | 3,000,000 | | 3,000,000 |
| 04-01-13 | - | 3.65% | | 3,000,000 | | 3,000,000 |
| 01-30-15 | - | 3.75% | | 3,000,000 | | 3,000,000 |
| 11-29-16 | 11-29-07 | 3.93% | | 5,000,000 | | 5,000,000 |
| 11-29-16 | 11-29-11 | 4.42% | | 5,000,000 | | 5,000,000 |
| 11-20-17 | 11-22-10 | 3.87% | | 3,000,000 | | 3,000,000 |
| 11-29-17 | 11-29-12 | 4.07% | | 2,500,000 | | 2,500,000 |
| 08-14-18 | 08-15-11 | 3.53% | | 4,000,000 | | 4,000,000 |
| 08-14-18 | 08-14-13 | 4.04% | | 5,000,000 | | 5,000,000 |
| | | TOTAL | | $ 33,500,000 | | $ 43,500,000 |
| Weighted-average rate | | | | 4.02% | | 4.48% |
| In addition to the above advances, the Bank had an available line of credit | | FHLB Advance Maturities | | |
| amounting to $108,332,000 and $103,318,000, with FHLB at June 30, 2011 | | July 1, 2011 to June 30, 2012 | | $ - |
| and 2010, respectively. | | July 1, 2012 to June 30, 2013 | | 6,000,000 |
| Advances from FHLB of Des Moines were secured by FHLB stock and | | July 1, 2013 to June 30, 2014 | | - |
| commercial real estate and one- to four-family mortgage loans of $49,084,000 | | July 1, 2014 to June 30, 2015 | | 3,000,000 |
| and $59,317,000 at June 30, 2011 and 2010, respectively. The principal | | July 1, 2015 to June 30, 2016 | | - |
| maturities of FHLB advances at June 30, 2011, are at right: | | July 1, 2016 and thereafter | | 24,500,000 |
| | | | Total | $ 33,500,000 |
> NOTES TO CONSOLIDATED FINANCIAL STATEMENTS (continued) <
Southern Missouri Bancorp, Inc.
NOTE 9: Subordinated Debt Southern Missouri Statutory Trust I issued $7.0 million of Floating Rate Capital Securities (the “Trust Preferred Securities”) with a liquidation value of $1,000 per share in March 2004. The securities are due in 30 years, redeemable after five years and bear interest at a floating rate based on LIBOR. At June 30, 2011, the current rate was 3.00%. The securities represent undivided beneficial interests in the trust, which was established by Southern Missouri for the purpose of issuing the securities. The Trust Preferred Securities were sold in a private transaction exempt from registration under the Securities Act of 1933, | | as amended (the “Act”) and have not been registered under the Act. The securities may not be offered or sold in the United States absent registration or an applicable exemption from registration requirements. Southern Missouri Statutory Trust I used the proceeds from the sale of the Trust Preferred Securities to purchase Junior Subordinated Debentures of Southern Missouri Bancorp. Southern Missouri Bancorp, Inc. used its net proceeds for working capital and investment in its subsidiaries. |
NOTE 10: Employee Benefits 401(k). The Bank has a 401(k) retirement plan that covers substantially all eligible employees. During fiscal 2011, the Bank amended the plan to be a safe harbor plan, making non-elective contributions of 3% of eligible salary for eligible participants. Additional profit-sharing contributions of 5% of eligible salary have been accrued for the plan year ended June 30, 2011, based on financial performance for fiscal 2011. Total 401(k) expense for fiscal 2011 was $385,000. For fiscal 2012, the Bank amended the plan again to be a safe harbor plan, making matching contributions of up to 4% of eligible salary for eligible participants, depending on the percentage of eligible pay deferred into the plan. Additional profit-sharing contributions may be awarded, subject to approval by the Board of Directors of the Bank. During fiscal 2010 and 2009, there were no contributions made to the plan. At June 30, 2011, 401(k) plan participants held approximately 192,000 shares of the Company’s stock in the plan. Employee deferrals and safe harbor contributions are fully vested. Profit-sharing or other contributions vest over a period of five years. Employee Stock Ownership Plan (ESOP). The Bank established a tax-qualified ESOP in April 1994. Effective September 30, 2010, the plan was merged with and into the Bank’s 401(k) retirement plan. The Bank made discretionary contributions to the ESOP for 2010 and 2009 of $240,000 and $210,000, respectively. Benefits are vested over five years; that vesting schedule remains intact following the merger into the 401(k) plan. At June 30, 2010, the ESOP held 225,139 shares of the Company’s stock, all of which were allocated. Shares held by the ESOP were transferred to participant 401(k) account balances effective September 30, 2010. Management Recognition Plan (MRP). The Bank adopted an MRP for the benefit of non-employee directors and two MRPs for officers and key employees (who may also be directors) in April 1994. During 2007, the Bank granted 1,000 MRP shares to employees; during 2008, an additional 2,500 shares were granted. The shares granted are in the form of restricted stock payable at the rate of 20% of such shares per year. During 2011, 700 MRP shares | | vested, which had been awarded in 2007 and 2008. Compensation expense, in the amount of the fair market value of the common stock at the date of grant, will be recognized pro-rata over the five years during which the shares vest. The Board of Directors can terminate the MRPs at any time, and if it does so, any shares not allocated will revert to the Company. The MRP expense for 2011, 2010, and 2009, was $13,153, $11,900, and $12,809, respectively. Unvested compensation expense related to the MRP was immaterial. Equity Incentive Plan. The Company adopted an Equity Incentive Plan (EIP) in 2008, reserving for award 66,000 shares. No shares have been awarded under the EIP. EIP shares are available for award to directors, officers, and employees of the Company and its affiliates by a committee of outside directors. The committee has the power to set vesting requirements for each award under the EIP. Stock Option Plan. The Company adopted a stock option plan in April 1994. The 1994 stock option plan expired in 2004, and the final options awarded and outstanding under that plan were exercised during fiscal 2011. In October 2003, a new stock option and incentive plan was adopted (“2003 Plan”). Under the 2003 Plan, the Company has granted 111,000 options to employees and directors, of which, 1,000 have been exercised, 22,500 have been forfeited, and 87,500 remain outstanding. Under both plans, exercised options may be issued from either authorized but unissued shares or treasury shares. As of June 30, 2011, there was $34,000 in remaining unrecognized compensation expense related to nonvested stock options, which will be recognized over the remaining weighted average vesting period. The aggregate intrinsic value of stock options outstanding at June 30, 2011, was $554,000. The aggregate intrinsic value of stock options exercisable at June 30, 2011, was $400,000. During fiscal 2011, options to purchase 11,000 shares were exercised. The intrinsic value of these options, based on the Company’s closing stock price of $20.78, was $146,000. The intrinsic value of options vested in fiscal 2011, 2010, and 2009 was $47,000, $3,610, and $0, respectively. |
> NOTES TO CONSOLIDATED FINANCIAL STATEMENTS (continued) <
Southern Missouri Bancorp, Inc.
Changes in options outstanding were as follows:
| | | Year Ended June 30 | |
| | | 2011 | | | 2010 | | | 2009 | |
| | | Weighted | | | | | | Weighted | | | | | | Weighted | | | | |
| | | Average | | | | | | Average | | | | | | Average | | | | |
| | | Price | | | Number | | | Price | | | Number | | | Price | | | Number | |
| Outstanding at beginning of year | | $ | 13.77 | | | | 105,500 | | | $ | 14.01 | | | | 85,500 | | | $ | 12.43 | | | | 104,500 | |
| Granted | | | - | | | | - | | | | 12.75 | | | | 20,000 | | | | 12.15 | | | | 5,000 | |
| Exercised | | | 7.52 | | | | (11,000 | ) | | | - | | | | - | | | | 6.71 | | | | (24,000 | ) |
| Forfeited | | | 15.23 | | | | (7,000 | ) | | | - | | | | - | | | | - | | | | - | |
| Outstanding at year-end | | $ | 14.44 | | | | 87,500 | | | $ | 13.77 | | | | 105,500 | | | $ | 14.01 | | | | 85,500 | |
| Options exercisable at year-end | | $ | 14.94 | | | | 68,500 | | | $ | 14.10 | | | | 80,500 | | | $ | 14.08 | | | | 75,500 | |
The following is a summary of the assumptions used in the Black-Scholes pricing model in determining the fair values of options granted during fiscal years 2010 and 2009. (No options were granted in fiscal 2011):
| | | 2011 | | | 2010 | | | 2009 | |
| | | | | | | | | | |
| Assumptions: | | | | | | | | | |
| Expected dividend yield | | | - | | | | 3.76 | % | | | 3.95 | % |
| Expected volatility | | | - | | | | 18.08 | % | | | 17.85 | % |
| Risk-free interest rate | | | - | | | | 3.70 | % | | | 3.68 | % |
| Weighted-average expected life (years) | | | - | | | | 10.00 | | | | 10.00 | |
| Weighted-average fair value of | | | | | | | | | | | | |
| options granted during the year | | | - | | | $ | 1.95 | | | $ | 1.73 | |
The following table summarizes information about stock options under the plan outstanding at June 30, 2011:
| | | | Options Outstanding | | Options Exercisable |
| | | | Weighted | | | | |
| | | | Average | Weighted | | | |
| | | | Remaining | Average | | | Weighted |
| | | Number | Contractual | Exercise | | Number | Average |
| | Exercise Price | Outstanding | Life | Price | | Exercisable | Exercise Price |
| | $ 15.23 | 42,500 | 34.6 mo. | $ 15.23 | | 42,500 | $ 15.23 |
| | 15.30 | 15,000 | 39.6 mo. | 15.30 | | 15,000 | 15.30 |
| | 14.26 | 5,000 | 50.5 mo. | 14.26 | | 5,000 | 14.26 |
| | 12.15 | 5,000 | 88.7 mo. | 12.15 | | 2,000 | 12.15 |
| | 12.75 | 20,000 | 102.6 mo. | 12.75 | | 4,000 | 12.75 |
> NOTES TO CONSOLIDATED FINANCIAL STATEMENTS (continued) <
Southern Missouri Bancorp, Inc.
NOTE 11: Income Taxes
The Company files income tax returns in the U.S. Federal jurisdiction and various states. The Company is no longer subject to U.S. federal and state tax examinations by tax authorities for years before 2008. The Company recognized no interest or penalties related to income taxes.
The components of net deferred tax assets (liabilities) are summarized as follows:
| | | 2011 | | | 2010 | |
| Deferred tax assets: | | | | | | |
| Provision for losses on loans | | $ | 2,889,770 | | | $ | 2,139,472 | |
| Accrued compensation and benefits | | | 168,375 | | | | 149,666 | |
| Other-than-temporary impairment on available | | | | | | | | |
| for sale securities | | | 261,405 | | | | 261,405 | |
| NOL carry forwards acquired | | | 169,005 | | | | 187,706 | |
| Unrealized loss on other real estate | | | 66,952 | | | | 89,570 | |
| Other | | | - | | | | 70,570 | |
| Total deferred tax assets | | | 3,555,507 | | | | 2,898,389 | |
| | | | | | | | | |
| | | | | | | | | |
| Deferred tax liabilities: | | | | | | | | |
| FHLB stock dividends | | | 188,612 | | | | 188,612 | |
| Purchase accounting adjustments | | | 1,828,472 | | | | 49,045 | |
| Depreciation | | | 525,096 | | | | 375,894 | |
| Prepaid expenses | | | 174,507 | | | | 126,217 | |
| Unrealized gain on available for sale securities | | | 306,229 | | | | 338,678 | |
| Other | | | 187,820 | | | | - | |
| Total deferred tax liabilities | | | 3,210,736 | | | | 1,078,446 | |
| NET DEFERRED TAX ASSET | | $ | 344,771 | | | $ | 1,819,943 | |
As of June 30, 2011, the Company had approximately $668,345 of federal and state net operating loss carryforwards which were acquired in the July 2009 acquisition of Southern Bank of Commerce. The amount reported is net of the IRC Sec. 382 limitation, or state equivalent, related to the utilization of net operating loss carryforwards of acquired corporations. Unless otherwise utilized, the net operating losses will begin to expire in 2027.
A reconciliation of income tax expense at the statutory rate to the Company’s actual income tax expense is shown below:
| | | Year Ended June 30 | |
| | | 2011 | | | 2010 | | | 2009 | |
| Tax at statutory rate | | $ | 5,923,356 | | | $ | 2,086,476 | | | $ | 1,914,747 | |
| Increase (reduction) in taxes | | | | | | | | | | | | |
| resulting from: | | | | | | | | | | | | |
| Nontaxable municipal income | | | (384,457 | ) | | | (327,299 | ) | | | (217,004 | ) |
| State tax, net of Federal benefit | | | 461,508 | | | | 104,354 | | | | 181,500 | |
| Cash surrender value of bank | | | | | | | | | | | | |
| owned life insurance | | | (94,364 | ) | | | (92,845 | ) | | | (93,172 | ) |
| Tax benefits realized on acquisition | | | - | | | | (258,000 | ) | | | - | |
| Acquisition costs | | | - | | | | 51,594 | | | | - | |
| Other, net | | | 45,560 | | | | (53,175 | ) | | | 10,462 | |
| ACTUAL PROVISION | | $ | 5,951,603 | | | $ | 1,511,105 | | | $ | 1,796,533 | |
Tax credit benefits in the amount of $292,430 were recognized in fiscal 2011, as compared to $219,983 and $56,700, respectively, in fiscal 2010 and 2009, under the flow-through method of accounting for investments in tax credits.
> NOTES TO CONSOLIDATED FINANCIAL STATEMENTS (continued) <
Southern Missouri Bancorp, Inc.
NOTE 12: Other Comprehensive (Loss) Income
Other comprehensive (loss) income components and related taxes were as follows:
| | | Year Ended June 30 | |
| | | 2011 | | | 2010 | | | 2009 | |
| | | | | | | | | | |
| Unrealized gains (losses) on available for sale securities: | | | | | | | | | |
| Unrealized holding gains (losses) arising during period | | $ | (185,554 | ) | | $ | 743,719 | | | $ | 1,206,610 | |
| Unrealized gains (losses) on available-for-sale securities for | | | | | | | | | | | | |
| which a portion of an other-than-temporary impairment | | | | | | | | | | | | |
| has been recognized in income | | | 97,826 | | | | 1,896 | | | | (42,162 | ) |
| Less: realized gains included in net income | | | - | | | | - | | | | - | |
| Total unrealized gains (losses) on securities | | $ | (87,728 | ) | | $ | 745,615 | | | $ | 1,164,448 | |
| Defined benefit pension plan net (loss) gain | | | 2,905 | | | | 2,218 | | | | (22,416 | ) |
| Income tax (expense) benefit | | | 32,479 | | | | (275,878 | ) | | | (430,845 | ) |
| Other comprehensive income (loss) | | $ | (52,344 | ) | | $ | 471,955 | | | $ | 711,187 | |
The components of accumulated other comprehensive income, included in stockholders’ equity, are as follows:
| | | June 30 | |
| | | 2011 | | | 2010 | |
| | | | | | | |
| Net unrealized gain on securities available-for-sale | | $ | 847,912 | | | $ | 1,033,466 | |
| Net unrealized gain (loss) on securities | | | | | | | | |
| impairment has been recognized | | | | | | | | |
| Net unrealized loss on securities available-for-sale | | | | | | | | |
| securities for which a portion of an other-than-temporary | | | | | | | | |
| impairment has been recognized in income | | | (20,295 | ) | | | (118,121 | ) |
| Unrealized gain from defined benefit pension plan | | | 14,202 | | | | 11,297 | |
| | | | 841,819 | | | | 926,642 | |
| Tax effect | | | (306,199 | ) | | | (338,678 | ) |
| Net of tax amount | | $ | 535,620 | | | $ | 587,964 | |
> NOTES TO CONSOLIDATED FINANCIAL STATEMENTS (continued) <
Southern Missouri Bancorp, Inc.
NOTE 13: Stockholders’ Equity and Regulatory Capital The Company and Bank are subject to various regulatory capital requirements administered by the Federal banking agencies. Failure to meet minimum capital requirements can result in certain mandatory — and possibly additional discretionary — actions by regulators that, if undertaken, could have a direct material effect on the Company’s financial statements. Under capital adequacy guidelines and the regulatory framework for prompt corrective action, the Company and Bank must meet specific capital guidelines that involve quantitative measures of the Company and Bank’s assets, liabilities, and certain off-balance-sheet items as calculated under regulatory accounting practices. The Company and Bank’s capital amounts and classification are also subject to qualitative judgments by the regulators about components, risk weightings, and other factors. Quantitative measures established by regulation to ensure capital adequacy require the Company and Bank to maintain minimum amounts and ratios | | (set forth in the table below) of total capital and Tier I capital (as defined in the regulations) to risk-weighted assets (as defined) and of Tier I capital (as defined) to average total assets (as defined). Management believes, as of June 30, 2011, that the Company and Bank meets all capital adequacy requirements to which they are subject. As of June 30, 2011, the most recent notification from the Federal Reserve categorized the Bank as well capitalized under the regulatory framework for prompt corrective action. To be categorized as well capitalized the Bank must maintain minimum total risk-based, Tier I risk-based, and Tier I leverage ratios as set forth in the table. There are no conditions or events since that notification that management believes have changed the Bank’s category. The following table summarizes the Bank’s actual and required regulatory capital: |
| | | | | | | | To Be Well |
| | | | | | | | Capitalized Under |
| (dollars in thousands) | | | | For Capital | | Prompt Corrective |
| | Actual | | Adequacy Purposes | | Action Provisions |
| As of June 30, 2011 | Amount | Ratio | | Amount | Ratio | | Amount | Ratio |
| Total Capital (to Risk-Weighted Assets) | $ 66,161 | 12.52% | | $ 42,276 | >8.00% | | $ 52,845 | >10.00% |
| Tier I Capital (to Risk-Weighted Assets) | 59,551 | 11.27% | | 21,138 | >4.00% | | 31,707 | >6.00% |
| Tier I Capital (to Average Assets) | 59,551 | 8.66% | | 27,518 | >4.00% | | 34,397 | >5.00% |
| | | | | | | | | |
| As of June 30, 2010 | | | | | | | | |
| Total Capital (to Risk-Weighted Assets) | $ 50,474 | 12.50% | | $ 32,305 | >8.00% | | $ 40,382 | >10.00% |
| Tier I Capital (to Risk-Weighted Assets) | 45,423 | 11.25% | | 16,153 | >4.00% | | 24,229 | >6.00% |
| Tier I Capital (to Average Assets) | 45,423 | 8.36% | | 21,742 | >4.00% | | 27,178 | >5.00% |
The Bank’s ability to pay dividends on its common stock to the Company is restricted to maintain adequate capital as shown in the above tables. Additionally, prior regulatory approval is required for the declaration of any dividends generally in excess of the sum of net income for that calendar year and retained net income for the preceding two calendar years. At June 30, 2011, approximately $14.1 million of the equity of the Bank was available for distribution as dividends to the Company without prior regulatory approval.
Additionally, effective March 31, 2011, the Company became subject to requirements to report regulatory capital ratios. Similar to requirements for the Bank, these address both risk-based capital and leverage capital. As of June 30, 2011, the Company met all applicable adequacy requirements.
The Company’s actual capital amounts and ratios are presented in the following table.
| (dollars in thousands) | | | For Capital |
| | Actual | Adequacy Purposes |
| As of June 30, 2011 | Amount | Ratio | Amount | Ratio |
| Total Capital (to Risk-Weighted Assets) | $ 65,528 | 12.40% | $ 42,290 | 8.00% |
| Tier I Capital (to Risk-Weighted Assets) | 59,090 | 11.18% | 21,145 | 4.00% |
| Tier I Capital (to Average Assets) | 59,090 | 8.60% | 27,492 | 4.00% |
> NOTES TO CONSOLIDATED FINANCIAL STATEMENTS (continued) <
Southern Missouri Bancorp, Inc.
NOTE 14: Capital Purchase Program Implemented by the U.S. Treasury In December 2008, the Company received $9.6 million from the U.S. Treasury through the sale of 9,550 shares of the Company’s Fixed Rate Cumulative Perpetual Preferred Stock, Series A, as part of the Treasury’s Capital Purchase Program. The Company also issued to the U.S. Treasury a warrant to purchase 114,326 shares of common stock at $12.53 per share. The amount of preferred shares sold represented approximately 3% of the Company’s risk-weighted assets as of September 30, 2008. The transaction was part of the Treasury’s program to infuse capital into the nation’s healthiest and strongest banks for the purpose of stabilizing the US financial system and promoting economic activity. The Company elected to | | participate in the program given the uncertain economic outlook, the relatively attractive cost of capital compared to the current market, and the strategic opportunities the Company foresees regarding potential uses of the capital. The additional capital increased the Company’s already well-capitalized position. The Company used the proceeds of the issue for working capital and investment in its banking subsidiary. The preferred shares pay a cumulative dividend of 5% per year for the first five years and 9% per year thereafter. The preferred shares are callable at 100% of the issue price, subject to the approval of the Company’s federal regulator. |
NOTE 15: Commitments and Credit Risk Standby Letters of Credit. In the normal course of business, the Company issues various financial standby, performance standby, and commercial letters of credit for its customers. As consideration for the letters of credit, the institution charges letter of credit fees based on the face amount of the letters and the creditworthiness of the counterparties. These letters of credit are standalone agreements, and are unrelated to any obligation the depositor has to the Company. Standby letters of credit are irrevocable conditional commitments issued by the Company to guarantee the performance of a customer to a third party. Financial standby letters of credit are primarily issued to support public and private borrowing arrangements, including commercial paper, bond financing and similar transactions. Performance standby letters of credit are issued to guarantee performance of certain customers under non-financial contractual obligations. The credit risk involved in issuing standby letters of credit is essentially the same as that involved in extending loans to customers. The Company had total outstanding standby letters of credit amounting to $1,102,000 at June 30, 2011, and $920,000 at June 30, 2010, with terms ranging from 12 to 24 months. At June 30, 2011, the Company’s deferred revenue under standby letters of credit agreements was nominal. Off-balance-sheet and Credit Risk. The Company’s Consolidated Financial Statements do not reflect various financial instruments to extend credit to meet the financing needs of its customers. These financial instruments include commitments to extend credit. These instruments involve, to varying degrees, elements of credit and interest rate risk in excess of the amount recognized in the balance sheets. Lines of credit are agreements to lend to a customer as long as there is no violation | | of any condition established in the contract. Lines of credit generally have fixed expiration dates. Since a portion of the line may expire without being drawn upon, the total unused lines do not necessarily represent future cash requirements. Each customer’s creditworthiness is evaluated on a case-by-case basis. The amount of collateral obtained, if deemed necessary, is based on management’s credit evaluation of the counterparty. Collateral held varies but may include accounts receivable, inventory, property, plant and equipment, commercial real estate and residential real estate. Management uses the same credit policies in granting lines of credit as it does for on balance sheet instruments. The Company had $73.6 million in commitments to extend credit at June 30, 2011 and $68.6 million at June 30, 2010. At June 30, 2011, total commitments to originate fixed-rate loans with terms in excess of one year were $5.4 million at rates ranging from 5.0% to 7.5%, with a weighted-average rate of 5.99%. Commitments to extend credit and standby letters of credit include exposure to some credit loss in the event of nonperformance of the customer. The Company’s policies for credit commitments and financial guarantees are the same as those for extension of credit that are recorded in the balance sheet. The commitments extend over varying periods of time with the majority being disbursed within a thirty-day period. The Company originates collateralized commercial, real estate, and consumer loans to customers in Missouri and Arkansas. Although the Company has a diversified portfolio, loans aggregating $229.8 million at June 30, 2011, are secured by single and multi-family residential real estate in the Company’s primary lending area. |
> NOTES TO CONSOLIDATED FINANCIAL STATEMENTS (continued) <
Southern Missouri Bancorp, Inc.
NOTE 16: Earnings Per Share
The following table sets forth the computations of basic and diluted earnings per common share:
| | | Year Ended June 30 | |
| | | 2011 | | | 2010 | | | 2009 | |
| | | | | | | | | | |
| Net income | | $ | 11,470,031 | | | $ | 4,625,588 | | | $ | 3,835,077 | |
| Less: Effective dividend on preferred shares | | | 511,814 | | | | 510,006 | | | | 288,841 | |
| Net income available to common stockholders | | $ | 10,958,217 | | | $ | 4,115,582 | | | $ | 3,546,236 | |
| | | | | | | | | | | | | |
| Denominator for basic earnings per share - | | | | | | | | | | | | |
| Weighted-average shares outstanding | | | 2,088,833 | | | | 2,083,458 | | | | 2,123,144 | |
| Effect of dilutive securities stock options | | | 52,258 | | | | 21,834 | | | | 1,225 | |
| Denominator for diluted earnings per share | | | 2,141,091 | | | | 2,105,292 | | | | 2,124,369 | |
| | | | | | | | | | | | | |
| Basic earnings per share available to common stockholders | | $ | 5.25 | | | $ | 1.98 | | | $ | 1.67 | |
| Diluted earnings per share available to common stockholders | | $ | 5.12 | | | $ | 1.95 | | | $ | 1.67 | |
At June 30, 2011, no options or warrants were outstanding with a grant price exceeding the market price. The Company had 15,000 and 180,000 exercisable stock options and warrants outstanding at June 30, 2010 and 2009, respectively, with a grant price exceeding the market price. These stock options were excluded from the above calculation as they were anti-dilutive.
NOTE 17: Acquisitions On December 17, 2010, the Bank entered into a Purchase and Assumption Agreement with the FDIC, as receiver, to acquire certain assets and assume certain liabilities of the former First Southern Bank, with headquarters in Batesville, Arkansas, and one branch location in Searcy, Arkansas. The results of operations of the former First Southern Bank locations have been included in the consolidated condensed financial statements since that date. As a result of the transaction, the Bank will have an opportunity to increase its deposit base and reduce transaction and other costs through economies of scale. | | The Company recorded $437,000 in third-party acquisition-related costs in fiscal 2011. The expenses are included in noninterest expense in the Company’s consolidated statement of income for fiscal 2011. The bargain purchase gain of $7.0 million arising from the acquisition is a result of the discount bid of $17.5 million made by the Company to acquire the assets and assume the liabilities of the failed financial institution. The transaction was accomplished without loss-share coverage from the FDIC. The full amount of the bargain purchase gain is expected to be taxable, on a deferred basis. |
The following table summarizes the assets acquired and liabilities assumed at the acquisition date.
Fair Value of Consideration Transferred
| Equity position of target at closing | | $ | (2,453,832 | ) |
| Asset discount bid | | | (17,500,000 | ) |
| Deposit premium bid | | | 224,028 | |
| Total cash (to) from buyer | | $ | (19,729,804 | ) |
> NOTES TO CONSOLIDATED FINANCIAL STATEMENTS (continued) <
Southern Missouri Bancorp, Inc.
| Recognized amounts of identifiable assets acquired | | Acquired from | | | Fair Value | | | | |
and liabilities assumed: | | the FDIC | | | Adjustments | | | As Recorded | |
| Cash and cash equivalents | | $ | 18,519,482 | | | $ | - | | | $ | 18,519,482 | |
| Loans | | | 124,409,033 | | | | (9,801,830 | ) | | | 114,607,203 | |
| Premises and equipment | | | 1,159 | | | | - | | | | 1,159 | |
| Identifiable intangible assets | | | - | | | | 624,952 | | | | 624,952 | |
| Other | | | 1,680,991 | | | | - | | | | 1,680,991 | |
| | | | | | | | | | | | | |
| Deposits | | | (130,314,617 | ) | | | (524,043 | ) | | | (130,838,660 | ) |
| Long-term debt | | | (16,658,022 | ) | | | (548,781 | ) | | | (17,206,803 | ) |
| Other | | | (91,858 | ) | | | (29,520 | ) | | | (121,378 | ) |
| TOTAL IDENTIFIABLE NET ASSETS | | $ | (2,453,832 | ) | | $ | (10,279,222 | ) | | $ | (12,733,054 | ) |
| | | | | | | | | | | | | |
| Bargain purchase gain | | | | | | | | | | $ | (6,996,750 | ) |
For the fiscal year ended June 30, 2011, the acquired business contributed revenues (net interest income and noninterest income) of $3.0 million, and earnings, net of tax, of $1.0 million to the Company. The figure reported for earnings does not include additional administrative expenses incurred by the Company that could be attributed to growth resulting from the acquisition. The following pro forma summary presents consolidated information of the Company as if the business combination had occurred on July 1, 2008:
| | | Pro forma | |
| | | Year Ended June 30 | |
| (dollars in thousands, except EPS) | | 2011 | | | 2010 | |
| | | | | | | |
| Interest income | | $ | 38,796 | | | $ | 33,641 | |
| Interest expense | | | 12,597 | | | | 13,413 | |
| Net interest income | | | 26,199 | | | | 20,228 | |
| Provision for loan losses | | | 2,632 | | | | 2,774 | |
| Net interest income after provision for loan losses | | | 23,567 | | | | 17,454 | |
| Noninterest income | | | 10,681 | | | | 3,228 | |
| Noninterest expense | | | 17,068 | | | | 16,276 | |
| Income before taxes | | | 17,180 | | | | 4,406 | |
| Income taxes | | | 5,862 | | | | 862 | |
| Net income | | | 11,318 | | | | 3,544 | |
| Less: effective dividend on preferred shares | | | 512 | | | | 510 | |
| Net income available to common shareholders | | $ | 10,806 | | | $ | 3,034 | |
| | | | | | | | | |
| Basic earnings per common share | | $ | 5.17 | | | $ | 1.46 | |
| Diluted earnings per common share | | $ | 5.05 | | | $ | 1.44 | |
The above pro forma summary excludes earnings on investment securities as they were not included with the asset purchase.
The fair value of the assets acquired included loans with a fair value of $114.6 million. The estimated gross amount due under the contracts was $124.4 million, of which $7.4 million was expected to be uncollectible. The determination of the initial fair value of assets acquired and liabilities assumed in the transaction involves a high degree of judgment and complexity. The carrying value of the acquired loans reflect management’s best estimate of the fair value of these assets as of the date of acquisition. However, the amount that we realize on these assets could differ materially from the carrying value reflected in these financial statements, based upon the timing and amount of collections on the acquired loans in future periods.
> NOTES TO CONSOLIDATED FINANCIAL STATEMENTS (continued) <
Southern Missouri Bancorp, Inc.
NOTE 18: Fair Value Measurements ASC Topic 820, Fair Value Measurements, defines fair value as the price that would be received to sell an asset or paid to transfer a liability in an orderly transaction between market participants at the measurement date. Topic 820 also establishes a fair value hierarchy which requires an entity to maximize the use of observable inputs and minimize the use of unobservable inputs when measuring fair value. The standard describes three levels of inputs that may be used to measure fair value: Level 1. Quoted prices in active markets for identical assets or liabilities Level 2. Observable inputs other than Level 1 prices, such as quoted prices for similar assets or liabilities; quoted prices in active markets that are not active; or other inputs that are observable or can be corroborated by observable market data for substantially the full term of the assets or liabilities Level 3. Unobservable inputs that are supported by little or no market activity and that are significant to the fair value of the assets or liabilities Following is a description of the valuation methodologies used for instruments measured at fair value on a recurring basis and recognized in the accompanying balance sheet, as well as the general classification of such instruments pursuant to the valuation hierarchy. | | Available-for-sale Securities. Available-for-sale securities are recorded at fair value on a recurring basis. Available-for-sale securities is the only balance sheet category our Company is required, in accordance with accounting principles generally accepted in the United States of America (US GAAP), to carry at fair value on a recurring basis. When quoted markets are available in an active market, securities are classified within Level 1. Level 1 securities include exchange-traded equities. If quoted market prices are not available, then fair values are estimated using pricing models or quoted prices of securities with similar characteristics. For these securities, our Company obtains fair value measurements from an independent pricing service. The fair value measurements consider observable data that may include dealer quotes, market spreads, cash flows, the U.S. Treasury yield curve, live trading levels, trade execution data, market consensus prepayment speeds, credit information and the bond’s terms and conditions, among other things. Level 2 securities include U.S. Government sponsored enterprises, state and political subdivisions, other securities and mortgage-backed GSE residential securities. In certain cases where Level 1 or Level 2 inputs are not available, securities are classified within Level 3 of the hierarchy. |
| | Fair Value Measurements at June 30, 2011, Using: |
| | | Quoted Prices in | | |
| | | Active Markets for | Significant Other | Significant |
| | | Identical Assets | Observable Inputs | Unobservable Inputs |
| | Fair Value | (Level 1) | (Level 2) | (Level 3) |
| | | | | |
| U.S. government sponsored enterprises (GSEs) | $ 12,976,070 | $ - | $ 12,976,070 | $ - |
| State and political subdivisions | 24,981,454 | - | 24,981,454 | - |
| Other securities | 834,141 | - | 763,137 | 71,004 |
| FHLMC preferred stock | - | - | - | - |
| Mortgage-backed GSE residential | 24,535,537 | - | 24,535,537 | - |
| | Fair Value Measurements at June 30, 2010, Using: |
| | | Quoted Prices in | | |
| | | Active Markets for | Significant Other | Significant |
| | | Identical Assets | Observable Inputs | Unobservable Inputs |
| | Fair Value | (Level 1) | (Level 2) | (Level 3) |
| | | | | |
| U.S. government sponsored enterprises (GSEs) | $ 12,413,977 | $ - | $ 12,413,977 | $ - |
| State and political subdivisions | 19,769,116 | - | 19,769,116 | - |
| Other securities | 441,868 | - | 441,868 | - |
| FHLMC preferred stock | 6,000 | 6,000 | - | - |
| Mortgage-backed GSE residential | 34,334,451 | - | 34,334,451 | - |
> NOTES TO CONSOLIDATED FINANCIAL STATEMENTS (continued) <
Southern Missouri Bancorp, Inc.
The following table presents a reconciliation of activity for available-for-sale securities measured at fair value based on significant unobservable (Level 3) information for the years ended June 30, 2011 and 2010. During fiscal 2011, a pooled trust preferred security was reclassified from Level 2 to Level 3 due to the unavailability of third-party vendor valuations determined by observable inputs – either quoted prices for similar assets; quoted prices in active markets that are not active; or other inputs that are observable or can be corroborated by observable market data for substantially the full terms of the assets.
| | 2011 | 2010 |
| Available-for-sale securities, beginning of year | $ - | $ - |
| Total unrealized gain (loss) included in comprehensive income | 65,998 | - |
| Transfer from Level 2 to Level 3 | 5,006 | - |
| Available-for-sale securities, end of year | $ 71,004 | $ - |
There were no gains or losses during fiscal 2011 included in net income attributable to the change in unrealized gains or losses related to the Level 3 securities held as of June 30, 2011.
The following is a description of valuation methodologies used for financial assets measured at fair value on a nonrecurring basis at June 30, 2011. Impaired Loans (Collateral Dependent). A collateral dependent loan is considered to be impaired when it is probable that all of the principal and interest due may not be collected according to its contractual terms. Generally, when a collateral dependent loan is considered impaired, the amount of reserve required is measured based on the fair value of the underlying collateral. The Company makes such measurements on all material collateral dependent loans deemed impaired using the fair value of the collateral for collateral dependent loans. The fair value of collateral used by the Company is determined by obtaining an observable market price or by obtaining an appraised value from an independent, licensed or certified appraiser, using observable market data. This data includes information such as selling price of similar properties and capitalization rates of similar properties sold within the market, expected future cash flows or earnings of the subject property based on current market expectations, and other relevant factors. In addition, management applies selling and other discounts to the underlying collateral value to determine the fair value. If an appraised value is not available, the fair value of the collateral dependent impaired loan is determined by an adjusted appraised value including unobservable cash flows. On a quarterly basis, loans classified as special mention, substandard, doubtful, or loss are evaluated, including the loan officer’s review of the collateral and its current condition, the Company’s knowledge of the current economic environment in the market where the collateral is located, and the Company’s recent experience with real estate in the area. The date of the most recent appraisal is also considered in conjunction with the economic environment and any decline in the real estate market since the appraisal was obtained. For all loan types, updated appraisals are obtained if considered necessary. Of the Company’s $12.4 million (outstanding balance) in impaired loans (collateral-dependent) at June 30, 2011, the Company utilized an appraisal performed in the past 12 months | | to serve as the primary basis of our valuation for approximately $1.7 million. Older real estate appraisals were available for impaired loans with an outstanding balance of approximately $6.3 million. For impaired loans totaling $1.4 million, an observable market price within the last 12 months was utilized. The remaining $3.1 million was secured by collateral such as closely-held stock or an assignment of notes receivable. In instances where the economic environment has worsened and/or the real estate market has declined since the last appraisal, a higher distressed sale discount would be applied to the appraised value. The Company records collateral dependent impaired loans as Nonrecurring Level 3. If a collateral dependent loan’s fair value, as estimated by the Company, is less than its carrying value, the Company either records a charge-off of the portion of the loan that exceeds the fair value or establishes a specific reserve as part of the allowance for loan losses. Foreclosed and Repossessed Assets Held for Sale. Foreclosed and repossessed assets held for sale are valued at the time the loan is foreclosed upon or collateral is repossessed and the asset is transferred to foreclosed or repossessed assets held for sale. The value of the asset is based on third party or internal appraisals, less estimated costs to sell and appropriate discounts, if any. The appraisals are generally discounted based on current and expected market conditions that may impact the sale or value of the asset and management’s knowledge and experience with similar assets. Such discounts typically may be significant and result in a Level 3 classification of the inputs for determining fair value of these assets. Foreclosed and repossessed assets held for sale are continually evaluated for additional impairment and are adjusted accordingly if impairment is identified. |
> NOTES TO CONSOLIDATED FINANCIAL STATEMENTS (continued) <
Southern Missouri Bancorp, Inc.
The following table presents the fair value measurement of assets measured at fair value on a nonrecurring basis during the period and the level within the ASC 820 fair value hierarchy in which the fair value measurements fell at June 30, 2011 and 2010:
| | | Fair Value Measurements at June 30, 2011, Using: | |
| | | | | | Quoted Prices in | | | | | | | |
| | | | | | Active Markets for | | | Significant Other | | | Significant | |
| | | | | | Identical Assets | | | Observable Inputs | | | Unobservable Inputs | |
| | | Fair Value | | | (Level 1) | | | (Level 2) | | | (Level 3) | |
| | | | | | | | | | | | | |
| Impaired loans | | $ | 543,000 | | | $ | - | | | $ | - | | | $ | 543,000 | |
| Foreclosed and repossessed assets held for sale | | | 1,150,000 | | | | - | | | | - | | | | 1,150,000 | |
| | | Fair Value Measurements at June 30, 2010, Using: | |
| | | | | | Quoted Prices in | | | | | | | |
| | | | | | Active Markets for | | | Significant Other | | | Significant | |
| | | | | | Identical Assets | | | Observable Inputs | | | Unobservable Inputs | |
| | | Fair Value | | | (Level 1) | | | (Level 2) | | | (Level 3) | |
| | | | | | | | | | | | | |
| Impaired loans | | $ | 1,320,000 | | | $ | - | | | $ | - | | | $ | 1,320,000 | |
| Foreclosed and repossessed assets held for sale | | | 1,306,000 | | | | - | | | | - | | | | 1,306,000 | |
The following table presents gains and (losses) recognized on assets measured on a non-recurring basis for the years ended June 30, 2011 and 2010:
| | | 2011 | | | 2010 | |
| Impaired loans | | $ | (231,000 | ) | | $ | (414,000 | ) |
| Other real estate owned | | | (384,000 | ) | | | (379,000 | ) |
| Total gains (losses) on assets measured on a nonrecurring basis | | $ | (615,000 | ) | | $ | (793,000 | ) |
| ASC 825, formerly Statement of Financial Accounting Standards No. 107, “Disclosures about Fair Value of Financial Instruments,” requires all entities to disclose the estimated fair value of their financial instrument assets and liabilities. For the Company, as for most financial institutions, the majority of its assets and liabilities are considered financial instruments as defined in ASC 825. Many of the Company’s financial instruments, however, lack an available trading market as characterized by a willing buyer and willing seller engaging in an exchange transaction. It is also the Company’s general practice and intent to hold its financial instruments to maturity and to not engage in trading or | | sales activities except for loans held-for-sale and available-for-sale securities. Therefore, significant estimations and assumptions, as well as present value calculations, were used by the Company for the purposes of this disclosure. Estimated fair values have been determined by the Company using the best available data and an estimation methodology suitable for each category of financial instruments. For those loans and deposits with floating interest rates, it is presumed that estimated fair values generally approximate the recorded book balances. |
> NOTES TO CONSOLIDATED FINANCIAL STATEMENTS (continued) <
Southern Missouri Bancorp, Inc.
The estimated methodologies used, the estimated fair values, and the recorded book balances at June 30, 2011 and 2010, were as follows:
| | 2011 | 2010 |
| | Carrying | Fair | Carrying | Fair |
| | Amount | Value | Amount | Value |
| | (in thousands) | (in thousands) |
| Financial Assets | | | | |
| Cash and cash equivalents | $ 33,896 | $ 33,896 | $ 33,383 | $ 33,383 |
| Interest-bearing time deposits | 792 | 792 | 1,089 | 1,089 |
| Investment and mortgage- | | | | |
| backed securities | | | | |
| available for sale | 63,327 | 63,327 | 66,965 | 66,965 |
| Stock in FHLB | 2,369 | 2,369 | 2,622 | 2,622 |
| Stock in Federal Reserve Bank | | | | |
| of St. Louis | 719 | 719 | 583 | 583 |
| Loans receivable, net | 556,576 | 558,083 | 418,683 | 419,917 |
| Accrued interest receivable | 3,800 | 3,800 | 3,043 | 3,043 |
| Financial Liabilities | | | | |
| Deposits | 560,151 | 561,063 | 422,893 | 426,738 |
| Securities sold under | | | | |
| agreements to repurchase | 25,230 | 25,230 | 30,369 | 30,369 |
| Advances from FHLB | 33,500 | 37,379 | 43,500 | 47,010 |
| Accrued interest payable | 834 | 834 | 857 | 857 |
| Subordinated Debt | 7,217 | 6,341 | 7,217 | 3,001 |
| Unrecognized financial instruments | | | | |
| (net of contract amount) | | | | |
| Commitments to originate loans | - | - | - | - |
| Letters of Credit | - | - | - | - |
| Lines of Credit | - | - | - | - |
The following methods and assumptions were used in estimating the fair values of financial instruments: Cash and cash equivalents and interest-bearing time deposits are valued at their carrying amounts which approximates fair value. Stock in FHLB and the Federal Reserve Bank of St. Louis is valued at cost which approximates fair value. Fair value of loans i estimated by discounting the future cash flows using the current rates at which similar loans would be made to borrowers with similar credit ratings and for the same remaining maturities. Loans with similar characteristics are aggregated for purposes of the calculations. The carrying amounts of accrued interest approximate their fair values. Deposits with no defined maturities, such as NOW accounts, savings accounts and money market deposit accounts, are valued at their carrying amount which approximates fair value. The fair value of fixed-maturity time deposits is estimated using a discounted cash flow calculation that applies the rates currently offered for deposits of similar remaining maturities. | | The carrying amounts of securities sold under agreements to repurchase approximate fair value. Fair value of advances from the FHLB is estimated by discounting maturities using an estimate of the current market for similar instruments. The fair value of subordinated debt is estimated using rates currently available to the Company for debt with similar terms and maturities. The fair value of commitments to originate loans is estimated using the fees currently charged to enter into similar agreements, taking into account the remaining terms of the agreements and the present creditworthiness of the counterparties. For fixed-rate loan commitments, fair value also considers the difference between current levels of interest rates and committed rates. The fair value of letters of credit and lines of credit are based on fees currently charged for similar agreements or on the estimated cost to terminate or otherwise settle the obligations with the counterparties at the reporting date. |
> NOTES TO CONSOLIDATED FINANCIAL STATEMENTS (continued) <
Southern Missouri Bancorp, Inc.
NOTE 19: Significant Estimates Accounting principles generally accepted in the United States of America require disclosure of certain significant estimates and current vulnerabilities due to certain concentrations. Estimates related to the allowance for loan losses are described in Note 1. Current Economic Conditions. The current economic environment presents financial institutions with unprecedented circumstances and challenges which in some cases have resulted in large declines in the fair values of investments and other assets, constraints on liquidity and significant credit | | quality problems, including severe volatility in the valuation of real estate and other collateral supporting loans. The financial statements have been prepared using values and information currently available to the Company. Given the volatility of current economic conditions, the values of assets and liabilities recorded in the financial statements could change rapidly, resulting in material future adjustments in asset values, the allowance for loan losses, and capital that could negatively impact the Company’s ability to meet regulatory capital requirements and maintain sufficient liquidity. |
NOTE 20: Subsequent Events On July 21, 2011, as part of the Small Business Lending Fund (SBLF) of the United States Department of the Treasury (Treasury), the Company entered into a Small Business Lending Fund-Securities Purchase Agreement (Purchase Agreement) with the Secretary of the Treasury, pursuant to which the Company sold 20,000 shares of the Company’s Senior Non-Cumulative Perpetual Preferred Stock, Series A (SBLF Preferred Stock) to the Secretary of the Treasury for a purchase price of $20,000,000. The SBLF Preferred Stock was issued pursuant to the SBLF program, a $30 billion fund established under the Small Business Jobs Act of 2010 that was created to encourage lending to small business by providing capital to qualified community banks with assets of less than $10 billion. The SBLF Preferred Stock qualifies as Tier 1 capital. The SBLF Preferred Stock is entitled to receive non-cumulative dividends, payable quarterly, on each January 1, April 1, July 1 and October 1, beginning October 1, 2011. The dividend rate, as a percentage of the liquidation amount, can fluctuate on a quarterly basis during the first 10 quarters during which the SBLF Preferred Stock is outstanding, based upon changes in the Bank’s level of Qualified Small Business Lending (QBSL), as defined in the Purchase Agreement. Based upon the increase in the Bank’s level of QBSL over the baseline level calculated under the terms of the Purchase Agreement, the dividend rate for the initial dividend period has been set at 2.8155%. For the second through ninth calendar quarters, the dividend rate may be adjusted to between one percent (1%) and five percent (5%) per annum, to reflect the amount of change in the Bank’s level of QBSL. For the tenth calendar quarter through four and one half years | | after issuance, the dividend rate will be fixed at between one percent (1%) and seven percent (7%) based upon the increase in QBSL as compared to the baseline. After four and one half years from issuance, the dividend rate will increase to 9% (including a quarterly lending incentive fee of 0.5%). The SBLF Preferred Stock is non-voting, except in limited circumstances. In the event that the Company misses five dividend payments, the holder of the SBLF Preferred Stock will have the right to appoint a representative as an observer on the Company’s Board of Directors. In the event that the Company misses six dividend payments, then the holder of the SBLF Preferred Stock will have the right to designate two directors to the Board of Directors of the Company. The SBLF Preferred Stock may be redeemed at any time at the Company’s option, at a redemption price of 100% of the liquidation amount plus accrued but unpaid dividends to the date of redemption for the current period, subject to the approval of its federal banking regulator. As required by the Purchase Agreement, $9,635,000 of the proceeds from the sale of the SBLF Preferred Stock was used to redeem the 9,550 shares of the Company’s Fixed Rate Cumulative Perpetual Preferred Stock, Series A issued in 2008 to the Treasury in the Troubled Asset Relief Program (TARP), plus the accrued dividends owed on those preferred shares. As part of the 2008 TARP transaction, the Company issued a warrant to Treasury to purchase 114,326 shares of the Company’s common stock for a per share price of $12.53 per share over a 10-year term. The Company has not repurchased the warrant. |
> NOTES TO CONSOLIDATED FINANCIAL STATEMENTS (continued) <
Southern Missouri Bancorp, Inc.
NOTE 21: Condensed Parent Company Only Financial Statements
The following condensed balance sheets, statements of income and cash flows for Southern Missouri Bancorp, Inc. should be read in conjunction with the consolidated financial statements and the notes thereto.
| | | June 30 |
| Condensed Balance Sheets | | 2011 | 2010 |
| | | | |
| Assets | | | |
| | | | |
| Cash and cash equivalents | | $ 816,033 | $ 4,461,236 |
| Other assets | | 404,518 | 841,579 |
| Investment in common stock of Bank | | 61,962,129 | 47,614,605 |
| TOTAL ASSETS | | $ 63,182,680 | $ 52,917,420 |
| | | | |
| Liabilities and Stockholders’ Equity | | | |
| | | | |
| Accrued expenses and other liabilities | | $ 233,572 | $ 51,222 |
| Subordinated debt | | 7,217,000 | 7,217,000 |
| TOTAL LIABILITIES | | 7,450,572 | 7,268,222 |
| | | | |
| Stockholders’ equity | | 55,732,108 | 45,649,198 |
| TOTAL LIABILITIES AND | | | |
| STOCKHOLDERS’ EQUITY | | $ 63,182,680 | $ 52,917,420 |
| | | Year Ended June 30 |
| Condensed Statements of Income | | 2011 | | 2010 | | 2009 |
| | | | | | | |
| Interest income | | $ 17,438 | | $ 62,324 | | $ 37,908 |
| Interest expense | | 226,776 | | 227,020 | | 357,387 |
| Net interest income (expense) | | (209,338) | | (164,696) | | (319,479) |
| Dividends from Bank | | 2,000,000 | | 2,000,000 | | 2,000,000 |
| | | | | | | |
| Operating expenses | | 325,857 | | 467,661 | | 464,801 |
| | | | | | | |
| Income before income taxes and | | | | | | |
| equity in undistributed income | | | | | | |
| of the Bank | | 1,464,805 | | 1,367,643 | | 1,215,720 |
| | | | | | | |
| Income tax benefit | | 170,100 | | 225,100 | | 293,500 |
| | | | | | | |
| Income before equity in undistributed | | | | | | |
| income of the Bank | | 1,634,905 | | 1,592,743 | | 1,509,220 |
| | | | | | | |
| Equity in undistributed income | | | | | | |
| of the Bank | | 9,835,126 | | 3,032,845 | | 2,325,857 |
| NET INCOME | | $ 11,470,031 | | $ 4,625,588 | | $ 3,835,077 |
> NOTES TO CONSOLIDATED FINANCIAL STATEMENTS (continued) <
Southern Missouri Bancorp, Inc.
| | | Year Ended June 30 | |
| Condensed Statements of Cash Flow | | 2011 | | | 2010 | | | 2009 | |
| Cash flows from operating activities: | | | | | | | | | |
| Net income | | $ | 11,470,031 | | | $ | 4,625,588 | | | $ | 3,835,077 | |
| Changes in: | | | | | | | | | | | | |
| Equity in undistributed income | | | | | | | | | | | | |
| of the Bank | | | (9,835,126 | ) | | | (3,032,845 | ) | | | (2,325,857 | ) |
| Other adjustments, net | | | 335,400 | | | | 258,960 | | | | (459,564 | ) |
| NET CASH PROVIDED BY | | | | | | | | | | | | |
| OPERATING ACTIVITIES | | | 1,970,305 | | | | 1,851,703 | | | | 1,049,656 | |
| | | | | | | | | | | | | |
| | | | | | | | | | | | | |
| Cash flows from investing activities: | | | | | | | | | | | | |
| Proceeds from (investment in) loan participations | | | 284,011 | | | | 2,465,989 | | | | (2,750,000 | ) |
| Proceeds from sale of real estate | | | - | | | | 2,016,991 | | | | - | |
| Investment in Bank subsidiary | | | (4,500,000 | ) | | | (2,000,000 | ) | | | (5,000,000 | ) |
| NET CASH (USED IN) OR PROVIDED BY | | | | | | | | | | | | |
| INVESTING ACTIVITIES | | | (4,215,989 | ) | | | 2,482,980 | | | | (7,750,000 | ) |
| | | | | | | | | | | | | |
| | | | | | | | | | | | | |
| Cash flows from financing activities: | | | | | | | | | | | | |
| Proceeds from issuance | | | | | | | | | | | | |
| of preferred stock | | | | | | | - | | | | 9,511,129 | |
| Dividends on preferred stock | | | (477,500 | ) | | | (477,500 | ) | | | (212,222 | ) |
| Dividends on common stock | | | (1,004,749 | ) | | | (1,002,156 | ) | | | (1,024,172 | ) |
| Exercise of stock options | | | 82,730 | | | | - | | | | 161,069 | |
| Payments to acquire treasury stock | | | | | | | - | | | | (1,507,825 | ) |
| NET CASH (USED IN) OR PROVIDED BY | | | | | | | | | | | | |
| FINANCING ACTIVITIES | | | (1,399,519 | ) | | | (1,479,656 | ) | | | 6,927,979 | |
| | | | | | | | | | | | | |
| | | | | | | | | | | | | |
| Net (decrease) increase in cash and | | | | | | | | | | | | |
| cash equivalents | | | (3,645,203 | ) | | | 2,855,027 | | | | 227,635 | |
| Cash and cash equivalents at beginning | | | | | | | | | | | | |
| of year | | | 4,461,236 | | | | 1,606,209 | | | | 1,378,574 | |
| CASH AND CASH EQUIVALENTS | | | | | | | | | | | | |
| AT END OF YEAR | | $ | 816,033 | | | $ | 4,461,236 | | | $ | 1,606,209 | |
> NOTES TO CONSOLIDATED FINANCIAL STATEMENTS (continued) <
Southern Missouri Bancorp, Inc.
NOTE 22: Quarterly Financial Data (Unaudited)
Quarterly operating data is summarized as follows (in thousands):
| | | June 30, 2011 |
| | | First | Second | Third | Fourth |
| | | Quarter | Quarter | Quarter | Quarter |
| | | | | | |
| Interest income | | $ 7,295 | $ 7,539 | $ 10,296 | $ 9,917 |
| Interest expense | | 2,780 | 2,776 | 2,903 | 2,825 |
| | | | | | |
| Net interest income | | 4,515 | 4,763 | 7,393 | 7,092 |
| | | | | | |
| Provision for loan losses | | 643 | 274 | 1,196 | 273 |
| Noninterest income | | 820 | 7,867 | 850 | 966 |
| Noninterest expense | | 2,861 | 3,695 | 4,068 | 3,834 |
| Income before income taxes | | 1,831 | 8,661 | 2,979 | 3,951 |
| Income tax expense | | 528 | 3,085 | 1,001 | 1,338 |
| NET INCOME | | $ 1,303 | $ 5,576 | $ 1,978 | $ 2,613 |
| | | | | | |
| | | | | | |
| | | June 30, 2010 |
| | | First | Second | Third | Fourth |
| | | Quarter | Quarter | Quarter | Quarter |
| | | | | | |
| Interest income | | $ 6,896 | $ 6,894 | $ 6,805 | $ 6,947 |
| Interest expense | | 2,824 | 2,849 | 2,797 | 2,755 |
| | | | | | |
| Net interest income | | 4,072 | 4,045 | 4,008 | 4,192 |
| | | | | | |
| Provision for loan losses | | 210 | 310 | 160 | 245 |
| Noninterest income | | 704 | 791 | 713 | 886 |
| Noninterest expense | | 3,161 | 2,914 | 3,168 | 3,106 |
| Income before income taxes | | 1,405 | 1,612 | 1,393 | 1,727 |
| Income tax expense | | 215 | 449 | 316 | 531 |
| NET INCOME | | $ 1,190 | $ 1,163 | $ 1,077 | $ 1,196 |
| | | | | | |
| | | | | | |
| | | June 30, 2009 |
| | | First | Second | Third | Fourth |
| | | Quarter | Quarter | Quarter | Quarter |
| | | | | | |
| Interest income | | $ 6,342 | $ 6,304 | $ 6,290 | $ 6,365 |
| Interest expense | | 2,889 | 2,846 | 2,714 | 2,755 |
| | | | | | |
| Net interest income | | 3,453 | 3,458 | 3,576 | 3,610 |
| | | | | | |
| Provision for loan losses | | 400 | 200 | 410 | 141 |
| Noninterest income | | 336 | 240 | 582 | 662 |
| Noninterest expense | | 2,016 | 2,185 | 2,320 | 2,615 |
| Income before income taxes | | 1,373 | 1,313 | 1,428 | 1,516 |
| Income tax expense | | 446 | 425 | 444 | 480 |
| NET INCOME | | $ 927 | $ 888 | $ 984 | $ 1,036 |
> CORPORATE INFORMATION <
CORPORATE HEADQUARTERS 531 Vine Street Poplar Bluff, Missouri 63901 COMPANY WEBSITE www.bankwithsouthern.com SPECIAL COUNSEL Silver, Freedman & Taff, LLP Washington, D.C. 20007 | | INDEPENDENT REGISTERED PUBLIC ACCOUNTING FIRM BKD, LLP Decatur, Illinois 62525 COMMON STOCK Nasdaq Global Market Nasdaq Symbol: SMBC |
| | | |
TRANSFER AGENT Stockholders should report lost stock certificates or direct inquiries concerning dividend payments, change of name, address, or ownership, or consolidation of accounts, to the Company’s transfer agent: Registrar and Transfer Company 10 Commerce Drive Cranford, New Jersey 07016 (800) 368-5948 |
| |
ANNUAL MEETING The Annual Meeting of Stockholders will be held Monday, October 17, 2011, at 9:00 a.m., Central Time, at the Greater Poplar Bluff Area Chamber of Commerce Building, 1111 West Pine, Poplar Bluff, Missouri 63901. |
| |
ANNUAL REPORT ON FORM 10-K AND OTHER REPORTS A copy of the Company’s annual report on Form 10-K, including financial statement schedules and our quarterly reports as filed with the Securities and Exchange Commission, will be furnished without charge to stockholders as of the record date upon written request to the Secretary, Southern Missouri Bancorp, Inc., 531 Vine Street, Poplar Bluff, Missouri 63901. These documents also may be accessed through Southern Bank’s website at www.bankwithsouthern.com, under the Investor Relations tab. |
> DIRECTORS and OFFICERS <
| | | Standing: Sammy Schalk, Dennis Robison, Rebecca Brooks, Charles Moffitt, Charles Love, Ronnie Black Seated: Douglas Bagby, Samuel Smith, Greg Steffens |
SOUTHERN MISSOURI BANCORP, INC.
| Directors | | |
Samuel H. Smith Chairman of the Board; Retired Engineer and former Majority Owner, S.H. Smith and Company, Inc. L. Douglas Bagby Vice-Chairman of the Board; City Manager, City of Poplar Bluff Ronnie D. Black Retired Executive Director, General Association of General Baptists | Sammy A. Schalk President, Gamblin Lumber Company Greg A. Steffens President and Chief Executive Officer, Southern Missouri Bancorp, Inc. Rebecca M. Brooks Financial Manager, McLane Transport Charles R. Love Certified Public Accountant, Kraft, Miles and Tatum | Charles R. Moffitt Agency Manager, Morse Harwell Jiles Insurance Agency Dennis C. Robison President, Robison Farms, Inc. Leonard W. Ehlers Director Emeritus, Retired Court Reporter, 36th Judicial Circuit James W. Tatum Director Emeritus, Retired Certified Public Accountant |
| | | |
| SOUTHERN BANK |
| Directors | | Senior Officers |
L. Douglas Bagby Chairman of the Board; City Manager, City of Poplar Bluff Sammy A. Schalk Vice-Chairman of the Board; President, Gamblin Lumber Company Samuel H. Smith Retired Engineer and former Majority Owner, S.H. Smith and Company, Inc. Ronnie D. Black Retired Executive Director, General Association of General Baptists | Greg A. Steffens President and Chief Executive Officer, Southern Missouri Bancorp, Inc. Rebecca M. Brooks Financial Manager, McLane Transport Charles R. Love Certified Public Accountant, Kraft, Miles and Tatum Charles R. Moffitt Agency Manager, Morse Harwell Jiles Insurance Agency Dennis C. Robison President, Robison Farms, Inc. | Greg A. Steffens President and Chief Executive Officer Kimberly A. Capps Chief Operations Officer William D. Hribovsek Chief Lending Officer Matthew T. Funke Chief Financial Officer Lora L. Daves Chief of Credit Administration |
SOUTHERN MISSOURI BANCORP, INC.
is a single bank holding company that maintained asset quality
while taking advantage of new opportunities
to grow our core business in fiscal 2011,
and, as a result, improved long-term shareholder value.
Southern Missouri Bancorp, Inc.
531 Vine Street, Poplar Bluff, Missouri 63901
(573) 778-1800
www.bankwithsouthern.com