EXHIBIT D
REPUBLIC OF COLOMBIA
Table of Contents
| | | | |
| | | Page | |
Map of Colombia | | | D-2 | |
Summary | | | D-3 | |
Currency of Presentation | | | D-4 | |
Introduction | | | D-4 | |
Republic of Colombia | | | D-6 | |
Economy | | | D-18 | |
Foreign Trade and Balance of Payment | | | D-50 | |
Monetary System | | | D-65 | |
Public Sector Finance | | | D-75 | |
Public Sector Debt | | | D-84 | |
Tables and Supplementary Information | | | D-90 | |
D-1
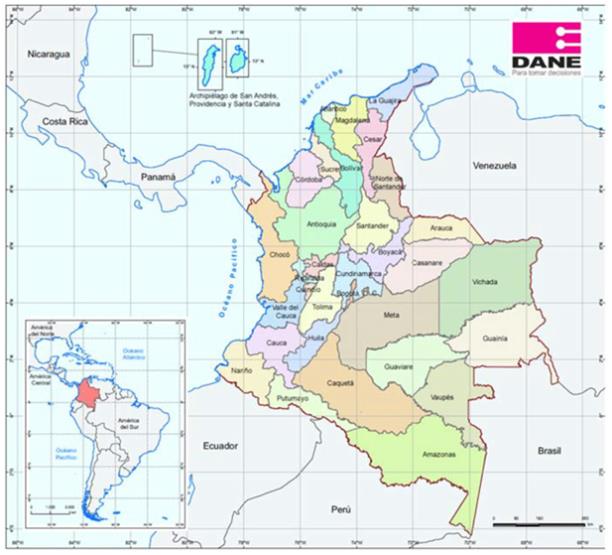
MAP OF COLOMBIA
D-2
SUMMARY
The following summary is qualified in its entirety by, and should be read in conjunction with, the detailed information appearing herein.
Selected Colombia Economic Indicators
| | | | | | | | | | | | | | | | | | | | |
| | | 2011 | | | 2012 | | | 2013 | | | 2014 | | | 2015 | |
Domestic Economy | | | | | | | | | | | | | | | | | | | | |
Real GDP Growth (percent)(1) | | | 6.6 | % | | | 4.0 | % | | | 4.9 | % | | | 4.4 | % | | | 3.1 | % |
Gross Fixed Investment Growth (percent)(1) | | | 19.0 | | | | 4.7 | | | | 6.8 | | | | 9.8 | | | | 2.8 | |
Private Consumption Growth (percent)(1) | | | 6.0 | | | | 4.4 | | | | 3.4 | | | | 4.2 | | | | 3.9 | |
Public Consumption Growth (percent)(1) | | | 3.6 | | | | 6.3 | | | | 9.2 | | | | 4.7 | | | | 2.8 | |
Consumer Price Index(2) | | | 3.7 | | | | 2.4 | | | | 1.9 | | | | 3.7 | | | | 6.8 | |
Producer Price Index(2) | | | 8.7 | | | | (4.9 | ) | | | (0.1 | ) | | | 6.0 | | | | 5.5 | |
Interest Rate (percent)(3) | | | 4.2 | | | | 5.4 | | | | 4.2 | | | | 4.1 | | | | 4.6 | |
Unemployment Rate (percent)(4) | | | 9.8 | | | | 9.6 | | | | 8.4 | | | | 8.7 | | | | 8.6 | |
| |
| | | (millions of U.S. dollars) | |
Balance of Payments(5) | | | | | | | | | | | | | | | | | | | | |
Exports of Goods | | | 58,262 | | | | 61,604 | | | | 60,281 | | | | 56,923 | | | | 38,120 | |
Imports of Goods | | | 52,126 | | | | 56,648 | | | | 57,101 | | | | 61,544 | | | | 52,038 | |
Current Account Balance | | | (9,710 | ) | | | (11,271 | ) | | | (12,355 | ) | | | (19,489 | ) | | | (18,755 | ) |
Net Direct Investment | | | (6,228 | ) | | | (15,646 | ) | | | (8,559 | ) | | | (12,426 | ) | | | (7,724 | ) |
Net International Reserves | | | 32,300 | | | | 37,467 | | | | 43,633 | | | | 47,323 | | | | 46,731 | |
Months of Coverage of Imports (Goods and Services) | | | 6.2 | | | | 6.5 | | | | 7.5 | | | | 7.6 | | | | 8.8 | |
| |
| | | (billions of pesos or percentage of GDP) | |
Public Finance(6) | | | | |
Non-financial Public Sector Revenue(7) | | Ps. | 249,989 | | | Ps. | 285,297 | | | Ps. | 309,713 | | | Ps. | 332,097 | | | Ps. | 333,804 | |
Non-financial Public Sector Expenditures(7) | | | 255,860 | | | | 278,032 | | | | 315,285 | | | | 341,205 | | | | 335,563 | |
Non-financial Public Sector Primary Surplus/(Deficit)(8) | | | 7,059 | | | | 21,984 | | | | 10,956 | | | | 7,395 | | | | (4,530 | ) |
Percent of Nominal GDP | | | 1.1 | % | | | 3.3 | % | | | 1.6 | % | | | 1.0 | % | | | (0.6 | )% |
Non-financial Public Sector Fiscal Surplus/(Deficit) | | | (11,549 | ) | | | 2,824 | | | | (6,968 | ) | | | (11,810 | ) | | | (27,167 | ) |
Percent of Nominal GDP | | | (1.8 | )% | | | 0.4 | % | | | (1.0 | )% | | | (1.8 | )% | | | (3.4 | )% |
Central Government Fiscal Surplus/ (Deficit) | | | (17,507 | ) | | | (15,440 | ) | | | (16,645 | ) | | | (18,356 | ) | | | (24,269 | ) |
Percent of Nominal GDP | | | (2.8 | )% | | | (2.3 | )% | | | (2.3 | )% | | | (2.4 | )% | | | (3.0 | )% |
| |
| | | (billions of pesos or percentage of GDP) | |
Public Debt(9) | | | | |
Public Sector Internal Funded Debt(10) | | Ps. | 192,105 | | | Ps. | 200,523 | | | Ps. | 227,032 | | | Ps. | 244,933 | | | Ps. | 251,863 | |
Percent of Nominal GDP(1) | | | 31.0 | % | | | 30.2 | % | | | 32.0 | % | | | 32.4 | % | | | 31.4 | % |
Public Sector External Funded Debt(11) | | $ | 38,725 | | | | $39,409 | | | | $41,268 | | | | $43,302 | | | | 44,851 | |
Percent of Nominal GDP(1) | | | 12.1 | % | | | 10.5 | % | | | 11.2 | % | | | 13.7 | % | | | 17.6 | % |
| 1: | Figures for 2014 and 2015 are preliminary. Preliminary figures are published in March in the year succeeding the reference period and become final two years thereafter. |
| 2: | Percentage change over the twelve months ended December 31 of each year. |
| 3: | Average for each year of the short-term composite reference rate, as calculated by the Superintendencia Financiera (Financial Superintendency). |
| 4: | Refers to the average national unemployment rates in December of each year. |
| 5: | Calculations based on the sixth edition of the IMF’s Balance of Payments Manual. For more information, see “—Foreign Trade and Balance of Payments—Balance of Payments”. |
| 6: | All figures calculated according to IMF methodology, which includes privatization, concession and securitization proceeds as part of public sector revenues and nets transfers among the different levels of the non-financial public sector. |
| 7: | The amounts of transfers among the different levels of the consolidated non-financial public sector are not eliminated in the calculation of consolidated non-financial public sector revenue and consolidated non-financial public sector expenditures and, accordingly, the revenue and expenditure figures included above are greater than those that would appear had such transfers been eliminated upon consolidation. |
| 8: | Primary surplus/(deficit) equals total consolidated non-financial public sector surplus/(deficit) without taking into account interest payments or interest income. |
| 9: | Exchange rates as of December 31 of each year. |
| 10: | Includes peso-denominated debt of the Government (excluding state-owned financial institutions) with an original maturity of more than one year and public sector entities’ guaranteed internal debt. |
| 11: | In millions of dollars. Includes external debt of the Government (including Banco de la República, public agencies and entities, departments and municipal governments and state-owned financial institutions) with an original maturity of more than one year. |
Sources: Banco de la República, Ministry of Finance and Public Credit (“Ministry of Finance”), DANE and CONFIS.
D-3
CURRENCY OF PRESENTATION
All references herein to “pesos” and “Ps.” are to the currency of Colombia, and all references herein to “U.S. dollars,” “dollars,” “U.S. $” and “$” are to the currency of the United States. Unless otherwise indicated, all peso amounts are stated in nominal terms. As used herein, the term “billion” means one thousand million, or 1,000,000,000, and the term “trillion” means one thousand billion, or 1,000,000,000,000. The Financial Superintendency calculates and publishes a rate (the “representative market rate”) on a daily basis which is the average of the buy and sell foreign exchange rates quoted on the previous business day by certain commercial banks and financial corporations in the four largest Colombian cities. On August 30, 2016, the representative market rate published by the Financial Superintendency for the payment of obligations denominated in U.S. dollars was Ps. 2,924.29. Historical amounts translated into pesos or dollars have been converted at the historical rates of exchange summarized below. See “Monetary System—Foreign Exchange Rates and International Reserves.” The fiscal year of Colombia ends on December 31 of each year. The fiscal year ended December 31, 2015 is referred to herein as “2015,” and other years are referred to in a similar manner.
INTRODUCTION
From 2011 to 2015, Colombia experienced real Gross Domestic Product (“GDP”) growth every year. Real GDP grew by 6.6% in 2011, 4.0% in 2012, 4.9% in 2013, 4.4% in 2014, and 3.1% in 2015. The following factors contributed to the lower GDP growth in 2015: (i) weakened demand from trading partners; (ii) reduced availability of international liquidity for emerging economies; (iii) effects of the weather phenomenum “El Niño”; and (iv) lower internal demand growth of 3.6% compared to 6.0% in 2014 mainly due to lower gross capital investment growth of 2.6% as compared to 11.6% in 2014, and lower private consumption growth of 3.9% in 2015 compared to 4.2% in 2014.
During 2015, all the economic sectors experienced positive growth, with three sectors growing at a rate above the economy as a whole. The sectors that experienced the greatest real growth were financial and housing services (4.3%), commerce, restaurants and hotels (4.1%), and construction (3.9%).
Inflation, as measured by the change in the consumer price index, was 3.7% in 2011, declined to 2.4% in 2012 and 1.9% in 2013 and increased to 3.7% in 2014 and 6.8% in 2015. Inflation was higher in 2015 than in 2014 mainly due to price increases of food and other expenses (10.85% and 6.90%, respectively, when compared to 2014). The items that registered the lowest price increases were communications, health, recreation and clothing (0.16%, 0.14%, 0.13% and 0.10%, respectively, when compared to 2014).
Due to the implementation of trade and foreign exchange liberalization policies, Colombia has experienced current account deficits in most years since 1994. In 2011, the current account deficit increased to $9,710 million, while the trade surplus increased to $6,137 million and the financial account deficit decreased to $8,925 million. In 2012, the current account deficit increased to $11,271 million, the trade surplus decreased to $4,956 million, and the financial account deficit increased to $11,754 million. In 2013, the current account deficit increased to $12,355 million, the trade surplus decreased to $3,180 million, and the financial account deficit increased to $11,848 million. In 2014, the current account deficit increased to $19,489 million, the trade surplus decreased to a deficit of $4,622 million, and the financial account deficit increased to $19,836 million. In 2015, the current account deficit decreased to $18,755 million, the trade deficit increased to $13,918 million and the financial account deficit decreased to $18,948 million. In 2015, exports of oil and its derivatives decreased by $14,687 million, or 50.8%, while exports of gold and emeralds decreased by $476.8 million, or 27.6%. Coal exports decreased by $2,250 million, or 33.0%, to $4,560 million. In the first four months of 2016, exports of oil and its derivatives decreased by $2,657 million, or 50.2%, while exports of gold and emeralds increased by $22.8 million, or 6.2%. Coal exports decreased by $588.7 million, or 33.6%.
Foreign direct investment recorded a decrease in the capital account in 2015, by 25.8%. Foreign direct investment fell mainly as a result of fewer investments in sectors such as oil, transportation and mining. Net foreign investment (including direct and portfolio investment) recorded a net inflow of $17,547 million. In 2012, net foreign investment increased to a net inflow of $18,666 million. In 2013, net foreign investment stood at $20,992 million. In 2014, net foreign investment increased to a net inflow of $28,982 million. In 2015, net foreign investment decreased to a net inflow of $16,562 million. The decrease in net foreign investment in 2015 was mainly due to lower investment in petroleum, mining and transportation and communications.
Net international reserves at year end increased from $32,300 million in 2011 to $37,467 in 2012. At the end of 2013, net international reserves totaled $43,633 million and increased to $47,323 million in 2014. By the end of 2015, net international reserves decreased to $46,740 million. According to preliminary figures, net international reserves at July 31, 2016 increased to $47,097.
D-4
Colombia’s ratio of total net non-financial public sector debt to GDP decreased from 34.1% in 2011 to 32.6% in 2012, then increased to 34.6% in 2013, 38.5% in 2014 and 41.5% of GDP in 2015. Colombia’s non-financial public sector recorded deficits of 1.8% of GDP in 2011, a surplus of 0.5% of GDP in 2012 and a deficit of 1.0% of GDP in 2013. In 2014, the deficit in the non-financial public sector was 1.8% of GDP. In 2015, the non-financial public sector deficit rose to 2.3% of GDP.
The Central Government’s deficit was 2.8% of GDP in 2011, 2.3% of GDP in 2012, 2.3% of GDP in 2013, 2.4% of GDP in 2014 and 3.0% of GDP in 2015. On June 13, 2016, the executive board of the International Monetary Fund (“IMF”) approved a two-year arrangement under the IMF’s Flexible Credit Line in SDR $8.18 billion, equivalent to approximately $11.5 billion at June 13, 2016. The two-year arrangement is a successor arrangement to the two-year SDR $3.87 billion (an amount equivalent to approximately $5.84 billion at June 24, 2013) Flexible Credit Line approved in June 2013. The original Flexible Credit Line was approved in May 2009 for $10.5 billion. The IMF’s Flexible Credit Line provides Colombia with access to IMF resources with no ongoing conditions, is a renewable credit line subject to a two-year limit and allows Colombia to draw on it at any time or to treat it as a precautionary instrument. To date, Colombia has not drawn on the Flexible Credit Line. See “Public Sector Finance—IMF Program—Flexible Credit Line with IMF.”
Since 1993, Colombia has accessed the international capital markets through the issuance of bonds in the United States, Europe and Japan and through borrowings from commercial bank syndicates. Colombia has regularly met all principal and interest obligations on its external debt for over 60 years.
Certain political, economic and diplomatic developments in or affecting Colombia could have a material adverse effect on the country’s economy. These factors include, but are not limited to increases in inflation, exchange rate fluctuations, increases in interest rates, declines in foreign direct and portfolio investment, adverse conditions in the international capital markets, changes in international commodity prices and violence and disruption associated with the guerilla groups and narcotics organizations.
Presidential elections took place in May 2014. Juan Manuel Santos was reelected as President of Colombia after winning the second ballot against Óscar Iván Zuluaga with 50.95% of the vote.
D-5
REPUBLIC OF COLOMBIA
Geography and Population
Colombia is the fourth largest country in South America, with a territory of 441,020 square miles (1,141,748 square kilometers). Located on the northwestern corner of the South American continent, Colombia borders Panama and the Caribbean Sea to the north, Peru and Ecuador to the south, Venezuela and Brazil to the east and the Pacific Ocean to the west.
Colombia is a country of great geographical diversity. Three ranges of the Andes, the Western, Central and Eastern Cordilleras, occupy the southwestern and central sections of the country, running through it from south to north. Grassland plains, known as Los Llanos, lie to the northeast of these ranges and extend to the Venezuelan border. The Amazon forest lies to the south of the grassland plains. The Magdalena River rises in the Central Cordillera and flows to the Caribbean Sea, near the city of Barranquilla, through a rich alluvial plain. Approximately 4% of the land is arable, approximately 41% is suitable for grazing and about 55% is forested. Colombia lies almost entirely in the north tropical zone; however, the country’s regional climates vary with altitude. A tropical climate predominates in the coastal and Amazon regions, while a temperate climate predominates in the mountains.
According to the National Administrative Department of Statistics (“DANE”), Colombia’s population in 2015 was estimated to be 48.2 million, compared with 47.7 million in 2014. Based on the latest available population statistics for Colombian cities, in 2015, 7.9 million people lived in the metropolitan area of Bogotá, the capital of Colombia. Furthermore, in 2015, Medellín and Cali, the second and third largest cities, had populations of approximately 2.5 million and 2.4 million, respectively. The most important urban centers, with the exception of Barranquilla (the largest port city), are located in the Cordillera valleys. Colombia has a population density of approximately 110 people per square mile (42 people per square kilometer).
Colombia is generally classified as a middle-income developing country. The following table sets forth the latest selective comparative statistics published by the World Bank.
Selected Comparative Statistics
| | | | | | | | | | | | | | | | | | | | |
| | | Colombia | | | Venezuela | | | Brazil | | | Mexico | | | U.S. | |
GNI Per Capita (2015)(l) | | $ | 7,130 | | | $ | 11,780 | | | $ | 9,850 | | | $ | 9,710 | | | $ | 54,960 | |
Life Expectancy at Birth (2014)(2) | | | 77.6 | | | | 78.5 | | | | 74.4 | | | | 76.7 | | | | 78.9 | |
Illiteracy Rate (2015)(3) | | | 6 | % | | | 5 | % | | | 9 | % | | | 6 | % | | | n/a | |
Infant Mortality (2015)(4) | | | 14 | | | | 13 | | | | 15 | | | | 11 | | | | 6 | |
Poverty (5) | | | 27.8 | % | | | 32.1 | % | | | 7.4 | % | | | 53.2 | % | | | n/a | |
n/a = Not available.
| 1: | GNI per capita (formerly GNP per capita) is the gross national income divided by the midyear population, converted to U.S. dollars using the World Bank Atlas method. Data for Venezuela is from 2013. |
| 2: | Life Expectancy at Birth: Data for Colombia is from 2015. |
| 3: | Percentage ages 15 and over. Data as of 2015. |
| 4: | Number of infants dying before reaching the age of one year, per 1,000 live births. |
| 5: | Percentage of population living below national poverty line. Data for Mexico and Brazil are from 2014, while Venezuela’s data is from 2013 and Colombia are from 2015. |
| Sources: | World Bank Group, Development Data Group. |
Government and Political Parties
The Republic of Colombia is one of the oldest democracies in the Americas, with regular transitions of power between successive administrations since 1957. In 1991, a popularly elected Constitutional Assembly approved a new Constitution, replacing the Constitution of 1886. The main features of the 1991 Constitution include further governmental decentralization, autonomy of the central bank, increased Congressional powers and the creation of several new public agencies. Colombia continues to be governed as a presidential republic. In the
D-6
presidential elections that took place on May 25, 2014, Óscar Iván Zuluaga of Centro Democrático Mano Firme Corazón Grande won the first ballot with 29.25% of the vote, while Juan Manuel Santos of Partido Social de La Unidad Nacional came in second with 25.69% of the vote. On June 15, 2014, Juan Manual Santos won the second ballot and was elected President of the Republic of Colombia for a second term with 50.95% of the vote. President-elect Santos took his oath and assumed the office of the President on August 7, 2014. The next presidential election is scheduled for May 2018.
In April 2014, President Santos presented his plan for the period 2014 to 2018. The plan aims to pursue the following goals, among others:
| | • | | develop a supportive and inclusive country and a country of opportunities: The Santos administration seeks to stimulate growth in vulnerable sectors, particularly in education, housing and health. In the education sector, the plan aims to improve the lives of teachers and students. In the housing sector, the Santos administration intends to stimulate a residential leasing plan, while in the health sector, the Santos administration seeks to support the rights of patients and improve the quality of service; |
| | • | | build a country of entrepreneurs and achieve full employment: The objective of this second goal is to support and expand the industrial sector, as well as enhance tourism and the service sector. Attention will also be paid to prioritizing water conservation and the environment; and |
| | • | | establish a country without fear or war and in peace: The third goal will focus on strengthening public safety, restructuring of the government prosecution office and the search for a responsive, transparent and efficient judicial system. |
No assurance can be given that any of these goals will be achieved.
Colombia is divided into 32 departments. Each department is divided into municipalities. Both the governors of the departments and mayors of the municipalities are elected by direct popular vote.
Judicial power is vested in the Corte Constitucional (Constitutional Court), the Corte Suprema de Justicia (Supreme Court of Justice, or Supreme Court), the Consejo de Estado (Council of State), the Consejo Superior de la Judicatura (Supreme Judicial Council), the Fiscalía General de la Nación (National Prosecutor General) and in such lower courts as may be established by law. The function of the Constitutional Court, whose nine members are elected by the Senate for an eight-year term, is to assure that all laws are consistent with the Constitution and to review all decisions regarding fundamental rights. The Supreme Court is the final appellate court for resolving civil, criminal and labor proceedings. The Council of State adjudicates all matters relating to the exercise of public authority or actions taken by the public sector, including the review of all administrative decisions or resolutions that are alleged to contradict the Constitution or the law. The Council of State also acts as advisor to the Government on administrative matters. Supreme Court and Council of State justices are appointed for eight-year terms by their predecessors from a list of candidates provided by the Supreme Judicial Council. The National Prosecutor General, who is appointed for a four-year term by the Supreme Court from a list of three candidates submitted by the President, acts as the nation’s prosecutor. The judicial branch is independent from the executive branch with respect to judicial appointments as well as budgetary matters.
National legislative power is vested in Congress, which consists of a 102-member Senate and a 166-member Chamber of Representatives. Senators and Representatives are elected by direct popular vote for terms of four years. The most recent Congressional elections occurred on March 9, 2014. The following table sets forth those Congressional election results by party.
D-7
Congressional Election Results by Party
| | |
| Party | | Number of elected officials |
| Senate |
| |
Partido Social de la Unidad Nacional | | 20 |
Centro Democrático Mano Firme Corazón Grande | | 18 |
Partido Conservador Colombiano | | 19 |
Partido Liberal Colombiano | | 17 |
Partido Cambio Radical | | 9 |
Partido Alianza Verde | | 5 |
Polo Democrático Alternativo | | 5 |
Partido Opción Ciudadana | | 5 |
|
| Chamber of Representatives |
Partido Social de la Unidad Nacional | | 39 |
Partido Liberal Colombiano | | 37 |
Partido Conservador Colombiano | | 27 |
Partido Cambio Radical | | 16 |
Centro Democrático Mano Firme Corazón Grande, | | 12 |
Partido Alianza Verde | | 6 |
Partido Opción Ciudadana | | 6 |
Polo Democrático Alternativo | | 3 |
Partido Movimiento Independiente de Renovación Absoluta | | 3 |
Source: Senate and Chamber of Represenatives
As of July 30, 2016, Senate consists of 101 senators of which 21 are from Partido de Union Nacional, 20 from Centro Democrático Mano Firme Coracón Grande, 18 from Partido Conservador Colombiano, 17 from Partido Liberal Colombiano, 9 from Partido Cambio Radical, 5 senators from each party Partido Alianza Verde, Partido Democrático Alternativo and Partido Opción Ciudadana, and 1 senator from Alianza Social Independiente.
Senators are elected on a non-territorial basis, while Representatives are elected on the basis of proportional, territorial representation. To be enacted into law, a bill must be approved by a majority of both houses of Congress. Differences between the two houses of Congress are resolved by a bicameral committee, which drafts a joint bill that is presented to both houses. The Constitution grants the President the right to veto bills passed by Congress, subject to Congressional override. Upon the signature of all ministers, the President may issue decrees under special circumstances, including a state of external war, significant domestic disruption or economic, social or ecological emergency. In each department, legislative power is vested in departmental assemblies whose members are elected by direct popular vote. At the municipal level, legislative power is vested in municipal councils, which preside over budgetary and administrative matters.
Traditionally, the principal political parties have been the Liberal Party and the Conservative Party. Since the late 1980’s and the drafting of the 1991 Constitution, the political party scene in Colombia has been changing substantially in the dimensions of its division, polarization and level of institutionalization. The pluralistic awareness of citizens and the realities and changing social contexts in the country has allowed the foundation of new political parties: Alianza Social Independiente founded in 1991, Cambio Radical in 1998, Partido Social de la Unidad Nacional and Polo Democrático Alternativo in 2005 and Partido Alianza Verde in 2009, among others.
Of these parties, the Partido Social de la Unidad Nacional has played an important role since the presidential election of 2006. Results of Partido Social de la Unidad Nacional in the Congressional elections of 2014 confirm that it is a party that has a major stake in Colombian politics. The next presidential and congressional elections will be held in 2018.
The following table shows the party composition of the Chamber of Representatives and Senate following the elections in the years indicated.
Party Composition of the Colombian Congress (1)
| | | | | | | | | | | | | | | | | | | | | | | | |
| Party | | Chamber of Representatives | | | Senate | |
| | | 2006 | | | 2010 | | | 2014 | | | 2006 | | | 2010 | | | 2014 | |
Partido Social de La Unidad Nacional | | | 20.5 | % | | | 28.4 | % | | | 16.1 | % | | | 19.6 | % | | | 28.0 | % | | | 15.6 | % |
Liberal | | | 21.7 | | | | 21.8 | | | | 14.1 | | | | 16.6 | | | | 17.0 | | | | 12.2 | |
Conservative | | | 17.6 | | | | 22.4 | | | | 13.2 | | | | 17.7 | | | | 22.0 | | | | 13.6 | |
Others | | | 40.2 | | | | 27.3 | | | | 56.7 | | | | 46.1 | | | | 33.0 | | | | 58.6 | |
| | | | | | | | | | | | | | | | | | | | | | | | |
| | | 100 | % | | | 100 | % | | | 100 | % | | | 100 | % | | | 100 | % | | | 100 | % |
| | | | | | | | | | | | | | | | | | | | | | | | |
| (1) | Totals may differ due to rounding. |
Source: Senado (Senate) and Registraduría Nacional del Estado Civil (National Civil Registry).
D-8
Internal Security
Guerilla Activity
Guerilla organizations have long been a part of Colombian society. The principal active guerilla organizations are the Fuerzas Armadas Revolucionarias Colombianas (Colombian Revolutionary Armed Forces, or “FARC”) and the Ejército de Liberación Nacional (National Liberation Army, or “ELN”). In many remote regions of the country that have traditionally lacked an effective government presence, the guerillas have exerted influence over the local population. In recent years, many of the guerillas have funded their activities through kidnappings and services rendered to narcotics organization, such as protection. In addition, the guerilla organizations have continued to commit acts of terrorism to draw attention to their causes and have focused much of their activities on the pipeline network owned by Empresa Colombiana de Petróleos (Colombian Petroleum Company, or “Ecopetrol”), the national oil company. Pursuant to the Ley Nacional de Regalías (National Royalties Law) of 1994, Ecopetrol pays a fee, based on the quantity of oil transported and the distance the oil is transported, to the various townships through which its pipelines run. This fee was implemented in order to help align the local communities’ interests with those of Ecopetrol. According to Ecopetrol, there were 32 attacks in 2011, which resulted in $37.1 million in lost revenues. In 2012, there were 151 attacks on oil infrastructure, including the Caño Limón Coveñas pipeline, which resulted in $248.3 million in lost revenues. In 2013, there were 225 attacks on oil infrastructure, which resulted in $289.9 million in lost revenues. In 2014, there were 130 attacks on oil infrastructure, which resulted in $408.9 million in lost revenues. In 2015, there were 80 attacks on oil infrastructure, which resulted in $100.7 million in lost revenues. In addition, Ecopetrol experienced production losses of 10.2 million barrels of oil in 2014 and 0.5 million barrels of oil in 2015 as a result of delays caused to pipeline repairs when indigenous communities blocked access to the site.
Over the past two decades, Colombia has implemented various measures to address the violence associated with the guerilla movements, including bilateral negotiations, enactment of legislation to protect the victims of armed conflicts, increased investment and economic development in conflict areas and the introduction of social, political and economic reforms designed to improve living conditions, increase access to the political process and equalize the distribution of income.
ELN
In June 2000, the Government and the ELN began formal peace discussions, which subsequently ceased and resumed several times. In addition, the Government decided to grant political status to the ELN, an important step in the official negotiation process. On August 29, 2013, following the release by ELN of a Canadian hostage that had been held hostage for seven months, President Santos announced that the Government was ready to start peace talks with the ELN.
On June 10, 2014, the Government announced that it had been engaged in exploratory peace talks with the ELN since January 2014, after a series of previous meetings were held in 2013. The Government further stated that formal discussions with the ELN would not be initiated until all the necessary conditions for the peace agreement had been agreed. On May 14, 2015, Humberto de la Calle, the chief negotiator for the Government’s delegation at the Havana peace talks, invited the ELN to join the peace process in order to end the conflict. Mr. de la Calle emphasized that the discussion must include a bilateral cease fire. See “— Internal Security — FARC” below for more information on the Havana peace talks. On June 11, 2015, the High Commissioner for Peace, Sergio Jaramillo, made a new call for the ELN to join to the dialogue with the Government and stated that peace process would require the disarmament of the ELN. Later, on January 27, 2016, the National Peace Council, established by president Juan Manual Santos to involve civil society in the peace process, agreed to an agenda between the Government and the ELN. However, the Council expressed concern about the delay in the opening of formal talks.
D-9
On March 30, 2016, the Agreement for Peace Talks between the National Government and the ELN was announced. The parties have agreed to install a public negotiating table to address the points set out in the Agenda in order to sign a final agreement to end the armed conflict. The agenda outlines six main points: participation of society in the building peace process, democracy for peace, transformations for peace, victims, end of armed conflict and implementation of the agreement.
FARC
In 2001 the Government and the FARC signed two agreements outlining the negotiation process: the Acuerdo de los Pozos and the Acuerdo de San Francisco. On February 20, 2002, however, then President Pastrana announced the suspension of peace negotiations with the FARC and the end of the negotiations due to increased violence by the FARC against the civilian population. Through 2006, the FARC continued its terrorist and narcotrafficking activities despite the Government’s ongoing military campaign against it. The FARC launched several bombings against military targets in urban areas, including Bogotá. The FARC also targeted numerous rural outposts, infrastructure targets and political adversaries and continued kidnappings across Colombia.
On September 4, 2012, President Santos announced a “General Agreement for the Termination of Conflict” between the Government and the FARC. The agreement establishes a procedure that aims to end the armed conflict. The proposed peace process includes an agenda with five concrete points: (i) rural development; (ii) guarantees for political opposition and public participation; (iii) the end of armed conflict, (iv) combating drug trafficking; and (v) the rights of the victims. The agreement does not contemplate the cession of land or cessation of military operations. Negotiations started in the first half of October 2012 in Oslo, Norway and have continued in Havana, Cuba.
On May 26, 2013, the Government and the FARC achieved an agreement on the first negotiation point concerning rural development. The main points of the agreement covered the following topics: access and land use, unproductive lands, registry of title to property, protection of agricultural frontier areas and reserves, development programs with a territorial approach, infrastructure and land improvement, social development, encouragement of agricultural production, economic cooperation, and food and nutrition policies.
An agreement on political participation, the next point in the negotiation agenda, was reached on November 6, 2013. The agreement includes: rights and guarantees for political opposition, including access to media, in particular for new political movements that are created once the final agreement is reached; democratic mechanisms for public participation, including direct participation; and measures to promote further participation, in equal conditions and with security guarantees, of all sectors of society in national, regional and local politics, including the most vulnerable population.
On May 16, 2014, the Government and the FARC announced an agreement concerning the problem of drug trafficking. The agreement aims to: work with the people concerned; transform the affected farmlands; open new opportunities for communities and territories; guarantee the rights of rural farmers; clear the areas affected by land mines and unexploded ordnance; promote a comprehensive strategy to ensure full respect of the rule of law in the territories concerned; implement a program for eradicating illicit crops; strengthen institutional capabilities for the detection, control and reporting of illicit financial transactions; and promote new plans against money laundering.
On June 7, 2014, the Government and the FARC announced an agreement to take responsibility for the victims of the internal conflict, one of the most important points in the peace negotiations between the Government and the FARC. The agreement outlined ten basic principles: recognition of victims; acknowledgment of responsibility; recognition of the rights of the victims; victim participation; the discovery of the truth of what happened during the conflict; reparation for victims; guarantees of protection and security; guarantee of non-repetition; principle of reconciliation; and focus on human rights. Finalization of this agreement, however, is conditioned on a general agreement upon the full negotiating agenda and no assurance can be given that such agreement will be reached or that if it is reached, that the agreement will not be materially modified.
On January 5, 2015, President Santos emphasized that the continuing peace negotiation is one of the principal objectives of the Government in 2015. At a meeting with the negotiating team in 2014, he emphasized the benefits to Colombia following the unilateral ceasefire by the FARC and invited the ELN to take the same initiative. The Government negotiating team returned to Havana with the aim of concluding a peace agreement as soon as possible.
D-10
On February 20, 2015, United States Secretary of State John Kerry announced that Bernie Aronson, a former United States Assistant Secretary of State for Inter-American Affairs, was appointed to support the Colombian peace process. The United States is not a direct participant in the negotiation table.
On March 7, 2015, as provided for in the de-escalation framework and seeking to build trust with, and to improve the security conditions of, the inhabitants of at risk zones in which land mines, improvised explosive devices, unexploded ordinance and other explosive remnants of war are present, the Government and the FARC agreed to request that the Norwegian People’s Aid organization lead and coordinate a clean-up and decontamination project in order to disarm and dispose of such explosive devices.
On July 12, 2015 delegations from the Government and the FARC announced that in order to provide confidence in the peace process, engender trust among the delegations, speed up agreement as to remaining items in the general agreement agenda and create the conditions for a general ceasefire of bilateral hostilities and disarmament, they decided to negotiate terms under which a general ceasefire of bilateral hostilities and disarmament would occur. Such ceasefire would require monitoring and verification of compliance with the ceasefire. To this effect, they have requested that a delegate from the Secretary General of the United Nations and a delegate of the Union of South American Nations follow the negotiations so as to aid in creating such a system. In the meantime, the FARC, as a gesture of de-escalation, agreed to maintain unilateral suspension of all offensive actions. The Government, starting July 20, 2015, de-escalated its own military actions.
On December 15, 2015 delegations from the Government and the FARC discussed and reached agreement on the “Victims” Agenda, which includes the sub-items “human rights of victims” and “truth”. Both parties agreed to create the Commission for the Clarification of Truth, Coexistence and Non Repetition, a Special Unit for the search of missing people and a Special Jurisdiction for Peace, which will count with courthouses and a Tribunal for Peace. In this framework, both parties reaffirmed their commitment to a formula that satisfies the rights of the victims and contributes to building a stable and lasting peace.
According to research conducted by the National Planning Department, the termination of the conflict would foster greater confidence in the country and is expected to increase domestic and foreign investment. Potential GDP growth could reach a 5.9% annual rate, in comparison with the current level of potential growth of 4%, according to the National Planning Department. Increase of foreign direct investment is expected to reach US$36,000 million in the long term, compared to the current US$12,000 million. In addition, net government expenditures are expected to increase to 0.7% of GDP, while the savings rate is expected to increase as higher economic growth improves disposable income.
On January 25, 2016, the UN Security Council approved the establishment of a political mission in Colombia for 12 months, to monitor the peace agreement between the Government and the FARC. The mission would be made up of unarmed international observers, responsible for the verification of the definitive bilateral ceasefire and cessation of hostilities, and as part of the tripartite mechanism that the parties will include in the final peace agreement.
On June 23, 2016, the Government and the FARC announced an agreement to enter into a definitive ceasefire and disarmament of FARC. The agreement also includes security guarantees and measures to combat criminal organizations that commit crimes against social, political and human rights groups, especially criminal organizations that are successors to paramilitary groups, and groups that threaten the peace agreement.
The objective of the ceasefire and disarmament is to end the offensive operations between the Colombian army and the FARC, in order to create the conditions for the execution of a final peace agreement and to the reincorporate FARC to civil society. Once a final agreement is executed, the FARC militias will leave their camps and relocate to 23 transitory zones and eight base camps in order to start their reincorporation to civil society. The process will be monitored by the Government, the FARC and an assigned international political mission of the United Nations.
D-11
On August 24, 2016, a final peace agreement was entered into by the Government and the FARC. The final agreement details the five fundamental points to terminating conflict, which had been negotiated in the previous months and consist of: (i) a final ceasefire and disarmament and bilateral end to hostilities; (ii) protection of victim’s rights and a Special Jurisdiction for Peace, which will include a tribunal to prosecute those who committed crimes related to and on either side of the conflict; (iii) an investment plan for rural areas and peasant farmers, (iv) reincorporation of members of FARC into civil life and to allow them to participate in political life and (v) a successful fight against the drug trafficking. The peace agreement will be subject to a plebiscite scheduled for October 2, 2016.
During 2015, 2,338 members of the FARC, ELN and other guerilla organizations were captured and 186 were killed during military encounters. In addition 1,018 members of the FARC, ELN and other rebel groups demobilized in 2015, which represented a decrease of 24.5% in demobilization compared to 2014. The Government estimated that in 2015 there were approximately 7,909 members of guerrilla groups, including the FARC and ELN rebels. With respect to Bandas Criminales al Servicio del Narcotráfico (criminal groups supporting drug traffic or “BACRIM”), in 2015, 2,856 members were captured and 21 were killed. The Colombian armed forces numbered 264,905 troops as of June 2016.
Paramilitary Activity
The emergence of so-called “paramilitary” organizations has added to the violence in the country and these groups, whose activities have been condemned by the Government, have shown little respect for human rights or the rule of law. The principal group of paramilitaries is the Autodefensas Unidas de Colombia (Colombian United Self-Defense Group, or “AUC”). On July 15, 2003, leaders of the AUC formally agreed to begin peace negotiations with the Government and announced their intention to demobilize their forces entirely by December 2005. Five divisions of unauthorized paramilitary organizations were dismantled in November and December 2004 under a demobilization plan developed by the Government. The demobilization plan is the result of the Santa Fe de Ralito Agreement that was signed between these paramilitary organizations and the Government on July 23, 2003 and ratified on October 7, 2004, through a public announcement called the “Acto de Fe por la Paz.” Since the start of the Uribe administration in August 2002 through December 31, 2015, 32,060 members of illegal armed groups, including paramilitary organizations, have been demobilized.
Project for Democratic Security
President Santos’s national development plan during his first term in office, “Prosperity for All,” sought to continue the internal security policy of the Project for Democratic Security of the previous administration.
In February 2007, Colombia’s “Strategy for Strengthening Democracy and Promoting Social Development” was developed as a mechanism to improve some factors of the Plan Colombia, the government initiative conceived during the Pastrana administration. The main purpose of this strategy was to consolidate the achievements in security for all citizens, promote peace, and development, and wage war on poverty through six components: war on terrorism and drug trafficking, strengthening justice and promoting human rights, opening markets, comprehensive social development, comprehensive care for displaced persons and demobilization, disarmaments, and reintegration. The strategy ended in December 2013.
On June 10, 2011, President Santos signed into law a Victims Law that aims to compensate victims of the internal conflict since 1985. The law, which uses international standards and principles, has the objective of assuring land restitution and economic compensation for the victims of the internal conflict through the support of different state institutions. The law will be effective for ten years and could be extended by the Congress.
Upon the conclusion of the “Strategy for Strengthening Democracy and Promoting Social Development” in 2013, on May 8, 2014, President Santos announced ten proposals for his administration’s plan of Seguridad Ciudadana for the 2014-2018 period. These proposals contemplate the creation of a ministry of public security, the addition of 25,000 policemen and the activation of 15 metropolitan police forces, in addition to the creation of elite forces or groups specializing in combating crimes such as theft of cell phones, extortion, kidnapping, smuggling and illegal mining.
D-12
Criminal Activity
The level of criminal activity has generally shown a decreasing trend since August 2002. In particular, violence by guerilla organizations has generally decreased. Incidents of homicide increased from 16,127 in 2011 to 16,440 in 2012, but decreased in 2013 to 15,419, in 2014 by 13.5% to 13,343 and continued diminishing by 4.2% to 12,782 in 2015. Incidents of kidnapping increased from 282 in 2010 to 305 in 2011, but remained constant in 2012. Incidents of kidnapping decreased from 299 in 2013 to 288 in 2014 and by 26.0% to 213 in 2015. Incidents of terrorism increased from 571 in 2011 to 894 in 2012. Incidents of terrorism decreased from 890 in 2013 to 763 in 2014 and by 41.9% to 443 in 2015. There can be no assurance, however, that the level of criminal activity will continue to be the same in the future. The Government has taken various steps to combat the activities of producing, processing and trafficking in narcotics and the violence and terrorism that have become associated with such activities since the mid-1980s. Among other measures, the Government has offered bounties for information leading to the capture of certain criminals, increased its spending on military and police forces and improved the effectiveness of the judicial system, in part through raising the salaries of, and providing greater personal security to, judges and prosecutors.
Colombia is also a party to the United Nations Convention Against Illicit Traffic in Narcotic Drugs and Psychotropic Substances. Other components of the Government’s anti-drug program include the following policies:
| | • | | eradicating illicit crops; |
| | • | | controlling the raw materials necessary to process coca; |
| | • | | providing an alternative livelihood for small coca growers through subsidies and other means; |
| | • | | destroying drug processing and distribution operations; and |
| | • | | arresting and prosecuting drug traffickers. |
From January to December 2015, 36,494 hectares of illicit cocaine crops were sprayed as compared to 55,532 hectares during the same 12 month period ended December 2014.
According to the United Nations Office on Drugs and Crime’s (UNODC) coca crop survey published in July 2016, both the country’s cultivation area and cocaine production increased substantially in 2015 compared to the previous year. The net coca cultivation area was up 39% year-over-year from 69,000 hectares in 2014 to 96,000 hectares in 2015. According to the survey, three departments have been free of coca crops since 2011: Caldas, La Guajira and Cundinamarca. Seven departments have had fewer than 100 hectares of cultivation area for coca crops: Guainía, Vaupés, Arauca, Boyacá, Magdalena, Cesar and Santander. Three departments represented 87% of the increase in cultivation area of coca crops in 2015: Nariño, Putumayo and Norte de Santander. Reasons for increase in the cultivation area of coca crops are in part due to an increase in the price of coca leaf, a reduction in risk associated with the cultivation of the crops due to the suspension of aerial spraying and community blockades which prevent manual eradication of the crops, and temporary contributing factors such as the oil crisis in the Catatumbo and drought in southern Bolívar and Antioquia.
Law 793 of 2002 permits the Government to initiate judicial proceedings to acquire assets obtained through illicit means or used in the furtherance of illegal activities. In 1997, the Constitution was amended to permit extradition of Colombian citizens accused of criminal activity abroad. Although drug trafficking activities and acts of violence and terrorism continue to occur, in the recent past, the Government has been successful in largely dismantling the “Cali” and “Medellin” cartels.
Decree 472, enacted in 1996, created the Plan Nacional de Desarrollo Alternativo (National Plan of Alternate Development). It seeks to remove, voluntarily, peasants and indigenous communities from activities related to the cultivation of illicit drug crops, through the introduction of sustainable and competitive alternative livelihoods for them. The plan is currently established in 96 Colombian municipalities. In an effort to improve the plan’s results, the Uribe administration announced in 2003 a program called “Familias Guardabosques” with the aim of paying 51,000 peasant families Ps. 3.6 million per year to cease cultivating illicit drug crops and instead
D-13
assist in the restoration of national forests. From 2003 to 2011, 122,991 families have been linked to the program. In this period, the Government has invested Ps. 1.1 billion to the program. During 2012, 2013 and 2014, the number of families added to the program was 14,874, 13,643 and 6,684, respectively. In 2015, the number of families added to the program was 8,740. Families received economic incentives of a total of Ps. 11.8 billion in 2012, Ps. 19.7 billion in 2013, Ps. 10.1 billion in 2014 and Ps. 10 billion in 2015.
The United States provides assistance to Colombia to support its efforts to combat illegal drug-related activities. The aid package to Colombia in July 2000 included American-supplied helicopters and U.S. military trainers to assist Colombia in its anti-drug operations. In August 2002, the U.S. President signed anti-terrorism legislation that, in a policy shift, authorized Colombia to use the military equipment and U.S.-trained Colombian soldiers directly against the rebels and paramilitary groups. In 2011, the United States provided Colombia with $342.0 million for military and police assistance and $214.0 million for economic and social assistance programs. In 2012, the United States provided Colombia with $246.9 million for military and police assistance programs and $197.0 million for economic and social assistance programs. In 2013, the United States provided Colombia with $239.9 million for military and police assistance programs and $195.9 million for economic and social assistance programs. In 2014, the United States provided Colombia with $221.7 million for military and police assistance programs and $170.7 million for economic and social assistance programs. In 2015, the United States provided Colombia with $167.9 million for military and police assistance programs and $139.8 million for economic and social assistance programs. Colombian government programs that have received U.S. aid include the Colombia National Police Project, the Colombia Military Project, the Narcotics Interdiction Project, the Alternative Development Program, the Democracy Project, the Vulnerable Groups Project, the Promotion of the Rule of Law Project and the Program of Development and Support. In addition, in August 2003, the U.S. President authorized the U.S. Department of State to resume assistance to Colombia in implementing an “Airbridge Denial Program” against civil aircraft suspected of trafficking in narcotics. The previous interdiction program was suspended in April 2001.
The United States, however, conditions its assistance on the periodic determination as to the effectiveness of Colombia’s efforts. On September 15, 2005, pursuant to U.S. law requirements, the President of the United States issued a presidential determination listing the 20 nations deemed to be major drug transit or major illicit drug-producing countries for fiscal year 2006. Although Colombia was included in the “major list,” the President of the United States determined that Colombia did not “fail demonstrably” during the previous 12 months to make substantial efforts to adhere to international counternarcotics agreements and take certain counternarcotics measures set forth in U.S. law. The White House Office of National Drug Control Policy and the Bureau for International Narcotics and Law Enforcement Affairs have highlighted the great progress made by Colombia in fighting drug-crop cultivation and drug trafficking. As long as the Annual Presidential Determinations for Major Illicit Drug Producing and Drug-Transit Countries is released by the U.S. Department of State, there will be an evaluation of whether Colombia is a member of the “major list”. As of September 14, 2015, Colombia remained on the “major list” for the United States’ fiscal year 2016, but is still considered certified by the President of the United States due to the substantial efforts of the Government to adhere to its obligations under international counter narcotics agreements. In the event of a future decertification of Colombia, unless the U.S. President waives the effects that a decertification would have under U.S. law, all United States assistance (other than certain counternarcotics and humanitarian assistance) to Colombia would be suspended and the United States would be obligated to vote against all loans and other assistance to Colombia by multilateral development banks. In addition, the United States could, but would not be obligated to, impose economic sanctions on Colombia, such as the withdrawal of certain trade preferences. The decertification of Colombia in 1996, 1997 and 1998 did not have a material adverse effect on the country, but no assurance can be given that a future decertification would not have this effect. On August 3, 2005, the U.S. Department of State announced that Colombia had met the criteria related to human rights set forth by the United States, which certification has not been withdrawn. These certifications ensure continued aid from the United States. Various other countries have programs to provide assistance to Colombia to reduce illegal drug-related activities.
The Government anticipates that continued large expenditures on security and justice will be necessary over the medium term to fight narcotics-related crime. The Government has in the past funded a portion of its increased security and justice expenditures through special taxes imposed on certain sectors, such as the petroleum industry. No official studies have been published regarding, and private studies vary widely in their assessment of, the effect on the Colombian economy of narcotics trafficking and drug-related violence, including their effect on Colombia’s balance of payments, foreign investment flows and the allocation of productive activity. See “Foreign Trade and Balance of Payments—Foreign Investment.”
D-14
Other Domestic Initiatives
On December 26, 2012, President Santos signed Law 1607, which modifies the Colombian tax regime. This reform is revenue neutral, and its primary objectives are the creation of new jobs and the reduction of inequalities. For those purposes, the reform modifies the income tax rates for wage earners, which are now progressive and sets a National Alternative Minimum Tax in order to limit the exemptions and deductions taken by individuals on their income tax. The reform also reduces the nonwage costs (payroll taxes, health and pensions) for firms with the aim of boosting formal employment, reduces the general income tax rate to 25% from 33% and creates a new tax for firms called Impuesto Sobre la Renta Para la Equidad - CREE (Business Contribution to Equality). Other relevant points of the reform are the reduction in value-added tax (“VAT”) rates in order to simplify tax rates, leaving three different rates versus the previous seven, the reduction of the withholding tax to foreign investors in the local market from 33% to 15% and the inclusion of measures against tax evasion and tax avoidance. The result of the implementation of this reform contributed to a reduction in the unemployment rate during 2013, particularly in the agricultural and industrial sectors, and in maintaining a low level of inflation through the reduction in indirect taxes on various goods and services such as fuel, vehicles and food items.
On December 23, 2014, President Santos signed Law 1739 of 2014. The law seeks to maintain the growth of the Colombian economy through infrastructure development and social programs and strike a balance between taxes on wealth and income without adversely affecting the middle class or small and medium size companies. The key provisions of the tax law include: (i) a temporary wealth tax on those with net assets above Ps. 1 billion effective as of January 1, 2015; (ii) a permanent increase on the CREE from 8% to 9%, starting in 2015; (iii) a temporary income tax surcharge of the CREE for a company’s earnings above Ps. 800 million, such surcharge to be 5% for 2015, 6% for 2016, 8% for 2017 and 9% for 2018; (iv) postponing the elimination of the tax on financial transactions, the Gravamen a los Movimientos Financieros – GMF, to 2019, at which point it will gradually be reduced by 1 point each year until its elimination in 2022; (v) a tax deduction for investments in innovation; (vi) extension of a subsidy in energy services (gas and electric) for the poor; and (v) creation of a Tax Expert Commission, Comisión de Expertos para la Equidad y la Competitividad Tributaria, which will propose reforms to make the Colombian tax system more equitable and efficient. The tax reform took effect on January 1, 2015.
On May 30, 2011, the “Mercado Integrado Latinoamericano” (MILA) began its operations. This project involves the integration of technology platforms of the Colombian, Chilean and Peruvian stock markets. The MILA allows investors to carry out cash transactions on investments in shares listed in the Bolsa de Valores de Colombia (BVC), Bolsa de Comercio de Santiago (BCS) and Bolsa de Valores de Lima (BVL), involving the three securities depositaries, DECEVAL (Déposito Centralizado de Valores de Colombia), CAVALI (Registro Central de Valores y Liquidaciones) and the Central Securities Depository (CSD) of Colombia, Peru and Chile, respectively. The main objective of the integration is to develop the capital markets by offering to investors a wider range of securities and to issuers larger funding sources. In the long term, the creation of MILA is expected to diversify, expand and improve the attractiveness of trading of securities in the three countries for both domestic and international investors. On June 19, 2014, the Bolsa Mexicana de Valores (BMV) became a member of MILA. As of December 31, 2014 the market capitalization of the MILA was $987.8 billion compared to $602.0 on December 31, 2013, an increase of 64.1%. As of December 31, 2015 the market capitalization of the MILA was $770.8 billion compared to $987.8 billion on December 31, 2014, a decrease of 21.97%.
On January 19, 2011, the President signed into law the Health Reform Law that provides more resources to the health system (Ps.1.5 trillion per year). The Government will contribute Ps.1.0 trillion from the national budget and other resources are expected to come from the Family Compensation Funds (a non-governmental agency that pays social security subsidies), municipalities and departments, among others. The law will also order periodic updates to the public health insurance plans in order to make them consistent with the epidemiological profile of the population, limiting and rationalizing the type of treatments and drugs that are included in the insurance plans.
D-15
On February 16, 2015, President Santos and Health Minister Alejandro Gaviria, signed Law 1751, which establishes health as an autonomous fundamental right. Under the law, the provision of emergency services becomes mandatory, eliminating any requirement for authorization prior to treatment. The law also provides that administrative or economic reasons cannot interrupt a patient’s care. Additionally, it establishes a cap on medicine prices based on international reference prices.
On June 9, 2015, the Law 1753 was approved by Congress and through which the Government has implemented the National Development Plan (“PDN”) for the period 2014 to 2018. The three main pillars of the PDN are: (i) peace, reflecting the Government’s political will to commit to sustainable peace; (ii) equity, in order to focus on human development with opportunities for all; and (iii) education, which the plan considers as the most powerful instrument for social equality and economic growth. Additionally, there are five cross strategies that are meant to implement the three pillars: (i). competitiveness and strategic infrastructure; (ii). social mobility; (iii). transformation of the country side (which includes initiatives on land access and distribution and improving the social-economic condition of those living in rural areas); (iv) security, justice and democracy for peace building; and (v) good governance. Additionally, there is an evolving strategy, green growth, which includes as objectives the growth of sustainable development, lowering of carbon emissions, protecting the environment and planning for natural disasters and the effects of climate change.
“Misión para la Transformación del Campo Colombiano” is an initiative of the National Government headed by the National Department of Planning (Departamento Nacional de Planeación), for defining the public policy guidelines that will lead to a robust and comprehensive portfolio of public policies and instruments. The objective is to make better investment decisions for developing public rural and agricultural projects in the next 20 years, in order to help transform the Colombian land. The Misión para la Transformación del Campo Colombiano is divided into six (6) strategies: (i) planning and territorial development; (ii) closing the gap with social rights approach; (iii) productive inclusion with the aims of incorporating the rural populations in economic dynamics, complementing the strategy of social inclusion; (iv) developing a competitive rurality with emphasis on the agricultural sector; (v) elements of environmental sustainability for rural development; and (vi) deep institutional reform.
Foreign Affairs and International Organizations
Colombia has established diplomatic relations with 186 countries. Colombia is a member of the United Nations, the IMF and the International Bank for Reconstruction and Development (the “World Bank”). On a regional level, Colombia is a member of the Organization of American States (“OAS”), the Organization of Caribbean States, the Inter-American Development Bank (“IADB”), the Caribbean Development Bank, the Latin American Economic System, the Association of Caribbean States, the Economic Commission for Latin America, Unión de Naciones Suramericanas and the Caribbean, Corporación Andina de Fomento, a multilateral development bank referred to as CAF, the Andean Parliament and the Andean Development Bank. Colombia is also a party to several trade and commodity agreements, including the Andean Community of Nations (formerly known as the Andean Pact), the Latin American Integration Association, the Union of Banana Exporting Countries, the International Sugar Association and the World Trade Organization. Colombia also has free trade agreements with the United States, Canada, Mexico, Chile, El Salvador, Guatemala, Honduras Switzerland, Norway, Iceland, Liechtenstein, Venezuela, Peru and the European Union.
On May 30, 2013, the 34 member countries of the Organization for Economic Co-operation and Development (“OECD”) invited Colombia to initiate the accession process to the OECD. On September 19, 2013, the OECD approved a roadmap for Colombia’s accession, establishing the process and setting the terms for future membership. Colombia has committed to cooperate with OECD committees in areas such as investment; bribery in international commercial transactions; corporate governance; financial markets; insurance and private pensions; competition; taxes; environment; public governance; regulatory policy; regional development; statistics; economy; education; employment, labor and social affairs; health; trade; export credits; agriculture; science and technology; information technology and communications; among other areas.
On January 27, 2015, during a meeting in the Colombian embassy in Paris with President Santos, the OECD Secretary General, Angel Gurría, delivered a document entitled “Colombia, political priorities for inclusive
D-16
development”, which aims to promote stronger, more inclusive and sustainable growth. The document includes recommendations on agricultural, environmental, information technology, communications, education and health matters. President Santos confirmed that those recommendations will be included, to the extent possible, into the PDN.
The Andean Community of Nations, referred to herein as the Andean Community, was designed to create a five-nation free-trade zone. It was originally created in 1969 by means of the Cartagena Agreement and revived in 1991. Pursuant to this agreement, Colombia, Venezuela (which has since withdrawn from the Andean Community), Peru, Ecuador and Bolivia implemented common external tariffs in 1995. In August 1997, the Andean Community members initiated a program to reduce the common external tariffs by 2005. In 2002, the Andean Community approved a new common external tariff that was scheduled to take effect on May 10, 2004. The Commission of the Andean Community decided to postpone, on several occasions, the initial effective date of the common external tariff due to the lack of agreement among members on the time frame and the criteria to apply to the common external tariff. On September 20, 2006, Chile was granted the status of Associate Member Country of the Andean Community.
On October 18, 2004, an economic agreement was signed among Argentina, Brazil, Paraguay and Uruguay, each members of Mercosur, and the governments of Colombia, Ecuador and Venezuela, then members of the Andean Community to create a South American free trade area.
On August 22, 2015, President Nicolás Maduro of Venezuela declared a state of emergency in certain parts of the border with Colombia and closed them due to alleged violence and smuggling. Certain Colombians who had been living in Venezuela in the areas affected by the state of emergency have been deported. On September 7, 2015, President Santos signed Decree No. 1770 of 2015, which placed 40 municipalities in seven departments near the border in a state of economic, social and ecological emergency as a response to the border crisis. The decree provides the government with the authority to act in several areas in order to relieve the effects of the border closing. On August 11, 2016, the governments of Venezuela and Colombia agreed to reopen the border in a gradual, orderly and controlled manner. This process will begin with the opening of five access points between the two countries: the Simón Bolívar and La Unión bridges, in Norte de Santander; the José Antonio Páez bridge, in Arauca; Paraguachón, in La Guajira and Puerto Carreño, in Vichada, helping to improve the situation of trade, health and combat smuggling.
On February 27, 2006, the United States and Colombia concluded negotiations on a free trade agreement that seeks to eliminate tariffs and other barriers to goods and services and expand trade between the two countries. The agreement was approved by the Colombian Congress in June 2007 and by the United States Congress on October 12, 2011. The president of the United States signed the agreement into law on October 21, 2011. An implementation phase in Colombia was intended to verify that the agreement is consistent with Colombia’s legal system. Thereafter, the two governments exchanged diplomatic notes at the Summit of the Americas in Cartagena, and the free trade agreement entered into force on May 15, 2012.
On June 6, 2012 Colombia, Chile, Mexico and Perú signed the framework agreement “Acuerdo de la Alianza del Pacífico” of the Pacific Alliance and on February 10, 2014, the same countries signed framework protocols, which were approved in Colombia by Law 1721 of 2014 and Law 1746 of 2014, respectively. The Pacific Alliance is a regional integration mechanism, which has as its objective for member states to create attractive integrated markets and to provide greater international competitiveness.
D-17
ECONOMY
Gross Domestic Product
Real GDP grew by 6.6%, 4.0% and 4.9% in 2011, 2012 and 2013, respectively, and, based on preliminary figures, grew by 4.4% in 2014 and 3.1% in 2015.
The following factors contributed to the growth in 2015:
| | • | | increased public consumption at an annual rate of 2.8% as compared to 2014 and investment in housing and civil works; |
| | • | | increased private consumption at an annual rate of 3.9% as compared to 2014 due to higher consumer spending in miscellaneous goods and services; restaurants and hotels and recreation and culture; |
| | • | | high activity in the financial institutions, insurance, real estate and business services, restaurants, hotels and construction sector; and |
| | • | | Government stimulus policies and favorable liquidity conditions, credit availability and low interest rates. |
These factors outweighed the performance of the mining and manufacturing sectors during the year, which was irregular due to weak external demand and increased international competitiveness.
The services sector has traditionally been the largest sector of the Colombian economy. In 2015, the services sector increased by 3.5% in real terms and represented 54.8% of GDP. The manufacturing sector increased by 1.2% in real terms in 2015 and represented approximately 11.0% of GDP in 2015. Agriculture, livestock, fishing, forestry and hunting have also traditionally played an important role in the Colombian economy. Production in this sector increased by 3.3% in real terms in 2015, and the sector accounted for 6.2% of GDP in 2015. Construction activity grew by 3.9% in real terms in 2015 and accounted for 7.3% of GDP in 2015. Mining (including oil), increased by 0.6% in real terms in 2015 and represented 7.1% of GDP in 2015. Electricity, gas and water grew by 2.9% in real terms in 2015 and represented 3.5% of GDP in 2015.
Gross fixed public investment, which represented 12% of 2015 GDP, registered a 41.6% increase in real terms in 2015, following a 10.9% increase in 2014. Gross fixed private investment, which represented 20.5% of GDP in 2015, increased by 3.9% in real terms in 2015 as compared to a 9.3% increase in real terms in 2014. In 2015, public consumption, which represented 17.2% of 2015 GDP, increased by 2.8% in real terms, following an increase of 4.7% in 2014. Private consumption grew by 3.9% in real terms in 2015, following positive real growth of 4.1% in 2014, and accounted for 65.0% of 2015 GDP.
Impact of Oil Prices
The mining sector (including oil) is a significant contributor to the Colombian economy and is a principal source of exports. The mining sector grew 5.0% in real terms in 2013, but contracted 1.1% in real terms in 2014. According to the preliminary figures, the mining sector grew 0.6% in real terms in 2015. According to the preliminary figures, during the first and second quarters of 2015, the mining sector grew 0.2 % and 4.2%, respectively, but contracted 0.3% and 1.4% in the third and fourth quarters of 2015, respectively. Oil and its derivatives accounted for 55.2% of total exports in 2013, 52.8% of total exports in 2014 and 39.9% of total exports in 2015. According to the preliminary figures, oil and its derivatives accounted for 32.5% of total exports in January 2016, 27.5% of total exports in February 2016, 30.5% of total exports in March 2016, 28.6% of total exports in April 2016, 33.5% of total exports in May 2016 and 37.5% of total exports in June 2016. On June 14, 2016, the Government published its medium-term fiscal framework, which reflects the Government’s expectation that the fall in oil prices will result in a shortfall in mining and energy industry revenues of approximately 3.0% of GDP. As a result, the fiscal rule advisory council (Comite Consultivo de la Regla Fiscal) anticipates there will be an increase in the Central Government fiscal deficit to 3.9% of GDP for 2016 and 3.3% of GDP for 2017. The Central Government expects to meet the deficit level allowed
D-18
under the Fiscal Rule for 2016 through spending reductions of 1.1% of GDP and increases in non-oil revenues of 1.6% of GDP. See “Public Sector Finance—General” in the 2015 Annual Report for more information on the results of a review of the Government’s financial plan for 2016 and the impact of oil prices.
The following tables set forth real GDP and demand as well as the composition and annual percentage growth rates of real GDP and demand, for the five years ended December 31, 2015.
Real GDP and Demand
| | | | | | | | | | | | | | | | | | | | |
| | | 2011 | | | 2012 | | | 2013 | | | 2014(1) | | | 2015(1) | |
| | | (millions of constant 2005 pesos) | |
GDP | | Ps. | 452,578,000 | | | Ps. | 470,880,000 | | | Ps. | 493,831,000 | | | Ps. | 515,489,000 | | | Ps. | 531,376,000 | |
Add: Imports of Goods and Services | | | 118,158,000 | | | | 128,880,000 | | | | 136,584,000 | | | | 147,215,000 | | | | 152,935,000 | |
| | | | | | | | | | | | | | | | | | | | |
Total Supply of Goods and Services | | | 567,944,000 | | | | 595,498,000 | | | | 625,603,000 | | | | 657,065,000 | | | | 677,034,000 | |
Less: Exports of Goods and Services | | | 76,438,000 | | | | 81,016,000 | | | | 85,233,000 | | | | 84,098,000 | | | | 83,538,000 | |
| | | | | | | | | | | | | | | | | | | | |
Total Domestic Supply | | Ps. | 491,506,000 | | | Ps. | 514,482,000 | | | Ps. | 540,370,000 | | | Ps. | 572,967,000 | | | Ps. | 593,496,000 | |
| | | | | | | | | | | | | | | | | | | | |
Allocation of Domestic Demand Consumption | | | | | | | | | | | | | | | | | | | | |
Private Consumption | | Ps. | 295,516,000 | | | Ps. | 308,471,000 | | | Ps. | 318,930,000 | | | Ps. | 332,173,000 | | | Ps. | 345,281,000 | |
Public Consumption | | | 72,881,000 | | | | 77,473,000 | | | | 84,627,000 | | | | 88,645,000 | | | | 91,167,000 | |
| | | | | | | | | | | | | | | | | | | | |
Total Consumption | | | 368,399,000 | | | | 386,023,000 | | | | 403,945,000 | | | | 421,269,000 | | | | 437,797,000 | |
Gross Fixed Investment(2) | | | | | | | | | | | | | | | | | | | | |
Private Investment(1) (3) | | | 87,600,000 | | | | 91,722,000 | | | | 96,186,916 | | | | 105,141,462 | | | | 109,195,981 | |
Public Investment(1) (3) | | | 34,677,000 | | | | 36,358,000 | | | | 40,564,084 | | | | 44,972,538 | | | | 63,699,797 | |
| | | | | | | | | | | | | | | | | | | | |
| | | 122,277,000 | | | | 128,080,000 | | | | 136,751,000 | | | | 150,114,000 | | | | 154,281,000 | |
Changes in Inventory | | | 1,340,000 | | | | 1,352,000 | | | | 634,000 | | | | 3,125,000 | | | | 3,014,000 | |
Total Domestic Demand | | Ps. | 567,944,000 | | | Ps. | 595,498,000 | | | Ps. | 625,603,000 | | | Ps. | 572,967,000 | | | Ps. | 593,496,000 | |
| | | | | | | | | | | | | | | | | | | | |
Totals may differ due to rounding,
| 2: | Investment is defined as gross fixed capital formation plus changes in inventory. |
| 3: | Information compiled from macroflows calculated by the General Directorate of Macroeconomic Policy – Ministry of Finance and Public Credit. |
Source: DANE.
D-19
| | | | | | | | | | | | | | | | | | | | | | | | | | | | | | | | | | | | | | | | |
| | | Percentage of GDP(1)(4) | | | Real Growth Rate(1)(4) | |
| | | 2011 | | | 2012 | | | 2013 | | | 2014(2) | | | 2015(2) | | | 2011 | | | 2012 | | | 2013 | | | 2014(2) | | | 2015(2 | |
GDP | | | 100.0 | % | | | 100.0 | % | | | 100.0 | % | | | 100.0 | % | | | 100.0 | % | | | 6.6 | % | | | 4.0 | % | | | 4.9 | % | | | 4.4 | % | | | 3.1 | % |
Add: Imports of Goods and Services | | | 26.1 | % | | | 27.4 | % | | | 27.7 | % | | | 28.6 | % | | | 28.8 | % | | | 21.5 | % | | | 9.1 | % | | | 6.0 | % | | | 7.8 | % | | | 3.9 | % |
| | | | | | | | | | |
Total Supply of Goods and Services | | | 125.5 | % | | | 126.5 | % | | | 126.7 | % | | | 127.5 | % | | | 127.4 | % | | | 8.8 | % | | | 4.9 | % | | | 5.1 | % | | | 5.0 | % | | | 3.0 | % |
Less: Exports of Goods and Services | | | 16.9 | % | | | 17.2 | % | | | 17.3 | % | | | 16.3 | % | | | 15.7 | % | | | 11.8 | % | | | 6.0 | % | | | 5.2 | % | | | (1.3 | )% | | | (0.7 | )% |
| | | | | | | | | | | | | | | | | | | | | | | | | | | | | | | | | | | | | | | | |
Total Domestic Supply | | | 108.6 | % | | | 109.3 | % | | | 109.4 | % | | | 111.2 | % | | | 111.7 | % | | | 8.4 | % | | | 4.7 | % | | | 5.0 | % | | | 6.0 | % | | | 3.6 | % |
| | | | | | | | | | | | | | | | | | | | | | | | | | | | | | | | | | | | | | | | |
Allocation of Domestic Demand(3) | | | | | | | | | | | | | | | | | | | | | | | | | | | | | | | | | | | | | | | | |
Consumption | | | | | | | | | | | | | | | | | | | | | | | | | | | | | | | | | | | | | | | | |
Private Consumption | | | 65.3 | % | | | 65.5 | % | | | 64.6 | % | | | 64.4 | % | | | 65.0 | % | | | 6.0 | % | | | 4.4 | % | | | 3.4 | % | | | 4.2 | % | | | 3.9 | % |
Public Consumption | | | 16.1 | % | | | 16.5 | % | | | 17.1 | % | | | 17.2 | % | | | 17.2 | % | | | 3.6 | % | | | 6.3 | % | | | 9.2 | % | | | 4.7 | % | | | 2.8 | % |
| | | | | | | | | | | | | | | | | | | | | | | | | | | | | | | | | | | | | | | | |
| | | 81.4 | % | | | 82.0 | % | | | 81.8 | % | | | 81.7 | % | | | 82.4 | % | | | 5.5 | % | | | 4.8 | % | | | 4.6 | % | | | 4.3 | % | | | 3.9 | % |
| | | | | | | | | | |
Gross Fixed Investment | | | | | | | | | | | | | | | | | | | | | | | | | | | | | | | | | | | | | | | | |
Private Investment(5) | | | 19.4 | % | | | 19.5 | % | | | 19.5 | % | | | 20.4 | % | | | 20.5 | % | | | 19.2 | % | | | 4.7 | % | | | 4.9 | % | | | 9.3 | % | | | 3.9 | % |
Public Investment(5) | | | 7.7 | % | | | 7.7 | % | | | 8.2 | % | | | 8.7 | % | | | 12.0 | % | | | 18.3 | % | | | 4.8 | % | | | 11.6 | % | | | 10.9 | % | | | 41.6 | % |
| | | | | | | | | | | | | | | | | | | | | | | | | | | | | | | | | | | | | | | | |
| | | 27.0 | % | | | 27.2 | % | | | 27.7 | % | | | 29.1 | % | | | 20.9 | % | | | 19.0 | % | | | 4.7 | % | | | 6.8 | % | | | 9.8 | % | | | 2.8 | % |
Changes in Inventory | | | 0.3 | % | | | 0.3 | % | | | 0.1 | % | | | 0.6 | % | | | 0.6 | % | | | (14.5 | )% | | | 0.9 | % | | | (53.1 | )% | | | 392.9 | % | | | (3.6 | )% |
| | | | | | | | | | | | | | | | | | | | | | | | | | | | | | | | | | | | | | | | |
Total Domestic Demand | | | 125.5 | % | | | 126.5 | % | | | 126.7 | % | | | 127.5 | % | | | 127.4 | % | | | 8.4 | % | | | 4.7 | % | | | 5.0 | % | | | 6.0 | % | | | 3.6 | % |
| | | | | | | | | | | | | | | | | | | | | | | | | | | | | | | | | | | | | | | | |
Totals may differ due to rounding.
| 1: | Calculated using constant 2005 pesos. |
| 3: | Includes the purchase of goods made abroad by residents and excludes that of non-residents made in Colombia. |
| 4: | Information compiled from macroflows calculated by the General Directorate of Macroeconomic Policy – Ministry of Finance and Public Credit. |
| 5: | Investment is defined as gross fixed capital formation plus changes in inventory. Information compiled from macroflows calculated by the General Directorate of Macroeconomic Policy – Ministry of Finance and Public Credit. |
D-20
Principal Sectors of the Economy
The following table sets forth the composition of Colombia’s GDP by economic sector, in constant pesos and percentage terms, for the five years ended December 31, 2015.
Real GDP by Sector
| | | | | | | | | | | | | | | | | | | | | | | | | | | | | | | | | | | | | | | | |
| | | 2011 | | | % of Total | | | 2012 | | | % of Total | | | 2013(1) | | | % of Total | | | 2014(1) | | | % of Total | | | 2015(1) | | | % of Total | |
| (millions of constant 2005 pesos and as a percentage of GDP) | |
Coffee | | Ps. | 2,421,000 | | | | 0.5 | % | | Ps. | 2,386,000 | | | | 0.5 | % | | Ps. | 3,251,000 | | | | 0.7 | % | | Ps. | 3,695,000 | | | | 0.7 | % | | Ps. | 4,271,000 | | | | 0.8 | % |
Other Agriculture and Livestock | | | 24,222,000 | | | | 5.4 | | | | 24,927,000 | | | | 5.3 | | | | 25,782,000 | | | | 5.2 | | | | 26,222,000 | | | | 5.1 | | | | 26,685,000 | | | | 5.0 | |
Fishing, Forestry and Hunting | | | 1,610,000 | | | | 0.4 | | | | 1,693,000 | | | | 0.4 | | | | 1,729,000 | | | | 0.4 | | | | 1,789,000 | | | | 0.3 | | | | 1,801,000 | | | | 0.3 | |
| | | | | | | | | | | | | | | | | | | | | | | | | | | | | | | | | | | | | | | | |
Total Agriculture | | | 28,295,000 | | | | 6.3 | | | | 29,005,000 | | | | 6.2 | | | | 30,895,000 | | | | 6.3 | | | | 31,849,000 | | | | 6.2 | | | | 32,914,000 | | | | 6.2 | |
Manufacturing Industry | | | 56,631,000 | | | | 12.5 | | | | 56,677,000 | | | | 12.0 | | | | 57,192,000 | | | | 11.6 | | | | 57,588,000 | | | | 11.2 | | | | 58,307,000 | | | | 11.0 | |
Mining(2) | | | 34,147,000 | | | | 7.5 | | | | 35,948,000 | | | | 7.6 | | | | 37,743,000 | | | | 7.6 | | | | 37,318,000 | | | | 7.2 | | | | 37,553,000 | | | | 7.1 | |
Electricity, Gas and Water | | | 16,376,000 | | | | 3.6 | | | | 16,752,000 | | | | 3.6 | | | | 17,253,000 | | | | 3.5 | | | | 17,832,000 | | | | 3.5 | | | | 18,352,000 | | | | 3.5 | |
Construction | | | 28,469,000 | | | | 6.3 | | | | 30,159,000 | | | | 6.4 | | | | 33,614,000 | | | | 6.8 | | | | 37,127,000 | | | | 7.2 | | | | 38,593,000 | | | | 7.3 | |
Services | | | | | | | | | | | | | | | | | | | | | | | | | | | | | | | | | | | | | | | | |
Transportation, Storage and Communications | | | 33,455,000 | | | | 7.4 | | | | 34,757,000 | | | | 7.4 | | | | 35,915,000 | | | | 7.3 | | | | 37,594,000 | | | | 7.3 | | | | 38,137,000 | | | | 7.2 | |
Retail, Restaurants and Hotels | | | 54,400,000 | | | | 12.0 | | | | 56,523,000 | | | | 12.0 | | | | 59,094,000 | | | | 12.0 | | | | 62,081,000 | | | | 12.0 | | | | 64,655,000 | | | | 12.2 | |
Financial Services | | | 22,470,000 | | | | 5.0 | | | | 24,406,000 | | | | 5.2 | | | | 26,154,000 | | | | 5.3 | | | | 28,240,000 | | | | 5.5 | | | | 30,975,000 | | | | 5.8 | |
Housing | | | 36,895,000 | | | | 8.2 | | | | 38,064,000 | | | | 8.1 | | | | 39,144,000 | | | | 7.9 | | | | 40,369,000 | | | | 7.8 | | | | 41,616,000 | | | | 7.8 | |
Services to Companies except Financial Services and Housing | | | 28,923,000 | | | | 6.4 | | | | 30,315,000 | | | | 6.4 | | | | 31,771,000 | | | | 6.4 | | | | 34,056,000 | | | | 6.6 | | | | 34,356,000 | | | | 6.5 | |
Public Administration and Defense | | | 37,555,000 | | | | 8.3 | | | | 39,332,000 | | | | 8.4 | | | | 41,911,000 | | | | 8.5 | | | | 44,289,000 | | | | 8.6 | | | | 45,356,000 | | | | 8.5 | |
Education | | | 7,934,000 | | | | 1.8 | | | | 8,187,000 | | | | 1.7 | | | | 8,504,000 | | | | 1.7 | | | | 8,816,000 | | | | 1.7 | | | | 8,899,700 | | | | 1.7 | |
Social and Health | | | 9,255,000 | | | | 2.0 | | | | 9,954,000 | | | | 2.1 | | | | 10,478,000 | | | | 2.1 | | | | 11,260,000 | | | | 2.2 | | | | 11,698,000 | | | | 2.2 | |
Recreation, Cultural, Sports and Other Services | | | 10,005,000 | | | | 2.2 | | | | 10,311,000 | | | | 2.2 | | | | 11,038,000 | | | | 2.2 | | | | 11,261,000 | | | | 2.2 | | | | 11,675,000 | | | | 2.2 | |
Domestic Services | | | 3,264,000 | | | | 0.7 | | | | 3,354,000 | | | | 0.7 | | | | 3,434,000 | | | | 0.7 | | | | 3,563,000 | | | | 0.7 | | | | 3,670,000 | | | | 0.7 | |
| | | | | | | | | | | | | | | | | | | | | | | | | | | | | | | | | | | | | | | | |
Total Services | | | 244,066,000 | | | | 53.9 | | | | 255,088,000 | | | | 54.2 | | | | 267,296,000 | | | | 54.1 | | | | 281,418,000 | | | | 54.6 | | | | 291,247,000 | | | | 54.8 | |
Plus: Duties and Tariffs on Imports | | | 43,420,000 | | | | 9.6 | | | | 45,770,000 | | | | 9.7 | | | | 47,608,000 | | | | 9.6 | | | | 50,272,000 | | | | 9.8 | | | | 52,294,000 | | | | 9.8 | |
| | | | | | | | | | | | | | | | | | | | | | | | | | | | | | | | | | | | | | | | |
Real GDP | | Ps. | 452,578,000 | | | | 100 | % | | Ps. | 470,880,000 | | | | 100 | % | | Ps. | 493,831,000 | | | | 100 | % | | Ps. | 515,489,000 | | | | 100 | % | | Ps. | 531,376,000 | | | | 100 | % |
| | | | | | | | | | | | | | | | | | | | | | | | | | | | | | | | | | | | | | | | |
Totals may differ due to rounding.
Source: DANE.
D-21
The following table sets forth the annual change in Colombia’s real GDP by sector for the five years ended December 31, 2015.
Real GDP Growth by Sector(1)
| | | | | | | | | | | | | | | | | | | | |
| | | 2011 | | | 2012 | | | 2013 | | | 2014(2) | | | 2015(2) | |
Agriculture, Livestock, Fishing, Forestry and Hunting | | | | | | | | | | | | | | | | | | | | |
Coffee | | | (7.7 | )% | | | (1.4 | )% | | | 36.3 | % | | | 13.7 | % | | | 15.6 | % |
Other Agriculture and Livestock | | | 3.5 | | | | 2.9 | | | | 3.4 | | | | 1.7 | | | | 1.8 | |
Fishing, Forestry and Hunting | | | 2.7 | | | | 5.2 | | | | 2.1 | | | | 3.5 | | | | 0.7 | |
Total Agriculture | | | 2.1 | | | | 2.5 | | | | 6.5 | | | | 3.1 | | | | 3.3 | |
Manufacturing Industry | | | 4.7 | | | | 0.1 | | | | 0.9 | | | | 0.7 | | | | 1.2 | |
Mining(3) | | | 14.5 | | | | 5.3 | | | | 5.0 | | | | (1.1 | ) | | | 0.6 | |
Electricity, Gas and Water | | | 3.0 | | | | 2.3 | | | | 3.0 | | | | 3.4 | | | | 2.9 | |
Construction | | | 8.2 | | | | 5.9 | | | | 11.5 | | | | 10.5 | | | | 3.9 | |
Services | | | | | | | | | | | | | | | | | | | | |
Transportation, Storage and Communications | | | 6.6 | | | | 3.9 | | | | 3.3 | | | | 4.7 | | | | 1.4 | |
Retail, Restaurants and Hotels | | | 6.7 | | | | 3.9 | | | | 4.5 | | | | 5.1 | | | | 4.1 | |
Financial Services | | | 13.0 | | | | 8.6 | | | | 7.2 | | | | 8.0 | | | | 9.7 | |
Housing | | | 2.8 | | | | 3.2 | | | | 2.8 | | | | 3.1 | | | | 3.1 | |
Services to Companies except Financial Services and Housing | | | 7.1 | | | | 4.8 | | | | 4.8 | | | | 7.2 | | | | 0.9 | |
Public Administration and Defense | | | 2.1 | | | | 4.7 | | | | 6.6 | | | | 5.7 | | | | 2.4 | |
Education | | | 3.1 | | | | 3.2 | | | | 3.9 | | | | 3.7 | | | | 2.1 | |
Social and Health | | | 3.4 | | | | 7.6 | | | | 5.3 | | | | 7.5 | | | | 3.9 | |
Recreation, Cultural, Sports and Other Services | | | 7.3 | | | | 3.1 | | | | 7.1 | | | | 2.0 | | | | 3.7 | |
Domestic Services | | | 3.4 | | | | 2.8 | | | | 2.4 | | | | 3.8 | | | | 3.0 | |
Total Services | | | 5.7 | | | | 4.5 | | | | 4.8 | | | | 5.3 | | | | 3.5 | |
Plus: Duties and Tariffs on Imports | | | 11.1 | | | | 5.4 | | | | 4.0 | | | | 5.6 | | | | 4.0 | |
| | | | | |
Real GDP | | | 6.6 | | | | 4.0 | | | | 4.9 | | | | 4.4 | | | | 3.1 | |
Totals may differ due to rounding.
| 1: | Calculated using constant 2005 pesos. |
Source: DANE.
Agriculture, Livestock, Fishing, Forestry and Hunting
Colombia’s tropical climate and range of altitudes are conducive to a wide variety of agriculture. Coffee, sugarcane, flowers, bananas, potatoes and plantains have traditionally been considered the most important products. In 2015, the combined sectors of agriculture (including coffee), livestock, fishing, forestry and hunting (the “total agriculture” sector) comprised, in the aggregate, 6.2% of total GDP. Total agriculture sector production increased by 3.3% in real terms in 2015, compared to a 3.1% increase in 2014. The non-coffee agricultural and livestock sector accounted for 5.0% of GDP in 2015, increasing by 1.8% in 2015, as compared to 1.7% real growth in 2014. In 2015, the fishing, forestry and hunting sector comprised 0.3% of GDP, increasing by 0.7% in real terms, as compared to 3.5% real growth in 2014.
Coffee production (excluding coffee processing) represented 0.8% of GDP in 2015, increasing by 15.6% in real terms, as compared with an increase of 13.7% in 2014. The weighted average price of coffee exported by Colombia decreased by 15.61% in 2015, from $1.91 per pound in 2014 to $1.61 per pound in 2015. Coffee exports accounted for 7.1% of total merchandise exports in 2015, as the volume of coffee exports increased by 14.0% in 2015, as compared to the volume exported in 2014.
D-22
The National Coffee Fund stabilizes domestic coffee prices. The fund is a trust account created by law for the primary purpose of stabilizing the coffee growers’ income by reducing the volatility caused by international prices. The fund is managed by the National Coffee Growers’ Committee, which is made up of representatives of coffee producers, the Minister of Finance and Public Credit, the Minister of Agriculture and Rural Development, the Minister of Commerce, Industry and Tourism and the Director of the National Planning Department. This committee, subject to the veto right by the Minister of Finance and Public Credit, periodically establishes an internal coffee price paid to local growers. To the extent that export prices, adjusted for transportation and insurance costs, exceed or fall below the established internal price for coffee, the National Coffee Fund accumulates a surplus or deficit. In 2011, the fund registered a fiscal surplus of Ps. 232 billion as a result of an increase in sales. In 2012, the fund registered a fiscal surplus of Ps. 37 billion, Ps. 196 billion lower than the fiscal surplus recorded in 2011 as a result of a decrease in sales volume and price. In 2013, the fund registered a fiscal deficit of Ps.106 billion due to lower volume of sales. In 2014, the fund registered a smaller fiscal deficit of Ps. 54.6 billion due to a Ps. 421 billion increase in revenues mainly due to an increase in other income and an increase in production. According to the preliminary figures, in 2015, the fund registered a fiscal surplus of Ps. 254 billion due to increased production during the month of December registering an increase of 34% compared to the same month in 2014.
On August 2013, agricultural workers staged protests in remote areas and small towns, demanding more government support for agricultural production in light of the fall in international coffee prices. The Government, having expressed its willingness to enter into a dialogue with the protesters and its commitment to the agricultural sector, met with the protesters on August 22, 2013 to discuss their demands, issues of agricultural policy and the availability of financial instruments for agricultural sector support. However, in May 2014, agricultural workers again staged protests demanding better conditions. In May 9, 2014, the Government reached an agreement with the protesters ending the protests and promising to strengthen the ethnic and rural economy. In September 2015, additional protests occurred at facilities of the Ministry of Agriculture and Rural Development. The Ministry of Agriculture and Rural Development, in response to the protests, reviewed the status of 238 agricultural projects instituting viability methodologies and providing deadlines for implementation of the projects.
The Government developed a Ps. 100 billion credit line for the agricultural sector in 2000 through the use of new “agricultural reactivation funds.” Banco Agrario (the successor to the liquidated Caja Agraria) made disbursements of Ps. 3.2 trillion in 2011, Ps. 4.1 trillion in 2012, Ps. 4.8 trillion in 2013, Ps. 4.6 trillion in 2014 and 5.7 trillion in 2015, ending the year with a total loan portfolio of Ps. 11.6 trillion, as compared to a total portfolio of Ps. 10.6 trillion on December 31, 2014, Ps. 9.5 trillion on December 31, 2013, Ps. 8.0 trillion on December 31, 2012 and Ps. 7.1 trillion on December 31, 2011.
Fondo para el Financiamiento del Sector Agropecuario (“Finagro”), acting in its capacity as a rediscount bank, extended Ps. 5,473.0 billion of loans, an increase of 30.9% compared to 2010. In 2012, the loans totaled Ps. 6,472.1 billion, an increase of 18.3% compared to 2011. In 2013, the loans totaled Ps. 6,961.2 billion, an increase of 7.6% compared to 2012. In 2014, the loans totaled Ps. 8,113.1 billion, an increase of 16.5% compared to 2013. In 2015, the loans totaled Ps. 8,486.6 billion, an increase of 4.6% compared to 2014.
Manufacturing
Manufacturing sector production increased by 1.25% in 2015 and accounted for 11.0% of 2015 GDP. Seven categories within the manufacturing sector experienced decreases in 2015, while 17 sectors experienced positive real growth. The largest decreases within the manufacturing sector were registered by other machinery and electrical equipment (which experienced a 5.4% decrease); yarns, threads and fabric fibers textile articles, except apparel (which experienced a 4.8% decrease); textile articles, except apparel (which experienced a 4.7% decrease); and machinery and equipment (which experienced a 4.2% decrease). The categories that experienced the largest increases were coffee products and threshing (which experienced a 12.4% increase); Products of wood, cork, straw products (which experienced a 7.4% increase); paper products and pasteboard (which experienced a 4.5% increase).
D-23
The following table summarizes the composition of the manufacturing sector output and sets forth the rates of real growth for each sector for the periods indicated.
Composition and Real Growth of the Manufacturing Sector(1)
| | | | | | | | | | | | | | | | | | | | | | | | | | | | | | | | | | | | | | | | |
| | | % of Manufacturing GDP | | | Real Growth | |
| | | 2011 | | | 2012 | | | 2013 | | | 2014(2) | | | 2015(2) | | | 2011 | | | 2012 | | | 2013 | | | 2014(2) | | | 2015(2) | |
Beef and Fish | | | 2.3 | % | | | 2.3 | % | | | 2.3 | % | | | 2.3 | % | | | 2.4 | % | | | 3.6 | % | | | 4.1 | % | | | (-1.0 | )% | | | 2.1 | % | | | 4.0 | % |
Oils, Fats, Cocoa and other Food Products | | | 4.3 | % | | | 4.4 | % | | | 4.4 | % | | | 4.6 | % | | | 4.5 | % | | | 2.8 | % | | | 0.9 | % | | | 3.0 | % | | | 4.1 | % | | | 0.1 | % |
Dairy Products | | | 1.7 | % | | | 1.8 | % | | | 1.8 | % | | | 1.8 | % | | | 1.8 | % | | | 3.8 | % | | | 1.2 | % | | | 4.2 | % | | | 1.1 | % | | | 1.6 | % |
Milling Products, Starch and its Products | | | 5.7 | % | | | 5.6 | % | | | 5.4 | % | | | 5.3 | % | | | 5.4 | % | | | 3.1 | % | | | (1.6 | )% | | | (2.5 | )% | | | (2.4 | )% | | | 4.3 | % |
Coffee Products and Threshing | | | 0.7 | % | | | 0.6 | % | | | 0.8 | % | | | 0.9 | % | | | 1.0 | % | | | (6.7 | )% | | | (7.8 | )% | | | 29.1 | % | | | 11.9 | % | | | 12.4 | % |
Sugar | | | 1.3 | % | | | 1.3 | % | | | 1.3 | % | | | 1.5 | % | | | 1.5 | % | | | 10.7 | % | | | (1.4 | )% | | | 4.1 | % | | | 12.8 | % | | | 1.4 | % |
Beverages | | | 6.0 | % | | | 6.2 | % | | | 6.4 | % | | | 6.6 | % | | | 6.8 | % | | | 2.0 | % | | | 3.5 | % | | | 4.2 | % | | | 3.5 | % | | | 4.5 | % |
Yarns, Threads and Fabric Fibers | | | 1.4 | % | | | 1.3 | % | | | 1.2 | % | | | 1.1 | % | | | 1.0 | % | | | 3.9 | % | | | (6.3 | )% | | | (5.5 | )% | | | (8.6 | )% | | | (4.8 | )% |
Textile Articles, except Apparel | | | 1.0 | % | | | 1.0 | % | | | 1.1 | % | | | 1.1 | % | | | 1.0 | % | | | 3.6 | % | | | 3.2 | % | | | 2.7 | % | | | 2.5 | % | | | (4.7 | )% |
Knitted and Crocheted Fabrics; Clothing | | | 7.2 | % | | | 7.3 | % | | | 7.0 | % | | | 7.1 | % | | | 7.3 | % | | | 8.7 | % | | | 0.7 | % | | | (2.3 | )% | | | 1.9 | % | | | 4.4 | % |
Leather and Leather Products, Footwear | | | 2.2 | % | | | 2.1 | % | | | 1.9 | % | | | 2.0 | % | | | 1.9 | % | | | 11.4 | % | | | (3.3 | )% | | | (6.4 | )% | | | 2.8 | % | | | (3.6 | )% |
Wood, Cork and Straw Products | | | 1.2 | % | | | 1.1 | % | | | 1.2 | % | | | 1.2 | % | | | 1.2 | % | | | (2.4 | )% | | | (1.8 | )% | | | 1.4 | % | | | 2.1 | % | | | 7.4 | % |
Paper and Pasteboard | | | 3.9 | % | | | 4.0 | % | | | 4.0 | % | | | 4.1 | % | | | 4.2 | % | | | 4.0 | % | | | 3.8 | % | | | (0.9 | )% | | | 3.3 | % | | | 4.5 | % |
Publishing, Printing and Analogous Articles | | | 3.8 | % | | | 3.9 | % | | | 3.8 | % | | | 3.8 | % | | | 3.8 | % | | | 3.2 | % | | | 2.8 | % | | | (3.1 | )% | | | 1.0 | % | | | 0.8 | % |
Processed Petroleum Products | | | 13.1 | % | | | 12.6 | % | | | 13.0 | % | | | 11.8 | % | | | 11.5 | % | | | 1.4 | % | | | (4.0 | )% | | | 3.9 | % | | | (8.3 | )% | | | (1.8 | )% |
Chemical Products | | | 12.6 | % | | | 12.7 | % | | | 12.9 | % | | | 12.9 | % | | | 13.0 | % | | | 4.4 | % | | | 1.2 | % | | | 2.1 | % | | | 1.2 | % | | | 1.9 | % |
Rubber and Plastic Products | | | 4.3 | % | | | 4.3 | % | | | 4.2 | % | | | 4.2 | % | | | 4.3 | % | | | 6.7 | % | | | (0.9 | )% | | | (0.9 | )% | | | 1.0 | % | | | 3.3 | % |
Non-Metallic Mineral Products | | | 8.5 | % | | | 8.7 | % | | | 8.7 | % | | | 9.5 | % | | | 9.5 | % | | | 11.3 | % | | | 2.7 | % | | | 0.8 | % | | | 10.4 | % | | | 0.9 | % |
Basic Metal Products (except Machinery and Equipment) | | | 6.9 | % | | | 7.1 | % | | | 6.7 | % | | | 6.9 | % | | | 6.9 | % | | | 5.6 | % | | | 3.0 | % | | | (4.6 | )% | | | 3.5 | % | | | 0.4 | % |
Machinery and Equipment | | | 2.8 | % | | | 2.8 | % | | | 2.8 | % | | | 2.9 | % | | | 2.7 | % | | | 4.7 | % | | | 0.1 | % | | | 2.6 | % | | | 2.2 | % | | | (4.2 | )% |
Other Machinery and Electric Equipment | | | 2.5 | % | | | 2.4 | % | | | 2.5 | % | | | 2.5 | % | | | 2.4 | % | | | 9.7 | % | | | (5.3 | )% | | | 5.8 | % | | | 1.4 | % | | | (5.4 | )% |
Transportation Equipment | | | 2.4 | % | | | 2.5 | % | | | 2.3 | % | | | 2.4 | % | | | 2.3 | % | | | 21.1 | % | | | 6.3 | % | | | (10.3 | )% | | | 6.9 | % | | | (3.1 | )% |
Furniture and Related Products | | | 2.2 | % | | | 2.3 | % | | | 2.3 | % | | | 2.3 | % | | | 2.3 | % | | | 8.2 | % | | | 2.2 | % | | | 2.2 | % | | | (0.8 | )% | | | 1.7 | % |
Other Manufactured Goods | | | 2.3 | % | | | 2.3 | % | | | 2.3 | % | | | 2.3 | % | | | 2.3 | % | | | (2.5 | )% | | | 1.0 | % | | | (0.8 | )% | | | 2.5 | % | | | 0.1 | % |
Total | | | 100.0 | % | | | 100.0 | % | | | 100.0 | % | | | 100.0 | % | | | 100.0 | % | | | 4.7 | % | | | 0.1 | % | | | 0.9 | % | | | 0.7 | % | | | 1.25 | % |
Totals may differ due to rounding.
| 1: | Calculated using constant 2005 pesos. |
Source: DANE.
D-24
Mining and Petroleum
Colombia holds substantial reserves of petroleum, natural gas, coal, minerals, precious metals and precious and semi-precious stones, including nickel, gold, silver, platinum and emeralds. It is among the world’s leading exporters of emeralds, gold and coal. According to statistics compiled by DANE, the mining sector as a whole (including the petroleum industry) accounted for approximately 7.1% of GDP in 2015, as compared to 7.2% in 2014. Mining sector production increased in 2015, recording real growth of 0.6%, as compared to a decrease of 1.1% in 2014, as a result of a surge in oil production, which decreased 2.4% in 2014 and increased 1.3% in 2015.
The Republic owns all oil and gas reserves within the territory of Colombia. Until 1974, the Government entered into concession contracts which allowed private companies to exploit oil or gas fields for limited periods of time (usually 20 years). From 1974 to 2003, Ecopetrol S.A., the Government-owned oil company, exploited these reserves either directly or in association with private companies.
In June 2003, the Government divided Ecopetrol S.A. into three state-owned entities. Ecopetrol S.A., the operating unit, continues to manage the operations of Colombia’s existing oil fields. Agencia Nacional de Hidrocarburos (“ANH”), the administrative unit, took charge, as of January 1, 2004, of the management of Colombia’s petroleum resources by assigning areas for exploration and production, evaluating the potential of the country’s petroleum reserves, promoting Colombia’s petroleum resources to attract investment and collecting royalties. According to Law 1760 of 2003, which created ANH, Ecopetrol S.A. could enter into new joint venture contracts through December 2003, but thereafter, ANH has been responsible for entering into all new oil and gas exploration and production contracts. Promotora de Energía de Colombia, the investment unit, manages some of Ecopetrol S.A.’s non-strategic investments. Ecopetrol S.A. is now a mixed economy company and is no longer 100% owned by the Ministry of Mines and Energy. Prior to the public offering of its shares described below, the Ministry of Finance owned 95% of Ecopetrol S.A.’s shares and the remaining shares were owned by other public sector enterprises. On July 25, 2007, the Government announced a public offering of 20% of the shares of Ecopetrol S.A. The newly issued shares, representing 10.1% of total shares, were offered from August 27, 2007 through September 25, 2007, to active employees, pension funds, cooperatives, mutual funds and Colombian citizens. On September 25, 2007, Ecopetrol S.A. received Ps. 5.7 trillion for all the offered shares. The proceeds from the sale were used to invest in exploration, exploitation of hydrocarbons, and modernization and development of biofuels. As of December 31, 2015, the Government owned 88.5% of Ecopetrol S.A.’s shares.
In October 2012, Ecopetrol S.A. transferred its direct interests in Ocensa, ODC, Oleoducto Bicentenario, ODL and Serviport to Cenit Transporte y Logística de Hidrocarburos S.A.S. (“Cenit”). On April 1, 2013, Ecopetrol S.A. transferred its hydrocarbon transport and logistics assets (crude oil and multiproduct pipelines and loading and unloading facilities) to Cenit, and Cenit started its operations as owner of the transportation and logistics infrastructure. On January 1, 2014 Ecopetrol S.A. transferred its port concessions and assets to Cenit.
On April 1, 2013, Ecopetrol S.A. entered into a number of contracts with Cenit in order to establish their operating relationship. Pursuant to transportation and service agreements, Cenit provides to Ecopetrol S.A., for a term of 30 years, hydrocarbon and refined products transportation, storage, loading and unloading and logistics services through the transportation assets that were transferred to it as an in-kind capitalization. Ecopetrol S.A. also
D-25
entered into an operation and maintenance agreement with Cenit pursuant to which Ecopetrol S.A. is in charge of the operation and maintenance of the transportation assets for a term of 15 years. In return, Cenit will pay Ecopetrol S.A. a variable monthly payment for the services rendered. The companies also entered into a project management agreement, pursuant to which Ecopetrol S.A. provides project management services on market terms to Cenit for a term of 15 years.
In December 2014, Ecopetrol S.A. received authorization from the Superintendency of Ports to merge its wholly owned subsidiary EPI into Cenit. The merger was completed on December 19, 2014, adding Ps. 1 billion in assets to Cenit. As a result of the merger, Cenit is now a direct wholly owned subsidiary of Ecopetrol S.A.
Under Colombia’s royalty system, the national, departmental and municipal governments share a royalty on all crude oil and natural gas production. For most of Ecopetrol S.A.’s oil field exploration and exploitation contracts, the royalty is equal to 20% of the total value of the oil production from the field. Concession contracts, however, individually provide a royalty percentage which is unique to each contract. In 1999, a modification to the royalty system established a sliding royalty percentage linked to the level of production for oil fields discovered after July 29, 1999. Under the various contract arrangements discussed below between Ecopetrol S.A. and private companies, it is customary for Ecopetrol S.A. to calculate its own share of production after payment of the royalty. Law 756 of 2002 further modified the oil royalties system and towards encouraging oil exploration in small- and medium-size fields. This law establishes variable royalties ranging from 8% for fields producing up to 5,000 barrels per day to 25% for fields producing in excess of 600,000 barrels per day.
To address the country’s exploration and production needs, Colombia has modified the contractual regime governing the exploration, development and production of hydrocarbons on a number of occasions since its introduction in 1970. The exploration and production contracts entered into with Ecopetrol S.A.’s business partners set forth the production split, the length of the exploration and production terms, and royalty payments.
Under Colombian law, an existing contract cannot be modified because of a change to the contractual regime unless the change is made through public order regulations. As a result, contracts that were executed prior to the issuance of a new contractual regime remain in full force and are not affected by the subsequent regime. As of December 31, 2015, Ecopetrol S.A. and certain of its subsidiaries carry out exploration and production operations through 55 exploration and production agreements and technical evaluation contracts signed with the ANH, as well as through association contracts and other types of contracts in various forms.
Under joint venture contracts entered into before March 1994, which include contracts regarding the Cusiana and Cupiagua crude oil fields, among others, the private investor explored a previously agreed upon area at its own risk and expense. Thereafter, Ecopetrol S.A. had the option to become a joint venture partner by reimbursing the investor 50% of the exploration costs of oil wells within commercially viable fields and 50% interest of all future development costs related to those fields. Once Ecopetrol S.A. became a partner, it had a 50% interest in the production of the field.
If Ecopetrol S.A. decided not to become a joint venture partner within a certain period of time, the private investor had the right to enter into a sole risk contract for the field’s crude oil production until it had recovered 200% of its investment and 100% of all its total costs. Thereafter, Ecopetrol S.A. could participate in the development of the field and all future costs and expenses would be automatically shared with the partner.
Beginning in 1994, modifications were made to standard joint venture contracts to maintain the private investor’s share of production at 50% until aggregate production exceeded 60 million barrels. Thereafter, Ecopetrol S.A.’s share increased gradually, up to a maximum of 70% of production. In 1995, further modifications to the standard joint venture contracts required Ecopetrol S.A. to pay for half of the exploration costs, not only for wells that ultimately proved to be productive, but also for dry wells, stratigraphic wells and seismic exploration in fields that became commercially viable. The modifications also provided for competitive bidding for the right to explore and develop marginal fields (defined according to certain technical, financial and operational criteria). In the bidding process, private companies presented bids based on percentages of production they would pay Ecopetrol S.A.in exchange for the rights to develop these fields. Winning bidders were responsible for all future investment and operating costs related to the field.
D-26
The standard joint venture contract was once again modified in 1997 in order to promote private sector activity in the development of inactive areas and small fields and in the exploration for natural gas. These modifications extended the exploration periods, increased the levels of reimbursement for private companies’ exploration costs and provided for the reimbursement of exploration costs in real terms and denominated in U.S. dollars.
In 1999, the Government adopted two additional modifications to the standard terms, applicable to new joint venture contracts:
| | • | | Reduction of Ecopetrol S.A.’s Initial Participation. Ecopetrol S.A.’s initial participation under the joint venture contracts signed after this reform was reduced from 50% to 30%. |
| | • | | Modified R Factor. The Government modified the formula used to determine the increase in Ecopetrol S.A.’s share of total production, the R Factor. The R Factor is calculated by dividing accumulated revenues in cash by investments and costs. If the R Factor increases above a certain profitability threshold, then Ecopetrol S.A.’s share of production increases above the initial 30%. Pursuant to the 1999 modifications, Ecopetrol S.A. raised the profitability threshold at which the R Factor triggers an increase in Ecopetrol S.A.´s share from 1.0 to 1.5. Additionally, prior to the 1999 modifications, the R Factor was calculated in constant U.S. dollars. The new calculation method was designed to prevent inflation from causing an increase in the R Factor and a corresponding increase in Ecopetrol S.A’s share. As of December 31, 2015, Ecopetrol S.A. had 46 joint venture contracts with a modified R Factor. |
Ecopetrol S.A. has entered into various joint venture and other contractual agreements for the exploration and production with regional and international oil companies. These arrangements include: risk participation contracts, incremental production agreements, shared risk production contracts, risk services production contracts and discovered undeveloped fields contracts.
Risk-participation contracts. Under these contracts, Ecopetrol S.A. assumes 20% of the exploration costs and risks at the beginning of the second year in exchange for a larger participation in the future production and equal representation on the executive committee of the joint venture. As of December 31, 2015, Ecopetrol S.A. had one risk participation contract in effect
Incremental Production Agreements. Ecopetrol S.A. currently has two types of incremental production agreements: the standard incremental production agreements (“SIPA”) and the development of incremental production project agreements (“DIPA”).
| | • | | SIPAs. Under the SIPAs, Ecopetrol S.A. calculates the total number of proved developed reserves available in a specific field or well and then establishes a base production curve for the reserves. Any future production exceeding the curve, which is referred to as incremental production, results from extracting proved undeveloped reserves or probable reserves which require additional investments funded by Ecopetrol S.A.’s partners under the SIPA. Ecopetrol S.A. has the right to a previously specified percentage of the incremental production. Ecopetrol S.A’s. percentage participation varies depending on the total amount invested by Ecopetrol S.A.’s partners and on the R Factor, which cannot be lower than 1.5. The volume produced under the production curve is not shared with the partners. As of December 31, 2015, Ecopetrol S.A. had five SIPAs in effect. |
| | • | | DIPAs. Under DIPAs, Ecopetrol S.A. must file a request with the Ministry of Mines and Energy to approve an incremental production project for a field that Ecopetrol S.A. directly operates. If the project is approved, Ecopetrol S.A. agrees with its partners to develop the field and Ecopetrol S.A. determines mandatory investment thresholds for the partners. Ecopetrol S.A. is not required to fund any investment. The production from the field is distributed to Ecopetrol S.A. and the partners receive a percentage of the total production from the field that varies depending on the invested amount. Once the mandatory investment stage expires, Ecopetrol S.A. agrees with its partners on the percentage of production, total costs and additional investments to be paid by each |
D-27
| | party. Ecopetrol S.A. pays 20% royalties to the Government on the base production curve and variable royalties on any incremental production. Additionally, in the event of higher prices and large volumes, Ecopetrol S.A. has adjustment clauses to increase its share in the production. As of December 31, 2015, Ecopetrol S.A. had one DIPA in effect. |
Shared-Risk Production Contracts. Under these contracts, Ecopetrol S.A. remains as operator of the field and assumes responsibility for 50% of all investments and costs. Private companies submit bids to enter into agreements with Ecopetrol S.A. based upon the production percentage they will assign to Ecopetrol S.A. The successful bidder has the right to enter into the shared risk contract with Ecopetrol S.A. As of December 31, 2015, Ecopetrol S.A. had one shared risk production contract outstanding.
Risk Service Production Contracts. Ecopetrol S.A. began using risk service production contracts in January 1998 to increase production through the use of new technologies in crude oil fields then operated by Ecopetrol S.A.’s partners. All investments in new technologies were made by its partners who received a previously specified fee per barrel. As of December 31, 2015, Ecopetrol S.A. had one risk service contract outstanding for the development of the Rancho Hermoso field located in the Mirador formation.
Discovered Undeveloped Fields Contracts. Ecopetrol S.A. has entered into discovered undeveloped fields contracts to promote exploration by private companies of both undeveloped and inactive fields. Under these contracts, the contracting party assumes all costs and expenses for the development and operation of a field in exchange for a certain amount of production. As of December 31, 2015, Ecopetrol S.A. had five discovered undeveloped fields contracts.
Ecopetrol S.A invested $456.5 million in technological improvements in 2015. Among these improvements are: specialized technological support for exploration and production; increased recovery factor and well productivity; dilution strategies for transport of crude oil; process optimizations and advanced control in refinery plants; implementation of roadmaps information technologies; application of technical standards refineries, and implementation of best knowledge practices and solutions.
The total budget in science and technology during 2015 was approximately US$75 million. Each year Ecopetrol S.A. presents to the Colombian Institute for the Development of Science and Technology (Instituto Colombiano para el Desarrollo de la Ciencia y la Tecnología, or COLCIENCIAS) its research, technology development projects and innovation initiatives in order to obtain certification for its science and technology investments. COLCIENCIAS certifies science and technology investments, which are deductible from income tax. In 2015, Ecopetrol S.A. obtained US$28 million in tax benefits from their science and technology investments that COLCIENCIAS certified in previous years. As of December 31, 2015, Ecopetrol S.A. signed 34 technology cooperation agreements, in which it invested Ps. $16 billion.
Current Joint Venture Contractual Regime
In 2004, the authority to enter into exploration and production contracts was assigned to ANH under a different exploration and production contractual arrangement. Ecopetrol S.A. became an operator like any other company, competing with all other regional and international oil companies in Colombia for exploration and production opportunities under the same conditions and without any special rights. Decree Law 1760 of 2003 gave Ecopetrol S.A. the right to maintain in effect all contracts that the company had entered into prior to January 1, 2004, as well as to have absolute discretion as to whether or not such contracts would be extended after their stated termination dates. If Ecopetrol S.A. decided not to extend the contracts, the production rights and assets related to the relevant block would revert to Ecopetrol S.A. and Ecopetrol S.A. would have the right, at no additional cost, to exploit the associated reserves indefinitely. Contracts entered into by Ecopetrol S.A. after January 1, 2004 that are not extended by ANH would revert to ANH and not to Ecopetrol S.A.
In 2004, ANH introduced two new model contracts to replace the previously used joint venture contracts: the exploration and production contract and the technical evaluation agreement.
Exploration and Production Contracts. Under exploration and production contracts, the contractor, including Ecopetrol S.A., undertakes all exploration and production activities. The contractor also assumes all risks and costs of exploration and is the sole owner of all production and assets involved in the exploration and production activities for the term of the contract. There is no partnership or joint venture between the contractor and ANH.
D-28
Technical Evaluation Agreements. The scope of the technical evaluation agreements is limited to exploration activities. Under this type of agreement, the contractor can evaluate a specific area and decide whether or not it will enter into an exploration and production contract. The contractor assumes all risks and costs of the activities and operations.
Ecopetrol S.A. entered into several agreements or “Convenios” with ANH in areas directly operated by Ecopetrol S.A., where Ecopetrol S.A. holds total exploration and production rights up to the point when revenue from the well falls below the costs of operations set by the company (the “economic limit”).
When the joint venture contracts agreed before December 31, 2003 expire, Ecopetrol S.A. is required to enter into agreements with ANH pursuant to Article 2 of Decree 2288 of 2004. The purpose of these agreements is to define the terms and conditions under which Ecopetrol S.A. can exercise its exclusive right of exploration and production of hydrocarbons—granted by Decree Law 1760 of 2003—in the agreement area until the economic limit of the area covered by the contract has been reached.
Ecopetrol S.A. has entered into a number of exploration and production contracts with regional and international oil companies.
In 2013, Ecopetrol S.A. issued bonds in the international capital markets in an aggregate principal amount of $2.5 billion. On May 28, 2014, Ecopetrol S.A. issued bonds in the international capital markets in an aggregate principal amount of $2 billion. On September 16, 2014, Ecopetrol S.A. issued bonds in the international capital markets in an aggregate principal amount of $1.2 billion. On June 26, 2015, Ecopetrol S.A. issued bonds in the international capital markets in an aggregate principal amount of $1.5 billion. On June 15, 2016, Ecopetrol S.A. issued bonds in the international capital markets in the aggregate principal amount of $500 million, the proceeds from the offering will be used for general corporate purposes, including capital expenditure. Ecopetrol S.A. stated that the proceeds of the 2013, 2014, 2015 and 2016 issuances would be used for general corporate purposes, including capital expenditures
As of December 31, 2015, Colombia’s proven crude oil reserves totaled approximately 2,308 million barrels and Colombia’s proven gas reserves totaled an estimated 4.7 trillion cubic feet. The following table sets forth Colombia’s proven crude oil and natural gas reserves at the dates indicated.
Proven Reserves of Colombia(1)
| | | | | | | | | | | | | | | | | | | | |
| | | | | | | | | As of December 31, | |
| | | 2011 | | | 2012 | | | 2013 | | | 2014 | | | 2015 | |
Crude Oil (millions of barrels) | | | 2,259 | | | | 2,377 | | | | 2,455 | | | | 2,308 | | | | 2,002 | |
Natural Gas (trillions of cubic feet)(2) | | | 5.5 | | | | 5.7 | | | | 5.5 | | | | 4.8 | | | | 4.4 | |
| 1: | “Proven reserves” are defined as the estimated quantities of crude oil and natural gas which geological and engineering data demonstrate with reasonable certainty to be recoverable in future years from known reservoirs. In the case of reserves to which Ecopetrol S.A. has the sole right of development, Ecopetrol S.A. estimates proven reserves in accordance with the methodology promulgated by the Society of Petroleum Engineers. While this methodology permits such estimates to be based on assumptions regarding future economic and operating conditions (including prices and costs), Ecopetrol S.A. includes as proven reserves only those reserves that, at the date of estimation, are recoverable under existing economic and operating conditions. Ecopetrol S.A. estimates its share of reserves that are to be developed pursuant to joint venture contracts using the same methodology as employed in the calculation of direct reserves, based on seismic, geological and other technical data supplied by the respective operators and reviewed by Ecopetrol S.A.’s petroleum engineers. |
| 2: | Corresponds to gas with concrete commercial viability. |
Until 2000, Colombia had witnessed relatively little exploration activity. This was the result of both the significant decline in oil prices in 1997 and 1998 and fiscal policies and contractual terms that were not
D-29
internationally competitive. Since 2002, however, exploration activity has generally increased as a result of higher investments in operations by Ecopetrol S.A., as well as reforms to the standard terms of exploration and production contracts (as discussed above) that have attracted investors, but experienced a decrease in 2011 and 2012. In 2011 total seismic exploration decreased to 23,963 kilometers and in 2012 further decreased to 18,205 kilometers. In 2013 total seismic exploration increased to 28,529 kilometers. In 2014 total seismic exploration increased to 40,473 kilometers. In 2015 total seismic exploration remained at 32,682 kilometers. The drilling of exploration oil wells generally increased from 2009 to 2012, but decreased slightly in 2013 and 2014. A total of 112 oil wells were drilled in 2010. In 2011 and 2012, the number of oil wells drilled increased to 126 and 131, respectively. In 2013, the number of oil wells drilled decreased to 115. In 2014, the number of oil wells drilled decreased to 113. In 2015, the number of oil wells drilled decreased to 25.
Production of crude oil in Colombia increased from an average of 990.0 thousand barrels per day in 2014 to 1,006.0 thousand barrels per day in 2015, due to environmental, public order (operational delays arising from strikes and demonstrations by indigenous communities) and operational issues. Ecopetrol S.A.’s direct production accounted for approximately 53.3% of the total crude oil production in 2015 as compared to 53.7% in 2014.
Of the 1,006 thousand barrels of crude oil produced per day in 2015, approximately 79.6% were exported, as compared to 79.8% of total crude oil production in 2014. Ecopetrol S.A. was responsible for exporting 53.3% of the total crude oil produced by Colombia in 2015, as compared to 53.7% in 2014. The value of Colombia’s exports of crude oil and its derivatives in 2015, according to balance of payments statistics, totaled an estimated $14.2 billion, a 50.8% decrease from the 2014 level. This decrease was due to a decrease in volume and price. The average export price of crude oil in 2015 for Ecopetrol S.A. was $43.8 per barrel as compared to $87.1 per barrel in 2014. Ecopetrol S.A.’s average daily volume of exports of crude oil in 2015 was estimated at 537.3 thousand barrels per day, a 0.99% increase over the average daily volume in 2014 of 532.1 thousand barrels per day. Since 1995, the Government has used a stabilization fund through which revenues from the Cusiana production are invested abroad in order to avoid the inflationary effects associated with large inflows of oil revenues into the country. For further details on the stabilization fund, see “Public Sector Finance—General” below.
In connection with its core activities of exploration and production of oil and gas, Ecopetrol S.A. has developed a network of pipelines used to transport crude oil, natural gas and oil products to domestic refineries, major distribution points and export facilities. The pipelines, some of which are wholly-owned by Ecopetrol S.A. while others are owned jointly with joint venture partners or other companies, transport oil and gas owned by Ecopetrol S.A., joint venture partners and concession operators. The 829 km OCENSA pipeline, a joint venture among Ecopetrol S.A., joint venture partners and other companies, was completed in February 1998. The pipeline transports crude oil from the Cusiana and Cupiagua and other nearby fields to the port of Coveñas. The pipeline maintained an average output of approximately 618 thousand barrels per day during 2015, 73% of which corresponds to Ecopetrol S.A. A subsidiary of Ecopetrol S.A., Oleoducto Bicentenario, is in the second phase of construction of the Araguaney-Coveñas pipeline, which is expected to be the longest of its kind in Colombia. The first phase of the construction permits the transportation of at least 110 thousand barrels per day, with a pipeline of 230 kilometers in length and a diameter of 42 inches, connecting Araguaney to Banadía. The first phase of the contract was completed in March 2014.
The Government, with private sector participation, intends to substantially expand the natural gas pipeline network and the related infrastructure over the next several years. The production of natural gas is driven by the growth of local demand and exports to Venezuela. In 2014, the average daily production of natural gas by Ecopetrol S.A. reached 121 thousand barrels of oil equivalent per day (“boepd”), a 3% reduction when compared with 2014. Colombia has three main natural gas production fields, Guajira, Cusiana and Cupiagua. The majority of Colombia’s natural gas is produced by joint ventures. In the Guajira field, Ecopetrol S.A. has partnered with Chevron. In the development of the Cusiana field, Ecopterol S.A.’s partners are Equión and Sinochem Petroleum Exploration and Production. Ecopetrol S.A. directly operates the Cupiagua field, including the Cupiagua gas plant, which is connected with the Cusiana field through the Cupiagua-Cusiana gas pipeline. Of Colombia’s total natural gas production as of December 31, 2015, 35% was supplied from the Guajira field, 22% from the Cusiana field, 20% from the Cupiagua field and the remaining 23% from fields located in other regions.
The Tauramena joint venture expires on July 3, 2016. The Tauramena block is part of the Cusiana unified exploitation plan wherein as a consequence of the termination of the Tauramena joint venture Ecopetrol’s participation will increase from 63.4% to 97.8%. Ecopetrol S.A. will assume the operation of the Cusiana unified exploitation plan as from the termination of the Tauramena joint venture.
D-30
In 2015, Ecopetrol S.A.’s daily gas production decreased by 3% from 125 thousand boepd, in 2014 to 121.2 thousand boepd in 2015, primarily due to the limitations on water disposal, mainly in Campo Rubiales, the natural decline of fields, especially in Guajira, and the operational difficulties associated with strikes which generated delays in the building of new facilities and wells. In 2009, Ecopetrol S.A. continued its investments directed at increasing gas supply by investing in gas treatment plants and the Cusiana Liquefied Petroleum Gas (LPG) plant. In November 2005, Colombia and Venezuela entered into an agreement to build a two-way gas pipeline between the two countries. Under the agreement, the pipeline was to send 450 million cubic feet of natural gas per day from Colombia’s La Guajira region to Venezuela’s Paraguana peninsula during the first four years of service. At the end of that period, the pipeline’s flow was to be reversed with Venezuela supplying 150 million cubic feet of gas per day to Colombia from 2012 to 2028. The construction of the pipeline began on July 8, 2006 at a projected cost of $335 million and was inaugurated on October 12, 2007.
In 2015, eight new pilot projects were initiated with the aim of increasing the recovery factor through water injection and chemical injection, meeting the pilot projects goal that was originally set for the year. These pilot projects were developed in the following fields: Provincia, Tisquirama, Llanito, Chichimente, Castilla, Suria and Caracara.
In December 2011, Ecopetrol S.A. extended the natural gas export agreement between Colombia and Venezuela for two years beginning in January 2012. In 2012, export sales of natural gas by Ecopetrol S.A. increased by 9.3% as compared with 2011, principally due to a 17.7% increase in average export prices in U.S. dollar terms. In 2013, export sales of natural gas by Ecopetrol S.A. increased by 2.3% as compared with 2012, despite a 2.8% decrease in average export prices in U.S. dollars. In 2014, the export of natural gas decreased by 52% compared to 2013 due in part to Resolution 90456 of 2014 of the Ministry of Mines and Energy, which gives priority to domestic consumption of natural gas by thermal plants, thus restricting exports. In 2015, the export of natural gas decreased by 56.5% compared to 2014 due to the termination of the contract of sale to Venezuela on June 30, 2015.
Construction
The construction sector grew by 8.2% in 2011, 5.9% in 2012 and 11.5% 2013. In 2014, the construction sector grew by 10.5%. This positive growth in 2014 was due to an increase in construction of buildings and civil works. In 2015, the construction sector grew by 3.9%.
D-31
Services
The services sector accounted for 54.8% of GDP in 2015. Activity in the services sector grew by 3.4% in real terms in 2015, following growth of 5.7%, 4.5%, 4.8% and 5.3% in 2011, 2012, 2013 and 2014, respectively. The following table shows the composition of the services sector for the years indicated.
Composition of Services Sector
| | | | | | | | | | | | | | | | | | | | |
| | | 2011 | | | 2012 | | | 2013 | | | 2014(1) | | | 2015(1) | |
| | | (Percentage of total services) | |
Transportation, Storage and Communications | | | 13.7 | % | | | 13.6 | % | | | 13.4 | % | | | 13.4 | % | | | 13.1 | % |
Retail, Restaurants and Hotels | | | 22.3 | % | | | 22.1 | % | | | 22.1 | % | | | 22.1 | % | | | 22.2 | % |
Financial Services | | | 9.2 | % | | | 9.6 | % | | | 9.8 | % | | | 10.0 | % | | | 10.6 | % |
Housing | | | 15.1 | % | | | 14.9 | % | | | 14.6 | % | | | 14.3 | % | | | 14.3 | % |
Services to Companies except Financial Services and Housing | | | 11.8 | % | | | 11.9 | % | | | 11.9 | % | | | 12.1 | % | | | 11.8 | % |
Public Administration and Defense | | | 15.4 | % | | | 15.4 | % | | | 15.7 | % | | | 15.7 | % | | | 15.6 | % |
Education | | | 3.2 | % | | | 3.2 | % | | | 3.2 | % | | | 3.1 | % | | | 3.1 | % |
Social and Health | | | 3.8 | % | | | 3.9 | % | | | 3.9 | % | | | 4.0 | % | | | 4.0 | % |
Recreation, Cultural, Sports and Other Services | | | 4.1 | % | | | 4.0 | % | | | 4.1 | % | | | 4.0 | % | | | 4.0 | % |
Domestic Services | | | 1.3 | % | | | 1.3 | % | | | 1.3 | % | | | 1.3 | % | | | 1.3 | % |
| | | | | | | | | | | | | | | | | | | | |
Total | | | 100.0 | % | | | 100.0 | % | | | 100.0 | % | | | 100.0 | % | | | 100.0 | % |
| | | | | | | | | | | | | | | | | | | | |
Totals may differ due to rounding.
The retail, restaurants and hotels subsector grew by 4.1% in real terms in 2015, as compared to a growth of 5.1% in 2014, and accounted for 12.2% of GDP in 2015. The financial services subsector grew by 9.7% in real terms in 2015, as compared to 8.0% real growth in 2014, and accounted for 5.8% of GDP in 2015. Transportation, storage and communications increased by 1.4% in real terms in 2015, as compared to 4.7% real growth in 2014, and accounted for 7.2% of GDP in 2015.
As of December 2015, there were approximately 206,708 km of roads in Colombia. The public roads within Colombia are categorized as primary, secondary, tertiary or other roads. The primary network consisted of 19,287 km of nationwide roads and expressways, which facilitates access to the capitals of the departments. The secondary network consisted of 45,137 km of regional roads which connect smaller cities. The tertiary network consisted of 142,284 km of roads which connect towns and other localities.
Over the last several years, the road concessions program has substantially increased the participation of private companies in the transportation sector. These concessions permit the construction of safer and more modern roadways. The transportation corridors to be constructed under these concessions will connect large industrial and agricultural centers, which are primarily located in the nation’s interior, with the most important Atlantic and Pacific ports. These corridors include the Bogotá–Santa Marta (“Ruta del Sol” concession) corridor, the Bogotá–Buenaventura corridor and the Caribbean road network. As of December 2015, the road concessions consisted of 10,389 km of roads (as part of the 19,287 km of the primary network).
With respect to the communications sector, Colombia had 15.5 telephone lines in service per 100 inhabitants on December 31, 2011, 13.5 telephone lines in service per 100 inhabitants on December 31, 2012, 15.2 telephone lines in service per 100 inhabitants on December 31, 2013, 15.1 telephone lines in service per 100 inhabitants on December 31, 2014 and 14.7 telephone lines in service per 100 inhabitants on December 31, 2015. Prior to 1998, Empresa Nacional de Telecomunicaciones, a state-owned company, was the primary provider of domestic and international long distance telephone services in Colombia. Since August 1997, however, ten-year licenses with automatic ten-year extensions have been granted to new operators of domestic and international long distance telephone services. In December 1998, Empresa de Teléfonos de Bogotá (“ETB”, owned by the capital district of Bogotá) and Orbitel (a privately owned company), began providing international and domestic long-distance services, ending the 50-year monopoly of Empresa Nacional de Telecomunicaciones.
In recent years, Colombia has witnessed increased demand for cellular telephone service. In 2003, Colombia had an estimated 14.3 mobile telephone lines in operation per 100 inhabitants, with service provided by
D-32
Telefonica Móvil, Comcel and the recently formed Colombia Movil. According to the Ministry of Communications, there were approximately 41.2 million mobile telephones in use at year-end 2009. At year-end 2010, there were 44.5 million mobile telephones in use in Colombia. As of the fourth quarter of 2015, there were 57.3 million mobile telephones in use in Colombia, a 3.6% increase from the same quarter in 2014. The Government has made cellular telephone service subject to private sector participation and competition.
In 2010, the Government aimed to quadruple the number of internet broadband connections from 2.2 million to 8.8 million by 2014 through the “Plan Vive Digital”, a program designed to reduce unemployment and poverty while increasing competitiveness. At the end of 2015, the number of internet broadband connections exceeded the target, reaching a total of 12,436,380 broadband subscribers, in comparison with 9,891,506 broadband subscribers recorded at the end of 2014.
The Government operates three national public television networks. In the first half of 1998, in accordance with a law that permits greater private sector participation in television networks, two private television networks, RCN and Caracol, began operations nationwide. In addition, local governments support eight regional networks and there is one regional private network. On October 29, 2009, the National Commission on Television (“CNTV”) initiated a bidding process to license a third private television network for a ten year period. In January 2012, some of the functions of CNTV were transferred to the newly created National Television Authority (“ANTV”). The ANTV is responsible for providing for the implementation of programs for the public television service. In April 2013, the ANTV entered into an agreement with Universidad Nacional de Colombia to establish the financial, economic, technical and legal criteria by which ANTV will award a license to private television networks. Although ANTV has initiated the bidding process to license the third private television network, the bidding process has been suspended. Caracol TV and RCN TV, two private television networks, were sanctioned in 2012 and 2013 and were each required to pay the Government Ps.32,000 million for the period between July 2010 and December 2012, a sum that was paid at the time by the channels. However, the sanction imposed on these channels since 2013 has not been paid voluntarily and consequently ANTV cannot proceed with the bidding process until a final award is made in the arbitration proceedings with Caracol and RCN.
Energy
In 2015, 63.8% of electric energy consumption in Colombia was derived from hydroelectric generated sources, while 28.7% was derived from thermally generated (gas and coal) sources and the remaining 7.5% was derived from other sources. In 2015, the output of the utility sector (electricity, gas and water) increased by 2.9% in real terms and accounted for 3.5% of GDP.
Colombia’s proven energy reserves in 2015 included approximately 6,252 million tons of coal, 2,002 million barrels of crude oil and 4.3 trillion cubic feet of natural gas, including natural gas with concrete commercial viability and natural gas that can be used for oil extraction purposes. In addition, it is estimated that Colombia has the capacity to generate more than 16,484 megawatts of electric power.
By the end of 1997, all of the major cities in Colombia were connected to an extensive gas pipeline network. Ecopetrol S.A. sponsored two significant projects consisting of a total of 1,350 km of pipeline, under a “build, own, operate, maintain and transfer” (“BOMT”) arrangement with private companies. Construction contracts for an additional 1,695 km of pipeline were awarded. Law 401 of 1997 created the Empresa Colombiana de Gas (Colombian Natural Gas Corporation, or “ECOGAS”) to manage the gas transmission network. In February 2007, Transportadora de Gas Internacional S.A. ESP (“TGI”) acquired ECOGAS. TGI, a subsidiary of Empresa de Energía de Bogotá, operates and maintains the most extensive network of pipelines in Colombia, transporting natural gas in the “interior system” through a network that extends from La Guajira to Cauca Valley and from the Eastern Plains to Huila and Tolima and several departments across the Andean region.
Over the past decade, the Government has restructured the energy sector in order to improve the economic performance of the companies within the sector. For example, the Government has encouraged competition, private investment and the development of alternative energy sources. The 1994 Electricity Law significantly transformed the electric power sector. It permits the formation of privately-owned electric utility companies and the privatization of all or part of existing public sector companies. However, it prohibits vertical integration of new entrants into the utilities sector. In addition, a 1995 restructuring program resulted in an increase in private participation in power generation.
D-33
Following the Government’s sale in 1996 of several major power generation plants, private sector investors purchased 48.5% of the capital stock of Empresa de Energía de Bogotá and 56.0% of the capital stock of Empresa de Energía del Pacifico S.A. E.S.P. in 1997. As of December 2015, 40.5% of Colombia’s total power generation capacity was privately held, while 60.0% continued to be state-owned, of which 31.5% is purely state-owned generation and the other 28.5% is of mixed ownership. The Superintendencia de Servicios Publicos (Superintendency of Public Services) has intervened in the management of Cedelca and Electrolima. On July 26, 2002, the Government announced the liquidation of the Chocó power generation plant and the creation of a new company, Dispac, which is operated by private parties. On February 26, 2007, the Government authorized the sale of 19.2% of its stake in Isagen, one of the largest power generation companies in Colombia. See “— Role of the State in the Economy; Privatization — Isagen” below for the additional information on the Government’s announced sale of its remaining interest in Isagen. The Government sold a portion of its shares of Interconexión Eléctrica S.A. (“ISA”), one of Colombia’s largest electricity transmission companies, in two successful public offerings in 2001 and 2002. As of December 31, 2015, private participation in electricity transmission was 21.3%.
In addition to electricity generation and transmission, the Government has also made progress in privatizing electricity distribution. As of December 2015, 22.2% of Colombia’s total distribution capacity was privately held.
Infrastructure Development
Deficiencies in Colombia’s infrastructure have created economic inefficiencies that have adversely affected the country’s economic performance. To address this concern, the Government has been working to expand the telecommunications infrastructure, cargo ports, airports and roads.
The Government is implementing 30 large scale projects for the development of improvements for new and upgraded highways. These projects are being implemented in three phases. The first phase consists of ten highways that are projected to cover 1,184 km, representing an investment of Ps. 12.1 trillion. The second phase consists of nine highways that are projected to cover 1,786 km, representing an investment of Ps. 12.2 trillion. The third phase is still undergoing planning-development and consists of two highways that are projected to cover 195 km, representing an investment of Ps. 2.1 trillion, and nine private public partnerships that were initiated by private parties, representing an investment of Ps. 9.9 trillion. The objective of these projects is to modernize the country’s road infrastructure, making it more competitive and boosting economic development.
The projects in first phase are in the initial stage of development, with five projects in the construction stage and the other five projects in the environmental licensing process and purchase of land stage. The nine projects in the second phase are in the process of being awarded for construction. The eleven projects in the third phase are still in the process of being structured or in the environmental licensing process and purchase of land stages.
Since 2010, the Ministry of Information Technologies and Communications, through the Connectivity Directorate (formerly the Compartel program), has initiated a project with the goal of providing access points to the internet, called Vive Digital Kiosks, to the population in rural or remote areas with more than 100 people. The project aims to promote and increase the use of information and communication technology through better equipment, faster connection speeds and workshops designed for children, youths and adults of all ages to be better attuned to the digital world.
The project consists of the following two phases:
| | • | | the first phase will ensure: (i) the provision of telecommunication services in community access points that were originally provided by the Compartel program, which ended its operations on March 30, 2013; (ii) that 70% of the targeted population centers have a community access point to the internet; and (iii) that community access points are installed in National Parks. |
D-34
| | • | | the second phase will seek to provide that all targeted population centers have an access point to the internet. |
To encourage private sector participation in the supply of communication services, the Government has encouraged a deregulation process that began in the early 1990’s. That process emphasized infrastructure modernization in specific areas that are key to attaining global competitiveness.
Under Law 1341 of July 30, 2009, the Ministry of Communications became the Ministry of Information Technologies and Communications. The law also provided a legal framework for the technological development of the sector and the promotion of access and the use of information technology and communication through substantial use, free competition and efficient use of infrastructure and user protection.
In addition to the expansion of the telecommunications infrastructure and the construction of new roadways and the repair of existing ones, the Government plans to continue promoting private investment participation to improve other infrastructure, such as cargo ports, airports and roads. The Government also is considering the implementation of long-term energy generation and transmission capacity expansion by encouraging strategic investors to explore and develop oil and natural gas offshore and onshore fields and to invest in the natural gas transportation and oil refining capacity expansions through privatizations, concessions and joint ventures. In addition, the Government plans to finance private investment activity from the domestic and international capital markets.
In 2006, Ecopetrol S.A. selected Glencore AG as its strategic partner in the development of a master plan with respect to the Cartagena refinery. In accordance with the master plan, Refinería de Cartagena S.A.-RCS (“Reficar”) was incorporated and began operations on April 1, 2007. Simultaneously with the incorporation of Reficar, Ecopetrol S.A. transferred all of the refinery’s assets to Reficar in exchange for a 49.0% interest. On August 19, 2008, the Government granted special treatment to the expansion of the Cartagena refinery project.
In February 2009, as a result of financing difficulties experienced by Glencore AG which were making it challenging to develop the master plan, Ecopetrol S.A. entered into a memorandum of understanding with Glencore AG pursuant to which it acquired in May 2009 an indirect interest in all of Glencore AG’s interest in Reficar. As part of this overhaul plan, Ecopetrol S.A. expects to increase the competitiveness and profitability of the refinery through the modernization of its facilities and processes and improve the reliability of its units. Ecopetrol S.A. planned to increase the refinery’s production capacity to 165 thousand barrels per day and improve refining margins by processing cheaper heavy crude oils, thus raising the conversion ratio and producing a higher quality product slate. The completion of the refinery, however, has been delayed. In 2013, the largest machines were successfully installed and 50 million hours were completed without fatal or environmental accidents. The installation of equipment and construction of the refinery has been completed. Since May 2014, the final industrial units have been delivered and recruitment of start-up workers, which will continue until the anticipated start of commercial operation in October 2015, has commenced. Ecopetrol S.A. also expects to satisfy existing environmental regulations for fuels by reducing sulfur content in gasoline and diesel fuel, thus complying with national and international fuel standards. The refinery went into operation on October 21, 2015, the refining capacity increased from 80,000 to 165,000 barrels per day; in addition, each barrel processed 97% of each barrel processed at the refinery is converted into valuable products such as diesel and gasoline. Previously this yield was 74%.
Role of the State in the Economy; Privatization
General
The Government is active in mining and the exploitation of other natural resources, as well as in the telecommunications and electricity industries. The Government expects its role in the production of goods and services to diminish as it continues to encourage private sector investment and participation in sectors previously dominated by the public sector, and as it implements other market-oriented reforms, such as the adjustment of public sector prices and utility rates to reflect market conditions.
D-35
In 2015, the most important state-owned non-financial companies included Ecopetrol S.A., Medellín’s urban transit system (the “Medellín Metro”), the energy generation company Isagen and the energy transmission company ISA.
The following table sets forth selected financial data for the principal non-financial state-owned enterprises.
Principal Non-Financial Public Sector Enterprises
| | | | | | | | | | | | | | | | |
| | | Total Assets on Dec. 31, 2015(1) | | | Total Liabilities on
Dec. 31, 2015(1) | | | Net Profits for 2015(2) | | | Total External
Debt Guaranteed
by the Republic on Dec. 31, 2015 | |
| | | (millions of U.S. dollars) | |
Ecopetrol S.A. | | $ | 39,053 | | | $ | 24,691 | | | $ | (979 | ) | | $ | 0 | |
ISA | | | 8,926 | | | | 5,309 | | | | 223 | | | | 0 | |
Isagen | | | 2,657 | | | | 1,559 | | | | 94 | | | | 117 | |
Medellín Metro | | | 1,336 | | | | 1,877 | | | | 64 | | | | 29 | |
| 1: | Audited. Converted into U.S. dollars at the rate of Ps. 3,149.5/$1.00, the representative market rate on December 31, 2015. |
| 2: | Converted into U.S. dollars at the rate of Ps. 2,743.4/$1.00, the average representative market rate for January-December 2015. |
| Source: | Directorate of Banking Investment – Ministry of Finance and Public Credit |
Ecopetrol S.A.
Ecopetrol S.A., which underwent a restructuring in June 2003, is the national oil company and is responsible for promoting and developing Colombia’s oil industry.
Ecopetrol S.A. reported a net loss of approximately Ps. 3.9 trillion ($0.979 billion) in 2015, mainly due to accounting changes from the implementation by Ecopetrol S.A. of International Financial Reporting Standards (“IFRS”) that impacted the results by $ 6.3 trillion and to the decrease in revenues as a result of a 50% drop of international oil prices due to excess international supply and slowdown in global growth. Ecopetrol S.A. contributes to public sector revenues through a combination of income taxes, royalties and dividends. Ecopetrol S.A.’s total direct contribution to governmental revenues was Ps. 18.1 trillion in 2015, as compared to Ps. 29.5 trillion in 2014. The principal sources of Ecopetrol S.A.’s contribution to public sector revenues during 2015 were approximately Ps. 5.4 trillion in royalties, Ps. 4.1 trillion in dividends paid with respect to profits earned in 2015, Ps. 5.3 trillion in income taxes and Ps. 0.4 trillion in indirect taxes.
For further information on Ecopetrol S.A., see “—Principal Sectors of the Economy—Mining and Petroleum” above.
ISA
ISA, the largest electricity transmission company in Colombia, owns a majority of the nation’s transmission networks and the national interconnection system. In 1995, ISA transferred its generation assets and functions to a new entity, Isagen. In August 1998, ISA made its first strategic portfolio investment with the capitalization of Transelca S.A. (“Transelca”), acquiring 65% of a company which accounts for 9.7% of the national transmission system. ISA consolidated its position in the market during 1999, by investing Ps. 276.6 billion and increasing its direct participation in the national transmission system to 75%. ISA’s tariffs and operational income are regulated by the Energy and Gas Regulatory Commission (“CREG”). ISA’s net profits in 2015 totaled Ps. 701.5 billion, as compared to Ps. 593.1 billion in 2014.
ISA is the first public service company to be listed on a Colombian stock exchange and now has the second largest number of shareholders of any Colombian company. As of December 31, 2015, private shareholders owned 31.4% of ISA’s total equity and the Government owned 51.4% of ISA’s total equity. The remaining stake is owned by Empresas Públicas de Medellín (10.2%), Empresa de Energía de Bogotá (1.7%) and Ecopetrol S.A. (5.3%).
D-36
Since 2000, ISA has been implementing a significant expansion strategy, becoming the largest international energy transmission company in Latin America. ISA has a presence in Colombia, Brazil, Peru and Bolivia, participates in transmission infrastructure development in Panama and Central America and participates in interconnection projects in Ecuador and Venezuela. Additionally, ISA has diversified its activities to the telecommunications sector, specifically in fiber-optic communications.
Isagen
Isagen which was a public service company, until its sale on January 2016, engages in the generation and sale of electricity. It has an installed capacity of 3,032 megawatts, of which 2,732 megawatts are derived from hydroelectric sources and 300 MW of thermal power. Isagen owns and operates seven hydroelectric units and one thermal plant with an installed capacity equivalent to 16.7% of the national total. Isagen is the sole beneficiary of a trust which owns, and was responsible for the construction of, the Miel I hydroelectric power plant. This plant has a generating capacity of 396 megawatts and has been operational since the end of 2002.
With the goals of serving Colombia’s future energy demands, providing growth opportunities for Isagen and strengthening the National Electric Grid (“SIN”), Isagen implemented an expansion plan which culminated with the inauguration of the Sogamoso hydroelectric power plant in December 2014. This plant increased Isagen’s installed capacity by 820 megawatts (“MW”) and has average annual generation of 5,056 gigawatt-hours/year (GWh/year), making it the fourth largest hydroelectric power plant in Colombia. . Since beginning operations, Isagen increased by 60% its energy production capacity in average hydrological conditions. During 2015, the Sogamoso hydroelectric plant (820 MW) accounted for 24.78% of total generation of Isagen.
Less rainfall due to the effects of “El Niño” impacted river flow and reservoirs water levels with Topocoro (central Sogamoso), San Lorenzo (central Jaguas) and Amani (central Honey I), respectively generating 77%, 93% and 72% less than the generating capacity of those power plants for 2015. In 2014, despite the low rainfall recorded, the Termocentro power plant generated 2,046.5 GWh, the most electric power generated in its history, an increase of 431.9 GWh as compared to 2013. In 2015 the Termocentro power plant generated 1,942.47 GWh, the second highest amount of electric power generated in its history. In addition, starting in December 2015, the Termocentro Power Plant started generating power with liquid fuel and natural gas, providing greater operational flexibility and support to the national grid during periods of shortage of natural gas. Isagen operates the power plants in compliance with the Environmental Management Plan as required by Colombian legislation to prevent, minimize, control and compensate for biological, physical and social impacts. Isagen also carries out complementary environmental management in response to voluntary commitments so as improve the quality of life in the communities in the areas it influences.
In 2015, Isagen registered net profits of Ps. 297.3 billion ($94 million) as compared to Ps. 436.0 billion ($218 million) in 2014. Net profits decreased 32% as compared to 2014, mainly due to effects of “El Niño”, which caused lower river flow, lower reservoir water levels and resulted in lower than expected electricity generation.
In 2000, the Government focused on the financial restructuring of the company in order to be able to offer it to potential buyers. As part of this process, in April 2000, Isagen purchased the interests of all the other shareholders of the Miel I project, thus becoming the sole owner of Miel I. In addition, in June 2000, one of Isagen’s most important liabilities, a $238 million loan from the IADB, was assumed by the Central Government. On February 26, 2007, the Government authorized the sale of 19.2% of the shares of Isagen. On August 3, 2007, the Government announced that it had completed the sale of such shares to the public. Following the sale, the Government owned 57.7% of the shares of Isagen.
On July 30, 2013, the Government announced its intention to sell its remaining interest in Isagen (57.7% of the total shares of Isagen). On August 12, 2014, the Government decided to extend the privatization of Isagen for up to a year because several bidders requested additional time to review the decision to acquire a controlling interest in Isagen and the extra time would allow for the completion of the Sogamoso hydroelectric project.
On January 13, 2016, the Government sold 100% of its ownership interests in the power generation company Isagen (57.6% of its total outstanding shares). The winning bidder in the auction process was the Canadian investment fund Brookfield Asset Management. The total purchase price for the Government’s ownership interest was Ps. 6.5 trillion.
D-37
Until December 31, 2015, before the privatization of Isagen, 38.25% of Colombia’s total electricity generating capacity was privately owned and 28.01% was public. In addition, the participation of Isagen in the total electricity generation in the National Interconnected System (Sistema Interconectado Nacional) was 19.37%.
Colombia Telecomunicaciones S.A. ESP
In response to the challenges associated with competition in the long distance market and after undergoing a major restructuring that lasted several years, the Government announced in June 2003 the liquidation of Empresa Nacional de Telecomunicaciones, or Telecom, and the creation of Colombia Telecomunicaciones S.A. ESP, which remained state-owned and provided the same services as its predecessor.
Colombia Telecomunicaciones S.A. ESP is a public service company organized as a stock company. It is a full-service telecommunications provider offering a range of integrated telecommunications services including fixed-line, mobile, data transmission (including broadband access and value-added services) and subscription television services throughout Colombia. It is the second-largest integrated telecommunications provider in Colombia in terms of subscribers and revenues, and, as of December 31, 2015, it operated the largest fixed-line network in Colombia in terms of geographical coverage.
On December 20, 2005, Colombia Telecomunicaciones S.A. ESP announced that it was seeking a strategic partner in order to obtain new capital, improve management, widen its service portfolio and guarantee the continuation of service in the long term. On April 7, 2006, Telefonica of Spain became a strategic partner after it purchased more than 50% of the company’s shares for Ps. 853.6 billion (approximately $369 million) in an auction process. The remaining capital of Colombia Telecomunicaciones S.A. ESP continues to be held by the Government. As a result of the recapitalization, Colombia Telecomunicaciones S.A. ESP became a private company and accordingly was no longer subject to regulation as a public sector entity.
In April 2011, the board of directors of Colombia Telecomunicaciones S.A. ESP approved the merger of the company with Telefónica Móviles de Colombia. In April 2012, the shareholders of the company approved the merger. The merger took place in the second half of 2012, reducing the Government’s participation in the company from 48% of total shares to 30% of total shares while Telefónica holds 70%. The merger was structured as part of a strategy to strengthen the financial condition of Colombia Telecomunicaciones S.A. ESP and to create one of the largest integrated telecommunications operators in Colombia. Colombia Telecomunicaciones S.A. ESP offers all of telecommunications services under the brand Movistar. As of December 31, 2015, the Ministry of Finance continued to hold 30.0% of the shares of Colombia Telecomunicaciones S.A. ESP. In 2015, Colombia Telecomunicaciones S.A. ESP registered net profits of approximately Ps 60.5 billion, as compared to net loss of Ps 688.0 billion in 2014.
Medellín Metro
Medellín Metro is the light rail transportation system of the state-owned Empresa de Transporte Masivo del Valle de Aburrá Ltda. (Aburrá Valley Mass Transit Corporation), an entity created in 1979 by the Department of Antioquia and the municipality of Medellín, each of which owns 50% of the entity’s shares. The Government guaranteed all of the Medellín Metro project’s external debt, which totaled $29 million as of December 31, 2015. The first line of the Medellín Metro became operational in November 1995. In 2015, the Medellín Metro was responsible for transporting 258.1 million passengers. In 2015, Empresa de Transporte Masivo del Valle de Aburrá Ltda. continued to be on a path to environmentally sustainable mobility, with the goal of improving the quality of life of its users by various initiatives, including use of clean fuels, lowering emissions, building public spaces and improving the efficiency of its schedules as provided for in its Plan Maestro 2006-2030 “Confianza en el Futuro” (2006 –2030 Master Plan “Trust in the Future”).
Medellín Metro registered a net loss of Ps. 203.1 billion ($64.5 million) in 2015, as compared to a net loss of Ps. 197.2 billion ($82 million) in 2014.
D-38
State-Owned Financial Institutions
The Government owns a substantial majority of the capital stock of several financial institutions, although it intends to decrease its participation in the financial system over the medium term, providing assistance only to specific sectors of the Colombian economy. Some of the most important state-owned financial institutions are National Development Finance S.A. (FDN) (formerly, Financiera Eléctrica Nacional (“FEN”)), Banco de Comercio Exterior de Colombia S.A. (“Bancoldex”) and Finagro. FDN is primarily intended to promote, finance and support investment by companies or projects for infrastructure development in Colombia in different sectors of the economy. Bancoldex’s principal activity is to provide long- and short-term financing and specialized financial products to support Colombian exports and foreign trade-related activities. Finagro is the financial entity in charge of implementing financial programs for the agricultural sector. The accounts of FDN, Bancoldex, Finagro and other financial institutions owned by the Government are not included in the consolidated public sector finance figures that appear in other sections of this document.
In 2003, the Government liquidated Instituto de Fomento Industrial (IFI), a state-owned financial institution. IFI’s principal activities included providing venture capital and loans on favorable terms to mid-sized and large businesses to support industrial development.
The following table sets forth the total assets, total liabilities and total external debt guaranteed by the Republic for principal state-owned financial institutions as of December 31, 2015, as well as their net profits for 2015.
Principal State-Owned Financial Institutions
| | | | | | | | | | | | | | | | |
| | | Total Assets as of
December 31,
2015(1) | | | Total Liabilities
as of December 31,
2015(1) | | | Net Profits for 2015(1) | | | Total External
Debt Guaranteed
by the Republic
as of December 31,
2015(1) | |
| | | (millions of U.S. dollars) | |
State-Owned Banks | | | | |
Banco Agrario | | | 7,204 | | | | 6,557 | | | | 648 | | | | 0 | |
| | | | |
Commercial Financing Companies | | | | | | | | | | | | | | | | |
Bancoldex Leasing | | | 174 | | | | 157 | | | | 17 | | | | 0 | |
| | | | |
Special State-Owned Institutions | | | 17,353 | | | | 15,054 | | | | 2,299 | | | | 754 | |
Bancoldex | | | 2,161 | | | | 1,721 | | | | 440 | | | | 307 | |
FINDETER | | | 2,514 | | | | 2,201 | | | | 313 | | | | 205 | |
FDN | | | 230 | | | | 7 | | | | 224 | | | | 0 | |
Finagro | | | 2,544 | | | | 2,268 | | | | 277 | | | | 0 | |
Icetex | | | 8 | | | | 1 | | | | 8 | | | | 243 | |
FONADE | | | 466 | | | | 419 | | | | 48 | | | | 0 | |
FOGAFIN | | | 4,824 | | | | 4,778 | | | | 45 | | | | 0 | |
Fondo Nacional del Ahorro | | | 2,236 | | | | 1,516 | | | | 721 | | | | 0 | |
FOGACOOP | | | 171 | | | | 145 | | | | 26 | | | | 0 | |
FNG | | | 305 | | | | 171 | | | | 134 | | | | 0 | |
Caja de Vivienda Militar | | | 1,893 | | | | 1,828 | | | | 65 | | | | 0 | |
| | | | |
Total | | $ | 24,731 | | | $ | 21,768 | | | $ | 2,963 | | | $ | 754 | |
| | | | | | | | | | | | | | | | |
Totals may differ due to rounding.
| 1: | Converted into dollars at the rate of Ps. 3,149.47/$1.00, the representative market rate on December 31, 2015. |
| Source: | Financial Superintendency and financial statements of each company as of and for the year ended December 31, 2015. |
D-39
Privatizations and Concessions
The following table lists the entities privatized since 2009, including the year in which the privatization occurred and the proceeds from the privatization for each enterprise.
Privatization of State-Owned Enterprises
| | | | | | | | |
| | | Year | | | Proceeds | |
| | | | | | (millions of U.S. dollars) | |
IFI Enterprises | | | | | | | | |
Electrical | | | | | | | | |
ESSA(1) | | | 2009 | | | | 145 | |
CENS(1) | | | 2009 | | | | 70 | |
EEC(1) | | | 2009 | | | | 82 | |
EBSA(3) | | | 2011 | | | | 417 | |
ISAGEN(4) | | | 2015 | | | | 2,063 | |
Others | | | | | | | | |
Devinorte(2) | | | 2009 | | | | 15 | |
| 1: | The value has been translated into dollars at a rate of Ps. 2,575.5/$1.00, which was the exchange rate on February 26, 2009. |
| 2: | The value has been translated into dollars at a rate of Ps. 2,016.17/$1.00, which was the exchange rate on December 11, 2009. |
| 3: | The value has been translated into dollars at a rate of Ps. 1,938.52/$1.00, which was the exchange rate on December 29, 2011. |
| 4: | The value has been translated into dollars at a rate of Ps. 3,149.7/$1.00, which was the exchange rate on December 31, 2015. |
| Sources: | Consejo Superior de Política Fiscal (Council of Fiscal Policy) and IFI, Subdirección de Banca de Inversión - Ministerio de Hacienda y Crédito Público. |
In order to foster private sector participation in public utility projects, the 1994 Ley de Servicios Públicos Domiciliarios (Residential Public Services Law) establishes the general framework for public utility services provided by both public and private sector companies. In addition to authorizing the privatization of public utility companies, the law permits consumers to purchase shares in those companies in installments. For example, consumers may pay for their share purchases through periodic payments in conjunction with utility bill payments.
Under the Constitution and Law 226 of 1995, all of the shares of any public entity being privatized must first be offered to its employees and to instituciones solidarias (social solidarity institutions), such as pension funds, cooperatives, mutual funds and severance funds, before they can be offered publicly to investors.
For more information on the privatization of electric power companies, see “—Principal Sectors of the Economy—Energy.”
The Government has also granted concession contracts to facilitate private participation in telecommunications and infrastructure projects. Infrastructure projects eligible for concession contracts include ports, railroads, airports and gas pipelines. In telecommunications, the Government has opened the market for cellular telephone services and “value-added” services, which include internet access, video services and electronic payment systems, and permits competition in domestic and international long distance, as well as local telephone services.
In August 2008, Electrificadora del Quindio S.A.–EDEQ was sold for $21.8 million to EPM Inversiones. In September 2008, Central Hidroelectrica de Caldas–CHEC was sold to EPM Inversiones, the State of Caldas and others for $122.4 million.
In February 2009, the Government sold its interest in the following companies: Electrificadora de Santander S.A. (“ESSA”) to EPM Inversiones and the State of Santander for $145 million; Centrales Electricas del Norte de Santander S.A. for $69.9 million to EPM Inversiones and the State of Norte de Santander; and Empresa de Energia de Cundinamarca S.A. to Empresa de Energia de Bogotá and the State of Cundinamarca for $82.0 million. In December 2009, the Instituto de Fomento Industrial –IFI (Industrial Promotion Institute) sold its interest in Desarrollo Víal del Norte de Bogotá, to the other members of the project for $15 million.
D-40
In December 2011, the Government sold its interest in Empresa de Energia de Boyaca ESP to BCIF Holding Colombia S.A. for $417 million.
On January 13, 2016, the Government sold 100% of its ownership interests in the power generation company, Isagen (57.6% of its total outstanding shares). The winning bidder in the auction process was the Canadian investment fund, Brookfield Asset Management. The total purchase price for the Government’s ownership interest was Ps. 6.5 trillion. The Government stated that the proceeds of the sale will be used to finance part of the 4G roadway infrastructure projects. To this end, the Government has approved the use of Ps. 1 trillion of the sale proceeds to capitalize the National Development Fund (“FDN”) in order to support the financing of the 4G road projects.
On June 21, 2016, the FDN, issued a private offering of subordinated bonds to the Special Account of the National Fund for Development and Infrastructure (Cuenta especial FONDES) of the National Treasury in the amount of Ps. 2.5 trillion, which is in additiont to the Ps 1 trillion previously authorized. The issuance was paid with funds from the sale of Isagen and the proceeds will be used to fund development projects.
Environment
Colombia, by virtue of its geographical location at the northwestern tip of South America, with mountainous regions, coasts on two oceans and the Amazon basin, has one of the most complex and diverse ecological and biological systems in the world. However, the pressures caused by growth and development have resulted in the exploitation of natural resources, and production methods directed at short-term productivity have been used without considering the environmental consequences. The principal environmental problems in Colombia today consist of soil erosion in the Andes; water, soil and air pollution in the Andes and the Caribbean region; and deforestation and instability of the water supply throughout the country.
In 1993, the Ministry of the Environment assumed responsibility for all environmental matters. The creation of a separate ministry had increased environmental regulations and centralized national environmental policymaking.
Decree 216 of February 3, 2003 merged the Ministry of the Environment with the Ministry of Housing and established the objective and organic structure of the Ministry of Environment, Housing and Regional Development. In 2011, the Ministry of Environment, Housing and Regional Development was reorganized, with some functions assigned to other government agencies and certain responsibilities retained by the renamed Ministry of Environment and Sustainable Development. The objective of the Ministry is to contribute and promote sustainable development through policies, plans, programs, projects and regulation related to the environment, natural renewable resources, land use, territorial organization, potable water, urban and regional development and housing.
Additionally, while increased economic growth has contributed significantly to improving the quality of life of many Colombians, it has been accompanied by environmental degradation and deepening of problems such as deforestation and water and air pollution. The Santos administration, specifically through the Ministry of Environment and Sustainable Development, has established strategic guidelines for environmental sustainability that include the protection of areas of special ecological relevance, the development of policies for conservation and recovery of biodiversity, the strengthening of management of water resources, the execution of a national policy on climate change, the reinforcement of institutions for improved risk prevention and immediate response to disasters and the development of strategies for environmental management in agricultural and mining industries.
The Plan Nacional de Desarrollo approved in June 2015 now includes as one of the six strategies of the Government, Crecimiento Verde (Green Growth), a program promoting research, technological development and innovation for strengthening national and regional competitiveness with products and activities that contribute to sustainable development and growth with a low carbon footprint.
D-41
Employment and Labor
Beginning in March 2001, Colombia’s unemployment surveys have been presented on a monthly basis, and are based on a sample of 13 cities. The following are results for 2011 through June 2016.
Employment Status in the Thirteen Largest Cities(1)
| | | | | | | | | | | | | | | | | | | | | | | | | | | | | | | | | | | | | | | | | | | | | | | | |
| | | 2011 | |
| | | Jan | | | Feb | | | Mar | | | Apr | | | May | | | June | | | July | | | Aug | | | Sept | | | Oct | | | Nov | | | Dec | |
Labor Force (in thousands) | | | 10,573 | | | | 10,702 | | | | 10,762 | | | | 10,789 | | | | 10,737 | | | | 10,905 | | | | 10,933 | | | | 10,771 | | | | 11,085 | | | | 11,313 | | | | 11,156 | | | | 11,092 | |
Employed (in thousands)(2) | | | 9,017 | | | | 9,289 | | | | 9,445 | | | | 9,519 | | | | 9,557 | | | | 9,621 | | | | 9,698 | | | | 9,651 | | | | 9,950 | | | | 10,162 | | | | 10,007 | | | | 9,939 | |
Participation Rate (%)(3) | | | 65.2 | | | | 65.9 | | | | 66.2 | | | | 66.3 | | | | 65.8 | | | | 66.8 | | | | 66.9 | | | | 65.8 | | | | 67.6 | | | | 68.9 | | | | 67.8 | | | | 67.4 | |
Unemployment Rate (%)(4) | | | 14.7 | | | | 13.2 | | | | 12.2 | | | | 11.8 | | | | 11.0 | | | | 11.8 | | | | 11.3 | | | | 10.4 | | | | 10.2 | | | | 10.2 | | | | 10.3 | | | | 10.4 | |
Underemployment Rate (%)(5) | | | 12.1 | | | | 13.9 | | | | 13.9 | | | | 13.1 | | | | 12.2 | | | | 12.4 | | | | 12.8 | | | | 12.8 | | | | 12.3 | | | | 13.0 | | | | 13.6 | | | | 11.6 | |
| |
| | | 2012 | |
| | | Jan | | | Feb | | | Mar | | | Apr | | | May | | | Jun | | | Jul | | | Aug | | | Sept | | | Oct | | | Nov | | | Dec | |
Labor Force (in thousands) | | | 10,993 | | | | 10,907 | | | | 11,227 | | | | 11,071 | | | | 11,318 | | | | 11,318 | | | | 11,414 | | | | 11,295 | | | | 11,266 | | | | 11,382 | | | | 11,414 | | | | 11,254 | |
Employed (in thousands)(2) | | | 9,532 | | | | 9,548 | | | | 9,994 | | | | 9,812 | | | | 9,976 | | | | 10,036 | | | | 10,101 | | | | 10,113 | | | | 10,060 | | | | 10,225 | | | | 10,290 | | | | 10,103 | |
Participation Rate (%)(3) | | | 66.7 | | | | 66.1 | | | | 67.9 | | | | 66.9 | | | | 68.3 | | | | 68.2 | | | | 68.7 | | | | 67.8 | | | | 67.6 | | | | 68.2 | | | | 68.3 | | | | 67.2 | |
Unemployment Rate (%)(4) | | | 13.3 | | | | 12.5 | | | | 11.0 | | | | 11.4 | | | | 11.9 | | | | 11.3 | | | | 11.5 | | | | 10.5 | | | | 10.7 | | | | 10.2 | | | | 9.8 | | | | 10.2 | |
Underemployment Rate (%)(5) | | | 11.9 | | | | 12.9 | | | | 13.0 | | | | 13.7 | | | | 13.1 | | | | 13.2 | | | | 12.9 | | | | 12.5 | | | | 12.5 | | | | 12.0 | | | | 11.5 | | | | 10.9 | |
| |
| | | 2013 | |
| | | Jan | | | Feb | | | Mar | | | Apr | | | May | | | Jun | | | Jul | | | Aug | | | Sept | | | Oct | | | Nov | | | Dec | |
Labor Force (in thousands) | | | 11,279 | | | | 11,235 | | | | 11,267 | | | | 11,203 | | | | 11,469 | | | | 11,375 | | | | 11,503 | | | | 11,527 | | | | 11,375 | | | | 11,386 | | | | 11,544 | | | | 11,492 | |
Employed (in thousands)(2) | | | 9,804 | | | | 9,853 | | | | 9,995 | | | | 10,001 | | | | 10,272 | | | | 10,104 | | | | 10,350 | | | | 10,344 | | | | 10,254 | | | | 10,394 | | | | 10,468 | | | | 10,383 | |
Participation Rate (%)(3) | | | 67.3 | | | | 66.9 | | | | 67.0 | | | | 66.6 | | | | 68.1 | | | | 67.4 | | | | 68.1 | | | | 68.1 | | | | 67.2 | | | | 67.1 | | | | 68.0 | | | | 67.6 | |
Unemployment Rate (%)(4) | | | 13.1 | | | | 12.3 | | | | 11.6 | | | | 10.7 | | | | 10.4 | | | | 11.2 | | | | 10.0 | | | | 10.3 | | | | 9.9 | | | | 8.7 | | | | 9.3 | | | | 9.7 | |
Underemployment Rate (%)(5) | | | 11.7 | | | | 12.9 | | | | 12.4 | | | | 12.6 | | | | 12.6 | | | | 12.7 | | | | 12.4 | | | | 12.8 | | | | 11.0 | | | | 11.8 | | | | 11.6 | | | | 10.2 | |
| |
| | | 2014 | |
| | | Jan | | | Feb | | | Mar | | | Apr | | | May | | | Jun | | | Jul | | | Aug | | | Sept | | | Oct | | | Nov | | | Dec | |
Labor Force (in thousands) | | | 11,399 | | | | 11,429 | | | | 11,423 | | | | 11,479 | | | | 11,591 | | | | 11,659 | | | | 11,642 | | | | 11,693 | | | | 11,896 | | | | 11,914 | | | | 11,826 | | | | 11,835 | |
Employed (in thousands)(2) | | | 10,000 | | | | 10,149 | | | | 10,218 | | | | 10,422 | | | | 10,429 | | | | 10,417 | | | | 10,491 | | | | 10,583 | | | | 10,792 | | | | 10,875 | | | | 10,798 | | | | 10,734 | |
Participation Rate (%)(3) | | | 66.9 | | | | 67.0 | | | | 66.9 | | | | 67.2 | | | | 67.7 | | | | 68.0 | | | | 67.8 | | | | 68.1 | | | | 69.2 | | | | 69.2 | | | | 68.6 | | | | 68.5 | |
Unemployment Rate (%)(4) | | | 12.3 | | | | 11.2 | | | | 10.5 | | | | 9.2 | | | | 10.0 | | | | 10.7 | | | | 9.9 | | | | 9.5 | | | | 9.3 | | | | 8.7 | | | | 8.7 | | | | 9.3 | |
Underemployment Rate (%)(5) | | | 10.6 | | | | 11.9 | | | | 11.0 | | | | 10.3 | | | | 11.2 | | | | 11.1 | | | | 10.8 | | | | 10.4 | | | | 12.0 | | | | 13.0 | | | | 11.7 | | | | 10.7 | |
D-42
| | | | | | | | | | | | | | | | | | | | | | | | | | | | | | | | | | | | | | | | | | | | | | | | |
| | | 2015 | |
| | | Jan | | | Feb | | | Mar | | | Apr | | | May | | | Jun | | | Jul | | | Aug | | | Sept | | | Oct | | | Nov | | | Dec | |
Labor Force (in thousands) | | | 11,742 | | | | 11,663 | | | | 11,790 | | | | 11,858 | | | | 11,838 | | | | 11,749 | | | | 11,837 | | | | 11,898 | | | | 11,863 | | | | 12,016 | | | | 12,015 | | | | 11,838 | |
Employed (in thousands)(2) | | | 10,352 | | | | 10,500 | | | | 10,599 | | | | 10,612 | | | | 10,703 | | | | 10,610 | | | | 10,770 | | | | 10,716 | | | | 10,713 | | | | 10,953 | | | | 11,037 | | | | 10,682 | |
Participation Rate (%)(3) | | | 67.9 | | | | 67.4 | | | | 68.0 | | | | 68.3 | | | | 68.1 | | | | 67.5 | | | | 68.0 | | | | 68.2 | | | | 67.9 | | | | 68.7 | | | | 68.6 | | | | 67.5 | |
Unemployment Rate (%)(4) | | | 11.8 | | | | 10.0 | | | | 10.1 | | | | 10.5 | | | | 9.6 | | | | 9.7 | | | | 9.0 | | | | 9.9 | | | | 9.7 | | | | 8.8 | | | | 8.1 | | | | 9.8 | |
Underemployment Rate (%)(5) | | | 11.3 | | | | 10.6 | | | | 11.0 | | | | 12.5 | | | | 12.4 | | | | 11.4 | | | | 11.4 | | | | 11.7 | | | | 10.9 | | | | 10.9 | | | | 10.1 | | | | 10.4 | |
| |
| | | 2016 | |
| | | Jan | | | Feb | | | Mar | | | Apr | | | May | | | Jun | | | Jul | | | Aug | | | Sept | | | Oct | | | Nov | | | Dec | |
Labor Force (in thousands) | | | 11,930 | | | | 12,022 | | | | 11,774 | | | | 11,839 | | | | 11,655 | | | | 11,945 | | | | n.a. | | | | n.a. | | | | n.a. | | | | n.a. | | | | n.a. | | | | n.a. | |
Employed (in thousands)(2) | | | 10,251 | | | | 10,780 | | | | 10,577 | | | | 10,762 | | | | 10,604 | | | | 10,722 | | | | n.a. | | | | n.a. | | | | n.a. | | | | n.a. | | | | n.a. | | | | n.a. | |
Participation Rate (%)(3) | | | 68.0 | | | | 68.4 | | | | 66.9 | | | | 67.2 | | | | 66.1 | | | | 67.7 | | | | n.a. | | | | n.a. | | | | n.a. | | | | n.a. | | | | n.a. | | | | n.a. | |
Unemployment Rate (%)(4) | | | 14.1 | | | | 10.3 | | | | 10.2 | | | | 9.1 | | | | 9.0 | | | | 10.2 | | | | n.a. | | | | n.a. | | | | n.a. | | | | n.a. | | | | n.a. | | | | n.a. | |
Underemployment Rate (%)(5) | | | 10.6 | | | | 11.9 | | | | 10.8 | | | | 10.3 | | | | 10.9 | | | | 10.6 | | | | n.a. | | | | n.a. | | | | n.a. | | | | n.a. | | | | n.a. | | | | n.a. | |
| 1: | Statistics for the cities and metropolitan areas of Bogotá, Medellín, Cali, Barranquilla, Bucaramanga, Manizales, Pasto, Pereira, Cúcuta, Ibagué, Montería, Cartagena and Villavicencio. Average rates for each month. |
| 2: | To be considered employed, a person above the minimum age requirement must have worked at least one hour with remuneration or 15 hours without remuneration during the preceding week. The working age is 12 years and above. |
| 3: | Participation rate is defined as the labor force divided by working age population. The working age is 12 years and above. |
| 4: | Unemployment rate is defined as the unemployed population divided by the labor force. |
| 5: | Underemployment rate is defined as the underemployed population divided by the labor force. Underemployed workers are employed workers who can perform and want additional employment, either because they work fewer than 12 hours per week and desire to work more, they consider their income insufficient or they are employed in a position unrelated to their profession or training and are therefore underproductive. |
The following table shows national employment statistics for 2011 through June 2016.
National Employment Status
| | | | | | | | | | | | | | | | | | | | | | | | | | | | | | | | | | | | | | | | | | | | | | | | |
| | | 2011 | |
| | | Jan | | | Feb | | | Mar | | | Apr | | | May | | | June | | | July | | | Aug | | | Sept | | | Oct | | | Nov | | | Dec | |
Labor Force (in thousands) | | | 21,895 | | | | 21,887 | | | | 21,973 | | | | 22,056 | | | | 22,353 | | | | 22,159 | | | | 22,330 | | | | 22,163 | | | | 22,588 | | | | 23,680 | | | | 23,232 | | | | 23,031 | |
Employed (in thousands)(1) | | | 18,927 | | | | 19,072 | | | | 19,585 | | | | 19,588 | | | | 19,839 | | | | 19,743 | | | | 19,753 | | | | 19,929 | | | | 20,389 | | | | 21,549 | | | | 21,090 | | | | 20,770 | |
Participation Rate (%)(2) | | | 62.6 | | | | 62.5 | | | | 62.6 | | | | 62.8 | | | | 63.5 | | | | 62.9 | | | | 63.3 | | | | 62.8 | | | | 63.9 | | | | 66.9 | | | | 65.5 | | | | 64.9 | |
Unemployment Rate (%)(3) | | | 13.6 | | | | 12.9 | | | | 10.9 | | | | 11.2 | | | | 11.2 | | | | 10.9 | | | | 11.5 | | | | 10.1 | | | | 9.7 | | | | 9.0 | | | | 9.2 | | | | 9.8 | |
Underemployment Rate (%)(4) | | | 11.9 | | | | 12.5 | | | | 12.1 | | | | 12.3 | | | | 11.8 | | | | 11.3 | | | | 12.5 | | | | 11.3 | | | | 11.1 | | | | 12.4 | | | | 11.9 | | | | 11.5 | |
D-43
| | | | | | | | | | | | | | | | | | | | | | | | | | | | | | | | | | | | | | | | | | | | | | | | |
| | | 2012 | |
| | | Jan | | | Feb | | | Mar | | | Apr | | | May | | | Jun | | | Jul | | | Aug | | | Sept | | | Oct | | | Nov | | | Dec | |
Labor Force (in thousands) | | | 22,718 | | | | 22,906 | | | | 22,864 | | | | 23,003 | | | | 23,302 | | | | 23,365 | | | | 22,982 | | | | 23,093 | | | | 22,825 | | | | 23,630 | | | | 23,138 | | | | 23,262 | |
Employed (in thousands)(1) | | | 19,884 | | | | 20,187 | | | | 20,494 | | | | 20,504 | | | | 20,807 | | | | 21,022 | | | | 20,485 | | | | 20,842 | | | | 20,555 | | | | 21,538 | | | | 20,998 | | | | 21,040 | |
Participation Rate (%)(2) | | | 63.9 | | | | 64.4 | | | | 64.2 | | | | 64.5 | | | | 65.2 | | | | 65.3 | | | | 64.2 | | | | 64.4 | | | | 63.6 | | | | 65.8 | | | | 64.3 | | | | 64.6 | |
Unemployment Rate (%)(3) | | | 12.5 | | | | 11.9 | | | | 10.4 | | | | 10.9 | | | | 10.7 | | | | 10.0 | | | | 10.9 | | | | 9.7 | | | | 9.9 | | | | 8.9 | | | | 9.2 | | | | 9.6 | |
Underemployment Rate (%)(4) | | | 11.3 | | | | 12.6 | | | | 11.8 | | | | 12.8 | | | | 12.8 | | | | 12.2 | | | | 13.2 | | | | 12.2 | | | | 11.9 | | | | 11.9 | | | | 11.4 | | | | 10.6 | |
| |
| | | 2013 | |
| | | Jan | | | Feb | | | Mar | | | Apr | | | May | | | Jun | | | Jul | | | Aug | | | Sept | | | Oct | | | Nov | | | Dec | |
Labor Force (in thousands) | | | 23,035 | | | | 23,005 | | | | 22,737 | | | | 22,970 | | | | 23,498 | | | | 23,124 | | | | 23,304 | | | | 23,488 | | | | 23,207 | | | | 24,089 | | | | 23,469 | | | | 23,574 | |
Employed (in thousands)(1) | | | 20,255 | | | | 20,293 | | | | 20,416 | | | | 20,633 | | | | 21,284 | | | | 20,988 | | | | 21,001 | | | | 21,310 | | | | 21,123 | | | | 22.211 | | | | 21,479 | | | | 21,584 | |
Participation Rate (%)(2) | | | 63.9 | | | | 63.7 | | | | 62.9 | | | | 63.5 | | | | 64.8 | | | | 63.7 | | | | 64.1 | | | | 64.6 | | | | 63.7 | | | | 66.1 | | | | 64.3 | | | | 64.5 | |
Unemployment Rate (%)(3) | | | 12.1 | | | | 11.8 | | | | 10.2 | | | | 10.2 | | | | 9.4 | | | | 9.2 | | | | 9.9 | | | | 9.3 | | | | 9.0 | | | | 7.8 | | | | 8.5 | | | | 8.4 | |
Underemployment Rate (%)(4) | | | 11.4 | | | | 12.4 | | | | 11.3 | | | | 12.0 | | | | 12.1 | | | | 11.3 | | | | 11.8 | | | | 11.6 | | | | 10.8 | | | | 10.9 | | | | 10.7 | | | | 10.4 | |
| |
| | | 2014 | |
| | | Jan | | | Feb | | | Mar | | | Apr | | | May | | | Jun | | | Jul | | | Aug | | | Sept | | | Oct | | | Nov | | | Dec | |
Labor Force (in thousands) | | | 23,280 | | | | 23,086 | | | | 23,047 | | | | 23,444 | | | | 23,509 | | | | 23,650 | | | | 23,416 | | | | 23,881 | | | | 23,840 | | | | 24,591 | | | | 24,202 | | | | 23,908 | |
Employed (in thousands)(1) | | | 20,696 | | | | 20,621 | | | | 20,803 | | | | 21,343 | | | | 21,441 | | | | 21,475 | | | | 21,241 | | | | 21,755 | | | | 21,849 | | | | 22,658 | | | | 22,336 | | | | 21,823 | |
Participation Rate (%)(2) | | | 63.6 | | | | 63.0 | | | | 62.8 | | | | 63.8 | | | | 63.9 | | | | 64.3 | | | | 63.5 | | | | 64.7 | | | | 64.5 | | | | 66.5 | | | | 65.4 | | | | 64.5 | |
Unemployment Rate (%)(3) | | | 11.1 | | | | 10.7 | | | | 9.7 | | | | 9.0 | | | | 8.8 | | | | 9.2 | | | | 9.3 | | | | 8.9 | | | | 8.4 | | | | 7.9 | | | | 7.7 | | | | 8.7 | |
Underemployment Rate (%)(4) | | | 10.6 | | | | 11.1 | | | | 10.1 | | | | 10.1 | | | | 10.8 | | | | 11.7 | | | | 10.6 | | | | 10.1 | | | | 11.4 | | | | 12.1 | | | | 10.3 | | | | 9.8 | |
| |
| | | 2015 | |
| | | Jan | | | Feb | | | Mar | | | Apr | | | May | | | Jun | | | Jul | | | Aug | | | Sept | | | Oct | | | Nov | | | Dec | |
Labor Force (in thousands) | | | 23.681 | | | | 23.651 | | | | 23.763 | | | | 24.388 | | | | 24,076 | | | | 24,039 | | | | 23,917 | | | | 24,220 | | | | 24,158 | | | | 25,077 | | | | 24,641 | | | | 24,469 | |
Employed (in thousands)(1) | | | 21.127 | | | | 21.320 | | | | 21.657 | | | | 22.070 | | | | 21,925 | | | | 22,056 | | | | 21,803 | | | | 22,018 | | | | 21,988 | | | | 23,024 | | | | 22,849 | | | | 22,367 | |
Participation Rate (%)(2) | | | 63.8 | | | | 63.7 | | | | 63.9 | | | | 65.5 | | | | 64.6 | | | | 64.4 | | | | 64.0 | | | | 64.7 | | | | 64.5 | | | | 66.9 | | | | 65.6 | | | | 65.1 | |
Unemployment Rate (%)(3) | | | 10.8 | | | | 9.9 | | | | 8.9 | | | | 9.5 | | | | 8.9 | | | | 8.2 | | | | 8.8 | | | | 9.1 | | | | 9.0 | | | | 8.2 | | | | 7.3 | | | | 8.6 | |
Underemployment Rate (%)(4) | | | 10.5 | | | | 10.0 | | | | 10.2 | | | | 11.3 | | | | 11.8 | | | | 11.3 | | | | 11.0 | | | | 11.0 | | | | 10.4 | | | | 10.6 | | | | 9.9 | | | | 10.2 | |
D-44
| | | | | | | | | | | | | | | | | | | | | | | | | | | | | | | | | | | | | | | | | | | | | | | | |
| | | 2016 | |
| | | Jan | | | Feb | | | Mar | | | Apr | | | May | | | Jun | | | Jul | | | Aug | | | Sept | | | Oct | | | Nov | | | Dec | |
Labor Force (in thousands) | | | 24,283 | | | | 24,244 | | | | 23,866 | | | | 24,377 | | | | 24,136 | | | | 24,420 | | | | n.a. | | | | n.a. | | | | n.a. | | | | n.a. | | | | n.a. | | | | n.a. | |
Employed (in thousands)(1) | | | 21,392 | | | | 21,819 | | | | 21,447 | | | | 22,179 | | | | 22,001 | | | | 22,251 | | | | n.a. | | | | n.a. | | | | n.a. | | | | n.a. | | | | n.a. | | | | n.a. | |
Participation Rate (%)(2) | | | 64.5 | | | | 64.4 | | | | 63.3 | | | | 64.6 | | | | 63.9 | | | | 64.6 | | | | n.a. | | | | n.a. | | | | n.a. | | | | n.a. | | | | n.a. | | | | n.a. | |
Unemployment Rate (%)(3) | | | 11.9 | | | | 10.0 | | | | 10.1 | | | | 9.0 | | | | 8.8 | | | | 8.9 | | | | n.a. | | | | n.a. | | | | n.a. | | | | n.a. | | | | n.a. | | | | n.a. | |
Underemployment Rate (%)(4) | | | 11.2 | | | | 11.7 | | | | 10.2 | | | | 10.4 | | | | 10.6 | | | | 10.3 | | | | n.a. | | | | n.a. | | | | n.a. | | | | n.a. | | | | n.a. | | | | n.a. | |
| 1: | To be considered employed, a person above the minimum age requirement must have worked at least one hour with remuneration or 15 hours without remuneration during the preceding week. |
| 2: | Participation rate is defined as the labor force divided by working age population. The working age is 12 years and above. |
| 3: | Unemployment rate is defined as the unemployed population divided by the labor force. |
| 4: | Underemployment rate is defined as the underemployed population divided by the labor force. Underemployed workers are employed workers who can perform and want additional employment, either because they work fewer than 12 hours per week and desire to work more, they consider their income insufficient or they are employed in a position unrelated to their profession or training and are therefore underproductive. |
National Quarterly Employment Rates by Gender
| | | | | | | | | | | | | | | | | | | | | | | | | | | | | | | | | | | | | | | | |
| | | 2012 | | | 2013 | | | 2014 | | | 2015 | | | 2016 | |
| | | Women | | | Men | | | Women | | | Men | | | Women | | | Men | | | Women | | | Men | | | Women | | | Men | |
First Quarter | | | 45.3 | % | | | 68.7 | % | | | 44.8 | % | | | 68.3 | % | | | 45.3 | % | | | 68.3 | % | | | 46.3 | % | | | 69.2 | % | | | 46.4 | % | | | 68.6 | % |
Second Quarter | | | 47.6 | | | | 69.3 | | | | 47.5 | | | | 68.7 | | | | 47.8 | | | | 69.2 | | | | 48.7 | | | | 69.9 | | | | n.a. | | | | n.a. | |
Third Quarter | | | 46.4 | | | | 69.2 | | | | 47.5 | | | | 69.2 | | | | 48.1 | | | | 69.5 | | | | 48.4 | | | | 69.4 | | | | n.a. | | | | n.a. | |
Fourth Quarter | | | 47.5 | | | | 70.8 | | | | 48.5 | | | | 71.2 | | | | 49.2 | | | | 71.6 | | | | 49.7 | | | | 72.0 | | | | n.a. | | | | n.a. | |
Source: DANE.
National Quarterly Employment Rates by Sector
| | | | | | | | | | | | | | | | |
| | | 2011 | |
| | | First
Quarter | | | Second
Quarter | | | Third
Quarter | | | Fourth
Quarter | |
Agriculture, fishing, hunting and forestry | | | 18.6 | % | | | 17.6 | % | | | 17.6 | % | | | 18.8 | % |
Mining and quarrying | | | 1.0 | % | | | 1.4 | % | | | 1.6 | % | | | 0.8 | % |
Manufacturing | | | 12.5 | % | | | 13.4 | % | | | 12.7 | % | | | 13.5 | % |
Electricity, gas and water supply | | | 0.5 | % | | | 0.5 | % | | | 0.6 | % | | | 0.6 | % |
Construction | | | 5.6 | % | | | 5.4 | % | | | 5.9 | % | | | 5.9 | % |
Retail, hotels and restaurants | | | 26.6 | % | | | 26.6 | % | | | 26.1 | % | | | 26.3 | % |
Transport, storage and communications | | | 8.8 | % | | | 8.2 | % | | | 8.2 | % | | | 8.0 | % |
Financial intermediation | | | 1.2 | % | | | 1.2 | % | | | 1.2 | % | | | 1.1 | % |
Real estate, renting and business activities | | | 6.4 | % | | | 6.7 | % | | | 6.5 | % | | | 6.4 | % |
Community, social and personal services | | | 18.7 | % | | | 19.0 | % | | | 19.5 | % | | | 18.5 | % |
Total | | | 100.0 | % | | | 100.0 | % | | | 100.0 | % | | | 100.0 | % |
D-45
| | | | | | | | | | | | | | | | |
| | | 2012 | |
| | | First
Quarter | | | Second
Quarter | | | Third
Quarter | | | Fourth
Quarter | |
Agriculture, fishing, hunting and forestry | | | 17.9 | % | | | 16.9 | % | | | 17.2 | % | | | 18.0 | % |
Mining and quarrying | | | 0.9 | % | | | 1.3 | % | | | 1.4 | % | | | 0.9 | % |
Manufacturing | | | 13.0 | % | | | 13.2 | % | | | 12.3 | % | | | 12.9 | % |
Electricity, gas and water supply | | | 0.6 | % | | | 0.5 | % | | | 0.5 | % | | | 0.6 | % |
Construction | | | 6.2 | % | | | 5.9 | % | | | 5.8 | % | | | 6.1 | % |
Retail, hotels and restaurants | | | 26.6 | % | | | 26.9 | % | | | 26.6 | % | | | 26.9 | % |
Transport, storage and communications | | | 8.6 | % | | | 8.1 | % | | | 8.7 | % | | | 7.9 | % |
Financial intermediation | | | 1.4 | % | | | 1.2 | % | | | 1.2 | % | | | 1.2 | % |
Real estate, renting and business activities | | | 6.2 | % | | | 6.5 | % | | | 7.2 | % | | | 6.9 | % |
Community, social and personal services | | | 18.6 | % | | | 19.6 | % | | | 19.1 | % | | | 18.6 | % |
Total | | | 100.0 | % | | | 100.0 | % | | | 100.0 | % | | | 100.0 | % |
| |
| | | 2013 | |
| | | First
Quarter | | | Second
Quarter | | | Third
Quarter | | | Fourth
Quarter | |
Agriculture, fishing, hunting and forestry | | | 17.7 | % | | | 16.1 | % | | | 16.7 | % | | | 17.0 | % |
Mining and quarrying | | | 1.2 | % | | | 1.1 | % | | | 1.3 | % | | | 0.6 | % |
Manufacturing | | | 11.8 | % | | | 12.7 | % | | | 11.6 | % | | | 12.0 | % |
Electricity, gas and water supply | | | 0.5 | % | | | 0.5 | % | | | 0.5 | % | | | 0.5 | % |
Construction | | | 5.5 | % | | | 5.5 | % | | | 5.8 | % | | | 6.4 | % |
Retail, hotels and restaurants | | | 27.8 | % | | | 27.1 | % | | | 27.3 | % | | | 27.6 | % |
Transport, storage and communications | | | 8.6 | % | | | 8.6 | % | | | 8.0 | % | | | 7.9 | % |
Financial intermediation | | | 1.3 | % | | | 1.3 | % | | | 1.5 | % | | | 1.4 | % |
Real estate, renting and business activities | | | 7.2 | % | | | 7.1 | % | | | 7.1 | % | | | 6.9 | % |
Community, social and personal services | | | 18.4 | % | | | 20.1 | % | | | 20.0 | % | | | 19.6 | % |
Total | | | 100.0 | % | | | 100.0 | % | | | 100.0 | % | | | 100.0 | % |
| |
| | | 2014 | |
| | | First
Quarter | | | Second
Quarter | | | Third
Quarter | | | Fourth
Quarter | |
Agriculture, fishing, hunting and forestry | | | 16.4 | % | | | 15.6 | % | | | 16.6 | % | | | 16.4 | % |
Mining and quarrying | | | 1.0 | % | | | 1.1 | % | | | 1.1 | % | | | 0.7 | % |
Manufacturing | | | 11.8 | % | | | 12.3 | % | | | 11.6 | % | | | 12.3 | % |
Electricity, gas and water supply | | | 0.6 | % | | | 0.6 | % | | | 0.5 | % | | | 0.6 | % |
Construction | | | 5.9 | % | | | 5.9 | % | | | 5.9 | % | | | 6.5 | % |
Retail, hotels and restaurants | | | 27.7 | % | | | 27.2 | % | | | 27.0 | % | | | 27.2 | % |
Transport, storage and communications | | | 8.6 | % | | | 8.3 | % | | | 8.1 | % | | | 8.3 | % |
Financial intermediation | | | 1.4 | % | | | 1.3 | % | | | 1.5 | % | | | 1.2 | % |
Real estate, renting and business activities | | | 6.9 | % | | | 7.2 | % | | | 7.6 | % | | | 7.4 | % |
Community, social and personal services | | | 19.7 | % | | | 20.6 | % | | | 20.1 | % | | | 19.3 | % |
Total | | | 100.0 | % | | | 100.0 | % | | | 100.0 | % | | | 100.0 | % |
D-46
| | | | | | | | | | | | | | | | |
| | | 2015 | |
| | | First Quarter | | | Second Quarter | | | Third Quarter | | | Fourth Quarter | |
Agriculture, fishing, hunting and forestry | | | 16.3 | % | | | 15.4 | % | | | 15.9 | % | | | 16.8 | % |
Mining and quarrying | | | 0.8 | % | | | 1.0 | % | | | 1.1 | % | | | 0.8 | % |
Manufacturing | | | 12.2 | % | | | 12.2 | % | | | 11.2 | % | | | 11.8 | % |
Electricity, gas and water supply | | | 0.6 | % | | | 0.5 | % | | | 0.5 | % | | | 0.5 | % |
Construction | | | 6.4 | % | | | 6.1 | % | | | 6,3 | % | | | 6.2 | % |
Retail, hotels and restaurants | | | 27.4 | % | | | 27.1 | % | | | 27.8 | % | | | 27.5 | % |
Transport, storage and communications | | | 8.5 | % | | | 8.4 | % | | | 8.1 | % | | | 7.7 | % |
Financial intermediation | | | 1.4 | % | | | 1.3 | % | | | 1.4 | % | | | 1.3 | % |
Real estate, renting and business activities | | | 7.4 | % | | | 7.7 | % | | | 7.5 | % | | | 7.8 | % |
Community, social and personal services | | | 19.0 | % | | | 20.2 | % | | | 20.2 | % | | | 19.6 | % |
Total | | | 100.0 | % | | | 100.0 | % | | | 100.0 | % | | | 100 | % |
| |
| | | 2016 | |
| | | First Quarter | | | Second Quarter | | | Third Quarter | | | Fourth Quarter | |
Agriculture, fishing, hunting and forestry | | | 16.0 | % | | | n.a. | | | | n.a. | | | | n.a. | |
Mining and quarrying | | | 0.9 | % | | | n.a. | | | | n.a. | | | | n.a. | |
Manufacturing | | | 11.0 | % | | | n.a. | | | | n.a. | | | | n.a. | |
Electricity, gas and water supply | | | 0.6 | % | | | n.a. | | | | n.a. | | | | n.a. | |
Construction | | | 6.4 | % | | | n.a. | | | | n.a. | | | | n.a. | |
Retail, hotels and restaurants | | | 28.2 | % | | | n.a. | | | | n.a. | | | | n.a. | |
Transport, storage and communications | | | 8.5 | % | | | n.a. | | | | n.a. | | | | n.a. | |
Financial intermediation | | | 1.5 | % | | | n.a. | | | | n.a. | | | | n.a. | |
Real estate, renting and business activities | | | 7.7 | % | | | n.a. | | | | n.a. | | | | n.a. | |
Community, social and personal services | | | 19.3 | % | | | n.a. | | | | n.a. | | | | n.a. | |
Total | | | 100.0 | % | | | n.a. | | | | n.a. | | | | n.a. | |
Source: DANE. Calculations: Ministry of Finance.
The average unemployment rate for December 2015 in the 13 largest urban areas was 9.8% as compared to 9.3% for the same period in 2014. The retail, hotels and restaurants and community, social and personal services subsectors and the agriculture, hunting, forestry and fishing sector accounted for the most employment. The national unemployment rate for June 30, 2016 was 8.9%, an increase from the unemployment rate of 8.2% on June 30, 2015. On December 31, 2015, the national unemployment rate was 8.6%, a decrease from the unemployment rate of 8.7% on December 31, 2014 and an increase from the unemployment rate of 8.4% on December 31, 2013. Although the months of April, August and December of 2015 witnessed marginal increases in the monthly national unemployment rate from the preceding month, the national unemployment rate decreased significantly during 2015 as a whole, from 10.8% in January 2015 to 8.6% in December 2015. The unemployment rate in the 13 largest cities has experienced a general decreasing trend during the past few years, from 10.4% in December 2011 to 9.8% in December 2015, however the unemployment rate in the 13 largest cities’ increased from 9.3% in December 2014 to 9.8% in December 2015. The 13 largest cities’ national unemployment rate also experienced a general decreasing trend during 2015, beginning at 11.8% in January 2015 and ending at 9.8% in December 2015.
In December 1990, the Government enacted legislation to permit greater flexibility in labor contracts by eliminating ambiguities over non-wage benefits and eliminating restrictions regarding severance and furlough of workers. The same law also modified the unemployment benefits system to allow workers to elect private sector management of their severance funds. The Colombian Labor Code now requires employers, on an annual basis, to
D-47
transfer severance payments equal to one month of salary plus 12% interest to the severance administration fund chosen by each employee. Employees only have access to these severance funds upon termination of their employment or, prior to termination, under special circumstances, including the purchase or improvement of a residence and the payment of qualifying tuition payments. A severance fund becomes available regardless of whether an employee is terminated involuntarily or resigns; the fund is not conditioned on unemployment. Colombia does not have an unemployment fund. However, Law 1636 of 2013 established the Loss Protection Mechanism (Mecanismo de Protección al Cesante), which seeks to assist the unemployed through a series of policies and initiatives to mitigate the effects of unemployment and facilitate their reintroduction into the work force, including receipt of monetary benefits, if eligible.
Under legislation enacted in 1993 to partially privatize the pension system, employees may elect that their pension contributions (both employee and employer derived) be deposited with private pension administrators. If no such election is made, the funds will continue to be managed by the Instituto de Seguros Sociales (Social Security Institute, or “ISS”). The Government guarantees both privately managed pensions and the ISS fund. The partial privatization of the pension system was intended to increase the efficiency of pension management, while injecting a new source of funds into local capital markets. The privately administered pension funds have more investment flexibility, having investment options including government obligations, certificates of deposit, bonds, commercial paper and, up to certain limits, equity securities. The 1993 law also allowed private companies to offer health and worker’s compensation insurance.
Because of a pension reform approved in 2002, starting in 2014, the retirement age has been raised from 60 to 62 for men and from 55 to 57 for women. The minimum number of weekly pension payments required for retirement has been gradually increased from 1,000 in 2005 to 1,300 in 2015.
Wages for workers in the public sector are customarily established at the beginning of each calendar year. Private sector wages are subject to the minimum wage set annually by the Government at the beginning of each calendar year. The following table shows the monthly minimum wage rates set by the Government and the real wage index for each of the years indicated:
Monthly Minimum Wage and Real Wage Index
| | | | | | | | | | | | |
Year | | Monthly Minimum
Wage | | | Percentage change | | | Real Wage Index(1) | |
| | | (in nominal pesos) | | | | | | (2013=100) | |
2011 | | | 535,600 | | | | 4.0 | | | | 94.9 | |
2012 | | | 566,700 | | | | 5.8 | | | | 98.0 | |
2013 | | | 589,500 | | | | 4.0 | | | | 100.0 | |
2014 | | | 616,000 | | | | 4.5 | | | | 104.5 | |
2015 | | | 644,350 | | | | 4.6 | | | | 109.3 | |
2016 | | | 689,455 | | | | 7.0 | | | | 117.0 | |
| 1: | Real Wage Index is the nominal monthly minimum wage corrected for changes in purchasing power measured by the consumer price index. |
Sources: Ministry of Social Security and DANE. Calculations by the General Directorate of Macroeconomic Policy – Ministry of Finance and Public Credit.
Poverty
In 2009, DANE and the National Planning Department (“DNP”) decided to consolidate and standardize the poverty and inequality time series data from 2002 to 2005 in order to make the data comparable with the data from the new survey introduced by DANE during the second half of 2006. Following the consolidation process, in August 2009, DNP released updated figures for poverty, homelessness and inequality for 2002 to 2008, excluding 2006 and 2007 because DNP determined that the information for 2006 was insufficient and 2007 was a transition year for the change in methodology. In September 2011, DNP released a new methodology that changed the poverty line and the construction of the family aggregate income. The following table shows the percentage of the population with incomes below the poverty line for the years indicated following the new methodology.
D-48
Poverty in Colombia(1)
(percentage of population below poverty line)
| | | | |
2011 | | | 34.1 | % |
2012 | | | 32.7 | % |
2013 | | | 30.6 | % |
2014 | | | 28.5 | % |
2015 | | | 27.8 | % |
| 1: | The poverty line is defined as the minimum level of income necessary to acquire an adequate amount of food and primary goods. Households whose annual income falls below that level are considered to be living in poverty. Households whose monthly income per-capita was lower than Ps. 223,638 for 2015, Ps. 211,807 for 2014, Ps. 206,091 for 2013, Ps. 202,083 for 2012 and Ps. 194,696 for 2011 were considered to be living in poverty. Households whose income per-capita was lower than Ps. 102,109 for 2015, Ps. 94,103 for 2014, Ps. 91,698 for 2013, Ps. 91,207 for 2012 and Ps. 87,672 for 2011 were living in extreme poverty. |
Although Colombia does not have a welfare system, the Government modified the pension system in 1993 to serve social welfare needs, as discussed above. For further discussion of the pension system, see “Public Sector Finance—Public Sector Accounts—Expenditures” below. Also in 1993, legislation created a decentralized health care system which should, in the long term, provide subsidized care to the entire population.
Other initiatives the Government has undertaken to alleviate poverty in Colombia include a program called “De cero a siempre”, which seeks to promote and ensure children’s comprehensive development from conception until the age of six. Furthermore, the Government has continued to develop the “Families in Action” program, a monetary transfer program that seeks to reduce poverty and income inequality by encouraging poor families to make certain commitments in education and health. The Government has also implemented the “Women Savers in Action Program”, which seeks to promote the autonomy and empowerment of women, as well as the “Income Generation and Employability Program”, which aims to provide job training and encourage entrepreneurship.
On May 28, 2015, President Santos presented the program called “Plan de Impulso a la Productividad y el Empleo” (Pipe 2.0) second phase. This plan seeks to stimulate the economy and mitigate the impact of the slowdown. This initiative seeks to generate investment in cross-sectors such as infrastructure, education, public works, housing, industry and mining. It includes almost Ps. 17 trillion of investment and is expected to create 300,000 jobs.
On January 19, 2011, the President signed into law the Health Reform Law that allocates more resources to the health system (Ps.1.5 trillion per year). The Government will contribute Ps. 1.0 trillion from the national budget, and other resources are expected to come from the Family Compensation Funds (a non-governmental agency that pays social security subsidies), municipalities and departments, among others. The law will also order periodic updates to the public health insurance plans in order to make them consistent with the epidemiological profile of the population, limiting and rationalizing the type of treatments and drugs that are included in the insurance plans.
D-49
FOREIGN TRADE AND BALANCE OF PAYMENTS
General
According to statistics compiled by Banco de la República, total trade in goods, both exports and imports grew 39.4% in 2011 and 7.1% in 2012, decreased 0.7% in 2013, increased 0.9% in 2014, further decreased 23.9% in 2015 and 26.7% in the first quarter of 2016. The decrease in trade in 2015 was mainly due to a decrease of 35% in exports. The decrease in exports in 2015 was mainly due to a decrease of 50.7% in exports of oil and its derivatives, while the decrease in imports in 2015 was mainly due to a decrease of 16.6% in imports of raw materials and intermediate goods. Direct investment increased by $5.3 billion in 2011, or 557.5%, as compared to 2010 due mainly to an increase in the net incurrence of liabilities in the commerce sector amounting to $2,325 million, and in the transportation and communications sector amounting to $2,115.9 million. Direct investment increased in 2012 by $9.4 billion, or 151.2%, as compared to 2011 due mainly to an increase in net incurrence of liabilities in the petroleum sector amounting to $771 million and in the manufacturing sector amounting to $771 million and a decrease in net acquisitions of financial assets in the petroleum and mining sector amounting to $3,239 million and in the financial services sector amounting to $3,397 million. Direct investment decreased in 2013 by $7.08 billion, or 45.3%, as compared to 2012 due mainly to net acquisition by Colombia of financial assets amounting to $8,258 million from 2012, mainly in the petroleum and mining sector increasing to $4,623.0 million and in the financial services sector increasing to $3,070.7 million. In 2014, direct investment increased $3,867 million, or 45.2%, mainly due to a decrease in net acquisition by Colombia of financial assets principally in financial services amounting to $3,114 million. In 2015, direct investment decreased $4.7 billion or 37.8%, mainly due to a decrease in net incurrence of liabilities by $4,382.7 million in the petroleum sector decreasing $1,672 and transportation and communication sector falling $1,468 million.
Banco de la República’s net international reserves increased by 13.5% in 2011, 16.0% in 2012, 16.5% in 2013, 8.5% in 2014 and decreased by 1.3% in 2015. According to the preliminary figures, the net international reserves increased 0.5% in July 2016.
In June 2014, Banco de la República adopted the sixth edition of the IMF’s Balance of Payments Manual framework, which has been implemented in balance of payments statistics from 2000 onward. The key changes from the fifth edition to the sixth edition of the IMF’s Balance of Payments Manual methodology include the reclassification of accounts within the balance of payments. On the current account side, a financial intermediation services account (FISIM) has been created and is included within the services account. The corresponding information was previously incorporated in the income line. On the capital account side, loans between affiliates (for nonfinancial sector companies), which had previously been incorporated within the loans account, are now included in the direct investment account. Furthermore, changes in the format for the presentation of information have been incorporated. Additionally, measurements of exports in the table “Balance of Payments” are different from the table “Exports (FOB) by Group of Products” and from the table “Trends in the Composition of Exports”, since these two latter tables do not incorporate special trade operations and commerce from the Free Trade Zones.
Balance of Payments
Colombia’s current account registered deficits from 2011 to 2015, recording shortfalls of $9,710 million in 2011, $11,271 million in 2012, $12,355 million in 2013, $19,489 million in 2014 and $18,755 million in 2015. For 2011, the trade surplus reached $6,137 million, an increase of $3,781 million from the trade surplus recorded in 2010. The increase in the trade surplus was due to an increase in exports of $17,500 million compared to 2010. In 2012, the trade surplus reached $4,956 million, a decrease of $1,181 million from the trade surplus recorded in 2011. The decrease in the trade surplus was due to an increase in consumer goods and raw materials and intermediate goods. For 2013, the trade surplus fell to $3,180 million, a decrease of $1,775 million from the trade surplus recorded in 2012. The decrease in trade surplus was due mainly to a decrease in exports of $1,323 million, mainly of coal and nontraditional products, such as gold. In 2014, the trade balance fell further to a deficit of $4,622 million, a decline of $7,802 million from 2013 mainly due to a decrease of $3,358 million in exports primarily caused by a decrease of oil and its derivatives exports, which decreased $3,556 million or 10.9%. Additionally, there was an increase in imports of $4,444 million from 2013 driven mainly by an increase in imports of raw material and intermediate goods. In 2015, the trade balance fell further to a deficit of $13,918 million, a decline of $9,296 million from 2014. The decline was mainly due to a decrease of $18,802 million in exports primarily caused by a decrease of oil and its derivatives exports, which decreased $14,687 million or 50.8%, and a decrease in coal exports of $2,250 million or 33%, from 2014 to 2015.
D-50
In 2011, 2012 and 2013, rising commodity prices, growth in Latin America and higher confidence in the region allowed capital flows to finance Latin America’s current account deficits, in particular foreign direct investment and payments of external debt. In Colombia, increasing domestic demand supported a growth in imports from 2010 to 2014, while exports were also increasing during those same years (except in 2013 and 2014 when exports decreased) due to higher international commodity prices. However, during 2015 international commodity prices decreased, including oil prices, which decreased from $67.8 per barrel during May 2015 to $36.1 per barrel at the end of 2015, a 46.8% decrease in eight months. The lower export price of oil, 35% lower in 2015 than in 2014 affected exports, which in 2015 recorded a decrease of 25.0%.
In recent years, Colombia has registered deficits in the primary income of the current account because inflows from its foreign assets have not been sufficient to offset the interest payable on its foreign liabilities. Each of the last five years ended with a deficit: $15,479 million in 2011, $14,989 million in 2012, $14,184 million in 2013, $12,549 million in 2014 and $5,809 million in 2015. The secondary income category, however, registered inflows of $4,834 million in 2011, $4,579 million in 2012, $4,594 million in 2013, $4,358 million in 2014, $5,117 million in 2015 and $1,309 million in the first quarter in 2016. Of the total expenditure, 57% was caused by the decrease in income earned by enterprises with foreign direct investment, and to a lesser extent in interest payments on debt securities, loans and other foreign credits, these were reduced mainly due by the lower payment for portfolio investment. Colombia has also continued to experience deficits in the services category in recent years because of decreased participation by Colombian shipping companies in the international freight market, falling international transport fares, reduced income from tourism and increased costs related to business and construction activities. However, the deficit in the service category has seen improvement in 2015 due to higher income for services of $7,159 million and lower expenses of $11,304 million. In 2015, exports of services were primarily driven by travel services. Net payments abroad for travel services and insurance and transportation services also contributed to the current account deficit.
The capital account stood at a deficit of $8,926 million in 2011, 3.8% lower than the deficit in 2010. In 2011, total foreign investment increased by 541.7% as compared to 2010, from $1,920 million to $12,319 million. Net direct investment increased by $5,281 million and net portfolio investment increased by $5,118 million in 2011 compared to 2010. The capital account stood at a deficit of $11,754 million in 2012, 31.7% higher than the deficit in 2011. In 2012, total foreign investment increased by 73.2% as compared to 2011, from $12,319 million to $21,335 million. Net direct investment increased by $9,417 million and net portfolio investment decreased by $401 million in 2012 compared to 2011. In 2013, Colombia registered a capital account deficit of $11,848 million, 0.8% higher than the deficit in 2012. In 2013, total foreign investment decreased by 27.2% as compared to 2012, from $21,335 million to $15,536 million. Net direct investment decreased by $7,087 million compared to 2012 and net portfolio investment increased by $1,288 million in 2013 compared to 2012. In 2014, Colombia registered a capital account deficit of $19,836 million, 67.4% higher than the deficit in 2013. In 2014, total foreign investment increased by 55.0% as compared to 2013, from $15,536 million to $24,080 million. Net direct investment increased by $3,867 million compared to 2013 and net portfolio investment increased $4,677 million in 2014 compared to 2013. This increase in the capital account was due to higher portfolio investment inflows, which accounted for $18,661 million, principally local transactions. The capital account stood at a deficit of $18,848 million in 2015, 4.5% lower than the deficit in 2014. In 2015, total foreign investment decreased by 28.3% as compared to 2014, from $24,080 million to $17,256 million. Net direct investment decreased by $4,701 million and net portfolio investment decreased by $2,123 million in 2015 compared to 2014.
The capital account of Colombia’s balance of payments includes direct investment flows, portfolio investment flows and net changes in external indebtedness. Liberalized foreign investment regulations and aggressive privatization programs contributed to a significant increase in net foreign direct investment (i.e., foreign direct investment in Colombia less direct investment by Colombians abroad), as measured for balance of payments purposes, from 2011 to 2015, although there were decreases experienced in 2013 and 2015. Net direct investment reached $6,228 million in 2011, $15,646 million in 2012, $8,559 million in 2013, $12,426 million in 2014 and $7,724 million in 2015.
The level of net direct investment in 2013 was influenced by the purchase of Ecopetrol shares abroad. The mining and petroleum sectors, however, reported inflows of foreign investment in 2011, reaching approximately
D-51
$7,180 million. In 2012, the mining, petroleum and manufacturing sectors continued reporting inflows of foreign investment reaching $9,930 million. Conversely, during 2013, 2014 and 2015 the petroleum sector reported a decrease in inflows of foreign investment of $359 million, $380 million and $1,672 million, respectively. In 2015, although the net acquisition of financial assets increased, net incurrence of liabilities decreased by $4,383 million from 2014 to 2015 mainly due to a decrease in foreign investment directed to petroleum, mining, transportation and communication sectors, which accounted for a $3,140 million decrease.
The table below sets forth data on Colombia’s balance of payments as compiled in accordance with the sixth edition IMF methodology currently employed by Banco de la República.
Balance of Payments (1)(2)(3)(4)
| | | | | | | | | | | | | | | | | | | | |
| | | 2011 | | | 2012 | | | 2013 | | | 2014 | | | 2015 | |
Account | | | | | | | | | | | | | | | | | | | | |
Current account | | | (9,710 | ) | | | (11.271 | ) | | | (12,355 | ) | | | (19.489 | ) | | | (18,755 | ) |
Credit | | | 72,248 | | | | 77,283 | | | | 76,249 | | | | 73,206 | | | | 55,670 | |
Debit | | | 81,958 | | | | 88,554 | | | | 88,604 | | | | 92,695 | | | | 74,425 | |
Goods and services | | | 935 | | | | (860 | ) | | | (2,764 | ) | | | (11,298 | ) | | | (18,062 | ) |
Credit | | | 63,898 | | | | 68,034 | | | | 67,149 | | | | 63,818 | | | | 45,279 | |
Debit | | | 62,963 | | | | 68,895 | | | | 69,913 | | | | 75,116 | | | | 63,342 | |
Goods | | | 6,137 | | | | 4,956 | | | | 3,180 | | | | (4,622 | ) | | | (13,918 | ) |
Credit | | | 58,262 | | | | 61,604 | | | | 60,281 | | | | 56,923 | | | | 38,121 | |
Debit | | | 52,126 | | | | 56,648 | | | | 57,101 | | | | 61,545 | | | | 52,038 | |
Services | | | (5,202 | ) | | | (5,816 | ) | | | (5.944 | ) | | | (6,676 | ) | | | (4,145 | ) |
Credit | | | 5,636 | | | | 6,430 | | | | 6,868 | | | | 6,895 | | | | 7,159 | |
Debit | | | 10,838 | | | | 12,246 | | | | 12,812 | | | | 13,571 | | | | 11,304 | |
Primary income | | | (15,479 | ) | | | (14,989 | ) | | | (14,184 | ) | | | (12,549 | ) | | | (5,809 | ) |
Credit | | | 2,780 | | | | 3,854 | | | | 3,627 | | | | 4,082 | | | | 4,497 | |
Debit | | | 18,260 | | | | 18,844 | | | | 17,811 | | | | 16,631 | | | | 10,306 | |
Secondary income | | | 4,834 | | | | 4,579 | | | | 4,594 | | | | 4,358 | | | | 5,117 | |
Credit | | | 5,570 | | | | 5,394 | | | | 5,473 | | | | 5,306 | | | | 5,894 | |
Debit | | | 735 | | | | 815 | | | | 880 | | | | 948 | | | | 777 | |
Financial account | | | (8,926 | ) | | | (11,754 | ) | | | (11,848 | ) | | | (19,836 | ) | | | (18,948 | ) |
Direct Investment | | | (6,228 | ) | | | (15,646 | ) | | | (8,559 | ) | | | (12,426 | ) | | | (7,724 | ) |
Net Acquisition of Financial Assets | | | 8,420 | | | | (606 | ) | | | 7,652 | | | | 3,899 | | | | 4,218 | |
Equity and Investment Fund Shares | | | 7,254 | | | | (557 | ) | | | 7,468 | | | | 2,935 | | | | 5,283 | |
Debt Instruments | | | 1,165 | | | | (49 | ) | | | 184 | | | | 963 | | | | (1,065 | ) |
D-52
| | | | | | | | | | | | | | | | | | | | |
Net Incurrence of liabilities | | | 14,648 | | | | 15,039 | | | | 16,211 | | | | 16,325 | | | | 11,942 | |
Equity and investment fund shares | | | 12,776 | | | | 13,801 | | | | 13,842 | | | | 13,832 | | | | 9,936 | |
Debt instruments | | | 1,872 | | | | 1,239 | | | | 2,368 | | | | 2,493 | | | | 2,006 | |
Portfolio investment | | | (6,090 | ) | | | (5,690 | ) | | | (6,978 | ) | | | (11,654 | ) | | | (9,531 | ) |
Net acquisition of financial assets | | | 2,111 | | | | 1,666 | | | | 4,096 | | | | 7,007 | | | | 276 | |
Equity and investment fund shares | | | 0 | | | | 0 | | | | 0 | | | | 0 | | | | 0 | |
Debt securities | | | 2,111 | | | | 1,666 | | | | 4,096 | | | | 7,007 | | | | 276 | |
Net incurrence of liabilities | | | 8,202 | | | | 7,356 | | | | 11,073 | | | | 18,661 | | | | 9,807 | |
Equity and investment fund shares | | | 2,288 | | | | 3,180 | | | | 1,926 | | | | 3,883 | | | | 1,760 | |
Debt securities | | | 5,914 | | | | 4,176 | | | | 9,147 | | | | 14,778 | | | | 8,047 | |
Financial derivatives (other than reserves) and employee stock options | | | (82 | ) | | | (714 | ) | | | (33 | ) | | | 268 | | | | 1,544 | |
Net acquisition of financial assets | | | (202 | ) | | | (780 | ) | | | (156 | ) | | | (411 | ) | | | (245 | ) |
Net incurrence of liabilities | | | (120 | ) | | | (66 | ) | | | (124 | ) | | | (680 | ) | | | (1,789 | ) |
Other investment | | | (267 | ) | | | 4,890 | | | | (3,225 | ) | | | (461 | ) | | | (3,651 | ) |
Net acquisition of financial assets | | | 3,417 | | | | 2,656 | | | | 1,826 | | | | 1,820 | | | | (429 | ) |
Net incurrence of liabilities | | | 3,684 | | | | (2,234 | ) | | | 5,051 | | | | 2,281 | | | | 3,222 | |
Reserve assets | | | 3,742 | | | | 5,406 | | | | 6,946 | | | | 4,437 | | | | 415 | |
Net errors and omissions | | | 784 | | | | (483 | ) | | | 507 | | | | (347 | ) | | | (193 | ) |
Memorandum financial account excluding reserve assets | | | (12,668 | ) | | | (17,160 | ) | | | (18,794 | ) | | | (24,273 | ) | | | (19,363 | ) |
| 1: | Data for 2015, 2014 and 2013 are preliminary and data for 2011 and 2012 are revised. |
| 2: | The calculation of the change in international reserves is based on the 6th edition of the IMF Balance of Payments manual, following the recommendation not to include in this calculation changes due to exchange rate and price valuations. |
| 3: | Other financial corporations are institutional units that provide financial services, and which asset and liabilities are, in general, not available in open financial markets. |
| 4: | Non-financial corporations are corporations whose principal activity is the production of goods or non-financial market services. This category includes legally established companies, branches of non-resident corporations, quasi-corporations, hypothetical resident land owners units and resident non-profit institutions that are market producers of goods and nonfinancial services. |
| Source: | Banco de la República — Economic Studies. |
Foreign Trade
Colombia’s trade has historically been, and continues to be, dominated by the export of raw materials and the import of intermediate and capital goods. Most consumer goods have traditionally been produced locally. Producers of these consumer goods had, until recent years, enjoyed the protection of high import tariffs and other trade barriers. Since the early 1990s, Colombia has reduced trade barriers, opening the economy to foreign competition. In 2011 and 2012 imports (CIF) of consumer goods increased by 25.7% and 14.4%, respectively, as compared to the immediately preceding year. In 2013, imports (CIF) of consumer goods increased by 1.4% as compared to 2012, by 8.6% in 2014 as compared to 2013 and decreased 15.3% in 2015 as compared to 2014.
D-53
Whereas tariffs used to be a means to raise tax revenues to remedy the growing fiscal deficit, tariffs are now regarded as a commercial policy instrument rather than a revenue source. In addition, changes to tariff rates have become less common due to Colombia’s participation in the Andean Community common external tariff agreement, which implemented common external tariffs in February 1995. See “—Geographic Distribution of Trade” for more information on the Andean Community.
Despite the free-trade policies adopted in recent years, the Government continues to recognize the special needs of some local producers. The program known as “Programa de Protección de Ingresos para Productores de Bienes Agrícolas Exportables” benefits producers of flowers and bananas, among other sectors. The program is expected to help the agricultural sector with a subsidy on the cost of exchange rate hedges, which initially will be at 60% and increase to 70% over the long term. In 2008, the Government announced the continuation of the program with Ps. 49 billion in funds allocated to protect the revenues of agricultural exporters. After it became the operator of the program on February 15, 2008, the Fondo para Financiamiento del Sector Agropecuario (Agricultural Sector Financing Fund or “Finagro”) established the subsidy to be between 70% and 90% of the cost of the exchange rate hedge, depending on the duration of the transaction, as well as the maximum hedge amount by producer and the maximum subsidy limit. From 2002 to 2008, the Government spent Ps. 1.3 trillion for measures taken in order to help alleviate the negative impact of peso appreciation. According to Finagro, as of December 31, 2014, Ps. 15.5 billion had been spent of the total amount of Ps. 15.9 billion allocated for 2014, which represented an execution of 98% of budgeted expenses for the program. The Foreign Exchange Hedging Program was inoperative in 2015. However, the Ministry of Agriculture allocated approximately Ps. 35,000 million to capitalize the National Agricultural Risk Fund (Fondo Nacional de Riesgos Agropecuarios), resources that are expected to be executed in 2016 and will be destined to the annual plan for agricultural risk management.
Colombia’s customs system, which is part of the Plan Vallejo (discussed further below under “—Exports”), is designed to foster investment in the export sector and includes the following features:
| | • | | large exporters—those which exported over $2 million during the past 12 months and for which exports represented at least 60% of their operating income—may utilize simplified procedures for the import of raw materials and capital goods to be used in the production of exportable goods; |
| | • | | special export programs grant customs and VAT exemptions for imports of raw materials, which are used to produce inputs and in turn used by other Colombian companies in the manufacture of goods to be exported; and |
| | • | | new procedures permit the storage of foreign merchandise, free of import tariffs for a six-month period, so long as the merchandise is distributed abroad. |
Exports
Commodities, particularly coffee, petroleum and coal, traditionally have been Colombia’s most important exports. In 1995, coffee accounted for 18.0% of exports while oil and its derivatives accounted for 21.5% of total exports, and in 2015, coffee accounted for an estimated 7.1% of total exports while oil and its derivatives accounted for 40.2% of total exports. Historically, the value of coffee exports began to decline in 1987 and accelerated with the price drop that followed the collapse of the International Coffee Agreement in 1989, an arrangement among coffee producing and consuming countries to stabilize coffee prices. Beginning in 1993, coffee exports recovered somewhat due to the effort led by Colombia to limit the world supply of coffee through an agreement with the World Association of Coffee Producing Countries, but coffee exports subsequently declined and are expected to remain a smaller portion of total exports than oil and its derivatives. Coffee exports have declined from $2,608 million in 2011 to $2,527 million in 2015 according to preliminary figures from Banco de la República. Nontraditional exports, which include products such as shrimp, bananas, flowers, emeralds and manufactured goods, have increased in recent years. Nontraditional exports, including emeralds, increased from $5,190 million in 1995 to $13,935 million in 2015 and accounted for 39% of exports in 2015. Industrial exports decreased from $10,924 million in 2011 to $9,844 million in 2015. During 2015, chemicals, food, beverages and tobacco and other
D-54
industries, including jewelry, musical instruments, sporting goods and other products were the sectors with the greatest share of total exports from the industry group representing 9.8%, 4.7% and 9.1% of total exports, respectively. The weighted average price of coffee exported by Colombian producers in 2015 decreased by 15.6% to $1.61 per pound in 2015 from an average price of $1.91 per pound in 2014. The volume of coffee exports increased by 14.0% in 2015 as compared with the volume exported in 2014.
Since 2004, the Government has been pursuing steps to promote exports, including:
| | • | | the formation of regional foreign trade advisory committees, which coordinate the knowledge and expertise of both the private sector and the Government, by exchanging initiatives and information, drafting proposals for overall programs and strategies, and implementing trade-related actions. These committees promote industry in areas conducive to exports, such as municipalities with shipping ports; |
| | • | | the formation of free trade zones — special enclaves which offer exchange, tax, customs and trade incentives to increase and diversify the production of goods and services for overseas markets. Industrial free trade zones may be used for goods and services, tourism promotion and science parks; and |
| | • | | the creation of EXPOPYME — a program that supports small and medium-size companies and provides business advice for entrepreneurs seeking export opportunities. |
The Government currently assists exporters through the Plan Vallejo, also known as Special System of Imports and Exports, a Government program that started in 2002, under which producers of goods intended for overseas markets may obtain partial or total exemptions from customs duties and taxes on imported raw materials, capital goods, intermediate goods and spare parts, as long as they are incorporated into the goods or services to be exported. In 2008, the Government extended the benefits of Plan Vallejo by removing the duties on imports of machinery and equipment for 30 different categories of services. Services sectors such as tourism, software development, construction, communications and transport, among others, benefitted from the expansion of Plan Vallejo.
The following table shows the trends in the composition of Colombia’s exports for the years indicated, based on the export figures maintained by Banco de la República for balance of payments purposes.
Trends in the Composition of Exports
2000, 2005, 2010 and 2015(1)
| | | | | | | | | | | | | | | | | | | | | | | | | | | | | | | | |
| | | (millions of U.S. dollars and percentage of total exports) | |
| | | 2000 | | | 2005 | | | 2010 | | | 2015 | |
Exports (FOB): | | | | | | | | | | | | | | | | | | | | | | | | | | | | | | | | |
Oil and its Derivatives | | $ | 4,776 | | | | 36.4 | % | | $ | 5,559 | | | | 26.7 | % | | $ | 16,499 | | | | 41.8 | % | | $ | 14,239 | | | | 40.2 | % |
Coffee | | $ | 1,067 | | | | 8.1 | % | | $ | 1,471 | | | | 7.1 | % | | $ | 1,884 | | | | 4.8 | % | | $ | 2,527 | | | | 7.1 | % |
Coal | | $ | 893 | | | | 6.8 | % | | $ | 2,598 | | | | 12.5 | % | | $ | 6,015 | | | | 15.2 | % | | $ | 4,560 | | | | 12.9 | % |
Nickel and Gold | | $ | 302 | | | | 2.3 | % | | $ | 1,255 | | | | 6.0 | % | | $ | 3,062 | | | | 7.8 | % | | $ | 1,512 | | | | 4.3 | % |
Nontraditional Exports (2) | | $ | 6,098 | | | | 46.4 | % | | $ | 9,935 | | | | 47.7 | % | | $ | 12,042 | | | | 30.5 | % | | $ | 12,541 | | | | 35.4 | % |
| | | | | | | | | | | | | | | | | | | | | | | | | | | | | | | | |
Total Exports | | $ | 13,136 | | | | 100.0 | % | | $ | 20,818 | | | | 100.0 | % | | $ | 39,502 | | | | 100.0 | % | | $ | 35,379 | | | | 100.0 | % |
| | | | | | | | | | | | | | | | | | | | | | | | | | | | | | | | |
Totals may differ due to rounding.
| 1: | Figures are based on the recommendations contained in the sixth edition of the IMF´s Balance of Payments Manual. Does not incorporate special trade operations. Total Exports figures from the Balance of Payments table include commerce from Free Trade Zones not included in DANE´s Total Exports statistics. Figures of 2015 are preliminary. |
| 2: | Includes emeralds but does not include gold. |
| Source: | DANE and Banco de la República—Economic Studies. |
D-55
Exports of goods (according to balance of payments figures) decreased by 33.0% in 2015 compared to 2014, principally due to a decrease in oil and its derivatives, external sales and a lesser extent due to a lower volume of coal and industrial products sales. Nontraditional exports including emeralds decreased by 12.6%, from $15,945 million in 2014 to $13,935 million in 2015. Among industry exports, the largest decreases among the categories of specifically identified export products were registered by textile and apparel (including leather, leather products and plastic), which decreased by 84.8%, Nonmetalic Minerals, which decreased by 25.5%, and paper and its byproducts, which decreased by 19.2%. Exports of goods (according to DANE and Banco de la República) in 2015 totaled approximately $35,379 million, including oil and its derivatives (40.2% of total exports), coal (12.9% of total exports), coffee (7.1% of total exports), nickel (1.2% of total exports) and nontraditional exports (38.5% of total exports).
According to preliminary figures supplied by DANE and the Dirección de Impuestos y Aduanas Nacionales de Colombia (“DIAN”), exports of goods totaled $8,899 million during the first four months of 2016, representing a 30% decrease as compared to the same period in 2015. During the same period, traditional exports decreased by 42.5%. This decrease in traditional exports was primarily caused by the decrease in external sales of oil and its derivatives. Nontraditional exports decreased by 7.7%. The following tables show the composition of Colombia’s exports and the volume and price of Colombia’s leading exports for the years indicated.
Exports (FOB) by Group of Products
(millions of U.S. dollars)
| | | | | | | | | | | | | | | | | | | | | | | | |
| | | | | | % of total | |
| | | 2011(1) | | | 2012(1) | | | 2013(1) | | | 2014(1) | | | 2015(1) | | | 2015(1) | |
Mining | | | | | | | | | | | | | | | | | | | | | | | | |
Oil and its Derivatives | | $ | 28,421 | | | $ | 31,497 | | | $ | 32,011 | | | $ | 28,885 | | | $ | 14,239 | | | | 40.2 | % |
Coal | | | 8,397 | | | | 7,805 | | | | 6,688 | | | | 6,810 | | | | 4,560 | | | | 12.9 | % |
Emeralds | | | 129 | | | | 117 | | | | 123 | | | | 137 | | | | 143 | | | | 0.4 | % |
Nickel | | | 827 | | | | 881 | | | | 680 | | | | 641 | | | | 430 | | | | 1.2 | % |
Gold(2) | | | 2,769 | | | | 3,382 | | | | 2,223 | | | | 1,578 | | | | 1,082 | | | | 3.1 | % |
Others(3) | | | 318 | | | | 302 | | | | 293 | | | | 349 | | | | 167 | | | | 0.5 | % |
Total | | $ | 40,861 | | | $ | 43,984 | | | $ | 42,017 | | | $ | 38,400 | | | $ | 20,621 | | | | 58.3 | % |
Agriculture, Livestock, Forestry and Fishing, except Coffee | | | 2,415 | | | | 2,790 | | | | 2,981 | | | | 2,732 | | | | 2,619 | | | | 7.4 | % |
Coffee | | | 2,608 | | | | 1,910 | | | | 1,884 | | | | 2,473 | | | | 2,527 | | | | 7.1 | % |
Industry | | | | | | | | | | | | | | | | | | | | | | | | |
Food, Beverages and Tobacco | | | 1,900 | | | | 1,787 | | | | 1,607 | | | | 1,935 | | | | 1,630 | | | | 4.6 | % |
Textiles and Apparel(4) | | | 1,752 | | | | 1,744 | | | | 1,579 | | | | 1,490 | | | | 227 | | | | 0.6 | % |
Wood and its Derivatives | | | 74 | | | | 89 | | | | 85 | | | | 93 | | | | 77 | | | | 0.2 | % |
Paper and its Byproducts | | | 727 | | | | 544 | | | | 487 | | | | 433 | | | | 350 | | | | 1.0 | % |
Chemicals | | | 3,355 | | | | 3,451 | | | | 3,715 | | | | 3,659 | | | | 3,404 | | | | 9.6 | % |
Nonmetalic Minerals | | | 448 | | | | 490 | | | | 409 | | | | 429 | | | | 320 | | | | 0.9 | % |
Iron and Steel Industries | | | 1,044 | | | | 1,082 | | | | 1,014 | | | | 892 | | | | 769 | | | | 2.2 | % |
Machinery and Equipment | | | 777 | | | | 890 | | | | 912 | | | | 912 | | | | 844 | | | | 2.4 | % |
Other Industries(5) | | | 705 | | | | 1,061 | | | | 1,340 | | | | 994 | | | | 1,992 | | | | 5.6 | % |
Total | | | 10,782 | | | | 11,139 | | | | 11,149 | | | | 10,838 | | | | 9,612 | | | | 27.2 | % |
Total Exports | | $ | 56,666 | | | $ | 59,823 | | | $ | 58,031 | | | $ | 54,443 | | | $ | 35,379 | | | | 100.0 | % |
Totals may differ due to rounding.
D-56
| 2: | From 1980 to 1993 includes domestic purchase of gold by Banco de la República. The gold figures in this table represent the amount of gold transactions officially registered with Banco de la República. |
| 3: | Includes salt, clay and sand mining and manufacture of fertilizers, chemicals and other products. |
| 4: | Includes leather, leather products and plastic. |
| 5: | Includes jewelry, musical instruments, sporting goods and other products. |
| Source: | DANE and Banco de la República. Figures are based on the recommendations contained in the sixth edition of the IMF´s Balance of Payments Manual. Does not incorporate special trade operations. Total Exports figures included under the Balance of Payments table above include commerce from Free Trade Zones that are not included in DANE´s Total Exports statistics. |
Volume and Price of Leading Exports
| | | | | | | | | | | | | | | | | | | | |
| | | 2011 | | | 2012 | | | 2013 | | | 2014(1) | | | 2015(1) | |
Crude Oil Export Volume (thousands of barrels/day) | | | 654 | | | | 702 | | | | 753 | | | | 788 | | | | 803 | |
Crude Oil Price ($/barrel) | | | 99.3 | | | | 104.2 | | | | 100.3 | | | | 92.5 | | | | 44.3 | |
Coffee Export Volume (millions of 60 kg. bags) | | | 7.2 | | | | 6.6 | | | | 9.0 | | | | 10.4 | | | | 11.9 | |
Coffee Price ($/lb, ex dock) | | | 2.84 | | | | 2.03 | | | | 1.48 | | | | 1.9 | | | | 1.6 | |
| Source: | Banco de la República. |
In 2015, the total volume of crude oil exported increased by 1.9%, and the average price of crude oil exported by Colombia decreased by 52.2% from $92.5 per barrel in 2014 to $44.3 per barrel in 2015. The weighted average price of coffee exported by Colombian producers decreased to $1.6 per pound in 2015, representing a decrease of 15.6% from the average price of $1.9 per pound in 2014. The volume of coffee exports increased by 14.0% in 2015 as compared with the volume exported in 2014.
Imports
Imports (CIF) totaled $54,233 million in 2011. Imports (CIF) increased by 9.0% in 2012, 0.5% in 2013 and 7.8% in 2014. In 2015, imports (CIF) decreased by 15.6% as compared to 2014. Comparing 2014 figures with 2015 figures, imports of consumer goods decreased by 15.3%, imports of raw materials and intermediate goods decreased by 16.6% and imports of capital goods decreased by 14.7%. In 2015, consumer goods comprised 22.3% of total imports, raw materials and intermediate goods accounted for 43.7% of total imports and capital goods comprised 34.0% of total imports.
According to preliminary figures supplied by DANE and DIAN, imports of goods totaled $21,547 million during the first half of 2016, representing a 20.9% decrease as compared to the same period in 2015. This decrease was primarily due to a decrease in imports of capital goods products by 32%.
D-57
The following table shows the composition of Colombia’s major imports for the last five years.
Imports (CIF)
| | | | | | | | | | | | | | | | | | | | | | | | |
| | | | | | | | | | | | % of total | |
| | | 2011(1) | | | 2012(1) | | | 2013(1) | | | 2014(1) | | | 2015 | | | 2015(1) | |
| | | (millions of U.S. dollars) | |
Consumer Goods | | | 11,315 | | | | 12,941 | | | | 13,122 | | | | 14,251 | | | | 12,070 | | | | 22.3 | % |
Non-Durable | | | 5,152 | | | | 6,282 | | | | 6,422 | | | | 6,793 | | | | 6,211 | | | | 10.6 | % |
Durable | | | 6,164 | | | | 6,659 | | | | 6,701 | | | | 7,457 | | | | 5,859 | | | | 116 | % |
Automobiles | | | 3,337 | | | | 3,512 | | | | 3,552 | | | | 3,896 | | | | 3,280 | | | | 6.1 | % |
Arms and Military Equipment | | | 93 | | | | 71 | | | | 73 | | | | 232 | | | | 72 | | | | 0.4 | % |
Others | | | 2,733 | | | | 3,075 | | | | 3,076 | | | | 3,329 | | | | 2,507 | | | | 5.2 | % |
Raw Materials and Intermediate Goods | | | 22,609 | | | | 25,552 | | | | 25,670 | | | | 27,953 | | | | 23,306 | | | | 43.7 | % |
Fuels(2) | | | 3,844 | | | | 5,732 | | | | 6,375 | | | | 7,544 | | | | 5,133 | | | | 11.8 | % |
Electric | | | 0 | | | | 0 | | | | 1 | | | | 2 | | | | 2 | | | | 0.0 | % |
Agricultural | | | 1,845 | | | | 2,030 | | | | 1,991 | | | | 2,061 | | | | 1,955 | | | | 3.2 | % |
Industrial | | | 16,920 | | | | 17,790 | | | | 17,303 | | | | 18,346 | | | | 16,216 | | | | 28.7 | % |
Industrial, Chemical and Pharmaceutical Products | | | 7,073 | | | | 7,549 | | | | 7,816 | | | | 8,109 | | | | 7,313 | | | | 12.7 | % |
Mineral Products | | | 4,714 | | | | 4,900 | | | | 4,507 | | | | 5,122 | | | | 4,282 | | | | 8.0 | % |
Non-Food Agricultural Products | | | 2,428 | | | | 2,415 | | | | 2,376 | | | | 2,561 | | | | 2,237 | | | | 4.0 | % |
Food Products | | | 2,706 | | | | 2,926 | | | | 2,602 | | | | 2,553 | | | | 2,384 | | | | 4.0 | % |
| | | | | | |
Capital Goods | | | 20,280 | | | | 20,591 | | | | 20,567 | | | | 21,800 | | | | 18,601 | | | | 34.0 | % |
Construction Materials | | | 1,898 | | | | 1,959 | | | | 1,919 | | | | 1,981 | | | | 1,739 | | | | 3.1 | % |
Agricultural | | | 174 | | | | 176 | | | | 172 | | | | 176 | | | | 163 | | | | 0.3 | % |
Transportation | | | 7,713 | | | | 6,684 | | | | 6,345 | | | | 6,777 | | | | 5,693 | | | | 10.6 | % |
Industrial | | | 10,495 | | | | 11,772 | | | | 12,132 | | | | 12,866 | | | | 11,006 | | | | 20.1 | % |
Industrial Machinery | | | 4,380 | | | | 4,855 | | | | 4,526 | | | | 4,431 | | | | 4,027 | | | | 6.9 | % |
Office and Technical Machinery | | | 2,653 | | | | 3,054 | | | | 3,323 | | | | 3,607 | | | | 2,802 | | | | 5.6 | % |
Others | | | 3,462 | | | | 3,864 | | | | 4,283 | | | | 4,828 | | | | 4,176 | | | | 7.5 | % |
Unclassified | | | 28 | | | | 27 | | | | 22 | | | | 23 | | | | 23 | | | | 0.0 | % |
Total | | | 54,233 | | | | 59,111 | | | | 59,381 | | | | 64,029 | | | | 54,058 | | | | 100.0 | % |
Totals may differ due to rounding.
| 2: | Includes oil derivatives and coal. |
| Sources: | DANE and Dirección de Impuestos y Aduanas Nacionales (National Directorate of Customs and Taxes). |
Geographic Distribution of Trade
The following tables show the destination and origin, respectively, of Colombia’s exports and imports.
Merchandise Exports to Major Trading Partners
| | | | | | | | | | | | | | | | | | | | |
| | | 2011 | | | 2012 | | | 2013 | | | 2014(1) | | | 2015(1) | |
| | | | | | (percentage of total exports) | |
United States | | | 38.6 | | | | 36.3 | | | | 31.4 | | | | 25.7 | | | | 27.6 | |
Panama | | | 3.8 | | | | 4.8 | | | | 5.5 | | | | 6.6 | | | | 6.7 | |
China | | | 3.5 | | | | 5.6 | | | | 8.7 | | | | 10.5 | | | | 6.3 | |
Spain | | | 3.0 | | | | 4.9 | | | | 4.9 | | | | 6.0 | | | | 4.4 | |
Netherlands | | | 4.4 | | | | 4.2 | | | | 3.9 | | | | 3.9 | | | | 4.2 | |
Ecuador | | | 3.4 | | | | 3.2 | | | | 3.4 | | | | 3.4 | | | | 4.0 | |
Brazil | | | 2.3 | | | | 2.1 | | | | 2.7 | | | | 3.0 | | | | 3.3 | |
Peru | | | 2.3 | | | | 2.6 | | | | 2.2 | | | | 2.2 | | | | 3.2 | |
Venezuela | | | 3.0 | | | | 4.3 | | | | 3.8 | | | | 3.6 | | | | 3.0 | |
Chile | | | 3.9 | | | | 3.6 | | | | 2.7 | | | | 1.8 | | | | 2.1 | |
United Kingdom | | | 2.1 | | | | 1.9 | | | | 1.9 | | | | 2.0 | | | | 1.8 | |
India | | | 1.3 | | | | 2.3 | | | | 5.1 | | | | 5.0 | | | | 1.5 | |
Switzerland | | | 1.7 | | | | 1.2 | | | | 0.8 | | | | 0.9 | | | | 1.2 | |
Others | | | 26.7 | | | | 23.0 | | | | 23.2 | | | | 25.3 | | | | 30.6 | |
Total | | | 100.0 | % | | | 100.0 | % | | | 100.0 | % | | | 100.0 | % | | | 100.0 | % |
Totals may differ due to rounding.
D-58
Merchandise Imports by Major Trading Partners
| | | | | | | | | | | | | | | | | | | | |
| | | 2011 | | | 2012 | | | 2013 | | | 2014(1) (2) | | | 2015(1) (2) | |
| | | (percentage of total exports) | |
United States | | | 35.6 | | | | 33.1 | | | | 34.7 | | | | 34.2 | | | | 34.7 | |
| | | | | |
China | | | 5.5 | | | | 6.0 | | | | 6.0 | | | | 6.6 | | | | 6.9 | |
Panama | | | 5.3 | | | | 5.8 | | | | 5.6 | | | | 4.9 | | | | 5.5 | |
Mexico | | | 7.5 | | | | 8.0 | | | | 5.9 | | | | 5.5 | | | | 4.7 | |
Switzerland | | | 3.4 | | | | 3.7 | | | | 3.6 | | | | 3.6 | | | | 4.0 | |
South Korea | | | 3.3 | | | | 3.1 | | | | 3.3 | | | | 3.6 | | | | 3.7 | |
Germany | | | 3.4 | | | | 3.3 | | | | 3.5 | | | | 3.1 | | | | 3.5 | |
Brazil | | | 3.2 | | | | 3.1 | | | | 2.8 | | | | 3.0 | | | | 3.1 | |
Chile | | | 2.1 | | | | 2.4 | | | | 2.3 | | | | 2.3 | | | | 2.4 | |
Japan | | | 2.8 | | | | 2.6 | | | | 1.9 | | | | 2.1 | | | | 2.2 | |
Spain | | | 1.5 | | | | 1.9 | | | | 2.0 | | | | 1.9 | | | | 2.1 | |
| | | | | |
Ecuador | | | 1.5 | | | | 1.6 | | | | 1.4 | | | | 1.5 | | | | 1.3 | |
Peru | | | 1.7 | | | | 1.5 | | | | 1.3 | | | | 1.1 | | | | 1.1 | |
Others | | | 23.1 | | | | 24.0 | | | | 25.7 | | | | 25.4 | | | | 24.8 | |
Total | | | 100.0 | % | | | 100.0 | % | | | 100.0 | % | | | 100.0 | % | | | 100.0 | % |
Totals may differ due to rounding.
| 2: | Correspond to country of purchase |
Sources: National Directorate of Customs and Taxes.
The United States is Colombia’s most important trading partner. During 2015, trade between the two countries accounted for approximately 27.6% of Colombia’s total exports and 34.7% of total imports. The major trading partners of Colombia classified by exports are the United States, Panama, China and the European Union. The major trading partners of Colombia classified by imports are the United States, China and Panama.
Exports to the United States were $22.0 billion in 2011, $21.8 billion in 2012, $18.5 billion in 2013, $14.2 billion in 2014, $9.9 billion in 2015 and $3.0 billion for the period from January to April 2016. In 2015, exports to the United States decreased by 30.6%, mainly due to lower sales of petroleum, which retracted 22.8% in comparison to 2014. Imports from the United States were $13.5 billion 2011, $14.2 billion in 2012, $16.3 billion in 2013, $18.2 billion in 2014, $15.5 billion in 2015 and $4.1 billion for the period from January to April of 2016. In 2015, imports from the United States decreased by 14.7%, mainly as a result of a decrease in imports of diesel, motor gasoline and other light oils.
Exports to China were $2.0 billion 2011, $3.3 billion in 2012, $5.1 billion in 2013, $5.8 billion in 2014 and $2.3 billion in 2015. For the period from January to April 2016 exports to China totaled $335 million. In 2015, exports to China decreased 60.7% over the previous year, mainly due to a 65.4% decrease in the export of oil and a 16.1% decrease in other products. Imports from China were $8.2 billion in 2011, $9.8 billion in 2012, $10.4 billion in 2013, $11.8 billion in 2014, $10.0 billion in 2015, and $2.6 billion from January to April of 2016. In 2015, imports from China decreased by 14.9%, mainly as a result of a 37.8% decrease in imports of laptop computers and a 12.7% decrease in imports of cellphones.
Exports to the European Union were $8.9 billion in 2011, $9.1 billion in 2012, $9.3 billion in 2013, $9.4 billion in 2014 and $6.0 billion in 2015. For the period from January to April 2016, exports totaled $1.5 billion. In 2015, exports to the European Union decreased 36.1% over the previous year. Imports from Mexico were $6.1
D-59
billion in 2011, $6.5 billion in 2012, $5.5 billion in 2013, $5.3 billion in 2014, $3.9 billion in 2015 and $1.1 billion for the period from January to April 2016. In 2015, imports from Mexico decreased by 26.9%, due to a decrease in imports of vehicles for the transport of goods and a reduction in imports of television sets.
In October 2002, Colombia became eligible to participate in the Andean Trade Promotion and Drug Eradication Act (“ATPDEA”), which then President Bush signed in August 2002 and which expired on February 12, 2011. On February 12, 2011, the privileges under the ATPDEA lapsed but were reauthorized, retroactively, on October 21, 2011 for eligible countries, such as Colombia and Ecuador. Colombia is no longer an eligible beneficiary country under the ATPDEA as of May 15, 2012, when the United States-Colombia free trade agreement entered into force. The ATPDEA expired on July 31, 2013. The ATPDEA extended the unilateral tariff preferences on certain goods accorded to the Andean countries through the Andean Trade Preference Act to certain new products, such as apparel made with regional fabrics, footwear, leather goods, petroleum and watches.
In March 2011, Bancoldex opened a new credit line of $30 million for Colombian exporters who had been covered under ATPDEA for the purpose of financing those exporters’ tariffs. This line of credit was in addition to the $150 million credit line offered on February 17, 2011. To facilitate access to the credit line, small to medium enterprises would have the benefit of a guaranty by the Fondo Nacional de Garantías (National Fund of Guarantees or “FNG”).
On November 22, 2006, the United States and Colombia signed a free trade agreement that had been under discussion since the middle of 2004. The benefits of the free trade agreement are intended to extend and expand the benefits received under ATPDEA, which originally had been set to expire by the end of 2006. On June 14, 2007, the Colombian Congress approved the Free Trade Agreement. Following the approval from Congress, on July 4, 2007, the President signed the law authorizing the Free Trade Agreement and on July 24, 2008 the Constitutional Court declared the agreement compatible with the Constitution. The Congress of the United States approved the free trade agreement between Colombia and the United States on October 12, 2011, and President Obama signed the agreement into law on October 21, 2011. The implementation phase in Colombia was intended to verify that the agreement is consistent with Colombia’s legal system. Thereafter, the two governments exchanged diplomatic notes at the Summit of the Americas in Cartagena, and the free trade agreement entered into force on May 15, 2012. According to the Ministry of Commerce, Industry and Tourism, with the entry into force of the Trade Promotion Agreement (Acuerdo de Promoción Comercial) with the United States of America, ATPDEA tariffs benefits will be maintained, consolidated and expanded to other products and services.
From 2008 to 2009, Venezuela was the second most significant destination for Colombian exports. In 2015, however, Venezuela accounted for only 3.0% of Colombia’s total exports, falling behind Panama (6.7%), China (6.3%), Spain (4.4%), Netherlands (4.2%) and Ecuador (4.0%). Venezuela is not a significant source of imports into Colombia.
Colombia has pursued a policy of reducing trade barriers by fostering economic integration with other countries and promoting bilateral and multilateral trade agreements with regional trading partners. The Andean Community of Nations (Comunidad Andina de Naciones), which originally included Bolivia, Ecuador, Venezuela, Colombia and Peru, was part of this effort to increase trade among member countries. Pursuant to this agreement, originally ratified in May 1969, the member nations implemented common external tariffs on February 1, 1995. On April 5, 2004, the Andean Community concluded a free trade agreement with Mercosur, the free trade association composed of Argentina, Brazil, Paraguay and Uruguay. This agreement, which became effective in July 2004, created a South American free trade area composed of 300 million inhabitants. On April 22, 2006, Venezuela announced its intention to withdraw from the Andean Community. The Cartagena Agreement, under which the Andean Community was created, provides, however, that a member country that withdraws from the community must maintain the agreed tariff program of the existing free trade zone among community members for at least five years. On September 20, 2006, Chile was accepted as an associated member country of the Andean Community.
On April 9, 2011, in the context of the withdrawal of Venezuela from the Andean Community effective April 21, 2011, the presidents of Colombia and Venezuela agreed to maintain the status quo regarding tariffs and free trade under the Andean Community for an additional three months beginning on April 21, 2011 with an option to renew the agreement for another three-month period thereafter until the negotiation teams of both countries concluded a new trade agreement.
D-60
On July 23, 2011, the Ministry of Commerce, Industry and Tourism announced that the Venezuelan government had extended until October 22, 2011 the effect of Venezuelan Decree 8,160 of April 18, 2011 which grants tariff exemptions provided under the Andean Community of Nations Agreement. On October 24, 2011, after finishing the bilateral commission meetings, the governments of Colombia and Venezuela signed an agreement to continue the tariff exemptions provided under the Andean Community of Nations Agreement until January 22, 2012. On November 28, 2011, Colombia and Venezuela signed a Partial Scope Agreement that will support and regulate the trade between the countries within the framework of the Asociación Latinoamericana de Integración, or ALADI, an association of 13 member countries (Argentina, Bolivia, Brazil, Chile, Colombia, Cuba, Ecuador, Mexico, Panama, Paraguay, Peru, Uruguay and Venezuela) that seeks to establish a common market in the region.
In 2015, bilateral trade between Colombia and the other countries of the Andean Community decreased compared to 2014. Exports to the Andean Community decreased by 15% from $3,210 million in 2014 to $2,730 million in 2015. Imports from the Andean Community decreased by 19.5% from $2,675 million in 2014 to $2,153 million in 2015.
In 2005, the European Union and the Andean Community announced their intention to begin negotiations in 2006 for a free trade agreement. Following the announcement by Venezuela of its intention to withdraw from the Andean Community, the start of the negotiations was postponed to 2007. Negotiations between the European Union and the Andean Community began in September 2007; however, in 2008, Peru expressed its desire to separately negotiate a free trade agreement with the European Union due to economic tensions with Bolivia and Ecuador. That circumstance created an environment of uncertainty and hampered the progress of negotiations among the Andean countries and the European Union. In May 2010, Colombia and Peru made official statements announcing the success of negotiations regarding the establishment of a free trade agreement with the European Union. On June 26, 2012, the European Commission signed the free trade agreement among Colombia, Peru and the European Union. The European Parliament approved the agreement in December 2012 and Colombia completed its internal ratification procedures in June 2013, clearing the way for provisional application of the agreement on August 1, 2013. The agreement is currently in force.
The members states of the European Free Trade Association, Iceland, Liechtenstein, Norway and Switzerland signed a free trade agreement with Colombia on November 25, 2008, which was approved by law on January 2010. Colombia, Liechtenstein and Switzerland ratified the agreement in 2009. Norway and Iceland ratified it in 2014 and the agreement entered into force in September and October 2014, respectively. The agreement contemplates the liberalization of trade in agricultural and industrial goods, rules of origin, customs procedures and trade facilitation. It also includes commitments regarding trade in services, the transit of persons, e-commerce, technical standardization, investment measures, competition policy and intellectual property.
Colombia is working to consolidate its relations with the members of the Asia-Pacific Economic Cooperation (APEC) forum on topics such as trade, tourism, economic cooperation and investment. In order to foster closer ties with China and Chinese businesses, Colombia hosted the Third Latin America and China Meeting in November 2009. In February 2012, Colombia attended the APEC Forum in Moscow. On May 22, 2013, President Santos signed the Framework Agreement of the Pacific Alliance that will provide Colombia with greater access in areas such as free movement of goods, services, capital and people with the other members of the Pacific Alliance, which includes Chile, Mexico and Peru. On May 23, 2013, President Santos met with the presidents of Chile, Mexico and Peru in the VIIth Presidential Summit of the Pacific Alliance in Cali, Colombia to discuss strategy to generate new business opportunities and to continue with the economic and commercial integration among the Pacific Alliance countries.
On May 23, 2011, Colombia signed a free trade agreement with Switzerland with the aim of increasing trade in fruits, manufactured goods, and chemical products, among others, between the two countries. Between May 30, 2011 and June 3, 2011, Colombia held the first bilateral meeting with Turkey in Bogotá to continue negotiations on a free trade agreement, a draft of which was agreed on March 15, 2011. Currently both countries have met six times, and most of the chapters of the agreement have been negotiated. The most recent meeting was held in Ankara between May 31 and June 2, 2012. Colombia also seeks to negotiate a free trade agreement with Japan. The most recent meetings between the countries were held between May 12, 2014 and May 16, 2014 in Tokyo, Japan.
In 2013, Colombia signed free trade agreements with South Korea, Costa Rica, Panama and Israel. The Colombian Congress ratified the free trade agreement with South Korea in December 2014, making it the first free
D-61
trade agreement with a country in Asia and thus opening a commercial door to the Asia-Pacific region. In 2015, the Colombian Congress passed Law 1763 by which the free trade agreement between Colombia and Costa Rica was approved. On April 6, 2016 the Constitutional Court of Colombia approved the free trade agreement which went into effect on August 1, 2016. As of 2016, trade agreements between Colombia and Panama and Israel are in the process of being debated in Congress.
Foreign Investment
Foreign investment in Colombia was traditionally directed towards the oil and mining sectors. Previously, investment in sectors such as public services was prohibited, and investments in the financial sector were limited to no more than 49% foreign ownership of financial institutions. As part of the Apertura process, the Gaviria administration (1990-1994) enacted reforms designed to make foreign investment in Colombia more attractive. For example, legislation was enacted that ensured equal treatment of foreign and local investors and foreign access to traditionally restricted economic sectors. The Pastrana administration removed many of the remaining restrictions on foreign investment in order to stimulate economic growth and reduce unemployment. In June 1999, Congress approved a constitutional amendment to guarantee adequate compensation for expropriation of property.
Moreover, Decree 241 of 1999 removed restrictions on foreign investments in Colombian real estate, one of the few sectors of the economy in which foreign investment had been banned by the International Investment Statute. The public sector restructuring decrees of June 1999 also allowed public entities to sign contracts of “juridical stability” to protect private investors from sudden changes in legislation (including tax rules). Ecopetrol S.A. has made changes to the standard terms of its association contracts that are designed to encourage foreign investment in the oil sector. For a more detailed discussion of Ecopetrol S.A.’s association contracts, see “Economy—Principal Sectors of the Economy—Mining and Petroleum.” Law 756 of 2002 created an oil royalties system geared towards encouraging oil exploration on small and medium-size fields, which establishes variable royalties ranging from 8% for fields producing up to 5,000 barrels per day to 25% for fields producing in excess of 600,000 barrels per day. Law 963 of 2005, or Ley del Inversionista, established “juridical stability” protections under which foreign and local investors whose investments are greater than or equal to 7,500 times the monthly minimum wage are protected. As of May 27, 2016, the Government has signed 71 of these contracts.
Under current law and regulations, foreign investments generally do not require prior governmental authorization. Foreign entities, however, must register investments with Banco de la República in order to establish their right to transfer profits and capital investments abroad. Investment in certain sectors, including financial services, still requires prior authorization. Foreign investment in national security and defense-related industries, as well as industries which process toxic and radioactive materials, is prohibited.
In 2011, net foreign direct investment registered a net inflow of $17,547 million, an increase of $8,768 million compared to 2010, and net portfolio investment was $6,090 million. In 2012, net foreign direct investment totaled a net inflow of $18,666 million, an increase of $1,119 million from the value recorded in 2011 and net portfolio investment was $5,690 million. In 2013, net foreign direct investment totaled a net inflow of $20,992 million, an increase of $2,326 million from the value recorded in 2012 and net portfolio investment was $6,978 million in 2013. In 2014, net foreign direct investment totaled a net inflow of $28,982 million, an increase of $7,990 million from the value recorded in 2013 and net portfolio investment was $11,654 million in 2014. According to preliminary data from Banco de la República, during 2015, net direct foreign investment was $16,562 million, a decrease of $12,420 million from the value recorded in 2014, and net portfolio investment had an inflow of $9,531 million. The decrease in net foreign direct investment during 2015 was mainly due to a decrease in foreign capital inflows. The following table sets forth information on net foreign direct investment by country of origin for the years indicated.
D-62
Net Foreign Direct Investment by Country of Origin(1)
| | | | | | | | | | | | | | | | | | | | |
| | | 2011(2) | | | 2012(2) | | | 2013(2) | | | 2014(2) | | | 2015(2) | |
| | | (millions of U.S. dollars) | |
North America | | | | | | | | | | | | | | | | | | | | |
United States | | | 2,155 | | | | 2,476 | | | | 2,839 | | | | 2.267 | | | | 2.121 | |
Mexico | | | 455 | | | | 849 | | | | 556 | | | | 654 | | | | -180 | |
Canada | | | 273 | | | | 291 | | | | 258 | | | | 443 | | | | 318 | |
| | | 2,884 | | | | 3,616 | | | | 3,653 | | | | 3,363 | | | | 2,259 | |
| | | | | |
South America | | | | | | | | | | | | | | | | | | | | |
Andean Group | | | 133 | | | | 211 | | | | 135 | | | | 314 | | | | 103 | |
Others | | | 1,021 | | | | 3,782 | | | | 767 | | | | 635 | | | | 955 | |
| | | 1,154 | | | | 3,993 | | | | 902 | | | | 949 | | | | 1,058 | |
Central America | | | 3,524 | | | | 2,423 | | | | 2,060 | | | | 2,511 | | | | 1,641 | |
Panama | | | 3,508 | | | | 2,395 | | | | 2,040 | | | | 2,446 | | | | 1,603 | |
| | | | | |
Central American | | | | | | | | | | | | | | | | | | | | |
Common Market(3) | | | 16 | | | | 28 | | | | 20 | | | | 65 | | | | 38 | |
| | | | | |
Caribbean | | | 2,151 | | | | 2,359 | | | | 3,240 | | | | 2,125 | | | | 1,986 | |
Europe | | | 4,828 | | | | 2,423 | | | | 6,096 | | | | 7,265 | | | | 4,967 | |
EEC Countries | | | 2,618 | | | | -50 | | | | 2,528 | | | | 3,272 | | | | 2,847 | |
European Free Trade | | | | | | | | | | | | | | | | | | | | |
Association | | | 1,008 | | | | 715 | | | | 2,113 | | | | 2,836 | | | | 1,170 | |
Other Countries | | | 1,201 | | | | 1,758 | | | | 1,455 | | | | 1,157 | | | | 951 | |
| | | | | |
Asia | | | 93 | | | | 147 | | | | 110 | | | | 111 | | | | 151 | |
Other Countries | | | 14 | | | | 78 | | | | 148 | | | | 0 | | | | 45 | |
| | | | | |
Portfolio Investment(4) | | | 2,899 | | | | 3,626 | | | | 4,784 | | | | 12,658 | | | | 4,454 | |
| | | | | |
TOTAL | | | 17,547 | | | | 18,666 | | | | 20,992 | | | | 28,982 | | | | 16,562 | |
Totals may differ due to rounding.
| 1: | Figures from balance of payments. Figures reflect foreign investment into Colombia and outflows of foreign direct investment, but do not reflect investment by Colombians abroad. |
| 4: | Figures reflect only short-term portfolio investment inflows. |
| Source: | Banco de la República. |
D-63
The following table sets forth information on net foreign direct investment by sector for the years indicated.
Net Foreign Direct Investment by Sector(1)
| | | | | | | | | | | | | | | | | | | | |
| | | 2011 (2) | | | 2012 (2) | | | 2013 (2) | | | 2014(2) | | | 2015(2) | |
| | | (millions of U.S. dollars) | |
Direct investment(3) (4) | | | 14,648 | | | | 15,039 | | | | 16,209 | | | | 16,325 | | | | 12,108 | |
Petroleum | | | 4,700 | | | | 5,471 | | | | 5,112 | | | | 4,732 | | | | 3,063 | |
Agriculture and Fishing | | | 156 | | | | 26 | | | | 296 | | | | 203 | | | | 220 | |
Mining | | | 2,480 | | | | 2,474 | | | | 2,977 | | | | 1,582 | | | | 533 | |
Manufacturing | | | 1,214 | | | | 1,985 | | | | 2,481 | | | | 2,837 | | | | 2,412 | |
Public Services | | | 381 | | | | 672 | | | | 314 | | | | 523 | | | | 251 | |
Construction | | | 444 | | | | 401 | | | | 354 | | | | 669 | | | | 760 | |
Commerce | | | 2,546 | | | | 1,339 | | | | 1,361 | | | | 1,122 | | | | 1,859 | |
Transportation and Communications | | | 1,760 | | | | 1,245 | | | | 1,386 | | | | 1,994 | | | | 668 | |
Finance | | | 1,160 | | | | 1,077 | | | | 1,606 | | | | 2,478 | | | | 2,103 | |
Social Services | | | -193 | | | | 349 | | | | 324 | | | | 185 | | | | 238 | |
Portfolio investment(5) | | | 2,899 | | | | 3,626 | | | | 4,784 | | | | 12,658 | | | | 4,454 | |
Total | | | 17,547 | | | | 18,666 | | | | 20,993 | | | | 28,982 | | | | 16,562 | |
Totals may differ due to rounding.
| 1: | Figures from balance of payments. |
| 3: | Includes reinvested earnings. |
| 4: | Figures from balance of payments. Figures reflect foreign investment into Colombia and outflows of foreign direct investment, but do not reflect investment by colombians abroad. |
| 5: | Figures reflect only short-term portfolio investment inflows. |
Source: Banco de la República.
D-64
MONETARY SYSTEM
Banco de la República
Banco de la República, Colombia’s central bank, was chartered in 1923. Following ratification of the 1991 Constitution, Banco de la República was granted greater independence from the Government in its administration and in the formulation of monetary policy. The 1991 Constitution charges Banco de la República with the primary mission of controlling inflation, as measured by changes in the consumer price index, in addition to other central banking functions.
Banco de la República’s board of directors is responsible for setting monetary and exchange rate policy. The board of directors has seven members, five of whom are appointed by the President to four-year terms. At the end of each four-year term, the President may replace up to two of the five presidential appointees and must re-appoint the remaining three appointees. The Minister of Finance and Public Credit is the sixth board member and is the sole representative of the Government on the board of directors. The seventh member is elected by the other six members and serves as the Governor of Banco de la República. Unless all seven members of the board of directors vote to do so, Banco de la República may not finance the Government’s budget deficits. The Constitution prohibits Banco de la República from making loans to the private sector except to provide liquidity to the financial system or to arrange and intermediate non-peso denominated loans in the local market for specific limited purposes.
Banco de la República is authorized by law, subject to certain restrictions, to regulate interest rates payable on time deposits, establish minimum reserve requirements for credit institutions and provide discount facilities for certain types of bank loans. In addition, Banco de la República performs other traditional functions of a central bank, including managing the country’s international reserves and acting as lender of last resort to the financial system. The Government is responsible for any losses and entitled to any profits generated from the operations of Banco de la República. Banco de la República registered an operating loss of Ps. 395.04 billion in 2015, Ps. 771.2 billion less than the loss registered in 2014. The bank, after many years of generating profits, started generating losses in 2010. This change is explained by the lower external interest rates and, during 2015, the decrease in the international price of oil and the depreciation of the currency against the U.S. dollar, which have significantly reduced income from international reserves.
Financial Sector
As of December 31, 2015, Colombia’s financial system was comprised of 25 banks (15 domestic and 10 foreign), five corporaciones financieras (financial corporations), 17 compañías de financiamiento comercial (commercial financing companies) and a number of securities brokerage houses and other non-banking institutions, such as insurance companies, trust companies and bonded warehouses. The main types of financial institutions are described below.
Banks. The Government owns one of the 15 Colombian banks. Commercial banks can offer a full scale of retail (including mortgage) and corporate banking services with the exception of investment banking and financial leasing.
Financial corporations. Financial corporations are specialized institutions that mainly make equity investments in and medium-term loans to various companies. Financial corporations also engage in project finance, an activity that has increased in recent years. Although they may engage in some banking activities, financial corporations are prohibited from receiving demand deposits and instead rely on savings, time deposits, certificates of deposit, bonds, intermediation of lines of credit from multilateral institutions and short-term deposits from companies and individuals to meet their funding needs. Most financial corporations are private sector institutions.
Commercial financing companies. Commercial financing companies specialize in providing working capital financing and credit for the purchase of consumer goods, but may also participate as intermediaries in foreign exchange transactions, conduct leasing operations and obtain short-term deposits.
The Colombian financial system also includes institutions that promote specific sectors of the Colombian economy, such as FEN (later becoming FDN (Financiera de Desarrollo Nacional S.A.)). See “Economy—Role of the State in the Economy; Privatization—State-Owned Financial Institutions.”
D-65
Decree 4174 of 2011 changed FEN into FDN and broadened its authority beyond the energy sector so that it can provide funding to other sectors of the economy. The FDN funds long term infrastructure projects in order to boost competitiveness and economic growth.
The following table shows the number of financial institutions and the percentage of loans and deposits corresponding to each category.
Colombian Financial System
as of December 31, 2015
| | | | | | | | | | | | |
| | | Number | | | % of Loans | | | % of Deposits | |
Banks | | | | | | | | | | | | |
Domestic Banks | | | 15 | | | | 68 | % | | | 65.6 | % |
State-Owned Banks | | | 1 | | | | 3.1 | % | | | 4.1 | % |
Foreign Banks | | | 10 | | | | 25.6 | % | | | 28.7 | % |
| | | | | | | | | | | | |
| | | 25 | | | | 93.7 | % | | | 94.4 | % |
Financial Corporations | | | 5 | | | | 0.1 | % | | | 1 | % |
Commercial Financing Companies(1) | | | 17 | | | | 6.2 | % | | | 4.6 | % |
Special State-Owned Institutions(2) | | | 11 | | | | 6.5 | % | | | 5.2 | % |
| | | | | | | | | | | | |
Total | | | 58 | | | | 100.0 | % | | | 100.0 | % |
| | | | | | | | | | | | |
Totals may differ due to rounding.
| 1: | Includes companies specialized in leasing. |
| 2: | Includes FDN, Bancoldex, Financiera de Desarrollo Territorial (Territorial Development Financing Agency or “FINDETER”), Finagro, Fondo Financiero de Proyectos de Desarrollo (Financial Fund for Development Projects or “FONADE”), Fondo Nacional del Ahorro (National Savings Fund or “FNA”), Fondo de Garantías de Instituciones Financieras (Financial Institutions Guarantee Fund or “FOGAFIN”), Fondo de Garantías de Entidades Cooperativas (Cooperative Institutions Guarantee Fund or “FOGACOOP”), FNG, Instituto Colombiano de Crédito Educativo y Estudios Técnicos en el Exterior (Colombian Institute of Educational Credit and Overseas Technical Studies, or “ICETEX”) and Caja de Vivienda Militar. |
| Source: | Financial Superintendency. |
During 2013, the Financial Superintendency gave approval to Coopcentral, a cooperative, through Resolutions 1683 of 2012 and 1635 of 2013, to become and operate as a bank so it could expand its operations.
The principal regulators of the financial institutions and the financial markets are the Ministry of Finance, Banco de la República and the Financial Superintendency. The Financial Superintendency was created by combining the Superintendency of Banks and the Superintendency of Securities into one office under Decree 4327 of 2005.
In 1989, the Government promulgated rules, which were further amended in 1994, setting forth the procedures to be followed in classifying loans as “non-performing” on the basis of specific risk and performance factors, establishing reserve requirements for loans and implementing capital adequacy requirements consistent with the standards recommended under the Basel accords. These rules are intended to improve the Colombian banking system and to ensure that standards followed by Colombian commercial banks are consistent with those followed by banks in other countries. Under these rules, banks are required to maintain net technical capital equal to at least 9.0% of their risk-weighted assets. The aggregate net technical capital (or solvency ratio) of Colombian banks was at 15.1% of risk-weighted assets on December 31, 2015, 0.05 basis points below the level recorded on December 31, 2014.
During the 1990s and early 2000s, the Government took steps to prevent a recurrence of past problems in the financial sector (particularly those problems of the early 1980’s that caused the Government to assume ownership of several commercial banks to prevent their failure), including the promulgation of stringent banking regulations and market-oriented foreign exchange policies. Law 45 of 1990 introduced the universal banking model, which permits commercial banks, through separate subsidiaries, to engage in stock brokerage, leasing, factoring, investment banking and other related activities, thereby stimulating competition among financial institutions and consolidating the financial sector.
D-66
In addition, under Law 45, foreign investment is now permitted in all types of financial institutions with no restrictions on the level of foreign ownership. As a result, with prior approval of the Financial Superintendency foreign entities are able either to purchase controlling interests in commercial banks or to increase their ownership in existing commercial bank subsidiaries. Law 45 has led to increased foreign investment in the banking sector.
Net profits of the financial sector, excluding special state owned institutions, increased from Ps. 6,824.1 billion in 2011, to Ps. 7,324.5 billion in 2012, Ps. 7,468.1 billion in 2013, Ps. 8,789.2 billion in 2014 and Ps. 8,884.3 billion in 2015. The Government did not liquidate any financial institutions from 2010 through 2015.
The following table shows the results of the financial sector as of and for the year ended December 31, 2015.
Selected Financial Sector Indicators
(in millions of pesos as of and for
the year ended December 31, 2015*)
| | | | | | | | | | | | | | | | |
| | | Assets | | | Liabilities | | | Net Worth | | | Earnings | |
Banks | | Ps. | 504,680,599 | | | Ps. | 437,326,633 | | | Ps. | 67,353,966 | | | Ps. | 8,884,327 | |
Non-Banking Financial Institutions(1) | | | 43,133,248 | | | | 34,340,679 | | | | 8,792,569 | | | | 530,349 | |
Special State-Owned Institutions(2) | | | 54,652,234 | | | | 47,411,987 | | | | 7,240,247 | | | | 230,411 | |
| | | | | | | | | | | | | | | | |
Total | | Ps. | 547,813,847 | | | Ps. | 471,667,312 | | | Ps. | 76,146,535 | | | Ps. | 9,414,676 | |
Totals may differ due to rounding.
| 1. | Includes Financial Corporations and Commercial Financing Companies. |
| 2. | Includes FDN, Bancoldex, FINDETER, FINAGRO, FNA, FOGAFIN, FONADE, FOGACOOP, FNG and ICETEX. |
| * | Starting 2015 Credit institutions (except IOE and Leasing Bancoldex) started to report under IFRS. In 2015 IOE and Leasing Bancoldex reported under COLGAAP. Data from 2015 are not comparable with previous years. |
| Source: | Financial Superintendency. |
FOGAFIN, the Colombian insurance deposit fund, is responsible for implementing many of the Government’s measures to support the financial sector. FOGAFIN’s primary mission is to maintain stability and public confidence in the Colombian financial institutions. During 2006-2015, FOGAFIN did not establish any new credit lines and no private institutions joined the FOGAFIN recapitalization program to inject capital into small and medium banks.
The Government assistance program for private financial institutions was designed to be self-financing and to yield returns to help pay for possible defaults. FOGAFIN issues bonds yielding the average short-term composite reference rate (DTF) and lends these bonds to financial institutions for terms of one to three years at the rate of DTF + 2% and for terms of four to seven years at the rate of DTF + 3%. It is estimated that the Government will not incur costs with respect to the assistance program, except for credit support provided to Interbanco, a private commercial bank.
As of December 31, 2015, there was no outstanding Government assistance to state-owned institutions or financial aid given to financial institutions or provision of credit support in the form of interest payments.
Since 1998, FOGAFIN has assumed management responsibility and control of four banks (Banco del Estado, Banco Uconal, Bancafé and Interbanco), a savings and loan institution (Granahorrar) and two private consumer credit institutions (Fundación FES Compañía de Financiamiento Comercial and Corficafe). In managing these financial institutions, the Central Government, along with FOGAFIN, has formulated a strategy based on the same principles followed by the private banks for improving the institutions’ balance sheets and increasing their net worth, in order to increase their financial viability. Granahorrar was privatized when Banco Bilbao Vizcaya Argentaria purchased Granahorrar in 2005. Bancafé was bought by Banco Davivienda S.A. in 2007.
D-67
Liquidity and Credit Aggregates
The total amount of loans outstanding, including leasing, from Colombian financial institutions was Ps. 377.1 trillion at December 31, 2015, Ps. 324.8 trillion at December 31, 2014, Ps. 281.8 trillion at December 31, 2013, Ps. 248.1 trillion at December 31, 2012 and Ps. 215.3 trillion at December 31, 2011. Leasing has been included in the amount of loans outstanding beginning in 2010 as a result of changes made by the Financial Superintendency through Circular Externa 35 of 2009 that came into force on April 1, 2010. Past due loans increased in absolute terms from Ps. 5.4 trillion at December 31, 2011 to Ps. 7.0 trillion at December 31, 2012 and further to Ps. 8.0 trillion at December 31, 2013. At December 31, 2014, past due loans stood at Ps. 9.6 trillion and to Ps. 10.8 trillion at December 31, 2015. As a percentage of total loans, past due loans decreased from 2.9% at December 31, 2010 to 2.5%, at December 31, 2011 and to 2.8% at December 31, 2012 and 2013. Past due loans as a percentage of total loans increased to 3.0% in 2014 but decreased to 2.9% in 2015. Provisions as a percentage of past due loans decreased from 183.5% at December 31, 2011 to 162.2% as of December 31, 2012, to 161.2% as of December 31, 2013, and to 151.7% as of December 31, 2014, but increased to 156.9% as of December 31, 2015. The following table shows selected monetary indicators for the years indicated.
Selected Monetary Indicators
| | | | | | | | | | | | | | | | | | | | |
| | | 2011 | | | 2012 | | | 2013 | | | 2014 | | | 2015 | |
Ml(1) (percentage change) | | | 11.0 | | | | 7.1 | | | | 16.4 | | | | 9.4 | | | | 9.9 | |
M2(2) (percentage change) | | | 18.9 | | | | 16.3 | | | | 15.0 | | | | 8.5 | | | | 13.3 | |
M3(3) (percentage change) | | | 18.2 | | | | 15.5 | | | | 13.7 | | | | 8.8 | | | | 9.9 | |
Credit from the Financial System (percentage change) (4) | | | 23.1 | | | | 16.3 | | | | 12.1 | | | | 14.7 | | | | 16.8 | |
Discount Rate(5) (percent) | | | 4.0 | | | | 5.0 | | | | 3.4 | | | | 3.9 | | | | 4.7 | |
| 1: | Currency in circulation plus demand deposits. |
| 2: | Ml plus certificates of deposit plus savings deposits. |
| 3: | M2 (i.e., currency in circulation plus liabilities subject to minimum reserve requirements) and bonds issued by the financial system. |
| 4: | Gross credit to private sector. Financial system excludes Banco de la República. |
| 5: | Banco de la República’s one-day discount rate for liquidity to the financial system. Weighted average for the year. |
| Source: | Banco de la República. |
Interest Rates and Inflation
During 2011, the average short-term composite reference rate, or DTF, was 4.2% and increased during 2012 to 5.4%. The average DTF decreased to 4.2% in 2013 and to 4.1% in 2014 but increased to 4.5% in 2015. The lowest point for DTF in 2015 was in October when it was at 4.3% and the highest recorded DTF in 2015 was in December when the rate was at 5.4%. As of July 2016, the highest recorded DTF was in July when it was 7.6% and the lowest was in January when the DTF was 5.2
The Central Bank’s policy has been to reduce inflation gradually to minimize the impact on economic growth. Since 1971, Colombia has experienced year-to-year consumer inflation rates ranging from a high of 32.4% in 1990 to a low of 3.7% in 2014. The decline in consumer inflation rates from the 25-30% range of the late 1980’s and early 1990’s was due in part to the effective implementation of a monetary policy that removed excess liquidity from the economy, providing only the amount of cash necessary for the optimal performance of the economy. During 2011, the consumer inflation rate recorded several increases, mainly due to the rise in food prices brought on by floods caused by severe rains, an increase in petroleum prices. Between October and December 2011, however, the consumer inflation rate decreased by 29 basis points, finishing on December 31, 2011 at 3.7%, a figure that was within the target range established by Banco de la República of between 2.0% and 4.0%. As of December 31, 2012, the consumer inflation rate was 2.4%, within Banco de la Reública’s target range of between 2.0% and 4.0%. A smaller increase in the prices of food, transportation and communications contributed to the lower consumer inflation rate compared to 2011. On the other hand, the inflation rate with respect to the prices of entertainment, health and clothing increased in 2012 compared to 2011. As of December 31, 2013, the consumer inflation rate stood slightly under the target range at 1.9%. The decrease in the prices of food, transport, housing and education contributed to the lower inflation rate. On the other hand, the prices of communications, entertainment and clothing saw an increase in 2013 compared to 2012. As of December 31, 2014, increases in the prices of food, education and housing contributed to a higher consumer inflation rate of 3.7% compared to 2013. As of December 31, 2015, consumer inflation rate increased to 6.77%. This increase was mainly because of the price increases of food (10.85%) and other expenses (6.90%).
D-68
Banco de la República implemented seven increases of the overnight interest rate of 25 basis points each on February 28, March 22, May 2, May 31, June 20 and August 1 and November 28, 2011 in which the discount rate increased from 3.0% to 4.75% during the course of 2011. In 2012, Banco de la República adjusted the discount rate six times from a high of 5.00% to a low of 4.25%. In 2013, Banco de la República adjusted the discount rate three times further lowering the rate from a high of 4.00% down to a low of 3.25%. The discount rate was increased by 25 basis points on April 25, 2014 to 3.50%, and raised an additional 25 basis points on May 30, 2014 to 3.75%. The increases were made because Banco de la Republica decided to phase out its monetary stimulus due to the improving economic situation of the country. On June 20, 2014, Banco de la República decided to increase the discount rate by 25 basis points to 4.0%, mainly because consumer inflation and first quarter GDP growth (6.4%) were higher than expected. Due to continued weakness in global demand and lower oil and raw material prices, Banco de la República increased the discount rate by 25 basis points to 4.25% on August 1, 2014. Finally, Banco de la República increased the discount rate to 4.5% on September 1, 2014 to combat higher seasonal inflation in entertainment services (2.8%) and transportation (3.2%) in the last quarter of the year. Through August 2015, Banco de la República maintained the rate at 4.5% due to a small increase in inflation, lower economic growth in the United States and Euro Zone, the risk of a greater deterioration in the Chinese economy, as well as a Yuan devaluation, low oil prices, low international demand, and the possibility of an increase in the United States interest rates made by the Federal Reserve. From September 2015 to July 2016, Banco de la República has adjusted the discount rate ten times from 4.50% to a high of 7.75%. The increases were made because Banco de la Republica decided to phase out its monetary stimulus due to the increase in the consumer inflation caused by higher food prices, the effects of the weather phenomenon “El Niño” and the continued weakness in global demand and lower oil and raw material prices.
The producer price index stood at 5.5% in 2011 and -3.0% in 2012. The producer price index stood at -0.5% in 2013 and increased to 6.3% in 2014 and to 6.77% in 2015.
Monetary policy has also focused on counterbalancing the effect of large capital inflows and maintaining the stability of the real exchange rate. To this end, from time to time the Government has imposed taxes on transfers of foreign currencies to Colombian residents from abroad, required mandatory investment of foreign exchange receipts in negotiable “exchange certificates” and imposed deposit requirements with respect to foreign currency denominated indebtedness of less than a specified term.
In February 2015, DANE introduced a new methodology for calculating the producer price index (“PPI”) based on recommendations from the IMF, the OECD and Banco de la República. While the old methodology measured the average monthly change in prices of a basket of domestic supply of goods in the first stage of commercialization, including goods produced and sold by national companies and importers, the new methodology measures the average monthly change in prices of a basket of goods produced domestically. The new methodology has been applied to figures beginning in January 2015. As of December 2015, the year-to-year PPI was 6.77%. As of July 2016, the year-to-date PPI was 5.91%.
D-69
The following table shows changes in the consumer price index and the producer price index and average 90-day deposit rates for the periods indicated.
Inflation and Interest Rates
| | | | | | | | | | | | |
Period | | Consumer
Price Index
(CPI) | | | Producer
Price Index
(PPI)(1) | | | Short-Term
Reference Rate
(DTF)(2) | |
2011 | | | 3.7 | | | | 5.5 | | | | 4.2 | |
2012 | | | 2.4 | | | | (3.0 | ) | | | 5.4 | |
2013 | | | 1.9 | | | | (0.1 | ) | | | 5.1 | |
2014 | | | 3.7 | | | | 3.7 | | | | 4.1 | |
2015 | | | | | | | | | | | | |
January | | | 3.8 | | | | (1.28 | ) | | | 4.5 | |
February | | | 4.4 | | | | (3.23 | ) | | | 4.5 | |
March | | | 4.6 | | | | 0.44 | | | | 4.4 | |
April | | | 4.6 | | | | (0.92 | ) | | | 4.5 | |
May | | | 4.4 | | | | (0.95 | ) | | | 4.4 | |
June | | | 4.4 | | | | 1.07 | | | | 4.4 | |
July | | | 4.5 | | | | 4.5 | | | | 4.5 | |
August | | | 4.8 | | | | 4.7 | | | | 4.5 | |
September | | | 5.4 | | | | 5.4 | | | | 4.4 | |
October | | | 5.9 | | | | 5.9 | | | | 4.6 | |
November | | | 6.4 | | | | 6.4 | | | | 4.9 | |
December | | | 6.8 | | | | 6.8 | | | | 5.2 | |
2016 | | | | | | | | | | | | |
January | | | 7.5 | | | | 6.7 | | | | 5.5 | |
February | | | 7.6 | | | | 9.3 | | | | 6.2 | |
March | | | 8.0 | | | | 5.7 | | | | 6.3 | |
April | | | 8.0 | | | | 6.7 | | | | 6.6 | |
May | | | 8.2 | | | | 8.2 | | | | 6.8 | |
June | | | 8.6 | | | | 7.0 | | | | 6.9 | |
July | | | 9.0 | | | | 5.9 | | | | 7.2 | |
| 1: | Percentage change over the previous twelve months at the end of each month indicated, except for 2015 and 2016, which registers percentage change from previous month. Figures for 2015 and 2016 apply the new methodology announced by DANE as described above. |
| 2: | Average for each of the years 2011-2014 and, for each indicated month in 2015 and 2016, year-on-year of the DTF, as calculated by the Financial Superintendency. |
| Sources: | DANE and Banco de la República. |
Foreign Exchange Rates and International Reserves
Exchange Rates
From January 1994 to September 1999, Banco de la República maintained a band within which the exchange rate was permitted to fluctuate. On September 25, 1999, the central bank decided to abandon the band system and adopt a free-floating exchange rate system. This change was made only after an initial agreement with the IMF for an Extended Fund Facility had been reached, evidencing a commitment by multilateral organizations to support the Colombian economic program. The transition to the new free-floating foreign exchange regime did not result in a significant deterioration of the exchange rate.
As of December 31, 2011, the representative market rate was Ps. 1,942.7/$1.00, a depreciation of 1.5% from the peso’s value on December 31, 2010. As of December 31, 2012, the representative market rate was Ps. 1,768.2/$1.00, an appreciation of 9.0% from the peso’s value on December 31, 2011. As of December 31, 2013, the representative market rate was Ps. 1,926.8/$1.00, a depreciation of 9.0% from the peso’s value as of December 31, 2012. As of December 31, 2014, the representative market rate was Ps. 2,392.5/$1.00, a depreciation of 24.2% from the peso’s value on December 31, 2013. As of December 31, 2015, the representative market rate was Ps. 3,149.47/$1.00, a depreciation of 31.6% from the peso’s value on December 31, 2014. As of July 31, 2016, the representative market rate was Ps. 3,081.75/$1.00, a depreciation of 2.15% since December 31, 2015.
On August 31, 2013, Banco de la República resumed the accumulation of international reserves through an average of daily purchases of $23.4 million in competitive auctions in response to indications of an exchange rate misalignment. From January to December 2013, Banco de la República accumulated $6.8 billion. From January to December 2014, Banco de la República accumulated $4.1 billion with average daily purchases of $18.2 million in competitive auctions.
As established by Decree 4712 of 2008 and in accordance with the technical criteria established by Resolution No. 262 of February 11, 2011, which governs the administration of excess liquidity, the General Directorate of Public Credit and the National Treasury is allowed to perform any transaction that Colombia may
D-70
require in the foreign exchange market, including the purchase of foreign exchange in such amounts and at such times as it may determine from time to time and derivatives operations that consist of swaps and forward contracts over foreign exchange. As of March, 2016, the General Directorate of Public Credit and National Treasury had no current position in swaps and forward contracts over foreign exchange.
The following table shows the average and end-of-period peso/dollar exchange rates and the real exchange rate index for the dates and periods indicated.
Exchange Rates
| | | | | | | | | | | | |
| | | Representative Market Rate(1) | | | | |
| Year | | Average | | | End-of- period | | | Real Exchange Rate
Index(2)(3) Average | |
| | | (pesos per U.S. dollar) | | | (Avg. 2010=100) | |
2011 | | | 1,847.0 | | | | 1,942.7 | | | | 102.85 | |
2012 | | | 1,797.0 | | | | 1,768.2 | | | | 100.04 | |
2013 | | | 1,869.13 | | | | 1,926.83 | | | | 106.21 | |
2014 | | | 2,000.33 | | | | 2,392.46 | | | | 114.23 | |
2015 | | | | | | | | | | | | |
January | | | 2,397.26 | | | | 2,441.10 | | | | 115.03 | |
February | | | 2,420.67 | | | | 2,496.99 | | | | 112.53 | |
March | | | 2,585.36 | | | | 2,576.05 | | | | 115.55 | |
April | | | 2,505.25 | | | | 2,388.06 | | | | 112.65 | |
May | | | 2,437.54 | | | | 2,533.79 | | | | 111.91 | |
June | | | 2,562.48 | | | | 2,585.11 | | | | 116.17 | |
July | | | 2,732.04 | | | | 2,866.04 | | | | 121.76 | |
August | | | 3,012.59 | | | | 3,101.10 | | | | 129.52 | |
September | | | 3,066.41 | | | | 3,121.94 | | | | 129.23 | |
October | | | 2,929.47 | | | | 2,897.83 | | | | 123.46 | |
November | | | 3,001.38 | | | | 3,101.10 | | | | 123.2 | |
December | | | 3,244.20 | | | | 3,149.47 | | | | 129.93 | |
2016 | | | | | | | | | | | | |
January | | | 3,270.20 | | | | 3,287.31 | | | | 129.96 | |
February | | | 3,354.96 | | | | 3,306.00 | | | | 131.9 | |
March | | | 3,128.79 | | | | 3,022.35 | | | | 125.54 | |
April | | | 2,997.73 | | | | 2,851.14 | | | | 121.14 | |
May | | | 2,993.517 | | | | 3,069.17 | | | | 119.35 | |
June | | | 2,992.86 | | | | 2,916.15 | | | | 118.45 | |
July | | | 2,961.00 | | | | 3,081.75 | | | | 117.35 | |
| 1: | Representative market rate. as calculated by the Financial Superintendency. |
| 2: | Colombian Peso Real Exchange Rate Index “1”: Based on the producer price index for non-traditional goods in global trade. The real exchange rate index is calculated by adjusting the nominal exchange rate by the producer price index of Colombia’s trading partners and the domestic producer price index. Yearly data corresponds to December of each year. From May 2015 Real Exchange Rate Index base is 2010. Producer price index figures used in calculating Colombian Peso Real Exchange Rate Index for 2015 use the new methodology described above. |
| 3: | The Real Exchange Rate Index figures for 2011-2016 are preliminary. |
| Source: | Superintendencia Financiera, Banco de la República. |
International Reserves
Banco de la República’s gross international reserves increased from $32,302.9 million at December 31, 2011 by $37,474.1 million as of December 31, 2012 at December 31, 2013, gross international reserves were
D-71
$43,639.3 million. As of December 31, 2014, gross international reserves increased by $3,688.8 million to $47,328.1 million. As of December 31, 2015, gross international reserves decreased by $587.7 million to $46,740.4. In December 2011, Banco de la República decided to resume the accumulation of international reserves mainly due to three factors: low interest rates in the developed economies, a decision to have a more conservative risk profile of the central bank’s portfolio and the depreciation of the euro against the dollar by 3% in 2011. During 2012 and 2013, Banco de la República continued accumulating international reserves mainly due to the adoption of a conservative risk profile in light of the global financial crisis. In July 2014, Banco de la República decided to increase the daily amount of dollar purchases and continued accumulating international reserves, totaling $2.0 billion between July and September 2014, buying at least $30 million daily. During October 2014, Banco de la República resumed accumulating international reserves through average daily purchases of $10.0 million in competitive auctions. In November 2014, Banco de la República purchased $165.0 million in the foreign exchange market through the auction mechanism of direct purchase. From January 2014 to December 2014, Banco de la República accumulated $4.1 billion. As of February 2015, Banco de la República decided not to continue increasing international reserves. Year-to-date, Banco de la República has not made purchases of foreign exchange.
Banco de la República invests its international reserves in a mix of currencies that reflects the profile of the country’s foreign debt. As of December 31 2015, the mix of currencies was approximately 86% in U.S. dollars, 7% in Australian dollars, 3% in Canadian dollars, 2% in New Zealand dollars, 1% in British pounds sterling and 1% in Norwegian kronas.
On May 22, 2012, the Government issued Decree 1076 of 2012, which establishes a system to administer the “Fondo de Ahorro y Estabilización del Sistema General de Regalías,” or Savings and Stabilization Fund. Based on Legislative Act No. 05 of 2011, up to 30% of the income from the General System of Royalties will be disbursed to the Savings and Stabilization Fund. The General Directorate of Public Credit and National Treasury is responsible for transferring such royalties to the Savings and Stabilization Fund, which is managed by Banco de la República. For this purpose, the General Directorate of Public Credit and National Treasury, at its sole discretion, may buy dollars in the secondary market. Royalties are derived from natural resources, such as oil, coal and other mining activities. As of May 27, 2016, royalties reached an aggregate amount of Ps. 38.2 trillion since inception and, as of June 30, 2016, transfers in dollars into the Savings and Stabilization Fund since inception were $3.3 billion.
The following table shows the composition of the international reserves of Banco de la República at the end of the years indicated.
International Reserves
| | | | | | | | | | | | | | | | | | | | |
| | | 2011 | | | 2012 | | | 2013(1) | | | 2014(1) | | | 2015(1) | |
| | | (millions of U.S. dollars) | |
Gross International Reserves | | | | |
Monetary Gold | | $ | 524.1 | | | $ | 553.8 | | | $ | 399.9 | | | $ | 399.2 | | | $ | 119.4 | |
Special Drawing Rights | | | 1,141.0 | | | | 1,131.4 | | | | 1,128.5 | | | | 1.048.4 | | | | 990.2 | |
International Monetary Fund | | | 369.6 | | | | 392.3 | | | | 433.3 | | | | 416.4 | | | | 335.9 | |
Investments | | | 29,831.8 | | | | 34,857.8 | | | | 41,117.4 | | | | 44,913.0 | | | | 44,731.8 | |
Others(2) | | | 436.4 | | | | 538.7 | | | | 560.3 | | | | 551.1 | | | | 563.0 | |
| | | | | | | | | | | | | | | | | | | | |
| | $ | 32,302.9 | | | | 37,474.1 | | | | 43,639.3 | | | | 47,328.1 | | | $ | 46,740.4 | |
| | | | | | | | | | | | | | | | | | | | |
Less: Short- and Medium-Term Liabilities of Banco de la República | | $ | 2.5 | | | $ | 7.5 | | | $ | 6.6 | | | $ | 5.0 | | | $ | 9.3 | |
| | | | | | | | | | | | | | | | | | | | |
Net International Reserves | | $ | 32,300.4 | | | | 37,466.6 | | | | 43,632.7 | | | | 47,323.1 | | | $ | 46,731.1 | |
| | | | | | | | | | | | | | | | | | | | |
Reserves (Months of Imports (FOB)) | | | | | | | | | | | | | | | | | | | | |
Goods(3) | | | 7.4 | | | | 7.9 | | | | 9.2 | | | | 9.2 | | | | 10.8 | |
Goods and Services(4) | | | 6.3 | | | | 6.7 | | | | 7.7 | | | | 7.6 | | | | 8.8 | |
Totals may differ due to rounding.
| 2: | Includes deposits in Latin American Reserve Fund, Cash, Andean pesos, sight deposits, remittance in process and compensation agreements. |
| 3: | Reflects imports of goods, as well as special trade operations. |
| 4: | Contains items included in (3) above, plus imports of factor and non-factor services. |
| Source: | Banco de la República. |
D-72
Securities Markets
On July 3, 2001, the Bolsa de Valores de Colombia (Colombian Stock Exchange) was formed as a result of the merger of the three then existing stock exchanges (Bolsa de Bogotá, Bolsa de Medellín and Bolsa de Occidente). Both debt and equity securities are traded on the Colombian Stock Exchange, although the vast majority of securities traded are fixed-income debt securities. The Colombian Stock Exchange has adopted an index called the Indice General de la Bolsa de Colombia (Colombian Stock Exchange Indicator, or “IGBC”), which comprises a group of equity securities the composition of which is determined in part by the frequency of trading in each quarter. As of December 31, 2011, the IGBC decreased by 15.6% to 12,665.71 points. On December 31, 2012, the IGBC further increased by 13.6% to 14,715.84 points. As of December 31, 2013, the IGBC had decreased by 11.8% compared to 2012. As of December 31, 2015, the IGBC had decreased by 26.54% compared to 2014, reaching a level of 8,547.3 points.
On January 15, 2008, the COLCAP and COL20 stocks indexes were introduced to the market in order to replace progressively the IGBC. COLCAP measures the variation of the 20 most traded stocks in the Colombian Stock Exchange by level of capitalization, while COL20 measures the variation of the 20 most traded stocks in the Colombian Stock Exchange by level of liquidity. The initial level of both indexes was 1,000 points. By December 2011, COLCAP increased to 1,571.55 points, and COL20 to 1,287.63 points. By December 2012, COLCAP increased by 16.6% to 1,832.75 points, and COL20 increased by 4.7% to 1,348.01 points. By December 2013, both indexes decreased, with the COLCAP having decreased by 12.4% to 1,606.33 points and the COL20 having decreased by 7.1% to 1,252.75 points. As of December 31, 2014, both indexes decreased, with the COLCAP decreasing by 5.8% to 1,513.0 points and the COL20 decreasing by 14.1% to 1,076.3 points. As of December 31, 2015, both indexes decreased, with the COLCAP decreasing by 15.4% to 1,153.7 points and the COL20 decreasing by 11.1% to 888.6 points.
The Colombian Stock Exchange began trading standardized derivatives in September 2008 with the negotiation of a five-year TES futures contract. The number of contracts traded increased to 795,298 in 2011. In 2012, the Colombian Stock Exchange continued its strategy of consolidating and strengthening the local derivatives market through the promotion of existing products, the creation of new ones and the implementation of an intensive training and educational program. In 2013 this strategy continued, along with the aim of further internationalizing the Colombian stock market. The number of derivatives contracts traded during 2013 was 685,135 contracts, representing an 8.65% increase from the 630,590 contracts negotiated in 2012. The increase in trading volume was due mainly to the legal action taken against InterBolsa, a Colombian securities broker, which resulted in the closure of the largest stock market operator and created distrust towards the stock market in general. The trading volume in the derivatives market during 2014 was 941,620 contracts, representing a 37.4% increase from the previous year, a historic high for traded futures in the Colombian stock market. During 2015, the trading volume was 1,017,921 contracts, representing a 8.1% increase from the previous year, a historic high for traded futures in the Colombian stock market.
The Colombian Stock Exchange is owned by member firms responsible for developing and implementing regulations governing trading on the exchange. Although self-regulating, the exchange remains subject to the approval and supervision of the Financial Superintendency. The market capitalization of the Colombian Stock Exchange was Ps. 278.68 trillion on December 31, 2015, compared to Ps. $364.11 trillion on December 31, 2014.
The total value of securities traded on the Colombian Stock Exchange during 2015 was Ps. 1,257.53 trillion, representing a nominal decrease of 10.40% in peso terms as compared to 2014.
Equity trading during 2015 amounted to approximately Ps. 39.9 trillion, or 1.29% of the total value of securities traded. This represents a nominal decrease of 1.13% in the total value of equity trading from 2014.
On May 30, 2011, the “Mercado Integrado Latinoamericano” (MILA) began its operations. This project involves the integration of technology platforms of the Colombian, Chilean and Peruvian stock markets. The MILA allows investors to carry out cash transactions in investments in shares listed on the Colombian Stock Exchange,
D-73
Bolsa de Comercio de Santiago (BCS) and Bolsa de Valores de Lima (BVL), involving the three securities depositaries, DECEVAL (Déposito Centralizado de Valores de Colombia), CAVALI (Registro Central de Valores y Liquidaciones) and the Central Securities Depository (CSD) of Colombia, Peru and Chile, respectively. The main objective of the integration is to develop the capital markets by offering investors a wider range of securities as well as larger funding sources for issuers. The creation of MILA is expected to diversify, expand and improve the attractiveness of trading of securities in the three countries for both domestic and international investors. By December 2013, the total number of issuers registered with MILA was 590. As of April 30, 2016, the number of registered issuers increased to 775.
D-74
PUBLIC SECTOR FINANCE
General
The Constitution and the Budgetary Organic Law of 1996 govern Colombia’s budgetary process. The budget process requires the participation of all governmental ministries and agencies. The Ministry of Finance prepares a revenue and expenditure summary for the Government and public sector agencies and then presents it in the form of a bill to Congress by the July prior to the beginning of the next fiscal year. Both houses of Congress must approve the budget by November of each year. It is then presented to the President, who has veto power over individual expenditures. Expenditure increases, but not expenditure reductions, must be approved by Congress as budget amendments. Local legislatures approve their budgets in accordance with the general procedures established pursuant to departmental and municipal law.
The Constitution and Law 60 of 1993 (described below under “—Public Sector Accounts—Revenues”) require the Government to transfer funds to departmental and municipal governments. Although the Government does not finance departmental and local government deficits, all domestic bond offerings and foreign debt incurred by these governmental entities must be approved by the Central Government. In addition, under Law 358 of 1997, municipalities and departments may not incur debt service obligations beyond a certain percentage of their operational savings (defined as current revenues less current expenditures).
The budgets for state-owned companies are evaluated by the Ministry of Finance and the National Planning Department, approved by the Consejo Superior de Política Fiscal (“CONFIS”) and sanctioned by Presidential decree. These budgets are devised in conformity with the macroeconomic plan adopted by the Government each fiscal year, which sets general revenue and expense targets for the state-owned companies. During the year, the Government may modify these budgets.
The budgets of Government ministries and agencies, departmental and municipal governments and state-owned companies constitute the consolidated non-financial public sector fiscal accounts. These accounts exclude both the revenues and the expenses of state-owned financial institutions. State-owned financial institutions, development banks and commercial banks have a separate budget process supervised by the Financial Superintendency.
The Contraloría General de la República (General Comptroller of the Republic) audits the financial accounts of the Government, which are submitted annually to Congress for approval.
Under the 1991 Constitution, royalties received from the exploitation of nonrenewable natural resources that are not directly distributed to departments and municipalities where the natural resources are located or transported are paid into the Fondo Nacional de Regalías (National Royalties Fund). Funds from the National Royalties Fund are used to finance mining development, environmental protection and other regional development projects, including health, education, water and sanitation projects.
In 1995, the Fondo de Ahorro y Estabilización Petrolera (Oil Stabilization and Savings Fund or “FAEP”) was created to monitor the macroeconomic effects of the large foreign exchange inflows due to the then recently discovered oil reserves and to ensure that local governments prudently use the revenues generated from petroleum royalties. Ecopetrol S.A., the National Royalties Fund and the departments and municipalities where oil is produced contribute to the FAEP. Banco de la República administers FAEP. Under the law establishing FAEP, royalties from petroleum production in excess of a predetermined amount payable to the national and local governments are invested abroad through FAEP and are only disbursed for infrastructure projects and social expenditures.
In July 2007, following the announcement by the Government of a public offering of 20% of Ecopetrol S.A.’s shares, Congress approved the National Development Plan for 2006-2010 (the “2006-2010 Development Plan”). Under Article 143 of the 2006-2010 Development Plan, Ecopetrol S.A. was no longer required to contribute to the FAEP and instead it was required to transfer the excess royalties to the Central Government. The 2006-2010 Development Plan contemplated that 60% of the fund balance in FAEP would be disbursed to the Central Government in 2008, with the remaining balance being transferred to the Central Government in 2009 and 2010 in order to achieve the Government’s goal of gradually receiving the funds from FAEP. In 2008, FAEP transferred Ps. 2,329 billion (0.5% of GDP) to the Central Government. In 2009, FAEP transferred Ps. 920 billion (0.2% of GDP)
D-75
to the Central Government. In 2010, FAEP transferred Ps. 370 billion (0.1% of GDP) to the Central Government. Following the transfer made in 2010, no further transfers by FAEP have been or will be made. Decree 1849 of 2013 established the maximum percentages of funds withdrawals per year until the liquidation of the FAEP in 2019. The Decree gives priority to withdrawals of local entities. The resources should be used to pay the debt of health entities and road investment according to articles 275 and 118 of National Development Plan 2010-2014.
Article 69 of the 2006-2010 Development Plan also created the Stabilization Fund for Fuel Prices (“FEPC”) and establishes, as an initial source of financing, part of the fund balance accumulated by Ecopetrol S.A. in FAEP. In 2008, FAEP transferred Ps. 420 billion (0.1% of GDP) to the FEPC. As of December 31, 2015, the total fund balance of the FEPC was a deficit of Ps. 297 billion, compared with a deficit of Ps. 614 billion, on December 31, 2014. The projected figures to the total fund balance of the FEPC for 2016 is a deficit of Ps. 802 million, or 0.1% of GDP, compared with a deficit of Ps. 266 million, or 0.0% of GDP in 2015.
Public Sector Accounts
The following tables set forth revenues and expenditures (on a cash-flow basis) for the consolidated non-financial public sector for the 2011-2015 period, budgeted figures for 2016 and the resulting fiscal surplus or deficit as a percentage of GDP.
Non-financial Public Sector Revenues and Expenditures(1)
(billions of pesos)
| | | | | | | | | | | | | | | | | | | | | | | | |
| | | | | | | | | | | | | | | | | | Budget | |
| | | 2011 | | | 2012 | | | 2013 | | | 2014(2) | | | 2015 | | | 2016(5) | |
Central Government | | | | | | | | | | | | | | | | | | | | | | | | |
Total Revenues | | Ps. | 94,247 | | | Ps. | 107,067 | | | Ps. | 119,744 | | | Ps. | 125,904 | | | Ps. | 129,321 | | | Ps. | 127,761 | |
Expenditures | | | | | | | | | | | | | | | | | | | | | | | | |
Current Expenditures | | | 79,664 | | | | 86,994 | | | | 93,696 | | | | 103,768 | | | | 106,467 | | | | 116,474 | |
Capital Expenditures | | | 26,887 | | | | 32,367 | | | | 41,269 | | | | 41,364 | | | | 44,116 | | | | 40,079 | |
Total Expenditures | | | 106,551 | | | | 119,361 | | | | 134,965 | | | | 145,132 | | | | 150,583 | | | | 156,553 | |
Net Loans to Other Entities | | | 183 | | | | 61 | | | | (2 | ) | | | (11 | ) | | | (18 | ) | | | 16 | |
Accrual adjustments(3) | | | 5,020 | | | | 3,085 | | | | 1,427 | | | | (861 | ) | | | 3,025 | | | | 4,511 | |
(Deficit)/Surplus | | | (17,507 | ) | | | (15,440 | ) | | | (16,645 | ) | | | (18,356 | ) | | | (24,269 | ) | | | (33,319 | ) |
Decentralized Agencies | | | | | | | | | | | | | | | | | | | | | | | | |
Total Revenues | | | 9,648 | | | | 12,537 | | | | 14,845 | | | | 15,195 | | | | 14,046 | | | | 14,903 | |
Expenditures | | | | | | | | | | | | | | | | | | | | | | | | |
Current Expenditures | | | 3,109 | | | | 2,456 | | | | 2,738 | | | | 1,297 | | | | 1,072 | | | | 1,412 | |
Capital Expenditures | | | 6,332 | | | | 10,167 | | | | 12,043 | | | | 13,543 | | | | 13,463 | | | | 13,810 | |
Total Expenditures | | | 9,441 | | | | 12,623 | | | | 14,781 | | | | 14,839 | | | | 14,535 | | | | 15,222 | |
Accrual adjustments(3) | | | 0 | | | | 171 | | | | 233 | | | | (357 | ) | | | 436 | | | | 0 | |
(Deficit)/Surplus | | | 207 | | | | (257 | ) | | | (168 | ) | | | 712 | | | | (925 | ) | | | (319 | ) |
Local Public Sector(4) | | | | | | | | | | | | | | | | | | | | | | | | |
Total Revenues | | | 59,270 | | | | 66,949 | | | | 70,484 | | | | 72,168 | | | | 69,314 | | | | 70,403 | |
Expenditures | | | | | | | | | | | | | | | | | | | | | | | | |
Current Expenditures | | | 34,300 | | | | 37,650 | | | | 38,647 | | | | 39,741 | | | | 34,059 | | | | 60,708 | |
Capital Expenditures | | | 25,363 | | | | 18,967 | | | | 23,709 | | | | 29,158 | | | | 39,357 | | | | 7,089 | |
Total Expenditures | | | 59,663 | | | | 56,617 | | | | 62,356 | | | | 68,898 | | | | 73,415 | | | | 67,798 | |
Net Loans to Other Entities | | | (10 | ) | | | (19 | ) | | | (24 | ) | | | (-23 | ) | | | 0 | | | | 0 | |
Accrual adjustments(3) | | | 78 | | | | 318 | | | | (349 | ) | | | 83 | | | | 0 | | | | 0 | |
(Deficit)/Surplus | | | (481 | ) | | | 9,995 | | | | 8,454 | | | | 3,164 | | | | (4,102 | ) | | | 2,606 | |
Social Security | | | | | | | | | | | | | | | | | | | | | | | | |
Total Revenues | | | 49,104 | | | | 56,891 | | | | 57,951 | | | | 71,239 | | | | 72,323 | | | | 76,740 | |
Expenditures | | | | | | | | | | | | | | | | | | | | | | | | |
Current Expenditures | | | 42,425 | | | | 46,883 | | | | 56,246 | | | | 67,048 | | | | 68,746 | | | | 71,532 | |
Capital Expenditures | | | 19 | | | | 14 | | | | 17 | | | | 16 | | | | 25 | | | | 268 | |
Total Expenditures | | | 42,443 | | | | 46,897 | | | | 56,264 | | | | 67,063 | | | | 68,771 | | | | 71,800 | |
Net Loans to Other Entities | | | 0 | | | | 0 | | | | 0 | | | | 0 | | | | 0 | | | | 0 | |
Accrual adjustments(3) | | | (180 | ) | | | 368 | | | | (238 | ) | | | 173 | | | | (30 | ) | | | 4 | |
(Deficit)/Surplus | | | 6,840 | | | | 9,626 | | | | 1,925 | | | | 4,002 | | | | 3,581 | | | | 4,936 | |
D-76
| | | | | | | | | | | | | | | | | | | | | | | | |
| | | | | | | | | | | | | | | | | | Budget | |
| | | 2011 | | | 2012 | | | 2013 | | | 2014(2) | | | 2015 | | | 2016(5) | |
Coffee Fund | | | | | | | | | | | | | | | | | | | | | | | | |
Total Revenues | | | 2,254 | | | | 1,583 | | | | 2,359 | | | | 2,780 | | | | 2,924 | | | | 2,693 | |
Expenditures | | | | | | | | | | | | | | | | | | | | | | | | |
Current Expenditures | | | 1,424 | | | | 1,321 | | | | 2,282 | | | | 1,900 | | | | 1,850 | | | | 2,408 | |
Capital Expenditures | | | 11 | | | | 13 | | | | 12 | | | | 12 | | | | 13 | | | | 13 | |
Total Expenditures | | | 1,434 | | | | 1,334 | | | | 2,295 | | | | 1,912 | | | | 1,863 | | | | 2,421 | |
Net Loans to Other Entities | | | 0 | | | | 0 | | | | 0 | | | | 0 | | | | 0 | | | | 0 | |
Accrual adjustments(3) | | | 587 | | | | 212 | | | | 170 | | | | 813 | | | | 807 | | | | 0 | |
(Deficit)/Surplus | | | 232 | | | | 37 | | | | (106 | ) | | | 55 | | | | 254 | | | | 272 | |
Non-financial Public Enterprises | | | | | | | | | | | | | | | | | | | | | | | | |
Total Revenues | | | 35,466 | | | | 40,269 | | | | 44,329 | | | | 45,921 | | | | 45,876 | | | | 29,379 | |
Expenditures | | | | | | | | | | | | | | | | | | | | | | | | |
Current Expenditures | | | 32,946 | | | | 38,885 | | | | 40,636 | | | | 44,863 | | | | 21,330 | | | | 21,039 | |
Capital Expenditures | | | 3,381 | | | | 2,316 | | | | 3,989 | | | | 3,830 | | | | 5,066 | | | | 4,579 | |
Total Expenditures | | | 36,327 | | | | 41,201 | | | | 44,625 | | | | 48,694 | | | | 26,396 | | | | 25,617 | |
Net Loans to Other Entities | | | (193 | ) | | | (81 | ) | | | (41 | ) | | | 29 | | | | (88 | ) | | | 73 | |
Accrual adjustments(3) | | | (212 | ) | | | 125 | | | | 90 | | | | 97 | | | | 21,099 | | | | 0 | |
(Deficit)/Surplus | | | (841 | ) | | | (1,137 | ) | | | (428 | ) | | | (2,841 | ) | | | (1,707 | ) | | | 3,835 | |
Total Consolidated Non-financial Public Sector (Deficit)/Surplus | | Ps. | (11,549 | ) | | Ps. | 2,824 | | | Ps. | (6,968 | ) | | Ps. | (13,264 | ) | | Ps. | (27,167 | ) | | Ps. | (21,989 | ) |
Primary (Deficit) Surplus | | Ps. | 7,059 | | | Ps. | 21,984 | | | Ps. | 10,956 | | | Ps. | 5,472 | | | Ps. | (4,530 | ) | | Ps. | 7,330 | |
(footnotes appear on the following table)
Non-financial Public Sector Surplus (Deficit)(1)
(as a percentage of GDP)(6)
| | | | | | | | | | | | | | | | | | | | | | | | |
| | | 2011 | | | 2012 | | | 2013 | | | 2014(2) | | | 2015 | | | Budget
2016(5) | |
Government Sectors | | | | | | | | | | | | | | | | | | | | | | | | |
Central Government | | | (2.8 | )% | | | (2.3 | )% | | | (2.4 | )% | | | (2.4 | )% | | | (3.0 | )% | | | (3.9 | )% |
Decentralized Agencies. | | | 0.1 | | | | 0.0 | | | | (0.1 | ) | | | 0.0 | | | | (0.3 | ) | | | 0.0 | |
Local Public Sector(4) | | | (0.1 | ) | | | 1.5 | | | | 1.2 | | | | 0.5 | | | | (0.5 | ) | | | 0.3 | |
Social Security | | | 1.1 | | | | 1.4 | | | | 0.3 | | | | 0.5 | | | | 0.4 | | | | 0.6 | |
Coffee Fund | | | 0.0 | | | | 0.0 | | | | 0.0 | | | | 0.0 | | | | 0.0 | | | | 0.0 | |
Other, including FAEP | | | (0.2 | ) | | | (0.2 | ) | | | (0.1 | ) | | | (0.4 | ) | | | 0.0 | | | | 0.0 | |
Total Consolidated Non-financial Public Sector (Deficit)/Surplus | | | (1.8 | ) | | | 0.4 | | | | (1.0 | ) | | | (1.8 | ) | | | (3.4 | ) | | | (3.0 | ) |
Primary (Deficit)/Surplus | | | 1.1 | % | | | 3.3 | % | | | 1.6 | % | | | 1.0 | % | | | (0.6 | )% | | | 0.9 | % |
Totals may differ due to rounding.
| 1: | All figures calculated according to IMF methodology, which includes privatization, concession and securitization proceeds as part of public sector revenues. Privatization, concession and securitization proceeds for the non-financial public sector totaled Ps. 5,114 billion and Ps. 868 billion in 2011 and 2012 respectively. There were no privatization, concession and securitization proceeds in 2013, 2014 and 2015. The 2016 Financial Plan doesn’t include revenues from other sources. |
| 2: | Figures for 2014 according to Cierre Fiscal GNC 2014 released by CONFIS on May 19, 2015. |
| 3: | Adjustment of certain cash expenditures to an accrual basis. |
| 4: | Includes municipal and departmental governments and local non-financial enterprises, such as water, telephone and electricity companies and the Medellín metro system. |
| 5: | Based on 2016 assumptions and projected figures. |
| 6: | Based on GDP figures for 2015 and estimated GDP for 2016 |
Sources: National Department of Planning, IMF staff estimates, Banco de la República and CONFIS.
In 2015, the Central Government deficit was 3.0% of GDP as compared to a deficit of 2.4% of GDP in 2014. The Central Government deficit for 2015 was Ps. 24,269 billion, an increase of 32.2% from the Ps. 18,356 billion deficit registered in 2014. Central Government revenues decreased by 2.7%, from Ps. 125,904 billion in 2014 to Ps. 129,321 billion in 2015, while Central Government expenditures increased by 3.8%, from Ps. 146,145 billion in 2014 to Ps. 145,132 billion in 2015. The increase in expenditures was primarily due to increases in operating and interest expenditures.
D-77
In 2015, the consolidated non-financial public sector deficit totaled Ps. 27,167 billion, or 3.4% of GDP, as compared to a deficit of Ps. 13,264 billion, or 1.8% of GDP in 2014. The deficit of the consolidated non-financial public sector during 2015 was primarily due to a deficit in the non-financial public enterprises and a deficit in Central Government. The Government currently projects a consolidated non-financial public sector deficit of 3.0% of GDP for 2016. The Government currently projects a Central Government deficit in 2016 of 3.9% of GDP. However, no assurances can be given concerning actual results for the 2016 period and beyond.
In recent years, the Government’s fiscal policy has included the following long-term objectives:
| | • | | establishing a macroeconomic foundation for sustained growth; |
| | • | | directing Government resources to those sectors in which the Government has the greatest impact in supporting social development and fostering competition within the Colombian economy; and |
| | • | | restructuring the budgetary system to facilitate the constitutionally mandated increases in net transfers from the Central Government to departmental and municipal governments. |
The public sector deficit figures presented in this section do not include certain contingent liabilities of the public sector, including certain guarantees and indemnities given by public sector agencies to joint venture partners.
Revenues
In recent years, the Government has modernized the tax system and expanded the tax base through new tax reform legislation. The recent tax reforms were intended to create new jobs and reduce inequalities, and also to bring the tax system into compliance with the constitutional requirement that the Government transfer a portion of its current revenues to departmental and municipal governments. There are two types of required net transfers to departmental and municipal governments. First, the Government transfers revenues to departments for health and educational purposes. Second, the Government transfers revenues to municipalities for social and educational programs as well as infrastructure projects. Both types of transfers are currently calculated as a percentage of current revenue. The actual allocation made to each local government is based on formulas developed by the National Planning Department which take into account each locality’s administrative efficiency, ability to raise revenues independently, population and level of poverty. Net transfers required by Law 60 of 1993 totaled an estimated 25.3% of current revenue in 2015, as compared to 26.3% in 2014, 27.7% in 2013, 26.9% in 2012 and 29.3% in 2011. These constitutionally required transfers may be supplemented by discretionary transfers to departments and municipalities. In December 2001, a constitutional reform established new standards that local governments are required to follow with respect to funds transferred by the Central Government, enhancing the control and allocation of these funds, particularly in the education and health care sectors.
The following table shows the composition of the Government’s revenue (on a cash-flow basis).
Central Government Revenue
| | | | | | | | | | | | | | | | | | | | | | | | |
| | | 2011 | | | 2012 | | | 2013 | | | 2014(1) | | | 2015(3) | | | Budget
2016 | |
Tax Revenue | | | | | | | | | | | | | | | | | | | | | | | | |
Income Tax | | | 35.5 | % | | | 40.8 | % | | | 37.4 | % | | | 29.9 | % | | | 30.0 | % | | | 32.4 | % |
Value-Added Tax | | | 37.2 | | | | 33.9 | | | | 28.9 | | | | 30.8 | | | | 32.3 | | | | 35.2 | |
Wealth Tax | | | 3.4 | | | | 3.0 | | | | 2.7 | | | | 3.3 | | | | 4.1 | | | | 3.7 | |
Tariffs | | | 4.3 | | | | 3.3 | | | | 3.3 | | | | 3.2 | | | | 3.6 | | | | 3.7 | |
Other Indirect Taxes | | | 8.4 | | | | 7.8 | | | | 11.8 | | | | 19.0 | | | | 20.2 | | | | 19.4 | |
| | | 88.9 | | | | 88.9 | | | | 84.2 | | | | 86.1 | | | | 90.2 | | | | 94.4 | |
Nontax Revenue(2) | | | 11.1 | | | | 11.1 | | | | 15.8 | | | | 13.9 | | | | 9.8 | | | | 5.6 | |
| | | 100.0 | | | | 100.0 | | | | 100.0 | | | | 100.0 | | | | 100.0 | | | | 100.0 | |
Revenue (as a percentage of GDP)(4) | | | 15.2 | % | | | 16.1 | % | | | 16.9 | % | | | 16.6 | % | | | 16.1 | % | | | 15.0 | % |
Totals may differ due to rounding.
| 1: | Figures correspond to the Cierre Fiscal released by Dirección General de Política Macroeconómica (General Directorate of Macro Economic Policy) (Documento Asesores 004/2016). |
| 2: | Includes concession revenues, hydrocarbon duties, fines, other duties, other current revenues and capital revenues. |
| 4: | Based on estimated GDP using new methodology implemented in 2008. |
| Sources: | Ministry of Finance and CONFIS. |
D-78
Central Government revenues totaled Ps. 129,321 billion (16.1% of GDP) in 2015 as compared to Ps. 125,904 billion in 2014, an increase of 2.7% in nominal terms. Total tax revenues increased by 7.4% in nominal terms in 2015 as compared to 2014.
Expenditures
Central Government expenditures totaled Ps. 150,583 billion in 2015 (19.2% of GDP), an increase of 3.8% in nominal terms from the 2014 level. Current interest payments increased by 21.6% in nominal terms in 2015 and current operational expenditures increased by 3.3% in nominal terms as compared to 2014 levels. Current investment expenditures increased by 9.8% in nominal terms in 2015
Based on preliminary figures, in 2015 Central Government expenditures were allocated as follows:
| | • | | social expenditures, 55.5%; |
| | • | | interest payments, 12.8%; |
| | • | | defense and internal security, 11.2%; |
| | • | | government overhead, 3.5%; |
| | • | | infrastructure, 8.6%; and |
| | • | | transfers to local governments, 2.5%. |
Transfers to departments and municipalities totaled Ps. 24,710 billion in 2011 (representing 22.1% of the total 2011 expenditures), Ps. 25,943 billion in 2012 (representing 21.2% of the total 2012 expenditures), Ps. 28,193 billion in 2013 (representing 20.7% of the total 2013 expenditures), Ps. 28,634 billion in 2014 (representing 19.8% of the total 2014 expenditures) and Ps. 29,395 billion in 2015 (representing 18.9% of the total 2015 expenditures). These transfers were made in accordance with the territorial transfer reform legislation enacted in December 2001 that provides for such transfers to be made based on the average revenue growth of Colombia over the previous four years, adjusted by the inflation rate plus a certain percentage, during a transition period from 2002-2007. In 2007, Congress passed a constitutional amendment that modified the formula to calculate these transfers. From 2008 to 2009, transfers to regional governments increased by the inflation rate plus 4% with an additional 1.3% increase for education. In 2010, transfers increased by 3.5% with an additional 1.6% increase for education. Transfers grew by 7.7% in 2011, 5.0% in 2012, 8.7% in 2013, 1.6% in 2014 and 2.7% in 2015.
One of the greatest challenges in public finance is the growing rate of pension liabilities for workers and retirees, combined with the fact that most territorial entities lack proper resources to pay these obligations. In December 1999, Congress enacted Law 549, which established the National Pension Fund for Territorial Entities. Law 549 provides for full funding of pension liabilities within 30 years from the date of its enactment. Both the Central Government and the territorial entities contribute to this fund, although the Central Government has not assumed responsibility to pay these pension payments. The Central Government recognized, however, that further pension reform was necessary and as a result, Law 797 of 2003 was enacted. Law 797 of 2003 modified the official retirement age and increased payroll taxes in order to reduce the rate of growth of pension expenditures. Due to legal challenges brought before the Colombian Constitutional Court challenging certain provisions of Law 797, Law 860 of 2003 was enacted in December 2003 to cure certain procedural flaws. According to the Medium Term Fiscal Framework 2016, the net present value of the Central Government’s pension liability for the next 50 years (2014-2064), not including the transition cost, decreased by 1.4 percentage points from 72.4% of GDP to 71.0% of GDP between 2015 and 2016 (using a discount rate of 6%) and the annual expenditure by the Central Government for pension liabilities was 3.7% of GDP for 2015 and is estimated to be 3.8% of GDP for 2016.
D-79
The following table shows the principal categories of Government expenditures, according to the General Directorate of the Budget of the Ministry of Finance.
Central Government Expenditures(1)
| | | | | | | | | | | | | | | | | | | | |
| | | 2011 | | | 2012 | | | 2013 | | | 2014 | | | 2015 | |
Social Expenditures | | | | | | | | | | | | | | | | | | | | |
Education | | | 16.3 | % | | | 15.5 | % | | | 15.3 | % | | | 15.9 | % | | | 16.1 | % |
| | | | | |
Health | | | 6.1 | | | | 8.0 | | | | 8.0 | | | | 10.2 | | | | 11.6 | |
Potable Water and Sewage | | | 1.4 | | | | 1.3 | | | | 1.6 | | | | 1.3 | | | | 1.2 | |
Housing | | | 0.8 | | | | 0.7 | | | | 0.8 | | | | 1.4 | | | | 1.4 | |
Social Security | | | 21.9 | | | | 20.5 | | | | 21.1 | | | | 20.2 | | | | 19.0 | |
Other | | | 4.0 | | | | 3.9 | | | | 4.8 | | | | 5.7 | | | | 6.3 | |
| | | | | | | | | | | | | | | | | | | | |
| | | 50.5 | | | | 49.9 | | | | 51.6 | | | | 54.8 | | | | 55.5 | |
| | | | | | | | | | | | | | | | | | | | |
Justice | | | 7.2 | | | | 7.2 | | | | 5.6 | | | | 5.8 | | | | 5.9 | |
Defense and Security (Internal) | | | 13.3 | | | | 13.2 | | | | 12.9 | | | | 11.9 | | | | 11.2 | |
| | | | | |
Infrastructure | | | | | | | | | | | | | | | | | | | | |
Mines and Energy | | | 1.7 | | | | 2.1 | | | | 2.1 | | | | 1.7 | | | | 1.8 | |
Transportation | | | 4.2 | | | | 5.6 | | | | 6.3 | | | | 5.3 | | | | 4.3 | |
Irrigation Projects and Agriculture | | | 1.0 | | | | 1.5 | | | | 2.3 | | | | 1.6 | | | | 2.0 | |
Environment | | | 0.2 | | | | 0.2 | | | | 0.2 | | | | 0.3 | | | | 0.3 | |
Other | | | 0.6 | | | | 0.8 | | | | 0.4 | | | | 0.4 | | | | 0.3 | |
| | | | | | | | | | | | | | | | | | | | |
| | | 7.7 | | | | 10.3 | | | | 11.3 | | | | 9.3 | | | | 8.6 | |
| | | | | | | | | | | | | | | | | | | | |
Government Overhead Expenses | | | 3.1 | | | | 3.3 | | | | 3.4 | | | | 4.0 | | | | 3.5 | |
Transfers to Local Governments(2) | | | 2.7 | | | | 2.6 | | | | 2.8 | | | | 2.4 | | | | 2.5 | |
Interest payments | | | 15.5 | | | | 13.6 | | | | 12.3 | | | | 12.0 | | | | 12.8 | |
| | | | | | | | | | | | | | | | | | | | |
Total Expenditures | | | 100 | % | | | 100 | % | | | 100 | % | | | 100 | % | | | 100 | % |
| | | | | | | | | | | | | | | | | | | | |
Expenditures (as a percentage of GDP)(3) | | | 17.6 | % | | | 18.2 | % | | | 19.0 | % | | | 19.5 | % | | | 19.3 | % |
Totals may differ due to rounding.
| 1: | 2015 figures are preliminary. |
| 2: | Figures only include transfers to municipalities, not to other regional governments. |
| 3: | Based on estimated GDP figures calculated using 2005 as the base year for calculating constant prices. |
| Sources: | Dirección General del Presupuesto (General Directorate of the Budget), CONFIS and Tesorería General de la República (National Treasury). |
2016 Budget
The 2016 budget became Law 1769 on November 24, 2015. The consolidated public sector deficit is expected to be 2.3% of GDP (Ps. 19,938 billion) and the consolidated non-financial public sector deficit is anticipated to be approximately 2.6% of GDP (Ps. 21,989 billion). The 2016 budget estimates a Central Government deficit of approximately 3.9% of GDP (Ps. 33,319 billion). Total non-financial public sector expenditures for 2016 are currently budgeted to reach Ps. 339,410 billion, out of which Ps. 156,553 billion corresponds to expenditures by the Central Government and Ps. 182,857 billion corresponds to expenditures by public entities at the national and local level and transfers to departmental and local governments.
Under the 2016 budget, the Central Government’s revenues (on a cash-flow basis) are projected to total Ps. 127,761 billion (approximately 15.0% of GDP), a decrease of 1.2% as compared to revenues of Ps. 129.321 billion recorded in 2015. Total tax revenues are expected to grow by 3.6%, from Ps. 116,403 billion in 2015 to Ps. 120,643 billion in 2016. Income tax revenues and CREE, including withholding tax are expected to amount to Ps. 52,259 billion in 2016, a decrease of 0.8% as compared to 2015 income tax revenues and CREE of Ps. 52,657 billion. Internal value-added tax and consumption tax revenues are expected to total Ps. 33,900 billion as compared to Ps. 29,376 billion in 2015, an increase of 15.4%. Revenues from the tax on financial transactions are anticipated to
D-80
amount to Ps. 7,209 billion, as compared to Ps. 6,741 billion in 2015, representing an increase of 6.9%. Tariffs and external value-added tax revenues are expected to increase by 1.5% in 2016, from Ps. 18,559 billion in 2015 to Ps. 18,838 billion in 2016. Non-tax revenues are expected to amount to Ps. 7,118 billion in 2016, a 44.9% decrease as compared to 2015 (Ps. 12,918 billion).
According to CONFIS, Central Government expenditures (net of amortizations of public debt and on a cash-flow basis) under the 2016 budget are expected to total Ps. 161,080 billion (approximately 19.0% of GDP) as compared to Ps. 153,190 billion in 2015, representing an increase of 4.9%. Operational expenditures are expected to total Ps. 117,455 billion in 2016, an increase of 8.3% as compared to Ps. 108,451 billion registered in 2015. Expenditures for interest payments are expected to increase by 31.1%, from Ps. 20,646 billion in 2015 to Ps. 27,074 billion in 2016. Investment expenditures are expected to amount to Ps. 16,535 billion in 2016, a decrease of 32.5% as compared to Ps. 24,510 billion in 2015. Transfers, including pension transfers and transfers to regional governments, are expected to increase by 8.8%, from Ps. 83,987 billion in 2015 to Ps. 91,405 billion in 2016.
The 2016 budget is based on the following principal budget assumptions:
Principal 2016 Budget Assumptions
| | | | |
| | | 2016 Budget
Assumptions as
of June 2016(1) | |
Gross Domestic Product | | | | |
Nominal GDP (billions of pesos) | | | 849.28 | |
Real GDP Growth | | | 3.0 | % |
Inflation(2) | | | | |
Domestic Inflation (consumer price index) | | | 6.5 | % |
External Inflation(3) | | | 0.8 | % |
Real Devaluation at end of period | | | 0 | % |
Export Prices | | | | |
Coffee (ex-dock) ($/lb.) (4) | | | 1.3 | |
Oil ($/barrel) (5) | | | 30.0 | |
Coal ($/ton) | | | 50.0 | |
Gold ($/Troy oz.) (6) | | | 995.0 | |
| 1: | Figures correspond to statistics released by the General Directorate of Macroeconomic Policy in June 2016 in connection with the release of the Medium Term Fiscal Plan 2016. |
| 3: | “External Inflation” is based on projected inflation in the United States as published in the IMF, World Economic Outlook Database, April 2016. |
| 4: | Budget assumptions based on Banco de la República data. |
| 5: | Based on inputs provided by the Mining and Energy Technical Group established by the Fiscal Rule and oil futures market. 6: Projections include an average price of Brent oil of $42 per barrel. |
| 6: | Based on projections by the General Directorate of Macroeconomic Policy. |
| Sources: | General Directorate of Macroeconomic Policy, Ministry of Finance |
The figures set forth above represent the Government’s forecast, as of June 14, 2016, of the 2016 Colombian economy. While the Government believes that these assumptions and targets were reasonable when made, some are beyond the control or significant influence of the Government, and actual outcomes will depend on future events. Accordingly, no assurance can be given that economic results will not differ materially from the figures set forth above.
The Government has implemented three policies to maintain fiscal responsibility and economic growth: (i) the tax reform law of 2014 (Law 1739 of 2014); (ii) committing to a strategy of lowering total spending of the Central Government from 19% of GDP in 2016 to 18% of GDP in 2022 and (iii) a plan to drive productivity and employment, the Plan de Impulso a la Prosperidad y el Empleo - PIPE 2.0, which has as its objective to contribute to economic growth promoting investment in infrastructure, energy and the mining sector and increasing the competitiveness of industry, tourism and the agriculture. The resources the Government will allocate for PIPE 2.0 have been reallocated from the budget, and such reallocation complies with the limits of the fiscal responsibility law.
D-81
IMF Program
Flexible Credit Line with IMF
On March 26, 2009, the IMF made available to Colombia the IMF’s Flexible Credit Line, a short-term facility intended to provide contingent liquidity to countries with sound macroeconomic policies and institutional frameworks. The Flexible Credit Line was designed to help Colombia during the global financial crisis by providing the flexibility to draw on the credit line at any time. Disbursements under the Flexible Credit Line were not phased or conditioned on compliance with policy targets as in traditional IMF-supported programs. On April 20, 2009, the Government made an official application for $10.4 billion under the Flexible Credit Line to the IMF. On May 11, 2009 the IMF’s Executive Board approved a one-year arrangement under the Flexible Credit Line for $10.5 billion. On May 7, 2010, the IMF’s Executive Board approved a successor one-year arrangement under the Flexible Credit Line for $3.5 billion. On May 9, 2011, the IMF’s Executive Board approved a two-year $6.2 billion successor arrangement under the IMF’s Flexible Credit Line. On June 24, 2013, the IMF’s Executive Board approved a two-year SDR 3.87 billion successor arrangement under the Flexible Credit Line. On June 24, 2013, the IMF’s Executive Board approved a two-year SDR 3.87 billion successor arrangement under the Flexible Credit Line. On June 17, 2015, the IMF’s executive board approved a two-year SDR 3.87 billion successor arrangement under the IMF’s Flexible Credit Line. . On June 13, 2016, the IMF’s executive board approved a two-year SDR 11.5 billion successor arrangement under the IMF’s Flexible Credit Line, which at June 17, 2015 was equivalent to approximately $5.45 billion. To date, Colombia has not drawn on the Flexible Credit Line. The Government intends to treat the credit line as precautionary and does not plan to draw on the facility. On June 13. 2016, the IMF’s Executive Board approved a successor two-year arrangement under the Flexible Credit Line in an amount equivalent to SDR 8.18 billion, about USD $11.5 billion and canceled the previous arrangement of SDR 3.87 billion, about USD $5.4 billion. The Government intends to treat the credit line as precautionary and does not plan to draw on the facility.
Recently Enacted Fiscal Reforms
Since 2010, the Santos administration has submitted to Congress, and Congress has approved, a package of structural reforms aimed at improving the conditions for the sustainability of public finances in the long term and imposing targets in several indicators of fiscal performance. The reforms are described below.
Health System Reforms: On July 12, 2010, a law that seeks to increase the resources available for the health system by between Ps. 3.5 and Ps. 3.6 trillion was enacted. The principal provisions of the law are as follows: (i) an increase in value added tax rates for beer, cigars, gambling and liquor; (ii) the authorization to use transfers from the Government to the departments and municipalities to equalize the benefits under Plan Obligatorio de Salud and Plan Obligatorio de Salud Subsidiado; and (iii) implementation of measures that are intended to reduce evasion and avoidance of the required contributions to the health system.
On January 19, 2011, the president signed into law the Health Reform Law that provides more resources to the health system (Ps.1.5 trillion per year). The Government will contribute Ps.1.0 trillion per year from the national budget and other resources are expected to come from the Family Compensation Funds (a non-governmental agency that pays social security subsidies), municipalities and departments, among others. The law will also order periodic updates to the public health insurance plans in order to make them consistent with the epidemiological profile of the population, limiting and rationalizing the type of treatments and drugs that are included in the insurance plans.
Fiscal Sustainability Reform: On June 8, 2011, Congress passed the constitutional reform of Fiscal Sustainability. The main effect of this reform is the protection of the fundamental economic, social and cultural rights embodied in the Constitution, establishing fiscal sustainability as a criterion and requiring the different branches of government to consider the implications of their decisions on macroeconomic stability.
Royalties Reform: On June 9, 2011, Congress approved the reform to the royalties system (called “Acto Legislativo de Reforma a las Regalías”). The main objective of this reform is to redistribute more equitably royalties received from the exploitation of natural resources among all the regions of Colombia, generate savings, promote transparent management by authorities and strengthen regional competitiveness. The reform requires that 40% of the royalties generated by the exploitation of natural resources be used to finance social, economic and environmental development projects in the regions based on objective criteria such as the size of the population and level of poverty.
D-82
Fiscal Responsibility Law: On June 14, 2011, Congress approved the fiscal responsibility law. The main objective of this reform is to reduce gradually the structural fiscal deficit of the Central Government to 2.3% of GDP or less by 2014, 1.9% of GDP or less by 2018 and 1.0% of GDP or less by 2022. The fiscal responsibility law states that, in the long term, structural spending cannot exceed structural revenue by more than 1%, which is aimed at reducing the Central Government debt to GDP ratio to below 20%.
Infrastructure Law: On November 22, 2013, a law on infrastructure was passed. The main purpose of the law is to establish a regulatory framework and provide tools for improving the country’s transportation infrastructure. It seeks to make the approval and execution process for transportation infrastructure more efficient and expeditious through structures that will support and facilitate the development of a modern transport network for the country.
On December 23, 2014, following approval by Congress, President Santos signed a tax reform bill into law (Law 1739 of 2014). The law seeks to maintain the growth of the Colombian economy through infrastructure development and social programs and strike a balance between taxes on wealth and income without adversely affecting the middle class or small and medium size companies. See “Republic of Colombia — Other Domestic Initiatives” for additional information on the tax reform law.
D-83
PUBLIC SECTOR DEBT
General
Public sector debt (“public debt”) in Colombia is comprised of the internal and external debt of the Central Government, Banco de la República and state-owned non-financial companies, as well as the external debt of state-owned financial institutions and departmental and municipal governments. External public debt encompasses all debt payable in currencies other than pesos (including debt denominated in pesos but payable in currencies other than pesos), while internal public debt includes all debt payable in pesos.
The type of authorization required for incurring public debt depends on the use of the proceeds and on whether the debt is issued directly or guaranteed by the Republic, or is issued by a public entity without the benefit of the Republic’s guarantee. The Ministry of Finance is the Government agency responsible for regulating public sector borrowing. The Ministry of Finance must authorize all external borrowing by government-owned corporations and national, departmental and municipal agencies.
New external debt issued or guaranteed by the Republic must comply with the global debt ceiling set periodically by Congress. This ceiling is set as part of the external financing program proposed by the executive branch. In addition, external public debt issued or guaranteed by the Republic that increases the amount of outstanding external debt issued or guaranteed by the Republic must be authorized by the Board of Directors of Banco de la República, the Consejo Nacional de Política Económica y Social (“CONPES”) and the Comisión Interparlamentaria de Crédito Público (Public Credit Congressional Commission), a special six-member Congressional committee. The General Director of Public Credit and National Treasury of the Ministry of Finance must give advance approval of external debt issuances by the Republic that will be used to prepay or refinance existing debt. External debt incurred by decentralized entities requires prior authorization by the Ministry of Finance.
Until 1990, loans from Banco de la República and proceeds from special purpose bonds were the primary source of the Government’s internal public debt. Pursuant to Law 51 of 1990, the Government initiated a program in 1991 to finance public sector internal debt with Treasury bond issuances in the domestic capital markets, thereby diminishing reliance upon the traditional sources of internal financing. Colombia’s external public debt consists of loans from multilateral institutions (such as the World Bank and the IADB), foreign governments, commercial banks, suppliers, export credit institutions and bonds.
The focus of the Government’s debt management is to diversify the Government’s sources of financing, issue bonds in the European, Asian and U.S. capital markets, reduce the public sector deficit by improving the maturity profile of public sector debt and lower debt service costs and currency risk exposure. In addition, the Republic has guaranteed less debt due to privatizations and stricter policies for authorizing guaranteed debt.
On June 14, 2016, the Directorate General of Macroeconomic Policy announced a revised Financing Plan for 2016 in the Medium Term Fiscal Framework 2016-2017, under which the Government planned to issue up to Ps. 31.45 trillion in internal debt and $ 4.52 billion in external debt for 2016, excluding the pre-existing external financing of $ 1.5 billion. On the same date, the Directorate General of Public Credit had funded 100% of its external requirements and 72% of domestic financing requirements through the issuance of TES. In addition, the Directorate General of Macroeconomic Policy announced the Financing Plan for 2017, which contemplated up to Ps. 33.46 trillion in internal debt and $6.0 billion in external debt for 2017. On June 9, 2016, the Government published the results of the Financing Plan for 2015. In 2015, the Government issued Ps. 30.6 trillion in internal debt and $6.58 billion in external debt for 2015. In June 2016, according to the Medium Term Fiscal Framework the Central Government deficit for 2015 was 3.0% of GDP, and the non-financial public sector deficit for 2015 was 2.3% of GDP.
Colombia’s ratio of total net non-financial public sector debt to GDP was at 34.1% in 2011, decreased to 32.6% in 2012, and increased to 34.6% in 2013, and to 38.5% in 2014. For the year ended December 31, 2015, the ratio of total net non-financial public sector debt to GDP increased to 41.5%, mainly due to the increase in debt of the Central Government.
Public Sector Internal Debt
In 2015, the Government’s internal debt consisted mainly of the following debt instruments:
| | • | | Treasury bonds known as Títulos de Tesorería (“TES”) sold, through auctions, to the public and to Government agencies (which could invest excess funds in these Government instruments); and |
D-84
| | • | | Various special-purpose bond issues. |
The Central Government’s internal funded debt (i.e., long-term debt with an original maturity of more than one year) was $70.3 billion (Ps. 2021.7 trillion) on December 31, 2015, a decrease of 20.7% in dollar terms (a 4.4% increase in Peso terms) from the $88.8 billion (Ps. 1212.5 trillion) outstanding on December 31, 2014. According to preliminary figures, total non-financial public sector internal funded debt was $80.0 billion (Ps. 251.8 trillion) on December 31, 2015, as compared to the $102.3 billion (Ps. 244.9 trillion) outstanding on December 31, 2014.
TES issuances in the domestic capital markets have become a significant source of Central Government funding. As of December 31, 2015, local TES bonds represented 58.5% of total Central Government debt (both internal and external) and 94.3% of total internal Central Government debt. TES issuances in the domestic capital markets are accounted for as internal debt, while global TES bond issuances, which are denominated in pesos but payable in dollars and offered and sold globally (in foreign capital markets), are accounted for as external debt.
In January 2003, the Government appointed 20 financial institutions as market makers in Government securities as part of its strategy to broaden the Treasury bond market and provide liquidity to the local capital markets. Furthermore, the Ministry of Finance has expanded the types and maturities of its bond issues. In addition to one-, two-, three- and five-year fixed-rate TES, beginning in March 1998 the Government issued three-, five-, seven- and ten-year TES, with interest rates pegged to changes in the consumer price index. To reduce interest rate pressures on the market and simultaneously offer an exchange rate hedging instrument, the Government has issued dollar-linked one-, two- and three-year TES. As of December 31, 2015, there were no dollar-linked TES outstanding. In May 1999, the Government introduced inflation-indexed TES, known as UVR (Unidad de Valor Real Constante) and since then has issued five-, seven-, ten-, twelve- seventeen- and twenty year UVR TES bonds. With the UVR, the principal amount of the bond (rather than the interest rate) changes according to movements in the consumer price index, in a manner similar to the inflation- adjusted government debt securities available in the United States and France. As of December 31, 2015, $18.3 billion (Ps. 57.6 trillion) of UVR TES bonds were outstanding.
In 2011, the Government issued short-term (357-day) bills and four-, six-, seven-, ten-, eleven-, fifteen- and sixteen- year fixed rate TES and , eight-, twelve- and seventeen-year UVR TES bonds. In 2012, the Government issued seven, ten, eleven and fifteen year fixed rate TES and eight-, ten-, twelve- and seventeen-year UVR TES bonds. In 2013, the Government issued six-, seven-, ten- and sixteen-year fixed rate TES and eight-, ten- and twenty-year UVR TES bonds. In 2014, the Government issued five-, ten- and fifteen-year fixed rate TES benchmarks and five-, seven- and nineteen UVR TES bonds. In 2015, the Government issued short-term (364-day) bills, five-, ten- and fifteen-year fixed rate TES benchmarks and five-, ten- and twenty UVR TES bonds.
The Government has taken additional measures during the last several years to strengthen the domestic capital markets. For example, the Government encourages electronic systems for trading public sector debt instruments. These systems should provide a more efficient pricing mechanism and greater liquidity for investors. The Government also encourages the participation of institutional investors in the capital markets, as evidenced by the increasing investment of private pension fund assets in new capital market instruments. The Government has also increased its consistency in the timing and amounts of TES issuances. In addition to these measures, the Government issued Peace Bonds in the aggregate principal amount of Ps. 0.7 billion in 2007. The Peace bonds fund agrarian reform and the reconstruction of social infrastructure in conflict zones. In 2010 and 2011, the Government issued Ps. 1.1 billion and Ps. 0.9 billion in aggregate principal amount of Peace Bonds, respectively. In 2012, the Government issued Ps. 0.2 billion in aggregate principal amount of Peace Bonds. In 2013, the Government issued Ps. 748 million in aggregate principal amount of Peace Bonds and in 2014, the Government issued Peace Bonds in aggregate principal amount of Ps. 99.3 million. In 2015, the Government issued Peace Bonds in aggregate principal amount of Ps. 51.5 million.
In 2015, the Government issued Ps. 30.6 trillion of TES bonds. Of this amount, 74.5% was issued through auctions (Ps. 22.8 trillion). In 2016, the Government plans to issue Ps. 31.4 trillion of TES bonds. It is expected that 72.% of this amount will be issued through auctions. As of June 27, 2016, 76% of the planned aggregate principal amount of TES bond issuances has been issued. Auctions of TES bonds are normally held on a weekly basis, alternating between TES bonds and UVR TES bonds each week.
D-85
On May 16, 2012, the Government developed a new strategy for the issuance of internal funded debt. The plan involves the issuance of benchmark peso-linked TES bonds and UVR TES bonds every two years, both launched at the same time in odd years, with a reopening of such securities when five years remain until maturity. Securities are expected to be issued for the maximum term established for each security (15 years in the case of TES bonds denominated in pesos and 20 years in the case of UVR bonds), where the maturity of peso-linked TES will occur in even years and the maturity of UVR TES bonds occur in odd years. This measure is taken with the objective of reducing the refinancing risk.
The following table shows the total internal funded debt of the public sector.
Public Sector Internal Funded Debt(1)
| | | | | | | | | | | | | | | | | | | | |
| | | 2011 | | | 2012 | | | 2013 | | | 2014 | | | 2015 | |
| | | (billions of pesos or percentage of GDP) | |
Central Government(2) | | Ps. | 162,494 | | | Ps. | 170,561 | | | Ps. | 195,152 | | | Ps. | 212,462 | | | Ps. | 221.705 | |
Public Sector Entities | | | 29,611 | | | | 29,962 | | | | 31,880 | | | | 32,470 | | | | 30,157 | |
Total Internal Debt(3) | | Ps. | 192,105 | | | Ps. | 200,523 | | | Ps. | 227,032 | | | Ps. | 244,933 | | | Ps. | 251.863 | |
As a Percentage of GDP | | | 31.0 | % | | | 30.2 | % | | | 32.0 | % | | | 32.4 | % | | | 31.4 | % |
Totals may differ due to rounding.
| 1: | Includes debt of the Government with an original maturity of more than one year, and public sector entities’ guaranteed internal debt. |
| 2: | Central Government figures exclude pension bonds and constant value bonds. |
| 3: | Includes peso-denominated debt of the Government excluding state-owned financial institutions. |
Sources: General Directorate of Public Credit and National Treasury, Ministry of Finance; CONFIS.
At December 31, 2015 there was Ps. 2,100 billion of direct internal floating debt (i.e., short-term debt with an original maturity of one year or less) of the Central Government.
Public Sector External Debt
As used herein, public sector external funded debt consists of long-term external debt of the Central Government and guaranteed and non-guaranteed long-term external debt of public sector agencies, departments and municipal governments and state-owned financial institutions. Long-term debt means debt with an original maturity of more than one year. Traditionally, Colombia has relied on the following six sources of external debt:
| | • | | capital markets, such as external bond offerings; |
| | • | | multilateral financial institutions, such as the IADB, the World Bank and CAF; |
| | • | | export credit institutions; |
As of December 31, 2015, debt from multilateral institutions and export credit institutions represented 31.7% of public sector external funded debt, while loans from commercial banks constituted 8.8% of the total. The amount of bonds outstanding as of December 31, 2015 was $36.6 billion, or 57.2% of public sector external funded debt. Total public sector external funded debt increased from $57.8 billion on December 31, 2014 to $64.1 billion on December 31, 2015.
As of December 31, 2015, floating (i.e., short-term debt with an original maturity of one year or less) public sector external debt totaled $0.7 billion.
On December 31, 2015, the Central Government accounted for 64.2% of public sector external funded debt and state-owned entities, including Banco de la República, accounted for 35.8%.
D-86
The following table shows the external funded debt of the public sector by type.
Public Sector External Funded Debt by Type(l)(2)
| | | | | | | | | | | | | | | | | | | | |
| | | As of December 31, | | | | | | | |
| | | 2011 | | | 2012 | | | 2013 | | | 2014 | | | 2015 | |
| | | (millions of U.S. dollars, except percentages) | |
Central Government | | $ | 32,934 | | | $ | 33,661 | | | $ | 35,658 | | | $ | 37,530 | | | $ | 41,153 | |
Public Entities(3) | | | | | | | | | | | | | | | | | | | | |
Guaranteed | | | 1,896 | | | | 1,957 | | | | 1,871 | | | | 1,656 | | | | 1,573 | |
Non-guaranteed | | | 5,775 | | | | 8,877 | | | | 13,093 | | | | 18,648 | | | | 21,358 | |
Total External Debt | | $ | 40,606 | | | $ | 44,496 | | | $ | 50,623 | | | $ | 57,835 | | | $ | 64,083 | |
Total Debt Service | | $ | 6,213 | | | $ | 5,828 | | | $ | 4,306 | | | $ | 5,498 | | | | 5,956 | |
| | | | | |
External Debt/GDP | | | 14.9 | % | | | 11.3 | % | | | 13.4 | % | | | 15.3 | % | | | 22.0 | % |
Total Debt Service/GDP | | | 2.3 | | | | 1.5 | | | | 1.1 | | | | 1.5 | % | | | 2.0 | % |
Total Debt Service/Exports | | | 18.9 | | | | 9.7 | | | | 7.3 | | | | 9.3 | % | | | 16.7 | % |
Totals may differ due to rounding.
| 1: | Debt with an original maturity of more than one year. |
| 2: | Debt in currencies other than U.S. dollars has been converted into U.S. dollars using exchange rates as of December 31 of each year. |
| 3: | Includes Banco de la República, public agencies and entities, departments and municipal governments and state-owned financial entities. |
| Source: | Debt Database—Ministry of Finance. |
As of December 31, 2011, 2012, 2013, 2014 and 2015 Colombia’s public sector external funded debt increased by $2.4 billion, $3.9 billion, $6.1 billion, $7.2 billion and $6.2 billion, respectively, from the corresponding figure on December 31 of the prior year. The increase in the public external funded debt in 2015 was primarily due to an increase in indebtedness of Central Government. Public sector external debt as a percentage of GDP increased to 14.9% on December 31, 2011. It then decreased to 11.3% on December 31, 2012, but increased to 13.4% on December 31, 2013. As of December 31, 2014, public sector external debt as a percentage of GDP increased to 15.3% and then increased to 22.0% on December 31, 2015. External debt service as a percentage of GDP decreased from 2.3% on December 31, 2011 to 1.5% on December 31, 2012 and 1.1% on December 31, 2013, then increasing on December 31, 2014 to 1.5% and 2.04% on December 31, 2015. As of December 31, 2015, Colombia’s public sector external funded debt totaled $64.1 billion, of which $41.2 billion was debt of the Central Government and $22.9 billion was debt of other public entities.
The Government’s external debt management strategy is comprised of several elements, including:
| | • | | diversifying the Government’s sources of funding in order to reduce its vulnerability to external market disruptions; |
| | • | | focusing on multilateral sources of funding, in order to finance social infrastructure projects that involve private sector investment; and |
| | • | | minimizing interest, exchange rate and refinancing risks associated with debt service through the medium term debt management strategy. |
On June 17, 2015, the IMF’s executive board approved a two-year SDR 3.87 billion successor arrangement under the IMF’s Flexible Credit Line, which as of June 17, 2015 was equivalent to approximately $5.45 billion. On June 13, 2016, the IMF’s Executive Board approved a successor two-year arrangement under the Flexible Credit Line in an amount equivalent to SDR 8.18 billion, about USD $11.5 billion and canceled the previous arrangement of SDR 3.87 billion, about USD $5.4 billion. The Government intends to treat the credit line as precautionary and does not plan to draw on the facility. See “Public Sector Finance—IMF Program—Flexible Credit Line with IMF.”
D-87
On March 16, 2016, Colombia issued €1,350,000,000 aggregate principal amount of its 3.875% Global Bonds due 2026.
As part of Colombia’s external liability management program, the Government has conducted and plans to continue to conduct liability management transactions in order to reduce exposure to exchange rate risks and refinancing risks.
The following table shows the external funded debt of the public sector by creditor.
Public Sector External Funded Debt by Creditor(1)(2)
| | | | | | | | | | | | | | | | | | | | |
| | | As of December 31, | | | | | | | |
| | | 2011 | | | 2012 | | | 2013 | | | 2014 | | | 2015 | |
| | | (millions of U.S. dollars) | |
Multilaterals | | | | | | | | | | | | | | | | | | | | |
IADB | | $ | 6,826 | | | $ | 6,894 | | | $ | 7,233 | | | | 7,258 | | | $ | 7,858 | |
World Bank | | | 7,624 | | | | 7,851 | | | | 7,938 | | | | 8,215 | | | | 8,394 | |
Others | | | 1,566 | | | | 1,439 | | | | 1,284 | | | | 1,125 | | | | 1,263 | |
Total Multilaterals | | | 16,016 | | | | 16,183 | | | | 16,455 | | | | 16,598 | | | | 17,515 | |
Commercial Banks | | | 1,149 | | | | 2,061 | | | | 2,775 | | | | 3,908 | | | | 5,631 | |
Export Credit Institutions | | | 97 | | | | 2,137 | | | | 2,687 | | | | 2,864 | | | | 2,729 | |
Bonds | | | 22,023 | | | | 23,597 | | | | 27,983 | | | | 33,343 | | | | 36,631 | |
Foreign Governments | | | 1,308 | | | | 510 | | | | 717 | | | | 1,121 | | | | 1,575 | |
Suppliers | | | 12 | | | | 7 | | | | 5 | | | | 3 | | | | 2 | |
Total | | $ | 40,606 | | | $ | 44,496 | | | $ | 50,623 | | | | 57,835 | | | $ | 64,083 | |
Totals may differ due to rounding.
| 1: | Debt with an original maturity of more than one year. |
| 2: | Debt in currencies other than U.S. dollars has been converted into U.S. dollars using exchange rates as of December 31 of each year. |
| Source: | Debt Database—Ministry of Finance. |
IADB Loans
Colombia uses loans from the IADB to finance public investment. Disbursements of loans from the IADB totaled approximately $327.5 million in 2010, $134.8 million in 2011, $83.2 million in 2012, $24.1 million in 2013, $35.7 million in 2014 and $57.1 million in 2015.
The following table shows the external funded debt of the public sector by currency.
Public Sector External Funded Debt by Currency
| | | | | | | | | | | | | | | | | | | | |
| | | As of December 31, 2015(1) | |
| | | Central
Government | | | Guaranteed | | | Non–
Guaranteed | | | Total | | | Percentage
of Total | |
| | | (millions of U.S. dollars) | |
U.S. Dollars | | $ | 37,647 | | | $ | 1,097 | | | $ | 20,001 | | | $ | 58,745 | | | | 91.67 | % |
Colombian Pesos | | | 2,033 | | | | 454 | | | | 1,356 | | | | 3,843 | | | | 6.00 | % |
Japanese Yen | | | 374 | | | | 0 | | | | 0 | | | | 374 | | | | 0.58 | % |
Euros | | | 1,044 | | | | 19 | | | | 1 | | | | 1,064 | | | | 1.66 | % |
Others | | | 55 | | | | 4 | | | | 0 | | | | 58 | | | | 0.09 | % |
Total | | $ | 41,153 | | | $ | 1,573 | | | $ | 21,358 | | | $ | 64,083 | | | | 100.00 | % |
Totals may differ due to rounding.
| 1: | Preliminary. Debt with an original maturity of more than one year. Debt in currencies other than U.S. dollars has been converted into U.S. dollars using exchange rates as of December 31, 2015. |
| Source: | Debt Database—Ministry of Finance. |
D-88
The following table sets forth the amortization schedule for principal payments on Colombia’s public sector external debt outstanding on December 31, 2015.
Public Sector External Debt Amortization Schedule(1)(2)
Loans and Bonds
| | | | | | | | | | | | | | | | | | | | | | | | |
| | | Debt Outstanding as of | | | 2015 | | | 2017 | | | 2018 | | | 2019 | | | After | |
| | | December 31, 2015 | | | | | | | | | | | | | | | | |
| | | (3) | | | | | | | |
| | | (millions of U.S. dollars) | |
Multilaterals | | | | |
IADB(3) | | $ | 434 | | | $ | 472 | | | $ | 502 | | | $ | 505 | | | $ | 537 | | | $ | 7,517 | |
World Bank(3) | | | 627 | | | | 548 | | | | 463 | | | | 466 | | | | 424 | | | | 9,671 | |
Others | | | 129 | | | | 147 | | | | 140 | | | | 152 | | | | 183 | | | | 1,495 | |
Total Multilaterals | | | 1,189 | | | | 1,167 | | | | 1,106 | | | | 1,124 | | | | 1,144 | | | | 18,682 | |
Commercial Banks | | | 425 | | | | 235 | | | | 202 | | | | 207 | | | | 300 | | | | 7,832 | |
Export Credit Institutions | | | 127 | | | | 230 | | | | 189 | | | | 182 | | | | 281 | | | | 2,122 | |
Bonds | | | 1,050 | | | | 92 | | | | 1,960 | | | | 350 | | | | 4,400 | | | | 31,302 | |
Foreign Governments | | | 6 | | | | 19 | | | | 27 | | | | 38 | | | | 49 | | | | 581 | |
Suppliers | | | 0 | | | | 0 | | | | 0 | | | | 0 | | | | 0 | | | | 150 | |
Total External Debt | | $ | 2,798 | | | $ | 1,743 | | | $ | 3,484 | | | $ | 1,900 | | | $ | 6,173 | | | $ | 60,668 | |
Totals may differ due to rounding.
| 1: | Debt with original maturity of more than one year. Amortization figures in this table include both scheduled payments on outstanding debt and projected payments on debt not yet disbursed but for which commitments have been made and are planned to be disbursed. |
| 2: | Debt in currencies other than U.S. dollars has been converted into U.S. dollars using exchange rates as of December 31, 2015. |
| 3: | Amortization payments to the IADB and World Bank have been re-expressed using a revaluation factor based on the basket of currencies in which those debts are denominated on the dates their respective transactions closed. |
| Source: | Debt Database—Ministry of Finance. |
Debt Record
Colombia has regularly met all principal and interest obligations on its external debt for over 80 years.
D-89
TABLES AND SUPPLEMENTARY INFORMATION
Public Debt of the Republic of Colombia
External Public Debt
Direct Funded Debt (1)
Bond Issues
| | | | | | | | | | | | | | | | | | | | |
| Interest Rate and Title | | Year of Issue | | | Year of Final Maturity | | | Currency | | | Principal Amount Disbursed (millions of original currency) | | | Principal Amount Outstanding at Dec. 31, 2015(2) (millions of U.S. dollars) | |
Central Government | | | | | | | | | | | | | | | | | | | | |
| | | | | |
8.700% Notes Due 2016 | | | 1996 | | | | 2016 | | | | USD | | | | 200 | | | | 76 | |
8.375% Notes Due 2027(*) | | | 1997 | | | | 2027 | | | | USD | | | | 250 | | | | 74 | |
11.85% Global Bonds Due 2028 | | | 2000 | | | | 2028 | | | | USD | | | | 500 | | | | 9 | |
11.75% Global Bonds 2020(*) | | | 2000 | | | | 2020 | | | | USD | | | | 1,075 | | | | 796 | |
10.375% Global Bonds 2033(*) | | | 2003 | | | | 2033 | | | | USD | | | | 635 | | | | 341 | |
8.66% Notes Due 2016 | | | 2004 | | | | 2016 | | | | USD | | | | 17 | | | | 17 | |
8.125% Global Bonds 2024 | | | 2004 | | | | 2024 | | | | USD | | | | 1,000 | | | | 1,000 | |
7.375% Notes 2017(*) | | | 2006 | | | | 2017 | | | | USD | | | | 1,650 | | | | 1,650 | |
7.375% Notes 2037(*) | | | 2006 | | | | 2037 | | | | USD | | | | 1,818 | | | | 1,818 | |
9.85% Global TES Bonds due 2027 | | | 2007 | | | | 2027 | | | | COP | | | | 1,924,515 | | | | 611 | |
7.375% Notes due 2019 | | | 2009 | | | | 2019 | | | | USD | | | | 2,000 | | | | 2,000 | |
6.125% Global Bonds due 2041(*) | | | 2009 | | | | 2041 | | | | USD | | | | 1,000 | | | | 2,500 | |
2.42% Notes due 2019 | | | 2009 | | | | 2019 | | | | JPY | | | | 45,000 | | | | 374 | |
7.75% Global TES Bonds due 2021(*) | | | 2010 | | | | 2021 | | | | COP | | | | 2,467,611 | | | | 784 | |
4.375% Global Bonds due 2021 | | | 2011 | | | | 2021 | | | | USD | | | | 2,000 | | | | 2,000 | |
4.375% Global TES Bonds due 2023(2)(*) | | | 2012 | | | | 2023 | | | | COP | | | | 1,000,000 | | | | 318 | |
2.625% Global Bonds due 2023 | | | 2013 | | | | 2023 | | | | USD | | | | 1,000 | | | | 1,000 | |
4.000% Global Bonds due 2024(*) | | | 2013 | | | | 2024 | | | | USD | | | | 1,600 | | | | 2,100 | |
5.625% Global Bonds due 2044(*) | | | 2014 | | | | 2044 | | | | USD | | | | 2,500 | | | | 2,500 | |
5.000% Global Bonds due 2045(*) | | | 2015 | | | | 2045 | | | | USD | | | | 2,500 | | | | 2,500 | |
4.500% Global Bonds due 2026 | | | 2015 | | | | 2026 | | | | USD | | | | 1,500 | | | | 1,500 | |
Total | | | | | | | | | | | | | | | | | | | 23,966 | |
| 1: | Includes only medium- and long-term funded debt (i.e., debt with an original maturity of more than one year). As of December 31, 2015. |
| 2: | Principal amount outstanding on December 31, 2015 was converted to U.S. dollars at the corresponding exchange rate on December 31, 2015. COP/USD = Ps. 3,149.47/$1.00; JPY/USD = ¥120.19/$1.00; USD/EUR = $1.0878/€1.00. |
Source: Debt Database—Ministry of Finance.
D-90
Loans from Multilateral Institutions
| | | | | | | | | | | | |
| Lender | | Interest Rate | | | Currency | | | Principal Amount
Outstanding as of
December 31, 2015 | |
| | | | | | | | | (millions of U.S. dollars) | |
World Bank | | | Various | | | | Various | | | $ | 8,011 | |
IADB | | | Various | | | | Various | | | | 6,829 | |
Others | | | Various | | | | Various | | | | 1,074 | |
Total | | | | | | | | | | $ | 15,914 | |
| | | | | | | | | | | | |
Totals may differ due to rounding.
Source: Debt Database—Ministry of Finance.
Loans from Banks(1)
| | | | | | | | | | | | | | | | | | | | | | | | |
Title | | Interest
Rate | | | Date of
Agreement | | | Year of Final
Maturity | | | Currency | | | Principal
Amount
Disbursed | | | Principal Amount
Outstanding as of
December 31, 2015 | |
| | | | | | | | | | | | | | | (millions of U.S. dollars) | |
Commercial Bank Loans | | | Various | | | | Various | | | | Various | | | | Various | | | | n.a. | | | $ | 5,631 | |
Export Credits | | | 2%-7.75% | | | | Various | | | | Various | | | | USD, EUR | | | | n.a. | | | $ | 2,729 | |
Governments | | | 0%-4.83% | | | | Various | | | | Various | | | | USD, EUR, CNY | | | | n.a. | | | $ | 1,575 | |
Total | | | | | | | | | | | | | | | | | | | | | | $ | 9,935 | |
| | | | | | | | | | | | | | | | | | | | | | | | |
Total Outstanding Long-Term Direct External Debt | | | | | | | | | | | | | | | | | | | | | | $ | 36,631 | |
n.a. = Not available.
Totals may differ due to rounding.
| 1: | Medium- and long-term indebtedness. |
Source: Debt Database—Ministry of Finance.
Other External Public Sector Debt
Guaranteed Debt and Non-guaranteed Debt
| | | | | | | | | | | | |
| Borrower | | Guaranteed Debt(1)(2) | | | Non-guaranteed Debt | | | Principal Amount Outstanding as of December 31, 2015 | |
| | | millions of U.S. dollars | |
Non-Financial Public Sector: | | | | | | | | | | | | |
AGUAS DEL MAGDALENA | | $ | 4 | | | $ | 0 | | | $ | 4 | |
AGUAS Y AGUAS DE PEREIRA | | | 14 | | | | 0 | | | | 14 | |
BOGOTA DISTRITO CAPITAL | | | 139 | | | | 286 | | | | 425 | |
C.A.R. | | | 18 | | | | 0 | | | | 18 | |
DEPARTAMENTO DE ANTIOQUIA | | | 67 | | | | 70 | | | | 137 | |
DEPARTAMENTO DE CESAR | | | 6 | | | | 0 | | | | 6 | |
DEPARTAMENTO DE CUNDINAMARCA | | | 11 | | | | 0 | | | | 11 | |
E.E.E.B- E.S.P | | | 0 | | | | 813 | | | | 813 | |
E.P.M.DE MEDELLIN | | | 351 | | | | 1,625 | | | | 1,977 | |
E.T.BARRANQUILLA | | | 0 | | | | 6 | | | | 6 | |
E.T.M.V.A.METRO | | | 29 | | | | 0 | | | | 29 | |
ECOPETROL | | | 0 | | | | 10,926 | | | | 10,926 | |
EMCALI | | | 4 | | | | 0 | | | | 4 | |
I.S.A. | | | 0 | | | | 29 | | | | 29 | |
D-91
| | | | | | | | | | | | |
ICETEX | | | 243 | | | | | | | | 243 | |
ISAGEN S.A. | | | 117 | | | | 101 | | | | 218 | |
MUNICIPIO DE CALI | | | 2 | | | | 0 | | | | 2 | |
MUNICIPIO DE MEDELLIN | | | 3 | | | | 250 | | | | 253 | |
I.D.E.A | | | 0 | | | | 7 | | | | 7 | |
PROPILCO S.A. | | | 0 | | | | 6 | | | | 6 | |
REFICAR | | | 0 | | | | 4,722 | | | | 4,722 | |
DEPARTAMENTO DE GUAJIRA | | | 33 | | | | 0 | | | | 33 | |
ESP GECELCA S.A. ESP. | | | 0 | | | | 93 | | | | 93 | |
EMPOPASTO S.A. ESP | | | 21 | | | | 0 | | | | 21 | |
E.T.B. | | | 0 | | | | 168 | | | | 168 | |
TGI S.A. ESP | | | 0 | | | | 860 | | | | 860 | |
OLEDUCTO CENTRAL S.A. | | | 0 | | | | 500 | | | | 500 | |
COLOMBIA MOVIL S.A ESP | | | | | | | 307 | | | | 307 | |
Total Non-Financial Public Sector: | | | 1,061 | | | | 20,771 | | | | 21,832 | |
Financial Public Sector: | | | | | | | | | | | | |
BANCOLDEX | | | 307 | | | | 70 | | | | 377 | |
FINDETER | | | 205 | | | | 517 | | | | 721 | |
Total Financial Public Sector: | | | 511 | | | | 587 | | | | 1,098 | |
| | | | | | | | | | | | |
TOTAL: | | $ | 1,573 | | | $ | 21,358 | | | $ | 64,083 | |
Totals may differ due to rounding.
| 1: | Medium- and long-term indebtedness. |
| Source: | Debt Database—Ministry of Finance. |
Internal Public Debt
Direct Debt(1)
Bond Issues and Banco de la República
| | | | | | | | | | | | |
| Description | | Year of Final Maturity | | | Interest Rate | | | Principal Amount Outstanding as of Dec 31, 2015 | |
| | | | | | | | | (millions of pesos) | |
Treasury Bonds | | | Various | | | | Various | | | Ps. | 199,442,067 | |
Pension Bonds | | | Various | | | | Various | | | | 10,945,389 | |
TRD | | | Various | | | | Various | | | | 96,353 | |
Peace Bonds | | | Various | | | | Various | | | | 7,654 | |
Constant Value Bonds | | | Various | | | | Various | | | | 1,167,231 | |
Security Bonds | | | Various | | | | Various | | | | 108 | |
Other Bonds | | | Various | | | | Various | | | | 56,840 | |
Other Assumed Debt | | | Various | | | | Various | | | | 252 | |
Other | | | Various | | | | Various | | | | 239,377 | |
Treasury Promissory Notes | | | Various | | | | Various | | | | 11,766,619 | |
Total | | | | | | | | | | Ps. | 223,721,890 | |
Totals may differ due to rounding.
| 1: | Total as of December 31, 2015. |
| Source: | Debt Registry Office—General Directorate of Public Credit—Ministry of Finance. |
D-92
Internal Public Debt
Guaranteed Debt(1)
| | | | |
| | | Principal Amount Outstanding as of December 31, 2015 | |
| | | (thousands of U.S. dollars) | |
Department of Magdalena | | | 7,854.30 | |
Municipality of Cali | | | 58,907.72 | |
Municipality of Magangue | | | 3,016.96 | |
Satena | | | 6,607.46 | |
Total | | | 76,386.43 | |
| 1: | Medium- and long-term indebtedness. As of December 31, 2015, the Republic had no outstanding guarantees of floating public sector internal debt. |
| Source: | Ministry of Finance. |
D-93