Exhibit D
REPUBLIC OF COLOMBIA
Table of Contents
Page | ||||
Map of Colombia | D-1 | |||
Summary | D-2 | |||
Currency of Presentation | D-4 | |||
Introduction | D-4 | |||
Republic of Colombia | D-7 | |||
Economy | D-36 | |||
Foreign Trade and Balance of Payment | D-66 | |||
Monetary System | D-80 | |||
Public Sector Finance | D-90 | |||
Public Sector Debt | D-102 | |||
Tables and Supplementary Information | D-109 |
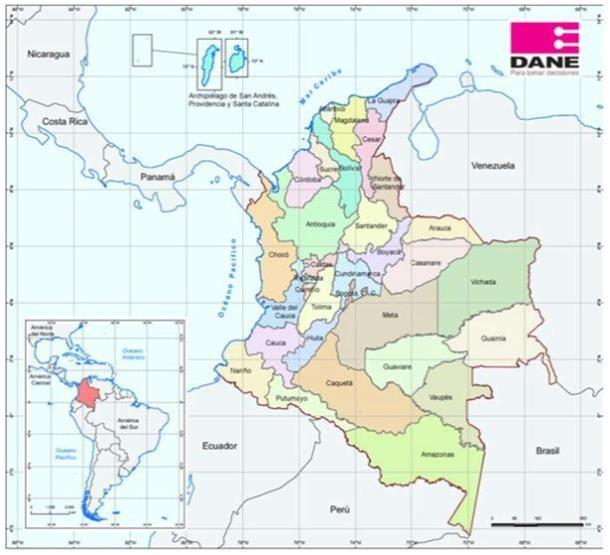
MAP OF COLOMBIA
D-1
SUMMARY
The following summary is qualified in its entirety by, and should be read in conjunction with, the detailed information appearing herein.
2017 | 2018 | 2019 | 2020 | 2021 | ||||||||||||||||
Domestic Economy | ||||||||||||||||||||
Real GDP Growth (percent)(1) | 1.4 | % | 2.6 | % | 3.2 | % | (7.0 | )% | 10.7 | % | ||||||||||
Private Consumption Growth (percent)(1) | 2.1 | 3.2 | 4.1 | (5.0 | ) | 14.8 | ||||||||||||||
Public Consumption Growth (percent)(1) | 3.6 | 7.4 | 5.3 | (0.6 | ) | 10.3 | ||||||||||||||
Consumer Price Index(2) | 4.1 | 3.2 | 3.8 | 1.6 | 5.6 | |||||||||||||||
Producer Price Index(2) | 3.3 | 2.3 | 6.1 | (0.9 | ) | 26.5 | ||||||||||||||
Interest Rate (percent)(3) | 6.0 | 4.7 | 4.5 | 3.4 | 2.1 | |||||||||||||||
Unemployment Rate (percent)(4) | 8.6 | 9.7 | 9.5 | 13.4 | 11.1 | |||||||||||||||
Balance of Payments(5) | (millions of U.S. dollars) | |||||||||||||||||||
Exports of Goods | 38,022 | 41,905 | 39,489 | 31,055 | 41,390 | |||||||||||||||
Imports of Goods | 46,076 | 51,233 | 52,703 | 43,489 | 61,101 | |||||||||||||||
Current Account Balance | (9,924 | ) | (14,041 | ) | (14,808 | ) | (9,258 | ) | (17,892 | ) | ||||||||||
Net Direct Investment | 13,701 | 11,299 | 13,989 | 7,459 | 9,310 | |||||||||||||||
Net International Reserves | 47,629 | 48,393 | 53,167 | 59,031 | 58,579 | |||||||||||||||
Months of Coverage of Imports (Goods and Services) | 9.8 | 9.0 | 9.7 | 13.8 | 9.9 | |||||||||||||||
Public Finance(6) | (billions of pesos or percentage of GDP) | |||||||||||||||||||
Non-financial Public Sector Revenue(7) | Ps. 363,394 | Ps. 424,544 | Ps. 450,263 | Ps. 452,934 | Ps. 541,310 | |||||||||||||||
Non-financial Public Sector Expenditures(7) | 384,794 | 450,080 | 471,115 | 527,592 | 619,776 | |||||||||||||||
Non-financial Public Sector Primary Surplus/ (Deficit)(8) | 4,371 | 1,651 | 5,672 | (52,464 | ) | (62,474 | ) | |||||||||||||
Percent of Nominal GDP | 0.5 | % | 0.2 | % | 0.5 | % | (5.3 | )% | (5.3 | %) | ||||||||||
Non-financial Public Sector Fiscal Surplus/(Deficit) | (24,581 | ) | (27,918 | ) | (25,611 | ) | (76,004 | ) | (84,460 | ) | ||||||||||
Percent of Nominal GDP | (2.7 | )% | (2.9 | )% | (2.4 | )% | (7.6 | )% | (7.2 | )% | ||||||||||
Central Government Fiscal Surplus/ (Deficit) | (33,636 | ) | (30,316 | ) | (26,049 | ) | (77,763 | ) | (83,149 | ) | ||||||||||
Percent of Nominal GDP | (3.7 | )% | (3.1 | )% | (2.5 | )% | (7.8 | )% | (7.1 | )% | ||||||||||
Public Debt(9) | (billions of pesos or percentage of GDP) | |||||||||||||||||||
Public Sector Internal Funded Debt(10) | Ps. 318,309,291 | Ps. 355,595,931 | Ps. 397,364,761 | Ps.454,157,968 | Ps.502,200,228 | |||||||||||||||
Percent of Nominal GDP(1) | 34.6 | % | 36.0 | % | 37.5 | % | 45.5 | % | 42.7 | % | ||||||||||
Public Sector External Funded Debt(11) | $ | 70,396 | $ | 71,554 | $ | 72,326 | $ | 91,187 | $ | 106,658 | ||||||||||
Percent of Nominal GDP(1) | 24.1 | % | 21.6 | % | 22.4 | % | 33.6 | % | 45.7 | % |
D-2
1: | Figures for 2020 and 2021 are preliminary. Preliminary figures are published in March in the year succeeding the reference period and become final two years thereafter. |
2: | Percentage change over the twelve months ended December 31 of each year. |
3: | Average for each year of the short-term composite reference rate, as calculated by the Financial Superintendency. |
4: | Refers to the average national unemployment rates in December of each year. |
5: | Calculations based on the sixth edition of the IMF’s Balance of Payments Manual. For more information, see “—Foreign Trade and Balance of Payments—Balance of Payments”. |
6: | All figures calculated according to IMF methodology, which includes privatization, concession and securitization proceeds as part of public sector revenues and nets transfers among the different levels of the non-financial public sector. |
7: | The amounts of transfers among the different levels of the consolidated non-financial public sector are not eliminated in the calculation of consolidated non-financial public sector revenue and consolidated non-financial public sector expenditures and, accordingly, the revenue and expenditure figures included above are greater than those that would appear had such transfers been eliminated upon consolidation. |
8: | Primary surplus/(deficit) equals total consolidated non-financial public sector surplus/(deficit) without taking into account interest payments or interest income. |
9: | Exchange rates as of December 31 of each year. |
10: | Includes peso-denominated debt of the Government (excluding state-owned financial institutions) with an original maturity of more than one year and public sector entities’ guaranteed internal debt. |
11: | In millions of dollars. Includes external debt of the Government (including Banco de la República, public agencies and entities, departments and municipal governments and state-owned financial institutions) with an original maturity of more than one year. |
Sources: Banco de la República, Ministry of Finance and Public Credit (“Ministry of Finance”), DANE and CONFIS.
D-3
CURRENCY OF PRESENTATION
All references herein to “pesos” and “Ps.” are to the currency of Colombia, and all references herein to “U.S. dollars,” “dollars,” “U.S. $” and “$” are to the currency of the United States. Unless otherwise indicated, all peso amounts are stated in nominal terms. As used herein, the term “billion” means one thousand million, or 1,000,000,000, and the term “trillion” means one thousand billion, or 1,000,000,000,000. The Financial Superintendency calculates and publishes a rate (the “representative market rate”) on a daily basis which is the average of the buy and sell foreign exchange rates quoted on the previous business day by certain commercial banks and financial corporations in the four largest Colombian cities. On September 13, 2022, the representative market rate published by the Financial Superintendency for the payment of obligations denominated in U.S. dollars was Ps. 4,346.91. Historical amounts translated into pesos or dollars have been converted at the historical rates of exchange summarized below. See “Monetary System—Foreign Exchange Rates and International Reserves.” The fiscal year of Colombia ends on December 31 of each year. The fiscal year ended December 31, 2021 is referred to herein as “2021,” and other years are referred to in a similar manner.
PRESENTATION OF FINANCIAL INFORMATION
Because Colombia’s official financial and economic statistics are subject to review by the Central Bank, National Administrative Department of Statistics (“DANE”), and the Ministry of Finance, the information and data contained in this annual report for the year ended December 31, 2021 and thereafter is preliminary and subject to further revision. As a member of the OECD, Colombia has implemented an updated methodology based on 2015 constant pesos instead of 2005 constant pesos and revised historical figures in accordance with that methodology. The Government does not expect revisions to be material, although it cannot assure you that changes will not be made.
INTRODUCTION
From 2016 to 2019, Colombia experienced real Gross Domestic Product (“GDP”) growth every year. Real GDP grew by 2.1% in 2016, 1.4% in 2017, 2.6% in 2018, and 3.3% in 2019. In 2020, Colombia’s real GDP experienced a contraction by 6.8%. In 2021 GDP grew by 10.7% due to a higher public consumption annual rate and an increase in public expense and social programs to promote economic recovery after COVID-19 pandemic; and a higher private consumption. In the first quarter of 2022, the real GDP grew by 8.5% compared to the same period of 2021.
During 2021, Colombia experienced great dynamism as the economy recovered from COVID-19 pandemic and the lockdowns. The sectors that experienced the greatest increase in 2021 were recreation, cultural, sports and other services (33.1%), transportation, storage, retail, restaurants and hotels (20.9%) and manufacturing (16.4%). In contrast, the primary sectors that experienced a contraction were agriculture and livestock (1.0%). Inflation, as measured by the change in the consumer price index, was 5.8% in 2016, 4.1% in 2017, 3.2% in 2018, 3.8% in 2019, 1.6% in 2020 and 5.6% in 2021. The rate of inflation increase was mainly due to an increase in the prices of foods (2.73%) and Restaurants and Hotels (0.85%) and an increase in the price of transport (0.73%).
Due to the implementation of trade and foreign exchange liberalization policies, Colombia has experienced current account deficits in most years since 1994. In 2017, the current account deficit decreased to $9,924 million, the trade deficit decreased to $8,762 million and the financial account deficit decreased to $9,625 million. In 2018, the current account deficit increased to $14,041 million, the trade deficit increased to $10,556 million and the financial account deficit increased to $12,954 million. In 2019, the current account deficit increased to $14,808 million, the trade deficit increased to $14,146 million and the financial account deficit increased to $13,298 million. In 2020, the current account deficit decreased to $9,258 million, the trade deficit decreased to $13,089 million and the financial account deficit decreased to $8,161 million. In 2021, the current account deficit increased to $17,892 million, the trade deficit increased to $20,308 million and the financial account deficit increased to $16,418 million. In the first quarter of 2022, Colombia also registered a deficit in the primary income of the current account of $3,506 million. The secondary income category, however, registered inflows of $6,883 million in 2017, $7,957 million in 2018, $9,055 million in 2019, $8,788 million in 2020 and $10,775 million in 2021 and $3,197 in the first quarter of 2022.
D-4
In 2020, exports of oil and its derivatives decreased by 45.2%, from $15,962.0 million FOB in 2019 to $8,755.0 million FOB in 2020. Oil exports decreased mainly due to a drop in sales of oil and its derivatives (-45.2%). In 2021, exports of oil and its derivates increased by 54.37%, from 8,755 million FOB in 2020 to $13,514 FOB in 2021. Oil exports increased mainly due to the growth in the external sales of oil and its derivates. As of July 2022, exports of oil and its derivatives increased by 71.03%, from $7,289 million FOB in the same period of 2021 to $12,125 million FOB. Oil exports increased mainly due to a growth in sales of oil and its derivatives (71.3%).
Foreign direct investment recorded a decrease in the capital account in 2020 of 43.4% compared to 2019. Foreign direct investment decreased primarily as a result of a decrease in investments in sectors such as commerce, restaurants and hotels and transport and communication. In 2016, net foreign investment inflows totaled $13,848 million. In 2017, net foreign investment decreased to an inflow of $13,837 million. In 2018, net foreign investment decreased to an inflow of $11,535 million. In 2019, net foreign investment increased to an inflow of $14,313 million. According to preliminary data from Banco de la República, during 2020, net foreign direct investment totaled $10,096 million, a decrease of $2,442 million from the value recorded in 2019, and net portfolio investment registered an inflow of $2,638 million. According to preliminary data from Banco de la República, during 2021, net foreign direct investment totaled $11,254 million, an increase of $1,157 million from the value recorded in 2020, and net portfolio investment registered an inflow of $1,944 million.
Banco de la República’s gross international reserves stood at $46,682.8 million as of December 31, 2016. As of December 31, 2017, gross international reserves increased by $954.4 million to $47,637.2 million. As of December 31, 2018, gross international reserves increased by $764.3 million to $48,401.5 million. As of December 31, 2019, gross international reserves increased by $4,772.7 million to $53,174.2 million. As of December 31, 2020, gross international reserves increased by $5,865.1 million to $59,039.3 million. As of December 31, 2021, gross international reserves decreased by $451.5 million to $58,587.8 million. As of June 30, 2022, gross international reserves decreased by $1,416.9 million to $57,170.91 million.
Colombia’s ratio of total net non-financial public sector debt to GDP has increased from 42.9% in 2016, 44.2% in 2017, 45.9% in 2018, 47.5% in 2019 and 61.8% in 2020. Colombia’s non-financial public sector recorded a deficit of 2.4% of GDP in 2016, 2.7% of GDP in 2017, 2.8% in 2018, 2.4% in 2019 and 7.6% in 2020. The Central Government’s deficit was 4.0% of GDP in 2016, 3.7% of GDP in 2017, 3.1% of GDP in 2018, 2.5% in 2019 and 7.8 in 2020. For the year ended December 31, 2021, the ratio of total net non-financial public sector debt to GDP decreased to 61.7%, mainly due to the increase in debt of the Central Government.
On June 13, 2016, the executive board of the International Monetary Fund (“IMF”) approved a two-year arrangement under the IMF’s Flexible Credit Line (“FCL”) in SDR 8.18 billion, equivalent to approximately $11.5 billion. This two-year arrangement was a successor arrangement to the two-year FCL for SDR 3.87 billion, approved in June 2013. On June 6, 2017, the IMF’s Executive Board reaffirmed Colombia’s continued qualification to access U.S.$11.4 billion under the FCL. On May 25, 2018, the Executive Board of the IMF approved a successor two-year arrangement for Colombia under the FCL in an amount equivalent to SDR 7.9 billion (approximately U.S. $11.4 billion) and canceled the previous arrangement for SDR 8.2 billion. The original FCL was approved in May 2009 for $10.5 billion. The IMF’s FCL provides Colombia with access to IMF resources with no ongoing conditions and provides a renewable credit line subject to a two-year limit that allows Colombia to draw on it at any time or to treat it as a precautionary instrument. On May 20, 2019, the Executive Board of the IMF completed its review of Colombia’s qualification for the arrangement under the FCL and reaffirmed Colombia’s qualification to access FCL resources. On May 1, 2020, The IMF approved a successor two-year arrangement for Colombia under the Flexible Credit Line (FCL), designed for crisis prevention, of about U.S.$10.8 billion. On September 25, 2020, the IMF approved an increase of the FCL to U.S.$17.6 billion (approximately SDR 12,267) and the Government made a drawing of U.S.$5.4 billion (approximately SDR 3.75 billion) under the FCL in the context of the COVID-19 pandemic. The authorities used the funds to help meet higher financing needs whilst maintaining strong external buffers in a context of heightened global uncertainty. The remaining amount available to Colombia under the FCL stands at U.S.$12.2 billion (approximately SDR 8.517 billion) after the drawdown. The authorities intend to treat this remaining amount under the FCL as precautionary. See “Public Sector Finance—IMF Program—Flexible Credit Line with IMF.”
D-5
Since 1993, Colombia has accessed the international capital markets through the issuance of bonds in the United States, Europe and Japan and through borrowings from commercial bank syndicates. Colombia has regularly met all principal and interest obligations on its external debt for over 80 years.
Certain political, economic, public health and diplomatic developments in or affecting Colombia could have a material adverse effect on the country’s economy. These factors include, but are not limited to, increases in inflation, exchange rate fluctuations, increases in interest rates, declines in foreign direct and portfolio investment, adverse conditions in the international capital markets, the COVID-19 pandemic, including any new wave or resurgence and/or new pandemic, changes in international commodity prices and violence and disruption associated with guerilla groups and narcotics organizations.
D-6
REPUBLIC OF COLOMBIA
Geography and Population
Colombia is the fourth largest country in South America, with a territory of 441,020 square miles (1,141,748 square kilometers). Located on the northwestern corner of the South American continent, Colombia borders Panama and the Caribbean Sea to the north, Peru and Ecuador to the south, Venezuela and Brazil to the east and the Pacific Ocean to the west.
Colombia is a country of great geographical diversity. Three ranges of the Andes, the Western, Central and Eastern Cordilleras, occupy the southwestern and central sections of the country, running through it from south to north. Grassland plains, known as Los Llanos, lie to the northeast of these ranges and extend to the Venezuelan border. The Amazon tropical rainforest is located to the south of the grassland plains. The Magdalena River rises in the Central Cordillera and flows to the Caribbean Sea, near the city of Barranquilla, through a rich alluvial plain. According to the World Wildlife Fund, Colombia is the most biodiverse country per square kilometer in the world. There are more bird, amphibian, butterfly and frog species in Colombia than anywhere else in the world. Approximately 56.7% of the land is composed of forests, 38.6% is fit for agriculture, and 4.7% is destined for other uses. Colombia lies almost entirely in the north tropical zone; however, the country’s regional climates vary with altitude. A tropical climate predominates in the coastal and Amazon regions, while a temperate climate predominates in the mountains.
According to the results of the 2018 Census (“2018 Census”) performed by the DANE, in 2018 Colombia’s population was estimated to be 48.3 million and in 2019 was estimated to be 49.4 million. Also, DANE estimated Colombia’s population at 50.4 million for 2020. In 2020, 76% of the population lived in a municipal capital, and 24% dispersed in rural areas and in small townships. In addition, DANE estimated Colombia’s population at 51.0 million for 2021 and 51.6 million for 2022.
Colombia is generally classified as a middle-income developing country. The following table sets forth the latest selective comparative statistics, for 2020, published by the World Bank.
Selected Comparative Statistics
Colombia | Peru | Brazil | Mexico | U.S. | ||||||||||||||||
GNI Per Capita(l) | $ | 5,790 | $ | 6,030 | $ | 7,850 | $ | 8,480 | $ | 64,140 | ||||||||||
Life Expectancy at Birth | 77.5 | 76.9 | 76.1 | 75.1 | 77.3 | |||||||||||||||
Illiteracy Rate(2) | 4.4 | % | 5.5 | % | n/a | 4.8 | % | n/a | ||||||||||||
Infant Mortality(3) | 11 | 10 | 13 | 12 | 5 | |||||||||||||||
Poverty (4) | 42.5 | % | 30.1 | % | n/a | 43.9 | % | n/a |
n/a = Not available.
1: | GNI per capita (formerly GNP per capita) is the gross national income divided by the midyear population, converted to U.S. dollars using the World Bank Atlas method. |
2: | Percentage ages 15 and over. |
3: | Number of infants dying before reaching the age of one year, per 1,000 live births. |
4: | Percentage of population living below national poverty line. |
Sources: World Bank Group, Development Data Group.
D-7
Government and Political Parties
The Republic is one of the oldest democracies in the Americas, with regular and peaceful transitions of power between successive administrations since 1957. In 1991, a popularly elected Constitutional Assembly approved a new Constitution, replacing the Constitution of 1886. The main features of the 1991 Constitution include further governmental decentralization, autonomy of the Central Bank, increased Congressional powers and the creation of several new public agencies. Colombia continues to be governed as a presidential republic. In the most recent presidential elections that took place on May 29, 2022, Gustavo Petro of Pacto Histórico won the first ballot with 40.32% of the vote, while Rodolfo Hernández of Liga de Gobernantes Anticorrupción came in second with 28.15% of the vote. On June 19, 2022, Mr. Petro won the second ballot and was elected President of the Republic of Colombia with 50.44% of the vote. President Petro took his oath and assumed the office of the President on August 7, 2022. The next presidential election is scheduled for May 2026.
The National Development Plan 2018—2022 (the “2018-2022 Plan”), approved on May 25, 2019, is focused on consolidating the Republic’s social advances and improvements. The 2018-2022 Plan is based on three main pillars: (i) rule of law, (ii) entrepreneurship and (iii) social justice.
• | Rule of Law: promotion of the rule of law, increase security and the consolidation of peace; |
• | Entrepreneurship: Economic growth will be enhanced with an environment favorable to the creation and consolidation of a friendly business environment; and |
• | Social Justice: promote social mobility and increased prosperity. |
The 2018-2022 Plan aims to increase local, regional and national integration as well as reduce poverty and inequality and increase employment. For 2022, an investment budget of Ps 69.6 billion was approved, an 18.8% increase compared to the 2021 budget. Budgetary appropriations include the main pillars of the 2018-2022 Plan. The 2018-2022 Plan focuses on promoting economic growth in the agricultural, infrastructure, housing, health, utilities and education sectors. The 2018-2022 Plan also seeks to reduce poverty and inequality. This National Development Plan will be updated within months after the new Government took office.
The new government has not yet presented the New National Development Plan. Nevertheless on August 7, 2022, President Petro published a ten point roadmap for his term in office. The ten points are: 1) consolidating and achieving a total peace; 2) care for the elderly, the young and those with disabilities; 3) promote women’s rights; 4) a government open to dialogue with all parties; 5) will continue to listen to all Colombians; 6) protect all Colombians from violence; 7) combat corruption; 8) protect the environment; 9) develop the national industry, the economy and rural areas; and 10) defend and uphold the constitution.
Colombia is divided into 32 departments. Each department is divided into municipalities. Both the governors of the departments and mayors of the municipalities are elected by direct popular vote. The next local elections are scheduled for October 2023.
Judicial power is vested in the Corte Constitucional (Constitutional Court), the Corte Suprema de Justicia (Supreme Court of Justice, or Supreme Court), the Consejo de Estado (Council of State), the Consejo Superior de la Judicatura (Supreme Judicial Council), the Fiscalía General de la Nación (National Prosecutor General) and in such lower courts as may be established by law. The function of the Constitutional Court, whose nine members are elected by the Senate for an eight-year term, is to assure that all laws are consistent with the Constitution and to review all decisions regarding protected fundamental rights. The Supreme Court is the final appellate court for deciding civil, criminal, family and labor proceedings. The Council of State adjudicates all matters relating to the exercise of public authority or actions taken by the public sector, including the review of all administrative decisions or resolutions that are alleged to contradict the Constitution or Colombian law. The Council of State also acts as advisor to the Government on administrative matters. The Supreme Court and Council of State justices are appointed for eight-year terms by their predecessors from a list of candidates provided by the Supreme Judicial Council. The National Prosecutor General, who is appointed for a four-year term by the Supreme Court from a list of three candidates submitted by the President, acts as the nation’s chief prosecutor. The judicial branch is independent from the executive branch with respect to judicial appointments as well as budgetary matters.
The Jurisdiccion Especial Para la Paz (Special Jurisdiction for Peace) (“JEP”) is the justice component of the integral system of truth, justice, reparation and non-repetition implemented by the peace agreement between the Government and Fuerzas Armadas Revolucionarias Colombianas (Colombian Revolutionary Armed Forces, or “FARC”), which entered into force in March 2017. The JEP has the function of administering transitional justice and deciding cases related to crimes within the framework of the armed conflict committed before December 1, 2016. The JEP was created to last for no more than 20 years.
D-8
As of March 25, 2022, the JEP had issued 48,283 judicial decisions and the JEP’s peace tribunal had adopted 9,838 judicial decisions. The JEP had received 607 reports from victims’ organizations and state institutions and 142 proceedings of dialogical construction of truth and inter-jurisdictional coordination and intercultural dialogue.
National legislative power is vested in Congress, which consists of a 108-member Senate and a 172-member Chamber of Representatives. Senators and Representatives are elected by direct popular vote for terms of four years. The most recent Congressional elections occurred on March 13, 2022. The following tables show the composition of Congress by political party.
Congressional Members by Party
Party | Number of elected officials | |||
Senate | ||||
Pacto Histórico | 16 | |||
Partido Conservador Colombiano | 16 | |||
Partido Liberal Colombiano | 15 | |||
Coalición Alianza Verde y Centro Esperanza | 14 | |||
Partido Centro Democrático | 14 | |||
Partido Cambio Radical | 11 | |||
Partido de la Unión por la Gente (Partido de la U) | 10 | |||
Coalición Mira – Colombia Justa Libres | 4 | |||
Movimiento Alternativo Indigena y Social (MAIS) | 1 | |||
Movimiento Autoridades Indígenas de Colombia “AICO” | 1 | |||
Total | 102 | |||
Chamber of Representatives |
| |||
Pacto Histórico | 27 | |||
Partido Liberal Colombiano | 32 | |||
Partido Conservador Colombiano | 25 | |||
Partido Centro Democrático | 16 | |||
Partido de la Unión por la Gente “Partido de la U” | 15 | |||
Partido Cambio Radical | 16 | |||
Partido Alianza Verde | 11 | |||
Coalición Mira – Colombia Justa Libres | 1 | |||
Partido Nuevo Liberalismo | 1 | |||
Coalición Centro Esperanza | 1 | |||
Liga de Gobernantes Anticorrupción | 2 | |||
Coalición Partidos Cambio Radical – Colombia Justa Libres - Mira | 1 | |||
Coalición Centro Esperanza | 1 | |||
Coalición Partido Conservador Colombiano y Partido de la “U” | 1 | |||
Coalición Partido Conservador Colombiano y Partido Centro Democrático | 1 | |||
Pacto Histórico Alianza Verde | 1 | |||
Coalición Partido Cambio Radical y Partido Político Mira | 1 | |||
Coalición Partido Liberal Colombiano – Colombia Justa Libres | 1 | |||
Fuerza Ciudadana la Fuerza del Cambio Magdalena | 1 |
D-9
Partido Colombia Renaciente | 1 | |||
Alternativos | 2 | |||
Gente en Movimiento | 1 | |||
Pacto Histórico y Verdes | 1 | |||
Coalición Juntos por Caldas | 1 | |||
Coalición Partido de la U y Partido Colombia Justa Libres | 1 | |||
Movimiento Alternativo Indígena y Social “MAIS” | 1 | |||
Palenque de la Vereda las Trecientas y del Municipio de Galapa | 1 | |||
Fernando Ríos Hidalgo | 1 | |||
Total | 165 |
Source: Registraduría Nacional del Estado Civil (National Civil Registry)
As a result of the peace agreements signed with the FARC party (Partido Político Comunes) and the related political reform approved in 2015, (i) the Partido Político Comunes was awarded five seats in the Senate and five seats in the Chamber of Representatives regardless of the vote obtained, and (ii) an additional seat was added in the Senate for the candidate who obtained the second highest vote in the presidential elections and an additional seat in the Chamber of Representatives was added for the losing vice presidential candidate. Additionally, through Legislative Act No. 2, dated August 25, 2021, 16 seats in the Chamber of Representatives were temporarily designated for candidates from the Special Constituencies for Peace (Circunscripciones para la Paz) for the 2022-2026 and 2026-2030 legislatures to represent victims of the armed conflict. For this reason, the Partido Político Comunes and Circunscripciones para la Paz seats have not been included in the table above.
Senators are elected on a non-territorial basis, while Representatives are elected on the basis of proportional territorial representation. To be enacted into law, a bill must be approved by a majority of both houses of Congress. Differences between the two houses of Congress are resolved by a bicameral committee, which drafts a joint bill that is presented to both houses. The Constitution grants the President the right to veto bills passed by Congress, subject to Congressional override. Upon the signature of all the cabinet ministers, the President may issue decrees under special circumstances, including a state of external war, significant domestic disruption or economic, social or ecological emergency. In each department, legislative power is vested in departmental assemblies whose members are elected by direct popular vote. At the municipal level, legislative power is vested in municipal councils, which preside over budgetary and administrative matters.
Traditionally, the principal political parties have been the Liberal Party and the Conservative Party. Since the late 1980s and the drafting of the 1991 Constitution, the political party environment in Colombia has changed substantially in the dimensions of its division, polarization and level of institutionalization. The pluralistic awareness of citizens and the realities and changing social contexts in the country has allowed the foundation of new political parties: Alianza Social Independiente founded in 1991, Cambio Radical in 1998, Partido Social de la Unidad Nacional in 2005, Polo Democrático Alternativo in 2005, Partido Alianza Verde in 2005, Partido FARC and Pacto Histórico among others.
On August 26, 2018, a referendum was held to decide on the implementation of certain anti-corruption measures. Seven questions were on the ballot. Although every single proposal received a 99% approval, none of the proposals met the minimum threshold of votes required for implementation.
The following table shows the party composition of the Chamber of Representatives and Senate following the elections in the years indicated.
D-10
Party Composition of the Colombian Congress (1)
Chamber of Representatives | Senate | |||||||||||||||||||||||
Party | 2014 | 2018 | 2022 | 2014 | 2018 | 2022 | ||||||||||||||||||
Pacto Histórico | N/A | N/A | 15.61 | % | N/A | N/A | 14.14 | % | ||||||||||||||||
Partido Centro Democrático | 9.47 | % | 18.60 | % | 9.86 | % | 14.29 | % | 17.59 | % | 11.85 | % | ||||||||||||
Partido Cambio Radical | 7.74 | % | 17.44 | % | 8.52 | % | 6.96 | % | 14.81 | % | 9.89 | % | ||||||||||||
Partido Conservador Colombiano | 13.17 | % | 12.21 | % | 12.56 | % | 13.58 | % | 12.04 | % | 13.59 | % | ||||||||||||
Partido Liberal Colombiano | 14.13 | % | 20.35 | % | 14.26 | % | 12.22 | % | 12.96 | % | 12.74 | % | ||||||||||||
Partido de la Unión por la Gente(2) | 16.05 | % | 14.53 | % | 8.73 | % | 15.58 | % | 12.96 | % | 9.25 | % | ||||||||||||
Others | 39.40 | % | 16.86 | % | 30.46 | % | 37.40 | % | 29.63 | % | 28.54 | % | ||||||||||||
|
|
|
|
|
|
|
|
|
|
|
| |||||||||||||
100.00 | % | 100.00 | % | 100.00 | % | 100.00 | % | 100.00 | % | 100.00 | % | |||||||||||||
|
|
|
|
|
|
|
|
|
|
|
|
(1) | Totals may differ due to rounding. |
(2) | Formerly, Partido Social de la Unidad Nacional. |
Source: Registraduría Nacional del Estado Civil (National Civil Registry).
Internal Security
Guerilla Activity
Guerilla organizations have existed in Colombia for several decades. In recent periods, the principal active guerilla organizations have been the FARC and the Ejército de Liberación Nacional (National Liberation Army, or “ELN”). In many remote regions of the country that have traditionally lacked an effective government presence, the guerillas have exerted influence and coercive pressure over the local population. In recent years, many of the guerillas have funded their activities through kidnappings and through narcotrafficking. In addition, the guerilla organizations have committed acts of terrorism to draw attention to their causes and have focused much of their activities on the pipeline network owned by Ecopetrol S.A., the national oil company (“Ecopetrol”). Pursuant to Law 1530 of 2012, fees paid for the transport of oil and gas through pipelines as stipulated in each agreement and regulation are partially assigned to the appropriate territorial entities. These fees were implemented in order to help align the interests of Ecopetrol with territorial entities, such as departments, municipalities, districts and indigenous territories.
According to Ecopetrol, in 2018, there were 105 attacks on oil infrastructure, an increase of 66% compared to 2017, totaling $47 million in direct costs of repairs. In 2019, there were 72 attacks on oil infrastructure, a decrease of 31.4% compared to 2018, resulting in direct costs of repairs due to terrorist attacks of approximately $72.0 million. In 2020, there were 51 attacks on oil infrastructure, a decrease of 29% compared to 2019, resulting in direct costs of repairs due to terrorist attacks of approximately $62.1 million. In 2021, there were 41 attacks on oil infrastructure, a decrease of 33% compared to 2020, resulting in direct costs of repairs due to terrorist attacks of approximately $47.66 million. As a result, there was a deferred production of 2,154 barrels directly related to these attacks in 2021, as compared to zero deferred production in 2020. As of March 31, 2022, there were 16 attacks against our pipeline infrastructure. On several occasions, guerilla attacks have resulted in unscheduled suspensions of Ecopetrol’s transportation systems in order to repair or replace sections of pipelines or production facilities that have been damaged. This has in turn caused production delays in certain fields. Ecopetrol has also strived to remediate environmental damage.
D-11
Over the past two decades, Colombia has implemented various measures to address the violence associated with the guerilla movements, including bilateral negotiations, enactment of legislation to protect the victims of armed conflicts, increased investment and economic development in conflict areas and the introduction of social, political and economic reforms designed to improve living conditions, increase access to the political process and equalize the distribution of income and peace negotiations. As of 2017, tax incentives were granted to companies that developed productions programs in at least one of 344 eligible municipalities affected by the armed conflict. The Agencia de Renovación del Territorio (ART) reported that between 2018 and 2021, 92 companies joined the program with plans to execute 139 social projects with an aggregate investment of Ps. 939.8 billion, of which 76 projects have been approved with an investment of Ps. 607.5 billion for the benefit of 101 municipalities.
FARC
On September 4, 2012, then President Santos announced a “General Agreement for the Termination of Conflict” between the Government and the FARC. The agreement established a procedure to end the armed conflict. The proposed peace process included an agenda with five concrete points: (i) rural development; (ii) guarantees for political opposition and public participation; (iii) the end of armed conflict; (iv) combating drug trafficking; and (v) the rights of the victims. The agreement did not contemplate the cession of land or cessation of military operations. Negotiations started in the first half of October 2012 in Oslo, Norway, and continued in Havana, Cuba.
On January 25, 2016, the UN Security Council approved the establishment of a political mission in Colombia for 12 months to monitor the peace agreement between the Government and the FARC. The mission was made up of unarmed international observers, responsible for the verification of the definitive bilateral ceasefire and cessation of hostilities, and as part of the tripartite mechanism that the parties were to include in the final peace agreement.
On June 23, 2016, the Government and the FARC announced an agreement to enter into a definitive ceasefire and disarmament of FARC. The agreement also included security guarantees and measures to combat criminal organizations that commit crimes against social, political and human rights groups, especially criminal organizations that are successors to paramilitary groups, and groups that threaten the peace agreement.
The objective of the ceasefire and disarmament was to end offensive operations between the Colombian army and the FARC in order to create the conditions for the execution of a final peace agreement and to reincorporate the FARC to civil society. The final agreement contemplated that the FARC militias would leave their camps and relocate to 23 transitory zones and eight base camps in order to start their reincorporation into civil society. The process is being monitored by the Government, the FARC and an assigned international political mission of the United Nations.
On August 24, 2016, a final peace agreement was entered into by the Government and the FARC. The final agreement detailed the five fundamental points to terminating conflict, which had been negotiated in the previous months and consisted of: (i) a final ceasefire and disarmament and bilateral end to hostilities; (ii) the protection of victims’ rights and a Special Jurisdiction for Peace, which will include a tribunal to prosecute those who committed crimes related to and on either side of the conflict; (iii) an investment plan for rural areas and peasant farmers; (iv) reincorporation of members of FARC into civil life and to allow them to participate in political life; and (v) a successful fight against drug trafficking.
On September 26, 2016, then President Santos and the leader of FARC, Rodrigo Londoño Echeverri, a.k.a. Timochenko, executed the peace agreement in Cartagena, Colombia, in the presence of representatives of the international community, including the guarantor countries and the Secretary General of the United Nations. The peace agreement was subject to, and was rejected by, a plebiscite that took place on October 2, 2016. As a result, then President Santos reopened negotiations with the FARC and the plebiscite opposition with the goal of revising the final version of the peace agreement. On October 21, 2016, delegations from the Government and the FARC returned to Havana, Cuba, to continue the dialogue and to address several of the concerns of the plebiscite
D-12
opposition. On November 24, 2016, then President Santos and Mr. Londoño executed a new peace agreement in Bogotá. The new agreement included changes that addressed some of the plebiscite opposition’s concerns, including: (a) revisions to the treatment of drug traffic offenses, including lowering the amnesty from prosecution from two years to one; (b) several changes to the Tribunal for Peace, including judicial review of the decisions by Colombian courts and modifications to the Tribunal’s composition, from one partially composed of international jurists to one composed only of Colombian jurists; (c) the requirement that FARC provide a list of its assets to be used in reparations for victims; and (d) a reduction in the amount of funds the political movement of FARC will receive in the four years after the agreement. Former FARC members are still allowed participation in Congress.
On November 30, 2016, Congress approved the peace agreement. In December 2016, Colombia’s Constitutional Court approved the revised peace agreement and declared constitutional the ratification of the agreement by Congress through a “fast track” legislative process, which reduced the number of legislative sessions required, prevented efforts to amend elements of the peace agreement and removed the need to have the peace agreement approved by another plebiscite. The peace agreement contains a timeline for implementation of certain provisions of the agreement based on the number of days from the day the agreement went into effect, referred to as the D-day. Certain actions were taken as early as D+1 and others, such as disarmament of FARC, were contemplated to be completed by D+180, or 180 days after the agreement went into effect.
On December 10, 2016, then President Santos, accompanied by a group of victims of the armed conflict in Colombia, received the Nobel Peace Prize. In January 2017, the National Commission of Security Guarantees was created in order to monitor and dismantle criminal organizations that threaten social leaders and the implementation of the Peace Agreement. In February 2017, 6,934 members of the FARC arrived at 26 concentration areas situated across the country to begin the disarmament process. In March 2017, the Congress approved the legislative act that instituted the Integral System of Truth, Justice, Reparation and Non-Repetition. This act also created the JEP, which is the judicial component of the system. In June 2017, members of the FARC finished the disarmament process, with the United Nations acting as observer in the process.
On May 5, 2017, the United States signed an economic assistance bill that ensured Colombia will receive the $450 million that was pledged in 2016 in commemoration of the fifteen-year anniversary of Plan Colombia, the U.S. initiative to aid the Colombian Government with its ongoing war on drugs. The assistance will be allocated by Colombia to fund peace efforts called “Paz Colombia.”
On July 10, 2017, then President Santos signed a presidential decree which granted amnesty to 3,252 members of the FARC convicted of political crimes. In total 7,400 members of the FARC have received amnesty, 6,005 by decree and 1,400 through the courts.
On November 30, 2017, Congress approved the final text of the draft bill which implemented the regulatory framework of the JEP (the “JEP Bill”). On August 15, 2018, the Constitutional Court declared the JEP Bill constitutional and on February 11, 2018, the Constitutional Court sent the JEP Bill to the President of the Congress and the President of the Republic for their signatures. On March 10, 2019, then President Duque objected to six of the 159 articles of the JEP Bill. On April 8, and May 1, 2019, the Chamber of Representatives and the Senate, respectively, rejected the objections. On June 6, 2019, then President Duque enacted the regulatory framework of the JEP into law. On May 28, 2021, 12,929 individuals were admitted into the JEP process. Of that group, 9,804 were members of the FARC, 2,972 were members of the military, 141 were other agents of the state, such as police officers, and 12 were social protesters.
On August 29, 2019, Ivan Marquez and Jesus Santrich (“Santrich”), former senior leaders of the FARC, announced that they would once again take up arms and return to conflict. On October 9, 2019, the FARC party, the successor of the guerrilla group, expelled all the guerrilla members that announced their rebellion. Several FARC dissidents, including Santrich, are requested in extradition by the United States on drug trafficking and money laundering charges. Furthermore, in December 2020, the Consejo de Estado ruled that Santrich would no longer be a member of the House of Representatives for the 2018-2022 legislative period.
On September 30, 2019, the Presidential Counselor for Stabilization and Consolidation stated before a committee of Congress the Government’s continued commitment to the implementation of the peace agreements reached with the FARC. The Government has invested approximately Ps. 900 billion in projects related to the implementation of the peace agreements.
D-13
On May 12, 2020, the Truth and Responsibility Acknowledgment Section of the JEP (“La Sección de Reconocimiento de Verdad y Responsabilidad del Tribunal para la Paz”) issued guidelines for its sanctions and for works and activities with restorative and reparative content. The sanctions for direct participants will last from five to eight years. Other types of participants will also be subject to their own sanctions for a period of two to five years. As of May 28, 2021, the courts of justice have adopted 36,376 judicial decisions and the tribunal for peace 6,812 judicial decisions. The JEP has received 380 reports from victims’ organizations and institutions of the state and 84 proceedings of dialogical construction of truth and inter-jurisdictional coordination and intercultural dialogue.
On March 12, 2021, the High Commissioner for Peace announced the Government’s commitment to establish the basis for the next eight years for the continuation of the implementation of the peace accords, focused on the special jurisdiction for peace and the comprehensive system of reparation, justice and non-repetition. Land restitution and the importance of progress in productive projects will also be addressed.
On April 14, 2021, through Decree Nos. 312, 313 and 314 of 2021, the Special Administrative Unit for Military and Police Criminal Justice was created. This new unit is part of an effort to strengthen criminal justice within the military and complies with congressional criteria set forth in the Military Penal Code (Law No. 1407 of 2010) regarding a criminal justice system under military jurisdiction.
On March 26, 2021, FARC dissidents detonated an explosive device in front of the mayor’s office of Corinto, Cauca, causing injuries to 43 individuals. On May 18, 2021, FARC dissidents announced that Santrich died on May 17, 2021, during a combat with the military.
On June 15, 2021, the military base of the 30th Brigade of the Colombian army was the target of an explosion in the city of Cucuta, causing injuries to 44 individuals. The special tasks group designated by the Attorney General to clarify the facts, established that the dissidents of the 33rd Front of the FARC would be responsible for the terrorist attack.
On June 25, 2021, the presidential helicopter was the target of an attack when it was landing in Cucuta. The Minister of Defense, the Minister of the Interior, the Governor of Norte de Santander and then President Duque were onboard and unharmed in the attack. The special tasks group designated by the Attorney General to clarify the facts, attributed this attack to dissidents of the 33rd Front of the FARC. On July 27, 2021, the Minister of the Interior confirmed that some dissidents of the FARC and the Gulf Clan were the responsible of the forced displacement of approximately 4,099 people, which 900 are children. The Government attended the victims with humanitarian aid, established measures seeking their safe return to their hometowns and continue to strengthen the fight against criminal groups.
On August 3, 2021, the Minister of the Interior and the Minister of Defense announced the capture of Henry Darío Areiza Jaramillo, one of the main organizers of drug trafficking, attacks on the military and forced displacement, in Ituango, Antioquia.
On September 13, 2021, the Minister of Defense announced the success of a military operation against the Gulf Clan in Ituango, which operation neutralized seven members of the Gulf Clan and captured two members. The Gulf Clan is responsible for numerous terrorist attacks against the police in that region.
On September 16, 2021, the Minister of Defense attributed responsibility for a terrorist attack that killed a police officer in San Vicente del Caguán, to FARC dissidents.
On September 20, 2021, the Minister of Interior announced that progress was made in a military operation against ELN structure, where two longtime ELN leaders in the department of Chocó were neutralized.
D-14
On October 21, 2021, the Minister of Defense confirmed that John Carlos Rincón, known as “Colacho”, the leader of a FARC dissident group which had been committing crimes in the South of Bolívar department, was captured in a hotel in Bogotá.
On November 10, 2021, then President Duque announced that the armed forces had neutralized a main leader of the FARC dissidents in Valle del Cauca, known as “Hugo”, during military encounters. On December 14, 2021, in a joint operation, the military, the Attorney General’s office and the Air Force captured Boris Bohórquez, who was part of the FARC dissident group that operates in the Caquetá department and is considered to be the right-hand man of “Gentil Duarte”, the head of such dissident group.
On January 24, 2022, then President Duque confirmed that Euclides Espana Caicedo, known as “Jhonnier”, the highest leader of the FARC dissident group in the southwestern part of the country, was killed in the department of Cauca during military encounters.
Between January 20, 2022, and February 9, 2022, three separate terrorist attacks were carried out in the departments of Arauca, Caqueta and Meta, for which the Minister of Defense attributed blame to FARC dissident groups.
On February 5, 2022, the Minister of the Interior, the Minister of Defense and the Minister of the Environment confirmed that FARC dissidents were responsible for forest fires in several places throughout the Colombian Amazon. The ministers announced the deployment of 400 members of the military, accompanied by police and ESMAD members, to attempt to capture the dissidents.
On February 24, 2022, the Minister of Defense announced that as a result of a military and police offensive in response to the terrorist actions of criminal groups in the border area with Venezuela, 23 FARC dissidents were neutralized and five more were captured.
On March 26, 2022, a terrorist attack in Ciudad Bolivar, Bogotá, killed one civilian and injured 10 others.
On May 4, 2022, then President Duque announced that Dairo Antonio Úsuga, known as “Otoniel”, the leader of the “Clan del Golfo”, was extradited to the United States.
On May 26, 2022, then President Duque announced that Juan Larinson Castro Estupiñán, known as “Matamba”, a top leader of the “Clan del Golfo”, was killed in a joint military operation by the military and National Police.
On June 13,2022, then President Duque announced that as a result of a military operation, Leider Yohani Noscue Bototo, known as “Mayimbú” a top leader of FARC dissident was neutralized in Suarez, Cauca.
ELN
In June 2000, the Government and the ELN began formal peace discussions, which have ceased and been resumed several times. In addition, the Government decided to grant political status to the ELN, an important step in the official negotiation process. On August 29, 2013, following the release by the ELN of a Canadian hostage that had been held for seven months, then President Santos announced that the Government was ready to start peace talks with the ELN.
On June 10, 2014, the Government announced that it had been engaged in exploratory peace talks with the ELN since January 2014, after a series of meetings held in 2013. The Government further stated that formal discussions with the ELN would not be initiated until all the necessary conditions for the peace agreement had been agreed. On May 14, 2015, Humberto de la Calle, the chief negotiator for the Government’s delegation at the Havana peace talks, invited the ELN to join the peace process in order to end the conflict. Mr. de la Calle emphasized that the discussion must include a bilateral cease fire. On June 11, 2015, the High Commissioner for Peace, Sergio Jaramillo, made renewed calls for the ELN to join to the dialogue with the Government and stated that the peace process would require the complete disarmament of the ELN. Later, on January 27, 2016, the National Peace Council (“NPC”), established by then President Juan Manual Santos to involve civil society in the peace process, agreed to an agenda between the Government and the ELN. However, the NPC expressed concern about the delay in the opening of formal talks.
D-15
On March 30, 2016, an agreement to commence peace negotiations between the Government and the ELN was announced. The parties agreed to install a public negotiating table to address the points set out in the agenda in order to sign a final agreement to end the armed conflict. The agenda outlined six main points: participation of society in the peace building process, democracy for peace, transformations for peace, victims, end of armed conflict and implementation of the agreement. On September 27, 2016, then President Santos announced the possibility of a public phase of peace dialogues with the ELN provided that the ELN released the hostages it then held. Former President Santos further stated that the Government and the ELN had agreed on an agenda for the negotiations.
On October 10, 2016, the Government announced the installation of the public phase of negotiations with the ELN. The delegations of the Government and the ELN had agreed: (i) to install a public negotiation table in Quito, Ecuador on October 27, 2016; (ii) that the agenda of talks would begin with a discussion of the participation of society in peace building; and (iii) to start the process of releasing kidnapped /retained persons by October 27, 2016. In addition, each party agreed to engage in other humanitarian actions and dynamics to create a favorable environment for peace. On January 14, 2017, the delegations of the Government and the ELN attended a meeting in Ecuador to discuss the sequence of events for peace negotiations. On June 6, 2017, the delegation of the Government and the ELN agreed to: (i) the creation of a team for the education and communication of peace which would support the dialogues and eventual agreements, (ii) the supervision of a group of countries for support and cooperation of the peace talks consisting of Germany, the Netherlands, Italy, Sweden and Switzerland, and (iii) the establishment of a financing fund for the negotiations.
On September 4, 2017, the Government and the ELN entered into a temporary ceasefire and ceased hostilities between October 1, 2017, and January 12, 2018. The ceasefire agreement included security guarantees and commitments to suspend any kidnapping against national or foreign citizens, any terrorist attack against the infrastructure of the country, including pipelines, and forceful recruitment of minors. However, in January 2018, the ELN breached the agreement by staging attacks in Aguazul, in the department of Casanare, Arauquita and Saravena, in the department of Arauca and Cañaguata in the department of Boyacá. The Government objected to these actions, and as a result the ceasefire was terminated. The Government stressed the importance of compliance with the agreements as a precondition for the continuation of peace talks.
On May 5, 2018, the ELN and the Government announced a continuation of peace talks in Havana, Cuba. The cycle of negotiations was focused on achieving a new ceasefire and future participation in society. The ELN agreed to a unilateral ceasefire from June 15, 2018, until June 19, 2018.
On August 1, 2018, the Government and the ELN concluded the sixth cycle of peace talks in Havana, Cuba. The talks received the support of the international community. During the cycle, progress was made in the construction of the mechanisms for the participation of civil society in the implementation of a peace agreement and in an agreement commencing a bilateral, temporary and national ceasefire.
On January 15, 2019, then President Duque, during his meeting with the head of the United Nation’s verification mission in Colombia, Carlos Ruiz Massieu, reaffirmed the commitment of the Government to the reintegration of ex-combatants, comprehensive reparation to victims of violence, and the promotion of 170 municipalities impacted by violence and poverty.
On January 17, 2019, a car bomb was detonated in a police academy in Bogotá, killing at least 21 people and injuring 68 civilians and police. The Government announced that the ELN was behind the attack, and the ELN has admitted to having committed it. As a result, the Government suspended the peace talks with the ELN and reinstated arrest warrants for its former negotiators.
On January 15, 2020, the Government requested the extradition of the leader of the ELN, Nicolás Rodríguez Bautista, from Cuba.
D-16
On February 18, 2020, then President Duque stated that before resuming any negotiations with the ELN, the armed group must stop criminal and violent acts.
During 2020, 459 members of the ELN were captured and 24 were killed during military encounters. In addition, 251 members of the ELN demobilized in 2020, which represented a decrease of 21.8% in demobilizations compared to 2019. With respect to Bandas Criminales al Servicio del Narcotráfico (criminal groups supporting drug traffic or “BACRIM”), in 2020, 4,693 members were captured and 136 were killed.
On March 30, 2020, the ELN declared a unilateral ceasefire from April 1 to April 30, 2020, due to the COVID-19 emergency in Colombia and although the Ombudsman’s Office requested an extension of the ceasefire, the ELN rejected it. The ELN has publicly requested the Government to continue peace dialogues, however, the Government replied that their continuity will be subject to the cessation of terrorist activities and the release of hostages.
On March 30, 2021, a member of the ELN was extradited to the United States on drug trafficking charges.
In May 2021, the Commissioner for the Peace declared that the Government has been articulating an indirect approach with ELN to explore ELN’s real intention to achieve the peace. However, the ELN has not accepted the basic conditions set forth by the Government to reach an agreement which implicates to stop kidnapping and criminal acts such as (i) the recruitment of minors, (ii) the installation of antipersonnel mines, and (iii) attacks against energy infrastructure.
On September 28, 2021, a leader of the ELN, known as “Fabian”, was confirmed dead after being injured in an operation carried out by the military.
On November 23, 2021, José Elecid Gañan Bañol, known as “Shumager”, a secondary leader of the ELN’s western war front, was killed in a joint military operation by the military and National Police in the department of Chocó.
On November 30, 2021, in a joint operation, the military, the National Police and the Attorney General’s office captured a leader of the ELN’s eastern war front, known as “El Indio”, in the Huila department.
On January 7, 2022, the ELN launched an attack against the Mobile Anti-Disturbance Squadron (“ESMAD”) in Cali, which injured 13 ESMAD members.
On February 2, 2022, then President Duque announced that five members of the ELN linked to the January 7, 2022 attack in Cali had been arrested.
Pact for the Construction of Peace: Culture of Legality, Coexistence, Stabilization and Victims (“2018-2022 Pact”)
The National Development Plan 2018-2022, presented and approved by Congress in May 2019, also approved the 2018-2022 Pact, which aims to build a culture of legality based on the essential relationship between security and justice for a peaceful coexistence. A budget of Ps. 37.1 trillion was approved to fund the 2018-2022 Pact. National development plans are published every four years and act as a framework for the Government’s goals, programs and investment plans.
The main objectives of the 2018-2022 Pact include (i) increased investments in the municipalities most affected by violence; (ii) welfare and assistance programs focused on 1.7 million vulnerable individuals and (iii) increased efficiency in the use of resources aimed at providing reparations to approximately 1.3 million victims of the armed conflict.
D-17
The Presidential Council for Stabilization and Consolidation reported that as part of the 2018-2022 Pact, and as of February 2022, the Government had invested more than Ps. 3.08 billion for the benefit of victims of violence in Colombia.
On March 28, 2022, the United Nations Secretary General published a report on the United Nations Verification Mission in Colombia. The report highlighted progress in victim reparations, ex-combatant reintegration, and crop substitution and development programs. The report recognized that the Government has allocated U.S. $134 million for productive projects, culminating in 116 collective productive projects benefitting 3,855 people and 3,918 individual productive projects benefitting 4,736 people, and that 63% of ex-combatants participate in productive projects. Finally, the report touches on the Comprehensive Municipal and Community Substitution and Alternative Development Plan (“PISDA”), through which, as of January 2022, approximately 46,000 hectares of illicit crops had been voluntarily eradicated.
On June 28, 2022, the Truth Commission in Colombia published a report consisting of ten volumes, including a statement. The statement is the compendium of the collected truths. The volume of findings and recommendations contains this statement, a first part with the synthesis of the issues that were investigated in depth by the Commission. A second part of this volume contains the Commission’s recommendations on peace matters. The other volumes of the final report do not have a hierarchy and respond to specific aspects of the mandate of the Peace Agreement. There are four contribution volumes whose specific purpose is to make visible the impacts that the conflict had on sectors and human groups that suffered the war differently.
On August 7, 2022, the President, Gustavo Petro, in his inauguration ceremony called for an end to violence in the country and the reincorporation into society of armed actors.
On August 8, 2022, the President, Gustavo Petro, ratified that his Government will resume the peace process with the ELN guerrillas, and announced that he will consult the countries that participated as guarantors if they are willing to offer the same collaboration. For his part, the President of Chile, Gabriel Boric, who accompanied the Colombian president in the statement to the media, announced that at the time dialogues with the ELN are resumed, his country will continue to be a guarantor.
Criminal Activity
The level of criminal activity in Colombia has generally shown a decreasing trend since August 2002. In particular, violence by guerilla organizations has generally decreased. Incidents of homicide decreased by 4.2% from 13,343 in 2014 to 12,783 in 2015, by 3.0% to 12,402 in 2016, by 0.8% to 12,298 in 2017, but increased by 5.1% to 12,926 in 2018, stood at 12,925 in 2019, decreased by 4.5% to 12,347 in 2020 but increased by 14.7% to 14,159 in 2021. As of May 31, 2022, 5,727 incidents of homicide have been reported, an increase of 2% compared to the same period to in 2021, which reported 5,641 incidents of homicide. Incidents of kidnapping decreased by 26.0% from 288 in 2014 to 213 in 2015, by 2.8% to 207 in 2016, by 5.8% to 195 in 2017, by 9.7% to 176 in 2018, by 7.4% to 163 in 2019, stood at 162 in 2020 and decreased by 15.4% to 137 in 2021. As of May 31, 2022, 44 incidents of kidnapping have been reported, a decrease of 20% compared to the same period in 2021, which reported 55 incidents of kidnapping. Incidents of terrorism decreased by 42.8% from 776 in 2014 to 444 in 2015, by 49.5% to 224 in 2016, by 44.2% to 125 in 2017, but increased by 20.8% to 151 in 2018, by 37.7% to 208 in 2019 and by 94.7% to 405 in 2020 and then decreased by 43.7% to 228 in 2021. As of May 31, 2022, 335 incidents of terrorism have been reported, an increase of 191% compared to the same period in 2021, which reported 115 incidents of terrorism. There can be no assurance, however, that the level of criminal activity will continue to be the same in the future. The Government has taken various steps to combat the activities of producing, processing and trafficking in narcotics and the violence and terrorism that have become associated with such activities since the mid-1980s. Among other measures, the Government has offered bounties for information leading to the capture of certain criminals, increased its spending on military and police forces and improved the effectiveness of the judicial system, in part through raising the salaries of, and providing greater personal security to, judges and prosecutors.
D-18
Colombia is also a party to the United Nations Convention Against Illicit Traffic in Narcotic Drugs and Psychotropic Substances. Other components of the Government’s anti-drug program include the following policies:
• | eradicating illicit crops; |
• | controlling the raw materials necessary to process coca; |
• | providing an alternative livelihood for small coca growers through subsidies and other means; |
• | destroying drug processing and distribution operations; and |
• | arresting, prosecuting and extraditing drug traffickers. |
On May 5, 2015, the National Council for Narcotic Drugs approved a suspension of fumigations due to the negative effects on public health. There was no fumigation undertaken since 2016. The Environmental Management Plan (“PMA”) of the Program for the Eradication of Illicit Crops by Aerial Fumigation with the Herbicide Glyphosate has been in force since 2001 for activities not related to fumigation. On April 14, 2021, the Government issued Resolution No. 694 of 2021, which modified the PMA by adding additional management measures and implementing a more detailed monitoring program for better control if fumigation is resumed. Furthermore, on April 12, 2021, the Government issued Decree No. 380 of 2021, which regulated the control of health and environmental risks within the aerial fumigation. On November 29, 2021 the Constitutional Court halted the government’s intention to resume fumigation with glyphosate and ordered that the Police, the ANLA and the Ministry of the Interior must carry out a process of prior consultation with the ethnic communities on the fumigation within a year and ordered the suspension of the environmental procedure for the modification of the Environmental Management Plan.
The eradication of illicit crops has continued via manual eradication, which increased from 17,642 hectares in 2016 to 52,001 hectares in 2017, 59,978 hectares in 2018, 94,606 hectares in 2019 and 130,000 hectares in 2020.
As of December 30, 2021, with the three forms of eradication of illicit crops carried out in the year: manual, ground spraying and that carried out by soldiers, 103,100 hectares were eradicated.
On November 3, 2017, Colombia and UNODC announced a new program to invest up to $315 million in an effort to reduce illicit crops and strengthen rural development.
According to the White House Office of National Drug Control Policy (ONDCP) report on July 14, 2022, the coca cultivation and cocaine production numbers decreased by 4.7% but remained high at 234,000 hectares and 972 metric tons, respectively. Colombia remains a close ally and partner with the United States in reducing and replacing coca cultivation and cocaine production. In 2021, the Colombian Government reported more than 103,000 hectares of manual eradication, 757 metric tons of cocaine and cocaine base seized, and more than 5,700 drug laboratories destroyed.
Law 793 of 2002 permits the Government to initiate judicial proceedings to acquire assets obtained through illicit means or used in the furtherance of illegal activities. In 1997, the Constitution was amended to permit extradition of Colombian citizens accused of criminal activity abroad. Although drug trafficking activities and acts of violence and terrorism continue to occur, in the recent past, the Government has been successful in largely dismantling the “Cali” and “Medellin” cartels.
Decree 472, enacted in 1996, created the Plan Nacional de Desarrollo Alternativo (National Plan of Alternate Development), which seeks to voluntarily remove peasants and indigenous communities from activities related to the cultivation of illicit drug crops, through the introduction of sustainable and competitive alternative livelihoods for them. The plan is currently established in 96 Colombian municipalities. In an effort to improve the plan’s results, the Government announced in 2003 a program called “Familias Guardabosques” with the aim of paying 51,000 peasant families Ps. 3.6 million per year to cease cultivating illicit drug crops and instead assist in the restoration of national forests. From 2003 to 2011, 122,991 families have been linked to the program. In this period, the Government has invested Ps. 1.1 billion in the program. During 2012, 2013 and 2014, the number of families added to the program was 14,874, 13,643 and 6,684, respectively. In 2015 and 2016, the number of families added to the program was 8,740. Families received economic incentives totaling Ps. 11.8 billion in 2012, Ps. 19.7 billion in 2013, Ps. 10.1 billion in 2014 and Ps. 10 billion in 2015. In 2015, the Agencia de Renovación del Territorio (“ART”) was
D-19
created with the objective of coordinating the construction and execution of development programs with a territorial approach contemplated in the peace agreements. The agency has the responsibility of structuring productive projects, infrastructure projects, economic reactivation programs, environmental and forestry protection projects in the regions that were affected by violence. The “Familias Guardabosques” program has since became part of these productive projects developed by ART.
In March 2019, ART and UNODC established a comprehensive intervention proposal to strengthen the competitiveness of 86 organizations of agricultural producers. As of May 2022, 99,097 families have been linked to the Integral National Program for the Substitution of Illicit Crops (Programa Nacional Integral de Sustitución de Cultivos Ilícitos) (“PNIS”), of which 82,242 are producers of illicit crops and farmers who do not produce illicit crops, but live in affected areas for drug trafficking, and 16,855 are coca leaf pickers.
Between August 2018 and April 2022, the Government invested in PNIS $421 million through “Colombia en Paz” Fund. The diagnosis of implementation was carried out and an action plan was developed for 56 municipalities. A total of 99,097 families had joined the program, of which 21,437 entered during then President Duque’s administration. During then President Duque’s administration, 19,752 hectares of illegal crops were eradicated voluntarily and assisted, with an investment of approximately $7.6 million. The aggregate amount of hectares eradicated during the term of the Program is 45,970.
The Government has implemented security measures to protect ex-combatants. As of April 30, 2022, a total of 1,480 collective reparation actions have been performed, of which 247 actions for ethnic group and 1,233 for non-ethnic groups, and a total of 601 victim relocation plans have been identified and were in place. As of April 30, 2022, 4,359 productive projects employing 8,983 ex-combatants have been approved, for which Ps. 86,824 million have been allocated. As of May 31, 2022, a total of 26,931 ex-combatants have successfully completed the reintegration process, of which 72% have had job training.
On November 24, 2020, the Government issued Decree No. 1543, which establishes the requirements for ex-combatants to have access to land to carry out productive projects and regulates the transfer of rural properties to those ex-combatants. On December 11, 2020, the National Reincorporation Council approved a health program benefitting ex-combatants in the process of reincorporation. As of May 31, 2022, 13,872 ex-combatants in the process of reincorporation were affiliated to healthcare programs.
The United States provides assistance to Colombia to support its efforts to combat illegal drug-related activities. In 2016, the United States provided Colombia with $239.9 million for military and police assistance programs and $133.2 million for economic and social assistance programs. In 2017, the United States provided Colombia with $260.6 million for military and police assistance programs and $191.1 million for economic and social assistance programs. In 2018, the United States provided Colombia with $204.0 million for military and police assistance programs and $105.0 million for economic and social assistance programs. In 2019, the United States committed to provide Colombia with $240.2 million for military and police assistance programs and $100.0 million for economic and social assistance programs. In 2020, the United States committed to provide Colombia with $244.4 million for military and police assistance programs and $210.1 million for economic assistance programs. In 2021, the United States committed to provide Colombia with $248.3 million for security assistance programs and $273.8 million for economic assistance programs Colombian government programs that have received U.S. aid include the Colombia National Police Project, the Colombia Military Project, the Narcotics Interdiction Project, the Alternative Development Program, the Democracy Project, the Vulnerable Groups Project, the Promotion of the Rule of Law Project and the Program of Development and Support.
United States assistance is conditioned upon the periodic determination as to the effectiveness of Colombia’s efforts. On September 15, 2005, pursuant to U.S. law requirements, President George W. Bush issued a presidential determination listing the 20 nations deemed to be major drug transit or major illicit drug-producing countries for fiscal year 2006. Although Colombia was included in the “major list,” President Bush determined that Colombia did not “fail demonstrably” during the previous 12 months to make substantial efforts to adhere to international counternarcotics agreements and take certain counternarcotics measures set forth in U.S. law. The White House Office of National Drug Control Policy and the Bureau for International Narcotics and Law Enforcement Affairs have highlighted the progress made by Colombia in fighting drug-crop cultivation and drug trafficking. As long as
D-20
the Annual Presidential Determinations for Major Illicit Drug Producing and Drug-Transit Countries is released by the U.S. Department of State, there will be an evaluation of whether Colombia is a member of the “major list”. As of September 14, 2015, Colombia remained on the “major list” for the United States’ fiscal year 2016, but is still considered certified by the President of the United States due to the substantial efforts of the Government to adhere to its obligations under international counternarcotics agreements. In the event of a future decertification of Colombia, unless the U.S. President waives the effects that a decertification would have under U.S. law, all United States assistance (other than certain counternarcotics and humanitarian assistance) to Colombia would be suspended and the United States would be obligated to vote against all loans and other assistance to Colombia by multilateral development banks. In addition, the United States could, but would not be obligated to, impose economic sanctions on Colombia, such as the withdrawal of certain trade preferences. The prior decertifications of Colombia in 1996, 1997 and 1998 did not have a material adverse effect on the country, but no assurance can be given that a future decertification would not have this effect. On August 3, 2005, the U.S. Department of State announced that Colombia had met the criteria related to human rights set forth by the United States, which certification has not been withdrawn. As of August 8, 2019, Colombia remained on the “major list” for the United States’ fiscal year 2020, but is still considered certified by the President of the United States due to the substantial efforts of the Government to adhere to its obligations under international counter narcotics agreements. As of September 16, 2020, Colombia remained on the “major list” for the United States’ fiscal year 2021. The Government has demonstrated commitment by targeting high-level drug traffickers, interdicting drug shipments and manually eradicating coca plants. In spite of the Government’s efforts, coca plant cultivation and cocaine production remain at high levels. In case of cocaine production, its high levels are caused in part due to the high international demand. As of September 15, 2021, Colombia remained on the “major list” for the United States’ fiscal year 2022 and the Biden administration announced that will seek to expand cooperation with key partners. Colombia aims to shape a collective and comprehensive response and expand efforts to address the production and trafficking of dangerous synthetic drugs, particularly fentanyl, fentanyl analogues, and methamphetamine. As of May 23, 2022, the U.S. Secretary of State designated to Colombia as a Major Non-NATO Ally of the United States for the purposes of the Act and the Arms Export Control Act. Colombia must resume aerial eradication to reach the goal to reduce coca cultivation and cocaine production by half by the end of 2023.
The Government anticipates that continued large expenditures on security and justice will be necessary over the medium term to fight narcotics-related crime. The Government has in the past funded a portion of its increased security and justice expenditures through special taxes imposed on certain sectors, such as the petroleum industry. No official studies have been published regarding, and private studies vary widely in their assessment of, the effect on the Colombian economy of narcotics trafficking and drug-related violence, including their effect on Colombia’s balance of payments, foreign investment flows and the allocation of productive activity. See “Foreign Trade and Balance of Payments—Foreign Investment.”
Unconventional Reservoir Projects
On February 28, 2020, the Government issued Decree No. 328 of 2020, establishing guidelines to perform advancements in pilot projects of integral research regarding unconventional reservoirs of hydrocarbons using the multistage hydraulic fracturing with horizontal drilling technique, among other provisions.
In December 2020, the National Hydrocarbon Agency (“ANH”) and Ecopetrol executed a contract to collaborate on the Comprehensive Research Pilot Project Kalé. On February 11, 2021, the Ministry of Mines and Energy, the Ministry of the Interior, the Ministry of Environment and Sustainable Development and the ANH held an initial meeting with the local authorities and citizens of Puerto Wilches, Santander, where Project Kalé will be carried out, to discuss local concerns with respect to the project.
After reports about threats made against environmental leaders in Puerto Wilches who opposed Project Kalé, the Ministry of Mines and Energy and Ecopetrol publicly announced their opposition to these threats and reiterated their emphasis on public dialogue about the project.
On June 4, 2021, the ANH and ExxonMobil Exploration Colombia Limited entered into the Comprehensive Research Platero Pilot Project to perform scientific research in the area of the project to analyze, among others, its capacity to produce hydrocarbons. This project is the second unconventional reservoir project awarded by the ANH and will be carried out in Puerto Wilches, Santander.
D-21
On June 11, 2021, the ANH approved the alliance of Ecopetrol and ExxonMobile to develop hydrocarbon research pilot projects Kalé and Platero in Puerto Wilches, Santander. Ecopetrol will be the operator of the pilots.
On, July 8, 2021, local and national authorities and social leaders of Puerto Wilches, Santander, presented to the public the Comprehensive Research Platero Pilot Project to socialize the scope, purposes and roadmap of the project and its several components, and the technical, environmental and social features that operating companies will need to comply.
On February 22, 2022, Ecopetrol held a virtual public meeting with respect to its Pilot Project Kalé. The meeting had originally been planned to be held in person, but had to be changed to a virtual meeting due to a group of people entering the meeting auditorium, kicking furniture and insulting those present.
On March 28, 2022, after evaluating the proposal for Project Kalé, including consideration of public input, an environmental impact study, and multiple field visits, the ANLA approved the commencement of Ecopetrol’s exploratory pilot project using hydraulic fracturing.
On April 21, 2022, a judge in Colombia suspended an environmental license granted to a hydraulic fracturing or fracking pilot project, on the grounds that Afrowilches, a local Afro-Colombian group, had not been properly consulted. Ecopetrol was given 48 hours to initiate the corresponding actions and was ordered to consult the communities to reactivate the operation.
On June 2, 2022, the Administrative Court of Santander repealed the sentence of the First Administrative Court of Barrancabermeja, which issued a suspension for the licensing of the fracking pilots Kalé and Platero, in Santander.
On August 10, 2022, the Government led by the Ministry of Mines and Energy, congressmen, socio-environmental organizations and the Colombia Alliance Fracking Free, among other representatives of civil society, filed the bill that will prohibit fracking in Colombia. The proposal would expressly prohibit the exploration and production of hydrocarbons from unconventional deposits as well as the subscription, addition or granting of contracts, concessions, licenses and environmental permits for these exploitations and fracking.
Corruption Investigations
On January 12, 2017, the Fiscalía General de la Nación initiated a corruption investigation into the activities of the Brazilian construction firm Odebrecht. While the investigation is still on going, at that time five people were convicted, including two former public officials.
On September 14, 2018, the Superintendencia de Industria y Comercio initiated a corruption investigation into Odebrecht’s actions in relation to the adjudication of the Ruta del Sol II highway concession.
On December 13, 2018, a local court disqualified Odebrecht from bidding and contracting with the Republic for a period of 10 years.
On August 6, 2019, an arbitral tribunal ruled in favor of the Colombian Infrastructure Agency (“ANI”) in a claim filed by CONSOL, a construction consortium in which Odebrecht owns a 62% stake. The arbitral tribunal decided that the ANI only needed to pay CONSOL Ps. 211 billion in construction costs and not the Ps. 2.3 trillion that were claimed to be due.
On May 22, 2019, the Attorney General announced the conviction of an individual, a businessman, for activities related to the Odebrecht case.
D-22
On November 14, 2019, the Superintendencia de Sociedades ordered the judicial liquidation of Constructora Norberto Odebrecht de Colombia S.A.S., due to, among other reasons, the company’s default on its financial obligations and the fact that its liabilities were 484% of its assets.
On February 22, 2021, the Colombian prosecutor’s office announced the indictment of 12 individuals for different alleged crimes related to corruption investigations into activities of Odebrecht.
On March 30, 2021, the Attorney General announced the indictment of three former officers of Odebrecht for alleged crimes related to several phases of the Ruta del Sol project. Furthermore, the prosecutor’s office will request international arrest warrants against those three Brazilian citizens.
On April 8, 2021, the Attorney General announced that two individuals, two businessmen, were convicted for several crimes related to the Odebrecht case.
On July 29, 2021, the Supreme Court of Justice convicted a former senator for his actions as a co-conspirator of crimes related to the Odebrecht case, including money laundering.
On March 25, 2022, the Attorney General announced that businessman Andrés Salazar Ferro was sentenced to four years in prison for the crime of illicit enrichment of individuals in connection with the Odebrecht investigation. Salazar acted on behalf of Grupo Mundial de Ingenieros S.A.S., part of the Ruta del Sol consortium, making payments to ensure that such consortium was awarded one of the Ruta del Sol II projects.
On June 22, 2022, the Attorney General charged Daniel Andrés García Arizabaleta with receiving payments from Odebrecht through another company by means of false contracts and false invoices.
Covid-19
On March 17, 2020, through Decree 417 of 2020, then President Duque declared a national Estado de Emergencia Económica, Social y Ecológica, or State of Emergency, for a period of 30 calendar days, in accordance with the provisions of article 215 of the Political Constitution of Colombia, to manage the coronavirus (COVID-19) pandemic. The state of emergency allows the Government to take extraordinary legislative measures necessary to handle the crisis. Decree 417 of 2020 provides for the adoption of measures including: the use of resources such as the Fondo de Ahorro y Estabilización (FAE) of the Sistema General de Regalías, the Fondo de Pensiones Territoriales (FONPET) and the new Fondo de Mitigación de Emergencias (FOME); the strengthening of the Fondo Nacional de Garantías (FNG) to maintain the availability of credit; the reduction of tax burdens on residents during the crisis; changes to the general budget and measures to render more flexible certain procedures to enable the Government to access the credit markets; isolation and social distancing; and the continuance of social assistance programs, among other measures adopted by the Government. On March 22, 2020, the Government issued Decree 457 of 2020, providing instructions regarding the sanitary emergency generated by the COVID-19 pandemic and the maintenance of public order, including, among others, the mandatory quarantine by 19 days of all the citizens within the Colombian territory and the exceptions for such measure. On May 6, 2020, the Government issued Decree 637 of 2020, declaring a new State of Emergency for a period of 30 calendar days, with the aim of continuing to attend to the crisis derived from the COVID-19 pandemic.
In the framework of the declaration of the States of Emergency, on March 18, 2020, March 22, 2020 and May 6, 2020, respectively, then President Duque announced social and economic measures aimed at helping the country through the COVID-19 pandemic, including: the provision of resources for the health system to manage the increased need for medical supplies; additional monetary transfers for beneficiaries of the Families in Action, Youth in Action and Colombia Mayor programs; reconnecting water service to the nearly 200,000 families for whom the service was suspended due to non-payment; accelerating the start of the VAT refund program for the most vulnerable population; allowing the request of temporary deferment of mortgage payments, credit card payments, and automobile payments; and offering guarantees through the FNG to facilitate the lines of credit of small and medium-sized companies; subsidizing a portion of minimum wages for certain companies experiencing losses of income; and extending the term for the payment of income tax.
D-23
The main economic measures taken to date during the COVID-19 emergency are described below:
2021 Budget
The 2021 budget was enacted by Law No. 2063 on November 28, 2020 and authorizes the Government to incorporate into the 2021 budget the uncommitted outstanding balances of 2020 that had been financed with resources from FOME. These resources have been appropriated to the public health sector, economic recovery and development and the promotion of job creation. On January 26, 2021, through Decree No. 85 of 2021, the Government supplemented the 2021 budget with an additional Ps. 18.5 trillion, and on September 14, 2021, through Law No. 2155 of 2021, the Government added an additional Ps. 11.0 trillion to the 2021 budget, of which Ps. 3.3 trillion were allocated to FOME.
• | 2022 Budget |
The 2022 budget was enacted by Law No. 2159 on November 12, 2021 and authorizes the Government to incorporate into the 2022 budget the uncommitted outstanding balances of 2021 that had been financed with resources from FOME. These resources have been appropriated to the public health sector.
• | Fondo de Mitigación de Emergencias (FOME) |
On March 21, 2020, the Government issued Decree 444 of 2020, which created the FOME, a fund through which resources will be channeled to the sectors affected by COVID-19, such as the health sector and social spending programs. FOME’s resources are estimated at Ps. 40.5 trillion and come from the following sources: (1) FAE, (2) FONPET, (3) Fondo de Riesgos Laborales (FRL), (4) funds collected from the solidarity tax, (5) mandatory investments by credit institutions in public debt securities, (6) allocations from the general budget, (7) financial returns generated from the administration of resources, and (8) other funds, as determined by the Government. On, April 15, 2020, the Government issued Decree 552 of 2020, which added resources to the FOME from Fondo de Riesgos Laborales (FRL) and other provisions were issued. On April 15, 2020, the Government issued Decrees 562 and 568 providing additional sources of funding for the FOME.
As of December 31, 2021, aggregate use of FOME funds in 2020 and 2021 totaled Ps. 43.9 trillion, which was distributed as follows: Ps. 16.1 trillion for the COVID-19 healthcare emergency, Ps. 17.4 trillion for care of vulnerable populations and Ps. 10.4 trillion for job protection and economic recovery.
• | Of the Ps. 16.1 trillion in FOME funds allocated for COVID-19 expenses, the Government specifically designated Ps. 14.8 trillion for (i) improving the quality of and access to health insurance, (ii) implementing a strategy of testing, tracking and isolation and (iii) the implementing the national COVID-19 vaccination plan. |
Solidarity tax for the public sector
On April 15, 2020, the Government issued Decree 568 of 2020, which created the solidarity tax. The solidarity tax was imposed on public officials who earned more than Ps. 10 million each month, who must pay the tax for six months to support Colombians experiencing reduced income or loss of employment. On August 5, 2020, the Constitutional Court declared the solidarity tax unenforceable. For this reason, the contributions received for this tax will be credited to the officials’ 2021 income tax returns.
• | Fondo Nacional de Garantías |
On March 28, 2020, the Government issued Decree 492 of 2020, which establishes measures to strengthen the FNG. The FNG is a fund consisting of Ps. 3.25 trillion through which the Government seeks to facilitate access to credit for micro-, small- and medium-sized companies, by granting guarantees for credit extended to these companies. The capitalization of the FNG comes from the Fondo Nacional para el Desarollo de la Infraestructura (FONDES) and from the surplus capital of entities with state ownership. As of March 31, 2021, FNG has guaranteed operations in an amount of approximately Ps. 21.0 trillion, of which Ps. 15.2 trillion was directed to the program Unidos por Colombia and Ps. 5.8 trillion to other programs. As of December 30, 2021, FNG had guaranteed operations in an amount of approximately Ps. 36.0 trillion, of which Ps. 25.1 trillion was directed to the program Unidos por Colombia and Ps. 10.8 trillion to other programs.
• | Programa de Apoyo al Empleo Formal (PAEF) |
D-24
On May 8, 2020, the Government issued Decree 639 of 2020, which creates the Programa de Apoyo al Empleo Formal (PAEF), through which the Government will make up to three monthly payments of 40% of the minimum wage, or, Ps. 351,000, per employee, to help companies pay the wages of their workers.
The Government, through the Ministry of Housing and the Ministry of Finance, announced a new measure to help the economy by boosting the construction sector, which has gradually resumed activities under strict public health safety protocols. The initiative consists of granting subsidies for the purchase of 200,000 housing units between 2020 and 2022, of which 100,000 will be designated as low-income housing and 100,000 will be for families of any income level, with certain pricing requirements.
According to a preliminary report from the Health Superintendency, the National Government allocated Ps. 5.1 trillion to the health sector during March 2020, corresponding to current income and budget advances that the National Government has made to the health sector through the Administradora de los Recursos del Sistema General de Seguridad Social en Salud (ADRES). These funds were used mainly to pay service providers. According to the preliminary report by Health Superintendency, the Health Promotion Agencies (EPS) allocated Ps. 1 trillion for investments, Ps. 1.3 billion for their current cash and paid a total of Ps. 4.1 trillion. Of the Ps. 4.1 trillion, 60% went to private or mixed institutional health service providers (IPS), 17% to public IPS and 23% went to other providers, including independent professionals, providers with a different corporate purpose, special patient transport, providers of supplies and medicine, as well as administrative expenses.
On August 14, 2020, the Government submitted a bill to Congress which proposes to extend PAEF through the end of 2020. On October 22, 2020, the Government announced that PAEF would continue until March 2021 to provide support to the labor market. On January 25, 2021, the Government submitted Bill No. 373 to the Congress proposing to extend PAEF until September 2021.During the second debate in the Senate, the proposal was modified to extend PAEF until December 2021. On September 14, 2021, Congress approved Law No. 2155 of 2021, the Ley de Inversión Social, under which the PAEF was extended until December 2021 for companies that had up to 50 employees on their payroll and natural persons that had two employees.
The Government, through Decree 789 of 2020, announced a temporary exclusion of VAT for specific products and services including (i) chemical raw materials for medicines for the duration of the public health emergency; (ii) restaurants and cafeterias, until December 31, 2020; (iii) imported vehicles, until December 31, 2021; and (iv) hotel and tourism services, until December 31, 2020. The temporary exclusion of VAT for hotel and tourism services was extended until December 31, 2021 by Law No. 2068 of 2020, and again until December 31, 2022, by the Ley de Inversión Social.
The Government announced on February 25, 2021, that the declaration of a health emergency will be extended until at least May 31, 2021. On May 26, 2021, through Resolution 738 of 2021, the Government announced the extension of the health emergency until August 31, 2021. On August 27, 2021, through Resolution No. 1315 of 2021, the Government announced the extension of the health emergency until November 30, 2021. On November 25, 2021, through Resolution No. 1913 of 2021, the Government announced the extension of the health emergency until February 28, 2022. On February 23, 2022, through Resolution No. 304 of 2022, the Government announced the extension of the health emergency until April 30, 2022. On April 25, 2022, the Government announced the extension of the health emergency until June 30, 2022. On June 21,2022, the Government announced that Declaration of Health Emergency ended on June 30, 2022.
Through Law 2073 of December 31, 2020, Colombia approved an increase in the country’s debt ceiling by the amount of $14.0 billion. This increase will give the Government sufficient flexibility in the budget and a prudent financing margin to face potential economic shocks.
D-25
On December 29, 2020, the Government issued Decree 1787 of 2020, which regulates the approval of emergency use of medicines used to diagnose, treat, and prevent COVID-19.
On January 29, 2021, the Government issued Decree 109 of 2021, which establishes the vaccination plan against COVID-19, which program consists of vaccinating the population in two phases and five stages, prioritizing at-risk groups and thus progressively reaching 37.8 million vaccinated individuals. In the first phase, the plan sought to reduce mortality and the incidence of serious cases from the virus, as well as protect health workers. The second phase aimed to reduce contagion and generate herd immunity. Vaccinations started on February 20, 2021. On July 17, 2021, the last stage of the vaccination program began. On November 24, 2021, the Government began a COVID-19 booster vaccine plan to apply a third dose of the COVID-19 vaccine to individuals who already received their initial doses. The booster vaccine plan consists of two phases and five stages, giving priority to at-risk groups in the population, and the final stage began on February 16, 2022. As of March 31, 2022, the Government had purchased 88.2 million doses of COVID-19 vaccines for 48.6 million people, of which 20.4 million doses were purchased through the multilateral Covax agreement and 67.8 million doses were purchased through bilateral mechanisms. The bilateral agreements include 16 million doses from Pfizer, 10.0 million doses from AstraZeneca, 20.8 million doses from Moderna, 9.0 million doses from Janssen, and 12.0 million doses from Sinovac.
On February 26, 2021, the Government issued Decree No. 206 of 2021, which imposes public health measures for the continued management of the COVID-19 pandemic, including requiring compliance with social distancing measures, directing municipalities with high COVID-19 infection rates to promulgate selective isolation measures and extending the prohibition on the operation of nightclubs. On March 23, 2021, the Government issued an External Circular ordering local governments to adopt additional measures to contain the spread of COVID-19, which has been increasing in some cities. The measures include curfews, restrictions on the sale of liquor, restrictions on the opening of public places based on intensive care unit occupancy, and prohibitions on public events involving crowds.
On April 13, 2021, the Minister of Health and Social Protection, Fernando Ruiz Gómez, ordered the implementation of additional public health measures, such as curfews, quarantine on certain days of the week, and recommending that employers allow employees to work from home, in the cities of Medellín, Bogotá, Barranquilla and in the department of Atlántico, due to high COVID-19 contagion levels and intensive care unit occupancy in those cities.
On April 19, 2021, the Government issued Resolution No. 507 of 2021, which establishes measures for the import, purchase and administration of vaccines against COVID-19 for the private sector and the entities with public participation regulated by private law.
On May 31, 2021, the Government issued Decree No. 580 of 2021, which imposes public health measures for the continued management of the COVID-19 pandemic, including the maintenance of public order, and the selective isolation with social responsible distancing measures is decreed and the safe economic reactivation. The economic reactivation measures included, among others, granting to the Ministry of Heal and Social Protection the faculties to determine the criteria and conditions to allow the development of economic, social and governmental activities and adopt general biosafety protocols, and determine that cities with UCI occupancy rates higher than 85% will not be able to open clubs and dancing places or to host public or private events involving crowds.
On February 28, 2022, the Government issued Decree No. 298 of 2022, which establishes conditions for the reopening of economic, social and government activities. The gradual reopening of activities will be subject to certain biosecurity protocols, such as operation of businesses below maximum capacity and social distancing. The progression of the reopening will partly depend on evolving health statistics, such as vaccination rate, infection rate and availability of ICU beds.
On April 25, 2022, the Government announced other measures towards normalization for municipalities with a 70% vaccination rate. These measures included lifting the requirements to i) use face masks indoors (from May 1, 2022), except in health centers, nursing homes, public transportation, and educational institutions; ii) present a vaccination card to enter large events, such as concerts, bars, nightclubs, restaurants and cinemas; and iii) use certain other biosafety protocols, including PRASS ((the “Programa de Pruebas, Rastreo y Aislamiento Selectivo Sostenible”), which is the Colombian implementation of the test, trace and isolate quarantine strategy), except for health services.
D-26
On April 27, 2022, the Minister of Health and Social Protection, Fernando Ruiz, announced the decision to eliminate, from May 15, 2022, the mandatory use of face masks in open and closed spaces in schools, colleges and universities.
As of August 16, 2022, a total of 87.7 million doses of COVID-19 vaccines have been administered in Colombia.
As of September 22, 2022, COVID-19 infections in Colombia totaled 3,217 active cases.
Other Domestic Initiatives
On January 13, 2016, the Government sold 100% of its ownership interests in the power generation company, Isagen (57.6% of its total outstanding shares). The winning bidder in the auction process was the Canadian investment fund Brookfield Asset Management. The total purchase price for the Government’s ownership interest was Ps. 6.5 trillion. The Government stated that the proceeds of the sale would be used to finance part of the 4G roadway infrastructure projects. To this end, the Government has approved the use of Ps. 1 trillion of the sale proceeds to capitalize the Financiera de Desarrollo Nacional (“FDN”) in order to support the financing of 4G road projects.
On June 21, 2016, the FDN issued a private offering of Ps. 2.5 trillion of its subordinated bonds to the National Treasury. The National Treasury purchased the bonds through its Special Account of the National Fund for Development and Infrastructure (Cuenta Especial FONDES) with proceeds from the sale of Isagen. The proceeds of the sale of the bonds issued by the FDN will be used to fund development projects. The amount received by the FDN as proceeds for the issuance is in addition to the Ps. 1 trillion of proceeds from the sale of Isagen previously authorized to capitalize the FDN.
On August 2, 2016, the Government implemented the “De Cero a Siempre” initiative which aims to promote healthy and safe development in children from birth until the age of six.
On July 24, 2017, then President Santos launched the “Development Plan with Territorial Approach” which seeks to implement a comprehensive rural reform in 170 of the municipalities that were most affected by the armed conflict in the country. This initiative involves the participation of around 250,000 people, and includes territorial entities, ethnic authorities, communities, social, communal and community organizations and the private sector.
On March 6, 2018, the Government enacted Decree 437 of 2018, which establishes a public policy aimed at promoting religious tolerance and fostering religious freedom.
On April 17, 2018, the Government enacted Decree 660 of 2018, which implements in part the peace agreement reached with the FARC by protecting isolated and vulnerable communities.
On October 18, 2018, the Government enacted Decree 935 of 2018, which implements and regulates the operation of the National Council of the Orange Economy (“Orange Council”) as an advisory and consultative body to the President of the Republic. The Orange Council’s aim is to formulate general policy guidelines and to promote investments in the cultural and creative industries such as architecture, audiovisual arts, digital services, fashion, graphic and industrial design, handcrafts, music and software (the “Orange Economy”).
On December 28, 2018, Law No. 1943 (the “Financing Law”) was signed by then President Duque. The Financing Law, which entered into force on January 1, 2019, aims to increase government revenues by approximately Ps. 7.5 trillion pesos. The Financing Law includes, among others, the following measures: (1) a new transactional tax on the sale of certain real estate; (2) a regular VAT for beer and for certain sugar drinks; (3) a 1% annual wealth tax on certain individuals for years 2019, 2020, and 2021; and (4) a tax on certain dividends at a rate of 7.5% or 15% depending on the nature of the recipient of the dividend. Further, the Financing Law strengthens the Dirección de Impuestos y Aduanas Nacionales de Colombia (“DIAN”); increases the Republic’s ability to collect fiscal revenues; promotes formal employment; incentivizes large-scale investments that create more than 250 new jobs; and promotes incentives for investments in sectors of the Orange Economy.
D-27
The 2018-2022 Plan includes programs aimed at promoting and developing the various sectors of the Orange Economy. Additionally, the 2018-2022 Plan includes programs for (i) improved digital and technological development; (ii) development of small and medium agricultural producers; (iii) fiscal incentives for entrepreneurship activities; (iv) efficient public spending and (v) social programs aimed at reducing poverty.
On October 16, 2019, Congress approved the Budget Law for the year 2020 with a total budget of Ps. 271.7 trillion and an increase in investment of Ps. 7.3 trillion.
On October 16, 2019, the Financing Law was declared unconstitutional by the Constitutional Court due to errors in the legislative approval process. The decision of the Constitutional Court was not retroactive. On October 22, 2019, the Government presented to Congress a tax reform bill aimed at replacing the Financing Law (the “Economic Growth Law”). On December 27, 2019, the President of the Republic signed the Economic Growth Law (Law No. 2010), after it was approved by Congress. The law seeks to continue promoting economic development and creates the basis for reducing inequality gaps in the country. The Economic Growth Law includes the same provisions from the Financing Law and in addition includes four measures that seek to benefit the most vulnerable in the population: (i) a VAT refund to the 20% poorest in the population; (ii) a gradual reduction in health contributions, from 12% to 4%, by retirees who receive a minimum pension salary; (iii) incentives for companies to hire young people; and (iv) three days a year without VAT. On November 24, 2019, then President Duque signed Law No. 2111, which created the “Grupo Bicentenario,” an independent legal entity linked to the Ministry of Finance. Grupo Bicentenario will serve as a financial holding entity overseeing the group of state entities that provide financial services, with the objective of expanding their portfolios, improving the quality of service, and protecting the savings and assets of Colombians.
On August 5, 2020, the Government submitted to Congress a bill aimed at improving investment and efficiencies in the use of funds obtained from the exploitation of natural resources. The bill seeks to promote the protection of the environment and promote science, technology and innovation.
On August 17, 2020, Colombia and the United States launched “Colombia Crece” aimed at strengthening the rule of law, fighting crime, investing in sustainable development and increasing access to basic utilities to vulnerable communities in Colombia. Under this program, the United States has pledged $84 million in aid.
On October 27, 2020, the Government announced that it introduced to Congress a bill titled “Integral Law for Transparency, Prevention and Fight Against Corruption” which intends to increase the Government’s means to confront corruption.
On December 12, 2020, the Board of Directors of the Banco de la República elected economist Leonardo Villar Gómez as the new governor of Banco de la República, effective January 4, 2021. Mr. Villar served as a Deputy Executive Director of the OECD at the IMF and will be replacing Dr. Juan José Echavarría, who did not seek re-election to a second four-year term. On February 3, 2021, then President Duque appointed Mauricio Villamizar and Bibiana Taboada, both economists, to replace Gerardo Hernandez and Ana Fernanda Maiguashca, respectively, as members of the board of directors of Banco de la República. On April 5, 2021, then President Duque appointed the economist Jaime Jaramillo Vallejo as a member of the board of directors of Banco de la República to replace Arturo Galindo.
On December 31, 2020, Law No. 2069 of 2020 was enacted into law. The law aims to foster and develop a culture of entrepreneurship.
On January 19, 2021, the Government submitted a constitutional amendment to Congress aimed at amending article 79 of the constitution. The amendment would prohibit mining activities in protected highlands and other protected regions. This amendment has been presented to Congress in response to requests from the civilian population.
D-28
On February 11, 2021, the CONPES approved CONPES No. 4023. This CONPES aims to reactivate and promote six main sectors of the economy through a Ps. 135 trillion investment plan. The main sectors are housing, infrastructure, healthcare, education, cultural activities and agriculture.
On April 8, 2021, the Government enacted Decree No. 371 of 2021, through which the expenditure austerity plan is created. This decree enacts austerity measures related to personnel hiring, overtime, vacations, tickets and per diem, official delegations, commissions abroad, events, security schemes and official vehicles, among others.
On April 15, 2021, the Government submitted a tax bill to Congress called the Sustainable Solidarity Law (Ley de Solidaridad Sostenible). The proposed bill included a set of measures that are intended to achieve higher equity and economic growth within a sustainable fiscal framework. To counteract the effects of the COVID-19 pandemic on fiscal accounts, the Central Government estimated that it should increase its primary balance and increase the collection of taxes to help maintain fiscal sustainability in the medium-term, by lowering public debt and leaving room to absorb possible adverse macroeconomic shocks. Furthermore, this project proposed to eliminate the withholding tax on the profits obtained from foreign capital portfolio investments in fixed income securities and also included certain economic incentives to reduce pollution, such as a modification of the carbon tax and a single-use plastics tax. The bill proposed changes to the fiscal rule’s parameters. On May 2, 2021, then President Duque announced withdrawal of the tax reform bill.
On July 10, 2021, the Government enacted Law No. 2099 of 2021 (the “Energy Transition Law”), through which the provisions for the energy transition, the energy market dynamic and the economic reactivation for the country, among other measures, were created. With the Energy Transition Law, the green and blue hydrogen projects will be able to obtain tax benefits. On July 15, 2021, the Government enacted Law No. 2101 of 2021, through which the weekly working day is reduced gradually, without decreasing the salary of the workers and establishing other provisions.
On July 20, 2021, CONPES Document No. 4037 was approved declaring as of strategic importance the financing of projects through the Regional Fund for Territorial Pacts (Regional Fondo por Pactos Territoriales) with Ps. 2.7 trillion for 142 strategic works. This document aims to reactivate regional economy in the agricultural, infrastructure, water, healthcare, education, energy and road sectors.
On July 20, 2021, the Government submitted to the Congress two bills with the purpose of improving the quality of the services provided by the National Police. One of the initiatives is a Statute for the Career and Professionalization which will create a new category that will be the organizational support to the police service. The other initiative is a Police Disciplinary Statute, which will seek to accelerate disciplinary investigations updating conducts regulating the use of force and setting forth the institutional obligation to regulate police tactics and procedures.
On July 20, 2021, the Government submitted a new fiscal bill to Congress called the Ley de Inversión Social. The proposed bill includes a set of measures intended to protect the most vulnerable population, reactivate economic activity and stabilize public finances. The proposal is a result of a consensus with different political and social actors, and seeks to collect Ps. 15.2 trillion per year. On September 7, 2021, the Congress approved the bill, and on September 14, 2021, then President Duque enacted the Ley de Inversión Social as Law No. 2155 of 2021.On July 27, 2021, Colombia adopted a sovereign green bonds framework (“Sovereign Green Bond Framework”) through resolution 1687 of July 2021, as part of its commitment to contribute to sustainable growth and development.
The Sovereign Green Bond Framework is aligned with the International Capital Market Associations’ Green Bond Principles (2021) and it establishes the principles that Colombia will follow for the use of proceeds, evaluation and selection process, management of proceeds and reporting to investors of the expenditures included in the National General Budget associated with the issuance of the green bonds.
On August, 20, 2021, then President Duque announced that Colombia joined the group of more than 15 countries that will temporarily receive Afghan citizens who worked with the U.S. government in Afghanistan, until their immigration paperwork is processed in the United States. The expenses associated to the Afghan citizens in Colombia will be covered by the U.S. government.
D-29
On December 22, 2021, then President Duque signed Law No. 2169 of 2021, which set forth Colombia’s path towards reducing emissions and compliance with COP26 and the Paris Agreement.
On January 25, 2022, then President Duque signed Law No. 2197 of 2022, known as the Security Law, which had previously been unanimously approved by Congress. The Security Law increases the resources available to authorities to promote internal security throughout the country, such as by regulating possession of firearms and other weapons and modifying the Penal Code to increase penalties for attacks on police officers and government officials.
On March 11, 2022, U.S. President Joe Biden designated Colombia as a strategic non-NATO ally of the U.S. While this designation does not provide security guarantees like those extended among NATO members, it does entail coordination with respect to military issues and military equipment and also with respect to key issues for the future of Colombia and the bilateral relationship, including economic development, education, rural development, security and defense, democracy, migration, climate change and COVID-19.
On April 11, 2022, then President of the Republic, Iván Duque at the New York Stock Exchange, launched the Colombia’s Green Taxonomy. Colombia is the first country in the Americas to publish a Green Taxonomy.
Colombia’s Green Taxonomy is a classification system for economic activities and assets that contribute to the achievement of the country’s environmental objectives and commitments. The Taxonomy incorporates a set of definitions aimed at supporting different actors in the public and private sector, such as bond issuers, investors, financial institutions, public entities, among others, in the identification and evaluation of investments that can meet environmental objectives and that can be considered green or environmentally sustainable in Colombia.
On April 20, 2022, the Minister of Finance and Public Credit, José Manuel Restrepo, and the Minister of Mines and Energy, Diego Mesa Puyo, presented the strategy to seek solutions in the short and long term to the current situation of the Fuel Price Stabilization Fund – FEPC-, which due to rising international oil prices and exchange rate levels, is accumulating high deficits. The strategy consists of: i) solutions that commit the Government to pay the largest amount of the deficit that has been accumulating; ii) a roadmap to avoid accumulation of deficits in the future that will be included in the 2022 Medium-Term Fiscal Framework, which is structural reform alternatives to the convergence mechanism; and iii) the elaboration of a draft decree that includes a new proposal for the price-setting methodology and a price convergence proposal, which will be arranged with the incoming government.
On April 25, 2022, the Autonomous Committee of the Fiscal Rule commented on the FEPC and announced that the FEPC deficit could reach an estimated COP 33.7 trillion by the end of 2022.
On June 9, 2022, the Ministry of Environment and Sustainable Development and regional and national authorities of the environmental sector signed the Blue Manifesto for Colombia 2030, a document that contains recommendations for the comprehensive management of the country’s seas in the future.
On June 13, 2022, the President, Iván Duque, signed the Agreement on privileges and exemptions with the Financial Fund for the Development of the River Plate Basin (FONPLATA), the Development Bank is a multilateral development bank with international legal status and unlimited duration.
On June 14, 2022, the Government announced that Colombia adheres to the Global Agreement on Trade and Gender, made up of Canada, Chile, Mexico and New Zealand, which aims to improve women’s access to international trade.
On July 8, 2022, the President, Iván Duque, and the director of the National Planning Department (DNP), Alejandra Botero Barco, presented the publication of the book Visión Colombia 2050. At the launch they explained that Vision Colombia 2050 is a proposed roadmap built from discussions with experts from the public and private sectors, civil society organizations, academia, unions and the general public. The document was structured under the metaphor of a tree in whose trunk spreads from four main bases: consolidate a path of human development so can live long lives, where there is equity and opportunities for all; transform Colombia into an environmental power; achieve a productive and sustainable economy; and an inclusive society with a strong social model and stronger institutions.
D-30
Tax Bill for Equality and Social Justice
On August 8, 2022, President Petro and his Government submitted to Congress a tax reform bill aimed at increasing Government revenue by approximately Ps. 25 trillion in 2023, or 1.72% of GDP (the “2022 Tax Reform”).
The 2022 Tax Reform aims to advance in two dimensions: i) to reduce the inequitable exemptions of individuals with the highest income and some companies, as well as closing paths for tax evasion and avoidance. ii)collect enough resources to finance the strengthening of the social protection system and fund programs aimed at reducing poverty. The new tax system would be progressive and increase equity, justice, simplicity and efficiency.
The 2022 Tax Reform has several objectives including: i) reduction of exemptions that have benefited individuals with higher incomes; ii) increased redistribution to the vulnerable population; iii) improvements in the efficiency of the use of natural resources, prioritizing stimuli targeted at strategic sectors in accordance with the government plan; iii) expansion of collection sources through measures to maximize environmental and health initiatives; and iv) measures to combat tax evasion and avoidance.
The 2022 Tax Reform seeks to levy higher taxes on people who earn more than Ps. 10 million monthly (about 2% of Colombia’s population). It would instate a permanent wealth tax, and charge a tax on dividend distribution of stock exchange listed companies. Individuals with assets of more than P. 3 billion will pay a rate that starts at 0.5%. Those with assets greater than Ps. 5 billion will pay 1%.
It is estimated that the 2022 Tax Reform would increase the Government budget by Ps. 11.53 trillion annually. The funds, raised by levying more charges on high-earning individuals and exports of coal and oil, will be directed toward an ambitious agenda of social programs including anti-hunger efforts, free public universities, and aid for elderly people without pensions.
The 2022 Tax Reform would impose a 10% tax on exports of coal, oil and gold on income earned when each commodity exceeds a certain price threshold. The threshold for oil would be $48 per barrel, while coal exports would see the duty levied when prices exceed $87 per ton. The threshold for gold shipments would be $400 per troy ounce. In addition, the payment of royalties by commodity companies would no longer be deductible from their income tax payments under the bill.
The 2022 Tax Reform includes taxes on carbon emissions and public health, that is, those that cover sugary drinks, highly-processed foods and single-use plastics. The carbon tax is levied on the equivalent carbon content of all fossil fuels, including petroleum derivatives and all types of fossil gas that are used for combustion.
The initiative also offers new tools to the DIAN to better control evasion in Colombia, which will be complemented with an additional advance in the modernization.
The estimated results of the 2022 Tax Reform by sectors for 2023 are: i) natural person income tax Ps. 8.1 trillion (0.56% of GDP), ii) corporative income tax Ps. 5.1 trillion (0.35% of GDP), iii) State subsoil use resources Ps. 7.0 trillion (0.48% of GDP), iv) healthy and environmental taxes Ps. 2.5 trillion (0.18% of GDP) and v) other measures Ps. 2.1 trillion (0.15% of GDP).
D-31
Judgment in the case concerning Alleged Violations of Sovereign Rights and Maritime Spaces in the Caribbean Sea
On April 21, 2022, the International Court of Justice delivered its judgment in the case concerning Alleged Violations of Sovereign Rights and Maritime Spaces in the Caribbean Sea (Nicaragua v. Colombia). In its Judgment, which is final, without appeal and binding on the Parties, the Court found that: i) the Republic of Colombia violated the Republic of Nicaragua’s sovereign rights and jurisdiction in this maritime zone by interfering with activities in the Republic of Nicaragua’s exclusive economic zone, and therefore must immediately cease this conduct; ii) the “integral contiguous zone” established by the Republic of Colombia by Presidential Decree 1946 of 9 September 2013, as amended by Decree 1119 of 17 June 2014, is not in conformity with customary international law and therefore, the Republic of Colombia must bring into conformity with customary international law the provisions of said Presidential Decrees; iii) the Republic of Nicaragua’s straight baselines established by Decree No. 33-2013 of 19 August 2013, as amended by Decree No. 17-2018 of 10 October 2018, is not in conformity with customary international law; and otherwise rejected all other submissions made by the Parties.
Foreign Affairs and International Organizations
Colombia has established diplomatic relations with 188 countries. Colombia is a member of the United Nations, the IMF and the International Bank for Reconstruction and Development (the “World Bank”). On a regional level, Colombia is a member of the Organization of American States (“OAS”), the Inter-American Development Bank (“IADB”), the Caribbean Development Bank, the Latin American Economic System, the Association of Caribbean States, the Economic Commission for Latin America, Unión de Naciones Suramericanas and the Caribbean, the Corporación Andina de Fomento, a multilateral development bank referred to as CAF, the Andean Parliament and the Andean Development Bank. Colombia is also a party to several trade and commodity agreements, including the Andean Community of Nations (formerly known as the Andean Pact), the Latin American Integration Association, the Union of Banana Exporting Countries, the International Sugar Association and the World Trade Organization. Colombia also has free trade agreements with the United States, Canada, Mexico, Chile, El Salvador, Guatemala, Honduras, Switzerland, Norway, Iceland, Liechtenstein, Venezuela, Peru, the European Union, South Korea, Costa Rica, Israel and Panama.
On May 30, 2013, the 34 member countries of the Organization for Economic Co-operation and Development (“OECD”) invited Colombia to initiate the accession process to the OECD. On September 19, 2013, the OECD approved a roadmap for Colombia’s accession, establishing the process and setting the terms for future membership. Colombia has committed to cooperate with OECD committees in areas such as investment; bribery in international commercial transactions; corporate governance; financial markets; insurance and private pensions; competition; taxes; environment; public governance; regulatory policy; regional development; statistics; economy; education; employment, labor and social affairs; health; trade; export credits; agriculture; science and technology; information technology and communications; among other areas.
On January 27, 2015, during a meeting in the Colombian embassy in Paris with then President Santos, the OECD Secretary General, Angel Gurría, delivered a document entitled “Colombia, political priorities for inclusive development”, aimed at promoting stronger, more inclusive and sustainable growth. The document includes recommendations on agricultural, environmental, information technology, communications, education and health matters. The former President confirmed that those recommendations will be included, to the extent possible, into the PDN. On May 25, 2018, the OECD invited Colombia to become a member of the organization. On January 8, 2019, then President Duque enacted law 1950, which ratified the adhesion of the Republic to the OECD. On April 28, 2020, the Republic officially became a member of the OECD.
On February 27, 2006, the United States and Colombia concluded negotiations on a free trade agreement that sought to eliminate tariffs and other barriers to goods and services and to expand trade between the two countries. The agreement was approved by the Colombian Congress in June 2007 and by the United States Congress on October 12, 2011. President Obama signed the agreement into law on October 21, 2011. An implementation phase in Colombia was intended to verify that the agreement is consistent with Colombia’s legal system. Thereafter, the two governments exchanged diplomatic notes at the Summit of the Americas in Cartagena, and the free trade agreement entered into force on May 15, 2012.
On November 25, 2008, the European Free Trade Association (“EFTA”) and Colombia concluded negotiations on a free trade agreement. The ratification of the agreement was done individually by each member country. The agreement was ratified in 2009 by Switzerland and Lichtenstein and in 2014 by Norway and Iceland.
On August 15, 2011, the free trade agreement between Colombia and Canada entered into force.
D-32
On June 6, 2012, Colombia, Chile, Mexico and Perú signed the framework agreement “Acuerdo de la Alianza del Pacífico” or the Pacific Alliance, and on February 10, 2014, the same countries signed framework protocols, which were approved in Colombia by Law 1721 of 2014 and Law 1746 of 2014, respectively. The Pacific Alliance is a regional integration mechanism, which has as its objective for member states to create attractive integrated markets and to provide greater international competitiveness.
On June 26, 2012, Colombia and Perú signed a free trade agreement with the European Union, which is currently in force.
On May 22, 2013, Colombia and Costa Rica signed a free trade agreement which increased Colombia’s commercial ties with the Central American nation. The agreement is currently in force.
On December 19, 2017, Colombian products, including automobiles, gained preferential trade tariffs access into the Mercosur market, the free trade association composed of Argentina, Brazil, Paraguay and Uruguay. This agreement, which became effective in July 2004, created a South American free trade area composed of 300 million inhabitants.
On May 31, 2018, Colombia joined the North Atlantic Treaty Organization (“NATO”) as a global partner.
On August 27, 2018, Colombia notified the Union of South American Nations (“UNASUR”), of its intent to withdraw from the international body.
On October 4, 2018, Law No. 1939 was enacted into law by then President Duque. Law 1939 implements the double taxation treaty signed on November 2, 2016, between the United Kingdom and the Republic. The main objective of the treaty is to prevent fiscal fraud.
On June 29, 2022, after completing the internal procedures, Colombia and the United Kingdom launched the Trade Agreement that they signed in May 2019, and which was approved through Law 2067 of 2020.
Humanitarian Crisis in Venezuela
On August 22, 2015, President Nicolás Maduro of Venezuela declared a state of emergency in certain parts of the border with Colombia and closed them due to alleged violence and smuggling. Certain Colombians who had been living in Venezuela in the areas affected by the state of emergency have been deported. On September 7, 2015, then President Santos signed Decree No. 1770 of 2015, which placed 40 municipalities in seven departments near the border in a state of economic, social and ecological emergency as a response to the border crisis. The decree provides the Government with the authority to act in several areas in order to relieve the effects of the border closing. On August 11, 2016, the governments of Venezuela and Colombia agreed to reopen the border in a gradual, orderly and controlled manner. This process began with the opening of five access points between the two countries: The Simón Bolívar and La Unión bridges, in Norte de Santander; the José Antonio Páez bridge, in Arauca; Paraguachón, in La Guajira and Puerto Carreño, in Vichada.
Beginning in 2017, Venezuela began to experience a severe political, economic and humanitarian crisis that has impacted the Andean Region and Colombia in particular. The Government estimates that as of December 31, 2018, 1.2 million Venezuelans were living in Colombia in search of work, housing and food security, an increase from 0.2 million in May of 2017.
On August 21, 2018, Foreign Affairs Minister, Carlos Holmes Trujillo, met with governors and representatives of Departments bordering Venezuela with the aim of addressing the refugee and humanitarian crisis in Venezuela. The Government plans to implement the following three strategies:
• | Local: Provide access to health, education, safety and housing to Venezuelan refugees; |
• | Regional: Jointly address the refugee crisis in coordination with other regional countries; and |
• | Multilateral: Request assistance from the OAS. |
D-33
On November 23, 2018, the Department of National Planning published CONPES 3950 (“CONPES 3950”), aimed at addressing the influx of Venezuelan migrants. The action plan aims to provide health care and education to Venezuelan migrants. The plan further provides for increased attention to children and the elderly. The provision of water, food and housing is also addressed. A total of Ps. 422.8 million have been directed for these purposes.
In its report of June 2019, (the “2019 Report”) the Comite Consultivo de la Regla Fiscal (the “Fiscal Rule Advisory Council”) recommended that the Government budget an additional deficit of 0.5%, 0.4%, 0.3%, 0.2% and 0.1% of GDP for 2019, 2020, 2021, 2022 and 2023, respectively, in order to address the influx of Venezuelan migrants. During the first eight months of 2019, Colombia received $96 million in foreign aid to address the Venezuelan migrant crisis.
On January 23, 2019, the Government of Colombia recognized and expressed its full support to the President of the National Assembly, Juan Guaidó, who was designated as interim president of the Bolivarian Republic of Venezuela. Additionally, the Government ratified the decision to continue to strongly support the recovery of democracy in Venezuela. Colombia is a member of the Lima Group, a group of 14 western hemisphere nations that has recognized the Guaidó administration and is proposing efforts to reinstall democracy in Venezuela.
According to the Director of Migración Colombia, as of May 21, 2020, there are 1,825,000 Venezuelans in Colombia, some of whom have demonstrated a desire to return to Venezuela. Around 62,000 Venezuelans have already returned to Venezuela through a humanitarian return process led by the Government with the cooperation of regional authorities, the Attorney General’s Office and the Ombudsman’s Office.
On May 26, 2020, the international donors conference in solidarity with Venezuelan refugees and migrants was held. Delegates from more than 60 countries, as well as from United Nations agencies, such as the Office of the United Nations High Commissioner for Refugees (UNHCR) and the International Organization for Migration (IOM), and financial institutions, participated in the online meeting and pledged a total of 2,544 million euros in contributions for the countries who received most of the Venezuelan refugees, including Colombia, to address their living conditions.
On March 1, 2021, through Decree No. 216 of 2021, the Temporary Protection Statute for Venezuelan migrants, which is valid for 10 years, was enacted. The Temporary Protection Statute, which will serve as a complementary mechanism to the international refugee protection regime, establishes a registry to identify Venezuelan migrants, provides them with a temporary protected status and allows them to obtain a resident visa.
On March 29, 2021, the Government declared a state of public calamity in the department of Arauca. The declaration was made in light of clashes between illegally armed groups on the border with Venezuela. The clashes prompted the displacement of approximately 5,737 persons.
On April 14, 2021, the Chancellor Claudia Blum sent to the United Nations Secretary General and to the President of the United Nations Security Council a communication in which Colombia reported the serious situation that exists at the border with Venezuela due to the support that the Venezuelan regime gives to armed terrorist groups, as well as the massive displacement of Venezuelan migrants to Colombia. In the communication, the Chancellor reiterates Colombia’s commitment to international humanitarian law and the provision of humanitarian assistance to Venezuelan migrants.
On June 2, 2021, Colombia reopened the border with Venezuela and began allowing border crossings according to a designated schedule. The border crossing schedule permits travelers to enter Colombia according to the final number of their identification document (allowing entry for travelers with identification numbers ending in an even number on even days and for those with identification numbers ending in an odd number, on odd days), and only during certain hours of the day. On October 5, 2021, the Colombian-Venezuelan border was reopened. The Colombian government announced that it expected the border reopening to be gradual and orderly.
D-34
On May 5, 2021, one year passed since the implementation of the Temporary Protection Statue, with more than 2.2 million of Venezuelan citizens registered, of them, more than 2.1 million have filled out the socioeconomic characterization survey, and about 52%, equivalent to more than 1.1 million have already been authorized with their Temporary Protection Permit – PPT.
Migration
Since July 2021, Colombia has received over 15,000 migrants from Haiti traveling to cross the Colombian border to Panamá. Due to the small number of boats available to transport the migrants across the Gulf of Urabá, a large number of migrants have been gathering in Necoclí, Colombia, causing a humanitarian crisis. On August 10, 2021, the Colombian government met with the Panamanian government to discuss cooperation between the two countries to prevent crime and guarantee migrants’ rights at the border.
President Gustavo Petro, announced that on September 26, 2022, the borders between Colombia and Venezuela are expected to reopen, resuming commercial flights and cargo transportation. Additionally, the Inter-Institutional Unit for the Reactivation of Relations with Venezuela (La Unidad Inter-institucional para la Reactivación de las Relaciones con Venezuela) was installed, with the purpose of coordinating the actions of national entities with a view to the reopening of the border in a progressive and articulated manner.
Hurricane Damage
During the first two weeks of November 2020, hurricanes Eta and Iota hit the archipelago of San Andrés, Providencia and Santa Catalina. On the island of Providencia, approximately 98% of the infrastructure suffered structural damage. Similarly, on the island of San Andrés, 1,400 homes, 60 commercial establishments and 100 accommodations were partially damaged, and 15 houses were totally destroyed. Further, Hurricane Eta caused flooding in the Department of Magdalena that affected 26,000 people. On November 20, 2020, the IDB approved a donation of $400,000 for the purchase of goods such as drinking water, food and other basic necessities. Additionally, at the IDB Assembly on March 16, 2021, the Executive Director of the IDB for Colombia and Peru, Sergio Díaz Granados, gave a donation of approximately $47,000 in the name of employees and friends of the IDB to finance projects related to the reconstruction of the archipelago of San Andrés and Providencia.
On December 14, 2020, the Government announced a plan to rebuild the islands after hurricanes Eta and Iota, called Plan 100. As of March 29, 2021, approximately Ps. 40,000 million had been allocated to address damages to the main road on the island of San Andrés. The Government expects to complete 95% of the reconstruction on the islands of San Andrés and Providencia by the end of 2021. As of June 19, 2021, more than 500 homes have been repaired, nearly 700 roofs have been installed and the construction of 136 new homes is progressing. As of December 11, 2021, after a year of the hurricane Iota, 630 households that were affected have their homes repaired; and another 460 families have new housing, which represents an advance of 61%. In addition, Duque announced the inauguration of the submarine communications cable that will improve the connectivity of the Archipelago and a new headquarters of the Hotel and Tourism SENA in San Andrés. The Government has allocated more than $939 billion in investment to strengthen the development and economic reactivation.
D-35
ECONOMY
Methodology
In 2018, DANE implemented an updated methodology based on 2015 constant pesos instead of 2005 constant pesos. The new methodology will reflect the economic activity of the Republic and provide useful information for policy and decision making. In developing the methodology, DANE followed the guidance and recommendations from the United Nations System of National Accounts, the OECD and the IMF.
Gross Domestic Product
Real GDP grew by 1.4% and 2.6% in 2017 and 2018, respectively, and, based on preliminary figures, by 3.2% in 2019, decreased by 7.0% in 2020 and grew by 10.7% in 2021. In the first quarter of 2022, the real GDP grew by 8.5% compared to the same period of 2021.
The following factors contributed to the significant growth in 2021:
• | higher public consumption at an annual rate of 10.3% compared to 2020, representing 17.2% of GDP, due to an increase in public expenses and social programs to promote economic recovery after COVID-19 pandemic; and |
• | higher private consumption at an annual rate of 14.8% compared to 2020, representing 73.8% of GDP, due to an increase in consumer spending and a recovery of the economy after the lockdowns and restrictions derived from the COVID-19 pandemic. |
The services sector has traditionally been the largest sector of the Colombian economy. In 2021, the services sector increased by 11.5% in real terms and represented approximately 60.2% of GDP. The manufacturing sector increased by 16.4% in real terms in 2021 and represented approximately 12.2% of GDP in 2021. Agriculture, livestock, fishing, forestry and hunting have also traditionally played an important role in the Colombian economy. Production in this sector increased by 3.1% in real terms in 2021, and the sector accounted for approximately 6.5% of GDP in 2021. Construction activity increased by 5.7% in real terms in 2021 and accounted for approximately 4.9% of GDP in 2021. Mining (including oil) increased by 0.2% in real terms in 2021 and represented approximately 4.2% of GDP in 2021. Electricity, gas and water increased by 5.1% in real terms in 2021 and represented approximately 3.0% of GDP in 2021.
According to preliminary data, in the first quarter of 2022 the manufacturing sector increased by 9.1% and represented approximately 12.3% of GDP in the first quarter of 2022, compared to 8.5% growth in the same period of 2021. Agriculture, livestock, fishing, forestry sector decreased by 2.4% in the first quarter of 2022 in comparison to the first quarter of 2021, and the sector accounted for approximately 5.9% of GDP in the first quarter of 2022. Construction activity increased by 4.4% in the first quarter of 2022, compared to a decrease of 6.6% in the same quarter of 2021 and accounted for approximately 4.7% of GDP in the first quarter of 2022. Mining (including oil) increased by 1.0% in real terms in the first quarter of 2022, compared to a decrease of 14.8% in the same period of 2021, and represented approximately 3.9% of GDP in the first quarter of 2022. Electricity, gas and water increased by 4.8% in real terms in the first quarter of 2022, compared to a decrease of 0.5% in the same period of 2021 and represented approximately 2.9% of GDP in the same period.
Gross fixed public investment, which represented 17.2% of 2021 GDP, registered a 10.3% increase in real terms in 2021. Gross fixed private investment, which represented 73.8% of GDP in 2021, registered a 14.8% increase in real terms in 2021, compared to a 5.0% decrease in 2020 due to COVID-19 negative impact in households. According to preliminary figures, gross fixed public investment represented 13.2% in the first quarter of 2022 and registered a growth of 8.2% in comparison to the same period of 2021. Gross fixed private investment, which represented 75.8% of GDP in the first quarter of 2022 and registered a 12.2% increase compared to the same period in 2021,
D-36
Impact of Oil Prices
The mining and quarrying sector (including oil) is a contributor to the Colombian economy and a principal source of exports. The mining and quarrying sector contracted 5.8% and 1.7% in real terms in 2017 and 2018, respectively. According to the preliminary figures, the mining and quarrying sector increased 2.0% in real terms in 2019, and contracted 15.6% in 2020 and increased 0.2% in 2021. In the first quarter of 2022 the mining and quarrying sector increased 1.0%, compared to a decrease of 14.8% in the same period of 2021. Oil and its derivatives accounted for 34.5% of total exports in 2017, 40.1% in 2018, 40.0% in 2019, 28.0% in 2020 and 33% in 2021.
D-37
The following tables set forth real GDP and demand as well as the composition and annual percentage growth rates of real GDP and demand for the five years ended December 31, 2021.
Real GDP
(In millions of constant 2015 pesos)
2017 | 2018 | 2019(1) | 2020(1) | 2021(1) | ||||||||||||||||
GDP | Ps. 832,656,000 | Ps. 854,008,000 | Ps. 881,224,000 | Ps. 819,114,000 | Ps. 906,571,000 | |||||||||||||||
Add: Imports of Goods and Services | 178,075,000 | 188,413,000 | 202,250,000 | 160,786,000 | 206,930,000 | |||||||||||||||
Less: Exports of Goods and Services | 128,902,000 | 129,730,000 | 133,731,000 | 103,373,000 | 118,699,000 | |||||||||||||||
Private Consumption | Ps. 571,235,000 | Ps. 589,723,000 | Ps. 613,728,000 | Ps. 583,229,000 | Ps. 669,348,000 | |||||||||||||||
Public Consumption | 125,783,000 | 135,030,000 | 142,152,000 | 141,280,000 | 155,871,000 | |||||||||||||||
Total Consumption | 696,973,000 | 724,648,000 | 755,756,000 | 724,348,000 | 825,010,000 | |||||||||||||||
Gross Fixed Investment(2) (3) | 184,828,000 | 187,608,000 | 193,147,000 | 153,548,000 | 172,304,000 |
Totals may differ due to rounding.
1: | Preliminary figures. |
2: | Investment is defined as gross fixed capital formation plus changes in inventory. |
3: | Information compiled from macroflows calculated by the General Directorate of Macroeconomic Policy – Ministry of Finance. |
Source: DANE.
2017 | 2018 | 2019(2) | 2020 | 2021 | 2017 | 2018 | 2019(2) | 2020(2) | 2021 | |||||||||||||||||||||||||||||||
GDP | 100.0 | % | 100.0 | % | 100.0 | % | 100.0 | % | 100.0 | % | 1.4 | % | 2.6 | % | 3.3 | % | (7.0 | )% | 10.7 | % | ||||||||||||||||||||
Add: Imports of Goods and Services | 21.4 | % | 22.1 | % | 23.0 | % | 19.6 | % | 22.8 | % | 1.0 | % | 5.8 | % | 7.3 | % | (20.5 | )% | 28.7 | % | ||||||||||||||||||||
Less: Exports of Goods and Services | 15.5 | % | 15.2 | % | 15.2 | % | 12.6 | % | 13.1 | % | 2.6 | % | 0.6 | % | 3.1 | % | (22.7 | )% | 14.8 | % | ||||||||||||||||||||
|
|
|
|
|
|
|
|
|
|
|
|
|
|
|
|
|
|
|
| |||||||||||||||||||||
Private Consumption | 68.6 | % | 69.1 | % | 69.6 | % | 71.2 | % | 73.8 | % | 2.1 | % | 3.2 | % | 4.1 | % | (5.0 | )% | 14.8 | % | ||||||||||||||||||||
Public Consumption | 15.1 | % | 15.8 | % | 16.1 | % | 17.2 | % | 17.2 | % | 3.6 | % | 7.4 | % | 5.3 | % | (0.6 | )% | 10.3 | % | ||||||||||||||||||||
|
|
|
|
|
|
|
|
|
|
|
|
|
|
|
|
|
|
|
| |||||||||||||||||||||
Total Consumption(5) | 83.7 | % | 84.9 | % | 85.8 | % | 88.4 | % | 91.0 | % | 2.3 | % | 4.0 | % | 4.3 | % | (4.2 | )% | 13.9 | % | ||||||||||||||||||||
Gross Fixed Investment(5) | 22.2 | % | 22.0 | % | 21.9 | % | 18.7 | % | 19.0 | % | (3.2 | )% | 1.5 | % | 3.0 | % | (20.5 | )% | 12.2 | % |
Totals may differ due to rounding.
1: | Calculated using constant 2015 pesos. |
2: | Preliminary figures. |
3: | Includes the purchase of goods made abroad by residents and excludes that of non-residents made in Colombia. |
4: | Information compiled from macroflows calculated by the General Directorate of Macroeconomic Policy – Ministry of Finance. |
D-38
5: | Investment is defined as gross fixed capital formation plus changes in inventory. Information compiled from macroflows calculated by the General Directorate of Macroeconomic Policy – Ministry of Finance. |
Source: DANE.
Principal Sectors of the Economy
The following table sets forth the composition of Colombia’s GDP by economic sector, in constant pesos and percentage terms, for the five years ended December 31, 2021.
Real GDP by Sector
(In millions of constant 2015 pesos)
2017 | % of Total | 2018 | % of Total | 2019(1) | % of Total | 2020(1) | % of Total | 2021(1) | % of Total | |||||||||||||||||||||||||||||||
Agriculture, Livestock, Fishing, Forestry and Hunting | ||||||||||||||||||||||||||||||||||||||||
Agriculture and Livestock | 47,418,000 | 5.9 | 48,341,000 | 5.9 | 49,069,000 | 5.7 | 49,038,000 | 5.9 | . 49,267,000 | 6.1 | ||||||||||||||||||||||||||||||
Fishing, Forestry and Hunting | 3,182,000 | 0.4 | 3,139,000 | 0.4 | 3,172,000 | 0.4 | 3,151,831 | 0.4 | 3,119,000 | 0.3 | ||||||||||||||||||||||||||||||
Total Agriculture | 52,198,000 | 6.3 | 53,030,000 | 6.3 | 54,471,000 | 6.1 | 55,579,000 | 6.4 | 57,280,000 | 6.5 | ||||||||||||||||||||||||||||||
Manufacturing | 101,135,000 | 12.4 | 102,627,00 | 12.1 | 103,863,000 | 11.8 | 93,679,000 | 11.3 | 109,005,000 | 12.2 | ||||||||||||||||||||||||||||||
Mining and quarrying | 43,592,000 | 5.3 | 42,868,000 | 5.0 | 43,693,000 | 5.1 | 36,882,000 | 4.9 | 36,946,000 | 4.2 | ||||||||||||||||||||||||||||||
Electricity, Gas and Water | 25,307,000 | 3.0 | 25,952,000 | 3.0 | 26,605,000 | 3.0 | 25,906,000 | 3.1 | 27,239,000 | 3.0 | ||||||||||||||||||||||||||||||
Construction | 58,907,000 | 7.0 | 58,156,000 | 6.7 | 55,893,000 | 6.5 | 40,923,000 | 5.3 | 43,254,000 | 4.9 | ||||||||||||||||||||||||||||||
Services | ||||||||||||||||||||||||||||||||||||||||
Transportation, Retail, Storage, Restaurants and Hotels | 141,652,000 | 17.0 | 145,438,000 | 17.2 | 150,890,000 | 17.0 | 130,234,000 | 17.4 | 157,401,000 | 17.0 | ||||||||||||||||||||||||||||||
Communications | 23,758,000 | 2.9 | 24,595,000 | 2.8 | 24,821,000 | 2.8 | 24,175,000 | 2.8 | 26,939,000 | 2.8 | ||||||||||||||||||||||||||||||
Financial Services | 37,651,000 | 4.4 | 39,057,000 | 4.5 | 41,505,000 | 4.7 | 42,441,000 | 4.7 | 43,898,000 | 4.9 | ||||||||||||||||||||||||||||||
Housing | 74,495,000 | 8.9 | 77,499,000 | 9.0 | 79,964,000 | 9.1 | 81,150,000 | 9.3 | 83,250,000 | 9.4 | ||||||||||||||||||||||||||||||
Professional, scientific and technical activities | 56,810,000 | 6.8 | 59,066,000 | 6.9 | 61,099,000 | 6.9 | 57,753,000 | 7.0 | 63,405,000 | 6.9 | ||||||||||||||||||||||||||||||
Public Administration and Defense, Social Health and Education, Domestic Services | 120,222,00 | 14.3 | 125,916,00 | 14.7 | 132,333,000 | 15.0 | 132,514,000 | 15.1 | 142,579,000 | 15.7 | ||||||||||||||||||||||||||||||
Recreation, Cultural, Sports and Other Services | 20,456,000 | 2.4 | 20,925,000 | 2.3 | 23,653,000 | 2.5 | 20,965,000 | 2.7 | 27,907,000 | 2.9 | ||||||||||||||||||||||||||||||
Total Services | 475,044,00 | 57.1 | 492,446,00 | 57.7 | 514,265,000 | 58.4 | 489,232,000 | 59.7 | 545,334,000 | 60.2 | ||||||||||||||||||||||||||||||
Plus: Duties and Tariffs on Imports | 75,773,000 | 9.1 | 78,088,000 | 9.1 | 81,489,000 | 9.2 | 76,382,000 | 9.3 | 86,761,000 | 9.4 | ||||||||||||||||||||||||||||||
Real GDP | 832,656,00 | 100 | 854,008,00 | 100 | 881,224,000 | 100 | 819,114,000 | 100 | 906,571,000 | 100 |
Totals may differ due to rounding.
1: | Preliminary figures. |
2: | Includes petroleum. |
Source: | DANE. |
D-39
The following table sets forth the annual change in Colombia’s real GDP by sector for the five years ended December 31, 2021.
Real GDP Growth by Sector(1)
2017 | 2018 | 2019(2) | 2020(2) | 2021(2) | ||||||||||||||||
Agriculture, Livestock, Fishing, Forestry and Hunting | ||||||||||||||||||||
Agriculture and Livestock | 2.5 | % | 1.9 | % | 1.5 | % | (0.1 | )% | 0.5 | % | ||||||||||
Fishing, Forestry and Hunting | (0.4 | )% | (1.4 | )% | 1.1 | % | (0.7 | )% | (1.0 | )% | ||||||||||
Total Agriculture | 5.6 | % | 1.6 | % | 2.7 | % | 2.0 | % | 3.1 | % | ||||||||||
Manufacturing | (1.8 | )% | 1.5 | % | 1.2 | % | (9.8 | )% | 16.4 | % | ||||||||||
Mining and Quarrying(3) | (5.8 | )% | (1.7 | )% | 1.9 | % | (15.6 | )% | 0.2 | % | ||||||||||
Electricity, Gas and Water | 2.9 | % | 2.5 | % | 2.5 | % | (2.6 | )% | 5.1 | % | ||||||||||
Construction | (2.0 | )% | (1.3 | )% | (3.9 | )% | (26.8 | )% | 5.7 | % | ||||||||||
Services | ||||||||||||||||||||
Transportation, Storage, Retail, Restaurants and Hotels | 1.9 | % | 2.7 | % | 3.7 | % | (13.7 | )% | 20.9 | % | ||||||||||
Communications | (0.2 | )% | 3.5 | % | 0.9 | % | (2.6 | )% | 11.4 | % | ||||||||||
Financial Services | 5.4 | % | 3.7 | % | 6.3 | % | 2.3 | % | 3.4 | % | ||||||||||
Housing | 3.1 | % | 4.0 | % | 3.2 | % | 1.5 | % | 2.5 | % | ||||||||||
Professional, scientific and technical activities | 1.5 | % | 4.0 | % | 3.4 | % | (5.5 | )% | 9.8 | % | ||||||||||
Public Administration and Defense, Social Health and Education, Domestic Services | 3.5 | % | 4.7 | % | 5.1 | % | 0.1 | % | 7.6 | % | ||||||||||
Recreation, Cultural, Sports and Other Services | 2.1 | % | 2.3 | % | 13.0 | % | (11.4 | )% | 33.1 | % | ||||||||||
Total Services | 2.6 | % | 3.7 | % | 4.4 | % | (4.9 | )% | 11.5 | % | ||||||||||
Plus: Duties and Tariffs on Imports | 1.1 | % | 3.1 | % | 4.4 | % | (6.3 | )% | 13.6 | % | ||||||||||
Real GDP | 1.4 | % | 2.6 | % | 3.2 | % | (7.0 | )% | 10.7 | % |
Totals may differ due to rounding.
1: | Calculated using constant 2015 pesos. |
2: | Preliminary figures. |
3: | Includes petroleum. |
Source: DANE.
Agriculture, Livestock, Fishing, Forestry and Hunting
Colombia’s tropical climate and range of altitudes are conducive to a wide variety of agriculture. Coffee, sugarcane, flowers, bananas, potatoes and plantains have traditionally been considered the most important products. In 2021, the combined sectors of agriculture (including coffee), livestock, fishing, forestry and hunting (the “total agriculture” sector) comprised, in the aggregate, 6.5% of total GDP. Total agriculture sector production increased by 3.1% in real terms in 2021, compared to a 2.0% increase in 2021. The non-agricultural and livestock sub-sector accounted for 0.3% of GDP in 2021, decreasing by 0.1% in 2021, compared to a decrease of 0.7% in 2020. In 2021, the agricultural sub-sector comprised 6.1% of GDP, increasing by 0.5% in real terms, compared to a decrease of 0.1% in 2020. According to preliminary data, the total agriculture sector production decreased by 2.4% in the first quarter of 2022, compared to an increase of 3.0% in the same period of 2021.
Coffee production (excluding coffee processing) represented 0.6% of GDP in 2021, a 4.8% decrease in real terms, compared to a decrease of 10.4% in 2020. The price of coffee exported by Colombia increased by 39.3% in 2021, reaching a historic record of Ps. 2,116,484 per 125 kgs in 2021, from Ps. 1.519,050 per 125 kgs in 2020. Coffee exports accounted for 7.0% of total merchandise exports in 2021, and the volume of coffee exports increased by 26% in 2021, compared to 2020.
D-40
The National Coffee Fund stabilizes domestic coffee prices. The fund is a trust account created by law for the primary purpose of stabilizing coffee growers’ income by reducing the volatility caused by international prices. The fund is managed by the National Coffee Growers’ Committee, which is comprised of representatives of coffee producers, the Minister of Finance, the Minister of Agriculture and Rural Development, the Minister of Commerce, Industry and Tourism and the Director of the National Planning Department. This committee, subject to a veto right by the Minister of Finance, periodically establishes an internal coffee price paid to local growers. To the extent that export prices, adjusted for transportation and insurance costs, exceed or fall below the established internal price for coffee, the National Coffee Fund accumulates a surplus or deficit. In 2017, the fund registered a fiscal surplus of Ps. 787 billion due to an increase in revenue, registering an increase of 102% compared to the surplus in 2016. In 2018, the fund registered a fiscal deficit of Ps. 148 billion due to an increase in costs. In 2019, the fund registered a fiscal deficit of Ps. 66 million. In 2020 the fund registered a fiscal deficit of Ps. 243 million. According to preliminary figures, in 2021, the fund had a deficit close to 0 and the forecast is that for 2022 the deficit will be of Ps. 185 million.
Banco Agrario (the successor to the liquidated Caja Agraria) made disbursements of Ps. 5.7 trillion in 2017, Ps. 5.7 trillion in 2018, Ps. 6.8 trillion in 2019, Ps. 6.7 trillion in 2020 and Ps. 7.4 trillion in 2021, with a total loan portfolio of Ps. 15.5 trillion as of December 2021, compared to a total loan portfolio of Ps. 14.9 trillion on December 31,2020, Ps. 13.9 trillion on December 31, 2019, Ps. 12.9 trillion on December 31, 2018, Ps. 12.9 trillion on December 31, 2017 and Ps. 13.1 trillion on December 31, 2016.
In 2016, disbursements of the Fondo para el Financiamiento del Sector Agropecuario (“Finagro”), totaled Ps. 10.4 trillion, an increase of 22.3% compared to 2015. In 2017, disbursements totaled Ps. 14.8 trillion, an increase of 52% compared to 2016. In 2018, disbursements totaled Ps. 15.3 trillion, an increase of 3.3% compared to 2017. In 2019, disbursements totaled Ps. 19.3 trillion, an increase of 26% compared to 2018. In 2020, disbursements totaled Ps. 30.9 trillion, an increase of 15% compared to 2019. In 2021, disbursements totaled Ps. 34.5 trillion, an increase of 12% compared to 2020.
Manufacturing
Manufacturing sector production increased by 16.4% in 2021 and accounted for 12.2% of GDP in 2021. The seven main categories within the manufacturing sector experienced a real growth in 2021. The categories that experienced the largest increase were textiles articles and furniture related articles, which increased by 40.6% and 25.8%, respectively.
The following table summarizes the composition of the manufacturing sector output and sets forth the rates of real growth for each sector for the periods indicated.
Composition and Real Growth of the Manufacturing Sector(1)
GDP % Manufacture | Real Growth | |||||||||||||||||||||||||||||||||||||||
2017 | 2018 | 2019(2) | 2020(2) | 2021(2) | 2017 | 2018 | 2019(2) | 2020(2) | 2021(2) | |||||||||||||||||||||||||||||||
Food products; Drinks and Tobacco | 3.4 | % | 3.4 | % | 3.3 | % | 3.3 | % | 3.4 | % | 0.2 | % | 2.4 | % | 2.8 | % | (3.9 | )% | 7.7 | % | ||||||||||||||||||||
Textiles Articles; Leathers; Footwear; Suitcases and Handbags | 1.3 | % | 1.3 | % | 1.2 | % | 1.1 | % | 1.2 | % | (2.8 | )% | (1.1 | )% | 0.7 | % | (24.3 | )% | 40.6 | % | ||||||||||||||||||||
Wood and Cork, except furniture; Paper, Cardboard and Printing Activities | 0.8 | % | 0.87 | % | 0.7 | % | 0.7 | % | 0.7 | % | (0.2 | )% | 0.4 | % | (0.6 | )% | (8.5 | )% | 15.2 | % |
D-41
GDP % Manufacture | Real Growth | |||||||||||||||||||||||||||||||||||||||
2017 | 2018 | 2019(2) | 2020(2) | 2021(2) | 2017 | 2018 | 2019(2) | 2020(2) | 2021(2) | |||||||||||||||||||||||||||||||
Petroleum Refining Products, Chemical, Pharmaceuticals, Medicinal Products | 4.5 | % | 4.4 | % | 4.3 | % | 4.2 | % | 4.4 | % | 0.1 | % | 1.1 | % | 0.4 | % | (9.8 | )% | 15.6 | % | ||||||||||||||||||||
Basic Metal Products, Machinery and Equipment and Other Machinery and Electric Equipment | 1.7 | % | 1.6 | % | 1.6 | % | 1.6 | % | 1.7 | % | (10.1 | )% | 2.2 | % | 1.9 | % | (10.8 | )% | 20.8 | % | ||||||||||||||||||||
Furniture and Related Products | 0.7 | % | 0.7 | % | 0.6 | % | 0.6 | % | 0.7 | % | (2.3 | )% | 2.9 | % | (0.5 | )% | (12.5 | )% | 25.8 | % | ||||||||||||||||||||
Total | 12.1 | % | 12.0 | % | 11.8 | % | 11.3 | % | 12.2 | % | (1.8 | )% | 1.5 | % | 1.2 | % | (9.8 | )% | 16.4 | % |
Totals may differ due to rounding.
1: | Calculated using constant 2015 pesos. |
2: | Preliminary figures. |
Source: DANE.
Mining and Quarrying
Colombia holds substantial reserves of petroleum, natural gas, coal, minerals, precious metals and precious and semi-precious stones, including nickel, gold, silver, platinum and emeralds. It is among the world’s leading exporters of emeralds, gold and coal. According to statistics compiled by DANE, the mining and quarrying sector as a whole (including the petroleum industry) accounted for approximately 4.2% of GDP in 2021, compared to 4.9% in 2020. Mining and quarrying sector production increased by 0.2% in 2021, compared to a decrease of 15.6% in 2020. According to preliminary data, the mining and quarrying sector increased by 1.0% in the first quarter of 2022, compared to a decrease of 14.8% in the same period of 2021, and accounted for 3.9% of GDP in the first quarter of 2022.
The government of President Petro has a sustainable approach towards renewable energy; therefore, the priority for the country will continue to be self-sufficient and independent in matters of natural gas, a source of energy essential to carrying out a safe, progressive, social and successful transition process.
The Republic owns all oil and gas reserves within the territory of Colombia. Until 1974, the Government entered into concession contracts which allowed private companies to exploit oil or gas fields for limited periods of time (usually 20 years). From 1974 to 2003, Ecopetrol, the Government-owned oil company, exploited these reserves either directly or in association with private companies.
On July 25, 2007, the Government announced a public offering of 20% of the shares of Ecopetrol. The newly issued shares, representing 10.1% of total shares, were offered from August 27, 2007 through September 25, 2007, to active employees, pension funds, cooperatives, mutual funds and Colombian citizens. On September 25, 2007, Ecopetrol received Ps. 5.7 trillion for all the offered shares. The proceeds from the sale were used to invest in exploration, exploitation of hydrocarbons, and modernization and development of biofuels. As of April 30, 2022, the Government owned 88.5% of Ecopetrol’s shares.
In October 2012, Ecopetrol transferred its direct interests in Ocensa, ODC, Oleoducto Bicentenario, ODL and Serviport to Cenit Transporte y Logística de Hidrocarburos S.A.S. (“Cenit”). On April 1, 2013, Ecopetrol transferred its hydrocarbon transport and logistics assets (crude oil and multiproduct pipelines and loading and unloading facilities) to Cenit, and Cenit started its operations as owner of the transportation and logistics infrastructure. On January 1, 2014, Ecopetrol transferred its port concessions and assets to Cenit.
D-42
On April 1, 2013, Ecopetrol entered into a number of contracts with Cenit in order to establish their operating relationship. Pursuant to transportation and service agreements, Cenit provides to Ecopetrol, for a term of 30 years, hydrocarbon and refined product transportation, storage, loading and unloading and logistics services through the transportation assets that were transferred to it as an in-kind capitalization. Ecopetrol also entered into an operation and maintenance agreement with Cenit pursuant to which Ecopetrol is in charge of the operation and maintenance of the transportation assets for a term of 15 years. In return, Cenit will pay Ecopetrol a variable monthly payment for the services rendered. The companies also entered into a project management agreement, pursuant to which Ecopetrol provides project management services on market terms to Cenit for a term of 15 years.
In December 2014, Ecopetrol received authorization from the Superintendency of Ports to merge its wholly-owned subsidiary EPI into Cenit. The merger was completed on December 19, 2014, adding Ps. 1 billion in assets to Cenit. As a result of the merger, Cenit is now a direct wholly-owned subsidiary of Ecopetrol.
Under Colombia’s royalty system, the national, departmental and municipal governments share a royalty on all crude oil and natural gas production. For most of Ecopetrol’s oil field exploration and exploitation contracts, the royalty is equal to 20% of the total value of the oil production from the field. Concession contracts, however, individually provide a royalty percentage which is unique to each contract. In 1999, a modification to the royalty system established a sliding royalty percentage linked to the level of production for oil fields discovered after July 29, 1999. Under the various contract arrangements discussed below between Ecopetrol and private companies, it is customary for Ecopetrol to calculate its own share of production after payment of the royalty. Law 756 of 2002 further modified the oil royalties system towards encouraging oil exploration in small- and medium-size fields. This law establishes variable royalties ranging from 8% for fields producing up to 5,000 barrels per day to 25% for fields producing in excess of 600,000 barrels per day. Legislative Act 40 of 2019 reformed the royalty system and established a new distribution allocation as follows: 37% for direct allocations; 28% for the Regional Development Fund and the Regional Compensation Fund; 8% for the Science, Technology and Innovation Fund; 10% for territorial pension savings; 14% for the Savings and Stabilization Fund; 1% for the Royalty Monitoring, Follow-up, Control and Evaluation System; 1% for the operation of the General Royalty System; 0.5% for the control of royalties from the exploitation of the deposits; and 0.5% for the municipalities of the Magdalena River and Canal del Dique. Of the total resources destined to the Regional Development and Regional Compensation Funds, 60% will go to the Regional Compensation Fund and 40% to the Regional Development Fund. Of the total resources destined for direct allocations, 80% will go to productive entities and 20% to river and seaports.
To address the country’s exploration and production needs, Colombia has modified the contractual regime governing the exploration, development and production of hydrocarbons on a number of occasions since its introduction in 1970. The exploration and production contracts entered into with Ecopetrol’s business partners set forth the production split, the length of the exploration and production terms, and royalty payments.
Ecopetrol conducts its exploration and production business through a variety of types of contractual arrangements with the Colombian government or with third parties. A general description of each type of contractual arrangement to which Ecopetrol was a party as of December 31, 2021 is set forth below.
Risk-Participation Contracts
Under these contracts, Ecopetrol assumes 20% of the exploration costs and risks at the beginning of the second year in exchange for a larger participation in the future production and equal representation on the executive committee of the joint venture. As of December 31, 2021, Ecopetrol had no risk participation contracts in effect.
Association Contracts – (previously known as DIPAs)
The purpose of this type of contract, created by Decree 2310 of 1974, is the exploration of the areas covered by the contract, and the exploitation of hydrocarbons found in that area. This type of contract, together with E&P contracts and Special Contracts (Casabe, La Cira and Teca-Cocorná fields) which are described below, are the most significant in terms of the company’s production and proved reserves.
D-43
Under association contracts, the exploratory risk is assumed entirely by Ecopetrol’s contractual partner, the associate. If there is a discovery and Ecopetrol agrees that the relevant field is commercially viable, Ecopetrol will participate in the field’s development. A joint account will be created, and Ecopetrol and the partner will participate in the expenses and investments in the proportions established in the corresponding contract. Ecopetrol will reimburse the direct exploratory expenses incurred by the contractual partner in the proportions established by the contract.
If Ecopetrol does not believe that the relevant field is commercially viable, the partner has the right to execute on its own all activities considered necessary for the field’s exploitation as a “sole risk operation,” and to be reimbursed for a defined percentage of all investments for such sole risk operation in accordance with the corresponding contract. Every association contract provides for an executive committee that makes all technical, financial and operational decisions if Ecopetrol has agreed that a field is economically viable. All major decisions of this committee must be made unanimously by the parties.
The maximum term of an association contract is 28 years. The first six years of the contract are for the exploratory phase, and are extendible for 1 or 2 more years at the partner’s request. The remaining time is for the exploitation phase. As of December 31, 2020, Ecopetrol had 37 association contracts in effect.
Incremental Production Contracts – (previously known as SIPAs)
Ecopetrol enters into incremental production contracts to obtain additional hydrocarbon production beyond a base production curve that is established based on the proven reserves of a specific field or well. Under this type of arrangement, Ecopetrol owns 100% of the hydrocarbons defined by the base production curve. The incremental production (i.e., the hydrocarbon volume obtained beyond the basic production as a result of investment activities), will be owned by the parties to such incremental production contract in the proportions established by such contract.
The initial phase of an incremental production contract has a term of up to 3 years, in which the contractual partner executes an initial work program approved by Ecopetrol in order to gain the right (but not the obligation) to continue with the second phase. If Ecopetrol’s partner decides to continue with the project for the second phase (the complementary phase), it must inform Ecopetrol in writing no later than 90 days prior to the termination date of the initial phase and deliver a proposed development plan for each covered field.
The second phase is the production phase and has a maximum term of 22 years minus the length of the initial phase. Incremental production contracts provide for an executive committee that is responsible for taking all decisions in order to approve, control and supervise all operations that take place during the duration of the contract. These contracts also provide for a steering committee, which is responsible for the supervision of the execution of the work programs, the annual budget and other items.
Shared-Risk Production Contracts
Under these contracts, Ecopetrol remains as operator of the field and assumes responsibility for 50% of all investments and costs. Private companies submit bids to enter into agreements with Ecopetrol based upon the production percentage they will assign to Ecopetrol. The successful bidder has the right to enter into the shared risk contract with Ecopetrol. As of December 31, 2021, Ecopetrol had one shared risk production contract in effect.
Risk Service Production Contracts
Ecopetrol began using risk service production contracts in January 1998 to increase production through the use of new technologies in crude oil fields then operated by Ecopetrol’s partners. All investments in new technologies were made by its partners who received a previously specified fee per barrel. As of December 31, 2021, Ecopetrol had no risk service contracts outstanding.
D-44
Discovered Undeveloped Fields Contracts
Ecopetrol has entered into discovered undeveloped fields contracts to promote exploration by private companies of both undeveloped and inactive fields. Under these contracts, the contracting party assumes all costs and expenses for the development and operation of a field in exchange for a certain amount of production. As of December 31, 2021, Ecopetrol did not have any discovered undeveloped fields contracts in effect.
Ecopetrol invested approximately Ps. 156.9 billion in technological improvements in 2020. Among these improvements are: viability of water production as a profitable resource; study if new technologies for the increase of recovery factor the study of advanced materials from asphaltenes and their potentials applications; the appropriation study of technologies for the energy transition; and investment for continuity operation, purchase and replacement of equipment laboratory and pilot plant 2021-2022. Each year, Ecopetrol presents to the National Council of Tax Benefits (Consejo Nacional de Beneficios Tributarios, or CNBT) its research, technology development projects and innovation initiatives, in order to obtain certifications for its science and technology investments. The CNBT certifies eligible science and technology investments, which are deductible from income tax upon execution and Ecopetrol is eligible for such tax benefit. The intangible assets of Ecopetrol are preserved through a technological value-generation process and an intellectual property protection process, which include the consolidation of trade secrets, patents, copyrights, trademarks, industrial designs, and publications in specialized journals. Ecopetrol has filed more than 260 patent applications in the last 15 years, 24 of them in 2021. Ecopetrol currently holds 114 patents in Colombia, the United States, Mexico, Argentina, Peru, Venezuela, Ecuador, Brazil, Russia, Nigeria, Indonesia, India, and Malaysia.
Current Joint Venture Contractual Regime
In 2004, the Government granted authority to the National Hydrocarbon Agency (“ANH”) to enter into exploration and production contracts under a different exploration and production contractual arrangement. Ecopetrol became an operator like any other company, competing with all other regional and international oil companies in Colombia for exploration and production opportunities under the same conditions and without any special rights. Decree Law 1760 of 2003 gave Ecopetrol the right to maintain in effect all contracts that the company had entered into prior to January 1, 2004, as well as to have absolute discretion as to whether or not such contracts would be extended after their stated termination dates. If Ecopetrol decided not to extend the contracts, the production rights and assets related to the relevant block would revert to Ecopetrol, and Ecopetrol would have the right, at no additional cost, to exploit the associated reserves indefinitely. Contracts entered into by Ecopetrol after January 1, 2004 that are not extended by ANH would revert to ANH and not to Ecopetrol.
In 2004, ANH introduced two new model contracts to replace the previously used joint venture contracts: the exploration and production contract and the technical evaluation agreement.
Exploration and Production Contracts. Under exploration and production contracts, the contractor, including Ecopetrol, undertakes all exploration and production activities. The contractor also assumes all risks and costs of exploration and is the sole owner of all production and assets involved in the exploration and production activities for the term of the contract. There is no partnership or joint venture between the contractor and ANH.
Technical Evaluation Agreements. The scope of the technical evaluation agreements is limited to exploration activities. Under this type of agreement, the contractor can evaluate a specific area and decide whether or not it will enter into an exploration and production contract. The contractor assumes all risks and costs of the activities and operations.
Ecopetrol entered into several agreements or “Convenios” with ANH in areas directly operated by Ecopetrol, where Ecopetrol holds total exploration and production rights up to the point when revenue from the well falls below the costs of operations set by the company (the “economic limit”).
When the joint venture contracts agreed before December 31, 2003 expire, Ecopetrol is required to enter into agreements with ANH pursuant to Article 2 of Decree 2288 of 2004. The purpose of these agreements is to define the terms and conditions under which Ecopetrol can exercise its exclusive right of exploration and production of hydrocarbons—granted by Decree Law 1760 of 2003—in the agreement area until the economic limit of the area covered by the contract has been reached.
D-45
Ecopetrol has entered into a number of exploration and production contracts with regional and international oil companies.
Between 2013 and 2016, Ecopetrol issued bonds in the international capital markets in an aggregate principal amount of $7.7 billion for general corporate purposes, including capital expenditures. No bonds were issued between 2017 and 2019. In April 2020, Ecopetrol issued $2.0 billion for general corporate purposes, including capital expenditures.
As of December 31, 2021, Colombia’s proven crude oil reserves totaled approximately 2,039 million barrels and Colombia’s proven gas reserves totaled an estimated 2.5 trillion cubic feet. The following table sets forth Colombia’s proven crude oil and natural gas reserves at the dates indicated.
Proven Reserves of Colombia(1)
2017 | 2018 | 2019 | 2020 | 2021 | ||||||||||||||||
Crude Oil (millions of barrels) | 1,782 | 1,958 | 2,041 | 1,816 | 2,039 | |||||||||||||||
Natural Gas (trillions of cubic feet)(2) | 3.9 | 3.8 | 3.2 | 2.6 | 2.5 |
1: | “Proven reserves” are defined as the estimated quantities of crude oil and natural gas which geological and engineering data demonstrate with reasonable certainty to be recoverable in future years from known reservoirs. In the case of reserves to which Ecopetrol has the sole right of development, Ecopetrol estimates proven reserves in accordance with the methodology promulgated by the Society of Petroleum Engineers. While this methodology permits such estimates to be based on assumptions regarding future economic and operating conditions (including prices and costs), Ecopetrol includes as proven reserves only those reserves that, at the date of estimation, are recoverable under existing economic and operating conditions. Ecopetrol estimates its share of reserves that are to be developed pursuant to joint venture contracts using the same methodology as employed in the calculation of direct reserves, based on seismic, geological and other technical data supplied by the respective operators and reviewed by Ecopetrol’s petroleum engineers. |
2: | Corresponds to gas with concrete commercial viability. |
Source: ANH
Colombia’s proven energy reserves in 2021 included approximately 564 million tons of coal, 2,039 million barrels of crude oil and 2.5 trillion cubic feet of natural gas, including natural gas with concrete commercial viability and natural gas that can be used for oil extraction purposes.
Beginning in 2002, exploration activity has generally increased as a result of higher investments in operations by Ecopetrol, as well as reforms to the standard terms of exploration and production contracts (as discussed above) that have attracted investors, but in 2012 total seismic exploration decreased to 18,205 kilometers. In 2016, total seismic exploration increased to 39,766 kilometers. In 2017, total seismic exploration decreased to 1,588.8 kilometers. The drilling of exploration oil wells generally increased from 2009 to 2012 but decreased slightly in 2013 and 2014. In 2015, the number of oil wells drilled decreased to 25. In 2016, the number of oil wells drilled decreased to 21. In 2018, the number of oil wells drilled increased to 48. In 2019, the number of oil wells drilled decreased to 7. In 2020, the number of wells drilled increased to 16. In 2021, the number of wells drilled by Ecopetrol decreased to 15.
Production of crude oil in Colombia decreased from an average of 760 thousand barrels per day in December 2020 to 745 thousand barrels per day in December 2021. Ecopetrol’s group production accounted for approximately 527.1 thousand barrels per day or 72% of the total crude oil production of Colombia in 2021.
D-46
Of the 736,000 barrels of crude oil produced per day in 2021, approximately 19% were exported. Ecopetrol was responsible for exporting 18.6% of the total crude oil produced by Colombia in 2021, compared to 19.6% in 2020. The value of Colombia’s exports of crude oil and derivatives in 2021 totaled approximately $13.5 billion, a 54% increase, compared to $8.8 billion in 2020. The increase was due to an increase in the demand of energy caused by the reactivation of the economy. The average export price of crude oil in 2021 for Ecopetrol was $66.8 in 2021 compared to $34.4 per barrel in 2020, $58.7 per barrel in 2019, $63.2 per barrel in 2018 and $47.8 per barrel in 2017. Ecopetrol’s average daily volume of exports of crude oil in 2021 was estimated at 485.9 thousand barrels per day in 2021 compared to 418.5 thousand barrels per day in 2020. Since 1995, the Government has used a stabilization fund through which revenues from the Cusiana production are invested abroad in order to avoid the inflationary effects associated with large inflows of oil revenues into the country. For further details on the stabilization fund, see “Public Sector Finance—General” below.
In connection with its core activities of exploration and production of oil and gas, Ecopetrol has developed a network of pipelines used to transport crude oil, natural gas and oil products to domestic refineries, major distribution points and export facilities. The pipelines, some of which are wholly-owned by Ecopetrol while others are owned jointly with joint venture partners or other companies, transport oil and gas owned by Ecopetrol, joint venture partners and concession operators. The 836-kilometer OCENSA pipeline, a joint venture among Ecopetrol, joint venture partners and other companies, was completed in February 1998. The pipeline transports crude oil from the Cusiana and Cupiagua and other nearby fields to the port of Coveñas. The pipeline maintained an average output of approximately 745 thousand barrels per day during 2017, 72.7% of which is owned by Ecopetrol. A subsidiary of Ecopetrol, Oleoducto Bicentenario, is in the second phase of construction of the Araguaney-Coveñas pipeline, which is expected to be the longest of its kind in Colombia. The first phase of the construction permits the transportation of at least 110 thousand barrels per day, with a pipeline of 230 kilometers in length and a diameter of 42 inches, connecting Araguaney to Banadía. The first phase of the contract was completed in March 2014.
The Government, with private sector participation, intends to substantially expand the natural gas pipeline network and the related infrastructure over the next several years. In 2014, the average daily production of natural gas by Ecopetrol reached 121 thousand barrels of oil equivalent per day (“boepd”), a 3% reduction when compared with 2014. On June 30, 2015, there was a suspension of natural gas exports due to termination of the sales contract to Venezuela, which has not since resumed. Colombia has three main natural gas production fields, Guajira, Cusiana and Cupiagua. The majority of Colombia’s natural gas is produced by joint ventures. In the Guajira field, Ecopetrol has partnered with Chevron. In the development of the Cusiana field, Ecopetrol’s partners are Equión and Sinochem Petroleum Exploration and Production. Ecopetrol directly operates the Cupiagua field, including the Cupiagua gas plant, which is connected with the Cusiana field through the Cupiagua-Cusiana gas pipeline. Of Colombia’s total natural gas production as of December 31, 2021, 12.6% was supplied from the Guajira field, 26.6% from the Cusiana field, 47.7% from the Cupiagua field and the remaining 30% from fields located in other regions.
The Tauramena joint venture expired on July 3, 2016. The Tauramena block is part of the Cusiana unified exploitation plan wherein as a consequence of the termination of the Tauramena joint venture Ecopetrol’s participation increased from 63.4% to 97.8%. Ecopetrol assumed the operation of the Cusiana unified exploitation plan upon the termination of the Tauramena joint venture.
In 2020, Ecopetrol’s gross gas production increased by 6.6% to 142.3 thousand boepd from 133.5 thousand boepd in 2019, primarily due to the rise in the production in the Cupiagua and Floreña field. In 2009, Ecopetrol continued its investments directed at increasing gas supply by investing in gas treatment plants and the Cusiana Liquefied Petroleum Gas (LPG) plant. In November 2005, Colombia and Venezuela entered into an agreement to build a two-way gas pipeline between the two countries. Under the agreement, the pipeline was to send 450 million cubic feet of natural gas per day from Colombia’s La Guajira region to Venezuela’s Paraguana peninsula during the first four years of service. At the end of that period, the pipeline’s flow was to be reversed with Venezuela supplying 150 million cubic feet of gas per day to Colombia from 2012 to 2028. The construction of the pipeline began on July 8, 2006 and was inaugurated on October 12, 2007. As of December 31, 2020, Ecopetrol’s main pipelines include Caño Limón-Coveñas, Oleoducto de Alto Magdalena (OAM) and Oleoducto de Colombia (ODC).
In 2015, eight new pilot projects were initiated with the aim of increasing the recovery factor through water injection and chemical injection, meeting the pilot projects goal that was originally set for the year. These pilot projects were developed in the following fields: Provincia, Tisquirama, Llanito, Chichimene, Castilla, Suria and Caracara. In 2016, Ecopetrol prioritized opportunities within its recovery factor increase program, keeping 18 active pilot projects in operation and developing an additional project. From the current pilot projects, 12 have resulted in an increase in production. Among these were pilot projects in the Castilla and Chichimene fields.
D-47
Construction
In 2017 and 2018, the construction sector contracted by 2.0% and 1.3%, respectively. In 2019, the construction sector decreased by 3.9%, and contracted by 26.8% in 2020 mainly due to the impact of COVID-19 pandemic, lockdowns, quarantines and other mobility restrictions imposed by the Government to contain its spread. In 2021, the construction sector increased by 5.7%. According to preliminary figures, in the first quarter of 2022, the construction sector grew 4.4% in comparison to the same period of 2021.
Services
The services sector accounted for 60.2% of GDP in 2021. Activity in the services sector grew by 11.5% in real terms in 2021, following growth of 2.6%, 3.7%, 4.4% and a decrease of 4.9% in 2017, 2018, 2019 and 2020 respectively. The following table shows the composition of the services sector for the years indicated.
D-48
Composition of Services Sector
2017(1) | 2018(1) | 2019(1) | 2020 | 2021 | ||||||||||||||||
Transportation, Retail, Restaurants and Hotels | 29.8 | % | 29.5 | % | 29.3 | % | 26.6 | % | 28.9 | % | ||||||||||
Storage and Communications | 5.0 | % | 5.0 | % | 4.8 | % | 4.9 | % | 4.9 | % | ||||||||||
Financial Services | 7.9 | % | 7.9 | % | 8.1 | % | 8.7 | % | 8.0 | % | ||||||||||
Housing | 15.7 | % | 15.7 | % | 15.6 | % | 16.6 | % | 15.3 | % | ||||||||||
Professional, scientific and technical activities | 12.0 | % | 12.0 | % | 11.9 | % | 11.8 | % | 11.6 | % | ||||||||||
Public Administration and Defense, Social Health and Education, Domestic Services | 25.3 | % | 25.6 | % | 25.7 | % | 27.1 | % | 26.1 | % | ||||||||||
Recreation, Cultural, Sports and Other Services | 4.3 | % | 4.2 | % | 4.6 | % | 4.3 | % | 5.1 | % | ||||||||||
|
|
|
|
|
|
|
|
|
| |||||||||||
Total | 100.0 | % | 100.0 | % | 100.0 | % | 100.0 | % | 100.0 | % | ||||||||||
|
|
|
|
|
|
|
|
|
|
Totals may differ due to rounding.
1: | Preliminary figures. |
Source: DANE.
The transportation, restaurants and hotels sub-sector grew 20.9% in real terms in 2021, compared to a contraction of 13.7% in 2020, and accounted for 8.2% of GDP in 2021. According to preliminary figures, in the first quarter of 2022 the transportation, restaurants and hotels sub-sector grew 19.0%, compared to a decrease of 11% in the same period of 2021. The financial services sub-sector grew by 3.4% in real terms in 2021, compared to a growth of 2.3% in 2020, and accounted for 4.9% of GDP in 2021. According to preliminary figures, the financial services sub-sector decreased 3.2% in real terms in the first quarter of 2022, compared to a decrease of 4.9% in the same period of 2021. The storage and communications sub-sector grew by 11.4% in real terms in 2021, compared to a contraction of 2.6% in 2020, and accounted for 2.8% of GDP in 2020. According to preliminary data, the storage and communications sub-sector grew 19.5% in the first quarter of 2022, compared to an increase of 2.1% in the same period of 2021.
As of December 2021, there were approximately 205,317 km of roads. Approximately 9% (17,896 km) consisted of primary roads, 22% (45.137 km) of secondary roads and 69% (142,284 km) of tertiary roads. From the 17,896 kilometers of primary roads: 62% (11,008.7 kms) are administered by the Instituto Nacional de Vías (National Institute of Roads, or “INVIAS”) and 38% (6,809 kms) are administrated by the ANI. In the case of secondary roads, all of them are administrated by regions and all of the tertiary roads are administrated by municipalities.
Over the last several years, the road concessions program has substantially increased the participation of private companies in the transportation sector. These concessions permit the construction of safer and more modern roadways. The transportation corridors to be constructed under these concessions will connect large industrial and agricultural centers, which are primarily located in the nation’s interior, with the most important Atlantic and Pacific ports. These corridors include the Bogotá–Santa Marta (“Ruta del Sol” concession) corridor, the Bogotá–Buenaventura corridor and the Caribbean road network.
With respect to the transportation, storage and communications sub-sector, Colombia had 14.2 telephone lines in service per 100 inhabitants on December 31, 2017, 14.0 telephone lines in service per 100 inhabitants on December 31, 2018, 13.9 telephone lines in service per 100 inhabitants on December 31, 2019, 14.8 telephone lines in service per 100 inhabitants on December 31, 2020 and 14.4 telephone lines in service per 100 inhabitants in December 31, 2021. Prior to 1998, Empresa Nacional de Telecomunicaciones, a state-owned company, was the primary provider of domestic and international long distance telephone services in Colombia. Since August 1997, however, ten-year licenses with automatic ten-year extensions have been granted to new operators of domestic and international long distance telephone services. In December 1998, Empresa de Teléfonos de Bogotá (“ETB” owned by the capital district of Bogotá) and Orbitel, (a privately owned company), began providing international and domestic long-distance services, ending the 50-year monopoly of Empresa Nacional de Telecomunicaciones.
D-49
In recent years, Colombia has witnessed increased demand for cellular telephone service. In 2003, Colombia had an estimated 14.3 mobile telephone lines in operation per 100 inhabitants, with service provided by Telefonica Móvil, Comcel and the recently formed Colombia Movil. According to the Ministry of Communications, there were approximately 41.2 million mobile telephones in use at year-end 2009. At year-end 2010, there were 44.5 million mobile telephones in use in Colombia. As of the fourth quarter of 2020, there were 67.7 million mobile telephones in use in Colombia, a 2.1% increase from the same quarter in 2019. As for the fourth quarter of 2021, there were 75.1 million mobile telephone in use in Colombia, a 10.9% increase from the same quarter in 2020. The Government has made cellular telephone service subject to private sector participation and competition.
In 2010, the Government aimed to quadruple the number of internet broadband connections from 2.2 million to 8.8 million by 2014 through the “Plan Vive Digital”, a program designed to reduce unemployment and poverty while increasing competitiveness. In the fourth quarter of 2020, the number of internet broadband connections exceeded the target, reaching a total of 46.4 million broadband subscribers, a 15.4% increase from the same quarter in 2019.
Electricity, Gas and Water
In 2020, 68.3% of electric energy consumption in Colombia was derived from hydroelectric generated sources, while 31.2% was derived from thermally generated (gas and coal) sources and the remaining 0.5% was derived from other sources. In 2021, the output of the utility sector (electricity, gas and water) increased by 5.1% in real terms and accounted for 3.0% of GDP. In addition, it is estimated that Colombia has the capacity to generate approximately 17,485 megawatts of electric power. According to preliminary figures, the output of the utility sector (electricity, gas and water) grew 4.8% in the first quarter of 2022, compared to a decrease of 0.5% in the same period of 2021.
By the end of 1997, all of the major cities in Colombia were connected to an extensive gas pipeline network. Ecopetrol sponsored two significant projects consisting of a total of 1,350 kilometers of pipeline, under a “build, own, operate, maintain and transfer” (“BOMT”) arrangement with private companies. Construction contracts for an additional 1,695 kilometers of pipeline were awarded. Law 401 of 1997 created the Empresa Colombiana de Gas (Colombian Natural Gas Corporation, or “ECOGAS”) to manage the gas transmission network. In February 2007, Transportadora de Gas Internacional S.A. ESP (“TGI”) acquired ECOGAS. TGI, a subsidiary of Empresa de Energía de Bogotá, operates and maintains the most extensive network of pipelines in Colombia, transporting natural gas in the “interior system” through a network that extends from La Guajira to Cauca Valley and from the Eastern Plains to Huila and Tolima and several departments across the Andean region.
Over the past decade, the Government has restructured the energy sector in order to improve the economic performance of the companies within the sector. For example, the Government has encouraged competition, private investment and the development of alternative energy sources. The 1994 Electricity Law significantly transformed the electric power sector. It permits the formation of privately-owned electric utility companies and the privatization of all or part of existing public sector companies. However, it prohibits vertical integration of new entrants into the utilities sector. In addition, a 1995 restructuring program resulted in an increase in private participation in power generation.
Following the Government’s sale in 1996 of several major power generation plants, private sector investors purchased 48.5% of the capital stock of Empresa de Energía de Bogotá and 56.0% of the capital stock of Empresa de Energía del Pacifico S.A. E.S.P. in 1997. As of December 2016, 46.3% of Colombia’s total power generation capacity was privately held, while 53.8% continued to be state-owned, of which 30.9% is purely state-owned generation and the other 22.9% is of mixed ownership. On January 13, 2016, the Government sold 100% of its ownership interests in Isagen, the power generation company. The Government sold a portion of its shares of Interconexión Eléctrica S.A. (“ISA”), one of Colombia’s largest electricity transmission companies, in two successful public offerings in 2001 and 2002. As of December 31, 2020, public and private participation in electricity transmission was as described in the following table:
D-50
Enterprise | Participation (%) | |||
Intercolombia | 50.39 | |||
GEB | 19.91 | |||
ISA | 11.92 | |||
EPM | 7.31 | |||
TRANSELCA | 6.64 | |||
CELCIA | 1.73 | |||
ESSA | 1.03 | |||
DELSUR | 0.54 | |||
DISTASA | 0.22 | |||
CENS | 0.14 | |||
EBSA | 0.13 | |||
CHEC | 0.04 | |||
TOTAL | 100 |
Source: Intercolombia
Infrastructure Development
Deficiencies in Colombia’s infrastructure have created economic inefficiencies that have adversely affected the country’s economic performance. To address this concern, the Government has been working to expand the telecommunications infrastructure, cargo ports, airports and roads.
The Government is in the process of implementing 30 public private partnerships as a part of the fourth generation (“4G”) program, in order to improve the domestic road network in the departments of Antioquia, Bolivar, Cundinamarca, Caldas, Cauca and Santander as well as in the Caribbean Coast and Llanos regions. The objective of these projects is to modernize the country’s road infrastructure, making it more competitive and boosting economic development. In accordance with Law 1508 of 2012, the Government divided the projects in two groups: public initiatives (with three phases) and private initiatives. The first public initiative phase consists of nine highways that are projected to cover 1,117 kilometers and representing an investment of Ps. 13.1 trillion. The second public initiative consists of nine highways that are projected to cover 1,815 kilometers and representing an investment of Ps. 14.3 trillion. The third public initiative consists of two highways that are projected to cover 6,195 kilometers, representing an investment of Ps. 2.6 trillion. In addition, there are nine private public partnerships that were initiated by private partners that are projected to cover 2,092 kilometers and represent an investment of Ps. 12.1 trillion.
In December 2020, the Government announced, through the ANI, that they were working on structuring Fifth Generation-5G projects seeking to encourage job creation, boosting the regional economy and mainly connect more and better Colombian citizens. To this end, the 5G projects involve the structuring of projects divided in two waves. 15 projects are part of the first wave: eight highways, four airport, two related to navigability and one rail.
In December 2020, the Government revealed some of the projects that will be part of the second wave of 5G projects, such as Terminación Ruta del Sol 1, Calarcá - La Paila, Popayán - Pasto, Sistema Aeroportuario de Bogotá - SAB 2050, Campo de Vuelo and IP Dragado de Buenaventura. These projects are in an early structuring stage and will seek to transform the country’s connectivity and infrastructure for the next 100 years. According to the estimates made by the Fundación para la Educación Superior y el Desarrollo - Fedesarrollo, when the demand for civil works grows by Ps. 1 billion, on average, about 28,204 jobs are generated.
D-51
As of December 2021, 22 projects had financing closing. The financing sourced for these projects include international banks (34%), local banks (24%), capital markets (13%), debt funds (11%), FDN (13%) and other sources (5%). Also, as of February 2022, 27 of 30 projects are under construction with 20 of them having completed over 50% of the work.
Since 2010, the Ministry of Information Technologies and Communications, through the Connectivity Directorate (formerly the Compartel program), has initiated a project with the goal of providing access points to the internet, called Vive Digital Kiosks, to the population in rural or remote areas with more than 100 people. The project aims to promote and increase the use of information and communication technology through better equipment, faster connection speeds and workshops designed for children, youth and adults of all ages to be better attuned to the digital world.
The project consists of the following three phases:
• | The first phase was aimed at ensuring: (i) the provision of telecommunication services in community access points that were originally provided by the Compartel program, which ended its operations on March 30, 2013; (ii) that 70% of the targeted population centers have a community access point to the internet; and (iii) that community access points are installed in National Parks. The first phase concluded during the first quarter of 2016. |
• | The second phase sought to ensure that all targeted population centers had an access point to the internet. The Government provided 5,524 digital kiosks throughout all the departments of the country. |
• | In the third phase of the project, 1,231 digital kiosks were installed to continue the policy of universal access of information and communications technology to rural and remote areas of the country in the areas historically serviced by the digital kiosks in the first phase. |
In 2006, Ecopetrol selected Glencore AG as its strategic partner in the development of a master plan with respect to the Cartagena refinery. In accordance with the master plan, Refinería de Cartagena S.A.-RCS (“Reficar”) was incorporated and began operations on April 1, 2007. Simultaneously with the incorporation of Reficar, Ecopetrol transferred all of the refinery’s assets to Reficar in exchange for a 49.0% interest. On August 19, 2008, the Government granted special treatment to the expansion of the Cartagena refinery project. In February 2009, as a result of financing difficulties experienced by Glencore AG which were making it challenging to develop the master plan, Ecopetrol entered into a memorandum of understanding with Glencore AG pursuant to which it acquired in an indirect interest in all of Glencore AG’s interest in Reficar in May 2009.
After seven years of construction work, Reficar initiated the operations of 34 operating units in July 2016. Reficar’s new and expanded processing capacity may exceed 150 thousand barrels of crude oil per day with a high value product conversion factor of 97.5%. A number of critical milestones were reached during the first six months of 2016, including finishing project construction activities and developing successful sequential start-up of the units. In September 2016, the operation of the new refinery was formally transferred to Ecopetrol under an operation and maintenance agreement that leverages Ecopetrol’s existing refining capabilities while keeping Reficar as an independent manager and owner of the assets. Following full start-up of the refinery, the focus has been on stabilization of the production process and the execution of performance tests of each individual unit of the refinery. The reliability test of the refinery as a whole was completed on December 5, 2017.
Reficar’s 2021 financials reflect the operation of the new units, with total sales increasing by 70.7% in 2021 as compared to 2020, from $2,413 million in 2020 to $4,121 million in 2021, primarily due to the positive impact in the global economic reactivation causing a high demand of oil and refined products. The margin of Reficar grew from an annual average of $6.6 per barrel in 2020 to $8.5 in 2021 per barrel mainly due to the increase in the prices and demand of its products due to the global reactivation in the economy. Exports to international markets represented 30% of total sales during 2021.
On March 13, 2017, the Contraloría General de la República opened an inquiry into corruption allegations associated with the refinery upgrade. The inquiry is focused on members of the former and the current boards and employees of Ecopetrol and Reficar and certain subcontractors hired to upgrade the refinery. On June 6, 2018, the Contraloría General de la República, found that Reficar and 20 former and current employees and directors were responsible for approximately $2.4 billion in losses due to failed investments during the expansion of the refinery.
D-52
Role of the State in the Economy; Privatization
General
The Government is active in mining and the exploitation of other natural resources, as well as in the telecommunications and electricity industries. The Government expects its role in the production of goods and services to diminish as it continues to encourage private sector investment and participation in sectors previously dominated by the public sector and as it implements other market-oriented reforms, such as the adjustment of public sector prices and utility rates to reflect market conditions.
In 2021, the most important state-owned non-financial companies included Ecopetrol and Medellín’s urban transit system (the “Medellín Metro”).
The following table sets forth selected financial data for certain non-financial state-owned enterprises.
Principal Non-Financial Public Sector Enterprises
Total Assets on | Total Liabilities on | Net Profits for | Total External | |||||||||||||
(millions of U.S. dollars) | ||||||||||||||||
Ecopetrol | $ | 61,351 | $ | 37,803 | $ | 4995 | $ | 0 | ||||||||
Medellín Metro | 1,280 | 1,660 | 87.7 | 9.7 |
1: | Audited. Converted into U.S. dollars at the rate of Ps. 3,981.16/$1.00, the representative market rate on December 31, 2021. |
2: | Converted into U.S. dollars at the rate of Ps. 3,749.12/$1.00, the average representative market rate for January-December 2021. |
Source: Directorate of Banking Investment – Ministry of Finance
Ecopetrol
Ecopetrol is the national oil company and is responsible for promoting and developing Colombia’s oil industry.
Ecopetrol reported a net profit of approximately Ps. 16.7 trillion in 2021, compared with a net profit of approximately Ps. 1.2 trillion in 2020, the best results in the history of the company mainly due to the reactivation of the global economy and the competitive strategy of the company. Total savings and efficiencies of 7.5% with respect to total managed for supply. Ecopetrol contributes to public sector revenues through a combination of income taxes, royalties and dividends. Ecopetrol’s total direct contribution to governmental revenues was Ps. 16.8 trillion in 2021 compared to Ps. 19.4 trillion in 2020. The principal sources of Ecopetrol’s contribution to public sector revenues during 2021 were approximately Ps. 5.6 trillion in royalties, Ps. 0.6 trillion in dividends paid with respect to profits earned in 2020 and Ps. 10.6 trillion in income taxes. For further information on Ecopetrol, see “—Principal Sectors of the Economy—Mining and Quarrying” above.
On August 11, 2021, Ecopetrol and the Ministry of Finance entered into an Inter-Administrative Agreement by means of which Ecopetrol acquired 569,472,561 shares of ISA, equivalent to the 51.4% of its capital stock, which represented the 100% interest of the Government in such company. The price paid per share was Ps. 25,000. On August 20, 2021, Ecopetrol announced that the closing conditions for the purchsae of ISA’s shares where met and the transaction finalized. Ecopetrol paid the Ministry of Finance $3.7 billion dolars for 51.4% of ISA’s capital stock.
D-53
Medellín Metro
Medellín Metro is the light rail transportation system of the state-owned Empresa de Transporte Masivo del Valle de Aburrá Ltda. (Aburrá Valley Mass Transit Corporation), an entity created in 1979 by the Department of Antioquia and the municipality of Medellín, each of which owns 50% of the entity’s shares. The Government guaranteed all of the Medellín Metro project’s external debt, which totaled $23.5 billion as of December 31, 2017. The first line of the Medellín Metro became operational in November 1995. In 2021, the Medellín Metro was responsible for transporting 219.8 million passengers. The Aburrá Valley Mass Transit Corporation continued on a path to environmentally sustainable mobility, with the goal of improving the quality of life of its users by various initiatives, including use of clean fuels, lowering emissions, building public spaces and improving the efficiency of its schedules as provided for in its Strategic Plan 2016-2020.
Medellín Metro registered a net profit of Ps. 328.9 billion in 2021 compared to a net loss of Ps. 179.1 billion in 2020.
State-Owned Financial Institutions
The Government owns a substantial majority of the capital stock of several financial institutions, although it intends to decrease its participation in the financial system over the medium term, providing assistance only to specific sectors of the Colombian economy. Some of the most important state-owned financial institutions are FDN (formerly, Financiera Eléctrica Nacional (“FEN”)), Banco de Comercio Exterior de Colombia S.A. (“Bancoldex”) and Finagro. FDN is primarily intended to promote, finance and support investment by companies or projects for infrastructure development in Colombia in different sectors of the economy. Bancoldex’s principal activity is to provide long- and short-term financing and specialized financial products to support Colombian exports and foreign trade-related activities. Finagro is the financial entity in charge of implementing financial programs for the agricultural sector. The accounts of FDN, Bancoldex, Finagro and other financial institutions owned by the Government are not included in the consolidated public sector finance figures that appear in other sections of this document.
The following table sets forth the total assets, total liabilities and total external debt guaranteed by the Republic for principal state-owned financial institutions as of December 31, 2020, as well as their net profits for 2020.
Principal State-Owned Financial Institutions
Total Assets as of | Total Liabilities | Net Profit for 2021(1) | Total External | |||||||||||||
(millions of U.S. dollars) | ||||||||||||||||
State-Owned Banks | ||||||||||||||||
Banco Agrario | 8,092 | 7,472 | 620 | 0 | ||||||||||||
Commercial Financing Companies | ||||||||||||||||
Bancoldex Leasing | 0 | 0 | 0 | 337 | ||||||||||||
Special State-Owned Institutions | 24,150 | 13,915 | 10,235 | 899 | ||||||||||||
Bancoldex | 2,588 | 2,261 | 327 | 337 | ||||||||||||
FINDETER | 2,913 | 2,586 | 327 | 324 | ||||||||||||
FDN | 1,487 | 1,041 | 446 | 0 | ||||||||||||
Finagro | 3,481 | 3,213 | 268 | 0 | ||||||||||||
Icetex | 2 | 0 | 2 | 239 | ||||||||||||
FONADE | 206 | 154 | 52 | 0 | ||||||||||||
FOGAFIN | 7,501 | 414 | 7,087 | 0 | ||||||||||||
Fondo Nacional del Ahorro | 2,562 | 1,953 | 609 | 0 | ||||||||||||
FOGACOOP | 237 | 17 | 220 | 0 |
D-54
Total Assets as of | Total Liabilities | Net Profit for 2021 (1) | Total External | |||||||||||||
(millions of U.S. dollars) | ||||||||||||||||
FNG | 1,382 | 557 | 825 | 0 | ||||||||||||
Caja de Vivienda Militar | 1,791 | 1,718 | 72 | 0 | ||||||||||||
Total | $ | 32,243 | $ | 21,387 | $ | 10,855 | $ | 899 | ||||||||
|
|
|
|
|
|
|
|
Totals may differ due to rounding.
1: | Converted into dollars at the rate of Ps. 3,981.16/$1.00, the representative market rate on December 31, 2021. |
Source: Financial Superintendency and financial statements of each company as of and for the year ended December 31, 2021.
Privatizations and Concessions
The following table lists the entities privatized since 2013, including the year in which the privatization occurred and the proceeds from the privatization for each enterprise.
Privatization of State-Owned Enterprises
Year | Proceeds (millions of U.S. dollars) | |||||||
ISAGEN(1) | 2015-2016 | $ | 2,063 | |||||
ISA | 2021 | $ | 3,673 |
1: | The value has been translated into dollars at a rate of Ps. 3,149.7/$1.00, which was the exchange rate on December 31, 2015. |
Sources: Consejo Superior de Política Fiscal (Council of Fiscal Policy) and IFI, Subdirección de Banca de Inversión—Ministerio de
Hacienda y Crédito Público.
In order to foster private sector participation in public utility projects, the 1994 Ley de Servicios Públicos Domiciliarios (Residential Public Services Law) establishes the general framework for public utility services provided by both public and private sector companies. In addition to authorizing the privatization of public utility companies, the law permits consumers to purchase shares in those companies in installments. For example, consumers may pay for their share purchases through periodic payments in conjunction with utility bill payments.
Under the Constitution and Law 226 of 1995, all of the shares of any public entity being privatized must first be offered to its employees and to instituciones solidarias (social solidarity institutions), such as pension funds, cooperatives, mutual funds and severance funds, before they can be offered publicly to investors. For more information on the privatization of electric power companies, see “—Principal Sectors of the Economy—Energy.”
The Government has also granted concession contracts to facilitate private participation in telecommunications and infrastructure projects. Infrastructure projects eligible for concession contracts include ports, railroads, airports and gas pipelines. In telecommunications, the Government has opened the market for cellular telephone services and “value-added” services, which include internet access, video services and electronic payment systems, and permits competition in domestic and international long distance, as well as local telephone services.
As part of its fiscal strategy for the 2019-2022 period, the Republic is considering strategic divestment of public assets. The Republic is a shareholder in 105 companies with a participation worth approximately Ps. 79 trillion.
D-55
Isagen
In 2000, the Government focused on the financial restructuring of Isagen in order to be able to offer it to potential buyers. On February 26, 2007, the Government authorized the sale of 19.2% of the shares of Isagen. On August 3, 2007, the Government announced that it had completed the sale of such shares to the public. Following the sale, the Government owned 57.7% of the shares of Isagen.
On July 30, 2013, the Government announced its intention to sell its remaining interest in Isagen (57.7% of the total shares of Isagen). On January 13, 2016, the Government sold 100% of its remaining interest in Isagen. The winning bidder in the auction process was the Canadian investment fund, Brookfield Asset Management. The total purchase price for the Government’s ownership interest was Ps. 6.5 trillion. The Government stated that the proceeds of the sale would be used to finance part of the 4G roadway infrastructure projects. To this end, the Government has approved the use of Ps. 1 trillion of the sale proceeds to capitalize the FDN in order to support the financing of the 4G road projects.
Ecopetrol’s purchase of ISA
In 2018, the Ministry of Finance and Public Credit of Colombia initiated a thorough analysis to maximize the value of its portfolio of State-Owned Enterprises. Among the different strategies that the Ministry carried out to improve its portfolio, in 2021, the Government of Colombia agreed with Ecopetrol to sell 569,472,561 shares of Interconexión Eléctrica S.A. ESP (“ISA”), equivalent to 51.4% of its outstanding shares, which represents 100% of the stake that the Ministry had in ISA.
The state-controlled oil company, Ecopetrol, finalized the purchase of a majority stake in electricity transmission company ISA from the Government for US$ 3.67 billion. While maintaining fiscal discipline, this agreement allowed the Government to fund new social expenditures and balance the devastating consequences of the pandemic. Furthermore, it is important to recognize that the Government will keep its role as the controlling shareholder of Ecopetrol and receive dividends from ISA through Ecopetrol. For this reason, this transaction is considered a portfolio restructuring rather than a privatization.
Colombia Telecomunicaciones S.A. ESP
Colombia Telecomunicaciones S.A. ESP is a full-service telecommunications provider offering a range of integrated telecommunications services including fixed-line, mobile, data transmission (including broadband access and value-added services) and subscription television services throughout Colombia. It is the second-largest integrated telecommunications provider in Colombia in terms of subscribers and mobile services.
On December 20, 2005, Colombia Telecomunicaciones S.A. ESP announced that it was seeking a strategic partner in order to obtain new capital, improve management, widen its service portfolio and guarantee the continuation of service in the long term. On April 7, 2006, Telefonica of Spain became a strategic partner after it purchased more than 50% of the company’s shares for Ps. 853.6 billion (approximately $369 million) in an auction process. The remaining capital of Colombia Telecomunicaciones S.A. ESP continues to be held by the Government. As a result of the recapitalization, Colombia Telecomunicaciones S.A. ESP became a private company and accordingly was no longer subject to regulation as a public sector entity.
In April 2011, the board of directors of Colombia Telecomunicaciones S.A. ESP approved the merger of the company with Telefónica Móviles de Colombia. In April 2012, the shareholders of the company approved the merger. The merger took place in the second half of 2012, reducing the Government’s participation in the company from 48% of total shares to 32.5% of total shares while Telefónica holds 67.5%. The merger was structured as part of a strategy to strengthen the financial condition of Colombia Telecomunicaciones S.A. ESP and to create one of the largest integrated telecommunications operators in Colombia. Colombia Telecomunicaciones S.A. ESP offers all of its telecommunication services under the brand Movistar.
D-56
As of December 31, 2020, the Ministry of Finance continued to hold 32.5% of the shares of Colombia Telecomunicaciones S.A. ESP. In 2020, Colombia Telecomunicaciones S.A. ESP registered net profit of approximately Ps. 8.3 billion, compared to net profit Ps. 23.4 billion in 2019.
Environment
By virtue of its geographical location at the northwestern tip of South America, with mountainous regions, coasts on two oceans and the Amazon basin, Colombia has one of the most complex and diverse ecological and biological systems in the world. According to the World Wildlife Fund, Colombia is the most biodiverse country per square kilometer in the world. There are more bird, amphibian, butterfly and frog species in Colombia than anywhere else in the world. However, the pressures caused by growth and development have resulted in the exploitation of natural resources, and production methods directed at short-term productivity have been used without considering the environmental consequences. The principal environmental problems in Colombia today consist of soil erosion in the Andes; water, soil and air pollution in the Andes and the Caribbean region; and deforestation and instability of the water supply throughout the country.
In 1993, the Ministry of the Environment assumed responsibility for all environmental matters. The creation of a separate ministry had as its objective to increase environmental regulations and create centralized national environmental policymaking.
Decree 216 of February 3, 2003 merged the Ministry of the Environment with the Ministry of Housing and established the objective and organic structure of the Ministry of Environment, Housing and Regional Development. In 2011, the Ministry of Environment, Housing and Regional Development was reorganized, with some functions assigned to other government agencies and certain responsibilities retained by the renamed Ministry of Environment and Sustainable Development. The objective of the Ministry is to contribute and promote sustainable development through policies, plans, programs, projects and regulation related to the environment, natural renewable resources, land use, territorial organization, potable water, urban and regional development and housing.
Additionally, while increased economic growth has contributed significantly to improving the quality of life of many Colombians, it has been accompanied by environmental degradation and deepening of problems such as deforestation and water and air pollution. The Government, through the Ministry of Environment and Sustainable Development, has established strategic guidelines for environmental sustainability that include the protection of areas of special ecological relevance, the development of policies for conservation and recovery of biodiversity, the strengthening of management of water resources, the execution of a national policy on climate change, the reinforcement of institutions for improved risk prevention and immediate response to disasters and the development of strategies for environmental management in agricultural and mining industries.
The Plan Nacional de Desarrollo approved in June 2015 includes as one of the six strategies of the Government, Crecimiento Verde (Green Growth), a program promoting research, technological development and innovation for strengthening national and regional competitiveness with products and activities that contribute to sustainable development and growth with a low carbon footprint.
On June 16, 2017, Colombia’s Congress unanimously ratified the Paris Agreement to reduce greenhouse gas emissions.
The 2018-2022 Plan aims to fight deforestation and increase the use of clean renewable resources.
D-57
Employment and Labor
The National Department of Statistics of Colombia (DANE) changed the methodology and the approach of the labor market data and the new data is available from January 2021. This new approach intends to update the survey to the regulatory framework of the labor statistics of the International Labor Organization (ILO), for responding to agreements institutions and good practices for income measurement in Colombia, and for addressing the recommendations and needs of public policy regarding the visualization of prioritized population.
Colombia’s unemployment surveys are presented on a monthly basis, and are based on a sample of 13 cities. The following are results for 2017 through July 2022.
Employment Status in the Thirteen Largest Cities(1)
2017 | ||||||||||||||||||||||||||||||||||||||||||||||||
Jan | Feb | Mar | Apr | May | Jun | Jul | Aug | Sept | Oct | Nov | Dec | |||||||||||||||||||||||||||||||||||||
Labor Force (in thousands) | 12,007 | 11,892 | 11,908 | 11,993 | 11,929 | 12,134 | 11,996 | 12,063 | 12,104 | 11,985 | 11,984 | 12,016 | ||||||||||||||||||||||||||||||||||||
|
|
|
|
|
|
|
|
|
|
|
|
|
|
|
| �� |
|
|
|
|
|
|
|
| ||||||||||||||||||||||||
Employed (in thousands)(2) | 10,395 | 10,582 | 10,648 | 10,707 | 10,715 | 10,822 | 10,639 | 10,867 | 10,830 | 10,848 | 10,837 | 10,834 | ||||||||||||||||||||||||||||||||||||
Participation Rate (%)(3) | 67.4 | 66.7 | 66.7 | 67.1 | 66.7 | 67.8 | 66.9 | 67.2 | 67.4 | 66.6 | 66.5 | 66.6 | ||||||||||||||||||||||||||||||||||||
Unemployment Rate (%)(4) | 13.4 | 11.0 | 10.6 | 10.7 | 10.2 | 10.8 | 11.3 | 9.9 | 10.5 | 9.5 | 9.6 | 9.8 | ||||||||||||||||||||||||||||||||||||
Underemployment Rate (%)(5) | 8.3 | 9.6 | 9.4 | 9.4 | 10.3 | 10.4 | 9.8 | 10.0 | 9.7 | 8.8 | 8.9 | 7.9 |
2018 | ||||||||||||||||||||||||||||||||||||||||||||||||
Jan | Feb | Mar | Apr | May | Jun | Jul | Aug | Sept | Oct | Nov | Dec | |||||||||||||||||||||||||||||||||||||
Labor Force (in thousands) | 11,799 | 11,888 | 12,112 | 12,013 | 12,174 | 12,056 | 12,194 | 11,963 | 12,270 | 12,114 | 11,961 | 12,137 | ||||||||||||||||||||||||||||||||||||
|
|
|
|
|
|
|
|
|
|
|
|
|
|
|
|
|
|
|
|
|
|
|
| |||||||||||||||||||||||||
Employed (in thousands)(2) | 10,213 | 10,476 | 10,834 | 10,730 | 10,941 | 10,721 | 10,959 | 10,757 | 10,985 | 10,874 | 10,783 | 10,835 | ||||||||||||||||||||||||||||||||||||
Participation Rate (%)(3) | 65.4 | 65.8 | 66.9 | 66.3 | 67.1 | 66.4 | 67.1 | 65.7 | 67.3 | 66.4 | 65.5 | 66.4 | ||||||||||||||||||||||||||||||||||||
Unemployment Rate (%)(4) | 13.4 | 11.9 | 10.6 | 10.7 | 10.1 | 11.1 | 10.1 | 10.1 | 10.5 | 10.2 | 9.8 | 10.7 | ||||||||||||||||||||||||||||||||||||
Underemployment Rate (%)(5) | 7.8 | 9.1 | 9.3 | 9.2 | 9.1 | 9.4 | 10.0 | 9.1 | 10.0 | 9.3 | 8.9 | 9.7 |
2019 | ||||||||||||||||||||||||||||||||||||||||||||||||
Jan | Feb | Mar | Apr | May | Jun | Jul | Aug | Sept | Oct | Nov | Dec | |||||||||||||||||||||||||||||||||||||
Labor Force (in thousands) | 11,957 | 12,056 | 12,225 | 11,965 | 12,182 | 12,155 | 12,235 | 12,050 | 12,202 | 12,190 | 12,289 | 12,297 | ||||||||||||||||||||||||||||||||||||
|
|
|
|
|
|
|
|
|
|
|
|
|
|
|
|
|
|
|
|
|
|
|
| |||||||||||||||||||||||||
Employed (in thousands)(2) | 10,314 | 10,558 | 10,761 | 10,632 | 10,813 | 10,848 | 10,970 | 10,679 | 10,976 | 10,926 | 11,014 | 11,001 | ||||||||||||||||||||||||||||||||||||
Participation Rate (%)(3) | 65.3 | 65.8 | 66.7 | 65.2 | 66.3 | 66.1 | 66.4 | 65.3 | 66.1 | 66.0 | 66.4 | 66.4 | ||||||||||||||||||||||||||||||||||||
Unemployment Rate (%)(4) | 13.7 | 12.4 | 12.0 | 11.1 | 11.2 | 10.7 | 10.3 | 11.4 | 10.1 | 10.4 | 10.4 | 10.5 | ||||||||||||||||||||||||||||||||||||
Underemployment Rate (%)(5) | 10.5 | 11.1 | 10.9 | 10.0 | 10.9 | 10.8 | 9.9 | 10.6 | 11.0 | 10.6 | 10.4 | 9.9 |
2020 | ||||||||||||||||||||||||||||||||||||||||||||||||
Jan | Feb | Mar | Apr | May | Jun | Jul | Aug | Sept | Oct | Nov | Dec | |||||||||||||||||||||||||||||||||||||
Labor Force (in thousands) | 12,164 | 12,235 | 11,324 | 10,013 | 11,106 | 11,237 | 11,332 | 11,498 | 11,896 | 12,132 | 12,059 | 11,966 | ||||||||||||||||||||||||||||||||||||
|
|
|
|
|
|
|
|
|
|
|
|
|
|
|
|
|
|
|
|
|
|
|
| |||||||||||||||||||||||||
Employed (in thousands)(2) | 10,599 | 10,823 | 9,809 | 7,663 | 8,386 | 8,442 | 8,534 | 9,249 | 9,724 | 10,097 | 10,203 | 10,101 | ||||||||||||||||||||||||||||||||||||
Participation Rate (%)(3) | 65.6 | 65.9 | 60.9 | 53.8 | 59.6 | 60.3 | 60.7 | 61.5 | 63.6 | 64.8 | 64.3 | 63.7 | ||||||||||||||||||||||||||||||||||||
Unemployment Rate (%)(4) | 12.9 | 11.5 | 13.4 | 23.5 | 24.5 | 24.9 | 24.7 | 19.6 | 18.3 | 16.8 | 15.4 | 15.6 | ||||||||||||||||||||||||||||||||||||
Underemployment Rate (%)(5) | 11.0 | 11.1 | - | * | - | * | - | * | - | * | - | * | 9.9 | 10.4 | 12.5 | 10.7 | 10.7 |
D-58
2021(6) | ||||||||||||||||||||||||||||||||||||||||||||||||
Jan | Feb | Mar | Apr | May | Jun | Jul | Aug | Sept | Oct | Nov | Dec | |||||||||||||||||||||||||||||||||||||
Labor Force (in thousands) | 11,098 | 11,357 | 11,314 | 11,169 | 11,226 | 11,334 | 11,146 | 11,203 | 11,174 | 11,084 | 11,247 | 11,116 | ||||||||||||||||||||||||||||||||||||
|
|
|
|
|
|
|
|
|
|
|
|
|
|
|
|
|
|
|
|
|
|
|
| |||||||||||||||||||||||||
Employed (in thousands)(2) | 8,943 | 9,305 | 9,431 | 9,225 | 9,369 | 9,496 | 9,510 | 9,707 | 9,690 | 9,651 | 9,877 | 9,848 | ||||||||||||||||||||||||||||||||||||
Participation Rate (%)(3) | 63.3 | 64.7 | 64.4 | 63.4 | 63.7 | 64.2 | 63.1 | 63.3 | 63.1 | 62.5 | 63.4 | 62.6 | ||||||||||||||||||||||||||||||||||||
Unemployment Rate (%)(4) | 19.4 | 18.1 | 16.6 | 17.4 | 16.5 | 16.2 | 14.7 | 13.4 | 13.3 | 12.9 | 12.2 | 11.4 | ||||||||||||||||||||||||||||||||||||
Underemployment Rate (%)(5) | 8.0 | 7.6 | 7.3 | 7.0 | 7.9 | 7.8 | 7.6 | 7.7 | 7.6 | 6.8 | 6.2 | 6.0 | ||||||||||||||||||||||||||||||||||||
2022(6) | ||||||||||||||||||||||||||||||||||||||||||||||||
Jan | Feb | Mar | Apr | May | Jun | Jul | Aug | Sept | Oct | Nov | Dec | |||||||||||||||||||||||||||||||||||||
Labor Force (in thousands) | 11,468 | 11,667 | 11,767 | 11,681 | 11,635 | 11,688 | 11,646 | - | - | - | - | - | ||||||||||||||||||||||||||||||||||||
|
|
|
|
|
|
|
|
|
|
|
|
|
|
|
|
|
|
|
|
| �� |
|
| |||||||||||||||||||||||||
Employed (in thousands)(2) | 9,767 | 10,183 | 10,280 | 10,390 | 10,352 | 10,317 | 10,333 | - | - | - | - | - | ||||||||||||||||||||||||||||||||||||
Participation Rate (%)(3) | 64.5 | 65.5 | 66.0 | 65.5 | 65.1 | 65.4 | 65.0 | - | - | - | - | - | ||||||||||||||||||||||||||||||||||||
Unemployment Rate (%)(4) | 14.8 | 12.7 | 12.6 | 11.1 | 11.0 | 11.7 | 11.3 | - | - | - | - | - | ||||||||||||||||||||||||||||||||||||
Underemployment Rate (%)(5) | 5.9 | 8.0 | 7.8 | 7.1 | 6.8 | 8.0 | 7.7 | - | - | - | - | - |
1: | Statistics for the cities and metropolitan areas of Bogotá, Medellín, Cali, Barranquilla, Bucaramanga, Manizales, Pasto, Pereira, Cúcuta, Ibagué, Montería, Cartagena and Villavicencio. Average rates for each month. |
2: | To be considered employed, a person above the minimum age requirement must have worked at least one hour with remuneration or 15 hours without remuneration during the preceding week. The working age is 12 years and above. |
3: | Participation rate is defined as the labor force divided by working age population. The working age is 12 years and above. |
4: | Unemployment rate is defined as the unemployed population divided by the labor force. |
5: | Underemployment rate is defined as the underemployed population divided by the labor force. Underemployed workers are employed workers who can perform and want additional employment, either because they work fewer than 12 hours per week and desire to work more, they consider their income insufficient or they are employed in a position unrelated to their profession or training and are therefore underproductive. |
6: | New methodology of labor market. |
-*: | Due to the change in the Gran Encuesta Integrada de Hogares (GEIH) collection operation due to the COVID-19 pandemic, it was not possible to obtain underemployment information between the months of March and July 2020. |
n.a.: | Not available. |
Source: DANE.
The following table shows national employment statistics for 2017 through July 2022.
National Employment Status
2017 | ||||||||||||||||||||||||||||||||||||||||||||||||
Jan | Feb | Mar | Apr | May | Jun | Jul | Aug | Sept | Oct | Nov | Dec | |||||||||||||||||||||||||||||||||||||
Labor Force (in thousands) | 24,336 | 24,415 | 24,290 | 24,885 | 24,577 | 24,980 | 24,438 | 24,772 | 24,673 | 25,241 | 24,963 | 24,788 | ||||||||||||||||||||||||||||||||||||
|
|
|
|
|
|
|
|
|
|
|
|
|
|
|
|
|
|
|
|
|
|
|
| |||||||||||||||||||||||||
Employed (in thousands)(1) | 21,481 | 21,851 | 21,932 | 22,669 | 22,263 | 22,803 | 22,073 | 22,518 | 22,397 | 23,082 | 22,873 | 22,649 | ||||||||||||||||||||||||||||||||||||
Participation Rate (%)(2) | 63.8 | 64.0 | 63.6 | 65.1 | 64.2 | 65.2 | 63.7 | 64.5 | 64.2 | 65.6 | 64.8 | 64.2 | ||||||||||||||||||||||||||||||||||||
Unemployment Rate (%)(3) | 11.7 | 10.5 | 9.7 | 8.9 | 9.4 | 8.7 | 9.7 | 9.1 | 9.2 | 8.6 | 8.4 | 8.6 | ||||||||||||||||||||||||||||||||||||
Underemployment Rate (%)(4) | 9.7 | 10.6 | 9.1 | 9.9 | 9.9 | 10.7 | 10.1 | 9.7 | 9.4 | 9.3 | 9.0 | 8.6 | ||||||||||||||||||||||||||||||||||||
2018 | ||||||||||||||||||||||||||||||||||||||||||||||||
Jan | Feb | Mar | Apr | May | Jun | Jul | Aug | Sept | Oct | Nov | Dec | |||||||||||||||||||||||||||||||||||||
Labor Force (in thousands) | 24,470 | 24,485 | 24,361 | 25,041 | 24,871 | 24,907 | 24,735 | 24,964 | 25,082 | 25,400 | 24,618 | 25,425 | ||||||||||||||||||||||||||||||||||||
|
|
|
|
|
|
|
|
|
|
|
|
|
|
|
|
|
|
|
|
|
|
|
| |||||||||||||||||||||||||
Employed (in thousands)(1) | 21,591 | 21,840 | 22,062 | 22,671 | 22,451 | 22,645 | 22,331 | 22,678 | 22,704 | 23,098 | 22,462 | 22,953 | ||||||||||||||||||||||||||||||||||||
Participation Rate (%)(2) | 63.2 | 63.3 | 62.9 | 64.6 | 64.1 | 64.1 | 63.6 | 64.1 | 64.4 | 65.1 | 63.1 | 65.1 | ||||||||||||||||||||||||||||||||||||
Unemployment Rate (%)(3) | 11.8 | 10.8 | 9.4 | 9.5 | 9.7 | 9.1 | 9.7 | 9.2 | 9.5 | 9.1 | 8.8 | 9.7 | ||||||||||||||||||||||||||||||||||||
Underemployment Rate (%)(4) | 8.8 | 9.5 | 9.7 | 10.0 | 9.3 | 9.6 | 10.0 | 9.7 | 10.9 | 10.4 | 9.9 | 10.1 |
D-59
2019 | ||||||||||||||||||||||||||||||||||||||||||||||||
Jan | Feb | Mar | Apr | May | Jun | Jul | Aug | Sept | Oct | Nov | Dec | |||||||||||||||||||||||||||||||||||||
Labor Force (in thousands) | 24,827 | 25,015 | 24,796 | 24,420 | 24,775 | 24,975 | 24,797 | 24,793 | 24,761 | 25,304 | 25,206 | 25,159 | ||||||||||||||||||||||||||||||||||||
|
|
|
|
|
|
|
|
|
|
|
|
|
|
|
|
|
|
|
|
|
|
|
| |||||||||||||||||||||||||
Employed (in thousands)(1) | 21,650 | 22,071 | 22,114 | 21,896 | 22,164 | 22,618 | 22,140 | 22,116 | 22,230 | 22,813 | 22,874 | 22,761 | ||||||||||||||||||||||||||||||||||||
Participation Rate (%)(2) | 63.5 | 63.9 | 63.2 | 62.2 | 63.1 | 63.5 | 63.0 | 62.9 | 62.8 | 64.1 | 63.7 | 63.6 | ||||||||||||||||||||||||||||||||||||
Unemployment Rate (%)(3) | 12.8 | 11.8 | 10.8 | 10.3 | 10.5 | 9.4 | 10.7 | 10.8 | 10.2 | 9.8 | 9.3 | 9.5 | ||||||||||||||||||||||||||||||||||||
Underemployment Rate (%)(4) | 10.9 | 10.7 | 10.5 | 10.9 | 11.1 | 10.8 | 10.1 | 10.6 | 10.6 | 10.8 | 10.5 | 10.6 | ||||||||||||||||||||||||||||||||||||
2020 | ||||||||||||||||||||||||||||||||||||||||||||||||
Jan | Feb | Mar | Apr | May | Jun | Jul | Aug | Sept | Oct | Nov | Dec | |||||||||||||||||||||||||||||||||||||
Labor Force (in thousands) | 24,761 | 25,051 | 23,500 | 20,607 | 21,956 | 22,877 | 22,542 | 23,662 | 24,020 | 24,926 | 24,585 | 24,714 | ||||||||||||||||||||||||||||||||||||
|
|
|
|
|
|
|
|
|
|
|
|
|
|
|
|
|
|
|
|
|
|
|
| |||||||||||||||||||||||||
Employed (in thousands)(1) | 21,545 | 22,006 | 20,531 | 16,525 | 17,262 | 18,345 | 17,984 | 19,697 | 20,232 | 21,275 | 21,313 | 21,409 | ||||||||||||||||||||||||||||||||||||
Participation Rate (%)(2) | 62.5 | 63.2 | 59.2 | 51.8 | 55.2 | 57.4 | 56.5 | 59.3 | 60.1 | 62.3 | 61.4 | 61.7 | ||||||||||||||||||||||||||||||||||||
Unemployment Rate (%)(3) | 13.0 | 12.2 | 12.6 | 19.8 | 21.4 | 19.8 | 20.2 | 16.8 | 15.8 | 14.7 | 13.3 | 13.4 | ||||||||||||||||||||||||||||||||||||
Underemployment Rate (%)(4) | 11.0 | 11.0 | - | * | - | * | - | * | - | * | - | * | 9.7 | 9.8 | 10.7 | 10.3 | 10.1 | |||||||||||||||||||||||||||||||
2021 (5) | ||||||||||||||||||||||||||||||||||||||||||||||||
Jan | Feb | Mar | Apr | May | Jun | Jul | Aug | Sept | Oct | Nov | Dec | |||||||||||||||||||||||||||||||||||||
Labor Force (in thousands) | 23,176 | 23,884 | 23,564 | 23,377 | 23,573 | 23,517 | 23,483 | 23,614 | 23,491 | 23,958 | 24,040 | 24,178 | ||||||||||||||||||||||||||||||||||||
|
|
|
|
|
|
|
|
|
|
|
|
|
|
|
|
|
|
|
|
|
|
|
| |||||||||||||||||||||||||
Employed (in thousands)(1) | 19,106 | 20,162 | 20,094 | 19,756 | 19,989 | 20,073 | 20,417 | 20,577 | 20,681 | 21,084 | 21,267 | 21,495 | ||||||||||||||||||||||||||||||||||||
Participation Rate (%)(2) | 60.7 | 62.5 | 61.6 | 61.0 | 61.4 | 61.2 | 61.1 | 61.3 | 60.9 | 62.1 | 62.2 | 62.5 | ||||||||||||||||||||||||||||||||||||
Unemployment Rate (%)(3) | 17.6 | 15.6 | 14.7 | 15.5 | 15.2 | 14.6 | 13.1 | 12.9 | 12.0 | 12.0 | 11.5 | 11.1 | ||||||||||||||||||||||||||||||||||||
Underemployment Rate (%)(4) | 8.0 | 7.4 | 7.0 | 7.7 | 7.9 | 7.9 | 7.6 | 7.8 | 7.2 | 7.8 | 7.4 | 7.6 | ||||||||||||||||||||||||||||||||||||
2022 (5) | ||||||||||||||||||||||||||||||||||||||||||||||||
Jan | Feb | Mar | Apr | May | Jun | Jul | Aug | Sept | Oct | Nov | Dec | |||||||||||||||||||||||||||||||||||||
Labor Force (in thousands) | 24,247 | 24,893 | 24,670 | 24,718 | 24,829 | 24,817 | 24.778 | - | - | - | - | - | ||||||||||||||||||||||||||||||||||||
|
|
|
|
|
|
|
|
|
|
|
|
|
|
|
|
|
|
|
|
|
|
|
| |||||||||||||||||||||||||
Employed (in thousands)(1) | 20,696 | 21,681 | 21,680 | 21,957 | 22,185 | 22,023 | 22,055 | - | - | - | - | - | ||||||||||||||||||||||||||||||||||||
Participation Rate (%)(2) | 62.6 | 64.2 | 63.5 | 63.6 | 63.8 | 63.7 | 63.5 | - | - | - | - | - | ||||||||||||||||||||||||||||||||||||
Unemployment Rate (%)(3) | 14.6 | 12.9 | 12.1 | 11.2 | 10.6 | 11.3 | 11.0 | - | - | - | - | - | ||||||||||||||||||||||||||||||||||||
Underemployment Rate (%)(4) | 7.3 | 8.8 | 8.4 | 8.4 | 8.0 | 8.4 | 8.2 | - | - | - | - | - |
1: | To be considered employed, a person above the minimum age requirement must have worked at least one hour with remuneration or 15 hours without remuneration during the preceding week. |
2: | Participation rate is defined as the labor force divided by working age population. The working age is 12 years and above. |
3: | Unemployment rate is defined as the unemployed population divided by the labor force. |
4: | Underemployment rate is defined as the underemployed population divided by the labor force. Underemployed workers are employed workers who can perform and want additional employment, either because they work fewer than 12 hours per week and desire to work more, they consider their income insufficient or they are employed in a position unrelated to their profession or training and are therefore underproductive. |
5: | New methodology of labor market. |
-*: | Due to the change in the GEIH collection operation due to the COVID-19 pandemic, it was not possible to obtain underemployment information between the months of March and July 2020. |
n.a.: | Not available. |
Source: DANE.
D-60
National Quarterly Employment Rates by Gender (%)
2017 | 2018 | 2019 | 2020 | 2021 (1) | 2022 (1) | |||||||||||||||||||||||||||||||||||||||||||
Women | Men | Women | Men | Women | Men | Women | Men | Women | Men | Women | Men | |||||||||||||||||||||||||||||||||||||
First Quarter | 46.0 | % | 68.5 | % | 45.3 | % | 68.0 | % | 45.1 | % | 67.4 | % | 42.6 | % | 65.6 | % | 38.7 | % | 66.0 | % | 42.6 | % | 68.5 | % | ||||||||||||||||||||||||
Second Quarter | 48.7 | % | 69.6 | % | 47.7 | % | 69.2 | % | 46.0 | % | 67.6 | % | 33.1 | % | 54.7 | % | 39.1 | % | 65.9 | % | 44.5 | % | 69.9 | % | ||||||||||||||||||||||||
Third Quarter | 47.5 | % | 69.3 | % | 47.3 | % | 69.2 | % | 45.6 | % | 67.3 | % | 36.2 | % | 61.1 | % | 40.1 | % | 67.7 | % | - | - | ||||||||||||||||||||||||||
Fourth Quarter | 48.9 | % | 70.2 | % | 47.6 | % | 69.9 | % | 46.7 | % | 69.2 | % | 41.3 | % | 65.8 | % | 42.0 | % | 69.2 | % | - | - |
Source: DANE.
1: New labor market methodology.
National Quarterly Employment Rates by Sector
2017 | ||||||||||||||||
First Quarter | Second Quarter | Third Quarter | Fourth Quarter | |||||||||||||
Agriculture, fishing, hunting and forestry | 16.2 | % | 16.4 | % | 16.9 | % | 17.1 | % | ||||||||
Mining and quarrying | 0.8 | % | 1.0 | % | 1.0 | % | 0.6 | % | ||||||||
Manufacturing | 11.5 | % | 12.2 | % | 11.2 | % | 12.2 | % | ||||||||
Electricity, gas and water supply | 0.5 | % | 0.5 | % | 0.5 | % | 0.5 | % | ||||||||
Construction | 6.1 | % | 6.0 | % | 6.1 | % | 6.3 | % | ||||||||
Retail, hotels and restaurants | 27.8 | % | 26.6 | % | 27.1 | % | 27.2 | % | ||||||||
Transport, storage and communications | 8.5 | % | 8.1 | % | 7.9 | % | 7.9 | % | ||||||||
Financial intermediation | 1.4 | % | 1.4 | % | 1.4 | % | 1.3 | % | ||||||||
Real estate, renting and business activities | 8.1 | % | 8.1 | % | 8.3 | % | 8.3 | % | ||||||||
Community, social and personal services | 19.2 | % | �� | 19.8 | % | 19.7 | % | 18.6 | % | |||||||
Total | 100.0 | % | 100.0 | % | 100.0 | % | 100.0 | % |
2018 | ||||||||||||||||
First Quarter | Second Quarter | Third Quarter | Fourth Quarter | |||||||||||||
Agriculture, fishing, hunting and forestry | 17.1 | % | 16.1 | % | 16.5 | % | 17.3 | % | ||||||||
Mining and quarrying | 0.9 | % | 1.1 | % | 1.1 | % | 0.7 | % | ||||||||
Manufacturing | 11.6 | % | 12.1 | % | 11.9 | % | 12.6 | % | ||||||||
Electricity, gas and water supply | 0.6 | % | 0.6 | % | 0.6 | % | 0.5 | % | ||||||||
Construction | 5.8 | % | 6.0 | % | 6.4 | % | 6.7 | % | ||||||||
Retail, hotels and restaurants | 27.5 | % | 26.7 | % | 27.0 | % | 26.1 | % | ||||||||
Transport, storage and communications | 8.2 | % | 8.0 | % | 7.9 | % | 7.8 | % | ||||||||
Financial intermediation | 1.3 | % | 1.3 | % | 1.5 | % | 1.4 | % | ||||||||
Real estate, renting and business activities | 8.1 | % | 7.8 | % | 7.6 | % | 7.8 | % | ||||||||
Community, social and personal services | 19.0 | % | 20.3 | % | 19.6 | % | 19.0 | % | ||||||||
Total | 100.0 | % | 100.0 | % | 100.0 | % | 100.0 | % |
D-61
2019 | ||||||||||||||||
First Quarter | Second Quarter | Third Quarter | Fourth Quarter | |||||||||||||
Agriculture, fishing, hunting and forestry | 15.8 | % | 15.4 | % | 15.7 | % | 16.3 | % | ||||||||
Mining and quarrying | 0.8 | % | 1.2 | % | 0.9 | % | 0.7 | % | ||||||||
Manufacturing | 11.1 | % | 11.7 | % | 10.7 | % | 11.4 | % | ||||||||
Electricity, gas and water supply | 0.8 | % | 0.8 | % | 1.0 | % | 1.0 | % | ||||||||
Construction | 6.5 | % | 6.9 | % | 6.9 | % | 7.1 | % | ||||||||
Retail, hotels and restaurants | 26.9 | % | 25.7 | % | 26.5 | % | 26.9 | % | ||||||||
Transport, storage and communications | 8.7 | % | 8.4 | % | 8.4 | % | 8.1 | % | ||||||||
Financial intermediation | 1.5 | % | 1.4 | % | 1.5 | % | 1.3 | % | ||||||||
Real estate, renting and business activities | 7.2 | % | 7.4 | % | 7.7 | % | 7.5 | % | ||||||||
Community, social and personal services | 20.8 | % | 21.1 | % | 20.9 | % | 19.7 | % | ||||||||
Total | 100.0 | % | 100.0 | % | 100.0 | % | 100.0 | % |
2020 | ||||||||||||||||
First Quarter | Second Quarter | Third Quarter | Fourth Quarter | |||||||||||||
Agriculture, fishing, hunting and forestry | 15.4 | % | 17.3 | % | 17.9 | % | 16.8 | % | ||||||||
Mining and quarrying | 0.8 | % | 1.4 | % | 1.0 | % | 0.8 | % | ||||||||
Manufacturing | 10.9 | % | 10.5 | % | 11.0 | % | 11.6 | % | ||||||||
Electricity, gas and water supply | 1.2 | % | 1.3 | % | 1.2 | % | 1.0 | % | ||||||||
Construction | 6.8 | % | 6.1 | % | 7.2 | % | 7.2 | % | ||||||||
Retail, hotels and restaurants | 26.6 | % | 25.8 | % | 25.3 | % | 26.3 | % | ||||||||
Transport, storage and communications | 9.0 | % | 8.7 | % | 8.2 | % | 8.5 | % | ||||||||
Financial intermediation | 1.5 | % | 1.6 | % | 1.4 | % | 1.2 | % | ||||||||
Real estate, renting and business activities | 7.7 | % | 7.8 | % | 7.3 | % | 7.3 | % | ||||||||
Community, social and personal services | 20.0 | % | 19.4 | % | 19.6 | % | 19.3 | % | ||||||||
Total | 100.0 | % | 100.0 | % | 100.0 | % | 100.0 | % |
2021 | ||||||||||||||||
First Quarter | Second Quarter | Third Quarter | Fourth Quarter | |||||||||||||
Agriculture, fishing, hunting and forestry | 15.6 | % | 15.4 | % | 15.3 | % | 15.0 | % | ||||||||
Mining and quarrying | 1.1 | % | 1.3 | % | 1.2 | % | 1.3 | % | ||||||||
Manufacturing | 10.0 | % | 10.3 | % | 10.4 | % | 10.1 | % | ||||||||
Electricity, gas and water supply | 1.1 | % | 1.3 | % | 1.4 | % | 1.2 | % | ||||||||
Construction | 7.5 | % | 7.2 | % | 7.3 | % | 7.2 | % | ||||||||
Retail, hotels and restaurants | 24.9 | % | 24.8 | % | 24.6 | % | 24.8 | % | ||||||||
Transport, storage and communications | 8.6 | % | 8.6 | % | 9.0 | % | 9.1 | % | ||||||||
Financial intermediation | 1.8 | % | 1.8 | % | 1.9 | % | 1.7 | % | ||||||||
Real estate, renting and business activities | 8.7 | % | 9.0 | % | 9.1 | % | 9.3 | % | ||||||||
Community, social and personal services | 20.4 | % | 20.2 | % | 19.7 | % | 19.9 | % | ||||||||
Total | 100.0 | % | 100.0 | % | 100.0 | % | 100.0 | % |
D-62
2022 | ||||||||||||||||
First Quarter | Second Quarter | Third Quarter | Fourth Quarter | |||||||||||||
Agriculture, fishing, hunting and forestry | 14.7 | % | 15.0 | % | - | - | ||||||||||
Mining and quarrying | 1.2 | % | 1.3 | % | - | - | ||||||||||
Manufacturing | 10.6 | % | 10.3 | % | - | - | ||||||||||
Electricity, gas and water supply | 1.5 | % | 1.4 | % | - | - | ||||||||||
Construction | 7.2 | % | 7.0 | % | - | - | ||||||||||
Retail, hotels and restaurants | 25.1 | % | 24.4 | % | - | - | ||||||||||
Transport, storage and communications | 9.0 | % | 9.3 | % | - | - | ||||||||||
Financial intermediation | 1.9 | % | 1.8 | % | - | - | ||||||||||
Real estate, renting and business activities | 8.7 | % | 8.6 | % | - | - | ||||||||||
Community, social and personal services | 20.2 | % | 20.9 | % | - | - | ||||||||||
Total | 100.0 | % | 100.0 | % | - | - |
Source: DANE. Calculations: Ministry of Finance.
According to the new methodology, on December 2021, the average unemployment rate in the 13 largest urban areas was of 11.4% In December 2020, the average unemployment rate in the 13 largest urban areas decreased to 15.6%, compared to 10.5% for the same period in 2019. The retail, hotels and restaurants and community, social and personal services subsectors, the agriculture, hunting, forestry and fishing sector and the manufacturing sector accounted for the most employment. On December 31, 2019, the national unemployment rate was 9.5%, a decrease from the unemployment rate of 9.7% on December 31, 2018. The months of March, April, May, June and July of 2020 registered a rapid increase of the unemployment rate due to the outbreak of the COVID-19 pandemic and the lockdowns and restrictions implemented to control the spread of the virus. From August 2020 onwards the unemployment rate started to decrease as a consequence of the staggered reopening of the Colombian economy and the programs implemented by the Government to stimulate the economy and the employment. As of May 2022, the national unemployment rate was 10.6% and the unemployment rate from the 13 main cities was 11.0%.
In December 1990, the Government enacted legislation to permit greater flexibility in labor contracts by eliminating ambiguities over non-wage benefits and eliminating restrictions regarding severance and furlough of workers. The same law also modified the unemployment benefits system to allow workers to elect private sector management of their severance funds. The Colombian Labor Code now requires employers, on an annual basis, to transfer severance payments equal to one month of salary plus 12% interest to the severance administration fund chosen by each employee. Employees only have access to these severance funds upon termination of their employment or, prior to termination, under special circumstances, including the purchase or improvement of a residence and the payment of qualifying tuition payments. A severance fund becomes available regardless of whether an employee is terminated involuntarily or resigns; the fund is not conditioned on unemployment and workers can receive severance funds while searching for a new job. Colombia does not have an unemployment fund. However, Law 1636 of 2013 established the Loss Protection Mechanism (Mecanismo de Protección al Cesante), which seeks to assist the unemployed through a series of policies and initiatives to mitigate the effects of unemployment and facilitate their reintroduction into the work force, including receipt of monetary benefits, if eligible.
Under legislation enacted in 1993 to partially privatize the pension system, employees may elect that their pension contributions (both employee and employer derived) be deposited with private pension administrators. If no such election is made, the funds will continue to be managed by the Instituto de Seguros Sociales (Social Security Institute, or “ISS”), and from 2002, by the Administradora Colombiana de Pensiones (COLPENSIONES). The Government guarantees both privately managed pensions and the ISS fund. The partial privatization of the pension system was intended to increase the efficiency of pension management, while injecting a new source of funds into local capital markets. The privately administered pension funds have more investment flexibility, having investment options including government obligations, certificates of deposit, bonds, commercial paper and, up to certain limits, equity securities. The 1993 law also allowed private companies to offer health and worker’s compensation insurance.
D-63
Because of a pension reform approved in 2002, starting in 2014 the retirement age was raised from 60 to 62 for men and from 55 to 57 for women. The minimum number of weekly pension payments required for retirement has been gradually increased from 1,000 in 2005 to 1,300 in 2015.
Wages for workers in the public sector are customarily established at the beginning of each calendar year. Private sector wages are subject to the minimum wage set annually by the Government at the beginning of each calendar year. The following table shows the monthly minimum wage rates set by the Government and the real wage index for each of the years indicated:
Monthly Minimum Wage and Real Wage Index
Year | Monthly Minimum Wage | Percentage change | Real Wage Index(1) | |||||||||
(in nominal pesos) | (2014=100) | |||||||||||
2016 | 689,455 | 7.0 | 100.1 | |||||||||
2017 | 737,717 | 7.0 | 102.4 | |||||||||
2018 | 781,242 | 5.9 | 103.5 | |||||||||
2019 | 828,116 | 6.0 | 104.5 | |||||||||
2020 | 877,802 | 6.0 | 99.3 | |||||||||
2021 | 908,526 | 3.5 | 105.5 | |||||||||
2022 | 1,000,000 | 10.1 | 107.2 |
1: | Real Wage Index is the nominal monthly minimum wage corrected for changes in purchasing power measured by the consumer price index. |
Sources: Ministry of Social Security and DANE. Calculations by the General Directorate of Macroeconomic Policy – Ministry of Finance.
Poverty
In September 2020, the DANE released a new methodology that changed the poverty line and the classification of family aggregate income.
D-64
The following table shows the percentage of the population with incomes below the poverty line for the years indicated following the new methodology.
Poverty in Colombia(1)
(Percentage of population below poverty line)
2017 | 35.2 | % | ||
2018 | 34.7 | % | ||
2019 | 35.7 | % | ||
2020 | 42.5 | % | ||
2021 | 39.3 | % |
(1): | The poverty line represents a monetary value in which two components are considered: the cost to acquire a basic food basket and the cost of other goods and services, expressed based on the ratio between total expenses and food expenses. The new methodology incorporates different variables beyond the household income. |
Source: DANE.
Although Colombia does not have a welfare system, the Government modified the pension system in 1993 to serve social welfare needs, as discussed above. For further discussion of the pension system, see “Public Sector Finance—Public Sector Accounts—Expenditures” below. Also in 1993, legislation created a decentralized health care system which should, in the long term, provide subsidized care to the entire population.
Other initiatives undertaken by the Government to alleviate poverty in Colombia include a program called “De Cero a Siempre”, which sought to promote and ensure children’s comprehensive development from birth until the age of six. On May 25, 2016, a plenary session of the Senate approved the bill which established this program as a permanent policy. Furthermore, the Government continued to develop the “Families in Action” program, a monetary transfer program originally instituted in 2000 that sought to reduce poverty and income inequality by encouraging poor families to make certain commitments in education and health. In 2007, the Government also implemented the “Women Savers in Action Program”, which seeks to promote the autonomy and empowerment of women, as well as the “Income Generation and Employability Program”, which aims to provide job training and encourage entrepreneurship.
D-65
FOREIGN TRADE AND BALANCE OF PAYMENTS
General
In June 2014, Banco de la República adopted the sixth edition of the IMF’s Balance of Payments Manual framework, which has been implemented in balance of payments statistics from 2000 onward. The key changes from the fifth edition to the sixth edition of the IMF’s Balance of Payments Manual methodology include the reclassification of accounts within the balance of payments. On the current account side, a financial intermediation services account (FISIM) has been created and is included within the services account. The corresponding information was previously incorporated in the income line. On the capital account side, loans between affiliates (for nonfinancial sector companies), which had previously been incorporated within the loans account, are now included in the direct investment account. Furthermore, changes in the format for the presentation of information have been incorporated. Additionally, measurements of exports in the table “Balance of Payments” are different from the table “Exports (FOB) by Group of Products” and from the table “Trends in the Composition of Exports”, because these two latter tables do not incorporate special trade operations and commerce from the Free Trade Zones.
According to statistics compiled by Banco de la República, total trade in goods, including exports and imports, increased 8.5% in 2017, increased 10.2% in 2018, decreased 1.3% in 2019, decreased 19.4% in 2020 and increased 35.3% in 2021. In 2017, direct investment increased by $0.6 billion, or 7.2% compared to 2016, mainly due to an increase in equity and investment funds of $2,721 million. In 2018, direct investment decreased by $3.8 billion, or 38.3%, due to a decrease in net incurrence of liabilities of $2.4 billion, mainly due to a decrease of equity and investment funds of $2.2 billion. In 2019, direct investment increased by $4.7 billion, or 75.6%, mainly due to an increase in net incurrence of liabilities of $2.7 billion due to an increase of equity and investment funds of $2.0 billion. In 2020, direct investment decreased by $5.0 billion, or 46.7%, mainly due to a decrease in net incurrence of liabilities of $6.5 billion due to a decrease of equity and investment funds of $6.6 billion. In 2021, direct investment increased by $0.4 billion, or 6.5%, mainly due to an increase in net incurrence of liabilities of $1.9 billion due to an increase of equity and investment funds of $1.9 billion. In the first quarter of 2022, total trade in goods, including exports and imports, increased 47.2% compared to the same period of 2021, and direct investment increased by $2.0 billion, or 105.1%, mainly due to an increase in net incurrence of liabilities of $2.5 billion due to an increase in equity and investment fund participations and debt instruments.
Banco de la República’s net international reserves increased by 2.0% in 2017, 1.6% in 2018, 9.9% in 2019 and 11.0% in 2020, and decreased by 0.8% in 2021. As of August 2022, net international reserves decreased by 2.7%.
Balance of Payments
Colombia’s current account registered deficits from 2017 to 2021, recording shortfalls of $9,924 million in 2017, $14,041 million in 2018, $14,808 in 2019, $9,258 million in 2021 and $17,892 in 2022. In 2017, the trade balance registered a deficit of $4,285 million, a decrease of $4,891 from 2016. The decrease in the deficit was due to an increase in exports of $5,722 million, mainly due to an increase of $2,751 million or 59.3% in the exports of coal. In 2018, the trade balance registered a deficit of $6,394 million, an increase in the deficit of $2,109 million compared to 2017, mainly due to an increase of $5,317 million in imports primarily caused by an increase in imports of raw materials and intermediate products of $2,402 million, or 11.5%. In 2019, the trade balance registered a deficit of $9,393 million, an increase of $3,469 million compared to 2018, mainly due to a decrease of $2,337 million in exports primarily caused by a decrease in exports of coal, which decreased $1,780 million, or 23.9%. In 2020, the trade balance registered a deficit of $8,870 million, a decrease of $993 million from 2019. The lower deficit was mainly due to a decrease in imports of $9,340 million primarily caused by a decrease in imports of raw materials and intermediate products, which decreased by $4,326 million, or 18.3%, compared to 2019, and a decrease in imports of capital goods and construction materials of $3,058 million, or 18.5%, compared to 2019. In 2021, the trade balance registered a deficit of $13,984 million, an increase of $5,114 million compared to 2019, mainly due to an increase of $15,540 million in imports primarily caused by an increase in imports of raw materials and intermediate products of $10,903 million, or 56.4%. In the first quarter of 2022, the trade balance registered a deficit of $3,558 million, an increase of $971 million compared to the same period in 2021, mainly due to an increase of $5,453 million in imports primarily caused by an increase in imports of raw materials and intermediate products of $7,072 million, or 116.7% compared to the same period of 2021.
D-66
In recent years, Colombia has registered deficits in the primary income of the current account because inflows from its foreign assets have not been sufficient to offset the interest payable on its foreign liabilities. Each of the last five years ended with a deficit: $8,046 million in 2017, $11,442 million in 2018, $9,717 million in 2019, $4,957 million in 2020 and $8,358 million in 2021. In the first quarter of 2022, Colombia also registered a deficit in the primary income of the current account of $3,506 million. The secondary income category, however, registered inflows of $6,883 million in 2017, $7,957 million in 2018, $9,055 million in 2019, $8,788 million in 2020 and $10,775 million in 2021 and $3,197 in the first quarter of 2022. Of total expenditures, 48.9% corresponds to income earned by enterprises with foreign direct investment, and to a lesser extent in interest payments on debt securities, loans and other foreign credits, which decreased mainly due to a decrease in income earned by enterprises with foreign direct investment. Colombia has also continued to experience deficits in the services category in recent years because of decreased participation by Colombian shipping companies in the international freight market, falling international transport fares, reduced income from tourism and increased costs related to business and construction activities. In 2017, the deficit in the services category recorded a deterioration due to higher expenses of $14,013 million. In 2018, the deficit in the services category recorded an improvement due to a higher income of $10,731 million. Nonetheless, the deficit in the services category recorded a deterioration in 2019 due to a lower income for services of $10,668 million and higher expenses of $14,952 million. This trend continued in 2020 due to a lower income of $5,915 million. Similarly, the deficit in the services category recorded a deterioration in 2021 mainly due a to higher expenses of $14,142 despite higher income of $7,818. Net payments abroad for travel services and insurance and transportation services also contributed to the current account deficit. In the first quarter of 2022, the deficit in the services category recorded a deterioration compared to the same period in 2021, mainly due to a higher expenses of $4,157 million.
The capital account registered a deficit of $9,625 million, 22.0% lower than the deficit in 2016. Total foreign investment decreased by 17.3% compared to 2016, from $14,286 million to $11,811 million. Net direct investment increased by $671 million and net portfolio investment decreased by $3,145 million compared to 2016. In 2018, Colombia registered a capital account deficit of $12,954 million, 34.6% higher than the deficit in 2017 and total foreign investment decreased by 55.0% compared to 2017, from $11,811 million to $5,310 million. Net direct investment decreased in 2018 by $3,839 million compared to 2017, and net portfolio investment decreased by $2,662 million compared to 2017. In 2019, Colombia registered a capital account deficit of $13,298 million, 2.7% higher than the deficit in 2018. Total foreign investment increased by 103.6% compared to 2018, from $5,310 million to $10,812 million. Net direct investment increased by $4,663 million compared to 2018, and net portfolio investment increased by $838 million compared to 2018. In 2020, Colombia registered a capital account deficit of $8,1611 million, 38.6% lower than the deficit in 2019 and total foreign investment decreased by 30.0% compared to 2019, from $10,811 million to $7,565 million. Net direct investment decreased in 2020 by $5,063 million compared to 2019, and net portfolio investment increased by $1,816 million compared to 2019. In 2021, Colombia registered a capital account deficit of $16,418 million, 101.2% higher than the deficit in 2020 and total foreign investment increased by 42.5% compared to 2020, from $7,565 million to $10,778 million. Net direct investment increased in 2021 by $375 million compared to 2020, and net portfolio investment increased by $2,838 million compared to 2020. In the first quarter of 2022, Colombia registered a capital account deficit of $4,718 million, 49.2% higher than the deficit in the same period of 2021. Total foreign investment increased by 80.8% compared to the first quarter of 2021, from $1,132 million to $2,047 million. Net direct investment increased by $1,970 million and net portfolio investment increased by $1,056 million compared to the same period of 2021.
D-67
The capital account of Colombia’s balance of payments includes direct investment flows, portfolio investment flows and net changes in external indebtedness. Liberalized foreign investment regulations and aggressive privatization programs contributed to a significant increase in net foreign direct investment (i.e., foreign direct investment in Colombia less direct investment by Colombians abroad), as measured for balance of payments purposes from 2013 to 2014, although there were decreases experienced in 2015, 2016 and 2017. Net direct investment totaled $10,011 million in 2017, $6,172 million in 2018, $10,836 million in 2019, $5,773 million in 2020, $6,148 in 2021 and $3,844 million in the first quarter of 2022.
In 2017, net acquisition of financial assets decreased by $828 million and the net incurrence of liabilities decreased by $157 million. In 2018, net acquisition of financial assets increased by $1,437 million and net incurrence of liabilities decreased by $2,402 million. In 2019, net acquisition of financial assets decreased by $1,973 million and net incurrence of liabilities increased by $2,690 million. In 2020, net acquisition of financial assets decreased by $1,468 million and the net incurrence of liabilities decreased by $6,531 million. In 2021, net acquisition of financial assets increased by $1,476 million and the net incurrence of liabilities increased by $1,851 million. In the first quarter of 2022, net acquisition of financial assets increased by $513 million and the net incurrence of liabilities increased by $2,483 million compared to the same period of 2021.
The table below sets forth data on Colombia’s balance of payments as compiled in accordance with the 6th edition IMF methodology currently employed by Banco de la República.
Balance of Payments (1)(2)(3)(4)
2017 | 2018 | 2019 | 2020 | 2021 | ||||||||||||||||
(in millions of U.S. Dollars) | ||||||||||||||||||||
Account | ||||||||||||||||||||
Current account | (9,924 | ) | (14,041 | ) | (14,808 | ) | (9,258 | ) | (17,892 | ) | ||||||||||
Credit | 62,655 | 68,800 | 68,317 | 52,325 | 68,361 | |||||||||||||||
Debit | 72,579 | 82,841 | 83,125 | 61,583 | 86,253 | |||||||||||||||
Goods and services | (8,762 | ) | (10,556 | ) | (14,146 | ) | (13,089 | ) | (20,308 | ) | ||||||||||
Credit | 49,322 | 53,724 | 51,324 | 38,224 | 50,553 | |||||||||||||||
Debit | 58,083 | 64,280 | 65,470 | 51,312 | 70,861 | |||||||||||||||
Goods | (4,285 | ) | (6,394 | ) | (9,863 | ) | (8,870 | ) | (13,984 | ) | ||||||||||
Credit | 39,786 | 42,993 | 40,656 | 32,309 | 42,736 | |||||||||||||||
Debit | 44,070 | 49,387 | 50,518 | 41,179 | 56,719 | |||||||||||||||
Services | (4,477 | ) | (4,162 | ) | (4,283 | ) | (4,219 | ) | (6,325 | ) | ||||||||||
Credit | 9,536 | 10,731 | 10,668 | 5,915 | 7,818 | |||||||||||||||
Debit | 14,013 | 14,893 | 14,952 | 10,134 | 14,142 | |||||||||||||||
Primary income | (8,046 | ) | (11,442 | ) | (9,717 | ) | (4,957 | ) | (8,358 | ) | ||||||||||
Credit | 5,577 | 6,177 | 6,976 | 4,448 | 5,870 | |||||||||||||||
Debit | 13,623 | 17,619 | 16,693 | 9,405 | 14,229 | |||||||||||||||
Secondary income | 6,883 | 7,957 | 9,055 | 8,788 | 10,775 | |||||||||||||||
Credit | 7,757 | 8,899 | 10,017 | 9,654 | 11,937 | |||||||||||||||
Debit | 873 | 941 | 962 | 866 | 1,162 | |||||||||||||||
Financial account | (9,625 | ) | (12,954 | ) | (13,298 | ) | (8,161 | ) | (16,418 | ) | ||||||||||
Direct Investment | (10,011 | ) | (6,172 | ) | (10,836 | ) | (5,773 | ) | (6,148 | ) | ||||||||||
Net Acquisition of Financial Assets | 3,690 | 5,126 | 3,153 | 1,686 | 3,162 | |||||||||||||||
Equity and Investment Fund Shares | 3,386 | 3,656 | 3,301 | 2,706 | 2,905 | |||||||||||||||
Debt Instruments | 304 | 1,471 | (147 | ) | (1,020 | ) | 257 | |||||||||||||
Net Incurrence of liabilities | 13,701 | 11,299 | 13,989 | 7,459 | 9,310 | |||||||||||||||
Equity and investment fund shares | 11,907 | 9,695 | 11,578 | 4,932 | 6,825 | |||||||||||||||
Debt instruments | 1,794 | 1,604 | 2,411 | 2,527 | 2,485 | |||||||||||||||
Portfolio investment | (1,800 | ) | 862 | 24 | (1,792 | ) | (4,630 | ) | ||||||||||||
Net acquisition of financial assets | 6,012 | 1,211 | 315 | 5,747 | 3,741 | |||||||||||||||
Debt securities | 6,012 | 1,211 | 315 | 5,747 | 3,741 | |||||||||||||||
Net incurrence of liabilities | 7,812 | 349 | 291 | 7,539 | 8,372 | |||||||||||||||
Equity and investment fund shares | 472 | (823 | ) | (1,232 | ) | (454 | ) | (1,189 | ) | |||||||||||
Debt securities | 7,340 | 1,172 | 1,523 | 7,993 | 9,561 | |||||||||||||||
Financial derivatives (other than reserves) and employee stock options | 365 | 21 | 84 | (513 | ) | 365 | ||||||||||||||
Net acquisition of financial assets | (169 | ) | (473 | ) | (405 | ) | (1,081 | ) | (419 | ) | ||||||||||
Net incurrence of liabilities | (534 | ) | (494 | ) | (489 | ) | (568 | ) | (784 | ) | ||||||||||
Other investment | 1,276 | (8,852 | ) | (5,904 | ) | (4,411 | ) | (6,659 | ) |
D-68
2017 | 2018 | 2019 | 2020 | 2021 | ||||||||||||||||
(in millions of U.S. Dollars) | ||||||||||||||||||||
Net acquisition of financial assets | (264 | ) | 211 | (3,476 | ) | 3,485 | 2,996 | |||||||||||||
Net incurrence of liabilities | (1,540 | ) | 9,062 | 2,428 | 7,897 | 9,655 | ||||||||||||||
Reserve assets | 545 | 1,187 | 3,333 | 4,328 | 654 | |||||||||||||||
Net errors and omissions | 299 | 1,087 | 1,509 | 1,097 | 1,474 | |||||||||||||||
Memorandum financial account excluding reserve assets | (10,170 | ) | (14,141 | ) | (16,631 | ) | (12,490 | ) | (17,072 | ) |
1: | Data for 2021 and 2020 are preliminary and data for 2019, 2018 and 2017 are revised. |
2: | The calculation of the change in international reserves is based on the 6th edition of the IMF Balance of Payments manual, following the recommendation not to include in this calculation changes due to exchange rate and price valuations. |
3: | Other financial corporations are institutional units that provide financial services and which asset and liabilities are, in general, not available in open financial markets. |
4: | Non-financial corporations are corporations whose principal activity is the production of goods or non-financial market services. This category includes legally established companies, branches of non-resident corporations, quasi-corporations, hypothetical resident land owner’s units and resident non-profit institutions that are market producers of goods and nonfinancial services. |
Source: Banco de la República — Economic Studies.
Foreign Trade
Colombia’s trade has historically been, and continues to be, dominated by the export of raw materials and the import of intermediate and capital goods. Most consumer goods have traditionally been produced locally. Producers of these consumer goods had enjoyed the protection of high import tariffs and other trade barriers. Since the early 1990s, Colombia has reduced trade barriers, opening the economy to foreign competition. Imports (CIF) of consumer goods decreased by 0.1% in 2017 compared to 2016, increased by 10.2% in 2018 compared to 2017 and 3.7% in 2019 compared to 2018, decreased by 14.5% in 2020 compared to 2019 and increased 25.9% in 2021 compared to 2020. As of June 2022, imports (CIF) of consumer goods were $7,492 million according to preliminary figures from DANE.
Whereas tariffs used to be a means to raise tax revenues to address fiscal deficits, tariffs are now regarded as a commercial policy instrument rather than a revenue source. In addition, changes to tariff rates have become less common due to Colombia’s participation in the Andean Community common external tariff agreement, which implemented common external tariffs in February 1995. See “—Geographic Distribution of Trade” for more information on the Andean Community.
Despite the free-trade policies adopted in recent years, the Government continues to recognize the special needs of some local producers. The program known as “Programa de Protección de Ingresos para Productores de Bienes Agrícolas Exportables” (“Foreign Exchange Hedging Program” or “FEHP”) benefits producers of flowers and bananas, among other sectors. The program is expected to help the agricultural sector with a subsidy on the cost of exchange rate hedges. After it became the operator of the program on February 15, 2008, the Fondo para Financiamiento del Sector Agropecuario (Agricultural Sector Financing Fund or “Finagro”) established the subsidy to be between 70% and 90% of the cost of the exchange rate hedge, depending on the duration of the transaction, as well as the maximum hedge amount by producer and the maximum subsidy limit. According to Finagro, as of December 31, 2014, Ps. 15.5 billion had been spent, which represented an execution of 98% of budgeted expenses for the program. The FEHP was inoperative in 2015 and 2016. However, the Ministry of Agriculture allocated approximately Ps. 35,000 million to capitalize the National Agricultural Risk Fund (Fondo Nacional de Riesgos Agropecuarios). In 2017, 2018, 2019, 2020 and 2021, the FEHP was not active and the Ministry of Agriculture did not allocate budget to the program due to the exchange rate levels.
Colombia’s customs system, which is part of the Plan Vallejo (discussed further below under “—Exports”), is designed to foster investment in the export sector. Plan Vallejo includes simplified procedures for large exporters, special export grants, exemptions for the importation of raw materials and storage of foreign merchandise free of tariffs under certain conditions.
D-69
Exports
Commodities, particularly coffee, petroleum and coal, traditionally have been Colombia’s most important exports. In 1995, coffee accounted for 18.0% of exports while oil and its derivatives accounted for 21.5% of total exports. Over the next two decades, the relative importance of the two commodities changed significantly, and in 2015 coffee accounted for an estimated 7.0% of total exports while oil and its derivatives accounted for 40.4% of total exports. Historically, the value of coffee exports began to decline in 1987 and accelerated with the price drop that followed the collapse of the International Coffee Agreement in 1989, an arrangement among coffee producing and consuming countries to stabilize coffee prices. Beginning in 1993, coffee exports recovered somewhat due to the effort led by Colombia to limit the world supply of coffee through an agreement with the World Association of Coffee Producing Countries, but coffee exports subsequently declined and are expected to remain a smaller portion of total exports than oil and its derivatives. Coffee exports have increased from $2,447 million in 2020 to $3,092 million in 2021 according to preliminary figures from Banco de la República and have increased from $1,126 million in May 2021 to $1,668 million in the same period of 2022. The weighted average price of coffee exported by Colombian producers in 2021 increased by 27.3% to $2.03 per pound in 2021 from an average price of $1.60 per pound in 2020. The volume of coffee exports decreased by 1.2% in 2021 compared with the volume exported in 2020.
In 2017, exports of oil and its derivatives increased by 23.3%, from $10,796.0 million FOB in 2016 to $13,308.0 million FOB in 2017. This was mainly due to the growth in external sales of hard coal, coke and briquettes (59.3%) and oil, petroleum and related products (21.0%). In 2018, exports of oil and its derivatives increased by 26.6%, from $13,308.0 million FOB in 2017 to $16,843.0 million FOB in 2018. External sales of oil and its derivatives made the largest contribution to the growth of oil exports representing 27.3% of the growth. In 2019, exports of oil and its derivatives decreased by 5.2%, from $16,843.0 million FOB in 2018 to $15,962.0 million FOB in 2018. Oil exports decreased mainly due to a drop in sales of hard coal, coke and briquettes (-23.9%). In 2020, exports of oil and its derivatives decreased by 45.2%, from $15,962.0 million FOB in 2019 to $8,755.0 million FOB in 2020. Oil exports decreased mainly due to a drop in sales of oil and its derivatives (-45.2%). In 2021, exports of oil and its derivates increased by 54.37%, from 8,755 million FOB in 2020 to $13,514 FOB in 2021. Oil exports increased mainly due to the growth in the external sales of oil and its derivates. As of July 2022, exports of oil and its derivatives increased by 71.03%, from $7,289 million FOB in the same period of 2021 to $12,125 million FOB. Oil exports increased mainly due to a growth in sales of oil and its derivatives (71.3%).
Nontraditional exports, which include products such as shrimp, bananas, flowers, emeralds and manufactured goods, have increased in recent years. Nontraditional exports, including emeralds, increased from $14,450 million in 2017 to $18,603 million in 2021 and accounted for 44.9% of exports in 2021. As of May 2022, nontraditional exports increased from $5,741 million to $6,795 million compared to the same period in 2021 and accounted for 37.0% of exports in 2022. Industrial exports decreased from $9,300 million in 2017 to $10,970 million in 2021. During 2021, chemicals; food, beverages and tobacco; and textiles and apparel were the sectors with the greatest share of total exports from the industry group representing 9.3%, 5.6% and 3.1% of total exports, respectively.
Since 2004, the Government has been pursuing steps to promote exports, including:
• | the formation of regional foreign trade advisory committees, which coordinate the knowledge and expertise of both the private sector and the Government by exchanging initiatives and information, drafting proposals for overall programs and strategies, and implementing trade-related actions. These committees promote industry in areas conducive to exports, such as municipalities with shipping ports; |
• | the formation of free trade zones — special enclaves which offer exchange, tax, customs and trade incentives to increase and diversify the production of goods and services for overseas markets. Industrial free trade zones may be used for goods and services, tourism promotion and science parks; and |
• | the creation of EXPOPYME — a program that supports small and medium-size companies and provides business advice for entrepreneurs seeking export opportunities. |
D-70
The Government currently assists exporters through the Plan Vallejo, also known as Special System of Imports and Exports, a Government program that started in 2002, under which producers of goods intended for overseas markets may obtain partial or total exemptions from customs duties and taxes on imported raw materials, capital goods, intermediate goods and spare parts, as long as they are incorporated into the goods or services to be exported. In 2008, the Government extended the benefits of Plan Vallejo by removing the duties on imports of machinery and equipment for 30 different categories of services. Services sectors such as tourism, software development, construction, communications and transport, among others, benefitted from the expansion of Plan Vallejo. In 2017, the Government added 636 new tariff items, including capital goods and machinery, which became part of the category of goods that can benefit from the advantages offered by the Vallejo Plan. This increased the amount of goods which can be imported into the country without tariffs and with deferred VAT from 1,500 to 2,136. On February 26, 2020, the Government modernized Plan Vallejo, adapting it to current market circumstances and making the list of goods benefiting from the program more flexible, increasing its accessibility to small and medium-sized companies, mainly in the services sector. In addition, the temporary importation of supplies such as industrial machinery and equipment, computer equipment and its accessories, equipment for the health and telecommunications sectors, was authorized. The modification also includes external purchases in the aeronautical sector. On February 18, 2021, the Government renewed Plan Vallejo through Plan Vallejo Exprés, which included measures to cut the time to approve applications to the plan, make flexible the commitments to export the products prepared with the goods, spare parts and raw materials imported without tariffs and with deferred VAT and set flexible requirements for the export of services. These measures aim to increase the number of users or programs under Plan Vallejo by 30% between 2021 and 2022. On March 16, 2022, through Decree 379, the Ministry of Commerce, Industry and Tourism extended until December 2023 the deadline to access the benefits of the Plan Vallejo Exprés, with the aim of continuing to promote the productive activities of the business sector, the generation of employment and the facilitation of foreign trade operations. To date, 53 companies (programs) have joined to the Plan Vallejo Exprés, of which 42 correspond to raw materials and supplies and 11 to capital goods.
The following table shows the trends in the composition of Colombia’s exports for the years indicated, based on the export figures maintained by Banco de la República for balance of payments purposes.
Trends in the Composition of Exports(1)
2012, 2015, 2018 and 2021(2)
(millions of U.S. dollars and percentage of total exports) | ||||||||||||||||||||||||||||||||
2012 | 2015 | 2018 | 2021 | |||||||||||||||||||||||||||||
Exports (FOB): | ||||||||||||||||||||||||||||||||
Oil and its Derivatives | $ | 31,497 | 52.7 | % | $ | 14,518 | 40.7 | % | $ | 16,843 | 40.5 | % | $ | 13,513 | 33.2 | % | ||||||||||||||||
Coffee | $ | 1,910 | 3.2 | % | $ | 2,527 | 7.1 | % | $ | 2,268 | 5.5 | % | $ | 3,092 | 7.6 | % | ||||||||||||||||
Coal | $ | 7,805 | 13.0 | % | $ | 4,560 | 12.8 | % | $ | 7,448 | 17.9 | % | $ | 5,652 | 13.9 | % | ||||||||||||||||
Nickel and Gold | $ | 4,263 | 7.1 | % | $ | 1,512 | 4.2 | % | $ | 1,782 | 4.3 | % | $ | 3,130 | 7.7 | % | ||||||||||||||||
Nontraditional Exports (2) | $ | 14,346 | 24.0 | % | $ | 12,522 | 35.1 | % | $ | 13,235 | 31.8 | % | $ | 15,371 | 37.7 | % | ||||||||||||||||
|
|
|
|
|
|
|
|
|
|
|
|
|
|
|
| |||||||||||||||||
Total Exports | $ | 59,821 | 100.0 | % | $ | 35,638 | 100.0 | % | $ | 41,575 | 100.0 | % | $ | 40,758 | 100.0 | % | ||||||||||||||||
|
|
|
|
|
|
|
|
|
|
|
|
|
|
|
|
Totals may differ due to rounding.
1: | Figures are based on the recommendations contained in the sixth edition of the IMF´s Balance of Payments Manual. Does not incorporate special trade operations. Total Exports figures from the Balance of Payments table include commerce from Free Trade Zones not included in DANE´s figures. |
2: | Preliminary figures. |
3: | Includes emeralds but does not include gold. |
Source: DANE and Banco de la República—Economic Studies.
Exports of goods (according to Banco de la República) increased by 32.3% in 2021 compared to 2020, principally due to a 35.7% increase in exports of coal and a 54.4% increase in exports of oil and its derivatives. Nontraditional exports including emeralds increased by 22.0%, from $15,253 million in 2020 to $18,603 million in 2021. Among industrial exports, the largest increases among the categories of specifically identified export products were registered by iron and steel industries, which increased by 59.0%, wood and its derivates, which increased by 39.0% and textiles and apparel, which increased by 37.8%. Exports of goods in 2021 totaled approximately $40,758 million, including oil and its derivatives (33.2% of total exports), coal (13.9% of total exports), coffee (7.6% of total exports), emeralds (0.3% of total exports), gold (6.4% of total exports), nickel (1.3% of total exports) and nontraditional exports (44.9% of total exports).
D-71
The following tables show the composition of Colombia’s exports and the volume and price of Colombia’s leading exports for the years indicated.
Exports (FOB) by Group of Products
(millions of U.S. dollars)
2017 | 2018 | 2019(1) | 2020(1) | 2021(1) | ||||||||||||||||
Mining | ||||||||||||||||||||
Oil and its Derivatives | $ | 13,308 | $ | 16,843 | $ | 15,961 | $ | 8,749 | $ | 13,513 | ||||||||||
Coal | 7,390 | 7,448 | 5,668 | 4,166 | 5,652 | |||||||||||||||
Emeralds | 145 | 138 | 128 | 35 | 114 | |||||||||||||||
Nickel | 361 | 558 | 545 | 435 | 528 | |||||||||||||||
Gold(2) | 1,306 | 1,224 | 1,442 | 2,356 | 2,602 | |||||||||||||||
Others(3) | 156 | 154 | 131 | 162 | 276 | |||||||||||||||
Total | $ | 22,666 | $ | 26,365 | $ | 23,875 | $ | 15,904 | $ | 22,686 | ||||||||||
Agriculture, Livestock, Forestry and Fishing, except Coffee | 2,972 | 3,056 | 3,196 | 3,374 | 4,011 | |||||||||||||||
Coffee | 2,514 | 2,268 | 2,273 | 2,447 | 3,092 | |||||||||||||||
Industry | ||||||||||||||||||||
Food, Beverages and Tobacco | 1,815 | 1,916 | 1,822 | 1,997 | 2,272 | |||||||||||||||
Textiles and Apparel(4) | 1,092 | 1,161 | 1,134 | 915 | 1,261 | |||||||||||||||
Wood and its Derivatives | 79 | 93 | 86 | 81 | 113 | |||||||||||||||
Paper and its Byproducts | 310 | 325 | 334 | 274 | 296 | |||||||||||||||
Chemicals | 3,049 | 3,209 | 3,156 | 2,894 | 3,799 | |||||||||||||||
Nonmetallic Minerals | 309 | 325 | 276 | 241 | 304 | |||||||||||||||
Iron and Steel Industries | 813 | 932 | 896 | 744 | 1,182 | |||||||||||||||
Machinery and Equipment | 879 | 869 | 876 | 844 | 989 | |||||||||||||||
Other Industries(5) | 955 | 1,057 | 1,115 | 684 | 753 | |||||||||||||||
|
|
|
|
|
|
|
|
|
| |||||||||||
Total | 9,300 | 9,887 | 9,693 | 8,673 | 10,970 | |||||||||||||||
|
|
|
|
|
|
|
|
|
| |||||||||||
Total Exports | $ | 37,452 | $ | 41,575 | $ | 39,037 | $ | 30,397 | $ | 40,758 | ||||||||||
|
|
|
|
|
|
|
|
|
|
Totals may differ due to rounding.
1: | Preliminary. |
2: | The gold figures in this table represent the amount of gold transactions officially registered with Banco de la República. |
3: | Includes salt, clay and sand mining and manufacture of fertilizers, chemicals and other products. |
4: | Includes leather, leather products and plastic. |
5: | Includes jewelry, musical instruments, sporting goods and other products. |
Source: | DANE and Banco de la República. Figures are based on the recommendations contained in the sixth edition of the IMF´s Balance of Payments Manual. Does not incorporate special trade operations. Total Exports figures included under the Balance of Payments table above include commerce from Free Trade Zones that are not included in DANE´s Total Exports statistics. |
Volume and Price of Leading Exports
2017 | 2018 | 2019(1) | 2020(1) | 2021(1) | ||||||||||||||||
Crude Oil Export Volume (thousands of barrels/day) | 653 | 609 | 617 | 552 | 470 | |||||||||||||||
Crude Oil Price ($/barrel) | 47.7 | 62.9 | 58.3 | 35.8 | 66.0 | |||||||||||||||
Coffee Export Volume (millions of 60 kg. bags) | 11.8 | 11.8 | 12.5 | 11.6 | 11.4 | |||||||||||||||
Coffee Price ($/lb. ex dock) | 1.60 | 1.45 | 1.37 | 1.60 | 2.03 |
1: | Preliminary. |
Source: Banco | de la República and Federación Nacional de Cafeteros. |
D-72
In 2020, the total volume of crude oil exported decreased by 14.9%, while the average price of crude oil exported by Colombia increased by 84.5% from $35.8 per barrel in 2020 to $66.0 per barrel in 2021. The weighted average price of coffee exported by Colombian producers increased to $2.03 per pound in 2021 from $1.60 per pound in 2020, an increase of 27.3%. The volume of coffee exports decreased by 1.2% from 11.6 million bags in 2020 to 11.4 million bags in 2021.
Imports
Imports (CIF) increased by 2.6% in 2017, 11.2% in 2018 and 2.9% in 2019, each as compared to the prior year. Imports (CIF) decreased by 17.5% in 2020 compared to 2019 and increased by 40.5% in 2021 compared to 2020. In 2021, imports of consumer goods increased by 25.9%, imports of raw materials and intermediate goods increased by 56.4% and imports of capital goods increased by 29.3%, in each case compared to 2020. In 2021, consumer goods comprised 22.1% of total imports, raw materials and intermediate goods accounted for 49.5% of total imports and capital goods comprised 28.4% of total imports.
The following table shows the composition of Colombia’s major imports for the last five years.
Imports (CIF)
% of total | ||||||||||||||||||||||||
2017 | 2018(1) | 2019(1) | 2020(1) | 2021(1) | 2021(1) | |||||||||||||||||||
(millions of U.S. dollars) | ||||||||||||||||||||||||
Consumer Goods | 10,960 | 12,098 | 12,543 | 10,721 | 13,497 | 22.1 | % | |||||||||||||||||
Non-Durable | 6,018 | 6,500 | 6,809 | 6,511 | 7,506 | 12.3 | % | |||||||||||||||||
Durable | 4,942 | 5,598 | 5,734 | 4,210 | 5,990 | 9.8 | % | |||||||||||||||||
Automobiles | 2,497 | 2,862 | 3,036 | 2,076 | 3,187 | 5.2 | % | |||||||||||||||||
Arms and Military Equipment | 40 | 31 | 34 | 42 | 52 | 0.1 | % | |||||||||||||||||
Others | 2,404 | 2,705 | 2,663 | 2,093 | 2,751 | 4.5 | % | |||||||||||||||||
Raw Materials and Intermediate Goods | 20,936 | 23,338 | 23,653 | 19,327 | 30,231 | 49.5 | % | |||||||||||||||||
Fuels(2) | 3,713 | 3,540 | 4,491 | 2,147 | 3,773 | 6.2 | % | |||||||||||||||||
Electric | 2 | 5 | 55 | 64 | 7 | 0.0 | % | |||||||||||||||||
Agricultural | 1,865 | 2,039 | 2,006 | 2,098 | 2,936 | 4.8 | % | |||||||||||||||||
Industrial | 15,355 | 17,755 | 17,102 | 15,018 | 23,514 | 38.5 | % | |||||||||||||||||
Industrial, Chemical and Pharmaceutical Products | 6,873 | 7,854 | 7,583 | 6,765 | 10,825 | 17.7 | % | |||||||||||||||||
Mineral Products | 3,984 | 4,670 | 4,398 | 3,537 | 6,039 | 9.9 | % | |||||||||||||||||
Non-Food Agricultural Products | 2,081 | 2,517 | 2,258 | 1,804 | 2,616 | 4.3 | % | |||||||||||||||||
Food Products | 2,418 | 2,714 | 2,862 | 2,912 | 4,034 | 6.6 | % | |||||||||||||||||
Capital Goods | 14,163 | 15,781 | 16,488 | 13,429 | 17,359 | 28.4 | % | |||||||||||||||||
Construction Materials | 1,461 | 1,610 | 1,649 | 1,085 | 1,828 | 3.0 | % | |||||||||||||||||
Agricultural | 186 | 155 | 135 | 132 | 168 | 0.3 | % | |||||||||||||||||
Transportation | 3,689 | 4,219 | 4,659 | 3,303 | 4,558 | 7.5 | % | |||||||||||||||||
Industrial | 8,828 | 9,797 | 10,043 | 8,909 | 10,804 | 17.7 | % | |||||||||||||||||
Industrial Machinery | 2,974 | 3,294 | 3,207 | 2,639 | 3,167 | 5.2 | % | |||||||||||||||||
Office and Technical Machinery | 2,180 | 2,390 | 2,531 | 2,575 | 2,968 | 4.9 | % | |||||||||||||||||
Others | 3,673 | 4,114 | 4,306 | 3,694 | 4,669 | 7.6 | % | |||||||||||||||||
Unclassified | 17 | 15 | 19 | 11 | 16 | 0.0 | % | |||||||||||||||||
Total | 46,076 | 51,233 | 52,703 | 43,489 | 61,101 | 100.0 | % | |||||||||||||||||
|
|
|
|
|
|
|
|
|
|
|
|
Totals may differ due to rounding.
1: | Preliminary. |
2: | Includes oil derivatives and coal. |
Sources: DANE and Dirección de Impuestos y Aduanas Nacionales (National Directorate of Customs and Taxes).
D-73
Geographic Distribution of Trade
The following tables show the destination and origin, respectively, of Colombia’s exports and imports.
Merchandise Exports to Major Trading Partners
2017 | 2018 | 2019(1) | 2020(1) | 2021(1) | ||||||||||||||||
_ | (percentage of total exports) | |||||||||||||||||||
United States | 33.4 | 28.1 | 27.5 | 22.6 | 35.3 | |||||||||||||||
Venezuela | 1.0 | 0.9 | 0.5 | 0.5 | 1.18 | |||||||||||||||
China | 7.0 | 11.0 | 10.9 | 7.0 | 11.88 | |||||||||||||||
Netherlands | 4.9 | 2.7 | 2.9 | 1.8 | 3.24 | |||||||||||||||
Ecuador | 4.6 | 4.9 | 4.7 | 3.7 | 5.72 | |||||||||||||||
Panama | 7.8 | 7.7 | 5.6 | 3.6 | 7.7 | |||||||||||||||
Spain | 3.1 | 3.1 | 1.2 | 1.3 | 2.37 | |||||||||||||||
Chile | 3.3 | 3.1 | 2.3 | 2.0 | 3.56 | |||||||||||||||
Peru | 3.6 | 3.1 | 2.7 | 2.2 | 3.56 | |||||||||||||||
Brazil | 4.3 | 4.1 | 3.5 | 3.2 | 6.6 | |||||||||||||||
India | 0.9 | 1.4 | 0.8 | 2.0 | 7.2 | |||||||||||||||
United Kingdom | 1.3 | 1.1 | 1.1 | 1.0 | 1.5 | |||||||||||||||
Switzerland | 1.1 | 0.9 | 0.4 | 0.3 | 0.5 | |||||||||||||||
Others | 23.9 | 27.9 | 35.9 | 48.9 | 10.3 | |||||||||||||||
|
|
|
|
|
|
|
|
|
| |||||||||||
Total | 100.0 | % | 100.0 | % | 100.0 | % | 100.0 | % | 100.0 | % | ||||||||||
|
|
|
|
|
|
|
|
|
|
Totals may differ due to rounding.
1: | Preliminary. |
Sources: DANE. |
Merchandise Imports by Major Trading Partners(1)
2017 | 2018 | 2019(2) | 2020(2) | 2021(2) | ||||||||||||||||
(percentage of total imports) | ||||||||||||||||||||
United States | 26.0 | 25.2 | 25.1 | 24.1 | 23.6 | |||||||||||||||
Mexico | 7.6 | 7.8 | 7.5 | 6.9 | 6.5 | |||||||||||||||
China | 18.9 | 20.6 | 20.8 | 23.8 | 23.1 | |||||||||||||||
Panama | 0.1 | 0.1 | 0.1 | 0.1 | 0.1 | |||||||||||||||
Switzerland | 0.9 | 0.9 | 0.9 | 0.9 | 0.7 | |||||||||||||||
South Korea | 1.7 | 1.6 | 1.3 | 1.5 | 1.5 | |||||||||||||||
Germany | 4.1 | 4.3 | 4.2 | 3.8 | 3.5 | |||||||||||||||
Brazil | 5.0 | 5.5 | 6.0 | 5.7 | 5.7 | |||||||||||||||
Chile | 1.5 | 1.4 | 1.2 | 1.4 | 1.2 | |||||||||||||||
Japan | 2.7 | 2.5 | 2.3 | 2.0 | 2.1 | |||||||||||||||
Spain | 2.1 | 1.9 | 1.9 | 1.8 | 2.1 | |||||||||||||||
Uruguay | 0.1 | 0.1 | 0.1 | 0.2 | 0.1 | |||||||||||||||
Ecuador | 1.6 | 1.6 | 1.6 | 1.9 | 1.4 | |||||||||||||||
Others | 27.8 | 26.4 | 26.9 | 26.0 | 28.2 | |||||||||||||||
|
|
|
|
|
|
|
|
|
| |||||||||||
Total | 100.0 | % | 100.0 | % | 100.0 | % | 100.0 | % | 100.0 | % | ||||||||||
|
|
|
|
|
|
|
|
|
|
Totals may differ due to rounding.
1: | Correspond to country of purchase. |
2: | Preliminary |
Sources: National | Directorate of Customs and Taxes. |
D-74
The United States is Colombia’s most important trading partner. During 2021, trade between the two countries accounted for approximately 23.6% of Colombia’s total imports and 35.3% of total exports. The major trading partners of Colombia classified by exports are the United States, China and Panama. The major trading partners of Colombia classified by imports are the United States, China and the European Union.
Exports to the United States were $10.6 billion in 2017, $10.7 billion in 2018, $11.5 billion in 2019, $8.9 billion in 2020 and $11.0 billion in 2021. In 2021, exports to the United States increased by 22.8%, mainly due to an increase of 23.5% in exports of oil and its derivatives in comparison to 2020. Imports from the United States were $12.0 billion in 2017, $13.0 billion in 2018, $13.3 billion in 2019, $10.5 billion in 2020 and $14,1 in 2021. In 2021, imports from the United States increased by 33.5%, mainly as a result of an increase in imports of gasoline, other light fuels and diesel fuel. As of July 2022, exports to the United States were $9.0 billion, an increase of 46.9% compared to the same period in 2021, mainly due to higher exports of crude petroleum oil. Moreover, as of June 2022, imports from the United States were $9.9 billion, which represented an increase of 55.7%, compared to the same period of 2021, mainly as a result of higher imports of gas oils.
Exports to China were $2.2 billion in 2017, $4.2 billion in 2018, $4.6 billion in 2019, $2.8 billion in 2020 and $3.6 billion in 2021. In 2021, exports to China increased 33.1% compared to the prior year, mainly due to a 1715% increase in exports of copper and its manufactures and a 273.5% increase in exports of hides and skins. Imports from China were $8.8 billion in 2017, $10.5 billion in 2018, $11.0 billion in 2019, $10.4 billion in 2020 and $14.8 billion in 2021. In 2021, imports from China increased by 42.3%, mainly as a result of a 934.2% increase in imports of glycosides. As of July 2022, exports to China were $1.2 billion, a decrease of 47.8% compared to the same period in 2021, mainly due to a decrease in exports of crude petroleum oils. Moreover, as of June 2022, imports from China were $9.3 billion, which represented an increase of 45.8%, compared to the same period of 2021.
Exports to the European Union were $5.4 billion in 2017, $4.9 billion in 2018, $4.6 billion in 2019, $4.0 billion in 2020 and $4.4 billion in 2021. In 2021, exports to the European Union decreased 11.8% compared to the prior year. Imports from the European Union were $6.4 billion in 2017, $7.1 billion in 2018, $7.5 billion in 2019, $5.8 billion in 2020 and $8.2 billion in 2021. In 2021, imports from the European Union increased by 41.6%. As of July 2022, exports to the European Union were $4.5 billion, an increase of 94.7% compared to the same period in 2021. Moreover, as of June 2022, imports from the European Union were $5.3 billion, which represented an increase of 42.4%, compared to the same period of 2021.
Free Trade Agreements
On November 22, 2006, the United States and Colombia signed a free trade agreement that had been under discussion since 2004. On June 14, 2007, the Colombian Congress approved the Free Trade Agreement with the United States. Following the approval from Congress, on July 4, 2007, then President Uribe signed the law authorizing the Free Trade Agreement and on July 24, 2008, the Constitutional Court declared the agreement compatible with the Constitution. The Congress of the United States approved the Free Trade Agreement on October 12, 2011, and President Obama signed the agreement into law on October 21, 2011. The implementation phase in Colombia was intended to verify that the agreement is consistent with Colombia’s legal system. Thereafter, the two governments exchanged diplomatic notes at the Summit of the Americas in Cartagena, and the free trade agreement entered into force on May 15, 2012.
D-75
Colombia has pursued a policy of reducing trade barriers by fostering economic integration with other countries and promoting bilateral and multilateral trade agreements with regional trading partners. The Andean Community of Nations (Comunidad Andina de Naciones), which originally included Bolivia, Ecuador, Venezuela, Colombia and Peru, was part of an effort to increase trade among member countries. Pursuant to this agreement, originally ratified in May 1969, the member nations implemented common external tariffs on February 1, 1995. On April 5, 2004, the Andean Community concluded a free trade agreement with Mercosur. On April 22, 2006, Venezuela announced its intention to withdraw from the Andean Community. The Cartagena Agreement, under which the Andean Community was created, provides, however, that a member country that withdraws from the community must maintain the agreed tariff program of the existing free trade zone among community members for at least five years. On September 20, 2006, Chile was accepted as an associated member country of the Andean Community.
On November 28, 2011, Colombia and Venezuela signed a Partial Scope Agreement that supports and regulates the trade between the countries within the framework of the Asociación Latinoamericana de Integración, or ALADI, an association of 13 member countries (Argentina, Bolivia, Brazil, Chile, Colombia, Cuba, Ecuador, Mexico, Panama, Paraguay, Peru, Uruguay and Venezuela) that seeks to establish a common market in the region.
Exports to the Andean Community decreased by 13% from $2,768 million in 2015 to $2,399 million in 2016. Exports to the Andean Community increased by 15% in 2017 compared to 2016. Exports to the Andean Community increased by 14.5% from $2,759 million in 2017 to $3,160 million in 2018, due to an increase of 26.4% in exports to Ecuador and an increase of 2.3% in exports to Peru. Exports to the Andean Community increased by 2.4% from $3,160 million in 2018 to $3,234 million in 2019. In 2020, exports to the Andean Community decreased by 24.9% from $3,234 million in 2019 to $2,430. In 2021, exports to the Andean Community increased by 22.1% from $2,430 in 2020 to $2,967 million. Imports from the Andean Community decreased by 6.1% from $2,153 million in 2015 to $2,021 million in 2016. Imports from the Andean Community decreased by 14.3% from $2,021 million in 2016 to $1,731 million in 2017. Imports from the Andean Community increased by 9.3% from $1,731 in 2017 to $1,893 in 2018. Imports from the Andean Community increased by 5.6% from $1,893 in 2018 to $1,999 in 2019. Imports from the Andean Community decreased by 10.1% from $1,999 in 2019 to $1,798 in 2020. Imports from the Andean Community increased by 22.9% from $1,798 in 2020 to $2,210 in 2021.
On June 26, 2012, the European Commission signed the free trade agreement among Colombia, Peru and the European Union. The European Parliament approved the agreement in December 2012 and Colombia completed its internal ratification procedures in June 2013, clearing the way for provisional application of the agreement on August 1, 2013. The agreement is currently in force.
The member states of the European Free Trade Association, Iceland, Liechtenstein, Norway and Switzerland signed a free trade agreement with Colombia on November 25, 2008, which was approved by law in January 2010. Colombia, Liechtenstein and Switzerland ratified the agreement in 2009. Norway and Iceland ratified it in 2014, and the agreement entered into force in September and October 2014, respectively. The agreement contemplates the liberalization of trade in agricultural and industrial goods, rules of origin, customs procedures and trade facilitation. It also includes commitments regarding trade in services, the transit of persons, e-commerce, technical standardization, investment measures, competition policy and intellectual property.
In February 2012, Colombia attended the Asia-Pacific Economic Cooperation (APEC) forum in Moscow to discuss topics such as trade, tourism, economic cooperation and investment. On May 22, 2013, then President Santos signed the Framework Agreement of the Pacific Alliance that will provide Colombia with greater access in areas such as free movement of goods, services, capital and people with the other members of the Pacific Alliance, which includes Chile, Mexico and Peru. On May 23, 2013, then President Santos met with the presidents of Chile, Mexico and Peru in the 7th Presidential Summit of the Pacific Alliance in Cali, Colombia, to discuss strategy to generate new business opportunities and to continue with the economic and commercial integration among the Pacific Alliance countries. On February 10, 2014, the 8th presidential summit of the Pacific Alliance was held in Cartagena, Colombia. During the summit, an additional protocol to the framework agreement of the Pacific Alliance was signed. The protocol is a central instrument for the liberalization of goods, services and investments. On
D-76
June 30, 2017, the 12th presidential summit of the Pacific Alliance was held in Cali, Colombia. The member countries of the alliance reaffirmed their commitment to integration, celebrated the achievements and the entry into force of the free trade zone, welcomed Croatia, Slovenia and Lithuania as observer states of the Pacific Alliance and designated Colombia as President pro tempore of the alliance for the 2017-2018 period. On June 24, 2018, the 13th Presidential Summit of the Pacific Alliance was held in Mexico, where attendees signed the Declaration of Puerto Vallarta, which includes an action plan that seeks commercial integration between Mercosur and the Pacific Alliance.
In 2013, Colombia signed free trade agreements with South Korea, Costa Rica, Panama and Israel. The Colombian Congress ratified the free trade agreement with South Korea in December 2014, making it the first free trade agreement with a country in Asia and thus opening a commercial door to the Asia-Pacific region. In 2015, the Colombian Congress passed Law 1763 by which the free trade agreement between Colombia and Costa Rica was approved. On April 6, 2016, the Constitutional Court of Colombia approved the free trade agreement with Costa Rica which went into effect on August 1, 2016. On July 12, 2017, then President Santos enacted Law 1841, which ratified the free trade agreement with Israel, pending constitutionality review by the Constitutional Court. As of 2017, the trade agreement between Colombia and Panama was not in force.
Colombia has signed and ratified several double taxation treaties aimed at reducing international tax evasion. In 2015, a double taxation treaty among Portugal and Colombia entered into force. In March 2012, Colombia signed an agreement with the Czech Republic which entered into force in May 2015. In 2016 Colombia signed an agreement with the United Kingdom of Great Britain and Northern Ireland to which entered into force on December 2019.
On July 30, 2018, negotiations for a double taxation agreement with Japan concluded. The agreement seeks to promote foreign investment and to implement policies that aim to reduce tax fraud, also known as base erosion and profit shifting.
Foreign Investment
Foreign investment in Colombia was traditionally directed towards the oil and mining sectors. Previously, investment in sectors such as public services was prohibited, and investments in the financial sector were limited to no more than 49% foreign ownership of financial institutions. As part of the Apertura process, the Gaviria administration (1990-1994) enacted reforms designed to make foreign investment in Colombia more attractive. For example, legislation was enacted that ensured equal treatment of foreign and local investors and foreign access to traditionally restricted economic sectors. The Pastrana administration removed many of the remaining restrictions on foreign investment in order to stimulate economic growth and reduce unemployment. In June 1999, Congress approved a constitutional amendment to guarantee adequate compensation for expropriation of property.
Moreover, Decree 241 of 1999 removed restrictions on foreign investments in Colombian real estate, one of the few sectors of the economy in which foreign investment had been banned by the International Investment Statute. The public sector restructuring decrees of June 1999 also allowed public entities to sign contracts of “juridical stability” to protect private investors from sudden changes in legislation (including tax rules). Ecopetrol has made changes to the standard terms of its association contracts that are designed to encourage foreign investment in the oil sector. For a more detailed discussion of Ecopetrol’s association contracts, see “Economy—Principal Sectors of the Economy—Mining and Petroleum.” Law 756 of 2002 created an oil royalties’ system geared towards encouraging oil exploration on small and medium-size fields, which establishes variable royalties ranging from 8% for fields producing up to 5,000 barrels per day to 25% for fields producing in excess of 600,000 barrels per day. Likewise, with the objective of promoting foreign direct investment, Colombia has signed agreements with the International Center of Settlement of Investment Dispute, the Multilateral Investment Guarantee Agency and the Overseas Private Investment Corporation.
Under current law and regulations, foreign investments generally do not require prior governmental authorization. Foreign entities, however, must register investments with Banco de la República in order to establish their right to transfer profits and capital investments abroad. Investment in certain sectors, including financial services, still requires prior authorization. Foreign investment in national security and defense-related industries, as well as industries which process toxic and radioactive materials, is prohibited.
D-77
In 2016, net foreign direct investment totaled a net inflow of $20,877 million, an increase of $5,919 million from the value recorded in 2015, and net portfolio investment was $7,019 million in 2016. According to data from Banco de la República, during 2017, net direct foreign investment was $17,954 million, a decrease of $2,923 million from the value recorded in 2016, and net portfolio investment had an inflow of $4,253 million. During 2018, net foreign direct investment was $14,005 million, a decrease of $3,949 million from the value recorded in 2017, and net portfolio investment had an inflow of $2,706 million. According to preliminary data from Banco de la República, during 2019, net foreign direct investment totaled $12,538 million, a decrease of $1,466 million from the value recorded in 2018, and net portfolio investment registered an outflow of $1,451 million. According to preliminary data from Banco de la República, during 2020, net foreign direct investment totaled $10,096 million, a decrease of $2,442 million from the value recorded in 2019, and net portfolio investment registered an inflow of $2,638 million. According to preliminary data from Banco de la República, during 2021, net foreign direct investment totaled $11,254 million, an increase of $1,157 million from the value recorded in 2020, and net portfolio investment registered an inflow of $1,944 million.
The following table sets forth information on net foreign direct investment by country of origin for the years indicated.
Net Foreign Direct Investment by Country of Origin(1)
2017 | 2018 | 2019(2) | 2020(2) | 2021(2) | ||||||||||||||||
(millions of U.S. dollars) | ||||||||||||||||||||
North America | 4,124 | 3,785 | 3,444 | 1,465 | 2,202 | |||||||||||||||
Canada | 231 | 644 | 463 | 556 | 274 | |||||||||||||||
United States | 2,172 | 2,410 | 2,475 | 1,843 | 1,722 | |||||||||||||||
Mexico | 1,721 | 731 | 506 | (934 | ) | 206 | ||||||||||||||
South America | 574 | 1,002 | 1,775 | 708 | 516 | |||||||||||||||
Andean Group | 401 | 664 | 456 | 526 | 355 | |||||||||||||||
Others | 172 | 338 | 1,320 | 182 | 161 | |||||||||||||||
Central America | 1,458 | 1,269 | 1,018 | 674 | 611 | |||||||||||||||
Panama | 1,429 | 1,215 | 968 | 613 | 620 | |||||||||||||||
Central American | ||||||||||||||||||||
Common Market(3) | 29 | 54 | 50 | 61 | (10 | ) | ||||||||||||||
Caribbean | 1,150 | (220 | ) | 1,938 | 473 | 1,123 | ||||||||||||||
Europe | 6,184 | 5,203 | 5,645 | 4,044 | 4,664 | |||||||||||||||
EEC Countries | 5,304 | 4,168 | 4,502 | 3,605 | 3,605 | |||||||||||||||
European Free Trade | ||||||||||||||||||||
Association | 794 | 912 | 1,159 | 594 | 1,098 | |||||||||||||||
Other Countries | 85 | 123 | (17 | ) | (155 | ) | (40 | ) | ||||||||||||
Asia | 137 | 159 | 100 | 117 | 193 | |||||||||||||||
Other Countries | 74 | 101 | 69 | (24 | ) | 1 | ||||||||||||||
Portfolio Investment(4) | 4,253 | 2,706 | (1,451 | ) | 2,638 | 1,944 | ||||||||||||||
Total | $ | 17,954 | $ | 14,005 | $ | 12,538 | $ | 10,096 | $ | 11,254 | ||||||||||
|
|
|
|
|
|
|
|
|
|
Totals may differ due to rounding.
1: | Figures from balance of payments. Figures reflect foreign investment into Colombia and outflows of foreign direct investment, but do not reflect investment by Colombians abroad. |
2: | Preliminary. |
3: | Excluding Panama and including Belize. |
4: | Figures reflect only short-term portfolio investment inflows. |
Source: Banco | de la República. |
D-78
The following table sets forth information on net foreign direct investment by sector for the years indicated.
Net Foreign Direct Investment by Sector(1)
2017 | 2018 | 2019(2) | 2020(2) | 2021(2) | ||||||||||||||||
(millions of U.S. dollars) | ||||||||||||||||||||
Direct investment(3)(4) | 13,701 | 11,299 | 13,989 | 7,459 | 9,310 | |||||||||||||||
Petroleum | 3,106 | 2,540 | 2,755 | 457 | 811 | |||||||||||||||
Agriculture and Fishing | 214 | 204 | 365 | 193 | 246 | |||||||||||||||
Mining | 1,019 | 1,187 | 1,362 | 438 | 933 | |||||||||||||||
Manufacturing | 2,368 | 1,310 | 1,499 | 894 | 1,345 | |||||||||||||||
Public Services | 413 | 141 | 316 | 764 | 1,052 | |||||||||||||||
Construction | 298 | 486 | 881 | 409 | 325 | |||||||||||||||
Commerce | 694 | 1,146 | 2,125 | 847 | 755 | |||||||||||||||
Transportation and Communications | 3,294 | 1,550 | 1,006 | 538 | 1,045 | |||||||||||||||
Finance | 1,908 | 2,358 | 3,132 | 1,920 | 2,305 | |||||||||||||||
Social Services | 387 | 377 | 547 | 998 | 492 | |||||||||||||||
Portfolio investment(5) | 4,253 | 2,706 | (1,451 | ) | 2,638 | 1,944 | ||||||||||||||
|
|
|
|
|
|
|
|
|
| |||||||||||
Total | 17,954 | 14,005 | 12,538 | 10,096 | 11,254 | |||||||||||||||
|
|
|
|
|
|
|
|
|
|
Totals may differ due to rounding.
1: | Figures from balance of payments. |
2: | Preliminary. |
3: | Includes reinvested earnings. |
4: | Figures from balance of payments. Figures reflect foreign investment into Colombia and outflows of foreign direct investment, but do not reflect investment by Colombians abroad. |
5: | Figures reflect only short-term portfolio investment inflows. |
Source: Banco | de la República |
D-79
MONETARY SYSTEM
Banco de la República
Banco de la República, Colombia’s central bank, was chartered in 1923. Following ratification of the 1991 Constitution, Banco de la República was granted greater independence from the Government in its administration and in the formulation of monetary policy. The 1991 Constitution charges Banco de la República with the primary mission of controlling inflation, as measured by changes in the consumer price index, in addition to other central banking functions.
Banco de la República’s board of directors is responsible for setting monetary and exchange rate policy. The board of directors has seven members, five of whom are appointed by the President to four-year terms. At the end of each four-year term, the President may replace up to two of the five presidential appointees and must re-appoint the remaining three appointees. The Minister of Finance and Public Credit is the sixth board member and is the sole representative of the Government on the board of directors. The seventh member is elected by the other six members and serves as the Governor of Banco de la República. Unless all seven members of the board of directors vote to do so, Banco de la República may not finance the Government’s budget deficits. The Constitution prohibits Banco de la República from making loans to the private sector except to provide liquidity to the financial system or to arrange and intermediate non-peso denominated loans in the local market for specific limited purposes.
Banco de la República is authorized by law, subject to certain restrictions, to regulate interest rates payable on time deposits, establish minimum reserve requirements for credit institutions and provide discount facilities for certain types of bank loans. In addition, Banco de la República performs other traditional functions of a central bank, including managing the country’s international reserves and acting as lender of last resort to the financial system. The Government is responsible for any losses and entitled to any profits generated from the operations of Banco de la República. After many years of generating profits, Banco de la República began to record losses in 2010 due to lower external interest rates and, during 2015, the decrease in the international price of oil and the depreciation of the currency against the U.S. dollar, which have significantly reduced income from international reserves. After 2015, Banco de la República started to generate profits again because of an increase in interest and returns coming from international reserves. Banco de la República registered an operating gain of Ps. 631.8 billion in 2021, a loss of Ps. 6,851.4 billion from the operating gain of Ps. 7,483.1 billion registered in 2020, due to an increase in profits from active exchange regulation operations and exchange regulation operations.
Financial Sector
As of December 31, 2021, Colombia’s financial system was comprised of 28 banks (18 domestic and 10 foreign), 5 corporaciones financieras (financial corporations), 11 compañías de financiamiento comercial (commercial financing companies) and a number of securities brokerage houses and other non-banking institutions, such as insurance companies, trust companies and bonded warehouses. The main types of financial institutions are described below.
Banks. The Government owns 1 of the sixteen domestic banks. Commercial banks can offer a full scale of retail (including mortgage) and corporate banking services with the exception of investment banking.
Financial corporations. Financial corporations are specialized institutions that mainly make equity investments in and medium-term loans to various companies. Financial corporations also engage in project finance, an activity that has increased in recent years. Although they may engage in some banking activities, financial corporations are prohibited from receiving demand deposits and instead rely on savings, time deposits, certificates of deposit, bonds, intermediation of lines of credit from multilateral institutions and short-term deposits from companies and individuals to meet their funding needs. Most financial corporations are private sector institutions.
Commercial financing companies. Commercial financing companies specialize in providing working capital financing and credit for the purchase of consumer goods, but may also participate as intermediaries in foreign exchange transactions, conduct leasing operations and obtain short-term deposits.
D-80
The Colombian financial system also includes institutions that promote specific sectors of the Colombian economy, such as FEN (later becoming FDN). See “Economy—Role of the State in the Economy; Privatization—State-Owned Financial Institutions.”
Decree 4174 of 2011 changed FEN into FDN and broadened its authority beyond the energy sector so that it can provide funding to other sectors of the economy. The FDN funds long term infrastructure projects in order to boost competitiveness and economic growth.
The following table shows the number of financial institutions and the percentage of loans and deposits corresponding to each category.
Colombian Financial System
as of December 31, 2021
Number | % of Loans | % of Deposits | ||||||||||
Banks | ||||||||||||
Domestic Banks | 18 | 73.2 | % | 70.19 | % | |||||||
State-Owned Banks | 1 | 2.8 | % | 3.27 | % | |||||||
Foreign Banks | 10 | 23.7 | % | 26.60 | % | |||||||
|
|
|
|
|
| |||||||
28 | 97.6 | % | 97.33 | % | ||||||||
5 | 0.0 | % | 0.96 | % | ||||||||
Financial Corporations | 11 | 2.4 | % | 1.70 | % | |||||||
Commercial Financing Companies(1) | 11 | 7.2 | % | 4.61 | % | |||||||
Special State-Owned Institutions(2) | 55 | 100.0 | % | 100.0 | % | |||||||
|
|
|
|
|
|
Totals may differ due to rounding.
1: | Includes companies that specialize in leasing. |
2: | Includes FDN, Bancoldex, Financiera de Desarrollo Territorial (Territorial Development Financing Agency or “FINDETER”), Finagro, Fondo Financiero de Proyectos de Desarrollo (Financial Fund for Development Projects or “FONADE”), Fondo Nacional del Ahorro (National Savings Fund or “FNA”), Fondo de Garantías de Instituciones Financieras (Financial Institutions Guarantee Fund or “FOGAFIN”), Fondo de Garantías de Entidades Cooperativas (Cooperative Institutions Guarantee Fund or “FOGACOOP”), FNG, Instituto Colombiano de Crédito Educativo y Estudios Técnicos en el Exterior (Colombian Institute of Educational Credit and Overseas Technical Studies, or “ICETEX”) and Caja de Vivienda Militar. |
Source: Financial | Superintendency. |
The principal regulators of the financial institutions and the financial markets are the Ministry of Finance, Banco de la República and the Financial Superintendency. The Financial Superintendency was created by combining the Superintendency of Banks and the Superintendency of Securities into one office under Decree 4327 of 2005.
In 1989, the Government promulgated rules, which were further amended in 1994, setting forth the procedures to be followed in classifying loans as “non-performing” on the basis of specific risk and performance factors, establishing reserve requirements for loans and implementing capital adequacy requirements consistent with the standards recommended under the Basel accords. These rules are intended to improve the Colombian banking system and to ensure that standards followed by Colombian commercial banks are consistent with those followed by banks in other countries. Under these rules, banks are required to maintain net technical capital equal to at least 9.0% of their risk-weighted assets. The aggregate net technical capital (or solvency ratio) of Colombian banks was at 20.5% of risk-weighted assets on December 31, 2021, 420 basis points higher than the level recorded on December 31, 2020. As of April 2022, the aggregate net technical capital (or solvency ratio) of Colombian banks was at 16.2% of risk-weighted assets, 387 basis points lower than the level recorded in April 2021.
D-81
During the 1990s and early 2000s, the Government took steps to prevent a recurrence of past problems in the financial sector (particularly those problems of the early 1980’s that caused the Government to assume ownership of several commercial banks to prevent their failure), including the promulgation of stringent banking regulations and market-oriented foreign exchange policies. Law 45 of 1990 introduced the universal banking model, which permits commercial banks, through separate subsidiaries, to engage in stock brokerage, leasing, factoring, investment banking and other related activities, thereby stimulating competition among financial institutions and consolidating the financial sector.
In addition, under Law 45, foreign investment is now permitted in all types of financial institutions with no restrictions on the level of foreign ownership. As a result, with prior approval of the Financial Superintendency, foreign entities are able either to purchase controlling interests in commercial banks or to increase their ownership in existing commercial bank subsidiaries. Law 45 has led to increased foreign investment in the banking sector.
Net profits of the financial sector, excluding special state-owned institutions, decreased from Ps. 12,380.6 billion in 2016 to Ps. 8,238.4 billion in 2017. Net profits increased to Ps. 11,576.5 billion in 2018 and to Ps. 12,908.3 billion in 2019. Net profits decreased to Ps. 6,080.2 billion in 2020 but increased to Ps. 16,032.7 in 2021. The Government did not liquidate any financial institutions from 2014 through 2021.
The following table shows the results of the financial sector as of and for the year ended December 31, 2021.
Selected Financial Sector Indicators
(in millions of pesos as of and for
the year ended December 31, 2021*)
Assets | Liabilities | Net Worth | Earnings | |||||||||||||
Banks | Ps. 817,570,848 | Ps. 713,074,126 | Ps. 104,496,722 | Ps. 13,922,520 | ||||||||||||
Non-Banking Financial Institutions(1) | 39,001,767 | 23,900,950 | 15,100,817 | 2,110,201 | ||||||||||||
Special State-Owned Institutions(2) | 96,145,787 | 55,396,827 | 40,748,960 | 4,015,528 | ||||||||||||
|
|
|
|
|
|
|
| |||||||||
Total | Ps. 952,718,402 | Ps. 792,371,903 | Ps. 160,346,499 | Ps. 20,048,249 | ||||||||||||
|
|
|
|
|
|
|
|
Totals may differ due to rounding.
1. | Includes Financial Corporations and Commercial Financing Companies. |
2. | Includes FDN, Bancoldex, FINDETER, FINAGRO, FNA, FOGAFIN, FONADE, FOGACOOP, FNG and ICETEX. |
* | Starting in 2015 credit institutions (except IOE and Leasing Bancoldex) started to report under IFRS. In 2015 IOE and Leasing Bancoldex reported under COLGAAP. Data from 2015 are not comparable with previous years. |
Source: Financial | Superintendency. |
FOGAFIN, the Colombian insurance deposit fund, is responsible for implementing many of the Government’s measures to support the financial sector. FOGAFIN’s primary mission is to maintain stability and public confidence in Colombian financial institutions. During 2016-2020 FOGAFIN did not establish any new credit lines and no private institutions joined the FOGAFIN recapitalization program to inject capital into small and medium banks.
The Government assistance program for private financial institutions was designed to be self-financing and to yield returns to help pay for possible defaults. FOGAFIN issues bonds yielding the average short-term composite reference rate (DTF) and lends these bonds to financial institutions for terms of one to three years at the rate of DTF + 2% and for terms of four to seven years at the rate of DTF + 3%. It is estimated that the Government will not incur costs with respect to the assistance program.
As of December 31, 2021, there was no outstanding Government assistance to state-owned institutions or financial aid given to financial institutions or provision of credit support in the form of interest payments.
D-82
Since 1998, FOGAFIN has assumed management responsibility and control of four banks (Banco del Estado, Banco Uconal, Bancafé and Interbanco), a savings and loan institution (Granahorrar) and two private consumer credit institutions (Fundación FES Compañía de Financiamiento Comercial and Corficafe). In managing these financial institutions, the Government, along with FOGAFIN, has formulated a strategy based on the same principles followed by the private banks for improving the institutions’ balance sheets and increasing their net worth, in order to increase their financial viability. Granahorrar was privatized when Banco Bilbao Vizcaya Argentaria purchased Granahorrar in 2005. Bancafé was bought by Banco Davivienda S.A. in 2007.
Liquidity and Credit Aggregates
The total amount of loans outstanding, including leasing, from Colombian financial institutions was. Ps. 455.5 trillion at December 31, 2018, Ps. 490.3 trillion at December 31, 2019, Ps. 509.5 trillion at December 31, 2020 and Ps. 562.1 trillion at December 31, 2021. Leasing has been included into the amount of loans outstanding beginning in 2010 because of changes made by the Financial Superintendency through Circular Externa 35 of 2009 that came into force on April 1, 2010. Past due loans stood at Ps. 18.7 trillion at December 31, 2017, Ps 20.9 trillion at December 31, 2018, Ps 21.3 trillion at December 31, 2019, Ps 25.6 trillion at December 31, 2020 and PS 22.2 trillion at December 31, 2021. Past due loans stood at Ps. 22.7 trillion at April 30, 2022. As a percentage of total loans, past due loans increased to 4.3% and 4.6% in 2017 and 2018, respectively. In 2019, past due loans decreased to 4.3% of total loans and increased to 5.0% in 2020 and 3.9% in 2021. As of April 30, 2022, decreased to 3.8%. Provisions as a percentage of past due loans increased from 133.8% as of December 31, 2017 to 137.3%, 142.6%, 153.9% and 166.1% as of December 31, 2018, 2019, 2020 and 2021, respectively. As of April 30, 2022, provisions as a percentage of past due loans were 162.3%. The following table shows selected monetary indicators for the years indicated.
As of December 31, 2021, the aggregate net technical capital (or solvency ratio) of Colombian banks was 20.5% of risk-weighted assets. As of April 30, 2022, the aggregate net technical capital decreased to 16.2%. As of December 31, 2021, risk-weighted assets decreased to Ps. 498.7 trillion compared to Ps. 506.5 as of December 31, 2020. As of April 30, 2022, risk-weighted assets decreased to Ps. 495.1 trillion compared to Ps. 441.7 as of April 30, 2021.
Selected Monetary Indicators
2017 | 2018 | 2019 | 2020 | 2021 | ||||||||||||||||
M1(1) (percentage change) | 6.4 | 7.9 | 10.4 | 24.5 | 17.1 | |||||||||||||||
M2(2) (percentage change) | 7.0 | 5.0 | 8.7 | 14.4 | 11.8 | |||||||||||||||
M3(3) (percentage change) | 7.3 | 5.6 | 8.0 | 13.6 | 12.1 | |||||||||||||||
Credit from the Financial System (percentage change) (4) | 12.8 | 6.8 | 11.6 | (0.8 | ) | 12.5 | ||||||||||||||
Discount Rate (percent)(5) | 6.1 | 4.4 | 4.3 | 2.9 | 1.9 | |||||||||||||||
|
|
|
|
|
|
|
|
|
|
1: | Currency in circulation plus demand deposits. |
2: | M1 plus certificates of deposit plus savings deposits. |
3: | M2 (i.e., currency in circulation plus liabilities subject to minimum reserve requirements) and bonds issued by the financial system. |
4: | Gross credit to private sector. Financial system excludes Banco de la República. |
5: | Banco de la República’s one-day discount rate for liquidity to the financial system. Weighted average for the year. |
Source: Banco | de la República. |
Interest Rates and Inflation
During 2017, the average short-term composite reference rate, or DTF, was 4.7% and decreased to 4.7% in 2018, 4.5% in 2019 and 3.4% in 2020. During 2021, the highest recorded DTF was December at 3.1% and the lowest was in April when the DTF was 1.8%. The average DTF rate in 2021 was 2.1%. As of August 31, 2022, the DTF was 10.6%.
D-83
Banco de la República’s policy has been to reduce inflation gradually to minimize the impact on economic growth. Since 1971, Colombia has experienced year-to-year consumer inflation rates ranging from a high of 32.4% in 1990 to a low of 1.9% in 2013. The decline in consumer inflation rates from the 25-30% range of the late 1980’s and early 1990s was due in part to the effective implementation of a monetary policy that removed excess liquidity from the economy, providing only the amount of cash necessary for the optimal performance of the economy. As of December 31, 2017, consumer inflation decreased to 4.1%. This decrease in inflation rate was mainly attributable to the lower increases in the price of foods (1.9%) and clothing (2.0%). As of December 31, 2018, consumer inflation decreased to 3.2%. This decrease in inflation rate was mainly attributable to the lower price increases of food (2.4%) and clothing (0.3%). As of December 31, 2019, the consumer inflation rate increased to 3.8%, which increase was mainly due to an increase in the prices of food and non-alcoholic beverages (5.8%), education (5.8%) and alcoholic beverages (5.5%). As of December 31, 2020, the consumer inflation rate decreased to 1.6%, which decrease was mainly due to a decrease in the prices of clothing & footwear (0.2%) and furniture, household items and for its ordinary conservation (0.04%) and a lower increase in the price of foods (0.7%). As of December 31, 2021, the consumer inflation rate decreased to 5.6%, which increase was mainly due to an increase in the prices of price of foods (2.73%) and Restaurants and Hotels (0.85%) and an increase in the price of transport (0.73%).
Through August 2015, Banco de la República maintained the discount rate at 4.5% due to a small increase in inflation, lower economic growth in the United States and Euro Zone, the risk of a greater deterioration in the Chinese economy, as well as a Yuan devaluation, low oil prices, low international demand, and the possibility of an increase in the United States interest rates made by the Federal Reserve. From September 2015 to August 2016, Banco de la República has adjusted the discount rate ten times from 4.50% to a high of 7.75%. The increases were made because Banco de la Republica decided to phase out its monetary stimulus due to the increase in the consumer inflation caused by higher food prices, the effects of the weather phenomenon “El Niño” and the continued weakness in global demand and lower oil and raw material prices. From December 2016 to April 2018, Banco de la República has adjusted the discount rate twelve times from 7.50% to a low of 4.25%. These decreases were made because of a reduction in consumer inflation since September 2016. On March 27, 2020, Banco de la República decreased the discount rate by 50 basis points to 3.75% due to COVID-19, which directly affected the Colombian economic activity and contracted the international trade, and the collapse in the price of oil. From March 30, 2020, to September 28, 2020, Banco de la República decreased the discount rate by additional 200 basis points to 1.75% as a countercyclical monetary policy stance in response to the global economic collapse caused by the COVID-19 pandemic. From October 1, 2021, to August 1, 2022, Banco de la República increased the discount rate by additional 725 basis points to 9.00% due to inflation expectations for 2022 are around 9.2%, Economic activity continues to exhibit good dynamism, faster-than-expected increase in interest rates in the United States and the impact on international prices of the Russian invasion to Ukraine that could generate additional inflationary pressures. As of September 13, 2022, the discount rate remains in 9.00%.
The producer price index stood at 3.3% in 2017, decreased to 2.3% in 2018, increased to 6.1% in 2019 and decreased to 0.9% in 2020. However, producer price index increased to 26.5% in 2021. The increase in the year-over-year producer price index was mainly due to an increase in prices of mining (70.2%). As of June 30, 2022, the year-over-year PPI increased to an estimated 32.1%, mainly due to increases in prices of mining (78.2%) and agriculture, livestock and fishing (37.9%) and of industrial prices (18.0%).
Monetary policy has also focused on counterbalancing the effect of large capital inflows and maintaining the stability of the real exchange rate. To this end, from time to time the Government has imposed taxes on transfers of foreign currencies to Colombian residents from abroad, required mandatory investment of foreign exchange receipts in negotiable “exchange certificates” and imposed deposit requirements with respect to foreign currency denominated indebtedness of less than a specified term.
In February 2015, DANE introduced a new methodology for calculating the producer price index (“PPI”) based on recommendations from the IMF, the OECD and Banco de la República. While the old methodology measured the average monthly change in prices of a basket of domestic supply of goods in the first stage of commercialization, including goods produced and sold by national companies and importers, the new methodology measures the average monthly change in prices of a basket of goods produced domestically. The new methodology has been applied to figures beginning in January 2015.
D-84
The following table shows changes in the consumer price index and the producer price index and average 90-day deposit rates for the periods indicated:
Inflation and Interest Rates
Period | Consumer Price Index (CPI)(1) | Producer Price Index (PPI)(1) | Short-Term Reference Rate (DTF)(2) | |||||||||
2017 | 4.3 | 3.3 | 6.0 | |||||||||
2018 | 3.2 | 2.3 | 4.7 | |||||||||
2019 | 3.5 | 6.1 | 4.5 | |||||||||
2020 | 1.6 | (0.9 | ) | 3.4 | ||||||||
2021 | ||||||||||||
January | 1.6 | 2.6 | 1.9 | |||||||||
February | 1.6 | 6.3 | 1.8 | |||||||||
March | 1.5 | 11.3 | 1.8 | |||||||||
April | 2.0 | 16.5 | 1.8 | |||||||||
May | 3.3 | 18.7 | 1.8 | |||||||||
June | 3.6 | 18.2 | 1.9 | |||||||||
July | 4.0 | 18.3 | 1.9 | |||||||||
August | 4.4 | 17.6 | 2.0 | |||||||||
September | 4.5 | 19.7 | 2.1 | |||||||||
October | 4.6 | 22.3 | 2.2 | |||||||||
November | 5.3 | 25.8 | 2.7 | |||||||||
December | 5.6 | 26.5 | 3.1 | |||||||||
2022 | ||||||||||||
January | 6.9 | 29.4 | 3.5 | |||||||||
February | 8.0 | 31.1 | 4.3 | |||||||||
March | 8.5 | 33.8 | 5.0 | |||||||||
April | 9.2 | 34.3 | 6.0 | |||||||||
May | 9.1 | 34.3 | 7.0 | |||||||||
June | 9.7 | 32.1 | 7.7 | |||||||||
July | 10.2 | 33.0 | 9.3 | |||||||||
August | 10.8 | 30.0 | 10.6 |
1: | Percentage change over the previous twelve months at the end of each month indicated. Figures for 2018, 2019, 2020, 2021 and 2022 apply the new methodology announced by DANE as described above. |
2: | Average for each of the years 2017-2020 and, for each indicated month in 2021 and 2022, year-on-year of the DTF, as calculated by the Financial Superintendency. |
Sources: DANE | and Banco de la República. |
Foreign Exchange Rates and International Reserves
Exchange Rates
From January 1994 to September 1999, Banco de la República maintained a band within which the exchange rate was permitted to fluctuate. On September 25, 1999, Banco de la República decided to abandon the band system and adopt a free-floating exchange rate system. This change was made only after an initial agreement with the IMF for an Extended Fund Facility had been reached, evidencing a commitment by multilateral organizations to support the Colombian economic program. The transition to the new free-floating foreign exchange regime did not result in a significant deterioration of the exchange rate.
D-85
As of December 31, 2017, the representative market rate was Ps. 2,984.00/$1.00, an appreciation of 0.6% since December 31, 2016. As of December 31, 2018, the representative market rate was Ps. 3,249.75/$1.00, a depreciation of 9.4% since December 31, 2017. As of December 31, 2019, the representative market rate was Ps. 3,277.14/$1.00, a depreciation of 0.8% since December 31, 2018. As of December 31, 2020, the representative market rate was Ps. 3,432.50/$1.00, a depreciation of 4.7% since December 31, 2019. As of December 31, 2021, the representative market rate was Ps. 3,981.16/$1.00, a depreciation of 16.0% since December 31, 2020. As of September 13, 2022, the representative market rate was Ps. 4,346.91/$1.00, a depreciation of 9.19% since December 31, 2021.
As established by Decree 4712 of 2008 and in accordance with the technical criteria established by Resolution No. 262 of February 11, 2011, which governs the administration of excess liquidity, the General Directorate of Public Credit and the National Treasury is allowed to perform any transaction that Colombia may require in the foreign exchange market, including the purchase of foreign exchange in such amounts and at such times as it may determine from time to time and derivatives operations that consist of swaps and forward contracts over foreign exchange. As of December 2021, the General Directorate of Public Credit and National Treasury had no current position in swaps and forward contracts over foreign exchange.
The following table shows the average and end-of-period peso/dollar exchange rates and the real exchange rate index for the dates and periods indicated.
Exchange Rates
Year | Average(1) | End-of- period | Real Exchange Rate Index(2)(3) Average | |||||||||
(pesos per U.S. dollar) | (Avg. 2010=100) | |||||||||||
2017 | 2,950.62 | 2,984.00 | 130.84 | |||||||||
2018 | 2,954.92 | 3,249.75 | 129.50 | |||||||||
2019 | 3,282.14 | 3,277.14 | 137.54 | |||||||||
2020 | 3,693.36 | 3,432.50 | 149.20 | |||||||||
2021 | ||||||||||||
January | 3,494.53 | 3,559.46 | 146.08 | |||||||||
February | 3,552.43 | 3,624.39 | 148.05 | |||||||||
March | 3,617.00 | 3,736.91 | 148.97 | |||||||||
April | 3,651.85 | 3,712.89 | 151.12 | |||||||||
May | 3,741.96 | 3,715.28 | 155.31 | |||||||||
June | 3,693.00 | 3,756.67 | 153.56 | |||||||||
July | 3,832.24 | 3,867.88 | 157.68 | |||||||||
August | 3,887.68 | 3,806.87 | 158.96 | |||||||||
September | 3,820.28 | 3,834.68 | 156.10 | |||||||||
October | 3,771.68 | 3,784.44 | 153.37 | |||||||||
November | 3,900.51 | 4,010.98 | 157.36 | |||||||||
December | 3,967.77 | 3,981.16 | 158.5 | |||||||||
2022 | ||||||||||||
January | 4,000.72 | 3,982.60 | 159.94 | |||||||||
February | 3,938.36 | 3,910.64 | 157.10 | |||||||||
March | 3,805.52 | 3,748.15 | 156.43 | |||||||||
April | 3,796.39 | 3,966.27 | 155.75 | |||||||||
May | 4,027.60 | 3,912.34 | 152.67 | |||||||||
June | 3,922.50 | 4,127.47 | 152.49 | |||||||||
July | 4,394.01 | 4,300.30 | ||||||||||
August | 4,326.77 | 4,400.16 |
D-86
1: | Representative market rate as calculated by the Financial Superintendency. |
2: | Colombian Peso Real Exchange Rate Index “1”: Based on the producer price index for non-traditional goods in global trade. The real exchange rate index is calculated by adjusting the nominal exchange rate by the producer price index of Colombia’s trading partners and the domestic producer price index. Yearly data corresponds to December of each year. From May 2015 Real Exchange Rate Index base is 2010. Producer price index figures used in calculating Colombian Peso Real Exchange Rate Index for 2015 use the new methodology described above. |
3: | The Real Exchange Rate Index figures for 2017-2022 are preliminary. |
Source: Superintendencia | Financiera, Banco de la República. |
International Reserves
Banco de la República’s gross international reserves stood at $46,682.8 million as of December 31, 2016. As of December 31, 2017, gross international reserves increased by $954.4 million to $47,637.2 million. As of December 31, 2018, gross international reserves increased by $764.3 million to $48,401.5 million. As of December 31, 2019, gross international reserves increased by $4,772.7 million to $53,174.2 million. As of December 31, 2020, gross international reserves increased by $5,865.1 million to $59,039.3 million. As of December 31, 2021, gross international reserves decreased by $451.5 million to $58,587.8 million. As of June 30, 2022, gross international reserves decreased by $1,416.9 million to $57,170.91 million.
In December 2011, Banco de la República decided to resume the accumulation of international reserves mainly due to three factors: (i) low interest rates in the developed economies; (ii) a decision to have a more conservative risk profile of the central bank’s portfolio; and (iii) the depreciation of the euro against the dollar by 3% in 2011. During 2012 and 2013, Banco de la República continued accumulating international reserves mainly due to the adoption of a conservative risk profile in light of the global financial crisis. In July 2014, Banco de la República decided to increase the daily amount of dollar purchases and continued accumulating international reserves, in an amount totaling $2.0 billion between July and September 2014, buying at least $30 million daily. During October 2014, Banco de la República resumed accumulating international reserves through average daily purchases of $10.0 million in competitive auctions. In November 2014, Banco de la República purchased $165.0 million in the foreign exchange market through the auction mechanism of direct purchase. From January 2014 to December 2014, Banco de la República accumulated $4.1 billion. From February 2015 to September 2018, Banco de la República did not increase its international reserves. On October 1, 2018, Banco de la República initiated a program to accumulate international reserves with an initial auction of up to $400 million, which accumulated $1,878.4 million in four auctions being the last one on April 1, 2019.
Banco de la República invests its international reserves in a mix of currencies that reflects the profile of the country’s foreign debt. As of December 31, 2021, the mix of currencies was approximately 87.8% in U.S. dollars, 5.7% in Australian dollars, 3.2% in Canadian dollars, 1.3% in Norwegian kroner, 0.6% in Korean won and 0.6% in New Zealand dollars.
On May 22, 2012, the Government issued Decree 1076 of 2012, which establishes a system to administer the “Fondo de Ahorro y Estabilización del Sistema General de Regalías,” or Savings and Stabilization Fund. Based on Legislative Act No. 05 of 2011, up to 30% of the income from the General System of Royalties will be disbursed to the Savings and Stabilization Fund. The General Directorate of Public Credit and National Treasury is responsible for transferring such royalties to the Savings and Stabilization Fund, which is managed by Banco de la República. For this purpose, the General Directorate of Public Credit and National Treasury, at its sole discretion, may buy dollars in the secondary market. Royalties are derived from natural resources, such as oil, coal and other mining activities. On March 21, 2020, the Government issued Decree 444 of 2020, which established that the Central Government could borrow money from the Savings and Stabilization Fund in order to attend the national emergency due to the COVID-19 pandemic. As of December 31, 2021, transfers in dollars into the Savings and Stabilization Fund since inception totaled $4.47 billion. As of May 31, 2022, transfers in dollars into the Savings and Stabilization Fund since inception totaled $4.50 billion.
D-87
The following table shows the composition of the international reserves of Banco de la República at the end of the years indicated.
International Reserves
2017 | 2018 | 2019 | 2020 | 2021 | ||||||||||||||||
(millions of U.S. dollars) | ||||||||||||||||||||
Gross International Reserves | ||||||||||||||||||||
Monetary Gold | $ | 432.0 | $ | 529.3 | $ | 678.9 | $ | 252.2 | $ | 273.6 | ||||||||||
Special Drawing Rights | 959.2 | 914.0 | 883.8 | 892.4 | 3,583.6 | |||||||||||||||
International Monetary Fund | 293.5 | 359.6 | 563.7 | 712.7 | 692.5 | |||||||||||||||
Investments | 45,241.2 | 45,878.8 | 50,347.1 | 56,478.9 | 53,163.2 | |||||||||||||||
Others(1) | 711.3 | 719.8 | 700.8 | 703.2 | 874.9 | |||||||||||||||
|
|
|
|
|
|
|
|
|
| |||||||||||
47,637.2 | 48,401.5 | 53,174.2 | 59,039.3 | 58,587.8 | ||||||||||||||||
|
|
|
|
|
|
|
|
|
| |||||||||||
Less: Short Term Liabilities of Banco de la República | 8.2 | 8.9 | 7.0 | 8.5 | 8.6 | |||||||||||||||
|
|
|
|
|
|
|
|
|
| |||||||||||
Net International Reserves | $ | 47,629.0 | $ | 48,392.6 | $ | 53,167.2 | $ | 59,030.8 | $ | 58,579.2 | ||||||||||
|
|
|
|
|
|
|
|
|
| |||||||||||
Reserves (Months of Imports (FOB)) | ||||||||||||||||||||
Goods(2) | 12.9 | 11.7 | 12.6 | 17.2 | 12.4 | |||||||||||||||
Goods and Services(3) | 9.8 | 9.0 | 9.7 | 13.8 | 9.9 |
Totals may differ due to rounding.
1: | Includes deposits in Latin American Reserve Fund, cash, Andean pesos, bank deposits and compensation agreements. |
2: | Reflects imports of goods, as well as special trade operations. |
3: | Contains items included in (3) above, plus imports of factor and non-factor services. |
Source: Banco de la República.
Securities Markets
On July 3, 2001, the Bolsa de Valores de Colombia (Colombian Stock Exchange) was formed as a result of the merger of the three then existing stock exchanges (Bolsa de Bogotá, Bolsa de Medellín and Bolsa de Occidente). Both debt and equity securities are traded on the Colombian Stock Exchange, although the vast majority of securities traded are fixed-income debt securities. The Colombian Stock Exchange has adopted an index called the Indice General de la Bolsa de Colombia (Colombian Stock Exchange Indicator, or “IGBC”), which comprises a group of equity securities the composition of which is determined in part by the frequency of trading in each quarter. As of December 31, 2015, the IGBC decreased by 26.5% compared to 2014 to 8,547.3 points. As of December 31, 2016, the IGBC increased by 18.2% compared to 2015 to 10,106.25 points. As of December 31, 2017, the IGBC increased by 13.6% compared to 2016 to 11,478.10 points. As of December 31, 2018, the IGBC decreased by 2.9% compared to 2017 to 11,144.08 points. As of November 18, 2019, the IGBC ceased to be published by the Colombian Stock Exchange.
On January 15, 2008, the COLCAP and COL20 stocks indexes were introduced to the market in order to replace gradually the IGBC. COLCAP measures the variation of the 20 most traded stocks in the Colombian Stock Exchange by level of capitalization, while COL20 measures the variation of the 20 most traded stocks in the Colombian Stock Exchange by level of liquidity. The initial level of both indexes was 1,000 points. As of December 31, 2014, both indexes decreased, with the COLCAP decreasing by 5.8% to 1,513.0 points and the COL20 decreasing by 14.1% to 1,076.3 points. As of December 31, 2015, both indexes decreased, with the COLCAP decreasing by 15.4% to 1,153.7 points and the COL20 decreasing by 11.1% to 888.6 points. As of December 31, 2017, both indexes increased, with the COLCAP increasing by 12.0% to 1,513.65 points and the COL20 increasing by 5.8% to 1,207.40 points. As of December 31, 2016, both indexes increased, with the COLCAP increasing by 17.2% to 1,351.68 points and the COL20 increasing by 28.5% to 1,141.49 points. As of December 31,
D-88
2017, both indexes increased, with the COLCAP increasing by 12.0% to 1,513.65 points and the COL20 increasing by 5.8% to 1,207.40 points. As of December 31, 2018, The COLCAP decreased by 12.4% to 1,325.9 points and the COL20 increased by 780.6% to 10,631.9 points. As of November 18, 2019, the COL20 ceased to be published by the Colombian Stock Exchange. As of December 31, 2019, the COLCAP increased by 25.4% to 1,662.4 points. As of December 31, 2021, the COLCAP decreased by 1.9% to 1,411.0 points. As of July 13, 2022, the COLCAP decreased by 5.6% to 1,33.2 points.
The Colombian Stock Exchange began trading standardized derivatives in September 2008 with the negotiation of a five-year TES futures contract. In 2012, the Colombian Stock Exchange continued its strategy of consolidating and strengthening the local derivatives market through the promotion of existing products, the creation of new ones and the implementation of an intensive training and educational program. In 2013 this strategy continued, along with the aim of further internationalizing the Colombian stock market. The number of derivatives contracts traded during 2013 was 685,135 contracts, representing an 8.7% increase from the 630,590 contracts negotiated in 2012. The increase in trading volume was due mainly to the legal action taken against InterBolsa, a Colombian securities broker, which resulted in the closure of the largest stock market operator and created distrust towards the stock market in general. The trading volume in the derivatives market during 2014 was 941,620 contracts, representing a 37.4% increase from the previous year, a historic high for traded futures in the Colombian stock market. During 2015, the trading volume was 1,044,000 contracts, representing a 10.9% increase from the previous year, a historic high for traded futures in the Colombian stock market. During 2016, the trading volume was 1,403,000 contracts, representing a 34.4% increase from the previous year. During 2017, the trading volume was 1,117,000 contracts, representing a 20.4% decrease from the previous year. During 2018, the trading volume was 1,064,000 contracts, representing a 4.7% decrease from the previous year. During 2019, the trading volume was 905,000 contracts, representing a 14.9% decrease from the previous year. During 2021, the trading volume was 751,522 contracts, representing a 23.0% decrease from the previous year. As of June 30, 2022, the trading volume in 2022 was 419,633 contracts.
The Colombian Stock Exchange is owned by member firms responsible for developing and implementing regulations governing trading on the exchange. Although largely self-regulated, capital markets intermediaries require a license from the Superintendence of Finance in order to operate. The market capitalization of the Colombian Stock Exchange was Ps. 370 trillion on December 31, 2021, compared to Ps. 366 trillion on December 31, 2020. The market capitalization of the Colombian Stock Exchange was Ps. 349 trillion on June 30, 2022.
The total value of securities traded on the Colombian Stock Exchange during 2021 was Ps. 1,289.64 trillion, representing a nominal decrease of 10.5% in peso terms compared to 2020.
Equity trading during 2021 amounted to approximately Ps. 31.1 trillion, or 2.4%, of the total value of securities traded. This represents a nominal decrease of 7.5% in the total value of equity trading from 2020.
On May 30, 2011, the “Mercado Integrado Latinoamericano” (“MILA”) began its operations. This project involves the integration of technology platforms of the Colombian, Chilean and Peruvian stock markets. The MILA allows investors to carry out cash transactions in investments in shares listed on the Colombian Stock Exchange, Bolsa de Comercio de Santiago (BCS) and Bolsa de Valores de Lima (“BVL”), involving the three securities depositaries, DECEVAL (Déposito Centralizado de Valores de Colombia), CAVALI (Registro Central de Valores y Liquidaciones) and the Central Securities Depository (CSD) of Colombia, Peru and Chile, respectively. The main objective of the integration is to develop the capital markets by offering investors a wider range of securities as well as larger funding sources for issuers. The creation of MILA is expected to diversify, expand and improve the attractiveness of trading of securities in the three countries for both domestic and international investors. By December 2013, the total number of issuers registered with MILA was 590. On June 19, 2014, the Bolsa Mexicana de Valores (“BMV”) became a member of MILA. As of December 31, 2020, the number of registered issuers was 616. As of June 30, 2021, the number of registered issuers with MILA was 613. As of December 31, 2020, the capitalization of MILA was $779.3 billion, a 7.7% increase from the previous year. As of June 30, 2021, the capitalization of MILA was $797.0 billion, a 0.8% decreased from the previous year.
D-89
PUBLIC SECTOR FINANCE
General
The Constitution and the Budgetary Organic Law of 1996 govern Colombia’s budgetary process. The budget process requires the participation of all governmental ministries and agencies. The Ministry of Finance prepares a revenue and expenditure summary for the Government and public sector agencies and then presents it in the form of a bill to Congress by the July prior to the beginning of the next fiscal year. Both houses of Congress must approve the budget by November of each year. It is then presented to the President, who has veto power over individual expenditures. Expenditure increases, but not expenditure reductions, must be approved by Congress as budget amendments. Local legislatures approve their budgets in accordance with the general procedures established pursuant to departmental and municipal law.
The Constitution and Law 60 of 1993 (described below under “—Public Sector Accounts—Revenues”) require the Government to transfer funds to departmental and municipal governments. Although the Government does not finance departmental and local government deficits, all domestic bond offerings and foreign debt incurred by these governmental entities must be approved by the Central Government. In addition, under Law 358 of 1997 and its regulations set forth by Decree 610 of 2002, municipalities and departments may not incur debt service obligations beyond a certain percentage of their operational savings (defined as current revenues less current expenditures).
The budgets for state-owned companies are evaluated by the Ministry of Finance and the National Planning Department, approved by the Consejo Superior de Política Fiscal (“CONFIS”) and sanctioned by Presidential decree. These budgets are devised in conformity with the macroeconomic plan adopted by the Government each fiscal year, which sets general revenue and expense targets for the state-owned companies. During the year, the Government may modify these budgets.
The budgets of Government ministries and agencies, departmental and municipal governments and state-owned companies constitute the consolidated non-financial public sector fiscal accounts. These accounts exclude both the revenues and the expenses of state-owned financial institutions. State-owned financial institutions, development banks and commercial banks have a separate budget process supervised by the Financial Superintendency.
The Contraloría General de la República (General Comptroller of the Republic) audits the financial accounts of the Government, which are submitted annually to Congress for its approval.
Under the 1991 Constitution, royalties received from the exploitation of nonrenewable natural resources that are not directly distributed to departments and municipalities where the natural resources are located or transported are paid into the Fondo Nacional de Regalías (National Royalties Fund). Funds from the National Royalties Fund are used to finance mining development, environmental protection and other regional development projects, including health, education, water and sanitation projects. On January 1, 2012, Decree No. 4923-2011 was enacted by the Government in order to operate the General Royalty System. The decree establishes the objectives, goals, administration, execution, control and distribution of income of proceeds from non-renewable natural resources. On July 18, 2018, Law No. 1923 was issued, regulating the provisions of paragraph 5 of article 361 of the Constitution, regarding investment programs and projects that will be financed with resources from the Fund for Science, Technology and Innovation of the General System of Royalties. The projects that are financed with these resources will be decided by the Órgano Colegiado de Administración y Decisión (OCAD) for Science, Technology and Innovation, through an open, competitive and public process.
In 1995, the Fondo de Ahorro y Estabilización Petrolera (Oil Stabilization and Savings Fund or “FAEP”) was created to monitor the macroeconomic effects of the large foreign exchange inflows due to the then recently discovered oil reserves and to ensure that local governments prudently use the revenues generated from petroleum royalties. Ecopetrol, the National Royalties Fund and the departments and municipalities where oil is produced contribute to the FAEP. Banco de la República administers FAEP. Under the law establishing FAEP, royalties from petroleum production in excess of a predetermined amount payable to the national and local governments are invested abroad through FAEP and are only disbursed for infrastructure projects and social expenditures.
D-90
Decree 1849 of 2013 established the maximum percentages of funds withdrawals per year. Decree 1082 of 2015 established that FAEP had to disburse 100% of its funds by the end of 2019. The Decree gives priority to withdrawals of local entities. The resources should be used to pay the debt of health entities and road investment according to articles 275 and 118 of National Development Plan 2010-2014.
Article 69 of the National Development Plan for 2006-2010 (“2006-2010 National Development Plan”) also created the Stabilization Fund for Fuel Prices (“FEPC”) and established, as an initial source of financing, part of the fund balance accumulated by Ecopetrol in FAEP. In 2008, FAEP transferred Ps. 420 billion (0.1% of GDP) to the FEPC. Article 203 of Law 2056 of 2020, established the liquidation of the FAEP and indicated that the Central Bank should transfer to the “Cuenta única del Sistema General de Regalías” managed by the General Directorate of Public Credit and National Treasury of the Ministry of Finance the remaining resources of the Fondo de Ahorro y Estabilización Petrolera (Oil Stabilization and Savings Fund or “FAEP”).
For 2021, the national government estimates that the FEPC presented a compensation differential of Ps. 11.4 trillion. It is expected that the fund would continue to accumulate a liability in 2022 for Ps. 25.4 trillion. To cover the accumulated deficit for the first semester of 2021, the Central Government transferred Ps. 3.9 trillion to the FEPC, of which Ps.0.3 trillion was used to pay off the accumulated deficit during the second semester of 2020. Preliminary information estimate that the fund closed 2021 with an outstanding balance of Ps. 7.8 billion. As for 2022, the result would be in line with the trend in international reference prices of Liquid Fuels, which, according to projections, would remain at high levels for the rest of the current term.
On June 14, 2022, the Government published its medium-term fiscal framework, which reflects the reactivation process after the economic and social crisis that the country went through due to the pandemic. In 2021, the GDP increased by 10.7%, mainly due to an increase in 16.4% and 20.9% in the industrial and commercial sectors, respectively.
As a consequence of the macroeconomic shock caused by the COVID-19 pandemic, the Colombian Government, with the prior favorable opinion of the Fiscal Rule Advisory Council (Comite Consultivo de la Regla Fiscal), decided to suspend the fiscal rules for 2020 and 2021. However, on September, 2021, through Article 61 of the Social Investment Law (Law 2155), The Fiscal Rule Committee was created. The Fiscal Rule Committee is an autonomous body within the Ministry of Finance and Public Credit composed of seven members, five of which are independent experts in public finance. The expert members of the Fiscal Rule Committee were appointed through Resolution No. 3498 of December 31, 2021. The Fiscal Rule Committee issues recommendations to maintain the fiscal sustainability of the Government’s finances.
The fiscal rule’s parameters are based on the following main principles: (i) reaching a stable public debt at prudential levels, (ii) redefining fiscal balance targets in order to include one-time transactions and reduce biases that may affect the estimation of structural balance targets, (iii) establishing a correction mechanism in fiscal balance targets that internalizes changes in debt levels and ensures their convergence to the debt limit and (iv) establishing a transition regime, considering the effects of the COVID-19 pandemic on public finance.
In 2021, the Central Government deficit decreased to 7.1% of GDP compared to a deficit of 7.8% of GDP in 2020. This decrease in the deficit was mainly due to higher than expected economic growth of 10.6% in 2021, and increase in tax collection. On the other hand, the adjustment of public finances would continue in 2022, in such a way that the total deficit would stand at 5.6% of GDP and would have a decrease of 1.5% of GDP compared to 2021. The decrease in the fiscal deficit would be driven by growth in income, and by a reduction in spending, mainly in items associated with costs arising from the pandemic.
D-91
Public Sector Accounts
The following tables set forth revenues and expenditures (on a cash-flow basis) for the consolidated non-financial public sector for the 2017-2021 period, budgeted figures for 2022 and the resulting fiscal surplus or deficit as a percentage of GDP.
Non-financial Public Sector Revenues and Expenditures (1)
(billions of pesos)
2017 | 2018 | 2019 | 2020 | 2021 | Budget 2022(5) | |||||||||||||||||||
Central Government | ||||||||||||||||||||||||
Total Revenues | Ps. 144,062 | Ps. 149,292 | Ps. 171,861 | Ps. 152,568 | Ps. 192,058 | Ps. 227,535 | ||||||||||||||||||
Current Expenditures(2) | 152,325 | 163,108 | 175,667 | 208,294 | 243,839 | 250,589 | ||||||||||||||||||
Capital Expenditures | 21,815 | 14,040 | 18,511 | 20,393 | 25,734 | 40,577 | ||||||||||||||||||
Total Expenditures | 174,140 | 177,148 | 194,178 | 228,687 | 269,573 | 291,166 | ||||||||||||||||||
Net Lending | (92 | ) | (267 | ) | (174 | ) | (94 | ) | (19 | ) | 0 | |||||||||||||
Accrual adjustments(3) | 3,650 | 2,726 | 3,906 | 1,739 | 5,653 | 12,024 | ||||||||||||||||||
(Deficit)/Surplus | (33,636 | ) | (30,316 | ) | (26,049 | ) | (77,763 | ) | (83,149 | ) | (75,655 | ) | ||||||||||||
Decentralized Agencies | ||||||||||||||||||||||||
Total Revenues | 15,912 | 15,041 | 17,046 | 18,342 | 21,424 | 24,257 | ||||||||||||||||||
Expenditures | ||||||||||||||||||||||||
2017 | 2018 | 2019 | 2020 | 2021 | Budget 2022(5) | |||||||||||||||||||
Current Expenditures | 2,565 | 5,551 | 6,017 | 6,323 | 6,781 | 7,652 | ||||||||||||||||||
Capital Expenditures | 12,719 | 9,919 | 10,596 | 11,167 | 15,058 | 17,443 | ||||||||||||||||||
Total Expenditures | 15,284 | 15,469 | 16,613 | 17,491 | 21,839 | 25,095 | ||||||||||||||||||
Net Lending | 0 | 0 | 0 | 0 | 0 | 0 | ||||||||||||||||||
Accrual adjustments(3) | (14 | ) | (366 | ) | 829 | (318 | ) | 165 | 121 | |||||||||||||||
(Deficit)/Surplus | 642 | (62 | ) | (397 | ) | 1,169 | (580 | ) | (959 | ) | ||||||||||||||
Local Public Sector(4) | ||||||||||||||||||||||||
Total Revenues | 65,546 | 73,959 | 80,203 | 76,332 | 86,985 | 100,156 | ||||||||||||||||||
Expenditures | ||||||||||||||||||||||||
Current Expenditures | 10,286 | 10,949 | 12,850 | 11,748 | 12,124 | 13,374 | ||||||||||||||||||
Capital Expenditures | 51,091 | 57,577 | 71,112 | 63,458 | 71,016 | 82,184 | ||||||||||||||||||
Total Expenditures | 61,377 | 68,526 | 83,962 | 75,206 | 83,140 | 95,558 | ||||||||||||||||||
Net Lending | 0 | 0 | 0 | 0 | 0 | 0 | ||||||||||||||||||
Accrual adjustments(3) | 0 | 0 | 0 | 0 | 0 | 0 | ||||||||||||||||||
(Deficit)/Surplus | 4,169 | 5,433 | (3,759 | ) | 1,126 | 3,846 | 4,597 | |||||||||||||||||
Social Security | ||||||||||||||||||||||||
Total Revenues | 86,937 | 112,979 | 121,925 | 125,000 | 136,793 | 142,567 |
D-92
2017 | 2018 | 2019 | 2020 | 2021 | Budget 2022(5) | |||||||||||||||||||
Expenditures | ||||||||||||||||||||||||
Current Expenditures | 79,505 | 109,651 | 117,877 | 119,895 | 131,920 | 142,478 | ||||||||||||||||||
Capital Expenditures | 109 | 16 | 16 | 4 | 7 | 15 | ||||||||||||||||||
Total Expenditures | 79,614 | 109,667 | 117,893 | 119,899 | 131,927 | 142,494 | ||||||||||||||||||
Net Lending | 0 | 140 | 3 | 00 | 0 | 0 | ||||||||||||||||||
Accrual adjustments(3) | 0 | 0 | 0 | 0 | 0 | 0 | ||||||||||||||||||
(Deficit)/Surplus | 7,323 | 3,172 | 4,029 | 5,100 | 5,100 | 73 | ||||||||||||||||||
Coffee Fund | ||||||||||||||||||||||||
Total Revenues | 2,253 | 2,015 | 2,364 | 2,947 | 4,341 | 4,683 | ||||||||||||||||||
Expenditures | ||||||||||||||||||||||||
Current Expenditures | 1,441 | 1,828 | 2,216 | 2,928 | 4,874 | 5,003 | ||||||||||||||||||
Capital Expenditures | 26 | 335 | 214 | 263 | 203 | 220 | ||||||||||||||||||
Total Expenditures | 1,466 | 2,163 | 2,430 | 3,191 | 5,078 | 5,223 | ||||||||||||||||||
Net Lending | 0 | 0 | 0 | 0 | 0 | 0 | ||||||||||||||||||
Accrual adjustments(3) | 0 | 0 | 0 | 0 | 0 | 0 | ||||||||||||||||||
(Deficit)/Surplus | 787 | (148 | ) | (66 | ) | (243 | ) | (737 | ) | (541 | ) | |||||||||||||
2017 | 2018 | 2019 | 2020 | 2021 | Budget 2022(5) | |||||||||||||||||||
Total Non-financial Public Enterprises | ||||||||||||||||||||||||
Total Revenues | 48,683 | 71,257 | 56,863 | 77,745 | 99.706 | 55,854 | ||||||||||||||||||
Expenditures | ||||||||||||||||||||||||
Current Expenditures | 47,080 | 70,453 | 49,855 | 76,958 | 103,162 | 59,216 | ||||||||||||||||||
Capital Expenditures | 5,833 | 6,653 | 6,183 | 6,162 | 5,067 | 6,959 | ||||||||||||||||||
Total Expenditures | 52,913 | 77,106 | 56,039 | 83,119 | 108,220 | 66,175 | ||||||||||||||||||
Net Lending | (302 | ) | 267 | 173 | 53 | 53 | 53 | |||||||||||||||||
Accrual adjustments(3) | (61 | ) | (118 | ) | 20 | (34 | ) | 141 | 55 | |||||||||||||||
(Deficit)/Surplus | (3,867 | ) | (5,998 | ) | 631 | (5,393 | ) | (8,705 | ) | (10,430 | ) | |||||||||||||
Total Consolidated Non-financial Public Sector (Deficit)/Surplus | Ps. (24,581 | ) | Ps. (27,918 | ) | Ps. (25,611 | ) | Ps. (76,004 | ) | Ps. (84,460 | ) | Ps. (82,913 | ) | ||||||||||||
Primary (Deficit) Surplus(4) | Ps. 4,371 | Ps. 1,651 | Ps. 5,672 | Ps. (52,464 | ) | Ps. (62,474 | ) | Ps. (27,381 | ) |
(footnotes appear on the following table)
Non-financial Public Sector Revenues and Expenditures Surplus/(Deficit)(1)
(as a percentage of GDP)
2017 | 2018 | 2019 | 2020 | 2021 | Budget 2022(5) | |||||||||||||||||||
Government Sectors | ||||||||||||||||||||||||
Central Government | (3.6 | ) | (3.1 | ) | (2.5 | ) | (7.8 | ) | (7.1 | ) | (5.6 | ) | ||||||||||||
Decentralized Agencies | 0.1 | 0.0 | 0.0 | 0.1 | 0.0 | (0.1 | ) | |||||||||||||||||
Local Public Sector(3) | 0.5 | 0.6 | (0.4 | ) | 0.1 | 0.3 | 0.3 | |||||||||||||||||
Social Security | 0.8 | 0.3 | 0.4 | 0.5 | 0.4 | 0.0 | ||||||||||||||||||
Coffee Fund | 0.1 | 0.0 | 0.0 | 0.0 | (0.1 | ) | 0.0 |
D-93
2017 | 2018 | 2019 | 2020 | 2021 | Budget 2022(5) | |||||||||||||||||||
Other, including FAEP | (0.4 | ) | (0.6 | ) | 0.1 | (0.5 | ) | (0.7 | ) | (0.8 | ) | |||||||||||||
Total Consolidated Non-financial Public Sector (Deficit)/Surplus | (2.7 | ) | (2.9 | ) | (2.4 | ) | (7.6 | ) | (7.2 | ) | (6.1 | ) | ||||||||||||
Primary (Deficit)/Surplus(4) | 0.5 | 0.2 | 0.5 | (5.3 | ) | (0.5 | ) | (2.0 | ) |
Totals may differ due to rounding.
1: | All figures calculated according to IMF methodology, which includes privatization, concession and securitization proceeds as part of public sector revenues. The 2016, 2017 and 2018 Financial Plan does not include revenues from other sources. |
2: | Excludes National Hydrocarbon Agency |
3: | Includes municipal and departmental governments and local non-financial enterprises, such as water, telephone and electricity companies and the Medellín metro system. |
4: | The primary balance result reported is based on the Law 819 of 2003. Thus, it excludes dividends transferred from the Central Bank to the Central Government, and registered by the Government as revenues. |
5: | Estimated for 2021 and 2022. |
Sources: National Department of Planning, IMF staff estimates, Banco de la República and General Directorate of Macroeconomic Policy.
In 2021, the Central Government deficit decreased to 7.1% of GDP compared to a deficit of 7.8% of GDP in 2020. This decrease in the deficit was mainly due to higher than expected economic growth of 10.6% in 2021. The Central Government deficit for 2021 was Ps. 83,149billion, an increase of 6.9% from the Ps. 77,763 billion deficit registered in 2020. Central Government revenues increased by 25.9%, from Ps. 152,568 billion in 2020 to Ps. 192,058 billion in 2021, while Central Government expenditures increased by 17,9%, from Ps. 228,687 billion in 2020 to Ps. 269,573 billion in 2021. The increase in expenditures was primarily due to increased spending during the COVID-19 pandemic. Total tax revenues increased from Ps. 130,763 billion in 2020 to Ps. 162,228 billion in 2021. Non-tax revenues decreased from Ps. 1,658 billion in 2020 to Ps. 1,451 billion in 2021. Revenues from special funds increased from Ps. 1,414 billion in 2020 to Ps. 2,842 billion in 2021.
In 2021, the consolidated non-financial public sector deficit totaled Ps. 84,460 billion, or 7.2% of GDP, compared to a deficit of Ps. 76.004 billion, or 7.6% of GDP in 2020. The deficit of the consolidated non-financial public sector during 2021 was primarily due by the 0.3 percentage points improvement in the fiscal balance of public companies (0.2 percentage points of GDP) and the Non-Modeled Public Sector (0.1pp of GDP), while the GG adjusted its deficit in 0.1pp of GDP.
In recent years, the Government’s countercyclical fiscal policy has included the following long-term objectives:
• | establishing a macroeconomic foundation for sustained growth; |
• | directing Government resources to those sectors in which the Government has the greatest impact in supporting social development and fostering competition within the Colombian economy; and |
• | restructuring the budgetary system to facilitate the constitutionally mandated increases in net transfers from the Central Government to departmental and municipal governments. |
The public sector deficit figures presented in this section do not include certain contingent liabilities of the public sector, including certain guarantees and indemnities given by public sector agencies to joint venture partners.
D-94
Revenues
In recent years, the Government has modernized the tax system and expanded the tax base through new tax reform legislation. The tax reforms approved in 2016 were intended to create new jobs and reduce inequalities, and also to bring the tax system into compliance with the constitutional requirement that the Government transfer a portion of its current revenues to departmental and municipal governments. There are two types of required net transfers to departmental and municipal governments. First, the Government transfers revenues to departments for health and educational purposes. Second, the Government transfers revenues to municipalities for social and educational programs as well as infrastructure projects. Both types of transfers are currently calculated as a percentage of current revenue. The actual allocation made to each local government is based on formulas developed by the National Planning Department which take into account each locality’s administrative efficiency, ability to raise revenues independently, population and level of poverty. Net transfers required by Law 60 of 1993 totaled an estimated 30.4%% of current revenue in 2021 and 23.1% in 2022, compared to 32.8% in 2020, 27.4% in 2019, 26.9% in 2018, and 27.0% in 2017. These constitutionally required transfers may be supplemented by discretionary transfers to departments and municipalities. In December 2001, a constitutional reform established new standards that local governments are required to follow with respect to funds transferred by the Central Government, enhancing the control and allocation of these funds, particularly in the education and health care sectors.
On July 20, 2021, the Government submitted a fiscal bill to Congress called the Ley de Inversión Social or Law No. 2155 of 2021 (“Law No. 2155”) which was approved and enacted into law on September 14, 2021 by then President Duque. Law No. 2155 includes a set of measures intended to protect the most vulnerable population, reactivate economic activity and stabilize public finances. Additionally, Law No. 2155 is a result of a consensus with different political and social actors, and seeks to collect Ps. 15.2 trillion per year of permanent resources through a set of actions that will not affect individuals or alter the VAT rate. Finally, Law No. 2155 added Ps. 10.9 trillion in revenue to the General Budget of the Nation for 2021.
Law No. 2155 contains an austerity plan, expected to generate recurrent savings of Ps. 1.9 trillion annually on average between 2022 and 2032. It is expected that the plan will generate reductions in public expenses and limit the growth in personnel expenses and bureaucracy, among others.
Law No. 2155 aims to increase tax revenues by Ps. 2.7 trillion annually, derived from the tools and measures implemented to aid the DIAN’s monitoring and compliance activities. These measures include the issuance of the RUT (tax registration) and income tax return forms suggested by the DIAN for people who do not comply with their tax obligations, among others.
The Government expects a significant increase in tax revenues, derived from corporate taxation, of about Ps. 11 trillion per year commencing on 2022. The permanent sources of this additional revenue are expected to be: (i) the reduction to 50% of the Industry and Commerce Tax - ICA tax credit in the corporate income tax, which would generate additional revenues of Ps. 3.9 trillion per year, and (ii) an increase in the corporate income tax rate to 35% (yielding Ps. 6.7 trillion annually in tax revenue). Law No. 2155 also contemplates the following temporary sources of additional revenues: (i) a corporate income tax surcharge to the financial sector of three percentage points until 2025 and (ii) a normalization tax to incentivize the reporting of the assets of Colombians abroad.
As a complementary measure to boost economic activity and household consumption, Law No. 2155 allows the Government to regulate the use of electronic commerce to establish up to three days per year free of VAT. On August 8, 2022, the Ministry of Finance submitted a tax reform proposal to Congress which would, if approved, eliminate the VAT free days.
Also, as an indirect result of Law No. 2155, the Government expects an increase in revenues and, consequently, expects an increase in the transfers to subnational governments through the Sistema General de Participaciones. These transfers are used to finance expenditures mostly in education and health.
The expected use of proceeds derived from Law No. 2155 between 2021 and 2022 are, among others: (i) Ps. 10.1 trillion for the extension to December 2022 of the Ingreso Solidario program (Solidary Income), of which Ps. 2.9 trillion are budgeted for 2021 and Ps. 7.2 trillion are for 2022, to provide a minimum income to socioeconomically vulnerable households that are not beneficiaries of any other cash transfer program of the national Government, (ii) Ps. 0.8 trillion for programs that promote employment for youth and the rest of the population through partial wage subsidies for new workers, (iii) Ps. 1.1 trillion for the extension of payrolls subsidies (PAEF) until December 2021, and (iv) Ps. 1.0 trillion to provide permanent access to higher education for vulnerable students.
D-95
Furthermore, Law No. 2155 aims to strengthen fiscal sustainability to ensure sustainable financing of social spending through a strengthening of the independence and operational capacity of the Fiscal Rule Committee, the establishment of a limit for public debt (71% of GDP) and setting of goals for the fiscal balance to move public debt towards the prescribed limit.
Central Government revenues totaled Ps.192,058 billion (16.3% of GDP) in 2021 compared to Ps. 152,568 billion in 2020, an increase of 6.8% in nominal terms. Total tax revenues increased by 24% in nominal terms in 2021 compared to 2020. The Government currently projects revenues of Ps. 206,941 billion (15.2% of GDP) in 2022 and Ps. 249.132 billion (17,2% of GDP) for the Central Government. However, no assurances can be given concerning actual results for the 2022 and 2023 period and beyond.
The following table shows the composition of the Government’s revenues on a cash-flow basis.
Central Government Revenues
2017 | 2018 | 2019 | 2020 | 2021 | 2022(4) | |||||||||||||||||||
Tax Revenue | ||||||||||||||||||||||||
Income Tax(1) | 40.0 | % | 42.9 | % | 39.3 | % | 40.4 | % | 52.8 | % | 61.3 | % | ||||||||||||
Value-Added Tax | 35.1 | 37.4 | 36.0 | 35.2 | 40.6 | 56.3 | ||||||||||||||||||
Wealth Tax | 2.7 | 0.3 | 0.5 | 0.6 | 0.7 | 0.0 | ||||||||||||||||||
Tariffs | 2.7 | 2.4 | 2.2 | 1.9 | 2.8 | 3.8 | ||||||||||||||||||
Other Indirect Taxes | 7.3 | 7.3 | 7.3 | 6.7 | 8.8 | 10.4 | ||||||||||||||||||
Total Tax Revenue | 87.8 | 90.4 | 85.3 | 84.9 | 105.6 | 131.9 | ||||||||||||||||||
Nontax Revenue(2) | 12.2 | 9.6 | 14.7 | 15.1 | 20.2 | 17.3 | ||||||||||||||||||
100.0 | 100.0 | 100.0 | 100.0 | 100.0 | 100.0 | |||||||||||||||||||
Total Revenues (as a percentage of GDP)(3) | 15.7 | % | 15.1 | % | 16.2 | % | 15.23 | % | 16.3 | % | 16.7 |
Totals may differ due to rounding.
1: | Includes CREE. |
2: | Includes 2017 payment of fines to telecom companies. |
3: | Includes concession revenues, hydrocarbon duties, fines, other duties, other current revenues and capital revenues. |
4: | Estimated for 2021 and 2022 |
Sources: Ministry of Finance and General Directorate of Macroeconomic Policy.
Expenditures
Central Government expenditures (Ps. 269,573 billion), including Net Lending (Ps. (19) billion) and Accrual Adjustment (Ps. 5,653 billion) totaled Ps. 275,207 billion in 2021 (23.0% of GDP), an increase of 19.5% in nominal terms from 2020. Current interest payments increased by 29.8% in nominal terms in 2021 and current operational expenditures increased by 8.4% in nominal terms compared to 2020 levels. Current investment expenditures increased by 47.5% in nominal terms in 2021. The Government currently projects current interest payments increased by 44.8% in nominal terms in 2022, current operational expenditures increased by 6.3% in nominal terms compared to 2021 levels and current investment expenditures increased by 34.9% in nominal terms in 2022. However, no assurances can be given concerning actual results for the 2021 period and beyond.
D-96
Based on preliminary figures, in 2021 Central Government expenditures were allocated as follows:
• | social expenditures, 60.7%; |
• | interest payments, 12.1%; |
• | defense and internal security, 8.2%; |
• | government overhead, 5.1%; |
• | justice, 5.5%; |
• | infrastructure, 6.1%; and |
• | transfers to local governments, 2.3%. |
Transfers to departments and municipalities totaled Ps. 35,740 billion in 2017 (representing 20.5% of total 2017 expenditures), Ps. 36,612 billion in 2018 (representing 20.4% of the total 2018 expenditures), Ps. 41,066 billion in 2019 (representing 20.7% of the total 2019 expenditures), Ps. 43,432 billion in 2020 (representing 18.9% of the total 2020 expenditures) and Ps. 46,371 billion in 2021 (representing 4,3% of the total 2021 expenditures). The Government currently projects Ps. 47.866 billion in transfers to departments and municipalities for 2022 (representing 3.5% of the total 2022 expenditures). These transfers were made in accordance with the territorial transfer reform legislation enacted in December 2001 that provides for such transfers to be made based on the average revenue growth of Colombia over the previous four years, adjusted by the inflation rate plus a certain percentage, during a transition period from 2002-2007. In 2007, Congress passed a constitutional amendment that modified the formula to calculate these transfers. From 2008 to 2009, transfers to regional governments increased by the inflation rate plus 4% with an additional 1.3% increase for education. Transfers increased by 10.9% in 2017, 2.4% in 2018, 12.2% in 2019, 5.8% in 2020 and 6.8% in 2021.
According to the Medium Term Fiscal Framework 2022, the Government expects that the balance of the pension subsector for 2022 will remain stable (0.3% of GDP), as a result of the surplus balances of the funds comprising this subsector: (i) The Fondo de Garantía de Pensión Mínima (FGPM) maintains its accumulation level based on a new contributors to the Régimen de Ahorro Individual con Solidaridad (RAIS); (ii) FONPET estimates that the projected surplus explained mainly by the financial yields that would be obtained, which they would return to positive territory in 2023, once they would stop experiencing the devaluations in its portfolio, mainly composed of TES, which are projected in the short term. The rest of the funds that are part of the pension subsector would have a neutral fiscal balance, in which the Nation’s transfers act as a variable closing for the financing needs.
The value of the Central Government’s pension liability totaled 3.5% of GDP for 2019 and 2020. The Government currently projects Central Government’s pension liability of 3.7% of GDP for 2021.
The following table shows the principal categories of Government expenditures, according to the General Directorate of the Budget of the Ministry of Finance.
Central Government Expenditures (1)
2017 | 2018 | 2019 | 2020 | 2021(4) | ||||||||||||||||
Social Expenditures | ||||||||||||||||||||
Education | 16.9 | % | 16.9 | % | 17.8 | % | 16.0 | % | 15.3 | % | ||||||||||
Health | 12.3 | 12.6 | 14.2 | 14.0 | 15.4 | |||||||||||||||
Potable Water and Sewage | 1.2 | 1.2 | 1.3 | 1.1 | 1.1 | |||||||||||||||
Housing | 0.9 | 1.1 | 1.1 | 1.0 | 1.0 | |||||||||||||||
Social Security | 20.6 | 20.0 | 18.0 | 19.1 | 16.7 | |||||||||||||||
Other | 5.7 | 5.1 | 4.6 | 10.5 | 11.2 | |||||||||||||||
|
|
|
|
|
|
|
|
|
|
D-97
2017 | 2018 | 2019 | 2020 | 2021(4) | ||||||||||||||||
57.7 | 56.7 | 57.0 | 61.6 | 60.7 | ||||||||||||||||
|
|
|
|
|
|
|
|
|
| |||||||||||
Justice | 6.1 | 6.5 | 6.3 | 5.8 | 5.5 | |||||||||||||||
Defense and Security (Internal) | 10.7 | 10.6 | 10.3 | 9.0 | 8.2 | |||||||||||||||
Infrastructure | ||||||||||||||||||||
Mines and Energy | 1.7 | 2.0 | 1.4 | 1.4 | 1.7 | |||||||||||||||
Works and Transportation | 2.6 | 2.7 | 2.7 | 2.5 | 3.2 | |||||||||||||||
Irrigation Projects, Land Adaptation and Agriculture | 1.2 | 1.0 | 0.8 | 0.7 | 0.7 | |||||||||||||||
Environment | 0.3 | 0.3 | 0.3 | 0.2 | 0.3 | |||||||||||||||
Other | 0.3 | 0.3 | 0.3 | 0.3 | 0.2 | |||||||||||||||
|
|
|
|
|
|
|
|
|
| |||||||||||
6.2 | 6.2 | 5.5 | 5.0 | 6.1 | ||||||||||||||||
|
|
|
|
|
|
|
|
|
| |||||||||||
Government Overhead Expenses | 3.5 | 4.4 | 4.0 | 3.6 | 5.1 | |||||||||||||||
Transfers to Local Governments(2) | 2.6 | 2.4 | 2.6 | 2.3 | 2.3 | |||||||||||||||
Interest payments | 13.2 | 13.1 | 14.3 | 12.6 | 12.1 | |||||||||||||||
|
|
|
|
|
|
|
|
|
| |||||||||||
Total Expenditures | 100 | % | 100 | % | 100 | % | 100 | % | 100 | % | ||||||||||
|
|
|
|
|
|
|
|
|
| |||||||||||
Expenditures (as a percentage of GDP)(3) | 19.0 | % | 18.7 | % | 18.5 | % | 23.4 | % | 22.9 | % |
Totals may differ due to rounding.
1: | 2021 figures are preliminary. |
2: | Figures only include transfers to municipalities, not to other regional governments. |
3: | Based on estimated GDP figures calculated using 2015 as the base year for calculating constant prices. |
4: | The 2021 variations are mainly due to: the most representative variation is presented in Infrastructure - works and transport, going from $5.8 billion in 2020 to $8.6 billion in 2021 being the most relevant projects: Infrastructure to connect territories, corridors productive rural and mass transport systems; the share of social expenditure - social security decreased by 2.3% because its increase in payments (1%) was lower than the total increase in payments (14%). |
Sources: Dirección General del Presupuesto (General Directorate of the Budget), CONFIS and Tesorería General de la República (National Treasury).
2022 Budget
The 2022 budget became Law No. 2159 on November 12, 2021. The consolidated public sector deficit is expected to experience a decrease of 1.4% compared to 2021 (7.9% of GDP), reaching a deficit level of 6.5% of GDP by 2022, mainly by a significant increase in tax collection, the modernization of the DIAN and the reactivation and normalization of investment. The 2022 budget estimated a Central Government deficit of approximately 0.9%, an increase of 0.1% compared to the deficit in 2021. Total consolidated non-financial public sector expenditures for 2022 are currently budgeted to reach Ps. 625,711 billion, out of which Ps. 291,166 billion corresponds to expenditures by the Central Government and Ps. 334,545 billion corresponds to expenditures by public entities at the national and local level and transfers to departmental and local governments.
Under the 2022 budget, the Central Government’s revenues on a cash-flow basis are projected to total Ps. 227,535 billion (approximately 16.7% of GDP), an increase of 18.5% compared to revenues of Ps. 192,058 billion recorded in 2021. Total tax revenues are expected to increase 25.0%, from Ps. 162,228 billion in 2021 to Ps. 202,469 billion in 2022. Income tax revenues and CREE, including withholding tax, are expected to amount to Ps. 93,546 billion in 2022, an increase of 16.1% compared to 2021 income tax revenues and CREE of Ps. 80,560 billion. Internal value-added tax and consumption tax revenues are expected to total Ps. 52,394 billion in 2022, an increase of 45.3% compared to Ps. 36,071 billion in 2021. Tariffs and external value-added tax revenues are expected to increase by 29.5% in 2022, from Ps. 25,912 billion in 2021 to Ps. 33,566 billion in 2022. Non-tax revenues are expected to amount to Ps. 1,800 billion in 2022, a 24.0% increase compared to Ps. 1,451 billion in 2021.
D-98
According to CONFIS, Central Government expenditures (net of amortizations of public debt and on a cash-flow basis) under the 2022 budget are expected to total Ps. 303,190 billion (approximately 22.3% of GDP) compared to Ps. 275,207 billion in 2021, representing an increase of 10.3%. Operational expenditures are expected to total Ps. 209,368 billion in 2022, an increase of 6.3% compared to Ps. 197,007 billion registered in 2021. Expenditures for interest payments are expected to increase by 44.8%, from Ps. 36,771 billion in 2021 to Ps. 53,245 billion in 2022. Investment expenditures are expected to amount to Ps. 40,577 billion in 2022, an increase of 34.9% compared to Ps. 30,083 billion in 2021. Transfers, including pension transfers and transfers to regional governments, are expected to decrease by 1.1%, from Ps. 174,708 billion in 2021 to Ps. 172,713 billion in 2022.
The following table provides principal assumptions as of May 20, 2022:
Principal 2022 Assumptions
2022 Assumptions(1) | ||||
Gross Domestic Product | ||||
Nominal GDP (billions of pesos 2015) | 1,361,476,676 | |||
Real GDP Growth | 6.5 | % | ||
Inflation(2) | ||||
Domestic Inflation (consumer price index) | 8.5 | % | ||
External Inflation(3) | 5.3 | % | ||
Real Devaluation at end of period | -1.8 | % | ||
Export Prices | ||||
Oil ($/barrel)(4) | 100.0 | |||
Coal ($/ton) | 195.2 |
1: | Figures correspond to statistics released by the General Directorate of Macroeconomic Policy in May 2022. |
2: | End of period. |
3: | “External Inflation” is based on projected inflation in the United States as published in the IMF, World Economic Outlook Database, April 2022. |
4: | Based on inputs provided by the Mining and Energy Technical Group established by the Fiscal Rule and oil futures market. |
The figures set forth above represent the Government’s forecast, as of May, 2022, of the 2022 Colombian economy. While the Government believes that these assumptions and targets were reasonable when made, some are beyond the control or significant influence of the Government, and actual outcomes will depend on future events. Accordingly, no assurance can be given that economic results will not differ materially from the figures set forth above.
IMF Program
Flexible Credit Line with IMF
On June 24, 2013, the IMF’s Executive Board approved a two-year SDR 3.87 billion successor arrangement under the FCL, which at June 24, 2013, was equivalent to approximately $5.84 billion. On June 17, 2015, the IMF’s Executive Board approved a two-year SDR 3.87 billion successor arrangement under the IMF’s FCL, which at June 17, 2015, was equivalent to approximately $5.45 billion. On June 13, 2016, the IMF’s Executive Board approved a successor two-year arrangement under the FCL in the amount of SDR 8.18 billion, approximately U.S.$11.35 billion, and canceled the previous arrangement of SDR 3.87 billion. On June 6, 2017, the IMF’s Executive Board reaffirmed Colombia’s continued qualification to access U.S.$11.4 billion under the FCL. On
D-99
May 25, 2018, the Executive Board of the IMF approved a successor two-year arrangement for Colombia under the FCL in an amount equivalent to SDR 7.9 billion (approximately U.S.$11.4 billion) and canceled the previous arrangement for SDR 8.2 billion. The Government has stated its intention to treat the arrangement as precautionary and does not plan to draw on the facility. On May 20, 2019, the Executive Board of the IMF completed its review of Colombia’s qualification for the arrangement under the FCL and reaffirmed Colombia’s qualification to access FCL resources.
On May 1, 2020, The IMF approved a successor two-year arrangement for Colombia under the Flexible Credit Line (FCL), designed for crisis prevention, of about U.S.$10.8 billion. On September 25, 2020, the Government made a drawing of U.S.$5.4 billion (approximately SDR 3.75 billion) under the FCL in the context of the COVID-19 pandemic. The authorities used the funds to help meet higher financing needs whilst maintaining strong external buffers in a context of heightened global uncertainty. The remaining amount available to Colombia under the FCL stands at U.S.$12.2 billion (approximately SDR 8.517 billion) after the drawdown. The authorities intend to treat this remaining amount under the FCL as precautionary.
On April 29, 2022, the Executive Board of the International Monetary Fund (IMF) approved a successor two-year arrangement under the Flexible Credit Line (FCL) for 7,155.7 million Special Drawing Rights (SDR), equivalent to about USD $9.8 billion. This arrangement will replace the previous one approved in 2020 and will be treated by Colombian authorities as a precautionary instrument against external risks. The IMF considers that Colombia continues to meet the criteria to access this credit line and emphasized the soundness of the country’s institutional policy framework, made up by a credible inflation targeting strategy, a fiscal policy framework anchored in sustainability of public debt and effective financial surveillance and regulation.
Legislative Financing Reforms
The following reforms have been enacted in recent years to address the budget deficits experienced by the Government in those periods:
On December 29, 2016, then President Santos signed into law the Structural Tax Reform that includes the following main reforms: (i) anti-tax evasion measures; (ii) a unified and reduced corporate income tax of 33% starting in 2019; (iii) elimination of certain personal taxes, such as the alternative minimum tax and the simplified minimum tax; (iv) implementation of the monotax on small businesses with special tariffs; (v) an increase in the overall rate of the value added tax to 19% from 16%; and (vi) a tax on carbon emissions from fossil fuels. See “Republic of Colombia — Other Domestic Initiatives” for additional information on the tax reform laws.
On December 28, 2018, Law No. 1943 (the “Financing Law”) was signed by then President Duque. The Financing Law, which entered into force on January 1, 2019, aims to increase government revenues by approximately Ps. 7.5 trillion pesos. The Financing Law includes, among others, the following measures: (1) a new transactional tax on the sale of certain real estate; (2) a regular VAT for beer and for certain sugar drinks; (3) a 1% annual wealth tax on certain individuals for years 2019, 2020, and 2021; and (4) a tax on certain dividends at a rate of 7.5% or 15% depending on the nature of the recipient of the dividend. Further, the Financing Law strengthens the DIAN; increases the Republic’s ability to collect fiscal revenues; promotes formal employment; incentivizes large-scale investments that create more than 250 new jobs; and promotes incentives for investments in sectors of the Orange Economy.
On October 16, 2019, the Financing Law was declared unconstitutional by the Constitutional Court due to errors in the legislative approval process. The decision of the Constitutional Court is not retroactive and will be enforced starting January 1, 2020. On October 22, 2019, the Government presented to Congress a tax reform bill aimed at replacing the Financing Law (the “Economic Growth Law”). On December 27, 2019, the President of the Republic signed the Economic Growth Law (Law No. 2010), after it was approved by Congress. The law seeks to continue promoting economic development and creates the basis for reducing inequality gaps in the country. The Economic Growth Law includes the same provisions from the Financing Law and in addition includes four measures that seek to benefit the most vulnerable in the population: (i) a VAT refund to the 20% poorest in the population; (ii) a gradual reduction in health contributions, from 12% to 4%, by retirees who receive a minimum pension salary; (iii) incentives for companies to hire young people; and (iv) three days a year without VAT.
D-100
On November 24, 2019, then President Duque signed Law No. 2111, which created the “Grupo Bicentenario,” an independent legal entity linked to the Ministry of Finance. Grupo Bicentenario will serve as a financial holding entity overseeing the group of state entities that provide financial services, with the objective of expanding their portfolios, improving the quality of service, and protecting the savings and assets of Colombians.
On October 27, 2020, the Government introduced to Congress a bill titled “Integral Law for Transparency, Prevention and Fight Against Corruption” which intended to increase the Government’s means to confront corruption.
On December 12, 2020, the Board of Directors of Banco de la República elected economist Leonardo Villar Gómez as the new governor of Banco de la República, effective January 4, 2021. Mr. Villar served as a Deputy Executive Director of the OECD at the IMF and replaced Dr. Juan José Echavarría, who did not seek re-election to a second four-year term.
On December 23, 2020, by Law No. 2067, the Government approved the trade agreement between the United Kingdom of Great Britain and Northern Ireland, as one party, and the Republic of Colombia, the Republic of Ecuador and the Republic of Peru, as another party, signed in Quito, Ecuador, on May 15, 2019.
On July 1, 2021, by Law No. 2095, the Government approved the agreement for the suppression of double taxation with respect to income tax and the prevention of tax evasion and elusion between the Republic of Colombia and Japan.
On July 6, 2021, by Law No. 2098, the Government approved the law by which life imprisonment is regulated and the criminal code, the criminal proceeding code and the penitentiary and prison code are reformed.
On December 30, 2021, by Law No. 2173, The Government established the creation of “Áreas De Vida” and the creation of forests in each of the country’s municipalities, with the active participation of the entire population in the restoration and ecological conservation of the territory, through the planting of trees for the creation of forests and the increase in plant cover, with the joint work of companies and relevant entities.
On January 6, 2022, by Law No. 2191, the Government regulated leave and vacation time of employees in labor relations within the different contracting modalities in force in the Colombian legal system.
On August 8, 2022, the New Government formally proposed a tax reform bill to lawmakers which would raise some 25 trillion pesos in 2023, equivalent to some 1.72% of gross domestic product, in an effort to increase revenue for anti-poverty programs.
This tax reform bill aims to advance in two dimensions: first, to reduce the inequitable exemptions by individuals with the highest income and some companies, as well as closing paths for tax evasion and avoidance; and second, achieve to collect enough resources to finance the strengthening of the social protection system. It is achieved through definitions of the tax system, which allow progress in terms of progressivity, equity, justice, simplicity and efficiency. See “Republic of Colombia — Other Domestic Initiatives” for additional information on the tax reform laws.
D-101
PUBLIC SECTOR DEBT
General
Public sector debt (“public debt”) in Colombia is comprised of the internal and external debt of the Central Government, Banco de la República and state-owned non-financial companies, as well as the external debt of state-owned financial institutions and departmental and municipal governments. External public debt encompasses all debt payable in currencies other than pesos (including debt denominated in pesos but payable in currencies other than pesos), while internal public debt includes all debt payable in pesos.
The type of authorization required for incurring public debt depends on the use of the proceeds and on whether the debt is issued directly or guaranteed by the Republic, or is issued by a public entity without the benefit of the Republic’s guarantee. The Ministry of Finance is the Government agency responsible for regulating public sector borrowing. The Ministry of Finance must authorize all external borrowing by government-owned corporations and national, departmental and municipal agencies.
New external debt issued or guaranteed by the Republic must comply with the global debt ceiling set periodically by Congress. This ceiling is set as part of the external financing program proposed by the executive branch. In addition, external public debt issued or guaranteed by the Republic that increases the amount of outstanding external debt issued or guaranteed by the Republic must be authorized by the Consejo Nacional de Política Económica y Social (“CONPES”) and the Comisión Interparlamentaria de Crédito Público (Public Credit Congressional Commission), a special six-member Congressional committee. The Director General of Public Credit and National Treasury of the Ministry of Finance must give advance approval of external debt issuances by the Republic that will be used to prepay or refinance existing debt. External debt incurred by decentralized entities requires prior authorization by the Ministry of Finance.
Until 1990, loans from Banco de la República and proceeds from special purpose bonds were the primary source of the Government’s internal public debt. Pursuant to Law 51 of 1990, the Government initiated a program in 1991 to finance public sector internal debt with Treasury bond issuances in the domestic capital markets, thereby diminishing reliance upon the traditional sources of internal financing. Colombia’s external public debt consists of loans from multilateral institutions (such as the World Bank and the IADB), foreign governments, commercial banks, suppliers, export credit institutions and bonds.
The focus of the Government’s debt management is to diversify the Government’s sources of financing, issue bonds in the European, Asian and U.S. capital markets, reduce the public sector deficit by improving the maturity profile of public sector debt and lower debt service costs and currency risk exposure. In addition, in recent years, the Republic has guaranteed less debt due to privatizations and stricter policies for authorizing guaranteed debt.
On June 14, 2022, a revised Financing Plan for 2022 as part of the Medium Term Fiscal Framework 2022-2023 was published, under which the Government plans to issue up to Ps. 49.7 trillion in internal debt and $17.3 trillion in external debt for 2022. In addition, the Financing Plan for 2023 was announced, which contemplates up to Ps. 43.9 trillion in internal debt and $24.0 trillion in external debt. According to the Medium Term Fiscal Framework, the Central Government deficit for 2022 is projected to be 5.6% of GDP, and the non-financial public sector deficit for 2022 is projected to be 6.1% of GDP.
Colombia’s ratio of total net non-financial public sector debt to GDP was 44.2% in 2017, 45.8% in 2018, 47.6% in 2019 and 62.1% in 2020. For the year ended December 31, 2021, the ratio of total net non-financial public sector debt to GDP decreased to 61.7%, mainly due to the increase in debt of the Central Government.
Public Sector Internal Debt
In 2021, the Government’s internal debt consisted mainly of the following debt instruments:
• | treasury bonds known as Títulos de Tesorería (“TES”) sold through auctions to the public and to Government agencies (which could invest excess funds in these Government instruments), these TES also include Green Bonds denominated in Colombian Pesos. The Green Bonds have the same financial terms of the conventional TES but with a separate ISIN; and |
D-102
• | various special-purpose bond issues. |
The Central Government’s internal funded debt (i.e., long-term debt with an original maturity of more than one year) was $115.2 billion (Ps. 458.6 trillion) on December 31, 2021, a decrease of 5.8% in dollar terms (a 9.3% increase in peso terms) from the $122.2 billion (Ps. 419.6 trillion) outstanding on December 31, 2021. According to preliminary figures, total non-financial public sector internal funded debt was $126.1 billion (Ps. 502.2 trillion) on December 31, 2021, compared to $132.3 billion (Ps. 454.2 trillion) outstanding on December 31, 2020.
TES issuances in the domestic capital markets have become a significant source of Central Government funding. As of December 31, 2021, local TES bonds represented 54.9% of total Central Government debt (both internal and external) and 92.1% of total internal Central Government debt. TES issuances in the domestic capital markets are accounted for as internal debt, while global TES bond issuances, which are denominated in pesos but payable in dollars and offered and sold globally (in foreign capital markets), are accounted for as external debt.
In January 2003, the Government appointed 20 financial institutions as market makers in Government securities as part of its strategy to broaden the Treasury bond market and provide liquidity to the local capital markets. Furthermore, the Ministry of Finance has expanded the types and maturities of its bond issues. In addition to one-, two-, three- and five-year fixed-rate TES, beginning in March 1998 the Government issued three-, five-, seven- and ten-year TES, with interest rates pegged to changes in the consumer price index. To reduce interest rate pressures on the market and simultaneously offer an exchange rate hedging instrument, the Government has issued dollar-linked one-, two- and three-year TES. As of December 31, 2019, there were no dollar-linked TES outstanding. In May 1999, the Government introduced UVR TES bonds and since then has issued five-, seven-, ten-, twelve- seventeen- and twenty-year UVR TES bonds. With the UVR, the principal amount of the bond (rather than the interest rate) changes according to movements in the consumer price index, in a manner similar to the inflation-adjusted government debt securities available in the United States and France.
On May 16, 2012, the Government developed a new strategy for the issuance of internal funded debt. The plan involves the issuance of benchmark peso-linked TES bonds and inflation-indexed TES, known as UVR (Unidad de Valor Real Constante) TES bonds every two years, both launched at the same time in odd years, with a reopening of such securities within five years of maturity. Securities are expected, but not required, to be issued for the maximum term established for each security (15 years in the case of TES bonds denominated in pesos and 20 years in the case of UVR TES bonds), such that the maturity of peso-linked TES will occur in even years and the maturity of UVR TES bonds occur in odd years. This measure was taken to reduce refinancing risk.
In 2021, the Government issued short-term (364-day) bills, 2027, 2036 and 2050-fixed rate TES benchmarks and 2029, 2037 and 2049 UVR TES bonds. In 2021, the Government issued Ps. 49.5 trillion of TES. Of this amount, 87.2% was issued through auctions (Ps. 43.1 trillion). As of December 31, 2021, $32.9 billion (Ps. 131.0 trillion) of UVR TES bonds were outstanding.
In 2022, the Government plans to issue Ps. 49.7 trillion in internal debt. As of June 30, 2021, Ps. 21.0 trillion of the planned aggregate principal amount of TES bonds have been issued. Auctions of TES bonds are normally held on a weekly basis, alternating between TES bonds and UVR TES bonds each week.
The Government has taken additional measures during the last several years to strengthen the domestic capital markets. For example, the Government encourages electronic systems for trading public sector debt instruments. These systems should provide a more efficient pricing mechanism and greater liquidity for investors. The Government also encourages the participation of institutional investors in the capital markets, as evidenced by the increasing investment of private pension fund assets in new capital market instruments. The Government has also increased its consistency in the timing and amounts of TES issuances. In addition to these measures, the Government issued bonds for the financing of the peace process and the post-conflict period (“Peace Bonds”). The Peace Bonds fund agrarian reform and the reconstruction of social infrastructure in conflict zones. In 2015, the Government issued Peace Bonds in aggregate principal amount of Ps. 51.5 million. In 2016, the Government issued Peace Bonds in aggregate principal amount of Ps. 44.6 million. In 2017, the Government issued Peace Bonds in
D-103
aggregate principal amount of Ps. 5.5 million. In 2018, the Government issued Peace Bonds in aggregate principal amount of Ps. 18.1 million. In 2019, the Government issued Peace Bonds in aggregate principal amount of Ps. 667.6 million. In 2020, the Government issued Peace Bonds in aggregate principal amount of Ps. 34.6 million. In 2021, the Government did not issue Peace Bonds.
The following table shows the total internal funded debt of the public sector.
Public Sector Internal Funded Debt(1)
2017 | 2018 | 2019 | 2020 | 2021 | ||||||||||||||||
(billions of pesos or percentage of GDP) | ||||||||||||||||||||
Central Government(2) | Ps. 284,359 | Ps. 323,179 | Ps. 364,176 | Ps. 419,607 | Ps. 458,645 | |||||||||||||||
Public Sector Entities | 33,950 | 32,417 | 33,189 | 34,551 | 43,556 | |||||||||||||||
Total Internal Debt(3) | Ps. 318,309 | Ps. 355,596 | Ps. 397,365 | Ps. 454,158 | Ps. 502,200 | |||||||||||||||
As a Percentage of GDP | 34.6 | % | 36.1 | % | 37.4 | % | 45.5 | % | 42.7 | % |
Totals may differ due to rounding.
1: | Includes debt of the Government with an original maturity of more than one year, and public sector entities’ guaranteed internal debt. |
2: | Central Government figures exclude pension bonds and constant value bonds. |
3: | Includes peso-denominated debt of the Government excluding state-owned financial institutions. |
Sources: General Directorate of Public Credit and National Treasury, Ministry of Finance.
As of December 31, 2021, Ps. 68.4 billion of direct internal floating debt (i.e., short-term debt with an original maturity of one year or less) of the Central Government was outstanding.
Public Sector External Debt
As used herein, public sector external funded debt consists of long-term external debt of the Central Government and guaranteed and non-guaranteed long-term external debt of public sector agencies, departments and municipal governments and state-owned financial institutions. Long-term debt means debt with an original maturity of more than one year. Traditionally, Colombia has relied on the following six sources of external debt:
• | capital markets, such as external bond offerings; |
• | multilateral financial institutions, such as the IADB, the World Bank and CAF; |
• | commercial banks; |
• | export credit institutions; |
• | suppliers; and |
• | bilateral agreements. |
As of December 31, 2021, debt from multilateral institutions and export credit institutions represented 36.2% of public sector external funded debt, while loans from commercial banks constituted 6.3% of the total. The amount of bonds outstanding as of December 31, 2021, was $52.5 billion, or 52.3% of public sector external funded debt. Total public sector external funded debt increased from $91.2 billion on December 31, 2020, to $100.3 billion on December 31, 2021.
As of December 31, 2021, floating (i.e., short-term debt with an original maturity of one year or less) public sector external debt totaled $976.4 million.
D-104
On December 31, 2021, the Central Government accounted for 68.7% of public sector external funded debt, and state-owned entities, including Banco de la República, accounted for 25.3%.
The following table shows the external funded debt of the public sector by type.
Public Sector External Funded Debt by Type(l)(2)
As of December 31, | ||||||||||||||||||||
2017 | 2018 | 2019 | 2020 | 2021 | ||||||||||||||||
(millions of U.S. dollars, except percentages) | ||||||||||||||||||||
Central Government | $ | 47,803 | $ | 51,003 | $ | 51,713 | $ | 66,911 | $ | 73,306 | ||||||||||
Public Entities(3) | ||||||||||||||||||||
Guaranteed | 1,887 | 2,080 | 2,084 | 1,996 | 1,514 | |||||||||||||||
Non-guaranteed | 20,707 | 18,472 | 18,528 | 22,280 | 25,442 | |||||||||||||||
Total External Debt | $ | 70,396 | $ | 71,554 | $ | 72,326 | $ | 91,187 | $ | 106,658 | ||||||||||
Total Debt Service | $ | 10,524 | $ | 8,681 | $ | 7,198 | $ | 6,409 | $ | 8,353 | ||||||||||
External Debt/GDP | 24.1 | % | 21.6 | % | 22.4 | % | 33.6 | % | 45.7 | % | ||||||||||
Total Debt Service/GDP | 3.6 | % | 2.6 | % | 2.2 | % | 2.4 | % | 3.8 | % | ||||||||||
Total Debt Service/Exports | 29.5 | % | 19.6 | % | 17.0 | % | 19.3 | % | 34.6 | % |
Totals may differ due to rounding.
1: | Debt with an original maturity of more than one year. |
2: | Debt in currencies other than U.S. dollars has been converted into U.S. dollars using exchange rates as of December 31 of each year. |
3: | Includes Banco de la República, public agencies and entities, departments and municipal governments and state-owned financial entities. |
Source: Debt Database—Ministry of Finance.
As of December 31, 2017, 2018, 2019 and 2020, Colombia’s public sector external funded debt increased by $0.9 billion, $1.2 billion, $0.8 billion, $18.9 billion and $9.1, respectively, from the corresponding figure on December 31 of the prior year. The increase in the public external funded debt in 2021 was primarily due to an increase in indebtedness of the Central Government. As of December 31, 2017, public sector external debt as a percentage of GDP increased to 24.1%, but decreased to 21.6% on December 31, 2018, and increased to 22.4% on December 31, 2019, to 33.6% on December 31, 2020 and to 45.7% on December, 2021. Debt service on public sector external debt as a percentage of GDP was 3.6% on December 31, 2017, decreased to 2.6% on December 31, 2018 and to 2.2% on December 31, 2019, but increased to 2.4% on December 31, 2020 and to 3.8% on December 31, 2021. As of December 31, 2021, Colombia’s public sector external funded debt totaled $106.7 billion, of which $73.3 billion was debt of the Central Government and $27.0 billion was debt of other public entities. The Government’s external debt management strategy is comprised of several elements, including:
• | diversifying the Government’s sources of funding in order to reduce its vulnerability to external market disruptions; |
• | focusing on multilateral sources of funding in order to finance social infrastructure projects that involve private sector investment; and |
• | minimizing interest, exchange rate and refinancing risks associated with debt service through the medium term debt management strategy. |
On June 17, 2015, the IMF’s executive board approved a two-year SDR 3.87 billion successor arrangement under the IMF’s FCL, which as of June 17, 2015 was equivalent to approximately $5.45 billion. On June 13, 2016, the IMF’s Executive Board approved a successor two-year arrangement under the FCL in an amount equivalent to SDR 8.18 billion, approximately USD $11.5 billion, and canceled the previous arrangement of SDR 3.87 billion, about USD $5.4 billion. On June 6, 2017, the IMF’s Executive Board reaffirmed Colombia’s continued qualification
D-105
to access U.S.$11.4 billion under the FCL. On May 25, 2018, The Executive Board of the IMF approved a successor two-year arrangement for Colombia under the FCL in an amount equivalent to SDR 7.9 billion (approximately U.S. $11.4 billion) and canceled the previous arrangement for SDR 8.2 billion. On May 20, 2019, the IMF’s Executive Board completed its review of Colombia’s qualification for the arrangement under the Flexible Credit Line (FCL) and reaffirmed Colombia’s continued qualification to access FCL resources. On May 1, 2020, the IMF approved a successor two-year arrangement for Colombia under the FCL, designed for crisis prevention, of about U.S.$10.8 billion. On September 25, 2020, the IMF increased the FCL to SDR 12.267 billion (US$17.6 billion). On December 2, 2020, Colombia drew on its FCL by SDR 3.75 billion (about US$5.4 billion). Access to the resources provided by the IMF helped the Government to meet balance of payments needs and provide support for the budgetary response to the COVID-19 pandemic while at the same time allowed Colombia to maintain sufficient international liquidity to insure against heighted external risks. This was the first time Colombia had drawn on funds available under the FCL. Colombia retains access to about US$ 12.2 billion (SDR 8.517 billion) under the existing two-year arrangement after its first drawing. The authorities will treat this remaining amount as precautionary. See “Public Sector Finance—IMF Program—Flexible Credit Line with IMF.”
On October 3, 2018, Colombia issued U.S.$1.5 billion aggregate principal amount of its 4.50% Global Bonds due 2029 and U.S.$0.5 billion aggregate principal amount of its 5.000% Global Bonds due 2045. Simultaneously, Colombia executed a tender offer for Colombia’s $1 billion of its existing 7.375% Global Bonds due 2019.
On January 23, 2019, Colombia issued U.S.$1.5 billion aggregate principal amount of its 5.200% Global Bonds due 2049 and U.S.$0.5 billion aggregate principal amount of its 4.500% Global Bonds due 2029.
On January 30, 2020, Colombia issued U.S.$1,542,968,000 aggregate principal amount of its 3.000% Global Bonds due 2030 (the “2030 Bonds”) and U.S.$300,000,000 aggregate principal amount of its 5.200% Global Bonds due 2049 (the “2049 Bonds”), the proceeds of which were used in part for liability management transactions.
On June 4, 2020, Colombia issued U.S.$1.0 billion aggregate principal amount of its 3.125% Global Bonds due 2031 and U.S.$1.5 billion aggregate principal amount of its 4.125% Global Bonds due 2051.
On January 22, 2021, Colombia issued U.S.$1,539,952,000 aggregate principal amount of its 3.125% Global Bonds due 2031 (the “2031 Bonds”) and U.S.$1.3 billion aggregate principal amount of its 3.875% Global Bonds due 2061 (the “2061 Bonds”), the proceeds of which were used in part for liability management transactions.
On April 22, 2021, Colombia issued U.S.$2.0 billion aggregate principal amount of its 3.250% Global Bonds due 2032 and U.S.$1 billion aggregate principal amount of its 4.125% Global Bonds due 2042.
On October 20, 2021, Colombia issued U.S.$1.0 billion aggregate principal amount of its 5.200% Global Bonds due 2049.
As part of Colombia’s external liability management program, the Government has conducted and plans to continue to conduct liability management transactions in order to reduce exposure to exchange rate risks and refinancing risks.
On March 19, 2021, S&P downgraded Colombia’s long-term foreign currency rating to BB+ from BBB- and revised its outlook to stable from negative. On July 1, 2021, Fitch downgraded Colombia’s long-term foreign currency rating to BB+ from BBB- and revised its outlook to stable from negative. Moody’s has had a Baa2 rating since May 23, 2019, and on December 3, 2020, revised Colombia’s outlook from stable to negative.
D-106
The following table shows the external funded debt of the public sector by creditor.
Public Sector External Funded Debt by Creditor(1)(2)
As of December 31, | ||||||||||||||||||||
2017 | 2018 | 2019 | 2020 | 2021 | ||||||||||||||||
(millions of U.S. dollars) | ||||||||||||||||||||
Multilaterals | ||||||||||||||||||||
IADB | $ | 9,061 | $ | 9,478 | $ | 10,016 | $ | 10,775 | $ | 11,416 | ||||||||||
World Bank | $ | 9,409 | $ | 10,117 | $ | 10,523 | $ | 11,939 | $ | 13,512 | ||||||||||
Others | $ | 1,770 | $ | 2,138 | $ | 1,969 | $ | 8,055 | $ | 8,231 | ||||||||||
Total Multilaterals | $ | 20,240 | $ | 21,732 | $ | 22,508 | $ | 30,768 | $ | 33,160 | ||||||||||
Commercial Banks | $ | 4,099 | $ | 4,429 | $ | 4,077 | $ | 4,984 | $ | 6,294 | ||||||||||
Export Credit Institutions | $ | 2,635 | $ | 3,017 | $ | 2,924 | $ | 3,245 | $ | 3,095 | ||||||||||
Bonds | $ | 41,685 | $ | 40,273 | $ | 40,784 | $ | 47,024 | $ | 52,462 | ||||||||||
Foreign Governments | $ | 1,735 | $ | 2,102 | $ | 2,030 | $ | 5,163 | $ | 5,253 | ||||||||||
|
|
|
|
|
|
|
|
|
|
Totals may differ due to rounding.
1: | Debt with an original maturity of one year or more. |
2: | Debt in currencies other than U.S. dollars has been converted into U.S. dollars using exchange rates as of December 31 of each year. |
Source: DebtDatabase—Ministry of Finance.
IADB Loans
Colombia uses loans from the IADB to finance public investment. Disbursements of loans from the IADB totaled approximately $93.0 million in 2017, 77.6 million in 2018, $100.1 million in 2019, $1,285.7 million in 2020 and $36.7 million in 2021.
The following table shows the external funded debt of the public sector by currency.
Public Sector External Funded Debt by Currency
As of December 31, 20211) | ||||||||||||||||||||
Central Government | Guaranteed | Non– Guaranteed | Total | Percentage of Total | ||||||||||||||||
(millions of U.S. dollars) | ||||||||||||||||||||
U.S. Dollars | 60,416 | 867 | 21,608 | 82,891 | 82.67 | % | ||||||||||||||
Colombian Pesos | 977 | 640 | 3,666 | 5,283 | 5.27 | % | ||||||||||||||
Japanese Yen | 0 | 0 | 0 | 0 | 0.00 | % | ||||||||||||||
Euros | �� | 6,633 | 8 | 69 | 6,710 | 6.69 | % | |||||||||||||
Others | 5,279 | 0 | 99 | 5,378 | 5.36 | % | ||||||||||||||
|
|
|
|
|
|
|
|
|
| |||||||||||
Total | 73,306 | 1,514 | 25,442 | 100,263 | 100.00 | % | ||||||||||||||
|
|
|
|
|
|
|
|
|
|
Totals may differ due to rounding.
1: | Preliminary. Debt with an original maturity of more than one year. Debt in currencies other than U.S. dollars has been converted into U.S. dollars using exchange rates as of December 31, 2021. |
Source: DebtDatabase—Ministry of Finance.
D-107
The following table sets forth the amortization schedule for principal payments on Colombia’s public sector external debt outstanding on December 31, 2021.
Public Sector External Debt Amortization Schedule(1)(2)
Loans and Bonds
Debt Outstanding as of | ||||||||||||||||||||||||
December 31, 2021(3) | 2022 | 2023 | 2024 | 2025 | After | |||||||||||||||||||
(millions of U.S. dollars) | ||||||||||||||||||||||||
Multilaterals | ||||||||||||||||||||||||
IADB(3) | 11,416 | 185 | 531 | 592 | 1,298 | 8,810 | ||||||||||||||||||
World Bank(3) | 13,512 | 94 | 303 | 251 | 553 | 12,312 | ||||||||||||||||||
Others | 8,231 | 72 | 184 | 2,647 | 2,658 | 2,670 | ||||||||||||||||||
Total Multilaterals | 33,160 | 350 | 1,018 | 3,490 | 4,510 | 23,792 | ||||||||||||||||||
Commercial Banks | 6,294 | 142 | 1,811 | 1,646 | 833 | 1,863 | ||||||||||||||||||
Export Credit Institutions | 3,092 | 183 | 438 | 515 | 363 | 1,593 | ||||||||||||||||||
Bonds | 52,462 | 0 | 3,140 | 3,047 | 1,200 | 45,075 | ||||||||||||||||||
Foreign Governments | 5,253 | 64 | 374 | 404 | 463 | 3,948 | ||||||||||||||||||
Suppliers | 2 | 0 | 0 | 0 | 0 | 0 | ||||||||||||||||||
Total External Debt | 100,260 | 1,090 | 7,800 | 12,590 | 11,877 | 66,902 |
Totals may differ due to rounding.
1: | Debt with original maturity of more than one year. Amortization figures in this table include both scheduled payments on outstanding debt and projected payments on debt not yet disbursed but for which commitments have been made and are planned to be disbursed. |
2: | Debt in currencies other than U.S. dollars has been converted into U.S. dollars using exchange rates as of December 31, 2020. |
3: | Amortization payments to the IADB and World Bank have been re-expressed using a revaluation factor based on the basket of currencies in which those debts are denominated on the dates their respective transactions closed. |
Source: Debt Database—Ministry of Finance.
D-108
TABLES AND SUPPLEMENTARY INFORMATION
Public Debt of the Republic of Colombia
External Public Debt
Direct Funded Debt (1)
Bond Issues
Interest Rate and Title | Year of Issue | Year of Final Maturity | Currency | Principal Amount Disbursed (millions of original currency) | Principal Amount Outstanding at June 30, 2022(2) (millions of U.S. dollars) | |||||||||||||||
Central Government | ||||||||||||||||||||
8.375% Notes Due 2027(*) | 1997 | 2027 | USD | 250 | 74 | |||||||||||||||
11.85% Global Bonds Due 2028 | 2000 | 2028 | USD | 22 | 9 | |||||||||||||||
10.375% Global Bonds 2033(*) | 2003 | 2033 | USD | 635 | 341 | |||||||||||||||
8.125% Global Bonds 2024 | 2004 | 2024 | USD | 1,000 | 1,000 | |||||||||||||||
7.375% Notes 2037(*) | 2006 | 2037 | USD | 1,818 | 1,818 | |||||||||||||||
9.85% Global TES Bonds due 2027 | 2007 | 2027 | COP | 1,924,515 | 466 | |||||||||||||||
6.125% Global Bonds due 2041(*) | 2009 | 2041 | USD | 2,500 | 2,500 | |||||||||||||||
4.375% Global TES Bonds due 2023(2)(*) | 2012 | 2023 | COP | 1,000,000 | 242 | |||||||||||||||
2.625% Global Bonds due 2023 | 2013 | 2023 | USD | 1,000 | 1,000 | |||||||||||||||
4.000% Global Bonds due 2024(*) | 2013 | 2024 | USD | 2,100 | 1,566 | |||||||||||||||
5.625% Global Bonds due 2044(*) | 2014 | 2044 | USD | 2,500 | 2,500 | |||||||||||||||
5.000% Global Bonds due 2045(*) | 2015 | 2045 | USD | 4,500 | 4,500 | |||||||||||||||
4.500% Global Bonds due 2026 | 2015 | 2026 | USD | 1,500 | 1,500 | |||||||||||||||
3.875% Global Bonds due 2026(2) | 2016 | 2026 | EUR | 1,350 | 1,415 | |||||||||||||||
3.875% Global Bonds due 2027(*) | 2017 | 2027 | USD | 2,400 | 1,897 | |||||||||||||||
4.500% Global Bonds due 2029(*) | 2018 | 2029 | USD | 2,000 | 2,000 | |||||||||||||||
5.200% Global Bonds due 2049 | 2019 | 2049 | USD | 2,800 | 2,800 | |||||||||||||||
3.000% Global Bonds due 2030 | 2020 | 2030 | USD | 1,543 | 1,543 | |||||||||||||||
3.125% Global Bonds due 2031 | 2020 | 2031 | USD | 2,540 | 2,540 | |||||||||||||||
4.125% Global Bonds due 2051 | 2020 | 2051 | USD | 1,500 | 1,500 | |||||||||||||||
3.250% Global Bonds due 2032 | 2021 | 2032 | USD | 2,000 | 2,000 | |||||||||||||||
4.125% Global Bonds due 2042 | 2021 | 2042 | USD | 1,000 | 1,000 | |||||||||||||||
3.875% Global Bonds due 2061 | 2021 | 2061 | USD | 1,300 | 1,300 | |||||||||||||||
Total | $ | 35,511 |
1: | Includes only medium- and long-term funded debt (i.e., debt with an original maturity of more than one year). As of June 30, 2022. |
2: | Principal amount outstanding on December 31, 2021 was converted to U.S. dollars at the corresponding exchange rate on June 30, 2022. COP/USD = Ps. 41,27.47/$1.00; USD/EUR = $1.0479/€1.00. |
(*) | Includes reopenings. |
Source: Debt Database—Ministry of Finance.
D-109
Loans from Multilateral Institutions
Lender | Interest Rate | Currency | Principal Amount Outstanding as of June 30, 2022 | |||||||||
(millions of U.S. dollars) | ||||||||||||
World Bank | Various | Various | $ | 13.908 | ||||||||
IADB | Various | Various | 11,131 | |||||||||
Others | Various | Various | 8,198 | |||||||||
Total | $ | 33,237 | ||||||||||
|
|
Totals may differ due to rounding.
Source: Debt Database—Ministry of Finance.
Loans from Banks (1)
Title | Interest Rate | Date of Agreement | Year of Final Maturity | Currency | Principal Amount Disbursed | Principal Amount Outstanding as of June 30, 2022 | ||||||||||||||||||
(millions of U.S. dollars) | ||||||||||||||||||||||||
Commercial Bank Loans | Various | Various | Various | Various | n.a. | $ | 5,946 | |||||||||||||||||
Export Credits | 2%-7.75% | Various | Various | USD, EUR | n.a. | $ | 2,522 | |||||||||||||||||
Governments | 0%-4.83% | Various | Various | USD, EUR, CNY | n.a. | $ | 451 | |||||||||||||||||
Total | $ | 8,919 | ||||||||||||||||||||||
Total Outstanding Long-Term Direct External Debt | $ | 52,174 |
n.a. = Not available.
Totals may differ due to rounding.
1: | Medium- and long-term indebtedness. |
Source: Debt Database—Ministry of Finance.
Other External Public Sector Debt
Guaranteed Debt and Non-Guaranteed Debt
Borrower | Guaranteed Debt | Non-guaranteed Debt | Principal Amount Outstanding as of June 30, 2022 | |||||||||
(millions of U.S. dollars) | ||||||||||||
Non-Financial Public Sector: | ||||||||||||
AGUAS Y AGUAS DE PEREIRA | $ | 4 | $ | 0 | $ | 4 | ||||||
BOGOTA DISTRITO CAPITAL | $ | 36 | $ | 501 | $ | 537 | ||||||
C.A.R. | $ | 63 | $ | 0 | $ | 63 | ||||||
DEPARTAMENTO DE ANTIOQUIA | $ | 36 | $ | 41 | $ | 76 | ||||||
DEPARTAMENTO DE CUNDINAMARCA | $ | 1 | $ | 0 | $ | 1 | ||||||
E.P.M.DE MEDELLIN | $ | 274 | $ | 3,331 | $ | 3,605 | ||||||
E.T.BARRANQUILLA | $ | 0 | $ | 6 | $ | 6 | ||||||
E.T.M.V.A.METRO | $ | 8 | $ | 0 | $ | 8 | ||||||
ECOPETROL | $ | 0 | $ | 15,013 | $ | 15,013 | ||||||
ICETEX | $ | 247 | $ | 0 | $ | 247 |
D-110
Borrower | Guaranteed Debt | Non-guaranteed Debt | Principal Amount Outstanding as of June 30, 2022 | |||||||||
(millions of U.S. dollars) | ||||||||||||
REFICAR | $ | 0 | $ | 1,657 | $ | 1,657 | ||||||
DEPARTAMENTO DE GUAJIRA | $ | 5 | $ | 0 | $ | 5 | ||||||
ESP GECELCA S.A. ESP. | $ | 0 | $ | 93 | $ | 93 | ||||||
EMPOPASTO S.A. ESP | $ | 13 | $ | 0 | $ | 13 | ||||||
E.T.B. | $ | 0 | $ | 86 | $ | 86 | ||||||
TGI S.A. ESP | $ | 0 | $ | 750 | $ | 750 | ||||||
OLEDUCTO CENTRAL S.A. | $ | 0 | $ | 500 | $ | 500 | ||||||
COLOMBIA MOVIL S.A ESP | $ | 0 | $ | 44 | $ | 44 | ||||||
FIDUPREVISORA | $ | 125 | $ | 0 | $ | 125 | ||||||
GRUPO ENERGIA BOGOTA S.A. E.S.P. | $ | 0 | $ | 1,072 | $ | 1,072 | ||||||
I.S.A. | $ | 0 | $ | 330 | $ | 330 | ||||||
CONSORCIO FONDO DIAN PARA COLOMBIA 2020 | $ | 2 | $ | 0 | $ | 2 | ||||||
DISTRITO BARRANQUILLA | $ | 0 | $ | 209 | $ | 209 | ||||||
CONCESIÓN COSTERA CARTAGENA BARRANQUILLA S.A.S | $ | 0 | $ | 245 | $ | 245 | ||||||
DISTRITO DE MEDELLIN | $ | 0 | $ | 150 | $ | 150 | ||||||
ESSA | $ | 0 | $ | 34 | $ | 34 | ||||||
Total Non-Financial Public Sector: | $ | 814 | $ | 24,061 | $ | 24,875 | ||||||
Financial Public Sector: | ||||||||||||
BANCOLDEX | $ | 336 | $ | 70 | $ | 406 | ||||||
FINDETER | $ | 311 | $ | 368 | $ | 679 | ||||||
Total Financial Public Sector: | $ | 648 | $ | 438 | $ | 1,086 | ||||||
|
|
|
|
|
| |||||||
TOTAL: | $ | 1,461 | $ | 24,499 | $ | 25,960 |
Totals may differ due to rounding.
1: | Medium- and long-term indebtedness. |
2: | Subject to revision |
Source: DebtDatabase—Ministry of Finance.
Internal Public Debt
Direct Debt (1)
Bond Issues and Banco de la República
Description | Year of Final Maturity | Interest Rate | Principal Amount Outstanding as of June 30, 2022 | |||||||||
(millions of pesos) | ||||||||||||
Treasury Bonds | Various | Various | Ps. 422,339,507 | |||||||||
Pension Bonds | Various | Various | 6,470,510 | |||||||||
Peace Bonds | Various | Various | 782 | |||||||||
Constant Value Bonds | Various | Various | 1,036,067 | |||||||||
Security Bonds | Various | Various | 1 | |||||||||
Other Bonds | Various | Various | 70,231 | |||||||||
Other | Various | Various | 1,846,432 | |||||||||
Treasury Promissory Notes | Various | Various | 27,857,877 | |||||||||
Solidarity Instruments | Various | Various | 9,741,703 | |||||||||
Total | Ps. 469,363,110 |
D-111
Totals may differ due to rounding.
1: | Total as of June 30, 2022. |
Source: Debt Registry Office—General Directorate of Public Credit—Ministry of Finance.
Internal Public Debt
Guaranteed Debt (1)
Principal Amount Outstanding as of June 30, 2022 | ||||
(thousands of U.S. dollars) | ||||
District of Bogota | $ | 134,172 | ||
Empopasto S.A. E.S.P. | $ | 13,478,501 | ||
ESP Gecelca S.A. E.S.P. | $ | 60,569,698 | ||
Public Companies of Medellín (EPM) | $ | 274,059,282 | ||
ICETEX | $ | 242,539,859 | ||
Total | $ | 590,781,512 |
1: | Medium- and long-term indebtedness. As of June 30, 2022, the Republic had no outstanding guarantees of floating public sector internal debt. |
Principal amount outstanding on June 30, 2022, was converted to U.S. dollars at the corresponding exchange rate on June 30, 2022. COP/USD = Ps. 4,127.47
Source: Ministry of Finance.
D-112