NI 43-101 Technical Report Preliminary Economic Assessment Florida Canyon Zinc Project Amazonas Department, Peru
Effective Date: July 13, 2017
Report Date:August3, 2017
Report Prepared for


Votorantim Metais Holding S.A. Solitario Zinc Corp.
43 John F. Kennedy Ave., 3rd floor 4251 Kipling Street. Suite 390
Luxembourg, L-1855 Wheat Ridge, Colorado 80033
Report prepared by

SRK Consulting (U.S.), Inc.
1125 SeventeenthStreet, Suite 600
Denver, CO 80202
SRK Project Number:181700.110
Signed by Qualified Persons:
WalterHunt, CPG / SolitarioZinc Corp, COO
J.B. Pennington, MSc, CPG,AIPG / SRK Principal Mining GeologistDaniel H.Sepulveda / SRKAssociate Consultant(Metallurgist)
Joanna Poeck,BEng Mining, SME-RM, MMSAQP / SRKSenior Consultant (Mining Engineer)Jeff Osborn, BEng Mining,MMSAQP / SRK PrincipalConsultant (MiningEngineer)
JamesGilbertson, MCSM,CGeol, FGS / SRK Principal Exploration GeologistJohn Tinucci,PhD, PE / SRK Principal Consultant (GeotechnicalEngineer)
Reviewedby:
Kent Hartley,P.E. (Mining Engineer)
Table of Contents
| 1.2 | PropertyDescriptionand Ownership16 |
| 1.3 | Geology andMineralization 16 |
| 1.4 | Status of Exploration, Development andOperations 17 |
1.4.1 History17
1.4.2Exploration Status 17
1.4.3 DevelopmentandOperations18
| 1.5 | MineralProcessing and MetallurgicalTesting 18 |
| 1.6 | Mineral Resource Estimate19 |
| 1.7 | MineralReserve Estimate21 |
| 1.10 | Project Infrastructure 23 |
| 1.11 | Environmental Studies andPermitting 24 |
| 1.12 | ConclusionsandRecommendations 24 |
1.12.1General 24
1.12.2 Mineral Resource Estimate25
1.12.3MineralProcessing and MetallurgicalTesting 25
1.12.4MineralReserve Estimate26
1.12.5 MiningMethods 26
1.12.6 RecoveryMethods 27
1.12.7Project Infrastructure 27
1.12.8Environmental Studies andPermitting 27
1.12.8Recommendations –Work Programsand Costs 28
| 2.1 | Termsof Reference and Purpose of the Report29 |
| 2.2 | Qualifications of Consultants(SRK) 29 |
| 2.3 | Details of Inspection 30 |
| 2.4 | Sources of Information 30 |
| 3 | Reliance on Other Experts31 |
| 4 | Property Description and Location32 |
4.2.1Nature and Extentof Issuer’sInterest 39
4.2.2 Property and Title inPeru 39
| 4.3 | Royalties, Agreements andEncumbrances 40 |
| 4.4 | Environmental Liabilitiesand Permitting40 |
4.4.1Required Exploration Permitsand Status 40
4.4.2Required Mining Permits40
| 4.5 | Other SignificantFactors andRisks41 |
| 5 | Accessibility, Climate,Local Resources, Infrastructure and Physiography42 |
| 5.1 | Topography, Elevationand Vegetation42 |
| 5.2 | Accessibility and Transportationto the Property42 |
| 5.3 | Climate and Lengthof Operating Season 43 |
| 5.4 | Sufficiencyof Surface Rights43 |
| 5.5 | Infrastructure Availability andSources 43 |
5.5.1 Proximityto PopulationCenter 45
5.5.2Power 45
5.5.3 Water45
5.5.4 Mining Personnel45
5.5.5Potential MineInfrastructureAreas 46
| 6.1 | PriorOwnership and Ownership Changes48 |
| 6.2 | Previous Exploration and DevelopmentResults 48 |
| 6.3 | Historical Mineral Resourceand Reserve Estimates48 |
| 6.4 | HistoricalProduction 49 |
| 7 | Geological Setting and Mineralization50 |
7.2.1 Lithology andStratigraphy 52
7.2.2Structure 53
7.2.3Alteration 54
7.2.4Mineralization 54
| 7.4 | Significant Mineralized Zones57 |
| 9.1 | Relevant ExplorationWork60 |
| 9.2 | Surveys and Investigations 60 |
| 9.3 | Sampling Methodsand Sample Quality60 |
| 9.4 | Significant Results andInterpretation 60 |
| 10.3 | Interpretation and Relevant Results 68 |
| 11 | Sample Preparation, Analysis and Security70 |
11.1.1Sampling for GeochemicalAnalysis 70
11.1.2Sampling for Density Measurement70
| 11.3 | Sample Preparation forAnalysis 71 |
11.4.1Standards 73
11.4.2 Blanks74
11.4.3Duplicates 74
11.4.4Actions 75
| 11.5 | Opinion on Adequacy75 |
| 12.3 | Opinion onData Adequacy77 |
| 13 | Mineral Processing and MetallurgicalTesting78 |
| 13.1 | Testing and Procedures 78 |
13.2.1 Mineralogy78
13.2.2 Recoveryand Concentrate Grades 79
13.2.3Hardness 82
13.2.4Reagents 83
| 13.3 | RecoveryProjections 83 |
| 13.4 | SignificantFactors andRecommendations 84 |
| 14 | Mineral Resource Estimate85 |
| 14.1 | Geology and Mineral DomainModeling 86 |
14.2.1Database 88
14.2.2 Topography and SampleLocations 89
14.2.3Oxidation Classification in Drillhole Logging 89
| 14.3 | Drilling DataAnalysis 89 |
14.3.1Capping 90
14.3.2Compositing 90
| 14.5 | Variogram Analysis andModeling 92 |
14.6.1Model Specifications 92
14.6.2Model Construction 93
| 14.8 | Zinc, Lead, andSilver Recovery Calculation96 |
| 14.9 | ZincEquivalent Grade Calculation96 |
14.10.1SRK Grade Estimatevs VotorantimGrade Estimate97
14.10.2 Visual Comparison97
14.10.3Comparative Statistics98
| 14.11 | Resource Classification98 |
| 14.12 | Mineral Resource Statement 99 |
| 14.13 | Mineral ResourceCut-offGrade Determination 99 |
| 14.14 | Mineral Resource Sensitivity100 |
| 15 | Mineral Reserve Estimate101 |
| 16.1 | Proposed MiningMethods 107 |
| 16.2 | Geotechnical InputforMine Design108 |
16.2.1Geotechnical Characterization 108
16.2.2StressField and topography110
16.2.3Cut and Fillparameters 110
16.2.4Sub-level Open Stoping Parameters111
16.2.5Crown Pillar 113
16.2.6Sill Pillar Dimensioning113
16.2.7Ground Support 114
16.2.8 Tailings Backfill117
16.3.1Net Smelter Return 118
16.3.2Operating Costs120
16.3.2Stope Optimization 121
16.3.4 Mining Recovery andDilution 122
16.3.5Cut-off Evaluation 123
16.3.6 MiningMethods 124
16.3.7 Mine Plan Resource128
16.3.8 DevelopmentLayout 129
16.3.8 WasteRock Management and Backfilling 136
| 16.4 | Mine Production Schedule136 |
16.2.1Underground MineEquipment 139
16.2.2Electrical 139
16.5.3Ventilation 139
16.2.4 MinePersonnel 141
16.2.5Health and Safety141
| 17.1 | Processing Projections andMethods 142 |
| 17.2 | Processing Methods andFlowSheet 142 |
| 17.3 | ConsumablesRequirement144 |
| 18 | Project Infrastructure146 |
| 18.1 | Infrastructure and Logistics Requirements 146 |
18.1.1 AccessandLocalCommunities 146
18.1.2 SiteWaterManagement 147
18.1.3Project Facilities 148
18.1.4Power Supplyand Distribution 150
| 18.2 | Project Logistics 152 |
| 18.3 | Tailings Management 153 |
| 19 | Market Studies and Contracts155 |
| 19.1 | ContractsandStatus 155 |
| 20 | Environmental Studies, Permitting and Social or Community Impact 156 |
| 20.1 | Required Permitsand Status 156 |
20.1.1Required Exploration Permitsand Status 156
20.1.2Required Mining Permits156
| 20.2 | Environmental Monitoring Results 157 |
| 20.4 | Environmental Issues 159 |
| 20.3.1 | Post Mining Land Use160 |
| 20.3.2 | PortalsandVents 160 |
| 20.3.3 | Buildingsand Infrastructure 160 |
| 20.3.4 | RoadsandMiscellaneous Disturbance 161 |
| 20.3.5 | Tailings Facility161 |
| 20.6 | Post ClosurePlans 161 |
| 20.7 | Reclamation and Closure Cost Estimate162 |
| 20.8 | Post-Performanceor ReclamationsBonds 162 |
| 20.9 | Social and Community162 |
| 21 | Capital and Operating Costs164 |
| 21.1 | CapitalCostEstimates 164 |
21.1.1Basisfor Capital Cost Estimates165
| 21.2 | Operating Cost Estimates168 |
21.2.1BasisforOperating Cost Estimates168
| 22.3 | Taxes,Royalties and OtherInterests 172 |
| 22.5 | Base Case SensitivityAnalysis 179 |
| 22.6 | Conservative Metal Price Alternative Analysis 181 |
22.6.1 ImpacttoMinePlanning 182
22.6.2 ImpacttoEconomics183
| 24 | Other Relevant Data and Information190 |
| 25 | Interpretation and Conclusions191 |
| 25.2 | Mineral Resource Estimate191 |
| 25.3 | MineralProcessing and MetallurgicalTesting 192 |
| 25.4 | MineralReserve Estimate193 |
| 25.7 | Project Infrastructure 193 |
| 25.8 | Environmental Studies andPermitting 194 |
| 25.9 | Capitaland Operating Costs194 |
| 26.1 | RecommendedWorkPrograms 196 |
26.1.1 EngineeringStudies (Prefeasibility Level)196
26.1.2 Drilling197
26.1.3 Mining197
| 26.2 | WorkProgram Costs 197 |
| 28.1 | Mineral Resources 201 |
| 28.3 | Definition of Terms202 |
List of Tables
Table1-1: Indicative EconomicResults (US$) 14
Table1-2: CapitalCosts 15
Table1-3: Operating Costs 15
Table1-4: Operating Costs 15
Table1-5: Florida CanyonMetal RecoveriesbyMaterial Type 18
Table1-6: Mineral Resource Statement forthe Florida Canyon Zn-Pb-Ag Deposit, Amazonas Department,Peru, SRK Consulting(U.S.), Inc., July13, 201721
Table1-7: Mine Plan Resource forthe Florida CanyonZn-Pb-Ag Deposit, Amazonas Department,Peru, SRKConsulting (U.S.),Inc.,July21, 201722
Table1-8: Mine Plan ResourceAverageProcess Recovery22
Table1-9: Summaryof Costs forRecommendedWork28
Table4-1: List of Minera Bongará MineralClaims35
Table4-2: List of Minera ChambaraMineralClaims36
Table5-1: Distance and TravelTimeto Florida CanyonProject fromLima, Peru 43
Table6-1: Mineral Resource Statement forthe Florida Canyon Zn-Pb-Ag Deposit, Amazonas Department,Peru, SRK Consulting(U.S.), Inc.,05 June,2014 49
Table 10-1: Downhole Survey DataPoint Spacing68
Table 11-1: Analytical Codesand Methods 71
Table 11-2: Analyzed Elements and MethodDetection Limits 72
Table 11-3: Summaryof SRM Statistics forLead 73
Table 11-4: Summaryof SRM Statistics forZinc 73
Table 11-5: Summaryof Duplicate Samples 74
Table 13-1: Summaryof Florida Canyon Metallurgical Test Work78
Table 13-2: Mineralogyof SulfideComposite79
Table 13-3: Mineralogyof OxideComposite79
Table 13-4: Metallurgical Tests – SelectedResults 81
Table 13-5: Hardness TestResults 82
Table 13-6:Florida CanyonMetal RecoveriesbyMaterialType83
Table 14-1: Statisticsof RawAssays – AllIntervals 89
Table 14-2: Statisticsof RawAssays–Manto IntervalsOnly90
Table 14-3:Item ID’sandDescriptions 91
Table 14-4: Statisticsof AllComposites Inside Mantos 91
Table 14-5:Block Model Specifications 92
Table 14-6:Block Model ItemDescriptions 93
Table 14-7: AdditionalSRK BlockModel ItemDescriptions 93
Table 14-8:Variogram and GradeEstimationParameters 95
Table 14-9:Comparison of Composite and BlockGrades 98
Table 14-10: Mineral Resource Statement for the Florida Canyon Zn-Pb-Ag Deposit,Amazonas Department,Peru, SRK Consulting(U.S.), Inc., July13, 201799
Table 16-1: RockMass Classification Parameters 109
Table 16-2: Stope StabilityGraph Input Parameters 112
Table 16-3:Proposed StopeDimensions 113
Table 16-4: Parameters forthe Barton Method115
Table 16-5: Estimated Support Accordingto theBarton Method 116
Table 16-6: ExpectedProcessing Recoveries 118
Table 16-7: NSR Calculation Parameters forStope Optimization119
Table 16-8: Example NSRCalculation 120
Table 16-9: Operating Costs Used forDetermining Potential Mining Shapes 121
Table 16-10:Stope Optimization Parameters forBase CaseAnalysis 121
Table 16-11:Mine Plan Resource forthe Florida Canyon Zn-Pb-AgDeposit, Amazonas Department,Peru, SRK Consulting (U.S.), Inc., July 21,2017 128
Table 16-12:Mine Plan ResourceAverage Process Recovery128
Table 16-13: DevelopmentDesign Assumptions 130
Table 16-14: DevelopmentQuantities 130
Table 16-15: LoM Backfill and CementQuantitiesby Type136
Table 16-16: Florida Canyon Production Schedule138
Table 16-17:Mine Equipment 139
Table 16-18:Estimated Airflow Requirements –Central/North and Northwest Areas140
Table 16-19:Estimated Airflow Requirements – F1 (SanJorge) 140
Table 16-20:Estimated Airflow Requirements - SAM140
Table 16-21: Hourly and SalariedPersonnel (OnSite) 141
Table 17-1:FloridaCanyon PEA Level Throughputand ConcentrateProduction Projections 142
Table 17-2: Overland Conveying fromUnderground Portals to the Process Plant 143
Table 20-1:Environmental Monitoring During MiningExploration 158
Table 21-1:Florida Canyon Capital Estimate Summary165
Table 21-2:FloridaCanyonUnderground MineEquipment AcquisitionSchedule166
Table 21-3:FloridaCanyon Offsite,Site,Power,WaterandBackfillInfrastructure 167
Table 21-4:Florida CanyonOperatingCosts Summary168
Table 22-1:Florida CanyonPrice Assumptions 170
Table 22-2:Florida CanyonNet Smelter Return Terms170
Table 22-3:Florida Canyon ProductLogistics Cost171
Table 22-4:Florida Canyon MineProduction Assumptions 171
Table 22-5:Florida CanyonMill Production Assumptions172
Table 22-6:Florida Canyon RoyaltyRates 173
Table 22-7:Florida CanyonIndicative EconomicResults(Dry Basis)175
Table 22-8:Florida CanyonLoM AnnualProduction andRevenues 176
Table 22-9:Florida Canyon CashCosts 178
Table 22-10:Alternate MarketForecast Metal Prices 181
Table 22-11: Florida CanyonAlternate CaseIndicativeEconomicResults(Dry Basis)185
Table 22-12: Florida CanyonAlternate Case LoMAnnual Production and Revenues186
Table 22-13: Florida Canyon Cash Costs188
Table 25-1:Florida CanyonOperatingCosts Summary194
Table 26-1: Summaryof Costs forRecommendedWork198
Table 28-1:Definition of Terms202
Table 28-2:Abbreviations 203
List of Figures
Figure 1-1: Florida CanyonMetal Recoveries RelativetoZnO/ZnT Ratio 19
Figure 4-1: Project Location Map33
Figure 4-2: Map of MineralClaims38
Figure 5-1: Photograph of theFlorida CanyonProject Area 42
Figure 5-2: ProjectAccessRoad 44
Figure 5-3: Photograph of Drilling Campat Project Site44
Figure 5-4: Potential Mine InfrastructureLocations 47
Figure 7-1:Regional Geologic Map51
Figure 7-2: Project AreaStratigraphic Column52
Figure 7-3:Florida CanyonProject Geologic Map56
Figure 7-4: CrossSectionofthe ProjectGeologic Model57
Figure 8-1: MississippiValley-TypeDepositSchematic Model 59
Figure 9-1: Florida CanyonArea Prospect and GeochemistryMap 62
Figure 9-2:Regional GeochemicalResults 64
Figure 9-3: Florida CanyonArea Simplified Geology, Resource and Drillhole Map65
Figure 10-1: ProjectDrilling History66
Figure 10-2:Geologic Mapwith Drillhole Locations 67
Figure 12-1: Photograph of Project Core Lithology Reference Sample Library76
Figure 13-1: MetallurgicalSampleResults –Zinc and Lead HeadGrades 80
Figure 13-2: Florida CanyonMetal RecoveriesRelativeto ZnO/ZnTRatio 83
Figure 14-1: North-South LongitudinalSection of GeologicModel87
Figure 14-2: Florida Canyon Geologicaland Structural Map Projectedon Topography87
Figure 14-3: Geological CrossSection of Karen-Milagros Domain88
Figure 14-4:Oblique Viewof Mineral Domains88
Figure 14-5: EstimationBLOCKZones 94
Figure 14-6: Grade-Tonnage Curve forContainedZnEq%100
Figure 16-1: Overviewof Florida Canyon MineralizedBodies 104
Figure 16-2: Section Viewof the F1Mineralized Bodyand Nearby Mantos(9,352,100N -Looking North)..105Figure 16-3: Section Viewof the SAM Mineralized Body and Nearby Mantos(9,352,530N - LookingNorth)
...........................................................................................................................................................106
Figure 16-4: Southwestto Northeast Section View Showing theDomeStructure of Mantos (LookingNorthwest)
...........................................................................................................................................................106
Figure 16-5: UCS Strength Testing Summary110
Figure 16-6: EmpiricalStability Graph for StopeGeometriesin Chambara 2112
Figure 16-7: Grimstadand Barton Ground Support Estimate114
Figure 16-8: Section View Showing Resource and Re-blockedModel (9,353,600N-Looking North) 117
Figure 16-9: Section View Showing BlocksRemovedfromInventory 122
Figure16-10: Plan Viewof F1Area Showing Cut and Filland Longhole Blocks125
Figure16-11: Section View Showing Typical LongholeLevel Layout(Elevation 1981) 126
Figure 16-12: Example DriftandFill Layout, M10 Manto127
Figure 16-13: Florida Canyon Mining Inventory129
Figure 16-14: Plan Viewof Mining Blocksand DevelopmentLayout 131
Figure 16-15: Rotated Viewof Mining Blocksand Development Layout – AllAreas (Looking Northeast) 132
Figure 16-16: Rotated Viewof Mining Blocksand Development Layout – AllAreas (Looking Northwest) ...133
Figure 16-17: Rotated Viewof Mining Blocksand Development Layout – Drift andFill/Cut and Fill(Looking Northeast) 134
Figure 16-18: Rotated Viewof Mining Blocksand Development Layout – F1 and SAM(Looking Northwest)
...........................................................................................................................................................135
Figure16-19: Rotated Viewof Mining BlocksShowing ProductionSchedule137
Figure 17-1: Florida Canyon PEA Level Process FlowSheet 145
Figure 18-1:Florida Canyon General Location146
Figure 18-2: Florida CanyonExisting and New RoadConstruction 147
Figure 18-3: Florida CanyonSiteGeneral Arrangement149
Figure 18-4: Florida Canyon Third Power SupplyAlternative 151
Figure 18-5: Typical30 Tonne Concentrate Transport Truck152
Figure 18-6: Port and SmelterLocations 153
Figure 22-1: Florida Canyon After-Tax Free Cash FlowandEquivalent Metal Production174
Figure 22-2: Metal Participationin Revenue – FloridaCanyon 177
Figure 22-3: Florida CanyonCumulative NPVCurves(aftertax) 179
Figure 22-4: Florida Canyon NPV SensitivitytoHurdle Rate 180
Figure 22-5: Florida Canyon NPVSensitivity (US$000’s)181
Figure 22-6: Mine Plan Resourcecoloredby SensitivityNSR (rotated view, lookingNortheast) 183
Figure 22-7: Florida CanyonAlternate Case After-Tax FCFandEquivalentMetal Production 184
Appendices
Appendix A: Certificates of Qualified Persons
Thisreport was preparedas aNational Instrument43-101 (NI 43-101) TechnicalReport, Preliminary Economic Assessment (TechnicalReport or PEA)by SRK Consulting (U.S.), Inc.(SRK), for Votorantim Metais Holding S.A. (Votorantim)with Solitario ZincCorp. (Solitario), (collectively, owners)on the FloridaCanyon ZincProject locatedin Amazonas Department,Peru (Florida Canyonor Project). TheProject namewas changed in 2017from Bongará, as it was calledpreviously, to FloridaCanyon.
This studyrepresents the advancementof the Project from a2014 Technical Reporton Resources,tothis 2017 PEA.Highlights of this PEA include athirteen-year life-of-mineunderground mineplan, comminution and flotationof zinc andlead concentratesat anominal productionrate of 2,500 millthroughput tonnes perday followedbydry-stack tailings storage. Site infrastructure includesline power to the site, water distribution systems, atownsite and accessroadsforconstruction andre-supplyas wellas forconcentrate transportto the pointof sale.
Akey developmentin thepreparation of this PEAwas the additionof newmetallurgical datathat provided an accurateratio of zinc oxideto zinc sulfide. Theratio allowed block-by-blockrecoverytobe estimated. For each blockin this polymetallic (zinc-lead-silver)deposit a Net SmelterReturn valuewas calculated, making thedefinition of mineablemineralization independent of material type. Thedeposit naturally contains a high percentageof zinc sulfidemineralization; but usingthenew approach, mostof the transitionandsomeof the oxide materialsare alsosuitable for flotationprocessing when they carry sufficient recoverablemetal.
This Technical Reportwasprepared in supportof apress release issuedby the ownerson August2, 2017, inwhich economicresults were reported. Those economicresults are summarized herein.
Technical economicresults forthis PEAare summarized below and inTable 1-1 through Table1-4.
| · | Mill Throughput Rate: 2,500tonnes perday(t/d); |
| · | Recoverable Metal of 1.643 billion poundszinc, 165million pounds (Mlb) lead and 2 millionounces (Moz) silver; |
| · | Average Recovery: 80% forzinc 74% for lead, 52% forsilver; |
| · | Initial Capital Cost: US$214million; |
| · | Lifeof Mine Capital Cost: US$296 million andSustaining Capitalof US$83 million; |
| · | Underlying NSR-Royalty: 1.0%; |
| · | All-in Cost perZinc-Equivalent Payable Pound: US$0.73; |
| · | Average Payable Annual ZincProduction: 131.4 Mlb;Average run-of Mine Zinc Grade:8.34%; |
| · | Average Payable Annual LeadProduction: 13.2Mlb; Average Lead Grade: 0.90%; |
| · | Average Payable AnnualSilver Production: 168 thousand ounces (koz);Average Silver Grade: 11.31 gramsper tonne (g/t); |
| · | After tax NPVat 8%: US$198million; |
| · | After tax Internal Rateof Return (IRR): 24.7%; and |
| · | After tax paybackPeriod: 2.6years. |
Table1-1: Indicative Economic Results(US$)
| Description | Value | Units |
| MarketPrices | | |
| Silver | 16.50 | US$/oz |
| Lead | 1.00 | US$/lb |
| Zinc | $1.20 | US$/lb |
| EstimateofCash Flow (all values in$000s) | | |
| Concentrate Net Return | | $/oz-Ag |
| Silver Sales | $32,957 | $0.02 |
| LeadSales | $156,937 | $0.11 |
| ZincSales | $1,675,977 | $1.20 |
| TotalRevenue | $1,865,871 | $1.34 |
| Treatment, Smelting and Refining Charges | ($337,076) | |
| Freight, Impurities&Third Parties | ($96,935) | ($0.07) |
| Gross Revenue | $1,431,860 | |
| Royalties | ($61,734) | ($0.04) |
| Net Revenue | $1,370,126 | |
| Operating Costs | | |
| Open Pit Mining | $0 | $0.00 |
| Underground Mining | ($228,547) | ($0.16) |
| Process | ($144,063) | ($0.10) |
| G&A | ($39,153) | ($0.03) |
| Ordinary Rights | $0 | $0.00 |
| TotalOperating | ($411,764) | ($0.29) |
| Operating Margin (EBITDA) | $958,362 | |
| Initial Capital | ($213,667) | |
| LoMSustaining Capital | ($82,722) | |
| IncomeTax | ($224,873) | |
| AfterTaxFree Cash Flow | $437,100 | |
| Payback | 2.59 | years |
| After-Tax IRR | 24.7% | |
| NPV @:8% | $197,521 | |
Source: SRK, 2017
Table1-2: Capital Costs
| Description | Initial(US$000’s) | Sustaining (US$000’s) | LoM(US$000’s) |
| Development | 12,293 | 35,741 | 48,033 |
| Vent Raises | 686 | 672 | 1,358 |
| Underground Mining Equipment | 24,625 | 2,474 | 27,099 |
| Surface Crushing&Conveying | 1,430 | 0 | 1,430 |
| OffsiteInfrastructure | 16,227 | 0 | 16,227 |
| Site Facilities | 14,697 | 0 | 14,697 |
| Process Plant | 60,000 | 0 | 60,000 |
| Power Supply | 2,472 | 0 | 2,472 |
| WaterSupply | 250 | 0 | 250 |
| BackFill Infrastructure | 13,200 | 0 | 13,200 |
| CementRockfill Infrastructure | 200 | 0 | 200 |
| Tailings Storage Facility | 12,854 | 11,814 | 24,668 |
| Owner's | 14,595 | 0 | 14,595 |
| Contingencies | 40,138 | 0 | 40,138 |
| Sustaining Capital | 0 | 26,272 | 26,272 |
| Closure | 0 | 4,920 | 4,920 |
| TotalCapital | $213,667 | $81,893 | $295,559 |
Source: SRK, 2017
Table1-3: Operating Costs
| Period | TotalCost (US$/t-Ore) |
| Underground Mining | 20.43 |
| Process | 12.88 |
| G&A | 3.50 |
| Total | $36.81 |
Source: SRK, 2017
Table1-4: Operating Costs
Description | LoM(US$000’s) | LoM(US$/t-Ore) | LoM(US$/lb-Zn) |
| Underground Mining | 228,547 | 20.43 | 0.16 |
| Process | 144,063 | 12.88 | 0.10 |
| G&A | 39,153 | 3.50 | 0.03 |
| TotalOperating | $411,764 | $36.81 | $0.29 |
Source: SRK, 2017
Alternative Economic Case Study
Theowners also requested SRKto evaluate the Project economicsunder a specificalternative metalprice structure. Thisalternative used a pricingof US$1.06/lb, US$0.88/lb, and US$18.19/oz forzinc,lead, andsilver respectively. Thealternative case alsoused a higherdiscount rate of 9%. Allother economicinputs were keptthe sameas the basecase.
Results of thealternative casestudy:
| · | All-in Cost perZinc Pound Recovered: US$0.72; |
| · | After tax NPVat 9%: US$106 million; |
| · | After tax Internal Rateof Return (IRR): 19.1%; and |
| · | After tax paybackPeriod: 3.2years. |
Both the base case andalternative case economicsare detailed in Section22 of this report.
| 1.2 | Property Description and Ownership |
TheFlorida Canyon ZincProject (the Project) is owned and operatedby Minera BongaráS.A., ajoint venture betweenSolitarioand Votorantimin existence since2006. Florida Canyonisan advancedmineral exploration project comprisedof sixteen contiguous mining concessions, covering approximately12,600 hectares (ha). Theconcession titlesare inthe nameof Minera Bongará. Allof these concessions are currently titled.
TheMinera Bongará concessionsare completelyenvelopedby asecond groupof thirty-seven contiguous mining concessions, covering approximately30,700 ha. The concession titlesare in the nameof Minera Chambara,alsoownedby the Owners. Ofthe thirty-sevenconcessions, twelvetitles are pending.
Votorantim, as operatorof the joint venture company Minera Bongará,has entered into a surfacerights agreement with thelocal communityofShipasbambawhich controls the surfacerights of the Project. Thisagreement provides forannual payments andfunding for mutuallyagreed upon socialdevelopment programsin return for theright to performexploration work including road building anddrilling. From time to time,Votorantim alsoenters into surfacerights agreements with individualprivate landowners within the communityto provide access forexploration work.
TheProject islocatedin theEastern Cordillera of Peruat the sub-Andean front in theupper AmazonRiver Basin. It is within the boundaryof the Shipasbambacommunity, 680 kilometer (km)north- northeast of Limaand and 245 kmnortheast of Chiclayo, Peru, inthe Districtof Shipasbamba, Bongará Province, Amazonas Department. TheProject areacanbe reachedfrom the coastal cityof Chiclayoby thepaved Carretera Marginal road. The central pointcoordinates of the Project are approximately825,248 East and, 9,352,626 North (UTM Zone 17S,Datum WGS84). Elevation ranges from 1,800 metersabove sea level (masl)to approximately 3,200 masl. The climateis classifiedas high altitudetropical junglein the upper regions of the Amazon basin. Theannual rainfall averageexceeds 1 meter
(m)withupto 2 min the cloud forestat higher elevations.
| 1.3 | Geology andMineralization |
TheProject is located withinan extensive beltof Mesozoic carbonate rocksbelonging to theUpper Triassicto Lower JurassicPucará Group andequivalents. This beltextends through the central andeastern extentof the Peruvian Andes fornearly 1000 kmand which is the host for manypolymetallic and base metalvein and replacement depositsin the Peruvian MineralBelt. Among theseis the San Vicente Mississippi ValleyType (MVT)zinc-lead deposit thathas manysimilarities to the FloridaCanyon deposit and other MVT occurrences in the Projectarea.
Knownzinc,lead andsilver mineralizationin theProjectarea is hostedin dolomitized limestone of the ChambaraFormation subunit 2 in the Pucará Group. The structureat Florida Canyonis dominatedby aN50º-60ºW trendingdomal anticline cutonthe westbytheSam Fault and totheeastby the Tesoro-FloridaFault.Inthe Projectarea, thethreeprospective corridorsfor economicmineralizationstudiedindetailareSanJorge, Karen-Milagros, andSam.In these areas, dolomitization andkarstingis best developed inproximitytofaulting andfracturing associated with each structural zone. Inturn,these structures providedaccess forthe alteringfluidstoflowlaterally into stratigraphic horizons withmorepermeablesedimentarycharacteristics.
The primaryzinc-lead-silver mineralization of the Florida Canyondeposit occursas sphalerite andgalena. Sphalerite is low iron andtogether, zinc andlead sulfideis 70% of the mineablematerial. At shallowdepths, thesesulfide minerals are altered to smithsonite, hemimorphite, and cerussite and collectivelyreferred toas oxides. The mineral suiteis low in pyrite.
| 1.4 | Status ofExploration, DevelopmentandOperations |
1.4.1History
Prior to the discoveryof mineraloccurrencesby Solitarioin 1994, no mineralprospecting had beendone on the Property andnoconcessions had been historicallyrecorded.In 1995and later, Solitario and its joint venture partners stakedthe current mineral concessionsin the Project area.
In 1996, ComincoLtd.formed ajoint venture partnership (JV)with Solitario. This agreementwas terminated in 2000 and Solitarioretained ownership of the property. Between 1997and 1999, Cominco completedgeologic mapping, geophysical surveys, surfacesampling, and82 diamond drillholes.
In 2006, Votorantim andSolitario formed a JV forthe exploration and possibledevelopment of the property. As theoperator of the JVcompany, Votorantimhas carried out surface diamond core drilling,geologic mapping, surfaceoutcrop sampling, underground explorationand drifting andunderground drilling programs.As of August15, 2013, Votorantim had completed404 diamonddrillholes which,when combined with the previous drilling of Cominco,totals 117,260 m.
Therehas not beenany commercial miningin theProject area. The onlyunderground excavationhas been 700 mof underground driftingby Votorantimto provide drill platformsat the San Jorgearea. A subsidiaryof Hochschild MiningPLC tested openpit mining for ashort timeat theMina Grandedeposit off ofProject properties nearthe villageof Yambrasbamba,18 kmnortheast of Florida Canyon,where Solitario had previouslydefined an oxidizedzinc resourcebypitting.
1.4.2Exploration Status
The focusofVotorantim’smostrecent explorationwork at the Project has been resourcedefinition drilling with HQ-diameter coreinthe SanJorge and Karen-Milagros areas. Drilling in theSan Jorge areawas completedunderground froman adit, while drillingin the Karen-Milagros areawas completed from surface.
Future exploration work will focuson infill drilling between the Karen-Milagros, SanJorge andSam areas. Mineralization is opento the northand southand remains largely untestedto the eastof the TesoroFault and westof theSam fault where greater target depthshave lowered the near-termdrilling priority.
1.4.3Development and Operations
Road accessto the Bongaráregion is provided primarilybythe Carretera Marginal paved highwayconnecting theportcityof Chiclayo to Pedro Ruiz (inland).Traveltimeto Pedro Ruiz takeson average 6 hoursby car.It is a regional commercecenter with hotels, restaurants, communication and a populationestimated tobe10,000. The immediate Projectarea is not populated butthere are several smallvillages nearby, whichare supportedby subsistence farming.
Current accessto the Projectisby foot, muleor helicopter. A roadis under construction fromthe communityof Shipasbamba. The Project areahas little existing infrastructure withonly an accessroad under construction and a numberof primitive campsand drill pads. Drilling hasbeen accomplished using helicopter support fromthe village of Shipasbambawhich lies 10 kmto the southeast. AProject coreshed, officeand samplestorage facilityis located in Shipasbamba.
| 1.5 | MineralProcessingand MetallurgicalTesting |
Votorantimretainedametallurgical consultant, SmallvillS.A.C. of Lima, Peru (Smallvill)to perform metallurgical studieson Florida Canyon mineralizationtypes in 2010, 2011and 2014. Allthe metallurgical testing programsaimed to produce commercial quality concentratesfrom apolymetalic lead-zinc mineralization. The tested samples show headsgrades significantly higherwhen comparedto other known mineraldeposits in the region.SRK hasrelied heavilyon these studies for recoveryand cost forecastingto develop cut-offgrades forresource reporting.
The majorityof the resourceis sulfide. TheFlorida Canyon sulfideresource consistsof zinc and lead sulfides in alimestone matrix where zinc is inhigher proportions thanlead. Thereare no deleterious elements present in concentratesin high enough levels totrigger smelter penalties.
The2014 metallurgicaltesting focusedon quantifying recovery inthe transitionaland oxide materialas it relatesto a measurablezinc oxide:zinc total ratio (ZnO/ZnT). Theratio was determined from2,813 samples from423 drillholeswith good spatialrepresentation.Depending ontheir availabilityand applicability, sampleswere takenfrom either coarserejects or pulp samples.Theratio was estimated into the block model foreach metalof interest. SRKdeveloped asliding-scale recovery curve foreach metalusing the ratio.
The recoveryestimates forFlorida Canyon relativeto ZnO/ZnT are illustrated in Figure 1-1. Table 1-5provides the recovery estimatesbymaterial type.
Table1-5: Florida Canyon MetalRecoveriesbyMaterial Type
| Parameter | | MaterialType | |
| | Sulfide | Mixed | Oxide |
| ZnOx/ZnT Ratio | <= 0.2 | 0.2 to 0.8 | >= 0.8 |
| ZnRecovery | 93% | (-0.8833 (ZnOx/ZnT)+1.1067) * 100 | 40% |
| PbRecovery | 84% | (-0.7333 (ZnOx/ZnT)+0.9867) * 100 | 40% |
| Ag Recovery | 56% | (-0.4(ZnOx/ZnT) + 0.64) *100 | 32% |
Source: SRK, 2017
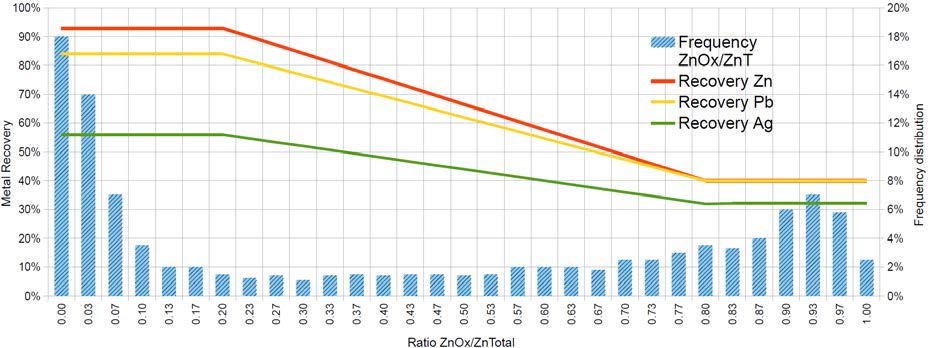
Source: SRK, 2017
Figure 1-1: Florida Canyon MetalRecoveries Relative toZnO/ZnT Ratio
Anticipated concentrategrades used in cut-offgrade calculations are 50% forbothzinc andlead concentrates, the latter containing associated silver.
SRK sees opportunities for moreadvanced test work to optimizethe metallurgicalflow sheet.Previous test work used conventionalprocedures thatwere not specificto Florida Canyon material types.Similarly, finesencountered in previous work were not handledappropriately, resulting in sub-optimalflotation. Sample selectionis akey element and moresite-specific test work is expected to enhanceoverall recoveryprojections at the next levelof study.
| 1.6 | Mineral Resource Estimate |
Since the 2013 resource estimate(SRK, 2013), Millpoconducted aconsiderable amountof resampling and metallurgicaltest work to determinerecoverable sulfideand oxide grades forboth zinc and lead to better understand recoverable metalin the deposit. Thiswork led to a changein thedefinition of oxide, transition, and sulfide domains.In the2013 model, oxide,transition, andsulfide domains were developed basedon corelogging and then individual metallurgicalrecoveries were assignedas to each domain. Following the 2014 metallurgicaltest work, it was determinedthat aquantitative approach utilizing the ratioof estimated oxidezinc gradetoestimated total zinc gradewould provide the bestrepresentation of the recoverable resource.
The2017 resource modelwas builtbyVotorantim andvalidatedby SRK. Developmentof the 2017 resource estimateinvolved two separategrade estimations. First, primary reporting gradeswere estimated using thesamesamples as the 2013resource estimate. Thisestimate assigned the grades from which metalquantities were calculated in the resource. A secondresource estimatewas conducted using the Votorantim 2014 sampleprogram to assign sulfideand oxidegrades for bothzinc andlead. Thesegrades were usedto calculate azinc oxideto total zinc ratio (ZnOx/ZnT),which was then usedto determine if material wasoxide, sulfide,or mixedandto assign a recoverytoeach modeled blockbased on that ratio.
TheMineral Resource estimatewasbased on a 3-D geological modelof majorstructuralfeatures and stratigraphically controlledalteration andmineralization.Atotal of 23 mineral domainswere interpreted from mineralized drill intercepts, comprised mostly of 1 m core samples. The project is in metric units. Zinc, lead and silver were estimated into model blocks using Ordinary Kriging (OK). Oxide, Sulfide and Mixed material types were determined based on the ZnOx/ZnT ratio. Density was determined from a large percentage (55%) of measured values, which were usedtodevelop equations for density assignment based on rock type and kriged metal content of the samples.
Resources were reported to Measured, Indicated andInferred classification compliantwith CIMdefinitions according to NI 43-101 guidance. Blocksclassified as Measuredwere estimatedby Ordinary Krigingusingat least three compositeswithin 25 min the majorand semi-major searchdirections and10 min the minor searchdirection. Blocksclassified as Indicatedwere estimatedby Ordinary Krigingusingat least three compositeswithin 50 min the majorand semi-major searchdirections and20 min the minor searchdirection. Blocksclassified as inferred were estimatedby Ordinary Kriging usingat least two composites within 100 min the majorand semi-major searchdirections and40 min the minor searchdirection. Afourth categorywas flagged inthe model including blocksestimated beyond the limitsabove.
SRK validated theVotorantim model using the followingcriteria:
| · | SRK independent grade estimate comparedto the Votorantim gradeestimate; |
| · | Visualcomparative analysisbetween composite and blockgrades; and |
| · | Statistical comparisonof global averages of the original composite valuesand the model estimates. |
SRK concludes that the modelis adequate if not slightly conservative forthe deposit and is suitable for usein preliminary mineplanning.
TheMineral Resource estimate forthe Florida Canyonzinc-lead-silver deposit is presented in Table1-6.
Table1-6: MineralResource Statement for the FloridaCanyon Zn-Pb-AgDeposit, Amazonas Department, Peru,SRK Consulting (U.S.), Inc., July13, 2017
Zn EqContained
Category | Mass (kt) | ZnGrade | PbGrade | Ag Grade | ZnEqGrade | ZnContained | PbContained | AgContained | Zn Eq Contained |
| (%) | (%) | (g/t) | (%) | (kt) | (klb) | (kt) | (klb) | (kg) | (koz) | (kt) | (klb) |
| Measured | 1,285 | 13.13 | 1.66 | 19.42 | 14.68 | 169 | 372,200 | 21 | 46,900 | 25,000 | 800 | 189 | 415,900 |
| Indicated | 1,970 | 11.59 | 1.45 | 17.91 | 12.95 | 228 | 503,500 | 29 | 63,200 | 35,300 | 1,130 | 255 | 562,700 |
Measured + Indicated | 3,256 | 12.2 | 1.53 | 18.51 | 13.63 | 397 | 875,700 | 50 | 110,100 | 60,300 | 1,930 | 444 | 978,600 |
| Inferred | 8,843 | 10.15 | 1.05 | 13.21 | 11.16 | 898 | 1,978,900 | 93 | 204,900 | 116,900 | 3,760 | 986 | 2,174,80 0 |
Source: SRK, 2017
| · | Mineral Resources are not Mineral Reserves and do not have demonstrated economic viability. Thereisno certainty that all or any part of the Mineral Resourcesestimatedwill be converted into Mineral Reserves. |
| · | Grades reportedinthis table are "contained" and donotincluderecovery. |
| · | Mineral resources are reportedto a2.8% recovered zinc-equivalent (RecZnEq%) cut-off grade. |
| o | Assuming the average recoveries for the resource, this correspondstonon-recovered cut-off grade of 3.6% contained ZnEq%. |
| · | RecZnEq%wascalculated by multiplying each block grade byitsestimated recovery, then applying miningcosts, processing costs, general and administrative (G&A) costs,smeltingcosts, and transportation costs todetermine an equivalent contributionofeachgradeitem tothe Net Smelter Return. |
| o | Mining costs, processing,G&A,smelting, and transportation costs total US$74.70/t. |
| o | Metal price assumptionswere:Zinc (US$/lb 1.20), Lead (US$/lb 1.0) and Silver (US$/oz 17.50), |
| o | Asthe recovery for each elementwasaccounted for inthe RecZnEq%, recoverieswerenot factored into the calculationofthe 2.8% cut-off grade. |
| o | Average metallurgical recoveries for the resource are: Zinc (79%),Lead(72%) and Silver (50%) |
| o | The equivalent grade contribution factors used for calculating RecZnEq%were:(1.0xrecovered Zn%) +(0.807 xrecovered Pb%) +(0.026 xrecovered Agppm). |
| · | The contained ZnEq% grade reported abovewascalculated by dividing the RecZnEq% grade by the calculated zinc recovery. |
| · | Densitywascalculated based on material types and metal grades. The average densityinthe mineralized zonewas |
3.01g/cm3.
| · | Mineral Resources,asreported,areundiluted. |
| · | Mineral Resource tonnage and containedmetalhave been rounded toreflect the precision of the estimate and numbers maynot add due torounding. |
| 1.7 | MineralReserveEstimate |
No MineralReserves were estimated as part of this PEA.
Both longhole open stopingwith backfill and cutand fill miningmethods have been selected forthe mineplanning work. The mining methodselectionwasbased on themineralization shape, orientation, and thedesire to put tailingmaterial underground. Geotechnical assessmentof the orebody shapeand ground conditions confirmedthe mining method selection. Thedesign parametershave beenlaid out usingempirical designmethods based on similar casehistories. Cut and fillopening sizesare 3 m x 3 mand stopes are 3 mwide x16 min height.
AnNSRapproach was usedto calculate thevalue of a block. Twoproducts willbeproduced, lead andzinc concentrates. Thelead concentrate will contain a payable amountsilver.Stopeoptimization within VulcanTMsoftware was usedto determine potentially economically minable material, basedon theNSR value and a cut-offof US$42.93 for cut and fillareas, and a cut-offof US$41.40 for longholeareas.The stope optimizeroutput shapeswerevisuallyinspected andisolated blocks(i.e., small blocks farfrom larger groups of blocks or where additional development is not practical or economicallyfeasible) were removedfromthe mining blockinventory. Theresource modelwas queried against the final stope optimization shapestodeterminetonnes and gradeof material inside the shapes and mining dilution and recovery factorswere applied.
A developmentlayoutwascreatedtoprovide accessto the mining levels andto tie levelsinto ramps. Accessto the undergroundworkings willbevia three mainportals (San Jorge, P01 and P03). Anadditional portal (P02)will be used primarily forventilation, and three additionaldrifts will daylighttofacilitate ventilation.
Thetonnes and gradeof the resource material containedwithin the mining blocks,adjustedby recoveryand dilution, and categorizedby theresource classification is provided in Table 1-7. The mine plan resourceconsists of atotal of 11.2Mt with an averagegrade of 8.34% Zn, 0.90% Pb, and
11.3 g/t Ag and is madeup of Measured, Indicated,andInferred material. Estimated averagedilution, processing recoveries and theZnOx/ZnT ratio is alsoprovided in Table 1-8.
Table1-7: MinePlan Resource for the FloridaCanyon Zn-Pb-Ag Deposit, Amazonas Department, Peru,SRK Consulting (U.S.), Inc., July21, 2017
Category | Mass | ZnGrade | PbGrade | AgGrade | NSR* | ZnEq ** | ZnContained | PbContained | AgContained | ZnEq** Contained |
| | (kt) | (%) | (%) | (g/t) | (US$/t) | (%) | (kt) | (kt) | (kg) | (kt) |
| Measured | 1,293 | 10.64 | 1.33 | 15.60 | 197.12 | 12.38 | 138 | 17 | 20,157 | 160 |
| Indicated | 2,011 | 8.77 | 1.08 | 13.44 | 166.85 | 10.22 | 176 | 22 | 27,026 | 206 |
| M&I | 3,303 | 9.51 | 1.18 | 14.28 | 178.69 | 11.05 | 314 | 39 | 47,182 | 365 |
| Inferred | 7,883 | 7.86 | 0.78 | 10.07 | 135.36 | 9.03 | 619 | 62 | 79,354 | 712 |
| TotalMineDesign | 11,187 | 8.34 | 0.90 | 11.31 | 148.16 | 9.66 | 933 | 101 | 126,536 | 1,081 |
Source: SRK, 2017
*NSRiscalucalted usingvariablerecoveries based on sulfide/oxide ratios (recovery ranging from 32%-93%), a Znprice of US$1.20/lb,a Pbprice of US$1.00/lb, an AgpriceofUS$17.50/oz.Thetransportation chargeis US$70.00/tconc, Zntreatment charge of US$115/t conc, Pbtreatment chargeofUS$100/t conc, Znrefining charge of US$0.115/lb Zn, and Pbrefining charge of US$0.1/lb Pb. These factors were used for mineplanning andvarysomewhat from the final economic model.
** ZnEq estimate isbased on aNSRvalueofUS$19.62 per 1% Zn.TheUS$19.62iscalculated usinga Znprice of US$1.20/lb, a PbpriceofUS$1.00/lb, an Agprice of US$17.50/oz. The ZnEq also includes TC/RC and transportation costs and assumes an average Znrecovery of 78.15% which differs somewhat from that presented inthe economic model. Anexample of the NSR toZnEq calculation is(148.16/19.62)/0.7815.
Table1-8: MinePlan Resource Average Process Recovery
| | Process Recovery | |
| Ag (%) | Pb(%) | Zn(%) | ZnOx/ZnT Ratio | Dilution |
| Mine Plan Resource | 51.7 | 74.3 | 79.8 | 0.26 | 34% |
Source: SRK, 2017
ThePEA is preliminary innature, thatit includesInferred Mineral Resourcesthat are considered toospeculative geologicallytohave the economicconsiderations applied to themthat would enablethem to be categorizedas MineralReserves, and there isno certainty thatthe PEA willbe realized.Mineral Resources thatare not MineralReserves do not havedemonstrated economicviability.
A production schedulewasgenerated using iGanttsoftware. Theschedule targeted a productionrate of 2,500 t/d (912,500 mineralizedtonnes per year).
Given the locationof the deposit, itis anticipatedthree undergroundportals willbe producing mineralized materialat anygiven time.Because of the challenging topography androad conditions,trucking Run-of-Mine (ROM)mineralized materialwould demand a lengthy route fromthe underground portals to the plant’s location. Instead, SRK has designed a setof conventional overland conveyorswith a maximumslope of 20°to simplify theoperation and significantly reduce the costof transferring mineralized material from the mineportals to the processplant. Aportable, primaryjawcrusher is to be installedat eachunderground mineportalto ensure the ROMis adequately sized forthe conveying system.
Florida Canyon mineralizedmaterial willbe processed using a conventional concentrationplant consisting of three stage crushing,grinding using asingle-stage ball millto80% minus44 microns,and differential flotation to produce two final products: azinc concentrate and alead concentrate containing payablesilver. Theconcentrate willbe truck transported to thepoint of sale. Tailingswillbeused as backfillor filtered and conveyedto adry stacktailings storagefacility.
The millwill process 2,500t/d of freshmineralized material, and produce approximately 287 tofzincconcentrate grading 50% Zn,1% Pb, and 0.6g/t Ag and approximately46 tof lead concentrate grading50% Pb, 8.4 g/t Ag, and6%Zn.
Thepower requirements for the projected milling operationis estimated atmaximum3.5 MW.Power formilling operations will be suppliedby a third-partyas line powerat an estimated costof US$0.084/kWh. Thewater requirement for the millat a capacityof 2,500 t/dis estimatedat maximum20 liters per second.Water forprocessing will be acquiredfrom surfacewatersources and as recycled water fromtailings dewatering operations. Reagents andgrinding balls,willbesuppliedby roadfrom Pedro Ruizand stored locally.
Thereare potential synergies forprocessing oxide mineralization at Florida Canyon using expertisethat Votorantim has gained at the Vazante and Morro Agudo mines in Brazil. These other existing operations have demonstrated success recovering hemimorphite, smithsonite, and hydrozincite, which may improve future recovery projections for Florida Canyon.
| 1.10 | Project Infrastructure |
Florida Canyonis agreenfield project with no substantiveexisting infrastructure. Thecommunities in the regionare smalland cannot support theoperation froman infrastructure standpoint so acampwill be required. Theinfrastructure requirements forthe Project will include an upgrade to the existing 26 kmaccess road and the construction of an additional24 kmofsupport roads for accessto mineportals, plant, andother infrastructure.
Sitefacilities will includethe processing plant, mine,crushers and conveyors forore/waste transportation, mine backfill systemsincluding a paste backfill plant and cementedrock fillplant, water supplypiping and tank, a dry stack TSF,400 person camp,septic system,potable water treatment system,site power distribution, health/safetyenvironmental office, mineoffice, minedry, rescue and firstaid building, securitygate house,truck scale, truck wash, laboratory, incinerator system,fuel storage andpumping system.
Makeup water forthe processing plant willbesuppliedfrom alocal creek througha piping systemto a storage tankthatwillalso provide fire systemwater.The majorityof thewater requirements willbeprovidedbyrainfalland recycle water from thedry stacktailingsstorage facility (TSF)returnedto theprocessing plantfacility. A third-party will supplylinepower through ahydroelectric power generator,transmissionline, andsubstation ownedbythethirdpartywithcostsrecovered throughan electricitysurcharge over thelifeoftheProject. Zinc concentrate willbe transported by30toverthe road truckstotheVotorantim CajamarquillasmelternearLima. Lead concentratewillbe truckedtothePort of Callao nearLima,and shippedto anoverseaslead smelter.
| 1.11 | EnvironmentalStudiesandPermitting |
Environmental permits for mineralexploration programsare divided into two classes.Class I permits allowconstruction and drilling forup to20 platformswith a maximumdisturbance of 10 ha. A ClassII permitprovides for morethan20 drilllocations or for adisturbance area of greater than 10 ha. Votorantimhas filed applicationsforand received Class II permits forvariousphasesof the Project and has filedand receivedthe requiredassociated permits.
Permitting requirements for mining includean Estudio de Impacto Ambiental (EIA)that describes in detail themining plan andevaluates the impactsof the planon environmental andsocial attributes of the property. Baseline studies includeair quality, surface andgroundwater quality, flora and faunasurveys,archeological surveys and a studyofthe social conditionsoftheimmediate propertyandanarea of interest thatincludes local communities.Public meetings are required inorder that local community members canlearn about and commenton the proposed operation. Manyof the baseline studies required formining have been completed byVotorantim.
| 1.12 | ConclusionsandRecommendations |
1.12.1 General
TheFlorida Canyon Zinc Projectis asignificant greenfields potentially underground mineablehigh- gradezincdeposit containing associated lead andsilver. The Project has a large landposition andstrong technical and financial backingthrough Solitario’searn-inJVpartner Votorantim. Whilethis document represents the first formal economicevaluation of the Project, Votorantim and Comincoreport having previously spentover US$60 millionon drilling,test work and strategic planning fordevelopment (Solitario, 2014). Currentprojections in thezinc metal marketsuggest a near-termreduction inzinc supplyas current majorproducers exhaust reserves.
SRK’s sitevisit to the projecton theground in northern Peru found itto be awell-organized facility,with current QA/QC protocols in place fordrilling dataverification andvalidation. Material handling, corestorage and securitywere allator above industrystandards.
SRK used a numberof methodsto validatethe Votorantim resource block model startingwith a face-to-facemeeting with themodeler and followingonwith athorough auditof the model sourcedata, geologic modeling techniques, gradeand tonnageestimation methodsand classificationprotocols. SRK foundthesetobe in linewith industrystandards, having beenproduced with recognized miningsoftware, defensible data andreasonable assumptions. SRKwas ableto independentlyvalidate the modelresults.
Asignificant component of theSRKinput tothis PEAwas thedevelopmentof the undergroundmineplan.Because Florida Canyonis a polymetalliczinc-lead-silver deposit, each model blockin the mine modelwas evaluatedonan NSR basis,which included an estimateof recovery. Recoverywasdeveloped fromarobust 2014 metallurgicalcampaign thatcharacterizedall expectedmaterialtypes. Arecoveredgradebyblock wasusedtobuildthe undergroundstoping plan,completewithaccess,ventilation and an assessment ofmine recoveryand dilution.
SRK is unaware ofanyenvironmental, permitting, legal,title,taxation or marketing factorsthat couldlimit or affectthe resource stated inthis document. The project will benefitfrom additional infill andexploration drilling, additional process-metallurgicaltest work,detailed engineering studies forinfrastructure andtailings managementand forwardplanning to clearlydefine concentratetransport and smelter costs.
1.12.2Mineral Resource Estimate
Thecurrent exploration model for theProject has beenapplied successfully in drillholeplanning andresource definition. There is low riskto the Project if no additional explorationis completed. However,additional drilling for resourcedefinition has astrong potentialto expand the knownresource extent and upgrade Inferred resourcesto Measured andIndicated. Themostprospective targets include:
| · | Extension drillingsouth of the SanJorge zone and northeastof the Karen-Milagroszones are considered thehighest priorityto increasehigh-grade zinc sulfide mineralization. Both zones are openin the recommended areasof drill testing; |
| · | Infill drillingseveral large un-drill testedareas surroundedbymineralized zones within the mineralized footprint hasthe potentialto significantly increaseresources; |
| · | Extension drillingperipheral to the currentlydefined mineralized footprint; and |
| · | Further developdrill targets over the 20 kmlong northernFlorida Canyonmineralized corridor where large areas of strongzinc in soil and rockchip geochemistry indicate thepotential foradditional mineralized zones. |
At present, thedeposit is open laterallytothe north andsouth as wellas tothe westand easton thedownthrown sidesof the horstthat definesthe limits of explorationtodate. Gapsin the drillpattern within thefootprint of the existingdrilling provide anotheropportunityto increaseresources where drillspacing limits the continuityof stratigraphically controlled mineralization. A constraintoneffective exploration anddelineation drilling in these areas is the accessto drillingstations due to the ruggedterrain. Thecompletion of a roadinto the area will helptoexpedite future drilling anddevelopment programsby providingincreased accessand lowering costs.
The discoveryof the high-angle, high-gradeSan Jorge zone has prompted more emphasison angleddrilling, wheremostof the historic drilling is vertical to near-vertical andis thereforeineffective at locating and definingnear-vertical structures. These“break-through” structures have been mappedon surfacein several locations,but due to logisticalconstraints, have not been adequatelydrill tested fortheir down-dipcontinuity. Similarly, thereappear tobeadditional drill targets at theintersection of the high-angle structures and the flat mantozones, where grades are locally enhanced. Theseconcentrations maybe presentwithin the existing drillingfootprint, but requireadditional drilling to delineate. The highgrade and potential tonnageof suchtargets provideanincentiveto locate andfurther define resourcesof this geometry.
1.12.3Mineral Processing and Metallurgical Testing
Processing of sulfidemineralization (zinc-lead-silver)from the Florida Canyondeposit is straightforwardusing conventionalflotation to a concentrate followedbyoffsitesmelting. Producing a commercial qualityzinc concentrate from mixedmaterial needed to incorporate Dense MediaSeparation methods (DMS)in order to maintainhigh recoveries (80+%). A conventionalflotation approach reached commercial quality(about 50% Zn) at theexpense of lower metal recovery,witha similar outcome forthe lead concentrate. It is SRK’s opinion thatconventional flotation shouldbe ableto achieveenhancedcommercial level results(gradeandrecovery) under improved crushing, grinding,andflotation conditions.
Available information aboutsilver is verylimited. The laboratory developed a relationshipbetween lead's head grade and silvergrade inthe finallead concentrate. Thisrelationship followswhatis typically observed in this typeof deposit, thereforeas this stageof development itis assumedto be valid, but SRK recommends confirmingit in thenext testing phase of the project.
Tooptimize recoveryand grade when attempting to reach separationof thezincand lead minerals into theirrespective commercial quality concentrates, SRK recommendsapproaching the selectionof samples forthe next phaseof metallurgical sampling and testing:
| · | The corelogging needs to incorporate attributes like claypercent,claytype, RQD, oxidecontent, sulfidecontent; |
| · | Assaying of the core should includewhole rockanalysis; and |
| · | Collect samples for metallurgicaltesting representing distinctive zones in the deposit. Grade variability shouldbe secondary criteriawhen selecting samples,but theymustbe reasonably closeto what a potential miningoperation would be able to deliver to the mill. |
1.12.4Mineral Reserve Estimate
Therewere no MineralReserves estimated forthis PEA.
1.12.5Mining Methods
Depending uponthe geometryof the mineralizedzones, SRK selectedlonghole stopingto be used in steeplydipping zones and mechanized drift-and-fill extraction methods in shallowly dipping mantos.Conventional room and pillar miningon a checkerboardpattern couldbe appliedto specificzones of the Florida Canyonproject, particularly in lowergrade areas,and shouldbe consideredin future trade- offstudiesatthe prefeasibilitylevel. Cemented paste backfill will be placed underground to increase mining recovery andto stabilize mined-out areas. Adits will provide accessfrom the surfaceto the mineralized zones currently defined in the mineplan.
Sub-level open stoping parameters forthisstudywere basedon empirical relations from casehistories. As the project advances,additional geotechnical stabilitymodeling using numericalmethods is recommended. Karst topographyis prevalentin the district and karstcaverns were encountered duringthe excavation of the SanJorge Adit. Additional geotechnical and hydrogeological evaluationof this condition is required to ensure safeoperating conditionsin the undergroundmining. A crownpillar of 30 mhas beenused forplanning. This assumption shouldbe reevaluatedin future work. Overall, acost-benefit analysisof ground support, dilution, minerecovery, andventilation shouldbe undertaken at thenext levelof study.
Operating costs,which ultimately define NSR value anddrive stopedesigns, were developed from benchmarks,analogous projects in the region,and commercial cost sources. SRK recommends arevision of these costsfrom firstprinciples as the projectadvances.
SRK notes that thereare likelyopportunities to improve the production schedule.Opportunities includeimproved sequencingof high grade material and,potentially, adecreasein thepre-production timeframe. A more detaileddesign and schedulewith corresponding trade-offstudies, as wellas moredetailed construction timeframeestimates, wouldbe required forthe next phaseof study.
1.12.6Recovery Methods
TheFlorida Canyonpolymetallic zinc-lead-silver deposit canbe processed using a conventionalconcentration plant consistingof three-stage crushing, grinding using ball mill, anddifferential flotation to produce twofinal products: azincconcentrate and a leadconcentrate. Detailedsizingand costingof the processing plant componentswillfollowadditional metallurgicaltesting proposed inthis study. Power supply andwater supplyappear to be fairlywell defined forthe project, though additionalstudies maybe neededto refine theseservices and the costsof these servicesto theproject.
1.12.7Project Infrastructure
TheFlorida Canyondeposit is located in steepterrain in a remote partof northern Peru withmoderate to high rainfall. Thesegeographic and climaticconditions pose challengesto both accessand infrastructure development.
As presentlyunderstood, thekey support servicesof power supplyand water supplyare availableandpart of a district-wideinfrastructure improvement campaign beingimplementedbythe Peruviangovernment and related third-partyproviders. Themostsignificantadvancementin the infrastructure investigation forthe PEAwas identifying the probabilityof hydroelectric power distributionto thesite, as alower costalternative to on-sitepower generation.Water supply for operations appearsto be straight forward, with abundant surfacewater available formineral processing andcampsupport.
Theinfrastructure componentwith the largestfootprint and projected costis thetailings storage facility.As part of this study, SRKhas evaluated this as adrystack facilityin order to achievegeotechnical stability and reducethe area requiringreclamation. Trade-off studies are warranted to optimize moisturecontent, bindingcharacteristics, and placementand compactionmethods during tailings placement.
1.12.8Environmental Studies and Permitting
Additional environmental baseline studiesare required forfurther project development.
Impactto groundwater is expectedtobe minimalas underground surfaceexposures are minorand future exposed sulfidesare not acid generating. Thereare no groundwater wells required forprocessing or potablewater supply. Therewill be littleorno surfacearea disturbance related to waste rock placement.
Tailings are predictedto have lowamounts of iron sulfide andto be geochemicallystable withrespect to acid rockdrainage. Thereis also substantialneutralization capacity inthe carbonatehostrocksto mitigate acid generation. Residuallead andzinc sulfideshave low acid-generating capacity; however, theyare subjectto metal leaching and therefore requirecompaction during placement.
SRK recommendsin future studies to design the tailings surfaceand spillway stormwaterstructure and evaluate options to reduceor eliminate the long-term obligation formonitoring and maintenance.
1.12.8Recommendations– WorkPrograms and Costs
SRK acknowledges,after examination of the Project data set, thatthere havebeen a significant numberof technical studies completedby Votorantim,manyof whichare beyondPEA. Therefore,the work elements listed in Table 1-9represent mostly prefeasibility and feasibility levelengineering and drillingto support those studies.
At the juncturewhere prefeasibility levelengineering hasbeen completed, the Project will likelywarrant further public reporting to an internationalstandard (JORC,or NI43-101). Technicalinformation required to achievethislevelof project developmentare listed in Table 1-9. A cost estimate forthese work elements is included inthe table.
Table1-9: Summary of Costs forRecommended Work
| Work Program | Estimated | Assumptions/Comments |
| Engineering Studies | Cost US$ | |
| Metallugical variability and recovery optimization test work | 500,000 | Commercial Laboratory |
| Prefeasibility Study(PFS)and Trade-off Studies | 600,000 | Votorantimorconsultant engineer |
| SubtotalStudies | $1,100,000 | |
| Drilling | | Salaried newhire orcontractPM |
| Exploration Drilling | 2,100,000 | 20holesto350 m atUS$300/m |
| Resource Conversion Drilling | 2,100,000 | 20holesto350 m atUS$300/m |
| Metallurgical Drilling for Flotation and Comminution | 1,225,000 | 10PQ holesto350 m atUS$350/m |
| Geotechical DrillingforMining | 500,000 | 10holes oriented to 100 m atUS$500/m |
| Geotechnical Drilling for Foundation Stability | 225,000 | 50holesto30 m atUS$150/m |
| Hydrogeological Drilling | 600,000 | 4holesto300 m atUS$500/m |
| Subtotal Drilling | $6,750,000 | |
| Studies+Drilling | 7,600,000 | |
| Contingencyat15% | 1,435,000 | |
| Total | $9,285,000 | |
Source: SRK, 2017
| 2.1 | Terms of Reference and Purpose of the Report |
Thisreport was preparedas aNational Instrument43-101 (NI 43-101) TechnicalReport, Preliminary Economic Assessment(Technical Reportor PEA)by SRKConsulting (U.S.),Inc. (SRK),with Votorantim Metais Holding S.A. (Votorantim) withSolitario ZincCorp. (Solitario), (collectively, owners)on theFlorida Canyon ZincProject located in Amazonas Department,Peru (Florida Canyonor Project). TheProject namewas changed in 2017from Bongará,asit was called previously, to FloridaCanyon. Someof the figures in this report stillreference Bongará. Thereader is advisedtouse Bongará interchangeably with Florida Canyonwhen reviewing thosefigures.
This studyrepresents the advancementof the Project from a2014 Technical Reporton Resources,tothis 2017 PEA.Highlights of this PEA include athirteen-year life-of-mineunderground mineplan, comminution andflotationofzinc and lead concentrateswith at aproduction rateof2,500 t/d followedbydry-stack tailings storage. Siteinfrastructure includes line powerto the site,water distribution systems, atownsite and accessroads forconstruction and re-supplyas well as forzinc concentrate transportto apoint of saleat theCajamarquilla smelter.
The qualityof information,conclusions, andestimates containedherein is consistent with the levelof effortinvolved in SRK’sservices, basedon: i) information availableat thetimeof preparation, ii) datasuppliedby outside sources,and iii) the assumptions, conditions, and qualifications set forthin this report. Thisreport is intended for use by the owners subjectto the termsand conditions of its contract with SRK andrelevant securities legislation. The contract permitsthe owners to file thisreport as aTechnical Report with Canadian securities regulatoryauthorities pursuant toNI43-101, Standards of Disclosure for Mineral Projects.Except forthe purposeslegislated under provincial securities law,anyother uses of this reportby anythird partyis at thatparty’s solerisk. The responsibility forthis disclosure remainswith the issuing companies. The userof this document should ensurethat thisis themostrecent TechnicalReport for the propertyas it is not validif a new Technical Report hasbeen issued.
ThePEA is preliminary innature, thatit includesInferred Mineral Resourcesthat are considered toospeculative geologicallytohave the economicconsiderations applied to themthat would enablethem to be categorizedas MineralReserves, and there isno certainty thatthe PEA willbe realized.Mineral Resources thatare not MineralReserves do not havedemonstrated economicviability.
Thisreport provides Mineral Resources, and a classificationof resources prepared in accordance with the CanadianInstitute of Mining, Metallurgy andPetroleum Standards on Mineral Resourcesand Reserves: Definitions andGuidelines, May 10, 2014 (CIM, 2014).
| 2.2 | Qualifications of Consultants(SRK) |
TheConsultants preparing this technical reportare specialists in the fieldsof geology, exploration, Mineral Resource andMineral Reserve estimation andclassification, underground mining, geotechnical, environmental, permitting, metallurgical testing, mineralprocessing, processing design, capital andoperating cost estimation, and mineral economics.
Thefollowing individuals,by virtueof their education, experience and professionalassociation, are considered QualifiedPersons(QP)as definedintheNI 43-101standard, forthis report,andare members in good standing of appropriate professional institutions.QPcertificates of authors are provided in Appendix A.TheQP’s are responsible for specific sections as follows:
| · | WalterHunt, CPG,an employeeof Solitario, is the QPresponsible forSections 2, 4and partsof 20; |
| · | J.B. Pennington, CPG is the QP responsible for Sections5-10, 12, 14, 23,24 andpart of 1, 20, 25, and26; |
| · | Joanna Poeck,PE, MMSA isthe QPresponsible forSections 15-16and partof 1, 25 and 26; |
| · | Jeff Osborn BEngMining, MMSA is theQPresponsible forSection 18-19, 21-22and partof 1, 25 and 26; |
| · | Daniel Sepulveda, RM-SMEis theQP responsibleforSections 13, 17, the capital andoperating cost forprocessing in Section 21, andpartof1, 25 and 26; and |
| · | JamesGilbertson, CGeol isthe QPresponsible forSection 11, thesite visit, inspection of geological sampling and datacollection practices, and reviewof resource estimationpractices. |
| · | John Tinucci,PhD, PEisthe QP responsible for Section16.2. |
��
JamesGilbertson, C. Geol.,of SRKExploration Services(U.K.), visited the Florida CanyonProject site and core storage facility in Shipasbamba, Peruon May 5to7, 2014. Thistrip included a follow-upvisit to Votorantim’s Lima,PeruofficeonMay9, 2014.Mr.Gilbertsonis a Chartered Geologist in the Geological Societyof London, and a Qualified Personin the disciplineof resource geology, accordingto NI43-101 requirements.
Thesources of information include dataand reports suppliedbySolitario personnel andrepresentatives of Votorantim, as well as documentscited throughout thereport andreferencedinSection 27.
Theeffective date of this reportisJuly13, 2017.
The metricsystem has beenused throughout this report.Tonnes are metricof 1,000 kg,or 2,204.6 lb. All currencyis in U.S. dollars(US$) unlessotherwise stated.
TheConsultants used theirexperience to determineif the information from previous reports was suitable forinclusion in thistechnical report and adjustedinformation that required amending. Thisreport includestechnical information,which requiredsubsequent calculations to derivesubtotals, totals and weighted averages. Suchcalculations inherentlyinvolve adegree of rounding and consequentlyintroduce a marginof error. Wherethese occur, theConsultants do not consider themto be material.
Items suchas mineraltitles and agreementshave not been independently reviewedby SRK and SRKdid not seekan independent legal opinionof theseitems.
| 4 | Property Description and Location |
TheFlorida Canyon ZincProject (the Project, formerly calledBongará) is located in theEastern Cordillera of Peru at the sub-Andean frontin theupper AmazonRiver Basin. It is within the boundaryof the Shipasbamba community, 680 kmnorth-northeast of Limaand and 245 kmnortheast of Chiclayo,Peru, in the Districtof Shipasbamba, Bongará Province,Amazonas Department(Figure 4-1). TheProject area canbe reached from the coastal cityof Chiclayoby thepaved Carretera Marginalroad. Thecentral point coordinates of the Project areapproximately 825,248East and,9,352,626 North(UTM Zone 17S, Datum WGS84). Elevationranges from1,800maslto approximately 3,200 masl. The climateis classified as highaltitude tropical junglein theupper regionsofthe Amazon basin. Theannual rainfall averageexceeds 1 mwith upto 2 min the cloud forestat higher elevations.
Source: Votorantim, 2013b
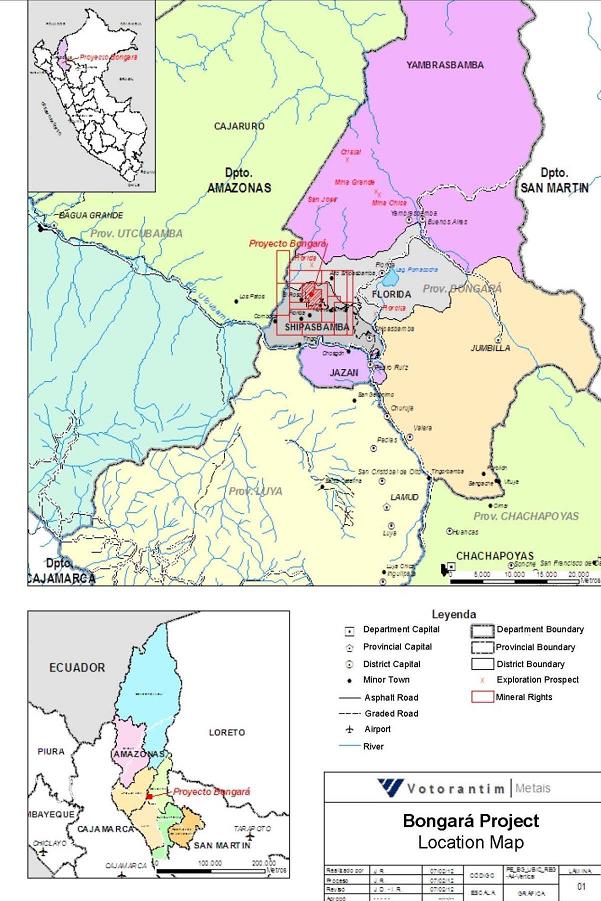
Figure 4-1: Project LocationMap
Florida Canyonis a mineralexploration projectcomprised of sixteen contiguous miningconcessions covering approximately12,600 ha (Table4-1). Theconcession titles are inthe nameof Minera Bongará andare subjectto the Minera Bongará jointventure agreementbetween Solitario andVotorantim. Allof these concessionsare currentlytitled.
TheMinera Bongará concessionsare completely envelopedby asecond groupof thirty-seven contiguous mining concessions, covering approximately 30,700ha (Table4-2). The concession titlesare in the nameof Minera Chambara. Ofthe thirty-seven concessions, twelvetitles are pending. Claim areas are shownin Figure4-2.
According to Peruvian law,concessionsmaybe heldindefinitely, subject onlyto paymentof annual feesto the government. Atthetimeof this study, concessionpayments were current forMinera Bongará claims, with 2017 feesof US$122,600 (Table4-1). The fees forMinera Chambaratotal US$140,530 and these feesdo not include the additional nine Charlita claimsfiled in January,2017, which are still pending (Table4-2). Minera Chambara, aPeruvian companyalso subjectof aseparate joint venture agreementbetween Votorantimand Solitario,holds mineral concessionssurrounding theMinera Bongará claimsbut which do not containanyof the resources subjectof thiseconomic analysis.
Votorantim, who has servedas operator of the joint venture company MineraBongará, entered into a surfacerights agreementwith the local communityof Shipasbambawhich controls the surfacerights of the Project. This agreementprovides for annual paymentsand funding for mutuallyagreed upon socialdevelopment programsin return for theright to performexploration work including road building anddrilling.
Table4-1: List of MineraBongará Mineral Claims
| Concession Name | Number | Status | Hectares | Claim Date | 2017 Holding Fees (US$) | District |
| BONGARA CINCUENTICINCO | 10233396 | Titled | 1,000 | 8/7/1996 | 23,000.00 | FLORIDA/SHIPASBAMBA |
| BONGARA CINCUENTICUATRO | 10233296 | Titled | 600 | 8/7/1996 | 13,800.00 | FLORIDA/SHIPASBAMBA |
| BONGARA VEINTISIETE | 10783595 | Titled | 300 | 6/26/1995 | 6,900.00 | SHIPASBAMBA |
| DEL PIERO UNO | 10338505 | Titled | 1,000 | 11/2/2005 | 9,000.00 | FLORIDA/SHIPASBAMBA |
| DEL PIER DOS | 10338405 | Titled | 600 | 11/2/2005 | 5,400.00 | FLORIDA/SHIPASBAMBA |
| DEL PIERO TRES | 10338605 | Titled | 700 | 11/2/2005 | 6,300.00 | FLORIDA/SHIPASBAMBA |
| DEL PIERO CUATRO | 10000206 | Titled | 500 | 1/3/2006 | 4,500.00 | FLORIDA/SHIPASBAMBA |
| DEL PIERO CINCO | 10000306 | Titled | 1,000 | 1/3/2006 | 9,000.00 | SHIPASBAMBA |
| DEL PIERO SEIS | 10204507 | Titled | 1,000 | 3/23/2007 | 9,000.00 | CAJARURO/FLORIDA |
| VM42 | 10190507 | Titled | 1,000 | 3/21/2007 | 9,000.00 | CAJARURO/FLORIDA/ SHIPASBAMBA |
| VM74 | 10193707 | Titled | 1,000 | 3/21/2007 | 9,000.00 | SHIPASBAMBA |
| VM75 | 10193807 | Titled | 1,000 | 3/21/2007 | 9,000.00 | SHIPASBAMBA |
| VM94 | 10045708 | Titled | 900 | 1/28/2008 | 2,700.00 | FLORIDA/SHIPASBAMBA |
| VM95 | 10045808 | Titled | 500 | 1/28/2008 | 1,500.00 | FLORIDA |
| VM97 | 10046008 | Titled | 1,000 | 1/28/2008 | 3,000.00 | FLORIDA/SHIPASBAMBA |
| VM98 | 10046108 | Titled | 500 | 1/28/2008 | 1,500.00 | FLORIDA/SHIPASBAMBA |
| Total | | | | | $122,600.00 | |
Source: Solitario, 2017
Table4-2: List of MineraChambara Mineral Claims
| Concession Name | Number | Status | Hectares | Claim Date | 2017 Holding Fees (US$) | District |
| ANGIE KAROLL TRES | 10387906 | Titled | 900 | 1/3/2006 | 8,100.00 | CAJARURO |
| ANGIE KAROLL CUATRO | 10388106 | Titled | 300 | 1/3/2006 | 2,700.00 | CAJARURO |
| BONGARA VEINTIDOSM | 10053315 | Titled | 1000 | 1/5/2015 | 3,000.00 | CAJARURO/ YAMBRASBAMBA |
| BONGARA VEINTITRESM | 10053215 | Titled | 671.9322 | 1/5/2015 | 2,015.80 | YAMBRASBAMBA |
| CAROLINA1 M | 10106114 | TitlePending | 500 | 1/2/2014 | 1,500.00 | YAMBRASBAMBA |
| CAROLINA2 M | 10106014 | Titled | 500 | 1/2/2014 | 1,500.00 | FLORIDA/ YAMBRASBAMBA |
| CHARITO 2007 | 10199807 | Titled | 1000 | 3/23/2007 | 9,000.00 | CAJARURO/ SHIPASBAMBA |
| DEL PIERO SIETE | 10205907 | Titled | 1000 | 3/23/2007 | 9,000.00 | CAJARURO/ YAMBRASBAMBA |
| DEL PIERO OCHO | 10205807 | Titled | 1000 | 3/23/2007 | 9,000.00 | CAJARURO/ YAMBRASBAMBA |
| MINA4 M | 10052215 | Titled | 300 | 1/5/2015 | 900.00 | CAJARURO |
| SANJOSECITO M | 10052015 | TitlePending | 1000 | 1/5/2015 | 3,000.00 | CAJARURO/ YAMBRASBAMBA |
| TIAVIOLETAM | 10113114 | TitlePending | 1000 | 1/2/2014 | 3,000.00 | YAMBRASBAMBA |
| VIOLETA1 M | 10113214 | Titled | 1000 | 1/2/2014 | 3,000.00 | FLORIDA/ YAMBRASBAMBA |
| VM29 | 10189207 | Titled | 1000 | 3/21/2007 | 9,000.00 | CAJARURO |
| VM30 | 10189307 | Titled | 1000 | 3/21/2007 | 9,000.00 | CAJARURO |
| VM33 | 10189707 | Titled | 1000 | 3/21/2007 | 9,000.00 | CAJARURO |
| VM34 | 10189607 | Titled | 1000 | 3/21/2007 | 9,000.00 | CAJARURO |
| VM36 | 10190107 | Titled | 1000 | 3/21/2007 | 9,000.00 | CAJARURO |
| VM37 | 10189907 | Titled | 1000 | 3/21/2007 | 9,000.00 | CAJARURO |
| VM39 | 10190207 | Titled | 1000 | 3/21/2007 | 9,000.00 | CAJARURO/JAMALCA |
| VM40 | 10190407 | Titled | 1000 | 3/21/2007 | 9,000.00 | CAJARURO/JAMALCA/ SHIPASBAMBA |
| VM96 | 10045908 | Titled | 271.4725 | 1/28/2008 | 814.42 | FLORIDA |
| VM99 | 10046208 | Titled | 244.745 | 1/28/2008 | 734.24 | FLORIDA/ SHIPASBAMBA |
| VM100 | 10046308 | Titled | 1000 | 1/28/2008 | 3,000.00 | JAZAN/ SHIPASBAMBA |
| VM101 | 10046408 | Titled | 1000 | 1/28/2008 | 3,000.00 | JAZAN/SANJERONIMO/ SHIPASBAMBA |
| VM102 | 10046508 | Titled | 600 | 1/28/2008 | 1,800.00 | SANJERONIMO/ SHIPASBAMBA |
| VM133 | 10134708 | Titled | 600 | 2/6/2008 | 1,800.00 | JAZAN/ SHIPASBAMBA |
| VM311 | 10099610 | Titled | 555.282 | 2/1/2010 | 1,665.85 | FLORIDA/ YAMBRASBAMBA |
| | | | | | | |
| CHARLITA 5BM | 10049017 | TitlePending | 600 | 1/2/2017 | 0.00 | FLORIDA/ YAMBRASBAMBA |
| CHARLITA 5AM | 10049117 | TitlePending | 800 | 1/2/2017 | 0.00 | FLORIDA/ YAMBRASBAMBA |
| CHARLITA4 M | 10049217 | TitlePending | 1000 | 1/2/2017 | 0.00 | FLORIDA/ YAMBRASBAMBA |
| CHARLITA3 M | 10049317 | TitlePending | 1000 | 1/2/2017 | 0.00 | CAJARURO/FLORIDA/ YAMBRASBAMBA |
| CHARLITA2 M | 10049417 | TitlePending | 1000 | 1/2/2017 | 0.00 | CAJARURO/FLORIDA/ YAMBRASBAMBA |
| Concession Name | Number | Status | Hectares | Claim Date | 2017 Holding Fees (US$) | District |
| CHARLITA 1BM | 10049517 | TitlePending | 900 | 1/2/2017 | 0.00 | CAJARURO/ YAMBRASBAMBA |
| CHARLITA 1AM | 10049617 | TitlePending | 1000 | 1/2/2017 | 0.00 | CAJARURO/ YAMBRASBAMBA |
| BONGARA 60AM | 10049717 | TitlePending | 1000 | 1/2/2017 | 0.00 | YAMBRASBAMBA |
| BONGARA 57M | 10049817 | TitlePending | 1000 | 1/2/2017 | 0.00 | YAMBRASBAMBA |
| Total | | | | | $140,530.30 | |
Source: Solitario, 2017
 Source: Solitario2017
Figure 4-2:Map of MineralClaims
4.2.1Nature and Extent of Issuer’s Interest
Bongará
TheProject is controlledbyMinera BongaráS.A., and is subjectto ajoint ventureagreement between VotorantimandSolitariosince2006. Votorantimistheoperatorofthe Project andisresponsible for keepingthe propertyin good standing.Current ownershipis39%Solitario, 61% Votorantim. Votorantimwill earn a70% interest in Minera Bongaráby continuingto fund all projectexpenditures through a feasibility studywith no paybackby Solitario. Votorantimis requiredtooffer a loan facilityat marketrates forrepayment of Solitario’s portion of construction capital.Solitario repaysthe loanthrough 50%of its project cash flow.
On August15,2006,an Agreement LetterwassignedbetweenSolitario, Minera Bongará andVotorantim Metais. TheLetter defined the commitmentofVotorantimto fund US$1.0 millionin an annual mineralexploration program,which began inlate October 2006.
OnMarch 24, 2007, a definitive agreement superseding theLetter Agreementwas signed betweenthe Companies. Thisdefinitive agreement (Agreement)provides that the projectinterest ownedbyVotorantim andSolitario will be heldthrough the ownership ofshares in the joint operating companyMinera Bongará ,which controls 100%of the mineralrights andassets of the project.
Chambara
Current Chambara Ownershipis 85%/15% Solitario/Votorantim. Votorantimmay increase theirinterest to 49%of Minera Chambaraby completingcumulative expenditures of US$6.25 million.Votorantimmayfurther increase their interest to70% by funding a feasibility studyand providing aloanforSolitario’s30%of construction capital.Solitario willrepay the loan through80% of its cash flow fromproduction.
4.2.2Property and Title in Peru
Miningin Peruis governedby the GeneralMining Law,which specifiesthat allmineral assets belongto thefederal government. Mining concessions grantedto individualsor other entities authorizethe title holdertoperform all minerals relatedactivates fromexplorationto exploitation and,once titled, are irrevocable for solong as the feesare paid to the federalgovernment on time. Aprovisional claimis applied for and titleis granted ifnoother claimexists over thesame area. Aclaim can onlybe granted inmultiples of aquadricula, which is a 100haplot,upto a maximumsize of 1,000ha.Nomonumentation of the claimboundary in the fieldis necessary.
Annually a paymentof US$3.00/ha (US$1.00 for a“small miner”)mustbe madeby the 30thof June or the firstbusinessday thereafterto the Ministryof Energyand Mines (MEM) or the claimis automatically forfeited.Any claimnot in commercialproduction exceeding apro-rated averageofUS$100/ha foranyyear after the sixth anniversaryincurs a penalty paymentof US$6.00added to theannual payment. If,by the 12thanniversary, commercialproduction has not beenachieved thenthe penaltyincreases to US$20.00. Thepenalties are waivedif the title holdershows thatinvestments foreach claimexceed ten timesthe valueof the penalty forany given year.
Concessions are real assetsand are subjectto lawsof private property. Foreignentities havethe samerights as Peruviansto hold claimsexcept for azone within 50kmof internationalborders. Titleholders have aright of accessand developmentof minerals butan agreementis required withprivate property surfacerights owners and formalized “Communities”.To ratifyan agreementwith a Community a majorityof all membersmustvote in favorof the agreementas written. A recently issued law(as modified) also requires formalconsultation with indigenous tribes in certainareas.
| 4.3 | Royalties,AgreementsandEncumbrances |
Peru imposes a sliding scale net smelterreturn royalty (NSR)on allprecious and base metalproduction of 1% on all grossproceeds from production up to US$60,000,000, a2% NSRonproceeds between US$60,000,000and US$120,000,000 and a3% NSRon proceeds in excessof US$120,000,000. Noother royaltyencumbrances exist forthe Project.
Corporate incometax in Peruis charged at a flat rateof30%. However, mining companiesmustalso payan additional tax varyingfrom 2to 8.4% of net operating profit.
| 4.4 | Environmental Liabilities andPermitting |
4.4.1Required Exploration Permits and Status
Environmental permits for mineralexploration programsare divided into two classes.Class I permits allowconstruction and drilling forup to20 platformswith a maximumdisturbance of 10 ha. A ClassII permitprovides for morethan20drill locationsor for adisturbance area of greaterthan 10ha.
Class I permitsrequire little morethan anotification process forapproval. ClassII drilling permitsrequire an environmental impactdeclaration (DIA), a permit forharvesting trees(if applicable),anarcheological survey report(CIRA), awater use permit(ALA) and a ClosurePlan.
Votorantim has previously filedapplications for and received ClassIIpermits forvarious phasesof the Project andhas filedand received the required associated permits. The2017 reviewofexisting exploration permitstatus indicates that only the archeological permitsand thelatest tree harvesting permitare stillvalid.
During exploration, Votorantim hasdeveloped aSocial Management Plan with several programsongoingin the communityincluding:
| · | Communication, Information andCoordination Programwith Residents |
| · | Attentionto Concern, Claimsand Conflict ResolutionProgram |
| · | Support Program forParticipatory Environmental Monitoring andInformation Workshops |
| · | Recruitment and TrainingProgram forLocal Labor |
| · | Support Program forSustainable SocioeconomicDevelopment |
| · | Community Support Programin Education and Training. |
4.2.2Required Mining Permits
Permitting requirements for mining includean Estudio de Impacto Ambiental (EIA)that describes in detail themining plan and evaluatesthe impactsof the planon environmental andsocial attributes of the property. Baseline studies includeair quality, surface andgroundwater quality, flora and faunasurveys,archeological surveys and a studyofthe social conditionsofthe immediate propertyand anarea of interest that includeslocal communities. Manyof the baseline studies required for mining havebeen completed byVotorantim. Public meetingsare required in order that local community memberscan learn about and commentonthe proposed operation. Socialoutreach hasbeen clearlydemonstrated during Votorantim’s exploration effortsas described above.
Specific authorizations, permitsand licenses required forfuture mininginclude:
| · | EIA (as modifiedduring the minelife); |
| · | Mine ClosurePlan and Final Mine ClosurePlan within twoyearsof endof operation; |
| · | Certificate of Nonexistence of Archaeological Remains; |
| · | Water UseLicense (groundwater and/or surfacewater); |
| · | Waterconstruction authorization; |
| · | Drinking water treatment facilitylicense; |
| · | Explosives uselicense andexplosives storage licenses; |
| · | Controlled chemicalscertificate; |
| · | Beneficiation concession; |
| · | Environmental ManagementPlan approval. |
Informationonenvironmental monitoring waslimitedin the SRKdocument review.Nevertheless, theneed foradditional monitoring inat least one dryandone wet period will be required forthe EIAincluding terrestrial andaquatic fauna and floraand groundwater level and quality.
| 4.5 | Other Significant Factors and Risks |
Thereareno known significant factorsor risksaffecting access,title or right or abilitytoperform work on the property thatare not discussedherein.
| 5 | Accessibility, Climate, LocalResources,Infrastructure and Physiography |
| 5.1 | Topography,Elevation andVegetation |
TheProject area elevation ranges between 1,800 and 3,200 masl,withareasofsteep topographyconsisting of prominent escarpmentsand deep valleys.Dense jungleor forestvegetation coversthe Project area, as shown in Figure5-1.
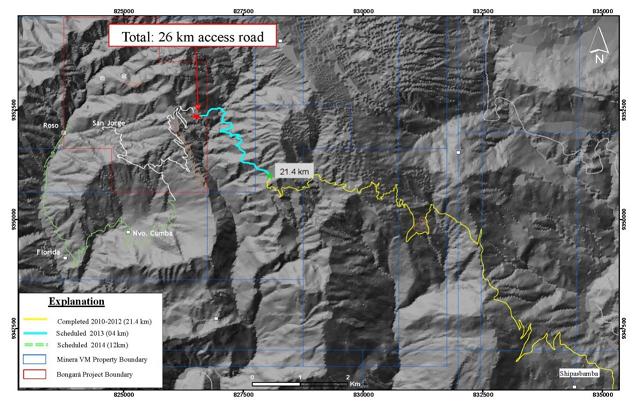
Source: Solitario, 2014
Figure 5-1: Photograph of theFlorida CanyonProject Area
| 5.2 | Accessibility and Transportation tothe Property |
Road accessto the Bongaráregion is provided primarilybythe Carretera Marginal paved highwayconnecting the portcityof ChiclayotoPedro Ruiz Gallo (inland).Traveltimeto Pedro Ruiz takeson average 6hoursby car. Pedro Ruizis a regional commercecenter with hotels, restaurants, communication and apopulation estimated tobe 10,000. The immediateProject area is not populated but there areseveral smallvillages nearby.
The accessroutes to the townof Pedro Ruiz near theFlorida CanyonProject area,as well as thedistance and road conditionsare summarized in Table5-1.
Table5-1: Distance and Travel Time toFlorida CanyonProject from Lima,Peru
| Route | Distance(km) | Traveltime(hours) | Access |
| Lima-Chiclayo | 800 | 1 hour 20 min | air |
| | | 10hours | asphalt |
| Chiclayo-Pedro Ruiz Gallo | 300 | 6hours | asphalt |
| Total | | 10hours | air |
| | | 1 ½days | ground |
Source: Solitario, 2014
| 5.3 | Climate andLengthof OperatingSeason |
The climateat theProject is highaltitude tropical jungle. Theannual temperatureatelevations between1,000masland 2,000maslaverages around 25°C.Mostprecipitation occursduring the rainy season,between Novemberand April. The annualrainfall averageexceeds 1 mwith up to 2 min the cloud forestat higher elevations.Although exploration cancontinue year-round, surfaceexploration is more difficultduring the rainy seasonwhen visibility hampershelicopter supported programsand muddyconditions hinder ground travel.
| 5.4 | Sufficiency of Surface Rights |
TheProject concession packageprovides legal basis forentry, exploration andmining. However,agreements are required with local surfacerights ownersprior to surface disturbingactivities. Throughthe explorationperiod conducted todate, Votorantim has signed bi-annualagreements forthe useof SurfaceLands. These agreementsestablish the commitmentsand counter-commitmentsto which both parties are bound (Companyand communityor private owner).
| 5.5 | Infrastructure Availability andSources |
TheProject area has little existinginfrastructure with onlyan accessroad under construction and a numberof primitive campsand drill pads(Figure 5-2 andFigure 5-3). Drillinghas been accomplished using helicopter support fromthe village of Shipasbambawhich lies 10 kmto the southeast. TheProject core shed and sample storage facilityis locatedin Shipasbamba.
Proposed infrastructure presented as part of this PEA includesthe following:
| · | Portal facilities(3) forunderground mine access; |
| · | Mobile crushing plantat portals; |
| · | Waterstorage and supplypiping; |
| · | Conveyor systems forore and tailings; |
| · | Powerlines from offsite powersupply; and |
| · | Mine camp, accommodations,water treatmentfacility. |
Source: Votorantim, 2013a
Figure 5-2: Project Access Road
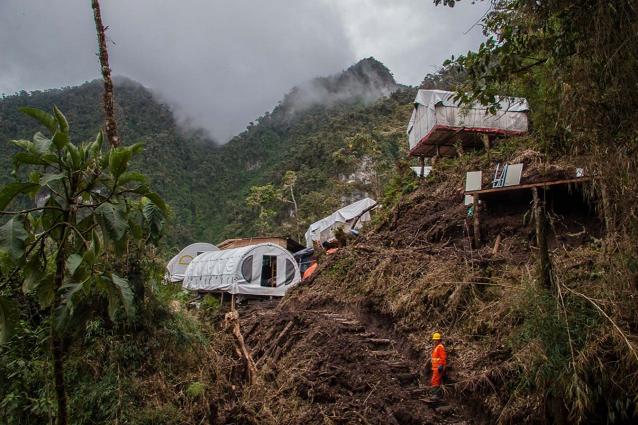
Source: Solitario, 2014
Figure 5-3: Photograph ofDrilling Camp at Project Site
5.5.1 Proximityto Population Center
TheProject hasan officein Pedro Ruiz and a core shed andheliport locatedin the townof Shipasbambanearer the deposit. No services are availablein Shipasbamba.Drill sites, field campsand underground workings are located 10 kmnorthwest of Shipasbamba. The small communityof Florida is 1to 2 kmsouthofthe drill campson the foottrail fromTingo to the Project. Floridais a oneto two hourwalk from the largest fieldcampat El Roso. Road constructionis planned toconnectthe drill campsand Florida.
Pedro Ruizis the nearesttown with commercialservice includingretail, hotels,restaurants and maintenance services. Thenearestlargest citywithregularair service is Chiclayo, acoastalport cityor Jaen, a small city approximately three hoursby road. A pavedair strip is available forprivate aircraftat Bagua Grande two hoursfrom Pedro Ruizon the Carretera Marginalroad.
The smallpopulation nearthe Projectis supportedbysubsistence farming. Saleable cropsinclude coffee, rocoto pepper, yucca, fruitand vegetables. Cedartrees are also harvestedand used in localconstruction.
5.5.2Power
Thereis currentlyno substantiveline power near the site. SRK considered a diesel-poweredgenerator option forpower supply.However, a third-partysupplier, Energoret S.A.C,has ahydropower generation and transmission developmentproject thatwillbe located in close proximityto the mine. TheEnergoret system will generate 20 MWof power from aplant on a tributaryto the UtcubambaRiver. Energoret indicatesthat halfof the project, approximately10 MW,has already beencommitted. Theplant is designedto provide powerto thecityof Bagua Grande, westof their project,andtoPedro Ruizto the eastof Florida Canyon. Energoret indicatesthat it willinvest in a transmissionline to theFlorida Canyon mine site and a substationon site.
5.5.3 Water
Theoperation will require water for use forprocessing, mining, dust suppressionand potableconsumption. Theprocessing facilitywill utilize recycledwater fromthe tailings facility andrainfall shedfrom the tailings forthe majorityof the processing needs.It is anticipated that there willbe someground water that will be encounteredin the mineand captured in sumpsand decantation basins for minewater needs.
Tesoro Creek, a smalllocal drainage, has beenused for domesticwater supplyby nearbyresidents. Cleanwater from this creekmaybe used for make-upprocess water, for fire suppression and for domesticrequirements. It willbe pipedby gravityfromthe creek to awater storage tank. A smalltreatment plant willbe utilized forpotable water needs fortownsite and other support areas.
5.5.4Mining Personnel
Notrained mining personnel reside near theProject. Untrained labor is readily availablefrom local communities wherefewemployment opportunities exist. Peruis a maturemining countrywith a mobile workforce.Abundant trainedlabor is present in all categoriesof mining throughout Peru.
5.5.5Potential Mine InfrastructureAreas
Potential sites for mineinfrastructure, including aprocessing plant,tailings impoundmentand waste rock storage are locatedeastof the San Jorge deposit. A schematicdiagram of planned infrastructure is shown in Figure 5-4. Adetailed discussionof planned infrastructure forthe Project is found in Section18 of this report.
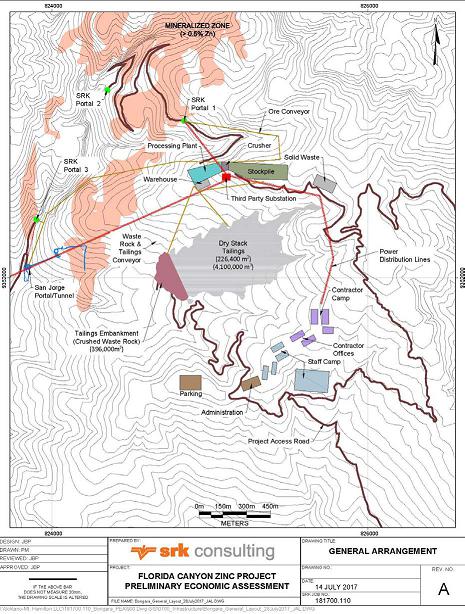
Source: SRK, 2017
Figure 5-4: Potential MineInfrastructure Locations
| 6.1 | Prior OwnershipandOwnershipChanges |
Prior to the discoveryof mineraloccurrencesby Solitarioin 1994, no mineralprospecting had beendone on the Property andnoconcessions had been historicallyrecorded.In 1995and later, Solitario stakedthe current mineralconcessions in theProject area.
In 1996, ComincoLtd.formed ajoint venture partnership (JV)with Solitario. This agreementwas terminated in 2000 andSolitario retained ownership of the property.
In 2006, and Solitario formed a JVwith Votorantim forthe exploration and possibledevelopment of the property.
| 6.2 | Previous Exploration andDevelopmentResults |
In 1993through 1995, Solitario executed aprogram of pitting and drillingat the previously known MinaGrande andMina Chicaoxide zinc prospectslocated 18 kmnortheast of the Projectarea. Solitario subsequently identified theCrystal prospect nearby andother zinc occurrences inthe generalarea. TheFlorida Canyon zincdeposit waslocated through follow-upof an anomalygenerated during a regionalprogram of stream sediments in 1994.
In 1997to 1999, ComincoLtd. completed varioustypes of field work including geologic mapping,geophysical surveys, surfacesampling, and diamond drilling. The scopeof these programsis summarized below.
| · | Geologic mappingat 1:1,000 scale covering 352hain theProject area. Mappingwasconducted within Florida Canyon andits tributaries aidedbycuttrails. Mappinghas been validatedbyVotorantim. |
| · | Known mineralized outcropsin the Project areawere clearedand sampledand atotal of 347rock chip channel sampleswere collected. Thissampling consistedof channels with individualsamples of thicknessesup to 2.0 mat non-regular spacing. |
| · | Sediment samplingof majordrainages and streamswas completed with consistent 500 mspacing along the drainages. |
| · | Soil sampleswere collectedalong topographic contourlines spaced vertically50 mapart but with irregular lateral spacing.Part of this soil sampling followed the crestsof hills, especiallyin thewestern part of Florida Canyon, mainlyto identifymineralized linear structures. A totalof 600 sampleswere collected. |
| · | Diamond drilling between 1997and 2000totaled 82 holes and 24,781m. |
| · | An Induced Polarization (IP)geophysical surveyin 3lines covered 5.2 linearkm. Two lineswere located along the drainages A and Bof the northern part of Florida Canyonwith dipole- dipole spacingat 150m,and a thirdline with dipole-dipole spacing a =100 malong thesouthern sector of the Sam Fault target. Comincoalso surveyed 6.5 kmof radial lines from holes FC-41 and FC-47, drilled in1999. |
| 6.3 | Historical Mineral Resource andReserveEstimates |
Thecurrent Mineral Resource Statement for the Florida Canyonzinc-lead-silver depositwasprepared in Juneof 2014pursuant to the requirementsof NI43-101. The statementis presented in Table6-1.
Table6-1: MineralResource Statement for the FloridaCanyon Zn-Pb-Ag Deposit, Amazonas Department, Peru,SRK Consulting (U.S.), Inc.,05 June, 2014
Category | Mass | Grade | Contained Metal (millions) |
| Zn | Pb | Ag | ZnEq | Zn | Pb | Ag | ZnEq |
| (Mt) | (%) | (%) | (g/t) | (%) | (Mlbs) | (Mlbs) | (Moz) | (Mt) | (Mlbs) |
| Measured | 1.43 | 13.02 | 1.85 | 19.3 | 15.45 | 410.0 | 58.3 | 0.884 | 0.221 | 486.5 |
| Indicated | 1.35 | 12.51 | 1.71 | 17.1 | 14.74 | 372.6 | 50.9 | 0.744 | 0.199 | 438.8 |
| Measured+Indicated | 2.78 | 12.77 | 1.78 | 18.2 | 15.10 | 782.5 | 109.2 | 1.628 | 0.420 | 925.3 |
| Inferred | 9.07 | 10.87 | 1.21 | 12.2 | 12.44 | 2,173.0 | 241.5 | 3.554 | 1.130 | 2,487.6 |
Source: SRK, 2014
| · | Mineral Resources are not Mineral Reserves and do not have demonstrated economic viability. Thereisno certainty that all or any part of the Mineral Resourcesestimatedwill be converted into Mineral Reserves; |
| · | Mineral resources are reportedtoan NSR zinc-equivalent (ZnEq%) cut-off grade based on metalprice assumptions*, metallurgical recovery assumptions**, mining costs, processing costs, general and administrative (G&A) costs, and NSR factors***. Mining costs, processing,G&A,and transportation costs total US$51.30/t. |
| · | *Metal price assumptions considered for the calculationofmetal equivalent grades are: Zinc (US$/lb0.95),Lead (US$/lb 0.95) and Silver (US$/oz20.00), |
· **Cut-off grade calculationsassumevariable metallurgical recoveries asafunctionofgrade and relative metal distribution. Average metallurgical recoveries for sulfide andoxiderespectively are: Zinc (93.1%, 73%), Lead (84.8, 0%)and Silver (55.6%,0%)
| · | *** NSR factors for calculating cut-off gradeswere:ZnEq%=Zn% * 1 +Pb% *0.74 + Agg/t *0.02 |
| · | Resulting cut-off grades used in this resource statementwere4.1% ZnEq for sulfide, 5.0% ZnEq for oxide, and 4.5% ZnEq for mixed materialtypes. |
| · | Zinc equivalency for reportinginsitu resourceswascalculated using: |
·ZnEq (%)= Zn(%) +1.0 *PB (%) +0.03 * Ag(g/t)
| · | Densitywascalculated based on material types and metal grades. The average densityinthe mineralized zonewas2.91 g/cm3asafunctionofthe zinc and lead sulfide mineral content. |
| · | Mineral Resources as reportedareundiluted. |
| · | Mineral resource tonnage and contained metal have been rounded to reflect the precisionofthe estimate, and numbersmaynot add due torounding. |
o There are no Mineral Reserves previously developed for the deposit.
Therehas not beenany commercial miningin theProject area. The onlyunderground excavationhas been 700 mof underground driftingby Votorantimto providedrill platformsat the SanJorge area.
A subsidiaryof Hochschild Mining PLC tested open pitmining for a short timeat the Mina Grandedeposit offofthe claimsheldby Votorantim andSolitario nearthe village of Yambrasbamba, 18 kmnortheast of Florida Canyon,where Solitario had previously definedanoxidized zinc resource bypitting.
| 7 | Geological SettingandMineralization |
Information presentedherein is derived frommaterial providedby Votorantimand Solitario, including Comincoreports, andwasverified and augmentedbySRK during a sitevisit inMay2014.
TheProject is located withinan extensive beltof Mesozoic carbonate rocksbelonging to theUpper Triassicto Lower JurassicPucará Group andequivalents. This beltextends through the central andeastern extentof the Peruvian Andes for nearly 1000 kmand is the host for manypolymetallic andbase metalvein and replacement deposits in thePeruvian MineralBelt. Among theseis the SanVicente Mississippi ValleyType (MVT)zinc-lead deposit thathas manysimilarities to the FloridaCanyon deposit andother MVT occurrences in the Projectarea. Aregional geologic mapis shown inFigure 7-1.
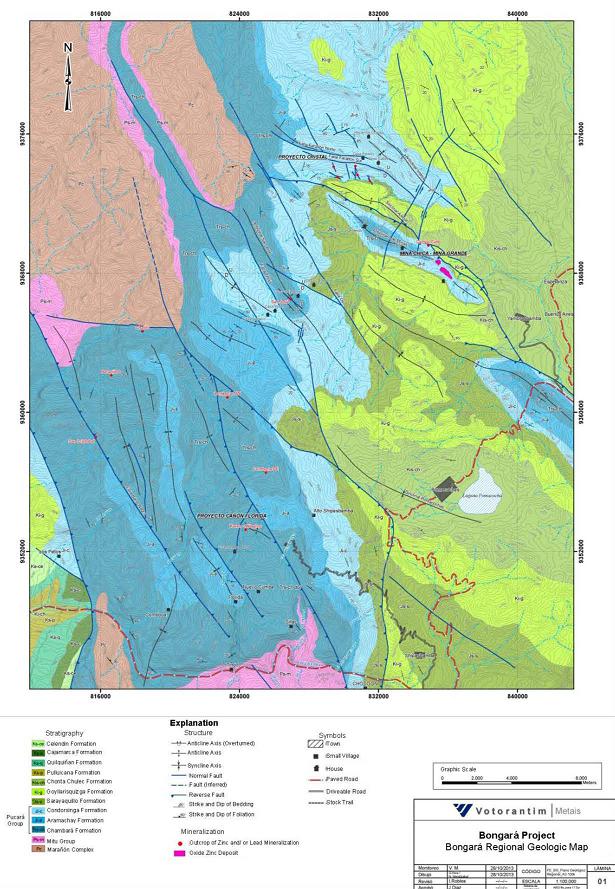
Source: Solitario, 2014
Figure 7-1: Regional GeologicMap
7.2.1Lithology and Stratigraphy
A schematicstratigraphic columndevelopedbyComincoand refinedby Votorantimshows the majorgeologic rockunits in theProject area (Figure 7-2). Thebasement rocksare the Pre-Cambrian Marañón Complexconsisting of gneisses, mica-schists,phyllites andquartzites. Theseare overlainby anangular unconformitywith theoverlying Permo-Triassic Mitu Group composedof asequence of redbeds consistingof polymictic conglomerates interspersed with beds of fine-grained sandstones.
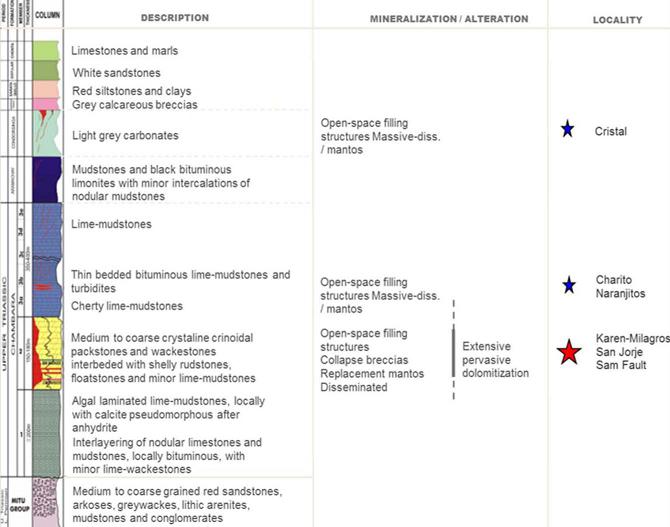
Source: Votorantim, 2013b, translated by Solitario
Figure 7-2: ProjectAreaStratigraphic Column
Overlying the MituGroup is the Pucará Groupof Triassic -lower Jurassicage, which hosts the zinc- lead-silver mineralization of the Florida Canyon Project. The Pucará Groupis dividedinto the ChambaraFormation atthe base, the Aramachay Formation in the middle and the CondorsingaFormation on top.
The Chambaraformationhasan approximate thickness between 650 mand 750 min the project area, and consists of crinoidal packstone, wackstonesand rudstones. It is divided into three membersin the Florida Canyonvicinity; frombottom to top,theyare Chambara1,Chambara 2 and Chambara3. Thebulk of knownzinc mineralizationis hostedin Chambara2. The stratigraphy betweenthe distinctiveCoquina (CM)and Intact Bivalve(IBM) paleontological markerhorizons in Chambara 2define asequence of permeable higher energy facieswithin the Chambara 2that control muchof the especiallystrong dolomitization withinthesequence.
The Aramachayformation lies concordantly on the Chambarawith avariable thicknessbetween 150 mand 250m, consistingof amonotonous sequenceof blackand limonitic lutites and bitumenwith thin interbedded nodular limestones. The Condorsinga Formation concordantlylies above,with restricted outcrop distribution dueto erosion. It consists of calcareous gray mudstoneswith thicknessesvarying between 150 mand 300m.
TheCorontochaca Formation of Upper Jurassic agelies unconformablyonthe Pucará Group.It outcrops in erosionalremnants and is locally morethan 300 mthick consistingof a packageof monotonous oligomicticand polymictic fluvial calcareoussediments and colluvial limestone breccias with local fragmentsof Paleozoic or Precambrian fragments.
TheGoyllarisquizga Formation occursin angular unconformityover the Corontochaca andPucará Group and is present mainlyin theeastern andwestern sections of the Project area. It consists of poorly sortedyellowish to white sandstone depositedin coastal marineto fluvial-deltaic environments.It also contains somethin, lenticular intercalations of siltstones andmudstones whitish to reddish. The thicknessranges from 300 to 400 m.
7.2.2 Structure
Thefollowing discussionof structural geology in the Projectarea is adaptedin partfrom an internal reportby Cominco(2000).
Thestructure at Florida Canyonis dominatedby aN50º-60ºW trending domalanticline (or doubly- plunging anticline) as defined fromthe base of Chambará 2 structural contourmap inFigure 7-2. This domalanticline is cuton thewest by theSam Fault andto the east by the Tesoro-FloridaFault. TheSam Fault, which has been definedby drilling, has anorth-south to northeast trend and a steep80 to 85º westerlydip. TheSam Fault has an apparent scissordip-slip displacementof >120 min the north and <50 min the south.Tothe southits trace is uncertain and complicated by northwest and possiblyeast-west structures. Thisappearsto have been a long-livedstructure, withits last strike-slip displacementbeing dextral. A facies changein the Chambará 2 fromhigh energyto theeast of the fault tolow energyto the westmany be duetooriginal depositionalfeatures during growth faultformation thathas important exploration implications.
At Florida Canyonthere are also well defined northwest and northeast fracture systems,which appearto haveimportant controls on thelocation of mineralization. Mineralized structures occurin conjugate fractures,withN10º-50ºEtrends present ata numberof mineralized surfaceoutcrops while trends of N50º-80ºW are identified at othershowings. Mineralizationof mantoswithin theKaren-Milagrosareaappears tobe preferentiallycontrolled bynortheast feederstructures.
TheTesoro-FloridaFault definingthe eastern limitsofmostdrilling to dateisaN15º-30ºW trending structure, part of a regionallineament,and definedby an escarpment.It is interpreted to have asteep dip, with its senseofmotion not having beendefined, but with the east blockbeingstructurallylower than the west block,which results in significantly deeper drillingon the east faultblock to reach the Chambará 2stratigraphy. Becausemostof the work has concentrated further weston the San Jorge,Karen Milagros and Sam Fault areas thereis little informationon the Tesoro-FloridaFault, but it likelyhas similarly complex splaysas the Sam Fault andmaybe, likethe Sam fault, acontrolling feeder foruntested mineralpotential inthe eastern area.
At both theKaren-Milagros and San Jorgeareas, feederstructures have an important controlonthe mineralized mantos but alsorepresent a significant portionof theresource as steeply dipping structuralfillings and replacement. The displacementalong thesestructures is not largealthough the exact throwis often difficultto ascertain due tothestrong alteration and later mineralization. The interpretation of displacementis further obscuredby likelysubtle variation in thicknessand lithologyof localstratigraphic units on eitherside of structures dueto growthfaulting.
Pre-mineral karstingalso played a rolein controlling mineralization along with simplestructural fillingand passive replacementadjacentto conduits. Replacementof karstfragments and cave sedimentsare commonly observed inlarger structurally controlledmineralized bodies.The configuration of mineralized structures as they controland mergewith manto replacements often take the formofChristmas–tree breakthrough structures and will likelybe showntorepresent alarger proportion of the resource as morehorizontally oriented drilling fromunderground workings supplants the dominantly high angle surfacedrilling performedto date.
Post mineralstructure and karsting overprints earlierstructural trends and controls inpart oxidized remobilized mineralization.
7.2.3Alteration
Thealteration and solution overprints in theFlorida Canyondeposit includedolomitization, pseudobrecciation and karstification, mainly affectingthe limestonesof Chambara 2 and locally Chambara 1and 3. Dolomitization andkarstification occurredin multiple events spatiallyoverlapping the structural corridorsSam,San Jorge and Karen-Milagros. Dolomitization wasan important controlon the movementof mineralizing fluids and has been studiedand logged in detailthroughout allof thedrilling campaigns. It is also modeled in this studyas alimiting constraint onmineralization.
Thealteration halo is open in alldirections andis especially pervasivein the stratigraphicinterval lying between the paleontological markerhorizonsCM (Coquina Marker)and IBM (IntactBivalve Marker)of the Chambara 2 formation. Thealterationhalois composed mostlyof medium and coarse-grained crystalline dolomitereplacing calcareous packstone, rudstones, floatstones and wackestones.Mostly the dolomiticrudstones, and locally the packstones,transform laterally whenin proximityof faults and majorfractures (Sam,San Jorge and Karen-Milagros)to mineralized pseudobreccias and karststructures.
7.2.4Mineralization
Thezinc-lead-silver mineralizationof the Florida Canyondeposit occursas sulfides hosted indolomitized zones of the Chambara 2Formation. Dolomiteparagenesis and later sulfide mineralizationare controlledby a combinationof porosity, permeability and structuralpreparation. Metals occur insphalerite and lessergalena, which containssilver. Minormineralization is hostedin limestones,but the bulkof sphalerite and galenais hosted indolomite.
Ina numberof coresamples, the mineralizationhas verysharp contactsalong the dolomitization boundary. Characteristic mineralization textures include massiveand disseminated mantosmineralization in dissolutionbreccias, collapse brecciasand pseudobreccias. Thedifferent breccias and vein typesare structurally controlledbyfaults of north-south and northeast-southwest direction.
Themineralization is characterizedby the presenceofsphalerite, galena and locallypyrite. Sulfidereplacements occurin dolomitized limestoneof variable grainsized andin solution breccias with whitedolospar andlesser amounts of late generation calcite.Pyrite content is generallylow, with percentages averagingless than 2%by volume.Sphalerite in mineralized sectionshas variable grain size from0.1 to greater than 5mm,with colors rangingfrom dark brown through reddish brownto light brown. It occursas individual crystalsor in massiveform,sometimes displaying colloformtextures with bands of slightly differingcolor zoning, indicators of polyphase hydrothermaldeposition.
Early fine-grained sphaleritehas evidenceof later deformation andreactions to secondarymineralizing fluids. A secondphase of moremassive sphalerite mineralizationis observed within the coreof the deposit. These crystals arecoarse-grained, regular, euhedral and show verylittle evidence of anypost-depositional deformation. The sphaleriteis contemporaneous withfine to coarsegrained galena and is often overprinted with alater stage coarse-grained, euhedralgalena.
Thepresence of zinc oxides, locallyto considerabledepths, is dueto syngenetic oxidation, with later contributions of basin-derived connatewater and movementof rainwater throughfractures that leached thelimestones and formedsignificant karstcavities.
Theareas of currentexplorationinterest are theKaren/Milagros, SanJorge and SamFaultdeposits. Thesemineralized zones are hostedin thedolomitized Chambará 2 sub-unitofthe Pucará Groupcarbonates, bracketedbythe Coquina and Intact Bivalve Markerbeds. Geologic mapping andmodeling includes refining theextents of Chambará2, and further defining the steeplydipping feederstructures to predict additionalzinc-lead-silver mineralization. Theoutcrop geologyof the deposit area is shown in Figure7-3,with emphasison the ChambaráFormation.
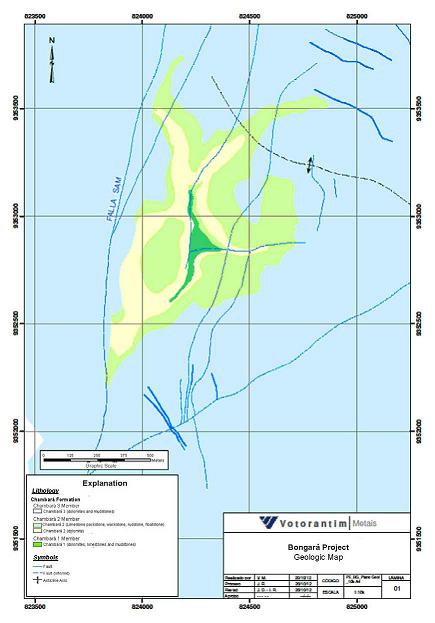
Source: Solitario, 2014
Figure 7-3: Florida CanyonProject Geologic Map
| 7.4 | Significant MineralizedZones |
Local andregional geologicmapping, geologicdrillhole logs, and the dome-shaped geometryof the deposit suggestthe mineralization is hostedin a broadanticline structure. Florida Canyonis the collectivenameof the depositsin theProject area inFlorida Canyon, andincludes the Karen-Milagros, San Jorge,Sam Fault zonesand similarmineralized strata between these areas.
Modeled mantozones are between 1 mand 9 mthick and occurover an area of about 1 km x 3 kmand are openin all directions.Unmineralized gaps existwithin themineralized mantozones, as is typical forhydrothermal replacement deposits. Irregular steeplydipping replacementbodies also occur,frequently at theintersection of vein-likefeeder structures and in karst-controlled mineralization.
Mineralization outcrops locally in a numberof areas, and have beendrilled at depths of up to about 450 mbelow ground surface.Figure 7-4is awest-facing crosssection of thegeologic modelin themineralized zone. Zinc mineralization occursas massive sphalerite (ZnS), andis locally oxidizedtosmithsonite (ZnCO3) and hemimorphite (Zn4Si2O7 (OH)2).Lead occursin galena(PbS), cerussite (PbCO3) and anglesite (PbSO4).
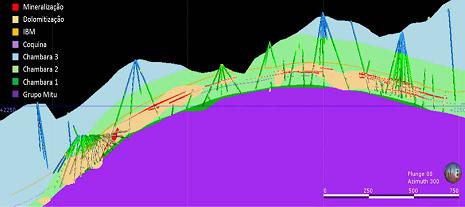
Source: Votorantim, 2013b
Figure 7-4: CrossSection of theProject Geologic Model
MVT deposits are hosted in carbonate rocks,andshow cavity-fillingor replacement-style mineralization. Thecharacteristic minerals are sphalerite, galena, fluorite, andbarite. Thehost rockmaybe silicified, andcommonalteration minerals includedolomite, calcite, jasperoidandsilica.MVT deposits are typically spatiallyextensive, but limitedby the permeabilityof the host rockunits. Thiscontrolmakesthem appear stratabound. Chemicaland structural preparationare the maincontrolsonpermeability, andtherefore, the extent of fluid migrationand metalprecipitation (Guilbert and Park,1986).
An area of 20 km x100 kmextending fromMina Grandeto northto80 kmsouth of the Florida Canyon deposit has becomethe focusof what isanemerging Mississippi-Valley Type (MVT)zinc and leadprovince, withmany surfaceoccurrences and stream sediment anomaliesdistributed throughout thePucará Group. The main host rockof zinc and leadoccurrences inthe mineral district andProject areais dolomitized limestone, which may show karstor collapse brecciatextures.
Thecurrent genetic modelfor Florida Canyonconsists of mineralization being classifiedas syn-to post tectonic. Specifically,upwellingmineralizing fluids enteredtheChambaraFormation andprecipitated in porous and reactive dolomiteswith interaction of sulfide andorganic ions (H2Sand CH4) resulting from reaction with overlying evaporitic and bituminous sequences, allchanneledbyaxial planarfaults. Theschematic mineralization modelis presented in Figure 8-1.
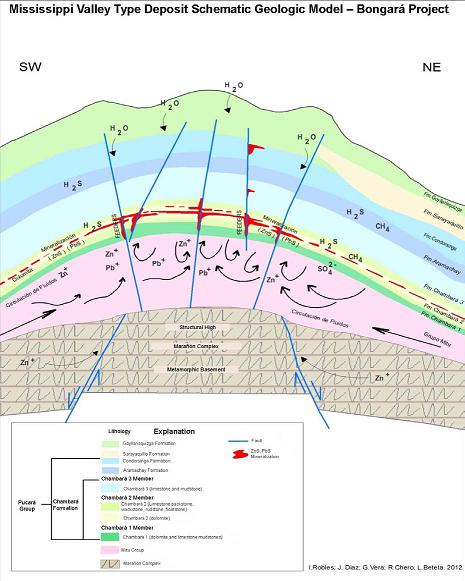
Source: Votorantim, 2014a
Figure 8-1: Mississippi Valley-Type Deposit Schematic Model
| 9.1 | Relevant ExplorationWork |
TheFlorida CanyonProject has identified and delineated mineral resourcesin the SanJorge, Sam and Karen-Milagros areas. Theresults and methodologyare describedbelow.
In earlier years Cominco and thenVotorantim executed detailed surface mapping programs,mineralized outcrop clearing andmapping andsampling of the areasnear the reported resource.Stream sediment andsoil sampleswere collectedand analyzed as describedin Section 6.2.An extensive regional reconnaissance exploration program wasalso conductedoveralarge area throughout the Mesozoiccarbonate beltto the northand southof the Property. Geochemical sampleswere collected of stream sediments, soils and rocks.
During development of the San Jorgeadit, Votorantim completed geologicmapping andchip samplingof the underground workings. Results were applied to theProject geologic modelin support of resource estimation and continuedexploration drillhole planning.
Future exploration work will focuson infill drilling between the Karen-Milagros, SanJorge andSam areas. Mineralization is opento the northand southand remains largely untestedto the eastof the TesoroFault andwest of theSam Fault where greatertarget depths have loweredthe near-term drilling priority. As discussedin Section 9.4prospective targets forgrass roots exploration existfurther northon theProject Property
| 9.2 | Surveysand Investigations |
Solitario, Votorantim and Comincohave notcompletedanyadditional surveys or other investigations outsideof drilling, mapping and sampling surfaceand underground workings as described.
| 9.3 | SamplingMethodsand Sample Quality |
Sampling of drill coreis described in detail in Section11. The regionalstream sediment program collected sediments that were screenedto -80 mesh,ashed andanalyzed for amultielment suitebyICP. Soil samples collectedwere compositesof Bhorizon soilsand Chorizon whenaccessible.
Rocksample methodologyvaried accordingto location. Grab sampleswere takenwhere outcrops were found that showedevidence of dolomitizationofcarbonate beds.Mineralized outcrops were cleared manuallywith machetes and shovels and systematically chip channeled.Channels were oriented perpendicular to beddingtomostaccurately represent stratigraphic thickness.Channel samples were limited to 2 min length by Cominco and 1 mbyVotorantim. Mostof thechip channelsampling of higher grademineralization has been conducted in theKaren Milagros zone andother areas in thecentral part of the Propertywhere outcrops of mineralization aremost common,as illustrated in Figure9-1.
| 9.4 | SignificantResultsand Interpretation |
Exploration strategy for MVTdeposits at the Florida Canyonproject has been stronglyinfluencedbythe interpreted favorabilityof specificunits of the stratigraphyof the region. Numerousoccurrences of alteration andmineralization occurthroughout the PucaraGroup but economic deposits have onlybeen thus farlocated within the Triassic Chambara formation(Stratigraphic Section, Figure 7.1).
More specifically the middle memberof the ChambaraFormation (Chambara2) has beenfound to host themostpersistentandhighest grade manto deposits dueto its higher permeability and susceptibilityto altering andmineralizing fluids. Synsedimentarystructures, formedduring or slightlyafter sedimentation, controlled the flowof basinal brinesthat dolomitized and subsequentlymineralized the carbonates. The mineral rich fluidsmigrated fromthese “feeders” laterally into thestratigraphic columnto formmantos.
Economicresources have been delineated in both thestratigraphically controlled mantosas well as the feeders, suchas the SanJorge and Sam mineralized bodies. The higherangle structures have also been subjectto karstformation that further enhancedfluid flow andare themselvesoften well mineralized with higher gradewider mineralization e.g. San Jorge.
Particularlyprospective locations to explore forthese highgrade, high tonnagedeposits existalong the northeast trending lineaments(drainages) immediatelynorth and southof Karen Milagros where outcroppingmassive mineralizationmaybeexpressionsof breakthrough structures.Theselocations have not been adequatelytestedto date dueto the difficult access forhelicopter supported drilling. Thecompletion of road access willfacilitate testing of these targets.
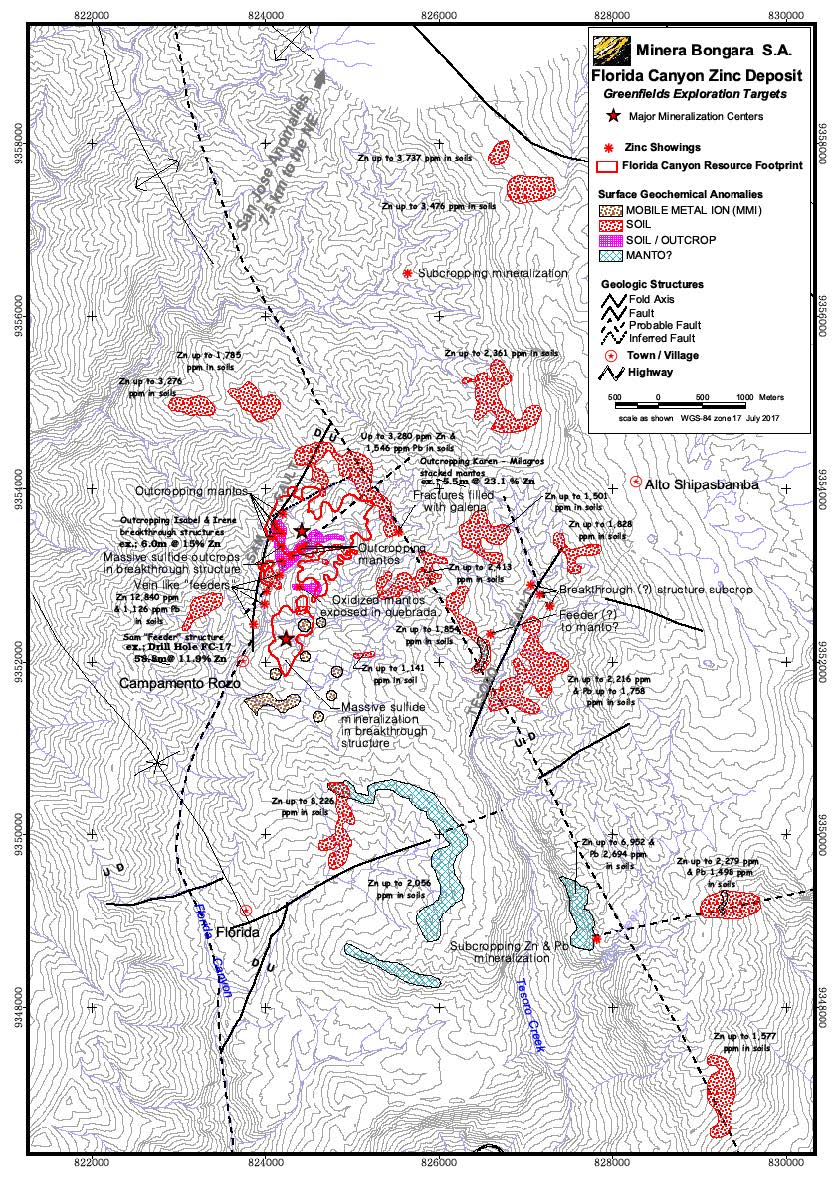
Figure 9-1: Florida CanyonAreaProspect and Geochemistry Map
These steeply dipping bodies occurover stratigraphic intervals that extendupwards into the Chambara3, Aramachay andCondorsinga formations. Thedepth extentof mineralization in thefeeders is currentlyunknown. Theseconduits enabled metal richfluids to enrich theoverlying stratigraphy andprovide potentially important evidence forexploration.
Geochemicalprospecting is veryeffective in locating the leakage halos inoverlying stratigraphyaround thesestructures. Initiallystream sediments were used to identify geochemically enricheddrainages andwere followed upwith prospecting and soilsurveys to pinpointmineralized centers. Although no detailed mappinghas been doneover muchof theproperty, geologists madeobservations of the stratigraphic location within areas of high geochemicalresponse.
Figure 9-2shows theresults of the regional geochemistry program. Thearea inthe immediate vicinityof the Florida Canyon resourceexhibits veryhigh base metalcontent instream sediment, soils and rocks. Only a smallarea of Chambara 2crops out in thisarea as shown in orange coloron thegeologicmapof the Florida/Tesoro vicinity(Figure 9-3). Outcropping high grademineralization inthis window of Chambaraledto the initial discoveryof the known Florida Canyondeposits.
Nearby, thereare significant soilanomalies in higher stratigraphy thatwarrant future explorationdrilling.Theseanomalies occurin undrilled areas within the horstthathosts thecurrentresources as wellas to the west of the SamFault and East of the TesoroFault.
Further to thenorth two verylarge andstrong soilanomalies have beendefinedbythe regionalgeochemical sampling program(Figure 9-2). The San Josesoil anomalyis of similar size andgrade to thatatFlorida Cayon.It is, as yet, untestedwith drilling. Basedon theclear relationship between surface geochemistryand subsurface mineralizationat Florida Canyon,drilling is warranted in the San Joseand Naranjitos areas.
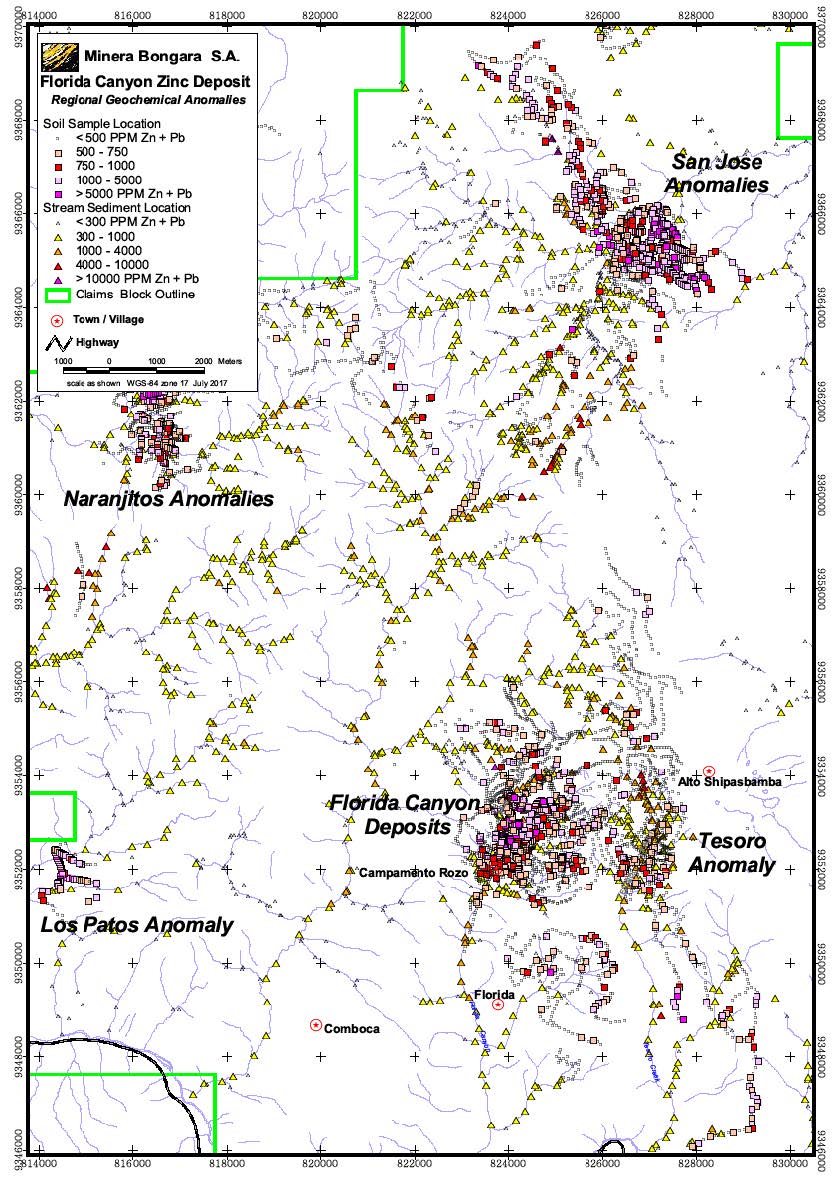
Figure 9-2: Regional Geochemical Results
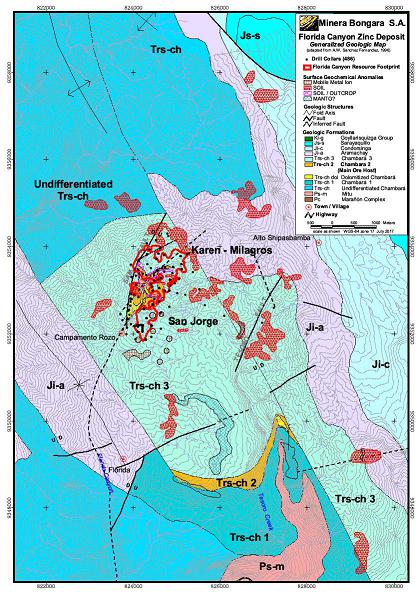
Figure 9-3: Florida CanyonAreaSimplified Geology,Resource and Drillhole Map
Thedatabase usedformodelingandestimation ofmineralresources has not beenaugmented since August15, 2013 and includes486 diamond drillholes,with atotal of 117,280.25 mdrilled length. Therehas beenno new drillingonthe project since the 2014 Technical Report (SRK, 2014b).
Alldrillholes completedin theProject areaare HQ-diameter core(63.5mm).If poor ground conditionsnecessitated, the core diameterwasreducedto NQ(47.6mm). Cominco completed a totalof 82 drillholes from the current ground surfacein theKaren-Milagrosand Samdeposit areas, and theSanJorge structural corridor. Votorantimcompleted 404drillholes between 2006and 2013, from surfaceor from the San JorgeAdit. The Votorantimdrilling is distributed throughout theProject area. All holes mentioned aboveare includedin the geologic modeling andresource estimationdatabase, and shownin Figure 10-1.
Thecombined Cominco andVotorantim drilling forthe project totals 117,260m.Figure 10-2 showsdrilled lengthby program,including 4,047 mof oriented core geotechnical drillingin13drillholes.

Source: Votorantim, 2013b
Figure 10-1:Project DrillingHistory
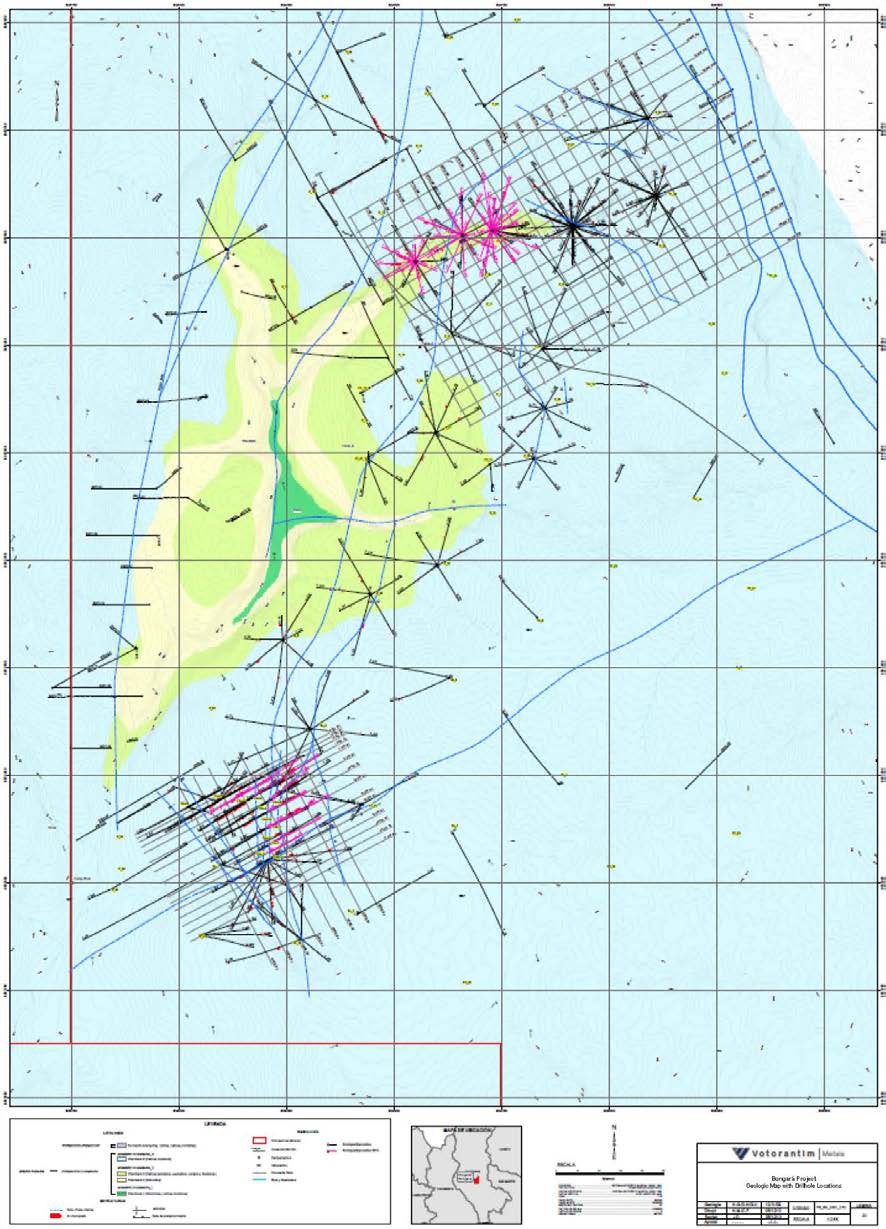
Source: Solitario, 2014
Figure 10-2:GeologicMap withDrillhole Locations
All drilling contractedbyVotorantimwas completedwith triple-tube HQ toolingand followed industrystandard procedures to ensure samplequality. Surfacedrillingwas executedwith ahelicopter- supported LD-250 diamond corerig operatedby BradleyBros. Limited. Sermincompleted theunderground developmentand also completed drillingfrom the San Jorge aditwith a LM-70electric diamond core rig.
Drillingwas performedon two 12-hour shiftswith full24-hour geological supervisionby a Votorantimgeologist. Therig geologist role included:
| · | Coordination and communication between the drillingcontractor andVotorantim; |
| · | Monitoring drilling procedures and inspecting the coreextraction for samplequality; |
| · | Measuring and recording core recoveryand Rock Quality Designation (RQD);and |
| · | Completing a preliminary geologicallog. |
Downholesurveys were completedwith aReflex EZ-Shot survey toolby the drillersat varying spacing, as summarized in Table 10-1. The surveyrecords arestored digitallyatthe core facility andSRK reviewed themduring the 2014 sitevisit. Drillhole collarlocations were surveyedbyVotorantim with a GPS-based instrument.
Table10-1: Downhole Survey DataPoint Spacing
| Drilling Program (Year) | SurveySpacing (m) |
| 2010 | 100 |
| 2011 | 50 |
| 2012to2013 | 20 |
Source: SRK, 2014
Votorantim completed 13 oriented geotechnicaldrillholes, totaling 4,046.70m.In theseholes, the recoverywas excellent (90%to 100%)with RQDresults greaterthan 75%.
From the drill site, filled coreboxes were transported inbatches of 14 viahelicopter to thedrill corelogging facility in Shipasbamba. Thesewere photographed and fully loggedbyVotorantim geologists in natural light.During the 2012to 2013 program, manyof the core photographswere takenafter the corehad been cut for sampling, dueto thelarge quantityof core produced.
| 10.3 | Interpretation andRelevantResults |
Thegeologic logging andanalytical datawere addedto the Projectdatabase after validation andappliedtomodeling and resourceestimation. Dueto thelarge numberof drillholes in thedatabase, and because the modelingand resource estimation arediscussed in detail, inSection14 (MineralResources), the drilling resultsbyinterval are not presented here. Thetrue thicknessof the mineralized intercepts is about 80% of the drilled length, andvaries with the orientationof the drillhole.
Votorantim’s documentation of drillingprocedures and SRK’sobservation of the program indicate thatthere is little or negligible samplingbias introduced duringdrilling.
SRK considersthe drilling procedures to be appropriate forthe geology,conducted according to industrybest practiceand standards, andthe relevantresults are sufficient for usein resource estimation.
| 11 | Sample Preparation, Analysis and Security |
Sampling procedures for coredrilled on behalfof Comincoare not well-documented. Comincoincluded assay quality control samplesin the analytical programs,but theresults were not availableto review. Theresource classification from these samples is limited because thelocation and analytical datawas not obtained accordingto current industrystandard protocol.
Most of theinformation in this sectionpertainstothe sampling completedbyVotorantim. Available information about sampling completedby Comincois includedif available,and is specified as such.About 20%of the holes in thecurrent drillhole databasewere drilled by Cominco.
11.1.1Sampling for GeochemicalAnalysis
After photographing the coreand completinggeotechnical and geologiclogging, ageologist markedthe core for sample intervalsthat averaged 100 cmlong. Sampleshad a minimumlength of 30 cmand a maximumof 150 cm,but were defined so that100 cm sampleswere maintained as muchas possible. Cut lines parallelto the coreaxis were drawnby thelogging geologist, to ensure nearly symmetricalhalves and minimal sampling biasrelative to anyvisible mineralization. The core was cuton a rock sawwitha40 cmblade, under supervisionof aProject geologist. After the corewas cut, both halves were replaced in the core box.
Samples were always takenfrom the left side of the saw-cutcore, double baggedand markedwith sample numbersin two places. Thesewere transportedin larger bagscontaining seven sampleseachbyMobiltours freight companyto the ALSMinerals laboratoryin Trujilloor Lima, operated byALS Minerals. Prior to 2012,analysis wascompleted in Trujillo. Sincethen, it has been donein Lima.
Comincoalso splitthe coresamples and sampledhalf for geochemical analysis. Sample breakswere determinedbygeologic criteria. Cominco core sampleswere analyzedby AcmeLabs, in Lima,Peru.
11.1.2Sampling for Density Measurement
Specific gravity (SG) measurementswere completedon siteby Votorantimon every samplefrom the 2013drilling program.For previous drilling programs,SG measurementswere completedon all mineralizedintervals. ThreeSG measurementmethods were used:
| · | Amesh method for brokenmaterial. |
Thesetechniques were designedand implementedby Inspectorate Services PeruSAC. Votorantim hasalso performed some density measurementson older Comincocore.
During the SRK sitevisit, theobserved samplestorage was secure,and providedadequate protection from rainfall. Sample security and chainof custodywas maintained while the sampleswere transported from the coreshed in Shipasbambato Lima. Assay certificatesare retained in theVotorantim officein Lima.
Analytical datais loaded directly fromthe laboratory resultsfiles to the drillholedatabase,to minimizethe riskof accidental or intentional edits.
| 11.3 | SamplePreparationforAnalysis |
ALS Minerals (ALS)in Trujillo or Lima,Peru, completed sample preparationandanalysis for all Votorantim coresamples. ALS isanindependent, global analytical company recognized forquality,andis usedbymanyexplorationand miningcompanies for geochemical analysis. Currentcertifications and credentials includeISO17025:2005AccreditedMethods &ISO 9001:2008 Registration inPeru, Brazil, Chile and Argentina(ALSMinerals, 2014a).
Upon deliveryatthelab, barcodedsampleidentificationlabelswere scanned andthe sampleswere registered to the LaboratoryInformation Management System (LIMS). Samples were weighed, andthen air-dried in ambient conditions. Excessivelywet samples were dried in an oven at a maximum120°C. The samplepreparation andanalysis proceduresused are summarizedin Table 11-1.Specific analytical procedures and methoddetection limits forelements in the suiteare reported in Table 11-2.
After analysis is complete, the remaining coarse rejectand pulp samplesare returnedto the FloridaCanyon coreshed forstorage.
Comincoanalyzed sampleswith visiblezincor leadmineralizationby atomicabsorption spectrophotometry. Allsamples containinggreater than10,000 ppmzinc +lead were then analyzed bywet chemistry and the latterresults were recorded inthe data base.
Table11-1: Analytical Codes and Methods
| Procedure Code | Description |
| Sample Prep |
| CRU-31 | Crushto70% less than 2mm. |
| SPL-21 | Riffle split off 1kg and retain thecoarsereject. |
| PUL-32 | Pulverize splittobetter than85% passing 75microns. |
| Multi-Element Methods |
| ME-ICP61,-a | Multi-element Inductively-Coupled Plasma method with Atomic Emission Spectroscopy analysis. Includes 4-acid, "near-total" digestionof 0.5 gsample. |
| (+)-AA62 | HF, HNO3, HClO4 digestion, HCl leach and Atomic Absorption Spectroscopy analysis. |
| (+)-VOL70 | Volumetric titration for very high grade samples. |
| XRF10 | X-Rayfluorescence onfused pellet, 5 gsample. |
| Element-Specific Methods |
| Au-AA23 | Goldby fireassay and Atomic Absorption Spectrometry, 30 gsample. |
| Au-AA25 | Ore-grade goldby fireassay and Atomic Absorption Spectrometry, 30 gsample. |
| Au-GRA21 | Goldby fireassay and gravimetric finish, 30 gsample. |
| Hg-CV41 | Trace level mercurybyaqua regia andcold vapor/AAS. |
| Hg-ICP42 | High grade mercurybyaqua regia andICP-AES. |
| In-MS61 | Multi-element Inductively-Coupled Plasma method with Mass Spectrometry detection. Includes 4-acid, "near-total" digestionof0.5 gsample. |
| S-IR08 | Total sulfurbyLeco furnace. |
Source: ALS Minerals, 2014b, compiled by SRK, 2014
SRK Consulting (U.S.), Inc.
NI 43-101 Technical Report, Preliminary Economic Assessment –Florida Canyon Zinc Project Page 72
Table11-2: Analyzed Elementsand MethodDetection Limits
| Element | Symbol | Method | Unit | LowerMDL | UpperMDL | Overlimit Method | Unit | LowerMDL | UpperMDL | Overlimit Method | Unit | LowerMDL | UpperMDL |
| Silver | Ag | ME-ICP61 | ppm | 0.5 | 100 | Ag-AA62 | ppm | 1 | 1,500 | | | | |
| Aluminum | Al | ME-ICP61 | % | 0.01 | 50 | | | | | | | | |
| Arsenic | As | ME-ICP61 | ppm | 5 | 10,000 | | | | | | | | |
| Barium | Ba | ME-ICP61 | ppm | 10 | 10,000 | ME-ICP61a | ppm | 50 | 50,000 | XRF10 | % | 0.01 | 50 |
| Beryllium | Be | ME-ICP61 | ppm | 0.5 | 1,000 | | | | | | | | |
| Bismuth | Bi | ME-ICP61 | ppm | 2 | 10,000 | | | | | | | | |
| Calcium | Ca | ME-ICP61 | % | 0.01 | 50 | | | | | | | | |
| Cadmium | Cd | ME-ICP61 | ppm | 0.5 | 1,000 | Cd-AA62 | % | 0.0005 | 10 | | | | |
| Cobalt | Co | ME-ICP61 | ppm | 1 | 10,000 | | | | | | | | |
| Chromium | Cr | ME-ICP61 | ppm | 1 | 10,000 | | | | | | | | |
| Copper | Cu | ME-ICP61 | ppm | 1 | 10,000 | | | | | | | | |
| Iron | Fe | ME-ICP61 | % | 0.01 | 50 | | | | | | | | |
| Gallium | Ga | ME-ICP61 | ppm | 10 | 10,000 | | | | | | | | |
| Potassium | K | ME-ICP61 | % | 0.01 | 10 | | | | | | | | |
| Lanthanum | La | ME-ICP61 | ppm | 10 | 10,000 | | | | | | | | |
| Magnesium | Mg | ME-ICP61 | % | 0.01 | 50 | | | | | | | | |
| Manganese | Mn | ME-ICP61 | ppm | 5 | 100,000 | | | | | | | | |
| Molybdenum | Mo | ME-ICP61 | ppm | 1 | 10,000 | | | | | | | | |
| Sodium | Na | ME-ICP61 | % | 0.01 | 10 | | | | | | | | |
| Nickel | Ni | ME-ICP61 | ppm | 1 | 10,000 | | | | | | | | |
| Phosphate | P | ME-ICP61 | ppm | 10 | 10,000 | | | | | | | | |
| Lead | Pb | ME-ICP61 | ppm | 2 | 10,000 | Pb-AA62 | % | 0.001 | 20 | Pb-VOL70 | % | 0.01 | 100 |
| Sulfur | S | ME-ICP61 | % | 0.01 | 10 | S-IR08 | % | 0.01 | 50 | | | | |
| Antimony | Sb | ME-ICP61 | ppm | 5 | 10,000 | | | | | | | | |
| Scandium | Sc | ME-ICP61 | ppm | 1 | 10,000 | | | | | | | | |
| Strontium | Sr | ME-ICP61 | ppm | 1 | 10,000 | | | | | | | | |
| Thorium | Th | ME-ICP61 | ppm | 20 | 10,000 | | | | | | | | |
| Titanium | Ti | ME-ICP61 | % | 0.01 | 10 | | | | | | | | |
| Thallium | Tl | ME-ICP61 | ppm | 10 | 10,000 | | | | | | | | |
| Uranium | U | ME-ICP61 | ppm | 10 | 10,000 | | | | | | | | |
| Vanadium | V | ME-ICP61 | ppm | 1 | 10,000 | | | | | | | | |
| Tungsten | W | ME-ICP61 | ppm | 10 | 10,000 | | | | | | | | |
| Zinc | Zn | ME-ICP61 | ppm | 2 | 10,000 | Pb-AA62 | % | 0.001 | 30 | Zn-VOL70 | % | 0.01 | 100 |
| Gold | Au | Au-AA23 | ppm | 0.005 | 10 | Au-AA25 | ppm | 0.01 | 100 | Au-GRA21 | ppm | 0.05 | 1,000 |
| Indium | In | In-MS61 | ppm | 0.005 | 500 | | | | | | | | |
| Mercury | Hg | Hg-CV41 | ppm | 0.01 | 100 | Hg-ICP42 | % | 0.1 | 10 | | | | |
Source:Votorantim(2014b), translated bySRK
Votorantim’s Technical Report (Votorantim,2014b) includes assay qualityassurance/ quality control (QA/QC)results available through June15, 2013. Sampledates in the QA/QC data filesare between2011 and2013, andno information forprior sampleswasavailable. For the 2011to 2013drilling programs, assay QC sampleswere 10.9% of the total samplesanalyzed. Some programsincluded duplicate coreor coarse reject samples,and/or duplicateanalysis of finepulp samples. Votorantimcompiled and analyzedthe results from 2011 to 2013 drilling programs,which SRKhas reviewed andsummarized below. Assay QCresults fromdrilling programsprior to 2011were not availableto includein this report.
11.4.1Standards
Summariesof the Standard Reference Material (SRM)certified values andanalytical results forleadand zinc are shown in Table 11-3 and Table 11-4,respectively. Thecertified Standard ReferenceMaterial, ST800044B,wasincluded in the core samplesuite, andis highlighted with boldtext in thetables. Other, lower-grade reference materials madefrom Florida Canyon corewere also included.
Table11-3: Summary of SRMStatistics forLead
| PbSRM | Mean(ppm) | Standard Deviation (ppm) | Samples | Outliers | Percent Outliers | Bias |
| STD_RK1 | 13.4 | 2.35 | 127 | 1 | 1% | -4.3% |
| STD_RK2 | 439.18 | 17.26 | 154 | 2 | 1% | 2.6% |
| STD_RK3 | 3149.47 | 113.00 | 134 | 0 | 0% | -2.9% |
| ST800044B | 18100 | 500 | 80 | 0 | 0% | 0.3% |
Source: Votorantim (2014b), formatted and translated by SRK
Table11-4: Summary of SRMStatistics forZinc
| ZnSRM | Mean(ppm) | Standard Deviation (ppm) | Samples | Outliers | Percent Outliers | Bias |
| STD_RK1 | 22.93 | 4.32 | 125 | 3 | 2.4% | -4.5% |
| STD_RK2 | 452.5 | 18.62 | 154 | 3 | 2% | 2.8% |
| STD_RK3 | 2688.13 | 86.32 | 134 | 2 | 1.5% | -0.4% |
| ST800044B | 33400 | 1000 | 80 | 0 | 0% | 1.8% |
Source:Votorantim(2014b), formatted and translated by SRK
Low-grade standards STD_RK1, -2 and -3are less than economicgrade for bothzinc and lead.However,theresults provideimportant information onthe qualityof analytical data across arange of values. The lowest-gradestandard, RK1,shows consistentlowbias forboth leadandzinc (about 4.5% lower thanthe mean),while RK2has consistent, but minor,high bias for both elements(about 2.8% higher). Although lead values for RK3have slightlylowbias (-2.9%),zinc values average very closeto the mean.
Allresults forST800044B werewithin three standarddeviations of the certified value forlead andzinc; all resultsbut two forlead and four forzinc were within twostandard deviationsof the respective certified values. Onaverage, results were greater thanthe certifiedvalueby 1.8% forzinc and0.3% forlead, indicating unbiased analyticaldata.
11.4.2Blanks
Twotypes of blank sampleswere included in the sample suite:
| · | Fine-grained BLK_RK1 (n = 223); and |
| · | Coarse-grained BLK_RK1_GR (n =229). |
Thefine-grained blankmaterial servedas a controlonanalytical quality, andwas not subjectedtoanystage of thesample preparation process. The coarseblank material was included toidentify possiblycross-contamination during sample preparation. BetweenAugust 2011and June2013, 452blank samples were analyzed withdrill samples. Allblank samplesbut one were less than 7 timesthe lower methoddetection limit forzinc, and allwere lessthan 4 timesthe methoddetection limit forlead. One samplewas greater than10timesthe methoddetection limit forzinc. The acceptedtolerance range forblank samples is up to 10 timesthe lower methoddetection limit. Blank sample results from the 2011 and 2012drilling programsindicate that therewasno cross-contaminationduring samplepreparation.
Statistical and graphicanalysis of blank sample andprevious sample pairs showed thatsomeblank sampleresults were outsideof acceptable limits, causedby“drag” in the ICPinstrument. However,the percentageof samplesoutside of tolerance is lessthan 5%, andindicates acceptable analyticaldata quality.
11.4.3Duplicates
Severaltypes of duplicate sampleswere included inthe 2013 drilling program:
| · | Quartered core samples,to assessthe qualityof the samplingprocedure and identify sample mix-ups; |
| · | Coarse rejects (samplepreparation); |
| · | Pulps from previous drilling as blind duplicates (analysis). |
A summaryof all duplicate sample pairsis shown in Table11-5.In the 2011to 2012drilling programs, only quartered-core sampleduplicates were included.
Table11-5: Summary ofDuplicate Samples
| Type | Program | Pairs(n) |
| Quarter-core | 2011to2013 | 811 |
| Coarserejects | 2013 | 38 |
| Pulps | 2013 | 76 |
| Blind Pulps | 2013 | 33 |
Source: SRK, 2014
Votorantim collected aduplicatecore sampleapproximately every50th sampleinterval, on average. Theseintervals were halved,and then the halveswere halved again. Two opposingquadrants of corewere sampled separatelyas theoriginal and duplicate sample. The remaining twoquarters of corewere retained in the corebox.
Startingin2013, Votorantimincluded additionaltypes of duplicate samplesto assess the qualityof eachstep of samplepreparation and analysis. Coarse rejectduplicates were collectedbythelaboratory,bytakinga second1,000 g splitfrom the crushedsample,and pulverizing it separatelytocreate a secondpulp sample.Pulp duplicatesare re-analysis of the prepared original pulp. Votorantimspecified the pulpduplicate sampleintervals and the labprepared them.Votorantimalsoincluded blindduplicate samplesof prepared pulps of recent drilling programs,to test the repeatabilityofanalytical resultswithout thelab’s knowledge.
Votorantim analyzedzinc, lead andsilver results forall duplicatepair types. Theresults from each type of duplicate sample showed repeatableresults at all stagesof samplepreparation and analysis.
11.4.4Actions
Standard and blank sampleresults indicateaccurate lab data freeof analytical bias.Duplicate sampleresults show that sample qualityis adequate and the reportedresults were freeof sample mix-ups.
Some improvements, fixesand deploymentsin the assay QCprogram were identified in 2013 andare alreadyunderway. Votorantim has recently changed assay QCprotocols sothat:
| · | Each holestarts with a coarseblank and has ablank for every50 drill samples; |
| · | A SRMis inserted for every20 drillintervals; |
| · | A typeof duplicate is included for every20drill samples,as ¼core,coarse rejects, pulps,or blind pulps; and |
| · | Check analysis at a secondindependent laboratorywas completed for2010 to 2012 samplesat SGS Labs and for 2013samples at BVI (Inspectorate) labs. |
Additional planned qualitycontrol measuresinclude:
| · | Generatenewstandards fromFlorida Canyoncore, and continue using the highgrade standard ST800044B; and |
| · | Separate about 200kgof unmineralized material fromthe Project to create a certified blank. |
Oneor two additionalSRM with zinc, lead and silver gradesin the rangeof economicinterest shouldbe included in future drilling programs.If possible, theseshould be matrix-matchedto theProject. Coarse blank samples shouldbe adoptedin favor of prepared blank samples,to test all phasesof samplepreparation and analysis.
The assay QCdatabase is organized well and freeoferrors in the cellsthat SRK checked.Votorantim maintains the assay QC datawell, and analyzes it in realtimeto addressanyissues promptly. Therewere no systematic issues apparent in the results availableto review.
SRK considers the samplepreparation andanalysis procedures, and the QA/QCmethods and results to adequately verify the analytical databaseas sufficient for usein resource estimation.
All analytical datais checkedby the on-site and Lima-basedgeologists before it is addedtothe database. Thisincludes reviewof standard, blank and duplicate sample results foroutliers, andrequesting re-analysisif necessary. Final analytical datais appended to the databaseby theSao Paulo officestaff after additional verification.
During the sitevisitby SRK,the geologicdatabase was checked forits consistencytoa) loggedcore,
b) logging sheetsand samplerecords and c) databaseprovidedto SRK. All aspectsof the data captureand storagewere seen to be in good order. The core sample libraryin the coreshed (Figure12-1) helps tomakethe logged geologyconsistent.
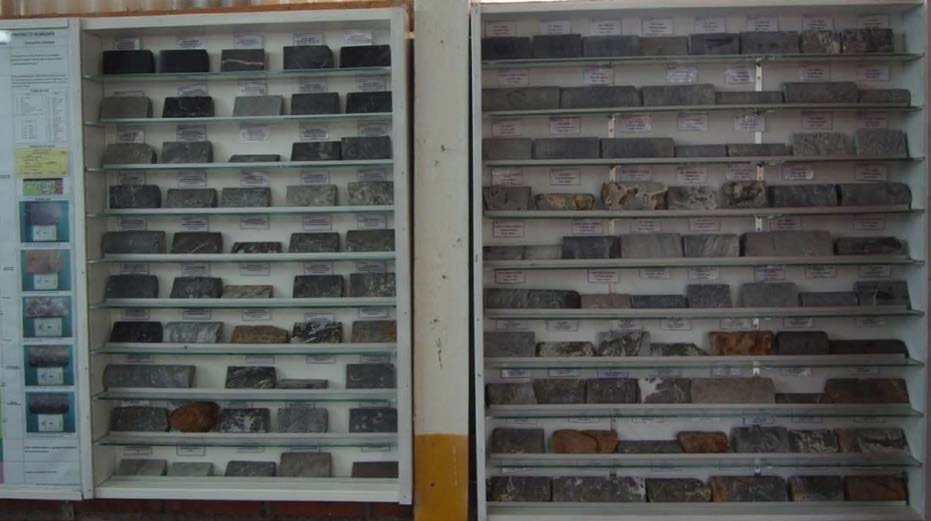
Source: SRK, 2014
Figure 12-1:Photograph ofProject Core Lithology Reference Sample Library
Drillhole collar locations areverified againsttopography, and comparedwith the survey reports. Downhole survey dataare reviewedbyan on-sitegeologisttoverify the results.
SRK did not verify the analyticalvalues inthe databasewith reported values onassay certificates.An additional meansto verifyanalytical zinc andlead grades in thedrillhole database couldbe comparisonto visualestimations of sphalerite and galena abundanceor to measuredspecific gravity.
| 12.3 | Opinion on Data Adequacy |
TheProject geologists and support staffwere diligentabout data verificationand the qualityof the drillhole database. Databasevalidation in preparationforresource estimation hasbeen donebyVotorantim. Although SRK did notverify theanalytical values in the databasewith reportedvalues from assaycertificates, there were no indicators of erroneous data. SRKbelieves the degreeof organization of the database and the measuresin placeto minimizeerrors in dataensure a high-qualitydatabase.
| 13 | Mineral Processing and Metallurgical Testing |
Votorantimretainedametallurgical consultant, SmallvillS.A.C. of Lima, Peru (Smallvill)to perform metallurgical studieson Florida Canyon mineralizationtypes in 2010, 2011and 2014. Allthe metallurgical testing programsaimed to produce commercial quality concentratesfrom apolymetallic lead-zinc mineralization. The tested samples show headsgrades significantly higherwhen comparedto other known mineraldeposits in the region.SRK hasrelied heavilyon these studies for recoveryand cost forecastingto develop cut-offgrades forresource reporting.
TheFlorida Canyonsulfide resource consists ofzincand leadsulfides in alimestone matrixwhere zinc is in higher proportionsthan lead. Therearenodeleterious elements presentin concentrates in high enoughlevelsto triggersmelter penalties.
| 13.1 | Testing andProcedures |
Atotal of eight metallurgicaltesting documents addressing the metallurgical development forFlorida Canyon Project were madeavailableto SRK. Allof the metallurgicaltestwork to datehave been executed between 2011 and 2014 (Table 13-1)bySmalvill S.A.C.,anindependent commercial laboratory based in Lima,Peru.
Table13-1: Summary ofFlorida CanyonMetallurgical Test Work
| Report Date | Laboratory | Sample | SampleType | TestType |
| 2010Apr | Smallvill, Lima,Peru | Core composite | Sulfide | Batchscale |
| 2010May | Smallvill, Lima,Peru | Bulk sample, pilot testing | 1 tox, 1 tmx, 1 tsul, 1 t ofvein andsurface material fromShalipayco | Pilot plant |
| 2011 Jul | Smallvill, Lima,Peru | Core composite | Oxide | Batchscale |
| 2011Aug | Smallvill, Lima,Peru | Core composite | Mixed | Batchscale |
| 2011Aug | Smallvill, Lima,Peru | Core composite | Sulfide | Batchscale |
| 2011Aug | Smallvill, Lima,Peru | Core composite | Mixed | Batchscale |
| 2014Feb | Smallvill, Lima,Peru | San Jorge | Sulfide | Batchscale |
| 2014Feb | Smallvill, Lima,Peru | Karen Milagros | Sulfide | Batchscale |
Source: SRK, 2017
13.2.1Mineralogy
Mineralogical analysisof asulfide compositewasconductedonthehead sample byX-raydiffraction.Theresults are providedin Table 13-2.Themajorityof thesample (80%) consists of calciumandmagnesium carbonates fromthedolomite matrix,withlow ironsulfide content as pyrite, arsenopyrite,andpyrrhotite.
Table13-2: Mineralogy ofSulfide Composite
| Mineral | Weight % |
| Dolomite | 76.7 |
| Quartz | 4.8 |
| Calcite | 3 |
| Smithsonite | 2 |
| Hemimorphite | 0.2 |
| Pyrite | 3.5 |
| Sphalerite | 7.9 |
| Galena | 1.5 |
| Cerussite | 0.3 |
| Total | 100 |
Source: Smallvill, 2011
A mineralogicalanalysisby X-raydiffraction was conductedon an oxide compositeand the resultsare provided in Table13-3.
Table13-3: Mineralogy ofOxide Composite
| Mineral | Weight % |
| Dolomite | 45.83 |
| Smithsonite | 27.16 |
| Hemimorphite | 10.05 |
| Calcite | 9.1 |
| Quartz | 6.3 |
| Barite | 0.88 |
| Sphalerite | 0.67 |
| Total | 100 |
Source: Smallvill, 2011
Approximately 60%(by volume)of the material is gangue comprisedof dolomite, calciteand quartz. Theseminerals have specificgravities between 2.70and 2.85 g/cm3. XRDanalysis also confirmedthe presenceof zinc oxides, predominantlyas smithsonite, andto alesser extent, hemimorphite.
13.2.2Recovery and Concentrate Grades
Allthe metallurgical testing programs aimedto produce commercial qualityconcentrates from apolymetallic lead-zinc mineralization. The tested samples show headgrades significantlyhigher whencompared to other known mineraldeposits in the region. Grades forthe eight metallurgicaltests forFlorida Canyonare shown in Table 13-4 and Figure 13-1.
Head grade inthe tested samplesranged from 5.7% Zntotal up to 31.7% Zntotal. Meanwhile, theoxidezincranged from0% up to 18.4%. Leadgrades forthe samesampleswassignificantly lower than thoseof zinc, but stillhigher than typical mill feedgrades inthe other MVT deposits in theregion ranging 0.5% up to 3.9%.
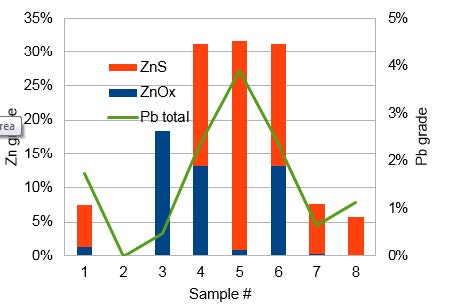
Source: SRK, 2017
Figure 13-1:Metallurgical Sample Results – Zinc andLead Head Grades
Table13-4: Metallurgical Tests –Selected Results
| Report Date | Sample | SampleType | Head Grade | Grinding | Pb Concentrate | ZnConcentrate | Comments |
| Zn Total | ZnOx | ZnS | ZnOx/ZnT | Pb Total | Pb S | Pb Ox | Agg/t | Rec.Pb | GradePb | Rec.Zn | Rec.ZnT | Rec.ZnS | GradeZnT | GradeAgoz/t |
| 2010Apr | Core composite | Sulfide | 7.52% | 1.4% | 6.1% | 0.19 | 1.72% | 1.26% | 0.46% | 11.6 | 65%-74mm | 61.20% | 52.60% | 30.00% | 93.10% | | 50.60% | 0.95 | |
2010May | bulksample, pilottesting | 1 tox, 1 tmx, 1 tsul, 1 t ofvein and material fromShalipayco | Results reported below forindividual samples |
| 2011 Jul | Core composite | Oxide | 18.36% | 18.4% | 0.0% | 1.00 | 0.47% | | | 7.8 | | | | | 92.40% | | 50.00% | | DMS- Flot+Calcine |
| 2011Aug | Core composite | Mixed | 31.25% | 13.2% | 18.1% | 0.42 | 2.38% | | | 26.5 | | 80.90% | | | 82.30% | | | | DMS-Flot |
| 2011Aug | Core composite | Sulfide | 31.68% | 0.98% | 30.7% | 0.03 | 3.88% | | | 56.19 | | | | | | | | | |
| 2011Aug | Core composite | Mixed | 31.25% | 13.2% | 18.1% | 0.42 | 2.38% | | | 26.5 | | 75.00% | | 50.00% | 75.00% | | 50.00% | | Projected flotationonly |
| 2014Feb | San Jorge | Sulfide | 7.63% | 0.41% | 7.22% | 0.05 | 0.65% | | | | 62%-44mm | 60.00% | 50.00% | | 90.10% | 83.50% | 55.00% | | |
| 2014Feb | Karen Milagros | Sulfide | 5.70% | 0.00% | 5.7% | 0.00 | 1.12% | | | | 80%-44mm | 72.00% | 50.00% | | 80.00% | | 49.00% | | |
Source: SRK, 2017
Based on the characteristics of the samplestested, SRKis of the opinion that Florida Canyonisbestclassified as apolymetallic deposit of mixed rocktypes. It is definedas apolymetallic deposit because all tested sampleshave varyinglevels of Zn, Pb, and Agwith goodpotential of producing a commercial qualityzincconcentrate, and leadconcentrate. It is defined as mixed rock,because all tested samplespresent varying levels of oxidization, withzinc oxide andlead oxideappearing to be in similar relativeproportion to each other,i.e., ratio ZnOx/ZnT is comparable to PbOx/PbTin thetested samples.
Producing a commercial qualityzinc concentratewas easily achieved fromthe three samplesshowing a fresh feedratio of ZnOx/ZnT<0.05, 0.06, and 0.19;allthree sampleswould typically qualifyas sulfideore.
In previous test work,producing a commercial qualityzinc concentrate from mixedmineralized material needed to incorporate DenseMedia Separationmethods(DMS)to maintain highrecoveries(80+%). Aconventional flotationapproach reached commercial quality(about 50%Zn)at the expenseof significantlylower metalrecovery, with a similar outcome forthe lead concentrate.It is SRK’s opinion that conventionalflotation should be ableto achieve commerciallevel results (grade andrecovery) under improved crushing,grinding, and flotation conditions.
Thegeneration of slimesandultrafine particlesduring grindingwas constant for alltested samples.In addition to minimizing slimesgeneration during grinding, therewasan opportunityto have adjustedflotation conditions to dealwith theloss of recoveryto the slimesin a single stage.Removing slimesfrom the circuit for additionalprocessing is oneapproach, butanother approach couldbe be morecost-effective, and shouldbe addressed infuture testing.
No penalty elementswere present in finalconcentrates inhigh enough levelsto triggerpenalties under typical marketconditions.
13.2.3Hardness
Lithology seemsto playanimportant rolein the metallurgical performanceof the tested samples.Ultrafine particle generationduring conventional grindingis high, anditseemstobe drivenby naturalweathering of the rock. Thetype of mineralization at Florida Canyon canalsobeobserved in existing operating minesin theregion.
Results from the rock’shardness tests were consistentwith above observations forall tested samples, see Table13-5. The BondWorkIndex results ranged from8.54 kWh/tonne to a maximumof
| 12.6 | kWh/tonnewhich typicallyqualifies as a softplant feed. |
Table13-5: Hardness TestResults
| Sampletype | BondWikWh/t |
| Sulfide | 8.54 |
| Oxide | 12.6 |
| Mixed | 11.75 |
| Mixed | 11.75 |
Source: SRK, 2017
13.2.4Reagents
Commonlead andzinc collectors anddepressants at varying dosagerates were tested. Details ofthetest procedures andresults are available in Smallvill(2011).
| · | Zinc sulfate as a depressantin lead flotationwas determined to notbe required; |
| · | Theoptimum lead flotationpHwas determinedto beneutral at 7.6; |
| · | Sodium Isopropyl Xanthate,as a lead collector non selective forzinc andiron, at a dosageof 12 g/t was optimal forlead recovery.Higher dosages were requiredto depresszinc andpyrite; and |
| · | Copper sulfate, coupled with Z-11to depress pyrite,was testedtoactivate thezinc in zinc flotation. The optimumdosages were 100 and20 g/t,respectively. |
The2014 recoverytesting focusedon quantifying recoveryas it relatesto a measurablezinc oxide:zinc total ratio (ZnO/ZnT). Theratio was determined from 2,813 samplesfrom 423 drillholes with goodspatial representation. Dependingon their availability and applicability, sampleswere takenfrom either coarserejects or pulp samples.Theratio was estimatedinto the block model foreach metalof interest. SRK developed asliding-scale recovery curve foreach metalusing suchratio.
The recoveryestimates forFlorida Canyon relativeto ZnO/ZnT are illustrated in Figure 13-2. Table13-6provides the recoveryestimatesbymaterial type.
Table13-6: Florida Canyon MetalRecoveriesbyMaterial Type
| Parameter | | MaterialType | |
| | Sulfide | Mixed | Oxide |
| ZnOx/ZnT Ratio | <= 0.2 | 0.2 to 0.8 | >= 0.8 |
| ZnRecovery | 93% | (-0.8833 (ZnOx/ZnT)+1.1067)*100 | 40% |
| Pb Recovery | 84% | (-0.7333 (ZnOx/ZnT)+0.9867)*100 | 40% |
| Ag Recovery | 56% | (-0.4(ZnOx/ZnT) +0.64)*100 | 32% |
Source: SRK, 2017

Source: SRK, 2017
Figure 13-2:Florida Canyon MetalRecoveries Relative toZnO/ZnT Ratio
Theaverage metallurgical recoveries calculated fromthe mineplan resource for thediluted mineabledeposit were 80%, 74% and52% forzinc, lead, and silver, respectively.
Anticipated concentrategrades used in cut-offgrade calculations are 50% forboth zinc andlead concentrates, the latter containing associated silver.
| 13.4 | SignificantFactorsandRecommendations |
SRK seesopportunities for moreadvanced testwork to optimize the metallurgical recovery flow sheet.Previous test work used conventional procedures thatwere notspecific to Florida Canyonmaterial types.Similarly,finesencountered in previous work were not handled appropriately,resulting insub- optimal flotation conditionsand consequently metallurgical results. Sample selectionis a key elementand moresite-specific test work is expected to enhanceoverall recovery projectionsat the next level of study.
Considering that the laboratoryencountered difficulties in termsof recovery andgrade when attempting to reachseparation of the zinc and leadminerals into their respective commercial qualityconcentrates, SRK recommendsapproaching the selection of samples forthe next phaseof metallurgical testingconsidering the following:
| · | The corelogging needs to incorporate attributes likeclay%,claytype, RQD, oxidecontent, sulfide content; |
| · | Develop the block modelto a levelof confidence that identify lithologies,mineralization andalteration throughout the deposit,as well as incorporating all the parametersrecorded in during the corelogging; |
| · | Assaying of thecore should include whole rockanalysis. Iflithologyvaries significantly alongthe core, then the coreinterval’s lengthshouldbeadjusted (lengthened or shortened)with thepurpose of capturing variability; and |
| · | Collect samples formetallurgical testingrepresenting distinctivezones in the deposit.Representationmustbe understoodas distinctive lithology,mineralization, oxide-to-sulfideratio. Grade variability shouldbe a secondarycriterion when selecting samples,but theymustbe reasonably closeto what a potential mining operationwould be ableto deliverto the mill. |
Additionally, SRK recommends developing a suitablemetallurgical testing program with the assistance of an experienced professional, select a reputable commercialtesting facilitywith proven QA/QCprotocols fortesting and chemical assaying,and have the testingprogram directly supervised by aprofessional thatis independent fromthe testing facility.
| 14 | Mineral Resource Estimate |
Mineral Resource estimation forthe Florida CanyondepositwasconductedbyVotorantim Metais (Votorantim) in August, 2013and reportedby Mineral Resources Management(MRM), an internalresource modeling group ofVotorantim, in Decemberof 2013 (Votorantim,2013b). In April of 2014, SRK Consultingwascontracted bySolitario to auditthe MRM resource estimateand prepare aTechnical Report on Resourcescompliant with the guidanceof National Instrument43-101 (NI 43-101). Thisdetailed independent analysis showed that the modelingmethods used byVotorantim in2013 were valid andproduced an appropriate resource estimate. These samemethods were usedbyVotorantim forupdating the estimatedtotal zinc andtotal leadin thepreparation of this 2017resource estimate.
Since the 2013 resourceestimate, Millpo hasconducted a considerable amountof resampling andmetallurgical test work to determine recoverable sulfide and oxidegrades forbothzincand leadto better understand recoverable metal in the deposit. Thiswork led to a change in thedefinition of oxide, transition, and sulfide domains.In the 2013 model,oxide, transition, and sulfidedomains were developed basedon logged valuesand then individualmetallurgical recoveries wereassigned as to each domain. Followingthe 2014 metallurgicaltest work, itwasdetermined that aquantitative approach utilizing theratio of estimated oxidezinc grade to estimated total zinc grade would providethe best representationof the recoverableresource.
Developmentof the 2017resource estimate involvedtwo separate gradeestimations. First, primaryreporting grades were estimatedusing thesamesamples as theVotorantim 2013 resource estimate. This estimateassigned the grades fromwhich metalquantities were calculatedin theresource. Asecond resource estimate was conducted using the Votorantim 2014 sampleprogram to assign sulfide andoxide grades for bothzinc and lead. Thesegrades were usedto calculate a zincoxidetototal zinc ratio (ZnOx/ZnT),which wasthen used to determineif material was oxide, sulfide,or mixed andto assign a recoveryto eachmodeled blockbased on thatratio.
The2014 Votorantimtest work included 2,813 intervals from 423 drillholes resampledoutof the 2006-2013 drilling campaigns. Dependingon their availabilityand applicability, samples were takenfrom either coarserejects or pulp samples. Following a detailed samplevalidation program,which included 539control samples(blanks andstandards), 238 sampleswere rejectedleaving 2,575 samplesto complete this exercise. After the newassays were tabulated theywere usedto estimatesulfide and oxide grades in the block model.
In preparing thecurrent resourcestatement, SRKhasused engineering experience and informedassumptions to define theappropriate cut-offgrade to reflect the mining and processingmethods and anticipated costs. This reportprovides a mineral resource estimate and a classificationof resources and reserves reported in accordancewith the CanadianInstitute of Mining, Metallurgy and Petroleum Standardson Mineral Resourcesand Reserves: Definitions and Guidelines, November27, 2010 (CIM). Theresource estimate andrelated geologic modelauditing were conducted by,or under the supervision of, J.B. Pennington, M.Sc., C.P.G.,of SRKConsulting in Reno, Nevada,who is aCertified Professional Geologistas recognized by the American Instituteof Professional Geologists and aQualified Person as defined by NI43-101.
TheMineral Resource estimatewasbased on a 3-D geological modelof majorstructuralfeatures andstratigraphically controlledalterationandmineralization. Atotal of 23 mineral domainswere interpreted from mineralized drill intercepts, comprised mostly of 1 m core samples. The project is in metric units. Zinc, lead and silver were estimated into model blocks using Ordinary Kriging (OK). Oxide, Sulfide and Mixed material types were determined based on the ZnOx/ZnT ratio. Density was determined from a large percentage (55%) of measured values, which were used to develop equations for density assignment based on rock type and kriged metal content of the samples.
| 14.1 | Geology andMineral DomainModeling |
Florida Canyonis interpreted as a Mississippi ValleyType (MVT)base metal depositdominatedbythe zinc andlead sulfidessphalerite and galena. Theseminerals occuras disseminated and massivereplacements hosted instratigraphically controlled dolomitizedlimestones of the Upper Triassicto Lower Jurassic ChambaraFormation. Thedeposit is located in karstterrain and, due to locallyhigh degrees of water percolation, shallow sulfide mineralizationis locallyaltered to oxidized carbonateand silicate minerals (smithsonite, hemimorphite and cerussite), collectively referredto in thisreport as “oxides”. Mineralization occursboth as a setofnearlyflat-lying stratiform “mantos” intersected locally byhigh-angle mineralizedzones (e.g.: Sam and San Jorge).
The geological model underpinningthe resource estimatewasgenerated in Leapfrog Geo™ 1.3software usingthe drillhole database fromthe drilling campaignsof Comincoand Votorantim.
Theunderlying carbonatestratigraphy of theFlorida Canyon depositis dome-shapedon aregional scale(Figure 14-1). Thisgeometrywas fundamentaltothe constructionof the geological contactsand boundaries of mineralized bodies.
Surfaces that represent stratigraphic units Chambara1, 2and 3were constructed through the contactpoints of the lithologies in 3-D. The fossil markerbeds of Coquina and IBMwere identified and usedas guide horizons. Thenthe five mainfaults that cut thedeposit were modeled. Thefaults were located using a 3-Dprojection of the geological surface map onto topography in conjunctionwith faultintercepts as loggedin drillholes. Theprojected geologic surfacemapis shown inFigure 14-2.
Mineralization is hosted exclusively indolomitized limestone. Theinterpreted dolomitizedzonesbetween the lower Coquinaand the upper IBM markerhorizons are shownin tan inFigure 14-3. Theextent of dolomite alterationwas loggedin drillholes and modeledwithin the five majorstructural domains.
Mineralized wireframes were built in close relationshipto the dolomitization envelope andmodified (offset)byinternal structureswhen these offsetswere clearlydefined. Mineral domainswere constructed using a 0.5%zinc cut-offgrade. The mineral domain wireframeswere built inLeapfrog Geo™ and thenimportedtoMineSight 3D® format forblock coding and resource estimation.
In total,23 individual wireframeswere built, which vary from 1to 12 min thickness, butmostwere aminimumof 2to 3 mthicktoaddress dilution. SRKobserved several mineralizedintercepts outside of all mineral domains. Thesewere intentionallyleft outdue to insufficient understanding of continuity. Figure 14-4illustrates thestratiform manto-style mineralization(red, n =21) and the N-Soriented steeplydipping (70°) Samand San Jorge zones (blue, n =2).
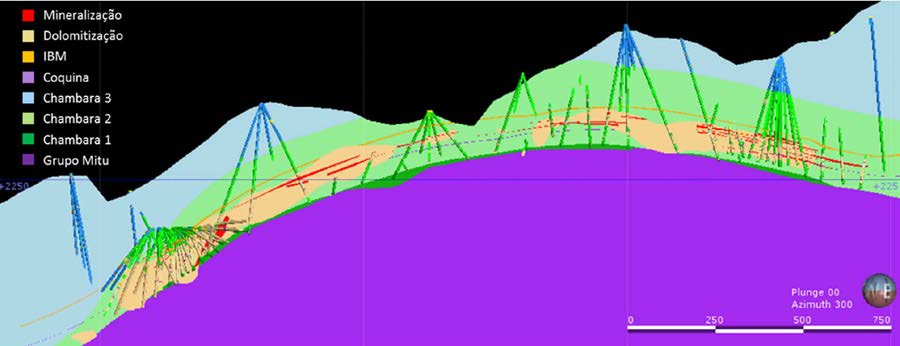
Source: SRK, 2014
Figure 14-1:North-South Longitudinal Section of Geologic Model

Source: SRK, 2014
Figure 14-2:Florida CanyonGeological and StructuralMapProjected on Topography
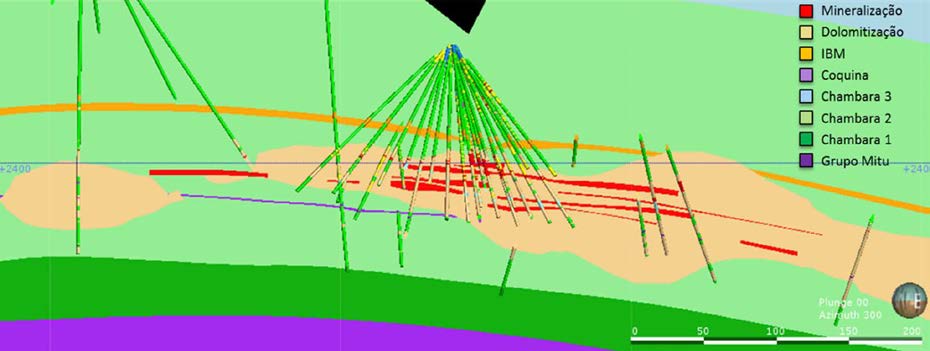
Source: SRK, 2014
Figure 14-3:Geological CrossSection ofKaren-Milagros Domain
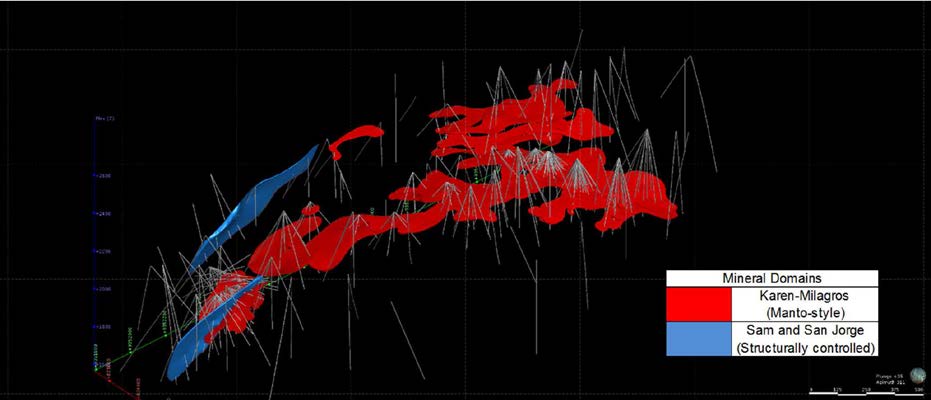
Source: SRK, 2014
Figure 14-4:Oblique View of Mineral Domains
14.2.1Database
SRK acquired the project drilling datain MineSight formatfrom Votorantim. The databaseincludes drilling campaigns of two different companies,as wellas the resampleddata from Votorantim. Atotal of 82 drillholes were completedby Comincototaling 24,781 mdrilled from 1997 to 2000, and404 drillholes were completedbyVotorantim including 92,499 mdrilled from 2006 to 2013. TheMineSight drillhole database contains a subsetof the relevant portion of thisdata.
14.2.2Topography and Sample Locations
Surface topographywasgenerated using a digital aerial survey modifiedby the pointsof the drill collars surveyed with a total stationinstrument.
SRK imported the digital topographyinto MineSightsoftware andvalidated drillcollar elevations relative to topography.
Downholesurveys were completedbyReflex EZ-Shotby thedrillers at 100 m(2010), 50 m(2011) and20 m(2012/13) down-hole spacings. Therecordsofthese are keptdigitally at the core facility andwere verified during the SRKsite visit.
14.2.3Oxidation Classification inDrillhole Logging
Oxidation classification of core sampleintervals has previously beendetermined visually accordingto the abundanceof sphalerite and galena,as well as accordingto hemimorphiteand smithsonitephases.Withthe dedicated 2014 metallurgical sampling program,the ratio ofestimatedzinc oxide to zinc total ratiois basedonthe Votorantim grade estimationwhich has superseded thevisual logging of sulfides. In this resource estimate, any blocks with aZnOx/ZnT ratio less than0.2 are consideredsulfide, aZnOx/ZnT ratio between 0.2 and0.8 is considered mixed, and a ZnOx/ZnTratio greater than
0.8 is considered oxide.
| 14.3 | Drilling DataAnalysis |
The sourcedatabase contains 486 diamond coredrillholes totaling 117,280.25m. Thereare 47,970 intervals with geologicaldescription, fromwhich 23,863were sampled andhave chemicalanalyses forzinc. Fewer have analyses forlead and silver,13,780 and 23,699 intervals,respectively. Approximately 91%of the sampleintervals had measured core recovery andthe core recoveryaveraged 98.3%. TheVotorantim MineSight drillhole databaseused to build thisresource modelcontains asubset of 441 holes totaling 109762.2 m ofdrilling, from which, 24,244intervals have chemicalanalyses forzinc. Theraw assay statistics forthe samples in the databaseused to develop theresource are presented in Table 14-1.
For grade estimation forthe mantobodies, only theintervals that fellwithin theManto solidswere used. Intervals thatwere drilledwithin a given manto wireframewere flaggedwith its correspondingcode and thencomposited at fixedlengths honoring those flags. Table 14-2includes thesummarystatistics forthe 2,875 assayintervals flaggedwith aManto code.
Table14-1: Statistics of RawAssays –AllIntervals
| Item | ItemDescription | Weightedby | Valid Intervals | Total Intervals | Min | Max | Mean | Variance | Standard Deviation |
| ZNVOT | Zn%Total (VM-2013) | Length | 24244 | 27737 | 0.00 | 57.31 | 1.46 | 31.87 | 5.65 |
| ZNTOT | Zn%Total(VM-2017) | Length | 2880 | 27737 | 0.00 | 56.27 | 7.32 | 124.19 | 11.14 |
| ZNOXS | Zn%Oxide(VM-2017) | Length | 2880 | 27737 | 0.00 | 48.22 | 2.15 | 32.99 | 5.74 |
| ZNSFS | Zn%Sulfide(VM-2017) | Length | 2880 | 27737 | 0.00 | 53.84 | 5.17 | 99.01 | 9.95 |
| PBVOT | Pb%Total(VM-2013) | Length | 24244 | 27737 | 0.00 | 44.60 | 0.21 | 1.65 | 1.29 |
| PBTOT | Pb %Total(VM-2017) | Length | 2880 | 27737 | 0.01 | 38.95 | 0.99 | 6.89 | 2.62 |
| PBOXS | Pb %Oxide(VM-2017) | Length | 2880 | 27737 | 0.01 | 13.37 | 0.27 | 0.55 | 0.74 |
| PBSFS | Pb %Sulfide(VM-2017) | Length | 2880 | 27737 | 0.00 | 27.06 | 0.72 | 4.82 | 2.20 |
| AGVOT | Agppm (VM-2013) | Length | 24080 | 27737 | 0.00 | 258.00 | 2.63 | 117.33 | 10.83 |
| DENS | Density (SG) | - | 6585 | 27737 | 1.88 | 4.86 | 2.80 | 0.05 | 0.23 |
Source: SRK, 2017
Table
14-2: Statistics of RawAssays – MantoIntervals Only
| Assay Item ID | ItemDescription | Weightedby | Valid Data | TotalData | Min | Max | Mean | Variance | Standard Deviation |
| ZNVOT | Zn % Total(Votorantim) | Length | 2875 | 2875 | 0.00 | 57.31 | 9.79 | 149.91 | 12.24 |
| ZNTOT | Zn % Total (VM-2017) | Length | 2228 | 2875 | 0.00 | 56.27 | 9.47 | 141.38 | 11.89 |
| ZNOXS | Zn %Oxide (VM-2017) | Length | 2228 | 2875 | 0.00 | 48.22 | 2.77 | 41.39 | 6.43 |
| ZNSFS | Zn %Sulfide (VM-2017) | Length | 2228 | 2875 | 0.00 | 53.84 | 6.70 | 118.44 | 10.88 |
| PBVOT | Pb% Total(Votorantim) | Length | 2875 | 2875 | 0.00 | 40.84 | 1.36 | 9.21 | 3.04 |
| PBTOT | Pb% Total (VM-2017) | Length | 2228 | 2875 | 0.01 | 38.95 | 1.26 | 8.54 | 2.92 |
| PBOXS | Pb%Oxide (VM-2017) | Length | 2228 | 2875 | 0.01 | 13.37 | 0.34 | 0.69 | 0.83 |
| PBSFS | Pb%Sulfide (VM-2017) | Length | 2228 | 2875 | 0.00 | 27.06 | 0.92 | 6.04 | 2.46 |
| AGVOT | Ag ppm (VM-2013) | Length | 2795 | 2875 | 0.09 | 258.00 | 14.14 | 642.66 | 25.35 |
| DENS | Density(SG) | - | 1578 | 2875 | 1.88 | 4.86 | 2.97 | 0.12 | 0.35 |
Source: SRK, 2017
14.3.1Capping
SRK’s approach for cappingwasto analyze raw assay data and identify statisticaloutliers in eachelement of economicinterest. For this analysis,those assays containedwithin the interpreted mineral domains were analyzed. Histogramsand cumulative frequencygraphs were prepared forzinc, lead and silvervariability. In the variability charts, a predominantly log-normal distributionwas observed, which doesnot showclear inflections, signifying a singlepopulation distribution andnot separate highand low-grade populations.For these reasons, SRK concludeszinc, lead and silverdo not require capping. Thesingle anomalouslyhighzinc value (57.3%) in thedatabase in holeV_465 (116.1 to
117.1m)wasinspected in 3-Dand foundtobeconsistent with andpart of a10 m high gradeinterval inanarea of the San Jorge mineral domain supportedby high-gradeintercepts in neighboringdrillholes.
During gradeestimation, Votorantim elected to use a sliding-scale percentile method forcapping relativeto search pass,in amulti-pass estimation process. SRK has reviewedthe Votorantim approachand considers it appropriate if not slightlyconservative relativeto our analysis of the gradepopulations.
14.3.2Compositing
In the software, the rawassay databasewas back-codedusing the mineral domain(Manto) wireframesdescribed in Section14.1, resulting in 2,875 interceptsinside the mineralized shapes. The codedsamples were thencompositedtothe length of 1.5 mgenerating 1,931 composited samplesout of 2,875 original samples.Intervals at the endof aManto domain less than 0.75 min lengthwere mergedinto theprevious interval. Asnumerous analyses were run using this data set inaddition to generating the resource estimate, several itemswere addedto the datafiles with differentIDs.For clarity,Table 14-3includes the itemID’s used in the drillholes andtheir corresponding compositeID anddescription including the company samplingprogram associated with the sourcedata. Table14-4provides summary statistics forall Compositeswithin the manto wireframes.
Table14-3: Item ID’sand Descriptions
| Assay Item ID | Composite Item ID | Description |
| ZNVOT | ZNVOT | Total Zinc Grade - 2013 Sampling |
| ZNTOT | ZNT0 | Total Zinc Grade (ZNOXS + ZNSFS) |
| ZNOXS | ZNO0 | Oxide Zinc Grade - 2014 Sampling |
| ZNSFS | ZNS0 | Sulfide Zinc Grade - 2014 Sampling |
| PBVOT | PBVOT | Total Lead Grade - 2013 Sampling |
| PBTOT | PBT0 | Total Lead Grade (PBOXS + PBSFS) |
| PBOXS | PBO0 | Oxide Lead Grade - 2014 Sampling |
| PBSFS | PBS0 | Sulfide Lead Grade - 2014 Sampling |
| AGVOT | AGVOT | Total Silver Grade - 2013 Sampling |
| DENS | DENS | Density - 2013 Sampling |
| LITO | LITO | Logged Lithology – 2013 |
| MANTO | MANTO | Manto Zone Flag |
Source: SRK, 2017
Table14-4: Statistics ofAllComposites Inside Mantos
Composite Item ID | Item Description | Weighted by | Valid Data | Total Data | Min | Max | Mean | Variance | Standard Deviation |
| ZNVOT | Zn % Total (2013) | Length | 1931 | 1931 | 0.01 | 56.49 | 9.60 | 115.80 | 10.76 |
| ZNT0 | Zn % Total (2014) | Length | 1931 | 1931 | 0.01 | 55.63 | 9.26 | 113.22 | 10.64 |
| ZNOX0 | Zn % Oxide (2014) | Length | 1931 | 1931 | 0.00 | 45.00 | 2.95 | 37.39 | 6.11 |
| ZNSF0 | Zn % Sulfide (2014) | Length | 1931 | 1931 | 0.00 | 50.56 | 6.31 | 91.72 | 9.58 |
| PBVOT | Pb % Total (2013) | Length | 1931 | 1931 | 0.00 | 21.98 | 1.33 | 6.83 | 2.61 |
| PBT0 | Pb % Total (2014) | Length | 1931 | 1931 | 0.00 | 21.36 | 1.26 | 6.42 | 2.53 |
| PBOX0 | Pb % Oxide (2014) | Length | 1931 | 1931 | 0.00 | 9.07 | 0.38 | 0.62 | 0.79 |
| PBSF0 | Pb % Sulfide (2014) | Length | 1931 | 1931 | 0.00 | 20.31 | 0.88 | 4.25 | 2.06 |
| AGVOT | Ag ppm (2013) | Length | 1862 | 1931 | 0.12 | 161.67 | 13.84 | 494.37 | 22.23 |
| DENS | Density (SG) | - | 1064 | 1931 | 2.06 | 4.66 | 2.96 | 0.10 | 0.32 |
Source: SRK, 2017. Separate sampling programs are identified inthe Item description(Votorantim-2013or Votorantim-2014 )
Densityis calculated in the modelusing the following equation: DENSITY =2.786 + (0.016* ZN ) + (0.037 *PB)
SRK checkedthe assigned density valuesin the model and found the densitytobe definedbythis equation. Spot checks forblock values show a veryslight discrepancy forsome blocks,however, aglobal validation checkshowed thesediscrepancies amountto aresource densitychange of less than0.01%. SRKis of the opinion that, dueto the minimal impactthis difference has on the reported resource tonnage, this discrepancyis not materialto theresource and considers the densityassignment tobevalid.
| 14.5 | VariogramAnalysisandModeling |
In preparing theprevious 2014 Resource Estimate,an extensive reviewof the deposit variographywas conducted.Separate semi-variograms,normalized to a sillof 1.0 were generated using samplesfrom both the high-anglestructurally controlleddomains (Sam,San Jorge) and the flatstratiform mineralized mantos(Karen-Milagros). Inpreparing this 2017 resource estimate, a similar exercisewas conducted by Votorantim, with theaddition of Block1, Block 2 and Block3domains that were designedto capture the different structuraltrends of the deposit (Figure 14-6).
As the underlyingtotal leadand zinc grade data being estimatedhas not changed between thecurrent and the 2014resource estimates,SRK did notrepeat this exercise. Rather, the searchranges and directions used forthis estimationrun were comparedto those used inthe 2014Resource Estimate and comparedto the underlying geology. Basedon thatreview, SRKfinds thatthe searchcriteria used forthis modeling effortare appropriate, and well supported by theunderlying geology.
Details of the variography arepresented in Table 14-8.
14.6.1Model Specifications
Theblock modelwas constructedinUTM metriccoordinates using MineSightTM modelingsoftware. Ablock size of 6 mwide x 6 mlong x 3 mhighwas used.Horizontal blockdimensions were determined based on drill sample spacing andthe blockheight wasselected to maintain the resolution needed for mineplanning. Theparameters used in the generationof the block modelare summarizedin Table14-5. Fielddescriptions of model itemsare provided in Table 14-6. SRK added itemsto facilitate engineeringas outlinedin Table 14-7.
Table14-5: Block ModelSpecifications
| Coordinate | Min | Max | Size | No. Blocks |
| Easting | 823700 | 825650 | 6 | 325 |
| Northing | 9351680 | 9354422 | 6 | 457 |
| Elevation | 1550 | 3161 | 3 | 537 |
Source:SRK2017
Table14-6: Block ModelItem Descriptions
| Item | Description |
| TOPO | Percentage of theblock below the topography |
| ZNOKC | OKEstimate ZincOxides from 2014 Sampling |
| ZNSKC | OKEstimate ZincSulfides from 2014Sampling |
| PBOKC | OKEstimate Lead Oxides from 2014Sampling |
| PBSKC | OKEstimate LeadSulfides from 2014 Sampling |
| DENS | Density |
| CATGE | Resource Categorization(1=measured,2=indicated, 3=inferred) |
| MANTO | MantoZone Code (IncludesVertical Structures) |
| MANT% | Percentage of eachblockwithin theManto Solids |
| BLOCK | Interpolation Sectorsfor Varying SearchDirections |
| ZNVKC | OKEstimate of Zinc fromtheVotorantim 2013 sampling |
| PBVKC | OKEstimate of Lead fromtheVotorantim 2013 sampling |
| AGVKC | Silver Interpolationby OK ofVotorantim 2013sampling |
| FEVKC | Interpolation of Ironby OKof thesamplingof Votorantim2013 |
| RATZN | Zinc Oxide Ratio:ZNOKC / (ZNOKC + ZNSKC) |
| RATPB | OxideLeadRatio: PBOKC / (PBOKC + PBSKC) |
| ZNTKV | Copyof ZNVKC (EstimatedVotorantim 2013 Grade) |
| ZNSKV | Value ofZnsulfides: ZNTKV * (1-RATZN) |
| ZNOKV | Value ofZn oxides: ZNTKV * (RATZN) |
| PBTKV | Copyof PBVKC (EstimatedVotorantim 2013 Grade) |
| PBSKV | PBsulphidevalue: PBTKV *(1-RATPB) |
| PBOKV | Value of PBoxides: PBTKV * (RATPB) |
Source: Votorantim, 2017, edited by SRK, 2017
Table14-7: Additional SRKBlock ModelItem Descriptions
| Item | Description |
| ZNREC | ZincRecovery |
| PBREC | LeadRecovery |
| AGREC | SilverRecovery |
| ZNTRC | RecoveredTotalZinc Grade (ZNVKC * ZNREC) |
| PBTRC | RecoveredTotal Lead Grade (PBVKC * PBREC) |
| AGVRC | RecoveredTotal AgGrade (AGVKC * AGREC) |
| ZNREQ | Recovered Equivalent Zinc Grade |
| ZNEQ | EquivalentZinc Grade (ZNREQ / ZNREC x100) |
| SGSRK | SRKDesnityCheck Item |
| OTFLG | MaterialType fromZnOx/ZnT Ratio (1=Oxide, 2=Mixed,3=Sulfide) |
Source: SRK, 2017
14.6.2Model Construction
Thetwo setsof mineralized wireframeswere imported and codedinto the MANTOitem in the MineSight model. Boththe code of each solid andthepercentage of each solidwere storedin the blocks.
Given the unevendistribution of holes andthe domalshape of thedeposit, the modelwas dividedinto three areasbasedonthe orientation of the mineralized shapes. Theareas, flaggedin the BLOCK item,were then usedto controlthe anisotropic searchdirection used during grade estimation. Thetwo vertical structures,Sam and SamJorge,we estimatedindependently. Theblock codes storedin the modelare shown inFigure 14-5.
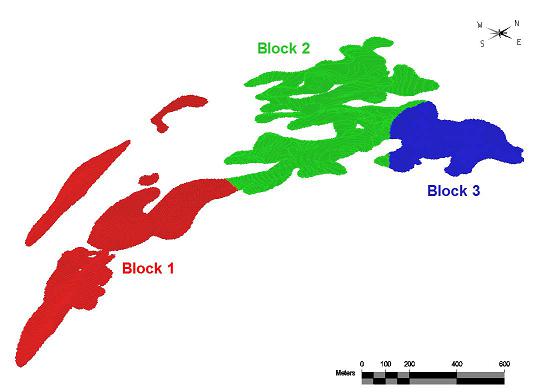
Source: SRK, 2017
Figure 14-5:Estimation BLOCKZones
Thestrategy forblock grade estimation was thesamefor all variables consideredin each of the mineral domains. Grades ineach domain were estimated only with composites codedtothat domain. The estimate forzinc, lead, andsilver was performedby fourpass Ordinary Kriging forboth theVotorantim 2014 and Votorantim 2017 grade items. The firstpass used alongsearchdistance intended to fill the mineral domainswith grade. This pass wascapped atthe 95th percentileto preventproliferation of highgrades during the estimate.For the second and third passes, distanceswere shortened with each pass and the grade capadjustedtothe 97th and 99thpercentiles, respectively. Thefourth pass ran with theshortest searchdistance and highgrades were not capped. Each pass was reviewed foreach estimationdomain andadjusted as necessaryto validate comparedto input composites.
Details of the gradeestimationby Blockand Manto are presented in Table 14-8.
Table14-8: Variogram andGrade Estimation Parameters
Block 1Estimation ParametersforTotal ZincGradeUsingVotorantim SampleData | | | | | | | | | | | | | | | | | | | | | | | | | | | | | | | | | | | | | | | | |
| BlockFlag | 1 | 1 | 1 | 1 | 1 | 1 | 1 | 1 | 1 | 1 | 1 | 1 | 1 | 1 | 1 | 1 | 1 | 1 | 1 | 1 | 1 | 1 | 1 | 1 | 1 | 1 | 1 | 1 | 1 | 1 | 1 | 1 | 1 | 1 | 1 | 1 | 1 | 1 | 1 | 1 | 1 | 1 | 1 | 1 |
| MantoFlag | 3 | 3 | 3 | 3 | 6 | 6 | 6 | 6 | 12 | 12 | 12 | 12 | 14 | 14 | 14 | 14 | 15 | 15 | 15 | 15 | 16 | 16 | 16 | 16 | 17 | 17 | 17 | 17 | 18 | 18 | 18 | 18 | 19 | 19 | 19 | 19 | 20 | 20 | 20 | 20 | 21 | 21 | 21 | 21 |
| MinCompositesto Estimate | 1 | 1 | 3 | 2 | 1 | 1 | 3 | 2 | 1 | 1 | 3 | 2 | 1 | 1 | 3 | 2 | 1 | 1 | 3 | 2 | 1 | 1 | 3 | 2 | 1 | 1 | 3 | 2 | 1 | 1 | 3 | 2 | 1 | 1 | 3 | 2 | 1 | 1 | 3 | 2 | 1 | 1 | 3 | 2 |
| MaxCompositesto Estimate | 4 | 6 | 8 | 12 | 4 | 6 | 8 | 12 | 4 | 6 | 8 | 12 | 4 | 6 | 8 | 12 | 4 | 6 | 8 | 12 | 4 | 6 | 8 | 12 | 4 | 6 | 8 | 12 | 4 | 6 | 8 | 12 | 4 | 6 | 8 | 12 | 4 | 6 | 8 | 12 | 4 | 6 | 8 | 12 |
| MaxCompositesPer Hole | 2 | 2 | 2 | 2 | 2 | 2 | 2 | 2 | 2 | 2 | 2 | 2 | 2 | 2 | 2 | 2 | 2 | 2 | 2 | 2 | 2 | 2 | 2 | 2 | 2 | 2 | 2 | 2 | 2 | 2 | 2 | 2 | 2 | 2 | 2 | 2 | 2 | 2 | 2 | 2 | 2 | 2 | 2 | 2 |
| Composite Item | ZNVOT | ZNVOT | ZNVOT | ZNVOT | ZNVOT | ZNVOT | ZNVOT | ZNVOT | ZNVOT | ZNVOT | ZNVOT | ZNVOT | ZNVOT | ZNVOT | ZNVOT | ZNVOT | ZNVOT | ZNVOT | ZNVOT | ZNVOT | ZNVOT | ZNVOT | ZNVOT | ZNVOT | ZNVOT | ZNVOT | ZNVOT | ZNVOT | ZNVOT | ZNVOT | ZNVOT | ZNVOT | ZNVOT | ZNVOT | ZNVOT | ZNVOT | ZNVOT | ZNVOT | ZNVOT | ZNVOT | ZNVOT | ZNVOT | ZNVOT | ZNVOT |
| ModelItem | ZNVKC | ZNVKC | ZNVKC | ZNVKC | ZNVKC | ZNVKC | ZNVKC | ZNVKC | ZNVKC | ZNVKC | ZNVKC | ZNVKC | ZNVKC | ZNVKC | ZNVKC | ZNVKC | ZNVKC | ZNVKC | ZNVKC | ZNVKC | ZNVKC | ZNVKC | ZNVKC | ZNVKC | ZNVKC | ZNVKC | ZNVKC | ZNVKC | ZNVKC | ZNVKC | ZNVKC | ZNVKC | ZNVKC | ZNVKC | ZNVKC | ZNVKC | ZNVKC | ZNVKC | ZNVKC | ZNVKC | ZNVKC | ZNVKC | ZNVKC | ZNVKC |
| 1stVariogram Structure Type | SPH | SPH | SPH | SPH | SPH | SPH | SPH | SPH | SPH | SPH | SPH | SPH | SPH | SPH | SPH | SPH | SPH | SPH | SPH | SPH | SPH | SPH | SPH | SPH | SPH | SPH | SPH | SPH | SPH | SPH | SPH | SPH | SPH | SPH | SPH | SPH | SPH | SPH | SPH | SPH | SPH | SPH | SPH | SPH |
| 2ndVariogram Structure Type | SPH | SPH | SPH | SPH | SPH | SPH | SPH | SPH | SPH | SPH | SPH | SPH | SPH | SPH | SPH | SPH | SPH | SPH | SPH | SPH | SPH | SPH | SPH | SPH | SPH | SPH | SPH | SPH | SPH | SPH | SPH | SPH | SPH | SPH | SPH | SPH | SPH | SPH | SPH | SPH | SPH | SPH | SPH | SPH |
| VariogramNugget | 0.35 | 0.35 | 0.35 | 0.35 | 0.35 | 0.35 | 0.35 | 0.35 | 0.35 | 0.35 | 0.35 | 0.35 | 0.35 | 0.35 | 0.35 | 0.35 | 0.35 | 0.35 | 0.35 | 0.35 | 0.35 | 0.35 | 0.35 | 0.35 | 0.35 | 0.35 | 0.35 | 0.35 | 0.35 | 0.35 | 0.35 | 0.35 | 0.35 | 0.35 | 0.35 | 0.35 | 0.35 | 0.35 | 0.35 | 0.35 | 0.35 | 0.35 | 0.35 | 0.35 |
| 1stVariogramSill | 0.42 | 0.42 | 0.42 | 0.42 | 0.42 | 0.42 | 0.42 | 0.42 | 0.42 | 0.42 | 0.42 | 0.42 | 0.42 | 0.42 | 0.42 | 0.42 | 0.42 | 0.42 | 0.42 | 0.42 | 0.42 | 0.42 | 0.42 | 0.42 | 0.42 | 0.42 | 0.42 | 0.42 | 0.42 | 0.42 | 0.42 | 0.42 | 0.42 | 0.42 | 0.42 | 0.42 | 0.42 | 0.42 | 0.42 | 0.42 | 0.42 | 0.42 | 0.42 | 0.42 |
| 2ndVariogramSill | 0.23 | 0.23 | 0.23 | 0.23 | 0.23 | 0.23 | 0.23 | 0.23 | 0.23 | 0.23 | 0.23 | 0.23 | 0.23 | 0.23 | 0.23 | 0.23 | 0.23 | 0.23 | 0.23 | 0.23 | 0.23 | 0.23 | 0.23 | 0.23 | 0.23 | 0.23 | 0.23 | 0.23 | 0.23 | 0.23 | 0.23 | 0.23 | 0.23 | 0.23 | 0.23 | 0.23 | 0.23 | 0.23 | 0.23 | 0.23 | 0.23 | 0.23 | 0.23 | 0.23 |
| Variogram Structure1MajorRange(m) | 7 | 7 | 7 | 7 | 7 | 7 | 7 | 7 | 7 | 7 | 7 | 7 | 7 | 7 | 7 | 7 | 7 | 7 | 7 | 7 | 7 | 7 | 7 | 7 | 7 | 7 | 7 | 7 | 7 | 7 | 7 | 7 | 7 | 7 | 7 | 7 | 7 | 7 | 7 | 7 | 7 | 7 | 7 | 7 |
| Variogram Structure1Semi-MajorRange(m) | 5 | 5 | 5 | 5 | 5 | 5 | 5 | 5 | 5 | 5 | 5 | 5 | 5 | 5 | 5 | 5 | 5 | 5 | 5 | 5 | 5 | 5 | 5 | 5 | 5 | 5 | 5 | 5 | 5 | 5 | 5 | 5 | 5 | 5 | 5 | 5 | 5 | 5 | 5 | 5 | 5 | 5 | 5 | 5 |
| Variogram Structure1Minor Range(m) | 5 | 5 | 5 | 5 | 5 | 5 | 5 | 5 | 5 | 5 | 5 | 5 | 5 | 5 | 5 | 5 | 5 | 5 | 5 | 5 | 5 | 5 | 5 | 5 | 5 | 5 | 5 | 5 | 5 | 5 | 5 | 5 | 5 | 5 | 5 | 5 | 5 | 5 | 5 | 5 | 5 | 5 | 5 | 5 |
| Variogram Structure2MajorRange(m) | 22 | 22 | 22 | 22 | 22 | 22 | 22 | 22 | 22 | 22 | 22 | 22 | 22 | 22 | 22 | 22 | 22 | 22 | 22 | 22 | 22 | 22 | 22 | 22 | 22 | 22 | 22 | 22 | 22 | 22 | 22 | 22 | 22 | 22 | 22 | 22 | 22 | 22 | 22 | 22 | 22 | 22 | 22 | 22 |
| Variogram Structure2Semi-MajorRange(m) | 17 | 17 | 17 | 17 | 17 | 17 | 17 | 17 | 17 | 17 | 17 | 17 | 17 | 17 | 17 | 17 | 17 | 17 | 17 | 17 | 17 | 17 | 17 | 17 | 17 | 17 | 17 | 17 | 17 | 17 | 17 | 17 | 17 | 17 | 17 | 17 | 17 | 17 | 17 | 17 | 17 | 17 | 17 | 17 |
| Variogram Structure2Minor Range(m) | 10 | 10 | 10 | 10 | 10 | 10 | 10 | 10 | 10 | 10 | 10 | 10 | 10 | 10 | 10 | 10 | 10 | 10 | 10 | 10 | 10 | 10 | 10 | 10 | 10 | 10 | 10 | 10 | 10 | 10 | 10 | 10 | 10 | 10 | 10 | 10 | 10 | 10 | 10 | 10 | 10 | 10 | 10 | 10 |
| VariogramMajorDirection(deg) | 28 | 28 | 28 | 28 | 28 | 28 | 28 | 28 | 347 | 347 | 347 | 347 | 20 | 20 | 20 | 20 | 40 | 40 | 40 | 40 | 22 | 22 | 22 | 22 | 28 | 28 | 28 | 28 | 28 | 28 | 28 | 28 | 13 | 13 | 13 | 13 | 52 | 52 | 52 | 52 | 35 | 35 | 35 | 35 |
| VariogramSemi-Major direction(deg) | 18 | 18 | 18 | 18 | 22 | 22 | 22 | 22 | 30 | 30 | 30 | 30 | 8 | 8 | 8 | 8 | 18 | 18 | 18 | 18 | 43 | 43 | 43 | 43 | 41 | 41 | 41 | 41 | 41 | 41 | 41 | 41 | 41 | 41 | 41 | 41 | 29 | 29 | 29 | 29 | 36 | 36 | 36 | 36 |
| Variogram MinorDirection(deg) | 0 | 0 | 0 | 0 | 0 | 0 | 0 | 0 | 0 | 0 | 0 | 0 | 0 | 0 | 0 | 0 | 0 | 0 | 0 | 0 | 0 | 0 | 0 | 0 | 0 | 0 | 0 | 0 | 0 | 0 | 0 | 0 | 0 | 0 | 0 | 0 | 0 | 0 | 0 | 0 | 0 | 0 | 0 | 0 |
| MajorSearchEllipseRange(m) | 220 | 132 | 88 | 44 | 400 | 132 | 88 | 44 | 150 | 132 | 88 | 44 | 350 | 132 | 88 | 44 | 150 | 132 | 88 | 44 | 150 | 132 | 88 | 44 | 150 | 132 | 88 | 44 | 150 | 132 | 88 | 44 | 150 | 132 | 88 | 44 | 150 | 132 | 88 | 44 | 150 | 132 | 88 | 44 |
| Semi-MajorSearch EllipseRange(m) | 170 | 102 | 68 | 34 | 250 | 102 | 68 | 34 | 150 | 102 | 68 | 34 | 250 | 102 | 68 | 34 | 150 | 102 | 68 | 34 | 150 | 102 | 68 | 34 | 150 | 102 | 68 | 34 | 150 | 102 | 68 | 34 | 150 | 102 | 68 | 34 | 150 | 102 | 68 | 34 | 150 | 102 | 68 | 34 |
| Minor SearchEllipseRange(m) | 40 | 30 | 20 | 10 | 40 | 30 | 20 | 10 | 40 | 30 | 20 | 10 | 40 | 30 | 20 | 10 | 40 | 30 | 20 | 10 | 40 | 30 | 20 | 10 | 40 | 30 | 20 | 10 | 40 | 30 | 20 | 10 | 40 | 30 | 20 | 10 | 40 | 30 | 20 | 10 | 40 | 30 | 20 | 10 |
| Capon ZincGrade(%) | 15 | 22 | 38 | | 15 | 22 | 38 | | 15 | 22 | 38 | | 15 | 22 | 38 | | 15 | 22 | 38 | | 15 | 22 | 38 | | 15 | 22 | 38 | | 15 | 22 | 38 | | 15 | 22 | 38 | | 15 | 22 | 38 | | 15 | 22 | 38 | |
| Source:Votorantim2017 | | | | | | | | | | | | | | | | | | | | | | | | | | | | | | | | | | | | | | | | | | | | |
| | | | | | | | | | | | | | | | | | | | | | | | | | | | | | | | | | | | | | | | | | | | | |
| Block2Estimation ParametersforTotal ZincGradeUsingVotorantim SampleData | | | | | | | | | | | | | | | | | | | | | | | | | | | | | | | | | | | | | | | | |
| BlockFlag | 2 | 2 | 2 | 2 | 2 | 2 | 2 | 2 | 2 | 2 | 2 | 2 | 2 | 2 | 2 | 2 | 2 | 2 | 2 | 2 | 2 | 2 | 2 | 2 | 2 | 2 | 2 | 2 | 2 | 2 | 2 | 2 | 2 | 2 | 2 | 2 | 2 | 2 | 2 | 2 | | | | |
| MantoFlag | 2 | 2 | 2 | 2 | 3 | 3 | 3 | 3 | 4 | 4 | 4 | 4 | 6 | 6 | 6 | 6 | 7 | 7 | 7 | 7 | 8 | 8 | 8 | 8 | 9 | 9 | 9 | 9 | 10 | 10 | 10 | 10 | 11 | 11 | 11 | 11 | 13 | 13 | 13 | 13 | | | | |
| MinCompositesto Estimate | 1 | 1 | 3 | 2 | 1 | 1 | 3 | 2 | 1 | 1 | 3 | 2 | 1 | 1 | 3 | 2 | 1 | 1 | 3 | 2 | 1 | 1 | 3 | 2 | 1 | 1 | 3 | 2 | 1 | 1 | 3 | 2 | 1 | 1 | 3 | 2 | 1 | 1 | 3 | 2 | | | | |
| MaxCompositesto Estimate | 4 | 6 | 8 | 12 | 4 | 6 | 8 | 12 | 4 | 6 | 8 | 12 | 4 | 6 | 8 | 12 | 4 | 6 | 8 | 12 | 4 | 6 | 8 | 12 | 4 | 6 | 8 | 12 | 4 | 6 | 8 | 12 | 4 | 6 | 8 | 12 | 4 | 6 | 8 | 12 | | | | |
| MaxCompositesPer Hole | 2 | 2 | 2 | 2 | 2 | 2 | 2 | 2 | 2 | 2 | 2 | 2 | 2 | 2 | 2 | 2 | 2 | 2 | 2 | 2 | 2 | 2 | 2 | 2 | 2 | 2 | 2 | 2 | 2 | 2 | 2 | 2 | 2 | 2 | 2 | 2 | 2 | 2 | 2 | 2 | | | | |
| Composite Item | ZNVOT | ZNVOT | ZNVOT | ZNVOT | ZNVOT | ZNVOT | ZNVOT | ZNVOT | ZNVOT | ZNVOT | ZNVOT | ZNVOT | ZNVOT | ZNVOT | ZNVOT | ZNVOT | ZNVOT | ZNVOT | ZNVOT | ZNVOT | ZNVOT | ZNVOT | ZNVOT | ZNVOT | ZNVOT | ZNVOT | ZNVOT | ZNVOT | ZNVOT | ZNVOT | ZNVOT | ZNVOT | ZNVOT | ZNVOT | ZNVOT | ZNVOT | ZNVOT | ZNVOT | ZNVOT | ZNVOT | | | | |
| ModelItem | ZNVKC | ZNVKC | ZNVKC | ZNVKC | ZNVKC | ZNVKC | ZNVKC | ZNVKC | ZNVKC | ZNVKC | ZNVKC | ZNVKC | ZNVKC | ZNVKC | ZNVKC | ZNVKC | ZNVKC | ZNVKC | ZNVKC | ZNVKC | ZNVKC | ZNVKC | ZNVKC | ZNVKC | ZNVKC | ZNVKC | ZNVKC | ZNVKC | ZNVKC | ZNVKC | ZNVKC | ZNVKC | ZNVKC | ZNVKC | ZNVKC | ZNVKC | ZNVKC | ZNVKC | ZNVKC | ZNVKC | | | | |
| 1stVariogram Structure Type | SPH | SPH | SPH | SPH | SPH | SPH | SPH | SPH | SPH | SPH | SPH | SPH | SPH | SPH | SPH | SPH | SPH | SPH | SPH | SPH | SPH | SPH | SPH | SPH | SPH | SPH | SPH | SPH | SPH | SPH | SPH | SPH | SPH | SPH | SPH | SPH | SPH | SPH | SPH | SPH | | | | |
| 2ndVariogram Structure Type | SPH | SPH | SPH | SPH | SPH | SPH | SPH | SPH | SPH | SPH | SPH | SPH | SPH | SPH | SPH | SPH | SPH | SPH | SPH | SPH | SPH | SPH | SPH | SPH | SPH | SPH | SPH | SPH | SPH | SPH | SPH | SPH | SPH | SPH | SPH | SPH | SPH | SPH | SPH | SPH | | | | |
| VariogramNugget | 0.35 | 0.35 | 0.35 | 0.35 | 0.35 | 0.35 | 0.35 | 0.35 | 0.35 | 0.35 | 0.35 | 0.35 | 0.35 | 0.35 | 0.35 | 0.35 | 0.35 | 0.35 | 0.35 | 0.35 | 0.35 | 0.35 | 0.35 | 0.35 | 0.35 | 0.35 | 0.35 | 0.35 | 0.35 | 0.35 | 0.35 | 0.35 | 0.35 | 0.35 | 0.35 | 0.35 | 0.35 | 0.35 | 0.35 | 0.35 | | | | |
| 1stVariogramSill | 0.4 | 0.4 | 0.4 | 0.4 | 0.4 | 0.4 | 0.4 | 0.4 | 0.4 | 0.4 | 0.4 | 0.4 | 0.4 | 0.4 | 0.4 | 0.4 | 0.4 | 0.4 | 0.4 | 0.4 | 0.4 | 0.4 | 0.4 | 0.4 | 0.4 | 0.4 | 0.4 | 0.4 | 0.4 | 0.4 | 0.4 | 0.4 | 0.4 | 0.4 | 0.4 | 0.4 | 0.4 | 0.4 | 0.4 | 0.4 | | | | |
| 2ndVariogramSill | 0.25 | 0.25 | 0.25 | 0.25 | 0.25 | 0.25 | 0.25 | 0.25 | 0.25 | 0.25 | 0.25 | 0.25 | 0.25 | 0.25 | 0.25 | 0.25 | 0.25 | 0.25 | 0.25 | 0.25 | 0.25 | 0.25 | 0.25 | 0.25 | 0.25 | 0.25 | 0.25 | 0.25 | 0.25 | 0.25 | 0.25 | 0.25 | 0.25 | 0.25 | 0.25 | 0.25 | 0.25 | 0.25 | 0.25 | 0.25 | | | | |
| Variogram Structure1MajorRange(m) | 34 | 34 | 34 | 34 | 34 | 34 | 34 | 34 | 34 | 34 | 34 | 34 | 34 | 34 | 34 | 34 | 34 | 34 | 34 | 34 | 34 | 34 | 34 | 34 | 34 | 34 | 34 | 34 | 34 | 34 | 34 | 34 | 34 | 34 | 34 | 34 | 34 | 34 | 34 | 34 | | | | |
| Variogram Structure1Semi-MajorRange(m) | 12 | 12 | 12 | 12 | 12 | 12 | 12 | 12 | 12 | 12 | 12 | 12 | 12 | 12 | 12 | 12 | 12 | 12 | 12 | 12 | 12 | 12 | 12 | 12 | 12 | 12 | 12 | 12 | 12 | 12 | 12 | 12 | 12 | 12 | 12 | 12 | 12 | 12 | 12 | 12 | | | | |
| Variogram Structure1Minor Range(m) | 5 | 5 | 5 | 5 | 5 | 5 | 5 | 5 | 5 | 5 | 5 | 5 | 5 | 5 | 5 | 5 | 5 | 5 | 5 | 5 | 5 | 5 | 5 | 5 | 5 | 5 | 5 | 5 | 5 | 5 | 5 | 5 | 5 | 5 | 5 | 5 | 5 | 5 | 5 | 5 | | | | |
| Variogram Structure2MajorRange(m) | 53 | 53 | 53 | 53 | 53 | 53 | 53 | 53 | 53 | 53 | 53 | 53 | 53 | 53 | 53 | 53 | 53 | 53 | 53 | 53 | 53 | 53 | 53 | 53 | 53 | 53 | 53 | 53 | 53 | 53 | 53 | 53 | 53 | 53 | 53 | 53 | 53 | 53 | 53 | 53 | | | | |
| Variogram Structure2Semi-MajorRange(m) | 45 | 45 | 45 | 45 | 45 | 45 | 45 | 45 | 45 | 45 | 45 | 45 | 45 | 45 | 45 | 45 | 45 | 45 | 45 | 45 | 45 | 45 | 45 | 45 | 45 | 45 | 45 | 45 | 45 | 45 | 45 | 45 | 45 | 45 | 45 | 45 | 45 | 45 | 45 | 45 | | | | |
| Variogram Structure2Minor Range(m) | 10 | 10 | 10 | 10 | 10 | 10 | 10 | 10 | 10 | 10 | 10 | 10 | 10 | 10 | 10 | 10 | 10 | 10 | 10 | 10 | 10 | 10 | 10 | 10 | 10 | 10 | 10 | 10 | 10 | 10 | 10 | 10 | 10 | 10 | 10 | 10 | 10 | 10 | 10 | 10 | | | | |
| VariogramMajorDirection(deg) | 55 | 55 | 55 | 55 | 28 | 28 | 28 | 28 | 28 | 28 | 28 | 28 | 28 | 28 | 28 | 28 | 72 | 72 | 72 | 72 | 28 | 28 | 28 | 28 | 28 | 28 | 28 | 28 | 28 | 28 | 28 | 28 | 10 | 10 | 10 | 10 | 4 | 4 | 4 | 4 | | | | |
| VariogramSemi-Major direction(deg) | 0 | 0 | 0 | 0 | 0 | 0 | 0 | 0 | 0 | 0 | 0 | 0 | 0 | 0 | 0 | 0 | 0 | 0 | 0 | 0 | 0 | 0 | 0 | 0 | 0 | 0 | 0 | 0 | 0 | 0 | 0 | 0 | 0 | 0 | 0 | 0 | 0 | 0 | 0 | 0 | | | | |
| Variogram MinorDirection(deg) | 0 | 0 | 0 | 0 | 0 | 0 | 0 | 0 | 0 | 0 | 0 | 0 | 0 | 0 | 0 | 0 | 0 | 0 | 0 | 0 | 0 | 0 | 0 | 0 | 0 | 0 | 0 | 0 | 0 | 0 | 0 | 0 | 0 | 0 | 0 | 0 | 0 | 0 | 0 | 0 | | | | |
| MajorSearchEllipseRange(m) | 212 | 159 | 106 | 53 | 159 | 159 | 106 | 53 | 500 | 159 | 106 | 53 | 350 | 159 | 106 | 53 | 132.5 | 106 | 53 | 53 | 350 | 159 | 106 | 53 | 300 | 159 | 106 | 53 | 300 | 159 | 106 | 53 | 300 | 159 | 106 | 53 | 350 | 159 | 106 | 53 | | | | |
| Semi-MajorSearch EllipseRange(m) | 112.5 | 135 | 90 | 45 | 135 | 135 | 90 | 45 | 400 | 135 | 90 | 45 | 250 | 135 | 90 | 45 | 112.5 | 90 | 45 | 45 | 250 | 135 | 90 | 45 | 150 | 135 | 90 | 45 | 150 | 135 | 90 | 45 | 150 | 135 | 90 | 45 | 250 | 135 | 90 | 45 | | | | |
| Minor SearchEllipseRange(m) | 40 | 30 | 20 | 10 | 40 | 30 | 20 | 10 | 40 | 30 | 20 | 10 | 40 | 30 | 20 | 10 | 40 | 30 | 20 | 10 | 40 | 30 | 20 | 10 | 40 | 30 | 20 | 10 | 40 | 30 | 20 | 10 | 40 | 30 | 20 | 10 | 40 | 30 | 20 | 10 | | | | |
| Capon ZincGrade(%) | 9 | 14 | 29 | | 9 | 14 | 29 | | 9 | 14 | 29 | | 9 | 14 | 29 | | 9 | 14 | 29 | | 9 | 14 | 29 | | 9 | 14 | 29 | | 9 | 14 | 29 | | 9 | 14 | 29 | | 9 | 14 | 29 | | | | | |
| Source:Votorantim2017 | | | | | | | | | | | | | | | | | | | | | | | | | | | | | | | | | | | | | | | | | | | | |
| | | | | | | | | | | | | | | | | | | | | | | | | | | | | | | | | | | | | | | | | | | | | |
| Block3Estimation ParametersforTotal ZincGradeUsingVotorantim SampleData | | | | | | | | | | | | | | | | | | | | | | | | | | | | | | | | | | | | | | | | |
| BlockFlag | 3 | 3 | 3 | 3 | 3 | 3 | 3 | 3 | 3 | 3 | 3 | 3 | 3 | 3 | 3 | 3 | 3 | 3 | 3 | 3 | 3 | 3 | 3 | | | | | | | | | | | | | | | | | | | | | |
| MantoFlag | 1 | 1 | 1 | 1 | 2 | 2 | 2 | 2 | 3 | 3 | 3 | 3 | 4 | 4 | 4 | 4 | 6 | 6 | 6 | 6 | 7 | 7 | 7 | | | | | | | | | | | | | | | | | | | | | |
| MinCompositesto Estimate | 1 | 1 | 3 | 2 | 1 | 1 | 3 | 2 | 1 | 1 | 3 | 2 | 1 | 1 | 3 | 2 | 1 | 1 | 3 | 2 | 1 | 1 | 3 | | | | | | | | | | | | | | | | | | | | | |
| MaxCompositesto Estimate | 4 | 6 | 8 | 12 | 4 | 6 | 8 | 12 | 4 | 6 | 8 | 12 | 4 | 6 | 8 | 12 | 4 | 6 | 8 | 12 | 4 | 6 | 8 | | | | | | | | | | | | | | | | | | | | | |
| MaxCompositesPer Hole | 2 | 2 | 2 | 2 | 2 | 2 | 2 | 2 | 2 | 2 | 2 | 2 | 2 | 2 | 2 | 2 | 2 | 2 | 2 | 2 | 2 | 2 | 2 | | | | | | | | | | | | | | | | | | | | | |
| Composite Item | ZNVOT | ZNVOT | ZNVOT | ZNVOT | ZNVOT | ZNVOT | ZNVOT | ZNVOT | ZNVOT | ZNVOT | ZNVOT | ZNVOT | ZNVOT | ZNVOT | ZNVOT | ZNVOT | ZNVOT | ZNVOT | ZNVOT | ZNVOT | ZNVOT | ZNVOT | ZNVOT | | | | | | | | | | | | | | | | | | | | | |
| ModelItem | ZNVKC | ZNVKC | ZNVKC | ZNVKC | ZNVKC | ZNVKC | ZNVKC | ZNVKC | ZNVKC | ZNVKC | ZNVKC | ZNVKC | ZNVKC | ZNVKC | ZNVKC | ZNVKC | ZNVKC | ZNVKC | ZNVKC | ZNVKC | ZNVKC | ZNVKC | ZNVKC | | | | | | | | | | | | | | | | | | | | | |
| 1stVariogram Structure Type | SPH | SPH | SPH | SPH | SPH | SPH | SPH | SPH | SPH | SPH | SPH | SPH | SPH | SPH | SPH | SPH | SPH | SPH | SPH | SPH | SPH | SPH | SPH | | | | | | | | | | | | | | | | | | | | | |
| 2ndVariogram Structure Type | SPH | SPH | SPH | SPH | SPH | SPH | SPH | SPH | SPH | SPH | SPH | SPH | SPH | SPH | SPH | SPH | SPH | SPH | SPH | SPH | SPH | SPH | SPH | | | | | | | | | | | | | | | | | | | | | |
| VariogramNugget | 0.2 | 0.2 | 0.2 | 0.2 | 0.2 | 0.2 | 0.2 | 0.2 | 0.2 | 0.2 | 0.2 | 0.2 | 0.2 | 0.2 | 0.2 | 0.2 | 0.2 | 0.2 | 0.2 | 0.2 | 0.2 | 0.2 | 0.2 | | | | | | | | | | | | | | | | | | | | | |
| 1stVariogramSill | 0.52 | 0.52 | 0.52 | 0.52 | 0.52 | 0.52 | 0.52 | 0.52 | 0.52 | 0.52 | 0.52 | 0.52 | 0.52 | 0.52 | 0.52 | 0.52 | 0.52 | 0.52 | 0.52 | 0.52 | 0.52 | 0.52 | 0.52 | | | | | | | | | | | | | | | | | | | | | |
| 2ndVariogramSill | 0.28 | 0.28 | 0.28 | 0.28 | 0.28 | 0.28 | 0.28 | 0.28 | 0.28 | 0.28 | 0.28 | 0.28 | 0.28 | 0.28 | 0.28 | 0.28 | 0.28 | 0.28 | 0.28 | 0.28 | 0.28 | 0.28 | 0.28 | | | | | | | | | | | | | | | | | | | | | |
| Variogram Structure1MajorRange(m) | 18 | 18 | 18 | 18 | 18 | 18 | 18 | 18 | 18 | 18 | 18 | 18 | 18 | 18 | 18 | 18 | 18 | 18 | 18 | 18 | 18 | 18 | 18 | | | | | | | | | | | | | | | | | | | | | |
| Variogram Structure1Semi-MajorRange(m) | 15 | 15 | 15 | 15 | 15 | 15 | 15 | 15 | 15 | 15 | 15 | 15 | 15 | 15 | 15 | 15 | 15 | 15 | 15 | 15 | 15 | 15 | 15 | | | | | | | | | | | | | | | | | | | | | |
| Variogram Structure1Minor Range(m) | 5 | 5 | 5 | 5 | 5 | 5 | 5 | 5 | 5 | 5 | 5 | 5 | 5 | 5 | 5 | 5 | 5 | 5 | 5 | 5 | 5 | 5 | 5 | | | | | | | | | | | | | | | | | | | | | |
| Variogram Structure2MajorRange(m) | 70 | 70 | 70 | 70 | 70 | 70 | 70 | 70 | 70 | 70 | 70 | 70 | 70 | 70 | 70 | 70 | 70 | 70 | 70 | 70 | 70 | 70 | 70 | | | | | | | | | | | | | | | | | | | | | |
| Variogram Structure2Semi-MajorRange(m) | 45 | 45 | 45 | 45 | 45 | 45 | 45 | 45 | 45 | 45 | 45 | 45 | 45 | 45 | 45 | 45 | 45 | 45 | 45 | 45 | 45 | 45 | 45 | | | | | | | | | | | | | | | | | | | | | |
| Variogram Structure2Minor Range(m) | 10 | 10 | 10 | 10 | 10 | 10 | 10 | 10 | 10 | 10 | 10 | 10 | 10 | 10 | 10 | 10 | 10 | 10 | 10 | 10 | 10 | 10 | 10 | | | | | | | | | | | | | | | | | | | | | |
| VariogramMajorDirection(deg) | 25 | 25 | 25 | 25 | 76 | 76 | 76 | 76 | 28 | 28 | 28 | 28 | 28 | 28 | 28 | 28 | 28 | 28 | 28 | 28 | 72 | 72 | 72 | | | | | | | | | | | | | | | | | | | | | |
| VariogramSemi-Major direction(deg) | -11 | -11 | -11 | -11 | -9 | -9 | -9 | -9 | -11 | -11 | -11 | -11 | -11 | -11 | -11 | -11 | -13 | -13 | -13 | -13 | -9 | -9 | -9 | | | | | | | | | | | | | | | | | | | | | |
| Variogram MinorDirection(deg) | 0 | 0 | 0 | 0 | 0 | 0 | 0 | 0 | 0 | 0 | 0 | 0 | 0 | 0 | 0 | 0 | 0 | 0 | 0 | 0 | 0 | 0 | 0 | | | | | | | | | | | | | | | | | | | | | |
| MajorSearchEllipseRange(m) | 140 | 105 | 70 | 70 | 210 | 105 | 70 | 70 | 175 | 105 | 70 | 70 | 600 | 210 | 70 | 70 | 300 | 140 | 70 | 70 | 140 | 105 | 70 | | | | | | | | | | | | | | | | | | | | | |
| Semi-MajorSearch EllipseRange(m) | 90 | 67 | 45 | 45 | 135 | 67 | 45 | 45 | 112.5 | 67 | 45 | 45 | 400 | 135 | 45 | 45 | 200 | 90 | 45 | 45 | 90 | 67 | 45 | | | | | | | | | | | | | | | | | | | | | |
| Minor SearchEllipseRange(m) | 40 | 10 | 20 | 10 | 40 | 10 | 20 | 10 | 40 | 10 | 20 | 10 | 40 | 10 | 20 | 10 | 40 | 10 | 20 | 10 | 40 | 10 | 10 | | | | | | | | | | | | | | | | | | | | | |
| Capon ZincGrade(%) | 9 | 12.4 | 24 | | 9 | 12.4 | 24 | | 9 | 12.4 | 24 | | 9 | 12.4 | 24 | | 9 | 12.4 | 24 | | 9 | 12.4 | 24 | | | | | | | | | | | | | | | | | | | | | |
SRK, 2017
| 14.8 | Zinc,Lead,and Silver Recovery Calculation |
As outlined in Metallurgical Section 13 of thisreport, SRK’s metallurgicalQP determined that thezinc oxidetototal ratio (ZnOx/ZnT)provided the best analogto define thematerial types(oxide, mixed,or sulfide) and thereforeprovided thebest analog for recovery forzinc, lead, and silver. Withthis information,onlythe zinc ratiowas used for calculationof recovery. Recoverywas calculatedon ablockby blockbasis and stored to the model using thefollowing criteria:
If:ZnOx/ZnT <0.2 Then:
Zn Recovery (ZNREC) = 93%, Pb Recovery (PBREC) = 84%,Ag Recovery (AGREC) =56% Or:
If:0.2 ≤ZnOx/ZnT ≤0.8 Then:
ZNREC =(-0.8833 * ZnOx/ZnT +1.1067) * 100
PBREC=(-0.7333 * ZnOx/ZnT +0.9867) * 100
AGREC = (-0.4 * ZnOx/ZnT +0.64) * 100
Or:
If:ZnOx/ZnT >0.8 Then:
ZNREC = 40%,PBREC =40%, and AGREC =32%
Therecoveries foreach were thenmultipliedby thetotal estimated grades from the Votorantim samples to calculate arecovered grade foreach element, which was thenstored backthe model.
| 14.9 | ZincEquivalentGradeCalculation |
For multi-element deposits, mineplanning work and reportingof mineable resourcesis simplifiedbyconverting the gradecontribution of eachelementinto anequivalent gradeofthe primary commoditytobesold.For Florida Canyon, the primary economic commodityis zinc, therefore azinc equivalentgrade was calculated.Withthis equivalentgrade, a cut-offcould be calculated utilizingonly thezinc prices, costs, and recoveries,since the prices, costs, andrecoveries of the other elementshave been factored into the equivalentgrade.
Dueto thevariable recovery in themodel, the cut-offgrade for each estimated blockis different.Tocompensate for this, SRKdeveloped a “recovered”zinc equivalent grade (RecZnEq%or ZNREQ)that accounted forthe recoveryof each element blockby block.Withthis item defined, aconstant cut-offgrade could thenbe appliedto the RecZnEq% itemin the model.
Acontained (non-recovered)equivalent gradewas alsogenerated forreporting purposes.
Theinputs fordetermining the factorsused to calculatethe contained zinc equivalent are provided below:
Contained Zinc EquivalentGrade: ZNEQ = ZNREQ / ZNREC * 100
Theinputs fordetermining the factorsused to calculaterecovered zinc equivalentgrade, alongwith further discussionon equivalentgrades and cut-offcalculations areprovided in sections 14.13 and16.3.
Recovered ZincEquivalent Grade:
ZNREQ = ZNTRC + 0.807 x PBTRC +0.029 x AGVRC
Validation of the block modelinvolved an SRK reviewof the Votorantim model coupledwith an independent estimation of the modelgradesby SRK.To carryout theindependent evaluation, SRKutilized the drilling database(assays and composites)and block modelfiles providedby Votorantimin MineSight format.
SRK validated the modelby several methods:
| · | SRK independent grade estimate comparedto the Votorantim gradeestimate; |
| · | Visualcomparative analysisbetween composite and blockgrades; and |
| · | Statistical comparisonof global averages of the original composite valuesand the model estimates. |
14.10.1SRK Grade EstimatevsVotorantim Grade Estimate
SRK’s firststep invalidating the block modelwas to replicate the estimatedgrades in theVotorantim model,using a simplified resource estimate foreach mineral domain. SRKran asingle passspherical search, inverse distance squaredinterpolation. This estimateonly allowed blockgrades to be calculatedfrom composites with a matching MANTOcode. Aspherical searchwas deemedsufficient forthis exerciseas the wireframeswere narrow and “vein-like”andonly compositesfrom thesamemineral domainas a blockwere used in the estimateof grade in that block.
SRK foundthat a150 msearch distance filled roughlythesamevolume of blocks with gradeas the Votorantim estimateand therefore, that search distancewas used forall mantos and grade items.SRK thencompared the totalgradesofthe SRK estimate andto theVotorantim estimateat both a0.00% zinc (ZNTKV) cut-offas wellas a3.00% ZNTKV cut-off.
At a 0.0% ZNTKV cut-offgrade, the SRKzinc, lead, andsilver grade estimates were 20% higher, 23%higher, and14% lower thanthe Votorantim grade estimate,respectively. As the SRK estimate used a relatively long searchand did not limit highgrades, thisindicates that the moreconservative multi-pass approach used by Votorantimin conjunctionwith gradecapping duringlonger searchdistance was successfulin limiting the propagation of the high zinc and lead grades.Silver grades were similarbetween the two estimates.Upon visual inspection, theVotorantim grade estimation appearedto holdgrade closeto the composite dataand appearedto be geologicallyaccurate.
At a 3.0% ZNTKV cut-offgrade, the SRKzinc, lead, andsilver grade estimates were 14% higher, 21%higher, and19% lower thanthe Votorantim gradeestimate, respectively.
Thisexercisewas performed forSRK to verify thatthe Votorantim modelwas notoverestimating or overstating mineral resources. Once confirmed,the Votorantim modelwas used as the basis for SRKresource reporting andfurther, downstream mineplanning.
14.10.2Visual Comparison
SRKconducted avisual comparisonof blockgrades to drillhole compositesin 2-D(plan, section) and in 3-D. Stepping through theplansand sections, SRKnotes closecorrelation between compositegrades in drillholes and adjacent modelblock grades. In general, gradetrends on section appear geologically correctin relation to the composite grades.
14.10.3Comparative Statistics
The global meanof zinc, lead, and silverof compositesamples foreach of the mineral domaingroups was comparedto the meanof estimated values of the blocksat zero cut-offgrade. The comparisonis presented in Table 14-9 forall classifications of resource (Measured, Indicated andInferred) combined. Blockgrades are lower than compositegrades forall elementsas desired, confirmingthat the estimationprocess didnot “manufacture” metal.
Table14-9: ComparisonofComposite and Block Grades
| Source | Item | Metal | ValidData | Min | Max | Mean | Variance | Standard Deviation |
Composites | ZNVOT | zinc | 1931 | 0.01 | 56.49 | 9.60 | 115.80 | 10.76 |
| PBVOT | lead | 1931 | 0.00 | 21.98 | 1.33 | 6.83 | 2.61 |
| AGVOT | silver | 1862 | 0.12 | 161.67 | 13.84 | 494.37 | 22.23 |
Blocks | ZNVKC | zinc | 131225 | 0.04 | 50.15 | 7.95 | 39.96 | 6.32 |
| PBVKC | lead | 131225 | 0 | 17.1 | 0.94 | 1.14 | 1.07 |
| AGVKC | silver | 131225 | 0.19 | 115.63 | 11.28 | 112.71 | 10.62 |
Source: SRK, 2017
| 14.11 | Resource Classification |
TheMineral Resourcesof the Florida Canyon depositwere classifiedbased on the guidelinespromulgatedby CIMDefinition Standards for Mineral Resources, November27, 2010 (CIM) where resources are ranked in orderof decreasing geologicalconfidence into classesof Measured, Indicated and Inferred. Mineraldomaining was the first levelof classification. Mineral domainswere boundedbydrill intercepts, where the wireframeboundaries were defined halfway betweenmineralized and non-mineralized sampleson aninterpreted grade horizonor structure. Thestructure and stratigraphic controls on the Florida Canyon depositare wellunderstood; hence, allof the material in the block modelinside the mineraldomains achieved at least Inferred classification. Higherclassification categories (Measured and Indicated) required close-spaced sampling.
Classification of the resourcesreflects the relative confidenceof the grade estimates. Thisis based on several factors, including: sample spacing relativetothe geologicaland geostatisticalobservations regardingthe continuityof mineralization; mininghistory; specificgravity determinations; accuracyof drill collar locations; and qualityand reliabilityof theassaydata.
Resource classificationat Florida Canyonwas basedon numericalcriteria. Blocksclassified as Measured were estimatedby Ordinary Kriging usingat leastthree composites within25 min the majorand semi-major searchdirections and10 min the minor searchdirection.
Blocksclassified as Indicated were estimatedby OrdinaryKriging usingat leastthree composites within 50 min the majorand semi-major searchdirections and20 min the minor searchdirection.
Blocksclassified as inferredwere estimatedby Ordinary Krigingusingatleasttwo compositeswithin 100 min the majorand semi-major searchdirections and 40 min the minor searchdirection.
Afourthcategorywas flaggedin the model including blocksestimated beyond the limitsabove. Because this materialis wellcontrolledby the mineralizedwireframes and is spatially controlledby thegeologic model, this material has been includedas Inferred Resourcesin the resourcestatement. For the Mine Plan Resource(Section 16.3.7, thisreport), this material was excluded.
| 14.12 | Mineral ResourceStatement |
TheMineral Resource estimate forthe Florida Canyonzinc-lead-silver deposit is presented in Table14-10.
Table14-10: Mineral ResourceStatement for the Florida CanyonZn-Pb-Ag Deposit, Amazonas Department, Peru,SRK Consulting (U.S.), Inc., July13, 2017
| Category | Mass | Zn Grade | Pb Grade | Ag Grade | ZnEq Grade | Zn Contained | Pb Contained | Ag Contained | Zn Eq Contained |
| (kt) | (%) | (%) | (g/t) | (%) | (kt) | (klb) | (kt) | (klb) | (kg) | (koz) | (kt) | (klb) |
| Measured | 1,285 | 13.13 | 1.66 | 19.42 | 14.68 | 169 | 372,200 | 21 | 46,900 | 25,000 | 800 | 189 | 415,900 |
| Indicated | 1,970 | 11.59 | 1.45 | 17.91 | 12.95 | 228 | 503,500 | 29 | 63,200 | 35,300 | 1,130 | 255 | 562,700 |
Measured + Indicated | 3,256 | 12.20 | 1.53 | 18.51 | 13.63 | 397 | 875,700 | 50 | 110,100 | 60,300 | 1,930 | 444 | 978,600 |
| Inferred | 8,843 | 10.15 | 1.05 | 13.21 | 11.16 | 898 | 1,978,900 | 93 | 204,900 | 116,900 | 3,760 | 986 | 2,174,800 |
Zn EqContained
Source: SRK, 2017
| · | Mineral Resources are not Mineral Reserves and do not have demonstrated economic viability. Thereisno certainty that all or any part of the Mineral Resourcesestimatedwill be converted into Mineral Reserves. |
| · | Grades reportedinthis table are "contained" and donotincluderecovery. |
| · | Mineral resources are reportedto a2.8% recovered zinc-equivalent (RecZnEq%) cut-off grade. |
| · | Assuming the average recoveries for the resource, this correspondstonon-recovered cut-off grade of 3.6% contained ZnEq%. |
· RecZnEq%wascalculated by multiplying each block grade byitsestimated recovery, then applying miningcosts, processing costs, general and administrative (G&A) costs, smelting terms, and transportation costs todetermine an equivalent contributionofeachgradeitem tothe Net Smelter Return.
| · | Mining costs, processing,G&A,smelting, and transportation costs total US$74.70/t. |
| · | Metal price assumptionswere:Zinc (US$/lb 1.20), Lead (US$/lb 1.0) and Silver (US$/oz 17.50). |
| · | Asthe recovery for each elementwasaccounted for inthe RecZnEq%, recoverieswerenot factored into the calculation of the 2.8% cut-off grade. |
| · | Average metallurgical recoveries for the resource are: Zinc (80%),Lead(74%) and Silver (52%). |
| · | The equivalent grade contribution factors used for calculating RecZnEq%were:(1.0xrecovered Zn %) +(0.807 xrecovered Pb %) +(0.026 xrecovered Agppm). |
| · | The contained ZnEq% grade reported abovewascalculated by dividing the RecZnEq% grade by the calculatedzincrecovery. |
| · | Densitywascalculated based on material types and metal grades. The average densityinthe mineralized zonewas3.01 g/cm3. |
| · | Mineral Resources,asreported,areundiluted. |
| · | Mineral Resource tonnage and containedmetalhave been rounded toreflect the precision of the estimate and numbers maynot add due torounding. |
| 14.13 | Mineral Resource Cut-off GradeDetermination |
A cut-offgrade (CoG)of2.8%recovered ZnEq%wascalculated forreporting reportresources. TheCoG forthe resourcewas determined using azinc salesprice of US$1.20/lb, totalmineralized material processing, transportation, smelting, and general andadministrative coststotaling US$74.70/t. Nodilution was applied to the cut-offcalculation and,as recoverywas includedin the grade item, recoverywas applied as 100% in theequation below.
CoG = (TotalMineralized Material Mining and Processing Costs) ZnPrice x (ZnProcess Recovery) x22.046
Therecovered ZnEq% is SRK’s preferred parameter for reporting resources as it is equivalent to apositive Net Smelter Return(NSR).
By comparison,if cut-offgrade is evaluatedagainst contained zinc equivalent, then SRKwould applythe averagezinc recoveryforthe resource and theresulting cut-offgrade is 3.6%contained ZnEq.
| 14.14 | Mineral Resource Sensitivity |
Thegrade-tonnage curve forthe Florida Canyon Mineral Resource basedonzincequivalent grade is provided inFigure 14-6. Quantitiesinclude Measured, Indicatedand Inferred Resources.
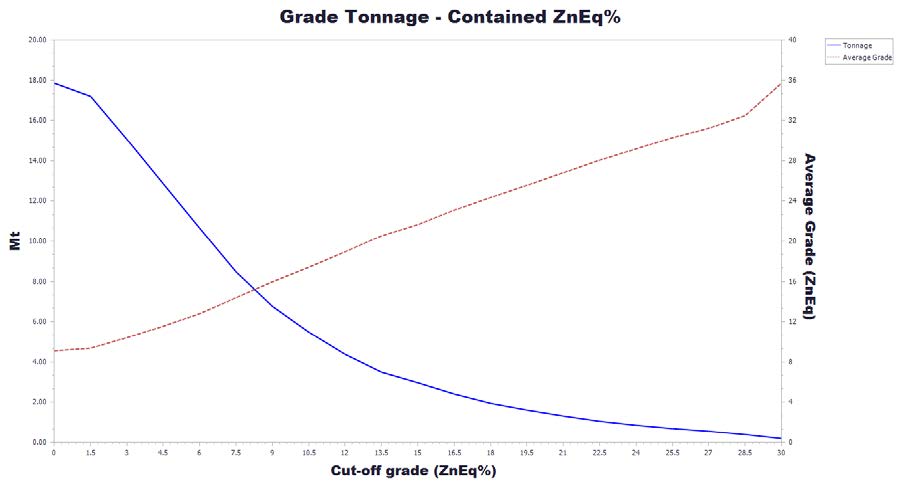
Source: SRK, 2017
Figure 14-6: Grade-Tonnage Curve for ContainedZnEq%
SRK is unaware ofanyenvironmental, permitting, legal, title,taxation or marketing factorsthat couldlimit or affectthe resource stated in this document.
| 15 | Mineral Reserve Estimate |
Therewere no MineralReserves estimated forthe Florida CanyonProject.
TheFlorida Canyon projectis located approximately680 kmnorth-northeast of Lima,Peru in the Shipasbambacommunity, Bongará Province, Amazonas Department,Peru. Theapproximate centralpoint coordinatesof the Projectare 825,248East and,9,352,626 North (UTM Zone 17S,Datum WGS84). Thezone of interest is adolomitized limestone-hostedpolymetallic deposit containing knownzinc, lead and silver mineralization. The topography consistsof mountainous terrain with deep canyons andelevations in the immediate area of the deposit rangingfrom 1950 to 3310 masl.
A numberof factorsare considered in the selectionof an appropriate mining methodto exploit amineralized zone. The factorsinclude, but are not limited to, the geometry, depth, mineralogy, continuityof mineralization, geotechnical conditions, hydrologicalconditions, valueof the mineral, andenvironmental factors.In thecontext of the Florida Canyonproject, the following key parameterswere considered in the selectionof appropriate miningmethods describedin this study:
| · | Geometry: ThestructureatFlorida Canyonis dominatedby aN50º-60ºW trending domalanticline (or doubly plunginganticline) (SRK, 2014b). Thisanticlinal structure results inpotential mining blocksof the mantodeposits oriented along shallowdipping footwall/floorswith dips rangingfrom 0° at the hingeto 25° nearthe middle to outer edges of the dome. Thedip is as steep as 50°in the southof the deposit near the SanJorge exploration adit. Additionally, two steeply dippingmineralized bodies have beeninterpreted to exist. The first,known as SanJorge (zone F1),is located at the southern endof the deposit,andthe other, known as SAM (zones 2 and 3),is locatedon the southwest edgeof the deposit. The dipof these bodiesranges from 60° to 85° in San Jorge and55°to 80°in the SAM body. |
| · | Higher grade mantomineralizationin theanticlinaldomeconsists of zones between 1 mand 9 mthick mantoswith barren gaps between the mantosas smallas 1.5m. Twentymantos and two steeply dipping veinstructures have been modeledand are of sufficient grade to be considered forpotential mining. |
| · | Depth: the mineralized bodiesoutcrop inseveral areas and the potential miningdepth reaches 550 min the steeply dippingareas and 470 min the shallow dipping mantosin thenorthern extremities of the deposit. |
| · | Mineralization: the lead-zincmineralization is generally classifiedinto threematerial types –sulfide, oxideand mixed.Oxidized mineralization tends to occur in theupper zones of the deposit nearthe surfacewith sulfidematerial generallyoccurring in deeperzones. Mixedmaterial, ranging from ZnOxide to Total Znratios of 0.2 to0.8 occurs throughoutthe mineralized zone but generally overly the sulfidezones. |
| · | Continuity: themodeled mantos are fairly continuousand extend2.1 kmfrom the southwestto the northeast. The northern areaextends laterally 1.1 kmperpendicular to aSW-NEtrend. The steeply dipping SAM area 600 mnorth to south with a thicknessof 2 mto morethan 30 m. The modeled San Jorgebody measures500 mnorthtosouth with thicknessesranging from 1 mto morethan25 m. |
| · | Geotechnical: Rock qualityin the Chambará2, the primarymineralized unit, is quite good(Goodto Very Good Quality – Q’20-40).Q’values ranged from 4to40 for the geotechnicaldomains. Open stoping withpastefill is thepreferred mining methodwhere the mineralized zone is steeper than45°to50°. Flatterdipping sectionsof the depositmaybe minedbyroom and pillar or drift and fill methods. |
| · | Hydrological: The mineis located in ahigh rainfall environment.Infiltration of surfacewater persists to approximately50 mdepth andrecharges groundwater via structural pathways andinterconnected karstfeatures in dolomitized and de-dolomitized carbonatestratigraphy. Thepotentiometric surfacehas been determinedby aseries of piezometers. Thisgroundwater surfacefollows the south-southwest flow directionof Florida Canyon anddaylights at the river level in the canyon.Most of the planned miningof the flat mantos will occur abovethe water table. Steeper zones of mineralization, suchas San Jorgeand Samwill occur below thewater table as willparts of the KarenMilagros mantosto the north. Localinflows maybe encountered when crossingfaults or intercepting karstfeatures. |
| · | Mineral Value: the averageNSR value of mineralized material containedwithin minableshapes, including dilution,is over US$140/t. Twoconcentrate products,lead andzinc, are expected to be produced with the leadconcentrate containing payable amountof lead andsilver. |
| · | Environmental Factors: theProject is located in theupper Amazon River Basin in a highaltitude tropicaljungle. The rugged topographyandhigh annualrainfall hasimpacted exploration and is expectedto impactany future site development and construction. Thelocation, climate, topography and sensitivityof the surrounding environment are, andwill continuetobe,important considerations in thedesign and future operation of any producing mineat the site. |
Figure 16-1 showsan overviewof the modeled Mantos, SAM vein, and San Jorgevein as well as the existing San Jorgeadit.
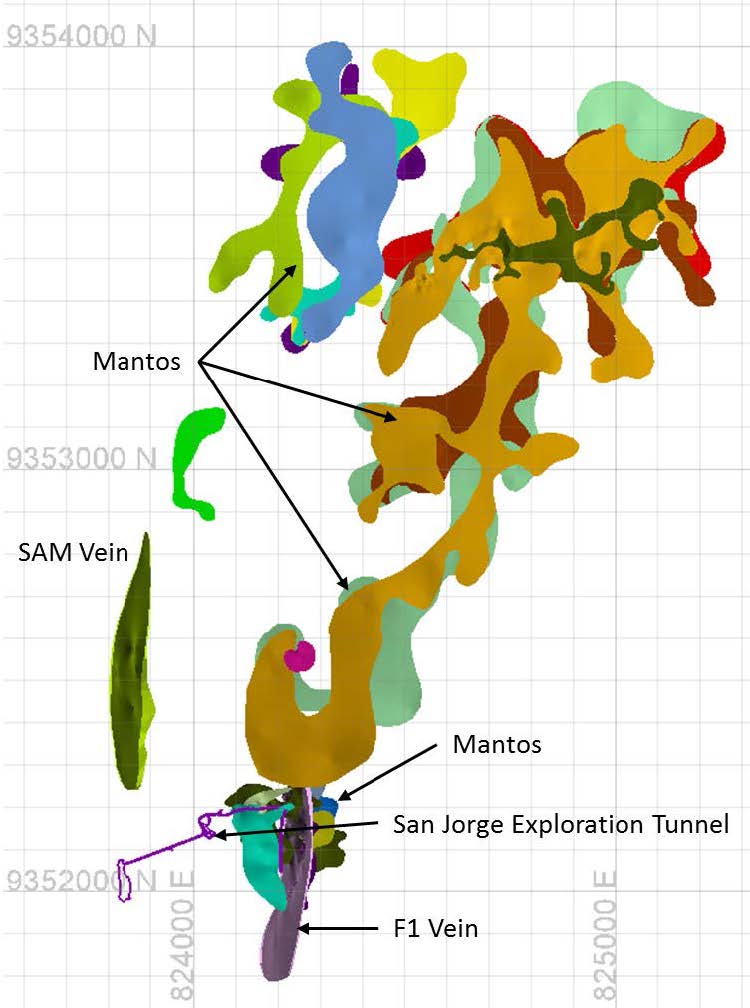
Source: SRK, 2017
Figure 16-1: Overview ofFlorida CanyonMineralized Bodies
Figure 16-2shows a section viewof the F1mineralized body and nearby mantosat 9,352,100N, looking north.
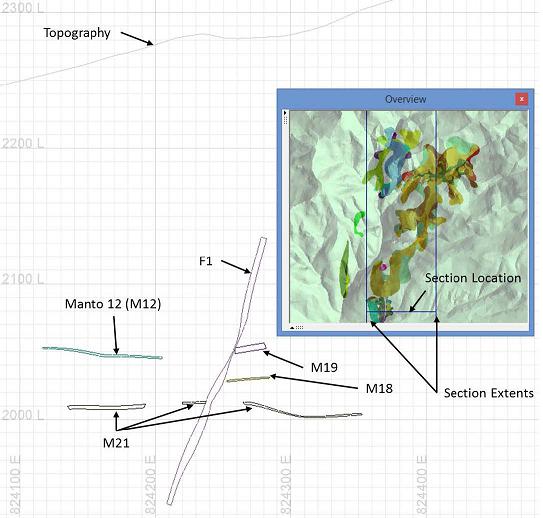
Source: SRK, 2017
Figure 16-2:Section View of the F1Mineralized Bodyand Nearby Mantos(9,352,100N - LookingNorth)
Figure 16-3 shows a sectionthrough the SAMmineralizedbody and nearby mantosat 9,352,530N,looking north.
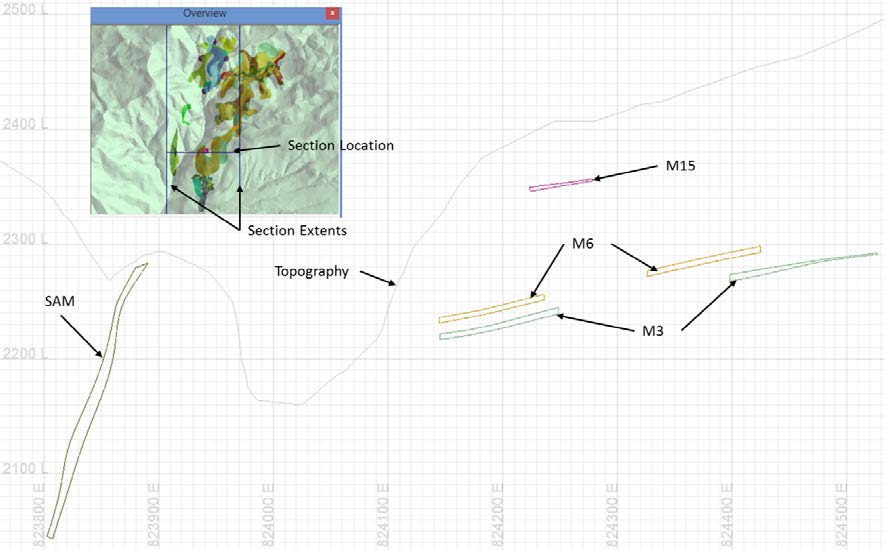
Source: SRK, 2017
Figure 16-3: Section View of theSAM Mineralized Bodyand Nearby Mantos(9,352,530N -Looking North)
Figure 16-4shows a sectionoriented N33E throughthe mantosillustrating thedomestructure of the mantosorebodies.
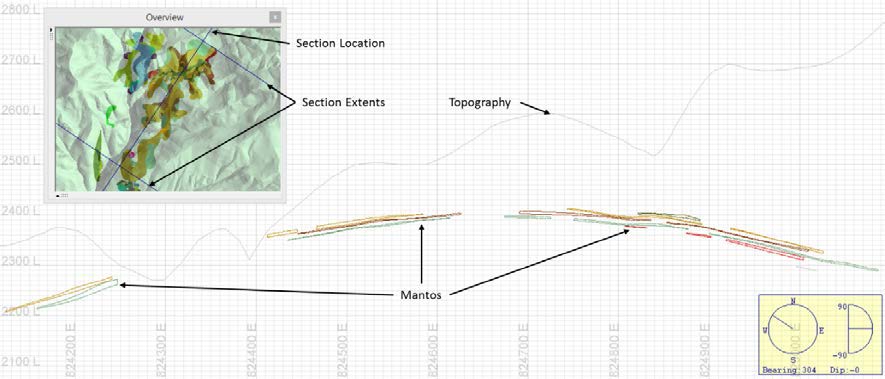
Source: SRK, 2017
Figure 16-4: Southwest toNortheast Section ViewShowing the DomeStructure of Mantos(Looking Northwest)
| 16.1 | Proposed MiningMethods |
Thehigh-relief topography, depth andlateral extentof the mineralizedzones, and environmental factors makesopen pit miningof thedeposit impractical. The selectionof asuitable underground methodor methods is required. Belowis abrief generic summaryof potential underground mining methods and keyattributes that were considered for theapplication of eachmethod.
| · | Caving techniques including blockcaving and sublevel caving: Typically appliedto large, thickdeposits with a fairly steepdip. Blocksorlevelsare undercutto induce cavingof the block. Surfacesubsidence is likely. Highproduction rates are possible. Amountof initial developmentis generallyhigh. |
| · | SublevelStoping: Typicallyapplied to steeply dippingveins withvarying thickness.Vertical continuityis important. Topand bottom cuts (sills) are excavated above and belowthe stope.Parallel or fanpattern blastholesare drilled. Themineralized material is blasted in verticalslices and then mucked fromthe bottom sill. Stopes canbe backfilled to preventsubsidence and allow miningof adjacent stopes. |
| · | Vertical Crater Retreat: Typically appliedto steeplydipping, massivedeposits. Similartosublevel stopingexcept that blasting occursin horizontal slicesand uses large diameterblast holes. |
| · | Room and Pillar:Typicallyapplied toflator shallow dipping deposits.Openings aredriven at regular intervals and pillarsof intact rockare left behindto provide support forthe openings. Recoverythe mineralizedmaterial is typicallylower thanother miningmethods dueto pillarsbeing leftbehind. Pillar recoverytechniquescanbe appliedtoimprove recovery. |
| · | Cut andFill: Typically appliedto moderate to steeply dipping deposits.Cuts are madein the mineralized material and then backfilledto provide supportand allow miningof the cutabove (overhandcut and fill). Mining recoveryis typically high. Operating cost typicallyhigher than unsupported or self-supported (caving,room and pillar) methods dueto the costof backfill. |
| · | Driftand Fill: Similarto cutand fill except thatdrift andfill is applied where the width of themineralized material requires morethan one cuton agiven level. |
Other methods suchas stull stopingand square set stoping havenot been considered dueto the high costand generally low productivityof the methods.
Takinginto account thekey parameterof the Florida Canyon project, the followingunderground methods are suitable forapplication.
| · | SublevelStoping (Longhole Stoping) forthe steeply dippingbodies identifiedas F1 and SAM(Figure 16-1). |
| · | Mechanized Cut and Fill forthe moderatedipping bodies. |
| · | DriftandFill fortheflatto moderate dipping bodieswheremorethan one cutis requireddue tothewidth of the zone.Toincrease mining recoveryinitial (primary) cuts are backfilledwith cemented pasteor rockfill and intervening secondariesare removed and backfilledwith unconsolidated waste rockor paste as required. |
SRK notes that roomand pillar mininghasbeen specified inprevious studies with varying mining recoveries andcutheights applied. The applicationof room and pillartechniques is appropriate. However, duetothe relativelyhigh gradeof the mineralizedmaterial,cut andfill and driftand fillare used in the moderately dippingtoflatlying zones with the goalof higher recoveryofthemineralized material. Additionally, duetothe topography, climate, and environmental sensitivity of the area SRK has attemptedtoplace as much waste rock and tailings underground as possible. Conventional room and pillar mining on a checkerboard pattern could be applied to specific zones of the Florida Canyon project, particularly in lower grade areas, and shouldbeconsidered in future trade-off studies at the prefeasibility level.
| 16.2 | GeotechnicalInputfor MineDesign |
The maximumthickness of the Sam and F1 mineralizedzones is 12 mdipping ranging from65° to 85°. Themineralized zonesare typically 2to 6 mwide. Openstoping with pastefill is thepreferred mining methodwhen the mineralizedzone is steeper than45° to 50°. Flatterdipping sectionsof the deposit maybe mined by driftand fillmethods as summarized in thissection.
Severallarge (largest 25 mhigh x 8 mwide x35 long) karstcaverns were intersectedby theexploration tunnel in a faulted area. Additional karstis observed indrilling, associatedwith the same normalfault plane. Karst and voidsmay resultin difficult miningconditions and potentiallydelays to mining, requiring backfillingand/or additional ground support. An allowance shouldbe made for a certain amountof non-mineable areasin karsticareas duetounfavorable ground conditions.
It is assumed forthe geotechnical analysis thatthe ground will be depressurizedbynatural drainage through the mine. Thisis typical in karsticconditions where groundwater gradients are significant. The hydrogeology data available indicates that groundwateris structurally controlled,so localinflowsmaybe encountered when crossing faults or interceptingkarstfeatures. It is also possible thattheinflows will disappearinto other karstic features downstream.
16.2.1Geotechnical Characterization
Thegeotechnical characterization work forthe projectwas performedby Klohn CrippenBerger anddocumented in a geotechnical reportdated October 2013 (KCB,2013a). Followingis a summaryof parameters developed fromthat study.
Within the projectedunderground workings, the unitspresent are dominatedby limestonesand dolomites of the Chambaráformation. The Chambaráformation is composedof medium to darkgreylimestones, dolomiticlimestones anddolomites. Nodulesand silicicinclusions canbe found insomeof these limestones. These rocksare typically massive, however karsticcavities are a commoncharacteristic inthe area. Thereare three mainunits inthe Chambaráformation that are characterized and influence thegeomechanics of the mine design, named Chambará1, 2 and3, in order fromearlier to latertimeof sediment deposition.
| · | Chambará 1 Below themineralized zoneand Chambará2. Thisunit is the Footwall(FW)and will influence developmentofstoping areas of the mine.It is composedof sequences of fine-grain dolomites and marlstones. Theunits thathost themineralized bodyoverlie the Chambará 1units andno extraction work is expected inthese zones. |
| · | Chambará 2 Thisis the maingeotechnical domainand comprisethe mineralizedzone andthe immediate Hangingwall (HW)and development access.It consists of dolomites and limestones. Theseunitshostthe mineralized bodyand havean average thicknessof about 200 m. Thestratigraphy of Chambará 2is geologically subdividedinto 7 units,which are distinguished bythe rocktextural fabric and composition(packstone, wackstone,mudstone, and floatstone). |
| · | Chambará 3 Thisis above the hangingwallof the mineralized zone, and therewill be development through thedomain. It consists mainlyof limestones of thewackestone and mudstone types. These are moderately to high bituminouslimestones, and cherts canbe found in someareas. Chambará 3has an average thicknessof 250 m.Fault or joint infill is typically composedof bitumenor clays. |
Thesegeologic units arethe primary Geotechnical Domains forthe project.
Rock massclassifications including Rock QualityDesignation, (RQD) RockMass Rating (RMR) (Bieniawaski,1989) andBarton’s QSystem (Q)(Barton, Lien, &Lunde 1974) forthe units of interest are listed in Table16-1. Q’values ranged from 4to40 forthe geotechnical domains listed. Values listed in bold are median values, andthe rangeof values is listed in parentheses. Thesetests were conducted accordingto ISRMstandards which are the industry standard. Rockquality in the Chambará2, the primary mineralizedunit, is consideredquitegood(Goodto VeryGood Quality – Q’20-40).
Table16-1: Rock MassClassification Parameters
| Group | Rock Types | RQD | RMR | Q’ |
| Chambará1(FW) | Dolomite and Marlstone | 80(30-100) | 85(61-100) | 40(1-100) |
| Chambará2(mz zone) | Dolomite and Limestone | 80(0-100) | 80(41-100) | 20-40(10-100) |
| Chambará3 | WackestoneandMudstone | 45(0-100) | 75(41-100) | 4 (1-30) |
Source: SRK, 2017
Intact Rockstrengths, as measuredbyUniaxial Compressive Strength (UCS) testing,are more than75to 100 MPa, basedon the laboratorytesting completedon Chambará 2 and3.Figure 16-5illustrates ahistogram of the intact UCS test results. Statisticalanalysis of the dataindicates the mean UCSis 125 MPa, with a lower boundof 100 MPa andan upper boundof 150 MPa in Chambará2. Thesetests were conducted accordingto ASTMstandards whichare the industry standard. Rockstrength in the Chambará 2(mzzone) is considered quite strong.

Source:KCB2013a
Figure 16-5: UCSStrength TestingSummary
16.2.2Stress Field and topography
No stress measurementshave been madeon-site.Theorientation of the principal stressfield is in an east to east-northeast horizontal directionestimated fromthe world stressmapbased on back-analysis of earthquake focal mechanismsat great depths. Thisis oriented sub-parallelto the directionof subduction thatis occurringalong the Andean mountainrange.
Steep terrain and localfaulting willresult in localvariations in the stress field.Maximum horizontal stresseswill tendtobe sub-parallelto the strikeof major faults. Minimumstresses near the existingnatural slope faceswill tendto be aligned normalto this face. Within themineralized body, thepresence of large karsticcaverns will also cause stressrelief and rotation of stresses near caverns.
Thevertical in situ stress (sv)magnitude is generally takenas the unitweight of the overlying rock timesthe depth. The averagevertical stress gradient is assumedat 0.027 MPa/m.
Thehorizontal stressratio (sH:sv) is not known, butin seismicallyactive subductionregions of Peru, it is thoughtto be elevatedabove thevertical stress. Theaverage horizontal stressratiocan beconservatively assumedas 1.2 forunderground design purposes.
16.2.3Cut and Fill parameters
Incut andfill areas KCB recommended35mstope lengths in 2.50to 3.0 mwide andhigh mineralized zones.Theyalso recommend16 mhigh sillpillarsevery 35 mvertically.Basedon SRK’s reviewof the available data, with good paste filling itmaybepossible to get three times that distance (about 100m) basedonthe good rock mass quality of the hangingwall rocks and tight backfilling for the PEA level design. Forcutand fill paste backfill will require a minimumof1% to 2% cementtodewater the fill and minimize the potential for liquefaction.
16.2.4Sub-level Open Stoping Parameters
Whenthe mineralizedzone is steeper than45° to 50°open stopingwith pastebackfill is thepreferred miningmethod. Therecommendations and dimensionslisted are also applicableto the nearvertical sections of the deposit. Rockquality in the Chambará 2is quite good (Goodto Very Good Quality – Q20-40) which means largerstopes. Areas with flatterdips need stope stabilityto be managed. Chambara 2contains the mineralized zone of the deposit. Thereis sufficientthickness of Chambara 2on the orderof tens of meters and is sufficienttosupport the hanging wallof thestoping sectionof the mine. Stacked mantostope areasshould be mined fromthe top hangingwallto the footwallsequence.
Assessmentof stable stope dimensions has been madeusing the empirical Stability GraphMethod (Potvin 1988). The mainobjective has beento first confirmthe stability of 16 m highstopes, then examinethe potential for alternative dimensions.
Stability Graph Method
TheStability Graph method makes useof astability number,N’, to derive hydraulic radius values (area
÷perimeter) forlimiting stable stope wall dimensions from astability graph. The methodis based on empirical relations fromcase histories andis well provenas an industry acceptedmethod, especiallyat the PEA leveldesign. As theproject movesto a feasibilityor design level additional stability modelingusing numericalmethods is recommended.
The stability numberis calculated from a Q’rating multipliedby factorsA, B, andC,whichtakeaccount of the stressto strength ratio inthe stopewall (A), theorientation of critical jointsets relativetothe stope wall(B), andthe orientation of the stope wallitself (C).
N’ = Q’ x A x B x C(Equation 16.1)
An empiricalchart (the Stability Graph), has been derived(Potvin, 2001) from many real stope stability casesstudies from various countries worldwide, and relates N’to hydraulic radius for caseswhere stope dimensionsare stable, partially unstable(or wouldprove unstableover long timeperiods), or would collapse or cave. Stability limitsare defined both forunsupportedand supported cases,where support would comprisecable bolting.
Hydraulic radius (HR)is theratio of the surfacearea to perimeterof the stope wall, from which walldimensions canbe derived.
HR =Area of open stope hanging wall surface =width xlength Perimeter of hanging wall surface 2(length +width)
It is possible to define critical hydraulic radii for stabilityunder bothunsupported and supportedconditions using thismethod, given local geotechnicalconditions and stopewall orientations. The HRis then adjustedto optimize possible stope dimensionswithout makingdimensions solarge thatthe stope is likelyto becomeunstable.
Figure 16-6illustrates themedian andlower bound stability numbers forthe wall and back. Theseare basedon alower bound Qvalue of 10 inthe Chambará 2 Boththe medianand lower bound values plot within the unsupportedtransition zone, indicatingthat thewall andback will be stablewithout support. Input parameters forthe stability graph arelisted in Table 16-2. Chambara 3ground conditions are poorer comparedto Chambara2, but there willis sufficient thicknessof Chambara 2above theback of the stopes,and it is thecontrolling geotechnical domain for thestope dimensions.
Table16-2: Stope Stability Graph Input Parameters
| Material | | Q’ | A | B | C | | N’ | HR |
| | low | med | | | | low | median | |
| Chambara2 -wall | 40 | 70 | 1 | 0.4 | 5 | 80 | 140 | 16 |
| Chambara2 -back | 10 | 20 | 1 | 0.8 | 5 | 40 | 80 | 13 |
SRK, 2017

Source: SRK, 2017
Figure 16-6: Empirical Stability Graph forStope Geometriesin Chambara 2
Stabilityof the transverse hangingwall in 50°to 60° dippingmineralization will be thelimitation on thesize of the opening. KCB has recommended300 mlong transverse stopesin mantos thatare 7 mhigh. Thissize stopes mightbemostefficiently minedwith overcut and undercut with retreat mining the sillin between. The2.5 to 3 mheight is consideredquite narrow such that stabilityof the back is not the critical factor in the design in thesteeper dippingvertical sections of the mine.
Therockmassinputs to thedesign andresulting stopedimensions are basedon medianvalues of rock massparameters and aresulting stability numberN’.Thelower bound casefor the Chambara 2rockmasshas been analyzed, andthe stope dimensionspresented are stillvalid forthis case. Theresults stillplot within the limitsof the unsupported transition zone. If ground conditions are worse than indicatedbythe drill core the transverse stope lengthmaybe shortened without affecting the overall design.
Table16-3 liststhe recommendedstope dimensions forvarying drift sizes. Theseare appropriateat a PEAlevel. Detailed stope sequencing and stressanalysis is recommended for a feasibility level studyand final mine design.
Table16-3: Proposed Stope Dimensions
| Sizes w x h (m) | MzZone | HR | Width (m) | Height (m) | Length (m) | Area(m2) | Perimeter (m) | Maximum HeightAllowed (m) |
| 2.5 x 2.5 | Wall | 16 | | 6.5 | 300 | 1,950 | 613 | 36 |
| | Back | 13 | 2.5 | 6.5 | | 16.25 | 18 | NA |
| 2.5 x 3.0 | Wall | 16 | | 7 | 300 | 2,100 | 614 | 36 |
| | Back | 13 | 3 | 7 | | 21 | 20 | NA |
| 3.0 x 2.5 | Wall | 16 | | 6.5 | 300 | 1,950 | 613 | 36 |
| | Back | 13 | 2.5 | 6.5 | | 16.25 | 18 | NA |
| 3.0 x 3.0 | Wall | 16 | | 7 | 300 | 2,100 | 614 | 36 |
| | Back | 13 | 3 | 7 | | 21 | 20 | NA |
Source:KCB(2014a)
16.2.5 CrownPillar
Thescaled span methodwas used to assessthe stabilityof the crown pillar for the stopes (Carter,2014). Thisanalysiswas conductedto prevent a collapseof mineworkings tothe surface. Basedon this analysis,if the stope sizeis restricted just below the crown and near the surface, then the crownpillar couldbe reducedtoanequivalent of twoto three timesthe span width.
However, a minimum crownpillar of 30 mis assumedand used forthis study. Thisis basedon thesteep topographyat the site,and wanting to ensurethat no stopesor openings approached the surface. Tightpaste backfillof all stopeopenings is required.
Detailed analysis, including local surfacetopography, and calculation of crown pillar thicknessshould be reevaluated at aFS level study and forfinal stopedesign. An opportunity forthe project is to evaluate the mineralized zone near the surface andto determineif additional material couldbe brought into the mineplan.
16.2.6 SillPillar Dimensioning
According to the analysis sill pillars willbe requiredat35 mintervals, laterally alongdip inthe shallowdipping areas (less than 45°).In the steeply dippingvertical areas sillpillars with aheight of 16 mmaybe used for every96 m (six levels)of vertical excavation.It isassumedthat 50%ofthese pillarlevels willbe ableto be recovered on retreat. This maybe ableto be optimized dependingon the geotechnicalparameters of the paste fillmaterial used. Thesill pillars left shouldbethe widthof the stope being opened, which is expectedto be the heightof the orebody between 2.5to 3 m.
Partial recoveryof the sillpillarsmaybepossible. Detailed numerical modelingofthe stope sequencingand a cost benefitanalysis of ground support, dilution and recovery shouldbe made. During feasibilityand final design sillpillars should optimallybeplaced in eitherlower gradezones or waste if possible.
16.2.7Ground Support
Theground support estimateis basedon the rock massclassification and on-siteexperience in theexploration drift.Basedon the median Qvalues of 20to40 in Chambará 1 and2, 75% to 90% of the ground is not estimated to require groundsupport. Local spotbolting around faultsor shearzonesmaystillbe required. The localsupport classificationis supportclass 1 (lowestlevel) unsupportedground. It is estimated that 10%to25% of development openings willrequire mesh,bolts and 50mmofshotcrete.Somedrifts and openings in Chambará 3will require pattern bolting andmesh/shotcrete (Class 4support).
Short-term accessto stopesand cut and fill areas(less than 2years)may usefriction bolts. Long term(greater than 2years) boltelements should consistof fullygrouted (cementor resin) bar.
Theestimated ground supportparameters were developed basedonBarton’s tunnelingqualityindex Qvalues as illustrated on Figure 16-7.Dimensions of the accessdrifts and input parameters forthe Barton analysis are listedon Table16-4. Aground support schedule estimateis listed on Table 16-5. Thistable liststhe estimated percentageof ground foreach ground support classand each geotechnical unit. Groundsupport elements foreach class are detailed.
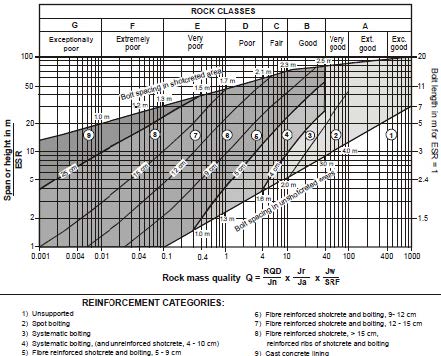
Source: Grimstad and Barton, 1993
Figure 16-7:Grimstad andBarton GroundSupport Estimate
Table16-4: Parameters for the Barton Method
| Excavation | TypeofExcavation | Opening DimensionsW x H (m) | ESR | De |
| | | | Min | |
| AccessDrives | LongTerm2+years | 5 x 5 | 3 | 1.7 m |
| Development Drives | ShorttoMedium Term 1-2 years | 4 x 4 | 2.5 | 1.6 m |
Source:SRK
SRK Consulting (U.S.), Inc.
NI 43-101 Technical Report, Preliminary Economic Assessment –Florida Canyon Zinc Project Page 116
Table16-5: Estimated Support According to the Barton Method
| GeotechnicalZone | AmountofExpected Ground | Q' | AveQ | Rock Classes | Excavation | Support Categories | BoltLength | Bolt Spacing | Other support |
Chambara 1 & 2 | 75% - 90% | 40 + | 20 | Good -Very Good | Access | 1 -Spot bolting (15/10m) | 2.5 m | ‘- | groutedbar |
| | | | | | Development | 1 -Spot bolting (15/10m) | 2.5 m | ‘- | Split sets |
Chambara 1 & 2 | 10% - 25% | 20-40 | 4 - 20 | Fair-Good | Access | 4-Bolts, mesh and shotcrete | 2.5 m | 1.2 m | fullygrouted bar,mesh, 4 cmshotcrete |
| | | | | | Development | 4-Bolts, mesh and shotcrete | 2.5 m | 1.2 m | fullygrouted bar,mesh, 4 cmshotcrete |
Chambara 3 | 65% - 75% | 4 + | 2 | Fair | Access | 1 -Spot bolting (15/10m) | 2.5 m | 1.6 m | grouted bar |
Chambara 3 | 10% - 25% | 1 - 4 | 0.2-0.7 | Poor | Access | 4-Bolts, mesh and shotcrete | 2.5 m | 1.2 m | fullygrouted bar,mesh, 6 cmshotcrete |
Source:SRK
16.2.8Tailings Backfill
Paste-fill assumesufficientcementcontent to de-water the paste, sothat the material will notliquefy. For stope backfill1%to 2% cementbackfill is recommended for costing.
Theanalysis provided in this reportis preliminaryin nature. Thereader is cautioned thatMineral Resources are not OreReserves andhave not demonstrated economicviability. Thereis no certaintythat this preliminary economicassessment will be realized.
Twenty manto shapesandtwo steeply dipping veinstructures have beenmodeled as three dimensional (3D) wireframesbased on drilling andrepresent shapes above a0.5% Zn cut-off. Aresource block modelwas also used. The block model contained estimated silver,lead, andzinc values as wellas estimatesforthe ratioof oxideto totalcontent for each commodity (silver,lead and zinc). Each block model blockhas been classified sothat Measured, Indicated andInferred Mineral Resourcescanbe identified. Blocksin the resource model measures 6 m x 6 m x 3 min the x, y and z directions,respectively.
Potential mining blocksshapes were constructed usingMaptek Vulcan’s implementation of Alford Mining System’sStope Shape Optimizer (Stope Optimizer). Considering the size and shapeof the individual mineralized bodiesas well as the conceptsinherent inStope Optimizer, the resource model blocksneeded tobe resizedto produce a more realisticrepresentation of thepotential mining blockshapes. Blocksin the modelwere re-blockedto a minimumsize of 1 m x 1 m x0.5 mbased on the wireframeshapes. Thegrade values of the original blockswere appliedto the blocksinside the wireframeshapes. Grade valuesof 0were assigned tothe blocksoutside the wireframes.Figure 16-8shows an example sectionat 9,353,600N (looking north) comparing theoriginal resource model blocksand the re-blocked model blocks withthe M6 manto wireframe.
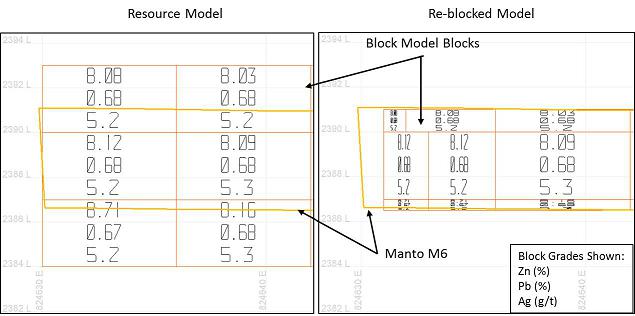
Source: SRK, 2017
Figure 16-8: Section ViewShowing Resource and Re-blocked Model(9,353,600N -Looking North)
16.3.1Net Smelter Return
Themineralized zones at Florida Canyon arepolymetallic with zinc, lead and silvercontributingto thetotal valueof mineralized material. Becausethe valueof themineralization is not basedon onecommodity, theminable inventoryestimate utilizes a NetSmelter Return (NSR) cut-offapproach. NSRis definedas theproceeds from the sale of mineralproducts after deducting off-site processingand distribution costs andis typicallyexpressed on adollar per tonne basis. An NSRapproach is commonlyused in themining industry forpolymetallic deposits andis considered best practice.Inputs into the NSR calculationincludethegrade of material, processingrecovery, commodityprices, concentrate shipping charges, and treatmentand refining charges.
Resource grades are estimated foreach block intheresource block model.As described above, theresource block modelhas been reblockedto provide better definition around thewireframe models.Processing recoveriesare modeled to be variable dependingon the ratioofzinc metalassociated withoxide mineralization to totalzinc (ZnOx/ZnT). Theexpected processing recovery foreach element is shown in Table 16-6.
Table16-6: Expected Processing Recoveries
| Parameter | | AlterationState | |
| | Sulfide | Mixed | Oxide |
| ZnOx/ZnT Ratio | <= 0.2 | 0.2 to 0.8 | >= 0.8 |
| ZnRecovery | 93% | (-0.8833 (ZnOx/ZnT)+1.1067)*100 | 40% |
| Pb Recovery | 84% | (-0.7333 (ZnOx/ZnT)+0.9867)*100 | 40% |
| Ag Recovery | 56% | (-0.4(ZnOx/ZnT) +0.64)*100 | 32% |
Source: SRK, 2017
Recent work completedbyVotorantim has demonstrated that oxide and mixedmaterial with higheroxide contentcanbe processed,though at alower recovery, andshouldbeincluded as potential mining material in theinventory. Materialprocessed at FloridaCanyon willbe madeup of primarilysulfide and transition material.In SRK’s opinion thereisno needto exclude oxide materialfrom consideration unless economicsor further metallurgical and processingtest resultsindicate that aspecific ZnOx/ZnT cut-offshould be usedto restrictmaterial input to processing.
Twoconcentrate products willbeproduced, a lead concentrateand azinc concentrate. Thelead concentrate will contain payable amountof lead andsilver. No payablesilver content is expected in the zinc concentrate.
As of the effective dateof this report, metals pricing in US dollarsis exhibiting relatively significantvolatility. The spotzinc price has ranged betweenUS$1.10/lb and US$1.33/lbover thepast six months,spot lead price has rangedfrom US$0.89/lb toUS$1.00/lb, and spot silver pricehas ranged from US$15.74/ozto US$18.56/oz. Longterm analyst forecastsrange from US$0.80/lb to US$1.38/lb, US$0.55/lb toUS$0.96/lb, and US$10.94/ozto US$20.00/oz forzinc, lead and silver,respectively. Forthe purposes of stope optimization anddefining potential mining blocks forfurther analysis in this study, pricing of US$1.20/lb Zn, US$1.00/lbPb, and US$17.50/oz Ag has been used.
Theparameters used in the NSR calculation for stope optimizationare summarizedinTable 16-7.Note that thesevaluesmay vary somewhat fromthose used inthe final economicmodel. An NSRvaluewas assignedto each block model blockin Vulcansoftware. Blocksoutsidethe modeled wireframes,or with azero grade, or with a classificationof undefined have beenassigned an NSRvalue of 0.
Themineralized bodies outcropin several areas. Underground miningin these near-surfacezones is higher riskandmay notbepossible given the topography andenvironmental conditions. A30 mbuffer below topographywas created, and the blockswithin this bufferzone have been assignedan NSRvalue of 0 so thatunderground stopes shapes are not producedin these areas. The quantityof Measured, Indicatedor Inferredmaterial inthe resource modelabove theNSR cut-offand above the30 mbuffer is 151,000t.Further studyis requiredtodetermine if this materialis minable usingunderground or surfacemethods.
Table16-7: NSR CalculationParameters forStope Optimization
| Parameter | Unit | Value |
| MetalPrices |
| Znprice | US$/ lb Zn | $1.20 |
| Pbprice | US$/ oz Ag | $1.00 |
| Ag price | US$/ ozAg | $17.50 |
| Recovery toConcentrate |
| Zn | % | 40% to93% |
| Pb | % | 40% to84% |
| Ag | % | 32% to56% |
| Concentrate Grade |
| Zn | % | 50% |
| Pb | % | 50% |
| Moisture Content | % | 9% |
| Transportation and Treatment/Refining Charges |
| Transportation Charge | US$/t concentrate | $70.00 |
| Zntreatment charge | US$/t concentrate | $115.00 |
| Pb treatment charge | US$/t concentrate | $100.00 |
| Znrefining charge | US$/lbZn | $0.115 |
| Pbrefining charge | US$/lbPb | $0.100 |
Source: SRK, 2017
An example NSR calculation foran individual blockis shown in Table 16-8.
Table16-8: Example NSR Calculation
| Parameter | Units | Value |
| Volume | m3 | 7.5 |
| Density | t/m3 | 2.89 |
| Tonnage | t | 21.7 |
| Resource Zn | % | 6.62 |
| Resource Pb | % | 0.05 |
| Resource Ag | g/t | 9.78 |
| Contained Zn | lb | 3163.4 |
| Contained Pb | lb | 23.89 |
| Contained Ag | oz | 6.82 |
| ZnRecovery | | 0.93 |
| Pb Recovery | | 0.84 |
| Ag Recovery | | 0.56 |
| RecoveredZn | lb | 2941.9 |
| RecoveredPb | lb | 20.06 |
| RecoveredAg | oz | 3.82 |
| Value Zn | US$ | $3530.33 |
| ValuePb | US$ | $20.06 |
| ValueAg | US$ | $66.79 |
| ZnConcentrate (wet) | t | 2.91 |
| ZnConcentrate (dry) | t | 2.67 |
| Pb Concentrate (wet) | t | 0.20 |
| Pb Concentrate (dry) | t | 0.18 |
| ZnConcentrate Shipping | US$ | $203.60 |
| ZnConcentrate Treatment/Refining | US$ | $645.25 |
| Pb Concentrate Shipping | US$ | $1.40 |
| Pb Concentrate Treatment/Refining | US$ | $3.83 |
| Net Block Value | US$ | $2,763.09 |
| NSR | US$/t | $127.48 |
Source: SRK, 2017
16.3.2Operating Costs
A numberof technical studieshave beencompleted on the projectby both internal teamsand external consultants. Theproduction rate in thesestudies has ranged from2,000 to 4,000 t/d.Considering theprevious work and the geometryand sizeof the mineralized zones as theyare currently known, a2,500 t/d production rate has beenselected. Operating costsused in the determinationof potential miningshapes are basedonprevious studies of the Florida Canyonproject, estimating manuals, firstprincipals, and comparingthe Florida Canyonproject with similar operations inCentral and South America. Table16-9 lists theoperating costsused to determine potential mining shapes forFlorida Canyon.
Table16-9: Operating CostsUsed forDetermining Potential MiningShapes
Item | Cost (US$/t) Longhole | Cost (US$/t) DriftandFill/ Cut andFill |
| Mining | 24.40 | 25.93 |
| Processing | 12.00 | 12.00 |
| G&A | 5.00 | 5.00 |
| Total | $41.40 | $42.93 |
Source: SRK, 2017
16.3.3Stope Optimization
Potential mining blocksshapes were constructed usingMaptek Vulcan’s implementationof Alford Mining System’sStope Shape Optimizer (Stope Optimizer). NSR values were calculated usingthe parameters described in Section 16.3.1 formaterial classifiedas Measured, Indicated or Inferred. Allother blocksare assumedto be waste with NSR and gradevalues of zero.
The mining method applicableto theSan Jorge and SAMmineralized bodies islonghole stoping. Nominal level spacingin the longholeareas is 16 mfrom sill to sill. Potential miningshapes were allowedto have a minimumwidth of 3m.Mining in these narrowareas would likelyutilizing aresue miningtechnique to controldilution, and upon inspectionof the resulting shapes therewere fewstopes at the minimumwidth in F1 andSAM. Both longitudinal stopes (stopes oriented along strike)and transverse stopes(oriented perpendicular to strike) existin the miningzones.
The miningmethods applicabletothe flatto moderate dipping areasis driftandfilland cut and fill. Aminimum cutheight of 3 mhas beenused withthe potential mining blocksare oriented horizontally. SRK notes thatin practicethe miningcuts in the flatto shallowdipping areaswill likely follow thefootwall. That levelof detaileddesign, however,is beyond the scopeof this studyand shouldbeundertaken in subsequentPFS levelstudy.
Key parametersused forstope optimization are provided in Table 16-10.
Table16-10: Stope Optimization Parameters for Base CaseAnalysis
| MiningMethod | Longhole | DriftandFill/ Cut andFill |
| Minimum StopeWidth (m) | 3 | 3 |
| MinimumWastePillar Width(m) | 3 | 3 |
| Stope Height(m) | 16 | 3 |
| Cut-off (NSR) | US$41.40 | US$42.93 |
Source: SRK, 2017
Thestopeblocksoutput from Stope Shape Optimizerwerevisually inspected. Isolated blocks;i.e., small blocks farfrom larger groups of blocksor where additional developmentis not practicalor economicallyfeasible, were identified forremoval from the mining blockinventory.A small number of blockswere alsoremovedin manto areas near the F1 longhole blocks. The blockswere removed dueto the likelihood that mininginduced stressesfrom exploitation of the nearby manto blockswould introduce stabilityissues in F1zone. Figure 16-9 showsan examplelevel sectionat 2044.5 elevationin the F1area. Blocksflaggedforremoval are outlined inred. Approximately 273,000 tof material wasremoved from the inventoryover the entire Florida Canyonproject area and islessthan 2.5%ofthetonnes within the inventory.
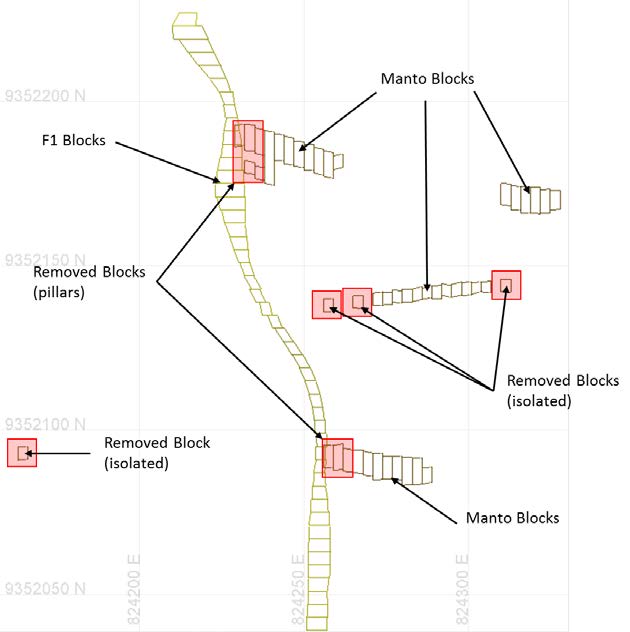
Source: SRK, 2017
Figure 16-9:Section View ShowingBlocks Removedfrom Inventory
Theresource modelwas queriedagainst the final stope optimization shapesto determinetonnes andgrade of material inside the shapes,and miningdilution and recovery factorswere applied in aspreadsheet.
16.3.4Mining Recovery and Dilution
Theundiluted tonnes and gradeof each potential miningblock is based on the resource block model. Minable inventory tonnes and gradeare calculated using the following factors:
| · | MiningRecovery: a factorresulting inmaterial loss (tonnage reduction) due to themining methodapplied and thedeposit geometry; and |
| · | Dilution: a factor resulting in areduction of the overall average grade dueto themining of waste with themineralized material. |
Thegeneralized formula forcalculating the reserve tonnagein each mining block is:Tinventory= Tmining block* Mining Recovery% *(1+Dilution%unplanned)
Thegeneralized formula forcalculating the reserve grade is:Ginventory= ResourceGrademiningblock/(1+Dilution%unplanned)
Recoveryof 100% of the mineralized material within a minedesign is rarely, if ever, achieved. Loss of mineralized material canbe the result of:
| · | Underbreak –the mineralizedmaterial is not blasted loose andremains in the stopewalls; |
| · | Mineralized materialloss within stope – the blasted mineralizedmaterial is leftin the stopedue to poor access forthe loader, buriedby fallsof waste rock from walls, lefton thefloor, or material blasted but does notfall fromflatter lying walls;and |
| · | Mineralized material left in pillars –loss dueto leavingmaterial behindto provide groundsupport. |
Themining recovery appliedto the areas usingthe longhole methodis 90%. Pillarswith a heightof 16 mhave beenplannedforevery96 m (sixlevels) of vertical excavation. It is assumedthat 50% of these pillar levelswill beabletobe recovered on retreat. The mining recoveryapplied in thedrift andfill and cutand fill areas is 95%.
Dilution is defined as the ratioof waste to mineralizedmaterial above cut-off.There are twotypes of dilution that wouldbe expectedin the mine:internal, also calledplanned dilution;and external, alsocalled unplanneddilution.
| · | Internal or planned dilution occurswhen materiallessthan a cut-offgrade falls within adesigned stope boundary(i.e., itwould be drilled andblasted within the stope duringmining). |
Internal dilution is incorporated into the designwhen constructing shapesencompassing the material above cut-off.If the averagegrade of the stope fallstoolowwhen thismaterial is incorporated into the stope,the stope shouldbe redesigned to exclude moreof this low-grade material. Judgmentmustbe exercised during the stopeoptimization and/or designprocess to minimize dilutionfrom this source, but practical mining considerations usuallymakethe inclusion of internal dilution unavoidable. Internal dilutionis straightforward to quantifyin a mineplan using softwaretocalculate tonnes and grade above and below the NetSmelter Return (NSR) cut-offwithin the designed stope blocks.
| · | External or unplanned dilutionis derived from low- or zero-grade material outside the stope design boundaries. Thisdilution is the resultof over-break arising frompoor drilling andblasting techniques, adverse geologicalstructures, and failure within zones of weakrock. |
No additionalexternal dilutionhas been appliedto theFlorida Canyon mining shapes. Internal dilution forthe base caseFlorida Canyon scenarioranges from 13% to 73% and averages 34%. It is expectedthatadetailed design would likelyreduce the overallaveragedilution. A detaileddesign, however,is beyond the scopeof this study.
16.3.5Cut-off Evaluation
TheNSR value of each potentialmining blockwascalculatedandevaluated againstthe NSR cut-offvalue fortheparticular mining methodtobe appliedto the block. TheNSR cut-offincludes mining costs,processing costs, andgeneral and administrative costsas described in Section16.3.2. Mining blockswith an averageNSRvalue above the NSR cut-offare included in the minableinventory. In some cases,marginal blocks,defined as blocksbelow the economic cut-offbutabove the sumof the costof mining and processing, are included in the inventoryif theyare adjacent to economic blocksand it isreasonabletoexpect thatnosignificant additional developmentwould be required to extract the marginal block. Mining blocks not meeting the criteria described above are classified as waste and excluded from the inventory.
16.3.6Mining Methods
Approximately26% of the miningresource will be mined usinglonghole stoping in the SAM andF1areas with the remainingmined usingmechanized driftand fill and cut andfill. Cementedpaste fill andcemented rockfill willbe usedto backfill primary stopes. Minedevelopment waste willbeused in secondary stopeswithsomesecondaries backfilled with low-content cementedpaste fillwhere required.
Longhole Stoping
Sublevelsin the longhole areas willbe developedat 16 mintervals. Stopes less than 8 mwidewillbe mined longitudinally (along strike)with stopesgreater than 8 mwide mined transversely(perpendicular to strike). Ramp, mainhaulage, and cross-cut developmentwill be in the footwall. Haulage drifts have been offsetfrom the stopes by20 m. Silldevelopment in the mineralizedzones willprovide access fordrilling, blasting, ground support, and mucking.Blasthole drilling willbe fromthe top sill usingtop hammerdrills.Brokenmaterial willbemuckedfrom the bottom of the stopes using remotecontrolled Load Haul Dumpunits (LHD). Typical blast patterns willbe drilled using2.5 m(burden) x2.0 m(spacing) ringpatterns. It is expected thatwater willbepresent requiring blastholes to be chargedwith ANFO/emulsion blends as required forwater resistance. Cutand fill mining blocksexist in the hangingwall and footwallin the F1area. Consideration for goodground controland the influence of mining induced stresseshas an impacton the sequenceof mining in these areas. Theproduction schedule describedin this study has miningoccurring fromthe hangingwall to footwallwithcut and fill blocksin the footwall minedon retreat. Figure16-10 showsthe F1 area andthe proximityof cutand fill blocksto longholeblocks.Figure 16-11shows atypical longhole levellayout.
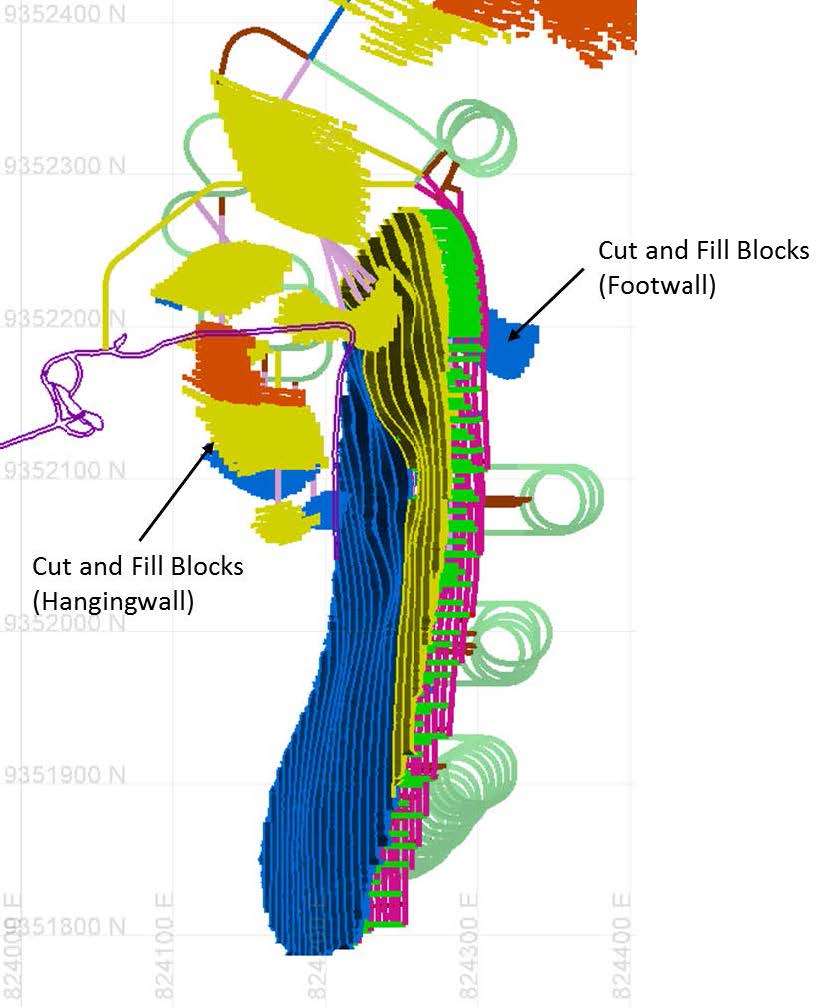
Source: SRK, 2017
Figure 16-10: Plan View of F1Area Showing Cutand Fill and Longhole Blocks
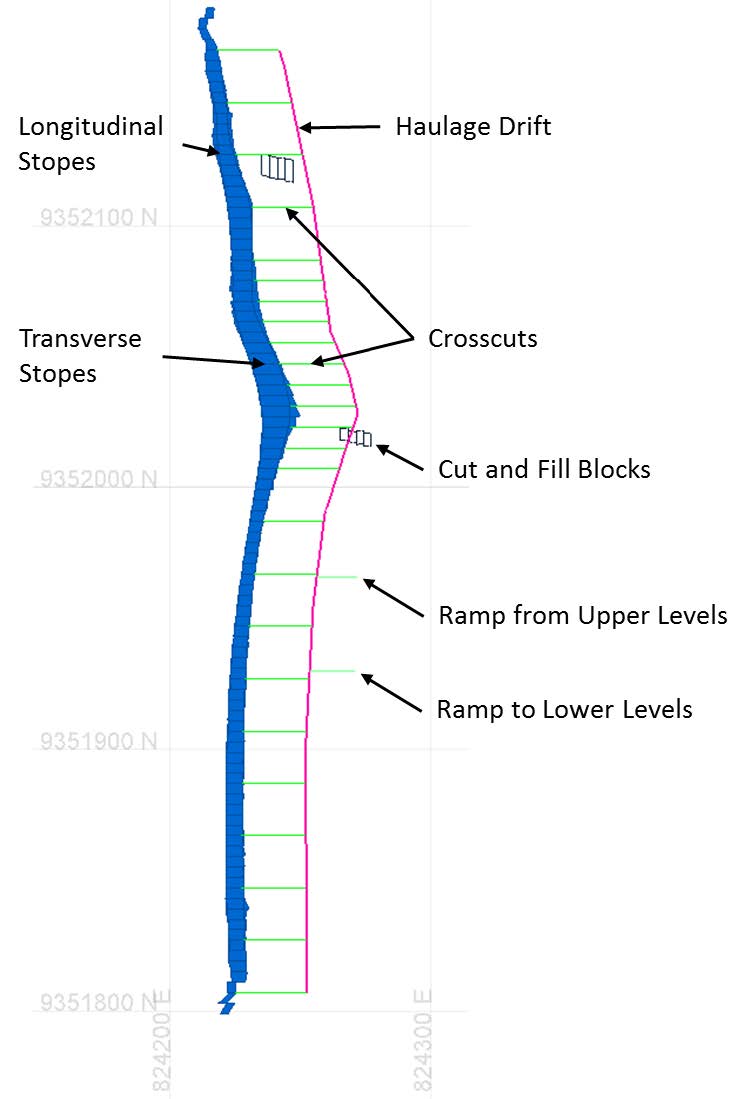
Source: SRK, 2017
Figure 16-11: Section ViewShowing TypicalLonghole LevelLayout (Elevation1981)
Drift and Fill, Cutand Fill
Miningofshallow dipping (lessthan 27°) accounts for70% of mineproduction. Mining cuts measuring 4 mwidex a minimum 3 mhigh willbe used to minimize dilution in thin areas.Stopes within a given mantoor group of mantos willbe developedfromthe bottom-up witheach subsequent 3 mlevel developed above themined-out andbackfilledcutbelow. It willbe possibleto develop rampsand haulage driftsin the mineralizedmaterial where thedip of the mineralizedzone allows a maximum12% gradient. Stopes will alsobe able tofollowthe gradeof thefootwallupto amaximum allowable gradient of 15%. Anexample driftandfill layoutin the M10 mantois showninFigure 16-12with haulage access progression labeled. Drill jumbos will be used to drill 45mmholes with each round advancing 4m.Blasting will primarily use ANFO/emulsion blends willbeused as required.
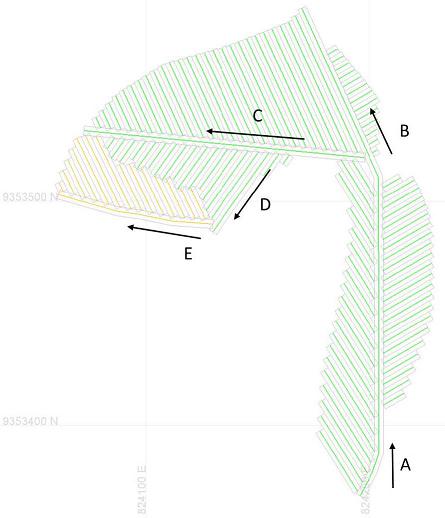
Source: SRK, 2017
Figure 16-12: Example Driftand Fill Layout,M10 Manto
Areas thatrequire footwallwaste development forstope block accesswillutilizeaccessrampswith amaximum grade of 15%. Blocksof 12to16 mhigh will be mined usingcuts of 3to 4 mdepending on the geometryof the mineralized material. Miningof cuts within a stope blockwill progress from the bottom to thetop with lowercuts filledwith cemented paste fill, cemented rock fillor development waste.
Large karstcaverns have beenencounteredduringtheexcavation of the San Jorge adit, and karsticfeatures have been observedin drilling. Additional geotechnical and hydrogeologicalinformation and studyis requiredto better understandthe potential impacton mining and riskmitigation measuresthatmaybe requiredto ensure a safe workingenvironment.
Mineralized material willbe muckedusing LHDs (4.5 to 6.5 m3),loaded onto30tonne trucksand hauled to the appropriateportal. Thematerial willbecrushed at the portal and transported to the processing facilityvia conveyor.
16.3.7Mine PlanResource
Thetonnes and gradeof the resource material containedwithin the mining blocks,adjustedby recovery anddilution, and categorizedby the resource classificationis provided in Table16-11. The mineplanresource consistsof atotal of 11.2 Mt with anaverage gradeof 8.34% Zn, 0.90% Pb, and
11.3 g/tAg. andis madeup of Measured, Indicated, andInferred material.Estimated average dilution,processing recoveries and theZnOx/ZnT ratio is also provided.Average processrecovery and dilution forthe mine planresource are shown in Table 16-12.
Table16-11: Mine PlanResource for the FloridaCanyon Zn-Pb-Ag Deposit, Amazonas Department, Peru,SRK Consulting (U.S.), Inc., July21, 2017
Category | Mass (kt) | ZnGrade (%) | PbGrade (%) | AgGrade (g/t) | NSR * (US$/t) | ZnEq** (%) | ZnContained (kt) | PbContained (kt) | AgContained (kg) | ZnEq** Contained (kt) |
| Measured | 1,293 | 10.64 | 1.33 | 15.60 | 197.12 | 12.38 | 138 | 17 | 20,157 | 160 |
| Indicated | 2,011 | 8.77 | 1.08 | 13.44 | 166.85 | 10.22 | 176 | 22 | 27,026 | 206 |
| M&I | 3,303 | 9.51 | 1.18 | 14.28 | 178.69 | 11.05 | 314 | 39 | 47,182 | 365 |
| Inferred | 7,883 | 7.86 | 0.78 | 10.07 | 135.36 | 9.03 | 619 | 62 | 79,354 | 712 |
| TotalMineDesign | 11,18 7 | 8.34 | 0.90 | 11.31 | 148.16 | 9.66 | 933 | 101 | 126,536 | 1,081 |
Source: SRK, 2017
* NSRiscalucalted usingvariablerecoveries based on sulfide/oxide ratios (recovery ranging from 32%-93%),a Znprice of US$1.20/lb,a Pbprice of US$1.00/lb, an AgpriceofUS$17.50/oz.Thetransportation chargeis US$70.00/tconc, Zntreatment charge of US$115/t conc, Pbtreatment chargeofUS$100/t conc, Znrefining charge of US$0.115/lb Zn, and Pbrefining charge of US$0.1/lb Pb. These factors were used for mineplanning andvarysomewhat from the final economic model.
** ZnEq estimate isbased on aNSRvalueofUS$19.62 per 1% Zn.TheUS$19.62iscalculated usinga Znprice of US$1.20/lb, a PbpriceofUS$1.00/lb, an Agprice of US$17.50/oz. The ZnEq also includes TC/RC and transportation costs and assumes an average Znrecovery of 78.15% which differs somewhat from that presented inthe economic model. Anexample of the NSR toZnEq calculation is(148.16/19.62)/0.7815
Table16-12: MinePlan ResourceAverage Process Recovery
| | Process Recovery | ZnOx/ZnT Ratio | Dilution |
| Ag (%) | Pb(%) | Zn(%) |
| Mine Plan Resource | 51.7 | 74.3 | 79.8 | 0.26 | 34% |
ThePEA is preliminary innature, thatit includesInferred Mineral Resourcesthat are considered toospeculative geologicallytohave the economicconsiderations applied to themthat would enablethem to be categorizedas MineralReserves, and there isno certainty thatthe PEA willbe realized.Mineral Resources thatare not MineralReserves do not havedemonstrated economicviability.
Figure 16-13shows an overviewof blocksincluded in the final mineral inventoryas wellas theexisting San Jorge adit.

Source: SRK, 2017
Figure 16-13: FloridaCanyon MiningInventory
16.3.8Development Layout
A developmentlayoutwascreatedtoprovide accessto the mining levels andto tie levelsinto ramps. Accessto the undergroundworkings willbevia three mainportals (San Jorge, P01 and P03). Anadditional portal (P02)will be used primarily forventilation, and threeadditional drifts will daylighttofacilitate ventilation. The only undergroundexcavation that currentlyexists at the siteis the SanJorge exploration adit. Thisadit will be utilized for accessto the F1 area andsurrounding cuts in the mantos.Dimensions of the San Jorge aditare currently 2.5 m x3.5 m. Thisadit will needto be enlarged andground supportinstalled in thepreproduction phase of theproject. Production blocksin the centralpart of the project allow forthe connection of the southern and northern areasvia undergrounddrifts and ramps. Thisunderground connectionwill improve ventilation, willmakethe movementof personnel and equipment moreefficient, andwill allow for moreflexibility in the production plan.
It is expected thatdevelopment in theflat and shallowdipping mineralized zones will follow the footwallwhere the gradient of the drift canbeless than12%.Waste developmentin thoseareas willbelimited to the primary accesstothemining blocksand smallconnector drifts between larger blocks; forthis study,onlythe primary accesshas been designedin these flatand shallow dipping areas. A moredetailed leveland rampdesignwas created forthe more steeplydipping mantos, F1 and SAM areas. Cross-cutsare spaced 8 mapart on a level in transverselonghole stope areas,and 20 mcross-cut spacing is used in the transverseareas. Attackramps in the mantoswhere developmentof ramps within themineralization are typically55 mor less and have a maximumgradient of 15%.
The minedesign assumptions are listed in Table 16-12.
Table16-13: DevelopmentDesign Assumptions
| Parameter | Value |
| MaximumRampGradient (Primary Ramps) | 12% |
| Maximum Gradient (Stope Access, Attack Ramps) | 15% |
| PrimaryDevelopment Dimensions (w x h) | 4 m x 5 m |
| Secondary Development Dimensions(w x h) | 4 m x 4 m |
| PrimaryVentilation Raise (diameter) | 4 m |
| Ventilation Raise Between Levels (diameter) | 3 m |
| OrePass(diameter) | 2 m |
Source: SRK, 2017
An additionaldevelopment allowance of 10% has beenapplied to the primary ramp, main haulage andlevel accessdrifts to account forturnouts, laydowns, and miscellaneous ventilation andore passdevelopment that will be requiredbut was not designedin detail oneach level.It isexpected thatraise boring will be contracted. Developmentquantities are presented in Table 16-13.
Developmenthasbeen classifiedas capital and operating. Capitalwaste development makesup the mine’slong termand permanent infrastructure and includes primaryramps,level accesses, main haulage levels,ore passes,and ventilation raises. Operating waste developmentincludes stope accessesand crosscuts.Three ventilation raisesto surfaceare designed to ensureproper ventilation of four primaryzones and the relativelylarge lateral extent of the project.
Table16-14: DevelopmentQuantities
| Category | Development Drifting (Meters) |
| Lateral Development (Capital) | 30,944 |
| Ventilation RaisetoSurface (Capital) | 617 |
| Ventilation RaiseandOre Passes Between Levels (Capital) | 1,078 |
| TotalCapital Development Meters | 32,639 |
| Operating | 23,504 |
| TotalDevelopment Meters | 56,143 |
Source: SRK, 2017
Thefollowing figures showthe developmentlayout:
| · | Figure 16-14shows aplan viewof the miningblock inventory and developmentlayout; |
| · | Figure 16-15shows arotated view of the layout lookingnortheast; |
| · | Figure 16-16shows arotated view of the layout lookingnorthwest; |
| · | Figure 16-17shows a rotated viewof the layoutin thenorthern areaof the project (drift and fill/cut and fill)looking northeast; and |
| · | Figure 16-18shows arotated view of the layout in F1and SAM looking northwest. |
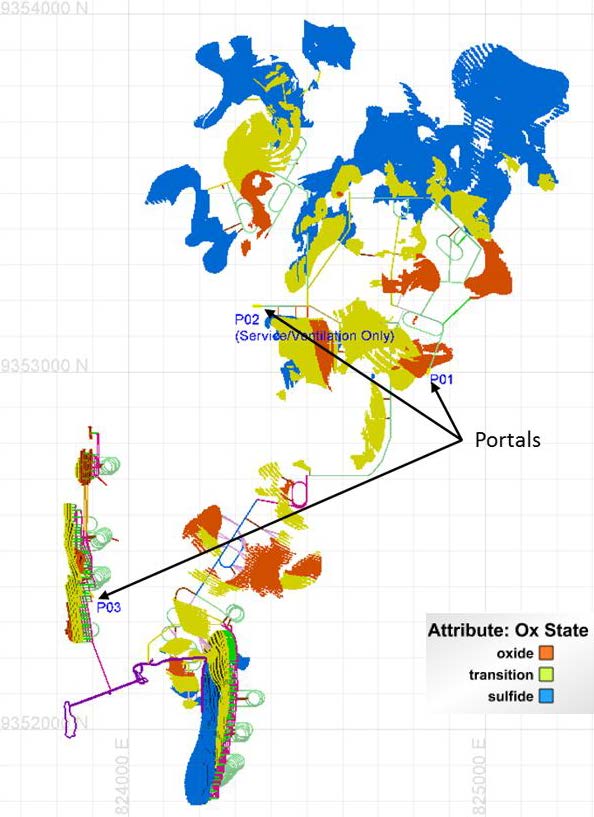
Source: SRK, 2017
Figure 16-14: Plan View of MiningBlocks and DevelopmentLayout
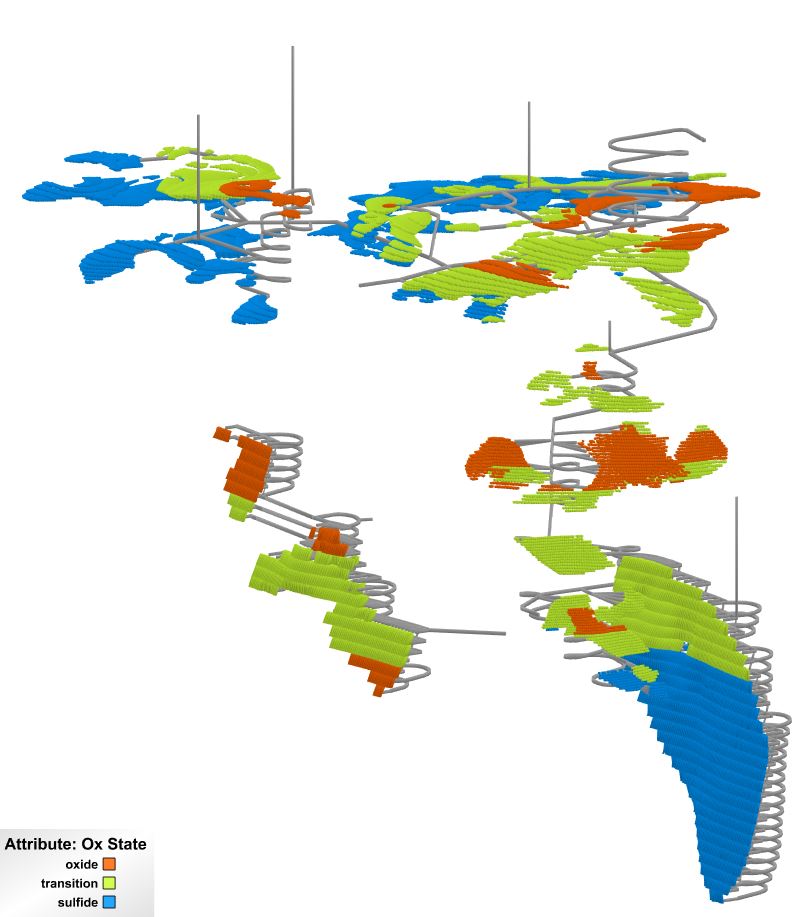
Source: SRK, 2017
Figure 16-15: Rotated View of MiningBlocks and Development Layout –All Areas (Looking Northeast)
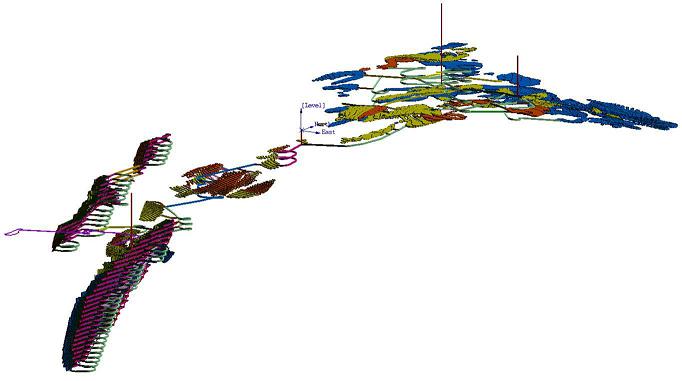
Source: SRK, 2017
Figure 16-16: Rotated View of MiningBlocks and Development Layout –All Areas (Looking Northwest)
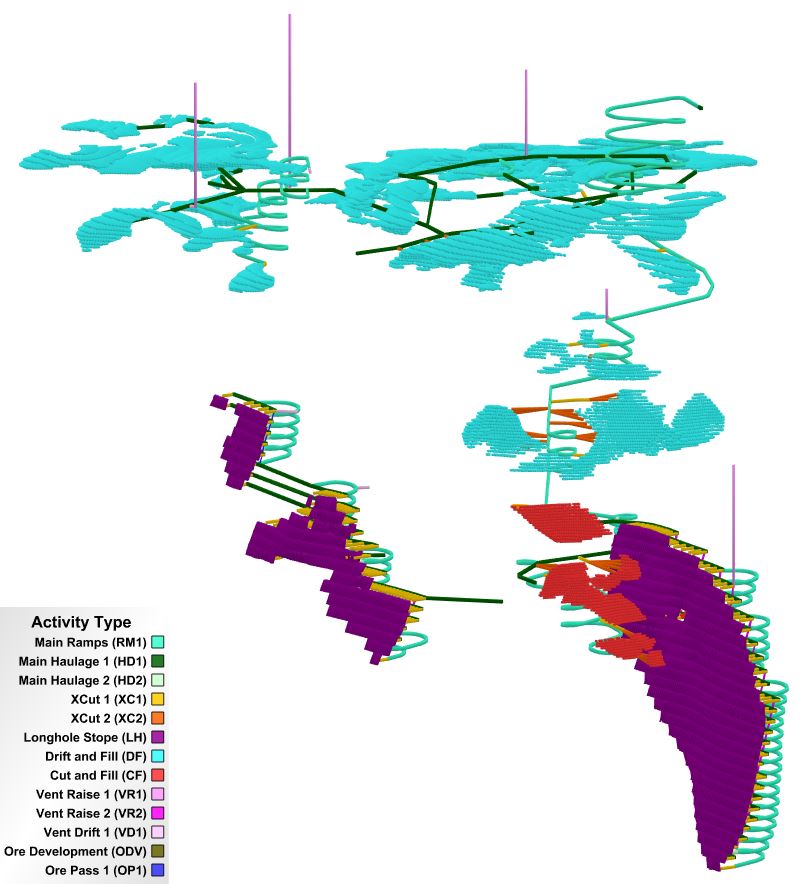
Source: SRK, 2017
Figure 16-17:Rotated Viewof MiningBlocks and Development Layout – Driftand Fill/Cut and Fill (Looking Northeast)
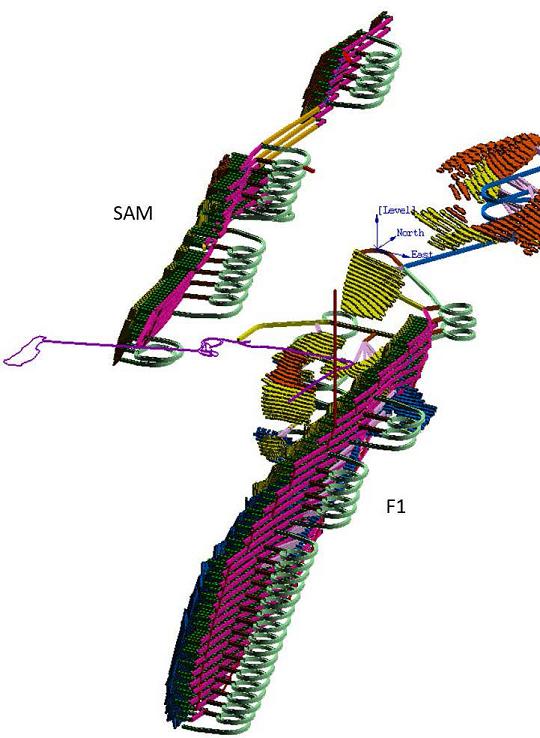
Source: SRK, 2017
Figure 16-18: Rotated View of MiningBlocks and DevelopmentLayout – F1 andSAM(Looking Northwest)
16.3.9 WasteRock Management and Backfilling
Developmentwaste excavatedduring the two-yearpre-production period will be hauledto surfaceand used as constructionmaterials; e.g., constructionof the TSF embankment. Thiswill allow stope miningto progress to a point wheredevelopment waste canbe placedunderground. Additional developmentwastecanbe hauledto surface forconstruction materialswhere it is necessary and more costeffective than sourcing materialon surface.Wastematerial has not been categorized in termsof its acidgenerating potential.It willbe important infuture studies to determine whether thewaste material ispotentially acid generating(PAG) and design storageor specify appropriatemitigation techniques should PAGmaterial be encountered.
Backfilling isanimportant part of the mine plan. Backfilling stopesprovides forground support, a workingplatform during mining, storage fortailings, andstorage of waste rockwithanassociated shorter haul comparedto storageon surface. Amixof material will be usedto backfillstopes includingcemented pastetailings, cementedrockfill, and RoM developmentwaste. The cementcontent will varybased on the typeof waste and where it willbe placed.
| · | Primarypaste fill cementcontent: 6%byweight; |
| · | Primary rockfill cementcontent: 4%byweight; and |
| · | Secondarypaste fill cementcontent (to prevent liquefaction):2%byweight. |
It is assumedthat 50% of the stopesare primaries and50% aresecondaries. The life-of-mine(LoM) backfill and cementquantitiesby typeis shown inTable 16-15.
Table16-15: LoMBackfill and Cement Quantitiesby Type
| Parameter | Qty Fill (m3) | QtyCement Used (dmt*) |
| Primarycemented rock fill | 161,424 | 10,957 |
| Primarycemented paste fill | 1,700,164 | 214,221 |
| Secondary un-cemented rock fill | 1,861,588 | 0 |
| Secondary cemented paste fill | 508,479 | 4,843 |
| Total | 4,231,655 | 230,021 |
Source: SRK, 2017
*dry metric tonne (dmt)
Thetotal tailingssent to the TSF(i.e., Process tailing lesstailing required forbackfill) is 4,092,844m3,based onan average dry densityof 1.6 t/m3.
| 16.4 | MineProduction Schedule |
Aproduction rate of 2,500t/d has been selectedtomine 912,500mineralized tonnesper year. The minewill utilize two 12-hour shiftsand operate 365 daysper year. A two-yearpre-production period is plannedwheremine development effortswillinclude enlargingofthe San Jorgeadit,development inthe F1 area, and development in thenorth of the projectarea. Productionwillrampup in schedule year 3 (productionyear 1) with an average dailymineralized materialproductionrate of 2,005 t/d. Longhole, cutandfill,and driftand fill mining occur simultaneously.Longhole mininghas been plannedat arate of 1,000 t/dand drift and fill/cut and fill miningwillrangefrom 1,500 to 2,500 t/d. Fullproductionoccursin schedule years four through 14 (11years of full production) with mining finishedlate in schedule year 15. Table 16-15shows the Florida Canyonproduction schedule.It is illustrated in Figure 16-19. SRKnotes that there are likelyopportunities to optimize theproductionschedule.Opportunities include improved sequencing of high grade material and, potentially, a decrease in the pre-production timeframe. A more detailed design and schedule with corresponding trade-off studies, as well as more detailed construction timeframe estimates, wouldberequired for the next phase of study.

Source: SRK, 2017
Figure 16-19: Rotated View of MiningBlocks ShowingProduction Schedule
SRK Consulting (U.S.), Inc.
NI 43-101 Technical Report, Preliminary Economic Assessment –Florida Canyon Zinc Project Page 138
Table16-16: Florida CanyonProduction Schedule
| Parameter | Units | Period |
| ScheduleYearProductionYear | yr yr | 1 -2 | 2 -1 | 3 1 | 4 2 | 5 3 | 6 4 | 7 5 | 8 6 |
| Mineralizedt/d | t/d | - | - | 2,005 | 2,498 | 2,500 | 2,502 | 2,503 | 2,505 |
| Wastet/d | t/d | 437 | 504 | 729 | 905 | 819 | 753 | 481 | 660 |
| Totalt/d | t/d | 437 | 504 | 2,734 | 3,403 | 3,320 | 3,255 | 2,984 | 3,165 |
| Ag | g/t | - | - | 12.2 | 10.1 | 17.7 | 17.4 | 15.5 | 15.4 |
| Pb | % | - | - | 0.85 | 0.97 | 1.12 | 1.22 | 1.00 | 1.03 |
| Zn | % | - | - | 9.15 | 10.21 | 12.24 | 10.25 | 11.65 | 10.90 |
| ZnOx/ZnT Ratio | - | - | 0.42 | 0.52 | 0.24 | 0.16 | 0.09 | 0.07 |
| Mineralized Tonnes | t | - | - | 733,813 | 911,858 | 912,584 | 913,222 | 915,955 | 914,271 |
| WasteTonnes | t | 159,597 | 183,798 | 266,986 | 330,158 | 299,096 | 274,792 | 176,144 | 240,886 |
| TotalTonnes | t | 159,597 | 183,798 | 1,000,799 | 1,242,017 | 1,211,679 | 1,188,014 | 1,092,099 | 1,155,157 |
| LHTonnes | t | - | - | 294,548 | 365,000 | 365,000 | 365,000 | 366,000 | 365,000 |
| DriftandFillTonnes | t | - | - | 277,995 | 514,621 | 480,998 | 534,828 | 549,955 | 549,271 |
| CutandFillTonnes | t | - | - | 161,270 | 32,237 | 66,586 | 13,394 | - | - |
| Capital Dev Length (excl. Vnt. raisetosurface) | m | 2,545 | 3,133 | 2,517 | 4,256 | 3,278 | 2,283 | 1,532 | 2,855 |
| VentRaisetoSurface | m | 181 | - | 131 | 42 | 8 | - | - | - |
| Opex Dev Length | m | 272 | 198 | 2,773 | 2,181 | 2,602 | 3,408 | 2,097 | 1,999 |
| Parameter | Units | Period | Totals |
| ScheduleYear | yr | 9 | 10 | 11 | 12 | 13 | 14 | 15 | |
| ProductionYear | yr | 7 | 8 | 9 | 10 | 11 | 12 | 13 |
| Mineralizedt/d | t/d | 2,501 | 2,503 | 2,507 | 2,503 | 2,508 | 2,500 | 1,093 | 2,076 |
| Wastet/d | t/d | 965 | 880 | 40 | 97 | 339 | 135 | - | 525 |
| Totalt/d | t/d | 3,466 | 3,383 | 2,547 | 2,600 | 2,847 | 2,635 | 1,093 | 2,601 |
| Ag | g/t | 9.9 | 8.9 | 6.4 | 8.3 | 7.0 | 9.3 | 6.4 | 11.3 |
| Pb | % | 1.11 | 0.90 | 0.77 | 0.98 | 0.40 | 0.56 | 0.69 | 0.90 |
| Zn | % | 8.53 | 6.39 | 4.94 | 6.43 | 5.65 | 5.40 | 5.08 | 8.34 |
| ZnOx/ZnT Ratio | 0.13 | 0.42 | 0.13 | 0.43 | 0.45 | 0.20 | 0.47 | 0.26 |
| Mineralized Tonnes | t | 912,955 | 913,419 | 917,431 | 913,524 | 915,319 | 912,402 | 399,948 | 11,186,701 |
| WasteTonnes | t | 352,067 | 321,253 | 14,802 | 35,532 | 123,862 | 49,225 | - | 2,828,197 |
| TotalTonnes | t | 1,265,022 | 1,234,671 | 932,233 | 949,056 | 1,039,181 | 961,627 | 399,948 | 14,014,897 |
| LHTonnes | t | 334,680 | 358,729 | 82,538 | - | - | - | - | 2,896,495 |
| DriftandFillTonnes | t | 496,400 | 477,383 | 834,893 | 913,524 | 915,319 | 912,402 | 399,948 | 7,857,537 |
| CutandFillTonnes | t | 81,875 | 77,307 | - | - | - | - | - | 432,669 |
| Capital Dev Length (excl. Vnt. raisetosurface) | m | 3,278 | 3,174 | 118 | 475 | 1,718 | 861 | - | 32,022 |
| VentRaisetoSurface | m | - | - | - | 255 | - | - | - | 617 |
| Opex Dev Length | m | 3,847 | 3,382 | 184 | - | 482 | 78 | - | 23,504 |
Source: SRK, 2017
16.5.1Underground Mine Equipment
Mine equipment selectionis basedon the mining methods employed, production requirements,expected numberof open facesrequiredto meetproduction, and developmentand stope dimensions. Double boom jumbos willbe used forlateral developmentand single boom, low profile jumboshave been specified fordrift and fill areaswithcutheights of 3m.LHDs withremote operating capabilities willbeused forstope anddevelopment muckingand willload 30 t trucks. Table16-16provides a summaryof the mining equipment.
Table16-17: MineEquipment
| Equipment | Example | Number |
| LHStope DTH Drills | Atlas Copco Simba Series | 2 |
| LHProduction LHD (6 m3) | Sandvik LH514 | 3 |
| ProductionJumbo(D&F/C&F) | LowProfile,AtlasCopcoM1L | 6 |
| D&F/C&F Production LHD(4 m3) | Sandvik LH410 | 6 |
| Horizontal Development Jumbos(2boom) | Atlas Copco Boomer(2boom) | 4 |
| Development LHD(6m3) | Sandvik LH514 | 4 |
| Haul Trucks (30t) | Sandvik TH430 | 6 |
| RockBolter | Atlas Copco Boltec Series | 2 |
| Anfo Loader | | 2 |
| Miscellaneous/Service Vehicles | | 5 |
| LightVehicles/General | | 5 |
Source: SRK, 2017
16.5.2Electrical
Theunderground minewill be suppliedby power fromthe mainProject substation. The mainunderground power willbeused forthe crusherslocated at the portals, jumbos,drills, ventilation, andelectric pumps.Additionally, power will support auxiliary usein theshops and forsmaller loads suchas secondary fans, temporary pumps,and auxiliarylighting.
16.5.3Ventilation
A conceptual ventilationlayout has been developed forthis PEA studyin order to estimatethe numberand locationof ventilation openings to surface andto develop a cost estimate forventilation. Additional detailed ventilation design isrequired in thenext phaseof study.
Ventilation of the Florida Canyonproject willbe subdivided into fourzones. The SanJorge adit and araise to surfacewillbe usedto ventilatethesouthern sections, the F1 area,of the mine. Workingsin the central andnorthern partsof the mine, the flatto moderate dipping mantos, will utilize the newlyexcavated decline, aventilation portal, and two raisesto surface. The SAM areais largelyisolated from the restof the network and willbe ventilated via its portals and ventilation driftsthat daylight on surface. Thenorthwestern part of the mine willbeventilatedvia a raise andventilation driftdaylighting on the surface.
Basedon the equipment list SRKestimated airflowrequirements usingsome generalassumptions of average power andutilization.The airflow requirementis based on 125cfmper brakehorsepower (bhp) which isa commonlyused rule-of-thumb value forthis type of preliminary estimate. Thenumber of personnel underground were estimated and airflow calculates used 55 cfm/person. A utilization percentage for equipment has not been used for airflow calculations and would reduce the required airflow. The estimated airflow requirement by zone are shown in Table 16-17 through Table 16-19 at typical production in the given zone.
Table16-18: Estimated Airflow Requirements –Central/North and NorthwestAreas
| Description | Quantity | EstimateSRK (hp) | Utilization(%) | Air Required(cfm) |
| Scoops/LHD(4 m3) | 4 | 300 | 100% | 150,000 |
| Scoops/LHD(6 m3) | 3 | 350 | 100% | 131,250 |
| Bolters | 1 | 75 | 100% | 9,375 |
| Development Jumbos | 3 | 80 | 100% | 30,000 |
| Production Jumbos | 4 | 110 | 100% | 55,000 |
| Trucks(30 t) | 4 | 420 | 100% | 210,000 |
| Explosives Trucks | 1 | 150 | 100% | 18,750 |
| Miscellaneous | 7 | 120 | 100% | 105,000 |
| Personnel | 40 | | 100% | 2,200 |
| Subtotal | | | | 561,575 |
| Misc Allowance | 20% | | | 112,315 |
| Total | | | | 673,890 |
Source: SRK, 2017
Table16-19: Estimated Airflow Requirements – F1 (SanJorge)
| Description | Quantity | EstimateSRK (hp) | Utilization(%) | Air Required(cfm) |
| Scoops/LHD(6 m3) | 4 | 350 | 100% | 175,000 |
| Bolters | 1 | 75 | 100% | 9,375 |
| LHDrills | 2 | 80 | 100% | 20,000 |
| Jumbos | 2 | 110 | 100% | 27,500 |
| Trucks(30 t) | 3 | 420 | 100% | 157,500 |
| Explosives Trucks | 1 | 150 | 100% | 18,750 |
| Miscellaneous | 5 | 120 | 100% | 75,000 |
| Personnel | 25 | | 100% | 1,375 |
| Subtotal | | | | 484,500 |
| Misc Allowance | 20% | | | 96,900 |
| Total | | | | 581,400 |
Source: SRK, 2017
Table16-20: Estimated Airflow Requirements -SAM
| Description | Quantity | EstimateSRK (hp) | Utilization(%) | Air Required(cfm) |
| Scoops/LHD(4 m3) | 4 | 300 | 100% | 150,000 |
| Scoops/LHD(6 m3) | 3 | 350 | 100% | 131,250 |
| Bolters | 1 | 75 | 100% | 9,375 |
| Production Jumbos | 4 | 110 | 100% | 55,000 |
| Trucks(30 t) | 4 | 420 | 100% | 210,000 |
| Explosives Trucks | 1 | 150 | 100% | 18,750 |
| Miscellaneous | 7 | 120 | 100% | 105,000 |
| Personnel | 40 | | 100% | 2,200 |
| Subtotal | | | | 561,575 |
| Misc Allowance | 20% | | | 112,315 |
| Total | | | | 673,890 |
Source: SRK, 2017
16.5.4Mine Personnel
Required minepersonnel hasbeen estimated basedonproduction requirements, equipment selection, guidance from estimating manuals, anddata from similaroperations in production inCentral andSouth America. The minewill utilizetwo 12-hour shiftsand operate 365 days per year.Production personnel willbe housedat thecampwhile on shift andwill work a twoweek on/two week offrotation. Four crews willbe requiredwith twocrewsonsiteatany giventime.Management and technical staffwill work 4 day on/3day offschedule. Table 16-20 liststhe hourly and salaried personnelonsite atany given time.
Table16-21: Hourlyand Salaried Personnel (On Site)
| HourlyPersonnel | Count |
| Stope Miners | 24 |
| Development Miners | 15 |
| General Equipment Operators | 6 |
| Ground Support | 4 |
| Exploration Drillers | 3 |
| Backfill Plant | 2 |
| Electricians | 5 |
| Mechanics | 14 |
| General Maintenance | 7 |
| Laborers/Helpers | 16 |
| Surface Laborers | 7 |
| Total Hourly | 103 |
| Salaried Personnel | Count |
| General Manager | 1 |
| Superintendents | 2 |
| MineForeman | 5 |
| Engineering | 3 |
| Geology | 3 |
| Environmental | 3 |
| ShiftSupervisors | 8 |
| Technicians | 3 |
| Accountants | 3 |
| Purchasing | 5 |
| Personnel | 5 |
| Secretaries | 7 |
| Clerks | 9 |
| TotalSalaried | 57 |
Source: SRK, 2017
16.5.5Health and Safety
The minewill have a communicationssystem that hasboth minephones andwireless communication through aleaky feeder system. Astench gas emergencywarning system will be installed inthe mine’s intake ventilation system. Thissystem canbeactivatedtowarn underground employees of a firesituation or other emergency whereupon emergencyprocedures will be followed. Typically,two meansof egress fromaworking areaare designedor useof aportable refugestation is assumed.
17 Recovery Methods
| 17.1 | Processing Projections andMethods |
The millwill process 2,500t/d of freshmineralized material, and produce approximately 287 tofzincconcentrate grading 50% Zn,1% Pb, and 0.6g/t Ag and approximately46 tof lead concentrate grading50% Pb, 8.4 g/t Ag, and6%Zn. Throughput and concentrateprojections are providedin Table 17-1.
Table17-1: Florida Canyon PEA Level Throughputand Concentrate ProductionProjections
Concentrate | Feed | Concentrate | Tails |
| Tonne | Lead (grade) | Silver (g/t) | Zinc(%) | Tonne | Lead (grade) | Silver (g/t) | Zinc(%) | Tonne | Lead (grade) | Silver (g/t) | Zinc(grade) |
| Global | 2,500 | 1.13% | 0.44 | 6.9% | 333 | 50% | 8.4 | 6% | 2,167 | 0.1% | 0.2 | 1.2% |
| Lead circuit | 2,500 | 1.13% | 0.44 | 6.9% | 46 | 2,454 | 0.2% | 0.3 | 6.9% |
| Zinc circuit | 2,454 | 0.22% | 0.29 | 6.9% | 287 | 1.0% | 0.6 | 50% | 2,167 | 0.1% | 0.2 | 1.2% |
Source: SRK, 2017
| 17.2 | Processing Methods andFlow Sheet |
Because the challenging topography and road conditions, truckingRun-of-Mine (ROM)material would demand a lengthy route fromthe underground portals to the plant’slocation. Instead, SRKhas designed a setof conventional overland conveyorswith a maximumslope of 20° to simplify theoperation and significantly reducethe costof transferring mill feedfrom the mineportals to the processplant. Aportable, 75 hp primary jawcrusher is to be installed at each underground mineportal toensure the ROMis adequately sized forthe conveying system.Planned overland conveying fromthe underground mineportals tothe process plant is shownin Table 17-2.
Given the locationof thedeposit, it is anticipated threeunderground portalswillbeproducing millfeed atanygiven time,and at different rates as presented in Table 17-2.
| · | The existingPortal San Joseis expectedto produce in average 30%of the millfeed, equivalent to 750 tperdaythat is transferred to theoverland conveyor at Portal 03 using a297 mlong conveyor. |
| · | Approximately 60%of the mill feedwillbeproduced throughthe newPortal 01 equivalentto 1,500 t perday anddistant 840 malong the overland conveyor. |
| · | Thenew Portal03will produce approximately10% of the mill feedatan averageof 250 t/dand willbe transferredto theprocess plant area using a 1,855 mlong conveyor. |
Specifications foroverland conveying are provided in Table 17-2.
Table17-2: Overland Conveyingfrom UndergroundPortals to the Process Plant
Origin orMine Portal ID | PortalType | Portal Elevation | Production | Conveyor |
| Throughput | Tonnes (/d) | Tonnes (/h) | Tonnes (/d max) | Destination | Elevation Difference | Length (m) | Slope (°) |
| Portal San Jose | Existing | 2,107 | 30.0% | 750 | 31 | 1,000 | P03 | 24 | 297 | 5 |
| P01 | New | 2,574 | 60.0% | 1,500 | 63 | 2,500 | Crushing Plant | 41 | 840 | 20 |
| P02 (ventilation) | New | | 0.0% | 0 | 0 | 0 | none | | | |
| P03 | New | 2,131 | 10.0% | 250 | 10 | 1,000 | Crushing Plant | 484 | 1,855 | 20 |
| Plant Area Elevation | m.a.s.l. | 2,615 | | | | | | | | |
| Mine Production | tonnes/day | 2,500 | | | | | | | | |
Source: SRK, 2017
Crushed materialproducedbythe primaryjaw crushersis transferred to a2,500 tsilo located at theprocess plant area. A secondary-tertiary crushing plant using150hp cone crushersin closed-circuitwith vibrating screens will reduce the mill feedto approximately80% passing12 mm. Theproduct fromthe crushingplant willbe transferredto a mill feed silo (fineore silo) capableof holding 2,500 t.
Thesingle stage1,800 kW conventional ball milloperating in closed-circuitwith a classification screen will produce a product sizing approximately80% minus44 micronsthat will feed thedifferential flotationstage.
Theflotation will havetwo multi-stage flotation circuits,the first will produce a leadconcentrate. Thesecond multi-stage flotationcircuit, thezinccircuit, receivestails fromthe lead circuitto produce azincconcentrate. Both finalconcentrates will be transferredto its respective thickenersand then filtered(10 m2filtration area forlead concentrate,and 60 m2filtration area forzinc concentrate) to approximately9% moisturebefore being truckedoffsite to smelters.
Tailings from the flotation plant willbethickenedto approximately 50% solidsbyweight.Afraction of the tails representing approximately 60%of the solidswill be pipedto a filtrationplant (600m2tails filtration area) locatedby the tailings storagearea and then dry stackedat a moistureof approximately17%byweight.Waterrecoveredin the tailsfilter willberecycledto theprocess plant. Theremaining 40% of the solid’s stream willbe transferred to a backfillplanttobe used in theunderground operation.
The PEA flow sheet forFlorida Canyon mineralprocessing is shown in Figure 17-1.
| 17.3 | Consumables Requirement |
Thepower requirements for the projected milling operationis estimated atmaximum3.5 MW.Power formilling operations will be suppliedby a third-partyas line powerat an estimated costof US$0.084/kWh.
Thewater requirement forthe millat a capacityof 2,500 t/dis estimated at maximum20 liters per second.Water forprocessing willbe acquired from surfacewater sources andas recycled water from tailings dewatering operations.
All theconsumables willbe suppliedby roadfromLimaport and storedin the mill complex.It is estimated that storing 5days of consumption will ensurecontinuous supplyto the operation. Typicalflotation reagents include: Lime,NaCN, ZnSulfate, Sodium Isopropyl Xanthate,Aerophine 3418, MIBC,CuSulfate, Sodium Isopropyl Xanthate (Z11), MIBC, and flocculants. Grinding media (steelballs) couldarrive viaLimaport, or alternativelyon trucksfrom northern Chile.
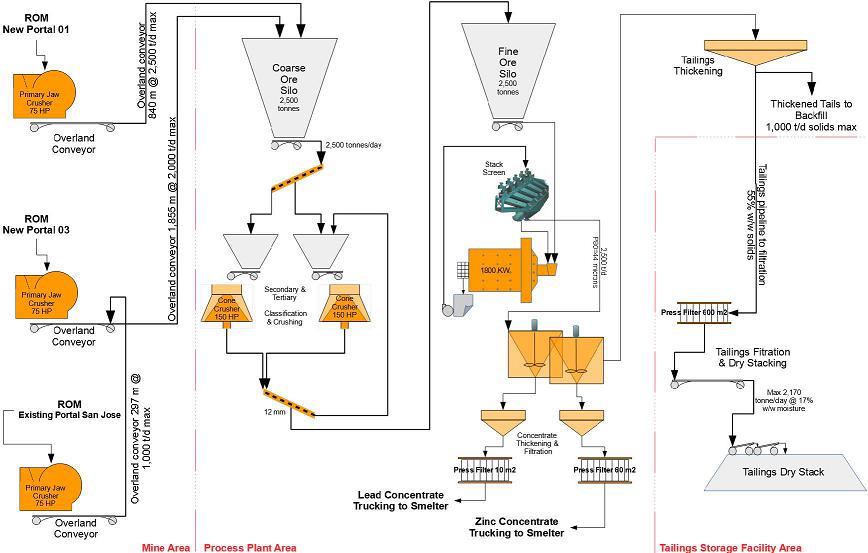
Source: SRK, 2017
Figure 17-1:Florida Canyon PEA Level Process FlowSheet
18 Project Infrastructure
| 18.1 | Infrastructure and LogisticsRequirements |
18.1.1Access and Local Communities
Florida Canyonis agreenfield sitewith minimal infrastructure currently available. Theoperation is located in north central Peru(Figure 18-1) approximately 700 kmnorth of the (capital, Lima. TheProject is in a sparsely populatedarea approximately 39 kmnorthwest of Pedro Luis Gallo(population approximately 3,000), thelargest townwith any infrastructure nearthe Project. Thereare severalsmaller communities locatednearer to the proposed operation, but theyhave no developed infrastructure to support theproject. A camp foremployees andcontractors will berequired.
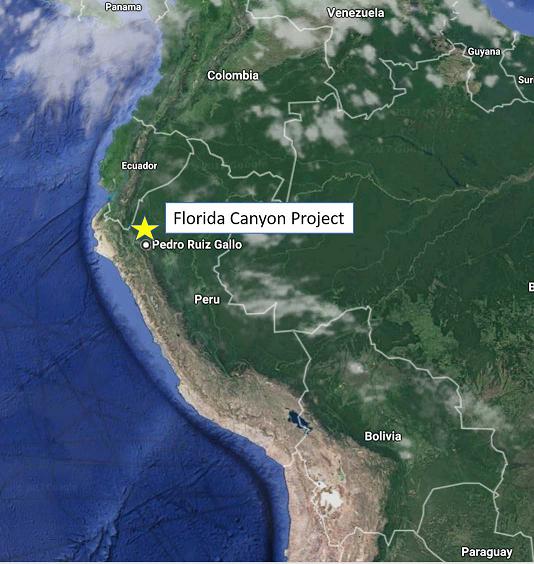
Source: Google Earth/SRK, 2017
Figure 18-1:Florida CanyonGeneral Location
Accessto the site isby pavedroad fromChiclayo (population approximately740,000) located on thePacific coast approximately380 kmto the west of Pedro RuizGallo.Adirt road connectsPedroRuizwith thedistrict capitolofShipasbambawhere the project officeand core storage facilityis located. A26 kmnewly constructed road connectsShipasbamba to the project area. Thisexisting sectionof road willrequire upgrade to supportconstruction andProject logistics includingconcentrate transport. Approximately24 kmof newroad at thesite willbe required to allow accessto the facilities andinfrastructure. Figure 18-2shows the new roadsin thehighlighted areanear theProject. Newroad construction is in fairlyrugged topographyinanarea of highrainfall thatwill requireconstruction during the drier monthstobeefficient.
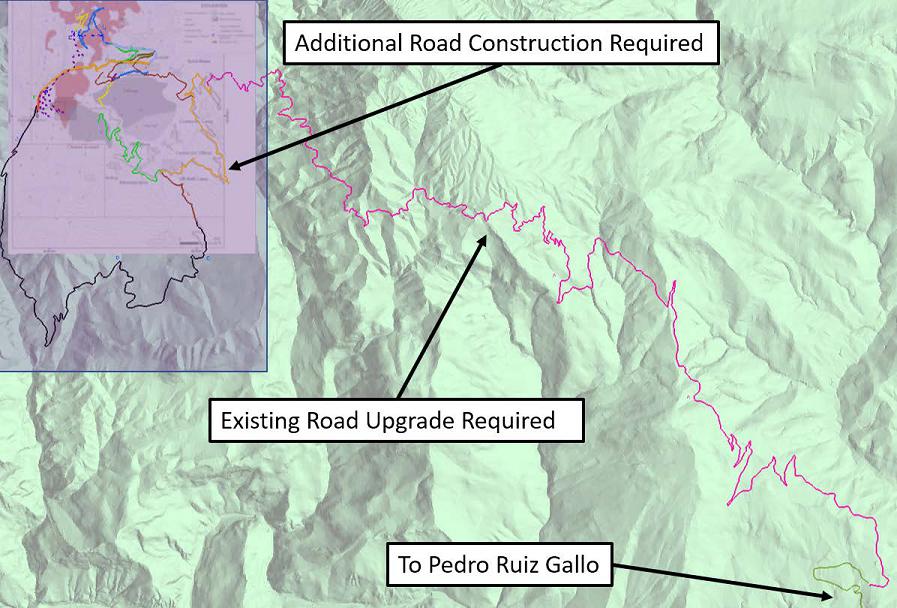
Source: SRK, 2017
Figure 18-2:Florida CanyonExisting and New RoadConstruction
18.1.2Site Water Management
Theoperation will require water for use forprocessing, mining, dust suppressionand potableconsumption. Theprocessing facilitywill utilize recycledwater fromthe tailings facility and rainfall shedfrom the tailings forthe majorityof the processing needs.It is anticipated that there willbe someground water that will be encounteredin the mineand captured in sumpsand decantation basins for minewater needs.
Tesoro Creek, a smalllocal drainage, has beenused for domesticwater supplyby nearbyresidents.Cleanwater fromthis creekwill be used for make-upprocess water, for fire suppressionandfor domesticrequirements. It willbe pipedby gravityfromthe creek to awater storage tank. A smalltreatment plant willbe utilized forpotable water needs forthe Projectcampandother support areas.
Surfacewater controlis discussedin the tailings Section18.3.
18.1.3Project Facilities
Theproject support infrastructure is shownin Figure 18-3. Thefacilities include the processingplant and associated infrastructure, mininginfrastructure withportals, vent holes,road accessto portals, tailings storage area,and support infrastructure including fuelstorage, security,camp,power supplyand distribution, and water supply andstorage.Wasterock willbe consumed intheconstruction of thetailings embankment sono separate waste rock storageis required.
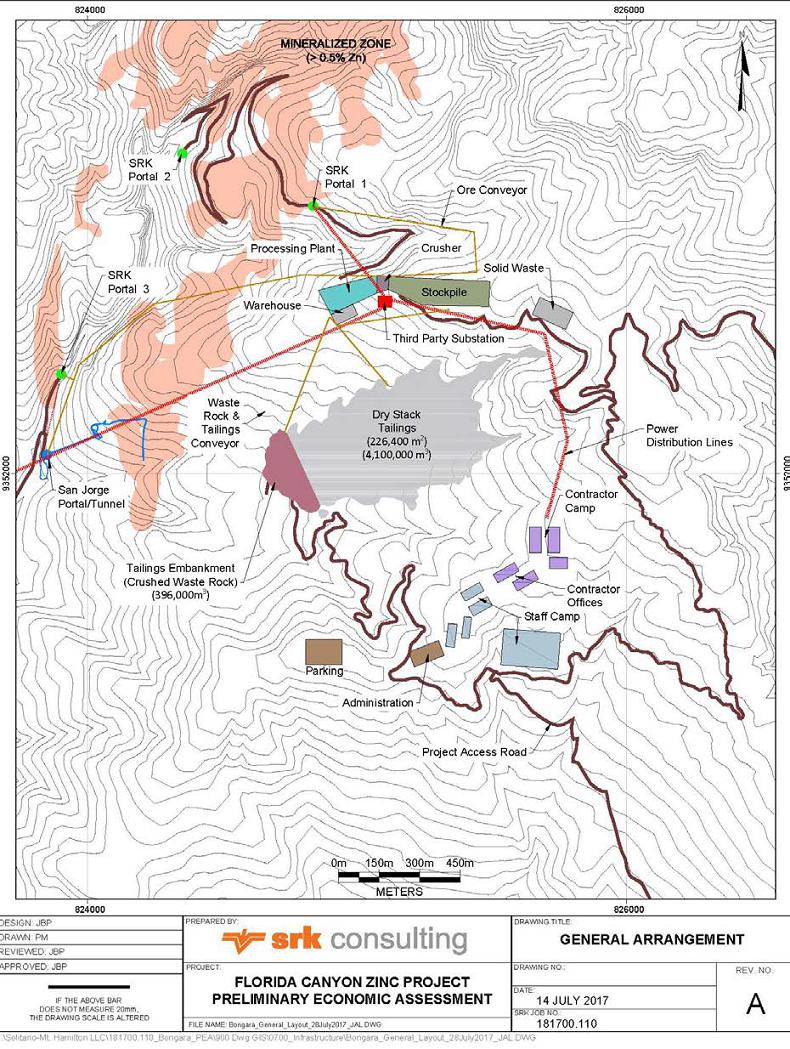
Source: SRK, 2017
Figure 18-3:Florida CanyonSite GeneralArrangement
MineOperations and SupportFacilities
Theproduction-related project elementsinclude a mine office, mine dry,and minemaintenance shops near theplant location to support the undergroundoperations.Additional detailis included in Section
16. The mining method selected forthe underground operationwill require backfillconsisting of cemented paste andwaste rock,both cemented andunconsolidated. The capital costof apaste backfillplant and operating costof distribution is includedin the economicsfor the Project. An allowance for a small cemented rockfill plant is alsoprovided fortwo production periods whencemented rockfill is required for secondary stopes.
Process Support Facilities
Theinfrastructure at the process facilities includethe plant, mill feedstockpile, secondarycrusher, supply conveyors, primarycrushers at the portals and an office/maintenancebuilding. Theplant facilities are discussed inSection 17.
Additional Support Facilities
TheProject requires acampto support the operationas it is remote. A400-personcampwith acafeteria andrecreation centerwillberequired. Additionalsupportfacilities include a rescue and firstaid building,warehouse, health/safety/environmental office, security gate house,truck scale, truck wash, laboratory, septic, andincinerator system. Two50,000 liter fuel tanksand associated pumpfacilities will store fuel foruse bythe Project.
18.1.4Power Supply and Distribution
Thereis currentlyno substantiveline power near the site. SRK considered a diesel-poweredgenerator option forpower supply.However, a third-partysupplier, Energoret S.A.C,has ahydropower generation and transmission developmentproject thatwillbe located in close proximityto the mine. TheEnergoret system will generate 20 MWof power from aplant on a tributaryto the UtcubambaRiver. Energoret indicatesthat half of the project, approximately10 MW,has already beencommitted. Theplant is designedto provide powerto thecityof Bagua Grande, westof their project,andtoPedro Ruizto the eastof the Project.Energoret indicates that itwill invest in a transmissionline to the FloridaCanyon mine site and a substationon site. Theircapital estimateis US$25 million.Figure 18-4 showsthe location of Energoret’s proposed hydroelectric plant,distribution lines to Bagua Grande andPedro Ruizas well asanextensionto the Florida CanyonProject. Thelayout of theproposed system is shown in Figure18-4 with thehigh voltage transmissionlines delineatedby the blue andwhite dotted line.
Neither Votorantim nor Solitario have entered into definitive negotiationswith Energoretat this stageof study. Based on discussionswith Energoret SRK estimated apower costcharge that would recover the capital expense for 6 MW of capacityof the plantplus the costof transmission linesand asubstation over the current13 year lifeof the project including arisk premium andprofit on boththe capital and theoperating costs. Theestimated operating costof poweris US$0.084/kWhr.
SRK also includedin theestimated capital cost for theproject including amedium voltage power switchgear and 2.3 kmofdistribution lines to the processingplant andportals.

Source: Solitario, 2017
Figure 18-4:Florida Canyon Third Power SupplyAlternative
TheProject will generate both lead andzinc concentrates which will be shippedby 30 tover-the-road trucksto market.Figure 18-5shows aphotograph of atypical 30 t truck.

Source: Solitario, 2017
Figure 18-5: Typical30 TonneConcentrate Transport Truck
SRK hasconsidered shippingto the portsat Paita, Chiclayo (Pimental), and Lima(Callao) as wellas direct shippingto Votorantim’sCajamarquilla Smelter near Lima. A high leveltrade-off studyof concentrate transportation was preparedby SRKconsidering truckhaulage, capital cost for additionalport and/or handling facilities,and ocean freight/handling charges. This studyindicated that thedirect shipping option to Cajamarquillawasmost costeffective. Figure 18-6shows the locations of ports and the Cajamarquilla smelter.
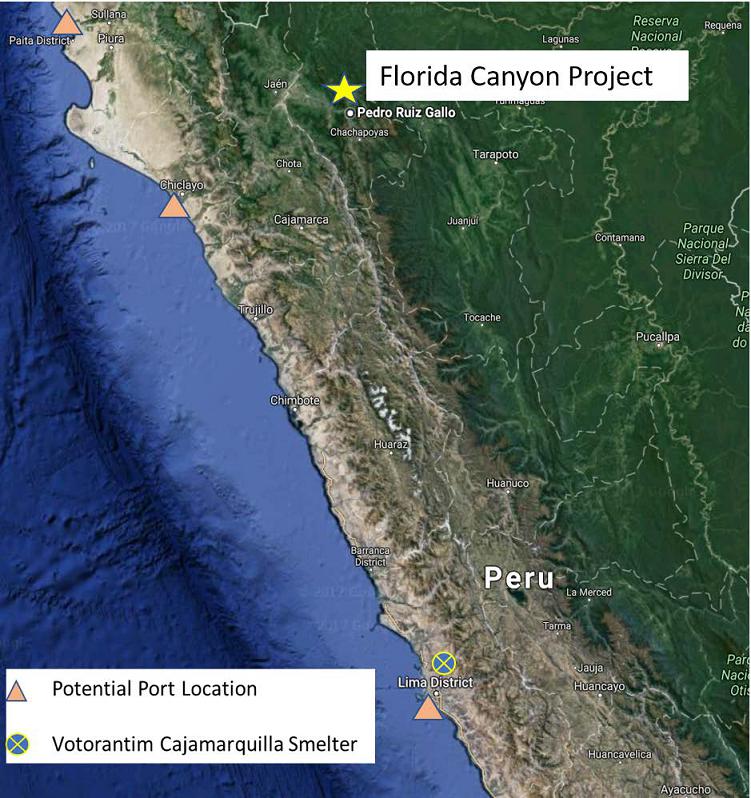
Source: SRK, 2017
Figure 18-6:Port and Smelter Locations
Thetailings storage facility (TSF)will be located inthe valleyto thesouth of the process plant as shown in Figure 18-3. Thetailings will be filtered at theplant siteto a“dry stack”condition (i.e. typical moisturecontent less than 20%).From the plant site,tailings willbe transported to the TSF viaoverland conveyors.
Approximately 6.56Mtofdry stacktailings will be willbe producedover lifeof the mine and will have a final surfacearea of 266,400m2. The TSF basinwillbe lined with 2mmgeomembrane. Approximately 1 mof topsoil willbe excavated fromthe embankmentand basinfootprint and stockpiled for useduring closure.All tailingsnot placed in theTSF willbeutilized as backfill inthe mine.
The TSFstarterdamwillbe keyedinto native ground approximately 4.5m. Thedamwillhave with aslope of 2:1 Horizontal:Vertical (H:V) andwillbe constructedof waste rockfrom underground and residual soilsfrom the tailings basin. Additional raiseswillbeconstructed viaanupstream method using waste rockor blasted rock from the tailings basinto construct the upstream containment berms. Theupstream containment bermswill have an overall slopeof 3:1 H:V.Tailings willbeplaced using mobile mining equipmentat a slopeof 4:1 H:V.Upstream construction is suitable forthis seismicenvironment because the tailingshave been dewatered andwill be compactedas theyare placed.
An upstream diversion will be constructedto managestormwater during operations and convey itdownstream to be released beyondthe toeof the dam. Thisdiversion will consistof a 2 mdeep and 5 m wide channel cutinto native ground andlined with 300mmrip rap.
19 Market Studies and Contracts
Nospecific market study hasbeen conducted forthis study. This PEA assumes metalprices based on thecurrent spot market.
TheFlorida CanyonProject is agreen field lead-zincdeposit that currentlyhasnocontracts that cover the salesof the projected lead andzinc concentrate production.
20 Environmental Studies, Permitting and Social orCommunity Impact
| 20.1 | Required Permits and Status |
20.1.1Required Exploration Permits and Status
Environmental permits for mineralexploration programsare divided into two classes.Class I permits allowconstruction and drilling forup to20 platformswith a maximumdisturbance of 10 ha. A ClassII permitprovides for morethan20drill locationsor for adisturbance area of greaterthan 10ha.
Class I permitsrequire little morethan anotification process forapproval. ClassII drilling permitsrequire an environmental impactdeclaration (DIA), a permit forharvesting trees(if applicable),anarcheological survey report(CIRA), awater use permit(ALA) and a ClosurePlan.
Votorantimhas previously filed applications forand received ClassII permits forvarious phases of the Project and hasfiled and receivedthe requiredassociated permits. The2017 reviewof existingexploration permitstatus indicates that onlythe archeological permitsand the latest treeharvesting permitare stillvalid.
During exploration, Votorantim developed aSocial Management Plan with several programsongoing in the communityincluding:
| · | Communication, Information andCoordination Programwith Residents; |
| · | Attentionto Concern, Claimsand Conflict Resolution Program; |
| · | Support Program forParticipatory Environmental Monitoring andInformation Workshops; |
| · | Recruitment and TrainingProgram forLocal Labor; |
| · | Support Program forSustainable SocioeconomicDevelopment; and |
| · | Community Support Programin Education and Training. |
20.1.2Required Mining Permits
Permitting requirements for mining includean Estudio de Impacto Ambiental (EIA)that describes in detail themining plan and evaluatesthe impactsof the planon environmental andsocial attributes of the property. Baseline studies includeair quality, surface andgroundwater quality, flora and faunasurveys,archeological surveys and a studyofthe social conditionsofthe immediate propertyand anarea of interest that includeslocal communities. Manyof the baseline studies required for mining havebeen completed by Votorantim.Public meetingsare required in order that local community memberscan learn about and commentonthe proposed operation. Socialoutreach hasbeen clearlydemonstrated during Votorantim’s exploration effortsas described above.
Specific authorizations, permitsand licenses required forfuture mining include:
| · | EIA (as modifiedduring the minelife); |
| · | Mine ClosurePlan and Final Mine ClosurePlan within twoyearsof endof operation; |
| · | Certificate of Nonexistence of Archaeological Remains; |
| · | Water UseLicense (groundwater and/or surfacewater); |
| · | Waterconstruction authorization; |
| · | Drinking water treatment facilitylicense; |
| · | Explosives uselicense andexplosives storage licenses; |
| · | Controlled chemicalscertificate; |
| · | Beneficiation concession; |
| · | Environmental ManagementPlan approval. |
Informationonenvironmental monitoring waslimitedin the SRKdocument review.Nevertheless, theneed foradditional monitoring inat least one dryandone wet period will be required forthe EIAincluding terrestrial andaquatic fauna andflora and groundwater level and quality.
| 20.2 | Environmental Monitoring Results |
Environmental monitoring has been performedper therequirementstoobtain theexploration permits,including thevariables listedin the Table20-1.
SRK Consulting (U.S.), Inc.
NI 43-101 Technical Report, Preliminary Economic Assessment –Florida Canyon Zinc Project Page 158
Table20-1: EnvironmentalMonitoring During MiningExploration
| Factor | LegalNorm | Variables | Frequency |
Surface water quality(14 to18monitoring stations) | Environmental standardsforsurface water quality as toD.S. Nº 002-2008-MINAM | Temperature, Conductivity, pH, Total Suspended Solids (TSS), Oils and Grease, Cyanide –Total, Arsenic,Cadmium, ChromiumVI,Copper, Iron, Lead,Mercury, Zinc,Sulphur, Nitrates, Phenols Dissolved oxygen thermotolerant coliforms totalcoliforms | Quarterly |
Air quality (4to 5monitoring stations) | Environmental standardsforairquality: PM10, NO2, COandO3 astoD.S. Nº 074-2001-PCM PM2,5 andSO2 as toD.S. N° 003-2008-MINAM lead inPM10, D.S. Nº 085-2003-PCM | PM10-PM2.5-lead inPM 10-arsenicinPM10- gases. | Quarterly |
| Noice(2monitoring stations) | D.S. Nº 085-2003-PCM | Sound pressure | Quarterly |
Terrestrial fauna and flora | D.S. Nº 004-2014 IUCN 2014CITES | various | variable |
| Soil quality | Environmental standardsforsoil quality, D.S. N°002-2013 MINAM | As, Ba,Cd, Hg, FreeCN | variable |
SRK, 2017
Information that SRKwas ableto reviewin the databasewas limited. Nevertheless,the need foradditional monitoring in at least onedry and onewet period will be required for the EIA-dincluding terrestrial andaquatic fauna and flora and groundwaterlevel andquality.
Groundwater has been studiedbyHydro-Geo Consultores(2010) and Klohn CrippenBerger (2013).SRK reviewed these studiesin contextof underground mining. The mineis locatedin a highrainfall environment. Infiltration of surfacewaterpersists to approximately50 mdepth andrecharges groundwater via structuralpathways and interconnected karstfeatures in dolomitized andde- dolomitized carbonate stratigraphy. Thepotentiometric surfacehas been determinedby aseries of piezometers. Thisgroundwater surfacefollows the south-southwest flowdirection of Florida Canyonand daylights at theriver level in the canyon. Mostof the plannedmining of the flat mantos willoccur above thewater table. Steeperzones of mineralization, suchas SanJorge and Samwill occur belowthe water tableas will partsof the Karen Milagros mantosto thenorth. Local inflowsmaybe encountered when crossingfaults or intercepting karstfeatures.
Impactto groundwater is expectedtobe minimalas underground surface exposuresare minorand exposed sulfidesare not acidgenerating. There areno groundwater wells required forprocessing or potable water supply. Theseneeds will bemetby surfacewater available from nearby Tesoro Creek.
Theproposed underground miningoperation is expectedtohave a small disturbancefootprint comparedtoother mining methods.Wasterock from underground mining willbe crushedand conveyedto thetailing storage facility (TSF) for usein constructionof thetailings embankment. A small percentageof the waste rockwill be used as underground backfill.As aresult, therewill be little or no surfacearea disturbancerelated to waste rockplacement.
Wasterock generated fromthe mine and usedin the tailings facilityconstruction is composedof limestone and dolomite with a highneutralizing capacity.Most waste rock verylow sulfide content sothe potential for acidgeneration and metals leachis judgedto be low. Neverthelesswaste rockcharacterizationstudyis recommended forfuture work.
The primaryarea of surfacedisturbance is relatedtotailings placement.As shownin Figure18-3,thefinal tailingsplacement willhave an areaof 23.5 ha. Tailings alsorequire geotechnical andgeochemical stabilization during placementand closure.Tailings are predictedtohavelowamounts of iron sulfide andtobe geochemically stable withrespect to acid rockdrainage. Thereis alsosubstantial neutralization capacity inthe carbonate host rocksto mitigate acid generation. Residual leadand zinc sulfides have lowacid-generating capacity; however, theyare subjectto metalleaching and thereforerequire compaction during placementto minimize water infiltration. Theclosure planto stabilize tailingsis describedlater in this sectionof the report.
Water forprocessing is expected to be collectedfrom surface streamsand reclaimedfrom filtered tailings. Therewillbe noneed forgroundwater consumption in the currentprocessing plan. Groundwater willbe intersectedin deeperreaches of the underground mine.Most of this water willbe used fordust suppression or pipedto the millto support comminution andflotation.
A conceptual closure planwas developedtofacilitate the calculationof the reclamation and closure coststo includein the PEA economicanalysis. Closuredesigns and costsare based primarilyonclosure actions typically performedat similarsites.
Closure Design Objectives
| · | Promote positive and controlleddrainage offthe tailings surfaceandaway fromthe dam face; |
| · | Maintain an erosional and geotechnically stable landform; |
| · | Promotenative vegetation growth on thetailings surface,and |
| · | Create a closed facility thatminimizes long-termmonitoring andmaintenance. |
Closure Design Objectives
| · | Prevent public accessto underground workings. |
| · | Maintain an erosional and geotechnically stable landform. |
| · | Create alandform that visuallyapproximates the surrounding landscape. |
| · | Promotenative vegetation growth on thedisturbed surface. |
| · | Create a closed facility thatminimizes long-termmonitoring andmaintenance. |
Closure Tasks
| · | Portals andvents willbe decommissionedby fillingwith waste rockor capping with aconcrete bulkhead. Disturbed areas willberevegetated with native species. |
| 20.3.3 | Buildings and Infrastructure |
Closure Design Objectives
| · | Removeany facilitiesnot needed forfuture use. |
| · | Maintain an erosional and geotechnically stable landform. |
| · | Create alandform that visuallyapproximates the surrounding landscape. |
| · | Promotenative vegetation growth on disturbed surfaces. |
| · | Create a closed facility thatminimizes long-termmonitoring andmaintenance. |
Closure Tasks
| · | Buildingswithnoidentified post-mining land use willbe demolished andthe debris will be hauled to the permitted landfillonsite. |
| · | Mill and conveyorparts with useful remaining lifewill be removed fromthe site and sold. The restof the structure willbe demolished and recyclablematerials hauled offsiteand the resthauled to the permitted landfillonsite. |
| 20.3.4 | Roads and Miscellaneous Disturbance |
Closure Design Objectives
| · | Maintain an erosional and geotechnically stable landform. |
| · | Create alandform that visuallyapproximates the surrounding landscape. |
| · | Promotenative vegetation growth on thedisturbed surface. |
| · | Create a closed facility thatminimizes long-termmonitoring andmaintenance. |
Closure Tasks
| · | Roads not needed foranidentified post-mining land usewillbe regradedto approximatelyoriginal contours and revegetatedwith native plant species. |
| · | The main accessroads andsomeinternal mineroadsmayremain. Roads mightbe reconstructed to be smallerin width andinclude water control features to prevent erosion of the roadbed. |
| · | Miscellaneous disturbancearound other facilities will be regradedto approximatelyoriginal contours andrevegetated with native plant species. |
Closure Design Objectives
| · | Promote positive and controlleddrainage offthe tailings surfaceandaway fromthe dam face. |
| · | Maintain an erosional and geotechnically stable landform. |
| · | Promotenative vegetation growth on thetailings surface. |
| · | Create a closed facility thatminimizes long-termmonitoring andmaintenance. |
Closure Tasks
Thetailings dam facewill be constructedof waste rock at either 2:1H:Vor 3:1 H:V.As longas stormwater is directed away fromthe dam faceand theslopes are not changed fromdesign the facility willbe erosionally and geotechnically stable. Nofurther reclamation will be performed.Tailings operations and closure involve:
| · | During operations,at the endof mine-life,deposit tails suchthat the surface slopesup to 1% toward the centerof thetailings; |
| · | Place 0.5 mof growth mediaon the tailings surface; |
| · | Construct astormwater channelin the centerof the tailings to conveywater to thesouthwest corner upstream from the dam into native ground; |
| · | Construct astormwater channel innative groundfromthe southwest cornerof the tailings surfaceto spill into the natural drainageto thesouth; |
| · | Decommission the stormwaterdrainon the northsideof thetailings facilityand direct flowonto the tailings surfaceto be capturedbythe center stormwater ditch; and |
| · | Revegetate the tailings surface. |
Postminingland use will approximate anatural park setting which couldbe used forlivestock grazing and visuallyappears likethesurroundinglandscape. Generally, disturbed areaswill be physicallyreclaimed and revegetated to approximatesurroundinglandforms.Disturbed areas will alsobe re-vegetated withnative species. Somefacilitiesmayremaininplacetosupportfutureaccess forexploration and/or furthermineraldevelopment.
SRK recommendsin future studies to design the tailings surfaceand spillway stormwaterstructure and evaluate options to reduceor eliminate the long-term obligation formonitoring and maintenance.
| 20.7 | Reclamation and ClosureCost Estimate |
Closure costswere calculated usingthe Standardized Reclamation Cost Estimator(SRCE) 2.0. The SRCEis aspreadsheet modelthat uses a firstprinciples approachto calculatelengths, areasand volumesof common minefacilities and applyproductivities for common mineequipment to estimate the timerequired. Unit costs forlabor, materials and equipmentare then applied to estimate atotal cost.
Unit costswere as follows:
| · | Laborcostswere factored fromNevada labor usedbythe Nevada Divisionof Environmental Protection (NDEP) forfinancial suretyby multiplyingby40%; |
| · | Equipment and material costswere used without factoring from the NDEP costsused forfinancial surety; and |
| · | A fuel costof US$1.24 per literwasused fromthe PEAdocumentation. |
Closure costincludes provision for General andAdministrative, closure planning andengineering and staff oversite during the active closure.Provision is also included formonitoring andmaintenance.
Theestimated costto closethe mineis US$4,919,935 which will be spentover thetwo years following the endof mining. An additionallong termmonitoring and maintenance expenseof US$829,835 will be required spreadover50years starting in 2034. Thetotal estimatedclosure costis US$5,749,770.
| 20.8 | Post-Performance orReclamations Bonds |
Reclamation bonds have notyet been definedor posted forthe project.
From thesocialpoint of view, theFlorida Canyon Projectis developed on landsoftheCommunityof Shipasbamba,located inthe districtof thesame name, in the provinceof Bongará inthe department of Amazonas. This communitywasregistered in the Directoryof Peasant CommunitiesbyR.S. 49on December17, 1959 (220 families).
In orderto developits exploration work, Votorantim Metais (VM) –Cajamarquilla S.A., has signedwith theCCof Shipasbamba,biannual agreementsfrom 2009 to 2017 forthe useof 12,500 ha.In summary, VM -Cajamarquilla has performedthe followingactions with the:
Government
| · | Complywith the requirements demandedby thesector to obtain the necessary environmental permitsto carryout its explorationactivities. |
| · | In this context,it has developed severalCitizen Participation Mechanismsin which the population has beeninformed about the objectives and scopeof the Project andthe typeof relationship with the community that willbe developedthrough its Communityrelations office. |
Community
| · | Agreements forthe useof SurfaceLands |
| o | From the point of view of social responsibilityVM -Cajamarquilla, in orderto be abletooperate in thearea in harmony with the localinhabitants, has signedbi-annual agreements forthe Useof Land; |
| o | Theseestablish the commitmentsand counter-commitmentsto which both partiesare bound (company and community); |
| o | Thelast agreement signedbyboth parties expiredinJuly2017, and |
| o | Therevised documents state that the necessary stepswere being takento sign the Convention forthe period 2016-2018. |
| o | VM -Cajamarquilla has developed aSocial Management Planwith several Programs,on which detailedinformation isnot available. It is assumed,from the photos includedin a reviewof the company'sactivities that the programsare developing normally andare accepted bythe community. These Programsare: |
| - | SocialManagement Plan and CommunityRelations; |
| - | Communication, Information andCoordination Programwith Residents; |
| - | Attentionto Concern, Claimsand Conflict Resolution Program; |
| - | Support Program forParticipatory Environmental Monitoring andInformation Workshops; |
| - | Recruitment and TrainingProgram forLocal Labor; |
| - | Support Program forSustainable SocioeconomicDevelopment; and |
| - | Community Support Programin Education and Training. |
21 Capital and Operating Costs
As part of the Florida Canyonvaluation exercise, SRKpreparedan estimateof both capital andoperating costsassociated with the designed mineableresources production schedule. Thissection of the report presents and details theseestimates of Capital Expenditure andOperating Expenditure. All estimatesare basedon yearly inputsof physicals and all financial datais secondquarter 2017and currencyis in U.S.dollars (US$),unless otherwise stated.
The useof “ore” in thesummaryof tables of this PEA is a relative mineablematerial estimated.Ore,bydefinition, can onlybe ascribedto economicmineralization supportedby MineralReserves.
| 21.1 | CapitalCost Estimates |
TheFlorida CanyonProject is a green fieldlead-zinc deposit and the estimateof capital includes bothan estimateof initial capital investmentto install and commissionthe mineand asustaining capitalto maintain the equipment and expandingany supportinginfrastructure necessaryto continue runningthe project untilthe endof the projected production schedule. The estimateof capitalwas broken downinto the following main areas:
| · | Miningareas accessdevelopment and vent raises; |
| · | Underground Mining Equipment; |
| · | Surfacecrushing and conveying systems; |
| · | Backfill Infrastructure; |
| · | Cement RockfillInfrastructure; |
| · | Tailings Storage Facility; |
| · | Closure and Post-Closure Monitoring. |
Thecapital cost estimates developed for this study comprise the costs associatedwith the engineering,procurement, construction and commissioning required forall items. The costestimatewas basedSRK’s experience with similarprojects installed in the regionor estimates of costspecifically prepared forthe project under a firstprinciples basis. Thework indicates that theproject will require an initialcapital of US$213.7 millionand asustaining capital ofUS$81.9 million Table 21-1summarizes the estimateof capital.
Table21-1: Florida CanyonCapital Estimate Summary
| Description | Initial(US$000’s) | Sustaining (US$000’s) | LoM(US$000’s) |
| Development | 12,293 | 35,741 | 48,033 |
| Vent Raises | 686 | 672 | 1,358 |
| Underground Mining Equipment | 24,625 | 2,474 | 27,099 |
| Surface Crushing&Conveying | 1,430 | 0 | 1,430 |
| OffsiteInfrastructure | 16,227 | 0 | 16,227 |
| Site Facilities | 14,697 | 0 | 14,697 |
| Process Plant | 60,000 | 0 | 60,000 |
| Power Supply | 2,472 | 0 | 2,472 |
| WaterSupply | 250 | 0 | 250 |
| Backfill Infrastructure | 13,200 | 0 | 13,200 |
| CementRockfill Infrastructure | 200 | 0 | 200 |
| Tailings Storage Facility | 12,854 | 11,814 | 24,668 |
| Owner's | 14,595 | 0 | 14,595 |
| Contingencies | 40,138 | 0 | 40,138 |
| Sustaining Capital | 0 | 26,272 | 26,272 |
| Closure | 0 | 4,920 | 4,920 |
| Post-Closure Monitoring | 0 | 830 | 830 |
| TotalCapital | $213,667 | $82,722 | $296,389 |
Source: SRK, 2017
21.1.1Basis for Capital Cost Estimates
The cost associatedwith mining area access developmentand the constructionof vent raiseswasbased on the preparation of amineable resources production schedule that included adesign of metersofdevelopment and metersof vent raises, thesewere combined with the followingunit coststo result in the costestimate:
| · | Development: US$1,500/m;and |
| · | Vent Raises: US$2,200/m. |
Theseunit costsare based on datafrom comparable underground minesalso located inPeru or other South Americanareas with similarmining conditions.
A scheduleof acquisitionofunderground mining equipment specificto theproduction schedulewasprepared, Table21-2presents the unit costs and acquisitionsof these equipment.
Table21-2: Florida CanyonUnderground Mine EquipmentAcquisition Schedule
| Equipment | UnitCost (US$) | TotalCost (US$) | Acquisition Year |
| 1 | 2 | 3 | 4 | 5 | 6 | 7 | 8 | 9 | 10 | 11 | 11 |
| LH StopeDTHDrills | 432,000 | 864,000 | 3 | 1 | 1 | 1 | | | | | | | 1 | 1 |
| LH Production LHD | 900,000 | 2,700,000 | 2 | 1 |
| Production Jumbo (D&F/C&F) | 644,000 | 3,864,000 | 3 | 2 |
| D&F/C&F Production LHD | 675,000 | 4,050,000 | 3 | 1 | 2 |
| Horizontal Development Jumbos(2boom) | 644,000 | 2,576,000 | 1 | |
| Development LHD | 900,000 | 3,600,000 | 3 | 1 | |
| Haul Trucks | 765,000 | 4,590,000 | 4 | 2 | |
| Rock Bolter | 829,000 | 1,658,000 | 1 | 1 | |
| Anfo Loader | 437,000 | 437,000 | | 1 | |
| Miscellaneous/Service Vehicles | 320,000 | 1,600,000 | 3 | 2 | |
| Light Vehicles/General | 40,000 | 200,000 | 3 | 2 | |
| Ventilation Fans | 240,000 | 960,000 | 1 | 1 |
Source: SRK, 2017
Theprocess plantcost estimateis based ondata from similarflotation plants with thesamecapacity andsameregion. Thisinvestigation resulted in an estimateof about US$60 million.
The cost associatedwith the required surface crushing and conveyingwasbased on requireddistances andelevation gainto cover. Theseinclude the movementof mineralized material from three mineportals to theplant feedarea andsomewaste material that willbe usedto build the embankment forthe tailings storage facility. Thisinvestigation resulted inanestimate of around US$1.4 million.
Offsite-infrastructure, site infrastructure, powersupply, water supply and backfillinfrastructure costestimates were prepared basedthe required structures costsfrom comparable operations. It shouldbe noted that this study assumesthat athird-party is planning to build a hydro powerplant thatwill provide powerto the project. A company has approachedSolitario to offerthis option, includingthe construction of the transmissionline andproject substation. Table 21-3 summarizesthe basisof these cost estimates.
SRK Consulting (U.S.), Inc.
NI 43-101 Technical Report, Preliminary Economic Assessment –Florida Canyon Zinc Project Page 167
Table21-3: Florida CanyonOffsite, Site, Power, Waterand Backfill Infrastructure
| Type | Description | Quantity | Units | Unit Cost (US$) | Units | TotalCost (US$ millions) |
| OffsiteInfrastructure | AccessRoad New Construction | 15.6 | km | 339,000 | US$/km | 5,285,996 |
| OffsiteInfrastructure | AccessRoad Upgrade | 33.1 | km | 330,500 | US$/km | 10,940,724 |
| Energy | FuelTanks (50k liters each) | 2 | each | 83,333 | US$/tank | 166,667 |
| Energy | Fuelpumpsandassociated facilities | 1 | LS | 225,000 | US$/system | 225,000 |
| Energy | Medium Voltage Powerlines(onsite) | 2.3 | km | 900,000 | US$/km | 2,080,800 |
| WaterSupply | PotableWaterTreatment | 1 | each | 100,000 | US$/unit | 100,000 |
| Facilities | MineOffice | 1 | each | 858,479 | US$/unit | 858,479 |
| Facilities | Mine Dry | 1 | each | 822,418 | US$/unit | 822,418 |
| Facilities | Rescue and First Aid | 1 | each | 622,950 | US$/unit | 622,950 |
| Facilities | Warehouse | 1 | each | 1,701,300 | US$/unit | 1,701,300 |
| Facilities | Health/Safety/EnvironmentalOffice | 1 | each | 487,945 | US$/unit | 487,945 |
| Facilities | Mine Maintenance Shops | 1 | each | 4,159,230 | US$/unit | 4,159,230 |
| Facilities | Administrative Building | 1 | each | 1,212,554 | US$/unit | 1,212,554 |
| WaterSupply | WaterSystem Tankandpiping | 1 | each | 150,000 | US$/unit | 150,000 |
| Facilities | Security Gatehouse | 1 | each | 298,204 | US$/unit | 298,204 |
| Facilities | Truck Scale | 1 | each | 159,515 | US$/unit | 159,515 |
| Facilities | TruckWash | 1 | each | 280,239 | US$/unit | 280,239 |
| Facilities | Personnel Camp with Cafeteria, Rec Center,400people | 1 | LS | 3,000,000 | US$/unit | 3,000,000 |
| Facilities | Laboratory | 1 | each | 418,896 | US$/unit | 418,896 |
| Facilities | Sewer | 1 | each | 400,000 | US$/unit | 400,000 |
| Facilities | Incinerator System | 1 | each | 275,000 | US$/unit | 275,000 |
| Backfill | Plant Cost | 1 | LS | 10,300,000 | US$/each | 10,300,000 |
| Backfill | Underground | 1 | LS | 2,900,000 | US$/each | 2,900,000 |
Source: SRK, 2017
Cementwillbe addedto undergroundwaste rockand used to fill designated primary fill areas,this willbe donebyunderground installed facilities thatare estimatedto cost roughlyUS$200,000.
SRK prepared a design for a dry stacktailings storage facilitytocontain allthe filtered tailings generatedby the lead andzinc concentrates production. The costestimate includedthe preparationof a stage construction using borrow material fromthe underground mineand construction area. Thisresulted in a total costof US$24.7 million, which is split US$12.9 millioninitial capital andUS$11.8 million sustainingcapital. Therelevant sectionof this report contains moredetails about thistailings storage facilitydesign.
Closure costswere estimatedby SRKas US$4.9 million forthe actual closureand about US$830,000 forpost closure site monitoring. Details of this estimate canbe found in therelevant sectionof this report.
Other capital cost estimatesinclude the following:
| · | Owner’s cost: Estimateof about 10% of initial capital, excluding developmentand vent raises; |
| · | Sustaining Capital:2% of initial capital, excluding development,vent raises and owner’s costs;and |
| · | Contingencies: 25% contingencieswere appliedtoinitial capital, excluding developmentand vent raises andowner’s costs. |
| 21.2 | OperatingCostEstimates |
SRK prepared the estimateof operating costs for theassociated mineable resourcesproduction schedule. These costswere subdividedinto the following categories:
| · | Mining Operating Expenditure; |
| · | Processing Operating Expenditure; and |
| · | G&A OperatingExpenditure. |
Theresulting LoM cost estimateis presented in Table21-4.
Table21-4: Florida CanyonOperating Costs Summary
| Description | LoM(US$000’s) | LoM(US$/t-Ore) | LoM(US$/lb-Zn) |
| Underground Mining | 228,547 | 20.43 | 0.16 |
| Process | 144,063 | 12.88 | 0.10 |
| G&A | 39,153 | 3.50 | 0.03 |
| TotalOperating | 411,764 | 36.81 | 0.29 |
Source: SRK, 2017
21.2.1Basis for Operating Cost Estimates
Theprepared estimatesthat compose the operating costsconsist of domestic andinternational services, equipment,labor, etc.Whererequired, the followingwere included:
No specificwork schedule has been defined forthe mine, plant and site operations.
Allof the operating cost estimatesare basedon the quantities associated with theproduction schedule,including the following:
| · | Primaryand SecondaryBackfill; and |
Unit costsfrom similar projects in thesameregion or in the Americas, adjusted forlabor and consumables differences,were usedto estimatethe LoM operating costs. Alloperating costsinclude supervision staff,operations labor, maintenance labor,consumables, electricity, fuels, lubricants, maintenance partsand anyother operating expenditure identified bycontributing engineers. Thefollowing unit costswere used to calculate the operating costs:
| · | Underground Mining: US$15.30/t-RoM; |
| · | Primary CementRockfill: US$22.18/m3; |
| · | Primary CementPastefill: US$26.23/m3; |
| · | Secondary Cement Pastefill: US$18.13/m3;and |
| · | Processing: US$12.00/t-Feed. |
General andAdministration costswere considered as 10%of the other operating costs,which resultedin a unit rateof US$3.50/t-RoM.
22 EconomicAnalysis
Thefinancial results presented here are based on annual inputsfrom the production schedule preparedby SRK. All financial datais secondquarter 2017 and currencyis inU.S. dollars (US$),unless otherwise stated.
Florida Canyon doesnot holdcontracts forthe provision of its products. The costsand discountsassociated with the salesof the products are basedonrecent information from similar operations. This studywas prepared under theassumption thatthe project will sellthe following products.
Itwas also considered thatthe leadconcentrate also contains payableamounts of silver.
Assumedprices are based on currentmarketspot prices.Table22-1presents theprices usedinthe cashflow model,which were also used for mineable resourcecalculations.
Table22-1: Florida CanyonPrice Assumptions
| Description | Value | Unit |
| Silver | 16.50 | US$/oz |
| Lead | 1.00 | US$/lb |
| Zinc | 1.20 | US$/lb |
Source: Solitario, 2017
Treatmentcharges andnet smelter returns (NSR)terms foreach typeof productare summarizedin Table 22-2.
Table22-2: Florida CanyonNet Smelter Return Terms
| Description | Value | Units |
| LeadConcentrate | | |
| Treatment Charges | 210.10 | US$/t-conc. |
| Payable Lead | 95.0% | No deducts |
| Silver Smelting&Refining Charges | 1.50 | US$/oz-Ag |
| Payable Silver | 95.0% | No deducts |
| ZincConcentrate | | |
| Treatment Charges | 203.00 | US$/t-conc. |
| Payable Zinc | 85.0% | No deducts |
Source: SRK, 2017
It was assumedthatzincconcentrates willbe truckedto the Cajamarquilla smelter ownedbyVotorantim near Lima, Peru. Leadconcentrates willbe truckedto thePort of Callaonear Lima andshipped overseas to a leadsmelter. It was assumedthat theconcentrates willhavean average moisturecontent of 8%. Table22-3presents the calculatedtransportation costs considered foreach product.
Table22-3: Florida CanyonProduct Logistics Cost
| Items | Value | Unit |
| LeadConcentrate | 87.05 | US$/t |
| ZincConcentrate | 51.08 | US$/t |
Source: SRK, 2017
Commonprices for consumables,labor, fuel, lubricants andexplosives were usedby all engineeringdisciplines to derive capital andoperating costs.Included in thelabor costs are shift differentials,vacation rotations, all taxesand the payrollburdens. All currencyis in U.S. dollars (US$)unless otherwise stated.
Thepre-production period was estimatedtobe two years. This shouldbeenough to develop accessto mining areas, install and commissionthe plant andsite infrastructure. Mine production is basedonan average assumedLoM minematerial movementof 2,358 t-ore/d (365 days/yr basis). The mineschedule doesnot includestockpiling asall blendingofrun of mine(RoM) isdoneinthe mine. Table22-4presents the LoM mine assumptions.
Table22-4: Florida Canyon MineProduction Assumptions
| Description | Value | Units |
| Mine Production | | |
| Underground Ore | 11,187 | kt |
| TotalMaterial | 11,187 | kt |
| Avg. Daily Capacity | 2,358 | t perday |
| Stripping Ratio | N/A | w:o |
| RoM Grade | | |
| Silver | 11.3 | g/t |
| Lead | 0.90% | % |
| Zinc | 8.34% | % |
| Contained Metal | | |
| Silver | 4,068 | koz |
| Lead | 222,347 | klb |
| Zinc | 2,057,796 | klb |
Source: SRK, 2017
Theaverage mill feedis also 2,358t/d (365days/yr basis)over the LoM. The mill feedhas an averagehead gradeof 11.3 g/t Ag, 0.90% Pb and 8.34% Zn. The processingcircuit is designed to recover a leadconcentrate and a zincconcentrate, the leadconcentrate alsocontains payableamounts of silver. Table22-5presents the projected LoMplant production.
Table22-5: Florida Canyon MillProduction Assumptions
| Description | Value | Units |
| RoM Ore Milled | 11,187 | kt |
| Daily Capacity | 2,358 | tperday |
| LeadConcentrate | | |
| Moisture Content | 8% | |
| Concentrate Silver Grade | 436 | g/t |
| Concentrate Lead Grade | 50% | % |
| Concentrate Zinc Grade | 0% | % |
| Recovery | | |
| Silver | 52% | |
| Lead | 74% | |
| Zinc | 0% | |
| Concentrate Yield | 150 | kt(dry) |
| ZincConcentrate | | |
| Moisture Content | 8% | |
| Concentrate Silver Grade | 0 | g/t |
| Concentrate Lead Grade | 0.0% | % |
| Concentrate Zinc Grade | 50% | % |
| Recovery | | |
| Silver | 0% | |
| Lead | 0% | |
| Zinc | 80% | |
| Concentrate Yield | 1,491 | kt(dry) |
Source: SRK, 2017
| 22.3 | Taxes, RoyaltiesandOther Interests |
Theanalysis of the Florida CanyonProject includes atotal of 30% of incometaxes over taxable income.Losses carried forward are usedwhen possible, limitedto 50%of profits. Adepreciation schedulewascalculated by SRK assuming a ten-yearstraight line depreciation.
TheProjectincludes paymentof twotypesof governmental royalties, the first called a mining royaltyand thesecond called a special miningtax. Both royaltiesare calculatedas a rate dependingon theratio between theEarnings Before Interest and Taxes (EBIT) and theNet Revenue. Thisrate is applied on top of the EBIT,with thedifference that the mining royaltycanbe replacedby a minimumrate of 1% over thenet revenue, in case this1% is higher than the mining royalty rateover the EBIT. Therates foreach royaltyare presented in Table22-6.
Table22-6: Florida Canyon RoyaltyRates
| EBIT (%) | Special Mining Tax | Mining Royalty |
| Marg. (%) | Cum. (%) | Marg. (%) | Cum. (%) |
| 0.00 | 0.00 | 0.00 | 0.00 | 0.00 |
| 10.00 | 2.00 | 0.20 | 1.00 | 0.10 |
| 15.00 | 2.40 | 0.32 | 1.75 | 0.19 |
| | | | | |
| 20.00 | 2.80 | 0.46 | 2.50 | 0.31 |
| 25.00 | 3.20 | 0.62 | 3.25 | 0.48 |
| 30.00 | 3.60 | 0.80 | 4.00 | 0.68 |
| 35.00 | 4.00 | 1.00 | 4.75 | 0.91 |
| 40.00 | 4.40 | 1.22 | 5.50 | 1.19 |
| 45.00 | 4.80 | 1.46 | 6.25 | 1.50 |
| 50.00 | 5.20 | 1.72 | 7.00 | 1.85 |
| 55.00 | 5.60 | 2.00 | 7.75 | 2.24 |
| 60.00 | 6.00 | 2.30 | 8.50 | 2.66 |
| 65.00 | 6.40 | 2.62 | 9.25 | 3.13 |
| 70.00 | 6.80 | 2.96 | 10.00 | 3.63 |
| 80.00 | 7.60 | 3.70 | 11.50 | 4.74 |
| 85.00 | 8.00 | 4.10 | 12.00 | 5.34 |
| 90.00 | 8.40 | 4.52 | 12.00 | 5.34 |
Source: SRK, 2017
Thevaluation results of theFlorida CanyonProject indicate that theProjecthas apotential present value of approximately US$198 million, withan Internal Rateof Return (IRR) of 25%, basedon an 8% discount rate. The operation willhave two yearsof negative free cash flow,as it hasto be constructedin this period. Evenwithsomeof the capital spent inthe firstyear of operation, it isprojected thatthis year will have apositivefree cash flow. This economicanalysis indicates that theinvestment payback should occur2. 6years fromthe start of the commercialproduction. The estimate free cash flowof theproject is presented inFigure22-1.

Source: SRK, 2017
Figure 22-1:Florida CanyonAfter-Tax Free Cash Flowand Equivalent MetalProduction
Indicative economicresults are presented in Table 22-7, thetable evidences thatzinc is responsible forthe clear majorityof the revenue generation andthe underground mining costis the heaviestburden on the operation,followedby themineral processing costas a farsecond.
Table22-7: Florida CanyonIndicative Economic Results (DryBasis)
| Description | Value | Units |
| MarketPrices | | |
| Silver | 16.50 | US$/oz |
| Lead | 1.00 | US$/lb |
| Zinc | $1.20 | US$/lb |
| EstimateofCash Flow (all values inUS$000s) | | |
| Concentrate Net Return | | $/oz-Ag |
| Silver Sales | $32,957 | $0.02 |
| LeadSales | $156,937 | $0.11 |
| ZincSales | $1,675,977 | $1.20 |
| TotalRevenue | $1,865,871 | $1.34 |
| Treatment, Smelting and Refining Charges | ($337,076) | |
| Freight, Impurities&Third Parties | ($96,935) | ($0.07) |
| Gross Revenue | $1,431,860 | |
| Royalties | ($61,734) | ($0.04) |
| Net Revenue | $1,370,126 | |
| Operating Costs | | |
| Open Pit Mining | $0 | $0.00 |
| Underground Mining | ($228,547) | ($0.16) |
| Process | ($144,063) | ($0.10) |
| G&A | ($39,153) | ($0.03) |
| Ordinary Rights | $0 | $0.00 |
| TotalOperating | ($411,764) | ($0.29) |
| Operating Margin (EBITDA) | $958,362 | |
| Initial Capital | ($213,667) | |
| LoMSustaining Capital | ($82,722) | |
| IncomeTax | ($224,873) | |
| AfterTaxFree Cash Flow | $437,100 | |
| Payback | 2.59 | years |
| After-Tax IRR | 24.7% | |
| NPV @:8% | $197,521 | |
Source: SRK, 2017
Table22-8shows annual production and revenue forecasts forthe life of the project. All production forecasts,material grades,plant recoveries andother productivity measureswere developedby SRKand Solitario.
Table22-8: Florida CanyonLoM Annual Production and Revenues
Period | RoM(Mt) | Plant Feed (Mt) | LeadConc. (kt) | ZincConc. (kt) | Free Cash Flow (US$ millions) | Discounted Cash Flow (US$ millions) |
| -2 | 0.00 | 0.00 | 0.00 | 0.00 | (72) | (72) |
| -1 | 0.00 | 0.00 | 0.00 | 0.00 | (103) | (96) |
| 1 | 0.73 | 0.73 | 9.06 | 95.86 | 2 | 2 |
| 2 | 0.91 | 0.91 | 11.07 | 119.02 | 50 | 40 |
| 3 | 0.91 | 0.91 | 14.87 | 180.57 | 78 | 57 |
| 4 | 0.91 | 0.91 | 17.73 | 161.95 | 80 | 54 |
| 5 | 0.92 | 0.92 | 14.78 | 191.19 | 92 | 58 |
| 6 | 0.91 | 0.91 | 15.26 | 181.90 | 84 | 49 |
| 7 | 0.91 | 0.91 | 15.80 | 138.77 | 68 | 37 |
| 8 | 0.91 | 0.91 | 12.22 | 80.34 | 36 | 18 |
| 9 | 0.92 | 0.92 | 11.73 | 79.35 | 31 | 14 |
| 10 | 0.91 | 0.91 | 11.24 | 83.01 | 35 | 15 |
| 11 | 0.92 | 0.92 | 4.82 | 69.77 | 18 | 7 |
| 12 | 0.91 | 0.91 | 7.76 | 81.33 | 28 | 10 |
| 13 | 0.40 | 0.40 | 3.53 | 27.54 | 14 | 5 |
| 14 | 0.00 | 0.00 | 0.00 | 0.00 | 0 | 0 |
| 15 | 0.00 | 0.00 | 0.00 | 0.00 | (3) | (1) |
| 16 | 0.00 | 0.00 | 0.00 | 0.00 | 0 | 0 |
| 17 | 0.00 | 0.00 | 0.00 | 0.00 | 0 | 0 |
| Total | 11.19 | 11.19 | 150 | 1,491 | 437 | 198 |
Source: SRK, 2017
TheFloridaCanyonproject ismainly azinc project, as this metalrepresentsroughly 90%of the total projected revenue. The remainderof the revenueis relatedto lead andsilver, where boththese metalsare by-products, as nonerepresent a minimumof20% of the revenueprojection. Figure 22-2presents the revenue broken downby eachmetal.

Source:SRK
Figure 22-2: MetalParticipation in Revenue – FloridaCanyon
Project cash costsare reported under an equivalent zinc production. All-in costs forzinc, includinginitial and sustaining capital costs,are estimated at US$0.73/Zn-lb. Considering byproductcredits for lead andsilver, all-inzinc costis US$0.47/Zn-lb. Table22-9presents the compositionof the FloridaCanyon cash costs.
Table22-9: Florida CanyonCash Costs
| Cash Costs | US$000's |
| Direct Cash Cost | |
| Underground MiningCost | $228,547 |
| Process Cost | $144,063 |
| SiteG&A Cost | $39,153 |
| Ordinary Rights | $0 |
| Treatment Charges | $334,080 |
| Smelting&Refining Charges | $2,996 |
| Freight | $96,935 |
| By-Product Credits | ($189,894) |
| Direct Cash Costs | $655,881 |
| US$/t-ore | $58.63 |
| US$/lb-Zn | $0.47 |
| Indirect Cash Cost | |
| Royalties | $61,734 |
| Exploration Expense | $0 |
| Social Responsibility/Community Relations Expense | $0 |
| Indirect Cash Costs | $61,734 |
| US$/t-ore | $5.52 |
| US$/lb-Zn | $0.04 |
| Direct+Indirect Cash Costs | $717,615 |
| US$/t-ore | $64.15 |
| US$/lb-Zn | $0.51 |
| Sustaining Capital Cash Cost | |
| Sustaining Capital | $82,722 |
| Sustaining Cash Costs | $82,722 |
| US$/t-ore | $7.39 |
| US$/lb-Zn | $0.06 |
| All-In Sustaining CashCosts | $800,337 |
| US$/t-ore | $71.54 |
| US$/lb-Zn | $0.57 |
| InitialCapital Cash Cost | |
| Initial Capital | $213,667 |
| InitialCapital Cash Costs | $213,667 |
| US$/t-ore | $19.10 |
| US$/lb-Zn | $0.15 |
| All-In Cash Costs | $1,014,004 |
| US$/t-ore | $90.64 |
| US$/lb-Zn | $0.73 |
Source: SRK, 2017
| 22.5 | Base Case SensitivityAnalysis |
Sensitivity on discount ratesand different metal pricesscenarios were conducted. The resultsare presented inFigure 22-3 andFigure 22-4.
Figure 22-3presents the behaviorof the accumulated after-tax net presentvalue, where:
| · | Distressed metalprices are 20% lower than neutral prices; |
| · | Neutral metalprices as presented in this section; and |
| · | Robust metalprices are 20%higher thanneutral prices. |
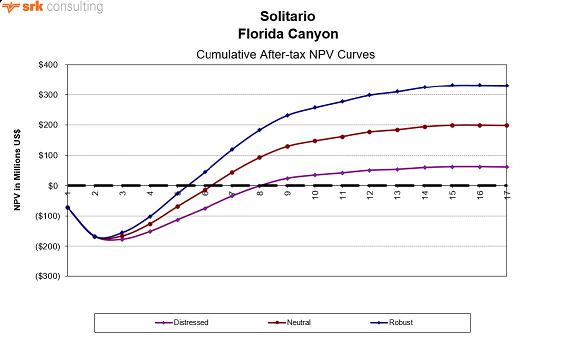
Source: SRK, 2017
Figure 22-3:Florida CanyonCumulative NPV Curves(after tax)

Source: SRK, 2017
Figure 22-4:Florida CanyonNPV Sensitivity to HurdleRate
A sensitivityanalysis on variation of Project costs,both capital and operating,and metalprices indicated thatthe cash generatingis mostly sensitivetothe reductionof metalprices, or possibly losson metal recovery, and secondlyto the increaseof capital costs. Achart of typical sensitivities is provided inFigure 22-5.
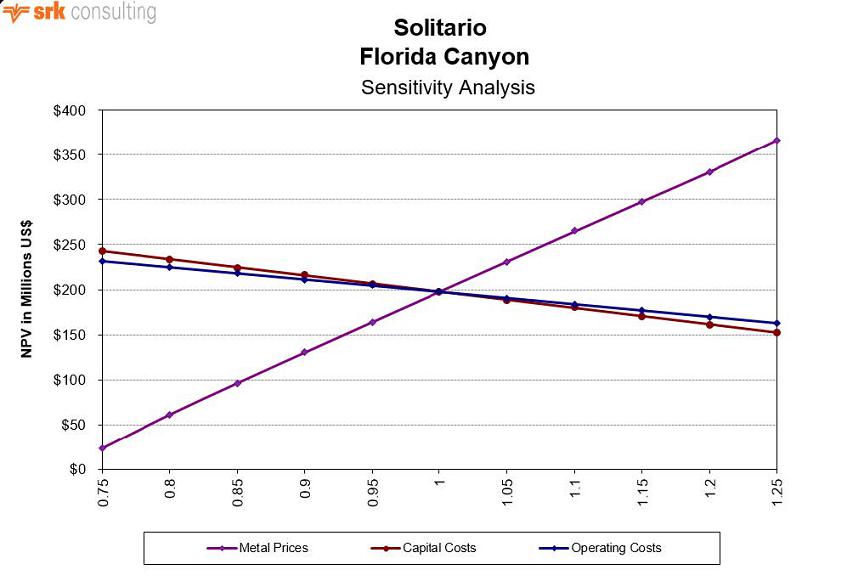
Source: SRK, 2016
Figure 22-5:Florida CanyonNPV Sensitivity (US$000’s)
| 22.6 | ConservativeMetal PriceAlternative Analysis |
Theowners requested SRKto evaluatethe Florida CanyonProject under a specificalternate metalprice structure. This forecastincludes a new setof long term metalprices, whichare considerablylower than current spot metalprices forzinc andlead. Thealternative pricing is presented in Table22-10.
Table22-10: Alternate Market Forecast Metal Prices
| Description | Value | Unit |
| Silver | 18.91 | US$/oz |
| Lead | 0.88 | US$/lb |
| Zinc | 1.06 | US$/lb |
Source: SRK, 2017
Theowners also askedthat forthese marketconditions the project be evaluatedwith a higherdiscount rate of 9%.Only these metal prices and the discount rate were changed in this alternative valuation. Other inputs and estimates were maintained thesameas the base case, including:
| · | On-Site and Off-SiteOperating Costs; |
22.6.1Impact to Mine Planning
SRK investigated the impactof using the moreconservative economicinputs on mineplanning, specifically, the NSRcalculation. Using thenew NSRcalculation andapplying it to the mineplan resource presented in this document, has the effectof lowering theoverall average NSR by23%. Overall, the revenuegenerated fromthe mineplan resource is 77%of the original assumptions.
Figure 22-6 shows themine plan resource, coloredbythe sensitivity NSR (US$/t). The economic cut- offis approximatelyUS$40/t-NSR. Dark blue miningareas inthe figure arenow below cut-offand light blueareas are marginal.Using the sensitivity NSR,when all areasare combined, the mine planis still economic.Given thesenew sensitivityinputs, the mineplan couldbeoptimized to eliminate the un- economicmaterial and minimize the amountof marginalmaterial in the mineplan.

Figure 22-6: MinePlan Resource coloredbySensitivity NSR(rotated view,looking Northeast)
22.6.2Impact to Economics
Thevaluation of these alternate market assumptionsis estimated to yield a netpresent value of US$106.1million. The free cash flowproject inthis casepresents threeyears of negative results,with cash flow becoming positive on the secondyear of commercialproduction. Thisalso resulted in alonger payback period of around 3.15years, comparedto the base case paybackperiod of 2.6 years. The lowerzinc price is especially impactful inthis case,as zinc is by far thehighest revenue generator of the deposit, andthis change reducedprofits from every period modeled. The estimateof free cashflow of this alternate case ispresented inFigure 22-6.
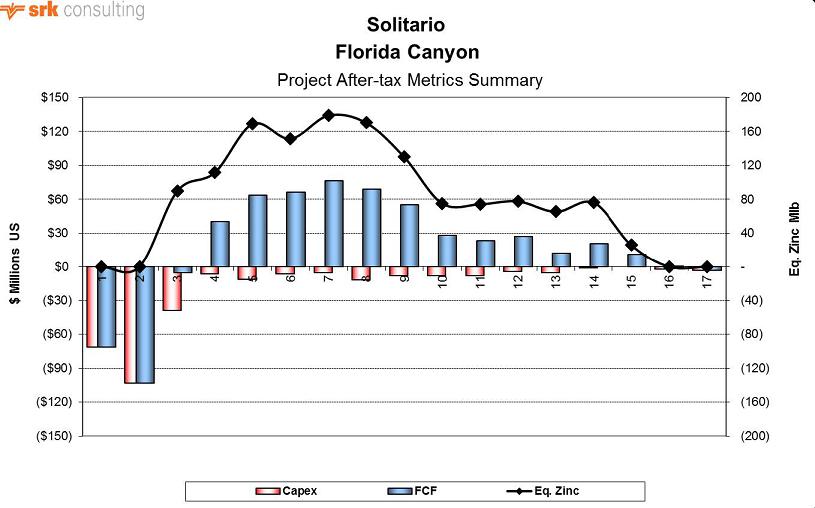
Source: SRK, 2017
Figure 22-7:Florida CanyonAlternate CaseAfter-Tax FCFand Equivalent MetalProduction
Theindicative economicresults of this alternate caseare presented in Table22-11, thetable further evidences that zinc is responsible forthe majorityof the revenuegeneration, andthe underground mining cost continuesto be the heaviest cost centerof the operation, followedby themineral processing costas a distantsecond.
Table22-11: Florida CanyonAlternate Case IndicativeEconomic Results (DryBasis)
| Description | Value | Units |
| MarketPrices | | |
| Silver | 18.91 | US$/oz |
| Lead | 0.88 | US$/lb |
| Zinc | $1.06 | US$/lb |
| EstimateofCash Flow (all values inUS$000’s) | | |
| Concentrate Net Return | | $/oz-Ag |
| Silver Sales | $37,771 | $0.03 |
| LeadSales | $137,603 | $0.10 |
| ZincSales | $1,481,158 | $1.06 |
| TotalRevenue | $1,656,532 | $1.19 |
| Treatment, Smelting and Refining Charges | ($337,076) | |
| Freight, Impurities&Third Parties | ($96,935) | ($0.07) |
| Gross Revenue | $1,222,521 | |
| Royalties | ($42,624) | ($0.03) |
| Net Revenue | $1,179,897 | |
| Operating Costs | | |
| Open Pit Mining | $0 | $0.00 |
| Underground Mining | ($228,547) | ($0.16) |
| Process | ($144,063) | ($0.10) |
| G&A | ($39,153) | ($0.03) |
| Ordinary Rights | $0 | $0.00 |
| TotalOperating | ($411,764) | ($0.29) |
| Operating Margin (EBITDA) | $768,133 | |
| Initial Capital | ($213,667) | |
| LoMSustaining Capital | ($82,722) | |
| IncomeTax | ($162,071) | |
| AfterTaxFree Cash Flow | $309,673 | |
| Payback | 3.15 | years |
| After-Tax IRR | 19.1% | |
| NPV @:9% | $106,137 | |
Source: SRK, 2017
Table22-12 shows annualproduction and revenue forecasts forthe life of mineof the alternate case.
Table22-12: Florida CanyonAlternate Case LoMAnnual Production and Revenues
Period | RoM (Mt) | PlantFeed (Mt) | LeadConc. (kt) | ZincConc. (kt) | Free Cash Flow (US$ millions) | Discounted Cash Flow (US$ millions) |
| -2 | 0.00 | 0.00 | 0.00 | 0.00 | (72) | (72) |
| -1 | 0.00 | 0.00 | 0.00 | 0.00 | (103) | (95) |
| 1 | 0.73 | 0.73 | 9.06 | 95.86 | (5) | (5) |
| 2 | 0.91 | 0.91 | 11.07 | 119.02 | 40 | 31 |
| 3 | 0.91 | 0.91 | 14.87 | 180.57 | 64 | 45 |
| 4 | 0.91 | 0.91 | 17.73 | 161.95 | 66 | 43 |
| 5 | 0.92 | 0.92 | 14.78 | 191.19 | 76 | 46 |
| 6 | 0.91 | 0.91 | 15.26 | 181.90 | 69 | 38 |
| 7 | 0.91 | 0.91 | 15.80 | 138.77 | 55 | 28 |
| 8 | 0.91 | 0.91 | 12.22 | 80.34 | 28 | 13 |
| 9 | 0.92 | 0.92 | 11.73 | 79.35 | 23 | 10 |
| 10 | 0.91 | 0.91 | 11.24 | 83.01 | 27 | 11 |
| 11 | 0.92 | 0.92 | 4.82 | 69.77 | 12 | 4 |
| 12 | 0.91 | 0.91 | 7.76 | 81.33 | 21 | 7 |
| 13 | 0.40 | 0.40 | 3.53 | 27.54 | 11 | 3 |
| 14 | 0.00 | 0.00 | 0.00 | 0.00 | 0 | 0 |
| 15 | 0.00 | 0.00 | 0.00 | 0.00 | (3) | (1) |
| Total | 11.19 | 11.19 | 150 | 1,491 | 310 | 106 |
Source: SRK, 2017
Thischange ofmetalprices in thealternate case economics,including the reductionof both zincand lead andthe raiseof silver, does not significantly changethe distribution of the revenue generationbymetal. Figure 22-8 presents a very similarprofile foreach metalcontribution comparedto the basecase.

Source:SRK
Figure 22-8:Alternate Case MetalParticipation in Revenue
Theestimated all-inLoM costdecreasedby US$0.01toUS$0.72/EqZn-lbas aresult of reducing the royaltypayments due to lower metalprices. Directcash costswere raisedbyabout US$0.01/EqZn-lbto atotal of US$0.48/EqZn-lbdue to the lower byproduct credit fromthe lower leadand silver price. Table 22-13presents thedetails of the LoM cash costs.
Table22-13: Florida CanyonCash Costs
| Cash Costs | US$000's |
| Direct Cash Cost | |
| Underground MiningCost | $228,547 |
| Process Cost | $144,063 |
| SiteG&A Cost | $39,153 |
| Treatment Charges | $334,080 |
| Smelting&Refining Charges | $2,996 |
| Freight | $96,935 |
| By-Product Credits | ($175,374) |
| Direct Cash Costs | $670,401 |
| US$/t-ore | $59.93 |
| US$/lb-Zn | $0.48 |
| Indirect Cash Cost | |
| Royalties | $42,624 |
| Indirect Cash Costs | $42,624 |
| US$/t-ore | $3.81 |
| US$/lb-Zn | $0.03 |
| Direct+Indirect Cash Costs | $713,026 |
| US$/t-ore | $63.74 |
| US$/lb-Zn | $0.51 |
| Sustaining Capital Cash Cost | |
| Sustaining Capital | $82,722 |
| Sustaining Cash Costs | $82,722 |
| US$/t-ore | $7.39 |
| US$/lb-Zn | $0.06 |
| All-In Sustaining CashCosts | $795,748 |
| US$/t-ore | $71.13 |
| US$/lb-Zn | $0.57 |
| InitialCapital Cash Cost | |
| Initial Capital | $213,667 |
| InitialCapital Cash Costs | $213,667 |
| US$/t-ore | $19.10 |
| US$/lb-Zn | $0.15 |
| All-In Cash Costs | $1,009,415 |
| US$/t-ore | $90.23 |
| US$/lb-Zn | $0.72 |
Source: SRK, 2017
Thisconservative metal pricealternative has a significant effecton the economicresults of the project in comparisonwith the base case, probably in ascale thatit would warrant additional optimizationof the mineable resources andproject plan.
23 Adjacent Properties
Thereare no developedor advancedstageproperties near theProject.Theonlyhistoric commercialminerals undertakingwas ashort period of trialminingat Mina Grande18 kmnortheast of the Property.
Minera Chambaracontrols the largest claim position within30 kmof the Property. Minera Chambarais a jointventure companybetween Votorantim and Solitario. Thesetwo companies andaffiliates are title holders forthe claimssubject to this JV.
Theonly other publicly reporteddocumentation relatedto mineral properties inthe area is a NI 43-101report filedby the companyRio Cristal (Brophy,2012) pertainingto the Cristal property approximately20 kmto the north of the Property. Thisreport does not include aMineral ResourceStatement. RioCristalnolonger controls the claimsconsidered inthis report butthe claimsthemselves remainin goodstanding held by individualclaim owners.
24 Other Relevant Data and Information
SRK is unaware of anyother information or explanation necessaryto makethe technical reportunderstandable and not misleading.
25 Interpretation and Conclusions
TheFlorida Canyon Zinc Projectis asignificant greenfields potentially underground mineablehigh- grade zinc deposit containingassociated lead and silver. The Project has a large landposition andstrong technical and financial backingthrough Solitario’searn-inJVpartner Votorantim. Whilethis document represents the first formal economicevaluation of the Project, Votorantim and Comincoreport having previously spentover US$60 millionon drilling, test work and strategic planning fordevelopment (Solitario, 2014). Currentprojections in thezinc metal marketsuggest a near-termreduction in zinc supplyas current majorproducers exhaust reserves.
SRK’s sitevisit to the projecton theground in northern Peru found itto be awell-organized facility,with current QA/QC protocols in place fordrilling dataverification andvalidation. Material handling, corestorage and securitywere allator above industrystandards.
SRK used a numberof methodstovalidate the Votorantim resource block model startingwith a face-to-facemeeting with themodeler and followingonwith athorough auditof the model sourcedata, geologic modeling techniques, gradeand tonnageestimation methodsand classification protocols. SRK foundthesetobe in linewith industrystandards, having beenproduced with recognized miningsoftware, defensible data andreasonable assumptions. SRKwas ableto independentlyvalidate the modelresults.
Asignificant component of theSRKinput tothis PEAwas thedevelopmentof the undergroundmineplan. Because Florida Canyonis a polymetalliczinc-lead-silver deposit, each model blockin the mine modelwas evaluatedonan NSR basis,which included an estimateof recovery. Recoverywasdeveloped from arobust 2014 metallurgical campaign thatcharacterized all expectedmaterial types. Arecovered gradeby blockwasusedtobuild the undergroundstoping plan, completewith access,ventilation and an assessment of mine recoveryand dilution.
SRK is unaware ofanyenvironmental, permitting, legal,title,taxation or marketing factorsthat couldlimit or affectthe resource stated inthis document. The project will benefitfrom additional infill andexploration drilling, additional process-metallurgicaltest work,detailed engineering studies forinfrastructure andtailings managementand forwardplanning to clearlydefine concentratetransport and smelter costs.
| 25.2 | Mineral Resource Estimate |
Thecurrent exploration model for theProject has beenapplied successfully in drillholeplanning andresource definition. There is low riskto the Project if no additional explorationis completed. However,additional drilling for resourcedefinition has astrong potentialto expand the knownresource extent and upgrade Inferred resourcesto Measured andIndicated. Themostprospective targets include:
| · | Extension drillingsouth of the SanJorge zone and northeastof the Karen-Milagroszones are considered thehighest priorityto increasehigh-grade zinc sulfide mineralization. Both zones are openin the recommended areasof drill testing. |
| · | Infill drillingseveral large un-drill testedareas surroundedbymineralized zones within the mineralized footprint hasthe potentialto significantly increaseresources. |
| · | Extension drillingperipheral to the currently definedmineralized footprint. |
| · | Further developdrill targets over the 20 kmlong northernFlorida Canyonmineralized corridor where large areas of strongzinc in soil and rockchip geochemistry indicate thepotential foradditional mineralized zones. |
At present, thedeposit is open laterallytothe north andsouth as wellas tothe westand easton thedownthrown sidesof the horstthat definesthe limits of explorationtodate. Gapsin the drillpattern within thefootprint of the existingdrilling provide anotheropportunityto increaseresources where drillspacing limits the continuityof stratigraphically controlled mineralization. A constraintoneffective exploration anddelineation drilling in these areas is the accessto drillingstations due to the ruggedterrain. Thecompletion of a roadinto the area will helptoexpedite future drilling anddevelopment programsby providingincreased accessand lowering costs.Additional drillingfrom underground is also under consideration.
The discoveryof the high-angle, high-gradeSan Jorge zone has prompted more emphasison angleddrilling, wheremostof the historic drilling is vertical to near-vertical andis thereforeineffective at locating and definingnear-vertical structures. These“break-through” structures have been mappedon surfacein several locations,but due to logisticalconstraints, have not been adequatelydrill tested fortheir down-dipcontinuity. Similarly, thereappear tobeadditional drill targets at theintersection of the high-angle structures and the flat mantozones, where grades are locally enhanced. Theseconcentrations maybe presentwithin the existing drillingfootprint, but requireadditional drilling to delineate. The highgrade and potential tonnageof suchtargets provideanincentiveto locate andfurther define resourcesof this geometry.
| 25.3 | MineralProcessingand MetallurgicalTesting |
Processing of sulfidemineralization (zinc-lead-silver)from the Florida Canyondeposit is straightforward using conventionalflotation to aconcentrate followedby offsitesmelting. Testwork indicates that producing a commercial qualityzinc concentrate from mixedmaterial neededtoincorporate DenseMedia Separation methods(DMS) in orderto maintain highrecoveries (80+%). However, aconventional flotation approach reached commercial quality(about 50%Zn)at the expenseof lower metalrecovery, with a similar outcome forthe lead concentrate.It is SRK’s opinion that conventionalflotation shouldbeable to achieve enhanced commercial level results(gradeandrecovery) under improved crushing, grinding, and flotation conditions.
Available information aboutsilver is verylimited. The laboratory developed a relationshipbetween lead's head grade and silvergrade inthe finallead concentrate. Thisrelationship followswhatis typically observed inthis typeof deposit, thereforeas this stageof development itis assumedto bevalid, but SRK recommendsconfirming it in thenext testing phase of the project.
Tooptimize recoveryand grade when attempting to reach separationof the zinc and lead minerals into theirrespective commercial quality concentrates, SRK recommendsapproaching the selectionof samples forthe next phaseof metallurgical sampling and testing.
| · | The corelogging needs to incorporate attributes likeclay%,claytype, RQD, oxidecontent, sulfide content. |
| · | Assaying of the core should includewhole rockanalysis. |
| · | Collect samples for metallurgicaltesting representing distinctive zones in the deposit. Grade variability shouldbe secondary criteriawhen selecting samples,but theymustbe reasonably closeto what a potential miningoperation would be able to deliver to the mill. |
| · | Thereare potential synergies forprocessing oxide mineralizationat Florida Canyonusing expertise thatVotorantim has gained at the Vazante and Morro Agudo mines in Brazil. These other existing operations have experience recovering hemimorphite, smithsonite, and hydrozincite, whichmayimprove future recovery projectionsforFlorida Canyon. |
| 25.4 | MineralReserveEstimate |
Therewere no MineralReserves estimated forthis PEA.
Using longhole stoping in steeplydipping areas, and cutand fill miningin flat lying areasof mineralization are seenasthe appropriate miningmethods forthe deposit geometry, and bothmethods incorporate the useof tailings backfill. AnNSRapproach was usedto calculate the valueof a blockand revenue for Pb,Zn, andAg is considered.Stope optimization was completedto identify economicmining areas. The 3-Dstope optimizer shapesand developmentdesign, along with dilutionand mining recovery assumptions,are used to calculatetonnages and gradesin the mineplan resource. A production schedulewasgenerated usingiGantt softwaretargeting aproduction rate of 2,500 t/d (912,500mineralized tonnes peryear).
TheFlorida Canyonpolymetallic zinc-lead-silver deposit canbe processed using a conventionalconcentration plant consistingof three-stage crushing, grinding using ball mill, anddifferential flotation to produce twofinal products: azincconcentrate and a leadconcentrate. Detailedsizing and costingof the processing plant componentswillfollowadditional metallurgicaltesting proposed inthis study. Power supply andwater supplyappear to be fairlywell defined forthe project, though additionalstudies maybe neededto refine theseservices and the costsof these servicesto theproject.
| 25.7 | Project Infrastructure |
TheFlorida Canyondeposit is located in steepterrain in a remote partof northern Peru withmoderate to high rainfall. Thesegeographic and climaticconditions pose challengesto both accessand infrastructure development.
As presentlyunderstood, thekey support servicesof power supplyand water supplyare availableandpart of a district-wideinfrastructure improvement campaign beingimplementedbythe Peruviangovernment and related third-partyproviders. Themostsignificant advancementin the infrastructure investigation forthe PEAwas identifying the probabilityof hydroelectric powerdistributionto thesite, as alower costalternative to on-sitepower generation.Water supply for operations appearsto be straight forward, with abundant surfacewater available formineral processing andcampsupport.
Theinfrastructure componentwith the largestfootprint and projected costis thetailings storage facility.As part of this study, SRKhas evaluatedthis as adrystack facilityin order to achieve geotechnical stability and reducethe area requiringreclamation. Trade-off studies are warranted to optimize moisturecontent, bindingcharacteristics, andcompaction methods duringtailings placementto minimize water infiltration.
| 25.8 | EnvironmentalStudiesandPermitting |
Additional environmental baseline studiesare required forfurther project development.
Impactto groundwater is expectedtobe minimalas underground surfaceexposures are minorand future exposed sulfidesare not acid generating. Thereare no groundwater wells required forprocessing or potablewater supply. Therewill be littleorno surfacearea disturbance related to waste rock placement.
Tailings are predictedto have lowamounts of iron sulfide andto be geochemicallystable withrespect to acid rockdrainage. Thereis also substantialneutralization capacity inthe carbonatehostrocksto mitigate acid generation. Residuallead andzinc sulfideshave low acid-generating capacity; however, theyare subjectto metal leaching and therefore require compaction during placement.
SRK recommendsin future studies to design the tailings surfaceand spillway stormwaterstructure and evaluate options to reduceor eliminate the long-term obligation formonitoring and maintenance.
| 25.9 | Capital andOperatingCosts |
As part of the Florida Canyonvaluation exercise, SRKpreparedan estimateof both capital andoperating costs associatedwith thedesigned mineableresourcesproduction schedule. All estimateswere basedon yearly inputsof physicals and allfinancial datais secondquarter 2017 and currencyis in U.S.dollars (US$), unlessotherwise stated.
Thetotal capital costestimated forthe ProjectwasUS$296 million,including US$213 millionof initial capital and US$83 millionofsustaining capital.
Capital costs for miningwere basedon a preliminary stopingplan for the Florida Canyondeposit complete with development, accessand ventilation. The assessmentresulted inan estimateof approximately US$76 million. Theprocess plant cost estimatewas basedon data fromsimilar flotation plants with thesame capacity andsameregion. This investigation resultedinan estimateof about US$60 million. The costassociated with the required surfacecrushing and conveyingwas basedonrequired distances andelevation gain to cover. These includethe movementof material fromthree mineportals to theplant feedarea andsomewaste material that willbe usedto build the embankment forthe tailings storagefacility. Thisinvestigation resulted inan estimateof around US$1.4 million.Offsite-infrastructure, site infrastructure, powersupply, water supply and backfillinfrastructure costestimates were prepared basedthe required structures costsfrom comparable operations. It shouldbe noted that this study assumesthat athird partyis planning to build a hydro powerplant thatwill provide powerto theproject,
Operating costs forthe life of mineare presented in Table25-1.
Table25-1: Florida CanyonOperating Costs Summary
| Description | LoM(US$000’s) | LoM(US$/t-Ore) | LoM(US$/lb-Zn) |
| Underground Mining | 228,547 | 20.43 | 0.16 |
| Process | 144,063 | 12.88 | 0.10 |
| G&A | 39,153 | 3.50 | 0.03 |
| TotalOperating | 411,764 | 36.81 | 0.29 |
Source: SRK, 2017
Unit costsfrom similar projects in thesameregion or in the Americas, adjusted forlabor and consumables differences,were usedto estimatethe LoM operating costs. Alloperating costsinclude supervision staff,operations labor, maintenance labor,consumables, electricity, fuels, lubricants, maintenance parts andanyother operating expenditureidentifiedbycontributing engineers.
25.10 Economics
Florida Canyonis azincproject, in which zinc contributes 90%to the overallrevenue. Lead andsilver are considered by-productsof the operation. Thesemetals contribute approximately8% and 2% respectively.
Using theassumptions discussedin theprevious sections,the Project is valuated at US$198 million. TheProject’s all-in costsare estimated to be US$0.73/Zn-lb, onan equivalentproduction basis.
Underground mining costsare themostrelevant direct costsof the operation,corresponding to approximately56%tothe on-site operating costs. Approximately 76%of the off-site costsare the treatment, smelting and refining charges.
Theassumption of line power, comparedto on-sitepower generation, makes significantpositive impactto projecteconomics.Whilethere is sufficient confidenceinthe applicationof linepower forit tobeused as the base-case, therearesomeuncertainties regardingthe timingofimplementation of this component.
Thehigh insitu grades of thezincmineralization and lowimpurities in sulfidesat Florida Canyon should generate a premiumconcentrate and a highly saleable productin a marketwhere strong future demandis forecasted. Thechallenge to Project developmentlies in its remotelocation, which raises capital costs forconstruction and operating costs forconcentrate delivery, amongother things. Road accessto the siteis still underconstruction andis seenas a keycomponent to Projectadvancement. High-relief terrain and high annual rainfallare conditionsaffecting development, especiallyin the areaof infrastructure construction andprocess/tailings containment andstability.
Politically andsocially, thedevelopment of a miningoperation at this locationis consideredlowrisk asmanyof the local residentsare alreadyemployed or seekingemployment withVotorantim.
TheProject seemsto be mostsensitive to fluctuations of the metalprices. The impactofexchange rate fluctuations was not evaluated, as all costswere estimated directlyin US$.It is recommended that this information is updated infuture evaluationstobetter estimatethe impactof exchange ratefluctuations.
Even under distressed (-20%) metalprices theproject will payback.Project break-even occurswhen metalprices are reducedbyabout 32%.
The impactof actual net smelter termsand of impurities in theconcentrateswasnot evaluated in thisstudy. It is recommended thatin the future a studyof the Net Smelter Termsrelated to the Florida Canyon concentratesis conducted.
26 Recommendations
| 26.1 | RecommendedWork Programs |
SRK acknowledges,after examination of the Project data set, thatthere havebeen a significant numberof technical studies completedbyVotorantim,manyof which are beyond PEAlevel. Therefore, thework elements listed in Table 26-1represent mostly prefeasibilityand feasibility levelengineering and drillingto support thosestudies.
At the juncturewhere prefeasibility levelengineering hasbeen completed, the Project will likelywarrant further public reporting to an internationalstandard (JORC,or NI43-101). Technicalinformation required to achieve this levelof project developmentis described below.Costs forthe recommendedwork are listed in Table 26-1.
26.1.1Engineering Studies (Prefeasibility Level)
A Prefeasibility Study (PFS) forFlorida Canyon requiresadditional metallurgicaland geochemicaltest work as wellas various detaileddesign improvements to refine costs. Thekey elementsof the PFS are listed below.
| · | Mining methods, equipmentselection and costs; |
| · | Mining dilution optimizationand cost refinement; |
| · | Geotechnical testing and modeling: |
| o | Numericalmodeling forunderground mine stability andpillar definition; and |
| o | Modeling forfacilities foundation stability. |
| o | Flotation optimization; and |
| · | Processing trade-off studies; |
| · | Processing optimization and costrefinement; |
| · | Infrastructure design and costs: |
| o | Map and further quantify thecondition of the existing roads and identify deficitsand further design features (drainage/poor soil conditions)on the road systemto optimize the locationand numberof roads forthe project; |
| o | Develop a site-widewater balance todeterminewhether thereis needtofurther develop surfacewaterand ground water sources for makeupwater; |
o Determine actual flowrates available from TesoroCreek and confirmit as awater source;oPrepare a moredetailed site-wide load estimateto determine a moredetailed requiredpower load andfurther developthe cost and timingof the third-party power supplyoption;
and
| o | Revisit thetransportation studyto optimize freight costsand to determine optimal marketlocation and freight operating costs and capital costs. |
| · | Marketstudies forconcentrate sales and treatment; |
| · | Hydrogeologicalcharacterization andmodeling forwater supply, permitting and water pollution control; |
| · | Geochemicalcharacterization and modeling (waste rockand tailings); |
| · | Environmental baseline characterization; and |
| · | Technical EconomicModeling. |
26.1.2Drilling
Drilling programsrecommendedbySRKwill facilitatethe modelingand trade-offstudies plannedat prefeasibility level.SRK also recommendsdrilling for resource expansion.
| · | Exploration targeting bothknown outcropping andnew high-anglestructures andstructural intersections inside thecurrent drilling footprint; |
| · | North and south step-outexploration on San Jorgestructure (south) andK-Mmantos (north); |
| · | Resource conversion coredrilling (HQ):Inferred upgradetoMeasured/Indicated in theresource (includes matrix-matchedreference materials for QC); |
| · | Metallurgical drilling for flotation and comminution testing (PQ); |
| · | Geotechnical drilling and compressivestrength testingto characterize ground conditions forunderground mine planning; |
| · | Geotechnical characterization drilling for milland tailingsfoundation stability; |
| · | Geotechnical drilling to provide stability analysis fortailings storage; and |
| · | Watersupply definition and hydrogeologicalcharacterization fordewatering. |
26.1.3Mining
Miningrecommendations areas follows:
| · | Refine the underground mine planwith additionaldrilling; |
| · | Optimize the locationof ramps/accessesand the orderin which areas are mined; |
| · | Complete test work to determinethe backfillmaterial characteristicsand placement options; |
| · | Geotechnical drilling andtesting; and |
| · | Confirm productivities andoperating cost assumptionsbased on detailed firstprinciple’s buildup. |
Table26-1summarizes the costs forrecommended work programs.
Table26-1: Summary ofCosts forRecommended Work
| Work Program | Estimated | Assumptions/Comments |
| Engineering Studies | Cost US$ | |
| Metallugical variability and recovery optimization test work | 500,000 | Commercial Laboratory |
| Prefeasibility Study(PFS)and Trade-off Studies | 600,000 | Votorantimorconsultant engineer |
| SubtotalStudies | $1,100,000 | |
| Drilling | | Salaried newhire orcontractPM |
| Exploration Drilling | 2,100,000 | 20holesto350 m atUS$300/m |
| Resource Conversion Drilling | 2,100,000 | 20holesto350 m atUS$300/m |
| Metallurgical Drilling for Flotation and Comminution | 1,225,000 | 10PQ holesto350 m atUS$350/m |
| Geotechical DrillingforMining | 500,000 | 10holes oriented to 100 m atUS$500/m |
| Geotechnical Drilling for Foundation Stability | 225,000 | 50holesto30 m atUS$150/m |
| Hydrogeological Drilling | 600,000 | 4holesto300 m atUS$500/m |
| Subtotal Drilling | $6,750,000 | |
| Studies+Drilling | 7,600,000 | |
| Contingencyat15% | 1,435,000 | |
| Total | $9,285,000 | |
Source: SRK, 2017
ALSMinerals (2014a). Global CapabilityStatement 2014. Accessed16 May2014, fromhttp://www.alsglobal.com/Our-Services/Minerals
ALSMinerals (2014b). ALS GeochemistrySchedule of Services and Fees 2014 (USD). Accessed20May, 2014, from http://www.alsglobal.com/en/Our-Services/Minerals/Geochemistry/Service- Schedule
AMEC(2013). Declaracionde Objectivo de Negociopara Proyecto Bongará (Scoping Study for theBongará Project). 14 January2013. 28 pages.
Barton, N.R.,Lien, R., &Lunde, J.(1974). Engineering classification of rockmasses forthe design of tunnel support. Rock mechanics,6(4), 189–236.Brophy, J.A.(2012). NI 43-101Technical Report, Rio Cristal ResourcesCorp., Bongará Zinc Project.Effective date31 January,2012. 104 pages.
Bieniawski, Z.T.(1989) Engineering RockMass Classifications. Wiley, New York.
CIM (2014). Canadian Institute of Mining, Metallurgy andPetroleum Standards on Mineral Resourcesand Reserves:Definitions and Guidelines,May10, 2014.
Carter, T.G.(2014) Guidelines for useof the Scaled Span Method for SurfaceCrown Pillar Stability Assessment.Ontario Ministryof Northern Developmentand Mines, 2010pp 1-34.
Cominco(Perú) S.R.L. (2000). BongaráProject, Peru, 2000 Year-End Report, J.L.R. Muñozand M.A.Tapia. 15 December,2000. 55 pages.
Grimstad, E. &Barton, N(1993) Updatingof the Q-System for NMT.Proc. Int. Conf. SprayedConcrete- Modern UsofWetMix SprayedConcrete forUnderground Support, Fagernes(eds R.Kompen, O.A. Apsahl andK.R. Berg), 46-66. Norwegian Concrete Association,Oslo.
Guilbert, J.M. and Park,C.F., Jr.(1986). The Geologyof OreDeposits. Waveland Press,Inc., Long Grove, Illinois. 985 pages.
Hydro-Geo Consultores SAC(2010). Estudio hidrologico ehidrogeologico para sustentar el EIAsd delproyecto de exploracion minera CañonFlorida
Klohn CrippenBerger (2013). Geotechnical and HydrologicalInvestigations forthe GeneralInstallations of the Bongará Project - HydrogeologicalCharacterization.
Klohn CrippenBerger (2013a). Investigaciones Geotécnicas e Hidrológicasparael ÁreadeInstalaciones Generales. 101 pages.
Klohn CrippenBerger (2013b). Investigaciones Geotécnicas e Hidrológicasparael ÁreadeInstalaciones Generales del Proyecto Bongará. CaracterizaciónGeotécnica yRecomendaciones de Cimentación. 36 pages.
Potvin, Y. 1988. Empirical open stopedesign in Canada. The Universityof British Columbia,1998.
p.350. (Ph.D. Thesis).Smallvill(2010). Tratamiento Metalurgico del Mineralde Bongará, InformeFinal (Metallurgical Treatment of the Bongará [Sulfide] Ore, FinalReport). April 2010. 89 pages.
Smallvill(2011a). Tratamiento Metalurgico delMineral de Bongará Oxidos, InformeFinal (Metallurgical Treatmentof the Bongará Oxide Ore, FinalReport).July2011. 192 pages.
Smallvill (2011b). TratamientoMetalurgico delMineral de Bongará Mixtos, Informe Final(Metallurgical Treatmentof the BongaráMixed Ore, FinalReport). August 2011. 202 pages.
Solitario (2014). Solitario Exploration and Royalty Corp.website. Accessed09June 2014, from http://www.solitarioresources.com/index.php
SRK Consulting(2014). Bongará ZincProject Site Visit Notes,10May2014. 19 pages includingfigures.
SRK Consulting (2014b). NI43-101 Technical Report Mineral Resources Bongará ZincProject. Prepared for SolitarioExploration and Royalty Corp.by SRK Consulting (U.S.) Inc. EffectiveDate June 05, 2014, Report Date,June 16, 2014, 145p.
Votorantim (2013a) BongaráProject Workshop,May2013. Electronic slidepresentation. 29 slides.
Votorantim (2013b). Mineral ResourcesEvaluation, BongaráProject, Amazonas Department, Peru.PreparedbyVotorantim Metais Mineral Explorationand Mineral Resources ManagementGroups. December,2013. 79 pages.
Votorantim (2014a).InformeInterno, Geología delDeposito MississippiValley Type CañónFlorida –Bongará, Bongará – Amazonas –Perú. (InternalReport, Geologyof the Mississippi ValleyType Florida Canyon Deposit, BongaráProject, Bongará, Amazonas,Perú.) January2014. 49 pages.
Votorantim (2014b). Informe Técnico,Muestreo y Análisis Químico,Proyecto Bongará. (Technical Report, Sampling and ChemicalAnalysis, Bongará Project.)06 February2014.16 pages.
TheMineral Resources and MineralReserves havebeen classifiedaccordingto CIM (CIM, 2014).Accordingly, the Resourceshave beenclassified as Measured, Indicated or Inferred, the Reserves have been classifiedas Proven, andProbable basedon theMeasured andIndicated Resources as defined below.
AMineralResource is aconcentration or occurrence of solid material of economicinterest in or on the Earth’s crustin such form,grade or quality and quantity that thereare reasonable prospects foreventual economicextraction. The location, quantity,grade or quality, continuityand other geologicalcharacteristics of a Mineral Resourceare known, estimatedor interpreted fromspecific geological evidence and knowledge,including sampling.
AnInferred MineralResource is thatpart of a Mineral Resource forwhich quantity andgrade or qualityare estimatedon thebasis of limited geological evidenceand sampling. Geological evidenceis sufficientto implybut not verify geologicaland grade or quality continuity.An Inferred MineralResource has a lower levelof confidence than thatapplying to an Indicated MineralResource and mustnot be convertedto a Mineral Reserve.It is reasonably expectedthat the majorityof Inferred Mineral Resources couldbe upgraded to Indicated MineralResources with continued exploration.
AnIndicated MineralResource is thatpart of a MineralResource forwhich quantity, gradeor quality, densities, shape and physicalcharacteristics are estimatedwith sufficient confidenceto allow theapplication of Modifying Factorsin sufficient detailto support mineplanning and evaluationof the economic viabilityof the deposit. Geologicalevidence isderived from adequately detailed and reliableexploration, samplingand testing andis sufficientto assume geological and gradeor quality continuitybetween pointsof observation. An Indicated Mineral Resourcehas a lower levelof confidence than that applyingto a Measured Mineral Resourceandmay onlybe convertedto aProbable MineralReserve.
AMeasured Mineral Resourceis thatpart of a Mineral Resource forwhich quantity, gradeor quality, densities, shape,and physical characteristics are estimatedwith confidence sufficientto allow theapplication of Modifying Factorsto support detailed mine planning and finalevaluation of the economic viabilityof the deposit. Geological evidenceis derived fromdetailed and reliable exploration, samplingand testing and is sufficientto confirm geological andgrade or quality continuitybetween pointsof observation. AMeasured Mineral Resourcehas a higher levelof confidence thanthat applyingto either an Indicated MineralResource or an InferredMineral Resource.It may beconverted to aProven Mineral Reserveor to a Probable MineralReserve.
AMineral Reserveis the economically mineablepart of aMeasured and/orIndicated MineralResource. It includes dilutingmaterials and allowances for losses,whichmay occurwhen the materialis minedor extracted and isdefinedby studiesat prefeasibilityor feasibility levelas appropriate that include application of modifying factors.Such studiesdemonstrate that, at the timeof reporting, extraction could reasonablybe justified.
Thereference point at whichMineral Reservesare defined, usually the pointwhere the ore is delivered to the processingplant,mustbe stated. It is important that, in all situationswhere the reference point is different, suchas for a saleableproduct, a clarifyingstatement is included to ensure thatthe reader is fully informedas to whatis beingreported. Thepublic disclosure of a Mineral Reservemustbe demonstrated by a prefeasibility studyor feasibility study.
AProbable Mineral Reserveis the economicallymineable part of an Indicated, andinsome circumstances, aMeasured MineralResource. The confidence in theModifying Factorsapplying to aProbable MineralReserve islower thanthat applyingto aProven Mineral Reserve.
AProven Mineral Reserveis the economically mineablepart of aMeasured Mineral Resource. AProven Mineral Reserveimplies a highdegree of confidence in theModifying Factors.
Thefollowing general mining termsmaybe used in this report.
Table28-1: Definition of Terms
| Term | Definition |
| Assay | The chemical analysisofmineral samples todetermine the metal content. |
| Capital Expenditure | All other expendituresnotclassified as operating costs. |
| Composite | Combining more than onesampleresulttogive anaverage result over alarger distance. |
| Concentrate | Ametal-rich product resulting from amineral enrichment processsuchas gravity concentration orflotation, in which mostof the desired mineral has been separated from thewaste material inthe ore. |
| Crushing | Initial processofreducing oreparticle sizetorender it more amenable forfurther processing. |
| Cut-off Grade (CoG) | Thegrade ofmineralized rock, which determines as towhether ornot it iseconomictorecover its gold content byfurther concentration. |
| Dilution | Waste, which is unavoidably mined withore. |
| Dip | Angleofinclination of ageological feature/rock from the horizontal. |
| Fault | Thesurfaceof afracture along which movement has occurred. |
| Footwall | The underlying sideofan orebodyorstope. |
| Gangue | Non-valuable componentsofthe ore. |
| Grade | Themeasure ofconcentration ofgold within mineralized rock. |
| Hangingwall | The overlying sideofan orebodyorslope. |
| Haulage | Ahorizontal underground excavation which isused totransport mined ore. |
| Hydrocyclone | Aprocess whereby material isgradedaccording tosize byexploiting centrifugal forces ofparticulate materials. |
| Igneous | Primarycrystalline rock formed by thesolidification ofmagma. |
| Kriging | An interpolation methodofassigning values from samplestoblocksthatminimizes the estimation error. |
| Level | Horizontal tunnel the primary purpose is the transportationofpersonnel and materials. |
| Lithological | Geological description pertainingtodifferent rock types. |
| LoMPlans | Life-of-Mine plans. |
| LRP | LongRange Plan. |
| Material Properties | Mine properties. |
| Milling | Ageneral term used todescribe theprocess inwhich the ore iscrushed and ground andsubjected tophysical orchemical treatmenttoextract the valuable metalsto aconcentrate orfinished product. |
| Mineral/Mining Lease | Alease area forwhich mineral rights are held. |
| Mining Assets | The Material PropertiesandSignificant Exploration Properties. |
| Ongoing Capital | Capital estimatesof aroutine nature,which is necessaryforsustaining operations. |
| Ore Reserve | See Mineral Reserve. |
| | |
| | |
| Term | Definition |
| Pillar | Rock leftbehindtohelp support theexcavationsinan underground mine. |
| RoM | Run-of-Mine. |
| Sedimentary | Pertainingtorocks formed bythe accumulation ofsediments, formed bythe erosion of other rocks. |
| Shaft | An opening cut downwards fromthesurface fortransporting personnel, equipment, supplies, ore and waste. |
| Sill | A thin,tabular, horizontal tosub-horizontal body ofigneous rock formed bythe injection of magmainto planar zones ofweakness. |
| Smelting | A hightemperature pyrometallurgical operation conducted in afurnace, inwhich thevaluable metal iscollected to amolten matte ordoréphase andseparated fromthe gangue components that accumulate in aless dense molten slag phase. |
| Stope | Underground void createdbymining. |
| Stratigraphy | Thestudy ofstratified rocks in terms oftimeand space. |
| Strike | Direction of line formedbythe intersection ofstrata surfaces with thehorizontal plane, always perpendicular to thedip direction. |
| Sulfide | Asulfur bearing mineral. |
| Tailings | Finelyground waste rockfromwhich valuable minerals ormetals have beenextracted. |
| Thickening | Theprocess ofconcentrating solid particles insuspension. |
| Total Expenditure | All expenditures including thoseofan operating and capital nature. |
| Variogram | Astatistical representation ofthe characteristics (usually grade). |
Thefollowing abbreviationsmaybe used in thisreport.
Table28-2: Abbreviations
| Abbreviation | UnitorTerm |
| A | ampere |
| AA | atomic absorption |
| A/m2 | amperespersquare meter |
| ANFO | ammonium nitrate fuel oil |
| Ag | silver |
| Au | gold |
| AuEq | goldequivalent grade |
| °C | degrees Centigrade |
| CCD | counter-current decantation |
| CIL | carbon-in-leach |
| CoG | cut-off grade |
| cm | centimeter |
| cm2 | square centimeter |
| cm3 | cubic centimeter |
| cfm | cubic feet per minute |
| ConfC | confidence code |
| CRec | corerecovery |
| CSS | closed-side setting |
| CTW | calculatedtruewidth |
| ° | degree(degrees) |
| dia. | diameter |
| EIS | Environmental Impact Statement |
| EMP | Environmental Management Plan |
| FA | fireassay |
| ft | foot(feet) |
| ft2 | square foot (feet) |
| ft3 | cubic foot (feet) |
| g | gram |
| | |
| | |
| Abbreviation | UnitorTerm |
| gal | gallon |
| g/L | gram perliter |
| g-mol | gram-mole |
| gpm | gallonsperminute |
| g/t | gramspertonne |
| ha | hectares |
| HDPE | Height Density Polyethylene |
| hp | horsepower |
| HTW | horizontal true width |
| ICP | induced couple plasma |
| ID2 | inverse-distance squared |
| ID3 | inverse-distance cubed |
| IFC | International Finance Corporation |
| ILS | Intermediate Leach Solution |
| kA | kiloamperes |
| kg | kilograms |
| km | kilometer |
| km2 | square kilometer |
| koz | thousandtroyounce |
| kt | thousand tonnes |
| kt/d | thousand tonnesper day |
| kt/y | thousand tonnesperyear |
| kV | kilovolt |
| kW | kilowatt |
| kWh | kilowatt-hour |
| kWh/t | kilowatt-hour per metric tonne |
| L | liter |
| L/sec | literspersecond |
| L/sec/m | literspersecond permeter |
| lb | pound |
| LHD | Long-Haul Dump truck |
| LLDDP | Linear LowDensity Polyethylene Plastic |
| LOI | Loss On Ignition |
| LoM | Life-of-Mine |
| m | meter |
| m2 | square meter |
| m3 | cubicmeter |
| masl | meters above sea level |
| MARN | Ministryof theEnvironment and Natural Resources |
| MDA | Mine Development Associates |
| mg/L | milligrams/liter |
| mm | millimeter |
| mm2 | square millimeter |
| mm3 | cubic millimeter |
| MME | Mine&Mill Engineering |
| Mlb | million pounds |
| Moz | milliontroyounces |
| Mt | million tonnes |
| MTW | measured truewidth |
| MW | million watts |
| m.y. | million years |
| NGO | non-governmental organization |
| NI 43-101 | Canadian National Instrument43-101 |
| OSC | Ontario Securities Commission |
| oz | troyounce |
| % | percent |
| PLC | Programmable Logic Controller |
| PLS | Pregnant Leach Solution |
| PMF | probable maximum flood |
| | |
| | |
| Abbreviation | UnitorTerm |
| ppb | parts perbillion |
| ppm | parts permillion |
| QA/QC | Quality Assurance/Quality Control |
| RC | rotarycirculation drilling |
| RoM | Run-of-Mine |
| RQD | RockQuality Description |
| SEC | U.S. Securities&Exchange Commission |
| sec | second |
| SG | specific gravity |
| SPT | standard penetration testing |
| st | short ton(2,000 pounds) |
| t | tonne(metricton)(2,204.6 pounds) |
| t/h | tonnes per hour |
| t/d | tonnes perday |
| t/y | tonnes per year |
| TSF | tailings storage facility |
| TSP | totalsuspended particulates |
| µm | micronormicrons |
| V | volts |
| VFD | variable frequency drive |
| W | watt |
| XRD | x-ray diffraction |
| y | year |
Appendices
AppendixA: Certificates ofQualified Persons
CERTIFICATE OFAUTHOR
I, Walter Hunt, B.Sc.M. Sc.,C.P.G do hereby certifythat:
| 1. | Iam Chief Operating Officerof Solitario ZincCorp, 4251 Kipling St.Ste. 390,WheatRidge CO, USA. |
| 2. | Thiscertificate applies tothetechnical report titled “NI 43-101 TechnicalReport, Preliminary Economic Assessment,Florida CanyonZinc Project, AmazonasDepartment, Peru” withanEffective Dateof July13, 2017(the “TechnicalReport”). |
Igraduated with adegree in Bachelorof Science from FurmanUniversity in 1974. In addition, Ihave obtained aMaster of Engineering fromColorado Schoolof Mines in 1980. IamaCertified Professional Geologist through membershipin the American Instituteof Professional Geologists,CPG-11550.
| 3. | Ihave workedas a Geologist for atotal of 40yearssincemygraduation fromuniversity.Myrelevant experience includes asanindependent contract geologist andas Geologist for ConocoMinerals, Anaconda Exploration andNoranda Exploration,as aSenior Geologist for American Gold Minerals Corp(1976-1986), as Senior Geologist, ChiefGeologist and Superintendent of TechnicalServices forEchoBayMines (1986-1994),as Vice President, Exploration andas President,South AmericaOperations forCrown Resources and Solitario Resources, (1994-2008), Solitario Resourcesand as Chief Operating Officer,Solitario Resources,Solitario Exploration and Royalty Corp andSolitario Zinc Corp (2008-present). |
| 4. | Ihave read the definitionof “qualified person” setout in NationalInstrument 43-101 (NI 43-101) and certifythatby reasonofmyeducation, affiliationwith a professional association (asdefined in NI43-101) and past relevant work experience, I fulfill the requirementsto be a “qualified person” forthe purposes of NI43-101. |
| 5. | Isupervised exploration workon the Bongará Propertyfrom 1994 to 1996 and haveacted as owner representativeto jointventure work from 1996 to present. |
| 6. | Iam responsible forthe preparation of Sections 2, 4, and portionsof 20 summarized therefrom,of this Technical Report. |
| 7. | Iam not independent of the issuer and have beenemployedbythe issuer since1994. |
| 8. | Ihave had prior involvement with the property thatis the subjectof the TechnicalReport. Thenature ofmyprior involvementis as an employeeof Solitario ResourcesCorp andas joint venture representative of Solitario Resourcesand Solitario Exploration Corp. |
| 9. | Ihave read NI 43-101and Form 43-101-F1 and the sectionsof the Technical Report Iam responsible forhave beenprepared in compliancewith that instrumentandform. |
| 10. | As of the aforementioned Effective Date, to thebest ofmy knowledge,information and belief, thesections of the TechnicalReport Iam responsible forcontains all scientificand technicalinformation that is requiredto be disclosedto makethe Technical Reportnot misleading. |
Dated this 3rdDayof August, 2017“signed”
_ WalterHunt, B.Sc.M. Sc., C.P.G
CERTIFICATE OF QUALIFIED PERSON
I, J.B. Pennington, M.Sc., C.P.G., do hereby certifythat:
| 1. | Iam Principal Mining Geologistof SRK Consulting (U.S.),Inc., 5250 Neil Road,Suite 300,Reno, Nevada 89502. |
| 2. | Thiscertificate applies tothetechnical report titled “NI 43-101Technical Report, Preliminary Economic Assessment,Florida CanyonZinc Project, AmazonasDepartment, Peru” withanEffective Dateof July13, 2017(the “TechnicalReport”). |
| 3. | Igraduated with aBachelor of Science Degree in Geology fromTulane University, New Orleans, La., USA;May1985; and aMaster of Science Degreein Geologyfrom Tulane University, New Orleans, La., USA;May1987. Iam aCertified Professional Geologistthrough membership in the AmericanInstitute of Professional Geologists, C.P.G. #11245. Ihave been employedas a geologistin the mining andmineral exploration business,continuously, forthe past30 years, sincemy undergraduategraduation from university.My relevantexperience for the purposeof the Technical Reportis: |
| · | Project Geologist,Archaen gold exploration with Freeport-McMoRanAustralia Ltd. Perth Australia, 1987-1989; |
| · | Exploration Geologist,polymetallic regionalexploration, Freeport-McMoRan Inc;Papua, Indonesia,1990-1994; |
| · | Chief Mine Geologist, mine geologyand resource estimation,Grasberg Cu-Au Deposit,Freeport- McMoRanInc, Papua, Indonesia1995-1998; |
| · | Corporate Strategic Planning: Geology and Resources,Freeport-McMoRan Inc., New Orleans,LA., 1999; |
| · | Independent Consultant: Geology,Steamboat Springs, CO.,2000; |
| · | Senior Geologist, environmental geology and mine closure,MWHConsulting, Inc.,Steamboat Springs, CO.,2000-2003; |
| · | Principal Mining Geologist,precious and base metalexploration, resource modeling, and minedevelopment, SRK Consulting (U.S.),Inc., 2004to present; |
| · | Experience in the above positionsworking with, reviewingand conducting resourceestimation and feasibilitystudies in concertwith mining and process engineers; and |
| · | As aconsultant, Ihave participated in the preparation of NI 43-101Technical reports from 2006-to present. |
| 4. | Ihave read the definitionof “qualified person” setout in NationalInstrument 43-101 (NI 43-101) and certifythatby reasonofmyeducation, affiliationwith a professional association (asdefined in NI43-101) and past relevant work experience, I fulfill the requirementsto be a“qualified person” forthe purposes of NI43-101. |
| 5. | Ihave not visited the Florida Canyonproperty. |
| 6. | Iam responsible forthe preparation of Sections 5, 6,7,8, 9, 10, 12, 14, 23, 24, andportions of 1, 20, 25, and 26 summarized therefrom,of this Technical Report. |
| 7. | Iam independent of the issuerapplying allof the tests in section1.5 of NI43-101. |
| 8. | Ihave had prior involvement with the property thatis the subjectof the TechnicalReport. Thenature ofmyprior involvementis co-author and Qualified Person forthe NI 43-101 TechnicalReport on Resources, Bongará Zinc Project,effective date June5,2014. |
U.S. Offices:
Canadian Offices:
Group Offices:
| Anchorage | 907.677.3520 | Saskatoon | 306.955.4778 | Africa |
| Clovis | 559.452.0182 | Sudbury | 705.682.3270 | Asia |
| Denver | 303.985.1333 | Toronto | 416.601.1445 | Australia |
| Elko | 775.753.4151 | Vancouver | 604.681.4196 | Europe |
| Fort Collins | 970.407.8302 | Yellowknife | 867.873.8670 | North America |
| Reno | 775.828.6800 | | | SouthAmerica |
| Tucson | 520.544.3688 | | | |
SRK Consulting (U.S.), Inc. Page 2
| 9. | Ihave read NI 43-101and Form 43-101F1 and the sectionsof the Technical Report Iam responsible forhave beenprepared in compliancewith that instrumentandform. |
| 10. | As of the aforementioned Effective Date, to thebest ofmy knowledge,information and belief, thesections of the TechnicalReport Iam responsible forcontains all scientificand technicalinformation that is requiredto be disclosedto makethe Technical Reportnot misleading. |
Dated this 3rdDayof August,2017.
“signed”
_
J.B. Pennington, M.Sc., C.P.G.[#11245]
QP_Cert_Pennington_20170802
CERTIFICATE OF QUALIFIED PERSON
I, Joanna Poeck, BEngMining, SME-RM, MMSAQP,do hereby certifythat:
| 1. | IamaSenior Mining Engineerof SRK Consulting(U.S.), Inc., 1125Seventeenth Street, Suite 600,Denver, CO, USA, 80202. |
| 2. | Thiscertificate applies tothetechnical report titled “NI 43-101Technical Report, Preliminary Economic Assessment,Florida CanyonZinc Project, AmazonasDepartment, Peru” withanEffective Dateof July13, 2017(the “TechnicalReport”). |
| 3. | Igraduated with adegree inMining Engineering fromColorado Schoolof Mines in2003. Iam aRegistered Memberof the Societyof Mining, Metallurgy &Exploration Geology. Iam a QP memberofthe Mining &Metallurgical Societyof America. Ihave workedas aMining Engineer for atotal of 14 years sincemy graduation fromuniversity.My relevantexperience includes open pit andunderground design, minescheduling, pitoptimization andtruck productivity analysis. |
| 4. | Ihave read the definitionof “qualified person” setout in NationalInstrument 43-101 (NI 43-101) and certifythatby reasonofmyeducation, affiliationwith a professional association (asdefined in NI43-101) and past relevant work experience, I fulfill the requirementsto be a“qualified person” forthe purposes of NI43-101. |
| 5. | Ihave not visited the Florida Canyon Zincproperty. |
| 6. | Iam responsible forthe preparation of Sections 15, 16.1,16.3, 16.4, 16.5 andportions of 1,25 and26summarized therefrom,ofthis Technical Report. |
| 7. | Iam independent of the issuerapplying allof the tests in section1.5 of NI43-101. |
| 8. | Ihave not had prior involvementwith the property thatis the subjectof the TechnicalReport. |
| 9. | Ihave read NI 43-101and Form 43-101F1 and the sectionsof the Technical Report Iam responsible forhave beenprepared in compliancewith that instrumentandform. |
| 10. | As of the aforementioned Effective Date, to the bestofmy knowledge,information and belief, thesections of the TechnicalReport Iam responsible forcontains all scientificand technicalinformation that is requiredto be disclosedto makethe Technical Reportnot misleading. |
Dated this 3rdDayof August,2017.
“signed”
_
Joanna Poeck,BEng Mining, SME-RM [#4131289RM], MMSAQP [#01387QP]
U.S. Offices:
Canadian Offices:
Group Offices:
| Anchorage | 907.677.3520 | Saskatoon | 306.955.4778 | Africa |
| Clovis | 559.452.0182 | Sudbury | 705.682.3270 | Asia |
| Denver | 303.985.1333 | Toronto | 416.601.1445 | Australia |
| Elko | 775.753.4151 | Vancouver | 604.681.4196 | Europe |
| Fort Collins | 970.407.8302 | Yellowknife | 867.873.8670 | North America |
| Reno | 775.828.6800 | | | SouthAmerica |
| Tucson | 520.544.3688 | | | |
SRKConsulting (U.S.), Inc. Suite 600
1125 Seventeenth Street
Denver, CO80202
T: 303.985.1333
F: 303.985.9947
denver@srk.com www.srk.com
CERTIFICATE OF QUALIFIED PERSON
I, JeffOsborn, BEng Mining, MMSAQPdo herebycertify that:
| 1. | Iam aPrincipal Consultant(Mining Engineer) of SRKConsulting (U.S.),Inc., 1125 Seventeenth, Suite600, Denver, CO, USA,80202. |
| 2. | Thiscertificate applies tothetechnical report titled “NI 43-101Technical Report, Preliminary Economic Assessment,Florida CanyonZinc Project, AmazonasDepartment, Peru” withanEffective Dateof July13, 2017(the “TechnicalReport”). |
| 3. | Igraduated with a Bachelorof Science Mining Engineering degreefrom the Colorado Schoolof Mines in1986. Iam aQualified Professional (QP) Memberof the Mining and Metallurgical Societyof America. Ihave worked as aMining Engineer for a totalof 29yearssincemygraduation fromuniversity.Myrelevant experience includesresponsibilities in operations, maintenance, engineering, management, andconstruction activities. |
| 4. | Ihave read the definitionof “qualified person” setout in NationalInstrument 43-101 (NI 43-101) and certifythatby reasonofmyeducation, affiliationwith a professional association (asdefined in NI43-101) and past relevant work experience, I fulfill the requirementsto be a“qualified person” forthe purposes of NI43-101. |
| 5. | Ihave not visited the Florida Canyon ZincProperty. |
| 6. | Iam responsible forthe preparation of Sections 18, 19,21, 22, and portions of 1,25 and26 summarized therefromofthis Technical Report. |
| 7. | Iam independent of the issuerapplying allof the tests in section1.5 of NI43-101. Ihave not had prior involvement with the property thatis the subjectof the TechnicalReport. |
| 8. | Ihave read NI 43-101and Form 43-101F1 and the sectionsof the Technical Report Iam responsible forhave beenprepared in compliancewith that instrumentandform. |
| 9. | As of the aforementioned Effective Date, to thebest ofmy knowledge,information and belief, thesections of the TechnicalReport Iam responsible forcontains all scientificand technical informationthat is requiredto be disclosedto makethe Technical Reportnot misleading. |
Dated this 3rdDayof August,2017.
“signed”
_ Jeff Osborn, BEng Mining, MMSAQP [#01458QP]
CERTIFICATE OF QUALIFIED PERSON
I, Daniel H.Sepulveda, B.Sc,SME-RM, do hereby certifythat:
| 1. | Iam Associate Consultant(Metallurgy) of SRK Consulting (U.S.), Inc., 1125Seventeenth Street, Suite600, Denver, CO, USA,80202. |
| 2. | Thiscertificate applies tothetechnical report titled “NI 43-101Technical Report, Preliminary Economic Assessment,Florida CanyonZinc Project, AmazonasDepartment, Peru” withanEffective Dateof July13, 2017(the “TechnicalReport”). |
| 3. | Igraduated with adegree inExtractive Metallurgy fromUniversity of Chile in 1992. Iamaregistered memberofthe Societyof Mining, Metallurgy, andExploration, Inc. (SME), member No 4206787RM. Ihave worked as a Metallurgist for atotal of 25 years sincemygraduation fromuniversity.Myrelevant experience includes: employeeof several mining companies,engineering &construction companies, andas a consulting engineer. |
| 4. | Ihave read the definitionof “qualified person” setout in NationalInstrument 43-101 (NI 43-101) and certifythatby reasonofmyeducation, affiliationwith a professional association (asdefined in NI43-101) and past relevant work experience, I fulfill the requirementsto be a“qualified person” forthe purposes of NI43-101. |
| 5. | Ihave not visited the Florida Canyon site |
| 6. | Iam responsible forthe preparation of Sections 13, 17,the capitaland operating cost forprocessing inSection 21, andportions of 1, 25 and26 summarized therefrom,of this Technical Report. |
| 7. | Iam independent of the issuerapplying allof the tests in section1.5 of NI43-101. |
| 8. | Ihave not had prior involvementwith the property thatis the subjectof the TechnicalReport. |
| 9. | Ihave read NI 43-101and Form 43-101F1 and the sectionsof the Technical Report Iam responsible forhave beenprepared in compliancewith that instrumentandform. |
| 10. | As of the aforementioned Effective Date, to thebest ofmy knowledge,information and belief, thesections of the TechnicalReport Iam responsible forcontains all scientificand technicalinformation that is requiredto be disclosedto makethe Technical Reportnot misleading. |
Dated this 3rdDayof August,2017.
“signed”
_Daniel H.Sepulveda, B.Sc, SME-RM
U.S. Offices:
Canadian Offices:
Group Offices:
| Anchorage | 907.677.3520 | Saskatoon | 306.955.4778 | Africa |
| Clovis | 559.452.0182 | Sudbury | 705.682.3270 | Asia |
| Denver | 303.985.1333 | Toronto | 416.601.1445 | Australia |
| Elko | 775.753.4151 | Vancouver | 604.681.4196 | Europe |
| Fort Collins | 970.407.8302 | Yellowknife | 867.873.8670 | North America |
| Reno | 775.828.6800 | | | SouthAmerica |
SRKExploration Services 12 St.Andrews Crescent, Cardiff,CF10 3DD Wales, UK
T: +44 2920 233233
F: +44 2920 233211
www.srk.com
CERTIFICATE OF QUALIFIED PERSON
I, JamesGilbertson, Chartered Geologist,do hereby certifythat:
| 1. | Iam aPrincipal Exploration Geologist of SRK Exploration Services,12 St. AndrewsCrescent, Cardiff,CF10 3DD,Wales,UK. |
| 2. | Thiscertificate applies tothetechnical report titled “NI 43-101Technical Report, Preliminary Economic Assessment,Florida CanyonZinc Project, AmazonasDepartment, Peru” withanEffective DateofJuly13, 2017(the “TechnicalReport”). |
| 3. | Igraduated with adegree in Geology fromDurham University in 2000.Inaddition, Ihave obtained aMasters in Mining Geologyfrom Camborne Schoolof Mines in 2002. IamaChartered Geologistof the Geological Societyof London. Ihave workedas a Geologist for atotal of 17 years sincemygraduation from university.My relevantexperience includes exploration planning, mineral projectauditing, mineral resource estimation and projectdue diligence on a verityof commodities anddeposit styleglobally. |
| 4. | Ihave read the definitionof “qualified person” setout in NationalInstrument 43-101 (NI 43-101) and certifythatby reasonofmyeducation, affiliationwith a professional association (asdefined in NI43-101) and past relevant work experience, I fulfill the requirementsto be a“qualified person” forthe purposes of NI43-101. |
| 5. | Ivisited theFlorida Canyon propertyon May5, 2014 forthree days. |
| 6. | Iam responsible forthe preparation of Section 11, thesite visit, inspection of geologicalsampling anddata collection practices, and reviewof resource estimationpractices of the TechnicalReport. |
| 7. | Iam independent of the issuerapplying allof the tests in section1.5 of NI43-101. |
| 8. | Ihave had prior involvement with the property thatis the subjectof the TechnicalReport. Thenature ofmyprior involvementis as an independent consultantduring the 2014 Mineral Resourceestimate. |
| 9. | Ihave read NI 43-101and Form 43-101F1 and the sectionsof the Technical Report Iam responsible forhave beenprepared in compliancewith that instrumentandform. |
| 10. | As of the aforementioned Effective Date, to thebest ofmy knowledge,information and belief, thesections of the TechnicalReport Iam responsible forcontains all scientificand technicalinformation that is requiredto be disclosedto makethe Technical Reportnot misleading. |
Dated this 3rdDayof August,2017.
“signed”
_ JamesGilbertson, ProfessionalChartered Geologist
CERTIFICATE OF QUALIFIED PERSON
I, John Tinucci,Ph.D., P.E., ISRMdo hereby certify that:
| 1. | Iam aPrincipal Geotechnical Mining Engineerof SRK Consulting (U.S.),Inc., 1125 SeventeenthStreet, Suite 600,Denver, CO, USA, 80202. |
| 2. | Thiscertificate applies tothetechnical report titled “NI 43-101Technical Report, Preliminary Economic Assessment,Florida CanyonZinc Project, AmazonasDepartment, Peru” withanEffective Dateof July13, 2017(the “TechnicalReport”). |
| 3. | Igraduated with adegree in B.S.in Civil Engineering fromColorado State University,in 1980.Inaddition, Ihave obtained aM.S. in Geotechnical Engineering fromUniversity of California, Berkeley, in1983 and I have obtained aPh.D. in GeotechnicalEngineering, RockMechanics fromthe Universityof California, Berkeley in 1985. Iam memberof the American RockMechanics Association, a memberof the International Societyof RockMechanics, a memberof the ASCEGeoInstitute, and aRegistered Memberof the Society forMining, Metallurgy &Exploration. Ihave workedas aMining and GeotechnicalEngineer for atotal of 37 years since mygraduation fromuniversity.My relevantexperience includes34 years of professional experience. Ihave 15yearsmanagerial experience leading project teams,managing P&Loperations for120staff,and directed own companyof 8 staff for 8years. Ihave technical experience in minedesign, prefeasibility studies, feasibility studies, geomechanical assessments,rock masscharacterization, project management, numerical analyses, underground mine stability,subsidence, tunneling, ground support, slopedesign andstabilization, excavation remediation, induced seismicityand dynamicground motion. My industry commodities experience includessalt, potash, coal,platinum/palladium, iron, molybdenum,gold, silver, zinc,diamonds, and copper.My mine designexperience includes openpit, room and pillar, (single and multi-level), conventionaldrill-and-blast andmechanized cutting, longwall, steep narrow vein, cut and fill, blockcaving, sublevel caving and cut and fill longhole stoping and pastebackfilling |
| 4. | Ihave read the definitionof “qualified person” setout in NationalInstrument 43-101 (NI 43-101) and certifythatby reasonofmyeducation, affiliationwith a professional association (asdefined in NI43-101) and past relevant work experience, I fulfill the requirementsto be a“qualified person” forthe purposes of NI43-101. |
| 5. | Ihave not visited the Florida Canyonproperty. |
| 6. | Iam responsible forthe preparation of Section 16.2of the TechnicalReport. |
| 7. | Iam independent of the issuerapplying allof the tests in section1.5 of NI43-101. |
| 8. | Ihave not had prior involvementwith the property thatis the subjectof the TechnicalReport. |
| 9. | Ihave read NI 43-101and Form 43-101F1 and the sectionsof the Technical Report Iam responsible forhave beenprepared in compliancewith that instrumentandform. |
| 10. | As of the aforementioned Effective Date,to thebest ofmy knowledge,information and belief, thesections of the TechnicalReport Iam responsible forcontains all scientificand technicalinformation that is requiredto be disclosedto makethe Technical Reportnot misleading. |
U.S. Offices:
Canadian Offices:
Group Offices:
| Anchorage | 907.677.3520 | Saskatoon | 306.955.4778 | Africa |
| Clovis | 559.452.0182 | Sudbury | 705.682.3270 | Asia |
| Denver | 303.985.1333 | Toronto | 416.601.1445 | Australia |
| Elko | 775.753.4151 | Vancouver | 604.681.4196 | Europe |
| Fort Collins | 970.407.8302 | Yellowknife | 867.873.8670 | North America |
| Reno | 775.828.6800 | | | SouthAmerica |
SRK Consulting (U.S.), Inc. Page 2
Dated this3rdDayof August,2017.
“signed”
_ John Tinucci,Ph.D., P.E., ISRM
QP_Cert-Tinucci_20170803-signed