Exhibit 99.1
NI 43-101 Technical Report on
Resources and Reserves
Mt. Hamilton Gold Project
Centennial Deposit
White Pine County, Nevada
Report Prepared for
Mt. Hamilton LLC
With
Solitario Exploration & Royalty Corp.
And
Ely Gold Minerals Inc.
|
Report Prepared by
SRK Project Number 181700.040
Effective Date: February 22, 2012 Report Date: February 22, 2012 |


| SRK Consulting (U.S.), Inc. | ||||
| NI 43-101 Technical Report – Mt. Hamilton Gold Project, Centennial Deposit | Page i |
NI 43-101 Technical Report on
Resources and Reserves
Mt. Hamilton Gold Project
Centennial Deposit
White Pine County, Nevada
Prepared for:
Mt. Hamilton LLC
4251 Kipling Street, Suite 390
Wheat Ridge, CO 80033, USA
Phone: +1.303.534.1030
Fax: +1.303.534.1809
With
Solitario Exploration & Royalty Corp.
4251 Kipling Street, Suite 390
Wheat Ridge, CO 80033, USA
Phone: +1.303.534.1030
Fax: +1.303.534.1809
And
Ely Gold & Minerals Inc.
Suite 3364, Four Bentall Centre
1055 Dunsmuir Street
Vancouver, British Columbia V7X 1L2, Canada
Phone: +1.604.488.1104
Fax: +1.604.488.1105
Prepared by:
SRK Consulting (U.S.), Inc.
7175 West Jefferson Avenue, Suite 3000
Lakewood, CO 80235, USA
e-mail: denver@srk.com
website: www.srk.com
Tel: +1.303.985.1333
Fax: +1.303.985.9947
Qualified Persons:
J. Pennington, (SRK) C.P.G., MSc.
Richard DeLong, MS, PG, RG, CEM (Enviroscientists)
Frank Daviess, (SRK), MAusIMM, Registered SME
Herb Osborne, (SRK Associate), P.E.
Joanna Poeck, (SRK), B. Eng., MMSA
Kent Hartley (SRK) P.E. Mining, SME, BSc
Mike Levy (SRK), P.E, P.G.
Evan Nikirk (SRK), P.E., MSc.
Peer Reviewed by:
Neal Rigby, (SRK) CEng, MIMMM, PhD
| JBP/MLM | February 22, 2012 |
| SRK Consulting (U.S.), Inc. | ||||
| NI 43-101 Technical Report – Mt. Hamilton Gold Project, Centennial Deposit | Page ii |
Summary (Item 1)
Introduction
This report was prepared as a National Instrument 43-101 (NI 43-101) Technical Report on Resources and Reserves for Mt. Hamilton LLC (MH-LLC) a limited liability company owned by Solitario Exploration & Royalty Corp. (Solitario) and Ely Gold and Minerals Inc. (Ely Gold), by SRK Consulting (U.S.), Inc. (SRK). Within this report, MH-LLC may be construed as MH-LLC separately or collectively as MH-LLC, Solitario and Ely Gold.
This report provides mineral resource and mineral reserve estimates, and a classification of resources and reserves in accordance with the Canadian Institute of Mining, Metallurgy and Petroleum Standards on Mineral Resources and Reserves: Definitions and Guidelines, November 27, 2010 (CIM). It also meets the standards of the U.S. Securities and Exchange Commission Industry Guide 7 for estimating and reporting reserves.
The mineral property addressed in this report is MH-LLC’s wholly owned Centennial gold and silver Project (“Centennial”, or the “Project”), located in the historic Mt. Hamilton mining district of central Nevada. This report represents Feasibility-level reserve, mining, processing, cost estimation and economic evaluation for the Centennial Project. A Feasibility Study (FS) document will be produced in conjunction with this Technical Report and will contain all recent and relevant data to support the summary descriptions and conclusions made herein.
Centennial is an advanced mineral project with a favorable economic projection based on Feasibility- level capital and operating costs from a thorough mining and processing development plan. Mining will occur in a single open pit at high elevation (8,600 to 9,400 ft) using conventional truck and shovel methods to deliver ore to a mine-level primary jaw crusher at 8,450 ft elevation. Crushed ore will be dropped approximately 350 ft in a vertical ore pass to an underground chamber, where it will be reclaimed and loaded onto a conveyor. Ore will travel via conveyor 3,450 ft underground on a -15% decline to the adit portal and then transferred to a coarse-ore stockpile at 7,550 ft elevation. A reclaim tunnel under the stockpile will feed a secondary cone crusher, reducing the particle size to -3/4 inch for radial stacking on a 22.5 Mt capacity HDPE-lined leach pad. Stacked ore will be leached with a cyanide solution. Pregnant solution will be collected in ponds and processed using conventional adsorption, desorption, recovery (ADR) carbon-in-column technology to produce a gold/silver doré product.
Economics
The indicative economic results are shown on Table 1. The following provide the basis of the SRK LoM plan and economics:
| • | Production Rate: 8,500 tons ore per day; |
| • | Mine Life: 8.0 years; |
| • | Average Gold Recovery: 79%; |
| • | Average Silver Recovery: 90% of soluble silver (~ 36% of total contained silver); |
| • | Life of Mine Strip Ratio: 2.4:1.0 (waste:ore); |
| • | Initial Capital Cost: $71.9 million; |
| • | Life of Mine Capital Cost: $107.2 million; |
| JBP/MLM | February 22, 2012 |
| SRK Consulting (U.S.), Inc. | ||||
| NI 43-101 Technical Report – Mt. Hamilton Gold Project, Centennial Deposit | Page iii |
| • | Underlying NSR-Royalty: 1%; |
| • | Cash Costs per Gold-Equivalent Ounce of Gold Recovered: US$535; |
| • | Average Annual Gold Production: 48,000 ounces; |
| • | Average Annual Silver Production: 330,000 ounces; |
| • | Average Annual Gold Equivalent Production: 54,000 ounces (at a 55:1 silver to gold ratio); |
| • | After tax Internal Rate of Return (IRR): 25.4%; and |
| • | Payback Period: 3.2 years. |
Table 1: Indicative Economic Results
Description | Value | Units | ||||||
Market Prices | ||||||||
Gold (LoM Avg) | $ | 1,323 | /oz-Au | |||||
Silver (LoM Avg) | $ | 25.34 | /oz-Ag | |||||
Estimate of Cash Flow (all values in $000s) | ||||||||
Payable Metal | ||||||||
Gold | 384.5 | koz | ||||||
Silver | 2,643.6 | koz | ||||||
Gross Revenue | ||||||||
Gold | $ | 508,785 | ||||||
Silver | $ | 66,991 | ||||||
|
| |||||||
Revenue | $ | 575,775 | ||||||
Freight & Handling | ($ | 2,860 | ) | |||||
|
| |||||||
Gross Revenue | $ | 572,916 | ||||||
Royalty | ($ | 4,529 | ) | |||||
|
| |||||||
Net Revenue | $ | 568,387 | ||||||
Operating Costs | $ | /t-ore | ||||||
|
| |||||||
Mining | $ | 129,457 | $ | 5.75 | ||||
Processing | $ | 87,634 | $ | 3.89 | ||||
G&A | $ | 15,617 | $ | 0.69 | ||||
Property & Nevada Net Proceeds Tax | $ | 16,155 | $ | 0.72 | ||||
|
|
|
| |||||
Total Operating | $ | 248,864 | $ | 11.05 | ||||
|
|
|
| |||||
Operating Margin (EBITDA) | $ | 319,523 | ||||||
LoM Capital | $ | 107,207 | ||||||
Federal Income Tax | $ | 75,874 | ||||||
|
| |||||||
Cash Flow | $ | 136,442 | ||||||
NPV 5% | $ | 83,088 | ||||||
NPV 8% | $ | 60,678 | ||||||
IRR (after tax) | 25.4 | % | ||||||
|
| |||||||
A breakdown of the capital costs is presented in Table 2.
Table 2: Capital Cost Summary
Initial Capital Cost Item | Cost US$ (000s) | |||
Mining | $ | 6,007 | ||
Processing | $ | 21,773 | ||
Leach Pad | $ | 5,532 | ||
Infrastructure | $ | 8,212 | ||
Owner | $ | 23,818 | ||
Contingency | $ | 6,543 | ||
|
| |||
Initial Capital Total | $ | 71,885 | ||
|
| |||
Ongoing | $ | 20,497 | ||
Closure Costs | $ | 10,760 | ||
Contingency | $ | 4,065 | ||
|
| |||
LoM Total Capital | $ | 107,207 | ||
|
| |||
| JBP/MLM | February 22, 2012 |
| SRK Consulting (U.S.), Inc. | ||||
| NI 43-101 Technical Report – Mt. Hamilton Gold Project, Centennial Deposit | Page iv |
Table 3 provides an upward sensitivity analysis of project economics using alternative metal prices.
Table 3: Metal Price Sensitivity Analysis
Item | Pre-Tax | After Tax (Federal=35%, State=5%) | ||||||||||||||||||||||||||||||
Gold US$/oz. | $ | 1,323 | $ | 1,500 | $ | 1,700 | $ | 1,900 | $ | 1,323 | $ | 1,500 | $ | 1,700 | $ | 1,900 | ||||||||||||||||
Silver US$/oz. | $ | 25.34 | $ | 29.00 | $ | 33.00 | $ | 37.00 | $ | 25.34 | $ | 29.00 | $ | 33.00 | $ | 37.00 | ||||||||||||||||
Cash Flow (US$M) | $ | 226.4 | $ | 284.9 | $ | 389.9 | $ | 476.1 | $ | 136.4 | $ | 183.9 | $ | 237.5 | $ | 290.8 | ||||||||||||||||
NPV @ 8% (US$M) | $ | 111.1 | $ | 154.4 | $ | 207.0 | $ | 259.3 | $ | 60.7 | $ | 87.3 | $ | 120.0 | $ | 152.3 | ||||||||||||||||
NPV @ 5% (US$M) | $ | 145.3 | $ | 198.5 | $ | 261.5 | $ | 324.1 | $ | 83.1 | $ | 116.0 | $ | 155.0 | $ | 193.7 | ||||||||||||||||
IRR | 35.0 | % | 41.3 | % | 51.2 | % | 60.6 | % | 25.4 | % | 30.5 | % | 37.9 | % | 44.9 | % | ||||||||||||||||
Payback (Years) | 2.7 | 2.5 | 2.2 | 1.9 | 3.2 | 2.9 | 2.6 | 2.3 | ||||||||||||||||||||||||
Base case is bolded
Property Description and Ownership
The Mt. Hamilton Property (Property), which contains the Centennial gold and silver deposit, is located in White Pine County, Nevada at 115.558890° W Longitude and 39.250867° N Latitude, in the northern White Pine Mountains. The terrain is high mountain desert with cold winters and warm summers. Project elevations range from 7,000 ft. to 9,500 ft. above mean sea level (amsl). Centennial has good connections to the infrastructure of northeastern Nevada, and is accessed from U. S. Highway 50 on gravel-surfaced public and private roads. Project economics have been developed using generated power, though line power may be available at some time during the life of the mine. Water will be supplied by an existing well in Seligman Canyon. Water rights sufficient for project start-up have been secured by MH-LLC. Water rights for full production are under application.
History
Phillips Petroleum Co. (Phillips) acquired much of the area of the current Property in 1968 and, between 1968 and 1982, drilled over 100,000 ft. in the exploration for tungsten-copper-molybdenum deposits. In 1984 Northern Illinois Coal, Oil and Resources Mineral Ventures, subsequently renamed Westmont Gold Inc., (Westmont) entered into a joint venture with Phillips and Queenstake Resources Ltd. to explore the property for open-pit mineable gold-silver mineralization. By early 1989, this work had defined the Seligman and Centennial gold deposits. The property was transferred to Mt. Hamilton Mining Company (MHMC, a Westmont subsidiary) after November 1993. Rea Gold Corp. (Rea) acquired MHMC in June 1994 and began production of the Seligman deposit located to the north of Centennial in November 1994. Rea had planned to commence mining of the Centennial deposit in 1997, but this never occurred. Rea ceased mining in June 1997, but continued leaching until declaring bankruptcy in Canadian Bankruptcy Court in November 1997. In 2002, the US Bankruptcy Trustee abandoned all of the unpatented claims, allowing them to lapse for failure to pay the annual maintenance fees. Centennial Minerals Company LLC staked claims covering the Centennial Deposit in late 2002, and in 2003 purchased all of the patented mining claims and Fee lands from the US Bankruptcy court. Augusta, through its 100% owned subsidiary Diamond Hill Minerals Ltd (DHI), acquired a leasehold interest in the property from Centennial in late 2003. Under an agreement with Augusta Resource Corporation (Augusta) dated November 15, 2007, Ivana acquired 100% of the shares of DHI. Ivana changed its name to Ely Gold & Minerals (Ely) in 2008. On August 26, 2010, Solitario Exploration and Royalty Corporation (Solitario) signed a Letter of Intent with Ely to earn up to an 80% interest in Ely’s Mt. Hamilton gold property. In December 2010,
| JBP/MLM | February 22, 2012 |
| SRK Consulting (U.S.), Inc. | ||||
| NI 43-101 Technical Report – Mt. Hamilton Gold Project, Centennial Deposit | Page v |
Solitario and Ely formed MH-LLC which now holds 100% of the Mt. Hamilton project assets, and signed an LLC Operating Agreement.
Ownership
The Property is comprised of two parcels of fee simple land totaling 240 acres, nine surveyed Patented Mineral Claims totaling 120.57 acres, and 255 unpatented Federal mining claims totaling approximately 4,530 acres. Claims are located in Sections 8, 9, 15, 16, 17, 21, 22, 27, 28, Township 16N, Range 57E, White Pine County, Nevada. All unpatented claims are staked on the ground in accordance with Bureau of Land Management and Nevada regulations. The lands which comprise the unpatented mining claims are controlled by the US Mining Law of 1872 and are situated on Public Lands administered by the U.S. Department of Agriculture, Forest Service (USFS). The patented claims and the two fee simple parcels are private lands in which MH-LLC controls all surface and mineral rights. The entire property package is controlled by MH-LLC through direct ownership or lease/option interests with third parties.
Environmental Liabilities and Permitting
Previous mining at the Property was conducted by Rea in the NE Seligman area, and included the construction of open pit excavations, a waste rock dump and a heap leach pad. The site of the former mine-associated facilities has been reclaimed by the U.S. Forest Service and Bureau of Land Management. All buildings have been removed and the leach pad associated with previous mining has been covered with soil, re-contoured, and seeded. MH-LLC currently has no environmental liabilities related to this previous mining activity. However, MH-LLC has conducted exploration in the Centennial and Chester areas and is currently liable for reclamation of the exploration-related disturbances. Most of the drilling was done on land administered by the USFS under a Plan of Operation (PoO) submitted by the Company, as is standard practice for mineral exploration activity that uses USFS-administered land.
Various federal agencies, departments within the State of Nevada and White Pine County, and local governments will be cooperating agencies in permitting mining development and process facilities at the site. The Centennial Project is being permitted separately on National Forest System (NFS) lands, where the mining will occur, and on private land owned by MH-LLC where the processing of the ore is planned. A Plan of Operations (PoO) for submission to the USFS will be submitted for mining activities on NFS lands. A Nevada Reclamation Permit (NRP) Application will also be required for the area covered by the PoO. This application review and approval is through the Nevada Division of Environmental Protection (NDEP) Bureau of Mining Regulation and Reclamation (BMRR).
Once the PoO is determined to be complete by the USFS, public and internal scoping of the project will be initiated in order to determine the issues that will be evaluated to comply with the National Environmental Policy Act (NEPA). The USFS will decide whether an Environmental Assessment (EA) or an Environmental Impact Statement (EIS) will be required. An EA is prepared when there are no expected significant impacts and an EIS is prepared when there are significant impacts that need to be disclosed to the public. Both documents provide an analysis of potential impacts to resources and if it is determined through the preparation of an EA that there will be significant impacts, the project analysis could be completed through an EIS.
| JBP/MLM | February 22, 2012 |
| SRK Consulting (U.S.), Inc. | ||||
| NI 43-101 Technical Report – Mt. Hamilton Gold Project, Centennial Deposit | Page vi |
A bond for reclamation will be required for the mining operations conducted as part of the Centennial Project. The bond will be required to be in place prior to construction activities associated with the mine and the bond costs and the agency (either the USFS or the BMRR) that will hold the bond for the project will need to be agreed upon by the USFS and BMRR. A separate bond will be required for reclamation on private land.
Because of previously permitted mining activity at the Project, SRK currently has no reason to believe that permits to mine the mineral resources at Centennial could not be reasonably obtained from State and Federal regulatory agencies.
Geology and Mineralization
The Mt. Hamilton Property is located in the White Pine Mountains, which are in the eastern sector of the Great Basin in east-central Nevada. The White Pine Mountains are one of the many mountain ranges that have been uplifted along north-striking steeply dipping normal faults formed during extension that formed the Great Basin Physiographic Province. This region was subjected to east-to-west compression during the Sevier and Laramide orogenies in the Cretaceous and early Tertiary periods. This compression resulted in the formation of broadly north-trending folds and thrust faults. Two major folds are present in the project area: the Hoppe Springs anticline (into which the Seligman stock has intruded) and the Silver Bell syncline to the west. The folded units are a package of Cambrian- to Pennsylvanian-age sedimentary rocks, but only the Cambrian age units are present in the Project area. The igneous intrusive stocks were the cause of district-wide contact metamorphism that resulted in hornfels and skarn alteration of the Cambrian-age host rock units.
The units that host gold mineralization are the Middle Cambrian Secret Canyon Shale and the Upper Cambrian Dunderberg Shale (Burgoyne, 1993). In general, both units consist of calcareous laminated mudstones with thin limestone interbeds. The Dunderberg disconformably overlies the Secret Canyon, and both of these units are exposed at the surface in the Project area. Together, they are up to 2000 ft thick, and host all gold and silver mineralization considered in this report. Younger Paleozoic rock units form the Pancake and White Pine Mountain Ranges, west and east of the project area.
Early metasomatic alteration converted shales and carbonaceous siltstones of the upper Secret Canyon shale to hornfels after shales and calc-silicate skarn after silty carbonates. Mineralization at Mt. Hamilton consists of skarn-hosted tungsten, molybdenum, and copper +/- zinc with later epithermal gold and silver. Gold mineralization is primarily hosted in a 200 to 300 ft thick skarn horizon, bounded by upper (200 ft thick) and lower (450 ft thick) hornfels units. The bounding hornfels had lower permeability and were therefore less receptive to late-stage mineralization. The interbedded skarn in the Centennial area was subject to late-stage, low-angle faulting. These faults were conduits to late mineralizing solutions and oxidation. The result is an oxide-hosted epithermal gold deposit overprinting a retrograde polymetallic skarn. The main Centennial precious metal mineralization is contained within a south dipping (15° to 20°) tabular zone that ranges from 20 to 250 ft thickness. In the NE Seligman area, ore grade mineralization appears to be largely stratiform in shallow-dipping, bedding-parallel, structurally and chemically prepared zones with local high-angle, cross-cutting, possible “feeder” zones (Burgoyne, 1993). At Centennial, the mineralization is controlled by late low-angle structures that are discordant to bedding and oxidized to significant depth. Gold grades of samples within the retrograde alteration range from <0.001 oz/t Au (lower
| JBP/MLM | February 22, 2012 |
| SRK Consulting (U.S.), Inc. | ||||
| NI 43-101 Technical Report – Mt. Hamilton Gold Project, Centennial Deposit | Page vii |
analytical method detection limit) to 0.995 oz/t. The occasional high grades appear to be associated with crosscutting structures and veins within the skarn as described below.
In the Centennial deposit, weathering and oxidation of original sulfide mineralization caused formation of oxide mineralization (with low sulfide mineral residuals) from which gold is recoverable by cyanide heap leaching. In general, the acid generating capacity of the surrounding carbonate rocks is low or nil, and their acid consuming capacity is high. Gold is present as free gold, residing in iron oxide minerals or quartz, and adsorbed on clay minerals. Sulfosalt-bearing veins consisting primarily of quartz and stibnite with minor, variable amounts of sphalerite, galena, pyrite, covellite, bornite, chalcopyrite, bournonite and jamesonite typically occur within the mineralized zones and may be associated locally with the higher grades of gold and particularly silver. These veins cut both skarn and intrusive rocks and are closely associated with zones of retrograde alteration. These veins range in thickness from about 2 cm to 60cm. As seen in the mine excavations of the NE Seligman deposit, these veins seem to exhibit strong continuity along strike.
Exploration Drilling and Data Quality
Bore hole drilling and sampling is the most significant aspect of exploration work done by MH-LLC at the Project. Surface mapping to define local geology was also done, but only results from drilling will be discussed further in this report.
Three drilling programs have been completed by MH-LLC in the Project area since 2008. Drill holes designed to enhance the resource model, gather rock quality geotechnical data and provide material for metallurgical testing have been completed using wireline diamond drilling techniques (core) and reverse circulation (RC) techniques. Regardless of the main application, all drill holes were sampled and analyzed for whole-rock composition and abundance of precious metals using standard industry procedures.
RC samples were collected at the rig and were under the control of MH-LLC staff or consultants until they were relinquished to the analytical lab for prep and analysis. Whole core was collected in boxes at the rig and transported back to the MH-LLC core shed for photographing, logging, and splitting with a diamond-blade saw. A continuous half-core was sampled, and the other half was retained in the original core box for future reference. Core samples remained under MH-LLC control until they were relinquished to the analytical lab for preparation and analysis. Similarly, equivalent analysis procedures at two accredited analytical labs have been used for recent drilling samples. Evaluation of check assay results from an outside lab is concurrent with this report. Drill hole sample sequences included QA/QC samples at a frequency equal to or greater than currently accepted industry standards, and most analytical programs included duplicate analysis on samples selected randomly to assess the quality of the analytical data. All available results are discussed in the Data Verification section of this report. Recent results support resource model estimations and confirm existing data from respective nearby drill holes. Primary assay results indicate that preparation and analytical procedures are defensible, and results are suitable for inclusion in a CIM-compliant resource and reserve estimates.
Metallurgy
The ore lithology of the Centennial deposits consists primarily of oxidized metasediments and some igneous rock (Seligman Stock), with a much smaller percentage of un-oxidized equivalents of the
| JBP/MLM | February 22, 2012 |
| SRK Consulting (U.S.), Inc. | ||||
| NI 43-101 Technical Report – Mt. Hamilton Gold Project, Centennial Deposit | Page viii |
same rock types. The confirmation of the recovery characteristics of these material types was considered critical to the assessment of profitability of the Project. In 2011, SRK supervised a program of drilling and metallurgical test work to support this investigation. Bottle roll and column tests were run on typical oxidized core intervals, as well as blended oxidized and un-oxidized samples. Bottle-roll tests were run on igneous-hosted samples. The results of the test work demonstrated favorable recovery for all materials tested, with good gold recoveries in oxidized rock (83%), similar gold recoveries in mixed oxide/sulfide material (81%) and reasonable gold recoveries in igneous rocks determined from bottle roll tests (73%). The conclusion from the 2011 metallurgical test results, in combination with the entire database of previous work, was a projected cyanide leach recovery of gold of 79%. This gold recovery was applied in the economic evaluation.
Metal recovery from Centennial ores is crush sensitive, and through a series of tests using different size fractions of core from 2009-2011, an optimum crush size of 91% passing -3/4 inch was selected for the leach operation.
Recovery is also a function of leaching time. Typically 70% or more of the recoverable gold in column tests is recovered in the first 30 days. But after analyzing leach recovery curves for all of the column test work, SRK recommends a leach cycle of 210 days during field operations to achieve full recovery.
Recovery is less sensitive to head grade. A regression analysis of all available column data suggests that a 2% downward correction factor should be applied to the laboratory test results to account for the difference between the average column test head grade of 0.036 oz/t Au, and the predicted mining head grade of 0.022 oz/t Au.
Comminution test results suggest that the ore fractures easily at a low power requirement and has low abrasion characteristics. These data were factored into crusher sizing and operating costs for wear parts. Based on height-percolation testing the ore can be stacked without agglomeration to a maximum height of 220 ft (limit of test). SRK has designed a lower, more conservative maximum stacking height of 200 ft in 25 ft lifts.
Mineral Resource Estimate
SRK estimated gold grades using inverse distance weighted (IDW) to the second power for each geologically controlled individual grade wireframe using a three-pass search, with increasingly expanded search distances. In addition to IDW metal grades, the estimation runs stored average distance to composites, number of composites and number of drill holes used for the block estimate. A second grade estimation routine was conducted to store nearest neighbour (NN) grades and distance to closest composite for use in model validation.
Mineral resources were classified under the categories of Measured, Indicated and Inferred according to standards as defined by the CIM. Classification of the resources reflects the relative confidence of the grade estimates. This is based on several factors, including: sample spacing relative to the geological and geostatistical observations regarding the continuity of mineralization; mining history; specific gravity determinations; accuracy of drill collar locations; and quality and reliability of the assay data. Resource classification criteria are presented in Table 4.
| JBP/MLM | February 22, 2012 |
| SRK Consulting (U.S.), Inc. | ||||
| NI 43-101 Technical Report – Mt. Hamilton Gold Project, Centennial Deposit | Page ix |
Table 4: Resource Classification Criteria
Centennial Confidence Classification Scheme | ||||||||||||||||
Class | Isotropic Absolute Distance | Minimum Number Of Composites | Maximum From One Drillhole | |||||||||||||
| Estim. Pass | Mineralization Shell | |||||||||||||||
Measured | 1 | Interior | 3 | 2 | ||||||||||||
Indicated | 1 | Exterior | 3 | 2 | ||||||||||||
Indicated | 2 | Interior | 3 | 2 | ||||||||||||
Inferred | 3 | Unconstrained | 2 | 2 | ||||||||||||
The resource model was further investigated with a Whittle™ v4.1.3 pit optimization to ensure areasonable stripping ratio was applied and a reasonable assumption of potential economic extraction could be made. Whittle™ software was used to generate a Lerchs Grossmann pit optimization using operating cost inputs described in the footnotes of the resource statement. Table 5 is the Mineral Resource Statement for the Centennial Gold-Silver Deposit.
Table 5: Mineral Resource Statement Centennial Gold-Silver Deposit, White Pine County, Nevada, SRK Consulting (U.S.), Inc.
Resource Category | Tons (000’s) | Au Grade (oz/t) | Contained Au (oz) | Ag Grade (oz/t) | Recoverable Ag (oz)* | |||||||||||||||
Measured | 918 | 0.032 | 29,524 | 0.155 | 142,152 | |||||||||||||||
Indicated | 22,732 | 0.022 | 497,330 | 0.132 | 3,010,471 | |||||||||||||||
Measured and Indicated | 23,650 | 0.022 | 526,854 | 0.133 | 3,152,624 | |||||||||||||||
Inferred | 3,454 | 0.018 | 60,859 | 0.079 | 273,457 | |||||||||||||||
| • | Mineral Resources are not Mineral Reserves and do not have demonstrated economic viability. There is no certainty that all or any part of the Mineral Resources estimated will be converted into Mineral Reserves estimate; |
| • | Resources stated as contained within a potentially economically minable open pit above a 0.006 oz/t AuEq CoG; |
| • | Pit optimization is based on assumed gold and silver prices of US$1,600/oz and US$40.00/oz, respectively, effective heap leach recoveries of 75% and 30% for gold and silver, respectively, a mining, processing and G&A cost of US$5.81/t; Net Smelter Return 1% and pit slopes of 50°. |
| • | Reported Au ounces are contained metal subject to process recovery which will result in a reduced number of payable ounces; |
| • | * Reported Ag ounces have already received a recovery discount during resource modeling; therefore, there will be minimal further reduction of payable Ag ounces after processing; and |
| • | Mineral resource tonnage and contained metal have been rounded to reflect the accuracy of the estimate, and numbers may not add due to rounding. |
The Resource Statement for gold reportscontained gold ounces that are potentially mineable by open pit, derived from the estimation of total-gold assay composites. The Resource Statement for silver reportsrecoverable silver ounces that are potentially mineable by open pit, derived from the estimation of recoverable silver assay composites, rather than total silver values (see Section 12.5 for additional detail). The Resource Statement tabulates “associated Silver”; the silver assay variable is “normalized” and as such is less robust than that provided for gold and should be evaluated accordingly. The resource confidence classification established for gold is also not necessarily applicable for silver given the lower sampling density and nature of assays for silver. SRK has consequently restricted silver estimation by a scheme of conservative capping and a conservative recovery was used for silver during pit optimization.
Mineral Reserve Statement
The Mineral Reserves stated below for Centennial were developed using Whittle™ pit optimization software based on pit slopes developed from dedicated geotechnical drilling supervised and analyzed by SRK in 2011.
| JBP/MLM | February 22, 2012 |
| SRK Consulting (U.S.), Inc. | ||||
| NI 43-101 Technical Report – Mt. Hamilton Gold Project, Centennial Deposit | Page x |
Pit optimization is based on preliminary economic estimations of mining, processing and selling related costs, slope angles, and metal recoveries. These pit optimization factors are likely to vary from those reported in the final economic analysis, which are based on the final pit design and production schedule. The pit optimization software considered grades and tonnages in the model along with estimated recoveries, mining and processing factors, and costs to determine what material could be economically extracted through the use of the Lerchs-Grossman algorithm. Table 6 shows the parameters used for pit optimization. Note that a more conservative gold price was used to guide pit designs (US$1,200/oz) than was used in mineral resource development (US$1,600/oz). Similarly, a conservative royalty of 3% was used. The royalty has since been reduced to 1%.
Table 6: Whittle™ Optimization Parameters
Item | Units | Cost | ||||
Gold Price | US$/oz | $1,200.00 | ||||
Silver Price | US$/oz | $20.00 | ||||
Mining Cost Waste | US$/t mined | $1.61 | ||||
Mining Cost Ore | US$/t mined | $1.75 | ||||
Processing Cost | US$/t processed | $3.59 | ||||
G & A | US$/t processed | $0.72 | ||||
Royalty | % of recovered revenue | 3% | ||||
Recovery Gold | 75% | |||||
Recovery Silver(1) | 75% | |||||
Interramp Slope Angle | 50° | |||||
Calculated CoG(2) | oz/t AuEq | 0.006 | ||||
| (1) | Recovery used for Ag is a percentage of the modeled Ag value for the block, which is a cyanide soluble or “recoverable” Ag. |
| (2) | Calculated CoG is the internal CoG, which does not include mining cost. |
The statement of Proven and Probable Reserves for Centennial is presented in Table 7.
Table 7: Mineral Reserves Statement, Centennial Gold-Silver Deposit, White Pine County, Nevada, SRK Consulting (U.S.), Inc.
Classification | Resource (kt) | Au Grade (oz/t) | Contained Au (koz) | Ag Grade (oz/t) | Contained Ag (koz) | |||||||||||||||
Proven | 923 | 0.032 | 29.3 | 0.155 | 142.7 | |||||||||||||||
Probable | 21,604 | 0.021 | 457.8 | 0.134 | 2,884.3 | |||||||||||||||
Total Proven and Probable* | 22,527 | 0.022 | 487.1 | 0.134 | 3,028.2 | |||||||||||||||
Some numbers may not add properly as a function of rounding.
Reserves are based upon 0.006 oz/t – AuEq Cut-off Grade (CoG), using US$1,200/oz-Au gold price and US$20/oz-Ag.
Two aspects are related for the conversion of resources to reserves:
| • | The ore extraction method(s) used in relation to the orebody characteristics which determine mining dilution and recovery; and |
| • | Associated project operating costs and resulting CoG’s. |
In accordance with the CIM classification system only Measured and Indicated resource categories can be converted to reserves (through inclusion within the open-pit mining limits). In this Mineral Reserve statement Inferred mineral resources is reported as waste. Inferred resources, while not
| JBP/MLM | February 22, 2012 |
| SRK Consulting (U.S.), Inc. | ||||
| NI 43-101 Technical Report – Mt. Hamilton Gold Project, Centennial Deposit | Page xi |
convertible to reserves, may be extracted during the mining of Proven and Probable reserves, and constitute “non-reserve material” that may add incremental ounces to the life of mine production.
Development and Operations
Mining
Mineralization at the Centennial deposit is close to the surface and the resource lends itself to an open pit mining method. The mine design consists of a pit with the approximate dimensions of 1,600 ft wide by 2,000 ft long by 600 ft deep; with a volume of 24.4 Myd3. The pit design was segregated into four phases for production scheduling with 80 ft wide ramps at a maximum in-pit road grade of 8%. Mining operations at Centennial have a stripping ratio 2.4:1, waste to ore, with mining taking place on the side of a hill at an approximate elevation of 9,000 ft amsl. Ore will be hauled downhill from the pit rim approximately 0.5 miles west and transferred to a primary crusher or stockpiled near the crusher for later use. Waste rock will be placed as valley fill in Cabin Gulch, located approximately 0.5 miles northwest of the mine. Waste rock volumes were artificially inflated by 20% for planning purposes to improve operational flexibility. The final waste rock storage facility will be regraded to 2.5 H/1V per State of Nevada regulations for reclamation.
The mine life is estimated to be 8 years with an additional one half year of pit pre-stripping. LoM mining-rate averages for the mine are estimated at 3 Mt/y ore and approximately 7.6 Mt/y waste.
Open pit mining will be by conventional diesel-powered equipment, utilizing a combination of blast hole drills, hydraulic shovel, rubber-tired wheel loaders and off-highway 100 ton trucks. Support equipment composed of graders, track dozers, and a water truck will aid in the mining of the Mineral Reserve and waste.
The mine is scheduled to initially operate on two 12 hour shifts per day, 360 days per year and will continue at this rate through year five. Starting in year six, the waste removal rate begins to decline. To match the slowdown in production, the number of hours per shift and the number of shifts per year begins to drop until at the end of the mine the number shift drops to one per day. Operating efficiency was estimated to be 83% (50 minutes/hour) and mechanical availability estimated at 85%.
Mining operations will require four crews operating on 12 hour rotating shifts. There are several rotating shift schedules. The most widely used schedule in Nevada is based on a 28 day rotation. Because of the distance from the towns of Ely or Eureka, the crews will be transported to the site in company supplied vans.
Mining crew manpower during the peak production years will include 49 hourly equipment operators and 12 salaried personnel for a total of 61 full-time employees at the mine. In addition, two contract personnel will work on an as needed basis for blast hole loading.
Tables 8 and 9 list the mining equipment planned to support the project. This equipment fleet was the basis for the mining capital cost estimate.
| JBP/MLM | February 22, 2012 |
| SRK Consulting (U.S.), Inc. | ||||
| NI 43-101 Technical Report – Mt. Hamilton Gold Project, Centennial Deposit | Page xii |
Table 8: Primary Mining Equipment List
Equipment Type | Description | Size | Max Number Required | |||
AtlasCopco DM45 | Blast Drill Rig | 540hp, 5-7/8 inch to 8 inch hole diameter, up to 175 ft hole depth, 45,000 ft lb pulldown | 2 | |||
Caterpillar 6030FS | Hydraulic Shovel | 1,039 hp, 14.4 yd3 | 1 | |||
Caterpillar 992K | Wheel Loader | 801 hp, 14 yd3 | 1 | |||
Caterpillar 777F | Haul Truck | 1,108 hp, 104.9 t payload | 5 |
Table 9: Support Mining Equipment List
Equipment Type | Description | Size/Comment | Max Number Required | |||
Contractor Supplied | ANFO loading truck | 1 | ||||
Caterpillar 16M | Motor Grader | 297 hp,16 ft blade | 1 | |||
CAT D9T | Bulldozer | 410 hp, 110,447 lb, SEMI-U Blade | 1 | |||
CAT D10T | Bulldozer | 580 hp, 146,500 lb, U-blade | 1 | |||
Volvo A40E | Water Truck | 464 hp, 8,000 gallon | 1 | |||
Manufacturer TBD | Fuel/Lube Truck | 33,000 lb 6x4 | 1 | |||
Manufacturer TBD | Mechanics Truck | 33,000 lb 6x4 | 2 | |||
Manufacturer TBD | Light Plant | 30 ft mast | 6 |
Processing
Recovery of gold and silver from the Centennial Project will be performed by heap leaching and conventional adsorption, desorption, recovery (ADR) carbon-in-column processing. The dedicated heap leach pad (leach pad), process ponds and ancillary facilities were designed to accommodate a leachable reserve of approximately 22.5 Mt of crushed ore from the Centennial open pit.
Mined ore will be primary crushed near the open pit to minus 4 inch and conveyed to an ore pass. The ore pass will drop the ore vertically approximately 350 ft where it will be loaded on a conveyor in a 3,400 ft long adit. From the loading point at the base of the ore pass, the drift and conveyor have a -15% grade to the portal. Once out of the adit, the ore will be belt transferred to a coarse ore stockpile. A reclaim tunnel under the coarse ore stockpile will feed a secondary crusher where the ore will be secondary crushed to 91% passing 3/4 inch and conveyed and stacked on the leach pad with a radial stacker. A summary of heap leach pad design parameters is presented in Table 10.
Table 10: Summary of Heap Leach Pad Operations Design Parameters
Design Parameter | Feasibility Design | |
| Ore stacking rate | 550 t/h | |
| Crushed Ore Bulk Density | 110 lb/ft2 | |
| Ore lift height | 25 ft | |
| Solution application rate | 0.004 gpm/ft2 | |
| Ore leach cycle | 210 days | |
| Ore leach area | 4.43 million square feet | |
| Solution pumping rate | 2,400 gpm | |
| HLP base slope | 17% upper (east), 13% lower pad (west) | |
| HLP max design height | 210 ft above base |
The proposed heap leach pad and associated facilities will have an approximate footprint area of 134 acres. Including the crusher pad and growth media stockpile, heap leach pad construction and operation will occupy the entire area of the private parcel upon which it is located. The heap leach
| JBP/MLM | February 22, 2012 |
| SRK Consulting (U.S.), Inc. | ||||
| NI 43-101 Technical Report – Mt. Hamilton Gold Project, Centennial Deposit | Page xiii |
pad will be located on moderately sloping and generally uniform topography southwest of the pit in the valley. The leach pad will extend in a west-to-east direction at an average elevation of 7,400 ft amsl. The HDPE-lined base receiving ore will range from approximately 13% upslope from the stability berm and toe pad to 17% at the eastern boundary of the heap leach pad. The leach pad will have a total lined area of 4.43 million square feet, or approximately 102 acres. Underliner for the leach pad will be bentonite-amended soil or a local low-permeability native soil sourced locally. Overliner will be crushed ore. The stacked ore height will gradually increase as it progresses from west to east until reaching its apex, with a regraded maximum vertical separation of approximately 210 feet above the prepared base.
An ADR circuit will be used at the Centennial Project. The ADR plant will be fed at the rate of 2,400 gpm by a submersible pump in the pregnant pond. The ADR plant consists of five, 12 ft diameter carbon columns, a 4 t strip and acid wash system, electrolytic cells, mercury retort and mercury controls and an induction smelting furnace. The final product will be a doré bar. Electrolytic cells of the ADR plant have been sized to accommodate Ag/Au ratios of 6/1 in the final doré. A list of the major processing equipment is provided in Table 11. This list was the basis for the process capital cost estimate.
| JBP/MLM | February 22, 2012 |
| SRK Consulting (U.S.), Inc. | ||||
| NI 43-101 Technical Report – Mt. Hamilton Gold Project, Centennial Deposit | Page xiv |
Table 11: Major Process Equipment Items Specifications and Quantities
Equipment Description | Size | Max Required | ||
| Primary Crusher Area | ||||
| Rock Box | 130 t live load | 1 | ||
| Lipman J3650 Portable Jaw Crushing Plant | 36 inch x 50 inch jaw crusher, 250 hp, 51 inch wide x 24ft long vibrating grizzly feeder, on steel truck frame | 1 | ||
| NPK Pedestal Breaker system | 2,000 ft-lb, 50 hp | 1 | ||
| C1-Jaw Transfer conveyor | 119 ft long, 60 inch belt, 25 hp, w/ tramp iron magnet | 1 | ||
| AES Control van | 8 ft x 6 ft | 1 | ||
| Underground Equipment | ||||
| Universal FL4 Chain Apron Feeder | 48 inch wide x 12 ft long, 15 hp variable speed drive | 1 | ||
| C2-Feed Tunnel Conveyor | 3,539 ft long, 36 inch belt, 300 hp | 1 | ||
| Secondary Crusher (Drift to Leach Pad ) | ||||
| C3 Radial Stacker Feed Conveyor | 266 ft long, 36 inch belt, 15 hp | 1 | ||
| C4 Radial Stacker | 125 ft long, 36 inch belt, 40 hp | 1 | ||
| C5 Stockpile Reclaim Conveyor | 248 ft long, 36 inch belt, 30 hp, w/3 vibro-mechanical feeders rated at 500 t/h | 1 | ||
| C6 Screen Feed Conveyor | 125 ft long, 36 inch belt, 25 hp | 1 | ||
| Fabtec Portable MVP 550 Cone Plant | MVP 550 Cone crusher, 500 hp, 6 ft x 20 ft, 2 deck 40 hp feed screen, on steel truck frame | 1 | ||
| Control Van w/ Operators Module | 8 ft x 6 ft | 1 | ||
| Lime Storage Silo | 1 | |||
| C7 Crusher Discharge Conveyor | 98 ft long, 36 inch belt, 30 hp | 1 | ||
| C9 Ground Line Conveyor | 600 ft long, 36 inch belt, 20 hp | 1 | ||
| C10 Ground Line conveyor | 965 ft long, 36 inch belt, 75 hp | 1 | ||
| Leach pad Conveyors | ||||
| C11 Jump Conveyor | 50 ft long, 36 inch belt, 10 hp | 1 | ||
| “grasshopper” Conveyors | 100 ft long, 36 inch belt, 20 hp | 16 | ||
| Telestacker Conveyor | 136 ft long, 36 inch belt, 55 hp | 1 | ||
| ADR Plant | ||||
| CIC Circuit | 5-12 ft dia. columns, 4T carbon | 1 | ||
| Acid Wash System | 3 t acid wash vessel w/pumps, tanks and controls | 1 | ||
| Strip System | 3 t carbon strip system w/ pumps, tanks and controls | 1 | ||
| Solution Heat Skid | Electric heaters, 400 kW, w/heat exchangers and controls | 1 | ||
| Electrowinning | 75 ft3 cells, 18 cathodes, 20 anodes, 15 kW rectifier, sludge filter, w/ tanks, pumps, controls | 1 | ||
| Carbon Handling System | Tanks, pumps, filter and controls | 1 | ||
| Carbon Regeneration | 1 t kiln, electric, w/ hoppers, tanks screens and pumps | 1 | ||
| Refining | Electric induction furnace, flux and slag handling, molds, balances, jaw and roll crushers, screen and concentrating table | 1 | ||
| Mercury Removal System | Scrubbers, Mercury Retort | 1 | ||
| Booster Pump to Heap | 2,400 gpm @ 30 0ft TDH, 300 hp | 1 | ||
| Tsurumi Submersible Pump | 2,400 gpm @ 60 ft TDH, 75 hp | 3 | ||
| Process Mobile Equipment | ||||
| Caterpillar 236B2 Skid Steer loader | 71 hp w/ bucket, cab, A/C | 1 | ||
| Bobcat S650 Skid steer | 74 hp, w/ bucket, pallet forks, cab, A/C, underground package | 1 | ||
| Kubota Maintenance Tractor | 50 hp, underground package | 1 | ||
| Pallet Jack | Battery powered, 4,400 lb capacity | 1 | ||
| Caterpillar D7E Dozer | 235 hp, 56,670 lb, standard blade | 1 | ||
| Caterpillar 420E IT Backhoe | 93 hp, 1.3 yd3 loader bucket, backhoe | 1 | ||
| Caterpillar TL1055 Telehandler | 119 hp, 10,000 lb capacity, 55 ft lift height | 1 | ||
| Trailer mounted Compressor | 79 hp, 260 cfm @ 100 psi | 1 | ||
| Pipe trailer | 2 axle, 43 ft bed | 1 | ||
| Emitter Plow | 4 gang plow | 1 | ||
| Flatbed truck | 2 t | 1 | ||
| Mechanic Service Truck | TBD | 1 | ||
| McElroy 412 pipe fusion machine | 18 hp, HDPE Pipe fusion from 4 inch to 12 inch pipe | 1 |
| JBP/MLM | February 22, 2012 |
| SRK Consulting (U.S.), Inc. | ||||
| NI 43-101 Technical Report – Mt. Hamilton Gold Project, Centennial Deposit | Page xv |
Manpower for crushing, processing and analytical will include seven salaried and 50 hourly staff, for a total of 57 full-time employees supporting processing. Combined with the mining staff, the operation will require 118 full-time employees.
Conclusions and Recommendations
The purpose of the Feasibility Study was to collect and analyze sufficient data to reduce or eliminate risk in the technical components of the project and to refine economic projections based on current cost data. SRK offers the following conclusions for key components of the proposed mining operation at Centennial.
Exploration
MH-LLC has assembled a complete and current land package for mine development. SRK has verified the claim block to the extent that it covers the area proposed for mining, processing and waste rock placement.
MH-LLC has opportunities within this claim block to conduct additional exploration on several prospects that lie outside of the Centennial mine footprint. These include most notably:
NE Seligman Residuals: Historic drilling and resource models suggest residual mineralization remains in the bottom of and adjacent to some of the previous NE Seligman open pits located immediately north (<1,000 ft) of Centennial. The quantity, grade and leach response of this material should be characterized with additional drilling and metallurgical testing. However, if an economic resource is defined in this area there would be an opportunity to mine ore with little stripping and existing equipment early in the project life.
Chester Prospect: Chester is a large soil anomaly, a portion of which was tested by 40 RC holes in 1995. From the drilling, two gold-bearing zones were interpreted ranging in thickness from 5 to 50 ft thick and averaging approximately 0.04 oz/t Au. The geometry of mineralization is currently not well understood. Chester is located approximately 3,000 ft SE of Centennial. Several exploration holes were drilled on this target in late 2011. At the time of this writing, results were not yet reviewed by SRK.
Five-Way Prospect: This original surface rock chip and soil anomaly yielded rock chips in excess of 40,000 parts per billion (1.37 oz/t) gold. This area was drilled in hole 92-008, and produced an intercept of 15 ft of 0.19 oz/t Au. The mineralization was accompanied by sericite alteration and quartz veining. The Five-Way anomaly is near the ridge top <1,000 ft NE of Centennial. Additional drilling is warranted at Five-Way as part of the Centennial mine development.
Mineral Resource Estimate
The Mineral Resource identified in this study is greater than in the previous Technical Reports. The increase is a function of: 1) successful 2011 infill-drilling connecting and extending high grade areas; and 2) higher metal prices driving lower CoGs and larger interpreted grade envelopes.
The quality of the historic data used in the resource estimate has been verified by recent drilling and confirmed by an analysis of quality control data by SRK. While recent drilling results for silver substantiate previous grade-thickness intercepts, the historic silver database is less complete compared to gold, and therefore there is less confidence in the resource estimate for silver. On average silver contributes 11% to the gold-equivalent value of the model blocks above the CoG.
| JBP/MLM | February 22, 2012 |
| SRK Consulting (U.S.), Inc. | ||||
| NI 43-101 Technical Report – Mt. Hamilton Gold Project, Centennial Deposit | Page xvi |
Silver contributes 19% to the gold-equivalent value in the relatively minor quantity of igneous-hosted ores above cut-off.
The resource and reserve estimation exercises described in this report demonstrate a potential to increase the size of the existing Centennial deposit through step-out exploration around the east and southeast margins of the current pit configuration. Approximately 2.6 million tons of Indicated Resources grading 0.017 oz/t gold (45.3 koz of gold) and 0.153 oz/t silver (397.6 koz of silver) and 2.8 million tons of Inferred Resource grading 0.018 oz/t gold (50.2 koz of gold) and 0.080 oz/t silver (223.5 oz of silver) above a 0.006 oz/t gold cut-off have been identified outside of the reserve pit, but within the resource envelope (Whittle™ shell). Most of these resources are in the Inferred classification. Drilling will be required to define these possible additions to the category of Indicated mineralization.
Mineral Reserves and Mining
The conversion of Mineral Resources to Mineral Reserves used US$1,200 and US$20 for Au and Ag respectively for pit optimization. Dedicated oriented-core drilling for geotechnical characterization of the rock mass has reduced the risk of the mineral reserve. SRK’s analysis of the geotechnical data supports an overall pit slope of 50°.
All previous drilling at Centennial and mining in the adjacent NE Seligman mine indicate that groundwater exceeds the depth of proposed mining. Therefore, the open pit will be dry and will require no provisions for dewatering.
SRK has proposed a design for mining and ore flow that accommodates winter operating conditions at high elevations. Haul-road grades were limited to 8%, mostly to ensure safe transport during loaded down-hill hauls. The predominantly underground ore-flow system will protect conveyors and should require less maintenance with less weather-related down-time.
Mining on 20 ft benches, triple benched to 60 ft using a hydraulic shovel allows for selectivity in fairly tabular ore. Oxide ore is visibly distinguishable from un-oxidized waste and in most cases, this will improve grade control efficiency.
MH-LLC should investigate alternative rolling stock manufacturers that could result in cost savings compared to the equipment costs used in this study.
Metallurgy and Processing
A 2010-2011 dedicated drilling and metallurgical testing program supervised by SRK was designed to get better spatial coverage of the ore body and to investigate recoveries in atypical ores, such as mixed oxide/sulfide ores and igneous ore. Column leach test work conducted in 2011 confirmed anticipated gold and silver recoveries in typical oxidized and mixed oxide/sulfide ores.
Comparing recent 2011 column test work, which was conducted at finer crush sizes, to previous and historic results demonstrates that the recovery of Centennial ores is size sensitive. To address this, the Feasibility Study processing design requires crushing to 91% passing 3/4 inch. Appropriate primary and secondary crushing equipment has been sized and priced to achieve this optimum size.
North Area ore, hosted entirely in igneous rock, was investigated using bottle roll tests of RC drill cuttings. Gold recoveries were better than anticipated from low average head grades (0.013 oz/t Au). The bottle roll test results should be validated with future column tests. Overall SRK believes the bulk of the deposit has been well characterized with respect to recovery.
| JBP/MLM | February 22, 2012 |
| SRK Consulting (U.S.), Inc. | ||||
| NI 43-101 Technical Report – Mt. Hamilton Gold Project, Centennial Deposit | Page xvii |
Recent column work also provided results from comminution and height percolation tests that were used to define crushing horsepower, crusher wear, and stacking height parameters for the processing design. There is no requirement for agglomeration and the ore can be stacked to a height of 220ft (limit of test).
There remain some uncertainties in ore-flow system related to the geotechnical characterization of the proposed adit and ore-pass chamber. Ideally, both of these excavations would have received a geotechnical evaluation at Feasibility level based on pilot-hole drilling; however, rig availability and seasonal limitations precluded this assessment. To mitigate the uncertainty, SRK, based on outside underground subcontractor pricing, applied heavy contingencies for ground support, which added costs to the planned underground development. This was deemed necessary in the absence of geotechnical supporting data.
Other components of the ore flow system, including the conveyor and stacker array are well understood, vendor quoted, and considered to be of low risk for consistent ore delivery.
Similarly, the selected processing methodology is considered low risk. The ADR carbon-in-column method for gold and silver recovery is proven technology and widely used in analogous operations in Nevada.
Power will be supplied at the mine and ADR by generators. The production water supply has been defined and water rights sufficient for project start-up have been secured by MH-LLC, with additional water rights under application. This Feasibility Study used the existing Seligman well as the primary source for production water, but further hydrogeologic exploration is planned to locate a source closer to the planned leach operation to reduce costs.
There is no tailings risk associated with this processing plan as no tailings will be generated. Spent ore will remain on containment (HDPE liner) after leaching and the facility will be reclaimed in place during closure.
Projected Economic Outcomes
Capital costs used in the Feasibility-level economic analysis for Centennial were based heavily on vendor and specialist quotations and accurate to +/-15%. A total of 98% of mining, 97% of process, and 80% of owner and infrastructure capital costs are linked to vendor quotes. SRK has applied additional contingencies to these estimates for omissions. Similarly, operating costs, as driven by consumables and labor rates were supported by recent relevant vendor information or public domain mining services cost providers, typically InfoMine®.
The project economics are based on a two year pre-development period (followed by one year of pre-stripping and construction) that coincides with the time requirement for permitting. This permitting time requirement is still unknown. The USFS is the controlling agency responsible for determining which permitting path (EA vs. EIS) is most appropriate for Project development after the Plan of Operations is submitted. The Project has several characteristics that are favorable for permitting including: 1) No anticipated pit lake; 2) Acid neutralizing waste rock; 3) Deep groundwater beneath the proposed leach pad; and 4) Process components operated and closed on private land.
Economics of the Centennial Project are sensitive to commodity prices, which are currently near all-time high levels and have been elevated for the past five years. These high gold and silver prices have created a very vibrant mining market and also a high demand for skilled labor and technical
| JBP/MLM | February 22, 2012 |
| SRK Consulting (U.S.), Inc. | ||||
| NI 43-101 Technical Report – Mt. Hamilton Gold Project, Centennial Deposit | Page xviii |
services. One of the challenges MH-LLC faces in developing Centennial is attracting qualified management and staff to operate the mine.
Over the course of the last several years, MH-LLC has successfully negotiated and bought down most of the production royalty obligation that the Project carried previously. The Project will be subject to a 1% Net Smelter Return royalty.
Recommendations
Work programs recommended to advance the Centennial Project include drilling, engineering designs and technical studies as follows:
Drilling:
| • | Resource conversion drilling (RC) (Inferred upgrade to Measured/Indicated outside of but adjacent to the ore within the current mine plan); |
| • | North area resource/metallurgical confirmation core drilling; |
| • | Step out exploration drilling (RC) (NES residuals); |
| • | Geotechnical drilling and analysis for underground development; and |
| • | Water supply well relocation to optimize proximity to operations. |
Engineering Designs:
| • | Detailed design project management; and |
| • | Detailed designs for crushing, processing and infrastructure. |
Technical Studies:
| • | North Area metallurgical test work and analysis; |
| • | Completion of on-going waste rock (humidity cell testing) HCT and analysis; and |
| • | Environmental permitting. |
A total anticipated cost for advancement of the project during the Pre-Construction phase is US$3.7 million. The cost break-down for the work programs described above are presented in Table 12.
Table 12: Recommended Pre-Construction Work Program Costs
Work Program | Estimated | Assumptions/Comments | ||||
| Centennial resource conversion drilling (RC) | 195,000 | 6 holes to 500 ft @ $65/ft | ||||
| Centennial resource/met confirmation drilling (DD) | 75,000 | 2 holes to 300 ft @ $125/ft | ||||
| Step out exploration drilling (RC) | 104,000 | 8 holes to 200 ft @ $65/ft | ||||
| Geotechnical drilling for underground development (DD) | 500000 | 2,500 ft @ 200/ft incl. supervision | ||||
| Water supply production well installation | 600,000 | 2 large diameter wells, drilled, completed, pump tested and pumps | ||||
| Total Drilling | 1,474,000 | |||||
| Detailed design project management | 200,000 | salaried new hire or contract PM | ||||
| Detailed design for crushing, process and infrastructure and preliminary EPCM | 1,000,000 | specialist contractor/engineer | ||||
| Total Detailed Design | 1,200,000 | |||||
| Metallurgical test work and analysis | 50,000 | consultant engineer | ||||
| Heap and waste rock geochem | 35,000 | on-going HCT | ||||
| Environmental permitting | 500,000 | environmental contractor | ||||
| Total Technical Studies | 585,000 | |||||
| Sub Total | 3,259,000 | |||||
| Contingency @15% | 488,850 | |||||
| Total | 3,747,850 | |||||
| JBP/MLM | February 22, 2012 |
| SRK Consulting (U.S.), Inc. | ||||
| NI 43-101 Technical Report – Mt. Hamilton Gold Project, Centennial Deposit | Page xix |
Table of Contents
| Summary (Item 1) | ii | |||||||
| 1 | Introduction (Item 2) | 1 | ||||||
| 1.1 | Terms of Reference and Purpose of the Report | 1 | ||||||
| 1.2 | Qualifications of Consultants (SRK) | 1 | ||||||
1.2.1 Details of Inspection | 2 | |||||||
| 1.3 | Reliance on Other Experts (Item 3) | 3 | ||||||
1.3.1 Sources of Information and Extent of Reliance | 3 | |||||||
| 1.4 | Effective Date | 3 | ||||||
| 1.5 | Units of Measure | 3 | ||||||
| 2 | Property Description and Location (Item 4) | 4 | ||||||
| 2.1 | Property Description and Location | 4 | ||||||
| 2.2 | Mineral Titles | 4 | ||||||
| 2.3 | Nature and Extent of Issuer’s Interest | 7 | ||||||
| 2.4 | Royalties, Agreements and Encumbrances | 7 | ||||||
| 2.5 | Environmental Liabilities and Permitting | 7 | ||||||
2.5.1 Environmental Liabilities | 7 | |||||||
2.5.2 Required Permits and Status | 8 | |||||||
| 2.6 | Other Significant Factors and Risks | 10 | ||||||
| 3 | Accessibility, Climate, Local Resources, Infrastructure and Physiography (Item 5) | 14 | ||||||
| 3.1 | Topography, Elevation and Vegetation | 14 | ||||||
| 3.2 | Climate and Length of Operating Season | 14 | ||||||
| 3.3 | Sufficiency of Surface Rights | 15 | ||||||
| 3.4 | Accessibility and Transportation to the Property | 15 | ||||||
| 3.5 | Infrastructure Availability and Sources | 15 | ||||||
3.5.1 Power | 15 | |||||||
3.5.2 Communications | 15 | |||||||
3.5.3 Water | 15 | |||||||
3.5.4 Mining Personnel | 16 | |||||||
3.5.5 Potential Tailings Storage Areas | 16 | |||||||
3.5.6 Potential Waste Disposal Areas | 16 | |||||||
3.5.7 Potential Heap Leach Pad Areas | 16 | |||||||
3.5.8 Potential Processing Plant Sites | 16 | |||||||
| 4 | History (Item 6) | 17 | ||||||
| 4.1 | Prior Ownership and Ownership Changes | 17 | ||||||
| 4.2 | Previous Exploration and Development Results | 18 | ||||||
| JBP/MLM | February 22, 2012 |
| SRK Consulting (U.S.), Inc. | ||||
| NI 43-101 Technical Report – Mt. Hamilton Gold Project, Centennial Deposit | Page xx |
| 4.3 | Historic Mineral Resource and Reserve Estimates | 18 | ||||||||
| 4.4 | Historic Production | 20 | ||||||||
| 5 | Geological Setting and Mineralization (Item 7) | 21 | ||||||||
| 5.1 | Regional Geology | 21 | ||||||||
| 5.2 | Local and Property Geology | 21 | ||||||||
5.2.1 Stratigraphy | 21 | |||||||||
5.2.2 Alteration | 22 | |||||||||
5.2.3 Structure | 23 | |||||||||
| 5.3 | Significant Mineralized Zones | 23 | ||||||||
| 6 | Deposit Type (Item 8) | 26 | ||||||||
| 6.1 | Mineral Deposit | 26 | ||||||||
| 6.2 | Geological Model | 26 | ||||||||
| 7 | Exploration (Item 9) | 27 | ||||||||
| 7.1 | Relevant Exploration Work | 27 | ||||||||
| 7.2 | Surveys and Investigations | 27 | ||||||||
7.2.1 Procedures and Parameters | 27 | |||||||||
| 7.3 | Sampling Methods and Quality | 27 | ||||||||
| 7.4 | Significant Results and Interpretation | 27 | ||||||||
| 8 | Drilling (Item 10) | 28 | ||||||||
| 8.1 | Type and Extent | 28 | ||||||||
| 8.2 | Procedures | 29 | ||||||||
8.2.1 Drill Core Sampling | 29 | |||||||||
8.2.2 Reverse Circulation Drill Sampling | 30 | |||||||||
8.2.3 Standard Reference Material Samples | 30 | |||||||||
| 8.3 | Interpretation and Relevant Results | 31 | ||||||||
8.3.1 Field Duplicate Results- 2011 RC Drilling | 31 | |||||||||
| 9 | Sample Preparation, Analysis and Security (Item 11) | 38 | ||||||||
| 9.1 | Methods | 38 | ||||||||
| 9.2 | Security Measures | 38 | ||||||||
| 9.3 | Sample Preparation | 38 | ||||||||
9.3.1 Laboratories | 38 | |||||||||
| 9.4 | QA/QC Procedures | 39 | ||||||||
9.4.1 QA/QC Actions | 39 | |||||||||
9.4.2 Results | 39 | |||||||||
| 9.5 | Opinion on Adequacy | 44 | ||||||||
| 10 | Data Verification (Item 12) | 63 | ||||||||
| JBP/MLM | February 22, 2012 |
| SRK Consulting (U.S.), Inc. | ||||
| NI 43-101 Technical Report – Mt. Hamilton Gold Project, Centennial Deposit | Page xxi |
| 10.1 | Procedures | 63 | ||||||
| 10.2 | Limitations | 64 | ||||||
| 10.3 | Data Adequacy | 64 | ||||||
| 11 | Mineral Processing and Metallurgical Testing (Item 13) | 65 | ||||||
| 11.1 | Introduction | 65 | ||||||
| 11.2 | Ore Description | 65 | ||||||
| 11.3 | Metallurgical Test History and Results | 65 | ||||||
11.3.1 Metallurgical Test History - Pre-1997 | 65 | |||||||
11.3.2 KCA Test Program - 1997 | 66 | |||||||
11.3.3 McClelland Laboratories - 2009-2010 | 68 | |||||||
11.3.4 McClelland Laboratories - 2011 | 70 | |||||||
| 11.4 | Effect of Crush Size on Leach Recovery | 73 | ||||||
| 11.5 | Effect of Time on Leach Recovery | 74 | ||||||
11.5.1 Field Recovery | 74 | |||||||
| 11.6 | Effect of Grade on Recovery | 75 | ||||||
| 11.7 | Igneous Ores | 76 | ||||||
| 11.8 | Recovery Projection Summary | 77 | ||||||
| 12 | Mineral Resource Estimation | 83 | ||||||
| 12.1 | Introduction | 83 | ||||||
| 12.2 | Block Models | 83 | ||||||
| 12.3 | Model Geology and Mineralization Envelopes | 84 | ||||||
| 12.4 | Density | 85 | ||||||
| 12.5 | Assay Data Population Domain Analysis | 85 | ||||||
| 12.6 | Compositing | 87 | ||||||
| 12.7 | Search Criteria and Dynamic Anisotropy | 87 | ||||||
| 12.8 | Grade Estimation | 88 | ||||||
| 12.9 | Resource Classification | 89 | ||||||
| 12.10 | Resource Statement | 89 | ||||||
| 12.11 | Block Model Validation | 90 | ||||||
| 12.12 | Resource Sensitivity | 91 | ||||||
| 13 | Mineral Reserve Estimate | 110 | ||||||
| 13.1 | Reserve Estimation | 110 | ||||||
13.1.1 Reserve Statement | 110 | |||||||
| 13.2 | Conversion of Resources to Reserves | 110 | ||||||
13.2.1 Break Even Cut-off Grade | 111 | |||||||
13.2.2 Internal Cut-off Grade | 111 | |||||||
| 13.3 | Estimate of Residual Resources | 111 | ||||||
| JBP/MLM | February 22, 2012 |
| SRK Consulting (U.S.), Inc. | ||||
| NI 43-101 Technical Report – Mt. Hamilton Gold Project, Centennial Deposit | Page xxii |
| 14 | Mining Methods (Item 16) | 114 | ||||||
| 14.1 | Mining History | 114 | ||||||
| 14.2 | Pre-Production Mine Development | 114 | ||||||
14.2.1 Pre-stripping and Access Road Construction | 114 | |||||||
| 14.3 | Mine Block Model | 115 | ||||||
14.3.1 Material Types | 115 | |||||||
14.3.2 Dilution | 115 | |||||||
| 14.4 | Pit Slope Geotechnical Evaluation | 116 | ||||||
14.4.1 Geotechnical Program Objectives | 116 | |||||||
14.4.2 Geotechnical Work Program | 116 | |||||||
14.4.3 Recommended Pit Slope Configurations | 116 | |||||||
| 14.5 | Pit Optimization | 117 | ||||||
14.5.1 Pit Optimization Parameters | 117 | |||||||
14.5.2 Pit Optimization Results | 118 | |||||||
| 14.6 | Mine Design | 119 | ||||||
14.6.1 Mine Design Parameters | 120 | |||||||
14.6.2 Phase Design | 120 | |||||||
14.6.3 Mining Losses | 121 | |||||||
| 14.7 | Waste Rock Storage Design | 121 | ||||||
| 14.8 | Haulage Profile | 121 | ||||||
14.8.1 Haulage Parameters | 121 | |||||||
| 14.9 | Mine Production Schedule | 122 | ||||||
14.9.1 Production Scheduling Methodology | 122 | |||||||
14.9.2 Production Schedule Results | 123 | |||||||
14.9.3 Grade Distribution | 125 | |||||||
14.9.4 Tonnage Distribution | 125 | |||||||
14.9.5 Ore Haulage Schedule | 125 | |||||||
| 14.10 | Mining Operations and Equipment | 125 | ||||||
14.10.1 Mine Operations and Equipment | 125 | |||||||
14.10.2 Ancillary Mining Operations | 128 | |||||||
| 15 | Recovery Methods | 151 | ||||||
| 15.1 | Processing Methods - General | 151 | ||||||
| 15.2 | Crushing and Conveying and Stacking | 151 | ||||||
15.2.1 Primary Crushing | 151 | |||||||
15.2.2 Raise and Underground Conveyor | 152 | |||||||
15.2.3 Coarse Ore Stockpile | 152 | |||||||
15.2.4 Secondary Crushing | 153 | |||||||
| JBP/MLM | February 22, 2012 |
| SRK Consulting (U.S.), Inc. | ||||
| NI 43-101 Technical Report – Mt. Hamilton Gold Project, Centennial Deposit | Page xxiii |
| 15.2.5 Overland Conveying and Stacking | 153 | |||||||
| 15.3 | Heap Leach Pad Design | 153 | ||||||
15.3.1 Pad Size and Configuration | 154 | |||||||
15.3.2 Pad Construction | 154 | |||||||
15.3.3 Leach Pad Stability Analysis | 157 | |||||||
15.3.4 Stormwater Diversion Design | 158 | |||||||
15.3.5 Process Pond Design and Storage Requirements | 159 | |||||||
15.3.6 Process Pond Construction | 160 | |||||||
| 15.4 | Leach Solution Application | 161 | ||||||
| 15.5 | Plant Design and Operations | 161 | ||||||
15.5.1 ADR Plant Design | 161 | |||||||
15.5.2 ADR Operations | 161 | |||||||
15.5.3 Assay Laboratory | 163 | |||||||
| 15.6 | Consumable Requirements | 163 | ||||||
15.6.1 Power | 163 | |||||||
15.6.2 Water Supply | 164 | |||||||
15.6.3 Major Reagents | 164 | |||||||
15.6.4 Labor Requirements | 165 | |||||||
| 15.7 | Process Equipment Requirements | 165 | ||||||
| 16 | Project Infrastructure (Item 18) | 185 | ||||||
| 16.1 | Office | 185 | ||||||
| 16.2 | Warehouse & Plant Maintenance Shop | 185 | ||||||
| 16.3 | Process building | 185 | ||||||
| 16.4 | Laboratory | 185 | ||||||
| 16.5 | Administration/Plant Access Roads | 185 | ||||||
| 16.6 | Septic | 186 | ||||||
| 16.7 | Water | 186 | ||||||
| 16.8 | Power | 186 | ||||||
| 16.9 | Fuel | 187 | ||||||
| 16.10 | Communications | 187 | ||||||
| 17 | Market Studies and Contracts (Item 19) | 190 | ||||||
| 17.1 | Relevant Market Studies | 190 | ||||||
| 17.2 | Commodity Price Projections | 190 | ||||||
| 17.3 | Contracts and Status | 190 | ||||||
| 18 | Environmental Studies, Permitting and Social or Community Impact (Item 20) | 191 | ||||||
| 18.1 | Environmental Study Results | 191 | ||||||
18.1.1 Waste Rock and Ore Characterization | 191 | |||||||
| JBP/MLM | February 22, 2012 |
| SRK Consulting (U.S.), Inc. | ||||
| NI 43-101 Technical Report – Mt. Hamilton Gold Project, Centennial Deposit | Page xxiv |
18.1.2 Hydrogeologic Characterization | 194 | |||||||
18.1.3 Cultural Resources Investigation | 195 | |||||||
18.1.4 Biological Resources Investigation | 195 | |||||||
| 18.2 | Operating and Post Closure Requirements and Plans | 195 | ||||||
| 18.3 | Post Performance or Reclamations Bonds | 196 | ||||||
| 18.4 | Social and Community | 196 | ||||||
| 18.5 | Mine Closure | 197 | ||||||
| 19 | Capital and Operating Costs (Item 21) | 201 | ||||||
| 19.1 | Capital Cost Estimates | 201 | ||||||
19.1.1 Basis for Capital Cost Estimates | 201 | |||||||
19.1.2 Mining Capital | 202 | |||||||
19.1.3 Process Capital | 203 | |||||||
19.1.4 Infrastructure and Owners Capital | 204 | |||||||
| 19.2 | Operating Cost Estimates | 206 | ||||||
19.2.1 Basis for Operating Cost Estimates | 206 | |||||||
19.2.2 Operating Costs – Mining | 207 | |||||||
19.2.3 Operating Costs – Processing | 208 | |||||||
19.2.4 General and Administrative Cost | 210 | |||||||
| 20 | Economic Analysis (Item 22) | 212 | ||||||
| 20.1 | Principal Assumptions | 212 | ||||||
| 20.2 | Cash flow Forecasts and Annual Production Forecasts | 212 | ||||||
| 20.3 | Taxes, Royalties and Other Interests | 215 | ||||||
20.3.1 Federal income Tax | 215 | |||||||
20.3.2 Net Proceeds Tax | 216 | |||||||
20.3.3 Royalties | 216 | |||||||
| 20.4 | Sensitivity Analysis | 216 | ||||||
| 21 | Adjacent Properties (Item 23) | 219 | ||||||
| 21.1 | Verification | 219 | ||||||
| 22 | Other Relevant Data and Information (Item 24) | 220 | ||||||
| 23 | Interpretation and Conclusions (Item 25) | 221 | ||||||
| 23.1 | Results | 221 | ||||||
23.1.1 Metallurgy and Processing | 221 | |||||||
23.1.2 Geotechnical Pit Slope Stability | 222 | |||||||
23.1.3 Geochemical Characterization of Waste Rock | 222 | |||||||
23.1.4 Hydrogeology: Groundwater Monitoring and Production Water Supply | 223 | |||||||
| 23.2 | Significant Risks and Uncertainties | 223 | ||||||
23.2.1 Exploration | 223 | |||||||
| JBP/MLM | February 22, 2012 |
| SRK Consulting (U.S.), Inc. | ||||
| NI 43-101 Technical Report – Mt. Hamilton Gold Project, Centennial Deposit | Page xxv |
23.2.2 Mineral Resource Estimate | 224 | |||||||
23.2.3 Mineral Reserves and Mining | 224 | |||||||
23.2.4 Metallurgy and Processing | 225 | |||||||
23.2.5 Projected Economic Outcomes | 226 | |||||||
23.2.6 Foreseeable Impacts of Risks | 227 | |||||||
| 24 | Recommendations (Item 26) | 228 | ||||||
| 24.1 | Recommended Work Programs | 228 | ||||||
24.1.1 Drilling | 228 | |||||||
24.1.2 Engineering Designs | 229 | |||||||
24.1.3 Technical Studies | 229 | |||||||
24.1.4 Costs | 229 | |||||||
| 25 | References (Item 27) | 231 | ||||||
| 26 | Glossary | 232 | ||||||
| 26.1 | Mineral Resources | 232 | ||||||
| 26.2 | Mineral Reserves | 232 | ||||||
| 26.3 | Definition of Terms | 233 | ||||||
| 26.4 | Abbreviations | 234 | ||||||
List of Tables
Table 1: Indicative Economic Results | iii | |||
Table 2: Capital Cost Summary | iii | |||
Table 3: Metal Price Sensitivity Analysis | iv | |||
Table 4: Resource Classification Criteria | ix | |||
Table 5: Mineral Resource Statement Centennial Gold-Silver Deposit, White Pine County, Nevada, SRK Consulting (U.S.), Inc. | ix | |||
Table 6: Whittle™ Optimization Parameters | x | |||
Table 7: Mineral Reserves Statement, Centennial Gold-Silver Deposit, White Pine County, Nevada, SRK Consulting (U.S.), Inc. | x | |||
Table 8: Primary Mining Equipment List | xii | |||
Table 9: Support Mining Equipment List | xii | |||
Table 10: Summary of Heap Leach Pad Operations Design Parameters | xii | |||
Table 11: Major Process Equipment Items Specifications and Quantities | xiv | |||
Table 12: Recommended Pre-Construction Work Program Costs | xviii | |||
Table 1.2.1.1: SRK Site Visit Participants | 3 | |||
Table 2.2.1: Patented Mineral Claim List for Ely Gold Mt. Hamilton Property | 4 | |||
Table 2.2.2: Federal Mining Claim List for Mt. Hamilton LLC Property | 5 | |||
Table 4.3.1: Centennial Inferred Resources (SWRPA 2008) | 18 | |||
| JBP/MLM | February 22, 2012 |
SRK Consulting (U.S.), Inc. | ||||
| NI 43-101 Technical Report – Mt. Hamilton Gold Project, Centennial Deposit | Page xxvi |
Table 4.3.2: Mineral Resource Statement for Ely Gold’s Centennial Deposit 2009 | 18 | |||
Table 4.3.3: 2009 Classification of Potentially Mineable Resources with Pit Design, Gold | 19 | |||
Table 4.3.4: 2009 Classification of Potentially Mineable Resources with Pit Design, Silver | 19 | |||
Table 4.3.5: 2010 Classification of Potentially Mineable Resources with Pit Design, Gold | 19 | |||
Table 4.3.6: 2010 Classification of Potentially Mineable Resources with Pit Design, Silver | 19 | |||
Table 8.1.1: Drilling Completed at the Mount Hamilton Complex | 28 | |||
Table 8.1.2: Centennial Resource Model Extents | 28 | |||
Table 8.1.3: Drilling in the Centennial Model Area | 29 | |||
Table 8.2.3.1: Certified Values of Standard Reference Materials used at Centennial | 31 | |||
Table 11.3.2.1: Sample Identifications for KCA 1997 Metallurgical Test Program | 66 | |||
Table 11.3.2.2: KCA 1997 Column Test Results | 67 | |||
Table 11.3.2.3: Recovery vs. Head Grade Relationship | 67 | |||
Table 11.3.2.4: KCA 1997 Bottle Roll Test Results | 68 | |||
Table 11.3.3.1: 2009 McClelland Bottle Roll Test Specifications | 68 | |||
Table 11.3.3.2: 2009 McClelland Column Leach Test Results | 69 | |||
Table 11.3.4.1: 2011 McClelland Bottle Roll Test Materials | 70 | |||
Table 11.3.4.2: 2011 McClelland Bottle Roll Test Results (96-hour, p80 3/4 inch) | 71 | |||
Table 11.3.4.3: 2011 McClelland Bottle Roll Test Results (48-hour 150 mesh) | 71 | |||
Table 11.3.4.4: 2011 McClelland Column Test Results | 72 | |||
Table 11.3.4.5: Comminution Results from 2011 Metallurgical Test Work | 72 | |||
Table 11.4.1: Effect of Crush Size on Au Recovery | 73 | |||
Table 11.4.2: Au Recovery Projection Normalized to Crush Size | 74 | |||
Table 11.5.1.1: Effect of Time on Leach Recovery | 74 | |||
Table 11.5.1.2: Column Au Recovery Projections Normalized to 210 Days of Leach | 75 | |||
Table 11.6.1: Comparison of 2010 and 2011 Mineral Resources | 75 | |||
Table 11.6.2: 2009-2010 and 2011 McClelland Column Tests | 75 | |||
Table 11.6.3: 1997 KCA Column Tests | 75 | |||
Table 11.7.1: 2011 McClelland Igneous Bottle Roll Test Results | 76 | |||
Table 11.8.1: Overall Projected Au Recovery Relative to Crush Size, Leach Time and Au Grade | 77 | |||
Table 11.8.2: Overall Projected Ag Recovery | 77 | |||
Table 12.2.1: Model Limits | 84 | |||
Table 12.5.1: Assay Basic Statistics for Centennial Au and Ag Database | 86 | |||
Table 12.5.2: Grade Capping Thresholds | 87 | |||
Table 12.6.1: Composite Statistics | 87 | |||
Table 12.8.1: Grade Interpolation Parameters | 88 | |||
Table 12.9.1: Resource Classification Criteria | 89 | |||
Table 12.10.1: Mineral Resource Statement Centennial Gold-Silver Deposit, White Pine County, Nevada, SRK Consulting (U.S.), Inc. | 90 | |||
| JBP/MLM | February 22, 2012 |
| SRK Consulting (U.S.), Inc. | ||||
| NI 43-101 Technical Report – Mt. Hamilton Gold Project, Centennial Deposit | Page xxvii |
Table 12.11.1: Composite/Model Comparison Summary Statistics | 91 | |||
Table 12.12.1: Resource Sensitivity | 91 | |||
Table 13.1.1.1: Mineral Reserve Statement Centennial Gold-Silver Deposit, White Pine County, Nevada, SRK Consulting (U.S.), Inc. | 110 | |||
Table 14.3.1.1: Text Field Based Geologic Block Model | 115 | |||
Table 14.5.1.1: Whittle™ Optimization Parameters | 118 | |||
Table 14.5.2.1: Pit Optimization Results | 119 | |||
Table 14.6.1.1: Mine Design Parameters | 120 | |||
Table 14.6.2.1: Phase Tonnage | 120 | |||
Table 14.6.3.1: Mining Losses from Pit Design vs. Optimized Pit | 121 | |||
Table 14.8.1.1: Gradient Truck Speed for Caterpillar 777F Haul Truck | 122 | |||
Table 14.9.2.1: Production Schedule | 124 | |||
Table 14.10.1.1: Production Shift Schedule | 126 | |||
Table 14.10.1.2: Loader Operating Parameters | 127 | |||
Table 14.10.1.3: Truck Operating Parameters | 127 | |||
Table 14.10.1.4: Primary Mining Equipment List | 128 | |||
Table 14.10.1.5: Support Mining Equipment List | 128 | |||
Table 15.1.1: Summary of Heap Leach Pad Feasibility Design Parameters | 151 | |||
Table 15.3.3.1: Summary of Results for Heap Leach Pad Slope Stability Analyses | 158 | |||
Table 15.3.5.1: Process Pond Storage Characteristics | 160 | |||
Table 15.6.3.1: Major Reagent Consumption | 164 | |||
Table 15.6.4.1: 24hr/7day per week Scheduled Labor | 165 | |||
Table 15.6.4.2: 10-hour/5-day per week Scheduled Labor | 165 | |||
Table 15.7.1: Major Process Equipment Items Specifications and Quantities | 166 | |||
Table 17.2.1: Commodity Price Projections—Gold | 190 | |||
Table 18.1.1.1: Material Types in the Centennial Deposit | 192 | |||
Table 18.1.2.1: Groundwater Monitoring Well Locations | 194 | |||
Table 18.1.2.2: Well Completion Details | 194 | |||
Table 18.1.2.3: Hydrogeologic Contacts | 195 | |||
Table 19.1.1: Capital Cost Summary | 201 | |||
Table 19.1.2.1: Primary Equipment Capital Unit Costs | 202 | |||
Table 19.1.2.2: Support Equipment Capital Unit Costs | 203 | |||
Table 19.1.3.1: Process Capital Cost Summary | 204 | |||
Table 19.1.4.1: Major Components of Owner and Infrastructure Capital | 205 | |||
Table 19.1.4.2: Owner and Infrastructure Capital Cost Summary | 206 | |||
Table 19.2.1: Operating Cost Summary | 206 | |||
Table 19.2.2.1: Operating Costs for Primary Mining Equipment | 207 | |||
Table 19.2.2.2: Labor Rates Mining | 207 | |||
| JBP/MLM | February 22, 2012 |
| SRK Consulting (U.S.), Inc. | ||||
| NI 43-101 Technical Report – Mt. Hamilton Gold Project, Centennial Deposit | Page xxviii |
Table 19.2.2.3: Life of Mine, Mine Operating Costs Summary | 208 | |||
Table 19.2.2.4: Detailed Mining Operating Costs | 208 | |||
Table 19.2.3.1: LoM Process Operating Costs | 208 | |||
Table 19.2.3.2: Detailed Process Operating Costs | 209 | |||
Table 19.2.3.3: Reagents | 209 | |||
Table 19.2.3.4: Labor Rates Processing | 209 | |||
Table 19.2.4.1: G&A Operating Cost Summary | 210 | |||
Table 19.2.4.2: G&A Costs | 210 | |||
Table 19.2.4.3: G&A Labor Rates | 210 | |||
Table 19.2.4.4: G&A Labor | 211 | |||
Table 20.2.1: Mine Production Summary | 213 | |||
Table 20.2.2: Process Production Summary | 213 | |||
Table 20.2.3: Project Economic Results | 214 | |||
Table 20.2.4: Cash Cost | 214 | |||
Table 20.2.5: Annual Production and Cash flow Summary | 215 | |||
Table 20.4.1: Project Sensitivities: NPV at 8% (US$ millions) | 216 | |||
Table 20.4.2: Project Sensitivity to Metal Prices | 217 | |||
Table 24.1.4.1: Recommended Pre-Construction Work Program Costs | 230 | |||
Table 26.3.1: Definition of Terms | 233 | |||
List of Figures
Figure 2-1: Centennial Site Location Map | 11 | |||
Figure 2-2: Centennial Pre-construction Site Conditions | 12 | |||
Figure 2-3: Centennial Project Claims Map | 13 | |||
Figure 5-1: Western White Pine County Regional Geology Map | 24 | |||
Figure 5-2: Centennial Project Area Local Geology Map | 25 | |||
Figure 8-1: Mt. Hamilton District Drill Hole Location Map | 33 | |||
Figure 8-2: Centennial Area Drill Hole Location Map | 34 | |||
Figure 8-3: Duplicate vs. Original Results, RC Field Duplicate Samples | 35 | |||
Figure 8-4: Difference vs. Average Value, RC Field Duplicate Sample Pairs | 36 | |||
Figure 8-5: Relative Percent Difference vs. Average Value, RC Field Duplicate Pairs | 37 | |||
Figure 9-1: Blank Samples, Fire Assay-AAS Gold | 45 | |||
Figure 9-2: MH08 SRM Results- Gold, Fire Assay | 46 | |||
Figure 9-3: Duplicate Analysis, Soluble Gold | 47 | |||
Figure 9-4: Duplicate Analysis, Soluble Silver, All Pairs | 48 | |||
Figure 9-5: Fire Assay Gold, All Blank Samples (ppm) | 49 | |||
| JBP/MLM | February 22, 2012 |
| SRK Consulting (U.S.), Inc. | ||||
| NI 43-101 Technical Report – Mt. Hamilton Gold Project, Centennial Deposit | Page xxix |
Figure 9-6: Fire Assay Gold, All Blank Samples (oz/t) | 50 | |||
Figure 9-7: 2010 Gold results for SRM MEGAu.09.01 (ppm) | 51 | |||
Figure 9-8: 2010 Gold results for SRM MEGAu.09.03 (ppm) | 52 | |||
Figure 9-9: 2010 Gold results for SRM MEGAu.09.04 (ppm) | 53 | |||
Figure 9-10: Duplicate Pair Gold Values, Drill Core Samples | 54 | |||
Figure 9-11: Soluble vs. Total Gold in Drill Core | 55 | |||
Figure 9-12: Soluble vs. Total Silver in Drill Core | 56 | |||
Figure 9-13: Fire Assay Gold Blank Sample Results, 2011 Drilling (ppm) | 57 | |||
Figure 9-14: Total Gold and Silver Results, Blank Samples in 2011 Drilling (ppm) | 58 | |||
Figure 9-15: MEGAu.09.01 Gold Results, 2011 Drilling | 59 | |||
Figure 9-16: MEGAu.09.03 Gold Results | 60 | |||
Figure 9-17: MEGAu.09.04 Gold Results | 61 | |||
Figure 9-18: Duplicate vs. Original Results, Gold, Fire Assay, 2011 Drilling | 62 | |||
Figure 11-1: Centennial Metallurgical Test Sample Locations | 78 | |||
Figure 11-2: Column Tests—% Au Recovery vs. Crush Size – 120 Days Column Leach | 79 | |||
Figure 11-3: Test MH08004 & MH08005 Gold & Silver Leach Rate Profiles | 80 | |||
Figure 11-4: Test MH10002 & MH1003/4 Gold & Silver Leach Rate Profiles | 81 | |||
Figure 11-5: Selected Grade vs. Recovery from 96-hour Bottle Roll Tests @ p100 in | 82 | |||
Figure 12-1: SRK 2011 3D Geologic Model with 2008-2011 Drill Collars and Resource Pit Shell | 92 | |||
Figure 12-2: Geologic Cross Section B-B’ (636650N) with Au 0.007 oz/t Grade Shell and Drill Hole Au Values | 93 | |||
Figure 12-3: Geologic Cross Section B-B’ (636650N) with Block Model Au oz/t | 94 | |||
Figure 12-4: Geologic Cross Section A-A’ (507600E) with Au 0.007 oz/t Grade Shell and Drill Hole Au Assay Values | 95 | |||
Figure 12-5: Geologic Cross Section A-A’ (507600E) with Block Model Au oz/t | 96 | |||
Figure 12-6: Centennial Drill Hole Locations | 97 | |||
Figure 12-7: Centennial Lognormal Probability Plot, Au Assays | 98 | |||
Figure 12-8: Centennial Lognormal Probability Plot, Ag Assays | 99 | |||
Figure 12-9: Isotropic Variogram for Au | 100 | |||
Figure 12-10: Isotropic Variogram for Ag | 101 | |||
Figure 12-11: Centennial Mineralization Au Dynamic Anisotropy 3D | 102 | |||
Figure 12-12: Centennial Mineralization Ag Dynamic Anisotropy 3D | 103 | |||
Figure 12-13: Centennial Block Au Model Projection | 104 | |||
Figure 12-14: Centennial Block Ag Model Projection | 105 | |||
Figure 12-15: Centennial Block Au Model Cross Section | 106 | |||
Figure 12-16: Centennial Block Au Model Cross Section | 107 | |||
Figure 12-17: Centennial Block Au Model Cross Section | 108 | |||
Figure 12-18: Centennial Block Ag Model Cross Section | 109 | |||
| JBP/MLM | February 22, 2012 |
| SRK Consulting (U.S.), Inc. | ||||
| NI 43-101 Technical Report – Mt. Hamilton Gold Project, Centennial Deposit | Page xxx |
Figure 13-1: Reserve Calculation Flow Diagram | 112 | |||
Figure 13-2: Potential Residual Mineral Resources (colored by oz/t Au) | 113 | |||
Figure 14-1: Facilities Location Map | 129 | |||
Figure 14-2: Pre-Production Access (Plan View) | 130 | |||
Figure 14-3: Grade/Ton Curves for Au | 131 | |||
Figure 14-4: Grade/Ton Curves for Ag | 132 | |||
Figure 14-5: Grade/Ton Curves for AuEq | 133 | |||
Figure 14-6: Location of Geotechnical Drillholes | 134 | |||
Figure 14-7: Whittle™ Pit by Pit Graph | 135 | |||
Figure 14-8: Whittle™ Pits Selected for Pit Design | 136 | |||
Figure 14-9: Pit Design, E-W Section, Looking North | 137 | |||
Figure 14-10: Pit Design with Block Model, E-W Cross Section, Looking North | 138 | |||
Figure 14-11: Final Pit Design, Rotated View Looking East and Down | 139 | |||
Figure 14-12: Centennial Annual Mining Year 0 (Pre-Strip) | 140 | |||
Figure 14-13: Centennial Annual Mining Year 1 | 141 | |||
Figure 14-14: Centennial Annual Mining Year 2 | 142 | |||
Figure 14-15: Centennial Annual Mining Year 3 | 143 | |||
Figure 14-16: Centennial Annual Mining Year 4 | 144 | |||
Figure 14-17: Centennial Annual Mining Year 5 | 145 | |||
Figure 14-18: Centennial Annual Mining Year 6 | 146 | |||
Figure 14-19: Centennial Annual Mining Year 7 | 147 | |||
Figure 14-20: Centennial Annual Mining Year 8 – Post Reclamation | 148 | |||
Figure 14-21: Production Schedule Grade Distribution | 149 | |||
Figure 14-22: Production Schedule Tonnage Distribution | 150 | |||
Figure 15-1: Crush – Conveying – Stacking Flowsheet | 167 | |||
Figure 15-2: Crusher Layout | 168 | |||
Figure 15-3: Heap Leach Pad Site Layout | 169 | |||
Figure 15-4: Heap Leach Pad Final Regraded Surface | 170 | |||
Figure 15-5: Heap Leach Pad Phase 1 Earthwork Overview | 171 | |||
Figure 15-6: HLP Phase 1 Base Grading and Collection Piping | 172 | |||
Figure 15-7: HLP Phases 2-4 Base Grading & Collection Piping | 173 | |||
Figure 15-8: Heap Leach Pad Cross-sections | 174 | |||
Figure 15-9: Details, Sheet 2 | 175 | |||
Figure 15-10: Details, Sheet 4 | 176 | |||
Figure 15-11: Details, Sheet 5 | 177 | |||
Figure 15-12: Details, Sheet 3 | 178 | |||
Figure 15-13: Diversion Channel Grading Plan and Profile | 179 | |||
| JBP/MLM | February 22, 2012 |
| SRK Consulting (U.S.), Inc. | ||||
| NI 43-101 Technical Report – Mt. Hamilton Gold Project, Centennial Deposit | Page xxxi |
Figure 15-14: Details, Sheet 6 | 180 | |||
Figure 15-15: Details, Sheet 1 | 181 | |||
Figure 15-16: Grading Plan and Profile | 182 | |||
Figure 15-17: Heap Leach Dore Recovery | 183 | |||
Figure 15-18: Plant Infrastructure Diagrams | 184 | |||
Figure 16-1: Plant Area Power Distribution | 188 | |||
Figure 16-2: Mine Area Power Distribution | 189 | |||
Figure 18-1: Net Neutralization Potential vs. Neutralization Potential Ratio | 198 | |||
Figure 18-2: Humidity Cell Weekly Extract pH | 199 | |||
Figure 18-3: Monitoring Well Location Map | 200 | |||
Figure 20-1: Project Sensitivities: NPV @ 8% | 218 | |||
Appendices
Appendix A: Certificate of Author
| JBP/MLM | February 22, 2012 |
| SRK Consulting (U.S.), Inc. | ||||
| NI 43-101 Technical Report – Mt. Hamilton Gold Project, Centennial Deposit | Page 1 |
| 1 | Introduction (Item 2) |
| 1.1 | Terms of Reference and Purpose of the Report |
This report was prepared as a National Instrument 43-101 (NI 43-101) Technical Report for Mt. Hamilton LLC (MH-LLC) a limited liability company owned by Solitario Exploration & Royalty Corp. (Solitario) and Ely Gold and Minerals Inc. (Ely Gold), by SRK Consulting (U.S.), Inc. (SRK). Within this report, MH-LLC may be construed as MH-LLC separately or collectively as MH-LLC, Solitario and Ely Gold. The quality of information, conclusions, and estimates contained herein is consistent with the level of effort involved in SRK’s services, based on: i) information available at the time of preparation, ii) data supplied by outside sources, and iii) the assumptions, conditions, and qualifications set forth in this report. This report is intended for use by MH-LLC subject to the terms and conditions of its contract with SRK and relevant securities legislation. The contract permits MH-LLC to file this report as a Technical Report with Canadian securities regulatory authorities pursuant to NI 43-101, Standards of Disclosure for Mineral Projects. Except for the purposes legislated under provincial securities law, any other uses of this report by any third party is at that party’s sole risk. The responsibility for this disclosure remains with MH-LLC. The user of this document should ensure that this is the most recent Technical Report for the property as it is not valid if a new Technical Report has been issued.
This report provides mineral resource and mineral reserve estimates, and a classification of resources and reserves in accordance with the Canadian Institute of Mining, Metallurgy and Petroleum Standards on Mineral Resources and Reserves: Definitions and Guidelines, November 27, 2010 (CIM). It also meets the standards of the U.S. Securities and Exchange Commission Industry Guide 7 for estimating and reporting reserves.
The mineral property addressed in this report is MH-LLC’s wholly owned Centennial gold and silver Project (“Centennial”, or the “Project”), located in the historic Mt. Hamilton mining district of central Nevada. This report represents Feasibility-level reserve, mining, processing, cost estimation and economic evaluation for the Centennial Project. A Feasibility Study (FS) document will be produced in conjunction with this Technical Report and will contain all recent and relevant data to support the conclusions made herein.
| 1.2 | Qualifications of Consultants (SRK) |
The SRK Group comprises over 1,100 staff worldwide, offering expertise in a wide range of mineral resource engineering disciplines. The SRK Group’s independence is ensured by the fact that it holds no equity in any project and that its ownership rests solely with its staff. This relationship permits SRK to provide its clients with conflict-free and objective recommendations on crucial judgment issues. SRK has a demonstrated record of accomplishment in undertaking independent assessments of Mineral Resources and Mineral Reserves, project evaluations and audits, technical reports and independent feasibility evaluations to bankable standards on behalf of exploration and mining companies and financial institutions worldwide. The SRK Group has also worked with a large number of major international mining companies and their projects, providing mining industry consultancy service inputs. Neither SRK nor any of its employees and associates employed in the preparation of this report has any beneficial interest in MH-LLC or in the assets of MH-LLC. The results of the technical review by SRK are not dependent on any prior agreements concerning the
| JBP/MLM | February 22, 2012 |
| SRK Consulting (U.S.), Inc. | ||||
| NI 43-101 Technical Report – Mt. Hamilton Gold Project, Centennial Deposit | Page 2 |
conclusions to be reached, nor are there any undisclosed understandings concerning any future business dealings. SRK will be paid a fee for this work in accordance with normal professional consulting practice.
This FS has been prepared by a team of consultants sourced principally from SRK’s Reno, Nevada and Denver, Colorado offices (the Consultants). These consultants are specialists in the fields of geology, hydrogeology, geochemistry, Mineral Resource and Mineral Reserve estimation and classification, open pit mining, underground mining, geotechnical, environmental, permitting, mineral processing and mineral economics disciplines.
The SRK personnel involved with the Project, by virtue of their education, experience and professional association, are considered Qualified Persons (QP) as defined in the NI 43-101 standard, for this report, and are members in good standing of appropriate professional institutions. . Listed below are the QPs who have provided input to this technical report and the Sections for which they are responsible:
| • | J. Pennington, (SRK) C.P.G., MSc. (Sections: Summary, 1, 2.1, 2.2, 2.3, 2.5,3, 4, 5, 6, 7, 8, 9, 10, 17, 21, 22, 23, 24, 25); |
| • | Richard DeLong (Enviroscientists), MS, PG, RG, CEM (Section: 2.4, 18); |
| • | Frank Daviess, (SRK), MAusIMM, SME, MSc. (Section 12); |
| • | Herb Osborne, (SRK Associate), P.E., (Sections: 11,15.1, 15.2, 15.3, 15.5); |
| • | Joanna Poeck, (SRK), B. Eng., MMSA (Sections: 13, 14.1, 14.2, 14.3, 14.5, 14.6, 14.8, 14.9) |
| • | Kent Hartley (SRK) P.E. Mining, SME, BSc (Sections: 14.7, 14.10, 16, 17, 19, 20); |
| • | Mike Levy (SRK), P.E, P.G. (Section: 14.4); |
| • | Evan Nikirk (SRK), P.E., MSc. (Section: 15.4); and |
| • | Neal Rigby, (SRK) CEng, MIMMM, PhD. (Document review/Quality Control). |
Other contributing authors:
| • | Walt Hunt, (Solitario) (Sections: 2.1,2.2, 2.3); |
| • | Brooke Miller, (SRK) (Sections: 7, 8,9,10, 18.1.1, drilling data quality control, geochem.); |
| • | Bret Swanson, BE Mining, MAusIMM (Section: 14, mine planning); |
| • | Rennie Kaunda, (SRK) PhD. (Section: 14.4); |
| • | John Cooper, (SRK) P.E. (Sections: 15.4, leach pad design); |
| • | Gary Hurban, (SRK) EI, CFM (Section: 15.4); |
| • | Valerie Obie (SRK) P.E. (Sections: 19 and 20); |
| • | Amy Prestia, (SRK) P.G. Msc. (Section: 18.1.1, geochemistry); and |
| • | Matt Banta, (SRK) (Section 18.1.2, hydrogeology). |
| 1.2.1 | Details of Inspection |
MH-LLC has hosted several site visits to the Centennial property over the last four years of SRK project involvement, including most recently a QP visit on June 29, 2011. The site visit was conducted to review drill core and chips, drilling, logging and sampling procedures in MH-LLC’s core storage facility in Ely, Nevada, as well as a visit to the project site at Mt. Hamilton to review the proposed pit area, waste-rock storage areas the future potential leach pad site. Table 1.2.1.1 lists the site visit participants.
| JBP/MLM | February 22, 2012 |
| SRK Consulting (U.S.), Inc. | ||||
| NI 43-101 Technical Report – Mt. Hamilton Gold Project, Centennial Deposit | Page 3 |
Table 1.2.1.1: SRK Site Visit Participants
Personnel | SRK Office | Expertise | Date(s) of Visit | |||
J. Pennington | Reno | Geology, Resources | June 29, 2011 | |||
Herb Osborne | Denver | Metallurgy & Processing | October, 1995 | |||
Kent Hartley | Reno | Mining & Economics | June 29, 2011 | |||
John Cooper | Elko | Civil Geotechnical | October, 2011 | |||
Evan Nikirk | Reno | Civil Geotechnical | June 29, 2011 | |||
Amy Prestia | Reno | Geochemistry | September 21, 2009 | |||
Dr. Rob Bowell | Cardiff | Geochemistry | September 21, 2009 | |||
| 1.3 | Reliance on Other Experts (Item 3) |
SRK’s opinion contained herein is based on information provided to SRK by MH-LLC throughout the course of the investigations. SRK has relied upon the work of other consultants in the project areas in support of this Technical Report. The sources of information include data and reports supplied by MH-LLC personnel as well as documents referenced in Section 25.
The Consultants used their experience to determine if the information from previous reports was suitable for inclusion in this technical report and adjusted information that required amending. This report includes technical information, which required subsequent calculations to derive subtotals, totals and weighted averages. Such calculations inherently involve a degree of rounding and consequently introduce a margin of error. Where these occur, the Consultants do not consider them to be material.
| 1.3.1 | Sources of Information and Extent of Reliance |
SRK relied on others for the following information in the referenced sections:
| • | MH-LLC for Land Tenure and Permit Status Section 2; |
| • | Enviroscientists for Section 18; and, |
| • | McClelland Laboratories (McClelland): Recent relevant test results for Section 11. |
The items pertaining to land tenure have not been independently reviewed by SRK and SRK did not seek an independent legal opinion of these items.
| 1.4 | Effective Date |
The effective date of this report is February 22, 2012.
| 1.5 | Units of Measure |
The data described in this report are generally expressed as US units of measure: miles, feet, for the land/legal subdivision, etc., as these are the common units of measure in the United States. All currency references are US dollars (US$) unless specified otherwise. Unless otherwise specified, values are expressed in ounces per short ton (oz/t) for drillhole assay and resource gold (Au) and silver (Ag) values. Drillhole coordinates may be listed with both truncated Nevada East State Plane coordinates (feet) and UTM coordinates (meters).
| JBP/MLM | February 22, 2012 |
| SRK Consulting (U.S.), Inc. | ||||
| NI 43-101 Technical Report – Mt. Hamilton Gold Project, Centennial Deposit | Page 4 |
| 2 | Property Description and Location (Item 4) |
| 2.1 | Property Description and Location |
The Mt. Hamilton Property (Property), which contains the Centennial gold and silver deposit, is located in White Pine County, Nevada at 115.558890° W Longitude and 39.250867° N Latitude. The project area is in Township 16 North, Range 57 East. Within that area, the planned mine site is in Sections 16 and 21, planned waste rock storage in Sections 16 and 17, and the proposed heap leach facility in Section 20. The project site is on the western flank of Mount Hamilton, which is on the north end of the White Pine Mountains. The property lies about 10 miles south of U.S. Highway 50 and about 60 miles from Ely, Nevada via U.S. Highway 50 and White Pine County Road 5. The nearby communities, Ely and Eureka, are approximately equidistant from the project site. From either community, the project site can be accessed by car, on paved and gravel-surface roads, in about an hour. The general project location is shown in Figure 2-1. The Centennial project site location map is presented in Figure 2-2.
| 2.2 | Mineral Titles |
The Mt. Hamilton Property is located 35 miles west of Ely in White Pine county Nevada. MH-LLC consists of both private property and unpatented mining claims on federal land and controls the Property through direct ownership and through lease option agreements. The Property is comprised of two parcels of fee simple land totaling 240 acres, nine surveyed Patented Mineral Claims (Table 2.2.1), totaling 120.57 acres, and 255 unpatented Federal mining claims (Table 2.2.2), totaling approximately 4,530 acres. Claims are located in Sections 8, 9, 15, 16, 17, 21, 22, 27, 28, Township 16N, Range 57E, White Pine County, Nevada (Figure 2-3). All unpatented claims are staked on the ground in accordance with Bureau of Land Management and Nevada regulations. The lands which comprise the unpatented mining claims are controlled by the US Mining Law of 1872 and are situated on Public Lands administered by the U.S Department of Agriculture, Forest Service. The patented claims and the two fee simple parcels are private lands in which MH-LLC controls all surface and mineral rights. The entire property package is controlled by MH-LLC through direct ownership or lease/option interests with third parties.
Table 2.2.1: Patented Mineral Claim List for Ely Gold Mt. Hamilton Property
Parcel # | US Mineral Survey # | Name | Date Issued | Acreage | ||||||
09-400-07 | n/a | Henkle-Buchanan | n/a | 160 | ||||||
09-400-06 | n/a | Schuh | n/a | 80 | ||||||
99-059-05 | 69 | Badger state | 09/15/1882 | 4.59 | ||||||
99-059-25 | 66 | Centennial | 05/31/1881 | 9.54 | ||||||
99-059-66 | 41 | Gloucester | 04/15/1874 | 5.51 | ||||||
99-060-81 | 68 | Woo Hop | 02/28/1882 | 11.48 | ||||||
99-059-27 | 42 | Chester | 12/211874 | 6.89 | ||||||
99-059-28 | Chester #1 | |||||||||
99-059-29 | 3763 | Chester #2 | 04/11/1912 | 82.56 | ||||||
99-059-30 | Chester#3 | |||||||||
99-059-31 | Chester #4 | |||||||||
| JBP/MLM | February 22, 2012 |
| SRK Consulting (U.S.), Inc. | ||||
| NI 43-101 Technical Report – Mt. Hamilton Gold Project, Centennial Deposit | Page 5 |
Table 2.2.2: Federal Mining Claim List for Mt. Hamilton LLC Property
Claim Name | BLM NMC # | Location Date | ||
AR 1 | 899951 | 2-Jun-05 | ||
AR 2 | 899952 | 2-Jun-05 | ||
AR 3 | 899953 | 2-Jun-05 | ||
AR 4 | 899954 | 2-Jun-05 | ||
AR 5 | 899955 | 2-Jun-05 | ||
AR 6 | 899956 | 2-Jun-05 | ||
AR 7 | 899957 | 2-Jun-05 | ||
AR 8 | 899958 | 2-Jun-05 | ||
AR 9 | 899959 | 2-Jun-05 | ||
AR 10 | 899960 | 2-Jun-05 | ||
AR 11 | 899961 | 2-Jun-05 | ||
AR 12 | 899962 | 2-Jun-05 | ||
AR 13 | 899963 | 2-Jun-05 | ||
AR 14 | 899964 | 2-Jun-05 | ||
AR 15 | 899965 | 2-Jun-05 | ||
AR 16 | 899966 | 2-Jun-05 | ||
AR 17 | 899967 | 2-Jun-05 | ||
AR 18 | 899968 | 2-Jun-05 | ||
AR 19 | 899969 | 2-Jun-05 | ||
AR 20 | 899970 | 2-Jun-05 | ||
AR 21 | 899971 | 2-Jun-05 | ||
AR 22 | 899972 | 2-Jun-05 | ||
AR 23 | 899973 | 2-Jun-05 | ||
AR 24 | 899974 | 2-Jun-05 | ||
AR 25 | 899975 | 2-Jun-05 | ||
AR 26 | 899976 | 2-Jun-05 | ||
AR 27 | 899977 | 2-Jun-05 | ||
AR 28 | 899978 | 2-Jun-05 | ||
AR 29 | 899979 | 2-Jun-05 | ||
AR 30 | 899980 | 2-Jun-05 | ||
AR 31 | 899981 | 2-Jun-05 | ||
AR 32 | 899982 | 2-Jun-05 | ||
AR 33 | 896926 | 5-Apr-05 | ||
AR 34 | 896927 | 5-Apr-05 | ||
AR 35 | 896928 | 5-Apr-05 | ||
AR 36 | 896929 | 5-Apr-05 | ||
AR 37 | 896930 | 5-Apr-05 | ||
AR 38 | 896931 | 5-Apr-05 | ||
AR 41 | 933798 | 1-Sep-06 | ||
AR 43 | 933800 | 1-Sep-06 | ||
AR 45 | 896938 | 5-Apr-05 | ||
AR 46 | 896939 | 5-Apr-05 | ||
AR 47 | 896940 | 5-Apr-05 | ||
AR 48 | 896941 | 5-Apr-05 | ||
AR 49 | 896942 | 5-Apr-05 | ||
AR 50 | 896943 | 5-Apr-05 | ||
AR 51 | 896944 | 5-Apr-05 | ||
AR 52 | 896945 | 5-Apr-05 | ||
AR 57 | 933806 | 1-Sep-06 | ||
AR 58 | 896951 | 5-Apr-05 | ||
AR 59 | 896952 | 5-Apr-05 | ||
AR 60 | 896953 | 5-Apr-05 | ||
AR 61 | 899983 | 2-Jun-05 | ||
SC 1 | 1005079 | 23-Feb-09 | ||
SC 2 | 1005080 | 23-Feb-09 | ||
SC 3 | 1005081 | 23-Feb-09 | ||
SC 4 | 1005082 | 23-Feb-09 | ||
SC 5 | 1005083 | 23-Feb-09 | ||
SC 6 | 1005084 | 23-Feb-09 | ||
SC 7 | 1005085 | 23-Feb-09 | ||
SC 8 | 1005086 | 23-Feb-09 | ||
SC 9 | 1005087 | 23-Feb-09 | ||
SC 10 | 1005088 | 23-Feb-09 | ||
SC 11 | 1005089 | 23-Feb-09 | ||
SC 12 | 1005090 | 23-Feb-09 | ||
SC 13 | 1005091 | 23-Feb-09 | ||
Claim Name | BLM NMC # | Location Date | ||
SC 14 | 1005092 | 23-Feb-09 | ||
SC 15 | 1005093 | 23-Feb-09 | ||
SC 16 | 1005094 | 23-Feb-09 | ||
SC 17 | 1005095 | 23-Feb-09 | ||
SC 18 | 1005096 | 23-Feb-09 | ||
SC 19 | 1005097 | 23-Feb-09 | ||
SC 20 | 1005098 | 23-Feb-09 | ||
SC 21 | 1005099 | 23-Feb-09 | ||
SC 22 | 1005100 | 23-Feb-09 | ||
SC 23 | 1005101 | 23-Feb-09 | ||
SC 24 | 1005102 | 23-Feb-09 | ||
SC 25 | 1005103 | 23-Feb-09 | ||
SC 26 | 1005104 | 23-Feb-09 | ||
SC 27 | 1005105 | 23-Feb-09 | ||
SC 28 | 1005106 | 23-Feb-09 | ||
SC 29 | 1005107 | 23-Feb-09 | ||
SC 30 | 1005108 | 23-Feb-09 | ||
HF 1 | 1056978 | 1-Sep-11 | ||
HF 2 | 1056979 | 1-Sep-11 | ||
HF 3 | 1056980 | 1-Sep-11 | ||
HF 4 | 1056981 | 1-Sep-11 | ||
HF 5 | 1056982 | 1-Sep-11 | ||
HF 6 | 1056983 | 1-Sep-11 | ||
HF 7 | 1056984 | 1-Sep-11 | ||
HF 8 | 1056985 | 1-Sep-11 | ||
HF 9 | 1056986 | 12-Sep-11 | ||
HF 10 | 1056987 | 12-Sep-11 | ||
MH 1 | 1049740 | 6-May-11 | ||
MH 2 | 1049741 | 6-May-11 | ||
MH 3 | 1049742 | 6-May-11 | ||
MH 4 | 1049743 | 6-May-11 | ||
MH 5 | 1049744 | 7-May-11 | ||
MH 6 | 1049745 | 6-May-11 | ||
MH 7 | 1049746 | 7-May-11 | ||
MH 8 | 1049747 | 7-May-11 | ||
MH 9 | 1049748 | 7-May-11 | ||
MH 10 | 1049749 | 7-May-11 | ||
MH 11 | 1049750 | 7-May-11 | ||
MH 12 | 1049751 | 7-May-11 | ||
MH 13 | 1049752 | 6-May-11 | ||
MH 14 | 1049753 | 7-May-11 | ||
MH 15 | 1049754 | 7-May-11 | ||
MH 16 | 1049755 | 9-May-11 | ||
MH 17 | 1049756 | 9-May-11 | ||
MH 18 | 1049757 | 9-May-11 | ||
MH 19 | 1049758 | 9-May-11 | ||
MH 20 | 1049759 | 9-May-11 | ||
MH 21 | 1049760 | 9-May-11 | ||
MH 22 | 1049761 | 9-May-11 | ||
MH 23 | 1049762 | 9-May-11 | ||
MH 24 | 1049763 | 9-May-11 | ||
MH 25 | 1049764 | 9-May-11 | ||
MH 26 | 1049765 | 8-May-11 | ||
MH 27 | 1049766 | 8-May-11 | ||
MH 28 | 1049767 | 8-May-11 | ||
MH 29 | 1049768 | 8-May-11 | ||
MH 30 | 1049769 | 8-May-11 | ||
MH 31 | 1049770 | 8-May-11 | ||
MH 32 | 1049771 | 8-May-11 | ||
MH 33 | 1049772 | 8-May-11 | ||
MH 34 | 1049773 | 8-May-11 | ||
MH 35 | 1049774 | 8-May-11 | ||
MH 36 | 1049775 | 8-May-11 | ||
MH 37 | 1049776 | 8-May-11 | ||
MH 38 | 1049777 | 8-May-11 | ||
MH 39 | 1049778 | 8-May-11 | ||
| JBP/MLM | February 22, 2012 |
| SRK Consulting (U.S.), Inc. | ||||
| NI 43-101 Technical Report – Mt. Hamilton Gold Project, Centennial Deposit | Page 6 |
Claim Name | BLM NMC # | Location Date | ||||||
MH 40 | 1049779 | 8-May-11 | ||||||
MH 41 | 1049780 | 8-May-11 | ||||||
MH 42 | 1049781 | 8-May-11 | ||||||
MH 43 | 1049782 | 8-May-11 | ||||||
MH 44 | 1049783 | 9-May-11 | ||||||
MH 45 | 1049784 | 9-May-11 | ||||||
MH 46 | 1049785 | 9-May-11 | ||||||
MH 47 | 1049786 | 9-May-11 | ||||||
MH 48 | 1049787 | 9-May-11 | ||||||
MH 49 | 1049788 | 9-May-11 | ||||||
MH 50 | 1049789 | 9-May-11 | ||||||
MH 51 | 1049790 | 9-May-11 | ||||||
MH 52 | 1049791 | 9-May-11 | ||||||
MH 53 | 1049792 | 9-May-11 | ||||||
MH 54 | 1049793 | 9-May-11 | ||||||
MH 55 | 1049794 | 9-May-11 | ||||||
MH 56 | 1049795 | 9-May-11 | ||||||
MH 57 | 1049796 | 9-May-11 | ||||||
MH 58 | 1049797 | 9-May-11 | ||||||
MH 59 | 1049798 | 9-May-11 | ||||||
MH 60 | 1049799 | 9-May-11 | ||||||
MH 61 | 1049800 | 9-May-11 | ||||||
MH 62 | 1049801 | 9-May-11 | ||||||
MH 63 | 1049802 | 9-May-11 | ||||||
MH 64 | 1049803 | 9-May-11 | ||||||
MH 65 | 1049804 | 9-May-11 | ||||||
MH 66 | 1049805 | 9-May-11 | ||||||
MH 67 | 1049806 | 9-May-11 | ||||||
MH 68 | 1049807 | 9-May-11 | ||||||
MH 69 | 1049808 | 9-May-11 | ||||||
MH 70 | 1049809 | 9-May-11 | ||||||
MH 71 | 1049810 | 9-May-11 | ||||||
MH 72 | 1049811 | 4-Jul-11 | ||||||
MH 79 | 1053918 | 9-Jul-11 | ||||||
MH 80 | 1053919 | 10-Jul-11 | ||||||
MH 81 | 1053920 | 10-Jul-11 | ||||||
AR 39 | 933796 | 1-Sep-06 | ||||||
AR 40 | 933797 | 1-Sep-06 | ||||||
AR 42 | 933799 | 1-Sep-06 | ||||||
AR 44 | 933801 | 1-Sep-06 | ||||||
AR 53 | 933802 | 1-Sep-06 | ||||||
AR 54 | 933803 | 1-Sep-06 | ||||||
AR 55 | 933804 | 1-Sep-06 | ||||||
AR 56 | 933805 | 1-Sep-06 | ||||||
AR 102 | 1044898 | 21-May-11 | ||||||
AR 103 | 1044899 | 21-May-11 | ||||||
H 10 | 839910 | 26-Nov-02 | ||||||
H 11 | 839911 | 26-Nov-02 | ||||||
H 12 | 839912 | 26-Nov-02 | ||||||
H 13 | 839913 | 26-Nov-02 | ||||||
H 14 | 839914 | 26-Nov-02 | ||||||
H 15 | 839915 | 26-Nov-02 | ||||||
H 16 | 839916 | 26-Nov-02 | ||||||
H 17 | 839917 | 26-Nov-02 | ||||||
H 18 | 839918 | 26-Nov-02 | ||||||
H 19 | 839919 | 23-Nov-02 | ||||||
H 20 | 839920 | 26-Nov-02 | ||||||
H 21 | 839921 | 23-Nov-02 | ||||||
H 22 | 839922 | 23-Nov-02 | ||||||
H 25 | 839923 | 23-Nov-02 | ||||||
H 26 | 839924 | 23-Nov-02 | ||||||
H 27 | 839925 | 26-Nov-02 | ||||||
H 28 | 839926 | 23-Nov-02 | ||||||
H 36 | 839927 | 26-Nov-02 | ||||||
H 37 | 839928 | 26-Nov-02 | ||||||
H 38 | 839929 | 26-Nov-02 | ||||||
Claim Name | BLM NMC # | Location Date | ||||||
H 39 | 839930 | 26-Nov-02 | ||||||
MC | 839931 | 23-Nov-02 | ||||||
Ada | 839932 | 23-Nov-02 | ||||||
Mack #3 | 839933 | 23-Nov-02 | ||||||
Mack Fraction | 839934 | 23-Nov-02 | ||||||
VENUS | 861421 | 18-Nov-03 | ||||||
MAY | 861422 | 18-Nov-03 | ||||||
MACK | 861423 | 18-Nov-03 | ||||||
ADA FRACTION | 861424 | 18-Nov-03 | ||||||
Monte 1 | 875113 | 7-Jun-04 | ||||||
Monte 2 | 875114 | 7-Jun-04 | ||||||
Monte 3 | 875115 | 7-Jun-04 | ||||||
Monte 4 | 875116 | 7-Jun-04 | ||||||
Monte 5 | 875117 | 7-Jun-04 | ||||||
Monte 6 | 875118 | 7-Jun-04 | ||||||
Monte 9 | 1061262 | 9-Nov-11 | ||||||
Monte 10 | 1061263 | 9-Nov-11 | ||||||
Monte 11 | 1061264 | 9-Nov-11 | ||||||
Monte 12 | 1061265 | 9-Nov-11 | ||||||
Monte 13 | 1061266 | 9-Nov-11 | ||||||
Monte 14 | 1061267 | 9-Nov-11 | ||||||
Monte 15 | 1061268 | 9-Nov-11 | ||||||
Monte 16 | 1061269 | 9-Nov-11 | ||||||
Monte 17 | 1061270 | 9-Nov-11 | ||||||
Monte 18 | 1061271 | 9-Nov-11 | ||||||
Monte 19 | 1061272 | 9-Nov-11 | ||||||
Monte 20 | 1061273 | 9-Nov-11 | ||||||
Monte 21 | 1061274 | 9-Nov-11 | ||||||
Monte 22 | 1061275 | 9-Nov-11 | ||||||
Monte 23 | 1061276 | 9-Nov-11 | ||||||
Monte 24 | 1061277 | 9-Nov-11 | ||||||
Monte 25 | 1061278 | 9-Nov-11 | ||||||
Monte 26 | 1061279 | 9-Nov-11 | ||||||
Monte 27 | 1061280 | 9-Nov-11 | ||||||
Monte 28 | 1061281 | 9-Nov-11 | ||||||
Monte 29 | 1061282 | 9-Nov-11 | ||||||
Monte 30 | 1061283 | 9-Nov-11 | ||||||
Monte 31 | 1061284 | 9-Nov-11 | ||||||
Monte 32 | 1061285 | 9-Nov-11 | ||||||
Monte 33 | 1061286 | 9-Nov-11 | ||||||
Monte 34 | 1061287 | 9-Nov-11 | ||||||
Monte 35 | 1061288 | 9-Nov-11 | ||||||
Monte 36 | 1061289 | 10-Nov-11 | ||||||
Monte 37 | 1061290 | 10-Nov-11 | ||||||
Monte 38 | 1061291 | 10-Nov-11 | ||||||
Monte 39 | 1061292 | 10-Nov-11 | ||||||
Monte 40 | 1061293 | 10-Nov-11 | ||||||
Monte 41 | 1061294 | 10-Nov-11 | ||||||
Monte 42 | 1061295 | 10-Nov-11 | ||||||
Monte 43 | 1061296 | 10-Nov-11 | ||||||
Monte 44 | 1061297 | 10-Nov-11 | ||||||
Monte 45 | 1061298 | 10-Nov-11 | ||||||
Monte 46 | 1061299 | 10-Nov-11 | ||||||
Monte 47 | 1061300 | 10-Nov-11 | ||||||
Monte 48 | 1061301 | 10-Nov-11 | ||||||
Monte 49 | 1061302 | 10-Nov-11 | ||||||
Monte 50 | 1061303 | 10-Nov-11 | ||||||
Monte 51 | 1061304 | 10-Nov-11 | ||||||
| JBP/MLM | February 22, 2012 |
| SRK Consulting (U.S.), Inc. | ||||
| NI 43-101 Technical Report – Mt. Hamilton Gold Project, Centennial Deposit | Page 7 |
| 2.3 | Nature and Extent of Issuer’s Interest |
Ely Gold’s predecessor, Ivana Ventures Inc., acquired DHI Minerals (US) Ltd. (DHI) from Augusta Resource Corporation (Augusta) in November, 2007. DHI had previously acquired, through a lease agreement with Centennial Minerals Company (Centennial), the mineral rights to the “H” series claims and patented claims shown in Table 2.2.2 and Figure 2-3. These claims cover the resources and reserves at the Centennial Deposit in the north central part of the Property. DHI has assigned 100% of its lease holding interest in the above mentioned claims to MH-LLC.
MH-LLC also directly owns unpatented claims and controls through lease-holding interest additional unpatented claims as shown on Figure 2-3.
The Fee lands shown in Sections 19 and 20 on Figure 2-3 are titled to MH-LLC.
| 2.4 | Royalties, Agreements and Encumbrances |
In order to maintain the Property in good standing MH-LLC has the following land obligations and options.
| • | Annual advance minimum royalty payments to Centennial of US$300,000. These payments are credited against an existing 6% future production royalty to Centennial subject to royalty buydown options (as discussed below). As of the date of this report, MH-LLC has paid US$1.1 million in advanced royalty payments that are deductible from future royalty distributions. |
| • | The Centennial royalty may be reduced to 2.75% by Solitario making a payment of US$3.5 million prior to commercial production. |
| • | The Centennial royalty may be further reduced to 1% by Solitario making a US$1.5 million payment within one-year after commencement of commercial production. |
| • | The CMC Shell and JC Shell lease agreements pertaining to certain unpatented claims outside of the Centennial resource area require annual payments of US$80,000 for each property for so long as the lease agreements are in force. |
| • | The Monte claims are subject to a lease/option agreement with payments totaling US$420,000 through 2015. After option payments are completed and for so long as the agreement is in good standing an annual royalty is paid to the underlying owner consisting of cash payments equal to 33 oz gold annually. There are no current reserves or resources on the Monte claims property. |
| 2.5 | Environmental Liabilities and Permitting |
| 2.5.1 | Environmental Liabilities |
SRK is unaware of any outstanding environmental liabilities aside from minor reclamation obligations associated with existing drill roads that are still actively used.
A portion of the Mt. Hamilton Property which was previously mined during the 1990’s by a previous operator has been extensively reclaimed by the U.S. Department of Agriculture, United States Forest Service (USFS, or Forest Service). The leach pad associated with previous mining has also been covered with soil, contoured, and revegetated. At the time of SRK’s site visits, seeding was successful and the pad is now completely grass-covered. The site of the former mine-associated
| JBP/MLM | February 22, 2012 |
| SRK Consulting (U.S.), Inc. | ||||
| NI 43-101 Technical Report – Mt. Hamilton Gold Project, Centennial Deposit | Page 8 |
infrastructure has been completely reclaimed and virtually all remains of buildings have been removed. The only significant artifact of the former mining operation is the haulage road from the old leach pad to the NE Seligman Mine site. This road remains in excellent repair and provides ready access to the Centennial deposit area. MH-LLC currently has no environmental liabilities related to this previous mining activity.
| 2.5.2 | Required Permits and Status |
The Centennial Project is being permitted separately on National Forest System (NFS) lands, where the mining will occur, and on private land owned by MH-LLC where the processing of the ore is planned. A Plan of Operations (PoO) for submission to the USFS will be submitted for mining activities on NFS lands. A Nevada Reclamation Permit (NRP) Application will also be required for the area covered by the PoO. This application review and approval is through the Nevada Division of Environmental Protection (NDEP) Bureau of Mining Regulation and Reclamation (BMRR).
A bond for reclamation will be required for the mining operations conducted as part of the Centennial Project. The bond will be required to be in place prior to construction activities associated with the mine and the bond costs and the agency (either the USFS or the BMRR) that will hold the bond for the project will need to be agreed upon by the USFS and BMRR.
The private land used for processing the ore will be permitted and bonded separately through the NDEP BMRR and will have a separate Nevada Reclamation Permit that is only associated with the private land. The USFS will not be involved in this permitting.
Major permits for future mining operations are summarized in Table 2.5.2.1.
| JBP/MLM | February 22, 2012 |
| SRK Consulting (U.S.), Inc. | ||||
| NI 43-101 Technical Report – Mt. Hamilton Gold Project, Centennial Deposit | Page 9 |
Table 2.5.2.1: Summary of Major Permits Required for Mining Operations
Regulatory Agency | Permit Name | |
Federal Permits | ||
US Forest Service | • Approved Plan of Operations/Decision Memo • Roads and utility Rights-of-Way | |
Bureau of Alcohol, Tobacco, Firearms, and Explosives | • Authorization to purchase, transport, or store explosives | |
Mine Safety and Health Administration | • Notification of Commencement of Operation • Employee and Facility Health and Safety | |
Environmental Protection Agency | • Hazardous Waste ID No. (small quantity generator) | |
State Permits | ||
Nevada Division of Environmental Protection | ||
Bureau of Mining Regulation and Reclamation | • Water Pollution Control Permit • Reclamation Permit | |
Bureau of Air Pollution Control | • Class I Air Quality Operating Permit • Mercury Operating Permit | |
Bureau of Water Pollution Control | • Septic Permit | |
Bureau of Waste Management | • Approval to Operate a Solid Waste System • Hazardous Waste Management Permit | |
Bureau of Safe Drinking Water | • Potable Water Permit | |
Nevada Division of Water Resources | ||
• Permit to Appropriate Water • Permit to Construct a Dam • Hole Plugging | ||
Nevada Department of Wildlife | ||
• Industrial Artificial Pond Permit | ||
State Fire Marshall | ||
• Hazardous Materials Permit | ||
Local Permits | ||
White Pine County | ||
• Special Use Permit • Building Permit • Business License | ||
Federal Permitting National Forest System Lands
A PoO will be required, in accordance with 36 CFR 228 et seq., which describes the construction, operation, reclamation, and closure of the proposed mining facilities on NFS lands. The following information will be included in the PoO: open pit location(s) and footprint of disturbance; location of haul roads; ore stockpiles; waste rock disposal facilities; growth media stockpiles; fuel/lubricant storage; and other mine related structures or facilities. Reclamation activities will be described in detail in the PoO and these activities will form the basis of the cost estimate for bonding. A reclamation cost estimate is required that presents the reclamation and closure costs for a third party contractor if MH-LLC does not reclaim the applicable surface disturbance associated with the mining activities.
Once the PoO is determined to be complete by the USFS, public and internal scoping of the project will be initiated in order to determine the issues that will be evaluated to comply with the National Environmental Policy Act (NEPA). The USFS will decide whether an Environmental Assessment (EA) or an Environmental Impact Statement (EIS) will be required. An EA is prepared when there are no expected significant impacts and an EIS is prepared when there are significant impacts that need to be disclosed to the public. Both documents provide an analysis of potential impacts to
| JBP/MLM | February 22, 2012 |
| SRK Consulting (U.S.), Inc. | ||||
| NI 43-101 Technical Report – Mt. Hamilton Gold Project, Centennial Deposit | Page 10 |
resources and if it is determined through the preparation of an EA that there will be significant impacts, the project analysis could be completed through an EIS.
State of Nevada Permitting on National Forest System Lands
In conjunction with the USFS PoO, a NRP is required for any surface disturbance greater than five acres, regardless of land status. This NRP will be associated only with the mining activities on NFS lands.
State of Nevada Permitting on Private Land
A separate NRP will be required for the processing facilities that are located completely on private land. Private land does not require NEPA analysis.
Other State of Nevada Permits
A Water Pollution Control Permit (WPCP) will be required that covers both NFS lands and private land. The WPCP is issued by Nevada NDEP BMRR.
Air quality permits are issued by the Bureau of Air Pollution Control (BAPC). The Centennial Project (mining and processing) will require a Class I Air Quality Operating Permit and a Mercury Operating Permit.
Permits from the Bureau of Water Pollution Control (BWPC) are associated with water-related issues (e.g., storm water discharges and sanitary septic systems).
Water appropriations are processed through the Nevada Division of Water Resources (NDWR) and the State Engineer’s Office. Currently MH-LLC has appropriated 263 acre-feet of water per annum (AFA). An additional 240 AFA is currently under application.
Local Permitting
A Special Use Permit will be required from White Pine County; usually a copy of the PoO provides sufficient information for the County to review and issue this permit.
To the best of SRK’s knowledge, MH-LLC is in full compliance with all contractual and regulatory obligations. Because of previously permitted mining activity at the Project, SRK currently has no reason to believe that permits to mine the mineral resources at Centennial could not be reasonably obtained from the state and federal regulatory agencies.
| 2.6 | Other Significant Factors and Risks |
SRK is not aware of any other significant factors or risks associated with the proposed mine development at this site.
| JBP/MLM | February 22, 2012 |
| SRK Consulting (U.S.), Inc. | ||||
| NI 43-101 Technical Report – Mt. Hamilton Gold Project, Centennial Deposit | Page 11 |
Figure 2-1: Centennial Site Location Map

| JBP/MLM | February 22, 2012 |
| SRK Consulting (U.S.), Inc. | ||||
| NI 43-101 Technical Report – Mt. Hamilton Gold Project, Centennial Deposit | Page 12 |
Figure 2-2: Centennial Pre-construction Site Conditions
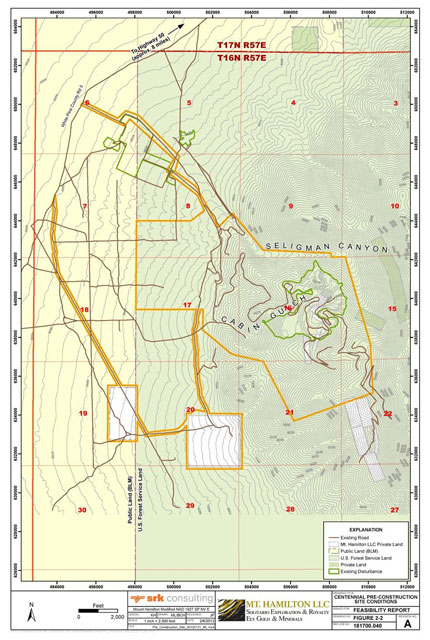
| JBP/MLM | February 22, 2012 |
| SRK Consulting (U.S.), Inc. | ||||
| NI 43-101 Technical Report – Mt. Hamilton Gold Project, Centennial Deposit | Page 13 |
Figure 2-3: Centennial Project Claims Map
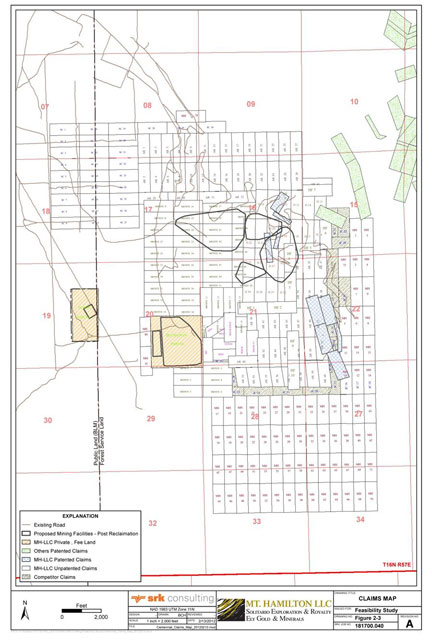
| JBP/MLM | February 22, 2012 |
| SRK Consulting (U.S.), Inc. | ||||
| NI 43-101 Technical Report – Mt. Hamilton Gold Project, Centennial Deposit | Page 14 |
| 3 | Accessibility, Climate, Local Resources, Infrastructure and Physiography (Item 5) |
| 3.1 | Topography, Elevation and Vegetation |
The Mt. Hamilton Property lies in the Basin and Range physiographic province, which is a series of north-trending mountain ranges with typically 2,000 to 5,000 ft of topographic relief above relatively broad and flat intervening valleys. The property is situated in the rugged western flanks of the White Pine Mountains. Seligman Canyon is an ephemeral drainage and is the largest in the project area; several smaller canyons also transect the property.
Local relief is approximately 4,000 ft in the area, ranging from about 6,500 ft (above mean sea level) amsl at the base of Newark Valley to 10,745 ft amsl at the summit of Mt. Hamilton, which is located about one mile southeast of the property. The project area is on the flank of Mt. Hamilton, between 6,500 ft and 9,500 ft amsl, and most of the infrastructure will be built on private land on the gravel and silt alluvial fan downslope from exposed bedrock. This soil is well-drained, and has incised dry drainages spaced several hundred feet apart. Surface slope averages about 6%, and increases to more than 10% closer to the exposed bedrock of the range front. Terrain is rugged in higher areas with shallow soil and exposed bedrock, and slopes are very steep. The former processing plant and leach pad site used during operation at the historical Seligman Mine is located at the boundary between scrubland (dominated by sagebrush and various grasses) and forest dominated by juniper and piñon pine at an elevation of approximately 7,000 ft. At the abandoned mine site, located at 9,000 ft elevation, forest cover is less dense and pine is dominant. No agriculture exists in the area, but there are leases in effect for cattle grazing.
Dominant flora species include piñon and white pine trees at higher elevations; sagebrush, saltbrush, rabbitbrush and other low shrubs, and grasses along with juniper and piñon pine dominate at lower elevations. Cacti and perennial wildflowers are also present, but shrubs and trees are the dominant land cover. Soil is well-drained, and has poorly-developed topsoil less than 3 ft thick. Root penetration has been observed up to 6 ft below ground surface (bgs) in the planned leach pad area, and is more typically about 3 ft deep. Caliche horizons have also been observed 3-9 ft bgs.
| 3.2 | Climate and Length of Operating Season |
Climate is typical for the high-desert regions of eastern Nevada- typically with hot, dry summers and cold snowy winters. Summer high temperatures can peak at 100° Fahrenheit (F) (38°C), with winter low temperatures typically at 0 to 15°F (-18° to -9°C), and winter high temperatures of only 30-40°F (-1° to 4°C). Most of the precipitation for the region falls as snow in the winter months, with lesser precipitation as rainfall in the spring and as thunderstorms during the late summer. Winter storms can deposit many feet of snow in the upper mountains. During years of high-snowfall, elevations above about 7,000 ft can be continually snow-covered from November through April.
In the absence of better road access and the equipment necessary to keep roads open, the typical exploration season for the Mt. Hamilton Property is from May through November. Drilling activities in the region are commonly conducted during June through October. Improved road access and road maintenance/snow removal equipment would extend the operating season through the winter months for year-round mining.
| JBP/MLM | February 22, 2012 |
| SRK Consulting (U.S.), Inc. | ||||
| NI 43-101 Technical Report – Mt. Hamilton Gold Project, Centennial Deposit | Page 15 |
| 3.3 | Sufficiency of Surface Rights |
The surface rights on the Mt. Hamilton Property are owned in part by MH-LLC but are predominantly public domain administered by the USFS. Minor portions of the local access to the Property are administered by the U.S. Bureau of Land Management. All areas of proposed activities fall either on MH-LLC private land or on unpatented mining claims controlled by MH-LLC. In the latter case proposed actions will be subject to approval by the USFS of a Plan of Operations and qualified by the terms of the Record of Decision for that document.
| 3.4 | Accessibility and Transportation to the Property |
The property lies about 10 miles south of U.S. Highway 50 via White Pine County Road 5, and thence about 50 miles west of Ely, Nevada. The nearby communities, Ely and Eureka, are approximately equidistant from the project site. From either community, the project site can be accessed by car, on paved and unpaved roads, in about an hour. The deposit area is accessed from the Northeast Seligman (NES) haul road, and a network of narrow prospecting roads. All roads off Highway 50 are gravel-surface, one- or two-lane, and most transect land administered by the BLM or the USFS. Local roads are continuous over sub-sections of privately-owned land, all of which are owned by Mt. Hamilton LLC.
| 3.5 | Infrastructure Availability and Sources |
Ely is the nearest town and has a population of about 4,000. Ely is the support community for the Robinson (Copper) Mine. Ely is also the County seat for White Pine County and all land records and related support material are located in the county offices there. The city of Elko, Nevada is located approximately a three-hour drive north of the Mt. Hamilton Property. Elko has a population base of about 36,000 and is a support community for many major gold mining operations in northern Nevada. As such, Elko has all the services available to support gold exploration and development activities in the region. Eureka, with a population of approximately 2,000, is located approximately 50 miles west of the property along Nevada State Route 50 and is the support community for the Ruby Hill (Gold) Mine.
| 3.5.1 | Power |
The nearest power line of sufficient capacity for mine operations is approximately 17 miles from the project site along Hwy 50. The current mine plan includes on-site diesel generated electrical power.
| 3.5.2 | Communications |
Cellular phone service is intermittently available at the proposed leach pad and truck shop facilities, but is limited in the proposed pit area due to the steep topography. As is typical of most pre-construction mine sites, landline telephones and internet services are not currently available at the site.
| 3.5.3 | Water |
There is a water well in Seligman Canyon capable of producing 550 gallons per minutes (gpm) and a second, backup well that produces 200 gpm. These wells were utilized by Rea Gold for production during the mining at the Seligman operation and are believed to have more than adequate
| JBP/MLM | February 22, 2012 |
| SRK Consulting (U.S.), Inc. | ||||
| NI 43-101 Technical Report – Mt. Hamilton Gold Project, Centennial Deposit | Page 16 |
production capacity for the Centennial Project. MH-LLC has water rights at the location of these wells.
Additional water resources are being evaluated closer to the planned leach pad site. An initial phase hydrogeologic exploration drilling program was completed in October 2011, and results suggest that one or more wells in an alluvium-hosted aquifer could supply water needed for mining and heap leach operations. If a production well or wells can be developed at the leach pad site then this would reduce operating costs associated with project water supply. This FS assumes that water would be obtained from the more distant, Seligman Canyon site.
| 3.5.4 | Mining Personnel |
The labor force for mining at Centennial would be drawn largely from Ely and Eureka, Nevada. These local populations are part of established mining communities with producing mines nearby where a sufficient workforce of experienced open pit miners is available. All personnel would live in nearby communities and there is adequate housing available to accommodate all future personnel.
| 3.5.5 | Potential Tailings Storage Areas |
The mine plan is based on a cyanide heap leach gold and silver recovery system, and will not require a tailings storage area. Spent ore material will not be removed from the lined leach pad.
| 3.5.6 | Potential Waste Disposal Areas |
There is currently a waste rock disposal area in Cabin Gulch from the historical mining in the NE Seligman Pits. Waste rock produced during Centennial mining will also be placed at the Cabin Gulch site and in a smaller location directly upslope. The expansion of the Cabin Gulch dump will allow for reclamation of this historical disposal facility which was never reclaimed after mining was completed at the NE Seligman mine site.
| 3.5.7 | Potential Heap Leach Pad Areas |
The planned leach pad lies on private land approximately 4,500 ft southwest of the planned Centennial Pit and immediately west of the range front on pediment gravel. The ore will be transported from the mine to a primary crusher and ore pass where the crushed ore will be dropped about 350 vertical feet onto a conveyor in an underground tunnel. The conveyor will deliver ore through the portal of the tunnel directly onto the private land. Near the tunnel opening, ore will undergo secondary crushing and then be placed on the leach pad by radial stacker.
| 3.5.8 | Potential Processing Plant Sites |
The ore will be crushed and conveyed to the heap leach pad where it will be leached. Solutions will be treated by conventional ADR technology. The ADR processing plant will be located immediately adjacent to the leach pad and will have associated process ponds. No milling, flotation or vat leach processing is planned for the ores at Centennial.
| JBP/MLM | February 22, 2012 |
| SRK Consulting (U.S.), Inc. | ||||
| NI 43-101 Technical Report – Mt. Hamilton Gold Project, Centennial Deposit | Page 17 |
| 4 | History (Item 6) |
| 4.1 | Prior Ownership and Ownership Changes |
Phillips Petroleum Co. (Phillips) acquired much of the area of the current Property in 1968 and, between 1968 and 1982, drilled over 100,000 ft. in the exploration for tungsten-copper-molybdenum deposits. A study prepared for Phillips in June 1978 quoted an “ore reserve” of 6.2 Mt at a grade of 0.37% WO3 including 4.2 Mt grading 0.42% WO3, 0.37% Mo and 0.6% Cu. These data are historical and have not been reviewed by a QP. The resource is not reconciled with or compliant with CIM resource classifications; and, MH-LLC is not reporting this as a current or compliant resource estimate.
In 1984 Northern Illinois Coal, Oil and Resources Mineral Ventures, subsequently renamed Westmont Gold Inc., (Westmont) entered into a joint venture with Phillips and Queenstake Resources Ltd. to explore the property for open-pit mineable gold-silver mineralization. By early 1989, this work had defined the Seligman and Centennial gold deposits. Permitting activities for the Mt. Hamilton Project were commenced in 1988. In 1991, Westmont reported a geological resource of 11.4 Mt at 0.05 oz/t Au and 0.5 oz/t Ag (Myers et al., 1991). These data are historical and have not been reviewed by a QP. The resource is not reconciled with or compliant with CIM resource classifications; and, MH-LLC is not reporting this as a current or compliant resource estimate.
The property was transferred to Mt. Hamilton Mining Company (MHMC, a Westmont subsidiary) after November 1993. In 1993, the Mt. Hamilton resources were estimated at 10.4 Mt at 0.05 oz/t Au and 0.334 oz/t Ag in the Seligman deposit (0.02 oz/t Au cut-off) and 6.187 Mt at 0.046 oz/t Au and 0.555 oz/t Ag in the Centennial deposit (0.016 oz/t Au cut-off). These data are historical and have not been reviewed by a QP. The resource is not reconciled with or compliant with CIM resource classifications; and, MH-LLC is not reporting this as a current or compliant resource estimate.
Rea Gold Corp. acquired MHMC in June 1994 and began production of the Seligman deposit in November 1994. Rea encountered a number of operational problems during the first year of production amplified by low gold price. Rea had planned to commence mining of the Centennial deposit in 1997, which contained resources as defined below. Rea ceased mining in June 1997, but continued leaching until declaring bankruptcy in Canadian Bankruptcy Court in November 1997. Subsequently the US subsidiary, Mt. Hamilton Mines Corporation was forced into US bankruptcy when the State of Nevada rescinded their permit to purchase and use cyanide.
In 2002, the US Bankruptcy Trustee abandoned all of the unpatented claims allowing them to lapse for failure to pay the annual maintenance fees. Centennial Minerals Company LLC staked claims covering the Centennial Deposit in late 2002, and in 2003 purchased all of the patented mining claims and Fee lands from the US Bankruptcy court. Augusta, through its 100% owned subsidiary Diamond Hill Minerals Ltd (DHI), acquired a leasehold interest in the property from Centennial in late 2003. Under an agreement with Augusta Resource Corporation (Augusta) dated November 15, 2007, Ivana acquired 100% of the shares of DHI. Ivana changed its name to Ely Gold & Minerals in 2008. On August 26, 2010, Solitario signed a Letter of Intent with Ely to earn up to an 80% interest in Ely’s Mt. Hamilton gold property. In December 2010, Solitario and Ely formed MH-LLC which now holds 100% of the Mt. Hamilton project assets, and signed an LLC Operating Agreement.
| JBP/MLM | February 22, 2012 |
| SRK Consulting (U.S.), Inc. | ||||
| NI 43-101 Technical Report – Mt. Hamilton Gold Project, Centennial Deposit | Page 18 |
| 4.2 | Previous Exploration and Development Results |
As stated in Section 4.1 exploration was conducted by Phillips, Westmont and Queenstake on the northern core of the Property containing the Centennial, Seligman and tungsten-molybdenum mineralization arranged symmetrically around the Seligman intrusive stock. Ely Gold completed infill drilling and conducted additional metallurgical testing at the Centennial Deposit during 2008-10.
Additional exploration was conducted in the late 1980’s and 1990’s peripheral to the Monte Cristo stock approximately one mile to the south of the Centennial deposit. Shell Oil Company, Umont and Augusta all drilled exploration holes in this area in search of copper, and tungsten-molybdenum deposits.
The only mine development of commercial scale was by Rea Gold Corp. at the Seligman mine as described above.
| 4.3 | Historic Mineral Resource and Reserve Estimates |
All of the resources mentioned in Section 4.1 for the Seligman, Centennial and tungsten molybdenum deposits calculated by Phillips, Westmont and Rea do not comply with CIM resource classifications.
An NI 43-101 Technical Report by Scott Wilson Roscoe Postle & Associates (SWRPA) stated a CIM-compliant resource for the Project dated February 11, 2008 (SWRPA, 2008) (Table 4.3.1). SWRPA classified all resources at the Centennial deposit as inferred due to the lack of supporting documentation and drill samples.
Table 4.3.1: Centennial Inferred Resources (SWRPA 2008)
Cut-off Grade | Mt | Au (oz/t) | Au (oz) | Ag (oz/t) | Ag (oz) | |||||
| 0.016 | 12.3 | 0.034 | 415,200 | 0.177 | 2,175,000 |
Ag grade and contained ounces are in terms of NaCN soluble Ag
In 2008, Ely Gold subsequently located drill core and chips and supporting data including drill logs and assay certificates. The new materials and data were catalogued and audited by SRK. A revised resource estimate was issued by Ely Gold in an NI 43-101 compliant Technical Report and Preliminary Economic Assessment dated May 8, 2009 (SRK, 2009). The resource statement from that report is provided in Table 4.3.2 at a CoG of 0.009 oz/t Au. The cut-off grade was developed using metal prices of US$750/oz Au and US$13/oz Ag with a projected gold recovery of 73%.
Table 4.3.2: Mineral Resource Statement for Ely Gold’s Centennial Deposit 2009
In Pit | Tons | Au Grade (oz/t) | Au (oz) | Ag Grade (oz/t) | Ag (oz) | |||||||||||||||
Measured | 760,000 | 0.039 | 29,640 | 0.130 | 98,800 | |||||||||||||||
Indicated | 11,857,000 | 0.030 | 355,710 | 0.145 | 1,719,265 | |||||||||||||||
Meas+Ind | 12,617,000 | 0.031 | 385,350 | 0.144 | 1,818,065 | |||||||||||||||
Inferred | 1,491,000 | 0.012 | 17,892 | 0.122 | 181,902 | |||||||||||||||
Cut-off grade: 0.009 oz/t Au.
Gold ounces are contained metal and will be discounted in accordance with leach recovery.
Silver ounces are CN soluble and will be discounted minimally during processing and recovery.
Mineral resources that are not reserves do not have demonstrated economic viability.
| JBP/MLM | February 22, 2012 |
| SRK Consulting (U.S.), Inc. | ||||
| NI 43-101 Technical Report – Mt. Hamilton Gold Project, Centennial Deposit | Page 19 |
In the above referenced 2009 PEA, SRK on behalf of Ely Gold also reported a “Potentially Mineable Resource” as shown in Tables 4.3.3 and 4.3.4 for gold and silver respectively. These resources were quantified inside of an engineered pit design. At PEA level of study, all classifications of resources (Measured, Indicated and Inferred) can be used to evaluate economics, but by using Inferred resources, they cannot be stated as Mineral Reserves.
Table 4.3.3: 2009 Classification of Potentially Mineable Resources with Pit Design, Gold
Measured Tonnage (kt) | Measured Au Grade (oz/t) | Indicated Tonnage (kt) | Indicated Au Grade (oz/t) | Inferred Tonnage (kt) | Inferred Au Grade (oz/t) | |||||
760 | 0.039 | 11,857 | 0.030 | 1,491 | 0.012 |
Cut-off grade: 0.009 oz/t Au
Table 4.3.4: 2009 Classification of Potentially Mineable Resources with Pit Design, Silver
Measured Tonnage (kt) | Measured Ag Grade (oz/t) | Indicated Tonnage (kt) | Indicated Ag Grade (oz/t) | Inferred Tonnage (kt) | Inferred Ag Grade (oz/t) | |||||||||||||||
760 | 0.130 | 11,857 | 0.145 | 1,491 | 0.122 | |||||||||||||||
Cut-off grade: 0.009 oz/t Au
In Tables 4.3.3 and 4.3.4 Potentially Mineable Resources were developed using metal prices and recoveries appropriate at the time. Specifically, the gold price used was US$750/oz and the silver price was US$13/oz with a gold recovery of 73% and a silver recovery of 36%.
In 2010 with metal prices up sharply, Ely Gold requested SRK to update the economic evaluation for Centennial from which they issued a new PEA (SRK, 2010). In the 2010 PEA Potentially Mineable Resources were re-estimated as shown in Tables 4.3.5 and 4.3.6 for gold and silver respectively. The underlying resource block model was unchanged from 2009 to 2010. Metal prices used in the 2010 update were US$900/oz gold and US$15/oz silver. Gold recovery was increased from 73% to 75%, based on favorable metallurgical results that were received in the time period between the two reports. The combination of higher metal prices and higher recovery estimates resulted in a lower CoG calculation of 0.0065 oz/t Au for the 2010 statement.
Table 4.3.5: 2010 Classification of Potentially Mineable Resources with Pit Design, Gold
Measured Tonnage (kt) | Measured Au Grade (oz/t) | Indicated Tonnage (kt) | Indicated Au Grade (oz/t) | Inferred Tonnage (kt) | Inferred Au Grade (oz/t) | |||||||||||||||
823 | 0.037 | 13,534 | 0.028 | 3,369 | 0.010 | |||||||||||||||
Cut-off grade: 0.0065 oz/t Au
Table 4.3.6: 2010 Classification of Potentially Mineable Resources with Pit Design, Silver
Measured Tonnage (kt) | Measured Ag Grade (oz/t) | Indicated Tonnage (kt) | Indicated Ag Grade (oz/t) | Inferred Tonnage (kt) | Inferred Ag Grade (oz/t) | |||||||||||||||
823 | 0.129 | 13,534 | 0.153 | 3,369 | 0.129 | |||||||||||||||
|
|
|
|
|
|
|
|
|
| |||||||||||
Cut-off grade: 0.0065 oz/t Au
| JBP/MLM | February 22, 2012 |
| SRK Consulting (U.S.), Inc. | ||||
| NI 43-101 Technical Report – Mt. Hamilton Gold Project, Centennial Deposit | Page 20 |
| 4.4 | Historic Production |
Between 1994 to1997, production by Rea from the NE Seligman mine is reported to be 124,000 oz Au and 310,250 oz Ag. The haul road was extended to the Centennial pit area and the area of the starter pit was clear-cut and grubbed of vegetation in preparation for preproduction stripping which was scheduled to begin in 1997, but was never initiated. Hence, there has been no historic production from the Centennial deposit.
| JBP/MLM | February 22, 2012 |
| SRK Consulting (U.S.), Inc. | ||||
| NI 43-101 Technical Report – Mt. Hamilton Gold Project, Centennial Deposit | Page 21 |
| 5 | Geological Setting and Mineralization (Item 7) |
| 5.1 | Regional Geology |
The Mt. Hamilton Property is located in the White Pine Mountains, which are in the eastern sector of the Great Basin in east-central Nevada. This region was subjected to east to west compression during the Sevier and Laramide orogenies in the Cretaceous and early Tertiary. This compression resulted in the formation of broadly north-trending folds and thrust faults. Two major folds are present in the project area: the Hoppe Springs anticline (into which the Seligman stock has intruded) and the Silver Bell syncline to the west. Scattered magmatism was common during this time period, as evidenced in the Mt. Hamilton area by the Cretaceous Seligman and Monte Cristo stocks, which are dated at 104.5 to 106.6 Ma (K-Ar, biotite) and 101.2 Ma (K-Ar, biotite), respectively. Base- and precious-metal deposits related to igneous activity of this general age are widespread across western North America.
Extension beginning in the middle Tertiary has affected much of southwestern North America, resulting in the basin and range style of physiography that is present from southern Oregon to central Mexico. The White Pine Mountains are one of the many mountain ranges that have been uplifted along north-striking steeply dipping normal faults. A map of the regional geology is shown in Figure 5-1 (Crafford, A.E.J, 2007).
| 5.2 | Local and Property Geology |
The Mt. Hamilton Property is located near the southern end of the Battle Mountain Gold Trend, a northwest-oriented trend that contains several major gold mines as well as dozens of smaller mines and prospects and together with the Carlin trend to the northeast are the two largest gold belts in Nevada. The property consists of gently folded Cambrian-age sedimentary rocks intruded by the Monte Cristo and Seligman stocks. A map of local geology in Figure 5-2 shows the location of the igneous intrusive units relative to existing and planned open pit excavations (Crafford, A.E.J, 2007).
| 5.2.1 | Stratigraphy |
Burgoyne (1993, p. 2) provides a succinct summary of the sedimentary and igneous rock sequence at the Mt. Hamilton Property:
“Sedimentary rocks in the Mount Hamilton area range from Middle Cambrian to Pennsylvanian [age]. Stratigraphic units include the middle Cambrian Eldorado Dolomite, Geddes Limestone, and Secret Canyon Shale and the Upper Cambrian Dunderberg Shale.
The Eldorado Dolomite, the oldest formation in the area, consists of gray to white stromatalitic dolomite up to 660 ft thick. The Geddes Limestone overlies the Eldorado Dolomite and deep drilling indicates that the Eldorado Dolomite-Geddes Limestone contact is a breccia zone. The Geddes Limestone consists of dark gray, platy limestone and has a thickness in excess of 100 ft.
The Secret Canyon Shale accounts for the majority of the sedimentary sequence in the project area and is about 1,000 ft thick. It consists of four sub-units: a basal thin-bedded pale green shale, a thin-bedded limestone with shale partings, a thin-bedded greenish shale, and an uppermost series of interbedded limestone and shale.
| JBP/MLM | February 22, 2012 |
| SRK Consulting (U.S.), Inc. | ||||
| NI 43-101 Technical Report – Mt. Hamilton Gold Project, Centennial Deposit | Page 22 |
The Dunderberg Shale disconformably overlies the Secret Canyon Shale and is 400 to 1,000 ft thick. This formation consists of a basal greenish shale and mudstone with thin limestone interbeds. A middle sequence of interbedded carbonaceous shale and limestone with shale partings forms the bulk of the formation. An uppermost sequence consists of thinly bedded, nodular limestone with shale partings.
The sedimentary sequence has been intruded by two stocks of Cretaceous age. The Seligman stock is a medium-grained, hornblende-biotite granodiorite. The stock is elongated in a north-south direction along the axis of the Hoppe Springs anticline. Potassium-argon age dating on the biotite gives [ages] of 104.5 to 106.6 million years.
The Monte Cristo stock, composed of biotite granite-porphyry, is located 0.6mi southwest of the Seligman stock. The stock displays extensive quartz stockwork [veining] and quartz flooding. Potassium-argon age dating on biotite gives [an age of] 101.2 million years.
Several dykes and sills occur throughout the area and range from 3 to 30 ft thick and are compositionally similar to the Seligman and Monte Cristo stocks.”
| 5.2.2 | Alteration |
A description of the alteration at Mt. Hamilton is provided by Burgoyne (1993):
“Alteration within the Seligman stock is marked by secondary biotite (potassic alteration), propylitic alteration of mafic minerals and plagioclase to chlorite, epidote, and calcite. Sericitic alteration is associated with pervasive silicification and locally with extensive pyrite.
A hydrothermal alteration aureole is present in the sedimentary rocks concentrically about the Monte Cristo and Seligman stocks. The alteration aureole is about 3 mi long by 1.5mi wide. Alteration is complex but an early first stage is represented by the formation of hornfels, a dominantly metamorphic stage. A later cross-cutting, metasomatic [alteration phase] resulted in the formation of skarn.
The hornfels stage has altered shales and calcareous shales to fine grained, pale green diopside-quartz-potassium feldspar proximal to the intrusives. This alteration grades outward to fine-grained biotite-quartz hornfels distal to the intrusives. The shales have been bleached and silicified up to several hundred feet beyond the biotite hornfels. The limestone layers within the shales have been altered to medium-grained marble with occasional fine-to-medium grained tremolite or wollastonite, often with garnet, developed at the limestone-shale contacts.
The transition from hornfels to skarn is marked by increasing iron content in the pyroxene and the formation of andraditic garnet.
Retrograde alteration or extensive oxidation and breakdown of primary mineralogy is limited in extent and consists of two periods. The earliest and most common (Type I) is garnet altered to quartz, calcite, and pyrite. The later alteration (Type 2) is represented by gold and silver mineralization and is represented by the alteration of garnet and pyroxene to quartz, epidote, iron oxides, actinolite, chlorite, and manganese enriched epidote.”
| JBP/MLM | February 22, 2012 |
| SRK Consulting (U.S.), Inc. | ||||
| NI 43-101 Technical Report – Mt. Hamilton Gold Project, Centennial Deposit | Page 23 |
| 5.2.3 | Structure |
A description of the structural control of mineralization at Mt. Hamilton is provided by Burgoyne (1993):
“The main Centennial mineralization is contained within a south dipping (15°-20°) tabular zone that ranges from 20 to 250 ft thickness. It is postulated that northwest and northeast feeder faults containing gold-silver mineralization are present.
[At nearby NE Seligman] ore grade mineralization appears to be largely stratiform in shallow-dipping, bedding-parallel, structurally and chemically prepared zones with local high-angle, cross-cutting, possible “feeder” zones.”
| 5.3 | Significant Mineralized Zones |
Two zones of gold mineralization have been recognized at Mt. Hamilton: the NE Seligman and Centennial Zones. Prior to mining, the NE Seligman deposits were modeled as shallow-dipping zones approximately 3,300 ft by 1,000 ft, averaging 50 ft in thickness. During mining, REA Gold found that some high-grade mineralized zones at NE Seligman appeared to be controlled by steeply, north dipping fractures and shear zones.
At Centennial the mineralization is controlled by late low-angle structures that are discordant to bedding and oxidized to significant depth. The low-angle structures dip to the SSE at approximately 10-15°, and carry the majority of the oxide mineralization. Natural weathering and oxidation of original sulfide mineralization caused formation of oxide mineralization (with low sulfide mineral residuals) from which gold is recoverable by cyanide heap leaching. The acid generating capacity of the surrounding carbonate rocks is low or nil, and their acid consuming capacity is high. Gold is present as free gold, residing in iron oxide minerals or quartz, and adsorbed on clay minerals.
Gold occurs predominantly in zones of retrograde alteration and, to a minor extent, in prograde garnet-pyroxene skarn. The retrograde alteration zones are comprised of a quartz-goethite-epidote-calcite assemblage that replaces garnet-pyroxene skarn. Gold grades of samples within the retrograde alteration range from <0.001 oz/t Au (lower analytical method detection limit) to 0.995 oz/t. The occasional high grades appear to be associated with crosscutting structures and veins within the skarn as described below. In the Centennial gold database, a total of seven values were greater than the 0.36 oz/t value used as a cap for the resource estimate.
Sulfosalt-bearing veins consisting primarily of quartz and stibnite with minor, variable amounts of sphalerite, galena, pyrite, covellite, bornite, chalcopyrite, bournonite and jamesonite typically occur within the mineralized zones and may be associated locally with the higher grades of gold. These veins cut both skarn and intrusive rocks and are closely associated with zones of retrograde alteration. These veins range in thickness from about 2 cm to 60 cm. As seen in the mine excavations of the NE Seligman deposit, these veins seem to exhibit strong continuity along strike.
| JBP/MLM | February 22, 2012 |
| SRK Consulting (U.S.), Inc. | ||||
| NI 43-101 Technical Report – Mt. Hamilton Gold Project, Centennial Deposit | Page 24 |
Figure 5-1: Western White Pine County Regional Geology Map
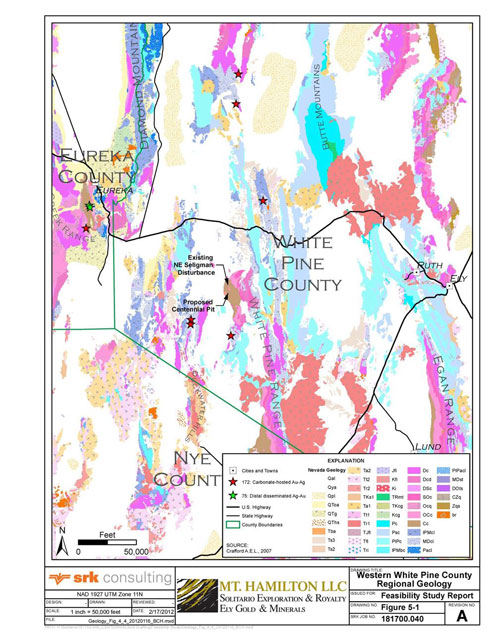
| JBP/MLM | February 22, 2012 |
| SRK Consulting (U.S.), Inc. | ||||
| NI 43-101 Technical Report – Mt. Hamilton Gold Project, Centennial Deposit | Page 25 |
Figure 5-2: Centennial Project Area Local Geology Map
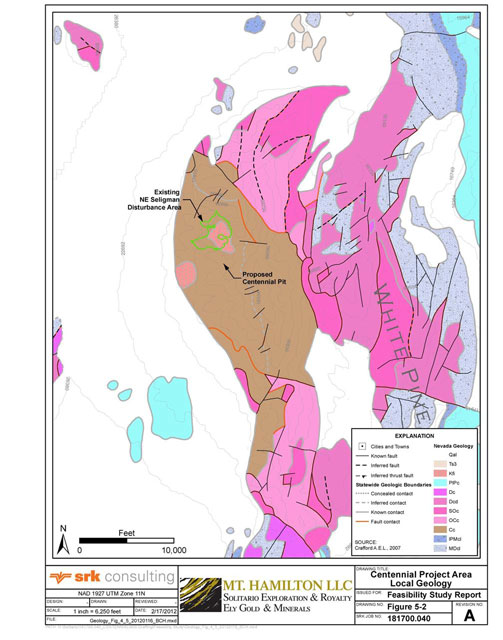
| JBP/MLM | February 22, 2012 |
| SRK Consulting (U.S.), Inc. | ||||
| NI 43-101 Technical Report – Mt. Hamilton Gold Project, Centennial Deposit | Page 26 |
| 6 | Deposit Type (Item 8) |
The mineralization associated with the Seligman stock, including the NE Seligman and Centennial deposits as well as other less-explored occurrences, is described by SWRPA as the polymetallic skarn deposit type (Myers et al., 1991). Deposits of this type have been described by numerous authors, including G.E. Ray of the British Columbia Geological Survey. Typically, these deposits range from 0.4 Mt to 13 Mt and from 2 g/t (0.065 oz/t) Au to 15 g/t (0.48 oz/t) Au, with median grades and tonnage of 8.6 g/t (0.28 oz/t) Au, 5.0 g/t (0.16 oz/t) Ag and 213,000 t. Nickel Plate (Hedley District, BC) produced over 71 t of Au from 13.4 Mt of ore (grading 5.3 g/t [0.17 oz/t] Au). The 10.3 Mt Fortitude deposit (Battle Mountain Gold Trend, Nevada) graded 6.9 g/t (0.22 oz/t) Au, whereas the 13.2 Mt McCoy skarn (Nevada) graded 1.5 g/t (0.048 oz/t) Au (Ray, G.E, 1988).
More recent work suggests that the gold deposits at NE Seligman and Centennial are actually epithermal deposits that were controlled by structures that cut the skarn-altered carbonate rocks and are not directly associated with fluids related to contact metasomatism.
| 6.1 | Mineral Deposit |
Mineralization at Mt. Hamilton consists of skarn-hosted tungsten, molybdenum, and copper. Late stage epithermal activity with associated gold and silver mineralization overprinted the older skarn alteration. Metal mineralization appears to have been emplaced in several separate events. Tungsten, as scheelite, is disseminated in thin-bedded skarn zones within diopsidic hornfels or skarn replacements of the Secret Canyon Shale, and overlying dolomite and shale of the Dunderberg Shale, and is locally associated with massive garnet-pyroxenite skarns that replace limestone beds. Tungsten grades are locally as high as 2% WO3 but generally range in the tens to hundreds of parts per million (ppm).
Molybdenum is associated with prograde pyroxene-dominant skarn and grades range from tens to hundreds of ppm Mo. Silicified molybdenum-bearing breccias cut both the NE Seligman stock and adjacent pyroxene-tremolite hornfels. Molybdenum mineralization is in part contemporaneous with, and in part post-dates the tungsten mineralization.
Copper, as chalcopyrite, is disseminated within garnet-pyroxene skarn, occurs primarily southeast of the Seligman stock, and appears to be cogenetic with tungsten and molybdenum. Cu grades are usually <250 ppm. Zinc is associated with garnet-pyroxene skarn and locally grades up to 3%.
| 6.2 | Geological Model |
Centennial is hosted by a polymetallic skarn overprinted by late-stage epithermal gold mineralization concentrated along two shallowly dipping faults that provided ingress to hydrothermal fluids likely sourced from the Seligman stock, or a related intrusion. Early metasomatic alteration converted shales and silty carbonates of the upper Secret Canyon shale (and/or Hamburg dolomite) to hornfels (after shales) and calc-silicate skarn (after silty carbonates). Gold mineralization is primarily hosted in a 200-300 ft thick skarn horizon, bounded by upper (200 ft thick) and lower (450 ft thick) hornfels units. The bounding hornfels had lower permeability and were therefore less receptive to late-stage mineralization. The interbedded skarn was subject to late-stage, low-angle faulting. These faults were conduits to late mineralizing solutions and oxidation. The result is an oxide-hosted epithermal gold deposit overprinting a retrograde polymetallic skarn.
| JBP/MLM | February 22, 2012 |
| SRK Consulting (U.S.), Inc. | ||||
| NI 43-101 Technical Report – Mt. Hamilton Gold Project, Centennial Deposit | Page 27 |
| 7 | Exploration (Item 9) |
Most of the exploration work done by Ely Gold and Solitario at the Centennial Project was borehole drilling and sampling for resource definition. Drilling methods, sample preparation and analysis methods for gold and silver are discussed below in Sections 8 and 9. The majority of drilling was in the Centennial resource area. Several holes were drilled in the Chester Prospect area, south and slightly east of Centennial.
During the 2011 field season, a surface mapping program was conducted in the planned Centennial Pit area. No other exploration sampling or survey work has been done at the Centennial Project since Ely Gold assumed ownership of the property.
| 7.1 | Relevant Exploration Work |
Previous property owners conducted extensive exploration programs on the property, including mapping, surface geochemical sampling, and exploratory drilling. The methods and results from these programs are elaborated in the SRK PEA document, and were determined to be conducted according to industry standard practices.
| 7.2 | Surveys and Investigations |
Surface geologic mapping was done in the fall of 2011 by a Solitario staff geologist. The area surveyed included the vicinity north and east of the Monte Cristo stock. The intent was to identify marker beds favorable for mineralization in the Centennial area, and tie the new data to data in the Westmont surface geology map produced during the 1980’s and 90’s.
| 7.2.1 | Procedures and Parameters |
Surface mapping data are currently stored in a digital MapInfo database. Mapping methods include measurement of feature orientation and description of materials according to standard geologic mapping practices.
| 7.3 | Sampling Methods and Quality |
Bore hole logging and sampling methods are described in the following sections. No other materials were sampled or analyzed during recent additional exploration programs.
| 7.4 | Significant Results and Interpretation |
To date, results from the surface geologic mapping program have not been applied to additional exploration plans. Integration of the new data with previous mapping in the area is intended in 2012.
| JBP/MLM | February 22, 2012 |
| SRK Consulting (U.S.), Inc. | ||||
| NI 43-101 Technical Report – Mt. Hamilton Gold Project, Centennial Deposit | Page 28 |
| 8 | Drilling (Item 10) |
Drilling in the Mt. Hamilton district is shown in Figure 8-1. Recent resource definition and related drilling at Centennial was completed by Solitario in the Centennial area. Ely Gold also completed a drilling program in 2008. Sample QA/QC analytical results from the 2008, 2010 and 2011 drilling programs are discussed in Section 9. A summary of the drill hole database, drilling methods and sampling procedures used for these programs is presented in Section 8.
Drilling completed prior to 2008 was evaluated for the SRK PEA Report (2009), and the associated data set was determined to be sufficiently verifiable for use in a CIM-compliant resource estimate. Drilling results from 2008, 2010 and 2011 are discussed in this document.
| 8.1 | Type and Extent |
New data included in the resource model is from two phases of diamond core drilling (2.5 inch HQ diameter) in the Centennial Deposit area. The drilling program completed during the 2011 field season provided material for metallurgical testing that will also be discussed in this report. These drill holes were designed to confirm the resource and provide material for geotechnical and metallurgical testing. Drilling completed by previous property owners is extensive, but not all drill samples were analyzed for gold and silver. Table 8.1.1 summarizes all drilling completed in the Mt. Hamilton Complex area, and compares it to drill holes with gold values for select intervals. The drill holes with gold values are highlighted in Figure 8-2. Many of the historic drill holes across the Mt Hamilton complex have assay data for very select intervals, and do not provide a complete profile of mineralization.
Table 8.1.1: Drilling Completed at the Mount Hamilton Complex
Company | Hole Type | Number of Holes | Total Length Drilled (ft) | Holes with Gold Assays | Total Length, Holes with Gold Assays (ft) | |||||||||||||
Pre- Ely Gold | RC | 852 | 256,009 | 304 | 112,593 | |||||||||||||
Pre- Ely Gold | Core | 26 | 9,219 | 7 | 2,666 | |||||||||||||
Ely Gold | HQ Core | 5 | 2,241 | 5 | 2,241 | |||||||||||||
Solitario | HQ Core | 12 | 7,121 | 12 | 7,121 | |||||||||||||
Solitario | RC | 6 | 3,625 | 6 | 3,625 | |||||||||||||
The Centennial resource model is spatially limited to exclude NE Seligman, Chester, and other prospect areas. Table 8.1.2 shows the spatial extents that bound the Centennial resource model. Drill holes that are collared in the Centennial model area are described in Table 8.1.3. Drilling completed in 2008, by Ely Gold, included one drill hole southeast of the Centennial area. The more recent drilling completed by Solitario included three exploration drill holes in the Chester prospect southeast of Centennial.
Table 8.1.2: Centennial Resource Model Extents
Model Extents | Easting | Northing | ||||||
Minimum (ft) | 506,000 | 635,680 | ||||||
Maximum (ft) | 508,220 | 638,600 | ||||||
| JBP/MLM | February 22, 2012 |
| SRK Consulting (U.S.), Inc. | ||||
| NI 43-101 Technical Report – Mt. Hamilton Gold Project, Centennial Deposit | Page 29 |
Table 8.1.3: Drilling in the Centennial Model Area
Company | Hole Type | Number of Holes | Total Length Drilled (ft) | Holes with Gold Values | Total Length, Holes with Gold Values (ft) | |||||||||||||
Pre- Ely Gold | RC | 297 | 112,649 | 284 | 107,553 | |||||||||||||
Pre- Ely Gold | Core | 8 | 3,029 | 7 | 2,666 | |||||||||||||
Ely Gold | Core | 4 | 1,595 | 4 | 1,595 | |||||||||||||
Solitario | Core | 12 | 7,121 | 12 | 7,121 | |||||||||||||
Solitario | RC | 3 | 1,300 | 3 | 1,300 | |||||||||||||
The drill holes in Centennial consistently have gold and silver assays- 95.6% of pre- Ely Gold drill holes have at least some gold and silver data, and all of the more recent drilling has been assayed for gold and silver.
| 8.2 | Procedures |
Drill core and reverse circulation (RC) chip samples are collected differently. Sampling RC boreholes for geochemical analysis is done at the rig, during borehole advance, and drill core sampling is done in the core shed in Ely, Nevada after photographing, logging and saw-splitting the core. Both procedures are elaborated below. Representative samples from boreholes are logged for mineralogy, lithology and other available parameters. Geologic data is digitally tabulated and added to the drill hole database as it is available.
After sampling was completed, all drill hole samples were delivered to ALS Chemex (2008) or American Assay Labs (2010-2011), both in Sparks, Nevada. Samples were initially analyzed for gold by fire assay (FA), and a suite of elements including silver with a 2-acid sample digestion and Inductively-Coupled Plasma-Mass Spectrometry (ICP). Select mineralized intervals from 2008 and 2010 drill holes were subsequently analyzed for cyanide-soluble gold and silver between April and June of 2011. Sample selection for cyanide-soluble gold and silver analysis from 2011 program drill hole samples was concurrent with data collection for this report.
All drill holes were surveyed down hole to map deviation so individual drill samples are located accurately in three dimensions for modeling.
| 8.2.1 | Drill Core Sampling |
After photographing and geologic logging was completed, drill core was sawn in two equal halves with a diamond-blade rock saw. One continuous half of the core was sampled, except in zones of incompetent rock. In these zones, a representative half of the recovered material was sampled. Drill core was generally sampled on geologic criteria, in lengths between 1.5 ft and 5.0 ft along the core axis. In zones of relatively homogeneous mineralogy and geology, samples are 5 ft long. Samples were placed in appropriately marked cloth sample bags and prepared for transport to the analytical laboratory. The remaining half-core remains in the core boxes for future reference or additional testing, if needed. Standard Reference Material (SRM) samples were included in the core sample sequence at a frequency greater than the minimum industry requirement, and provide robust data verification for FA gold and ICP silver results. Materials used are discussed below.
| JBP/MLM | February 22, 2012 |
| SRK Consulting (U.S.), Inc. | ||||
| NI 43-101 Technical Report – Mt. Hamilton Gold Project, Centennial Deposit | Page 30 |
| 8.2.2 | Reverse Circulation Drill Sampling |
The RC drilling procedure consists of impact- and rotation-driven borehole advance with a hammer bit on the end of the string of double-walled pipe. The cuttings are sent up the center chamber of the pipe by air and water injected into the outside chamber, to an enclosed cyclone that splits the sample with a rotating bladed funnel. Approximately half of the volume of cuttings is collected from one of two cyclone outlets during borehole advance.
RC drilling provides a relatively large sample as compared to diamond core drilling. Typical RC drill bit diameter is 5 5/8 inches, while the standard core drilling bit, HQ diameter, is 2.5 inches. A larger sample is advantageous in mineral deposits with highly variable grades. RC drilling also requires less material consumption, has greater penetration rates in most ground conditions, and can be adapted to adverse ground conditions more easily than core drilling. Some of the drawbacks of RC drilling are potential sampling bias and cross-contamination, which can be mitigated by the driller and samplers applying best practice procedures during borehole advance. Sampling bias can be accentuated with the injection of water as a dust control measure, which is required for drilling in the United States. During drilling, care must be taken to keep the rotating riffle splitter funnel in the cyclone from clogging up with mud and potentially biasing the split. Borehole samples are collected from the same of two discharge ports during hole advance.
At Centennial, sample intervals 5 ft long are collected from the entire borehole. Sampling starts at the surface, and assay results for the entire length drilled are included in the database for most RC bore holes. Sample identification codes are a concatenation of the drill hole ID and a sequential number, e.g. MH11002 001. They are associated with the drill hole ID and the depth from and depth to in the assay database for 3-D resource modeling. Sample ID codes are marked on cloth sample bags with indelible marker and are ready before the interval is drilled. Cloth bags allow excess moisture to seep out while retaining fine-grained particles.
Sample bags are collected from the drill rig and transported to the analytical laboratory at timely intervals, by Solitario staff. Sample security on site and during transportation is maintained until the samples are relinquished to the analytical laboratory.
After the bore hole is drilled, it is backfilled with bentonite chips and a surface marker is left to survey later. The drill hole collar locations were surveyed by Basin Engineering, Ely, Nevada, with a Trimble R8 GNSS system, to easting/northing precision of 5 cm, and elevation precision 10 cm.
| 8.2.3 | Standard Reference Material Samples |
Analysis of standard reference material (SRM) samples with known metal abundance is part of the exploration industry standard practices to assess the quality of sample preparation and analytical procedures and to verify results that serve as the foundation of resource models. The SRM used for drill hole samples at Centennial were made from natural materials, and all steps in the preparation and data analysis process were overseen by Shea Clark Smith, C.P.G., at MEG Labs in Washoe City, Nevada. Materials used in this evaluation have statistically significant mean and standard deviation values, which are shown in Table 8.2.3.1. No SRM samples for cyanide-soluble (CN) gold and silver analysis were used.
Blank samples are barren material known to be absent of the metals of interest at the applied method detection limits. Coarse blank materials were used for all drilling programs; initially, a
| JBP/MLM | February 22, 2012 |
| SRK Consulting (U.S.), Inc. | ||||
| NI 43-101 Technical Report – Mt. Hamilton Gold Project, Centennial Deposit | Page 31 |
certified rhyolite was used, until the Solitario staff began using landscape marble rock instead. Metrics to evaluate the “Marble Blank” results are based on the method detection limits because this material is assumed to be void of precious metals and it does not have certified mean values.
Table 8.2.3.1: Certified Values of Standard Reference Materials used at Centennial
Sample Type | Average Gold | Standard Deviation Gold | Gold Min. 95% Confidence Interval | Gold Max. 95% Confidence Interval | Average Silver | |||||||||||||||
MEGAu.09.01 | 0.68 | 0.01 | 0.54 | 0.83 | 9.58 | |||||||||||||||
MEGAu.09.03 | 2.09 | 0.16 | 1.75 | 2.42 | 17.22 | |||||||||||||||
MEGAu.09.04 | 3.39 | 0.2 | 2.99 | 3.8 | 26.27 | |||||||||||||||
Prep Blank | 0.009 | 0.006 | — | — | 0.1 | |||||||||||||||
S104007x | 0.75 | 0.01 | 0.71 | 0.78 | 40 | |||||||||||||||
S104011x | 7.12 | 0.3 | — | — | 0.6 | |||||||||||||||
S105005x | 2.41 | 0.08 | 2.25 | 2.58 | 4 | |||||||||||||||
2008 Drilling
The three types of reference materials used for 2008 drill samples were provided to Augusta Resources by MEG Labs. These are identical blanks and standards to those used during the 1996 and 1997 drill programs. The analytical values of these materials are not certified because they did not have complete round-robin analysis of at least 20 samples at least four different analytical labs. MEG Labs was contacted to verify the quality of these samples and to request the mean values of select elements. No mean values for gold were calculated, so these seven samples are not applicable for the Centennial resource verification. At that time, SRK was informed that these data were confidential and the samples were intended for internal verification of Augusta’s analytical results. Thus, the results from these SRM samples are not considered in the assessment of the 2008 drilling results.
The suite of SRM samples used for 2008 drill samples included a coarse (>1 inch clast size) rhyolite Prep Blank sample. Material of this size fraction passes through all steps of the sample prep process, and is preferable to the standard silica sand material that many exploration companies use. Coarse blank sample material was used to ensure the sample preparation equipment is cleaned properly, in addition to ensuring a systematic high bias in analytical results does not exist.
2010-2011 Drilling
SRM samples for these drilling programs were from the certified MEGAu09XX series of materials for gold and silver. Blank materials used were coarse rhyolite for the initial 2010 drilling, and coarse marble for the balance. All results are applicable to assessing the quality of the analytical data from 2010 and 2011 drilling programs.
| 8.3 | Interpretation and Relevant Results |
8.3.1 Field Duplicate Results- 2011 RC Drilling
Fire assay analysis results for gold are reported by the certified laboratory in ppm and oz/t and delivered as digital tabular data files and digital certificates for incorporation to the database and secure archives. Data are reviewed and QA/QC sample results are considered before data are
| JBP/MLM | February 22, 2012 |
| SRK Consulting (U.S.), Inc. | ||||
| NI 43-101 Technical Report – Mt. Hamilton Gold Project, Centennial Deposit | Page 32 |
added to the master database. Values in ppm are used for verification statistics, because these values have greater precision than values in oz/t, and the SRM certified values are reported in ppm.
One of the measures used to verify quality of the RC drill samples is the collection and analysis of rig duplicate samples. Every 20 samples, or 100 ft drilled, both splits of the sample interval were collected from the cyclone splitter. Samples were treated as distinct intervals by the lab, and comparison of the interval pairs provides insight in sampling consistency. Comparison of historic and recent drill sample results was also done. Although the results of the 2011 drilling program are not included in this iteration of the resource model, they substantiate the existing body of drillhole assay data. Drill rig duplicate samples from 2011 drilling and twin hole comparisons are discussed below.
Results from 34 original and duplicate sample pairs are graphed in Figure 8-3, and show that there is substantial variation between original and duplicate sample grades. The original value +/- 30% range is marked with blue lines on the graph, and is typically used as a benchmark for comparison of field duplicate samples. Two of the three ore-grade original samples have duplicate values within 30%. Four other sample pairs have duplicate results above CoG, and sub-grade original samples.
Other calculations to compare results of sample pairs may show trends more clearly. The difference vs. average value for the duplicate pairs is graphed in Figure 8-4. Curved blue lines bracket the target values +/- 30% of the mean duplicate pair value. These parameters show the change in variance increases with gold grade. This pattern is typical for gold deposits. Available field duplicate results of this relatively small but statistically significant data set do not indicate sample bias trends. Despite the observed variability, these results do not necessarily indicate poor sample quality.
Another parameter to consider for pairs of duplicate samples is relative percent difference (RPD), as the quotient of the difference and average value. The resulting value is a unitless ratio.
RPD = ([original] ppm - [duplicate] ppm) / (([original] ppm + [duplicate] ppm) / 2)
Relative percent difference vs. average gold grade for each sample pair is plotted in Figure 8-5. Compared to the difference vs. average grade data, the calculated RPD data appear to have more variation overall, especially at low average grades. A slightly high bias in ore-grade duplicate samples is also evident in this data set.
One of the challenges of RC drilling is to collect unbiased samples. As the cuttings travel from the face of the bit and out the cyclone in water-based slurry, there are many opportunities for fractionation of material by particle size and density. Maintaining clean equipment, and watching for material build-up, especially in the cyclone, is often the most effective way of ensuring sample quality.
| JBP/MLM | February 22, 2012 |
| SRK Consulting (U.S.), Inc. | ||||
| NI 43-101 Technical Report – Mt. Hamilton Gold Project, Centennial Deposit | Page 33 |
Figure 8-1: Mt. Hamilton District Drill Hole Location Map
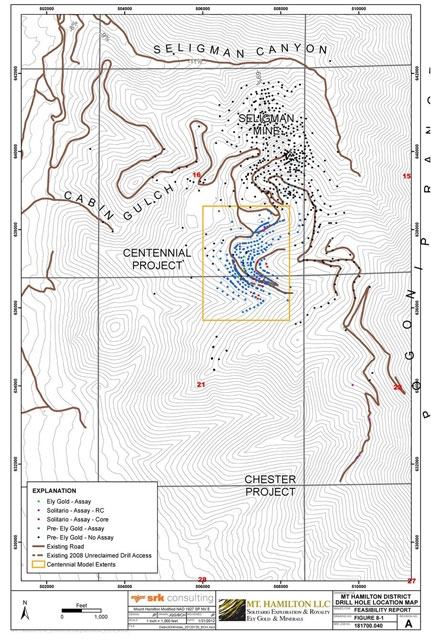
| JBP/MLM | February 22, 2012 |
| SRK Consulting (U.S.), Inc. | ||||
| NI 43-101 Technical Report – Mt. Hamilton Gold Project, Centennial Deposit | Page 34 |
Figure 8-2: Centennial Area Drill Hole Location Map
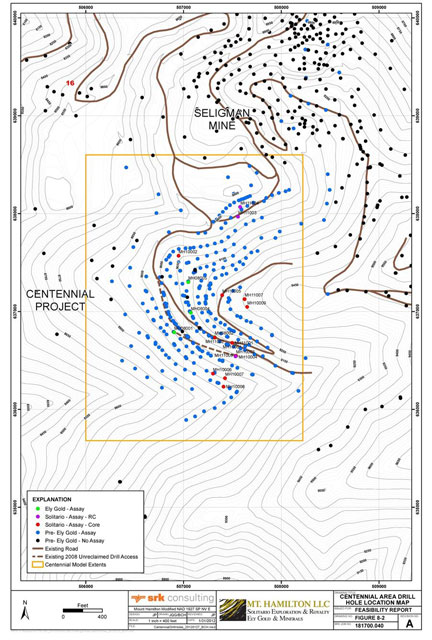
| JBP/MLM | February 22, 2012 |
| SRK Consulting (U.S.), Inc. | ||||
| NI 43-101 Technical Report – Mt. Hamilton Gold Project, Centennial Deposit | Page 35 |
Figure 8-3: Duplicate vs. Original Results, RC Field Duplicate Samples
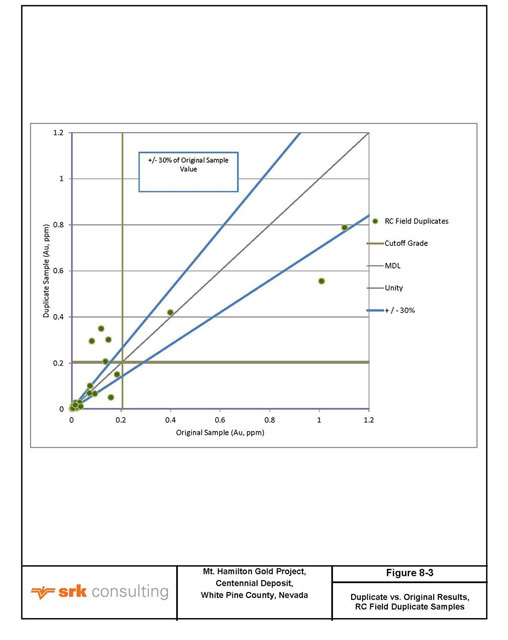
| JBP/MLM | February 22, 2012 |
| SRK Consulting (U.S.), Inc. | ||||
| NI 43-101 Technical Report – Mt. Hamilton Gold Project, Centennial Deposit | Page 36 |
Figure 8-4: Difference vs. Average Value, RC Field Duplicate Sample Pairs
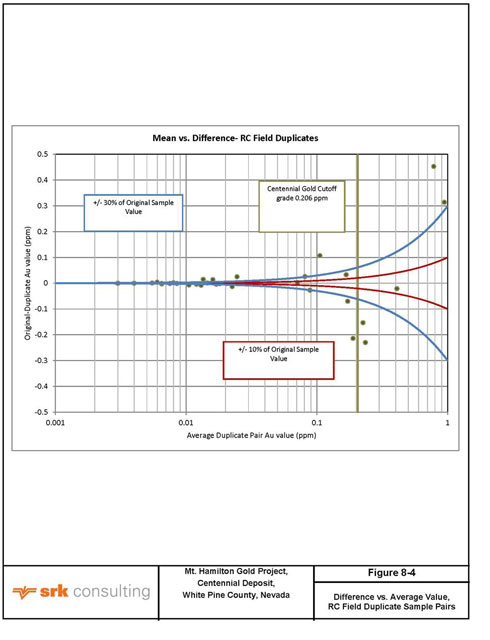
| JBP/MLM | February 22, 2012 |
| SRK Consulting (U.S.), Inc. | ||||
| NI 43-101 Technical Report – Mt. Hamilton Gold Project, Centennial Deposit | Page 37 |
Figure 8-5: Relative Percent Difference vs. Average Value, RC Field Duplicate Pairs
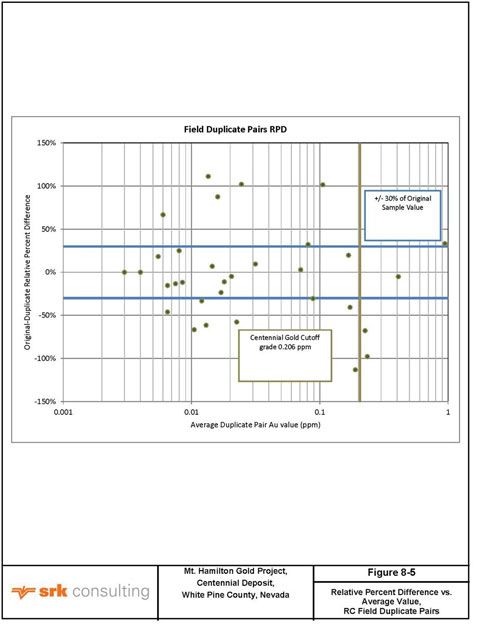
| JBP/MLM | February 22, 2012 |
| SRK Consulting (U.S.), Inc. | ||||
| NI 43-101 Technical Report – Mt. Hamilton Gold Project, Centennial Deposit | Page 38 |
| 9 | Sample Preparation, Analysis and Security (Item 11) |
For all Ely Gold and Solitario drilling programs, independent and reputable laboratories performed all steps of the sample preparation and analysis process. Samples were delivered to either of two laboratories in Sparks or Elko, Nevada by Company staff or consultants. Samples from the 2008 drilling program were prepared and analyzed for gold, silver and bulk geochemistry at ALS Chemex (ALS); samples from the 2010 and 2011 drilling programs were prepared and analyzed with comparable methods at American Assay Laboratories (AAL).
| 9.1 | Methods |
All samples submitted were analyzed for gold using a fire assay process with atomic absorption spectroscopy (AAS), and samples from most drill holes were also analyzed for whole-rock geochemistry including silver, with a two-acid digestion, Inductively-Coupled Plasma Mass Spectroscopy (ICP-MS) process. Pulp material consumed by these processes is 30 g and 0.5 g, respectively. Select mineralized intervals were later analyzed for cyanide-soluble (CN) gold and silver with a cyanide extraction and AAS solution analysis. This CN-soluble analysis was done at AAL for all samples, and consumed 30 g of pulp sample.
| 9.2 | Security Measures |
After an RC hole was completed, samples were loaded for transport to the assay lab from the drill site. Until samples were delivered, they remained under supervision by company staff or contractors. Boxes of drill core were periodically loaded and transported to the Solitario core shed in Ely for logging and splitting. Until sampling was completed and the bagged half-core samples were delivered to the analytical laboratory, they remained under secure control, under the supervision of Company staff or contractors at the company.
| 9.3 | Sample Preparation |
Sample preparation was done at ALS for 2008 drill samples, and AAL for subsequent drilling samples. Prep procedures at the two labs are comparable, and are detailed below.
| 9.3.1 | Laboratories |
ALS Chemex (now ALS Minerals) Labs
Samples from the 2008 drilling program were delivered to ALS Chemex Labs (Chemex) in Elko or Reno, Nevada for both sample preparation and analysis. Chemex held ISO 9002:1994 and ISO 9001:2000 certifications for its laboratories in North America when the Ely Gold samples were processed.
The standard prep procedure used for Ely Gold samples included drying the samples to remove excess moisture, fine crushing samples with a jaw crusher to at least 70% of the volume less than 2 mm, split off 250 g with a riffle splitter and pulverize the 250 g split to better than 85% passing 75 microns.
| JBP/MLM | February 22, 2012 |
| SRK Consulting (U.S.), Inc. | ||||
| NI 43-101 Technical Report – Mt. Hamilton Gold Project, Centennial Deposit | Page 39 |
American Assay Labs
Samples from 2010 and 2011 drilling programs were delivered to American Assay Labs (AAL) in Sparks, Nevada for preparation and analysis. Since incorporation in 1987, AAL has provided laboratory services in North and South America to all major mining companies and has documentation for ISO 17025 certification. AAL has participated in all CANMET-PTP MAL studies since their inception in 1998.
The standard sample prep procedure used for Solitario samples included drying the samples to remove excess moisture, crushing with a jaw crusher to nominally passing 10 mesh (2 mm), split off 300 g with a Jones splitter (riffle-style), and pulverize the 300 g split to nominally passing 150 mesh (about 100 microns).
| 9.4 | QA/QC Procedures |
Both laboratories insert samples of standard reference material (SRM) into the sequence of samples for internal sample verification. Results from internal standards are verified by the lab before the analytical results are finalized and released to the client. The Company also inserted SRM samples in the drill sample sequence, and received duplicate analysis of randomly selected pulp samples for analysis run at AAL. Results of duplicate analysis and the Company’s SRM samples are discussed in this section and are used to assess the quality of sample preparation and analysis.
| 9.4.1 | QA/QC Actions |
Standard Reference Material (SRM) samples were included in the drill sample sequence at a frequency equal to or greater than the minimum industry requirement, and provide robust data verification for FA gold and ICP silver results. A blank sample and mineralized SRM sample were inserted in the drill sample sequence after every 15 drill samples for core, and after every 20 drill samples for RC. For cyanide-soluble (CN-) gold and silver analysis, no mineralized SRM samples were used. Soluble gold and silver ratios for new drill samples were compared with historical and recent metallurgical test results to verify lab data.
| 9.4.2 | Results |
Analytical results of QA/QC samples are discussed by drilling program, beginning with the 2008 Ely Gold program.
2008 Drilling Program Results
The sample suite from MH08001—MH08005 drill holes is 321 drill core, 22 blank SRM, 15 certified gold and silver SRM, and 7 qualitative silver SRM samples. Seven samples of three different SRM batches prepared for Augusta were used, and did not have certified gold or silver mean values. These results were considered qualitatively during our review of the data, but are not included in this quantitative discussion of analytical results. Results for silver have been reviewed, but most are excluded from this report for the sake of brevity.
Discussion of results- Blanks
All blank SRM used were coarse rhyolite Prep Blank material. There are 22 blank SRM for 321 core samples, inserted in the sample sequence after every 15th core sample. About 6.5% of the samples were blanks in the 2008 drilling program. Industry standards require at least one blank for 20 or 30
| JBP/MLM | February 22, 2012 |
| SRK Consulting (U.S.), Inc. | ||||
| NI 43-101 Technical Report – Mt. Hamilton Gold Project, Centennial Deposit | Page 40 |
drill samples, or between 5% and 3.3% of drill samples. The ratio of blank samples to total samples meets and exceeds industry standards. Coarse blank sample material was used to ensure the sample preparation equipment is cleaned properly, in addition to ensuring a systematic high bias in analytical results does not exist.
Figure 9-1 shows blank SRM results for total gold in ppm plotted in order of Sample ID, with MH08001 on the left and MH08005 on the right. Certified mean values are provided by MEG Labs in ppm, and results in ppm have greater precision than results reported in oz/t, which are units 34.28 times larger than grams per metric ton, equivalent to ppm. Values in oz/t, the standard resource unit in the United States, are used in the Centennial resource model, but ppm values are used for QA/QC data analysis. Typically, results more than twice the standard deviation from the mean are considered “out of control” and should be considered for re-analysis, especially if they were in an interval of mineralized samples.
The rhyolite Prep Blank material is not perfectly barren of gold or silver at very low detection limits, so mean values and their standard deviation were considered instead of multiples of the method detection limit to interpret results. There is also inherent variation in the composition in this coarse material. Typically, exploration companies use clean silica sand as blank material, but coarse gravel, like the material used in this study, is preferable because it is subjected to the same steps of the preparation process as the drilling samples.
Gold values for eight of the 22 blanks were reported less than the MDL, and were assigned zero values for plotting and statistical analysis. Two blanks were greater than the certified mean value plus two standard deviations, which approximately coincides with 4 times the MDL. If oz/t values are considered, then the maximum reported gold value for the blank SRM samples is 0.0008 oz/t, less than the MDL, which is equal to 0.17 oz/t (converted). Although there is apparent variation in the coarse rhyolite used for blank samples, all samples have gold results within acceptable limits, and results do not show a bias in the analytical results.
Discussion of Results—SRM
Fifteen certified gold and silver SRM samples were inserted in the sequence of 321 core samples in the 2008 drilling program; on average, one certified SRM sample per 22 drill core samples. Mineralized materials within the range of core sample values for elements of interest are inserted in the sequence of core samples to assess the accuracy of the laboratory analysis. Systematic bias in SRM results would be readily apparent, and should be addressed with re-analysis of sample intervals including the control sample with results outside of accepted range.
Results for these samples deviate from the respective certified values by less than 10%. Results plotted in Figure 9-2 show results relative to mean values. There is good agreement between the analytical results and the certified mean values.
Lab Duplicates—Cyanide-soluble Gold and Silver
No duplicate samples or analyses were included for the initial fire assay and ICP analysis, but duplicate analysis of cyanide-soluble gold and silver was done on a percentage of the samples subsequently analyzed. Sample prep and analysis was done at ALS Chemex Labs in Reno, Nevada. Subsequent CN-gold and silver analysis was done at American Assay Labs for samples in mineralized zones. The QA/QC protocol in place at American Assay Labs includes pulp duplicate analysis on randomly selected samples.
| JBP/MLM | February 22, 2012 |
| SRK Consulting (U.S.), Inc. | ||||
| NI 43-101 Technical Report – Mt. Hamilton Gold Project, Centennial Deposit | Page 41 |
Duplicate analysis was done on19 (9%) of the samples analyzed for CN-soluble metals from the MH08 series. Duplicate results show the repeatability of the analysis procedures and are one factor used to assess the quality of the analytical data.
Soluble gold duplicate results nearly match original results, and this data set has R2 = 0.9991 (Figure 9-3. Silver duplicates also match original results well, except for the highest grade sample (25/22 ppm Ag). This data set has R2 = 0.9955 with all 19 samples (Figure 9-4). If the highest-grade sample pair, with 10% variation, is excluded, R2 = 0.9987 and the regression line falls very close to parity.
2010 Results
The sample suite from the MH10-11 drill holes is 1393 drill core samples, 95 total blank samples, 70 of which are Prep Blank material, and 95 certified SRM samples, of low-, middle-, or high-grade gold and silver abundance (1583 samples total). Sample prep and analysis was done at American Assay Labs in Sparks, Nevada. Results for fire assay gold were reported in both ppm and oz/t. Multi-element results, including total silver, were reported in ppm and calculated oz/t were included in the resource model. The statistical analysis for QA/QC sample verification is reported in ppm because certified values are in ppm; if converted to oz/t, some values are less than the respective MDL. Although grades in oz/t are used in the resource model, values in ppm units show greater precision and are considered first for QA/QC evaluation.
Blank Sample Results
Blank material included with the mineralized intervals was from the same batch of coarse rhyolite Prep Blank used in the MH08 drilling program. Analytical method detection limits differ from those of the 2008 drilling data. The reference values plotted on the following graphs and interpretations of data quality vary accordingly. Sample quality criteria are more stringent for results from AAL because more precise analytical methods were employed.
Results for total gold in all blank samples are shown in Figure 9-5. Most results are from rhyolite Prep Blank samples; results from coarse marble (Marble Blank) samples are highlighted. Toward the end of the sampling program, the supply of Prep Blank was consumed, so decorative landscaping marble greater than about one inch was used instead. These samples are coded as MarbleBlank in the database, to differentiate it from PrepBlank rhyolite. The marble does not have any statistics for precious metals, but it is expected that contained gold and silver would be less than or equal to average crustal abundance, and negligible at the ppm level. For this statistical analysis, a tolerance of three times the MDL will be used to assess the quality of laboratory analytical results. All intervals selected for CN-soluble gold and silver analysis included Prep Blank.
Fire assay gold results have much greater precision than silver results; consequently, gold results have more apparent variation. The MDL for fire assay gold is an order of magnitude less than the MDL for ICP silver, both in ppm units. Several samples are greater than the ore CoG for gold (about 0.2 ppm), and appear to be sample mix-ups. There is greater random variation in the rhyolite than in the marble blank material for both gold and silver. Rhyolite blank samples have some silver results greater than the method detection limit, and marble blank samples show no variability.
Although results in ppm were compared to certified values, the results reported in oz/t were imported directly to the database. Most gold values reported in oz/t, shown in Figure 9-6, are within the range of acceptable values relative to the method detection limits. Reported results in oz/t are less precise
| JBP/MLM | February 22, 2012 |
| SRK Consulting (U.S.), Inc. | ||||
| NI 43-101 Technical Report – Mt. Hamilton Gold Project, Centennial Deposit | Page 42 |
than ppm results, which is why the graph of oz/t values has less “noise” than the graph of ppm results. If certified values are converted to oz/t, they fall below the method detection limit value in oz/t units, and are not useful for comparison. There are two samples that appear to be mixed up with mineralized core samples, and were also evident in the ppm data set.
SRM
Three certified gold and silver SRM were used to verify laboratory accuracy. No standard deviation values for silver are available for these SRM, but values were calculated from the results. A total of 95 SRM samples were inserted in the MH10-MH11 drill core sample sequence, immediately before blank samples, after every fifteenth core sample. Certified SRM samples are 6.0% of the total samples in the suite from 2010-11 drilling.
Thirty one samples of “low” gold ore-grade MEGAu.09.01 were used in the 2010-11 drilling program. Gold results are shown in Figure 9-7. All gold results are within about 8% of the mean value, 0.68 ppm. Round-robin analysis results of this material have a very small standard deviation, as does this data set. For that reason, percent deviation from the certified value was considered, in addition to the standard deviation of the sample population. Distribution of the results about the mean value is unbiased.
Thirty five samples of MEGAu.09.03 were analyzed. Gold results of all samples are shown in Figure 9-8. Three samples have gold values less than two standard deviations below the certified value, but the rest are within the range of acceptable values. Values are distributed about the mean, and no analytical bias is apparent.
Twenty-nine samples of MEGAu.09.04 were analyzed. Gold results of these samples are graphed in Figure 9-9. All gold values are within two standard deviations (11%) of the certified value. Silver values seem to be biased high relative to the certified value, and three samples were analyzed at greater than two standard deviations from the mean.
Overall, gold and silver results for SRM samples used in the 2010-2011 drilling program show analytical accuracy and unbiased results. Three of 95 samples (3.2%) have gold results lower than accepted value, but gold results seem to be symmetrically distributed about the mean values. Twelve of 95 samples (12.6%) have silver results greater than the certified value plus two standard deviations. Silver results of SRM samples, for the three materials used, seem to be biased high relative to the certified value. This systematic high bias for silver results may be attributed to a different analytical method used for certification (fire assay, AAS finish) than the method used for these drill core samples (2-acid digest, ICP finish).
Lab Duplicates
Part of the standard analytical procedure at AAL is duplicate analysis of randomly-selected pulp samples. Between fire assay gold, multi-element ICP (silver), and CN-soluble gold and silver methods, there are a total of 242 duplicate analyses for 2010-2011 drilling program samples, for 1583 initial analyses and 992 CN-soluble metals analyses. There are 25 pairs of SRM duplicate analyses, and 217 pairs of core samples. Of the core sample pairs, 144 pairs have fire assay gold values and 141 of these have silver values. Duplicate pair results for SRM samples have very little variation. The graph of duplicate core sample results in Figure 9-10 shows regression analysis for the data sets. Duplicate fire assay gold results were 2-3% lower, on average, than original results.
| JBP/MLM | February 22, 2012 |
| SRK Consulting (U.S.), Inc. | ||||
| NI 43-101 Technical Report – Mt. Hamilton Gold Project, Centennial Deposit | Page 43 |
Cyanide-Soluble Gold and Silver
After fire assay gold and ICP silver results were evaluated, samples from mineralized zones were selected for cyanide-soluble gold and silver analysis. “Recoverable” silver results from cyanide leach are used in the resource model, so verification of CN-soluble silver results is especially critical. Leachable gold and silver values are not known for the three batches of SRM in this sample suite, so duplicate sample analysis results and CN:FA ratios for this material were used to qualitatively verify results.
Previous metallurgical testing has shown that cyanide-soluble gold is consistently about 73% of total gold in the Centennial deposit; soluble silver, between 50 and 60%. From the 1393 drill core samples in the MH10-11 suite, 873 (63%) have measured values for CN-soluble gold and silver. Leachable vs. total gold results for drill core samples are plotted in Figure 9-11, which shows regression analysis of the data set. Most of the samples analyzed fall between 50% and 100% leachable gold. Some of the samples with low total gold also have lower leachable gold than average. These samples have less than about 5 ppm total gold.
Cyanide-soluble silver is a lower percentage (average 52%) than CN-soluble gold (average 73%). Figure 9-12 shows CN-soluble versus total silver for all 869 drill core samples and regression analysis of the data set. Four samples were excluded because they are high-grade outliers with low soluble silver results, which skewed the regression analysis. Like recoverable gold, the ratio of recoverable silver increases with total silver. With several exceptions for CN-soluble gold values, all leachable results are less than or equal to total precious metal values, which indicates that the CN leach results are defensible. Cyanide-soluble gold and silver duplicate pair results have accurate and repeatable analysis. No analytical issues are apparent from this data set.
2011 Results
Standard Reference Material (SRM) samples were inserted in the RC drill sample sequence after every 20th drill sample. For the drill core hole, MH11007, SRM samples were inserted after every 15th drill sample. SRM samples were landscape marble for the blank, and the MEGAu.09.xx group of standards was used again.
Blank Samples
Gold results in ppm and oz/t were reported by AAL, and ppm results were considered first for QA analysis because they offer greater precision than results in oz/t units. Values in oz/t are used for the resource model. In the set of ppm results, seven blank samples have gold values greater than three times the method detection limit, shown in Figure 9-13. There are three samples with gold values that are anomalous for the analysis methods as reported in oz/t. These three samples, from MH11004, -005 and -007, should be considered for re-analysis, because they may indicate sample mix-ups or cross-contamination.
Silver and gold values for the blank samples are shown in Figure 9-14 to highlight the difference in precision between the gold fire assay and silver ICP analysis methods. All blank samples have analyzed silver values below the method detection limit.
SRM Samples
There were a total of 14 samples of MEGAu.09.01 included with this batch of drilling. The analytical results for these samples are graphed in Figure 9-15 and appear to be systematically low. Nine of
| JBP/MLM | February 22, 2012 |
| SRK Consulting (U.S.), Inc. | ||||
| NI 43-101 Technical Report – Mt. Hamilton Gold Project, Centennial Deposit | Page 44 |
the 14 samples have analytical values 10-25% less than the mean value. There are five samples with acceptable results: two samples are within one standard deviation of the mean; one, within 2, and two samples are about 5% lower than the mean value. Silver results (not shown) appear to be systematically high, with 6 of 8 samples with values 10-20% greater than the mean value.
A total of 16 samples of SRM MEGAu.09.03 were analyzed. Gold results for these samples are graphed in Figure 9-16, which shows systematically low results. Although all samples have results less than the mean value, only three of them are more than two standard deviations from the mean value. Silver results (not shown) are all greater than the mean value but only three are greater than 10% above it, and therefore, outside the range of acceptable results.
Eleven samples of SRM MEGAu.09.04 were included with the 2011 drill samples. Gold results for these samples are graphed in Figure 9-17. Five of the eleven samples were analyzed within 2 standard deviations of the mean value; five of the six samples outside of this range have low values. Silver results from seven of eight samples are within 10% of the mean value, and one is greater than 10% more than the mean. Like the silver results for the other two SRM batches, all of these are greater than the mean value.
A systematic low bias in the SRM results was observed in gold fire assay results for all three SRM materials. Variable high bias in silver ICP results was apparent for all SRM samples, but most of the results from the two high-grade SRM batches are within acceptable value ranges. The low-grade SRM results for silver show a consistently large high bias and 75% of them deviate from the mean by more than 10%.
Analytical Duplicate Sample Pairs
The analytical lab duplicate analysis on 86 of the 943 (9.1%) drill and SRM samples submitted. Gold results are graphed in Figure 9-18 as duplicate vs. original values. There is good agreement between the paired values, especially for ore-grade samples (n = 10). Duplicate samples appear to have slightly higher values than the original analysis for samples with less than 0.2 ppm gold. The difference between original and duplicate values increases with average value and variance is proportionately less for high-grade samples. The laboratory analysis duplicate samples show good repeatability for ore-grade samples, and proportionally greater but unbiased variance for waste-grade samples.
| 9.5 | Opinion on Adequacy |
The proportion of control samples to drill core samples in the 2008, 2010 and 2011 drilling programs met or exceeded industry standards. Most results for control samples and, if available, duplicate analyses, indicate accurate and repeatable data were provided by both ALS Chemex and American Assay Labs.
It is the opinion of SRK that implemented controls on analytical QA/QC meet industry standard practice. Results show that the analytical data is of quality suitable to be used for mineral resource estimations.
| JBP/MLM | February 22, 2012 |
| SRK Consulting (U.S.), Inc. | ||||
| NI 43-101 Technical Report – Mt. Hamilton Gold Project, Centennial Deposit | Page 45 |
Figure 9-1: Blank Samples, Fire Assay-AAS Gold
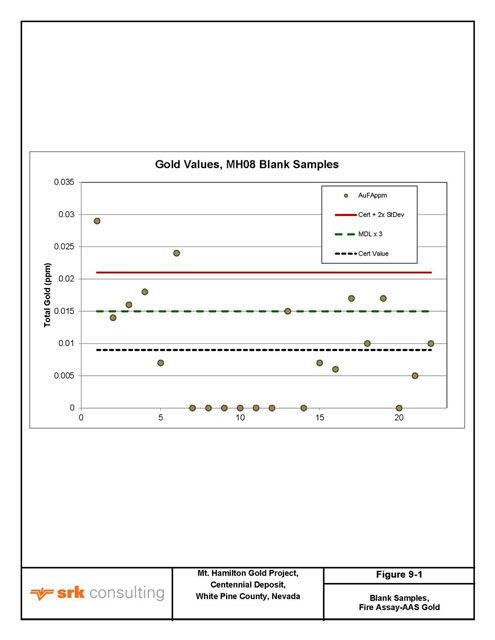
| JBP/MLM | February 22, 2012 |
| SRK Consulting (U.S.), Inc. | ||||
| NI 43-101 Technical Report – Mt. Hamilton Gold Project, Centennial Deposit | Page 46 |
Figure 9-2: MH08 SRM Results- Gold, Fire Assay
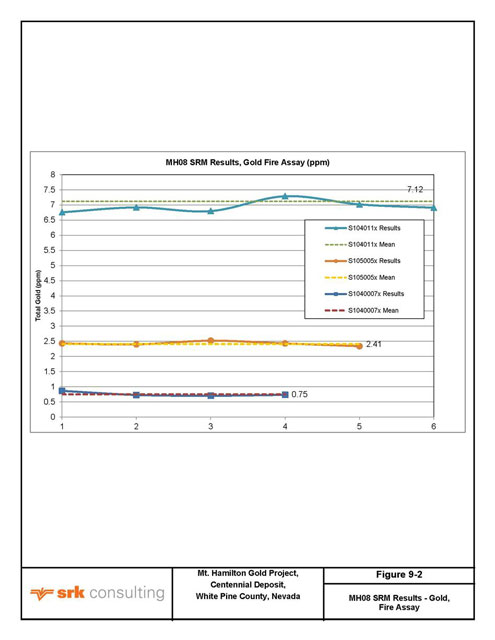
| JBP/MLM | February 22, 2012 |
| SRK Consulting (U.S.), Inc. | ||||
| NI 43-101 Technical Report – Mt. Hamilton Gold Project, Centennial Deposit | Page 47 |
Figure 9-3: Duplicate Analysis, Soluble Gold
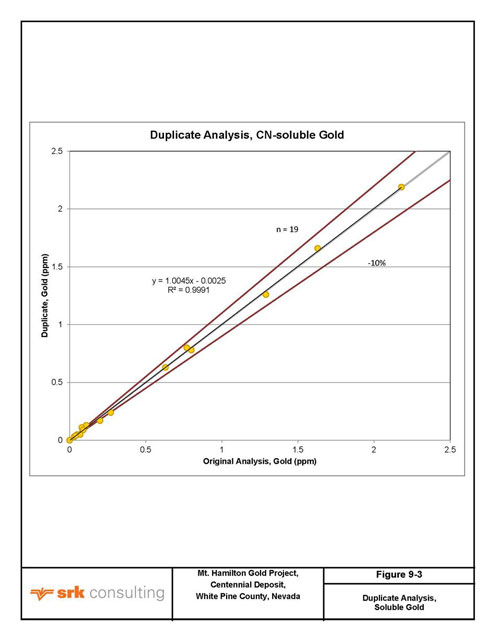
| JBP/MLM | February 22, 2012 |
| SRK Consulting (U.S.), Inc. | ||||
| NI 43-101 Technical Report – Mt. Hamilton Gold Project, Centennial Deposit | Page 48 |
Figure 9-4: Duplicate Analysis, Soluble Silver, All Pairs
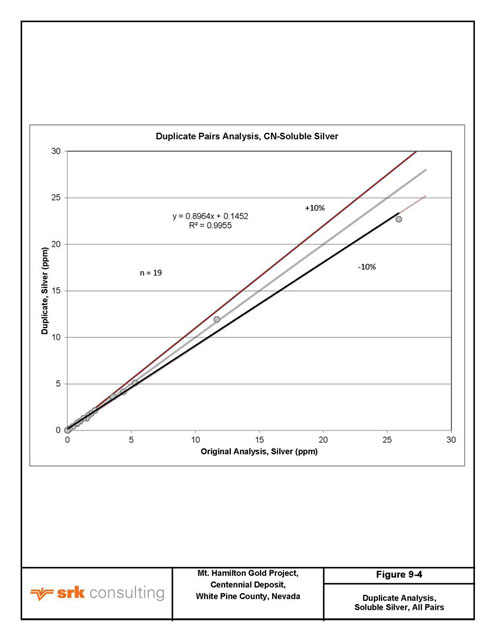
| JBP/MLM | February 22, 2012 |
| SRK Consulting (U.S.), Inc. | ||||
| NI 43-101 Technical Report – Mt. Hamilton Gold Project, Centennial Deposit | Page 49 |
Figure 9-5: Fire Assay Gold, All Blank Samples (ppm)
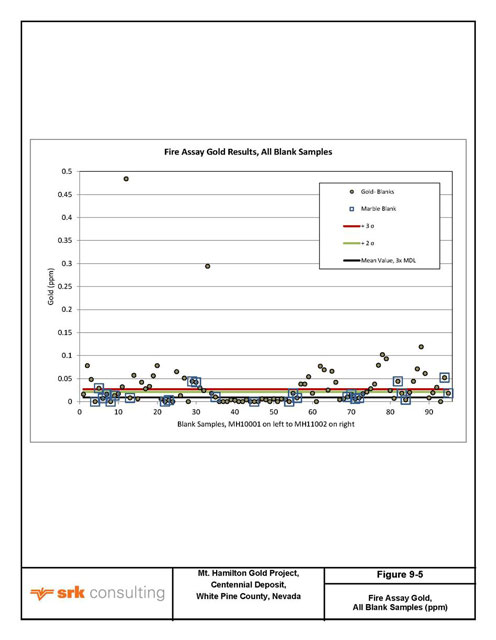
| JBP/MLM | February 22, 2012 |
| SRK Consulting (U.S.), Inc. | ||||
| NI 43-101 Technical Report – Mt. Hamilton Gold Project, Centennial Deposit | Page 50 |
Figure 9-6: Fire Assay Gold, All Blank Samples (oz/t)
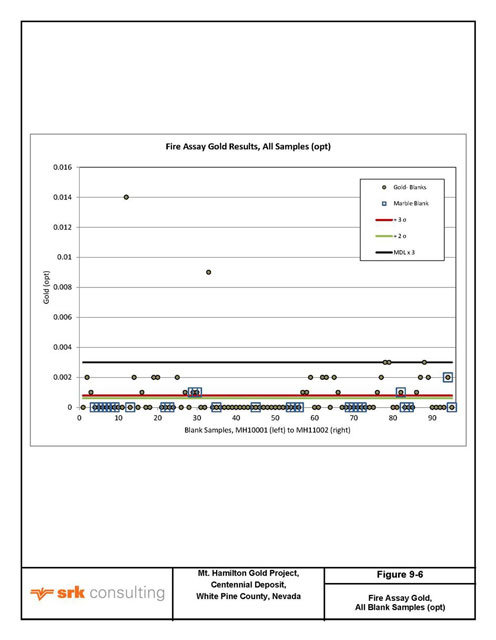
| JBP/MLM | February 22, 2012 |
| SRK Consulting (U.S.), Inc. | ||||
| NI 43-101 Technical Report – Mt. Hamilton Gold Project, Centennial Deposit | Page 51 |
Figure 9-7: 2010 Gold results for SRM MEGAu.09.01 (ppm)
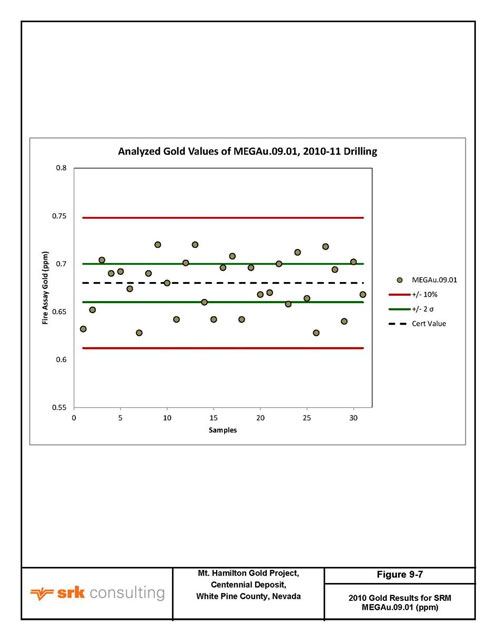
| JBP/MLM | February 22, 2012 |
| SRK Consulting (U.S.), Inc. | ||||
| NI 43-101 Technical Report – Mt. Hamilton Gold Project, Centennial Deposit | Page 52 |
Figure 9-8: 2010 Gold results for SRM MEGAu.09.03 (ppm)
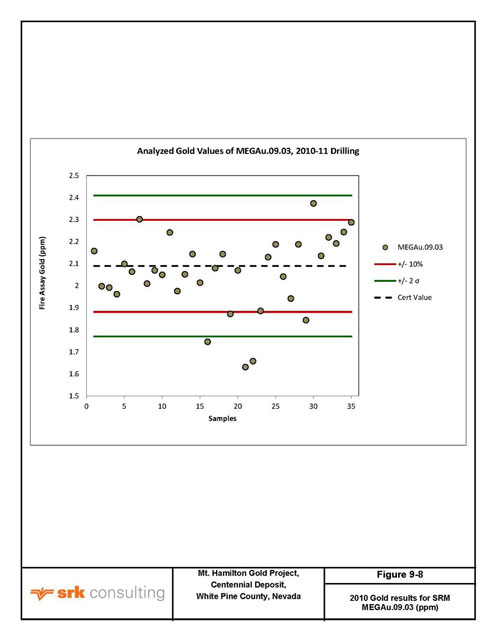
| JBP/MLM | February 22, 2012 |
| SRK Consulting (U.S.), Inc. | ||||
| NI 43-101 Technical Report – Mt. Hamilton Gold Project, Centennial Deposit | Page 53 |
Figure 9-9: 2010 Gold results for SRM MEGAu.09.04 (ppm)
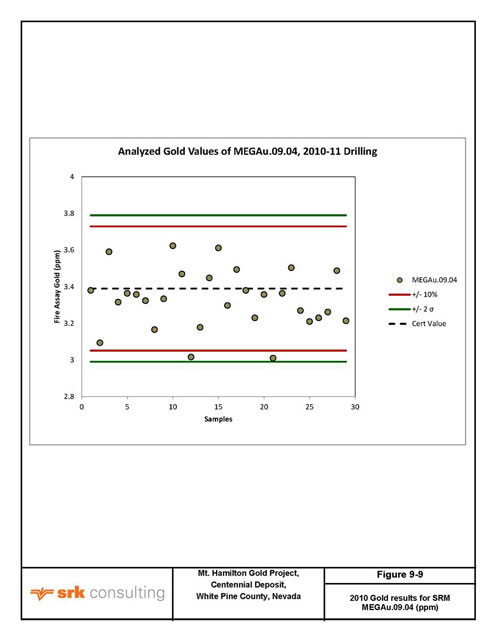
| JBP/MLM | February 22, 2012 |
| SRK Consulting (U.S.), Inc. | ||||
| NI 43-101 Technical Report – Mt. Hamilton Gold Project, Centennial Deposit | Page 54 |
Figure 9-10: Duplicate Pair Gold Values, Drill Core Samples
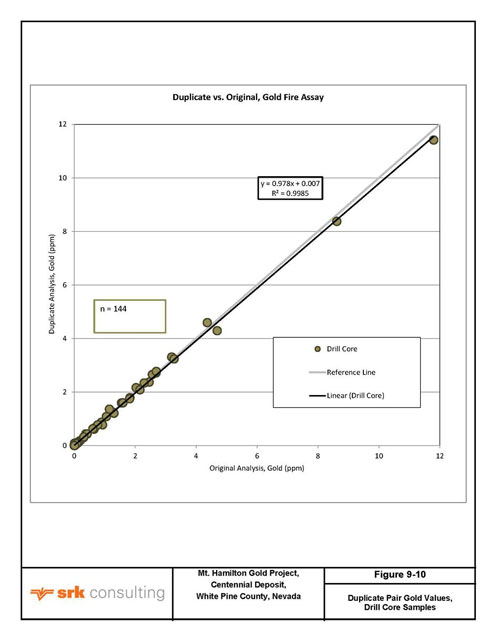
| JBP/MLM | February 22, 2012 |
| SRK Consulting (U.S.), Inc. | ||||
| NI 43-101 Technical Report – Mt. Hamilton Gold Project, Centennial Deposit | Page 55 |
Figure 9-11: Soluble vs. Total Gold in Drill Core
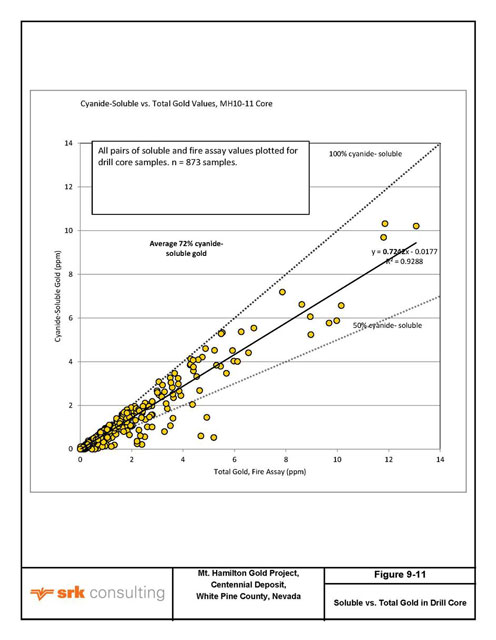
| JBP/MLM | February 22, 2012 |
| SRK Consulting (U.S.), Inc. | ||||
| NI 43-101 Technical Report – Mt. Hamilton Gold Project, Centennial Deposit | Page 56 |
Figure 9-12: Soluble vs. Total Silver in Drill Core
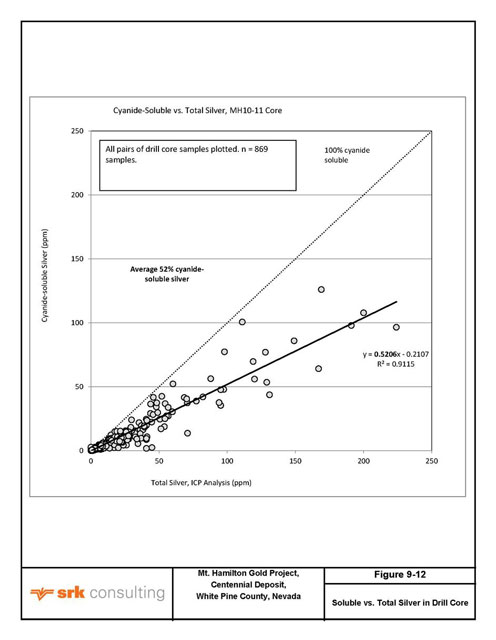
| JBP/MLM | February 22, 2012 |
| SRK Consulting (U.S.), Inc. | ||||
| NI 43-101 Technical Report – Mt. Hamilton Gold Project, Centennial Deposit | Page 57 |
Figure 9-13: Fire Assay Gold Blank Sample Results, 2011 Drilling (ppm)
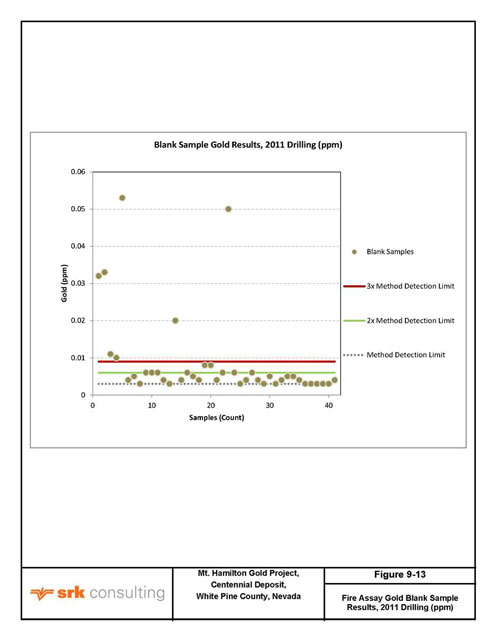
| JBP/MLM | February 22, 2012 |
| SRK Consulting (U.S.), Inc. | ||||
| NI 43-101 Technical Report – Mt. Hamilton Gold Project, Centennial Deposit | Page 58 |
Figure 9-14: Total Gold and Silver Results, Blank Samples in 2011 Drilling (ppm)
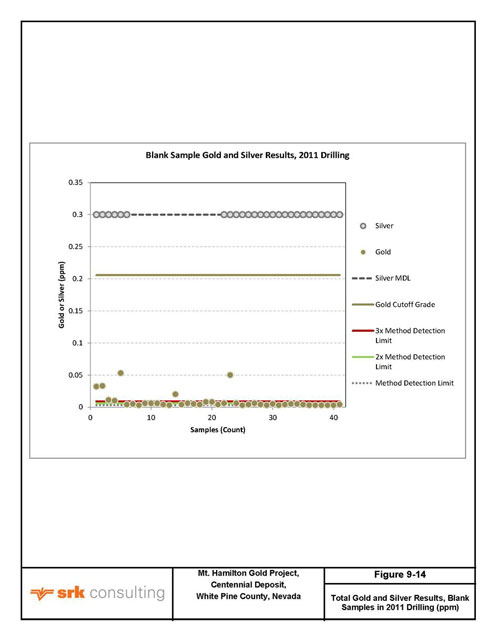
| JBP/MLM | February 22, 2012 |
| SRK Consulting (U.S.), Inc. | ||||
| NI 43-101 Technical Report – Mt. Hamilton Gold Project, Centennial Deposit | Page 59 |
Figure 9-15: MEGAu.09.01 Gold Results, 2011 Drilling
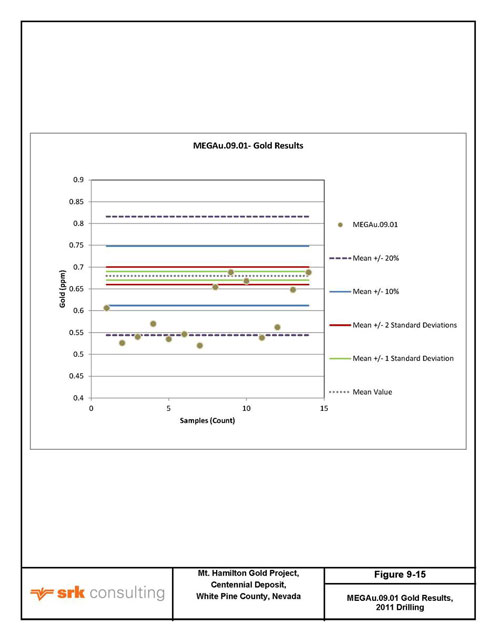
| JBP/MLM | February 22, 2012 |
| SRK Consulting (U.S.), Inc. | ||||
| NI 43-101 Technical Report – Mt. Hamilton Gold Project, Centennial Deposit | Page 60 |
Figure 9-16: MEGAu.09.03 Gold Results
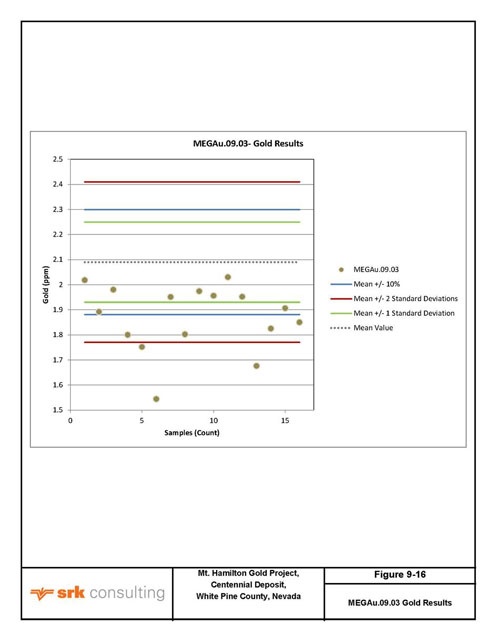
| JBP/MLM | February 22, 2012 |
| SRK Consulting (U.S.), Inc. | ||||
| NI 43-101 Technical Report – Mt. Hamilton Gold Project, Centennial Deposit | Page 61 |
Figure 9-17: MEGAu.09.04 Gold Results
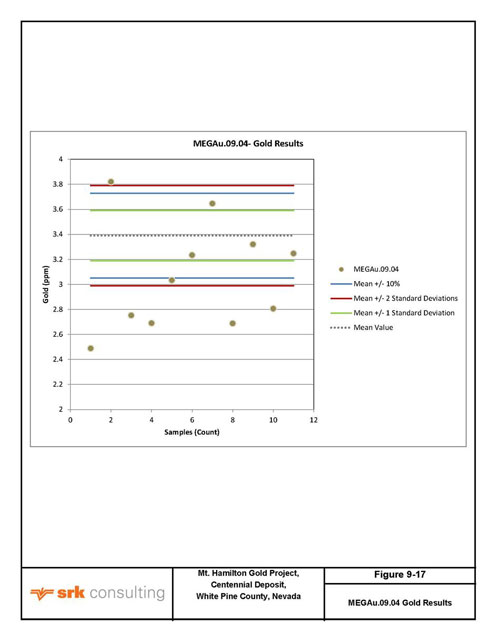
| JBP/MLM | February 22, 2012 |
| SRK Consulting (U.S.), Inc. | ||||
| NI 43-101 Technical Report – Mt. Hamilton Gold Project, Centennial Deposit | Page 62 |
Figure 9-18: Duplicate vs. Original Results, Gold, Fire Assay, 2011 Drilling
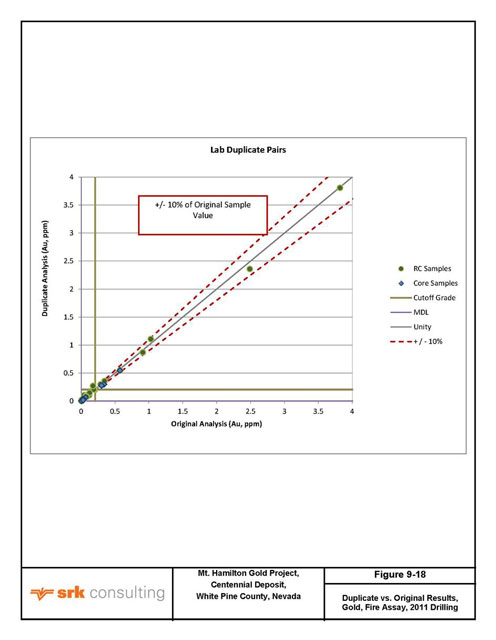
| JBP/MLM | February 22, 2012 |
| SRK Consulting (U.S.), Inc. | ||||
| NI 43-101 Technical Report – Mt. Hamilton Gold Project, Centennial Deposit | Page 63 |
| 10 | Data Verification (Item 12) |
The database of gold and silver results from drilling completed prior to 2008 was evaluated by SRK for the Preliminary Economic Assessment report dated May 13, 2009 (SRK, 2009). This data set was audited and determined to be suitable for estimation of a CIM-compliant resource. Drill hole data collected by Ely Gold and Solitario has been reviewed, compiled and managed by SRK Consulting in the Reno, Nevada office. New drilling results are appended to the existing database as they are available.
| 10.1 | Procedures |
SRK continues to build the assay and geology data tables by using the format of the existing ones. To store new data, and have the ability to add it to the existing data tables, a Microsoft Access database is maintained with multiple related tables. New assay data was coded by sample type, to create queries that would automatically return all drill hole samples with data relevant to modeling. Geologic data is coded and tabulated digitally, and also imported to the main Access database as a table.
When new assay data are received, a digital copy of the original data sheet is made. The copy is formatted to be suitable for importing, and fields are added for sample coding and renamed as necessary, to comply with the established naming convention. Modified field headers for assay results include the element, analysis method and reported units. They are a concatenation of the information provided by the lab, and are the only items modified before the data is imported to Access as a new table. For silver or gold results only reported in ppm units, a calculated oz/t field is populated with the quotient of the ppm result and 34.28- the grams per metric tonne to 1 troy ounce per short ton conversion factor. All assay data in the model database is in oz/t units, so this is a crucial step. Because fire assay gold and “recoverable” silver values are used in the inherited model database, these are the values used in the appended database records. Many samples have total silver and soluble gold values that are not used for the resource calculation, but are included in the data table for comparison purposes. The available data are summarized by the AuFLG and AgFLG fields, which contain an integer “flag” that symbolizes the analytical method of the data used.
Records with flag values—1 have no data, and are treated as null or zero values, depending in the user selection in Leapfrog. Flag values of 1 have total gold or silver and no soluble gold or silver results. Flag values of 2 indicate that soluble gold or silver results exist for that interval, or that a scaled total silver value was used in lieu of soluble silver results. The factored silver results are only used in the older drill samples, from before Ely Gold’s tenure. New drill samples that have a soluble silver value have 3 in the AgFLG field.
Samples for QA/QC analysis are queried and reviewed, and if the data meet quality criteria, the drill hole assay results are appended to the digital master database table. Or, new results can be added to the Leapfrog 3D Modeling Software from a separate table. When results are imported, Leapfrog automatically generates a list of errors, including overlapping sample intervals and sample depths that exceed the total depth value for the associated drill hole. Any errors are corrected in the master database tables and integrated with data in Leapfrog. The statistical analysis of QA/QC sample results with the automated audit of drill hole samples in Leapfrog ensures the working data set is free of errors.
| JBP/MLM | February 22, 2012 |
| SRK Consulting (U.S.), Inc. | ||||
| NI 43-101 Technical Report – Mt. Hamilton Gold Project, Centennial Deposit | Page 64 |
| 10.2 | Limitations |
The current database and model update procedure was established in 2011 and has been in effect for one year, as a way to simplify data management by an outside consultant. The process is not automated, but the data is secure from tampering because it is stored on the SRK server in Reno, Nevada. A system of secure file delivery and uploading should be adopted if Solitario chooses to manage the drill hole data, especially for assay data.
Fire assay and cyanide-soluble results can be reported in oz/t or ppm units; the most recent results were reported in both units for use in the resource model and QA/QC analysis, respectively. Requesting oz/t and ppm results for assay data would ensure documentation of results to be used in the resource model. Laboratory results can be delivered in several formats, including Access database tables. Changes in laboratory reporting should be implemented for future analysis.
| 10.3 | Data Adequacy |
Detail on geologic logs was adequate for gathering geological and basic mineralogy data to incorporate in the model. Some practices of logging and sampling could be improved to create a more complete data set.
Mineralized intervals with total gold values greater than the CoG, approximately 0.2 ppm, were selected for soluble gold and silver analysis. Consequently, there are some sample intervals without soluble silver results.
Some drill core intervals were not sampled, so there are data gaps in the spatial mineralization model. SRK recommends a minimum sampling and assaying of a 40 ft interval per drill hole, above top of bedrock or just above the top of mineralization, to below the bottom of mineralization. This ensures that mineralization is properly “bracketed” for grade estimation purposes.
SRK considers the current geologic and analytical database suitable for use in resource modeling.
| JBP/MLM | February 22, 2012 |
| SRK Consulting (U.S.), Inc. | ||||
| NI 43-101 Technical Report – Mt. Hamilton Gold Project, Centennial Deposit | Page 65 |
| 11 | Mineral Processing and Metallurgical Testing (Item 13) |
| 11.1 | Introduction |
The FS is intended for the use of MH-LLC for the further development and advancement of the Project. This Section provides a description of:
| • | The metallurgical characteristics of the ore; |
| • | Historic and recent metallurgical testing and results; and |
| • | Interpretations and applications of test results for recovery projections. |
| 11.2 | Ore Description |
The Centennial ore body is composed of predominately calc-silicate skarn. Within the ore body are minor hornfels, which respond metallurgically the same as adjacent skarns. A small amount of ores to be mined later in the mine life are identified as igneous (intrusive). Much of the igneous ore in the reserve is of lower grade. These lower grade igneous ores (0.013 oz/t Au) were tested by bottle rolls (as described in this report). The test results indicated slightly reduced recoveries in comparison to recoveries from skarn and hornfels ores.
Rock types are further subdivided into oxide and non-oxide. This was done primarily to assign density to the block model. The non-oxidized skarns are predominately at depth and constitute a small percentage of the ore reserve. Non-oxide ores have very low sulfide minerals, generally comprising less than 2% of any given rock type. Both oxidized and non-oxidized ores have been tested and have similar leach response to sodium cyanide (NaCN). Recent column tests contained a representative amount of non-oxidized ores (as described in this report).
The Centennial reserve is adjacent to the Seligman Pit, which was mined as the Mount Hamilton Project in the 1990s by REA Gold. The bottle roll and column testing done during these operations indicate a differing metallurgical response to the Seligman vs. Centennial ores.
Gold mineralization occurs in discrete particles of fine gold or electrum in the Centennial ores. Assay replicability is 90% for gold in Centennial ores.
Silver mineralization is highly variable in content and metallurgical response in the Centennial ores. The metallurgical tests indicate that silver mineralization is not metallurgically associated with gold mineralization, though they are often spatially coincident. Silver mineralization is in the form of sulfosalts or jarosites.
| 11.3 | Metallurgical Test History and Results |
| 11.3.1 | Metallurgical Test History—Pre-1997 |
The metallurgical test history of the Centennial Project began in 1988 with Westmont as the owner of the property. The Centennial testing programs were concurrent with mining operations for the NE Seligman Mine. In some cases, the source of metallurgical test samples (i.e. NE Seligman vs. Centennial) was unclear. For this study, only tests and samples clearly labeled “Centennial” and located within the boundaries, as defined by SRK as Centennial, were utilized. Approximately 60
| JBP/MLM | February 22, 2012 |
| SRK Consulting (U.S.), Inc. | ||||
| NI 43-101 Technical Report – Mt. Hamilton Gold Project, Centennial Deposit | Page 66 |
bottle roll tests at varying crush sizes were carried out. There were 4 column tests performed, however the material makeup of the columns was not detailed. The test programs were done at various outsourced laboratories and at the Mt. Hamilton (REA) laboratories. Bottle roll test results for some of the 1997 drilling are provided in Volume VII of the FS (Carrington, 2009).
The data from these tests and a more definitive 1997 study were used in part to guide sample selection for the 2009-2011 test programs overseen by SRK. The 2009-2011 test programs’ results moreover validated the 1997 test program results. Locations of Centennial core and RC drill holes sampled for metallurgical testing discussed in this report are shown in Figure 11-1.
| 11.3.2 | KCA Test Program—1997 |
A scoping metallurgical test program on Centennial core holes was performed by Kappes Cassidy & Associates (KCA) of Reno, Nevada in 1997. The report entitled “Final metallurgical test work on core samples from the Mt. Hamilton – Centennial Zone” (KCA, 1997) is provided in Volume VII of the FS. The Centennial ores were identified as Main Zone and NW Upper Zone. The program consisted of nine column tests and five bottle roll tests. In a separate program described below, eighteen samples of RC cuttings were also evaluated by bottle roll testing.
Core holes 87005D and 91019 were received as composites by KCA. Core holes 96002D, 96003D, 97002, 97012, and 97024 were received in boxed 5 ft intervals. Each interval was fire assayed for gold and silver. The intervals were then composited by assay according to the client’s direction to approximate the ore resource head grade at the time.
The test sample locations are shown in Figure 11-1. The sample identifications are listed in Table 11.3.2.1.
Table 11.3.2.1: Sample Identifications for KCA 1997 Metallurgical Test Program
Hole | Head oz/t Au | Head *oz/Ag | Composited By | |||||||
87005D | 0.038 | 0.37 | Mt. Hamilton | |||||||
91011D | 0.062 | 0.49 | Mt. Hamilton | |||||||
96002D | 0.040 | 0.28 | KCA | |||||||
96003D | 0.023 | 0.17 | KCA | |||||||
97002 | 0.108 | 0.82 | KCA | |||||||
97012 | 0.039 | 0.16 | KCA | |||||||
97024 | 0.056 | 0.37 | KCA | |||||||
| * | Silver head grades and recoveries are not reported in the summary tables. The reported silver head grades and recoveries are derived from column and bottle roll test data. The grades and recoveries for gold and silver are based on fire assays. |
Column Tests
The KCA Column Test Program consisted of nine tests at 1 1/2 in and 1 in sizes. Test materials and results are shown in Table 11.3.2.2.
| JBP/MLM | February 22, 2012 |
| SRK Consulting (U.S.), Inc. | ||||
| NI 43-101 Technical Report – Mt. Hamilton Gold Project, Centennial Deposit | Page 67 |
Table 11.3.2.2: KCA 1997 Column Test Results
Sample ID | Calculated Head Au oz/t | Calculated Head Ag oz/t | Size (inches) | Days Leach | Recovery % | |||||||||||||||||||||
| Au | Ag | |||||||||||||||||||||||||
| 87005D | 0.043 | 0.17 | 1.00 | 48 | 74.4 | 58.8 | ||||||||||||||||||||
| 87005D | 0.043 | 0.57 | 1.50 | 54 | 86.0 | 36.9 | ||||||||||||||||||||
| 91019D | 0.056 | 0.43 | 1.00 | 54 | 79.3 | 46.5 | ||||||||||||||||||||
| 91019D | 0.062 | 0.51 | 1.50 | 54 | 77.4 | 47.0 | ||||||||||||||||||||
| *96002D | 0.040 | 0.28 | 1.00 | 48 | 82.5 | 32.1 | ||||||||||||||||||||
| *96003D | 0.023 | 0.16 | 1.00 | 48 | 78.3 | 12.5 | ||||||||||||||||||||
| 97002 | 0.112 | 0.56 | 1.00 | 44 | 80.4 | 37.3 | ||||||||||||||||||||
| 97012 | 0.041 | 0.11 | 1.00 | 44 | 65.9 | 9.1 | ||||||||||||||||||||
| 97024 | 0.056 | 0.44 | 1.00 | 44 | 75.0 | 15.9 | ||||||||||||||||||||
|
|
|
|
|
|
|
|
|
|
|
| |||||||||||||||
| Average | 0.053 | 0.36 | 49 | 76.5 | 32.9 | |||||||||||||||||||||
|
|
|
|
|
|
|
|
|
|
|
| |||||||||||||||
| * | Tests outside of current pit limits |
The KCA column tests were leaching slowly at the end of the testing period. The leach curves did not provide sufficient data for statistically valid regression analysis to project the recovery into an extended field leach time. A regression analysis of a mature curve usually adds 3% to 4% recovery to the field leach recovery.
The lack of relationship of gold recovery to head grade is shown in Table 11.3.2.3, which has the lowest and highest head grades with two mid-grades.
Table 11.3.2.3: Recovery vs. Head Grade Relationship
Sample ID | Head oz/t Au | Recovery % Au | Head oz/t Ag | Recovery % Ag | ||||||||||||
96003 | 0.023 | 78.3 | 0.16 | 12.5 | ||||||||||||
96002 | 0.040 | 85.2 | 0.28 | 32.1 | ||||||||||||
97012 | 0.041 | 65.9 | 0.11 | 9.1 | ||||||||||||
97002 | 0.112 | 80.4 | 0.56 | 46.5 | ||||||||||||
|
|
|
|
|
|
|
| |||||||||
Average | 0.054 | 77.45 | 0.28 | 25.05 | ||||||||||||
|
|
|
|
|
|
|
| |||||||||
Silver head grades in the column tests were highly variable as were the recoveries. Silver head grades (Fire Assay) ranged from 0.11 to 0.57 oz/t and averaged 0.36 oz/t. Silver recoveries ranged from 9.1% to 58.8% and averaged 32.9%. The silver recovery does not appear to be related to the silver grade.
The five bottle roll tests at 100 mesh, done in conjunction with the column tests, had silver head grades ranging from 0.11 to 0.85 oz/t and silver recoveries ranging from 22.2% to 69.7%. The average silver recovery was 50.86%, 18% higher than the column test recovery.
Bottle Roll Tests
The KCA Program included five bottle roll tests on the column composites at 100 mesh size for 48 hours. The bottle roll test results are shown in Table 11.3.2.4.
| JBP/MLM | February 22, 2012 |
| SRK Consulting (U.S.), Inc. | ||||
| NI 43-101 Technical Report – Mt. Hamilton Gold Project, Centennial Deposit | Page 68 |
Table 11.3.2.4: KCA 1997 Bottle Roll Test Results
Sample ID | Calculated Head Au oz/t | Calculated Head Ag oz/t | Size | Duration (hours) | Recovery % | |||||||||||||||||||
| Au | Ag | |||||||||||||||||||||||
87005D | 0.044 | 0.33 | 100 mesh | 48 | 86.4 | 69.7 | ||||||||||||||||||
91019D | 0.064 | 0.11 | 100 mesh | 48 | 90.6 | 63.6 | ||||||||||||||||||
97002 | 0.110 | 0.85 | 100 mesh | 48 | 82.5 | 62.4 | ||||||||||||||||||
97012 | 0.039 | 0.22 | 100 mesh | 48 | 82.1 | 36.4 | ||||||||||||||||||
97024 | 0.057 | 0.54 | 100 mesh | 48 | 87.7 | 22.2 | ||||||||||||||||||
|
|
|
|
|
|
|
|
|
|
|
| |||||||||||||
Average | 0.051 | 0.41 | 85.86 | 50.86 | ||||||||||||||||||||
The increased silver recovery is due to the finer grind. According to the column head and tail screen analysis, the increased recovery does not occur at sizes above 28 mesh.
RC Bottle Roll Tests
KCA performed eighteen bottle roll tests on RC cuttings from the Centennial Deposit. The 24-hour bottle tests at 100 mesh size were duplicated by a 4-hour CN soluble shake assay at 150 mesh. In the bottle roll tests, gold grades ranged from 0.01 to 0.070 oz/t. The average gold dissolution was 86.8%. In the duplicate CN soluble shake tests gold grades ranged from 0.008 to 0.075 oz/t. The average gold dissolution was 86.8%, identical to the 24 hour bottle roll tests.
| 11.3.3 | McClelland Laboratories—2009-2010 |
In 2009-2010, McClelland Laboratories of Reno, Nevada (McClelland) conducted a metallurgical test program on core samples from drilling done by Ely Gold & Silver in 2008. The McClelland report entitled “Report on Heap Leach Cyanidation Testing Centennial Project MLI Job Number 3354” (McClelland, 2010) is provided in Volume VII of the FS.
The half core samples were selected to fill in the gaps from the 1997 KCA column/bottle roll tests, geographically and at depth. The holes selected were MH08004 and MH08005. The half cores were composited into 20 ft intervals. MH08004 had a continuous ore zone of 142 to 249 ft. MH08005 had a continuous ore zone from 100 to 276 ft.
The bottle roll testing is utilized to establish sample variability and to establish an economic grind size. The long term column tests will produce 10% to 15% better recoveries as compared to the short term bottle roll tests.
Bottle Roll Tests
A total of 64 bottle roll tests were performed during the McClelland test program. A total of 48 tests were done on the half-core composites, and 16 tests were done on assay rejects from the corresponding intervals to preserve sample for the column tests. Table 11.3.3.1 lists the bottle roll test specifications.
Table 11.3.3.1: 2009 McClelland Bottle Roll Test Specifications
Size | Source | Duration | ||
p100 1 1/2 inch | 1/2 core composite | 96 hours | ||
p100 1 inch | 1/2 core composite | 96 hours | ||
p100 1/2 inch | 1/2 core composite | 96 hours | ||
p100 10 mesh | Assay Reject | 48 hours |
| JBP/MLM | February 22, 2012 |
| SRK Consulting (U.S.), Inc. | ||||
| NI 43-101 Technical Report – Mt. Hamilton Gold Project, Centennial Deposit | Page 69 |
The bottle roll testing included timed solution, assays, rinsing and assay of tailings. The calculated head for each test was utilized for the recovery calculation.
The sized bottle roll tests were done to establish a size/relationship to recovery. The p100 1 inch size was determined to be the economic size for Centennial and was utilized in the ensuing column tests. Bottle roll recovery as well as the rate of recovery at the end of the 96 hour tests were utilized in the selection of the p100 1 inch crush size for column testing.
Assay Variability
An assay was run on the composites crushed to p100 1 1/2 inch size. The 1 1/2 inch size was stage crushed to p100 1 inch and p100 1/2 inch for the bottle roll tests. The calculated head for each test was utilized for determination of the recoveries in the bottle roll tests. The variation between individual assay heads and calculated heads was very high, in instances as much as 30%. The average calculated head and the average assay head for the bottle roll program as a whole were nearly identical.
Column Tests
Two column tests were done at McClelland Laboratories. The tests were on drill holes MH08004 and MH080005 at p100 1 inch size.
The 20 ft interval composites at p100 1 1/2 inch from the bottle roll series were reduced to p100 1 inch size by stage crushing. The 20 ft intervals assaying less than 0.005 oz/t Au were excluded from the columns.
The column testing included:
| • | Duplicate head assaying; |
| • | Screen assay tests of column tailings; |
| • | Induced couple plasma (ICP) ICP-33 element analysis of heads and 1st 5-day pregs; |
| • | NaCN rinse and drain down tests; and |
| • | Lime and sodium cyanide consumption. |
Column testing was continued until the leach curves were “mature” so that a recovery could be projected beyond the column leach time. The results of the column leach tests are presented in Table 11.3.3.2.
Table 11.3.3.2: 2009 McClelland Column Leach Test Results
Column | Calculated Head Assay oz/t | Recovery % | Column Days | Au Recovery Projected at 160 Days | ||||||||||||||||||||
| Au | Ag | Au | Ag | |||||||||||||||||||||
MH08004 | 0.032 | 0.38 | 72.1 | 21.7 | 120 | 74.1 | ||||||||||||||||||
MH08005 | 0.033 | 0.42 | 75.4 | 37.9 | 120 | 78.2 | ||||||||||||||||||
The major reagent requirements were calculated to be:
| • | Lime (CaO) 5 lb/t; and |
| • | Sodium Cyanide 0.40 lb/t. |
| JBP/MLM | February 22, 2012 |
| SRK Consulting (U.S.), Inc. | ||||
| NI 43-101 Technical Report – Mt. Hamilton Gold Project, Centennial Deposit | Page 70 |
ICP Scans
Thirty-three element ICP scans on bottle roll composites and the first five day solutions from the columns show low concentrations of cyanocides (Cu-Mn-Ni) in the Centennial ores.
Mercury in solution was low (0.03 ppm), however a mercury retort and controls are included in the design of the processing plant described in this FS in accordance with state permitting requirements.
In 2010 Nevada published regulations for mercury vapor control in ADR plants. The regulations state in part that if mercury is present or could be present, controls are required on any plant operating elements exceeding 175ºF.
| 11.3.4 | McClelland Laboratories—2011 |
McClelland Laboratories conducted a metallurgical test program directed by SRK on drill core samples in 2011. The McClelland report entitled “Metallurgical Testing Centennial Drill Core Composites MLI Job No. 3528” (McClelland, 2011) is provided in Volume VII of the FS.
The drilling sites were selected by SRK to test sections in new areas of mineralization defined in the drilling.
The three holes utilized for testing were MH10002, MH10003, and MH10004. MH10002 and MH10003 were vertical holes. MH10004 was a 65º angle hole. MH10003 and MH10004 were in the same ore zone and both oxide and non-oxide were combined for the column test. Half core samples were used for testing.
The bottle roll testing is utilized to establish sample variability and to establish an economic grind size. The long term column tests will produce 10 to 15% better recoveries as compared to the short term bottle roll tests.
Bottle Roll Testing
Nine composite samples were prepared from the half cores. The composites were reduced to p80 3/4 inch size for bottle roll testing and subsequent column testing. Bottle roll test materials are presented in Table 11.3.4.1.
Table 11.3.4.1: 2011 McClelland Bottle Roll Test Materials
Composite | Hole | Depth (ft) | Length (ft) | |||||||
| 1 | MH 10002 | 25.5-43.2 | 17.7 | |||||||
| 2 | MH 10002 | 76.4-98.7 | 22.3 | |||||||
| 3 | MH 10003 | 331.6-341.5 | 10.9 | |||||||
| 4 | MH 10003 | 367.3-376.7 | 9.4 | |||||||
| 5 | MH 10003 | 426.0-443.9 | 17.9 | |||||||
| 6 | MH 10003 | 506.6-512.2 | 6.4 | |||||||
| 7 | MH 10003 | 490-506.6 | 15.6 | |||||||
| 8 | *MH 10004 |
| 399.9-418.8 427.5-441.0 |
|
| *10.1 *13.1 |
| |||
| 9 | *MH 10004 | 414.8-427.5 | *10.1 | |||||||
| * | 65º hole adjusted to vertical length |
The intervals were selected on the basis of cross sections and assays. Excluded from the composites were intervals of less than 0.005 oz/t Au. Results of the 2011 bottle roll tests are presented in Table 11.3.4.2.
| JBP/MLM | February 22, 2012 |
| SRK Consulting (U.S.), Inc. | ||||
| NI 43-101 Technical Report – Mt. Hamilton Gold Project, Centennial Deposit | Page 71 |
Table 11.3.4.2: 2011 McClelland Bottle Roll Test Results (96-hour, p80 3/4 inch)
Composite | Size | Hours | Calculated Head Grade oz/t Au | Recovery % Au | ||||||||||
| 1 | p80 3/4 inch | 96 | 0.046 | 67.1 | ||||||||||
| 2 | p80 3/4 inch | 96 | 0.019 | 62.1 | ||||||||||
| 3 | p80 3/4 inch | 96 | 0.021 | 66.2 | ||||||||||
| 4 | p80 3/4 inch | 96 | 0.028 | 73.7 | ||||||||||
| 5 | p80 3/4 inch | 96 | 0.019 | 58.5 | ||||||||||
| 6 | p80 3/4 inch | 96 | 0.039 | 51.1 | ||||||||||
| 7 | p80 3/4 inch | 96 | 0.039 | 51.8 | ||||||||||
| 8 | p80 3/4 inch | 96 | 0.100 | 64.0 | ||||||||||
| 9 | p80 3/4 inch | 96 | 0.107 | 32.2 | ||||||||||
The 48-hour bottle roll tests were done at 150 mesh on all the composites. These bottle roll tests were intended to simulate a cyanide soluble assay.
Table 11.3.4.3: 2011 McClelland Bottle Roll Test Results (48-hour 150 mesh)
Composite | Size | Hours | Calculated Head Grade oz/t Au | Recovery % Au | ||||||||||
| 1 | 150 mesh | 48 | 0.046 | 84.7 | ||||||||||
| 2 | 150 mesh | 48 | 0.020 | 63.2 | ||||||||||
| 3 | 150 mesh | 48 | 0.019 | 63.2 | ||||||||||
| 4 | 150 mesh | 48 | 0.034 | 71.6 | ||||||||||
| 5 | 150 mesh | 48 | 0.019 | 75.4 | ||||||||||
| 6 | 150 mesh | 48 | 0.036 | 46.7 | ||||||||||
| 7 | 150 mesh | 48 | 0.037 | 40.9 | ||||||||||
| 8 | 150 mesh | 48 | 0.084 | 71.8 | ||||||||||
| 9 | 150 mesh | 48 | 0.11 | 50.5 | ||||||||||
Silver assays and recoveries were tracked through the bottle roll series.
Silver recoveries ranged from 12% to 41% on the p80 3/4 inch bottle rolls. Recovery was found to be independent of grade.
The silver recovery was size dependent; the p80 3/4 inch bottle roll average recovery was 29.55% while the 150 mesh size (0.0041 inch) average recovery was 56.4%.
An additional eight bottle roll tests were done in the program. Seven of the eight follow-up bottle roll tests were run on five intervals from the MH10003 and MH10004 holes representing grade in areas that were classified as waste. Where sufficient sample was available 96-hour bottle tests at 10 mesh size were run in addition the 24-hour tests run on an interval from MH10004 that was identified as being non-oxide in core logs.
The gold grades and recoveries in the first seven holes were consistent with grades and recoveries in the ore zones surrounding them.
The gold grade and recovery in the eighth bottle roll was consistent with Comp 9 (MH10004 414.8-427.5). The samples containing higher amounts of sulfide tend to display lower recovery rates in short-term bottle roll tests.
Column Tests—2011
Two column tests were done at McClelland: Column C1 from MH10002, Column C2 from MH10003 and MH10004. The columns were run at a specified size of p80 3/4 inch.
| JBP/MLM | February 22, 2012 |
| SRK Consulting (U.S.), Inc. | ||||
| NI 43-101 Technical Report – Mt. Hamilton Gold Project, Centennial Deposit | Page 72 |
| • | Bottle Roll Composites 1-2 were composited for the C1 Columns; and |
| • | Bottle Roll Composites 4-9 were composited for the C2 Columns. |
The column testing included:
| • | Duplicate head assaying; |
| • | Screen Assay tails analysis; |
| • | ICP 33-element scan of composites; |
| • | CN rinse and drain down tests; |
| • | Lime and sodium cyanide consumptions; |
| • | Comminution Testing; and |
| • | Height/Percolation Testing. |
Results from the 2001 column tests are shown in Table 11.3.4.4.
Table 11.3.4.4: 2011 McClelland Column Test Results
Column | Calculated Head oz/t | Recovery % | Column Days | Projected Au Recovery at 160 Days | ||||||||||||||||||||
| Au | Ag | Au | Ag | |||||||||||||||||||||
MH 10002 | 0.034 | 0.44 | 81.7 | 35.6 | 118 | 83.4 | ||||||||||||||||||
MH 10003/4 | 0.045 | 0.61 | 79.4 | 56.6 | 118 | 81.0 | ||||||||||||||||||
Column testing was continued until the leach curves were “mature” and a regression analysis could be made to extend the leach curve.
Major Reagent Consumptions
The major reagent requirements from the 2011 column tests were calculated to be:
| • | Lime (CaO) 5 lb/t; and |
| • | Sodium Cyanide (NaCN) 0.8 lb/t. |
The sodium cyanide consumption was twice the consumption indicated in the 2009-2010 test program. The ICP analysis indicated a slightly elevated copper content in the 2011 studies, possibly accounting for the difference in cyanide consumption.
For the FS SRK recommends average reagent consumption of:
| • | Lime (CaO) 5 lb/t; and |
| • | Sodium Cyanide (NaCN) 0.6 lb/t. |
Comminution Testing
Comminution tests were performed on whole core samples. The test samples were selected to represent the ores at three depths and grades. Results are presented in Table 11.3.4.5.
Table 11.3.4.5: Comminution Results from 2011 Metallurgical Test Work
Hole | Depth | Work Index (kWh-ton) | Abrasion Index | |||||||||
MH 10009 | 493-507 | 4.97 | 0.0422 | |||||||||
MH 10009 | 569-579 | 7.85 | 0.0717 | |||||||||
MH 10009 | 641-650 | 8.03 | 0.0351 | |||||||||
| JBP/MLM | February 22, 2012 |
| SRK Consulting (U.S.), Inc. | ||||
| NI 43-101 Technical Report – Mt. Hamilton Gold Project, Centennial Deposit | Page 73 |
The Work Index (Wi) is a measure of breakability of the ore and power requirement. For design purposes SRK used 8.03 KWH/t. Overall, the ores fracture easily at a low power requirement.
The Abrasion Index (Ai) is a measure of the wear rates to be expected in chutes, screens and crusher liners. The Centennial ore has a low abrasion index. For costing purposes SRK used 0.0717 for the abrasion index.
Height/Percolation Tests
A Height/Percolation study was done on a residue sample from the C-2 (MH10003/4) column tests. The test consists of measuring percolation rates at varying heights. The heights are simulated by applying pressure by a hydraulic ram. The residues were tested at 12 heights from 0-220 ft.
The results indicate that Centennial ores will maintain adequate percolation rates up to a 220 ft heap height without agglomeration.
| 11.4 | Effect of Crush Size on Leach Recovery |
The 2009 column test MH8004 and MH08005 were conducted at a crush size of p100 1 inch. The crush size was selected to confirm the results of the crush sizes used in the 1997 KCA program.
The McClelland 2009-2010 bottle roll tests at p100 1 1/2 inch, 1 inch, 1/2 inch indicated that the p100 1 inch was the optimum economic crush size for the project. SRK specified a p80 3/4 inch size for the McClelland 2011 MH10002 and MH10003/4 column tests.
In most ores a p100 1 inch would be equivalent to a p80 3/4 inch. In the Centennial Ores, there is a remarkable difference, which has an effect on recovery. All samples were stage crushed in the tests to simulate a two-stage operating plant. The differential in the crush sizing is attributed to the inherent characteristics of the Centennial ores. In general, gold is contained within ores that are more easily crushed. The effect of crush size on recovery is summarized in Table 11.4.1.
The effect of crush size on recovery can be estimated by the column tail screen assay. The screen assay is a result of screening the column residues after leaching and rinsing at sizes from 3/4 inch down to 200 mesh. Each size fraction is weighed and assayed for gold. A gold distribution then is made. The Table 11.4.1 shows the distribution of gold in the tailings of the McClelland 2009-2011 test programs at the plus 3/4 inch size fraction.
Table 11.4.1: Effect of Crush Size on Au Recovery
Test | Spec Size | Actual | Grade Au oz/t | Column Au Recovery % For 120 Days | % Au in Tails At plus 3/4 inch | |||||||||||
MH08004 | p100 1 inch | p74 3/4 inch | 0.032 | 72.1 | 53.7 | |||||||||||
MH08005 | p100 1 inch | p72 3/4 inch | 0.033 | 75.4 | 29.9 | |||||||||||
MH10002 | p80 3/4 inch | p94 3/4 inch | 0.034 | 81.7 | 6.0 | |||||||||||
MH10003/4 | P80 3/4 inch | p85 3/4 inch | 0.045 | 79.4 | 19.7 | |||||||||||
|
|
|
|
|
|
|
| |||||||||
Average | 0.036 | 77.15 | ||||||||||||||
According to the manufacturer’s specifications the crushing circuit selected for Centennial will produce a p91 3/4 inch product, at 550 t/h. This actual crush size will enhance field recoveries over that projected at a P80 3/4 inch size.
Figure 11-2 is a graphic representation of the crush recovery relationship.
| JBP/MLM | February 22, 2012 |
| SRK Consulting (U.S.), Inc. | ||||
| NI 43-101 Technical Report – Mt. Hamilton Gold Project, Centennial Deposit | Page 74 |
The comparative results indicate that the MH08004-MH08005 column’s recovery would have benefited by up to 7% by finer crushing. SKR has utilized a correction factor of 4% increase in recovery for these columns for conservatism.
Table 11.4.2: Au Recovery Projection Normalized to Crush Size
Test | Size | Au Recovery % | ||||
MH08004 | p91 3/4 inch | 76.1 | ||||
MH08005 | p91 3/4 inch | 79.4 | ||||
MH10002 | p91 3/4 inch | 81.7 | ||||
MH10003/4 | p91 3/4 inch | 79.4 | ||||
|
|
| ||||
Average | 79.65 | |||||
|
| |||||
The recoveries utilized in this comparison are column leach/rinse days.
| 11.5 | Effect of Time on Leach Recovery |
The mature column data allows for a regression analysis in the end of the tests where leaching was still occurring, albeit at a slow rate.
Figure 11-3 is the projected leach recovery for the MH08004-MH08005 columns. The recovery was projected to 160 days column leach. The figure does not include the crush/recovery adjustment.
Figure 11-4 is the projected leach recovery for the MH10002 – MH10003/4 column test. The recovery was projected to 160 days column leach.
| 11.5.1 | Field Recovery |
The column leach times must be projected to field leach days. In the fixed wall columns, a plug flow is predominant. In the heap, diffusion flow is predominant.
Empirical formulas are used to project column days to field days. The initial leach is multiplied by 3x (times), the knee of the curve is multiplied by 2x (times) and the “tail out” is 1x (time). In the Centennial ore 160 days of column leach is equivalent to 210 days of field leach.
The readily available gold leaches quickly in Centennial ores. The effect of time on leach recovery is summarized in Table 11.5.1.1.
Table 11.5.1.1: Effect of Time on Leach Recovery
Column Days | Field Days | Recovery | ||||||
10 | 30 | 50 | % | |||||
10-20 | 20 | 20 | % | |||||
20-210 | 190 days | 8-9 | % | |||||
According to regression analysis, the column will continue to leach very slowly beyond the 210 day field leach.
The 210 day leach was selected as a reasonable economic leach time for the multi-lift Centennial heap leach. The projected leach recovery in 210 days field leach is shown in Table 11.5.1.2.
| JBP/MLM | February 22, 2012 |
| SRK Consulting (U.S.), Inc. | ||||
| NI 43-101 Technical Report – Mt. Hamilton Gold Project, Centennial Deposit | Page 75 |
Table 11.5.1.2: Column Au Recovery Projections Normalized to 210 Days of Leach
Test | Recovery | |||
MH08004 | 77.6 | |||
MH08005 | 80.8 | |||
MH10002 | 84.8 | |||
MH10003/4 | 82.6 | |||
Average Recovery in 210 days field leach at 0.036 oz/t Au head grade is 81.72% Au.
| 11.6 | Effect of Grade on Recovery |
In the studies leading up to the 2010 SRK PEA (SRK, 2010), several resources and mining reserves were calculated.
In the 2010 PEA, a mining resource of 17.7 Mt at 0.025 oz/t Au was identified at a 0.0065 oz/t Au CoG. The 2011 SRK FS mining resource is stated as 23.6 Mt at 0.022 oz/t Au at 0.006 oz/t Au CoG. A comparison of resources is shown in Table 11.6.1.
Table 11.6.1: Comparison of 2010 and 2011 Mineral Resources
Report | Mass (Mt) | Grade Au (oz/t) | Contained Au (oz) | |||||||||
2011 FS | 23.6 | 0.022 | 520,300 | |||||||||
2010 PEA | 17.7 | 0.025 | 442,500 | |||||||||
|
|
|
|
|
| |||||||
Difference | 6.3 | 77,800 | ||||||||||
The differential indicates that 6.3 Mt were added at a 0.012 oz/t Au grade.
Column leach tests done by KCA and McClelland indicate that gold recoveries tend to be independent of head grades. This is indicated in Table 11.6.2 and 11.6.3.
Table 11.6.2: 2009-2010 and 2011 McClelland Column Tests
Year | Sample ID | Au Head oz/t | *Recovery % Au | |||||||||
2009-2010 | 8004 | 0.032 | 77.6 | |||||||||
2009-2010 | 8005 | 0.033 | 80.8 | |||||||||
2011 | 11002 | 0.034 | 83.4 | |||||||||
2011 | 1103/4 | 0.045 | 81.0 | |||||||||
| * | Normalized for crush size and 210 day leach cycle |
KCA conducted nine column tests in 1997. The grade range was 0.023 to 0.110 oz/t gold in tests.
Seven columns were done at 1 inch crush size.
Table 11.6.3: 1997 KCA Column Tests
Sample ID | Head Assays oz/t | *Recovery % Au | Days Leach | |||||||||
**96003 | 0.023 | 78.3 | 48 | |||||||||
**96002 | 0.040 | 85.2 | 48 | |||||||||
87005D | 0.043 | 74.4 | 48 | |||||||||
91019D | 0.056 | 77.4 | 54 | |||||||||
97002 | 0.112 | 80.4 | 44 | |||||||||
97012 | 0.041 | 65.9 | 44 | |||||||||
97024 | 0.056 | 75.0 | 44 | |||||||||
| * | Column data recovery – no adjustments |
| ** | Outside of pit limit |
| JBP/MLM | February 22, 2012 |
| SRK Consulting (U.S.), Inc. | ||||
| NI 43-101 Technical Report – Mt. Hamilton Gold Project, Centennial Deposit | Page 76 |
The 2009-2010 McClelland Test Program contained bottle roll testing at differing crush sizes. The range of head assays included grades ranging from a 0.006 oz/t cut-off through the reserve grade of 0.022 oz/t and included the average test grade. It is important to note that short term bottle roll recoveries and column/field recoveries are different with the column/field tests being much higher. Within the framework of the bottle roll tests however, the recovery differential is valid.
Figure 11-5 graphically displays a regression analysis of the 2009-2010 bottle roll tests at p100 1 inch size.
A similar review of the 2011 McClelland bottle roll tests at p80 3/4” had insufficient data points at the lower grades for a meaningful regression analysis.
The KCA and McClelland column tests indicate that there is little or no relationship between head grade and recovery.
The bottle roll regression analysis suggests that a -2% recovery differential should be applied to the McClelland column test results at 0.036 oz/t head to account for the ore body grade of 0.022 oz/t.
| 11.7 | Igneous Ores |
In the 2010 SRK PEA (SRK, 2010) resource ores were identified as skarns with minor hornfels. The 2011 FS evaluation identified a new resource north of the previous open pit consisting mostly of igneous ores. The igneous ores are located in part of the Seligman Stock.
In 2011 McClelland conducted bottle roll testing on assay rejects from the north part of the ore body. In previous technical studies that used lower metal prices, this material was sub-economic. The igneous material represents about a 10% addition of gold ounces to the mining reserve. The average gold grade of the igneous material is 0.013 oz/t Au. The results of the 2011 igneous bottle roll tests are presented in Table 11.7.1.
Table 11.7.1: 2011 McClelland Igneous Bottle Roll Test Results
Hole | Depth (ft) | Size (mm) | Au Recovery (%) | Au Recovery @ 150 mesh (%) | Au Assay (oz/t) | |||||||||||||||
11003 | 40-55 | 1.7 | 80.7 | 78.6 | 0.008 | |||||||||||||||
11003 | 79-95 | 1.7 | 71.8 | 72.9 | 0.010 t | |||||||||||||||
11003 | 110-145 | 1.7 | 70.9 | 70.3 | 0.020 | |||||||||||||||
11003 | 260-275 | 1.7 | 78.6 | 79.2 | 0.013 | |||||||||||||||
11004 | 15-25 | 1.7 | 82.1 | 83.2 | 0.011 | |||||||||||||||
11004 | 100-125 | 1.7 | 71.9 | 72.3 | 0.009 | |||||||||||||||
*11004 | 170-215 | 1.7 | 59.2 | 57.5 | 0.019 | |||||||||||||||
11004 | 275-245 | 1.7 | 74.3 | 72.9 | 0.012 | |||||||||||||||
|
|
|
|
|
|
|
|
|
| |||||||||||
Average | 73.69 | 73.36 | 0.013 | |||||||||||||||||
|
|
|
|
|
| |||||||||||||||
| * | Identified as non-oxide in core logs |
The results indicate that these igneous ores contain recoverable gold at a slightly lower recovery rate than the other skarn-dominated ores. As is the case with skarn hosted ores, the location has a greater effect on recovery than the head grade. The igneous material has variable gold recovery, which is a reflection of its variable bulk composition and mineralogy. The average tailing in these tests was 0.003 oz/t Au.
These igneous bottle roll test results at 1.7 millimeter are comparable to bottle roll tests on skarn material at the same crush size.
| JBP/MLM | February 22, 2012 |
| SRK Consulting (U.S.), Inc. | ||||
| NI 43-101 Technical Report – Mt. Hamilton Gold Project, Centennial Deposit | Page 77 |
| 11.8 | Recovery Projection Summary |
A considerable volume of metallurgical testing was conducted prior to SRK becoming involved in the project and is presented in greater detail in the Appendices to this report. Building on this significant data base, SRK designed a number of studies in the period 2008-2011 to verify previous results and optimize gold recoveries for the Centennial ore deposit and to make a definitive estimate of gold recoveries under the process parameters utilized in this FS.
A summary of gold recoveries and adjustments is presented in Table 11.8.1 utilizing the most recent column tests as a basis.
Table 11.8.1: Overall Projected Au Recovery Relative to Crush Size, Leach Time and Au Grade
Column Test | 120 Day Column | 4% Increase for Finer Operating Crush Size | Increase from Regression of Recovery Curves for Longer Operating Leach Time | 2% Decrease for Operational Head Grade Lower than Column Test Head Grades | ||||||||||||
MH08004 | 72.1 | 76.1 | 78.1 | 76.1 | ||||||||||||
MH08005 | 75.4 | 79.4 | 81.4 | 79.4 | ||||||||||||
MH10002 | 81.7 | 81.7 | 83.7 | 81.7 | ||||||||||||
MH1003/4 | 79.4 | 79.4 | 81.4 | 79.4 | ||||||||||||
|
|
|
|
|
|
|
| |||||||||
Projected Au Recovery |
| 79.15 | ||||||||||||||
Adjustments
Column tests MH08004 and MH08005 recoveries were raised by 4% recovery to account for the finer crush size planned in operations.
All column recovery curves were extrapolated to a 160-day column leach, which is equivalent to a 210 day field leach.
For conservatism, column test recoveries were reduced by 2% to account for the grade differential in testing head grades compared to predicted mining head grades.
Silver
Silver recoveries in bottle roll and column tests varied widely and were dependent on mineralization type. The column test silver results are shown in Table 11.8.2.
Table 11.8.2: Overall Projected Ag Recovery
Test | Ag Grade (oz/t) | Ag Recovery (%) | ||||||
MH08004 | 0.38 | 21.7 | ||||||
MH08005 | 0.42 | 37.9 | ||||||
MH10002 | 0.43 | 35.6 | ||||||
MH10003/4 | 0.62 | 56.6 | ||||||
|
|
|
| |||||
Average | 0.46 | 38.0 | ||||||
A silver recovery projection to 160 days column leach (210 days field leach) will raise silver recoveries by 2%, up to 40% of total silver based on a regression analysis. Therefore, a 40% silver recovery from a total silver head assay can be expected in the Centennial ores.
Since the silver reserves reported in this study are “recoverable silver” this 40% recovery has already been applied and therefore there is minimal adjustment needed for economic evaluation of silver. To be conservative, SRK applied a 10% discount to the recoverable silver reserve to address potential heap inefficiencies.
| JBP/MLM | February 22, 2012 |
| SRK Consulting (U.S.), Inc. | ||||
| NI 43-101 Technical Report – Mt. Hamilton Gold Project, Centennial Deposit | Page 78 |
Figure 11-1: Centennial Metallurgical Test Sample Locations
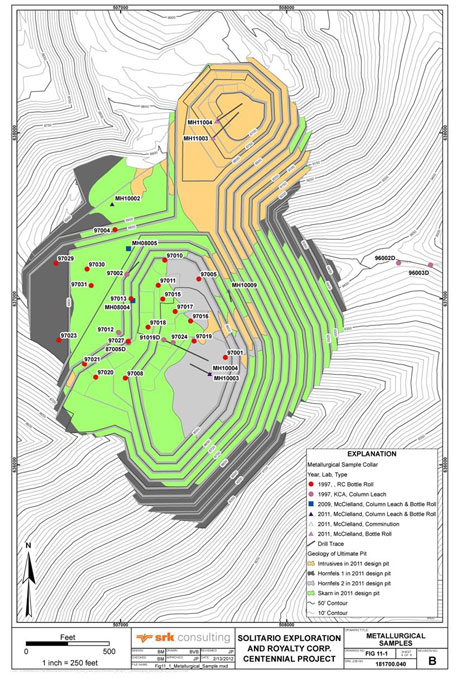
| JBP/MLM | February 22, 2012 |
| SRK Consulting (U.S.), Inc. | ||||
| NI 43-101 Technical Report – Mt. Hamilton Gold Project, Centennial Deposit | Page 79 |
Figure 11-2: Column Tests—% Au Recovery vs. Crush Size – 120 Days Column Leach
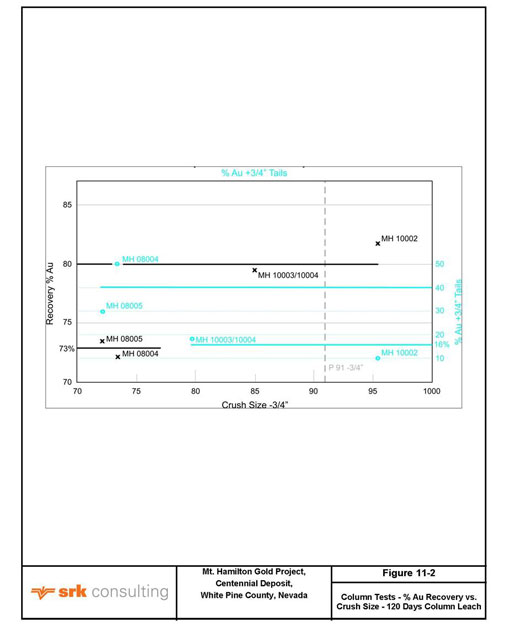
| JBP/MLM | February 22, 2012 |
| SRK Consulting (U.S.), Inc. | ||||
| NI 43-101 Technical Report – Mt. Hamilton Gold Project, Centennial Deposit | Page 80 |
Figure 11-3: Test MH08004 & MH08005 Gold & Silver Leach Rate Profiles
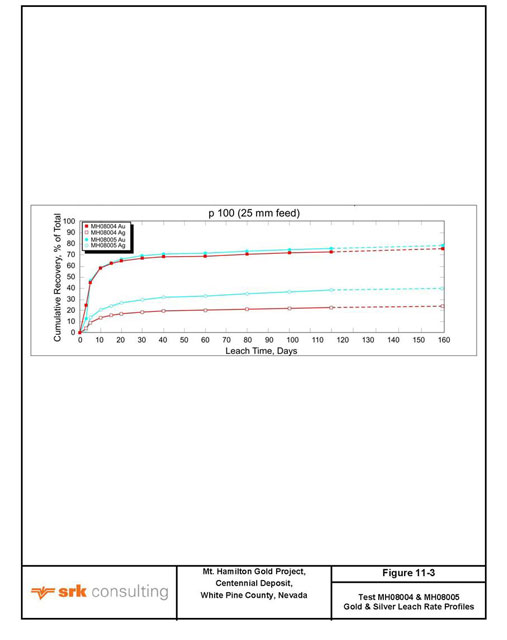
| JBP/MLM | February 22, 2012 |
| SRK Consulting (U.S.), Inc. | ||||
| NI 43-101 Technical Report – Mt. Hamilton Gold Project, Centennial Deposit | Page 81 |
Figure 11-4: Test MH10002 & MH1003/4 Gold & Silver Leach Rate Profiles
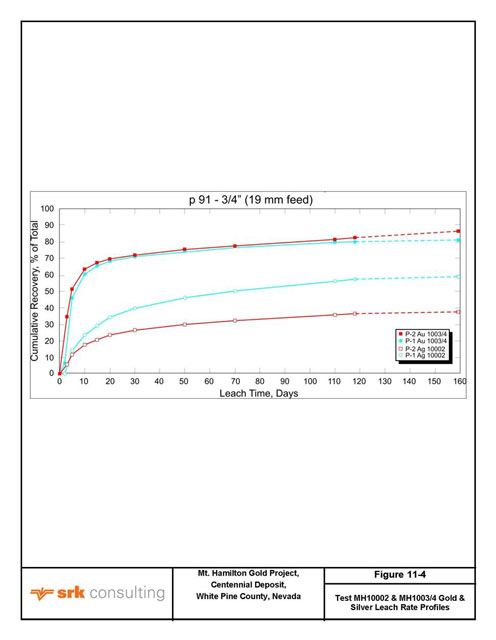
| JBP/MLM | February 22, 2012 |
| SRK Consulting (U.S.), Inc. | ||||
| NI 43-101 Technical Report – Mt. Hamilton Gold Project, Centennial Deposit | Page 82 |
Figure 11-5: Selected Grade vs. Recovery from 96-hour Bottle Roll Tests @ p100 in
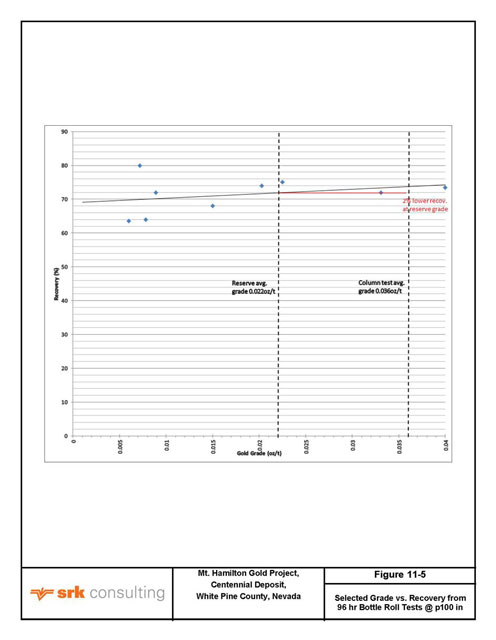
| JBP/MLM | February 22, 2012 |
| SRK Consulting (U.S.), Inc. | ||||
| NI 43-101 Technical Report – Mt. Hamilton Gold Project, Centennial Deposit | Page 83 |
| 12 | Mineral Resource Estimation |
| 12.1 | Introduction |
The FS is intended for the use of MH-LLC for the further development and advancement of the Project. This report provides a mineral resource estimate and classification of resources in accordance with the Canadian Institute of Mining, Metallurgy and Petroleum Standards on Mineral Resources and Reserves: Definitions and Guidelines, dated November 27, 2010 (CIM).
SRK estimated mineral resources for Centennial using lithology, structure, alteration and oxidation remodeled in 2011. The revised geologic model was used to update block model densities for a more accurate tonnage prediction, and to better control the distribution of gold and silver grades. In particular the “grade shells” and anisotropies (preferential orientations or “trends”) for gold and silver were modeled independently providing an independent representation of the mineralization of each. However, as described below, the silver assay variable is “normalized” and as such is less robust than that provided for gold and should be evaluated accordingly. The resource confidence classification established for gold is also not necessarily applicable for silver given the lower sampling density and nature of assays for silver. SRK has consequently restricted silver estimation by a scheme of conservative capping and a conservative recovery was used for silver during pit optimization.
Cautionary Note to U.S. Investors concerning estimates of Measured and Indicated Resources and Inferred Resources: This report uses the terms “measured” and “indicated resources.” These terms are recognized and required by Canadian regulations; The SEC does not recognize them and U.S. investors are cautioned not to assume that any part or all of mineral resources in these categories will ever be converted into reserves. This section also uses the term “inferred resources.” This term is recognized and required by Canadian regulations; the SEC does not recognize it. “Inferred resources” have a great amount of uncertainty as to their existence, and great uncertainty as to their economic and legal feasibility. It cannot be assumed that all or any part of an Inferred Mineral Resource will ever be upgraded to a higher category. Under Canadian rules, estimates of Inferred Mineral Resources may not form the basis of Feasibility or Prefeasibility studies, except in rare cases. U.S. investors are cautioned not to assume that part or all of an inferred resource exists, or is economically or legally minable.Reserves meeting the requirements of the Securities and Exchange Commission’s Industry Guide 7 for Mt. Hamilton project are described in the Mining section of this FS.
| 12.2 | Block Models |
SRK constructed a block model, using the Datamine Studio3® mining software package, for the Centennial Deposit with data provided by MH-LLC and audited by SRK.
The model has the spatial characteristics and limits shown in Table 12.2.1. Extents are given in the Mount Hamilton Mine Grid, which is based on Nevada State Plane, North America Datum 1927.
| JBP/MLM | February 22, 2012 |
| SRK Consulting (U.S.), Inc. | ||||
| NI 43-101 Technical Report – Mt. Hamilton Gold Project, Centennial Deposit | Page 84 |
Table 12.2.1: Model Limits
| $000,000.00 | $000,000.00 | $000,000.00 | $000,000.00 | |||||||||||||
Direction | Minimum (ft) | Maximum (ft) | 20 ft x 20 ft x 20 ft Blocks | |||||||||||||
Easting | 506,000 | 508,220 | 111 | Columns | ||||||||||||
Northing | 635,680 | 636,556 | 146 | Rows | ||||||||||||
Elevation | 8,300 | 8,576 | 46 | Levels | ||||||||||||
The block size of 20 ft x 20 ft x 20 ft was considered appropriate for Centennial given the drilling density and the approximation of a 20 ft bench height (expected for open pit mining in the area).
| 12.3 | Model Geology and Mineralization Envelopes |
SRK rebuilt the Centennial geologic model to support resource estimation in 2011. This was done to assign density to the block model and also to update grade shells using new drilling data from 2008-2011. Using the raw drill data, and hand-interpreted grade constraints, Leapfrog® mining software was used to develop three-dimensional (3D) solid models of the key geologic components including:
| • | Lithology (skarn, hornfels, igneous, waste rock); |
| • | Oxidation (model of oxidation to facilitate density assignments); |
| • | Structure (structural trends to control grade shells); and |
| • | Gold and Silver Grade Shells (@ 0.007 oz/t and 0.07 oz/t respectively). |
The lithology model was based on stratigraphic interpretations of the middle Cambrian sedimentary sequence of calcareous shales, limestones and dolomites of the Secret Canyon Shale and Dunderberg Dolomite units that strike N182°E and dip gently to the west at 10° to 20°. SRK modeled this sequence as a series of layers of skarn and hornfels, which are the metamorphic equivalent of the shale/siltstone layered Secret Canyon protolith (Figure 12-1). In general terms, the Centennial ore body is hosted in a 50 to 200 ft-thick unit of calc-silicate skarn that lies stratigraphically below a 200 ft-thick impermeable and rarely mineralized upper unit of hornfels. Igneous granodiorite of the Seligman stock intrudes the sedimentary sequence in a series of discontinuous sills along sedimentary bedding planes (Figure 12-2, 12-3). These sills coalesce into a broader contiguous intrusion that lies north and east of the main skarn ore body (Figure 12-4, 12-5). In the set of figures for this section (Figures 12-1 through 12-5) igneous rock is pink colored, skarn is green and hornfels is tan.
This package of sedimentary geology was subsequently faulted in a direction antithetic to bedding causing both oxidation and mineralization to be concentrated along a set of low-angle structures that strike approximately N80°E, and dip 10°SSE.
Oxide was modeled from geologic logs. The 3D-wireframe controlling block model oxide coding was interpreted from strong to moderate oxidation as represented in drill log oxide codes 2 and 3. From examination of drill core this seemed to be appropriate as this level of oxidation had the effect of lowering rock density.
The distribution of oxide and sulfide was then used to evaluate the effects of sulfide on NaCN solubility of gold (i.e. recovery). The ratio of cyanide soluble assays to fire assays (CN/FA) was displayed in three dimensions using the software and reviewed in context with modeled sulfide. Low CN/FA ratios were extremely sporadic and could not be modeled as a contiguous zone. There was little to no spatial correlation between samples with low CN/FA ratios and zones of high sulfide in
| JBP/MLM | February 22, 2012 |
| SRK Consulting (U.S.), Inc. | ||||
| NI 43-101 Technical Report – Mt. Hamilton Gold Project, Centennial Deposit | Page 85 |
mineable grade ranges. The conclusion was that excluding or segregating sulfide mineralization from resource estimation is not required, especially since it is a minor percentage of the total resource. This conclusion was further supported by 2011 metallurgical test work. In column leach test MH-10003/4, typical oxide mineralization was mixed with sulfide mineralization. Gold recovery from the mixed column was 78.6%, which is comparable to projected recovery for the deposit. Gold associated with sulfide, from the test work, appears to be recoverable, but leaches at a slower rate than gold in oxide.
A set of late, low-angle faults dip shallowly from northwest to southeast into the Centennial hillside at an angle opposite to bedding. The faults are indicated by high concentrations of silicification (quartz veining) and strong oxidation. Strong oxidation forms an envelope around the fault zones coincident with high assay grades. Assay data were manually interpreted in cross section to define planes of continuity (structural trends) that were subsequently used to control 3D interpolations (grade shells) of gold and silver grades. The grade shells were built from 20 ft composites to smooth the raw assays. Some degree of outer-margin dilution was introduced by using the 20 ft composites, but this was deemed appropriate in relation to the model block size and planned mining bench height (20 ft).
Grade shells were used to constrain grade estimation and limit the projection of high grades away from data. In the absence of a lower population break in the gold assay data set, the grade shell for gold was built at 0.007 Au oz/t so as not to artificially limit grades near the expected mining cut-off grade. The grade shell for silver was built at 0.07 oz/t Ag to mimic the shape and volume of the gold grade shell. The silver grade shell was built independently of gold using an independent interpretation of structural controls. Gold and silver grade shells were allowed search radii of 200 ft and 150 ft respectively. Grade shells defined by single drill holes were eliminated prior to grade estimation. Examples of the gold grade shells are shown in cross section (red) in Figure 12-2 through 12-5.
| 12.4 | Density |
A total of 58 density determinations were performed on Centennial core in order to determine the tonnage factor. Of these, 51 samples were submitted to Advance Terra Testing in 1997. Also in 1997, Mineral Resources Development Inc. (MRDI) checked and confirmed the accuracy of 25% of the density measurements.
Based on the previous work, average densities are 12.34 ft3/t for strong and moderately oxidized rock, 10.52 ft3/t for skarn and hornfels, and 11.7 ft3/t for igneous rocks. In the block model, density was assigned on the basis of lithology (igneous, skarn, hornfels, oxide) as modeled in Leapfrog® by SRK as displayed on Figure 12-1. Recent metallurgical and geotechnical test work has confirmed the density values used in modeling.
To represent areas of historic mining where waste rock was placed (north of main ore body) as outlined on Figure 12-1, a density of 18.18 ft3/t was assigned to waste rock and no grades were estimated in waste-rock model blocks. The average thickness of waste rock in the north, Cabin Gulch model area is approximately 150 ft.
| 12.5 | Assay Data Population Domain Analysis |
Drillhole collars and surveys were checked and validated as described in the data verification section of this report (Figure 12-6). The Centennial assay database consists of 25,057 intervals with Au
| JBP/MLM | February 22, 2012 |
| SRK Consulting (U.S.), Inc. | ||||
| NI 43-101 Technical Report – Mt. Hamilton Gold Project, Centennial Deposit | Page 86 |
assays and 16,770 with Ag assays from 317 drill holes including 26 diamond core holes and 291 reverse circulation drill holes. Basic statistics for the assay database are presented in Table 12.5.1. Most of the data were collected on 5 ft drilled intervals from reverse circulation drilling. Silver was not always assayed; therefore, there are fewer silver grades than gold grades.
Table 12.5.1: Assay Basic Statistics for Centennial Au and Ag Database
Basic Statistics | Au | Ag | ||||||
# Samples in Database | 25,057 | 16,770 | ||||||
|
|
|
| |||||
Minimum (oz/t) | 0 | 0 | ||||||
Maximum (oz/t) | 0.995 | 18.25 | ||||||
Average (oz/t) | 0.0085 | 0.1217 | ||||||
Variance | 0.0007 | 0.1601 | ||||||
Standard Deviation | 0.026 | 0.4001 | ||||||
Gold and silver are handled differently in the database. Prior to 1995, all gold assays were determined by fire assay, and these constitute the majority of the database. However, during the years 1995, 1996 and 1997 gold values were analyzed at the NE Seligman mine laboratory. As a first pass screening method, all samples were analyzed by NaCN soluble techniques. If the result was > 0.009 oz/t from the NaCN technique, the sample was fire assayed. The majority of these samples did not meet the minimum grade requirement and were never fire assayed.
In 1997, MRDI used 2,419 samples in the database having both fire assay (total gold) results and cyanide soluble results to develop a mathematical relationship to assign a fire assay value to samples where only cyanide soluble assays were originally present. The equation MRDI developed was conditionally unbiased for grades up to 0.09 oz/t and had a high correlation coefficient (97%). Using this equation, a total of 6,408 gold assays previously missing were assigned values as related to their cyanide soluble assay. This increased the population of the total gold assay data set by 66% and greatly increased the data available for resource estimation. The assignment resulted in a 16% global decrease in the average gold grade (all samples). However, there was no appreciable change in the average grade or grade distribution (histogram) in the range of gold grades greater than 0.01 oz/t. The conclusion drawn by MRDI, and supported by SRK, is that the assignment of total gold grades using the regression equation impacted the low grade ranges of the gold distribution and had little or no impact on grades greater than 0.01 oz/t Au. SRK considers the calculation of gold grades in this manner to be reasonable and statistically defensible; and it has added a significant percentage of low-grade to the database in place of missing data, which serves to more accurately constrain grade estimation.
The Ag database for older, pre-2008 drilling was determined largely by acid digestion with an atomic absorption (AA) finish. In 1997, MRDI applied a linear regression to establish a “Recoverable Ag” factor. This factor was applied to all of the previous total silver values in the database and then all of the silver data were normalized to recoverable silver. The recoverable Ag field in the database is considered the most complete and most accurate data for resource modeling.
Figures 12-7 and 12-8 below are lognormal probability plots for the Centennial Au and Ag raw data assay distributions respectively.
Using the lognormal probability diagrams as a guide, in conjunction with an examination of the distribution of drillhole data, “thresholds” were selected for each metal; an inflection point was selected to identify assays that are to be considered “outliers” to the general distribution and
| JBP/MLM | February 22, 2012 |
| SRK Consulting (U.S.), Inc. | ||||
| NI 43-101 Technical Report – Mt. Hamilton Gold Project, Centennial Deposit | Page 87 |
“capped” or set back to the defined threshold. The thresholds identified are tabulated below on Table 12.5.2.
Table 12.5.2: Grade Capping Thresholds
Description | Au (oz/t) | Ag (oz/t) | ||||||
Assay Cap | 0.36 | 1.00 | ||||||
Number Of Values Affected | 7 | 258 | ||||||
Maximum Assay Value | 0.995 | 18.25 | ||||||
| 12.6 | Compositing |
SRK composited the raw data after capping values and compositing sample values into 10 ft fixed-length down-hole intervals. This resulted in 9,169 composites with Au grades and 8,438 with Ag grades of which 3,159 and 3,300 are inside the respective gradeshells. Composites were coded using geologic solids of lithology, alteration, oxidation and mineralization. Coded composites inside the mineralized envelope were compared to raw assays using a cumulative probability plot which shows a good correlation with some expected downward averaging of the composites relative to the raw data. Composites were selected for each metal using data interior to the respective grade shell and conversely exterior. Table 12.6.1 presents summarized statistics for the resultant assay populations; the coefficient of variation for each population decreases subsequent to grade shell segregation indicating both that the selection is realistic and that nonlinear estimation is not required.
Table 12.6.1: Composite Statistics
Description | Au 10 ft Composites | Ag 10 ft Composites | ||||||||||||||||||||||
| All | Interior | Exterior | All | Interior | Exterior | |||||||||||||||||||
Number Of Values | 9,169 | 3,159 | 6,010 | 8,438 | 3,300 | 5,138 | ||||||||||||||||||
Maximum Value | 0.358 | 0.358 | 0.120 | 1.000 | 1.000 | 1.000 | ||||||||||||||||||
Minimum Value | 0.000 | 0.000 | 0.000 | 0.000 | 0.000 | 0.000 | ||||||||||||||||||
Mean | 0.007 | 0.024 | 0.001 | 0.051 | 0.116 | 0.015 | ||||||||||||||||||
Variance | 0.0003 | 0.0011 | 0.0000 | 0.015 | 0.033 | 0.001 | ||||||||||||||||||
Standard Deviation | 0.019 | 0.032 | 0.003 | 0.121 | 0.181 | 0.033 | ||||||||||||||||||
Coefficient Of variation | 2.82 | 1.38 | 2.09 | 2.38 | 1.56 | 2.20 | ||||||||||||||||||
| 12.7 | Search Criteria and Dynamic Anisotropy |
Variograms, indicator variograms and correlograms were constructed for raw and composited assay values for both Au and Ag. The variograms had fairly high nugget values relative to sills and there was no clear preferential orientation (anisotropy) of the continuity of mineralization. Displayed on Figures 12-9 and 12-10 are ordinary isotropic variograms for Au and Ag; these can be interpreted as having first structure continuity (a range) on the order of 30 to 40 ft and a second structure with a range approaching 100 ft. SRK used approximately these distances for the first and second search volumes as described in Section 2.7.
SRK is of the opinion from general geologic inspection that variable orientation trends exist at the Centennial deposit as noted previously. Determining the preferential orientation to the continuity of mineralization with these structural complexities can be problematic given the variations over short distances. The dynamic anisotropy option in Datamine Studio3® allows the anisotropy rotation angles for defining the search volume to be defined individually for each cell in the model. The
| JBP/MLM | February 22, 2012 |
| SRK Consulting (U.S.), Inc. | ||||
| NI 43-101 Technical Report – Mt. Hamilton Gold Project, Centennial Deposit | Page 88 |
search volume is oriented precisely to follow the trend of the mineralization. The rotation angles are assigned to each cell in the model; it is assumed that the dimensions of the ellipsoid, the lengths of the three axes, remain constant. A point file, where each point has a value for dip and dip direction, is created from wireframes and is intended to represent the preferential “down dip” direction, which varies locally, over the vertical and horizontal extent of the wireframes. Since the three axes of the search volume are orthogonal and only two rotations are used (dip and dip direction) the orientation of all axes are explicitly defined. The point values are taken from the orientation of the triangular facets that comprise the surface of the wireframe.
For Centennial the dynamic anisotropy points for each metal were established from the facets of the structural trend surfaces that underpin the grade shell as described in Section 2.2. For Au the mean azimuth was 155° with a dip of 16° which supports a general interpretation of the trends of the overall mineralization. For Ag the mean azimuth is 192° with the same dip. Planes controlling the dynamic anisotropy are shown in Figures 12-11 and 12-12 for Au and Ag respectively.
| 12.8 | Grade Estimation |
Based on the sample set available and the variography, an inverse to the distance power of two (ID2) was chosen to weight grades selected in the search ellipse. Testing with alternative powers yielded similar results. An Ordinary Kriging (OK) comparison produced what appeared to be an overly smoothed representation. ID2 puts much more weight on close samples at short distances compared to OK with a nested spherical model variogram but less weight if the first sample is farther away. On the other hand, the weighting derived from the kriging equations is not a simple function of distance and is influenced by data geometry and anisotropy. Overestimating the nugget reduces the global estimate of grade, at higher cut offs, and increases the global estimate of tonnage. Underestimating the nugget has the opposite effect on global estimates at higher cut offs. Locally the overestimation of nugget affects the higher grades the most, under-representing their value and thereby smoothing the distribution. Again the opposite effect is seen for underestimation of the nugget. With problematic variography and fitting concerns the use of the somewhat simplistic ID2 methodology is appropriate given the prevalence of its application in similar gold/silver deposits.
The orientation of the search ellipse was controlled by the dynamic anisotropies as discussed in Section 2.6. Table 12.8.1 below summarizes the grade interpolation parameters.
Table 12.8.1: Grade Interpolation Parameters
Centennial Search Neighborhood Strategy | ||||||||||||||||||||||||
SVOL | Search Distance (ft) | Minimum Number Of Composites | Maximum From One Drillhole | |||||||||||||||||||||
| Search Orientation | X | Y | Z | |||||||||||||||||||||
1 | Dynamic | 30 | 40 | 10 | 3 | 2 | ||||||||||||||||||
2 | Dynamic | 90 | 120 | 30 | 3 | 2 | ||||||||||||||||||
3 | Dynamic | 150 | 200 | 50 | 2 | 2 | ||||||||||||||||||
To preserve local grade variation, a search neighborhood strategy with three search ellipse volumes (SVOL) was used; only blocks not estimated with the first set of parameters were estimated with a subsequent expanded search. In order to preserve this local variation of grades and also have a requirement for grade assignment using data from more than one drillhole, a minimum of three 10 ft composites was required, with a maximum of two from any given hole, for estimation with the first
| JBP/MLM | February 22, 2012 |
| SRK Consulting (U.S.), Inc. | ||||
| NI 43-101 Technical Report – Mt. Hamilton Gold Project, Centennial Deposit | Page 89 |
two search volumes. If there were a larger data set, multiple indicator kriging or conditional simulation methodologies might have been more appropriate.
| 12.9 | Resource Classification |
Mineral resources were classified under the categories of Measured, Indicated and Inferred according to standards as defined by the CIM. Classification of the resources reflects the relative confidence of the grade estimates. This is based on several factors including; sample spacing relative to geological and geostatistical observations regarding the continuity of mineralization, mining history, specific gravity determinations, accuracy of drill collar locations, quality of the assay data and many other factors which influence the confidence of the mineral estimation.
Block-by-block resource classifications should be defined by geologically sensible and coherent zones that reflect a realistic level of geological and grade estimation confidence taking into account the amount, distribution and quality of data. A common way of implementing this classification process is to create resource classifications based on block estimation attributes and then apply broader geological and data confidence considerations for final classifications. This process involves geological in addition to purely mathematical input for resource classification. Subsequent to an initial pit optimization exercise (utilizing all blocks including inferred) the confidence classification of all blocks falling within the optimized pit were examined and modifications were made to minimize the occurrence of “spots” of, for example, blocks classified mathematically as inferred that are encompassed by those classified as indicated, within areas with reasonable geological continuity and sufficient sampling. The result is a contiguous body of measured and indicated resources bordered by an outlying area of inferred resource. Resource classification criteria are presented in Table 12.9.1.
Table 12.9.1: Resource Classification Criteria
Centennial Confidence Classification Scheme | ||||||||||||||||
Class | Isotropic Absolute Distance | Minimum Number Of Composites | Maximum From One Drillhole | |||||||||||||
| SVOL | Mineralization Shell | |||||||||||||||
Measured | 1 | Interior | 3 | 2 | ||||||||||||
Indicated | 1 | Exterior | 3 | 2 | ||||||||||||
Indicated | 2 | Interior | 3 | 2 | ||||||||||||
Inferred | 3 | Unconstrained | 2 | 2 | ||||||||||||
Figures 12-13 and 12-14 are projections of the model blocks within the Au and Ag shells respectively.
Figures 12-15 through 12-17 are cross sections through the block model displaying the composite values and anisotropy interpretations for Au while Figure 12-18 is the equivalent for Ag. The “points of anisotropy” are displayed along with the composites and block values. As can be seen the variable anisotropy adequately represents the interpreted dips and dip directions across the deposit resulting in a “draping” of the mineralization. The effects of this process are markedly more apparent for the silver values displayed on Figure 12-18; possibly the result of a more relatively heterogeneous population compared to gold.
| 12.10 | Resource Statement |
The resource estimate is presented in Table 12.10.1.
| JBP/MLM | February 22, 2012 |
| SRK Consulting (U.S.), Inc. | ||||
| NI 43-101 Technical Report – Mt. Hamilton Gold Project, Centennial Deposit | Page 90 |
Table 12.10.1: Mineral Resource Statement Centennial Gold-Silver Deposit, White Pine County, Nevada, SRK Consulting (U.S.), Inc.
Resource Category | Tons (000’s) | Au Grade (oz/t) | Contained Au (oz) | Ag Grade (oz/t) | Recoverable Ag (oz)* | |||||||||||||||
Measured | 918 | 0.032 | 29,524 | 0.155 | 142,152 | |||||||||||||||
Indicated | 22,732 | 0.022 | 497,330 | 0.132 | 3,010,471 | |||||||||||||||
Measured and Indicated | 23,650 | 0.022 | 526,854 | 0.133 | 3,152,624 | |||||||||||||||
Inferred | 3,454 | 0.018 | 60,859 | 0.079 | 273,457 | |||||||||||||||
Notes:
| • | Mineral Resources are not Mineral Reserves and do not have demonstrated economic viability. There is no certainty that all or any part of the Mineral Resources estimated will be converted into Mineral Reserves estimate; |
| • | Resources stated as contained within a potentially economically minable open pit stated above a 0.006 oz/t Au cut-off grade; |
| • | Pit optimization is based on assumed gold and silver prices of US$1,600/oz and US$40.00/oz, respectively, effective heap leach recoveries of 75% and 30% for gold and silver, respectively, a mining, processing and G&A cost of US$5.81/t; Net Smelter Return 1% and pit slopes of 50°. |
| • | Reported Au ounces are contained metal subject to process recovery which will result in a reduced number of payable ounces; |
| • | * Reported Ag ounces have already received a recovery discount during resource modeling; therefore, there will be minimal further reduction of payable Ag ounces after processing; and |
| • | Mineral resource tonnage and contained metal have been rounded to reflect the accuracy of the estimate, and numbers may not add due to rounding. |
Mineral Resources were constrained by an economically minable open pit using optimistic metal prices and operating cost criteria. This was to ensure that an adequate stripping ratio was applied and resources have a reasonable expectation of economic extraction. SRK considers reporting resources within an optimized pit to be necessary for NI 43-101 compliance for a project at this level of study.
The Resource Statement for gold reportscontained gold ounces from the estimation of total-gold assay composites. The Resource Statement for silver reportsrecoverable silver ounces from the estimation of recoverable silver assay composites, rather than total silver values (see Section 2.4 for additional detail). The Ag database for older, pre-2008 drilling was determined largely by acid digestion with an AA finish. In 1997, MRDI applied a linear regression to establish a “Recoverable Ag” factor. This factor was applied to all of the previous total silver values in the database and then all of the silver data were normalized to recoverable silver. The recoverable Ag field in the database was the most complete and most accurate data for resource modeling. SRK chose to model the recoverable Ag values rather than to apply another factor. As a result, gold-equivalent has not been utilized in the Resource Statement.
| 12.11 | Block Model Validation |
The estimated values of resource model blocks visually compare satisfactorily with composited values when examined in conjunction with the interpreted anisotropies and grade shells.
Table 12.11.1 shows comparative statistics for the model blocks (at a zero cut-off within the shells) and the composited assay values within the relevant gold and silver grade shells.
| JBP/MLM | February 22, 2012 |
| SRK Consulting (U.S.), Inc. | ||||
| NI 43-101 Technical Report – Mt. Hamilton Gold Project, Centennial Deposit | Page 91 |
Table 12.11.1: Composite/Model Comparison Summary Statistics
Population | Au | Ag | ||||||||||||||
| Model Blocks | Interior Composites | Model Blocks | Interior Composites | |||||||||||||
Maximum Value | 0.227 | 0.358 | 0.943 | 1.000 | ||||||||||||
Minimum Value | 0.000 | 0.000 | 0.000 | 0.000 | ||||||||||||
Mean | 0.0211 | 0.0235 | 0.1235 | 0.1160 | ||||||||||||
Standard Deviation | 0.017 | 0.032 | 0.117 | 0.181 | ||||||||||||
Coefficient Of variation | 0.81 | 1.38 | 0.95 | 1.56 | ||||||||||||
The average estimated Au grade of resource model blocks is marginally lower than the average grade of the composited values used for the estimation while the average for silver is marginally higher. The heterogeneity of the Ag grade population is expressed by the higher coefficient of variation. As noted above Ag has been modeled independently of Au, the quality of the Ag assay database is inferior to the Au database and resource confidence classifications were constructed (both mathematical and geological) for the Au variable only. The proper confidence classification of Ag, given the separate grade shell, interpreted anisotropies and data distribution would not overlay that of Au and the combined confidence would be quite complex. The emphasis here is that the deposit model was constructed primarily for an estimation of Au with Ag as a secondary value. As the economic contribution of Ag is significantly lower than gold for all of the modeled deposit, silver distribution should not drive mine design.
| 12.12 | Resource Sensitivity |
In order to assess the sensitivity of the resource to changes in cut-off grade, SRK summarized tonnage and grade above cut-off at a series of increasing cut-offs by resource category. The sensitivity analysis for Indicated and Inferred category blocks within the resource pit are provided in Table 12.12.1. The base case is highlighted at a cut-off grade of 0.006 oz/t Au.
Table 12.12.1: Resource Sensitivity
Cut-off (oz/t) | Tons (k) | Au Grade (oz/t) | Au (oz) | Ag Grade (oz/t) | Ag (oz) | |||||||||||||||
0.002 | 36,953 | 0.015 | 570,134 | 0.109 | 4,045,401 | |||||||||||||||
0.004 | 26,765 | 0.020 | 541,903 | 0.127 | 3,398,810 | |||||||||||||||
|
|
|
|
|
|
|
|
|
| |||||||||||
0.006 | 23,650 | 0.022 | 526,854 | 0.133 | 3,152,624 | |||||||||||||||
|
|
|
|
|
|
|
|
|
| |||||||||||
0.008 | 21,950 | 0.023 | 515,013 | 0.137 | 2,999,799 | |||||||||||||||
0.01 | 20,073 | 0.025 | 498,059 | 0.140 | 2,807,202 | |||||||||||||||
| JBP/MLM | February 22, 2012 |
| SRK Consulting (U.S.), Inc. | ||||
| NI 43-101 Technical Report – Mt. Hamilton Gold Project, Centennial Deposit | Page 92 |
Figure 12-1: SRK 2011 3D Geologic Model with 2008-2011 Drill Collars and Resource Pit Shell
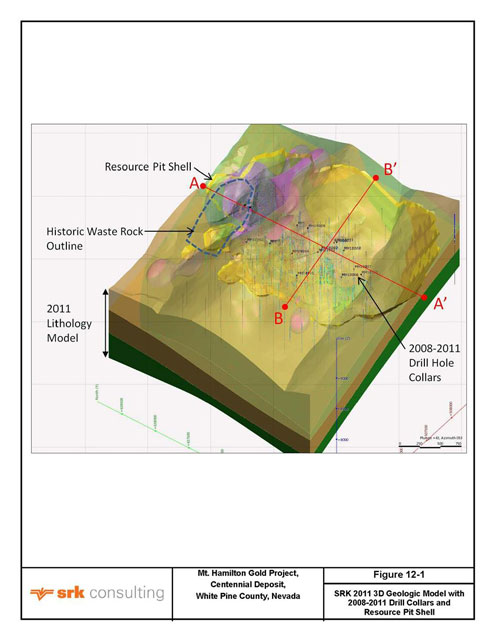
| JBP/MLM | February 22, 2012 |
| SRK Consulting (U.S.), Inc. | ||||
| NI 43-101 Technical Report – Mt. Hamilton Gold Project, Centennial Deposit | Page 93 |
Figure 12-2: Geologic Cross Section B-B’ (636650N) with Au 0.007 oz/t Grade Shell and Drill Hole Au Values
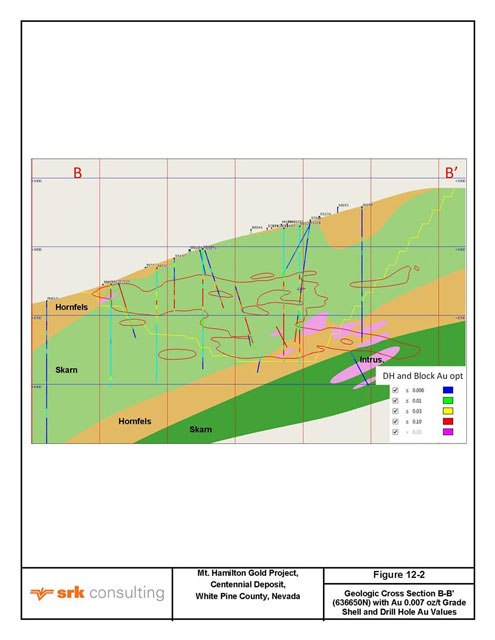
| JBP/MLM | February 22, 2012 |
| SRK Consulting (U.S.), Inc. | ||||
| NI 43-101 Technical Report – Mt. Hamilton Gold Project, Centennial Deposit | Page 94 |
Figure 12-3: Geologic Cross Section B-B’ (636650N) with Block Model Au oz/t
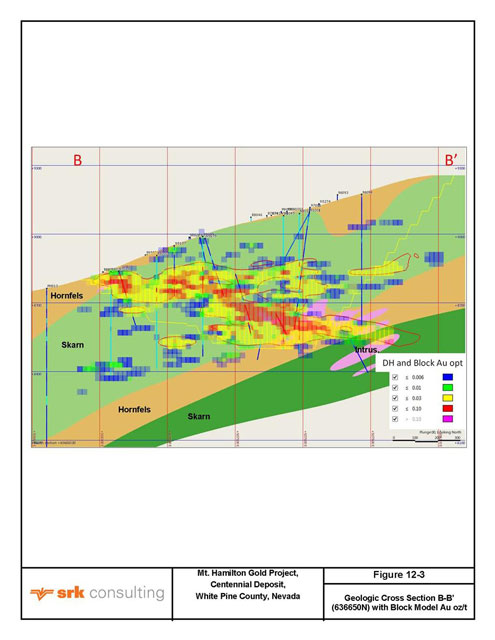
| JBP/MLM | February 22, 2012 |
| SRK Consulting (U.S.), Inc. | ||||
| NI 43-101 Technical Report – Mt. Hamilton Gold Project, Centennial Deposit | Page 95 |
Figure 12-4: Geologic Cross Section A-A’ (507600E) with Au 0.007 oz/t Grade Shell and Drill Hole Au Assay Values
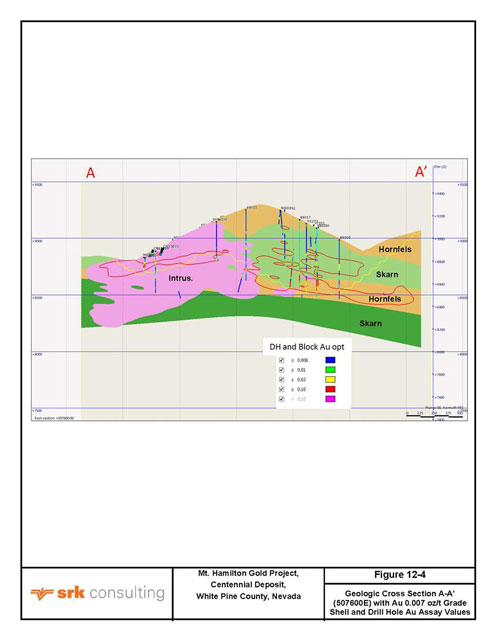
| JBP/MLM | February 22, 2012 |
| SRK Consulting (U.S.), Inc. | ||||
| NI 43-101 Technical Report – Mt. Hamilton Gold Project, Centennial Deposit | Page 96 |
Figure 12-5: Geologic Cross Section A-A’ (507600E) with Block Model Au oz/t
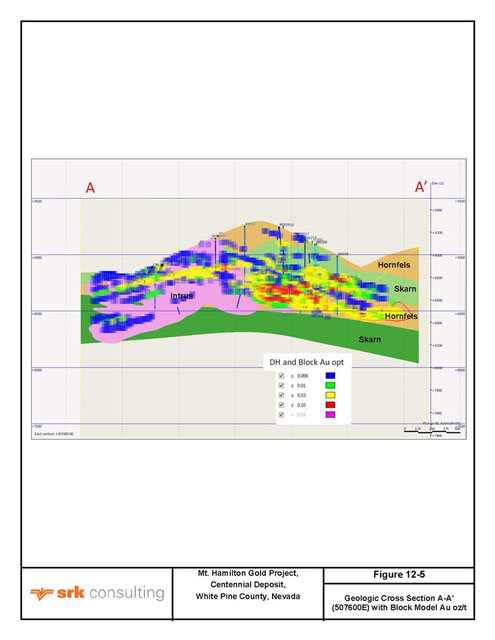
| JBP/MLM | February 22, 2012 |
| SRK Consulting (U.S.), Inc. | ||||
| NI 43-101 Technical Report – Mt. Hamilton Gold Project, Centennial Deposit | Page 97 |
Figure 12-6: Centennial Drill Hole Locations
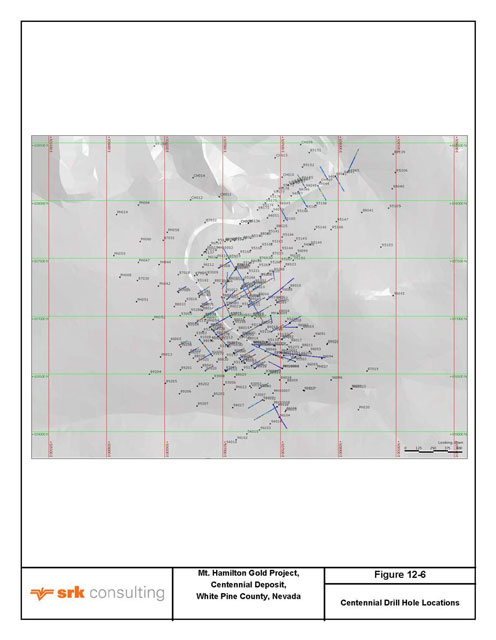
| JBP/MLM | February 22, 2012 |
| SRK Consulting (U.S.), Inc. | ||||
| NI 43-101 Technical Report – Mt. Hamilton Gold Project, Centennial Deposit | Page 98 |
Figure 12-7: Centennial Lognormal Probability Plot, Au Assays
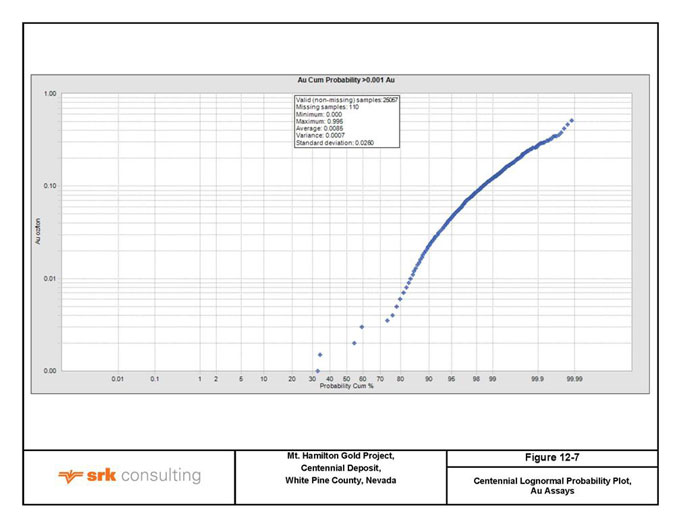
| JBP/MLM | February 22, 2012 |
| SRK Consulting (U.S.), Inc. | ||||
| NI 43-101 Technical Report – Mt. Hamilton Gold Project, Centennial Deposit | Page 99 |
Figure 12-8: Centennial Lognormal Probability Plot, Ag Assays
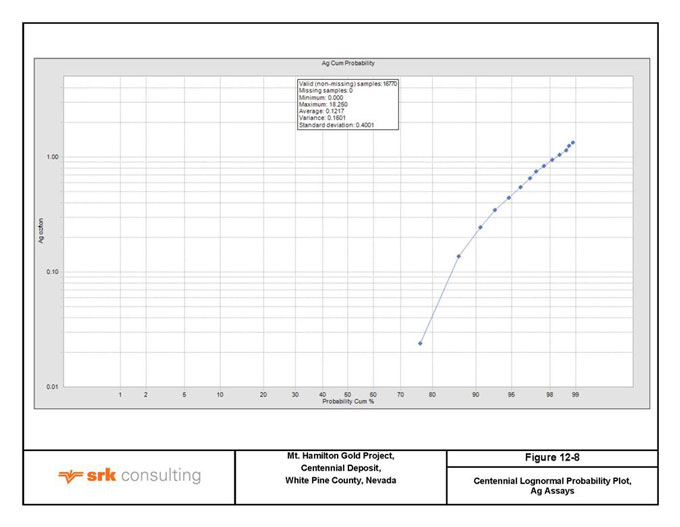
| JBP/MLM | February 22, 2012 |
| SRK Consulting (U.S.), Inc. | ||||
| NI 43-101 Technical Report – Mt. Hamilton Gold Project, Centennial Deposit | Page 100 |
Figure 12-9: Isotropic Variogram for Au
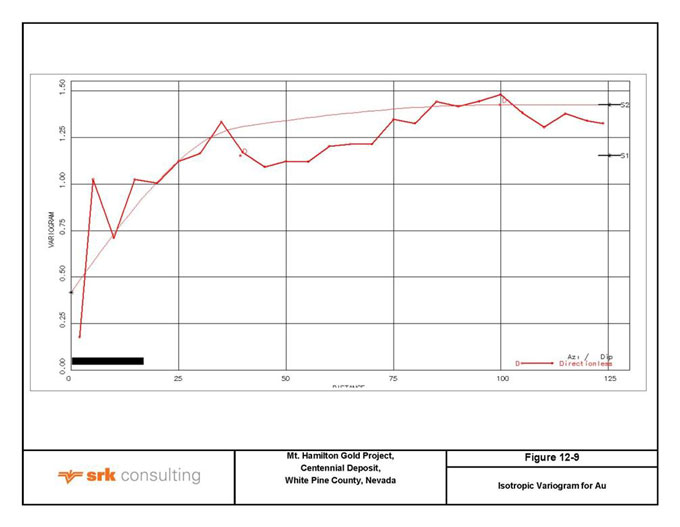
| JBP/MLM | February 22, 2012 |
| SRK Consulting (U.S.), Inc. | ||||
| NI 43-101 Technical Report – Mt. Hamilton Gold Project, Centennial Deposit | Page 101 |
Figure 12-10: Isotropic Variogram for Ag
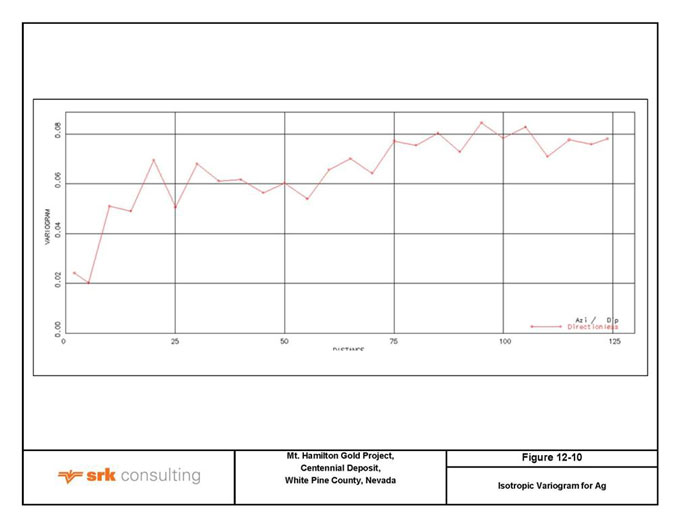
| JBP/MLM | February 22, 2012 |
| SRK Consulting (U.S.), Inc. | ||||
| NI 43-101 Technical Report – Mt. Hamilton Gold Project, Centennial Deposit | Page 102 |
Figure 12-11: Centennial Mineralization Au Dynamic Anisotropy 3D
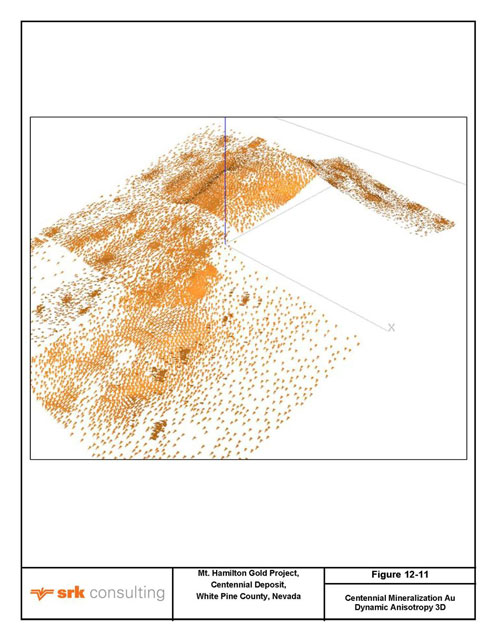
| JBP/MLM | February 22, 2012 |
| SRK Consulting (U.S.), Inc. | ||||
| NI 43-101 Technical Report – Mt. Hamilton Gold Project, Centennial Deposit | Page 103 |
Figure 12-12: Centennial Mineralization Ag Dynamic Anisotropy 3D
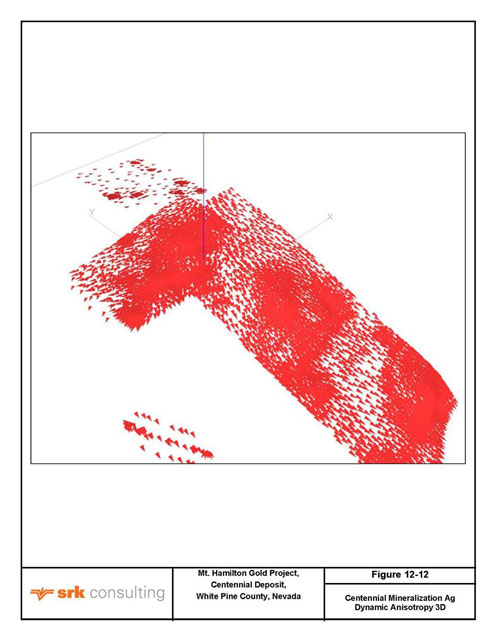
| JBP/MLM | February 22, 2012 |
| SRK Consulting (U.S.), Inc. | ||||
| NI 43-101 Technical Report – Mt. Hamilton Gold Project, Centennial Deposit | Page 104 |
Figure 12-13: Centennial Block Au Model Projection
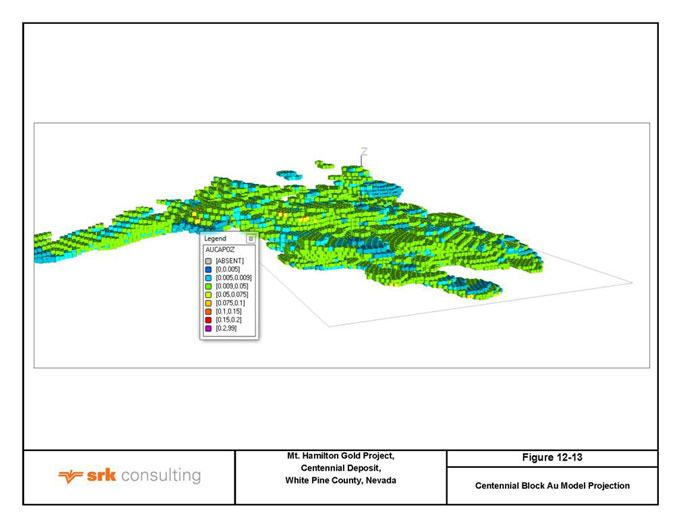
| JBP/MLM | February 22, 2012 |
| SRK Consulting (U.S.), Inc. | ||||
| NI 43-101 Technical Report – Mt. Hamilton Gold Project, Centennial Deposit | Page 105 |
Figure 12-14: Centennial Block Ag Model Projection
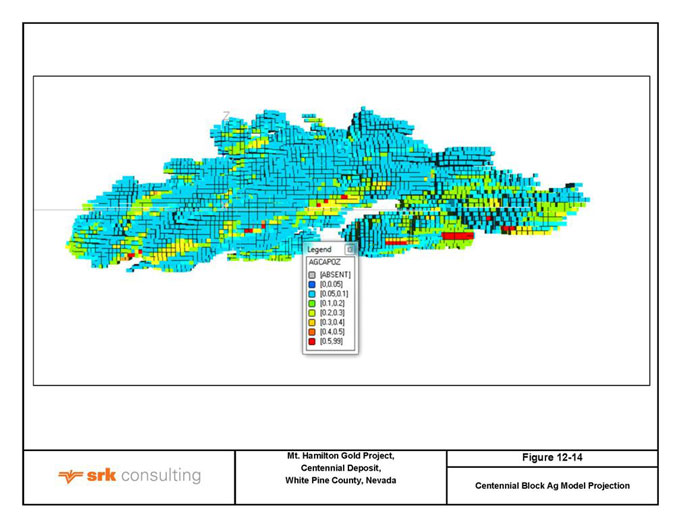
| JBP/MLM | February 22, 2012 |
| SRK Consulting (U.S.), Inc. | ||||
| NI 43-101 Technical Report – Mt. Hamilton Gold Project, Centennial Deposit | Page 106 |
Figure 12-15: Centennial Block Au Model Cross Section
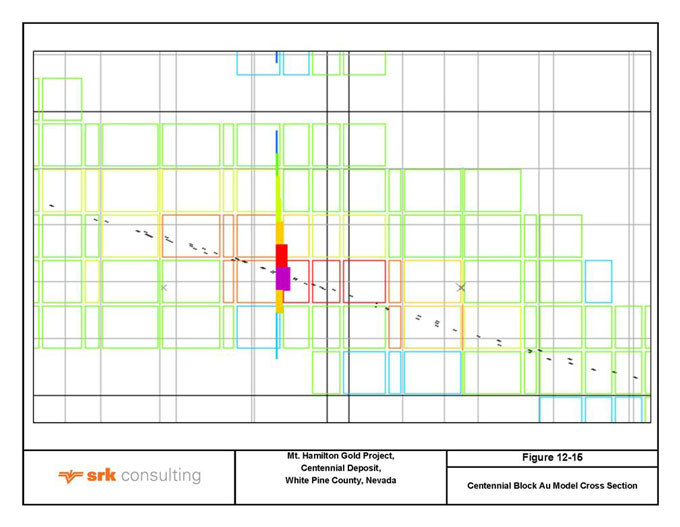
| JBP/MLM | February 22, 2012 |
| SRK Consulting (U.S.), Inc. | ||||
| NI 43-101 Technical Report – Mt. Hamilton Gold Project, Centennial Deposit | Page 107 |
Figure 12-16: Centennial Block Au Model Cross Section
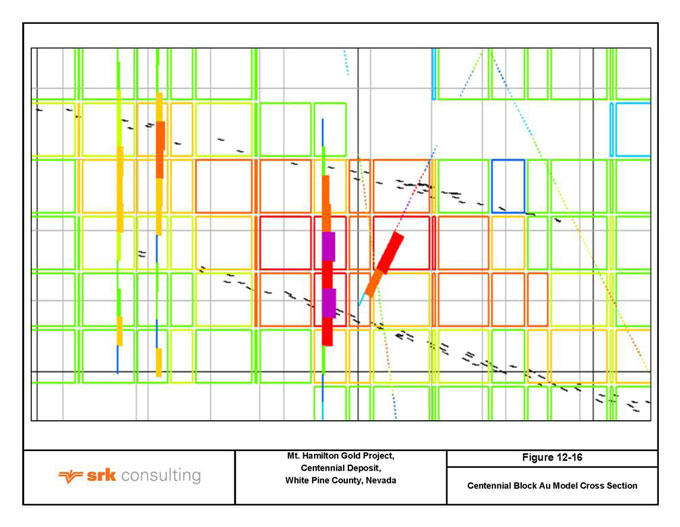
| JBP/MLM | February 22, 2012 |
| SRK Consulting (U.S.), Inc. | ||||
| NI 43-101 Technical Report – Mt. Hamilton Gold Project, Centennial Deposit | Page 108 |
Figure 12-17: Centennial Block Au Model Cross Section
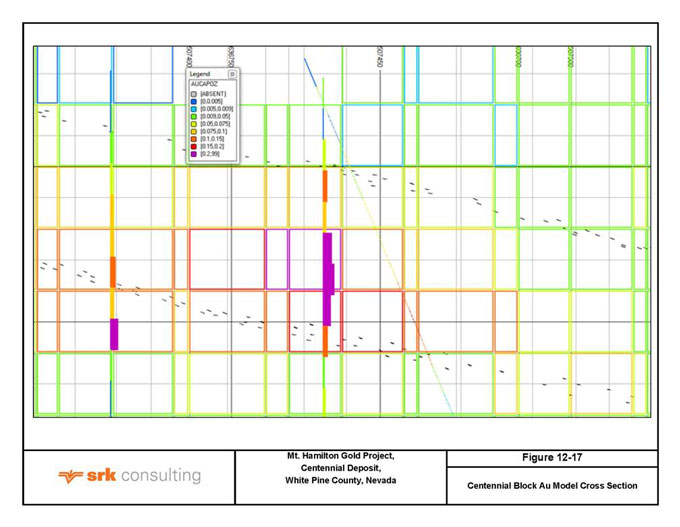
| JBP/MLM | February 22, 2012 |
| SRK Consulting (U.S.), Inc. | ||||
| NI 43-101 Technical Report – Mt. Hamilton Gold Project, Centennial Deposit | Page 109 |
Figure 12-18: Centennial Block Ag Model Cross Section
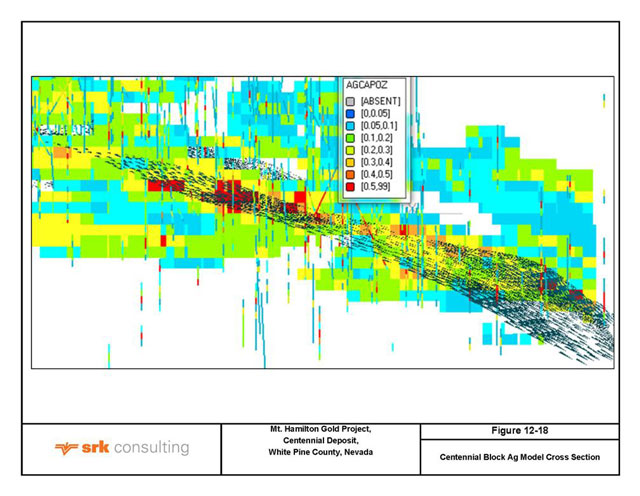
| JBP/MLM | February 22, 2012 |
| SRK Consulting (U.S.), Inc. | ||||
| NI 43-101 Technical Report – Mt. Hamilton Gold Project, Centennial Deposit | Page 110 |
| 13 | Mineral Reserve Estimate |
| 13.1 | Reserve Estimation |
The conversion of mineral resources to ore reserves requires accumulated knowledge achieved through pit optimization, pit design and associated modifying parameters. Reserve estimation is achieved through the use of Whittle™ (v4.4) and of Vulcan™ (v8.1.2) software.
The orientation, proximity to the topographic surface, and geological controls of the Centennial ore body support mining of the ore reserves with open pit mining techniques. The mineable reserve was calculated based on a gold price of US$1,200/oz Au and US$20/oz Ag which are both slightly lower than the approximate three-year trailing price averages.
Through the process of pit optimization and pit layout, a series of pit solid triangulations are created forming the basis for mine reserves. Figure 13-1 Illustrates the overall process flow and logic behind the formulation of mine reserves specific to the Project.
| 13.1.1 | Reserve Statement |
Table 13.1.1.1 shows the Centennial mine open pit ore reserve statement,.
Table 13.1.1.1: Mineral Reserve Statement Centennial Gold-Silver Deposit, White Pine County, Nevada, SRK Consulting (U.S.), Inc.
Classification | Resource (kt) | Au Grade (oz/t) | Contained Au (koz) | Ag Grade (oz/t) | Contained Ag (koz) | |||||||||||||||
Proven | 923 | 0.032 | 29.3 | 0.155 | 142.7 | |||||||||||||||
Probable | 21604 | 0.021 | 457.8 | 0.134 | 2,884.3 | |||||||||||||||
Total Proven and Probable* | 22,527 | 0.022 | 487.1 | 0.134 | 3,028.2 | |||||||||||||||
|
|
|
|
|
|
|
|
|
| |||||||||||
Reserves are based upon 0.006 oz/t – AuEq Cut-off Grade (CoG), using US$1,200/oz-Au gold price and US$20/oz-Ag. Gold equivalent is calculated using the following equation:
aueq = au + ((ag * 20 * .75)/(1200 * .75))
Note: A 75% recovery was applied to calculated silver values, which already represent “recoverable” silver. This was done to ensure that silver was not overly weighted in the definition of an ore block in the reserve.
| 13.2 | Conversion of Resources to Reserves |
Two aspects are related for the conversion of resources to reserves:
| • | The ore extraction method(s) used in relation to the orebody characteristics which determine mining dilution and recovery; and |
| • | Associated project operating costs and resulting CoG’s. |
In accordance with the CIM classification system only Measured and Indicated resource categories can be converted to reserves (through inclusion within the open-pit mining limits). In all mineral reserve statements Inferred mineral resources are reported as waste. In some mineral resource statements Inferred mineral resources are reported separately and are clearly identified.
CoG is a function of technical and economical parameters and defines the economic portion of the resource at the time of determination. Break even CoG considers the total unit operating costs,
| JBP/MLM | February 22, 2012 |
| SRK Consulting (U.S.), Inc. | ||||
| NI 43-101 Technical Report – Mt. Hamilton Gold Project, Centennial Deposit | Page 111 |
including mining, processing and administration, process recovery, metal prices and additional costs for freight, smelting and/or refining. Where applicable, royalties are included in the calculation.
Once such a CoG is defined all the ore with a gold grade above this value should be considered as economically mineable. Ore feed to plant will have an average grade higher than the CoG value, and this difference provides the profit (return on capital) for the business.
The CoG may be modified to other values during the mining operations in order to optimize business profits. These operational CoG grades may accomplish different specific purposes.
| 13.2.1 | Break Even Cut-off Grade |
The typical expression for a break-even (BE) gold CoG is (allowing for appropriate use of units):
BE CoG =Total Unit Mining, Processing and Administration Operating Costs
(Au Price – (Royalty + Final Refining Costs)) x Process Recovery
| 13.2.2 | Internal Cut-off Grade |
An alternative (operational) CoG , the internal CoG, takes into account all operating costs, but mostly excludes mining costs based on the concept that once material has been mined (for example to access ore with grades above the BE CoG) the mining cost is considered to be a sunk cost. If the material can pay for the downstream processing and other costs then it qualifies as ore. This can be adjusted to allow for differential ore and waste haulage (or other) costs.
The typical expression for an internal (Int.) gold CoG is (allowing for appropriate use of units):
Int. CoG =Total Unit Processing and Administration Operating Costs
(Au Price – (Royalty + Final Refining Costs)) x Process Recovery
The CoG used by Whittle™ to determine whether a block was ore or waste was reported as 0.006 oz/t-AuEq. To keep consistency with what was used in the optimization, 0.006 oz/t was used to define ore and waste. This value is subject to change due to actual processing cost and realized gold price.
All CoG calculations were based on AuEq, however it can noted that the calculated internal Ag CoG was 0.300 oz/t.
| 13.3 | Estimate of Residual Resources |
Residual resources exist at Centennial as extensions of mineralization that were not captured in the mine design. Figure 13-2 illustrates the difference between the Whittle™ optimized shell (Resource Shell) for defining the Mineral Resource and the pit design used to define the Mineral Reserve.
Residual resources represent potential future resource growth for the deposit, which will require additional drilling to quantify. These resources on the outer margin of the proposed reserve pit design. Approximately 2.6 Mt of Indicated Resources grading 0.017 oz/t gold (45.3 koz of gold) and 0.153 oz/t silver (397.6 koz of silver) and 2.8 Mt of Inferred Resource grading 0.018 oz/t gold (50.2 koz of gold) and 0.080 oz/t silver (223.5 oz of silver) above a 0.006 oz/t gold cut-off have been identified outside of the reserve pit, but within the resource envelope (Whittle™ shell).
| JBP/MLM | February 22, 2012 |
| SRK Consulting (U.S.), Inc. | ||||
| NI 43-101 Technical Report – Mt. Hamilton Gold Project, Centennial Deposit | Page 112 |
Figure 13-1: Reserve Calculation Flow Diagram
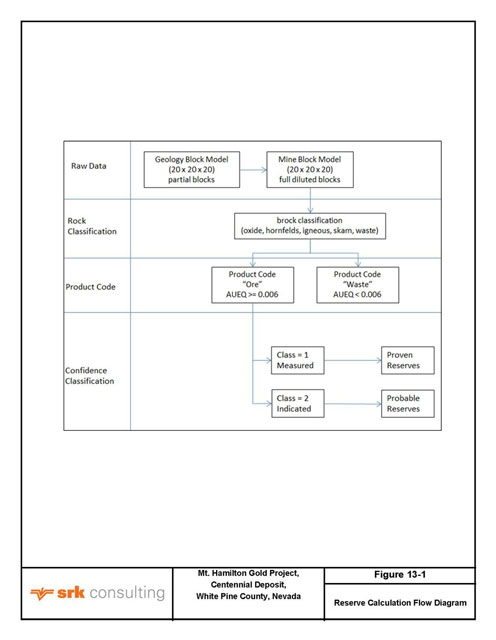
| JBP/MLM | February 22, 2012 |
| SRK Consulting (U.S.), Inc. | ||||
| NI 43-101 Technical Report – Mt. Hamilton Gold Project, Centennial Deposit | Page 113 |
Figure 13-2: Potential Residual Mineral Resources (colored by oz/t Au)
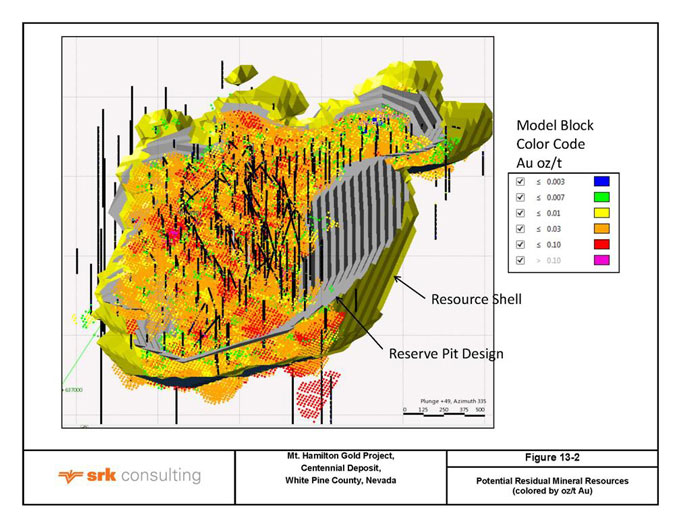
| JBP/MLM | February 22, 2012 |
| SRK Consulting (U.S.), Inc. | ||||
| NI 43-101 Technical Report – Mt. Hamilton Gold Project, Centennial Deposit | Page 114 |
| 14 | Mining Methods (Item 16) |
Centennial is a low-grade gold deposit, averaging approximately 0.022 oz/t. Silver is also present in the deposit at an average grade of 0.134 oz/t. The mineralization is close to the surface and the resource lends itself to an open pit mining method.
Mining operations at the Centennial deposit have a stripping ratio of 2.4:1, waste to ore with mining taking place on the side of a hill at an approximate elevation of 9,000 ft above sea level.
The mine design consists of a pit with the approximate dimensions of 1,600 ft wide by 2,000 ft long by 600 ft deep; with a volume of 660 Mft3. The pit design was segregated into four phases for production scheduling with 80 ft wide ramps at a maximum in-pit road grade of 8%.
Open pit mining will be by conventional diesel-powered equipment, utilizing a combination of blast hole drills, hydraulic shovel, rubber-tired wheel loaders and off-highway 100 t trucks. Support equipment composed of graders, track dozers, and a water truck will aid in the mining of the Mineral Reserve and waste. Ore grade materials will be hauled and dumped in the primary crusher or stockpiled near the crusher for later processing. The ore will be crushed to -4 inch and conveyed to an ore pass. The ore pass will drop the ore vertically approximately 350 ft where it will be loaded on a conveyor in a 3,400 ft long drift. From the loading point at the base of the ore pass, the drift and conveyor have a -15% grade to the portal. Once out of the drift, the ore will be transferred through to a series of belts to a coarse ore stockpile. A reclaim tunnel under the coarse ore stockpile feeds a secondary crusher where the ore will be crushed to -3/4 inch and conveyed and stacked on the leach pad with a radial stacker. A general facilities layout is provided in Figure 14-1.
| 14.1 | Mining History |
Immediately to the north of the Centennial Project is the NE Seligman Mine. This mine was operated by Rea Gold from 1994-1997. The Nevada Department of Minerals and Nevada Bureau of Mines report total production of 124,000 oz of gold and 310,250 oz of silver from the NE Seligman Mine by Rea Gold over this operating period. The haul road was extended to the Centennial pit area and the area of the starter pit was clear-cut and grubbed of vegetation in preparation for preproduction stripping which was scheduled to begin in 1997, but was never initiated.
| 14.2 | Pre-Production Mine Development |
| 14.2.1 | Pre-stripping and Access Road Construction |
The mine is located in steep terrain, making access difficult. Initial access will be made from the existing haul road that was developed by Rea Gold when they started to develop the Centennial pit. A portion of this road will require widening in areas that were previously reclaimed.
The upper portion of the pit will be accessed by two haul roads cut across the pit from the existing haul road at the 8,900 ft elevation (Figure 14-2). The roads are planned to be developed by a contractor. The road to the top of the pit is at a 15% grade. It is assumed that the top benches of the mine will be removed by a contractor using articulating haul trucks. Articulating trucks are designed to work on steeper roads than the rigid frame trucks to be used for mining the majority of the pit. The use of articulating trucks allows for a narrow (65 ft running surface) and a steep haul road, both of which lower development costs.
| JBP/MLM | February 22, 2012 |
| SRK Consulting (U.S.), Inc. | ||||
| NI 43-101 Technical Report – Mt. Hamilton Gold Project, Centennial Deposit | Page 115 |
A second road will be developed from the upper pit access to accommodate 100 t rigid frame trucks. This Upper Pit Spur road will be developed by the contractor with an 80 ft running surface and a nominal 8% grade. This road is designed to remove the upper benches of the Phases 1 and 2.
Inside the pit, these roads will be built primarily by cutting the full width of the road into the rock. Some fill will be used at switchbacks to avoid very large cuts. The cut material will be used to start the fill road north of the pit. When completed, the North Road will become the main access to the upper pit access and used to haul the ore to the crusher and waste to the waste dumps. The North Road will be completed using waste rock during the pre-stripping phase of operation. A short portion of the North Road will be in cut. This road is designed with a 9% grade and illustrated in Figure 14-2.
A road will be built from the existing dump north of the pit to the lower pit access (Lower Road). This road is outside the pit boundary and will be eventually become the main access to the pit, crusher, and to the top of the Lower Cabin Gulch Dump. Most of this road will be built using all fill or cut to fill. However, a portion of the road crosses very steep terrain. To avoid a large reclamation liability in this steep area, this portion of the road will be built completely in cut. It is anticipated the contractor will build this road. This road will be 80 ft wide and is nearly flat to 4% grade.
One final pre-development road will be built to access the middle benches of Phases 1 and 2. This road will start from the North Road slightly above the lower pit access as shown in Figure 14-2.
| 14.3 | Mine Block Model |
Based on the resource block model a grade tonnage chart was created to show material quantities at particular grades. These charts are shown in Figures 14-3 through 14-5 for Au, Ag, and AuEq.
In order to perform detailed mine planning a manipulation of the block model was required. This manipulation included the addition of geology flags, material classifications, and addition of haul profile variables used in the production schedule.
| 14.3.1 | Material Types |
The geologic block model contained a numeric rock code flag. For ease of use this was converted to a text field based on the conversation shown in Table 14.3.1.1.
Table 14.3.1.1: Text Field Based Geologic Block Model
Rock Code | Brock Conversion | Description | ||
| 0 | Oxid | Oxide | ||
| 1 | Horn | Hornfels | ||
| 2 | Igns | Igneous | ||
| 3 | Skrn | Skarn | ||
| Other | Waste | All other material was classified as waste. |
| 14.3.2 | Dilution |
The geologic model provided a percentage of mineralization within a block. For mining purposes, the selective mining unit (SMU) was determined to be a full block having dimensions of 20 ft x 20 ft x 20 ft. The mineralized percentage of the block was therefore utilized and the grade of the block was diluted to the full block using the equation shown below.
au = (au * (100 - min_pct)) / 100
| JBP/MLM | February 22, 2012 |
| SRK Consulting (U.S.), Inc. | ||||
| NI 43-101 Technical Report – Mt. Hamilton Gold Project, Centennial Deposit | Page 116 |
Both Au and Ag grades were diluted and then AuEq was re-calculated from the diluted grades.
| 14.4 | Pit Slope Geotechnical Evaluation |
After defining objectives and completing the dedicated geotechnical drilling program described below, SRK prepared a Feasibility-level geotechnical pit slope evaluation report incorporating recommendations pertaining to optimal pit slope angles and pit architecture for mine design purposes (SRK, 2011a). The significant findings of that report related to pit slope configuration are described in this Section. The locations of 2010-2011 geotechnical drill holes are illustrated in Figure 14-6.
| 14.4.1 | Geotechnical Program Objectives |
The primary objectives of the Feasibility-level geotechnical evaluation for the Centennial project were:
| • | To collect geotechnical information pertaining to the in-situ materials appropriate for a Feasibility level evaluation; |
| • | To characterize geotechnical conditions in and around the area of the proposed open pits; |
| • | To undertake laboratory testing of geomechanical properties of representative samples of the in-situ materials; |
| • | To develop a geotechnical model to serve as the basis for the geomechanical evaluation; |
| • | To conduct geomechanical analyses; and |
| • | To make recommendations pertaining to optimal slope angles and pit architecture for mine design purposes. |
| 14.4.2 | Geotechnical Work Program |
The principle stages of the geotechnical evaluation work program were comprised of the following:
| • | Recommendation of the number, location and orientation of core holes sufficient for a Feasibility-level characterization of in-situ materials in the open pit area; |
| • | Geotechnical core logging and orientation (oriented core) of discontinuities intersecting core recovered from the drill holes; |
| • | Selection of representative drill core samples from the respective lithological units encountered in the geotechnical drill holes for laboratory testing; |
| • | Submission of the representative samples to the University of Arizona Rock Mechanics Laboratory in Tucson, Arizona, for geomechanical testing; |
| • | Analyses and interpretation of the geotechnical data and laboratory test results to produce a comprehensive analytical model of in-situ properties; |
| • | Examination of the anticipated behavior of the geotechnical model relative to expected mining-induced stresses, using various analytical methods; and |
| • | Formulation of pit slope design recommendations. |
| 14.4.3 | Recommended Pit Slope Configurations |
For certain geologic environments, the combination of the average anticipated bench face angle and the preferred interramp angle, based on global (interramp/overall) stability considerations, alone, do not provide a sufficiently wide average catch bench width to effectively control rock fall and/or
| JBP/MLM | February 22, 2012 |
| SRK Consulting (U.S.), Inc. | ||||
| NI 43-101 Technical Report – Mt. Hamilton Gold Project, Centennial Deposit | Page 117 |
overbank slough accumulation. In such instances, recommended interramp angles are flattened sufficiently to provide adequately wide average catch benches. This is primarily determined by the analytic indications that a bench could be totally lost and the overlying bench undercut approximately 2% of the time.
Recommendations for interramp and overall slope angles are premised on the rock mass being dry, but depressurization up to approximately 10 meters to 60 meters behind slope faces can be expected should groundwater be encountered. Based on these criteria, SRK recommends that pit slopes at Centennial be designed with a 50 degree maximum interramp angle using 60 ft high benches with 70 degree bench face angles and 28 ft wide catch benches. These recommendations are based heavily on achievable bench face angles and less on overall, interramp stability due to the highly competent nature of the skarn and hornfels. Relatively conservative discontinuity lengths were used in the bench design analyses. Significant opportunity exists to steepen certain sectors of the pit depending primarily on actual joint lengths (expected to be less conservative than those assumed here) which can be obtained from mapping of existing surface outcrops or from bench excavations during operation.
| 14.5 | Pit Optimization |
Pit optimization was carried out on the Centennial deposit using Whittle™ v4.4 pit optimization software in conjunction with Maptek’s Vulcan 8.1.2™ general-purpose mine planning package. Pit optimization is based on preliminary economic estimations of mining, processing and selling related costs, slope angles, and metal recoveries. These pit optimization factors are likely to vary from those reported in the final economic analysis, which are based on the final pit design and production schedule. The pit optimization software considered grades and tonnages in the model along with the inserted recoveries, mining and processing factors, and costs to determine what material could be economically extracted through the use of the Lerch-Grossman algorithm.
With the mining model manipulated to account for geology, geotechnical considerations and grade, the Vulcan™ model reblk.bmf was exported to Whittle™ format using “brock” as the rock type variable, “bden” as the density variable, “bau” as the gold variable, and “bag” as the silver variable representing measured and indicated blocks.
No additional limits were used in the pit optimization.
| 14.5.1 | Pit Optimization Parameters |
Table 14.5.1.1 shows the parameters used for pit optimization.
| JBP/MLM | February 22, 2012 |
| SRK Consulting (U.S.), Inc. | ||||
| NI 43-101 Technical Report – Mt. Hamilton Gold Project, Centennial Deposit | Page 118 |
Table 14.5.1.1: Whittle™ Optimization Parameters
Item | Units | Cost | ||||
Gold Price | US$/oz | $ | 1,200.00 | |||
Silver Price | US$/oz | $ | 20.00 | |||
Mining Cost Waste | US$/t mined | $ | 1.61 | |||
Mining Cost Ore | US$/t mined | $ | 1.75 | |||
Processing Cost | US$/t processed | $ | 3.59 | |||
G & A | US$/t processed | $ | 0.72 | |||
Royalty | % of recovered revenue | 3 | % | |||
Recovery Gold | 75 | % | ||||
Recovery Silver* | 75 | % | ||||
Interramp Slope Angle | 50 | ° | ||||
Calculated CoG* | oz/t | 0.006 | ||||
*Note: Calculated CoG is the internal CoG, which does not include mining cost.
Recovery used for Ag is a percentage of the modeled Ag value for the block, which is a cyanide soluble or “recoverable” Ag.
| 14.5.2 | Pit Optimization Results |
Figure 14-7 shows a pit-by-pit graph that is a representation of how the deposit reacts to different revenue factors or price manipulations from a US$1,200/oz gold price. Pit 36 represents a revenue factor of one, which equates to the maximum cash flow possible for the deposit at US$1,200/oz gold and US$20.00/oz silver and the costs shown in Table 14.5.1.1 above. The lines on the graph show the best and worst-case cash flows. A best-case cash flow is if material is mined in the optimum order to generate revenue upfront.
Pits 13, 22, 28, and 36 were targeted for mine phase design. These pits provided sufficient space for minimum pushback widths and provided access to higher grade ore in early years. The sizes of phases were also staged in such a way as to provide enough ounces to the leach pad from one pushback to allow stripping of the next pushback while ensuring consistent ore delivery.
Pit optimization results are summarized in Table 14.5.2.1.
| JBP/MLM | February 22, 2012 |
| SRK Consulting (U.S.), Inc. | ||||
| NI 43-101 Technical Report – Mt. Hamilton Gold Project, Centennial Deposit | Page 119 |
Table 14.5.2.1: Pit Optimization Results
Pit # | Gold Price (US$/oz) | Silver Price (US$/oz) | Ore Tons (kt) | Au | Ag | Waste | SR | |||||||||||||||||||||||
| *13 | 648 | 6.48 | 16,061 | 0.025 | 0.133 | 34,478 | 2.15 | |||||||||||||||||||||||
| 14 | 672 | 6.72 | 16,572 | 0.025 | 0.133 | 335,513 | 2.14 | |||||||||||||||||||||||
| 15 | 696 | 6.96 | 16,956 | 0.025 | 0.133 | 36,027 | 2.12 | |||||||||||||||||||||||
| 16 | 720 | 7.2 | 17,624 | 0.024 | 0.134 | 37,704 | 2.14 | |||||||||||||||||||||||
| 17 | 744 | 7.44 | 17,930 | 0.024 | 0.133 | 37,731 | 2.10 | |||||||||||||||||||||||
| 18 | 768 | 7.68 | 18,540 | 0.024 | 0.134 | 39,141 | 2.11 | |||||||||||||||||||||||
| 19 | 792 | 7.92 | 18,937 | 0.024 | 0.134 | 40,331 | 2.13 | |||||||||||||||||||||||
| 20 | 816 | 8.16 | 19,226 | 0.024 | 0.134 | 40,660 | 2.11 | |||||||||||||||||||||||
| 21 | 840 | 8.4 | 19,580 | 0.023 | 0.135 | 41,387 | 2.11 | |||||||||||||||||||||||
| *22 | 864 | 8.64 | 19,805 | 0.023 | 0.135 | 41,529 | 2.10 | |||||||||||||||||||||||
| 23 | 888 | 8.88 | 20,103 | 0.023 | 0.134 | 42,036 | 2.09 | |||||||||||||||||||||||
| 24 | 912 | 9.12 | 20,426 | 0.023 | 0.134 | 42,675 | 2.09 | |||||||||||||||||||||||
| 25 | 936 | 9.36 | 20,666 | 0.023 | 0.134 | 42,724 | 2.07 | |||||||||||||||||||||||
| 26 | 960 | 9.6 | 20,869 | 0.023 | 0.134 | 42,875 | 2.05 | |||||||||||||||||||||||
| 27 | 984 | 9.84 | 21,234 | 0.022 | 0.134 | 43,710 | 2.06 | |||||||||||||||||||||||
| *28 | 1008 | 10.08 | 21,467 | 0.022 | 0.134 | 44,033 | 2.05 | |||||||||||||||||||||||
| 29 | 1032 | 10.32 | 21,811 | 0.022 | 0.134 | 45,612 | 2.09 | |||||||||||||||||||||||
| 30 | 1056 | 10.56 | 22,450 | 0.022 | 0.135 | 47,940 | 2.14 | |||||||||||||||||||||||
| 31 | 1080 | 10.8 | 22,520 | 0.022 | 0.135 | 47,934 | 2.13 | |||||||||||||||||||||||
| 32 | 1104 | 11.04 | 22,822 | 0.022 | 0.136 | 49,223 | 2.16 | |||||||||||||||||||||||
| 33 | 1128 | 11.28 | 22,913 | 0.022 | 0.136 | 49,264 | 2.15 | |||||||||||||||||||||||
| 34 | 1152 | 11.52 | 23,189 | 0.021 | 0.136 | 50,617 | 2.18 | |||||||||||||||||||||||
| 35 | 1176 | 11.76 | 23,293 | 0.021 | 0.136 | 50,648 | 2.17 | |||||||||||||||||||||||
| *36 | 1,200 | 12 | 23,448 | 0.021 | 0.136 | 51,392 | 2.19 | |||||||||||||||||||||||
| 38 | 1248 | 12.48 | 23,867 | 0.021 | 0.137 | 52,727 | 2.21 | |||||||||||||||||||||||
| 40 | 1296 | 12.96 | 24,193 | 0.021 | 0.137 | 53,858 | 2.21 | |||||||||||||||||||||||
| 42 | 1344 | 13.44 | 24,555 | 0.021 | 0.137 | 55,126 | 2.24 | |||||||||||||||||||||||
| 44 | 1392 | 13.92 | 24,820 | 0.021 | 0.137 | 55,821 | 2.25 | |||||||||||||||||||||||
| 46 | 1440 | 14.4 | 25,105 | 0.021 | 0.138 | 56,622 | 2.26 | |||||||||||||||||||||||
| 48 | 1488 | 14.88 | 25,283 | 0.020 | 0.138 | 56,939 | 2.25 | |||||||||||||||||||||||
| 50 | 1536 | 15.36 | 25,502 | 0.020 | 0.138 | 57,450 | 2.25 | |||||||||||||||||||||||
| 52 | 1584 | 15.84 | 25,661 | 0.020 | 0.138 | 57,603 | 2.24 | |||||||||||||||||||||||
| * | Pits targeted for phase design. Pit 36 is the ultimate pit. |
| 14.6 | Mine Design |
A multi-phase pit design was created based on Whittle™ shells 13, 22, 28, and 36. All phases were designed at an overall pit slope angle of 50°using a 70° face angle and a 28 ft-wide catch bench per geotechnical recommendations (Section 14.4). A bench height of 20 ft was selected to match the block model blocks and anticipated equipment sizing. Triple benching was used, where a catch bench is left every 60 ft rather than on each bench.
During the process of pit construction, several iterations were conducted that produced a final pit design that would:
| • | Maintain comfortable operating width on all phases; |
| • | Provide higher grade mineralization early in the project life; and |
| • | Allow for constructing of surface roads to provide access to higher benches. |
| JBP/MLM | February 22, 2012 |
| SRK Consulting (U.S.), Inc. | ||||
| NI 43-101 Technical Report – Mt. Hamilton Gold Project, Centennial Deposit | Page 120 |
| 14.6.1 | Mine Design Parameters |
To reduce any stripping penalty incurred from ramp placement, the ramp was located on the low-wall (west) side of the mineralization. Ramp widths were based on expected mining trucks on the order of 100 t capacity. One-way traffic haul roads were used at the pit bottom at a width of 40 ft.
Geotechnical benches were based on a 20 ft inter-berm change in elevation. The final pit design was based on 20 ft projections with zero berms being applied every two projections and berm widths used on the third projection. This triple benching methodology did not restrict the pit design to geometry changes every 60 ft and maintained the overall geotechnical requirements for the deposit.
Haul roads were 80 ft wide for two way traffic and 40 ft for one-way traffic. An 80 ft wide ramp provides a truck width to running surface width ratio of about 3.5, which is considered safe. In deeper areas of the pit, it was necessary to reduce road width to single lane traffic to minimize excessive waste stripping or loss of recoverable ore.
Roads have a maximum gradient of 8% assigned to the shortest distance along a ramp, which prevents gradient rules being broken around corners. The inside circumference of a ramp may be greater than 8% if the gradient is applied to the ramp centerline or high wall.
Table 14.6.1.1 summarizes the parameters used for pit design.
Table 14.6.1.1: Mine Design Parameters
Parameter | Value | |||
Bench Height | 20 ft | |||
Face Angle | 70 | ° | ||
Overall Angle | 50 | ° | ||
Catch Bench Width (Triple Benching) | 28 ft | |||
Road Width | 80 ft | |||
Road Grade | 8 | % | ||
| 14.6.2 | Phase Design |
From the Whittle™ results and selected pits, phase designs were created.
Table 14.6.2.1 details the ore and waste tonnages defined by the different phases.
Table 14.6.2.1: Phase Tonnage
Item | Phase 1 | Phase 2 | Phase 3 | Phase 4 | Total | |||||||||||||||
Ore Tons (t) | 687,910 | 4,274,859 | 6,895,122 | 10,669,568 | 22,527,460 | |||||||||||||||
Ave Au Grade (oz/t) | 0.029 | 0.020 | 0.022 | 0.021 | 0.022 | |||||||||||||||
Contained Au (oz) | 19,676 | 84,642 | 154,277 | 228,380 | 487,096 | |||||||||||||||
Avg Ag Grade (oz/t) | 0.118 | 0.120 | 0.108 | 0.159 | 0.134 | |||||||||||||||
Contained Ag (oz) | 81,011 | 512,556 | 741,742 | 1,693,261 | 3,028,225 | |||||||||||||||
Ave AuEq Grade (oz/t) | 0.031 | 0.022 | 0.024 | 0.024 | 0.024 | |||||||||||||||
Contained AuEq (oz) | 21,034 | 93,192 | 166,584 | 256,685 | 537,611 | |||||||||||||||
Waste Tons | 1,363,370 | 6,462,277 | 19,069,698 | 27,942,070 | 54,837,414 | |||||||||||||||
Strip Ratio | 2.0 | 1.5 | 2.8 | 2.6 | 2.4 | |||||||||||||||
Figure 14-8 shows the Whittle™ pits selected for pit design. Figures 14-9 and 14-10 illustrate an East West cross-section plot and show drillhole, block model and pit design results. Figure 14-11 shows a perspective view of the final pit design.
| JBP/MLM | February 22, 2012 |
| SRK Consulting (U.S.), Inc. | ||||
| NI 43-101 Technical Report – Mt. Hamilton Gold Project, Centennial Deposit | Page 121 |
| 14.6.3 | Mining Losses |
The inclusion of haul roads and creation of a practical pit design when compared with pit optimization results, indicate a 11% increase in stripping ratio, 7% increase in waste generation, and 4% decrease in feed tonnage.
Table 14.6.3.1 shows the mining losses associated with the larger pit size after the inclusion of in-pit ramps and minimum mining widths. The engineered pit is slightly larger than the optimized Whittle™ pit.
Table 14.6.3.1: Mining Losses from Pit Design vs. Optimized Pit
Variable | Optimization | Pit Design | Variation | |||||||||
Final Pit Design Ore Tons Compared to Whittle™ Optimization (kt) | 23,448 | 22,527 | -4 | % | ||||||||
Final Pit Design Waste Tons Compared to Whittle™ Optimization (kt) | 51,392 | 54,837 | +7 | % | ||||||||
Strip Ratio | 2.19 | 2.43 | +11 | % | ||||||||
Au Grade (oz/t) | 0.021 | 0.022 | +5 | % | ||||||||
Ag Grade (oz/t) | 0.136 | 0.134 | -1 | % | ||||||||
Contained Gold koz | 500 | 487 | -3 | % | ||||||||
Contained Silver koz | 3,193 | 3,028 | -5 | % | ||||||||
| 14.7 | Waste Rock Storage Design |
Waste rock storage facilities (dumps) are located northwest of the mined pit in Cabin Gulch. The facilities have been designed for a final reclaimed slope 2.5H:1V angle consistent with Nevada State reclamation requirements (Figure 14-1). Waste rock is assumed to have a loose material density factor of 1.50 tons per cubic yard. The dump was designed with a minimum of 20% additional volume to increase operational flexibility. In most cases, end-dump methods will be used to place the waste rock. The design is a valley fill in two lifts, a large lower lift and a smaller upper lift to facilitate high elevation stripping.
While there was no plan to backfill any of the existing NE Seligman pits, this alternative is still under consideration.
| 14.8 | Haulage Profile |
Haulage calculations based on the production schedule were estimated using Vulcan™ 8.1.2 haul profile software and were used to calculate annual distance and cycle times for ore and waste. Haul profiles were calculated by digitizing ore and waste profiles from the pit haul road to either a dump centroid or crusher location. Blocks on a given bench elevation, in each phase, had their distances estimated to a pit road and added to the digitized haul routes at the pit exit. The result of this process was each block flagged as ore and waste received individual haul distance and cycle time values. These values then acted as a value variables and were subsequently reported according to the production schedule.
| 14.8.1 | Haulage Parameters |
Central to the estimation of cycle time is the estimation of Caterpillar 777F truck speeds for different gradients defined by digitized haul profiles. Table 14.8.1.1 shows the values interpreted from the Caterpillar Handbook charts for rimpull and braking performance. Speeds were capped at 25 mph for safety reasons.
| JBP/MLM | February 22, 2012 |
| SRK Consulting (U.S.), Inc. | ||||
| NI 43-101 Technical Report – Mt. Hamilton Gold Project, Centennial Deposit | Page 122 |
Table 14.8.1.1: Gradient Truck Speed for Caterpillar 777F Haul Truck
Item | Gradient (%) | Uphill Speed (Mph) | Downhill Speed (Mph) | |||||||||
Loaded | Flat | 25 | 25 | |||||||||
| 2 | 25 | 25 | ||||||||||
| 5 | 16 | 24 | ||||||||||
| 7 | 14 | 22 | ||||||||||
| 10 | 9 | 16 | ||||||||||
| 13 | 8 | 9 | ||||||||||
| 15 | 6 | 9 | ||||||||||
Unloaded | Flat | 25 | 25 | |||||||||
| 2 | 25 | 25 | ||||||||||
| 5 | 24 | 24 | ||||||||||
| 7 | 24 | 24 | ||||||||||
| 10 | 17 | 22 | ||||||||||
| 13 | 16 | 19 | ||||||||||
| 15 | 14 | 16 | ||||||||||
| 14.9 | Mine Production Schedule |
Production scheduling was carried out using Vulcan™ (v8.1.2) and its scheduling package Chronos™. The schedule was constructed around a daily leach pad feed of 8,333 short tons per day (t/d), which translates to 3 million short tons per year (Mt/y). The amount of waste stripping was maximized at approximately 20,000 t/d translating to 7.6 Mt/y using 360 operating days per year.
Ore was defined using a 0.006 oz/t Au cut-off grade (CoG) as indicated from pit optimization work. Material was tracked by rock type (oxide, skarn, igneous, etc) however this was not a limiting factor in the scheduling process. The production schedule was used to estimate the quantities of waste material produced each year for dump design and as an estimation for annual haul cycle times and distances.
A preproduction pre-strip period was scheduled and contractor mining was assumed for this material. Subsequent to pre-strip, time periods in the schedule are monthly for the first two years and then quarterly for the Life-of-Mine (LoM). Total mine life in the schedule is 8 years.
| 14.9.1 | Production Scheduling Methodology |
Phase design triangulations were cut into benches, and then into reasonably sized mining shapes for creating a monthly schedule. Tons and grades were calculated for each of these mining shapes and this information was imported to the schedule. A manual scheduling method was then used where individual mining shapes were selected and scheduled until ore and waste targets were met for each time period. A stockpile of approximately 0.5 Mt was created during pre-strip and is utilized throughout the schedule as additional feed in higher stripping periods and as ore overflow storage for high ore tonnage periods.
This scheduling method ensured control of the following:
| • | Number of benches mined in a period; |
| • | Lag between phases; |
| • | Development of access to upper benches; and |
| • | Consistent ore feed. |
| JBP/MLM | February 22, 2012 |
| SRK Consulting (U.S.), Inc. | ||||
| NI 43-101 Technical Report – Mt. Hamilton Gold Project, Centennial Deposit | Page 123 |
Preproduction stripping was schedule for approximately three months prior to ore production. The stripping will be in two areas, A contractor will be used to strip the top portion of Phase 3 from near the top of the pit. The access to this area requires a steep ramp that is better suited for articulating dump trucks. This stripping program will continue into Year 1 of production. The mine fleet will be used for prestripping the Phase 1 and 2 areas. A second stripping effort is required in year 2 and due to steep access ramps, contractor mining is planned.
| 14.9.2 | Production Schedule Results |
Table 14.9.2.1 summarized the production schedule. Yearly progress maps are shown as Figures 14-12 through 14-20. The production schedule shows material movement from the mine and will differ from schedule to the leach pad as shown in the economic model due to material in/out of the stockpile.
| JBP/MLM | February 22, 2012 |
| SRK Consulting (U.S.), Inc. | ||||
| NI 43-101 Technical Report – Mt. Hamilton Gold Project, Centennial Deposit | Page 124 |
Table 14.9.2.1: Production Schedule
| Ore | Waste | |||||||||||||||||||||||||||||||
Period | Tons (kt) | Au Grade (oz/t) | Ag Grade (oz/t) | Contained Au oz | Contained Ag oz | Tons (kt) | Contractor Strip | |||||||||||||||||||||||||
| 1 | Prestrip | 557 | 0.012 | 0.137 | 6,851 | 76,112 | 2,317 | 4,231,699 | ||||||||||||||||||||||||
| 2 | Year 1 | Month 1 | 160 | 0.014 | 0.114 | 2,238 | 18,143 | 646 | — | |||||||||||||||||||||||
| 3 | Month 2 | 140 | 0.014 | 0.117 | 1,984 | 16,325 | 604 | — | ||||||||||||||||||||||||
| 4 | Month 3 | 257 | 0.018 | 0.119 | 4,636 | 30,486 | 646 | — | ||||||||||||||||||||||||
| 5 | Month 4 | 250 | 0.024 | 0.092 | 6,053 | 22,957 | 625 | — | ||||||||||||||||||||||||
| 6 | Month 5 | 258 | 0.024 | 0.142 | 6,076 | 36,575 | 646 | — | ||||||||||||||||||||||||
| 7 | Month 6 | 252 | 0.018 | 0.105 | 4,478 | 26,492 | 625 | — | ||||||||||||||||||||||||
| 8 | Month 7 | 261 | 0.018 | 0.106 | 4,594 | 27,548 | 646 | — | ||||||||||||||||||||||||
| 9 | Month 8 | 253 | 0.024 | 0.128 | 5,996 | 32,458 | 646 | — | ||||||||||||||||||||||||
| 10 | Month 9 | 248 | 0.019 | 0.146 | 4,793 | 36,249 | 625 | — | ||||||||||||||||||||||||
| 11 | Month 10 | 262 | 0.031 | 0.131 | 8,033 | 34,375 | 646 | — | ||||||||||||||||||||||||
| 12 | Month 11 | 257 | 0.021 | 0.132 | 5,327 | 34,004 | 625 | — | ||||||||||||||||||||||||
| 13 | Month 12 | 265 | 0.025 | 0.134 | 6,546 | 35,374 | 646 | — | ||||||||||||||||||||||||
| 14 | Year 2 | Month 1 | 265 | 0.026 | 0.124 | 7,027 | 32,918 | 646 | — | |||||||||||||||||||||||
| 15 | Month 2 | 238 | 0.019 | 0.119 | 4,631 | 28,473 | 583 | — | ||||||||||||||||||||||||
| 16 | Month 3 | 269 | 0.026 | 0.130 | 6,935 | 34,839 | 646 | — | ||||||||||||||||||||||||
| 17 | Month 4 | 247 | 0.024 | 0.122 | 5,947 | 30,017 | 625 | — | ||||||||||||||||||||||||
| 18 | Month 5 | 266 | 0.023 | 0.113 | 6,030 | 30,053 | 646 | — | ||||||||||||||||||||||||
| 19 | Month 6 | 260 | 0.022 | 0.095 | 5,670 | 24,543 | 625 | — | ||||||||||||||||||||||||
| 20 | Month 7 | 257 | 0.018 | 0.081 | 4,504 | 20,749 | 646 | — | ||||||||||||||||||||||||
| 21 | Month 8 | 206 | 0.014 | 0.076 | 2,934 | 15,633 | 646 | — | ||||||||||||||||||||||||
| 22 | Month 9 | 253 | 0.019 | 0.109 | 4,855 | 27,515 | 625 | 1,942,174 | ||||||||||||||||||||||||
| 23 | Month 10 | 258 | 0.021 | 0.087 | 5,490 | 22,465 | 646 | — | ||||||||||||||||||||||||
| 24 | Month 11 | 250 | 0.023 | 0.120 | 5,639 | 30,086 | 625 | — | ||||||||||||||||||||||||
| 25 | Month 12 | 258 | 0.024 | 0.153 | 6,071 | 39,446 | 646 | — | ||||||||||||||||||||||||
| 26 | Year 3 | Q-1 | 750 | 0.023 | 0.183 | 17,222 | 137,403 | 1,875 | — | |||||||||||||||||||||||
| 27 | Q-2 | 766 | 0.024 | 0.101 | 18,202 | 77,192 | 1,896 | — | ||||||||||||||||||||||||
| 28 | Q-3 | 767 | 0.023 | 0.102 | 17,960 | 78,247 | 1,917 | |||||||||||||||||||||||||
| 29 | Q-4 | 769 | 0.022 | 0.083 | 16,544 | 63,969 | 1,917 | |||||||||||||||||||||||||
| 30 | Year 4 | Q-1 | 757 | 0.024 | 0.090 | 17,932 | 67,868 | 1,875 | ||||||||||||||||||||||||
| 31 | Q-2 | 765 | 0.022 | 0.092 | 16,890 | 70,216 | 1,896 | |||||||||||||||||||||||||
| 32 | Q-3 | 770 | 0.021 | 0.128 | 16,474 | 98,430 | 1,917 | |||||||||||||||||||||||||
| 33 | Q-4 | 677 | 0.018 | 0.130 | 12,084 | 87,649 | 1,917 | |||||||||||||||||||||||||
| 34 | Year 5 | Q-1 | 758 | 0.015 | 0.237 | 11,468 | 179,534 | 1,896 | ||||||||||||||||||||||||
| 35 | Q-2 | 758 | 0.012 | 0.163 | 9,058 | 123,392 | 1,896 | |||||||||||||||||||||||||
| 36 | Q-3 | 770 | 0.014 | 0.177 | 10,779 | 136,107 | 1,917 | |||||||||||||||||||||||||
| 37 | Q-4 | 771 | 0.019 | 0.106 | 14,574 | 81,815 | 1,917 | |||||||||||||||||||||||||
| 38 | Year 6 | Q-1 | 750 | 0.021 | 0.101 | 15,481 | 76,033 | 1,727 | ||||||||||||||||||||||||
| 39 | Q-2 | 758 | 0.026 | 0.122 | 19,779 | 92,173 | 1,313 | |||||||||||||||||||||||||
| 40 | Q-3 | 767 | 0.029 | 0.153 | 22,024 | 117,039 | 1,010 | |||||||||||||||||||||||||
| 41 | Q-4 | 767 | 0.024 | 0.126 | 18,528 | 96,944 | 977 | |||||||||||||||||||||||||
| 42 | Year 7 | Q-1 | 750 | 0.032 | 0.179 | 23,645 | 133,997 | 868 | ||||||||||||||||||||||||
| 43 | Q-2 | 758 | 0.026 | 0.190 | 19,771 | 144,268 | 905 | |||||||||||||||||||||||||
| 44 | Q-3 | 767 | 0.022 | 0.165 | 17,207 | 126,577 | 586 | |||||||||||||||||||||||||
| 45 | Q-4 | 767 | 0.023 | 0.150 | 17,545 | 114,705 | 430 | |||||||||||||||||||||||||
| 46 | Year 8 | Q-1 | 750 | 0.024 | 0.174 | 18,209 | 130,164 | 261 | ||||||||||||||||||||||||
| 47 | Q-2 | 169 | 0.015 | 0.181 | 2,457 | 30,703 | 206 | |||||||||||||||||||||||||
| JBP/MLM | February 22, 2012 |
| SRK Consulting (U.S.), Inc. | ||||
| NI 43-101 Technical Report – Mt. Hamilton Gold Project, Centennial Deposit | Page 125 |
| 14.9.3 | Grade Distribution |
Ore grade from the mine was not held constant during scheduling. The phases were designed to take advantage of ore near surface and higher grade pods giving an irregular grade distribution with lower grades at the beginning of each phase and higher grades towards the end of the phases. By scheduling multiple phases at once this effect was minimized, however grade variability is still seen in the production schedule. Figure 14-21 shows the production schedule grade distribution graphically.
Initial years show an approximate grade of 0.023 oz/t Au and 0.13 oz/t Ag. In year 5 gold grade dips and silver grade increases while mining the north end of the pit (igneous host), before leveling out again in years 6 and 7.
| 14.9.4 | Tonnage Distribution |
Figure 14-22 shows ore and waste tonnage distributions.
Ore tonnage distribution is constant at approximately 3 Mt/y with the exception of Y4 – Q4 where ore feed will need to be supplemented from stockpiled material.
Waste tonnage is also constant at approximately 7.6 Mt/y until the end of year 5. In subsequent years waste tonnage drops significantly as the pit is fully developed and stripping of all phases is completed.
In addition to the waste tonnage two pre-stripping efforts will be undertaken by a contractor in order to remove waste material from high narrow benches where considerable roadwork will be necessary for access. Contractor mining was assumed in these areas as mining would be difficult with planned mine equipment, and purchasing a fleet for a small tonnage of material was deemed less economic.
| 14.9.5 | Ore Haulage Schedule |
All ore material is trucked to the crusher location as shown in the yearly progress maps (Figures 14-12 through 14-20). The pad area for the crusher will be developed in the pre-production year. Average ore haul distance over the LoM is approximately 5,500 ft one way. Cycle time for the ore haul varies between 5 and 46 minutes largely depending upon the elevation of the ore dictating if the loaded travel is uphill or downhill.
| 14.10 | Mining Operations and Equipment |
Centennial will be mined by conventional truck and shovel open-pit mining methods. The mine life is estimated to be 8 years with an additional one half year of pit pre-stripping. LoM mining-rate averages for the mine are estimated at 3 Mt/y ore and approximately 7.6 Mt/y waste.
| 14.10.1 | Mine Operations and Equipment |
The mine is scheduled to initially operate on two 12 hour shifts per day, 360 days per year and will continue at this rate through year 5. Staring in year 6, the waste removal rate begins to decline. To match the slowdown in production, the number of hours per shift and the number of shifts per year begins to drop until at the end of the mine the number shift drops to one per day. Table 14.10.1.1 shows how the number of shifts and hours per shift varies through the LoM.
| JBP/MLM | February 22, 2012 |
| SRK Consulting (U.S.), Inc. | ||||
| NI 43-101 Technical Report – Mt. Hamilton Gold Project, Centennial Deposit | Page 126 |
Table 14.10.1.1: Production Shift Schedule
Product year | 1 | 2 | 3 | 4 | 5 | 6 | 7 | 8 | ||||||||||||||||||||||||
Working days/year | 350 | 350 | 350 | 350 | 350 | 350 | 250 | 195 | ||||||||||||||||||||||||
Hours/shift | 12 | 12 | 12 | 12 | 12 | 10 | 10 | 10 | ||||||||||||||||||||||||
Shift/day | 2 | 2 | 2 | 2 | 2 | 2 | 2 | 1 | ||||||||||||||||||||||||
Operating efficiency was estimated to be 83% (50 minutes/hour) and mechanical availability estimated at 85%.
Manpower
Mining operations will require four crews operating on 12 hour rotating shifts. There are several rotating shift schedules. The most popular in Nevada is based on a 28 day rotating schedule. Because of the distance from the towns of Ely or Eureka, the crews will be transported to the site in company supplied vans.
Mining crew manpower during the peak production years will include a total of 42 equipment operators, 12 maintenance personnel and 13 salaried and support personnel. In addition, two contract personnel will work on an as needed basis for blasthole loading and initiation.
Blast-Hole Drilling
Blast-Hole drilling will be done with a track-mounted blasthole drill. The Atlas Copco DM45 was selected for the blasthole drill for this project based on its use in similar sized projects throughout Nevada and the Western United States. Two drills will be required to assure that the production drilling will meet production requirements. Waste drilling is planned with a 13 ft x 13 ft pattern on the 20 ft bench with 3 ft of subdrilling. The hole diameter will be 6- 3/4 inch. Drilling will be done with a 6 inch downhole hammer on 5- 1/2 inch drill steel. Ore zones will be drilled with the same equipment on a 12 ft x 12 ft pattern for better ore control.
Blasting
A blasting contractor will be responsible for loading the blastholes and blasting. The hole loading sequence will start by lowering a 1 lb booster down the hole. The booster will be attached to a non-electric blasting cap. It is anticipated that the mine will be dry and that Ammonium Nitrate and Fuel Oil (ANFO) will be used as the primary blasting agent. Bulk ammonium nitrate prills would be delivered to an on-site silo. A blasthole loading truck would transport the prill to the shot pattern, mix the prills with fuel oil (Diesel) and a measured amount of powder will be loaded into each hole. The remaining part of the hole will be filled with drill cuttings or crushed rock (stemming) to control the blast energy and minimize fly rock. Once the holes are loaded, the lead lines to the blasting caps will be tied together with a series of down hole and surface delays to control the blast.
To minimize operational delays, blasting will occur during the lunch break or between shifts.
Initially, the powder factor (pound explosives per ton of rock) will be 0.5 for waste and 0.4 for ore. Once in production, the powder factor will be modified to minimize the drilling, blasting, loading and crushing cost.
In addition to loading the blastholes and initiating the blast, the blasting contractor will supply prill silos, explosive magazines, ANFO mixing and loading truck and a skid steer loader to stem the holes. In addition, the contractor will supply inventory control for the blasting agents and supplies
| JBP/MLM | February 22, 2012 |
| SRK Consulting (U.S.), Inc. | ||||
| NI 43-101 Technical Report – Mt. Hamilton Gold Project, Centennial Deposit | Page 127 |
and be responsible for regulatory control of the blasting materials. In this study, a cost of US$0.055/t was used for these services.
Loading
The primary loading unit will be a Caterpillar 6030FS hydraulic shovel. The 6030FS is a 1,900 metric tonne class shovel with a 14.4 yd3 bucket. A hydraulic shovel was selected as the primary loader due to its ability to selectively mine on the bench. The ore-waste contacts lies on near horizontal boundaries that will cross the digging face. The ore and waste have enough color difference that will allow visual discrimination. The digging characteristics of a hydraulic shovel will allow the operator to segregate the ore from the waste on a truck by truck basis, minimizing dilution and ore loss. The 6030FS is sized to load a 100 t truck in four to five passes.
The ore and waste have relatively high densities. The bucket fill factors for ore and waste were adjusted to assure a minimum four pass loading cycle Loading was estimated assuming an 88% bucket fill factor and 30% swell factor. Loading operating parameters are shown on Table 14.10.1.2.
Table 14.10.1.2: Loader Operating Parameters
CAT 6030FS | Capacity (yd3) | Bank Dens. (ft3/t) | Swell Factor | Fill Factor | Bucket Cap. (t) | Cycle Time (min) | ||||||||||||||||||
Waste | 14.4 | 10.50 | 50.00 | % | 70.00 | % | 25.92 | 0.55 | ||||||||||||||||
Ore | 14.4 | 12.34 | 50.00 | % | 80.00 | % | 25.21 | 0.55 | ||||||||||||||||
The shovel will be backed up by a Caterpillar 992K wheel loader with a 14 yd3 bucket. This loader is also sized to match the 100 t haul trucks. The loader will also be used to feed the crusher from stockpiles when ore is not available in the pit. It was assumed that the loader would be used to feed the crusher 50% of the time the crusher was in operation.
Hauling
Haulage will be done with Caterpillar 777F 100 t haul trucks. These trucks were used to develop the haulage profiles previously shown in Table 14.8.1.1.
The loading, hauling dumping, delays and availability were used to determine fleet requirements.
Table 14.10.1.3 shows the fixed haulage times assumed for the loading, spotting and dumping. This table shows the estimated load per truck based on the EX1900-6 hydraulic shovel loading unit. Trucks are loaded with four cycles of the loading shovel.
Table 14.10.1.3: Truck Operating Parameters
CAT 777F | Capacity (t) | Loaded (t) | Load Time (min) | Spot Time (min) | Dump Time (min) | |||||||||||||||
Waste | 104.9 | 103.7 | 2.20 | 0.50 | 0.75 | |||||||||||||||
Ore | 104.9 | 100.8 | 2.20 | 0.50 | 0.75 | |||||||||||||||
Major Support Equipment
Support equipment would include a Caterpillar D9 dozers, a Caterpillar D10 dozer, a Caterpillar 16M motor grader and a Volvo A40E articulated truck with an 8,000 gallon water tank.
| JBP/MLM | February 22, 2012 |
| SRK Consulting (U.S.), Inc. | ||||
| NI 43-101 Technical Report – Mt. Hamilton Gold Project, Centennial Deposit | Page 128 |
Equipment Fleet Summary
The following equipment is a proposed fleet that would be used at the mine. The primary mine equipment fleet is summarized in Table 14.10.1.4, and the support mine equipment is summarized in Table 14.10.1.5.
Table 14.10.1.4: Primary Mining Equipment List
Equipment Type | Description | Size | Max Number Required | |||
AtlasCopco DM45 | Blast Drill Rig | 540hp, 5-7/8 inch to 8 inch hole diameter, up to 175 ft hole depth, 45,000 ft-lb pulldown | 2 | |||
Caterpillar 6030FS | Hydraulic Shovel | 1,039 hp, 14.4 yd3 | 1 | |||
Caterpillar 992K | Wheel Loader | 801 hp, 14 yd3 | 1 | |||
Caterpillar 777F | Haul Truck | 1,108 hp, 104.9 t payload | 5 | |||
| Table 14.10.1.5: Support Mining Equipment List | ||||||
Equipment Type | Description | Size/Comment | Max Number Required | |||
Contractor Supplied | ANFO loading truck | 1 | ||||
Caterpillar 16M | Motor Grader | 297 hp,16 ft blade | 1 | |||
Cat D9T | Bulldozer | 410 hp, 110,447 lb, SEMI-U Blade | 1 | |||
Cat D10T | Bulldozer | 580 hp, 146,500 lb, U-blade | 1 | |||
Volvo A40E | Water Truck | 464 hp, 8,000 gallon | 1 | |||
Manufacturer TBD | Fuel/Lube Truck | 33,000 lb 6x4 | 1 | |||
Manufacturer TBD | Mechanics Truck | 33,000 lb 6x4 | 2 | |||
Manufacturer TBD | Light Plant | 30 ft mast | 6 | |||
| 14.10.2 | Ancillary Mining Operations |
Site Preparation
The mine sites and dumps are located on steep terrain, with little or no topsoil. Where topsoil is thick enough to be recovered, and on slopes not too steep to safely operate, it will be dozed to stockpiles where it can be picked up with loaders and trucked to stockpiles for future reclamation.
Drainage Preparation
Storm water management will occur through the use of cut-off contour drains to control and separate mine-impacted surface water from clean water catchments. It is assumed that 1.5 ft deep V-ditches will be constructed using bulldozers or motor grader with 1.5:1 side slope. These should provide adequate capacity to divert water around the waste-rock storage facilities during storm events.
Snow Removal
Snow removal will be required on the pit access road and along the pit haul roads, loading areas, drilling bench and dump areas. The mine support motor grader and dozers will be used for snow removal. Snow removal around the administrative area and crusher will be done by plant operations and support personnel using a motor grader dedicated to the plant area and other support equipment. The capital and operating cost of this equipment is included in the Project’s G&A costs.
z
| JBP/MLM | February 22, 2012 |
| SRK Consulting (U.S.), Inc. | ||||
| NI 43-101 Technical Report – Mt. Hamilton Gold Project, Centennial Deposit | Page 129 |
Figure 14-1: Facilities Location Map
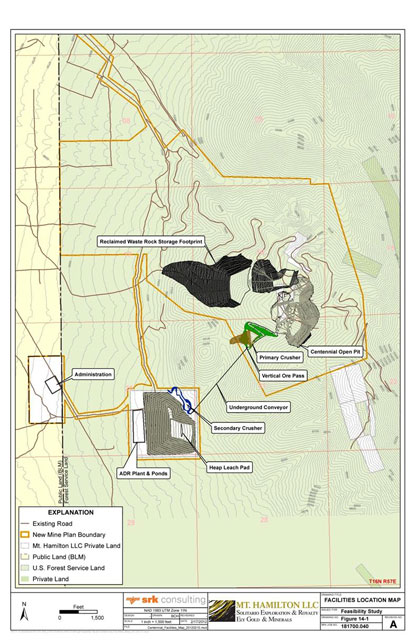
| JBP/MLM | February 22, 2012 |
| SRK Consulting (U.S.), Inc. | ||||
| NI 43-101 Technical Report – Mt. Hamilton Gold Project, Centennial Deposit | Page 130 |
Figure 14-2: Pre-Production Access (Plan View)
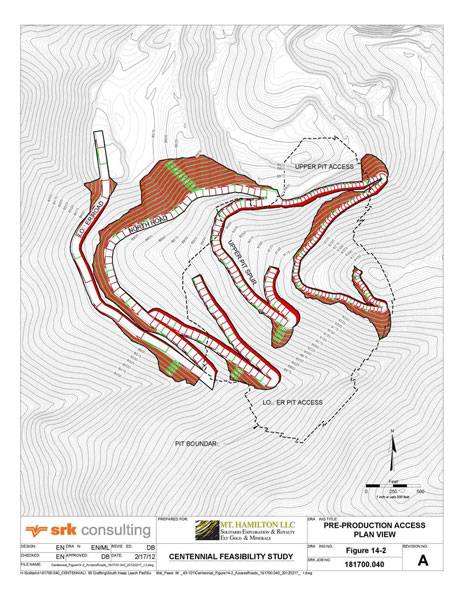
| JBP/MLM | February 22, 2012 |
| SRK Consulting (U.S.), Inc. | ||||
| NI 43-101 Technical Report – Mt. Hamilton Gold Project, Centennial Deposit | Page 131 |
Figure 14-3: Grade/Ton Curves for Au
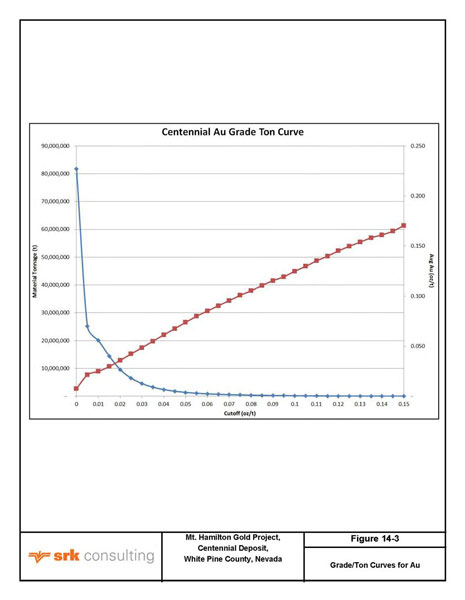
| JBP/MLM | February 22, 2012 |
| SRK Consulting (U.S.), Inc. | ||||
| NI 43-101 Technical Report – Mt. Hamilton Gold Project, Centennial Deposit | Page 132 |
Figure 14-4: Grade/Ton Curves for Ag
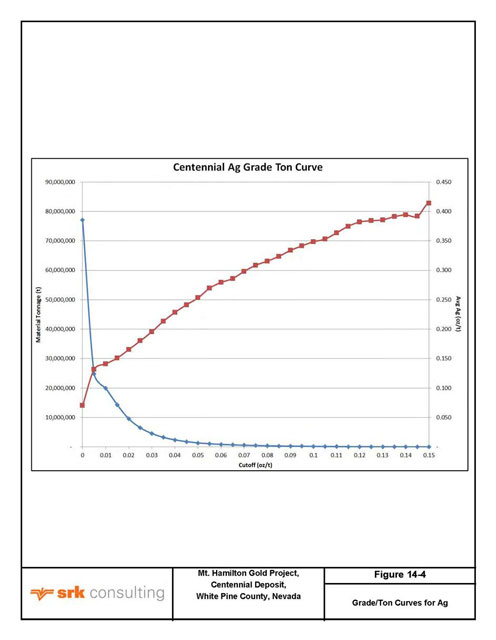
| JBP/MLM | February 22, 2012 |
| SRK Consulting (U.S.), Inc. | ||||
| NI 43-101 Technical Report – Mt. Hamilton Gold Project, Centennial Deposit | Page 133 |
Figure 14-5: Grade/Ton Curves for AuEq
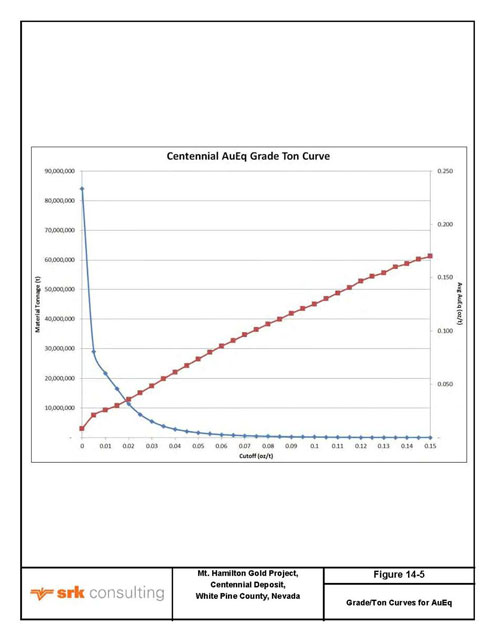
| JBP/MLM | February 22, 2012 |
| SRK Consulting (U.S.), Inc. | ||||
| NI 43-101 Technical Report – Mt. Hamilton Gold Project, Centennial Deposit | Page 134 |
Figure 14-6: Location of Geotechnical Drillholes
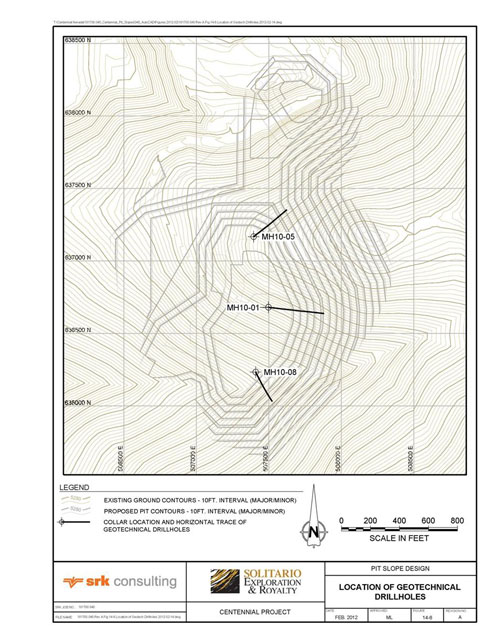
| JBP/MLM | February 22, 2012 |
| SRK Consulting (U.S.), Inc. | ||||
| NI 43-101 Technical Report – Mt. Hamilton Gold Project, Centennial Deposit | Page 135 |
Figure 14-7: Whittle™ Pit by Pit Graph
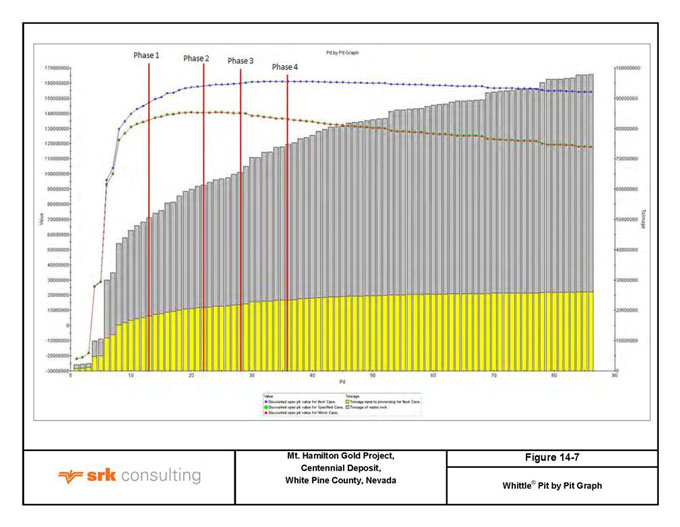
| JBP/MLM | February 22, 2012 |
| SRK Consulting (U.S.), Inc. | ||||
| NI 43-101 Technical Report – Mt. Hamilton Gold Project, Centennial Deposit | Page 136 |
Figure 14-8: Whittle™ Pits Selected for Pit Design
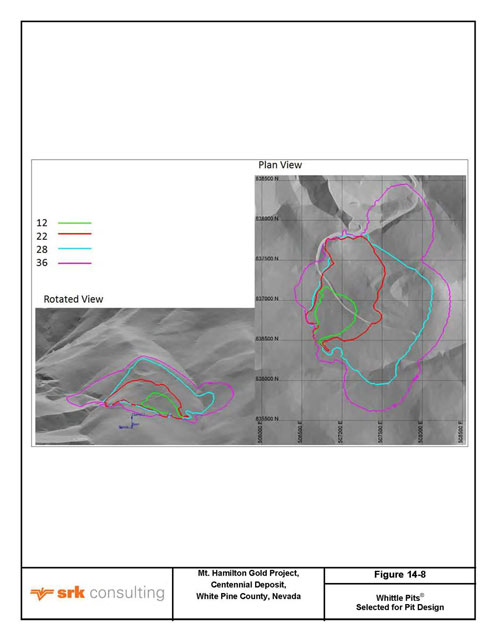
| JBP/MLM | February 22, 2012 |
| SRK Consulting (U.S.), Inc. | ||||
| NI 43-101 Technical Report – Mt. Hamilton Gold Project, Centennial Deposit | Page 137 |
Figure 14-9: Pit Design, E-W Section, Looking North
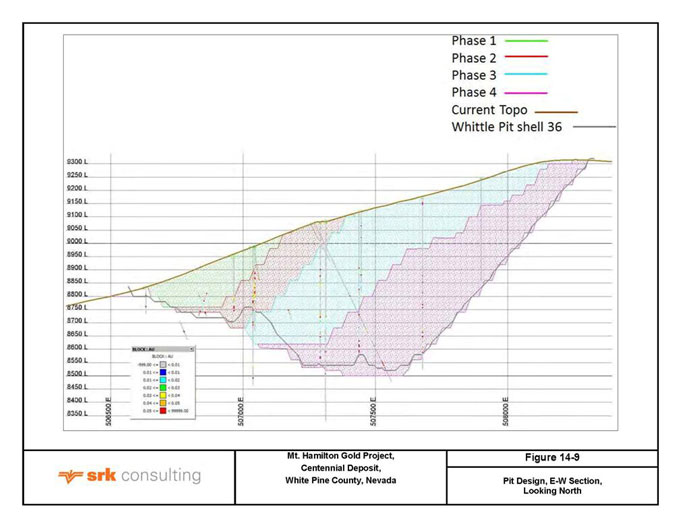
| JBP/MLM | February 22, 2012 |
| SRK Consulting (U.S.), Inc. | ||||
| NI 43-101 Technical Report – Mt. Hamilton Gold Project, Centennial Deposit | Page 138 |
Figure 14-10: Pit Design with Block Model, E-W Cross Section, Looking North
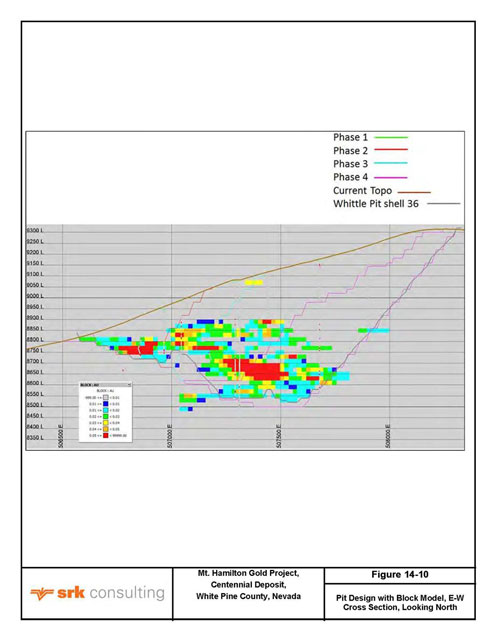
| JBP/MLM | February 22, 2012 |
| SRK Consulting (U.S.), Inc. | ||||
| NI 43-101 Technical Report – Mt. Hamilton Gold Project, Centennial Deposit | Page 139 |
Figure 14-11: Final Pit Design, Rotated View Looking East and Down
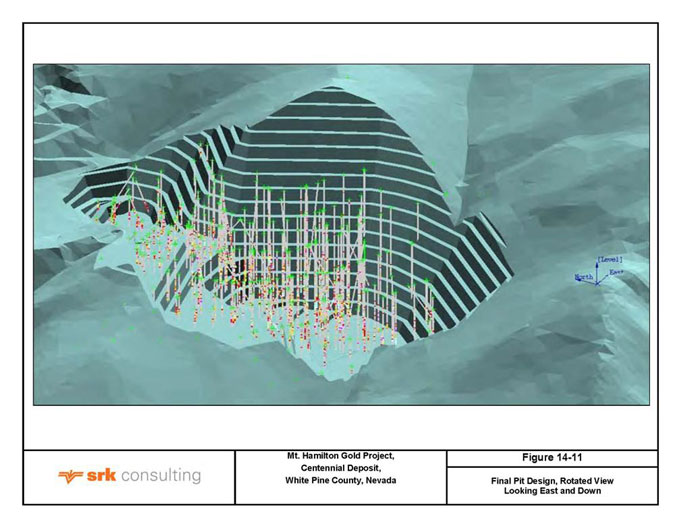
| JBP/MLM | February 22, 2012 |
| SRK Consulting (U.S.), Inc. | ||||
| NI 43-101 Technical Report – Mt. Hamilton Gold Project, Centennial Deposit | Page 140 |
Figure 14-12: Centennial Annual Mining Year 0 (Pre-Strip)
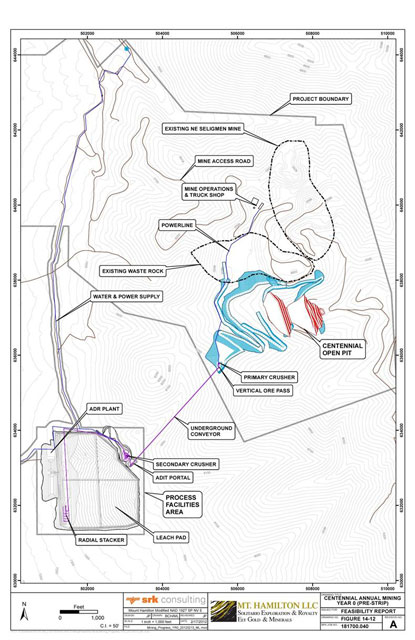
| JBP/MLM | February 22, 2012 |
| SRK Consulting (U.S.), Inc. | ||||
| NI 43-101 Technical Report – Mt. Hamilton Gold Project, Centennial Deposit | Page 141 |
Figure 14-13: Centennial Annual Mining Year 1
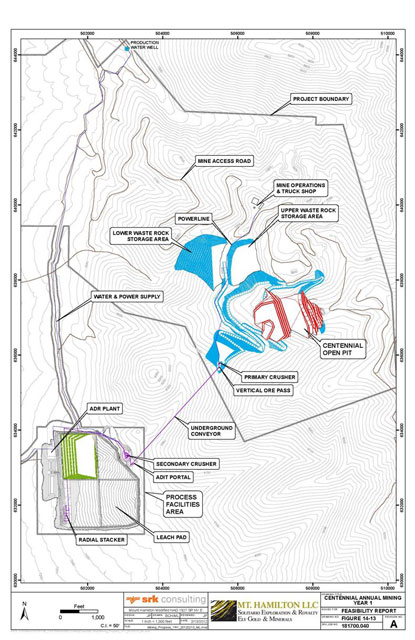
| JBP/MLM | February 22, 2012 |
| SRK Consulting (U.S.), Inc. | ||||
| NI 43-101 Technical Report – Mt. Hamilton Gold Project, Centennial Deposit | Page 142 |
Figure 14-14: Centennial Annual Mining Year 2
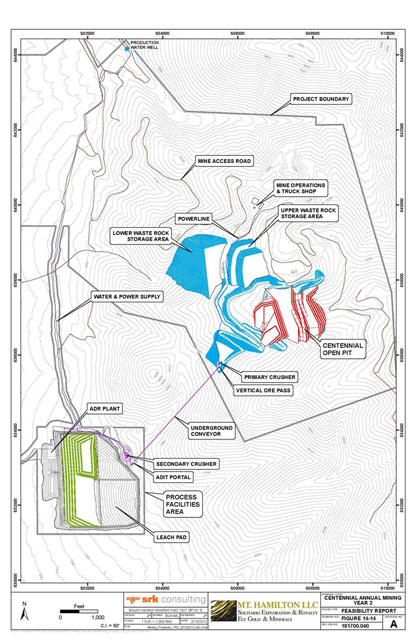
| JBP/MLM | February 22, 2012 |
| SRK Consulting (U.S.), Inc. | ||||
| NI 43-101 Technical Report – Mt. Hamilton Gold Project, Centennial Deposit | Page 143 |
Figure 14-15: Centennial Annual Mining Year 3
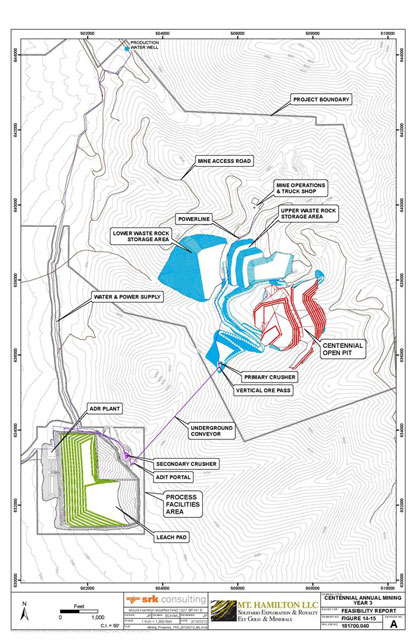
| JBP/MLM | February 22, 2012 |
| SRK Consulting (U.S.), Inc. | ||||
| NI 43-101 Technical Report – Mt. Hamilton Gold Project, Centennial Deposit | Page 144 |
Figure 14-16: Centennial Annual Mining Year 4
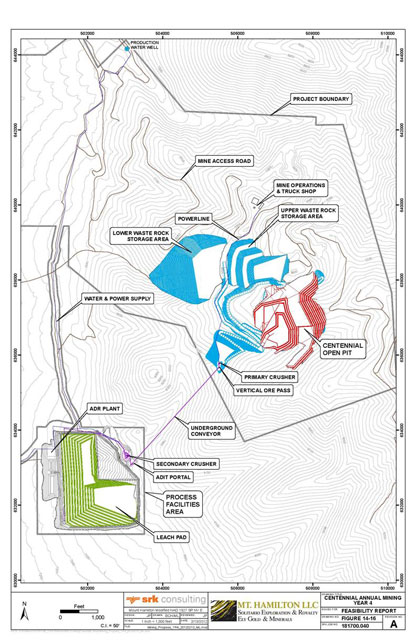
| JBP/MLM | February 22, 2012 |
| SRK Consulting (U.S.), Inc. | ||||
| NI 43-101 Technical Report – Mt. Hamilton Gold Project, Centennial Deposit | Page 145 |
Figure 14-17: Centennial Annual Mining Year 5
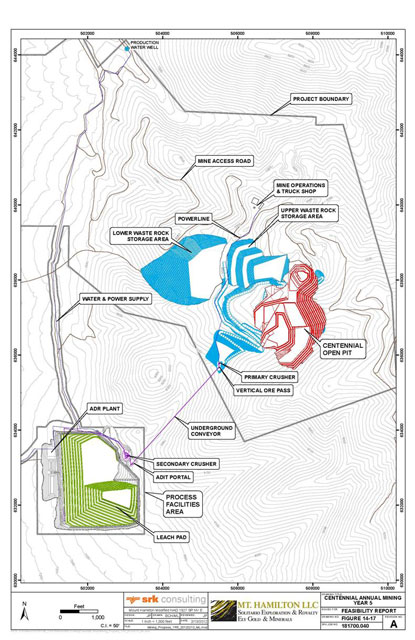
| JBP/MLM | February 22, 2012 |
| SRK Consulting (U.S.), Inc. | ||||
| NI 43-101 Technical Report – Mt. Hamilton Gold Project, Centennial Deposit | Page 146 |
Figure 14-18: Centennial Annual Mining Year 6
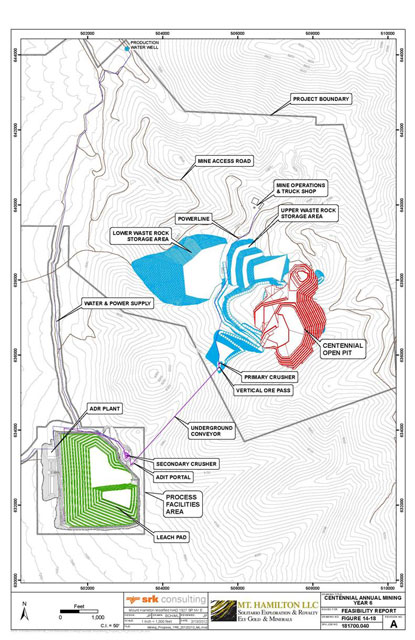
| JBP/MLM | February 22, 2012 |
| SRK Consulting (U.S.), Inc. | ||||
| NI 43-101 Technical Report – Mt. Hamilton Gold Project, Centennial Deposit | Page 147 |
Figure 14-19: Centennial Annual Mining Year 7
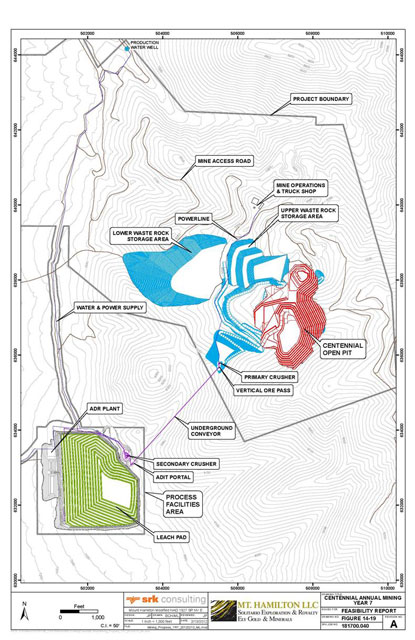
| JBP/MLM | February 22, 2012 |
| SRK Consulting (U.S.), Inc. | ||||
| NI 43-101 Technical Report – Mt. Hamilton Gold Project, Centennial Deposit | Page 148 |
Figure 14-20: Centennial Annual Mining Year 8 – Post Reclamation
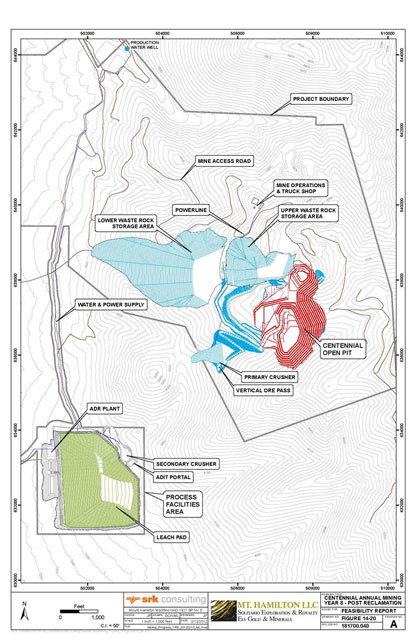
| JBP/MLM | February 22, 2012 |
| SRK Consulting (U.S.), Inc. | ||||
| NI 43-101 Technical Report – Mt. Hamilton Gold Project, Centennial Deposit | Page 149 |
Figure 14-21: Production Schedule Grade Distribution
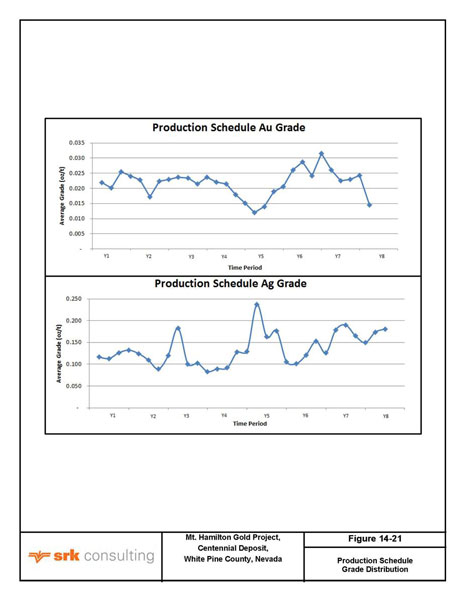
| JBP/MLM | February 22, 2012 |
| SRK Consulting (U.S.), Inc. | ||||
| NI 43-101 Technical Report – Mt. Hamilton Gold Project, Centennial Deposit | Page 150 |
Figure 14-22: Production Schedule Tonnage Distribution
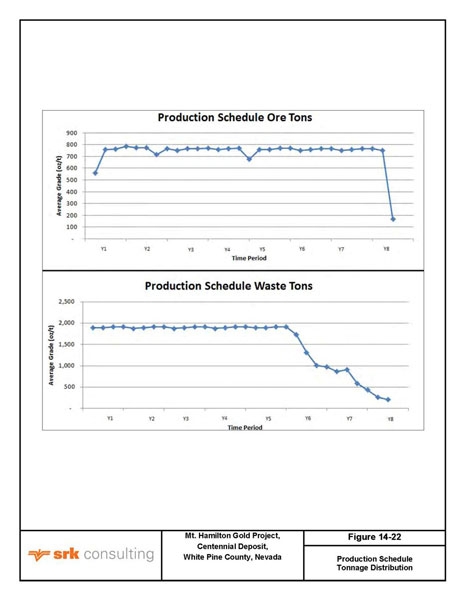
| JBP/MLM | February 22, 2012 |
| SRK Consulting (U.S.), Inc. | ||||
| NI 43-101 Technical Report – Mt. Hamilton Gold Project, Centennial Deposit | Page 151 |
| 15 | Recovery Methods |
Recovery of gold from the Centennial Project will be accomplished by a multi-lift heap leach with a carbon ADR plant. The dedicated heap leach pad (leach pad), process ponds, ADR plant and ancillary facilities were designed to accommodate a leachable reserve of approximately 22.5 Mt of crushed ore from the Centennial open pit.
| 15.1 | Processing Methods—General |
Run-of-Mine (RoM) ore will be primary crushed near the open pit edge, and transported to the secondary crushing facility adjacent to the leach pad by a 350 ft, 42 inch vertical raise, and underground conveyor belt. Secondary crushed ore will be transported to the leach pad via overland and portable conveyors, and stacked on the leach pad by a radial stacker.
Table 15.1.1 provides the feasibility design parameters for the heap leach pad.
Table 15.1.1: Summary of Heap Leach Pad Feasibility Design Parameters
Design Parameter | Feasibility Design | |||
Ore stacking rate | 550 t/h | |||
Crushed Ore Bulk Density | 110 lb/ft2 | |||
Ore lift height | 25 ft | |||
Solution application rate | 0.004 gpm/ft2 | |||
Ore leach cycle | 210 days days | |||
Ore leach area | 4.43 million square feet | |||
Solution pumping rate | 2,400 gpm | |||
HLP base slope | 17% upper (east), 13% lower pad (west) | |||
HLP maximum height | 210 ft above base |
| 15.2 | Crushing and Conveying and Stacking |
The flow sheet for crushing conveying and stacking is presented in Figure 15-1 and described below.
Ores will be crushed in two stages to 91% passing 3/4 inch size and conveyor stacked to a maximum height of 210 ft in multiple lifts. Primary crushing will be done on a crushing pad built near the open pit at an elevation of 8,450 ft (amsl). A 350 ft, steel lined, 42 inch diameter vertical raise will transport the crushed ore to a feeder and a conveyor belt. The 3,540 ft long conveyor belt will transport the ore at a grade of -15% to a series of 36 inch conveyor belts, and to a stockpile located at the crusher facility, adjacent to the leach pad (Figure 15-2). The stockpile will feed a secondary cone crusher plant at an elevation of 7,550 ft (amsl). The secondary cone crusher plant will feed an overland conveyor, a series of portable conveyors and radial stacker to the heap leach pad. The conveyor alignment is presented in Figure 15-2. Individual conveyor segment specifications are presented in Section 15.7, Table 15.7.1.
| 15.2.1 | Primary Crushing |
RoM ores will be fed to a 130 t dump bin by 100 t trucks, via front end loader. From the dump bin, the ores will be fed to a vibrating grizzly feeder with 4 inch openings. Oversize from the grizzly feeder will feed directly to a 36 inch x 50 inch Lippman jaw crusher with a closed side setting of 4 inches. The undersize from the grizzly and the jaw crusher product will be combined and conveyed to a 42 inch steel lined raise.
| JBP/MLM | February 22, 2012 |
| SRK Consulting (U.S.), Inc. | ||||
| NI 43-101 Technical Report – Mt. Hamilton Gold Project, Centennial Deposit | Page 152 |
The dump bin will be a free standing structure. The vibrating grizzly and jaw crusher will be mounted on a portable steel frame. The primary crusher layout is illustrated in Figure 15-3.
A free standing structure adjacent to the plant will be built containing an operator control module and a NH rock hammer. The rock hammer will service both the jaw crusher and rock bin openings. The bottom levels of the structure will be steel cladded and insulated for a MCC (motor control center) and dust control pumps.
The rock hammer will be utilized to handle crusher liners, and crusher and grizzly motors for routine maintenance. For major overhauls the portable plant will be lowered and pulled away from the bin to allow crane access.
Dust control will be achieved by an engineered wet dust suppression system with surfactant. At temperatures below 27º F, snow guns will provide dust suppression in the dump bin.
The harsh climate at 8,350 ft elevation requires a housing to be built around the crusher. The housing will consist of cladding the dump bin structure and a pre-engineered steel building with a 20 ft wide x 40 ft long x 24 ft eave height. On the control module side, an 8 ft x 8 ft sliding door in the roof will open to allow operator and rock hammer access while operating. During down times the door will be closed to retain and add heat.
| 15.2.2 | Raise and Underground Conveyor |
The primary crushed ore will be conveyed to a 42 inch diameter x 350 ft long steel lined raise. The raise will have a rock box and a 6 ft long replaceable extension at the top. The bottom will have a hydraulic cut off valve pinned to the back of a 26 ft x 20 ft x 20 ft high underground chamber. The cut off valve will feed a replaceable 6 ft section consisting of a chute feeding a 48 inch wide heavy duty apron feeder with a variable speed drive. The apron feed will feed a 3,540 ft long, 36 inch wide conveyor belt. The conveyor belt will be a channel frame suspended from the back of the adit in a 10 ft high x 12 ft wide decline drift at -15% grade. The drift portal is located at 7,600 ft elevation (amsl). The drive for the conveyor will be a 300-horsepower motor located in the underground chamber. The motor will provide regenerative braking, backed up by a standard friction brake for the decline conveyor. A gravity tower belt take up system will be located at the portal.
A belt scale will be provided on the conveyor to regulate the variable speed apron feeder.
A second, 42 inch diameter steel raise will be installed a short distance from the ore raise. The second raise will be utilized for power and water lines, ventilation fan and an emergency escape-way.
| 15.2.3 | Coarse Ore Stockpile |
The ore from the decline conveyor will be conveyed by a 266 ft long, 26 inch wide conveyor belt to a 125 ft long, 36 inch wide radial stacker. The radial stacker will create a stockpile with a 12,500 t live capacity and 38,000 t total capacity. The coarse ore will be reclaimed via three electromechanical vibrating feeders located in a 10 ft diameter tunnel under the stockpile feeding a 248 ft long, 36 inch wide conveyor belt. A belt scale on the conveyor will regulate the feeders to provide a flow of 550 t/h. The dead storage will be reclaimed by dozer pushing to the feeders. The stockpile and reclaim configuration are depicted in Figure 15-3.
| JBP/MLM | February 22, 2012 |
| SRK Consulting (U.S.), Inc. | ||||
| NI 43-101 Technical Report – Mt. Hamilton Gold Project, Centennial Deposit | Page 153 |
| 15.2.4 | Secondary Crushing |
The secondary crushing plant consists of a 6 ft x 20 ft two-deck screen and a Terex MVP 550 cone crusher. A 125 ft long, 36 inch wide conveyor will feed the screen at 550 TPH. Material from the screen greater than 3/4 inch in size will gravity feed to the Terex MVP 550 cone crusher with a closed side setting (CCS) of 3/4 inch. The screen undersize, at 100% passing 3/4 inch, will be combined with the crusher product to produce a 91% passing 3/4 inch size feed to the heap leach pad. A 98 ft long, 36 inch wide conveyor will feed the ore to the overland and heap stacking conveyors. A 75 t capacity lime silo will be placed on the crusher discharge belt to add pebble lime to the ore. The pebble lime addition will be applied by a rotary valve controlled by a belt scale.
A sampling system will be installed on the 98 ft long belt conveyor consisting of a swing arm belt sampler feeding a 1,200 lb capacity bin. The bin will be taken to the assay laboratory on a shift basis.
Dust control for secondary crushing will be provided by a wet dust suppression system with surfactant; water at 250 psi is available. The system will consist of surfactant addition and spray bars. The dust control system will be regulated by belt scales with an operator override.
The control for the secondary crusher will be by an enclosed operator module located atop a 50 ft trailer van. The van will house the MCC’s for the stockpiling conveyors, secondary crushing stockpile withdrawal, and overland conveyor.
The secondary crushing unit will be housed in a 26 ft wide x 40 ft long x 30 ft pre-engineered steel building. The building will have a 12 ft x 12 ft sliding door opening to enable the operator to view the crusher and screen while operating, closed to retain and add heat during downtimes.
| 15.2.5 | Overland Conveying and Stacking |
A 600 ft long, 36 inch wide overland conveyor will convey the ore at 550 TPH to a heap stacking system. The channel overland conveyor will be mounted on concrete sleepers. The head and tail pulleys will be skid mounted. The overland conveyor can be easily shortened or lengthened as necessary to accommodate the heap stacking system.
The overland conveyor will feed a series of 50 ft and 100 ft jump (grasshopper) portable conveyors with a working length of 1,320 ft. The jump conveyors will feed a radial stacker. The overall length of the radial stacker is 137 ft, of which 60 ft is in the stinger (telescoping) portion. The stacking height full extended is 41 ft; at the retracted length, the stack height is 25 ft.
The heap will be stacked in 25 ft lifts by the stacker system. The initial slopes of the base of the leach pad are up to 15% grade. The ore must be stacked from the heap base upslope to prevent liner damage. In the initial construction of each phase, the stacking system will be aided by dozer pushing.
| 15.3 | Heap Leach Pad Design |
The heap leach pad construction will be completed in four phases. Each phase will consist of five cells, for a total of 20 cells. Each cell will be approximately 240 ft wide, except for the southernmost cells, which extend approximately 300 ft in width. The cells in the lower phases (Phase 1 and Phase 2) and those in the upper phases (Phase 3 and Phase 4) will be divided into “A” and “B” sections,
| JBP/MLM | February 22, 2012 |
| SRK Consulting (U.S.), Inc. | ||||
| NI 43-101 Technical Report – Mt. Hamilton Gold Project, Centennial Deposit | Page 154 |
respectively. The numbering of cells, as shown on Figure 15-3, will range from 1 through 10 from north to south and will be divided into “A” (west) and “B” (east) sections.
Construction of each phase will include clearing and grubbing of surface vegetation, stripping of the upper 1.6 ft of soil (average minimum) for growth media stockpiling, subgrade and liner preparation, construction of cell and phase divider berms, construction of a perimeter containment berm consisting of access road, drainage channel, and anchor trench, and the installation of the leachate collection and conveyance system. Construction of Phase 1 and Phase 2 will also include completion of the building pad for process facilities, the process ponds, solution channels, and the stability berm and toe pad.
The leachate collection system will consist of perforated pipes laid on top of the synthetic liner. Each cell will have a primary solution pipe to collect flows from the system of lateral pipes. The primary solution pipe in the eastern “B” cells will be connected directly to the downstream “A” section solution pipe. Flows from the primary solution pipe in each cell will be conveyed to the process ponds via pipes in a lined solution channel. Valves at a pipe junction in the solution channel will enable the operator to send the flow from each cell to either the pregnant solution pond or the barren pond as dictated by the flow and the assay.
| 15.3.1 | Pad Size and Configuration |
The proposed heap leach pad and associated facilities will have an approximate footprint area of 134 acres. Including the crusher pad and growth media stockpile, the heap leach pad construction and operation will occupy the entire parcel of private property upon which it is located. The heap leach pad will be located on moderately sloping and generally uniform topography southwest of the pit. The leach pad will extend in a west-to-east direction from an elevation of 7,264 ft amsl at the toe of the process ponds to an elevation of 7,640 ft amsl at the crest of the eastern perimeter road. The lined base receiving ore will range from approximately 13% upslope from the stability berm and toe pad to 17% at the eastern boundary of the heap leach pad. The leach pad will have a total lined area of 4.43 million square feet, or approximately 102 acres.
An average dry density of 110 lb/ft3 (or, 1.5 t/yd2) for stacked ore was used to determine the proper leach pad dimensions to contain the proposed ore reserve of 22.5 Mt. The proposed final grades of the regraded spent ore and reclaimed surface of the heap leach pad at the end of the project life is shown on Figure 15-4.
The topography of the leach pad slopes from east to west with a naturally-occurring drainage approximately located along the longitudinal axis of the leach pad. The stacked ore height will gradually increase as it progresses from west to east until reaching its apex, with a regraded maximum vertical separation of approximately 210 ft above the prepared base. Large column height/percolation tests performed in 2011 confirmed a maximum stacking height of 220 ft without agglomeration using a solution application rate 0.004 gpm/ft2. Therefore, the proposed maximum design height is within tested limits.
| 15.3.2 | Pad Construction |
Construction of the heap leach pad is planned for four phases. In addition to base preparation and perimeter containment berm installation, Phase 1 construction will include the process facilities pad,
| JBP/MLM | February 22, 2012 |
| SRK Consulting (U.S.), Inc. | ||||
| NI 43-101 Technical Report – Mt. Hamilton Gold Project, Centennial Deposit | Page 155 |
process ponds, solution channel, access roads, and the stormwater diversion facilities. The grades and limits of earthwork required for Phase 1 construction are shown in Figure 15-5.
Pad construction will include foundation preparation, leachate collection and recovery system (LCRS) installation, liner system installation, solution collection piping system installation, placement of overliner material, and the construction of cell and phase divider berms. A close-up view of features and facilities for each phase, including earthwork requirements, grades, alignments, dimensions, and pipe layouts, are presented in Figure 15-6 (Phase 1), Figure 15-7 (Phases 2 through 4).
Foundation Preparation
Prior to developing each phase, the pad and perimeter berm footprint will be cleared and grubbed of existing vegetation. Phase 1 construction will also include clearing, grubbing, and cut-to-fill grading in the areas where the process ponds, plant, offices, shop, and warehouse will be constructed. Topsoil will be removed to a minimum average depth of 1.6 ft from the base of each phase and stockpiled for later use as growth media cover. It is estimated that 332,000 cubic yards of growth media will be required to complete reclamation of the final regraded ore surface at the end of the project. The growth media stockpile area for all phases will be in the southwestern corner of the site, as shown on Figure 15-2 and Figure 15-3.
Following clearing and grubbing, minor regrading of the leach pad base will be performed to smooth out the final surface for underliner construction and liner installation. Regrading will generally consist of minimal amounts of cut on high areas to obtain a maximum slope of 3H:1V and filling in incised drainages and low areas to promote solution drainage. The pad of each phase will be graded to follow the existing terrain and direct solution flows to the system of collection pipes and, generally, to either the north or south perimeter of each cell.
Base preparation for Phase 1 and Phase 2 will also include the cut-to-fill grading of a relatively level stability pad and berm along the western toe of each phase. The 150 ft-wide pad will be sloped at 2% to the earthen stability berm along the western cell boundary and 2% toward the south (Phase 1) or north (Phase 2). This compound slope will result in an overall 2.5% slope to the southeast (Phase 1) or northeast (Phase 2).
The leach pad grading layout is shown on Figure 15-5 through Figure 15-7, the leach pad cross section in Figure 15-8, and the leach pad details and typical sections, including the stability pad and berm described above, are shown on Figure 15-15, Figure 15-9, and Figure 15-10.
Liner System
The leach pad liner system will be a compacted 12 inch-thick low-permeability soil layer overlain by a single geosynthetic liner. The primary liner will be a double-textured (i.e., roughened on both sides) 80-mil high density polyethylene (HDPE) geomembrane liner. The subliner will consist of a compacted 12 inch-thick layer of either imported low-permeability soil or an admixture of bentonite and native soil with a hydraulic conductivity of 1x10⁻⁶ cm/sec or less. If the latter, the low-permeability soil layer will be constructed in place by excavating to a minimum depth of 12 inches, mixing the excavated soil with bentonite at the designated ratio, moisture conditioning, then placing and compacting the mixture to a finished base grade. The finished surface of this secondary containment system will then be overlain by the primary liner and overliner material. A typical section of the leach pad liner system is shown in Detail 3 on Figure 15-15.
| JBP/MLM | February 22, 2012 |
| SRK Consulting (U.S.), Inc. | ||||
| NI 43-101 Technical Report – Mt. Hamilton Gold Project, Centennial Deposit | Page 156 |
The geomembrane liner will be extended up the interior slopes of the perimeter containment berms, and over the stability berm, phase divider berms, and cell divider berms. Liner treatment at the phase divider berm is shown in Detail 9 on Figure 15-10.
The solution channel and process ponds will each be constructed with a double synthetic liner system consisting of an 80-mil HDPE primary liner over a polyethylene geonet, overlying a 60-mil HDPE secondary liner. A typical section of the proposed double liner construction is shown in Detail 11 on Figure 15-11.
Heap Leach Pregnant Solution Recovery System
The pregnant solution collection and recovery system will consist of a network of collection pipes designed to collect leach solution and transport it to the process ponds. The pipe network will utilize three different pipe sizes and two types, consisting of 4 inch, 12 inch, and 24 inch diameters and both corrugated, smooth interior, perforated HDPE (also referred to as corrugated polyethylene tubing, or “CPT”) and smooth, solid-wall HDPE pressure pipe.
The 4 inch diameter collection pipes (corrugated, smooth interior, perforated HDPE) will be placed oblique to the base gradient in an approximate herringbone configuration and serve as the first collection point for pregnant solution. These pipe “laterals” will be installed cross-gradient to achieve an approximate 4% flowline slope, and will be placed at 25 ft intervals (i.e., 25 ft on center) as construction progresses upslope. The laterals will convey solution to the 12 inch diameter and 24 inch diameter solution pipes. The layout of lateral collection pipes in Phase 1 cells (i.e., 1A through 5A) is presented in Figure 15-6; this general configuration will be replicated in subsequent phases.
The 12 inch diameter solution pipes (corrugated, smooth interior, perforated HDPE) will be placed on the downslope side of each cell, along either the cell divider berm or phase divider berm (except in cells 3A and 3B, where the solution pipe will extend up the natural swale that projects diagonally through each cell). Location and alignment of the 12 inch diameter solution pipes are shown on Figure 15-6 (Phase 1), Figure 15-7 (Phase 2), and Figure 15-4 (Phases 2 through 4).
In Phase 1 and Phase 2, the 12 inch diameter corrugated, perforated HDPE solution pipes will connect to standard 12 inch diameter solid-wall (or, “blank”) HDPE pipes at the interior toe of the stability berm. The solid-wall HDPE pipes will extend through a lined notch in the stability berm and connect to the two solution conveyance pipes by a combination of tees, elbows, and valves in the solution channel. The solution collected from the heap leach pad will then be conveyed to the pregnant pond and barren pond via two 24 inch diameter corrugated HDPE solid-wall (“CPT”) pipes in the solution channel. The extension of the solid-wall HDPE solution pipe through the stability berm is shown in Detail 8 on Figure 15-10, and the installation of the pipe junction in the solution channel is shown in Detail 6 on Figure 15-12.
At the time of Phase 1 and Phase 2 construction, the 12 inch diameter solution pipes will be placed up to the downslope toe of the phase divider berm on the eastern perimeter of each cell. There it will be capped for future extension into the “B” section of each cell. During Phase 3 and Phase 4 construction, a lined notch will be constructed through the phase divider berm and the 12 inch diameter solution pipe from the upslope (or “B” section) cell will connect to the solution pipe in the downstream (or “B” section) cell. This construction is presented in Detail 7 on Figure 15-10. In each cell, Section B pregnant solution will be transported through Section A in the 12 inch diameter solution pipes and discharged into the 24 inch diameter conveyance pipe in the solution channel.
| JBP/MLM | February 22, 2012 |
| SRK Consulting (U.S.), Inc. | ||||
| NI 43-101 Technical Report – Mt. Hamilton Gold Project, Centennial Deposit | Page 157 |
Overliner
To protect the primary liner and complete the solution recovery system, a 3 ft-thick overliner layer comprised of crushed ore will be applied with the radial stacker and then redistributed with a small dozer over the primary liner and network of collection pipes. This layer will protect the synthetic liner and pipe network during subsequent stacking operations.
Solution Channel Leak Collection and Recovery System (LCRS)
A leak collection and recovery system (LCRS, or “leak detection system”) will be installed under the solution channel to monitor and detect leaks if they develop in the liner system. The LCRS will consist of a 4 inch diameter corrugated, smooth-interior, perforated HDPE pipe embedded in drain rock wrapped in an 8 ounce per square yard (8 oz/yd2) non-woven geotextile. The perforated pipe and drainage media will be installed in a 20 inch deep v-ditch constructed below the primary liner along the centerline of the solution channel. The LCRS perforated pipe and drainage media will be underlain by the secondary liner, a 60-mil HDPE geomembrane. The geonet that will be installed in between the primary and secondary liner will be extended into the LCRS v-ditch. A typical section of the LCRS collection ditch under the solution channel is shown in Detail 5 on Figure 15-9.
| 15.3.3 | Leach Pad Stability Analysis |
Seismicity
A seismic hazard analysis was performed for the heap leach pad design using Probabilistic Seismic Hazard Analysis (PSHA). PSHA uses a Poisson Probability Model to estimate ground accelerations expressed as a percent chance of exceedance for a given time period and is expressed with a recurrence interval. Peak ground accelerations estimated for the site from the 2008 USGS National Seismic Hazard maps are 0.08284 g with a 10% probability of exceedance in 50 years. A peak acceleration of 0.1 g was used to represent seismic conditions for the heap leach pad stability analysis. This peak acceleration is appropriate as the facility operational life is relatively short.
SLIDE Stability Analysis
Slope stability analyses were executed using the computer program SLIDE (Version 5.026). SLIDE is a 2-dimensional slope stability analysis program for evaluating the factor of safety, or probability of failure, for circular and non-circular failure surfaces in a defined slope section. SLIDE analyzes the stability of slip surfaces using vertical slice limit equilibrium methods (e.g., Bishop, Janbu, Spencer, etc.). Individual slope surfaces can be analyzed, or random search methods can be applied to locate the critical slip surface for a given slope. Deterministic (safety factor) or probabilistic (probability of failure) analyses can be carried out.
The stability of the west-facing slope of the leach pad was evaluated both for the initial lift of the ore at the stability berm and toe pad during operations and for the full height of the final regraded configuration of the reclaimed heap leach pad at the end of the project. The results for both analyses are presented in Table 15.3.3.1.
| JBP/MLM | February 22, 2012 |
| SRK Consulting (U.S.), Inc. | ||||
| NI 43-101 Technical Report – Mt. Hamilton Gold Project, Centennial Deposit | Page 158 |
Table 15.3.3.1: Summary of Results for Heap Leach Pad Slope Stability Analyses
Sections | Circular Failure | Noncircular Failure | ||||||||||||||
| Static | Pseudo-Static | Static | Pseudo-Static | |||||||||||||
Initial Lift | 1.33 | 1.11 | 1.91 | 1.65 | ||||||||||||
Final Reclaimed Surface | 2.02 | 1.50 | 1.99 | 1.47 | ||||||||||||
|
|
|
|
|
|
|
| |||||||||
For all analyses, the factors of safety (FoS) under static condition and pesudostatic conditions are higher than the required minimum FoS of 1.3 and 1.05, respectively. Therefore, the proposed heap leach pad will be stable under both static and pesudostatic conditions for both the initial lift and final ore grading configurations.
| 15.3.4 | Stormwater Diversion Design |
The Centennial project heap leach pad will require the construction of an upgradient stormwater diversion channel to mitigate potential drainage of stormwater onto the leach pad. The proposed diversion channel will be located on the upslope side of the eastern property boundary, as shown on Figure 15-2.
The hydrologic analysis of the watershed upgradient of the heap leach pad was performed using the proposed site design depicted on Figure 15-3 and Figure 15-4. Utilizing the WinTR-55 computer program, the United States Department of Agriculture TR-55 methodology (USDA, 1986) was used to calculate the 100-year, 24-hour peak flood discharge for the drainage area upgradient of the diversion channel (753 acres). Based on run-on flows and channel flowline slope, two geometries were developed for the diversion channel utilizing Manning’s equation for normal depth hydraulic calculations. The geometry of the upper portion of the diversion channel is a diversion berm forming a v-ditch, and the lower portion is a trapezoidal channel. For a v-ditch with 2:1 (horizontal to vertical, or 2H:1V) sideslopes and a 5.1% flowline slope, a minimum channel depth of 1.5 ft is required. With a trapezoidal channel geometry consisting of a 10 ft bottom width, 2H:1V sideslopes, and a 5.1% flowline slope at its flattest, the hydraulic analysis resulted in a channel design depth of 2.5 ft. The full flow capacity of the channels is 22 cubic feet per second (cfs) for the v-ditch and 348 cfs for the trapezoidal channel. Both design capacities exceed the predicted peak discharges of 19 cfs and 162 cfs, respectively, for the 100-year, 24-hour storm event. The proposed diversion channel alignment and associated earthwork is shown in plan and profile on Figure 15-13; details of channel geometry are presented on Figure 15-14.
Rip-rap sizing and the associated roughness coefficients for rip-rap-lined open channels were determined from the methodology outlined by the United Stated Department of Interior, Office of Surface Mining in its Surface Mining Water Diversion Design Manual (USDI, 1982). The diversion channel will be armored with a 1.5 ft thick layer of rip-rap with a median rock diameter (D50) of 12 inches for erosion protection.
Leach Pad Stormwater Control
During leach pad operations, precipitation falling directly within the leach pad footprint will be managed by the solution collection and recovery system in the same manner as the applied leaching solution. Stormwater that does not infiltrate into the heap will be handled by the perimeter channel formed between the toe of the heap and the perimeter containment berm. During heap operations,
| JBP/MLM | February 22, 2012 |
| SRK Consulting (U.S.), Inc. | ||||
| NI 43-101 Technical Report – Mt. Hamilton Gold Project, Centennial Deposit | Page 159 |
the overliner in this separation forms an 6.5 ft wide, 2 ft deep open channel, as shown by Detail 2 on Figure 15-15.
Stormwater run-off from the growth media surface over the final, post-reclamation configuration of the ore heap will be managed by a channel around the perimeter of the leach pad. This channel will be constructed along with the perimeter containment berm during phased leach pad construction and grading. The channel configuration is a proposed trapezoidal channel, 2 ft deep with a base width of 4 ft, and 2H:1V sideslopes.
A preliminary hydrologic analysis using Win-TR55 was performed on the proposed final ore grading (Figure 15-17) to estimate peak flows in the perimeter channel following heap reclamation grading. The maximum peak discharge in the perimeter channel from the reclaimed ore heap will be less than 75 cfs and, based on Manning’s equation, will have a maximum flow depth of 1.3 ft. Thus, the perimeter collection channel is adequately sized to effectively manage the 100-year, 24-hour storm flow. The diversion channel will be armored with a 15 inch thick layer of rip-rap with a median rock diameter (D50) of 9 inches for erosion protection.
| 15.3.5 | Process Pond Design and Storage Requirements |
Two solution ponds will be required for the Centennial Project, a pregnant solution pond and a combination barren / stormwater pond. Each pond will be double-lined and equipped with a leak containment and recovery system.
Process Pond Design Criteria and Storage Requirements
Pregnant solution from the leach pad will be piped to the pregnant pond via 24 inch diameter pipes. The pregnant pond will have crest dimensions of 300 ft long by 160 ft wide with 3H:1V sideslopes and a depth of 24 ft.
Barren solution and stormwater overflow will be handled by a single pond, the barren pond. Barren solution will be piped to the barren pond from the process plant and stormwater will be conveyed to the barren pond by the solution channel. If necessary, excess stormwater captured with draindown in the heap solution collection system can be directed to the barren pond in the solution conveyance pipes. Further, overflow from the pregnant pond will also be conveyed to the barren pond through a spillway channel connecting the two ponds. The barren pond will have crest dimensions of 600 ft long by 215 ft wide with 3H:1V sideslopes and a depth of 24 ft. In addition, a 4 ft-deep “step-down” will be installed at the north end of the pond to provide the dead storage required for pump draft. The dead storage area will extend along the full width of the pond and its crest dimensions will be 71 ft long by 46 ft wide. With 3H:1V sideslopes and a depth of 4 ft, its base dimensions will be 47 ft long by 22 ft wide. The layout and dimensions of the process ponds are shown in plan and profile on Figure 15-16.
The pregnant pond was sized to accommodate the volumes required by the following design criteria:
| • | 8-hour operating volume; |
| • | 12-hour draindown volume; |
| • | 2 ft of freeboard; and, |
4 ft of pump draft.
The barren pond was sized to accommodate the volumes required by the following design criteria:
| JBP/MLM | February 22, 2012 |
| SRK Consulting (U.S.), Inc. | ||||
| NI 43-101 Technical Report – Mt. Hamilton Gold Project, Centennial Deposit | Page 160 |
| • | 8-hour operating volume; |
| • | One-half of the 25-year, 24-hour storm rainfall volume falling on the heap leach pad; |
| • | 2 ft of freeboard; and, |
| • | 4 ft of pump draft. |
The 8-hour operating volume was determined from a process pumping rate of 2,400 gallons of solution per minute. The volume for 12 hours of draindown was determined assuming the draindown rate will be equal the process pumping rate and a portion of draindown from areas previously under leach, or 2,700 gpm.
The freeboard volume for each pond was calculated based on a freeboard depth of 2 ft and a dead storage volume was determined based on a required pump draft of 4 ft.
To accommodate the volume of rainfall that falls on the leach pad and process ponds during mine operation, it was assumed that the entire 100-year, 24-hour storm depth (3.7 inches) will report to the process ponds. Rainfall on the leach pad will enter the solution process either as infiltration through the heap, or as surface runoff into the channel formed between the perimeter berm and toe of the heap. These storm flows will be collected by the perforated 4 inch diameter collector pipes and 12 inch diameter solution pipes. The stormwater collected on the heap leach pad can report to either the barren pond or pregnant pond, but design capacity has been provided in the barren pond. In the event it is first sent to the pregnant pond, once that pond’s capacity is reached it will flow into the barren pond through a spillway between the two ponds. The volume required for each storage component of the pregnant and barren ponds are summarized in Table 15.3.5.1.
Table 15.3.5.1: Process Pond Storage Characteristics
Storage Component | Pregnant Pond Volume (ft3) | Barren Pond Volume (ft3) | ||||||
8-hour Operating Volume | 154,000 | 154,000 | ||||||
12-hour Draindown Volume | 260,000 | n/a | ||||||
Stormwater Volume | n/a | 1,525,000 | ||||||
Freeboard Volume | 90,600 | 248,000 | ||||||
Dead Storage (Pump Draft) | 19,400 | 8,600 | ||||||
Sum of Component Volumes | 524,000 | 1,935,600 | ||||||
Total Design Volume of Pond | 606,000 | 1,945,100 | ||||||
|
|
|
| |||||
The above table demonstrates that the total volume of each pond is greater than the sum of component volumes required for each pond, and thus the ponds are adequately sized for the design criteria described above.
| 15.3.6 | Process Pond Construction |
The process ponds will be constructed as part of the Phase 1 leach pad construction and will include foundation preparation, leak collection and recovery system (LCRS) installation, and a double- containment liner system. The process pond footprint will be cleared and grubbed of existing vegetation and topsoil will be placed in the growth media stockpile. Excavation and grading of the ponds will be performed to achieve the proposed pond geometries as shown in Figure 15-16.
A double synthetic liner system is proposed for both the pregnant and barren ponds. The system will consist of an 80-mil HDPE primary liner placed over a polyethylene geonet, overlying a 60-mil HDPE
| JBP/MLM | February 22, 2012 |
| SRK Consulting (U.S.), Inc. | ||||
| NI 43-101 Technical Report – Mt. Hamilton Gold Project, Centennial Deposit | Page 161 |
secondary liner. A typical section of the proposed double liner construction is shown in Detail 11 on Figure 15-11.
The pregnant and barren ponds are each designed with a leak collection and recovery system (LCRS, or “leak detection system”) consisting of a gravel-filled sump and recovery port located at the southwest corner of the pregnant pond and the northwest corner of the barren pond. Each sump will have drainage gravel placed 2 ft deep in the 10 ft x 10 ft base area and wrapped in an 8 oz/yd2 non-woven geotextile. Each sump will be underlain by the secondary 60-mil HDPE liner and overlain by the geonet and primary 80-mil HDPE liner. A typical section of the LCRS sump is shown in Detail 12 on Figure 15-11.
| 15.4 | Leach Solution Application |
Solutions to the stacked ore (heap) on the leach pad will be distributed from the barren pond via a submerged pump feeding a booster pump and 12 inch steel distribution at the heap base. Every 240 ft on the header, at cell dividers, there will be a reducer and valve followed by 8 inch diameter HDPE piping to the heap. The 8 inch diameter HDPE piping will connect to 4 inch diameter yelomine pipe at 350 ft intervals. The 4 inch diameter yelomine pipe will be drilled and tapped on both sides to accept ore max emitter’s lines for solution distribution at the rate of 0.004 gpm/ft2 for 90 days. The emitter’s lines will be 175 ft long. The primary leach rate is 0.004 gpm/ft2 for 90 days. The secondary leach rate is 0.001-0.002 gpm/ft2. The pregnant leach solution flow will be up to 3,200 gpm.
The emitter’s lines will be buried from October to March to prevent freezing. A filter will be installed on the barren solution piping to prevent emitter clogging. The barren solution pump will have a variable frequency drive and will be capable of providing 3,200 gpm flow to the heap for three years leaching. A booster pump will be required to maintain flows to the ultimate heap leach height.
| 15.5 | Plant Design and Operations |
| 15.5.1 | ADR Plant Design |
A carbon ADR circuit will be used at the Centennial Project. The ADR plant will have all the mercury controls installed as currently required by the State of Nevada
The ADR plant consists of five, 12 ft diameter carbon columns, a 3 t strip and acid wash system, electrolytic cells, mercury retort and mercury controls and an induction smelting furnace. The final product will be a doré bar. Electrolytic cells of the ADR plant have been sized to accommodate Ag/Au ratios of 6/1 in the final doré. The flow sheet for the Heap Leach Dore Recovery is presented in Figure 15-17. The plant layout details are presented in Figure 15-18.
| 15.5.2 | ADR Operations |
The ADR plant will be fed at the rate of 2,400 gpm by a submersible pump in the pregnant pond. The pregnant solution will flow over a trash screen and then to a cascading series of 12 ft diameter carbon columns. The barren solution from the column series will flow over a safety screen and then, by gravity, to the barren pond. The purpose of the safety screen is to remove occasional carbon “floaters.” The activated carbon will be transferred countercurrent to the solution flow in 3 t lots by a
| JBP/MLM | February 22, 2012 |
| SRK Consulting (U.S.), Inc. | ||||
| NI 43-101 Technical Report – Mt. Hamilton Gold Project, Centennial Deposit | Page 162 |
recessed impeller pump. The countercurrent flow of carbon allows the carbon to become fully loaded in the initial tank of the series, while providing a barren solution discharge from the last tank.
The loaded carbon will be transferred to a 3 t acid wash vessel. After acid washing and neutralization, the 3 t lot will be stripped of doré in a pressure vessel. The stripped carbon will be regenerated by heating in a kiln to remove oil and grease. The regenerated carbon will be quenched and screened and returned to the last carbon column. The regeneration kiln is rated at 1 t/d; the strip circuit is rated at 3 T/D. The excess carbon will report directly to the screening and then to the last carbon column. New carbon will be wetted and screened prior to being added to the last carbon column. Fines from the screening operation will be collected in a filter press.
The carbon will be “stripped” of doré values in a 3 t capacity pressure vessel at 240º F. Sodium hydroxide will be added to the stripping solution to aid stripping and provide electrolyte for the subsequent electrowinning. The solution will be heated to 240º F by an electric immersion heater. The strip solution will flow to an insulated holding tank. The stripping cycle will be 6-12 hours at 50 gpm.
Solution from the insulated holding tank will be pumped to two sludging electrolytic cells. The barren solution from the electrolytic cells will be pumped back to the insulated holding tank. The sludge from the electrolytic cells will be pumped to a filter press. The damp filter cake will be manually loaded into trays. The trays will be placed in a 15 ft3 mercury retort. After the 24 hour retorting process, the trays will be cooled, dumped and the sludge mixed with fluxes. The retorted sludge/flux mix will be charged to an electric induction furnace for smelting into doré bars.
The ADR building will be a 100 ft long x 60 ft wide x 32 ft eave height pre-engineered steel structure; a 60 ft. x 40 ft. x 16 ft. eave height pre-engineered steel building will be attached to the 32 ft section. The 32 ft eave portion will contain the cascading carbon columns and screens, the regeneration kiln and carbon handling system, the acid wash and stripping vessel, the strip heating system and insulated holding tank. The 16 ft eave height building will be the secure area [refinery] A16 ft, separated from the 32 ft eave height by a double wall. The secure area will contain the electrolytic cells, mercury retort, flux mixing and the induction melting furnace. The mercury retort will be contained in 16 ft x10 ft enclosed area An adjacent 14 ft x 64 ft curbed concrete slab will contain the dust collectors, mercury controls, exhaust fans and furnace chillers for the secure area.
The refinery area contains space for a 10 ft. x 10 ft x 10 ft. safe. The safe will have rebar reinforced cement block walls with a steel framed combination safe door. A 16 ft x 26 ft concrete slab with a 10 ft cyclone fence and lockable gates will be constructed adjacent to the refinery main door. This area will allow materials to money in and out of the refinery area without compromising security. Security cameras will be installed at strategic locations, connected to remote monitors and DVD recorders
The cyanide mix store and distribution system will be on a 14 ft x 20 ft curbed concrete slab, located adjacent to the refinery slab.
An operations office for the ADR plant will be a 30 ft x 12 ft wide trailer connected to the 32 ft high portion of the ADR building. The operations office will contain a wet lab bench and AA (atomic adsorption) machine, an operations panel for the ADR, generation and water supply, and lunch facilities.
A security office will be a 20 ft x 10 ft wide trailer connected to the 16 ft high secure area. The security office will contain an office, lunch and sanitary facilities for the refinery crew.
| JBP/MLM | February 22, 2012 |
| SRK Consulting (U.S.), Inc. | ||||
| NI 43-101 Technical Report – Mt. Hamilton Gold Project, Centennial Deposit | Page 163 |
A change/lunch area for the secondary crushing, conveying and heap piping crews will be a 30 ft x 12 ft wide trailer located inside the 32 ft high ADR building. The trailer will contain male and female toilets and showers, lunch facilities and space for line out and safety meetings. The trailer will have a 4 ft wide walkway along one side for lockers.
| 15.5.3 | Assay Laboratory |
An Assay Laboratory capable of performing 80 wet atomic adsorption analyses, and 40 fire assay analyses will be installed at the office complex. The assay laboratory will be housed in a 60 ft x 40 ft x 14 ft eave height pre-engineered steel building.
The building will contain an office and sanitary facilities. The sample preparation will have drying ovens, crushing and pulverizing and splitting equipment for up to 180 samples per day. The sample preparation area will have a dedicated ventilation system for dust control. The fire assay section will have two large electric furnaces for fusion and one smaller furnace for cupellation. The fire assay section will have a dedicated ventilation system. The AA section will have hot plates, centrifuges and an acid fuming hood. A four-element AA machine will be installed.
The building will contain space and equipment for a metallurgical laboratory. The metallurgical laboratory will have wet and dry screen sizing equipment, bottle rolling equipment, filtering equipment and equipment for up to four column tests.
The ADR plant will have an identical four-element AA machine for routine plant and heap solution assays.
The assay laboratory work schedule is five, ten hour days. Fire Assaying will be done five days per week, AA analysis and sample preparation will work six days per week. The assay laboratory will be staffed to provide five, ten hour days for the personnel.
The heap leach feed shift sample will be crushed to ± 1/8 inch size, split twice and reduced to four, 20 lb samples for pulverization. The sample will be delivered to the lab in a 1,200 lb bin at 91%-passing 3/4 inch size. The rejects at ± 1/8 inch size will return to an empty bin. The sampling system will consist of a conveyor belt feeding a small jaw or cone crusher, a rotating Vezin sample cutter, a rotating turn table with four buckets and a conveyor from the Vezin sample for rejects.
| 15.6 | Consumable Requirements |
| 15.6.1 | Power |
The primary crushing station, ventilation, raise, drift conveyor, and apron feeder will be powered by two, 340-Kilowatt diesel generators mounted in a trailer van. One generator will be on line at all times, the second is for backup power supply. The largest horsepower motor in the system is the 300-horsepower drive conveyor motor. This motor will require full load amperage at startup. Once the belt is operating at full speed the amperage drops to 0.25 of full amperage. At the operating capacity of 550 TPH of ore, the regenerative drive motor will generate sufficient power to offset the jaw crusher 250-horsepower motor. The system start-up will be interlocked so that the drift conveyor must be started and come to empty speed before the jaw crusher can be started.
The generators will operate at 480 volts. The voltage will be transformed to 4,160 volt for installation in the ventilation raise, and then transformed back to 480 volt to service the drift conveyor apron
| JBP/MLM | February 22, 2012 |
| SRK Consulting (U.S.), Inc. | ||||
| NI 43-101 Technical Report – Mt. Hamilton Gold Project, Centennial Deposit | Page 164 |
feeder. The generators will provide power for a continuously operating ventilation fan, a process water booster pump, heating and lighting for the crushing and drift conveyor systems.
Power for the secondary crushing system, conveying and heap stacking, ADR plant and heap pumps, office complex will be provided by four, 725-Kilowatt Cat® generators, operating at 480 volts. The generators will have an automatic paralleling system to start and stop the generators according to load demand. The maximum demand will require three generators on line, leaving a spare generator for service.
The generators will be housed in a three-sided 40 ft long x 20 ft wide x 16 ft high eave, pre-engineered steel structure. The switchgear and controls will be housed in an attached 20 ft x 10 ft x 12 ft high eave, full enclosed space.
Power for the mine shop will be provided by a 100 kW diesel generator with a 30 kW diesel generator standby.
| 15.6.2 | Water Supply |
The peak make-up water requirement for the Project is 500 gpm. The water source for the Project will be an existing well located at the mouth of the Seligman Canyon, a distance of 11,000 ft from an 80 ft diameter x 20 ft high water storage tank. The well will be equipped with a submersible pump, pumping to an enclosed tank and booster pump. The system is designed for a peak flow of 500 gpm, and consistent delivery of 400 gpm. The booster pump will pump to the 80 ft diameter x 20 ft high, 750,000 gallon tank located above the Heap/ADR site at an elevation of 7,614 ft (amsl). Power for the well and booster pump will be provided by an overhead 4,160 volt power line. The power source will be the four, 725 kW generators.
Mine Site Water Supply (Pit Location)
The water supply for the primary crushing plant, mine dust control and truck shop will consist of a booster pump (located at the secondary cone crusher plant) pumping to the base of the ventilation raise, and a booster pump, pumping to a 30,000 gallon tank located at elevation 8,500 ft (amsl). The 30,000 gallon tank will provide a gravity flow for mine road dust control and gravity flow for primary crushing dust control. The mine shop will be serviced by a booster pump.
| 15.6.3 | Major Reagents |
Major reagents and usage for the leach operation are provided in Table 15.6.3.1. The reagent amounts were determined during metallurgical test work performed by McClelland Laboratories in 2011 and summarized in Section 11 of this report.
Table 15.6.3.1: Major Reagent Consumption
Reagent | Use | |||
Lime (CaO) | 5 lb/t | |||
Sodium Cyanide | 0.6 lb/t | |||
| JBP/MLM | February 22, 2012 |
| SRK Consulting (U.S.), Inc. | ||||
| NI 43-101 Technical Report – Mt. Hamilton Gold Project, Centennial Deposit | Page 165 |
| 15.6.4 | Labor Requirements |
Labor requirements are divided into two sets: 1) 24hr/7 day per week, and 2) 10hr/5 day per week schedules. Labor in each category is listed in Table 15.6.4.1 and 15.6.4.2. The total processing plant and assay laboratory labor requirement is 50 workers.
Table 15.6.4.1: 24hr/7day per week Scheduled Labor
24 hr. /7 day Schedule | Per Shift | Total | ||||||
Primary Crush | 1 | 4 | ||||||
Convey/Stockpile | 1 | 4 | ||||||
Secondary Crush to Overload | 1 | 4 | ||||||
Overland to Stack | 1 | 4 | ||||||
ADR | 2 | 8 | ||||||
Utility | 2 | 8 | ||||||
|
|
|
| |||||
Totals | 8 | 32 | ||||||
|
|
|
| |||||
Table 15.6.4.2: 10-hour/5-day per week Scheduled Labor
10-hour/5-day Schedule - Day Shift | Per Shift | Total | ||||||
Laboratory | 7 | 7 | ||||||
Leach Pad Pipers/Utility | 5 | 5 | ||||||
Refiner | 1 | 1 | ||||||
Maintenance | 5 | 5 | ||||||
|
|
|
| |||||
Totals | 18 | 18 | ||||||
|
|
|
| |||||
| 15.7 | Process Equipment Requirements |
Table 15.7.1 lists the major process equipment items identified along with the number of units required and specifications. These items form the basis for process capital cost estimation.
| JBP/MLM | February 22, 2012 |
| SRK Consulting (U.S.), Inc. | ||||
| NI 43-101 Technical Report – Mt. Hamilton Gold Project, Centennial Deposit | Page 166 |
Table 15.7.1: Major Process Equipment Items Specifications and Quantities
| Equipment Description | Size | Max Required | ||
Primary Crusher Area | ||||
Rock Box | 130 t live load | 1 | ||
Lipman J3650 Portable Jaw Crushing Plant | 36 inch x 50 inch jaw crusher, 250 hp, 51 inch wide x 24ft long vibrating grizzly feeder, on steel truck frame | 1 | ||
NPK Pedestal Breaker system | 2,000 ft-lb, 50 hp | 1 | ||
C1-Jaw Transfer conveyor | 119 ft long, 60 inch belt, 25 hp, w/ tramp iron magnet | 1 | ||
AES Control van | 8 ft x 6 ft | 1 | ||
Underground Equipment | ||||
Universal FL4 Chain Apron Feeder | 48 inch wide x 12 ft long, 15 hp variable speed drive | 1 | ||
C2-Feed Tunnel Conveyor | 3,539 ft long, 36 inch belt, 300 hp | 1 | ||
Secondary Crusher (Drift to Leach Pad) | ||||
C3 Radial Stacker Feed Conveyor | 266 ft long, 36 inch belt, 15 hp | 1 | ||
C4 Radial Stacker | 125 ft long, 36 inch belt, 40 hp | 1 | ||
C5 Stockpile Reclaim Conveyor | 248 ft long, 36 inch belt, 30 hp, w/3 vibro-mechanical feeders rated at 500 t/h | 1 | ||
C6 Screen Feed Conveyor | 125 ft long, 36 inch belt, 25 hp | 1 | ||
Fabtec Portable MVP 550 Cone Plant | MVP 550 Cone crusher, 500 hp, 6 ft x 20 ft, 2 deck 40 hp feed screen, on steel truck frame | 1 | ||
Control Van w/ Operators Module | 8 ft x 6 ft | 1 | ||
Lime Storage Silo | 1 | |||
C7 Crusher Discharge Conveyor | 98 ft long, 36 inch belt, 30 hp | 1 | ||
C9 Ground Line Conveyor | 600 ft long, 36 inch belt, 20 hp | 1 | ||
C10 Ground Line conveyor | 965 ft long, 36 inch belt, 75 hp | 1 | ||
Leach pad Conveyors | ||||
C11 Jump Conveyor | 50 ft long, 36 inch belt, 10 hp | 1 | ||
“grasshopper” Conveyors | 100 ft long, 36 inch belt, 20 hp | 16 | ||
Telestacker Conveyor | 136 ft long, 36 inch belt, 55 hp | 1 | ||
ADR Plant | ||||
CIC Circuit | 5-12ft dia. columns 4T carbon | 1 | ||
Acid Wash System | 3 t acid wash vessel w/pumps, tanks and controls | 1 | ||
Strip System | 3 t carbon strip system w/ pumps, tanks and controls | 1 | ||
Solution Heat Skid | Electric heaters, 400 kW, w/heat exchangers and controls | 1 | ||
Electrowinning | 75 ft3 cells, 18 cathodes, 20 anodes, 15 kW rectifier, sludge filter, w/ tanks, pumps, controls | 1 | ||
Carbon Handling System | Tanks, pumps, filter and controls | 1 | ||
Carbon Regeneration | 1 t kiln, electric, w/ hoppers, tanks screens and pumps | 1 | ||
Refining | Electric induction furnace, flux and slag handling, molds, balances, jaw and roll crushers, screen and concentrating table | 1 | ||
Mercury Removal System | Scrubbers, Mercury Retort | 1 | ||
Booster Pump to Heap | 2,400 gpm @ 30 0ft TDH, 300 hp | 1 | ||
Tsurumi Submersible Pump | 2,400 gpm @ 60 ft TDH, 75 hp | 3 | ||
Process Mobile Equipment | ||||
Caterpillar 236B2 Skid Steer loader | 71 hp w/ bucket, cab, A/C | 1 | ||
Bobcat S650 Skid steer | 74 hp, w/ bucket, pallet forks, cab, A/C, underground package | 1 | ||
Kubota Maintenance Tractor | 50 hp, underground package | 1 | ||
Pallet Jack | Battery powered, 4,400 lb capacity | 1 | ||
Caterpillar D7E Dozer | 235 hp, 56,670 lb, standard blade | 1 | ||
Caterpillar 420E IT Backhoe | 93 hp, 1.3 yd3 loader bucket, backhoe | 1 | ||
Caterpillar TL1055 Telehandler | 119 hp, 10,000 lb capacity, 55 ft lift height | 1 | ||
Trailer mounted Compressor | 79 hp, 260 cfm @ 100 psi | 1 | ||
Pipe trailer | 2 axle, 43 ft bed | 1 | ||
Emitter Plow | 4 gang plow | 1 | ||
Flatbed truck | 2 t | 1 | ||
Mechanic Service Truck | TBD | 1 | ||
McElroy 412 pipe fusion machine | 18 hp, HDPE Pipe fusion from 4 inch to 12 inch pipe | 1 |
| JBP/MLM | February 22, 2012 |
| SRK Consulting (U.S.), Inc. | ||||
| NI 43-101 Technical Report – Mt. Hamilton Gold Project, Centennial Deposit | Page 167 |
Figure 15-1: Crush – Conveying – Stacking Flowsheet
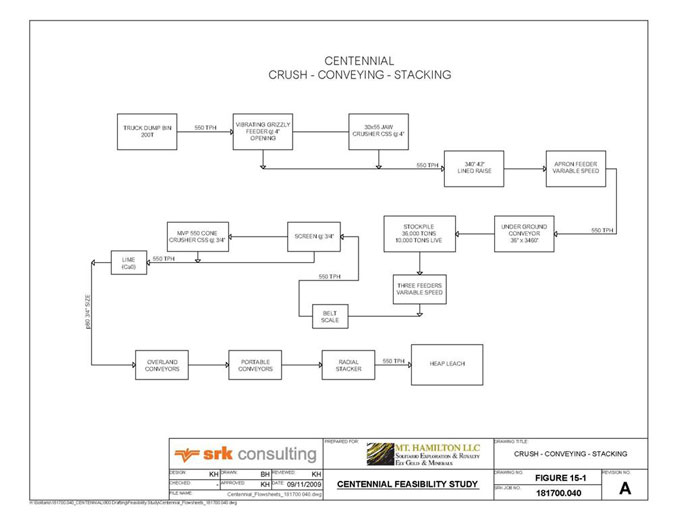
| JBP/MLM | February 22, 2012 |
| SRK Consulting (U.S.), Inc. | ||||
| NI 43-101 Technical Report – Mt. Hamilton Gold Project, Centennial Deposit | Page 168 |
Figure 15-2: Crusher Layout
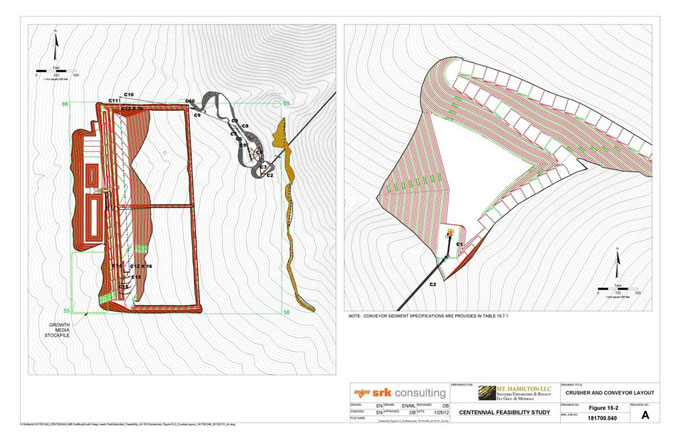
| JBP/MLM | February 22, 2012 |
| SRK Consulting (U.S.), Inc. | ||||
| NI 43-101 Technical Report – Mt. Hamilton Gold Project, Centennial Deposit | Page 169 |
Figure 15-3: Heap Leach Pad Site Layout
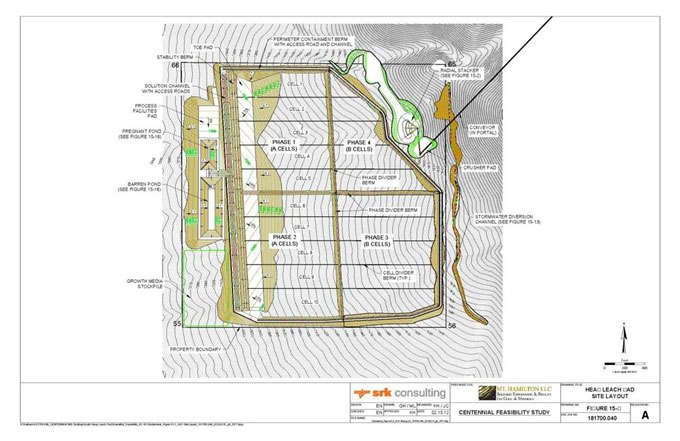
| JBP/MLM | February 22, 2012 |
| SRK Consulting (U.S.), Inc. | ||||
| NI 43-101 Technical Report – Mt. Hamilton Gold Project, Centennial Deposit | Page 170 |
Figure 15-4: Heap Leach Pad Final Regraded Surface
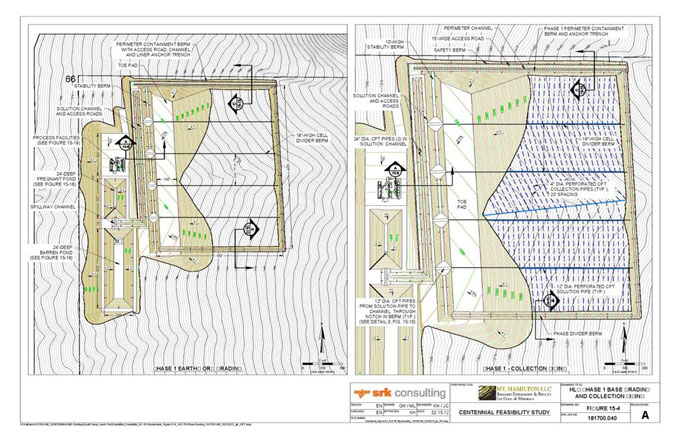
| JBP/MLM | February 22, 2012 |
| SRK Consulting (U.S.), Inc. | ||||
| NI 43-101 Technical Report – Mt. Hamilton Gold Project, Centennial Deposit | Page 171 |
Figure 15-5: Heap Leach Pad Phase 1 Earthwork Overview
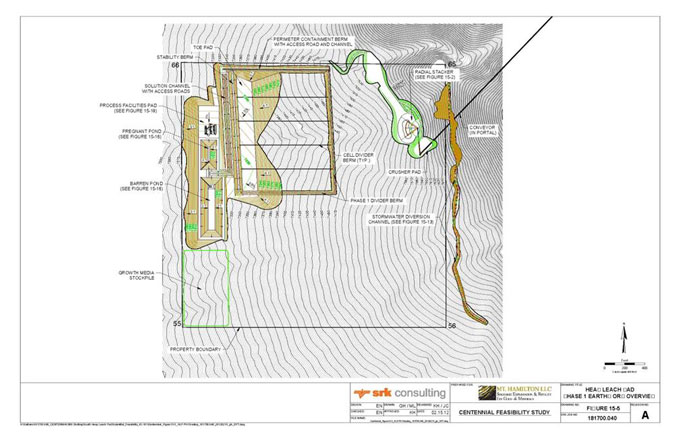
| JBP/MLM | February 22, 2012 |
| SRK Consulting (U.S.), Inc. | ||||
| NI 43-101 Technical Report – Mt. Hamilton Gold Project, Centennial Deposit | Page 172 |
Figure 15-6: HLP Phase 1 Base Grading and Collection Piping
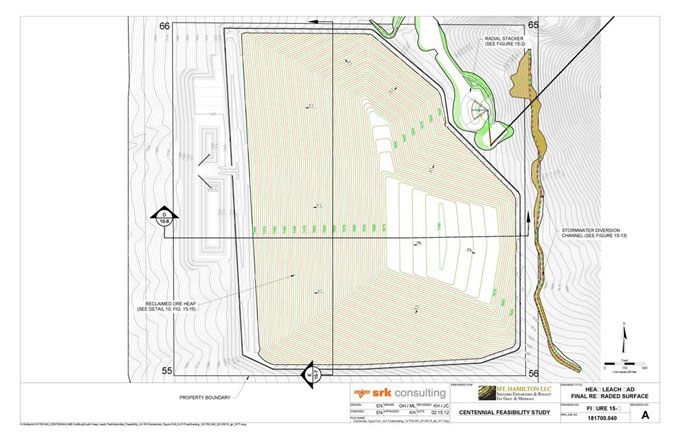
| JBP/MLM | February 22, 2012 |
| SRK Consulting (U.S.), Inc. | ||||
| NI 43-101 Technical Report – Mt. Hamilton Gold Project, Centennial Deposit | Page 173 |
Figure 15-7: HLP Phases 2-4 Base Grading & Collection Piping
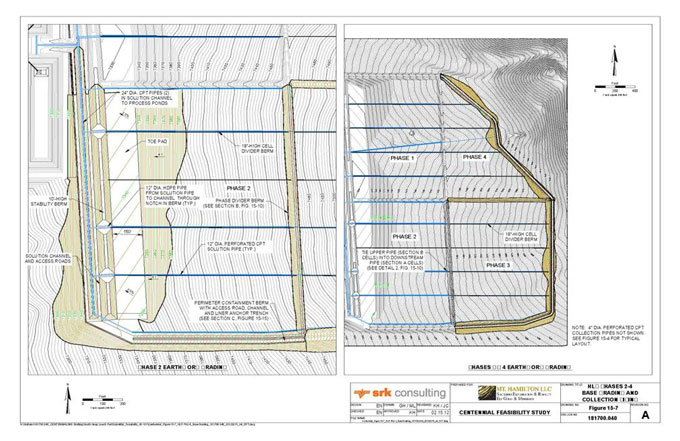
| JBP/MLM | February 22, 2012 |
| SRK Consulting (U.S.), Inc. | ||||
| NI 43-101 Technical Report – Mt. Hamilton Gold Project, Centennial Deposit | Page 174 |
Figure 15-8: Heap Leach Pad Cross-sections
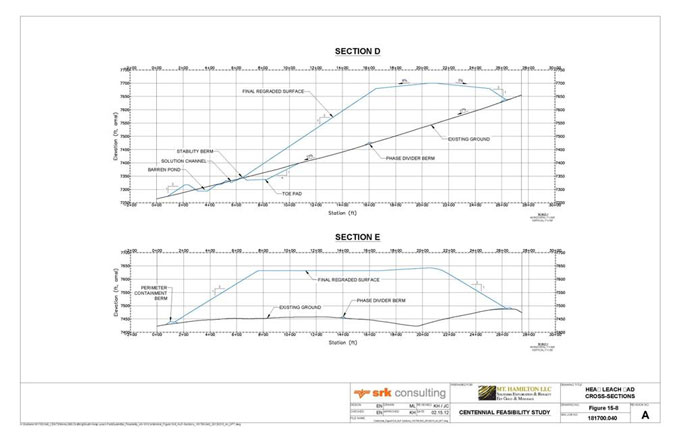
| JBP/MLM | February 22, 2012 |
| SRK Consulting (U.S.), Inc. | ||||
| NI 43-101 Technical Report – Mt. Hamilton Gold Project, Centennial Deposit | Page 175 |
Figure 15-9: Details, Sheet 2
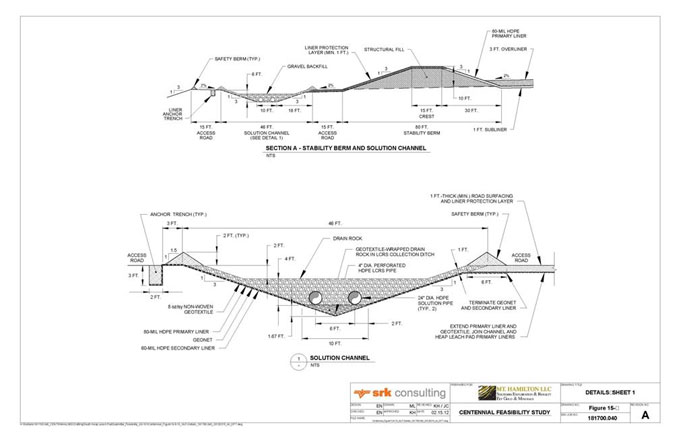
| JBP/MLM | February 22, 2012 |
| SRK Consulting (U.S.), Inc. | ||||
| NI 43-101 Technical Report – Mt. Hamilton Gold Project, Centennial Deposit | Page 176 |
Figure 15-10: Details, Sheet 4
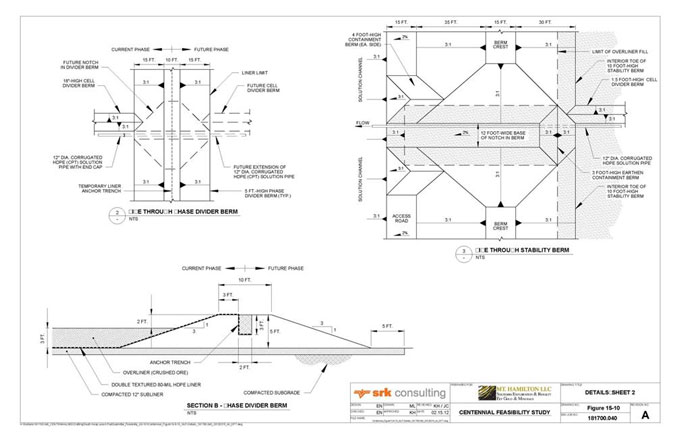
| JBP/MLM | February 22, 2012 |
| SRK Consulting (U.S.), Inc. | ||||
| NI 43-101 Technical Report – Mt. Hamilton Gold Project, Centennial Deposit | Page 177 |
Figure 15-11: Details, Sheet 5
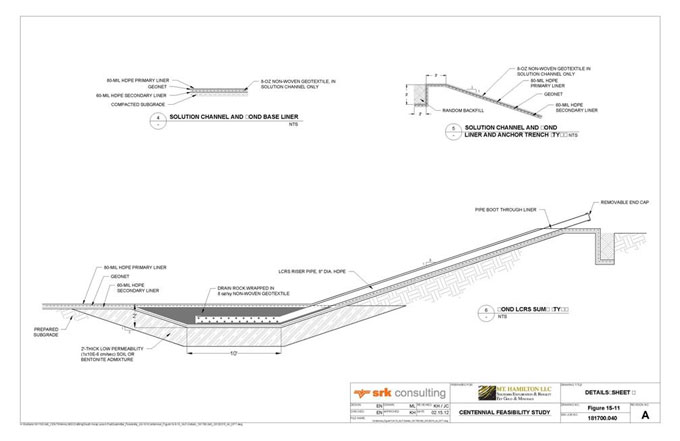
| JBP/MLM | February 22, 2012 |
| SRK Consulting (U.S.), Inc. | ||||
| NI 43-101 Technical Report – Mt. Hamilton Gold Project, Centennial Deposit | Page 178 |
Figure 15-12: Details, Sheet 3
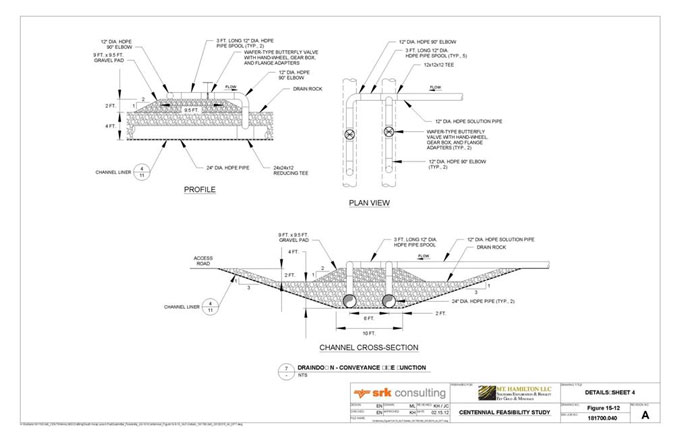
| JBP/MLM | February 22, 2012 |
| SRK Consulting (U.S.), Inc. | ||||
| NI 43-101 Technical Report – Mt. Hamilton Gold Project, Centennial Deposit | Page 179 |
Figure 15-13: Diversion Channel Grading Plan and Profile
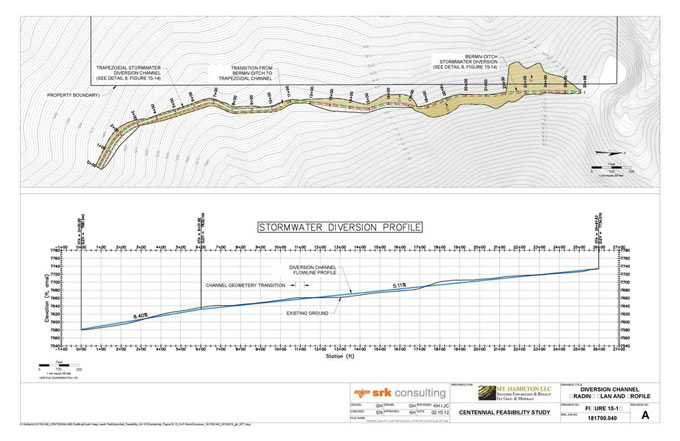
| JBP/MLM | February 22, 2012 |
| SRK Consulting (U.S.), Inc. | ||||
| NI 43-101 Technical Report – Mt. Hamilton Gold Project, Centennial Deposit | Page 180 |
Figure 15-14: Details, Sheet 6
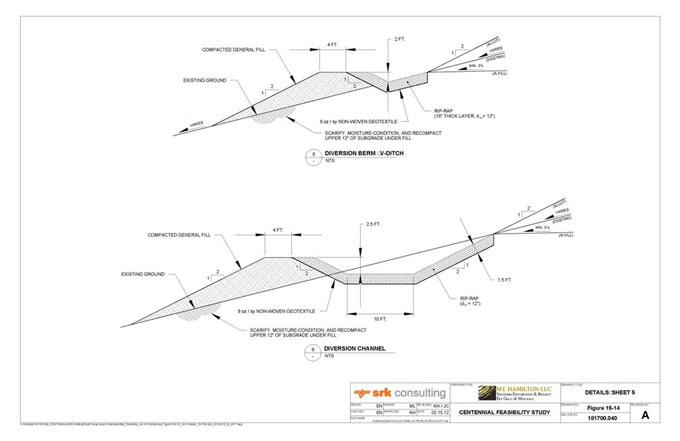
| JBP/MLM | February 22, 2012 |
| SRK Consulting (U.S.), Inc. | ||||
| NI 43-101 Technical Report – Mt. Hamilton Gold Project, Centennial Deposit | Page 181 |
Figure 15-15: Details, Sheet 1
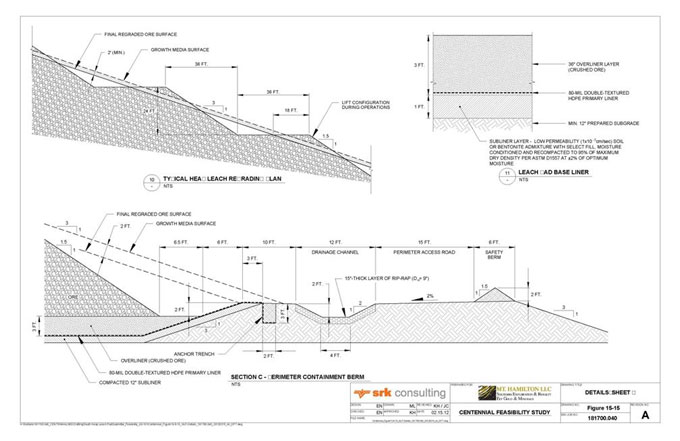
| JBP/MLM | February 22, 2012 |
| SRK Consulting (U.S.), Inc. | ||||
| NI 43-101 Technical Report – Mt. Hamilton Gold Project, Centennial Deposit | Page 182 |
Figure 15-16: Grading Plan and Profile
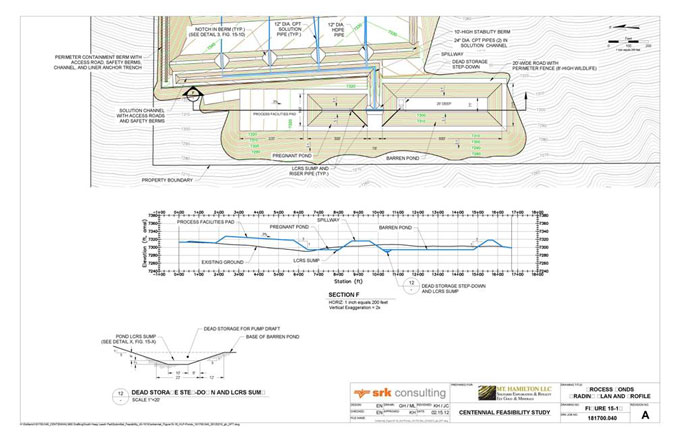
| JBP/MLM | February 22, 2012 |
| SRK Consulting (U.S.), Inc. | ||||
| NI 43-101 Technical Report – Mt. Hamilton Gold Project, Centennial Deposit | Page 183 |
Figure 15-17: Heap Leach Dore Recovery
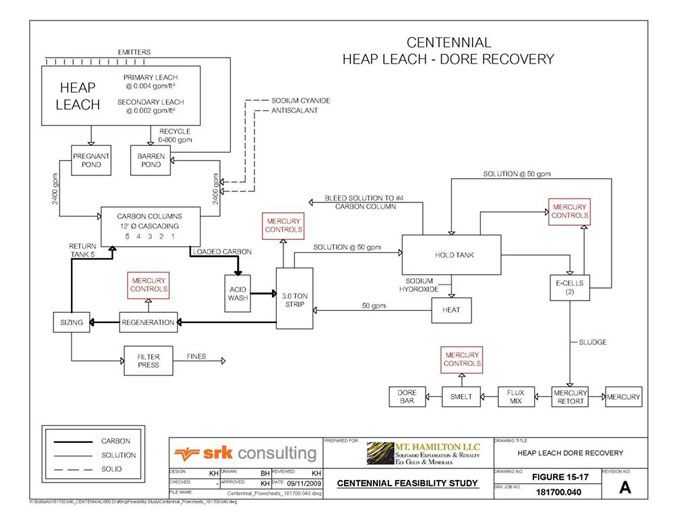
| JBP/MLM | February 22, 2012 |
| SRK Consulting (U.S.), Inc. | ||||
| NI 43-101 Technical Report – Mt. Hamilton Gold Project, Centennial Deposit | Page 184 |
Figure 15-18: Plant Infrastructure Diagrams
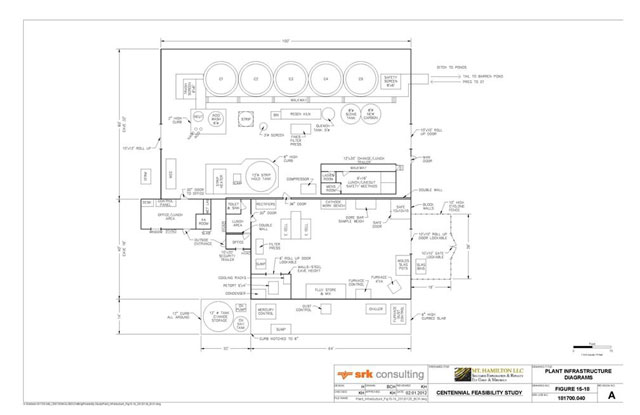
| JBP/MLM | February 22, 2012 |
| SRK Consulting (U.S.), Inc. | ||||
| NI 43-101 Technical Report – Mt. Hamilton Gold Project, Centennial Deposit | Page 185 |
| 16 | Project Infrastructure (Item 18) |
The Mt. Hamilton Property, which contains the Centennial gold and silver deposit, is located in White Pine County, Nevada at 115.558890o W Longitude and 39.250867o N Latitude. The project area is in Township 16 North, Range 57 East. Within that area, the planned mine site is in Sections 16 and 21, planned waste rock storage in Sections 16 and 17, and the proposed heap leach facility in Section 20. The project site is on the western flank of Mount Hamilton, which is on the north end of the White Pine Mountains. The property lies about 10 miles south of U.S. Highway 50 and about 60 miles from Ely, Nevada via U.S. Highway 50 and White Pine County Road 5. The project site can be accessed by car, on paved and gravel-surface roads, in about an hour.
| 16.1 | Office |
The office building will contain 10 offices, restroom facilities, survey/engineering bull pen, cubical space for 4 clerks, a conference room, file/copy room and a lunch room. A septic system will be required. The office could attach to the warehouse building or be a separate building. Building can be steel or modular. Office building requirement is 4,100 ft2.
| 16.2 | Warehouse & Plant Maintenance Shop |
The warehouse area is requirement is 4,000 ft2and will have two offices. The attached 1,500 ft2 shop area would include an office, 2 t pedestal crane, compressor and welding outlets. The building would share restroom facilities and lunch area.
| 16.3 | Process building |
The ADR building will be a 100 ft long x 60 ft wide x 32 ft eave height pre-engineered steel structure; a 60 ft x 40 ft x 16 ft eave height pre-engineered steel building will be attached to the 32 ft section. The 32 ft eave portion will contain the cascading carbon columns and screens, the regeneration kiln and carbon handling system, the acid wash and stripping vessel, the strip heating system and insulated holding tank. The 16 ft. eave height building will be the secure area [refinery] A16 ft, separated from the 32 ft eave height by a double wall. The secure area will contain the electrolytic cells, mercury retort, flux mixing and the induction melting furnace. The mercury retort will be contained in 16 ft x10 ft enclosed area An adjacent 14 ft x 64 ft curbed concrete slab will contain the dust collectors, mercury controls, exhaust fans and furnace chillers for the secure area.
| 16.4 | Laboratory |
The laboratory will be a separate building, 60 ft x 40 ft x 14 ft eave located near the administration building. Laboratory building will consist of a sample prep room, a fire assay area, Met/Wet lab area, two offices, restroom facilities and a lunch area. The power requirement is 480/240/120V.
| 16.5 | Administration/Plant Access Roads |
Primary access to the administration office will be via White Pine County Rd #5, then 0.57 miles southeast on an existing BLM gravel road to the reclaimed Rea Gold leach pad on BLM-administered land. Continuing on the same gravel road, and crossing to USFS-administered land, the proposed leach pad and process facility is 3.4 miles in a south-southeast direction to a parcel of
| JBP/MLM | February 22, 2012 |
| SRK Consulting (U.S.), Inc. | ||||
| NI 43-101 Technical Report – Mt. Hamilton Gold Project, Centennial Deposit | Page 186 |
MH-LLC private land. The Project office is located on a separate parcel of MH-LLC private land located 0.87 miles west of the proposed leach pad.
Alternative access to the Project exits White Pine County Rd #5 farther south, then 2.1 miles southeast on an existing gravel road on BLM-administered land to the Project office, which will be located on private land held by MH-LLC. This road has an approximate 3% grade. Access from the administration office to the plant site (and heap leach facility) will be 0.85 miles by improved gravel road controlled by USFS to the facility on private land held by MH-LLC. The grade of this section of road is approximately 3%.
| 16.6 | Septic |
Two septic systems will be installed. One will service the process building, administration building and laboratory. The second will service the warehouse and plant maintenance building. The mine and crusher areas will use portable toilets.
| 16.7 | Water |
There is a water well in Seligman Canyon capable of producing 550 gpm and a second, backup well that produces 200 gpm. These wells were utilized by Rea Gold for production during the mining at the Seligman operation and are believed to have more than adequate production capacity for the Centennial Project. MH-LLC has current water rights and water rights under application at the location of these wells.
For the purposes of the FS and costing, SRK has developed a water line layout and piping plan using the Seligman Canyon well as the source. This well is located approximately 2.5 miles north of the proposed leach pad and ADR facility. A pump at the Seligman well will supply 400 gpm of water conveyed in an 8 inch HDPE pipe to the plant site. From the plant site, water will flow in an 8 inch pipe 1,460 ft to a storage tank located on the east side of the leach pad facility for subsequent gravity distribution to the secondary crusher. A second 2.5 inch steel pipe will be used to deliver water 650 ft to the adit portal and then 3,300 ft to the ore pass receiving bin. A booster pump at this location will pump 60 gpm from the 7,600 ft bottom elevation up the ore pass to the primary crusher at 8,092 ft elevation. From the plant site, a separate three inch HDPE pipe will deliver 25 gpm to the administration/laboratory facility, located 3,060 ft west of the plant on an MH-LLC private parcel in the valley.
Additional water resources are being evaluated closer to the planned leach pad site. An initial phase hydrogeologic exploration drilling program was completed in October 2011, and results suggest that one or more wells in an alluvium-hosted aquifer could supply water needed for mining and heap leach operations. If a production well or wells can be developed at the leach pad site then this would reduce operating costs associated with project water supply. This FS assumes that water would be obtained from the more distant, Seligman Canyon site.
| 16.8 | Power |
Power for the plant area will be supplied by four 725 kW paralleling generators to supply electricity to the ADR, office and warehouse area, secondary crusher, water well and all the conveyors except conveyors C1 and C2. All generators will be housed in a three-sided 40 ft long x 20 ft wide x 16 ft high eave, pre-engineered steel structure. The switchgear and controls will be housed in an attached
| JBP/MLM | February 22, 2012 |
| SRK Consulting (U.S.), Inc. | ||||
| NI 43-101 Technical Report – Mt. Hamilton Gold Project, Centennial Deposit | Page 187 |
20 ft x 10 ft x 12 ft high eave, fully enclosed space. The flow sheet for plant area power distribution is presented in Figure 16-1.
The plant area generators will be located near the ADR and supply 460 volts to this plant. Power to the other locations will be stepped up to 4160 volts for distribution. The voltage will be stepped down at the load locations to 460 volts or 110/220 volts as needed.
The mine area generators will include two 340 kW trailer mounted generator to supply electricity to the jaw (primary) crusher and conveyors C1 and C2. A 100 kW trailer mounted generator will provide power for heating and lighting at the mine shop. A 30KW generator will be supplied for stand by. The generators will be located near the jaw crusher and supply 460 volt power to the crusher. The 4160 volt feed to the underground conveyor will be completed by the underground contractor. The flow sheet for mine area power distribution is presented in Figure 16-2.
The plant generators will have 20,000 gallons of bulk fuel storage. This fuel storage facility will also be used to supply fuel to the area equipment. The generators at the jaw crusher will have day tanks serviced by the mine fuel truck. A 10,000 gallon tank will be installed for the generators at the jaw crusher.
| 16.9 | Fuel |
Both diesel and gasoline will be stored near the ADR plant. Fuel will be purchased in bulk and stored in 10,000 gallon diesel and 5,000 gallon gasoline tanks inside appropriate containment. Fuel will be dispensed directly to most vehicles. One service truck will be fitted with a fuel tank to supply fuel to the leach pad dozer. Diesel will also be stored at the mine in a tank located near the truck shop.
| 16.10 | Communications |
Communications will be either through a satellite or microwave-based system. This system will support internet and telephone communications. Radio communications for mining operations will use line-of-site repeater technology.
| JBP/MLM | February 22, 2012 |
| SRK Consulting (U.S.), Inc. | ||||
| NI 43-101 Technical Report – Mt. Hamilton Gold Project, Centennial Deposit | Page 188 |
| Figure | 16-1: Plant Area Power Distribution |
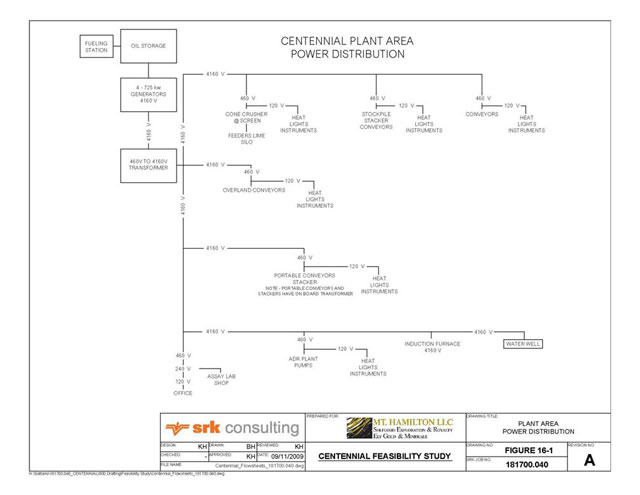
| JBP/MLM | February 22, 2012 |
| SRK Consulting (U.S.), Inc. | ||||
| NI 43-101 Technical Report – Mt. Hamilton Gold Project, Centennial Deposit | Page 189 |
Figure 16-2: Mine Area Power Distribution
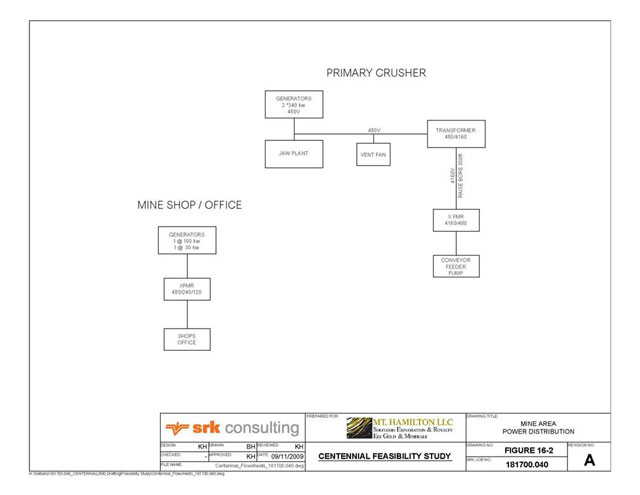
| JBP/MLM | February 22, 2012 |
| SRK Consulting (U.S.), Inc. | ||||
| NI 43-101 Technical Report – Mt. Hamilton Gold Project, Centennial Deposit | Page 190 |
| 17 | Market Studies and Contracts (Item 19) |
The process facility proposed for this operation will produce gold doré bars between 80-99% purity. Gold bars will be weighed and assayed at the mine to establish value. The bars will be shipped regularly to a commercial refiner where their value will be verified. Sale prices are obtained based on world spot or London Metals Exchange market pricing and are easily transacted.
| 17.1 | Relevant Market Studies |
A market study for the gold product was not undertaken for this FS. Gold is sold through commercial banks and market dealers. The gold market is experiencing historic highs in terms of commodity price and investment interest.
| 17.2 | Commodity Price Projections |
This study assumes a declining price curve for the gold market price. In the economic evaluations, the gold price was set at US$1,600/oz for the first year of production, US$1,420/oz for the second year of production and $US1,280/oz, for subsequent years. These prices are based on the 12 month, 24 month and 36 month trailing average of gold prices, respectively. These price assumptions are shown in Table 17.2.1.
Table 17.2.1: Commodity Price Projections—Gold
Model Parameter | Technical Input | |||
Gold Price Year 1 -12 month trailing average (US$/oz) | $ | 1,600 | ||
Gold Price Year 2 -24 month trailing average (US$/oz) | $ | 1,420 | ||
Gold Price Subsequent Years – 36 month trailing average (US$/oz) | $ | 1,280 | ||
| 17.3 | Contracts and Status |
Terms for an off-take and smelting agreement are based on recent communications with Johnson Matthey, an international smelting and refining company with a facility at 4601 West 2100 South, Salt Lake City, Utah 84120.
Contract terms and doré treatment charges listed below are current as of Q4, 2011. These terms are suitable for use in this study:
| • | Treatment Charge: US$0.35/oz net weight received; |
| • | Refining Charge: US$1.00/oz fine gold credited; |
| • | Gold Return: 99.85% of assayed content; |
| • | Silver Return: 99.00% of assayed content; and |
| • | Settlement: 25 working days from receipt. |
| JBP/MLM | February 22, 2012 |
| SRK Consulting (U.S.), Inc. | ||||
| NI 43-101 Technical Report – Mt. Hamilton Gold Project, Centennial Deposit | Page 191 |
| 18 | Environmental Studies, Permitting and Social or Community Impact (Item 20) |
| 18.1 | Environmental Study Results |
| 18.1.1 | Waste Rock and Ore Characterization |
Introduction
On behalf of MH-LLC, SRK designed and executed a geochemical characterization program for geologic materials that will be excavated during mining at Centennial. Results are applicable to many aspects of mine planning and design, and are also used for risk assessment studies and environmental permitting. For most mining operations, waste rock has more exposure to surface weathering processes than processed ore-grade material, and comprises the majority of material excavated. However, characterization of both waste and ore materials is needed for reclamation and mine closure planning.
Evaluation of materials in the planned mine area is needed to predict Acid Rock Drainage and Metal Leaching (ARDML) potential of heap leach and waste rock materials over time. Metallic ore deposits contain sulfide minerals that are unstable under atmospheric conditions, such as pyrite (iron sulfide, FeS2). When sulfides oxidize in the presence of oxygen and water, sulfuric acid forms. Many base metals are more soluble in low-pH solutions, so weathering of sulfides can contribute directly and indirectly to metal mobility in discharge from mining facilities.
To characterize the materials that will be mined and exposed, SRK designed a multi-phase program to collect samples representative of waste rock and ore material types that will be encountered during mining. These samples were tested with several industry-standard methods to quantify composition, acidification and neutralization potential, and metal release upon exposure to water. A sub-group of samples underwent long-term kinetic testing to quantify chemical changes over time.
Sampling and Testing
The major rock types in the Project area are metamorphosed Paleozoic calcareous shale and hydrothermally-altered Jurassic felsic intrusive. Hornfels and skarn alteration signatures in the shale have distinct compositions, so both of these material types were targeted in the characterization program. Abundance of pyrite is the major factor in potential acid production, so the degree of sulfide mineralization and later oxidation were considered when selecting samples. Gold grades were also considered in the sample selection. A sample matrix is provided in Table 18.1.1.1 and identifies three main material types based on rock type or alteration. Each material type has an ore and waste designation in the current mine plan.
Samples included in this characterization program were collected from recently-drilled HQ-diameter core. Three separate phases of waste rock sampling were completed as drill core became available for sampling that target spatially- and compositionally-representative sample intervals. A total of 97 drill core samples underwent static testing and kinetic testing is ongoing for six samples that represent the main material types for the project.
| JBP/MLM | February 22, 2012 |
| SRK Consulting (U.S.), Inc. | ||||
| NI 43-101 Technical Report – Mt. Hamilton Gold Project, Centennial Deposit | Page 192 |
Table 18.1.1.1: Material Types in the Centennial Deposit
Material Type | Approximate % to be Mined | ICP/ ABA/ NAG | MWMP | HCT | ||||||||||||||
| Ore | Waste | |||||||||||||||||
Hornfels | 11 | % | 31 | % | 23 | 4 | 2 | |||||||||||
Skarn | 79 | % | 55 | % | 59 | 11 | 2 | |||||||||||
Igneous | 10 | % | 14 | % | 15 | 4 | 2 | |||||||||||
Totals | 100 | % | 100 | % | 97 | 19 | 6 | |||||||||||
Source: SRK, Centennial_Static_Test_Database_BJM_Rev08.xlsx
The static test methods used for the geochemical characterization program include multi-element analysis using four-acid digest and ICP-MS analysis, modified Sobek Acid Base Accounting (ABA), Net Acid Generation (NAG) test and the Nevada Meteoric Water Mobility Procedure (MWMP—ASTM E-2242-02). These static tests were selected to address total acid generation or neutralization potential of the samples, potential reactive acidity and leachable concentration of constituents in leachates derived from meteoric weathering of the material. However, these static tests do not address the temporal variations that may occur in leachate chemistry as a result of long-term changes in oxidation, dissolution and desorption reaction rates. To address these factors, kinetic testing has also been initiated as part of this program and includes six humidity cell tests (HCTs) conducted according to the ASTM D-5744-96 methodology. At the time of writing, the HCT program was ongoing and data was available through Week 46, 29 and 27 depending upon when the cells were initiated.
Results
ABA results include Acid Generation Potential (AGP) and Acid Neutralization Potential (ANP), based on abundance of sulfide and carbonate minerals. The difference and ratio of these values are both used to assess acidification potential, and are applied by regulatory agencies to determine requirements for additional testing. Net Neutralization Potential (NNP) and Neutralization Potential Ratio (NPR) results are graphed in Figure 18-1 for the Centennial samples. According to the Nevada BLM Water Resource Data and Analysis Guide for Mining Activities (BLM, 2008), samples with a 300 percent excess of neutralizing capacity (i.e. NP:AP > 3) and with NNP values greater than 20 eq. kg CaCO3/ton can be considered non-acid generating. Based on these criteria, most of the Centennial samples are non-acid forming and show significant acid neutralization capacity. However, a few samples of ore-grade skarn, hornfels and igneous intrusive demonstrate an uncertain potential to generate acid and require kinetic testing according to the BLM criteria.
Net Acid Generation (NAG) testing was carried out on a total of 97 waste rock and ore samples in order to assess the potential for acid generation given complete oxidation of sulfide minerals in the Centennial materials. A NAG pH greater than 4.5 s.u. and a NAG value equal to zero are indicative of a non-acid generating material. Only four out of 97 (4.1%) samples are predicted to be acid generating with NAG pH values less than 4.5 and NAG values greater than zero. These samples also have ANP values less than method detection limit, negative NNP values, and low NPR values. The NAG test results indicate that essentially no acid generation is predicted for the waste rock to be mined from the Centennial deposit and the only material type predicted to have some potential for acid generation is the ore-grade skarn with the higher sulfide content. When compared with ABA results, NAG tests show that samples with AGP and ANP values nearly equal to each other (i.e.,
| JBP/MLM | February 22, 2012 |
| SRK Consulting (U.S.), Inc. | ||||
| NI 43-101 Technical Report – Mt. Hamilton Gold Project, Centennial Deposit | Page 193 |
uncertain acid generating potential) do not necessarily generate acid in the NAG test when all contributing mineral species are considered.
Nineteen samples were selected for MWMP testing including eleven skarn samples, four hornfels samples and four igneous intrusive samples to provide an indication of elemental mobility and metal(loid) release from the Centennial material types. Samples selected for MWMP are outlined (boxes) in Figure 18-1. MWMP results are consistent with the ABA and NAG results that indicate the waste rock and ore material types associated with the Centennial deposit generally demonstrate a low potential to generate acid or leach metals. Nonetheless, several parameters are likely to be mobile under the neutral to alkaline pH conditions, and the MWMP tests show elevated release of arsenic, antimony, manganese and mercury from one or more material type when compared to reference standards provided by the Nevada Division of Environmental Protection (NDEP). Although there is no NDEP reference value for molybdenum, mobilization of this constituent is comparable to antimony and arsenic. Base metals cadmium, cobalt, copper, lead, nickel and zinc are collectively referred to as the Ficklin Metals. These metals are typically mobilized by ARD, but most of them are not in high abundance in the Centennial deposit. Therefore, these metals have low mobility, from a combination of circum-neutral effluent pH and low availability in the Centennial samples.
Humidity cell testing was conducted on 6 samples in order to address the uncertainties of the ABA test and determine the rates and character of longer-term leaching of the Centennial ore and waste material. Figure 18-2 shows five of the six cells have a low potential for acid generation with slightly alkaline pH (7.4—8.0 s.u.) after 46, 29, or 27 weeks. Only one of the two samples of igneous intrusive waste rock shows a steady decline in pH and greater major element and metal mobility than the other HCTs. Extracts from this cell were initially neutral but have declined during the test and have been less than pH 5.5 s.u. for the last six weeks of available data. Trends in metal release and sulfate load for this cell are indicative of active sulfide oxidation.
The preliminary HCT results confirm the predictions for acid generation and metal leaching from the static tests and indicate acid generation is not predicted for the majority of the Centennial waste rock and ore material types. The exception to this is the igneous intrusive waste rock material that exhibits a higher risk for acid generation and metal leaching based on one out of two HCTs. A small sub-set of ore-grade skarn samples and one sample of ore-grade igneous intrusive material are also predicted to be acid generating, although kinetic testing was not conducted for any of these samples to confirm this prediction.
As part of this study, two samples of spent ore material were submitted for ABA, NAG and MWMP testing. The spent ore samples included in this study contain significant neutralizing capacity and are predicted to be non-acid generating from both the ABA and NAG results. From the MWMP results, the potential for metal leaching from the spent ore material is predicted to be low with the exception of aluminum, arsenic, antimony, iron and mercury that are leached at elevated concentrations under alkaline conditions (pH 9.7—10.3 s.u.). Consequently, these constituents are predicted to be elevated in the heap drain down solution.
Conclusions
Based on the results of the geochemical characterization program, the majority of waste rock and ore materials in the current mine plan present a low risk for ARDML as confirmed by the HCT program. The only material types to show a higher risk for acid generation and metal leaching are the ore-grade skarn and the igneous intrusive material (ore and waste). The ore grade material will
| JBP/MLM | February 22, 2012 |
| SRK Consulting (U.S.), Inc. | ||||
| NI 43-101 Technical Report – Mt. Hamilton Gold Project, Centennial Deposit | Page 194 |
report to a heap leach facility and will be managed as process material during operations and closure. The igneous intrusive material comprises a small percentage of the total waste rock that will be placed on the waste rock dumps (i.e., approximately 15 percent). Management of waste rock can therefore be achieved by blending materials with a higher risk of metal leaching (i.e., igneous intrusive) with the remaining 85 percent of the waste rock that has high neutralization capacity. Therefore, segregated waste rock management will likely not be required for the Project.
| 18.1.2 | Hydrogeologic Characterization |
Introduction
On behalf of MH-LLC, SRK completed an assessment of the hydrogeology beneath the proposed ore process facility at the Centennial site. The objective was to define the depth to static groundwater and to provide well access to monitor groundwater quality beneath the heap leach pad.
Two 10 inch groundwater monitoring wells were installed; one up-gradient groundwater monitoring well (MW-01) and one down-gradient well (MW-02) relative to the proposed ore process facility as well as the advancement of one 16.75 inch diameter water supply test well (PW-01). The locations of the wells are provided in Table 18.1.2.1 and illustrated in Figure 18-3.
Table 18.1.2.1: Groundwater Monitoring Well Locations
Hole ID | Approximated Locations (UTM-NAD27) | Collar Elevations (ft amsl) | Total Depth (ft bgs) | |||||
Easting (Meters) | Northing (Meters) | |||||||
MW-01 | 623079 | 4343939 | 7,570 | 862 | ||||
MW-02 | 622543 | 4343796 | 7,291 | 750 | ||||
The wells were installed by Stewart Brothers Drilling Company, a Nevada licensed well driller, under the direction of SRK. Field work occurred from September 15, 2011 to October 27. Well completion details are provided in Table 18.1.2.2. Well MW-02 was developed by Stewart Brothers with SRK supervision and is suitable for sampling. Well MW-01 has not yet been developed.
Table 18.1.2.2: Well Completion Details
Well ID | Well Completion Date | Well Completion Type | Well Casing Material | Total Drilled Depth (ft bgs) | Screen Bottom (ft bgs) | Screen Top (ft bgs) | Bottom Filter Pack (ft bgs) | Top Filter Pack (ft bgs) | Bentonite (ft bgs) | Cement Grout (ft bgs) | Depth to Water (ft bgs) | Geologic Unit Screened | ||||||||||||
MW-01 | 10/8/11 | 4 inch | PVC | 862 | 862 | 662 | 862 | 660 | 660 - 647 | 647 - 0 | 782.5 | Kqp/Csc | ||||||||||||
MW-02 | 9/22/11 | 4 inch | PVC | 750 | 750 | 590 | 750 | 586 | 586 - 577 | 577 - 0 | 365 | Qal |
Hydrogeologic Program Results
Groundwater monitoring well MW-01 (up gradient) was advanced deep into bedrock before encountering groundwater. MW-01 was advanced through a 200 ft alluvial sequence overlaying quartz monzonite porphyry to 600 ft bgs and tight shale with interbedded chert to a depth of 862 ft bgs. Static groundwater was initially recorded in MW-01 at 782.5 ft bgs, well within the shale unit.
Groundwater monitoring well MW-02 (down gradient) was advanced through an alluvial sequence (Qal) to a depth of 750 ft bgs. Bedrock was not encountered in this hole. The static groundwater level measured in MW-02 was 365 ft bgs. Drilling results are summarized in Table 18.1.2.3.
| JBP/MLM | February 22, 2012 |
| SRK Consulting (U.S.), Inc. | ||||
| NI 43-101 Technical Report – Mt. Hamilton Gold Project, Centennial Deposit | Page 195 |
Table 18.1.2.3: Hydrogeologic Contacts
Hole ID | Total Depth (ft bgs) | Static Water Elevation (ft amsl) | Bedrock to Alluvium Contact (ft amsl) | Status | ||||
MW-01 | 862 | 6787.5 | 7,370 | Completed 4 inch Groundwater Monitoring Well | ||||
MW-02 | 750 | 6,926 | < 6,541 | Completed 4 inch Groundwater Monitoring Well | ||||
PW-01 | 568 | — | 7,428 | Drilled to 568 ft; Not yet abandoned |
These data suggest the presence of both alluvial and bedrock groundwater systems at the Centennial site. The potentiometric surface of alluvial groundwater is higher in elevation than that of bedrock groundwater (6,926 ft vs. 6,787 ft amsl respectively). Directly beneath the proposed process facilities, the depth to groundwater has been projected to occur at about 500 ft bgs.
The PW-01 borehole was advanced to 568 ft bgs. This hole was drilled as a test well for potential production water supply. The PW-01 hole was advanced through an alluvial sequence overlaying dark gray, fairly homogeneous shale with chert. In PW-01, the depth to first noticeable groundwater occurred in bedrock at a depth of about 350 ft bgs; however, the water measurement was not sustained and appears to have been a perched groundwater system. The boring was terminated at 568 ft bgs due to a slow rate of penetration and the lack of significant water production. The hole is being monitored for static level of ground water. If feasible, an application may be made to convert this boring to an upgradient monitor well. Otherwise, it will be abandoned per Nevada well drilling regulations.
| 18.1.3 | Cultural Resources Investigation |
The USFS requires Class III surveys to inventory prehistoric and historic sites on National Forest System Lands in accordance with the provisions of the National Historic Preservation Act (NHPA) of 1966. Class III cultural surveys were conducted in phases over the entire Centennial project area. The first cultural report was finalized May 2009 (FS Report R2008041701876), and the second was submitted December 2011 (FS Report R2009041701948). In addition, MH-LLC has conducted a cultural resource inventory on private land where some of the mine facilities will be located.
| 18.1.4 | Biological Resources Investigation |
Biological surveys were conducted in phases by Enviroscientists, Inc. of Reno, Nevada over the entire Centennial project area in 2006, 2008, and 2009. After the field work was completed, reports were prepared and submitted to the USFS on August 23, 2006, September 26, 2008, and September 11, 2009. Biological studies are not required for work completed on private land.
| 18.2 | Operating and Post Closure Requirements and Plans |
As part of both the State Water Pollution Control Permit and the BLM Plan of Operations, MH-LLC will be required to submit a detailed plan for monitoring designed to demonstrate compliance with the approved PoO and other federal or state environmental laws and regulations, to provide early detection of potential problems, and to supply information that will assist in directing corrective actions, should they become necessary. The plan will include discussion on water quality in the area; monitoring locations, analytical profiles, and sampling/reporting frequency. Examples of
| JBP/MLM | February 22, 2012 |
| SRK Consulting (U.S.), Inc. | ||||
| NI 43-101 Technical Report – Mt. Hamilton Gold Project, Centennial Deposit | Page 196 |
monitoring programs which may be necessary include surface- and ground-water quality and quantity, air quality, revegetation, stability, noise levels, and wildlife mortality, etc.
The BMRR will require a process fluid management plan as part of the Water Pollution Control Permit. This plan will describe the management of process fluids, including the methods to be used for the monitoring and controlling of all process fluids. The plan will also provide a description of the means to evaluate the conditions in the fluid management system, so as to be able to quantify the available storage capacity for meteoric waters and to define when and to what extent the designed containment capacity may been exceeded. The management of non-process (non-contact) stormwater around and between process facilities is a necessary part of the Nevada General Permit for Stormwater Discharges Associated with Industrial Activity from metals Mining Activities (NVR300000), and is typically detailed in the site-wide Stormwater Pollution Prevention Plan (SWPPP). Neither of these documents has thus far been produced for the Centennial project.
| 18.3 | Post Performance or Reclamations Bonds |
A detailed discussion of the project permitting requirements is provided under Item 1(g) (Section 2.4) of this report. The project is located on National Forest System Lands administered by the USFS and on private land owned by MH-LLC. Bonding of the project is required by the USFS and by the State of Nevada. Three applications, the PoO, the Nevada Reclamation Permit for surface disturbance on National Forest System lands, and the Nevada Reclamation Permit for surface disturbance on private land must be submitted. The BMRR will determine if the reclamation cost estimate for private land is sufficient and will hold the bond for that permit. The reclamation cost estimate for the mining operations on National Forest System lands must be agreed to by both agencies (BMRR and USFS) prior to approval of the project by the USFS and the BMRR. The agencies will also determine who will hold the bond. No operational permits have been acquired, except for permitting for limited exploration under USFS Categorical Exclusions. Bonding requirements for the mine operations are provided under Item 20(e) (Section 18.5).
| 18.4 | Social and Community |
The Centennial Project workforce (including short-term construction contractors) will reside mainly in the towns of Ely or Eureka and the surrounding communities in White Pine, Eureka, or Elko County. As such, the project proponent will need to coordinate closely with local government and businesses to ensure that the needs of both the community and the workforce are being met, since many of the workers could necessarily originate from outside of White Pine County, which is sparsely populated, rural, with one population center in Ely. According to the Nevada State Demographer, the population of White Pine County was 10,030 in 2010, up 9.2% from 9,181 in 2000. This population growth has been slow, but steady, mainly because of increased mining activity in the area.
An important part of the income of predominantly rural counties in Nevada, like White Pine, is produced by sales tax and the net proceeds tax on mining activity within the county. Sales tax revenues are collected by the county in which delivery of the goods are taken. For the Centennial Project, this would be White Pine County. The median household income in the county rose from US$46,600 in 2000 to US$48,545 in 2010, indicating an increase in personal income for the residents of the county.
| JBP/MLM | February 22, 2012 |
| SRK Consulting (U.S.), Inc. | ||||
| NI 43-101 Technical Report – Mt. Hamilton Gold Project, Centennial Deposit | Page 197 |
Other proposed or existing mining projects in neighboring Eureka County, including the Eureka Moly LLC’s Mt. Hope Project and Barrick’s Ruby Hill Mine, have clearly demonstrated the need for open and transparent communications and negotiations with the local government, businesses, and residences, as well as the need for a clearly defined Social Management Plan (SMP). Without the support of this close-knit community the social license to operate may not be granted.
| 18.5 | Mine Closure |
After operations cease, solution in heap leach pad will be recirculated until the rate of flow from these facility can be passively managed through evaporation from the ponds or a combination of evaporation and infiltration. Given the physical characteristics of the ore material, heap draindown is expected to conclude within a relatively short period of time compared to average. Waste rock dumps will be regraded and revegetated. All buildings and facilities not identified for a post-mining use will be removed from the site during the salvage and site demolition phase. It is assumed that exploration disturbance will be mined out. Reclamation and closure activities will be conducted concurrently, to the extent practical, to reduce the overall reclamation and closure costs, minimize environmental liabilities, and limit bond exposure.
The revegetation release criteria for reclaimed areas are presented in the “Guidelines for Successful Revegetation for the Nevada Division of Environmental Protection, the Bureau of Land Management, and the U.S.D.A. Forest Service.” The revegetation goal is to achieve the permitted plant cover as soon as possible.
Conceptual reclamation and closure methods were used to evaluate the various components of the project to estimate reclamation costs. Version 1.4.14 of the Nevada Standardized Reclamation Cost Estimator (SRCE) was used to prepare this cost estimate. The SRCE uses first principles methods to estimate quantities, productivities and work hours required for various closure tasks based on inputs from the user. The physical layout, geometry and dimensions of the proposed project components were based on the current understanding of the site plan and facilities layout. These included current designs for the main project components including the open pit, infrastructure, waste rock facilities, heap leach pad, and process ponds. Equipment and labor costs were conservatively estimated using State and BLM-approved costs.
Because some of the closure activities are based on preliminary designs and conceptual approaches, the overall closure cost estimate accuracy is +20% to -10% based on the limitations of the design information available, the accuracy of available site plans and the uncertainty regarding a number of the proposed approaches. The closure cost associated with the Centennial Project is currently estimated to be US$11.8 million (including contractor profit). This total is an undiscounted internal cost to reclaim and close the facilities associated with the mining and processing project. Approximately 58% of the bond cost estimate is for the regrading and stabilization of the waste rock dumps, which are placed as valley fills with angle-of-repose slopes, and will need to achieve final reclaimed slopes on the order of 2.5H:1V.
| JBP/MLM | February 22, 2012 |
| SRK Consulting (U.S.), Inc. | ||||
| NI 43-101 Technical Report – Mt. Hamilton Gold Project, Centennial Deposit | Page 198 |
Figure 18-1: Net Neutralization Potential vs. Neutralization Potential Ratio
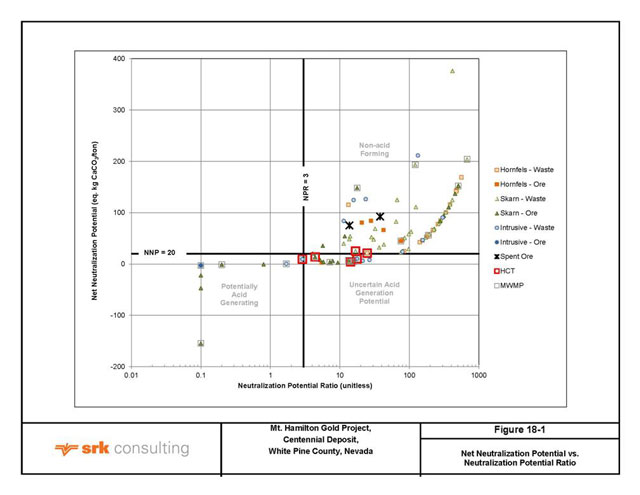
| JBP/MLM | February 22, 2012 |
| SRK Consulting (U.S.), Inc. | ||||
| NI 43-101 Technical Report – Mt. Hamilton Gold Project, Centennial Deposit | Page 199 |
Figure 18-2: Humidity Cell Weekly Extract pH
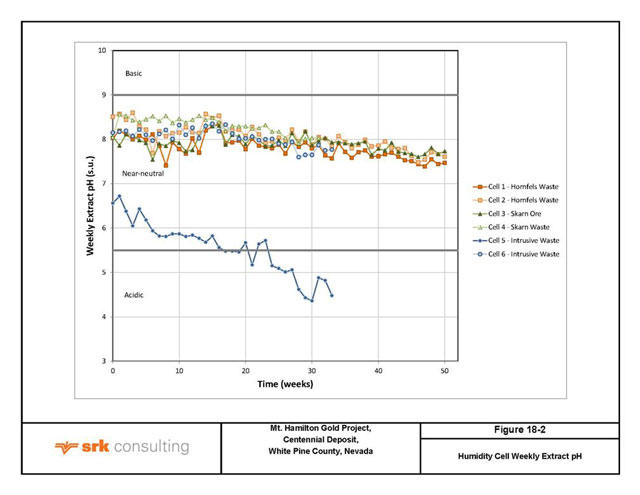
| JBP/MLM | February 22, 2012 |
| SRK Consulting (U.S.), Inc. | ||||
| NI 43-101 Technical Report – Mt. Hamilton Gold Project, Centennial Deposit | Page 200 |
Figure 18-3: Monitoring Well Location Map
| JBP/MLM | February 22, 2012 |
| SRK Consulting (U.S.), Inc. | ||||
| NI 43-101 Technical Report – Mt. Hamilton Gold Project, Centennial Deposit | Page 201 |
| 19 | Capital and Operating Costs (Item 21) |
| 19.1 | Capital Cost Estimates |
A summary of total estimated capital expenditures for the Project is presented in Table 19.1.1.
Table 19.1.1: Capital Cost Summary
Initial Capital Cost Item | Cost US$ (000s) | |||
Mining | $ | 6,007 | ||
Processing | $ | 21,773 | ||
Leach Pad | $ | 5,532 | ||
Infrastructure | $ | 8,212 | ||
Owner | $ | 23,818 | ||
Contingency | $ | 6,543 | ||
|
| |||
Initial Capital Total | $ | 71,885 | ||
|
| |||
Ongoing | $ | 20,497 | ||
Closure Costs | $ | 10,760 | ||
Contingency | $ | 4,065 | ||
|
| |||
LoM Total Capital | $ | 107,207 | ||
|
| |||
The support for this cost estimate is provided in the sections below.
19.1.1 Basis for Capital Cost Estimates
Capital costs used in the Feasibility-level economic analysis for Centennial were based heavily on vendor and specialist quotations. A total of 98% of mining, 97% of process, and 80% of owner and infrastructure capital costs are linked to vendor quotes. SRK has applied addition contingencies to these estimates for omissions. Similarly, operating costs, as driven by consumables or labor rates were supported by recent relevant vendor information or public domain mining services cost providers, typically InfoMine®.
The size of the mining equipment was based on matching the projected mine life to an equipment life cycle of 30,000 to 40,000 hours, which equates to about 7 to 8 years of continuous mining operation. A determination was made that a single equipment spread, consisting of one loading unit and a fleet of 100 ton trucks would be used. A hydraulic shovel was selected as the primary loading unit due to its ability to selectively separate ore and waste on a bench. A large wheel loader was selected as the back-up loading unit. The wheel loader would also be used to feed the crusher when ore from the pit was not available to directly dump ore into the crusher hopper.
Once the mine layout, including pit design, haulage roads, dump and crusher locations were determined, the haulage cycles were determined and the number of trucks required to make the scheduled production was calculated. Initially four trucks are required, with a fifth truck added to the fleet in the second year of production.
Support equipment required for a 100 ton truck fleet was based on experience of similar sized mines with similar loading and hauling fleets. One Caterpillar D9 and one D10 size dozers were selected to maintain the dumps and for cleanup in the pit. A Caterpillar 16 size motor grader will be used to maintain the roads and remove snow. An 8,000 gallon water truck was sized to maintain dust control on the haul roads.
| JBP/MLM | February 22, 2012 |
| SRK Consulting (U.S.), Inc. | ||||
| NI 43-101 Technical Report – Mt. Hamilton Gold Project, Centennial Deposit | Page 202 |
The low grade ore dictated a low cost processing system. Metallurgical testing indicated that high recovery was possible by crushing the ore and using a heap leach process. A number of locations for the leach pad and methods to get the ore to these locations were explored. It was determined that best location to operate the leach pad was on a parcel of private land located in the valley approximately 1,600 ft in elevation below the pit. To get the ore to the leach pad, the ore will be dropped down a vertical ore pass to a conveyor in an underground drift. The crushing and conveying system was sized to handle a mining production rate of 3 Mt/y.
The ADR processing plant was sized to meet the expected gold and silver values recovered from the leach pad based on tons of ore placed, the leaching cycle time, and the anticipated metal recovery from column leach tests.
The flow rate capacity of the ADR plant will be 2,400 gpm. The flow rate will allow 800,000 ft2 of heap area to be under leach. Provision has been made in the heap design to recirculate low-grade solutions for an additional 200,000 ft2 of heap area. The ADR (carbon) plant acid wash, and desorption systems were designed to handle silver to gold ratios of up to 6/1. The ADR plant will contain a mercury retort and all mercury control systems as currently required by the State of Nevada regulations.
| 19.1.2 | Mining Capital |
Mining Equipment
The Owner intends to lease most of the major mining equipment. The lease costs were included in the mining cost. A residual payment, due at the end of the lease period, was included the capital. All leased equipment was priced as new equipment. Table 19.1.2.1 shows a comparison of the purchase cost of the leased equipment, the monthly lease payments and residuals. All mining equipment was priced with options commonly specified for mining operations, including fire suppression systems price. Purchase price and lease payments were supplied by the equipment suppliers. Purchase price included taxes, delivery and assembly.
Table 19.1.2.1: Primary Equipment Capital Unit Costs
Equipment | Number of Units | Unit Capital Cost US$000s | Monthly Lease Payment (US$) (60 Month Term) | Residual Payment US$ | ||||||||||||
Atlas DM45 (Ore & Waste) | 2 | $ | 1,025 | $ | 18,193 | $ | 153,750 | |||||||||
CAT 6030FS | 1 | $ | 3,080 | |||||||||||||
CAT 992K | 1 | $ | 2,670 | $ | 39,919 | $ | 446,920 | |||||||||
CAT 777F | 5 | $ | 1,388 | |||||||||||||
CAT D10T | 1 | $ | 1,634 | $ | 25,993 | $ | 163,230 | |||||||||
Cat D9T | 1 | $ | 1,094 | $ | 17,177 | $ | 125,840 | |||||||||
CAT 16M | 1 | $ | 1,028 | $ | 13,538 | $ | 301,500 | |||||||||
Other Mining Equipment
Other support equipment that will be required include a fuel/lube truck, two mechanics trucks an 8,000 gallon water truck and light plants. These items will be purchased during the preconstruction and are listed in Table 19.1.2.2.
| JBP/MLM | February 22, 2012 |
| SRK Consulting (U.S.), Inc. | ||||
| NI 43-101 Technical Report – Mt. Hamilton Gold Project, Centennial Deposit | Page 203 |
Table 19.1.2.2: Support Equipment Capital Unit Costs
Equipment | Number of Units | Capital Cost US$000s | ||||||
Fuel/Lube Truck | 1 | $ | 250.000 | |||||
Mechanics Truck | 2 | $ | 150,000 | |||||
Light Plant | 6 | $ | 23,500 | |||||
Volvo A40E Water Truck | 1 | $ | 442,200 | |||||
The Volvo water truck quote was based on a used truck chassis (5,200 hours) with a new 8,000 gallon water tank installed. These trucks are readily available in the construction industry and getting a “like” model at the time of purchase should not present a problem.
The fuel/lube truck (650 gallon fuel tank), mechanics trucks and light plants were based on prices from recent projects and were estimated by SRK. These items represent about 3.5% of the total mining equipment fleet capital cost.
It is assumed that the blasting is to be performed by a contractor. The contractor will supply explosive magazines, prill silos, ANFO loading truck and a skid steer loader to stem holes. Capital costs for these items are not included.
In a similar fashion, it is assumed that mine tire supplier will also supply a tire truck on an “as needed” basis as part of the tire supply contract.
Mine Development and Pre-stripping
A number of access roads must be developed in order to initiate mining. These roads have been described in Section 12.2.1. A mining contractor supplied a price to develop these roads. It was estimated that 598,000 yd3 of cut would be required to develop these roads. Contractor cost to develop the roads, including mobilization and demobilization, totaled US$3.42 million.
Pre-stripping included work by both Company mine equipment and a contractor. Work prior to ore production was identified as a capital expense. A total of 625 kt of material will be moved by Company miners. The contractor will mine 632 kt. The cost for Company miners to remove this material is estimated at US$1.63 million. A mining contractor supplied an estimated price for this portion of the pre-strip at US$1.18 million including mobilization.
A 5% contingency was added to mine equipment and pre-stripping capital development.
| 19.1.3 | Process Capital |
Process capital will include the cost to purchase and install the process components of this project, including crushing and conveying equipment, leach pad construction, ADR plant, mobile equipment required for the process plant and maintenance equipment. Details of these items are supplied Section 15 of this report. A summary of the process capital cost is included in Table 19.1.3.1 for initial and sustaining capital.
| JBP/MLM | February 22, 2012 |
| SRK Consulting (U.S.), Inc. | ||||
| NI 43-101 Technical Report – Mt. Hamilton Gold Project, Centennial Deposit | Page 204 |
Table 19.1.3.1: Process Capital Cost Summary
Capital Summary | Initial Capital (US$000s) | Sustaining Capital (US$000s) | ||||||
Primary Crusher | 3,682 | — | ||||||
Drift—Mechanical and Process | 2,274 | — | ||||||
Secondary Crush and Convey (Drift to Leach pad) | 5,288 | — | ||||||
Electrical | 974 | — | ||||||
Leach Pad Conveyor and Piping | 856 | 778 | ||||||
ADR | 7,125 | — | ||||||
Process Mobile Equipment | 1,573 | |||||||
|
|
|
| |||||
Process Total | $ | 21,772 | $ | 778 | ||||
|
|
|
| |||||
Process capital was developed using supplier quotes for process components to make a complete working system. Sources of the quotes included: 1) a civil contractor for the earthworks quotes; and 2) a mechanical contractor to install the components and supply the buildings for the process components. SRK allowances and estimates totaled approximately 3.5% of the total process capital cost.
A contingency was applied to each of these items depending on the detail of the underlying engineering and level of confidence of the completeness of the items and their construction or application. Equipment supported by vendor quotations received a 5% contingency. If the work element contained a mix of contractor quotations and SRK estimates, a contingency of 10% was assigned. The average contingency for process capital expenditure averaged 8.3%.
The leach pad will be constructed in four phases. Table 19.1.3.2 lists the capital costs for the individual phases.
Table 19.1.3.2: Leach Pad Capital Cost
Capital Summary | Year Constructed | Phase Size(ft2) | Capital (US$000s) | |||||||||
Phase 1 (Initial Capital) | 0 | 1,196,000 | $ | 5,534 | ||||||||
Phase 2 | 1 | 1,226,000 | $ | 4,320 | ||||||||
Phase 3 | 2 | 1,240,000 | $ | 5,370 | ||||||||
Phase 4 | 4 | 681,000 | $ | 3,652 | ||||||||
|
|
|
| |||||||||
Total | 4,343,000 | $ | 18,876 | |||||||||
|
|
|
| |||||||||
Leach pad costs were developed in January 2012, by a Nevada mining contractor with recent experience constructing leach pads.
A 15% contingency was added to the leach pad capital estimate due to the steep terrain and the requirement for a underliner soil amendment. The cost estimate for the underliner was based on an amended soil rather than a sourced native clay-rich soil. The amended soil represents the more expensive alternative; however, if a local low permeability soil can be used this will provide a cost savings.
| 19.1.4 | Infrastructure and Owners Capital |
The major components of the Owner and Infrastructure capital are shown in Table 19.1.4.1. Owner and Infrastructure capital costs are shown in Table 19.1.4.2. The costs include light vehicles for administration and production, administration and warehouse buildings and site development. Pre-
| JBP/MLM | February 22, 2012 |
| SRK Consulting (U.S.), Inc. | ||||
| NI 43-101 Technical Report – Mt. Hamilton Gold Project, Centennial Deposit | Page 205 |
production activities consist mainly of permitting, technical studies and Owner overheads during construction.
Table 19.1.4.1: Major Components of Owner and Infrastructure Capital
Item | Size/Description | Max Required | ||||
Drift Construction | ||||||
Ventilation Fan | 50 HP | 1 | ||||
Drift and Raise Construction | 15 ft H x 12 ft W | 3,300 ft | ||||
Water Supply System | ||||||
Peerless Submersible Pumps | Well pump, 75 hp | 1 | ||||
Peerless Booster Pump | 125 hp | 1 | ||||
Tanks and installation | 750,000 gallon main storage, misc. smaller tanks | 1 | ||||
Power System | ||||||
Volvo generator Set | 2 – 340 kW Volvo gensets mounted in trailer for Primary Crusher | 1 | ||||
Generators, 100 kW/30 kW | Generac® generators at mine shop 100 KW operating, 30 kW standby | 1 | ||||
Packaged Generator Set | 4 – 725 kW Caterpillaer genset with controls located | |||||
Power lines | Installed | 4.5 miles | ||||
Other Infrastructure | ||||||
Buildings | ||||||
Admin Building (Contractor Direct Cost) | 4,100 ft2 | 1 | ||||
Mine Maintenance (Contractor Direct Cost) | 100 ft x 60 ft shop area with 60 x 50 office area | 1 | ||||
Ancillary Areas (Contractor Direct Cost) | Includes 40 ft x 04 ft lab building, 5,500 ft2 warehouse/maintenance bldg., utilities and piping | 1 | ||||
Owners Cost | ||||||
Access Road Development | ||||||
County Road Upgrade | ||||||
GPS Survey Equipment | ||||||
Radio System | ||||||
Laboratory Equipment and Supply | ||||||
EPCM | ||||||
Freight for Crusher and Conveyor System | ||||||
Contractor Overhead and Profit | ||||||
Light Vehicles | ||||||
Pick up trucks-Extended Cab | 8 | |||||
Pick up trucks-Standard Cab | 8 | |||||
Pick up trucks-Crew Cab | 5 | |||||
Staff Commuter Vans | 5 | |||||
Mobile Equipment | ||||||
John Deere 772G Motor Grader | 230 hp, 14 ft blade | 1 | ||||
Caterpillar P5000-LE Fork Lift | 63 hp, 5,000 lb lifting capacity | 1 | ||||
2000 gallon water Truck | 1 | |||||
Fuel truck small | 200 gallon Diesel tank w/ lube and evacuation tanks | |||||
Initial Fills | ||||||
Pre-Production Activities | ||||||
Technical Studies | ||||||
Admin+Permitting | ||||||
| JBP/MLM | February 22, 2012 |
| SRK Consulting (U.S.), Inc. | ||||
| NI 43-101 Technical Report – Mt. Hamilton Gold Project, Centennial Deposit | Page 206 |
Table 19.1.4.2: Owner and Infrastructure Capital Cost Summary
Capital Cost Item | Initial Capital US$(000s) | Sustaining Capital US$(000s) | ||||||
Drift Construction | 8,320 | — | ||||||
Water Supply System | 1,031 | — | ||||||
Power System | 2,091 | — | ||||||
Other Infrastructure | 5,879 | — | ||||||
Owners Costs | 14,817 | — | ||||||
Mine Reclamation | — | 10,760 | ||||||
|
|
|
| |||||
Process Total | $ | 32,138 | $ | 10,760 | ||||
|
|
|
| |||||
Infrastructure and owners capital was developed using supplier quotes for components, a civil contractor for the earthworks, an underground contractor for the conveyor drift and a mechanical contractor to install the components and supply the buildings. SRK allowances and estimates totaled approximately 17% of the total Infrastructure and Owner Capital cost.
A contingency was applied to each of these items depending on the detail of the underlying engineering and level of confidence of the completeness of the items and their construction or application. Equipment supported by vendor quotations received a 5% contingency. If the work element contained a mix of contractor quotations and SRK estimates, a contingency of 15% was assigned. The average contingency for process capital expenditure averaged 9.8%.
Mine closure capital was developed using the Standardized Reclamation Cost Estimator (SRCE) the Nevada State-approved method of calculating reclamation bonds. The “in-ground” reclamation cost including contractor profit was US$11.8 million. A 15% contingency was added to the mine closure capital.
19.2 Operating Cost Estimates
Total operating cost estimates for the Project are presented in Table 19.2.1. The unit operating costs are based on total mined material of 77,375 kt of which 54,847 kt is waste material and 22,528 kt is ore. The estimated mine life is 8 years.
Table 19.2.1: Operating Cost Summary
Operating Costs | LoM (US$000) | US$/t- total | US$/ t-ore | |||||||||
Mining | 129,457 | 1.67 | 5.75 | |||||||||
Processing | 87,634 | 1.13 | 3.89 | |||||||||
G&A | 15,617 | 0.20 | 0.69 | |||||||||
|
|
|
|
|
| |||||||
Total Operating | $ | 232,708 | $ | 3.00 | $ | 10.33 | ||||||
|
|
|
|
|
| |||||||
19.2.1 Basis for Operating Cost Estimates
Mining costs were dictated by the equipment selected and the conditions of the mine environment. Infomine® CostMine™ data was used to determine equipment hourly costs and hourly wage rates. The equipment productivities were determined from published manufacturer’s data. These factors were treated in a conservative manner to reflect the difficulties of operating at over 9,000 feet elevation in rural Nevada.
| JBP/MLM | February 22, 2012 |
| SRK Consulting (U.S.), Inc. | ||||
| NI 43-101 Technical Report – Mt. Hamilton Gold Project, Centennial Deposit | Page 207 |
Processing costs were developed from: 1) wage rates from similar projects in Nevada; 2) reagent consumption as determined by site-specific test programs or industry standards and current prices; and 3), wear and replacement parts by testing or manufactures recommendations.
The process staffing plan allows for the climatic conditions and the wide separation of the processing units.
The supervisory and administrative support staff was sized to efficiently handle the administrative, technical and management functions required for the proposed operation. Provisions for training, and regulatory mandated safety functions were also included.
19.2.2 Operating Costs—Mining
Mining equipment operating costs, on a $/hour basis, were developed from Infomine® CostMine™ Surface Mining Equipment cost guide. Operating cost included fuel and lube, tires, overhaul and maintenance parts and wear items and Diesel fuel at US$3.00 per gallon. Maintenance labor for overhaul and repair was included in the mine General and Administrative (G&A) costs. A breakdown of equipment costs are shown in Table 19.2.2.1.
Table 19.2.2.1: Operating Costs for Primary Mining Equipment
Equipment | Fuel (gph) | Lube (gph) | Tires (US$/ hr) | Overhaul (US$/hr) | Maint. (US$/ hr) | Wear Items (US$/ hr) | ||||||||||||||||||
Atlas DM45 | 16.3 | 1.2 | $ | 0.00 | $ | 9.91 | $ | 8.11 | $ | 12.34 | ||||||||||||||
CAT 6030FS | 41.7 | 2.1 | $ | 0.00 | $ | 34.91 | $ | 52.36 | $ | 8.17 | ||||||||||||||
CAT 992K | 24.3 | 1.3 | $ | 51.25 | $ | 6.80 | $ | 12.63 | $ | 1.06 | ||||||||||||||
CAT 777F | 20.1 | 1.1 | $ | 22.86 | $ | 4.09 | $ | 7.60 | $ | 0.00 | ||||||||||||||
CAT D10T | 19.2 | 0.8 | $ | 0.00 | $ | 5.96 | $ | 8.94 | $ | 16.64 | ||||||||||||||
CAT D9T | 13.8 | 0.7 | $ | 0.00 | $ | 5.49 | $ | 8.23 | $ | 15.89 | ||||||||||||||
CAT 16M | 9.8 | 0.5 | $ | 1.83 | $ | 5.40 | $ | 10.03 | $ | 1.33 | ||||||||||||||
Volvo A40 Water Truck | 7.6 | 0.5 | $ | 9.85 | $ | 2.35 | $ | 4.36 | $ | 0.00 | ||||||||||||||
Labor rates for mining are shown in Table 19.2.2.2.
Table 19.2.2.2: Labor Rates Mining
Job Classification | Average Number Required | Base Rate (US$/hr) | Hours per Year | Base (US$/yr) | Burden (%) | Overtime (%) | Burden Rate (US$/hr) | Annual Cost ($) | ||||||||||||||||||||||||
Salary | ||||||||||||||||||||||||||||||||
Mine Superintendent | 1 | — | — | $ | 100,000 | 40.0 | % | 0.0 | % | — | $ | 140,000 | ||||||||||||||||||||
Chief Engineer | 1 | — | — | $ | 90,000 | 40.0 | % | 0.0 | % | — | $ | 126,000 | ||||||||||||||||||||
Mining Engineer | 1 | — | — | $ | 80,000 | 40.0 | % | 0.0 | % | — | $ | 112,000 | ||||||||||||||||||||
Geologist | 2 | — | — | $ | 75,000 | 40.0 | % | 0.0 | % | — | $ | 210,000 | ||||||||||||||||||||
Surveyor | 2 | — | — | $ | 45,000 | 40.0 | % | 0.0 | % | — | $ | 126,000 | ||||||||||||||||||||
Mine Foreman | 3 | — | — | $ | 90,000 | 40.0 | % | 0.0 | % | — | $ | 378,000 | ||||||||||||||||||||
Maintenance Supervisor | 2 | — | — | $ | 80,000 | 40.0 | % | 0.0 | % | — | $ | 224,000 | ||||||||||||||||||||
|
| |||||||||||||||||||||||||||||||
Hourly | ||||||||||||||||||||||||||||||||
Driller | 6 | $ | 20.000 | 2,080 | $ | 41,600 | 40.0 | % | 8.0 | % | $ | 28.000 | $ | 377,395 | ||||||||||||||||||
Loader Operator | 6 | $ | 28.000 | 2,080 | $ | 58,240 | 40.0 | % | 8.0 | % | $ | 39.200 | $ | 528,353 | ||||||||||||||||||
Truck Driver | 12 | $ | 18.000 | 2,080 | $ | 37,440 | 40.0 | % | 8.0 | % | $ | 25.200 | $ | 679,311 | ||||||||||||||||||
Equipment Operator | 12 | $ | 22.000 | 2,080 | $ | 45,760 | 40.0 | % | 8.0 | % | $ | 30.800 | $ | 830,269 | ||||||||||||||||||
Laborer | 2 | $ | 15.000 | 2,080 | $ | 31,200 | 40.0 | % | 8.0 | % | $ | 21.000 | $ | 94,349 | ||||||||||||||||||
Lead Mechanic | 1 | $ | 30.000 | 2,080 | $ | 62,400 | 40.0 | % | 8.0 | % | $ | 42.000 | $ | 94,349 | ||||||||||||||||||
Mechanic | 6 | $ | 25.000 | 2,080 | $ | 52,000 | 40.0 | % | 8.0 | % | $ | 35.000 | $ | 471,744 | ||||||||||||||||||
Electrician | 1 | $ | 30.000 | 2,080 | $ | 62,400 | 40.0 | % | 8.0 | % | $ | 42.000 | $ | 94,349 | ||||||||||||||||||
Maintenance Worker | 3 | $ | 20.000 | 2,080 | $ | 41,600 | 40.0 | % | 8.0 | % | $ | 28.000 | $ | 188,698 | ||||||||||||||||||
|
| |||||||||||||||||||||||||||||||
Annual Mine Labor Cost | $ | 4,674,817 | ||||||||||||||||||||||||||||||
|
| |||||||||||||||||||||||||||||||
| JBP/MLM | February 22, 2012 |
| SRK Consulting (U.S.), Inc. | ||||
| NI 43-101 Technical Report – Mt. Hamilton Gold Project, Centennial Deposit | Page 208 |
Yearly mine cost statistics are shown in Table 19.2.2.3. LoM operating costs average US$1.61/t (including the preproduction stripping) when lease cost are included. Without lease cost, LoM costs average US$1.40/t. Mine cost are higher during preproduction primarily because the lease costs are fixed in a time of low production during ramp up.
Table 19.2.2.3: Life of Mine, Mine Operating Costs Summary
Pre-production | Production Years | |||||||||||||||||||||||||||||||||||||||||||
Mining |
| LoM Total | 0 | 1 | 2 | 3 | 4 | 5 | 6 | 7 | 8 | |||||||||||||||||||||||||||||||||
Drill & Blast | $ | 000s | 25,385 | 224 | 3,640 | 3,829 | 3,827 | 3,830 | 3,808 | 3,179 | 2,215 | 833 | ||||||||||||||||||||||||||||||||
Loading | $ | 000s | 18,642 | 105 | 2,628 | 2,713 | 2,712 | 2,714 | 2,703 | 2,318 | 1,791 | 958 | ||||||||||||||||||||||||||||||||
Hauling | $ | 000s | 21,578 | 194 | 2,766 | 3,288 | 3,384 | 3,483 | 3,516 | 2,689 | 1,688 | 570 | ||||||||||||||||||||||||||||||||
Roads & Dumps | $ | 000s | 13,849 | 94 | 2,013 | 2,217 | 2,078 | 2,079 | 2,071 | 1,666 | 1,152 | 479 | ||||||||||||||||||||||||||||||||
Mine Support | $ | 000s | 1,913 | 10 | 259 | 269 | 269 | 269 | 267 | 243 | 203 | 125 | ||||||||||||||||||||||||||||||||
Mine G&A Labor | $ | 000s | 18,508 | 360 | 2,472 | 2,543 | 2,519 | 2,519 | 2,519 | 2,330 | 2,220 | 1,025 | ||||||||||||||||||||||||||||||||
|
|
|
|
|
|
|
|
|
|
|
|
|
|
|
|
|
|
|
|
|
| |||||||||||||||||||||||
Mine Opex | $ | 000s | 99,874 | 986 | 13,779 | 14,857 | 14,789 | 14,894 | 14,885 | 12,426 | 9,268 | 3,991 | ||||||||||||||||||||||||||||||||
| $/total t | 1.403 | 1.577 | 1.373 | 1.394 | 1.388 | 1.397 | 1.406 | 1.379 | 1.453 | 1.545 | ||||||||||||||||||||||||||||||||||
Lease Cost | $ | 000s | 19,086 | 648 | 3,497 | 3,817 | 3,817 | 3,817 | 3,169 | 321 | 0 | 0 | ||||||||||||||||||||||||||||||||
Mine Cost | $ | 000s | 118,960 | 1,634 | 17,275 | 18,674 | 18,606 | 18,711 | 18,054 | 12,746 | 9,268 | 3,991 | ||||||||||||||||||||||||||||||||
| $/total t | 1.671 | 2.613 | 1.721 | 1.752 | 1.746 | 1.754 | 1.705 | 1.414 | 1.453 | 1.545 | ||||||||||||||||||||||||||||||||||
|
|
|
|
|
|
|
|
|
|
|
|
|
|
|
|
|
|
|
|
|
| |||||||||||||||||||||||
Detailed mine operating costs, by area, are shown in Table 19.2.2.4.
Table 19.2.2.4: Detailed Mining Operating Costs
Item | LoM (US$000s) | US$/t- mined | US$/ t-ore | |||||||||
Drilling & Blasting | $ | 25,385 | $ | 0.36 | $ | 1.13 | ||||||
Loading | $ | 18,642 | $ | 0.26 | $ | 0.83 | ||||||
Hauling | $ | 21,578 | $ | 0.30 | $ | 0.96 | ||||||
Roads & Dumps | $ | 13,849 | $ | 0.19 | $ | 0.61 | ||||||
Mine Support | $ | 1,913 | $ | 0.03 | $ | 0.08 | ||||||
Mine G&A Labor | $ | 18,508 | $ | 0.26 | $ | 0.82 | ||||||
Leasing Cost | $ | 19,086 | $ | 0.27 | $ | 0.85 | ||||||
|
|
|
|
|
| |||||||
Total Mining Cost | $ | 118,960 | $ | 1.67 | $ | 5.28 | ||||||
|
|
|
|
|
| |||||||
19.2.3 Operating Costs – Processing
LoM process operating costs, by area, are shown in Table 19.2.3.1. Detailed operating costs by area and category are shown in Table 19.2.3.2. Power costs were estimated at a rate of US$0.20 kWhr from Caterpillar® operating manuals for the generators specified in Section 16.
Table 19.2.3.1: LoM Process Operating Costs
Item | LoM (US$000) | US$/t- total | US$/ t-ore | |||||||||
Primary Crushing | $ | 8,335 | $ | 0.11 | $ | 0.37 | ||||||
Secondary Crushing | $ | 17,572 | $ | 0.23 | $ | 0.78 | ||||||
Conveying and Stacking | $ | 7,434 | $ | 0.10 | $ | 0.33 | ||||||
Heap Operations | $ | 7,660 | $ | 0.10 | $ | 0.34 | ||||||
ADR Plant | $ | 33,116 | $ | 0.43 | $ | 1.47 | ||||||
Laboratory | $ | 4,506 | $ | 0.06 | $ | 0.20 | ||||||
Maintenance | $ | 3,154 | $ | 0.04 | $ | 0.14 | ||||||
Water Supply | $ | 451 | $ | 0.01 | $ | 0.02 | ||||||
Plant G & A | $ | 5,407 | $ | 0.07 | $ | 0.24 | ||||||
|
|
|
|
|
| |||||||
Total Processing Cost | $ | 87,634 | $ | 1.13 | $ | 3.89 | ||||||
|
|
|
|
|
| |||||||
| JBP/MLM | February 22, 2012 |
| SRK Consulting (U.S.), Inc. | ||||
| NI 43-101 Technical Report – Mt. Hamilton Gold Project, Centennial Deposit | Page 209 |
Table 19.2.3.2: Detailed Process Operating Costs
Item | Labor (US$/t) | Power (US$/t) | Reagents (US$/t) | Parts (US$/t) | Consumables (US$/t) | Fuel (US$/t) | Total (US$/t) | |||||||||||||||||||||
Primary Crushing | $ | 0.19 | $ | 0.10 | $ | 0.00 | $ | 0.08 | $ | 0.00 | $ | 0.00 | $ | 0.37 | ||||||||||||||
Secondary Crushing | $ | 0.18 | $ | 0.20 | $ | 0.30 | $ | 0.10 | $ | 0.00 | $ | 0.00 | $ | 0.78 | ||||||||||||||
Conveying and Stacking | $ | 0.17 | $ | 0.08 | $ | 0.00 | $ | 0.08 | $ | 0.00 | $ | 0.00 | $ | 0.33 | ||||||||||||||
Heap Operations | $ | 0.09 | $ | 0.14 | $ | 0.00 | $ | 0.04 | $ | 0.00 | $ | 0.07 | $ | 0.34 | ||||||||||||||
ADR Plant | $ | 0.23 | $ | 0.25 | $ | 0.82 | $ | 0.12 | $ | 0.05 | $ | 0.00 | $ | 1.47 | ||||||||||||||
Laboratory | $ | 0.16 | $ | 0.01 | $ | 0.02 | $ | 0.01 | $ | 0.00 | $ | 0.00 | $ | 0.20 | ||||||||||||||
Maintenance | $ | 0.13 | $ | 0.00 | $ | 0.00 | $ | 0.01 | $ | 0.00 | $ | 0.00 | $ | 0.14 | ||||||||||||||
Water Supply | $ | 0.00 | $ | 0.02 | $ | 0.00 | $ | 0.00 | $ | 0.00 | $ | 0.00 | $ | 0.02 | ||||||||||||||
Plant G & A | $ | 0.23 | $ | 0.00 | $ | 0.00 | $ | 0.00 | $ | 0.01 | $ | 0.00 | $ | 0.24 | ||||||||||||||
|
|
|
|
|
|
|
|
|
|
|
|
|
| |||||||||||||||
Total Processing Cost | $ | 1.38 | $ | 0.80 | $ | 1.14 | $ | 0.44 | $ | 0.06 | $ | 0.07 | $ | 3.89 | ||||||||||||||
|
|
|
|
|
|
|
|
|
|
|
|
|
| |||||||||||||||
Major reagents consumed in the process include lime and sodium cyanide. Table 19.2.3.3 Reagents show the breakdown of major reagents and other chemicals required.
Table 19.2.3.3: Reagents
Reagent | Consumption (lb/t) | Unit Cost (US$/lb) | Per ton Ore (US$/t-ore) | Area Applied | ||||||||||||
Lime (CaO) | 5.0 | 0.06 | 0.30 | Secondary Crush | ||||||||||||
Sodium Cyanide | 0.6 | 1.10 | 0.66 | ADR Plant | ||||||||||||
Other reagents* | 0.16 | ADR Plant | ||||||||||||||
Lab Chemicals | 0.02 | Lab | ||||||||||||||
|
| |||||||||||||||
$/t-ore | 1.14 | |||||||||||||||
|
| |||||||||||||||
| *Other | reagents include dust suppressant, scalant, fluxes, acid, carbon, and NaOH. |
Labor rates for processing are provided in Table 19.2.3.4.
Table 19.2.3.4: Labor Rates Processing
| Job Classification | Average Number | Base Rate | Hours per | Base | Burden | Overtime | Burden Rate | Annual Cost | ||||||||||||||||||||||||
| Required | (US$/hr) | Year | (US$/yr) | (%) | (%) | (US$/hr) | ($) | |||||||||||||||||||||||||
Salary | ||||||||||||||||||||||||||||||||
Shift Foremen | 4 | — | — | $ | 66,000 | 40.00 | % | 0.00 | % | — | $ | 369,600 | ||||||||||||||||||||
Plant Superintendent | 1 | — | — | $ | 102,600 | 40.00 | % | 0.00 | % | — | $ | 143,640 | ||||||||||||||||||||
Metallurgist | 1 | — | — | $ | 85,800 | 40.00 | % | 0.00 | % | — | $ | 120,120 | ||||||||||||||||||||
Clerk | 1 | — | — | $ | 42,029 | 40.00 | % | 0.00 | % | — | $ | 58,841 | ||||||||||||||||||||
|
|
|
|
|
|
|
|
|
|
|
|
|
|
|
| |||||||||||||||||
Hourly | ||||||||||||||||||||||||||||||||
24X7 Schedule | ||||||||||||||||||||||||||||||||
Primary Crusher Operator | 4 | $ | 23.50 | 2,080 | $ | 48,880 | 40.00 | % | 8.00 | % | $ | 25.38 | $ | 290,621 | ||||||||||||||||||
Underground Conveyor Operator | 4 | $ | 21.90 | 2,080 | $ | 45,552 | 40.00 | % | 8.00 | % | $ | 23.65 | $ | 270,834 | ||||||||||||||||||
Secondary Crusher Operator | 4 | $ | 23.50 | 2,080 | $ | 48,880 | 40.00 | % | 8.00 | % | $ | 25.38 | $ | 290,621 | ||||||||||||||||||
Surface Conveyor Operator | 4 | $ | 21.90 | 2,080 | $ | 45,552 | 40.00 | % | 8.00 | % | $ | 23.65 | $ | 270,834 | ||||||||||||||||||
Utility Operator | 8 | $ | 20.40 | 2,080 | $ | 42,432 | 40.00 | % | 8.00 | % | $ | 22.03 | $ | 504,567 | ||||||||||||||||||
Plant Operator | 4 | $ | 24.00 | 2,080 | $ | 49,920 | 40.00 | % | 8.00 | % | $ | 25.92 | $ | 296,804 | ||||||||||||||||||
Plant Helper | 4 | $ | 20.40 | 2,080 | $ | 42,432 | 40.00 | % | 8.00 | % | $ | 22.03 | $ | 252,284 | ||||||||||||||||||
5x10 Schedule | ||||||||||||||||||||||||||||||||
Heap Piping | 4 | $ | 21.90 | 2,080 | $ | 45,552 | 40.00 | % | 8.00 | % | $ | 23.65 | $ | 270,834 | ||||||||||||||||||
Labor | 1 | $ | 19.00 | 2,080 | $ | 39,520 | 40.00 | % | 8.00 | % | $ | 20.52 | $ | 58,743 | ||||||||||||||||||
Refiner | 1 | $ | 24.00 | 2,080 | $ | 49,920 | 40.00 | % | 8.00 | % | $ | 25.92 | $ | 74,201 | ||||||||||||||||||
Assay Laboratory | ||||||||||||||||||||||||||||||||
Assayers | 3 | $ | 23.00 | 2,080 | $ | 47,840 | 40.00 | % | 8.00 | % | $ | 24.84 | $ | 213,328 | ||||||||||||||||||
Technicians | 1 | $ | 21.90 | 2,080 | $ | 45,552 | 40.00 | % | 8.00 | % | $ | 23.65 | $ | 67,708 | ||||||||||||||||||
Sample Preparation | 3 | $ | 20.40 | 2,080 | $ | 42,432 | 40.00 | % | 8.00 | % | $ | 22.03 | $ | 189,213 | ||||||||||||||||||
Maintenance | �� | |||||||||||||||||||||||||||||||
Mechanics/Electricians | 2 | $ | 26.50 | 2,080 | $ | 55,120 | 40.00 | % | 8.00 | % | $ | 28.62 | $ | 163,861 | ||||||||||||||||||
Helpers | 3 | $ | 23.50 | 2,080 | $ | 48,880 | 40.00 | % | 8.00 | % | $ | 25.38 | $ | 217,966 | ||||||||||||||||||
Total Annual Labor Cost | $ | 4,124,620 | ||||||||||||||||||||||||||||||
| JBP/MLM | February 22, 2012 |
| SRK Consulting (U.S.), Inc. | ||||
| NI 43-101 Technical Report – Mt. Hamilton Gold Project, Centennial Deposit | Page 210 |
Process labor rates are built up from base rates which a 40% burden factor has been applied. In addition SRK assumes an average 8% overtime for hourly job classifications. The total labor cost is estimated at US$4.12 million per year which equates to US$1.38/t-processed.
| 19.2.4 | General and Administrative Cost |
General and Administrative costs average US$0.69/t ore crushed. General and administrative costs are summarized in Table 19.2.4.1.
Table 19.2.4.1: G&A Operating Cost Summary
Item | LoM (US$000s) | US$/t- total | US$/ t-ore | |||||||||
G&A Costs | 5,208 | 0.07 | 0.23 | |||||||||
G&A Labor | 10,409 | 0.13 | 0.46 | |||||||||
|
|
|
|
|
| |||||||
Total Operating Cost | $ | 15,617 | $ | 0.20 | $ | 0.69 | ||||||
|
|
|
|
|
| |||||||
Table 19.2.4.2 shows the breakdown of costs by cost area.
Table 19.2.4.2: G&A Costs
Item | LoM Total (US$000s) | Production Years | ||||||||||||||||||||||||||||||||||
| 1 | 2 | 3 | 4 | 5 | 6 | 7 | 8 | |||||||||||||||||||||||||||||
Environmental, H&S | 1,950 | 221 | 260 | 260 | 260 | 260 | 260 | 260 | 171 | |||||||||||||||||||||||||||
Community Relations | 390 | 44 | 52 | 52 | 52 | 52 | 52 | 52 | 34 | |||||||||||||||||||||||||||
Legal Fees | 390 | 44 | 52 | 52 | 52 | 52 | 52 | 52 | 34 | |||||||||||||||||||||||||||
Insurance | 390 | 44 | 52 | 52 | 52 | 52 | 52 | 52 | 34 | |||||||||||||||||||||||||||
Licensing & Fees | 195 | 22 | 26 | 26 | 26 | 26 | 26 | 26 | 17 | |||||||||||||||||||||||||||
Power Line Maintenance | 195 | 22 | 26 | 26 | 26 | 26 | 26 | 26 | 17 | |||||||||||||||||||||||||||
Communications | 98 | 11 | 13 | 13 | 13 | 13 | 13 | 13 | 9 | |||||||||||||||||||||||||||
Rentals/leases | 98 | 11 | 13 | 13 | 13 | 13 | 13 | 13 | 9 | |||||||||||||||||||||||||||
First Aid Supplies | 98 | 11 | 13 | 13 | 13 | 13 | 13 | 13 | 9 | |||||||||||||||||||||||||||
Office/Training Supplies | 39 | 4 | 5 | 5 | 5 | 5 | 5 | 5 | 3 | |||||||||||||||||||||||||||
Software/Computers | 195 | 22 | 26 | 26 | 26 | 26 | 26 | 26 | 17 | |||||||||||||||||||||||||||
Small Vehicles | 780 | 88 | 104 | 104 | 104 | 104 | 104 | 104 | 68 | |||||||||||||||||||||||||||
Outside Services | 390 | 44 | 52 | 52 | 52 | 52 | 52 | 52 | 34 | |||||||||||||||||||||||||||
|
|
|
|
|
|
|
|
|
|
|
|
|
|
|
|
|
| |||||||||||||||||||
G&A | 5,208 | 589 | 694 | 694 | 694 | 694 | 694 | 694 | 457 | |||||||||||||||||||||||||||
|
|
|
|
|
|
|
|
|
|
|
|
|
|
|
|
|
| |||||||||||||||||||
$/t Crushed | 0.231 | 0.231 | 0.231 | 0.231 | 0.231 | 0.231 | 0.231 | 0.231 | 0.231 | |||||||||||||||||||||||||||
|
|
|
|
|
|
|
|
|
|
|
|
|
|
|
|
|
| |||||||||||||||||||
Table 19.2.4.3 and Table 19.2.4.4 show the G&A labor rates and yearly labor costs, respectively.
Table 19.2.4.3: G&A Labor Rates
Job Classification | Average Number Required | Base Rate (US$/hr) | Hours per Year | Base (US$/yr) | Burden (%) | Overtime (%) | Burden Rate (US$/hr) | Annual Cost (US$) | ||||||||||||||||||||||||
Salaried | ||||||||||||||||||||||||||||||||
General Manager | 1 | — | — | $ | 150,000 | 40.0 | % | 0.0 | % | — | $ | 210,000 | ||||||||||||||||||||
Accountant | 1 | — | — | $ | 65,000 | 40.0 | % | 0.0 | % | — | $ | 91,000 | ||||||||||||||||||||
Purchasing Agent | 1 | — | — | $ | 60,000 | 40.0 | % | 0.0 | % | — | $ | 84,000 | ||||||||||||||||||||
Environmental Manager | 1 | — | — | $ | 100,000 | 40.0 | % | 0.0 | % | — | $ | 140,000 | ||||||||||||||||||||
Environmental Engineer | 1 | — | — | $ | 78,000 | 40.0 | % | 0.0 | % | — | $ | 109,200 | ||||||||||||||||||||
Human Resources Manager | 1 | — | — | $ | 75,000 | 40.0 | % | 0.0 | % | — | $ | 105,000 | ||||||||||||||||||||
Safety Engineer | 1 | — | — | $ | 70,000 | 40.0 | % | 0.0 | % | — | $ | 98,000 | ||||||||||||||||||||
|
|
|
|
|
|
|
|
|
|
|
|
|
|
|
| |||||||||||||||||
Hourly | ||||||||||||||||||||||||||||||||
Technician | 4 | $ | 18.900 | 2,080 | $ | 39,312 | 40.0 | % | 8.0 | % | $ | 26.460 | $ | 237,760 | ||||||||||||||||||
Clerk | 3 | $ | 15.500 | 2,080 | $ | 32,240 | 40.0 | % | 8.0 | % | $ | 21.700 | $ | 97,495 | ||||||||||||||||||
Secretary | 1 | $ | 13.500 | 2,080 | $ | 28,080 | 40.0 | % | 8.0 | % | $ | 18.900 | $ | 42,460 | ||||||||||||||||||
Security Guard | 4 | $ | 12.000 | 2,080 | $ | 24,960 | 40.0 | % | 8.0 | % | $ | 16.800 | $ | 150,960 | ||||||||||||||||||
Janitor | 1 | $ | 9.500 | 2,080 | $ | 19,760 | 40.0 | % | 8.0 | % | $ | 13.300 | $ | 29,875 | ||||||||||||||||||
|
|
|
|
|
|
|
|
|
|
|
|
|
|
|
| |||||||||||||||||
Annual G&A Labor Cost | $ | 1,395,750 | ||||||||||||||||||||||||||||||
|
|
|
|
|
|
|
|
|
|
|
|
|
|
|
| |||||||||||||||||
| JBP/MLM | February 22, 2012 |
| SRK Consulting (U.S.), Inc. | ||||
| NI 43-101 Technical Report – Mt. Hamilton Gold Project, Centennial Deposit | Page 211 |
Table 19.2.4.4: G&A Labor
G&A Labor | LoM Total | Production Years | ||||||||||||||||||||||||||||||||||
| 1 | 2 | �� | 3 | 4 | 5 | 6 | 7 | 8 | ||||||||||||||||||||||||||||
General Manager | 1,575 | 210 | 210 | 210 | 210 | 210 | 210 | 210 | 105 | |||||||||||||||||||||||||||
Accountant | 683 | 91 | 91 | 91 | 91 | 91 | 91 | 91 | 46 | |||||||||||||||||||||||||||
Purchasing Agent | 630 | 84 | 84 | 84 | 84 | 84 | 84 | 84 | 42 | |||||||||||||||||||||||||||
Environmental Manager | 1,050 | 140 | 140 | 140 | 140 | 140 | 140 | 140 | 70 | |||||||||||||||||||||||||||
Environmental Engineer | 819 | 109 | 109 | 109 | 109 | 109 | 109 | 109 | 55 | |||||||||||||||||||||||||||
Human Resources Manager | 788 | 105 | 105 | 105 | 105 | 105 | 105 | 105 | 53 | |||||||||||||||||||||||||||
Safety Engineer | 735 | 98 | 98 | 98 | 98 | 98 | 98 | 98 | 49 | |||||||||||||||||||||||||||
Technicians | 1,724 | 238 | 238 | 238 | 238 | 238 | 238 | 238 | 59 | |||||||||||||||||||||||||||
Clerk | 731 | 97 | 97 | 97 | 97 | 97 | 97 | 97 | 49 | |||||||||||||||||||||||||||
Secretary | 318 | 42 | 42 | 42 | 42 | 42 | 42 | 42 | 21 | |||||||||||||||||||||||||||
Security Guard | 1,132 | 151 | 151 | 151 | 151 | 151 | 151 | 151 | 75 | |||||||||||||||||||||||||||
Janitor | 224 | 30 | 30 | 30 | 30 | 30 | 30 | 30 | 15 | |||||||||||||||||||||||||||
|
|
|
|
|
|
|
|
|
|
|
|
|
|
|
|
|
| |||||||||||||||||||
G&A Labor | 10,409 | 1,396 | 1,396 | 1,396 | 1,396 | 1,396 | 1,396 | 1,396 | 638 | |||||||||||||||||||||||||||
| — | 0.547 | 0.465 | 0.465 | 0.465 | 0.465 | 0.465 | 0.465 | 0.323 | ||||||||||||||||||||||||||||
|
|
|
|
|
|
|
|
|
|
|
|
|
|
|
|
|
| |||||||||||||||||||
| JBP/MLM | February 22, 2012 |
| SRK Consulting (U.S.), Inc. | ||||
| NI 43-101 Technical Report – Mt. Hamilton Gold Project, Centennial Deposit | Page 212 |
| 20 | Economic Analysis (Item 22) |
The financial results of this report have been prepared on an annual basis. All costs are in Quarter 1 2012 US dollars.
| 20.1 | Principal Assumptions |
A financial model was prepared on an unleveraged, post-tax basis the results of which are presented in this section. Key criteria used in this analysis are discussed in detail throughout this report. Financial assumptions used in this analysis are shown summarized in Table 20.1.1.
Table 20.1.1: Financial Assumptions for Economic Modeling
Model Parameter | Technical Input | |
Pre-Production Period | 3 years | |
Mine Life | 8 years | |
Gold Price Year 1 - 12 month trailing average (US$/oz) | $1,600 | |
Gold Price Year 2 - 24 month trailing average (US$/oz) | $1,420 | |
Gold Price Subsequent Years – 36 month trailing average (US$/oz) | $1,280 | |
Silver Price Year 1 - 12 month trailing average (US$/oz) | $35.45 | |
Silver Price Year 2 - 24 month trailing average (US$/oz) | $28.25 | |
Silver Price Subsequent Years – 36 month trailing average (US$/oz) | $23.90 | |
Operating Days per Year | 350 | |
Discount Rate | 8.0% |
A three year pre-production period allows for permitting, detailed engineering, due diligence/financing and pre-production stripping and facilities construction. The mine will have an eight year life given the Mineral Reserve described in this report.
The analysis assumes a declining price curve for the gold and silver market price. The gold price was set at US$1,600/oz for the first year of production, US$1,420/oz for the second year of production and $US1,280/oz, for subsequent years. The silver price was set at US$35.45/oz for the first year of production, US$28.25/oz for the second year of production and US$23.90/oz, for subsequent years. These prices are based on the 12 month, 24 month and 36 month trailing average of gold and silver prices, respectively. This declining price scenario results in an average life-of-mine price of $1,323/oz of gold and US$25.34/oz of silver.
| 20.2 | Cash flow Forecasts and Annual Production Forecasts |
The economic results, at a discount rate of 8%, indicate a Net Present Value of US$60.7 million with an IRR of 25.4% (after estimated taxes). Payback will be in 3.2 years from the start of production. The following provide the basis of the SRK LoM plan and economics:
| • | A mine life of 8 years; |
| • | An overall average gold recovery rate of 79%; |
| • | An average operating cost of US$535.03/AuEq oz-produced; |
| • | Capital costs of US$107.2 million, comprised of initial capital costs of US$71.9 million, and sustaining capital over the LoM of US$23.3 million; |
| • | A declining price curve for gold over the first three production years; |
| • | Mine closure cost estimate is US$11.8 million; and |
| JBP/MLM | February 22, 2012 |
| SRK Consulting (U.S.), Inc. | ||||
| NI 43-101 Technical Report – Mt. Hamilton Gold Project, Centennial Deposit | Page 213 |
| • | The analysis does not include any allowance for salvage value. |
Table 20.2.1 Mine Production Summary below shows the LoM production, ore grades and contained metal used in the economic analysis.
Table 20.2.1: Mine Production Summary
Item | Value | Units | ||||
Mine Production | ||||||
Waste | 54,847 | kt | ||||
Ore | 22,528 | kt | ||||
|
|
| ||||
Total Material | 77,375 | kt | ||||
Stripping Ratio | 2.43 | waste:ore | ||||
Avg. Daily Ore Capacity | 4,463 | t per day | ||||
RoM Grade | ||||||
Gold | 0.022 | oz/t | ||||
Silver | 0.134 | oz/t | ||||
Contained Metal | ||||||
Gold | 487.4 | koz | ||||
Silver | 3,025.4 | koz | ||||
|
|
| ||||
Table 20.2.2 Process Production Summary shows the LoM process tonnage, recoveries for gold and silver from the heap leach operation and recovered metal used in the economic analysis.
Table 20.2.2: Process Production Summary
Item | Value | Units | ||||
RoM Ore Processed | 22,528 | kt | ||||
Avg. Daily Capacity | 4,463 | t per day | ||||
Process Plant | ||||||
Contained Metal | ||||||
Gold | 487.4 | koz | ||||
Silver | 3,025.4 | koz | ||||
Recovery | ||||||
Gold | 79 | % | ||||
Silver | 90 | % | ||||
Recovered Metal | ||||||
Gold | 385.2 | koz | ||||
Silver | 2,725.3 | koz | ||||
|
|
| ||||
Table 20.2.3 Project Economic Results shown below contains the calculated project cash flow and Net Present Value at a 5% and 8% discount rate along with the IRR for the project.
| JBP/MLM | February 22, 2012 |
| SRK Consulting (U.S.), Inc. | ||||
| NI 43-101 Technical Report – Mt. Hamilton Gold Project, Centennial Deposit | Page 214 |
Table 20.2.3: Project Economic Results
Description | Value | Units | ||||||
Market Prices | ||||||||
Gold (LoM Avg) | $ | 1,323 | /oz-Au | |||||
Silver (LoM Avg) | $ | 25.34 | /oz-Ag | |||||
Estimate of Cash Flow (all values in $000s) | ||||||||
Payable Metal | ||||||||
Gold | 384.5 | koz | ||||||
Silver | 2,643.6 | koz | ||||||
Gross Revenue | ||||||||
Gold | $ | 508,785 | ||||||
Silver | $ | 66,991 | ||||||
|
| |||||||
Revenue | $ | 575,775 | ||||||
Freight & Handling | ($ | 2,860 | ) | |||||
|
| |||||||
Gross Revenue | $ | 572,916 | ||||||
Royalty | ($ | 4,529 | ) | |||||
|
| |||||||
Net Revenue | $ | 568,387 | ||||||
Operating Costs | $ | /t-ore | ||||||
|
| |||||||
Mining | $ | 129,457 | $ | 5.75 | ||||
Processing | $ | 87,634 | $ | 3.89 | ||||
G&A | $ | 15,617 | $ | 0.69 | ||||
Property & Net Proceeds Tax | $ | 16,155 | $ | 0.72 | ||||
|
|
|
| |||||
Total Operating | $ | 248,864 | $ | 11.05 | ||||
Operating Margin (EBITDA) | $ | 319,523 | ||||||
LoM Capital | $ | 107,207 | ||||||
Income Tax | $ | 75,874 | ||||||
|
| |||||||
Cash Flow Available for Debt Service | $ | 136,442 | ||||||
NPV 5% | $ | 83,088 | ||||||
NPV 8% | $ | 60,678 | ||||||
IRR | 25.4 | % | ||||||
|
| |||||||
Table 20.2.4 Cash Cost contains the LoM cash cost for the project and cost per ton processed based on total revenue, total operating cost and total operating margin.
Table 20.2.4: Cash Cost
Cash Costs | Value | Units | ||||||
Gold | $ | 1,323 | per oz | |||||
Silver | $ | 25.34 | per oz | |||||
Processed Ore | 22,528 | kt | ||||||
Total Revenue | ||||||||
Gold | $ | 508,785 | ||||||
Silver | $ | 66,991 | ||||||
|
| |||||||
Total Revenue | $ | 575,775 | ||||||
$/t-ore | $ | 25.56 | ||||||
Costs | ||||||||
Refining and Transport | $ | 2,860 | ||||||
Royalty | $ | 4,529 | ||||||
Operating Costs | $ | 248,864 | ||||||
|
| |||||||
Cash Cost | $ | 256,253 | ||||||
$/t-ore | $ | 11.37 | ||||||
Margin | ||||||||
Operating Margin | $ | 319,523 | ||||||
$/t-ore | $ | 14.18 | ||||||
|
| |||||||
| JBP/MLM | February 22, 2012 |
| SRK Consulting (U.S.), Inc. | ||||
| NI 43-101 Technical Report – Mt. Hamilton Gold Project, Centennial Deposit | Page 215 |
Table 20.2.5: Annual Production and Cash flow Summary
Year | Waste (kt) | Ore (kt) | Gold Contained Metal (koz) | Silver Contained Metal (koz) | Gold Payable Metal (koz) | Silver Payable Metal (koz) | Free Cashflow (US$000) | NPV @ 5% (US$000) | NPV @ 8% (US$000) | |||||||||||||||||||||||||||
-3 | 0 | 0 | 0.0 | 0.0 | 0.0 | 0.0 | ($ | 1,588 | ) | ($ | 1,588 | ) | ($ | 1,588 | ) | |||||||||||||||||||||
-2 | 0 | 0 | 0.0 | 0.0 | 0.0 | 0.0 | ($ | 1,588 | ) | ($ | 1,512 | ) | ($ | 1,470 | ) | |||||||||||||||||||||
-1 | 1,237 | 20 | 0.0 | 0.0 | 0.0 | 0.0 | ($ | 73,430 | ) | ($ | 66,603 | ) | ($ | 62,955 | ) | |||||||||||||||||||||
1 | 11,020 | 2,616 | 47.5 | 320.6 | 28.4 | 210.3 | $ | 1,719 | $ | 1,485 | $ | 1,365 | ||||||||||||||||||||||||
2 | 9,556 | 3,044 | 68.4 | 348.5 | 54.1 | 317.3 | $ | 37,274 | $ | 30,665 | $ | 27,397 | ||||||||||||||||||||||||
3 | 7,605 | 3,050 | 71.0 | 384.7 | 52.7 | 326.2 | $ | 31,435 | $ | 24,630 | $ | 21,394 | ||||||||||||||||||||||||
4 | 7,604 | 3,060 | 67.8 | 300.5 | 53.3 | 244.8 | $ | 24,926 | $ | 18,600 | $ | 15,707 | ||||||||||||||||||||||||
5 | 7,625 | 2,963 | 43.4 | 526.7 | 38.3 | 433.2 | $ | 17,148 | $ | 12,187 | $ | 10,006 | ||||||||||||||||||||||||
6 | 5,967 | 3,046 | 71.9 | 367.1 | 49.5 | 329.4 | $ | 30,975 | $ | 20,965 | $ | 16,735 | ||||||||||||||||||||||||
7 | 3,335 | 3,042 | 79.2 | 501.8 | 64.1 | 422.7 | $ | 44,460 | $ | 28,659 | $ | 22,241 | ||||||||||||||||||||||||
8 | 898 | 1,686 | 38.2 | 275.6 | 43.7 | 355.1 | $ | 30,220 | $ | 18,552 | $ | 13,998 | ||||||||||||||||||||||||
9 | 0 | 0 | 0.0 | 0.0 | 0.3 | 4.6 | ($ | 4,426 | ) | ($ | 2,588 | ) | ($ | 1,898 | ) | |||||||||||||||||||||
10 | 0 | 0 | 0.0 | 0.0 | 0.0 | 0.0 | ($ | 311 | ) | ($ | 173 | ) | ($ | 124 | ) | |||||||||||||||||||||
11 | 0 | 0 | 0.0 | 0.0 | 0.0 | 0.0 | ($ | 170 | ) | ($ | 90 | ) | ($ | 63 | ) | |||||||||||||||||||||
12 | 0 | 0 | 0.0 | 0.0 | 0.0 | 0.0 | ($ | 201 | ) | ($ | 102 | ) | ($ | 69 | ) | |||||||||||||||||||||
|
|
|
|
|
|
|
|
|
|
|
|
|
|
|
|
|
| |||||||||||||||||||
Total | 54,847 | 22,528 | 487.4 | 3,025.4 | 384.5 | 2,643.6 | $ | 136,442 | $ | 83,088 | $ | 60,678 | ||||||||||||||||||||||||
|
|
|
|
|
|
|
|
|
|
|
|
|
|
|
|
|
| |||||||||||||||||||
20.3 Taxes, Royalties and Other Interests
MH-LLC will be subject to the following taxes as they relate to the Project:
| • | Federal Income Tax |
| • | Net Proceeds Tax |
MH-LLC is also subject to royalties as described in Section 20.3.3.
| 20.3.1 | Federal income Tax |
Corporate Federal income tax is determined by computing and paying the higher of a regular tax or a Tentative Minimum Tax (TMT). If the TMT exceeds the regular tax, the difference is called the Alternative Minimum Tax (AMT). Regular tax is computed by subtracting all allowable operating expenses, overhead, depreciation, amortization and depletion from current year revenues to arrive at taxable income. The tax rate is then determined from the published progressive tax schedule. An operating loss may be used to offset taxable income, thereby reducing taxes owed, in the previous three and following 15 years. The highest effective corporate income tax is 35%.
The AMT is determined in three steps. First, regular taxable income is adjusted by recalculating certain regular tax deductions, based on AMT laws, to arrive at AMT Income (AMTI). Second, AMTI is multiplied by 20% to determine TMT. Third, if TMT exceeds regular tax, the excess is the AMT amount payable in addition to the regular tax liability.
To reduce tax liability, depreciation was calculated using:
| • | A five year Modified Accelerated Cost Recovery System (MACRS) table. US Tax laws allow five year depreciation for assets with a life of 4 to 10 years. As the project has a life of 8 years, the five year table was selected. |
| • | Permitting cost is straight lined amortized over a 15 year period. |
| • | Feasibility and other study costs were straight lined amortized over the life of the project. |
| JBP/MLM | February 22, 2012 |
| SRK Consulting (U.S.), Inc. | ||||
| NI 43-101 Technical Report – Mt. Hamilton Gold Project, Centennial Deposit | Page 216 |
| • | Reclamation costs were accrued over the life of the project on a per ton mined basis. |
| 20.3.2 | Net Proceeds Tax |
In Nevada, if the net proceeds of a mine in the taxable year totals US$4 million or more the tax rate is 5%. The gross proceeds from the sale of the minerals minus the allowable deductions determine the taxable net proceeds. The allowable deductions include the actual cost of:
| • | Extraction; |
| • | Transportation of the mineral from the mine or point of extraction to the point of processing and sale; |
| • | Processing; |
| • | Marketing and delivery; |
| • | Repair and maintenance of equipment; |
| • | Fire insurance on plant and equipment; |
| • | Depreciation of the cost of machinery and equipment; |
| • | Contributions or payments for unemployment insurance, social security, fringe benefits for Employees, etc.; |
| • | Royalties paid to claim holders, which are taxable to the recipient; and |
| • | Development in or about the mine or group of mines that are operated as a unit. |
Included in these costs are the cost of labor, supplies, and materials required to perform these activities. Only costs incurred in the process of performing these tasks in the current tax year may be deducted. Costs cannot be carried forward to future tax years or carried back to previous tax years.
Costs that are unrelated to the direct production of minerals, such as property and income taxes, charitable contributions, liability insurance or lobbying expenses are not deductible (Nevada Tax Payers Association, 2008).
| 20.3.3 | Royalties |
MH-LLC is subject to a 1% Net Smelter Return royalty. Royalty is prepaid at the rate of US$300,000 per year. As of time of this report, a total of US$1.1 million has been paid in prepaid royalties. Once production has begun, the royalty paid will continue to be US$300,000 per year until the prepaid portion has been depleted. Royalty payments will then revert to the 1% NSR until the end of the production.
| 20.4 | Sensitivity Analysis |
Based on sensitivities of Market Price, Operating costs and Capital costs, the Project is most sensitive to changes in Market Price and least sensitive to both Operating and Capital Costs. Table 20.4.1 and Figure 20-1 contain the sensitivities at an 8% discount rate.
Table 20.4.1: Project Sensitivities: NPV at 8% (US$ millions)
NPV (8%) | 85% | 90% | 95% | 100% | 105% | 110% | 115% | |||||||||||||||||||||
Market Price | $ | 28.1 | $ | 38.8 | $ | 50.0 | $ | 60.7 | $ | 71.5 | $ | 82.3 | $ | 93.1 | ||||||||||||||
Operating Cost | $ | 68.6 | $ | 66.0 | $ | 63.3 | $ | 60.7 | $ | 58.0 | $ | 55.4 | $ | 52.7 | ||||||||||||||
Capital Costs | $ | 73.0 | $ | 68.9 | $ | 64.8 | $ | 60.7 | $ | 56.6 | $ | 52.5 | $ | 48.3 | ||||||||||||||
| JBP/MLM | February 22, 2012 |
| SRK Consulting (U.S.), Inc. | ||||
| NI 43-101 Technical Report – Mt. Hamilton Gold Project, Centennial Deposit | Page 217 |
Table 20.4.2 provides a metal price sensitivity analysis.
Table 20.4.2: Project Sensitivity to Metal Prices
Item | Pre-Tax | After Tax (Federal=35%, State=5%) | ||||||||||||||||||||||||||||||
Gold US$/oz. | $ | 1,323 | $ | 1,500 | $ | 1,700 | $ | 1,900 | $ | 1,323 | $ | 1,500 | $ | 1,700 | $ | 1,900 | ||||||||||||||||
Silver US$/oz. | $ | 25.34 | $ | 29.00 | $ | 33.00 | $ | 37.00 | $ | 25.34 | $ | 29.00 | $ | 33.00 | $ | 37.00 | ||||||||||||||||
Cash Flow (US$M) | $ | 226.4 | $ | 284.9 | $ | 389.9 | $ | 476.1 | $ | 136.4 | $ | 183.9 | $ | 237.5 | $ | 290.8 | ||||||||||||||||
NPV @ 8% (US$M) | $ | 111.1 | $ | 154.4 | $ | 207.0 | $ | 259.3 | $ | 60.7 | $ | 87.3 | $ | 120.0 | $ | 152.3 | ||||||||||||||||
NPV @ 5% (US$M) | $ | 145.3 | $ | 198.5 | $ | 261.5 | $ | 324.1 | $ | 83.1 | $ | 116.0 | $ | 155.0 | $ | 193.7 | ||||||||||||||||
IRR | 35.0 | % | 41.3 | % | 51.2 | % | 60.6 | % | 25.4 | % | 30.5 | % | 37.9 | % | 44.9 | % | ||||||||||||||||
Payback (Years) | 2.7 | 2.5 | 2.2 | 1.9 | 3.2 | 2.9 | 2.6 | 2.3 | ||||||||||||||||||||||||
Base case is bolded
| JBP/MLM | February 22, 2012 |
| SRK Consulting (U.S.), Inc. | ||||
| NI 43-101 Technical Report – Mt. Hamilton Gold Project, Centennial Deposit | Page 218 |
Figure 20-1: Project Sensitivities: NPV @ 8%
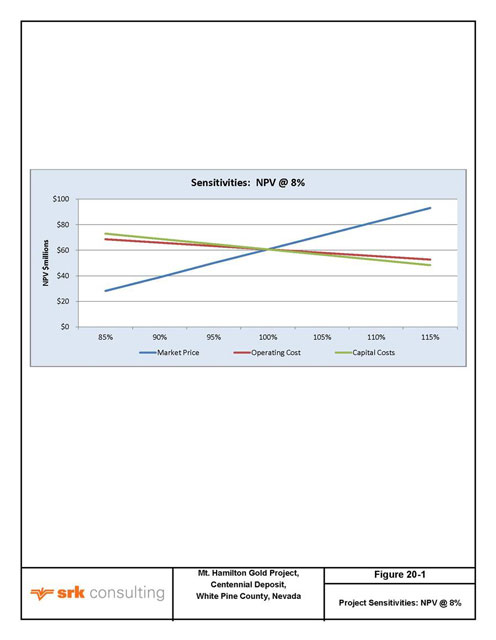
| JBP/MLM | February 22, 2012 |
| SRK Consulting (U.S.), Inc. | ||||
| NI 43-101 Technical Report – Mt. Hamilton Gold Project, Centennial Deposit | Page 219 |
| 21 | Adjacent Properties (Item 23) |
Immediately to the north of the Centennial Project is the NE Seligman Mine. This mine was operated by Rea from 1995-1997. The Nevada Department of Minerals and Nevada Bureau of Mines report total production of 124,000 oz of gold and 310,250 oz of silver from the NE Seligman Mine by Rea during the period 1995 to 1997. The NE Seligman Mine was hosted dominantly in intrusive granodiorite and hornfels along the northeast contact of the Seligman Stock and the Centennial deposit is an epithermal overprint in skarn-altered sediments along the southern contact of the Seligman stock. While both deposits are spatially close, the style and nature of mineralization are different and the characteristics of size, grade and geology of Centennial deposit cannot be inferred from, or compared with the NE Seligman Mine.
| 21.1 | Verification |
SRK has not done any form of verification of the information concerning the adjacent NE Seligman deposit or other prospects. None of the adjacent properties have a current economic impact on the development of the Centennial Project as described in this report.
| JBP/MLM | February 22, 2012 |
| SRK Consulting (U.S.), Inc. | ||||
| NI 43-101 Technical Report – Mt. Hamilton Gold Project, Centennial Deposit | Page 220 |
| 22 | Other Relevant Data and Information (Item 24) |
There is no additional relevant data that SRK is aware of that would materially impact the conclusions of this report. The details of mining, processing and economics at a Feasibility level of details are presented in earlier sections of this report.
| JBP/MLM | February 22, 2012 |
| SRK Consulting (U.S.), Inc. | ||||
| NI 43-101 Technical Report – Mt. Hamilton Gold Project, Centennial Deposit | Page 221 |
| 23 | Interpretation and Conclusions (Item 25) |
| 23.1 | Results |
Centennial is an advanced pre-development project with a strong economic projection based on Feasibility-level capital and operating costs from a thorough mining and processing development plan. A LoM Net after tax Present Value of US$60.7 million is forecast with and internal rate of return of 25.4% and a payback period of 3.2 years on an 8-year mine life using a discount rate of 8%.
Mining will occur in a single open pit at high elevation (8,600-9,400 ft) using conventional truck and shovel methods to deliver ore to a mine-level primary jaw crusher at 8,450 ft elevation. Crushed ore will be dropped approximately 350 ft in a vertical ore pass to an underground chamber, where it will be reclaimed and loaded onto a conveyor. Ore will travel via conveyor 3,400 ft underground on a -15% decline to the adit portal and transferred to a coarse-ore stockpile at 7,550 ft elevation. A reclaim tunnel under the stock pile will feed a secondary cone crusher, reducing the particle size to -3/4 inch for radial stacking on a 22.5 Mt capacity HDPE-lined leach pad. Stacked ore will be leached with a cyanide solution. Pregnant solution will be collected in ponds and processed using conventional ADR column leach technology to produce a gold/silver doré product.
In 2010, MH-LLC retained SRK to complete a FS for the Centennial Project. During 2010-11, several data collection programs were carried out to advance the project to Feasibility level including:
| • | Drilling and metallurgical testing to confirm gold recovery projections and process design; |
| • | Drilling and geotechnical pit slope stability evaluation for mine planning; |
| • | Drilling and a hydrogeologic investigation of production water supply and groundwater monitoring for permitting; and, |
| • | Geochemical characterization of waste rock to support permitting. |
The significant findings in these areas are summarized below.
| 23.1.1 | Metallurgy and Processing |
The ore lithology of the Centennial deposits consists primarily of oxidized metasediments and some igneous rock (Seligman Stock), with a much smaller percentage of un-oxidized equivalents of the same rock types. The confirmation of the recovery characteristics of these material types was considered critical to the assessment of profitability of the Project. In 2011, SRK supervised a program of drilling and metallurgical test work to support this investigation. Column tests were run on typical oxidized core intervals, as well as blended oxidized and un-oxidized samples. Bottle-roll tests were run on igneous-hosted samples. The results of the test work demonstrated favorable recovery for all materials tested, with good gold recoveries in oxidized rock (83%), good recovery in mixed oxide/sulfide material (81%) and reasonable gold recovery in igneous bottle roll tests (76%). The conclusion from the 2011 metallurgical test results, in combination with the entire database of previous work, was a projected cyanide leach recovery of gold of 79%. This was applied in the economic evaluation.
| JBP/MLM | February 22, 2012 |
| SRK Consulting (U.S.), Inc. | ||||
| NI 43-101 Technical Report – Mt. Hamilton Gold Project, Centennial Deposit | Page 222 |
Metal recovery from Centennial ores is crush sensitive, and through series of tests using different size fractions of core from 2009-2011, an optimum crush size of 91% passing -3/4 inch was selected for the leach operation.
Recovery is also a function of leaching time. Typically 70% or more of the recoverable gold in column tests is recovered in the first 30 days. But after analyzing leach recovery curves for all of the column test work, SRK recommends a leach cycle of 210 days during field operations to achieve full recovery.
Recovery is less sensitive to head grade. A regression analysis of all available column data suggests that a 2% downward correction factor should be applied to the laboratory test results to account for the difference between the average column test head grade of 0.036 oz/t Au, and the predicted mining head grade of 0.022 oz/t Au.
Comminution test results suggest that the ore fractures easily at a low power requirement and has low abrasion characteristics. These data were factored into crusher sizing and operating costs for wear parts. Based on height-percolation testing the ore can be stacked without agglomeration to a maximum height of 220 ft (limit of test). SRK has designed a lower, more conservative maximum stacking height of 200 ft in 25 ft lifts.
| 23.1.2 | Geotechnical Pit Slope Stability |
The Feasibility-level pit geotechnical program included the drilling of three dedicated HQ-sized geotechnical oriented core holes. Drilling, logging and analysis of these holes was supervised by SRK in 2010-2011. These data fed into an analysis of pit wall stability and a projection of pit slope angles that was used to design the interim and final pit configurations. According to the analysis, the east highwall of the Centennial designed pit will sustain an overall slope angle of 50 degrees.
| 23.1.3 | Geochemical Characterization of Waste Rock |
Waste rock and spent-ore geochemical characterization are required for permitting and closure design. Beginning in 2009, SRK prescribed and supervised a program of sample collection and geochemical test work to characterize waste and ore material for the Centennial Project. The analytical program consisted of a phased series of static tests (ABA, NAG, MWMP) followed by a more selective set of humidity cell tests, which were still in progress at advanced levels at the time of this writing.
Based on the results of the Centennial waste rock and ore characterization, the majority of material in the current mine plan presents a low risk for acid rock drainage and metal leaching. A few samples of ore-grade skarn and igneous intrusive material show a higher potential for acid generation and metal leaching. However, the igneous intrusive material comprises a small percentage of the total waste rock that will be placed on the waste rock dumps. Furthermore, most of the waste rock material has inherent acid neutralization potential due to the significant neutralization capacity of carbonate and calc-silicate altered rocks that comprise the bulk of the deposit. Therefore, management of potentially problematic waste rock can be achieved by blending it with acid neutralizing material and segregated waste rock management will likely not be required for the Project.
| JBP/MLM | February 22, 2012 |
| SRK Consulting (U.S.), Inc. | ||||
| NI 43-101 Technical Report – Mt. Hamilton Gold Project, Centennial Deposit | Page 223 |
| 23.1.4 | Hydrogeology: Groundwater Monitoring and Production Water Supply |
Previous adjacent mining at NE Seligman and recent exploration drilling suggest that the Centennial mine will not intersect the groundwater table, and therefore will neither require substantial dewatering nor create a pit lake. Consequently, the hydrogeological evaluation carried out in late 2011 focused on 1) location of, and preliminary design criteria for a water supply well(s) for the leach processing operation, and 2) the long-term physical and chemical characterization (monitoring) of groundwater up gradient and down gradient of the process facility.
A total of three wells were drilled for hydrogeological characterization purposes in the vicinity of the proposed heap leach pad. Groundwater monitoring well MW-01 (up gradient) was advanced deep into bedrock and initial static groundwater was measured at 782.5 ft bgs after well completion. Groundwater monitoring well MW-02 (down gradient) was drilled entirely in alluvium (Qal) to a depth of 750 ft bgs and static groundwater was measured at 365 ft bgs.
These data suggest the presence of both an alluvial and bedrock influenced groundwater system at the Centennial site. Directly beneath the proposed leach pad facility, the depth to groundwater is approximately 500 ft bgs.
The PW-01 borehole was drilled as a test well for potential production water supply. The PW-01 hole was terminated at 568 ft bgs due to a slow rate of penetration and a lack of significant water production. The hole is being monitored for static level of ground water. If feasible, an application may be made to convert this boring to an up gradient monitor well. If not it will be abandoned per Nevada well drilling regulations.
Water for production will be further evaluated on the MH-LLC’s private parcel located approximately 3,000 ft west of the ADR process plant. The initial hydrogeologic exploration carried out during 2011 monitor well installation indicated that one or more wells in an alluvium-hosted aquifer could supply water needed for mining and heap leach operations (peak requirement 500 gpm). If a production well or wells can be developed at the leach pad site then this would reduce operating costs associated with project water supply. This FS assumes that water will be obtained from the more distant, but proven Seligman Canyon source.
| 23.2 | Significant Risks and Uncertainties |
The purpose of the FS is to collect and analyze sufficient data to reduce or eliminate risk in the technical components of the project and to refine economic projections based on current cost data. Residual uncertainty for this project at the completion of this study is minor. A general assessment of risk for the principal elements of the Project is presented in the subsections below.
| 23.2.1 | Exploration |
MH-LLC has assembled a complete and current land package for mine development including nine (9) patented and 256 unpatented mineral claims surrounding the mineral deposit and proposed mine facilities. SRK has verified the claim block to ensure that it covers the area proposed for mining, processing and waste rock placement.
MH-LLC has opportunities within this claim block to conduct additional exploration on several prospects that lie outside of the Centennial mine footprint. These include most notably:
| JBP/MLM | February 22, 2012 |
| SRK Consulting (U.S.), Inc. | ||||
| NI 43-101 Technical Report – Mt. Hamilton Gold Project, Centennial Deposit | Page 224 |
NE Seligman Residuals: Historic drilling and resource models suggest residual mineralization remains in the bottom of some of the previous NE Seligman open pits located immediately north (<1,000 ft) of Centennial. The quantity, grade and leach response of this material is unknown and will have to be characterized with drilling and metallurgical testing. However, if an economic resource is defined in this area there would be an opportunity to mine ore with little stripping and existing equipment early in the project life.
Chester Prospect: Chester is a large soil anomaly, which was tested by 40 RC holes in 1995. From the drilling, two gold-bearing zones were interpreted ranging in thickness from 5 to 50 ft thick and averaging approximately 0.04 oz/t Au. The geometry of mineralization is currently not well understood. Chester is located approximately 3,000 ft SE of Centennial. Several exploration holes were drilled on this target in late 2011. At the time of this writing, results were not yet reviewed.
Five-Way Prospect: This original surface rock chip and soil anomaly yielded rock chips in excess of 40,000 parts per billion (1.37 oz/t) gold. This area was drilled in hole 92-008, and produced an intercept of 15 ft of 0.19 oz/t Au. The mineralization was accompanied by sericite alteration and quartz veining. The Five-Way anomaly is near the ridge top <1,000 ft NE of Centennial. Additional drilling is warranted at Five-Way as both exploration and condemnation as part of the Centennial mine development.
| 23.2.2 | Mineral Resource Estimate |
The Mineral Resource for Centennial is based on: 1) a 3D geologic model that was used to define block densities; and, 2) a structural interpretation that was used to define grade continuity and direction. The Mineral Resource identified in this study is greater than in the previous Technical Reports. The increase is a function of: 1) successful 2011 infill-drilling connecting and extending high grade areas; and 2) higher metal prices driving lower CoGs and larger grade shells.
The quality of the historic data used in the resource estimate has been verified by recent drilling and confirmed by an analysis of quality control data by SRK. While recent drilling results for silver substantiate previous grade-thickness intercepts, the historic silver database is incomplete compared to gold, and therefore there is less confidence in the resource estimate for silver. On average silver contributes 11% to the gold-equivalent value of the model blocks above the CoG. Silver contributes 19% to the gold-equivalent value in igneous ores above cut-off.
The resource and reserve estimation exercises described in Sections 12 and 13 demonstrate a potential to increase the size of the existing Centennial deposit through step-out exploration around the east and southeast margins of the current pit configuration. Approximately 2.6 Mt of Indicated Resources grading 0.017 oz/t gold (45.3 koz of gold) and 0.153 oz/t silver (397.6 koz of silver) and 2.8 Mt of Inferred Resource grading 0.018 oz/t gold (50.2 koz of gold) and 0.080 oz/t silver (223.5 oz of silver) above a 0.006 oz/t gold cut-off have been identified outside of the reserve pit, but within the resource envelope (Whittle™ shell). Most of these resources are in the Inferred classification. Additional drilling will be required to define these possible additions.
| 23.2.3 | Mineral Reserves and Mining |
The conversion of Mineral Resources to Mineral Reserves used conservative inputs for metal prices (US$1,200 and US$20 for Au and Ag respectively) and recoveries (75% and 75% for Au and Ag respectively). Silver recovery was intentionally discounted. Only 75% recovery was applied to silver
| JBP/MLM | February 22, 2012 |
| SRK Consulting (U.S.), Inc. | ||||
| NI 43-101 Technical Report – Mt. Hamilton Gold Project, Centennial Deposit | Page 225 |
values, which already represent “recoverable” silver. This was done to ensure that silver was not overly weighted in the definition of an ore block in the reserve.
All previous drilling at Centennial and mining in the adjacent NE Seligman mine indicate that groundwater exceeds the depth of proposed mining. Therefore, the open pit will be dry and will require no provisions for dewatering. This improves the probability that geotechnical requirements for slope stability will be achieved. The pit will require some surface water diversion as the footprint expands toward the end of the mine life.
The mine design addressed concerns for mining at high elevations in harsh winter operating conditions. As such, mine support facilities have been minimized, and haul road grades were limited to 8%, mostly to ensure safe transport during loaded down-hill hauls.
Mining on 20 ft benches, triple benched to 60 ft using a hydraulic shovel allows for selectivity in fairly tabular ore. Oxide ore is visibly distinguishable from un-oxidized waste and in most cases, this will improve grade control efficiency; however, no allowance has been made in this study for any improved efficiencies from visual ore segregation.
By designing a predominantly underground ore-flow system, the ore-haul distances in winter conditions are minimized and ore delivery is less susceptible to interruption related to weather. Conveyors protected by the underground adit should be easy to maintain with less weather-related down-time.
| 23.2.4 | Metallurgy and Processing |
A 2010-2011 dedicated drilling and metallurgical testing program supervised by SRK was designed to get better spatial coverage of the ore body and to investigate recoveries in atypical ores, such as mixed oxide/sulfide ores and igneous ore. Column leach test work conducted in 2011 confirmed anticipated gold and silver recoveries in typical oxidized and mixed oxide/sulfide ores.
Comparing 2011 column test work, which was conducted at finer crush sizes, to previous and historic results demonstrates that the recovery of Centennial ores is size sensitive. To address this, the FS processing design requires crushing to 91% passing -3/4 inch. Appropriate primary and secondary crushing equipment has been sized and priced to achieve this optimum size.
North Area ore, hosted entirely in igneous rock, was investigated using bottle roll tests of RC drill cuttings. Gold recoveries were better than anticipated (73%) from low average head grades (0.013 oz/t Au). The bottle roll test results should be validated with future column tests as described in Section 24. Overall SRK believes the bulk of the deposit has been well characterized with respect to recovery.
Recent column work also provided results from comminution and height percolation tests that were used to define crushing horsepower, crusher wear, and stacking height parameters for the processing design.
There remain some uncertainties in ore-flow system related to the geotechnical characterization of the proposed adit and ore-pass chamber. Ideally, both of these excavations would have received a geotechnical evaluation at Feasibility level based on pilot-hole drilling; however, permitting limitations and winter drilling conditions precluded this assessment. To mitigate the uncertainty, SRK has, based on outside underground subcontractor pricing, applied heavy contingencies for ground
| JBP/MLM | February 22, 2012 |
| SRK Consulting (U.S.), Inc. | ||||
| NI 43-101 Technical Report – Mt. Hamilton Gold Project, Centennial Deposit | Page 226 |
support, which added costs to planned underground development. This was deemed necessary in the absence of geotechnical supporting data.
Other components of the ore flow system, including the conveyor and stacker array are well understood, vendor quoted, and considered to be of low risk for consistent ore delivery.
Similarly, the selected processing methodology is considered low risk. ADR column leaching for gold and silver recovery is proven technology and widely used in analogous operations in Nevada.
The production water supply has been defined and water rights sufficient for production have been secured by MH-LLC. The FS used the existing Seligman well as the primary source for production water, but further hydrogeologic exploration is planned to locate a source closer to the leach operation in order to reduce operating costs.
There is no tailings risk associated with this processing plan as no tailings will be generated. Spent ore will remain on containment (HDPE liner) after leaching and the facility will be reclaimed in place during closure.
| 23.2.5 | Projected Economic Outcomes |
Capital costs used in the Feasibility-level economic analysis for Centennial were based heavily on vendor and specialist quotations to a minimum accuracy of +/- 15%. A total of 98% of mining, 97% of process, and 80% of owner and infrastructure capital costs are linked to vendor quotes. SRK has applied additional contingencies to these estimates for omissions. Similarly, operating costs, as driven by consumables or labor rates were supported by recent relevant vendor information or public domain mining services cost providers, typically InfoMine®.
The project economics are based on a three year pre-development period that coincides with the time requirement for permitting. This permitting time requirement is still unknown, since the controlling agency (USFS) has not yet determined which permitting path (EA vs. EIS) is most appropriate for Centennial Project development. The Project has several characteristics that are favorable for permitting including:
| • | No anticipated pit lake; |
| • | Acid neutralizing waste rock; |
| • | Deep groundwater beneath the proposed leach pad; and |
| • | Process components operated and closed on private land. |
Economics of the Centennial Project are sensitive to commodity prices, which are currently near all-time high levels and have been elevated for the past five years. These high gold and silver prices have created a very vibrant mining market and also a high demand for skilled labor and technical services. One of the challenges MH-LLC faces in developing Centennial is attracting qualified management and staff to operate the mine. For the foreseeable future, supply and demand for materials and labor to support the operation will be linked to metal prices.
Over the course of the last several years, MH-LLC has successfully negotiated and or bought down most of the production royalty obligation that the Project carried previously. The Project is currently subject to a 1% Net Smelter Return royalty.
| JBP/MLM | February 22, 2012 |
| SRK Consulting (U.S.), Inc. | ||||
| NI 43-101 Technical Report – Mt. Hamilton Gold Project, Centennial Deposit | Page 227 |
| 23.2.6 | Foreseeable Impacts of Risks |
The foreseeable impacts of risks as they are currently perceived are minimal for the Centennial Project. Of most concern are the uncertainties regarding the start date of operations related to permitting, and the potential short supply of qualified management and staff. These are typical uncertainties related to most developing mining properties in the current market.
| JBP/MLM | February 22, 2012 |
| SRK Consulting (U.S.), Inc. | ||||
| NI 43-101 Technical Report – Mt. Hamilton Gold Project, Centennial Deposit | Page 228 |
| 24 | Recommendations (Item 26) |
| 24.1 | Recommended Work Programs |
Work programs recommended to advance the Centennial Project include drilling, engineering designs and technical studies as follows:
Drilling:
| • | Resource conversion drilling (RC) (Inferred upgrade to Measured/Indicated outside of but adjacent to the ore within the current mine plan); |
| • | North area resource/metallurgical confirmation core drilling; |
| • | Step out exploration drilling (NE Seligman residuals); |
| • | Geotechnical drilling and analysis for underground development; and |
| • | Water supply well relocation to optimize proximity to operations. |
Engineering Designs:
| • | Detailed design project management; and |
| • | Detailed designs for crushing, processing and infrastructure. |
Technical Studies:
| • | North Area metallurgical test work and analysis; |
| • | Completion of on-going waste rock HCT and analysis; and |
| • | Environmental permitting. |
| 24.1.1 | Drilling |
A program of exploration drilling is recommended to convert some of the inferred mineralization in the resource model to a higher classification (Measured or Indicated) so that it can be considered in future reserve estimates and mine plans. Priority areas include: the east highwall, the southeast extension, the northeast gap area. These areas are currently accessible and are planned to be drilled using RC methods.
Additional drilling is proposed for the Centennial North Area, which is the north lobe of mineralization at Centennial hosted in igneous rock. The program will provide core for more thorough grade, metallurgical and geotechnical characterization, specifically metallurgical column testing. Existing North Area bottle-roll test results from RC cutting are favorable for recovery of gold and silver, but should be confirmed with column tests of core.
MH-LLC has expressed interest in exploring the residual resource at Rea Gold’s former NE Seligman mine. There is an existing drilling database supporting this area, but “twin” type confirmation holes will be required to validate the historic data and define the resource.
Based on two exploratory water wells drilled and tested in 2011, SRK recommends two wells for purposes of mine water supply for the Centennial project. These wells should be installed close to the proposed ADR processing plant to reduce pumping and piping costs. For the purposes of this Feasibility, the existing Seligman well has been assumed as the water supply for operations.
| JBP/MLM | February 22, 2012 |
| SRK Consulting (U.S.), Inc. | ||||
| NI 43-101 Technical Report – Mt. Hamilton Gold Project, Centennial Deposit | Page 229 |
The overall capital cost associated with drilling, well materials and construction, well development, pump installation, well head completion, and testing of new wells ultimately will vary based on the drilling contractor and well material manufacturing costs. SRK assumes based on general unit costs the construction of these wells will be within ±10% of US$600,000.
| 24.1.2 | Engineering Designs |
Pre-construction-level planning will require detailed designs and cost estimates for the project infrastructure and for the processing plant. At Feasibility, these elements are not sufficiently engineered to provide bid quality designs for construction. SRK recommends initiating these detailed designs and suggests that MH-LLC hire a qualified professional to coordinate this work. Preliminary Engineering Procurement Construction Management (EPCM) costs have been included in the next phase of project development.
| 24.1.3 | Technical Studies |
There are several on-going and new technical studies that must be undertaken to advance the Project. Some of these studies are extensions of on-going work in the areas of metallurgy and geochemistry. Environmental permitting is the highest cost item of the remaining technical work elements to be completed.
Commensurate with core drilling in the North Area, SRK recommends column test work to verify positive results from bottle-roll metallurgical testing in 2011.
Long-term waste rock chemical stability is assessed using HCTs. There are currently six HCTs in progress, which at the time of this writing were at week 46, 29, and 27 of a minimum 20 week test period. While the test results to date are well understood, to satisfy permitting requirements, SRK recommends continuing these tests until chemical parameters of the cells have completely stabilized. The analysis of the results will be finalized when the tests are complete.
SRK has estimated US$500,000 of additional permitting support to be provided by an environmental contractor. The regulatory agencies involved will determine the permitting path most appropriate for project development. This Technical Report will provide necessary details for the submittal of the project Plan of Operations, which is expected to be submitted in Q1, 2012.
| 24.1.4 | Costs |
A total anticipated cost for advancement of the project during the Pre-Construction phase is US$3.7 million. The cost break-down for the work programs described above are presented in Table 24.1.4.1.
| JBP/MLM | February 22, 2012 |
| SRK Consulting (U.S.), Inc. | ||||
| NI 43-101 Technical Report – Mt. Hamilton Gold Project, Centennial Deposit | Page 230 |
Table 24.1.4.1: Recommended Pre-Construction Work Program Costs
Work Program | Estimated Cost US$ | Assumptions/Comments | ||||
Centennial resource conversion drilling (RC) | 195,000 | 6 holes to 500 ft @ $65/ft | ||||
|
| |||||
Centennial resource/met confirmation drilling (DD) | 75,000 | 2 holes to 300 ft @ $125/ft | ||||
|
| |||||
Step out exploration drilling (RC) | 104,000 | 8 holes to 200 ft @ $65/ft | ||||
|
| |||||
Geotechnical drilling for underground development (DD) | 500000 | 2,500 ft @ 200/ft incl. supervision | ||||
|
| |||||
Water supply production well installation | 600,000 | 2 large diameter wells, drilled, | ||||
|
| |||||
| completed, pump tested and pumps | ||||||
|
| |||||
Total Drilling | 1,474,000 | |||||
|
| |||||
Detailed design project management | 200,000 | salaried new hire or contract PM | ||||
|
| |||||
Detailed design for crushing, process and infrastructure and preliminary EPCM | 1,000,000 | specialist contractor/engineer | ||||
|
| |||||
Total Detailed Design | 1,200,000 | |||||
|
| |||||
Metallurgical test work and analysis | 50,000 | consultant engineer | ||||
|
| |||||
Heap and waste rock geochem | 35,000 | on-going HCT | ||||
|
| |||||
Environmental permitting | 500,000 | environmental contractor | ||||
|
| |||||
Total Technical Studies | 585,000 | |||||
|
| |||||
Sub Total | 3,259,000 | |||||
|
| |||||
Contingency @15% | 488,850 | |||||
|
| |||||
Total | 3,747,850 | |||||
|
| |||||
| JBP/MLM | February 22, 2012 |
| SRK Consulting (U.S.), Inc. | ||||
| NI 43-101 Technical Report – Mt. Hamilton Gold Project, Centennial Deposit | Page 231 |
| 25 | References (Item 27) |
| Carrington, | (2009) 1997 RC Bottle Roll Leach Test Results. Project metallurgical file provided to SRK by Robert Carrington in 2009. |
| Crafford, | A.E.J., 2007, Geologic Map of Nevada: U.S. Geological Survey Data Series 249, 1 CD-ROM, 46 p., 1 plate. |
| KCA, | (1997).Final metallurgical test work on core samples from the Mt. Hamilton – Centennial Zone. Report prepared by Kappes Cassiday & Associates for REA Gold, May 8, 1997. |
| McClelland, | (2010).Report on Heap Leach Cyanidation Testing Centennial Project MLI Job Number 335.Report prepared by McClelland Laboratories of Reno, Nevada for Ely Gold & Minerals Inc. July, 2010. |
| McClelland, | (2011).Metallurgical Testing Centennial Drill Core Composites MLI Job No. 3528. Report prepared by McClelland Laboratories of Reno, Nevada for Solitario Exploration & Royalty Company, November, 2011. |
| SRK, | (2010).Updated NI 43-1010 Preliminary Economic Assessment Ely Gold & Minerals Inc. Centennial Gold and Silver Deposit Mt. Hamilton Property White Pine County, Nevada. Technical report prepared by SRK Consulting for Ely Gold & Minerals Inc. July 9, 2010. |
| USDA, | 1986, Urban Hydrology for Small Watersheds, Technical Release 55, Soil Conservation Service (now the Natural Resources Conservation Service), United States Department of Agriculture, Washington, D.C., June 1986 |
| USDI, | 1982, Surface Mining Water Diversion Design Manual, prepared for the Office of Surface Mining, United States Department of Interior, by Simons, Li, and Associates, Inc., Fort Collins, Colorado, September 1982. |
| JBP/MLM | February 22, 2012 |
| SRK Consulting (U.S.), Inc. | ||||
| NI 43-101 Technical Report – Mt. Hamilton Gold Project, Centennial Deposit | Page 232 |
| 26 | Glossary |
| 26.1 | Mineral Resources |
The mineral resources and mineral reserves have been classified according to the “CIM Standards on Mineral Resources and Reserves: Definitions and Guidelines” (November 27, 2010). Accordingly, the Resources have been classified as Measured, Indicated or Inferred, the Reserves have been classified as Proven, and Probable based on the Measured and Indicated Resources as defined below.
A Mineral Resource is a concentration or occurrence of natural, solid, inorganic or fossilized organic material in or on the Earth’s crust in such form and quantity and of such a grade or quality that it has reasonable prospects for economic extraction. The location, quantity, grade, geological characteristics and continuity of a Mineral Resource are known, estimated or interpreted from specific geological evidence and knowledge.
An ‘Inferred Mineral Resource’ is that part of a Mineral Resource for which quantity and grade or quality can be estimated on the basis of geological evidence and limited sampling and reasonably assumed, but not verified, geological and grade continuity. The estimate is based on limited information and sampling gathered through appropriate techniques from locations such as outcrops, trenches, pits, workings and drillholes.
An ‘Indicated Mineral Resource’ is that part of a Mineral Resource for which quantity, grade or quality, densities, shape and physical characteristics can be estimated with a level of confidence sufficient to allow the appropriate application of technical and economic parameters, to support mine planning and evaluation of the economic viability of the deposit. The estimate is based on detailed and reliable exploration and testing information gathered through appropriate techniques from locations such as outcrops, trenches, pits, workings and drillholes that are spaced closely enough for geological and grade continuity to be reasonably assumed.
A ‘Measured Mineral Resource’ is that part of a Mineral Resource for which quantity, grade or quality, densities, shape, physical characteristics are so well established that they can be estimated with confidence sufficient to allow the appropriate application of technical and economic parameters, to support production planning and evaluation of the economic viability of the deposit. The estimate is based on detailed and reliable exploration, sampling and testing information gathered through appropriate techniques from locations such as outcrops, trenches, pits, workings and drillholes that are spaced closely enough to confirm both geological and grade continuity.
| 26.2 | Mineral Reserves |
A Mineral Reserve is the economically mineable part of a Measured or Indicated Mineral Resource demonstrated by at least a Preliminary Feasibility Study. This Study must include adequate information on mining, processing, metallurgical, economic and other relevant factors that demonstrate, at the time of reporting, that economic extraction can be justified. A Mineral Reserve includes diluting materials and allowances for losses that may occur when the material is mined.
A ‘Probable Mineral Reserve’ is the economically mineable part of an Indicated, and in some circumstances a Measured Mineral Resource demonstrated by at least a Preliminary Feasibility
| JBP/MLM | February 22, 2012 |
| SRK Consulting (U.S.), Inc. | ||||
| NI 43-101 Technical Report – Mt. Hamilton Gold Project, Centennial Deposit | Page 233 |
Study. This Study must include adequate information on mining, processing, metallurgical, economic, and other relevant factors that demonstrate, at the time of reporting, that economic extraction can be justified.
A ‘Proven Mineral Reserve’ is the economically mineable part of a Measured Mineral Resource demonstrated by at least a Preliminary Feasibility Study. This Study must include adequate information on mining, processing, metallurgical, economic, and other relevant factors that demonstrate, at the time of reporting, that economic extraction is justified.
| 26.3 | Definition of Terms |
The following general mining terms may be used in this report.
Table 26.3.1: Definition of Terms
Term | Definition | |
Assay | The chemical analysis of mineral samples to determine the metal content. | |
Capital Expenditure | All other expenditures not classified as operating costs. | |
Composite | Combining more than one sample result to give an average result over a larger distance. | |
Concentrate | A metal-rich product resulting from a mineral enrichment process such as gravity concentration or flotation, in which most of the desired mineral has been separated from the waste material in the ore. | |
Crushing | Initial process of reducing ore particle size to render it more amenable for further processing. | |
Cut-off Grade (CoG) | The grade of mineralized rock, which determines as to whether or not it is economic to recover its gold content by further concentration. | |
Dilution | Waste, which is unavoidably mined with ore. | |
Dip | Angle of inclination of a geological feature/rock from the horizontal. | |
Fault | The surface of a fracture along which movement has occurred. | |
Footwall | The underlying side of an orebody or stope. | |
Gangue | Non-valuable components of the ore. | |
Grade | The measure of concentration of gold within mineralized rock. | |
Hangingwall | The overlying side of an orebody or slope. | |
Haulage | A horizontal underground excavation which is used to transport mined ore. | |
Hydrocyclone | A process whereby material is graded according to size by exploiting centrifugal forces of particulate materials. | |
Igneous | Primary crystalline rock formed by the solidification of magma. | |
Kriging | An interpolation method of assigning values from samples to blocks that minimizes the estimation error. | |
Level | Horizontal tunnel the primary purpose is the transportation of personnel and materials. | |
Lithological | Geological description pertaining to different rock types. | |
LoM Plans | Life-of-Mine plans. | |
LRP | Long Range Plan. | |
Material Properties | Mine properties. | |
Milling | A general term used to describe the process in which the ore is crushed and ground and subjected to physical or chemical treatment to extract the valuable metals to a concentrate or finished product. | |
Mineral/Mining Lease | A lease area for which mineral rights are held. | |
Mining Assets | The Material Properties and Significant Exploration Properties. | |
Ongoing Capital | Capital estimates of a routine nature, which is necessary for sustaining operations. | |
Ore Reserve | See Mineral Reserve. | |
Pillar | Rock left behind to help support the excavations in an underground mine. | |
RoM | Run-of-Mine. | |
Sedimentary | Pertaining to rocks formed by the accumulation of sediments, formed by the erosion of other rocks. | |
Shaft | An opening cut downwards from the surface for transporting personnel, equipment, supplies, ore and waste. |
| JBP/MLM | February 22, 2012 |
| SRK Consulting (U.S.), Inc. | ||||
| NI 43-101 Technical Report – Mt. Hamilton Gold Project, Centennial Deposit | Page 234 |
Term | Definition | |
Sill | A thin, tabular, horizontal to sub-horizontal body of igneous rock formed by the injection of magma into planar zones of weakness. | |
Smelting | A high temperature pyrometallurgical operation conducted in a furnace, in which the valuable metal is collected to a molten matte or doré phase and separated from the gangue components that accumulate in a less dense molten slag phase. | |
Stope | Underground void created by mining. | |
Stratigraphy | The study of stratified rocks in terms of time and space. | |
Strike | Direction of line formed by the intersection of strata surfaces with the horizontal plane, always perpendicular to the dip direction. | |
Sulfide | A sulfur bearing mineral. | |
Tailings | Finely ground waste rock from which valuable minerals or metals have been extracted. | |
Thickening | The process of concentrating solid particles in suspension. | |
Total Expenditure | All expenditures including those of an operating and capital nature. | |
Variogram | A statistical representation of the characteristics (usually grade). |
| 26.4 | Abbreviations |
The following abbreviations may be used in this report.
Abbreviation | Unit or Term | |
| % | percent | |
| ° | degree (degrees) | |
| °C | degrees Centigrade | |
| AA | atomic absorption | |
| AAS | atomic absorption spectroscopy | |
| ADR | adsorption-desorption-recovery | |
| AFA | acre-feet per annum | |
| Ag | silver | |
| AGP | Acid Generation Potential | |
| amsl | above mean sea level | |
| ANP | Acid Neutralization Potential | |
| Au | gold | |
| AuEq | gold equivalent grade | |
| bgs | below ground surface | |
| cfs | cubic feet per second | |
| CIM | Canadian Institute of Mining, Metallurgy and Petroleum Standards on Mineral Resources and Reserves: Definitions and Guidelines | |
| cm | centimeter | |
| CoG | cut-off grade | |
| EA | environmental assessment | |
| EIS | environmental impact statement | |
| FA | fire assay | |
| FS | feasibility study | |
| ft | foot (feet) | |
| ft2 | square foot (feet) | |
| ft3 | cubic foot (feet) | |
| g | gram | |
| g/t | grams per short ton | |
| gal | gallon | |
| gpm | gallons per minute | |
| H2O2 | hydrogen peroxide solution | |
| HCT | humidity cell test | |
| HDPE | high density polyethylene | |
| hp | horsepower | |
| ICP | induced couple plasma | |
| JBP/MLM | February 22, 2012 |
| SRK Consulting (U.S.), Inc. | ||||
| NI 43-101 Technical Report – Mt. Hamilton Gold Project, Centennial Deposit | Page 235 |
Abbreviation | Unit or Term | |
ID2 | inverse distance squared | |
IDW | inverse distance weighted | |
koz | thousand troy ounce | |
kt | thousand short tons | |
kW | kilowatt | |
kWh | kilowatt-hour | |
lb | pound | |
LoM | life-of-mine | |
MH-LLC | Mt. Hamilton LLC | |
Mt | million short tons | |
Mt/y | million tons per year | |
Myd3 | million cubic yards | |
NAG | Net Acid Generation | |
NI 43-101 | Canadian National Instrument 43-101 | |
NN | Nearest Neighbor | |
NNP | Net Neutralization Potential | |
NPR | Neutralization Potential Ratio | |
OK | ordinary kriging | |
oz | troy ounce | |
oz/t | ounces per short ton | |
oz/yd2 | ounces per square yard | |
PoO | plan of operations | |
ppm | parts per million | |
QA/QC | quality assurance/quality control | |
QP | qualified person | |
RC | rotary circulation | |
RoM | run-of-mine | |
s.u. | Standard units | |
sec | second | |
t | short ton (2,000 pounds) | |
t/d | short tons per day | |
t/h | short tons per hour | |
t/y | short tons per year | |
US$ | United States Dollar | |
V | volts | |
W | watt | |
y | year | |
| JBP/MLM | February 22, 2012 |
| SRK Consulting (U.S.), Inc. | ||||
| NI 43-101 Technical Report – Mt. Hamilton Gold Project, Centennial Deposit | Appendices |
Appendices
| JBP/MLM | February 22, 2012 |
| SRK Consulting (U.S.), Inc. | ||||
| NI 43-101 Technical Report – Mt. Hamilton Gold Project, Centennial Deposit | | Appendices | |
Appendix A: Certificates of Authors
| JBP/MLM | February 22, 2012 |