Exhibit 99.2

MAY 2022

1 © 20 22 AGREE REALTY CORPORATION . ALL RIGHTS RESERVED. CONFIDENTIAL. Agree Realty Overview (NYSE: ADC) OUR COMPANY Net lease growth REIT focused on the acquisition and development of high - quality retail properties Founded in 1971 by Executive Chairman, Richard Agree Public on the NYSE since 1994 $7.1 billion (1) retail net lease REIT headquartered in Bloomfield Hills, Michigan 1,510 retail properties totaling approximately 31 million square feet in 47 states Investment grade issuer ratings of Baa1 from Moody’s and BBB from S&P RE THINK RETAIL Capitalize on distinct market positioning in the retail net lease space Focus on 21 st century industry - leading retailers through our three unique external growth platforms Leverage our real estate acumen and relationships to identify superior risk - adjusted opportunities Maintain a conservative and flexible capital structure that enables our growth trajectory Provide consistent, high - quality earnings growth and a well - covered, growing dividend As of March 31, 2022 , unless otherwise noted. (1) As of May 2, 2022.
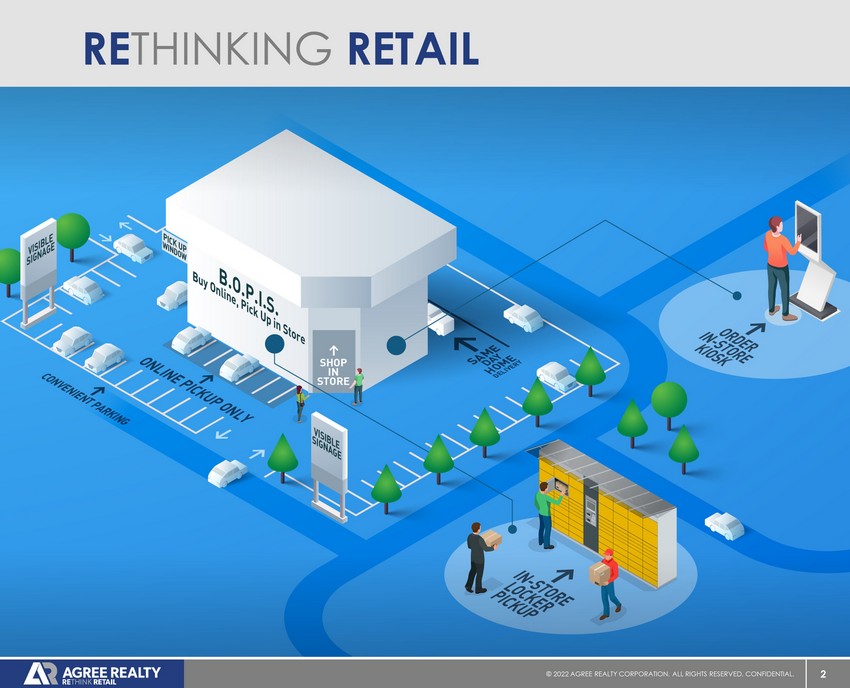
2 © 20 22 AGREE REALTY CORPORATION . ALL RIGHTS RESERVED. CONFIDENTIAL. RE THINKING RETAIL

3 © 20 22 AGREE REALTY CORPORATION . ALL RIGHTS RESERVED. CONFIDENTIAL. consistency noun steadfast adherence to the same principles, course, or form [ kuh n - sis - tuh n - see ]

4 © 20 22 AGREE REALTY CORPORATION . ALL RIGHTS RESERVED. CONFIDENTIAL. Raised 2022 acquisition guidance by 25% at the midpoint to $1.4 billion to $1.6 billion (1) As of May 2, 2022, unless otherwise noted. (1) Reflects increased full - year 2022 acquisition guidance provided by the Company on May 3, 2022. (2) Proforma for the settlement of the Company’s outstanding ATM forward equity offerings as of March 31, 2022. (3) Refer to footnote 1 on slide 7 for the Company’s definition of Investment Grade. Recent Highlights Declared a common cash dividend of $0.234 per share for April, representing a 7.8% year - over - year increase Settled approximately 3.8 million shares of outstanding forward equity during Q1 2022 for net proceeds of almost $251 million 4.3x Proforma Net Debt to Recurring EBITDA as of the end of Q1 2022 (2) Investment grade rating upgraded by Moody’s to Baa1 with a stable outlook 106 properties acquired in Q1 2022 for over $407 million 74.2% of base rents acquired in Q1 2022 derived from investment grade retailers (3) Sold one asset in Q1 2022 for more than $8 million, resulting in a gain of over $2 million 18 development or PCS projects completed or under construction for approximately $53 million as of March 31 st Ground lease portfolio represents 13.5% of annualized base rents as of March 31 st Approximately 4.1 million shares of outstanding forward equity available at March 31 st for net proceeds of almost $263 million

The Country’s Leading Retail Portfolio

6 © 20 22 AGREE REALTY CORPORATION . ALL RIGHTS RESERVED. CONFIDENTIAL. Agree Realty Snapshot TENANT SECTOR ANNUALIZED BASE RENT % OF TOTAL Grocery $39.3 9.9% Home Improvement 37.1 9.4% Tire and Auto Service 30.6 7.7% Convenience Stores 30.6 7.7% General Merchandise 25.7 6.5% Off - Price Retail 24.3 6.2% Auto Parts 23.9 6.0% Dollar Stores 23.9 6.0% Farm and Rural Supply 19.8 5.0% Pharmacy 18.4 4.6% Other 122.9 31.0% Total $396.5 100.0% Share Price (1) $66.17 Equity Market Capitalization (1)(2) $5.0 Billion Property Count 1,510 properties Top 3 Tenant Concentration 15.2% Net Debt to EBITDA 5.0x / 4.3x (3) Investment Grade % (4) 67.8% TENANT / CONCEPT ANNUALIZED BASE RENT % OF TOTAL $26.1 6.6% 17.8 4.5% 16.3 4.1% 13.2 3.3% 12.6 3.2% 12.3 3.1% 11.7 3.0% 10.9 2.8% 10.8 2.7% 10.5 2.7% 10.4 2.6% 9.5 2.4% 9.5 2.4% 9.2 2.3% 9.1 2.3% 8.3 2.1% 7.7 1.9% 7.0 1.8% 6.1 1.5% Other 177.6 44.7% Total $396.5 100.0% Company Overview Tenants ($ in millions) Retail Sectors ($ in millions) As of March 31, 2022, unless otherwise noted. Any differences are a result of rounding. (1) As of May 2, 2022. (2) Reflects c omm on shares and OP units outstanding multiplied by the closing price as of 5/2/2022. (3) Proforma for the settlement of the Company’s outstanding forward equity offerings as of March 31, 2022. (4) Ref er to footnote 1 on slide 7 for the Company’s definition of Investment Grade. (5) In April 2022, the Company sold the ownership of one LA Fitness asset that was acquired during Q1 2022, reducing t he Company’s LA Fitness exposure to 1.3% of ABR. (5)
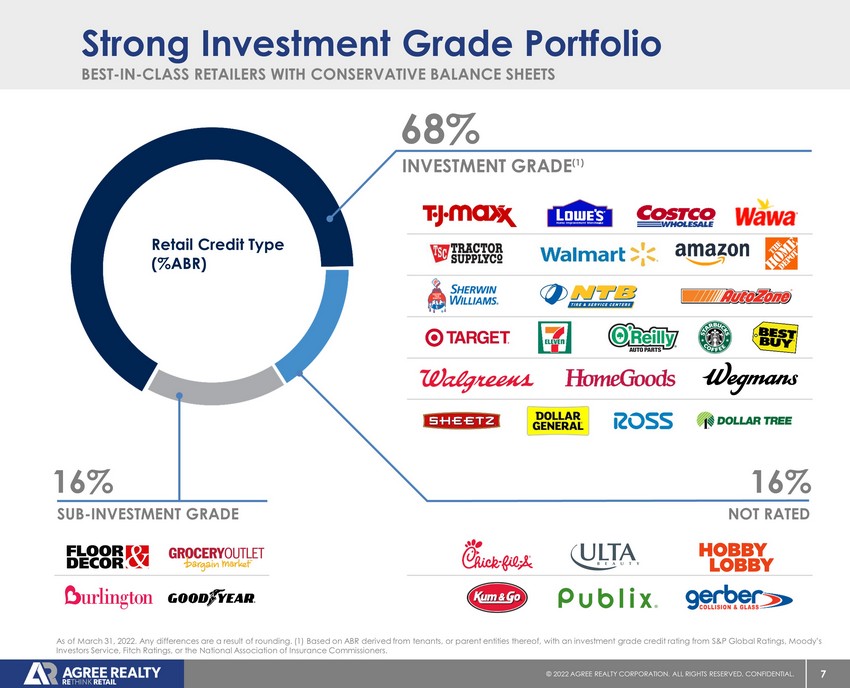
7 © 20 22 AGREE REALTY CORPORATION . ALL RIGHTS RESERVED. CONFIDENTIAL. BEST - IN - CLASS RETAILERS WITH CONSERVATIVE BALANCE SHEETS Strong Investment Grade Portfolio 16% SUB - INVESTMENT GRADE 16% NOT RATED 68% INVESTMENT GRADE (1) As of March 31, 2022. Any differences are a result of rounding. (1) Based on ABR derived from tenants, or parent entities the reo f, with an investment grade credit rating from S&P Global Ratings, Moody’s Investors Service, Fitch Ratings, or the National Association of Insurance Commissioners. Retail Credit Type (%ABR)

8 © 20 22 AGREE REALTY CORPORATION . ALL RIGHTS RESERVED. CONFIDENTIAL. INDUSTRY - LEADERS OPERATING IN E - COMMERCE RESISTANT SECTORS National and Super - Regional Retailers 1% FRANCHISE 13% SUPER - REGIONAL 86% NATIONAL As of March 31, 2022. Any differences are a result of rounding. Retail Tenant Type (%ABR)

9 © 20 22 AGREE REALTY CORPORATION . ALL RIGHTS RESERVED. CONFIDENTIAL. As of March 31, 2022. (1) Refer to footnote 1 on slide 7 for the Company’s definition of Investment Grade. FEE SIMPLE OWNERSHIP + SIGNIFICANT TENANT INVESTMENT Ground Lease Portfolio Breakdown Ground Lease Credit Overview (%ABR) 87% INVESTMENT GRADE (1) 10% NOT RATED 3% SUB - INVESTMENT GRADE Ground Lease Portfolio Overview 186 Properties 13.5% of total portfolio ABR 11.8 years weighted - average lease term Top Ground Lease Tenants (% ABR) 17% 14% 12% 12% 7% 7% 6% 4% 3% 2% 2%

10 © 20 22 AGREE REALTY CORPORATION . ALL RIGHTS RESERVED. CONFIDENTIAL. As of March 31, 2022, unless otherwise noted. (1) Retailer credit ratings are weighted by annualized base rent as of March 31 , 2 022. The weighted - average credit rating is determined by factoring in each Company’s unsecured ratings from S&P Global Ratings, Moody’s Investors Service, Fitch Ratings, or the National Association of In surance Commissioners. Assumes the equivalent of a B+/B1 rating for non - rated retailers. (2) Retailers’ weighted - average cost of debt factors in each Company’s 10 - year unsecured debt yields as of 3/31 /2022 (to the extent applicable). Assumes the same pricing as the 10 - Year Bloomberg BBB Composite Index for investment grade retailers that do not have applicable debt. Assumes the same pricing as t he ICE BofA US High Yield Index Effective Yield for sub - investment grade and non - rated retailers that do not have applicable debt. (3) Per Bloomberg as of March 31, 2022. BOND - LIKE CASH FLOWS FROM INVESTMENT GRADE CREDITS AT HIGHER YIELDS Ground Lease Portfolio Offers Superior Risk - Adjusted Returns Ground Lease Key Metrics 10 - Year Bloomberg BBB Composite Index (3) 186 Properties 13.5% of Total Portfolio ABR 11.8 Years Weighted – Average Lease Term $54M Annualized Base Rent 87% Investment Grade BBB+ WTD Average Credit Rating (1) 3.8% Retailers’ 10 - Year WTD Average Cost of Debt (2) ADC Ground Lease Portfolio vs. 10 - Year Bloomberg BBB Index Longer Term: WALT of 11.8 years vs. the 10 - year duration of the BBB Index Superior Credit Profile: Average credit rating of BBB+ Reversionary Interest: If the tenant were to ever vacate, the building and the improvements revert for free! Embedded Growth Profile: A verage internal growth of close to 1% 1.5% 2.0% 2.5% 3.0% 3.5% 4.0% 4.5% Apr-21 May-21 Jun-21 Jul-21 Aug-21 Sep-21 Oct-21 Nov-21 Dec-21 Jan-22 Feb-22 Mar-22

11 © 20 22 AGREE REALTY CORPORATION . ALL RIGHTS RESERVED. CONFIDENTIAL. Limited Exposure to Sectors Impacted by COVID SECTOR % ABR CHANGE IN EXPOSURE SINCE 1/1/2018 (2) NOTABLE TENANTS E - COMMERCE RESISTANCE RECESSION RESISTANCE PRIVATE EQUITY SPONSORSHIP REAL ESTATE ATTRIBUTES COMMENTS Health & Fitness (3) 1.8% HIGH YES HIGH WEAK Private equity sponsorship, proliferation of low - cost operators + single purpose boxes. 399 BPS Movie Theaters 1.0% LOW MODERATE LIMITED WEAK Single purpose boxes + online disruption = minimal exposure to leading operators. 153 BPS Entertainment Retail 0.6% HIGH MODERATE ACCELERATING MODERATE Discretionary nature = limited exposure to leading operator with strong underlying real estate. 114 BPS As of March 31, 2022, unless otherwise noted. (1) Reflects rent collections for July 2020 through April 2022, as of May 2, 20 22. (2) Represents the change in the Company’s exposure, measured as the % of total ABR, from January 1, 2018 to March 31, 2022. (3) Reflects the sale of the ownership of one LA Fitness asset that was ac qui red during Q1 2022 and subsequently sold in April 2022. THREE MOST IMPACTED SECTORS TOTAL JUST OVER 3% OF ABR At least 99% of rent payments received in each of the past twenty - two months (1)
Disciplined Investment Strategy & Active Portfolio Management

13 © 20 22 AGREE REALTY CORPORATION . ALL RIGHTS RESERVED. CONFIDENTIAL. Engage in consistent dialogue to understand store performance and tenant sustainability Leverage relationships to identify the best risk - adjusted opportunities Our Investment Strategy Agree leverages its three distinct investment platforms to target industry - leading retailers in e - commerce and recession resistant sectors THREE - PRONGED GROWTH STRATEGY COMPREHENSIVE REAL ESTATE SOLUTIONS FOR LEADING RETAILERS ACQUISITIONS DEVELOPMENT PARTNER CAPITAL SOLUTIONS RETAILER RELATIONSHIPS

14 © 20 22 AGREE REALTY CORPORATION . ALL RIGHTS RESERVED. CONFIDENTIAL. What Has ADC Been Investing In? The retail landscape continues to dynamically evolve as market forces cause disruption and change. To mitigate risk in a period of continued disruption, the Company adheres to a number of investment criteria, with a focus on four core principles : Focus on leading operators that have matured in omni - channel structure or those in e - commerce resistant sectors OMNI - CHANNEL CRITICAL (E - COMMERCE RESISTANCE) Emphasize a balanced portfolio with exposure to counter - cyclical sectors and retailers with strong credit profiles RECESSION RESISTANCE Strong emphasis on leading operators with strong balance sheets and avoidance of private equity sponsored retailers AVOIDANCE OF PRIVATE EQUITY SPONSORSHIP Protects against unforeseen changes to our top - down investment philosophy STRONG REAL ESTATE FUNDAMENTALS & FUNGIBLE BUILDINGS
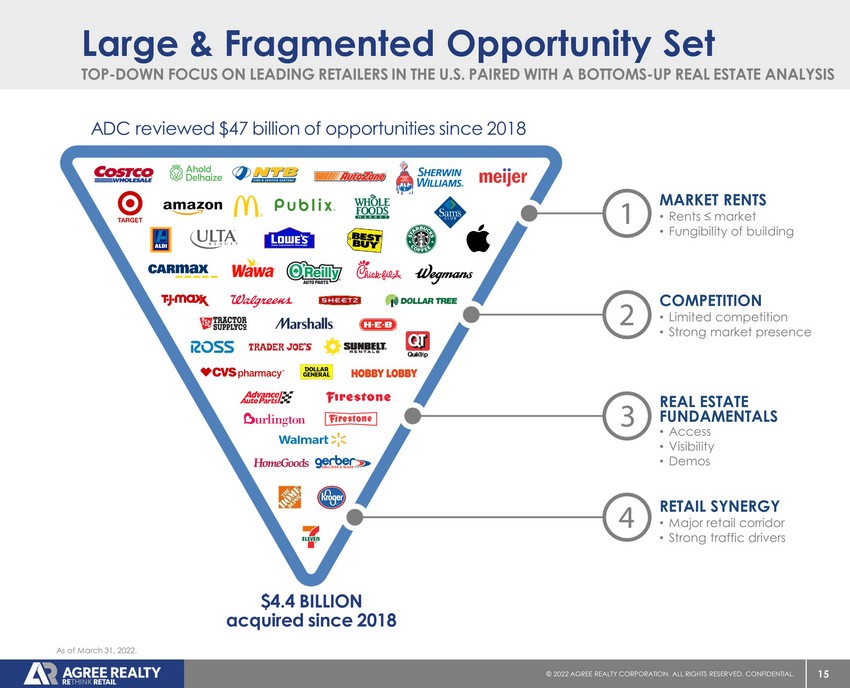
15 © 20 22 AGREE REALTY CORPORATION . ALL RIGHTS RESERVED. CONFIDENTIAL. TOP - DOWN FOCUS ON LEADING RETAILERS IN THE U.S. PAIRED WITH A BOTTOMS - UP REAL ESTATE ANALYSIS Large & Fragmented Opportunity Set REAL ESTATE FUNDAMENTALS • Rents ≤ market • Fungibility of building MARKET RENTS • Limited competition • Strong market presence COMPETITION • Access • Visibility • Demos • Major retail corridor • Strong traffic drivers RETAIL SYNERGY ADC reviewed $47 billion of opportunities since 2018 $4.4 BILLION acquired since 2018 As of March 31, 2022.

16 © 20 22 AGREE REALTY CORPORATION . ALL RIGHTS RESERVED. CONFIDENTIAL. As of March 31, 2022. Stores counts obtained from company filings and third - party sources including Progressive Grocer, Convenie nce Store News, Forbes, Biz Journals & Petroleum and Restaurant Business Magazine. 155,000+ NET LEASE OPPORTUNITIES AND GROWING WITH BEST - IN - CLASS RETAILERS Sandbox Offers Runway for Growth Tire & Auto Service Stores 4,600+ General Merchandise Stores 6,900+ Auto Parts Stores 22,700+ Dollar Stores 34,200+ Farm & Rural Supply Stores 2,100+ Crafts & Novelties Stores 900+ QSR Stores 31,500+ Equipment Rental Stores 900+ Warehouse Club Stores 1,400+ Off - Price Retail Stores 5,800+ Home Improvement Stores 8,400+ Consumer Electronics Stores 1,200+ Grocery Stores 10,300+ Dealerships 200+ Convenience Stores 24,100+
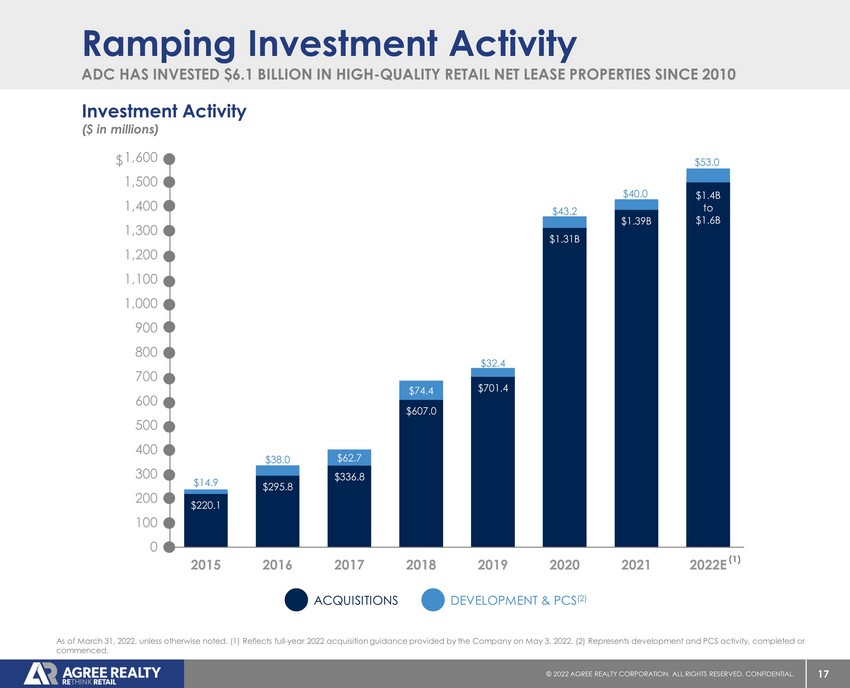
17 © 20 22 AGREE REALTY CORPORATION . ALL RIGHTS RESERVED. CONFIDENTIAL. $220.1 $295.8 $336.8 $607.0 $701.4 $1.31B $1.39B $1.4B to $1.6B $14.9 $38.0 $62.7 $74.4 $32.4 $43.2 $40.0 0 100 200 300 400 500 600 700 800 900 1,000 1,100 1,200 1,300 1,400 1,500 1,600 2015 2016 2017 2018 2019 2020 2021 2022E ADC HAS INVESTED $6.1 BILLION IN HIGH - QUALITY RETAIL NET LEASE PROPERTIES SINCE 2010 Ramping Investment Activity DEVELOPMENT & PCS (2) ACQUISITIONS Investment Activity ($ in millions) (1) $ As of March 31, 2022, unless otherwise noted. (1) Reflects full - year 2022 acquisition guidance provided by the Company on May 3, 2022. (2) Represents development and PCS activity, completed or commenced. $53.0
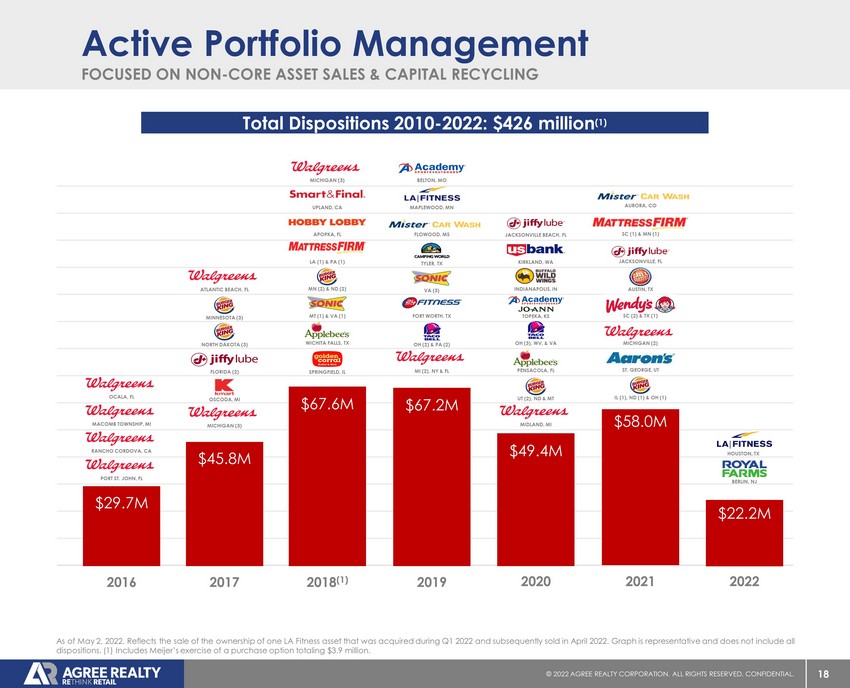
18 © 20 22 AGREE REALTY CORPORATION . ALL RIGHTS RESERVED. CONFIDENTIAL. FOCUSED ON NON - CORE ASSET SALES & CAPITAL RECYCLING Active Portfolio Management As of May 2, 2022. Reflects the sale of the ownership of one LA Fitness asset that was acquired during Q1 2022 and subsequent ly sold in April 2022. Graph is representative and does not include all dispositions. (1) Includes Meijer’s exercise of a purchase option totaling $3.9 million. Total Dispositions 2010 - 2022: $426 million (1) 2016 $29.7M PORT ST. JOHN, FL RANCHO CORDOVA, CA MACOMB TOWNSHIP, MI OCALA, FL 2017 $45.8M MICHIGAN (3) OSCODA, MI FLORIDA (2) NORTH DAKOTA (3) MINNESOTA (3) ATLANTIC BEACH, FL 2018 (1) $67.6M SPRINGFIELD, IL WICHITA FALLS, TX MT (1) & VA (1) MN (2) & ND (2) LA (1) & PA (1) APOPKA, FL UPLAND, CA MICHIGAN (3) 2019 $67.2M MI (2), NY & FL OH (2) & PA (2) FORT WORTH, TX VA (3) TYLER, TX FLOWOOD, MS MAPLEWOOD, MN BELTON, MO 2020 $49.4M MIDLAND, MI UT (2), ND & MT PENSACOLA, FL OH (3), WV, & VA TOPEKA, KS INDIANAPOLIS, IN KIRKLAND, WA JACKSONVILLE BEACH, FL 2021 $58.0M IL (1), ND (1) & OH (1) MICHIGAN (2) ST. GEORGE, UT SC (2) & TX (1) AUSTIN, TX JACKSONVILLE, FL SC (1) & MN (1) AURORA, CO 2022 $22.2M BERLIN, NJ HOUSTON, TX
Fortified Balance Sheet

20 © 20 22 AGREE REALTY CORPORATION . ALL RIGHTS RESERVED. CONFIDENTIAL. Leading With Our “Fortress” Balance Sheet CAPITALIZATION STATISTICS Equity Market Capitalization (2) $5.0 Billion Enterprise Value (2)(3) $7.1 Billion Total Debt to Enterprise Value 26.5% CREDIT METRICS Fixed Charge Coverage Ratio 5.2x Net Debt to Recurring EBITDA (4) 5.0x / 4.3x (5) Issuer Ratings Baa1 / BBB Ratings Outlooks Stable / Stable As of March 31, 2022, unless otherwise noted. (1) Excludes $320.0 million of borrowings outstanding under the Company’s $1.0 bil lion Revolving Credit Facility as of March 31, 2022; assumes two 6 - month extension options are exercised. (2) As of May 2, 2022. (3) Enterprise value is calculated as the sum of net debt, the liq uidation value of preferred equity and equity market capitalization. (4) Reflects net debt to annualized Q1 2022 recurring EBITDA. (5) Proforma for the settlement of the Company’s outstanding fo rwa rd equity offerings as of March 31, 2022. Debt Maturities ($ in millions) SECURED UNSECURED REVOLVING CREDIT FACILITY 1 c 2021 PUBLIC BOND OFFERING & TERM LOAN PAYOFF EXTENDED MATURITIES AND REDUCED AVERAGE INTEREST RATE TO ~3.2% (1) $28 $4 $50 $50 $410 $100 $475 $125 $300 $0 $100 $200 $300 $400 $500 2022 2023 2024 2025 2026 2027 2028 2029 2030 2031 2032 2033

21 © 20 22 AGREE REALTY CORPORATION . ALL RIGHTS RESERVED. CONFIDENTIAL. $100 $100 $100 $225 ( 30% ) $125 ( 22% ) $350 ( 26% ) $650 ( 34% ) $40 $237 $229 $531 ( 70% ) $433 ( 78% ) $988 ( 74% ) $1,095 ( 57% ) $175 ( 9% ) $0 $250 $500 $750 $1,000 $1,250 $1,500 $1,750 $2,000 2015 2016 2017 2018 2019 2020 2021 STRONG CAPITAL MARKETS EXECUTION HAS PROVIDED AMPLE LIQUIDITY; OVER $5.8 BILLION OF ACTIVITY SINCE 2010 Capital Markets Track Record Reflects gross proceeds for long - term debt and equity raised through March 31, 2022. Forward equity offerings are shown in the y ear they were raised, rather than settled. Capital Markets Activity ($ in millions) COMMON EQUITY UNSECURED DEBT SECURED DEBT PREFERRED EQUITY

22 © 20 22 AGREE REALTY CORPORATION . ALL RIGHTS RESERVED. CONFIDENTIAL. (includes outstanding forward equity offerings) ADC HAS BEEN AT OR BELOW 4.3X PROFORMA NET DEBT TO RECURRING EBITDA SINCE 2018 Low Leverage = Strong Positioning As of March 31, 2022. Proforma Net Debt to Recurring EBTIDA deducts the Company’s outstanding forward equity offerings for ea ch period from the Company’s net debt for each period. PROFORMA NET DEBT TO RECURRING EBITDA NET DEBT TO RECURRING EBITDA Q2 2021 Q3 2021 Q4 2021 Q1 2022 Q1 2019 Q2 2019 Q3 2019 Q4 2019 Q1 2020 Q2 2020 Q3 2020 Q4 2020 Q1 2021 5.0x 3.7x 4.4x 3.2x 5.1x 4.0x 4.5x 3.7x 4.8x 2.5x 3.5x 1.6x 4.7x 3.2x 4.8x 4.0x 4.9x 4.2x 4.5x 3.6x 4.4x 3.7x 4.9x 3.4x 5.0x 4.3x

23 © 20 22 AGREE REALTY CORPORATION . ALL RIGHTS RESERVED. CONFIDENTIAL. DEDICATED TO SUSTAINABILITY AND GOOD CORPORATE CITIZENSHIP Agree Realty’s ESG Practices Embraces responsibility to be a good steward of the environment and to use natural resources carefully Focus on industry leading, national & super - regional retailers provides for a relationship with some of the most environmentally conscientious retailers in the world The Company’s award - winning headquarters buildings utilize green technologies including programmable thermostats, Low - E window glass, LEED HVAC systems and LED occupancy - sensored lighting ENVIRONMENTAL PRACTICES The Agree Wellness program focuses on Health Wellness & Financial Wellness to enhance employee well - being Ongoing professional development is offered to help all team members advance their careers The Company has recently sponsored charities including Leader Dogs for the Blind and Kids Kicking Cancer ADC has received awards from Globe St, Crain’s Detroit Business, and Best and Brightest in Wellness recognizing its outstanding corporate culture and wellness initiatives SOCIAL RESPONSIBILITY ADC’s Board has nine directors, seven of whom are independent; five new independent directors added since 2018 All team members adhere to the Company’s Code of Business Conduct and Ethics, and ADC’s Rules for Victory The Nominating & Governance Committee has formal oversight responsibility for the Company’s ESG program CORPORATE GOVERNANCE
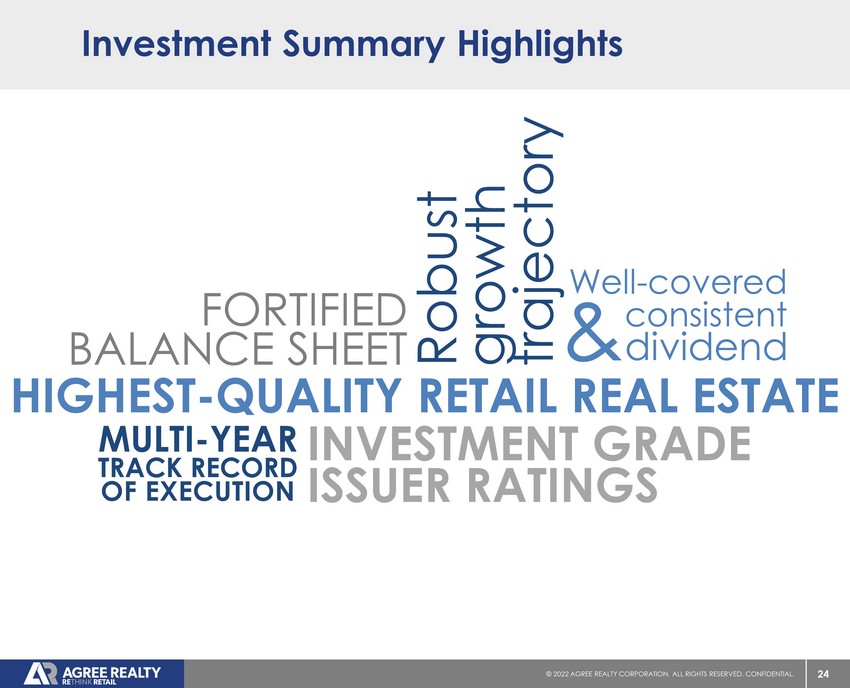
24 © 20 22 AGREE REALTY CORPORATION . ALL RIGHTS RESERVED. CONFIDENTIAL. Investment Summary Highlights FORTIFIED BALANCE SHEET HIGHEST - QUALITY RETAIL REAL ESTATE INVESTMENT GRADE ISSUER RATINGS Robust growth trajectory MULTI - YEAR TRACK RECORD OF EXECUTION Well - covered & consistent dividend

25 © 20 22 AGREE REALTY CORPORATION . ALL RIGHTS RESERVED. CONFIDENTIAL. APPENDIX

26 © 20 22 AGREE REALTY CORPORATION . ALL RIGHTS RESERVED. CONFIDENTIAL. Forward - Looking Statements This presentation contains forward - looking statements within the meaning of Section 27A of the Securities Act of 1933, as amended (the “Securities Act”) and Section 21E of the Securities Exchange Act of 1934, as amended (the “Exchange Act”). The Company intends such forward - looking statements to be covered by the safe harbor provisions for forward - looking statements contained in the Private Securities Litigation Reform Act of 1995 and includes this statement for purposes of complying with these safe harbor provisions. Forward - looking statements are generally identifiable by use of forward - looking terminology such as “may,” “will,” “should,” “potential,” “intend,” “expect,” “seek,” “anticipate,” “estimate,” “approximately,” “believe,” “could,” “project,” “predict,” “forecast,” “continue,” “assume,” “plan,” references to “outlook” or other similar words or expressions. Forward - looking statements are based on certain assumptions and can include future expectations, future plans and strategies, financial and operating projections and forecasts and other forward - looking information and estimates. These forward - looking statements are subject to various risks and uncertainties, many of which are beyond the Company’s control, which could cause actual results to differ materially from such statements. Certain factors could occur that might cause actual results to vary, including the current pandemic of the novel coronavirus, or COVID - 19, on the financial condition, results of operations, cash flows and performance of the Company and its tenants, the real estate market and the global economy and financial markets, the general deterioration in national economic conditions, weakening of real estate markets, decreases in the availability of credit, increases in interest rates, adverse changes in the retail industry, the Company’s continuing ability to qualify as a REIT and other risks and uncertainties as described in greater detail in the Company’s filings with the Securities and Exchange Commission (the “SEC”), including, without limitation, the Company’s Annual Report on Form 10 - K and subsequent quarterly reports. Except as required by law, the Company disclaims any obligation to update any forward - looking statements, whether as a result of new information, future events or otherwise. For further information about the Company’s business and financial results, please refer to the “Management’s Discussion and Analysis of Financial Condition and Results of Operations” and “Risk Factors” sections of the Company’s SEC filings, including, but not limited to, its Annual Report on Form 10 - K and Quarterly Reports on Form 10 - Q, copies of which may be obtained at the Investors section of the Company’s website at www.agreerealty.com . All information in this presentation is as of March 31 , 2022 , unless otherwise noted . The Company undertakes no duty to update the statements in this presentation to conform the statements to actual results or changes in the Company’s expectations .

27 © 20 22 AGREE REALTY CORPORATION . ALL RIGHTS RESERVED. CONFIDENTIAL. Non - GAAP Financial Measures This presentation includes a non - GAAP financial measure, Net Debt to Recurring EBITDA, which is presented on an actual and profo rma basis. A reconciliation of this non - GAAP financial measure to the most directly comparable GAAP measure appears on the following page. The components of this ratio and their use and utility to management are described further in the section below. In addition, this presentation includes the non - GAAP measure of Annualized Base Rent (“ABR”). ABR represents the annualized amount of contractual minimum rent required by tenant lease agreements, computed on a straight - line basis. ABR is not, and is not intended to be, a presentation in accordance with GA AP. The Company believes annualized contractual minimum rent is useful to management, investors, and other interested parties in anal yzi ng concentrations and leasing activity. Components of Net Debt to Recurring EBITDA EBITDAre is defined by Nareit to mean net income computed in accordance with GAAP, plus interest expense, income tax expense, deprecia ti on and amortization, any gains (or losses) from sales of real estate assets and/or changes in control, any impairment charges on de preciable real estate assets, and after adjustments for unconsolidated partnerships and joint ventures. The Company considers the non - GAAP meas ure of EBITDAre to be a key supplemental measure of the Company's performance and should be considered along with, but not as an alt ern ative to, net income or loss as a measure of the Company's operating performance. The Company considers EBITDAre a key supplemental mea sur e of the Company's operating performance because it provides an additional supplemental measure of the Company's performance and opera tin g cash flow that is widely known by industry analysts, lenders and investors. The Company’s calculation of EBITDAre may not be compa rab le to EBITDAre reported by other REITs that interpret the Nareit definition differently than the Company. Recurring EBITDA The Company defines Recurring EBITDA as EBITDAre with the addback of noncash amortization of above - and below - market lease intangibles, and after adjustments for the run - rate impact of the Company's investment, disposition and leasing activity f or the period presented, as well as adjustments for non - recurring benefits or expenses. The Company considers the non - GAAP measure of Recurrin g EBITDA to be a key supplemental measure of the Company's performance and should be considered along with, but not as an alternative to, ne t income or loss as a measure of the Company's operating performance. The Company considers Recurring EBITDA a key supplemental measure o f t he Company's operating performance because it represents the Company's earnings run rate for the period presented and because it is widely followed by industry analysts, lenders and investors. The Company’s calculation of Recurring EBITDA may not be comparable to Re curring EBITDA reported by other companies that have a different interpretation of the definition of Recurring EBITDA. The Company’s ratio o f N et Debt to Recurring EBITDA is used by management as a measure of leverage and may be useful to investors in understanding the Company’s ab ility to service its debt, as well as assess the borrowing capacity of the Company. The Company’s ratio of Net Debt to Recurring EBIT DA is calculated by taking annualized Recurring EBITDA and dividing it by our Net Debt per the consolidated balance sheet. Net Debt The Company defines Net Debt as total debt less cash, cash equivalents and cash held in escrows. The Company considers the no n - GAAP measure of Net Debt to be a key supplemental measure of the Company's overall liquidity, capital structure and leverage. Th e Company considers Net Debt a key supplemental measure because it provides industry analysts, lenders and investors useful information in understanding our financial condition. The Company’s calculation of Net Debt may not be comparable to Net Debt reported by other REITs that in terpret the definition differently than the Company. The Company presents Net Debt on both an actual and proforma basis, assuming the Antic ipated Net Proceeds from Outstanding Forwards are used to pay down debt. The Company believes the proforma measure may be useful to inve sto rs in understanding the potential effect of the Anticipated Net Proceeds from Outstanding Forwards on the Company’s capital structu re, its future borrowing capacity, and its ability to service its debt. Anticipated Net Proceeds from Outstanding Forwards Since the first quarter of 2018, the Company has utilized forward sale agreements to sell shares of common stock. Selling common stock through forward sale agreements enables the Company to set the price of such sha res upon pricing the offering (subject to certain adjustments) while delaying the issuance of such shares and the receipt of the net p roc eeds by the Company. Given the Company’s frequent use of forward sale agreements, the Company considers the non - GAAP measure of Anticipated Net Proceeds from Outstanding Forwards to be a key supplemental measure of the Company's overall liquidity, capital structure and le verage. The Company defines Anticipated Net Proceeds from Outstanding Forwards as the number of shares outstanding under forward sale agr eem ents at the end of each quarter, multiplied by the applicable forward sale price for each agreement, respectively.

28 © 20 22 AGREE REALTY CORPORATION . ALL RIGHTS RESERVED. CONFIDENTIAL. Net Debt to Recurring EBITDA Reconciliation Q2 2019 Q3 2019 Q4 2019 Q1 2020 Q2 2020 Q3 2020 Q4 2020 Q1 2021 Q2 2021 Q3 2021 Q4 2021 Q1 2022 Net Income $18,722 $20,781 $22,744 $21,370 $25,424 $21,416 $23,760 $30,278 $22,461 $36,830 $33,306 $36,289 Interest expense, net 7,455 8,352 9,730 9,670 8,479 10,158 11,791 11,653 12,549 13,066 13,111 13,931 Income tax expense 195 184 328 259 260 306 260 1,009 485 390 517 719 Depreciation of rental real estate assets 8,276 8,866 9,563 10,402 11,316 12,669 13,980 15,292 16,127 17,019 18,293 19,470 Amortization of lease intangibles - in - place leases and leasing costs 2,496 2,965 3,453 3,621 4,170 4,523 5,567 6,050 6,905 7,310 8,116 8,924 Non - real estate depreciation 64 66 89 109 121 135 144 147 156 159 156 167 Provision for impairment 1,193 0 0 0 1,128 2,868 141 0 0 0 1,919 1,015 (Gain) loss on sale of assets, net (2,949) (2,597) (4,333) (1,645) (4,952) (970) (437) (3,062) (6,753) (3,470) (1,826) (2,285) EBITDAre $35,452 $38,617 $41,574 $43,786 $45,947 $51,105 $55,206 $61,367 $51,930 $71,304 $73,592 $78,230 Run - Rate Impact of Investment, Disposition & Leasing Activity $1,641 $2,782 $1,435 $1,160 $3,015 $5,093 $3,973 $4,175 $3,939 $3,491 $3,372 $4,654 Amortization of above (below) market lease intangibles, net 3,225 3,381 3,618 3,809 3,779 3,964 4,333 4,756 5,260 6,615 7,654 8,178 Other expense (income) 0 0 0 0 (23) 0 0 0 14,614 0 0 0 Recurring EBITDA $40,318 $44,780 $46,627 $48,755 $52,717 $60,162 $63,512 $70,298 75,743 $81,410 $84,618 $91,062 Annualized Recurring EBITDA $161,272 $179,120 $186,508 $195,020 $210,868 $240,648 $254,048 $281,192 302,972 $325,640 $338,472 $364,248 Total Debt $739,166 $931,867 $876,115 $1,026,111 $783,878 $1,153,642 $1,225,433 $1,371,238 $1,543,040 $1,542,839 $1,702,635 $1,862,428 Cash, cash equivalents and cash held in escrows (22,429) (10,802) (42,157) (92,140) (36,384) (16,230) (7,955) (7,369) (188,381) (102,808) (45,250) (25,766) Net Debt $716,737 $921,065 $833,958 $933,971 $747,494 $1,137,412 $1,217,478 $1,363,869 $1,354,659 $1,440,031 $1,657,385 $1,836,662 Net Debt to Recurring EBITDA 4.4x 5.1x 4.5x 4.8x 3.5x 4.7x 4.8x 4.9x 4.5x 4.4X 4.9X 5.0X Anticipated Net Proceeds from Outstanding Forwards $199,900 $197,356 $144,676 $437,765 $411,062 $376,396 $203,211 $189,577 $258,749 $226,455 $519,183 $262,940 Proforma Net Debt 516,837 723,709 689,282 496,206 336,432 $761,016 $1,014,267 $1,174,291 $1,095,909 $1,213,576 $1,138,202 $1,573,722 Proforma Net Debt to Recurring EBITDA 3.2x 4.0x 3.7x 2.5x 1.6x 3.2x 4.0x 4.2x 3.6x 3.7X 3.4X 4.3X

29 © 20 22 AGREE REALTY CORPORATION . ALL RIGHTS RESERVED. CONFIDENTIAL. CONTACT PETER COUGHENOUR Chief Financial Officer (248) 737 - 4190 peter@agreerealty.com