Exhibit 99.2
MAY 2023
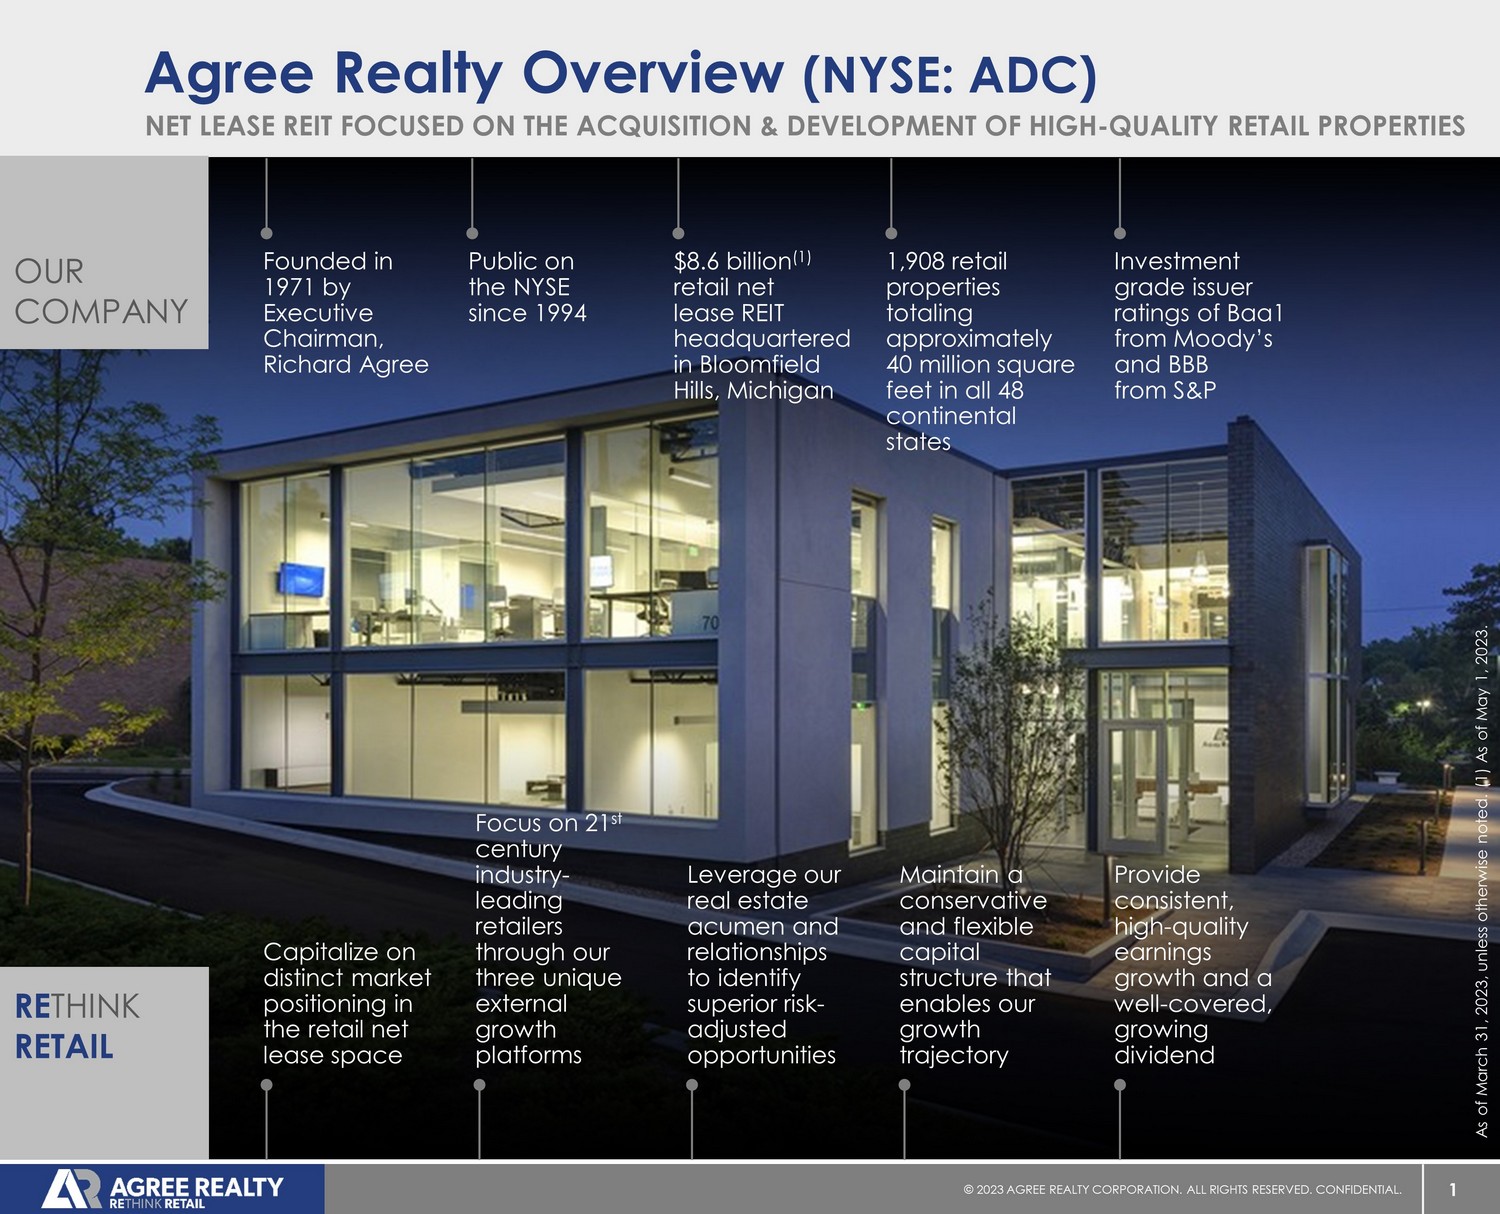
1 © 20 23 AGREE REALTY CORPORATION . ALL RIGHTS RESERVED. CONFIDENTIAL. Agree Realty Overview (NYSE: ADC) OUR COMPANY NET LEASE REIT FOCUSED ON THE ACQUISITION & DEVELOPMENT OF HIGH - QUALITY RETAIL PROPERTIES Founded in 1971 by Executive Chairman, Richard Agree Public on the NYSE since 1994 $ 8.6 billion (1) retail net lease REIT headquartered in Bloomfield Hills, Michigan 1,908 retail properties totaling approximately 40 million square feet in all 48 continental states Investment grade issuer ratings of Baa1 from Moody’s and BBB from S&P RE THINK RETAIL Capitalize on distinct market positioning in the retail net lease space Focus on 21 st century industry - leading retailers through our three unique external growth platforms Leverage our real estate acumen and relationships to identify superior risk - adjusted opportunities Maintain a conservative and flexible capital structure that enables our growth trajectory Provide consistent, high - quality earnings growth and a well - covered, growing dividend As of March 31, 2023 , unless otherwise noted. (1) As of May 1, 2023 .
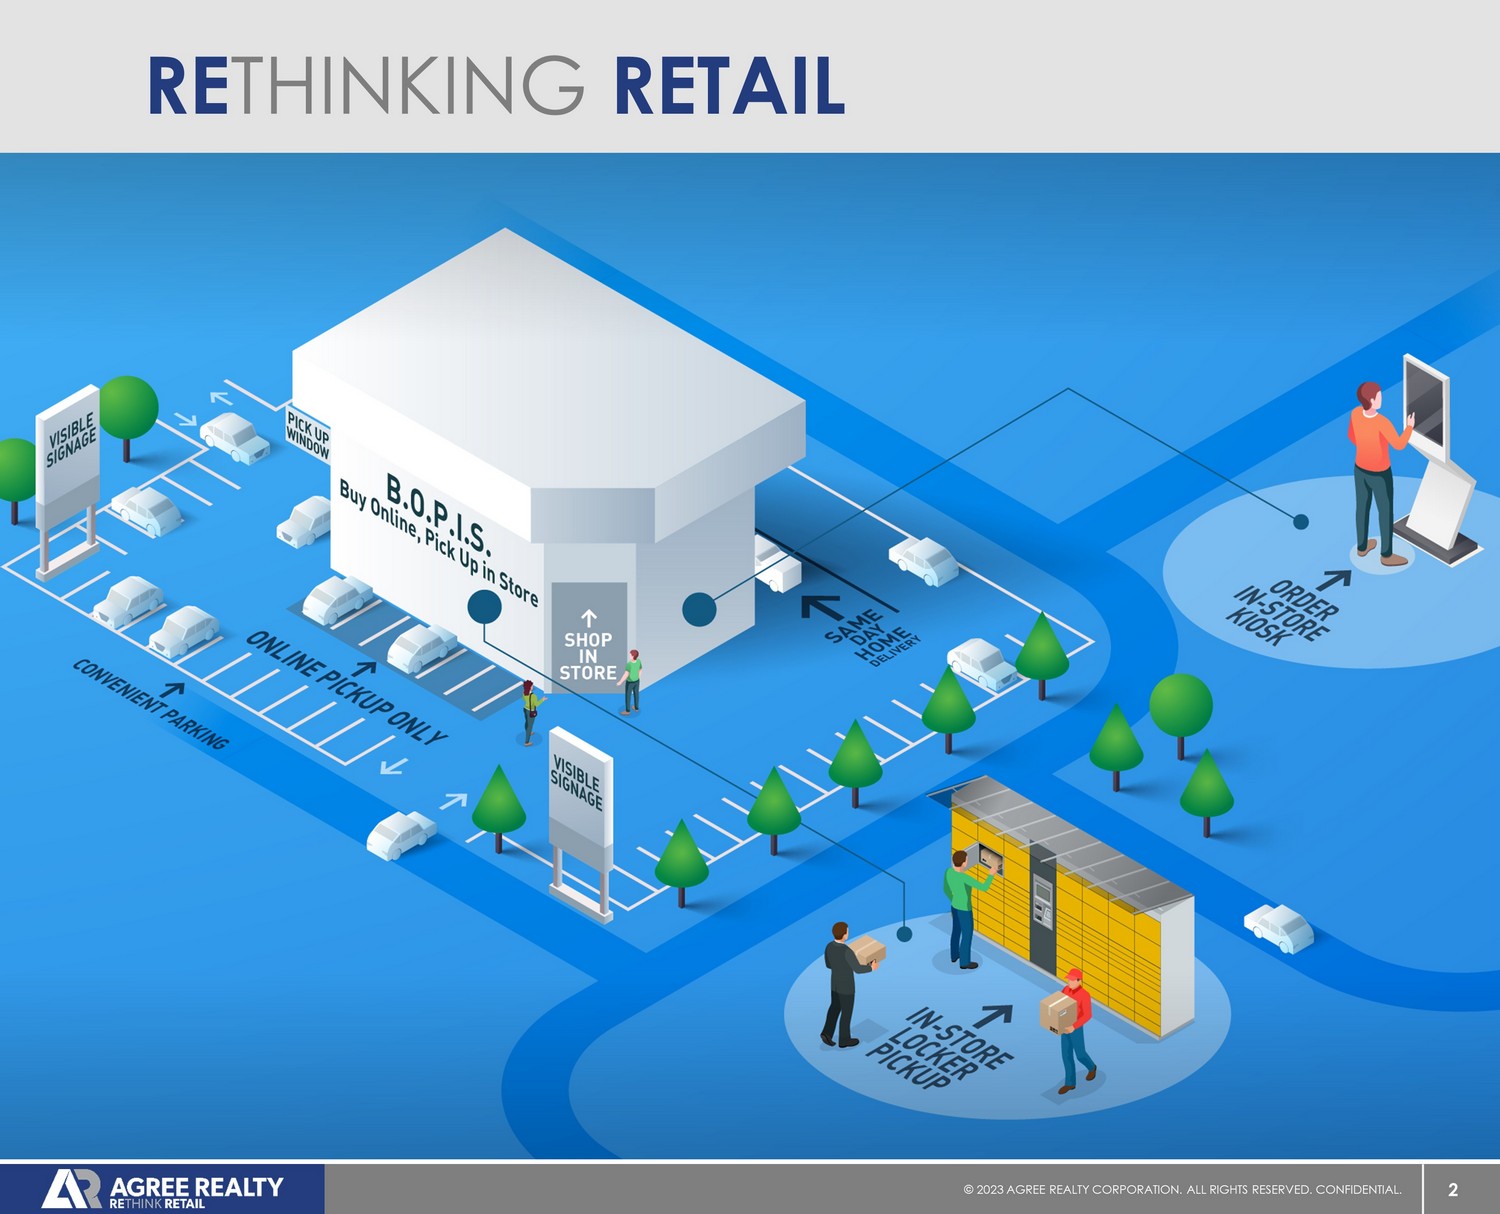
2 © 20 23 AGREE REALTY CORPORATION . ALL RIGHTS RESERVED. CONFIDENTIAL. RE THINKING RETAIL
3 © 20 23 AGREE REALTY CORPORATION . ALL RIGHTS RESERVED. CONFIDENTIAL. consistency noun steadfast adherence to the same principles, course, or form [ kuh n - sis - tuh n - see ]
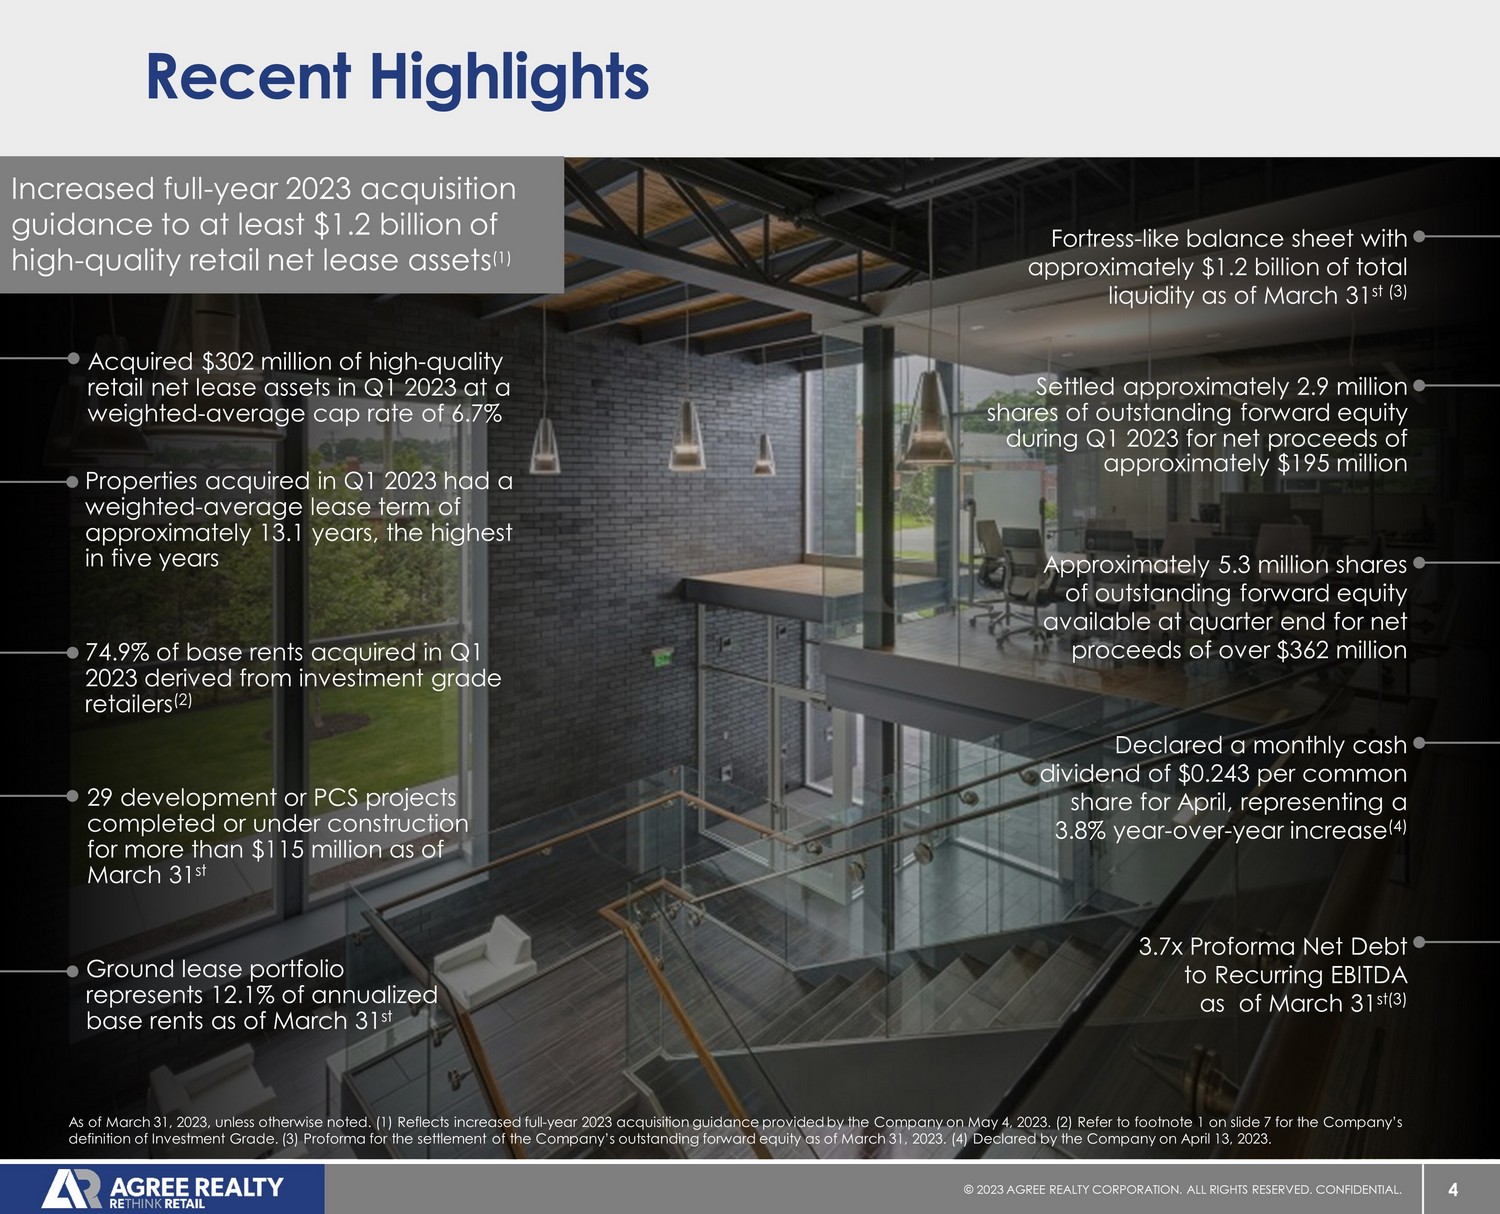
4 © 20 23 AGREE REALTY CORPORATION . ALL RIGHTS RESERVED. CONFIDENTIAL. Approximately 5.3 million shares of outstanding forward equity available at quarter end for net proceeds of over $362 million As of March 31, 2023, unless otherwise noted. (1) Reflects increased full - year 2023 acquisition guidance provided by the Company on May 4, 2023. (2) Refer to footnote 1 on slide 7 for the Company’s definition of Investment Grade. (3) Proforma for the settlement of the Company’s outstanding forward equity as of March 31, 2 023 . (4) Declared by the Company on April 13, 2023. Recent Highlights Declared a monthly cash dividend of $ 0.243 per common share for April , representing a 3.8 % year - over - year increase (4) Acquired $302 million of high - quality retail net lease assets in Q1 2023 at a weighted - average cap rate of 6.7% Fortress - like balance sheet with approximately $1.2 billion of total liquidity as of March 31 st (3) Ground lease portfolio represents 12.1% of annualized base rents as of March 31 st Settled approximately 2.9 million shares of outstanding forward equity during Q1 2023 for net proceeds of approximately $195 million 29 development or PCS projects completed or under construction for more than $115 million as of March 31 st 74.9% of base rents acquired in Q1 2023 derived from investment grade retailers (2) 3.7x Proforma Net Debt to Recurring EBITDA as of March 31 st(3) Properties acquired in Q1 2023 had a weighted - average lease term of approximately 13.1 years, the highest in five years Increased full - year 2023 acquisition guidance to at least $1.2 billion of high - quality retail net lease assets (1)

The Country’s Leading Retail Portfolio
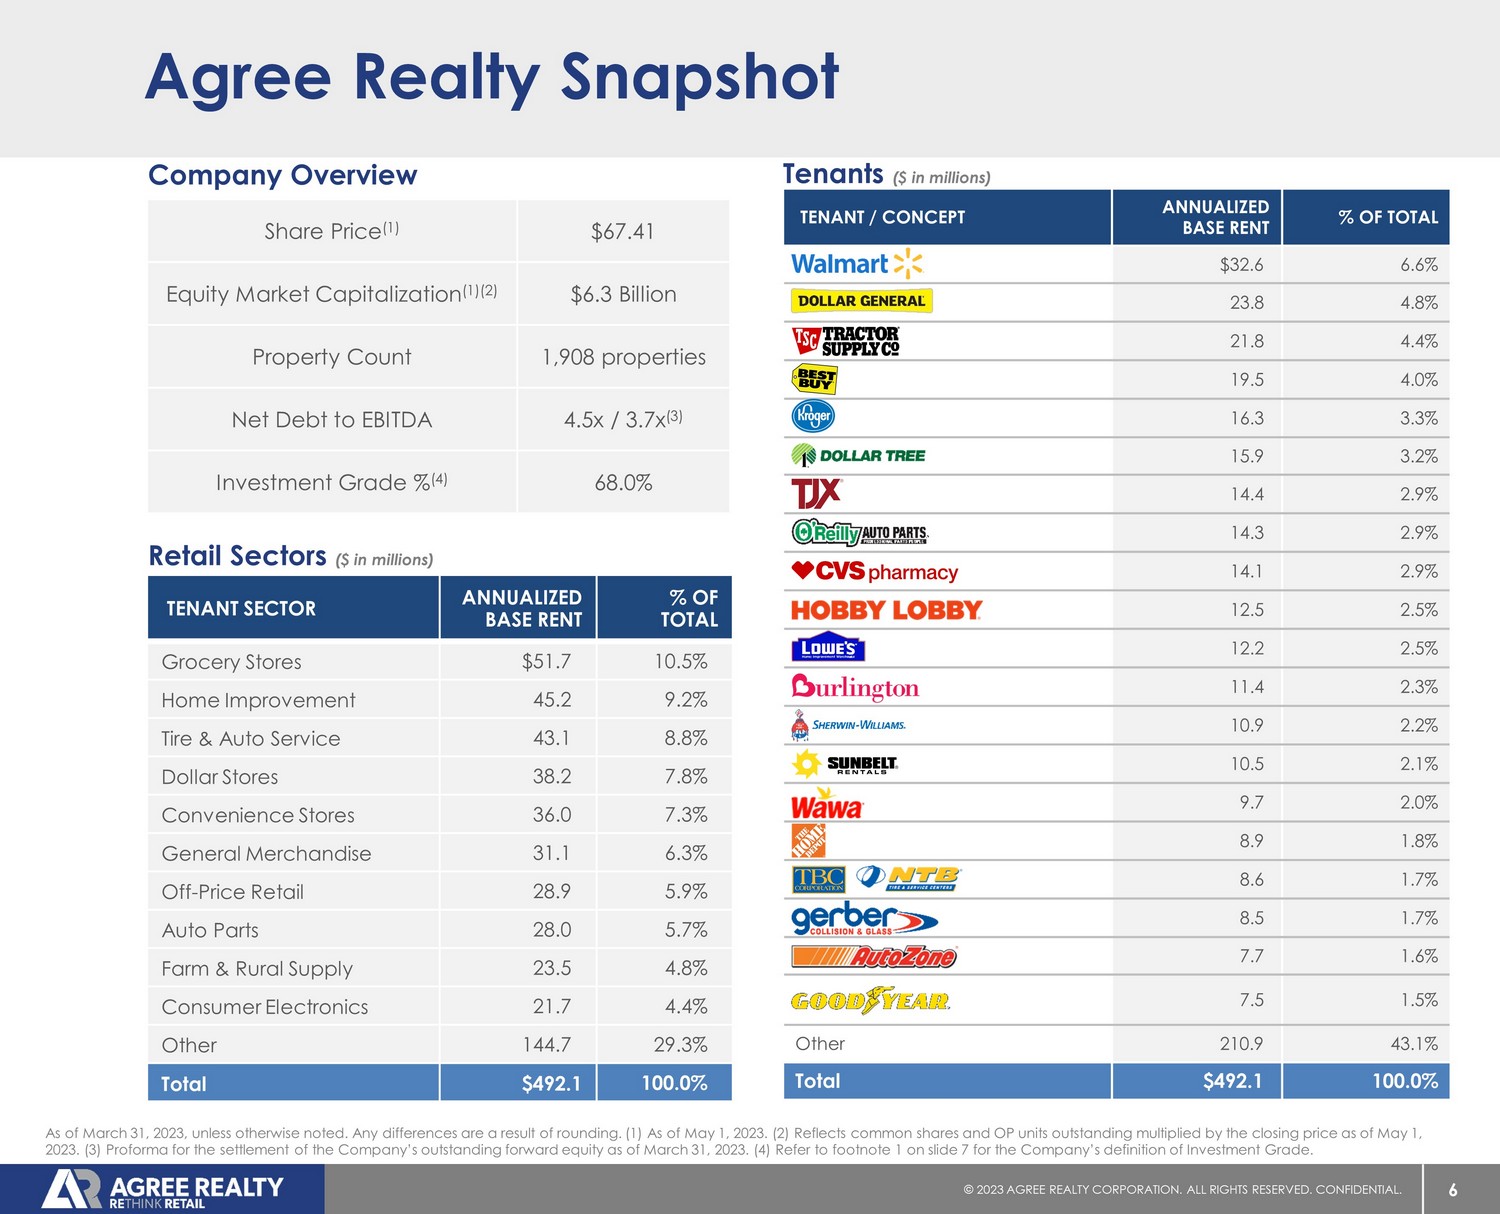
6 © 20 23 AGREE REALTY CORPORATION . ALL RIGHTS RESERVED. CONFIDENTIAL. TENANT / CONCEPT ANNUALIZED BASE RENT % OF TOTAL $32.6 6.6% 23.8 4.8% 21.8 4.4% 19.5 4.0% 16.3 3.3% 15.9 3.2% 14.4 2.9% 14.3 2.9% 14.1 2.9% 12.5 2.5% 12.2 2.5% 11.4 2.3% 10.9 2.2% 10.5 2.1% 9.7 2.0% 8.9 1.8% 8.6 1.7% 8.5 1.7% 7.7 1.6% 7.5 1.5% Other 210.9 43.1% Total $492.1 100.0% Agree Realty Snapshot TENANT SECTOR ANNUALIZED BASE RENT % OF TOTAL Grocery Stores $51.7 10.5% Home Improvement 45.2 9.2% Tire & Auto Service 43.1 8.8% Dollar Stores 38.2 7.8% Convenience Stores 36.0 7.3% General Merchandise 31.1 6.3% Off - Price Retail 28.9 5.9% Auto Parts 28.0 5.7% Farm & Rural Supply 23.5 4.8% Consumer Electronics 21.7 4.4% Other 144.7 29.3% Total $492.1 100.0% Share Price (1) $67.41 Equity Market Capitalization (1)(2) $6.3 Billion Property Count 1,908 properties Net Debt to EBITDA 4.5x / 3.7x (3) Investment Grade % (4) 68.0% Company Overview Tenants ($ in millions) Retail Sectors ($ in millions) As of March 31, 2023, unless otherwise noted. Any differences are a result of rounding. (1) As of May 1, 2023. (2) Reflects c omm on shares and OP units outstanding multiplied by the closing price as of May 1, 2023. (3) Proforma for the settlement of the Company’s outstanding forward equity as of March 31, 2023. (4) Refer to footnote 1 on slide 7 for the Company’s definition of Investment Grade.
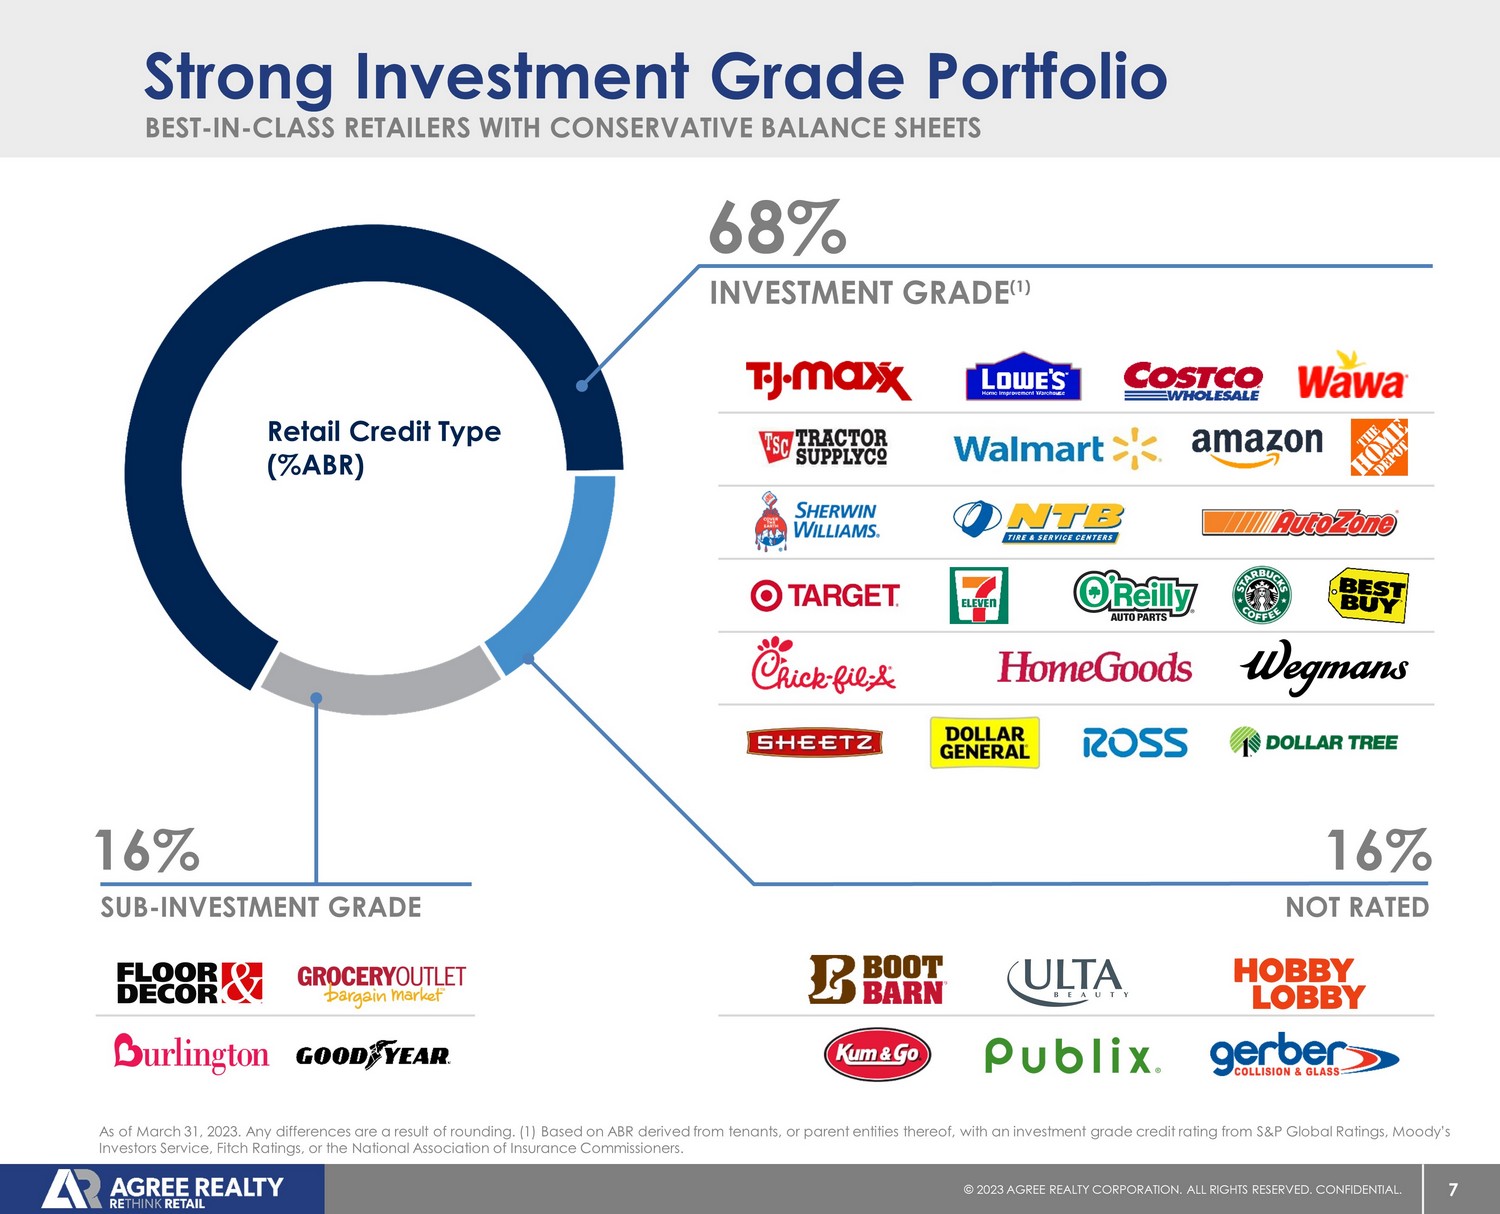
7 © 20 23 AGREE REALTY CORPORATION . ALL RIGHTS RESERVED. CONFIDENTIAL. BEST - IN - CLASS RETAILERS WITH CONSERVATIVE BALANCE SHEETS Strong Investment Grade Portfolio 16% SUB - INVESTMENT GRADE 16% NOT RATED 68% INVESTMENT GRADE (1) As of March 31, 2023. Any differences are a result of rounding. (1) Based on ABR derived from tenants, or parent entities the reo f, with an investment grade credit rating from S&P Global Ratings, Moody’s Investors Service, Fitch Ratings, or the National Association of Insurance Commissioners. Retail Credit Type (%ABR)

8 © 20 23 AGREE REALTY CORPORATION . ALL RIGHTS RESERVED. CONFIDENTIAL. INDUSTRY - LEADERS OPERATING IN E - COMMERCE RESISTANT SECTORS National and Super - Regional Retailers 1% FRANCHISE 12% SUPER - REGIONAL 87% NATIONAL As of March 31, 2023. Any differences are a result of rounding. Retail Tenant Type (%ABR)
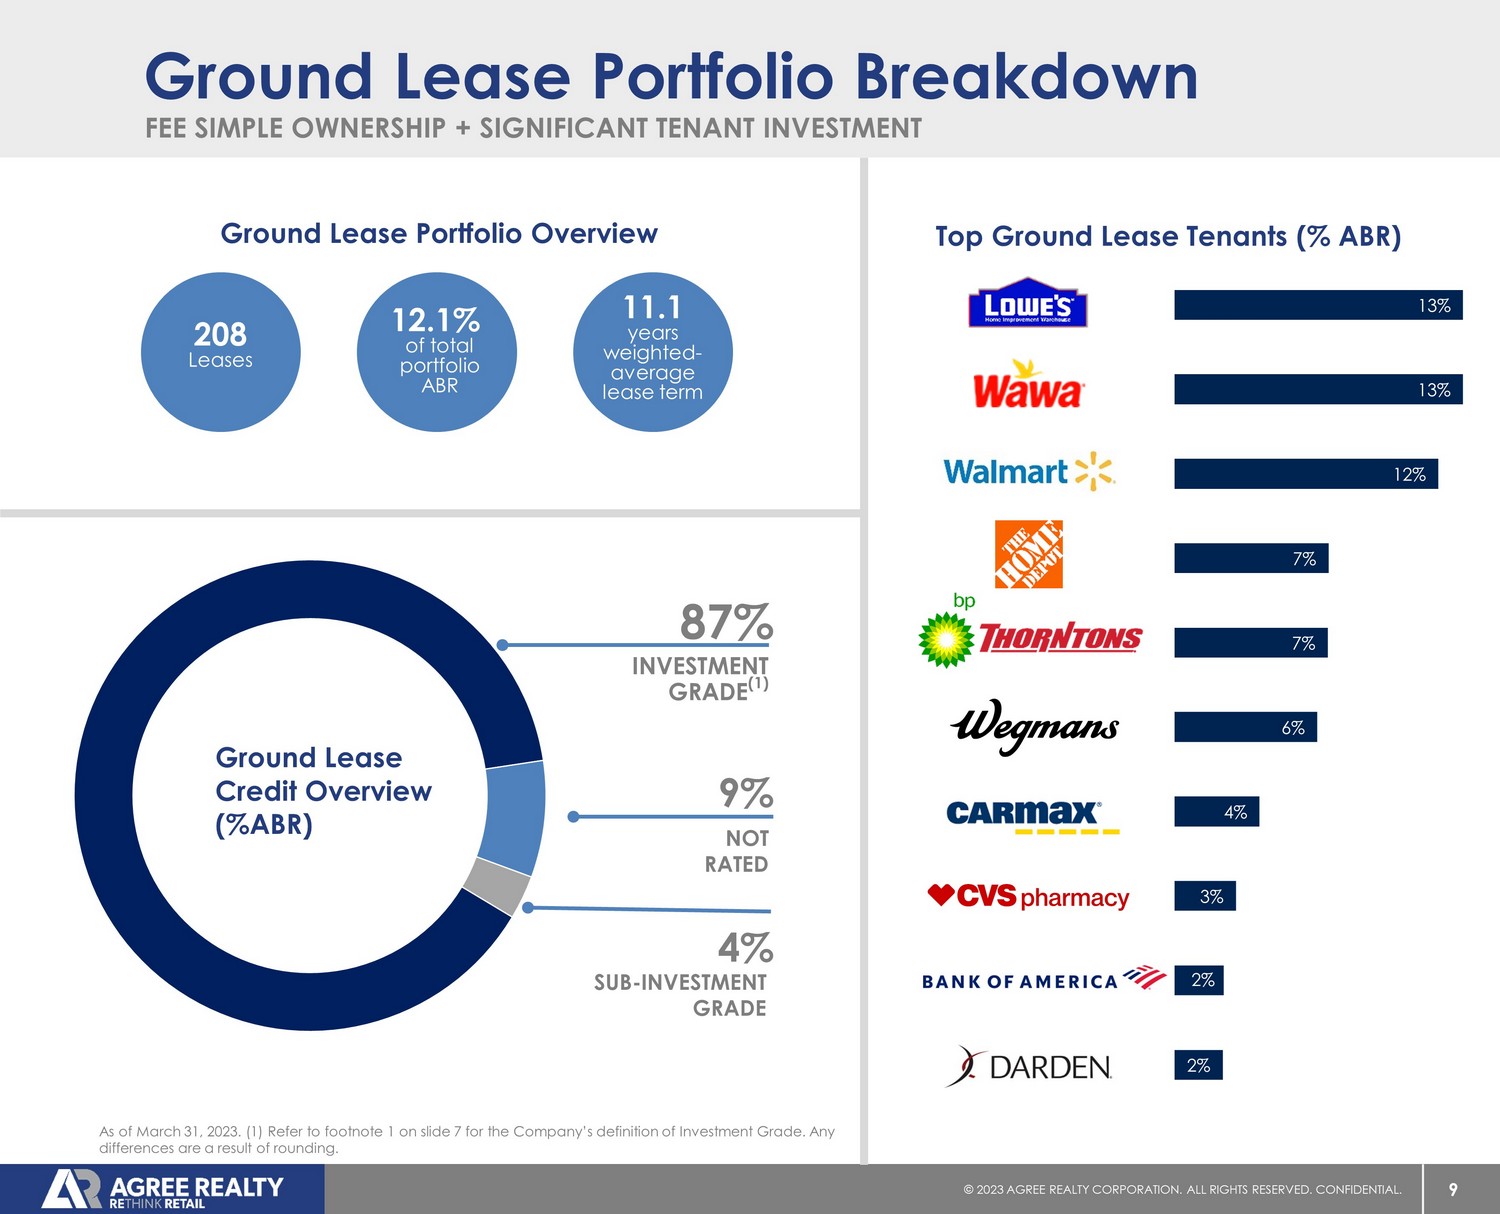
9 © 20 23 AGREE REALTY CORPORATION . ALL RIGHTS RESERVED. CONFIDENTIAL. 13% 13% 12% 7% 7% 6% 4% 3% 2% As of March 31, 2023. (1) Refer to footnote 1 on slide 7 for the Company’s definition of Investment Grade. Any differences are a result of rounding. FEE SIMPLE OWNERSHIP + SIGNIFICANT TENANT INVESTMENT Ground Lease Portfolio Breakdown Ground Lease Credit Overview (%ABR) 87% INVESTMENT GRADE (1) 9% NOT RATED 4% SUB - INVESTMENT GRADE Ground Lease Portfolio Overview 208 Leases 12.1% of total portfolio ABR 11.1 years weighted - average lease term Top Ground Lease Tenants (% ABR) 2%
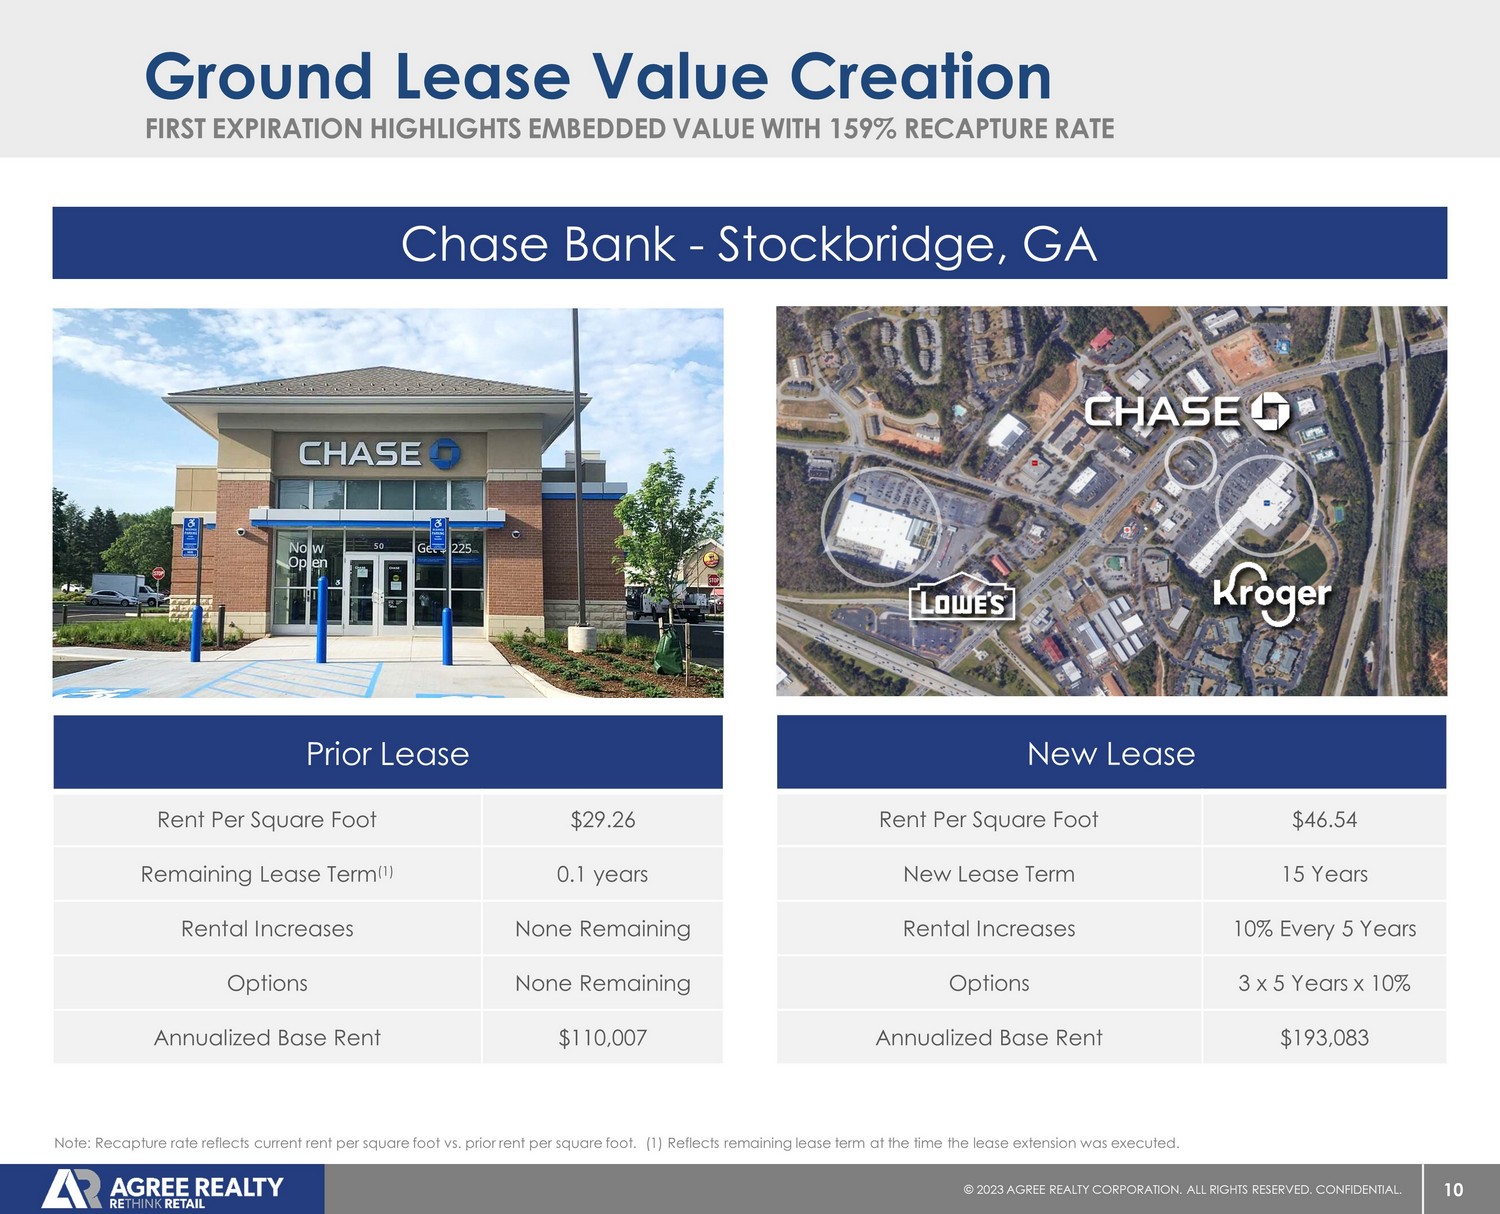
10 © 20 23 AGREE REALTY CORPORATION . ALL RIGHTS RESERVED. CONFIDENTIAL. FIRST EXPIRATION HIGHLIGHTS EMBEDDED VALUE WITH 159% RECAPTURE RATE Ground Lease Value Creation Chase Bank - Stockbridge, GA New Lease Rent Per Square Foot $46.54 New Lease Term 15 Years Rental Increases 10% Every 5 Years Options 3 x 5 Years x 10% Annualized Base Rent $193,083 Prior Lease Rent Per Square Foot $29.26 Remaining Lease Term (1) 0.1 years Rental Increases None Remaining Options None Remaining Annualized Base Rent $110,007 Note: Recapture rate reflects current rent per square foot vs. prior rent per square foot. (1) Reflects remaining lease term at the time the lease extension was executed.

Disciplined Investment Strategy & Active Portfolio Management
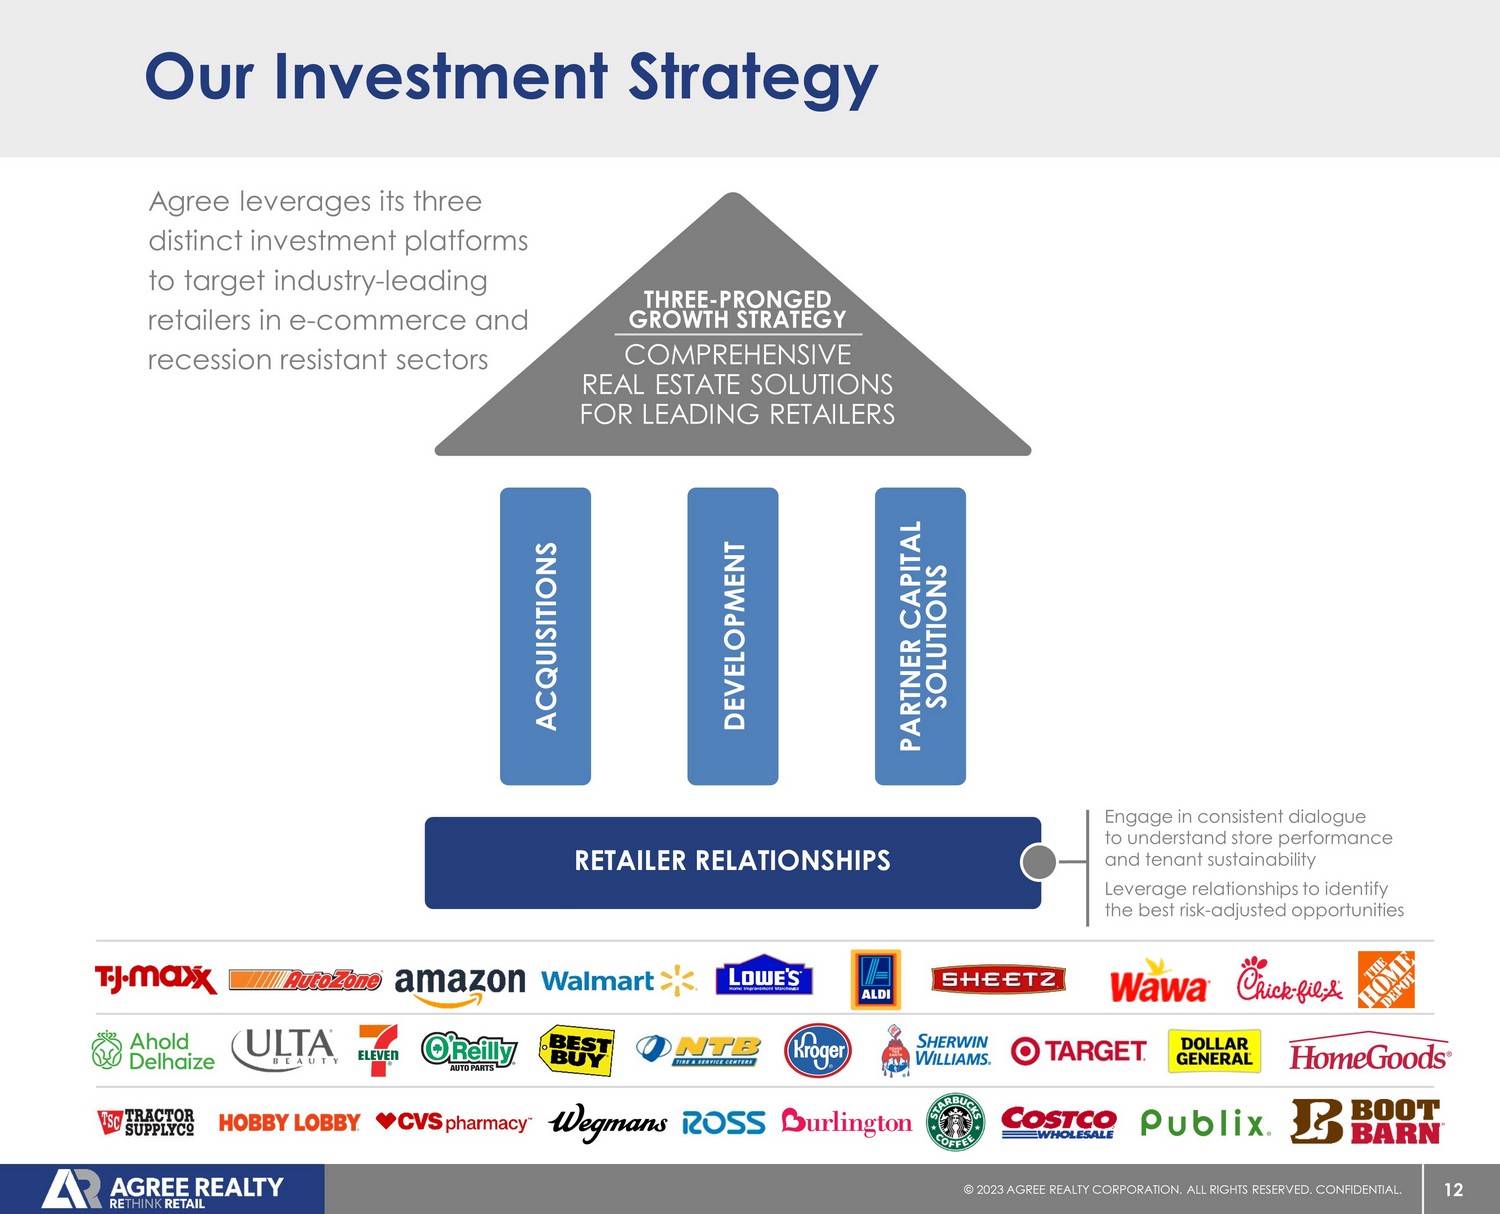
12 © 20 23 AGREE REALTY CORPORATION . ALL RIGHTS RESERVED. CONFIDENTIAL. Engage in consistent dialogue to understand store performance and tenant sustainability Leverage relationships to identify the best risk - adjusted opportunities Our Investment Strategy Agree leverages its three distinct investment platforms to target industry - leading retailers in e - commerce and recession resistant sectors THREE - PRONGED GROWTH STRATEGY COMPREHENSIVE REAL ESTATE SOLUTIONS FOR LEADING RETAILERS ACQUISITIONS DEVELOPMENT PARTNER CAPITAL SOLUTIONS RETAILER RELATIONSHIPS
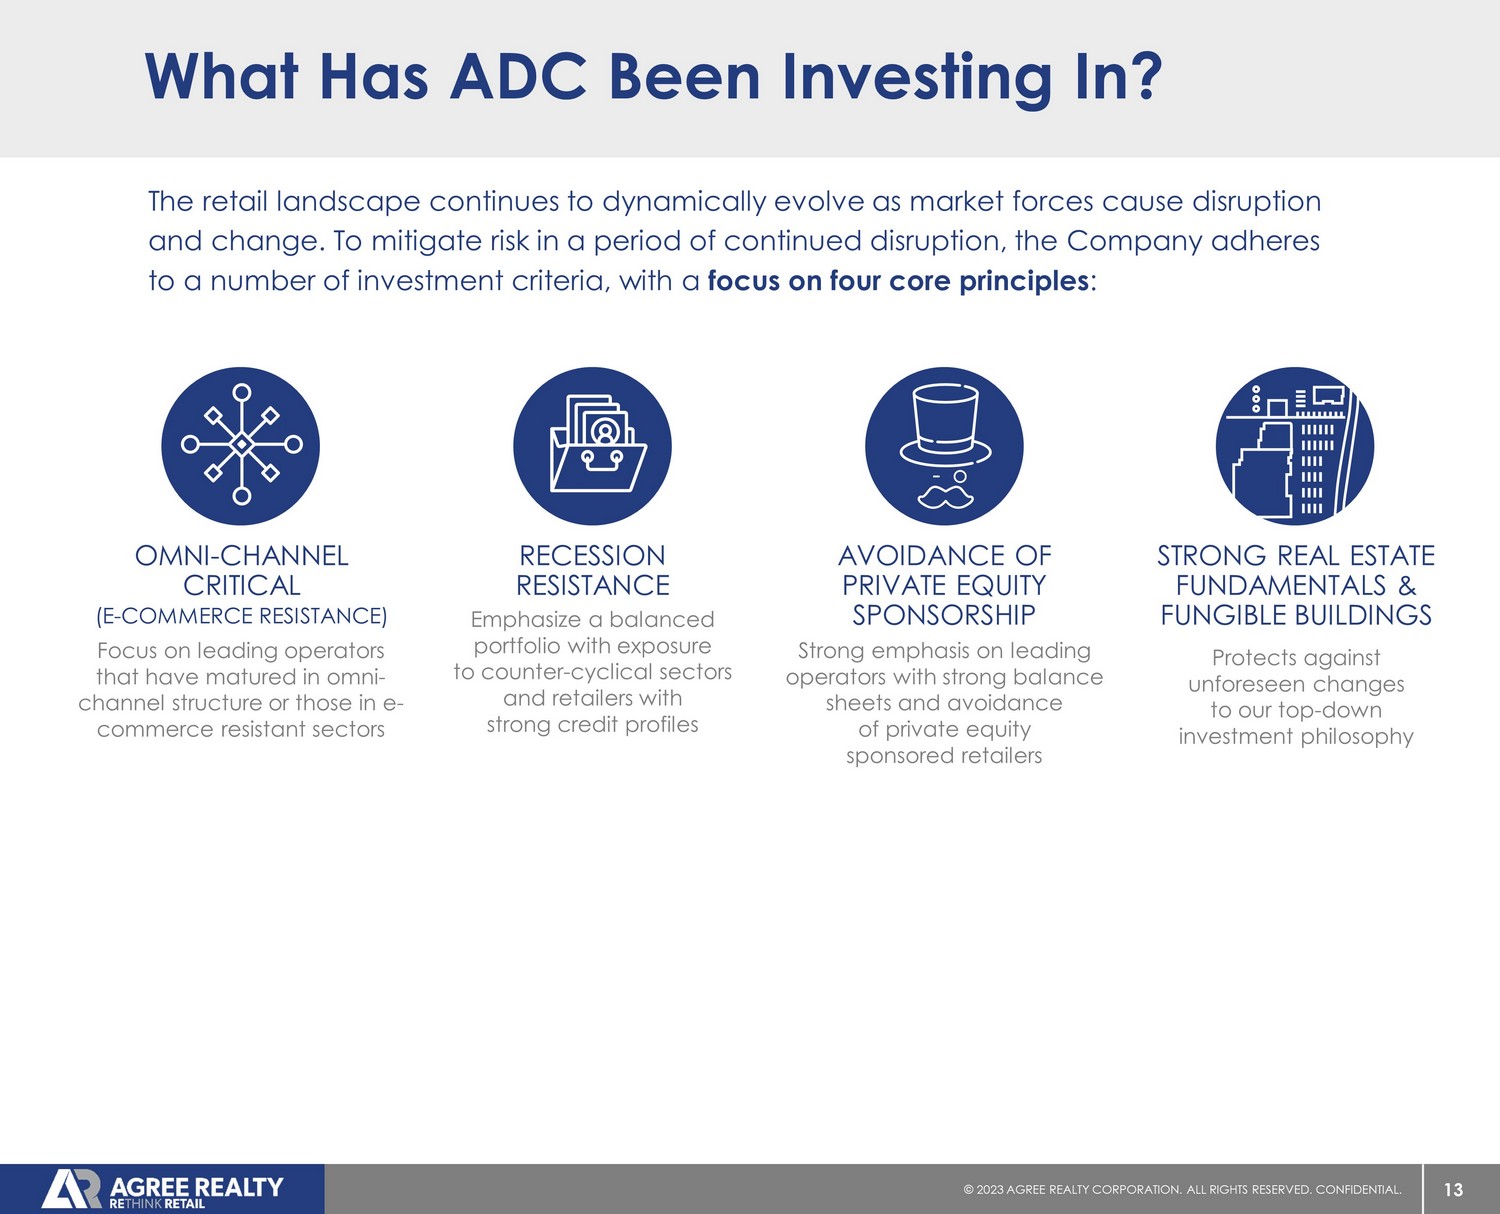
13 © 20 23 AGREE REALTY CORPORATION . ALL RIGHTS RESERVED. CONFIDENTIAL. What Has ADC Been Investing In? The retail landscape continues to dynamically evolve as market forces cause disruption and change. To mitigate risk in a period of continued disruption, the Company adheres to a number of investment criteria, with a focus on four core principles : Focus on leading operators that have matured in omni - channel structure or those in e - commerce resistant sectors OMNI - CHANNEL CRITICAL (E - COMMERCE RESISTANCE) Emphasize a balanced portfolio with exposure to counter - cyclical sectors and retailers with strong credit profiles RECESSION RESISTANCE Strong emphasis on leading operators with strong balance sheets and avoidance of private equity sponsored retailers AVOIDANCE OF PRIVATE EQUITY SPONSORSHIP Protects against unforeseen changes to our top - down investment philosophy STRONG REAL ESTATE FUNDAMENTALS & FUNGIBLE BUILDINGS
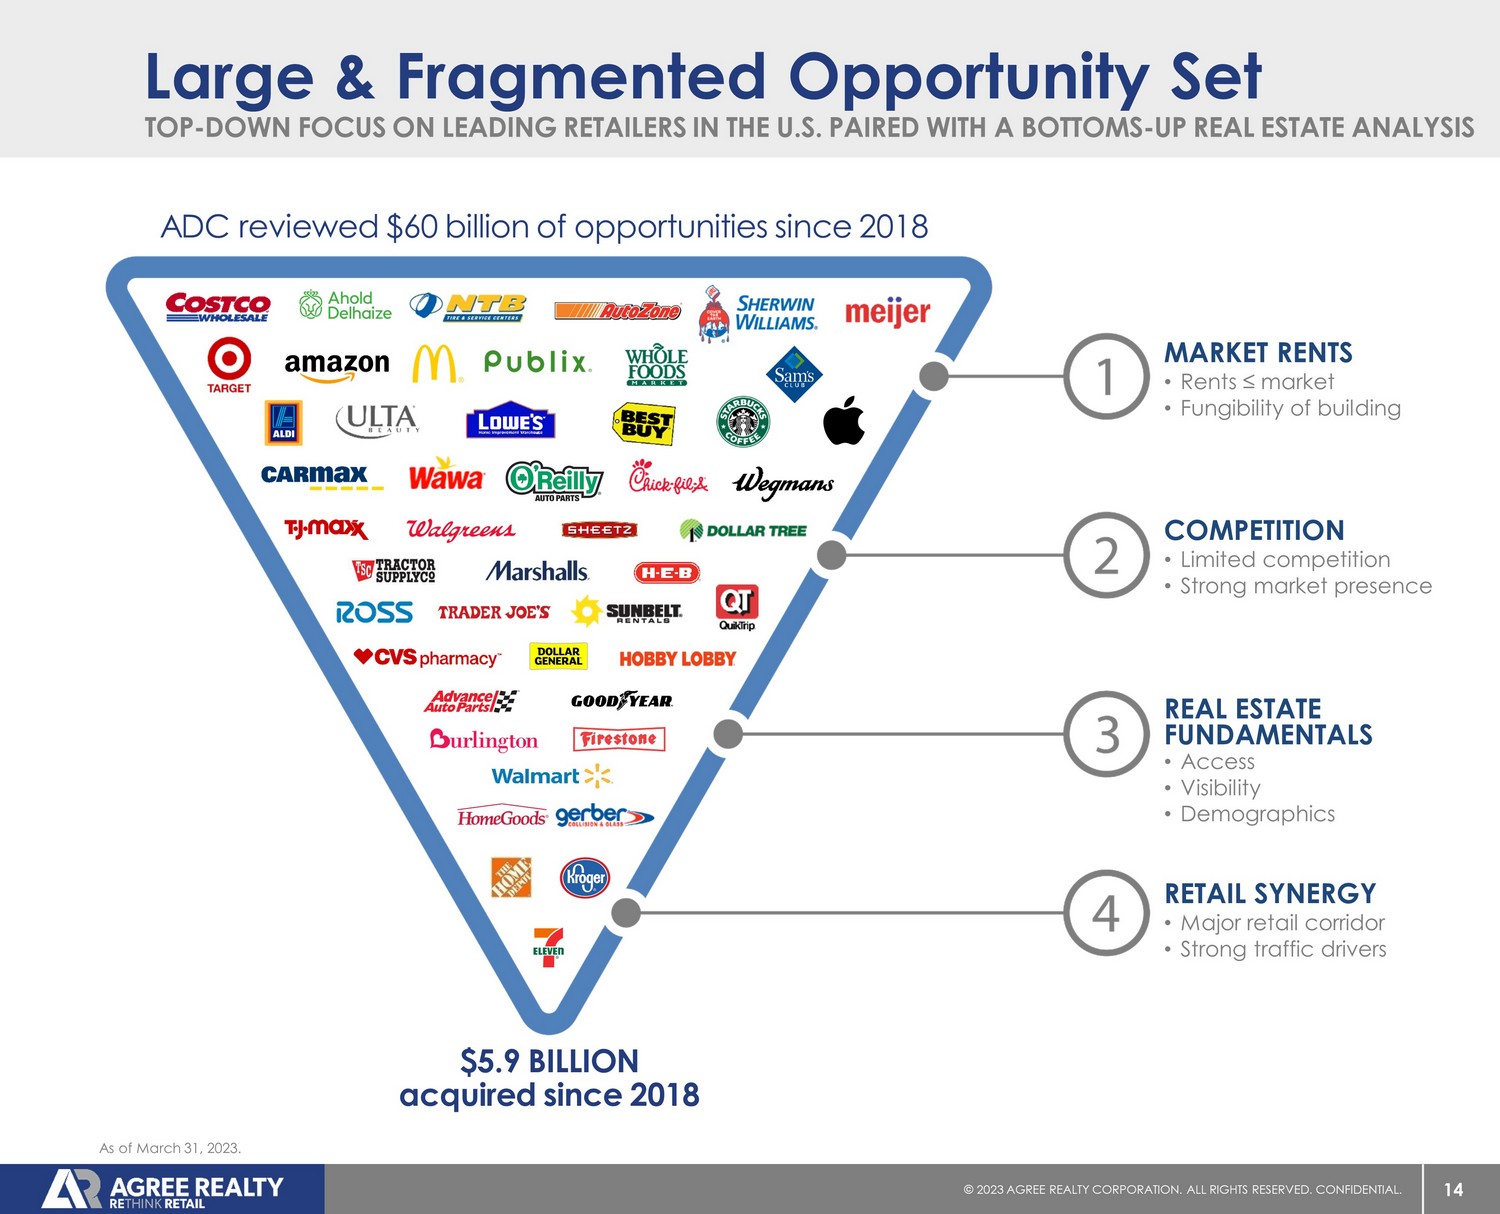
14 © 20 23 AGREE REALTY CORPORATION . ALL RIGHTS RESERVED. CONFIDENTIAL. TOP - DOWN FOCUS ON LEADING RETAILERS IN THE U.S. PAIRED WITH A BOTTOMS - UP REAL ESTATE ANALYSIS Large & Fragmented Opportunity Set REAL ESTATE FUNDAMENTALS • Rents ≤ market • Fungibility of building MARKET RENTS • Limited competition • Strong market presence COMPETITION • Access • Visibility • Demographics • Major retail corridor • Strong traffic drivers RETAIL SYNERGY ADC reviewed $60 billion of opportunities since 2018 $5.9 BILLION acquired since 2018 As of March 31, 2023.
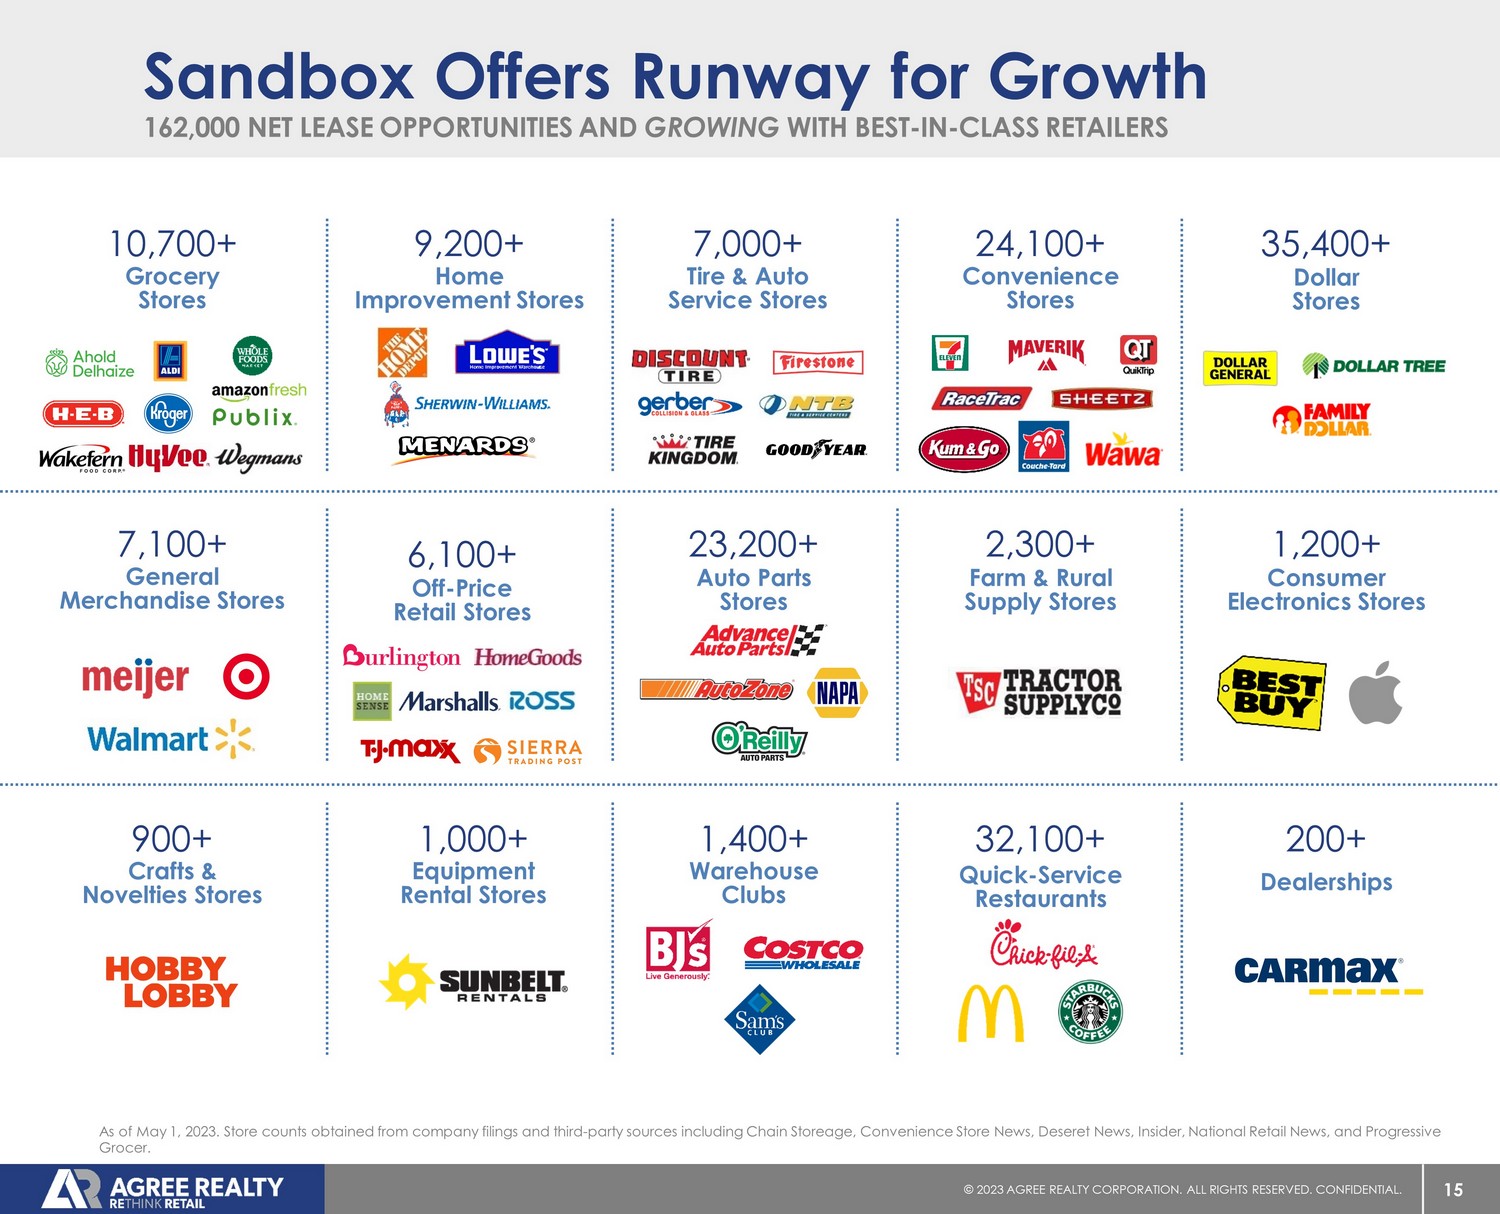
15 © 20 23 AGREE REALTY CORPORATION . ALL RIGHTS RESERVED. CONFIDENTIAL. As of May 1, 2023. Store counts obtained from company filings and third - party sources including Chain Storeage , Convenience Store News, Deseret News, Insider, National Retail News, and Progressive Grocer. 162,000 NET LEASE OPPORTUNITIES AND GROWING WITH BEST - IN - CLASS RETAILERS Sandbox Offers Runway for Growth Auto Parts Stores 23,200+ Farm & Rural Supply Stores 2,300+ Crafts & Novelties Stores 900+ Quick - Service Restaurants 32,100+ Equipment Rental Stores 1,000+ Warehouse Clubs 1,400+ Home Improvement Stores 9,200+ Consumer Electronics Stores 1,200+ Grocery Stores 10,700+ Dealerships 200+ Convenience Stores 24,100+ Off - Price Retail Stores 6,100+ Tire & Auto Service Stores 7,000+ Dollar Stores 35,400+ General Merchandise Stores 7,100+
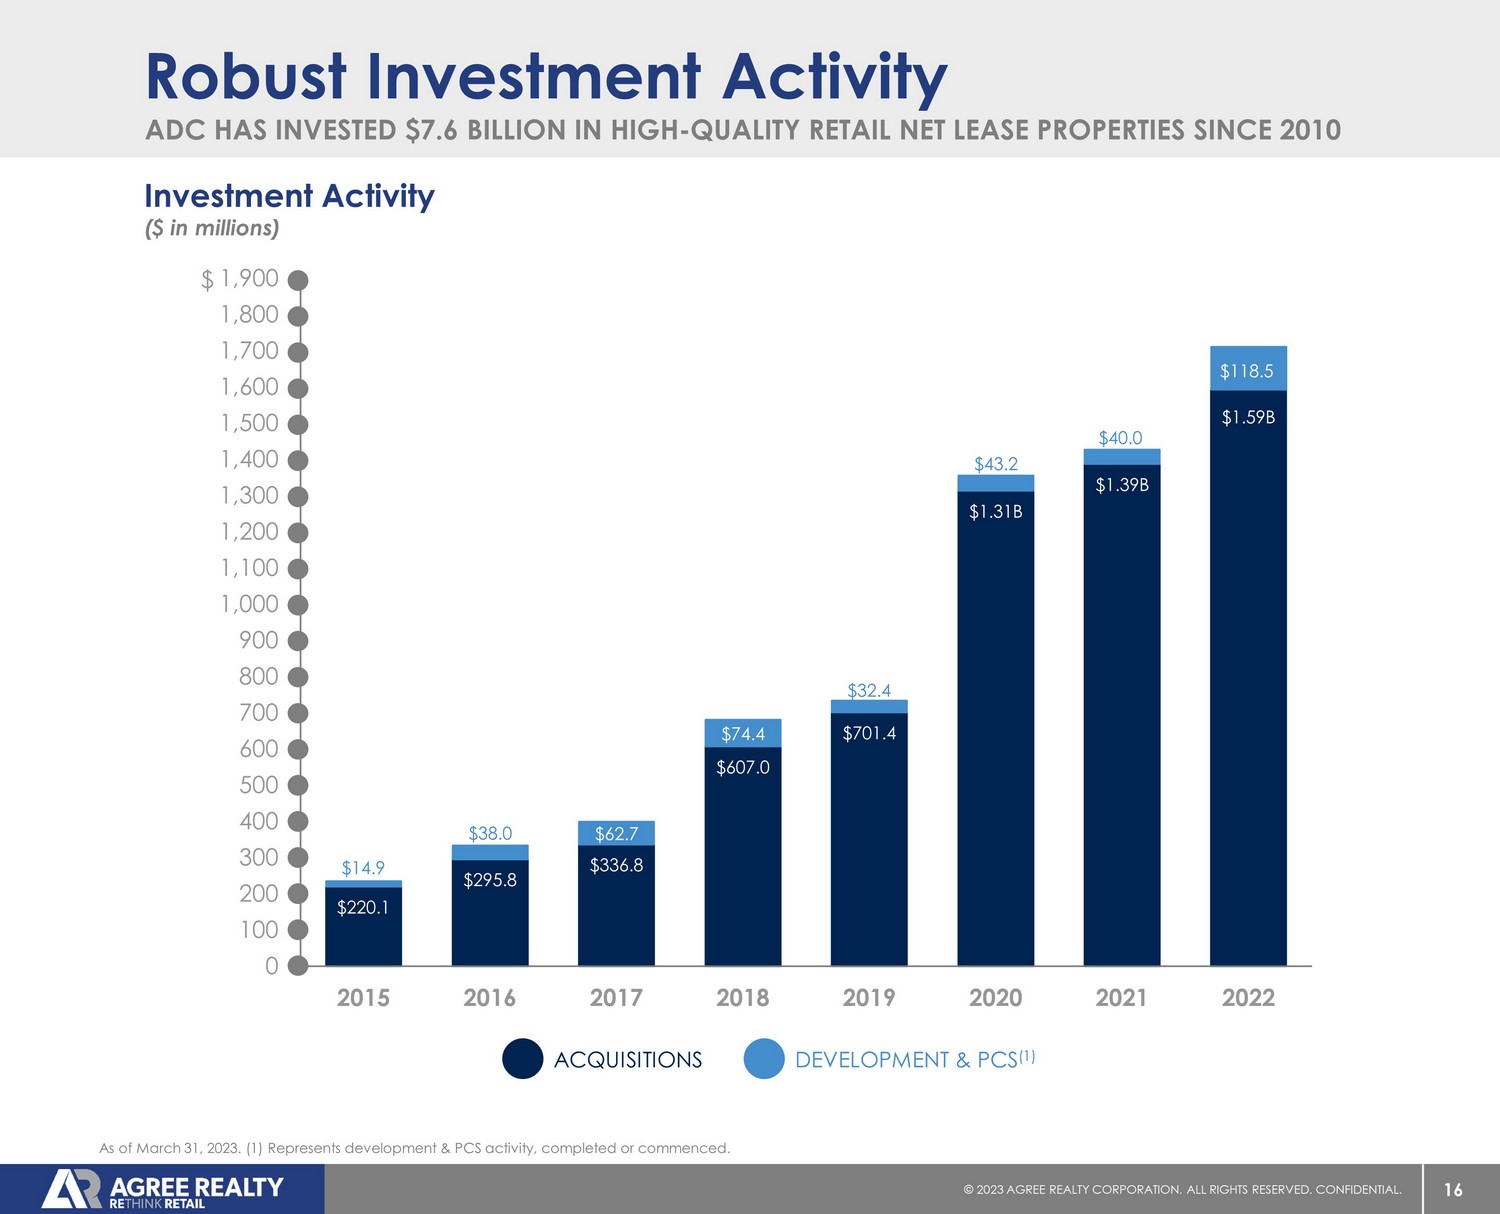
16 © 20 23 AGREE REALTY CORPORATION . ALL RIGHTS RESERVED. CONFIDENTIAL. $220.1 $295.8 $336.8 $607.0 $701.4 $1.31B $1.39B $1.59B $14.9 $38.0 $62.7 $74.4 $32.4 $43.2 $40.0 $118.5 0 100 200 300 400 500 600 700 800 900 1,000 1,100 1,200 1,300 1,400 1,500 1,600 1,700 1,800 1,900 2015 2016 2017 2018 2019 2020 2021 2022 ADC HAS INVESTED $7.6 BILLION IN HIGH - QUALITY RETAIL NET LEASE PROPERTIES SINCE 2010 Robust Investment Activity DEVELOPMENT & PCS (1) ACQUISITIONS Investment Activity ($ in millions) As of March 31, 2023. (1) Represents development & PCS activity, completed or commenced. $
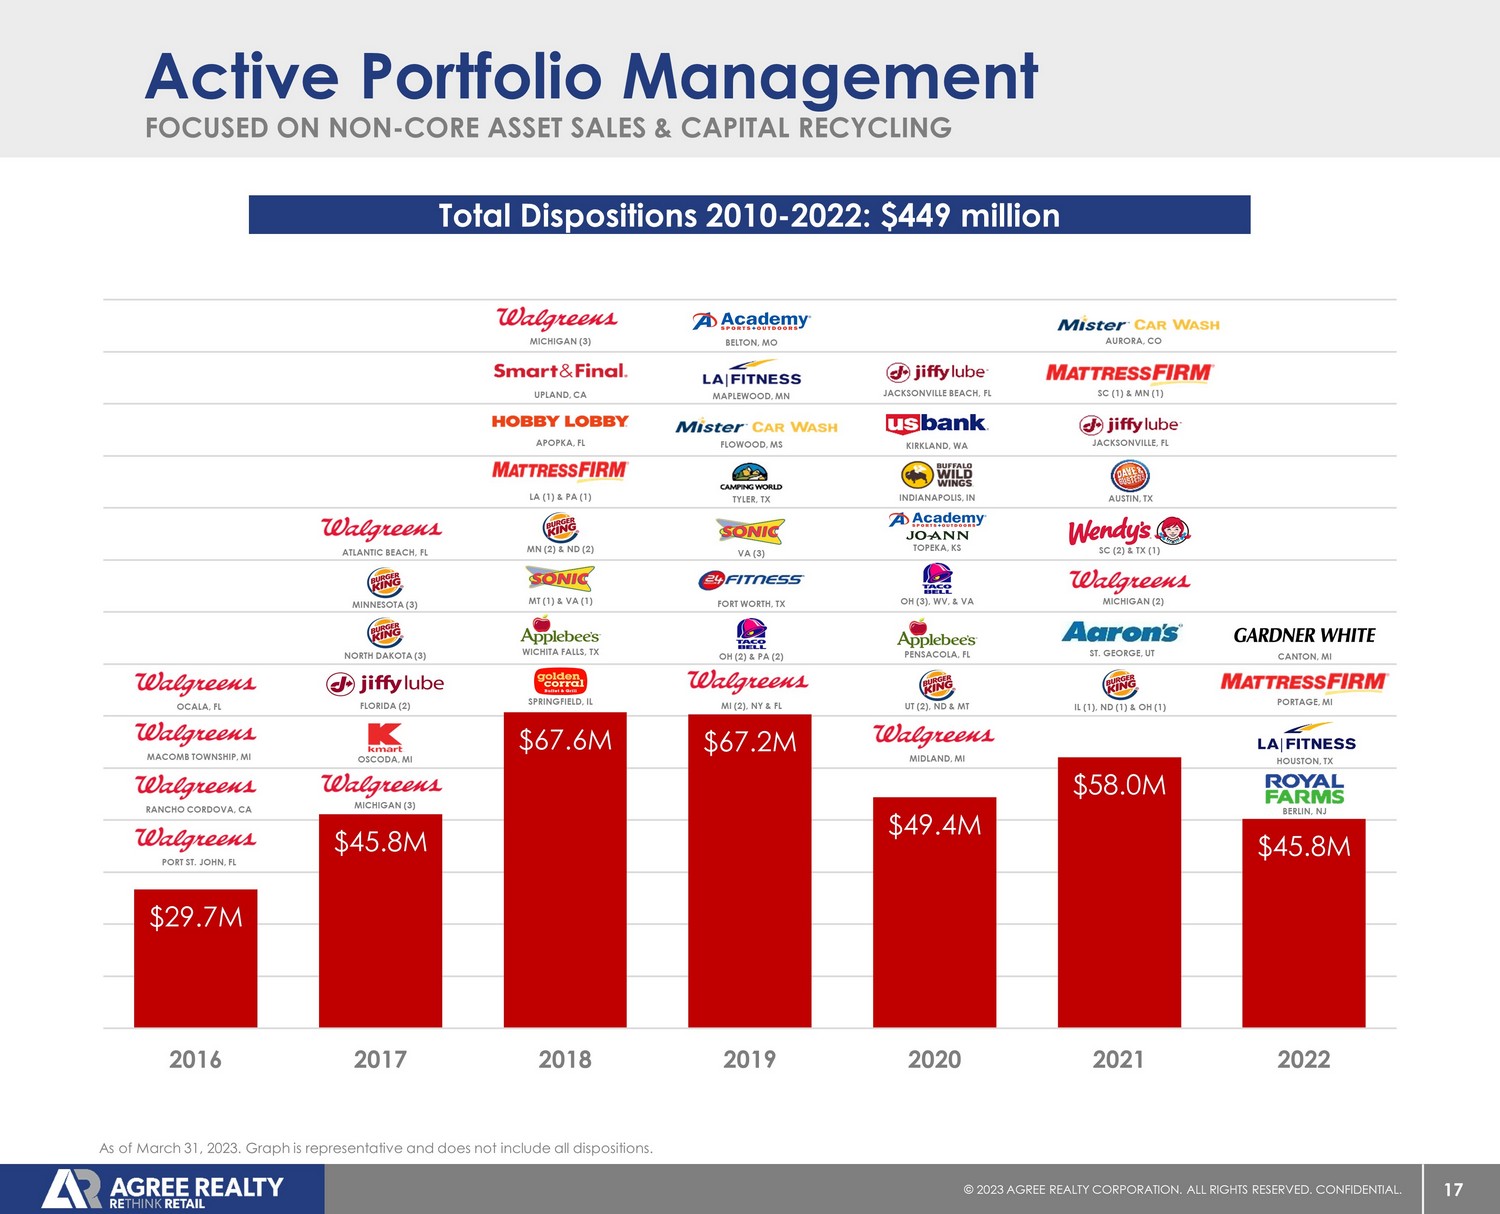
17 © 20 23 AGREE REALTY CORPORATION . ALL RIGHTS RESERVED. CONFIDENTIAL. $29.7M $45.8M $67.6M $67.2M $49.4M $58.0M $45.8M 2016 2017 2018 2019 2020 2021 2022 FOCUSED ON NON - CORE ASSET SALES & CAPITAL RECYCLING Active Portfolio Management As of March 31, 2023. Graph is representative and does not include all dispositions. Total Dispositions 2010 - 2022: $449 million PORT ST. JOHN, FL RANCHO CORDOVA, CA MACOMB TOWNSHIP, MI OCALA, FL MICHIGAN (3) OSCODA, MI FLORIDA (2) NORTH DAKOTA (3) MINNESOTA (3) ATLANTIC BEACH, FL MT (1) & VA (1) WICHITA FALLS, TX SPRINGFIELD, IL UPLAND, CA APOPKA, FL LA (1) & PA (1) MN (2) & ND (2) MICHIGAN (3) FORT WORTH, TX OH (2) & PA (2) FLOWOOD, MS MAPLEWOOD, MN TYLER, TX BELTON, MO MI (2), NY & FL VA (3) MIDLAND, MI UT (2), ND & MT PENSACOLA, FL OH (3), WV, & VA TOPEKA, KS INDIANAPOLIS, IN KIRKLAND, WA JACKSONVILLE BEACH, FL IL (1), ND (1) & OH (1) MICHIGAN (2) ST. GEORGE, UT SC (2) & TX (1) AUSTIN, TX JACKSONVILLE, FL SC (1) & MN (1) AURORA, CO BERLIN, NJ HOUSTON, TX PORTAGE, MI CANTON, MI
Fortified Balance Sheet
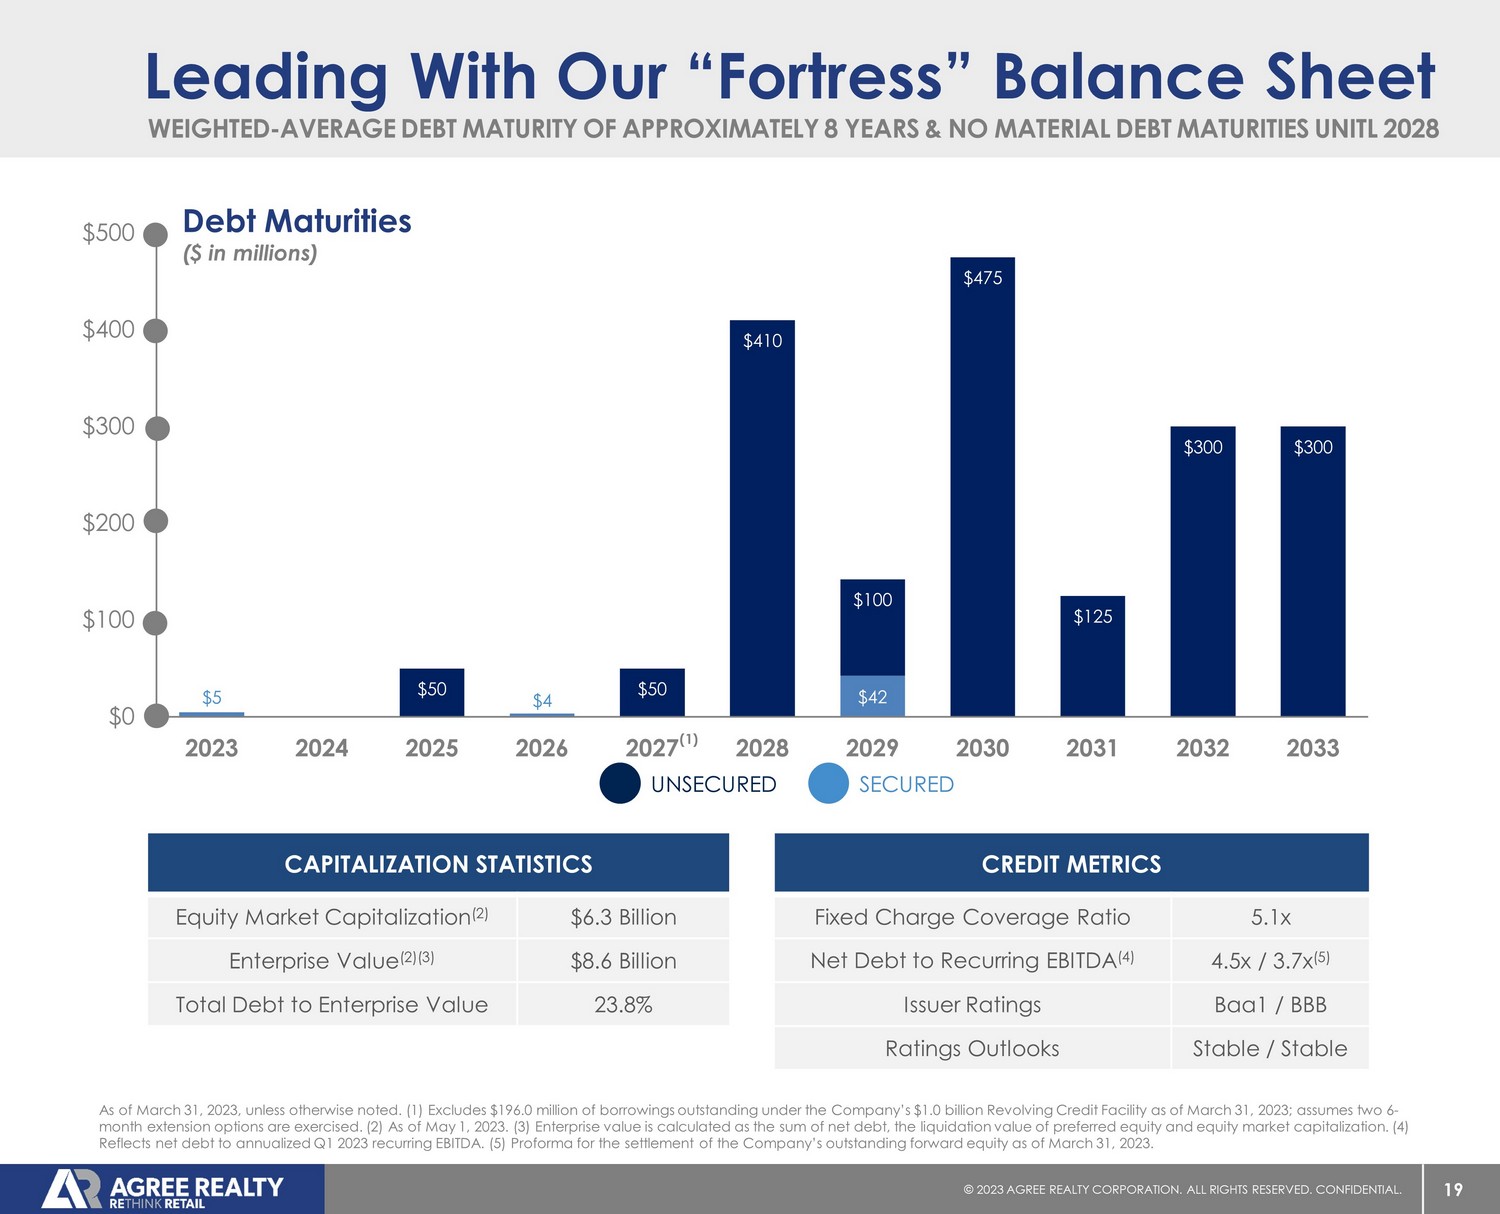
19 © 20 23 AGREE REALTY CORPORATION . ALL RIGHTS RESERVED. CONFIDENTIAL. $5 $4 $42 $0 $50 $0 $50 $410 $100 $475 $125 $300 $300 $0 $100 $200 $300 $400 $500 2023 2024 2025 2026 2027 2028 2029 2030 2031 2032 2033 Leading With Our “Fortress” Balance Sheet CAPITALIZATION STATISTICS Equity Market Capitalization (2) $6.3 Billion Enterprise Value (2)(3) $8.6 Billion Total Debt to Enterprise Value 23.8% CREDIT METRICS Fixed Charge Coverage Ratio 5.1x Net Debt to Recurring EBITDA (4) 4.5x / 3.7x (5) Issuer Ratings Baa1 / BBB Ratings Outlooks Stable / Stable As of March 31, 2023, unless otherwise noted. (1) Excludes $196.0 million of borrowings outstanding under the Company’s $1.0 bil lion Revolving Credit Facility as of March 31, 2023; assumes two 6 - month extension options are exercised. (2) As of May 1, 2023. (3) Enterprise value is calculated as the sum of net debt, the liq uidation value of preferred equity and equity market capitalization. (4) Reflects net debt to annualized Q1 2023 recurring EBITDA. (5) Proforma for the settlement of the Company’s outstanding forwar d e quity as of March 31, 2023. Debt Maturities ($ in millions) SECURED UNSECURED 1 c WEIGHTED - AVERAGE DEBT MATURITY OF APPROXIMATELY 8 YEARS & NO MATERIAL DEBT MATURITIES UNITL 2028 (1)
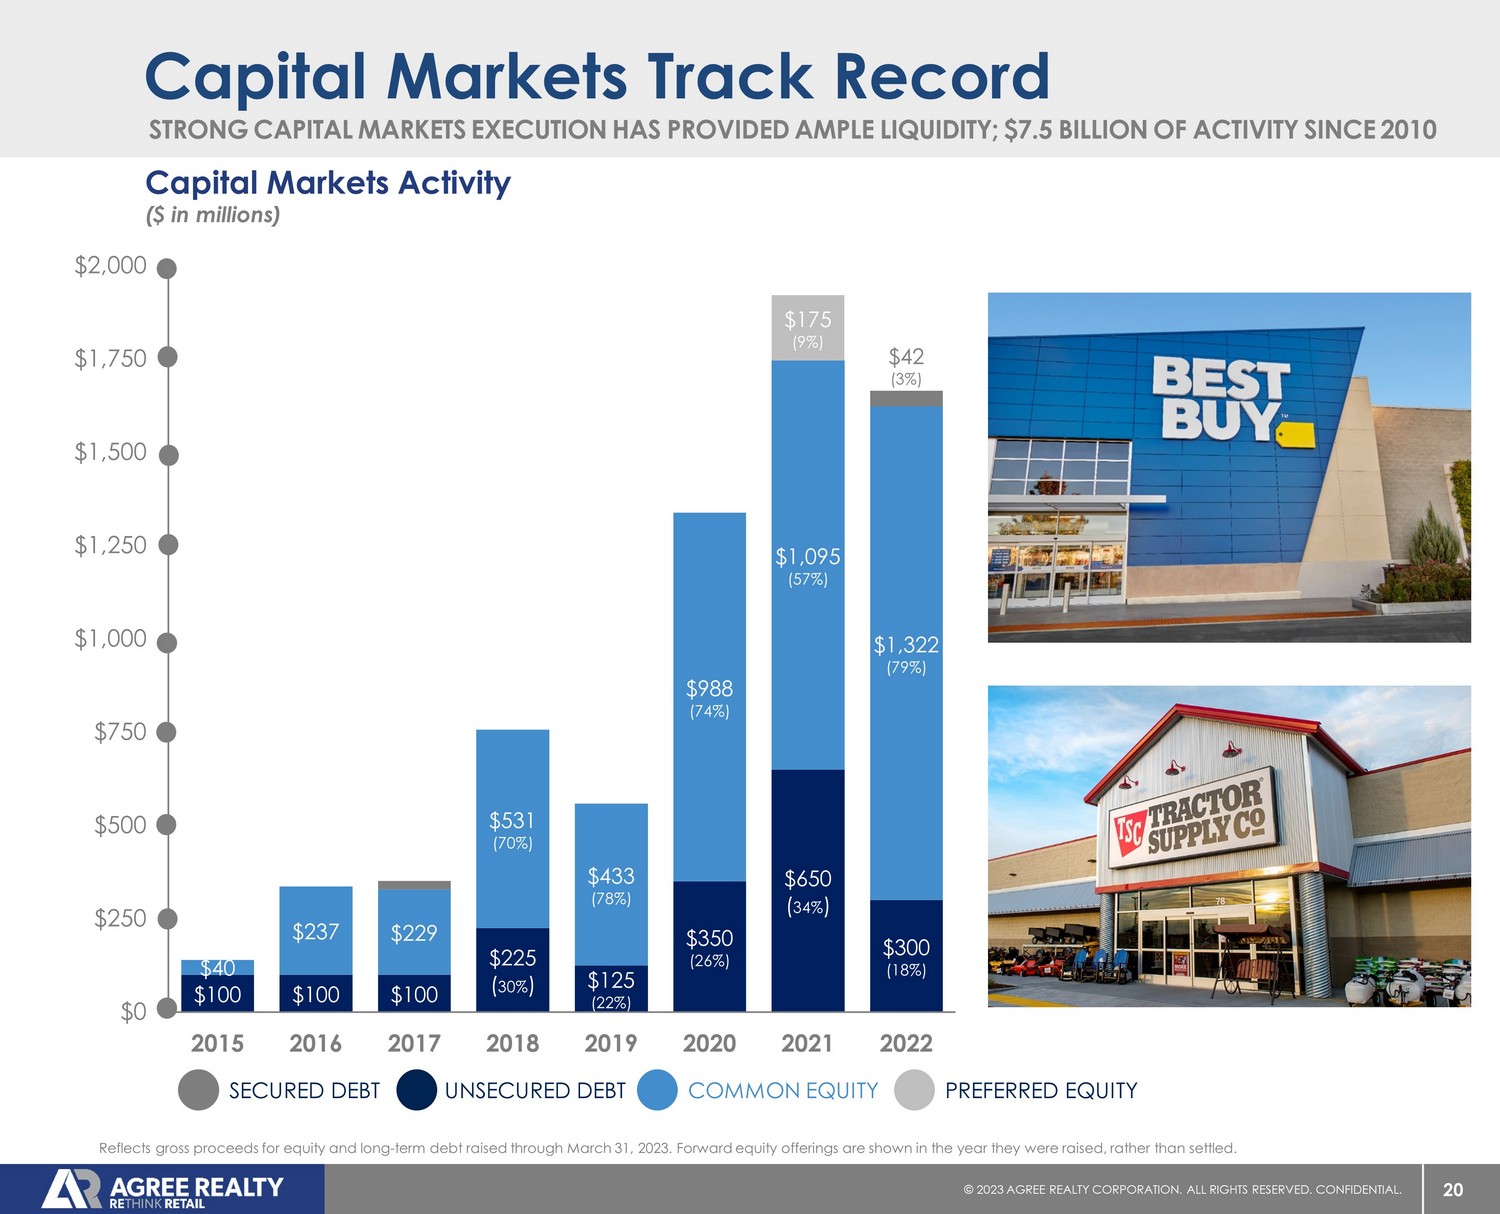
20 © 20 23 AGREE REALTY CORPORATION . ALL RIGHTS RESERVED. CONFIDENTIAL. STRONG CAPITAL MARKETS EXECUTION HAS PROVIDED AMPLE LIQUIDITY; $7.5 BILLION OF ACTIVITY SINCE 2010 Capital Markets Track Record Reflects gross proceeds for equity and long - term debt raised through March 31, 2023. Forward equity offerings are shown in the y ear they were raised, rather than settled. Capital Markets Activity ($ in millions) COMMON EQUITY UNSECURED DEBT SECURED DEBT PREFERRED EQUITY $100 $100 $100 $225 ( 30% ) $125 (22%) $350 (26%) $650 ( 34% ) $300 (18%) $40 $237 $229 $531 (70%) $433 (78%) $988 (74%) $1,095 (57%) $1,322 (79%) $42 (3%) $175 (9%) $0 $250 $500 $750 $1,000 $1,250 $1,500 $1,750 $2,000 2015 2016 2017 2018 2019 2020 2021 2022

21 © 20 23 AGREE REALTY CORPORATION . ALL RIGHTS RESERVED. CONFIDENTIAL. (includes outstanding forward equity offerings) ADC HAS BEEN AT OR BELOW 4.3X PROFORMA NET DEBT TO RECURRING EBITDA SINCE 2018 Low Leverage = Strong Positioning As of March 31, 2023. Proforma Net Debt to Recurring EBTIDA deducts the Company’s outstanding forward equity offerings for ea ch period from the Company’s net debt for each period. PROFORMA NET DEBT TO RECURRING EBITDA NET DEBT TO RECURRING EBITDA Q3 2022 Q4 2022 Q1 2023 Q2 2020 Q3 2020 Q4 2020 Q1 2021 Q2 2021 Q3 2021 Q4 2021 Q1 2022 Q2 2022 Q1 2020 4.8x 2.5x 3.5x 1.6x 4.7x 3.2x 4.8x 4.0x 4.9x 4.2x 4.5x 3.6x 4.4x 3.7x 4.9x 3.4x 5.0x 4.3x 5.0x 3.8x 4.0x 3.1x 4.4x 3.1x 4.5x 3.7x

22 © 20 23 AGREE REALTY CORPORATION . ALL RIGHTS RESERVED. CONFIDENTIAL. $1.60 $1.64 $1.74 $1.85 $1.92 $2.03 $2.16 $2.28 $2.41 $2.60 $2.81 $1.50 $1.70 $1.90 $2.10 $2.30 $2.50 $2.70 $2.90 2012 2013 2014 2015 2016 2017 2018 2019 2020 2021 2022 Annual Dividends Declared Per Common Share 134 CONSECUTIVE COMMON DIVIDENDS PAID; AVERAGE AFFO PAYOUT RATIO OF 76% OVER PAST 10 YEARS Growing, Well - Covered Monthly Dividend As of May 1, 2023. Reflects common dividends per share declared in each year, rounded to two decimals.
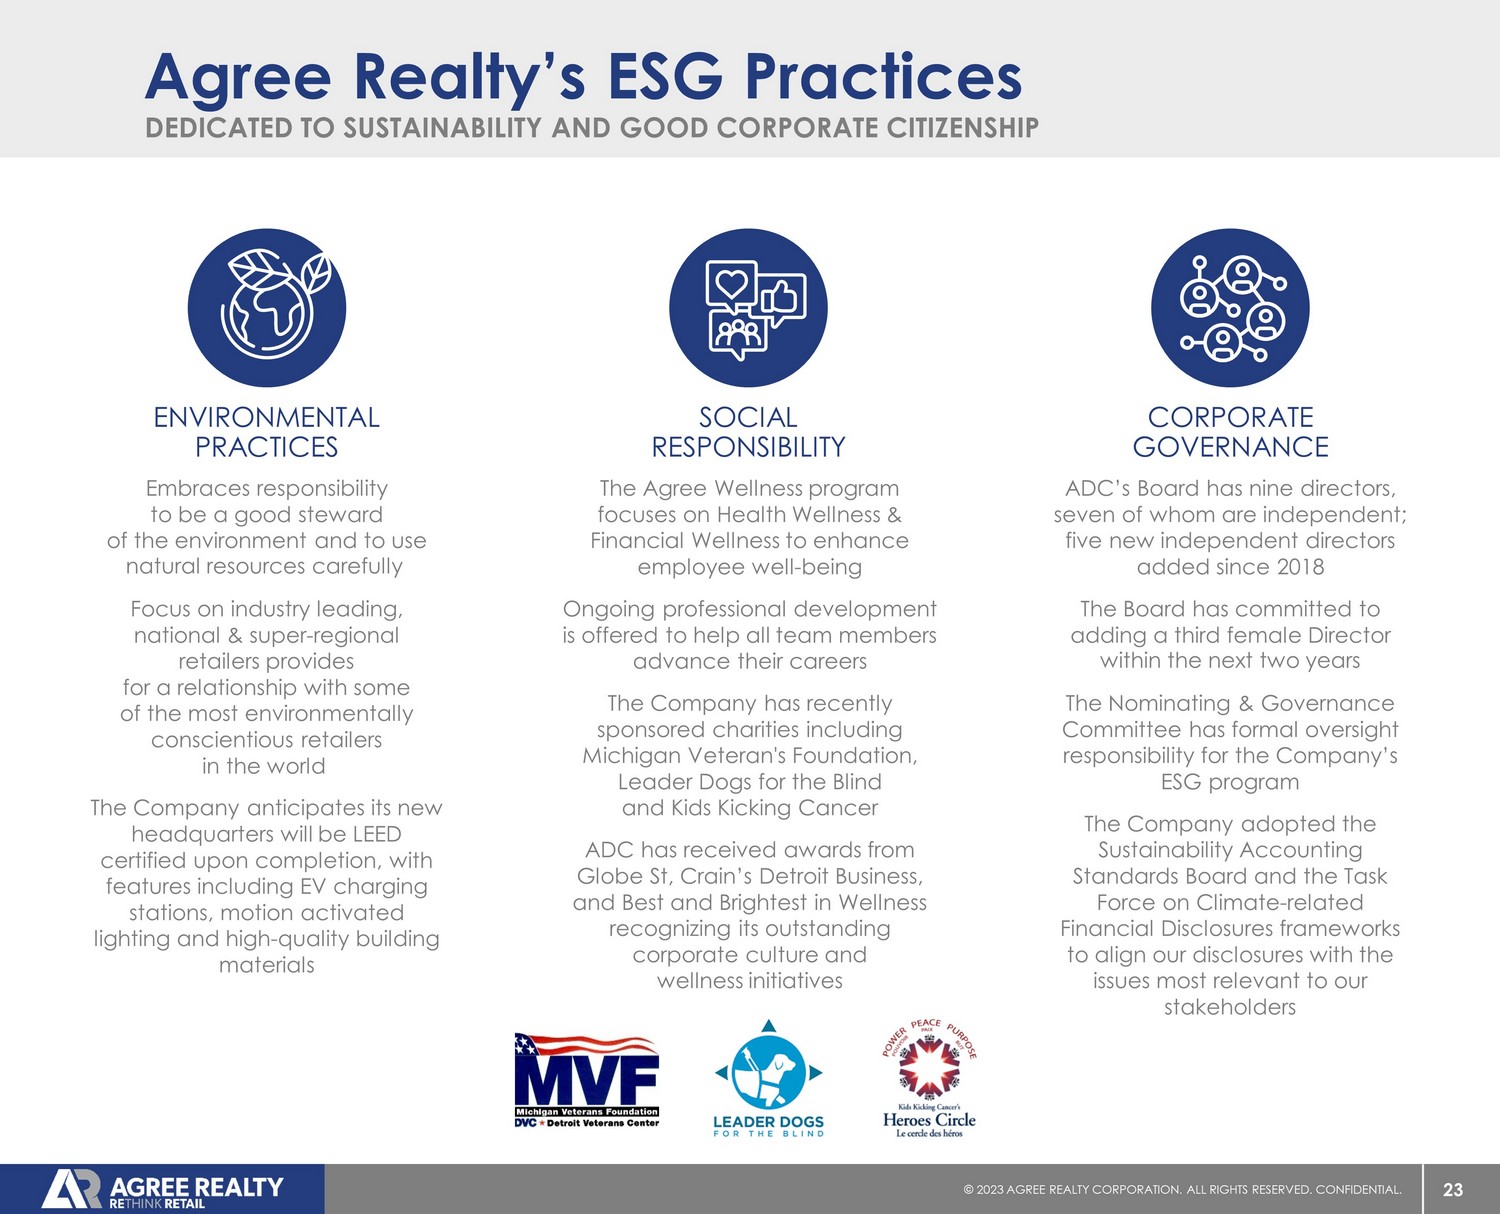
23 © 20 23 AGREE REALTY CORPORATION . ALL RIGHTS RESERVED. CONFIDENTIAL. DEDICATED TO SUSTAINABILITY AND GOOD CORPORATE CITIZENSHIP Agree Realty’s ESG Practices Embraces responsibility to be a good steward of the environment and to use natural resources carefully Focus on industry leading, national & super - regional retailers provides for a relationship with some of the most environmentally conscientious retailers in the world The Company anticipates its new headquarters will be LEED certified upon completion, with features including EV charging stations, motion activated lighting and high - quality building materials ENVIRONMENTAL PRACTICES The Agree Wellness program focuses on Health Wellness & Financial Wellness to enhance employee well - being Ongoing professional development is offered to help all team members advance their careers The Company has recently sponsored charities including Michigan Veteran's Foundation, Leader Dogs for the Blind and Kids Kicking Cancer ADC has received awards from Globe St, Crain’s Detroit Business, and Best and Brightest in Wellness recognizing its outstanding corporate culture and wellness initiatives SOCIAL RESPONSIBILITY ADC’s Board has nine directors, seven of whom are independent; five new independent directors added since 2018 The Board has committed to adding a third female Director within the next two years The Nominating & Governance Committee has formal oversight responsibility for the Company’s ESG program The Company adopted the Sustainability Accounting Standards Board and the Task Force on Climate - related Financial Disclosures frameworks to align our disclosures with the issues most relevant to our stakeholders CORPORATE GOVERNANCE
24 © 20 23 AGREE REALTY CORPORATION . ALL RIGHTS RESERVED. CONFIDENTIAL. Investment Summary Highlights FORTIFIED BALANCE SHEET HIGHEST - QUALITY RETAIL REAL ESTATE INVESTMENT GRADE ISSUER RATINGS Robust growth trajectory MULTI - YEAR TRACK RECORD OF EXECUTION Well - covered & consistent dividend
25 © 20 23 AGREE REALTY CORPORATION . ALL RIGHTS RESERVED. CONFIDENTIAL. APPENDIX
26 © 20 23 AGREE REALTY CORPORATION . ALL RIGHTS RESERVED. CONFIDENTIAL. Forward - Looking Statements This presentation contains forward - looking statements within the meaning of Section 27A of the Securities Act of 1933, as amended (the “Securities Act”) and Section 21E of the Securities Exchange Act of 1934, as amended (the “Exchange Act”). The Company intends such forward - looking statements to be covered by the safe harbor provisions for forward - looking statements contained in the Private Securities Litigation Reform Act of 1995 and includes this statement for purposes of complying with these safe harbor provisions. Forward - looking statements are generally identifiable by use of forward - looking terminology such as “may,” “will,” “should,” “potential,” “intend,” “expect,” “seek,” “anticipate,” “estimate,” “approximately,” “believe,” “could,” “project,” “predict,” “forecast,” “continue,” “assume,” “plan,” references to “outlook” or other similar words or expressions. Forward - looking statements are based on certain assumptions and can include future expectations, future plans and strategies, financial and operating projections and forecasts and other forward - looking information and estimates. These forward - looking statements are subject to various risks and uncertainties, many of which are beyond the Company’s control, which could cause actual results to differ materially from such statements. Certain factors could occur that might cause actual results to vary, including the potential adverse effect of ongoing worldwide economic uncertainties, disruptions in the banking system and financial markets, lingering effects from the pandemic of the novel coronavirus, or COVID - 19, increased inflation and interest rates on the financial condition, results of operations, cash flows and performance of the Company and its tenants, the real estate market and the global economy and financial markets, the general deterioration in national economic conditions, weakening of real estate markets, decreases in the availability of credit, increases in interest rates, adverse changes in the retail industry, the Company’s continuing ability to qualify as a REIT and other risks and uncertainties as described in greater detail in the Company’s filings with the Securities and Exchange Commission (the “SEC”), including, without limitation, the Company’s Annual Report on Form 10 - K and subsequent quarterly reports. Except as required by law, the Company disclaims any obligation to update any forward - looking statements, whether as a result of new information, future events or otherwise. For further information about the Company’s business and financial results, please refer to the “Management’s Discussion and Analysis of Financial Condition and Results of Operations” and “Risk Factors” sections of the Company’s SEC filings, including, but not limited to, its Annual Report on Form 10 - K and Quarterly Reports on Form 10 - Q, copies of which may be obtained at the Investors section of the Company’s website at www.agreerealty.com . All information in this presentation is as of March 31 , 2023 , unless otherwise noted . The Company undertakes no duty to update the statements in this presentation to conform the statements to actual results or changes in the Company’s expectations .
27 © 20 23 AGREE REALTY CORPORATION . ALL RIGHTS RESERVED. CONFIDENTIAL. Non - GAAP Financial Measures This presentation includes a non - GAAP financial measure, Net Debt to Recurring EBITDA, which is presented on an actual and profo rma basis. A reconciliation of this non - GAAP financial measure to the most directly comparable GAAP measure is included in the following page s. The components of this ratio and their use and utility to management are described further in the section below. Components of Net Debt to Recurring EBITDA EBITDAre is defined by Nareit to mean net income computed in accordance with GAAP, plus interest expense, income tax expense, depreciation and amortization, any gains (or losses) from sales of real estate assets and/or changes in control, any impairment charges on de preciable real estate assets, and after adjustments for unconsolidated partnerships and joint ventures. The Company considers the non - GAAP meas ure of EBITDAre to be a key supplemental measure of the Company's performance and should be considered along with, but not as an alternative to , net income or loss as a measure of the Company's operating performance. The Company considers EBITDAre a key supplemental measure of the Company's operating performance because it provides an additional supplemental measure of the Company's performance and opera tin g cash flow that is widely known by industry analysts, lenders and investors. The Company’s calculation of EBITDAre may not be comparable to EBITDAre reported by other REITs that interpret the Nareit definition differently than the Company. Recurring EBITDA The Company defines Recurring EBITDA as EBITDAre with the addback of noncash amortization of above - and below - market lease intangibles, and after adjustments for the run - rate impact of the Company's investment and disposition activity for the pe riod presented, as well as adjustments for non - recurring benefits or expenses. The Company considers the non - GAAP measure of Recurring EBITDA to be a key supplemental measure of the Company's performance and should be considered along with, but not as an alternative to, net inco me or loss as a measure of the Company's operating performance. The Company considers Recurring EBITDA a key supplemental measure of the Comp any 's operating performance because it represents the Company's earnings run rate for the period presented and because it is widely fo llowed by industry analysts, lenders and investors. Our Recurring EBITDA may not be comparable to Recurring EBITDA reported by other c omp anies that have a different interpretation of the definition of Recurring EBITDA. Our ratio of net debt to Recurring EBITDA is used by m ana gement as a measure of leverage and may be useful to investors in understanding the Company’s ability to service its debt, as well as ass ess the borrowing capacity of the Company. Our ratio of net debt to Recurring EBITDA is calculated by taking annualized Recurring EBITDA and d ivi ding it by our net debt per the consolidated balance sheet. Net Debt The Company defines Net Debt as total debt less cash, cash equivalents and cash held in escrows. The Company considers the no n - GAAP measure of Net Debt to be a key supplemental measure of the Company's overall liquidity, capital structure and leverage. Th e Company considers Net Debt a key supplemental measure because it provides industry analysts, lenders and investors useful information in understanding our financial condition. The Company’s calculation of Net Debt may not be comparable to Net Debt reported by other REITs that in terpret the definition differently than the Company. The Company presents Net Debt on both an actual and proforma basis, assuming the Antic ipated Net Proceeds from Outstanding Forwards are used to pay down debt. The Company believes the proforma measure may be useful to inve sto rs in understanding the potential effect of the Anticipated Net Proceeds from Outstanding Forwards on the Company’s capital structu re, its future borrowing capacity, and its ability to service its debt. Anticipated Net Proceeds from Outstanding Forwards Since the first quarter of 2018, the Company has utilized forward sale agreements to sell shares of common stock. Selling common stock through forward sale agreements enables the Company to set the price of such sha res upon pricing the offering (subject to certain adjustments) while delaying the issuance of such shares and the receipt of the net p roc eeds by the Company. Given the Company’s frequent use of forward sale agreements, the Company considers the non - GAAP measure of Anticipated Net Proceeds from Outstanding Forwards to be a key supplemental measure of the Company's overall liquidity, capital structure and le verage. The Company defines Anticipated Net Proceeds from Outstanding Forwards as the number of shares outstanding under forward sale agr eem ents at the end of each quarter, multiplied by the applicable forward sale price for each agreement, respectively.
28 © 20 23 AGREE REALTY CORPORATION . ALL RIGHTS RESERVED. CONFIDENTIAL. Non - GAAP Financial Measures This presentation also includes the non - GAAP measures of Annualized Base Rent (“ABR”), Funds From Operations (“FFO” or “Nareit F FO”), Core Funds From Operations (“Core FFO”) and Adjusted Funds From Operations (“AFFO”). ABR represents the annualized amount of contr act ual minimum rent required by tenant lease agreements, computed on a straight - line basis. ABR is not, and is not intended to be, a pr esentation in accordance with GAAP. The Company believes annualized contractual minimum rent is useful to management, investors, and other int erested parties in analyzing concentrations and leasing activity. FFO, Core FFO and AFFO are reconciled to the most directly comparab le GAAP measure in the following pages and are described in further detail below. Components of Funds from Operations, Core Funds from Operations, and Adjusted Funds from Operations Funds from Operations (“FFO” or “Nareit FFO”) is defined by the National Association of Real Estate Investment Trusts, Inc. (“Nareit”) to mean net income computed in accordance with GAAP, excluding gains (or losses) from sales of real estate assets and/or changes in contr ol, plus real estate related depreciation and amortization and any impairment charges on depreciable real estate assets, and after adjustments for un consolidated partnerships and joint ventures. Historical cost accounting for real estate assets in accordance with GAAP implicitly assumes th at the value of real estate assets diminishes predictably over time. Since real estate values instead have historically risen or fallen with marke t c onditions, most real estate industry investors consider FFO to be helpful in evaluating a real estate company’s operations. FFO should not be cons ide red an alternative to net income as the primary indicator of the Company’s operating performance, or as an alternative to cash flow as a measure of liquidity. Further, while the Company adheres to the Nareit definition of FFO, its presentation of FFO is not necessarily comparable to sim ilarly titled measures of other REITs due to the fact that all REITs may not use the same definition. Core Funds from Operations (“Core FFO”) The Company defines Core FFO as Nareit FFO with the addback of ( i ) noncash amortization of acquisition purchase price related to above - and below - market lease intangibles and discount on assumed debt and (ii) certain i nfrequently occurring items that reduce or increase net income in accordance with GAAP. Management believes that its measure of Core FFO fac ilitates useful comparison of performance to its peers who predominantly transact in sale - leaseback transactions and are thereby not requ ired by GAAP to allocate purchase price to lease intangibles. Unlike many of its peers, the Company has acquired the substantial majority of its net - leased properties through acquisitions of properties from third parties or in connection with the acquisitions of ground leases from th ird parties. Core FFO should not be considered an alternative to net income as the primary indicator of the Company’s operating performance, or as an alternative to cash flow as a measure of liquidity. Further, the Company’s presentation of Core FFO is not necessarily comparable to similar ly titled measures of other REITs due to the fact that all REITs may not use the same definition. Adjusted Funds from Operations (“AFFO”) is a non - GAAP financial measure of operating performance used by many companies in the REIT industry. AFFO further adjusts FFO and Core FFO for certain non - cash items that reduce or increase net income computed in accord ance with GAAP. Management considers AFFO a useful supplemental measure of the Company’s performance, however, AFFO should not be consi der ed an alternative to net income as an indication of its performance, or to cash flow as a measure of liquidity or ability to mak e d istributions. The Company’s computation of AFFO may differ from the methodology for calculating AFFO used by other equity REITs, and therefore may not be comparable to such other REITs.
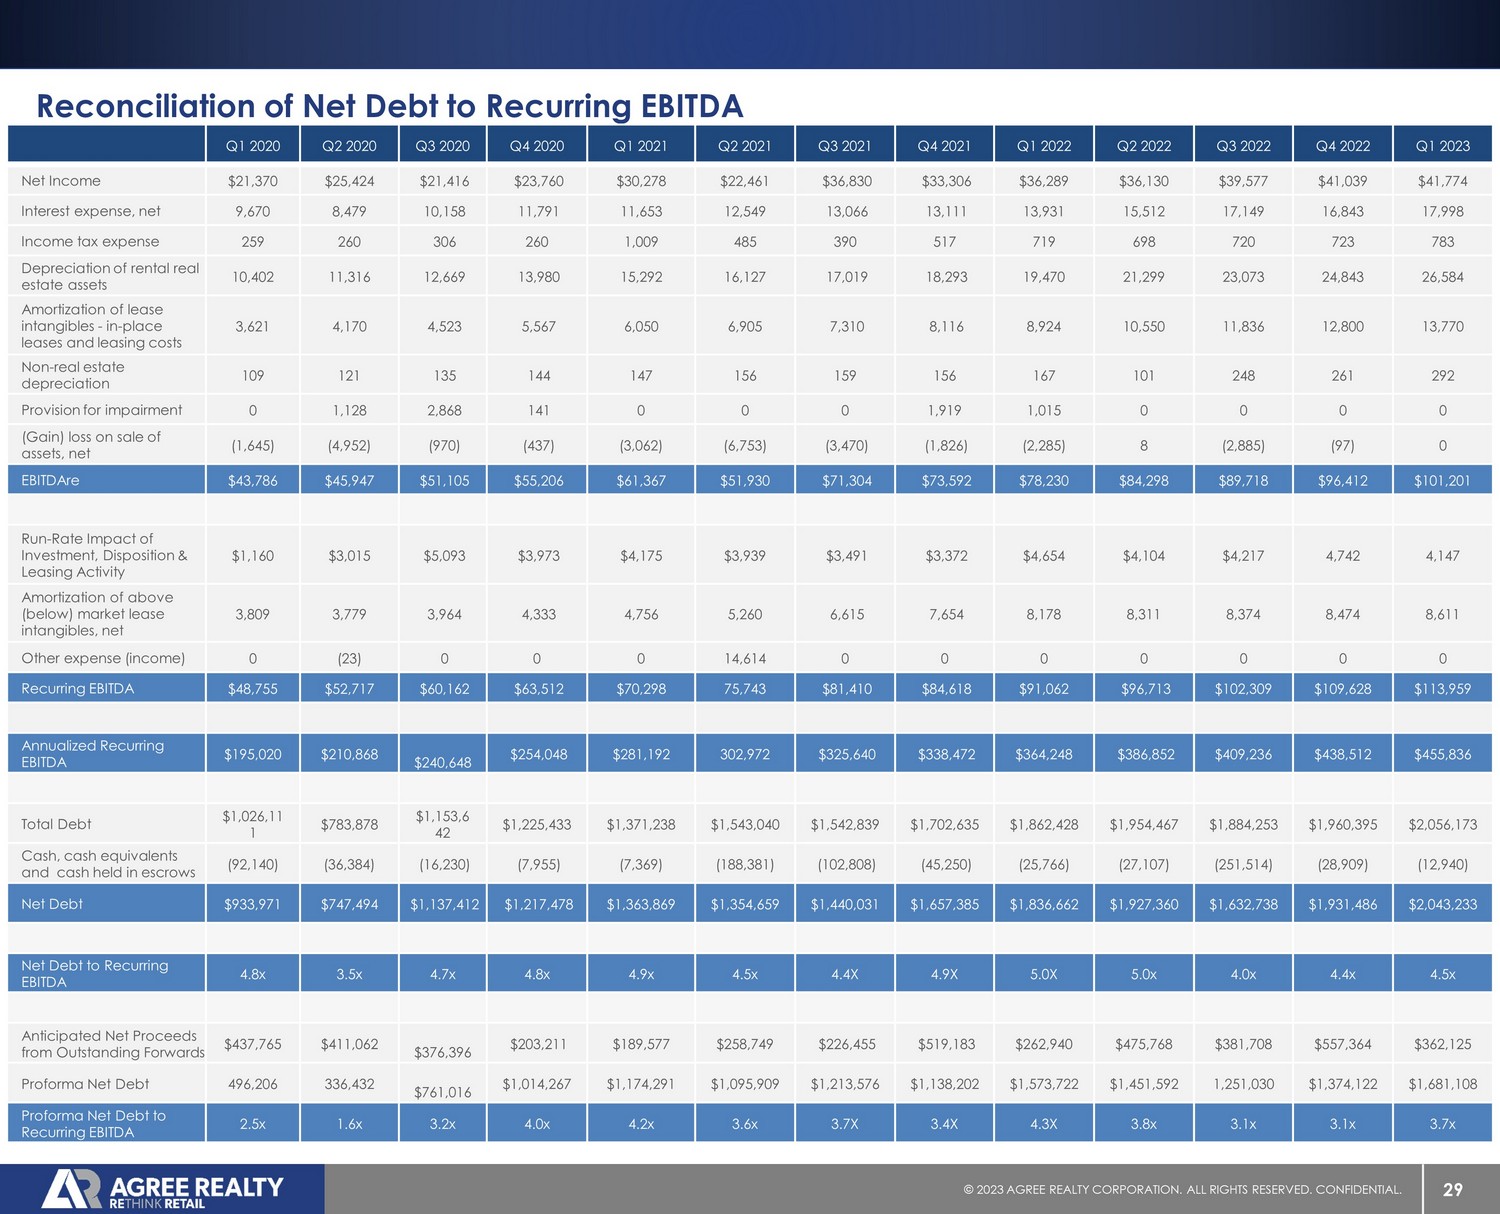
29 © 20 23 AGREE REALTY CORPORATION . ALL RIGHTS RESERVED. CONFIDENTIAL. Reconciliation of Net Debt to Recurring EBITDA Q1 2020 Q2 2020 Q3 2020 Q4 2020 Q1 2021 Q2 2021 Q3 2021 Q4 2021 Q1 2022 Q2 2022 Q3 2022 Q4 2022 Q1 2023 Net Income $21,370 $25,424 $21,416 $23,760 $30,278 $22,461 $36,830 $33,306 $36,289 $36,130 $39,577 $41,039 $41,774 Interest expense, net 9,670 8,479 10,158 11,791 11,653 12,549 13,066 13,111 13,931 15,512 17,149 16,843 17,998 Income tax expense 259 260 306 260 1,009 485 390 517 719 698 720 723 783 Depreciation of rental real estate assets 10,402 11,316 12,669 13,980 15,292 16,127 17,019 18,293 19,470 21,299 23,073 24,843 26,584 Amortization of lease intangibles - in - place leases and leasing costs 3,621 4,170 4,523 5,567 6,050 6,905 7,310 8,116 8,924 10,550 11,836 12,800 13,770 Non - real estate depreciation 109 121 135 144 147 156 159 156 167 101 248 261 292 Provision for impairment 0 1,128 2,868 141 0 0 0 1,919 1,015 0 0 0 0 (Gain) loss on sale of assets, net (1,645) (4,952) (970) (437) (3,062) (6,753) (3,470) (1,826) (2,285) 8 (2,885) (97) 0 EBITDAre $43,786 $45,947 $51,105 $55,206 $61,367 $51,930 $71,304 $73,592 $78,230 $84,298 $89,718 $96,412 $101,201 Run - Rate Impact of Investment, Disposition & Leasing Activity $1,160 $3,015 $5,093 $3,973 $4,175 $3,939 $3,491 $3,372 $4,654 $4,104 $4,217 4,742 4,147 Amortization of above (below) market lease intangibles, net 3,809 3,779 3,964 4,333 4,756 5,260 6,615 7,654 8,178 8,311 8,374 8,474 8,611 Other expense (income) 0 (23) 0 0 0 14,614 0 0 0 0 0 0 0 Recurring EBITDA $48,755 $52,717 $60,162 $63,512 $70,298 75,743 $81,410 $84,618 $91,062 $96,713 $102,309 $109,628 $113,959 Annualized Recurring EBITDA $195,020 $210,868 $240,648 $254,048 $281,192 302,972 $325,640 $338,472 $364,248 $386,852 $409,236 $438,512 $455,836 Total Debt $1,026,11 1 $783,878 $1,153,6 42 $1,225,433 $1,371,238 $1,543,040 $1,542,839 $1,702,635 $1,862,428 $1,954,467 $1,884,253 $1,960,395 $2,056,173 Cash, cash equivalents and cash held in escrows (92,140) (36,384) (16,230) (7,955) (7,369) (188,381) (102,808) (45,250) (25,766) (27,107) (251,514) (28,909) (12,940) Net Debt $933,971 $747,494 $1,137,412 $1,217,478 $1,363,869 $1,354,659 $1,440,031 $1,657,385 $1,836,662 $1,927,360 $1,632,738 $1,931,486 $2,043,233 Net Debt to Recurring EBITDA 4.8x 3.5x 4.7x 4.8x 4.9x 4.5x 4.4X 4.9X 5.0X 5.0x 4.0x 4.4x 4.5x Anticipated Net Proceeds from Outstanding Forwards $437,765 $411,062 $376,396 $203,211 $189,577 $258,749 $226,455 $519,183 $262,940 $475,768 $381,708 $557,364 $362,125 Proforma Net Debt 496,206 336,432 $761,016 $1,014,267 $1,174,291 $1,095,909 $1,213,576 $1,138,202 $1,573,722 $1,451,592 1,251,030 $1,374,122 $1,681,108 Proforma Net Debt to Recurring EBITDA 2.5x 1.6x 3.2x 4.0x 4.2x 3.6x 3.7X 3.4X 4.3X 3.8x 3.1x 3.1x 3.7x
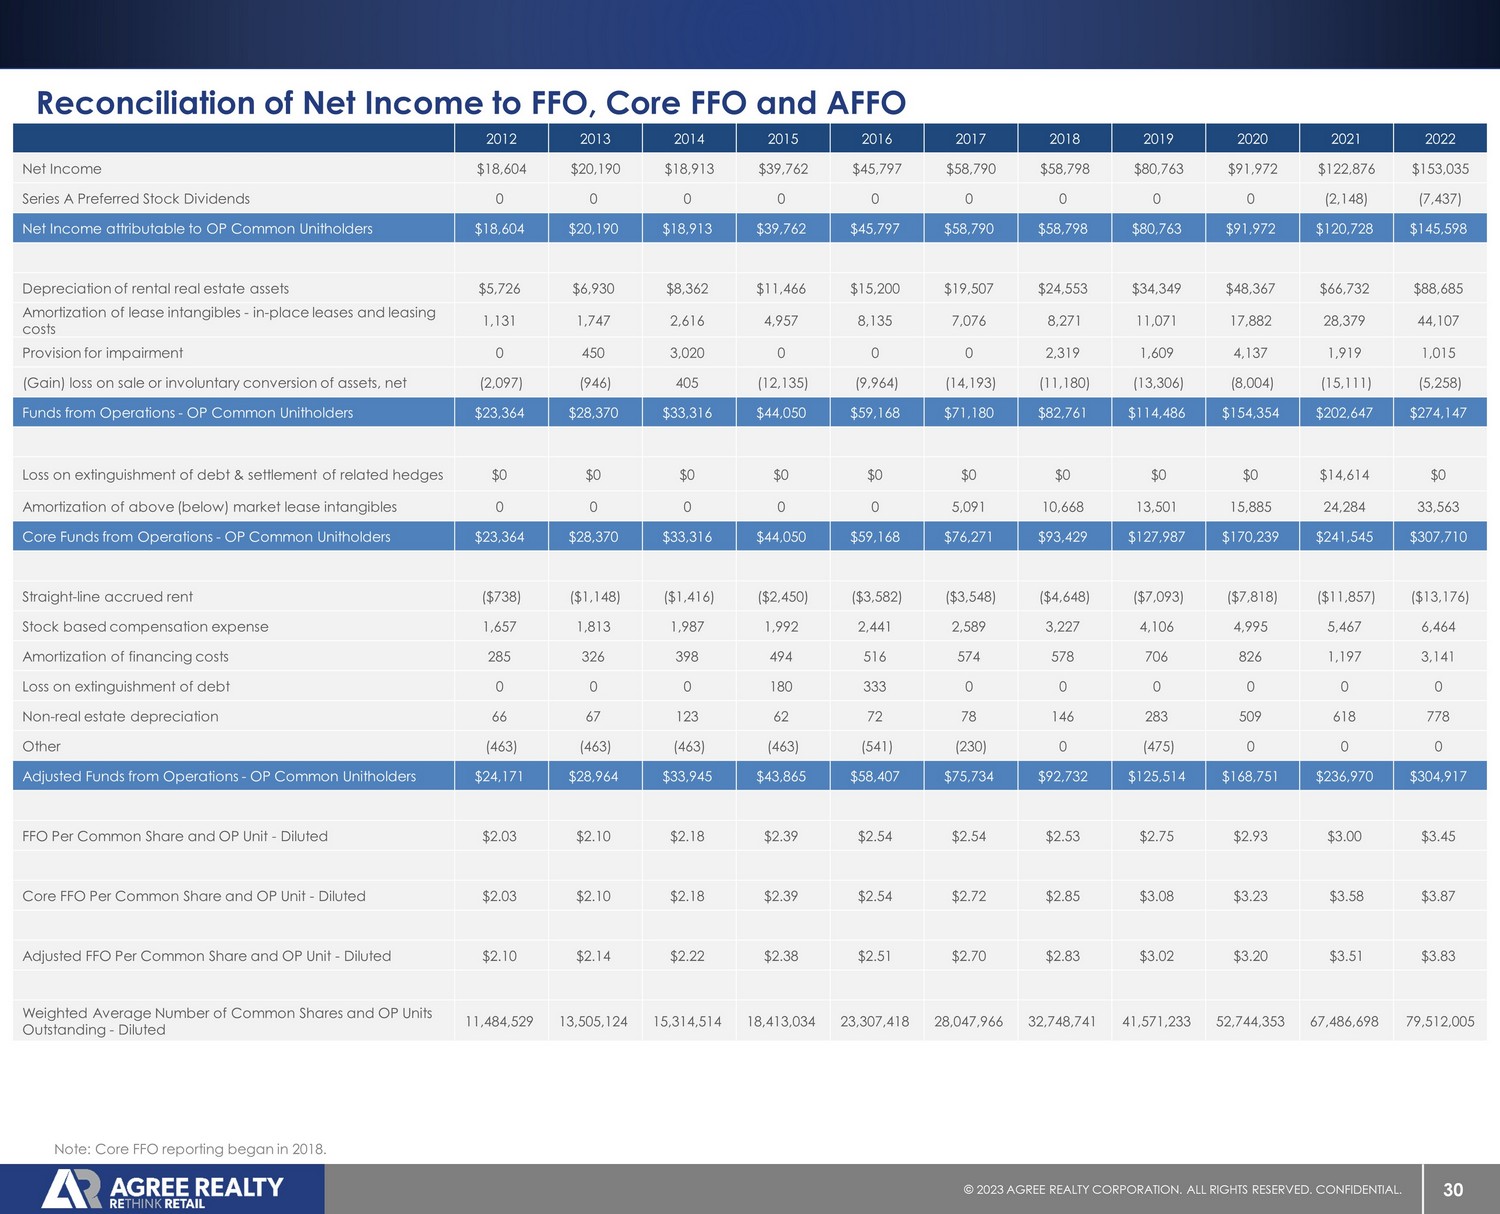
30 © 20 23 AGREE REALTY CORPORATION . ALL RIGHTS RESERVED. CONFIDENTIAL. 2012 2013 2014 2015 2016 2017 2018 2019 2020 2021 2022 Net Income $18,604 $20,190 $18,913 $39,762 $45,797 $58,790 $58,798 $80,763 $91,972 $122,876 $153,035 Series A Preferred Stock Dividends 0 0 0 0 0 0 0 0 0 (2,148) (7,437) Net Income attributable to OP Common Unitholders $18,604 $20,190 $18,913 $39,762 $45,797 $58,790 $58,798 $80,763 $91,972 $120,728 $145,598 Depreciation of rental real estate assets $5,726 $6,930 $8,362 $11,466 $15,200 $19,507 $24,553 $34,349 $48,367 $66,732 $88,685 Amortization of lease intangibles - in - place leases and leasing costs 1,131 1,747 2,616 4,957 8,135 7,076 8,271 11,071 17,882 28,379 44,107 Provision for impairment 0 450 3,020 0 0 0 2,319 1,609 4,137 1,919 1,015 (Gain) loss on sale or involuntary conversion of assets, net (2,097) (946) 405 (12,135) (9,964) (14,193) (11,180) (13,306) (8,004) (15,111) (5,258) Funds from Operations - OP Common Unitholders $23,364 $28,370 $33,316 $44,050 $59,168 $71,180 $82,761 $114,486 $154,354 $202,647 $274,147 Loss on extinguishment of debt & settlement of related hedges $0 $0 $0 $0 $0 $0 $0 $0 $0 $14,614 $0 Amortization of above (below) market lease intangibles 0 0 0 0 0 5,091 10,668 13,501 15,885 24,284 33,563 Core Funds from Operations - OP Common Unitholders $23,364 $28,370 $33,316 $44,050 $59,168 $76,271 $93,429 $127,987 $170,239 $241,545 $307,710 Straight - line accrued rent ($738) ($1,148) ($1,416) ($2,450) ($3,582) ($3,548) ($4,648) ($7,093) ($7,818) ($11,857) ($13,176) Stock based compensation expense 1,657 1,813 1,987 1,992 2,441 2,589 3,227 4,106 4,995 5,467 6,464 Amortization of financing costs 285 326 398 494 516 574 578 706 826 1,197 3,141 Loss on extinguishment of debt 0 0 0 180 333 0 0 0 0 0 0 Non - real estate depreciation 66 67 123 62 72 78 146 283 509 618 778 Other (463) (463) (463) (463) (541) (230) 0 (475) 0 0 0 Adjusted Funds from Operations - OP Common Unitholders $24,171 $28,964 $33,945 $43,865 $58,407 $75,734 $92,732 $125,514 $168,751 $236,970 $304,917 FFO Per Common Share and OP Unit - Diluted $2.03 $2.10 $2.18 $2.39 $2.54 $2.54 $2.53 $2.75 $2.93 $3.00 $3.45 Core FFO Per Common Share and OP Unit - Diluted $2.03 $2.10 $2.18 $2.39 $2.54 $2.72 $2.85 $3.08 $3.23 $3.58 $3.87 Adjusted FFO Per Common Share and OP Unit - Diluted $2.10 $2.14 $2.22 $2.38 $2.51 $2.70 $2.83 $3.02 $3.20 $3.51 $3.83 Weighted Average Number of Common Shares and OP Units Outstanding - Diluted 11,484,529 13,505,124 15,314,514 18,413,034 23,307,418 28,047,966 32,748,741 41,571,233 52,744,353 67,486,698 79,512,005 Reconciliation of Net Income to FFO, Core FFO and AFFO Note: Core FFO reporting began in 2018.
31 © 20 23 AGREE REALTY CORPORATION . ALL RIGHTS RESERVED. CONFIDENTIAL. CONTACT PETER COUGHENOUR Chief Financial Officer (248) 737 - 4190 peter@agreerealty.com