UNITED STATES
SECURITIES AND EXCHANGE COMMISSION
Washington, D.C. 20549
FORM N-CSR
CERTIFIED SHAREHOLDER REPORT OF REGISTERED
MANAGEMENT INVESTMENT COMPANIES
Investment Company Act file number 811-07139
Fidelity Hereford Street Trust
(Exact name of registrant as specified in charter)
245 Summer St., Boston, Massachusetts 02210
(Address of principal executive offices) (Zip code)
Margaret Carey, Secretary
245 Summer St.
Boston, Massachusetts 02210
(Name and address of agent for service)
Registrant's telephone number, including area code:
617-563-7000
Date of fiscal year end: | April 30 |
Date of reporting period: | April 30, 2023 |
Item 1.
Reports to Stockholders


Contents
| Current 7-Day Yields | ||
| Fidelity® Money Market Fund | 4.56% | |
| Premium Class | 4.68% | |
Yield refers to the income paid by the Fund over a given period. Yield for money market funds is usually for seven-day periods, as it is here, though it is expressed as an annual percentage rate. Past performance is no guarantee of future results. Yield will vary and it's possible to lose money investing in the Fund. | ||
| Effective Maturity Diversification (% of Fund's Investments) | ||
| Days | ||
| 1 - 7 | 81.2 | |
| 8 - 30 | 5.7 | |
| 31 - 60 | 4.3 | |
| 61 - 90 | 3.6 | |
| 91 - 180 | 5.2 | |
| Effective maturity is determined in accordance with the requirements of Rule 2a-7 under the Investment Company Act of 1940. | ||
Asset Allocation (% of Fund's net assets) |
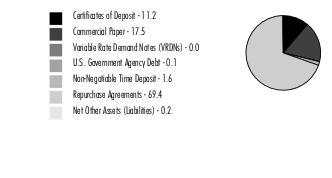 |
Percentages shown as 0.0% may reflect amounts less than 0.05%. |
| Certificate of Deposit - 11.2% | ||||
| Yield (%)(a) | Principal Amount (b) (000s) | Value ($) (000s) | ||
| Domestic Certificates Of Deposit - 0.5% | ||||
| Bank of America NA | ||||
| 7/11/23 to 8/31/23 (c) | 5.12 to 5.14 | 399,000 | 399,000 | |
| New York Branch, Yankee Dollar, Foreign Banks - 10.7% | ||||
| Bayerische Landesbank | ||||
| 5/30/23 to 5/31/23 | 5.20 to 5.20 | 856,000 | 856,000 | |
| BNP Paribas Fortis | ||||
| 7/31/23 | 5.37 | 208,000 | 208,000 | |
| Canadian Imperial Bank of Commerce | ||||
| 10/17/23 to 10/18/23 | 5.47 to 5.47 | 430,000 | 430,000 | |
| Credit Agricole CIB | ||||
| 5/2/23 to 8/18/23 (c) | 4.82 to 5.43 | 2,522,700 | 2,522,701 | |
| Landesbank Baden-Wuerttemberg New York Branch | ||||
| 5/2/23 | 4.88 | 214,000 | 214,000 | |
| Mitsubishi UFJ Trust & Banking Corp. | ||||
| 5/4/23 to 5/5/23 | 4.82 to 4.82 | 721,000 | 721,000 | |
| Mizuho Corporate Bank Ltd. | ||||
| 5/5/23 to 5/12/23 | 4.81 to 4.85 | 1,638,000 | 1,638,000 | |
| MUFG Bank Ltd. | ||||
| 7/6/23 to 7/12/23 (c)(d) | 5.11 to 5.11 | 562,000 | 562,000 | |
| Sumitomo Mitsui Trust Bank Ltd. | ||||
| 5/8/23 to 6/23/23 | 4.82 to 5.17 | 1,338,200 | 1,338,200 | |
TOTAL NEW YORK BRANCH, YANKEE DOLLAR, FOREIGN BANKS | 8,489,901 | |||
| TOTAL CERTIFICATE OF DEPOSIT (Cost $8,888,901) | 8,888,901 | |||
| Financial Company Commercial Paper - 16.8% | ||||
| Yield (%)(a) | Principal Amount (b) (000s) | Value ($) (000s) | ||
| Bank of Montreal | ||||
| 5/2/23 to 9/5/23 (c) | 5.16 to 5.51 | 1,204,000 | 1,196,764 | |
| Bank of Nova Scotia | ||||
| 5/1/23 to 7/17/23 (c) | 5.13 to 5.51 | 1,087,000 | 1,085,042 | |
| Barclays Bank PLC/Barclays U.S. CCP Funding LLC | ||||
| 5/5/23 to 6/1/23 (e) | 4.84 to 5.02 | 307,000 | 306,344 | |
| Bayerische Landesbank | ||||
| 5/3/23 to 5/4/23 | 5.06 to 5.06 | 428,000 | 427,850 | |
| BNP Paribas SA | ||||
| 7/31/23 | 5.36 | 209,250 | 206,457 | |
| BofA Securities, Inc. | ||||
| 5/3/23 to 8/7/23 (c)(d) | 5.19 to 5.51 | 567,000 | 567,000 | |
| BPCE SA | ||||
| 7/17/23 to 8/7/23 | 5.30 to 5.40 | 1,907,250 | 1,883,542 | |
| Credit Agricole CIB | ||||
| 5/3/23 | 4.84 | 146,000 | 145,961 | |
| Federation des caisses Desjardin | ||||
| 7/19/23 | 5.04 | 125,000 | 123,650 | |
| J.P. Morgan Securities, LLC | ||||
| 5/10/23 to 5/24/23 (c)(d) | 5.38 to 5.38 | 369,000 | 369,000 | |
| Landesbank Baden-Wurttemberg | ||||
| 5/1/23 | 4.85 | 1,931,000 | 1,931,000 | |
| Lloyds Bank PLC | ||||
| 5/11/23 to 5/12/23 | 4.92 to 4.92 | 164,000 | 163,768 | |
| Mizuho Bank Ltd. Singapore Branch | ||||
| 5/8/23 to 6/9/23 | 4.85 to 5.04 | 571,000 | 569,198 | |
| National Bank of Canada | ||||
| 5/25/23 | 5.26 | 407,000 | 405,611 | |
| NatWest Markets PLC | ||||
| 5/2/23 to 5/5/23 | 4.83 to 4.86 | 429,000 | 428,855 | |
| Sumitomo Mitsui Trust Bank Ltd. | ||||
| 5/22/23 to 6/21/23 | 4.92 to 5.15 | 1,180,000 | 1,173,611 | |
| Svenska Handelsbanken AB | ||||
| 9/1/23 to 9/5/23 (c) | 5.05 to 5.32 | 614,000 | 606,744 | |
| Svenska Handelsbanken, Inc. | ||||
| 7/24/23 (c)(d) | 5.20 | 202,000 | 202,000 | |
| The Toronto-Dominion Bank | ||||
| 5/22/23 to 10/17/23 | 5.18 to 5.38 | 1,349,000 | 1,328,996 | |
| Toyota Motor Credit Corp. | ||||
| 8/30/23 | 5.33 | 81,000 | 79,587 | |
| UBS AG London Branch | ||||
| 5/23/23 | 5.45 | 122,000 | 121,605 | |
| TOTAL FINANCIAL COMPANY COMMERCIAL PAPER (Cost $13,322,585) | 13,322,585 | |||
| Asset Backed Commercial Paper - 0.7% | ||||
| Yield (%)(a) | Principal Amount (b) (000s) | Value ($) (000s) | ||
| Gotham Funding Corp. (Liquidity Facility Bank of Tokyo-Mitsubishi UFJ Ltd.) | ||||
| 5/1/23 | 0.48 | 206,000 | 206,000 | |
| 7/10/23 | 0.53 | 128,000 | 126,706 | |
| 7/11/23 | 0.53 | 113,000 | 111,841 | |
| 7/17/23 | 0.53 | 96,000 | 94,926 | |
| TOTAL ASSET BACKED COMMERCIAL PAPER (Cost $539,473) | 539,473 | |||
| Variable Rate Demand Note - 0.0% | ||||
| Yield (%)(a) | Principal Amount (b) (000s) | Value ($) (000s) | ||
| Florida - 0.0% | ||||
| Florida Timber Fin. III LLC Taxable Series 2008, LOC Wells Fargo Bank NA, VRDN | ||||
| 5/5/23 (c) | 5.02 | 40,000 | 40,000 | |
| TOTAL VARIABLE RATE DEMAND NOTE (Cost $40,000) | 40,000 | |||
| U.S. Government Agency Debt - 0.1% | ||||
| Yield (%)(a) | Principal Amount (b) (000s) | Value ($) (000s) | ||
| Federal Agencies - 0.1% | ||||
| Federal Home Loan Bank | ||||
| 9/19/23 | 5.11 | 94,000 | 92,167 | |
| TOTAL U.S. GOVERNMENT AGENCY DEBT (Cost $92,167) | 92,167 | |||
| Non-Negotiable Time Deposit - 1.6% | ||||
| Yield (%)(a) | Principal Amount (b) (000s) | Value ($) (000s) | ||
| Time Deposits - 1.6% | ||||
| Landesbank Hessen-Thuringen London Branch | ||||
| 5/2/23 to 5/4/23 | 4.84 to 4.87 | 1,285,000 | 1,285,000 | |
| TOTAL NON-NEGOTIABLE TIME DEPOSIT (Cost $1,285,000) | 1,285,000 | |||
| U.S. Government Agency Repurchase Agreement - 11.5% | |||
Maturity Amount ($) (000s) | Value ($) (000s) | ||
| In a joint trading account at 4.81% dated 4/28/23 due 5/1/23 (Collateralized by U.S. Government Obligations) # | 4,090,739 | 4,089,100 | |
| With: | |||
| ABN AMRO Bank NV at 4.81%, dated 4/28/23 due 5/1/23 (Collateralized by U.S. Treasury Obligations valued at $179,591,980, 2.00% - 5.50%, 1/31/24 - 12/20/52) | 176,071 | 176,000 | |
| BMO Harris Bank NA at 4.81%, dated: | |||
3/23/23 due 5/4/23 (Collateralized by U.S. Government Obligations valued at $97,404,930, 2.50% - 6.50%, 7/20/41 - 1/20/63) | 95,533 | 95,000 | |
4/12/23 due 5/3/23 (Collateralized by U.S. Government Obligations valued at $85,897,508, 3.00% - 5.00%, 7/20/41 - 4/20/52) | 84,236 | 84,000 | |
| BNP Paribas, SA at: | |||
4.81%, dated 4/20/23 due 5/4/23 (Collateralized by U.S. Treasury Obligations valued at $734,725,273, 0.00% - 6.00%, 7/31/24 - 4/20/53) | 720,344 | 719,000 | |
4.82%, dated 4/4/23 due 5/4/23 (Collateralized by U.S. Treasury Obligations valued at $95,311,340, 0.00% - 6.00%, 7/15/23 - 4/20/53) | 93,374 | 93,000 | |
| BofA Securities, Inc. at 4.82%, dated: | |||
4/18/23 due 5/4/23 (Collateralized by U.S. Treasury Obligations valued at $120,569,167, 1.75%, 1/31/29) (c)(d)(f) | 118,253 | 118,000 | |
4/26/23 due 5/5/23 (Collateralized by U.S. Treasury Obligations valued at $96,964,823, 3.00%, 7/31/24) (c)(d)(f) | 95,382 | 95,000 | |
| CIBC Bank U.S.A. at 4.81%, dated 3/23/23 due 5/4/23 (Collateralized by U.S. Government Obligations valued at $251,298,573, 0.63% - 8.00%, 6/1/25 - 5/1/53) | 246,375 | 245,000 | |
| Citibank NA at 4.81%, dated 4/27/23 due 5/4/23 (Collateralized by U.S. Treasury Obligations valued at $146,915,283, 0.00% - 8.88%, 8/17/23 - 9/15/65) | 143,134 | 143,000 | |
| Citigroup Global Capital Markets, Inc. at 4.81%, dated: | |||
3/23/23 due 5/4/23 (Collateralized by U.S. Government Obligations valued at $145,594,770, 1.38% - 7.50%, 6/30/23 - 3/20/53) | 142,797 | 142,000 | |
4/27/23 due 5/4/23 (Collateralized by U.S. Government Obligations valued at $170,431,088, 1.88% - 6.50%, 6/30/26 - 4/20/53) | 167,156 | 167,000 | |
| Goldman Sachs & Co. at 4.81%, dated: | |||
4/24/23 due 5/1/23 (Collateralized by U.S. Government Obligations valued at $437,989,260, 0.00% - 7.00%, 6/8/23 - 1/1/58) | 429,401 | 429,000 | |
4/25/23 due 5/2/23 (Collateralized by U.S. Government Obligations valued at $291,953,862, 1.50% - 6.50%, 2/1/27 - 1/15/58) | 286,267 | 286,000 | |
4/26/23 due 5/3/23 (Collateralized by U.S. Government Obligations valued at $583,829,770, 2.50% - 6.50%, 5/1/37 - 8/15/57) | 572,535 | 572,000 | |
4/27/23 due 5/4/23 (Collateralized by U.S. Government Obligations valued at $194,924,121, 1.50% - 7.50%, 9/1/24 - 4/1/53) | 191,179 | 191,000 | |
4/28/23 due 5/4/23 (Collateralized by U.S. Government Obligations valued at $194,898,091, 1.50% - 6.50%, 7/31/24 - 5/1/53) | 191,153 | 191,000 | |
| RBC Dominion Securities at 4.81%, dated 3/23/23 due 5/4/23 (Collateralized by U.S. Government Obligations valued at $465,493,041, 0.00% - 5.50%, 1/15/26 - 1/20/53) | 456,548 | 454,000 | |
| RBC Financial Group at 4.81%, dated 3/23/23 due 5/4/23 (Collateralized by U.S. Government Obligations valued at $877,728,067, 0.00% - 7.50%, 7/20/23 - 5/1/53) | 859,798 | 855,000 | |
| TOTAL U.S. GOVERNMENT AGENCY REPURCHASE AGREEMENT (Cost $9,144,100) | 9,144,100 | ||
| U.S. Treasury Repurchase Agreement - 54.8% | |||
Maturity Amount ($) (000s) | Value ($) (000s) | ||
| With: | |||
| Credit AG at 4.81%, dated 4/20/23 due 5/4/23 (Collateralized by U.S. Treasury Obligations valued at $86,827,490, 2.88%, 6/15/25) | 85,159 | 85,000 | |
| Federal Reserve Bank of New York at 4.8%, dated 4/28/23 due 5/1/23 (Collateralized by U.S. Treasury Obligations valued at $43,393,350,408, 12.50% - 2.88%, 8/15/23 - 3/31/27) | 43,393,350 | 43,376,000 | |
| MUFG Securities (Canada), Ltd. at 4.81%, dated 4/24/23 due 5/4/23 (Collateralized by U.S. Treasury Obligations valued at $43,901,041, 0.00% - 6.13%, 8/15/23 - 2/15/50) | 43,057 | 43,000 | |
| TOTAL U.S. TREASURY REPURCHASE AGREEMENT (Cost $43,504,000) | 43,504,000 | ||
| Other Repurchase Agreement - 3.1% | |||
Maturity Amount ($) (000s) | Value ($) (000s) | ||
| Other Repurchase Agreement - 3.1% | |||
| With: | |||
| BMO Capital Markets Corp. at: | |||
4.95%, dated 4/28/23 due 5/1/23 (Collateralized by Corporate Obligations valued at $93,488,838, 2.85% - 5.87%, 9/10/24 - 6/1/77) | 89,037 | 89,000 | |
5.01%, dated 4/28/23 due 5/1/23 (Collateralized by Corporate Obligations valued at $94,356,131, 2.53% - 13.38%, 5/30/24 - 6/1/50) | 89,037 | 89,000 | |
| BMO Chicago Branch at 5.01%, dated 4/28/23 due 5/1/23 (Collateralized by Corporate Obligations valued at $11,555,421, 0.00% - 7.00%, 5/15/23 - 2/1/53) | 11,005 | 11,000 | |
| BNP Paribas Prime Brokerage, Inc. at: | |||
5.06%, dated 4/28/23 due 5/1/23 (Collateralized by Equity Securities valued at $142,620,113) | 132,056 | 132,000 | |
5.07%, dated 4/27/23 due 5/4/23 (Collateralized by Equity Securities valued at $189,106,527) (c)(d)(f) | 175,173 | 175,000 | |
5.26%, dated 3/29/23 due 5/30/23 (Collateralized by Corporate Obligations valued at $329,676,963, 0.00% - 7.50%, 7/1/23 - 8/15/52) (c)(d)(f) | 306,754 | 304,000 | |
| HSBC Securities, Inc. at 5.04%, dated 4/28/23 due 5/1/23 (Collateralized by Corporate Obligations valued at $22,690,369, 4.00% - 7.35%, 7/23/25 - 4/1/63) | 21,009 | 21,000 | |
| ING Financial Markets LLC at 5.05%, dated 4/28/23 due 5/1/23 (Collateralized by Equity Securities valued at $129,654,548) | 120,051 | 120,000 | |
| J.P. Morgan Securities, LLC at 5.38%, dated 4/27/23 due 7/27/23 (Collateralized by Corporate Obligations valued at $733,462,688, 0.00% - 7.50%, 6/1/23 - 12/1/59) (c)(d)(f) | 691,177 | 679,000 | |
| Mitsubishi UFJ Securities (U.S.A.), Inc. at: | |||
5.04%, dated 4/28/23 due 5/1/23 (Collateralized by Equity Securities valued at $59,424,985) | 55,023 | 55,000 | |
5.33%, dated 4/28/23 due 5/1/23 (Collateralized by Equity Securities valued at $8,643,886) | 8,004 | 8,000 | |
| Mizuho Securities U.S.A., Inc. at: | |||
5.08%, dated 4/28/23 due 5/1/23 (Collateralized by Equity Securities valued at $85,356,119) | 79,033 | 79,000 | |
5.31%, dated: | |||
4/10/23 due 6/9/23 (Collateralized by Corporate Obligations valued at $184,672,977, 2.51% - 13.25%, 9/18/23 - 6/5/2115) (c)(d)(f) | 175,540 | 174,000 | |
4/27/23 due 6/26/23 (Collateralized by Mortgage Loan Obligations valued at $97,168,302, 0.00% - 12.17%, 7/15/30 - 8/25/52) (c)(d)(f) | 88,779 | 88,000 | |
| RBC Capital Markets Co. at 5.31%, dated 4/28/23 due 6/27/23 (Collateralized by Corporate Obligations valued at $92,635,417, 2.56% - 9.75%, 2/15/27 - 6/15/39) (c)(d)(f) | 88,779 | 88,000 | |
| RBS Securities, Inc. at 5.07%, dated 4/28/23 due 5/1/23 (Collateralized by U.S. Treasury Obligations valued at $45,364,700, 0.00% - 5.39%, 1/22/24 - 4/25/34) | 44,019 | 44,000 | |
| Truist Securities, Inc. at 5.1%, dated 4/28/23 due 5/1/23 (Collateralized by Municipal Bond Obligations valued at $81,570,705, 0.00% - 6.50%, 7/1/27 - 10/1/53) | 77,033 | 77,000 | |
| Wells Fargo Securities, LLC at: | |||
4.97%, dated 4/28/23 due 5/1/23 (Collateralized by Commercial Paper valued at $158,685,696, 5/3/23 - 9/19/23) | 154,064 | 154,000 | |
5.4%, dated 2/3/23 due 5/4/23 (Collateralized by Commercial Paper valued at $65,843,407, 5/11/23 - 10/10/23) | 63,851 | 63,000 | |
5.82%, dated 4/26/23 due 7/24/23 (Collateralized by Corporate Obligations valued at $47,514,297, 0.00% - 6.50%, 10/15/23 - 2/15/30) | 44,633 | 44,000 | |
| TOTAL OTHER REPURCHASE AGREEMENT (Cost $2,494,000) | 2,494,000 | ||
| TOTAL INVESTMENT IN SECURITIES - 99.8% (Cost $79,310,226) | 79,310,226 |
NET OTHER ASSETS (LIABILITIES) - 0.2% | 131,822 |
| NET ASSETS - 100.0% | 79,442,048 |
| VRDN | - | VARIABLE RATE DEMAND NOTE (A debt instrument that is payable upon demand, either daily, weekly or monthly) |
| (a) | Yield represents either the annualized yield at the date of purchase, or the stated coupon rate, or, for floating and adjustable rate securities, the rate at period end. |
| (b) | Amount is stated in United States dollars unless otherwise noted. |
| (c) | Coupon rates for floating and adjustable rate securities reflect the rates in effect at period end. |
| (d) | Coupon is indexed to a floating interest rate which may be multiplied by a specified factor and/or subject to caps or floors. |
| (e) | Security exempt from registration under Rule 144A of the Securities Act of 1933. These securities may be resold in transactions exempt from registration, normally to qualified institutional buyers. At the end of the period, the value of these securities amounted to $306,344,000 or 0.4% of net assets. |
| (f) | The maturity amount is based on the rate at period end. |
| Other Information | ||
| # Additional information on each counterparty to the repurchase agreement is as follows: | ||
| Repurchase Agreement / Counterparty | Value ($) (000's) | |
| $4,089,100,000 due 5/01/23 at 4.81% | ||
| BNY Mellon Capital Markets LLC | 119,268 | |
| Bank of America, N.A. | 344,557 | |
| BofA Securities, Inc. | 245,290 | |
| Citigroup Global Markets, Inc. | 239,276 | |
| HSBC Securities (USA), Inc. | 43,075 | |
| JP Morgan Securities LLC | 95,722 | |
| Mitsubishi UFJ Securities Holdings Ltd | 95,722 | |
| Mizuho Securities USA, Inc. | 33,503 | |
| Nomura Securities International | 293,454 | |
| RBC Dominion Securities, Inc. | 287,131 | |
| Sumitomo Mitsui Banking Corp. | 1,387,805 | |
| Sumitomo Mitsui Banking Corp. NY | 330,035 | |
| Wells Fargo Securities LLC | 574,262 | |
| 4,089,100 | ||
| Statement of Assets and Liabilities | ||||
| Amounts in thousands (except per-share amounts) | April 30, 2023 | |||
| Assets | ||||
Investment in securities, at value (including repurchase agreements of $55,142,100) - See accompanying schedule Unaffiliated issuers (cost $79,310,226): | $ | 79,310,226 | ||
| Cash | 1,000 | |||
| Receivable for fund shares sold | 374,566 | |||
| Interest receivable | 107,562 | |||
| Receivable for interfund loans | 7,002 | |||
| Prepaid expenses | 12 | |||
| Receivable from investment adviser for expense reductions | 3,633 | |||
| Other affiliated receivables | 1 | |||
| Other receivables | 346 | |||
Total assets | 79,804,348 | |||
| Liabilities | ||||
| Payable for fund shares redeemed | $ | 286,922 | ||
| Distributions payable | 48,926 | |||
| Accrued management fee | 16,317 | |||
| Other affiliated payables | 7,113 | |||
| Other payables and accrued expenses | 3,022 | |||
| Total Liabilities | 362,300 | |||
| Net Assets | $ | 79,442,048 | ||
| Net Assets consist of: | ||||
| Paid in capital | $ | 79,441,885 | ||
| Total accumulated earnings (loss) | 163 | |||
| Net Assets | $ | 79,442,048 | ||
| Net Asset Value and Maximum Offering Price | ||||
| Fidelity Money Market Fund : | ||||
Net Asset Value , offering price and redemption price per share ($8,226,176 ÷ 8,225,511 shares) | $ | 1.00 | ||
| Premium Class : | ||||
Net Asset Value , offering price and redemption price per share ($71,215,872 ÷ 71,213,456 shares) | $ | 1.00 | ||
| Statement of Operations | ||||
| Amounts in thousands | Year ended April 30, 2023 | |||
| Investment Income | ||||
| Interest (including $1,134 from affiliated interfund lending) | $ | 2,001,571 | ||
| Expenses | ||||
| Management fee | $ | 134,585 | ||
| Transfer agent fees | 57,003 | |||
| Accounting fees and expenses | 1,982 | |||
| Custodian fees and expenses | 322 | |||
| Independent trustees' fees and expenses | 173 | |||
| Registration fees | 4,605 | |||
| Audit | 48 | |||
| Legal | 28 | |||
| Miscellaneous | 95 | |||
| Total expenses before reductions | 198,841 | |||
| Expense reductions | (30,896) | |||
| Total expenses after reductions | 167,945 | |||
| Net Investment income (loss) | 1,833,626 | |||
| Realized and Unrealized Gain (Loss) | ||||
| Net realized gain (loss) on: | ||||
| Investment Securities: | ||||
| Unaffiliated issuers | 5 | |||
| Total net realized gain (loss) | 5 | |||
| Net increase in net assets resulting from operations | $ | 1,833,631 | ||
| Statement of Changes in Net Assets | ||||
| Amount in thousands | Year ended April 30, 2023 | Year ended April 30, 2022 | ||
| Increase (Decrease) in Net Assets | ||||
| Operations | ||||
| Net investment income (loss) | $ | 1,833,626 | $ | 7,511 |
| Net realized gain (loss) | 5 | 91 | ||
Net increase in net assets resulting from operations | 1,833,631 | 7,602 | ||
| Distributions to shareholders | (1,833,654) | (7,509) | ||
| Share transactions - net increase (decrease) | 48,063,691 | (8,111,841) | ||
| Total increase (decrease) in net assets | 48,063,668 | (8,111,748) | ||
| Net Assets | ||||
| Beginning of period | 31,378,380 | 39,490,128 | ||
| End of period | $ | 79,442,048 | $ | 31,378,380 |
| Fidelity® Money Market Fund |
| Years ended April 30, | 2023 | 2022 | 2021 | 2020 | 2019 | |||||
Selected Per-Share Data | ||||||||||
| Net asset value, beginning of period | $ | 1.00 | $ | 1.00 | $ | 1.00 | $ | 1.00 | $ | 1.00 |
| Income from Investment Operations | ||||||||||
Net investment income (loss) A | .029 | - B | - B | .016 | .020 | |||||
Net realized and unrealized gain (loss) B | - | - | - | - | - | |||||
| Total from investment operations | .029 | - B | - B | .016 | .020 | |||||
| Distributions from net investment income | (.029) | - B | - B | (.016) | (.020) | |||||
| Total distributions | (.029) | - B | - B | (.016) | (.020) | |||||
| Net asset value, end of period | $ | 1.00 | $ | 1.00 | $ | 1.00 | $ | 1.00 | $ | 1.00 |
Total Return C | 2.94% | .01% | .02% | 1.61% | 2.03% | |||||
Ratios to Average Net Assets A,D,E | ||||||||||
| Expenses before reductions | .42% | .42% | .42% | .42% | .42% | |||||
| Expenses net of fee waivers, if any | .42% | .18% | .25% | .42% | .42% | |||||
| Expenses net of all reductions | .42% | .18% | .25% | .42% | .42% | |||||
| Net investment income (loss) | 3.31% | .01% | .03% | 1.56% | 2.06% | |||||
| Supplemental Data | ||||||||||
| Net assets, end of period (in millions) | $ | 8,226 | $ | 3,683 | $ | 4,430 | $ | 6,093 | $ | 5,196 |
| Fidelity® Money Market Fund Premium Class |
| Years ended April 30, | 2023 | 2022 | 2021 | 2020 | 2019 | |||||
Selected Per-Share Data | ||||||||||
| Net asset value, beginning of period | $ | 1.00 | $ | 1.00 | $ | 1.00 | $ | 1.00 | $ | 1.00 |
| Income from Investment Operations | ||||||||||
Net investment income (loss) A | .030 | - B | - B | .017 | .021 | |||||
Net realized and unrealized gain (loss) B | - | - | - | - | - | |||||
| Total from investment operations | .030 | - B | - B | .017 | .021 | |||||
| Distributions from net investment income | (.030) | - B | - B | (.017) | (.021) | |||||
| Total distributions | (.030) | - B | - B | (.017) | (.021) | |||||
| Net asset value, end of period | $ | 1.00 | $ | 1.00 | $ | 1.00 | $ | 1.00 | $ | 1.00 |
Total Return C | 3.07% | .02% | .05% | 1.73% | 2.16% | |||||
Ratios to Average Net Assets A,D,E | ||||||||||
| Expenses before reductions | .36% | .36% | .36% | .36% | .37% | |||||
| Expenses net of fee waivers, if any | .30% | .17% | .23% | .30% | .30% | |||||
| Expenses net of all reductions | .30% | .17% | .23% | .30% | .30% | |||||
| Net investment income (loss) | 3.43% | .02% B | .05% | 1.68% | 2.18% | |||||
| Supplemental Data | ||||||||||
| Net assets, end of period (in millions) | $ | 71,216 | $ | 27,695 | $ | 35,060 | $ | 48,570 | $ | 36,981 |
| Fidelity Money Market Fund | $344 |
| Gross unrealized appreciation | $- |
| Gross unrealized depreciation | - |
| Net unrealized appreciation (depreciation) | $- |
| Tax Cost | $79,310,226 |
| Undistributed ordinary income | $163 |
| April 30, 2023 | April 30, 2022 | |
| Ordinary Income | $1,833,654 | $7,509 |
| Amount | % of Class-Level Average Net Assets | |
| Fidelity Money Market Fund | $8,850 | .16 |
| Premium Class | 48,153 | .10 |
| $57,003 |
| % of Average Net Assets | |
| Fidelity Money Market Fund | - A |
| Average Loan Balance | Weighted Average Interest Rate | ||
| Fidelity Money Market Fund | Lender | 21,870 | 3.33% |
Year ended April 30, 2023 | Year ended April 30, 2022 | |
| Fidelity Money Market Fund | ||
| Distributions to shareholders | ||
| Fidelity Money Market Fund | $ 184,774 | $466 |
| Premium Class | 1,648,880 | 7,043 |
Total | $1,833,654 | $7,509 |
| Shares | Shares | Dollars | Dollars | |
Year ended April 30, 2023 | Year ended April 30, 2022 | Year ended April 30, 2023 | Year ended April 30, 2022 | |
| Fidelity Money Market Fund | ||||
| Fidelity Money Market Fund | ||||
| Shares sold | 10,688,040 | 1,328,747 | $10,688,040 | $1,328,747 |
| Reinvestment of distributions | 162,141 | 432 | 162,141 | 432 |
| Shares redeemed | (6,307,429) | (2,076,499) | (6,307,429) | (2,076,499) |
| Net increase (decrease) | 4,542,752 | (747,320) | $4,542,752 | $(747,320) |
| Premium Class | ||||
| Shares sold | 91,725,652 | 6,606,731 | $91,725,652 | $6,606,731 |
| Reinvestment of distributions | 1,413,717 | 6,493 | 1,413,717 | 6,493 |
| Shares redeemed | (49,618,430) | (13,977,745) | (49,618,430) | (13,977,745) |
| Net increase (decrease) | 43,520,939 | (7,364,521) | $43,520,939 | $(7,364,521) |
| The Example is based on an investment of $1,000 invested at the beginning of the period and held for the entire period (November 1, 2022 to April 30, 2023). |
Annualized Expense Ratio- A | Beginning Account Value November 1, 2022 | Ending Account Value April 30, 2023 | Expenses Paid During Period- C November 1, 2022 to April 30, 2023 | |||||||
| Fidelity® Money Market Fund | ||||||||||
| Fidelity® Money Market Fund | .42% | |||||||||
| Actual | $ 1,000 | $ 1,020.80 | $ 2.10 | |||||||
Hypothetical- B | $ 1,000 | $ 1,022.71 | $ 2.11 | |||||||
| Premium Class | .30% | |||||||||
| Actual | $ 1,000 | $ 1,021.40 | $ 1.50 | |||||||
Hypothetical- B | $ 1,000 | $ 1,023.31 | $ 1.51 | |||||||
 |


Contents
| Current 7-Day Yields | ||
| Capital Reserves Class | 3.97% | |
| Daily Money Class | 4.22% | |
| Advisor M Class | 4.22% | |
| Fidelity® Government Money Market Fund | 4.50% | |
| Class S | 4.50% | |
| Premium Class | 4.60% | |
| Class K6 | 4.67% | |
Yield refers to the income paid by the Fund over a given period. Yield for money market funds is usually for seven-day periods, as it is here, though it is expressed as an annual percentage rate. Past performance is no guarantee of future results. Yield will vary and it's possible to lose money investing in the Fund. A portion of the Fund's expenses was reimbursed and/or waived. Absent such reimbursements and/or waivers the yield for the period ending April 30, 2023, the most recent period shown in the table, would have been 2.88% for Advisor M Class, 4.19% for Premium Class, and 3.01% for Class K6. | ||
| Effective Maturity Diversification (% of Fund's Investments) | ||
| Days | ||
| 1 - 7 | 92.6 | |
| 8 - 30 | 0.4 | |
| 31 - 60 | 0.9 | |
| 61 - 90 | 0.7 | |
| 91 - 180 | 0.9 | |
| > 180 | 4.5 | |
| Effective maturity is determined in accordance with the requirements of Rule 2a-7 under the Investment Company Act of 1940. | ||
Asset Allocation (% of Fund's net assets) |
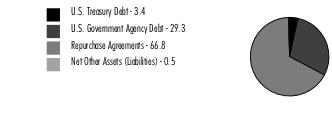 |
| U.S. Treasury Debt - 3.4% | ||||
| Yield (%)(a) | Principal Amount (b) | Value ($) | ||
| U.S. Treasury Obligations - 3.4% | ||||
| U.S. Treasury Notes | ||||
| 10/31/23 to 10/31/24 | 5.06 to 5.27 | 8,928,600,000 | 8,925,962,544 | |
| TOTAL U.S. TREASURY DEBT (Cost $8,925,962,544) | 8,925,962,544 | |||
| U.S. Government Agency Debt - 29.3% | ||||
| Yield (%)(a) | Principal Amount (b) | Value ($) | ||
| Federal Agencies - 29.3% | ||||
| Federal Farm Credit Bank | ||||
| 6/7/23 to 4/10/25 (c) | 2.59 to 5.01 | 4,585,550,000 | 4,585,394,386 | |
| Federal Home Loan Bank | ||||
| 5/18/23 to 11/22/24 (c) | 4.84 to 5.34 | 70,883,330,000 | 70,814,726,237 | |
| Freddie Mac | ||||
| 5/3/23 (c)(d) | 4.94 | 795,750,000 | 795,750,000 | |
| TOTAL U.S. GOVERNMENT AGENCY DEBT (Cost $76,195,870,623) | 76,195,870,623 | |||
| U.S. Government Agency Repurchase Agreement - 14.7% | |||
Maturity Amount ($) | Value ($) | ||
| In a joint trading account at: | |||
| 4.81% dated 4/28/23 due 5/1/23 (Collateralized by U.S. Government Obligations) # | 13,303,594,702 | 13,298,266,000 | |
| 4.82% dated 4/28/23 due 5/1/23 (Collateralized by U.S. Government Obligations) # | 50,280,188 | 50,260,000 | |
| With: | |||
| ABN AMRO Bank NV at 4.81%, dated 4/28/23 due 5/1/23 (Collateralized by U.S. Government Obligations valued at $589,796,410, 2.50% - 6.50%, 12/1/26 - 4/1/53) | 578,231,682 | 578,000,000 | |
| BMO Harris Bank NA at: | |||
4.81%, dated: | |||
| 3/23/23 due 5/4/23 (Collateralized by U.S. Government Obligations valued at $319,898,296, 5.00% - 5.50%, 4/1/53) | 313,750,840 | 312,000,000 | |
| 4/12/23 due 5/3/23 (Collateralized by U.S. Government Obligations valued at $285,302,439, 1.97% - 6.44%, 9/15/41 - 4/20/72) | 279,782,828 | 279,000,000 | |
4.99%, dated 4/24/23 due 5/5/23 (Collateralized by U.S. Government Obligations valued at $305,275,916, 3.86% - 6.63%, 9/20/71 - 2/20/73) | 300,243,342 | 299,000,000 | |
| BNP Paribas, SA at: | |||
4.8%, dated: | |||
| 2/17/23 due 5/5/23 (Collateralized by U.S. Government Obligations valued at $571,785,601, 0.00% - 7.50%, 7/31/24 - 10/15/63) | 561,586,000 | 555,000,000 | |
| 4/24/23 due 5/1/23 (Collateralized by U.S. Treasury Obligations valued at $222,567,572, 0.00% - 5.17%, 3/15/24 - 2/15/53) | 218,203,467 | 218,000,000 | |
4.81%, dated: | |||
| 3/6/23 due 5/5/23 (Collateralized by U.S. Government Obligations valued at $1,728,450,694, 0.00% - 7.00%, 5/2/23 - 1/15/58) | 1,695,135,109 | 1,681,000,000 | |
| 4/20/23 due 5/4/23 (Collateralized by U.S. Government Obligations valued at $2,409,732,845, 0.00% - 6.50%, 9/30/23 - 2/1/56) | 2,363,408,054 | 2,359,000,000 | |
4.82%, dated 4/4/23 due 5/4/23 (Collateralized by U.S. Treasury Obligations valued at $314,606,572, 0.00% - 7.50%, 7/31/23 - 4/20/53) | 307,229,100 | 306,000,000 | |
4.84%, dated 4/28/23 due 5/5/23 (Collateralized by U.S. Government Obligations valued at $1,531,392,796, 0.00% - 7.00%, 5/30/23 - 4/20/53) | 1,501,411,667 | 1,500,000,000 | |
4.87%, dated 4/11/23 due 5/5/23 (Collateralized by U.S. Treasury Obligations valued at $199,979,606, 0.00% - 6.50%, 7/31/24 - 3/20/53) | 195,791,375 | 195,000,000 | |
4.91%, dated 3/3/23 due 5/5/23 (Collateralized by U.S. Government Obligations valued at $620,198,972, 0.00% - 7.00%, 6/15/23 - 10/15/63) | 610,722,923 | 603,000,000 | |
| BNY Mellon Capital Markets Corp. at 4.84%, dated: | |||
3/27/23 due 5/4/23 (Collateralized by U.S. Government Obligations valued at $272,596,735, 0.00% - 6.00%, 5/2/23 - 5/1/53) | 267,358,964 | 266,000,000 | |
3/30/23 due 5/4/23 (Collateralized by U.S. Treasury Obligations valued at $271,471,103, 0.00% - 6.00%, 5/15/23 - 5/1/53) | 266,246,972 | 265,000,000 | |
| BofA Securities, Inc. at: | |||
4.75%, dated 2/28/23 due 5/4/23 (Collateralized by U.S. Government Obligations valued at $354,778,738, 3.00% - 5.50%, 6/20/51 - 1/20/53) | 347,958,854 | 345,000,000 | |
4.8%, dated 4/24/23 due 5/1/23 (Collateralized by U.S. Treasury Obligations valued at $202,148,525, 1.38%, 12/31/28) | 198,184,800 | 198,000,000 | |
4.82%, dated: | |||
| 4/18/23 due 5/4/23 (Collateralized by U.S. Government Obligations valued at $398,491,288, 2.00%, 2/20/51) (c)(d)(e) | 390,835,467 | 390,000,000 | |
| 4/26/23 due 5/5/23 (Collateralized by U.S. Government Obligations valued at $318,452,868, 3.00% - 6.00%, 6/20/46 - 4/20/53) (c)(d)(e) | 313,253,200 | 312,000,000 | |
| CIBC Bank U.S.A. at: | |||
4.81%, dated 3/23/23 due 5/4/23 (Collateralized by U.S. Government Obligations valued at $832,555,862, 1.13% - 7.00%, 7/1/27 - 7/1/60) | 816,556,673 | 812,000,000 | |
4.87%, dated 3/23/23 due 5/4/23 (Collateralized by U.S. Government Obligations valued at $20,034,000, 0.00% - 6.50%, 7/15/25 - 5/15/58) | 19,610,793 | 19,500,000 | |
| Citibank NA at 4.81%, dated 4/27/23 due 5/4/23 (Collateralized by U.S. Treasury Obligations valued at $478,684,088, 0.00% - 6.00%, 6/30/24 - 4/1/53) | 468,437,710 | 468,000,000 | |
| Citigroup Global Capital Markets, Inc. at 4.81%, dated: | |||
3/23/23 due 5/4/23 (Collateralized by U.S. Government Obligations valued at $479,847,451, 1.38% - 7.50%, 6/30/23 - 3/20/53) | 470,626,260 | 468,000,000 | |
4/27/23 due 5/4/23 (Collateralized by U.S. Treasury Obligations valued at $556,197,123, 0.00% - 6.75%, 7/10/23 - 1/25/38) | 545,509,726 | 545,000,000 | |
| Goldman Sachs & Co. at 4.81%, dated: | |||
4/24/23 due 5/1/23 (Collateralized by U.S. Government Obligations valued at $1,435,461,302, 0.00% - 7.00%, 9/14/23 - 11/15/57) | 1,407,315,001 | 1,406,000,000 | |
4/25/23 due 5/2/23 (Collateralized by U.S. Government Obligations valued at $956,506,186, 1.50% - 7.00%, 11/15/24 - 4/15/63) | 937,876,355 | 937,000,000 | |
4/26/23 due 5/3/23 (Collateralized by U.S. Government Obligations valued at $1,913,777,656, 1.50% - 6.50%, 3/1/34 - 4/20/53) | 1,876,753,646 | 1,875,000,000 | |
4/27/23 due 5/4/23 (Collateralized by U.S. Government Obligations valued at $635,799,618, 2.50% - 7.00%, 5/1/30 - 4/1/53) | 623,582,678 | 623,000,000 | |
4/28/23 due 5/4/23 (Collateralized by U.S. Government Obligations valued at $636,735,123, 1.50% - 7.50%, 7/20/26 - 11/15/64) | 624,500,240 | 624,000,000 | |
| Mitsubishi UFJ Securities (U.S.A.), Inc. at 4.84%, dated 3/23/23 due 6/5/23 (Collateralized by U.S. Government Obligations valued at $1,298,155,129, 0.00% - 6.50%, 6/1/25 - 5/1/53) | 1,273,148,680 | 1,266,000,000 | |
| RBC Dominion Securities at 4.81%, dated 3/23/23 due 5/4/23 (Collateralized by U.S. Government Obligations valued at $1,534,896,630, 1.50% - 5.50%, 9/24/26 - 12/20/52) | 1,505,400,665 | 1,497,000,000 | |
| RBC Financial Group at 4.81%, dated 3/23/23 due 5/4/23 (Collateralized by U.S. Government Obligations valued at $2,894,288,612, 0.00% - 7.50%, 5/15/23 - 8/1/59) | 2,834,819,288 | 2,819,000,000 | |
| TD Securities (U.S.A.) at 4.8%, dated 4/28/23 due 5/1/23 (Collateralized by U.S. Government Obligations valued at $889,795,776, 1.50% - 7.00%, 8/1/23 - 4/1/53) | 872,348,800 | 872,000,000 | |
| TOTAL U.S. GOVERNMENT AGENCY REPURCHASE AGREEMENT (Cost $38,241,026,000) | 38,241,026,000 | ||
| U.S. Treasury Repurchase Agreement - 52.1% | |||
Maturity Amount ($) | Value ($) | ||
| With: | |||
| ABN AMRO Bank NV at 4.8%, dated 4/28/23 due 5/1/23 (Collateralized by U.S. Treasury Obligations valued at $422,132,511, 2.00% - 5.25%, 2/15/25 - 11/15/48) | 412,978,125 | 412,813,000 | |
| Barclays Bank PLC at 4.8%, dated 4/28/23 due 5/1/23 (Collateralized by U.S. Treasury Obligations valued at $2,844,897,532, 0.75% - 4.63%, 4/30/24 - 8/15/42) | 2,789,115,200 | 2,788,000,000 | |
| BofA Securities, Inc. at 4.81%, dated 4/6/23 due 5/4/23 (Collateralized by U.S. Treasury Obligations valued at $49,123,547, 0.88%, 11/15/30) | 48,179,573 | 48,000,000 | |
| CIBC Bank U.S.A. at 4.81%, dated 3/23/23 due 5/4/23 (Collateralized by U.S. Treasury Obligations valued at $901,762,769, 0.50% - 4.38%, 2/29/24 - 11/15/51) | 880,910,710 | 876,000,000 | |
| Credit AG at 4.81%, dated 4/20/23 due 5/4/23 (Collateralized by U.S. Treasury Obligations valued at $284,998,287, 0.88% - 2.25%, 3/31/26 - 9/30/26) | 279,521,885 | 279,000,000 | |
| Federal Reserve Bank of New York at 4.8%, dated 4/28/23 due 5/1/23 (Collateralized by U.S. Treasury Obligations valued at $119,702,862,005, 1.88% - 4.50%, 5/15/38 - 5/15/52) | 119,702,862,000 | 119,655,000,000 | |
| Fixed Income Clearing Corp. - BNYM at 4.8%, dated 4/28/23 due 5/1/23 (Collateralized by U.S. Treasury Obligations valued at $5,333,580,043, 0.00% - 4.75%, 7/11/23 - 5/15/51) | 5,231,091,600 | 5,229,000,000 | |
| ING Financial Markets LLC at 4.8%, dated 4/28/23 due 5/1/23 (Collateralized by U.S. Treasury Obligations valued at $176,627,582, 1.13% - 2.75%, 8/31/25 - 11/15/29) | 173,069,200 | 173,000,000 | |
| Lloyds Bank PLC at: | |||
4.75%, dated: | |||
| 2/6/23 due 5/9/23 (Collateralized by U.S. Treasury Obligations valued at $148,391,296, 0.75% - 2.50%, 11/15/24 - 8/15/27) | 145,748,000 | 144,000,000 | |
| 2/7/23 due 5/9/23 (Collateralized by U.S. Treasury Obligations valued at $91,706,860, 2.38% - 2.88%, 8/15/24 - 11/30/25) | 90,068,618 | 89,000,000 | |
4.77%, dated 3/2/23 due 5/2/23 (Collateralized by U.S. Treasury Obligations valued at $180,801,133, 2.50% - 2.88%, 1/31/25 - 8/15/28) | 177,422,520 | 176,000,000 | |
4.82%, dated 3/9/23 due 5/9/23 (Collateralized by U.S. Treasury Obligations valued at $181,672,898, 1.88% - 2.50%, 1/31/25 - 2/28/29) | 178,445,598 | 177,000,000 | |
4.84%, dated 3/27/23 due 5/4/23 (Collateralized by U.S. Treasury Obligations valued at $142,340,307, 0.75% - 2.88%, 11/15/24 - 11/30/25) | 139,710,136 | 139,000,000 | |
4.86%, dated 3/16/23 due 5/16/23 (Collateralized by U.S. Treasury Obligations valued at $91,271,734, 2.00% - 3.25%, 1/31/25 - 6/30/27) | 89,732,915 | 89,000,000 | |
4.87%, dated 2/22/23 due 5/22/23 (Collateralized by U.S. Treasury Obligations valued at $146,054,900, 0.38%, 7/31/27) | 143,709,641 | 142,000,000 | |
4.9%, dated 2/28/23 due 5/30/23 (Collateralized by U.S. Treasury Obligations valued at $162,389,139, 2.88% - 3.25%, 6/30/27 - 8/15/28) | 159,957,006 | 158,000,000 | |
| Mizuho Bank, Ltd. at 4.8%, dated 4/28/23 due 5/1/23 (Collateralized by U.S. Treasury Obligations valued at $714,096,286, 1.63%, 5/15/31) | 697,278,800 | 697,000,000 | |
| MUFG Securities (Canada), Ltd. at 4.81%, dated 4/24/23 due 5/4/23 (Collateralized by U.S. Treasury Obligations valued at $142,757,417, 0.25% - 6.13%, 8/15/24 - 2/15/52) | 139,185,719 | 139,000,000 | |
| MUFG Securities EMEA PLC at 4.8%, dated 4/28/23 due 5/1/23 (Collateralized by U.S. Treasury Obligations valued at $1,066,632,567, 1.25% - 3.25%, 8/15/24 - 2/15/43) | 1,046,418,400 | 1,046,000,000 | |
| Natixis SA at 4.8%, dated 4/28/23 due 5/1/23 (Collateralized by U.S. Treasury Obligations valued at $710,183,343, 0.50% - 4.75%, 11/30/23 - 11/15/52) | 694,277,600 | 694,000,000 | |
| Norinchukin Bank at 4.85%, dated 4/25/23 due 5/2/23 (Collateralized by U.S. Treasury Obligations valued at $35,714,513, 2.75%, 5/31/29) | 35,033,007 | 35,000,000 | |
| RBS Securities, Inc. at 4.8%, dated: | |||
4/27/23 due 5/4/23 (Collateralized by U.S. Treasury Obligations valued at $518,436,402, 0.00% - 5.17%, 5/4/23 - 11/15/32) | 508,474,133 | 508,000,000 | |
4/28/23 due 5/1/23 (Collateralized by U.S. Treasury Obligations valued at $119,564,343, 1.25% - 4.00%, 12/15/25 - 9/30/28) | 117,219,869 | 117,173,000 | |
| SMBC Nikko Securities America, Inc. at 4.8%, dated 4/28/23 due 5/1/23 (Collateralized by U.S. Treasury Obligations valued at $714,310,368, 0.00% - 4.63%, 7/6/23 - 11/15/52) | 700,280,000 | 700,000,000 | |
| Societe Generale at 4.8%, dated: | |||
4/25/23 due 5/2/23 (Collateralized by U.S. Treasury Obligations valued at $268,014,291, 3.00%, 8/15/52) | 260,242,667 | 260,000,000 | |
4/27/23 due 5/3/23 (Collateralized by U.S. Treasury Obligations valued at $518,365,258, 1.88% - 3.00%, 2/15/42 - 5/15/52) | 503,402,400 | 503,000,000 | |
| Sumitomo Mitsui Trust Bank Ltd. at 4.97%, dated 4/26/23 due 5/5/23 (Collateralized by U.S. Treasury Obligations valued at $63,437,626, 1.63%, 8/15/29) | 62,119,832 | 62,000,000 | |
| TOTAL U.S. TREASURY REPURCHASE AGREEMENT (Cost $135,335,986,000) | 135,335,986,000 | ||
| TOTAL INVESTMENT IN SECURITIES - 99.5% (Cost $258,698,845,167) | 258,698,845,167 |
NET OTHER ASSETS (LIABILITIES) - 0.5% | 1,210,318,856 |
| NET ASSETS - 100.0% | 259,909,164,023 |
| (a) | Yield represents either the annualized yield at the date of purchase, or the stated coupon rate, or, for floating and adjustable rate securities, the rate at period end. |
| (b) | Amount is stated in United States dollars unless otherwise noted. |
| (c) | Coupon rates for floating and adjustable rate securities reflect the rates in effect at period end. |
| (d) | Coupon is indexed to a floating interest rate which may be multiplied by a specified factor and/or subject to caps or floors. |
| (e) | The maturity amount is based on the rate at period end. |
| Other Information | ||
| # Additional information on each counterparty to the repurchase agreement is as follows: | ||
| Repurchase Agreement / Counterparty | Value ($) | |
| $13,298,266,000 due 5/01/23 at 4.81% | ||
| BNY Mellon Capital Markets LLC | 390,293,000 | |
| Bank of America, N.A. | 1,127,525,000 | |
| BofA Securities, Inc. | 802,685,000 | |
| Citigroup Global Markets, Inc. | 783,003,000 | |
| HSBC Securities (USA), Inc. | 140,958,000 | |
| JP Morgan Securities LLC | 313,240,000 | |
| Mitsubishi UFJ Securities Holdings Ltd | 313,240,000 | |
| Mizuho Securities USA, Inc. | 109,634,000 | |
| Nomura Securities International | 960,296,000 | |
| RBC Dominion Securities, Inc. | 939,604,000 | |
| Sumitomo Mitsui Banking Corp. | 4,541,439,000 | |
| Sumitomo Mitsui Banking Corp. NY | 997,141,000 | |
| Wells Fargo Securities LLC | 1,879,208,000 | |
| 13,298,266,000 | ||
| $50,260,000 due 5/01/23 at 4.82% | ||
| BofA Securities, Inc. | 50,260,000 | |
| 50,260,000 | ||
| Statement of Assets and Liabilities | ||||
| April 30, 2023 | ||||
| Assets | ||||
Investment in securities, at value (including repurchase agreements of $173,577,012,000) - See accompanying schedule Unaffiliated issuers (cost $258,698,845,167): | $ | 258,698,845,167 | ||
| Cash | 628,000,861 | |||
| Receivable for fund shares sold | 1,908,686,574 | |||
| Interest receivable | 648,969,559 | |||
| Prepaid expenses | 84,046 | |||
| Receivable from investment adviser for expense reductions | 547,744 | |||
| Other receivables | 1,727,704 | |||
Total assets | 261,886,861,655 | |||
| Liabilities | ||||
| Payable for investments purchased | $ | 450,000,000 | ||
| Payable for fund shares redeemed | 1,233,879,270 | |||
| Distributions payable | 197,370,560 | |||
| Accrued management fee | 53,683,901 | |||
| Distribution and service plan fees payable | 3,747,601 | |||
| Other affiliated payables | 33,503,601 | |||
| Other payables and accrued expenses | 5,512,699 | |||
| Total Liabilities | 1,977,697,632 | |||
| Net Assets | $ | 259,909,164,023 | ||
| Net Assets consist of: | ||||
| Paid in capital | $ | 259,910,741,162 | ||
| Total accumulated earnings (loss) | (1,577,139) | |||
| Net Assets | $ | 259,909,164,023 | ||
| Net Asset Value and Maximum Offering Price | ||||
| Capital Reserves Class : | ||||
Net Asset Value , offering price and redemption price per share ($5,294,932,488 ÷ 5,293,440,482 shares) | $ | 1.00 | ||
| Daily Money Class : | ||||
Net Asset Value , offering price and redemption price per share ($7,151,811,842 ÷ 7,150,021,790 shares) | $ | 1.00 | ||
| Advisor M Class : | ||||
Net Asset Value , offering price and redemption price per share ($172,226,948 ÷ 172,231,631 shares) | $ | 1.00 | ||
| Fidelity Government Money Market Fund : | ||||
Net Asset Value , offering price and redemption price per share ($236,784,702,854 ÷ 236,781,545,167 shares) | $ | 1.00 | ||
| Class S : | ||||
Net Asset Value , offering price and redemption price per share ($116,643,101 ÷ 116,643,941 shares) | $ | 1.00 | ||
| Premium Class : | ||||
Net Asset Value , offering price and redemption price per share ($7,609,040,964 ÷ 7,607,212,570 shares) | $ | 1.00 | ||
| Class K6 : | ||||
Net Asset Value , offering price and redemption price per share ($2,779,805,826 ÷ 2,779,868,710 shares) | $ | 1.00 | ||
| Statement of Operations | ||||
Year ended April 30, 2023 | ||||
| Investment Income | ||||
| Interest | $ | 7,660,984,718 | ||
| Expenses | ||||
| Management fee | $ | 618,050,470 | ||
| Transfer agent fees | 398,095,029 | |||
| Distribution and service plan fees | 50,968,073 | |||
| Accounting fees and expenses | 5,656,012 | |||
| Custodian fees and expenses | 768,117 | |||
| Independent trustees' fees and expenses | 880,923 | |||
| Registration fees | 12,930,460 | |||
| Audit | 56,579 | |||
| Legal | 170,311 | |||
| Miscellaneous | 622,085 | |||
| Total expenses before reductions | 1,088,198,059 | |||
| Expense reductions | (7,685,045) | |||
| Total expenses after reductions | 1,080,513,014 | |||
| Net Investment income (loss) | 6,580,471,704 | |||
| Realized and Unrealized Gain (Loss) | ||||
| Net realized gain (loss) on: | ||||
| Investment Securities: | ||||
| Unaffiliated issuers | (1,421,339) | |||
| Total net realized gain (loss) | (1,421,339) | |||
| Net increase in net assets resulting from operations | $ | 6,579,050,365 | ||
| Statement of Changes in Net Assets | ||||
Year ended April 30, 2023 | Year ended April 30, 2022 | |||
| Increase (Decrease) in Net Assets | ||||
| Operations | ||||
| Net investment income (loss) | $ | 6,580,471,704 | $ | 23,906,078 |
| Net realized gain (loss) | (1,421,339) | 176,959 | ||
Net increase in net assets resulting from operations | 6,579,050,365 | 24,083,037 | ||
| Distributions to shareholders | (6,580,599,912) | (23,866,363) | ||
| Share transactions - net increase (decrease) | 8,353,454,402 | 30,047,248,045 | ||
| Total increase (decrease) in net assets | 8,351,904,855 | 30,047,464,719 | ||
| Net Assets | ||||
| Beginning of period | 251,557,259,168 | 221,509,794,449 | ||
| End of period | $ | 259,909,164,023 | $ | 251,557,259,168 |
| Fidelity® Government Money Market Fund Capital Reserves Class |
| Years ended April 30, | 2023 | 2022 | 2021 | 2020 | 2019 | |||||
Selected Per-Share Data | ||||||||||
| Net asset value, beginning of period | $ | 1.00 | $ | 1.00 | $ | 1.00 | $ | 1.00 | $ | 1.00 |
| Income from Investment Operations | ||||||||||
Net investment income (loss) A | .022 | - B | - B | .009 | .012 | |||||
Net realized and unrealized gain (loss) B | - | - | - | - | - | |||||
| Total from investment operations | .022 | - B | - B | .009 | .012 | |||||
| Distributions from net investment income | (.022) | - B | - B | (.009) | (.012) | |||||
| Total distributions | (.022) | - B | - B | (.009) | (.012) | |||||
| Net asset value, end of period | $ | 1.00 | $ | 1.00 | $ | 1.00 | $ | 1.00 | $ | 1.00 |
Total Return C | 2.20% | .01% | .01% | .94% | 1.26% | |||||
Ratios to Average Net Assets A,D,E | ||||||||||
| Expenses before reductions | .96% | .96% | .96% | .97% | .96% | |||||
| Expenses net of fee waivers, if any | .92% | .10% | .15% | .89% | .95% | |||||
| Expenses net of all reductions | .92% | .10% | .15% | .89% | .95% | |||||
| Net investment income (loss) | 2.18% | .01% | .01% | .87% | 1.26% | |||||
| Supplemental Data | ||||||||||
| Net assets, end of period (000 omitted) | $ | 5,294,932 | $ | 7,465,539 | $ | 7,539,252 | $ | 7,470,316 | $ | 6,491,629 |
| Fidelity® Government Money Market Fund Daily Money Class |
| Years ended April 30, | 2023 | 2022 | 2021 | 2020 | 2019 | |||||
Selected Per-Share Data | ||||||||||
| Net asset value, beginning of period | $ | 1.00 | $ | 1.00 | $ | 1.00 | $ | 1.00 | $ | 1.00 |
| Income from Investment Operations | ||||||||||
Net investment income (loss) A | .024 | - B | - B | .012 | .015 | |||||
Net realized and unrealized gain (loss) B | - | - | - | - | - | |||||
| Total from investment operations | .024 | - B | - B | .012 | .015 | |||||
| Distributions from net investment income | (.024) | - B | - B | (.012) | (.015) | |||||
| Total distributions | (.024) | - B | - B | (.012) | (.015) | |||||
| Net asset value, end of period | $ | 1.00 | $ | 1.00 | $ | 1.00 | $ | 1.00 | $ | 1.00 |
Total Return C | 2.43% | .01% | .01% | 1.16% | 1.51% | |||||
Ratios to Average Net Assets A,D,E | ||||||||||
| Expenses before reductions | .71% | .71% | .71% | .72% | .71% | |||||
| Expenses net of fee waivers, if any | .70% | .10% | .15% | .67% | .70% | |||||
| Expenses net of all reductions | .70% | .10% | .15% | .67% | .70% | |||||
| Net investment income (loss) | 2.40% | .01% | .01% | 1.08% | 1.51% | |||||
| Supplemental Data | ||||||||||
| Net assets, end of period (000 omitted) | $ | 7,151,812 | $ | 7,389,338 | $ | 7,356,206 | $ | 7,835,091 | $ | 6,038,320 |
| Fidelity® Government Money Market Fund Advisor M Class |
| Years ended April 30, | 2023 | 2022 | 2021 | 2020 | 2019 | |||||
Selected Per-Share Data | ||||||||||
| Net asset value, beginning of period | $ | 1.00 | $ | 1.00 | $ | 1.00 | $ | 1.00 | $ | 1.00 |
| Income from Investment Operations | ||||||||||
Net investment income (loss) A | .024 | - B | - B | .012 | .015 | |||||
Net realized and unrealized gain (loss) B | - | - | - | - | - | |||||
| Total from investment operations | .024 | - B | - B | .012 | .015 | |||||
| Distributions from net investment income | (.024) | - B | - B | (.012) | (.015) | |||||
| Total distributions | (.024) | - B | - B | (.012) | (.015) | |||||
| Net asset value, end of period | $ | 1.00 | $ | 1.00 | $ | 1.00 | $ | 1.00 | $ | 1.00 |
Total Return C | 2.43% | .01% | .01% | 1.17% | 1.52% | |||||
Ratios to Average Net Assets A,D,E | ||||||||||
| Expenses before reductions | .71% | .71% | .71% | .72% | .71% | |||||
| Expenses net of fee waivers, if any | .70% | .10% | .15% | .65% | .70% | |||||
| Expenses net of all reductions | .70% | .10% | .15% | .64% | .69% | |||||
| Net investment income (loss) | 2.40% | .01% | .01% | 1.12% | 1.53% | |||||
| Supplemental Data | ||||||||||
| Net assets, end of period (000 omitted) | $ | 172,227 | $ | 148,512 | $ | 124,205 | $ | 126,269 | $ | 50,630 |
| Fidelity® Government Money Market Fund |
| Years ended April 30, | 2023 | 2022 | 2021 | 2020 | 2019 | |||||
Selected Per-Share Data | ||||||||||
| Net asset value, beginning of period | $ | 1.00 | $ | 1.00 | $ | 1.00 | $ | 1.00 | $ | 1.00 |
| Income from Investment Operations | ||||||||||
Net investment income (loss) A | .027 | - B | - B | .014 | .018 | |||||
Net realized and unrealized gain (loss) B | - | - | - | - | - | |||||
| Total from investment operations | .027 | - B | - B | .014 | .018 | |||||
| Distributions from net investment income | (.027) | - B | - B | (.014) | (.018) | |||||
| Total distributions | (.027) | - B | - B | (.014) | (.018) | |||||
| Net asset value, end of period | $ | 1.00 | $ | 1.00 | $ | 1.00 | $ | 1.00 | $ | 1.00 |
Total Return C | 2.72% | .01% | .01% | 1.42% | 1.79% | |||||
Ratios to Average Net Assets A,D,E | ||||||||||
| Expenses before reductions | .42% | .42% | .42% | .42% | .42% | |||||
| Expenses net of fee waivers, if any | .42% | .10% | .15% | .42% | .42% | |||||
| Expenses net of all reductions | .42% | .10% | .15% | .42% | .42% | |||||
| Net investment income (loss) | 2.68% | .01% | .01% | 1.33% | 1.79% | |||||
| Supplemental Data | ||||||||||
| Net assets, end of period (000 omitted) | $ | 236,784,703 | $ | 230,027,515 | $ | 200,115,905 | $ | 165,823,962 | $ | 104,973,598 |
| Fidelity® Government Money Market Fund Class S |
| Years ended April 30, | 2023 | 2022 A | ||
Selected Per-Share Data | ||||
| Net asset value, beginning of period | $ | 1.00 | $ | 1.00 |
| Income from Investment Operations | ||||
Net investment income (loss) B | .027 | - C | ||
Net realized and unrealized gain (loss) C | - | - | ||
| Total from investment operations | .027 | - C | ||
| Distributions from net investment income | (.027) | - C | ||
| Total distributions | (.027) | - C | ||
| Net asset value, end of period | $ | 1.00 | $ | 1.00 |
Total Return D,E | 2.72% | -% F | ||
Ratios to Average Net Assets B,G,H | ||||
| Expenses before reductions | .46% | .46% I | ||
| Expenses net of fee waivers, if any | .42% | .14% I | ||
| Expenses net of all reductions | .42% | .14% I | ||
| Net investment income (loss) | 2.68% | .01% I | ||
| Supplemental Data | ||||
| Net assets, end of period (000 omitted) | $ | 116,643 | $ | 100 |
| Fidelity® Government Money Market Fund Premium Class |
| Years ended April 30, | 2023 | 2022 | 2021 | 2020 | 2019 | |||||
Selected Per-Share Data | ||||||||||
| Net asset value, beginning of period | $ | 1.00 | $ | 1.00 | $ | 1.00 | $ | 1.00 | $ | 1.00 |
| Income from Investment Operations | ||||||||||
Net investment income (loss) A | .028 | - B | - B | .015 | .019 | |||||
Net realized and unrealized gain (loss) B | - | - | - | - | - | |||||
| Total from investment operations | .028 | - B | - B | .015 | .019 | |||||
| Distributions from net investment income | (.028) | - B | - B | (.015) | (.019) | |||||
| Total distributions | (.028) | - B | - B | (.015) | (.019) | |||||
| Net asset value, end of period | $ | 1.00 | $ | 1.00 | $ | 1.00 | $ | 1.00 | $ | 1.00 |
Total Return C | 2.82% | .01% | .01% | 1.52% | 1.90% | |||||
Ratios to Average Net Assets A,D,E | ||||||||||
| Expenses before reductions | .36% | .36% | .36% | .37% | .36% | |||||
| Expenses net of fee waivers, if any | .32% | .09% | .15% | .32% | .32% | |||||
| Expenses net of all reductions | .32% | .09% | .15% | .32% | .32% | |||||
| Net investment income (loss) | 2.78% | .01% | -% F | 1.43% | 1.89% | |||||
| Supplemental Data | ||||||||||
| Net assets, end of period (000 omitted) | $ | 7,609,041 | $ | 4,352,205 | $ | 4,713,643 | $ | 5,726,124 | $ | 4,115,468 |
| Fidelity® Government Money Market Fund Class K6 |
| Years ended April 30, | 2023 | 2022 | 2021 | 2020 | 2019 | |||||
Selected Per-Share Data | ||||||||||
| Net asset value, beginning of period | $ | 1.00 | $ | 1.00 | $ | 1.00 | $ | 1.00 | $ | 1.00 |
| Income from Investment Operations | ||||||||||
Net investment income (loss) A | .029 | - B | - B | .016 | .019 | |||||
Net realized and unrealized gain (loss) B | - | - | - | - | - | |||||
| Total from investment operations | .029 | - B | - B | .016 | .019 | |||||
| Distributions from net investment income | (.029) | - B | - B | (.016) | (.019) | |||||
| Total distributions | (.029) | - B | - B | (.016) | (.019) | |||||
| Net asset value, end of period | $ | 1.00 | $ | 1.00 | $ | 1.00 | $ | 1.00 | $ | 1.00 |
Total Return C | 2.89% | .02% | .01% | 1.59% | 1.97% | |||||
Ratios to Average Net Assets A,D,E | ||||||||||
| Expenses before reductions | .27% | .27% | .27% | .28% | .27% | |||||
| Expenses net of fee waivers, if any | .25% | .09% | .14% | .25% | .25% | |||||
| Expenses net of all reductions | .25% | .09% | .14% | .25% | .25% | |||||
| Net investment income (loss) | 2.85% | .02% | .01% | 1.50% | 1.96% | |||||
| Supplemental Data | ||||||||||
| Net assets, end of period (000 omitted) | $ | 2,779,806 | $ | 2,174,050 | $ | 1,660,582 | $ | 1,313,087 | $ | 404,595 |
| Fidelity Government Money Market Fund | $1,727,704 |
| Gross unrealized appreciation | $- |
| Gross unrealized depreciation | - |
| Net unrealized appreciation (depreciation) | $- |
| Tax Cost | $258,698,845,167 |
| Undistributed tax-exempt income | $- |
| Undistributed ordinary income | $- |
| Capital loss carryforward | $(1,564,377) |
| Net unrealized appreciation (depreciation) on securities and other investments | $- |
| Short-term | $(268,591) |
| Long-term | (1,295,787) |
| Total capital loss carryforward | $(1,564,377) |
| April 30, 2023 | April 30, 2022 | |
| Ordinary Income | $6,580,599,912 | $23,866,363 |
| Distribution Fee | Service Fee | Total Fees | Retained by FDC | |
| Capital Reserves Class | .25% | .25% | $32,272,722 | $19,033,312 |
| Daily Money Class | - % | .25% | 18,280,541 | 8,634,843 |
| Advisor M Class | - % | .25% | 414,810 | 38,729 |
| $50,968,073 | $27,706,884 |
| Retained by FDC | |
| Daily Money Class | $36,540 |
| Advisor M Class | $35 |
| Amount | % of Class-Level Average Net Assets | |
| Capital Reserves Class | $12,909,089 | .20 |
| Daily Money Class | 14,624,433 | .20 |
| Advisor M Class | 331,848 | .20 |
| Fidelity Government Money Market Fund | 364,330,967 | .16 |
| Class S | 207,448 | .20 |
| Premium Class | 5,441,647 | .10 |
| Class K6 | 249,597 | .01 |
| $398,095,029 |
| % of Average Net Assets | |
| Fidelity Government Money Market Fund | - A |
| Purchases ($) | Sales ($) | Realized Gain (Loss) ($) | |
| Fidelity Government Money Market Fund | - | 75,145,000 | - |
| Expense Limitations | Reimbursement | Expiration Date | |
| Capital Reserves Class | .95% | $467,311 | August 31, 2024 |
| Daily Money Class | .70% | 606,433 | August 31, 2024 |
| Advisor M Class | .70% | 13,386 | August 31, 2024 |
| Class S | .42% | 39,851 | August 31, 2024 |
| Premium Class | .32% | 2,114,661 | August 31, 2024 |
| Class K6 | .25% | 457,899 | August 31, 2024 |
| $3,699,541 |
| Capital Reserves Class | $1,889,478 |
| Daily Money Class | 284,773 |
| Advisor M Class | 5,704 |
| Fidelity Government Money Market Fund | 1,722,312 |
| Class S | 1 |
| Expense reduction | |
| Daily Money Class | $602 |
Year ended April 30, 2023 | Year ended April 30, 2022 A | |
| Fidelity Government Money Market Fund | ||
| Distributions to shareholders | ||
| Capital Reserves Class | $ 132,294,501 | $758,597 |
| Daily Money Class | 173,911,146 | 748,324 |
| Advisor M Class | 4,026,868 | 13,196 |
| Fidelity Government Money Market Fund | 6,032,133,212 | 21,569,064 |
| Class S | 3,127,896 | 4 |
| Premium Class | 161,984,763 | 452,225 |
| Class K6 | 73,121,526 | 324,953 |
Total | $6,580,599,912 | $23,866,363 |
| Shares | Shares | Dollars | Dollars | |
Year ended April 30, 2023 | Year ended April 30, 2022 A | Year ended April 30, 2023 | Year ended April 30, 2022 A | |
| Fidelity Government Money Market Fund | ||||
| Capital Reserves Class | ||||
| Shares sold | 24,726,485,347 | 27,391,386,975 | $24,726,485,347 | $27,391,386,975 |
| Reinvestment of distributions | 82,299,780 | 460,810 | 82,299,780 | 460,810 |
| Shares redeemed | (26,978,689,833) | (27,465,582,704) | (26,978,689,833) | (27,465,582,704) |
| Net increase (decrease) | (2,169,904,706) | (73,734,919) | $(2,169,904,706) | $(73,734,919) |
| Daily Money Class | ||||
| Shares sold | 29,426,737,018 | 26,738,209,273 | $29,426,737,018 | $26,738,209,273 |
| Reinvestment of distributions | 124,369,442 | 516,833 | 124,369,442 | 516,833 |
| Shares redeemed | (29,788,519,287) | (26,705,576,696) | (29,788,519,287) | (26,705,576,695) |
| Net increase (decrease) | (237,412,827) | 33,149,410 | $(237,412,827) | $33,149,411 |
| Advisor M Class | ||||
| Shares sold | 146,781,874 | 155,775,755 | $146,781,874 | $155,775,755 |
| Reinvestment of distributions | 3,948,140 | 12,811 | 3,948,140 | 12,811 |
| Shares redeemed | (127,013,170) | (131,481,710) | (127,013,170) | (131,481,711) |
| Net increase (decrease) | 23,716,844 | 24,306,856 | $23,716,844 | $24,306,855 |
| Fidelity Government Money Market Fund | ||||
| Shares sold | 747,228,976,266 | 718,100,082,282 | $747,228,976,259 | $718,100,082,261 |
| Reinvestment of distributions | 4,973,485,810 | 19,163,112 | 4,973,485,810 | 19,163,113 |
| Shares redeemed | (745,443,820,532) | (688,207,963,906) | (745,443,820,524) | (688,207,963,886) |
| Net increase (decrease) | 6,758,641,544 | 29,911,281,488 | $6,758,641,545 | $29,911,281,488 |
| Class S | ||||
| Shares sold | 1,009,671,977 | 106,813 | $1,009,671,977 | $106,813 |
| Reinvestment of distributions | 2,753,148 | 4 | 2,753,148 | 4 |
| Shares redeemed | (895,881,428) | (6,573) | (895,881,428) | (6,573) |
| Net increase (decrease) | 116,543,697 | 100,244 | $116,543,697 | $100,244 |
| Premium Class | ||||
| Shares sold | 7,637,912,164 | 2,009,205,919 | $7,637,912,162 | $2,009,205,914 |
| Reinvestment of distributions | 147,283,681 | 431,259 | 147,283,681 | 431,259 |
| Shares redeemed | (4,529,107,357) | (2,370,975,882) | (4,529,107,803) | (2,370,975,877) |
| Net increase (decrease) | 3,256,088,488 | (361,338,704) | $3,256,088,040 | $(361,338,704) |
| Class K6 | ||||
| Shares sold | 2,269,895,570 | 1,794,922,596 | $2,269,895,570 | $1,794,922,596 |
| Reinvestment of distributions | 73,121,526 | 316,317 | 73,121,526 | 316,317 |
| Shares redeemed | (1,737,235,287) | (1,281,755,243) | (1,737,235,287) | (1,281,755,243) |
| Net increase (decrease) | 605,781,809 | 513,483,670 | $605,781,809 | $513,483,670 |
| The Example is based on an investment of $1,000 invested at the beginning of the period and held for the entire period (November 1, 2022 to April 30, 2023). |
Annualized Expense Ratio- A | Beginning Account Value November 1, 2022 | Ending Account Value April 30, 2023 | Expenses Paid During Period- C November 1, 2022 to April 30, 2023 | |||||||
| Fidelity® Government Money Market Fund | ||||||||||
| Capital Reserves Class | .95% | |||||||||
| Actual | $ 1,000 | $ 1,017.10 | $ 4.75 | |||||||
Hypothetical- B | $ 1,000 | $ 1,020.08 | $ 4.76 | |||||||
| Daily Money Class | .70% | |||||||||
| Actual | $ 1,000 | $ 1,018.40 | $ 3.50 | |||||||
Hypothetical- B | $ 1,000 | $ 1,021.32 | $ 3.51 | |||||||
| Advisor M Class | .70% | |||||||||
| Actual | $ 1,000 | $ 1,018.40 | $ 3.50 | |||||||
Hypothetical- B | $ 1,000 | $ 1,021.32 | $ 3.51 | |||||||
| Fidelity® Government Money Market Fund | .42% | |||||||||
| Actual | $ 1,000 | $ 1,019.80 | $ 2.10 | |||||||
Hypothetical- B | $ 1,000 | $ 1,022.71 | $ 2.11 | |||||||
| Class S | .42% | |||||||||
| Actual | $ 1,000 | $ 1,019.80 | $ 2.10 | |||||||
Hypothetical- B | $ 1,000 | $ 1,022.71 | $ 2.11 | |||||||
| Premium Class | .32% | |||||||||
| Actual | $ 1,000 | $ 1,020.30 | $ 1.60 | |||||||
Hypothetical- B | $ 1,000 | $ 1,023.21 | $ 1.61 | |||||||
| Class K6 | .25% | |||||||||
| Actual | $ 1,000 | $ 1,020.70 | $ 1.25 | |||||||
Hypothetical- B | $ 1,000 | $ 1,023.55 | $ 1.25 | |||||||
 |


Contents
| Current 7-Day Yields | ||
| Fidelity® Treasury Only Money Market Fund | 4.03% | |
Yield refers to the income paid by the Fund over a given period. Yield for money market funds is usually for seven-day periods, as it is here, though it is expressed as an annual percentage rate. Past performance is no guarantee of future results. Yield will vary and it's possible to lose money investing in the Fund. | ||
| Effective Maturity Diversification (% of Fund's Investments) | ||
| Days | ||
| 1 - 7 | 16.0 | |
| 8 - 30 | 84.0 | |
| Effective maturity is determined in accordance with the requirements of Rule 2a-7 under the Investment Company Act of 1940. | ||
Asset Allocation (% of Fund's net assets) |
 |
Net Other Assets (Liabilities) - (13.6)% |
Net Other Assets (Liabilities) are not available in the pie chart. |
| U.S. Treasury Debt - 113.6% | ||||
| Yield (%)(a) | Principal Amount (b) (000s) | Value ($) (000s) | ||
| U.S. Treasury Obligations - 113.6% | ||||
| U.S. Treasury Bills | ||||
| 5/2/23 to 5/30/23 | 3.17 to 4.95 | 4,586,142 | 4,577,212 | |
| U.S. Treasury Notes | ||||
| 5/15/23 to 10/31/24 (c) | 4.95 to 5.27 | 133,835 | 133,740 | |
| TOTAL U.S. TREASURY DEBT (Cost $4,710,952) | 4,710,952 | |||
| TOTAL INVESTMENT IN SECURITIES - 113.6% (Cost $4,710,952) | 4,710,952 |
NET OTHER ASSETS (LIABILITIES) - (13.6)% | (563,987) |
| NET ASSETS - 100.0% | 4,146,965 |
| (a) | Yield represents either the annualized yield at the date of purchase, or the stated coupon rate, or, for floating and adjustable rate securities, the rate at period end. |
| (b) | Amount is stated in United States dollars unless otherwise noted. |
| (c) | Coupon rates for floating and adjustable rate securities reflect the rates in effect at period end. |
| Statement of Assets and Liabilities | ||||
| Amounts in thousands (except per-share amount) | April 30, 2023 | |||
| Assets | ||||
Investment in securities, at value - See accompanying schedule Unaffiliated issuers (cost $4,710,952): | $ | 4,710,952 | ||
| Cash | 190,758 | |||
| Receivable for investments sold | 92,094 | |||
| Receivable for fund shares sold | 12,292 | |||
| Interest receivable | 1,213 | |||
Total assets | 5,007,309 | |||
| Liabilities | ||||
| Payable for investments purchased | $ | 841,735 | ||
| Payable for fund shares redeemed | 14,955 | |||
| Distributions payable | 2,197 | |||
| Accrued management fee | 1,457 | |||
| Total Liabilities | 860,344 | |||
| Net Assets | $ | 4,146,965 | ||
| Net Assets consist of: | ||||
| Paid in capital | $ | 4,146,961 | ||
| Total accumulated earnings (loss) | 4 | |||
| Net Assets | $ | 4,146,965 | ||
Net Asset Value , offering price and redemption price per share ($4,146,965 ÷ 4,146,179 shares) | $ | 1.00 | ||
| Statement of Operations | ||||
| Amounts in thousands | Year ended April 30, 2023 | |||
| Investment Income | ||||
| Interest | $ | 98,111 | ||
| Expenses | ||||
| Management fee | $ | 13,632 | ||
| Independent trustees' fees and expenses | 11 | |||
| Total Expenses | 13,643 | |||
| Net Investment income (loss) | 84,468 | |||
| Realized and Unrealized Gain (Loss) | ||||
| Net realized gain (loss) on: | ||||
| Investment Securities: | ||||
| Unaffiliated issuers | 25 | |||
| Total net realized gain (loss) | 25 | |||
| Net increase in net assets resulting from operations | $ | 84,493 | ||
| Statement of Changes in Net Assets | ||||
| Amount in thousands | Year ended April 30, 2023 | Year ended April 30, 2022 | ||
| Increase (Decrease) in Net Assets | ||||
| Operations | ||||
| Net investment income (loss) | $ | 84,468 | $ | 376 |
| Net realized gain (loss) | 25 | (37) | ||
Net increase in net assets resulting from operations | 84,493 | 339 | ||
| Distributions to shareholders | (84,477) | (446) | ||
| Share transactions | ||||
| Proceeds from sales of shares | 3,538,536 | 1,393,057 | ||
| Reinvestment of distributions | 75,134 | 405 | ||
| Cost of shares redeemed | (2,866,760) | (1,797,612) | ||
Net increase (decrease) in net assets and shares resulting from share transactions | 746,910 | (404,150) | ||
| Total increase (decrease) in net assets | 746,926 | (404,257) | ||
| Net Assets | ||||
| Beginning of period | 3,400,039 | 3,804,296 | ||
| End of period | $ | 4,146,965 | $ | 3,400,039 |
| Other Information | ||||
| Shares | ||||
| Sold | 3,538,536 | 1,393,057 | ||
| Issued in reinvestment of distributions | 75,134 | 405 | ||
| Redeemed | (2,866,760) | (1,797,612) | ||
| Net increase (decrease) | 746,910 | (404,150) | ||
| Fidelity® Treasury Only Money Market Fund |
| Years ended April 30, | 2023 | 2022 | 2021 | 2020 | 2019 | |||||
Selected Per-Share Data | ||||||||||
| Net asset value, beginning of period | $ | 1.00 | $ | 1.00 | $ | 1.00 | $ | 1.00 | $ | 1.00 |
| Income from Investment Operations | ||||||||||
Net investment income (loss) A | .026 | - B | - B | .014 | .018 | |||||
Net realized and unrealized gain (loss) B | - | - | - | - | - | |||||
| Total from investment operations | .026 | - | - B | .014 | .018 | |||||
| Distributions from net investment income | (.026) | - B | - B | (.014) | (.018) | |||||
| Distributions from net realized gain | - | - B | - | - | - | |||||
| Total distributions | (.026) | - B | - B | (.014) | (.018) | |||||
| Net asset value, end of period | $ | 1.00 | $ | 1.00 | $ | 1.00 | $ | 1.00 | $ | 1.00 |
Total Return C | 2.62% | .01% | .01% | 1.39% | 1.79% | |||||
Ratios to Average Net Assets A,D,E | ||||||||||
| Expenses before reductions | .42% | .42% | .42% | .42% | .42% | |||||
| Expenses net of fee waivers, if any | .42% | .11% | .15% | .42% | .42% | |||||
| Expenses net of all reductions | .42% | .11% | .15% | .42% | .42% | |||||
| Net investment income (loss) | 2.60% | .01% | .01% | 1.27% | 1.76% | |||||
| Supplemental Data | ||||||||||
| Net assets, end of period (in millions) | $ | 4,147 | $ | 3,400 | $ | 3,804 | $ | 5,045 | $ | 2,823 |
| Gross unrealized appreciation | $- |
| Gross unrealized depreciation | - |
| Net unrealized appreciation (depreciation) | $- |
| Tax Cost | $4,710,952 |
| Undistributed tax-exempt income | $- |
| Undistributed ordinary income | $10 |
| Net unrealized appreciation (depreciation) on securities and other investments | $- |
| April 30, 2023 | April 30, 2022 | |
| Ordinary Income | $84,477 | $446 |
| The Example is based on an investment of $1,000 invested at the beginning of the period and held for the entire period (November 1, 2022 to April 30, 2023). |
Annualized Expense Ratio- A | Beginning Account Value November 1, 2022 | Ending Account Value April 30, 2023 | Expenses Paid During Period- C November 1, 2022 to April 30, 2023 | |||||||
| Fidelity® Treasury Only Money Market Fund | .42% | |||||||||
| Actual | $ 1,000 | $ 1,019.20 | $ 2.10 | |||||||
Hypothetical- B | $ 1,000 | $ 1,022.71 | $ 2.11 | |||||||
 |


Contents
| Current 7-Day Yields | ||
| Fidelity Flex® Government Money Market Fund | 4.92% | |
Yield refers to the income paid by the Fund over a given period. Yield for money market funds is usually for seven-day periods, as it is here, though it is expressed as an annual percentage rate. Past performance is no guarantee of future results. Yield will vary and it's possible to lose money investing in the Fund. | ||
| Effective Maturity Diversification (% of Fund's Investments) | ||
| Days | ||
| 1 - 7 | 94.7 | |
| 31 - 60 | 1.0 | |
| 61 - 90 | 1.1 | |
| 91 - 180 | 0.5 | |
| > 180 | 2.7 | |
| Effective maturity is determined in accordance with the requirements of Rule 2a-7 under the Investment Company Act of 1940. | ||
Asset Allocation (% of Fund's net assets) |
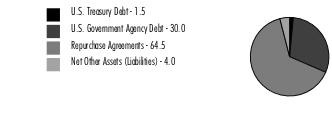 |
| U.S. Treasury Debt - 1.5% | ||||
| Yield (%)(a) | Principal Amount (b) | Value ($) | ||
| U.S. Treasury Obligations - 1.5% | ||||
| U.S. Treasury Notes | ||||
| 10/31/24 (c) | 5.27 | 1,500,000 | 1,501,176 | |
| TOTAL U.S. TREASURY DEBT (Cost $1,501,176) | 1,501,176 | |||
| U.S. Government Agency Debt - 30.0% | ||||
| Yield (%)(a) | Principal Amount (b) | Value ($) | ||
| Federal Agencies - 30.0% | ||||
| Federal Farm Credit Bank | ||||
| 9/26/23 to 7/26/24 (c)(d) | 4.87 to 4.96 | 3,350,000 | 3,349,938 | |
| Federal Home Loan Bank | ||||
| 5/22/23 to 11/22/24 (c) | 4.85 to 5.33 | 26,500,000 | 26,477,433 | |
| Freddie Mac | ||||
| 5/3/23 (c)(d) | 4.94 | 250,000 | 250,000 | |
| TOTAL U.S. GOVERNMENT AGENCY DEBT (Cost $30,077,371) | 30,077,371 | |||
| U.S. Government Agency Repurchase Agreement - 50.5% | |||
Maturity Amount ($) | Value ($) | ||
| In a joint trading account at 4.8% dated 4/28/23 due 5/1/23 (Collateralized by U.S. Government Obligations) # | 30,087,034 | 30,075,000 | |
| With: | |||
| ABN AMRO Bank NV at 4.81%, dated 4/28/23 due 5/1/23 (Collateralized by U.S. Government Obligations valued at $1,020,409, 3.00% - 5.00%, 3/1/50 - 10/20/52) | 1,000,401 | 1,000,000 | |
| BMO Harris Bank NA at 4.81%, dated 4/12/23 due 5/3/23 (Collateralized by U.S. Government Obligations valued at $1,022,590, 3.50%, 7/20/44) | 1,002,806 | 1,000,000 | |
| BNP Paribas, SA at: | |||
4.81%, dated 3/6/23 due 5/5/23 (Collateralized by U.S. Treasury Obligations valued at $1,035,265, 0.00% - 6.00%, 9/15/24 - 4/1/53) | 1,008,409 | 1,000,000 | |
4.82%, dated 4/4/23 due 5/4/23 (Collateralized by U.S. Treasury Obligations valued at $1,023,926, 0.00% - 5.50%, 11/15/33 - 10/20/51) | 1,004,017 | 1,000,000 | |
4.84%, dated 4/28/23 due 5/5/23 (Collateralized by U.S. Government Obligations valued at $1,020,500, 0.00% - 6.00%, 10/26/23 - 4/1/53) | 1,000,941 | 1,000,000 | |
4.87%, dated 4/11/23 due 5/5/23 (Collateralized by U.S. Treasury Obligations valued at $1,032,545, 0.00% - 5.50%, 2/15/34 - 4/1/53) | 1,004,058 | 1,000,000 | |
4.91%, dated 3/3/23 due 5/5/23 (Collateralized by U.S. Government Obligations valued at $1,028,204, 2.00% - 6.00%, 7/31/24 - 4/20/53) | 1,012,808 | 1,000,000 | |
| BNY Mellon Capital Markets Corp. at 4.84%, dated 3/30/23 due 5/4/23 (Collateralized by U.S. Treasury Obligations valued at $1,024,479, 0.00% - 4.00%, 8/10/23 - 2/1/52) | 1,004,706 | 1,000,000 | |
| BofA Securities, Inc. at: | |||
4.8%, dated 4/24/23 due 5/1/23 (Collateralized by U.S. Treasury Obligations valued at $1,020,979, 2.25%, 11/15/25) | 1,000,933 | 1,000,000 | |
4.82%, dated: | |||
| 4/18/23 due 5/4/23 (Collateralized by U.S. Treasury Obligations valued at $1,021,852, 2.25%, 11/15/25) (c)(d)(e) | 1,002,142 | 1,000,000 | |
| 4/26/23 due 5/5/23 (Collateralized by U.S. Treasury Obligations valued at $1,020,687, 2.25%, 11/15/25) (c)(d)(e) | 1,004,017 | 1,000,000 | |
| CIBC Bank U.S.A. at: | |||
4.81%, dated 3/23/23 due 5/4/23 (Collateralized by U.S. Government Obligations valued at $1,025,340, 0.75% - 5.44%, 7/31/23 - 5/15/58) | 1,005,612 | 1,000,000 | |
4.87%, dated 3/23/23 due 5/4/23 (Collateralized by U.S. Government Obligations valued at $513,336, 0.75% - 5.44%, 7/15/25 - 5/15/58) | 502,841 | 500,000 | |
| Citibank NA at 4.81%, dated 4/27/23 due 5/4/23 (Collateralized by U.S. Treasury Obligations valued at $1,027,039, 0.13% - 6.13%, 5/15/23 - 8/15/51) | 1,000,935 | 1,000,000 | |
| Citigroup Global Capital Markets, Inc. at 4.81%, dated 4/27/23 due 5/4/23 (Collateralized by U.S. Government Obligations valued at $1,020,639, 4.29% - 6.95%, 3/20/73) | 1,000,935 | 1,000,000 | |
| Goldman Sachs & Co. at 4.81%, dated: | |||
4/24/23 due 5/1/23 (Collateralized by U.S. Government Obligations valued at $1,020,954, 2.00% - 2.50%, 5/20/51 - 12/1/52) | 1,000,935 | 1,000,000 | |
4/25/23 due 5/2/23 (Collateralized by U.S. Treasury Obligations valued at $1,020,892, 4.00% - 6.00%, 10/31/29 - 5/1/42) | 1,000,935 | 1,000,000 | |
4/26/23 due 5/3/23 (Collateralized by U.S. Government Obligations valued at $1,020,681, 4.00%, 8/15/57) | 1,000,935 | 1,000,000 | |
4/27/23 due 5/4/23 (Collateralized by U.S. Government Obligations valued at $1,020,546, 2.25% - 6.50%, 10/1/27 - 12/1/49) | 1,000,935 | 1,000,000 | |
4/28/23 due 5/4/23 (Collateralized by U.S. Government Obligations valued at $1,020,409, 3.00% - 5.00%, 8/1/34 - 1/20/48) | 1,000,802 | 1,000,000 | |
| TD Securities (U.S.A.) at 4.8%, dated 4/28/23 due 5/1/23 (Collateralized by U.S. Government Obligations valued at $1,020,408, 3.00%, 8/20/51) | 1,000,400 | 1,000,000 | |
| TOTAL U.S. GOVERNMENT AGENCY REPURCHASE AGREEMENT (Cost $50,575,000) | 50,575,000 | ||
| U.S. Treasury Repurchase Agreement - 14.0% | |||
Maturity Amount ($) | Value ($) | ||
| With: | |||
| ABN AMRO Bank NV at 4.8%, dated 4/28/23 due 5/1/23 (Collateralized by U.S. Treasury Obligations valued at $1,020,453, 0.50% - 5.25%, 8/15/25 - 11/15/28) | 1,000,400 | 1,000,000 | |
| Barclays Bank PLC at 4.8%, dated 4/28/23 due 5/1/23 (Collateralized by U.S. Treasury Obligations valued at $1,020,410, 4.63%, 2/15/40) | 1,000,400 | 1,000,000 | |
| Credit AG at 4.81%, dated 4/20/23 due 5/4/23 (Collateralized by U.S. Treasury Obligations valued at $1,021,512, 4.63%, 3/15/26) | 1,001,871 | 1,000,000 | |
| Fixed Income Clearing Corp. - BNYM at 4.8%, dated 4/28/23 due 5/1/23 (Collateralized by U.S. Treasury Obligations valued at $2,040,060, 3.88%, 1/15/26) | 2,000,800 | 2,000,000 | |
| ING Financial Markets LLC at 4.8%, dated 4/28/23 due 5/1/23 (Collateralized by U.S. Treasury Obligations valued at $1,021,437, 4.13%, 9/30/27) | 1,000,400 | 1,000,000 | |
| Lloyds Bank PLC at 4.77%, dated 3/2/23 due 5/2/23 (Collateralized by U.S. Treasury Obligations valued at $1,029,034, 0.75% - 3.25%, 11/15/24 - 6/30/27) | 1,008,083 | 1,000,000 | |
| Mizuho Bank, Ltd. at 4.8%, dated 4/28/23 due 5/1/23 (Collateralized by U.S. Treasury Obligations valued at $1,026,306, 1.25%, 8/15/31) | 1,000,400 | 1,000,000 | |
| MUFG Securities (Canada), Ltd. at 4.81%, dated 4/24/23 due 5/4/23 (Collateralized by U.S. Treasury Obligations valued at $1,021,046, 0.25% - 6.13%, 8/15/24 - 2/15/52) | 1,001,336 | 1,000,000 | |
| MUFG Securities EMEA PLC at 4.8%, dated 4/28/23 due 5/1/23 (Collateralized by U.S. Treasury Obligations valued at $1,069,347, 3.13% - 4.63%, 2/28/25 - 2/15/43) | 1,000,400 | 1,000,000 | |
| Natixis SA at 4.8%, dated 4/28/23 due 5/1/23 (Collateralized by U.S. Treasury Obligations valued at $1,020,423, 2.38% - 4.75%, 2/15/37 - 11/15/42) | 1,000,400 | 1,000,000 | |
| Norinchukin Bank at 4.85%, dated 4/25/23 due 5/2/23 (Collateralized by U.S. Treasury Obligations valued at $1,020,420, 2.75%, 5/31/29) | 1,000,943 | 1,000,000 | |
| RBS Securities, Inc. at 4.8%, dated 4/28/23 due 5/1/23 (Collateralized by U.S. Treasury Obligations valued at $1,030,482, 2.50%, 2/15/45) | 1,000,400 | 1,000,000 | |
| Societe Generale at 4.8%, dated 4/25/23 due 5/2/23 (Collateralized by U.S. Treasury Obligations valued at $1,020,837, 2.25%, 5/15/41) | 1,000,933 | 1,000,000 | |
| TOTAL U.S. TREASURY REPURCHASE AGREEMENT (Cost $14,000,000) | 14,000,000 | ||
| TOTAL INVESTMENT IN SECURITIES - 96.0% (Cost $96,153,547) | 96,153,547 |
NET OTHER ASSETS (LIABILITIES) - 4.0% | 4,034,681 |
| NET ASSETS - 100.0% | 100,188,228 |
| (a) | Yield represents either the annualized yield at the date of purchase, or the stated coupon rate, or, for floating and adjustable rate securities, the rate at period end. |
| (b) | Amount is stated in United States dollars unless otherwise noted. |
| (c) | Coupon rates for floating and adjustable rate securities reflect the rates in effect at period end. |
| (d) | Coupon is indexed to a floating interest rate which may be multiplied by a specified factor and/or subject to caps or floors. |
| (e) | The maturity amount is based on the rate at period end. |
| Other Information | ||
| # Additional information on each counterparty to the repurchase agreement is as follows: | ||
| Repurchase Agreement / Counterparty | Value ($) | |
| $30,075,000 due 5/01/23 at 4.80% | ||
| BNY Mellon Capital Markets LLC | 155,000 | |
| Bank of America, N.A. | 447,000 | |
| BofA Securities, Inc. | 310,000 | |
| Citigroup Global Markets, Inc. | 310,000 | |
| Nomura Securities International | 26,000,000 | |
| RBC Dominion Securities, Inc. | 372,000 | |
| Sumitomo Mitsui Banking Corp. | 1,736,000 | |
| Wells Fargo Securities LLC | 745,000 | |
| 30,075,000 | ||
| Statement of Assets and Liabilities | ||||
| April 30, 2023 | ||||
| Assets | ||||
Investment in securities, at value (including repurchase agreements of $64,575,000) - See accompanying schedule Unaffiliated issuers (cost $96,153,547): | $ | 96,153,547 | ||
| Cash | 1,000,151 | |||
| Receivable for fund shares sold | 7,990,597 | |||
| Interest receivable | 236,111 | |||
Total assets | 105,380,406 | |||
| Liabilities | ||||
| Payable for fund shares redeemed | $ | 5,061,640 | ||
| Distributions payable | 130,538 | |||
| Total Liabilities | 5,192,178 | |||
| Net Assets | $ | 100,188,228 | ||
| Net Assets consist of: | ||||
| Paid in capital | $ | 100,187,097 | ||
| Total accumulated earnings (loss) | 1,131 | |||
| Net Assets | $ | 100,188,228 | ||
Net Asset Value , offering price and redemption price per share ($100,188,228 ÷ 100,183,180 shares) | $ | 1.00 | ||
| Statement of Operations | ||||
Year ended April 30, 2023 | ||||
| Investment Income | ||||
| Interest | $ | 2,929,839 | ||
| Expenses | ||||
| Independent trustees' fees and expenses | $ | 335 | ||
| Total Expenses | 335 | |||
| Net Investment income (loss) | 2,929,504 | |||
| Realized and Unrealized Gain (Loss) | ||||
| Net realized gain (loss) on: | ||||
| Investment Securities: | ||||
| Unaffiliated issuers | (151) | |||
| Total net realized gain (loss) | (151) | |||
| Net increase in net assets resulting from operations | $ | 2,929,353 | ||
| Statement of Changes in Net Assets | ||||
Year ended April 30, 2023 | Year ended April 30, 2022 | |||
| Increase (Decrease) in Net Assets | ||||
| Operations | ||||
| Net investment income (loss) | $ | 2,929,504 | $ | 105,483 |
| Net realized gain (loss) | (151) | 19 | ||
Net increase in net assets resulting from operations | 2,929,353 | 105,502 | ||
| Distributions to shareholders | (2,928,222) | (103,717) | ||
| Share transactions | ||||
| Proceeds from sales of shares | 3,537,387,735 | 4,525,434,007 | ||
| Reinvestment of distributions | 1,972,006 | 71,753 | ||
| Cost of shares redeemed | (3,555,577,849) | (4,508,081,749) | ||
Net increase (decrease) in net assets and shares resulting from share transactions | (16,218,108) | 17,424,011 | ||
| Total increase (decrease) in net assets | (16,216,977) | 17,425,796 | ||
| Net Assets | ||||
| Beginning of period | 116,405,205 | 98,979,409 | ||
| End of period | $ | 100,188,228 | $ | 116,405,205 |
| Other Information | ||||
| Shares | ||||
| Sold | 3,537,387,735 | 4,525,434,007 | ||
| Issued in reinvestment of distributions | 1,972,006 | 71,753 | ||
| Redeemed | (3,555,577,849) | (4,508,081,749) | ||
| Net increase (decrease) | (16,218,108) | 17,424,011 | ||
| Fidelity Flex® Government Money Market Fund |
| Years ended April 30, | 2023 | 2022 | 2021 | 2020 | 2019 | |||||
Selected Per-Share Data | ||||||||||
| Net asset value, beginning of period | $ | 1.00 | $ | 1.00 | $ | 1.00 | $ | 1.00 | $ | 1.00 |
| Income from Investment Operations | ||||||||||
Net investment income (loss) A | .031 | .001 | .002 | .018 | .022 | |||||
| Net realized and unrealized gain (loss) | - B | - B | (.001) | - B | - B | |||||
| Total from investment operations | .031 | .001 | .001 | .018 | .022 | |||||
| Distributions from net investment income | (.031) | (.001) | (.001) | (.018) | (.022) | |||||
| Total distributions | (.031) | (.001) | (.001) | (.018) | (.022) | |||||
| Net asset value, end of period | $ | 1.00 | $ | 1.00 | $ | 1.00 | $ | 1.00 | $ | 1.00 |
Total Return C | 3.17% | .10% | .15% | 1.81% | 2.22% | |||||
Ratios to Average Net Assets A,D,E | ||||||||||
Expenses before reductions F | -% | -% | -% | -% | -% | |||||
Expenses net of fee waivers, if any F | -% | -% | -% | -% | -% | |||||
Expenses net of all reductions F | -% | -% | -% | -% | -% | |||||
| Net investment income (loss) | 3.15% | .10% | .14% | 1.64% | 2.14% | |||||
| Supplemental Data | ||||||||||
| Net assets, end of period (000 omitted) | $ | 100,188 | $ | 116,405 | $ | 98,979 | $ | 50,942 | $ | 22,044 |
| Gross unrealized appreciation | $- |
| Gross unrealized depreciation | - |
| Net unrealized appreciation (depreciation) | $- |
| Tax Cost | $96,153,547 |
| Undistributed ordinary income | $1,283 |
| Capital loss carryforward | $(152) |
| Net unrealized appreciation (depreciation) on securities and other investments | $- |
Short-term | $(-) |
Long-term | (152) |
| Total capital loss carryforward | $(152) |
| April 30, 2023 | April 30, 2022 | |
| Ordinary Income | $2,928,222 | $ 103,717 |
| The Example is based on an investment of $1,000 invested at the beginning of the period and held for the entire period (November 1, 2022 to April 30, 2023). |
Annualized Expense Ratio- A | Beginning Account Value November 1, 2022 | Ending Account Value April 30, 2023 | Expenses Paid During Period- C November 1, 2022 to April 30, 2023 | |||||||
| Fidelity Flex® Government Money Market Fund | -%- D | |||||||||
| Actual | $ 1,000 | $ 1,021.90 | $- E | |||||||
Hypothetical- B | $ 1,000 | $ 1,024.79 | $- E | |||||||
 |


Contents
| Average Annual Total Returns | |||
Periods ended April 30, 2023 | Past 1 year | Life of Fund A |
| Fidelity® Series Treasury Bill Index Fund | 2.78% | 1.46% |
| $10,000 Over Life of Fund |
Let's say hypothetically that $10,000 was invested in Fidelity® Series Treasury Bill Index Fund, on August 17, 2018, when the fund started. The chart shows how the value of your investment would have changed, and also shows how the Bloomberg U.S. 3-6 Month Treasury Bill Index performed over the same period. |
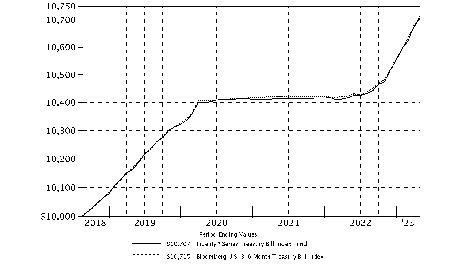 |
Asset Allocation (% of Fund's net assets) |
 |
| U.S. Government and Government Agency Obligations - 99.5% | |||
Principal Amount (a) | Value ($) | ||
| U.S. Treasury Obligations - 99.5% | |||
| U.S. Treasury Bills, yield at date of purchase: | |||
| 0%: | |||
8/22/23 | 52,500,000 | 51,679,955 | |
8/29/23 | 52,500,000 | 51,630,990 | |
| 4.71% to 5.05% 8/1/23 to 10/26/23 | 1,209,652,000 | 1,188,323,462 | |
| TOTAL U.S. GOVERNMENT AND GOVERNMENT AGENCY OBLIGATIONS (Cost $1,292,044,689) | 1,291,634,407 | ||
| Money Market Funds - 0.7% | |||
| Shares | Value ($) | ||
Fidelity Cash Central Fund 4.88% (b) (Cost $8,931,866) | 8,930,080 | 8,931,866 | |
| TOTAL INVESTMENT IN SECURITIES - 100.2% (Cost $1,300,976,555) | 1,300,566,273 |
NET OTHER ASSETS (LIABILITIES) - (0.2)% | (2,441,787) |
| NET ASSETS - 100.0% | 1,298,124,486 |
| (a) | Amount is stated in United States dollars unless otherwise noted. |
| (b) | Affiliated fund that is generally available only to investment companies and other accounts managed by Fidelity Investments. The rate quoted is the annualized seven-day yield of the fund at period end. A complete unaudited listing of the fund's holdings as of its most recent quarter end is available upon request. In addition, each Fidelity Central Fund's financial statements, which are not covered by the Fund's Report of Independent Registered Public Accounting Firm, are available on the SEC's website or upon request. |
| Affiliate | Value, beginning of period ($) | Purchases ($) | Sales Proceeds ($) | Dividend Income ($) | Realized Gain (loss) ($) | Change in Unrealized appreciation (depreciation) ($) | Value, end of period ($) | % ownership, end of period |
| Fidelity Cash Central Fund 4.88% | 506,214 | 249,973,384 | 241,547,732 | 250,881 | - | - | 8,931,866 | 0.0% |
| Total | 506,214 | 249,973,384 | 241,547,732 | 250,881 | - | - | 8,931,866 | |
| Valuation Inputs at Reporting Date: | ||||
| Description | Total ($) | Level 1 ($) | Level 2 ($) | Level 3 ($) |
Investments in Securities: | ||||
| U.S. Government and Government Agency Obligations | 1,291,634,407 | - | 1,291,634,407 | - |
| Money Market Funds | 8,931,866 | 8,931,866 | - | - |
| Total Investments in Securities: | 1,300,566,273 | 8,931,866 | 1,291,634,407 | - |
| Statement of Assets and Liabilities | ||||
| April 30, 2023 | ||||
| Assets | ||||
| Investment in securities, at value - See accompanying schedule: | ||||
Unaffiliated issuers (cost $1,292,044,689) | $ | 1,291,634,407 | ||
Fidelity Central Funds (cost $8,931,866) | 8,931,866 | |||
| Total Investment in Securities (cost $1,300,976,555) | $ | 1,300,566,273 | ||
| Receivable for investments sold | 516,306,556 | |||
| Receivable for fund shares sold | 22,478,487 | |||
| Distributions receivable from Fidelity Central Funds | 41,946 | |||
Total assets | 1,839,393,262 | |||
| Liabilities | ||||
| Payable for investments purchased | $ | 541,135,319 | ||
| Payable for fund shares redeemed | 129,449 | |||
| Other payables and accrued expenses | 4,008 | |||
| Total Liabilities | 541,268,776 | |||
| Net Assets | $ | 1,298,124,486 | ||
| Net Assets consist of: | ||||
| Paid in capital | $ | 1,306,492,204 | ||
| Total accumulated earnings (loss) | (8,367,718) | |||
| Net Assets | $ | 1,298,124,486 | ||
Net Asset Value , offering price and redemption price per share ($1,298,124,486 ÷ 130,574,685 shares) | $ | 9.94 | ||
| Statement of Operations | ||||
Year ended April 30, 2023 | ||||
| Investment Income | ||||
| Interest | $ | 36,724,484 | ||
| Income from Fidelity Central Funds | 250,881 | |||
| Total Income | 36,975,365 | |||
| Expenses | ||||
| Custodian fees and expenses | $ | 10,761 | ||
| Independent trustees' fees and expenses | 4,201 | |||
| Total expenses before reductions | 14,962 | |||
| Expense reductions | (218) | |||
| Total expenses after reductions | 14,744 | |||
| Net Investment income (loss) | 36,960,621 | |||
| Realized and Unrealized Gain (Loss) | ||||
| Net realized gain (loss) on: | ||||
| Investment Securities: | ||||
| Unaffiliated issuers | (5,793,880) | |||
| Total net realized gain (loss) | (5,793,880) | |||
| Change in net unrealized appreciation (depreciation) on investment securities | 372,355 | |||
| Net gain (loss) | (5,421,525) | |||
| Net increase (decrease) in net assets resulting from operations | $ | 31,539,096 | ||
| Statement of Changes in Net Assets | ||||
Year ended April 30, 2023 | Year ended April 30, 2022 | |||
| Increase (Decrease) in Net Assets | ||||
| Operations | ||||
| Net investment income (loss) | $ | 36,960,621 | $ | 3,082,388 |
| Net realized gain (loss) | (5,793,880) | (2,011,309) | ||
| Change in net unrealized appreciation (depreciation) | 372,355 | (854,283) | ||
| Net increase (decrease) in net assets resulting from operations | 31,539,096 | 216,796 | ||
| Distributions to shareholders | (36,902,734) | (3,435,494) | ||
| Share transactions | ||||
| Proceeds from sales of shares | 687,602,491 | 956,901,033 | ||
| Reinvestment of distributions | 36,339,394 | 3,435,372 | ||
| Cost of shares redeemed | (799,464,253) | (3,024,384,770) | ||
Net increase (decrease) in net assets resulting from share transactions | (75,522,368) | (2,064,048,365) | ||
| Total increase (decrease) in net assets | (80,886,006) | (2,067,267,063) | ||
| Net Assets | ||||
| Beginning of period | 1,379,010,492 | 3,446,277,555 | ||
| End of period | $ | 1,298,124,486 | $ | 1,379,010,492 |
| Other Information | ||||
| Shares | ||||
| Sold | 69,090,565 | 95,697,239 | ||
| Issued in reinvestment of distributions | 3,651,949 | 343,736 | ||
| Redeemed | (80,193,769) | (302,539,119) | ||
| Net increase (decrease) | (7,451,255) | (206,498,144) | ||
| Fidelity® Series Treasury Bill Index Fund |
| Years ended April 30, | 2023 | 2022 | 2021 | 2020 | 2019 A | |||||
Selected Per-Share Data | ||||||||||
| Net asset value, beginning of period | $ | 9.99 | $ | 10.00 | $ | 10.03 | $ | 9.98 | $ | 10.00 |
| Income from Investment Operations | ||||||||||
Net investment income (loss) B,C | .327 | .010 | .011 | .169 | .166 | |||||
| Net realized and unrealized gain (loss) | (.054) | (.005) | .002 | .062 | (.005) | |||||
| Total from investment operations | .273 | .005 | .013 | .231 | .161 | |||||
| Distributions from net investment income | (.323) | (.014) | (.012) | (.175) | (.181) | |||||
| Distributions from net realized gain | - | (.001) | (.031) | (.006) | - | |||||
| Total distributions | (.323) | (.015) | (.043) | (.181) | (.181) | |||||
| Net asset value, end of period | $ | 9.94 | $ | 9.99 | $ | 10.00 | $ | 10.03 | $ | 9.98 |
Total Return D,E | 2.78% | .05% | .13% | 2.34% | 1.62% | |||||
Ratios to Average Net Assets C,F,G | ||||||||||
Expenses before reductions H | -% | -% | -% | -% | -% I | |||||
Expenses net of fee waivers, if any H | -% | -% | -% | -% | -% I | |||||
Expenses net of all reductions H | -% | -% | -% | -% | -% I | |||||
| Net investment income (loss) | 3.28% | .10% | .11% | 1.69% | 2.36% I | |||||
| Supplemental Data | ||||||||||
| Net assets, end of period (000 omitted) | $ | 1,298,124 | $ | 1,379,010 | $ | 3,446,278 | $ | 2,211,901 | $ | 927,431 |
| Portfolio turnover rate | -% | -% | -% | -% | -% |
| Fidelity Central Fund | Investment Manager | Investment Objective | Investment Practices | Expense Ratio A |
| Fidelity Money Market Central Funds | Fidelity Management & Research Company LLC (FMR) | Each fund seeks to obtain a high level of current income consistent with the preservation of capital and liquidity. | Short-term Investments | Less than .005% |
| Gross unrealized appreciation | $42 |
| Gross unrealized depreciation | (410,324) |
| Net unrealized appreciation (depreciation) | $(410,282) |
| Tax Cost | $1,300,976,555 |
| Capital loss carryforward | $(7,805,165) |
| Net unrealized appreciation (depreciation) on securities and other investments | $(410,282) |
| Short-term | $(7,805,165) |
| Total capital loss carryforward | $(7,805,165) |
| April 30, 2023 | April 30, 2022 | |
| Ordinary Income | $36,902,734 | $3,435,494 |
| The Example is based on an investment of $1,000 invested at the beginning of the period and held for the entire period (November 1, 2022 to April 30, 2023). |
Annualized Expense Ratio- A | Beginning Account Value November 1, 2022 | Ending Account Value April 30, 2023 | Expenses Paid During Period- C November 1, 2022 to April 30, 2023 | |||||||
| Fidelity® Series Treasury Bill Index Fund | -%- D | |||||||||
| Actual | $ 1,000 | $ 1,022.30 | $- E | |||||||
Hypothetical- B | $ 1,000 | $ 1,024.79 | $- E | |||||||
- Highly liquid investments - cash or convertible to cash within three business days or less
- Moderately liquid investments - convertible to cash in three to seven calendar days
- Less liquid investments - can be sold or disposed of, but not settled, within seven calendar days
- Illiquid investments - cannot be sold or disposed of within seven calendar days
 |
Item 2.
Code of Ethics
As of the end of the period, April 30, 2023, Fidelity Hereford Street Trust (the trust) has adopted a code of ethics, as defined in Item 2 of Form N-CSR, that applies to its President and Treasurer and its Chief Financial Officer. A copy of the code of ethics is filed as an exhibit to this Form N-CSR.
Item 3.
Audit Committee Financial Expert
The Board of Trustees of the trust has determined that Elizabeth S. Acton is an audit committee financial expert, as defined in Item 3 of Form N-CSR. Ms. Acton is independent for purposes of Item 3 of Form N-CSR.
Item 4.
Principal Accountant Fees and Services
Fees and Services
The following table presents fees billed by Deloitte & Touche LLP, the member firms of Deloitte Touche Tohmatsu, and their respective affiliates (collectively, “Deloitte Entities”) in each of the last two fiscal years for services rendered to Fidelity Series Treasury Bill Index Fund (the “Fund”):
Services Billed by Deloitte Entities
April 30, 2023 FeesA
Audit Fees | Audit-Related Fees | Tax Fees | All Other Fees | |
Fidelity Series Treasury Bill Index Fund | $36,600 | $- | $7,900 | $900 |
April 30, 2022 FeesA
Audit Fees | Audit-Related Fees | Tax Fees | All Other Fees | |
Fidelity Series Treasury Bill Index Fund | $36,300 | $- | $7,400 | $900 |
A Amounts may reflect rounding.
The following table presents fees billed by PricewaterhouseCoopers LLP (“PwC”) in each of the last two fiscal years for services rendered to Fidelity Flex Government Money
Market Fund, Fidelity Government Money Market Fund, Fidelity Money Market Fund, and Fidelity Treasury Only Money Market Fund (the “Funds”):
Services Billed by PwC
April 30, 2023 FeesA
Audit Fees | Audit-Related Fees | Tax Fees | All Other Fees | |
Fidelity Flex Government Money Market Fund | $40,500 | $3,000 | $2,100 | $1,300 |
Fidelity Government Money Market Fund | $46,900 | $3,200 | $2,100 | $1,400 |
Fidelity Money Market Fund | $39,900 | $2,900 | $2,100 | $1,300 |
Fidelity Treasury Only Money Market Fund | $37,500 | $2,800 | $2,100 | $1,200 |
April 30, 2022 FeesA
Audit Fees | Audit-Related Fees | Tax Fees | All Other Fees | |
Fidelity Flex Government Money Market Fund | $38,700 | $3,100 | $2,000 | $1,300 |
Fidelity Government Money Market Fund | $41,200 | $3,300 | $2,000 | $1,400 |
Fidelity Money Market Fund | $37,100 | $3,000 | $2,000 | $1,300 |
Fidelity Treasury Only Money Market Fund | $35,800 | $2,900 | $2,000 | $1,200 |
A Amounts may reflect rounding.
The following table(s) present(s) fees billed by Deloitte Entities and PwC that were required to be approved by the Audit Committee for services that relate directly to the operations and financial reporting of the Fund(s) and that are rendered on behalf of Fidelity Management & Research Company LLC ("FMR") and entities controlling, controlled by, or under common control with FMR (not including any sub-adviser whose role is primarily portfolio management and is subcontracted with or overseen by another investment adviser) that provide ongoing services to the Fund(s) (“Fund Service Providers”):
Services Billed by Deloitte Entities
April 30, 2023A | April 30, 2022A | |
Audit-Related Fees | $- | $- |
Tax Fees | $- | $- |
All Other Fees | $- | $- |
A Amounts may reflect rounding.
Services Billed by PwC
April 30, 2023A | April 30, 2022A | |
Audit-Related Fees | $8,284,200 | $7,914,600 |
Tax Fees | $1,000 | $353,200 |
All Other Fees | $- | $- |
A Amounts may reflect rounding.
“Audit-Related Fees” represent fees billed for assurance and related services that are reasonably related to the performance of the fund audit or the review of the fund's financial statements and that are not reported under Audit Fees.
“Tax Fees” represent fees billed for tax compliance, tax advice or tax planning that relate directly to the operations and financial reporting of the fund.
“All Other Fees” represent fees billed for services provided to the fund or Fund Service Provider, a significant portion of which are assurance related, that relate directly to the operations and financial reporting of the fund, excluding those services that are reported under Audit Fees, Audit-Related Fees or Tax Fees.
Assurance services must be performed by an independent public accountant.
* * *
The aggregate non-audit fees billed by Deloitte Entities and PwC for services rendered to the Fund(s), FMR (not including any sub-adviser whose role is primarily portfolio management and is subcontracted with or overseen by another investment adviser), and any Fund Service Provider for each of the last two fiscal years of the Fund(s) are as follows:
Billed By | April 30, 2023A | April 30, 2022A |
Deloitte Entities | $251,400 | $465,900 |
PwC | $13,613,300 | $13,442,700 |
A Amounts may reflect rounding.
The trust's Audit Committee has considered non-audit services that were not pre-approved that were provided by Deloitte Entities and PwC to Fund Service Providers to be compatible with maintaining the independence of Deloitte Entities and PwC in its(their) audit of the Fund(s), taking into account representations from Deloitte Entities and PwC, in accordance with Public Company Accounting Oversight Board rules, regarding its independence from the Fund(s) and its(their) related entities and FMR’s review of the appropriateness and permissibility under applicable law of such non-audit services prior to their provision to the Fund(s) Service Providers.
Audit Committee Pre-Approval Policies and Procedures
The trust’s Audit Committee must pre-approve all audit and non-audit services provided by a fund’s independent registered public accounting firm relating to the operations or financial reporting of the fund. Prior to the commencement of any audit or non-audit services to a fund, the Audit Committee reviews the services to determine whether they are appropriate and permissible under applicable law.
The Audit Committee has adopted policies and procedures to, among other purposes, provide a framework for the Committee’s consideration of non-audit services by the audit firms that audit the Fidelity funds. The policies and procedures require that any non-audit service provided by a fund audit firm to a Fidelity fund and any non-audit service provided by a fund auditor to a Fund Service Provider that relates directly to the operations and financial reporting of a Fidelity fund (“Covered Service”) are subject to approval by the Audit Committee before such service is provided.
All Covered Services must be approved in advance of provision of the service either: (i) by formal resolution of the Audit Committee, or (ii) by oral or written approval of the service by the Chair of the Audit Committee (or if the Chair is unavailable, such other member of the Audit Committee as may be designated by the Chair to act in the Chair’s absence). The approval contemplated by (ii) above is permitted where the Treasurer determines that action on such an engagement is necessary before the next meeting of the Audit Committee.
Non-audit services provided by a fund audit firm to a Fund Service Provider that do not relate directly to the operations and financial reporting of a Fidelity fund are reported to the Audit Committee periodically.
Non-Audit Services Approved Pursuant to Rule 2-01(c)(7)(i)(C) and (ii) of Regulation S-X (“De Minimis Exception”)
There were no non-audit services approved or required to be approved by the Audit Committee pursuant to the De Minimis Exception during the Fund’s(s’) last two fiscal years relating to services provided to (i) the Fund(s) or (ii) any Fund Service Provider that relate directly to the operations and financial reporting of the Fund(s).
Item 5.
Audit Committee of Listed Registrants
Not applicable.
Item 6.
Investments
(a)
Not applicable.
(b)
Not applicable.
Item 7.
Disclosure of Proxy Voting Policies and Procedures for Closed-End Management Investment Companies
Not applicable.
Item 8.
Portfolio Managers of Closed-End Management Investment Companies
Not applicable.
Item 9.
Purchase of Equity Securities by Closed-End Management Investment Company and Affiliated Purchasers
Not applicable.
Item 10.
Submission of Matters to a Vote of Security Holders
There were no material changes to the procedures by which shareholders may recommend nominees to the trust’s Board of Trustees.
Item 11.
Controls and Procedures
(a)(i) The President and Treasurer and the Chief Financial Officer have concluded that the trust’s disclosure controls and procedures (as defined in Rule 30a-3(c) under the Investment Company Act) provide reasonable assurances that material information relating to the trust is made known to them by the appropriate persons, based on their evaluation of these controls and procedures as of a date within 90 days of the filing date of this report.
(a)(ii) There was no change in the trust’s internal control over financial reporting (as defined in Rule 30a-3(d) under the Investment Company Act) that occurred during the period covered by this report that has materially affected, or is reasonably likely to materially affect, the trust’s internal control over financial reporting.
Item 12.
Disclosure of Securities Lending Activities for Closed-End Management
Investment Companies
Not applicable.
Item 13.
Exhibits
(a) | (1) | Code of Ethics pursuant to Item 2 of Form N-CSR is filed and attached hereto as EX-99.CODE ETH. |
(a) | (2) | |
(a) | (3) | Not applicable. |
(b) |
SIGNATURES
Pursuant to the requirements of the Securities Exchange Act of 1934 and the Investment Company Act of 1940, the registrant has duly caused this report to be signed on its behalf by the undersigned, thereunto duly authorized.
Fidelity Hereford Street Trust
By: | /s/Laura M. Del Prato |
Laura M. Del Prato | |
President and Treasurer | |
Date: | June 22, 2023 |
Pursuant to the requirements of the Securities Exchange Act of 1934 and the Investment Company Act of 1940, this report has been signed below by the following persons on behalf of the registrant and in the capacities and on the dates indicated.
By: | /s/Laura M. Del Prato |
Laura M. Del Prato | |
President and Treasurer | |
Date: | June 22, 2023 |
By: | /s/John J. Burke III |
John J. Burke III | |
Chief Financial Officer | |
Date: | June 22, 2023 |