UNITED STATES
SECURITIES AND EXCHANGE COMMISSION
Washington, D.C. 20549
FORM N-CSR
CERTIFIED SHAREHOLDER REPORT OF REGISTERED
MANAGEMENT INVESTMENT COMPANIES
Investment Company Act file number 811-07139
Fidelity Hereford Street Trust
(Exact name of registrant as specified in charter)
245 Summer St., Boston, MA 02210
(Address of principal executive offices) (Zip code)
Margaret Carey, Secretary
245 Summer St.
Boston, Massachusetts 02210
(Name and address of agent for service)
Registrant's telephone number, including area code:
617-563-7000
Date of fiscal year end: | April 30 |
Date of reporting period: | October 31, 2023 |
Item 1.
Reports to Stockholders


Contents
| Current 7-Day Yields | ||
| Capital Reserves Class | 4.47% | |
| Daily Money Class | 4.72% | |
| Advisor M Class | 4.72% | |
| Fidelity® Government Money Market Fund | 4.99% | |
| Class S | 4.99% | |
| Premium Class | 5.09% | |
| Class K6 | 5.16% | |
Yield refers to the income paid by the Fund over a given period. Yield for money market funds is usually for seven-day periods, as it is here, though it is expressed as an annual percentage rate. Past performance is no guarantee of future results. Yield will vary and it's possible to lose money investing in the Fund. A portion of the Fund's expenses was reimbursed and/or waived. Absent such reimbursements and/or waivers the yield for the period ending October 31, 2023, the most recent period shown in the table, would have been 4.46% for Capital Reserves Class, 4.71% for Daily Money Class, 4.71% for Advisor M Class, 5.05% for Premium Class, and 5.14% for Class K6. | ||
| Effective Maturity Diversification (% of Fund's Investments) | ||
| Days | ||
| 1 - 7 | 62.7 | |
| 8 - 30 | 13.8 | |
| 31 - 60 | 12.7 | |
| 61 - 90 | 4.2 | |
| 91 - 180 | 3.5 | |
| > 180 | 3.1 | |
| Effective maturity is determined in accordance with the requirements of Rule 2a-7 under the Investment Company Act of 1940. | ||
Asset Allocation (% of Fund's net assets) |
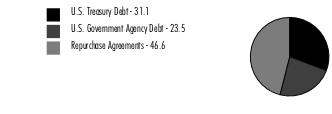 |
Net Other Assets (Liabilities) - (1.2)% |
| U.S. Treasury Debt - 31.1% | ||||
Yield (%)(a) | Principal Amount (b) | Value ($) | ||
| U.S. Treasury Obligations - 31.1% | ||||
| U.S. Treasury Bills | ||||
| 11/2/23 to 3/7/24 | 5.32 to 5.48 | 83,261,375,400 | 82,796,410,299 | |
| U.S. Treasury Notes | ||||
| 11/15/23 to 10/31/24 (c) | 5.31 to 5.52 | 7,726,000,000 | 7,722,745,197 | |
| TOTAL U.S. TREASURY DEBT (Cost $90,519,155,496) | 90,519,155,496 | |||
| U.S. Government Agency Debt - 23.5% | ||||
Yield (%)(a) | Principal Amount (b) | Value ($) | ||
| Federal Agencies - 23.5% | ||||
| Federal Farm Credit Bank | ||||
| 1/23/24 to 10/27/25 (c)(d) | 5.35 to 5.51 | 8,397,613,000 | 8,397,242,819 | |
| 11/3/25 (c)(d) | 5.49 | 50,000,000 | 50,000,000 | |
| 11/3/25 (c)(d) | 5.49 | 16,000,000 | 16,000,000 | |
| Federal Home Loan Bank | ||||
| 11/3/23 to 10/20/25 (c) | 5.00 to 5.50 | 58,673,986,000 | 58,601,128,608 | |
| 5/2/24 (c)(d) | 5.38 | 298,500,000 | 298,500,000 | |
| 5/2/24 (c)(d) | 5.38 | 18,500,000 | 18,500,000 | |
| Freddie Mac | ||||
| 6/12/24 | 5.35 | 1,185,500,000 | 1,185,500,000 | |
| TOTAL U.S. GOVERNMENT AGENCY DEBT (Cost $68,566,871,427) | 68,566,871,427 | |||
| U.S. Government Agency Repurchase Agreement - 16.6% | |||
Maturity Amount ($) | Value ($) | ||
| In a joint trading account at: | |||
| 5.3% dated 10/31/23 due 11/1/23 (Collateralized by U.S. Government Obligations) # | 49,961,355 | 49,954,000 | |
| 5.31% dated 10/31/23 due 11/1/23 (Collateralized by U.S. Government Obligations) # | 16,543,722,614 | 16,541,284,000 | |
| With: | |||
| ABN AMRO Bank NV at 5.31%, dated 10/31/23 due 11/1/23 (Collateralized by U.S. Government Obligations valued at $592,707,478, 1.25% - 6.50%, 6/30/26 - 10/20/53) | 581,085,698 | 581,000,000 | |
| BMO Harris Bank NA at: | |||
5.31%, dated 10/26/23 due 11/2/23 (Collateralized by U.S. Government Obligations valued at $160,281,725, 4.50% - 5.00%, 7/20/53 - 10/20/53) | 157,162,103 | 157,000,000 | |
5.32%, dated: | |||
| 9/21/23 due 11/2/23 (Collateralized by U.S. Government Obligations valued at $160,084,090, 5.00% - 5.50%, 7/20/53 - 9/20/53) | 156,968,240 | 156,000,000 | |
| 10/12/23 due 11/2/23 (Collateralized by U.S. Government Obligations valued at $239,385,432, 2.00% - 7.00%, 6/20/24 - 10/20/53) | 234,726,180 | 234,000,000 | |
| BNP Paribas, SA at: | |||
5.32%, dated 9/21/23 due 11/2/23 (Collateralized by U.S. Government Obligations valued at $4,187,948,871, 0.00% - 7.50%, 12/07/23 - 10/20/53) | 4,106,329,407 | 4,081,000,000 | |
5.35%, dated 10/25/23 due 11/7/23 (Collateralized by U.S. Treasury Obligations valued at $319,599,709, 0.00% - 7.00%, 2/22/24 - 10/01/53) | 315,325,764 | 313,000,000 | |
5.36%, dated: | |||
| 8/1/23 due 11/7/23 (Collateralized by U.S. Treasury Obligations valued at $325,106,834, 0.00% - 7.00%, 12/21/23 - 10/01/53) (c)(d)(e) | 319,703,636 | 314,000,000 | |
| 8/4/23 due 11/7/23 (Collateralized by U.S. Treasury Obligations valued at $324,831,669, 0.00% - 7.03%, 12/21/23 - 10/01/53) (c)(d)(e) | 319,703,636 | 314,000,000 | |
| 8/23/23 due 11/7/23 (Collateralized by U.S. Treasury Obligations valued at $322,864,482, 0.00% - 7.00%, 12/28/23 - 10/01/53) (c)(d)(e) | 317,574,400 | 312,000,000 | |
5.38%, dated: | |||
| 9/5/23 due 12/5/23 (Collateralized by U.S. Treasury Obligations valued at $839,729,092, 0.00% - 7.00%, 11/21/23 - 10/20/53) (c)(d)(e) | 827,097,143 | 816,000,000 | |
| 9/13/23 due 12/13/23 (Collateralized by U.S. Treasury Obligations valued at $829,634,627, 0.00% - 7.00%, 5/31/24 - 1/01/57) (c)(d)(e) | 815,937,382 | 805,000,000 | |
| 9/18/23 due 12/18/23 (Collateralized by U.S. Treasury Obligations valued at $415,892,031, 0.00% - 7.00%, 12/21/23 - 11/01/53) (c)(d)(e) | 410,502,658 | 405,000,000 | |
| 9/21/23 due 12/20/23 (Collateralized by U.S. Treasury Obligations valued at $1,669,265,107, 0.00% - 7.50%, 11/30/23 - 11/01/53) (c)(d)(e) | 1,646,835,944 | 1,625,000,000 | |
5.39%, dated: | |||
| 8/1/23 due 12/1/23 (Collateralized by U.S. Treasury Obligations valued at $420,847,777, 0.00% - 6.50%, 12/21/23 - 11/01/53) (c)(d)(e) | 413,416,040 | 406,000,000 | |
| 8/4/23 due 12/4/23 (Collateralized by U.S. Treasury Obligations valued at $419,549,325, 0.00% - 7.00%, 7/31/24 - 10/01/53) (c)(d)(e) | 411,379,508 | 404,000,000 | |
| 8/23/23 due 12/21/23 (Collateralized by U.S. Treasury Obligations valued at $416,198,887, 0.00% - 7.00%, 12/05/23 - 10/01/53) (c)(d)(e) | 410,240,566 | 403,000,000 | |
| BNY Mellon Capital Markets Corp. at 5.35%, dated 9/21/23 due 11/2/23 (Collateralized by U.S. Government Obligations valued at $564,424,999, 0.00% - 8.00%, 11/15/23 - 11/01/53) | 553,432,917 | 550,000,000 | |
| BofA Securities, Inc. at: | |||
5.34%, dated 10/30/23 due 11/7/23 (Collateralized by U.S. Government Obligations valued at $1,148,860,728, 1.50% - 6.50%, 5/01/35 - 4/01/59) | 1,131,177,723 | 1,126,000,000 | |
5.35%, dated 10/26/23 due 11/7/23 (Collateralized by U.S. Government Obligations valued at $159,261,882, 2.50% - 8.50%, 2/15/24 - 9/20/53) | 156,741,867 | 156,000,000 | |
5.37%, dated 9/27/23 due 11/7/23 (Collateralized by U.S. Government Obligations valued at $158,925,458, 6.00%, 9/20/53) (c)(d)(e) | 157,797,621 | 155,000,000 | |
5.39%, dated: | |||
| 9/28/23 due 1/25/24 (Collateralized by U.S. Government Obligations valued at $207,088,916, 2.50% - 6.50%, 5/20/50 - 10/20/53) (c)(d)(e) | 205,599,022 | 202,000,000 | |
| 10/18/23 due 11/7/23 (Collateralized by U.S. Treasury Obligations valued at $103,236,034, 0.50%, 3/31/25) | 101,922,439 | 101,000,000 | |
| 10/31/23 due 2/1/24 (Collateralized by U.S. Government Obligations valued at $208,111,154, 2.50% - 7.00%, 1/20/49 - 10/20/53) (c)(d)(e) | 206,840,530 | 204,000,000 | |
| CIBC Bank U.S.A. at: | |||
5.32%, dated 10/23/23 due 11/7/23 (Collateralized by U.S. Government Obligations valued at $144,011,300, 0.75% - 6.50%, 1/31/28 - 10/01/53) | 141,583,427 | 141,000,000 | |
5.34%, dated 10/12/23 due 11/7/23 (Collateralized by U.S. Government Obligations valued at $892,078,756, 0.75% - 7.50%, 6/30/24 - 10/01/53) | 876,139,093 | 872,000,000 | |
5.36%, dated 9/21/23 due 11/2/23 (Collateralized by U.S. Government Obligations valued at $20,615,094, 0.00% - 4.50%, 12/31/26 - 4/20/53) | 20,125,067 | 20,000,000 | |
| Citibank NA at 5.31%, dated 10/26/23 due 11/2/23 (Collateralized by U.S. Treasury Obligations valued at $479,478,227, 0.00% - 8.88%, 11/14/23 - 8/15/53) | 469,484,243 | 469,000,000 | |
| Citigroup Global Capital Markets, Inc. at: | |||
5.31%, dated 10/26/23 due 11/2/23 (Collateralized by U.S. Government Obligations valued at $559,454,680, 4.00% - 6.50%, 9/01/52 - 10/01/53) | 548,565,810 | 548,000,000 | |
5.32%, dated 10/23/23 due 11/7/23 (Collateralized by U.S. Government Obligations valued at $481,059,040, 2.00% - 4.92%, 7/31/24 - 5/01/52) | 473,436,117 | 471,000,000 | |
| FICC State Street GC (Gov. Repo) at 5.31%, dated 10/31/23 due 11/1/23 (Collateralized by U.S. Government Obligations valued at $641,274,975, 0.25% - 6.50%, 5/31/25 - 11/01/53) | 628,092,630 | 628,000,000 | |
| Goldman Sachs & Co. at 5.31%, dated: | |||
10/25/23 due 11/1/23 (Collateralized by U.S. Treasury Obligations valued at $1,437,642,853, 0.00% - 7.50%, 2/13/24 - 2/01/53) | 1,409,453,760 | 1,408,000,000 | |
10/26/23 due 11/2/23 (Collateralized by U.S. Treasury Obligations valued at $639,085,092, 1.50% - 6.50%, 1/01/28 - 11/15/64) | 626,646,345 | 626,000,000 | |
10/27/23 due 11/3/23 (Collateralized by U.S. Government Obligations valued at $1,114,661,457, 2.00% - 7.50%, 3/01/33 - 10/15/57) | 1,093,127,490 | 1,092,000,000 | |
10/30/23 due 11/6/23 (Collateralized by U.S. Treasury Obligations valued at $1,275,376,133, 0.00% - 4.00%, 1/11/24 - 11/15/42) | 1,251,290,625 | 1,250,000,000 | |
10/31/23 due 11/7/23 | |||
| (Collateralized by U.S. Government Obligations valued at $637,594,031, 2.00% - 6.50%, 2/01/25 - 11/01/53) | 625,645,313 | 625,000,000 | |
| (Collateralized by U.S. Government Obligations valued at $796,737,502, 1.50% - 7.50%, 2/20/27 - 6/15/64) | 781,806,383 | 781,000,000 | |
| ING Financial Markets LLC at 5.35%, dated 9/21/23 due 11/2/23 (Collateralized by U.S. Government Obligations valued at $103,647,707, 2.00% - 4.50%, 3/20/49 - 7/20/52) | 101,630,408 | 101,000,000 | |
| Mitsubishi UFJ Securities (U.S.A.), Inc. at 5.35%, dated: | |||
9/21/23 due 12/6/23 (Collateralized by U.S. Government Obligations valued at $1,311,502,664, 2.00% - 7.00%, 4/01/24 - 10/01/53) | 1,292,434,300 | 1,278,000,000 | |
10/3/23 due 12/15/23 (Collateralized by U.S. Government Obligations valued at $124,976,302, 2.00% - 6.00%, 5/01/24 - 9/01/53) | 123,323,531 | 122,000,000 | |
| Morgan Stanley & Co., LLC at 5.31%, dated 10/31/23 due 11/1/23 (Collateralized by U.S. Government Obligations valued at $320,354,752, 0.00% - 7.50%, 11/01/24 - 10/01/53) | 314,046,315 | 314,000,000 | |
| MUFG Securities (Canada), Ltd. at 5.35%, dated 10/18/23 due 12/13/23 (Collateralized by U.S. Government Obligations valued at $208,512,938, 2.50% - 6.50%, 5/15/39 - 8/01/53) | 205,697,733 | 204,000,000 | |
| RBC Dominion Securities at 5.32%, dated 9/21/23 due 11/2/23 (Collateralized by U.S. Government Obligations valued at $1,537,783,572, 0.00% - 6.50%, 11/30/23 - 10/01/53) | 1,507,297,587 | 1,498,000,000 | |
| RBC Financial Group at 5.33%, dated 9/21/23 due 11/2/23 (Collateralized by U.S. Government Obligations valued at $3,386,590,070, 1.50% - 7.50%, 5/01/27 - 8/20/63) | 3,316,495,627 | 3,296,000,000 | |
| TD Securities (U.S.A.) at 5.32%, dated 10/31/23 due 11/1/23 (Collateralized by U.S. Government Obligations valued at $700,843,554, 2.00% - 7.00%, 12/01/31 - 11/01/53) | 687,101,523 | 687,000,000 | |
| Wells Fargo Securities, LLC at: | |||
5.36%, dated 9/21/23 due 11/7/23 (Collateralized by U.S. Government Obligations valued at $639,338,424, 1.50% - 8.50%, 11/25/23 - 11/01/53) (c)(d)(e) | 628,658,225 | 623,000,000 | |
5.46%, dated 10/20/23 due 12/19/23 (Collateralized by U.S. Government Obligations valued at $834,896,853, 1.50% - 7.00%, 11/20/23 - 11/01/53) | 824,434,700 | 817,000,000 | |
| TOTAL U.S. GOVERNMENT AGENCY REPURCHASE AGREEMENT (Cost $48,282,238,000) | 48,282,238,000 | ||
| U.S. Treasury Repurchase Agreement - 30.0% | |||
Maturity Amount ($) | Value ($) | ||
| With: | |||
| ABN AMRO Bank NV at 5.3%, dated 10/31/23 due 11/1/23 (Collateralized by U.S. Treasury Obligations valued at $454,987,029, 1.25% - 5.25%, 6/30/26 - 5/15/43) | 446,065,661 | 446,000,000 | |
| Barclays Bank PLC at: | |||
5.3%, dated 10/31/23 due 11/1/23 (Collateralized by U.S. Treasury Obligations valued at $2,007,557,872, 0.00% - 4.13%, 4/04/24 - 2/15/52) | 1,962,288,850 | 1,962,000,000 | |
5.32%, dated 9/21/23 due 11/2/23 (Collateralized by U.S. Treasury Obligations valued at $1,014,133,988, 1.25% - 4.50%, 11/30/24 - 8/15/45) | 992,119,773 | 986,000,000 | |
| BMO Capital Markets Corp. at 5.31%, dated 10/26/23 due 11/2/23 (Collateralized by U.S. Treasury Obligations valued at $144,968,253, 4.63%, 9/15/26) | 142,146,615 | 142,000,000 | |
| BNP Paribas, SA at 5.38%, dated 9/1/23 due 12/1/23 (Collateralized by U.S. Treasury Obligations valued at $731,863,195, 0.25% - 6.63%, 4/30/24 - 5/15/50) (c)(d)(e) | 720,669,202 | 711,000,000 | |
| BofA Securities, Inc. at: | |||
5.32%, dated 10/30/23 due 11/7/23 (Collateralized by U.S. Treasury Obligations valued at $185,694,928, 4.88%, 10/31/30) | 182,833,762 | 182,000,000 | |
5.33%, dated 9/21/23 due 11/2/23 (Collateralized by U.S. Treasury Obligations valued at $70,807,300, 0.63%, 10/15/24) | 69,429,065 | 69,000,000 | |
| CIBC Bank U.S.A. at: | |||
5.31%, dated 10/19/23 due 11/2/23 (Collateralized by U.S. Treasury Obligations valued at $91,976,075, 0.50% - 5.00%, 12/31/24 - 8/15/42) | 90,185,850 | 90,000,000 | |
5.32%, dated 9/21/23 due 11/2/23 (Collateralized by U.S. Treasury Obligations valued at $302,722,197, 0.50% - 4.50%, 2/29/24 - 5/15/53) | 296,829,246 | 295,000,000 | |
| Credit AG at: | |||
5.31%, dated 10/25/23 due 11/1/23 (Collateralized by U.S. Treasury Obligations valued at $272,621,199, 2.88% - 4.63%, 2/28/25 - 4/30/29) | 267,275,678 | 267,000,000 | |
5.32%, dated: | |||
| 9/21/23 due 11/2/23 (Collateralized by U.S. Treasury Obligations valued at $144,476,026, 1.88% - 4.63%, 2/15/40 - 11/15/51) | 140,868,933 | 140,000,000 | |
| 10/10/23 due 11/2/23 ((Collateralized by U.S. Treasury Obligations valued at $287,551,850, 2.88%, 4/30/29) | 281,955,088 | 281,000,000 | |
5.33%, dated 10/20/23 due 11/7/23 (Collateralized by U.S. Treasury Obligations valued at $288,151,113, 2.88% - 4.63%, 10/15/26 - 4/30/29) | 283,294,302 | 282,000,000 | |
| Federal Reserve Bank of New York at 5.3%, dated 10/31/23 due 11/1/23 (Collateralized by U.S. Treasury Obligations valued at $55,968,238,562, 0.50% - 6.13%, 1/15/25 - 5/15/52) | 55,968,238,556 | 55,960,000,000 | |
| Fixed Income Clearing Corp. - BNP at 5.31%, dated 10/31/23 due 11/1/23 (Collateralized by U.S. Treasury Obligations valued at $721,246,426, 1.88% - 5.55%, 7/31/24 - 2/15/53) | 707,104,283 | 707,000,000 | |
| Fixed Income Clearing Corp. - BNYM at 5.3%, dated 10/31/23 due 11/1/23 (Collateralized by U.S. Treasury Obligations valued at $7,276,680,050, 0.00% - 4.63%, 11/07/23 - 2/15/53) | 7,135,050,283 | 7,134,000,000 | |
| Fixed Income Clearing Corp. - SSB at: | |||
5.3%, dated 10/31/23 due 11/1/23 (Collateralized by U.S. Treasury Obligations valued at $7,272,842,738, 0.38% - 4.13%, 6/30/27 - 5/31/29) | 7,135,050,283 | 7,134,000,000 | |
5.31%, dated 10/31/23 due 11/1/23 (Collateralized by U.S. Treasury Obligations valued at $432,225,470, 4.63%, 10/15/26) | 424,062,540 | 424,000,000 | |
| ING Financial Markets LLC at: | |||
5.3%, dated 10/31/23 due 11/1/23 (Collateralized by U.S. Treasury Obligations valued at $181,692,071, 4.25%, 10/15/25) | 178,026,206 | 178,000,000 | |
5.31%, dated: | |||
| 10/27/23 due 11/3/23 (Collateralized by U.S. Treasury Obligations valued at $172,553,082, 0.00% - 4.63%, 12/15/23 - 2/15/51) | 169,174,493 | 169,000,000 | |
| 10/31/23 due 11/7/23 (Collateralized by U.S. Treasury Obligations valued at $42,870,617, 0.13% - 4.75%, 12/15/23 - 2/15/53) | 42,043,365 | 42,000,000 | |
5.34%, dated 9/21/23 due 11/2/23 (Collateralized by U.S. Treasury Obligations valued at $327,099,893, 0.00% - 5.00%, 11/30/23 - 8/15/51) | 319,981,140 | 318,000,000 | |
| Lloyds Bank PLC at: | |||
5.37%, dated 10/24/23 due 11/24/23 (Collateralized by U.S. Treasury Obligations valued at $182,711,258, 3.25% - 3.50%, 6/30/27 - 2/15/33) | 179,827,726 | 179,000,000 | |
5.4%, dated 10/30/23 due 12/20/23 (Collateralized by U.S. Treasury Obligations valued at $235,581,089, 2.50% - 3.88%, 1/31/25 - 12/31/27) | 232,767,150 | 231,000,000 | |
5.43%, dated: | |||
| 9/20/23 due 11/20/23 ((Collateralized by U.S. Treasury Obligations valued at $130,867,269, 0.75%, 11/15/24) | 128,673,106 | 127,500,000 | |
| 9/29/23 due 11/29/23 (Collateralized by U.S. Treasury Obligations valued at $127,092,720, 2.88%, 6/15/25) | 125,140,903 | 124,000,000 | |
| Mitsubishi UFJ Securities (U.S.A.), Inc. at 5.33%, dated 9/21/23 due 12/6/23 (Collateralized by U.S. Treasury Obligations valued at $363,271,931, 0.13% - 4.63%, 2/15/24 - 8/15/33) | 357,983,287 | 354,000,000 | |
| Mizuho Bank, Ltd. at 5.31%, dated 10/31/23 due 11/1/23 (Collateralized by U.S. Treasury Obligations valued at $722,229,289, 4.00%, 2/15/26) | 707,104,283 | 707,000,000 | |
| Morgan Stanley & Co., LLC at 5.3%, dated 10/31/23 due 11/1/23 (Collateralized by U.S. Treasury Obligations valued at $199,949,500, 0.00% - 3.38%, 1/25/24 - 11/15/48) | 196,028,856 | 196,000,000 | |
| MUFG Securities (Canada), Ltd. at 5.33%, dated 9/21/23 due: | |||
11/2/23 (Collateralized by U.S. Treasury Obligations valued at $143,687,421, 0.25% - 6.00%, 3/31/24 - 8/15/53) | 140,870,567 | 140,000,000 | |
12/6/23 (Collateralized by U.S. Treasury Obligations valued at $272,536,579, 0.25% - 6.50%, 3/31/24 - 8/15/53) | 267,981,839 | 265,000,000 | |
| MUFG Securities EMEA PLC at 5.31%, dated: | |||
10/31/23 due 11/1/23 | |||
| (Collateralized by U.S. Treasury Obligations valued at $577,072,125, 1.00% - 4.00%, 5/31/28 - 11/15/41) | 566,083,485 | 566,000,000 | |
| (Collateralized by U.S. Treasury Obligations valued at $879,250,882, 0.25% - 4.38%, 11/15/23 - 8/15/43) | 849,125,228 | 849,000,000 | |
11/1/23 due 11/2/23 (f) | 566,083,485 | 566,000,000 | |
| Natixis SA at: | |||
5.3%, dated 10/31/23 due 11/1/23 (Collateralized by U.S. Treasury Obligations valued at $363,681,063, 1.13% - 4.50%, 2/15/36 - 2/15/53) | 356,052,411 | 356,000,000 | |
5.34%, dated 9/21/23 due 11/2/23 (Collateralized by U.S. Treasury Obligations valued at $1,091,575,912, 0.00% - 6.38%, 11/09/23 - 8/15/53) | 1,069,622,490 | 1,063,000,000 | |
| NatWest Markets Securities, Inc. at: | |||
5.3%, dated 10/31/23 due 11/1/23 (Collateralized by U.S. Treasury Obligations valued at $177,506,196, 2.38% - 3.25%, 5/15/27 - 7/31/29) | 174,025,617 | 174,000,000 | |
5.31%, dated 10/26/23 due 11/2/23 (Collateralized by U.S. Treasury Obligations valued at $707,485,665, 0.00%, 1/16/24 - 4/25/24) | 693,715,523 | 693,000,000 | |
| Norinchukin Bank at 5.34%, dated 10/30/23 due 11/6/23 (Collateralized by U.S. Treasury Obligations valued at $145,245,228, 3.63% - 3.88%, 2/15/43 - 2/15/53) | 141,146,405 | 141,000,000 | |
| RBC Dominion Securities at 5.32%, dated 9/21/23 due 11/2/23 (Collateralized by U.S. Treasury Obligations valued at $215,497,877, 0.00% - 6.88%, 11/24/23 - 11/15/49) | 211,303,400 | 210,000,000 | |
| SMBC Nikko Securities America, Inc. at 5.3%, dated 10/31/23 due 11/1/23 (Collateralized by U.S. Treasury Obligations valued at $714,240,068, 0.00% - 5.00%, 12/19/23 - 8/15/51) | 700,103,056 | 700,000,000 | |
| Societe Generale at 5.31%, dated: | |||
10/26/23 due 11/2/23 | |||
| (Collateralized by U.S. Treasury Obligations valued at $286,071,382, 3.00% - 3.88%, 2/15/43 - 2/15/48) | 278,287,035 | 278,000,000 | |
| (Collateralized by U.S. Treasury Obligations valued at $577,830,931, 0.63% - 4.13%, 1/15/26 - 8/15/46) | 566,584,395 | 566,000,000 | |
10/31/23 due 11/7/23 (Collateralized by U.S. Treasury Obligations valued at $655,286,650, 1.63% - 4.00%, 11/15/42 - 11/15/51) | 637,657,703 | 637,000,000 | |
| Sumitomo Mitsui Trust Bank Ltd. at 5.37%, dated 10/25/23 due 11/7/23 (Collateralized by U.S. Treasury Obligations valued at $61,149,291, 1.63%, 8/15/29) | 59,874,778 | 59,750,000 | |
| Wells Fargo Bank NA at 5.36%, dated 10/11/23 due 11/13/23 (Collateralized by U.S. Treasury Obligations valued at $364,297,777, 0.50% - 5.00%, 1/31/24 - 5/15/53) | 355,739,320 | 354,000,000 | |
| TOTAL U.S. TREASURY REPURCHASE AGREEMENT (Cost $87,455,250,000) | 87,455,250,000 | ||
| TOTAL INVESTMENT IN SECURITIES - 101.2% (Cost $294,823,514,923) | 294,823,514,923 |
NET OTHER ASSETS (LIABILITIES) - (1.2)% | (3,569,471,957) |
| NET ASSETS - 100.0% | 291,254,042,966 |
| (a) | Yield represents either the annualized yield at the date of purchase, or the stated coupon rate, or, for floating and adjustable rate securities, the rate at period end. |
| (b) | Amount is stated in United States dollars unless otherwise noted. |
| (c) | Coupon rates for floating and adjustable rate securities reflect the rates in effect at period end. |
| (d) | Coupon is indexed to a floating interest rate which may be multiplied by a specified factor and/or subject to caps or floors. |
| (e) | The maturity amount is based on the rate at period end. |
| (f) | Represents a forward settling transaction and therefore no collateral securities had been allocated as of period end. The agreement contemplated the delivery of U.S. Treasury Obligations as collateral on settlement date. |
| Other Information | ||
| # Additional information on each counterparty to the repurchase agreement is as follows: | ||
| Repurchase Agreement / Counterparty | Value ($) | |
| $49,954,000 due 11/01/23 at 5.30% | ||
| Nomura Securities International | 46,213,000 | |
| Sumitomo Mitsui Banking Corp. | 3,741,000 | |
| 49,954,000 | ||
| $16,541,284,000 due 11/01/23 at 5.31% | ||
| BNY Mellon Capital Markets LLC | 391,963,000 | |
| Bank of America, N.A. | 1,128,196,000 | |
| BofA Securities, Inc. | 646,547,000 | |
| Citigroup Global Markets, Inc. | 924,969,000 | |
| Credit Agricole CIB New York Branch | 141,228,000 | |
| HSBC Securities (USA), Inc. | 141,025,000 | |
| ING Financial Markets LLC | 181,846,000 | |
| JP Morgan Securities LLC | 313,388,000 | |
| Mitsubishi UFJ Securities Holdings Ltd | 564,098,000 | |
| Mizuho Securities USA, Inc. | 313,388,000 | |
| Nomura Securities International | 2,432,171,000 | |
| RBC Dominion Securities, Inc. | 1,905,885,000 | |
| Royal Bank of Canada | 628,497,000 | |
| Sumitomo Mitsui Banking Corp. | 5,546,964,000 | |
| Sumitomo Mitsui Banking Corp. NY | 653,786,000 | |
| Wells Fargo Bank National Association | 558,000 | |
| Wells Fargo Securities LLC | 626,775,000 | |
| 16,541,284,000 | ||
| Statement of Assets and Liabilities | ||||
October 31, 2023 (Unaudited) | ||||
| Assets | ||||
Investment in securities, at value (including repurchase agreements of $135,737,488,000) - See accompanying schedule Unaffiliated issuers (cost $294,823,514,923): | $ | 294,823,514,923 | ||
| Cash | 1,583,000,083 | |||
| Receivable for fund shares sold | 1,650,291,380 | |||
| Interest receivable | 666,755,594 | |||
| Prepaid expenses | 328,507 | |||
| Receivable from investment adviser for expense reductions | 264,653 | |||
| Other receivables | 1,929,361 | |||
Total assets | 298,726,084,501 | |||
| Liabilities | ||||
| Payable for investments purchased | $ | 5,742,769,178 | ||
| Payable for fund shares redeemed | 1,385,932,298 | |||
| Distributions payable | 229,228,830 | |||
| Accrued management fee | 59,940,474 | |||
| Distribution and service plan fees payable | 3,611,905 | |||
| Other affiliated payables | 40,145,619 | |||
| Other payables and accrued expenses | 10,413,231 | |||
| Total Liabilities | 7,472,041,535 | |||
| Net Assets | $ | 291,254,042,966 | ||
| Net Assets consist of: | ||||
| Paid in capital | $ | 291,255,584,019 | ||
| Total accumulated earnings (loss) | (1,541,053) | |||
| Net Assets | $ | 291,254,042,966 | ||
| Net Asset Value and Maximum Offering Price | ||||
| Capital Reserves Class : | ||||
Net Asset Value, offering price and redemption price per share ($4,631,227,206 ÷ 4,629,907,039 shares) | $ | 1.00 | ||
| Daily Money Class : | ||||
Net Asset Value, offering price and redemption price per share ($7,938,254,446 ÷ 7,936,273,609 shares) | $ | 1.00 | ||
| Advisor M Class : | ||||
Net Asset Value, offering price and redemption price per share ($180,122,331 ÷ 180,131,348 shares) | $ | 1.00 | ||
| Fidelity Government Money Market Fund : | ||||
Net Asset Value, offering price and redemption price per share ($266,059,172,059 ÷ 266,056,326,455 shares) | $ | 1.00 | ||
| Class S : | ||||
Net Asset Value, offering price and redemption price per share ($71,710,569 ÷ 71,711,309 shares) | $ | 1.00 | ||
| Premium Class : | ||||
Net Asset Value, offering price and redemption price per share ($9,365,311,181 ÷ 9,363,084,614 shares) | $ | 1.00 | ||
| Class K6 : | ||||
Net Asset Value, offering price and redemption price per share ($3,008,245,174 ÷ 3,008,325,334 shares) | $ | 1.00 | ||
| Statement of Operations | ||||
Six months ended October 31, 2023 (Unaudited) | ||||
| Investment Income | ||||
| Interest | $ | 7,355,813,689 | ||
| Expenses | ||||
| Management fee | $ | 345,507,657 | ||
| Transfer agent fees | 218,184,840 | |||
| Distribution and service plan fees | 22,299,503 | |||
| Accounting fees and expenses | 3,105,616 | |||
| Custodian fees and expenses | 524,520 | |||
| Independent trustees' fees and expenses | 457,238 | |||
| Registration fees | 9,361,961 | |||
| Audit | 35,503 | |||
| Legal | 126,907 | |||
| Miscellaneous | 4,199,252 | |||
| Total expenses before reductions | 603,802,997 | |||
| Expense reductions | (2,678,563) | |||
| Total expenses after reductions | 601,124,434 | |||
| Net Investment income (loss) | 6,754,689,255 | |||
| Realized and Unrealized Gain (Loss) | ||||
| Net realized gain (loss) on: | ||||
| Investment Securities: | ||||
| Unaffiliated issuers | 51,884 | |||
| Total net realized gain (loss) | 51,884 | |||
| Net increase in net assets resulting from operations | $ | 6,754,741,139 | ||
| Statement of Changes in Net Assets | ||||
Six months ended October 31, 2023 (Unaudited) | Year ended April 30, 2023 | |||
| Increase (Decrease) in Net Assets | ||||
| Operations | ||||
| Net investment income (loss) | $ | 6,754,689,255 | $ | 6,580,471,704 |
| Net realized gain (loss) | 51,884 | (1,421,339) | ||
Net increase in net assets resulting from operations | 6,754,741,139 | 6,579,050,365 | ||
| Distributions to shareholders | (6,754,705,053) | (6,580,599,912) | ||
| Share transactions - net increase (decrease) | 31,344,842,857 | 8,353,454,402 | ||
| Total increase (decrease) in net assets | 31,344,878,943 | 8,351,904,855 | ||
| Net Assets | ||||
| Beginning of period | 259,909,164,023 | 251,557,259,168 | ||
| End of period | $ | 291,254,042,966 | $ | 259,909,164,023 |
| Fidelity® Government Money Market Fund Capital Reserves Class |
Six months ended (Unaudited) October 31, 2023 | Years ended April 30, 2023 | 2022 | 2021 | 2020 | 2019 | |||||||
Selected Per-Share Data | ||||||||||||
| Net asset value, beginning of period | $ | 1.00 | $ | 1.00 | $ | 1.00 | $ | 1.00 | $ | 1.00 | $ | 1.00 |
| Income from Investment Operations | ||||||||||||
Net investment income (loss) A | .022 | .022 | - B | - B | .009 | .012 | ||||||
Net realized and unrealized gain (loss) B | - | - | - | - | - | - | ||||||
| Total from investment operations | .022 | .022 | - B | - B | .009 | .012 | ||||||
| Distributions from net investment income | (.022) | (.022) | - B | - B | (.009) | (.012) | ||||||
| Total distributions | (.022) | (.022) | - B | - B | (.009) | (.012) | ||||||
| Net asset value, end of period | $ | 1.00 | $ | 1.00 | $ | 1.00 | $ | 1.00 | $ | 1.00 | $ | 1.00 |
Total Return C,D | 2.21% | 2.20% | .01% | .01% | .94% | 1.26% | ||||||
Ratios to Average Net Assets A,E,F | ||||||||||||
| Expenses before reductions | .96% G,H | .96% | .96% | .96% | .97% | .96% | ||||||
| Expenses net of fee waivers, if any | .95% G,H | .92% | .10% | .15% | .89% | .95% | ||||||
| Expenses net of all reductions | .95% G,H | .92% | .10% | .15% | .89% | .95% | ||||||
| Net investment income (loss) | 4.37% G,H | 2.18% | .01% | .01% | .87% | 1.26% | ||||||
| Supplemental Data | ||||||||||||
| Net assets, end of period (000 omitted) | $ | 4,631,227 | $ | 5,294,932 | $ | 7,465,539 | $ | 7,539,252 | $ | 7,470,316 | $ | 6,491,629 |
| Fidelity® Government Money Market Fund Daily Money Class |
Six months ended (Unaudited) October 31, 2023 | Years ended April 30, 2023 | 2022 | 2021 | 2020 | 2019 | |||||||
Selected Per-Share Data | ||||||||||||
| Net asset value, beginning of period | $ | 1.00 | $ | 1.00 | $ | 1.00 | $ | 1.00 | $ | 1.00 | $ | 1.00 |
| Income from Investment Operations | ||||||||||||
Net investment income (loss) A | .023 | .024 | - B | - B | .012 | .015 | ||||||
Net realized and unrealized gain (loss) B | - | - | - | - | - | - | ||||||
| Total from investment operations | .023 | .024 | - B | - B | .012 | .015 | ||||||
| Distributions from net investment income | (.023) | (.024) | - B | - B | (.012) | (.015) | ||||||
| Total distributions | (.023) | (.024) | - B | - B | (.012) | (.015) | ||||||
| Net asset value, end of period | $ | 1.00 | $ | 1.00 | $ | 1.00 | $ | 1.00 | $ | 1.00 | $ | 1.00 |
Total Return C,D | 2.33% | 2.43% | .01% | .01% | 1.16% | 1.51% | ||||||
Ratios to Average Net Assets A,E,F | ||||||||||||
| Expenses before reductions | .71% G,H | .71% | .71% | .71% | .72% | .71% | ||||||
| Expenses net of fee waivers, if any | .70% G,H | .70% | .10% | .15% | .67% | .70% | ||||||
| Expenses net of all reductions | .70% G,H | .70% | .10% | .15% | .67% | .70% | ||||||
| Net investment income (loss) | 4.63% G,H | 2.40% | .01% | .01% | 1.08% | 1.51% | ||||||
| Supplemental Data | ||||||||||||
| Net assets, end of period (000 omitted) | $ | 7,938,254 | $ | 7,151,812 | $ | 7,389,338 | $ | 7,356,206 | $ | 7,835,091 | $ | 6,038,320 |
| Fidelity® Government Money Market Fund Advisor M Class |
Six months ended (Unaudited) October 31, 2023 | Years ended April 30, 2023 | 2022 | 2021 | 2020 | 2019 | |||||||
Selected Per-Share Data | ||||||||||||
| Net asset value, beginning of period | $ | 1.00 | $ | 1.00 | $ | 1.00 | $ | 1.00 | $ | 1.00 | $ | 1.00 |
| Income from Investment Operations | ||||||||||||
Net investment income (loss) A | .023 | .024 | - B | - B | .012 | .015 | ||||||
Net realized and unrealized gain (loss) B | - | - | - | - | - | - | ||||||
| Total from investment operations | .023 | .024 | - B | - B | .012 | .015 | ||||||
| Distributions from net investment income | (.023) | (.024) | - B | - B | (.012) | (.015) | ||||||
| Total distributions | (.023) | (.024) | - B | - B | (.012) | (.015) | ||||||
| Net asset value, end of period | $ | 1.00 | $ | 1.00 | $ | 1.00 | $ | 1.00 | $ | 1.00 | $ | 1.00 |
Total Return C,D | 2.33% | 2.43% | .01% | .01% | 1.17% | 1.52% | ||||||
Ratios to Average Net Assets A,E,F | ||||||||||||
| Expenses before reductions | .71% G,H | .71% | .71% | .71% | .72% | .71% | ||||||
| Expenses net of fee waivers, if any | .70% G,H | .70% | .10% | .15% | .65% | .70% | ||||||
| Expenses net of all reductions | .70% G,H | .70% | .10% | .15% | .64% | .69% | ||||||
| Net investment income (loss) | 4.63% G,H | 2.40% | .01% | .01% | 1.12% | 1.53% | ||||||
| Supplemental Data | ||||||||||||
| Net assets, end of period (000 omitted) | $ | 180,122 | $ | 172,227 | $ | 148,512 | $ | 124,205 | $ | 126,269 | $ | 50,630 |
| Fidelity® Government Money Market Fund |
Six months ended (Unaudited) October 31, 2023 | Years ended April 30, 2023 | 2022 | 2021 | 2020 | 2019 | |||||||
Selected Per-Share Data | ||||||||||||
| Net asset value, beginning of period | $ | 1.00 | $ | 1.00 | $ | 1.00 | $ | 1.00 | $ | 1.00 | $ | 1.00 |
| Income from Investment Operations | ||||||||||||
Net investment income (loss) A | .025 | .027 | - B | - B | .014 | .018 | ||||||
Net realized and unrealized gain (loss) B | - | - | - | - | - | - | ||||||
| Total from investment operations | .025 | .027 | - B | - B | .014 | .018 | ||||||
| Distributions from net investment income | (.025) | (.027) | - B | - B | (.014) | (.018) | ||||||
| Total distributions | (.025) | (.027) | - B | - B | (.014) | (.018) | ||||||
| Net asset value, end of period | $ | 1.00 | $ | 1.00 | $ | 1.00 | $ | 1.00 | $ | 1.00 | $ | 1.00 |
Total Return C,D | 2.48% | 2.72% | .01% | .01% | 1.42% | 1.79% | ||||||
Ratios to Average Net Assets A,E,F | ||||||||||||
| Expenses before reductions | .42% G,H | .42% | .42% | .42% | .42% | .42% | ||||||
| Expenses net of fee waivers, if any | .42% G,H | .42% | .10% | .15% | .42% | .42% | ||||||
| Expenses net of all reductions | .42% G,H | .42% | .10% | .15% | .42% | .42% | ||||||
| Net investment income (loss) | 4.91% G,H | 2.68% | .01% | .01% | 1.33% | 1.79% | ||||||
| Supplemental Data | ||||||||||||
| Net assets, end of period (000 omitted) | $ | 266,059,172 | $ | 236,784,703 | $ | 230,027,515 | $ | 200,115,905 | $ | 165,823,962 | $ | 104,973,598 |
| Fidelity® Government Money Market Fund Class S |
Six months ended (Unaudited) October 31, 2023 | Years ended April 30, 2023 | 2022 A | ||||
Selected Per-Share Data | ||||||
| Net asset value, beginning of period | $ | 1.00 | $ | 1.00 | $ | 1.00 |
| Income from Investment Operations | ||||||
Net investment income (loss) B | .025 | .027 | - C | |||
Net realized and unrealized gain (loss) C | - | - | - | |||
| Total from investment operations | .025 | .027 | - C | |||
| Distributions from net investment income | (.025) | (.027) | - C | |||
| Total distributions | (.025) | (.027) | - C | |||
| Net asset value, end of period | $ | 1.00 | $ | 1.00 | $ | 1.00 |
Total Return D,E | 2.48% | 2.72% | -% F | |||
Ratios to Average Net Assets B,G,H | ||||||
| Expenses before reductions | .46% I,J | .46% | .46% I | |||
| Expenses net of fee waivers, if any | .42% I,J | .42% | .14% I | |||
| Expenses net of all reductions | .42% I,J | .42% | .14% I | |||
| Net investment income (loss) | 4.91% I,J | 2.68% | .01% I | |||
| Supplemental Data | ||||||
| Net assets, end of period (000 omitted) | $ | 71,711 | $ | 116,643 | $ | 100 |
| Fidelity® Government Money Market Fund Premium Class |
Six months ended (Unaudited) October 31, 2023 | Years ended April 30, 2023 | 2022 | 2021 | 2020 | 2019 | |||||||
Selected Per-Share Data | ||||||||||||
| Net asset value, beginning of period | $ | 1.00 | $ | 1.00 | $ | 1.00 | $ | 1.00 | $ | 1.00 | $ | 1.00 |
| Income from Investment Operations | ||||||||||||
Net investment income (loss) A | .025 | .028 | - B | - B | .015 | .019 | ||||||
Net realized and unrealized gain (loss) B | - | - | - | - | - | - | ||||||
| Total from investment operations | .025 | .028 | - B | - B | .015 | .019 | ||||||
| Distributions from net investment income | (.025) | (.028) | - B | - B | (.015) | (.019) | ||||||
| Total distributions | (.025) | (.028) | - B | - B | (.015) | (.019) | ||||||
| Net asset value, end of period | $ | 1.00 | $ | 1.00 | $ | 1.00 | $ | 1.00 | $ | 1.00 | $ | 1.00 |
Total Return C,D | 2.53% | 2.82% | .01% | .01% | 1.52% | 1.90% | ||||||
Ratios to Average Net Assets A,E,F | ||||||||||||
| Expenses before reductions | .36% G,H | .36% | .36% | .36% | .37% | .36% | ||||||
| Expenses net of fee waivers, if any | .32% G,H | .32% | .09% | .15% | .32% | .32% | ||||||
| Expenses net of all reductions | .32% G,H | .32% | .09% | .15% | .32% | .32% | ||||||
| Net investment income (loss) | 5.01% G,H | 2.78% | .01% | -% I | 1.43% | 1.89% | ||||||
| Supplemental Data | ||||||||||||
| Net assets, end of period (000 omitted) | $ | 9,365,311 | $ | 7,609,041 | $ | 4,352,205 | $ | 4,713,643 | $ | 5,726,124 | $ | 4,115,468 |
| Fidelity® Government Money Market Fund Class K6 |
Six months ended (Unaudited) October 31, 2023 | Years ended April 30, 2023 | 2022 | 2021 | 2020 | 2019 | |||||||
Selected Per-Share Data | ||||||||||||
| Net asset value, beginning of period | $ | 1.00 | $ | 1.00 | $ | 1.00 | $ | 1.00 | $ | 1.00 | $ | 1.00 |
| Income from Investment Operations | ||||||||||||
Net investment income (loss) A | .025 | .029 | - B | - B | .016 | .019 | ||||||
Net realized and unrealized gain (loss) B | - | - | - | - | - | - | ||||||
| Total from investment operations | .025 | .029 | - B | - B | .016 | .019 | ||||||
| Distributions from net investment income | (.025) | (.029) | - B | - B | (.016) | (.019) | ||||||
| Total distributions | (.025) | (.029) | - B | - B | (.016) | (.019) | ||||||
| Net asset value, end of period | $ | 1.00 | $ | 1.00 | $ | 1.00 | $ | 1.00 | $ | 1.00 | $ | 1.00 |
Total Return C,D | 2.56% | 2.89% | .02% | .01% | 1.59% | 1.97% | ||||||
Ratios to Average Net Assets A,E,F | ||||||||||||
| Expenses before reductions | .27% G,H | .27% | .27% | .27% | .28% | .27% | ||||||
| Expenses net of fee waivers, if any | .25% G,H | .25% | .09% | .14% | .25% | .25% | ||||||
| Expenses net of all reductions | .25% G,H | .25% | .09% | .14% | .25% | .25% | ||||||
| Net investment income (loss) | 5.08% G,H | 2.85% | .02% | .01% | 1.50% | 1.96% | ||||||
| Supplemental Data | ||||||||||||
| Net assets, end of period (000 omitted) | $ | 3,008,245 | $ | 2,779,806 | $ | 2,174,050 | $ | 1,660,582 | $ | 1,313,087 | $ | 404,595 |
| Fidelity Government Money Market Fund | $1,929,357 |
| Gross unrealized appreciation | $- |
| Gross unrealized depreciation | - |
| Net unrealized appreciation (depreciation) | $- |
| Tax cost | $294,823,514,923 |
| Short-term | $(268,591) |
| Long-term | (1,295,787) |
| Total capital loss carryforward | $(1,564,378) |
| Distribution Fee | Service Fee | Total Fees | Retained by FDC | |
| Capital Reserves Class | .25% | .25% | $12,504,800 | $1,638,156 |
| Daily Money Class | - % | .25% | 9,572,094 | 575,469 |
| Advisor M Class | - % | .25% | 222,609 | 2,938 |
| $22,299,503 | $2,216,563 |
| Retained by FDC | |
| Daily Money Class | $1,062 |
| Advisor M Class | $100 |
| Amount | % of Class-Level Average Net AssetsA | |
| Capital Reserves Class | $5,001,920 | .20 |
| Daily Money Class | 7,657,675 | .20 |
| Advisor M Class | 178,087 | .20 |
| Fidelity Government Money Market Fund | 200,889,251 | .16 |
| Class S | 108,902 | .20 |
| Premium Class | 4,207,797 | .10 |
| Class K6 | 141,208 | .01 |
| $218,184,840 |
| % of Average Net Assets | |
| Fidelity Government Money Market Fund | -A |
| Expense Limitations | Reimbursement | Expiration Date | |
| Capital Reserves Class | .95% | $191,334 | August 31, 2024 |
| Daily Money Class | .70% | 364,964 | August 31, 2024 |
| Advisor M Class | .70% | 8,141 | August 31, 2024 |
| Class S | .42% | 22,005 | August 31, 2024 |
| Premium Class | .32% | 1,732,523 | August 31, 2024 |
| Class K6 | .25% | 301,935 | August 31, 2024 |
| $2,620,902 |
| Expense reduction | |
| Capital Reserves Class | $139 |
| Daily Money Class | 886 |
| $1,025 |
Six months ended October 31, 2023 | Year ended April 30, 2023 | |
| Fidelity Government Money Market Fund | ||
| Distributions to shareholders | ||
| Capital Reserves Class | $109,064,827 | $132,294,501 |
| Daily Money Class | 176,780,299 | 173,911,146 |
| Advisor M Class | 4,116,061 | 4,026,868 |
| Fidelity Government Money Market Fund | 6,179,929,577 | 6,032,133,212 |
| Class S | 2,664,757 | 3,127,896 |
| Premium Class | 210,542,898 | 161,984,763 |
| Class K6 | 71,606,634 | 73,121,526 |
Total | $6,754,705,053 | $6,580,599,912 |
| Shares | Shares | Dollars | Dollars | |
Six months ended October 31, 2023 | Year ended April 30, 2023 | Six months ended October 31, 2023 | Year ended April 30, 2023 | |
| Fidelity Government Money Market Fund | ||||
| Capital Reserves Class | ||||
| Shares sold | 11,322,894,431 | 24,726,485,347 | $11,322,894,431 | $24,726,485,347 |
| Reinvestment of distributions | 68,002,053 | 82,299,780 | 68,002,053 | 82,299,780 |
| Shares redeemed | (12,054,429,927) | (26,978,689,833) | (12,054,429,927) | (26,978,689,833) |
| Net increase (decrease) | (663,533,443) | (2,169,904,706) | $(663,533,443) | $(2,169,904,706) |
| Daily Money Class | ||||
| Shares sold | 16,344,177,795 | 29,426,737,018 | $16,344,177,795 | $29,426,737,018 |
| Reinvestment of distributions | 124,380,483 | 124,369,442 | 124,380,483 | 124,369,442 |
| Shares redeemed | (15,682,306,459) | (29,788,519,287) | (15,682,306,647) | (29,788,519,287) |
| Net increase (decrease) | 786,251,819 | (237,412,827) | $786,251,631 | $(237,412,827) |
| Advisor M Class | ||||
| Shares sold | 68,342,167 | 146,781,874 | $68,343,152 | $146,781,874 |
| Reinvestment of distributions | 4,034,796 | 3,948,140 | 4,034,796 | 3,948,140 |
| Shares redeemed | (64,477,246) | (127,013,170) | (64,477,246) | (127,013,170) |
| Net increase (decrease) | 7,899,717 | 23,716,844 | $7,900,702 | $23,716,844 |
| Fidelity Government Money Market Fund | ||||
| Shares sold | 463,440,868,181 | 747,228,976,266 | $463,440,553,143 | $747,228,976,259 |
| Reinvestment of distributions | 6,965,836,319 | 4,973,485,810 | 6,965,836,319 | 4,973,485,810 |
| Shares redeemed | (441,131,923,212) | (745,443,820,532) | (441,131,561,531) | (745,443,820,524) |
| Net increase (decrease) | 29,274,781,288 | 6,758,641,544 | $29,274,827,931 | $6,758,641,545 |
| Class S | ||||
| Shares sold | 402,521,146 | 1,009,671,977 | $402,521,146 | $1,009,671,977 |
| Reinvestment of distributions | 2,361,686 | 2,753,148 | 2,361,686 | 2,753,148 |
| Shares redeemed | (449,815,464) | (895,881,428) | (449,815,464) | (895,881,428) |
| Net increase (decrease) | (44,932,632) | 116,543,697 | $(44,932,632) | $116,543,697 |
| Premium Class | ||||
| Shares sold | 5,805,282,733 | 7,637,912,164 | $5,805,282,733 | $7,637,912,162 |
| Reinvestment of distributions | 184,506,177 | 147,283,681 | 184,506,177 | 147,283,681 |
| Shares redeemed | (4,233,916,866) | (4,529,107,357) | (4,233,916,866) | (4,529,107,803) |
| Net increase (decrease) | 1,755,872,044 | 3,256,088,488 | $1,755,872,044 | $3,256,088,040 |
| Class K6 | ||||
| Shares sold | 1,014,802,537 | 2,269,895,570 | $1,014,802,537 | $2,269,895,570 |
| Reinvestment of distributions | 71,605,922 | 73,121,526 | 71,605,922 | 73,121,526 |
| Shares redeemed | (857,951,835) | (1,737,235,287) | (857,951,835) | (1,737,235,287) |
| Net increase (decrease) | 228,456,624 | 605,781,809 | $228,456,624 | $605,781,809 |
| The Example is based on an investment of $1,000 invested at the beginning of the period and held for the entire period (May 1, 2023 to October 31, 2023). |
Annualized Expense Ratio- A | Beginning Account Value May 1, 2023 | Ending Account Value October 31, 2023 | Expenses Paid During Period- C May 1, 2023 to October 31, 2023 | |||||||
| Fidelity® Government Money Market Fund | ||||||||||
| Capital Reserves Class | .95% | |||||||||
| Actual | $ 1,000 | $ 1,022.10 | $ 4.83 | |||||||
Hypothetical-B | $ 1,000 | $ 1,020.36 | $ 4.82 | |||||||
| Daily Money Class | .70% | |||||||||
| Actual | $ 1,000 | $ 1,023.30 | $ 3.56 | |||||||
Hypothetical-B | $ 1,000 | $ 1,021.62 | $ 3.56 | |||||||
| Advisor M Class | .70% | |||||||||
| Actual | $ 1,000 | $ 1,023.30 | $ 3.56 | |||||||
Hypothetical-B | $ 1,000 | $ 1,021.62 | $ 3.56 | |||||||
| Fidelity® Government Money Market Fund | .42% | |||||||||
| Actual | $ 1,000 | $ 1,024.80 | $ 2.14 | |||||||
Hypothetical-B | $ 1,000 | $ 1,023.03 | $ 2.14 | |||||||
| Class S | .42% | |||||||||
| Actual | $ 1,000 | $ 1,024.80 | $ 2.14 | |||||||
Hypothetical-B | $ 1,000 | $ 1,023.03 | $ 2.14 | |||||||
| Premium Class | .32% | |||||||||
| Actual | $ 1,000 | $ 1,025.30 | $ 1.63 | |||||||
Hypothetical-B | $ 1,000 | $ 1,023.53 | $ 1.63 | |||||||
| Class K6 | .25% | |||||||||
| Actual | $ 1,000 | $ 1,025.60 | $ 1.27 | |||||||
Hypothetical-B | $ 1,000 | $ 1,023.88 | $ 1.27 | |||||||
| A special meeting of shareholders was held on October 18, 2023. The results of votes taken among shareholders on the proposal before them are reported below. Each vote reported represents one dollar of net asset value held on the record date for the meeting. | ||
| Proposal 1 | ||
| To elect a Board of Trustees. | ||
# of Votes | % of Votes | |
| Abigail P. Johnson | ||
| Affirmative | 337,939,496,302.780 | 94.380 |
| Withheld | 20,121,891,677.960 | 5.620 |
| TOTAL | 358,061,387,980.740 | 100.000 |
| Jennifer Toolin McAuliffe | ||
| Affirmative | 337,261,756,605.130 | 94.190 |
| Withheld | 20,799,631,375.610 | 5.810 |
| TOTAL | 358,061,387,980.740 | 100.000 |
| Christine J. Thompson | ||
| Affirmative | 337,756,507,971.920 | 94.330 |
| Withheld | 20,304,880,008.820 | 5.670 |
| TOTAL | 358,061,387,980.740 | 100.000 |
| Elizabeth S. Acton | ||
| Affirmative | 336,673,811,160.640 | 94.030 |
| Withheld | 21,387,576,820.100 | 5.970 |
| TOTAL | 358,061,387,980.740 | 100.000 |
| Laura M. Bishop | ||
| Affirmative | 336,705,559,027.450 | 94.040 |
| Withheld | 21,355,828,953.280 | 5.960 |
| TOTAL | 358,061,387,980.730 | 100.000 |
| Ann E. Dunwoody | ||
| Affirmative | 336,791,135,924.560 | 94.060 |
| Withheld | 21,270,252,056.180 | 5.940 |
| TOTAL | 358,061,387,980.740 | 100.000 |
| John Engler | ||
| Affirmative | 336,187,619,932.530 | 93.890 |
| Withheld | 21,873,768,048.210 | 6.110 |
| TOTAL | 358,061,387,980.740 | 100.000 |
| Robert F. Gartland | ||
| Affirmative | 337,535,127,127.930 | 94.270 |
| Withheld | 20,526,260,852.810 | 5.730 |
| TOTAL | 358,061,387,980.740 | 100.000 |
| Robert W. Helm | ||
| Affirmative | 337,290,460,580.820 | 94.200 |
| Withheld | 20,770,927,399.920 | 5.800 |
| TOTAL | 358,061,387,980.740 | 100.000 |
| Arthur E. Johnson | ||
| Affirmative | 336,917,974,849.290 | 94.100 |
| Withheld | 21,143,413,131.450 | 5.900 |
| TOTAL | 358,061,387,980.740 | 100.000 |
| Michael E. Kenneally | ||
| Affirmative | 337,417,190,479.840 | 94.240 |
| Withheld | 20,644,197,500.900 | 5.760 |
| TOTAL | 358,061,387,980.740 | 100.000 |
| Mark A. Murray | ||
| Affirmative | 337,795,870,420.820 | 94.340 |
| Withheld | 20,265,517,559.920 | 5.660 |
| TOTAL | 358,061,387,980.740 | 100.000 |
| Carol J. Zierhoffer | ||
| Affirmative | 337,084,951,395.910 | 94.140 |
| Withheld | 20,976,436,584.830 | 5.860 |
| TOTAL | 358,061,387,980.740 | 100.000 |
| Proposal 1 reflects trust wide proposal and voting results. | ||
 |


Contents
Asset Allocation (% of Fund's net assets) |
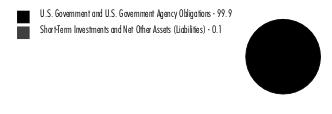 |
| U.S. Government and Government Agency Obligations - 99.9% | |||
Principal Amount (a) | Value ($) | ||
| U.S. Treasury Obligations - 99.9% | |||
U.S. Treasury Bills, yield at date of purchase 5.38% to 5.47% 2/1/24 to 4/25/24 (Cost $1,295,243,941) | 1,320,340,000 | 1,295,166,396 | |
| Money Market Funds - 0.1% | |||
| Shares | Value ($) | ||
Fidelity Cash Central Fund 5.40% (b) (Cost $1,200,016) | 1,199,776 | 1,200,016 | |
| TOTAL INVESTMENT IN SECURITIES - 100.0% (Cost $1,296,443,957) | 1,296,366,412 |
NET OTHER ASSETS (LIABILITIES) - 0.0% | (177,576) |
| NET ASSETS - 100.0% | 1,296,188,836 |
| (a) | Amount is stated in United States dollars unless otherwise noted. |
| (b) | Affiliated fund that is generally available only to investment companies and other accounts managed by Fidelity Investments. The rate quoted is the annualized seven-day yield of the fund at period end. A complete unaudited listing of the fund's holdings as of its most recent quarter end is available upon request. In addition, each Fidelity Central Fund's financial statements are available on the SEC's website or upon request. |
| Affiliate | Value, beginning of period ($) | Purchases ($) | Sales Proceeds ($) | Dividend Income ($) | Realized Gain (loss) ($) | Change in Unrealized appreciation (depreciation) ($) | Value, end of period ($) | % ownership, end of period |
| Fidelity Cash Central Fund 5.40% | 8,931,866 | 187,645,202 | 195,377,052 | 103,190 | - | - | 1,200,016 | 0.0% |
| Total | 8,931,866 | 187,645,202 | 195,377,052 | 103,190 | - | - | 1,200,016 | |
| Valuation Inputs at Reporting Date: | ||||
| Description | Total ($) | Level 1 ($) | Level 2 ($) | Level 3 ($) |
Investments in Securities: | ||||
| U.S. Government and Government Agency Obligations | 1,295,166,396 | - | 1,295,166,396 | - |
| Money Market Funds | 1,200,016 | 1,200,016 | - | - |
| Total Investments in Securities: | 1,296,366,412 | 1,200,016 | 1,295,166,396 | - |
| Statement of Assets and Liabilities | ||||
October 31, 2023 (Unaudited) | ||||
| Assets | ||||
| Investment in securities, at value - See accompanying schedule: | ||||
Unaffiliated issuers (cost $1,295,243,941) | $ | 1,295,166,396 | ||
Fidelity Central Funds (cost $1,200,016) | 1,200,016 | |||
| Total Investment in Securities (cost $1,296,443,957) | $ | 1,296,366,412 | ||
| Receivable for investments sold | 577,092,408 | |||
| Receivable for fund shares sold | 2,053,074 | |||
| Distributions receivable from Fidelity Central Funds | 17,646 | |||
Total assets | 1,875,529,540 | |||
| Liabilities | ||||
| Payable for investments purchased | $ | 567,186,966 | ||
| Payable for fund shares redeemed | 12,141,413 | |||
| Distributions payable | 7,694 | |||
| Other payables and accrued expenses | 4,631 | |||
| Total Liabilities | 579,340,704 | |||
| Net Assets | $ | 1,296,188,836 | ||
| Net Assets consist of: | ||||
| Paid in capital | $ | 1,305,465,953 | ||
| Total accumulated earnings (loss) | (9,277,117) | |||
| Net Assets | $ | 1,296,188,836 | ||
Net Asset Value, offering price and redemption price per share ($1,296,188,836 ÷ 130,471,148 shares) | $ | 9.93 | ||
| Statement of Operations | ||||
Six months ended October 31, 2023 (Unaudited) | ||||
| Investment Income | ||||
| Interest | $ | 35,256,275 | ||
| Income from Fidelity Central Funds | 103,190 | |||
| Total Income | 35,359,465 | |||
| Expenses | ||||
| Transfer agent fees | $ | 20 | ||
| Custodian fees and expenses | 6,950 | |||
| Independent trustees' fees and expenses | 2,221 | |||
| Miscellaneous | 33 | |||
| Total expenses before reductions | 9,224 | |||
| Expense reductions | (25) | |||
| Total expenses after reductions | 9,199 | |||
| Net Investment income (loss) | 35,350,266 | |||
| Realized and Unrealized Gain (Loss) | ||||
| Net realized gain (loss) on: | ||||
| Investment Securities: | ||||
| Unaffiliated issuers | (1,241,181) | |||
| Total net realized gain (loss) | (1,241,181) | |||
| Change in net unrealized appreciation (depreciation) on investment securities | 332,737 | |||
| Net gain (loss) | (908,444) | |||
| Net increase (decrease) in net assets resulting from operations | $ | 34,441,822 | ||
| Statement of Changes in Net Assets | ||||
Six months ended October 31, 2023 (Unaudited) | Year ended April 30, 2023 | |||
| Increase (Decrease) in Net Assets | ||||
| Operations | ||||
| Net investment income (loss) | $ | 35,350,266 | $ | 36,960,621 |
| Net realized gain (loss) | (1,241,181) | (5,793,880) | ||
| Change in net unrealized appreciation (depreciation) | 332,737 | 372,355 | ||
| Net increase (decrease) in net assets resulting from operations | 34,441,822 | 31,539,096 | ||
| Distributions to shareholders | (35,351,221) | (36,902,734) | ||
| Share transactions | ||||
| Proceeds from sales of shares | 142,581,278 | 687,602,491 | ||
| Reinvestment of distributions | 35,343,256 | 36,339,394 | ||
| Cost of shares redeemed | (178,950,785) | (799,464,253) | ||
Net increase (decrease) in net assets resulting from share transactions | (1,026,251) | (75,522,368) | ||
| Total increase (decrease) in net assets | (1,935,650) | (80,886,006) | ||
| Net Assets | ||||
| Beginning of period | 1,298,124,486 | 1,379,010,492 | ||
| End of period | $ | 1,296,188,836 | $ | 1,298,124,486 |
| Other Information | ||||
| Shares | ||||
| Sold | 14,347,803 | 69,090,565 | ||
| Issued in reinvestment of distributions | 3,557,434 | 3,651,949 | ||
| Redeemed | (18,008,774) | (80,193,769) | ||
| Net increase (decrease) | (103,537) | (7,451,255) | ||
| Fidelity® Series Treasury Bill Index Fund |
Six months ended (Unaudited) October 31, 2023 | Years ended April 30, 2023 | 2022 | 2021 | 2020 | 2019 A | |||||||
Selected Per-Share Data | ||||||||||||
| Net asset value, beginning of period | $ | 9.94 | $ | 9.99 | $ | 10.00 | $ | 10.03 | $ | 9.98 | $ | 10.00 |
| Income from Investment Operations | ||||||||||||
Net investment income (loss) B,C | .265 | .327 | .010 | .011 | .169 | .166 | ||||||
| Net realized and unrealized gain (loss) | (.011) | (.054) | (.005) | .002 | .062 | (.005) | ||||||
| Total from investment operations | .254 | .273 | .005 | .013 | .231 | .161 | ||||||
| Distributions from net investment income | (.264) | (.323) | (.014) | (.012) | (.175) | (.181) | ||||||
| Distributions from net realized gain | - | - | (.001) | (.031) | (.006) | - | ||||||
| Total distributions | (.264) | (.323) | (.015) | (.043) | (.181) | (.181) | ||||||
| Net asset value, end of period | $ | 9.93 | $ | 9.94 | $ | 9.99 | $ | 10.00 | $ | 10.03 | $ | 9.98 |
Total Return D,E | 2.59% | 2.78% | .05% | .13% | 2.34% | 1.62% | ||||||
Ratios to Average Net Assets C,F,G | ||||||||||||
Expenses before reductions H | -% I,J | -% | -% | -% | -% | -% J | ||||||
Expenses net of fee waivers, if any H | -% I,J | -% | -% | -% | -% | -% J | ||||||
Expenses net of all reductions H | -% I,J | -% | -% | -% | -% | -% J | ||||||
| Net investment income (loss) | 5.33% I,J | 3.28% | .10% | .11% | 1.69% | 2.36% J | ||||||
| Supplemental Data | ||||||||||||
| Net assets, end of period (000 omitted) | $ | 1,296,189 | $ | 1,298,124 | $ | 1,379,010 | $ | 3,446,278 | $ | 2,211,901 | $ | 927,431 |
| Portfolio turnover rate | -% J | -% | -% | -% | -% | -% |
| Fidelity Central Fund | Investment Manager | Investment Objective | Investment Practices | Expense RatioA |
| Fidelity Money Market Central Funds | Fidelity Management & Research Company LLC (FMR) | Each fund seeks to obtain a high level of current income consistent with the preservation of capital and liquidity. | Short-term Investments | Less than .005% |
| Gross unrealized appreciation | $91 |
| Gross unrealized depreciation | (77,636) |
| Net unrealized appreciation (depreciation) | $(77,545) |
| Tax cost | $1,296,443,957 |
| Short-term | $(7,805,165) |
| The Example is based on an investment of $1,000 invested at the beginning of the period and held for the entire period (May 1, 2023 to October 31, 2023). |
Annualized Expense Ratio- A | Beginning Account Value May 1, 2023 | Ending Account Value October 31, 2023 | Expenses Paid During Period- C May 1, 2023 to October 31, 2023 | |||||||
| Fidelity® Series Treasury Bill Index Fund | -%-D | |||||||||
| Actual | $ 1,000 | $ 1,025.90 | $-E | |||||||
Hypothetical-B | $ 1,000 | $ 1,025.14 | $-E | |||||||
| A special meeting of shareholders was held on October 18, 2023. The results of votes taken among shareholders on the proposal before them are reported below. Each vote reported represents one dollar of net asset value held on the record date for the meeting. | ||
| Proposal 1 | ||
| To elect a Board of Trustees. | ||
# of Votes | % of Votes | |
| Abigail P. Johnson | ||
| Affirmative | 337,939,496,302.780 | 94.380 |
| Withheld | 20,121,891,677.960 | 5.620 |
| TOTAL | 358,061,387,980.740 | 100.000 |
| Jennifer Toolin McAuliffe | ||
| Affirmative | 337,261,756,605.130 | 94.190 |
| Withheld | 20,799,631,375.610 | 5.810 |
| TOTAL | 358,061,387,980.740 | 100.000 |
| Christine J. Thompson | ||
| Affirmative | 337,756,507,971.920 | 94.330 |
| Withheld | 20,304,880,008.820 | 5.670 |
| TOTAL | 358,061,387,980.740 | 100.000 |
| Elizabeth S. Acton | ||
| Affirmative | 336,673,811,160.640 | 94.030 |
| Withheld | 21,387,576,820.100 | 5.970 |
| TOTAL | 358,061,387,980.740 | 100.000 |
| Laura M. Bishop | ||
| Affirmative | 336,705,559,027.450 | 94.040 |
| Withheld | 21,355,828,953.280 | 5.960 |
| TOTAL | 358,061,387,980.730 | 100.000 |
| Ann E. Dunwoody | ||
| Affirmative | 336,791,135,924.560 | 94.060 |
| Withheld | 21,270,252,056.180 | 5.940 |
| TOTAL | 358,061,387,980.740 | 100.000 |
| John Engler | ||
| Affirmative | 336,187,619,932.530 | 93.890 |
| Withheld | 21,873,768,048.210 | 6.110 |
| TOTAL | 358,061,387,980.740 | 100.000 |
| Robert F. Gartland | ||
| Affirmative | 337,535,127,127.930 | 94.270 |
| Withheld | 20,526,260,852.810 | 5.730 |
| TOTAL | 358,061,387,980.740 | 100.000 |
| Robert W. Helm | ||
| Affirmative | 337,290,460,580.820 | 94.200 |
| Withheld | 20,770,927,399.920 | 5.800 |
| TOTAL | 358,061,387,980.740 | 100.000 |
| Arthur E. Johnson | ||
| Affirmative | 336,917,974,849.290 | 94.100 |
| Withheld | 21,143,413,131.450 | 5.900 |
| TOTAL | 358,061,387,980.740 | 100.000 |
| Michael E. Kenneally | ||
| Affirmative | 337,417,190,479.840 | 94.240 |
| Withheld | 20,644,197,500.900 | 5.760 |
| TOTAL | 358,061,387,980.740 | 100.000 |
| Mark A. Murray | ||
| Affirmative | 337,795,870,420.820 | 94.340 |
| Withheld | 20,265,517,559.920 | 5.660 |
| TOTAL | 358,061,387,980.740 | 100.000 |
| Carol J. Zierhoffer | ||
| Affirmative | 337,084,951,395.910 | 94.140 |
| Withheld | 20,976,436,584.830 | 5.860 |
| TOTAL | 358,061,387,980.740 | 100.000 |
| Proposal 1 reflects trust wide proposal and voting results. | ||
 |


Contents
| Current 7-Day Yields | ||
| Fidelity® Treasury Only Money Market Fund | 5.01% | |
Yield refers to the income paid by the Fund over a given period. Yield for money market funds is usually for seven-day periods, as it is here, though it is expressed as an annual percentage rate. Past performance is no guarantee of future results. Yield will vary and it's possible to lose money investing in the Fund. | ||
| Effective Maturity Diversification (% of Fund's Investments) | ||
| Days | ||
| 1 - 7 | 17.6 | |
| 8 - 30 | 44.7 | |
| 31 - 60 | 21.8 | |
| 61 - 90 | 10.0 | |
| 91 - 180 | 5.9 | |
| Effective maturity is determined in accordance with the requirements of Rule 2a-7 under the Investment Company Act of 1940. | ||
Asset Allocation (% of Fund's net assets) |
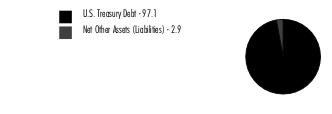 |
| U.S. Treasury Debt - 97.1% | ||||
Yield (%)(a) | Principal Amount (b) (000s) | Value ($) (000s) | ||
| U.S. Treasury Obligations - 97.1% | ||||
| U.S. Treasury Bills | ||||
| 11/2/23 to 3/7/24 | 5.04 to 5.48 | 4,129,065 | 4,108,173 | |
| U.S. Treasury Notes | ||||
| 11/30/23 to 1/31/25 (c) | 5.31 to 5.58 | 252,583 | 252,667 | |
| TOTAL U.S. TREASURY DEBT (Cost $4,360,840) | 4,360,840 | |||
| TOTAL INVESTMENT IN SECURITIES - 97.1% (Cost $4,360,840) | 4,360,840 |
NET OTHER ASSETS (LIABILITIES) - 2.9% | 129,377 |
| NET ASSETS - 100.0% | 4,490,217 |
| (a) | Yield represents either the annualized yield at the date of purchase, or the stated coupon rate, or, for floating and adjustable rate securities, the rate at period end. |
| (b) | Amount is stated in United States dollars unless otherwise noted. |
| (c) | Coupon rates for floating and adjustable rate securities reflect the rates in effect at period end. |
| Statement of Assets and Liabilities | ||||
| Amounts in thousands (except per-share amount) | October 31, 2023 (Unaudited) | |||
| Assets | ||||
Investment in securities, at value - See accompanying schedule Unaffiliated issuers (cost $4,360,840): | $ | 4,360,840 | ||
| Cash | 175,793 | |||
| Receivable for fund shares sold | 87,618 | |||
| Interest receivable | 217 | |||
Total assets | 4,624,468 | |||
| Liabilities | ||||
| Payable for investments purchased | $ | 111,162 | ||
| Payable for fund shares redeemed | 18,854 | |||
| Distributions payable | 2,727 | |||
| Accrued management fee | 1,508 | |||
| Total Liabilities | 134,251 | |||
| Net Assets | $ | 4,490,217 | ||
| Net Assets consist of: | ||||
| Paid in capital | $ | 4,490,264 | ||
| Total accumulated earnings (loss) | (47) | |||
| Net Assets | $ | 4,490,217 | ||
Net Asset Value, offering price and redemption price per share ($4,490,217 ÷ 4,489,482 shares) | $ | 1.00 | ||
| Statement of Operations | ||||
| Amounts in thousands | Six months ended October 31, 2023 (Unaudited) | |||
| Investment Income | ||||
| Interest | $ | 102,663 | ||
| Expenses | ||||
| Management fee | $ | 8,338 | ||
| Independent trustees' fees and expenses | 6 | |||
| Total Expenses | 8,344 | |||
| Net Investment income (loss) | 94,319 | |||
| Realized and Unrealized Gain (Loss) | ||||
| Net realized gain (loss) on: | ||||
| Investment Securities: | ||||
| Unaffiliated issuers | (53) | |||
| Total net realized gain (loss) | (53) | |||
| Net increase in net assets resulting from operations | $ | 94,266 | ||
| Statement of Changes in Net Assets | ||||
| Amount in thousands | Six months ended October 31, 2023 (Unaudited) | Year ended April 30, 2023 | ||
| Increase (Decrease) in Net Assets | ||||
| Operations | ||||
| Net investment income (loss) | $ | 94,319 | $ | 84,468 |
| Net realized gain (loss) | (53) | 25 | ||
Net increase in net assets resulting from operations | 94,266 | 84,493 | ||
| Distributions to shareholders | (94,317) | (84,477) | ||
| Share transactions | ||||
| Proceeds from sales of shares | 2,535,947 | 3,538,536 | ||
| Reinvestment of distributions | 80,175 | 75,134 | ||
| Cost of shares redeemed | (2,272,819) | (2,866,760) | ||
Net increase (decrease) in net assets and shares resulting from share transactions | 343,303 | 746,910 | ||
| Total increase (decrease) in net assets | 343,252 | 746,926 | ||
| Net Assets | ||||
| Beginning of period | 4,146,965 | 3,400,039 | ||
| End of period | $ | 4,490,217 | $ | 4,146,965 |
| Other Information | ||||
| Shares | ||||
| Sold | 2,535,947 | 3,538,536 | ||
| Issued in reinvestment of distributions | 80,175 | 75,134 | ||
| Redeemed | (2,272,819) | (2,866,760) | ||
| Net increase (decrease) | 343,303 | 746,910 | ||
| Fidelity® Treasury Only Money Market Fund |
Six months ended (Unaudited) October 31, 2023 | Years ended April 30, 2023 | 2022 | 2021 | 2020 | 2019 | |||||||
Selected Per-Share Data | ||||||||||||
| Net asset value, beginning of period | $ | 1.00 | $ | 1.00 | $ | 1.00 | $ | 1.00 | $ | 1.00 | $ | 1.00 |
| Income from Investment Operations | ||||||||||||
Net investment income (loss) A | .024 | .026 | - B | - B | .014 | .018 | ||||||
Net realized and unrealized gain (loss) B | - | - | - | - | - | - | ||||||
| Total from investment operations | .024 | .026 | - B | - B | .014 | .018 | ||||||
| Distributions from net investment income | (.024) | (.026) | - B | - B | (.014) | (.018) | ||||||
| Distributions from net realized gain | - | - | - B | - | - | - | ||||||
| Total distributions | (.024) | (.026) | - B | - B | (.014) | (.018) | ||||||
| Net asset value, end of period | $ | 1.00 | $ | 1.00 | $ | 1.00 | $ | 1.00 | $ | 1.00 | $ | 1.00 |
Total Return C,D | 2.40% | 2.62% | .01% | .01% | 1.39% | 1.79% | ||||||
Ratios to Average Net Assets A,E,F | ||||||||||||
| Expenses before reductions | .42% G | .42% | .42% | .42% | .42% | .42% | ||||||
| Expenses net of fee waivers, if any | .42% G | .42% | .11% | .15% | .42% | .42% | ||||||
| Expenses net of all reductions | .42% G | .42% | .11% | .15% | .42% | .42% | ||||||
| Net investment income (loss) | 4.73% G | 2.60% | .01% | .01% | 1.27% | 1.76% | ||||||
| Supplemental Data | ||||||||||||
| Net assets, end of period (in millions) | $ | 4,490 | $ | 4,147 | $ | 3,400 | $ | 3,804 | $ | 5,045 | $ | 2,823 |
| Gross unrealized appreciation | $- |
| Gross unrealized depreciation | - |
| Net unrealized appreciation (depreciation) | $- |
| Tax cost | $4,360,840 |
| The Example is based on an investment of $1,000 invested at the beginning of the period and held for the entire period (May 1, 2023 to October 31, 2023). |
Annualized Expense Ratio- A | Beginning Account Value May 1, 2023 | Ending Account Value October 31, 2023 | Expenses Paid During Period- C May 1, 2023 to October 31, 2023 | |||||||
| Fidelity® Treasury Only Money Market Fund | .42% | |||||||||
| Actual | $ 1,000 | $ 1,024.00 | $ 2.14 | |||||||
Hypothetical-B | $ 1,000 | $ 1,023.03 | $ 2.14 | |||||||
| A special meeting of shareholders was held on October 18, 2023. The results of votes taken among shareholders on the proposal before them are reported below. Each vote reported represents one dollar of net asset value held on the record date for the meeting. | ||
| Proposal 1 | ||
| To elect a Board of Trustees. | ||
# of Votes | % of Votes | |
| Abigail P. Johnson | ||
| Affirmative | 337,939,496,302.780 | 94.380 |
| Withheld | 20,121,891,677.960 | 5.620 |
| TOTAL | 358,061,387,980.740 | 100.000 |
| Jennifer Toolin McAuliffe | ||
| Affirmative | 337,261,756,605.130 | 94.190 |
| Withheld | 20,799,631,375.610 | 5.810 |
| TOTAL | 358,061,387,980.740 | 100.000 |
| Christine J. Thompson | ||
| Affirmative | 337,756,507,971.920 | 94.330 |
| Withheld | 20,304,880,008.820 | 5.670 |
| TOTAL | 358,061,387,980.740 | 100.000 |
| Elizabeth S. Acton | ||
| Affirmative | 336,673,811,160.640 | 94.030 |
| Withheld | 21,387,576,820.100 | 5.970 |
| TOTAL | 358,061,387,980.740 | 100.000 |
| Laura M. Bishop | ||
| Affirmative | 336,705,559,027.450 | 94.040 |
| Withheld | 21,355,828,953.280 | 5.960 |
| TOTAL | 358,061,387,980.730 | 100.000 |
| Ann E. Dunwoody | ||
| Affirmative | 336,791,135,924.560 | 94.060 |
| Withheld | 21,270,252,056.180 | 5.940 |
| TOTAL | 358,061,387,980.740 | 100.000 |
| John Engler | ||
| Affirmative | 336,187,619,932.530 | 93.890 |
| Withheld | 21,873,768,048.210 | 6.110 |
| TOTAL | 358,061,387,980.740 | 100.000 |
| Robert F. Gartland | ||
| Affirmative | 337,535,127,127.930 | 94.270 |
| Withheld | 20,526,260,852.810 | 5.730 |
| TOTAL | 358,061,387,980.740 | 100.000 |
| Robert W. Helm | ||
| Affirmative | 337,290,460,580.820 | 94.200 |
| Withheld | 20,770,927,399.920 | 5.800 |
| TOTAL | 358,061,387,980.740 | 100.000 |
| Arthur E. Johnson | ||
| Affirmative | 336,917,974,849.290 | 94.100 |
| Withheld | 21,143,413,131.450 | 5.900 |
| TOTAL | 358,061,387,980.740 | 100.000 |
| Michael E. Kenneally | ||
| Affirmative | 337,417,190,479.840 | 94.240 |
| Withheld | 20,644,197,500.900 | 5.760 |
| TOTAL | 358,061,387,980.740 | 100.000 |
| Mark A. Murray | ||
| Affirmative | 337,795,870,420.820 | 94.340 |
| Withheld | 20,265,517,559.920 | 5.660 |
| TOTAL | 358,061,387,980.740 | 100.000 |
| Carol J. Zierhoffer | ||
| Affirmative | 337,084,951,395.910 | 94.140 |
| Withheld | 20,976,436,584.830 | 5.860 |
| TOTAL | 358,061,387,980.740 | 100.000 |
| Proposal 1 reflects trust wide proposal and voting results. | ||
 |


Contents
| Current 7-Day Yields | ||
| Fidelity Flex® Government Money Market Fund | 5.42% | |
Yield refers to the income paid by the Fund over a given period. Yield for money market funds is usually for seven-day periods, as it is here, though it is expressed as an annual percentage rate. Past performance is no guarantee of future results. Yield will vary and it's possible to lose money investing in the Fund. | ||
| Effective Maturity Diversification (% of Fund's Investments) | ||
| Days | ||
| 1 - 7 | 68.2 | |
| 8 - 30 | 14.3 | |
| 31 - 60 | 10.9 | |
| 61 - 90 | 3.4 | |
| 91 - 180 | 0.9 | |
| > 180 | 2.3 | |
| Effective maturity is determined in accordance with the requirements of Rule 2a-7 under the Investment Company Act of 1940. | ||
Asset Allocation (% of Fund's net assets) |
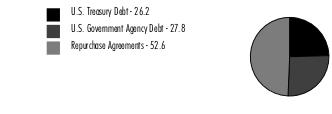 |
Net Other Assets (Liabilities) - (6.6)% |
| U.S. Treasury Debt - 26.2% | ||||
Yield (%)(a) | Principal Amount (b) | Value ($) | ||
| U.S. Treasury Obligations - 26.2% | ||||
| U.S. Treasury Bills | ||||
| 11/2/23 to 1/18/24 | 5.32 to 5.43 | 27,000,000 | 26,881,600 | |
| U.S. Treasury Notes | ||||
| 1/31/24 to 10/31/24 (c)(d) | 5.37 to 5.52 | 1,500,000 | 1,500,021 | |
| TOTAL U.S. TREASURY DEBT (Cost $28,381,621) | 28,381,621 | |||
| U.S. Government Agency Debt - 27.8% | ||||
Yield (%)(a) | Principal Amount (b) | Value ($) | ||
| Federal Agencies - 27.8% | ||||
| Federal Farm Credit Bank | ||||
| 1/24/24 to 7/7/25 (c)(d) | 5.37 to 5.49 | 3,850,000 | 3,849,976 | |
| Federal Home Loan Bank | ||||
| 11/7/23 to 5/12/25 (c) | 5.19 to 5.50 | 24,800,000 | 24,756,583 | |
| 5/2/24 (c)(d) | 0.00 | 1,000,000 | 1,000,000 | |
| Freddie Mac | ||||
| 6/12/24 | 5.35 | 500,000 | 500,000 | |
| TOTAL U.S. GOVERNMENT AGENCY DEBT (Cost $30,106,559) | 30,106,559 | |||
| U.S. Government Agency Repurchase Agreement - 27.2% | |||
Maturity Amount ($) | Value ($) | ||
| In a joint trading account at 5.3% dated 10/31/23 due 11/1/23 (Collateralized by U.S. Government Obligations) # | 11,887,751 | 11,886,000 | |
| With: | |||
| ABN AMRO Bank NV at 5.31%, dated 10/31/23 due 11/1/23 (Collateralized by U.S. Government Obligations valued at $1,020,197, 1.25% - 5.50%, 6/30/28 - 8/1/53) | 1,000,148 | 1,000,000 | |
| BMO Harris Bank NA at 5.32%, dated 10/12/23 due 11/2/23 (Collateralized by U.S. Government Obligations valued at $1,023,015, 4.50%, 6/20/46) | 1,003,103 | 1,000,000 | |
| BNP Paribas, SA at: | |||
5.32%, dated 9/21/23 due 11/2/23 (Collateralized by U.S. Treasury Obligations valued at $2,054,086, 0.00% - 5.55%, 2/27/24 - 10/1/53) | 2,012,413 | 2,000,000 | |
5.35%, dated 10/25/23 due 11/7/23 (Collateralized by U.S. Government Obligations valued at $1,021,211, 0.00% - 6.00%, 2/22/24 - 9/1/53) | 1,007,431 | 1,000,000 | |
5.36%, dated: | |||
| 8/1/23 due 11/7/23 (Collateralized by U.S. Government Obligations valued at $1,033,984, 0.00% - 5.50%, 2/22/24 - 10/1/53) (c)(d)(e) | 1,018,164 | 1,000,000 | |
| 8/23/23 due 11/7/23 (Collateralized by U.S. Treasury Obligations valued at $517,792, 0.00% - 6.08%, 2/22/24 - 10/1/53) (c)(d)(e) | 508,933 | 500,000 | |
5.38%, dated: | |||
| 9/18/23 due 12/18/23 (Collateralized by U.S. Government Obligations valued at $1,026,866, 0.00% - 6.50%, 2/15/24 - 10/1/53) (c)(d)(e) | 1,013,587 | 1,000,000 | |
| 9/21/23 due 12/20/23 (Collateralized by U.S. Government Obligations valued at $1,026,522, 0.00% - 6.50%, 2/15/30 - 11/1/53) (c)(d)(e) | 1,013,438 | 1,000,000 | |
| BofA Securities, Inc. at: | |||
5.34%, dated 10/30/23 due 11/7/23 (Collateralized by U.S. Treasury Obligations valued at $1,020,354, 1.25%, 9/30/28) | 1,004,598 | 1,000,000 | |
5.39%, dated 10/18/23 due 11/7/23 (Collateralized by U.S. Treasury Obligations valued at $1,022,213, 1.25%, 9/30/28) | 1,009,133 | 1,000,000 | |
| CIBC Bank U.S.A. at 5.34%, dated 10/12/23 due 11/7/23 (Collateralized by U.S. Government Obligations valued at $1,023,028, 0.75% - 7.50%, 1/31/28 - 10/1/53) | 1,004,747 | 1,000,000 | |
| FICC State Street GC (Gov. Repo) at 5.31%, dated 10/31/23 due 11/1/23 (Collateralized by U.S. Treasury Obligations valued at $1,290,163, 2.50% - 6.50%, 9/30/28 - 8/15/53) | 1,000,148 | 1,000,000 | |
| Goldman Sachs & Co. at 5.31%, dated: | |||
10/27/23 due 11/3/23 (Collateralized by U.S. Treasury Obligations valued at $1,020,808, 1.75%, 8/15/41) | 1,001,033 | 1,000,000 | |
10/31/23 due 11/7/23 (Collateralized by U.S. Government Obligations valued at $1,020,150, 3.00% - 5.50%, 8/15/38 - 2/20/43) | 1,001,033 | 1,000,000 | |
| Morgan Stanley & Co., LLC at 5.31%, dated 10/31/23 due 11/1/23 (Collateralized by U.S. Government Obligations valued at $1,020,940, 1.50% - 6.50%, 7/15/33 - 9/1/53) | 1,000,148 | 1,000,000 | |
| RBC Financial Group at 5.33%, dated 9/21/23 due 11/2/23 (Collateralized by U.S. Government Obligations valued at $1,026,230, 2.00% - 7.00%, 8/15/32 - 9/20/63) | 1,006,218 | 1,000,000 | |
| TD Securities (U.S.A.) at 5.32%, dated 10/31/23 due 11/1/23 (Collateralized by U.S. Government Obligations valued at $1,020,151, 6.00%, 8/20/53) | 1,000,148 | 1,000,000 | |
| TOTAL U.S. GOVERNMENT AGENCY REPURCHASE AGREEMENT (Cost $29,386,000) | 29,386,000 | ||
| U.S. Treasury Repurchase Agreement - 25.4% | |||
Maturity Amount ($) | Value ($) | ||
| With: | |||
| ABN AMRO Bank NV at 5.3%, dated 10/31/23 due 11/1/23 (Collateralized by U.S. Treasury Obligations valued at $1,020,196, 0.75% - 4.38%, 8/15/25 - 6/30/28) | 1,000,147 | 1,000,000 | |
| Barclays Bank PLC at 5.3%, dated 10/31/23 due 11/1/23 (Collateralized by U.S. Treasury Obligations valued at $1,020,156, 3.88%, 3/31/25) | 1,000,147 | 1,000,000 | |
| BofA Securities, Inc. at 5.33%, dated 9/21/23 due 11/2/23 (Collateralized by U.S. Treasury Obligations valued at $1,026,234, 4.63%, 6/30/25) | 1,006,218 | 1,000,000 | |
| CIBC Bank U.S.A. at 5.32%, dated 9/21/23 due 11/2/23 (Collateralized by U.S. Treasury Obligations valued at $1,026,197, 1.13% - 4.25%, 12/31/24 - 5/15/53) | 1,006,201 | 1,000,000 | |
| Credit AG at 5.32%, dated 10/10/23 due 11/2/23 (Collateralized by U.S. Treasury Obligations valued at $1,023,323, 3.38%, 8/15/42) | 1,003,399 | 1,000,000 | |
| Fixed Income Clearing Corp. - BNP at 5.31%, dated 10/31/23 due 11/1/23 (Collateralized by U.S. Treasury Obligations valued at $1,020,201, 5.51%, 7/31/25) | 1,000,148 | 1,000,000 | |
| Fixed Income Clearing Corp. - BNYM at 5.3%, dated 10/31/23 due 11/1/23 (Collateralized by U.S. Treasury Obligations valued at $3,060,037, 2.88%, 5/15/32) | 3,000,442 | 3,000,000 | |
| Fixed Income Clearing Corp. - SSB at: | |||
5.3%, dated 10/31/23 due 11/1/23 (Collateralized by U.S. Treasury Obligations valued at $3,058,042, 2.75%, 5/31/29) | 3,000,442 | 3,000,000 | |
5.31%, dated 10/31/23 due 11/1/23 (Collateralized by U.S. Treasury Obligations valued at $1,019,406, 4.63%, 10/15/26) | 1,000,148 | 1,000,000 | |
| ING Financial Markets LLC at: | |||
5.3%, dated 10/31/23 due 11/1/23 (Collateralized by U.S. Treasury Obligations valued at $1,023,570, 4.00%, 2/29/28) | 1,000,147 | 1,000,000 | |
5.31%, dated 10/31/23 due 11/7/23 (Collateralized by U.S. Treasury Obligations valued at $1,021,101, 0.63% - 3.75%, 8/31/25 - 2/15/47) | 1,001,033 | 1,000,000 | |
| Lloyds Bank PLC at: | |||
5.4%, dated 10/30/23 due 12/20/23 (Collateralized by U.S. Treasury Obligations valued at $1,019,588, 3.88%, 12/31/27) | 1,007,650 | 1,000,000 | |
5.43%, dated 9/20/23 due 11/20/23 (Collateralized by U.S. Treasury Obligations valued at $513,468, 0.75% - 2.38%, 8/15/24 - 11/15/24) | 504,600 | 500,000 | |
| Mizuho Bank, Ltd. at 5.31%, dated 10/31/23 due 11/1/23 (Collateralized by U.S. Treasury Obligations valued at $1,021,061, 1.63%, 5/15/31) | 1,000,148 | 1,000,000 | |
| Morgan Stanley & Co., LLC at 5.3%, dated 10/31/23 due 11/1/23 (Collateralized by U.S. Treasury Obligations valued at $1,020,200, 1.63% - 4.75%, 7/31/25 - 5/15/31) | 1,000,147 | 1,000,000 | |
| MUFG Securities (Canada), Ltd. at 5.33%, dated 9/21/23 due 11/2/23 (Collateralized by U.S. Treasury Obligations valued at $1,026,253, 1.00% - 4.25%, 3/31/24 - 11/15/51) | 1,006,218 | 1,000,000 | |
| MUFG Securities EMEA PLC at 5.31%, dated: | |||
10/31/23 due 11/1/23 | |||
| (Collateralized by U.S. Treasury Obligations valued at $1,066,779, 2.75% - 4.38%, 10/31/24 - 8/15/32) | 1,000,148 | 1,000,000 | |
| (Collateralized by U.S. Treasury Obligations valued at $1,056,867, 1.88% - 3.13%, 2/15/41 - 11/15/41) | 1,000,148 | 1,000,000 | |
11/1/23 due 11/2/23 (f) | 1,000,148 | 1,000,000 | |
| Natixis SA at 5.3%, dated 10/31/23 due 11/1/23 (Collateralized by U.S. Treasury Obligations valued at $1,026,120, 0.38% - 5.00%, 9/30/25 - 11/15/52) | 1,000,147 | 1,000,000 | |
| NatWest Markets Securities, Inc. at: | |||
5.3%, dated 10/31/23 due 11/1/23 (Collateralized by U.S. Treasury Obligations valued at $1,020,202, 4.00%, 2/28/30) | 1,000,147 | 1,000,000 | |
5.31%, dated 10/26/23 due 11/2/23 (Collateralized by U.S. Treasury Obligations valued at $1,020,969, 4.00%, 2/28/30) | 1,001,033 | 1,000,000 | |
| Norinchukin Bank at 5.34%, dated 10/30/23 due 11/6/23 (Collateralized by U.S. Treasury Obligations valued at $1,030,113, 3.63% - 3.88%, 2/15/43 - 2/15/53) | 1,001,038 | 1,000,000 | |
| Societe Generale at 5.31%, dated 10/31/23 due 11/7/23 (Collateralized by U.S. Treasury Obligations valued at $1,030,156, 3.63%, 2/15/53) | 1,001,033 | 1,000,000 | |
| TOTAL U.S. TREASURY REPURCHASE AGREEMENT (Cost $27,500,000) | 27,500,000 | ||
| TOTAL INVESTMENT IN SECURITIES - 106.6% (Cost $115,374,180) | 115,374,180 |
NET OTHER ASSETS (LIABILITIES) - (6.6)% | (7,095,763) |
| NET ASSETS - 100.0% | 108,278,417 |
| (a) | Yield represents either the annualized yield at the date of purchase, or the stated coupon rate, or, for floating and adjustable rate securities, the rate at period end. |
| (b) | Amount is stated in United States dollars unless otherwise noted. |
| (c) | Coupon rates for floating and adjustable rate securities reflect the rates in effect at period end. |
| (d) | Coupon is indexed to a floating interest rate which may be multiplied by a specified factor and/or subject to caps or floors. |
| (e) | The maturity amount is based on the rate at period end. |
| (f) | Represents a forward settling transaction and therefore no collateral securities had been allocated as of period end. The agreement contemplated the delivery of U.S. Treasury Obligations as collateral on settlement date. |
| Other Information | ||
| # Additional information on each counterparty to the repurchase agreement is as follows: | ||
| Repurchase Agreement / Counterparty | Value ($) | |
| $11,886,000 due 11/01/23 at 5.30% | ||
| BNY Mellon Capital Markets LLC | 143,000 | |
| Bank of America, N.A. | 410,000 | |
| BofA Securities, Inc. | 235,000 | |
| Citigroup Global Markets, Inc. | 336,000 | |
| Credit Agricole CIB New York Branch | 51,000 | |
| HSBC Securities (USA), Inc. | 51,000 | |
| ING Financial Markets LLC | 67,000 | |
| JP Morgan Securities LLC | 114,000 | |
| Mitsubishi UFJ Securities Holdings Ltd | 205,000 | |
| Mizuho Securities USA, Inc. | 114,000 | |
| Nomura Securities International | 6,087,000 | |
| RBC Dominion Securities, Inc. | 693,000 | |
| Royal Bank of Canada | 229,000 | |
| Sumitomo Mitsui Banking Corp. | 2,018,000 | |
| Sumitomo Mitsui Banking Corp. NY | 247,000 | |
| Wells Fargo Bank National Asso | 658,000 | |
| Wells Fargo Securities LLC | 228,000 | |
| 11,886,000 | ||
| Statement of Assets and Liabilities | ||||
October 31, 2023 (Unaudited) | ||||
| Assets | ||||
Investment in securities, at value (including repurchase agreements of $56,886,000) - See accompanying schedule Unaffiliated issuers (cost $115,374,180): | $ | 115,374,180 | ||
| Cash | 1,000,743 | |||
| Receivable for fund shares sold | 7,390,438 | |||
| Interest receivable | 251,855 | |||
Total assets | 124,017,216 | |||
| Liabilities | ||||
| Payable for investments purchased | $ | 2,993,817 | ||
| Payable for fund shares redeemed | 12,452,640 | |||
| Distributions payable | 161,849 | |||
| Other payables and accrued expenses | 130,493 | |||
| Total Liabilities | 15,738,799 | |||
| Net Assets | $ | 108,278,417 | ||
| Net Assets consist of: | ||||
| Paid in capital | $ | 108,281,108 | ||
| Total accumulated earnings (loss) | (2,691) | |||
| Net Assets | $ | 108,278,417 | ||
Net Asset Value, offering price and redemption price per share ($108,278,417 ÷ 108,267,758 shares) | $ | 1.00 | ||
| Statement of Operations | ||||
Six months ended October 31, 2023 (Unaudited) | ||||
| Investment Income | ||||
| Interest | $ | 2,842,429 | ||
| Expenses | ||||
| Independent trustees' fees and expenses | $ | 180 | ||
| Proxy | 130,230 | |||
| Total expenses before reductions | 130,410 | |||
| Expense reductions | (130,024) | |||
| Total expenses after reductions | 386 | |||
| Net Investment income (loss) | 2,842,043 | |||
| Realized and Unrealized Gain (Loss) | ||||
| Net realized gain (loss) on: | ||||
| Investment Securities: | ||||
| Unaffiliated issuers | 22 | |||
| Total net realized gain (loss) | 22 | |||
| Net increase in net assets resulting from operations | $ | 2,842,065 | ||
| Statement of Changes in Net Assets | ||||
Six months ended October 31, 2023 (Unaudited) | Year ended April 30, 2023 | |||
| Increase (Decrease) in Net Assets | ||||
| Operations | ||||
| Net investment income (loss) | $ | 2,842,043 | $ | 2,929,504 |
| Net realized gain (loss) | 22 | (151) | ||
Net increase in net assets resulting from operations | 2,842,065 | 2,929,353 | ||
| Distributions to shareholders | (2,845,887) | (2,928,222) | ||
| Share transactions | ||||
| Proceeds from sales of shares | 2,173,715,170 | 3,537,387,735 | ||
| Reinvestment of distributions | 1,892,667 | 1,972,006 | ||
| Cost of shares redeemed | (2,167,513,826) | (3,555,577,849) | ||
Net increase (decrease) in net assets and shares resulting from share transactions | 8,094,011 | (16,218,108) | ||
| Total increase (decrease) in net assets | 8,090,189 | (16,216,977) | ||
| Net Assets | ||||
| Beginning of period | 100,188,228 | 116,405,205 | ||
| End of period | $ | 108,278,417 | $ | 100,188,228 |
| Other Information | ||||
| Shares | ||||
| Sold | 2,173,715,170 | 3,537,387,735 | ||
| Issued in reinvestment of distributions | 1,892,667 | 1,972,006 | ||
| Redeemed | (2,167,523,259) | (3,555,577,849) | ||
| Net increase (decrease) | 8,084,578 | (16,218,108) | ||
| Fidelity Flex® Government Money Market Fund |
Six months ended (Unaudited) October 31, 2023 | Years ended April 30, 2023 | 2022 | 2021 | 2020 | 2019 | |||||||
Selected Per-Share Data | ||||||||||||
| Net asset value, beginning of period | $ | 1.00 | $ | 1.00 | $ | 1.00 | $ | 1.00 | $ | 1.00 | $ | 1.00 |
| Income from Investment Operations | ||||||||||||
Net investment income (loss) A | .027 | .031 | .001 | .002 | .018 | .022 | ||||||
| Net realized and unrealized gain (loss) | - B | - B | - B | (.001) | - B | - B | ||||||
| Total from investment operations | .027 | .031 | .001 | .001 | .018 | .022 | ||||||
| Distributions from net investment income | (.027) | (.031) | (.001) | (.001) | (.018) | (.022) | ||||||
| Total distributions | (.027) | (.031) | (.001) | (.001) | (.018) | (.022) | ||||||
| Net asset value, end of period | $ | 1.00 | $ | 1.00 | $ | 1.00 | $ | 1.00 | $ | 1.00 | $ | 1.00 |
Total Return C,D | 2.69% | 3.17% | .10% | .15% | 1.81% | 2.22% | ||||||
Ratios to Average Net Assets A,E,F | ||||||||||||
| Expenses before reductions | .12% G,H | -% I | -% I | -% I | -% I | -% I | ||||||
| Expenses net of fee waivers, if any | (.24)% G,H | -% I | -% I | -% I | -% I | -% I | ||||||
| Expenses net of all reductions | (.24)% G,H | -% I | -% I | -% I | -% I | -% I | ||||||
| Net investment income (loss) | 5.57% G,H | 3.15% | .10% | .14% | 1.64% | 2.14% | ||||||
| Supplemental Data | ||||||||||||
| Net assets, end of period (000 omitted) | $ | 108,278 | $ | 100,188 | $ | 116,405 | $ | 98,979 | $ | 50,942 | $ | 22,044 |
| Gross unrealized appreciation | $- |
| Gross unrealized depreciation | - |
| Net unrealized appreciation (depreciation) | $- |
| Tax cost | $115,374,180 |
Short-term | $(-) |
Long-term | (152) |
| Total capital loss carryforward | $(152) |
| The Example is based on an investment of $1,000 invested at the beginning of the period and held for the entire period (May 1, 2023 to October 31, 2023). |
Annualized Expense Ratio- A | Beginning Account Value May 1, 2023 | Ending Account Value October 31, 2023 | Expenses Paid During Period- C May 1, 2023 to October 31, 2023 | |||||||
| Fidelity Flex® Government Money Market Fund | -%-D | |||||||||
| Actual | $ 1,000 | $ 1,026.90 | $-E | |||||||
Hypothetical-B | $ 1,000 | $ 1,025.14 | $-E | |||||||
| A special meeting of shareholders was held on October 18, 2023. The results of votes taken among shareholders on the proposal before them are reported below. Each vote reported represents one dollar of net asset value held on the record date for the meeting. | ||
| Proposal 1 | ||
| To elect a Board of Trustees. | ||
# of Votes | % of Votes | |
| Abigail P. Johnson | ||
| Affirmative | 337,939,496,302.780 | 94.380 |
| Withheld | 20,121,891,677.960 | 5.620 |
| TOTAL | 358,061,387,980.740 | 100.000 |
| Jennifer Toolin McAuliffe | ||
| Affirmative | 337,261,756,605.130 | 94.190 |
| Withheld | 20,799,631,375.610 | 5.810 |
| TOTAL | 358,061,387,980.740 | 100.000 |
| Christine J. Thompson | ||
| Affirmative | 337,756,507,971.920 | 94.330 |
| Withheld | 20,304,880,008.820 | 5.670 |
| TOTAL | 358,061,387,980.740 | 100.000 |
| Elizabeth S. Acton | ||
| Affirmative | 336,673,811,160.640 | 94.030 |
| Withheld | 21,387,576,820.100 | 5.970 |
| TOTAL | 358,061,387,980.740 | 100.000 |
| Laura M. Bishop | ||
| Affirmative | 336,705,559,027.450 | 94.040 |
| Withheld | 21,355,828,953.280 | 5.960 |
| TOTAL | 358,061,387,980.730 | 100.000 |
| Ann E. Dunwoody | ||
| Affirmative | 336,791,135,924.560 | 94.060 |
| Withheld | 21,270,252,056.180 | 5.940 |
| TOTAL | 358,061,387,980.740 | 100.000 |
| John Engler | ||
| Affirmative | 336,187,619,932.530 | 93.890 |
| Withheld | 21,873,768,048.210 | 6.110 |
| TOTAL | 358,061,387,980.740 | 100.000 |
| Robert F. Gartland | ||
| Affirmative | 337,535,127,127.930 | 94.270 |
| Withheld | 20,526,260,852.810 | 5.730 |
| TOTAL | 358,061,387,980.740 | 100.000 |
| Robert W. Helm | ||
| Affirmative | 337,290,460,580.820 | 94.200 |
| Withheld | 20,770,927,399.920 | 5.800 |
| TOTAL | 358,061,387,980.740 | 100.000 |
| Arthur E. Johnson | ||
| Affirmative | 336,917,974,849.290 | 94.100 |
| Withheld | 21,143,413,131.450 | 5.900 |
| TOTAL | 358,061,387,980.740 | 100.000 |
| Michael E. Kenneally | ||
| Affirmative | 337,417,190,479.840 | 94.240 |
| Withheld | 20,644,197,500.900 | 5.760 |
| TOTAL | 358,061,387,980.740 | 100.000 |
| Mark A. Murray | ||
| Affirmative | 337,795,870,420.820 | 94.340 |
| Withheld | 20,265,517,559.920 | 5.660 |
| TOTAL | 358,061,387,980.740 | 100.000 |
| Carol J. Zierhoffer | ||
| Affirmative | 337,084,951,395.910 | 94.140 |
| Withheld | 20,976,436,584.830 | 5.860 |
| TOTAL | 358,061,387,980.740 | 100.000 |
| Proposal 1 reflects trust wide proposal and voting results. | ||
 |


Contents
| Current 7-Day Yields | ||
| Fidelity® Money Market Fund | 5.09% | |
| Premium Class | 5.21% | |
Yield refers to the income paid by the Fund over a given period. Yield for money market funds is usually for seven-day periods, as it is here, though it is expressed as an annual percentage rate. Past performance is no guarantee of future results. Yield will vary and it's possible to lose money investing in the Fund. A portion of the Fund's expenses was reimbursed and/or waived. Absent such reimbursements and/or waivers the yield for the period ending October 31, 2023, the most recent period shown in the table, would have been 5.12% for Premium Class. | ||
| Effective Maturity Diversification (% of Fund's Investments) | ||
| Days | ||
| 1 - 7 | 69.7 | |
| 8 - 30 | 10.5 | |
| 31 - 60 | 8.2 | |
| 61 - 90 | 5.2 | |
| 91 - 180 | 5.5 | |
| > 180 | 0.9 | |
| Effective maturity is determined in accordance with the requirements of Rule 2a-7 under the Investment Company Act of 1940. | ||
Asset Allocation (% of Fund's net assets) |
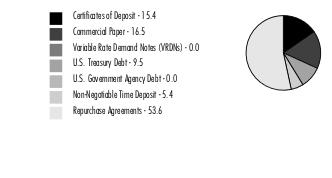 |
Net Other Assets (Liabilities) - (0.4)% |
Percentages shown as 0.0% may reflect amounts less than 0.05%. |
| Certificate of Deposit - 15.4% | ||||
Yield (%)(a) | Principal Amount (b) (000s) | Value ($) (000s) | ||
| Domestic Certificates Of Deposit - 3.5% | ||||
| Bank of America NA | ||||
| 11/9/23 to 2/28/24 | 5.57 to 5.75 | 2,606,000 | 2,606,000 | |
| BMO Harris Bank NA | ||||
| 12/5/23 to 1/12/24 (c)(d) | 5.75 to 5.77 | 436,000 | 436,000 | |
| State Street Bank & Trust Co., Boston | ||||
| 2/20/24 to 2/22/24 (c)(d) | 5.65 | 343,000 | 343,000 | |
TOTAL DOMESTIC CERTIFICATES OF DEPOSIT | 3,385,000 | |||
| New York Branch, Yankee Dollar, Foreign Banks - 11.9% | ||||
| Bank of Nova Scotia | ||||
| 3/7/24 to 5/1/24 (c) | 5.65 to 5.85 | 659,500 | 659,500 | |
| Credit Agricole CIB | ||||
| 11/1/23 to 2/2/24 | 5.58 to 5.68 | 1,094,000 | 1,094,000 | |
| Landesbank Baden-Wuerttemberg New York Branch | ||||
| 11/3/23 to 11/7/23 | 5.38 | 875,000 | 875,000 | |
| Mitsubishi UFJ Trust & Banking Corp. | ||||
| 11/1/23 to 12/15/23 | 5.58 to 5.64 | 3,039,500 | 3,039,500 | |
| Mizuho Corporate Bank Ltd. | ||||
| 11/13/23 to 12/22/23 (c) | 5.55 to 5.58 | 2,053,000 | 2,053,000 | |
| MUFG Bank Ltd. | ||||
| 11/20/23 to 1/25/24 | 5.62 to 5.70 | 831,000 | 831,000 | |
| Sumitomo Mitsui Banking Corp. | ||||
| 12/1/23 to 2/2/24 (c) | 5.51 to 5.74 | 2,196,000 | 2,196,000 | |
| Sumitomo Mitsui Trust Bank Ltd. | ||||
| 1/2/24 to 1/8/24 | 5.60 to 5.62 | 661,000 | 661,000 | |
TOTAL NEW YORK BRANCH, YANKEE DOLLAR, FOREIGN BANKS | 11,409,000 | |||
| TOTAL CERTIFICATE OF DEPOSIT (Cost $14,794,000) | 14,794,000 | |||
| Financial Company Commercial Paper - 16.0% | ||||
Yield (%)(a) | Principal Amount (b) (000s) | Value ($) (000s) | ||
| Australia & New Zealand Banking Group Ltd. | ||||
| 11/13/23 to 4/9/24 | 5.61 to 5.78 | 864,000 | 846,052 | |
| Bank of Montreal | ||||
| 11/9/23 to 4/5/24 (c) | 5.66 to 5.81 | 1,511,000 | 1,504,482 | |
| Bayerische Landesbank | ||||
| 11/1/23 to 11/10/23 | 5.53 to 5.54 | 1,255,000 | 1,254,227 | |
| Bedford Row Funding Corp. | ||||
| 3/20/24 (c)(d) | 5.66 | 108,000 | 108,000 | |
| 3/26/24 (c)(d) | 5.66 | 112,000 | 112,000 | |
| 4/15/24 (c)(d) | 5.66 | 65,000 | 65,000 | |
| 4/8/24 (c)(d) | 5.66 | 54,000 | 54,000 | |
| Bedford Row Funding Corp. (Liquidity Facility Royal Bank of Canada) | ||||
| 5/20/24 | 5.84 | 142,000 | 137,520 | |
| 5/23/24 | 5.85 | 66,000 | 63,883 | |
| BPCE SA | ||||
| 11/9/23 to 2/8/24 | 5.56 to 5.74 | 2,309,000 | 2,283,880 | |
| Canadian Imperial Bank of Commerce | ||||
| 11/9/23 to 12/22/23 (c) | 5.66 to 5.68 | 538,000 | 536,311 | |
| DNB Bank ASA | ||||
| 4/5/24 to 5/20/24 | 5.79 to 5.84 | 908,000 | 882,610 | |
| Federation des caisses Desjardin | ||||
| 11/9/23 to 1/22/24 | 5.58 to 5.80 | 653,000 | 647,336 | |
| Landesbank Baden-Wurttemberg | ||||
| 11/1/23 | 5.35 | 2,192,000 | 2,192,000 | |
| Mitsubishi UFJ Trust & Banking Corp. | ||||
| 11/10/23 | 5.61 | 86,000 | 85,881 | |
| Mizuho Bank Ltd. Singapore Branch | ||||
| 11/17/23 to 1/16/24 | 5.52 to 5.64 | 346,000 | 343,950 | |
| National Australia Bank Ltd. | ||||
| 3/18/24 (c)(d) | 5.64 | 196,000 | 196,000 | |
| National Bank of Canada | ||||
| 1/19/24 | 5.77 | 432,000 | 426,691 | |
| Podium Funding Trust | ||||
| 12/8/23 (c)(d) | 5.76 | 86,000 | 86,000 | |
| 2/22/24 (c)(d) | 5.67 | 86,000 | 86,000 | |
| Podium Funding Trust (Liquidity Facility Bank of Montreal) | ||||
| 1/12/24 | 5.81 | 65,000 | 64,267 | |
| 1/17/24 | 5.73 | 39,000 | 38,534 | |
| 4/18/24 | 5.84 | 44,000 | 42,829 | |
| Royal Bank of Canada | ||||
| 11/9/23 to 5/14/24 (c)(d) | 5.66 to 5.71 | 653,000 | 653,000 | |
| Skandinaviska Enskilda Banken AB | ||||
| 12/14/23 | 5.54 | 217,000 | 215,585 | |
| Sumitomo Mitsui Banking Corp. | ||||
| 1/24/24 | 5.70 | 219,000 | 216,128 | |
| Sumitomo Mitsui Trust Bank Ltd. | ||||
| 11/6/23 to 12/20/23 | 5.52 to 5.57 | 2,221,000 | 2,213,376 | |
| TOTAL FINANCIAL COMPANY COMMERCIAL PAPER (Cost $15,355,542) | 15,355,542 | |||
| Asset Backed Commercial Paper - 0.5% | ||||
Yield (%)(a) | Principal Amount (b) (000s) | Value ($) (000s) | ||
| Cabot Trail Funding LLC (Liquidity Facility The Toronto-Dominion Bank) | ||||
| 12/13/23 | 5.69 | 16,000 | 15,897 | |
| 2/9/24 | 5.76 | 43,000 | 42,331 | |
| Gotham Funding Corp. (Liquidity Facility Bank of Tokyo-Mitsubishi UFJ Ltd.) | ||||
| 12/19/23 | 5.59 | 20,000 | 19,853 | |
| 12/20/23 | 5.59 | 79,000 | 78,408 | |
| Liberty Street Funding LLC (Liquidity Facility Bank of Nova Scotia) | ||||
| 12/18/23 | 5.56 | 126,000 | 125,097 | |
| 12/19/23 | 5.56 | 90,000 | 89,341 | |
| 12/19/23 | 5.56 | 45,000 | 44,671 | |
| Victory Receivables Corp. (Liquidity Facility Bank of Tokyo-Mitsubishi UFJ Ltd.) | ||||
| 12/20/23 | 5.60 | 44,000 | 43,669 | |
| 12/21/23 | 5.60 | 66,000 | 65,494 | |
| TOTAL ASSET BACKED COMMERCIAL PAPER (Cost $524,761) | 524,761 | |||
| U.S. Treasury Debt - 9.5% | ||||
Yield (%)(a) | Principal Amount (b) (000s) | Value ($) (000s) | ||
| U.S. Treasury Obligations - 9.5% | ||||
| U.S. Treasury Bills | ||||
| 11/2/23 to 12/26/23 | 5.32 to 5.41 | 9,149,400 | 9,115,960 | |
| TOTAL U.S. TREASURY DEBT (Cost $9,149,400) | 9,115,960 | |||
| Non-Negotiable Time Deposit - 5.4% | ||||
Yield (%)(a) | Principal Amount (b) (000s) | Value ($) (000s) | ||
| Time Deposits - 5.4% | ||||
| Barclays Bank PLC | ||||
| 11/1/23 | 5.37 | 1,753,000 | 1,753,000 | |
| Canadian Imperial Bank of Commerce | ||||
| 11/1/23 | 5.31 | 47,609 | 47,609 | |
| Landesbank Hessen-Thuringen London Branch | ||||
| 11/1/23 to 11/7/23 | 5.37 | 984,000 | 984,000 | |
| Mizuho Bank Ltd. Canada Branch | ||||
| 11/1/23 | 5.33 | 2,012,000 | 2,012,000 | |
| Royal Bank of Canada | ||||
| 11/1/23 | 5.32 | 443,000 | 443,000 | |
| TOTAL NON-NEGOTIABLE TIME DEPOSIT (Cost $5,239,609) | 5,239,609 | |||
| U.S. Government Agency Repurchase Agreement - 13.6% | |||
Maturity Amount ($) (000s) | Value ($) (000s) | ||
| In a joint trading account at 5.31% dated 10/31/23 due 11/1/23 (Collateralized by U.S. Government Obligations) # | 5,522,019 | 5,521,205 | |
| With: | |||
| ABN AMRO Bank NV at 5.31%, dated 10/31/23 due 11/1/23 (Collateralized by U.S. Treasury Obligations valued at $196,889,037, 1.25% - 5.50%, 8/15/25 - 8/20/53) | 193,028 | 193,000 | |
| BMO Harris Bank NA at: | |||
5.31%, dated 10/26/23 due 11/2/23 (Collateralized by U.S. Government Obligations valued at $53,086,941, 3.50% - 7.00%, 3/20/47 - 10/20/63) | 52,054 | 52,000 | |
5.32%, dated: | |||
| 9/21/23 due 11/2/23 (Collateralized by U.S. Government Obligations valued at $52,335,184, 3.50% - 7.00%, 11/20/41 - 9/20/63) | 51,317 | 51,000 | |
| 10/12/23 due 11/2/23 (Collateralized by U.S. Government Obligations valued at $78,772,129, 3.00% - 5.00%, 6/20/41 - 11/20/49) | 77,239 | 77,000 | |
| BNP Paribas, SA at: | |||
5.32%, dated 9/21/23 due 11/2/23 (Collateralized by U.S. Treasury Obligations valued at $1,352,850,901, 0.00% - 7.00%, 11/30/23 - 10/1/53) | 1,323,162 | 1,315,000 | |
5.35%, dated 10/25/23 due 11/7/23 (Collateralized by U.S. Government Obligations valued at $106,205,785, 0.00% - 6.50%, 2/27/24 - 10/1/53) | 104,773 | 104,000 | |
5.36%, dated: | |||
| 8/1/23 due 11/7/23 (Collateralized by U.S. Treasury Obligations valued at $101,854,070, 0.00% - 7.00%, 12/21/23 - 10/1/53) (c)(d)(e) | 99,780 | 98,000 | |
| 8/4/23 due 11/7/23 (Collateralized by U.S. Government Obligations valued at $100,273,175, 0.00% - 7.00%, 12/21/23 - 10/1/53) (c)(d)(e) | 98,762 | 97,000 | |
| 8/23/23 due 11/7/23 (Collateralized by U.S. Treasury Obligations valued at $101,179,927, 0.00% - 7.00%, 2/27/24 - 10/1/53) (c)(d)(e) | 99,751 | 98,000 | |
| BofA Securities, Inc. at: | |||
5.34%, dated 10/30/23 due 11/7/23 (Collateralized by U.S. Government Obligations valued at $381,593,172, 2.00% - 5.00%, 2/20/51 - 8/20/53) | 375,720 | 374,000 | |
5.35%, dated 10/26/23 due 11/7/23 (Collateralized by U.S. Treasury Obligations valued at $53,087,330, 4.00%, 12/15/25) | 52,247 | 52,000 | |
5.37%, dated 9/27/23 due 11/7/23 (Collateralized by U.S. Treasury Obligations valued at $51,266,278, 1.25%, 4/30/28) (c)(d)(e) | 50,902 | 50,000 | |
| CIBC Bank U.S.A. at: | |||
5.32%, dated 10/23/23 due 11/7/23 (Collateralized by U.S. Government Obligations valued at $46,982,428, 0.75% - 6.50%, 12/31/26 - 9/1/53) | 46,190 | 46,000 | |
5.34%, dated 10/12/23 due 11/7/23 (Collateralized by U.S. Government Obligations valued at $291,562,413, 0.13% - 7.50%, 6/30/24 - 10/1/53) | 286,353 | 285,000 | |
| Citibank NA at 5.31%, dated 10/26/23 due 11/2/23 (Collateralized by U.S. Treasury Obligations valued at $160,816,499, 1.25% - 3.88%, 8/31/27 - 5/15/50) | 156,161 | 156,000 | |
| Citigroup Global Capital Markets, Inc. at: | |||
5.31%, dated 10/26/23 due 11/2/23 (Collateralized by U.S. Government Obligations valued at $184,783,479, 3.00% - 7.50%, 7/31/24 - 9/20/53) | 181,187 | 181,000 | |
5.32%, dated 10/23/23 due 11/7/23 (Collateralized by U.S. Government Obligations valued at $158,310,286, 2.00% - 5.00%, 7/31/24 - 5/1/51) | 155,802 | 155,000 | |
| FICC State Street GC (Gov. Repo) at 5.31%, dated 10/31/23 due 11/1/23 (Collateralized by U.S. Government Obligations valued at $212,404,820, 0.25% - 6.50%, 5/31/25 - 10/1/53) | 208,031 | 208,000 | |
| Goldman Sachs & Co. at 5.31%, dated: | |||
10/25/23 due 11/1/23 (Collateralized by U.S. Government Obligations valued at $476,831,822, 1.13% - 6.50%, 12/1/26 - 1/15/58) | 467,482 | 467,000 | |
10/26/23 due 11/2/23 (Collateralized by U.S. Government Obligations valued at $211,326,859, 2.50% - 6.50%, 2/1/31 - 10/1/53) | 207,214 | 207,000 | |
10/27/23 due 11/3/23 (Collateralized by U.S. Treasury Obligations valued at $370,533,122, 0.00% - 3.88%, 2/20/24 - 8/15/33) | 363,375 | 363,000 | |
10/30/23 due 11/6/23 (Collateralized by U.S. Treasury Obligations valued at $422,404,597, 2.00% - 4.38%, 5/15/41 - 8/15/43) | 414,427 | 414,000 | |
10/31/23 due 11/7/23 | |||
| (Collateralized by U.S. Government Obligations valued at $265,239,117, 2.50% - 6.50%, 3/20/25 - 8/15/64) | 260,268 | 260,000 | |
| (Collateralized by U.S. Treasury Obligations valued at $211,171,145, 0.00% - 4.38%, 11/7/23 - 11/20/51) | 207,214 | 207,000 | |
| Morgan Stanley & Co., LLC at 5.31%, dated 10/31/23 due 11/1/23 (Collateralized by U.S. Government Obligations valued at $106,101,010, 0.00% - 6.50%, 11/28/23 - 10/1/53) | 104,015 | 104,000 | |
| RBC Dominion Securities at 5.32%, dated 9/21/23 due 11/2/23 (Collateralized by U.S. Government Obligations valued at $496,824,348, 0.00% - 6.88%, 11/24/23 - 9/1/53) | 487,004 | 484,000 | |
| RBC Financial Group at 5.33%, dated 9/21/23 due 11/2/23 (Collateralized by U.S. Government Obligations valued at $1,091,602,927, 1.62% - 9.00%, 4/1/25 - 9/20/63) | 1,068,604 | 1,062,000 | |
| TD Securities (U.S.A.) at 5.32%, dated 10/31/23 due 11/1/23 (Collateralized by U.S. Government Obligations valued at $232,594,368, 2.50% - 6.50%, 6/20/43 - 10/20/53) | 228,034 | 228,000 | |
| Wells Fargo Securities, LLC at 5.36%, dated 9/21/23 due 11/7/23 (Collateralized by U.S. Government Obligations valued at $207,297,531, 1.50% - 6.50%, 12/1/23 - 10/1/53) (c)(d)(e) | 203,835 | 202,000 | |
| TOTAL U.S. GOVERNMENT AGENCY REPURCHASE AGREEMENT (Cost $13,111,205) | 13,111,205 | ||
| U.S. Treasury Repurchase Agreement - 37.8% | |||
Maturity Amount ($) (000s) | Value ($) (000s) | ||
| With: | |||
| Barclays Bank PLC at 5.32%, dated 9/21/23 due 11/2/23 (Collateralized by U.S. Treasury Obligations valued at $327,351,481, 1.50% - 4.38%, 8/15/26 - 11/30/28) | 320,980 | 319,000 | |
| BMO Capital Markets Corp. at 5.31%, dated 10/26/23 due 11/2/23 (Collateralized by U.S. Treasury Obligations valued at $47,982,509, 0.00% - 4.63%, 11/30/23 - 8/15/30) | 47,049 | 47,000 | |
| BofA Securities, Inc. at: | |||
5.32%, dated 10/30/23 due 11/7/23 (Collateralized by U.S. Treasury Obligations valued at $62,238,471, 0.63%, 10/15/24) | 61,279 | 61,000 | |
5.33%, dated 9/21/23 due 11/2/23 (Collateralized by U.S. Treasury Obligations valued at $22,576,305, 2.75%, 7/31/27) | 22,137 | 22,000 | |
| CIBC Bank U.S.A. at 5.32%, dated 9/21/23 due 11/2/23 (Collateralized by U.S. Treasury Obligations valued at $97,486,612, 0.50% - 4.00%, 2/15/26 - 5/15/50) | 95,589 | 95,000 | |
| Credit AG at: | |||
5.31%, dated 10/25/23 due 11/1/23 (Collateralized by U.S. Treasury Obligations valued at $90,733,605, 2.75% - 3.13%, 11/15/47 - 5/15/48) | 88,091 | 88,000 | |
5.32%, dated: | |||
| 9/21/23 due 11/2/23 (Collateralized by U.S. Treasury Obligations valued at $46,355,204, 2.25% - 3.00%, 5/15/41 - 5/15/47) | 45,279 | 45,000 | |
| 10/10/23 due 11/2/23 (Collateralized by U.S. Treasury Obligations valued at $94,145,114, 1.13% - 3.25%, 5/15/40 - 5/15/42) | 92,313 | 92,000 | |
5.33%, dated 10/20/23 due 11/7/23 (Collateralized by U.S. Treasury Obligations valued at $95,028,586, 1.13% - 4.25%, 5/15/39 - 5/15/40) | 93,427 | 93,000 | |
| Federal Reserve Bank of New York at 5.3%, dated 10/31/23 due 11/1/23 (Collateralized by U.S. Treasury Obligations valued at $33,282,899,311, 0.75% - 4.00%, 1/15/25 - 5/15/47) | 33,282,899 | 33,278,000 | |
| Fixed Income Clearing Corp. - BNP at 5.31%, dated 10/31/23 due 11/1/23 (Collateralized by U.S. Treasury Obligations valued at $239,735,363, 0.38% - 5.42%, 7/31/24 - 11/15/50) | 235,035 | 235,000 | |
| Fixed Income Clearing Corp. - SSB at 5.31%, dated 10/31/23 due 11/1/23 (Collateralized by U.S. Treasury Obligations valued at $143,735,388, 4.63%, 10/15/26) | 141,021 | 141,000 | |
| ING Financial Markets LLC at 5.31%, dated: | |||
10/27/23 due 11/3/23 (Collateralized by U.S. Treasury Obligations valued at $57,445,336, 0.25% - 5.00%, 7/31/24 - 5/15/47) | 56,058 | 56,000 | |
10/31/23 due 11/7/23 (Collateralized by U.S. Treasury Obligations valued at $14,296,079, 0.00% - 5.38%, 11/30/23 - 2/15/51) | 14,014 | 14,000 | |
| Mizuho Bank, Ltd. at 5.31%, dated 10/31/23 due 11/1/23 (Collateralized by U.S. Treasury Obligations valued at $239,916,226, 1.63%, 5/15/31) | 235,035 | 235,000 | |
| MUFG Securities (Canada), Ltd. at 5.33%, dated 9/21/23 due 11/2/23 (Collateralized by U.S. Treasury Obligations valued at $46,179,827, 0.25% - 6.50%, 3/31/24 - 8/15/53) | 45,280 | 45,000 | |
| MUFG Securities EMEA PLC at 5.31%, dated: | |||
10/31/23 due 11/1/23 | |||
| (Collateralized by U.S. Treasury Obligations valued at $191,654,530, 2.75% - 3.88%, 9/30/29 - 11/15/41) | 188,028 | 188,000 | |
| (Collateralized by U.S. Treasury Obligations valued at $310,073,355, 0.25% - 5.00%, 11/15/23 - 10/31/30) | 282,042 | 282,000 | |
11/1/23 due 11/2/23 (f) | 188,028 | 188,000 | |
| NatWest Markets Securities, Inc. at 5.31%, dated 10/26/23 due 11/2/23 (Collateralized by U.S. Treasury Obligations valued at $233,786,743, 0.50% - 4.00%, 11/30/23 - 4/30/29) | 229,236 | 229,000 | |
| Norinchukin Bank at 5.34%, dated 10/30/23 due 11/6/23 (Collateralized by U.S. Treasury Obligations valued at $47,947,144, 3.88%, 2/15/43) | 47,049 | 47,000 | |
| RBC Dominion Securities at 5.32%, dated 9/21/23 due 11/2/23 (Collateralized by U.S. Treasury Obligations valued at $69,782,079, 0.00% - 6.88%, 2/15/24 - 2/15/53) | 68,422 | 68,000 | |
| Societe Generale at 5.31%, dated: | |||
10/26/23 due 11/2/23 | |||
| (Collateralized by U.S. Treasury Obligations valued at $93,977,041, 3.25% - 3.63%, 5/15/42 - 2/15/53) | 92,095 | 92,000 | |
| (Collateralized by U.S. Treasury Obligations valued at $190,908,805, 0.38% - 4.00%, 12/31/25 - 5/15/32) | 187,193 | 187,000 | |
10/31/23 due 11/7/23 (Collateralized by U.S. Treasury Obligations valued at $216,739,209, 3.00% - 3.88%, 5/15/43 - 8/15/52) | 212,219 | 212,000 | |
| TOTAL U.S. TREASURY REPURCHASE AGREEMENT (Cost $36,359,000) | 36,359,000 | ||
| Other Repurchase Agreement - 2.2% | |||
Maturity Amount ($) (000s) | Value ($) (000s) | ||
| Other Repurchase Agreement - 2.2% | |||
| With: | |||
| BMO Capital Markets Corp. at: | |||
5.46%, dated 10/31/23 due 11/1/23 (Collateralized by Corporate Obligations valued at $95,564,542, 1.43% - 5.87%, 2/4/24 - 2/1/46) | 91,014 | 91,000 | |
5.52%, dated 10/31/23 due 11/1/23 (Collateralized by Corporate Obligations valued at $98,295,454, 3.88% - 5.75%, 8/1/28 - 4/1/29) | 91,014 | 91,000 | |
| BMO Chicago Branch at 5.52%, dated 10/31/23 due 11/1/23 (Collateralized by Corporate Obligations valued at $11,520,483, 0.00% - 8.63%, 3/1/24 - 9/20/72) | 11,002 | 11,000 | |
| BNP Paribas Prime Brokerage, Inc. at 5.57%, dated 10/31/23 due 11/1/23 (Collateralized by Equity Securities valued at $144,742,421) | 134,021 | 134,000 | |
| HSBC Securities, Inc. at 5.55%, dated 10/31/23 due 11/1/23 (Collateralized by Corporate Obligations valued at $23,763,997, 3.00% - 6.60%, 9/1/30 - 12/31/79) | 22,003 | 22,000 | |
| ING Financial Markets LLC at 5.55%, dated 10/31/23 due 11/1/23 (Collateralized by Equity Securities valued at $109,096,894) | 101,016 | 101,000 | |
| J.P. Morgan Securities, LLC at: | |||
5.82%, dated 10/10/23 due 1/29/24 (Collateralized by Equity Securities valued at $240,612,757) (c)(d)(e) | 226,307 | 222,000 | |
5.89%, dated 10/2/23 due 1/29/24 (Collateralized by Corporate Obligations valued at $741,010,899, 0.00% - 9.25%, 12/1/23 - 2/1/29) (c)(d)(e) | 700,488 | 687,000 | |
| Mitsubishi UFJ Securities (U.S.A.), Inc. at: | |||
5.55%, dated 10/31/23 due 11/1/23 (Collateralized by Equity Securities valued at $60,489,332) | 56,009 | 56,000 | |
5.84%, dated 10/31/23 due 11/1/23 (Collateralized by Equity Securities valued at $8,641,405) | 8,001 | 8,000 | |
| Mizuho Securities U.S.A., Inc. at: | |||
5.59%, dated 10/31/23 due 11/1/23 (Collateralized by Equity Securities valued at $87,493,589) | 81,013 | 81,000 | |
5.82%, dated 10/24/23 due 12/22/23 (Collateralized by Corporate Obligations valued at $305,202,793, 0.70% - 13.00%, 3/20/25 - 5/25/68) (c)(d)(e) | 292,766 | 290,000 | |
| NatWest Markets Securities, Inc. at 5.57%, dated 10/31/23 due 11/1/23 (Collateralized by U.S. Government Obligations valued at $45,978,340, 0.00% - 5.13%, 11/15/23 - 11/15/39) | 45,007 | 45,000 | |
| RBC Capital Markets Co. at 5.82%, dated 10/24/23 due 12/26/23 (Collateralized by Corporate Obligations valued at $93,491,682, 1.46% - 9.43%, 2/20/27 - 11/15/68) (c)(d)(e) | 89,906 | 89,000 | |
| Wells Fargo Securities, LLC at: | |||
5.48%, dated 10/31/23 due 11/1/23 (Collateralized by Commercial Paper valued at $161,734,617, 0.00% - 5.41%, 11/3/23 - 7/15/24) | 157,024 | 157,000 | |
5.95%, dated 10/20/23 due 1/19/24 (Collateralized by Corporate Obligations valued at $47,602,673, 0.00% - 4.63%, 3/1/24 - 10/15/30) | 44,662 | 44,000 | |
| TOTAL OTHER REPURCHASE AGREEMENT (Cost $2,129,000) | 2,129,000 | ||
| TOTAL INVESTMENT IN SECURITIES - 100.4% (Cost $96,629,077) | 96,629,077 |
NET OTHER ASSETS (LIABILITIES) - (0.4)% | (376,616) |
| NET ASSETS - 100.0% | 96,252,461 |
| (a) | Yield represents either the annualized yield at the date of purchase, or the stated coupon rate, or, for floating and adjustable rate securities, the rate at period end. |
| (b) | Amount is stated in United States dollars unless otherwise noted. |
| (c) | Coupon rates for floating and adjustable rate securities reflect the rates in effect at period end. |
| (d) | Coupon is indexed to a floating interest rate which may be multiplied by a specified factor and/or subject to caps or floors. |
| (e) | The maturity amount is based on the rate at period end. |
| (f) | Represents a forward settling transaction and therefore no collateral securities had been allocated as of period end. The agreement contemplated the delivery of U.S. Government Obligations as collateral on settlement date. |
| Other Information | ||
| # Additional information on each counterparty to the repurchase agreement is as follows: | ||
| Repurchase Agreement / Counterparty | Value ($) (000's) | |
| $5,521,205,000 due 11/01/23 at 5.31% | ||
| BNY Mellon Capital Markets LLC | 130,176 | |
| Bank of America, N.A. | 374,689 | |
| BofA Securities, Inc. | 214,726 | |
| Citigroup Global Markets, Inc. | 307,194 | |
| Credit Agricole CIB New York Branch | 46,903 | |
| HSBC Securities (USA), Inc. | 46,836 | |
| ING Financial Markets LLC | 60,393 | |
| JP Morgan Securities LLC | 104,080 | |
| Mitsubishi UFJ Securities Holdings Ltd | 187,344 | |
| Mizuho Securities USA, Inc. | 104,080 | |
| Nomura Securities International | 807,756 | |
| RBC Dominion Securities, Inc. | 632,969 | |
| Royal Bank of Canada | 208,732 | |
| Sumitomo Mitsui Banking Corp. | 1,842,219 | |
| Sumitomo Mitsui Banking Corp. NY | 225,571 | |
| Wells Fargo Bank National Association | 19,377 | |
| Wells Fargo Securities LLC | 208,160 | |
| 5,521,205 | ||
| Statement of Assets and Liabilities | ||||
| Amounts in thousands (except per-share amounts) | October 31, 2023 (Unaudited) | |||
| Assets | ||||
Investment in securities, at value (including repurchase agreements of $51,599,205) - See accompanying schedule Unaffiliated issuers (cost $96,629,077): | $ | 96,629,077 | ||
| Cash | 496,000 | |||
| Receivable for fund shares sold | 495,154 | |||
| Interest receivable | 161,347 | |||
| Receivable for interfund loans | 49,289 | |||
| Prepaid expenses | 101 | |||
| Receivable from investment adviser for expense reductions | 4,157 | |||
| Other receivables | 413 | |||
Total assets | 97,835,538 | |||
| Liabilities | ||||
| Payable for investments purchased | $ | 1,132,131 | ||
| Payable for fund shares redeemed | 357,701 | |||
| Distributions payable | 61,734 | |||
| Accrued management fee | 19,668 | |||
| Other affiliated payables | 8,615 | |||
| Other payables and accrued expenses | 3,228 | |||
| Total Liabilities | 1,583,077 | |||
| Net Assets | $ | 96,252,461 | ||
| Net Assets consist of: | ||||
| Paid in capital | $ | 96,252,279 | ||
| Total accumulated earnings (loss) | 182 | |||
| Net Assets | $ | 96,252,461 | ||
| Net Asset Value and Maximum Offering Price | ||||
| Fidelity Money Market Fund : | ||||
Net Asset Value, offering price and redemption price per share ($10,107,272 ÷ 10,106,622 shares) | $ | 1.00 | ||
| Premium Class : | ||||
Net Asset Value, offering price and redemption price per share ($86,145,189 ÷ 86,142,739 shares) | $ | 1.00 | ||
| Statement of Operations | ||||
| Amounts in thousands | Six months ended October 31, 2023 (Unaudited) | |||
| Investment Income | ||||
| Interest (including $576 from affiliated interfund lending) | $ | 2,342,466 | ||
| Expenses | ||||
| Management fee | $ | 108,593 | ||
| Transfer agent fees | 46,153 | |||
| Accounting fees and expenses | 1,305 | |||
| Custodian fees and expenses | 143 | |||
| Independent trustees' fees and expenses | 142 | |||
| Registration fees | 3,198 | |||
| Audit | 26 | |||
| Legal | 39 | |||
| Miscellaneous | 332 | |||
| Total expenses before reductions | 159,931 | |||
| Expense reductions | (23,489) | |||
| Total expenses after reductions | 136,442 | |||
| Net Investment income (loss) | 2,206,024 | |||
| Realized and Unrealized Gain (Loss) | ||||
| Net realized gain (loss) on: | ||||
| Investment Securities: | ||||
| Unaffiliated issuers | (16) | |||
| Total net realized gain (loss) | (16) | |||
| Net increase in net assets resulting from operations | $ | 2,206,008 | ||
| Statement of Changes in Net Assets | ||||
| Amount in thousands | Six months ended October 31, 2023 (Unaudited) | Year ended April 30, 2023 | ||
| Increase (Decrease) in Net Assets | ||||
| Operations | ||||
| Net investment income (loss) | $ | 2,206,024 | $ | 1,833,626 |
| Net realized gain (loss) | (16) | 5 | ||
Net increase in net assets resulting from operations | 2,206,008 | 1,833,631 | ||
| Distributions to shareholders | (2,205,989) | (1,833,654) | ||
| Share transactions - net increase (decrease) | 16,810,394 | 48,063,691 | ||
| Total increase (decrease) in net assets | 16,810,413 | 48,063,668 | ||
| Net Assets | ||||
| Beginning of period | 79,442,048 | 31,378,380 | ||
| End of period | $ | 96,252,461 | $ | 79,442,048 |
| Fidelity® Money Market Fund |
Six months ended (Unaudited) October 31, 2023 | Years ended April 30, 2023 | 2022 | 2021 | 2020 | 2019 | |||||||
Selected Per-Share Data | ||||||||||||
| Net asset value, beginning of period | $ | 1.00 | $ | 1.00 | $ | 1.00 | $ | 1.00 | $ | 1.00 | $ | 1.00 |
| Income from Investment Operations | ||||||||||||
Net investment income (loss) A | .025 | .029 | - B | - B | .016 | .020 | ||||||
Net realized and unrealized gain (loss) B | - | - | - | - | - | - | ||||||
| Total from investment operations | .025 | .029 | - B | - B | .016 | .020 | ||||||
| Distributions from net investment income | (.025) | (.029) | - B | - B | (.016) | (.020) | ||||||
| Total distributions | (.025) | (.029) | - B | - B | (.016) | (.020) | ||||||
| Net asset value, end of period | $ | 1.00 | $ | 1.00 | $ | 1.00 | $ | 1.00 | $ | 1.00 | $ | 1.00 |
Total Return C,D | 2.51% | 2.94% | .01% | .02% | 1.61% | 2.03% | ||||||
Ratios to Average Net Assets A,E,F | ||||||||||||
| Expenses before reductions | .42% G,H | .42% | .42% | .42% | .42% | .42% | ||||||
| Expenses net of fee waivers, if any | .42% G,H | .42% | .18% | .25% | .42% | .42% | ||||||
| Expenses net of all reductions | .42% G,H | .42% | .18% | .25% | .42% | .42% | ||||||
| Net investment income (loss) | 4.95% G,H | 3.31% | .01% | .03% | 1.56% | 2.06% | ||||||
| Supplemental Data | ||||||||||||
| Net assets, end of period (in millions) | $ | 10,107 | $ | 8,226 | $ | 3,683 | $ | 4,430 | $ | 6,093 | $ | 5,196 |
| Fidelity® Money Market Fund Premium Class |
Six months ended (Unaudited) October 31, 2023 | Years ended April 30, 2023 | 2022 | 2021 | 2020 | 2019 | |||||||
Selected Per-Share Data | ||||||||||||
| Net asset value, beginning of period | $ | 1.00 | $ | 1.00 | $ | 1.00 | $ | 1.00 | $ | 1.00 | $ | 1.00 |
| Income from Investment Operations | ||||||||||||
Net investment income (loss) A | .025 | .030 | - B | - B | .017 | .021 | ||||||
Net realized and unrealized gain (loss) B | - | - | - | - | - | - | ||||||
| Total from investment operations | .025 | .030 | - B | - B | .017 | .021 | ||||||
| Distributions from net investment income | (.025) | (.030) | - B | - B | (.017) | (.021) | ||||||
| Total distributions | (.025) | (.030) | - B | - B | (.017) | (.021) | ||||||
| Net asset value, end of period | $ | 1.00 | $ | 1.00 | $ | 1.00 | $ | 1.00 | $ | 1.00 | $ | 1.00 |
Total Return C,D | 2.57% | 3.07% | .02% | .05% | 1.73% | 2.16% | ||||||
Ratios to Average Net Assets A,E,F | ||||||||||||
| Expenses before reductions | .36% G,H | .36% | .36% | .36% | .36% | .37% | ||||||
| Expenses net of fee waivers, if any | .36% G,H | .30% | .17% | .23% | .30% | .30% | ||||||
| Expenses net of all reductions | .30% G,H | .30% | .17% | .23% | .30% | .30% | ||||||
| Net investment income (loss) | 5.07% G,H | 3.43% | .02% | .05% | 1.68% | 2.18% | ||||||
| Supplemental Data | ||||||||||||
| Net assets, end of period (in millions) | $ | 86,145 | $ | 71,216 | $ | 27,695 | $ | 35,060 | $ | 48,570 | $ | 36,981 |
| Fidelity Money Market Fund | $405 |
| Gross unrealized appreciation | $- |
| Gross unrealized depreciation | - |
| Net unrealized appreciation (depreciation) | $- |
| Tax cost | $96,629,077 |
| Amount | % of Class-Level Average Net AssetsA | |
Fidelity Money Market Fund | $7,223 | .16 |
Premium Class | 38,930 | .10 |
| $46,153 |
| % of Average Net Assets | |
| Fidelity Money Market Fund | -A |
| Borrower or Lender | Average Loan Balance | Weighted Average Interest Rate | |
| Fidelity Money Market Fund | Lender | 19,864 | 5.40% |
| Amount ($) | |
| Fidelity Money Market Fund | 2 |
Six months ended October 31, 2023 | Year ended April 30, 2023 | |
| Fidelity Money Market Fund | ||
| Distributions to shareholders | ||
| Fidelity Money Market Fund | $223,993 | $184,774 |
| Premium Class | 1,981,996 | 1,648,880 |
Total | $2,205,989 | $1,833,654 |
| Shares | Shares | Dollars | Dollars | |
Six months ended October 31, 2023 | Year ended April 30, 2023 | Six months ended October 31, 2023 | Year ended April 30, 2023 | |
| Fidelity Money Market Fund | ||||
| Fidelity Money Market Fund | ||||
| Shares sold | 6,505,675 | 10,688,040 | $6,505,675 | $10,688,040 |
| Reinvestment of distributions | 191,264 | 162,141 | 191,264 | 162,141 |
| Shares redeemed | (4,815,828) | (6,307,429) | (4,815,828) | (6,307,429) |
| Net increase (decrease) | 1,881,111 | 4,542,752 | $1,881,111 | $4,542,752 |
| Premium Class | ||||
| Shares sold | 48,947,056 | 91,725,652 | $48,947,056 | $91,725,652 |
| Reinvestment of distributions | 1,669,030 | 1,413,717 | 1,669,030 | 1,413,717 |
| Shares redeemed | (35,686,803) | (49,618,430) | (35,686,803) | (49,618,430) |
| Net increase (decrease) | 14,929,283 | 43,520,939 | $14,929,283 | $43,520,939 |
| The Example is based on an investment of $1,000 invested at the beginning of the period and held for the entire period (May 1, 2023 to October 31, 2023). |
Annualized Expense Ratio- A | Beginning Account Value May 1, 2023 | Ending Account Value October 31, 2023 | Expenses Paid During Period- C May 1, 2023 to October 31, 2023 | |||||||
| Fidelity® Money Market Fund | ||||||||||
| Fidelity® Money Market Fund | .42% | |||||||||
| Actual | $ 1,000 | $ 1,025.10 | $ 2.14 | |||||||
Hypothetical-B | $ 1,000 | $ 1,023.03 | $ 2.14 | |||||||
| Premium Class | .30% | |||||||||
| Actual | $ 1,000 | $ 1,025.70 | $ 1.53 | |||||||
Hypothetical-B | $ 1,000 | $ 1,023.63 | $ 1.53 | |||||||
| A special meeting of shareholders was held on October 18, 2023. The results of votes taken among shareholders on the proposal before them are reported below. Each vote reported represents one dollar of net asset value held on the record date for the meeting. | ||
| Proposal 1 | ||
| To elect a Board of Trustees. | ||
# of Votes | % of Votes | |
| Abigail P. Johnson | ||
| Affirmative | 337,939,496,302.780 | 94.380 |
| Withheld | 20,121,891,677.960 | 5.620 |
| TOTAL | 358,061,387,980.740 | 100.000 |
| Jennifer Toolin McAuliffe | ||
| Affirmative | 337,261,756,605.130 | 94.190 |
| Withheld | 20,799,631,375.610 | 5.810 |
| TOTAL | 358,061,387,980.740 | 100.000 |
| Christine J. Thompson | ||
| Affirmative | 337,756,507,971.920 | 94.330 |
| Withheld | 20,304,880,008.820 | 5.670 |
| TOTAL | 358,061,387,980.740 | 100.000 |
| Elizabeth S. Acton | ||
| Affirmative | 336,673,811,160.640 | 94.030 |
| Withheld | 21,387,576,820.100 | 5.970 |
| TOTAL | 358,061,387,980.740 | 100.000 |
| Laura M. Bishop | ||
| Affirmative | 336,705,559,027.450 | 94.040 |
| Withheld | 21,355,828,953.280 | 5.960 |
| TOTAL | 358,061,387,980.730 | 100.000 |
| Ann E. Dunwoody | ||
| Affirmative | 336,791,135,924.560 | 94.060 |
| Withheld | 21,270,252,056.180 | 5.940 |
| TOTAL | 358,061,387,980.740 | 100.000 |
| John Engler | ||
| Affirmative | 336,187,619,932.530 | 93.890 |
| Withheld | 21,873,768,048.210 | 6.110 |
| TOTAL | 358,061,387,980.740 | 100.000 |
| Robert F. Gartland | ||
| Affirmative | 337,535,127,127.930 | 94.270 |
| Withheld | 20,526,260,852.810 | 5.730 |
| TOTAL | 358,061,387,980.740 | 100.000 |
| Robert W. Helm | ||
| Affirmative | 337,290,460,580.820 | 94.200 |
| Withheld | 20,770,927,399.920 | 5.800 |
| TOTAL | 358,061,387,980.740 | 100.000 |
| Arthur E. Johnson | ||
| Affirmative | 336,917,974,849.290 | 94.100 |
| Withheld | 21,143,413,131.450 | 5.900 |
| TOTAL | 358,061,387,980.740 | 100.000 |
| Michael E. Kenneally | ||
| Affirmative | 337,417,190,479.840 | 94.240 |
| Withheld | 20,644,197,500.900 | 5.760 |
| TOTAL | 358,061,387,980.740 | 100.000 |
| Mark A. Murray | ||
| Affirmative | 337,795,870,420.820 | 94.340 |
| Withheld | 20,265,517,559.920 | 5.660 |
| TOTAL | 358,061,387,980.740 | 100.000 |
| Carol J. Zierhoffer | ||
| Affirmative | 337,084,951,395.910 | 94.140 |
| Withheld | 20,976,436,584.830 | 5.860 |
| TOTAL | 358,061,387,980.740 | 100.000 |
| Proposal 1 reflects trust wide proposal and voting results. | ||
 |
Item 2.
Code of Ethics
Not applicable.
Item 3.
Audit Committee Financial Expert
Not applicable.
Item 4.
Principal Accountant Fees and Services
Not applicable.
Item 5.
Audit Committee of Listed Registrants
Not applicable.
Item 6.
Investments
(a)
Not applicable.
(b)
Not applicable
Item 7.
Disclosure of Proxy Voting Policies and Procedures for Closed-End Management Investment Companies
Not applicable.
Item 8.
Portfolio Managers of Closed-End Management Investment Companies
Not applicable.
Item 9.
Purchase of Equity Securities by Closed-End Management Investment Company and Affiliated Purchasers
Not applicable.
Item 10.
Submission of Matters to a Vote of Security Holders
There were no material changes to the procedures by which shareholders may recommend nominees to the Fidelity Hereford Street Trust’s Board of Trustees.
Item 11.
Controls and Procedures
(a)(i) The President and Treasurer and the Chief Financial Officer have concluded that the Fidelity Hereford Street Trust’s (the “Trust”) disclosure controls and procedures (as defined in Rule 30a-3(c) under the Investment Company Act) provide reasonable
assurances that material information relating to the Trust is made known to them by the appropriate persons, based on their evaluation of these controls and procedures as of a date within 90 days of the filing date of this report.
(a)(ii) There was no change in the Trust’s internal control over financial reporting (as defined in Rule 30a-3(d) under the Investment Company Act) that occurred during the period covered by this report that has materially affected, or is reasonably likely to materially affect, the Trust’s internal control over financial reporting.
Item 12.
Disclosure of Securities Lending Activities for Closed-End Management
Investment Companies
Not applicable.
Item 18.
Recovery of Erroneously Awarded Compensation
(a)
Not applicable.
(b)
Not applicable.
Item 19.
Exhibits
(a) | (1) | Not applicable. |
(a) | (2) | |
(a) | (3) | Not applicable. |
(b) |
SIGNATURES
Pursuant to the requirements of the Securities Exchange Act of 1934 and the Investment Company Act of 1940, the registrant has duly caused this report to be signed on its behalf by the undersigned, thereunto duly authorized.
Fidelity Hereford Street Trust
By: | /s/Laura M. Del Prato |
Laura M. Del Prato | |
President and Treasurer | |
Date: | December 21, 2023 |
Pursuant to the requirements of the Securities Exchange Act of 1934 and the Investment Company Act of 1940, this report has been signed below by the following persons on behalf of the registrant and in the capacities and on the dates indicated.
By: | /s/Laura M. Del Prato |
Laura M. Del Prato | |
President and Treasurer | |
Date: | December 21, 2023 |
By: | /s/John J. Burke III |
John J. Burke III | |
Chief Financial Officer | |
Date: | December 21, 2023 |