UNITED STATES
SECURITIES AND EXCHANGE COMMISSION
Washington, D.C. 20549
FORM N-CSR
CERTIFIED SHAREHOLDER REPORT OF REGISTERED
MANAGEMENT INVESTMENT COMPANIES
Investment Company Act file number: 811-08282
Loomis Sayles Funds I
(Exact name of Registrant as specified in charter)
888 Boylston Street, Suite 800 Boston, Massachusetts 02199-8197
(Address of principal executive offices) (Zip code)
Susan McWhan Tobin, Esq.
Natixis Distribution, LLC
888 Boylston Street, Suite 800
Boston, Massachusetts 02199-8197
(Name and address of agent for service)
Registrant’s telephone number, including area code: (617) 449-2139
Date of fiscal year end: December 31
Date of reporting period: June 30, 2024
Item 1. Reports to Stockholders.
| | (a) | The Registrant’s Tailored Shareholder Reports transmitted to shareholders pursuant to Rule 30e-1 under the Investment Company Act of 1940 are as follows: |
Semi-annual Shareholder Report - June 30, 2024
This semi-annual shareholder report contains important information about Loomis Sayles Bond Fund for the period of January 1, 2024 to June 30, 2024. You can find additional information (including tax information) about the Fund at im.natixis.com/funddocuments. You can also request this information by contacting us at 800-225-5478 or by contacting your financial intermediary directly. This report describes changes to the Fund that occurred during the reporting period.
What were the fund costs for the last six months? (based on a hypothetical $10,000 investment)
| Class Name | Cost of a $10,000 investment | Costs paid as a percentage of a $10,000 investment |
|---|
| Admin Class | $54 | 1.09% |
| Total Net Assets | $4,356,767,123 |
| # of Portfolio Holdings (including overnight repurchase agreements and derivatives) | 611 |
| Portfolio Turnover Rate | 33% |
| Total Advisory Fees Paid | $11,111,452 |
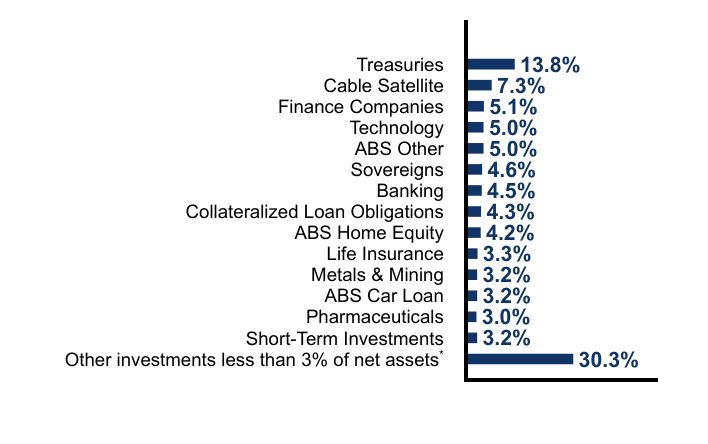
What did the Fund invest in? (% of Net Assets)
| Value | Value |
|---|
Other investments less than 3% of net assetsFootnote Reference* | 30.3% |
| Short-Term Investments | 3.2% |
| Pharmaceuticals | 3.0% |
| ABS Car Loan | 3.2% |
| Metals & Mining | 3.2% |
| Life Insurance | 3.3% |
| ABS Home Equity | 4.2% |
| Collateralized Loan Obligations | 4.3% |
| Banking | 4.5% |
| Sovereigns | 4.6% |
| ABS Other | 5.0% |
| Technology | 5.0% |
| Finance Companies | 5.1% |
| Cable Satellite | 7.3% |
| Treasuries | 13.8% |
| Footnote | Description |
Footnote* | Net of other assets less liabilities (including forward foreign currency and futures contracts) |
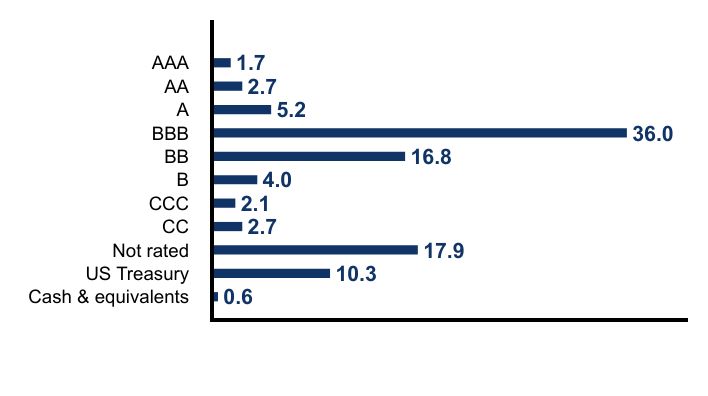
Credit QualityFootnote Reference†
| Value | Value |
|---|
| Cash & equivalents | 0.6 |
| US Treasury | 10.3 |
| Not rated | 17.9 |
| CC | 2.7 |
| CCC | 2.1 |
| B | 4.0 |
| BB | 16.8 |
| BBB | 36.0 |
| A | 5.2 |
| AA | 2.7 |
| AAA | 1.7 |
| Footnote | Description |
Footnote† | Credit ratings are by S&P Global Ratings. A credit rating is an assessment provided by a nationally recognized statistical rating organization (NRSRO) of the creditworthiness of an issuer with respect to debt obligations except for those debt obligations that are only privately rated. Ratings are measured on a scale that generally ranges from AAA (highest) to D (lowest). The credit ratings shown relate to the creditworthiness of the issuers of the underlying securities in the Fund, and not to the Fund or its shares. Credit ratings are subject to change. |
Effective July 1, 2024, the Fund had the following material changes, which were reported in a supplement to the Fund's prospectus. For more information, you may review the Fund's prospectus at im.natixis.com/funddocuments or upon request at 800-225-5478 or through your financial intermediary.
Expenses:The expense limit as a percentage of average daily net assets was reduced to 1.15% from 1.16%.
There were no changes in or disagreements with Accountants during the period.
For additional information about the Fund, including its prospectus, financial information, holdings and proxy information, scan the QR code or visit im.natixis.com/funddocuments
Semi-annual Shareholder Report
June 30, 2024
Semi-annual Shareholder Report - June 30, 2024
This semi-annual shareholder report contains important information about Loomis Sayles Bond Fund for the period of January 1, 2024 to June 30, 2024. You can find additional information (including tax information) about the Fund at im.natixis.com/funddocuments. You can also request this information by contacting us at 800-225-5478 or by contacting your financial intermediary directly. This report describes changes to the Fund that occurred during the reporting period.
What were the fund costs for the last six months? (based on a hypothetical $10,000 investment)
| Class Name | Cost of a $10,000 investment | Costs paid as a percentage of a $10,000 investment |
|---|
| Class N | $31 | 0.61% |
| Total Net Assets | $4,356,767,123 |
| # of Portfolio Holdings (including overnight repurchase agreements and derivatives) | 611 |
| Portfolio Turnover Rate | 33% |
| Total Advisory Fees Paid | $11,111,452 |
What did the Fund invest in? (% of Net Assets)
| Value | Value |
|---|
Other investments less than 3% of net assetsFootnote Reference* | 30.3% |
| Short-Term Investments | 3.2% |
| Pharmaceuticals | 3.0% |
| ABS Car Loan | 3.2% |
| Metals & Mining | 3.2% |
| Life Insurance | 3.3% |
| ABS Home Equity | 4.2% |
| Collateralized Loan Obligations | 4.3% |
| Banking | 4.5% |
| Sovereigns | 4.6% |
| ABS Other | 5.0% |
| Technology | 5.0% |
| Finance Companies | 5.1% |
| Cable Satellite | 7.3% |
| Treasuries | 13.8% |
| Footnote | Description |
Footnote* | Net of other assets less liabilities (including forward foreign currency and futures contracts) |
Credit QualityFootnote Reference†
| Value | Value |
|---|
| Cash & equivalents | 0.6 |
| US Treasury | 10.3 |
| Not rated | 17.9 |
| CC | 2.7 |
| CCC | 2.1 |
| B | 4.0 |
| BB | 16.8 |
| BBB | 36.0 |
| A | 5.2 |
| AA | 2.7 |
| AAA | 1.7 |
| Footnote | Description |
Footnote† | Credit ratings are by S&P Global Ratings. A credit rating is an assessment provided by a nationally recognized statistical rating organization (NRSRO) of the creditworthiness of an issuer with respect to debt obligations except for those debt obligations that are only privately rated. Ratings are measured on a scale that generally ranges from AAA (highest) to D (lowest). The credit ratings shown relate to the creditworthiness of the issuers of the underlying securities in the Fund, and not to the Fund or its shares. Credit ratings are subject to change. |
Effective July 1, 2024, the Fund had the following material changes, which were reported in a supplement to the Fund's prospectus. For more information, you may review the Fund's prospectus at im.natixis.com/funddocuments or upon request at 800-225-5478 or through your financial intermediary.
Expenses:The expense limit as a percentage of average daily net assets was reduced to 0.60% from 0.61%.
There were no changes in or disagreements with Accountants during the period.
For additional information about the Fund, including its prospectus, financial information, holdings and proxy information, scan the QR code or visit im.natixis.com/funddocuments
Semi-annual Shareholder Report
June 30, 2024
Semi-annual Shareholder Report - June 30, 2024
This semi-annual shareholder report contains important information about Loomis Sayles Bond Fund for the period of January 1, 2024 to June 30, 2024. You can find additional information (including tax information) about the Fund at im.natixis.com/funddocuments. You can also request this information by contacting us at 800-225-5478 or by contacting your financial intermediary directly. This report describes changes to the Fund that occurred during the reporting period.
What were the fund costs for the last six months? (based on a hypothetical $10,000 investment)
| Class Name | Cost of a $10,000 investment | Costs paid as a percentage of a $10,000 investment |
|---|
| Institutional Class | $33 | 0.66% |
| Total Net Assets | $4,356,767,123 |
| # of Portfolio Holdings (including overnight repurchase agreements and derivatives) | 611 |
| Portfolio Turnover Rate | 33% |
| Total Advisory Fees Paid | $11,111,452 |
What did the Fund invest in? (% of Net Assets)
| Value | Value |
|---|
Other investments less than 3% of net assetsFootnote Reference* | 30.3% |
| Short-Term Investments | 3.2% |
| Pharmaceuticals | 3.0% |
| ABS Car Loan | 3.2% |
| Metals & Mining | 3.2% |
| Life Insurance | 3.3% |
| ABS Home Equity | 4.2% |
| Collateralized Loan Obligations | 4.3% |
| Banking | 4.5% |
| Sovereigns | 4.6% |
| ABS Other | 5.0% |
| Technology | 5.0% |
| Finance Companies | 5.1% |
| Cable Satellite | 7.3% |
| Treasuries | 13.8% |
| Footnote | Description |
Footnote* | Net of other assets less liabilities (including forward foreign currency and futures contracts) |
Credit QualityFootnote Reference†
| Value | Value |
|---|
| Cash & equivalents | 0.6 |
| US Treasury | 10.3 |
| Not rated | 17.9 |
| CC | 2.7 |
| CCC | 2.1 |
| B | 4.0 |
| BB | 16.8 |
| BBB | 36.0 |
| A | 5.2 |
| AA | 2.7 |
| AAA | 1.7 |
| Footnote | Description |
Footnote† | Credit ratings are by S&P Global Ratings. A credit rating is an assessment provided by a nationally recognized statistical rating organization (NRSRO) of the creditworthiness of an issuer with respect to debt obligations except for those debt obligations that are only privately rated. Ratings are measured on a scale that generally ranges from AAA (highest) to D (lowest). The credit ratings shown relate to the creditworthiness of the issuers of the underlying securities in the Fund, and not to the Fund or its shares. Credit ratings are subject to change. |
Effective July 1, 2024, the Fund had the following material changes, which were reported in a supplement to the Fund's prospectus. For more information, you may review the Fund's prospectus at im.natixis.com/funddocuments or upon request at 800-225-5478 or through your financial intermediary.
Expenses:The expense limit as a percentage of average daily net assets was reduced to 0.65% from 0.66%.
There were no changes in or disagreements with Accountants during the period.
For additional information about the Fund, including its prospectus, financial information, holdings and proxy information, scan the QR code or visit im.natixis.com/funddocuments
Semi-annual Shareholder Report
June 30, 2024
Semi-annual Shareholder Report - June 30, 2024
This semi-annual shareholder report contains important information about Loomis Sayles Bond Fund for the period of January 1, 2024 to June 30, 2024. You can find additional information (including tax information) about the Fund at im.natixis.com/funddocuments. You can also request this information by contacting us at 800-225-5478 or by contacting your financial intermediary directly. This report describes changes to the Fund that occurred during the reporting period.
What were the fund costs for the last six months? (based on a hypothetical $10,000 investment)
| Class Name | Cost of a $10,000 investment | Costs paid as a percentage of a $10,000 investment |
|---|
| Retail Class | $45 | 0.91% |
| Total Net Assets | $4,356,767,123 |
| # of Portfolio Holdings (including overnight repurchase agreements and derivatives) | 611 |
| Portfolio Turnover Rate | 33% |
| Total Advisory Fees Paid | $11,111,452 |
What did the Fund invest in? (% of Net Assets)
| Value | Value |
|---|
Other investments less than 3% of net assetsFootnote Reference* | 30.3% |
| Short-Term Investments | 3.2% |
| Pharmaceuticals | 3.0% |
| ABS Car Loan | 3.2% |
| Metals & Mining | 3.2% |
| Life Insurance | 3.3% |
| ABS Home Equity | 4.2% |
| Collateralized Loan Obligations | 4.3% |
| Banking | 4.5% |
| Sovereigns | 4.6% |
| ABS Other | 5.0% |
| Technology | 5.0% |
| Finance Companies | 5.1% |
| Cable Satellite | 7.3% |
| Treasuries | 13.8% |
| Footnote | Description |
Footnote* | Net of other assets less liabilities (including forward foreign currency and futures contracts) |
Credit QualityFootnote Reference†
| Value | Value |
|---|
| Cash & equivalents | 0.6 |
| US Treasury | 10.3 |
| Not rated | 17.9 |
| CC | 2.7 |
| CCC | 2.1 |
| B | 4.0 |
| BB | 16.8 |
| BBB | 36.0 |
| A | 5.2 |
| AA | 2.7 |
| AAA | 1.7 |
| Footnote | Description |
Footnote† | Credit ratings are by S&P Global Ratings. A credit rating is an assessment provided by a nationally recognized statistical rating organization (NRSRO) of the creditworthiness of an issuer with respect to debt obligations except for those debt obligations that are only privately rated. Ratings are measured on a scale that generally ranges from AAA (highest) to D (lowest). The credit ratings shown relate to the creditworthiness of the issuers of the underlying securities in the Fund, and not to the Fund or its shares. Credit ratings are subject to change. |
Effective July 1, 2024, the Fund had the following material changes, which were reported in a supplement to the Fund's prospectus. For more information, you may review the Fund's prospectus at im.natixis.com/funddocuments or upon request at 800-225-5478 or through your financial intermediary.
Expenses:The expense limit as a percentage of average daily net assets was reduced to 0.90% from 0.91%.
There were no changes in or disagreements with Accountants during the period.
For additional information about the Fund, including its prospectus, financial information, holdings and proxy information, scan the QR code or visit im.natixis.com/funddocuments
Semi-annual Shareholder Report
June 30, 2024
Loomis Sayles Investment Grade Fixed Income Fund
Semi-annual Shareholder Report - June 30, 2024
This semi-annual shareholder report contains important information about Loomis Sayles Investment Grade Fixed Income Fund for the period of January 1, 2024 to June 30, 2024. You can find additional information (including tax information) about the Fund at im.natixis.com/funddocuments. You can also request this information by contacting us at 800-225-5478 or by contacting your financial intermediary directly.
What were the fund costs for the last six months? (based on a hypothetical $10,000 investment)
| Class Name | Cost of a $10,000 investment | Costs paid as a percentage of a $10,000 investment |
|---|
| Institutional Class | $26 | 0.53% |
| Total Net Assets | $206,243,272 |
| # of Portfolio Holdings (including overnight repurchase agreements and derivatives) | 646 |
| Portfolio Turnover Rate | 19% |
| Total Advisory Fees Paid | $353,027 |
What did the Fund invest in? (% of Net Assets)
| Value | Value |
|---|
Other investments less than 3% of net assetsFootnote Reference* | 32.8% |
| Short-Term Investments | 4.0% |
| Metals & Mining | 3.0% |
| Collateralized Loan Obligations | 3.2% |
| Midstream | 3.3% |
| Sovereigns | 3.5% |
| Finance Companies | 4.0% |
| ABS Home Equity | 4.5% |
| ABS Other | 4.5% |
| ABS Car Loan | 5.0% |
| Technology | 7.1% |
| Banking | 9.2% |
| Treasuries | 15.9% |
| Footnote | Description |
Footnote* | Net of other assets less liabilities (including futures contracts) |
Credit QualityFootnote Reference†
| Value | Value |
|---|
| Cash & equivalents | 1.2 |
| US Treasury | 13.1 |
| Not rated | 16.1 |
| CC | 0.4 |
| CCC | 0.6 |
| B | 0.7 |
| BB | 8.4 |
| BBB | 47.2 |
| A | 7.1 |
| AA | 2.7 |
| AAA | 2.5 |
| Footnote | Description |
Footnote† | Credit ratings are by S&P Global Ratings. A credit rating is an assessment provided by a nationally recognized statistical rating organization (NRSRO) of the creditworthiness of an issuer with respect to debt obligations except for those debt obligations that are only privately rated. Ratings are measured on a scale that generally ranges from AAA (highest) to D (lowest). The credit ratings shown relate to the creditworthiness of the issuers of the underlying securities in the Fund, and not to the Fund or its shares. Credit ratings are subject to change. |
There were no material fund changes during the period.
There were no changes in or disagreements with Accountants during the period.
For additional information about the Fund, including its prospectus, financial information, holdings and proxy information, scan the QR code or visit im.natixis.com/funddocuments
Loomis Sayles Investment Grade Fixed Income Fund
Semi-annual Shareholder Report
June 30, 2024
Item 2. Code of Ethics.
Not applicable.
Item 3. Audit Committee Financial Expert.
Not applicable.
Item 4. Principal Accountant Fees and Services.
Not applicable.
Item 5. Audit Committee of Listed Registrants.
Not applicable.
Item 6. Schedule of Investments.
The Schedule of Investments are incorporated by reference as part of the Financial Statements and Other Important Information for Open-End Management Investment Companies filed as Item 7 herewith.
Item 7. Financial Statements and Financial Highlights for Open-End Management Investment Companies.
The Registrant’s Financial Statements and Other Important Information are as follows:
|
Loomis Sayles Investment Grade Fixed Income Fund |
Semi-annual Financial Statements and Other Important Information
Portfolio of Investments – as of June 30, 2024 (Unaudited)Loomis Sayles Bond Fund
| | |
Bonds and Notes — 90.2% of Net Assets |
|
|
Non-Convertible Bonds — 83.4% |
| |
| American Credit Acceptance Receivables Trust, Series 2022-1, Class D, 2.460%, 3/13/2028(a) | |
| American Credit Acceptance Receivables Trust, Series 2022-4, Class C, 7.860%, 2/15/2029(a) | |
| Avis Budget Rental Car Funding AESOP LLC, Series 2020-2A, Class C, 4.250%, 2/20/2027(a) | |
| Avis Budget Rental Car Funding AESOP LLC, Series 2021-1A, Class C, 2.130%, 8/20/2027(a) | |
| Avis Budget Rental Car Funding AESOP LLC, Series 2021-2A, Class C, 2.350%, 2/20/2028(a) | |
| Avis Budget Rental Car Funding AESOP LLC, Series 2023-8A, Class C, 7.340%, 2/20/2030(a) | |
| Avis Budget Rental Car Funding AESOP LLC, Series 2024-1A, Class C, 6.480%, 6/20/2030(a) | |
| Bridgecrest Lending Auto Securitization Trust, Series 2024-2, Class D, 6.300%, 2/15/2030 | |
| CarMax Auto Owner Trust, Series 2022-1, Class D, 2.470%, 7/17/2028 | |
| CarMax Auto Owner Trust, Series 2024-1, Class D, 6.000%, 7/15/2030 | |
| Carvana Auto Receivables Trust, Series 2021-N3, Class C, 1.020%, 6/12/2028 | |
| Carvana Auto Receivables Trust, Series 2021-N4, Class C, 1.720%, 9/11/2028 | |
| Carvana Auto Receivables Trust, Series 2021-N4, Class D, 2.300%, 9/11/2028 | |
| Carvana Auto Receivables Trust, Series 2021-P4, Class C, 2.330%, 2/10/2028 | |
| Carvana Auto Receivables Trust, Series 2023-N4, Class D, 7.220%, 2/11/2030(a) | |
| Carvana Auto Receivables Trust, Series 2024-N1, Class D, 6.300%, 5/10/2030(a) | |
| Credit Acceptance Auto Loan Trust, Series 2021-3A, Class C, 1.630%, 9/16/2030(a) | |
| | |
|
| |
| Credit Acceptance Auto Loan Trust, Series 2021-4, Class C, 1.940%, 2/18/2031(a) | |
| Credit Acceptance Auto Loan Trust, Series 2024-1A, Class C, 6.710%, 7/17/2034(a) | |
| Credit Acceptance Auto Loan Trust, Series 2024-2A, Class C, 6.700%, 10/16/2034(a) | |
| Exeter Automobile Receivables Trust, Series 2022-6A, Class C, 6.320%, 5/15/2028 | |
| Exeter Automobile Receivables Trust, Series 2023-2A, Class D, 6.320%, 8/15/2029 | |
| First Investors Auto Owner Trust, Series 2022-2A, Class D, 8.710%, 10/16/2028(a) | |
| Ford Credit Auto Lease Trust, Series 2023-B, Class D, 6.970%, 6/15/2028 | |
| Foursight Capital Automobile Receivables Trust, Series 2021-2, Class D, 1.920%, 9/15/2027(a) | |
| GLS Auto Receivables Issuer Trust, Series 2021-4A, Class D, 2.480%, 10/15/2027(a) | |
| GLS Auto Receivables Issuer Trust, Series 2023-2A, Class D, 6.310%, 3/15/2029(a) | |
| GLS Auto Receivables Issuer Trust, Series 2024-1A, Class D, 5.950%, 12/17/2029(a) | |
| GLS Auto Receivables Issuer Trust, Series 2024-2A, Class D, 6.190%, 2/15/2030(a) | |
| GLS Auto Select Receivables Trust, Series 2024-1A, Class D, 6.430%, 1/15/2031(a) | |
| GLS Auto Select Receivables Trust, Series 2024-2A, Class C, 5.930%, 6/17/2030(a) | |
| Hertz Vehicle Financing III LLC, Series 2022-1A, Class D, 4.850%, 6/25/2026(a) | |
| Hertz Vehicle Financing III LLC, Series 2023-1A, Class 1D, 9.130%, 6/25/2027(a) | |
| Hertz Vehicle Financing LLC, Series 2022-2A, Class D, 5.160%, 6/26/2028(a) | |
| Hertz Vehicle Financing LLC, Series 2022-4A, Class D, 6.560%, 9/25/2026(a) | |
See accompanying notes to financial statements.
Portfolio of Investments – as of June 30, 2024 (Unaudited)Loomis Sayles Bond Fund (continued) | | |
|
| |
| JPMorgan Chase Bank NA, Series 2021-3, Class D, 1.009%, 2/26/2029(a) | |
| LAD Auto Receivables Trust, Series 2024-1A, Class B, 5.330%, 2/15/2029(a) | |
| LAD Auto Receivables Trust, Series 2024-1A, Class C, 5.640%, 6/15/2029(a) | |
| LAD Auto Receivables Trust, Series 2024-1A, Class D, 6.150%, 6/16/2031(a) | |
| Prestige Auto Receivables Trust, Series 2022-1A, Class D, 8.080%, 8/15/2028(a) | |
| Santander Bank Auto Credit-Linked Notes, Series 2021-1A, Class B, 1.833%, 12/15/2031(a) | |
| Santander Drive Auto Receivables Trust, Series 2024-3, Class D, 5.970%, 10/15/2031 | |
| SBNA Auto Receivables Trust, Series 2024-A, Class C, 5.590%, 1/15/2030(a) | |
| SBNA Auto Receivables Trust, Series 2024-A, Class D, 6.040%, 4/15/2030(a) | |
| VStrong Auto Receivables Trust, Series 2024-A, Class B, 5.770%, 7/15/2030(a) | |
| VStrong Auto Receivables Trust, Series 2024-A, Class D, 7.290%, 7/15/2030(a) | |
| Westlake Automobile Receivables Trust, Series 2021-3A, Class D, 2.120%, 1/15/2027(a) | |
| Westlake Automobile Receivables Trust, Series 2023-4A, Class D, 7.190%, 7/16/2029(a) | |
| | |
| |
| Fortiva Retail Credit Master Note Business Trust, Series 2024-ONE, Class B, 9.700%, 11/15/2029(a) | |
| Mission Lane Credit Card Master Trust, Series 2023-B, Class A, 7.690%, 11/15/2028(a) | |
| Mission Lane Credit Card Master Trust, Series 2024-A, Class B, 6.590%, 8/15/2029(a) | |
| | |
| |
| 510 Asset-Backed Trust, Series 2021-NPL1, Class A1, 5.240%, 6/25/2061(a)(b) | |
| | |
|
| ABS Home Equity — continued |
| CoreVest American Finance Ltd., Series 2021-1, Class C, 2.800%, 4/15/2053(a) | |
| CoreVest American Finance Ltd., Series 2021-2, Class C, 2.478%, 7/15/2054(a) | |
| CoreVest American Finance Ltd., Series 2021-3, Class D, 3.469%, 10/15/2054(a) | |
| CoreVest American Finance Ltd., Series 2023-RTL1, Class A1, 7.553%, 12/28/2030(a)(b) | |
| Credit Suisse Mortgage Trust, Series 2021-RPL6, Class M2, 3.125%, 10/25/2060(a) | |
| FirstKey Homes Trust, Series 2021-SFR1, Class E1, 2.389%, 8/17/2038(a) | |
| FirstKey Homes Trust, Series 2021-SFR2, Class E1, 2.258%, 9/17/2038(a) | |
| FirstKey Homes Trust, Series 2021-SFR2, Class E2, 2.358%, 9/17/2038(a) | |
| GITSIT Mortgage Loan Trust, Series 2024-NPL1, Class A1, 7.466%, 6/25/2054(a)(b) | |
| Home Partners of America Trust, Series 2021-1, Class E, 2.577%, 9/17/2041(a) | |
| Home Partners of America Trust, Series 2021-2, Class E1, 2.852%, 12/17/2026(a) | |
| Home Partners of America Trust, Series 2021-2, Class E2, 2.952%, 12/17/2026(a) | |
| Legacy Mortgage Asset Trust, Series 2021-GS2, Class A1, 4.750%, 4/25/2061(a)(b) | |
| Legacy Mortgage Asset Trust, Series 2021-GS4, Class A1, 1.650%, 11/25/2060(a)(b) | |
| Mill City Mortgage Loan Trust, Series 2019-GS1, Class M2, 3.250%, 7/25/2059(a)(b) | |
| New Residential Mortgage Loan Trust, Series 2024-RTL1, Class A1, 6.664%, 3/25/2039(a)(b) | |
| NYMT Loan Trust, Series 2024-BPL2, Class A1, 6.509%, 5/25/2039(a)(b) | |
| NYMT Loan Trust, Series 2024-CP1, Class A1, 3.750%, 2/25/2068(a)(b) | |
| Progress Residential Trust, Series 2021-SFR4, Class E1, 2.409%, 5/17/2038(a) | |
See accompanying notes to financial statements.
Portfolio of Investments – as of June 30, 2024 (Unaudited)Loomis Sayles Bond Fund (continued) | | |
|
| ABS Home Equity — continued |
| Progress Residential Trust, Series 2021-SFR4, Class E2, 2.559%, 5/17/2038(a) | |
| Progress Residential Trust, Series 2021-SFR5, Class E1, 2.209%, 7/17/2038(a) | |
| Progress Residential Trust, Series 2021-SFR5, Class E2, 2.359%, 7/17/2038(a) | |
| Progress Residential Trust, Series 2021-SFR6, Class E1, 2.425%, 7/17/2038(a) | |
| Progress Residential Trust, Series 2021-SFR6, Class E2, 2.525%, 7/17/2038(a) | |
| Progress Residential Trust, Series 2021-SFR7, Class E1, 2.591%, 8/17/2040(a) | |
| Progress Residential Trust, Series 2021-SFR7, Class E2, 2.640%, 8/17/2040(a) | |
| Progress Residential Trust, Series 2021-SFR9, Class E1, 2.811%, 11/17/2040(a) | |
| Progress Residential Trust, Series 2021-SFR9, Class E2, 3.010%, 11/17/2040(a) | |
| Progress Residential Trust, Series 2023-SFR2, Class B, 4.500%, 10/17/2040(a) | |
| PRPM LLC, Series 2021-10, Class A1, 2.487%, 10/25/2026(a)(b) | |
| PRPM LLC, Series 2021-4, Class A1, 4.867%, 4/25/2026(a)(b) | |
| PRPM LLC, Series 2021-8, Class A1, 1.743%, 9/25/2026(a)(b) | |
| PRPM LLC, Series 2021-9, Class A1, 2.363%, 10/25/2026(a)(b) | |
| PRPM LLC, Series 2024-2, Class A1, 7.026%, 3/25/2029(a)(b) | |
| RCO VII Mortgage LLC, Series 2024-1, Class A1, 7.021%, 1/25/2029(a)(b) | |
| Redwood Funding Trust, Series 2023-1, Class A, 7.500%, 7/25/2059(a)(b) | |
| Toorak Mortgage Trust, Series 2024-RRTL1, Class A1, 6.597%, 2/25/2039(a)(b) | |
| Towd Point Mortgage Trust, Series 2015-4, Class M2, 3.750%, 4/25/2055(a)(b) | |
| Towd Point Mortgage Trust, Series 2016-3, Class M2, 4.000%, 4/25/2056(a)(b) | |
| | |
|
| ABS Home Equity — continued |
| Towd Point Mortgage Trust, Series 2017-3, Class A2, 3.000%, 7/25/2057(a)(b) | |
| Towd Point Mortgage Trust, Series 2019-4, Class M1, 3.500%, 10/25/2059(a)(b) | |
| Towd Point Mortgage Trust, Series 2020-1, Class A2B, 3.250%, 1/25/2060(a)(b) | |
| Towd Point Mortgage Trust, Series 2020-2, Class A2B, 3.000%, 4/25/2060(a)(b) | |
| Tricon Residential Trust, Series 2021-SFR1, Class E1, 2.794%, 7/17/2038(a) | |
| Tricon Residential Trust, Series 2021-SFR1, Class E2, 2.894%, 7/17/2038(a) | |
| VCAT LLC, Series 2021-NPL1, Class A1, 5.289%, 12/26/2050(a)(b) | |
| VCAT LLC, Series 2021-NPL5, Class A1, 1.868%, 8/25/2051(a)(b) | |
| VCAT LLC, Series 2021-NPL6, Class A1, 1.917%, 9/25/2051(a)(b) | |
| VOLT XCIV LLC, Series 2021-NPL3, Class A1, 5.240%, 2/27/2051(a)(b) | |
| | |
| |
| Affirm Asset Securitization Trust, Series 2023-B, Class A, 6.820%, 9/15/2028(a) | |
| Affirm Asset Securitization Trust, Series 2024-A, Class 1D, 6.890%, 2/15/2029(a) | |
| Affirm Asset Securitization Trust, Series 2024-A, Class B, 5.930%, 2/15/2029(a) | |
| Aqua Finance Trust, Series 2019-A, Class C, 4.010%, 7/16/2040(a) | |
| Aqua Finance Trust, Series 2021-A, Class B, 2.400%, 7/17/2046(a) | |
| BHG Securitization Trust, Series 2022-A, Class B, 2.700%, 2/20/2035(a) | |
| BHG Securitization Trust, Series 2024-1CON, Class B, 6.490%, 4/17/2035(a) | |
| BHG Securitization Trust, Series 2024-1CON, Class C, 6.860%, 4/17/2035(a) | |
| Business Jet Securities LLC, Series 2024-1A, Class A, 6.197%, 5/15/2039(a) | |
See accompanying notes to financial statements.
Portfolio of Investments – as of June 30, 2024 (Unaudited)Loomis Sayles Bond Fund (continued) | | |
|
| |
| Castlelake Aircraft Securitization Trust, Series 2018-1, Class B, 5.300%, 6/15/2043(a) | |
| Castlelake Aircraft Structured Trust, Series 2019-1A, Class A, 3.967%, 4/15/2039(a) | |
| Clsec Holdings 22t LLC, Series 2021-1, Class B, 3.464%, 5/11/2037(a) | |
| Clsec Holdings 22t LLC, Series 2021-1, Class C, 6.171%, 5/11/2037(a) | |
| Elara HGV Timeshare Issuer LLC, Series 2021-A, Class C, 2.090%, 8/27/2035(a) | |
| EverBright Solar Trust, Series 2024-A, Class A, 6.430%, 6/22/2054(a) | |
| Foundation Finance Trust, Series 2023-2A, Class B, 6.970%, 6/15/2049(a) | |
| FREED ABS Trust, Series 2021-2, Class C, 1.940%, 6/19/2028(a) | |
| FREED ABS Trust, Series 2021-3FP, Class D, 2.370%, 11/20/2028(a) | |
| FREED ABS Trust, Series 2022-1FP, Class D, 3.350%, 3/19/2029(a) | |
| Frontier Issuer LLC, Series 2023-1, Class A2, 6.600%, 8/20/2053(a) | |
| Frontier Issuer LLC, Series 2024-1, Class C, 11.160%, 6/20/2054(a) | |
| Hilton Grand Vacations Trust, Series 2024-1B, Class C, 6.620%, 9/15/2039(a) | |
| Hilton Grand Vacations Trust, Series 2024-1B, Class D, 8.850%, 9/15/2039(a) | |
| HIN Timeshare Trust, Series 2020-A, Class C, 3.420%, 10/09/2039(a) | |
| HINNT LLC, Series 2024-A, Class A, 5.490%, 3/15/2043(a) | |
| HPEFS Equipment Trust, Series 2022-1A, Class D, 2.400%, 11/20/2029(a) | |
| HPEFS Equipment Trust, Series 2023-2A, Class D, 6.970%, 7/21/2031(a) | |
| Jack in the Box Funding LLC, Series 2019-1A, Class A2II, 4.476%, 8/25/2049(a) | |
| JOL Air Ltd., Series 2019-1, Class A, 3.967%, 4/15/2044(a) | |
| MAPS Trust, Series 2021-1A, Class A, 2.521%, 6/15/2046(a) | |
| Marlette Funding Trust, Series 2021-2A, Class C, 1.500%, 9/15/2031(a) | |
| | |
|
| |
| Marlette Funding Trust, Series 2021-3A, Class C, 1.810%, 12/15/2031(a) | |
| Marlette Funding Trust, Series 2024-1A, Class B, 6.070%, 7/17/2034(a) | |
| Mercury Financial Credit Card Master Trust, Series 2024-2A, Class A, 6.560%, 7/20/2029(a) | |
| MetroNet Infrastructure Issuer LLC, Series 2024-1A, Class A2, 6.230%, 4/20/2054(a) | |
| Mosaic Solar Loans LLC, Series 2024-1A, Class B, 6.250%, 9/20/2049(a) | |
| MVW LLC, Series 2021-2A, Class C, 2.230%, 5/20/2039(a) | |
| Navigator Aircraft ABS Ltd., Series 2021-1, Class A, 2.771%, 11/15/2046(a)(b) | |
| Nelnet Student Loan Trust, Series 2021-A, Class B2, 2.850%, 4/20/2062(a) | |
| OneMain Financial Issuance Trust, Series 2021-1A, Class D, 2.470%, 6/16/2036(a) | |
| PK Alift Loan Funding 3 LP, Series 2024-1, Class A1, 5.842%, 9/15/2039(a) | |
| Republic Finance Issuance Trust, Series 2021-A, Class C, 3.530%, 12/22/2031(a) | |
| SCF Equipment Leasing LLC, Series 2021-1A, Class D, 1.930%, 9/20/2030(a) | |
| SCF Equipment Leasing LLC, Series 2022-2A, Class C, 6.500%, 8/20/2032(a) | |
| SCF Equipment Leasing LLC, Series 2024-1A, Class C, 5.820%, 9/20/2032(a) | |
| SCF Equipment Leasing LLC, Series 2024-1A, Class D, 6.580%, 6/21/2033(a) | |
| SEB Funding LLC, Series 2024-1A, Class A2, 7.386%, 4/30/2054(a) | |
| Shenton Aircraft Investment I Ltd., Series 2015-1A, Class A, 4.750%, 10/15/2042(a) | |
| Slam Ltd., Series 2021-1A, Class A, 2.434%, 6/15/2046(a) | |
| SoFi Consumer Loan Program Trust, Series 2021-1, Class D, 2.040%, 9/25/2030(a) | |
See accompanying notes to financial statements.
Portfolio of Investments – as of June 30, 2024 (Unaudited)Loomis Sayles Bond Fund (continued) | | |
|
| |
| Stream Innovations Issuer Trust, Series 2024-1A, Class A, 6.270%, 7/15/2044(a) | |
| Sunnova Helios XIII Issuer LLC, Series 2024-A, Class A, 5.300%, 2/20/2051(a) | |
| TIF Funding III LLC, Series 2024-1A, Class A, 5.480%, 4/20/2049(a) | |
| Trafigura Securitisation Finance PLC, Series 2024-1A, Class A1, SOFR + 1.400%, 6.737%, 11/15/2027(a)(b) | |
| Trafigura Securitisation Finance PLC, Series 2024-1A, Class B, 7.290%, 11/15/2027(a) | |
| WAVE Trust, Series 2017-1A, Class A, 3.844%, 11/15/2042(a) | |
| Westlake Automobile Receivables Trust, Series 2024-2A, Class D, 5.910%, 4/15/2030(a) | |
| Willis Engine Structured Trust IV, Series 2018-A, Class B, 5.438%, 9/15/2043(a)(b) | |
| Willis Engine Structured Trust VI, Series 2021-A, Class A, 3.104%, 5/15/2046(a) | |
| Ziply Fiber Issuer LLC, Series 2024-1A, Class A2, 6.640%, 4/20/2054(a) | |
| | |
| |
| Ascent Education Funding Trust, Series 2024-A, Class A, 6.140%, 10/25/2050(a) | |
| College Ave Student Loans LLC, Series 2024-B, Class A1A, 5.690%, 8/25/2054(a) | |
| College Ave Student Loans LLC, Series 2024-B, Class B, 6.080%, 8/25/2054(a) | |
| College Avenue Student Loans LLC, Series 2021-A, Class C, 2.920%, 7/25/2051(a) | |
| College Avenue Student Loans LLC, Series 2021-C, Class D, 4.110%, 7/26/2055(a) | |
| College Avenue Student Loans LLC, Series 2023-B, Class C, 7.580%, 6/25/2054(a) | |
| ELFI Graduate Loan Program LLC, Series 2021-A, Class B, 2.090%, 12/26/2046(a)(b) | |
| Navient Private Education Refi Loan Trust, Series 2021-EA, Class B, 2.030%, 12/16/2069(a) | |
| | |
|
| ABS Student Loan — continued |
| Navient Private Education Refi Loan Trust, Series 2021-FA, Class B, 2.120%, 2/18/2070(a) | |
| Nelnet Student Loan Trust, Series 2021-BA, Class B, 2.680%, 4/20/2062(a) | |
| Nelnet Student Loan Trust, Series 2021-DA, Class C, 3.500%, 4/20/2062(a) | |
| Nelnet Student Loan Trust, Series 2021-DA, Class D, 4.380%, 4/20/2062(a) | |
| SMB Private Education Loan Trust, Series 2021-B, Class B, 2.650%, 7/17/2051(a) | |
| SMB Private Education Loan Trust, Series 2021-E, Class B, 2.490%, 2/15/2051(a) | |
| SMB Private Education Loan Trust, Series 2024-A, Class B, 5.880%, 3/15/2056(a) | |
| | |
| ABS Whole Business — 1.0% |
| Applebee's Funding LLC/IHOP Funding LLC, Series 2023-1A, Class A2, 7.824%, 3/05/2053(a) | |
| FOCUS Brands Funding, Series 2023-2, Class A2, 8.241%, 10/30/2053(a) | |
| Hardee's Funding LLC, Series 2021-1A, Class A2, 2.865%, 6/20/2051(a) | |
| Hardee's Funding LLC, Series 2024-1A, Class A2, 7.253%, 3/20/2054(a) | |
| Planet Fitness Master Issuer LLC, Series 2019-1A, Class A2, 3.858%, 12/05/2049(a) | |
| Planet Fitness Master Issuer LLC, Series 2022-1A, Class A2I, 3.251%, 12/05/2051(a) | |
| Planet Fitness Master Issuer LLC, Series 2022-1A, Class A2II, 4.008%, 12/05/2051(a) | |
| Planet Fitness Master Issuer LLC, Series 2024-1A, Class A2I, 5.765%, 6/05/2054(a) | |
| Subway Funding LLC, Series 2024-1A, Class A2I, 6.028%, 7/30/2054(a) | |
| | |
| Aerospace & Defense — 1.9% |
| BAE Systems PLC, 5.300%, 3/26/2034(a) | |
| Boeing Co., 3.625%, 2/01/2031 | |
See accompanying notes to financial statements.
Portfolio of Investments – as of June 30, 2024 (Unaudited)Loomis Sayles Bond Fund (continued) | | |
|
| Aerospace & Defense — continued |
| Boeing Co., 5.150%, 5/01/2030 | |
| Boeing Co., 5.705%, 5/01/2040 | |
| Boeing Co., 5.805%, 5/01/2050 | |
| Boeing Co., 5.930%, 5/01/2060 | |
| Boeing Co., 6.388%, 5/01/2031(a) | |
| Boeing Co., 6.528%, 5/01/2034(a) | |
| Boeing Co., 6.858%, 5/01/2054(a) | |
| Boeing Co., 7.008%, 5/01/2064(a) | |
| | |
| |
| General Motors Financial Co., Inc., 3.100%, 1/12/2032 | |
| General Motors Financial Co., Inc., 5.850%, 4/06/2030 | |
| General Motors Financial Co., Inc., 6.400%, 1/09/2033 | |
| ZF North America Capital, Inc., 6.750%, 4/23/2030(a) | |
| ZF North America Capital, Inc., 6.875%, 4/14/2028(a) | |
| ZF North America Capital, Inc., 6.875%, 4/23/2032(a) | |
| ZF North America Capital, Inc., 7.125%, 4/14/2030(a) | |
| | |
| |
| Barclays PLC, (fixed rate to 3/15/2028, variable rate thereafter), 4.375%(c) | |
| Barclays PLC, (fixed rate to 9/23/2030, variable rate thereafter), 3.564%, 9/23/2035 | |
| BNP Paribas SA, (fixed rate to 8/12/2030, variable rate thereafter), 2.588%, 8/12/2035(a) | |
| CaixaBank SA, (fixed rate to 9/13/2033, variable rate thereafter), 6.840%, 9/13/2034(a) | |
| Credit Agricole SA, (fixed rate to 1/10/2034, variable rate thereafter), 6.251%, 1/10/2035(a) | |
| Deutsche Bank AG, (fixed rate to 10/07/2031, variable rate thereafter), 3.742%, 1/07/2033 | |
| Deutsche Bank AG, (fixed rate to 10/14/2030, variable rate thereafter), 3.729%, 1/14/2032 | |
| Intesa Sanpaolo SpA, 7.200%, 11/28/2033(a) | |
| Intesa Sanpaolo SpA, (fixed rate to 6/01/2031, variable rate thereafter), 4.198%, 6/01/2032(a) | |
| Morgan Stanley, (fixed rate to 1/19/2033, variable rate thereafter), 5.948%, 1/19/2038 | |
| | |
|
| |
| NatWest Group PLC, (fixed rate to 8/28/2030, variable rate thereafter), 3.032%, 11/28/2035 | |
| Societe Generale SA, (fixed rate to 1/19/2034, variable rate thereafter), 6.066%, 1/19/2035(a) | |
| UBS Group AG, (fixed rate to 11/15/2032, variable rate thereafter), 9.016%, 11/15/2033(a) | |
| UBS Group AG, (fixed rate to 2/08/2034, variable rate thereafter), 5.699%, 2/08/2035(a) | |
| UBS Group AG, (fixed rate to 5/14/2031, variable rate thereafter), 3.091%, 5/14/2032(a) | |
| UBS Group AG, (fixed rate to 8/12/2032, variable rate thereafter), 6.537%, 8/12/2033(a) | |
| UniCredit SpA, (fixed rate to 6/30/2030, variable rate thereafter), 5.459%, 6/30/2035(a) | |
| | |
| |
| Blue Owl Finance LLC, 6.250%, 4/18/2034(a) | |
| Jefferies Financial Group, Inc., 6.200%, 4/14/2034 | |
| Jefferies Financial Group, Inc., 6.250%, 1/15/2036 | |
| | |
| Building Materials — 1.3% |
| Cemex SAB de CV, 3.875%, 7/11/2031(a) | |
| Cemex SAB de CV, (fixed rate to 3/14/2028, variable rate thereafter), 9.125%(a)(c) | |
| Cemex SAB de CV, (fixed rate to 6/08/2026, variable rate thereafter), 5.125%(a)(c) | |
| | |
| |
| CCO Holdings LLC/CCO Holdings Capital Corp., 4.250%, 1/15/2034(a) | |
| Charter Communications Operating LLC/Charter Communications Operating Capital, 2.300%, 2/01/2032 | |
| Charter Communications Operating LLC/Charter Communications Operating Capital, 2.800%, 4/01/2031 | |
See accompanying notes to financial statements.
Portfolio of Investments – as of June 30, 2024 (Unaudited)Loomis Sayles Bond Fund (continued) | | |
|
| Cable Satellite — continued |
| Charter Communications Operating LLC/Charter Communications Operating Capital, 3.700%, 4/01/2051 | |
| Charter Communications Operating LLC/Charter Communications Operating Capital, 3.850%, 4/01/2061 | |
| Charter Communications Operating LLC/Charter Communications Operating Capital, 3.950%, 6/30/2062 | |
| Charter Communications Operating LLC/Charter Communications Operating Capital, 4.400%, 4/01/2033 | |
| Charter Communications Operating LLC/Charter Communications Operating Capital, 5.125%, 7/01/2049 | |
| CSC Holdings LLC, 3.375%, 2/15/2031(a) | |
| CSC Holdings LLC, 4.125%, 12/01/2030(a) | |
| CSC Holdings LLC, 4.500%, 11/15/2031(a) | |
| CSC Holdings LLC, 4.625%, 12/01/2030(a) | |
| CSC Holdings LLC, 5.000%, 11/15/2031(a) | |
| CSC Holdings LLC, 5.375%, 2/01/2028(a) | |
| CSC Holdings LLC, 5.750%, 1/15/2030(a) | |
| DISH DBS Corp., 5.125%, 6/01/2029 | |
| DISH DBS Corp., 5.250%, 12/01/2026(a) | |
| DISH DBS Corp., 5.750%, 12/01/2028(a) | |
| DISH DBS Corp., 7.750%, 7/01/2026 | |
| Time Warner Cable LLC, 4.500%, 9/15/2042 | |
| Time Warner Cable LLC, 5.875%, 11/15/2040 | |
| | |
| |
| Braskem Netherlands Finance BV, 4.500%, 1/31/2030(a) | |
| Braskem Netherlands Finance BV, 5.875%, 1/31/2050(a) | |
| | |
|
| |
| Celanese U.S. Holdings LLC, 6.550%, 11/15/2030 | |
| Celanese U.S. Holdings LLC, 6.700%, 11/15/2033 | |
| | |
| Construction Machinery — 0.5% |
| Ashtead Capital, Inc., 5.500%, 8/11/2032(a) | |
| Ashtead Capital, Inc., 5.550%, 5/30/2033(a) | |
| Ashtead Capital, Inc., 5.800%, 4/15/2034(a) | |
| United Rentals North America, Inc., 6.125%, 3/15/2034(a) | |
| | |
| Consumer Cyclical Services — 1.1% |
| TriNet Group, Inc., 3.500%, 3/01/2029(a) | |
| Uber Technologies, Inc., 4.500%, 8/15/2029(a) | |
| Uber Technologies, Inc., 6.250%, 1/15/2028(a) | |
| | |
| |
| Alta Wind Holdings LLC, 7.000%, 6/30/2035(a) | |
| Duke Energy Corp., 5.450%, 6/15/2034 | |
| Southern Co., 5.700%, 3/15/2034 | |
| | |
| |
| AerCap Ireland Capital DAC/AerCap Global Aviation Trust, 3.300%, 1/30/2032 | |
| AerCap Ireland Capital DAC/AerCap Global Aviation Trust, 3.400%, 10/29/2033 | |
| AerCap Ireland Capital DAC/AerCap Global Aviation Trust, 6.150%, 9/30/2030 | |
| AGFC Capital Trust I, 3 mo. USD SOFR + 2.012%, 7.340%, 1/15/2067(a)(b) | |
| Air Lease Corp., Series B, (fixed rate to 6/15/2026, variable rate thereafter), 4.650%(c) | |
| Aircastle Ltd., 5.950%, 2/15/2029(a) | |
| Aircastle Ltd., Series A, (fixed rate to 6/15/2026, variable rate thereafter), 5.250%(a)(c) | |
| Ares Capital Corp., 2.875%, 6/15/2028 | |
See accompanying notes to financial statements.
Portfolio of Investments – as of June 30, 2024 (Unaudited)Loomis Sayles Bond Fund (continued) | | |
|
| Finance Companies — continued |
| Ares Capital Corp., 3.200%, 11/15/2031 | |
| Aviation Capital Group LLC, 6.250%, 4/15/2028(a) | |
| Aviation Capital Group LLC, 6.750%, 10/25/2028(a) | |
| Blackstone Secured Lending Fund, 2.125%, 2/15/2027 | |
| Blue Owl Capital Corp., 2.625%, 1/15/2027 | |
| Blue Owl Capital Corp., 2.875%, 6/11/2028 | |
| Macquarie Airfinance Holdings Ltd., 6.400%, 3/26/2029(a) | |
| Macquarie Airfinance Holdings Ltd., 6.500%, 3/26/2031(a) | |
| Nationstar Mortgage Holdings, Inc., 5.000%, 2/01/2026(a) | |
| OneMain Finance Corp., 3.500%, 1/15/2027 | |
| OneMain Finance Corp., 3.875%, 9/15/2028 | |
| OneMain Finance Corp., 4.000%, 9/15/2030 | |
| OneMain Finance Corp., 5.375%, 11/15/2029 | |
| OneMain Finance Corp., 7.125%, 3/15/2026 | |
| Rocket Mortgage LLC/Rocket Mortgage Co-Issuer, Inc., 2.875%, 10/15/2026(a) | |
| Rocket Mortgage LLC/Rocket Mortgage Co-Issuer, Inc., 3.625%, 3/01/2029(a) | |
| Rocket Mortgage LLC/Rocket Mortgage Co-Issuer, Inc., 3.875%, 3/01/2031(a) | |
| Rocket Mortgage LLC/Rocket Mortgage Co-Issuer, Inc., 4.000%, 10/15/2033(a) | |
| | |
| |
| Agile Group Holdings Ltd., 6.050%, 10/13/2025(d) | |
| Central China Real Estate Ltd., 7.250%, 7/16/2024(d) | |
| Central China Real Estate Ltd., 7.250%, 8/13/2024(d) | |
| Central China Real Estate Ltd., 7.250%, 4/28/2025(d) | |
| Central China Real Estate Ltd., 7.500%, 7/14/2025(d) | |
| Central China Real Estate Ltd., 7.650%, 8/27/2025(d) | |
| | |
|
| Financial Other — continued |
| Central China Real Estate Ltd., 7.750%, 5/24/2024(d) | |
| CIFI Holdings Group Co. Ltd., 6.000%, 7/16/2025(d) | |
| CIFI Holdings Group Co. Ltd., 6.450%, 11/07/2024(d) | |
| Country Garden Holdings Co. Ltd., 3.300%, 1/12/2031(d) | |
| Icahn Enterprises LP/Icahn Enterprises Finance Corp., 4.375%, 2/01/2029 | |
| Kaisa Group Holdings Ltd., 9.375%, 6/30/2024(d) | |
| Kaisa Group Holdings Ltd., 9.950%, 7/23/2025(d) | |
| Kaisa Group Holdings Ltd., 10.500%, 1/15/2025(d) | |
| Kaisa Group Holdings Ltd., 11.250%, 4/16/2025(d) | |
| Kaisa Group Holdings Ltd., 11.650%, 6/01/2026(d) | |
| Kaisa Group Holdings Ltd., 11.700%, 11/11/2025(d) | |
| Logan Group Co. Ltd., 4.250%, 7/12/2025(d) | |
| Logan Group Co. Ltd., 4.850%, 12/14/2026(d) | |
| Shimao Group Holdings Ltd., 3.450%, 1/11/2031(d) | |
| Shimao Group Holdings Ltd., 4.600%, 7/13/2030(d) | |
| Shimao Group Holdings Ltd., 5.200%, 1/16/2027(d) | |
| Shimao Group Holdings Ltd., 5.600%, 7/15/2026(d) | |
| Shimao Group Holdings Ltd., 6.125%, 2/21/2024(d) | |
| Sunac China Holdings Ltd., 6.000% PIK or 5.000% Cash, 9/30/2026(a)(e) | |
| Sunac China Holdings Ltd., 6.250% PIK or 5.250% Cash, 9/30/2027(a)(e) | |
| Sunac China Holdings Ltd., 6.500% PIK or 5.500% Cash, 9/30/2027(a)(e) | |
| Sunac China Holdings Ltd., 6.750% PIK or 5.750% Cash, 9/30/2028(a)(e) | |
| Sunac China Holdings Ltd., 7.000% PIK or 6.000% Cash, 9/30/2029(a)(e) | |
| Sunac China Holdings Ltd., 7.250% PIK or 6.250% Cash, 9/30/2030(a)(e) | |
See accompanying notes to financial statements.
Portfolio of Investments – as of June 30, 2024 (Unaudited)Loomis Sayles Bond Fund (continued) | | |
|
| Financial Other — continued |
| Times China Holdings Ltd., 5.750%, 1/14/2027(d) | |
| Times China Holdings Ltd., 6.200%, 3/22/2026(d) | |
| Times China Holdings Ltd., 6.750%, 7/08/2025(d) | |
| Yuzhou Group Holdings Co. Ltd., 6.350%, 1/13/2027(d) | |
| Yuzhou Group Holdings Co. Ltd., 7.700%, 2/20/2025(d) | |
| Yuzhou Group Holdings Co. Ltd., 7.850%, 8/12/2026(d) | |
| Yuzhou Group Holdings Co. Ltd., 8.300%, 5/27/2025(d) | |
| | |
| |
| Pilgrim's Pride Corp., 3.500%, 3/01/2032 | |
| Pilgrim's Pride Corp., 4.250%, 4/15/2031 | |
| | |
| |
| GLP Capital LP/GLP Financing II, Inc., 3.250%, 1/15/2032 | |
| Light & Wonder International, Inc., 7.000%, 5/15/2028(a) | |
| Light & Wonder International, Inc., 7.250%, 11/15/2029(a) | |
| Light & Wonder International, Inc., 7.500%, 9/01/2031(a) | |
| | |
| Government Owned - No Guarantee — 0.4% |
| Ecopetrol SA, 8.375%, 1/19/2036 | |
| Petroleos Mexicanos, 5.950%, 1/28/2031 | |
| Sino-Ocean Land Treasure IV Ltd., 4.750%, 8/05/2029(d) | |
| Sino-Ocean Land Treasure IV Ltd., 4.750%, 1/14/2030(d) | |
| | |
| |
| Centene Corp., 3.000%, 10/15/2030 | |
| Centene Corp., 3.375%, 2/15/2030 | |
| Centene Corp., 4.625%, 12/15/2029 | |
| Molina Healthcare, Inc., 3.875%, 5/15/2032(a) | |
| | |
| |
| Bausch & Lomb Corp., 8.375%, 10/01/2028(a) | |
| | |
|
| |
| HCA, Inc., 5.500%, 6/01/2033 | |
| HCA, Inc., 5.600%, 4/01/2034 | |
| | |
| Independent Energy — 2.7% |
| Aker BP ASA, 4.000%, 1/15/2031(a) | |
| Civitas Resources, Inc., 8.625%, 11/01/2030(a) | |
| Continental Resources, Inc., 2.875%, 4/01/2032(a) | |
| Continental Resources, Inc., 5.750%, 1/15/2031(a) | |
| Energean Israel Finance Ltd., 5.875%, 3/30/2031 | |
| EQT Corp., 3.625%, 5/15/2031(a) | |
| EQT Corp., 7.000%, 2/01/2030 | |
| Matador Resources Co., 6.875%, 4/15/2028(a) | |
| Ovintiv, Inc., 6.500%, 8/15/2034 | |
| Ovintiv, Inc., 6.500%, 2/01/2038 | |
| Ovintiv, Inc., 6.625%, 8/15/2037 | |
| Ovintiv, Inc., 7.200%, 11/01/2031 | |
| Ovintiv, Inc., 7.375%, 11/01/2031 | |
| Sanchez Energy Corp., 6.125%, 1/15/2023(d) | |
| Sanchez Energy Corp., 7.750%, 6/15/2021(d) | |
| Viper Energy, Inc., 7.375%, 11/01/2031(a) | |
| | |
| |
| Carnival Corp., 5.750%, 3/01/2027(a) | |
| Carnival Corp., 6.000%, 5/01/2029(a) | |
| Carnival Corp., 7.000%, 8/15/2029(a) | |
| NCL Corp. Ltd., 5.875%, 3/15/2026(a) | |
| NCL Corp. Ltd., 5.875%, 2/15/2027(a) | |
| NCL Corp. Ltd., 8.125%, 1/15/2029(a) | |
| NCL Finance Ltd., 6.125%, 3/15/2028(a) | |
| Royal Caribbean Cruises Ltd., 5.500%, 4/01/2028(a) | |
| Royal Caribbean Cruises Ltd., 6.250%, 3/15/2032(a) | |
| | |
| |
| Brighthouse Financial, Inc., 4.700%, 6/22/2047 | |
| MetLife, Inc., 9.250%, 4/08/2068(a) | |
| MetLife, Inc., 10.750%, 8/01/2069 | |
See accompanying notes to financial statements.
Portfolio of Investments – as of June 30, 2024 (Unaudited)Loomis Sayles Bond Fund (continued) | | |
|
| Life Insurance — continued |
| Mutual of Omaha Insurance Co., 6.800%, 6/15/2036(a) | |
| National Life Insurance Co., 10.500%, 9/15/2039(a) | |
| NLV Financial Corp., 7.500%, 8/15/2033(a) | |
| | |
| |
| Choice Hotels International, Inc., 5.850%, 8/01/2034 | |
| Marriott International, Inc., 5.300%, 5/15/2034 | |
| Marriott Ownership Resorts, Inc., 4.500%, 6/15/2029(a) | |
| Travel & Leisure Co., 4.500%, 12/01/2029(a) | |
| Travel & Leisure Co., 4.625%, 3/01/2030(a) | |
| | |
| Media Entertainment — 1.2% |
| iHeartCommunications, Inc., 4.750%, 1/15/2028(a) | |
| iHeartCommunications, Inc., 5.250%, 8/15/2027(a) | |
| Netflix, Inc., 4.875%, 6/15/2030(a) | |
| Paramount Global, 4.375%, 3/15/2043 | |
| Paramount Global, 5.850%, 9/01/2043 | |
| Paramount Global, 6.875%, 4/30/2036 | |
| | |
| |
| ArcelorMittal SA, 6.750%, 3/01/2041 | |
| ArcelorMittal SA, 7.000%, 10/15/2039 | |
| First Quantum Minerals Ltd., 6.875%, 10/15/2027(a) | |
| Glencore Funding LLC, 2.500%, 9/01/2030(a) | |
| Glencore Funding LLC, 5.700%, 5/08/2033(a) | |
| Glencore Funding LLC, 6.375%, 10/06/2030(a) | |
| Glencore Funding LLC, 6.500%, 10/06/2033(a) | |
| Steel Dynamics, Inc., 5.375%, 8/15/2034 | |
| | |
| |
| Cheniere Energy Partners LP, 3.250%, 1/31/2032 | |
| | |
|
| |
| Cheniere Energy Partners LP, 4.000%, 3/01/2031 | |
| Cheniere Energy Partners LP, 5.950%, 6/30/2033 | |
| DCP Midstream Operating LP, 6.450%, 11/03/2036(a) | |
| Energy Transfer LP, 5.600%, 9/01/2034 | |
| Hess Midstream Operations LP, 4.250%, 2/15/2030(a) | |
| NGPL PipeCo LLC, 7.768%, 12/15/2037(a) | |
| Targa Resources Partners LP/Targa Resources Partners Finance Corp., 4.000%, 1/15/2032 | |
| Western Midstream Operating LP, 5.250%, 2/01/2050 | |
| Western Midstream Operating LP, 5.300%, 3/01/2048 | |
| Western Midstream Operating LP, 5.450%, 4/01/2044 | |
| Western Midstream Operating LP, 5.500%, 8/15/2048 | |
| Western Midstream Operating LP, 6.150%, 4/01/2033 | |
| | |
| | |
| Federal Home Loan Mortgage Corp., 5.000%, 12/01/2031 | |
| |
| Southern Co. Gas Capital Corp., 5.750%, 9/15/2033 | |
| Non-Agency Commercial Mortgage-Backed |
| BBSG Mortgage Trust, Series 2016-MRP, Class A, 3.275%, 6/05/2036(a) | |
| BPR Trust, Series 2021-NRD, Class F, 1 mo. USD SOFR + 6.870%, 12.199%, 12/15/2038(a)(b) | |
| BPR Trust, Series 2022-STAR, Class A, 1 mo. USD SOFR + 3.232%, 8.561%, 8/15/2039(a)(b) | |
| BX Trust, Series 2024-VLT4, Class A, 1 mo. USD SOFR + 1.491%, 6.811%, 7/15/2029(a)(b) | |
| Commercial Mortgage Pass-Through Certificates, Series 2012-LTRT, Class A2, 3.400%, 10/05/2030(a) | |
| Credit Suisse Mortgage Trust, Series 2014-USA, Class B, 4.185%, 9/15/2037(a) | |
See accompanying notes to financial statements.
Portfolio of Investments – as of June 30, 2024 (Unaudited)Loomis Sayles Bond Fund (continued) | | |
|
| Non-Agency Commercial Mortgage-Backed Securities — continued |
| Credit Suisse Mortgage Trust, Series 2014-USA, Class C, 4.336%, 9/15/2037(a) | |
| Credit Suisse Mortgage Trust, Series 2014-USA, Class D, 4.373%, 9/15/2037(a) | |
| DC Commercial Mortgage Trust, Series 2023-DC, Class C, 7.379%, 9/12/2040(a)(b) | |
| Extended Stay America Trust, Series 2021-ESH, Class C, 1 mo. USD SOFR + 1.814%, 7.144%, 7/15/2038(a)(b) | |
| Extended Stay America Trust, Series 2021-ESH, Class D, 1 mo. USD SOFR + 2.364%, 7.694%, 7/15/2038(a)(b) | |
| GS Mortgage Securities Corp. Trust, Series 2013-G1, Class B, 3.845%, 4/10/2031(a)(b) | |
| GS Mortgage Securities Corp. Trust, Series 2013-PEMB, Class B, 3.668%, 3/05/2033(a)(b) | |
| JP Morgan Chase Commercial Mortgage Securities Trust, Series 2012-LC9, Class D, 3.686%, 12/15/2047(a)(b) | |
| Med Trust, Series 2021-MDLN, Class C, 1 mo. USD SOFR + 1.914%, 7.244%, 11/15/2038(a)(b) | |
| Med Trust, Series 2021-MDLN, Class D, 1 mo. USD SOFR + 2.114%, 7.444%, 11/15/2038(a)(b) | |
| Morgan Stanley Bank of America Merrill Lynch Trust, Series 2013-C11, Class B, 4.213%, 8/15/2046(b) | |
| MSBAM Commercial Mortgage Securities Trust, Series 2012-CKSV, Class A2, 3.277%, 10/15/2030(a) | |
| Wells Fargo Commercial Mortgage Trust, Series 2013-LC12, Class B, 4.083%, 7/15/2046(b) | |
| Wells Fargo Commercial Mortgage Trust, Series 2016-C36, Class B, 3.671%, 11/15/2059(b) | |
| WFRBS Commercial Mortgage Trust, Series 2012-C10, Class B, 3.744%, 12/15/2045 | |
| WFRBS Commercial Mortgage Trust, Series 2013-C15, Class B, 4.328%, 8/15/2046(b) | |
| WFRBS Commercial Mortgage Trust, Series 2014-C20, Class B, 4.378%, 5/15/2047 | |
| | |
| | |
|
| |
| EPR Properties, 3.600%, 11/15/2031 | |
| |
| Bausch Health Cos., Inc., 4.875%, 6/01/2028(a) | |
| Teva Pharmaceutical Finance Co. LLC, 6.150%, 2/01/2036 | |
| Teva Pharmaceutical Finance Netherlands II BV, 7.375%, 9/15/2029, (EUR) | |
| Teva Pharmaceutical Finance Netherlands II BV, 7.875%, 9/15/2031, (EUR) | |
| Teva Pharmaceutical Finance Netherlands III BV, 3.150%, 10/01/2026 | |
| Teva Pharmaceutical Finance Netherlands III BV, 4.100%, 10/01/2046 | |
| Teva Pharmaceutical Finance Netherlands III BV, 4.750%, 5/09/2027 | |
| Teva Pharmaceutical Finance Netherlands III BV, 5.125%, 5/09/2029 | |
| Teva Pharmaceutical Finance Netherlands III BV, 7.875%, 9/15/2029 | |
| Teva Pharmaceutical Finance Netherlands III BV, 8.125%, 9/15/2031 | |
| | |
| Property & Casualty Insurance — 0.4% |
| Arthur J Gallagher & Co., 5.450%, 7/15/2034 | |
| MBIA Insurance Corp., 3 mo. USD SOFR + 11.522%, 16.850%, 1/15/2033(a)(f) | |
| MBIA Insurance Corp., 3 mo. USD SOFR + 11.522%, 16.850%, 1/15/2033(f) | |
| Stewart Information Services Corp., 3.600%, 11/15/2031 | |
| | |
| |
| Dillard's, Inc., 7.000%, 12/01/2028 | |
| Dillard's, Inc., 7.750%, 7/15/2026 | |
| Dillard's, Inc., 7.750%, 5/15/2027 | |
| Lithia Motors, Inc., 3.875%, 6/01/2029(a) | |
| | |
| |
| Chile Government International Bonds, 3.500%, 1/31/2034 | |
See accompanying notes to financial statements.
Portfolio of Investments – as of June 30, 2024 (Unaudited)Loomis Sayles Bond Fund (continued) | | |
|
| |
| Chile Government International Bonds, 3.500%, 1/25/2050 | |
| Colombia Government International Bonds, 7.500%, 2/02/2034 | |
| Colombia Government International Bonds, 8.000%, 11/14/2035 | |
| Dominican Republic International Bonds, 4.875%, 9/23/2032 | |
| Dominican Republic International Bonds, 6.600%, 6/01/2036(a) | |
| Paraguay Government International Bonds, 6.000%, 2/09/2036(a) | |
| Philippines Government International Bonds, 2.650%, 12/10/2045 | |
| Philippines Government International Bonds, 2.950%, 5/05/2045 | |
| Qatar Government International Bonds, 5.103%, 4/23/2048 | |
| Republic of Poland Government International Bonds, 5.500%, 4/04/2053 | |
| Republic of Poland Government International Bonds, 5.500%, 3/18/2054 | |
| Republic of South Africa Government International Bonds, 4.850%, 9/30/2029 | |
| Republic of South Africa Government International Bonds, 5.875%, 4/20/2032 | |
| Republic of Uzbekistan International Bonds, 3.700%, 11/25/2030 | |
| Republic of Uzbekistan International Bonds, 3.900%, 10/19/2031 | |
| Republic of Uzbekistan International Bonds, 5.375%, 5/29/2027, (EUR)(a) | |
| Republic of Uzbekistan International Bonds, 5.375%, 2/20/2029 | |
| Republic of Uzbekistan International Bonds, 6.900%, 2/28/2032(a) | |
| Republic of Uzbekistan International Bonds, 7.850%, 10/12/2028(a) | |
| Romania Government International Bonds, 6.375%, 1/30/2034(a) | |
| Romania Government International Bonds, 7.125%, 1/17/2033 | |
| Serbia International Bonds, 6.000%, 6/12/2034(a) | |
| Turkiye Government International Bonds, 5.875%, 5/21/2030, (EUR) | |
| UAE International Government Bonds, 4.857%, 7/02/2034(a) | |
| | |
| | |
|
| |
| Block, Inc., 3.500%, 6/01/2031 | |
| Broadcom, Inc., 2.600%, 2/15/2033(a) | |
| Broadcom, Inc., 3.137%, 11/15/2035(a) | |
| Broadcom, Inc., 3.419%, 4/15/2033(a) | |
| Broadcom, Inc., 3.469%, 4/15/2034(a) | |
| Broadcom, Inc., 4.150%, 11/15/2030 | |
| Broadcom, Inc., 4.150%, 4/15/2032(a) | |
| CDW LLC/CDW Finance Corp., 3.569%, 12/01/2031 | |
| CommScope Technologies LLC, 5.000%, 3/15/2027(a) | |
| CommScope, Inc., 4.750%, 9/01/2029(a) | |
| Entegris, Inc., 4.750%, 4/15/2029(a) | |
| Gartner, Inc., 3.625%, 6/15/2029(a) | |
| Gartner, Inc., 3.750%, 10/01/2030(a) | |
| Global Payments, Inc., 2.900%, 11/15/2031 | |
| Global Payments, Inc., 5.400%, 8/15/2032 | |
| Leidos, Inc., 5.750%, 3/15/2033 | |
| Micron Technology, Inc., 5.875%, 2/09/2033 | |
| Micron Technology, Inc., 5.875%, 9/15/2033 | |
| Motorola Solutions, Inc., 5.400%, 4/15/2034 | |
| Sensata Technologies BV, 5.875%, 9/01/2030(a) | |
| Sensata Technologies, Inc., 3.750%, 2/15/2031(a) | |
| TD SYNNEX Corp., 6.100%, 4/12/2034 | |
| Western Digital Corp., 2.850%, 2/01/2029 | |
| | |
| Transportation Services — 0.1% |
| Rand Parent LLC, 8.500%, 2/15/2030(a) | |
| |
| Brazil Notas do Tesouro Nacional, Series F, 10.000%, 1/01/2029, (BRL) | |
| Indonesia Treasury Bonds, Series 101, 6.875%, 4/15/2029, (IDR) | |
| Mexico Bonos, Series M, 7.500%, 5/26/2033, (MXN) | |
| New Zealand Government Bonds, Series 433, 3.500%, 4/14/2033, (NZD) | |
See accompanying notes to financial statements.
Portfolio of Investments – as of June 30, 2024 (Unaudited)Loomis Sayles Bond Fund (continued) | | |
|
| |
| Norway Government Bonds, Series 477, 1.750%, 3/13/2025, (NOK) | |
| Republic of South Africa Government Bonds, Series 2035, 8.875%, 2/28/2035, (ZAR) | |
| U.K. Gilts, 0.250%, 1/31/2025, (GBP) | |
| U.S. Treasury Bonds, 3.250%, 5/15/2042(i) | |
| U.S. Treasury Notes, 4.500%, 3/31/2026 | |
| U.S. Treasury Notes, 4.625%, 6/30/2025 | |
| U.S. Treasury Notes, 4.875%, 4/30/2026 | |
| | |
| |
| American Tower Corp., 5.900%, 11/15/2033 | |
| SoftBank Group Corp., 4.625%, 7/06/2028 | |
| Sprint Capital Corp., 8.750%, 3/15/2032 | |
| T-Mobile USA, Inc., 5.750%, 1/15/2034 | |
| | |
| |
| Cincinnati Bell Telephone Co. LLC, 6.300%, 12/01/2028 | |
| Total Non-Convertible Bonds
(Identified Cost $4,041,417,499)
| |
|
|
|
| |
| Southwest Airlines Co., 1.250%, 5/01/2025 | |
| |
| DISH Network Corp., 3.375%, 8/15/2026 | |
| Consumer Cyclical Services — 0.2% |
| Booking Holdings, Inc., 0.750%, 5/01/2025 | |
| Uber Technologies, Inc., Series 2028, 0.875%, 12/01/2028(a) | |
| | |
| |
| Evergy, Inc., 4.500%, 12/15/2027(a) | |
| | |
|
| |
| NRG Energy, Inc., 2.750%, 6/01/2048 | |
| PPL Capital Funding, Inc., 2.875%, 3/15/2028 | |
| | |
| |
| Sunac China Holdings Ltd., 1.000% PIK or 0.000% Cash, 9/30/2032(a)(e) | |
| |
| Teladoc Health, Inc., 1.250%, 6/01/2027 | |
| |
| Carnival Corp., 5.750%, 12/01/2027 | |
| Royal Caribbean Cruises Ltd., 6.000%, 8/15/2025 | |
| | |
| Media Entertainment — 0.1% |
| Liberty Media Corp.-Liberty Formula One, 2.250%, 8/15/2027 | |
| |
| BioMarin Pharmaceutical, Inc., 1.250%, 5/15/2027 | |
| Jazz Investments I Ltd., 2.000%, 6/15/2026 | |
| | |
| |
| Datadog, Inc., 0.125%, 6/15/2025 | |
| Nutanix, Inc., 0.250%, 10/01/2027 | |
| ON Semiconductor Corp., 0.500%, 3/01/2029 | |
| Palo Alto Networks, Inc., 0.375%, 6/01/2025 | |
| Shift4 Payments, Inc., 0.500%, 8/01/2027 | |
| Zscaler, Inc., 0.125%, 7/01/2025 | |
| | |
| Total Convertible Bonds
(Identified Cost $324,345,072)
| |
|
|
|
| |
| Tobacco Settlement Financing Corp., 6.706%, 6/01/2046
(Identified Cost $63,126,729) | |
| Total Bonds and Notes
(Identified Cost $4,428,889,300)
| |
|
|
See accompanying notes to financial statements.
Portfolio of Investments – as of June 30, 2024 (Unaudited)Loomis Sayles Bond Fund (continued) | | |
|
Collateralized Loan Obligations — 4.3% |
| 522 Funding CLO Ltd., Series 2018-3A, Class DR, 3 mo. USD SOFR + 3.362%, 8.686%, 10/20/2031(a)(b) | |
| AGL CLO 12 Ltd., Series 2021-12A, Class B, 3 mo. USD SOFR + 1.862%, 7.186%, 7/20/2034(a)(b) | |
| AGL CLO 12 Ltd., Series 2021-12A, Class D, 3 mo. USD SOFR + 3.112%, 8.436%, 7/20/2034(a)(b) | |
| AGL CLO 7 Ltd., Series 2020-7A, Class DR, 3 mo. USD SOFR + 3.362%, 8.690%, 7/15/2034(a)(b) | |
| AIMCO CLO 12 Ltd., Series 2020-12A, Class AR, 3 mo. USD SOFR + 1.170%, 6.487%, 1/17/2032(a)(b) | |
| ARES Loan Funding I Ltd., Series 2021-ALFA, Class D, 3 mo. USD SOFR + 3.262%, 8.590%, 10/15/2034(a)(b) | |
| Bain Capital Credit CLO Ltd., Series 2017-2A, Class DR2, 3 mo. USD SOFR + 3.362%, 8.685%, 7/25/2034(a)(b) | |
| Ballyrock CLO Ltd., Series 2019-2A, Class A2RR, 3 mo. USD SOFR + 2.000%, 7.319%, 2/20/2036(a)(b) | |
| Benefit Street Partners CLO XVI Ltd., Series 2018-16A, Class DR, 3 mo. USD SOFR + 3.262%, 8.579%, 1/17/2032(a)(b) | |
| CarVal CLO III Ltd., Series 2019-2A, Class DR, 3 mo. USD SOFR + 3.212%, 8.536%, 7/20/2032(a)(b) | |
| Clover CLO LLC, Series 2021-1A, Class D, 3 mo. USD SOFR + 3.212%, 8.536%, 4/22/2034(a)(b) | |
| Clover CLO LLC, Series 2021-2A, Class D, 3 mo. USD SOFR + 3.312%, 8.636%, 7/20/2034(a)(b) | |
| Crown City CLO I, Series 2020-1A, Class CR, 3 mo. USD SOFR + 3.682%, 9.006%, 7/20/2034(a)(b) | |
| Elmwood CLO VIII Ltd., Series 2021-1A, Class DR, 3 mo. USD SOFR + 3.800%, 9.128%, 4/20/2037(a)(b) | |
| LCM 30 Ltd., Series 30A, Class BR, 3 mo. USD SOFR + 1.762%, 7.086%, 4/20/2031(a)(b) | |
| LCM 30 Ltd., Series 30A, Class CR, 3 mo. USD SOFR + 2.262%, 7.586%, 4/20/2031(a)(b) | |
| | |
|
| LCM 30 Ltd., Series 30A, Class DR, 3 mo. USD SOFR + 3.262%, 8.586%, 4/20/2031(a)(b) | |
| Madison Park Funding XXXI Ltd., Series 2018-31A, Class D1R, 3 mo. USD SOFR + 3.300%, 8.639%, 7/23/2037(a)(b) | |
| Neuberger Berman CLO XX Ltd., Series 2015-20A, Class BRR, 3 mo. USD SOFR + 1.912%, 7.240%, 7/15/2034(a)(b) | |
| OCP CLO Ltd., Series 2019-17A, Class DR, 3 mo. USD SOFR + 3.362%, 8.686%, 7/20/2032(a)(b) | |
| Octagon Investment Partners 42 Ltd., Series 2019-3A, Class DR, 3 mo. USD SOFR + 3.412%, 8.740%, 7/15/2034(a)(b) | |
| Octagon Investment Partners 46 Ltd., Series 2020-2A, Class DR, 3 mo. USD SOFR + 3.562%, 8.890%, 7/15/2036(a)(b) | |
| OHA Credit Funding 3 Ltd., Series 2019-3A, Class BR, 3 mo. USD SOFR + 1.912%, 7.236%, 7/02/2035(a)(b) | |
| Palmer Square BDC CLO 1 Ltd., Series 1A, Class A, 3 mo. USD SOFR + 1.600%, 6.925%, 7/15/2037(a)(b) | |
| Palmer Square BDC CLO 1 Ltd., Series 1A, Class B1, 3 mo. USD SOFR + 2.150%, 7.475%, 7/15/2037(a)(b) | |
| Palmer Square CLO Ltd., Series 2013-2A, Class CR3, 3 mo. USD SOFR + 2.962%, 8.279%, 10/17/2031(a)(b) | |
| Palmer Square CLO Ltd., Series 2015-1A, Class A2R4, 3 mo. USD SOFR + 1.962%, 7.287%, 5/21/2034(a)(b) | |
| Rockford Tower CLO Ltd., Series 2018-1A, Class A, 3 mo. USD SOFR + 1.362%, 6.687%, 5/20/2031(a)(b) | |
| Signal Peak CLO 1 Ltd., Series 2014-1A, Class AR3, 3 mo. USD SOFR + 1.422%, 6.739%, 4/17/2034(a)(b) | |
| THL Credit Wind River CLO Ltd., Series 2018-3A, Class D, 3 mo. USD SOFR + 3.212%, 8.536%, 1/20/2031(a)(b) | |
See accompanying notes to financial statements.
Portfolio of Investments – as of June 30, 2024 (Unaudited)Loomis Sayles Bond Fund (continued) | | |
|
| Verde CLO Ltd., Series 2019-1A, Class AR, 3 mo. USD SOFR + 1.362%, 6.690%, 4/15/2032(a)(b) | |
| Vibrant CLO XIV Ltd., Series 2021-14A, Class C, 3 mo. USD SOFR + 4.012%, 9.336%, 10/20/2034(a)(b) | |
| Total Collateralized Loan Obligations
(Identified Cost $187,564,962)
| |
|
|
|
| Aerospace & Defense — 0.1% |
| TransDigm, Inc., 2023 Term Loan J, 3 mo. USD SOFR + 2.500%, 7.843%, 2/28/2031(b)(j) | |
| TransDigm, Inc., 2024 Term Loan I, 3 mo. USD SOFR + 2.750%, 8.085%, 8/24/2028(b)(j) | |
| | |
| Building Materials — 0.2% |
| Foundation Building Materials Holding Co. LLC, 2024 Term Loan B2, 3 mo. USD SOFR + 4.000%, 9.330%, 1/29/2031(b)(j) | |
| Summit Materials LLC, 2023 Incremental Term Loan B, 3 mo. USD SOFR + 2.500%, 7.799%, 1/12/2029(b)(j) | |
| | |
| Consumer Cyclical Services — 0.1% |
| Uber Technologies, Inc., 2023 Term Loan B, 3 mo. USD SOFR + 2.750%, 8.089%, 3/03/2030(b)(j) | |
| Diversified Manufacturing — 0.3% |
| Resideo Funding, Inc., 2024 M&A Term Loan B, 5/21/2031(k) | |
| Resideo Funding, Inc., 2024 M&A Term Loan B, 1 mo. USD SOFR + 2.000%, 7.339%, 5/21/2031(b)(j) | |
| Resideo Funding, Inc., 2024 Term Loan B, 2/11/2028(k) | |
| Resideo Funding, Inc., 2024 Term Loan B, USD SOFR + 2.000%, 7.338%, 2/11/2028(b)(j) | |
| | |
| |
| Trans Union LLC, 2024 Term Loan B8, 6/24/2031(k) | |
| | |
|
| |
| Light & Wonder International, Inc., 2024 Term Loan, 1 mo. USD SOFR + 2.750%, 8.070%, 4/14/2029(b)(j) | |
| Light & Wonder International, Inc., 2024 Term Loan B2, 4/14/2029(k) | |
| | |
| |
| Star Parent, Inc., Term Loan B, 3 mo. USD SOFR + 3.750%, 9.085%, 9/27/2030(b)(j) | |
| |
| Carnival Corp., 2024 Term Loan B1, 1 mo. USD SOFR + 2.750%, 8.094%, 10/18/2028(b)(j) | |
| Carnival Corp., 2024 Term Loan B2, 1 mo. USD SOFR + 2.750%, 8.094%, 8/08/2027(b)(j) | |
| Cedar Fair LP, 2024 Term Loan B, 1 mo. USD SOFR + 2.000%, 7.329%, 5/01/2031(b)(j) | |
| | |
| |
| Hilton Domestic Operating Co., Inc., 2023 Term Loan B4, 11/08/2030(k) | |
| Hilton Domestic Operating Co., Inc., 2024 Term Loan B4, 11/08/2030(k) | |
| Hilton Grand Vacations Borrower LLC, 2024 1st Lien Term Loan B, 1/17/2031(k) | |
| Hilton Grand Vacations Borrower LLC, 2024 Incremental Term Loan B, 1 mo. USD SOFR + 2.750%, 8.094%, 1/17/2031(b)(j) | |
| Hilton Grand Vacations Borrower LLC, 2021 Term Loan B, 8/02/2028(k) | |
| Wyndham Hotels & Resorts, Inc., 2024 Term Loan, 5/24/2030(k) | |
| | |
| |
| Asplundh Tree Expert LLC, 2024 Incremental Term Loan B, 5/23/2031(k) | |
| Property & Casualty Insurance — 0.2% |
| HUB International Ltd., 2024 Term Loan B, 3 mo. USD SOFR + 3.250%, 8.575%, 6/20/2030(b)(j) | |
| Truist Insurance Holdings LLC, 1st Lien Term Loan, 3 mo. USD SOFR + 3.250%, 8.585%, 5/06/2031(b)(j) | |
| | |
See accompanying notes to financial statements.
Portfolio of Investments – as of June 30, 2024 (Unaudited)Loomis Sayles Bond Fund (continued) | | |
|
| |
| GTCR W Merger Sub LLC, 2024 USD Term Loan B, 1/31/2031(k) | |
| GTCR W Merger Sub LLC, USD Term Loan B, 3 mo. USD SOFR + 3.000%, 8.335%, 1/31/2031(b)(j) | |
| | |
| |
| SBA Senior Finance II LLC, 2024 Term Loan B, 1 mo. USD SOFR + 2.000%, 7.350%, 1/25/2031(b)(j) | |
| Total Senior Loans
(Identified Cost $154,048,892)
| |
| | |
|
|
|
Convertible Preferred Stocks — 0.2% |
| |
| Bank of America Corp., Series L, 7.250% | |
| Wells Fargo & Co., Series L, Class A, 7.500% | |
| | |
| |
| Apollo Global Management, Inc., 6.750% | |
| Total Convertible Preferred Stocks
(Identified Cost $8,961,850)
| |
|
|
Non-Convertible Preferred Stocks — 0.3% |
| |
| Hovnanian Enterprises, Inc., 7.625% | |
| |
| Highwoods Properties, Inc., Series A, 8.625%(l) | |
| |
| Prologis, Inc., Series Q, 8.540% | |
| Total Non-Convertible Preferred Stocks
(Identified Cost $10,688,684) | |
| Total Preferred Stocks
(Identified Cost $19,650,534)
| |
|
|
|
| |
| NexPoint Diversified Real Estate Trust | |
| |
| Altice USA, Inc., Class A(f) | |
| | |
|
| |
| iHeartMedia, Inc., Class A(f) | |
| Paramount Global, Class B | |
| | |
| Oil, Gas & Consumable Fuels — 0.0% |
| | |
| Technology Hardware, Storage & |
| | |
| Total Common Stocks
(Identified Cost $72,514,938)
| |
| | |
Short-Term Investments — 3.2% |
| Tri-Party Repurchase Agreement with Fixed Income Clearing Corporation, dated 6/28/2024 at 3.500% to be repurchased at $139,022,085 on 7/01/2024 collateralized by $143,195,900 U.S. Treasury Note, 4.125% due 6/15/2026 valued at $141,761,199 including accrued interest (Note 2 of Notes to Financial Statements)
(Identified Cost $138,981,548) | |
| Total Investments — 102.0%
(Identified Cost $5,001,650,174)
| |
| Other assets less liabilities — (2.0)% | |
| | |
| See Note 2 of Notes to Financial Statements. |
| Principal Amount stated in U.S. dollars unless otherwise noted. |
| All or a portion of these securities are exempt from registration under Rule 144A of the Securities Act of 1933. These securities may be resold in transactions exempt from registration, normally to qualified institutional buyers. At June 30, 2024, the value of Rule 144A holdings amounted to $2,043,904,709 or 46.9% of net assets. |
| Variable rate security. Rate as of June 30, 2024 is disclosed. Issuers comprised of various lots with differing coupon rates have been aggregated for the purpose of presentation in the Portfolio of Investments and show a weighted average rate. Certain variable rate securities are not based on a published reference rate and spread, rather are determined by the issuer or agent and are based on current market conditions. These securities may not indicate a reference rate and/or spread in their description. |
| Perpetual bond with no specified maturity date. |
| The issuer is in default with respect to interest and/or principal payments. Income is not being accrued. |
See accompanying notes to financial statements.
Portfolio of Investments – as of June 30, 2024 (Unaudited)Loomis Sayles Bond Fund (continued) | Payment–in–kind security for which the issuer, at each interest payment date, may make interest payments in cash and/or additional principal. For the period ended June 30, 2024, interest payments were made in principal. |
| Non-income producing security. |
| Amount shown represents units. One unit represents a principal amount of 1,000. |
| Amount shown represents units. One unit represents a principal amount of 100. |
| Security (or a portion thereof) has been pledged as collateral for open derivative contracts. |
| Stated interest rate has been determined in accordance with the provisions of the loan agreement and is subject to a minimum benchmark floor rate which may range from 0.00% to 1.00%, to which the spread is added. |
| Position is unsettled. Contract rate was not determined at June 30, 2024 and does not take effect until settlement date. Maturity date is not finalized until settlement date. |
| Level 3 security. Value has been determined using significant unobservable inputs. See Note 3 of Notes to Financial Statements. |
| |
| |
| Real Estate Investment Trusts |
| Secured Overnight Financing Rate |
At June 30, 2024, the Fund had the following open forward foreign currency contracts:
| | Currency
Bought/
Sold (B/S) | | | | Unrealized
Appreciation
(Depreciation) |
| | | | | | | |
At June 30, 2024, open long futures contracts were as follows:
| | | | | Unrealized
Appreciation
(Depreciation) |
CBOT 10 Year U.S. Treasury Notes Futures | | | | | |
CBOT 2 Year U.S. Treasury Notes Futures | | | | | |
CBOT U.S. Long Bond Futures | | | | | |
CBOT Ultra Long Term U.S. Treasury Bond Futures | | | | | |
| | | | | |
At June 30, 2024, open short futures contracts were as follows:
| | | | | Unrealized
Appreciation
(Depreciation) |
CBOT 5 Year U.S. Treasury Notes Futures | | | | | |
Ultra 10-Year U.S. Treasury Notes Futures | | | | | |
| | | | | |
See accompanying notes to financial statements.
Portfolio of Investments – as of June 30, 2024 (Unaudited)Loomis Sayles Bond Fund (continued) Industry Summary at June 30, 2024 (Unaudited)
| |
| |
| |
| |
| |
| |
| |
| |
| |
| |
| |
| |
| |
| |
| |
Other Investments, less than 2% each | |
Collateralized Loan Obligations | |
| |
| |
Other assets less liabilities (including forward foreign currency and futures contracts) | |
| |
See accompanying notes to financial statements.
Portfolio of Investments – as of June 30, 2024 (Unaudited)Loomis Sayles Investment Grade Fixed Income Fund
| | |
Bonds and Notes — 91.6% of Net Assets |
|
|
Non-Convertible Bonds — 89.9% |
| |
| American Credit Acceptance Receivables Trust, Series 2022-1, Class D, 2.460%, 3/13/2028(a) | |
| American Credit Acceptance Receivables Trust, Series 2022-4, Class C, 7.860%, 2/15/2029(a) | |
| American Credit Acceptance Receivables Trust, Series 2023-2, Class C, 5.960%, 8/13/2029(a) | |
| American Credit Acceptance Receivables Trust, Series 2023-3, Class D, 6.820%, 10/12/2029(a) | |
| American Credit Acceptance Receivables Trust, Series 2023-4, Class D, 7.650%, 9/12/2030(a) | |
| Avis Budget Rental Car Funding AESOP LLC, Series 2020-2A, Class A, 2.020%, 2/20/2027(a) | |
| Avis Budget Rental Car Funding AESOP LLC, Series 2023-4A, Class C, 7.240%, 6/20/2029(a) | |
| Avis Budget Rental Car Funding AESOP LLC, Series 2023-8A, Class C, 7.340%, 2/20/2030(a) | |
| Bridgecrest Lending Auto Securitization Trust, Series 2023-1, Class D, 7.840%, 8/15/2029 | |
| Bridgecrest Lending Auto Securitization Trust, Series 2024-2, Class C, 6.070%, 2/15/2030 | |
| Bridgecrest Lending Auto Securitization Trust, Series 2024-2, Class D, 6.300%, 2/15/2030 | |
| CarMax Auto Owner Trust, Series 2021-3, Class D, 1.500%, 1/18/2028 | |
| CarMax Auto Owner Trust, Series 2022-1, Class D, 2.470%, 7/17/2028 | |
| CarMax Auto Owner Trust, Series 2023-2, Class D, 6.550%, 10/15/2029 | |
| CarMax Auto Owner Trust, Series 2023-4, Class D, 7.160%, 4/15/2030 | |
| CarMax Auto Owner Trust, Series 2024-2, Class B, 5.690%, 11/15/2029 | |
| CarMax Auto Owner Trust, Series 2024-2, Class D, 6.420%, 10/15/2030 | |
| Carvana Auto Receivables Trust, Series 2024-N1, Class D, 6.300%, 5/10/2030(a) | |
| Carvana Auto Receivables Trust, Series 2024-N2, Class D, 6.440%, 9/10/2030(a) | |
| | |
|
| |
| Credit Acceptance Auto Loan Trust, Series 2024-1A, Class C, 6.710%, 7/17/2034(a) | |
| Credit Acceptance Auto Loan Trust, Series 2024-2A, Class A, 5.950%, 6/15/2034(a) | |
| Credit Acceptance Auto Loan Trust, Series 2024-2A, Class C, 6.700%, 10/16/2034(a) | |
| DT Auto Owner Trust, Series 2021-3A, Class D, 1.310%, 5/17/2027(a) | |
| DT Auto Owner Trust, Series 2023-2A, Class D, 6.620%, 2/15/2029(a) | |
| Exeter Automobile Receivables Trust, Series 2019-4A, Class D, 2.580%, 9/15/2025(a) | |
| Exeter Automobile Receivables Trust, Series 2021-1A, Class D, 1.080%, 11/16/2026 | |
| Exeter Automobile Receivables Trust, Series 2021-3A, Class D, 1.550%, 6/15/2027 | |
| Exeter Automobile Receivables Trust, Series 2022-2A, Class D, 4.560%, 7/17/2028 | |
| Exeter Automobile Receivables Trust, Series 2022-6A, Class C, 6.320%, 5/15/2028 | |
| Exeter Automobile Receivables Trust, Series 2023-3A, Class D, 6.680%, 4/16/2029 | |
| Exeter Automobile Receivables Trust, Series 2023-5A, Class D, 7.130%, 2/15/2030 | |
| First Investors Auto Owner Trust, Series 2021-1A, Class D, 1.620%, 3/15/2027(a) | |
| Flagship Credit Auto Trust, Series 2021-1, Class D, 1.270%, 3/15/2027(a) | |
| Flagship Credit Auto Trust, Series 2021-2, Class D, 1.590%, 6/15/2027(a) | |
| Flagship Credit Auto Trust, Series 2021-3, Class D, 1.650%, 9/15/2027(a) | |
| Flagship Credit Auto Trust, Series 2023-2, Class D, 6.620%, 5/15/2029(a) | |
| Flagship Credit Auto Trust, Series 2023-3, Class D, 6.580%, 8/15/2029(a) | |
| Ford Credit Auto Lease Trust, Series 2023-B, Class D, 6.970%, 6/15/2028 | |
| Ford Credit Auto Owner Trust, Series 2021-A, Class A3, 0.300%, 8/15/2025 | |
| Foursight Capital Automobile Receivables Trust, Series 2021-1, Class D, 1.320%, 3/15/2027(a) | |
See accompanying notes to financial statements.
Portfolio of Investments – as of June 30, 2024 (Unaudited)Loomis Sayles Investment Grade Fixed Income Fund (continued) | | |
|
| |
| Foursight Capital Automobile Receivables Trust, Series 2021-2, Class D, 1.920%, 9/15/2027(a) | |
| GLS Auto Receivables Issuer Trust, Series 2023-3A, Class D, 6.440%, 5/15/2029(a) | |
| GLS Auto Receivables Issuer Trust, Series 2023-4A, Class D, 7.180%, 8/15/2029(a) | |
| GLS Auto Receivables Issuer Trust, Series 2024-1A, Class D, 5.950%, 12/17/2029(a) | |
| GLS Auto Receivables Issuer Trust, Series 2024-2A, Class D, 6.190%, 2/15/2030(a) | |
| GLS Auto Select Receivables Trust, Series 2024-3A, Class C, 5.920%, 8/15/2030(a) | |
| GLS Auto Select Receivables Trust, Series 2024-3A, Class D, 6.340%, 8/15/2031(a) | |
| GM Financial Consumer Automobile Receivables Trust, Series 2021-1, Class A3, 0.350%, 10/16/2025 | |
| GM Financial Consumer Automobile Receivables Trust, Series 2021-2, Class A3, 0.510%, 4/16/2026 | |
| Hertz Vehicle Financing III LLC, Series 2022-1A, Class D, 4.850%, 6/25/2026(a) | |
| Hertz Vehicle Financing LLC, Series 2022-4A, Class D, 6.560%, 9/25/2026(a) | |
| Honda Auto Receivables Owner Trust, Series 2021-2, Class A3, 0.330%, 8/15/2025 | |
| JPMorgan Chase Bank NA, Series 2021-1, Class D, 1.174%, 9/25/2028(a) | |
| LAD Auto Receivables Trust, Series 2023-3A, Class C, 6.430%, 12/15/2028(a) | |
| LAD Auto Receivables Trust, Series 2023-4A, Class C, 6.760%, 3/15/2029(a) | |
| Prestige Auto Receivables Trust, Series 2023-1A, Class D, 6.330%, 4/16/2029(a) | |
| Santander Drive Auto Receivables Trust, Series 2021-3, Class D, 1.330%, 9/15/2027 | |
| Santander Drive Auto Receivables Trust, Series 2024-3, Class D, 5.970%, 10/15/2031 | |
| Westlake Automobile Receivables Trust, Series 2020-3A, Class D, 1.650%, 2/17/2026(a) | |
| | |
|
| |
| Westlake Automobile Receivables Trust, Series 2023-3A, Class D, 6.470%, 3/15/2029(a) | |
| Westlake Automobile Receivables Trust, Series 2023-4A, Class D, 7.190%, 7/16/2029(a) | |
| World Omni Auto Receivables Trust, Series 2021-B, Class A3, 0.420%, 6/15/2026 | |
| | |
| |
| Mission Lane Credit Card Master Trust, Series 2023-A, Class A, 7.230%, 7/17/2028(a) | |
| Mission Lane Credit Card Master Trust, Series 2023-B, Class A, 7.690%, 11/15/2028(a) | |
| Mission Lane Credit Card Master Trust, Series 2024-A, Class A1, 6.200%, 8/15/2029(a) | |
| | |
| |
| BINOM Securitization Trust, Series 2022-RPL1, Class M1, 3.000%, 2/25/2061(a)(b) | |
| CIM Trust, Series 2021-NR2, Class A1, 5.568%, 7/25/2059(a)(b) | |
| COLT Mortgage Loan Trust, Series 2021-6, Class A1, 1.907%, 12/25/2066(a)(b) | |
| CoreVest American Finance Ltd., Series 2021-1, Class C, 2.800%, 4/15/2053(a) | |
| CoreVest American Finance Ltd., Series 2021-2, Class C, 2.478%, 7/15/2054(a) | |
| CoreVest American Finance Ltd., Series 2021-3, Class D, 3.469%, 10/15/2054(a) | |
| CoreVest American Finance Ltd., Series 2021-RTL1, Class A1, 2.239%, 3/28/2029(a)(b) | |
| CoreVest American Finance Ltd., Series 2023-RTL1, Class A1, 7.553%, 12/28/2030(a)(b) | |
| Credit Suisse Mortgage Trust, Series 2021-RPL1, Class A1, 4.055%, 9/27/2060(a)(b) | |
| Credit Suisse Mortgage Trust, Series 2021-RPL4, Class A1, 4.052%, 12/27/2060(a)(b) | |
| Federal Home Loan Mortgage Corp. Structured Agency Credit Risk Debt Notes, Series 2022-DNA3, Class M1A, REMICS, 30 day USD SOFR Average + 2.000%, 7.335%, 4/25/2042(a)(b) | |
See accompanying notes to financial statements.
Portfolio of Investments – as of June 30, 2024 (Unaudited)Loomis Sayles Investment Grade Fixed Income Fund (continued) | | |
|
| ABS Home Equity — continued |
| Federal Home Loan Mortgage Corp. Structured Agency Credit Risk Debt Notes, Series 2023-DNA2, Class M1A, REMICS, 30 day USD SOFR Average + 2.100%, 7.435%, 4/25/2043(a)(b) | |
| FirstKey Homes Trust, Series 2021-SFR2, Class E1, 2.258%, 9/17/2038(a) | |
| FirstKey Homes Trust, Series 2021-SFR2, Class E2, 2.358%, 9/17/2038(a) | |
| FirstKey Homes Trust, Series 2022-SFR2, Class D, 4.500%, 7/17/2039(a) | |
| GCAT Trust, Series 2019-RPL1, Class A1, 2.650%, 10/25/2068(a)(b) | |
| GITSIT Mortgage Loan Trust, Series 2024-NPL1, Class A1, 7.466%, 6/25/2054(a)(b) | |
| Home Partners of America Trust, Series 2021-1, Class E, 2.577%, 9/17/2041(a) | |
| Home Partners of America Trust, Series 2021-2, Class E1, 2.852%, 12/17/2026(a) | |
| Home Partners of America Trust, Series 2021-2, Class E2, 2.952%, 12/17/2026(a) | |
| Legacy Mortgage Asset Trust, Series 2020-RPL1, Class A2, 3.250%, 9/25/2059(a)(b) | |
| Legacy Mortgage Asset Trust, Series 2021-GS2, Class A1, 4.750%, 4/25/2061(a)(b) | |
| Morgan Stanley Mortgage Loan Trust, Series 2005-3AR, Class 5A, 6.245%, 7/25/2035(b)(c) | |
| New Residential Mortgage Loan Trust, Series 2024-RPL1, Class A, 3.800%, 1/25/2064(a)(b) | |
| New Residential Mortgage Loan Trust, Series 2024-RTL1, Class A1, 6.664%, 3/25/2039(a)(b) | |
| NLT Trust, Series 2023-1, Class A1, 3.200%, 10/25/2062(a)(b) | |
| NYMT Loan Trust, Series 2024-BPL2, Class A1, 6.509%, 5/25/2039(a)(b) | |
| OBX Trust, Series 2021-NQM3, Class A1, 1.054%, 7/25/2061(a)(b) | |
| Progress Residential Trust, Series 2021-SFR2, Class E1, 2.547%, 4/19/2038(a) | |
| Progress Residential Trust, Series 2021-SFR3, Class E1, 2.538%, 5/17/2026(a) | |
| Progress Residential Trust, Series 2021-SFR3, Class E2, 2.688%, 5/17/2026(a) | |
| | |
|
| ABS Home Equity — continued |
| Progress Residential Trust, Series 2021-SFR4, Class E1, 2.409%, 5/17/2038(a) | |
| Progress Residential Trust, Series 2021-SFR4, Class E2, 2.559%, 5/17/2038(a) | |
| Progress Residential Trust, Series 2021-SFR5, Class E1, 2.209%, 7/17/2038(a) | |
| Progress Residential Trust, Series 2021-SFR6, Class E1, 2.425%, 7/17/2038(a) | |
| Progress Residential Trust, Series 2021-SFR6, Class E2, 2.525%, 7/17/2038(a) | |
| Progress Residential Trust, Series 2021-SFR7, Class E1, 2.591%, 8/17/2040(a) | |
| Progress Residential Trust, Series 2021-SFR7, Class E2, 2.640%, 8/17/2040(a) | |
| Progress Residential Trust, Series 2021-SFR9, Class E1, 2.811%, 11/17/2040(a) | |
| PRPM LLC, Series 2021-4, Class A1, 4.867%, 4/25/2026(a)(b) | |
| PRPM LLC, Series 2024-2, Class A1, 7.026%, 3/25/2029(a)(b) | |
| PRPM LLC, Series 2024-RCF2, Class A1, 3.750%, 3/25/2054(a)(b) | |
| RCO VII Mortgage LLC, Series 2024-1, Class A1, 7.021%, 1/25/2029(a)(b) | |
| Redwood Funding Trust, Series 2023-1, Class A, 7.500%, 7/25/2059(a)(b) | |
| Towd Point Mortgage Trust, Series 2016-3, Class M2, 4.000%, 4/25/2056(a)(b) | |
| Towd Point Mortgage Trust, Series 2019-4, Class A1, 2.900%, 10/25/2059(a)(b) | |
| VCAT LLC, Series 2021-NPL1, Class A1, 5.289%, 12/26/2050(a)(b) | |
| VCAT LLC, Series 2021-NPL5, Class A1, 1.868%, 8/25/2051(a)(b) | |
| Verus Securitization Trust, Series 2021-3, Class A1, 1.046%, 6/25/2066(a)(b) | |
| VOLT XCII LLC, Series 2021-NPL1, Class A1, 4.893%, 2/27/2051(a)(b) | |
| VOLT XCIII LLC, Series 2021-NPL2, Class A1, 4.893%, 2/27/2051(a)(b) | |
| VOLT XCIV LLC, Series 2021-NPL3, Class A1, 5.240%, 2/27/2051(a)(b) | |
| VOLT XCVI LLC, Series 2021-NPL5, Class A1, 5.116%, 3/27/2051(a)(b) | |
| VOLT XCVII LLC, Series 2021-NPL6, Class A1, 5.240%, 4/25/2051(a)(b) | |
| | |
See accompanying notes to financial statements.
Portfolio of Investments – as of June 30, 2024 (Unaudited)Loomis Sayles Investment Grade Fixed Income Fund (continued) | | |
|
| |
| AASET Trust, Series 2021-1A, Class A, 2.950%, 11/16/2041(a) | |
| Affirm Asset Securitization Trust, Series 2023-B, Class A, 6.820%, 9/15/2028(a) | |
| Affirm Asset Securitization Trust, Series 2023-X1, Class A, 7.110%, 11/15/2028(a) | |
| Affirm Asset Securitization Trust, Series 2024-A, Class 1A, 5.610%, 2/15/2029(a) | |
| Affirm Asset Securitization Trust, Series 2024-A, Class A, 5.610%, 2/15/2029(a) | |
| Aqua Finance Trust, Series 2021-A, Class B, 2.400%, 7/17/2046(a) | |
| Auxilior Term Funding LLC, Series 2023-1A, Class A2, 6.180%, 12/15/2028(a) | |
| BHG Securitization Trust, Series 2022-A, Class B, 2.700%, 2/20/2035(a) | |
| BHG Securitization Trust, Series 2023-B, Class B, 7.450%, 12/17/2036(a) | |
| Business Jet Securities LLC, Series 2021-1A, Class A, 2.162%, 4/15/2036(a) | |
| Business Jet Securities LLC, Series 2024-1A, Class A, 6.197%, 5/15/2039(a) | |
| EverBright Solar Trust, Series 2024-A, Class A, 6.430%, 6/22/2054(a) | |
| Foundation Finance Trust, Series 2023-2A, Class A, 6.530%, 6/15/2049(a) | |
| FREED ABS Trust, Series 2021-2, Class C, 1.940%, 6/19/2028(a) | |
| FREED ABS Trust, Series 2021-3FP, Class D, 2.370%, 11/20/2028(a) | |
| Frontier Issuer LLC, Series 2023-1, Class A2, 6.600%, 8/20/2053(a) | |
| Frontier Issuer LLC, Series 2024-1, Class A2, 6.190%, 6/20/2054(a) | |
| HINNT LLC, Series 2024-A, Class A, 5.490%, 3/15/2043(a) | |
| Jack in the Box Funding LLC, Series 2019-1A, Class A2II, 4.476%, 8/25/2049(a) | |
| Lunar Structured Aircraft Portfolio Notes, Series 2021-1, Class A, 2.636%, 10/15/2046(a) | |
| Marlette Funding Trust, Series 2021-2A, Class C, 1.500%, 9/15/2031(a) | |
| Marlette Funding Trust, Series 2021-3A, Class C, 1.810%, 12/15/2031(a) | |
| Marlette Funding Trust, Series 2023-2A, Class B, 6.540%, 6/15/2033(a) | |
| Mercury Financial Credit Card Master Trust, Series 2024-2A, Class A, 6.560%, 7/20/2029(a) | |
| | |
|
| |
| Mosaic Solar Loan Trust, Series 2024-2A, Class A, 5.600%, 4/22/2052(a) | |
| Mosaic Solar Loans LLC, Series 2024-1A, Class A, 5.500%, 9/20/2049(a) | |
| MVW LLC, Series 2021-1WA, Class C, 1.940%, 1/22/2041(a) | |
| Octane Receivables Trust, Series 2024-2A, Class C, 5.900%, 7/20/2032(a) | |
| OneMain Financial Issuance Trust, Series 2018-2A, Class B, 3.890%, 3/14/2033(a) | |
| OneMain Financial Issuance Trust, Series 2021-1A, Class D, 2.470%, 6/16/2036(a) | |
| OneMain Financial Issuance Trust, Series 2022-S1, Class D, 5.200%, 5/14/2035(a) | |
| SCF Equipment Leasing LLC, Series 2022-1A, Class D, 3.790%, 11/20/2031(a) | |
| SCF Equipment Leasing LLC, Series 2022-2A, Class C, 6.500%, 8/20/2032(a) | |
| SEB Funding LLC, Series 2024-1A, Class A2, 7.386%, 4/30/2054(a) | |
| Shenton Aircraft Investment I Ltd., Series 2015-1A, Class A, 4.750%, 10/15/2042(a) | |
| Sierra Timeshare Receivables Funding LLC, Series 2019-2A, Class C, 3.120%, 5/20/2036(a) | |
| Sierra Timeshare Receivables Funding LLC, Series 2019-3A, Class C, 3.000%, 8/20/2036(a) | |
| Sierra Timeshare Receivables Funding LLC, Series 2021-1A, Class C, 1.790%, 11/20/2037(a) | |
| Sierra Timeshare Receivables Funding LLC, Series 2023-3A, Class C, 7.120%, 9/20/2040(a) | |
| Slam Ltd., Series 2021-1A, Class A, 2.434%, 6/15/2046(a) | |
| Sunnova Helios X Issuer LLC, Series 2022-C, Class A, 5.300%, 11/22/2049(a) | |
| Textainer Marine Containers VII Ltd., Series 2021-2A, Class A, 2.230%, 4/20/2046(a) | |
| TIF Funding II LLC, Series 2021-1A, Class A, 1.650%, 2/20/2046(a) | |
| Trafigura Securitisation Finance PLC, Series 2024-1A, Class A1, SOFR + 1.400%, 6.737%, 11/15/2027(a)(b) | |
| WAVE Trust, Series 2017-1A, Class A, 3.844%, 11/15/2042(a) | |
See accompanying notes to financial statements.
Portfolio of Investments – as of June 30, 2024 (Unaudited)Loomis Sayles Investment Grade Fixed Income Fund (continued) | | |
|
| |
| Westlake Automobile Receivables Trust, Series 2024-2A, Class D, 5.910%, 4/15/2030(a) | |
| Willis Engine Structured Trust VII, Series 2023-A, Class A, 8.000%, 10/15/2048(a) | |
| Ziply Fiber Issuer LLC, Series 2024-1A, Class A2, 6.640%, 4/20/2054(a) | |
| | |
| |
| College Ave Student Loans LLC, Series 2024-B, Class A1A, 5.690%, 8/25/2054(a) | |
| College Ave Student Loans LLC, Series 2024-B, Class B, 6.080%, 8/25/2054(a) | |
| College Avenue Student Loans LLC, Series 2021-A, Class C, 2.920%, 7/25/2051(a) | |
| College Avenue Student Loans LLC, Series 2023-B, Class C, 7.580%, 6/25/2054(a) | |
| Navient Private Education Refi Loan Trust, Series 2020-HA, Class A, 1.310%, 1/15/2069(a) | |
| Navient Private Education Refi Loan Trust, Series 2021-A, Class A, 0.840%, 5/15/2069(a) | |
| Navient Private Education Refi Loan Trust, Series 2021-A, Class B, 2.240%, 5/15/2069(a) | |
| Navient Private Education Refi Loan Trust, Series 2021-EA, Class B, 2.030%, 12/16/2069(a) | |
| Navient Private Education Refi Loan Trust, Series 2021-FA, Class B, 2.120%, 2/18/2070(a) | |
| Navient Student Loan Trust, Series 2023-BA, Class B, 7.230%, 3/15/2072(a) | |
| Nelnet Student Loan Trust, Series 2021-BA, Class B, 2.680%, 4/20/2062(a) | |
| SMB Private Education Loan Trust, Series 2018-C, Class A2A, 3.630%, 11/15/2035(a) | |
| SMB Private Education Loan Trust, Series 2020-A, Class A2A, 2.230%, 9/15/2037(a) | |
| SMB Private Education Loan Trust, Series 2021-A, Class A2A2, 1 mo. USD SOFR + 0.844%, 6.173%, 1/15/2053(a)(b) | |
| SMB Private Education Loan Trust, Series 2021-B, Class B, 2.650%, 7/17/2051(a) | |
| | |
|
| ABS Student Loan — continued |
| SMB Private Education Loan Trust, Series 2023-C, Class B, 6.360%, 11/15/2052(a) | |
| SMB Private Education Loan Trust, Series 2024-A, Class A1A, 5.240%, 3/15/2056(a) | |
| | |
| ABS Whole Business — 0.9% |
| Applebee's Funding LLC/IHOP Funding LLC, Series 2023-1A, Class A2, 7.824%, 3/05/2053(a) | |
| Domino's Pizza Master Issuer LLC, Series 2018-1A, Class A2II, 4.328%, 7/25/2048(a) | |
| Hardee's Funding LLC, Series 2021-1A, Class A2, 2.865%, 6/20/2051(a) | |
| Hardee's Funding LLC, Series 2024-1A, Class A2, 7.253%, 3/20/2054(a) | |
| Planet Fitness Master Issuer LLC, Series 2024-1A, Class A2I, 5.765%, 6/05/2054(a) | |
| Subway Funding LLC, Series 2024-1A, Class A2I, 6.028%, 7/30/2054(a) | |
| | |
| Aerospace & Defense — 2.7% |
| BAE Systems PLC, 5.300%, 3/26/2034(a) | |
| Boeing Co., 3.625%, 2/01/2031 | |
| Boeing Co., 5.150%, 5/01/2030 | |
| Boeing Co., 5.705%, 5/01/2040 | |
| Boeing Co., 5.805%, 5/01/2050 | |
| Boeing Co., 5.930%, 5/01/2060 | |
| Boeing Co., 6.388%, 5/01/2031(a) | |
| Boeing Co., 6.528%, 5/01/2034(a) | |
| Boeing Co., 6.858%, 5/01/2054(a) | |
| Boeing Co., 7.008%, 5/01/2064(a) | |
| L3Harris Technologies, Inc., 5.350%, 6/01/2034 | |
| RTX Corp., 2.375%, 3/15/2032 | |
| RTX Corp., 5.150%, 2/27/2033 | |
| Textron, Inc., 2.450%, 3/15/2031 | |
| Textron, Inc., 3.000%, 6/01/2030 | |
| | |
| |
| American Airlines Pass-Through Trust, Series 2016-3, Class B, 3.750%, 4/15/2027 | |
| U.S. Airways Pass-Through Trust, Series 2012-2, Class A, 4.625%, 12/03/2026 | |
| United Airlines Pass-Through Trust, Series 20-1, Class A, 5.875%, 4/15/2029 | |
| | |
See accompanying notes to financial statements.
Portfolio of Investments – as of June 30, 2024 (Unaudited)Loomis Sayles Investment Grade Fixed Income Fund (continued) | | |
|
| |
| American Homes 4 Rent LP, 2.375%, 7/15/2031 | |
| |
| Daimler Truck Finance North America LLC, 5.500%, 9/20/2033(a) | |
| General Motors Financial Co., Inc., 5.850%, 4/06/2030 | |
| General Motors Financial Co., Inc., 6.000%, 1/09/2028 | |
| General Motors Financial Co., Inc., 6.100%, 1/07/2034 | |
| ZF North America Capital, Inc., 6.750%, 4/23/2030(a) | |
| ZF North America Capital, Inc., 6.875%, 4/23/2032(a) | |
| | |
| |
| Bank of America Corp., (fixed rate to 12/20/2027, variable rate thereafter), 3.419%, 12/20/2028 | |
| Bank of America Corp., (fixed rate to 3/08/2032, variable rate thereafter), 3.846%, 3/08/2037 | |
| Bank of America Corp., (fixed rate to 4/29/2030, variable rate thereafter), 2.592%, 4/29/2031 | |
| Bank of America Corp., (fixed rate to 9/21/2031, variable rate thereafter), 2.482%, 9/21/2036 | |
| Bank of America Corp., MTN, (fixed rate to 10/24/2030, variable rate thereafter), 1.922%, 10/24/2031 | |
| Bank of America Corp., MTN, (fixed rate to 7/22/2032, variable rate thereafter), 5.015%, 7/22/2033 | |
| Bank of America Corp., MTN, (fixed rate to 7/23/2030, variable rate thereafter), 1.898%, 7/23/2031 | |
| Bank of America Corp., Series L, 4.183%, 11/25/2027 | |
| Barclays PLC, (fixed rate to 3/15/2028, variable rate thereafter), 4.375%(d) | |
| Barclays PLC, (fixed rate to 5/09/2033, variable rate thereafter), 6.224%, 5/09/2034 | |
| Barclays PLC, (fixed rate to 9/23/2030, variable rate thereafter), 3.564%, 9/23/2035 | |
| BNP Paribas SA, 2.824%, 1/26/2041(a) | |
| BNP Paribas SA, (fixed rate to 3/01/2028, variable rate thereafter), 4.375%, 3/01/2033(a) | |
| CaixaBank SA, (fixed rate to 9/13/2033, variable rate thereafter), 6.840%, 9/13/2034(a) | |
| Credit Agricole SA, 2.811%, 1/11/2041(a) | |
| | |
|
| |
| Credit Agricole SA, (fixed rate to 1/10/2028, variable rate thereafter), 4.000%, 1/10/2033 | |
| Credit Agricole SA, (fixed rate to 1/10/2034, variable rate thereafter), 6.251%, 1/10/2035(a) | |
| Deutsche Bank AG, (fixed rate to 10/07/2031, variable rate thereafter), 3.742%, 1/07/2033 | |
| Deutsche Bank AG, (fixed rate to 10/14/2030, variable rate thereafter), 3.729%, 1/14/2032 | |
| Deutsche Bank AG, (fixed rate to 11/20/2028, variable rate thereafter), 6.819%, 11/20/2029 | |
| Goldman Sachs Group, Inc., (fixed rate to 2/24/2032, variable rate thereafter), 3.102%, 2/24/2033 | |
| Goldman Sachs Group, Inc., (fixed rate to 8/23/2027, variable rate thereafter), 4.482%, 8/23/2028 | |
| ING Groep NV, (fixed rate to 9/11/2033, variable rate thereafter), 6.114%, 9/11/2034 | |
| Intesa Sanpaolo SpA, 7.200%, 11/28/2033(a) | |
| JPMorgan Chase & Co., (fixed rate to 10/15/2029, variable rate thereafter), 2.739%, 10/15/2030 | |
| JPMorgan Chase & Co., (fixed rate to 7/25/2032, variable rate thereafter), 4.912%, 7/25/2033 | |
| Morgan Stanley, 3.950%, 4/23/2027 | |
| Morgan Stanley, (fixed rate to 1/19/2033, variable rate thereafter), 5.948%, 1/19/2038 | |
| Morgan Stanley, (fixed rate to 10/18/2032, variable rate thereafter), 6.342%, 10/18/2033 | |
| Morgan Stanley, (fixed rate to 2/07/2034, variable rate thereafter), 5.942%, 2/07/2039 | |
| Morgan Stanley, (fixed rate to 4/19/2034, variable rate thereafter), 5.831%, 4/19/2035 | |
| Morgan Stanley, (fixed rate to 4/20/2032, variable rate thereafter), 5.297%, 4/20/2037 | |
| Morgan Stanley, (fixed rate to 9/16/2031, variable rate thereafter), 2.484%, 9/16/2036 | |
| Morgan Stanley, MTN, (fixed rate to 2/13/2031, variable rate thereafter), 1.794%, 2/13/2032 | |
| Societe Generale SA, (fixed rate to 1/19/2034, variable rate thereafter), 6.066%, 1/19/2035(a) | |
| Societe Generale SA, (fixed rate to 7/08/2030, variable rate thereafter), 3.653%, 7/08/2035(a) | |
| Synchrony Bank, 5.400%, 8/22/2025 | |
See accompanying notes to financial statements.
Portfolio of Investments – as of June 30, 2024 (Unaudited)Loomis Sayles Investment Grade Fixed Income Fund (continued) | | |
|
| |
| UBS Group AG, (fixed rate to 11/15/2032, variable rate thereafter), 9.016%, 11/15/2033(a) | |
| UBS Group AG, (fixed rate to 2/08/2034, variable rate thereafter), 5.699%, 2/08/2035(a) | |
| UBS Group AG, (fixed rate to 8/12/2032, variable rate thereafter), 6.537%, 8/12/2033(a) | |
| UniCredit SpA, (fixed rate to 6/30/2030, variable rate thereafter), 5.459%, 6/30/2035(a) | |
| | |
| |
| Blue Owl Finance LLC, 6.250%, 4/18/2034(a) | |
| Jefferies Financial Group, Inc., 5.875%, 7/21/2028 | |
| Jefferies Financial Group, Inc., 6.200%, 4/14/2034 | |
| Jefferies Financial Group, Inc., 6.250%, 1/15/2036 | |
| | |
| Building Materials — 1.5% |
| Cemex SAB de CV, 3.875%, 7/11/2031(a) | |
| Cemex SAB de CV, 3.875%, 7/11/2031 | |
| Cemex SAB de CV, 5.450%, 11/19/2029 | |
| Cemex SAB de CV, (fixed rate to 6/08/2026, variable rate thereafter), 5.125%(a)(d) | |
| Masco Corp., 6.500%, 8/15/2032 | |
| Owens Corning, 5.700%, 6/15/2034 | |
| Owens Corning, 7.000%, 12/01/2036 | |
| | |
| |
| CCO Holdings LLC/CCO Holdings Capital Corp., 4.250%, 1/15/2034 | |
| CCO Holdings LLC/CCO Holdings Capital Corp., 4.500%, 5/01/2032 | |
| Charter Communications Operating LLC/Charter Communications Operating Capital, 2.300%, 2/01/2032 | |
| Charter Communications Operating LLC/Charter Communications Operating Capital, 2.800%, 4/01/2031 | |
| Charter Communications Operating LLC/Charter Communications Operating Capital, 3.700%, 4/01/2051 | |
| Charter Communications Operating LLC/Charter Communications Operating Capital, 3.850%, 4/01/2061 | |
| Charter Communications Operating LLC/Charter Communications Operating Capital, 3.950%, 6/30/2062 | |
| | |
|
| Cable Satellite — continued |
| Charter Communications Operating LLC/Charter Communications Operating Capital, 4.400%, 4/01/2033 | |
| Charter Communications Operating LLC/Charter Communications Operating Capital, 5.125%, 7/01/2049 | |
| CSC Holdings LLC, 3.375%, 2/15/2031(a) | |
| CSC Holdings LLC, 4.125%, 12/01/2030(a) | |
| CSC Holdings LLC, 4.625%, 12/01/2030(a) | |
| DISH DBS Corp., 5.125%, 6/01/2029 | |
| DISH DBS Corp., 5.250%, 12/01/2026(a) | |
| DISH DBS Corp., 5.750%, 12/01/2028(a) | |
| Time Warner Cable LLC, 5.500%, 9/01/2041 | |
| | |
| |
| Braskem Netherlands Finance BV, 4.500%, 1/31/2030(a) | |
| Braskem Netherlands Finance BV, 5.875%, 1/31/2050(a) | |
| Celanese U.S. Holdings LLC, 6.330%, 7/15/2029 | |
| Celanese U.S. Holdings LLC, 6.379%, 7/15/2032 | |
| Celanese U.S. Holdings LLC, 6.550%, 11/15/2030 | |
| Celanese U.S. Holdings LLC, 6.700%, 11/15/2033 | |
| | |
| Collateralized Mortgage Obligations — 0.1% |
| Federal Home Loan Mortgage Corp., Series 2912, Class EH, REMICS, 5.500%, 1/15/2035 | |
| Verus Securitization Trust, Series 2021-5, Class A1, 1.013%, 9/25/2066(a)(b) | |
| | |
| Construction Machinery — 0.5% |
| Ashtead Capital, Inc., 5.500%, 8/11/2032(a) | |
| Ashtead Capital, Inc., 5.800%, 4/15/2034(a) | |
| Ashtead Capital, Inc., 5.950%, 10/15/2033(a) | |
| United Rentals North America, Inc., 6.125%, 3/15/2034(a) | |
| | |
| Consumer Cyclical Services — 1.0% |
| Expedia Group, Inc., 2.950%, 3/15/2031 | |
| Expedia Group, Inc., 3.250%, 2/15/2030 | |
See accompanying notes to financial statements.
Portfolio of Investments – as of June 30, 2024 (Unaudited)Loomis Sayles Investment Grade Fixed Income Fund (continued) | | |
|
| Consumer Cyclical Services — continued |
| Uber Technologies, Inc., 4.500%, 8/15/2029(a) | |
| Uber Technologies, Inc., 7.500%, 9/15/2027(a) | |
| | |
| Diversified Manufacturing — 0.8% |
| Amphenol Corp., 2.200%, 9/15/2031 | |
| Amphenol Corp., 5.250%, 4/05/2034 | |
| Carrier Global Corp., 5.900%, 3/15/2034 | |
| Ingersoll Rand, Inc., 5.700%, 8/14/2033 | |
| Nordson Corp., 5.800%, 9/15/2033 | |
| Veralto Corp., 5.450%, 9/18/2033(a) | |
| | |
| |
| Duke Energy Corp., 5.450%, 6/15/2034 | |
| Pacific Gas & Electric Co., 3.250%, 6/01/2031 | |
| Pacific Gas & Electric Co., 4.300%, 3/15/2045 | |
| Pacific Gas & Electric Co., 4.550%, 7/01/2030 | |
| Pacific Gas & Electric Co., 5.450%, 6/15/2027 | |
| Southern Co., 5.700%, 3/15/2034 | |
| | |
| |
| AerCap Ireland Capital DAC/AerCap Global Aviation Trust, 3.300%, 1/30/2032 | |
| AerCap Ireland Capital DAC/AerCap Global Aviation Trust, 3.400%, 10/29/2033 | |
| Air Lease Corp., 3.125%, 12/01/2030 | |
| Air Lease Corp., 4.625%, 10/01/2028 | |
| Air Lease Corp., MTN, 3.000%, 2/01/2030 | |
| Aircastle Ltd., 5.950%, 2/15/2029(a) | |
| Aircastle Ltd., 6.500%, 7/18/2028(a) | |
| Ares Capital Corp., 2.875%, 6/15/2028 | |
| Ares Capital Corp., 3.200%, 11/15/2031 | |
| Aviation Capital Group LLC, 1.950%, 1/30/2026(a) | |
| Aviation Capital Group LLC, 6.250%, 4/15/2028(a) | |
| Aviation Capital Group LLC, 6.750%, 10/25/2028(a) | |
| Blackstone Secured Lending Fund, 2.125%, 2/15/2027 | |
| Blue Owl Capital Corp., 2.625%, 1/15/2027 | |
| Blue Owl Capital Corp., 2.875%, 6/11/2028 | |
| Blue Owl Capital Corp., 4.250%, 1/15/2026 | |
| Blue Owl Technology Finance Corp., 2.500%, 1/15/2027 | |
| | |
|
| Finance Companies — continued |
| Rocket Mortgage LLC/Rocket Mortgage Co-Issuer, Inc., 2.875%, 10/15/2026(a) | |
| Rocket Mortgage LLC/Rocket Mortgage Co-Issuer, Inc., 3.625%, 3/01/2029(a) | |
| Rocket Mortgage LLC/Rocket Mortgage Co-Issuer, Inc., 3.875%, 3/01/2031(a) | |
| Rocket Mortgage LLC/Rocket Mortgage Co-Issuer, Inc., 4.000%, 10/15/2033(a) | |
| SMBC Aviation Capital Finance DAC, 5.450%, 5/03/2028(a) | |
| | |
| |
| CIFI Holdings Group Co. Ltd., 6.450%, 11/07/2024(e) | |
| Country Garden Holdings Co. Ltd., 3.300%, 1/12/2031(e) | |
| Shimao Group Holdings Ltd., 4.750%, 7/03/2022(e) | |
| Shimao Group Holdings Ltd., 5.200%, 1/16/2027(e) | |
| Shimao Group Holdings Ltd., 5.600%, 7/15/2026(e) | |
| Shimao Group Holdings Ltd., 6.125%, 2/21/2024(e) | |
| Times China Holdings Ltd., 5.750%, 1/14/2027(e) | |
| Times China Holdings Ltd., 6.200%, 3/22/2026(e) | |
| | |
| |
| JBS USA Holding Lux SARL/JBS USA Food Co./JBS Lux Co. SARL, 3.000%, 2/02/2029 | |
| JBS USA Holding Lux SARL/JBS USA Food Co./JBS Lux Co. SARL, 3.750%, 12/01/2031 | |
| Pilgrim's Pride Corp., 3.500%, 3/01/2032 | |
| Pilgrim's Pride Corp., 4.250%, 4/15/2031 | |
| | |
| |
| GLP Capital LP/GLP Financing II, Inc., 3.250%, 1/15/2032 | |
| GLP Capital LP/GLP Financing II, Inc., 6.750%, 12/01/2033 | |
| VICI Properties LP, 5.125%, 5/15/2032 | |
| VICI Properties LP/VICI Note Co., Inc., 3.875%, 2/15/2029(a) | |
| VICI Properties LP/VICI Note Co., Inc., 4.250%, 12/01/2026(a) | |
See accompanying notes to financial statements.
Portfolio of Investments – as of June 30, 2024 (Unaudited)Loomis Sayles Investment Grade Fixed Income Fund (continued) | | |
|
| |
| VICI Properties LP/VICI Note Co., Inc., 4.500%, 9/01/2026(a) | |
| VICI Properties LP/VICI Note Co., Inc., 4.625%, 6/15/2025(a) | |
| | |
| Government Owned - No Guarantee — 0.4% |
| Antares Holdings LP, 3.750%, 7/15/2027(a) | |
| Sino-Ocean Land Treasure IV Ltd., 4.750%, 1/14/2030(e) | |
| | |
| |
| Centene Corp., 2.450%, 7/15/2028 | |
| Centene Corp., 2.500%, 3/01/2031 | |
| Centene Corp., 3.000%, 10/15/2030 | |
| Centene Corp., 3.375%, 2/15/2030 | |
| Centene Corp., 4.625%, 12/15/2029 | |
| | |
| |
| Alcon Finance Corp., 5.375%, 12/06/2032(a) | |
| HCA, Inc., 2.375%, 7/15/2031 | |
| HCA, Inc., 3.500%, 9/01/2030 | |
| HCA, Inc., 5.500%, 6/01/2033 | |
| HCA, Inc., 5.600%, 4/01/2034 | |
| Solventum Corp., 5.900%, 4/30/2054(a) | |
| | |
| |
| MDC Holdings, Inc., 3.966%, 8/06/2061 | |
| MDC Holdings, Inc., 6.000%, 1/15/2043 | |
| Meritage Homes Corp., 3.875%, 4/15/2029(a) | |
| PulteGroup, Inc., 6.000%, 2/15/2035 | |
| | |
| |
| Federal National Mortgage Association, 1 yr. RFUCC Treasury + 1.810%, 6.119%, 9/01/2036(b) | |
| Federal National Mortgage Association, 6 mo. RFUCC Treasury + 1.460%, 7.057%, 2/01/2037(b) | |
| | |
| Independent Energy — 2.3% |
| Continental Resources, Inc., 2.875%, 4/01/2032(a) | |
| Continental Resources, Inc., 5.750%, 1/15/2031(a) | |
| Energean Israel Finance Ltd., 5.375%, 3/30/2028 | |
| Energean Israel Finance Ltd., 5.875%, 3/30/2031 | |
| EQT Corp., 3.625%, 5/15/2031(a) | |
| | |
|
| Independent Energy — continued |
| EQT Corp., 5.000%, 1/15/2029 | |
| EQT Corp., 7.000%, 2/01/2030 | |
| Occidental Petroleum Corp., 6.125%, 1/01/2031 | |
| Occidental Petroleum Corp., 6.625%, 9/01/2030 | |
| Occidental Petroleum Corp., 7.500%, 5/01/2031 | |
| Ovintiv, Inc., 6.500%, 8/15/2034 | |
| Ovintiv, Inc., 7.375%, 11/01/2031 | |
| Southwestern Energy Co., 4.750%, 2/01/2032 | |
| Var Energi ASA, 8.000%, 11/15/2032(a) | |
| Viper Energy, Inc., 7.375%, 11/01/2031(a) | |
| | |
| |
| Jacobs Engineering Group, Inc., 6.350%, 8/18/2028 | |
| |
| Carnival Corp., 4.000%, 8/01/2028(a) | |
| Carnival Corp., 7.000%, 8/15/2029(a) | |
| NCL Corp. Ltd., 5.875%, 3/15/2026(a) | |
| NCL Corp. Ltd., 5.875%, 2/15/2027(a) | |
| NCL Corp. Ltd., 8.125%, 1/15/2029(a) | |
| Royal Caribbean Cruises Ltd., 5.500%, 4/01/2028(a) | |
| Royal Caribbean Cruises Ltd., 6.250%, 3/15/2032(a) | |
| | |
| |
| Athene Global Funding, 1.608%, 6/29/2026(a) | |
| Brighthouse Financial, Inc., 4.700%, 6/22/2047 | |
| National Life Insurance Co., 10.500%, 9/15/2039(a) | |
| NLV Financial Corp., 7.500%, 8/15/2033(a) | |
| | |
| |
| Choice Hotels International, Inc., 5.850%, 8/01/2034 | |
| Marriott International, Inc., 5.300%, 5/15/2034 | |
| Marriott International, Inc., Series HH, 2.850%, 4/15/2031 | |
| Marriott Ownership Resorts, Inc., 4.500%, 6/15/2029(a) | |
| | |
| Media Entertainment — 1.0% |
| Netflix, Inc., 4.875%, 6/15/2030(a) | |
| Netflix, Inc., 5.375%, 11/15/2029(a) | |
See accompanying notes to financial statements.
Portfolio of Investments – as of June 30, 2024 (Unaudited)Loomis Sayles Investment Grade Fixed Income Fund (continued) | | |
|
| Media Entertainment — continued |
| Netflix, Inc., 5.875%, 11/15/2028 | |
| Netflix, Inc., 6.375%, 5/15/2029 | |
| | |
| |
| Anglo American Capital PLC, 5.500%, 5/02/2033(a) | |
| ArcelorMittal SA, 6.800%, 11/29/2032 | |
| First Quantum Minerals Ltd., 6.875%, 10/15/2027(a) | |
| First Quantum Minerals Ltd., 9.375%, 3/01/2029(a) | |
| Glencore Funding LLC, 2.500%, 9/01/2030(a) | |
| Glencore Funding LLC, 2.850%, 4/27/2031(a) | |
| Glencore Funding LLC, 5.700%, 5/08/2033(a) | |
| Glencore Funding LLC, 6.125%, 10/06/2028(a) | |
| Glencore Funding LLC, 6.375%, 10/06/2030(a) | |
| Glencore Funding LLC, 6.500%, 10/06/2033(a) | |
| Steel Dynamics, Inc., 5.375%, 8/15/2034 | |
| | |
| |
| Cheniere Energy Partners LP, 3.250%, 1/31/2032 | |
| Cheniere Energy Partners LP, 4.000%, 3/01/2031 | |
| Cheniere Energy Partners LP, 4.500%, 10/01/2029 | |
| Cheniere Energy Partners LP, 5.950%, 6/30/2033 | |
| DCP Midstream Operating LP, 3.250%, 2/15/2032 | |
| DCP Midstream Operating LP, 5.125%, 5/15/2029 | |
| DCP Midstream Operating LP, 6.450%, 11/03/2036(a) | |
| Energy Transfer LP, 5.000%, 5/15/2044 | |
| Energy Transfer LP, 5.600%, 9/01/2034 | |
| Energy Transfer LP, 5.750%, 2/15/2033 | |
| Energy Transfer LP, 6.550%, 12/01/2033 | |
| EnLink Midstream LLC, 6.500%, 9/01/2030(a) | |
| MPLX LP, 5.000%, 3/01/2033 | |
| ONEOK Partners LP, 6.200%, 9/15/2043 | |
| Plains All American Pipeline LP/PAA Finance Corp., 3.550%, 12/15/2029 | |
| Plains All American Pipeline LP/PAA Finance Corp., 3.800%, 9/15/2030 | |
| Plains All American Pipeline LP/PAA Finance Corp., 4.300%, 1/31/2043 | |
| Targa Resources Corp., 6.125%, 3/15/2033 | |
| | |
|
| |
| Targa Resources Partners LP/Targa Resources Partners Finance Corp., 4.000%, 1/15/2032 | |
| Targa Resources Partners LP/Targa Resources Partners Finance Corp., 4.875%, 2/01/2031 | |
| Targa Resources Partners LP/Targa Resources Partners Finance Corp., 5.500%, 3/01/2030 | |
| Venture Global Calcasieu Pass LLC, 3.875%, 11/01/2033(a) | |
| Venture Global Calcasieu Pass LLC, 6.250%, 1/15/2030(a) | |
| Western Midstream Operating LP, 4.050%, 2/01/2030 | |
| Western Midstream Operating LP, 5.250%, 2/01/2050 | |
| Western Midstream Operating LP, 5.300%, 3/01/2048 | |
| Western Midstream Operating LP, 5.450%, 4/01/2044 | |
| Western Midstream Operating LP, 5.500%, 8/15/2048 | |
| Western Midstream Operating LP, 6.150%, 4/01/2033 | |
| Western Midstream Operating LP, 6.350%, 1/15/2029 | |
| Williams Cos., Inc., 5.150%, 3/15/2034 | |
| | |
| |
| Southern Co. Gas Capital Corp., 5.750%, 9/15/2033 | |
| Non-Agency Commercial Mortgage-Backed |
| BB-UBS Trust, Series 2012-TFT, Class A, 2.892%, 6/05/2030(a) | |
| BPR Trust, Series 2021-NRD, Class B, 1 mo. USD SOFR + 2.124%, 7.453%, 12/15/2038(a)(b) | |
| BPR Trust, Series 2021-NRD, Class C, 1 mo. USD SOFR + 2.424%, 7.753%, 12/15/2038(a)(b) | |
| BPR Trust, Series 2021-NRD, Class D, 1 mo. USD SOFR + 3.723%, 9.052%, 12/15/2038(a)(b) | |
| BPR Trust, Series 2022-STAR, Class A, 1 mo. USD SOFR + 3.232%, 8.561%, 8/15/2039(a)(b) | |
| BX Trust, Series 2024-VLT4, Class A, 1 mo. USD SOFR + 1.491%, 6.811%, 7/15/2029(a)(b) | |
| Credit Suisse Mortgage Trust, Series 2014-USA, Class B, 4.185%, 9/15/2037(a) | |
See accompanying notes to financial statements.
Portfolio of Investments – as of June 30, 2024 (Unaudited)Loomis Sayles Investment Grade Fixed Income Fund (continued) | | |
|
| Non-Agency Commercial Mortgage-Backed Securities — continued |
| DC Commercial Mortgage Trust, Series 2023-DC, Class B, 6.804%, 9/12/2040(a) | |
| Extended Stay America Trust, Series 2021-ESH, Class B, 1 mo. USD SOFR + 1.494%, 6.824%, 7/15/2038(a)(b) | |
| Extended Stay America Trust, Series 2021-ESH, Class C, 1 mo. USD SOFR + 1.814%, 7.144%, 7/15/2038(a)(b) | |
| Extended Stay America Trust, Series 2021-ESH, Class D, 1 mo. USD SOFR + 2.364%, 7.694%, 7/15/2038(a)(b) | |
| GS Mortgage Securities Corp. Trust, Series 2012-BWTR, Class A, 2.954%, 11/05/2034(a) | |
| GS Mortgage Securities Corp. Trust, Series 2013-PEMB, Class A, 3.668%, 3/05/2033(a)(b) | |
| GS Mortgage Securities Corp. Trust, Series 2013-PEMB, Class B, 3.668%, 3/05/2033(a)(b) | |
| JP Morgan Chase Commercial Mortgage Securities Trust, Series 2012-LC9, Class C, 3.686%, 12/15/2047(a)(b) | |
| JPMBB Commercial Mortgage Securities Trust, Series 2015-C32, Class A5, 3.598%, 11/15/2048 | |
| Med Trust, Series 2021-MDLN, Class B, 1 mo. USD SOFR + 1.564%, 6.894%, 11/15/2038(a)(b) | |
| Med Trust, Series 2021-MDLN, Class C, 1 mo. USD SOFR + 1.914%, 7.244%, 11/15/2038(a)(b) | |
| Med Trust, Series 2021-MDLN, Class D, 1 mo. USD SOFR + 2.114%, 7.444%, 11/15/2038(a)(b) | |
| Morgan Stanley Bank of America Merrill Lynch Trust, Series 2013-C12, Class C, 4.965%, 10/15/2046(b) | |
| Morgan Stanley Bank of America Merrill Lynch Trust, Series 2016-C30, Class C, 4.173%, 9/15/2049(b) | |
| MSBAM Commercial Mortgage Securities Trust, Series 2012-CKSV, Class A2, 3.277%, 10/15/2030(a) | |
| Wells Fargo Commercial Mortgage Trust, Series 2013-LC12, Class B, 4.083%, 7/15/2046(b) | |
| WFRBS Commercial Mortgage Trust, Series 2011-C3, Class D, 6.050%, 3/15/2044(a)(b) | |
| WFRBS Commercial Mortgage Trust, Series 2013-C15, Class B, 4.328%, 8/15/2046(b) | |
| | |
|
| Non-Agency Commercial Mortgage-Backed Securities — continued |
| WFRBS Commercial Mortgage Trust, Series 2014-C20, Class B, 4.378%, 5/15/2047 | |
| WFRBS Commercial Mortgage Trust, Series 2014-C24, Class B, 4.204%, 11/15/2047(b) | |
| | |
| |
| COPT Defense Properties LP, 2.750%, 4/15/2031 | |
| |
| Extra Space Storage LP, 2.350%, 3/15/2032 | |
| Extra Space Storage LP, 5.900%, 1/15/2031 | |
| | |
| |
| WestRock MWV LLC, 7.550%, 3/01/2047 | |
| WestRock MWV LLC, 8.200%, 1/15/2030 | |
| | |
| |
| Bausch Health Cos., Inc., 4.875%, 6/01/2028(a) | |
| Roche Holdings, Inc., 4.985%, 3/08/2034(a) | |
| Teva Pharmaceutical Finance Co. LLC, 6.150%, 2/01/2036 | |
| Teva Pharmaceutical Finance Netherlands III BV, 4.100%, 10/01/2046 | |
| Teva Pharmaceutical Finance Netherlands III BV, 4.750%, 5/09/2027 | |
| Teva Pharmaceutical Finance Netherlands III BV, 5.125%, 5/09/2029 | |
| Teva Pharmaceutical Finance Netherlands III BV, 7.875%, 9/15/2029 | |
| Teva Pharmaceutical Finance Netherlands III BV, 8.125%, 9/15/2031 | |
| | |
| Property & Casualty Insurance — 0.3% |
| Arthur J Gallagher & Co., 5.450%, 7/15/2034 | |
| CNA Financial Corp., 5.125%, 2/15/2034 | |
| Stewart Information Services Corp., 3.600%, 11/15/2031 | |
| | |
| |
| Brixmor Operating Partnership LP, 2.250%, 4/01/2028 | |
| Brixmor Operating Partnership LP, 5.750%, 2/15/2035 | |
| | |
See accompanying notes to financial statements.
Portfolio of Investments – as of June 30, 2024 (Unaudited)Loomis Sayles Investment Grade Fixed Income Fund (continued) | | |
|
| |
| AutoNation, Inc., 3.850%, 3/01/2032 | |
| Dollar Tree, Inc., 2.650%, 12/01/2031 | |
| Home Depot, Inc., 4.950%, 6/25/2034 | |
| Tapestry, Inc., Series ., 3.050%, 3/15/2032 | |
| | |
| |
| Chile Government International Bonds, 3.500%, 1/31/2034 | |
| Chile Government International Bonds, 3.500%, 1/25/2050 | |
| Colombia Government International Bonds, 7.500%, 2/02/2034 | |
| Colombia Government International Bonds, 8.000%, 11/14/2035 | |
| Dominican Republic International Bonds, 4.875%, 9/23/2032 | |
| Paraguay Government International Bonds, 6.000%, 2/09/2036(a) | |
| Philippines Government International Bonds, 2.650%, 12/10/2045 | |
| Philippines Government International Bonds, 2.950%, 5/05/2045 | |
| Qatar Government International Bonds, 5.103%, 4/23/2048 | |
| Republic of Poland Government International Bonds, 5.500%, 4/04/2053 | |
| Republic of Poland Government International Bonds, 5.500%, 3/18/2054 | |
| Republic of South Africa Government International Bonds, 4.850%, 9/30/2029 | |
| Republic of South Africa Government International Bonds, 5.875%, 4/20/2032 | |
| Republic of Uzbekistan International Bonds, 3.900%, 10/19/2031 | |
| Republic of Uzbekistan International Bonds, 5.375%, 5/29/2027, (EUR)(a) | |
| Republic of Uzbekistan International Bonds, 6.900%, 2/28/2032(a) | |
| Romania Government International Bonds, 6.375%, 1/30/2034(a) | |
| Romania Government International Bonds, 7.125%, 1/17/2033 | |
| Serbia International Bonds, 6.000%, 6/12/2034(a) | |
| UAE International Government Bonds, 4.857%, 7/02/2034(a) | |
| | |
| |
| Arrow Electronics, Inc., 2.950%, 2/15/2032 | |
| Atlassian Corp., 5.250%, 5/15/2029 | |
| Atlassian Corp., 5.500%, 5/15/2034 | |
| Broadcom, Inc., 2.450%, 2/15/2031(a) | |
| Broadcom, Inc., 2.600%, 2/15/2033(a) | |
| Broadcom, Inc., 3.137%, 11/15/2035(a) | |
| Broadcom, Inc., 3.187%, 11/15/2036(a) | |
| | |
|
| |
| Broadcom, Inc., 3.419%, 4/15/2033(a) | |
| Broadcom, Inc., 3.469%, 4/15/2034(a) | |
| Broadcom, Inc., 4.150%, 11/15/2030 | |
| Broadcom, Inc., 4.150%, 4/15/2032(a) | |
| Broadcom, Inc., 4.300%, 11/15/2032 | |
| CDW LLC/CDW Finance Corp., 3.250%, 2/15/2029 | |
| CDW LLC/CDW Finance Corp., 3.276%, 12/01/2028 | |
| CDW LLC/CDW Finance Corp., 3.569%, 12/01/2031 | |
| CDW LLC/CDW Finance Corp., 4.250%, 4/01/2028 | |
| CommScope Technologies LLC, 5.000%, 3/15/2027(a) | |
| CommScope, Inc., 4.750%, 9/01/2029(a) | |
| Dell International LLC/EMC Corp., 5.750%, 2/01/2033 | |
| Entegris, Inc., 4.750%, 4/15/2029(a) | |
| Equinix, Inc., 2.150%, 7/15/2030 | |
| Fiserv, Inc., 5.625%, 8/21/2033 | |
| Gartner, Inc., 3.625%, 6/15/2029(a) | |
| Global Payments, Inc., 2.900%, 5/15/2030 | |
| Global Payments, Inc., 2.900%, 11/15/2031 | |
| Global Payments, Inc., 5.300%, 8/15/2029 | |
| Global Payments, Inc., 5.400%, 8/15/2032 | |
| Jabil, Inc., 3.600%, 1/15/2030 | |
| Leidos, Inc., 2.300%, 2/15/2031 | |
| Leidos, Inc., 4.375%, 5/15/2030 | |
| Leidos, Inc., 5.750%, 3/15/2033 | |
| Marvell Technology, Inc., 2.950%, 4/15/2031 | |
| Marvell Technology, Inc., 5.950%, 9/15/2033 | |
| Microchip Technology, Inc., 5.050%, 3/15/2029 | |
| Micron Technology, Inc., 2.703%, 4/15/2032 | |
| Micron Technology, Inc., 4.663%, 2/15/2030 | |
| Micron Technology, Inc., 5.300%, 1/15/2031 | |
| Micron Technology, Inc., 5.875%, 2/09/2033 | |
| Micron Technology, Inc., 5.875%, 9/15/2033 | |
| Motorola Solutions, Inc., 5.400%, 4/15/2034 | |
| Motorola Solutions, Inc., 5.600%, 6/01/2032 | |
| Oracle Corp., 2.950%, 4/01/2030 | |
| Oracle Corp., 3.950%, 3/25/2051 | |
| Sensata Technologies, Inc., 3.750%, 2/15/2031(a) | |
| TD SYNNEX Corp., 6.100%, 4/12/2034 | |
| Trimble, Inc., 6.100%, 3/15/2033 | |
See accompanying notes to financial statements.
Portfolio of Investments – as of June 30, 2024 (Unaudited)Loomis Sayles Investment Grade Fixed Income Fund (continued) | | |
|
| |
| VMware LLC, 2.200%, 8/15/2031 | |
| Western Digital Corp., 2.850%, 2/01/2029 | |
| Western Digital Corp., 4.750%, 2/15/2026 | |
| | |
| Transportation Services — 0.3% |
| ERAC USA Finance LLC, 6.700%, 6/01/2034(a) | |
| |
| Brazil Notas do Tesouro Nacional, Series F, 10.000%, 1/01/2029, (BRL) | |
| Mexico Bonos, Series M, 7.500%, 5/26/2033, (MXN) | |
| New Zealand Government Bonds, Series 433, 3.500%, 4/14/2033, (NZD) | |
| Norway Government Bonds, Series 477, 1.750%, 3/13/2025, (NOK) | |
| Republic of South Africa Government Bonds, Series 2035, 8.875%, 2/28/2035, (ZAR) | |
| U.K. Gilts, 0.250%, 1/31/2025, (GBP) | |
| U.S. Treasury Bonds, 2.250%, 2/15/2052(h) | |
| U.S. Treasury Bonds, 3.250%, 5/15/2042(h) | |
| U.S. Treasury Bonds, 4.125%, 8/15/2053 | |
| U.S. Treasury Notes, 4.625%, 6/30/2025 | |
| U.S. Treasury Notes, 4.625%, 2/28/2026 | |
| | |
| |
| American Tower Corp., 5.450%, 2/15/2034 | |
| American Tower Corp., 5.900%, 11/15/2033 | |
| Sprint Capital Corp., 8.750%, 3/15/2032 | |
| T-Mobile USA, Inc., 2.400%, 3/15/2029 | |
| T-Mobile USA, Inc., 2.700%, 3/15/2032 | |
| T-Mobile USA, Inc., 3.500%, 4/15/2031 | |
| T-Mobile USA, Inc., 3.875%, 4/15/2030 | |
| T-Mobile USA, Inc., 5.750%, 1/15/2034 | |
| | |
| |
| Verizon Communications, Inc., 2.355%, 3/15/2032 | |
| Total Non-Convertible Bonds
(Identified Cost $196,127,128)
| |
|
|
|
| |
| Southwest Airlines Co., 1.250%, 5/01/2025 | |
| |
| DISH Network Corp., 3.375%, 8/15/2026 | |
| DISH Network Corp., Zero Coupon, 6.944%–9.514%, 12/15/2025(i) | |
| | |
| | |
|
| |
| PPL Capital Funding, Inc., 2.875%, 3/15/2028 | |
| |
| Teladoc Health, Inc., 1.250%, 6/01/2027 | |
| |
| Carnival Corp., 5.750%, 12/01/2027 | |
| |
| BioMarin Pharmaceutical, Inc., 1.250%, 5/15/2027 | |
| |
| Etsy, Inc., 0.125%, 9/01/2027 | |
| Etsy, Inc., 0.250%, 6/15/2028 | |
| | |
| Total Convertible Bonds
(Identified Cost $3,398,305)
| |
|
|
|
| |
| Tobacco Settlement Financing Corp., 6.706%, 6/01/2046
(Identified Cost $782,178) | |
| Total Bonds and Notes
(Identified Cost $200,307,611)
| |
|
|
Collateralized Loan Obligations — 3.2% |
| 522 Funding CLO Ltd., Series 2021-7A, Class D, 3 mo. USD SOFR + 3.162%, 8.488%, 4/23/2034(a)(b) | |
| AGL CLO 5 Ltd., Series 2020-5A, Class BR, 3 mo. USD SOFR + 1.962%, 7.286%, 7/20/2034(a)(b) | |
| Alinea CLO Ltd., Series 2018-1A, Class B, 3 mo. USD SOFR + 1.912%, 7.236%, 7/20/2031(a)(b) | |
| Battalion CLO VIII Ltd., Series 2015-8A, Class A2R2, 3 mo. USD SOFR + 1.812%, 7.139%, 7/18/2030(a)(b) | |
| Canyon CLO Ltd., Series 2021-4A, Class B, 3 mo. USD SOFR + 1.962%, 7.290%, 10/15/2034(a)(b) | |
| Carlyle U.S. CLO Ltd., Series 2021-9A, Class B, 3 mo. USD SOFR + 1.912%, 7.236%, 10/20/2034(a)(b) | |
| CIFC Funding Ltd., Series 2021-6A, Class B, 3 mo. USD SOFR + 1.912%, 7.240%, 10/15/2034(a)(b) | |
| Dryden 53 CLO Ltd., Series 2017-53A, Class B, 3 mo. USD SOFR + 1.662%, 6.990%, 1/15/2031(a)(b) | |
See accompanying notes to financial statements.
Portfolio of Investments – as of June 30, 2024 (Unaudited)Loomis Sayles Investment Grade Fixed Income Fund (continued) | | |
|
| Elmwood CLO VIII Ltd., Series 2021-1A, Class DR, 3 mo. USD SOFR + 3.800%, 9.128%, 4/20/2037(a)(b) | |
| Invesco CLO Ltd., Series 2021-1A, Class D, 3 mo. USD SOFR + 3.312%, 8.640%, 4/15/2034(a)(b) | |
| Magnetite XV Ltd., Series 2015-15A, Class AR, 3 mo. USD SOFR + 1.272%, 6.595%, 7/25/2031(a)(b) | |
| Morgan Stanley Eaton Vance CLO Ltd., Series 2022-16A, Class B, 3 mo. USD SOFR + 1.950%, 7.279%, 4/15/2035(a)(b) | |
| Neuberger Berman CLO XX Ltd., Series 2015-20A, Class BRR, 3 mo. USD SOFR + 1.912%, 7.240%, 7/15/2034(a)(b) | |
| Octagon Investment Partners 18-R Ltd., Series 2018-18A, Class A2, 3 mo. USD SOFR + 1.732%, 7.059%, 4/16/2031(a)(b) | |
| Octagon Investment Partners XV Ltd., Series 2013-1A, Class A1RR, 3 mo. USD SOFR + 1.232%, 6.558%, 7/19/2030(a)(b) | |
| OHA Credit Partners XVI, Series 2021-16A, Class A, 3 mo. USD SOFR + 1.412%, 6.739%, 10/18/2034(a)(b) | |
| Palmer Square BDC CLO 1 Ltd., Series 1A, Class A, 3 mo. USD SOFR + 1.600%, 6.925%, 7/15/2037(a)(b) | |
| Palmer Square Loan Funding Ltd., Series 2021-3A, Class A1, 3 mo. USD SOFR + 1.062%, 6.386%, 7/20/2029(a)(b) | |
| Rad CLO 15 Ltd., Series 2021-15A, Class B, 3 mo. USD SOFR + 1.912%, 7.236%, 1/20/2034(a)(b) | |
| Recette CLO Ltd., Series 2015-1A, Class BRR, 3 mo. USD SOFR + 1.662%, 6.986%, 4/20/2034(a)(b) | |
| Sixth Street CLO XVIII Ltd., Series 2021-18A, Class D, 3 mo. USD SOFR + 3.162%, 8.486%, 4/20/2034(a)(b) | |
| Total Collateralized Loan Obligations
(Identified Cost $6,630,624)
| |
|
|
|
| Building Materials — 0.1% |
| Summit Materials LLC, 2023 Incremental Term Loan B, 3 mo. USD SOFR + 2.500%, 7.799%, 1/12/2029(b)(j) | |
| Diversified Manufacturing — 0.3% |
| Resideo Funding, Inc., 2024 M&A Term Loan B, 5/21/2031(k) | |
| Resideo Funding, Inc., 2024 M&A Term Loan B, 1 mo. USD SOFR + 2.000%, 7.339%, 5/21/2031(b)(j) | |
| | |
|
| Diversified Manufacturing — continued |
| Resideo Funding, Inc., 2024 Term Loan B, 2/11/2028(k) | |
| Resideo Funding, Inc., 2024 Term Loan B, USD SOFR + 2.000%, 7.338%, 2/11/2028(b)(j) | |
| | |
| |
| Trans Union LLC, 2024 Term Loan B8, 6/24/2031(k) | |
| |
| Carnival Corp., 2024 Term Loan B1, 1 mo. USD SOFR + 2.750%, 8.094%, 10/18/2028(b)(j) | |
| Carnival Corp., 2024 Term Loan B2, 1 mo. USD SOFR + 2.750%, 8.094%, 8/08/2027(b)(j) | |
| | |
| |
| Hilton Domestic Operating Co., Inc., 2023 Term Loan B4, 11/08/2030(k) | |
| Hilton Domestic Operating Co., Inc., 2024 Term Loan B4, 11/08/2030(k) | |
| Hilton Grand Vacations Borrower LLC, 2021 Term Loan B, 8/02/2028(k) | |
| Hilton Grand Vacations Borrower LLC, 2024 1st Lien Term Loan B, 1/17/2031(k) | |
| Hilton Grand Vacations Borrower LLC, 2024 Incremental Term Loan B, 1 mo. USD SOFR + 2.750%, 8.094%, 1/17/2031(b)(j) | |
| Wyndham Hotels & Resorts, Inc., 2024 Term Loan, 5/24/2030(k) | |
| | |
| |
| Asplundh Tree Expert LLC, 2024 Incremental Term Loan B, 5/23/2031(k) | |
| |
| GTCR W Merger Sub LLC, USD Term Loan B, 3 mo. USD SOFR + 3.000%, 8.335%, 1/31/2031(b)(j) | |
| |
| SBA Senior Finance II LLC, 2024 Term Loan B, 1 mo. USD SOFR + 2.000%, 7.350%, 1/25/2031(b)(j) | |
| Total Senior Loans
(Identified Cost $5,342,647)
| |
See accompanying notes to financial statements.
Portfolio of Investments – as of June 30, 2024 (Unaudited)Loomis Sayles Investment Grade Fixed Income Fund (continued)
| | |
|
|
|
Convertible Preferred Stocks — 0.4% |
| |
| Bank of America Corp., Series L, 7.250% | |
| Wells Fargo & Co., Series L, Class A, 7.500% | |
| | |
| |
| El Paso Energy Capital Trust I, 4.750% | |
| Total Convertible Preferred Stocks
(Identified Cost $895,769)
| |
| Total Preferred Stocks
(Identified Cost $895,769)
| |
|
|
|
| Aerospace & Defense — 0.1% |
| | |
| |
| | |
| Total Common Stocks
(Identified Cost $337,576)
| |
| | |
Short-Term Investments — 4.0% |
| Tri-Party Repurchase Agreement with Fixed Income Clearing Corporation, dated 6/28/2024 at 3.500% to be repurchased at $8,311,980 on 7/01/2024 collateralized by $9,104,300 U.S. Treasury Note, 0.750% due 4/30/2026 valued at $8,475,878 including accrued interest (Note 2 of Notes to Financial Statements)
(Identified Cost $8,309,556) | |
| Total Investments — 102.0%
(Identified Cost $221,823,783)
| |
| Other assets less liabilities — (2.0)% | |
| | |
| See Note 2 of Notes to Financial Statements. |
| Principal Amount stated in U.S. dollars unless otherwise noted. |
| All or a portion of these securities are exempt from registration under Rule 144A of the Securities Act of 1933. These securities may be resold in transactions exempt from registration, normally to qualified institutional buyers. At June 30, 2024, the value of Rule 144A holdings amounted to $82,363,362 or 39.9% of net assets. |
| Variable rate security. Rate as of June 30, 2024 is disclosed. Issuers comprised of various lots with differing coupon rates have been aggregated for the purpose of presentation in the Portfolio of Investments and show a weighted average rate. Certain variable rate securities are not based on a published reference rate and spread, rather are determined by the issuer or agent and are based on current market conditions. These securities may not indicate a reference rate and/or spread in their description. |
| Level 3 security. Value has been determined using significant unobservable inputs. See Note 3 of Notes to Financial Statements. |
| Perpetual bond with no specified maturity date. |
| The issuer is in default with respect to interest and/or principal payments. Income is not being accrued. |
| Amount shown represents units. One unit represents a principal amount of 1,000. |
| Amount shown represents units. One unit represents a principal amount of 100. |
| Security (or a portion thereof) has been pledged as collateral for open derivative contracts. |
| Interest rate represents annualized yield at time of purchase; not a coupon rate. The Fund’s investment in this security is comprised of various lots with differing annualized yields. |
| Stated interest rate has been determined in accordance with the provisions of the loan agreement and is subject to a minimum benchmark floor rate which may range from 0.00% to 0.75%, to which the spread is added. |
| Position is unsettled. Contract rate was not determined at June 30, 2024 and does not take effect until settlement date. Maturity date is not finalized until settlement date. |
| |
| Adjustable Rate Mortgages |
| |
| Real Estate Investment Trusts |
| Real Estate Mortgage Investment Conduits |
| Secured Overnight Financing Rate |
See accompanying notes to financial statements.
Portfolio of Investments – as of June 30, 2024 (Unaudited)Loomis Sayles Investment Grade Fixed Income Fund (continued) At June 30, 2024, open long futures contracts were as follows:
| | | | | Unrealized
Appreciation
(Depreciation) |
CBOT 10 Year U.S. Treasury Notes Futures | | | | | |
CBOT 2 Year U.S. Treasury Notes Futures | | | | | |
CBOT U.S. Long Bond Futures | | | | | |
CBOT Ultra Long Term U.S. Treasury Bond Futures | | | | | |
| | | | | |
At June 30, 2024, open short futures contracts were as follows:
| | | | | Unrealized
Appreciation
(Depreciation) |
CBOT 5 Year U.S. Treasury Notes Futures | | | | | |
Ultra 10-Year U.S. Treasury Notes Futures | | | | | |
| | | | | |
Industry Summary at June 30, 2024 (Unaudited)
| |
| |
| |
| |
| |
| |
| |
| |
| |
| |
| |
| |
| |
| |
Non-Agency Commercial Mortgage-Backed Securities | |
Other Investments, less than 2% each | |
Collateralized Loan Obligations | |
| |
| |
Other assets less liabilities (including futures contracts) | |
| |
See accompanying notes to financial statements.
Statements of Assets and Liabilities
June 30, 2024 (Unaudited)
| | Investment
Grade Fixed
Income Fund |
| | |
| | |
Net unrealized depreciation | | |
| | |
| | |
Foreign currency at value (identified cost $1,743 and $46, respectively) | | |
Receivable for Fund shares sold | | |
Receivable for securities sold | | |
Collateral received for open forward foreign currency contracts (Notes 2 and 4) | | |
Dividends and interest receivable | | |
Unrealized appreciation on forward foreign currency contracts (Note 2) | | |
| | |
| | |
| | |
Payable for securities purchased | | |
Payable for Fund shares redeemed | | |
Payable for variation margin on futures contracts (Note 2) | | |
Foreign taxes payable (Note 2) | | |
| | |
Management fees payable (Note 6) | | |
Deferred Trustees’ fees (Note 6) | | |
Administrative fees payable (Note 6) | | |
Payable to distributor (Note 6d) | | |
Audit and tax services fees payable | | |
Other accounts payable and accrued expenses | | |
| | |
COMMITMENTS AND CONTINGENCIES(a) | | |
| | |
| | |
| | |
| | |
| | |
See accompanying notes to financial statements.
Statements of Assets and Liabilities (continued)
June 30, 2024 (Unaudited)
| | Investment Grade Fixed Income Fund |
COMPUTATION OF NET ASSET VALUE AND OFFERING PRICE: | | |
| | |
| | |
Shares of beneficial interest | | |
Net asset value, offering and redemption price per share | | |
| | |
| | |
Shares of beneficial interest | | |
Net asset value, offering and redemption price per share | | |
| | |
| | |
Shares of beneficial interest | | |
Net asset value, offering and redemption price per share | | |
| | |
| | |
Shares of beneficial interest | | |
Net asset value, offering and redemption price per share | | |
| As disclosed in the Notes to Financial Statements, if applicable. |
See accompanying notes to financial statements.
For the Six Months Ended June 30, 2024 (Unaudited)
| | Investment
Grade Fixed
Income Fund |
| | |
| | |
| | |
Less net foreign taxes withheld | | |
| | |
| | |
| | |
Service and distribution fees (Note 6) | | |
Administrative fees (Note 6) | | |
Trustees' fees and expenses (Note 6) | | |
Transfer agent fees and expenses (Notes 6, 7 and 8) | | |
Audit and tax services fees | | |
Custodian fees and expenses | | |
| | |
| | |
Shareholder reporting expenses | | |
| | |
| | |
Less waiver and/or expense reimbursement (Note 6) | | |
Less expense offset (Note 8) | | |
| | |
| | |
Net realized and unrealized gain (loss) on Investments, Futures contracts, Forward foreign currency contracts and Foreign currency transactions | | |
Net realized gain (loss) on: | | |
| | |
| | |
Forward foreign currency contracts (Note 2d) | | |
Foreign currency transactions (Note 2c) | | |
Net change in unrealized appreciation (depreciation) on: | | |
| | |
| | |
Forward foreign currency contracts (Note 2d) | | |
Foreign currency translations (Note 2c) | | |
Net realized and unrealized loss on Investments, Futures contracts, Forward foreign currency contracts and Foreign currency transactions | | |
NET INCREASE IN NET ASSETS RESULTING FROM OPERATIONS | | |
See accompanying notes to financial statements.
Statements of Changes in Net Assets
| | Investment Grade Fixed Income Fund |
| Six Months Ended
June 30,2024
(Unaudited) | Year Ended
December 31,2023 | Six Months Ended
June 30,2024
(Unaudited) | Year Ended
December 31,2023 |
| | | | |
| | | | |
Net realized loss on investments, futures contracts, forward foreign currency contracts and foreign currency transactions | | | | |
Net change in unrealized appreciation (depreciation) on investments, futures contracts, forward foreign currency contracts and foreign currency translations | | | | |
Net increase in net assets resulting from operations | | | | |
FROM DISTRIBUTIONS TO SHAREHOLDERS: | | | | |
| | | | |
| | | | |
| | | | |
| | | | |
| | | | |
NET INCREASE (DECREASE) IN NET ASSETS
FROM CAPITAL SHARES TRANSACTIONS
(Note 12) | | | | |
Net increase (decrease) in net assets | | | | |
| | | | |
| | | | |
| | | | |
See accompanying notes to financial statements.
For a share outstanding throughout each period.
| Bond Fund – Institutional Class |
| Six Months
Ended
June 30,
2024
(Unaudited) | Year Ended
December 31,
2023 | Year Ended
December 31,
2022 | Year Ended
December 31,
2021 | Period Ended
December 31,
2020* | Year Ended
September 30,
2020 | Year Ended
September 30,
2019 |
Net asset value, beginning of the period | | | | | | | |
INCOME (LOSS) FROM INVESTMENT OPERATIONS: | | | | | | | |
| | | | | | | |
Net realized and unrealized gain (loss) | | | | | | | |
Total from Investment Operations | | | | | | | |
| | | | | | | |
| | | | | | | |
Net realized capital gains | | | | | | | |
| | | | | | | |
Net asset value, end of the period | | | | | | | |
| | | | | | | |
RATIOS TO AVERAGE NET ASSETS: | | | | | | | |
Net assets, end of the period (000's) | | | | | | | |
| | | | | | | |
| | | | | | | |
| | | | | | | |
| | | | | | | |
| For the three month period ended December 31, 2020 due to change in fiscal year. |
| Per share net investment income has been calculated using the average shares outstanding during the period. |
| Had certain expenses not been waived/reimbursed during the period, total returns would have been lower. |
| Periods less than one year are not annualized. |
| The investment adviser agreed to waive its fees and/or reimburse a portion of the Fund’s expenses during the period. Without this waiver/reimbursement, expenses would have been higher. |
| Computed on an annualized basis for periods less than one year. |
| Effective July 1, 2023, the expense limit decreased from 0.67% to 0.66%. |
| The variation in the Fund’s turnover rate from the year ended September 30, 2020 to the year ended December 31, 2021 was primarily due to a repositioning of the portfolio. |
| The variation in the Fund’s turnover rate, if annualized, from the year ended September 30, 2020 to the period ended December 31, 2020 was primarily due to the disposition and realignment of certain foreign currency-denominated positions. |
See accompanying notes to financial statements.
Financial Highlights (continued)
For a share outstanding throughout each period.
| |
| Six Months
Ended
June 30,
2024
(Unaudited) | Year Ended
December 31,
2023 | Year Ended
December 31,
2022 | Year Ended
December 31,
2021 | | Year Ended
September 30,
2020 | Year Ended
September 30,
2019 |
Net asset value, beginning of the period | | | | | | | |
INCOME (LOSS) FROM INVESTMENT OPERATIONS: | | | | | | | |
| | | | | | | |
Net realized and unrealized gain (loss) | | | | | | | |
Total from Investment Operations | | | | | | | |
| | | | | | | |
| | | | | | | |
Net realized capital gains | | | | | | | |
| | | | | | | |
Net asset value, end of the period | | | | | | | |
| | | | | | | |
RATIOS TO AVERAGE NET ASSETS: | | | | | | | |
Net assets, end of the period (000's) | | | | | | | |
| | | | | | | |
| | | | | | | |
| | | | | | | |
| | | | | | | |
| For the three month period ended December 31, 2020 due to change in fiscal year. |
| Per share net investment income has been calculated using the average shares outstanding during the period. |
| Had certain expenses not been waived/reimbursed during the period, total returns would have been lower. |
| Periods less than one year are not annualized. |
| The investment adviser agreed to waive its fees and/or reimburse a portion of the Fund’s expenses during the period. Without this waiver/reimbursement, expenses would have been higher. |
| Computed on an annualized basis for periods less than one year. |
| Effective July 1, 2023, the expense limit decreased from 0.92% to 0.91%. |
| The administrator agreed to waive its fees and/or reimburse a portion of the Fund’s expenses during the period. Without this waiver/reimbursement, expenses would have been higher. |
| The variation in the Fund’s turnover rate from the year ended September 30, 2020 to the year ended December 31, 2021 was primarily due to a repositioning of the portfolio. |
| The variation in the Fund’s turnover rate, if annualized, from the year ended September 30, 2020 to the period ended December 31, 2020 was primarily due to the disposition and realignment of certain foreign currency-denominated positions. |
See accompanying notes to financial statements.
Financial Highlights (continued)
For a share outstanding throughout each period.
| |
| Six Months
Ended
June 30,
2024
(Unaudited) | Year Ended
December 31,
2023 | Year Ended
December 31,
2022 | Year Ended
December 31,
2021 | | Year Ended
September 30,
2020 | Year Ended
September 30,
2019 |
Net asset value, beginning of the period | | | | | | | |
INCOME (LOSS) FROM INVESTMENT OPERATIONS: | | | | | | | |
| | | | | | | |
Net realized and unrealized gain (loss) | | | | | | | |
Total from Investment Operations | | | | | | | |
| | | | | | | |
| | | | | | | |
Net realized capital gains | | | | | | | |
| | | | | | | |
Net asset value, end of the period | | | | | | | |
| | | | | | | |
RATIOS TO AVERAGE NET ASSETS: | | | | | | | |
Net assets, end of the period (000's) | | | | | | | |
| | | | | | | |
| | | | | | | |
| | | | | | | |
| | | | | | | |
| For the three month period ended December 31, 2020 due to change in fiscal year. |
| Per share net investment income has been calculated using the average shares outstanding during the period. |
| Had certain expenses not been waived/reimbursed during the period, total returns would have been lower. |
| Periods less than one year are not annualized. |
| The investment adviser agreed to waive its fees and/or reimburse a portion of the Fund’s expenses during the period. Without this waiver/reimbursement, expenses would have been higher. |
| Computed on an annualized basis for periods less than one year. |
| Includes refund of prior year service fee of 0.07%. See Note 6b of Notes to Financial Statements. |
| Includes refund of prior year service fee of 0.04%. |
| Effective July 1, 2023, the expense limit decreased from 1.17% to 1.16%. |
| Includes refund of prior year service fee of 0.02%. |
| The administrator agreed to waive its fees and/or reimburse a portion of the Fund’s expenses during the period. Without this waiver/reimbursement, expenses would have been higher. |
| The variation in the Fund’s turnover rate from the year ended September 30, 2020 to the year ended December 31, 2021 was primarily due to a repositioning of the portfolio. |
| The variation in the Fund’s turnover rate, if annualized, from the year ended September 30, 2020 to the period ended December 31, 2020 was primarily due to the disposition and realignment of certain foreign currency-denominated positions. |
See accompanying notes to financial statements.
Financial Highlights (continued)
For a share outstanding throughout each period.
| |
| Six Months
Ended
June 30,
2024
(Unaudited) | Year Ended
December 31,
2023 | Year Ended
December 31,
2022 | Year Ended
December 31,
2021 | Period Ended
December 31,
2020* | Year Ended
September 30,
2020 | Year Ended
September 30,
2019 |
Net asset value, beginning of period | | | | | | | |
INCOME (LOSS) FROM INVESTMENT OPERATIONS: | | | | | | | |
| | | | | | | |
Net realized and unrealized gain (loss) | | | | | | | |
Total from Investment Operations | | | | | | | |
| | | | | | | |
| | | | | | | |
Net realized capital gains | | | | | | | |
| | | | | | | |
Net asset value, end of the period | | | | | | | |
| | | | | | | |
RATIOS TO AVERAGE NET ASSETS: | | | | | | | |
Net assets, end of the period (000's) | | | | | | | |
| | | | | | | |
| | | | | | | |
| | | | | | | |
| | | | | | | |
| For the three month period ended December 31, 2020 due to change in fiscal year. |
| Per share net investment income has been calculated using the average shares outstanding during the period. |
| Had certain expenses not been waived/reimbursed during the period, total returns would have been lower. |
| Periods less than one year are not annualized. |
| The investment adviser agreed to waive its fees and/or reimburse a portion of the Fund’s expenses during the period. Without this waiver/reimbursement, expenses would have been higher. |
| Computed on an annualized basis for periods less than one year. |
| Effective July 1, 2023, the expense limit decreased from 0.62% to 0.61%. |
| The variation in the Fund’s turnover rate from the year ended September 30, 2020 to the year ended December 31, 2021 was primarily due to a repositioning of the portfolio. |
| The variation in the Fund’s turnover rate, if annualized, from the year ended September 30, 2020 to the period ended December 31, 2020 was primarily due to the disposition and realignment of certain foreign currency-denominated positions. |
See accompanying notes to financial statements.
Financial Highlights (continued)
For a share outstanding throughout each period.
| Investment Grade Fixed Income Fund – Institutional Class |
| Six Months
Ended
June 30,
2024
(Unaudited) | Year Ended
December 31,
2023 | Year Ended
December 31,
2022 | Year Ended
December 31,
2021 | Period Ended
December 31,
2020* | Year Ended
September 30,
2020 | Year Ended
September 30,
2019 |
Net asset value, beginning of the period | | | | | | | |
INCOME (LOSS) FROM INVESTMENT OPERATIONS: | | | | | | | |
| | | | | | | |
Net realized and unrealized gain (loss) | | | | | | | |
Total from Investment Operations | | | | | | | |
| | | | | | | |
| | | | | | | |
Net realized capital gains | | | | | | | |
| | | | | | | |
Net asset value, end of the period | | | | | | | |
| | | | | | | |
RATIOS TO AVERAGE NET ASSETS: | | | | | | | |
Net assets, end of the period (000's) | | | | | | | |
| | | | | | | |
| | | | | | | |
| | | | | | | |
| | | | | | | |
| For the three month period ended December 31, 2020 due to change in fiscal year. |
| Per share net investment income has been calculated using the average shares outstanding during the period. |
| Had certain expenses not been waived/reimbursed during the period, total returns would have been lower. |
| Periods less than one year are not annualized. |
| The investment adviser agreed to waive its fees and/or reimburse a portion of the Fund’s expenses during the period. Without this waiver/reimbursement, expenses would have been higher. |
| Computed on an annualized basis for periods less than one year. |
| Effective July 1, 2023, the expense limit decreased from 0.55% to 0.53%. |
| The variation in the Fund’s turnover rate from the year ended September 30, 2020 to the year ended December 31, 2021 was primarily due to a repositioning of the portfolio. |
| The variation in the Fund’s turnover rate, if annualized, from the year ended September 30, 2020 to the period ended December 31, 2020 was primarily due to the disposition and realignment of certain foreign currency-denominated positions. |
See accompanying notes to financial statements.
Notes to Financial Statements
June 30, 2024 (Unaudited)
1.Organization. Loomis Sayles Funds I (the “Trust”) is organized as a Massachusetts business trust. The Trust is registered under the Investment Company Act of 1940, as amended (the “1940 Act”) as an open-end management investment company. The Declaration of Trust permits the Board of Trustees to authorize the issuance of an unlimited number of shares of the Trust in multiple series. The financial statements for certain funds of the Trust are presented in separate reports. The following funds (individually, a “Fund” and collectively, the “Funds”) are included in this report:
Loomis Sayles Bond Fund (“Bond Fund”)
Loomis Sayles Investment Grade Fixed Income Fund ("Investment Grade Fixed Income Fund")
Each Fund is a diversified investment company.
Each Fund offers Institutional Class shares. In addition, Bond Fund also offers Retail Class, Admin Class and Class N shares.
Each share class is sold without a sales charge. Retail Class and Admin Class shares pay a Rule 12b-1 fee. Admin Class shares are primarily intended for employer-sponsored retirement plans and are offered exclusively through intermediaries. Class N shares do not pay a front-end sales charge, a contingent deferred sales charge (“CDSC”) or Rule 12b-1 fees. Class N shares are offered with an initial minimum investment of $1,000,000. Institutional Class shares are intended for institutional investors with a minimum initial investment of $100,000 for Bond Fund and $3,000,000 for Investment Grade Fixed Income Fund. Certain categories of investors are exempted from the minimum investment amounts for Class N and Institutional Class as outlined in the relevant Fund’s prospectus.
Most expenses can be directly attributed to a Fund. Expenses which cannot be directly attributed to a Fund are generally apportioned based on the relative net assets of each of the Funds in Natixis Funds Trust I, Natixis Funds Trust II, Natixis Funds Trust IV, and Gateway Trust (“Natixis Funds Trusts”), and Loomis Sayles Funds I and Loomis Sayles Funds II (“Loomis Sayles Funds Trusts”), and Natixis ETF Trust and Natixis ETF Trust II (“Natixis ETF Trusts”). Expenses of a Fund are borne pro rata by the holders of each class of shares, except that each class bears expenses unique to that class (such as the Rule 12b-1 fees applicable to Retail Class and Admin Class) and transfer agent fees are borne collectively for Institutional Class, Retail Class, and Admin Class, and individually for Class N. In addition, each class votes as a class only with respect to its own Rule 12b-1 Plan. Shares of each class would receive their pro rata share of the net assets of a Fund if the Fund were liquidated. The Trustees approve separate distributions from net investment income on each class of shares.
2.Significant Accounting Policies. The following is a summary of significant accounting policies consistently followed by each Fund in the preparation of its financial statements. The Funds' financial statements follow the accounting and reporting guidelines provided for investment companies and are prepared in accordance with accounting principles generally accepted in the United States of America which require the use of management estimates that affect the reported amounts and disclosures in the financial statements. Actual results could differ from those estimates. Management has evaluated the events and transactions subsequent to period-end through the date the financial statements were issued and has determined that there were no material events that would require disclosure in the Funds' financial statements.
a. Valuation. Registered investment companies are required to value portfolio investments using an unadjusted, readily available market quotation. Each Fund obtains readily available market quotations from independent pricing services. Fund investments for which readily
available market quotations are not available are priced at fair value pursuant to the Funds’ Valuation Procedures. The Board of Trustees has approved a valuation designee who is subject to the Board’s oversight.
Unadjusted readily available market quotations that are utilized for exchange traded equity securities (including shares of closed-end investment companies and exchange-traded funds) include the last sale price quoted on the exchange where the security is traded most extensively. Futures contracts are valued at the closing settlement price on the exchange on which the valuation designee believes that, over time, they are traded most extensively. Shares of open-end investment companies are valued at net asset value ("NAV") per share.
Exchange traded equity securities for which there is no reported sale during the day are fair valued at the closing bid quotation as reported by an independent pricing service. Unlisted equity securities (except unlisted preferred equity securities) are fair valued at the last sale price quoted in the market where they are traded most extensively or, if there is no reported sale during the day, the closing bid quotation as reported by an independent pricing service. If there is no last sale price or closing bid quotation available, unlisted equity securities will be fair valued using evaluated bids furnished by an independent pricing service, if available.
Debt securities and unlisted preferred equity securities are fair valued based on evaluated bids furnished to the Funds by an independent pricing service or bid prices obtained from broker-dealers. Senior loans and collateralized loan obligations ("CLOs") are fair valued at bid prices supplied by an independent pricing service, if available. Broker-dealer bid prices may be used to fair value debt, unlisted equities, senior loans and CLOs where an independent pricing service is unable to price an investment or where an independent pricing service does not provide a reliable price for the investment. Forward foreign currency contracts are fair valued utilizing interpolated rates determined based on information provided by an independent pricing service.
The Funds may also fair value investments in other circumstances such as when extraordinary events occur after the close of a foreign market, but prior to the close of the New York Stock Exchange. This may include situations relating to a single issuer (such as a declaration of
Notes to Financial Statements (continued)
June 30, 2024 (Unaudited)
bankruptcy or a delisting of the issuer’s security from the primary market on which it has traded) as well as events affecting the securities markets in general (such as market disruptions or closings and significant fluctuations in U.S. and/or foreign markets). When fair valuing a Fund’s investments, the valuation designee may, among other things, use modeling tools or other processes that may take into account factors such as issuer specific information, or other related market activity and/or information that occurred after the close of the foreign market but before the time the Fund’s NAV is calculated. Fair valuation by the Fund(s) valuation designee may require subjective determinations about the value of the investment, and fair values used to determine a Fund’s NAV may differ from quoted or published prices, or from prices that are used by others, for the same investments. In addition, the use of fair value pricing may not always result in adjustments to the prices of investments held by a Fund.
b. Investment Transactions and Related Investment Income. Investment transactions are accounted for on a trade date plus one day basis for daily NAV calculation. However, for financial reporting purposes, investment transactions are reported on trade date. Dividend income (including income reinvested) and foreign withholding tax, if applicable, are recorded on the ex-dividend date, or in the case of certain foreign securities, as soon as a Fund is notified, and interest income is recorded on an accrual basis. Loan consent fees, upfront origination fees and/or amendment fees are recorded when received and included in interest income on the Statements of Operations. Interest income is increased by the accretion of discount and decreased by the amortization of premium, if applicable. For securities with paydown provisions, principal payments received are treated as a proportionate reduction to the cost basis of the securities, and excess or shortfall amounts are recorded as income. Distributions received from investments in securities that represent a return of capital or capital gain are recorded as a reduction of cost of investments or as a realized gain, respectively. In determining net gain or loss on securities sold, the cost of securities has been determined on an identified cost basis. Investment income, non-class specific expenses and realized and unrealized gains and losses are allocated on a pro rata basis to each class based on the relative net assets of each class to the total net assets of the Fund.
c. Foreign Currency Translation. The books and records of the Funds are maintained in U.S. dollars. The values of securities, currencies and other assets and liabilities denominated in currencies other than U.S. dollars, if any, are translated into U.S. dollars based upon foreign exchange rates prevailing at the end of the period. Purchases and sales of investment securities, income and expenses are translated into U.S. dollars on the respective dates of such transactions.
Net realized foreign exchange gains or losses arise from sales of foreign currency, changes in exchange rates between the trade and settlement dates on securities transactions and the difference between the amounts of dividends, interest and foreign withholding taxes recorded in the Funds’ books and records and the U.S. dollar equivalent of the amounts actually received or paid. Net unrealized foreign exchange gains or losses arise from changes in the value of assets and liabilities, other than investment securities, as of the end of the fiscal period, resulting from changes in exchange rates. Net realized foreign exchange gains or losses and the net change in unrealized foreign exchange gains or losses are disclosed in the Statements of Operations. For federal income tax purposes, net realized foreign exchange gains or losses are characterized as ordinary income and may, if the Funds have net losses, reduce the amount of income available to be distributed by the Funds.
The values of investment securities are presented at the foreign exchange rates prevailing at the end of the period for financial reporting purposes. Net realized and unrealized gains or losses on investments reported in the Statements of Operations reflect gains or losses resulting from changes in exchange rates and fluctuations which arise due to changes in market prices of investment securities. For federal income tax purposes, a portion of the net realized gain or loss on investments arising from changes in exchange rates, which is reflected in the Statements of Operations, may be characterized as ordinary income and may, if the Funds have net losses, reduce the amount of income available to be distributed by the Funds.
The Funds may use foreign currency exchange contracts to facilitate transactions in foreign-denominated investments. Losses may arise from changes in the value of the foreign currency or if the counterparties do not perform under the contracts’ terms.
d. Forward Foreign Currency Contracts. A Fund may enter into forward foreign currency contracts, including forward foreign cross currency contracts, to acquire exposure to foreign currencies or to hedge the Funds’ investments against currency fluctuation. A contract can also be used to offset a previous contract. These contracts involve market risk in excess of the unrealized appreciation (depreciation) reflected in the Funds’ Statements of Assets and Liabilities. The U.S. dollar value of the currencies a Fund has committed to buy or sell represents the aggregate exposure to each currency a Fund has acquired or hedged through currency contracts outstanding at period end. Gains or losses are recorded for financial statement purposes as unrealized until settlement date. Contracts are traded over-the-counter directly with a counterparty. Risks may arise upon entering into these contracts from the potential inability of counterparties to meet the terms of their contracts and from unanticipated movements in the value of a foreign currency relative to the U.S. dollar. Certain contracts may require the movement of cash and/or securities as collateral for the Funds’ or counterparty’s net obligations under the contracts. Forward foreign currency contracts outstanding at the end of the period, if any, are listed in each applicable Fund's Portfolio of Investments.
e. Futures Contracts. A Fund may enter into futures contracts. Futures contracts are agreements between two parties to buy and sell a particular instrument or index for a specified price on a specified future date.
When a Fund enters into a futures contract, it is required to deposit with (or for the benefit of) its broker an amount of cash or short-term high-quality securities as “initial margin.” As the value of the contract changes, the value of the futures contract position increases or declines.
Notes to Financial Statements (continued)
June 30, 2024 (Unaudited)
Subsequent payments, known as “variation margin,” are made or received by a Fund, depending on the price fluctuations in the fair value of the contract and the value of cash or securities on deposit with the broker. The aggregate principal amounts of the contracts are not recorded in the financial statements. Daily fluctuations in the value of the contracts are recorded in the Statements of Assets and Liabilities as a receivable (payable) and in the Statements of Operations as unrealized appreciation (depreciation) until the contracts are closed, when they are recorded as realized gains (losses). Realized gain or loss on a futures position is equal to the difference between the value of the contract at the time it was opened and the value at the time it was closed, minus brokerage commissions. When a Fund enters into a futures contract certain risks may arise, such as illiquidity in the futures market, which may limit a Fund’s ability to close out a futures contract prior to settlement date, and unanticipated movements in the value of securities or interest rates. Futures contracts outstanding at the end of the period, if any, are listed in each applicable Fund's Portfolio of Investments.
Futures contracts are exchange-traded. Exchange-traded futures contracts are standardized and are settled through a clearing house with fulfillment supported by the credit of the exchange. Therefore, counterparty credit risks to the Funds are reduced; however, in the event that a counterparty enters into bankruptcy, a Fund’s claim against initial/variation margin on deposit with the counterparty may be subject to terms of a final settlement in bankruptcy court.
f. When-Issued and Delayed Delivery Transactions. A Fund may enter into when-issued or delayed delivery transactions. When-issued refers to transactions made conditionally because a security, although authorized, has not been issued. Delayed delivery refers to transactions for which delivery or payment will occur at a later date, beyond the normal settlement period. The price of when-issued and delayed delivery securities and the date when the securities will be delivered and paid for are fixed at the time the transaction is negotiated. The security and the obligation to pay for it are recorded by the Funds at the time the commitment is entered into. The value of the security may vary with market fluctuations during the time before the Funds take delivery of the security. No interest accrues to the Funds until the transaction settles.
Delayed delivery transactions include those designated as To Be Announced (“TBAs”) in the Portfolios of Investments. For TBAs, the actual security that will be delivered to fulfill the transaction is not designated at the time of the trade. The security is “to be announced” 48 hours prior to the established trade settlement date. Certain transactions require the Funds or counterparty to post cash and/or securities as collateral for the net mark-to-market exposure to the other party.
Purchases of when-issued or delayed delivery securities may have a similar effect on the Funds’ NAV as if the Funds’ had created a degree of leverage in the portfolio. Risks may arise upon entering into such transactions from the potential inability of counterparties to meet their obligations under the transactions. Additionally, losses may arise due to changes in the value of the underlying securities.
There were no when-issued or delayed delivery securities held by the Funds as of June 30, 2024.
g. Federal and Foreign Income Taxes. The Trust treats each Fund as a separate entity for federal income tax purposes. Each Fund intends to meet the requirements of the Internal Revenue Code of 1986, as amended, applicable to regulated investment companies, and to distribute to its shareholders substantially all of its net investment income and any net realized capital gains at least annually. Management has performed an analysis of each Fund’s tax positions for the open tax years as of June 30, 2024 and has concluded that no provisions for income tax are required. The Funds’ federal tax returns for the prior three fiscal years remain subject to examination by the Internal Revenue Service. Management is not aware of any events that are reasonably possible to occur in the next six months that would result in the amounts of any unrecognized tax benefits significantly increasing or decreasing for the Funds. However, management’s conclusions regarding tax positions taken may be subject to review and adjustment at a later date based on factors including, but not limited to, new tax laws and accounting regulations and interpretations thereof.
A Fund may be subject to foreign withholding taxes on investment income and taxes on capital gains on investments that are accrued and paid based upon the Fund’s understanding of the tax rules and regulations that exist in the countries in which the Fund invests. Foreign withholding taxes on dividend and interest income are reflected on the Statements of Operations as a reduction of investment income, net of amounts that have been or are expected to be reclaimed and paid. Dividends and interest receivable on the Statements of Assets and Liabilities are net of foreign withholding taxes. Foreign withholding taxes where reclaims have been or are expected to be filed and paid are reflected on the Statements of Assets and Liabilities as tax reclaims receivable. Capital gains taxes paid are included in net realized gain (loss) on investments in the Statements of Operations. Accrued but unpaid capital gains taxes are reflected as foreign taxes payable on the Statements of Assets and Liabilities, if applicable, and reduce unrealized gains on investments. In the event that realized gains on investments are subsequently offset by realized losses, taxes paid on realized gains may be returned to a Fund. Such amounts, if applicable, are reflected as foreign tax rebates receivable on the Statements of Assets and Liabilities and are recorded as a realized gain when received.
h. Dividends and Distributions to Shareholders. Dividends and distributions are recorded on the ex-dividend date. The timing and characterization of certain income and capital gain distributions are determined in accordance with federal tax regulations, which may differ from accounting principles generally accepted in the United States of America. Permanent differences are primarily due to differing treatments for book and tax purposes of items such as defaulted and/or non-income producing securities, premium amortization, convertible bond adjustments, corporate actions, foreign currency gains and losses, forward foreign currency contract mark-to-market, futures contract mark-to-
Notes to Financial Statements (continued)
June 30, 2024 (Unaudited)
market, trust preferred securities, return of capital distributions received, capital gain distributions received and paydown gains and losses. Permanent book and tax basis differences relating to shareholder distributions, net investment income and net realized gains will result in reclassifications to capital accounts reported on the Statements of Assets and Liabilities. Temporary differences between book and tax distributable earnings are primarily due to deferred Trustees’ fees, wash sales, defaulted and/or non-income producing securities, return of capital distributions received, trust preferred securities, corporate actions, capital gain distributions received, premium amortization, forward foreign currency contract mark-to-market, perpetual bond adjustments, paydown gains and losses, straddle loss deferral adjustments, convertible bond adjustments and futures contract mark-to-market. Amounts of income and capital gain available to be distributed on a tax basis are determined annually, and at other times during the Funds’ fiscal year as may be necessary to avoid knowingly declaring and paying a return of capital distribution. Distributions from net investment income and net realized short-term capital gains are reported as distributed from ordinary income for tax purposes.
The tax characterization of distributions is determined on an annual basis. The tax character of distributions paid to shareholders during the year ended December 31, 2023 was as follows:
| |
| | | |
| | | |
Investment Grade Fixed Income Fund | | | |
Distributions paid to shareholders from net investment income and net realized capital gains, based on accounting principles generally accepted in the United States of America, are consolidated and reported on the Statements of Changes in Net Assets as Distributions to Shareholders. Distributions paid to shareholders from net investment income and net realized capital gains expressed in per-share amounts, based on accounting principles generally accepted in the United States of America, are separately stated and reported within the Financial Highlights.
As of December 31, 2023, capital loss carryforwards were as follows:
| | Investment
Grade Fixed
Income Fund |
Capital loss carryforward: | | |
| | |
| | |
| | |
| | |
Total capital loss carryforward | | |
As of June 30, 2024, the tax cost of investments (including derivatives, if applicable) and unrealized appreciation (depreciation) on a federal tax basis were as follows:
| | Investment
Grade Fixed
Income Fund |
| | |
| | |
| | |
| | |
Amounts in the table above exclude certain adjustments that will be made at the end of the Fund’s fiscal year for tax purposes. Adjustments may include, but are not limited to, wash sales and derivatives mark-to-market.
i. Senior Loans. A Fund’s investment in senior loans may be to corporate, governmental or other borrowers. Senior loans, which include both secured and unsecured loans made by banks and other financial institutions to corporate customers, typically hold the most senior position in a borrower’s capital structure, may be secured by the borrower’s assets and have interest rates that reset frequently. Senior Loans can include term loans, revolving credit facility loans and second lien loans. A senior loan is often administered by a bank or other financial institution
Notes to Financial Statements (continued)
June 30, 2024 (Unaudited)
that acts as agent for all holders. The agent administers the terms of the senior loan, as specified in the loan agreement. Large loans may be shared or syndicated among several lenders. The Fund may enter into the primary syndicate for a loan or it may also purchase all or a portion of loans from other lenders (sometimes referred to as loan assignments), in either case becoming a direct lender. The settlement period for senior loans is uncertain as there is no standardized settlement schedule applicable to such investments. Senior loans outstanding at the end of the period, if any, are listed in each applicable Fund’s Portfolio of Investments.
j. Collateralized Loan Obligations. A Fund may invest in CLOs. A CLO is a type of asset-backed security designed to redirect the cash flows from a pool of leveraged loans to investors based on their risk preferences. Cash flows from a CLO are split into two or more portions, called tranches, varying in risk and yield. The risk of an investment in a CLO depends largely on the type of the collateralized securities and the class of the instrument in which the Fund invests. CLOs outstanding at the end of the period, if any, are listed in each applicable Fund’s Portfolio of Investments.
k. Repurchase Agreements. Each Fund may enter into repurchase agreements, under the terms of a Master Repurchase Agreement, under which each Fund acquires securities as collateral and agrees to resell the securities at an agreed upon time and at an agreed upon price. It is each Fund’s policy that the market value of the collateral for repurchase agreements be at least equal to 102% of the repurchase price, including interest. Certain repurchase agreements are tri-party arrangements whereby the collateral is held in a segregated account for the benefit of the Fund and on behalf of the counterparty. Repurchase agreements could involve certain risks in the event of default or insolvency of the counterparty, including possible delays or restrictions upon a Fund’s ability to dispose of the underlying securities. As of June 30, 2024, each Fund, as applicable, had investments in repurchase agreements for which the value of the related collateral exceeded the value of the repurchase agreement. The gross value of repurchase agreements is included in the Statements of Assets and Liabilities for financial reporting purposes.
l. Due to Brokers. Transactions and positions in certain forward foreign currency contracts are maintained and cleared by registered U.S. broker/dealers pursuant to customer agreements between the Funds and the various broker/dealers. The due to broker balance in the Statements of Assets and Liabilities for Bond Fund represents securities received as collateral for forward foreign currency contracts. In certain circumstances the Funds’ use of cash held at brokers is restricted by regulation or broker mandated limits.
m. Indemnifications. Under the Trust’s organizational documents, its officers and Trustees are indemnified against certain liabilities arising out of the performance of their duties to the Funds. Additionally, in the normal course of business, the Funds enter into contracts with service providers that contain general indemnification clauses. The Funds' maximum exposure under these arrangements is unknown as this would involve future claims that may be made against the Funds that have not yet occurred. However, based on experience, the Funds expect the risk of loss to be remote.
3.Fair Value Measurements In accordance with accounting standards related to fair value measurements and disclosures, the Funds have categorized the inputs utilized in determining the value of each Fund’s assets or liabilities. These inputs are summarized in the three broad levels listed below:
• Level 1 — quoted prices in active markets for identical assets or liabilities;
• Level 2 — prices determined using other significant inputs that are observable either directly, or indirectly through corroboration with observable market data (which could include quoted prices for similar assets or liabilities, interest rates, credit risk, etc.); and
• Level 3 — prices determined using significant unobservable inputs when quoted prices or observable inputs are unavailable such as when there is little or no market activity for an asset or liability (unobservable inputs reflect each Fund’s own assumptions in determining the fair value of assets or liabilities and would be based on the best information available).
The inputs or methodology used for valuing securities are not necessarily an indication of the risk associated with investing in those securities.
The Funds' pricing policies have been approved by the Board of Trustees. Investments for which market quotations are readily available are categorized in Level 1. Other investments for which an independent pricing service is utilized are categorized in Level 2. Broker-dealer bid prices for which the Funds have knowledge of the inputs used by the broker-dealer are categorized in Level 2. All other investments, including broker-dealer bid prices for which the Funds do not have knowledge of the inputs used by the broker-dealer, as well as investments fair valued by the valuation designee, are categorized in Level 3. All Level 2 and 3 securities are defined as being fair valued.
Notes to Financial Statements (continued)
June 30, 2024 (Unaudited)
Under certain conditions and based upon specific facts and circumstances, the Fund’s valuation designee may determine that a fair valuation should be made for portfolio investment(s). These valuation designee fair valuations will be based upon a significant amount of Level 3 inputs.
The following is a summary of the inputs used to value the Funds' investments as of June 30, 2024, at value:
|
|
| | | | |
| | | | |
Collateralized Loan Obligations | | | | |
| | | | |
| | | | |
Convertible Preferred Stocks(a) | | | | |
Non-Convertible Preferred Stocks | | | | |
| | | | |
| | | | |
| | | | |
Total Non-Convertible Preferred Stocks | | | | |
| | | | |
| | | | |
Technology Hardware, Storage & Peripherals | | | | |
All Other Common Stocks(a) | | | | |
| | | | |
| | | | |
| | | | |
Forward Foreign Currency Contracts (unrealized appreciation) | | | | |
Futures Contracts (unrealized appreciation) | | | | |
| | | | |
Liability Valuation Inputs |
| | | | |
Futures Contracts (unrealized depreciation) | | | | |
| Details of the major categories of the Fund’s investments are reflected within the Portfolio of Investments. |
Notes to Financial Statements (continued)
June 30, 2024 (Unaudited)
Investment Grade Fixed Income Fund |
|
| | | | |
| | | | |
| | | | |
| | | | |
All Other Non-Convertible Bonds(a) | | | | |
Total Non-Convertible Bonds | | | | |
All Other Bonds and Notes(a) | | | | |
| | | | |
Collateralized Loan Obligations | | | | |
| | | | |
| | | | |
| | | | |
| | | | |
| | | | |
Futures Contracts (unrealized appreciation) | | | | |
| | | | |
Liability Valuation Inputs |
| | | | |
Futures Contracts (unrealized depreciation) | | | | |
| Details of the major categories of the Fund’s investments are reflected within the Portfolio of Investments. |
The following is a reconciliation of Level 3 investments for which significant unobservable inputs were used to determine fair value as of December 31, 2023 and/or June 30, 2024:
|
|
Investments in Securities | Balance as of
December 31,
2023 | Accrued
Discounts
(Premiums) | | Change in
Unrealized
Appreciation
(Depreciation) | | | | | Balance as of
June 30,
2024 | Change in
Unrealized
Appreciation
(Depreciation)
from
Investments
Still Held at
June 30,
2024 |
| | | | | | | | | | |
Non-Convertible Preferred Stocks | | | | | | | | | | |
| | | | | | | | | | |
Notes to Financial Statements (continued)
June 30, 2024 (Unaudited)
Investment Grade Fixed Income Fund |
|
Investments in Securities | Balance as of
December 31,
2023 | Accrued
Discounts
(Premiums) | | Change in
Unrealized
Appreciation
(Depreciation) | | | | | Balance as of
June 30,
2024 | Change in
Unrealized
Appreciation
(Depreciation)
from
Investments
Still Held at
June 30,
2024 |
| | | | | | | | | | |
| | | | | | | | | | |
| | | | | | | | | | |
4.Derivatives. Derivative instruments are defined as financial instruments whose value and performance are based on the value and performance of an underlying asset, reference rate or index. Derivative instruments that the Funds used during the period include forward foreign currency contracts and futures contracts.
The Funds are subject to the risk that changes in foreign currency exchange rates will have an unfavorable effect on the value of Fund assets denominated in foreign currencies. The Funds may enter into forward foreign currency exchange contracts for hedging purposes to protect the value of the Funds’ holdings of foreign securities. The Funds may also use forward foreign currency contracts to gain exposure to foreign currencies, regardless of whether securities denominated in such currencies are held in the Funds. During the six months ended June 30, 2024, Bond Fund engaged in forward foreign currency contracts for hedging purposes and to gain exposure to foreign currencies.
The Funds are subject to the risk that changes in interest rates will affect the value of the Funds’ investments in fixed-income securities. The Funds will be subject to increased interest rate risk to the extent that they invest in fixed-income securities with longer maturities or durations, as compared to investing in fixed-income securities with shorter maturities or durations. The Funds may use futures contracts to hedge against changes in interest rates and to manage duration without having to buy or sell portfolio securities. The Funds may also use futures contracts to gain investment exposure. During the six months ended June 30, 2024, the Funds used futures contracts to manage duration.
The following is a summary of derivative instruments for Bond Fund as of June 30, 2024, as reflected within the Statements of Assets and Liabilities:
| Unrealized
appreciation
on forward
foreign
currency
contracts | Unrealized
appreciation
on futures
| |
Over-the-counter asset derivatives | | | |
Foreign exchange contracts | | | |
Exchange-traded asset derivatives | | | |
| | | |
| | | |
| Represents cumulative unrealized appreciation (depreciation) on futures contracts. Only the current day’s variation margin on futures contracts is reported within the Statements of Assets and Liabilities as receivable or payable for variation margin, as applicable. |
| Unrealized
depreciation
on futures
|
Exchange-traded liability derivatives | |
| |
| Represents cumulative unrealized appreciation (depreciation) on futures contracts. Only the current day’s variation margin on futures contracts is reported within the Statements of Assets and Liabilities as receivable or payable for variation margin, as applicable. |
Notes to Financial Statements (continued)
June 30, 2024 (Unaudited)
Transactions in derivative instruments for Bond Fund during the six months ended June 30, 2024, as reflected within the Statements of Operations were as follows:
Net Realized Gain (Loss) on: | Forward
foreign
currency
contracts | |
| | |
Foreign exchange contracts | | |
| | |
Net Change in Unrealized
Appreciation (Depreciation) on: | Forward
foreign
currency
contracts | |
| | |
Foreign exchange contracts | | |
| | |
The following is a summary of derivative instruments for Investment Grade Fixed Income Fund as of June 30, 2024, as reflected within the Statements of Assets and Liabilities:
| Unrealized
appreciation
on futures
|
Exchange-traded asset derivatives | |
| |
| Represents cumulative unrealized appreciation (depreciation) on futures contracts. Only the current day’s variation margin on futures contracts is reported within the Statements of Assets and Liabilities as receivable or payable for variation margin, as applicable. |
| Unrealized
depreciation
on futures
|
Exchange-traded liability derivatives | |
| |
| Represents cumulative unrealized appreciation (depreciation) on futures contracts. Only the current day’s variation margin on futures contracts is reported within the Statements of Assets and Liabilities as receivable or payable for variation margin, as applicable. |
Transactions in derivative instruments for Investment Grade Fixed Income Fund during the six months ended June 30, 2024, as reflected within the Statements of Operations were as follows:
Net Realized Gain (Loss) on: | |
| |
Net Change in Unrealized
Appreciation (Depreciation) on: | |
| |
As the Funds value their derivatives at fair value and recognize changes in fair value through the Statements of Operations, they do not qualify for hedge accounting under authoritative guidance for derivative instruments. The Funds’ investments in derivatives may represent an economic hedge; however, they are considered to be non-hedge transactions for the purpose of these disclosures.
Notes to Financial Statements (continued)
June 30, 2024 (Unaudited)
The volume of forward foreign currency contract and futures contract activity, as a percentage of net assets for the Funds, based on gross month-end or daily (as applicable) notional amounts outstanding during the period, including long and short positions at absolute value, was as follows for the six months ended June 30, 2024:
| | |
Average Notional Amount Outstanding | | |
Highest Notional Amount Outstanding | | |
Lowest Notional Amount Outstanding | | |
Notional Amount Outstanding as of June 30, 2024 | | |
Investment Grade Fixed Income Fund | |
Average Notional Amount Outstanding | |
Highest Notional Amount Outstanding | |
Lowest Notional Amount Outstanding | |
Notional Amount Outstanding as of June 30, 2024 | |
Notional amounts outstanding at the end of the prior period, if applicable, are included in the average notional amount outstanding.
Unrealized gain and/or loss on open forwards and futures is recorded in the Statements of Assets and Liabilities. The aggregate notional values of forwards and futures contracts are not recorded in the Statements of Assets and Liabilities, and therefore are not included in the Funds’ net assets.
Over-the-counter derivatives, including forward foreign currency contracts, are entered into pursuant to International Swaps and Derivatives Association, Inc. (“ISDA”) agreements negotiated between the Funds and their counterparties. ISDA agreements typically contain, among other things, terms for the posting of collateral and master netting provisions in the event of a default or other termination event. Collateral is posted by a Fund or the counterparty to the extent of the net mark-to-market exposure to the other party of all open contracts under the agreement, subject to minimum transfer requirements. Master netting provisions allow the Funds and the counterparty, in the event of a default or other termination event, to offset amounts owed by each related to derivative contracts, including any posted collateral, to one net amount payable by either the Funds or the counterparty. The Funds’ ISDA agreements typically contain provisions that allow a counterparty to terminate open contracts early if the NAV of a Fund declines beyond a certain threshold. For financial reporting purposes, the Funds do not offset derivative assets and liabilities, and any related collateral received or pledged, on the Statements of Assets and Liabilities.
As of June 30, 2024, gross amounts of over-the-counter derivative assets and liabilities not offset in the Statements of Assets and Liabilities and the related net amounts after taking into account master netting arrangements, by counterparty, are as follows:
|
| | | | Collateral
(Received)/
Pledged | |
| | | | | |
The actual collateral received or pledged, if any, may exceed the amounts shown in the table due to overcollateralization. Timing differences may exist between when contracts under the ISDA agreements are marked-to-market and when collateral moves. The ISDA agreements include tri-party control agreements under which collateral is held for the benefit of the secured party at a third party custodian, State Street Bank and Trust Company (“State Street Bank”).
Counterparty risk is managed based on policies and procedures established by each Fund’s adviser. Such policies and procedures may include, but are not limited to, minimum counterparty credit rating requirements, monitoring of counterparty credit default swap spreads and posting of collateral. A Fund’s risk of loss from counterparty credit risk on over-the-counter derivatives is generally limited to the Fund’s aggregated unrealized gains and the amount of any collateral pledged to the counterparty, which may be offset by any collateral posted to the Fund by the counterparty. ISDA master agreements can help to manage counterparty risk by specifying collateral posting arrangements at pre-arranged exposure levels. Under these ISDA agreements, collateral is routinely transferred if the total net exposure in respect of certain transactions, net of existing collateral already in place, exceeds a specified amount. With exchange-traded derivatives, there is minimal counterparty credit risk to the Fund because the exchange’s clearing house, as counterparty to these instruments, stands between the buyer and the seller of the contract. Credit risk still exists in exchange-traded derivatives with respect to initial and variation margin that is held in a broker’s customer accounts. While brokers typically are required to segregate customer margin for exchange-traded derivatives from their own assets, in the event that a broker becomes insolvent or goes into bankruptcy and at that time there is a shortfall in the aggregate amount of margin held by the broker for all its customers, U.S. bankruptcy laws will typically allocate that shortfall on a pro rata basis across all of the broker’s customers, potentially resulting in losses to the Fund.
Notes to Financial Statements (continued)
June 30, 2024 (Unaudited)
5.Purchases and Sales of Securities. For the six months ended June 30, 2024, purchases and sales of securities (excluding short-term investments and including paydowns) were as follows:
| U.S. Government/
Agency Securities | |
| | | | |
| | | | |
Investment Grade Fixed Income Fund | | | | |
6.Management Fees and Other Transactions with Affiliates.
a. Management Fees. Loomis, Sayles & Company, L.P. (“Loomis Sayles”) serves as investment adviser to each Fund. Loomis Sayles is a limited partnership whose sole general partner, Loomis, Sayles & Company, Inc., is indirectly owned by Natixis Investment Managers, LLC, which is part of Natixis Investment Managers, an international asset management group based in Paris, France.
Under the terms of the management agreements, each Fund pays a management fee at the following annual rates, calculated daily and payable monthly, based on the Fund’s average daily net assets:
| Percentage of Average Daily Net Assets |
| | | |
| | | |
Investment Grade Fixed Income Fund | | | |
Loomis Sayles has given binding undertakings to the Funds to waive management fees and/or reimburse certain expenses to limit the Funds’ operating expenses, exclusive of acquired fund fees and expenses, brokerage expenses, interest expense, taxes, organizational and extraordinary expenses such as litigation and indemnification expenses. These undertakings are in effect until April 30, 2025, may be terminated before then only with the consent of the Funds’ Board of Trustees, and are reevaluated on an annual basis. Management fees payable, as reflected on the Statements of Assets and Liabilities, are net of waivers and/or expense reimbursements, if any, pursuant to these undertakings. Waivers/reimbursements that exceed management fees payable are reflected on the Statements of Assets and Liabilities as receivable from investment adviser.
For the six months ended June 30, 2024, the expense limits as a percentage of average daily net assets under the expense limitation agreements were as follows:
| Expense Limit as a Percentage of
Average Daily Net Assets |
| | | | |
| | | | |
Investment Grade Fixed Income Fund | | | | |
Effective July 1, 2024, the expense limits as a percentage of average daily net assets under the expense limitation agreements for Bond Fund are as follows:
| Expense Limit as a Percentage of
Average Daily Net Assets |
| | | | |
| | | | |
This new undertaking is in effect until April 30, 2026, may be terminated before then only with the consent of the Fund’s Board of Trustees, and will be reevaluated on an annual basis.
Loomis Sayles shall be permitted to recover expenses borne under the expense limitation agreements (whether through waiver of management fees or otherwise) on a class by class basis in later periods to the extent the annual operating expenses of a class fall below both (1) a class’ expense limitation ratio in place at the time such amounts were waived/reimbursed and (2) a class’ current applicable expense limitation ratio, provided, however, that a class is not obligated to pay such waived/reimbursed fees or expenses more than one year after the end of the fiscal year in which the fees or expenses were waived/reimbursed.
Notes to Financial Statements (continued)
June 30, 2024 (Unaudited)
For the six months ended June 30, 2024, the management fees for each Fund were as follows:
| | Contractual
Waivers of
Management
| | Percentage of
Average
Daily Net Assets |
| | |
| | | | | |
Investment Grade Fixed Income Fund | | | | | |
| Management fee waivers are subject to possible recovery until December 31, 2025. |
No expenses were recovered for either Fund during the six months ended June 30, 2024 under the terms of the expense limitation agreements.
b. Service and Distribution Fees. Natixis Distribution, LLC (“Natixis Distribution”), which is a wholly-owned subsidiary of Natixis Investment Managers, LLC, has entered into a distribution agreement with the Trust. Pursuant to this agreement, Natixis Distribution serves as principal underwriter of the Funds of the Trust.
Pursuant to Rule 12b-1 under the 1940 Act, Bond Fund has adopted Distribution Plans relating to the Fund’s Retail Class shares (the “Retail Class Plan”) and Admin Class shares (the “Admin Class Plan”).
Under the Retail Class Plan, Bond Fund pays Natixis Distribution a monthly distribution fee at an annual rate not to exceed 0.25% of the average daily net assets attributable to the Fund’s Retail Class shares, as compensation for services provided by Natixis Distribution in connection with the marketing or sale of Retail Class shares or for payments made by Natixis Distribution to securities dealers or other financial intermediaries as commissions, asset-based sales charges or other compensation with respect to the sale of Retail Class shares, or for providing personal services to investors and/or the maintenance of shareholder accounts.
Under the Admin Class Plan, Bond Fund pays Natixis Distribution a monthly distribution fee at an annual rate not to exceed 0.25% of the average daily net assets attributable to the Fund’s Admin Class shares, as compensation for services provided by Natixis Distribution in connection with the marketing or sale of Admin Class shares or for payments made by Natixis Distribution to securities dealers or other financial intermediaries as commissions, asset-based sales charges or other compensation with respect to the sales of Admin Class shares, or for providing personal services to investors and/or the maintenance of shareholder accounts.
In addition, the Admin Class shares of Bond Fund may pay Natixis Distribution an administrative service fee, at an annual rate not to exceed 0.25% of the average daily net assets attributable to Admin Class shares. These fees are subsequently paid to securities dealers or financial intermediaries for providing personal services and/or account maintenance for their customers who hold such shares.
For the six months ended June 30, 2024, the service and distribution fees for Bond Fund were as follows:
For the six months ended June 30, 2024, Natixis Distribution refunded Bond Fund $9,675 of prior year Admin Class service fees paid to Natixis Distribution in excess of amounts subsequently paid to securities dealers or financial intermediaries. Service and distribution fees on the Statements of Operations have been reduced by these amounts.
c. Administrative Fees. Natixis Advisors, LLC (“Natixis Advisors”) provides certain administrative services for the Funds and contracts with State Street Bank to serve as sub-administrator. Natixis Advisors is a wholly-owned subsidiary of Natixis Investment Managers, LLC. Pursuant to an agreement among Natixis Funds Trusts, Loomis Sayles Funds Trusts, Natixis ETF Trusts and Natixis Advisors, each Fund pays Natixis Advisors monthly its pro rata portion of fees equal to an annual rate of 0.0540% of the first $15 billion of the average daily net assets of the Natixis Funds Trusts, Loomis Sayles Funds Trusts and Natixis ETF Trusts, 0.0500% of the next $15 billion, 0.0400% of the next $30 billion, 0.0275% of the next $30 billion and 0.0225% of such assets in excess of $90 billion, subject to an annual aggregate minimum fee for the Natixis Funds Trusts, Loomis Sayles Funds Trusts and Natixis ETF Trusts of $10 million, which is reevaluated on an annual basis.
For the six months ended June 30, 2024, the administrative fees for each Fund were as follows:
| |
| |
Investment Grade Fixed Income Fund | |
Notes to Financial Statements (continued)
June 30, 2024 (Unaudited)
d. Sub-Transfer Agent Fees. Natixis Distribution has entered into agreements, which include servicing agreements, with financial intermediaries that provide recordkeeping, processing, shareholder communications and other services to customers of the intermediaries that hold positions in the Funds and has agreed to compensate the intermediaries for providing those services. Intermediaries transact with the Funds primarily through the use of omnibus accounts on behalf of their customers who hold positions in the Funds. These services would have been provided by the Funds’ transfer agent and other service providers if the shareholders’ accounts were maintained directly at the Funds’ transfer agent. Accordingly, the Funds have agreed to reimburse Natixis Distribution for all or a portion of the servicing fees paid to these intermediaries. The reimbursement amounts (sub-transfer agent fees) paid to Natixis Distribution are subject to a current per-account equivalent fee limit approved by the Funds’ Board of Trustees, which is based on fees for similar services paid to the Funds’ transfer agent and other service providers. Class N shares do not bear such expenses.
For the six months ended June 30, 2024, the sub-transfer agent fees (which are reflected in transfer agent fees and expenses in the Statements of Operations) for Bond Fund were $1,525,885.
As of June 30, 2024, Bond Fund owes Natixis Distribution $37,786 in reimbursements for sub-transfer agent fees (which are reflected in the Statements of Assets and Liabilities as payable to distributor).
Sub-transfer agent fees attributable to Institutional Class, Retail Class and Admin Class are allocated on a pro rata basis to each class based on the relative net assets of each class to the total net assets of those classes.
e. Trustees Fees and Expenses. The Trust does not pay any compensation directly to its officers or Trustees who are directors, officers or employees of Natixis Advisors, Natixis Distribution, Natixis Investment Managers, LLC or their affiliates. The Chairperson of the Board of Trustees receives a retainer fee at the annual rate of $400,000. The Chairperson does not receive any meeting attendance fees for Board of Trustees meetings or committee meetings that he attends. Each Independent Trustee (other than the Chairperson) receives, in the aggregate, a retainer fee at the annual rate of $225,000. Each Independent Trustee also receives a meeting attendance fee of $10,000 for each meeting of the Board of Trustees that he or she attends in person and $5,000 for each meeting of the Board of Trustees that he or she attends telephonically. In addition, the Chairperson of the Contract Review Committee and the Chairperson of the Audit Committee each receive an additional retainer fee at the annual rate of $25,000. The Chairperson of the Governance Committee receives an additional retainer fee at the annual rate of $20,000. Each Contract Review Committee member is compensated $6,000 for each Committee meeting that he or she attends in person and $3,000 for each meeting that he or she attends telephonically. Each Audit Committee member is compensated $6,000 for each Committee meeting that he or she attends in person and $3,000 for each meeting that he or she attends telephonically. Each Governance Committee member is compensated $2,500 for each Committee meeting that he or she attends. These fees are allocated among the funds in the Natixis Funds Trusts, Loomis Sayles Funds Trusts and Natixis ETF Trusts based on a formula that takes into account, among other factors, the relative net assets of each fund. Trustees are reimbursed for travel expenses in connection with attendance at meetings.
A deferred compensation plan (the “Plan”) is available to the Trustees on a voluntary basis. The value of a participating Trustee’s deferral account is based on theoretical investments of deferred amounts, on the normal payment dates, in certain funds of the Natixis Funds Trusts, Loomis Sayles Funds Trusts and Natixis ETF Trusts as designated by the participating Trustees. Changes in the value of participants’ deferral accounts are allocated pro rata among the funds in the Natixis Funds Trusts, Loomis Sayles Funds Trusts and Natixis ETF Trusts and are normally reflected as Trustees’ fees and expenses in the Statements of Operations. Deferred amounts remain in the funds until distributed in accordance with the provisions of the Plan. The portions of the accrued obligations allocated to the Funds under the Plan are reflected as Deferred Trustees’ fees in the Statements of Assets and Liabilities.
Certain officers and employees of Natixis Advisors and Loomis Sayles are also officers and/or Trustees of the Trust.
f. Affiliated Ownership. As of June 30, 2024, Loomis Sayles Employees’ Profit Sharing Retirement Plan held shares of Bond Fund representing 0.57% of the Fund's net assets.
7.Class-Specific Transfer Agent Fees and Expenses. Transfer agent fees and expenses for Bond Fund attributable to Institutional Class, Retail Class and Admin Class are allocated on a pro rata basis to each class based on relative net assets of each class to the total net assets of those classes. Transfer agent fees and expenses attributable to Class N are allocated to Class N.
For the six months ended June 30, 2024, Bond Fund incurred the following class-specific transfer agent fees and expenses (net of expense offsets and including sub-transfer agent fees, where applicable):
| Transfer Agent Fees and Expenses |
| | | | |
| | | | |
Notes to Financial Statements (continued)
June 30, 2024 (Unaudited)
8.Expense Offset Arrangements. The Funds have entered into an agreement with the transfer agent whereby certain transfer agent fees and expenses may be paid indirectly by credits earned on the Funds' cash balances. Transfer agent fees and expenses are presented in the Statements of Operations gross of such credits, and the credits are presented as offsets to expenses.
9.Line of Credit. Each Fund, together with certain other funds of Natixis Funds Trusts, Loomis Sayles Funds Trusts and Natixis ETF Trusts, entered into a syndicated, revolving, committed, unsecured line of credit with State Street Bank as administrative agent. The aggregate revolving commitment amount is $575,000,000. Any one Fund may borrow up to $402,500,000 under the line of credit agreement (as long as all borrowings by all Funds in the aggregate do not exceed the $575,000,000 limit at any time), subject to each Fund’s investment restrictions and its contractual obligations under the line of credit. Interest is charged to the Funds based upon the terms set forth in the agreement. In addition, a commitment fee of 0.15% per annum, payable at the end of each calendar quarter, is accrued and apportioned among the participating funds based on their average daily unused portion of the line of credit.
For the six months ended June 30, 2024, neither Fund had borrowings under this agreement.
10.Risk. Geopolitical events (such as trading halts, sanctions or wars) could increase volatility and uncertainty in the financial markets and adversely affect regional and global economies. These, and other related events, could significantly impact a Fund's performance and the value of an investment in the Fund, even if the Fund does not have direct exposure to issuers in the country or countries involved.
11.Concentration of Ownership. From time to time, a Fund may have a concentration of one or more accounts constituting a significant percentage of shares outstanding. Investment activities by holders of such accounts could have material impacts on the Funds. As of June 30, 2024, based on management’s evaluation of the shareholder account base, the Funds had accounts representing controlling ownership of more than 5% of the Funds' total outstanding shares. The number of such accounts, based on accounts that represent more than 5% of an individual class of shares, and the aggregate percentage of net assets represented by such holdings were as follows:
| Number of 5%
Account Holders | |
| | |
Investment Grade Fixed Income Fund | | |
Omnibus shareholder accounts for which Natixis Advisors understands that the intermediary has discretion over the underlying shareholder accounts or investment models where a shareholder account may be invested for a non-discretionary customer are included in the table above. For other omnibus accounts, the Funds do not have information on the individual shareholder accounts underlying the omnibus accounts; therefore, there could be other 5% shareholders in addition to those disclosed in the table above.
Notes to Financial Statements (continued)
June 30, 2024 (Unaudited)
12.Capital Shares. Each Fund may issue an unlimited number of shares of beneficial interest, without par value. Transactions in capital shares were as follows:
|
| Six Months Ended
June 30, 2024 | Year Ended
December 31, 2023 |
| | | | |
| | | | |
Issued from the sale of shares | | | | |
Issued in connection with the reinvestment of distributions | | | | |
| | | | |
| | | | |
| | | | |
Issued from the sale of shares | | | | |
Issued in connection with the reinvestment of distributions | | | | |
| | | | |
| | | | |
| | | | |
Issued from the sale of shares | | | | |
Issued in connection with the reinvestment of distributions | | | | |
| | | | |
| | | | |
| | | | |
Issued from the sale of shares | | | | |
Issued in connection with the reinvestment of distributions | | | | |
| | | | |
| | | | |
Decrease from capital share transactions | | | | |
|
| Six Months Ended
June 30, 2024 | Year Ended
December 31, 2023 |
Investment Grade Fixed Income Fund | | | | |
| | | | |
Issued from the sale of shares | | | | |
Issued in connection with the reinvestment of distributions | | | | |
| | | | |
| | | | |
Increase (decrease) from capital share transactions | | | | |
BOARD APPROVAL OF THE EXISTING ADVISORY AGREEMENTS
The Board of Trustees of the Trust (the “Board”), including the Independent Trustees, considers matters bearing on each Fund’s advisory agreement (collectively, the “Agreements”) at most of its meetings throughout the year. Each year, usually in the spring, the Contract Review Committee of the Board meets to review the Agreements to determine whether to recommend that the full Board approve the continuation of the Agreements, typically for an additional one-year period. This meeting typically includes all the Independent Trustees, including the Trustees who do not serve on the Contract Review Committee. After the Contract Review Committee has made its recommendation, the full Board, including the Independent Trustees, determines whether to approve the continuation of the Agreements at its June Board meeting.
In connection with these meetings, the Trustees receive materials that the Funds’ investment adviser (the “Adviser”) believes to be reasonably necessary for the Trustees to evaluate the Agreements. These materials generally include, among other items, (i) information on the investment performance of the Funds and the performance of peer groups of funds and the Funds’ performance benchmarks, (ii) information on the Funds’ advisory fees and other expenses, including information comparing the Funds’ advisory fees to the fees charged to institutional accounts with similar strategies managed by the Adviser, if any, and to those of peer groups of funds and information about any applicable expense limitations and/or fee “breakpoints,” (iii) sales and redemption data in respect of the Funds, (iv) information about the profitability of the Agreements to the Adviser, including how profitability is determined for the Funds, and (v) information obtained through the completion by the Adviser of questionnaires distributed on behalf of the Trustees throughout the year. The Board, including the Independent Trustees, also considers other matters such as (i) each Fund’s investment objective and strategies and the size, education and experience of the Adviser’s investment staff and its use of technology, external research and trading cost measurement tools, (ii) arrangements in respect of the distribution of the Funds’ shares and the related costs, (iii) the allocation of the Funds’ brokerage, if any, including, to the extent applicable, allocations to brokers affiliated with the Adviser and the use of “soft” commission dollars to pay for research and other similar services, (iv) the Adviser’s policies and procedures relating to, among other things, compliance, trading and best execution, proxy voting, liquidity and valuation, (v) information about amounts invested by the Funds’ portfolio managers in the Funds or in similar accounts that they manage and (vi) the general economic outlook with particular emphasis on the mutual fund industry. Throughout the process, the Trustees are afforded the opportunity to ask questions of and request additional materials from the Adviser and the Independent Trustees meet separately with independent legal counsel outside the presence of Adviser personnel.
In addition to the materials requested by the Trustees in connection with their annual consideration of the continuation of the Agreements, the Trustees receive materials in advance of each regular quarterly meeting of the Board that provide detailed information about the Funds’ investment performance and the fees charged to the Funds for advisory and other services. The information received by the Trustees generally includes, where available, among other things, an internal performance rating for each Fund based on agreed-upon criteria, graphs showing each Fund’s performance and expense differentials against each Fund’s peer group/category of funds, total return information for various periods, performance rankings provided by a third-party data provider for various periods comparing a Fund against similarly categorized funds, and performance ratings provided by a different third-party rating organization. The portfolio management team for each Fund or other representatives of the Adviser make periodic presentations to the Contract Review Committee and/or the full Board, and Funds identified as presenting possible performance concerns may be subject to more frequent Board or Committee presentations and reviews. In addition, the Trustees are periodically provided with detailed statistical information about each Fund’s portfolio. The Trustees also receive periodic updates between meetings, both at the Board and at the Committee level.
The Board most recently approved the continuation of the Agreements for a one-year period at its meeting held in June 2024. In considering whether to approve the continuation of the Agreements, the Board, including the Independent Trustees, did not identify any single factor as determinative. Individual Trustees may have evaluated the information presented differently from one another, giving different weights to various factors. Matters considered by the Trustees, including the Independent Trustees, in connection with their approval of the Agreements included, but were not limited to, the factors listed below.
The nature, extent and quality of the services provided to the Funds under the Agreements. The Trustees considered the nature, extent and quality of the services provided by the Adviser and its affiliates to the Funds and the resources dedicated to the Funds by the Adviser and its affiliates. The Trustees also considered their experience with other funds advised or sub-advised by the Adviser, as well as the affiliation between the Adviser and Natixis Investment Managers, LLC, whose affiliates provide investment advisory services to other funds in the Natixis family of funds.
The Trustees considered not only the advisory services provided by the Adviser to the Funds, but also the benefits to the Funds from the monitoring and oversight services provided by Natixis Advisors, LLC (“Natixis Advisors”). They also considered the administrative and shareholder services provided by Natixis Advisors and its affiliates to the Funds. They also took into consideration increases in the services provided resulting from new regulatory requirements, such as recent rules relating to the fair valuation of investments and the use of derivatives, implementation of tailored shareholder reports and amendments to the Names Rule, as well as from monitoring proposed rules, such as those relating to cybersecurity, environmental, social, and governance-specific regulatory changes, and vendor oversight.
For each Fund, the Trustees also considered the benefits to shareholders of investing in a mutual fund that is part of a family of funds that offers shareholders the right to exchange shares of one type of fund for shares of another type of fund, and provides a variety of fund and shareholder services.
After reviewing these and related factors, the Trustees concluded, within the context of their overall conclusions regarding each of the Agreements, that the nature, extent and quality of services provided supported the renewal of the Agreements.
Investment performance of the Funds and the Adviser. As noted above, the Trustees received information about the performance of the Funds over various time periods, including information that compared the performance of the Funds to the performance of peer groups and categories of funds and the Funds’ respective performance benchmarks. The Board noted that while it found the data provided by the independent third-party data provider useful, it recognized its limitations, including, in particular, that notable differences may exist between the Funds and the performance comparisons (for example, with respect to investment strategies) and that the results of the performance comparisons may vary depending on (i) the end dates for the performance periods that were selected and (ii) the selection of the performance comparisons. The Trustees also received information about how comparative peer groups are constructed. In addition, the Trustees reviewed data prepared by an independent third-party rating organization that analyzed the performance of the Funds using a variety of performance metrics, including metrics that measured the performance of the Funds on a risk adjusted basis.
The Board noted that through December 31, 2023, each Fund’s one-, three- and five-year performance, stated as percentile rankings within categories selected by the independent third-party data provider, was as follows (where the best performance would be in the first percentile of its category):
| | | |
| | | |
Loomis Sayles Investment Grade Fixed Income Fund | | | |
In the case of the Fund that had performance that lagged that of a relevant category median as determined by the independent third-party data provider for the relevant periods, the Board concluded that other factors relevant to performance supported renewal of the Fund’s Agreement. These factors included one or more of the following: (1) that the underperformance was attributable, to a significant extent, to investment decisions (such as security selection or sector allocation) by the Adviser that were reasonable and consistent with the Fund’s investment objective and policies; (2) that the Fund’s performance for a recent (though not necessarily the most recent) calendar year was stronger relative to its category; and (3) that the Fund had outperformed its relevant benchmark for the one-year period ended December 31, 2023. The Board also considered information about each Fund’s more recent performance, including how performance over various periods had been impacted by various factors such as market and economic events.
The Trustees also considered the Adviser’s performance and reputation generally, the performance of the fund family generally, and the historical responsiveness of the Adviser to Trustee concerns about performance and the willingness of the Adviser to take steps intended to improve performance.
After reviewing these and related factors, the Trustees concluded, within the context of their overall conclusions regarding each of the Agreements, that the performance of the Funds and the Adviser and/or other relevant factors supported the renewal of the Agreements.
The costs of the services to be provided and profits to be realized by the Adviser and its affiliates from their respective relationships with the Funds. The Trustees considered the fees charged to the Funds for advisory and administrative services as well as the total expense levels of the Funds. This information included comparisons (provided both by management and by an independent third party) of the Funds’ advisory fees and total expense levels to those of their peer groups and information about the advisory fees charged by the Adviser to comparable accounts (such as institutional separate accounts), as well as information about differences in such fees and the reasons for any such differences. In considering the fees charged to comparable accounts, the Trustees considered, among other things, management’s representations about the differences between managing mutual funds as compared to other types of accounts, including the additional resources required to effectively manage mutual fund assets, the greater regulatory costs associated with the management of such assets, and the entrepreneurial, regulatory and other risks associated with sponsoring and managing mutual funds. In evaluating each Fund’s advisory fee, the Trustees also took into account the demands, complexity and quality of the investment management of such Fund, as well as the need for the Adviser to offer competitive compensation and the potential need to expend additional resources to the extent the Fund grows in size. The Trustees considered that over the past several years, management had demonstrated its intention to have competitive fee levels by making recommendations regarding reductions in advisory fee rates, implementation of advisory fee breakpoints and the institution of advisory fee waivers and expense limitations for various funds in the fund family. They noted that both of the Funds have expense limitations in place, and they considered the amounts waived or reimbursed by the Adviser for the Funds under their expense limitation agreements. They further noted that management had proposed to reduce the expense limitation for Loomis Sayles Bond Fund on all share classes, effective as of July 1, 2024. The Board also considered that the fee and expense information reflected information as of a certain date and that historical asset levels may differ from current asset levels, particularly in a period of market volatility.
The Trustees noted that the Funds had total advisory fee rates that were above the median of a peer group of funds. In this regard, the Trustees considered the factors that management believed justified such a relatively higher advisory fee rate, including: (1) that the advisory fee was only one basis point higher than the median of the peer group of funds for Loomis Sayles Bond Fund; (2) that the advisory fee was only three basis points higher than the median of the peer group of funds for Loomis Sayles Investment Grade Fixed Income Fund; (3) that management
had proposed to reduce the expense limitation of Loomis Sayles Bond Fund , which is expected to reduce the Fund’s effective advisory fee rate; and (4) that Loomis Sayles Investment Grade Fixed Income Fund had experienced top quartile performance over multiple time periods ended December 31, 2023.
The Trustees also considered the compensation directly or indirectly received by the Adviser and its affiliates from their relationships with the Funds. The Trustees reviewed information provided by management as to the profitability of the Adviser’s and its affiliates’ relationships with the Funds, and information about how expenses are determined and allocated for purposes of profitability calculations. They also reviewed information provided by management about the effect of distribution costs and changes in asset levels on Adviser profitability, including information regarding resources spent on distribution activities. When reviewing profitability, the Trustees also considered information about court cases in which adviser compensation or profitability were issues, the performance of the Funds, the expense levels of the Funds, whether the Adviser had implemented breakpoints and/or expense limitations with respect to such Funds and the overall profit margin of Natixis Investment Managers, LLC compared to that of certain other investment managers for which such data was available. The Board also noted the competitive nature of the global asset management industry.
After reviewing these and related factors, the Trustees concluded, within the context of their overall conclusions regarding each of the Agreements, that the advisory fee charged to each of the Funds was fair and reasonable, and that the costs of these services generally and the related profitability of the Adviser and its affiliates in respect of their relationships with the Funds supported the renewal of the Agreements.
Economies of Scale. The Trustees considered the existence of any economies of scale in the provision of services by the Adviser and whether those economies are shared with the Funds through breakpoints in their investment advisory fees or other means, such as expense limitations. The Trustees also considered management’s explanation of the factors that are taken into account with respect to the implementation of breakpoints in investment advisory fees or expense limitations, which reduced the total expenses borne by shareholders of certain Funds. With respect to economies of scale, the Trustees noted that the Loomis Sayles Bond Fund had breakpoints in its advisory fee and that each of the Funds was subject to an expense limitation. The Trustees also considered management’s proposal to reduce the expense limitation for Loomis Sayles Bond Fund. In considering these issues, the Trustees also took note of the costs of the services provided (both on an absolute and on a relative basis) and the profitability to the Adviser and its affiliates of their relationships with the Funds, as discussed above. The Trustees also considered that the Funds have benefitted from the substantial reinvestment the Adviser has made into its business.
After reviewing these and related factors, the Trustees concluded, within the context of their overall conclusions regarding each of the Agreements, that the extent to which economies of scale were shared with the Funds supported the renewal of the Agreements.
The Trustees also considered other factors, which included but were not limited to the following:
• The effect of various factors and recent market and economic events, such as recent market volatility, geopolitical instability, aggressive domestic and foreign central bank policies, and adverse developments affecting the financial services industry generally, as applicable, on the performance, asset levels and expense ratios of each Fund.
• Whether each Fund has operated in accordance with its investment objective and the Fund’s record of compliance with its investment restrictions, and the compliance programs of the Funds and the Adviser. They also considered the compliance-related resources the Adviser and its affiliates were providing to the Funds.
• So-called “fallout benefits” to the Adviser, such as the engagement of affiliates of the Adviser to provide distribution and administrative services to the Funds, and the benefits of research made available to the Adviser by reason of brokerage commissions (if any) generated by the Funds’ securities transactions. The Trustees considered the possible conflicts of interest associated with these fallout and other benefits, and the reporting, disclosure and other processes in place to disclose and monitor such possible conflicts of interest.
• The Trustees’ review and discussion of the Funds’ advisory arrangements in prior years, and management’s record of responding to Trustee concerns raised during the year and in prior years.
Based on their evaluation of all factors that they deemed to be material, including those factors described above, and assisted by the advice of independent counsel, the Trustees, including the Independent Trustees, concluded that each of the existing Agreements should be continued through June 30, 2025.
This Page Intentionally Left Blank
Loomis Sayles Funds, a Boston-based family of mutual funds advised by Loomis, Sayles & Company, L.P., offers a range of fixed income and equity investments to fit the goals of the most demanding investor. Investment minimums and a pricing structure that includes multiple share classes make the funds suitable investments for individual investors, retirement plan participants, high net worth individuals and small institutions, including endowments and foundations.
PHONE 800-633-3330 FOR THE FOLLOWING FUND INFORMATION:
• Net asset values, yields, distribution information, fund information and fund literature
• Speak to a customer service representative regarding new or existing accounts
Before investing, consider the fund’s investment objectives, risks, charges, and expenses. Please visit www.loomissayles.com or call 800-633-3330 for a prospectus and a summary prospectus, if available, containing this and other information.
If you wish to communicate with the funds’ Board of Trustees, you may do so by writing to:
Natixis Advisors, LLC
888 Boylston Street, Suite 800
Boston, MA 02199-8197
The correspondence must be in writing, signed by the shareholder, including the shareholder’s name and address, and should identify the fund(s), account number, class of shares, and number of shares held in the fund(s) as of a recent date.
or by email at:secretaryofthefunds@natixis.comCommunications regarding recommendations for Trustee candidates may not be submitted by e-mail.Please note: Unlike written correspondence, e-mail is not secure. Please do NOT include your account number, social security number, PIN, or any other non-public, personal information in an e-mail communication because this information may be viewed by others.
 Exp. 8/30/20255884310.2.1M-LSBFSA-0624
Item 8. Changes in and Disagreements with Accountants for Open-End Management Investment Companies
Not applicable.
Item 9. Proxy Disclosures for Open-End Management Investment Companies.
Not applicable.
Item 10. Remuneration Paid to Directors, Officers, and Others of Open-End Management Investment Companies.
The remuneration paid to Directors and Officers are incorporated by reference as part of the Financial Statements and Other Important Information for Open-End Management Investment Companies filed as Item 7 herewith.
Item 11. Statement Regarding Basis for Approval of Investment Advisory Contract.
The statements regarding basis for approval of investment advisory contracts are incorporated by reference as part of the Financial Statements and Other Important Information for Open-End Management Investment Companies filed as Item 7 herewith.
Item 12. Disclosure of Proxy Voting Policies and Procedures for Closed-End Management Investment Companies.
Not applicable.
Item 13. Portfolio Managers of Closed-End Management Investment Companies.
Not applicable.
Item 14. Purchases of Equity Securities by Closed-End Management Investment Companies and Affiliated Purchasers.
Not applicable.
Item 15. Submission of Matters to a Vote of Securities Holders.
There were no material changes to the procedures by which shareholders may recommend nominees to the Registrant’s Board of Trustees.
Item 16. Controls and Procedures.
The Registrant’s principal executive officer and principal financial officer have concluded that the Registrant’s disclosure controls and procedures are sufficient to ensure that information required to be disclosed by the Registrant in this Form N-CSR was recorded, processed, summarized and reported within the time periods specified in the Securities and Exchange Commission’s rules and forms, based upon such officers’ evaluation of these controls and procedures as of a date within 90 days of the filing date of the report.
There were no changes in the Registrant’s internal control over financial reporting that occurred during the period covered by the report that have materially affected, or are reasonably likely to materially affect, the Registrant’s internal control over financial reporting.
Item 17. Disclosure of Securities Lending Activities for Closed-End Management Investment Companies.
Not applicable.
Item 18. Recovery of Erroneously Awarded Compensation.
Not applicable.
Item 19. Exhibits.
| | (a) (1) | Any code of ethics, or amendment thereto, that is the subject of the disclosure required by Item 2, to the extent that the registrant intends to satisfy the Item 2 requirements through filing of an exhibit. Not Applicable. |
| | (a) (2) | Any policy required by the listing standards adopted pursuant to Rule 10D-1 under the Exchange Act by the registered national securities exchange or registered national securities association upon which the registrants securities are listed. Not Applicable. |
| | (a) (3)(1) | Any written solicitation to purchase securities under Rule 23c-1 under the Act (17 CFR 270.23c-1) sent or given during the period covered by the report by or on behalf of the registrant to 10 or more persons. Not Applicable |
| | (a) (3)(2) | Changes in the registrant’s independent public accountant. Not Applicable |
| | (101) | Inline Interactive Data File-the instance document does not appear in the Interactive Data File because its XBRL tags are embedded within the inline XBRL document. |
SIGNATURES
Pursuant to the requirements of the Securities Exchange Act of 1934 and the Investment Company Act of 1940, the Registrant has duly caused this report to be signed on its behalf by the undersigned, thereunto duly authorized.
| | |
Loomis Sayles Funds I |
|
By: /s/ Kevin Charleston |
| |
Name: | | Kevin Charleston |
Title: | | President and Chief Executive Officer |
Date: | | August 21, 2024 |
Pursuant to the requirements of the Securities Exchange Act of 1934 and the Investment Company Act of 1940, this report has been signed by the following persons on behalf of the Registrant and in the capacities and on the dates indicated.
| | |
By: /s/ Kevin Charleston |
| |
Name: | | Kevin Charleston |
Title: | | President and Chief Executive Officer |
Date: | | August 21, 2024 |
|
By: /s/ Matthew J. Block |
| |
Name: | | Matthew J. Block |
Title: | | Treasurer and Principal Financial and Accounting Officer |
Date: | | August 21, 2024 |