As filed with the Securities and Exchange Commission on December 19, 2001
Registration No. 333-73464
SECURITIES AND EXCHANGE COMMISSION
Washington, D.C. 20549
_________________
FORM S-6
FOR REGISTRATION UNDER THE SECURITIES ACT OF 1933
OF SECURITIES OF UNIT INVESTMENT TRUSTS
REGISTERED ON FORM N-8B-2
Pre-effective Amendment No. 1
_________________
SECURITY LIFE SEPARATE ACCOUNT L1
(Exact Name of Trust)
SECURITY LIFE OF DENVER INSURANCE COMPANY
(Name of Depositor)
1290 Broadway
Denver, Colorado 80203-5699
(Address of Depositor's Principal Executive Offices)
| J. NEIL MCMURDIE, ESQ. |
| Security Life of Denver Insurance Company |
| 1290 Broadway |
| Denver, Colorado 80203-5699 |
| (303) 860-2127 |
| |
| (Name and Address of Agent for Service) |
____________________________
Approximate date of proposed public offering: as soon as practicable after the effective date of this Registration Statement.
The Registrant hereby amends this Registration Statement on such date or dates as may be necessary to delay its effective date until the Registrant shall file a further amendment which specifically states that this Registration Statement shall thereafter become effective in accordance with Section 8(a) of the Securities Act of 1933 or until the Registration Statement shall become effective on such date as the Commission, acting pursuant to said Section 8(a), may determine.
Title of securities being registered: Strategic Investor variable life insurance policies.
SECURITY LIFE SEPARATE ACCOUNT L1 (File No. 333-73464)
Cross-Reference Table
| Form N-8B-2 Item No. | Caption in Prospectus |
| |
| |
| 1, 2 | Cover; Security Life of Denver Insurance Company; Security Life Separate Account L1 |
| |
| 3 | Inapplicable |
| |
| 4 | Security Life of Denver Insurance Company |
| |
| 5, 6 | Security Life Separate Account L1 |
| |
| 7 | Inapplicable |
| |
| 8 | Financial Statements |
| |
| 9 | Inapplicable |
| |
| 10(a), (b), (c), (d), (e) | Policy Summary; Policy Values, Determining Values in the Variable Investment Option; Charges and Deductions; Surrender; Partial Withdrawals; Guaranteed Interest Division; Transfer of Account Value; Lapse; Reinstatement; Premium Payments |
| |
| 10(f) | Voting Privileges; Right to Change Operations |
| |
| 10(g), (h) | Right to Change Operations |
| |
| 10(i) | Tax Considerations; Detailed Information about the Policy; General Policy Provisions; Guaranteed Interest Division |
| |
| 11, 12 | Security Life Separate Account L1 |
| |
| 13 | Policy Summary; Charges and Deductions; Group, Sponsored or Wrap Fee Arrangements, or Corporate Purchasers |
| |
| 14, 15 | Policy Summary; Free Look Period; General Policy Provisions; Applying for a Policy |
| |
| 16 | Premium Payments; Allocation of Net Premium; How We Calculate Accumulation Unit Values |
| |
| 17 | Premium Payments Affect Your Coverage; Surrender; Partial Withdrawals |
| |
| 18 | Policy Summary; Tax Considerations; Detailed Information about the Policy; Security Life Separate Account L1 |
| |
| 19 | Reports to Owners; Notification and Claims Procedures; Performance Information (Appendix C) |
| |
| 20 | See 10(g) & 10(a) |
| |
| 21 | Policy Loans |
| |
| 22 | Policy Summary; Premium Payments; Grace Period; Security Life Separate Account L1; Detailed Information about the Policy |
| |
| 23 | Inapplicable |
| |
| 24 | Inapplicable |
| |
| 25 | Security Life of Denver Insurance Company |
| |
| 26 | Inapplicable |
| |
| 27, 28, 29, 30 | Security Life of Denver Insurance Company |
| |
| 31, 32, 33, 34 | Inapplicable |
| |
| 35 | Inapplicable |
| |
| 36 | Inapplicable |
| |
| 37 | Inapplicable |
| |
| 38, 39, 40, 41(a) | General Policy Provisions; Distribution of the Policies; Security Life of Denver Insurance Company |
| |
| 41(b), 41(c), 42, 43 | Inapplicable |
| |
| 44 | Determining Values in the Variable Investment Option; How We Calculate Accumulation Unit Values |
| |
| 45 | Inapplicable |
| |
| 46 | Partial Withdrawals; Detailed Information about the Policy |
| |
| 47, 48, 49, 50 | Inapplicable |
| |
| 51 | Detailed Information about the Policy |
| |
| 52 | Determining Values in the Variable Investment Option; Right to Change Operations |
| |
| 53(a) | Tax Considerations |
| |
| 53(b), 54, 55 | Inapplicable |
| |
| 56, 57, 58 | Inapplicable |
| |
| 59 | Financial Statements |
STRATEGIC INVESTOR VARIABLE UNIVERSAL LIFE
A FLEXIBLE PREMIUM VARIABLE UNIVERSAL LIFE INSURANCE POLICY
issued by
Security Life of Denver Insurance Company
and
Security Life Separate Account L1
| Consider carefully the policy charges and deductions beginning on page 45 in this prospectus. You should read this prospectus and keep it for future reference. A prospectus for each underlying investment portfolio must accompany and should be read together with this prospectus. This policy is not available in all jurisdictions. This policy is not offered in any jurisdiction where this type of offering is not legal. Depending on the state where it is issued, policy features may vary. You should rely only on the information contained in this prospectus. We have not authorized anyone to provide you with information that is different. We and our affiliates offer other products to insure people which may or may not better match your needs. Replacing your existing life insurance policy(ies) with this policy may not be beneficial to you. Your existing policy may be subject to fees or penalties upon surrender or cancellation. |
Your Policy
- is a flexible premium variable universal life insurance policy
- is issued by Security Life of Denver Insurance Company
- is designed primarily for use on a individual life basis but is also available on a multi-life basis when the insured people share a common employment or business relationship.
- is returnable by you during the free look period if you are not satisfied.
Your Premium Payments
- are flexible, so the premium amount and frequency may vary
- are allocated to variable investment options and the guaranteed interest division, based on your instructions
- are subject to specified deductions.
Your Account Value
- is the sum of your holdings in the variable investment options, the guaranteed interest division and the loan division
- has no guaranteed minimum value under the variable investment options. The value varies with the value of the underlying investment portfolio
- has a minimum guaranteed rate of return for amounts in the guaranteed interest division
- is subject to specified expenses and charges.
Death Proceeds
- are paid if the policy is in force when the insured person dies
- are equal to the death benefit minus an outstanding policy loan, accrued loan interest and unpaid charges incurred before the insured person dies
- are calculated under your choice of options:
* Option 1 - a stated death benefit;
* Option 2 - a stated death benefit plus your account value;
* Option 3 - a stated death benefit plus the sum of premium payments we receive minus partial withdrawals you have taken - are generally not subject to federal income tax if your policy continues to meet the federal income tax definition of life insurance.
Neither the Securities and Exchange Commission ("SEC") nor any state securities commission has approved these securities or determined that this Prospectus is accurate or complete. Any representation to the contrary is a criminal offense.
This life insurance policy IS NOT a bank deposit or obligation, federally insured or backed by any bank or government agency.
<R>Date of Prospectus December 26, 2001</R>
| ISSUED BY: | Security Life of Denver
Insurance Company
ING Security Life Center
1290 Broadway
Denver, CO 80203-5699
(800) 525-9852 | | UNDERWRITTEN BY: | ING America Equities, Inc.
1290 Broadway
Denver, CO 80203-5699
(303) 860-2000 |
THROUGH ITS: Security Life Separate Account L1
| ADMINISTERED BY: | Customer Service Center
P.O. Box 173888
Denver, CO 80217-3888
(800) 848-6362 |
"ING Security Life," "we," "us," "our" and the "company" refer to Security Life of Denver Insurance Company. "You" and "your" refer to the policy owner. The owner is the individual, entity, partnership, representative or party who may exercise all rights over the policy and receive the policy benefits during the insured person's lifetime.
State variations are covered in a special policy form used in that state. This prospectus provides a general description of the policy. Your actual policy and any riders and endorsements are the controlling documents. If you would like to review a copy of the policy and any riders and endorsements, contact our customer service center or your agent/registered representative.
Strategic Investor 2
TABLE OF CONTENTS
| <R>POLICY SUMMARY | 4 |
| | Your Policy | 4 |
| Free Look Period | 4 |
| Premium Payments | 4 |
| Charges and Deductions | 4 |
| Guaranteed Interest Division | 6 |
| Variable Investment Options | 6 |
| Policy Values | 9 |
| Transfer of Account Value | 9 |
| Special Policy Features | 9 |
| Policy Modification, Termination and Continuation Features | 10 |
| Death Benefits | 10 |
| Tax Considerations | 10 |
| |
| INFORMATION ABOUT ING SECURITY LIFE, THE SEPARATE ACCOUNT AND THE INVESTMENT OPTIONS | 13 |
| Security Life of Denver Insurance Company | 13 |
| Security Life Separate Account L1 | 13 |
| Guaranteed Interest Division | 19 |
| |
| DETAILED INFORMATION ABOUT THE POLICY | 20 |
| Applying for a Policy | 20 |
| Temporary Insurance | 20 |
| Policy Issuance | 21 |
| Premium Payments | 21 |
| Premium Payments Affect Your Coverage | 23 |
| Death Benefits | 23 |
| Riders | 28 |
| Special Features | 30 |
| Refund of Sales Charges | 32 |
| Policy Values | 32 |
| Transfer of Account Value | 33 |
| Dollar Cost Averaging | 34 |
| Automatic Rebalancing | 35 |
| Policy Loans | 35 |
| Lapse | 38 |
| Reinstatement | 38 |
| Surrender | 39 |
| General Policy Provisions | 39 |
| | Free Look Period | 39 |
| | Your Policy | 39 |
| | Guaranteed Issue | 39 |
| | Age | 40 |
| | Ownership | 40 |
| | Beneficiaries | 40 |
| | Collateral Assignment | 40 |
| | Incontestability | 40 |
| | Misstatements of Age or Gender | 40 |
| | Suicide | 41 |
| | Transaction Processing | 41 |
| | Notification and Claims Procedures | 41 |
| | Telephone Privileges | 42 |
| | Non-participation | 42 |
| | Distribution of the Policies | 42 |
| | Advertising Practices and Sales Literature | 43 |
| | Settlement Provisions | 43 |
| Administrative Information About the Policy | 43 |
| |
| CHARGES AND DEDUCTIONS | 45 |
| Deductions from Premium | 45 |
| Monthly Deductions from Account Value | 46 |
| Policy Transaction Fees | 48 |
| Group, Sponsored or Wrap Fee Arrangements, or Corporate Purchasers | 48 |
| |
| TAX CONSIDERATIONS | 49 |
| Tax Status of the Policy | 49 |
| Diversification and Investor Control Requirements | 49 |
| Tax Treatment of Policy Death Benefits | 50 |
| Modified Endowment Contracts | 50 |
| Multiple Policies | 50 |
| Distributions Other than Death Benefits | 50 |
| Investment in the Policy | 51 |
| Policy Loans | 51 |
| Accelerated Death Benefit Rider | 52 |
| Continuation of Policy Beyond Age 100 | 52 |
| Section 1035 Exchanges | 52 |
| Tax-exempt Policy Owners | 52 |
| Possible Tax Law Changes | 52 |
| Changes to Comply with the Law | 52 |
| Other | 52 |
| |
| ADDITIONAL INFORMATION | 54 |
| Directors and Officers | 54 |
| Regulation | 55 |
| Legal Matters | 55 |
| Legal Proceedings | 55 |
| Experts | 55 |
| Registration Statement | 55 |
| |
| FINANCIAL STATEMENTS | 56 |
| |
| APPENDIX A | 232 |
| |
| APPENDIX A - Enhanced | 233 |
| |
| APPENDIX B | 234 |
| |
| APPENDIX B - Enhanced | 235 |
| |
| APPENDIX C | 236</R> |
Strategic Investor 3
POLICY SUMMARY
This summary highlights some important points about your policy. The policy is more fully described in the other sections of this prospectus which should be read carefully before you purchase the policy.
Your Policy
Your policy provides life insurance protection on the insured person. The policy includes the basic policy, applications and riders or endorsements. As long as the policy remains in force, we pay a death benefit at the death of the insured person. While your policy is in force, you may access a portion of your policy value by taking loans or partial withdrawals. You may surrender your policy for its net cash surrender value. At the policy anniversary nearest the insured person's 100th birthday, if the insured person is still alive, you may surrender your policy or it will continue under the continuation of coverage provisions. See Continuation of Coverage, page 30.
We designed the Strategic Investor policy primarily for use on an individual-life basis but it is also available on a multi-life basis when the insured people share a common employment or business relationship. The policy may be owned individually or by a corporation, trust, association or similar entity. The policy may be used for such purposes as informally funding non-qualified executive deferred compensation, salary continuation plans, retiree medical benefits or other purposes.
Life insurance is not a short-term investment. You should evaluate your need for life insurance coverage and this policy's long-term investment potential and risks before purchasing a policy.
We pay compensation to firms for sales of this policy. See Distribution of the Policies, page 42.
Free Look Period
Within the time limits specified by law, you have the right to examine your policy and return it for a refund if you are not satisfied for any reason. Generally, the refund will equal all premium payments we have received or the account value, depending on state law. The policy is then void. See Free Look Period, page 39.
Premium Payments
The policy is a flexible premium policy because the amount and frequency of the premium payments you make may vary within limits. You must make premium payments:
- for us to issue your policy;
- sufficient to keep your policy in force; and
- as necessary to continue certain benefits.
Depending on the amount of premium you choose to pay, it may not be enough to keep your policy or certain riders in force. See Premium Payments Affect Your Coverage, page 23.
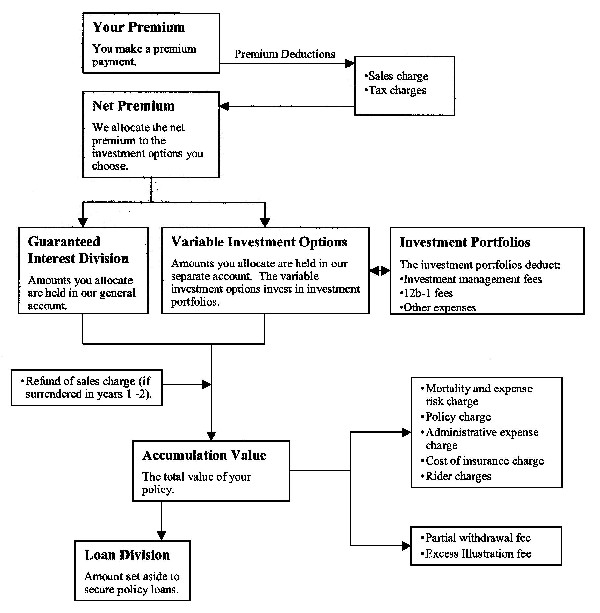
Allocation of Net Premium
This policy has premium-based charges which are subtracted from your payments. We add the balance, or net premium, to your policy based on your investment instructions. You may allocate the net premium among one or more variable investment options and the guaranteed interest division. See Allocation of Net Premium, page 22.
Charges and Deductions
All charges presented here are guaranteed unless stated otherwise.
Strategic Investor 4
Charges
Other Than Investment Portfolio Annual Expenses
(See Charges and Deductions, page 45)
Premium Deductions -- Maximum amount deducted when each premium is received.
| Charge | Amount Deducted |
| Tax Charges | - 2.5% for state and local taxes;
- 1.5% for estimated federal income tax treatment of deferred acquisition costs.
|
| Sales Charge | - 11% of premium up to policy or segment target premium in policy or segment years 1-10.
- There is no sales charge on premium above the policy or segment target premium, or on any premium after policy or segment year 10.
|
| Monthly Policy Charges -- Maximum amount deducted each month from account value. |
| Charge | Amount Deducted |
| Mortality and Expense Risk Charge | Account Value | 1st Policy Year | Policy Years
2 - 10 | Policy Years 11+ |
| Less than $25,000 | .0625%
(0.75% annually) | .0625%
(0.75% annually) | .0250%
(0.30% annually) |
| $25,000 to $250,000 | .0625%
(0.75% annually) | .0583%
(0.6996% annually) | .0167%
(0.2004% annually) |
| Greater than $250,000 | .0625%
(0.75% annually) | .0542%
(0.6504% annually) | .0083%
(0.0996% annually) |
| Policy Charge | - $13 per month in policy years 1 - 3.
- $3 per month in policy years 4+.
|
| Administrative Charge | Per $1,000 of stated death benefit (or target death benefit, if greater) up to $5 million: |
| Issue Ages | Policy Years 1 - 5 | Policy Years 6 + |
| 0 - 14 | $0.038 | $0.010 |
| 15 - 50 | $0.043 | $0.010 |
| 51 - 62 | $0.049 | $0.010 |
| 63 - 73 | $0.054 | $0.010 |
| 74 - 77 | $0.060 | $0.010 |
| 78 - 85 | $0.065 | $0.010 |
| 86 - 89 | $0.070 | $0.010 |
| 90 | $0.076 | $0.010 |
| Cost of Insurance Charge | Varies based on current cost of insurance rates for each segment and the net amount at risk. Current cost of insurance rates depend on age, gender, policy duration, amount of target death benefit and premium class. Different cost of insurance rates will apply to each segment. |
| Rider Charges | Varies depending on the rider benefits you choose. |
| Transaction Fees -- Maximum amount deducted on the transaction date. |
| Charge | Amount Deducted |
| Partial Withdrawal Fee | Two percent of the amount withdrawn, up to $25. |
| Excess Illustration Fee | $25 per illustration after the first each policy year. |
Strategic Investor 5
Guaranteed Interest Division
The guaranteed interest division guarantees principal and is part of our general account. Amounts you direct into the guaranteed interest division are credited with interest at a fixed rate. See Guaranteed Interest Division, page 19.
Variable Investment Options
The variable investment options under your policy are divisions of Security Life Separate Account L1 (the separate account), a separate account of the company. Each variable investment option invests in a corresponding mutual fund (investment portfolio). If you invest in the variable investment options, you may make or lose money depending on market conditions. You do not invest directly in or hold shares of the investment portfolios.
The variable investment options purchase shares of the investment portfolios at net asset value. This price reflects investment management fees, 12b-1 fees and other direct expenses deducted from the investment portfolio's assets as described in the following table. The fees and expenses are shown in gross amounts and net amounts after waiver or reimbursement of fees or expenses by the investment portfolio adviser.
These fees and expenses are not direct charges against a variable investment option's assets or reductions from policy values; rather, these expenses are included in computing each underlying investment portfolio's net asset value, which is the share price used to calculate the unit values of the variable investment options. For a more complete description of the investment portfolios' fees and expenses, see the prospectuses for each of the investment portfolios.
We receive 12b-1 fees from some investment portfolios. Some investment portfolio advisers and distributors (or their affiliates) may pay us compensation for servicing, distribution, administration or other expenses. The amount of compensation is usually based on the aggregate assets of the investment portfolio from policies that we issue or administer. Some advisers and distributors may pay us more or less than others. We receive compensation from AIM Advisors, Inc., Fred Alger Management Inc., Fidelity Management & Research Company, Directed Services Inc., INVESCO Funds Group Inc., Janus Capital, Neuberger Berman Management, ING Pilgrim Investments, LLC, Putnam Investment Management, LLC and Van Eck Associates Corporation.
Risks Associated with Investing in the Investment Portfolios
Each investment portfolio has its own and risks. Information about the risks associated with investing in the investment portfolios is located in their separate prospectuses. Read the investment portfolio prospectuses in conjunction with this prospectus, and retain the prospectuses for future reference. See also Investment Portfolio Objectives, page 14.
An investment portfolio available through the policy may not be the same as a retail mutual fund with a similar name. Accordingly, the management, expenses and performance of an investment portfolio is likely to differ from a similarly named retail mutual fund.
The information in the following table was provided to us by the investment portfolios and we have not independently verified this information.
Strategic Investor 6
Investment Portfolio Annual Expenses (As a Percentage of Portfolio Average Net Assets)
| <R>Investment Portfolio | Investment
Management Fees | 12b-1 Fees | Other Expenses | Total Portfolio
Expenses |
| AIM Variable Insurance Funds | | | | |
| AIM V.I. Capital Appreciation Fund | 0.61% | N/A | 0.21% | 0.82% |
| AIM V.I. Government Securities Fund 1 | 0.50% | N/A | 0.47% | 0.97% |
| The Alger American Fund | | | | |
| Alger American Growth Portfolio | 0.75% | 0.0% | 0.04% | 0.79% |
| Alger American Leveraged AllCap Portfolio | 0.85% | 0.0% | 0.05% | 0.90% |
| Alger American MidCap Growth Portfolio | 0.80% | 0.0% | 0.04% | 0.84% |
| Alger American Small Capitalization Portfolio | 0.85% | 0.0% | 0.05% | 0.90% |
| Fidelity Variable Insurance Products Fund | | | | |
| VIP Growth Portfolio - Service Class 2 | 0.57% | 0.10% | 0.09% | 0.76% |
| VIP Overseas Portfolio - Service Class 2 | 0.72% | 0.10% | 0.17% | 0.99% |
| Fidelity Variable Insurance Products Fund II | | | | |
| VIP II Asset Manager Portfolio - Service Class | 0.53% | 0.10% | 0.09% | 0.72% |
| VIP II Index 500 Portfolio - Initial Class 3 | 0.24% | N/A | 0.09% | 0.33% |
| The GCG Trust 4 | | | | |
| Fully Managed Portfolio | 0.94% | N/A | 0.01% | 0.95% |
| Liquid Asset Portfolio | 0.54% | N/A | 0.01% | 0.55% |
| Mid-Cap Growth Portfolio | 0.88% | N/A | 0.01% | 0.89% |
| INVESCO Variable Investment Funds, Inc. | | | | |
| INVESCO VIF-Equity Income Fund 5 | 0.75% | N/A | 0.33% | 1.08% |
| INVESCO VIF-High Yield Fund 5 | 0.60% | N/A | 0.45% | 1.05% |
| INVESCO VIF-Small Company Growth Fund 5, 6 | 0.75% | N/A | 0.68% | 1.43% |
| INVESCO VIF-Total Return Fund 5, 7 | 0.75% | N/A | 0.69% | 1.44% |
| INVESCO VIF-Utilities Fund 5, 8 | 0.60% | N/A | 0.81% | 1.41% |
| Janus Aspen Series | | | | |
| Janus Aspen Aggressive Growth - Service Shares 9 | 0.65% | 0.25% | 0.02% | 0.92% |
| Janus Aspen Growth - Service Shares 9 | 0.65% | 0.25% | 0.02% | 0.92% |
| Janus Aspen International Growth - Service Shares 9 | 0.65% | 0.25% | 0.06% | 0.96% |
| Janus Aspen Worldwide Growth - Service Shares 9 | 0.65% | 0.25% | 0.05% | 0.95% |
| Neuberger Berman Advisers Management Trust | | | |
| Growth Portfolio 10 | 0.82% | N/A | 0.08% | 0.90% |
| Limited Maturity Bond Portfolio 10 | 0.65% | N/A | 0.11% | 0.76% |
| Partners Portfolio 10 | 0.82% | N/A | 0.10% | 0.92% |
| Pilgrim Variable Products Trust 11 | | | | |
| Growth Opportunities Portfolio - Class R Shares 12 | 0.75% | N/A | 1.44% | 2.19% |
| MagnaCap Portfolio - Class R Shares 12 | 0.75% | N/A | 7.15% | 7.90% |
| MidCap Opportunities Portfolio - Class R Shares 12 | 0.75% | N/A | 5.01% | 5.76% |
| SmallCap Opportunities Portfolio - Class R Shares 12 | 0.75% | N/A | 0.23% | 0.98% |
| Putnam Variable Trust | | | | |
| Putnam VT Growth and Income Fund - Class IB Shares13 | 0.46% | 0.25% | 0.04% | 0.75% |
| Putnam VT New Opportunities Fund - Class IB Shares13 | 0.52% | 0.25% | 0.05% | 0.82% |
| Putnam VT Small Cap Value Fund - Class IB Shares13 | 0.80% | 0.25% | 0.30% | 1.35% |
| Putnam VT Voyager Fund - Class IB Shares13 | 0.51% | 0.25% | 0.05% | 0.81% |
| Van Eck Worldwide Insurance Trust 14 | | | | |
| Worldwide Bond Fund 15 | 1.00% | N/A | 0.21% | 1.21% |
| Worldwide Emerging Markets Fund 16 | 1.00% | N/A | 0.33% | 1.33% |
| Worldwide Hard Assets Fund 17 | 1.00% | N/A | 0.16% | 1.16% |
| Worldwide Real Estate Fund 18 | 1.00% | N/A | 1.27% | 2.27% |
| | | | |
Strategic Investor 7
____________________________
1 Included in AIM V.I. Government Securities Fund's "Other Expenses" is 0.12% of interest expense.
2 Actual annual class operating expenses were lower because a portion of the brokerage commissions that the fund paid was used to reduce the fund's expenses, and/or because through arrangements with the fund's custodian, credits realized as a result of uninvested cash balances were used to reduce a portion of the fund's custodian expenses. See the accompanying fund prospectus for details.
3 The fund's manager has voluntarily agreed to reimburse the class's expenses if they exceed a certain level. Including this reimbursement, the annual class operating expenses were 0.28%. This arrangement may be discontinued by the fund's manager at any time.
4 The GCG Trust pays Directed Services, Inc. ("DSI") a monthly management fee for their services based on the annual rates of the average daily net assets of the investment portfolios. DSI (and not the GCG Trust) in turn pays each portfolio manager a monthly fee for managing the assets of the portfolios.
5 The Portfolios' "Other Expenses" and "Total Portfolio Expenses" were lower than the figure shown because their custodian fees were reduced under expense offset arrangements.
6 INVESCO assumed a portion of VIF-Small Company Growth Fund's "Other Expenses" and "Total Portfolio Expenses." After this, these expenses are 0.62% and 1.37%, respectively.
7 INVESCO assumed a portion of VIF-Total Return Fund's "Other Expenses" and "Total Portfolio Expenses." After this, these expenses are 0.46% and 1.21%, respectively.
8 INVESCO assumed a portion of VIF-Utilities Fund's "Other Expenses" and "Total Portfolio Expenses." After this, these expenses are 0.62% and 1.22%, respectively.
9 Janus Aspen Service Shares has a distribution plan or "Rule 12b-1 plan" which is described in the funds' prospectuses. Expenses are based on expenses for the fiscal year that ended on December 31, 2000, restated to reflect a reduction in the management fee for those portfolios. All expenses are shown without the effect of any expense offset arrangements.
10 Neuberger Berman Management Inc. ("NBMI") has undertaken through April 30, 2002 to reimburse certain operating expenses, excluding taxes, interest, extraordinary expenses, brokerage commissions and transaction costs, that exceed, in the aggregate, 1% of the Portfolios' average daily net asset value.
11 The table shows the estimated operating expenses for each Portfolio as a ratio of expenses to average daily net assets. These estimates are based on each Portfolio's actual operating expenses for its most recently completed fiscal year and do not include fee waivers to which the Adviser has agreed for each Portfolio.
12 ING Pilgrim Investments has entered into written expense limitation agreements with each Portfolio which it advises under which it will limit expenses of the Portfolio, excluding interest, taxes, brokerage and extraordinary expenses, subject to possible reimbursement to ING Pilgrim Investments within three years. The expense limit for each such Fund is 0.90%. For each Portfolio, the expense limits will continue through at least December 31, 2001.
13 Restated to reflect an increase in 12b-1 fees currently payable to Putnam Investment Management, LLC ("Putnam Management"). The Trustees currently limit payments on class IB shares to 0.25% of average net assets. Actual 12b-1 fees during the most recent fiscal year were 0.15% of average net assets.
14 Operating Expenses for the Worldwide Hard Assets Fund, the Worldwide Emerging Markets Fund and the Worldwide Real Estate Fund were reduced by a brokerage agreement where the Funds direct certain portfolio trades to a broker that, in return, pays a portion of the Funds' operating expenses.
15 The Adviser may sometimes waive fees and/or reimburse certain expenses of the fund.
16 The Adviser may sometimes waive fees and/or reimburse certain expenses of the fund. After Advisory fee waiver and expense reimbursements with brokers, the total net fund expenses were 1.31%. These fee waivers are not contractual and may be discontinued at the discretion of the Adviser.
17 The Adviser may sometimes waive fees and/or reimburse certain expenses of the fund, but is not obligated to do so. After expense reimbursement agreement with brokers, the total net fund expenses were 1.14%.
18The Adviser may sometimes waive fees and/or reimburse certain expenses of the fund. After Advisory fee waiver and expense reimbursements with brokers, the total net fund expenses were 1.48%. These fee waivers are not contractual and may be discontinued at the discretion of the Adviser. </R>
Strategic Investor 8
Policy Values
Your policy account value is the amount you have in the guaranteed interest division, plus the amount you have in each variable investment option. If you have an outstanding policy loan, your account value includes the amount in the loan division. See Policy Values, page 32, and Partial Withdrawals, page 36.
Your Account Value in the Variable Investment Options
Accumulation units are the way we measure value in the variable investment options. Accumulation unit value is the value of one unit of a variable investment option on a valuation date. Each variable investment option has a different accumulation unit value. See Determining Values in the Variable Investment Options, page 32.
The accumulation unit value for each variable investment option reflects the investment performance of the underlying investment portfolio during the valuation period. Each accumulation unit value reflects the expenses of the investment portfolio. See Determining Values in the Variable Investment Options, page 32, and How We Calculate Accumulation Unit Values, page 33.
Transfer of Account Value
You may make an unlimited number of free transfers among the variable investment options or to the guaranteed interest division each policy year. There are restrictions on transfers from the guaranteed interest division. The minimum transfer amount is $100. See Transfer of Account Value, page 33.
Special Policy Features
Designated Deduction Option
You may designate one investment option from which we will deduct all of your monthly deductions. See Designated Deduction Option, page 30.
Riders
You may attach additional benefits to your policy by rider. In most cases, we deduct a monthly charge from your account value for these benefits. See Riders, page 28.
Dollar Cost Averaging
Dollar cost averaging is a systematic plan of transferring account values to selected variable investment options. It is intended to protect your policy's value from short-term price fluctuations. However, dollar cost averaging does not assure a profit, nor does it protect against a loss in a declining market. Dollar cost averaging is free. See Dollar Cost Averaging, page 34.
Automatic Rebalancing
Automatic rebalancing periodically reallocates your net account value among your selected investment options to maintain your specified distribution of account value among those investment options. Automatic rebalancing is free. See Automatic Rebalancing, page 35.
Loans
You may take loans against your policy's net account value. We charge an annual loan interest rate of 3.75% in policy years 1 - 10 and 3.15% thereafter. We credit an annual interest rate of 3.00% on amounts held in the loan division as collateral for your loan. See Policy Loans, page 35.
Policy loans reduce your policy's death benefit and may cause your policy to lapse.
Loans may have tax consequences. See Tax Considerations, page 49.
Partial Withdrawals
You may withdraw part of your net account value after your first policy anniversary. You may make twelve partial withdrawals per policy year. Partial
Strategic Investor 9
withdrawals may reduce your policy's death benefit and will reduce your account value. We assess a fee for each withdrawal. See Partial Withdrawals, page 36.
Some policies with a high account value may qualify for a partial withdrawal before the first policy anniversary. Partial withdrawals may have tax consequences. See Partial Withdrawals, page 36, and Tax Considerations, page 49.
Refund of Sales Charges
If you surrender your policy within the first two policy years and it has not lapsed, we may refund a portion of the sales charges we previously deducted from your premium payments. See Refund of Sales Charges, page 32.
Policy Modification, Termination and Continuation Features
Right to Change Policy
For 24 months after the policy date you may change your policy to a guaranteed policy, unless state law requires differently. There is no charge for this change. See Right to Change Policy, page 30.
Surrender
You may surrender your policy for its net cash surrender value at any time before the death of the insured person. All insurance coverage ends on the date we receive your request. See Surrender, page 39.
A surrender may have tax consequences. See Tax Considerations, page 49.
Lapse
In general, insurance coverage continues as long as your net account value is enough to pay the monthly deductions. See Lapse, page 38.
Reinstatement
You may reinstate your policy and riders within five years of its lapse if you still own the policy and the insured person is still insurable. You will also need to pay the required reinstatement premium.
If you had a policy loan existing when coverage ended, we will reinstate it with accrued loan interest to the date of the lapse. See Reinstatement, page 38.
Continuation of Coverage
If the policy is in force on the policy anniversary nearest the insured person's 100th birthday, the policy will continue pursuant to the terms of the policy unless you surrender it. See Continuation of Coverage, page 30.
Death Benefits
After the insured person's death, we pay death proceeds to the beneficiaries if your policy is in force. Based on the death benefit option you have chosen and whether or not you have coverage under an adjustable term insurance rider, your policy's death benefit may vary.
Generally we require a minimum total death benefit of $100,000 ($50,000 for guaranteed issue policies) to issue your policy.
We may lower this minimum for group, sponsored or wrap fee arrangements, or corporate purchasers. A separate cost of insurance applies to your base death benefit.
Tax Considerations
Under current federal income tax law, death benefits of life insurance policies generally are not subject to income tax. In order for this treatment to apply, the policy must qualify as a life insurance contract. We believe it is reasonable to conclude that the policy will qualify as a life insurance contract. See Tax Status of the Policy, page 49.
Assuming the policy qualifies as a life insurance contract under current federal income tax law, your account value earnings are generally not subject to income tax as long as they remain within your policy. However depending on circumstances, the following events may cause taxable consequences for you:
- partial withdrawals
- loans
- surrender
- lapse.
Strategic Investor 10
In addition, if your policy is a modified endowment contract, a loan against or secured by the policy may cause income taxation. A penalty tax may be imposed on a distribution from a modified endowment contract as well. See Modified Endowment Contracts, page 50.
In recent years, Congress has adopted new rules relating to life insurance owned by businesses. A business contemplating the purchase of a new policy or a change in an existing policy should consult a tax adviser.
You should consult a qualified legal or tax adviser before you purchase your policy.
Strategic Investor 11
How the Policy Works
Strategic Investor 12
INFORMATION ABOUT ING SECURITY LIFE, THE SEPARATE ACCOUNT AND THE INVESTMENT OPTIONS
Security Life of Denver Insurance Company
We are a stock life insurance company organized under the laws of the State of Colorado in 1929. Our headquarters are located at 1290 Broadway, Denver, Colorado 80203-5699. We are admitted to do business in the District of Columbia and all states except New York. At the close of 2000, we had over $41.5 billion of life insurance in force. As of December 31, 2000 our total assets were over $8.8 billion and capital and surplus were over $491 million measured on a statutory basis of accounting, as prescribed or permitted by the Colorado Division of Insurance.
We are a wholly owned indirect subsidiary of ING Groep, N.V. ("ING"), a global financial institution active in the field of insurance, banking and asset management. ING ranks 10th among the top 20 global financial institutions by market capitalization and is headquartered in Amsterdam, The Netherlands.
ING companies offer a complete line of life insurance products, including:
- annuities
- individual life
- group life
- pension products
- market life reinsurance.
The principal underwriter and distributor for our policies is ING America Equities, Inc. ING America Equities is a stock corporation organized under the laws of the State of Colorado in 1993. It is a wholly owned subsidiary of ING Security Life and is registered as a broker-dealer with the SEC and the National Association of Securities Dealers, Inc. ("NASD"). ING America Equities, Inc., is located at 1290 Broadway, Denver, Colorado 80203-5699.
Security Life Separate Account L1
Separate Account Structure
We established separate account on November 3, 1993, under Colorado insurance law. It is a unit investment trust, registered with the SEC under the Investment Company Act of 1940. The SEC does not supervise our management of the separate account or ING Security Life.
The separate account is used to support our variable life insurance policies and for other purposes allowed by law and regulation. We may offer other variable life insurance policies with different benefits and charges that invest in the separate account. We do not discuss these policies in this prospectus. The separate account may invest in other securities not available for the policy described in this prospectus.
We own all the assets in the separate account. We credit gains to or charge losses against the separate account without regard to performance of other investment accounts.
Order of Separate Account Liabilities
State law provides that we may not charge general account liabilities against the separate account's assets equal to its reserves and other liabilities. This means that if we ever became insolvent, the separate account assets will be used first to pay separate account policy claims. Only if separate account assets remain after these claims have been satisfied can these assets be used to pay other policy owners and creditors.
The separate account may have liabilities from assets credited to other variable life policies offered by the separate account. If the assets of the separate account are greater than required reserves and policy liabilities, we may transfer the excess to our general account.
Investment Options
Investment options include the variable and the guaranteed interest divisions, but not the loan division. The separate account has several variable investment options which invest in shares of underlying investment portfolios. The investment
Strategic Investor 13
performance of a policy depends on the performance of the investment portfolios you choose.
Investment Portfolios
Each of the investment portfolios is a separate series of an open-end management investment company. The investment company receives investment advice from a registered investment adviser who, other than Directed Services, Inc., is not affiliated with us.
The investment portfolios sell shares to separate accounts of insurance companies. These insurance companies may or may not be affiliated with us. This is known as "shared funding." Investment portfolios may sell shares as the underlying investment for both variable annuity and variable life insurance contracts. This process is known as "mixed funding."
The investment portfolios may sell shares to certain qualified pension and retirement plans that qualify under Section 401 of the Internal Revenue Code of 1986, as amended ("IRC"). As a result, a material conflict of interest may arise between insurance companies, owners of different types of contracts and retirement plans, or their participants.
If there is a material conflict, we will consider what should be done, including removing the investment portfolio from the separate account. There are certain risks with mixed and shared funding, and with selling shares to qualified pension and retirement plans. See the investment portfolios' prospectuses.
Investment Portfolio Objectives
Each investment portfolio has a different investment objective that it tries to achieve by following its own investment strategy. The objectives and policies of each investment portfolio affect its return and its risks. With this prospectus, you must receive the current prospectus for each investment portfolio. We summarize the investment objectives for each investment portfolio here, but you should carefully read each investment portfolio prospectus.
Certain investment portfolios offered under this policy have investment objectives and policies similar to other funds managed by the portfolio's investment adviser. The investment results of a portfolio may be higher or lower than those of other funds managed by the same adviser. There is no assurance, and no representation is made, that the investment results of any investment portfolio will be comparable to those of another fund managed by the same investment adviser.
INVESTMENT PORTFOLIO OBJECTIVES |
| Investment Portfolios | Investment Company/ Adviser/ Manager/ Sub-Adviser | Investment Objective |
| AIM V.I. Capital Appreciation Fund | Investment Company:
AIM Variable Insurance Funds
Investment Adviser:
A I M Advisors, Inc. | Seeks growth of capital. |
| AIM V.I. Government Securities Fund | Investment Company:
AIM Variable Insurance Funds
Investment Adviser:
A I M Advisors, Inc. | Seeks to achieve a high level of current income consistent with reasonable concern for safety of principal. |
| Alger American Growth Portfolio | Investment Company:
The Alger American Fund
Investment Manager:
Fred Alger Management, Inc. | Seeks long-term capital appreciation by focusing on growing companies that generally have broad product lines, markets, financial resources and depth of management. |
Strategic Investor 14
INVESTMENT PORTFOLIO OBJECTIVES |
| Investment Portfolios | Investment Company/ Adviser/ Manager/ Sub-Adviser | Investment Objective |
| Alger American Leveraged AllCap Portfolio | Investment Company:
The Alger American Fund
Investment Manager:
Fred Alger Management, Inc. | Seeks long-term capital appreciation by investing, under normal circumstances, in the equity securities of companies of any size which demonstrate promising growth potential. |
| Alger American MidCap Growth Portfolio | Investment Company:
The Alger American Fund
Investment Manager:
Fred Alger Management, Inc. | Seeks long-term capital appreciation by focusing on midsize companies with promising growth potential. |
| Alger American Small Capitalization Portfolio | Investment Company:
The Alger American Fund
Investment Manager:
Fred Alger Management, Inc. | Seeks long-term capital appreciation by focusing on small, fast-growing companies that offer innovative products, services or technologies to a rapidly expanding marketplace. |
| VIP Growth Portfolio - Service Class | Investment Company:
Fidelity Variable Insurance Products Fund
Investment Manager:
Fidelity Management & Research Company | Seeks capital appreciation by normally investing in common stocks of companies that it believes have above-average growth potential. |
| VIP Overseas Portfolio - Service Class | Investment Company:
Fidelity Variable Insurance Products Fund
Investment Manager:
Fidelity Management & Research Company | Seeks long-term growth of capital by normally investing at least 65% of total assets in foreign securities. |
| VIP II Asset Manager Portfolio - Service Class | Investment Company:
Fidelity Variable Insurance Products Fund II
Investment Manager:
Fidelity Management & Research Company | Seeks high total return with reduced risk over the long term by allocating its assets among stocks, bonds, and short-term instruments. |
| VIP II Index 500 Portfolio - - Initial Class | Investment Company:
Fidelity Variable Insurance Products Fund II
Investment Manager:
Fidelity Management & Research Company
Sub-Advisor:
Bankers Trust Company | Seeks investment results that correspond to the total return of common stocks publicly traded in the United States as represented by the S&P® 500. |
Strategic Investor 15
INVESTMENT PORTFOLIO OBJECTIVES |
| Investment Portfolios | Investment Company/ Adviser/ Manager/ Sub-Adviser | Investment Objective |
| Fully Managed Portfolio | Investment Company:
The GCG Trust
Investment Manager:
Directed Services, Inc.
Portfolio Manager:
T. Rowe Price Associates, Inc. | Seeks, over the long term, a high total investment return consistent with the preservation of capital and with prudent investment risk. |
| Liquid Asset Portfolio | Investment Company:
The GCG Trust
Investment Manager:
Directed Services, Inc.
Portfolio Manager:
ING Investment Management, LLC | Seeks high level of current income consistent with the preservation of capital and liquidity. |
| Mid-Cap Growth Portfolio | Investment Company:
The GCG Trust
Investment Manager:
Directed Services, Inc.
Portfolio Manager:
Massachusetts Financial Services Company | Seeks long-term growth of capital by normally investing at least 65% of its total assets in common stocks and related securities of companies with medium market capitalization which the portfolio manager believes have above-average growth potential. |
| INVESCO VIF-Equity Income Fund | Investment Company:
INVESCO Variable Investment Funds, Inc.
Investment Adviser:
INVESCO Funds Group, Inc. | Seeks high total return through both growth and current income by investing in a mix of equity securities and debt securities, as well as options and other investments whose value is based on the values of these securities. |
| INVESCO VIF-High Yield Fund | Investment Company:
INVESCO Variable Investment Funds, Inc.
Investment Adviser:
INVESCO Funds Group, Inc. | Seeks to provide a high level of current income through investments in debt securities and preferred stocks. It also seeks capital appreciation. |
| INVESCO VIF-Small Company Growth Fund | Investment Company:
INVESCO Variable Investment Funds, Inc.
Investment Adviser:
INVESCO Funds Group, Inc. | Seeks to make an investment grow by investing primarily in equity securities that it believes will rise in price faster than other securities, as well as in options and other investments whose values are based upon the values of equity securities. |
| INVESCO VIF-Total Return Fund | Investment Company:
INVESCO Variable Investment Funds, Inc.
Investment Adviser:
INVESCO Funds Group, Inc. | Seeks to provide high total return through both growth and current income by investing in a mix of equity securities and debt securities, as well as in options and other investments whose values are based upon the values of these securities. |
Strategic Investor 16
INVESTMENT PORTFOLIO OBJECTIVES |
| Investment Portfolios | Investment Company/ Adviser/ Manager/ Sub-Adviser | Investment Objective |
| INVESCO VIF-Utilities Fund | Investment Company:
INVESCO Variable Investment Funds, Inc.
Investment Adviser:
INVESCO Funds Group, Inc. | Seeks investment growth and current income by investing primarily in equity securities of companies that produce, generate, transmit or distribute natural gas or electricity or that provide telecommunications services. |
| Janus Aspen Aggressive Growth Portfolio - Service Shares | Investment Company:
Janus Aspen Series
Investment Adviser:
Janus Capital | Seeks long-term growth of capital by investing primarily in common stocks selected for their growth potential, and normally investing at least 50% of its equity assets in medium-sized companies which fall within the range of companies in the S&P® MidCap 400 Index. |
| Janus Aspen Growth Portfolio - Service Shares | Investment Company:
Janus Aspen Series
Investment Adviser:
Janus Capital | Seeks long-term growth of capital in a manner consistent with preservation of capital by investing primarily in common stocks selected for their growth potential. Although the portfolio can invest in companies of any size, it generally invests in larger, more established companies. |
| Janus Aspen International Growth Portfolio - Service Shares | Investment Company:
Janus Aspen Series
Investment Adviser:
Janus Capital | Seeks long-term growth of capital by normally investing at least 65% of its total assets in securities of issuers from at least five different countries, excluding the United States. |
| Janus Aspen Worldwide Growth Portfolio - Service Shares | Investment Company:
Janus Aspen Series
Investment Adviser:
Janus Capital | Seeks long-term growth of capital in a manner consistent with preservation of capital by investing primarily in common stocks of companies of any size throughout the world. |
| Growth Portfolio | Investment Company:
Neuberger Berman Advisers Management Trust
Investment Adviser:
Neuberger Berman Management Inc.
Sub-Adviser:
Neuberger Berman, LLC | Seeks growth of capital by investing mainly in common stock mid-capitalization companies. |
| Limited Maturity Bond Portfolio | Investment Company:
Neuberger Berman Advisers Management Trust
Investment Adviser:
Neuberger Berman Management Inc.
Sub-Adviser:
Neuberger Berman, LLC | Seeks the highest available current income consistent with liquidity and low risk to principal by investing mainly in investment-grade bonds and other debt securities from U.S. Government and corporate issuers. Total return is a secondary goal. |
Strategic Investor 17
INVESTMENT PORTFOLIO OBJECTIVES |
| Investment Portfolios | Investment Company/ Adviser/ Manager/ Sub-Adviser | Investment Objective |
| Partners Portfolio | Investment Company:
Neuberger Berman Advisers Management Trust
Investment Adviser:
Neuberger Berman Management Inc.
Sub-Adviser:
Neuberger Berman, LLC | Seeks growth of capital by investing mainly in common stock of mid- to large-capitalization companies. |
| Pilgrim VP Growth Opportunities Portfolio - Class R Shares | Investment Company:
Pilgrim Variable Products Trust
Investment Adviser:
ING Pilgrim Investments, LLC | Seeks long-term growth of capital. |
| Pilgrim VP MagnaCap Portfolio - Class R Shares | Investment Company:
Pilgrim Variable Products Trust
Investment Adviser:
ING Pilgrim Investments, LLC | Seeks growth of capital with dividend income as a secondary consideration. |
| Pilgrim VP MidCap Opportunities Portfolio - Class R Shares | Investment Company:
Pilgrim Variable Products Trust
Investment Adviser:
ING Pilgrim Investments, LLC | Seeks long-term capital appreciation. |
| Pilgrim VP SmallCap Opportunities Portfolio - Class R Shares | Investment Company:
Pilgrim Variable Products Trust
Investment Adviser:
ING Pilgrim Investments, LLC | Seeks long-term capital appreciation. |
| Putnam VT Growth and Income Fund - Class IB Shares | Investment Company:
Putnam Variable Trust
Investment Adviser:
Putnam Investment Management, LLC | Seeks capital growth and current income by investing mainly in common stocks of U.S. companies with a focus on value stocks that offer the potential for capital growth, current income or both. |
| Putnam VT New Opportunities Fund - Class IB Shares | Investment Company:
Putnam Variable Trust
Investment Adviser:
Putnam Investment Management, LLC | Seeks long-term capital appreciation by investing mainly in commons stocks of U.S. companies with a focus on growth stocks within sectors of the economy believed to have high growth potential. |
| Putnam VT Small Cap Value Fund - Class IB Shares | Investment Company:
Putnam Variable Trust
Investment Adviser:
Putnam Investment Management, LLC | Seeks capital appreciation by investing in common stocks of U.S. companies with a focus on value stocks. |
Strategic Investor 18
INVESTMENT PORTFOLIO OBJECTIVES |
| Investment Portfolios | Investment Company/ Adviser/ Manager/ Sub-Adviser | Investment Objective |
| Putnam VT Voyager Fund - Class IB Shares | Investment Company:
Putnam Variable Trust
Investment Adviser:
Putnam Investment Management, LLC | Seeks to provide capital appreciation by investing mainly in stocks of U.S. companies with a focus on growth stocks. |
| Worldwide Bond Fund | Investment Company:
Van Eck Worldwide Insurance Trust
Investment Adviser and Manager:
Van Eck Associates Corporation | Seeks high total return--income plus capital appreciation--by investing globally, primarily in a variety of debt securities. |
| Worldwide Emerging Markets Fund | Investment Company:
Van Eck Worldwide Insurance Trust
Investment Adviser and Manager:
Van Eck Associates Corporation | Seeks long-term capital appreciation by investing primarily in equity securities in emerging markets around the world. |
| Worldwide Hard Assets Fund | Investment Company:
Van Eck Worldwide Insurance Trust
Investment Adviser and Manager:
Van Eck Associates Corporation | Seeks long-term capital appreciation by investing primarily in "hard asset securities." Hard assets securities are stocks, bonds and other securities of companies that derive at least 50% of gross revenue or profit from exploration, development, production or distribution of precious metals, natural resources, real estate and commodities. |
| Worldwide Real Estate Fund | Investment Company:
Van Eck Worldwide Insurance Trust
Investment Adviser and Manager:
Van Eck Associates Corporation | Seeks to maximize return by investing in equity securities of companies that own significant real estate or that principally do business in the real estate industry. |
Guaranteed Interest Division
You may allocate all or a part of your net premium and transfer your net account value into the guaranteed interest division. The guaranteed interest division guarantees principal and is part of our general account. It pays interest at a fixed rate that we declare.
The general account contains all of our assets other than those held in the separate account variable investment options or other separate accounts.
The general account supports our non-variable insurance and annuity obligations. We have not registered interests in the guaranteed interest division under the Securities Act of 1933. Also, we have not registered the guaranteed interest division or the general account as an investment company under the Investment Company Act of 1940 (because of exemptive and exclusionary provisions). This means that the general account, the guaranteed interest division and its interests are generally not subject to regulation under these Acts.
Strategic Investor 19
The SEC staff has not reviewed the disclosures in this prospectus relating to the general account and the guaranteed interest division. These disclosures, however, may be subject to certain requirements of the federal securities law regarding accuracy and completeness of statements made.
The amount you have in the guaranteed interest division is the net premium you allocate to that division, plus amounts you transfer to it, plus interest earned, minus amounts you transfer out or withdraw. It may be reduced by deductions for charges based on your account value allocated to it.
We declare the interest rate that applies to all amounts in the guaranteed interest division. This interest rate is never less than the minimum guaranteed interest rate of 3.0%. Interest compounds daily at an effective annual rate that equals the declared rate. We credit interest to the guaranteed interest division on a daily basis. We pay interest regardless of the actual investment performance of our general account. We bear all of the investment risk for the guaranteed interest division.
DETAILED INFORMATION ABOUT THE POLICY
This prospectus describes our standard Strategic Investor variable universal life insurance policy. There may be differences in the policy features, benefits and charges because of state requirements where we issue your policy. We describe all such differences in your policy.
If you would like to know about variations specific to your state, please ask your agent/registered representative. ING Security Life can provide him/her with the list of variations that will apply to your policy.
Applying for a Policy
You purchase a Strategic Investor variable universal life policy by submitting an application to us. The policy is issued on a guaranteed issue, fully-underwritten or simplified-underwritten basis. On the policy date, the insured person must be no less than age 15. For a guaranteed issue policy, the insured person generally can be no more than age 70. For a fully-underwritten policy, the insured person generally can be no more than age 85. For a simplified-underwritten policy, the insured person generally can be no more than age 70 and certain other conditions/restrictions may apply. The insured person is the person on whose life we issue the policy. See Age, page 40.
You may request that we back-date the policy up to six months to allow the insured person to give proof of a younger age for the purposes of your policy.
From time to time, we may accept an insured person who exceeds our normal maximum age limit. We will not unfairly discriminate in determining the maximum age at issue. All exceptions to our normal limits are dependent upon our ability to obtain acceptable reinsurance coverage for our risk with an older insured.
We and our affiliates offer other products to insure people which may or may not better match your needs.
Temporary Insurance
If you apply and qualify, we may issue temporary insurance in an amount equal to the face amount of insurance for which you applied. The maximum amount of temporary insurance for binding limited life insurance coverage is $3 million, which includes other in-force coverage you have with us.
Temporary coverage begins when all of the following events have occurred:
- you have completed and signed our binding limited life insurance coverage form
- we receive and accept a premium payment of at least your scheduled premium (selected on your application)
- part I of the application is complete.
Temporary life insurance coverage ends on the earliest of:
- the date we return your premium payments
- five days after we mail notice of termination to the address on your application
- the date your policy coverage starts
- the date we refuse to issue a policy based on your application
- 90 days after you sign our binding limited life insurance coverage form.
Strategic Investor 20
There is no death benefit under the temporary insurance agreement if any of the following events occurs:
- there is a material misrepresentation in your answers on the binding limited life insurance coverage form
- there is a material misrepresentation in statements on your application
- the person or persons intended to be insured die by suicide or self-inflicted injury
- the bank does not honor your premium check.
Policy Issuance
Before we issue a policy, we require satisfactory evidence of insurability of the insured person and payment of your initial premium. This evidence may include completion of underwriting and issue requirements.
The policy date shown on your policy schedule determines:
- monthly processing dates
- policy months
- policy years
- policy anniversaries.
It is not affected by when you receive the policy. The policy date may be different from the date we receive your first premium payment. Generally, we charge monthly deductions from your policy date.
The policy date is determined one of three ways:
- the date you designate on your application, subject to our approval.
- the back-date of the policy to save age, subject to our approval and law.
- if there is no designated date or back-date, the policy date is:
- the date all underwriting and administrative requirements have been met if we receive your initial premium before we issue your policy; or
- the date we receive your initial premium if it is after we approve your policy for issue.
If you choose to have your policy date be earlier than the date we issue your policy (called back-dating), then the following monthly policy charges will be charged from that earlier date on your first monthly processing date:
- mortality and expense risk charge
- policy charge
- administrative charge
- cost of insurance charges
- rider charges
If you have elected to backdate your policy which enables you to gain benefit of a lower age for the purposes of calculating the cost of insurance charges on your policy, you should understand there are some inherent costs associated with your decision to backdate. For each month that your policy is backdated, the applicable cost of insurance charges are accumulated and deducted from your initial premium payment. Thus, backdating your policy has the effect of lowering your initial net premium and thus the amount available to be allocated to the investment options. On backdated policies the accrued cost of insurance charges deducted from the initial premium result in policy values being lower than those in any policy illustrations you have received.
Definition of Life Insurance
At policy issue, you may choose one of two tests for the federal income tax definition of life insurance. You cannot change your choice later.
The tests are the cash value accumulation test and the guideline premium/cash value corridor test. If you choose the guideline premium/cash value corridor test, we may limit premium payments relative to your policy death benefit under this test. See Tax Status of the Policy, page 49.
Premium Payments
You may choose the amount and frequency of premium payments, within limits. You cannot make premium payments after the death of the insured person or after the continuation of coverage period begins. See Continuation of Coverage, page 30.
We consider payments we receive to be premium payments if you do not have an outstanding loan and your policy is not in the continuation of coverage period. After we deduct certain charges from your premium payment, we add the remaining net premium to your policy.
Strategic Investor 21
A payment is received by us when it is received at our offices. After you have paid your initial premium, we suggest you send payments directly to the Company, rather than through your agent/registered representative, to assure the earliest crediting date.
Scheduled Premium
Your premium payments are flexible. You may select your scheduled (planned) premium (within our limits) when you apply for your policy. The scheduled premium, shown in your policy and schedule, is the amount you choose to pay over a stated time period. This amount may or may not be enough to keep your policy in force. You may receive premium reminder notices for the scheduled premium on a quarterly, semi-annual or annual basis. You are not required to pay the scheduled premium.
You may choose to pay your premium by electronic funds transfer each month. Your financial institution may charge for this service. If you choose to pay your initial premium by electronic transfer, please be sure to include the appropriate information as part of your application to avoid a delay in making your coverage effective.
You can change the amount of your scheduled premium within our minimum and maximum limits at any time. If you fail to pay your scheduled premium or if you change the amount of your scheduled premium, your policy performance will be affected.
Unscheduled Premium Payments
Generally speaking, you may make unscheduled premium payments at any time, however:
- We may limit the amount of your unscheduled premium payments that would result in an increase in the base death benefit amount required by the federal income tax law definition of life insurance. We may require satisfactory evidence that the insured person is insurable at the time that you make the unscheduled premium payment if the death benefit is increased due to your unscheduled premium payments.
- We may require proof that the insured person is insurable if your unscheduled premium payment will cause the net amount at risk to increase.
- We will return premium payments which are greater than the "seven-pay" limit for your policy if your payment would cause your policy to become a modified endowment contract, unless you have acknowledged in writing the new modified endowment contract status for your policy. The "seven-pay" limit is defined by the Internal Revenue Code and actuarially determined. It varies based on the age, gender and premium class of each insured, as well as the death benefit and additional benefits or riders on the policy. It is generally the maximum possible premium that we may receive during the first seven policy years in order for the policy not to be classified as a modified endowment contract.
See Modified Endowment Contracts, page 50, and Changes to Comply with the Law, page 52.
If you have an outstanding policy loan and you make an unscheduled payment, we will consider it a loan repayment, unless you tell us otherwise. If your payment is a loan repayment, we do not take tax or sales charges.
Target Premium
Target premium is not based on your scheduled premium. Target premium is actuarially determined based on the age and gender of the insured person. The target premium is used to determine your initial sales charge and the sales compensation we pay. It may or may not be enough to keep your policy in force. You are not required to pay the target premium and there is no penalty for paying more or less. The target premium for your policy and additional segments is listed in your policy schedule pages.
Allocation of Net Premium
The net premium is the balance remaining after we deduct tax and sales charges from your premium payment.
Insurance coverage does not begin until we receive your initial premium. It must be at least the sum of the scheduled premium payments due from your policy date through your investment date.
Strategic Investor 22
The investment date is the first date we apply net premium to your policy. If we receive your initial premium after we approve your policy for issue, the investment date is the date we receive your initial premium.
We apply the initial net premium to your policy after all of the following conditions have been met:
- we receive the required amount of premium
- all issue requirements have been received by our customer service center
- we approve your policy for issue.
Amounts you designate for the guaranteed interest division will be allocated to that division on the investment date. If your state requires return of your premium during the free look period, we initially invest amounts you have designated for the variable investment options in the variable investment option which invests in the GCG Trust Liquid Asset investment portfolio. We later transfer these amounts from this variable investment option to your selected variable investment options, based on your most recent premium allocation instructions, at the earlier of the following dates:
- five days after the date we mailed your policy plus the length of your state free look period; or
- the date we have received your delivery receipt plus the length of your state free look period.
If your state provides for return of account value during the free look period (or provides no free look period), we invest amounts you designated for the variable investment options directly into your selected variable investment options.
We allocate all later premium payments to your policy on the valuation date of receipt. We will use your most recent premium allocation instructions specified in percentages stated to the nearest tenth and totaling 100%. A payment is received by us when it is received at our offices. After you have paid your initial premium, we suggest you send payments directly to us, rather than through your agent/registered representative, to assure the earliest crediting date.
Premium Payments Affect Your Coverage
Your coverage lasts only as long as your net account value is enough to pay the monthly charges and your account value is more than your outstanding policy loan plus accrued loan interest. If you do not meet these conditions, your policy will enter the 61-day grace period and you must make a premium payment to avoid lapse. See Lapse, page 38, and Grace Period, page 38.
Modified Endowment Contracts
There are special federal income tax rules for distributions from life insurance policies which are modified endowment contracts. These rules apply to policy loans, surrenders and partial withdrawals. Whether or not these rules apply depends upon whether or not the premium we receive is greater than the "seven-pay" limit.
If we find that your scheduled premium causes your policy to be a modified endowment contract on your policy date, we will require you to acknowledge that you know the policy is a modified endowment contract. We will issue your policy based on the scheduled premium you selected. If you do not want your policy to be issued as a modified endowment contract, you may reduce your scheduled premium to a level which does not cause your policy to be a modified endowment contract. We will then issue your policy based on the revised scheduled premium. See Modified Endowment Contracts, page 50.
Death Benefits
You decide the amount of insurance you need, now and in the future. You can combine the long-term advantages of permanent life insurance (base coverage) with the flexibility and short-term advantages of term life insurance. Both permanent and term life insurance are available with one policy. The stated death benefit is the permanent element of your policy. The adjustable term insurance rider is the term insurance element of your policy. See Adjustable Term Insurance Rider, page 28.
Generally, we require a minimum total death benefit of $100,000 ($50,000 for guaranteed issue policies). Our underwriting procedures in effect at the time
Strategic Investor 23
you apply may limit the maximum stated death benefit.
It may be to your economic advantage to include part of your insurance coverage under the adjustable term insurance rider. The adjustable term insurance rider has no cash value, though, and provides no growth potential. Both the cost of insurance under the adjustable term insurance rider and the cost of insurance for the base death benefit are deducted monthly from your account value and generally increase with the age of the insured person. Use of the adjustable term insurance rider may reduce sales compensation, but may increase the monthly cost of insurance. See Adjustable Term Insurance Rider, page 28.
Your death benefit is calculated as of the date of death of the insured person.
Death Benefit Summary
This chart assumes no death benefit option changes and that partial withdrawals are less than the premium we receive.
| Option 1 | Option 2 | Option 3 |
| Stated Death Benefit | The sum of death benefit segments under the policy. The stated death benefit changes when there is an increase or decrease or when a policy transaction causes it to change. | The sum of death benefit segments under the policy. The stated death benefit changes when there is an increase or decrease or when a policy transaction causes it to change. | The sum of death benefit segments under the policy. The stated death benefit changes when there is an increase or decrease or when a policy transaction causes it to change. |
| Base Death Benefit | The greater of:- the stated death benefit; or
- the account value plus the refund of sales charges, if any, multiplied by the appropriate factor from the definition of life insurance factors.
| The greater of:- the stated death benefit plus the account value; or
- the account value plus the refund of sales charges, if any, multiplied by the appropriate factor from the definition of life insurance factors.
| The greater of:- the stated death benefit plus the sum of all premium payments we receive minus partial withdrawals you have taken; or
- the account value plus the refund of sales charges, if any, multiplied by the appropriate factor from the definition of life insurance factors.
|
| Target Death Benefit | Stated death benefit plus adjustable term insurance rider benefit, if any. | Stated death benefit plus adjustable term insurance rider benefit, if any. | Stated death benefit plus adjustable term insurance rider benefit, if any. |
Strategic Investor 24
| Option 1 | Option 2 | Option 3 |
| Total Death Benefit | It is the greater of:- the target death benefit; or
- the account value plus the refund of sales charges, if any, multiplied by the appropriate factor from the definition of life insurance factors.
| It is the greater of:- the target death benefit plus the account value; or
- the account value plus the refund of sales charges, if any, multiplied by the appropriate factor from the definition of life insurance factors.
| It is the greater of:- the target death benefit plus the sum of all premium payments we receive minus partial withdrawals you have taken; or
- the account value plus the refund of sales charges, if any, multiplied by the appropriate factor from the definition of life insurance factors.
|
| Adjustable Term Insurance Rider Benefit | The total death benefit minus the base death benefit provided by the policy, but not less than zero
<R>If the account value plus the refund of sales charges, if any, multiplied by the death benefit factor is greater than the stated death benefit, the adjustable term insurance benefit will be decreased. It will be decreased so that the sum of the base death benefit and the adjustable term insurance rider benefit is not greater than the target death benefit. If the base death benefit becomes greater than the target death benefit, then the adjustable term insurance rider benefit is zero.</R> | The total death benefit minus the base death benefit provided by the policy, but not less than zero.
<R>If the account value plus the refund of sales charges, if any, multiplied by the death benefit factor is greater than the stated death benefit plus the account value, the adjustable term insurance rider benefit will be decreased. It will be decreased so that the sum of the base death benefit and the adjustable term insurance rider benefit is not greater than the target death benefit plus the account value. If the base death benefit becomes greater than the target death benefit plus the account value, then the adjustable term insurance rider benefit is zero.</R> | The total death benefit minus the base death benefit provided by the policy, but not less than zero.
<R>If the account value plus the refund of sales charges, if any, multiplied by the death benefit factor is greater than the stated death benefit plus the sum of all premium payments we receive minus partial withdrawals you have taken, the adjustable term insurance rider benefit will be decreased. It will be decreased so that the sum of the base death benefit and the adjustable term insurance rider benefit is not greater than the target death benefit plus the sum of all premium payments we receive minus partial withdrawals you have taken. If the base death benefit becomes greater than the target death benefit plus the sum of all premium payments we receive minus partial withdrawals you have taken, then the adjustable term insurance rider benefit is zero.</R> |
Strategic Investor 25
Base Death Benefit
Your base death benefit can be different from your stated death benefit as a result of:
- your choice of death benefit option
- increases or decreases in the stated death benefit
- a change in your death benefit option.
Federal income tax law requires that your death benefit be at least as much as your account value multiplied by a factor defined by law. This factor is based on:
- the insured person's age
- the insured person's gender
- the cash value accumulation test or the guideline premium/cash value corridor test for the federal income tax law definition of life insurance. See Appendix A, page 232, or Appendix B, page 234.
As long as your policy is in force, we will pay the death proceeds to your beneficiaries after the insured person dies. The beneficiaries are the people you name to receive the death proceeds from your policy. The death proceeds are:
- your base death benefit on the date of the insured person's death; plus
- the amount of any rider benefits; minus
- any outstanding policy loan with accrued loan interest; minus
- any outstanding policy charges incurred before the death of the insured person.
There could be outstanding policy charges if the insured person dies while your policy is in the grace period.
Death Benefit Options
You have a choice of three death benefit options. Your choice may result in your base death benefit being greater than your stated death benefit.
Option 1: Under death benefit option 1, your base death benefit is the greater of:
- your stated death benefit on the date of the insured person's death; or
- your account value on the date of the insured person's death plus the refund of sales charges, if any, multiplied by the appropriate factor from the definition of life insurance factors shown in Appendix A or B.
With option 1, positive investment performance generally reduces your net amount at risk, which lowers your policy's cost of insurance charge. Option 1 offers insurance coverage at a set amount with potentially lower cost of insurance charges over time.
Option 2: Under death benefit option 2, your base death benefit is the greater of:
- your stated death benefit plus your account value on the date of the insured person's death; or
- your account value on the date of the insured person's death plus the refund of sales charges, if any, multiplied by the appropriate factor from the definition of life insurance factors shown in Appendix A or B.
With option 2, investment performance is reflected in your insurance coverage.
Death benefit option 2 is not available during the continuation of coverage period. If you have option 2 on your policy, it automatically converts to death benefit option 1 when the continuation of coverage period begins. See Continuation of Coverage, page 30.
Option 3: Under death benefit option 3, your base death benefit is the greater of:
- your stated death benefit on the date of the insured person's death plus the sum of all premium payments we receive minus partial withdrawals you have taken; or
- the account value on the date of the insured person's death plus the refund of sales charges, if any, multiplied by the appropriate factor from the definition of life insurance factors shown in Appendix A or B.
With option 3, the base death benefit generally will increase as we receive premium and decrease if you take partial withdrawals. In no event will your base death benefit be less than your stated death benefit.
Death benefit option 3 is not available during the continuation of coverage period. If you have option 3 on your policy, it automatically converts to death
Strategic Investor 26
benefit option 1 when the continuation of coverage period begins. See Continuation of Coverage, page 30.
Changes in Death Benefit Options
You may request a change in your death benefit option on or after your first monthly processing date and before the continuation of coverage period begins.
Your death benefit option change is effective on your next monthly processing date after we approve it, so long as at least one day remains before your monthly processing date. If less than one day remains before your monthly processing date, your change will be effective on the second following monthly processing date.
After we approve your request, we send a new policy schedule page to you. You should attach it to your policy. We may ask you to return your policy to our customer service center so that we can make this change for you.
A death benefit option change applies to your entire stated or base death benefit. Changing your death benefit option may reduce or increase your target death benefit, as well as your stated death benefit. We may not approve a death benefit option change if it reduces the target or stated death benefit below the minimum we require to issue your policy.
You may change from death benefit option 1 to option 2, from option 2 to option 1, and from option 3 to option 1. For you to change from death benefit option 1 to option 2 we may require proof that the insured person is insurable under our normal rules of underwriting.
On the effective date of your option change, your stated death benefit changes as follows:
| Change From | Change
To | Stated Death Benefit Following Change: |
| |
| Option 1 | Option 2 | your stated death benefit before the change minus your account value as of the effective date of the change.
|
| Option 2 | Option 1 | your stated death benefit before the change plus your account value as of the effective date of the change.
|
| Option 3 | Option 1 | your stated death benefit before the change plus the sum all premium payments we have received minus all partial withdrawals you have taken as of the effective date of the change. |
We increase or decrease your stated death benefit to keep the net amount at risk the same. There is no change to the amount of term insurance if you have an adjustable term insurance rider. See Cost of Insurance Charge, page 47.
If you change your death benefit option, we adjust the stated death benefit for each of your segments by allocating your account value to each benefit segment. For example, if you change from death benefit option 1 to option 2, your stated death benefit is decreased by the amount of your account value allocation to that segment. If you change from death benefit option 2 to option 1, your stated death benefit is increased by the amount allocated to that segment.
Changing your death benefit option may have tax consequences. You should consult a tax adviser before making changes.
Changes in Death Benefit Amounts
Contact your agent/registered representative or our customer service center to request a change in your policy's death benefit. The change is effective on the next monthly processing date after we receive and approve your request. There may be underwriting or other requirements which must be met before your request can be approved. Your requested change must be for at least $1,000.
After we make your requested change, we will send you a new policy schedule page. Keep it with your policy. We may ask you to send your policy to us so that we can make the change for you. You may change your target death benefit once a policy year.
Strategic Investor 27
We may not approve a requested change if it will disqualify your policy as life insurance under federal income tax law. If we disapprove a change for any reason, we provide you with a notice of our decision. See Tax Considerations, page 49.
You may change your policy's stated death benefit on or after your first policy anniversary (first monthly processing date for an increase). You may not decrease the stated death benefit below the minimum we require to issue your policy.
Requested reductions in the death benefit will first decrease the target death benefit. We decrease your stated death benefit only after your adjustable term insurance rider coverage is reduced to zero. If you have more than one segment, we divide decreases in stated death benefit among your benefit segments pro rata unless law requires differently.
You must provide satisfactory evidence that the insured person is still insurable to increase your death benefit. Unless you tell us differently, we assume your request for an increase in your target death benefit is a request for an increase to your stated death benefit. Thus, the amount of your adjustable term insurance rider will not change.
<R>A segment is a block of death benefit coverage. The initial segment, or first segment, is the stated death benefit on your policy's effective date. A requested increase in stated death benefit will cause a new segment to be created. Once we create a new segment, it is permanent unless law requires differently. The segment year runs from the segment effective date to its anniversary.</R>
Each new segment may have:
- a new sales charge
- new cost of insurance charges, guaranteed and current
- a new incontestability period
- a new suicide exclusion period
- a new target premium.
<R>We allocate the net amount at risk among death benefit segments in the same proportion that each segment bears to the total stated death benefit. Premium we receive after an increase is applied to your segments in the same proportion as the target premium for each segment bears to the total target premium for all segments. Sales charges are deducted from each segment's premium based on the length of time that segment has been effective.</R>
If a death benefit option change causes the stated benefit to increase, no new segment is created. Instead, the size of each existing segment(s) is (are) changed. If it causes the stated death benefit to decrease, each segment is decreased.
There may be tax consequences as a result of a change in your death benefit. You should consult a tax adviser before changing your death benefit amount. See Tax Status of the Policy, page 49, and Modified Endowment Contracts, page 50.
Riders
Your policy may include benefits, attached by rider. A rider may have an additional cost. You may cancel riders at any time.
We may offer riders not listed here. Not all riders may be available under your policy. Contact your agent/registered representative for a list of riders and their availability.
Adding or canceling riders may have tax consequences. See Modified Endowment Contracts, page 50.
Adjustable Term Insurance Rider
You may increase your death proceeds by adding an adjustable term insurance rider. This rider allows you to schedule the pattern of death benefits appropriate for your anticipated needs. As the name suggests, the adjustable term insurance rider adjusts over time to maintain your desired level of coverage.
You specify a target death benefit when you apply for this rider. The target death benefit can be level for the life of your policy or can be scheduled to change at the beginning of a selected policy year(s). See Death Benefits, page 23.
The adjustable term insurance rider death benefit is the difference between your target death benefit and your base death benefit, but not less than zero. The rider's death benefit automatically adjusts daily as your base death benefit changes. Your death benefit depends on which death benefit option is in effect:
Strategic Investor 28
<R>Option 1: If option 1 is in effect, the total death benefit is the greater of:
- the target death benefit; or
- the account value plus the refund of sales charges, if any, multiplied by the appropriate factor from the death benefit factors in the applicable Appendix B.
Option 2: If option 2 is in effect, the total death benefit is the greater of:
- the target death benefit plus the account value; or
- the account value plus the refund of sales charges, if any, multiplied by the appropriate factor from the death benefit factors in the applicable Appendix B.
Option 3: If option 3 is in effect, the total death benefit is the greater of:
- the target death benefit plus the sum of all premium payments we receive minus partial withdrawals you have taken; or
- the account value plus the refund of sales charges, if any, multiplied by the appropriate factor from the death benefit factors in the applicable Appendix B.</R>
For example, under option 1, assume your base death benefit changes as a result of a change in your account value. The adjustable term insurance rider adjusts to provide a death benefit equal to your target death benefit in each year:
| Base Death Benefit | Target Death Benefit | Adjustable Term Insurance Rider Amount |
| |
| $201,500 | $250,000 | $48,500 |
| 202,500 | 250,000 | 47,500 |
| 202,250 | 250,000 | 47,750 |
It is possible that the amount of your adjustable term insurance may be zero if your base death benefit increases enough. Using the same example, if the base death benefit under your policy grew to $250,000 or more, the adjustable term insurance would be zero.
Even when the adjustable term insurance is reduced to zero, your rider remains in effect until you remove it from your policy. Therefore, if the base death benefit later drops below your target death benefit, the adjustable term insurance rider coverage reappears to maintain your target death benefit.
You may change the target death benefit schedule after it is issued, based on our rules. See Changes in Death Benefit Amounts, page 27.
We may deny future, scheduled increases to your target death benefit if you cancel a scheduled change or if you ask for an unscheduled decrease in your target death benefit.
Partial withdrawals, changes from death benefit option 1 to option 2, and base decreases may reduce your target death benefit. See Partial Withdrawals, page 36, and Changes in Death Benefit Options, page 27.
There is no defined premium for a given amount of adjustable term insurance coverage. Instead, we deduct a separate monthly cost of insurance charge from your account value. The cost of insurance for this rider is calculated as the monthly cost of insurance rate for the rider coverage multiplied by the adjustable term death benefit in effect at the monthly processing date. The cost of insurance rates are determined by us from time to time. They are based on the issue age, gender and premium class of the insured person, as well as the length of time since your policy date.
If the target death benefit is increased by you after the adjustable term insurance rider is issued, we use the same cost of insurance rate schedule for the entire coverage for this rider. These rates are based on the original premium class even though satisfactory new evidence of insurability is required for the increased schedule. Although the maximum cost of insurance rates for this rider are greater than the maximum cost of insurance rates for the base death benefit, the current rates for this rider may be lower than current cost of insurance rates for the base death benefit. Guaranteed maximum cost of insurance rates will be stated in the policy. See Cost of Insurance Charge, page 47.
Not all policy features apply to the adjustable term insurance rider. The rider does not contribute to the policy account value nor to surrender value. It does not affect investment performance and cannot be used for a policy loan. The adjustable term insurance rider provides benefits only at the insured person's death.
Strategic Investor 29
Accelerated Death Benefit Rider
This rider pays part of the death benefit to you if a qualified doctor diagnoses a terminal illness of the insured person. Receipt of such an accelerated payment reduces the death benefit of your policy and its net cash surrender value. There is no charge for this rider. There may be tax consequences to requesting payment under this rider. See Tax Status of the Policy, page 49.
Waiver of Cost of Insurance Rider
If the insured person becomes totally disabled while your policy is in force, this rider provides that we waive the monthly expense, cost of insurance and rider charges during the disability period. The insured person must be no less than age 15 and no more than age 55. If you add this rider to your policy, you may not add the waiver of specified premium rider. This rider is not available if your policy is issued based on guaranteed issue or simplified underwriting. The rider charges are included as part of your monthly cost of insurance charge. See Cost of Insurance Charge, page 47.
Waiver of Specified Premium Rider
If the insured person becomes totally disabled while your policy is in force, this rider provides that after a waiting period, we credit a specified premium amount monthly to your policy during the disability period. Subject to our underwriting, you specify this amount on the application for the policy. The insured person must be no less than age 15 and no more than age 55. The minimum coverage under this rider is $25 monthly. The monthly charge for this rider is $1.70 to $12.70 per $100 of rider coverage depending on the insured person's age. If your policy is a guaranteed issue policy, the monthly charge for this rider is $3.40 to $25.40 per $100 of coverage depending on issue age. This rider is not available if your policy is issued based on simplified underwriting.
A policy may contain either the Waiver of Cost of Insurance Rider or the Waiver of Specified Premium Rider, but not both.
Special Features
Designated Deduction Option
You may designate one investment option from which we will deduct your monthly charges. You may make this designation at any time. You may not use the loan division as your designated deduction option.
If you elect not to choose a designated deduction investment option or if the amount in your designated deduction investment option is not enough to cover the monthly deductions, then your monthly charges are taken from the variable investment options and guaranteed interest division in the same proportion that your account value in each has to your total net account value on the monthly processing date.
Right to Change Policy
During the first 24 months after your policy date, you have the right to permanently change your policy to a guaranteed policy, unless state law requires differently. If you elect to make this change, unless state law requires that we issue to you a new guaranteed policy, we will transfer the amount you have in the variable investment options to the guaranteed interest division and allocate all future net premium to the guaranteed interest division. We do not allow future payments or transfers to the variable investment options after you exercise this right. We do not charge for this change. See Guaranteed Interest Division, page 19.
Continuation of Coverage
The continuation of coverage feature continues your insurance coverage in force beyond the policy anniversary nearest the insured person's 100th birthday. If you do not surrender your policy before this date, on this date we:
- convert target death benefit to stated death benefit
- convert death benefit options 2 and 3 to death benefit option 1, if applicable
- terminate all riders
- transfer your net account value (excluding the amount in the loan division) into the guaranteed interest division
- terminate dollar cost averaging and automatic rebalancing.
Strategic Investor 30
Your insurance coverage continues in force until the death of the insured person, unless the policy lapses or is surrendered. However we accept no more premium payments, we deduct no further charges and we cease monthly deductions.
You may not make transfers into the variable investment options during the continuation of coverage period but you may take a policy loan or partial withdrawals.
If you have an outstanding policy loan, interest continues to accrue. If you fail to make sufficient loan or loan interest payments, it is possible that the loan balance plus accrued interest may become greater than your account value and cause your policy to lapse. To avoid lapse, you may repay the loan and loan interest during the continuation of coverage period.
If you wish to stop coverage during the continuation of coverage period, you may surrender your policy and receive the net account value. All other normal consequences of surrender apply. See Surrender, page 39.
The continuation of coverage feature is not available in all states. If a state has approved this feature, it is an automatic feature and you do not need to take any action to activate it. In certain states the death benefit during the continuation of coverage period is the account value. Contact your agent/registered representative or our customer service center to find out if this feature is available in your state and which type of death benefit applies in your state.
The tax consequences of coverage continuing beyond the insured person's 100th birthday are uncertain. You should consult a tax adviser as to those consequences. See Continuation of Policy Beyond Age 100, page 52.
Enhanced Death Benefit Corridor Option
For policies issued with select guaranteed issue rates, an additional benefit option is available. The policyowner may elect, at any time prior to policy issuance, the enhanced death benefit corridor option.
Existing group or corporate owners of Strategic Investor policies who have select guaranteed issue rates can add this option to their policies if it is added to all policies within that issue group. If you would like to do this, contact your agent/ registered representative or our customer service center for instructions.
This option generally provides an opportunity for an increased death benefit on the life of the insured person at certain ages. Under death benefit options 1 and 2 the account value plus the refund of sales charges, if any, is multiplied by a factor shown in Appendix A or B. The result of this calculation is the base death benefit if it exceeds the stated death benefit. Under the enhanced death benefit corridor option, the calculation uses the factor shown on the attached Appendix A and Appendix B (depending on which definition of life insurance is in effect for your policy). The result of this calculation is then used to determine the base death benefit as described under Death Benefit Options, page 26.
There is no separate charge for this feature. However, the same account value may generate a higher base death benefit under policies with this option than on policies not electing the option. Cost of insurance charges are based on the net amount at risk, which is the difference between the account value and the base death benefit. Therefore, as a result of the increased death benefit, the cost of insurance charges may be higher for policies electing this option. Your registered representative/agent can provide you with a personalized illustration to show the difference between a policy with this option and one without it. If your policy does not have sufficient account value, electing this option may have no effect on the base death benefit.
Adding this option to your policy does not affect the operation of your policy's riders, including the Adjustable Term Insurance Rider. When the base death benefit exceeds the stated death benefit, transactions which reduce your account value (such as a partial withdrawal) also reduce the death benefit. The dollar reduction to the death benefit under these circumstances is greater for policies with the enhancement option than on those without the option.
Once elected, this option cannot be deleted. Once elected, this option continues as long as coverage on the original insured person continues. You may lose the benefit of this option if your account value falls below the minimum level needed to keep it in effect.
Strategic Investor 31
Refund of Sales Charges
If you surrender your policy within the first two policy years and your policy has not lapsed, we may refund a portion of the sales charges we previously deducted from your premium payments. In the first policy year, the amount of the refund will not be less than 3.00% of the premium we received. In the second policy year, the refund will not be less than 2.5% of the premium we received in the first policy year. The refund of sales charge is guaranteed only for the first two policy years. We reserve the right to extend the refund of sales charges beyond the first two policy years.
The refund of sales charge is not available if your policy was purchased with the proceeds of a policy issued by us or one of our affiliates. Also, the refund of sales charge is not available if your policy is surrendered to another insurer as part of a Section 1035 exchange.
Policy Values
Account Value
Your account value is the total amount you have in the guaranteed interest division, the variable investment options and the loan division. Your account value reflects:
- net premium applied
- charges deducted
- partial withdrawals taken
- investment performance of the investment portfolios
- interest earned on the guaranteed interest division
- interest earned on the loan division.
Net Account Value
Your policy's net account value is your account value minus the amount of your outstanding policy loan and accrued loan interest, if any.
Cash Surrender Value
Your cash surrender value is your account value plus any refund of sales charge due.
Net Cash Surrender Value
Your net cash surrender value is your cash surrender value minus the amount of your outstanding policy loan and accrued loan interest, if any.
Determining Values in the Variable Investment Options
The amounts in the variable investment options are measured by accumulation units and accumulation unit values. The value of each variable investment option is the accumulation unit value for that option multiplied by the number of accumulation units you own in that option. Each variable investment option has a different accumulation unit value.
The accumulation unit value is the value determined on each valuation date. The accumulation unit value of each variable investment option varies with the investment performance of the underlying investment portfolio. It reflects:
- investment income
- realized and unrealized gains and losses
- investment portfolio expenses
- taxes, if any.
A valuation date is one on which the net asset value of the investment portfolio shares and unit values of the variable investment options are determined. Valuation dates are each day the New York Stock Exchange and the company's customer service center are open for business, except for days on which an investment portfolio does not value its shares or any other day as required by law. Each valuation date ends at 4:00 p.m. Eastern time. Our customer service center may not be open on major holidays.
You purchase accumulation units when you allocate premium or make transfers to a variable investment option, including transfers from the loan division.
We redeem accumulation units:
- when amounts are transferred from a variable investment option (including transfers to the loan division)
- for the monthly deductions from your account value
- for policy transaction fees
- when you take a partial withdrawal
- if you surrender your policy
- to pay the death proceeds.
Strategic Investor 32
To calculate the number of accumulation units purchased or sold we divide the dollar amount of your transaction by the accumulation unit value for the variable investment option calculated at the close of business on the valuation date of the transaction.
The date of a transaction is the date we receive your premium or transaction request at our customer service center, so long as the date of receipt is a valuation date. We use the accumulation unit value which is next calculated after we receive your premium or transaction request and we use the number of accumulation units attributable to your policy on the date of receipt.
We take monthly deductions from your account value on the monthly processing date. If your monthly processing date is not a valuation date, the monthly deduction is processed on the next valuation date.
The value of amounts allocated to the variable investment options goes up or down depending on investment performance of the corresponding investment portfolios.
For amounts in the variable investment options, there is no guaranteed minimum value.
How We Calculate Accumulation Unit Values
We determine accumulation unit values on each valuation date.
We generally set the accumulation unit value for a variable investment option at $10 when the division is first opened. After that, the accumulation unit value on any valuation date is:
- the accumulation unit value for the preceding valuation date multiplied by
- the variable investment option's accumulation experience factor for the valuation period.
Every valuation period begins at 4:00 p.m. Eastern time on a valuation date and ends at 4:00 p.m. Eastern time on the next valuation date.
We calculate an accumulation experience factor for each variable investment option every valuation date as follows:
- We take the net asset value of the underlying investment portfolio shares as reported to us by the investment portfolio managers as of the close of business on that valuation date.
- We add dividends or capital gain distributions declared and reinvested by the investment portfolio during the current valuation period.
- We subtract a charge for taxes, if applicable.
- We divide the resulting amount by the net asset value of the shares of the underlying investment portfolio at the close of business on the previous valuation date.
Transfer of Account Value
You generally may make transfers of your account value among the variable investment options and the guaranteed interest division. If your state requires a refund of premium during the free look period, you may not make transfers until after your free look period ends.
Currently, we do not limit your number of transfers, but we reserve the right to do so if we determine the trading within your policy is excessive. You may not make transfers during the continuation of coverage period. See Excessive Trading, page 34, and Continuation of Coverage, page 30.
You may make transfer requests in writing, or by telephone if you have telephone privileges, to our customer service center. You may fax your request to us. Telephone and facsimile transfers may not always be available. Telephone or fax systems, whether yours, your service provider's or your agent's, can experience outages or slowdowns for a variety of reasons. These outages or slowdowns may delay or prevent our processing of your request. Although we have taken precautions to help our systems handle heavy use, we cannot promise complete reliability under all circumstances. If you are experiencing problems, you should make your transfer request in writing.
Your transfer takes effect on the valuation date we receive your request. The minimum amount you may transfer is $100. This minimum does not need to come from one investment option or be transferred to one investment option as long as the total amount you transfer is at least $100. However, if the amount remaining in an investment option is less than $100 and you make a transfer request, we transfer the entire amount.
Strategic Investor 33
Excessive Trading
Excessive trading activity can disrupt investment portfolio management strategies and increase portfolio expenses through:
- increased trading and transaction costs
- forced and unplanned portfolio turnover
- lost opportunity costs
- large asset swings that decrease the investment portfolio's ability to provide maximum investment return to all policyowners.
In response to excessive trading, we may place restrictions or refuse transfers and impose a fee for each future transfer of up to $25. We will take such actions when we determine, in our sole discretion, that transfers are harmful to the investment portfolios or to policyowners as a whole.
Guaranteed Interest Division Transfers
Transfers into the guaranteed interest division are not restricted.
You may transfer amounts from the guaranteed interest division only in the first 30 days of each policy year. Transfer requests received within 30 days before your policy anniversary will occur on your policy anniversary. A request received by us within 30 days after your policy anniversary is effective on the valuation date we receive it. Transfer requests made at any other time will not be processed. The minimum amount you may transfer is $100.
Dollar Cost Averaging
If your policy has at least $10,000 invested in the underlying GCG Trust Liquid Asset investment portfolio, you may elect dollar cost averaging. There is no charge for this feature.
Dollar cost averaging does not assure a profit nor does it protect you against a loss in a declining market.
The main goal of dollar cost averaging is to protect your policy values from short-term price changes. This systematic plan of transferring account values is intended to reduce the risk of investing too much when the price of an investment portfolio's shares is high. It also reduces the risk of investing too little when the price of an investment portfolio's shares is low. Since you transfer the same dollar amount to the variable investment options each period, you purchase more units when the unit value is low and you purchase fewer units when the unit value is high.
You may add dollar cost averaging to your policy at any time. The first dollar cost averaging date must be at least one day after we receive your dollar cost averaging request. If your state requires a refund of all premium received during the free look period, dollar cost averaging begins after the end of your free look period.
With dollar cost averaging, you designate either a dollar amount or a percentage of your account value to be automatically transferred at regular intervals from the variable investment option investing in the GCG Trust Liquid Asset investment portfolio to one or more other variable investment options. Fractional percentages, stated to the nearest tenth, are permitted. You may not use the guaranteed interest division or the loan division in dollar cost averaging.
The minimum percentage you may transfer to one investment division is 1% of the total amount you transfer. You must transfer at least $100 on each dollar cost averaging transfer date.
Dollar cost averaging may occur on the same day of the month on a monthly, quarterly, semi-annual or annual basis. Unless you tell us otherwise, dollar cost averaging automatically takes place monthly on the monthly processing date.
You may have both dollar cost averaging and automatic rebalancing at the same time. However, your dollar cost averaging source portfolio cannot be included in your automatic rebalancing program.
Changing Dollar Cost Averaging
If you have telephone privileges, you may change the program by telephoning our customer service center or you may fax your request to us. Telephone and facsimile transfers may not always be available. Telephone or fax systems, whether yours, your service provider's or your agent's, can experience outages or slowdowns for a variety of reasons. These outages or slowdowns may delay or prevent our processing of your request. Although we have
Strategic Investor 34
taken precautions to help our systems handle heavy use, we cannot promise complete reliability under all circumstances. If you are experiencing problems, you should make your transfer request in writing. See Telephone Privileges, page 42.
Terminating Dollar Cost Averaging
You may cancel dollar cost averaging by sending satisfactory notice to our customer service center. We must receive it at least one day before the next dollar cost averaging date.
Dollar cost averaging will terminate on the date:
- you specify
- your balance in the GCG Trust Liquid Asset investment portfolio reaches a dollar amount you set
- the amount in the GCG Trust Liquid Asset investment portfolio is equal to or less than the amount to be transferred. We will transfer the remaining amount and dollar end cost averaging ends.
Automatic Rebalancing
Automatic rebalancing is a method of maintaining a consistent approach to investing account values over time and simplifying the process of asset allocation among your chosen investment options. There is no charge for this feature.
If you choose this feature, on each rebalancing date we transfer amounts among the investment options to match your pre-set automatic rebalancing allocation. You may select allocation percentages stated to the nearest tenth. After the transfer, the ratio of your account value in each investment option to your total account value for all investment options included in automatic rebalancing matches the automatic rebalancing allocation percentage you set for that investment option. This action rebalances the amounts in the investment options that do not match your set allocation. This mismatch can happen if an investment option outperforms the other investment options for that time period.
You may choose automatic rebalancing on your application or later by completing our customer service form. Automatic rebalancing may occur on the same day of the month on a monthly, quarterly, semi-annual or annual basis. If you do no specify a frequency, automatic rebalancing will occur quarterly.
The first transfer occurs on the date you select (after your free look period if your state requires return of premium during the free look period). If you do not request a date, processing is on the last valuation date of the calendar quarter in which we receive your request.
You may have both automatic rebalancing and dollar cost averaging at the same time. However, the source portfolio for your dollar cost averaging cannot be included in your automatic rebalancing program. You may not include the loan division.
Changing Automatic Rebalancing
You may change your allocation percentages for automatic rebalancing at any time. Your allocation change is effective on the valuation date that we receive it at our customer service center. If you reduce the amount allocated to the guaranteed interest division, it is considered a transfer from that division. You must meet the requirements for the maximum transfer amount and time limitations on transfers from the guaranteed interest division. See Transfers of Account Value, page 33.
Terminating Automatic Rebalancing
You may terminate automatic rebalancing at any time, as long as we receive your notice of termination at least one day before the next automatic rebalancing date.
Policy Loans
You may borrow from your policy at any time after the first monthly processing date, by using your policy as security for a loan, or as otherwise required by law.
The amount you borrow (policy loan) is:
- the total amount you borrow from your policy; plus
- policy loan interest that is capitalized when due; minus
- policy loan or interest repayments you make.
Unless law requires differently, a new policy loan must be at least $100. The maximum amount you
Strategic Investor 35
may borrow on any valuation date, unless required differently by law, is your net account value minus the monthly deductions to your next policy anniversary or 13 monthly deductions if you take a
loan within thirty days before your next policy anniversary.
Your request for a policy loan must be directed to our customer service center. If you have telephone privileges, you may request a policy loan for less than $25,000 by telephone or fax. Telephone and facsimile transfers may not always be available. Telephone or fax systems, whether yours, your service provider's or your agent's, can experience outages or slowdowns for a variety of reasons. These outages or slowdowns may delay or prevent our processing of your request. Although we have taken precautions to help our systems handle heavy use, we cannot promise complete reliability under all circumstances. If you are experiencing problems, you should make your transfer request in writing. See Telephone Privileges, page 42.
When you request a loan you may specify the investment options from which the loan will be taken. If you do not specify the investment options, the loan will be taken proportionately from each active investment option you have, including the guaranteed interest division.
Loan interest charges on your policy loan accrue daily at an annual interest rate of 3.75% during policy years 1 through 10 and 3.15% thereafter (3.00% on a current basis). Interest is due in arrears on each policy anniversary. If you do not pay it when due, we add it to your policy loan balance.
When you take a policy loan, we transfer an amount equal to your policy loan to the loan division. We follow this same process for loan interest due at your policy anniversary. The loan division is part of our general account specifically designed to hold collateral for policy loans and interest. We credit the loan division with interest at an annual rate of 3.00%.
If you request an additional loan, we add the new loan amount to your existing policy loan. This way, there is only one loan outstanding on your policy at any time.
Loan Repayment
You may repay your policy loan at any time. We assume that payments you make, other than scheduled premium payments, are policy loan repayments. You must tell us if you want payments to be premium payments.
When you make a loan repayment, we transfer an amount equal to your payment from the loan division to the variable investment options and the guaranteed interest division in the same proportion as your current premium allocation, unless you tell us otherwise.
Effects of a Policy Loan
Taking a loan decreases the amount you have in the investment options. Accruing loan interest will change your net account value as compared to what it would have been if you did not take a loan.
Even if you repay your loan, it has a permanent effect on your account value. The benefits under your policy may be affected.
The loan is a first lien on your policy. If you do not repay your policy loan, we deduct your outstanding policy loan and accrued loan interest from the death proceeds or the cash surrender value when payable.
If you do not make loan payments your policy could lapse. Policy loans may cause your policy to lapse if your account value minus policy loan amounts and accrued loan interest is not enough to pay your deductions each month. See Lapse, page 38.
Policy loans may have tax consequences. If your policy lapses with a loan outstanding, you may have further tax consequences. See Distributions Other than Death Benefits, page 51.
If you use the continuation of coverage feature and you have a policy loan, loan interest continues to accrue.
Partial Withdrawals
You may request a partial withdrawal to be processed on any valuation date after your first policy anniversary by contacting our customer service center.
Strategic Investor 36
You make a partial withdrawal by withdrawing part of your net account value. If your request is by telephone or fax, it must be for less than $25,000 and may not cause a decrease in your death benefit. Otherwise, your request must be in writing. Telephone and facsimile transfers may not always be available. Telephone or fax systems, whether yours, your service provider's or your agent's, can experience outages or slowdowns for a variety of reasons. These outages or slowdowns may delay or prevent our processing of your request. Although we have taken precautions to help our systems handle heavy use, we cannot promise complete reliability under all circumstances. If you are experiencing problems, you should make your transfer request in writing. See Telephone Privileges, page 42.
You may take up to twelve partial withdrawals per policy year. The minimum partial withdrawal you may take is $100. The maximum partial withdrawal you may take is the amount which leaves $500 as your net cash surrender value. If you request a withdrawal of more than this maximum, we require you to surrender your policy or reduce the withdrawal.
When you take a partial withdrawal, we deduct your withdrawal amount plus a service fee from your account value. See Charges and Deductions, page 45.
Partial withdrawals do not reduce the stated death benefit if your base death benefit has been increased to qualify your policy as life insurance under the federal income tax laws and if you withdraw an amount that is no greater than the amount that reduces your account value to a level which no longer requires your base death benefit to be increased to qualify as life insurance for federal income tax law purposes. See Tax Status of the Policy, page 49.
We require a minimum death benefit to issue your policy. You are not allowed to take a partial withdrawal if it reduces your death benefit below this minimum.
We will make a partial withdrawal from the guaranteed interest division and the variable investment options in the same proportion that each has to your net account value immediately before your withdrawal, or you may select the investment options from which your partial withdrawal will be taken. If you select the guaranteed interest division, however, the amount withdrawn from it may not be for more than your total withdrawal multiplied by the ratio of your account value in the guaranteed interest division to your total net account value immediately before the partial withdrawal.
Partial withdrawals may have adverse tax consequences. See Distributions Other than Death Benefits, page 51.
Partial Withdrawals under Death Benefit Option 1
Under death benefit option 1, if no more than fifteen years have passed since your policy date and the insured person is not yet age 81, you may make a partial withdrawal of up to the greater of 10% of your account value or 5% of your stated death benefit without decreasing your stated death benefit. Any additional amount withdrawn will reduce your stated death benefit by that additional amount.
Otherwise, amounts you withdraw will reduce your stated death benefit by the amount of the withdrawal unless your policy death benefit has been increased to meet the federal income tax definition of life insurance. Then at least part of your partial withdrawal may be taken without reducing your stated death benefit.
Partial Withdrawals under Death Benefit Option 2
Under death benefit option 2, a partial withdrawal does not reduce your stated death benefit.
Partial Withdrawals under Death Benefit Option 3
Under death benefit option 3, a partial withdrawal will reduce the stated death benefit by the amount of the partial withdrawal in excess of the total premium we have received minus the total of your partial withdrawals.
If a partial withdrawal reduces the stated death benefit, the target death benefit for the current year and all future years will be reduced by an amount equal to the reduction in the stated death benefit.
If your partial withdrawal is more than the total premium we have received minus the total of your prior partial withdrawals, a two step process is used:
Strategic Investor 37
- Your withdrawal of the amount that makes premium received minus all partial withdrawals equal to zero is taken; then
- The excess withdrawal amount you requested will reduce your stated death
benefit if:
- The excess amount is greater than 10% of your account value after step "1" above; or
- The excess amount is greater than 5% of your stated death benefit.
A reduction in the stated death benefit as a result of a partial withdrawal will be pro-rated among the existing coverage segments, unless state law requires otherwise. Target premium will be adjusted for the reduced stated death benefit.
Lapse
Your insurance coverage continues as long as your net account value is enough to pay your deductions each month.
If you have an outstanding policy loan, your policy will lapse if the loan plus accrued interest is more than your account value. Thus, during the continuation of coverage period, the policy could lapse if there is an outstanding policy loan even though there are no further monthly deductions.
Grace Period
Your policy enters a 61-day lapse grace period if, on a monthly processing date your net account value is zero (or less).
We notify you that your policy is in a grace period at least 30 days before it ends. We send this notice to you (or a person to whom you have assigned your policy) at your last known address in our records. We notify you of the premium payment necessary to prevent your policy from lapsing. This amount generally is the past due charges, plus your estimated monthly policy and rider deductions for the next two months. If the insured person dies during the grace period we do pay death proceeds to your beneficiaries with reductions for your policy loan balance, accrued loan interest and monthly deductions owed.
If we receive payment of the required amount before the end of the grace period, we apply it to your account value in the same manner as your other premium payments, then we deduct the overdue amounts from your account balance.
If you do not pay the full amount within the 61-day grace period, your policy and its riders lapse without value. We withdraw your remaining account balance from the variable and guaranteed interest divisions. We deduct amounts you owe us and inform you that your coverage has ended.
Reinstatement
If you do not pay enough premium before the end of the grace period, your policy lapses. You may still reinstate your policy and its riders within five years of the end of the grace period.
Unless state law requires differently, we will reinstate your policy and riders if:
- you are the owner and have not surrendered your policy
- you provide satisfactory evidence that the insured person (including those under your riders) is still insurable according to our normal rules of underwriting
- we receive enough premium to keep your policy and riders in force from the beginning to the end of the grace period and for two months after the reinstatement date.
Reinstatement is effective on the monthly processing date following our approval of your reinstatement application. If you had a policy loan when coverage ended, we reinstate it with accrued loan interest to the date of lapse. The cost of insurance charges at the time of reinstatement are adjusted to reflect the time since the lapse.
We apply net premium received after reinstatement according to your most recent instructions which may be those in effect at the start of the grace period.
A policy that is restated more than 90 days after lapsing will be classified as a modified endowment contract for tax purposes. See Modified Endowment Contract, page 48.
Strategic Investor 38
Surrender
You may surrender your policy for its net cash surrender value any time after the free look period while the insured person is alive. You may take your net cash surrender value in other than one payment.
We compute your net cash surrender value as of the valuation date we receive your written surrender request and policy (or lost policy form) at our customer service center. All insurance coverage ends on the date we receive your surrender request and policy. See Policy Values, page 32, and Settlement Provisions, page 43.
If you surrender your policy within the first two policy years, the net cash surrender value may include a refund of a portion of the sales charges previously deducted. See Refund of Sales Charges, page 32. Otherwise we do not pro-rate or add back to your account value charges or expenses which we deducted before your surrender.
Surrender of your policy may have adverse tax consequences. See Distributions Other than Death Benefits, page 51.
General Policy Provisions
Free Look Period
You have the right to examine your policy and return it (for any reason) to us within the period shown in the policy. The right to examine your policy (also called free look period) starts on the date you receive it. If you return your policy to us within your state's specified time limit, we cancel it as of your policy date.
If you cancel your policy during this free look period, you will receive a refund as determined by state law. Generally, there are two types of free look refunds:
- some states require a return of all premium we receive
- other states require payment of account value plus a refund of all charges deducted.
Your policy will specify what type of free look refund applies in your state. The type of free look refund will affect when premium we receive before the end of the free look period is allocated into the variable investment options. See Allocation of Net Premium, page 22.
Your Policy
The contract between you and us is the combination of:
- your policy
- a copy of your original application and applications for benefit increases or decreases
- your riders
- endorsements
- policy schedule pages
- reinstatement applications.
If you make a change to your coverage, we give you a copy of your changed application and new policy schedules. If you send your policy to us, we attach these items to your policy and return it to you. Otherwise, you need to attach them to your policy.
Unless there is fraud, we consider all statements made in an application to be representations and not guarantees. We use no statement to deny a claim, unless it is in an application.
A president or other officer of our company and our secretary or assistant secretary must sign all changes or amendments to your policy. No other person may change its terms or conditions.
Guaranteed Issue
We may offer policies on a guaranteed issue basis for certain individuals, groups or sponsored arrangements. We issue these policies up to a preset face amount with reduced evidence of insurability. Guaranteed issue policies carry a different mortality risk compared with policies that are fully underwritten. So, we may charge different cost of insurance rates for guaranteed issue policies. The cost of insurance rates under these circumstances may depend on the:
- issue age of the insured people
- risk class of the insured people
- size of the group
- total premium the group pays.
Generally, most guaranteed issued policies have higher overall charges for insurance than a similar underwritten policy issued in the standard tobacco
Strategic Investor 39
non-user or standard tobacco user class. This means that the insured person in a group or sponsored arrangement could get individual, simplified or fully underwritten insurance coverage at a lower overall cost.
Age
We issue your policy at the insured person's age (stated in your policy schedule) based on the nearest birthday to the policy date. The policy is issued on a guaranteed issue, fully-underwritten or simplified-underwritten basis. On the policy date, the insured person must be no less than age 15. For a guaranteed issue policy, the insured person generally can be no more than age 70. For a fully-underwritten policy, the insured person generally can be no more than age 85. For a simplified underwritten policy, the insured person can generally be no more than age 70.
We often use age to calculate rates, charges and values. We determine the insured person's age at a given time by adding the number of completed policy years to the age calculated at issue and shown in the schedule.
Ownership
The original owner is the person named as the owner in the policy application. The owner can exercise all rights and receive benefits during the life of the insured person. These rights include the right to change the owner, beneficiaries or the method designated to pay death proceeds.
As a matter of law, all rights of ownership are limited by the rights of any person who has been assigned rights under the policy and any irrevocable beneficiaries.
You may name a new owner by giving us written notice. The effective date of the change to the new owner is the date the prior owner signs the notice. However, we will not be liable for any action we take before a change is recorded at our customer service center. A change in ownership may cause the prior owner to recognize taxable income on gain under the policy.
Beneficiaries
You, as owner, name the beneficiaries when you apply for your policy. The primary beneficiaries who survive the insured person receives the death proceeds. Other surviving beneficiaries receive death proceeds only if there is no surviving primary beneficiaries. If more than one beneficiary survives the insured person, they share the death proceeds equally, unless you specify otherwise. If none of your policy beneficiaries has survived the insured person, we pay the death proceeds to you or to your estate, as owner.
You may name new beneficiaries during the insured person's lifetime. We pay death proceeds to the beneficiaries whom you have most recently named according to our records. We do not make payments to multiple sets of beneficiaries. The designation of certain beneficiaries may have tax consequences. See Other, page 52.
Collateral Assignment
You may assign your policy by sending written notice to us. After we record the assignment, your rights as owner and the beneficiaries' rights (unless the beneficiaries were made irrevocable beneficiaries under an earlier assignment) are subject to the assignment. It is your responsibility to make sure the assignment is valid. The transfer or assignment of a policy may have tax consequences. See Other, page 52.
Incontestability
After your policy has been in force and the insured person is alive for two years from your policy date, and from the effective date of any new segment, an increase in any other benefit or reinstatement, we will not question the validity of statements in your applicable application.
Misstatements of Age or Gender
Notwithstanding the Incontestability provision above, if the insured person's age or gender has been misstated, we adjust the death benefit to the amount which would have been purchased for the insured person's correct age and gender. We base the adjusted death benefit on the cost of insurance charges deducted from your account value on the
Strategic Investor 40
last monthly processing date before the insured person's death, or as otherwise required by law.
If unisex cost of insurance rates apply, we do not make any adjustments for a misstatement of gender.
Suicide
If the insured person commits suicide (while sane or insane), within two years of your policy date, unless otherwise required by law, we limit death proceeds to:
- the total premium we receive to the time of death; minus
- outstanding policy loan and accrued loan interest; minus
- any partial withdrawals taken.
If the person insured under the policy changed, and the new insured person dies by suicide within two years of the change date, we limit the death proceeds to:
- your net account value as of the change date; plus
- premium we received since the change; minus
- increases in the policy loan balance, accrued loan interest, and partial withdrawals since the change date.
We make a limited payment to the beneficiaries for a new segment or other increase if the insured person commits suicide (while sane or insane), within two years of the effective date of a new segment or within two years of an increase in any other benefit, unless otherwise required by law. The limited payment is equal to the cost of insurance and monthly expense charges which were deducted for the increase.
Transaction Processing
Generally, within seven days of when we receive all information required to process a payment, we pay:
- death proceeds
- net cash surrender value
- partial withdrawals
- loan proceeds.
We may delay processing these transactions if:
- the New York Stock Exchange ("NYSE") is closed for trading
- trading on the NYSE is restricted by the SEC
- the SEC declares that an emergency exists so that it is not reasonably possible to sell securities in the variable investment options or to determine the account value in the variable investment options
- a governmental body with jurisdiction over the separate account allows suspension by its order.
SEC rules and regulations generally determine whether or not these conditions exist.
We execute transfers among the variable investment options as of the valuation date of our receipt of your request at our customer service center.
We determine the death benefit as of the date of the insured person's death. The death proceeds are not affected by subsequent changes in the value of the variable investment options.
We may delay payment from our guaranteed interest division for up to six months, unless law requires otherwise, of surrender proceeds, withdrawal amounts or loan amounts. If we delay payment more than 30 days, we pay interest at our declared rate (or at a higher rate if required by law) from the date we receive your complete request.
Notification and Claims Procedures
Except for certain authorized telephone requests, we must receive in writing any election, designation, change, assignment or request made by the owner.
You must use a form acceptable to us. We are not liable for actions taken before we receive and record the written notice. We may require you to return your policy for policy changes or if you surrender it.
If the insured person dies while your policy is in force, please let us know as soon as possible. We will send you instructions on how to make a claim. As proof of the insured person's death, we may require proof of the deceased insured person's age and a certified copy of the death certificate.
Strategic Investor 41
The beneficiaries and the deceased insured person's next of kin may need to sign authorization forms. These forms allow us to get information such as medical records of doctors and hospitals used by the deceased insured person.
Telephone Privileges
Telephone privileges are automatically provided to you and your agent/registered representative, unless you decline it on the application or contact our customer service center. Telephone privileges allow you or your agent/ registered representative to call our customer service center to:
- make transfers
- change premium allocations
- change your dollar cost averaging and automatic rebalancing programs
- request partial withdrawals
- request a policy loan.
Our customer service center uses reasonable procedures to make sure that instructions received by telephone are genuine. These procedures may include:
- requiring some form of personal identification
- providing written confirmation of any transactions
- tape recording telephone calls.
By accepting telephone privileges, you authorize us to record your telephone calls with us. If we use reasonable procedures to confirm instructions, we are not liable for losses from unauthorized or fraudulent instructions. We may discontinue this privilege at any time.
Non-participation
Your policy does not participate in the surplus earnings of ING Security Life.
Distribution of the Policies
The principal underwriter (distributor) for our policies is ING America Equities, Inc., a wholly owned subsidiary of ING Security Life. It is registered as a broker/dealer with the SEC and the NASD. We pay ING America Equities, Inc., under a distribution agreement.
We sell our policies through licensed insurance agents who are registered representatives of other broker/dealers including, but not limited to:
- VESTAX Securities Corporation, an indirect affiliate;
- Locust Street Securities, Inc., an indirect affiliate;
- Multi-Financial Securities, Corp., an indirect affiliate;
- IFG Network Securities, Inc., an indirect affiliate;
- Financial Network Investment Corporation, an indirect affiliate;
- Washington Square Securities, Inc., an indirect affiliate;
- Guaranty Brokerage Services, Inc., an indirect affiliate;
- AETNA Investment Services, LLC, an indirect affiliate;
- PrimeVest Financial Services, Inc., an indirect affiliate;
- Granite Investment Services, Inc., an indirect affiliate; and
- Financial Northeastern Securities, Inc., an indirect affiliate.
All broker/dealers who sell this policy have entered into selling agreements with us. Under these selling agreements, we pay a distribution allowance to broker/dealers, who pay commissions to their agents/registered representatives who sell this policy.
During the first policy year, we may pay a distribution allowance of up to 12% (10% for policies issued based on simplified underwriting) of premium we receive up to target premium and lower thereafter.
Although it varies by policy, we estimate the typical first year compensation payable to a selling broker/dealer if a policy pays target premium to be
Strategic Investor 42
$7.00 per $1,000 of stated death benefit ($6.00 per $1,000 for policies issued based on simplified underwriting).
Broker/dealers receive renewal payments (trails) of up to 0.15% of the average net account value beginning in the second policy month.
We pay wholesaler fees and marketing and training allowances. We may provide repayments or make sponsor payments for broker/dealers to use in sales contests for their registered representatives. We do not hold contests directly based on sales of this product. We do hold training programs from time to time at our own expense. We pay dealer concessions, wholesaling fees, other allowances and the costs of all other incentives or training programs from our resources which include sales charges.
Some broker/dealers receive a slightly lower distribution allowance because we provide them with greater marketing and administrative support. For sales of certain policies with reduced or waived sales and mortality and expense risk charges, distribution allowances and renewal payments may be reduced or eliminated.
Advertising Practices and Sales Literature
We may use advertisements and sales literature to promote this product, including:
- articles on variable life insurance and other information published in business or financial publications
- indices or rankings of investment securities
- comparisons with other investment vehicles, including tax considerations.
We may use information regarding the past performance of the variable investment options and investment portfolios. Past performance is not indicative of future performance of the variable investment options or investment portfolios and is not reflective of the actual investment experience of policyowners.
We may feature certain investment portfolios and their managers, as well as describe asset levels and sales volumes. We may refer to past, current, or prospective economic trends, and, investment performance or other information we believe may be of interest to our customers.
Settlement Provisions
You may take your net cash surrender value in other than one payment. Likewise, you may elect to have the beneficiaries receive the death proceeds other than in one payment, if you make this election during the insured person's lifetime. If you have not made this election, the beneficiaries may do so within 60 days after we receive proof of the insured person's death.
The investment performance of the variable investment options does not affect payments under these settlement options. Instead, interest accrues at a fixed rate based on the option you choose. Payment options are subject to our rules at the time you make your selection. Currently, a periodic payment must be at least $20 and the total proceeds must be $2,000 or more.
| Option I: | Payouts for a Designated Period |
| Option II: | Life Income with Payouts Guaranteed for a Designated Period |
| Option III: | Hold at Interest |
| Option IV: | Payouts of a Designated Amount |
| Option V: | Other Options We Offer at the Time We Pay the Benefit |
Administrative Information About the Policy
Voting Privileges
We invest the variable investment options' assets in shares of investment portfolios. We are the legal owner of the shares held in the separate account and we have the right to vote on certain issues. Among other things, we may vote on issues described in the fund's current prospectus or issues requiring a vote by shareholders under the Investment Company Act of 1940.
Even though we own the shares, we give you the opportunity to tell us how to vote the number of shares attributable to your policy. We count fractional shares. If you have a voting interest, we send you proxy material and a form on which to give us your voting instructions.
Strategic Investor 43
Each investment portfolio share has the right to one vote. The votes of all investment portfolio shares are cast together on a collective basis, except on issues for which the interests of the portfolios differ. In these cases, voting is on a portfolio-by-portfolio basis.
Examples of issues that require a portfolio-by-portfolio vote are changes in the fundamental investment policy of a particular investment portfolio or approval of an investment advisory agreement.
We vote the shares in accordance with your instructions at meetings of investment portfolio shareholders. We vote any investment portfolio shares that are not attributable to policies and any investment portfolio shares for which the owner does not give us instructions, the same way we vote as if we did receive owner instructions.
We reserve the right to vote investment portfolio shares without getting instructions from policy owners if the federal securities laws, regulations or their interpretations change to allow this.
You may instruct us only on matters relating to the investment portfolios corresponding to those in which you have invested assets as of the record date set by the investment portfolio's Board for the portfolio's shareholders meeting. We determine the number of investment portfolio shares in each variable investment option for your policy by dividing your account value in that division by the net asset value of one share of the matching investment portfolio.
Material Conflicts
We are required to track events to identify material conflicts arising from using investment portfolios for both variable life and variable annuity separate accounts. The Boards of the investment portfolios, ING Security Life, and other insurance companies participating in the investment portfolios, have this same duty. There may be a material conflict if:
- state insurance law or federal income tax law changes
- investment management of an investment portfolio changes
- voting instructions given by owners of variable life insurance policies and variable annuity contracts differ.
The investment portfolios may sell shares to certain qualified pension and retirement plans qualifying under Code Section 401. These include cash or deferred arrangements under Code Section 401(k). Therefore, there is a possibility that a material conflict may arise between the interests of owners in general or between certain classes of owners; and these retirement plans or participants in these retirement plans.
If there is a material conflict, we have the duty to determine appropriate action including removing the portfolios involved from our variable investment options. We may take other action to protect policy owners. This could mean delays or interruptions of the variable operations.
When state insurance regulatory authorities require it, we may ignore voting instructions relating to changes in an investment portfolio's adviser or its investment policies. If we do ignore voting instructions, we give you a summary of our actions in our next semi-annual report to owners.
Under the Investment Company Act of 1940, we must get your approval for certain actions involving our separate account. In this case, you have one vote for every $100 of value you have in the variable investment options. We cast votes credited to amounts in the variable investment options, but not credited to policies in the same proportion as votes cast by owners.
Right to Change Operations
Subject to state and federal law limitations and the rules and regulations thereunder, we may, from time to time, make any of the following changes to our separate account with respect to some or all classes of policies:
- Change the investment objective.
- Offer additional variable investment options which will invest in investment portfolios we find appropriate for policies we issue.
- Eliminate variable investment options.
- Combine two or more variable investment options.
- Substitute a new investment portfolio for a portfolio in which the variable investment option currently invests. A substitution may become necessary if, in our judgment:
» an investment portfolio no longer suits the purposes of your policy
Strategic Investor 44
» there is a change in laws or regulations
» there is a change in an investment portfolio's investment objectives or restrictions
» the investment portfolio is no longer available for investment
» a substitution is deemed appropriate for some other reason
- Transfer assets related to your policy class to another separate account.
- Withdraw the separate account from registration under the Investment Company Act of 1940, as amended (the "1940 Act").
- Operate the separate account as a management investment company under the 1940 Act.
- Cause one or more variable investment options to invest in a mutual fund other than, or in addition to, the investment portfolios.
- Stop selling these policies.
- End any employer or plan trustee agreement with us under the agreement's terms.
- Limit or eliminate any voting rights for the separate account.
- Make any changes required by the 1940 Act or its rules or regulations.
- Close an investment option to new investments.
We will not make a change until it is effective with the SEC and approved by the appropriate state insurance departments, if necessary. We will notify you of changes. If you wish to transfer the amount you have in the affected investment option to another variable investment option or to the guaranteed interest division, you may do so free of charge. Just notify us at our customer service center.
Reports to Owners
At the end of each policy year we send a report to you that shows:
- your total net policy death benefit (your stated death benefit plus adjustable term insurance rider death benefit, if any)
- your account value
- your policy loan, if any, plus accrued interest
- your net cash surrender value
- your account transactions during the policy year showing net premium, transfers, deductions, loan amounts and withdrawals.
We send semi-annual reports with financial information on the investment portfolios, including a list of the investment holdings of each portfolio.
We send confirmation notices to you throughout the year for certain policy transactions such as partial withdrawals and loans.
CHARGES AND DEDUCTIONS
The amount of a charge may not correspond to the cost incurred by us to provide the service or benefit. For example, the sales charge may not cover all of our sales and distribution expenses. Some proceeds from other charges, including the mortality and expense risk charge or cost of insurance charges, may be used to cover such expenses.
Deductions from Premium
We treat payments we receive as premium if you do not have an outstanding loan and your policy is not in the continuation of coverage period. After we deduct certain charges from your payment, we add the remaining net premium to your policy.
Initial Sales Charge
We deduct a percentage from each premium payment to help cover the costs of distribution, preparing our sales literature, promotional expenses and other direct and indirect expenses to sell the policy.
We base the percentage on the length of time since your policy or a segment becomes effective:
Segment Charge Percentage
|
| Policy or Segment Year | Up To Policy or Segment Target | Above Policy or Segment Target Premium |
1-10
11+ | 11%
0% | 0%
0% |
<R>To determine your applicable sales charge, premium payments we receive after an increase in stated death benefit are allocated to your death benefit segments in the same proportion as the target premium for
Strategic Investor 45
each segment bears to the total target premium of your stated death benefit.</R>
We may reduce or waive the sales charge for certain group, sponsored or wrap fee arrangements, or for corporate purchasers. See Group, Sponsored or Wrap Fee Arrangements, or Corporate Purchasers, page 48.
Tax Charges
We pay state and local taxes in almost all states. These taxes vary in amount from state to state and may vary from jurisdiction to jurisdiction within a state. Currently, state and local taxes range from 0% to 5%. We deduct 2.5% of each premium payment to cover these taxes. This rate approximates the average tax rate we expect to pay.
To cover our estimated costs for the federal income tax treatment of deferred acquisition costs we deduct 1.5% of each premium payment. This cost is determined solely by the amount of life insurance premium we receive.
We reserve the right to increase or decrease this charge for taxes if there are changes in the tax law, within limits set by state law. We also reserve the right to increase or decrease the charge for the federal income tax treatment of deferred acquisition costs based on any change in that cost to us.
Monthly Deductions from Account Value
We deduct charges from your account value on each monthly processing date until the policy anniversary nearest the insured person's 100th birthday.
Mortality and Expense Risk Charge
Each month we deduct from your account value a percentage of the amount in the variable investment options for the mortality and expense risks we assume. This charge appears on your statement or confirmation.
This charge is assessed at the following monthly rates:
| Account Value | 1st Policy Year | Policy Years 2-10 | Policy Years 11+ |
| Less than $25,000 | 0.0625% | 0.0625% | 0.0250% |
| $25,000 to $250,000 | 0.0625% | 0.0583% | 0.0167% |
| More than $250,000 | 0.0625% | 0.0542% | 0.0083% |
The annualized rates for the mortality and expense risk charge are:
| Account Value | 1st Policy Year | Policy Years 2-10 | Policy Years 11+ |
| Less than $25,000 | 0.75% | 0.75% | 0.30% |
| $25,000 to $250,000 | 0.75% | 0.6996% | 0.2004% |
| More than $250,000 | 0.75% | 0.6504% | 0.0996% |
The mortality and expense risk charge is assessed each month at each account value level shown in the monthly table above. For example, an account value of $400,000 in the separate account in policy year three would result in a monthly mortality and expense risk charge of $25,000 multiplied by .0625%, plus $225,000 multiplied by .0583%, plus $150,000 multiplied by .0542%.
The mortality risk is that insured people, as a group, may live less time than we estimated. The expense risk is that the costs of issuing and administering the policies and in operating the variable investment options are greater than the amount we estimated.
The mortality and expense risk charge does not apply to your account value in the guaranteed interest division or the loan division.
We may reduce or waive the mortality and expense risk charge for certain group or sponsored arrangements, groups or individuals who purchase the policy through wrap fee arrangements or for corporate purchasers. See Group, Sponsored or Wrap Fee Arrangements, or Corporate Purchasers, page 48.
Strategic Investor 46
Policy Charge
The policy charge is $13.00 per month for the first three policy years and $3.00 per month thereafter.
This charge compensates us for such costs as:
- application processing
- medical examinations
- establishment of policy records
- insurance underwriting costs.
Administrative Charge
We charge a per month administrative charge per $1,000 of stated death benefit (or target death benefit, if greater) as follows:
| Issue Ages | Policy Years 1 - 5 | Policy Years 6+ |
| 0 - 14 | $0.038 | $0.010 |
| 15 - 50 | $0.043 | $0.010 |
| 51 - 62 | $0.049 | $0.010 |
| 63 - 73 | $0.054 | $0.010 |
| 74 - 77 | $0.060 | $0.010 |
| 78 - 85 | $0.065 | $0.010 |
| 86 - 89 | $0.070 | $0.010 |
| 90 | $0.076 | $0.010 |
This charge applies to the first $5 million of death benefit. The rate per $1,000 of death benefit is based on the length of time the policy has been in force.
This charge is designed to compensate us for ongoing costs such as:
- premium billing and collections.
- claim processing
- policy transactions
- record keeping
- reporting and communications with policy owners
- other expenses and overhead.
Cost of Insurance Charge
The cost of insurance charge compensates us for the ongoing costs of providing insurance coverage, including the expected cost of paying death proceeds that may be more than your account value.
The cost of insurance charge is equal to our current monthly cost of insurance rate multiplied by the net amount at risk for each segment of your death benefit. We calculate the net amount at risk monthly, on the monthly processing date. For the base death benefit, the net amount at risk is calculated using the difference between the current base death benefit and your account value. We determine your account value after we deduct your policy and rider charges due on that date other than cost of insurance charges.
If your base death benefit on a monthly processing date increases as a requirement of the federal income tax law definition of life insurance, the net amount at risk for your base death benefit for that month also increases. Because your target death benefit did not change, the net amount at risk for your adjustable term insurance rider decreases. The amount of your cost of insurance charge varies from month to month as a result of changes in your net amount at risk, changes in the death benefit and the increasing age of the insured person. We allocate the net amount at risk to segments in the same proportion that each segment has to the total stated death benefit for all coverage as of the monthly processing date.
We base your current cost of insurance rates on the insured person's age, gender and premium class on the policy and each segment date. For fully underwritten policies, we make lower cost of insurance rates available for total death benefit amounts of $250,000 or more.
We apply unisex rates where appropriate under the law. This currently includes the state of Montana and policies purchased by employers and employee organizations in connection with employment-related insurance or benefit programs.
Separate cost of insurance rates apply to each segment of the base death benefit, and your riders.
The cost of insurance or rider charges for a class of insured persons may change from time to time. We base the new charge on changes in expectations about:
- investment earnings
- mortality
- the time policies remain in effect
- expenses
- taxes.
Strategic Investor 47
These rates are never more than the guaranteed maximum rates shown in your policy. The guaranteed maximum rates are based on the 1980 Commissioner's Standard Ordinary Sex Distinct Mortality Table. The guaranteed maximum rates for the adjustable term insurance rider are 125% of the levels in the Commissioner's Standard Ordinary Sex Distinct Mortality Table.
The maximum rates for the initial and each new segment will be printed in your policy schedule pages.
There are no cost of insurance charges during the continuation of coverage period.
Rider Charges
On each monthly processing date, we deduct the cost of your riders. Rider charges do not include those which are charged as a cost of insurance. See Riders, page 28.
Policy Transaction Fees
We charge fees for certain transactions under your policy. We deduct these fees from the variable and guaranteed interest divisions pro rata to the account value in each.
Excess Illustration Fee
Your first policy illustration in each policy year is free. After that, we assess a fee of $25 per illustration.
Partial Withdrawal Fee
We deduct a service fee of 2% of the requested partial withdrawal (but not more than $25) from your account value for each partial withdrawal. See Partial Withdrawals, page 36.
How We Deduct Charges, Loans and Partial Withdrawals
| Monthly Charges: Cost of Insurance Charges, Rider Charges, Administrative Fees | Policy Transactions and Fees: Excess Illustration Fee, Loans and Partial Withdrawals |
| Choice | May choose a designated deduction investment option, including the guaranteed interest division | May choose any investment option or combination of investment options |
| Default | Proportionally among variable investment options and guaranteed interest division | Proportionally among variable investment options and guaranteed interest division |
Other Charges
Under current law, we pay no tax on investment income and capital gains included in variable life insurance policy reserves. So no charge is currently made for our federal income taxes. If the tax law changes and we have federal income tax chargeable to the variable investment options, we may make such a charge in the future.
Group, Sponsored or Wrap Fee Arrangements, or Corporate Purchasers
Individuals, corporations or other institutions may purchase this policy. For group or sponsored arrangements (including employees and certain family members of employees of ING Security Life, its affiliates and appointed sales agents), corporate purchasers, groups or individuals who purchase the policy through wrap fee arrangements, or special exchange programs which we may offer from time to time, we may reduce or waive the:
- administrative charge
- minimum death benefit
- minimum annual premium
- target premium
- sales charges
- cost of insurance charges
- refund of sales charges
- mortality and expense risk charges
- other charges normally assessed.
Strategic Investor 48
We reduce or waive these items based on expected economies. Our sales, administration and mortality costs generally vary with the size and stability of the group, among other factors. We take all these factors into account when we reduce charges. A group, sponsored or wrap fee arrangement must meet certain requirements to qualify for reduced charges. We make reductions to charges based on our rules in effect when we approve a policy application. We may change these rules from time to time.
Group arrangements include those in which there is a trustee, an employer or an association. The group may purchase multiple policies covering a group of individuals on a group basis or endorse a policy to a group of individuals. Sponsored arrangements include those in which an employer or association allows us to offer policies to its employees or members on an individual basis.
Each sponsored arrangement or corporation may have different group premium payments and premium requirements.
We will not unfairly discriminate in any variation in the administrative charge, or other charges, fees and privileges. These variations are based on differences in costs or services.
TAX CONSIDERATIONS
The following summary provides a general description of the federal income tax considerations associated with the policy and does not purport to be complete or to cover all tax situations. This discussion is not intended as tax advice. Counsel or other competent tax advisers should be consulted for more complete information. This discussion is based upon our understanding of the present federal income tax laws. No representation is made as to the likelihood of continuation of the present federal income tax laws or as to how they may be interpreted by the Internal Revenue Service.
Tax Status of the Policy
This policy is designed to qualify as a life insurance contract under the Internal Revenue Code. All terms and provisions of the policy shall be construed in a manner which is consistent with that design. In order to qualify as a life insurance contract for federal income tax purposes and to receive the tax treatment normally accorded life insurance contracts under federal tax law, a policy must satisfy certain requirements which are set forth in the Internal Revenue Code Section 7702. While there is very little guidance as to how these requirements are applied, we believe it is reasonable to conclude that our policies satisfy the applicable requirements. If it is subsequently determined that a policy does not satisfy the applicable requirements, we will take appropriate and reasonable steps to bring the policy into compliance with such requirements and we reserve the right to restrict policy transactions or modify your policy in order to do so.
Section 7702 provides that if one of two alternate tests is met, a policy will be treated as a life insurance policy for federal income tax purposes. These tests are referred to as the "cash value accumulation test" and the "guideline premium/cash value corridor test."
Under the cash value accumulation test, there is no limit to the amount that may be paid in premiums as long as there is enough death benefit in relation to account value at all times. The death benefit at all times must be at least equal to an actuarially determined factor, depending on the insured person's age, sex and premium class at any point in time, multiplied by the account value. See Appendix C, page 236, for a table of the Cash Value Accumulation Test factors.
The guideline premium/cash value corridor test provides for a maximum premium in relation to the death benefit and a minimum "corridor" of death benefit in relation to account value. In most situations, the death benefit that results from the guideline premium/cash value corridor test will ultimately be less than the amount of death benefit required under the cash value accumulation test. See Appendix B, page 234, for a table of the Guideline Premium/Cash Value Corridor Test factors.
We will at all times strive to assure that the policy meets the statutory definition which qualifies the policy as life insurance for federal income tax purposes. See Tax Treatment of Policy Death Benefits, page 50.
Strategic Investor 49
Diversification and Investor Control Requirements
In addition to meeting the Code Section 7702 tests, Code Section 817(h) requires separate account investments, such as our separate account, to be adequately diversified. The Treasury has issued regulations which set the standards for measuring the adequacy of any diversification. To be adequately diversified, each variable investment option must meet certain tests. If your variable life policy is not adequately diversified under these regulations, it is not treated as life insurance under Code Section 7702. You would then be subject to federal income tax on your policy income as you earn it. Our variable investment options' investment portfolios have represented that they will meet the diversification standards that apply to your policy.
In certain circumstances, you, as owner of a variable life insurance policy, may be considered the owner for federal income tax purposes of the separate account assets used to support your policy. Any income and gains from the separate account assets are includable in the gross income from your policy under these circumstances. The IRS has stated in published rulings that a variable contract owner is considered the owner of separate account assets if the contract owner has "indicia of ownership" in those assets. "Indicia of ownership" includes the ability to exercise investment control over the assets.
Your ownership rights under your policy are similar to, but different in some ways from those described by the IRS in rulings in which it determined that policy owners are not owners of separate account assets. For example, you have additional flexibility in allocating your premium payments and in your policy values. These differences could result in the IRS treating you as the owner of a pro rata share of the separate account assets. We do not know what standards will be set forth in the future, if any, in Treasury regulations or rulings. We reserve the right to modify your policy, as necessary, to try to prevent you from being considered the owner of a pro rata share of the separate account assets, or to otherwise qualify your policy for favorable tax treatment.
The following discussion assumes that the policy will qualify as a life insurance contract for federal income tax purposes.
Tax Treatment of Policy Death Benefits
We believe that the death benefit under a policy is generally excludable from the gross income of the beneficiary(ies) under section 101(a)(1) of the Code. However, there are exceptions to this general rule. Additionally, federal and local transfer, estate inheritance and other tax consequences of ownership or receipt of policy proceeds depend on the circumstances of each policy owner or beneficiary(ies). A tax adviser should be consulted about these consequences.
Modified Endowment Contracts
Under the Internal Revenue Code, certain life insurance contracts are classified as "modified endowment contracts" and are given less favorable tax treatment than other life insurance contracts. Due to the flexibility of the policies as to premiums and benefits, the individual circumstances of each policy will determine whether or not it is classified as a modified endowment contract. The rules are too complex to be summarized here, but generally depend on the amount of premiums we receive during the first seven policy years. Certain changes in a policy after it is issued, such as reduction in benefits, could also cause it to be classified as a modified endowment contract. A current or prospective policy owner should consult with a competent adviser to determine whether or not a policy transaction will cause the policy to be classified as a modified endowment contract.
If a policy becomes a modified endowment contract, distributions that occur during the policy year will be taxed as distributions from a modified endowment contract. In addition, distributions from a policy within two years before it becomes a modified endowment contract will be taxed in this manner. This means that a distribution made from a policy that is not a modified endowment contract could later become taxable as a distribution from a modified endowment contract.
Multiple Policies
All modified endowment contracts that are issued by us (or our affiliates) to the same policy owner during any calendar year are treated as one modified endowment contract for purposes of determining the
Strategic Investor 50
amount includable in the policy owner's income when a taxable distribution occurs.
Distributions Other than Death Benefits
Generally, the policy owner will not be taxed on any of the policy account value until there is a distribution. When distributions from a policy occur, or when loan amounts are taken from or secured by a policy, the tax consequences depend on whether or not the policy is a "modified endowment contract."
Special rules also apply if you are subject to the alternative minimum tax. You should consult a tax adviser if you are subject to the alternative minimum tax.
Modified Endowment Contracts
Once a policy is classified as a modified endowment contract, the following tax rules apply both prospectively and to any distributions made in the prior two years:
- All distributions other than death benefits, including distributions upon surrender and withdrawals, from a modified endowment contact will be treated first as distributions of gain taxable as ordinary income and as tax-free recovery of the policy owner's investment in the policy only after all gain has been distributed.
- Loan amounts taken from or secured by a policy classified as a modified endowment contract are treated as distributions and taxed first as distributions of gain taxable as ordinary income and as tax-free recovery of the policy owner's investment in the policy only after all gain has been distributed.
- A 10% additional income tax penalty may be imposed on the distribution amount subject to income tax. This tax penalty generally does not apply to distributions (a) made on or after the date on which the taxpayer attains age 59 ½, (b) which are attributable to the taxpayer's becoming disabled (as defined in the Internal Revenue Code), or (c) which are part of a series of substantially equal periodic payments (not less frequently than annually) made for the life (or life expectancy) of the taxpayer or the joint lives (or joint life expectancies) of the taxpayer and his or her beneficiary. Consult a tax adviser to determine whether or not you may be subject to this penalty tax.
Policies That Are Not Modified Endowment Contracts
Distributions other than death benefits from a policy that is not classified as a modified endowment contract are generally treated first as a recovery of the policy owner's investment in the policy. Only after the recovery of all investment in the policy, is there taxable income. However, certain distributions which must be made in order to enable the policy to continue to qualify as a life insurance contract for federal income tax purposes, if policy benefits are reduced during the first fifteen policy years, may be treated in whole or in part as ordinary income subject to tax.
Loan amounts from or secured by a policy that is not a modified endowment contract are generally not taxed as distributions. However, the tax consequences of such a loan that is outstanding after policy year 10 are uncertain and a tax advisor should be consulted about such loans. Finally, neither distributions from, nor loan amounts from or secured by, a policy that is not a modified endowment contract are subject to the 10% additional income tax.
Investment in the Policy
Your investment in the policy is generally the total of your aggregate premiums. When a distribution is taken from the policy, your investment in the policy is reduced by the amount of the distribution that is tax free.
Policy Loans
In general, interest on a policy loan will not be deductible. Moreover, the tax consequences associated with a preferred loan available in the policy are uncertain. Before taking out a policy loan, you should consult a tax adviser as to the tax consequences.
Strategic Investor 51
If a loan from a policy is outstanding when the policy is canceled or lapses, then the amount of the outstanding indebtedness will be added to the amount treated as a distribution from the policy and will be taxed accordingly.
Accelerated Death Benefit Rider
We believe that payments under the accelerated death benefit rider should be fully excludable from the gross income of the beneficiary if the beneficiary is the insured under the policy. (See Accelerated Death Benefit Rider, page 30, for more information about this rider.) However, you should consult a qualified tax adviser about the consequences of adding this rider to a policy or requesting payment under this rider.
Continuation of Policy Beyond Age 100
The tax consequences of continuing the policy beyond the policy anniversary nearest the insured person's 100th birthday are unclear. You should consult a tax adviser if you intend to keep the policy in force beyond the policy anniversary nearest the insured person's 100th birthday.
Section 1035 Exchanges
Code Section 1035 generally provides that no gain or loss shall be recognized on the exchange of one life insurance policy for another life insurance policy or for an endowment or annuity contract. We accept 1035 exchanges with outstanding loans. Special rules and procedures apply to Section 1035 exchanges. If you wish to take advantage of Section 1035, you should consult your tax adviser.
Tax-exempt Policy Owners
Special rules may apply to a policy that is owned by a tax-exempt entity. Tax-exempt entities should consult their tax adviser regarding the consequences of purchasing and owning a policy. These consequences could include an effect on the tax-exempt status of the entity and the possibility of the unrelated business income tax.
Possible Tax Law Changes
Although the likelihood of legislative action is uncertain, there is always the possibility that the tax treatment of the policy could be changed by legislation or otherwise. You should consult a tax adviser with respect to legislative developments and their effect on the policy.
Changes to Comply with the Law
So that your policy continues to qualify as life insurance under the Code, we reserve the right to refuse to accept all or part of your premium payments or to change your death benefit. We may refuse to allow you to make partial withdrawals that would cause your policy to fail to qualify as life insurance. We also may make changes to your policy or its riders or take distributions from your policy to the degree that we deem necessary to qualify your policy as life insurance for tax purposes.
If we make any change of this type, it applies the same way to all affected policies.
Any increase in your death benefit will cause an increase in your cost of insurance charges.
Other
The policy is not available for sale to and cannot be acquired with funds that are assets of (i) an employee benefit plan as defined in section 3(3) of the Employee Retirement Income Security Act of 1974, as amended ("ERISA"), and that is subject to Title I of ERISA; (ii) a plan described in section 4975(e)(1) of the Internal Revenue Code of 1986 or (iii) an entity whose underlying assets include plan assets by reason of the investment by an employee benefit plan or other plan in such entity within the meaning of 29 C.F.R. Section 2510.3-101 or otherwise.
Policy owners may use our policies in various other arrangements, including:
- non-qualified deferred compensation or salary continuance plans
- split dollar insurance plans
- executive bonus plans
- retiree medical benefit plans
- other plans.
The tax consequences of these plans may vary depending on the particular facts and circumstances of each arrangement. If you want to use any of your
Strategic Investor 52
policies in this type of arrangement, you should consult a qualified tax adviser regarding the tax issues of your particular arrangement.
In recent years, Congress has adopted new rules relating to life insurance owned by businesses. Any business contemplating the purchase of a new policy or a change in an existing policy should consult a tax adviser.
The IRS requires us to withhold income taxes from any portion of the amounts individuals receive in a taxable transaction. We do not withhold income taxes if you elect in writing not to have withholding apply. If the amount withheld for you is insufficient to cover income taxes, you may have to pay income taxes and possibly penalties later.
The transfer of the policy or designation of a beneficiary may have federal, state and/or local transfer and inheritance tax consequences, including the imposition of gift, estate and generation-skipping transfer taxes. For example the transfer of the policy to, or the designation as a beneficiary of, or the payment of proceeds to a person who is assigned to a generation which is two or more generations below the generation assignment of the policy owner may have generation skipping transfer tax consequences under federal tax law. The individual situation of each policy owner or beneficiary will determine the extent, if any, to which federal, state and local transfer and inheritance taxes may be imposed and how ownership or receipt of policy proceeds will be treated for purposes of federal, state and local estate, inheritance, generation skipping and other taxes.
You should consult qualified legal or tax advisers for complete information on federal, state, local and other tax considerations.
Strategic Investor 53
ADDITIONAL INFORMATION
Directors and Officers
Set forth below is information regarding the directors and principal officers of Security Life of Denver Insurance Company. Security Life's address, and the business address of each person named, except as noted with one or two asterisks (*/**), is Security Life Center, 1290 Broadway, Denver, Colorado 80203-5699. The business address of each person denoted with one asterisk (*) is 5780 Powers Ferry Road, Atlanta, Georgia 30327-4390. The business address of each person denoted with two asterisks (**) is 20 Washington Avenue South, Minneapolis, MN 55401.
Name and Principal
Business and Address | Position and Offices with Security Life of Denver Insurance Company |
|
| Robert C. Salipante** | Chief Executive Officer, Director |
| Wayne R. Huneke* | Chief Financial Officer, Director |
| Mark A. Tullis | Director |
|
| P. Randall Lowery | Director |
|
| Thomas J. McInerney | Director |
|
| Chris D. Schreier** | President |
|
| James L. Livingston, Jr. | Executive Vice President |
|
|
| Douglas W. Campbell | Senior Vice President, Agency Sales |
|
|
| Paula Cludray-Engelke** | Secretary |
|
| Eric G. Banta | Assistant Secretary |
|
| Rita J. Kummer | Assistant Secretary |
Strategic Investor 54
Regulation
We are regulated and supervised by the Division of Insurance of the Department of Regulatory Agencies of the State of Colorado which periodically examines our financial condition and operations. In addition, we are subject to the insurance laws and regulations in every jurisdiction in which we do business. As a result, the provisions of this policy may vary somewhat from jurisdiction to jurisdiction.
We are required to submit annual statements, including financial statements, of our operations and finances to the insurance departments of the various jurisdictions in which we do business to determine solvency and compliance with state insurance laws and regulations.
We are also subject to various federal securities laws and regulations.
Legal Matters
The legal matters in connection with the policy described in this prospectus and certain matters relating to the federal securities laws have been passed on by Counsel of ING Security Life.
Legal Proceedings
ING Security Life, as an insurance company, is ordinarily involved in litigation. We do not believe that any current litigation is material to ING Security Life's ability to meet its obligations under the policy or to the separate account and we do not expect to incur significant losses from such actions. ING America Equities, Inc., the principal underwriter and distributor of the policy, is not engaged in any litigation of any material nature.
Experts
<R>The statutory basis financial statements of Security Life of Denver Insurance Company at December 31, 2000 and 1999, and for each of the three years in the period ended December 31, 2000, and the financial statements of the Security Life Separate Account L1 at December 31, 2000, and for each of the three years in the period ended December 31, 2000, appearing in this prospectus and registration statement have been audited by Ernst & Young LLP, independent auditors, as set forth in their reports thereon appearing elsewhere herein, and are included in reliance upon such reports given on the authority of such firm as experts in accounting and auditing. Other financial statements included in the prospectus are unaudited.</R>
Actuarial matters in this prospectus have been examined by James L. Livingston, Jr., F.S.A., M.A.A.A., who is Executive Vice President of ING Security Life. His opinion on actuarial matters is filed as an exhibit to the Registration Statement we filed with the SEC.
Registration Statement
We have filed a Registration Statement relating to the separate account and the variable life insurance policy described in this prospectus with the SEC. The Registration Statement, which is required by the Securities Act of 1933, includes additional information that is not required in this prospectus under the rules and regulations of the SEC. The additional information may be obtained from the SEC's principal office in Washington, DC. There is a charge for this material.
Strategic Investor 55
FINANCIAL STATEMENTS
<R>The statutory-basis financial statements of Security Life of Denver Insurance Company ("Security Life") at December 31, 2000 and 1999, and for each of the three years in the period ended December 31, 2000, are prepared in conformity with accounting practices prescribed or permitted by the Division of Insurance of the Department of Regulatory Agencies of the State of Colorado (Colorado Division of Insurance), which is a comprehensive basis of accounting other than accounting principles generally accepted in the United States, and start on page 57. The financial statements included for the Security Life Separate Account L1 at December 31, 2000, and for each of the three years in the period ended December 31, 2000, are prepared in accordance with accounting principles generally accepted in the United States and represent those divisions that had commenced operations by that date. The financial statements of Security Life, as well as the financial statements included for the Security Life Separate Account L1 referred to above, have been audited by Ernst & Young LLP. The financial statements of Security Life should be distinguished from the financial statements of the Security Life Separate Account L1 and should be considered only as bearing upon the ability of Security Life to meet its obligations under the policies. They should not be considered as bearing upon the investment experience of the divisions of Security Life Separate Account L1. Other financial statements included in the prospectus are unaudited.
Strategic Investor 56
Security Life of Denver Insurance Company
Financial Statements -- Statutory Basis
Years ended December 31, 2000, 1999, and 1998
with Report of Independent Auditors
Strategic Investor 57
Security Life of Denver Insurance Company
Financial Statements - Statutory Basis
Years ended December 31, 2000, 1999 and 1998
Contents
Report of Independent Auditors 59
Audited Financial Statements - Statutory Basis
Balance Sheets - Statutory Basis 60
Statements of Operations - Statutory Basis 62
Statements of Changes in Capital and Surplus - Statutory Basis 64
Statements of Cash Flow - Statutory Basis 65
Notes to Financial Statements - Statutory Basis 67
Strategic Investor 58
Report of Independent Auditors
Board of Directors and Stockholder
Security Life of Denver Insurance Company
We have audited the accompanying statutory-basis balance sheets of Security Life of Denver Insurance Company (a wholly owned subsidiary of ING America Insurance Holdings, Inc.) as of December 31, 2000 and 1999, and the related statutory-basis statements of operations, changes in capital and surplus, and cash flows for each of the three years in the period ended December 31, 2000. These financial statements are the responsibility of the Company's management. Our responsibility is to express an opinion on these financial statements based on our audits.
We conducted our audits in accordance with auditing standards generally accepted in the United States. Those standards require that we plan and perform the audit to obtain reasonable assurance about whether the financial statements are free of material misstatement. An audit includes examining, on a test basis, evidence supporting the amounts and disclosures in the financial statements. An audit also includes assessing the accounting principles used and significant estimates made by management, as well as evaluating the overall financial statement presentation. We believe that our audits provide a reasonable basis for our opinion.
As described in Note 1 to the financial statements, the Company presents its financial statements in conformity with accounting practices prescribed or permitted by the Division of Insurance of the Department of Regulatory Agencies of the State of Colorado (Colorado Division of Insurance), which practices differ from accounting principles generally accepted in the United States. The variances between such practices and accounting principles generally accepted in the United States are described in Note 1. The effects on the financial statements of these variances are not reasonably determinable but are presumed to be material.
In our opinion, because of the effects of the matter described in the preceding paragraph, the financial statements referred to above do not present fairly, in conformity with accounting principles generally accepted in the United States, the financial position of Security Life of Denver Insurance Company at December 30, 2000 and 1999 or the results of its operations or its cash flows for each of the three years in the period ended December 31, 2000.
However, in our opinion, the financial statements referred to above present fairly, in all material respects, the financial position of Security Life of Denver Insurance Company at December 31, 2000, and the results of its operations and its cash flows for each of the three years in the period ended December 31, 2000, in conformity with accounting practices prescribed or permitted by the Colorado Division of Insurance.
March 23, 2001
Strategic Investor 59
Security Life of Denver Insurance Company
Balance Sheets--Statutory Basis
(In Thousands)
| September 30,
2001
| December 31 |
2000
| 1999
|
| Admitted assets | (Unaudited) | | |
| Cash and invested assets: | | | |
| Bonds | $ 6,601,832 | $4,573,658 | $3,418,381 |
| Preferred stocks | 12,819 | 13,524 | 2,560 |
| Common stocks | 19,112 | 15,483 | 4,977 |
| Subsidiaries | 88,870 | 85,324 | 77,127 |
| Mortgage loans | 2,191,673 | 1,672,169 | 983,087 |
Real estate, less accumulated depreciation
(2001 - $11,469; 2000 - $10,961;
1999 - $10,069) | 33,702 | 34,066 | 31,363 |
| Policy loans | 1,056,246 | 992,911 | 943,185 |
| Other invested assets | 58,530 | 42,926 | 35,666 |
| Cash and short-term investments | 354,643
| 203,664
| 226,054
|
| Total cash and invested assets | 10,417,427 | 7,633,725 | 5,722,400 |
| | | | |
| | | | |
| | | | |
Deferred and uncollected premiums, less loading
(2001 - $995; 2000 - $1,814; 1999 - $2,684) | 119,891 | 135,041 | 101,343 |
| Accrued investment income | 115,864 | 95,887 | 75,101 |
| Reinsurance balances recoverable | 863,261 | 54,559 | 43,179 |
Data processing equipment, less accumulated
depreciation (2001 - $1,386; 2000 - $1,340;
1999 - $8,381) | 171 | 216 | 202 |
| Indebtedness from related parties | 35,769 | 69,338 | 42,451 |
| Federal income tax recoverable | 63,436 | 32,108 | 25,626 |
| Separate account assets | 772,267 | 799,966 | 644,975 |
| Other assets | 13,894 | 14,902 | 15,930 |
| | | | |
| | | | |
| | | | |
| |
|
|
|
| Total admitted assets | $12,401,980
| $8,835,742
| $6,671,207
|
Strategic Investor 60
| September 30,
2001
| December 31 |
2000
| 1999
|
| (Unaudited) | (In Thousands,
except share
amounts) | |
| Liabilities and capital and surplus | | | |
| Liabilities: | | | |
| Policy and contract liabilities: | | | |
| Life and annuity reserves | $ 6,193,466 | $5,247,418 | $4,924,746 |
| Accident and health reserves | 23 | 23 | 11 |
| Deposit type contracts | 3,877,860 | - | - |
| Guaranteed investment contracts | - | 1,685,391 | 335,507 |
| Policyholders' funds | 100,482 | 71,669 | 91,920 |
| Dividends left on deposit | 8,800 | 8,748 | 8,647 |
| Dividends payable | 4,129 | 2,755 | 2,626 |
| Unpaid claims | 245,875
| 182,051
| 126,172
|
| Total policy and contract liabilities | 10,430,635 | 7,198,055 | 5,489,629 |
| | | | |
| Accounts payable and accrued expenses | 206,494 | 126,512 | 86,580 |
| Reinsurance balances due | 13,951 | 15,520 | 14,565 |
| Indebtedness to related parties | 15,000 | 8,016 | 18,329 |
| Litigation reserve | 18,912 | 20,449 | 37,538 |
| Asset valuation reserve | 70,071 | 52,125 | 29,875 |
| Interest maintenance reserve | - | - | 1,523 |
| Borrowed money | 228,673 | 127,993 | 15,200 |
| Other liabilities | 131,833 | (4,226) | (25,008) |
| Separate account liabilities | 772,267
| 799,966
| 644,975
|
| Total liabilities | 11,887,836 | 8,344,410 | 6,313,206 |
| | | | |
| Commitments and contingencies | | | |
| | | | |
| Capital and surplus: | | | |
| Common stock, $20,000 par value: | | | |
| Authorized - 149 shares | | | |
| Issued and outstanding - 144 shares | 2,880 | 2,880 | 2,880 |
| Surplus notes | 165,032 | 184,259 | 100,000 |
| Paid-in and contributed surplus | 435,562 | 435,562 | 374,562 |
| Unassigned deficit | (89,330)
| (131,369)
| (119,441)
|
| Total capital and surplus | 514,144
| 491,332
| 358,001
|
| Total liabilities and capital and surplus | $ 12,401,980
| $8,835,742
| $6,671,207
|
See accompanying notes - statutory basis.
Strategic Investor 61
Security Life of Denver Insurance Company
Statements of Operations--Statutory Basis
(In Thousands)
| September 30,
2001
| Year ended December 31 |
2000
| 1999
| 1998
|
| (Unaudited) | | | |
| Premiums and other revenues: | | | | |
Life, annuity, and accident and health
premiums | $ 1,788,490 | $2,959,593 | $1,459,361 | $1,130,674 |
Policy proceeds and dividends left on
deposit | 15 | 388 | 651 | 515 |
| Net investment income | 452,953 | 474,021 | 387,685 | 349,605 |
Amortization of interest maintenance
reserve | 531 | 670 | 2,358 | 3,793 |
Commissions, expense allowances and
reserve adjustments on reinsurance
ceded | 1,501 | 9,832 | 11,331 | 13,255 |
Considerations and reserve allowances on
modified coinsurance | 4,491
| 2,632
| 3,670
| 945
|
| Total premiums and other revenues | 2,247,981 | 3,447,136 | 1,865,056 | 1,498,787 |
| | | | | |
| Benefits paid or provided: | | | | |
| Death benefits | 272,281 | 316,167 | 273,368 | 270,537 |
| Annuity benefits | 9,642 | 11,782 | 24,573 | 10,769 |
| Surrender benefits | 204,191 | 258,858 | 229,434 | 198,988 |
| Interest on policy or contract funds | 104,061 | 64,719 | 17,473 | 13,832 |
| Accident and health benefits | 2,902 | 93 | 2,235 | 3,699 |
Guaranteed investment contract
withdrawals | - | 1,072,574 | 12,186 | - |
| Life contract withdrawals | 951,798 | - | - | - |
| Other benefits | 995 | 17,198 | 13,612 | 17,750 |
Increase in life, annuity, and accident and
health reserves | 194,623 | 320,721 | 491,978 | 581,110 |
Increase in liability for guaranteed
investment contracts | - | 721,725 | 335,507 | - |
| Net transfers to separate accounts | 129,817
| 256,538
| 78,988
| 65,738
|
| Total benefits paid or provided | 1,870,310 | 3,040,375 | 1,479,354 | 1,162,423 |
| | | | | |
| Insurance expenses: | | | | |
| Commissions | 186,512 | 242,998 | 222,005 | 199,786 |
| General expenses | 91,263 | 130,962 | 104,808 | 96,891 |
Insurance taxes, licenses and fees,
excluding federal income taxes | 10,474
| 23,103
| 23,861
| 23,121
|
| Total insurance expenses | 288,249
| 397,063
| 350,674
| 319,798
|
| | | | | |
Gain from operations before policyholder
dividends, federal income taxes and net
realized capital gains | 89,422 | 9,698 | 35,028 | 16,566 |
Strategic Investor 62
Security Life of Denver Insurance Company
Statements of Operations--Statutory Basis (continued)
(In Thousands)
| September 30,
2001
| Year ended December 31 |
| 2000
| 1999
| 1998
|
| (Unaudited) | | | |
| | | | | |
| Dividends to policyholders | 2,560
| 2,546
| 2,594
| 2,399
|
| | | | | |
Gain from operations before federal income
taxes and net realized capital losses | 86,862 | 7,152 | 32,434 | 14,167 |
| Federal income taxes | 54,406
| (1,339)
| 8,613
| 2,371
|
Gain from operations before net realized
capital losses | 32,456 | 8,491 | 23,821 | 11,796 |
Net realized capital gains (losses) net of
income taxes (2001 - $5,806; 2000 -
$(7,916); 1999 - $(15,108), 1998-
$2,001) and excluding net transfers to the
interest maintenance reserve (2001 -
$8,487; 2000 - $(18,289); 1999 -
$(19,866); 1998 - $8,549) | (10,017)
| 3,589
| (8,194)
| (4,834)
|
| Net income | $ 22,439
| $ 12,080
| $ 15,627
| $ 6,962
|
See accompanying notes - statutory basis.
Strategic Investor 63
Security Life of Denver Insurance Company
Statements of Changes in Capital and Surplus--Statutory Basis
(In Thousands)
| September 30,
2001
| Year ended December 31 |
2000
| 1999
| 1998
|
| (Unaudited) | | | |
| Common stock: | | | | |
| Balance at beginning and end of year | $ 2,880
| $ 2,880
| $ 2,880
| $ 2,880
|
| | | | | |
| Surplus note: | | | | |
| Balance at beginning of year | $ 184,259 | $ 100,000 | $ 100,000 | $ 75,000 |
| Increase (decrease) in surplus note | (19,227)
| 84,259
| -
| 25,000
|
| Balance at end of year | $ 165,032
| $ 184,259
| $ 100,000
| $ 100,000
|
| | | | | |
| Paid-in and contributed surplus: | | | | |
| Balance at beginning of year | $ 435,562 | $ 374,562 | $ 344,562 | $ 344,562 |
| Capital contributions | -
| 61,000
| 30,000
| -
|
| Balance at end of year | $ 435,562
| $ 435,562
| $ 374,562
| $ 344,562
|
| | | | | |
| Unassigned deficit: | | | | |
| Balance at beginning of year | $(131,369) | $(119,441) | $(134,540) | $ (86,233) |
| Net income | 22,439 | 12,080 | 15,627 | 6,962 |
| Change in net unrealized capital gains or losses | 1,847 | 12,101 | (61) | 7,839 |
| Change in net deferred income tax | 1,158 | - | - | - |
| Decrease (increase) in nonadmitted assets | 1,625 | (11,048) | (7,336) | (28,686) |
(Increase) decrease in liability for reinsurance in
unauthorized companies | ( 915) | (393) | (550) | 545 |
| (Increase) decrease in asset valuation reserve | (17,947) | (22,250) | 1,726 | (6,084) |
| Increase in reserve valuation basis | - | - | - | (2,994) |
| Increase in litigation reserve, net of tax | - | - | - | (26,000) |
| Cession of existing risks, net of tax | - | (2,418) | 127 | 12,591 |
| Prior period adjustments | (8,054) | - | - | (12,480) |
| Change in accounting policy, net of tax | - | - | 5,566 | - |
| Change in accounting principle | 41,886
| -
| -
| -
|
| Balance at end of year | $ (89,330)
| $(131,369)
| $(119,441)
| $(134,540)
|
| | | | | |
| Total capital and surplus | $ 514,144
| $ 491,332
| $ 358,001
| $ 312,902
|
See accompanying notes - statutory basis.
Strategic Investor 64
Security Life of Denver Insurance Company
Statements of Cash Flow--Statutory Basis
(In Thousands)
| September 30,
2001
| Year ended December 31 |
| 2000
| 1999
| 1998
|
| (Unaudited) | | | |
| Operations | | | | |
Premiums, policy proceeds, and other
considerations received, net of reinsurance
paid | $ 4,033,087 | $2,910,602 | $1,453,924 | $1,128,910 |
| Net investment income received | 425,249 | 470,812 | 379,574 | 361,645 |
Commission and expense allowances
received on reinsurance ceded | 1,501 | 9,831 | 9,246 | 10,709 |
| Benefits paid | (1,466,686) | (1,691,985) | (558,572) | (494,981) |
| Net transfers to separate accounts | (139,957) | (225,694) | (101,948) | (96,273) |
| Insurance expenses paid | (293,043) | (361,130) | (337,254) | (325,688) |
| Dividends paid to policyholders | (1,186) | (2,417) | (2,562) | (2,317) |
| Federal income taxes received (paid) | (39,119) | 11,961 | (28,779) | (17,582) |
| Other revenues in excess of other (expenses) | 189,818
| 611,646
| (9,832)
| 11,734
|
| Net cash provided by operations | 2,709,664 | 1,733,626 | 803,797 | 576,157 |
| | | | | |
| Investments | | | | |
Proceeds from sales, maturities, or
repayments | | | | |
| of investments: | | | | |
| Bonds | 2,596,755 | 2,254,036 | 2,051,280 | 4,353,422 |
| Preferred stocks | - | 67 | 1,900 | 627 |
| Common stocks | 5,450 | - | - | 1,362 |
| Mortgage loans | 75,249 | 79,874 | 45,272 | 48,709 |
| Other invested assets | 51,802 | 106,724 | 310,554 | 362,419 |
| Miscellaneous proceeds | (15,926) | 11,213 | - | 9,836 |
Net proceeds from sales, maturities, or
repayments of investments | 2,713,330 | 2,451,914 | 2,409,006 | 4,776,375 |
| | | | | |
| Cost of investments acquired: | | | | |
| Bonds | 4,635,879 | 3,458,376 | 2,631,687 | 4,720,513 |
| Preferred stocks | - | 11,031 | - | 2,060 |
| Common stocks | 10,740 | 10,450 | 10 | 341 |
| Mortgage loans | 595,269 | 769,741 | 262,886 | 246,511 |
| Real estate | 145 | 3,653 | 189 | 98 |
| Other invested assets | 46,932 | 109,244 | 88,661 | 387,144 |
| Miscellaneous (receipts) applications | -
| 23,155
| (18,179)
| 8,516
|
| Total cost of investments acquired | 5,288,965 | 4,385,650 | 2,965,254 | 5,365,183 |
| | | | | |
| Net increase in policy loans | 63,335
| 49,725
| 35,890
| 51,702
|
| Net cash used in investment activities | (2,638,970) | (1,983,461) | (592,138) | (640,510) |
Strategic Investor 65
Security Life of Denver Insurance Company
Statements of Cash Flow--Statutory Basis (continued)
(In Thousands)
| September 30,
2001
| Year ended December 31 |
| 2000
| 1999
| 1998
|
| (Unaudited) | | | |
| Financing and miscellaneous activities | | | | |
| Cash provided: | | | | |
| Capital and surplus paid-in | (19,228) | 126,000 | 20,000 | 25,000 |
| Borrowed money | 100,681 | 112,792 | 15,200 | - |
| Other sources | (1,168)
| (11,347)
| (50,565)
| 1,390
|
Net cash provided by (used in) financing and
miscellaneous activities | 80,285
| 227,445
| (15,365)
| 26,390
|
| | | | | |
| | | | | |
Net (decrease) increase in cash and short-
term investments | 150,979 | (22,390) | 196,294 | (37,963) |
| Cash and short-term investments: | | | | |
| Beginning of year | 203,664
| 226,054
| 29,760
| 67,723
|
| End of year | $354,643
| $203,664
| $226,054
| $ 29,760
|
See accompanying notes - statutory basis.
Strategic Investor 66
Security Life of Denver Insurance Company
Notes to Financial Statements - Statutory Basis
December 31, 2000
1. Nature of Operations and Basis of Financial Reporting
Security Life of Denver Insurance Company (the Company) is a wholly owned subsidiary of ING America Insurance Holdings, Inc. (ING America). The Company focuses on three markets, the advanced market, reinsurance to other insurers and the investment products market. The life insurance products offered for the advanced market include wealth transfer and estate planning, executive benefits, charitable giving and corporate-owned life insurance. These products include traditional life, interest-sensitive life, universal life, and variable life. Operations are conducted almost entirely on the general agency basis and the Company is presently licensed in all states (approved for reinsurance only in New York), the District of Columbia and the U.S. Virgin Islands. In the reinsurance market, the Company offers financial security to clients through a mix of total risk management and traditional life insurance services. In the investment products market, the Company offers guaranteed investment contracts, funding agreements, and Trust notes to institutional buyers.
The preparation of financial statements of insurance companies requires management to make estimates and assumptions that affect amounts reported in the financial statements and accompanying notes. Such estimates and assumptions could change in the future as more information becomes known, which could impact the amounts reported and disclosed herein.
Basis of Presentation
The accompanying financial statements of the Company have been prepared in conformity with accounting practices prescribed or permitted by the Division of Insurance of the Department of Regulatory Agencies of the State of Colorado (Colorado Division of Insurance), which practices differ from accounting principles generally accepted in the United States ("GAAP"). The most significant variances from GAAP are as follows:
Investments
Investments in bonds and mandatorily redeemable preferred stocks are reported at amortized cost or market value based on the National Association of Insurance Commissioners ("NAIC") rating; for GAAP, such fixed maturity investments are designated at purchase as held-to-maturity, trading or available-for-sale. Held-to-maturity investments are reported at amortized cost, and the remaining fixed maturity investments are reported at fair value with unrealized capital gains and losses reported in operations for those designated as trading and as a separate component of other comprehensive income in stockholder's equity for those designated as available-for-sale.
Investments in real estate are reported net of related obligations rather than on a gross basis. Real estate owned and occupied by the Company is included in investments rather than reported as an operating asset, and investment income and operating expenses include rent for the Company's occupancy of those properties. Changes between depreciated cost and admitted asset investment amounts are credited or charged directly to unassigned surplus rather than income.
Strategic Investor 67
Security Life of Denver Insurance Company
Notes to Financial Statements - Statutory Basis (continued)
1. Nature of Operations and Basis of Financial Reporting (continued)
Valuation Allowances
The asset valuation reserve (AVR) is determined by an NAIC-prescribed formula and is reported as a liability rather than as a valuation allowance or an appropriation of surplus. The change in AVR is reported directly to unassigned surplus.
Under a formula prescribed by the NAIC, the Company defers the portion of realized gains and losses on sales of fixed-income investments, principally bonds and mortgage loans attributable to changes in the general level of interest rates and amortizes those deferrals over the remaining period to maturity based on groupings of individual securities sold in five-year bands. The net deferral is reported as the interest maintenance reserve (IMR) in the accompanying balance sheets.
Realized gains and losses on investments are reported in operations net of federal income tax and transfers to the IMR. Under GAAP, realized capital gains and losses are reported in the statements of operations on a pretax basis in the period that the asset giving rise to the gain or loss is sold and valuation allowances are provided when there has been a decline in value deemed other than temporary, in which case the provision for such declines is charged to income.
Policy Acquisition Costs
The costs of acquiring and renewing business are expensed when incurred. Under GAAP, acquisition costs related to traditional life insurance, to the extent recoverable from future policy revenues, are deferred and amortized over the premium-paying period of the related policies using assumptions consistent with those used in computing policy benefit reserves. For universal life insurance and investment products, acquisition costs are amortized generally in proportion to the present value of expected gross margins from surrender charges and investment, mortality, and expense margins.
Benefit and Contract Reserves
Life policy and contract reserves under statutory accounting practices are calculated based upon both the net level premium and Commissioners' Reserve Valuation methods using statutory rates for mortality and interest. GAAP requires that policy reserves for traditional products be based upon the net level premium method utilizing reasonably conservative estimates of mortality, interest, and withdrawals prevailing when the policies were sold. For interest-sensitive products, the GAAP policy reserve is equal to the policy fund balance plus an unearned revenue reserve which reflects the unamortized balance of early year policy loads over renewal year policy loads.
Reinsurance
For business ceded to unauthorized reinsurers, statutory accounting practices require that reinsurance credits permitted by the treaty be recorded as an offsetting liability and charged against unassigned surplus. Such treatment is not required by GAAP. Statutory income recognized on certain reinsurance treaties representing financing arrangements is not recognized on a GAAP basis.
Strategic Investor 68
Security Life of Denver Insurance Company
Notes to Financial Statements - Statutory Basis (continued)
1. Nature of Operations and Basis of Financial Reporting (continued)
Policy and contract liabilities ceded to reinsurers have been reported as reductions of the related reserves rather than as assets as required under GAAP.
Commissions allowed by reinsurers on business ceded are reported as income when received rather than being deferred and amortized with deferred policy acquisition costs as required under GAAP.
Subsidiaries
The accounts and operations of the Company's subsidiaries are not consolidated with the accounts and operations of the Company as required under GAAP.
Nonadmitted Assets
Certain assets designated as "nonadmitted," principally the difference between amortized cost and fair value of less-than-investment-grade bonds, agents' debit balances, furniture and equipment and deferred federal income tax recoverable, are excluded from the accompanying balance sheets and are charged directly to unassigned surplus.
Employee Benefits
For purposes of calculating the Company's postretirement benefit obligation, only vested participants and current retirees are included in the valuation. Under GAAP, active participants not currently vested are also included.
Investment-type Products
Revenues for investment-type products consist of the entire premium received and benefits represent the death benefits paid and the change in policy reserves. Under GAAP, premiums received in excess of policy charges are not recognized as premium revenue; benefits represent the excess of benefits paid over the policy account value and interest credited to the account values.
Policyholder Dividends
Policyholder dividends are recognized when declared rather than over the term of the related policies.
Surplus Notes
Surplus notes are reported as a component of surplus. Under statutory accounting practices, no interest is recorded on the surplus notes until payment has been approved by the Colorado Division of Insurance. Under GAAP, surplus notes are reported as liabilities and the related interest is reported as a charge to earnings over the term of the note.
Strategic Investor 69
Security Life of Denver Insurance Company
Notes to Financial Statements - Statutory Basis (continued)
1. Nature of Operations and Basis of Financial Reporting (continued)
Statements of Cash Flows
Cash and short-term investments in the statements of cash flows represent cash balances and investments with initial maturities of one year or less. Under GAAP, the corresponding caption of cash and cash equivalents include cash balances and investments with initial maturities of three months or less.
Reconciliation to GAAP
The effects of the preceding variances from GAAP on the accompanying Statutory-basis financial statements have not been determined, but are presumed to be material.
Other significant accounting practices are as follows:
Investments
Bonds, preferred stocks, common stocks, short-term investments and derivative instruments are stated at values prescribed by the NAIC, as follows:
| Bonds not backed by other loans are principally stated at amortized cost using the interest method. |
| | |
| Single class and multi-class mortgage-backed/asset-backed securities are valued at amortized cost using the interest method including anticipated prepayments. Prepayment assumptions are obtained from dealer surveys or internal estimates and are based on the current interest rate and economic environment. The retrospective adjustment method is used to value all such securities except for higher-risk asset backed securities, which are valued using the prospective method. |
| |
| Redeemable preferred stocks are reported at cost or amortized cost or the lower of cost, amortized cost, or market value and nonredeemable preferred stocks are reported at market value or the lower of cost or market value as determined by the Securities Valuation Office of the NAIC ("SVO"). |
| |
| Common stocks are reported at market value as determined by the SVO and the related unrealized capital gains/(losses) are reported in unassigned surplus without any adjustment for federal income taxes. |
| |
| The Company uses interest rate swaps, caps and floors, options and certain other derivatives as part of its overall interest rate risk management strategy for certain life insurance and annuity products. As the Company only uses derivatives for hedging purposes, the Company values all derivative instruments on a consistent basis with the hedged item. Upon termination, gains and losses on those instruments are included in the carrying values of the underlying hedged items and are amortized over the remaining lives of the hedged items as adjustments to investment income or benefits from the hedged items. Any unamortized gains or losses are recognized when the underlying hedged items are sold. |
Strategic Investor 70
Security Life of Denver Insurance Company
Notes to Financial Statements - Statutory Basis (continued)
1. Nature of Operations and Basis of Financial Reporting (continued)
| |
| | Interest rate swap contracts are used to convert the interest rate characteristics (fixed or variable) of certain investments to match those of the related insurance liabilities that the investments are supporting. The net interest effect of such swap transactions is reported as an adjustment of interest income from the hedged items as incurred. |
| |
| Interest rate caps and floors are used to limit the effects of changing interest rates on yields of variable rate or short-term assets or liabilities. The initial cost of any such agreement is amortized to net investment income over the life of the agreement. Periodic payments that are receivable as a result of the agreements are accrued as an adjustment of interest income or benefits from the hedged items. |
| |
| The Company's insurance subsidiaries are reported at their underlying statutory-basis net assets plus the admitted portion of goodwill, and the Company's noninsurance subsidiary is reported at the GAAP-basis of its net assets. The admitted portion of goodwill, which represents the excess of the purchase price over the statutory-basis net assets of the subsidiary at acquisition, is amortized on a straight-line basis over ten years. Dividends from subsidiaries are included in net investment income. The remaining net change in the subsidiaries' equity is included in the change in net unrealized capital gains or losses. |
|
| Mortgage loans are reported at unpaid principal balances, less allowance for impairments. |
| |
| Policy loans are reported at unpaid principal balances. |
| |
| Land is reported at cost. Real estate occupied by the company is reported at depreciated cost; other real estate is reported at the lower of depreciated cost or fair value. Depreciation is calculated on a straight-line basis over the estimated useful lives of the properties. |
| |
| Dollar roll transactions are accounted for as collateral borrowings, where the amount borrowed is equal to the sales price of the underlying securities. |
| |
| Short-term investments are reported at cost. Short-term investments include investments with maturities of less than one year at the date of acquisition. |
| |
| Other invested assets are reported at amortized cost using the effective interest method. Other invested assets primarily consist of residual collateralized mortgage obligations and partnership interests. |
| |
| Realized capital gains and losses are determined using the specific identification basis. Changes in market values of common stocks are reported as a change in unrealized gains or losses directly in unassigned surplus and, accordingly, have no effect on net income. |
Strategic Investor 71
Security Life of Denver Insurance Company
Notes to Financial Statements - Statutory Basis (continued)
1. Nature of Operations and Basis of Financial Reporting (continued)
Aggregate Reserve for Life Policies and Contracts
Life, annuity, and accident and health reserves are developed by actuarial methods and are determined based on published tables using statutorily specified interest rates and valuation methods that will provide, in the aggregate, reserves that are greater than or equal to the minimum or guaranteed policy cash value or the amounts required by law. Interest rates range from 2% to 11.25%.
The Company waives the deduction of deferred fractional premiums upon the death of the insured. It is the Company's practice to return a pro rata portion of any premium paid beyond the policy month of death, although it is not contractually required to do so for certain issues.
The methods used in valuation of substandard policies are as follows:
| | 1. | For Life, Endowment and Term policies issued substandard, the standard reserve during the premium-paying period is increased by 50% of the gross annual extra premium. Standard reserves are held on Paid-Up Limited Pay contracts. |
| |
| 2. | For reinsurance accepted: |
| |
| | a. | with table rating, the reserve established is a multiple of the standard reserve corresponding to the table rating; |
| |
| | b. | with flat extra premiums, the standard reserve is increased by 50% of the flat extra. |
The amount of insurance in force for which the gross premiums are less than the net premiums, according to the standard of valuation required by the State of Colorado, is $61,062,274,000 at December 31, 2000. The amount of reserves for policies on which gross premiums are less than the net premiums is $783,259,000 at December 31, 2000.
The tabular interest has been determined from the basic data for the calculation of policy reserves for all direct ordinary life insurance and for the portion of group life insurance classified as group Section 79. The method of determination of tabular interest of funds not involving life contingencies is as follows: current year reserves, plus payments, less prior year reserves, less funds added.
Reinsurance
Reinsurance premiums, commissions, expense reimbursements, and reserves related to reinsured business are accounted for on bases consistent with those used in accounting for the original policies issued and the terms of the reinsurance contracts. Reserves are based on the terms of the reinsurance contracts, and are consistent with the risks assumed. Premiums and benefits ceded to other companies have been reported as a reduction of premium revenue and benefits expense. Amounts applicable to reinsurance ceded for reserves and unpaid claim liabilities have been reported as reductions of these items, and expense allowances received in connection with reinsurance ceded have been reflected in operations.
Strategic Investor 72
Security Life of Denver Insurance Company
Notes to Financial Statements - Statutory Basis (continued)
1. Nature of Operations and Basis of Financial Reporting (continued)
Real Estate and Electronic Data Processing Equipment
Real estate and electronic data processing equipment are carried at cost less accumulated depreciation. Depreciation for major classes of assets is calculated on a straight-line basis over the estimated useful life.
Participating Insurance
Participating business approximates less than 1% of the Company's ordinary life insurance in force and 1.5% of premium income. The amount of dividends to be paid is determined annually by the Board of Directors. Amounts allocable to participating policyholders are based on published dividend projections or expected dividend scales. Dividends of $2,417,000, $2,562,000 and $2,317,000 were paid in 2000, 1999 and 1998, respectively.
Federal Income Taxes
Deferred federal income taxes have been recognized to reflect prepayment of taxes relating to significant timing differences between income reported for tax and financial statement purposes using assumptions that are both reasonable and conservative. The deferred tax asset has been nonadmitted as a charge against surplus.
Pension Plans
The Company provides noncontributory retirement plans for substantially all employees and certain agents. Pension costs are charged to operations as contributions are made to the plan. The Company also provides a contributory retirement plan for substantially all employees.
Nonadmitted Assets
Nonadmitted assets are summarized as follows:
| December |
| 2000
| 1999
|
| (In thousands) |
| | | |
| Deferred federal income tax recoverable | $159,281 | $169,893 |
| Agents' debit balances | 2,354 | 2,652 |
| Furniture and equipment | 4,308 | 4,168 |
| Bonds in default | 549 | 4,303 |
| Disallowed Interest Maintenance Reserves | 17,436 | - |
| Other | 4,910
| 714
|
| Total nonadmitted assets | $188,838
| $181,730
|
Changes in nonadmitted assets are generally reported directly in surplus as an increase or decrease in nonadmitted assets. Certain changes are reported directly in surplus as a change in unrealized capital gains or losses.
Strategic Investor 73
Security Life of Denver Insurance Company
Notes to Financial Statements - Statutory Basis (continued)
1. Nature of Operations and Basis of Financial Reporting (continued)
Claims and Claims Adjustment Expenses
Claim expenses represent the estimated ultimate net cost of all reported and unreported claims incurred through December 31. The Company does not discount claim and claim adjustment expense reserves. Such estimates are based on actuarial projections applied to historical claim payment data. Such liabilities are considered to be reasonable and adequate to discharge the Company's obligations for claims incurred but unpaid as of December 31.
Cash Flow Information
Cash and short-term investments include cash on hand, demand deposits and short-term fixed maturity instruments (with a maturity of less than one year at date of acquisition).
The Company borrowed $1,387,826,000 and repaid $1,382,300,000 during 2000, borrowed $2,055,061,000 and repaid $2,039,861,000 during 1999, and borrowed $837,411,000 and repaid $837,411,000 during 1998. These borrowings were on a short-term basis, at an interest rate that approximated current money market rates and exclude borrowings from dollar roll transactions. Interest paid on borrowed money was $1,586,000, $2,180,000 and $4,500,000 during 2000, 1999 and 1998, respectively.
Separate Accounts
Separate accounts held by the Company represent funds held for the benefit of the Company's variable life and annuity policy and contract holders who bear all of the investment risk associated with the policies. All net investment experience, positive or negative, is attributed to the policy and contract holders' account values. The assets and liabilities of these accounts are carried at fair value.
Reserves related to the Company's mortality risk associated with these policies are included in life and annuity reserves. The operations of the separate accounts are not included in the accompanying statements of operations.
2. Permitted Statutory-Basis Accounting Practices
The Company prepares statutory-basis financial statements in accordance with accounting practices prescribed or permitted by the Colorado Division of Insurance. Currently, prescribed statutory accounting practices are interspersed throughout state insurance laws and regulations, NAIC's Accounting Practices and Procedures Manual and a variety of publications of the NAIC. "Permitted" statutory accounting practices encompass all accounting practices that are not prescribed; such practices may differ from state to state, and from company to company within a state, and may change in the future.
The NAIC has revised the Accounting Practices and Procedures Manual in a process referred to as Codification. The revised manual will be effective January 1, 2001. The State of Colorado has adopted the provisions of the revised manual. The revised manual has changed, to some extent, prescribed statutory accounting practices and will result in changes to the accounting practices that the Company uses to prepare its statutory-basis financial statements. The cumulative effect of changes in accounting principles adopted to
Strategic Investor 74
Security Life of Denver Insurance Company
Notes to Financial Statements - Statutory Basis (continued)
2. Permitted Statutory-Basis Accounting Practices (continued)
conform to the revised Accounting Practices and Procedures Manual, will be reported as an adjustment to surplus as of January 1, 2001. Management believes the effect of these changes will not result in a significant reduction in the Company's statutory-basis capital and surplus as of adoption. (See Note 19).
The Company is required to identify those significant accounting practices that are permitted, and obtain written approval of the significant practices from the Colorado Division of Insurance.
Prescribed statutory reserve methodology does not fully encompass universal life-type products. The NAIC, however, has promulgated a Model Regulation regarding universal life reserves. The Colorado Division of Insurance has not adopted the regulation, but requires that reserves be held which are at least as great as those required by Colorado statutes. The NAIC Universal Life Model Regulation is used by the Company to provide reserves consistent with the principles of this article. Because the reserves satisfy the requirements prescribed by the State of Colorado for the valuation of universal life insurance, the Company is permitted to compute reserves in accordance with this model regulation.
3. Investments
The amortized cost and fair value of bonds and equity securities are as follows:
| Amortized
Cost
| Gross
Unrealized
Gains
| Gross
Unrealized
Losses
| Fair Value
|
| (In Thousands) |
| At December 31, 2000: | | | | |
U.S. Treasury securities and obligations of
U.S. government corporations and
agencies | $ 90,840 | $ 3,049 | $ 317 | $ 93,572 |
States, municipalities, and political
subdivisions | 125 | 2 | - | 127 |
| Public utilities securities | 285,546 | 3,616 | 10,684 | 278,478 |
| Corporate securities | 2,269,006 | 45,861 | 67,427 | 2,247,440 |
| Mortgage-backed securities | 1,166,237 | 43,237 | 23,305 | 1,186,169 |
| Other asset-backed securities | 762,453
| 18,052
| 18,770
| 761,735
|
| Total fixed maturities | 4,574,207 | 113,817 | 120,503 | 4,567,521 |
| | | | | |
| Preferred stocks | 13,524 | 3 | - | 13,527 |
| Common stocks | 12,853
| 2,630
| -
| 15,483
|
| Total equity securities | 26,377
| 2,633
| -
| 29,010
|
| Total | $4,600,584
| $116,450
| $120,503
| $4,596,531
|
Strategic Investor 75
Security Life of Denver Insurance Company
Notes to Financial Statements - Statutory Basis (continued)
3. Investments (continued)
| Amortized
Cost
| Gross
Unrealized
Gains
| Gross
Unrealized
Losses
| Fair
Value
|
| (In Thousands) |
| At December 31, 1999: | | | | |
U.S. Treasury securities and obligations
of U.S. government corporations and Agencies | $ 54,461 | $ 42 | $ 5,112 | $ 49,391 |
States, municipalities, and political
Subdivisions | 751 | - | 9 | 742 |
| Public utilities securities | 255,807 | 272 | 18,221 | 237,858 |
Debt securities issued by foreign
Governments | 452 | - | - | 452 |
| Corporate securities | 1,338,680 | 3,801 | 71,739 | 1,270,742 |
| Mortgage-backed securities | 1,055,856 | 23,727 | 56,039 | 1,023,544 |
| Other asset-backed securities | 716,677
| 7,580
| 32,221
| 692,036
|
| Total fixed maturities | 3,422,684 | 35,422 | 183,341 | 3,274,765 |
| | | | | |
| Preferred stocks | 2,560 | 329 | - | 2,889 |
| Common stocks | 2,404
| 2,573
| -
| 4,977
|
| Total equity securities | 4,964
| 2,902
| -
| 7,866
|
| Total | $3,427,648
| $38,324
| $183,341
| $3,282,631
|
| Amortized
Cost
| Fair
Value
|
|
| December 31, 2000 | (In Thousands) |
| Maturity: | | |
| Due in 1 year or less | $ - | $ - |
| Due after 1 year through 5 years | 676,919 | 682,616 |
| Due after 5 years through 10 years | 881,403 | 862,763 |
| Due after 10 years | 1,087,195
| 1,074,238
|
| | | |
| Mortgage-backed securities | 1,166,237 | 1,186,169 |
| Other asset-backed securities | 762,453
| 761,735
|
| Total | $4,574,207
| $4,567,521
|
At December 31, 2000, investments in certificates of deposit, bonds, and mortgage loans, with an admitted asset value of $20,777,000, were on deposit with state insurance departments to satisfy regulatory requirements.
Strategic Investor 76
Security Life of Denver Insurance Company
Notes to Financial Statements - Statutory Basis (continued)
3. Investments (continued)
Reconciliation of bonds from amortized cost to carrying value as of December 31:
| 2000
| 1999
|
| (In Thousands) |
| | | |
| Amortized cost | $4,574,207 | $3,422,684 |
| Less nonadmitted bonds | 549
| 4,303
|
| Carrying value | $4,573,658
| $3,418,381
|
The amortized cost and fair value of investments in bonds at December 31, 2000, by contractual maturity, are shown below. Expected maturities may differ from contractual maturities because borrowers may have the right to call or prepay obligations with or without call or prepayment penalties.
Proceeds from sales of investments in bonds and other fixed maturity interest securities were $2,254,036,000, $3,273,528,000 and $4,527,803,000 in 2000, 1999 and 1998, respectively. Gross gains of $31,736,000, $18,928,000 and $38,615,000 and gross losses of $54,352,000, $55,203,000 and $33,297,000 during 2000, 1999 and 1998, respectively, were realized on those sales. A portion of the gains realized in 2000, 1999 and 1998 has been deferred to future periods in the interest maintenance reserve.
Net realized gains (losses), before capital gains tax and interest maintenance reserve transfers and changes in net unrealized gains (losses), are summarized as follows:
| Capital Gains (Losses)
| Net Capital
Gain (Loss)
|
Bonds
| Stocks
| Other
|
| (In Thousands) |
| 2000: | | | | |
| Net realized | $(35,399) | $ - | $12,783 | $(22,616) |
| Net unrealized | 3,754
| 8,244
| 103
| 12,101
|
| Total | $(31,645)
| $8,244
| $12,886
| $(10,515)
|
| | | | | |
| 1999: | | | | |
| Net realized | $(44,838) | $ 124 | $1,546 | $(43,168) |
| Net unrealized | (4,303)
| 4,078
| 174
| (51)
|
| Total | $(49,141)
| $4,202
| $1,720
| $(43,219)
|
| | | | | |
| 1998: | | | | |
| Net realized | $ 5,318 | $ 165 | $ 233 | $ 5,716 |
| Net unrealized | -
| 7,040
| 799
| 7,839
|
| Total | $ 5,318
| $7,205
| $1,032
| $ 13,555
|
Strategic Investor 77
Security Life of Denver Insurance Company
Notes to Financial Statements - Statutory Basis (continued)
3. Investments (continued)
Major categories of net investment income are summarized as follows:
| Year ended December 31 |
| 2000
| 1999
| 1998
|
| (In Thousands) |
| Income: | | | |
| Bonds | $316,733 | $233,247 | $216,972 |
| Mortgage loans | 101,617 | 66,456 | 51,173 |
| Policy loans | 67,909 | 59,085 | 56,767 |
| Company-occupied property | 2,154 | 2,313 | 2,252 |
| Other | 4,733
| 41,800
| 44,469
|
| Total investment income | 493,146 | 402,901 | 371,633 |
| Investment expenses | (19,126)
| (15,216)
| (22,028)
|
| Net investment income | $474,021
| $387,685
| $349,605
|
As part of its overall investment strategy, the Company has entered into agreements to purchase securities as follows:
| December 31 |
| 2000
| 1999
| 1998
|
| (In Thousands) |
| | | | |
| Investment purchase commitments | $98,228 | $140,600 | $75,575 |
The Company also entered into dollar roll transactions to increase its return on investments and improve liquidity. Dollar rolls involve a sale of securities and an agreement to repurchase substantially the same securities as those sold. The dollar rolls are accounted for as short term collateralized financings and the repurchase obligation is reported in borrowed money. The repurchase obligation totaled $121,936,000 at December 31, 2000. Such borrowings averaged approximately $122,215,000 during the last three months of 2000 and were collateralized by investment securities with fair values approximately equal to the loan value. The primary risk associated with short-term collateralized borrowings is that the counterparty will be unable to perform under the terms of the contract. The Company's exposure is limited to the excess of the net replacement cost of the securities over the value of the short-term investments (such excess was not material at December 31, 2000). The Company believes the counterparties to the dollar roll agreements are financially responsible and that the counterpary risk is minimal
The Company has an outstanding liability for borrowed money in the amount of $5,926,875 which is due to an affiliate. The principal amount is due January 5, 2001. Interest at 6.75% is required to be paid at maturity.
The maximum and minimum lending rates for long-term mortgage loans during 2000 were 9.10% and 6.85%. Fire insurance is required on all properties covered by mortgage loans and must at least equal the excess of the loan over the maximum loan which would be permitted by law on the land without the buildings.
Strategic Investor 78
Security Life of Denver Insurance Company
Notes to Financial Statements - Statutory Basis (continued)
3. Investments (continued)
The maximum percentage of any loan to the value of collateral at the time of the loan, exclusive of insured or guaranteed or purchase money mortgages, was 75.7% on commercial properties. As of December 31, 2000, the Company held no mortgages with interest more than one year overdue. Total interest due equals $101,607.
4. Derivative Financial Instruments Held for Purposes Other than Trading
The Company enters into interest rate and currency contracts, including swaps, caps, floors, and options, to reduce and manage risks which include the risk of a change in the value, yield, price, cash flows, exchange rates or quantity of, or a degree of exposure with respect to, assets, liabilities, or future cash flows which the Company has acquired or incurred. Hedge accounting practices are supported by cash flow matching, scenario testing and duration matching.
Interest rate swap agreements generally involve the exchange of fixed and floating interest payments over the life of the agreement without an exchange of the underlying principal amount. Currency swap agreements generally involve the exchange of local and foreign currency payments over the life of the agreements without an exchange of the underlying principal amount. Interest rate cap and interest rate floor agreements owned entitle the Company to receive payments to the extent reference interest rates exceed or fall below strike levels in the contracts based on the notional amounts.
Premiums paid for the purchase of interest rate contracts are included in other invested assets and are being amortized to interest expense over the remaining terms of the contracts or in a manner consistent with the financial instruments being hedged. Amounts paid or received, if any, from such contracts are included in interest expense or income. Accrued amounts payable to or receivable from counterparties are included in other liabilities or other invested assets.
Gains or losses as a result of early terminations of interest rate contracts are amortized to investment income over the remaining term of the items being hedged to the extent the hedge is considered to be effective; otherwise, they are recognized upon termination.
Interest rate contracts that are matched or otherwise designated to be associated with other financial instruments are recorded at fair value if the related financial instruments mature, are sold, or are otherwise terminated or if the interest rate contracts cease to be effective hedges. Changes in the fair value of the derivative are recorded as investment income. The Company manages the potential credit exposure from interest rate contracts through careful evaluation of the counterparties' credit standing, collateral agreements, and master netting agreements.
The Company is exposed to credit loss in the event of nonperformance by counterparties on interest rate contracts; however, the Company does not anticipate nonperformance by any of these counterparties. The amount of such exposure is generally the unrealized gains in such contracts.
Strategic Investor 79
Security Life of Denver Insurance Company
Notes to Financial Statements - Statutory Basis (continued)
4. Derivative Financial Instruments Held for Purposes Other than Trading (continued)
The table below summarizes the Company's interest rate contracts included in other invested assets at December 31, 2000 and 1999 (in thousands):
| December 31, 2000
|
| Notional
Amount
| Carrying
Value
| Fair
Value
|
| | | | |
| Interest rate contracts: | | | |
| Swaps | $2,478,442 | $ 95 | $(49,375) |
| Swaps--affiliates | 1,645,143
| (95)
| 60,703
|
| Total swaps | 4,123,585 | - | 11,328 |
| | | | |
| Caps owned | 53,543 | 1,224 | 492 |
| Caps owned--affiliates | 20,525
| 26
| -
|
| Total caps owned | 74,068 | 1,250 | 492 |
| | | | |
| Floors owned | 259,637
| 905
| 1,975
|
| Total floors owned | 259,637 | 905 | 1,975 |
| | | |
| Options owned | 97,000
| 627
| 342
|
| Total options owned | 97,000 | 627 | 342 |
| | | | |
| Total derivatives | $4,554,290
| $2,782
| $ 14,137
|
Strategic Investor 80
Security Life of Denver Insurance Company
Notes to Financial Statements - Statutory Basis (continued)
4. Derivative Financial Instruments Held for Purposes Other than Trading (continued)
| December 31, 1999
|
| Notional
Amount
| Carrying
Value
| Fair
Value
|
| | | | |
| Interest rate contracts: | | | |
| Swaps | $1,340,582 | $ (125) | $ 19,014 |
| Swaps--affiliates | 1,034,535
| 125
| (18,869)
|
| Total swaps | 2,375,117 | - | 145 |
| | | | |
| Caps owned | 20,525 | (39) | (17) |
| Caps owned--affiliates | 50,525
| 80
| 17
|
| Total caps owned | 71,050 | 41 | - |
| | | | |
| Floors owned | 90,500
| 252
| 172
|
| Total floors owned | 90,500 | 252 | 172 |
| | | | |
| Options owned | 302,000 | 4,000 | 7,118 |
| Options owned--affiliates | 277,000
| (3,210)
| (6,198)
|
| Total options owned | 579,000 | 790 | 920 |
| | | | |
| Forwards owned | 152,300 | - | 37 |
| Forwards owned--affiliates | 144,300
| -
| (32)
|
| Total forwards owned | 296,600
| -
| 5
|
| | | | |
| Total derivatives | $3,412,267
| $1,083
| $ 1,242
|
5. Concentrations of Credit Risk
The Company held less-than-investment-grade corporate bonds with an aggregate book value of $419,904,000 and $317,271,000 with an aggregate market value of $395,837,000 and $305,533,000 at December 31, 2000 and 1999, respectively. Those holdings amounted to 9.2% of the Company's investments in bonds and 4.8% of total admitted assets at December 31, 2000. The holdings of less-than-investment-grade bonds are widely diversified and of satisfactory quality based on the Company's investment policies and credit standards.
The Company held unrated bonds of $723,168,000 and $335,079,000 with an aggregate NAIC market value of $724,545,000 and $332,404,000 at December 31, 2000 and 1999, respectively. The carrying value of these holdings amounted to 16% of the Company's investment in bonds and 8% of the Company's total admitted assets at December 31, 2000.
At December 31, 2000, the Company's commercial mortgages involved a concentration of properties located in Calfornia (14%) and Florida (10%). The remaining commercial mortgages relate to properties located in 37 other states. The portfolio is well diversified, covering many different types of income-producing properties on which the Company has first mortgage liens. The maximum mortgage outstanding on any individual property is $45,000,000.
Strategic Investor 81
Security Life of Denver Insurance Company
Notes to Financial Statements - Statutory Basis (continued)
6. Annuity Reserves
At December 31, 2000 and 1999, the Company's annuity reserves, including those held in separate accounts and deposit fund liabilities that are subject to discretionary withdrawal (with adjustment), subject to discretionary withdrawal (without adjustment), and not subject to discretionary withdrawal provisions are summarized as follows:
| December 31, 2000 |
| Amount
| Percent
|
| (In Thousands) | |
| Subject to discretionary withdrawal (with adjustment): | | |
| With market value adjustment | $2,619,437 | 60.8% |
| At book value less surrender charge | 134,697
| 3.1
|
| Subtotal | 2,754,134 | 63.9 |
Subject to discretionary withdrawal (without adjustment)
at book value with minimal or no charge or adjustment | 248,208 | 5.8 |
| Not subject to discretionary withdrawal | 1,305,567
| 30.3
|
Total annuity reserves and deposit fund liabilities--
Before reinsurance | 4,307,909 | 100.0%
|
| Less reinsurance | 2,269,160
| |
| Net annuity reserves and deposit fund liabilities | $2,038,749
| |
| | | |
| December 31, 1999 |
| Amount
| Percent
|
| (In Thousands) | |
| Subject to discretionary withdrawal (with adjustment): | | |
| With market value adjustment | $2,918,405 | 69.3% |
| At book value less surrender charge | 119,807
| 2.9
|
| Subtotal | 3,038,212 | 72.2 |
Subject to discretionary withdrawal (without adjustment)
at book value with minimal or no charge or adjustment | 367,014 | 8.7 |
| Not subject to discretionary withdrawal | 803,795
| 19.1
|
Total annuity reserves and deposit fund liabilities--
before reinsurance | 4,209,021 | 100.0
|
| Less reinsurance | 3,555,109
| |
| Net annuity reserves and deposit fund liabilities | $ 653,912
| |
Strategic Investor 82
Security Life of Denver Insurance Company
Notes to Financial Statements - Statutory Basis (continued)
7. Employee Benefit Plans
Pension Plan and Postretirement Benefits
The Company has a qualified noncontributory defined benefit retirement plan covering substantially all employees. In addition, the Company maintains a nonqualified unfunded Supplemental Employees Retirement Plan (SERP).
In addition to providing pension plans, the Company provides certain health care and life insurance benefits for retired employees. Net postretirement benefit cost for the year ended December 31, 2000, 1999 and 1998 was $1,016,000, $1,118,000 and $930,000 respectively, and includes the expected cost of such benefits for newly eligible or vested employees, interest cost, gains and losses arising from differences between actuarial assumptions and actual experiences, and amortization of the transition obligation. At December 31, 2000 and 1999, the unfunded postretirement benefit obligation for retirees and other fully eligible or vested plan participants was $6,245,000 and $5,549,000, respectively. The estimated cost of the benefit obligation for active nonvested employees was $1,906,000.
The funded status for the defined benefit plans and other postretirement benefit plan is as follows (in thousands):
| Qualified
Plan
| SERP
| Post-
Retirement
|
| | | | |
| December 31, 2000 | | | |
| Projected benefit obligation | $(39,931) | $(13,135) | $(6,370) |
| Less plan assets at fair value | 47,098
| -
| -
|
| Plan assets in excess of (less than) projected benefit obligation | $ 7,167
| $(13,135)
| $(6,370)
|
| | | | |
| Qualified
Plan
| SERP
| Post-
Retirement
|
| | | | |
| December 31, 1999 | | | |
| Projected benefit obligation | $(36,352) | $(11,803) | $(6,256) |
| Less plan assets at fair value | 50,495
| -
| -
|
| Plan assets in excess of (less than) projected benefit obligation | $ 14,143
| $(11,803)
| $(6,256)
|
Strategic Investor 83
Security Life of Denver Insurance Company
Notes to Financial Statements - Statutory Basis (continued)
7. Employee Benefit Plans (continued)
Pension Plan and Postretirement Benefits (continued)
The net periodic pension cost, employer contribution, plan participant contributions, and benefits paid for the defined benefit plans are as follows (in thousands):
| Qualified
Plan
| SERP
| Post-
Retirement
|
| December 31, 2000 | | | |
| Net periodic pension (benefit) expense | $ (337) | $2,426 | $1,016 |
| Employer contributions | - | 375 | 320 |
| Plan participants' contributions | - | - | 120 |
| Benefits paid | 1,916 | 375 | 440 |
| | | | |
| Qualified
Plan
| SERP
| Post-
Retirement
|
| December 31, 1999 | | | |
| Net periodic pension expense | $ 40 | $1,971 | $1,236 |
| Employer contributions | - | 387 | 467 |
| Plan participants' contributions | - | - | 94 |
| Benefits paid | 1,238 | 387 | 561 |
| | | | |
| Qualified
Plan
| SERP
| Post-
Retirement
|
| December 31, 1998 | | | |
| Net periodic pension expense | $82 | $1,109 | $893 |
| Employer contributions | - | 325 | 218 |
| Plan participants' contributions | - | - | 77 |
| Benefits paid | 890 | 325 | 296 |
Assumptions used in determining the accounting for the defined benefit plans as of December 31, 2000 and 1999 were as follows:
| 2000
| 1999
|
| | |
| Weighted-average discount rate | 7.75% | 8.00% |
| Rate of increase in compensation level | 5.00% | 5.00% |
| Expected long-term rate of return on assets | 9.25% | 9.25% |
Strategic Investor 84
Security Life of Denver Insurance Company
Notes to Financial Statements - Statutory Basis (continued)
7. Employee Benefit Plans (continued)
Plan assets of the defined benefit plans at December 31, 2000 are invested primarily in U.S. government securities, corporate bonds, mutual funds, mortgage loans, money market funds, and common stock. Certain of the Qualified Plan's investments are held in the ING-NA Master Trust, which was established in 1998 for the investment of assets of the Plan and several other ING-NA sponsored retirement plans.
The annual assumed rate of increase in the per capita cost of covered benefits (i.e., health care cost trend rate) for the medical plan is 8.5% graded to 5.5% over 6 years. The health care cost trend rate assumption has a significant effect on the amounts reported. For example, increasing the assumed health care cost trend rates by one percentage point in each year would increase the accumulated postretirement benefit obligation for the medical plan as of December 31, 2000 by $501,000. Decreasing the assumed health care cost trend rates by one percentage point in each year would decrease the accumulated postretirement benefit obligation for the medical plan as of December 31, 2000 by $(436,000).
The weighted-average discount rate used in determining the accumulated postretirement benefit obligation was 7.75% at December 31, 2000 and 8.00 % at December 31, 1999.
401(k) Plan
Effective January 1, 2000, the Security Life of Denver Insurance Company Savings Incentive Plan was merged into the ING Savings Plan (Savings Plan), a defined contribution plan sponsored by ING America. The Savings Plan is a defined contribution plan, which is available to substantially all home office employees. Participants may make contributions to the plan through salary reductions up to a maximum of $10,500 for 2000, 1999 and 1998. Such contributions are not currently taxable to the participants. The Company matches 100% of the first 3% of participant contributions, plus 50% of contributions which exceed 3% of participants' compensation, subject to a maximum matching percentage of 4-1/2% of the individual's salary. Company matching contributions were $1,552,000, $1,423,000 and $1,343,000 for 2000, 1999 and 1998, respectively.
Plan assets of the Savings Plan at December 31, 2000 are invested in a group deposit administration contract (the Contract) with the Company, various mutual funds maintained by the Principal Financial Group, and loans to participants. The Contract is an employee benefit liability of the Company and had a balance of $28.0 million and $28.7 million at December 31, 2000 and 1999, respectively.
8. Separate Accounts
Separate account assets and liabilities represent funds segregated by the Company for the benefit of certain policy and contract holders who bear the investment risk. Revenues and expenses on the separate account assets and related liabilities equal the benefits paid to the separate account policy and contract holders.
Premiums, deposits, and other considerations received for the years ended December 31, 2000, 1999 and 1998 were $256,712,000, $153,671,000 and $129,527,000, respectively.
Strategic Investor 85
Security Life of Denver Insurance Company
Notes to Financial Statements - Statutory Basis (continued)
8. Separate Accounts (continued)
A reconciliation of the amounts transferred to and from the separate accounts is presented below:
| 2000
| 1999
| 1998
|
| (In Thousands) |
Transfers as reported in the summary of operations
of the Separate Accounts Statement: | | | |
| Transfers to separate accounts | $317,529 | $161,205 | $136,617 |
| Transfers from separate accounts | 61,187
| 82,218
| 70,879
|
| Net transfers to separate accounts | 256,342 | 78,987 | 65,738 |
| | | |
| Reconciling adjustments: | | | |
| Miscellaneous transfers | 196
| 1
| -
|
| Transfers as reported in the Statement of Operations | $256,538
| $ 78,988
| $ 65,738
|
9. Reinsurance
The Company is involved in both ceded and assumed reinsurance with other companies for the purpose of diversifying risk and limiting exposure on larger risks. As of December 31, 2000, the Company's retention limit for acceptance of risk on life insurance policies had been set at various levels up to $3,000,000.
To the extent that the assuming companies become unable to meet their obligations under these treaties, the Company remains contingently liable to its policyholders for the portion reinsured. To minimize its exposure to significant losses from retrocessionaire insolvencies, the Company evaluates the financial condition of the retrocessionaire and monitors concentrations of credit risk.
Assumed premiums amounted to $612,585,000, $520,490,000 and $426,503,000 for the years ended December 31, 2000, 1999 and 1998 respectively.
The Company's ceded reinsurance arrangements reduced certain items in the accompanying financial statements by the following amounts:
| 2000
| 1999
| 1998
|
| (In Thousands) |
| | | |
| Premiums | $ 859,405 | $1,701,959 | $2,916,141 |
| Benefits paid or provided | 247,622 | 216,778 | 71,001 |
| Policy and contract liabilities at year end | 2,647,258 | 3,890,702 | 3,525,241 |
During 2000, 1999 and 1998, the Company had ceded blocks of insurance under reinsurance treaties to provide funds for financing and other purposes. These reinsurance transactions, generally known as "financial reinsurance," represent financing arrangements. Financial reinsurance has the effect of increasing current statutory surplus while reducing future statutory surplus as the reinsurers recapture amounts.
Strategic Investor 86
Security Life of Denver Insurance Company
Notes to Financial Statements - Statutory Basis (continued)
10. Federal Income Taxes and Policyholders' Surplus Account
Federal income tax expense consists of the following:
| 2000
| 1999
| 1998
|
| (In Thousands) |
| Operations: | | | |
| Current | $(1,339) | $ 21,193 | $20,910 |
| Deferred | -
| (12,580)
| (18,539)
|
| Federal income tax expense | $(1,339)
| $ 8,613
| $2,371
|
Deferred federal income taxes arise from the recognition of timing differences between income determined for financial statement purposes and income tax purposes (principally differences relating to the recognition of tax-basis deferred acquisition costs, policy and contract liabilities and investment income). The resulting deferred tax asset is nonadmitted and charged against surplus.
The Company files a consolidated federal income tax return with its parent, ING America, and other U.S. affiliates and subsidiaries. The parties that join in the consolidated return have an agreement for the allocation of taxes. The agreement specifies that the separate return payable or the separate return receivable of each member will be the federal income tax payable or receivable that the member would have had for the period had it filed a separate return.
The Policyholders' Surplus Account is an accumulation of certain special deductions for income tax purposes and a portion of the "gain from operations" which were not subject to current taxation under the Life Insurance Company Income Tax Act of 1959. At December 31, 1984, the balance in this account for tax return purposes was approximately $60,490,000. The Tax Reform Act of 1984 provides that no further accumulations will be made in this account. If amounts accumulated in the Policyholders' Surplus Account exceed certain limits, or if distributions to the shareholder exceed amounts in the Shareholder's Surplus Account as determined for income tax purposes, amounts in the Policyholders' Surplus Account would become subject to income tax at rates in effect at that time. Should this occur, the maximum tax, under current tax law, which would be paid is $21,172,000. The Company does not anticipate any such action or foresee any events that would result in such tax.
11. Investment in and Advances to Subsidiaries
The Company has two wholly owned insurance subsidiaries, Midwestern United Life Insurance Company (Midwestern United) and First ING Life Insurance Company of New York (First ING). The Company also has three wholly owned noninsurance subsidiaries, First Secured Mortgage Deposit Corporation, Tailored Investments Notes Trust, and ING America Equities, Inc.
ING America Equities, Inc. is a wholesale broker/dealer whose business activities consist only of the distribution of variable life and annuity contracts. ING America Equities, Inc. does not hold customer funds or securities.
Strategic Investor 87
Security Life of Denver Insurance Company
Notes to Financial Statements - Statutory Basis (continued)
11. Investment in and Advances to Subsidiaries (continued)
Amounts invested in and advanced to the Company's subsidiaries are summarized as follows:
| December 31 |
| 2000
| 1999
|
| (In Thousands) |
| | |
| Common stock (cost--$61,318 in 2000 and 1999) | $85,324 | $77,127 |
| (Payable) receivable from subsidiaries | (2,476) | 2,060 |
Summarized financial information for these subsidiaries is as follows:
| 2000
| 1999
| 1998
|
| (In Thousands) |
| | | |
| Revenues | $ 97,086 | $ 89,507 | $ 74,536 |
| Income before net realized gains on investments | 9,783 | 7,884 | 6,123 |
| Net income | 9,571 | 6,301 | 6,123 |
| Admitted assets | 298,260 | 296,265 | 308,771 |
| Liabilities | 212,936 | 219,139 | 234,881 |
Midwestern United and First ING paid a common stock dividend to the Company of $1,320,000 and $1,970,000 in 1999 and $1,385,000 and $0 in 1998, respectively. No such dividend was paid in 2000.
12. Capital and Surplus
Under Colorado insurance regulations, the Company is required to maintain a minimum total capital and surplus of $1,500,000. Additionally, the amount of dividends which can be paid by the Company to its stockholder without prior approval of the Colorado Division of Insurance is limited to the greater of 10% of statutory surplus or the statutory net gain from operations.
The Company has two surplus notes to a related party for $84,259,000 and $100,000,000 which represent the cumulative cash draws on two $100,000,000 commitments issued by ING America through December 31, 2000, less principal payments.
Strategic Investor 88
Security Life of Denver Insurance Company
Notes to Financial Statements - Statutory Basis (continued)
12. Capital and Surplus (continued)
These subordinated notes bear interest at a variable rate equal to the prevailing rate for 10-year U.S. Treasury bonds plus 1/4% adjusted annually. The principal and interest is scheduled to be repaid in five annual installments beginning on April 15, 2000 and continuing through April 15, 2004 for the first note and April 2005 and continuing through April 15, 2009, for the second note, respectively. Future minimum payments, assuming a current effective interest rate of 5.11%, are as follows (in thousands):
Year
| Total
Payments
|
| |
| 2001 | $ 25,842 |
| 2002 | 25,842 |
| 2003 | 25,842 |
| 2004 | 25,842 |
| Subsequent years | 143,788
|
| Total | 247,156 |
| Less imputed interest | (62,897)
|
| Outstanding principal | $184,259
|
The repayment of these notes require approval of the Commissioner of Insurance of the State of Colorado and are payable only out of surplus funds of the Company and only at such time as the surplus of the Company, after payment is made, does not fall below the prescribed level. In July 2000, the Company made payments of $15,741,000 and $11,098,000 for principal and interest, respectively, after receiving approval from the Commissioner of Insurance of the State of Colorado.
13. Fair Values of Financial Instruments
In cases where quoted market prices are not available, fair values are based on estimates using present value or other valuation techniques. Those techniques are significantly affected by the assumptions used, including the discount rate and estimates of future cash flows. In that regard, the derived fair value estimates cannot be substantiated by comparison to independent markets and, in many cases, could not be realized in immediate settlement of the financial instrument. Accordingly, the aggregate fair value amounts presented herein do not represent the underlying value of the Company.
Life insurance liabilities that contain mortality risk and all nonfinancial instruments have been excluded from the disclosure requirements. However, the fair values of liabilities under all insurance contracts are taken into consideration in the Company's overall management of interest rate risk, such that the Company's exposure to changing interest rates is minimized through the matching of investment maturities with amounts due under insurance contracts.
Strategic Investor 89
Security Life of Denver Insurance Company
Notes to Financial Statements - Statutory Basis (continued)
13. Fair Values of Financial Instruments (continued)
The carrying amounts and fair values of the Company's financial instruments are summarized as follows:
| December 31 |
| 2000 | 1999 |
| Carrying
Amount
| Fair
Value
| Carrying
Amount
| Fair
Value
|
| (In Thousands) |
| Assets: | | | | |
| Bonds | $4,573,658 | $4,567,521 | $3,418,381 | $3,274,765 |
| Preferred stocks | 13,524 | 13,527 | 2,560 | 2,889 |
| Unaffiliated common stocks | 15,483 | 15,483 | 4,977 | 4,977 |
| Mortgage loans | 1,672,169 | 1,705,801 | 983,087 | 943,041 |
| Policy loans | 992,911 | 992,911 | 943,185 | 943,185 |
| Residual collateralized | | | | |
| mortgage obligations | 30,846 | 13,141 | 18,200 | 16,922 |
| Derivative securities | 2,782 | 14,137 | 1,083 | 1,242 |
| Short-term investments | 114,848 | 114,848 | 179,036 | 179,036 |
| Cash | 88,816 | 88,816 | 47,018 | 47,018 |
| Indebtedness from related parties | 69,338 | 69,338 | 42,451 | 42,451 |
| Separate account assets | 799,966 | 799,966 | 644,975 | 644,975 |
| Receivable for securities | 5,084 | 5,084 | 102 | 102 |
| | | | | |
| Liabilities: | | | | |
| Individual and group annuities | 203,489 | 142,743 | 133,025 | 132,984 |
| Guaranteed investment contracts | 1,578,057 | 1,575,822 | 335,507 | 332,275 |
| Policyholder funds | 71,669 | 71,669 | 91,920 | 91,920 |
| Policyholder dividends | 11,503 | 11,503 | 11,273 | 11,273 |
| Indebtedness to related parties | 8,016 | 8,016 | 18,329 | 18,239 |
| Separate account liabilities | 799,966 | 799,966 | 644,975 | 644,975 |
| Payable for securities | 3,162 | 3,162 | 14,023 | 14,023 |
The following methods and assumptions were used by the Company in estimating the fair value disclosures for financial instruments:
| | Fixed maturities and equity securities: The fair values for bonds, preferred stocks and common stocks, reported herein, are based on quoted market prices, where available. For securities not actively traded, fair values are estimated using values obtained from independent pricing services or, in the case of private placements, collateralized mortgage obligations and other mortgage derivative investments, are estimated by discounting expected future cash flows. The discount rates used vary as a function of factors such as yield, credit quality, and maturity, which fall within a range between 6% and 15% over the total portfolio. Fair values determined on this basis can differ from values published by the NAIC Securities Valuation Office. Market value as determined by the NAIC as of December 31, 2000 and 1999 was $4,675,995,000 and $3,448,196,000, respectively. |
Strategic Investor 90
Security Life of Denver Insurance Company
Notes to Financial Statements - Statutory Basis (continued)
13. Fair Values of Financial Instruments (continued)
| | Mortgage loans: Estimated market values for commercial real estate loans were generated using a discounted cash flow approach. Loans in good standing are discounted using interest rates determined by U.S. Treasury yields on December 31 and spreads implied by independent published surveys. The same is applied on new loans with similar characteristics. The amortizing features of all loans are incorporated in the valuation. Where data on option features is available, option values are determined using a binomial valuation method, and are incorporated into the mortgage valuation. Restructured loans are valued in the same manner; however, these loans were discounted at a greater spread to reflect increased risk. All residential loans are valued at their outstanding principal balances, which approximate their fair values. |
| |
| Residual collateralized mortgage obligations: Residual collateralized mortgage obligations are included in the other invested assets balance. Fair values are calculated using discounted cash flows. The discount rates used vary as a function of factors such as yield, credit quality, and maturity, which fall within a range between 6% and 15% over the total portfolio. |
| |
| Derivative financial instruments: Fair values for on-balance-sheet derivative financial instruments (caps and floors) and off-balance-sheet derivative financial instruments (swaps) are based on broker/dealer valuations or on internal discounted cash flow pricing models taking into account current cash flow assumptions and the counterparties' credit standing. |
| |
| Guaranteed investment contracts: The fair values of the Company's guaranteed investment contracts are estimated using discounted cash flow calculations, based on interest rates currently being offered for similar contracts with maturities consistent with those remaining for the contracts being valued. |
| |
| Off-balance-sheet instruments: The Company accepted additional deposits on existing synthetic guaranteed investment contracts in the amounts of $0, $70,000,000 and $66,480,000 in 2000, 1999 and 1998, respectively, from trustees of 401(k) plans. Pursuant to the terms of these contracts, the trustees own and retain the assets related to these contracts. Such assets had a value of $406,896,000 and $471,380,000 at December 31, 2000 and 1999, respectively. Under synthetic guaranteed investment contracts, the synthetic issuer may assume interest rate risk on individual plan participant initiated withdrawals from stable value options of 401(k) plans. Approximately 88% of the synthetic guaranteed investment contract book values are on a participating basis and have a credited interest rate reset mechanism which passes such interest rate risk to plan participants. |
| |
| Other investment-type insurance contracts: The fair values of the Company's deferred annuity contracts are estimated based on the cash surrender values. The carrying values of other policyholder liabilities, including immediate annuities, dividend accumulations, supplementary contracts without life contingencies, and premium deposits, approximate their fair values. |
| |
| Letters of credit: The Company is the recipient of letters of credit totaling $250,071,000 (see Note 15), which have a market value to the Company of $0, and two lines of credit totaling $340,136,000 which have a market value to the Company of $0. |
The carrying value of all other financial instruments approximates their fair value.
Strategic Investor 91
Security Life of Denver Insurance Company
Notes to Financial Statements - Statutory Basis (continued)
14. Commitments and Contingencies
The Company is a party to pending or threatened lawsuits arising from the normal conduct of its business. Due to the climate in insurance and business litigation, suits against the Company sometimes include substantial additional claims, consequential damages, punitive damages and other similar types of relief. While it is not possible to forecast the outcome of such litigation, it is the opinion of management that the disposition of such lawsuits will not have a materially adverse effect on the Company's financial position or interfere with its operations. The Company has established an accrued liability in the financial statements of $20,449,000 related to certain pending litigation. The Company is vigorously defending its position in these cases.
The Company guarantees the obligations incurred by its wholly owned subsidiary, Midwestern United, with respect to all life insurance policies in force in both 2000, 1999 and 1998. In the event Midwestern United is unable to fulfill its obligations under these policies, the Company would be required to assume the policy obligations. The statutory reserve liabilities for the guaranteed policies totaled $201,306,000 and $209,203,000 as of December 31, 2000 and 1999, respectively.
The Company entered into a Tangible Net Worth Maintenance Agreement, dated June 25, 1998 pursuant to which the Company agreed to cause First ING, a wholly owned subsidiary of the Company, to have a tangible net worth equal to an NAIC-defined risk-based capital ratio of at least 200%, calculated by dividing (total adjusted capital x 100) by (the authorized control level risk based capital x 2). The contingent statutory reserve liability for this guarantee is $189,036.
The Company has agreed to guarantee a revolving line of credit issued to Pen-Cal Administrators, Inc., a California producer group, and represented by the credit agreement dated January 1, 2000 between Bank One and Pen-Cal Administrators, Inc., in the principal amount of $2,500,000.
15. Financing Agreements
The Company has a line of credit of $100,000,000 to provide short-term liquidity which expires July 31, 2001. The amount of funds available under this line is reduced by borrowings of certain affiliates also party to the agreement. Interest on all loans is based on the cost of funds by the lender plus .23%. The Company had outstanding borrowings under this agreement at December 31, 2000 and 1999 of $-0- and $200,000, respectively.
The Company is the beneficiary of letters of credit totaling $250,071,000 that were established in accordance with the terms of reinsurance agreements. The terms of the letters of credit provide for automatic renewal for the following year at December 31, unless otherwise canceled or terminated by either party to the financing. The letters were unused during both 2000 and 1999.
Strategic Investor 92
Security Life of Denver Insurance Company
Notes to Financial Statements - Statutory Basis (continued)
16. Related Party Transactions
Affiliates
The Company has a $200,136,000 line of credit issued by the Company's parent to provide short-term liquidity. Interest on the loans are indexed to the A1+/P1 commercial paper rates. The average borrowing by the Company in 2000 and 1999 was $17,453,000 and $10,365,000, respectively, with an average borrowing rate of 6.29% and 5.16%, respectively. At December 31, 2000 and 1999, outstanding borrowings were $5,927,000 and $15,000,000, respectively.
The Company provides administrative, investment and other operating services to affiliates. Amounts received for these services were $13,053,000, $2,606,000 and $1,605,000 for 2000, 1999 and 1998, respectively.
The Company also has an Investment Advisory Agreement with an affiliate whereby it receives investment and portfolio management services for a fee. Total fees under the agreement were approximately $9,885,000, $11,373,000 and $10,504,000 for 2000, 1999 and 1998, respectively.
Subsidiaries
The Company provides administrative, investment and other operating services to certain of its subsidiaries pursuant to contractual arrangements. Amounts received for these services were $3,561,000, $4,057,000 and $4,280,000 for 2000, 1999 and 1998, respectively.
17. Guaranty Fund Assessments
Insurance companies are assessed the costs of funding the insolvencies of other insurance companies by the various state guaranty associations, generally based on the amount of premium companies collect in that state.
The Company accrues the cost of future guaranty fund assessments based on estimates of insurance company insolvencies provided by the National Organization of Life and Health Insurance Guaranty Associations (NOLHGA) and the amount of premiums written in each state. The Company reduces the accrual by credits allowed in some states to reduce future premium taxes by a portion of assessments in that state. The Company has estimated this liability to be $2,305,000 as of December 31, 2000 and 1999 and has recorded a reserve. The Company has also recorded an asset of $5,045,000 and $5,950,000 as of December 31, 2000 and 1999, respectively, for future credits to premium taxes for assessments already paid. Payments received for guaranty fund assessments in 2000 and 1999 were $267,000 and $120,000, respectively.
18. Regulatory Risk-Based Capital
The NAIC prescribes risk-based capital (RBC) requirements for life/health insurance companies. RBC is a series of dynamic surplus-related formulas for monitoring solvency. At December 31, 2000, the Company exceeded all minimum RBC requirements.
Strategic Investor 93
Security Life of Denver Insurance Company
Notes to Financial Statements - Statutory Basis (continued)
19. Accounting Changes ( Unaudited )
Accounting changes adopted to conform to the provisions of the NAIC Accounting Practices and Procedures manual - Version effective January 1, 2001 are reported as changes in accounting principles. The cumulative effect of changes in accounting principles is reported as an adjustment to unassigned deficit, a component of capital and surplus, in the period of the change in accounting principle. The cumulative effect is the difference between the amount of capital and surplus at the beginning of the year and the amount of capital and surplus that would have been reported at that date if the new accounting principles had been applied retroactively for all prior periods. As a result of these changes, the Company decreased its unassigned deficit, $41.9 million as of January 1, 2001.
The net decrease in unassigned deficit is comprised of increases to capital and surplus of approximately $51.3 million related to admitting deferred tax assets and $4.7 million related to prepayment penalties on bonds and mortgage loans released from the IMR liability. Partially offsetting these increases to capital and surplus are increases of approximately $12.3 million and $1.3 million related to Supplemental Employee Retirement Liability (SERP) and vacation liability, respectively.
Strategic Investor 94
Security Life Separate Account L1 of
Security Life of Denver Insurance Company
Financial Statements - Unaudited
As of September 30, 2001
Strategic Investor 95
Security Life Separate Account L1
Financial Statements - Unaudited
As of September 30, 2001
Contents
Unaudited Financial Statements
Statement of Assets and Liabilities 97
Statement of Operations 108
Statement of Changes in Net Assets 119
Notes to Financial Statements 130
Strategic Investor 96
Security Life Separate Account L1
Statement of Assets and Liabilities
(Unaudited)
September 30, 2001
| NB
|
| Limited
Maturity
Bond
| Growth
| Partners
|
| Assets | | | |
Investments in mutual funds at
market value (Note 4) | $18,301,630
| $10,009,825
| $24,550,654
|
| Total assets | 18,301,630
| 10,009,825
| 24,550,654
|
| | | | |
| Liabilities | | | |
Due to (from) Security Life of
Denver | (8,224)
| (65,701)
| (106,901)
|
| Total liabilities | (8,224)
| (65,701)
| (106,901)
|
| | | | |
| Net assets | $18,309,854
| $10,075,526
| $24,657,555
|
| | | | |
| Policyholder reserves | | | |
Reserves attributable to the
policyholders (Note 2) | $18,309,854
| $10,075,526
| $24,657,555
|
| | | | |
| Total policyholder reserves | $18,309,854
| $10,075,526
| $24,657,555
|
| | | | |
Number of divisional units
outstanding (Note 8): | | | |
| Class A | 1,266,146.581
| 678,719.272
| 1,223,913.915
|
| Class B | 11,739.142
| 5,038.762
| 3,445.477
|
| | | | |
| Value per divisional unit: |
| Class A | $14.36
| $14.79
| $20.12
|
| Class B | $10.53
| $6.97
| $8.30
|
| | | | |
| Number of Shares | 1,366,7867
| 10,737,983
| 1,902,292
|
See accompanying notes.
Strategic Investor 97
Security Life Separate Account L1
Statement of Assets and Liabilities (continued)
(Unaudited)
September 30, 2001
| Alger
|
| American
Small
Capitalization
| American
MidCap
Growth
| American
Growth
| American
Leveraged
AllCap
|
| Assets | | | | |
| Investments in mutual funds at | | | | |
| market value (Note 4) | $18,138,243
| $31,406,350
| $42,934,697
| $17,762,534
|
| Total assets | 18,138,243
| 31,406,350
| 42,934,697
| 17,762,534
|
| | | | | |
| Liabilities | | | | |
| Due to (from) Security Life of Denver | 58,749
| (70,248)
| 87,611
| (81,638)
|
| Total liabilities | 58,749
| (70,248)
| 87,611
| (81,638)
|
| | | | | |
| Net assets | $18,079,494
| $31,476,598
| $42,847,086
| $17,844,172
|
| | | | | |
| Policyholder reserves | | | | |
| Reserves attributable to the | | | | |
| policyholders (Note 2) | $18,079,494
| $31,476,598
| $42,847,086
| $17,844,172
|
| | | | | |
| Total policyholder reserves | $18,079,494
| $31,476,598
| $42,847,086
| $17,844,172
|
| | | | | |
Number of divisional units outstanding
(Note 8):
Class A |
1,509,536.384
|
1,198,930.258
|
1,986,333.871
|
602,773.575
|
| Class B | 62,310.934
| 40,121.720
| 69,337.261
| 5,114.120
|
| | | | | |
| Value per divisional unit: |
| Class A | $11.73
| $25.89
| $21.30
| $29.53
|
| Class B | $6.00
| $10.73
| $7.86
| $8.29
|
| | | | | |
| Number of Shares | 1,241,369
| 2,077,414
| 1,335,871
| 647,849
|
See accompanying notes.
Strategic Investor 98
Security Life Separate Account L1
Statement of Assets and Liabilities (continued)
(Unaudited)
September 30, 2001
| Fidelity
|
| Asset
Manager
| Growth
| Growth SC
| Overseas
| Overseas SC
| Money
Market
| Index 500
|
| Assets | | | | | | | |
| Investments in mutual funds at | | | | | | | |
| market value (Note 4) | $18,403,338
| $48,559,314
| $39,069
| $35,140,928
| $56,392
| $104,269,952
| $165,134,818
|
| Total assets | 18,403,338
| 48,559,314
| 39,069
| 35,140,928
| 56,392
| 104,269,952
| 165,134,818
|
| | | | | | | | |
| Liabilities | | | | | | | |
| Due to (from) Security Life of Denver | 116,954
| 188,725
| -
| (141,095)
| -
| 270,052
| (118,217)
|
| Total liabilities | 116,954
| 188,725
| -
| (141,095)
| -
| 270,052
| (118,217)
|
| | | | | | | | |
| Net assets | 18,286,384
| $48,370,589
| $39,069
| $35,282,023
| $56,392
| $103,999,900
| $165,253,035
|
| | | | | | | | |
| Policyholder reserves | | | | | | | |
| Reserves attributable to the | | | | | | | |
| policyholders (Note 2) | $18,286,384
| $48,370,589
| $39,069
| $35,282,023
| $56,392
| $103,999,900
| $165,253,035
|
| | | | | | | | |
| Total policyholder reserves | $18,286,384
| $48,370,589
| $39,069
| $35,282,023
| $56,392
| $103,999,900
| $165,253,035
|
| | | | | | | | |
Number of divisional units outstanding
(Note 8):
Class A |
1,156,791.661
|
2,250,864.880
|
-
|
2,597,785.408
|
-
|
7,625,127.938
|
6,918,271,816
|
| Class B | 26,313.332
| 62,913.082
| 5,211.697
| 694,477.886
| 8,179.664
| -
| 1,111,443.792
|
| | | | | | | | |
Value per divisional unit:
Class A | $15.60
| $21.28
| $ -
| $11.61
| $ -
| $13.64
| $22.61
|
| Class B | $9.12
| $7.60
| $7.50
| $7.37
| $6.89
| $ -
| $7.93
|
| | | | | | | | |
| Number of Shares | 1,381,501
| 1,697,925
| 1,364.97
| 2,809,870
| 4,511
| 104,269,976
| 1,416,735
|
See accompanying notes.
Strategic Investor 99
Security Life Separate Account L1
Statement of Assets and Liabilities (continued)
(Unaudited)
September 30, 2001
| INVESCO
|
| Total
Return
| Equity
Income
| High Yield
| Utilities
| Small Company
Growth
|
| Assets | | | | | |
| Investments in mutual funds at | | | | | |
| market value (Note 4) | $12,144,819
| $25,681,577
| $9,214,844
| $7,467,107
| $10,460,141
|
| Total assets | 12,144,819
| 25,681,577
| 9,214,844
| 7,467,107
| 10,460,141
|
| | | | | | |
| Liabilities | | | | | |
| Due to (from) Security Life of Denver | (13,157)
| 55,392
| (72,271)
| (4,960)
| (145,016)
|
| Total liabilities | (13,157)
| 55,392
| (72,271)
| (4,960)
| (145,016)
|
| | | | | | |
| Net assets | $12,157,976
| $25,626,185
| $9,287,115
| $7,472,067
| $10,605,157
|
| | | | | | |
| Policyholder reserves | | | | | |
| Reserves attributable to the | | | | | |
| policyholders (Note 2) | $12,157,976
| $25,626,185
| $9,287,115
| $7,472,067
| $10,605,157
|
| | | | | | |
| Total policyholder reserves | $12,157,976
| $25,626,185
| $9,287,115
| $7,472,067
| $10,605,157
|
| | | | | | |
Number of divisional units outstanding
(Note 8):
Class A |
784,615.582
|
1,120,571.435
|
705,483.302
|
497,812.071
|
864,531.358
|
| Class B | 9,292.612
| 72,952.755
| 29,772.229
| 4,758.584
| 20,749.332
|
| | | | | | |
Value per divisional unit:
Class A | $15.39
| $22.29
| $12.85
| $14.94
| $12.05
|
| Class B | $9.31
| $8.92
| $7.56
| $6.84
| $8.84
|
| | | | | | |
| Number of Shares | 996,292
| 1,500,790
| 1,098,432
| 539,357
| 859,733
|
See accompanying notes.
Strategic Investor 100
Security Life Separate Account L1
Statement of Assets and Liabilities (continued)
(Unaudited)
September 30, 2001
| Van Eck
|
| Worldwide
Hard
Assets
| Worldwide
Bond
| Worldwide
Emerging
Markets
| Worldwide
Real
Estate
|
| Assets | | | | |
| Investments in mutual funds | | | | |
| at market value (Note 4) | $1,807,820
| $1,231,030
| $3,467,592
| $2,187,361
|
| Total assets | 1,807,820
| 1,231,030
| 3,467,592
| 2,187,361
|
| | | | | |
| Liabilities | | | | |
| Due to (from) Security Life of Denver | 10
| (4)
| 2,381
| -
|
| Total liabilities | 10
| (4)
| 2,381
| -
|
| | | | | |
| Net assets | $1,807,810
| $1,231,034
| $3,465,211
| $2,187,361
|
| | | | | |
| Policyholder reserves | | | | |
| Reserves attributable to the | | | | |
| policyholders (Note 2) | $1,807,810
| $1,231,034
| $3,465,211
| $2,187,361
|
| | | | | |
| Total policyholder reserves | $1,807,810
| $1,231,034
| $3,465,211
| $2,187,361
|
| | | | | |
| | | | | |
Number of divisional units outstanding
(Note 8):
Class A |
203,521.465
|
123,234.447
|
535,825.114
|
217,366.861
|
| Class B | 13.677
| 255.806
| 36,852.978
| 1,575.885
|
| | | | | |
Value per divisional unit:
Class A | $8.88
| $9.97
| $6.03
| $9.98
|
| Class B | $8.19
| $9.86
| $6.38
| $11.05
|
| | | | | |
| Number of Shares | 182,475
| 126,247
| 541,673
| 210,490
|
See accompanying notes.
Strategic Investor 101
Security Life Separate Account L1
Statement of Assets and Liabilities (continued)
(Unaudited)
September 30, 2001
| AIM
|
| Capital
Appreciation
| Government
Securities
|
| Assets | | |
| Investments in mutual funds at market value (Note 4) | $10,908,024
| $69,368,797
|
| Total assets | 10,908,024
| 69,368,797
|
| | | |
| Liabilities | | |
| Due to (from) Security Life of Denver | (19,484)
| (6,315)
|
| Total liabilities | (19,484)
| (6,315)
|
| | | |
| Net assets | $10,927,508
| $69,375,112
|
| | | |
| Policyholder reserves | | |
| Reserves attributable to the policyholders (Note 2) | $10,927,508
| $69,375,112
|
| | | |
| Total policyholder reserves | $10,927,508
| $69,375,112
|
| | | |
Number of divisional units outstanding (Note 8):
Class A |
971,640.477
|
1,786,935.309
|
| Class B | 232,658.986
| 4,049,142.811
|
| | | |
Value per divisional unit:
Class A |
$9.37
|
$11.96
|
| Class B | $7.86
| $11.85
|
| | | |
| Number of Shares | 545,671
| 5,834,261
|
See accompanying notes.
Strategic Investor 102
Security Life Separate Account L1
Statement of Assets and Liabilities (continued)
(Unaudited)
September 30, 2001
| GCG
|
| Equity
Income
| Growth
| Hard
Assets
| Limited
Maturity
Bond
| Liquid
Asset
| MidCap
Growth
| Research
| Total
Return
| Fully
Managed
|
| Assets | | | | | | | | | |
Investments in mutual funds
at market value (Note 4) |
$3,226
|
$5,172
|
$ -
|
$1,144,133
|
$4,137,301
|
$110,991
|
$1,539
|
$29,482
|
$2,253,669
|
| Total assets | 3,226
| 5,172
| -
| 1,144,133
| 4,137,301
| 110,991
| 1,539
| 29,482
| 2,253,669
|
| | | | | | | | | | |
| Liabilities | | | | | | | | | |
Due to (from) Security Life
of Denver |
-
|
-
|
-
|
-
|
-
|
-
|
-
|
-
|
-
|
| Total liabilities | -
| -
| -
| -
| -
| -
| -
| -
| -
|
| | | | | | | | | | |
| Net assets | $3,226
| $5,172
| $ -
| $1,144,133
| $4,137,301
| $110,991
| $1,539
| $29,482
| $2,253,669
|
| | | | | | | | | | |
| Policyholder reserves | | | | | | | | | |
Reserves attributable to the
policyholders (Note 2) |
$3,226
|
$5,172
|
$ -
|
$1,144,133
|
$4,137,301
|
$110,991
|
$1,539
|
$29,482
|
$2,253,669
|
| | | | | | | | | | |
| Total policyholder reserves |
$3,226
|
$5,172
|
$ -
|
$1,144,133
|
$4,137,301
|
$110,991
|
$1,539
|
$29,482
|
$2,253,669
|
Number of divisional units
outstanding (Note 8):
Class A |
-
|
-
|
-
|
-
|
-
|
12,588.249
|
-
|
-
|
219,306.572
|
| Class B | 325.075
| 686.746
| -
| 96,914.830
| 373,052.660
| 1,149.040
| 197.916
| 2,688.403
| 3,993.953
|
Value per divisional unit:
Class A |
$ -
|
$ -
|
$ -
|
$ -
|
$ -
|
$7.85
|
$ -
|
$ -
|
$10.09
|
| Class B | $9.92
| $7.53
| $ -
| $11.81
| $11.10
| $10.57
| $7.77
| $10.97
| $10.13
|
| | | | | | | | | | |
| Number of Shares | 296
| 413
| -
| 100,272
| 4,137,301
| 9,683
| 106
| 1,834
| 129,878
|
See accompanying notes.
Strategic Investor 103
Security Life Separate Account L1
Statement of Assets and Liabilities (continued)
(Unaudited)
September 30, 2001
| Janus
|
| Growth
| Aggressive
Growth
| Worldwide
Growth
| International
Growth
|
| Assets | | | | |
Investments in mutual funds at market
value (Note 4) | $2,155,887
| $1,515,206
| $1,908,586
| $4,139,907
|
| Total assets | 2,155,887
| 1,515,206
| 1,908,586
| 4,139,907
|
| | | | | |
| Liabilities | | | | |
| Due to (from) Security Life of Denver | -
| -
| -
| -
|
| Total liabilities | -
| -
| -
| -
|
| | | | | |
| Net assets | $2,155,887
| $1,515,206
| $1,908,586
| $4,139,907
|
| | | | | |
| Policyholder reserves | | | | |
Reserves attributable to the policyholders
(Note 2) | $2,155,887
| $1,515,206
| $1,908,586
| $4,139,907
|
| | | | | |
| Total policyholder reserves | $2,155,887
| $1,515,206
| $1,908,586
| $4,139,907
|
Number of divisional units
outstanding (Note 8):
Class A |
374,228.179
|
386,703.945
|
302,692.294
|
686,018.038
|
| Class B | 22,582.056
| 28,184.319
| 21,263.352
| 28,976.041
|
| | | | | |
Value per divisional unit:
Class A | $5.43
| $3.65
| $5.89
| $5.79
|
| Class B | $5.47
| $3.68
| $5.94
| $5.83
|
| | | | | |
| Number of Shares | 124,301
| 78,678
| 76,347
| 202,889
|
See accompanying notes.
Strategic Investor 104
Security Life Separate Account L1
Statement of Assets and Liabilities (continued)
(Unaudited)
September 30, 2001
| M
|
| International
Equity
| Enhanced
US Equity
| Capital
Appreciation
| Core
Growth
|
| Assets | | | | |
Investments in mutual funds at market
value (Note 4) | $1,099,802
| $666,240
| $890,363
| $146,464
|
| Total assets | 1,099,802
| 666,240
| 890,363
| 146,464
|
| | | | | |
| Liabilities | | | | |
| Due to (from) Security Life of Denver | -
| -
| -
| -
|
| Total liabilities | -
| -
| -
| -
|
| | | | | |
| Net assets | $1,099,802
| $666,240
| $890,363
| $146,464
|
| | | | | |
| Policyholder reserves | | | | |
Reserves attributable to the policyholders
(Note 2) | $1,099,802
| $666,240
| $890,363
| $146,464
|
| | | | | |
| Total policyholder reserves | $1,099,802
| $666,240
| $890,363
| $146,464
|
Number of divisional units
outstanding (Note 8):
Class A |
125,031.764
|
74,088.595
|
105,033.545
|
17,267.848
|
| Class B | 231.817
| 34.188
| 543.718
| 106.670
|
| | | | | |
Value per divisional unit:
Class A | $8.78
| $8.99
| $8.43
| $8.43
|
| Class B | $8.81
| $9.01
| $8.46
| $8.47
|
| | | | | |
| Number of Shares | 91,516
| 52,050
| 65,685
| 12,323
|
See accompanying notes.
Strategic Investor 105
Security Life Separate Account L1
Statement of Assets and Liabilities (continued)
(Unaudited)
September 30, 2001
| Pilgrim
|
| Growth
Opportunities
| MagnaCap
| MidCap
Opportunities
| SmallCap
Opportunities
|
| Assets | | | | |
Investments in mutual funds at market
value (Note 4) | $8,492
| $76,342
| $75,286
| $109,219
|
| Total assets | 8,492
| 76,342
| 75,286
| 109,219
|
| | | | | |
| Liabilities | | | | |
| Due to (from) Security Life of Denver | -
| -
| -
| -
|
| Total liabilities | -
| -
| -
| -
|
| | | | | |
| Net assets | $8,492
| $76,342
| $75,286
| $109,219
|
| | | | | |
| Policyholder reserves | | | | |
Reserves attributable to the policyholders
(Note 2) | $8,492
| $76,342
| $75,286
| $109,219
|
| | | | | |
| Total policyholder reserves | $8,492
| $76,342
| $75,286
| $109,219
|
Number of divisional units
outstanding (Note 8):
Class A |
1,138.989
|
7,618.144
|
9,945.500
|
12,810.621
|
| Class B | -
| 864.888
| 26.044
| 367.643
|
| | | | | |
Value per divisional unit:
Class A | $7.46
| $9.00
| $7.55
| $8.29
|
| Class B | $ -
| $8.98
| $7.45
| $8.30
|
| | | | | |
| Number of Shares | 1,798
| 9,241
| 15,271
| 6,775
|
See accompanying notes.
Strategic Investor 106
Security Life Separate Account L1
Statement of Assets and Liabilities (continued)
(Unaudited)
September 30, 2001
| Putnam
|
| New
Opportunities
| Voyager
| Growth
and Income
| Small Cap
Value
|
| Assets | | | | |
Investments in mutual funds at market
value (Note 4) | $175,596
| $38,193
| $716,653
| $895,460
|
| Total assets | 175,596
| 38,193
| 716,653
| 895,460
|
| | | | | |
| Liabilities | | | | |
| Due to (from) Security Life of Denver | -
| -
| -
| -
|
| Total liabilities | -
| -
| -
| -
|
| | | | | |
| Net assets | $175,596
| $38,193
| $716,653
| $895,460
|
| | | | | |
| Policyholder reserves | | | | |
Reserves attributable to the policyholders
(Note 2) | $175,596
| $38,193
| $716,653
| $895,460
|
| | | | | |
| Total policyholder reserves | $175,596
| $38,193
| $716,653
| $895,460
|
Number of divisional units
outstanding (Note 8):
Class A |
20,496.413
|
4,416.369
|
77,415.535
|
89,076.344
|
| Class B | 1,686.535
| 23.864
| 157.737
| 1,954.892
|
| | | | | |
Value per divisional unit:
Class A | $7.91
| $8.60
| $9.24
| $9.84
|
| Class B | $7.94
| $8.63
| $9.27
| $9.84
|
| | | | | |
| Number of Shares | 12,845
| 1,482
| 32,596
| 70,356
|
See accompanying notes.
Strategic Investor 107
Security Life Separate Account L1
Statement of Operations
(Unaudited)
Nine months ended September 30, 2001
| NB
|
| Limited
Maturity Bond
| Growth
| Partners
|
| Investment Income | | | |
| Dividends from mutual funds | $953,448 | $6,951,959 | $1,186,558 |
| Less valuation period deductions | | | |
| (Note 2) | 92,409
| 81,874
| 161,085
|
| Net investment income (loss) | 861,039
| 6,870,085
| 1,025,473
|
| | | | |
| Realized and unrealized gains | | | |
| (losses) on investments | | | |
| Net realized gains (losses) on | | | |
| Investments | (143,790) | (8,528,144) | (1,054,314) |
| Net unrealized gains (losses) on | | | |
| Investments | 495,407
| (6,570,124)
| (4,918,083)
|
| Net realized and unrealized gains | | | |
| (losses) on investments | 351,617
| (15,098,268)
| (5,972,397)
|
| | | | |
| Net increase (decrease) in net assets | | | |
| resulting from operations | $1,212,656
| $(8,228,183)
| $(4,946,924)
|
See accompanying notes.
Strategic Investor 108
Security Life Separate Account L1
Statement of Operations (continued)
(Unaudited)
Nine months ended September 30, 2001
| Alger
|
| American
Small
Capitalization
| American
MidCap
Growth
| American
Growth
| American
Leveraged
AllCap
|
| Investment Income | | | | |
| Dividends from mutual funds | $11,078 | $16,595,646 | $6,375,756 | $844,791 |
Less valuation period deductions
(Note 2) | 122,654
| 198,151
| 280,040
| 130,145
|
| Net investment income (loss) | (111,576)
| 16,397,495
| 6,095,716
| 714,646
|
| | | | | |
| Realized and unrealized gains | | | | |
| (losses) on investments | | | | |
| Net realized gains (losses) on | | | | |
| investments | (3,211,611) | (10,113,537) | (574,752) | (10,400,578) |
| Net unrealized gains (losses) on | | | | |
| investments | (7,316,939)
| (14,244,865)
| (18,464,604)
| 2,152,849
|
| Net realized and unrealized gains | | | | |
| (losses) on investments | (10,528,550)
| (24,358,402)
| (19,039,356)
| (8,247,729)
|
| | | | | |
| Net increase (decrease) in net assets | | | | |
| resulting from operations | $(10,640,126)
| $(7,960,907)
| $(12,943,640)
| $(7,533,083)
|
See accompanying notes.
Strategic Investor 109
Security Life Separate Account L1
Statement of Operations (continued)
(Unaudited)
Nine months ended September 30, 2001
| Fidelity
|
| Asset
Manager
| Growth
| Growth SC
| Overseas
| Overseas SC
| Money
Market
| Index 500
|
| Investment income | | | | | | | |
| Dividends from mutual funds | $903,965 | $4,536,923 | $ - | $5,340,174 | $ - | $2,511,589 | $1,936,486 |
| Less valuation period deductions | | | | | | | |
| (Note 2) | 104,838
| 351,213
| -
| 216,162
| -
| 421,406
| 974,190
|
| Net investment income (loss) | 799,127
| 4,185,710
| -
| 5,124,012
| -
| 2,090,183
| 962,296
|
| | | | | | | | |
| Realized and unrealized gains | | | | | | | |
| (losses) on investments | | | | | | | |
| Net realized gains (losses) on | | | | | | | |
| investments | (1,333,723) | (8,394,238) | (8,299) | (7,918,094) | (64) | - | 2,005,052 |
| Net unrealized gains (losses) on | | | | | | | |
| investments | (1,786,550)
| (17,260,429)
| (6,406)
| (11,186,604)
| (15,770)
| -
| (46,372,634)
|
| Net realized and unrealized gains | | | | | | | |
| (losses) on investments | (3,120,273)
| (25,654,667)
| (14,705)
| (19,104,698)
| (15,834)
| -
| (44,367,582)
|
| | | | | | | | |
| Net increase (decrease) in net assets | | | | | | | |
| resulting from operations | $(2,321,146)
| $(21,468,957)
| $(14,705)
| $(13,980,686)
| $(15,834)
| $2,090,183
| $(43,405,286)
|
See accompanying notes.
Strategic Investor 110
Security Life Separate Account L1
Statement of Operations (continued)
(Unaudited)
Nine months ended September 30, 2001
| INVESCO
|
| Total
Return
| Equity
Income
| High Yield
| Utilities
| Small Company
Growth
|
| Investment Income | | | | | |
| Dividends from mutual funds | $ - | $ - | $ - | $ - | $ - |
| Less valuation period deductions | | | | | |
| (Note 2) | 66,544
| 140,586
| 58,859
| 47,837
| 68,303
|
| Net investment income (loss) | (66,544)
| (140,586)
| (58,859)
| (47,837)
| (68,303)
|
| | | | | | |
| Realized and unrealized gains | | | | | |
| (losses) on investments | | | | | |
| Net realized gains (losses) on | | | | | |
| investments | (468,777) | 143,442 | (472,065) | (100,255) | (1,478,280) |
| Net unrealized gains (losses) on | | | | | |
| investments | (547,842)
| (5,021,480)
| (1,317,590)
| (3,455,761)
| (3,256,600)
|
| Net realized and unrealized gains | | | | | |
| (losses) on investments | (1,016,619)
| (4,878,038)
| (1,789,655)
| (3,556,016)
| (4,734,880)
|
| | | | | | |
| Net increase (decrease) in net assets | | | | | |
| resulting from operations | $(1,083,163)
| $(5,018,624)
| $(1,848,514)
| $(3,603,853)
| $(4,803,183)
|
See accompanying notes.
Strategic Investor 111
Security Life Separate Account L1
Statement of Operations (continued)
(Unaudited)
Nine months ended September 30, 2001
| Van Eck
|
| Worldwide
Hard
Assets
| Worldwide
Bond
| Worldwide
Emerging
Markets
| Worldwide
Real Estate
|
| | | | | |
| Investment Income | | | | |
| Dividends from mutual funds | $25,272 | $44,322 | $ - | $38,335 |
| Less valuation period deductions | | | | |
| (Note 2) | 13,526
| 5,895
| 22,837
| 10,015
|
| Net investment income (loss) | 11,746
| 38,427
| (22,837)
| 28,320
|
| | | | | |
| Realized and unrealized gains | | | | |
| (losses) on investments | | | | |
| Net realized gains (losses) on | | | | |
| investments | 135,326 | (26,384) | (990,221) | 58,819 |
| Net unrealized gains (losses) on | | | | |
| investments | (532,795)
| (28,601)
| (6,036)
| (92,801)
|
| Net realized and unrealized gains | | | | |
| (losses) on investments | (397,469)
| (54,985)
| (996,257)
| (33,982)
|
| | | | | |
| Net increase (decrease) in net assets | | | | |
| resulting from operations | $(385,723)
| $(16,558)
| $(1,019,094)
| $(5,662)
|
See accompanying notes.
Strategic Investor 112
Security Life Separate Account L1
Statement of Operations (continued)
(Unaudited)
Nine months ended September 30, 2001
| AIM
|
| Capital
Appreciation
| Government
Securities
|
| Investment Income | | |
| Dividends from mutual funds | $ - | $ - |
| Less valuation period deductions | | |
| (Note 2) | 56,237
| 96,489
|
| Net investment income (loss) | (56,237)
| (96,489)
|
| | | |
| Realized and unrealized gains | | |
| (losses) on investments | | |
| Net realized gains (losses) on | | |
| Investments | (2,469,266) | 188,570 |
| Net unrealized gains (losses) on | | |
| Investments | (4,603,030)
| 3,416,228
|
| Net realized and unrealized gains | | |
| (losses) on investments | (7,072,296)
| 3,604,798
|
| | | |
| Net increase (decrease) in net assets | | |
| resulting from operations | $(7,128,533)
| $3,508,309
|
See accompanying notes.
Strategic Investor 113
Security Life Separate Account L1
Statement of Operations (continued)
(Unaudited)
Nine months ended September 30, 2001
| GCG
|
| Equity
Income
| Growth
| Hard
Assets
| Limited
Maturity
Bond
| Liquid
Asset
| MidCap
Growth
| Research
| Total
Return
| Fully
Managed
|
| Investment income | | | | | | | | | |
| Dividends from mutual funds | $ - | $ - | $ - | $ - | $155,365 | $ - | $ - | $ - | $ - |
Less valuation period deductions
(Note 2) | -
| -
| -
| -
| -
| 121
| -
| -
| 2,623
|
| | | | | | | | | | |
| Net investment income (loss) | -
| -
| -
| -
| 155,365
| (121)
| -
| -
| (2,623)
|
| | | | | | | | | | |
Realized and unrealized gains (losses)
on investments | | | | | | | | | |
Net realized gains (losses) on
investments | 4 | (473) | - | (2,533) | - | (5,748) | (270) | (376) | (1,507) |
Net unrealized gains (losses) on
investments | (248)
| (815)
| -
| 86,154
| -
| (31,208)
| (356)
| (1,106)
| (76,768)
|
Net realized and unrealized gains
(losses) on investments | (244)
| (1,288)
| -
| 83,621
| -
| (36,956)
| (626)
| (1,482)
| (78,275)
|
| | | | | | | | | | |
Net increase (decrease) in net assets
resulting from operations | $(244)
| $(1,288)
| $ -
| $83,621
| $155,365
| $(37,077)
| $(626)
| $(1,482)
| $(80,898)
|
See accompanying notes.
Strategic Investor 114
Security Life Separate Account L1
Statement of Operations (continued)
(Unaudited)
Nine months ended September 30, 2001
| Janus
|
| Growth
| Aggressive
Growth
| Worldwide
Growth
| International
Growth
|
| Investment Income | | | | |
| Dividends from mutual funds | $4,387 | $ - | $4,480 | $22,708 |
| Less valuation period deductions | | | | |
| (Note 2) | 8,354
| 5,763
| 7,792
| 16,351
|
| Net investment income (loss) | (3,967)
| (5,763)
| (3,312)
| 6,357
|
| | | | | |
| Realized and unrealized gains | | | | |
| (losses) on investments | | | | |
| Net realized gains (losses) on | | | | |
| investments | (66,138) | (52,832) | (188,602) | (45,901) |
| Net unrealized gains (losses) on | | | | |
| investments | (770,447)
| (620,228)
| (490,331)
| (1,192,508)
|
| Net realized and unrealized gains | | | | |
| (losses) on investments | (836,585)
| (673,060)
| (678,933)
| (1,238,409)
|
| | | | | |
| Net increase (decrease) in net assets | | | | |
| resulting from operations | $(840,552)
| $(678,823)
| $(682,245)
| $(1,232,052)
|
See accompanying notes.
Strategic Investor 115
Security Life Separate Account L1
Statement of Operations (continued)
(Unaudited)
Nine months ended September 30, 2001
| M
|
| International
Equity
| Enhanced
US Equity
| Capital
Appreciation
| Core Growth
|
| Investment Income | | | | |
| Dividends from mutual funds | $68 | $ - | $172 | $4 |
| Less valuation period deductions | | | | |
| (Note 2) | 656
| 484
| 523
| 118
|
| Net investment income (loss) | (588)
| (484)
| (351)
| (114)
|
| | | | | |
| Realized and unrealized gains | | | | |
| (losses) on investments | | | | |
| Net realized gains (losses) on | | | | |
| investments | (2,402) | (1,096) | (3,447) | (110) |
| Net unrealized gains (losses) on | | | | |
| investments | (97,793)
| (47,816)
| (149,084)
| (14,305)
|
| Net realized and unrealized gains | | | | |
| (losses) on investments | (100,195)
| (48,912)
| (152,531)
| (14,415)
|
| | | | | |
| Net increase (decrease) in net assets | | | | |
| resulting from operations | $(100,783)
| $(49,396)
| $(152,882)
| $(14,529)
|
See accompanying notes.
Strategic Investor 116
Security Life Separate Account L1
Statement of Operations (continued)
(Unaudited)
Nine months ended September 30, 2001
| Pilgrim
|
| Growth
Opportunities
| MagnaCap
| MidCap
Opportunities
| SmallCap
Opportunities
|
| Investment Income | | | | |
| Dividends from mutual funds | $ - | $ - | $ - | $241 |
| Less valuation period deductions | | | | |
| (Note 2) | 9
| 88
| 98
| 101
|
| Net investment income (loss) | (9)
| (88)
| (98)
| 140
|
| | | | | |
| Realized and unrealized gains | | | | |
| (losses) on investments | | | | |
| Net realized gains (losses) on | | | | |
| investments | (135) | (833) | (4,931) | (684) |
| Net unrealized gains (losses) on | | | | |
| investments | (1,677)
| (6,117)
| (14,824)
| (20,337)
|
| Net realized and unrealized gains | | | | |
| (losses) on investments | (1,812)
| (6,950)
| (19,755)
| (21,021)
|
| | | | | |
| Net increase (decrease) in net assets | | | | |
| resulting from operations | $(1,821)
| $(7,038)
| $(19,853)
| $(20,881)
|
See accompanying notes.
Strategic Investor 117
Security Life Separate Account L1
Statement of Operations (continued)
(Unaudited)
Nine months ended September 30, 2001
| Putnam
|
| New
Opportunities
| Voyager
| Growth
and Income
| Small Cap
Value
|
| Investment Income | | | | |
| Dividends from mutual funds | $ - | $ - | $ - | $ - |
| Less valuation period deductions | | | | |
| (Note 2) | 36
| 35
| 579
| 1,028
|
| Net investment income (loss) | (36)
| (35)
| (579)
| (1,028)
|
| | | | | |
| Realized and unrealized gains | | | | |
| (losses) on investments | | | | |
| Net realized gains (losses) on | | | | |
| investments | (1,711) | (292) | (488) | 2,286 |
| Net unrealized gains (losses) on | | | | |
| investments | (2,405)
| (3,672)
| (40,786)
| (86,221)
|
| Net realized and unrealized gains | | | | |
| (losses) on investments | (4,116)
| (3,964)
| (41,274)
| (83,935)
|
| | | | | |
| Net increase (decrease) in net assets | | | | |
| resulting from operations | $(4,152)
| $(3,999)
| $(41,853)
| $(84,963)
|
See accompanying notes.
Strategic Investor 118
Security Life Separate Account L1
Statement of Changes in Net Assets
(Unaudited)
Nine months ended September 30, 2001
| NB
|
| Limited
Maturity Bond
| Growth
| Partners
|
| Increase (decrease) in net assets | | | |
| | | | |
| Operations | | | |
| Net investment income (loss) | $861,039 | $6,870,085 | $1,025,473 |
| Net realized gains (losses) on | | | |
| investments | (143,790) | (8,528,144) | (1,054,314) |
| Net unrealized gains (losses) on | | | |
| investments | 495,407
| (6,570,124)
| (4,918,083)
|
| Increase (decrease) in net assets from | | | |
| operations | 1,212,656
| (8,228,183)
| (4,946,924)
|
| | | | |
| Changes from principal | | | |
| transactions | | | |
| Net premiums | 1,873,806 | 2,923,785 | 3,589,106 |
| Cost of insurance and | | | |
| administrative charges | (466,860) | (548,934) | (1,176,952) |
| Benefit payments | - | - | - |
| Surrenders | (467,521) | (202,352) | (1,062,230) |
| Net transfers among divisions | | | |
| (including the loan division and | | | |
| guaranteed interest division in | | | |
| the general account) | 1,667,688 | (3,810,780) | 679,750 |
| Other | (4,066)
| (2,916)
| 19,026
|
| Increase (decrease) from principal | | | |
| transactions | 2,603,047
| (1,641,197)
| 2,048,700
|
| | | | |
| Total increase (decrease) in net assets | 3,815,703 | (9,869,380) | (2,898,224) |
| | | | |
| Net assets at beginning of year | 14,494,151
| 19,944,906
| 27,555,779
|
| | | | |
| Net assets at end of year | $18,309,854
| $10,075,526
| $24,657,555
|
See accompanying notes.
Strategic Investor 119
Security Life Separate Account L1
Statement of Changes in Net Assets (continued)
(Unaudited)
Nine months ended September 30, 2001
| Alger
|
| American
Small
Capitalization
| American
MidCap
Growth
| American
Growth
| American
Leveraged
AllCap
|
| Increase (decrease) in net assets | | | | |
| | | | | |
| Operations | | | | |
| Net investment income (loss) | $(111,576) | $16,397,495 | $6,095,716 | $714,646 |
| Net realized gains (losses) on | | | | |
| investments | (3,211,611) | (10,113,537) | (574,752) | (10,400,578) |
| Net unrealized gains (losses) on | | | | |
| investments | (7,316,939)
| (14,244,865)
| (18,464,604)
| 2,152,849
|
| Increase (decrease) in net assets from | | | | |
| operations | (10,640,126)
| (7,960,907)
| (12,943,640)
| (7,533,083)
|
| | | | | |
| Changes from principal | | | | |
| transactions | | | | |
| Net premiums | 4,553,211 | 7,796,119 | 9,023,477 | 5,069,199 |
| Cost of insurance and | | | | |
| administrative charges | (981,734) | (1,465,438) | (2,106,987) | (1,311,526) |
| Benefit payments | - | - | - | - |
| Surrenders | (595,965) | (1,197,795) | (1,117,742) | (777,555) |
| Net transfers among divisions | | | | |
| (including the loan division and | | | | |
| guaranteed interest division in | | | | |
| the general account) | (402,843) | 1,111,738 | (58,483) | (2,120,485) |
| Other | (22,179)
| (100,870)
| (67,971)
| 140,014
|
| Increase (decrease) from principal | | | | |
| transactions | 2,550,490
| 6,143,754
| 5,672,294
| 999,647
|
| | | | | |
| Total increase (decrease) in net assets | (8,089,636) | (1,817,153) | (7,271,346) | (6,533,436) |
| | | | | |
| Net assets at beginning of year | 26,169,130
| 33,293,751
| 50,118,432
| 24,377,608
|
| | | | | |
| Net assets at end of year | $18,079,494
| $31,476,598
| $42,847,086
| $17,844,172
|
See accompanying notes.
Strategic Investor 120
Security Life Separate Account L1
Statement of Changes in Net Assets (continued)
(Unaudited)
Nine months ended September 30, 2001
| Fidelity
|
| Asset
Manager
| Growth
| Growth SC
| Overseas
| Overseas SC
| Money
Market
| Index 500
|
| Increase (decrease) in net assets | | | | | | | |
| | | | | | | | |
| Operations | | | | | | | |
| Net investment income (loss) | $799,127 | $4,185,710 | $ - | $5,124,012 | $ - | $2,090,183 | $962,296 |
| Net realized gains (losses) on | | | | | | | |
| investments | (1,333,723) | (8,394,238) | (8,299) | (7,918,094) | (64) | 1,798,913 | 2,005,052 |
| Net unrealized gains (losses) on | | | | | | | |
| investments | (1,786,550)
| (17,260,429)
| (6,406)
| (11,186,604)
| (15,770)
| (1,798,913)
| (46,372,634)
|
| Increase (decrease) in net assets from | | | | | | | |
| operations | (2,321,146)
| (21,468,957)
| (14,705)
| (13,980,686)
| (15,834)
| 2,090,183
| (43,405,286)
|
| | | | | | | | |
| Changes from principal | | | | | | | |
| transactions | | | | | | | |
| Net premiums | 3,679,706 | 10,807,387 | 62,782 | 7,272,439 | 66,462 | 88,102,103 | 35,902,623 |
| Cost of insurance and | | | | | | | |
| administrative charges | (835,313) | (2,441,729) | (1,532) | (1,506,200) | (1,319) | (3,455,771) | (7,689,386) |
| Benefit payments | - | - | - | - | - | (579,967) | - |
| Surrenders | (372,658) | (2,041,763) | - | (1,448,283) | - | (3,072,457) | (4,304,294) |
| Net transfers among divisions | | | | | | | |
| (including the loan division and | | | | | | | |
| guaranteed interest division in | | | | | | | |
| the general account) | 2,403,551 | (4,975,532) | (7,345) | 1,750,726 | 6,130 | (41,128,003) | 3,791,793 |
| Other | (22,374)
| (15,020)
| (131)
| (127,850)
| 953
| 29,000
| 17,144
|
| Increase (decrease) from principal | | | | | | | |
| transactions | 4,852,912
| 1,333,343
| 53,774
| 5,940,832
| 72,226
| 39,894,905
| 27,717,880
|
| | | | | | | | |
| Total increase (decrease) in net assets | 2,531,766 | (20,135,614) | 39,069 | (8,039,854) | 56,392 | 41,985,088 | (15,687,406) |
| | | | | | | | |
| Net assets at beginning of year | 15,754,618
| 68,506,203
| -
| 43,321,877
| -
| 62,014,812
| 180,940,441
|
| | | | | | | | |
| Net assets at end of year | $18,286,384
| $48,370,589
| $39,069
| $35,282,023
| $56,392
| $103,999,900
| $165,253,035
|
See accompanying notes.
Strategic Investor 121
Security Life Separate Account L1
Statement of Changes in Net Assets (continued)
(Unaudited)
Nine months ended September 30, 2001
| INVESCO
|
| Total
Return
| Equity
Income
| High Yield
| Utilities
| Small Company
Growth
|
| Increase (decrease) in net assets | | | | | |
| | | | | | |
| Operations | | | | | |
| Net investment income (loss) | $(66,544) | $(140,586) | $(58,859) | $(47,837) | $(68,303) |
| Net realized gains (losses) on | | | | | |
| investments | (468,777) | 143,442 | (472,065) | (100,255) | (1,478,280) |
| Net unrealized gains (losses) on | | | | | |
| investments | (547,842)
| (5,021,480)
| (1,317,590)
| (3,455,761)
| (3,256,600)
|
| Increase (decrease) in net assets from | | | | | |
| operations | (1,083,163)
| (5,018,624)
| (1,848,514)
| (3,603,853)
| (4,803,183)
|
| | | | | | |
| Changes from principal | | | | | |
| transactions | | | | | |
| Net premiums | 1,645,834 | 3,594,047 | 1,794,573 | 2,226,839 | 2,568,865 |
| Cost of insurance and | | | | | |
| administrative charges | (698,137) | (1,244,698) | (480,469) | (411,603) | (493,547) |
| Benefit payments | - | - | - | - | - |
| Surrenders | (577,591) | (359,353) | (208,715) | (99,927) | (452,315) |
| Net transfers among divisions | | | | | |
| (including the loan division and | | | | | |
| guaranteed interest division in | | | | | |
| the general account) | 1,172,479 | 7,159,477 | (469,867) | 1,501,839 | 1,953,248 |
| Other | 3,923
| (40,760)
| 3,755
| 46,840
| (16,014)
|
| Increase (decrease) from principal | | | | | |
| transactions | 1,546,508
| 9,108,713
| 639,277
| 3,263,988
| 3,560,237
|
| | | | | | |
| Total increase (decrease) in net assets | 463,345 | 4,090,089 | (1,209,237) | (339,865) | (1,242,946) |
| | | | | | |
| Net assets at beginning of year | 11,694,631
| 21,536,096
| 10,496,352
| 7,811,932
| 11,848,103
|
| | | | | | |
| Net assets at end of year | $12,157,976
| $25,626,185
| $9,287,115
| $7,472,067
| $10,605,157
|
See accompanying notes.
Strategic Investor 122
Security Life Separate Account L1
Statement of Changes in Net Assets (continued)
(Unaudited)
Nine months ended September 30, 2001
| Van Eck
|
| Worldwide
Hard
Assets
| Worldwide
Bond
| Worldwide
Emerging
Markets
| Worldwide
Real
Estate
|
| Increase (decrease) in net assets | | | | |
| | | | | |
| Operations | | | | |
| Net investment income (loss) | $11,746 | $38,427 | $(22,837) | $28,320 |
| Net realized gains (losses) on | | | | |
| investments | 135,326 | (26,384) | (990,221) | 58,819 |
| Net unrealized gains (losses) on | | | | |
| investments | (532,795)
| (28,601)
| (6,036)
| (92,801)
|
| Increase (decrease) in net assets from | | | | |
| operations | (385,723)
| (16,558)
| (1,019,094)
| (5,662)
|
| | | | | |
| Changes from principal | | | | |
| transactions | 226,207 | 299,916 | 952,897 | 468,455 |
| Net premiums | | | | |
| Cost of insurance and | | | | |
| administrative charges | (104,223) | (69,357) | (189,443) | (72,864) |
| Benefit payments | - | - | - | - |
| Surrenders | (290,575) | (9,234) | (80,627) | (288) |
| Net transfers among divisions | | | | |
| (including the loan division and | | | | |
| guaranteed interest division in | | | | |
| the general account) | 49,675 | 93,709 | (764,206) | 485,639 |
| Other | (902)
| 1,131
| 3,684
| (227)
|
| Increase (decrease) from principal | | | | |
| transactions | (119,818)
| 316,165
| (77,695)
| 880,715
|
| | | | | |
| Total increase (decrease) in net assets | (505,541) | 299,607 | (1,096,789) | 875,053 |
| | | | | |
| Net assets at beginning of year | 2,313,351
| 931,427
| 4,562,000
| 1,312,308
|
| | | | | |
| Net assets at end of year | $1,807,810
| $1,231,034
| $3,465,211
| $2,187,361
|
See accompanying notes.
Strategic Investor 123
Security Life Separate Account L1
Statement of Changes in Net Assets (continued)
(Unaudited)
Nine months ended September 30, 2001
| AIM
|
| Capital
Appreciation
| Government
Securities
|
| Increase (decrease) in net assets | | |
| | | |
| Operations | | |
| Net investment income (loss) | $(56,237) | $(96,489) |
| Net realized gains (losses) on | | |
| investments | (2,469,266) | 188,570 |
| Net unrealized gains (losses) on | | |
| investments | (4,603,030)
| 3,416,228
|
| Increase (decrease) in net assets from | | |
| operations | (7,128,533)
| 3,508,309
|
| | | |
| Changes from principal | | |
| transactions | | |
| Net premiums | 3,519,507 | 2,241,128 |
| Cost of insurance and | | |
| administrative charges | (708,763) | (1,873,858) |
| Benefit payments | - | - |
| Surrenders | (287,754) | (219,941) |
| Net transfers among divisions | | |
| (including the loan division and | | |
| guaranteed interest division in | | |
| the general account) | (37,907,694) | 48,560,641 |
| Other | 2,402,069
| 394,935
|
| Increase (decrease) from principal | | |
| transactions | (32,982,635)
| 49,102,905
|
| | | |
| Total increase (decrease) in net assets | (40,111,168) | 52,611,214 |
| | | |
| Net assets at beginning of year | 51,038,676
| 16,763,898
|
| | | |
| Net assets at end of year | $10,927,508
| $69,375,112
|
See accompanying notes.
Strategic Investor 124
Security Life Separate Account L1
Statement of Changes in Net Assets (continued)
(Unaudited)
Nine months ended September 30, 2001
| GCG
|
| Equity
Income
| Growth
| Hard
Assets
| Limited
Maturity
Bond
| Liquid
Asset
| MidCap
Growth
| Research
| Total
Return
| Fully
Managed
|
| Increase (decrease) in net assets | | | | | | | | | |
| | | | | | | | | | |
| Operations | | | | | | | | | |
| Net investment income (loss) | $ - | $ - | $ - | $ - | $155,365 | $(121) | $ - | $ - | $(2,623) |
| Net realized gains (losses) on | | | | | | | | | |
| investments | 4 | (473) | - | (2,533) | - | (5,748) | (270) | (376) | (1,507) |
| Net unrealized gains (losses) on | | | | | | | | | |
| investments | (248)
| (815)
| -
| 86,154
| -
| (31,208)
| (356)
| (1,106)
| (76,768)
|
| Increase (decrease) in net assets from | | | | | | | | | |
| operations | (244)
| (1,288)
| -
| 83,621
| 155,365
| (37,077)
| (626)
| (1,482)
| (80,898)
|
| | | | | | | | | | |
| Changes from principal | | | | | | | | | |
| transactions | | | | | | | | | |
| Net premiums | 4,020 | 5,529 | - | 125,575 | 11,154,856 | 32,152 | 4,019 | 25,913 | 132,198 |
| Cost of insurance and | | | | | | | | | |
| administrative charges | (262) | (218) | - | (25,656) | (192,824) | (2,517) | (237) | (992) | (10,015) |
| Benefit payments | - | - | - | - | - | - | - | - | - |
| Surrenders | - | - | - | (28,821) | (64,165) | - | - | - | - |
| Net transfers among divisions | | | | | | | | | |
| (including the loan division and | | | | | | | | | |
| guaranteed interest division in | | | | | | | | | |
| the general account) | (287) | (361) | - | 112,849 | (8,917,271) | 116,110 | (1,617) | (4,384) | 2,212,603 |
| Other | (1)
| 277
| -
| (233)
| 9,838
| 2,323
| -
| (106)
| (219)
|
| Increase (decrease) from principal | | | | | | | | | |
| transactions | 3,470
| 5,227
| -
| 183,714
| 1,990,434
| 148,068
| 2,165
| 20,431
| 2,334,567
|
| | | | | | | | | |
| Total increase (decrease) in net assets | 3,226 | 3,939 | - | 267,335 | 2,145,799 | 110,991 | 1,539 | 18,949 | 2,253,669 |
| | | | | | | | | | |
| Net assets at beginning of year | -
| 1,233
| -
| 876,798
| 1,991,502
| -
| -
| 10,533
| -
|
| | | | | | | | | | |
| Net assets at end of year | $3,226
| $5,172
| $ -
| $1,144,133
| $4,137,301
| $110,991
| $1,539
| $29,482
| $2,253,669
|
See accompanying notes.
Strategic Investor 125
Security Life Separate Account L1
Statement of Changes in Net Assets (continued)
(Unaudited)
Nine months ended September 30, 2001
| Janus
|
| Growth
| Aggressive
Growth
| Worldwide
Growth
| International
Growth
|
| Increase (decrease) in net assets | | | | |
| | | | | |
| Operations | | | | |
| Net investment income (loss) | $(3,967) | $(5,763) | $(3,312) | $6,357 |
| Net realized gains (losses) on investments | (66,138) | (52,832) | (188,602) | (45,901) |
| Net unrealized gains (losses) on investments | (770,447)
| (620,228)
| (490,331)
| (1,192,508)
|
Increase (decrease) in net assets from
operations | (840,552)
| (678,823)
| (682,245)
| (1,232,052)
|
| | | | | |
| Changes from principal transactions | | | | |
| Net premiums | 843,683 | 656,670 | 770,445 | 997,292 |
Cost of insurance and administrative
expenses | (68,517) | (59,897) | (73,929) | (87,762) |
| Benefit payments | - | - | - | - |
| Surrenders | (2,404) | (5,593) | (55,040) | (1,942) |
Net transfers among divisions (including the
loan division and guaranteed interest
division in the general account) | 1,979,388 | 1,073,793 | 1,630,824 | 4,043,370 |
| Other | 648
| 4,473
| (889)
| 385
|
| Increase (decrease) from principal transactions | 2,752,798
| 1,669,446
| 2,271,411
| 4,951,343
|
| | | | | |
| Total increase (decrease) in net assets | 1,912,246 | 990,623 | 1,589,166 | 3,719,291 |
| | | | | |
| Net assets at beginning of year | 243,641
| 524,583
| 319,420
| 420,616
|
| | | | | |
| Net assets at end of year | $2,155,887
| $1,515,206
| $1,908,586
| $4,139,907
|
See accompanying notes.
Strategic Investor 126
Security Life Separate Account L1
Statement of Changes in Net Assets (continued)
(Unaudited)
Nine months ended September 30, 2001
| M
|
| International
Equity
| Enhanced
US Equity
| Capital
Appreciation
| Core Growth
|
| Increase (decrease) in net assets | | | | |
| | | | | |
| Operations | | | | |
| Net investment income (loss) | $(588) | $(484) | $(351) | $(114) |
| Net realized gains (losses) on investments | (2,402) | (1,096) | (3,447) | (110) |
| Net unrealized gains (losses) on investments | (97,793)
| (47,816)
| (149,084)
| (14,305)
|
| Increase (decrease) in net assets from operations | (100,783)
| (49,396)
| (152,882)
| (14,529)
|
| | | | | |
| Changes from principal transactions | | | | |
| Net premiums | 27,786 | 37,540 | 22,739 | 8,845 |
| Cost of insurance and administrative expenses | (5,028) | (2,196) | (4,405) | (648) |
| Benefit payments | - | - | - | - |
| Surrenders | (423) | - | (420) | - |
Net transfers among divisions (including the
loan division and guaranteed interest division
in the general account) | 1,178,592 | 680,257 | 1,026,098 | 152,791 |
| Other | (342)
| 35
| (767)
| 5
|
| Increase (decrease) from principal transactions | 1,200,585
| 715,636
| 1,043,245
| 160,993
|
| | | | | |
| Total increase (decrease) in net assets | 1,099,802 | 666,240 | 890,363 | 146,464 |
| | | | | |
| Net assets at beginning of year | -
| -
| -
| -
|
| | | | | |
| Net assets at end of year | $1,099,802
| $666,240
| $890,363
| $146,464
|
See accompanying notes.
Strategic Investor 127
Security Life Separate Account L1
Statement of Changes in Net Assets (continued)
(Unaudited)
Nine months ended September 30, 2001
| Pilgrim
|
| Growth
Opportunities
| MagnaCap
| MidCap
Opportunities
| SmallCap
Opportunities
|
| Increase (decrease) in net assets | | | | |
| | | | | |
| Operations | | | | |
| Net investment income (loss) | $(9) | $(88) | $(98) | $140 |
| Net realized gains (losses) on investments | (135) | (833) | (4,931) | (684) |
| Net unrealized gains (losses) on investments | (1,677)
| (6,117)
| (14,824)
| (20,337)
|
| Increase (decrease) in net assets from operations | (1,821)
| (7,038)
| (19,853)
| (20,881)
|
| | | | | |
| Changes from principal transactions | | | | |
| Net premiums | 1,989 | 22,346 | 1,547 | 49,789 |
| Cost of insurance and administrative expenses | (153) | (1,616) | (671) | (2,102) |
| Benefit payments | - | - | - | - |
| Surrenders | - | - | - | (181) |
Net transfers among divisions (including the
loan division and guaranteed interest division
in the general account) | 8,413 | 62,752 | 92,340 | 82,640 |
| Other | 64
| (102)
| 1,923
| (46)
|
| Increase (decrease) from principal transactions | 10,313
| 83,380
| 95,139
| 130,100
|
| | | | | |
| Total increase (decrease) in net assets | 8,492 | 76,342 | 75,286 | 109,219 |
| | | | | |
| Net assets at beginning of year | -
| -
| -
| -
|
| | | | | |
| Net assets at end of year | $8,492
| $76,342
| $75,286
| $109,219
|
See accompanying notes.
Strategic Investor 128
Security Life Separate Account L1
Statement of Changes in Net Assets (continued)
(Unaudited)
Nine months ended September 30, 2001
| Putnam
|
| New
Opportunities
| Voyager
| Growth
and Income
| Small Cap
Value
|
| Increase (decrease) in net assets | | | | |
| | | | | |
| Operations | | | | |
| Net investment income (loss) | $(36) | $(35) | $(579) | $(1,028) |
| Net realized gains (losses) on investments | (1,711) | (292) | (488) | 2,286 |
| Net unrealized gains (losses) on investments | (2,405)
| (3,672)
| (40,786)
| (86,221)
|
| Increase (decrease) in net assets from operations | (4,152)
| (3,999)
| (41,853)
| (84,963)
|
| | | | | |
| Changes from principal transactions | | | | |
| Net premiums | 27,153 | 12,573 | 167,986 | 167,132 |
| Cost of insurance and administrative expenses | (696) | (1,145) | (6,504) | (10,083) |
| Benefit payments | - | - | - | - |
| Surrenders | - | - | - | (10,133) |
Net transfers among divisions (including the loan
division and guaranteed interest division in the
general account) | 153,503 | 30,741 | 596,974 | 832,214 |
| Other | (212)
| 23
| 50
| 1,293
|
| Increase (decrease) from principal transactions | 179,748
| 42,192
| 758,506
| 980,423
|
| | | | | |
| Total increase (decrease) in net assets | 175,596 | 38,193 | 716,653 | 895,460 |
| | | | | |
| Net assets at beginning of year | -
| -
| -
| -
|
| | | | | |
| Net assets at end of year | $175,596
| $38,193
| $716,653
| $895,460
|
See accompanying notes.
Strategic Investor 129
Security Life Separate Account L1
Notes to Financial Statements
(Unaudited)
September 30, 2001
1. Organization
Security Life Separate Account L1 (the "Separate Account") was established by resolution of the Board of Directors of Security Life of Denver Insurance Company (the "Company") on November 3, 1993. The Separate Account is organized as a unit investment trust registered with the Securities and Exchange Commission under the Investment Company Act of 1940.
The Separate Account supports the operations of the FirstLine Variable Universal Life, FirstLine II Variable Universal Life, Strategic Advantage Variable Universal Life, Strategic Advantage II Variable Universal Life, Variable Survivorship Universal Life, Corporate Benefits Variable Universal Life, Strategic Benefits Variable Universal Life, Asset Portfolio Manager Variable Universal Life, and Estate Designer policies ("Variable Universal Life Policies") offered by the Company. Corporate Benefits Variable Universal Life and Strategic Benefits Variable Universal Life became effective in 2000 and are defined as Class B policies due to their mortality and expense charge structure. Asset Portfolio Manager Variable Universal Life became effective in 2001 and is also defined as a Class B policy. All other Variable Universal Life Policies are defined as Class A policies. The Separate Account may be used to support other variable life policies as the Company offers them. The assets of the Separate Account are the property of the Company. However, the portion of the Separate Account's assets attributable to the policies will not be used to satisfy liabilities arising out of any other operations of the Company.
As of September 30, 2001, the Separate Account offered 50 investment divisions (collectively "Funds") available to the policyholders, 37 of which invest in an independently managed mutual fund portfolio and thirteen of which invest in a mutual fund portfolio managed by an affiliate, either Direct Services, Inc. or ING Pilgrim Investments, LLC. The Funds are as follows:
Portfolio Managers/Portfolios (Funds)
Neuberger Berman Management Incorporated (NB)
Neuberger Berman Limited Maturity Bond Portfolio
Neuberger Berman Growth Portfolio
Neuberger Berman Partners Portfolio
Fred Alger Management, Inc. (Alger)
Alger American Small Capitalization Portfolio
Alger American MidCap Growth Portfolio
Alger American Growth Portfolio
Alger American Leveraged AllCap Portfolio
Fidelity Management & Research Company (Fidelity)
Fidelity Investments VIP II Asset Manager Portfolio
Fidelity Investments VIP Growth Portfolio
Fidelity Investments VIP Growth Service Class Portfolio
Fidelity Investments VIP Overseas Portfolio
Fidelity Investments VIP Overseas Service Class Portfolio
Fidelity Investments VIP Money Market Portfolio
Fidelity Investments VIP II Index 500 Portfolio
Strategic Investor 130
Security Life Separate Account L1
(Unaudited)
Notes to Financial Statements (continued)
1. Organization (continued)
Portfolio Managers/Portfolios (Funds) (continued)
INVESCO Funds Group, Inc. (INVESCO)
INVESCO VIF Total Return Portfolio
INVESCO VIF Equity Income Portfolio
INVESCO VIF High Yield Portfolio
INVESCO VIF Utilities Portfolio
INVESCO VIF Small Company Growth Portfolio
Van Eck Associates Corporation (Van Eck)
Van Eck Worldwide Hard Assets Portfolio
Van Eck Worldwide Bond Portfolio
Van Eck Worldwide Emerging Markets Portfolio
Van Eck Worldwide Real Estate Portfolio
AIM Advisors, Inc. (AIM)
AIM VI - Capital Appreciation Portfolio
AIM VI - Government Securities Portfolio
Directed Services, Inc. ("GCG")
GCG Trust - Equity Income Portfolio
GCG Trust - Growth Portfolio
GCG Trust - Hard Assets Portfolio
GCG Trust - Limited Maturity Bond Portfolio
GCG Trust - Liquid Asset Portfolio
GCG Trust - MidCap Growth Portfolio
GCG Trust - Research Portfolio
GCG Trust - Total Return Portfolio
GCG Trust - Fully Managed Portfolio
Janus Aspen Series Funds ("Janus")
Growth Portfolio
Aggressive Growth Portfolio
Worldwide Growth Portfolio
International Growth Portfolio
M Fund, Inc. ("M")
Brandes International Equity Fund
Clifton Enhanced U.S. Equity Fund
Frontier Capital Appreciation Fund
Turner Core Growth Fund
Strategic Investor 131
Security Life Separate Account L1
(Unaudited)
Notes to Financial Statements (continued)
1. Organization (continued)
Portfolio Managers/Portfolios (Funds) (continued)
ING Pilgrim Investments, LLC ("Pilgrim")
VP Growth Opportunities Portfolio
VP MagnaCap Portfolio
VP MidCap Opportunities Portfolio
VP SmallCap Opportunities Portfolio
Putnam Investment Management, LLC ("Putnam")
Putnam VT New Opportunities Fund - Class 1B Shares
Putnam VT Voyager Fund - Class 1B Shares
Putnam VT Growth and Income Fund - Class 1B Shares
Putnam VT Small Cap Value Fund - Class 1B Shares
Effective May 1, 2001 fifteen new divisions became available to the policyholders for investment in the following funds:
Fidelity Management & Research Company (Fidelity)
Fidelity Investments VIP Growth Service Class Portfolio
Fidelity Investments VIP Overseas Service Class Portfolio
Directed Services, Inc. ("GCG")
GCG Trust - Fully Managed Portfolio
M Fund, Inc. ("M")
Brandes International Equity Fund
Clifton Enhanced U.S. Equity Fund
Frontier Capital Appreciation Fund
Turner Core Growth Fund
ING Pilgrim Investments, LLC ("Pilgrim")
VP Growth Opportunities Portfolio
VP MagnaCap Portfolio
VP MidCap Opportunities Portfolio
VP SmallCap Opportunities Portfolio
Putnam Investment Management, LLC ("Putnam")
Putnam VT New Opportunities Fund - Class 1B Shares
Putnam VT Voyager Fund - Class 1B Shares
Putnam VT Growth and Income Fund - Class 1B Shares
Putnam VT Small Cap Value Fund - Class 1B Shares
Strategic Investor 132
Security Life Separate Account L1
(Unaudited)
Notes to Financial Statements (continued)
1. Organization (continued)
Portfolio Managers/Portfolios (Funds) (continued)
The Variable Universal Life Policies allow the policyholders to specify the allocation of their net premium to the various Funds. They can also transfer their account values among the Funds. The Variable Universal Life Policies also provide the policyholders the option to allocate their net premiums, or to transfer their account values, to a Guaranteed Interest Division ("GID") in the Company's general account. The GID guarantees a rate of interest to the policyholder, and it is not variable in nature. Therefore, it is not included in these Separate Account statements.
2. Summary of Significant Accounting Policies
The accompanying financial statements of the Separate Account have been prepared on the basis of accounting principles generally accepted in the United States ("U.S. GAAP"). The preparation of financial statements in conformity with U.S. GAAP requires management to make estimates and assumptions that affect the reported amounts of assets and liabilities and disclosure of contingent assets and liabilities at the date of the financial statements and the reported amounts of revenues and expenses during the reporting period. Actual results could differ from those estimates.
The significant accounting principles followed by the Separate Account and the methods of applying those principles are presented below or in the footnotes that follow:
Investment Valuation
The investments in shares of the Funds are valued at the closing net asset value (market value) per share as determined by the Funds on the day of measurement.
Investment Transactions and Related Investment Income
The investments in shares of the Funds are accounted for on the date the order to buy or sell is confirmed. Dividend income and distributions of capital gains are recorded on the ex-dividend date. Realized gains and losses from sales transactions are reported using the first-in, first-out ("FIFO") method of accounting for cost. The difference between cost and current market value of investments owned on the day of measurement is recorded as unrealized gain or loss on investment.
Valuation Period Deductions
For FirstLine, FirstLine II, Strategic Advantage, Strategic Advantage II, Variable Survivorship and Estate Designer policies (Class A Policies), charges are made directly against the assets of the Separate Account divisions and are reflected daily in the computation of the unit values of the divisions.
A daily deduction, at an annual rate of .75% of the daily asset value of the Separate Account divisions, is charged to the Separate Account for mortality and expense risks assumed by the Company. Total mortality and expense charges for the nine months ended September 30, 2001 were $3,766,054
Strategic Investor 133
Security Life Separate Account L1
(Unaudited)
Notes to Financial Statements (continued)
2. Summary of Significant Accounting Policies (continued)
For the Corporate Benefits, Strategic Benefits and Asset Portfolio Manager policies (Class B Policies), mortality and expense charges result in the redemption of units rather than a deduction in the daily computation of unit values
For Corporate Benefits policies, a monthly deduction, at an annual rate of .20% of the account value, is charged. For Strategic Benefits policies, a monthly deduction, at an annual rate of .85%, .60% and .05% of the account value, is charged during policy years 1 through 10, 11 through 20, and 21 and later, respectively. For Asset Portfolio Manager, a monthly deduction, at an annual rate of .90% and .45% of the account value, is charged during policy years 1 through 10 and 11 through 20, respectively. There is no mortality and expense charge after year 20 for Asset Portfolio Manager policies. Total mortality and expense charges for these policies for the nine months ended September 30, 2001 were $117,234 and are included in the Statement of Changes in Net Assets as cost of insurance and administrative charges.
Policyholder Reserves
Policyholder reserves are recorded in the Separate Account at the aggregate account values of the policyholders invested in the Separate Account divisions. To the extent that benefits to be paid to the policyholders exceed their account values, the Company will contribute additional funds to the benefit proceeds.
3. Related Party Transactions
During the nine months ended September 30, 2001, management fees were paid indirectly to Direct Services, Inc., an affiliate of the Company, in its capacity as investment manager to GCG Trust. The Fund's advisory agreement provided for a fee at an annual rate of .94% of the average net assets of the Equity Income, Hard Assets and Fully Managed Portfolios, .99% of the average net assets of the Growth Portfolio, .54% of the average net assets of the Limited Maturity Bond and Liquid Assets Portfolios, and .88% of the average net assets of the MidCap, Research and Total Return Portfolios. In addition, management fees were paid to ING Pilgrim Investments, LLC, an affiliate of the Company, in its capacity as investment advisor to Pilgrim Variable Products Trust. The Fund's advisory agreement provides for a fee at an annual rate of .75% of the average net assets of the fund for all available Pilgrim funds.
4. Investments
Fund shares are purchased at net asset value with net premiums (premium payments, less sales and tax loads charged by the Company) and divisional transfers from other divisions. Fund shares are redeemed for the payment of benefits, for surrenders, for transfers to other divisions, and for charges by the Company for certain cost of insurance and administrative charges. The cost of insurance and administrative charges for the nine months ended September 30, 2001 was $30,894,716. Dividends made by the Funds are reinvested in the Funds.
Strategic Investor 134
Security Life Separate Account L1
(Unaudited)
Notes to Financial Statements (continued)
4. Investments (continued)
For the nine months ended September 30, 2001 the cost of purchases (plus reinvested dividends) and sales of investments are as follows:
Fund
| Beginning
of Year
| Purchases
| Sales
| End
of Year
|
| | | | | |
| Neuberger Berman Management Inc.: | | | | |
| Limited Maturity Bond | $14,317,177 | $9,833,157 | $(6,515,553) | $17,634,781 |
| Growth | 23,675,702 | 11,654,195 | (15,008,036) | 20,321,861 |
| Partners | 26,760,069 | 23,327,672 | (21,312,796) | 28,774,945 |
| | | | | |
| Fred Alger Management, Inc.: | | | | |
| American Small Capitalization | 29,017,464 | 7,200,099 | (7,970,932) | 28,246,631 |
| American MidCap Growth | 32,585,413 | 47,695,306 | (35,334,268) | 44,946,451 |
| American Growth | 57,519,366 | 17,361,380 | (6,055,876) | 68,824,870 |
| American Leveraged AllCap | 30,403,675 | 30,525,084 | (39,280,783) | 21,647,976 |
| | | | | |
| Fidelity Management & Research Co.: | | | | |
| Asset Manager | 16,794,005 | 12,581,884 | (8,145,836) | 21,230,053 |
| Growth | 76,947,214 | 25,701,078 | (28,420,205) | 74,228,087 |
| Growth SC | - | - | - | - |
| Overseas | 47,778,416 | 36,291,549 | (33,079,359) | 50,990,606 |
| Overseas SC | - | - | - | - |
| Money Market | 62,301,092 | 134,998,767 | (93,029,907) | 104,269,952 |
| Index 500 | 171,986,004 | 46,080,738 | (15,471,172) | 202,595,570 |
| | | | | |
| INVESCO Funds Group, Inc.: | | | | |
| Total Return | 13,758,395 | 3,323,740 | (2,356,356) | 14,725,779 |
| Equity Income | 20,783,337 | 12,004,405 | (2,835,000) | 29,952,742 |
| High Yield | 11,975,324 | 3,851,647 | (3,800,870) | 12,026,101 |
| Utilities | 7,691,761 | 4,628,178 | (1,517,562) | 10,802,377 |
| Small Company Growth | 14,096,290 | 6,001,772 | (4,003,922) | 16,094,140 |
| | | | | |
| Van Eck Associates Corporation: | | | | |
| Worldwide Hard Assets | 2,041,764 | 1,220,311 | (1,193,058) | 2,069,017 |
| Worldwide Bond | 913,802 | 642,334 | (314,200) | 1,241,936 |
| Worldwide Emerging Markets | 6,215,858 | 2,124,071 | (3,214,716) | 5,125,213 |
| Worldwide Real Estate | 1,192,797 | 1,591,292 | (623,412) | 2,160,677 |
| | | | | |
| AIM Advisors, Inc.: | | | | |
| Capital Appreciation | 51,815,173 | 9,320,530 | (44,829,713) | 16,305,990 |
| Government Securities | 16,599,323 | 53,962,296 | (4,773,896) | 65,787,723 |
Strategic Investor 135
Security Life Separate Account L1
(Unaudited)
Notes to Financial Statements (continued)
4. Investments (continued)
Fund
| Beginning
of Year
| Purchases
| Sales
| End
of Year
|
| | | | |
| Directed Services, Inc. (GCG): | | | | |
| Equity Income | - | 3,991 | (517) | 3,474 |
| Growth | 1,401 | 7,709 | (2,954) | 6,156 |
| Hard Assets | - | - | - | - |
| Limited Maturity Bond | 922,084 | 311,237 | (130,056) | 1,103,265 |
| Liquid Asset | 1,991,502 | 14,647,461 | (12,501,662) | 4,137,301 |
| MidCap Growth | - | 158,554 | (16,356) | 142,198 |
| Research | - | 3,991 | (2,095) | 1,896 |
| Total Return | 11,083 | 28,275 | (8,220) | 31,138 |
| Fully Managed | - | 2,377,472 | (47,035) | 2,330,437 |
| | | | | |
| Janus Aspen Series Funds: | | | | |
| Growth | 258,748 | 2,995,398 | (312,693) | 2,941,453 |
| Aggressive Growth | 575,061 | 1,753,178 | (142,309) | 2,185,930 |
| Worldwide Growth | 336,173 | 2,942,885 | (863,379) | 2,415,679 |
| International Growth | 437,129 | 5,208,140 | (296,326) | 5,348,943 |
| | | | | |
| M Fund, Inc.: | | | | |
| Brandes | - | 1,240,840 | (43,244) | 1,197,596 |
| Clifton | - | 724,772 | (10,716) | 714,056 |
| Frontier | - | 1,082,801 | (43,354) | 1,039,447 |
| Turner | - | 161,512 | (743) | 160,769 |
| | | | | |
| ING Pilgrim Investments, LLC: | | | | |
| Growth Opportunities | - | 13,010 | (2,841) | 10,169 |
| MagnaCap | - | 91,882 | (9,395) | 82,487 |
| Mid-Cap Opportunities | - | 106,497 | (16,387) | 90,110 |
| Small Cap Opportunities | - | 133,734 | (4,178) | 129,556 |
| | | | | |
| Putnam Investment Management, LLC: | | | | |
| New Opportunity | - | 188,345 | (10,344) | 178,001 |
| Voyager | - | 44,823 | (2,957) | 41,866 |
| Growth and Income | - | 765,548 | (8,109) | 757,439 |
| Small Cap Value | - | 1,057,284 | (75,602) | 981,682 |
Aggregate proceeds from sales of investments for the year ended September 30, 2001 were $339,904,411.
Strategic Investor 136
Security Life Separate Account L1
(Unaudited)
Notes to Financial Statements (continued)
5. Other Policy Deductions
The Variable Universal Life Policies provide for certain deductions for sales and tax loads from premium payments received from the policyholders and for surrender charges and taxes from amounts paid to policyholders. Such deductions are taken before the purchase of divisional units or after the redemption of divisional units of the Separate Account. Such deductions are not included in the Separate Account financial statements.
6. Policy Loans
The Variable Universal Life Policies allow the policyholders to borrow against their policies by using them as collateral for a loan. At the time of borrowing against the policies, an amount equal to the loan amount is transferred from the Separate Account divisions to a Loan Division in the Company's General Account to secure the loan. As payments are made on the policy loan, amounts are transferred back from the Loan Division to the Separate Account divisions. Interest is credited to the balance in the Loan Division at a fixed rate. The Loan Division is not variable in nature and is not included in these Separate Account statements.
7. Federal Income Taxes
The Separate Account is not taxed separately because the operations of the Separate Account are part of the total operations of the Company. The Company is taxed as a life insurance company under the Internal Revenue Code. The Separate Account is not taxed as a "Regulated Investment Company" under subchapter "M" of the Internal Revenue Code.
Strategic Investor 137
Security Life Separate Account L1
(Unaudited)
Notes to Financial Statements (continued)
8. Summary of Changes in Units
The following schedule summarizes the changes in divisional units for the nine months ended September 30, 2001:
Division
| Outstanding
at Beginning
of Year
| Increase
for Payments
Received
| (Decrease) for
Withdrawals
and Other
Deductions
| Outstanding
at End
of Year
|
| | | | | |
| Neuberger Berman Management Inc.: | | | | |
| Limited Maturity Bond: | | | | |
| Class A | 1,085,190.344 | 633,981.266 | (453,025.029) | 1,266,146.581 |
| Class B | - | 11,870.651 | (131.509) | 11,739.142 |
| Growth: | | | | |
| Class A | 755,032.816 | 211,630.138 | (297,943.682) | 678,719.272 |
| Class B | - | 5,187.887 | (149.125) | 5,038.762 |
| Partners: | | | | |
| Class A | 1,131,357.503 | 954,332.012 | (861,775.600) | 1,223,913.915 |
| Class B | 727.044 | 3,644.189 | (925.756) | 3,445.477 |
| Fred Alger Management, Inc.: | | | | |
| American Small Capitalization: | | | | |
| Class A | 1,351,105.091 | 494,615.223 | (336,183.930) | 1,509,536.384 |
| Class B | 55,669.122 | 13,745.027 | (7,103.215) | 62,310.934 |
| American MidCap Growth: | | | | |
| Class A | 1,022,948.192 | 992,259.366 | (816,277.300) | 1,198,930.258 |
| Class B | 4,581.526 | 42,048.850 | (6,508.656) | 40,121.720 |
| American Growth: | | | | |
| Class A | 1,795,058.476 | 402,366.412 | (211,091.017) | 1,986,333.871 |
| Class B | 11,503.557 | 64,282.741 | (6,449.037) | 69,337.261 |
| American Leveraged AllCap: | | | | |
| Class A | 602,197.766 | 819,661.610 | (819,085.801) | 602,773.575 |
| Class B | - | 5,213.278 | (99.158) | 5,114.120 |
| Fidelity Management & Research Co.: | | | | |
| Asset Manager: | | | | |
| Class A | 878,584.296 | 673,615.192 | (395,407.827) | 1,156,791.661 |
| Class B | - | 27,300.458 | (987.126) | 26,313.332 |
| Growth: | | | | |
| Class A | 2,222,867.138 | 780,227.088 | (752,229.346) | 2,250,864.880 |
| Class B | 40,727.108 | 28,191.232 | (6,005.258) | 62,913.082 |
| Growth SC: | | | | |
| Class A | - | - | - | - |
| Class B | - | 10,635.510 | (5,423.813) | 5,211.697 |
| Overseas: | | | | |
| Class A | 2,586,286.303 | 1,374,102.231 | (1,362,603.126) | 2,597,785.408 |
| Class B | 83,750.568 | 1,138,500.038 | (527,772.720) | 694,477.886 |
| Overseas SC: | | | | |
| Class A | - | - | - | - |
| Class B | - | 8,253.934 | (74.270) | 8,179.664 |
| Money Market: | | | | |
| Class A | 4,689,569.461 | 9,818,823.896 | (6,883,266.419) | 7,625,126.938 |
| Class B | - | - | - | - |
| Index 500: | | | | |
| Class A | 6,025,479.633 | 1,389,040.776 | (496,248.593) | 6,918,271.816 |
| Class B | 704,951.502 | 850,688.233 | (444,195.943) | 1,111,443.792 |
Strategic Investor 138
Security Life Separate Account L1
(Unaudited)
Notes to Financial Statements (continued)
8. Summary of Changes in Units (continued)
Division
| Outstanding
at Beginning
of Year
| Increase
for Payments
Received
| (Decrease) for
Withdrawals
and Other
Deductions
| Outstanding
at End
of Year
|
| | | | | |
| INVESCO Funds Group, Inc.: | | | | |
| Total Return: | | | | |
| Class A | 698,007.347 | 198,981.329 | (112,373.094) | 784,615.582 |
| Class B | - | 9,860.724 | (568.112) | 9,292.612 |
| Equity Income: | | | | |
| Class A | 782,880.410 | 452,568.963 | (114,877.938) | 1,120,571.435 |
| Class B | 23,197.396 | 53,355.532 | (3,600.173) | 72,952.755 |
| High Yield: | | | | |
| Class A | 680,080.798 | 235,922.007 | (210519.503) | 705,483.302 |
| Class B | 2,293.135 | 29,970.920 | (2,491.826) | 29,772.229 |
| Utilities: | | | | |
| Class A | 341,947.485 | 229,222.309 | (73,357.723) | 497,812.071 |
| Class B | - | 6,855.602 | (2,097.018) | 4,758.584 |
| Small Company Growth: | | | | |
| Class A | 658,499.168 | 378,941.248 | (172,909.058) | 864,531.358 |
| Class B | 2,459.473 | 20,102.781 | (1,812.922) | 20,749.332 |
| Van Eck Associates Corporation: | | | | |
| Worldwide Hard Assets: | | | | |
| Class A | 214,971.664 | 112,334.417 | (123,784.616) | 203,521.465 |
| Class B | - | 2,087.328 | (2,073.651) | 13.677 |
| Worldwide Bond: | | | | |
| Class A | 91,236.724 | 60,797.233 | (28,799.510) | 123,234.447 |
| Class B | 42.100 | 272.010 | (58.304) | 255.806 |
| Worldwide Emerging Markets: | | | | |
| Class A | 543,314.421 | 268,211.374 | (275,700.681) | 535,825.114 |
| Class B | 36,043.266 | 5,491.307 | (4,681.595) | 36,852.978 |
| Worldwide Real Estate: | | | | |
| Class A | 131,207.896 | 155,468.629 | (69,309.664) | 217,366.861 |
| Class B | 395.373 | 1,255.009 | (74.497) | 1,575.885 |
| AIM Advisors, Inc.: | | | | |
| Capital Appreciation: | | | | |
| Class A | 647,483.811 | 455,916.587 | (131,759.921) | 971,640.477 |
| Class B | 3,435,424.363 | 374,457.966 | (3,577,223.343) | 232,658.986 |
| Government Securities: | | | | |
| Class A | 1,022,213.843 | 909,066.908 | (144,345.442) | 1,786,935.309 |
| Class B | 469,535.280 | 3,863,575.759 | (283,968.228) | 4,049,142.811 |
Strategic Investor 139
Security Life Separate Account L1
(Unaudited)
Notes to Financial Statements (continued)
8. Summary of Changes in Units (continued)
Division
| Outstanding
at Beginning
of Year
| Increase
for Payments
Received
| (Decrease) for
Withdrawals
and Other
Deductions
| Outstanding
at End
of Year
|
| | | | | |
| Directed Services, Inc. (GCG): | | | | |
| Equity Income: | | | | |
| Class A | - | - | - | - |
| Class B | - | 373.031 | (47.956) | 325.075 |
| Growth: | | | | |
| Class A | - | - | - | - |
| Class B | 103.679 | 814.912 | (231.845) | 686.746 |
| Hard Assets: | | | | |
| Class A | - | - | - | - |
| Class B | - | - | - | - |
| Limited Maturity Bond: | | | | |
| Class A | - | - | - | - |
| Class B | 80,478.798 | 27,750.347 | (11,314.315) | 96,914.830 |
| Liquid Asset: | | | | |
| Class A | - | - | - | - |
| Class B | 183,932.621 | 1,320,267.028 | (1,131,146.989) | 373,052.660 |
| MidCap Growth: | | | | |
| Class A | - | 13,786.105 | (1,197.856) | 12,588.249 |
| Class B | - | 1,269.186 | (120.146) | 1,149.040 |
| Research: | | | | |
| Class A | - | - | - | - |
| Class B | - | 399.308 | (201.392) | 197.916 |
| Total Return: | | | | |
| Class A | - | - | - | - |
| Class B | 908.365 | 2,449.192 | (669.154) | 2,688.403 |
| Fully Managed: | | | | |
| Class A | - | 223,008.727 | (3,702.155) | 219,306.572 |
| Class B | - | 4,607.591 | (613.638) | 3,993.953 |
| Janus Aspen Series Funds: | | | | |
| Growth: | | | | |
| Class A | 29,430.276 | 378,803.998 | (34,006.095) | 374,228.179 |
| Class B | - | 23,700.310 | (1,118.254) | 22,582.056 |
| Aggressive Growth: | | | | |
| Class A | 53,752.789 | 345,618.839 | (12,667.683) | 386,703.945 |
| Class B | 22,786.649 | 11,209.173 | (5,811.503) | 28,184.319 |
| Worldwide Growth: | | | | |
| Class A | 19,710.545 | 380,733.407 | (97,751.658) | 302,692.294 |
| Class B | 17,011.166 | 6,125.993 | (1,873.807) | 21,263.352 |
| International Growth: | | | | |
| Class A | 42,106.076 | 671,293.298 | (27,381.336) | 686,018.038 |
| Class B | 6,269.387 | 27,479.028 | (4,772.374) | 28,976.041 |
| M Fund, Inc.: | | | | |
| Brandes: | | | | |
| Class A | - | 129,279.832 | (4,248.068) | 125,031.764 |
| Class B | - | 234.984 | (3.167) | 231.817 |
| Clifton: | | | | |
| Class A | - | 75,096.341 | (1,007.746) | 74,088.595 |
| Class B | - | 41.210 | (7.022) | 34.188 |
| Frontier: | | | | |
| Class A | - | 109,053.187 | (4,019.642) | 105,033.545 |
| Class B | - | 553.939 | (10.221) | 543.718 |
| Turner: | | | | |
| Class A | - | 17,312.395 | (44.547) | 17,267.848 |
| Class B | - | 119.092 | (12.422) | 106.670 |
Strategic Investor 140
Security Life Separate Account L1
(Unaudited)
Notes to Financial Statements (continued)
8. Summary of Changes in Units (continued)
Division
| Outstanding
at Beginning
of Year
| Increase
for Payments
Received
| (Decrease) for
Withdrawals
and Other
Deductions
| Outstanding
at End
of Year
|
| | | | | |
| ING Pilgrim Investments, LLC: | | | | |
| Growth Opportunities: | | | | |
| Class A | - | 1,429.571 | (290.582) | 1.138.989 |
| Class B | - | - | - | - |
| MagnaCap: | | | | |
| Class A | - | 8,476.145 | (858.001) | 7,618.144 |
| Class B | - | 890.161 | (25.273) | 864.888 |
| Mid-Cap Opportunities: | | | | |
| Class A | - | 11,454.437 | (1,508.937) | 9,945.500 |
| Class B | - | 26.044 | - | 26.044 |
| Small Cap Opportunities: | | | | |
| Class A | - | 13,141.785 | (331.164) | 12,810.621 |
| Class B | - | 369.609 | (1.966) | 367.643 |
| Putnam Investment Management, LLC: | | | | |
| New Opportunities: | | | | |
| Class A | - | 21,527.240 | (1,030.827) | 20,496.413 |
| Class B | - | 1,699.870 | (13.335) | 1,686.535 |
| Voyager: | | | | |
| Class A | - | 4,684.642 | (268.273) | 4,416.369 |
| Class B | - | 25.078 | (1.214) | 23.864 |
| Growth and Income: | | | | |
| Class A | - | 78,154.086 | (738.551) | 77,415.535 |
| Class B | - | 158.978 | (1.241) | 157.737 |
| Small Cap Value: | | | | |
| Class A | - | 95,839.897 | (6,763.553) | 89,076.344 |
| Class B | - | 2,247.174 | (292.282) | 1,954.892 |
Strategic Investor 141
Security Life Separate Account L1
(Unaudited)
Notes to Financial Statements (continued)
9. Summary of Expense and Investment Ratios
The following schedule summarizes expense ratios, excluding expenses of underlying funds and total return for the nine-month period ended September 30, 2001 and the years ended December 31, 2000, 1999, 1998, and 1997.
Division
| Units
| Net Assets
| Expenses as a
% of Average
Net Assets
| Total
Return
|
Unit
Value
| (000s)
|
| | | | | | |
| Neuberger Berman Management Inc.: | | | | | |
| Limited Maturity Bond - Class A | | | | | |
| | | | | | |
| September 30, 2001 | 1,266,146.581 | $14.36 | $18,186 | .30% | 7.49% |
| December 31, 2000 | 1,085,190.344 | 13.36 | 14,494 | .29 | 6.03 |
| December 31, 1999 | 889,159.604 | 12.60 | 11,201 | .28 | .72 |
| December 31, 1998 | 1,245,559.121 | 12.51 | 15,578 | * | 3.65 |
| December 31, 1997 | 552,985.394 | 12.97 | 6,675 | * | 5.97 |
| | | | | | |
| Neuberger Berman Management Inc.: | | | | | |
| Limited Maturity Bond - Class B | | | | | |
| | | | | | |
| September 30, 2001 | 11,739.142 | $10.53 | $124 | 1.55% | - |
| December 31, 2000 | - | - | - | - | - |
| December 31, 1999 | - | - | - | - | - |
| December 31, 1998 | - | - | - | - | - |
| December 31, 1997 | - | - | - | - | - |
| | | | | | |
| Neuberger Berman Management Inc.: | | | | | |
| Growth - Class A | | | | | |
| | | | | | |
| September 30, 2001 | 678,719.272 | $14.79 | $10,040 | .51% | (44.02)% |
| December 31, 2000 | 755,032.816 | 26.42 | 19,945 | .39 | (12.26) |
| December 31, 1999 | 434,338.368 | 30.11 | 13,076 | .41 | 49.28 |
| December 31, 1998 | 447,486.376 | 20.17 | 9,026 | * | 14.60 |
| December 31, 1997 | 316,146.084 | 17.60 | 5,564 | * | 28.09 |
| | | | | | |
| Neuberger Berman Management Inc.: | | | | | |
| Growth - Class B | | | | | |
| | | | | | |
| September 30, 2001 | 5,038.762 | $6.97 | $35 | 2.61% | - |
| December 31, 2000 | - | - | - | - | - |
| December 31, 1999 | - | - | - | - | - |
| December 31, 1998 | - | - | - | - | - |
| December 31, 1997 | - | - | - | - | - |
| | | | | | |
| Neuberger Berman Management Inc.: | | | | | |
| Government Income - Class A | | | | | |
| | | | | | |
| September 30, 2001 | - | - | - | - | - |
| December 31, 2000 | - | - | - | - | - |
| December 31, 1999 | - | - | - | - | - |
| December 31, 1998 | - | - | - | - | - |
| December 31, 1997 | 75,811.559 | 11.79 | 894 | * | 8.76 |
| | | | | | |
| Neuberger Berman Management Inc.: | | | | | |
| Partners - Class A | | | | | |
| | | | | | |
| September 30, 2001 | 1,223,913.915 | $20.12 | $24,629 | .37% | (17.37)% |
| December 31, 2000 | 1,131,357.503 | 24.35 | 27,548 | .55 | .33 |
| December 31, 1999 | 1,212,133.448 | 24.27 | 29,420 | .51 | 6.54 |
| December 31, 1998 | 986,298.018 | 22.78 | 22,463 | * | 3.45 |
| December 31, 1997 | 626,285.721 | 22.02 | 13,792 | * | 30.30 |
Strategic Investor 142
Security Life Separate Account L1
(Unaudited)
Notes to Financial Statements (continued)
9. Summary of Expense and Investment Ratios (continued)
Division
| Units
| Net Assets
| Expenses as a
% of Average
Net Assets
| Total
Return
|
Unit
Value
| (000s)
|
| | | | | | |
| Neuberger Berman Management Inc.: | | | | | |
| Partners - Class B | | | | | |
| | | | | | |
| September 30, 2001 | 3,445.477 | $8.30 | $29 | 5.51% | (16.75)% |
| December 31, 2000 | 727.044 | 9.97 | 7 | 8.66 | - |
| December 31, 1999 | - | - | - | - | - |
| December 31, 1998 | - | - | - | - | - |
| December 31, 1997 | - | - | - | - | - |
| | | | | | |
| Fred Alger Management, Inc: | | | | | |
| American Small Capitalization - Class A | | | | | |
| | | | | | |
| September 30, 2001 | 1,509,536.384 | $11.73 | $17,705 | 0.49% | (38.17)% |
| December 31, 2000 | 1,351,105.091 | 18.97 | 25,632 | 0.57 | (27.90) |
| December 31, 1999 | 1,055,757.484 | 26.31 | 27,780 | .053 | 42.29 |
| December 31, 1998 | 838,692.418 | 18.49 | 15,503 | * | 14.70 |
| December 31, 1997 | 648,733.740 | 16.12 | 11,275 | * | 10.56 |
| | | | | | |
| Fred Alger Management, Inc: | | | | | |
| American Small Capitalization - Class B | | | | | |
| | | | | | |
| September 30, 2001 | 62,310.934 | $6.00 | $374 | 0.50% | (37.82)% |
| December 31, 2000 | 55,669.122 | 9.65 | 537 | 1.26 | - |
| December 31, 1999 | - | - | - | - | - |
| December 31, 1998 | - | - | - | - | - |
| December 31, 1997 | - | - | - | - | - |
| | | | | | |
| Fred Alger Management, Inc: | | | | | |
| American MidCap Growth - Class A | | | | | |
| | | | | | |
| September 30, 2001 | 1,198,930.258 | $25.89 | $31,046 | 0.61% | (20.31)% |
| December 31, 2000 | 1,022,948.192 | 32.49 | 33,232 | 0.61 | 8.41 |
| December 31, 1999 | 576,738.314 | 29.97 | 17,287 | 0.71 | 30.82 |
| December 31, 1998 | 402,532.472 | 22.91 | 9,220 | * | 29.36 |
| December 31, 1997 | 288,809.482 | 17.71 | 5,115 | * | 14.11 |
| | | | | | |
| Fred Alger Management, Inc: | | | | | |
| American MidCap Growth - Class B | | | | | |
| | | | | | |
| September 30, 2001 | 40,121.720 | $10.73 | $430 | 3.34% | (20.10)% |
| December 31, 2000 | 4,581.526 | 13.43 | 62 | 14.13 | - |
| December 31, 1999 | - | - | - | - | - |
| December 31, 1998 | - | - | - | - | - |
| December 31, 1997 | - | - | - | - | - |
| | | | | | |
| Fred Alger Management, Inc: | | | | | |
| American Growth - Class A | | | | | |
| | | | | | |
| September 30, 2001 | 1,986,333.871 | $21.30 | $42,302 | 0.51% | (23.57)% |
| December 31, 2000 | 1,795,058.476 | 27.87 | 50,001 | 0.54 | (15.31) |
| December 31, 1999 | 1,257.371.637 | 32.89 | 41,383 | 0.54 | 32.70 |
| December 31, 1998 | 923,696.066 | 24.80 | 22,904 | * | 47.01 |
| December 31, 1997 | 569,990.309 | 16.87 | 9,616 | * | 24.78 |
Strategic Investor 143
Security Life Separate Account L1
(Unaudited)
Notes to Financial Statements (continued)
9. Summary of Expense and Investment Ratios (continued)
Division
| Units
| Net Assets
| Expenses as a
% of Average
Net Assets
| Total
Return
|
Unit
Value
| (000s)
|
| | | | | | |
| Fred Alger Management, Inc: | | | | | |
| American Growth - Class B | | | | | |
| | | | | | |
| September 30, 2001 | 69,337.261 | $7.86 | $545 | 1.77% | (22.64)% |
| December 31, 2000 | 11,503.557 | 10.16 | 117 | 8.26 | - |
| December 31, 1999 | - | - | - | - | - |
| December 31, 1998 | - | - | - | - | - |
| December 31, 1997 | - | - | - | - | - |
| | | | | | |
| Fred Alger Management, Inc: | | | | | |
| American Leveraged AllCap - Class A | | | | | |
| | | | | | |
| September 30, 2001 | 602,773.575 | $29.53 | $17,802 | 0.81% | (27.05)% |
| December 31, 2000 | 602,197.766 | 40.48 | 24,377 | 0.74 | (25.35) |
| December 31, 1999 | 425,281.099 | 54.23 | 23,064 | 0.63 | 76.70 |
| December 31, 1998 | 221,642.446 | 30.69 | 6,801 | * | 56.66 |
| December 31, 1997 | 148,542.639 | 19.59 | 2,910 | * | 18.80 |
| | | | | | |
| Fred Alger Management, Inc: | | | | | |
| American Leveraged AllCap - Class B | | | | | |
| | | | | | |
| September 30, 2001 | 5,114.120 | $8.29 | $42 | 4.87% | - |
| December 31, 2000 | - | - | - | - | - |
| December 31, 1999 | - | - | - | - | - |
| December 31, 1998 | - | - | - | - | - |
| �� December 31, 1997 | - | - | - | - | - |
| | | | | | |
| Fidelity Management & Research Co.: | | | | | |
| Asset Manager - Class A | | | | | |
| | | | | | |
| September 30, 2001 | 1,156,791.661 | $15.60 | $18,046 | 0.50% | (12.99)% |
| December 31, 2000 | 878,584.296 | 17.93 | 15,755 | 0.55 | (4.63) |
| December 31, 1999 | 722,717.906 | 18.80 | 13,590 | 0.50 | 10.26 |
| December 31, 1998 | 600,255.213 | 17.05 | 10,237 | * | 14.12 |
| December 31, 1997 | 410,906.106 | 14.94 | 6,137 | * | 19.81 |
| | | | | | |
| Fidelity Management & Research Co.: | | | | | |
| Asset Manager - Class B | | | | | |
| | | | | | |
| September 30, 2001 | 26,313.332 | $9.12 | $240 | 1.92% | - |
| December 31, 2000 | - | - | - | - | - |
| December 31, 1999 | - | - | - | - | - |
| December 31, 1998 | - | - | - | - | - |
| December 31, 1997 | - | - | - | - | - |
| | | | | | |
| Fidelity Management & Research Co.: | | | | | |
| Growth - Class A | | | | | |
| | | | | | |
| September 30, 2001 | 2,250,864.880 | $21.28 | $47,892 | 0.51% | (30.50)% |
| December 31, 2000 | 2,222,867.138 | 30.62 | 68,065 | 0.68 | (11.76) |
| December 31, 1999 | 1,676,236.646 | 34.70 | 58,158 | 0.49 | 36.40 |
| December 31, 1998 | 1,293,480.338 | 25.44 | 32,900 | * | 38.49 |
| December 31, 1997 | 983,842.388 | 18.37 | 18,075 | * | 22.55 |
Strategic Investor 144
Security Life Separate Account L1
(Unaudited)
Notes to Financial Statements (continued)
9. Summary of Expense and Investment Ratios (continued)
Division
| Units
| Net Assets
| Expenses as a
% of Average
Net Assets
| Total
Return
|
Unit
Value
| (000s)
|
| | | | | | |
| Fidelity Management & Research Co.: | | | | | |
| Growth - Class B | | | | | |
| | | | | | |
| September 30, 2001 | 62,913.082 | $7.60 | $478 | 1.95% | (28.89)% |
| December 31, 2000 | 40,727.108 | 10.84 | 441 | 4.93 | - |
| December 31, 1999 | - | - | - | - | - |
| December 31, 1998 | - | - | - | - | - |
| December 31, 1997 | - | - | - | - | - |
| | | | | | |
| Fidelity Management & Research Co.: | | | | | |
| Growth SC - Class A | | | | | |
| | | | | | |
| September 30, 2001 | - | - | - | - | - |
| December 31, 2000 | - | - | - | - | - |
| December 31, 1999 | - | - | - | - | - |
| December 31, 1998 | - | - | - | - | - |
| December 31, 1997 | - | - | - | - | - |
| | | | | | |
| Fidelity Management & Research Co.: | | | | | |
| Growth SC - Class B | | | | | |
| | | | | | |
| September 30, 2001 | 5,211.697 | $7.50 | $56 | 5.03% | - |
| December 31, 2000 | - | - | - | - | - |
| December 31, 1999 | - | - | - | - | - |
| December 31, 1998 | - | - | - | - | - |
| December 31, 1997 | - | - | - | - | - |
| | | | | | |
| Fidelity Management & Research Co.: | | | | | |
| Overseas - Class A | | | | | |
| | | | | | |
| September 30, 2001 | 2,597,785.408 | $11.61 | $30,163 | .48% | (29.25)% |
| December 31, 2000 | 2,586,286.303 | 16.41 | 42,453 | .45 | (19.48) |
| December 31, 1999 | 1,716,617.627 | 20.38 | 34,984 | .44 | 41.53 |
| December 31, 1998 | 1,429,659.907 | 14.40 | 20,582 | * | 11.98 |
| December 31, 1997 | 950,328.899 | 12.86 | 12,226 | * | 10.67 |
| | | | | | |
| Fidelity Management & Research Co.: | | | | | |
| Overseas - Class B | | | | | |
| | | | | | |
| September 30, 2001 | 694,477.886 | $7.37 | $5,119 | 2.53% | (29.00)% |
| December 31, 2000 | 83,750.568 | 10.38 | 869 | 1.40 | - |
| December 31, 1999 | - | - | - | - | - |
| December 31, 1998 | - | - | - | - | - |
| December 31, 1997 | - | - | - | - | - |
| | | | | | |
| Fidelity Management & Research Co.: | | | | | |
| Overseas SC- Class A | | | | | |
| | | | | | |
| September 30, 2001 | - | - | - | - | - |
| December 31, 2000 | - | - | - | - | - |
| December 31, 1999 | - | - | - | - | - |
| December 31, 1998 | - | - | - | - | - |
| December 31, 1997 | - | - | - | - | - |
Strategic Investor 145
Security Life Separate Account L1
(Unaudited)
Notes to Financial Statements (continued)
9. Summary of Expense and Investment Ratios (continued)
Division
| Units
| Net Assets
| Expenses as a
% of Average
Net Assets
| Total
Return
|
Unit
Value
| (000s)
|
| | | | | | |
| Fidelity Management & Research Co.: | | | | | |
| Overseas SC- Class B | | | | | |
| | | | | | |
| September 30, 2001 | 8,179.664 | $6.89 | $56 | 1.58% | - |
| December 31, 2000 | - | - | - | - | - |
| December 31, 1999 | - | - | - | - | - |
| December 31, 1998 | - | - | - | - | - |
| December 31, 1997 | - | - | - | - | - |
| | | | | | |
| Fidelity Management & Research Co.: | | | | | |
| Money Market - Class A | | | | | |
| | | | | | |
| September 30, 2001 | 7,625,127.938 | $13.64 | $104,000 | .72% | 3.18% |
| December 31, 2000 | 4,689,569.461 | 13.22 | 62,105 | 1.35 | 5.00 |
| December 31, 1999 | 2,763,648.297 | 12.59 | 34,797 | .99 | 4.39 |
| December 31, 1998 | 1,526,404.399 | 12.06 | 18,412 | * | 4.69 |
| December 31, 1997 | 1,303,059.881 | 11.52 | 15,013 | * | 4.63 |
| | | | | | |
| Fidelity Management & Research Co.: | | | | | |
| Money Market - Class B | | | | | |
| | | | | | |
| September 30, 2001 | - | - | - | - | - |
| December 31, 2000 | - | - | - | - | - |
| December 31, 1999 | - | - | - | - | - |
| December 31, 1998 | - | - | - | - | - |
| December 31, 1997 | - | - | - | - | - |
| | | | | | |
| Fidelity Management & Research Co.: | | | | | |
| Index 500 - Class A | | | | | |
| | | | | | |
| September 30, 2001 | 6,918,271,816 | $22.61 | $156,436 | .50% | (21.63)% |
| December 31, 2000 | 6,025,479.633 | 28.85 | 173,842 | .53 | (9.96) |
| December 31, 1999 | 4,772,484.597 | 32.04 | 152,916 | 1.08 | 19.60 |
| December 31, 1998 | 3,215,990.519 | 26.79 | 86,154 | * | 27.39 |
| December 31, 1997 | 1,863,056.104 | 21.03 | 39,185 | * | 31.68 |
| | | | | | |
| Fidelity Management & Research Co.: | | | | | |
| Index 500 - Class B | | | | | |
| | | | | | |
| September 30, 2001 | 1,111,443.792 | $7.93 | $8,817 | 1.72% | (21.25)% |
| December 31, 2000 | 704,951.502 | 10.07 | 7,098 | .99 | - |
| December 31, 1999 | - | - | - | - | - |
| December 31, 1998 | - | - | - | - | - |
| December 31, 1997 | - | - | - | - | - |
| | | | | | |
| INVESCO Funds Group, Inc: | | | | | |
| Total Return - Class A | | | | | |
| | | | | | |
| September 30, 2001 | 784,615.582 | $15.39 | $12,071 | 82% | (8.12)% |
| December 31, 2000 | 698,007.347 | 16.75 | 11,695 | .96 | (2.90) |
| December 31, 1999 | 602,187.614 | 17.25 | 10,387 | 1.02 | (4.11) |
| December 31, 1998 | 450,557.216 | 17.99 | 8,105 | * | 8.77 |
| December 31, 1997 | 184,042.238 | 16.54 | 3,045 | * | 21.98 |
Strategic Investor 146
Security Life Separate Account L1
(Unaudited)
Notes to Financial Statements (continued)
9. Summary of Expense and Investment Ratios (continued)
Division
| Units
| Net Assets
| Expenses as a
% of Average
Net Assets
| Total
Return
|
Unit
Value
| (000s)
|
| | | | | | |
| INVESCO Funds Group, Inc: | | | | | |
| Total Return - Class B | | | | | |
| | | | | | |
| September 30, 2001 | 9,292.612 | $9.31 | $87 | 1.00% | - |
| December 31, 2000 | - | - | - | - | - |
| December 31, 1999 | - | - | - | - | - |
| December 31, 1998 | - | - | - | - | - |
| December 31, 1997 | - | - | - | - | - |
| | | | | | |
| INVESCO Funds Group, Inc: | | | | | |
| Equity Income - Class A | | | | | |
| | | | | | |
| September 30, 2001 | 1,120,561.435 | $22.29 | $24,975 | .67% | (18.02)% |
| December 31, 2000 | 782,880.410 | 27.19 | 21,286 | .81 | 4.10 |
| December 31, 1999 | 621,047.937 | 26.12 | 16,221 | .85 | 13.96 |
| December 31, 1998 | 473,616.752 | 22.92 | 10,853 | * | 14.49 |
| December 31, 1997 | 297,553.033 | 20.02 | 5,958 | * | 27.19 |
| | | | | | |
| INVESCO Funds Group, Inc: | | | | | |
| Equity Income - Class B | | | | | |
| | | | | | |
| September 30, 2001 | 72,952.755 | $8.92 | $651 | .89% | (17.33)% |
| December 31, 2000 | 23,197.396 | 10.79 | 250 | 1.88 | - |
| December 31, 1999 | - | - | - | - | - |
| December 31, 1998 | - | - | - | - | - |
| December 31, 1997 | - | - | - | - | - |
| | | | | | |
| INVESCO Funds Group, Inc: | | | | | |
| High Yield - Class A | | | | | |
| | | | | | |
| September 30, 2001 | 705,483.302 | $12.85 | $9,062 | .52% | (16.56)% |
| December 31, 2000 | 680,080.798 | 15.40 | 10,476 | .54 | (12.25) |
| December 31, 1999 | 536,863.946 | 17.55 | 9,421 | .57 | 8.40 |
| December 31, 1998 | 486,858.648 | 16.19 | 7,883 | * | 0.68 |
| December 31, 1997 | 333,501.857 | 16.08 | 5,364 | * | 16.44 |
| | | | | | |
| INVESCO Funds Group, Inc: | | | | | |
| High Yield - Class B | | | | | |
| | | | | | |
| September 30, 2001 | 29,772.229 | $7.56 | $225 | 1.39% | (16.43)% |
| December 31, 2000 | 2,293.135 | 9.07 | 21 | 12.83 | - |
| December 31, 1999 | - | - | - | - | - |
| December 31, 1998 | - | - | - | - | - |
| December 31, 1997 | - | - | - | - | - |
| | | | | | |
| INVESCO Funds Group, Inc: | | | | | |
| Utilities - Class A | | | | | |
| | | | | | |
| September 30, 2001 | 497,812.071 | $14.94 | $7,440 | .76% | (34.62)% |
| December 31, 2000 | 341,947.485 | 22.85 | 7,812 | .72 | 4.53 |
| December 31, 1999 | 189,409.984 | 21.86 | 4,141 | .72 | 18.23 |
| December 31, 1998 | 110,379.616 | 18.49 | 2,041 | * | 24.51 |
| December 31, 1997 | 78,118.685 | 14.85 | 1,160 | * | 22.52 |
Strategic Investor 147
Security Life Separate Account L1
(Unaudited)
Notes to Financial Statements (continued)
9. Summary of Expense and Investment Ratios (continued)
Division
| Units
| Net Assets
| Expenses as a
% of Average
Net Assets
| Total
Return
|
Unit
Value
| (000s)
|
| | | | | | |
| INVESCO Funds Group, Inc: | | | | | |
| Utilities - Class B | | | | | |
| | | | | | |
| September 30, 2001 | 4,758.584 | $6.84 | $33 | 2.21% | - |
| December 31, 2000 | - | - | - | - | - |
| December 31, 1999 | - | - | - | - | - |
| December 31, 1998 | - | - | - | - | - |
| December 31, 1997 | - | - | - | - | - |
| | | | | | |
| INVESCO Funds Group, Inc: | | | | | |
| Small Company Growth - Class A | | | | | |
| | | | | | |
| September 30, 2001 | 864,531.358 | $12.05 | $10,422 | .72% | (32.91)% |
| December 31, 2000 | 658,499.168 | 17.96 | 11,825 | .83 | (14.60) |
| December 31, 1999 | 212,503.210 | 21.03 | 4,469 | .98 | 89.63 |
| December 31, 1998 | 67,506.441 | 11.09 | 749 | * | - |
| December 31, 1997 | - | - | - | * | - |
| | | | | | |
| INVESCO Funds Group, Inc: | | | | | |
| Small Company Growth - Class B | | | | | |
| | | | | | |
| September 30, 2001 | 20,749.332 | $8.84 | $183 | 2.26% | (33.13)% |
| December 31, 2000 | 2,459.473 | 13.22 | 33 | 9.94 | - |
| December 31, 1999 | - | - | - | - | - |
| December 31, 1998 | - | - | - | - | - |
| December 31, 1997 | - | - | - | - | - |
| | | | | | |
| Van Eck Associates Corporation: | | | | | |
| Worldwide Hard Assets - Class A | | | | | |
| | | | | | |
| September 30, 2001 | 203,521.465 | $8.88 | $1,808 | .37% | (17.47)% |
| December 31, 2000 | 214,971.664 | 10.76 | 2,313 | .36 | 10.59 |
| December 31, 1999 | 236,972.429 | 9.73 | 2,306 | .47 | 20.12 |
| December 31, 1998 | 132,513.824 | 8.10 | 1,074 | * | (31.47) |
| December 31, 1997 | 77,046.773 | 11.82 | 911 | * | (2.48) |
| | | | | | |
| Van Eck Associates Corporation: | | | | | |
| Worldwide Hard Assets - Class B | | | | | |
| | | | | | |
| September 30, 2001 | 13.677 | $8.19 | - | .64% | - |
| December 31, 2000 | - | - | - | - | - |
| December 31, 1999 | - | - | - | - | - |
| December 31, 1998 | - | - | - | - | - |
| December 31, 1997 | - | - | - | - | - |
| | | | | | |
| Van Eck Associates Corporation: | | | | | |
| Worldwide Bond - Class A | | | | | |
| | | | | | |
| September 30, 2001 | 123,234.447 | $9.97 | $1,229 | .72% | (2.25)% |
| December 31, 2000 | 91,236.724 | 10.20 | 931 | .80 | 1.09 |
| December 31, 1999 | 33,114.078 | 10.09 | 334 | 1.00 | (8.52) |
| December 31, 1998 | 18,656.317 | 11.03 | 206 | * | - |
| December 31, 1997 | - | - | - | * | - |
Strategic Investor 148
Security Life Separate Account L1
(Unaudited)
Notes to Financial Statements (continued)
9. Summary of Expense and Investment Ratios (continued)
Division
| Units
| Net Assets
| Expenses as a
% of Average
Net Assets
| Total
Return
|
Unit
Value
| (000s)
|
| | | | | | |
| Van Eck Associates Corporation: | | | | | |
| Worldwide Bond - Class B | | | | | |
| | | | | | |
| September 30, 2001 | 255.806 | $9.86 | $3 | 15.08% | (1.60)% |
| December 31, 2000 | 42.100 | 10.02 | 422 | 56.52 | - |
| December 31, 1999 | - | - | - | - | - |
| December 31, 1998 | - | - | - | - | - |
| December 31, 1997 | - | - | - | - | - |
| | | | | | |
| Van Eck Associates Corporation: | | | | | |
| Worldwide Emerging Markets - Class A | | | | | |
| | | | | | |
| September 30, 2001 | 535,825.114 | $6.03 | $3,230 | .71% | (23.18)% |
| December 31, 2000 | 543,314.421 | 7.85 | 4,264 | .64 | (42.32) |
| December 31, 1999 | 228,819.195 | 13.61 | 3,114 | .46 | 98.69 |
| December 31, 1998 | 67,354.295 | 6.85 | 461 | | - |
| December 31, 1997 | - | - | - | | - |
| | | | | | |
| Van Eck Associates Corporation: | | | | | |
| Worldwide Emerging Markets - Class B | | | | | |
| | | | | | |
| September 30, 2001 | 36,852.978 | $6.38 | $235 | .50% | (22.85)% |
| December 31, 2000 | 36,043.266 | 8.27 | 298 | 1.28 | - |
| December 31, 1999 | - | - | - | | - |
| December 31, 1998 | - | - | - | | - |
| December 31, 1997 | - | - | - | | - |
| | | | | | |
| Van Eck Associates Corporation: | | | | | |
| Worldwide Real Estate - Class A | | | | | |
| | | | | | |
| September 30, 2001 | 217,366.861 | $9.98 | $2,170 | .62% | .10% |
| December 31, 2000 | 131,207.896 | 9.97 | 1,308 | .63 | 17.85 |
| December 31, 1999 | 64,967.173 | 8.46 | 550 | .96 | (2.76) |
| December 31, 1998 | 8,765.232 | 8.70 | 76 | | - |
| December 31, 1997 | - | - | | | - |
| | | | | | |
| Van Eck Associates Corporation: | | | | | |
| Worldwide Real Estate - Class B | | | | | |
| | | | | | |
| September 30, 2001 | 1,575.885 | $11.05 | $17 | 6.01% | .73% |
| December 31, 2000 | 395.373 | 10.97 | 4 | 11.51 | - |
| December 31, 1999 | - | - | - | - | - |
| December 31, 1998 | - | - | - | - | - |
| December 31, 1997 | - | - | - | - | - |
| | | | | | |
| AIM Advisors, Inc.: | | | | | |
| Capital Appreciation- Class A | | | | | |
| | | | | | |
| September 30, 2001 | 971,640.477 | $9.37 | $9,099 | 1.10% | (34.01)% |
| December 31, 2000 | 647,483.811 | 14.52 | 9,404 | 1.20 | (13.36) |
| December 31, 1999 | 323,846.032 | 16.39 | 5,309 | 1.32 | 43.52 |
| December 31, 1998 | 105,457.867 | 11.42 | 1,204 | | - |
| December 31, 1997 | - | - | - | | - |
Strategic Investor 149
Security Life Separate Account L1
(Unaudited)
Notes to Financial Statements (continued)
9. Summary of Expense and Investment Ratios (continued)
Division
| Units
| Net Assets
| Expenses as a
% of Average
Net Assets
| Total
Return
|
Unit
Value
| (000s)
|
| | | | | | |
| AIM Advisors, Inc.: | | | | | |
| Capital Appreciation- Class B | | | | | |
| | | | | | |
| September 30, 2001 | 232,658.986 | $7.86 | $1,828 | .71% | (35.15)% |
| December 31, 2000 | 3,435,424.363 | 12.12 | 41,634 | .38 | - |
| December 31, 1999 | - | - | - | - | - |
| December 31, 1998 | - | - | - | - | - |
| December 31, 1997 | - | - | - | - | - |
| | | | | | |
| AIM Advisors, Inc.: | | | | | |
| Government Securities - Class A | | | | | |
| | | | | | |
| September 30, 2001 | 1,786,935.309 | $11.96 | $21,380 | .30% | 5.93% |
| December 31, 2000 | 1,022,213.843 | 11.29 | 11,540 | .32 | 5.29 |
| December 31, 1999 | 715,905.149 | 10.33 | 7,394 | .39 | (2.09) |
| December 31, 1998 | 246,150.062 | 10.55 | 2,596 | | - |
| December 31, 1997 | - | - | - | | - |
| | | | | | |
| AIM Advisors, Inc.: | | | | | |
| Government Securities - Class B | | | | | |
| | | | | | |
| September 30, 2001 | 4,049,142.811 | $11.85 | $47,995 | 1.47% | 6.47% |
| December 31, 2000 | 469,535.280 | 11.13 | 5,224 | .53 | - |
| December 31, 1999 | - | - | - | - | - |
| December 31, 1998 | - | - | - | - | - |
| December 31, 1997 | - | - | - | - | - |
| | | | | | |
| Directed Services, Inc. (GCG): | | | | | |
| Equity Income - Class A | | | | | |
| | | | | | |
| September 30, 2001 | - | - | - | - | - |
| December 31, 2000 | - | - | - | - | - |
| December 31, 1999 | - | - | - | - | - |
| December 31, 1998 | - | - | - | - | - |
| December 31, 1997 | - | - | - | - | - |
| | | | | | |
| Directed Services, Inc. (GCG): | | | | | |
| Equity Income - Class B | | | | | |
| | | | | | |
| September 30, 2001 | 325.075 | $9.92 | $3 | 3.13% | - |
| December 31, 2000 | - | - | - | - | - |
| December 31, 1999 | - | - | - | - | - |
| December 31, 1998 | - | - | - | - | - |
| December 31, 1997 | - | - | - | - | - |
| | | | | | |
| Directed Services, Inc. (GCG): | | | | | |
| Growth - Class A | | | | | |
| | | | | | |
| September 30, 2001 | - | - | - | - | - |
| December 31, 2000 | - | - | - | - | - |
| December 31, 1999 | - | - | - | - | - |
| December 31, 1998 | - | - | - | - | - |
| December 31, 1997 | - | - | - | - | - |
Strategic Investor 150
Security Life Separate Account L1
(Unaudited)
Notes to Financial Statements (continued)
9. Summary of Expense and Investment Ratios (continued)
Division
| Units
| Net Assets
| Expenses as a
% of Average
Net Assets
| Total
Return
|
Unit
Value
| (000s)
|
| | | | | | |
| Directed Services, Inc. (GCG): | | | | | |
| Growth - Class B | | | | | |
| | | | | | |
| September 30, 2001 | 687.746 | $7.53 | $5 | 1.91% | (36.67)% |
| December 31, 2000 | 103.679 | 11.89 | 1 | - | - |
| December 31, 1999 | - | - | - | - | - |
| December 31, 1998 | - | - | - | - | - |
| December 31, 1997 | - | - | - | - | - |
| | | | | | |
| Directed Services, Inc. (GCG): | | | | | |
| Hard Assets - Class A | | | | | |
| | | | | | |
| September 30, 2001 | - | - | - | - | - |
| December 31, 2000 | - | - | - | - | - |
| December 31, 1999 | - | - | - | - | - |
| December 31, 1998 | - | - | - | - | - |
| December 31, 1997 | - | - | - | - | - |
| | | | | | |
| Directed Services, Inc. (GCG): | | | | | |
| Hard Assets - Class B | | | | | |
| | | | | | |
| September 30, 2001 | - | - | - | - | - |
| December 31, 2000 | - | - | - | - | - |
| December 31, 1999 | - | - | - | - | - |
| December 31, 1998 | - | - | - | - | - |
| December 31, 1997 | - | - | - | - | - |
| | | | | | |
| Directed Services, Inc. (GCG): | | | | | |
| Limited Maturity Bond - Class A | | | | | |
| | | | | | |
| September 30, 2001 | - | - | - | - | - |
| December 31, 2000 | - | - | - | - | - |
| December 31, 1999 | - | - | - | - | - |
| December 31, 1998 | - | - | - | - | - |
| December 31, 1997 | - | - | - | - | - |
| | | | | | |
| Directed Services, Inc. (GCG): | | | | | |
| Limited Maturity Bond - Class B | | | | | |
| | | | | | |
| September 30, 2001 | 96,914.830 | $11.81 | $1,144 | .31% | 8.45% |
| December 31, 2000 | 80,478.798 | 10.89 | 877 | .72 | - |
| December 31, 1999 | - | - | - | - | - |
| December 31, 1998 | - | - | - | - | - |
| December 31, 1997 | - | - | - | - | - |
| | | | | | |
| Directed Services, Inc. (GCG): | | | | | |
| Liquid Assets - Class A | | | | | |
| | | | | | |
| September 30, 2001 | - | - | - | - | - |
| December 31, 2000 | - | - | - | - | - |
| December 31, 1999 | - | - | - | - | - |
| December 31, 1998 | - | - | - | - | - |
| December 31, 1997 | - | - | - | - | - |
Strategic Investor 151
Security Life Separate Account L1
(Unaudited)
Notes to Financial Statements (continued)
9. Summary of Expense and Investment Ratios (continued)
Division
| Units
| Net Assets
| Expenses as a
% of Average
Net Assets
| Total
Return
|
Unit
Value
| (000s)
|
| | | | | | |
| Directed Services, Inc. (GCG): | | | | | |
| Liquid Assets - Class B | | | | | |
| | | | | | |
| September 30, 2001 | 373,052.660 | $11.10 | $4,137 | .82% | 2.49% |
| December 31, 2000 | 183,932.621 | 10.83 | 1,992 | .37 | - |
| December 31, 1999 | - | - | - | - | - |
| December 31, 1998 | - | - | - | - | - |
| December 31, 1997 | - | - | - | - | - |
| | | | | | |
| Directed Services, Inc. (GCG): | | | | | |
| MidCap Growth - Class A | | | | | |
| | | | | | |
| September 30, 2001 | 12,588.249 | $7.85 | $99 | .93% | - |
| December 31, 2000 | - | - | - | - | - |
| December 31, 1999 | - | - | - | - | - |
| December 31, 1998 | - | - | - | - | - |
| December 31, 1997 | - | - | - | - | - |
| | | | | | |
| Directed Services, Inc. (GCG): | | | | | |
| MidCap Growth - Class B | | | | | |
| | | | | | |
| September 30, 2001 | 1,149.040 | $10.57 | $12 | 3.15% | |
| December 31, 2000 | - | - | - | - | - |
| December 31, 1999 | - | - | - | - | - |
| December 31, 1998 | - | - | - | - | - |
| December 31, 1997 | - | - | - | - | - |
| | | | | | |
| Directed Services, Inc. (GCG): | | | | | |
| Research - Class A | | | | | |
| | | | | | |
| September 30, 2001 | - | - | - | - | - |
| December 31, 2000 | - | - | - | - | - |
| December 31, 1999 | - | - | - | - | - |
| December 31, 1998 | - | - | - | - | - |
| December 31, 1997 | - | - | - | - | - |
| | | | | | |
| Directed Services, Inc. (GCG): | | | | | |
| Research - Class B | | | | | |
| | | | | | |
| September 30, 2001 | 197.916 | $7.77 | $1 | 3.38% | - |
| December 31, 2000 | - | - | - | - | - |
| December 31, 1999 | - | - | - | - | - |
| December 31, 1998 | - | - | - | - | - |
| December 31, 1997 | - | - | - | - | - |
| | | | | | |
| Directed Services, Inc. (GCG): | | | | | |
| Total Return - Class A | | | | | |
| | | | | | |
| September 30, 2001 | - | - | - | - | - |
| December 31, 2000 | - | - | - | - | - |
| December 31, 1999 | - | - | - | - | - |
| December 31, 1998 | - | - | - | - | - |
| December 31, 1997 | - | - | - | - | - |
Strategic Investor 152
Security Life Separate Account L1
(Unaudited)
Notes to Financial Statements (continued)
9. Summary of Expense and Investment Ratios (continued)
Division
| Units
| Net Assets
| Expenses as a
% of Average
Net Assets
| Total
Return
|
Unit
Value
| (000s)
|
| | | | | | |
| Directed Services, Inc. (GCG): | | | | | |
| Total Return - Class B | | | | | |
| | | | | | |
| September 30, 2001 | 2,688.403 | $10.97 | $3 | 2.56% | (5.43)% |
| December 31, 2000 | 908.365 | 11.60 | 11 | - | - |
| December 31, 1999 | - | - | - | - | - |
| December 31, 1998 | - | - | - | - | - |
| December 31, 1997 | - | - | - | - | - |
| | | | | | |
| Directed Services, Inc. (GCG): | | | | | |
| Fully Managed- Class A | | | | | |
| | | | | | |
| September 30, 2001 | 219,306.572 | $10.09 | $2,213 | .21% | - |
| December 31, 2000 | - | - | - | - | - |
| December 31, 1999 | - | - | - | - | - |
| December 31, 1998 | - | - | - | - | - |
| December 31, 1997 | - | - | - | - | - |
| | | | | | |
| Directed Services, Inc. (GCG): | | | | | |
| Fully Managed- Class B | | | | | |
| | | | | | |
| September 30, 2001 | 3,993.953 | $10.13 | $40 | 2.36% | - |
| December 31, 2000 | - | - | - | - | - |
| December 31, 1999 | - | - | - | - | - |
| December 31, 1998 | - | - | - | - | - |
| December 31, 1997 | - | - | - | - | - |
| | | | | | |
| Janus Aspen Series Funds: | | | | | |
| Growth - Class A | | | | | |
| | | | | | |
| September 30, 2001 | 374,228.179 | $5.43 | $2,032 | 1.19% | (32.42)% |
| December 31, 2000 | 29,430.276 | 8.28 | 244 | 0.24 | - |
| December 31, 1999 | - | - | - | - | - |
| December 31, 1998 | - | - | - | - | - |
| December 31, 1997 | - | - | - | - | - |
| | | | | | |
| Janus Aspen Series Funds: | | | | | |
| Growth - Class B | | | | | |
| | | | | | |
| September 30, 2001 | 22,582.056 | $5.47 | $123 | 4.04% | - |
| December 31, 2000 | - | - | - | - | - |
| December 31, 1999 | - | - | - | - | - |
| December 31, 1998 | - | - | - | - | - |
| December 31, 1997 | - | - | - | - | - |
| | | | | | |
| Janus Aspen Series Funds: | | | | | |
| Aggressive Growth - Class A | | | | | |
| | | | | | |
| September 30, 2001 | 386,073.945 | $3.65 | $1,411 | 1.34% | (46.72)% |
| December 31, 2000 | 53,752.789 | 6.85 | 368 | 0.16 | - |
| December 31, 1999 | - | - | - | - | - |
| December 31, 1998 | - | - | - | - | - |
| December 31, 1997 | - | - | - | - | - |
Strategic Investor 153
Security Life Separate Account L1
(Unaudited)
Notes to Financial Statements (continued)
9. Summary of Expense and Investment Ratios (continued)
Division
| Units
| Net Assets
| Expenses as a
% of Average
Net Assets
| Total
Return
|
Unit
Value
| (000s)
|
| | | | | | |
| Janus Aspen Series Funds: | | | | | |
| Aggressive Growth - Class B | | | | | |
| | | | | | |
| September 30, 2001 | 28,184.319 | $3.68 | $104 | 0.76% | (46.36)% |
| December 31, 2000 | 22.786.649 | 6.86 | 156 | 0.19 | - |
| December 31, 1999 | - | - | - | - | - |
| December 31, 1998 | - | - | - | - | - |
| December 31, 1997 | - | - | - | - | - |
| | | | | | |
| Janus Aspen Series Funds: | | | | | |
| Worldwide Growth - Class A | | | | | |
| | | | | | |
| September 30, 2001 | 302,692.294 | $5.89 | $1,782 | 1.17% | (32.22)% |
| December 31, 2000 | 19,710.545 | 8.69 | 171 | 0.24 | - |
| December 31, 1999 | - | - | - | - | - |
| December 31, 1998 | - | - | - | - | - |
| December 31, 1997 | - | - | - | - | - |
| | | | | | |
| Janus Aspen Series Funds: | | | | | |
| Worldwide Growth - Class B | | | | | |
| | | | | | |
| September 30, 2001 | 21,263.352 | $5.94 | $126 | 0.77% | (31.80)% |
| December 31, 2000 | 17,011.166 | 8.71 | 148 | 0.20 | - |
| December 31, 1999 | - | - | - | - | - |
| December 31, 1998 | - | - | - | - | - |
| December 31, 1997 | - | - | - | - | - |
| | | | | | |
| Janus Aspen Series Funds: | | | | | |
| International Growth - Class A | | | | | |
| | | | | | |
| September 30, 2001 | 686,018.038 | $5.79 | $3,971 | 0.47% | (33.37)% |
| December 31, 2000 | 42,106.076 | 8.69 | 366 | 0.24 | - |
| December 31, 1999 | - | - | - | - | - |
| December 31, 1998 | - | - | - | - | - |
| December 31, 1997 | - | - | - | - | - |
| | | | | | |
| Janus Aspen Series Funds: | | | | | |
| International Growth - Class B | | | | | |
| | | | | | |
| September 30, 2001 | 28,976.041 | $5.83 | $169 | 2.80% | (33.07)% |
| December 31, 2000 | 6,269.387 | 8.71 | 55 | - | - |
| December 31, 1999 | - | - | - | - | - |
| December 31, 1998 | - | - | - | - | - |
| December 31, 1997 | - | - | - | - | - |
| | | | | | |
| M Fund, Inc.: | | | | | |
| International Equity - Class A | | | | | |
| | | | | | |
| September 30, 2001 | 125,031.764 | $8.78 | $1,098 | .21% | - |
| December 31, 2000 | - | - | - | - | - |
| December 31, 1999 | - | - | - | - | - |
| December 31, 1998 | - | - | - | - | - |
| December 31, 1997 | - | - | - | - | - |
Strategic Investor 154
Security Life Separate Account L1
(Unaudited)
Notes to Financial Statements (continued)
9. Summary of Expense and Investment Ratios (continued)
Division
| Units
| Net Assets
| Expenses as a
% of Average
Net Assets
| Total
Return
|
Unit
Value
| (000s)
|
| | | | | | |
| M Fund, Inc.: | | | | | |
| International Equity - Class B | | | | | |
| | | | | | |
| September 30, 2001 | 231.817 | $8.81 | $2 | 12.05% | - |
| December 31, 2000 | - | - | - | - | - |
| December 31, 1999 | - | - | - | - | - |
| December 31, 1998 | - | - | - | - | - |
| December 31, 1997 | - | - | - | - | - |
| | | | | | |
| M Fund, Inc.: | | | | | |
| Enhanced US Equity- Class A | | | | | |
| | | | | | |
| September 30, 2001 | 74,088.595 | $8.99 | $665 | .14% | - |
| December 31, 2000 | - | - | - | - | - |
| December 31, 1999 | - | - | - | - | - |
| December 31, 1998 | - | - | - | - | - |
| December 31, 1997 | - | - | - | - | - |
| | | | | | |
| M Fund, Inc.: | | | | | |
| Enhanced US Equity- Class B | | | | | |
| | | | | | |
| September 30, 2001 | 34.188 | $9.01 | - | 34.61% | - |
| December 31, 2000 | - | - | - | - | - |
| December 31, 1999 | - | - | - | - | - |
| December 31, 1998 | - | - | - | - | - |
| December 31, 1997 | - | - | - | - | - |
| | | | | | |
| M Fund, Inc.: | | | | | |
| Capital Appreciation - Class A | | | | | |
| | | | | | |
| September 30, 2001 | 105,033.545 | $8.43 | $886 | .20% | - |
| December 31, 2000 | - | - | - | - | - |
| December 31, 1999 | - | - | - | - | - |
| December 31, 1998 | - | - | - | - | - |
| December 31, 1997 | - | - | - | - | - |
| | | | | | |
| M Fund, Inc.: | | | | | |
| Capital Appreciation - Class B | | | | | |
| | | | | | |
| September 30, 2001 | 523.718 | $8.46 | $4 | 13.74% | - |
| December 31, 2000 | - | - | - | - | - |
| December 31, 1999 | - | - | - | - | - |
| December 31, 1998 | - | - | - | - | - |
| December 31, 1997 | - | - | - | - | - |
| | | | | | |
| M Fund, Inc.: | | | | | |
| Core Growth - Class A | | | | | |
| | | | | | |
| September 30, 2001 | 17,267.848 | $8.43 | $146 | .32% | - |
| December 31, 2000 | - | - | - | - | - |
| December 31, 1999 | - | - | - | - | - |
| December 31, 1998 | - | - | - | - | - |
| December 31, 1997 | - | - | - | - | - |
Strategic Investor 155
Security Life Separate Account L1
(Unaudited)
Notes to Financial Statements (continued)
9. Summary of Expense and Investment Ratios (continued)
Division
| Units
| Net Assets
| Expenses as a
% of Average
Net Assets
| Total
Return
|
Unit
Value
| (000s)
|
| | | | | | |
| M Fund, Inc.: | | | | | |
| Core Growth - Class B | | | | | |
| | | | | | |
| September 30, 2001 | 106.670 | $8.47 | - | 20.53% | - |
| December 31, 2000 | - | - | - | - | - |
| December 31, 1999 | - | - | - | - | - |
| December 31, 1998 | - | - | - | - | - |
| December 31, 1997 | - | - | - | - | - |
| | | | | | |
| ING Pilgrim Investment, LLC: | | | | | |
| Growth Opportunities - Class A | | | | | |
| | | | | | |
| September 30, 2001 | 1,138.989 | $7.46 | $8,492 | 2.86% | - |
| December 31, 2000 | - | - | - | - | - |
| December 31, 1999 | - | - | - | - | - |
| December 31, 1998 | - | - | - | - | - |
| December 31, 1997 | - | - | - | - | - |
| | | | | | |
| ING Pilgrim Investment, LLC: | | | | | |
| Growth Opportunities - Class B | | | | | |
| | | | | | |
| September 30, 2001 | - | - | - | - | - |
| December 31, 2000 | - | - | - | - | - |
| December 31, 1999 | - | - | - | - | - |
| December 31, 1998 | - | - | - | - | - |
| December 31, 1997 | - | - | - | - | - |
| | | | | | |
| ING Pilgrim Investment, LLC: | | | | | |
| MagnaCap - Class A | | | | | |
| | | | | | |
| September 30, 2001 | 7,618.144 | $9.00 | $69 | 1.57% | - |
| December 31, 2000 | - | - | - | - | - |
| December 31, 1999 | - | - | - | - | - |
| December 31, 1998 | - | - | - | - | - |
| December 31, 1997 | - | - | - | - | - |
| | | | | | |
| ING Pilgrim Investment, LLC: | | | | | |
| MagnaCap - Class B | | | | | |
| | | | | | |
| September 30, 2001 | 864.888 | 8.98 | $8 | 9.16% | - |
| December 31, 2000 | - | - | - | - | - |
| December 31, 1999 | - | - | - | - | - |
| December 31, 1998 | - | - | - | - | - |
| December 31, 1997 | - | - | - | - | - |
| | | | | | |
| ING Pilgrim Investment, LLC: | | | | | |
| Mid-Cap Opportunities - Class A | | | | | |
| | | | | | |
| September 30, 2001 | 9,945.500 | $7.55 | $75 | .41% | - |
| December 31, 2000 | - | - | - | - | - |
| December 31, 1999 | - | - | - | - | - |
| December 31, 1998 | - | - | - | - | - |
| December 31, 1997 | - | - | - | - | - |
Strategic Investor 156
Security Life Separate Account L1
(Unaudited)
Notes to Financial Statements (continued)
9. Summary of Expense and Investment Ratios (continued)
Division
| Units
| Net Assets
| Expenses as a
% of Average
Net Assets
| Total
Return
|
Unit
Value
| (000s)
|
| | | | | | |
| ING Pilgrim Investment, LLC: | | | | | |
| Mid-Cap Opportunities - Class B | | | | | |
| | | | | | |
| September 30, 2001 | 26.044 | $7.45 | - | 51.50% | - |
| December 31, 2000 | - | - | - | - | - |
| December 31, 1999 | - | - | - | - | - |
| December 31, 1998 | - | - | - | - | - |
| December 31, 1997 | - | - | - | - | - |
| | | | | | |
| ING Pilgrim Investment, LLC: | | | | | |
| Small Cap Opportunities - Class A | | | | | |
| | | | | | |
| September 30, 2001 | 12,810.621 | $8.29 | $106 | 1.23% | - |
| December 31, 2000 | - | - | - | - | - |
| December 31, 1999 | - | - | - | - | - |
| December 31, 1998 | - | - | - | - | - |
| December 31, 1997 | - | - | - | - | - |
| | | | | | |
| ING Pilgrim Investment, LLC: | | | | | |
| Small Cap Opportunities - Class B | | | | | |
| | | | | | |
| September 30, 2001 | 367.643 | $8.30 | $3 | 28.22% | - |
| December 31, 2000 | - | - | - | - | - |
| December 31, 1999 | - | - | - | - | - |
| December 31, 1998 | - | - | - | - | - |
| December 31, 1997 | - | - | - | - | - |
| | | | | | |
| Putnam Investment Management, LLC: | | | | | |
| New Opportunities - Class A | | | | | |
| | | | | | |
| September 30, 2001 | 20,496.413 | $7.91 | $162 | 1.52% | - |
| December 31, 2000 | - | - | - | - | - |
| December 31, 1999 | - | - | - | - | - |
| December 31, 1998 | - | - | - | - | - |
| December 31, 1997 | - | - | - | - | - |
| | | | | | |
| Putnam Investment Management, LLC: | | | | | |
| New Opportunities - Class B | | | | | |
| | | | | | |
| September 30, 2001 | 1,686.535 | $7.94 | $13 | 2.88% | - |
| December 31, 2000 | - | - | - | - | - |
| December 31, 1999 | - | - | - | - | - |
| December 31, 1998 | - | - | - | - | - |
| December 31, 1997 | - | - | - | - | - |
| | | | | | |
| Putnam Investment Management, LLC: | | | | | |
| Voyager - Class A | | | | | |
| | | | | | |
| September 30, 2001 | 4,416.369 | $8.60 | $38 | 2.50% | - |
| December 31, 2000 | - | - | - | - | - |
| December 31, 1999 | - | - | - | - | - |
| December 31, 1998 | - | - | - | - | - |
| December 31, 1997 | - | - | - | - | - |
Strategic Investor 157
Security Life Separate Account L1
(Unaudited)
Notes to Financial Statements (continued)
9. Summary of Expense and Investment Ratios (continued)
Division
| Units
| Net Assets
| Expenses as a
% of Average
Net Assets
| Total
Return
|
Unit
Value
| (000s)
|
| | | | | | |
| Putnam Investment Management, LLC: | | | | | |
| Voyager - Class A | | | | | |
| | | | | | |
| September 30, 2001 | 23.864 | $8.63 | - | 15.79% | - |
| December 31, 2000 | - | - | - | - | - |
| December 31, 1999 | - | - | - | - | - |
| December 31, 1998 | - | - | - | - | - |
| December 31, 1997 | - | - | - | - | - |
| | | | | | |
| Putnam Investment Management, LLC: | | | | | |
| Growth and Income - Class A | | | | | |
| | | | | | |
| September 30, 2001 | 77,415.535 | $9.24 | $715 | .54% | - |
| December 31, 2000 | - | - | - | - | - |
| December 31, 1999 | - | - | - | - | - |
| December 31, 1998 | - | - | - | - | - |
| December 31, 1997 | - | - | - | - | - |
| | | | | | |
| Putnam Investment Management, LLC: | | | | | |
| Growth and Income - Class B | | | | | |
| | | | | | |
| September 30, 2001 | 157.737 | $9.27 | $1 | 27.46% | - |
| December 31, 2000 | - | - | - | - | - |
| December 31, 1999 | - | - | - | - | - |
| December 31, 1998 | - | - | - | - | - |
| December 31, 1997 | - | - | - | - | - |
| | | | | | |
| Putnam Investment Management, LLC: | | | | | |
| Small Cap Value - Class A | | | | | |
| | | | | | |
| September 30, 2001 | 89,076.344 | $9.84 | $876 | .55% | - |
| December 31, 2000 | - | - | - | - | - |
| December 31, 1999 | - | - | - | - | - |
| December 31, 1998 | - | - | - | - | - |
| December 31, 1997 | - | - | - | - | - |
| | | | | | |
| Putnam Investment Management, LLC: | | | | | |
| Small Cap Value - Class B | | | | | |
| | | | | | |
| September 30, 2001 | 1,954.892 | $9.84 | $19 | 3.32% | - |
| December 31, 2000 | - | - | - | - | - |
| December 31, 1999 | - | - | - | - | - |
| December 31, 1998 | - | - | - | - | - |
| December 31, 1997 | - | - | - | - | - |
*Ratio not provided for years ended December 31, 1998 and 1997.</R>
Strategic Investor 158
Security Life Separate Account L1 of
Security Life of Denver Insurance Company
Financial Statements
Years ended December 31, 2000, 1999 and 1998
Strategic Investor 159
Security Life Separate Account L1
Financial Statements
Years ended December 31, 2000, 1999 and 1998
Contents
| Report of Independent Auditors | 161 |
| |
| Audited Financial Statements |
| |
| Statement of Net Assets | 162 |
| Statement of Operations | 171 |
| Statement of Changes in Net Assets | 194 |
| Notes to Financial Statements | 217 |
Strategic Investor 160
Report of Independent Auditors
Policyholders
Security Life Separate Account L1 of
Security Life of Denver Insurance Company
We have audited the accompanying statement of net assets of Security Life Separate Account L1 of Security Life of Denver Insurance Company, comprising, respectively, the Neuberger Berman Advisers Management Trust (comprising the Limited Maturity Bond, Growth and Partners Divisions) ("NB"), the Alger American Fund (comprising the American Small Capitalization, American MidCap Growth, American Growth and American Leveraged AllCap Divisions) ("Alger"), the Fidelity Variable Insurance Products Fund and Variable Insurance Products Fund II (comprising the Asset Manager, Growth, Overseas, Money Market and Index 500 Divisions) ("Fidelity"), the INVESCO Variable Investment Funds, Inc. (comprising the Total Return, Equity Income, High Yield, Utilities and Small Company Growth Divisions) ("INVESCO"), the Van Eck Worldwide Trust (comprising the Worldwide Hard Assets, Worldwide Bond, Worldwide Emerging Markets and Worldwide Real Estate Divisions) ("Van Eck"), AIM Advisors, Inc. (comprising the Capital Appreciation and Government Securities Divisions) ("AIM"), the Directed Services, Inc. (comprising the Equity Income, Growth, Hard Asset, Limited Maturity Bond, Liquid Asset, MidCap, Research and Total Return Divisions) ("GCG"), and Janus Aspen Series Funds (comprising the Aggressive Growth, Growth, International Growth and Worldwide Growth Divisions) ("Janus"), as of December 31, 2000, and the related statements of operations and changes in net assets for each of the three years in the period then ended. These financial statements are the responsibility of the Company's management. Our responsibility is to express an opinion on these financial statements based on our audits.
We conducted our audits in accordance with auditing standards generally accepted in the United States. Those standards require that we plan and perform the audit to obtain reasonable assurance about whether the financial statements are free of material misstatement. An audit includes examining, on a test basis, evidence supporting the amounts and disclosures in the financial statements. Our procedures included confirmation of securities owned as of December 31, 2000, by correspondence with the transfer agents. An audit also includes assessing the accounting principles used and significant estimates made by management, as well as evaluating the overall financial statement presentation. We believe that our audits provide a reasonable basis for our opinion.
In our opinion, the financial statements referred to above present fairly, in all material respects, the financial position of Security Life Separate Account L1 at December 31, 2000, and the results of its operations and changes in its net assets for each of the three years in the period then ended, in conformity with accounting principles generally accepted in the United States.
April 3, 2001
Strategic Investor 161
Security Life Separate Account L1
Statement of Net Assets
December 31, 2000
| Total All Divisions
| Total NB
| Total Alger
| Total Fidelity
| Total INVESCO
| Total Van Eck
| Total AIM
| Total GCG
| Total Janus
|
| Assets | | | | | | | | | |
| Investments in mutual funds at market value (Note 3) | $711,116,580
| $61,876,992
| $133,977,481
| $370,730,205
| $63,237,456
| $9,121,476
| $67,784,644
| $2,880,066
| $1,508,260
|
| Total assets | 711,116,580
| 61,876,992
| 133,977,481
| 370,730,205
| 63,237,456
| 9,121,476
| 67,784,644
| 2,880,066
| 1,508,260
|
| | | | | | | | | |
| Liabilities | | | | | | | | | |
| Due to (from) Security Life of Denver | (72,228)
| (117,844)
| 18,560
| 192,254
| (149,658)
| 2,390
| (17,930)
| -
| -
|
| Total liabilities | (72,228)
| (117,844)
| 18,560
| 192,254
| (149,658)
| 2,390
| (17,930)
| -
| -
|
| | | | | | | | | |
| Net assets | $711,188,808
| $61,994,836
| $133,958,921
| $370,537,951
| $63,387,114
| $9,119,086
| $67,802,574
| $2,880,066
| $1,508,260
|
| | | | | | | | | |
| Policyholder reserves | | | | | | | | | |
| Reserves attributable to the policyholders (Note 2) | $711,188,808
| $61,994,836
| $133,958,921
| $370,537,951
| $63,387,114
| $9,119,086
| $67,802,574
| $2,880,066
| $1,508,260
|
| | | | | | | | | |
| Total policyholder reserves | $711,188,808
| $61,994,836
| $133,958,921
| $370,537,951
| $63,387,114
| $9,119,086
| $67,802,574
| $2,880,066
| $1,508,260
|
See accompanying notes.
Strategic Investor 162
Security Life Separate Account L1
Statement of Net Assets (continued)
December 31, 2000
| NB
|
| Total NB
| Limited Maturity Bond
| Growth
| Partners
|
| Assets | | | | |
| Investments in mutual funds at market value (Note 3) | $61,876,992
| $14,488,939
| $19,934,193
| $27,453,860
|
| Total assets | 61,876,992
| 14,488,939
| 19,934,193
| 27,453,860
|
| | | | |
| Liabilities | | | | |
| Due to (from) Security Life of Denver | (117,844)
| (5,212)
| (10,713)
| (101,919)
|
| Total liabilities | (117,844)
| (5,212)
| (10,713)
| (101,919)
|
| | | | |
| Net assets | $61,994,836
| $14,494,151
| $19,944,906
| $27,555,779
|
| | | | |
| Policyholder reserves | | | | |
| Reserves attributable to the policyholders (Note 2) | $61,994,836
| $14,494,151
| $19,944,906
| $27,555,779
|
| | | | |
| Total policyholder reserves | $61,994,836
| $14,494,151
| $19,944,906
| $27,555,779
|
| | | | |
| Number of divisional units outstanding (Note 7): |
Class A
| | 1,085,190.344
| 755,032.816
| 1,131,357.503
|
Class B
| | -
| -
| 727.044
|
| | | | |
| Value per divisional unit: |
Class A
| | $13.36
| $26.42
| $24.35
|
Class B
| | $ -
| $ -
| $ 9.97
|
See accompanying notes.
Strategic Investor 163
Security Life Separate Account L1
Statement of Net Assets (continued)
December 31, 2000
| Alger
|
| Total Alger
| American Small Capitalization
| American MidCap Growth
| American Growth
| American Leveraged AllCap
|
| Assets | | | | | |
| Investments in mutual funds at market value (Note 3) | $133,977,481
| $26,226,670
| $33,290,178
| $50,094,730
| $24,365,903
|
| Total assets | 133,977,481
| 26,226,670
| 33,290,178
| 50,094,730
| 24,365,903
|
| | | | | |
| Liabilities | | | | | |
| Due to (from) Security Life of Denver | 18,560
| 57,540
| (3,573)
| (23,702)
| (11,705)
|
| Total liabilities | 18,560
| 57,540
| (3,573)
| (23,702)
| (11,705)
|
| | | | | |
| Net assets | $133,958,921
| $26,169,130
| $33,293,751
| $50,118,432
| $24,377,608
|
| | | | | |
| Policyholder reserves | | | | | |
| Reserves attributable to the policyholders (Note 2) | $133,958,921
| $26,169,130
| $33,293,751
| $50,118,432
| $24,377,608
|
| | | | | |
| Total policyholder reserves | $133,958,921
| $26,169,130
| $33,293,751
| $50,118,432
| $24,377,608
|
| | | | | |
| Number of divisional units outstanding (Note 7): |
Class A
| | 1,351,105.091
| 1,022,948.192
| 1,795,058.476
| 602,197.766
|
Class B
| | 55,669.122
| 4,581.526
| 11,503.557
| -
|
| | | | | |
| Value per divisional unit: |
Class A
| | $18.97
| $32.49
| $27.87
| $40.48
|
| Class B | | $ 9.65
| $13.43
| $10.16
| $ -
|
See accompanying notes.
Strategic Investor 164
Security Life Separate Account L1
Statement of Net Assets (continued)
December 31, 2000
| Fidelity
|
| Total Fidelity
| Asset Manager
| Growth
| Overseas
| Money Market
| Index 500
|
| Assets | | | | | | |
| Investments in mutual funds at | | | | | | |
| market value (Note 3) | $370,730,205
| $15,754,225
| $68,586,160
| $43,188,471
| $62,301,092
| $180,900,257
|
| Total assets | 370,730,205
| 15,754,225
| 68,586,160
| 43,188,471
| 62,301,092
| 180,900,257
|
| | | | | | |
| Liabilities | | | | | | |
| Due to (from) Security Life of Denver | 192,254
| (393)
| 79,957
| (133,406)
| 286,280
| (40,184)
|
| Total liabilities | 192,254
| (393)
| 79,957
| (133,406)
| 286,280
| (40,184)
|
| | | | | | |
| Net assets | $370,537,951
| $15,754,618
| $68,506,203
| $43,321,877
| $62,014,812
| $180,940,441
|
| | | | | | |
| Policyholder reserves | | | | | | |
| Reserves attributable to the | | | | | | |
| policyholders (Note 2) | $370,537,951
| $15,754,618
| $68,506,203
| $43,321,877
| $62,014,812
| $180,940,441
|
| | | | | | |
| Total policyholder reserves | $370,537,951
| $15,754,618
| $68,506,203
| $43,321,877
| $62,014,812
| $180,940,441
|
| | | | | | |
| Number of divisional units outstanding (Note 7): |
Class A
| | 878,584.296
| 2,222,867.138
| 2,586,286.303
| 4,689,569.461
| 6,025,479.633
|
Class B
| | -
| 40,727.108
| 83,750.568
| -
| 704,951.502
|
| | | | | | |
Value per divisional unit:
Class A
| | $17.93
| $30.62
| $16.41
| $13.22
| $28.85
|
Class B
| | $ -
| $10.84
| $10.38
| $ -
| $10.07
|
See accompanying notes.
Strategic Investor 165
Security Life Separate Account L1
Statement of Net Assets (continued)
December 31, 2000
| INVESCO
|
| Total INVESCO
| Total Return
| Equity Income
| High Yield
| Utilities
| Small Company Growth
|
| Assets | | | | | | |
| Investments in mutual funds at | | | | | | |
| market value (Note 3) | $63,237,456
| $11,689,940
| $21,534,053
| $10,481,915
| $7,812,397
| $11,719,151
|
| Total assets | 63,237,456
| 11,689,940
| 21,534,053
| 10,481,915
| 7,812,397
| 11,719,151
|
| | | | | | |
| Liabilities | | | | | | |
| Due to (from) Security Life of Denver | (149,658)
| (4,691)
| (2,043)
| (14,437)
| 465
| (128,952)
|
| Total liabilities | (149,658)
| (4,691)
| (2,043)
| (14,437)
| 465
| (128,952)
|
| | | | | | |
| Net assets | $63,387,114
| $11,694,631
| $21,536,096
| $10,496,352
| $7,811,932
| $11,848,103
|
| | | | | | |
| Policyholder reserves | | | | | | |
| Reserves attributable to the | | | | | | |
| policyholders (Note 2) | $63,387,114
| $11,694,631
| $21,536,096
| $10,496,352
| $7,811,932
| $11,848,103
|
| | | | | | |
| Total policyholder reserves | $63,387,114
| $11,694,631
| $21,536,096
| $10,496,352
| $7,811,932
| $11,848,103
|
| | | | | | |
| Number of divisional units outstanding (Note 7): |
Class A
| | 698,007.347
| 782,880.410
| 680,080.798
| 341,947.485
| 658,499.168
|
Class B
| | -
| 23,197.396
| 2,293.135
| -
| 2,459.473
|
| | | | | | |
Value per divisional unit:
Class A
| | $16.75
| $27.19
| $15.40
| $22.85
| $17.96
|
Class B
| | $-
| $10.79
| $ 9.07
| $ -
| $13.22
|
See accompanying notes.
Strategic Investor 166
Security Life Separate Account L1
Statement of Net Assets (continued)
December 31, 2000
| Van Eck
|
| Total Van Eck
| Worldwide Hard Assets
| Worldwide Bond
| Worldwide Emerging Markets
| Worldwide Real Estate
|
| Assets | | | | | |
| Investments in mutual funds | | | | | |
| at market value (Note 3) | $9,121,476
| $2,313,362
| $931,424
| $4,564,382
| $1,312,308
|
| Total assets | 9,121,476
| 2,313,362
| 931,424
| 4,564,382
| 1,312,308
|
| | | | | |
| Liabilities | | | | | |
| Due to (from) Security Life of Denver | 2,390
| 11
| (3)
| 2,382
| -
|
| Total liabilities | 2,390
| 11
| (3)
| 2,382
| -
|
| | | | | |
| Net assets | $9,119,086
| $2,313,351
| $931,427
| $4,562,000
| $1,312,308
|
| | | | | |
| Policyholder reserves | | | | | |
| Reserves attributable to the | | | | | |
| policyholders (Note 2) | $9,119,086
| $2,313,351
| $931,427
| $4,562,000
| $1,312,308
|
| | | | | |
| Total policyholder reserves | $9,119,086
| $2,313,351
| $931,427
| $4,562,000
| $1,312,308
|
| | | | | |
| | | | | |
Number of divisional units outstanding (Note 7):
Class A
| | 214,971.664
| 91,236.724
| 543,314.421
| 131,207.896
|
Class B
| | -
| 42.100
| 36,043.266
| 395.373
|
| | | | | |
Value per divisional unit:
Class A
| | $10.76
| $10.20
| $7.85
| $ 9.97
|
Class B
| | $ -
| $10.02
| $8.27
| $10.97
|
See accompanying notes.
Strategic Investor 167
Security Life Separate Account L1
Statement of Net Assets (continued)
December 31, 2000
| AIM
|
| Total AIM
| Capital Appreciation
| Government Securities
|
| Assets | | | |
| Investments in mutual funds at | | | |
| market value (Note 3) | $67,784,644
| $51,020,236
| $16,764,408
|
| Total assets | 67,784,644
| 51,020,236
| 16,764,408
|
| | | |
| Liabilities | | | |
| Due to (from) Security Life of Denver | (17,930)
| (18,440)
| 510
|
| Total liabilities | (17,930)
| (18,440)
| 510
|
| | | |
| Net assets | $67,802,574
| $51,038,676
| $16,763,898
|
| | | |
| Policyholder reserves | | | |
| Reserves attributable to the | | | |
| policyholders (Note 2) | $67,802,574
| $51,038,676
| $16,763,898
|
| | | |
| Total policyholder reserves | $67,802,574
| $51,038,676
| $16,763,898
|
| | | |
Number of divisional units outstanding (Note 7):
Class A
| | 647,483.811
| 1,022,213.843
|
Class B
| | 3,435,424.363
| 469,535.280
|
| | | |
Value per divisional unit:
Class A
| | $14.52
| $11.29
|
Class B
| | $12.12
| $11.13
|
See accompanying notes.
Strategic Investor 168
Security Life Separate Account L1
Statement of Net Assets (continued)
December 31, 2000
| GCG
|
| Total GCG
| Equity Income
| Growth
| Hard Assets
| Limited Maturity Bond
| Liquid Asset
| MidCap Growth
| Research
| Total Return
|
| Assets | | | | | | | | | |
| Investments in mutual funds at market value (Note 3) | $2,880,066
| $ -
| $1,233
| $ -
| $876,798
| $1,991,502
| $ -
| $ -
| $10,533
|
| Total assets | 2,880,066
| -
| 1,233
| -
| 876,798
| 1,991,502
| -
| -
| 10,533
|
| | | | | | | | | |
| Liabilities | | | | | | | | | |
| Due to (from) Security Life of Denver | -
| -
| -
| -
| -
| -
| -
| -
| -
|
| Total liabilities | -
| -
| -
| -
| -
| -
| -
| -
| -
|
| | | | | | | | | |
| Net assets | $2,880,066
| $ -
| $1,233
| $ -
| $876,798
| $1,991,502
| $ -
| $ -
| $10,533
|
| | | | | | | | | |
| Policyholder reserves | | | | | | | | | |
| Reserves attributable to the policyholders (Note 2) | $2,880,066
| $ -
| $1,233
| $ -
| $876,798
| $1,991,502
| $ -
| $ -
| $10,533
|
| | | | | | | | | |
| Total policyholder reserves | $2,880,066
| $ -
| $1,233
| $ -
| $876,798
| $1,991,502
| $ -
| $ -
| $10,533
|
Number of divisional units outstanding (Note 7):
Class A
| | -
| -
| -
| -
| -
| -
| -
| -
|
Class B
| | -
| 103.679
| -
| 80,478.798
| 183,932.621
| -
| -
| 908.365
|
Value per divisional unit:
Class A
| | -
| -
| -
| -
| -
| -
| -
| -
|
Class B
| | -
| $11.89
| -
| $10.89
| $10.83
| -
| -
| $11.60
|
See accompanying notes.
Strategic Investor 169
Security Life Separate Account L1
Statement of Net Assets (continued)
December 31, 2000
| Janus
|
| Total Janus
| Growth
| Aggressive Growth
| Worldwide Growth
| International Growth
|
| Assets | | | | | |
| Investments in mutual funds at market value (Note 3) | $1,508,260
| $243,641
| $524,583
| $319,420
| $420,616
|
| Total assets | 1,508,260
| 243,641
| 524,583
| 319,420
| 420,616
|
| | | | | |
| Liabilities | | | | | |
| Due to (from) Security Life of Denver | -
| -
| -
| -
| -
|
| Total liabilities | -
| -
| -
| -
| -
|
| | | | | |
| Net assets | $1,508,260
| $243,641
| $524,583
| $319,420
| $420,616
|
| | | | | |
| Policyholder reserves | | | | | |
| Reserves attributable to the policyholders (Note 2) | $1,508,260
| $243,641
| $524,583
| $319,420
| $420,616
|
| | | | | |
| Total policyholder reserves | $1,508,260
| $243,641
| $524,583
| $319,420
| $420,616
|
Number of divisional units
outstanding (Note 7):
Class A
| | 29,430.276
| 53,752.789
| 19,710.545
| 42,106.076
|
Class B
| | -
| 22,786.649
| 17,011.166
| 6,269.387
|
| | | | | |
Value per divisional unit:
Class A
| | $8.28
| $6.85
| $8.69
| $8.69
|
Class B
| | $ -
| $6.86
| $8.71
| $8.71
|
See accompanying notes.
Strategic Investor 170
Security Life Separate Account L1
Statement of Operations
Year ended December 31, 2000
| Total All Divisions
| Total NB
| Total Alger
| Total Fidelity
| Total INVESCO
| Total Van Eck
| Total AIM
| Total GCG
| Total Janus
|
| Investment income | | | | | | | | | |
| Dividends from mutual funds | $ 50,577,183 | $ 7,022,071 | $ 21,585,044 | $ 16,687,757 | $ 3,487,264 | $ 59,217 | $ 818,477 | $916,460 | $ 893 |
| Less valuation period deductions | | | | | | | | | |
| (Note 2) | 4,508,171
| 450,958
| 982,444
| 2,480,381
| 404,934
| 59,822
| 128,874
| -
| 758
|
| Net investment income (loss) | 46,069,012
| 6,571,113
| 20,602,600
| 14,207,376
| 3,082,330
| (605)
| 689,603
| 916,460
| 135
|
| | | | | | | | | |
| Realized and unrealized gains | | | | | | | | | |
| (losses) on investments | | | | | | | | | |
| Net realized gains (losses) on | | | | | | | | | |
| investments | 5,695,914 | (1,808,706) | (5,036,278) | 10,515,603 | 1,339,426 | 220,229 | 475,369 | - | (9,729) |
| Net unrealized gains (losses) on | | | | | | | | | |
| investments | (118,856,269)
| (7,325,351)
| (40,865,515)
| (58,774,602)
| (7,701,130)
| (2,223,947)
| (1,820,869)
| (46,004)
| (98,851)
|
| Net realized and unrealized gains | | | | | | | | | |
| (losses) on investments | (113,160,355)
| (9,134,057)
| (45,901,793)
| (48,258,999)
| (6,361,704)
| (2,003,718)
| (1,345,500)
| (46,004)
| (108,580)
|
| | | | | | | | | |
| Net increase (decrease) in net assets | | | | | | | | | |
| resulting from operations | $ (67,091,343)
| $(2,562,944)
| $(25,299,193)
| $(34,051,623)
| $(3,279,374)
| $(2,004,323)
| $ (655,897)
| $870,456
| $(108,445)
|
See accompanying notes.
Strategic Investor 171
Security Life Separate Account L1
Statement of Operations (continued)
Year ended December 31, 2000
| NB
|
| Total NB
| Limited Maturity Bond
| Growth
| Partners
|
| Investment income | | | | |
| Dividends from mutual funds | $ 7,022,071 | $775,107 | $ 1,356,082 | $4,890,882 |
| Less valuation period deductions | | | | |
| (Note 2) | 450,958
| 92,250
| 138,445
| 220,263
|
| Net investment income (loss) | 6,571,113
| 682,857
| 1,217,637
| 4,670,619
|
| | | | |
| Realized and unrealized gains | | | | |
| (losses) on investments | | | | |
| Net realized gains (losses) on | | | | |
| investments | (1,808,706) | (281,540) | 3,777,374 | (5,304,540) |
| Net unrealized gains (losses) on | | | | |
| investments | (7,325,351)
| 351,484
| (7,971,190)
| 294,355
|
| Net realized and unrealized gains | | | | |
| (losses) on investments | (9,134,057)
| 69,944
| (4,193,816)
| (5,010,185)
|
| | | | |
| Net increase (decrease) in net assets | | | | |
| resulting from operations | $(2,562,944)
| $752,801
| $(2,976,179)
| $ (339,566)
|
See accompanying notes.
Strategic Investor 172
Security Life Separate Account L1
Statement of Operations (continued)
Year ended December 31, 2000
| Alger
|
| Total Alger
| American Small Capitalization
| American MidCap Growth
| American Growth
| American Leveraged AllCap
|
| Investment income | | | | | |
| Dividends from mutual funds | $21,585,044 | $9,941,662 | $2,936,254 | $6,249,935 | $2,457,193 |
| Less valuation period deductions | | | | | |
| (Note 2) | 982,444
| 222,078
| 194,721
| 366,802
| 198,843
|
| Net investment income (loss) | 20,602,600
| 9,719,584
| 2,741,533
| 5,883,133
| 2,258,350
|
| | | | | |
| Realized and unrealized gains | | | | | |
| (losses) on investments | | | | | |
| Net realized gains (losses) on | | | | | |
| investments | (5,036,278) | (9,976,931) | 1,057,836 | 1,775,571 | 2,107,246 |
| Net unrealized gains (losses) on | | | | | |
| investments | (40,865,515)
| (9,435,613)
| (2,672,195)
| (16,304,212)
| (12,453,495)
|
| Net realized and unrealized gains | | | | | |
| (losses) on investments | (45,901,793)
| (19,412,544)
| (1,614,359)
| (14,528,641)
| (10,346,249)
|
| | | | | |
| Net increase (decrease) in net assets | | | | | |
| resulting from operations | $(25,299,193)
| $(9,692,960)
| $1,127,174
| $(8,645,508)
| $(8,087,899)
|
See accompanying notes.
Strategic Investor 173
Security Life Separate Account L1
Statement of Operations (continued)
Year ended December 31, 2000
| Fidelity
|
| Total Fidelity
| Asset Manager
| Growth
| Overseas
| Money Market
| Index 500
|
| Investment income | | | | | | |
| Dividends from mutual funds | $ 16,687,757 | $1,469,444 | $ 6,670,347 | $ 3,516,677 | $2,798,325 | $ 2,232,964 |
| Less valuation period deductions | | | | | | |
| (Note 2) | 2,480,381
| 105,478
| 489,501
| 301,304
| 340,745
| 1,243,353
|
| Net investment income (loss) | 14,207,376
| 1,363,966
| 6,180,846
| 3,215,373
| 2,457,580
| 989,611
|
| | | | | | |
| Realized and unrealized gains | | | | | | |
| (losses) on investments | | | | | | |
| Net realized gains (losses) on | | | | | | |
| investments | 10,515,603 | 8,816 | 2,581,814 | 1,800,478 | - | 6,124,495 |
| Net unrealized gains (losses) on | | | | | | |
| investments | (58,774,602)
| (2,092,103)
| (17,925,268)
| (13,999,080)
| -
| (24,758,151)
|
| Net realized and unrealized gains | | | | | | |
| (losses) on investments | (48,258,999)
| (2,083,287)
| (15,343,454)
| (12,198,602)
| -
| (18,633,656)
|
| | | | | | |
| Net increase (decrease) in net assets | | | | | | |
| resulting from operations | $(34,051,623)
| $ (719,321)
| $(9,162,608)
| $(8,983,229)
| $2,457,580
| $(17,644,045)
|
See accompanying notes.
Strategic Investor 174
Security Life Separate Account L1
Statement of Operations (continued)
Year ended December 31, 2000
| INVESCO
|
| Total INVESCO
| Total Return
| Equity Income
| High Yield
| Utilities
| Small Company Growth
|
| Investment income | | | | | | |
| Dividends from mutual funds | $ 3,487,264 | $1,540,605 | $1,186,862 | $ 97,398 | $324,011 | $ 338,388 |
| Less valuation period deductions | | | | | | |
| (Note 2) | 404,934
| 80,022
| 139,132
| 78,969
| 43,912
| 62,899
|
| Net investment income (loss) | 3,082,330
| 1,460,583
| 1,047,730
| 18,429
| 280,099
| 275,489
|
| | | | | | |
| Realized and unrealized gains | | | | | | |
| (losses) on investments | | | | | | |
| Net realized gains (losses) on | | | | | | |
| investments | 1,339,426 | (314,414) | 593,634 | (390,743) | 256,021 | 1,194,928 |
| Net unrealized gains (losses) on | | | | | | |
| investments | (7,701,130)
| (1,435,710)
| (904,246)
| (1,002,431)
| (372,493)
| (3,986,250)
|
| Net realized and unrealized gains | | | | | | |
| (losses) on investments | (6,361,704)
| (1,750,124)
| (310,612)
| (1,393,174)
| (116,472)
| (2,791,322)
|
| | | | | | |
| Net increase (decrease) in net assets | | | | | | |
| resulting from operations | $(3,279,374)
| $ (289,541)
| $ 737,118
| $(1,374,745)
| $163,627
| $(2,515,833)
|
See accompanying notes.
Strategic Investor 175
Security Life Separate Account L1
Statement of Operations (continued)
Year ended December 31, 2000
| Van Eck
|
| Total Van Eck
| Worldwide Hard Assets
| Worldwide Bond
| Worldwide Emerging Markets
| Worldwide Real Estate
|
| | | | | |
| Investment income | | | | | |
| Dividends from mutual funds | $ 59,217 | $ 25,149 | $20,595 | $ - | $ 13,473 |
| Less valuation period deductions | | | | | |
| (Note 2) | 59,822
| 17,641
| 5,005
| 31,191
| 5,985
|
| Net investment income (loss) | (605)
| 7,508
| 15,590
| (31,191)
| 7,488
|
| | | | | |
| Realized and unrealized gains | | | | | |
| (losses) on investments | | | | | |
| Net realized gains (losses) on | | | | | |
| investments | 220,229 | 140,202 | (14,783) | 87,666 | 7,144 |
| Net unrealized gains (losses) on | | | | | |
| investments | (2,223,947)
| 123,530
| 23,588
| (2,508,578)
| 137,513
|
| Net realized and unrealized gains | | | | | |
| (losses) on investments | (2,003,718)
| 263,732
| 8,805
| (2,420,912)
| 144,657
|
| | | | | |
| Net increase (decrease) in net assets | | | | | |
| resulting from operations | $(2,004,323)
| $271,240
| $24,395
| $(2,452,103)
| $152,145
|
See accompanying notes.
Strategic Investor 176
Security Life Separate Account L1
Statement of Operations (continued)
Year ended December 31, 2000
| AIM
|
| Total AIM
| Capital Appreciation
| Government Securities
|
| Investment income | | | |
| Dividends from mutual funds | $ 818,477 | $ 266,665 | $551,812 |
| Less valuation period deductions | | | |
| (Note 2) | 128,874
| 58,290
| 70,584
|
| Net investment income (loss) | 689,603
| 208,375
| 481,228
|
| | | |
| Realized and unrealized gains | | | |
| (losses) on investments | | | |
| Net realized gains (losses) on | | | |
| Investments | 475,369 | 418,127 | 57,242 |
| Net unrealized gains (losses) on | | | |
| Investments | (1,820,869)
| (2,171,530)
| 350,661
|
| Net realized and unrealized gains | | | |
| (losses) on investments | (1,345,500)
| (1,753,403)
| 407,903
|
| | | |
| Net increase (decrease) in net assets | | | |
| resulting from operations | $ (655,897)
| $(1,545,028)
| $889,131
|
See accompanying notes.
Strategic Investor 177
Security Life Separate Account L1
Statement of Operations (continued)
Year ended December 31, 2000
| GCG
|
| Total GCG
| Equity Income
| Growth
| Hard Assets
| Limited Maturity Bond
| Liquid Asset
| MidCap Growth
| Research
| Total Return
|
| Investment income | | | | | | | | | |
| Dividends from mutual funds | $916,460 | $ - | $ 90 | $ - | $54,281 | $861,303 | $ - | $ - | $786 |
| Less valuation period deductions (Note 2) | -
| -
| -
| -
| -
| -
| -
| -
| -
|
| | | | | | | | | |
| Net investment income (loss) | 916,460
| -
| 90
| -
| 54,281
| 861,303
| -
| -
| 786
|
| | | | | | | | | |
| Realized and unrealized gains (losses) on investments | | | | | | | | | |
| Net realized gains (losses) on investments | - | - | - | - | - | - | - | - | - |
| Net unrealized gains (losses) on investments | (46,004)
| -
| (168)
| -
| (45,286)
| -
| -
| -
| (550)
|
| Net realized and unrealized gains (losses) on investments | (46,004)
| -
| (168)
| -
| (45,286)
| -
| -
| -
| (550)
|
| | | | | | | | | |
| Net increase (decrease) in net assets resulting from operations | $870,456
| $ -
| $ (78)
| $ -
| $ 8,995
| $861,303
| $ -
| $ -
| $236
|
See accompanying notes.
Strategic Investor 178
Security Life Separate Account L1
Statement of Operations (continued)
Year ended December 31, 2000
| Janus
|
| Total Janus
| Growth
| Aggressive Growth
| Worldwide Growth
| International Growth
|
| Investment income | | | | | |
| Dividends from mutual funds | $ 893 | $ - | $ - | $ 83 | $ 810 |
| Less valuation period deductions | | | | | |
| (Note 2) | 758
| 180
| 218
| 147
| 213
|
| Net investment income (loss) | 135
| (180)
| (218)
| (64)
| 597
|
| | | | | |
| Realized and unrealized gains | | | | | |
| (losses) on investments | | | | | |
| Net realized gains (losses) on | | | | | |
| investments | (9,729) | (1,546) | (86) | (7,584) | (513) |
| Net unrealized gains (losses) on | | | | | |
| investments | (98,851)
| (15,107)
| (50,478)
| (16,753)
| (16,513)
|
| Net realized and unrealized gains | | | | | |
| (losses) on investments | (108,580)
| (16,653)
| (50,564)
| (24,337)
| (17,026)
|
| | | | | |
| Net increase (decrease) in net assets | | | | | |
| resulting from operations | $(108,445)
| $(16,833)
| $(50,782)
| $(24,401)
| $(16,429)
|
See accompanying notes.
Strategic Investor 179
Security Life Separate Account L1
Statement of Operations
Year ended December 31, 1999
| Total All Divisions
| Total NB
| Total Alger
| Total Fidelity
| Total INVESCO
| Total Van Eck
| Total AIM
|
| Investment income | | | | | | | |
| Dividends from mutual funds | $18,884,169 | $2,123,919 | $ 7,325,481 | $ 7,908,482 | $1,183,695 | $ 30,826 | $ 311,766 |
| Less valuation period deductions | | | | | | | |
| (Note 2) | 2,908,885
| 371,218
| 557,411
| 1,629,301
| 272,130
| 27,814
| 51,011
|
| Net investment income (loss) | 15,975,284
| 1,752,701
| 6,768,070
| 6,279,181
| 911,565
| 3,012
| 260,755
|
| | | | | | | |
| Realized and unrealized gains | | | | | | | |
| (losses) on investments | | | | | | | |
| Net realized gains (losses) on | | | | | | | |
| investments | 18,191,446 | 557,950 | 5,023,269 | 11,358,812 | 1,094,239 | 73,144 | 84,032 |
| Net unrealized gains (losses) on | | | | | | | |
| investments | 55,998,041
| 3,797,732
| 17,500,945
| 30,152,442
| 2,135,798
| 1,374,192
| 1,036,932
|
| Net realized and unrealized gains | | | | | | | |
| (losses) on investments | 74,189,487
| 4,355,682
| 22,524,214
| 41,511,254
| 3,230,037
| 1,447,336
| 1,120,964
|
| | | | | | | |
| Net increase (decrease) in net assets | | | | | | | |
| resulting from operations | $90,164,771
| $6,108,383
| $29,292,284
| $47,790,435
| $4,141,602
| $1,450,348
| $1,381,719
|
See accompanying notes.
Strategic Investor 180
Security Life Separate Account L1
Statement of Operations (continued)
Year ended December 31, 1999
| NB
|
| Total NB
| Limited Maturity Bond
| Growth
| Partners
|
| Investment income | | | | |
| Dividends from mutual funds | $2,123,919 | $911,596 | $ 453,085 | $ 759,238 |
| Less valuation period deductions | | | | |
| (Note 2) | 371,218
| 108,699
| 70,308
| 192,211
|
| Net investment income (loss) | 1,752,701
| 802,897
| 382,777
| 567,027
|
| | | | |
| Realized and unrealized gains | | | | |
| (losses) on investments | | | | |
| Net realized gains (losses) on | | | | |
| investments | 557,950 | (293,615) | 318,964 | 532,601 |
| Net unrealized gains (losses) on | | | | |
| investments | 3,797,732
| (423,477)
| 3,714,218
| 506,991
|
| Net realized and unrealized gains | | | | |
| (losses) on investments | 4,355,682
| (717,092)
| 4,033,182
| 1,039,592
|
| | | | |
| Net increase (decrease) in net assets | | | | |
| resulting from operations | $6,108,383
| $ 85,805
| $4,415,959
| $1,606,619
|
See accompanying notes.
Strategic Investor 181
Security Life Separate Account L1
Statement of Operations (continued)
Year ended December 31, 1999
| Alger
|
| Total Alger
| American Small Capitalization
| American MidCap Growth
| American Growth
| American Leveraged AllCap
|
| Investment income | | | | | |
| Dividends from mutual funds | $ 7,325,481 | $2,200,048 | $1,636,538 | $2,764,203 | $ 724,692 |
| Less valuation period deductions | | | | | |
| (Note 2) | 557,411
| 141,734
| 88,955
| 233,373
| 93,349
|
| Net investment income (loss) | 6,768,070
| 2,058,314
| 1,547,583
| 2,530,830
| 631,343
|
| | | | | |
| Realized and unrealized gains | | | | | |
| (losses) on investments | | | | | |
| Net realized gains (losses) on | | | | | |
| investments | 5,023,269 | 94,825 | 322,974 | 2,007,625 | 2,597,845 |
| Net unrealized gains (losses) on | | | | | |
| investments | 17,500,945
| 5,993,398
| 2,015,333
| 4,584,649
| 4,907,565
|
| Net realized and unrealized gains | | | | | |
| (losses) on investments | 22,524,214
| 6,088,223
| 2,338,307
| 6,592,274
| 7,505,410
|
| | | | | |
| Net increase (decrease) in net assets | | | | | |
| resulting from operations | $29,292,284
| $8,146,537
| $3,885,890
| $9,123,104
| $8,136,753
|
See accompanying notes.
Strategic Investor 182
Security Life Separate Account L1
Statement of Operations (continued)
Year ended December 31, 1999
| Fidelity
|
| Total Fidelity
| Asset Manager
| Growth
| Overseas
| Money Market
| Index 500
|
| Investment income | | | | | | |
| Dividends from mutual funds | $ 7,908,482 | $ 798,528 | $ 3,508,501 | $ 820,014 | $1,277,704 | $ 1,503,735 |
| Less valuation period deductions | | | | | | |
| (Note 2) | 1,629,301
| 83,646
| 308,868
| 188,207
| 188,211
| 860,369
|
| Net investment income (loss) | 6,279,181
| 714,882
| 3,199,633
| 631,807
| 1,089,493
| 643,366
|
| | | | | | |
| Realized and unrealized gains | | | | | | |
| (losses) on investments | | | | | | |
| Net realized gains (losses) on | | | | | | |
| investments | 11,358,812 | 122,474 | 7,459,882 | 553,230 | - | 3,223,226 |
| Net unrealized gains (losses) on | | | | | | |
| investments | 30,152,442
| 316,538
| 3,509,953
| 8,740,414
| -
| 17,585,537
|
| Net realized and unrealized gains | | | | | | |
| (losses) on investments | 41,511,254
| 439,012
| 10,969,835
| 9,293,644
| -
| 20,808,763
|
| | | | | | |
| Net increase (decrease) in net assets | | | | | | |
| resulting from operations | $47,790,435
| $1,153,894
| $14,169,468
| $9,925,451
| $1,089,493
| $21,452,129
|
See accompanying notes.
Strategic Investor 183
Security Life Separate Account L1
Statement of Operations (continued)
Year ended December 31, 1999
| INVESCO
|
| Total INVESCO
| Total Return
| Equity Income
| High Yield
| Utilities
| Small Company Growth
|
| Investment income | | | | | | |
| Dividends from mutual funds | $1,183,695 | $ 276,071 | $ 252,055 | $618,531 | $ 37,038 | $ - |
| Less valuation period deductions | | | | | | |
| (Note 2) | 272,130
| 71,255
| 97,430
| 65,338
| 23,769
| 14,338
|
| Net investment income (loss) | 911,565
| 204,816
| 154,625
| 553,193
| 13,269
| (14,338)
|
| | | | | | |
| Realized and unrealized gains | | | | | | |
| (losses) on investments | | | | | | |
| Net realized gains (losses) on | | | | | | |
| investments | 1,094,239 | 286,623 | 506,767 | (241,611) | 304,911 | 237,549 |
| Net unrealized gains (losses) on | | | | | | |
| investments | 2,135,798
| (923,083)
| 965,264
| 379,005
| 179,598
| 1,535,014
|
| Net realized and unrealized gains | | | | | | |
| (losses) on investments | 3,230,037
| (636,460)
| 1,472,031
| 137,394
| 484,509
| 1,772,563
|
| | | | | | |
| Net increase (decrease) in net assets | | | | | | |
| resulting from operations | $4,141,602
| $(431,644)
| $1,626,656
| $690,587
| $497,778
| $1,758,225
|
See accompanying notes.
Strategic Investor 184
Security Life Separate Account L1
Statement of Operations (continued)
Year ended December 31, 1999
| Van Eck
|
| Total Van Eck
| Worldwide Hard Assets
| Worldwide Bond
| Worldwide Emerging Markets
| Worldwide Real Estate
|
| Investment income | | | | | |
| Dividends from mutual funds | $ 30,826 | $ 16,585 | $ 12,446 | $ - | $ 1,795 |
| Less valuation period deductions | | | | | |
| (Note 2) | 27,814
| 12,646
| 2,550
| 10,886
| 1,732
|
| Net investment income (loss) | 3,012
| 3,939
| 9,896
| (10,886)
| 63
|
| | | | | |
| Realized and unrealized gains | | | | | |
| (losses) on investments | | | | | |
| Net realized gains (losses) on | | | | | |
| investments | 73,144 | (313,009) | (25,853) | 410,384 | 1,622 |
| Net unrealized gains (losses) on | | | | | |
| investments | 1,374,192
| 592,123
| (9,920)
| 809,962
| (17,973)
|
| Net realized and unrealized gains | | | | | |
| (losses) on investments | 1,447,336
| 279,114
| (35,773)
| 1,220,346
| (16,351)
|
| | | | | |
| Net increase (decrease) in net assets | | | | | |
| resulting from operations | $1,450,348
| $283,053
| $(25,877)
| $1,209,460
| $(16,288)
|
See accompanying notes.
Strategic Investor 185
Security Life Separate Account L1
Statement of Operations (continued)
Year ended December 31, 1999
| AIM
|
| Total AIM
| Capital Appreciation
| Government Securities
|
| Investment income | | | |
| Dividends from mutual funds | $ 311,766 | $ 113,467 | $198,299 |
| Less valuation period deductions | | | |
| (Note 2) | 51,011
| 19,289
| 31,722
|
| Net investment income (loss) | 260,755
| 94,178
| 166,577
|
| | | |
| Realized and unrealized gains | | | |
| (losses) on investments | | | |
| Net realized gains (losses) on | | | |
| investments | 84,032 | 92,256 | (8,224) |
| Net unrealized gains (losses) on | | | |
| investments | 1,036,932
| 1,257,369
| (220,437)
|
| Net realized and unrealized gains | | | |
| (losses) on investments | 1,120,964
| 1,349,625
| (228,661)
|
| | | |
| Net increase (decrease) in net assets | | | |
| resulting from operations | $1,381,719
| $1,443,803
| $ (62,084)
|
See accompanying notes.
Strategic Investor 186
Security Life Separate Account L1
Statement of Operations
Year ended December 31, 1998
| Total All Divisions
| Total NB
| Total Alger
| Total Fidelity
| Total INVESCO
| Total Van Eck
| Total AIM
|
| Investment income | | | | | | | |
| Dividends from mutual funds | $17,747,833 | $4,273,690 | $ 4,617,072 | $ 6,943,854 | $1,625,860 | $ 189,620 | $ 97,737 |
| Less valuation period deductions | | | | | | | |
| (Note 2) | 1,740,661
| 291,487
| 290,412
| 971,160
| 162,321
| 11,393
| 13,888
|
| Net investment income (loss) | 16,007,172
| 3,982,203
| 4,326,660
| 5,972,694
| 1,463,539
| 178,227
| 83,849
|
| | | | | | | |
| Realized and unrealized gains | | | | | | | |
| (losses) on investments | | | | | | | |
| Net realized gains (losses) on | | | | | | | |
| investments | 8,536,274 | 347,823 | 1,685,294 | 6,403,348 | 355,780 | (260,570) | 4,599 |
| Net unrealized gains (losses) on | | | | | | | |
| investments | 18,766,977
| (2,323,636)
| 5,825,800
| 15,230,082
| 248,681
| (368,037)
| 154,087
|
| Net realized and unrealized gains | | | | | | | |
| (losses) on investments | 27,303,251
| (1,975,813)
| 7,511,094
| 21,633,430
| 604,461
| (628,607)
| 158,686
|
| | | | | | | |
| Net increase (decrease) in net | | | | | | | |
| assets resulting from operations | $43,310,423
| $2,006,390
| $11,837,754
| $27,606,124
| $2,068,000
| $(450,380)
| $242,535
|
See accompanying notes.
Strategic Investor 187
Security Life Separate Account L1
Statement of Operations (continued)
Year ended December 31, 1998
| NB
|
| Total NB
| Limited Maturity Bond
| Growth
| Government Income
| Partners
|
| Investment income | | | | | |
| Dividends from mutual funds | $4,273,690 | $409,268 | $1,579,109 | $136,565 | $2,148,748 |
| Less valuation period deductions | | | | | |
| (Note 2) | 291,487
| 87,183
| 52,660
| 3,213
| 148,431
|
| Net investment income (loss) | 3,982,203
| 322,085
| 1,526,449
| 133,352
| 2,000,317
|
| | | | | |
| Realized and unrealized gains | | | | | |
| (losses) on investments | | | | | |
| Net realized gains (losses) on | | | | | |
| investments | 347,823 | 10,003 | (264,148) | (53,894) | 655,862 |
| Net unrealized gains (losses) on | | | | | |
| investments | (2,323,636)
| 59,369
| (81,576)
| (60,954)
| (2,240,475)
|
| Net realized and unrealized gains | | | | | |
| (losses) on investments | (1,975,813)
| 69,372
| (345,724)
| (114,848)
| (1,584,613)
|
| | | | | |
| Net increase (decrease) in net | | | | | |
| assets resulting from operations | $2,006,390
| $391,457
| $1,180,725
| $ 18,504
| $ 415,704
|
See accompanying notes.
Strategic Investor 188
Security Life Separate Account L1
Statement of Operations (continued)
Year ended December 31, 1998
| Alger
|
| Total Alger
| American Small Capitalization
| American MidCap Growth
| American Growth
| American Leveraged AllCap
|
| Investment income | | | | | |
| Dividends from mutual funds | $ 4,617,072 | $1,681,373 | $ 593,045 | $2,196,712 | $ 145,942 |
| Less valuation period deductions | | | | | |
| (Note 2) | 290,412
| 95,588
| 53,316
| 113,376
| 28,132
|
| Net investment income (loss) | 4,326,660
| 1,585,785
| 539,729
| 2,083,336
| 117,810
|
| | | | | |
| Realized and unrealized gains | | | | | |
| (losses) on investments | | | | | |
| Net realized gains (losses) on | | | | | |
| investments | 1,685,294 | 186,963 | 316,932 | 915,872 | 265,527 |
| Net unrealized gains (losses) on | | | | | |
| investments | 5,825,800
| 166,990
| 1,022,340
| 3,099,428
| 1,537,042
|
| Net realized and unrealized gains | | | | | |
| (losses) on investments | 7,511,094
| 353,953
| 1,339,272
| 4,015,300
| 1,802,569
|
| | | | | |
| Net increase (decrease) in net | | | | | |
| assets resulting from operations | $11,837,754
| $1,939,738
| $1,879,001
| $6,098,636
| $1,920,379
|
See accompanying notes.
Strategic Investor 189
Security Life Separate Account L1
Statement of Operations (continued)
Year ended December 31, 1998
| Fidelity
|
| Total Fidelity
| Asset Manager
| Growth
| Overseas
| Money Market
| Index 500
|
| Investment income | | | | | | |
| Dividends from mutual funds | $ 6,943,854 | $ 808,986 | $2,663,618 | $1,015,626 | $830,137 | $ 1,625,487 |
| Less valuation period deductions | | | | | | |
| (Note 2) | 971,160
| 63,669
| 183,002
| 129,504
| 116,932
| 478,053
|
| Net investment income (loss) | 5,972,694
| 745,317
| 2,480,616
| 886,122
| 713,205
| 1,147,434
|
| | | | | | |
| Realized and unrealized gains | | | | | | |
| (losses) on investments | | | | | | |
| Net realized gains (losses) on | | | | | | |
| investments | 6,403,348 | 20,247 | 1,534,000 | 298,379 | - | 4,550,722 |
| Net unrealized gains (losses) on | | | | | | |
| investments | 15,230,082
| 315,702
| 4,444,805
| 707,398
| -
| 9,762,177
|
| Net realized and unrealized gains | | | | | | |
| (losses) on investments | 21,633,430
| 335,949
| 5,978,805
| 1,005,777
| -
| 14,312,899
|
| | | | | | |
| Net increase (decrease) in net | | | | | | |
| assets resulting from operations | $27,606,124
| $1,081,266
| $8,459,421
| $1,891,899
| $713,205
| $15,460,333
|
See accompanying notes.
Strategic Investor 190
Security Life Separate Account L1
Statement of Operations (continued)
Year ended December 31, 1998
| INVESCO
|
| Total INVESCO
| Total Return
| Equity Income
| High Yield
| Utilities
| Small Company Growth
|
| Investment income | | | | | | |
| Dividends from mutual funds | $1,625,860 | $312,534 | $ 514,174 | $769,805 | $ 29,058 | $ 289 |
| Less valuation period deductions | | | | | | |
| (Note 2) | 162,321
| 40,898
| 60,678
| 49,140
| 10,730
| 875
|
| Net investment income (loss) | 1,463,539
| 271,636
| 453,496
| 720,665
| 18,328
| (586)
|
| | | | | | |
| Realized and unrealized gains | | | | | | |
| (losses) on investments | | | | | | |
| Net realized gains (losses) on | | | | | | |
| investments | 355,780 | 136,473 | 342,342 | (151,382) | 35,245 | (6,898) |
| Net unrealized gains (losses) on | | | | | | |
| investments | 248,681
| 73,689
| 359,519
| (541,125)
| 282,500
| 74,098
|
| Net realized and unrealized gains | | | | | | |
| (losses) on investments | 604,461
| 210,162
| 701,861
| (692,507)
| 317,745
| 67,200
|
| | | | | | |
| Net increase (decrease) in net | | | | | | |
| assets resulting from operations | $2,068,000
| $481,798
| $1,155,357
| $ 28,158
| $336,073
| $66,614
|
See accompanying notes.
Strategic Investor 191
Security Life Separate Account L1
Statement of Operations (continued)
Year ended December 31, 1998
| Van Eck
|
| Total Van Eck
| Worldwide Balanced
| Worldwide Hard Assets
| Worldwide Bond
| Worldwide Emerging Markets
| Worldwide Real Estate
|
| Investment income | | | | | | |
| Dividends from mutual funds | $ 189,620 | $45,674 | $ 143,946 | $ - | $ - | $ - |
Less valuation period deductions
(Note 2)
| 11,393
| 1,050
| 8,170
| 212
| 1,736
| 225
|
Net investment income (loss)
| 178,227
| 44,624
| 135,776
| (212)
| (1,736)
| (225)
|
| | | | | | |
| Realized and unrealized gains (losses) on investments | | | | | | |
| Net realized gains (losses) on investments | (260,570) | 4,682 | (162,110) | 130 | (101,436) | (1,836) |
Net unrealized gains (losses) on investments
| (368,037)
| (23,403)
| (395,698)
| 3,953
| 47,140
| (29)
|
Net realized and unrealized gains (losses) on investments
| (628,607)
| (18,721)
| (557,808)
| 4,083
| (54,296)
| (1,865)
|
| | | | | | |
Net increase (decrease) in net assets resulting from operations
| $(450,380)
| $25,903
| $(422,032)
| $3,871
| $ (56,032)
| $(2,090)
|
See accompanying notes.
Strategic Investor 192
Security Life Separate Account L1
Statement of Operations (continued)
Year ended December 31, 1998
| AIM
|
| Total AIM
| Capital Appreciation
| Government Securities
|
| Investment income | | | |
| Dividends from mutual funds | $ 97,737 | $ 27,109 | $ 70,628 |
| Less valuation period deductions | | | |
| (Note 2) | 13,888
| 3,056
| 10,832
|
| Net investment income (loss) | 83,849
| 24,053
| 59,796
|
| | | |
| Realized and unrealized gains | | | |
| (losses) on investments | | | |
| Net realized gains (losses) on | | | |
| investments | 4,599 | (3,315) | 7,914 |
| Net unrealized gains (losses) on | | | |
| investments | 154,087
| 119,225
| 34,862
|
| Net realized and unrealized gains | | | |
| (losses) on investments | 158,686
| 115,910
| 42,776
|
| | | |
| Net increase (decrease) in net | | | |
| assets resulting from operations | $242,535
| $139,963
| $102,572
|
See accompanying notes.
Strategic Investor 193
Security Life Separate Account L1
Statement of Changes in Net Assets
Year ended December 31, 2000
| Total All Divisions
| Total NB
| Total Alger
| Total Fidelity
| Total INVESCO
| Total Van Eck
| Total AIM
| Total GCG
| Total Janus
|
| Increase (decrease) in net assets | | | | | | | | | |
| | | | | | | | | |
| Operations | | | | | | | | | |
| Net investment income (loss) | $ 46,069,012 | $ 6,571,113 | $ 20,602,600 | $ 14,207,376 | $ 3,082,330 | $ (605) | $ 689,603 | $ 916,460 | $ 135 |
| Net realized gains (losses) on | | | | | | | | | |
| investments | 5,695,914 | (1,808,706) | (5,036,278) | 10,515,603 | 1,339,426 | 220,229 | 475,369 | - | (9,729) |
| Net unrealized gains (losses) on | | | | | | | | | |
| investments | (118,856,269)
| (7,325,351)
| (40,865,515)
| (58,774,602)
| (7,701,130)
| (2,223,947)
| (1,820,869)
| (46,004)
| (98,851)
|
| Increase (decrease) in net assets from | | | | | | | | | |
| operations | (67,091,343)
| (2,562,944)
| (25,299,193)
| (34,051,623)
| (3,279,374)
| (2,004,323)
| (655,897)
| 870,456
| (108,445)
|
| | | | | | | | | |
| Changes from principal | | | | | | | | | |
| transactions | | | | | | | | | |
| Net premiums | 317,402,712 | 12,252,726 | 37,515,640 | 184,341,968 | 18,591,825 | 3,290,844 | 6,971,977 | 53,982,127 | 455,605 |
| Cost of insurance and | | | | | | | | | |
| administrative charges | (30,552,382) | (2,409,367) | (6,276,189) | (16,796,166) | (3,114,778) | (384,336) | (861,571) | (702,322) | (7,653) |
| Benefit payments | (1,594,522) | (19,938) | (28,371) | (1,534,182) | (12,031) | - | - | - | - |
| Surrenders | (21,566,997) | (3,720,641) | (4,011,887) | (11,413,075) | (1,965,457) | (86,249) | (369,688) | - | - |
| Net transfers among divisions | | | | | | | | | |
| (including the loan division and | | | | | | | | | |
| guaranteed interest division in | | | | | | | | | |
| the general account) | (7,189,963) | 4,582,877 | 21,813,159 | (44,990,539) | 8,412,713 | 2,032,846 | 51,053,800 | (51,255,284) | 1,160,465 |
| Other | 478,335
| 175,141
| 731,362
| 535,825
| 115,805
| (33,873)
| (1,039,302)
| (14,911)
| 8,288
|
| Increase (decrease) from principal | | | | | | | | | |
| transactions | 256,977,183
| 10,860,798
| 49,743,714
| 110,143,831
| 22,028,077
| 4,819,232
| 55,755,216
| 2,009,610
| 1,616,705
|
| | | | | | | | | |
| Total increase (decrease) in net assets | 189,885,840 | 8,297,854 | 24,444,521 | 76,092,208 | 18,748,703 | 2,814,909 | 55,099,319 | 2,880,066 | 1,508,260 |
| | | | | | | | | |
| Net assets at beginning of year | 521,302,968
| 53,696,982
| 109,514,400
| 294,445,743
| 44,638,411
| 6,304,177
| 12,703,255
| -
| -
|
| | | | | | | | | |
| Net assets at end of year | $711,188,808
| $61,994,836
| $133,958,921
| $370,537,951
| $63,387,114
| $9,119,086
| $67,802,574
| $ 2,880,066
| $1,508,260
|
See accompanying notes.
Strategic Investor 194
Security Life Separate Account L1
Statement of Changes in Net Assets (continued)
Year ended December 31, 2000
| NB
|
| Total NB
| Limited Maturity Bond
| Growth
| Partners
|
| Increase (decrease) in net assets | | | | |
| | | | |
| Operations | | | | |
| Net investment income (loss) | $ 6,571,113 | $ 682,857 | $ 1,217,637 | $ 4,670,619 |
| Net realized gains (losses) on | | | | |
| investments | (1,808,706) | (281,540) | 3,777,374 | (5,304,540) |
| Net unrealized gains (losses) on | | | | |
| investments | (7,325,351)
| 351,484
| (7,971,190)
| 294,355
|
| Increase (decrease) in net assets from | | | | |
| operations | (2,562,944)
| 752,801
| (2,976,179)
| (339,566)
|
| | | | |
| Changes from principal | | | | |
| transactions | | | | |
| Net premiums | 12,252,726 | 3,373,191 | 3,809,287 | 5,070,248 |
| Cost of insurance and | | | | |
| administrative charges | (2,409,367) | (422,495) | (645,717) | (1,341,155) |
| Benefit payments | (19,938) | - | - | (19,938) |
| Surrenders | (3,720,641) | (485,003) | (434,853) | (2,800,785) |
| Net transfers among divisions | | | | |
| (including the loan division and | | | | |
| guaranteed interest division in | | | | |
| the general account) | 4,582,877 | 72,092 | 7,083,628 | (2,572,843) |
| Other | 175,141
| 2,737
| 32,586
| 139,818
|
| Increase (decrease) from principal | | | | |
| transactions | 10,860,798
| 2,540,522
| 9,844,931
| (1,524,655)
|
| | | | |
| Total increase (decrease) in net assets | 8,297,854 | 3,293,323 | 6,868,752 | (1,864,221) |
| | | | |
| Net assets at beginning of year | 53,696,982
| 11,200,828
| 13,076,154
| 29,420,000
|
| | | | |
| Net assets at end of year | $61,994,836
| $14,494,151
| $19,944,906
| $27,555,779
|
See accompanying notes.
Strategic Investor 195
Security Life Separate Account L1
Statement of Changes in Net Assets (continued)
Year ended December 31, 2000
| Alger
|
| Total Alger
| American Small Capitalization
| American MidCap Growth
| American Growth
| American Leveraged AllCap
|
| Increase (decrease) in net assets | | | | | |
| | | | | |
| Operations | | | | | |
| Net investment income (loss) | $ 20,602,600 | $ 9,719,584 | $ 2,741,533 | $ 5,883,133 | $ 2,258,350 |
| Net realized gains (losses) on | | | | | |
| investments | (5,036,278) | (9,976,931) | 1,057,836 | 1,775,571 | 2,107,246 |
| Net unrealized gains (losses) on | | | | | |
| investments | (40,865,515)
| (9,435,613)
| (2,672,195)
| (16,304,212)
| (12,453,495)
|
| Increase (decrease) in net assets from | | | | | |
| operations | (25,299,193)
| (9,692,960)
| 1,127,174
| (8,645,508)
| (8,087,899)
|
| | | | | |
| Changes from principal | | | | | |
| transactions | | | | | |
| Net premiums | 37,515,640 | 6,777,077 | 8,256,914 | 14,199,181 | 8,282,468 |
| Cost of insurance and | | | | | |
| administrative charges | (6,276,189) | (1,361,117) | (1,182,610) | (2,244,564) | (1,487,898) |
| Benefit payments | (28,371) | (8,499) | - | - | (19,872) |
| Surrenders | (4,011,887) | (1,213,521) | (527,415) | (1,866,225) | (404,726) |
| Net transfers among divisions | | | | | |
| (including the loan division and | | | | | |
| guaranteed interest division in | | | | | |
| the general account) | 21,813,159 | 3,623,099 | 8,242,898 | 7,157,011 | 2,790,151 |
| Other | 731,362
| 265,296
| 89,303
| 135,039
| 241,724
|
| Increase (decrease) from principal | | | | | |
| transactions | 49,743,714
| 8,082,335
| 14,879,090
| 17,380,442
| 9,401,847
|
| | | | | |
| Total increase (decrease) in net assets | 24,444,521 | (1,610,625) | 16,006,264 | 8,734,934 | 1,313,948 |
| | | | | |
| Net assets at beginning of year | 109,514,400
| 27,779,755
| 17,287,487
| 41,383,498
| 23,063,660
|
| | | | | |
| Net assets at end of year | $133,958,921
| $26,169,130
| $33,293,751
| $50,118,432
| $24,377,608
|
See accompanying notes.
Strategic Investor 196
Security Life Separate Account L1
Statement of Changes in Net Assets (continued)
Year ended December 31, 2000
| Fidelity
|
| Total Fidelity
| Asset Manager
| Growth
| Overseas
| Money Market
| Index 500
|
| Increase (decrease) in net assets | | | | | | |
| | | | | | |
| Operations | | | | | | |
| Net investment income (loss) | $ 14,207,376 | $ 1,363,966 | $ 6,180,846 | $ 3,215,373 | $ 2,457,580 | $ 989,611 |
| Net realized gains (losses) on | | | | | | |
| investments | 10,515,603 | 8,816 | 2,581,814 | 1,800,478 | - | 6,124,495 |
| Net unrealized gains (losses) on | | | | | | |
| investments | (58,774,602)
| (2,092,103)
| (17,925,268)
| (13,999,080)
| -
| (24,758,151)
|
| Increase (decrease) in net assets from | | | | | | |
| operations | (34,051,623)
| (719,321)
| (9,162,608)
| (8,983,229)
| 2,457,580
| (17,644,045)
|
| | | | | | |
| Changes from principal | | | | | | |
| transactions | | | | | | |
| Net premiums | 184,341,968 | 4,246,313 | 16,858,828 | 10,774,262 | 102,634,205 | 49,828,360 |
| Cost of insurance and | | | | | | |
| administrative charges | (16,796,166) | (729,175) | (2,871,811) | (1,545,175) | (3,421,123) | (8,228,882) |
| Benefit payments | (1,534,182) | - | (8,585) | - | (1,512,600) | (12,997) |
| Surrenders | (11,413,075) | (523,096) | (1,526,139) | (1,310,651) | (1,580,652) | (6,472,537) |
| Net transfers among divisions | | | | | | |
| (including the loan division and | | | | | | |
| guaranteed interest division in | | | | | | |
| the general account) | (44,990,539) | (110,602) | 6,705,250 | 9,264,961 | (71,323,681) | 10,473,533 |
| Other | 535,825
| 41
| 353,438
| 137,428
| (36,325)
| 81,243
|
| Increase (decrease) from principal | | | | | | |
| transactions | 110,143,831
| 2,883,481
| 19,510,981
| 17,320,825
| 24,759,824
| 45,668,720
|
| | | | | | |
| Total increase (decrease) in net assets | 76,092,208 | 2,164,160 | 10,348,373 | 8,337,596 | 27,217,404 | 28,024,675 |
| | | | | | |
| Net assets at beginning of year | 294,445,743
| 13,590,458
| 58,157,830
| 34,984,281
| 34,797,408
| 152,915,766
|
| | | | | | |
| Net assets at end of year | $370,537,951
| $15,754,618
| $68,506,203
| $43,321,877
| $ 62,014,812
| $180,940,441
|
See accompanying notes.
Strategic Investor 197
Security Life Separate Account L1
Statement of Changes in Net Assets (continued)
Year ended December 31, 2000
| INVESCO
|
| Total INVESCO
| Total Return
| Equity Income
| High Yield
| Utilities
| Small Company Growth
|
| Increase (decrease) in net assets | | | | | | |
| | | | | | |
| Operations | | | | | | |
| Net investment income (loss) | $ 3,082,330 | $ 1,460,583 | $ 1,047,730 | $ 18,429 | $ 280,099 | $ 275,489 |
| Net realized gains (losses) on | | | | | | |
| investments | 1,339,426 | (314,414) | 593,634 | (390,743) | 256,021 | 1,194,928 |
| Net unrealized gains (losses) on | | | | | | |
| investments | (7,701,130)
| (1,435,710)
| (904,246)
| (1,002,431)
| (372,493)
| (3,986,250)
|
| Increase (decrease) in net assets from | | | | | | |
| operations | (3,279,374)
| (289,541)
| 737,118
| (1,374,745)
| 163,627
| (2,515,833)
|
| | | | | | |
| Changes from principal | | | | | | |
| transactions | | | | | | |
| Net premiums | 18,591,825 | 4,101,918 | 5,744,367 | 2,639,161 | 2,052,375 | 4,054,004 |
| Cost of insurance and | | | | | | |
| administrative charges | (3,114,778) | (753,096) | (1,128,125) | (507,500) | (326,968) | (399,089) |
| Benefit payments | (12,031) | - | (12,031) | - | - | - |
| Surrenders | (1,965,457) | (882,070) | (593,452) | (303,992) | (148,234) | (37,709) |
| Net transfers among divisions | | | | | | |
| (including the loan division and | | | | | | |
| guaranteed interest division in | | | | | | |
| the general account) | 8,412,713 | (858,136) | 588,741 | 584,364 | 1,906,098 | 6,191,646 |
| Other | 115,805
| (11,094)
| (21,075)
| 38,387
| 23,719
| 85,868
|
| Increase (decrease) from principal | | | | | | |
| transactions | 22,028,077
| 1,597,522
| 4,578,425
| 2,450,420
| 3,506,990
| 9,894,720
|
| | | | | | |
| Total increase (decrease) in net assets | 18,748,703 | 1,307,981 | 5,315,543 | 1,075,675 | 3,670,617 | 7,378,887 |
| | | | | | |
| Net assets at beginning of year | 44,638,411
| 10,386,650
| 16,220,553
| 9,420,677
| 4,141,315
| 4,469,216
|
| | | | | | |
| Net assets at end of year | $63,387,114
| $11,694,631
| $21,536,096
| $10,496,352
| $7,811,932
| $11,848,103
|
See accompanying notes.
Strategic Investor 198
Security Life Separate Account L1
Statement of Changes in Net Assets (continued)
Year ended December 31, 2000
| Van Eck
|
| Total Van Eck
| Worldwide Hard Assets
| Worldwide Bond
| Worldwide Emerging Markets
| Worldwide Real Estate
|
| Increase (decrease) in net assets | | | | | |
| | | | | |
| Operations | | | | | |
| Net investment income (loss) | $ (605) | $ 7,508 | $ 15,590 | $ (31,191) | $ 7,488 |
| Net realized gains (losses) on | | | | | |
| investments | 220,229 | 140,202 | (14,783) | 87,666 | 7,144 |
| Net unrealized gains (losses) on | | | | | |
| investments | (2,223,947)
| 123,530
| 23,588
| (2,508,578)
| 137,513
|
| Increase (decrease) in net assets from | | | | | |
| operations | (2,004,323)
| 271,240
| 24,395
| (2,452,103)
| 152,145
|
| | | | | |
| Changes from principal | | | | | |
| transactions | | | | | |
| Net premiums | 3,290,844 | 358,451 | 329,600 | 2,190,959 | 411,834 |
| Cost of insurance and | | | | | |
| administrative charges | (384,336) | (106,083) | (44,145) | (190,748) | (43,360) |
| Benefit payments | - | - | - | - | - |
| Surrenders | (86,249) | (36,625) | (12,576) | (35,659) | (1,389) |
| Net transfers among divisions | | | | | |
| (including the loan division and | | | | | |
| guaranteed interest division in | | | | | |
| the general account) | 2,032,846 | (475,702) | 298,840 | 1,965,172 | 244,536 |
| Other | (33,873)
| (4,008)
| 1,110
| (29,680)
| (1,295)
|
| Increase (decrease) from principal | | | | | |
| transactions | 4,819,232
| (263,967)
| 572,829
| 3,900,044
| 610,326
|
| | | | | |
| Total increase (decrease) in net assets | 2,814,909 | 7,273 | 597,224 | 1,447,941 | 762,471 |
| | | | | |
| Net assets at beginning of year | 6,304,177
| 2,306,078
| 334,203
| 3,114,059
| 549,837
|
| | | | | |
| Net assets at end of year | $9,119,086
| $2,313,351
| $931,427
| $4,562,000
| $1,312,308
|
See accompanying notes.
Strategic Investor 199
Security Life Separate Account L1
Statement of Changes in Net Assets (continued)
Year ended December 31, 2000
| AIM
|
| Total AIM
| Capital Appreciation
| Government Securities
|
| Increase (decrease) in net assets | | | |
| | | |
| Operations | | | |
| Net investment income (loss) | $ 689,603 | $ 208,375 | $ 481,228 |
| Net realized gains (losses) on | | | |
| investments | 475,369 | 418,127 | 57,242 |
| Net unrealized gains (losses) on | | | |
| investments | (1,820,869)
| (2,171,530)
| 350,661
|
| Increase (decrease) in net assets from | | | |
| operations | (655,897)
| (1,545,028)
| 889,131
|
| | | |
| Changes from principal | | | |
| transactions | | | |
| Net premiums | 6,971,977 | 4,809,190 | 2,162,787 |
| Cost of insurance and | | | |
| administrative charges | (861,571) | (550,172) | (311,399) |
| Benefit payments | - | - | - |
| Surrenders | (369,688) | (120,337) | (249,351) |
| Net transfers among divisions | | | |
| (including the loan division and | | | |
| guaranteed interest division in | | | |
| the general account) | 51,053,800 | 44,182,854 | 6,870,946 |
| Other | (1,039,302)
| (1,046,753)
| 7,451
|
| Increase (decrease) from principal | | | |
| transactions | 55,755,216
| 47,274,782
| 8,480,434
|
| | | |
| Total increase (decrease) in net assets | 55,099,319 | 45,729,754 | 9,369,565 |
| | | |
| Net assets at beginning of year | 12,703,255
| 5,308,922
| 7,394,333
|
| | | |
| Net assets at end of year | $67,802,574
| $51,038,676
| $16,763,898
|
See accompanying notes.
Strategic Investor 200
Security Life Separate Account L1
Statement of Changes in Net Assets (continued)
Year ended December 31, 2000
| GCG
|
| Total GCG
| Equity Income
| Growth
| Hard Assets
| Limited Maturity Bond
| Liquid Asset
| MidCap Growth
| Research
| Total Return
|
| Increase (decrease) in net assets | | | | | | | | | |
| | | | | | | | | |
| Operations | | | | | | | | | |
| Net investment income (loss) | $ 916,460 | $ - | $ 90 | $ - | $ 54,281 | $ 861,303 | $ - | $ - | $ 786 |
| Net realized gains (losses) on | | | | | | | | | |
| investments | - | - | - | - | - | - | - | - | - |
| Net unrealized gains (losses) on | | | | | | | | | |
| investments | (46,004)
| -
| (168)
| -
| (45,286)
| -
| -
| -
| (550)
|
| Increase (decrease) in net assets from | | | | | | | | | |
| operations | 870,456
| -
| (78)
| -
| 8,995
| 861,303
| -
| -
| 236
|
| | | | | | | | | |
| Changes from principal | | | | | | | | | |
| transactions | | | | | | | | | |
| Net premiums | 53,982,127 | - | - | - | 868,271 | 53,113,856 | - | - | - |
| Cost of insurance and | | | | | | | | | |
| administrative charges | (702,322) | - | - | - | (3,837) | (698,485) | - | - | - |
| Benefit payments | - | | | | | | | | |
| Surrenders | - | - | - | - | - | - | - | - | - |
| Net transfers among divisions | | | | | | | | | |
| (including the loan division and | | | | | | | | | |
| guaranteed interest division in | | | | | | | | | |
| the general account) | (51,255,284) | - | 1,311 | - | 3,369 | (51,270,261) | - | - | 10,297 |
| Other | (14,911)
| -
| -
| -
| -
| (14,911)
| -
| -
| -
|
| Increase (decrease) from principal | | | | | | | | | |
| transactions | 2,009,610
| -
| 1,311
| -
| 867,803
| 1,130,199
| -
| -
| 10,297
|
| | | | | | | | | |
| Total increase (decrease) in net assets | 2,880,066 | - | 1,233 | - | 876,798 | 1,991,502 | - | - | 10,533 |
| | | | | | | | | |
| Net assets at beginning of year | -
| -
| -
| -
| -
| -
| -
| -
| -
|
| | | | | | | | | |
| Net assets at end of year | $ 2,880,066
| $ -
| $1,233
| $ -
| $876,798
| $ 1,991,502
| $ -
| $ -
| $10,533
|
See accompanying notes.
Strategic Investor 201
Security Life Separate Account L1
Statement of Changes in Net Assets (continued)
Year ended December 31, 2000
| Janus
|
| Total Janus
| Growth
| Aggressive Growth
| Worldwide Growth
| International Growth
|
| Increase (decrease) in net assets | | | | | |
| | | | | |
| Operations | | | | | |
| Net investment income (loss) | $ 135 | $ (180) | $ (218) | $ (64) | $ 597 |
| Net realized gains (losses) on investments | (9,729) | (1,546) | (86) | (7,584) | (513) |
| Net unrealized gains (losses) on investments | (98,851)
| (15,107)
| (50,478)
| (16,753)
| (16,513)
|
| Increase (decrease) in net assets from operations | (108,445)
| (16,833)
| (50,782)
| (24,401)
| (16,429)
|
| | | | | |
| Changes from principal transactions | | | | | |
| Net premiums | 455,605 | 44,231 | 197,569 | 202,866 | 10,939 |
| Cost of insurance and administrative expenses | (7,653) | (1,752) | (2,059) | (1,621) | (2,221) |
| Benefit payments | - | - | - | - | - |
| Surrenders | - | - | - | - | - |
Net transfers among divisions (including the loan
division and guaranteed interest division in the general account) | 1,160,465 | 216,576 | 370,746 | 142,784 | 430,359 |
| Other | 8,288
| 1,419
| 9,109
| (208)
| (2,032)
|
| Increase (decrease) from principal transactions | 1,616,705
| 260,474
| 575,365
| 343,821
| 437,045
|
| | | | | |
| Total increase (decrease) in net assets | 1,508,260 | 243,641 | 524,583 | 319,420 | 420,616 |
| | | | | |
| Net assets at beginning of year | -
| -
| -
| -
| -
|
| | | | | |
| Net assets at end of year | $1,508,260
| $243,641
| $524,583
| $319,420
| $420,616
|
See accompanying notes.
Strategic Investor 202
Security Life Separate Account L1
Statement of Changes in Net Assets
Year ended December 31, 1999
| Total All Divisions
| Total NB
| Total Alger
| Total Fidelity
| Total INVESCO
| Total Van Eck
| Total AIM
|
| Increase (decrease) in net assets | | | | | | | |
| | | | | | | |
| Operations | | | | | | | |
| Net investment income (loss) | $ 15,975,284 | $ 1,752,701 | $ 6,768,070 | $ 6,279,181 | $ 911,565 | $ 3,012 | $ 260,755 |
| Net realized gains (losses) on | | | | | | | |
| investments | 18,191,446 | 557,950 | 5,023,269 | 11,358,812 | 1,094,239 | 73,144 | 84,032 |
| Net unrealized gains (losses) on | | | | | | | |
| investments | 55,998,041
| 3,797,732
| 17,500,945
| 30,152,442
| 2,135,798
| 1,374,192
| 1,036,932
|
| Increase (decrease) in net assets from | | | | | | | |
| operations | 90,164,771
| 6,108,383
| 29,292,284
| 47,790,435
| 4,141,602
| 1,450,348
| 1,381,719
|
| | | | | | | |
| Changes from principal | | | | | | | |
| transactions | | | | | | | |
| Net premiums | 162,042,407 | 9,691,552 | 19,246,531 | 115,810,413 | 12,770,723 | 1,311,620 | 3,211,568 |
| Cost of insurance and | | | | | | | |
| administrative charges | (20,649,015) | (2,172,531) | (3,837,369) | (11,622,709) | (2,460,819) | (173,456) | (382,131) |
| Benefit payments | (542,037) | - | - | (542,037) | - | - | - |
| Surrenders | (15,066,657) | (1,529,928) | (3,447,763) | (7,887,081) | (1,567,128) | (33,331) | (601,426) |
| Net transfers among divisions | | | | | | | |
| (including the loan division and | | | | | | | |
| guaranteed interest division in | | | | | | | |
| the general account) | 91,435 | (5,513,893) | 13,797,533 | (17,535,989) | 2,140,348 | 1,919,235 | 5,284,201 |
| Other | 231,958
| 45,648
| 34,663
| 146,782
| (17,068)
| 12,762
| 9,171
|
| Increase (decrease) from principal | | | | | | | |
| transactions | 126,108,091
| 520,848
| 25,793,595
| 78,369,379
| 10,866,056
| 3,036,830
| 7,521,383
|
| | | | | | | |
| Total increase (decrease) in net assets | 216,272,862 | 6,629,231 | 55,085,879 | 126,159,814 | 15,007,658 | 4,487,178 | 8,903,102 |
| | | | | | | |
| Net assets at beginning of year | 305,030,106
| 47,067,751
| 54,428,521
| 168,285,929
| 29,630,753
| 1,816,999
| 3,800,153
|
| | | | | | | |
| Net assets at end of year | $521,302,968
| $53,696,982
| $109,514,400
| $294,445,743
| $44,638,411
| $6,304,177
| $12,703,255
|
See accompanying notes.
Strategic Investor 203
Security Life Separate Account L1
Statement of Changes in Net Assets (continued)
Year ended December 31, 1999
| NB
|
| Total NB
| Limited Maturity Bond
| Growth
| Partners
|
| Increase (decrease) in net assets | | | | |
| | | | |
| Operations | | | | |
| Net investment income (loss) | $ 1,752,701 | $ 802,897 | $ 382,777 | $ 567,027 |
| Net realized gains (losses) on | | | | |
| investments | 557,950 | (293,615) | 318,964 | 532,601 |
| Net unrealized gains (losses) on | | | | |
| investments | 3,797,732
| (423,477)
| 3,714,218
| 506,991
|
| Increase (decrease) in net assets from | | | | |
| operations | 6,108,383
| 85,805
| 4,415,959
| 1,606,619
|
| | | | |
| Changes from principal | | | | |
| transactions | | | | |
| Net premiums | 9,691,552 | 2,691,658 | 1,968,259 | 5,031,635 |
| Cost of insurance and | | | | |
| administrative charges | (2,172,531) | (532,487) | (382,030) | (1,258,014) |
| Benefit payments | - | - | - | - |
| Surrenders | (1,529,928) | (1,033,731) | (175,255) | (320,942) |
| Net transfers among divisions | | | | |
| (including the loan division and | | | | |
| guaranteed interest division in | | | | |
| the general account) | (5,513,893) | (5,610,959) | (1,798,195) | 1,895,261 |
| Other | 45,648
| 22,193
| 21,256
| 2,199
|
| Increase (decrease) from principal | | | | |
| transactions | 520,848
| (4,463,326)
| (365,965)
| 5,350,139
|
| | | | |
| Total increase (decrease) in net assets | 6,629,231 | (4,377,521) | 4,049,994 | 6,956,758 |
| | | | |
| Net assets at beginning of year | 47,067,751
| 15,578,349
| 9,026,160
| 22,463,242
|
| | | | |
| Net assets at end of year | $53,696,982
| $11,200,828
| $13,076,154
| $29,420,000
|
See accompanying notes.
Strategic Investor 204
Security Life Separate Account L1
Statement of Changes in Net Assets (continued)
Year ended December 31, 1999
| Alger
|
| Total Alger
| American Small Capitalization
| American MidCap Growth
| American Growth
| American Leveraged AllCap
|
| Increase (decrease) in net assets | | | | | |
| | | | | |
| Operations | | | | | |
| Net investment income (loss) | $ 6,768,070 | $ 2,058,314 | $ 1,547,583 | $ 2,530,830 | $ 631,343 |
| Net realized gains (losses) on | | | | | |
| investments | 5,023,269 | 94,825 | 322,974 | 2,007,625 | 2,597,845 |
| Net unrealized gains (losses) on | | | | | |
| investments | 17,500,945
| 5,993,398
| 2,015,333
| 4,584,649
| 4,907,565
|
| Increase (decrease) in net assets from | | | | | |
| operations | 29,292,284
| 8,146,537
| 3,885,890
| 9,123,104
| 8,136,753
|
| | | | | |
| Changes from principal | | | | | |
| transactions | | | | | |
| Net premiums | 19,246,531 | 4,618,903 | 3,508,936 | 7,654,291 | 3,464,401 |
| Cost of insurance and | | | | | |
| administrative charges | (3,837,369) | (957,053) | (661,896) | (1,597,077) | (621,343) |
| Benefit payments | - | - | - | - | - |
| Surrenders | (3,447,763) | (986,740) | (286,174) | (1,594,894) | (579,955) |
| Net transfers among divisions | | | | | |
| (including the loan division and | | | | | |
| guaranteed interest division in | | | | | |
| the general account) | 13,797,533 | 1,461,610 | 1,637,697 | 4,904,801 | 5,793,425 |
| Other | 34,663
| (6,873)
| (17,173)
| (10,341)
| 69,050
|
| Increase (decrease) from principal | | | | | |
| transactions | 25,793,595
| 4,129,847
| 4,181,390
| 9,356,780
| 8,125,578
|
| | | | | |
| Total increase (decrease) in net assets | 55,085,879 | 12,276,384 | 8,067,280 | 18,479,884 | 16,262,331 |
| | | | | |
| Net assets at beginning of year | 54,428,521
| 15,503,371
| 9,220,207
| 22,903,614
| 6,801,329
|
| | | | | |
| Net assets at end of year | $109,514,400
| $27,779,755
| $17,287,487
| $41,383,498
| $23,063,660
|
See accompanying notes.
Strategic Investor 205
Security Life Separate Account L1
Statement of Changes in Net Assets (continued)
Year ended December 31, 1999
| Fidelity
|
| Total Fidelity
| Asset Manager
| Growth
| Overseas
| Money Market
| Index 500
|
| Increase (decrease) in net assets | | | | | | |
| | | | | | |
| Operations | | | | | | |
| Net investment income (loss) | $ 6,279,181 | $ 714,882 | $ 3,199,633 | $ 631,807 | $ 1,089,493 | $ 643,366 |
| Net realized gains (losses) on | | | | | | |
| investments | 11,358,812 | 122,474 | 7,459,882 | 553,230 | - | 3,223,226 |
| Net unrealized gains (losses) on | | | | | | |
| investments | 30,152,442
| 316,538
| 3,509,953
| 8,740,414
| -
| 17,585,537
|
| Increase (decrease) in net assets from | | | | | | |
| operations | 47,790,435
| 1,153,894
| 14,169,468
| 9,925,451
| 1,089,493
| 21,452,129
|
| | | | | | |
| Changes from principal | | | | | | |
| transactions | | | | | | |
| Net premiums | 115,810,413 | 3,791,052 | 9,969,268 | 5,963,624 | 62,143,060 | 33,943,409 |
| Cost of insurance and | | | | | | |
| administrative charges | (11,622,709) | (604,489) | (1,912,531) | (1,071,163) | (2,273,369) | (5,761,157) |
| Benefit payments | (542,037) | - | - | - | (542,037) | - |
| Surrenders | (7,887,081) | (641,428) | (1,308,922) | (1,227,419) | (1,281,819) | (3,427,493) |
| Net transfers among divisions | | | | | | |
| (including the loan division and | | | | | | |
| guaranteed interest division in | | | | | | |
| the general account) | (17,535,989) | (349,280) | 4,285,808 | 788,107 | (42,741,942) | 20,481,318 |
| Other | 146,782
| 3,430
| 54,597
| 23,794
| (8,230)
| 73,191
|
| Increase (decrease) from principal | | | | | | |
| transactions | 78,369,379
| 2,199,285
| 11,088,220
| 4,476,943
| 15,295,663
| 45,309,268
|
| | | | | | |
| Total increase (decrease) in net assets | 126,159,814 | 3,353,179 | 25,257,688 | 14,402,394 | 16,385,156 | 66,761,397 |
| | | | | | |
| Net assets at beginning of year | 168,285,929
| 10,237,279
| 32,900,142
| 20,581,887
| 18,412,252
| 86,154,369
|
| | | | | | |
| Net assets at end of year | $294,445,743
| $13,590,458
| $58,157,830
| $34,984,281
| $34,797,408
| $152,915,766
|
See accompanying notes.
Strategic Investor 206
Security Life Separate Account L1
Statement of Changes in Net Assets (continued)
Year ended December 31, 1999
| INVESCO
|
| Total INVESCO
| Total Return
| Equity Income
| High Yield
| Utilities
| Small
Company Growth
|
| Increase (decrease) in net assets | | | | | | |
| | | | | | |
| Operations | | | | | | |
| Net investment income (loss) | $ 911,565 | $ 204,816 | $ 154,625 | $ 553,193 | $ 13,269 | $ (14,338) |
| Net realized gains (losses) on | | | | | | |
| investments | 1,094,239 | 286,623 | 506,767 | (241,611) | 304,911 | 237,549 |
| Net unrealized gains (losses) on | | | | | | |
| investments | 2,135,798
| (923,083)
| 965,264
| 379,005
| 179,598
| 1,535,014
|
| Increase (decrease) in net assets from | | | | | | |
| operations | 4,141,602
| (431,644)
| 1,626,656
| 690,587
| 497,778
| 1,758,225
|
| | | | | | |
| Changes from principal | | | | | | |
| transactions | | | | | | |
| Net premiums | 12,770,723 | 4,580,034 | 4,374,844 | 1,987,501 | 1,127,118 | 701,226 |
| Cost of insurance and | | | | | | |
| administrative charges | (2,460,819) | (764,047) | (922,117) | (471,532) | (198,877) | (104,246) |
| Benefit payments | - | - | - | - | - | - |
| Surrenders | (1,567,128) | (239,246) | (333,959) | (155,182) | (820,016) | (18,725) |
| Net transfers among divisions | | | | | | |
| (including the loan division and | | | | | | |
| guaranteed interest division in | | | | | | |
| the general account) | 2,140,348 | (854,496) | 643,961 | (518,177) | 1,491,088 | 1,377,972 |
| Other | (17,068)
| (9,279)
| (21,837)
| 4,698
| 3,264
| 6,086
|
| Increase (decrease) from principal | | | | | | |
| transactions | 10,866,056
| 2,712,966
| 3,740,892
| 847,308
| 1,602,577
| 1,962,313
|
| | | | | | |
| Total increase (decrease) in net assets | 15,007,658 | 2,281,322 | 5,367,548 | 1,537,895 | 2,100,355 | 3,720,538 |
| | | | | | |
| Net assets at beginning of year | 29,630,753
| 8,105,328
| 10,853,005
| 7,882,782
| 2,040,960
| 748,678
|
| | | | | | |
| Net assets at end of year | $44,638,411
| $10,386,650
| $16,220,553
| $9,420,677
| $4,141,315
| $4,469,216
|
See accompanying notes.
Strategic Investor 207
Security Life Separate Account L1
Statement of Changes in Net Assets (continued)
Year ended December 31, 1999
| Van Eck
|
| Total Van Eck
| Worldwide Hard Assets
| Worldwide Bond
| Worldwide Emerging Markets
| Worldwide Real Estate
|
| Increase (decrease) in net assets | | | | | |
| | | | | |
| Operations | | | | | |
| Net investment income (loss) | $ 3,012 | $ 3,939 | $ 9,896 | $ (10,886) | $ 63 |
| Net realized gains (losses) on | | | | | |
| investments | 73,144 | (313,009) | (25,853) | 410,384 | 1,622 |
| Net unrealized gains (losses) on | | | | | |
| investments | 1,374,192
| 592,123
| (9,920)
| 809,962
| (17,973)
|
| Increase (decrease) in net assets from | | | | | |
| operations | 1,450,348
| 283,053
| (25,877)
| 1,209,460
| (16,288)
|
| | | | | |
| Changes from principal | | | | | |
| transactions | | | | | |
| Net premiums | 1,311,620 | 441,045 | 253,322 | 416,537 | 200,716 |
| Cost of insurance and | | | | | |
| administrative charges | (173,456) | (86,064) | (17,509) | (56,532) | (13,351) |
| Benefit payments | - | - | - | - | - |
| Surrenders | (33,331) | (23,325) | - | (5,545) | (4,461) |
| Net transfers among divisions | | | | | |
| (including the loan division and | | | | | |
| guaranteed interest division in | | | | | |
| the general account) | 1,919,235 | 602,367 | (80,721) | 1,091,100 | 306,489 |
| Other | 12,762
| 15,247
| (819)
| (2,117)
| 451
|
| Increase (decrease) from principal | | | | | |
| transactions | 3,036,830
| 949,270
| 154,273
| 1,443,443
| 489,844
|
| | | | | |
| Total increase (decrease) in net assets | 4,487,178 | 1,232,323 | 128,396 | 2,652,903 | 473,556 |
| | | | | |
| Net assets at beginning of year | 1,816,999
| 1,073,755
| 205,807
| 461,156
| 76,281
|
| | | | | |
| Net assets at end of year | $6,304,177
| $2,306,078
| $334,203
| $3,114,059
| $549,837
|
See accompanying notes.
Strategic Investor 208
Security Life Separate Account L1
Statement of Changes in Net Assets (continued)
Year ended December 31, 1999
| AIM
|
| Total AIM
| Capital Appreciation
| Government Securities
|
| Increase (decrease) in net assets | | | |
| | | |
| Operations | | | |
| Net investment income (loss) | $ 260,755 | $ 94,178 | $ 166,577 |
| Net realized gains (losses) on | | | |
| Investments | 84,032 | 92,256 | (8,224) |
| Net unrealized gains (losses) on | | | |
| Investments | 1,036,932
| 1,257,369
| (220,437)
|
| Increase (decrease) in net assets from | | | |
| operations | 1,381,719
| 1,443,803
| (62,084)
|
| | | |
| Changes from principal | | | |
| transactions | | | |
| Net premiums | 3,211,568 | 1,497,094 | 1,714,474 |
| Cost of insurance and | | | |
| administrative charges | (382,131) | (216,619) | (165,512) |
| Benefit payments | - | - | - |
| Surrenders | (601,426) | (18,584) | (582,842) |
| Net transfers among divisions | | | |
| (including the loan division and | | | |
| guaranteed interest division in | | | |
| the general account) | 5,284,201 | 1,391,719 | 3,892,482 |
| Other | 9,171
| 7,073
| 2,098
|
| Increase (decrease) from principal | | | |
| transactions | 7,521,383
| 2,660,683
| 4,860,700
|
| | | |
| Total increase (decrease) in net assets | 8,903,102 | 4,104,486 | 4,798,616 |
| | | |
| Net assets at beginning of year | 3,800,153
| 1,204,436
| 2,595,717
|
| | | |
| Net assets at end of year | $12,703,255
| $5,308,922
| $7,394,333
|
See accompanying notes.
Strategic Investor 209
Security Life Separate Account L1
Statement of Changes in Net Assets
Year ended December 31, 1998
| Total All Divisions
| Total NB
| Total Alger
| Total Fidelity
| Total INVESCO
| Total Van Eck
| Total AIM
|
| Increase (decrease) in net assets | | | | | | | |
| | | | | | | |
| Operations | | | | | | | |
| Net investment income (loss) | $ 16,007,172 | $ 3,982,203 | $ 4,326,660 | $ 5,972,694 | $ 1,463,539 | $ 178,227 | $ 83,849 |
| Net realized gains (losses) on | | | | | | | |
| investments | 8,536,274 | 347,823 | 1,685,294 | 6,403,348 | 355,780 | (260,570) | 4,599 |
| Net unrealized gains (losses) on | | | | | | | |
| investments | 18,766,977
| (2,323,636)
| 5,825,800
| 15,230,082
| 248,681
| (368,037)
| 154,087
|
| Increase (decrease) in net assets | | | | | | | |
| from operations | 43,310,423
| 2,006,390
| 11,837,754
| 27,606,124
| 2,068,000
| (450,380)
| 242,535
|
| | | | | | | |
| Changes from principal | | | | | | | |
| transactions | | | | | | | |
| Net premiums | 128,820,440 | 12,563,792 | 13,089,164 | 92,335,231 | 8,092,294 | 875,501 | 1,864,458 |
| Cost of insurance and | | | | | | | |
| administrative charges | (14,458,798) | (2,063,802) | (2,525,683) | (8,200,381) | (1,481,570) | (108,634) | (78,728) |
| Benefit payments | (306,862) | (11,220) | (26,492) | (259,989) | (9,161) | - | - |
| Surrenders | (10,842,736) | (725,767) | (859,454) | (8,654,377) | (586,533) | (15,198) | (1,407) |
| Net transfers among divisions | | | | | | | |
| (including the loan division and | | | | | | | |
| guaranteed interest division in | | | | | | | |
| the general account) | (3,936,799) | 8,461,193 | 4,831,250 | (25,231,056) | 6,011,967 | 216,552 | 1,773,295 |
| Other | (41,582)
| (87,331)
| (18,626)
| 54,208
| 9,107
| 1,060
| -
|
| Increase (decrease) from principal | | | | | | | |
| transactions | 99,233,663
| 18,136,865
| 14,490,159
| 50,043,636
| 12,036,104
| 969,281
| 3,557,618
|
| | | | | | | |
| Total increase (decrease) in net assets | 142,544,086 | 20,143,255 | 26,327,913 | 77,649,760 | 14,104,104 | 518,901 | 3,800,153 |
| | | | | | | |
| Net assets at beginning of year | 162,486,020
| 26,924,496
| 28,100,608
| 90,636,169
| 15,526,649
| 1,298,098
| -
|
| | | | | | | |
| Net assets at end of year | $305,030,106
| $47,067,751
| $54,428,521
| $168,285,929
| $29,630,753
| $1,816,999
| $3,800,153
|
See accompanying notes.
Strategic Investor 210
Security Life Separate Account L1
Statement of Changes in Net Assets (continued)
Year ended December 31, 1998
| NB
|
| Total NB
| Limited Maturity Bond
| Growth
| Government Income
| Partners
|
| Increase (decrease) in net assets | | | | | |
| | | | | |
| Operations | | | | | |
| Net investment income (loss) | $ 3,982,203 | $ 322,085 | $1,526,449 | $133,352 | $ 2,000,317 |
| Net realized gains (losses) on | | | | | |
| investments | 347,823 | 10,003 | (264,148) | (53,894) | 655,862 |
| Net unrealized gains (losses) on | | | | | |
| investments | (2,323,636)
| 59,369
| (81,576)
| (60,954)
| (2,240,475)
|
| Increase (decrease) in net assets | | | | | |
| from operations | 2,006,390
| 391,457
| 1,180,725
| 18,504
| 415,704
|
| | | | | |
| Changes from principal | | | | | |
| transactions | | | | | |
| Net premiums | 12,563,792 | 3,839,599 | 2,578,265 | 31,593 | 6,114,335 |
| Cost of insurance and | | | | | |
| administrative charges | (2,063,802) | (492,782) | (393,894) | (14,839) | (1,162,287) |
| Benefit payments | (11,220) | - | - | - | (11,220) |
| Surrenders | (725,767) | (15,922) | (419,497) | (3,243) | (287,105) |
| Net transfers among divisions | | | | | |
| (including the loan division and | | | | | |
| guaranteed interest division in | | | | | |
| the general account) | 8,461,193 | 5,212,588 | 513,663 | (894,126) | 3,629,068 |
| Other | (87,331)
| (31,757)
| 3,226
| (31,566)
| (27,234)
|
| Increase (decrease) from principal | | | | | |
| transactions | 18,136,865
| 8,511,726
| 2,281,763
| (912,181)
| 8,255,557
|
| | | | | |
| Total increase (decrease) in net assets | 20,143,255 | 8,903,183 | 3,462,488 | (893,677) | 8,671,261 |
| | | | | |
| Net assets at beginning of year | 26,924,496
| 6,675,166
| 5,563,672
| 893,677
| 13,791,981
|
| | | | | |
| Net assets at end of year | $47,067,751
| $15,578,349
| $9,026,160
| $ -
| $22,463,242
|
See accompanying notes.
Strategic Investor 211
Security Life Separate Account L1
Statement of Changes in Net Assets (continued)
Year ended December 31, 1998
| Alger
|
| Total Alger
| American Small Capitalization
| American MidCap Growth
| American Growth
| American Leveraged AllCap
|
| Increase (decrease) in net assets | | | | | |
| | | | | |
| Operations | | | | | |
| Net investment income (loss) | $ 4,326,660 | $ 1,585,785 | $ 539,729 | $ 2,083,336 | $ 117,810 |
| Net realized gains (losses) on | | | | | |
| investments | 1,685,294 | 186,963 | 316,932 | 915,872 | 265,527 |
| Net unrealized gains (losses) on | | | | | |
| investments | 5,825,800
| 166,990
| 1,022,340
| 3,099,428
| 1,537,042
|
| Increase (decrease) in net assets | | | | | |
| from operations | 11,837,754
| 1,939,738
| 1,879,001
| 6,098,636
| 1,920,379
|
| | | | | |
| Changes from principal | | | | | |
| transactions | | | | | |
| Net premiums | 13,089,164 | 4,154,774 | 2,573,424 | 5,298,963 | 1,062,003 |
| Cost of insurance and | | | | | |
| administrative charges | (2,525,683) | (803,988) | (473,224) | (989,260) | (259,211) |
| Benefit payments | (26,492) | (14,248) | (12,244) | - | - |
| Surrenders | (859,454) | (196,345) | (376,263) | (216,867) | (69,979) |
| Net transfers among divisions | | | | | |
| (including the loan division and | | | | | |
| guaranteed interest division in | | | | | |
| the general account) | 4,831,250 | (35,168) | 528,261 | 3,094,366 | 1,243,791 |
| Other | (18,626)
| (504)
| (14,286)
| 1,597
| (5,433)
|
| Increase (decrease) from principal | | | | | |
| transactions | 14,490,159
| 3,104,521
| 2,225,668
| 7,188,799
| 1,971,171
|
| | | | | |
| Total increase (decrease) in net assets | 26,327,913 | 5,044,259 | 4,104,669 | 13,287,435 | 3,891,550 |
| | | | | |
| Net assets at beginning of year | 28,100,608
| 10,459,112
| 5,115,538
| 9,616,179
| 2,909,779
|
| | | | | |
| Net assets at end of year | $54,428,521
| $15,503,371
| $9,220,207
| $22,903,614
| $6,801,329
|
See accompanying notes.
Strategic Investor 212
Security Life Separate Account L1
Statement of Changes in Net Assets (continued)
Year ended December 31, 1998
| Fidelity
|
| Total Fidelity
| Asset Manager
| Growth
| Overseas
| Money Market
| Index 500
|
| Increase (decrease) in net assets | | | | | | |
| | | | | | |
| Operations | | | | | | |
| Net investment income (loss) | $ 5,972,694 | $ 745,317 | $ 2,480,616 | $ 886,122 | $ 713,205 | $ 1,147,434 |
| Net realized gains (losses) on | | | | | | |
| investments | 6,403,348 | 20,247 | 1,534,000 | 298,379 | - | 4,550,722 |
| Net unrealized gains (losses) on | | | | | | |
| investments | 15,230,082
| 315,702
| 4,444,805
| 707,398
| -
| 9,762,177
|
| Increase (decrease) in net assets | | | | | | |
| from operations | 27,606,124
| 1,081,266
| 8,459,421
| 1,891,899
| 713,205
| 15,460,333
|
| | | | | | |
| Changes from principal | | | | | | |
| transactions | | | | | | |
| Net premiums | 92,335,231 | 2,713,832 | 8,443,426 | 5,709,711 | 55,421,815 | 20,046,447 |
| Cost of insurance and | | | | | | |
| administrative charges | (8,200,381) | (490,838) | (1,358,671) | (939,010) | (1,769,895) | (3,641,967) |
| Benefit payments | (259,989) | - | (8,890) | (8,379) | (240,733) | (1,987) |
| Surrenders | (8,654,377) | (652,157) | (2,494,098) | (438,536) | (2,335,262) | (2,734,324) |
| Net transfers among divisions | | | | | | |
| (including the loan division and | | | | | | |
| guaranteed interest division in | | | | | | |
| the general account) | (25,231,056) | 1,440,884 | 1,798,160 | 2,169,798 | (48,429,964) | 17,790,066 |
| Other | 54,208
| 7,219
| (14,128)
| (29,375)
| 39,827
| 50,665
|
| Increase (decrease) from principal | | | | | | |
| transactions | 50,043,636
| 3,018,940
| 6,365,799
| 6,464,209
| 2,685,788
| 31,508,900
|
| | | | | | |
| Total increase (decrease) in net assets | 77,649,760 | 4,100,206 | 14,825,220 | 8,356,108 | 3,398,993 | 46,969,233 |
| | | | | | |
| Net assets at beginning of year | 90,636,169
| 6,137,073
| 18,074,922
| 12,225,779
| 15,013,259
| 39,185,136
|
| | | | | | |
| Net assets at end of year | $168,285,929
| $10,237,279
| $32,900,142
| $20,581,887
| $18,412,252
| $86,154,369
|
See accompanying notes.
Strategic Investor 213
Security Life Separate Account L1
Statement of Changes in Net Assets (continued)
Year ended December 31, 1998
| INVESCO
|
| Total INVESCO
| Total Return
| Equity Income
| High Yield
| Utilities
| Small
Company Growth
|
| Increase (decrease) in net assets | | | | | | |
| | | | | | |
| Operations | | | | | | |
| Net investment income (loss) | $ 1,463,539 | $ 271,636 | $ 453,496 | $ 720,665 | $ 18,328 | $ (586) |
| Net realized gains (losses) on | | | | | | |
| investments | 355,780 | 136,473 | 342,342 | (151,382) | 35,245 | (6,898) |
| Net unrealized gains (losses) on | | | | | | |
| investments | 248,681
| 73,689
| 359,519
| (541,125)
| 282,500
| 74,098
|
| Increase (decrease) in net assets | | | | | | |
| from operations | 2,068,000
| 481,798
| 1,155,357
| 28,158
| 336,073
| 66,614
|
| | | | | | |
| Changes from principal | | | | | | |
| transactions | | | | | | |
| Net premiums | 8,092,294 | 2,104,849 | 3,170,236 | 2,297,048 | 435,105 | 85,056 |
| Cost of insurance and | | | | | | |
| administrative charges | (1,481,570) | (425,176) | (567,563) | (389,895) | (87,692) | (11,244) |
| Benefit payments | (9,161) | - | (9,161) | - | - | - |
| Surrenders | (586,533) | (56,509) | (192,220) | (329,292) | (8,210) | (302) |
| Net transfers among divisions | | | | | | |
| (including the loan division and | | | | | | |
| guaranteed interest division in | | | | | | |
| the general account) | 6,011,967 | 2,955,200 | 1,315,595 | 931,519 | 201,017 | 608,636 |
| Other | 9,107
| 556
| 22,617
| (18,840)
| 4,856
| (82)
|
| Increase (decrease) from principal | | | | | | |
| transactions | 12,036,104
| 4,578,920
| 3,739,504
| 2,490,540
| 545,076
| 682,064
|
| | | | | | |
| Total increase (decrease) in net assets | 14,104,104 | 5,060,718 | 4,894,861 | 2,518,698 | 881,149 | 748,678 |
| | | | | | |
| Net assets at beginning of year | 15,526,649
| 3,044,610
| 5,958,144
| 5,364,084
| 1,159,811
| -
|
| | | | | | |
| Net assets at end of year | $29,630,753 | $8,105,328 | $10,853,005 | $7,882,782 | $2,040,960 | $748,678 |
See accompanying notes.
Strategic Investor 214
Security Life Separate Account L1
Statement of Changes in Net Assets (continued)
Year ended December 31, 1998
| Van Eck
|
| Total Van Eck
| Worldwide Balanced
| Worldwide Hard Assets
| Worldwide Bond
| Worldwide Emerging Markets
| Worldwide Real Estate
|
| Increase (decrease) in net assets | | | | | | |
| | | | | | |
| Operations | | | | | | |
| Net investment income (loss) | $ 178,227 | $ 44,624 | $ 135,776 | $ (212) | $ (1,736) | $ (225) |
| Net realized gains (losses) on | | | | | | |
| investments | (260,570) | 4,682 | (162,110) | 130 | (101,436) | (1,836) |
| Net unrealized gains (losses) on | | | | | | |
| investments | (368,037)
| (23,403)
| (395,698)
| 3,953
| 47,140
| (29)
|
| Increase (decrease) in net assets | | | | | | |
| from operations | (450,380)
| 25,903
| (422,032)
| 3,871
| (56,032)
| (2,090)
|
| | | | | | |
| Changes from principal | | | | | | |
| transactions | | | | | | |
| Net premiums | 875,501 | (1,347) | 571,430 | 129,336 | 137,102 | 38,980 |
| Cost of insurance and | | | | | | |
| administrative charges | (108,634) | (9,423) | (86,867) | (1,544) | (7,777) | (3,023) |
| Benefit payments | - | - | - | - | - | - |
| Surrenders | (15,198) | (3,105) | (11,871) | - | - | (222) |
| Net transfers among divisions | | | | | | |
| (including the loan division and | | | | | | |
| guaranteed interest division in | | | | | | |
| the general account) | 216,552 | (399,466) | 111,286 | 74,151 | 387,960 | 42,621 |
| Other | 1,060
| 90
| 1,059
| (7)
| (97)
| 15
|
| Increase (decrease) from principal | | | | | | |
| transactions | 969,281
| (413,251)
| 585,037
| 201,936
| 517,188
| 78,371
|
| | | | | | |
| Total increase (decrease) in net assets | 518,901 | (387,348) | 163,005 | 205,807 | 461,156 | 76,281 |
| | | | | | |
| Net assets at beginning of year | 1,298,098
| 387,348
| 910,750
| -
| -
| -
|
| | | | | | |
| Net assets at end of year | $1,816,999
| $ -
| $1,073,755
| $205,807
| $461,156
| $76,281
|
See accompanying notes.
Strategic Investor 215
Security Life Separate Account L1
Statement of Changes in Net Assets (continued)
Year ended December 31, 1998
| AIM
|
| Total AIM
| Capital Appreciation
| Government Securities
|
| Increase (decrease) in net assets | | | |
| | | |
| Operations | | | |
| Net investment income (loss) | $ 83,849 | $ 24,053 | $ 59,796 |
| Net realized gains (losses) on | | | |
| investments | 4,599 | (3,315) | 7,914 |
| Net unrealized gains (losses) on | | | |
| investments | 154,087
| 119,225
| 34,862
|
| Increase (decrease) in net assets | | | |
| from operations | 242,535
| 139,963
| 102,572
|
| | | |
| Changes from principal | | | |
| transactions | | | |
| Net premiums | 1,864,458 | 329,635 | 1,534,823 |
| Cost of insurance and | | | |
| administrative charges | (78,728) | (28,940) | (49,788) |
| Benefit payments | - | - | - |
| Surrenders | (1,407) | (1,407) | - |
| Net transfers among divisions | | | |
| (including the loan division and | | | |
| guaranteed interest division in | | | |
| the general account) | 1,773,295 | 765,185 | 1,008,110 |
| Other | -
| -
| -
|
| Increase (decrease) from principal | | | |
| transactions | 3,557,618
| 1,064,473
| 2,493,145
|
| | | |
| Total increase (decrease) in net assets | 3,800,153 | 1,204,436 | 2,595,717 |
| | | |
| Net assets at beginning of year | -
| -
| -
|
| | | |
| Net assets at end of year | $3,800,153
| $1,204,436
| $2,595,717
|
See accompanying notes.
Strategic Investor 216
Security Life Separate Account L1
Notes to Financial Statements
December 31, 2000
1. Organization
Security Life Separate Account L1 (the "Separate Account") was established by resolution of the Board of Directors of Security Life of Denver Insurance Company (the "Company") on November 3, 1993. The Separate Account is organized as a unit investment trust registered with the Securities and Exchange Commission under the Investment Company Act of 1940.
The Separate Account supports the operations of the FirstLine Variable Universal Life, FirstLine II Variable Universal Life, Strategic Advantage Variable Universal Life, Strategic Advantage II Variable Universal Life, Variable Survivorship Universal Life, Corporate Benefits Variable Universal Life, Strategic Benefits Variable Universal Life, and Estate Designer policies ("Variable Universal Life Policies") offered by the Company. Corporate Benefits Variable Universal Life and Strategic Benefits Variable Universal Life became effective in 2000 and are defined as Class B policies due to their mortality and expense charge structure. All other Variable Universal Life Policies are defined as Class A policies. The Separate Account may be used to support other variable life policies as they are offered by the Company. The assets of the Separate Account are the property of the Company. However, the portion of the Separate Account's assets attributable to the policies will not be used to satisfy liabilities arising out of any other operations of the Company.
As of December 31, 2000, the Separate Account offered 35 investment divisions available to the policyholders, 27 of which invest in an independently managed mutual fund portfolio and eight of which invest in a mutual fund portfolio managed by an affiliate, Direct Services, Inc. (collectively, "Funds"). The Funds are as follows:
Portfolio Managers/Portfolios (Funds)
| Neuberger Berman Management Incorporated (NB) |
| | Neuberger Berman Limited Maturity Bond Portfolio |
| Neuberger Berman Growth Portfolio |
| Neuberger Berman Partners Portfolio |
| |
| Fred Alger Management, Inc. (Alger) |
| Alger American Small Capitalization Portfolio |
| Alger American MidCap Growth Portfolio |
| Alger American Growth Portfolio |
| Alger American Leveraged AllCap Portfolio |
Strategic Investor 217
Security Life Separate Account L1
Notes to Financial Statements (continued)
1. Organization (continued)
Portfolio Managers/Portfolios (Funds) (continued)
| Fidelity Management & Research Company (Fidelity) |
| | Fidelity Investments VIP II Asset Manager Portfolio |
| Fidelity Investments VIP Growth Portfolio |
| Fidelity Investments VIP Overseas Portfolio |
| Fidelity Investments VIP Money Market Portfolio |
| Fidelity Investments VIP II Index 500 Portfolio |
| |
| INVESCO Funds Group, Inc. (INVESCO) |
| INVESCO VIF Total Return Portfolio |
| INVESCO VIF Equity Income Portfolio |
| INVESCO VIF High Yield Portfolio |
| INVESCO VIF Utilities Portfolio |
| INVESCO VIF Small Company Growth Portfolio |
| |
| Van Eck Associates Corporation (Van Eck) |
| Van Eck Worldwide Hard Assets Portfolio |
| Van Eck Worldwide Bond Portfolio |
| Van Eck Worldwide Emerging Markets Portfolio |
| Van Eck Worldwide Real Estate Portfolio |
| |
| AIM Advisors, Inc. (AIM) |
| AIM VI - Capital Appreciation Portfolio |
| AIM VI - Government Securities Portfolio |
| |
| Directed Services, Inc. ("GCG") |
| The GCG Trust - Equity Income Portfolio |
| The GCG Trust - Growth Portfolio |
| The GCG Trust - Hard Assets Portfolio |
| The GCG Trust - Limited Maturity Bond Portfolio |
| The GCG Trust - Liquid Asset Portfolio |
| The GCG Trust - MidCap Growth Portfolio |
| The GCG Trust - Research Portfolio |
| The GCG Trust - Total Return Portfolio |
| |
| Janus Aspen Series Funds ("Janus") |
| Aggressive Growth |
| Growth |
| International Growth |
| Worldwide Growth |
Strategic Investor 218
Security Life Separate Account L1
Notes to Financial Statements (continued)
1. Organization (continued)
Portfolio Managers/Portfolios (Funds) (continued)
Effective February 19, 1998, six new divisions became available to the policyholders for investment in the following funds:
| Van Eck Associates Corporation (Van Eck) |
| | Van Eck Worldwide Bond Portfolio |
| Van Eck Worldwide Emerging Markets Portfolio |
| Van Eck Worldwide Real Estate Portfolio |
| |
| AIM Advisors, Inc. (AIM) |
| AIM VI - Capital Appreciation Portfolio |
| AIM VI - Government Securities Portfolio |
| |
| INVESCO Funds Group, Inc. (INVESCO) |
| INVESCO VIF Small Company Growth Portfolio |
Effective May 1, 2000, eight new divisions became available to the policyholders for investment in the following funds:
| Directed Services, Inc. ("GCG") |
| | GCG Trust - Equity Income Portfolio |
| GCG Trust - Growth Portfolio |
| GCG Trust - Hard Assets Portfolio |
| GCG Trust - Limited Maturity Bond Portfolio |
| GCG Trust - Liquid Asset Portfolio |
| GCG Trust - MidCap Growth Portfolio |
| GCG Trust - Research Portfolio |
| GCG Trust - Total Return Portfolio |
Effective October 13, 2000, four new divisions became available to the policyholders for investment in the following funds:
| Janus Aspen Series Funds ("Janus") |
| | Aggressive Growth |
| Growth |
| International Growth |
| Worldwide Growth |
Strategic Investor 219
Security Life Separate Account L1
Notes to Financial Statements (continued)
1. Organization (continued)
Portfolio Managers/Portfolios (Funds) (continued)
The Variable Universal Life Policies allow the policyholders to specify the allocation of their net premium to the various Funds. They can also transfer their account values among the Funds. The Variable Universal Life Policies also provide the policyholders the option to allocate their net premiums, or to transfer their account values, to a Guaranteed Interest Division ("GID") in the Company's general account. The GID guarantees a rate of interest to the policyholder, and it is not variable in nature. Therefore, it is not included in these Separate Account statements.
2. Summary of Significant Accounting Policies
The accompanying financial statements of the Separate Account have been prepared on the basis of accounting principles generally accepted in the United States ("U.S. GAAP"). The preparation of financial statements in conformity with U.S. GAAP requires management to make estimates and assumptions that affect the reported amounts of assets and liabilities and disclosure of contingent assets and liabilities at the date of the financial statements and the reported amounts of revenues and expenses during the reporting period. Actual results could differ from those estimates.
The significant accounting principles followed by the Separate Account and the methods of applying those principles are presented below or in the footnotes which follow:
Investment Valuation
The investments in shares of the Funds are valued at the closing net asset value (market value) per share as determined by the Funds on the day of measurement.
Investment Transactions and Related Investment Income
The investments in shares of the Funds are accounted for on the date the order to buy or sell is confirmed. Dividend income and distributions of capital gains are recorded on the ex-dividend date. Realized gains and losses from sales transactions are reported using the first-in, first-out ("FIFO") method of accounting for cost. The difference between cost and current market value of investments owned on the day of measurement is recorded as unrealized gain or loss on investment.
Strategic Investor 220
Security Life Separate Account L1
Notes to Financial Statements (continued)
2. Summary of Significant Accounting Policies (continued)
Valuation Period Deductions
For FirstLine, FirstLine II, Strategic Advantage, Strategic Advantage II, Variable Survivorship and Estate Designer policies (Class A Policies), charges are made directly against the assets of the Separate Account divisions and are reflected daily in the computation of the unit values of the divisions.
A daily deduction, at an annual rate of .75% of the daily asset value of the Separate Account divisions, is charged to the Separate Account for mortality and expense risks assumed by the Company. Total mortality and expense charges for the years ended December 31, 2000, 1999 and 1998 were $4,508,171, $2,908,885, and $1,740,661, respectively.
For the Corporate Benefits and Strategic Benefits policies (Class B Policies), mortality and expense charges result in the redemption of units rather than a deduction in the daily computation of unit values.
For Corporate Benefits policies, a monthly deduction, at an annual rate of .20% of the account value, is charged. For Strategic Benefits policies, a monthly deduction, at an annual rate of .85%, .60% and .05% of the account value, is charged during policy years 1 through 10, 11 through 20, and 21 and later, respectively. Total mortality and expense charges for these policies for the year ended December 31, 2000 were $42,000 and are included in the Statement of Changes in Net Assets as cost of insurance and administrative charges.
Policyholder Reserves
Policyholder reserves are recorded in the Separate Account at the aggregate account values of the policyholders invested in the Separate Account divisions. To the extent that benefits to be paid to the policyholders exceed their account values, the Company will contribute additional funds to the benefit proceeds.
3. Investments
Fund shares are purchased at net asset value with net premiums (premium payments, less sales and tax loads charged by the Company) and divisional transfers from other divisions. Fund shares are redeemed for the payment of benefits, for surrenders, for transfers to other divisions, and for charges by the Company for certain cost of insurance and administrative charges. The cost of insurance and administrative charges for the years ended December 31, 2000, 1999 and 1998 were $30,552,382, $20,649,015, and $14,458,798, respectively. Dividends made by the Funds are reinvested in the Funds.
Strategic Investor 221
Security Life Separate Account L1
Notes to Financial Statements (continued)
3. Investments (continued)
The following is a summary of Fund shares owned as of December 31, 2000:
Fund
| Number of Shares
| Net Asset Value
| Value of Shares at Market
| Cost of Shares
|
| | | | |
| Neuberger Berman Management Inc.: | | | | |
| Limited Maturity Bond | 1,098,479.067 | $13.19 | $ 14,488,939 | $ 14,317,177 |
| Growth | 650,381.500 | $30.65 | 19,934,193 | 23,675,702 |
| Partners | 1,697,826.869 | $16.17 | 27,453,860 | 26,760,069 |
| | | | |
| Fred Alger Management, Inc.: | | | | |
| American Small Capitalization | 1,116,503.632 | $23.49 | 26,226,670 | 29,017,464 |
| American MidCap Growth | 1,087,203.730 | $30.62 | 33,290,178 | 32,585,413 |
| American Growth | 1,059,757.353 | $47.27 | 50,094,730 | 57,519,366 |
| American Leveraged AllCap | 627,987.182 | $38.80 | 24,365,903 | 30,403,675 |
| | | | |
| Fidelity Management & Research Co.: | | | | |
| Asset Manager | 984,639.059 | $16.00 | 15,754,225 | 16,794,005 |
| Growth | 1,571,275.140 | $43.65 | 68,586,160 | 76,947,214 |
| Overseas | 2,160,503.810 | $19.99 | 43,188,471 | 47,778,416 |
| Money Market | 62,301,092.280 | $1.00 | 62,301,092 | 62,301,092 |
| Index 500 | 1,209,792.397 | $149.53 | 180,900,257 | 171,986,004 |
| | | | |
| INVESCO Funds Group, Inc.: | | | | |
| Total Return | 884,931.109 | $13.21 | 11,689,940 | 13,758,395 |
| Equity Income | 1,039,790.088 | $20.71 | 21,534,053 | 20,783,337 |
| High Yield | 1,040,905.170 | $10.07 | 10,481,915 | 11,975,324 |
| Utilities | 370,959.040 | $21.06 | 7,812,397 | 7,691,761 |
| Small Company Growth | 648,541.835 | $18.07 | 11,719,151 | 14,096,290 |
| | | | |
| Van Eck Associates Corporation: | | | | |
| Worldwide Hard Assets | 191,662.125 | $12.07 | 2,313,362 | 2,041,764 |
| Worldwide Bond | 89,819.082 | $10.37 | 931,424 | 913,802 |
| Worldwide Emerging Markets | 550,588.884 | $8.29 | 4,564,382 | 6,215,858 |
| Worldwide Real Estate | 123,569.451 | $10.62 | 1,312,308 | 1,192,797 |
| | | | |
| AIM Advisors, Inc.: | | | | |
| Capital Appreciation | 1,654,352.662 | $30.84 | 51,020,236 | 51,815,173 |
| Government Securities | 1,502,187.120 | $11.16 | 16,764,408 | 16,599,323 |
| | | | |
| Directed Services, Inc. (GCG): | | | | |
| Equity Income | - | - | - | - |
| Growth | 62.340 | $19.78 | 1,233 | 1,401 |
| Hard Assets | - | - | - | - |
| Limited Maturity Bond | 83,266.629 | $10.53 | 876,798 | 922,084 |
| Liquid Asset | 1,991,502.030 | $1.00 | 1,991,502 | 1,991,502 |
| MidCap Growth | - | - | - | - |
| Research | - | - | - | - |
| Total Return | 619.589 | $17.00 | 10,533 | 11,083 |
| | | | |
| Janus Funds: | | | | |
| Growth | 9,242.830 | $26.36 | 243,641 | 258,748 |
| Aggressive Growth | 14,583.894 | $35.97 | 524,583 | 575,061 |
| Worldwide Growth | 8,686.977 | $36.77 | 319,420 | 336,173 |
| International Growth | 13,727.681 | $30.64 | 420,616
| 437,129
|
| Total | | | $711,116,580
| $741,702,602
|
Strategic Investor 222
Security Life Separate Account L1
Notes to Financial Statements (continued)
3. Investments (continued)
For the year ended December 31, 2000, the cost of purchases (plus reinvested dividends) and sales of investments are as follows:
Fund
| Beginning of Year
| Purchases
| Sales
| End of Year
|
| Neuberger Berman Management Inc.: | | | | |
| Limited Maturity Bond | $ 11,380,242 | $ 7,233,774 | $ (4,296,839) | $ 14,317,177 |
| Growth | 8,836,640 | 20,151,116 | (5,312,054) | 23,675,702 |
| Partners | 28,931,311 | 47,152,244 | (49,323,486) | 26,760,069 |
| | | | |
| Fred Alger Management, Inc.: | | | | |
| American Small Capitalization | 21,103,331 | 74,629,293 | (66,715,160) | 29,017,464 |
| American MidCap Growth | 13,903,676 | 21,597,617 | (2,915,880) | 32,585,413 |
| American Growth | 32,482,027 | 31,091,492 | (6,054,153) | 57,519,366 |
| American Leveraged AllCap | 16,645,127 | 19,821,075 | (6,062,527) | 30,403,675 |
| | | | |
| Fidelity Management & Research Co.: | | | | |
| Asset Manager | 12,533,037 | 7,123,256 | (2,862,288) | 16,794,005 |
| Growth | 48,588,495 | 109,439,111 | (81,080,392) | 76,947,214 |
| Overseas | 25,474,948 | 31,328,225 | (9,024,757) | 47,778,416 |
| Money Market | 34,799,038 | 248,428,475 | (220,926,421) | 62,301,092 |
| Index 500 | 119,231,939 | 63,143,704 | (10,389,639) | 171,986,004 |
| | | | |
| INVESCO Funds Group, Inc.: | | | | |
| Total Return | 11,019,270 | 5,757,584 | (3,018,459) | 13,758,395 |
| Equity Income | 14,534,380 | 8,908,214 | (2,659,257) | 20,783,337 |
| High Yield | 9,910,525 | 4,917,230 | (2,852,431) | 11,975,324 |
| Utilities | 3,647,584 | 4,689,595 | (645,418) | 7,691,761 |
| Small Company Growth | 2,793,624 | 13,241,957 | (1,939,291) | 14,096,290 |
| | | | |
| Van Eck Associates Corporation: | | | | |
| Worldwide Hard Assets | 2,157,787 | 548,401 | (664,424) | 2,041,764 |
| Worldwide Bond | 341,712 | 782,955 | (210,865) | 913,802 |
| Worldwide Emerging Markets | 2,209,985 | 4,730,706 | (724,833) | 6,215,858 |
| Worldwide Real Estate | 567,839 | 963,776 | (338,818) | 1,192,797 |
| | | | |
| AIM Advisors, Inc.: | | | | |
| Capital Appreciation | 3,932,316 | 48,423,913 | (541,056) | 51,815,173 |
| Government Securities | 7,579,908 | 13,067,857 | (4,048,442) | 16,599,323 |
| | | | |
| Directed Services, Inc. (GCG): | | | | |
| Equity Income | | | | |
| Growth | - | 1,401 | - | 1,401 |
| Hard Assets | - | - | - | - |
| Limited Maturity Bond | - | 922,084 | - | 922,084 |
| Liquid Asset | - | 54,297,849 | (52,306,347) | 1,991,502 |
| MidCap Growth | - | - | - | - |
| Research | - | - | - | - |
| Total Return | - | 11,083 | - | 11,083 |
| | | | |
| Janus Funds: | | | | |
| Growth | - | 335,602 | (76,854) | 258,748 |
| Aggressive Growth | - | 575,493 | (432) | 575,061 |
| Worldwide Growth | - | 463,855 | (127,682) | 336,173 |
| International Growth | -
| 446,417
| (9,288)
| 437,129
|
| Total | $432,604,741
| $844,225,354
| $(535,127,493)
| $741,702,602
|
Strategic Investor 223
Security Life Separate Account L1
Notes to Financial Statements (continued)
3. Investments (continued)
Aggregate proceeds from sales of investments for the year ended December 31, 2000 were $540,823,407.
4. Other Policy Deductions
The Variable Universal Life Policies provide for certain deductions for sales and tax loads from premium payments received from the policyholders and for surrender charges and taxes from amounts paid to policyholders. Such deductions are taken before the purchase of divisional units or after the redemption of divisional units of the Separate Account. Such deductions are not included in the Separate Account financial statements.
5. Policy Loans
The Variable Universal Life Policies allow the policyholders to borrow against their policies by using them as collateral for a loan. At the time of borrowing against the policies, an amount equal to the loan amount is transferred from the Separate Account divisions to a Loan Division in the Company's General Account to secure the loan. As payments are made on the policy loan, amounts are transferred back from the Loan Division to the Separate Account divisions. Interest is credited to the balance in the Loan Division at a fixed rate. The Loan Division is not variable in nature and is not included in these Separate Account statements.
6. Federal Income Taxes
The Separate Account is not taxed separately because the operations of the Separate Account are part of the total operations of the Company. The Company is taxed as a life insurance company under the Internal Revenue Code. The Separate Account is not taxed as a "Regulated Investment Company" under subchapter "M" of the Internal Revenue Code.
Strategic Investor 224
Security Life Separate Account L1
Notes to Financial Statements (continued)
7. Summary of Changes in Units
The following schedule summarizes the changes in divisional units for the year ended December 31, 2000:
Division
| Outstanding at Beginning of Year
| Increase for Payments Received
| (Decrease) for Withdrawals and Other Deductions
| Outstanding at End of Year
|
| | | | |
| Neuberger Berman Management Inc.: | | | | |
| Limited Maturity Bond: | | | | |
| Class A | 889,159.604 | 504,777.566 | (308,746.826) | 1,085,190.344 |
| Class B | - | - | - | - |
| Growth: | | | | |
| Class A | 434,338.368 | 585,182.288 | (264,487.840) | 755,032.816 |
| Class B | - | - | - | - |
| Partners: | | | | |
| Class A | 1,212,133.448 | 1,779,259.060 | (1,860,035.005) | 1,131,357.503 |
| Class B | - | 776.829 | (49.785) | 727.044 |
| Fred Alger Management, Inc.: | | | | |
| American Small Capitalization: | | | | |
| Class A | 1,055,757.484 | 2,800,960.511 | (2,505,612.904) | 1,351,105.091 |
| Class B | - | 55,711.543 | (42.421) | 55,669.122 |
| American MidCap Growth: | | | | |
| Class A | 576,738.314 | 560,214.726 | (114,004.848) | 1,022,948.192 |
| Class B | - | 4,663.845 | (82.319) | 4,581.526 |
| American Growth: | | | | |
| Class A | 1,257,371.637 | 778,072.130 | (240,385.291) | 1,795,058.476 |
| Class B | - | 11,643.541 | (139.984) | 11,503.557 |
| American Leveraged AllCap: | | | | |
| Class A | 425,281.099 | 336,729.473 | (159,812.806) | 602,197.766 |
| Class B | - | - | - | - |
| Fidelity Management & Research Co.: | | | | |
| Asset Manager: | | | | |
| Class A | 722,717.906 | 310,205.974 | (154,339.584) | 878,584.296 |
| Class B | - | - | - | - |
| Growth: | | | | |
| Class A | 1,676,236.646 | 2,952,178.456 | (2,405,547.964) | 2,222,867.138 |
| Class B | - | 40,990.125 | (263.017) | 40,727.108 |
| Overseas: | | | | |
| Class A | 1,716,617.627 | 1,467,555.053 | (597,886.377) | 2,586,286.303 |
| Class B | - | 83,821.190 | (70.622) | 83,750.568 |
| Money Market: | | | | |
| Class A | 2,763,648.297 | 18,979,254.070 | (17,053,332.906) | 4,689,569.461 |
| Class B | - | - | - | - |
| Index 500: | | | | |
| Class A | 4,772,484.597 | 1,767,429.327 | (514,434.291) | 6,025,479.633 |
| Class B | - | 714,452.306 | (9,500.804) | 704,951.502 |
Strategic Investor 225
Security Life Separate Account L1
Notes to Financial Statements (continued)
7. Summary of Changes in Units (continued)
Division
| Outstanding at Beginning of Year
| Increase for Payments Received
| (Decrease) for Withdrawals and Other Deductions
| Outstanding at End of Year
|
| | | | |
| INVESCO Funds Group, Inc.: | | | | |
| Total Return: | | | | |
| Class A | 602,187.614 | 257,125.735 | (161,306.002) | 698,007.347 |
| Class B | - | - | - | - |
| Equity Income: | | | | |
| Class A | 621,047.937 | 283,695.785 | (121,863.312) | 782,880.410 |
| Class B | - | 23,229.266 | (31.870) | 23,197.396 |
| High Yield: | | | | |
| Class A | 536,863.946 | 285,666.502 | (142,449.650) | 680,080.798 |
| Class B | - | 2,314.001 | (20.866) | 2,293.135 |
| Utilities: | | | | |
| Class A | 189,409.984 | 190,914.332 | (38,376.831) | 341,947.485 |
| Class B | - | - | - | - |
| Small Company Growth: | | | | |
| Class A | 212,503.210 | 609,134.460 | (163,138.502) | 658,499.168 |
| Class B | - | 2,483.692 | (24.219) | 2,459.473 |
| Van Eck Associates Corporation: | | | | |
| Worldwide Hard Assets: | | | | |
| Class A | 236,972.429 | 53,067.697 | (75,068.462) | 214,971.664 |
| Class B | - | - | - | - |
| Worldwide Bond: | | | | |
| Class A | 33,114.078 | 77,355.439 | (19,232.793) | 91,236.724 |
| Class B | - | 51.386 | (9.286) | 42.100 |
| Worldwide Emerging Markets: | | | | |
| Class A | 228,819.195 | 390,868.355 | (76,373.129) | 543,314.421 |
| Class B | - | 36,097.306 | (54.040) | 36,043.266 |
| Worldwide Real Estate: | | | | |
| Class A | 64,967.173 | 103,195.970 | (36,955.247) | 131,207.896 |
| Class B | - | 439.384 | (44.011) | 395.373 |
| AIM Advisors, Inc.: | | | | |
| Capital Appreciation: | | | | |
| Class A | 323,846.032 | 377,520.848 | (53,883.069) | 647,483.811 |
| Class B | - | 3,435,588.521 | (164.158) | 3,435,424.363 |
| Government Securities: | | | | |
| Class A | 715,905.149 | 682,457.548 | (376,148.854) | 1,022,213.843 |
| Class B | - | 469,546.296 | (11.016) | 469,535.280 |
Strategic Investor 226
Security Life Separate Account L1
Notes to Financial Statements (continued)
7. Summary of Changes in Units (continued)
Division
| Outstanding at Beginning of Year
| Increase for Payments Received
| (Decrease) for Withdrawals and Other Deductions
| Outstanding at End of Year
|
| | | | |
| Directed Services, Inc. (GCG): | | | | |
| Equity Income: | | | | |
| Class A | - | - | - | - |
| Class B | - | - | - | - |
| Growth: | | | | |
| Class A | - | - | - | - |
| Class B | - | 103.679 | - | 103.679 |
| Hard Assets: | | | | |
| Class A | - | - | - | - |
| Class B | - | - | - | - |
| Limited Maturity Bond: | | | | |
| Class A | - | - | - | - |
| Class B | - | 80,478.798 | - | 80,478.798 |
| Liquid Asset: | | | | |
| Class A | - | - | - | - |
| Class B | - | 5,018,488.796 | (4,834,556.175) | 183,932.621 |
| MidCap Growth: | | | | |
| Class A | - | - | - | - |
| Class B | - | - | - | - |
| Research: | | | | |
| Class A | - | - | - | - |
| Class B | - | - | - | - |
| Total Return: | | | | |
| Class A | - | - | - | - |
| Class B | - | 908.365 | - | 908.365 |
| | | | |
| Janus Aspen Series Funds: | | | | |
| Growth: | | | | |
| Class A | - | 37,656.545 | (8,226.269) | 29,430.276 |
| Class B | - | - | - | - |
| Aggressive Growth: | | | | |
| Class A | - | 53,792.856 | (40.067) | 53,752.789 |
| Class B | - | 22,786.649 | - | 22,786.649 |
| Worldwide Growth: | | | | |
| Class A | - | 33,160.748 | (13,450.203) | 19,710.545 |
| Class B | - | 17,011.166 | - | 17,011.166 |
| International Growth: | | | | |
| Class A | - | 43,058.359 | (952.283) | 42,106.076 |
| Class B | - | 6,269.387 | - | 6,269.387 |
Strategic Investor 227
Security Life Separate Account L1
Notes to Financial Statements (continued)
7. Summary of Changes in Units (continued)
The following schedule summarizes the changes in divisional units for the year ended December 31, 1999:
Division
| Outstanding at Beginning of Year
| Increase for Payments Received
| (Decrease) for Withdrawals and Other Deductions
| Outstanding at End of Year
|
| | | | |
| Neuberger Berman Management Inc.: | | | | |
| Limited Maturity Bond | 1,245,559.121 | 421,349.898 | (777,749.415) | 889,159.604 |
| Growth | 447,486.376 | 233,319.969 | (246,467.977) | 434,338.368 |
| Partners | 986,298.018 | 385,667.451 | (159,832.021) | 1,212,133.448 |
| | | | |
| Fred Alger Management, Inc.: | | | | |
| American Small Capitalization | 838,692.418 | 603,898.891 | (386,833.825) | 1,055,757.484 |
| American MidCap Growth | 402,532.472 | 225,361.191 | (51,155.349) | 576,738.314 |
| American Growth | 923,696.066 | 585,374.403 | (251,698.832) | 1,257,371.637 |
| American Leveraged AllCap | 221,642.446 | 410,084.371 | (206,445.718) | 425,281.099 |
| | | | |
| Fidelity Management & Research Co.: | | | | |
| Asset Manager | 600,255.213 | 393,745.577 | (271,282.884) | 722,717.906 |
| Growth | 1,293,480.338 | 2,233,512.279 | (1,850,755.971) | 1,676,236.646 |
| Overseas | 1,429,659.907 | 963,512.218 | (676,554.498) | 1,716,617.627 |
| Money Market | 1,526,404.399 | 9,068,762.545 | (7,831,518.647) | 2,763,648.297 |
| Index 500 | 3,215,990.519 | 1,840,375.191 | (283,881.113) | 4,772,484.597 |
| | | | |
| INVESCO Funds Group, Inc.: | | | | |
| Total Return | 450,557.216 | 300,554.107 | (148,923.709) | 602,187.614 |
| Equity Income | 473,616.752 | 252,971.948 | (105,540.763) | 621,047.937 |
| High Yield | 486,858.648 | 226,071.484 | (176,066.186) | 536,863.946 |
| Utilities | 110,379.616 | 140,069.045 | (61,038.677) | 189,409.984 |
| Small Company Growth | 67,506.441 | 210,114.805 | (65,118.036) | 212,503.210 |
| | | | |
| Van Eck Associates Corporation: | | | | |
| Worldwide Hard Assets | 132,513.824 | 246,466.322 | (142,007.717) | 236,972.429 |
| Worldwide Bond | 18,656.317 | 43,237.412 | (28,779.651) | 33,114.078 |
| Worldwide Emerging Markets | 67,354.295 | 582,654.548 | (421,189.648) | 228,819.195 |
| Worldwide Real Estate | 8,765.232 | 67,514.147 | (11,312.206) | 64,967.173 |
| | | | |
| AIM Advisors, Inc.: | | | | |
| Capital Appreciation | 105,457.867 | 263,795.629 | (45,407.464) | 323,846.032 |
| Government Securities | 246,150.062 | 723,064.769 | (253,309.682) | 715,905.149 |
Strategic Investor 228
Security Life Separate Account L1
Notes to Financial Statements (continued)
7. Summary of Changes in Units (continued)
The following schedule summarizes the changes in divisional units for the year ended December 31, 1998:
Division
| Outstanding at Beginning of Year
| Increase for Payments Received
| (Decrease) for Withdrawals and
Other Deductions
| Outstanding at End of Year
|
| | | | |
| Neuberger Berman Management Inc.: | | | | |
| Limited Maturity Bond | 552,985.394 | 801,233.327 | (108,659.600) | 1,245,559.121 |
| Growth | 316,146.084 | 250,854.619 | (119,514.327) | 447,486.376 |
| Government Income | 75,811.559 | 58.537 | (75,870.096) | - |
| Partners | 626,285.721 | 455,096.290 | (95,083.993) | 986,298.018 |
| | | | |
| Fred Alger Management, Inc.: | | | | |
| American Small Capitalization | 648,733.740 | 333,770.247 | (143,811.569) | 838,692.418 |
| American MidCap Growth | 288,809.482 | 167,037.228 | (53,314.238) | 402,532.472 |
| American Growth | 569,990.309 | 442,313.190 | (88,607.433) | 923,696.066 |
| American Leveraged AllCap | 148,542.639 | 102,168.282 | (29,068.475) | 221,642.446 |
| | | | |
| Fidelity Management & Research Co.: | | | | |
| Asset Manager | 410,906.106 | 270,972.780 | (81,623.673) | 600,255.213 |
| Growth | 983,842.388 | 614,542.294 | (304,904.344) | 1,293,480.338 |
| Overseas | 950,328.899 | 861,220.218 | (381,889.210) | 1,429,659.907 |
| Money Market | 1,303,059.881 | 5,059,561.984 | (4,836,217.466) | 1,526,404.399 |
| Index 500 | 1,863,056.104 | 1,617,935.444 | (265,001.029) | 3,215,990.519 |
| | | | |
| INVESCO Funds Group, Inc.: | | | | |
| Total Return | 184,042.238 | 307,178.543 | (40,663.565) | 450,557.216 |
| Equity Income | 297,553.033 | 216,644.366 | (40,580.647) | 473,616.752 |
| High Yield | 333,501.857 | 283,205.205 | (129,848.414) | 486,858.648 |
| Utilities | 78,118.685 | 41,701.114 | (9,440.183) | 110,379.616 |
| Small Company Growth | - | 71,535.065 | (4,028.624) | 67,506.441 |
| | | | |
| Van Eck Associates Corporation: | | | | |
| Worldwide Balanced | 32,139.282 | 190.627 | (32,329.909) | - |
| Worldwide Hard Assets | 77,046.773 | 68,491.375 | (13,024.324) | 132,513.824 |
| Worldwide Bond | - | 18,882.425 | (226.108) | 18,656.317 |
| Worldwide Emerging Markets | - | 105,064.405 | (37,710.110) | 67,354.295 |
| Worldwide Real Estate | - | 9,848.072 | (1,082.840) | 8,765.232 |
| | | | |
| AIM Advisors, Inc.: | | | | |
| Capital Appreciation | - | 108,895.839 | (3,437.972) | 105,457.867 |
| Government Securities | - | 261,432.015 | (15,281.953) | 246,150.062 |
Strategic Investor 229
Security Life Separate Account L1
Notes to Financial Statements (continued)
8. Net Assets
Net assets at December 31, 2000 consisted of the following:
Division
| Principal Transactions
| Accumulated Investment Income (Loss)
| Accumulated Net Realized Gains (Losses) on Investments
| Net Unrealized Gains (Losses) on Investments
| Net Assets
|
| | | | | |
| Neuberger Berman Management Inc.: | | | | | |
| Limited Maturity Bond | $ 12,875,450 | $ 2,040,309 | $ (593,370) | $ 171,762 | $ 14,494,151 |
| Growth | 16,507,147 | 3,350,605 | 3,828,663 | (3,741,509) | 19,944,906 |
| Partners | 22,990,354 | 7,470,143 | (3,598,509) | 693,791 | 27,555,779 |
| | | | | |
| Fred Alger Management, Inc.: | | | | | |
| American Small Capitalization | 24,994,589 | 13,518,183 | (9,552,848) | (2,790,794) | 26,169,130 |
| American MidCap Growth | 25,790,401 | 4,859,141 | 1,939,444 | 704,765 | 33,293,751 |
| American Growth | 42,065,399 | 10,516,454 | 4,961,215 | (7,424,636) | 50,118,432 |
| American Leveraged AllCap | 22,124,855 | 2,992,031 | 5,298,494 | (6,037,772) | 24,377,608 |
| | | | | |
| Fidelity Management & Research Co.: | | | | | |
| Asset Manager | 13,593,835 | 3,007,490 | 193,073 | (1,039,780) | 15,754,618 |
| Growth | 52,479,909 | 12,125,623 | 12,261,725 | (8,361,054) | 68,506,203 |
| Overseas | 39,756,895 | 5,133,376 | 3,021,551 | (4,589,945) | 43,321,877 |
| Money Market | 56,817,693 | 5,197,119 | - | - | 62,014,812 |
| Index 500 | 154,623,275 | 3,154,401 | 14,248,512 | 8,914,253 | 180,940,441 |
| | | | | |
| INVESCO Funds Group, Inc.: | | | | | |
| Total Return | 11,552,212 | 2,025,307 | 185,567 | (2,068,455) | 11,694,631 |
| Equity Income | 17,049,701 | 2,143,899 | 1,591,780 | 750,716 | 21,536,096 |
| High Yield | 10,481,018 | 1,938,615 | (429,872) | (1,493,409) | 10,496,352 |
| Utilities | 6,663,951 | 338,852 | 688,493 | 120,636 | 7,811,932 |
| Small Company Growth | 12,539,097 | 260,565 | 1,425,580 | (2,377,139) | 11,848,103 |
| | | | | |
| Van Eck Associates Corporation: | | | | | |
| Worldwide Hard Assets | 2,194,793 | 156,270 | (309,310) | 271,598 | 2,313,351 |
| Worldwide Bond | 929,038 | 25,274 | (40,507) | 17,622 | 931,427 |
| Worldwide Emerging Markets | 5,860,675 | (43,813) | 396,614 | (1,651,476) | 4,562,000 |
| Worldwide Real Estate | 1,178,540 | 7,326 | 6,931 | 119,511 | 1,312,308 |
| | | | | |
| AIM Advisors, Inc.: | | | | | |
| Capital Appreciation | 50,999,939 | 326,605 | 507,069 | (794,937) | 51,038,676 |
| Government Securities | 15,834,280 | 707,601 | 56,932 | 165,085 | 16,763,898 |
Strategic Investor 230
Security Life Separate Account L1
Notes to Financial Statements (continued)
8. Net Assets (continued)
Division
| Principal Transactions
| Accumulated Investment Income (Loss)
| Accumulated Net Realized Gains (Losses) on Investments
| Net Unrealized Gains (Losses) on Investments
| Net Assets
|
| | | | | |
| Directed Services, Inc. (GCG): | | | | | |
| Equity Income | $ - | $ - | $ - | $ - | $ - |
| Growth | 1,311 | 90 | - | (168) | 1,233 |
| Hard Assets | - | - | - | - | - |
| Limited Maturity Bond | 867,803 | 54,281 | - | (45,286) | 876,798 |
| Liquid Asset | 1,130,199 | 861,303 | - | - | 1,991,502 |
| MidCap Growth | - | - | - | - | - |
| Research | - | - | - | - | - |
| Total Return | 10,297 | 786 | - | (550) | 10,533 |
| | | | | |
| Janus Aspen Series Funds: | | | | | |
| Growth | 260,474 | (180) | (1,546) | (15,107) | 243,641 |
| Aggressive Growth | 575,365 | (218) | (86) | (50,478) | 524,583 |
| Worldwide Growth | 343,821 | (64) | (7,584) | (16,753) | 319,420 |
| International Growth | 437,045 | 597 | (513) | (16,513) | 420,616 |
|
|
|
|
|
|
| Total | $623,529,361
| $82,167,971
| $36,077,498
| $(30,586,022)
| $711,188,808
|
Strategic Investor 231
APPENDIX A
Factors for the
Cash Value Accumulation Test
For a Life Insurance Policy
| Attained Age | Male | Female | Unisex | Attained Age | Male | Female | Unisex | Attained Age | Male | Female | Unisex |
| | |
| 0 | 11.727 | 14.234 | 12.149 | | | | | | | | |
| 1 | 11.785 | 14.209 | 12.194 | 34 | 4.188 | 4.902 | 4.314 | 67 | 1.617 | 1.815 | 1.657 |
| 2 | 11.458 | 13.815 | 11.857 | 35 | 4.052 | 4.742 | 4.173 | 68 | 1.583 | 1.769 | 1.620 |
| 3 | 11.128 | 13.417 | 11.515 | 36 | 3.920 | 4.586 | 4.037 | 69 | 1.550 | 1.724 | 1.585 |
| 4 | 10.803 | 13.023 | 11.178 | 37 | 3.793 | 4.437 | 3.906 | 70 | 1.518 | 1.681 | 1.552 |
| 5 | 10.481 | 12.635 | 10.845 | 38 | 3.670 | 4.293 | 3.780 | 71 | 1.488 | 1.639 | 1.520 |
| 6 | 10.161 | 12.253 | 10.514 | 39 | 3.553 | 4.154 | 3.658 | 72 | 1.459 | 1.599 | 1.489 |
| 7 | 9.844 | 11.875 | 10.187 | 40 | 3.439 | 4.021 | 3.541 | 73 | 1.432 | 1.560 | 1.460 |
| 8 | 9.530 | 11.505 | 9.863 | 41 | 3.330 | 3.894 | 3.429 | 74 | 1.406 | 1.524 | 1.433 |
| 9 | 9.221 | 11.141 | 9.545 | 42 | 3.226 | 3.771 | 3.322 | 75 | 1.382 | 1.490 | 1.407 |
| 10 | 8.918 | 10.784 | 9.233 | 43 | 3.125 | 3.654 | 3.218 | 76 | 1.359 | 1.457 | 1.383 |
| 11 | 8.623 | 10.436 | 8.928 | 44 | 3.028 | 3.541 | 3.119 | 77 | 1.338 | 1.427 | 1.360 |
| 12 | 8.338 | 10.098 | 8.634 | 45 | 2.936 | 3.432 | 3.023 | 78 | 1.318 | 1.398 | 1.338 |
| 13 | 8.066 | 9.771 | 8.353 | 46 | 2.846 | 3.328 | 2.931 | 79 | 1.299 | 1.371 | 1.318 |
| 14 | 7.808 | 9.455 | 8.085 | 47 | 2.761 | 3.227 | 2.843 | 80 | 1.281 | 1.345 | 1.298 |
| 15 | 7.564 | 9.150 | 7.831 | 48 | 2.678 | 3.129 | 2.758 | 81 | 1.264 | 1.321 | 1.280 |
| 16 | 7.335 | 8.857 | 7.592 | 49 | 2.599 | 3.035 | 2.676 | 82 | 1.248 | 1.298 | 1.262 |
| 17 | 7.118 | 8.575 | 7.364 | 50 | 2.522 | 2.945 | 2.597 | 83 | 1.233 | 1.277 | 1.245 |
| 18 | 6.911 | 8.302 | 7.148 | 51 | 2.449 | 2.858 | 2.522 | 84 | 1.218 | 1.257 | 1.230 |
| 19 | 6.713 | 8.038 | 6.939 | 52 | 2.378 | 2.774 | 2.449 | 85 | 1.205 | 1.238 | 1.215 |
| 20 | 6.521 | 7.782 | 6.737 | 53 | 2.311 | 2.693 | 2.379 | 86 | 1.193 | 1.221 | 1.202 |
| 21 | 6.334 | 7.534 | 6.540 | 54 | 2.246 | 2.615 | 2.312 | 87 | 1.181 | 1.205 | 1.189 |
| 22 | 6.150 | 7.293 | 6.347 | 55 | 2.184 | 2.540 | 2.248 | 88 | 1.171 | 1.190 | 1.177 |
| 23 | 5.969 | 7.059 | 6.158 | 56 | 2.125 | 2.468 | 2.187 | 89 | 1.160 | 1.176 | 1.166 |
| 24 | 5.791 | 6.831 | 5.971 | 57 | 2.068 | 2.398 | 2.128 | 90 | 1.151 | 1.163 | 1.155 |
| 25 | 5.615 | 6.611 | 5.788 | 58 | 2.014 | 2.330 | 2.071 | 91 | 1.141 | 1.150 | 1.144 |
| 26 | 5.441 | 6.396 | 5.608 | 59 | 1.962 | 2.265 | 2.017 | 92 | 1.131 | 1.137 | 1.133 |
| 27 | 5.271 | 6.188 | 5.431 | 60 | 1.912 | 2.201 | 1.965 | 93 | 1.120 | 1.125 | 1.122 |
| 28 | 5.104 | 5.986 | 5.258 | 61 | 1.864 | 2.139 | 1.915 | 94 | 1.109 | 1.112 | 1.110 |
| 29 | 4.940 | 5.791 | 5.089 | 62 | 1.818 | 2.079 | 1.867 | 95 | 1.097 | 1.098 | 1.097 |
| 30 | 4.781 | 5.601 | 4.925 | 63 | 1.774 | 2.022 | 1.821 | 96 | 1.083 | 1.084 | 1.084 |
| 31 | 4.626 | 5.418 | 4.765 | 64 | 1.732 | 1.967 | 1.777 | 97 | 1.069 | 1.069 | 1.069 |
| 32 | 4.476 | 5.241 | 4.610 | 65 | 1.692 | 1.914 | 1.735 | 98 | 1.054 | 1.054 | 1.054 |
| 33 | 4.330 | 5.069 | 4.459 | 66 | 1.654 | 1.863 | 1.695 | 99 | 1.040 | 1.040 | 1.040 |
| | | | | | | | 100 | 1.000 | 1.000 | 1.000 |
| | | | | | | | | | | |
Strategic Investor 232
APPENDIX A - Enhanced
Factors for the
Cash Value Accumulation Test
For a Life Insurance Policy
| Attained Age | Male | Female | Unisex | Attained Age | Male | Female | Unisex | Attained Age | Male | Female | Unisex |
| | |
| 0 | 11.727 | 14.234 | 12.149 | | | | | | | | |
| 1 | 11.785 | 14.209 | 12.194 | 34 | 4.188 | 4.902 | 4.314 | 67 | 1.617 | 1.815 | 1.657 |
| 2 | 11.458 | 13.815 | 11.857 | 35 | 4.052 | 4.742 | 4.173 | 68 | 1.583 | 1.769 | 1.620 |
| 3 | 11.128 | 13.417 | 11.515 | 36 | 3.920 | 4.586 | 4.037 | 69 | 1.550 | 1.724 | 1.585 |
| 4 | 10.803 | 13.023 | 11.178 | 37 | 3.793 | 4.437 | 3.906 | 70 | 1.518 | 1.681 | 1.552 |
| 5 | 10.481 | 12.635 | 10.845 | 38 | 3.670 | 4.293 | 3.780 | 71 | 1.503 | 1.655 | 1.535 |
| 6 | 10.161 | 12.253 | 10.514 | 39 | 3.553 | 4.154 | 3.658 | 72 | 1.488 | 1.631 | 1.519 |
| 7 | 9.844 | 11.875 | 10.187 | 40 | 3.439 | 4.021 | 3.541 | 73 | 1.475 | 1.607 | 1.504 |
| 8 | 9.530 | 11.505 | 9.863 | 41 | 3.330 | 3.894 | 3.429 | 74 | 1.462 | 1.585 | 1.490 |
| 9 | 9.221 | 11.141 | 9.545 | 42 | 3.226 | 3.771 | 3.322 | 75 | 1.451 | 1.565 | 1.477 |
| 10 | 8.918 | 10.784 | 9.233 | 43 | 3.125 | 3.654 | 3.218 | 76 | 1.441 | 1.544 | 1.466 |
| 11 | 8.623 | 10.436 | 8.928 | 44 | 3.028 | 3.541 | 3.119 | 77 | 1.432 | 1.527 | 1.455 |
| 12 | 8.338 | 10.098 | 8.634 | 45 | 2.936 | 3.432 | 3.023 | 78 | 1.423 | 1.510 | 1.445 |
| 13 | 8.066 | 9.771 | 8.353 | 46 | 2.846 | 3.328 | 2.931 | 79 | 1.416 | 1.494 | 1.437 |
| 14 | 7.808 | 9.455 | 8.085 | 47 | 2.761 | 3.227 | 2.843 | 80 | 1.409 | 1.480 | 1.428 |
| 15 | 7.564 | 9.150 | 7.831 | 48 | 2.678 | 3.129 | 2.758 | 81 | 1.378 | 1.440 | 1.395 |
| 16 | 7.335 | 8.857 | 7.592 | 49 | 2.599 | 3.035 | 2.676 | 82 | 1.348 | 1.402 | 1.363 |
| 17 | 7.118 | 8.575 | 7.364 | 50 | 2.522 | 2.945 | 2.597 | 83 | 1.319 | 1.366 | 1.332 |
| 18 | 6.911 | 8.302 | 7.148 | 51 | 2.449 | 2.858 | 2.522 | 84 | 1.291 | 1.332 | 1.304 |
| 19 | 6.713 | 8.038 | 6.939 | 52 | 2.378 | 2.774 | 2.449 | 85 | 1.265 | 1.300 | 1.276 |
| 20 | 6.521 | 7.782 | 6.737 | 53 | 2.311 | 2.693 | 2.379 | 86 | 1.241 | 1.270 | 1.250 |
| 21 | 6.334 | 7.534 | 6.540 | 54 | 2.246 | 2.615 | 2.312 | 87 | 1.216 | 1.241 | 1.225 |
| 22 | 6.150 | 7.293 | 6.347 | 55 | 2.184 | 2.540 | 2.248 | 88 | 1.194 | 1.214 | 1.201 |
| 23 | 5.969 | 7.059 | 6.158 | 56 | 2.125 | 2.468 | 2.187 | 89 | 1.172 | 1.188 | 1.178 |
| 24 | 5.791 | 6.831 | 5.971 | 57 | 2.068 | 2.398 | 2.128 | 90 | 1.151 | 1.163 | 1.155 |
| 25 | 5.615 | 6.611 | 5.788 | 58 | 2.014 | 2.330 | 2.071 | 91 | 1.141 | 1.150 | 1.144 |
| 26 | 5.441 | 6.396 | 5.608 | 59 | 1.962 | 2.265 | 2.017 | 92 | 1.131 | 1.137 | 1.133 |
| 27 | 5.271 | 6.188 | 5.431 | 60 | 1.912 | 2.201 | 1.965 | 93 | 1.120 | 1.125 | 1.122 |
| 28 | 5.104 | 5.986 | 5.258 | 61 | 1.864 | 2.139 | 1.915 | 94 | 1.109 | 1.112 | 1.110 |
| 29 | 4.940 | 5.791 | 5.089 | 62 | 1.818 | 2.079 | 1.867 | 95 | 1.097 | 1.098 | 1.097 |
| 30 | 4.781 | 5.601 | 4.925 | 63 | 1.774 | 2.022 | 1.821 | 96 | 1.083 | 1.084 | 1.084 |
| 31 | 4.626 | 5.418 | 4.765 | 64 | 1.732 | 1.967 | 1.777 | 97 | 1.069 | 1.069 | 1.069 |
| 32 | 4.476 | 5.241 | 4.610 | 65 | 1.692 | 1.914 | 1.735 | 98 | 1.054 | 1.054 | 1.054 |
| 33 | 4.330 | 5.069 | 4.459 | 66 | 1.654 | 1.863 | 1.695 | 99 | 1.040 | 1.040 | 1.040 |
| | | | | | | | 100 | 1.000 | 1.000 | 1.000 |
| | | | | | | | | | | |
Strategic Investor 233
APPENDIX B
<R>Definition of Life Insurance
Guideline Premium Test/Cash Value Corridor Test
Death Benefit Factors</R>
| Attained Age | Factor | Attained Age | Factor | Attained Age | Factor | Attained Age | Factor |
| |
| 0 | 2.50 | 25 | 2.50 | 50 | 1.85 | 75 | 1.05 |
| 1 | 2.50 | 26 | 2.50 | 51 | 1.78 | 76 | 1.05 |
| 2 | 2.50 | 27 | 2.50 | 52 | 1.71 | 77 | 1.05 |
| 3 | 2.50 | 28 | 2.50 | 53 | 1.64 | 78 | 1.05 |
| 4 | 2.50 | 29 | 2.50 | 54 | 1.57 | 79 | 1.05 |
| |
| 5 | 2.50 | 30 | 2.50 | 55 | 1.50 | 80 | 1.05 |
| 6 | 2.50 | 31 | 2.50 | 56 | 1.46 | 81 | 1.05 |
| 7 | 2.50 | 32 | 2.50 | 57 | 1.42 | 82 | 1.05 |
| 8 | 2.50 | 33 | 2.50 | 58 | 1.38 | 83 | 1.05 |
| 9 | 2.50 | 34 | 2.50 | 59 | 1.34 | 84 | 1.05 |
| |
| 10 | 2.50 | 35 | 2.50 | 60 | 1.30 | 85 | 1.05 |
| 11 | 2.50 | 36 | 2.50 | 61 | 1.28 | 86 | 1.05 |
| 12 | 2.50 | 37 | 2.50 | 62 | 1.26 | 87 | 1.05 |
| 13 | 2.50 | 38 | 2.50 | 63 | 1.24 | 88 | 1.05 |
| 14 | 2.50 | 39 | 2.50 | 64 | 1.22 | 89 | 1.05 |
|
| 15 | 2.50 | 40 | 2.50 | 65 | 1.20 | 90 | 1.05 |
| 16 | 2.50 | 41 | 2.43 | 66 | 1.19 | 91 | 1.04 |
| 17 | 2.50 | 42 | 2.36 | 67 | 1.18 | 92 | 1.03 |
| 18 | 2.50 | 43 | 2.29 | 68 | 1.17 | 93 | 1.02 |
| 19 | 2.50 | 44 | 2.22 | 69 | 1.16 | 94 | 1.01 |
| |
| 20 | 2.50 | 45 | 2.15 | 70 | 1.15 | 95 | 1.00 |
| 21 | 2.50 | 46 | 2.09 | 71 | 1.13 | 96 | 1.00 |
| 22 | 2.50 | 47 | 2.03 | 72 | 1.11 | 97 | 1.00 |
| 23 | 2.50 | 48 | 1.97 | 73 | 1.09 | 98 | 1.00 |
| 24 | 2.50 | 49 | 1.91 | 74 | 1.07 | 99 | 1.00 |
| |
| | | | | | 100 | 1.00 |
THE POLICY'S BASE DEATH BENEFIT AT ANY TIME WILL BE AT LEAST EQUAL TO THE ACCOUNT VALUE TIMES THE APPROPRIATE FACTOR FROM THIS TABLE.
Strategic Investor 234
APPENDIX B - Enhanced
<R>Definition of Life Insurance
Guideline Premium Test/Cash Value Corridor Test
Death Benefit Factors</R>
| Attained Age | Factor | Attained Age | Factor | Attained Age | Factor | Attained Age | Factor |
| |
| 0 | 2.50 | 25 | 2.50 | 50 | 1.85 | 75 | 1.10 |
| 1 | 2.50 | 26 | 2.50 | 51 | 1.78 | 76 | 1.11 |
| 2 | 2.50 | 27 | 2.50 | 52 | 1.71 | 77 | 1.12 |
| 3 | 2.50 | 28 | 2.50 | 53 | 1.64 | 78 | 1.13 |
| 4 | 2.50 | 29 | 2.50 | 54 | 1.57 | 79 | 1.14 |
| |
| 5 | 2.50 | 30 | 2.50 | 55 | 1.50 | 80 | 1.16 |
| 6 | 2.50 | 31 | 2.50 | 56 | 1.46 | 81 | 1.14 |
| 7 | 2.50 | 32 | 2.50 | 57 | 1.42 | 82 | 1.13 |
| 8 | 2.50 | 33 | 2.50 | 58 | 1.38 | 83 | 1.12 |
| 9 | 2.50 | 34 | 2.50 | 59 | 1.34 | 84 | 1.11 |
| |
| 10 | 2.50 | 35 | 2.50 | 60 | 1.30 | 85 | 1.10 |
| 11 | 2.50 | 36 | 2.50 | 61 | 1.28 | 86 | 1.09 |
| 12 | 2.50 | 37 | 2.50 | 62 | 1.26 | 87 | 1.08 |
| 13 | 2.50 | 38 | 2.50 | 63 | 1.24 | 88 | 1.07 |
| 14 | 2.50 | 39 | 2.50 | 64 | 1.22 | 89 | 1.06 |
|
| 15 | 2.50 | 40 | 2.50 | 65 | 1.20 | 90 | 1.05 |
| 16 | 2.50 | 41 | 2.43 | 66 | 1.19 | 91 | 1.04 |
| 17 | 2.50 | 42 | 2.36 | 67 | 1.18 | 92 | 1.03 |
| 18 | 2.50 | 43 | 2.29 | 68 | 1.17 | 93 | 1.02 |
| 19 | 2.50 | 44 | 2.22 | 69 | 1.16 | 94 | 1.01 |
| |
| 20 | 2.50 | 45 | 2.15 | 70 | 1.15 | 95 | 1.00 |
| 21 | 2.50 | 46 | 2.09 | 71 | 1.14 | 96 | 1.00 |
| 22 | 2.50 | 47 | 2.03 | 72 | 1.13 | 97 | 1.00 |
| 23 | 2.50 | 48 | 1.97 | 73 | 1.12 | 98 | 1.00 |
| 24 | 2.50 | 49 | 1.91 | 74 | 1.11 | 99 | 1.00 |
| |
| | | | | | 100 | 1.00 |
THE POLICY'S BASE DEATH BENEFIT AT ANY TIME WILL BE AT LEAST EQUAL TO THE ACCOUNT VALUE TIMES THE APPROPRIATE FACTOR FROM THIS TABLE.
Strategic Investor 235
APPENDIX C
Performance Information
POLICY PERFORMANCE
The following hypothetical illustrations demonstrate how the actual investment experience of each variable investment option of the separate account affects the cash surrender value, account value and death benefit of a policy. These hypothetical illustrations are based on the actual historical return of each investment portfolio as if a policy had been issued on the date indicated. Each investment portfolio's annual total return is based on the total return calculated for each fiscal year. These annual total return figures reflect the investment portfolio's net management fees after any voluntary waiver and other operating expenses but do not reflect the policy level or separate account asset-based charges and deductions, which if reflected, would result in lower total return figures than those shown.
The illustrations are based on the payment of a $3,750 annual premium, received at the beginning of each year, for a hypothetical policy with a $300,000 stated death benefit, the cash value accumulation test, death benefit option 1, issued to a preferred, tobacco non-user male, age 45. In each case, it is assumed that all premium is allocated to the variable investment option investing in the investment portfolio illustrated for the period shown. The benefits are calculated for a specific date. The amount and timing of premium payments and the use of other policy features, such as policy loans, would affect individual policy benefits.
The amounts shown for the cash surrender values, account values and death benefits take into account the charges from premium, current cost of insurance and monthly deductions, and each investment portfolio's charges and expenses. See Charges and Deductions, page 45.
Strategic Investor 236
| HYPOTHETICAL ILLUSTRATIONS |
| Tobacco Non-user Male Age 45 | | | Cash Value Accumulation Test |
| Preferred Risk Class | | | Death Benefit Option 1 |
| Stated Death Benefit $300,000 | | | Annual Premium $3,750 |
| | | | | |
| AIM V.I. Capital Appreciation Fund | | | | | |
| Year Ended: | | Annual Total Return* | | Cash Surrender Value | | Account Value | | Death Benefit |
| 12/31/94 | | 2.50% | | 3,119 | | 2,707 | | 300,000 |
| 12/31/95 | | 35.69% | | 7,704 | | 7,141 | | 300,000 |
| 12/31/96 | | 17.58% | | 11,595 | | 11,183 | | 300,000 |
| 12/31/97 | | 13.51% | | 15,369 | | 15,369 | | 300,000 |
| 12/31/98 | | 19.30% | | 21,057 | | 21,057 | | 300,000 |
| 12/31/99 | | 44.61% | | 33,862 | | 33,862 | | 300,000 |
| 12/31/00 | | -10.91% | | 32,006 | | 32,006 | | 300,000 |
| | | | | | | | | |
| AIM V.I. Government Securities Fund | | | | | |
| Year Ended: | | Annual Total Return* | | Cash Surrender Value | | Account Value | | Death Benefit |
| 12/31/94 | | -3.73% | | 2,940 | | 2,527 | | 300,000 |
| 12/31/95 | | 15.56% | | 6,388 | | 5,826 | | 300,000 |
| 12/31/96 | | 2.29% | | 8,753 | | 8,340 | | 300,000 |
| 12/31/97 | | 8.16% | | 11,569 | | 11,569 | | 300,000 |
| 12/31/98 | | 7.73% | | 14,902 | | 14,902 | | 300,000 |
| 12/31/99 | | -1.32% | | 16,932 | | 16,932 | | 300,000 |
| 12/31/00 | | 10.12% | | 21,097 | | 21,097 | | 300,000 |
| | | | | | | | | |
| Alger American Growth Portfolio | | | | | | |
Year Ended: | | Annual Total Return* | | Cash Surrender Value | | Account Value | | Death Benefit |
| 12/31/91 | | 40.39% | | 4,216 | | 3,803 | | 300,000 |
| 12/31/92 | | 12.38% | | 7,644 | | 7,081 | | 300,000 |
| 12/31/93 | | 22.47% | | 12,004 | | 11,591 | | 300,000 |
| 12/31/94 | | 1.45% | | 14,109 | | 14,109 | | 300,000 |
| 12/31/95 | | 36.37% | | 22,423 | | 22,423 | | 300,000 |
| 12/31/96 | | 13.35% | | 27,992 | | 27,992 | | 300,000 |
| 12/31/97 | | 25.75% | | 38,002 | | 38,002 | | 300,000 |
| 12/31/98 | | 48.07% | | 59,529 | | 59,529 | | 300,000 |
| 12/31/99 | | 33.74% | | 82,326 | | 82,326 | | 300,000 |
| 12/31/00 | | -14.78% | | 71,568 | | 71,568 | | 300,000 |
| | | | | | | | | |
The assumptions underlying these values are described in Performance Information, page 236.
* These annual total return figures reflect the investment portfolio's management fees and other operating expenses but do not reflect the policy level or separate account asset-based charges and deductions which, if reflected, would result in lower total return figures than those shown.
Strategic Investor 237
| HYPOTHETICAL ILLUSTRATIONS (continued) |
| Tobacco Non-user Male Age 45 | | | Cash Value Accumulation Test |
| Preferred Risk Class | | | Death Benefit Option 1 |
| Stated Death Benefit $300,000 | | | Annual Premium $3,750 |
| | | | | |
| Alger American Leveraged AllCap Portfolio | | | | |
| Year Ended: | | Annual Total Return* | | Cash Surrender Value | | Account Value | | Death Benefit |
| 12/31/96 | | 12.04% | | 3,394 | | 2,982 | | 300,000 |
| 12/31/97 | | 19.68% | | 7,148 | | 6,586 | | 300,000 |
| 12/31/98 | | 57.83% | | 14,695 | | 14,282 | | 300,000 |
| 12/31/99 | | 78.06% | | 29,834 | | 29,834 | | 300,000 |
| 12/31/00 | | -24.83% | | 23,941 | | 23,941 | | 300,000 |
| | | | | | | | | |
| Alger American MidCap Growth Portfolio | | | | | |
| Year Ended: | | Annual Total Return* | | Cash Surrender Value | | Account Value | | Death Benefit |
| 12/31/94 | | -1.54% | | 3,003 | | 2,590 | | 300,000 |
| 12/31/95 | | 44.45% | | 8,021 | | 7,458 | | 300,000 |
| 12/31/96 | | 11.90% | | 11,389 | | 10,976 | | 300,000 |
| 12/31/97 | | 15.01% | | 15,341 | | 15,341 | | 300,000 |
| 12/31/98 | | 30.30% | | 23,003 | | 23,003 | | 300,000 |
| 12/31/99 | | 31.85% | | 33,389 | | 33,389 | | 300,000 |
| 12/31/00 | | 9.18% | | 38,804 | | 38,804 | | 300,000 |
| | | | | | | | | |
| Alger American Small Capitalization Portfolio | | | | |
| Year Ended: | | Annual Total Return* | | Cash Surrender Value | | Account Value | | Death Benefit |
| 12/31/91 | | 57.54% | | 4,715 | | 4,303 | | 300,000 |
| 12/31/92 | | 3.55% | | 7,576 | | 7,013 | | 300,000 |
| 12/31/93 | | 13.28% | | 11,028 | | 10,615 | | 300,000 |
| 12/31/94 | | -4.38% | | 12,349 | | 12,349 | | 300,000 |
| 12/31/95 | | 44.31% | | 21,229 | | 21,229 | | 300,000 |
| 12/31/96 | | 4.18% | | 24,456 | | 24,456 | | 300,000 |
| 12/31/97 | | 11.39% | | 29,689 | | 29,689 | | 300,000 |
| 12/31/98 | | 15.53% | | 36,773 | | 36,773 | | 300,000 |
| 12/31/99 | | 43.42% | | 55,811 | | 55,811 | | 300,000 |
| 12/31/00 | | -27.20% | | 41,829 | | 41,829 | | 300,000 |
| | | | | | | | | |
| Fidelity VIP Growth Portfolio (Service Class) | | | | |
| Year Ended: | | Annual Total Return* | | Cash Surrender Value | | Account Value | | Death Benefit |
| 12/31/98 | | 39.38% | | 4,187 | | 3,774 | | 300,000 |
| 12/31/99 | | 37.29% | | 9,248 | | 8,686 | | 300,000 |
| 12/31/00 | | -11.05% | | 10,146 | | 9,734 | | 300,000 |
| | | | | | | | | |
The assumptions underlying these values are described in Performance Information, page 236.
* These annual total return figures reflect the investment portfolio's management fees and other operating expenses but do not reflect the policy level or separate account asset-based charges and deductions which, if reflected, would result in lower total return figures than those shown.
Strategic Investor 238
| HYPOTHETICAL ILLUSTRATIONS (continued) |
| Tobacco Non-user Male Age 45 | | | Cash Value Accumulation Test |
| Preferred Risk Class | | | Death Benefit Option 1 |
| Stated Death Benefit $300,000 | | | Annual Premium $3,750 |
| | | | | |
| Fidelity VIP Overseas Portfolio (Service Class) | | | | |
| Year Ended: | | Annual Total Return* | | Cash Surrender Value | | Account Value | | Death Benefit |
| 12/31/98 | | 12.69% | | 3,413 | | 3,001 | | 300,000 |
| 12/31/99 | | 42.44% | | 8,493 | | 7,930 | | 300,000 |
| 12/31/00 | | -19.18% | | 8,617 | | 8,205 | | 300,000 |
| | | | | | | | | |
| Fidelity VIP II Asset Manager Portfolio (Service Class) | | | | |
| Year Ended: | | Annual Total Return* | | Cash Surrender Value | | Account Value | | Death Benefit |
| 12/31/98 | | 14.82% | | 3,475 | | 3,062 | | 300,000 |
| 12/31/99 | | 11.01% | | 6,736 | | 6,173 | | 300,000 |
| 12/31/00 | | -4.06% | | 8,543 | | 8,131 | | 300,000 |
| | | | | | | | | |
| Fidelity VIP II Index 500 Portfolio | | | | |
| Year Ended: | | Annual Total Return* | | Cash Surrender Value | | Account Value | | Death Benefit |
| 12/31/93 | | 9.74% | | 3,328 | | 2,916 | | 300,000 |
| 12/31/94 | | 1.04% | | 6,006 | | 5,443 | | 300,000 |
| 12/31/95 | | 37.19% | | 11,212 | | 10,799 | | 300,000 |
| 12/31/96 | | 22.71% | | 16,179 | | 16,179 | | 300,000 |
| 12/31/97 | | 32.82% | | 24,563 | | 24,563 | | 300,000 |
| 12/31/98 | | 28.31% | | 34,474 | | 34,474 | | 300,000 |
| 12/31/99 | | 20.52% | | 44,182 | | 44,182 | | 300,000 |
| 12/31/00 | | -9.30% | | 41,865 | | 41,865 | | 300,000 |
| | | | | | | | | |
| The GCG Trust Fully Managed Portfolio | | | | |
| Year Ended: | | Annual Total Return* | | Cash Surrender Value | | Account Value | | Death Benefit |
| 12/31/91 | | 28.93% | | 3,883 | | 3,471 | | 300,000 |
| 12/31/92 | | 6.23% | | 6,887 | | 6,325 | | 300,000 |
| 12/31/93 | | 7.59% | | 9,739 | | 9,326 | | 300,000 |
| 12/31/94 | | -7.27% | | 10,776 | | 10,776 | | 300,000 |
| 12/31/95 | | 20.80% | | 15,808 | | 15,808 | | 300,000 |
| 12/31/96 | | 16.36% | | 21,085 | | 21,085 | | 300,000 |
| 12/31/97 | | 15.27% | | 26,869 | | 26,869 | | 300,000 |
| 12/31/98 | | 5.89% | | 30,691 | | 30,691 | | 300,000 |
| 12/31/99 | | 6.92% | | 34,997 | | 34,997 | | 300,000 |
| 12/31/00 | | 21.97% | | 45,129 | | 45,129 | | 300,000 |
| | | | | | | | | |
The assumptions underlying these values are described in Performance Information, page 236.
* These annual total return figures reflect the investment portfolio's management fees and other operating expenses but do not reflect the policy level or separate account asset-based charges and deductions which, if reflected, would result in lower total return figures than those shown.
Strategic Investor 239
| HYPOTHETICAL ILLUSTRATIONS (continued) |
| Tobacco Non-user Male Age 45 | | | Cash Value Accumulation Test |
| Preferred Risk Class | | | Death Benefit Option 1 |
| Stated Death Benefit $300,000 | | | Annual Premium $3,750 |
| | | | | |
| The GCG Trust Liquid Asset Portfolio | | | | |
| Year Ended: | | Annual Total Return* | | Cash Surrender Value | | Account Value | | Death Benefit |
| 12/31/91 | | 5.66% | | 3,210 | | 2,798 | | 300,000 |
| 12/31/92 | | 3.13% | | 6,004 | | 5,441 | | 300,000 |
| 12/31/93 | | 2.64% | | 8,390 | | 7,978 | | 300,000 |
| 12/31/94 | | 3.89% | | 10,724 | | 10,724 | | 300,000 |
| 12/31/95 | | 5.51% | | 13,699 | | 13,699 | | 300,000 |
| 12/31/96 | | 5.01% | | 16,786 | | 16,786 | | 300,000 |
| 12/31/97 | | 5.07% | | 19,957 | | 19,957 | | 300,000 |
| 12/31/98 | | 5.13% | | 23,231 | | 23,231 | | 300,000 |
| 12/31/99 | | 4.74% | | 26,489 | | 26,489 | | 300,000 |
| 12/31/00 | | 6.05% | | 30,175 | | 30,175 | | 300,000 |
| | | | | | | | | |
| The GCG Trust Mid-Cap Growth Portfolio | | | | |
| Year Ended: | | Annual Total Return* | | Cash Surrender Value | | Account Value | | Death Benefit |
| 12/31/99 | | 79.05% | | 5,343 | | 4,930 | | 300,000 |
| 12/31/00 | | 8.18% | | 8,579 | | 8,016 | | 300,000 |
| | | | | |
| INVESCO VIF-Equity Income Fund | | | | | |
| Year Ended: | | Annual Total Return* | | Cash Surrender Value | | Account Value | | Death Benefit |
| 12/31/95 | | 29.25% | | 3,893 | | 3,480 | | 300,000 |
| 12/31/96 | | 22.28% | | 7,904 | | 7,341 | | 300,000 |
| 12/31/97 | | 28.17% | | 12,894 | | 12,481 | | 300,000 |
| 12/31/98 | | 15.30% | | 17,107 | | 17,107 | | 300,000 |
| 12/31/99 | | 14.84% | | 22,239 | | 22,239 | | 300,000 |
| 12/31/00 | | 4.87% | | 25,675 | | 25,675 | | 300,000 |
| | | | | | | | | |
| INVESCO VIF-High Yield Fund | | | | | | |
| Year Ended: | | Annual Total Return* | | Cash Surrender Value | | Account Value | | Death Benefit |
| 12/31/95 | | 19.76% | | 3,618 | | 3,205 | | 300,000 |
| 12/31/96 | | 16.59% | | 7,228 | | 6,666 | | 300,000 |
| 12/31/97 | | 17.33% | | 11,016 | | 10,603 | | 300,000 |
| 12/31/98 | | 1.42% | | 13,108 | | 13,108 | | 300,000 |
| 12/31/99 | | 9.20% | | 16,782 | | 16,782 | | 300,000 |
| 12/31/00 | | -11.68% | | 16,768 | | 16,768 | | 300,000 |
| | | | | | | | | |
The assumptions underlying these values are described in Performance Information, page 236.
* These annual total return figures reflect the investment portfolio's management fees and other operating expenses but do not reflect the policy level or separate account asset-based charges and deductions which, if reflected, would result in lower total return figures than those shown.
Strategic Investor 240
| HYPOTHETICAL ILLUSTRATIONS (continued) |
| Tobacco Non-user Male Age 45 | | | Cash Value Accumulation Test |
| Preferred Risk Class | | | Death Benefit Option 1 |
| Stated Death Benefit $300,000 | | | Annual Premium $3,750 |
| | | | | |
| INVESCO VIF-Small Company Growth Fund | | | | |
| Year Ended: | | Annual Total Return* | | Cash Surrender Value | | Account Value | | Death Benefit |
| 12/31/98 | | 16.38% | | 3,520 | | 3,107 | | 300,000 |
| 12/31/99 | | 91.06% | | 11,531 | | 10,968 | | 300,000 |
| 12/31/00 | | -14.98% | | 11,630 | | 11,217 | | 300,000 |
| | | | | | | | | |
| INVESCO VIF-Total Return Fund | | | | | |
| Year Ended: | | Annual Total Return* | | Cash Surrender Value | | Account Value | | Death Benefit |
| 12/31/95 | | 22.79% | | 3,705 | | 3,293 | | 300,000 |
| 12/31/96 | | 12.18% | | 7,061 | | 6,499 | | 300,000 |
| 12/31/97 | | 22.91% | | 11,335 | | 10,923 | | 300,000 |
| 12/31/98 | | 9.56% | | 14,538 | | 14,538 | | 300,000 |
| 12/31/99 | | -3.40% | | 16,173 | | 16,173 | | 300,000 |
| 12/31/00 | | -2.17% | | 18,021 | | 18,021 | | 300,000 |
| | | | | | | | | |
| INVESCO VIF-Utilities Fund | | | | | | |
| Year Ended: | | Annual Total Return* | | Cash Surrender Value | | Account Value | | Death Benefit |
| 12/31/95 | | 9.08% | | 3,309 | | 2,896 | | 300,000 |
| 12/31/96 | | 12.76% | | 6,653 | | 6,090 | | 300,000 |
| 12/31/97 | | 23.41% | | 10,880 | | 10,467 | | 300,000 |
| 12/31/98 | | 25.48% | | 16,138 | | 16,138 | | 300,000 |
| 12/31/99 | | 19.13% | | 21,938 | | 21,938 | | 300,000 |
| 12/31/00 | | 5.28% | | 25,462 | | 25,462 | | 300,000 |
| | | | | | | | |
| Janus Aspen Aggressive Growth Portfolio Service Shares | | | |
| Year Ended: | | Annual Total Return* | | Cash Surrender Value | | Account Value | | Death Benefit |
| 12/31/94 | | 16.19% | | 3,514 | | 3,102 | | 300,000 |
| 12/31/95 | | 27.28% | | 7,740 | | 7,177 | | 300,000 |
| 12/31/96 | | 7.33% | | 10,624 | | 10,212 | | 300,000 |
| 12/31/97 | | 12.29% | | 14,116 | | 14,116 | | 300,000 |
| 12/31/98 | | 33.33% | | 21,923 | | 21,923 | | 300,000 |
| 12/31/99 | | 1.22% | | 24,450 | | 24,450 | | 300,000 |
| 12/31/00 | | -31.78% | | 18,025 | | 18,025 | | 300,000 |
| | | | | | | | |
The assumptions underlying these values are described in Performance Information, page 236.
* These annual total return figures reflect the investment portfolio's management fees and other operating expenses but do not reflect the policy level or separate account asset-based charges and deductions which, if reflected, would result in lower total return figures than those shown.
Strategic Investor 241
| HYPOTHETICAL ILLUSTRATIONS (continued) |
| Tobacco Non-user Male Age 45 | | | Cash Value Accumulation Test |
| Preferred Risk Class | | | Death Benefit Option 1 |
| Stated Death Benefit $300,000 | | | Annual Premium $3,750 |
| | | | | |
| Janus Aspen Growth Portfolio Service Shares | | | | |
| Year Ended: | | Annual Total Return* | | Cash Surrender Value | | Account Value | | Death Benefit |
| 12/31/94 | | 2.58% | | 3,122 | | 2,709 | | 300,000 |
| 12/31/95 | | 29.92% | | 7,388 | | 6,826 | | 300,000 |
| 12/31/96 | | 17.73% | | 11,241 | | 10,828 | | 300,000 |
| 12/31/97 | | 21.84% | | 16,096 | | 16,096 | | 300,000 |
| 12/31/98 | | 34.71% | | 24,808 | | 24,808 | | 300,000 |
| 12/31/99 | | 42.50% | | 38,683 | | 38,683 | | 300,000 |
| 12/31/00 | | -14.75% | | 34,702 | | 34,702 | | 300,000 |
| | | | | | | | |
| Janus Aspen International Growth Portfolio Service Shares | | | |
| Year Ended: | | Annual Total Return* | | Cash Surrender Value | | Account Value | | Death Benefit |
| 12/31/95 | | 23.15% | | 3,716 | | 3,303 | | 300,000 |
| 12/31/96 | | 34.07% | | 8,409 | | 7,847 | | 300,000 |
| 12/31/97 | | 17.22% | | 12,382 | | 11,969 | | 300,000 |
| 12/31/98 | | 16.14% | | 16,643 | | 16,643 | | 300,000 |
| 12/31/99 | | 78.93% | | 34,081 | | 34,081 | | 300,000 |
| 12/31/00 | | -16.14% | | 30,342 | | 30,342 | | 300,000 |
| | | | | | | | |
| Janus Aspen Worldwide Growth Portfolio Service Shares | | | |
| Year Ended: | | Annual Total Return* | | Cash Surrender Value | | Account Value | | Death Benefit |
| 12/31/94 | | 1.47% | | 3,090 | | 2,677 | | 300,000 |
| 12/31/95 | | 27.25% | | 7,201 | | 6,638 | | 300,000 |
| 12/31/96 | | 28.21% | | 12,001 | | 11,589 | | 300,000 |
| 12/31/97 | | 20.90% | | 16,883 | | 16,883 | | 300,000 |
| 12/31/98 | | 27.13% | | 24,383 | | 24,383 | | 300,000 |
| 12/31/99 | | 62.98% | | 43,618 | | 43,618 | | 300,000 |
| 12/31/00 | | -15.99% | | 38,319 | | 38,319 | | 300,000 |
| | | | | | | | | |
The assumptions underlying these values are described in Performance Information, page 236.
* These annual total return figures reflect the investment portfolio's management fees and other operating expenses but do not reflect the policy level or separate account asset-based charges and deductions which, if reflected, would result in lower total return figures than those shown.
Strategic Investor 242
| HYPOTHETICAL ILLUSTRATIONS (continued) |
| Tobacco Non-user Male Age 45 | | | Cash Value Accumulation Test |
| Preferred Risk Class | | | Death Benefit Option 1 |
| Stated Death Benefit $300,000 | | | Annual Premium $3,750 |
| | | | | |
| Neuberger Berman Growth Portfolio | | | | | |
| Year Ended: | | Annual Total Return* | | Cash Surrender Value | | Account Value | | Death Benefit |
| 12/31/91 | | 29.73% | | 3,906 | | 3,494 | | 300,000 |
| 12/31/92 | | 9.54% | | 7,120 | | 6,557 | | 300,000 |
| 12/31/93 | | 6.79% | | 9,913 | | 9,501 | | 300,000 |
| 12/31/94 | | -4.99% | | 11,215 | | 11,215 | | 300,000 |
| 12/31/95 | | 31.73% | | 17,852 | | 17,852 | | 300,000 |
| 12/31/96 | | 9.14% | | 21,972 | | 21,972 | | 300,000 |
| 12/31/97 | | 29.01% | | 31,266 | | 31,266 | | 300,000 |
| 12/31/98 | | 15.53% | | 38,587 | | 38,587 | | 300,000 |
| 12/31/99 | | 50.40% | | 61,272 | | 61,272 | | 300,000 |
| 12/31/00 | | -11.66% | | 55,671 | | 55,671 | | 300,000 |
| | | | | | | | | |
| Neuberger Berman Limited Maturity Bond Portfolio | | | | |
| Year Ended: | | Annual Total Return* | | Cash Surrender Value | | Account Value | | Death Benefit |
| 12/31/91 | | 11.34% | | 3,374 | | 2,962 | | 300,000 |
| 12/31/92 | | 5.18% | | 6,290 | | 5,727 | | 300,000 |
| 12/31/93 | | 6.63% | | 9,018 | | 8,606 | | 300,000 |
| 12/31/94 | | -0.15% | | 10,916 | | 10,916 | | 300,000 |
| 12/31/95 | | 10.94% | | 14,637 | | 14,637 | | 300,000 |
| 12/31/96 | | 4.31% | | 17,645 | | 17,645 | | 300,000 |
| 12/31/97 | | 6.74% | | 21,194 | | 21,194 | | 300,000 |
| 12/31/98 | | 4.39% | | 24,350 | | 24,350 | | 300,000 |
| 12/31/99 | | 1.48% | | 26,781 | | 26,781 | | 300,000 |
| 12/31/00 | | 6.78% | | 30,696 | | 30,696 | | 300,000 |
| | | | | | | | | |
| Neuberger Berman Partners Portfolio | | | | | |
| Year Ended: | | Annual Total Return* | | Cash Surrender Value | | Account Value | | Death Benefit |
| 12/31/95 | | 36.47% | | 4,102 | | 3,690 | | 300,000 |
| 12/31/96 | | 29.57% | | 8,632 | | 8,069 | | 300,000 |
| 12/31/97 | | 31.25% | | 14,153 | | 13,741 | | 300,000 |
| 12/31/98 | | 4.21% | | 16,730 | | 16,730 | | 300,000 |
| 12/31/99 | | 7.37% | | 20,363 | | 20,363 | | 300,000 |
| 12/31/00 | | 0.70% | | 22,759 | | 22,759 | | 300,000 |
| | | | | | | | |
| Pilgrim Growth Opportunities Portfolio | | | | | |
| Year Ended: | | Annual Total Return* | | Cash Surrender Value | | Account Value | | Death Benefit |
| | | | | | | | |
| | This fund is too new for experience to be shown | | |
| | | | | | | | |
The assumptions underlying these values are described in Performance Information, page 236.
* These annual total return figures reflect the investment portfolio's management fees and other operating expenses but do not reflect the policy level or separate account asset-based charges and deductions which, if reflected, would result in lower total return figures than those shown.
Strategic Investor 243
| HYPOTHETICAL ILLUSTRATIONS (continued) |
| Tobacco Non-user Male Age 45 | | | Cash Value Accumulation Test |
| Preferred Risk Class | | | Death Benefit Option 1 |
| Stated Death Benefit $300,000 | | | Annual Premium $3,750 |
| | | | | |
| Pilgrim MagnaCap Portfolio | | | | | |
| Year Ended: | | Annual Total Return* | | Cash Surrender Value | | Account Value | | Death Benefit |
| | | | | | | | |
| | This fund is too new for experience to be shown | | |
| | | | | | | | |
| Pilgrim MidCap Opportunities Portfolio | | | | | |
| Year Ended: | | Annual Total Return* | | Cash Surrender Value | | Account Value | | Death Benefit |
| | | | | | | | |
| | This fund is too new for experience to be shown | | |
| | | | | | | | |
| Pilgrim SmallCap Opportunities Portfolio | | | | |
| Year Ended: | | Annual Total Return* | | Cash Surrender Value | | Account Value | | Death Benefit |
| 12/31/95 | | 21.39% | | 3,665 | | 3,252 | | 300,000 |
| 12/31/96 | | 13.61% | | 7,103 | | 6,540 | | 300,000 |
| 12/31/97 | | 15.81% | | 10,729 | | 10,316 | | 300,000 |
| 12/31/98 | | 17.30% | | 14,885 | | 14,885 | | 300,000 |
| 12/31/99 | | 141.03% | | 41,878 | | 41,878 | | 300,000 |
| 12/31/00 | | 1.09% | | 44,501 | | 44,501 | | 300,000 |
| | | | | | | | |
| Putnam VT Growth and Income Fund - Class IB Shares | | | |
| Year Ended: | | Annual Total Return* | | Cash Surrender Value | | Account Value | | Death Benefit |
| 12/31/99 | | 1.46% | | 3,089 | | 2,677 | | 300,000 |
| 12/31/00 | | 7.92% | | 6,142 | | 5,579 | | 300,000 |
| | | | | | | | |
| Putnam VT New Opportunities Fund - Class IB Shares | | | |
| Year Ended: | | Annual Total Return* | | Cash Surrender Value | | Account Value | | Death Benefit |
| 12/31/99 | | 69.10% | | 5,052 | | 4,640 | | 300,000 |
| 12/31/00 | | -26.20% | | 5,723 | | 5,160 | | 300,000 |
| | | | | | | | |
| Putnam VT Small Cap Value Fund - Class IB Shares | | | | |
| Year Ended: | | Annual Total Return* | | Cash Surrender Value | | Account Value | | Death Benefit |
| 12/31/00 | | 24.44% | | 3,753 | | 3,341 | | 300,000 |
| | | | | | | | |
| Putnam VT Voyager Fund - Class IB Shares | | | | |
| Year Ended: | | Annual Total Return* | | Cash Surrender Value | | Account Value | | Death Benefit |
| 12/31/99 | | 58.01% | | 4,729 | | 4,316 | | 300,000 |
| 12/31/00 | | -16.54% | | 6,168 | | 5,605 | | 300,000 |
| | | | | | | | | |
The assumptions underlying these values are described in Performance Information, page 236.
* These annual total return figures reflect the investment portfolio's management fees and other operating expenses but do not reflect the policy level or separate account asset-based charges and deductions which, if reflected, would result in lower total return figures than those shown.
Strategic Investor 244
| HYPOTHETICAL ILLUSTRATIONS (continued) |
| Tobacco Non-user Male Age 45 | | | Cash Value Accumulation Test |
| Preferred Risk Class | | | Death Benefit Option 1 |
| Stated Death Benefit $300,000 | | | Annual Premium $3,750 |
| | | | | |
| Van Eck Worldwide Bond Fund | | | | | | |
| Year Ended: | | Annual Total Return* | | Cash Surrender Value | | Account Value | | Death Benefit |
| 12/31/91 | | 18.39% | | 3,578 | | 3,166 | | 300,000 |
| 12/31/92 | | -5.25% | | 5,883 | | 5,320 | | 300,000 |
| 12/31/93 | | 7.79% | | 8,680 | | 8,267 | | 300,000 |
| 12/31/94 | | -1.32% | | 10,452 | | 10,452 | | 300,000 |
| 12/31/95 | | 17.30% | | 14,959 | | 14,959 | | 300,000 |
| 12/31/96 | | 2.53% | | 17,665 | | 17,665 | | 300,000 |
| 12/31/97 | | 2.38% | | 20,332 | | 20,332 | | 300,000 |
| 12/31/98 | | 12.75% | | 25,369 | | 25,369 | | 300,000 |
| 12/31/99 | | -7.82% | | 25,218 | | 25,218 | | 300,000 |
| 12/31/00 | | 1.88% | | 27,677 | | 27,677 | | 300,000 |
| | | | | | | | | |
| Van Eck Worldwide Emerging Markets Fund | | | | |
| Year Ended: | | Annual Total Return* | | Cash Surrender Value | | Account Value | | Death Benefit |
| 12/31/96 | | 26.82% | | 3,822 | | 3,410 | | 300,000 |
| 12/31/97 | | -11.61% | | 5,720 | | 5,157 | | 300,000 |
| 12/31/98 | | -34.15% | | 5,220 | | 4,808 | | 300,000 |
| 12/31/99 | | 100.28% | | 14,742 | | 14,742 | | 300,000 |
| 12/31/00 | | -41.87% | | 9,707 | | 9,707 | | 300,000 |
| | | | | | | | | |
| Van Eck Worldwide Hard Assets Fund | | | | | |
| Year Ended: | | Annual Total Return* | | Cash Surrender Value | | Account Value | | Death Benefit |
| 12/31/91 | | -2.93% | | 2,963 | | 2,550 | | 300,000 |
| 12/31/92 | | -4.09% | | 5,365 | | 4,803 | | 300,000 |
| 12/31/93 | | 64.83% | | 12,426 | | 12,014 | | 300,000 |
| 12/31/94 | | -4.78% | | 13,620 | | 13,620 | | 300,000 |
| 12/31/95 | | 10.99% | | 17,630 | | 17,630 | | 300,000 |
| 12/31/96 | | 18.04% | | 23,536 | | 23,536 | | 300,000 |
| 12/31/97 | | -1.67% | | 25,257 | | 25,257 | | 300,000 |
| 12/31/98 | | -30.93% | | 18,764 | | 18,764 | | 300,000 |
| 12/31/99 | | 21.00% | | 25,295 | | 25,295 | | 300,000 |
| 12/31/00 | | 11.41% | | 30,402 | | 30,402 | | 300,000 |
| | | | | | | | | |
| Van Eck Worldwide Real Estate Fund | | | | | |
| Year Ended: | | Annual Total Return* | | Cash Surrender Value | | Account Value | | Death Benefit |
| 12/31/98 | | -11.35% | | 2,721 | | 2,309 | | 300,000 |
| 12/31/99 | | -2.01% | | 5,241 | | 4,678 | | 300,000 |
| 12/31/00 | | 18.71% | | 8,799 | | 8,387 | | 300,000 |
| | | | | | | | | |
The assumptions underlying these values are described in Performance Information, page 236.
* These annual total return figures reflect the investment portfolio's management fees and other operating expenses but do not reflect the policy level or separate account asset-based charges and deductions which, if reflected, would result in lower total return figures than those shown.
Strategic Investor 245
PART II
UNDERTAKING TO FILE REPORTS
Subject to the terms and conditions of Section 15(d) of the Securities Exchange Act of 1934, the undersigned hereby undertakes to file with the Securities and Exchange Commission such supplementary and periodic information, documents, and reports as may be prescribed by any rule or regulation of the Commission heretofore or hereafter duly adopted pursuant to authority conferred in that section.
UNDERTAKING REGARDING INDEMNIFICATION
Security Life of Denver's (the "corporation") Certificate of Incorporation and bylaws provide that the corporation shall have every power and duty of indemnification of directors, officers, employees and agents, without limitation, provided by the laws of the state of Colorado. Under Colorado law, the corporation has the power to indemnify such persons against expense, judgments, fines and amounts paid in settlement actually and reasonably incurred by such person in connection with any threatened, pending or completed action, suit or proceeding, if such person acted in good faith and in a manner which that person reasonably believed to be in or not opposed to the best interest of the corporation and, with respect to any criminal action or proceeding, had no reasonable cause to believe his conduct was unlawful. In the case of actions by or in the right of the corporation, such indemnification cannot be made where such person is adjudged liable to the corporation, except pursuant to a court order. The corporation is required to indemnify directors, officers, employees and agents against expenses actually and reasonably incurred in connection with actions where such persons have been successful on the merits or otherwise in defense of such actions.
Consistent with applicable law, the corporation's bylaws provide as follows:
Section 1. Non-Derivative Actions. The corporation shall indemnify any person who was or is a party or is threatened to be made a party to any threatened, pending, or completed action, suit, or proceeding, whether civil, criminal, administrative, or investigative (other than an action by or in the right of the corporation), by reason of the fact that he is or was a director, member of a committee appointed by the Board of Directors, officer, salaried employee, or fiduciary of the corporation or is or was serving at the request of the corporation (whether or not as a representative of the corporation) as a director, officer, employee, (for example, acting in a fiduciary capacity for welfare benefit plans including but not limited to Employees' Retirement Plan, Savings Incentive Plan, Group Medical Plan, Prescription Drug Program, Group Term Life Insurance, Group Dental Plan, Travel Accident Plan or Deferred Compensation Plan, et al.), or fiduciary of another corporation, partnership, joint venture, trust, or other enterprise, against expenses (including attorney fees), judgments, fines, and amounts paid in settlement actually and reasonably incurred by him in connection with such action, suit, or proceeding if he acted in good faith and in a manner he reasonably believed to in the best interest of the corporation and, with respect to any criminal action or proceeding, had no reasonable cause to believe his conduct was unlawful. The termination of any action, suit, or proceeding by judgment, order, settlement, or conviction or upon a plea of nolo contendere or its equivalent shall not of Itself create a presumption that the person did not act in good faith and in a manner which he reasonably believed to be in the best interests of the corporation and, with respect to any original criminal action or proceeding, had reasonable cause to believe that his conduct was unlawful.
Section 2. Derivative Actions. The corporation shall indemnify any person who was or is a party or is a party to or is threatened to be made a party to any threatened, pending, or completed action or suit by or in the right of the corporation to procure a judgment in its favor by reason of the fact that he is or was a director, member of a committee appointed by the Board of Directors, officer, salaried employee, or fiduciary of the corporation or is or was serving at the request of the corporation (whether or not as a representative of the corporation) as a director, officer, employee, (for example, acting in a fiduciary capacity for welfare benefit plans including but not limited to Employees' Retirement Plan, Savings Incentive Plan, Group Medical Plan, Prescription Drug Program, Group Term Life Insurance, Group Dental Plan, Travel Accident Plan or Deferred Compensation Plan, et al.), or fiduciary of another corporation, partnership, joint venture, trust, or other enterprise against expenses (including attorney fees) actually and reasonably incurred by him in connection with the defense or settlement of such action or suit if he acted in good faith and in a manner he reasonably believed, to be in the best interests or the corporation; but no indemnification shall be made in respect of any claim, issue, or matter as to which such person has been adjudged to be liable for negligence or misconduct in the performance of his duty to the corporation unless and only to the extent that the court in which such action or suit was brought determines upon application that, despite the adjudication of liability, but in view or all circumstances of the case, such person is fairly and reasonably entitled to indemnification for such expenses which such court deems proper.
Section 3. Expenses. To the extent that a director, member of a committee appointed by the Board of Directors, officer, salaried employee, or fiduciary of the corporation shall be successful on the merits in defense of any action, suit, or proceeding referred to in Section 1 or Section 2 of this Article VIII or in defense of any claim, issue, or matter therein, he shall be indemnified by the corporation against expenses (including attorney fees) actually and reasonably incurred by him in connection therewith.
Section 4. Authorization. Any indemnification under Section 1 or Section 2 of this Article VIII (unless ordered by a court) shall be made by the corporation only as authorized in the specific case upon a determination that indemnification of the director, member of a committee appointed by the Board of Directors, officer, salaried employee, or fiduciary is proper in the circumstances because he has met the applicable standard of conduct set forth in Section 1 or Section 2. Such determination shall be made by the Board of Directors by a majority vote of a quorum consisting of directors who were not parties to such action, suit, or proceeding, or, if such a quorum is not obtainable or even if obtainable a quorum of disinterested directors so directs, by independent legal counsel in a written opinion, or by the Stockholder.
Section 5. Advance Payment of Expenses. Expenses (including attorney fees) incurred in defending a civil or criminal action, suit, or proceeding may be paid by the corporation in advance of the final disposition of such action, suit, or proceeding as authorized in Section 4 Of this Article VIII upon receipt of an undertaking by or on behalf of the director, member of a committee appointed by the Board of Directors, officer, salaried employee, or fiduciary to repay such amount unless it is ultimately determined that he is entitled to be indemnified by the corporation as authorized in this Article VIII.
Section 6. Non-Exclusivity and Continuance. The indemnification provided by this Article VIII shall not be deemed exclusive of any other rights to which any person indemnified may be entitled under the Articles of Incorporation, any agreement, insurance policy, vote of the Stockholder or disinterested directors, or otherwise, and any procedure provided for by any of the foregoing, both as to action in his official capacity and as to action in another capacity while holding such office. Any indemnity otherwise payable under this Article VIII on account of any specific loss or expense shall be reduced by the amount of any insurance proceeds paid or payable to the person to be indemnified on account of the same loss or expense if such insurance is provided by the corporation or any of its affiliates. The indemnification provided by this Article VIII shall continue as to a person who has ceased to be a director, member of a committee appointed by the Board of Directors, officer, salaried employee, or fiduciary with regard to acts or omissions of such person occurring or alleged to have occurred while the person was so engaged, and shall inure to the benefit of heirs, executors, and administrators of such a person.
Section 7. Application of this Article. The provisions of this Article VIII shall apply to all actions, suits or proceedings described in Section 1 or Section 2 arising or alleged to arise out of any acts or omissions on the part of any person referred to in Section 1 or Section 2 occurring or alleged to occur prior to the adoption of this Article VIII or at any time while it remains in force.
Section 8. Exclusions. No indemnification is provided under this Article VIII for unsalaried persons under contract with the corporation in sales-capacities such as General Agents, Agents and Brokers. Except as expressly provided in this Article VIII, no indemnity is provided for persons performing services to the corporation as independent contractors.
Insofar as indemnification for liability arising under the Securities Act of 1933 (the "Act") may be permitted to directors, officers and controlling persons of the Registrant pursuant to the foregoing provisions or otherwise, the Registrant has been advised that in the opinion of the Securities and Exchange Commission such indemnification is against public policy as expressed in the Act and is, therefore, unenforceable. In the event that a claim for indemnification against such liabilities (other than the payment by the Registrant of expenses incurred or paid by a director, officer or controlling person of the Registrant in the successful defense of any action, suit or proceeding) is asserted by such director, officer or controlling person in connection with the securities being registered. the Registrant will, unless in the opinion of its counsel the matter has been settled by controlling precedent, submit to a court of appropriate jurisdiction the question whether such indemnification by it is against public policy as expressed in the Act and will be governed by the final adjudication of such issue.
UNDERTAKING REQUIRED BY SECTION 26(e)(2)(A) OF THE INVESTMENT
COMPANY ACT OF 1940, AS AMENDED
Security Life of Denver Insurance Company represents that the fees and charges deducted under the Policy, in the aggregate, are reasonable in relation to the services rendered, the expenses expected to be incurred and the risks assumed by the Company.
Contents of Registration Statement
| This Registration Statement comprises the following papers and documents: |
| |
| | The facing sheet. |
| |
| Cross-Reference table. |
| |
| The prospectus. |
| |
| The undertaking to file reports. |
| |
| The undertaking regarding indemnification. |
| |
| The undertaking required by Section 26(e)(2)(A) of the Investment Company Act of 1940, as amended. |
| |
| The signatures. |
| |
| Written consents of the following persons: |
| | J. Neil McMurdie (See Exhibit 2.). |
| | James L. Livingston, Jr. (See Exhibit 6.A). |
| | Ernst & Young LLP (See Exhibit 7.A). |
| |
| The following exhibits: |
| 1.A | (1) | Resolution of the Executive Committee of the Board of Directors of Security Life of Denver Insurance Company ("Security Life of Denver") authorizing the establishment of the Registrant.3 |
| (2) | Not Applicable. |
| (3) | (a) | Security Life of Denver Distribution Agreement.3 |
| | | (i) | Amendment to Security Life of Denver Insurance Company Distribution Agreement.5 |
| | | (ii) | Amendment to Security Life of Denver Insurance Company Distribution Agreement.4 |
| | | (iii) | Amendment to Security Life of Denver Insurance Company Distribution Agreement.10 |
| | | (iv) | Amendment to Security Life of Denver Insurance Company Distribution Agreement.11 |
| | (b) | Specimen Broker/Dealer Supervisory and Selling Agreement for Variable Contracts with Compensation Schedules. 2 |
| | | (i) | Compensation Schedule. |
| | (c) | Commission Schedule for Policies. |
| | (d) | Specimen Master Sales and Supervisory Agreement with Compensation Schedule.8 |
| (4) | Not Applicable. |
| (5) | (a) | Specimen Variable Universal Life Insurance Policy (Form No. 2513 (VUL)-1/02).13 |
| | (b) | Adjustable Term Insurance Rider (Form No. R2023-1/02).13 |
| | (c) | Waiver of Cost of Insurance Rider (Form No. R-1505).4 |
| | (d) | Waiver of Specified Premium Total Disability Rider (Form No. R-1506).4 |
| (6) | (a) | Security Life of Denver's Restated Articles of Incorporation.3 |
| | (b-g)Amendments to Articles of Incorporation through June 12, 1987.3 |
| | (h) | Security Life of Denver's By-Laws.3 |
| | | (i) | Bylaws of Security Life of Denver Insurance Company (Restated with Amendments through September 30, 1997).1 |
| (7) | Not Applicable. |
| (8) | (a) | Addendum to Sales Agreement.3 |
| | | (i) | Participation Agreement by and among AIM Variable Insurance Funds, Inc., Life Insurance Company, on Behalf of Itself and its Separate Accounts and Name of Underwriter of Variable Contracts and Policies. 2 |
| | | (ii) | Sales Agreement by and among The Alger American Fund, Fred Alger Management, Inc., and Security Life of Denver Insurance Company. 3 |
| | | (iii) | Sales Agreement by and among Neuberger & Berman Advisers Management Trust, Neuberger & Berman Management Incorporated, and Security Life of Denver Insurance Company. 3 |
| | | (iv) | Participation Agreement among Variable Insurance Products Fund, Fidelity Distributors Corporation and Security Life of Denver Insurance Company. 3 |
| | | (v) | Participation Agreement among Variable Insurance Products Fund II, Fidelity Distributors Corporation and Security Life of Denver Insurance Company. 3 |
| | | (vi) | Participation Agreement among INVESCO Variable Investment Funds, Inc., INVESCO Funds Group, Inc., and Security Life of Denver Insurance Company. 3 |
| | | (vii) | Participation Agreement between Van Eck Investment Trust and the Trust's investment adviser, Van Eck Associates Corporation, and Security Life of Denver Insurance Company. 3 |
| | | (viii) | Participation Agreement among Security Life of Denver Insurance Company, The GCG Trust and Directed Services, Inc.10 |
| | | (ix) | Participation Agreement among M Fund, Inc., M Financial Advisers, Inc. and Security Life of Denver Insurance Company.11 |
| | | (x) | Form of Participation Agreement among Security Life of Denver Insurance Company and Southland Life Insurance Company, Pilgrim Variable Products Trust and ING Pilgrim Investments, LLC. 11 |
| | | (xi) | Participation Agreement among Security Life of Denver Insurance Company and Southland Life Insurance Company, Putnam Variable Trust and Putnam Retail Management, Inc.13 |
| | (b) | (i) | First Amendment to Fund Participation Agreement between Security Life of Denver, Van Eck Investment Trust and Van Eck Associates Corporation. 2 |
| | | (ii) | Second Amendment to Participation Agreement between Security Life of Denver, Van Eck Worldwide Insurance Trust and Van Eck Associates Corporation. 2 |
| | | (iii) | Assignment and Modification Agreement between Neuberger & Berman Advisers Management Trust, Neuberger & Berman Management Incorporated, Neuberger & Berman Advisers Management Trust, Advisers Managers Trust and Security Life of Denver Insurance Company. 2 |
| | | (iv) | First Amendment to Participation Agreement by and among The Alger American Fund, Fred Alger Management, Inc., Security Life of Denver Insurance Company. 3 |
| | | (v) | First Amendment to Participation Agreement among Variable Insurance Products Fund, Fidelity Distributors Corporation and Security Life of Denver Insurance Company. 3 |
| | | (vi) | Second Amendment to Participation Agreement among Variable Insurance Products Fund, Fidelity Distributors Corporation and Security Life of Denver Insurance Company. 3 |
| | | (vii) | First Amendment to Participation Agreement among Variable Insurance Products Fund II, Fidelity Distributors Corporation and Security Life of Denver Insurance Company. 3 |
| | | (viii) | Second Amendment to Participation Agreement among Variable Insurance Products Fund II, Fidelity Distributors Corporation and Security Life of Denver Insurance Company. 3 |
| | | (ix) | First Amendment to Participation Agreement among Security Life of Denver Insurance Company, INVESCO Variable Investment Funds, Inc. and INVESCO Funds Group, Inc. 3 |
| | | (x) | Third Amendment to Participation Agreement among Variable Insurance Products Fund, Fidelity Distributors Corporation and Security Life of Denver Insurance Company.4 |
| | | (xi) | Third Amendment to Participation Agreement among Variable Insurance Products Fund II, Fidelity Distributors Corporation and Security Life of Denver Insurance Company.4 |
| | | (xii) | Fourth Amendment to Participation Agreement among Variable Insurance Products Fund, Fidelity Distributors Corporation and Security Life of Denver Insurance Company.1 |
| | | (xiii) | Fourth Amendment to Participation Agreement among Variable Insurance Products Fund II, Fidelity Distributors Corporation and Security Life of Denver Insurance Company.1 |
| | | (xiv) | Amendment No. 2 to Participation Agreement among AIM Variable Insurance Funds, Inc., Security Life of Denver Insurance Company and ING America Equities, Inc.1 |
| | | (xv) | Fourth Amendment to Participation Agreement among Security Life of Denver Insurance Company, INVESCO Variable Investment Funds, Inc. and INVESCO Funds Group, Inc.3 |
| | | (xvi) | Amendment No. 3 to Participation Agreement among AIM Variable Insurance Funds, Inc., Security Life of Denver Insurance Company and ING America Equities, Inc.3 |
| | | (xvii) | Fifth Amendment to Participation Agreement among Variable Insurance Products Fund, Fidelity Distributors Corporation and Security Life of Denver Insurance Company.3 |
| | | (xviii) | Fifth Amendment to Participation Agreement among Variable Insurance Products Fund II, Fidelity Distributors Corporation and Security Life of Denver Insurance Company.3 |
| | | (xix) | Amendment No. 4 to Participation Agreement among AIM Variable Insurance Funds, Inc., Security Life of Denver Insurance Company and ING America Equities, Inc.7 |
| | | (xx) | Sixth Amendment to Participation Agreement among Variable Insurance Products Fund, Fidelity Distributors Corporation and Security Life of Denver Insurance Company.7 |
| | | (xxi) | Sixth Amendment to Participation Agreement among Variable Insurance Products Fund II, Fidelity Distributors Corporation and Security Life of Denver Insurance Company.7 |
| | | (xxii) | Fifth Amendment to Participation Agreement among Security Life of Denver Insurance Company, INVESCO Variable Investment Funds, Inc. and INVESCO Funds Group, Inc.7 |
| | | (xxiii) | Seventh Amendment to Participation Agreement among Variable Insurance Products Fund, Fidelity Distributors Corporation and Security Life of Denver Insurance Company.6 |
| | | (xxiv) | Seventh Amendment to Participation Agreement among Variable Insurance Products Fund II, Fidelity Distributors Corporation and Security Life of Denver Insurance Company.9 |
| | | (xxv) | Eighth Amendment to Participation Agreement among Variable Insurance Products Fund, Fidelity Distributors Corporation and Security Life of Denver Insurance Company.9 |
| | | (xxvi) | Addendum to Fund Participation Agreement among Security Life of Denver Insurance Company, Neuberger Berman Advisers Management Trust, Advisers Managers Trust and Neuberger Berman Management Inc.9 |
| | | (xxvii) | Fund Participation Agreement between Janus Aspen Series and Security Life of Denver Insurance Company.9 |
| | | (xxviii) | Amendment to Janus Aspen Series Fund Participation Agreement.10 |
| | | (xxix) | Amendment No. 5 to Participation Agreement among AIM Variable Insurance Funds, Inc., Security Life of Denver Insurance Company and ING America Equities, Inc.10 |
| | | (xxx) | Amendment to Participation Agreement among Security Life of Denver Insurance Company, The GCG Trust and Directed Services, Inc.10 |
| | | (xxxi) | Sixth Amendment to Participation Agreement among Security Life of Denver Insurance Company, INVESCO Variable Investment Funds, Inc. and INVESCO Funds Group, Inc.10 |
| | | (xxxii) | Eighth Amendment to Participation Agreement among Variable Insurance Products Fund II, Fidelity Distributors Corporation and Security Life of Denver Insurance Company.11 |
| | | (xxxiii) | Ninth Amendment to Participation Agreement among Variable Insurance Products Fund, Fidelity Distributors Corporation and Security Life of Denver Insurance Company.11 |
| | | (xxxiv) | Amendment to Participation Agreement among M Fund, Inc., M Financial Advisers, Inc. and Security Life of Denver Insurance Company.11 |
| | | (xxxv) | Amendment to Participation Agreement among Variable Insurance Products Fund II, Fidelity Distributors Corporation and Security Life of Denver Insurance Company.13 |
| | | (xxxvi) | Amendment to Participation Agreement among Variable Insurance Products Fund, Fidelity Distributors Corporation and Security Life of Denver Insurance Company.13 |
| | | (xxxvii) | Form of Amendment to Participation Agreement among Security Life of Denver Insurance Company, The GCG Trust and Directed Services, Inc.11 |
| | | (xxxviii) | Amendment to Participation Agreement among M Fund, Inc., M Financial Advisers, Inc. and Security Life of Denver Insurance Company.11 |
| | | (xxxix) | Amendment No. 6 to Participation Agreement among AIM Variable Insurance Funds, Inc., Security Life of Denver Insurance Company and ING America Equities, Inc. |
| | | (xxxx) | Amendment to Participation Agreement among Variable Insurance Products Fund, Fidelity Distributors Corporation and Security Life of Denver Insurance Company. |
| | | (xxxxi) | Amendment to Participation Agreement among Variable Insurance Products Fund II, Fidelity Distributors Corporation and Security Life of Denver Insurance Company. |
| | | (xxxxii) | Seventh Amendment to Participation Agreement among Security Life of Denver Insurance Company, INVESCO Variable Investment Funds, Inc. and INVESCO Funds Group, Inc. |
| | | (xxxxiii) | Amendment to Janus Aspen Series Fund Participation Agreement. |
| | | (xxxxiv) | Amendment to Participation Agreement among Security Life of Denver Insurance Company, Pilgrim Variable Products Trust and ING Pilgrim Securities, Inc. |
| | (c) | (i) | Service Agreement between Fred Alger Management, Inc. and Security Life of Denver Insurance Company.3 |
| | | (ii) | Expense Allocation Agreement between A I M Advisors, Inc., A I M Distributors, Inc. and Security Life of Denver.4
a. Amendment No. 1 to Expense Allocation Agreement between A I M Advisors, Inc., A I M Distributors, Inc. and Security Life of Denver. |
| | | (iii) | Service Agreement between INVESCO Funds Group, Inc. and Security Life of Denver Insurance Company.4 |
| | | (iv) | Service Agreement between Neuberger & Berman Management Incorporated and Security Life of Denver Insurance Company.4 |
| | | (v) | Service Agreement between Fidelity Investments Institutional Operations Company, Inc. and Security Life of Denver Insurance Company.4 |
| | | (vi) | Side Letter between Van Eck Worldwide Insurance Trust and Security Life of Denver.4 |
| | | (vii) | Distribution and Shareholder Services Agreement between Janus Distributors, Inc. and Security Life of Denver Insurance Company.9 |
| | | (viii) | Administrative and Shareholder Service Agreement between Directed Services, Inc. and Security Life of Denver Insurance Company.11 |
| | | (ix) | Administrative and Shareholder Service Agreement between ING Pilgrim Investments, LLC and Security Life of Denver Insurance Company. |
| | | (x) | Letter of Agreement between Security Life of Denver and Janus Capital Corporation |
| | (d) | Administrative Services Agreement between Security Life of Denver and Financial Administrative Services Corporation. 3 |
| | (e) | Amendment to Administrative Services Agreement between Security Life of Denver and Financial Administrative Services Corporation. 3 |
| (9) | Not Applicable. |
| (10) | Specimen Application for Life Insurance Fixed and Variable Products (Form No. 110945).13 |
| | (a) | Investment Feature Selection Form (Form No. V-166-00 Rev. 5/1/01). 7 |
| (11) | Issuance, Transfer and Redemption Procedures Memorandum. |
| |
| 2. | Opinion and Consent of J. Neil McMurdie as to securities being registered.13 |
| |
| 3. | Not Applicable. |
| |
| 4. | Not Applicable. |
| |
| 5. | Not Applicable. |
| |
| 6.A | Opinion and Consent of James L. Livingston, Jr.13 |
| |
| 7.A | Consent of Ernst & Young, LLP. |
| |
| 8. | Not Applicable. |
| |
| 10. | Powers of Attorney.13 |
| |
| 11. | Issuance, Transfer and Redemption Memorandum13 |
_______________
| 1 | Incorporated herein by reference to Post-Effective Amendment No. 3 to the form S-6 Registration Statement of Security Life of Denver Insurance Company and its Security Life Separate Account L1, filed with the Securities and Exchange Commission on October 29, 1997 (File No. 33-88148). |
| |
| 2 | Incorporated herein by reference to Post-Effective Amendment No. 4 to the form S-6 Registration Statement of Security Life of Denver Insurance Company and its Security Life Separate Account L1, filed with the Securities and Exchange Commission on February 18, 1998 (File No. 33-88148). |
| |
| 3 | Incorporated herein by reference to Post-Effective Amendment No. 5 to the Form S-6 Registration Statement of Security Life of Denver Insurance Company and its Security Life Separate Account L1, filed with the Securities and Exchange Commission on April 17, 1998 (File No. 33-88148). |
| |
| 4 | Incorporated herein by reference to Post-Effective Amendment No. 10 to the Form S-6 Registration Statement of Security Life of Denver Insurance Company and its Security Life Separate Account L1, filed with the Securities and Exchange Commission on April 23, 1999 (File No. 33-74190). |
| |
| 5 | Incorporated herein by reference to Post-Effective Amendment No. 7 to the Form S-6 Registration Statement of Security Life of Denver Insurance Company and its Security Life Separate Account L1, filed with the Securities and Exchange Commission on April 29, 1999 (File No. 33-74190). |
| |
| 6 | Incorporated herein by reference to the Post-Effective Amendment No. 12 to the Form S-6 Registration Statement of Security Life of Denver Insurance Company and its Security Life Separate Account L1, filed with the Securities and Exchange Commission on April 25, 2000 (File No. 33-74190). |
| |
| 7 | Incorporated herein by reference to the Post-Effective Amendment No. 1 to the Form S-6 Registration Statement of Security Life of Denver Insurance Company and its Security Life Separate Account L1, filed with the Securities and Exchange Commission on February 29, 2000 (File No. 333-72753). |
| |
| 8 | Incorporated herein by reference to the Post-Effective Amendment No. 8 to the Form S-6 Registration Statement of Security Life of Denver Insurance Company and its Security Life Separate Account L1, filed with the Securities and Exchange Commission on April 29, 1999 (File No. 33-88148). |
| |
| 9 | Incorporated herein by reference to the Post-Effective Amendment No. 13 to the Form S-6 Registration Statement of Security Life of Denver Insurance Company and its Security Life Separate Account L1, filed with the Securities and Exchange Commission on October 13, 2000 (File No. 33-74190). |
| |
| 10 | Incorporated herein by reference to the Pre-Effective Amendment No. 1 to the Form S-6 Registration Statement of Security Life of Denver Insurance Company and its Security Life Separate Account L1, filed with the Securities and Exchange Commission on January 30, 2001 (File No. 333-50278). |
| |
| 11 | Incorporated herein by reference to the Post-Effective Amendment No. 14 to the Form S-6 Registration Statement of Security Life of Denver Insurance Company and its Security Life Separate Account L1, filed with the Securities and Exchange Commission on April 19, 2001 (File No. 33-74190). |
| |
| 12 | Incorporated herein by reference to the Post-Effective Amendment No. 1 to the Form S-6 Registration Statement of Security Life of Denver Insurance Company and its Security Life Separate Account L1, filed with the Securities and Exchange Commission on April 19, 2001 (File No. 333-50278). |
| |
| 13 | Incorporated herein by reference to the Initial Form S-6 Registration Statement of Security Life of Denver Insurance Company and its Security Life Separate Account L1, filed with the Securities and Exchange Commission on November 15, 2001 (File No. 333-73464). |
| |
SIGNATURES
Pursuant to the requirements of the Securities Act of 1933, Security Life of Denver Insurance Company and the Registrant, Security Life Separate Account L1, have duly caused this Registration Statement to be signed on their behalf by the undersigned, hereunto duly authorized, and their seal to be hereunto fixed and attested, all in the City and County of Denver and the State of Colorado on the 18th day of December, 2001.
SECURITY LIFE OF DENVER INSURANCE COMPANY
(Depositor)
BY: /s/ James L. Livingston, Jr.
James L. Livingston, Jr.
Executive Vice President
(Seal)
ATTEST:
/s/ Rita J. Kummer
Rita J. Kummer
SECURITY LIFE SEPARATE ACCOUNT L1
(Registrant)
BY: /s/ James L. Livingston, Jr.
James L. Livingston, Jr.
Executive Vice President
(Seal)
ATTEST:
/s/ Rita J. Kummer
Rita J. Kummer
Pursuant to the requirements of the Securities Act of 1933, this Registration Statement has been signed below by the following persons in the capacities with Security Life of Denver Insurance Company and on the date indicated.
PRINCIPAL EXECUTIVE OFFICERS:
/s/ James L. Livingston, Jr.
James L. Livingston, Jr.
Executive Vice President
/s/ Douglas W. Campbell
Douglas W. Campbell
Senior Vice President
CHIEF FINANCIAL OFFICER:
/s/ Wayne R. Huneke*
Wayne R. Huneke
Chief Financial Officer and Director
DIRECTORS:
/s/ Robert C. Salipante*
Robert C. Salipante
/s/ P. Randall Lowery*
P. Randall Lowery
BY: /s/ J. Neil McMurdie
J. Neil McMurdie
Attorney-in-Fact
December 18, 2001
EXHIBIT INDEX
| Exhibit No. | Description of Exhibit |
| |
| 1.A(3)(b)(i) | Compensation Schedule. |
| 1.A(3)(c) | Commission Schedule for Policies. |
| 1.A(8)(b)(xxxix) | Amendment No. 6 to Participation Agreement among AIM Variable Insurance Funds, Inc., Security Life of Denver Insurance Company and ING America Equities, Inc. |
| 1.A(8)(b)(xxxx) | Amendment to Participation Agreement among Variable Insurance Products Fund, Fidelity Distributors Corporation and Security Life of Denver Insurance Company. |
| 1.A(8)(b)(xxxxi) | Amendment to Participation Agreement among Variable Insurance Products Fund II, Fidelity Distributors Corporation and Security Life of Denver Insurance Company. |
| 1.A(8)(b)(xxxxii) | Seventh Amendment to Participation Agreement among Security Life of Denver Insurance Company, INVESCO Variable Investment Funds, Inc. and INVESCO Funds Group, Inc. |
| 1.A(8)(b)(xxxxiii) | Amendment to Janus Aspen Series Fund Participation Agreement. |
| 1.A(8)(b)(xxxxiv) | Amendment to Participation Agreement among Security Life of Denver Insurance Company, Pilgrim Variable Products Trust and ING Pilgrim Securities, Inc. |
| 1.A(8)(c)(ii)a. | Amendment No. 1 to Expense Allocation Agreement between A I M Advisors, Inc., A I M Distributors, Inc. and Security Life of Denver. |
| 1.A(8)(c)(ix) | Administrative and Shareholder Service Agreement between ING Pilgrim Investments, LLC and Security Life of Denver Insurance Company. |
| 1.A(8)(c)(x) | Letter of Agreement between Security Life of Denver and Janus Capital Corporation |
| |
| 7.A | Consent of Ernst & Young, LLP. |
| |
| 11. | Issuance, Transfer and Redemption Memorandum |