United States
Securities and Exchange Commission
Washington, D.C. 20549
FORM 6-K
Report of Foreign Private Issuer
Pursuant to Rule 13a-16 or 15d-16
of the
Securities Exchange Act of 1934
For the month of
July 2023
Vale S.A.
Praia de Botafogo nº 186, 18º andar, Botafogo
22250-145 Rio de Janeiro, RJ, Brazil
(Address of principal executive office)
(Indicate by check mark whether the registrant files or will file annual reports under cover of Form 20-F or Form 40-F.)
(Check One) Form 20-F x Form 40-F ¨

Vale’s 2Q23 production and sales report
Rio de Janeiro, July 18th, 2023
| • | Iron ore production increased 6% y/y driven by a record output for a second quarter at S11D, followed by solid performance at Itabira and Vargem Grande complexes, improving Vale’s average product portfolio quality. Torto dam received its license to operate, and commissioning is underway. Pellet production increased 5% y/y driven by the higher production at Tubarão plants as a result of higher pellet feed production. |
| • | Iron ore fines and pellet sales increased 1% y/y as Ponta da Madeira Terminal restored productivity during Q2, after restrictions due to heavy rains affected shipments and sales in Q1. Vale expects a lower production-to-sales gap in Q3 with the sale of the inventories from the first semester, depending on market conditions. |
| • | Copper production increased 41% y/y and 18% q/q largely attributed to the successful ramping up of Salobo III plant and the improved performance of the Sossego operation. Copper sales increased 43% y/y and 18% q/q as result of higher production volumes. |
| • | Nickel production increased 8% y/y largely attributed to better operational performance in Sudbury and Indonesia. Q/q, production was impacted by planned maintenance shutdowns, particularly at the Long Harbour and Clydach refineries. Nickel sales increased 3% y/y driven by improved production, remaining relatively stable q/q due to inventory buildup in Q1. |
Production summary
| % change | 2023 Guidance | ||||||||
| 000’ metric tons | 2Q23 | 1Q23 | 2Q22 | 1H23 | 1H22 | 2Q23/1Q23 | 2Q23/2Q22 | 1H23/1H22 | |
| Iron ore1 | 78,743 | 66,774 | 74,108 | 145,517 | 137,236 | 17.9% | 6.3% | 6.0% | 310-320 Mt |
| Pellets | 9,111 | 8,318 | 8,672 | 17,429 | 15,596 | 9.5% | 5.1% | 11.8% | 36-40 Mt2 |
| Copper | 78.8 | 67.0 | 55.9 | 145.9 | 112.5 | 17.6% | 41.0% | 29.7% | 335-370 kt |
| Nickel | 36.9 | 41.0 | 34.2 | 77.9 | 79.9 | -10.0% | 7.9% | -2.5% | 160-175 kt |
1 Including third-party purchases, run-of-mine and feed for pelletizing plants. 2 Iron ore agglomerates guidance, including iron ore pellets and briquettes. |
Sales summary
| % change | ||||||||
| 000’ metric tons | 2Q23 | 1Q23 | 2Q22 | 1H23 | 1H22 | 2Q23/1Q23 | 2Q23/2Q22 | 1H23/1H22 |
| Iron ore fines1 | 63,329 | 45,861 | 62,769 | 109,190 | 114,080 | 38.1% | 0.9% | -4.3% |
| Iron ore pellets | 8,809 | 8,133 | 8,843 | 16,942 | 15,854 | 8.3% | -0.4% | 6.9% |
| Iron ore ROM | 2,236 | 1,665 | 1,550 | 3,900 | 2,585 | 34.3% | 44.3% | 50.9% |
| Copper | 73.8 | 62.7 | 51.5 | 136.5 | 101.8 | 17.7% | 43.3% | 34.1% |
| Nickel | 40.3 | 40.1 | 39.3 | 80.4 | 78.3 | 0.5% | 2.5% | 2.7% |
1 Including third-party purchase sales. |
Price realization summary
| % change | ||||||||
| US$/t | 2Q23 | 1Q23 | 2Q22 | 1H23 | 1H22 | 2Q23/1Q23 | 2Q23/2Q22 | 1H23/1H22 |
| Iron ore fines (CFR/FOB, wmt) | 98.5 | 108.6 | 113.3 | 102.7 | 126.0 | -9.3% | -13.1% | -18.5% |
| Iron ore pellets (CFR/FOB, wmt) | 160.4 | 162.5 | 201.3 | 161.4 | 198.3 | -1.3% | -20.3% | -18.6% |
| Copper1 | 7,025 | 9,465 | 6,240 | 8,123 | 8,653 | -25.8% | 12.6% | -6.1% |
| Nickel | 23,070 | 25,260 | 26,221 | 24,162 | 24,216 | -8.7% | -12.0% | -0.2% |
| Gold (US$/oz) | 2,082 | 1,845 | 1,780 | 1,975 | 1,873 | 12.8% | 17.0% | 5.4% |
| Silver (US$/oz) | 22.3 | 22.4 | 19.0 | 22.3 | 21.3 | -0.4% | 17.4% | 4.7% |
| Cobalt | 34,694 | 32,830 | 81,915 | 33,790 | 80,077 | 5.7% | -57.6% | -57.8% |
1 Average realized price for copper operations only (Salobo and Sossego). Average realized copper price for all operations, including copper sales originated from nickel operations, was US$ 6,986/t in 2Q23. |
| 1 |
Business highlights in 2Q23
Iron Ore and Pellets operations
| · | S11D production increased by 2.6 Mt y/y, a record production for a second quarter, This performance reflects the positive results from continued initiatives to improve asset reliability and from installing new crushers in 2022. At Serra Norte, despite lower y/y production due to reduced run-of-mine availability, mine movement at the site improved 16% y/y with increased waste removal, enabling better execution of the mining plan in the 2H23. | 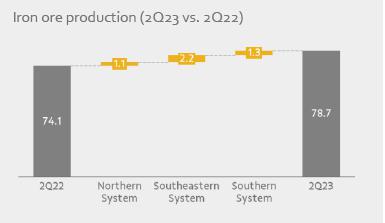 |
| · | Southeastern System production was 2.2 Mt higher y/y, mainly driven by (i) Itabira performance as a result of better run-of-mine quality improving the plants’ productivity, and (ii) higher third-party purchases. Torto dam at the Brucutu site received its license to operate, and commissioning is underway. The dam, together with the tailings filtering plant, will substantially improve overall average quality, increasing the availability of pellet feed to Vale’s pellet plants. |
| · | Southern System production increased by 1.3 Mt y/y mainly due to (i) better performance at Vargem Grande as a result of improvements in the wet processing and tailings disposal system and from asset reliability initiatives, and (ii) additional production and sales of run-of-mine from the Paraopeba complex, which were partially offset by unscheduled maintenance at Viga site in April and May. |
| · | Pellet production increased by 0.4 Mt y/y, driven by production at the Tubarão plants, with more pellet feed from Itabira, partially offset by the lower output at the São Luis plant due to maintenance activities. Vale expects to start-up one of two briquette plants in Tubarão in Q3. After the commissioning phase, both plants together will have a total capacity of 6 Mtpy. |
| · | Iron ore fines and pellet sales increased by 0.5 Mt y/y as Ponta da Madeira Terminal restored productivity during 2Q23, after loading restrictions due to heavy rains affected shipments and sales in 1Q23. All-in premium totaled US$ 4.5/t[1], US$ 2.8/t lower y/y, mainly driven by the lower quality market premiums for iron ore fines and pellets. Quarter on quarter, the all-in premium increased US$ 2.4/t, mainly driven by more Northern System products in our product mix and an increased contribution from the pellet business. |
| · | Iron ore fines realized price was US$ 98.5/t, US$ 14.8/t lower y/y, mainly due to lower benchmark prices (US$ 26.9/t lower y/y), partially offset by a lower impact of pricing system adjustments (US$ 9.1/t higher y/y). Iron ore pellets realized price was US$ 160.4/t, US$ 40.9/t lower y/y, mainly due to lower 65%Fe index prices and pellet premiums. |
[1] Iron ore premium of US$ 0.6/t and the weighted average contribution of the pellet business of US$ 3.9/t.
| 2 |
Copper operations
| · | Salobo copper production was 13.1 kt higher y/y due to the successful and ongoing ramp-up of Salobo III, which contributed 13.2 kt to overall production from the complex, surpassing our plan for the quarter. This was partially offset by planned maintenance activities and additional work on the crushers at Salobo I and II. The maintenance activities will continue in 2H23 as planned. |  |
| · | Sossego copper production increased by 9.6 kt y/y and 1.7 kt q/q, driven by improved operational performance, following the extended maintenance work that impacted last year’s performance. |
| · | Copper production in Canada was flat y/y. There was a slight decrease in production from Canadian ore sources, mainly due to the VBME ramp-up and changes in mining method at the high-copper-grade Coleman mine in Sudbury. This decline was offset by higher consumption of third-party feed. Annual planned maintenance of the Sudbury mines and mill will take place in 3Q23. |
| · | Copper sales were 22.3 kt higher y/y, in line with higher copper production in the same period. |
| · | The average realized copper price was US$ 7,025/t in the quarter, up 13% y/y, mainly due to the lower impact of provisional price adjustment that offset lower LME prices (US$ 8,424/t in 2Q23 vs. US$ 9,513/t in 2Q22) and higher TC/RC discounts. The realized prices in the quarter were negatively affected by the downward trend in prices and the effect of associated provisional pricing adjustments. |
| 3 |
| · |
| 4 |
Nickel operations
| · | Finished nickel production from Sudbury sourced ore increased by 3.5 kt y/y. Sudbury mine operations continue to improve y/y. The increase is also due to the lower production in 2022 as a result of the 28-day maintenance shutdown at the Sudbury smelter and refinery which began in early April and reached full production again in June. |  |
| · | Finished nickel production from Thompson sourced ore decreased by 1.1 kt y/y, mainly as a result of planned maintenance activities at the Long Harbour refinery. |
| · | Annual mine-mill maintenance is planned for 3Q23 at the Sudbury and Thompson operations. Nickel concentrates inventories accumulated in 2Q23 will offset the lower production during this period. |
| · | Finished nickel production from Voisey’s Bay sourced ore was 5.2 kt lower y/y since the annual maintenance schedule at the Long Harbour refinery (from May to July) was planned longer than the previous year. Voisey’s Bay continues to be impacted by the ongoing transition period between the depletion of the Ovoid mine and ramp-up to full production of the Voisey’s Bay underground project. |
| · | Finished nickel production sourced from third parties increased by 2.1 kt y/y. For 2H23, consumption of feed from third parties is expected to remain at higher levels, as planned, to maximize the utilization and performance of our downstream operations. |
| · | Finished nickel production from Indonesia sourced material was 4.1 kt higher y/y. Nickel-in-matte production reached 16.9 kt in 2Q23. In 1H22, PTVI matte deliveries to downstream operations were reduced as a result of the planned furnace rebuild. During the 2Q23, the Clydach refinery had to extend planned maintenance beyond the planned period, returning to activities in early July, while the Matsusaka refinery performed well. |
| · | Onça Puma production was 0.6 kt lower y/y as the furnace is currently operating at a lower rate in preparation for the furnace rebuild later in the year. |
| · | Nickel sales were 1.0 kt higher y/y as a result of higher production. Sales remained relatively stable q/q due to inventory buildup in Q1 to meet sales commitments during planned maintenance at Long Harbour and Clydach refineries. |
| · | The average realized nickel price was US$ 23,070/t in the quarter, representing a 12% decrease y/y, mainly as a result of lower LME prices (US$ 22,308/t in 2Q23 vs. US$ 28,940/t in 2Q22). The average realized nickel price was 3% (US$ 762/t) higher than LME average price primarily driven by a higher share of Upper Class I products in the mix combined with higher average Class I premiums. |
| 5 |
ANNEX - Production and sales summary
Iron ore
| % change | ||||||||
| 000’ metric tons | 2Q23 | 1Q23 | 2Q22 | 1H23 | 1H22 | 2Q23/1Q23 | 2Q23/2Q22 | 1H23/1H22 |
| Northern System | 40,157 | 35,771 | 39,073 | 75,928 | 76,805 | 12.3% | 2.8% | -1.1% |
| Serra Norte and Serra Leste | 21,000 | 19,450 | 22,548 | 40,450 | 45,134 | 8.0% | -6.9% | -10.4% |
| S11D | 19,156 | 16,321 | 16,525 | 35,477 | 31,672 | 17.4% | 15.9% | 12.0% |
| Southeastern System | 21,795 | 18,604 | 19,557 | 40,399 | 34,512 | 17.2% | 11.4% | 17.1% |
| Itabira (Cauê, Conceição and others) | 8,362 | 7,439 | 7,061 | 15,801 | 13,259 | 12.4% | 18.4% | 19.2% |
| Minas Centrais (Brucutu and others) | 6,537 | 5,411 | 5,950 | 11,948 | 9,519 | 20.8% | 9.9% | 25.5% |
| Mariana (Alegria, Timbopeba and others) | 6,895 | 5,753 | 6,547 | 12,648 | 11,735 | 19.9% | 5.3% | 7.8% |
| Southern System | 16,792 | 12,399 | 15,477 | 29,191 | 25,918 | 35.4% | 8.5% | 12.6% |
| Paraopeba (Mutuca, Fábrica and others) | 7,483 | 4,326 | 6,968 | 11,809 | 10,978 | 73.0% | 7.4% | 7.6% |
| Vargem Grande (Vargem Grande, Pico and others) | 9,308 | 8,074 | 8,510 | 17,382 | 14,942 | 15.3% | 9.4% | 16.3% |
| IRON ORE PRODUCTION1 | 78,743 | 66,774 | 74,108 | 145,517 | 137,236 | 17.9% | 6.3% | 6.0% |
| OWN PRODUCTION | 73,020 | 63,490 | 69,473 | 136,511 | 130,191 | 15.0% | 5.1% | 4.9% |
| THIRD-PARTY PURCHASES | 5,723 | 3,284 | 4,637 | 9,007 | 7,048 | 74.3% | 23.4% | 27.8% |
| FINES AND PELLET SALES | 72,138 | 53,994 | 71,612 | 126,132 | 129,934 | 33.6% | 0.7% | -2.9% |
| FINES SALES2 | 63,329 | 45,861 | 62,769 | 109,190 | 114,080 | 38.1% | 0.9% | -4.3% |
| PELLET SALES | 8,809 | 8,133 | 8,843 | 16,942 | 15,854 | 8.3% | -0.4% | 6.9% |
| ROM SALES | 2,236 | 1,665 | 1,550 | 3,900 | 2,585 | 34.3% | 44.3% | 50.9% |
| SALES FROM 3RD PARTY PURCHASE | 5,572 | 3,545 | 4,536 | 9,117 | 7,236 | 57.2% | 22.8% | 26.0% |
1 Including third-party purchases, run-of-mine and feed for pelletizing plants. Vale’s product portfolio Fe content reached 62.3%, alumina 1.2% and silica 6.2% in 2Q23. 2 Including third-party purchases. |
Pellets
| % change | ||||||||
| 000’ metric tons | 2Q23 | 1Q23 | 2Q22 | 1H23 | 1H22 | 2Q23/1Q23 | 2Q23/2Q22 | 1H23/1H22 |
| Northern System | 665 | 784 | 836 | 1,449 | 1,574 | -15.2% | -20.5% | -7.9% |
| São Luis | 665 | 784 | 836 | 1,449 | 1,574 | -15.2% | -20.5% | -7.9% |
| Southeastern System | 4,633 | 4,668 | 4,088 | 9,301 | 7,777 | -0.7% | 13.3% | 19.6% |
| Itabrasco (Tubarão 3) | 1,004 | 951 | 930 | 1,955 | 1,240 | 5.6% | 8.0% | 57.7% |
| Hispanobras (Tubarão 4) | 57 | - | - | 57 | - | n.m. | n.m. | n.m. |
| Nibrasco (Tubarão 5 and 6) | 1,130 | 1,208 | 921 | 2,338 | 1,985 | -6.5% | 22.7% | 17.8% |
| Kobrasco (Tubarão 7) | 800 | 948 | 963 | 1,748 | 1,932 | -15.6% | -16.9% | -9.5% |
| Tubarão 8 | 1,642 | 1,562 | 1,273 | 3,204 | 2,619 | 5.1% | 29.0% | 22.3% |
| Southern System | 1,200 | 1,147 | 1,136 | 2,347 | 1,815 | 4.6% | 5.6% | 29.3% |
| Fábrica | - | - | - | - | - | - | - | - |
| Vargem Grande | 1,200 | 1,147 | 1,136 | 2,347 | 1,815 | 4.6% | 5.6% | 29.3% |
| Oman | 2,613 | 1,719 | 2,612 | 4,332 | 4,430 | 52.0% | 0.0% | -2.2% |
| PELLET PRODUCTION | 9,111 | 8,318 | 8,672 | 17,429 | 15,596 | 9.5% | 5.1% | 11.8% |
| PELLET SALES | 8,809 | 8,133 | 8,843 | 16,942 | 15,854 | 8.3% | -0.4% | 6.9% |
Copper - Finished production by source
| % change | ||||||||
| 000’ metric tons | 2Q23 | 1Q23 | 2Q22 | 1H23 | 1H22 | 2Q23/1Q23 | 2Q23/2Q22 | 1H23/1H22 |
| Brazil | 57.7 | 46.1 | 35.0 | 103.8 | 72.7 | 25.2% | 64.9% | 42.8% |
| Salobo | 42.7 | 32.8 | 29.6 | 75.5 | 63.6 | 30.2% | 44.3% | 18.7% |
| Sossego | 15.0 | 13.3 | 5.4 | 28.3 | 9.1 | 12.8% | 177.8% | 211.0% |
| Canada | 21.1 | 20.9 | 20.9 | 42.1 | 39.8 | 1.0% | 1.0% | 5.8% |
| Sudbury | 16.7 | 16.3 | 16.9 | 33.0 | 30.8 | 2.5% | -1.2% | 7.1% |
| Thompson | 0.05 | 0.1 | 0.2 | 0.2 | 0.5 | -50.0% | -75.0% | -60.0% |
| Voisey's Bay | 2.2 | 2.0 | 2.5 | 4.3 | 5.6 | 10.0% | -12.0% | -23.2% |
| Feed from third parties1 | 2.1 | 2.5 | 1.3 | 4.6 | 2.9 | -16.0% | 61.5% | 58.6% |
| COPPER PRODUCTION | 78.8 | 67.0 | 55.9 | 145.9 | 112.5 | 17.6% | 41.0% | 29.7% |
| COPPER SALES | 73.8 | 62.7 | 51.5 | 136.5 | 101.8 | 17.7% | 43.3% | 34.1% |
| Copper Sales Brazil | 52.7 | 43.2 | 34.6 | 95.9 | 68.7 | 22.0% | 52.3% | 39.6% |
| Copper Sales Canada | 21.0 | 19.5 | 16.9 | 40.5 | 33.1 | 7.7% | 24.3% | 22.4% |
1 External feed purchased from third parties and processed into copper in our Canadian operations. |
| 6 |
Nickel - Finished production by source
| % change | ||||||||||
| 000’ metric tons | 2Q23 | 1Q23 | 2Q22 | 1H23 | 1H22 | 2Q23/1Q23 | 2Q23/2Q22 | 1H23/1H22 | ||
| Canada | 13.2 | 16.3 | 16.1 | 29.5 | 35.0 | -19.0% | -18.0% | -15.7% | ||
| Sudbury | 10.6 | 9.5 | 7.1 | 20.1 | 15.7 | 11.6% | 49.3% | 28.0% | ||
| Thompson | 0.9 | 2.5 | 2.0 | 3.3 | 4.9 | -64.0% | -55.0% | -32.7% | ||
| Voisey's Bay | 1.7 | 4.3 | 6.9 | 6.1 | 14.4 | -60.5% | -75.4% | -57.6% | ||
| Indonesia | 13.2 | 14.0 | 9.1 | 27.2 | 26.7 | -5.7% | 45.1% | 1.9% | ||
| Brazil | 5.7 | 4.9 | 6.3 | 10.6 | 11.7 | 16.3% | -9.5% | -9.4% | ||
| Feed from third parties1 | 4.8 | 5.9 | 2.7 | 10.7 | 6.5 | -18.6% | 77.8% | 64.6% | ||
| NICKEL PRODUCTION | 36.9 | 41.0 | 34.2 | 77.9 | 79.9 | -10.0% | 7.9% | -2.5% | ||
| NICKEL SALES | 40.3 | 40.1 | 39.3 | 80.4 | 78.3 | 0.5% | 2.5% | 2.7% | ||
1External feed purchased from third parties and processed into finished nickel in our Canadian operations.
|
Energy Transition Metals by-products - Finished production
| % change | ||||||||
| 2Q23 | 1Q23 | 2Q22 | 1H23 | 1H22 | 2Q23/1Q23 | 2Q23/2Q22 | 1H23/1H22 | |
| COBALT(000’ metric tons) | 361 | 597 | 541 | 958 | 1,296 | -39.5% | -33.3% | -26.1% |
| PLATINUM(000’ oz troy) | 36 | 34 | 21 | 70 | 44 | 5.9% | 71.4% | 59.1% |
| PALLADIUM(000’ oz troy) | 46 | 40 | 28 | 86 | 58 | 15.0% | 64.3% | 48.3% |
| GOLD(000’ oz troy)1 | 91 | 79 | 60 | 170 | 131 | 15.2% | 51.7% | 29.8% |
| TOTAL BY-PRODUCTS(000’ metric tons Cu eq.)2 3 | 39 | 34 | 28 | 73 | 59 | 14.7% | 39.3% | 23.7% |
1 Includes Gold from Copper and Nickel operations. 2 Includes Iridium, Rhodium, Ruthenium, and Silver. 3 Copper equivalent tons calculated using average market metal prices for each quarter. Market reference prices: for copper and cobalt: LME spot; for Gold and Silver: LME spot for 2Q22 (also included in 1H22) and NYMEX from 3Q22 onwards; for Platinum and Palladium: NYMEX spot; for other PGMs: Johnson Matthey. |
| 7 |
Further information on Vale can be found at: vale.com
Investor Relations
Vale IR: vale.ri@vale.com
Ivan Fadel: ivan.fadel@vale.com
Luciana Oliveti: luciana.oliveti@vale.com
Mariana Rocha: mariana.rocha@vale.com
Pedro Terra: pedro.terra@vale.com
This press release may include statements about Vale's current expectations about future events or results (forward-looking statements). Many of those forward-looking statements can be identified by the use of forward-looking words such as "anticipate," "believe," "could," "expect," "should," "plan," "intend," "estimate" “will” and "potential," among others. All forward-looking statements involve various risks and uncertainties. Vale cannot guarantee that these statements will prove correct. These risks and uncertainties include, among others, factors related to: (a) the countries where Vale operates, especially Brazil and Canada; (b) the global economy; (c) the capital markets; (d) the mining and metals prices and their dependence on global industrial production, which is cyclical by nature; and (e) global competition in the markets in which Vale operates. Vale cautions you that actual results may differ materially from the plans, objectives, expectations, estimates and intentions expressed in this presentation. Vale undertakes no obligation to publicly update or revise any forward-looking statement, whether as a result of new information or future events or for any other reason. To obtain further information on factors that may lead to results different from those forecast by Vale, please consult the reports that Vale files with the U.S. Securities and Exchange Commission (SEC), the Brazilian Comissão de Valores Mobiliários (CVM) and, in particular, the factors discussed under “Forward-Looking Statements” and “Risk Factors” in Vale’s annual report on Form 20-F.
| 8 |
Signatures
Pursuant to the requirements of the Securities Exchange Act of 1934, the registrant has duly caused this report to be signed on its behalf by the undersigned, thereunto duly authorized.
| Vale S.A. (Registrant) | ||
| By: | /s/ Ivan Fadel | |
| Date: July 18, 2023 | Head of Investor Relations | |