Exhibit 99.1
Transcript of Dominion Homes, Inc. Presentation at the Raymond James
Institutional Investors Conference on March 9, 2005 at 1:40 p.m. (Updated March 16, 2005)
Rick Murray (Raymond James): Thanks for sticking around today. We’ve got one more homebuilding presentation for you. This is Dominion Homes, small cap builder out of Columbus, Ohio. And here with us today is Doug Borror, Chairman and CEO of the Company, as well as Terry Thomas, the CFO and Senior Vice President of Finance. And I will turn it over to Doug.
Doug Borror:
Thank you very much Rick & Paul. Appreciate you guys having us here today and appreciate the strong willed folks that are here this late in the conference. Dominion Homes is the leading homebuilder in both Louisville, Kentucky and Columbus, Ohio. We build high quality homes for the entry-level and first time and move-up markets. We have an energetic management team. While 2004 was a challenging year for us, we believe that our land holdings and our product, we are poised for growth in the future.
Let me tell you about our Company. In 1952, we sold and built our first home in Columbus. In 1998, we expanded into Louisville, Kentucky. And last year, we started selling in Lexington, Kentucky. In Columbus, we had a 26% market share in 2004. In Louisville, we have almost 10% market share. We build top quality homes in distinctive communities throughout all of our markets. Presently, we have over 60 communities under development.
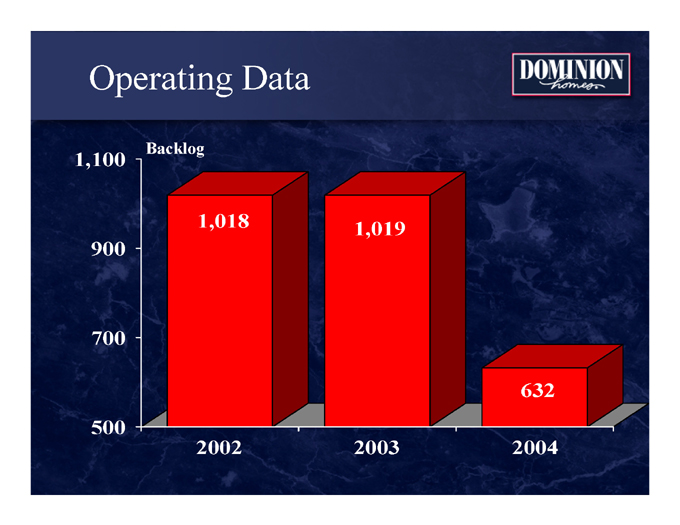
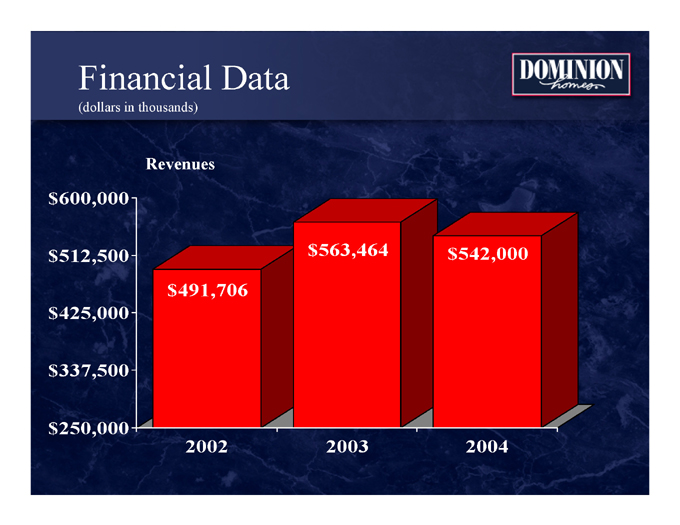
2004 was a solid, yet difficult year. Our revenues were over $540 million on closings of over 2800 homes. We posted a net income of over $20 million. Our sales in the last 3 quarters, however, were well below anticipated levels, which resulted in our backlog of 632 homes at year-end – the lowest level in many years.
Dominion Homes is a Midwest based builder. We build in Ohio, Kentucky and Indiana. As you probably know, the Midwest region has had a significant slowdown in the sale of new homes. This has impacted not only our sales, but our competitors’ sales in the Midwest. We have begun implementing new sales initiatives to aggressively confront the recent decline, and we are pleased to report that we are already off to what we believe will be a solid selling season.
Our markets are centrally located, have growing populations, and solid economies. Columbus has traditionally experienced lower economic highs and higher lows than most markets – last year’s drop-off in permits and sales was uncharacteristic. Louisville tends to be slightly more blue collar than Columbus with a more manufacturing based economy. Lexington is similar to Columbus, but smaller – a college town with a significantly more white collar work force.
While single-family permits in our two primary markets have suffered a drop-off, the drop-off was more prominent in our core business - the under $250,000 segment. Our
-1-
market share by price point however remains very strong. In the Columbus [Metropolitan Statistical Area] market we have a 49% [sic. approximately 47%] market share [of new homes closed] between [homes in the] $100,000 and $150,000 [range], and a 34% [sic. approximately 32%] market share [of new homes closed] between [the] $150,000 and $250,000 [range].
Let me tell you more about our products. We are not just a homebuilder, we are a community builder. We design and build “signature” neighborhood entrances which include stone monuments, ponds with fountains, and boulevards. Our communities range in size from 1,500 to 150 homes and commonly include amenities such as parks, bike paths, and playgrounds.
We are a “value” builder whose brand strategy is to provide families with high quality entry-level and first-time move-up homes in the best locations with more standard features than our competitors. Every home we sell includes Andersen wood windows, Kohler plumbing faucets and fixtures, and General Electric appliances.
Nearly three-fourths of our buyers are renters. We have a wide-array of product offerings to meet their housing needs. Our product family consists of the Independence Series, the Celebration Series, the Tradition Series, and Metropolitan Series Town homes.
Our Independence Series homes are single-family homes in condominium communities. We offer nine, neo-traditional home styles built on slab with front porches and rear-loaded garages, with a density of six per acre. With prices beginning at just over $100,000, we offer monthly payments as low as rent. This represents 35% [sic. 38%] of our business [in Central Ohio based on net sales] in the year 2004.
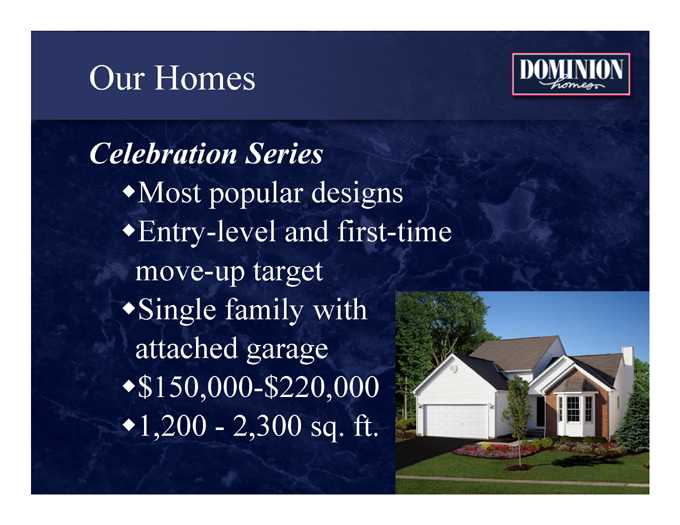
The Celebration Series represents 50% [sic. 47%] of our business [in Central Ohio based on net sales in 2004]. Celebration communities are typically built at four homes per acre. Built with standard features that include basements and other features that are optional by other builders. We sell this series to many first time homebuyers.
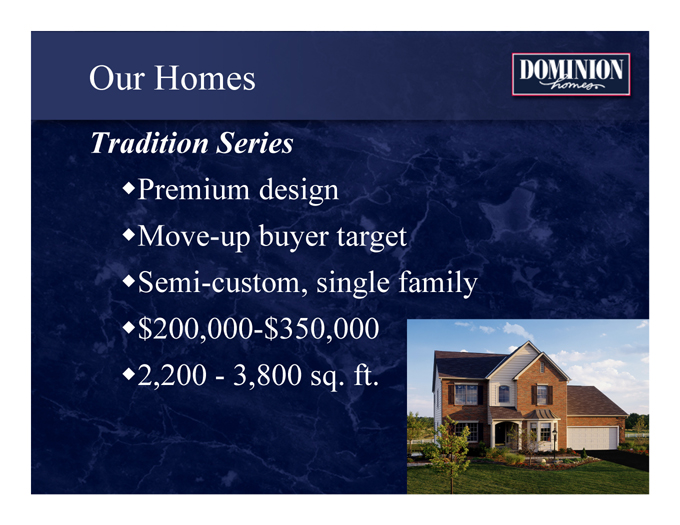
Our Tradition Series is our move-up series. We have 13 model designs that include nine foot ceilings, huge great rooms, oversized garages and home offices. We build these in upscale neighborhoods on larger home sites. This product series sells for an average sales price of over $300,000 and represents 15% of our business [in Central Ohio based on net sales in 2004].
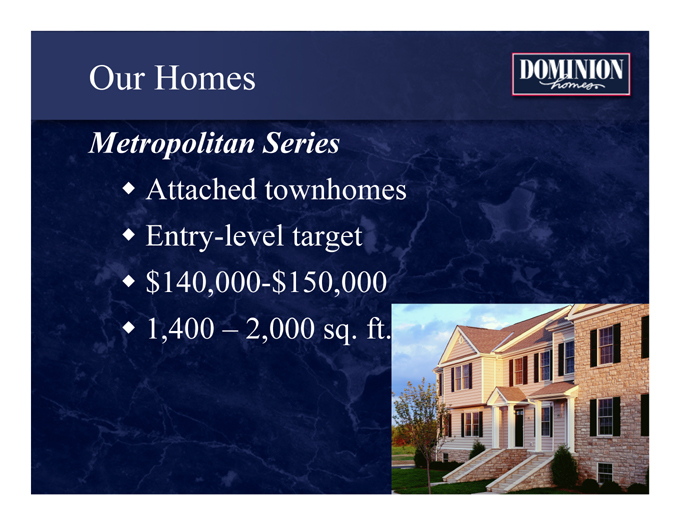
Our Metropolitan Series Town homes is our newest product. It is designed to meet the needs of the customer who is on the go and chooses a maintenance-free lifestyle over a single-family home. We offer four floor plans including two or three bedrooms, 2 1/2 baths, a finished lower level, and a two-car garage. This product series sells for an average price of over $140,000. We currently have one community for sale, and two others opening soon.
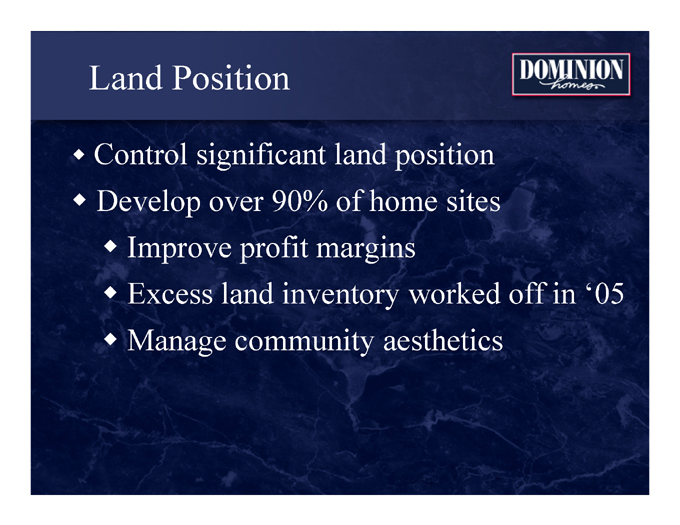
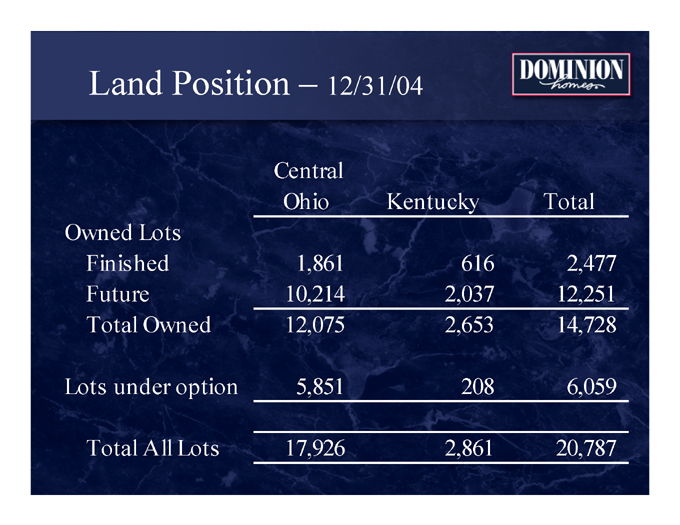
Our land position is one of our primary strengths. To control community aesthetics, costs and timing, we develop practically all of our communities. We control over 21,000 lots representing just over six years of inventory. All the lots are fully zoned, serviceable, entitled, and in premier locations in all three of our markets. This chart shows the mix. [Chart attached]
-2-
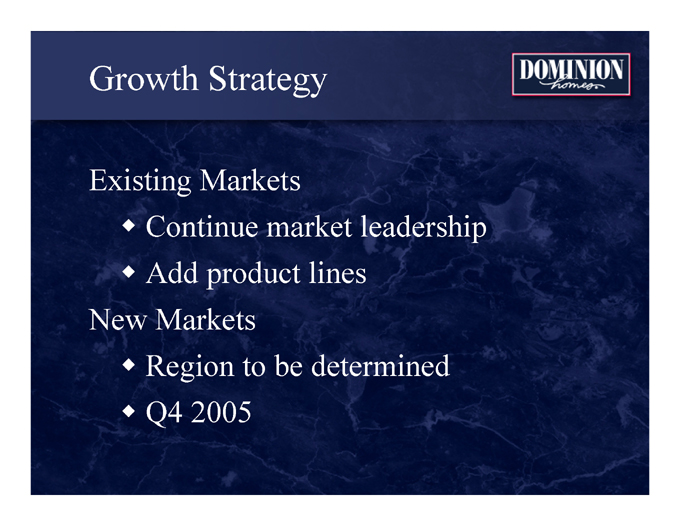
We have a continuing growth strategy. In our existing markets, we intend to continue our leadership in the first time and move-up markets. We continue to expand by adding product lines to existing and new communities. Finally as we move forward, we will look to other markets for additional expansion.
With that I’d like to invite Terry Thomas, our CFO, up to talk about our financials.
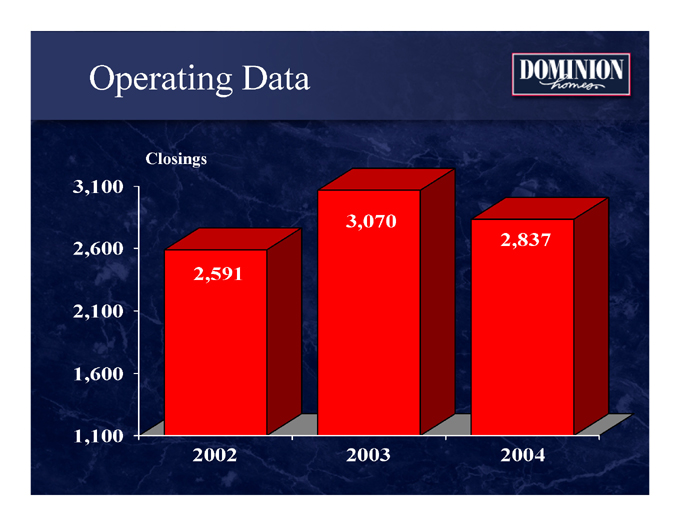
Terry Thomas: Thanks, Doug. As Doug stated, 2004 was a challenging year for us at Dominion Homes. We did however, have our second best year in closings and revenues. Our closings were 2837, which is an approximate decrease of 7.5% from 2004 (sic. 2003) and approximately 9.5% increase over 2002.
We entered the year with 1019 homes in backlog, we sold 2450 homes, we closed 2837 and ended the year with 632 units in backlog. As Doug stated, this is the lowest backlog we’ve had in years. We have stated in our earnings release that we do not anticipate being profitable in the first quarter of ‘05. We have and will focus and continue to work diligently to improve our first quarter results. We do anticipate being profitable in 2005, but with lower net income than in recent years.
Revenues exceeded $540 million in 2004, a 4% decrease from 2003. This is a result of a 7.5% decrease in closings offset by a 5% increase in our average sales price of homes closed during 2004. Revenues were 10% greater than 2002.
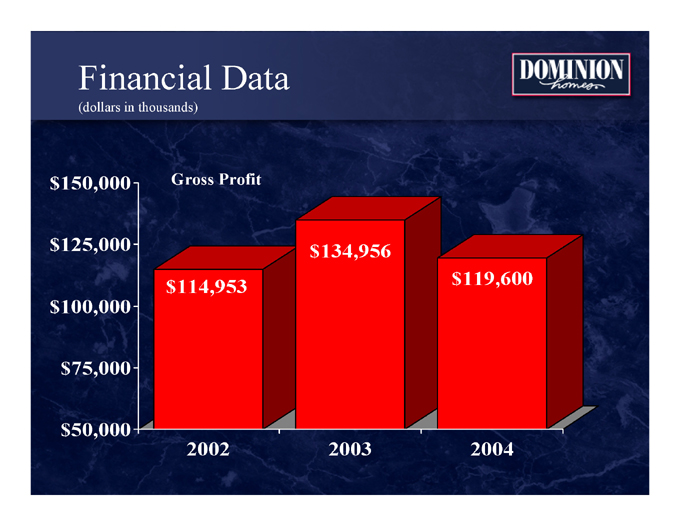
Gross Profit was $119.6 million in 2004, representing an 11% decrease from ‘03. In addition to a decline in closings, gross profit was impacted by an approximate write-off in 2004 of $4.8 million, predominately related to land deposits and preacquisition costs. With the majority, $3.6 million, coming in the fourth quarter as we evaluated our land pipeline and adjusted to the current business environment. In addition, on the upside - we improved our warranty cost from $3.2 million in ‘03 to $1.2 million in 2004, primarily due to working with our contractors to improve our warranty claim experience.
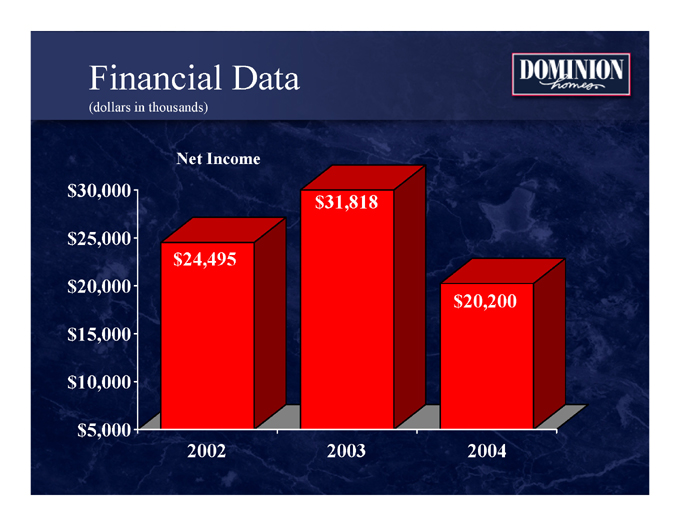
With all that said, we had our third best year in the Company’s history. Net income exceeded $20 million producing earnings per share of $2.47.
We manage our cash deposits to a minimum and sweep those against our line of credit as soon as possible. Debt to total capital at December 31, 2004, was at 51%; as of 12/31/04 we had [utilized] $194 million of our $300 million line of credit. We anticipate our capital needs will increase during the first half of the year as we bring on some of the new communities that Doug discussed. We are focused in ‘05 and we’re planning for our future.
-3-
And with that, I’d like to turn it back over to Doug.
Doug Borror: 2005 is a building year for us. With a steady economy, we expect to increase our sales this year. At Dominion, we have a dominant market share in our two established markets. And we will continue to expand our product offerings and continue to look at additional markets. We have zoned and developed ground in the right locations, and are fully prepared to take advantage of the market as it recovers. Our economically solid cities, coupled with our land position and our proven management team leave us poised for future growth and success, and continued shareholder value.
I’d like to thank everybody for being here today and would like to open the floor for questions at this time.
[Question from the audience regarding sales, and whether sales were a problem specific to the market or just to Dominion Homes]
Doug Borror: Well the data that we showed here - permits are down. You want me to go back to the slide? Oh - I’m sorry, okay, repeat the question. Is this a problem that is specific to the market or a problem that is specific to Dominion Homes? And the answer is our market has taken a significant drop, and it not only has taken a significant drop, but it has taken a significant drop in the market that we are strongest in, which is the under $250,000 permit range and permits are off. With a strong first quarter the permits were off 18% for the year – so that’s a three quarter - the last three quarters have been the bad three quarters, so it has been worse than that the last three quarters.
That is also if you look at other public homebuilders that have Midwestern markets, those numbers track very, very closely with theirs. Specifically ones that we track would include MI Homes and Beazer Homes.
[Question from the audience regarding the Company’s land position and general strategy for the Columbus market]
Doug Borror: Sure, Rick. We have - Columbus has tended to be a very stable yet growing market the last five years. We’ve grown at a fairly steady rate and our business has expanded to accommodate that. This year the market has declined. And our business plan was to continue to increase our sales, so our pipeline in land was greater than what our appetite now to use in the future appears. So what we’ve done is we’ve done a couple of things. We have analyzed the land that we have and we have not proceeded on purchasing ground that we thought we might need for additional expansion. We have repositioned some of our product to try to use the ground that we have in process quicker. And we are basically curtailing our asset expansion in our Columbus market to get it to the level that would be a level that we think will be more consistent in the future without the continued growth that we’ve had for five straight years.
[Question from the audience regarding whether the Company is anticipating that revenues will be higher in 2005 than in 2004]
-4-
Doug Borror: We are not expecting revenues – our backlog was 630 houses, so we are expecting - our sales - we sold 2,400 [sold] homes in 2004. We closed 2,800. We are expecting to sell more homes this year. We will not close as many homes this year. So revenue won’t be up. So to answer the question – I didn’t repeat the question.
[Inaudible question from the audience.]
Doug Borror: Well, we have expanded our – in anticipation of the sales we had in the first quarter, we have expanded our assets including developed land and developed lots so as you can see our balance sheet has more debt on the books, our interest expense is more, and frankly the cost in downsizing – we have reduced our overhead and we are downsizing as quickly as we can, but that has proven to be something that does not happen on a dime in our business and it takes a while for that to follow through to the operational level.
[Question from the audience as to whether the Company owns all of its land, and asking for Doug Borror to comment on the fair market value of the Company’s land.]
Doug Borror: No we don’t own it all outright – I think we own about 2/3 of it. And we carry it on a cost basis and we’ve capitalized very little overhead into it and I think that it’s certainly worth what we have it on the books for.
[Question from the audience regarding the interest rate on the Company’s debt in 2004]
Doug Borror: Interest rate on our debt is . . .
Terry Thomas: We experienced about a 5% cost of capital [sic. debt] last year.
[Question from the audience regarding the amount of the Company’s debt at the end of 2004.]
Doug Borror: And I think we also . . .
Terry Thomas: Our actual debt . . . at the end of the year was $194 million, and that was about 51% if you take that to total [capitalization – debt and equity]. At a rate of about 5%.
Doug Borror: We’ll get the answer here.
Doug Borror: Other questions?
[Question from the audience requesting that Doug Borror expand on his comments in the presentation regarding the Company’s’ growth plans.]
-5-
Doug Borror: Rick, we are – as we work through our inventory, because we have excess developed lots from not selling enough homes, we expect to work some cash into the balance sheet, and I would say that would be a 6-12 month period where that will start to grow. So as we start into the summer, seeing how our sales are in the spring, we expect to be analyzing that very seriously and very soon. So we would hope to be able to make some type of announcement by the end of the year. As to where we will go, that is something that we have not determined yet. We will give it great study.
[Question from the audience regarding the amount of land the Company owns as compared to the amount of land under options.]
Doug Borror: Roughly 21,000 – of which about 14,000 we own. And everything is totally entitled – including the options.
[Inaudible question from the audience.]
Doug Borror: Yes – I don’t believe we have.
[Question from the audience regarding the Company’s closings in 2005.]
Doug Borror: Yes. If we take the backlog of 635. So we are down 400 at the beginning of the year from where we were last year, yes.
Rick Murray (Raymond James): If there are no further questions, we will adjourn.
Doug Borror: Thank you all so much for coming. I appreciate it.
[End]
-6-

DOMINION HOMESP®
THE BEST OF EVERYTHING

Certain statements in this presentation may be “forward-looking statements” within the meaning of the Private Securities Litigation Reform Act of 1995. Such statements involve known and unknown risks, uncertainties and other factors that may cause actual results to differ materially. Such risks, uncertainties and other factors include, but are not limited to, weather conditions, changes in general economic conditions, fluctuations in interest rates, increases in raw materials and labor costs, levels of competition and other factors described in the Company’s most recent Annual Report and Form 10-K. All forward-looking statements made in this presentation are based on information presently available to the management of the Company. The Company assumes no obligation to update any forward-looking statements.
Investment Highlights
Core market leadership
Experienced management team
Solid financial strength
Identified growth opportunities

Company History
1952 Founded in Columbus
1976 Started production homebuilding
1994 Initial public offering
1997 Founded Title Agency
1998 Expansion into Louisville
2000 Started Mortgage Company
2003 Expansion into Lexington
Company Overview
#1 Homebuilder
Central Ohio – 26% market share
Louisville, KY – 10% market share
Target entry-level and first-time move up buyers
Over 60 communities under development
Company Financial Profile
2004 revenues of $542.0 million
2004 net income of $20.2 million or $2.47 per share
Total assets of $444 million at 12/31/04
Total book value of $188 million at 12/31/04
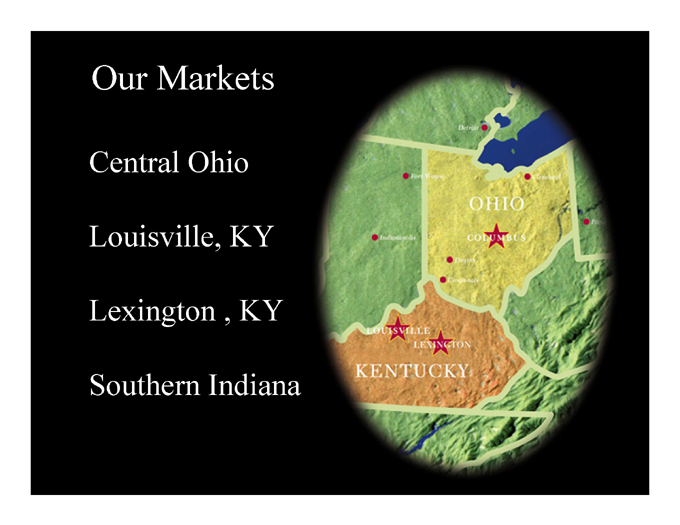
Our Markets
Central Ohio
Louisville, KY
Lexington, KY
Southern Indiana
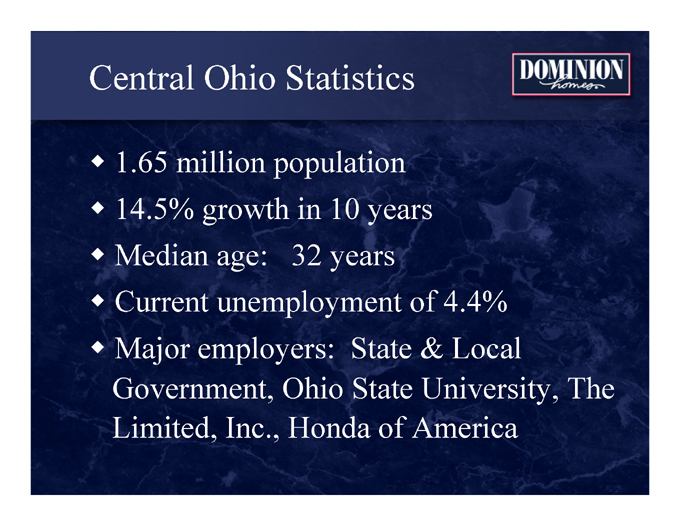
Central Ohio Statistics
1.65 million population
14.5% growth in 10 years
Median age: 32 years
Current unemployment of 4.4%
Major employers: State & Local Government, Ohio State University, The Limited, Inc., Honda of America

Louisville Statistics
1.2 million population
8.1% growth in 10 years
Median age: 36 years
Current unemployment of 4.2%
Major employers: UPS, Ford, Kroger, GE Appliances, Humana
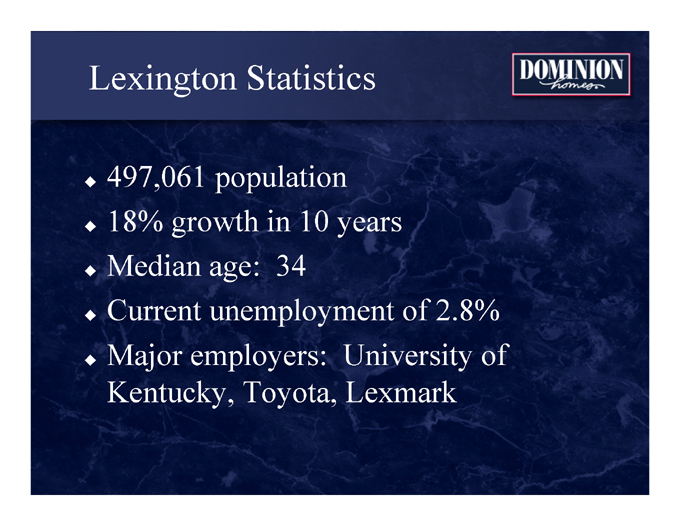
Lexington Statistics
497,061 population
18% growth in 10 years
Median age: 34
Current unemployment of 2.8%
Major employers: University of Kentucky, Toyota, Lexmark

Market Growth
Single Family Permits - 2002, 2003, 2004
12,000
10,000
8,000
6,000
4,000
2,000
Columbus
Louisville
Lexington

Columbus Market Share by Price Point
$250k-$350k
17%
$150k-$250k
34%
$100k-$150k
49%
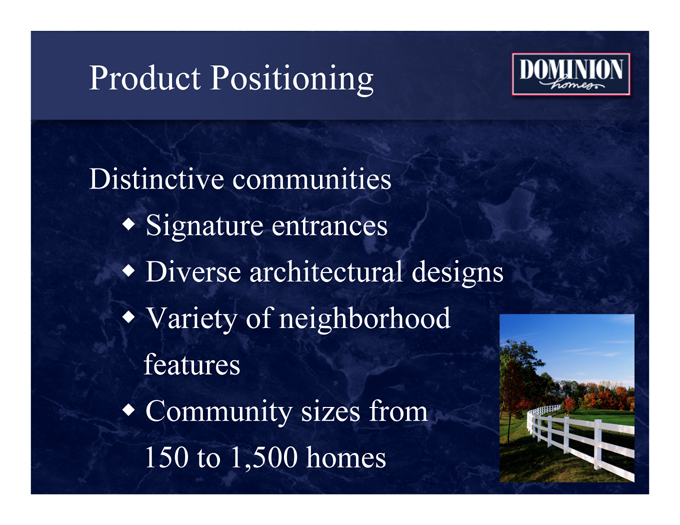
Product Positioning
Distinctive communities
Signature entrances
Diverse architectural designs
Variety of neighborhood features
Community sizes from 150 to 1,500 homes
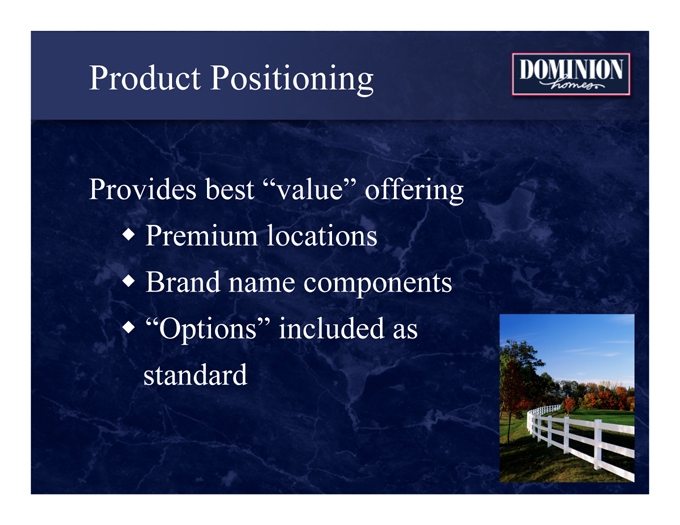
Product Positioning
Provides best “value” offering
Premium locations
Brand name components
“Options” included as standard
Product Positioning
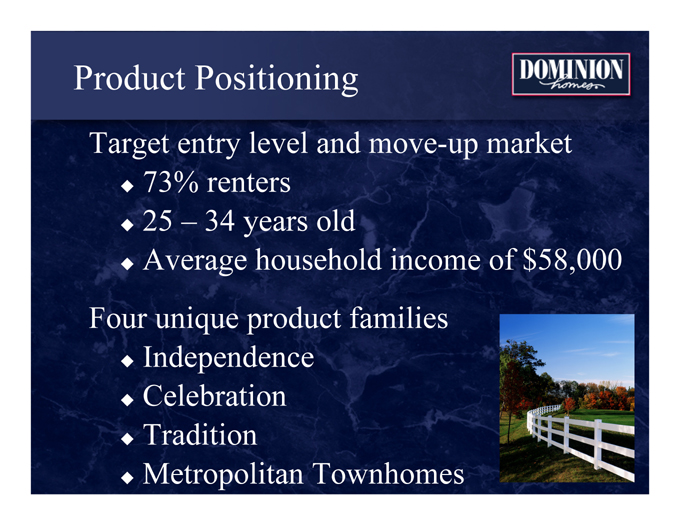
Target entry level and move-up market
73% renters
25 – 34 years old
Average household income of $58,000
Four unique product families
Independence
Celebration
Tradition
Metropolitan Townhomes

Our Homes
Independence Series
Neo-traditional
Entry-level target
Single-family homes in a condominium or traditional neighborhood community
$110,000-$180,000
1,000-1,800 sq. ft.
Our Homes
Celebration Series
Most popular designs
Entry-level and first-time move-up target
Single family with attached garage
$150,000-$220,000
1,200 - 2,300 sq. ft.
Our Homes
Tradition Series
Premium design
Move-up buyer target
Semi-custom, single family
$200,000-$350,000
2,200 - 3,800 sq. ft.
Our Homes
Metropolitan Series
Attached townhomes
Entry-level target
$140,000-$150,000
1,400 – 2,000 sq. ft.
Land Position
Control significant land position
Develop over 90% of home sites
Improve profit margins
Excess land inventory worked off in ‘05
Manage community aesthetics
Land Position – 12/31/04
Central Ohio
Kentucky
Total
Owned Lots
Finished
1,861
616
2,477
Future
10,214
2,037
12,251
Total Owned
12,075
2,653
14,728
Lots under option
5,851
208
6,059
Total All Lots
17,926
2,861
20,787
Growth Strategy
Existing Markets
Continue market leadership
Add product lines
New Markets
Region to be determined
Q4 2005

Financial Summary
Operating Data
Closings
3,100
2,600
2,100
1,600
1,100
2,591
2002
3,070
2003
2,837
2004
Operating Data
Backlog
1,100
900
700
500
1,018
2002
1,019
2003
632
2004
Financial Data
(dollars in thousands)
Revenues
$600,000
$512,500
$425,000
$337,500
$250,000
$491,706
2002
$563,464
2003
$542,000
2004
Financial Data
(dollars in thousands)
Gross Profit
$150,000
$125,000
$100,000
$75,000
$50,000
$114,953
2002
$134,956
2003
$119,600
2004
Financial Data
(dollars in thousands)
Net Income
$30,000
$25,000
$20,000
$15,000
$10,000
$5,000
$24,495
2002
$31,818
2003
$20,200
2004
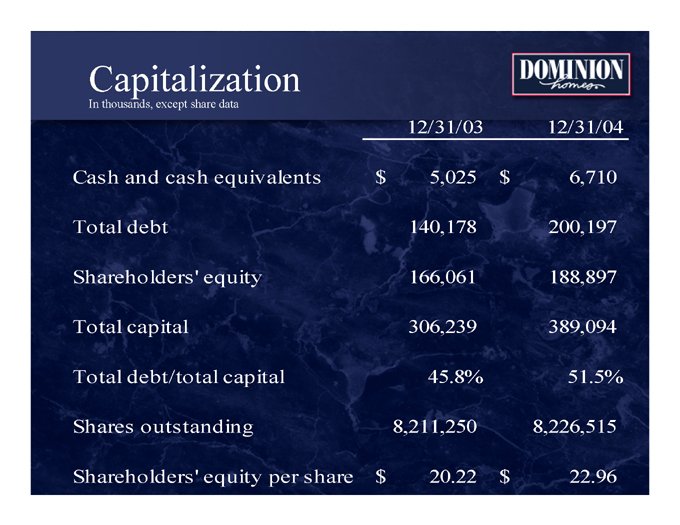
Capitalization
In thousands, except share data
12/31/04
12/31/03
Cash and cash equivalents
$ 5,025
$ 6,710
Total debt
140,178
200,197
Shareholders’ equity
166,061
188,897
Total capital
306,239
389,094
Total debt/total capital
45.8%
51.5%
Shares outstanding
8,211,250
8,226,515
Shareholders’ equity per share
$ 20.22
$ 22.96
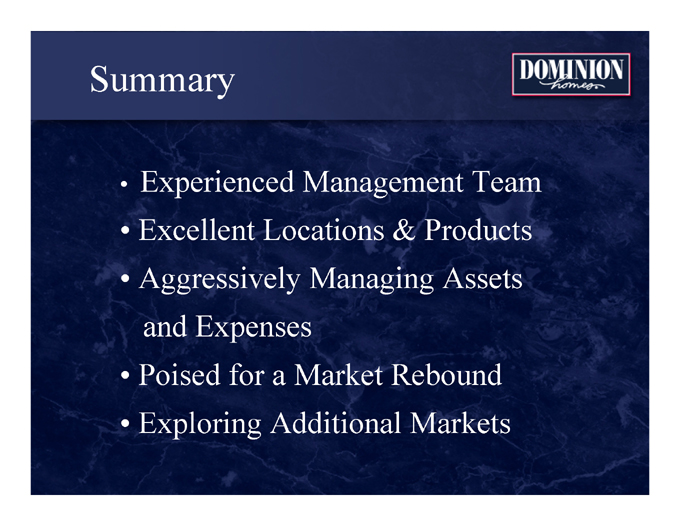
Summary
Experienced Management Team
Excellent Locations & Products
Aggressively Managing Assets and Expenses
Poised for a Market Rebound
Exploring Additional Markets

DOMINION HOMES
THE BEST OF EVERYTHING


