UNITED STATES
SECURITIES AND EXCHANGE COMMISSION
Washington, D.C. 20549
FORM N-CSR
CERTIFIED SHAREHOLDER REPORT OF REGISTERED
MANAGEMENT INVESTMENT COMPANIES
Investment Company Act File Number: 811-07145
| T. Rowe Price International Series, Inc. |
|
| (Exact name of registrant as specified in charter) |
| |
| 100 East Pratt Street, Baltimore, MD 21202 |
|
| (Address of principal executive offices) |
| |
| David Oestreicher |
| 100 East Pratt Street, Baltimore, MD 21202 |
|
| (Name and address of agent for service) |
Registrant’s telephone number, including area code: (410) 345-2000
Date of fiscal year end: December 31
Date of reporting period: December 31, 2019
Item 1. Reports to Shareholders
(a) Report pursuant to Rule 30e-1.
| International Stock Portfolio | December 31, 2019 |
| T. ROWE PRICE INTERNATIONAL STOCK PORTFOLIO |
|
HIGHLIGHTS
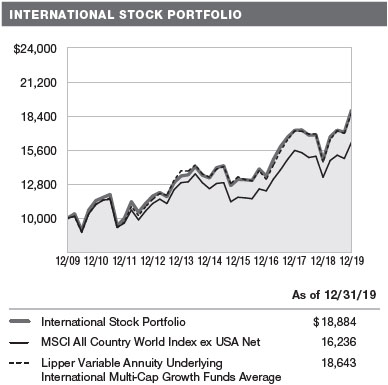
| ■ | Your portfolio returned 27.77% in the 12 months ended December 31, 2019, handily outperforming the MSCI All Country World Index ex USA Net and modestly outperforming its Lipper peer group average. |
| |
| ■ | The International Stock Portfolio benefited from stock selection in information technology and financials, but stock selection in the industrials and business services sector detracted. |
| |
| ■ | We buy and hold companies with durable franchises that we believe can generate steady earnings and cash flow growth over the long term. |
| |
| ■ | We think the portfolio is a balanced blend of defensive growth names, such as aerospace and defense stocks, and procyclical holdings, such as our positions in India and information technology. |

Log in to your account attroweprice.comfor more information.
*Certain mutual fund accounts that are assessed an annual account service fee can also save money by switching to e-delivery.
CIO Market Commentary
Dear Investor
Stocks posted strong gains in 2019 as most major U.S. indexes hit record highs in a broad-based rally that more than offset 2018’s losses. Large- and mid-cap growth stocks were the strongest performers, with the S&P 500 and Nasdaq benchmarks recording their best year since 2013. U.S. shares outpaced their global counterparts, although most non-U.S. indexes also finished with solid double-digit gains.
Technology shares performed best within the S&P 500, helped by strong gains from industry giants Apple and Microsoft, and financial stocks also outperformed the broader market. Fixed income securities produced solid gains during the period as well—with corporate bonds leading the way—as longer-term Treasury yields fell to historic lows in late summer before partially rebounding.
In a sign that public markets have retained discipline, investors expressed skepticism about certain private-equity valuation levels when compared with their prospects for financial profitability. Relatively few initial public offerings (IPOs) saw their prices appreciate during the year, and one high-profile IPO candidate (WeWork) decided to withdraw its offering altogether after its valuation was dramatically reduced in the weeks before its proposed IPO.
Although the year opened with concerns that an escalating U.S.-China trade dispute could lead to a recession, global central banks played a key role in supporting markets. Fed policymakers delivered quarter-percentage-point rate cuts in July, September, and October and took steps to maintain liquidity in short-term lending markets. Other central banks also acted to address flagging growth, including the European Central Bank, which lowered its benchmark deposit rate deeper into negative territory and announced that it was restarting its quantitative easing program.
The pivot to a more accommodative monetary policy was a marked change from 2018, when the Fed raised rates four times, and appeared to be successful in reenergizing the economy. After contracting earlier in 2019, key U.S. manufacturing indicators showed signs of stabilizing by year-end, and the labor market remained strong, with solid payroll gains and an unemployment rate hovering near a 50-year low. With this more encouraging economic backdrop, it was not a surprise that in December Fed officials seemed satisfied that monetary policy was properly positioned to support continued growth and forecast no additional rate moves in 2020.
Besides central bank policy, investors also closely followed developments in the U.S.-China trade dispute. Stocks stumbled in May and August after the U.S. announced new tariffs on some Chinese imports and China retaliated with new tariffs of its own. However, investors generally took an optimistic view of trade negotiations, which limited the trade war’s toll on markets, and in December the two countries announced a “phase one” agreement to reduce some existing tariffs and cancel the imposition of new ones.
With monetary policy worldwide largely committed to ensuring market liquidity and some global economic indicators showing signs of improvement, there are reasons to be optimistic in 2020. However, we caution investors not to expect the outsized gains of the past year. If the post-World War II era is to be a guide, the S&P 500 has on average generated mid-single-digit returns in the fourth year of a presidential cycle.
Further market advances will likely hinge on a resumption in earnings growth, which stalled in 2019, and there is no shortage of global risks in the year ahead. Unresolved trade issues, tensions in the Middle East, and policy debates on taxes, health care, and wealth disparity leading up to the U.S. presidential election all have the potential to cause market volatility.
In addition to these risks, T. Rowe Price analysts will be closely following how disruptive forces such as innovation, technological change, and automation could impact a growing number of global industries. In an uncertain environment, with a wide dispersion of returns possible, we believe that in-depth fundamental research that integrates environmental, social, and governance considerations will be critical to successfully assess opportunities and risks. I am confident our strategic investing approach will continue to serve our shareholders well.
Thank you for your continued confidence in T. Rowe Price.
Sincerely,

Robert Sharps
Group Chief Investment Officer
Management’s Discussion of Fund Performance
INVESTMENT OBJECTIVE
The fund seeks long-term growth of capital through investments primarily in the common stocks of established, non-U.S. companies.
FUND COMMENTARY
How did the fund perform in the past 12 months?
The International Stock Portfolio returned 27.77% in the 12 months ended December 31, 2019. The portfolio outperformed its benchmark, the MSCI All Country World Index ex USA Net, and the Lipper Variable Annuity Underlying International Multi-Cap Growth Funds Average. (Past performance cannot guarantee future results.)

What factors influenced the fund’s performance?
Stock selection was the primary driver of the portfolio’s strong relative performance, although allocation decisions also generated a good contribution. Stock selection and an overweight allocation to information technology generated excellent performance. The fund’s best absolute and relative performance contributor for the year wasNXP Semiconductors, a Netherlands-based diversified, mixed-signal semiconductor manufacturer. The company has posted solid revenues and earnings gains, led by new orders in the automotive area. Not only does the company have a good product portfolio and serve healthy end markets, but it also trades at a relatively inexpensive valuation. We expect strong organic revenue growth acceleration and operating margin expansion coupled with improvement in free cash flow generation. (Please refer to the portfolio of investments for a complete list of holdings and the amount each represents in the portfolio.)
The portfolio also benefited from solid gains in Netherlands-basedASML Holding. It is the dominant supplier of lithography equipment for semiconductor manufacturing, the most critical step in the semiconductor manufacturing process. Due to its unique technology leadership position (and virtual monopoly status), ASML maintains longer lead times than its semiconductor capital equipment peers, leading to revenue stability and unparalleled pricing power. The stock rallied on better-than-expected revenue and earnings. We believe that ASML has near- and long-term organic and free cash flow growth generation potential and that the company is deserving of its premium valuation.
Stock selection in the financials sector, coupled with an underweight allocation, generated the next-best relative performance contribution.London Stock Exchange Group, which operates a diversified exchange business, was a strong absolute and relative performance contributor. The stock rose sharply late in the year following an acquisition offer from fellow exchange operator Hong Kong Exchange that was later rejected. We like the stock because the company’s growth is underpinned by structural drivers, the company is under-earning in several areas that are showing improvement, and because we believe it can generate margin expansion for several years.
Banca Mediolanum, the Italian family-owned wealth manager, posted strong gains and has a solid long-term record as an asset gatherer. The company is benefiting from reconfiguring its performance-based fee structure into a more stable management fee structure, which we believe could result in a higher price/earnings multiple for the shares over time. Lower-than-expected costs and an announced dividend that exceeded 2018’s payout also boosted the stock in the fourth quarter. Management’s moves have gained investor favor that we believe can result in a larger customer base and improved customer retention.
Within the communication services sector, stock selection, notably in the interactive media and services industry, drove relative results.NAVERwas the best contributor in the sector. It is the leading search engine in South Korea and operates a leading mobile messenger (Line) in Japan, Taiwan, Thailand, and Indonesia. After a disappointing second quarter due to rising expenses and contracting margins, the stock staged a solid recovery. NAVER’s high-quality domestic business is generating stable growth, in part because of new initiatives in online video, e-commerce, and NAVER Pay. We believe the company offers good growth at an attractive valuation and it commands a solid position in its domestic market.
Stock selection and an overweight allocation in the industrials and business services sector detracted from relative returns.Thales, a large position in the aerospace segment, declined. The global aerospace and defense company operates in structurally growing end markets such as digital security, air traffic management, rail signaling, and in-flight entertainment and connectivity. In the past 12 months, the company has suffered from a weaker-than-anticipated rate of growth in the commercial satellite market that has caused the stock to suffer. We believe this is a transitory issue in what is a structurally growing market. In our view, Thales’s research and development investments will yield good results over time.
How is the fund positioned?
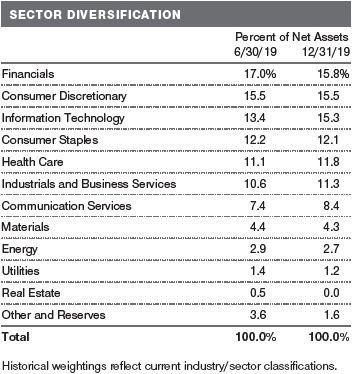
The International Stock Portfolio’s sector positioning is the result of bottom-up stock selection. While we may occasionally have a qualitative macroeconomic view that modestly influences sector and industry weightings, they are predominantly a residual of our bottom-up stock selection process. This process has proven to be extremely durable and style-consistent.
Overall, our regional allocations have not shifted materially over the year. Developed Europe (44% of portfolio assets) offers opportunities to buy durable growth companies with good risk/reward trade-offs. While it remained the largest regional weighting, we are slightly underweight versus the benchmark. Our holdings in the Pacific ex-Japan region totaled 24%, and we have remained underweight in Japan (15%), which has struggled to maintain economic growth thisyear. We have maintained a modest overweight allocation to emerging markets, where we continue to find solid growth companies trading at reasonable valuations.
The portfolio’s financials sector holdings generated a double-digit return, handily outperforming the benchmark. Our relative returns also benefited from an underweight allocation in the sector. We were active buyers and sellers in the sector, but, overall, we sold more than we added. We eliminated our position in insurerPrudential. While we still view the company as a structural compounder in the Asia business, we became concerned with the long-term outlook for its U.S. subsidiary. We also eliminated Finnish insurerSampo. The stock had been volatile. After it rebounded in October, we decided to close out our position as a source of funds for other ideas. We initiated a position in UK-listedHiscox, a specialty insurer domiciled in Bermuda, following poor earnings that disappointed the market. Hiscox’s management is one of the best in European insurance, and we are confident in its long-term earnings growth potential.
The portfolio’s overweight allocation in consumer discretionary was relatively unchanged for the year. We added to our position inProsus, the holding company for the international internet assets of South Africa-listedNaspers, which is also owned in the portfolio. Prosus’ portfolio includes stakes in Tencent Holdings, Mail.ru, Ctrip.com International, and others. The business also includes Naspers’ online classified ads business, food delivery investments, and financial technology interests. The stock trades at a significant discount to the underlying value of its assets, and management is committed to closing that gap while building out the classified, food delivery, and payments businesses.
What is portfolio management’s outlook?
At present, markets have been swinging between a more optimistic view that economic growth is bottoming and worries about a trade deal and late-cycle attributes of some economies. While cyclicals were extremely attractive earlier in the year, many of these cyclical stocks have had strong rallies on the narrative that economic growth is bottoming, and risk/reward has become somewhat less appealing in certain areas. Meanwhile, many of the classic defensive areas of the market remain expensive, in our opinion, leading us to areas such as defense companies, which we believe offer a better risk/reward trade-off. On the margin, we have moved the portfolio into a slightly more defensive position, given where we are finding better opportunities at the stock level after the rally in markets and considering the macro uncertainties we face in 2020, including Brexit, the U.S. presidential campaign, and the U.S.-China trade war.
Given the late-cycle nature of many economies and also the prospect that economic growth appears to be bottoming, we think the portfolio is well balanced between defensive and cyclical holdings where we can still find attractive risk/reward, such as certain auto parts and emerging markets holdings. We remain optimistic on a number of emerging markets, such as India, which have weathered a period of slower growth with low levels of investment and are now entering a rate-cutting cycle that should help to stimulate demand. We feel these emerging markets are at a different point in their economic cycle than many of the developed markets that have relied heavily on quantitative easing to stimulate growth and, therefore, have healthier midterm outlooks.
The views expressed reflect the opinions of T. Rowe Price as of the date of this report and are subject to change based on changes in market, economic, or other conditions. These views are not intended to be a forecast of future events and are no guarantee of future results.
RISKS OF INTERNATIONAL INVESTING
Funds that invest overseas generally carry more risk than funds that invest strictly in U.S. assets. Risks can result from varying stages of economic and political development; differing regulatory environments, trading days, and accounting standards; and higher transaction costs of non-U.S. markets. Non-U.S. investments are also subject to currency risk, or a decline in the value of a foreign currency versus the U.S. dollar, which reduces the dollar value of securities denominated in that currency. These risks are generally greater for investments in emerging markets.
BENCHMARK INFORMATION
Note: MSCI makes no express or implied warranties or representations and shall have no liability whatsoever with respect to any MSCI data contained herein. The MSCI data may not be further redistributed or used as a basis for other indices or any securities or financial products. This report is not approved, reviewed, or produced by MSCI.

GROWTH OF $10,000
This chart shows the value of a hypothetical $10,000 investment in the portfolio over the past 10 fiscal year periods or since inception (for portfolios lacking 10-year records). The result is compared with benchmarks, which include a broad-based market index and may also include a peer group average or index. Market indexes do not include expenses, which are deducted from portfolio returns as well as mutual fund averages and indexes.
AVERAGE ANNUAL COMPOUND TOTAL RETURN

FUND EXPENSE EXAMPLE
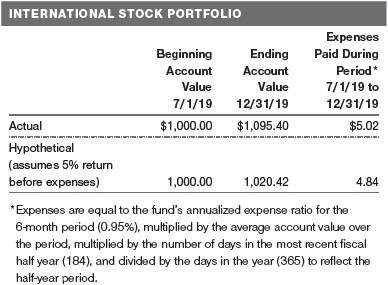
As a mutual fund shareholder, you may incur two types of costs: (1) transaction costs, such as redemption fees or sales loads, and (2) ongoing costs, including management fees, distribution and service (12b-1) fees, and other fund expenses. The following example is intended to help you understand your ongoing costs (in dollars) of investing in the fund and to compare these costs with the ongoing costs of investing in other mutual funds. The example is based on an investment of $1,000 invested at the beginning of the most recent six-month period and held for the entire period.
Actual Expenses
The first line of the following table (Actual) provides information about actual account values and actual expenses. You may use the information on this line, together with your account balance, to estimate the expenses that you paid over the period. Simply divide your account value by $1,000 (for example, an $8,600 account value divided by $1,000 = 8.6), then multiply the result by the number on the first line under the heading “Expenses Paid During Period” to estimate the expenses you paid on your account during this period.
Hypothetical Example for Comparison Purposes
The information on the second line of the table (Hypothetical) is based on hypothetical account values and expenses derived from the fund’s actual expense ratio and an assumed 5% per year rate of return before expenses (not the fund’s actual return). You may compare the ongoing costs of investing in the fund with other funds by contrasting this 5% hypothetical example and the 5% hypothetical examples that appear in the shareholder reports of the other funds. The hypothetical account values and expenses may not be used to estimate the actual ending account balance or expenses you paid for the period.
You should also be aware that the expenses shown in the table highlight only your ongoing costs and do not reflect any transaction costs, such as redemption fees or sales loads. Therefore, the second line of the table is useful in comparing ongoing costs only and will not help you determine the relative total costs of owning different funds. To the extent a fund charges transaction costs, however, the total cost of owning that fund is higher.
The accompanying notes are an integral part of these financial statements.


The accompanying notes are an integral part of these financial statements.

The accompanying notes are an integral part of these financial statements.

The accompanying notes are an integral part of these financial statements.
The accompanying notes are an integral part of these financial statements.
| NOTES TO FINANCIAL STATEMENTS |
T. Rowe Price International Series, Inc. (the corporation) is registered under the Investment Company Act of 1940 (the 1940 Act). The International Stock Portfolio (the fund) is a diversified, open-end management investment company established by the corporation. The fund seeks long-term growth of capital through investments primarily in the common stocks of established, non-U.S. companies. Shares of the fund are currently offered only to insurance company separate accounts established for the purpose of funding variable annuity contracts and variable life insurance policies.
NOTE 1 - SIGNIFICANT ACCOUNTING POLICIES
Basis of PreparationThe fund is an investment company and follows accounting and reporting guidance in the Financial Accounting Standards Board (FASB)Accounting Standards CodificationTopic 946 (ASC 946). The accompanying financial statements were prepared in accordance with accounting principles generally accepted in the United States of America (GAAP), including, but not limited to, ASC 946. GAAP requires the use of estimates made by management. Management believes that estimates and valuations are appropriate; however, actual results may differ from those estimates, and the valuations reflected in the accompanying financial statements may differ from the value ultimately realized upon sale or maturity. Certain prior year amounts in the accompanying financial statements and financial highlights have been restated to conform to current year presentation.
Investment Transactions, Investment Income, and Distributions Investment transactions are accounted for on the trade date basis. Income and expenses are recorded on the accrual basis. Realized gains and losses are reported on the identified cost basis. Income tax-related interest and penalties, if incurred, are recorded as income tax expense. Dividends received from mutual fund investments are reflected as dividend income; capital gain distributions are reflected as realized gain/loss. Dividend income and capital gain distributions are recorded on the ex-dividend date. Non-cash dividends, if any, are recorded at the fair market value of the asset received. Distributions to shareholders are recorded on the ex-dividend date. Income distributions, if any, are declared and paid annually. A capital gain distribution may also be declared and paid by the fund annually.
Currency TranslationAssets, including investments, and liabilities denominated in foreign currencies are translated into U.S. dollar values each day at the prevailing exchange rate, using the mean of the bid and asked prices of such currencies against U.S. dollars as quoted by a major bank. Purchases and sales of securities, income, and expenses are translated into U.S. dollars at the prevailing exchange rate on the respective date of such transaction. The effect of changes in foreign currency exchange rates on realized and unrealized security gains and losses is not bifurcated from the portion attributable to changes in market prices.
New Accounting GuidanceEffective January 1, 2019, the fund adopted FASB guidance that shortened the amortization period for certain callable debt securities held at a premium. Adoption had no effect on the fund’s net assets or results of operations.
Indemnification In the normal course of business, the fund may provide indemnification in connection with its officers and directors, service providers, and/or private company investments. The fund’s maximum exposure under these arrangements is unknown; however, the risk of material loss is currently considered to be remote.
NOTE 2 - VALUATION
The fund’s financial instruments are valued and its net asset value (NAV) per share is computed at the close of the New York Stock Exchange (NYSE), normally 4 p.m. ET, each day the NYSE is open for business. However, the NAV per share may be calculated at a time other than the normal close of the NYSE if trading on the NYSE is restricted, if the NYSE closes earlier, or as may be permitted by the SEC.
Fair Value The fund’s financial instruments are reported at fair value, which GAAP defines as the price that would be received to sell an asset or paid to transfer a liability in an orderly transaction between market participants at the measurement date. The T. Rowe Price Valuation Committee (the Valuation Committee) is an internal committee that has been delegated certain responsibilities by the fund’s Board of Directors (the Board) to ensure that financial instruments are appropriately priced at fair value in accordance with GAAP and the 1940 Act. Subject to oversight by the Board, the Valuation Committee develops and oversees pricing-related policies and procedures and approves all fair value determinations. Specifically, the Valuation Committee establishes procedures to value securities; determines pricing techniques, sources, and persons eligible to effect fair value pricing actions; oversees the selection, services, and performance ofpricing vendors; oversees valuation-related business continuity practices; and provides guidance on internal controls and valuation-related matters. The Valuation Committee reports to the Board and has representation from legal, portfolio management and trading, operations, risk management, and the fund’s treasurer.
Various valuation techniques and inputs are used to determine the fair value of financial instruments. GAAP establishes the following fair value hierarchy that categorizes the inputs used to measure fair value:
Level 1 – quoted prices (unadjusted) in active markets for identical financial instruments that the fund can access at the reporting date
Level 2 – inputs other than Level 1 quoted prices that are observable, either directly or indirectly (including, but not limited to, quoted prices for similar financial instruments in active markets, quoted prices for identical or similar financial instruments in inactive markets, interest rates and yield curves, implied volatilities, and credit spreads)
Level 3 – unobservable inputs
Observable inputs are developed using market data, such as publicly available information about actual events or transactions, and reflect the assumptions that market participants would use to price the financial instrument. Unobservable inputs are those for which market data are not available and are developed using the best information available about the assumptions that market participants would use to price the financial instrument. GAAP requires valuation techniques to maximize the use of relevant observable inputs and minimize the use of unobservable inputs. When multiple inputs are used to derive fair value, the financial instrument is assigned to the level within the fair value hierarchy based on the lowest-level input that is significant to the fair value of the financial instrument. Input levels are not necessarily an indication of the risk or liquidity associated with financial instruments at that level but rather the degree of judgment used in determining those values.
Valuation TechniquesEquity securities listed or regularly traded on a securities exchange or in the over-the-counter (OTC) market are valued at the last quoted sale price or, for certain markets, the official closing price at the time the valuations are made. OTC Bulletin Board securities are valued at the mean of the closing bid and asked prices. A security that is listed or traded on more than one exchange is valued at the quotation on the exchange determined to be the primary market for such security. Listed securities not traded on a particular day are valued at the mean of the closing bid and asked prices for domestic securities and the last quoted sale or closing price for international securities.
For valuation purposes, the last quoted prices of non-U.S. equity securities may be adjusted to reflect the fair value of such securities at the close of the NYSE. If the fund determines that developments between the close of a foreign market and the close of the NYSE will affect the value of some or all of its portfolio securities, the fund will adjust the previous quoted prices to reflect what it believes to be the fair value of the securities as of the close of the NYSE. In deciding whether it is necessary to adjust quoted prices to reflect fair value, the fund reviews a variety of factors, including developments in foreign markets, the performance of U.S. securities markets, and the performance of instruments trading in U.S. markets that represent foreign securities and baskets of foreign securities. The fund may also fair value securities in other situations, such as when a particular foreign market is closed but the fund is open. The fund uses outside pricing services to provide it with quoted prices and information to evaluate or adjust those prices. The fund cannot predict how often it will use quoted prices and how often it will determine it necessary to adjust those prices to reflect fair value. As a means of evaluating its security valuation process, the fund routinely compares quoted prices, the next day’s opening prices in the same markets, and adjusted prices.
Actively traded equity securities listed on a domestic exchange generally are categorized in Level 1 of the fair value hierarchy. Non-U.S. equity securities generally are categorized in Level 2 of the fair value hierarchy despite the availability of quoted prices because, as described above, the fund evaluates and determines whether those quoted prices reflect fair value at the close of the NYSE or require adjustment. OTC Bulletin Board securities, certain preferred securities, and equity securities traded in inactive markets generally are categorized in Level 2 of the fair value hierarchy.
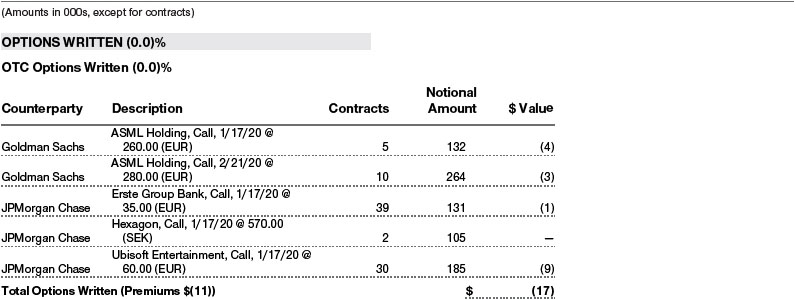
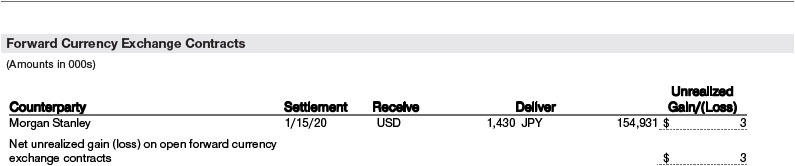
Investments in mutual funds are valued at the mutual fund’s closing NAV per share on the day of valuation and are categorized in Level 1 of the fair value hierarchy. Listed options, and OTC options with a listed equivalent, are valued at the mean of the closing bid and asked prices and generally are categorized in Level 2 of the fair value hierarchy. Forward currency exchange contracts are valued using the prevailing forward exchange rate and are categorized in Level 2 of the fair value hierarchy. Assets and liabilities other than financial instruments, including short-term receivables and payables, are carried at cost, or estimated realizable value, if less, which approximates fair value.
Thinly traded financial instruments and those for which the above valuation procedures are inappropriate or are deemed not to reflect fair value are stated at fair value as determined in good faith by the Valuation Committee. The objective of any fair value pricing determination is to arrive at a price that could reasonably be expected from a current sale. Financial instruments fair valued by the Valuation Committee are primarily private placements, restricted securities, warrants, rights, and other securities that are not publicly traded.
Subject to oversight by the Board, the Valuation Committee regularly makes good faith judgments to establish and adjust the fair valuations of certain securities as events occur and circumstances warrant. For instance, in determining the fair value of an equity investment with limited market activity, such as a private placement or a thinly traded public company stock, the Valuation Committee considers a variety of factors, which may include, but are not limited to, the issuer’s business prospects, its financial standing and performance, recent investment transactions in the issuer, new rounds of financing, negotiated transactions of significant size between other investors in the company, relevant market valuations of peer companies, strategic events affecting the company, market liquidity for the issuer, and general economic conditions and events. In consultation with the investment and pricing teams, the Valuation Committee will determine an appropriate valuation technique based on available information, which may include both observable and unobservable inputs. The Valuation Committee typically will afford greatest weight to actual prices in arm’s length transactions, to the extent they represent orderly transactions between market participants, transaction information can be reliably obtained, and prices are deemed representative of fair value. However, the Valuation Committee may also consider other valuation methods such as market-based valuation multiples; a discount or premium from market value of a similar, freely traded security of the same issuer; or some combination. Fair value determinations are reviewed on a regular basis and updated as information becomes available, including actual purchase and sale transactions of the issue. Because any fair value determination involves a significant amount of judgment, there is a degree of subjectivity inherent in such pricing decisions, and fair value prices determined by the Valuation Committee could differ from those of other market participants. Depending on the relative significance of unobservable inputs, including the valuation technique(s) used, fair valued securities may be categorized in Level 2 or 3 of the fair value hierarchy.
Valuation InputsThe following table summarizes the fund’s financial instruments, based on the inputs used to determine their fair values on December 31, 2019 (for further detail by category, please refer to the accompanying Portfolio of Investments):

Following is a reconciliation of the fund’s Level 3 holdings for the year ended December 31, 2019. Gain (loss) reflects both realized and change in unrealized gain/loss on Level 3 holdings during the period, if any, and is included on the accompanying Statement of Operations. The change in unrealized gain/loss on Level 3 instruments held at December 31, 2019, totaled $51,000 for the year ended December 31, 2019.

NOTE 3 - DERIVATIVE INSTRUMENTS
During the year ended December 31, 2019, the fund invested in derivative instruments. As defined by GAAP, a derivative is a financial instrument whose value is derived from an underlying security price, foreign exchange rate, interest rate, index of prices or rates, or other variable; it requires little or no initial investment and permits or requires net settlement. The fund invests in derivatives only if the expected risks and rewards are consistent with its investment objectives, policies, and overall risk profile, as described in its prospectus and Statement of Additional Information. The fund may use derivatives for a variety of purposes, such as seeking to hedge against declines in principal value, increase yield, invest in an asset with greater efficiency and at a lower cost than is possible through direct investment, to enhance return, or to adjust credit exposure. The risks associated with the use of derivatives are different from, and potentially much greater than, the risks associated with investing directly in the instruments on which the derivatives are based. The fund at all times maintains sufficient cash reserves, liquid assets, or other SEC-permitted asset types to cover its settlement obligations under open derivative contracts.
The fund values its derivatives at fair value and recognizes changes in fair value currently in its results of operations. Accordingly, the fund does not follow hedge accounting, even for derivatives employed as economic hedges. Generally, the fund accounts for its derivatives on a gross basis. It does not offset the fair value of derivative liabilities against the fair value of derivative assets on its financial statements, nor does it offset the fair value of derivative instruments against the right to reclaim or obligation to return collateral.
The following table summarizes the fair value of the fund’s derivative instruments held as of December 31, 2019, and the related location on the accompanying Statement of Assets and Liabilities, presented by primary underlying risk exposure:

Additionally, the amount of gains and losses on derivative instruments recognized in fund earnings during the year ended December 31, 2019, and the related location on the accompanying Statement of Operations is summarized in the following table by primary underlying risk exposure:

Counterparty Risk and CollateralThe fund invests in derivatives, such as bilateral swaps, forward currency exchange contracts, or OTC options, that are transacted and settle directly with a counterparty (bilateral derivatives), and thereby may expose the fund to counterparty risk. To mitigate this risk, the fund has entered into master netting arrangements (MNAs) with certain counterparties that permit net settlement under specified conditions and, for certain counterparties, also require the exchange of collateral to cover mark-to-market exposure. MNAs may be in the form of International Swaps and Derivatives Association master agreements (ISDAs) or foreign exchange letter agreements (FX letters).
MNAs govern the ability to offset amounts the fund owes a counterparty against amounts the counterparty owes the fund (net settlement). Both ISDAs and FX letters generally allow termination of transactions and net settlement upon the occurrence of contractually specified events, such as failure to pay or bankruptcy. In addition, ISDAs specify other events, the occurrence of which would allow one of the parties to terminate. For example, a downgrade in credit rating of a counterparty below a specified rating would allow the fund to terminate, while a decline in the fund’s net assets of more than a specified percentage would allow the counterparty to terminate. Upon termination, all transactions with that counterparty would be liquidated and a net termination amount determined. ISDAs include collateral agreements whereas FX letters do not. Collateral requirements are determined daily based on the net aggregate unrealized gain or loss on all bilateral derivatives with each counterparty, subject to minimum transfer amounts that typically range from $100,000 to $250,000. Any additional collateral required due to changes in security values is typically transferred the next business day.
Collateral may be in the form of cash or debt securities issued by the U.S. government or related agencies. Cash posted by the fund is reflected as cash deposits in the accompanying financial statements and generally is restricted from withdrawal by the fund; securities posted by the fund are so noted in the accompanying Portfolio of Investments; both remain in the fund’s assets. Collateral pledged by counterparties is not included in the fund’s assets because the fund does not obtain effective control over those assets. For bilateral derivatives, collateral posted or received by the fund is held in a segregated account at the fund’s custodian. While typically not sold in the same manner as equity or fixed income securities, OTC and bilateral derivatives may be unwound with counterparties or transactions assigned to other counterparties to allow the fund to exit the transaction. This ability is subject to the liquidity of underlying positions. As of December 31, 2019, no collateral was pledged by either the fund or counterparties for bilateral derivatives.
Forward Currency Exchange ContractsThe fund is subject to foreign currency exchange rate risk in the normal course of pursuing its investment objectives. It uses forward currency exchange contracts (forwards) primarily to protect its non-U.S. dollar-denominated securities from adverse currency movements relative to the U.S. dollar. A forward involves an obligation to purchase or sell a fixed amount of a specific currency on a future date at a price set at the time of the contract. Although certain forwards may be settled by exchanging only the net gain or loss on the contract, most forwards are settled with the exchange of the underlying currencies in accordance with the specified terms. Forwards are valued at the unrealized gain or loss on the contract, which reflects the net amount the fund either is entitled to receive or obligated to deliver, as measured by the difference between the forward exchange rates at the date of entry into the contract and the forward rates at the reporting date. Appreciated forwards are reflected as assets and depreciated forwards are reflected as liabilities on the accompanying Statement of Assets and Liabilities. Risks related to the use of forwards include the possible failure of counterparties to meet the terms of the agreements; that anticipated currency movements will not occur, thereby reducing the fund’s total return; and the potential for losses in excess of the fund’s initial investment. During the year ended December 31, 2019, the volume of the fund’s activity in forwards, based on underlying notional amounts, was generally less than 1% of net assets.
OptionsThe fund is subject to equity price risk in the normal course of pursuing its investment objectives and uses options to help manage such risk. The fund may use options to manage exposure to security prices, interest rates, foreign currencies, and credit quality; as an efficient means of adjusting exposure to all or a part of a target market; to enhance income; as a cash management tool; or to adjust credit exposure. Options are included in net assets at fair value, options purchased are included in Investments in Securities, and Options written are separately reflected as a liability on the accompanying Statement of Assets and Liabilities. Premiums on unexercised, expired options are recorded as realized gains or losses; premiums on exercised options are recorded as an adjustment to the proceeds from the sale or cost of the purchase. The difference between the premium and the amount received or paid in a closing transaction is also treated as realized gain or loss. In return for a premium paid, call and put options give the holder the right, but not the obligation, to purchase or sell, respectively, a security at a specified exercise price. Risks related to the use of options include possible illiquidity of the options markets; trading restrictions imposed by an exchange or counterparty; movements in the underlying asset values and, for options written, potential losses in excess of the fund’s initial investment. During the year ended December 31, 2019, the volume of the fund’s activity in options, based on underlying notional amounts, was generally less than 1% of net assets.
NOTE 4 - OTHER INVESTMENT TRANSACTIONS
Consistent with its investment objective, the fund engages in the following practices to manage exposure to certain risks and/or to enhance performance. The investment objective, policies, program, and risk factors of the fund are described more fully in the fund’s prospectus and Statement of Additional Information.
Emerging and Frontier MarketsThe fund invests, either directly or through investments in other T. Rowe Price funds, in securities of companies located in, issued by governments of, or denominated in or linked to the currencies of emerging and frontier market countries. Emerging markets, and to a greater extent frontier markets, generally have economic structures that are less diverse and mature, and political systems that are less stable, than developed countries. These markets may be subject to greater political, economic, and social uncertainty and differing regulatory environments that may potentially impact the fund’s ability to buy or sell certain securities or repatriate proceeds to U.S. dollars. Such securities are often subject to greater price volatility, less liquidity, and higher rates of inflation than U.S. securities. Investing in frontier markets is significantly riskier than investing in other countries, including emerging markets.
Restricted SecuritiesThe fund invests in securities that are subject to legal or contractual restrictions on resale. Prompt sale of such securities at an acceptable price may be difficult and may involve substantial delays and additional costs.
Securities LendingThe fund may lend its securities to approved borrowers to earn additional income. Its securities lending activities are administered by a lending agent in accordance with a securities lending agreement. Security loans generally do not have stated maturity dates, and the fund may recall a security at any time. The fund receives collateral in the form of cash or U.S. government securities. Collateral is maintained over the life of the loan in an amount not less than the value of loaned securities; any additional collateral required due to changes in security values is delivered to the fund the next business day. Cash collateral is invested in accordance with investment guidelines approved by fund management. Additionally, the lending agent indemnifies the fund againstlosses resulting from borrower default. Although risk is mitigated by the collateral and indemnification, the fund could experience a delay in recovering its securities and a possible loss of income or value if the borrower fails to return the securities, collateral investments decline in value, and the lending agent fails to perform. Securities lending revenue consists of earnings on invested collateral and borrowing fees, net of any rebates to the borrower, compensation to the lending agent, and other administrative costs. In accordance with GAAP, investments made with cash collateral are reflected in the accompanying financial statements, but collateral received in the form of securities is not. At December 31, 2019, the value of loaned securities was $3,458,000; the value of cash collateral and related investments was $3,538,000.
OtherPurchases and sales of portfolio securities other than short-term securities aggregated $94,443,000 and $134,711,000, respectively, for the year ended December 31, 2019.
NOTE 5 - FEDERAL INCOME TAXES
No provision for federal income taxes is required since the fund intends to continue to qualify as a regulated investment company under Subchapter M of the Internal Revenue Code and distribute to shareholders all of its taxable income and gains. Distributions determined in accordance with federal income tax regulations may differ in amount or character from net investment income and realized gains for financial reporting purposes.
The fund files U.S. federal, state, and local tax returns as required. The fund’s tax returns are subject to examination by the relevant tax authorities until expiration of the applicable statute of limitations, which is generally three years after the filing of the tax return but which can be extended to six years in certain circumstances. Tax returns for open years have incorporated no uncertain tax positions that require a provision for income taxes.
Financial reporting records are adjusted for permanent book/tax differences to reflect tax character but are not adjusted for temporary differences.
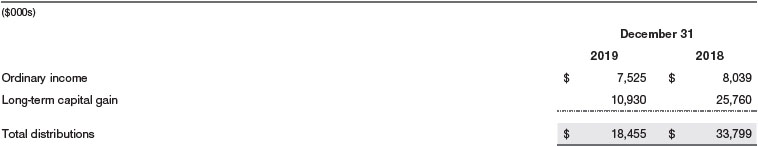
Distributions during the years ended December 31, 2019 and December 31, 2018, were characterized for tax purposes as follows:
At December 31, 2019, the tax-basis cost of investments, including derivatives, and components of net assets were as follows:
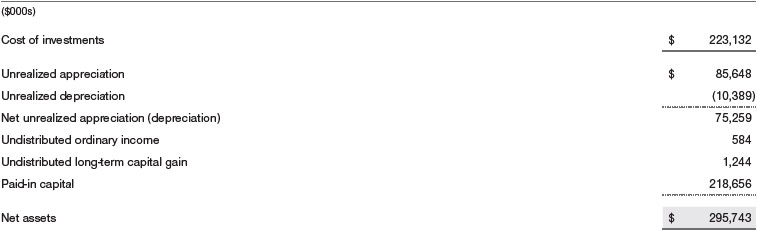
The difference between book-basis and tax-basis net unrealized appreciation (depreciation) is attributable to the deferral of losses from wash sales and the realization of gains/losses on passive foreign investment companies for tax purposes.
NOTE 6 - FOREIGN TAXES
The fund is subject to foreign income taxes imposed by certain countries in which it invests. Additionally, capital gains realized upon disposition of securities issued in or by certain foreign countries are subject to capital gains tax imposed by those countries. All taxes are computed in accordance with the applicable foreign tax law, and, to the extent permitted, capital losses are used to offset capital gains. Taxes attributable to income are accrued by the fund as a reduction of income. Current and deferred tax expense attributable to capital gains is reflected as a component of realized or change in unrealized gain/loss on securities in the accompanying financial statements. To the extent that the fund has country specific capital loss carryforwards, such carryforwards are applied against net unrealized gains when determining the deferred tax liability. Any deferred tax liability incurred by the fund is included in either Other liabilities or Deferred tax liability on the accompanying Statement of Assets and Liabilities.
NOTE 7 - RELATED PARTY TRANSACTIONS
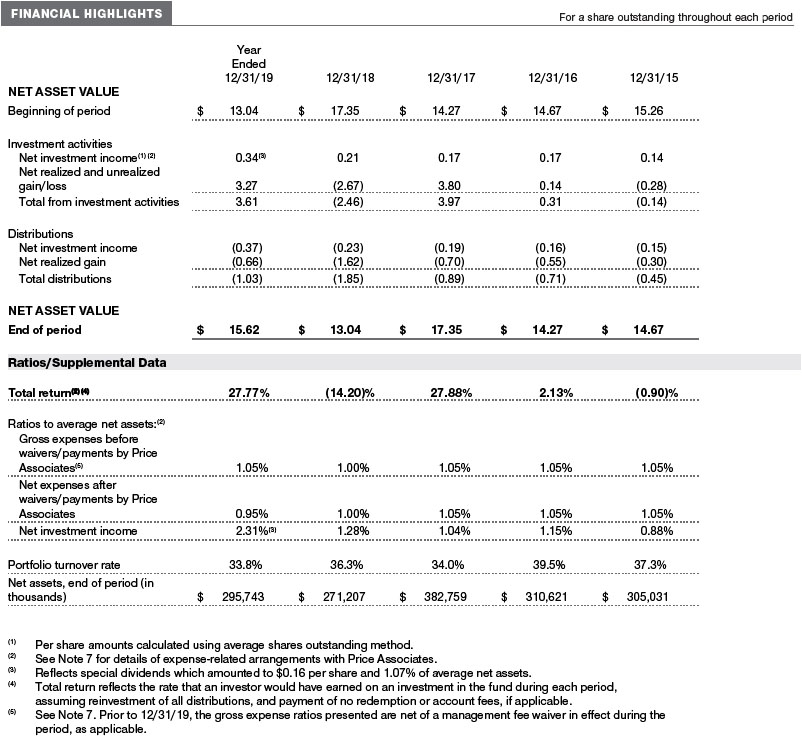
The fund is managed by T. Rowe Price Associates, Inc. (Price Associates), a wholly owned subsidiary of T. Rowe Price Group, Inc.(Price Group). Price Associates has entered into a sub-advisory agreement(s) with one or more of its wholly owned subsidiaries, to provide investment advisory services to the fund. The investment management and administrative agreement between the fund and Price Associates provides for an all-inclusive annual fee equal to 1.05% of the fund’s average daily net assets. The fee is computed daily and paid monthly. The all-inclusive fee covers investment management services and ordinary, recurring operating expenses but does not cover interest expense; expenses related to borrowing, taxes, and brokerage; or nonrecurring extraordinary expenses. Effective July 1, 2018, Price Associates has contractually agreed, at least through April 30, 2020 to waive a portion of its management fee in order to limit the fund’s management fee to 0.95% of the fund’s average daily net assets. Thereafter, this agreement automatically renews for one-year terms unless terminated or modified by the fund’s Board. Fees waived and expenses paid under this agreement are not subject to reimbursement to Price Associates by the fund. The total management fees waived were $288,000 for the year ended December 31, 2019.
The fund may invest its cash reserves in certain open-end management investment companies managed by Price Associates and considered affiliates of the fund: the T. Rowe Price Government Reserve Fund or the T. Rowe Price Treasury Reserve Fund, organized as money market funds, or the T. Rowe Price Short-Term Fund, a short-term bond fund (collectively, the Price Reserve Funds). The Price Reserve Funds are offered as short-term investment options to mutual funds, trusts, and other accounts managed by Price Associates or its affiliates and are not available for direct purchase by members of the public. Cash collateral from securities lending is invested in the T. Rowe Price Short-Term Fund. The Price Reserve Funds pay no investment management fees.
The fund may participate in securities purchase and sale transactions with other funds or accounts advised by Price Associates (cross trades), in accordance with procedures adopted by the fund’s Board and Securities and Exchange Commission rules, which require, among other things, that such purchase and sale cross trades be effected at the independent current market price of the security. During the year ended December 31, 2019, the fund had no purchases or sales cross trades with other funds or accounts advised by Price Associates.
Report of Independent Registered Public Accounting Firm
To the Board of Directors of T. Rowe Price International Series, Inc.
and Shareholders of T. Rowe Price International Stock Portfolio
Opinion on the Financial Statements
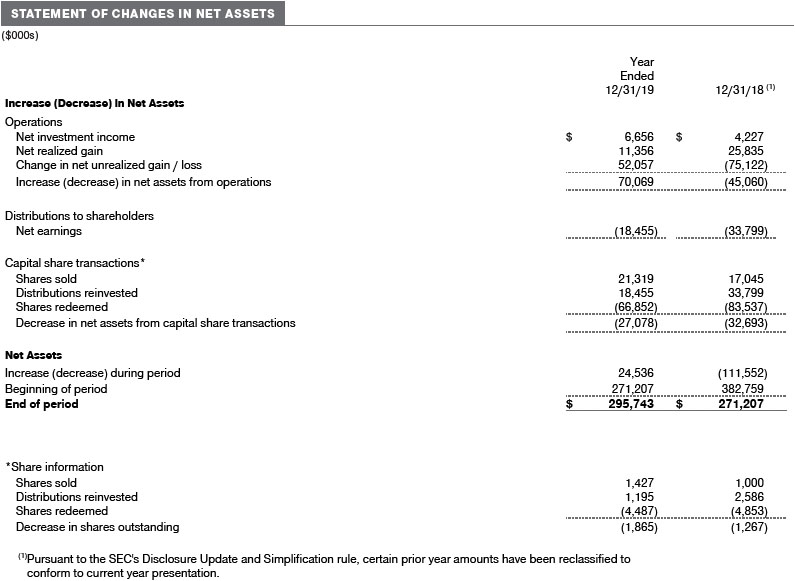
We have audited the accompanying statement of assets and liabilities, including the portfolio of investments, of T. Rowe Price International Stock Portfolio (constituting T. Rowe Price International Series, Inc., referred to hereafter as the “Fund”) as of December 31, 2019, the related statement of operations for the year ended December 31, 2019, the statement of changes in net assets for each of the two years in the period ended December 31, 2019, including the related notes, and the financial highlights for each of the five years in the period ended December 31, 2019 (collectively referred to as the “financial statements”). In our opinion, the financial statements present fairly, in all material respects, the financial position of the Fund as of December 31, 2019, the results of its operations for the year then ended, the changes in its net assets for each of the two years in the period ended December 31, 2019 and the financial highlights for each of the five years in the period ended December 31, 2019 in conformity with accounting principles generally accepted in the United States of America.
Basis for Opinion
These financial statements are the responsibility of the Fund’s management. Our responsibility is to express an opinion on the Fund’s financial statements based on our audits. We are a public accounting firm registered with the Public Company Accounting Oversight Board (United States) (PCAOB) and are required to be independent with respect to the Fund in accordance with the U.S. federal securities laws and the applicable rules and regulations of the Securities and Exchange Commission and the PCAOB.
We conducted our audits of these financial statements in accordance with the standards of the PCAOB. Those standards require that we plan and perform the audit to obtain reasonable assurance about whether the financial statements are free of material misstatement, whether due to error or fraud.
Our audits included performing procedures to assess the risks of material misstatement of the financial statements, whether due to error or fraud, and performing procedures that respond to those risks. Such procedures included examining, on a test basis, evidence regarding the amounts and disclosures in the financial statements. Our audits also included evaluating the accounting principles used and significant estimates made by management, as well as evaluating the overall presentation of the financial statements. Our procedures included confirmation of securities owned as of December 31, 2019 by correspondence with the custodian, transfer agent and brokers; when replies were not received from brokers, we performed other auditing procedures. We believe that our audits provide a reasonable basis for our opinion.
PricewaterhouseCoopers LLP
Baltimore, Maryland
February 7, 2020
We have served as the auditor of one or more investment companies in the T. Rowe Price group of investment companies since 1973.
TAX INFORMATION (UNAUDITED) FOR THE TAX YEAR ENDED 12/31/19
We are providing this information as required by the Internal Revenue Code. The amounts shown may differ from those elsewhere in this report because of differences between tax and financial reporting requirements.
The fund’s distributions to shareholders included:
| ● | $896,000 from short-term capital gains, |
| |
| ● | $10,929,000 from long-term capital gains, subject to a long-term capital gains tax rate of not greater than 20%. |
For taxable non-corporate shareholders, $4,903,000 of the fund’s income represents qualified dividend income subject to a long-term capital gains tax rate of not greater than 20%.
For corporate shareholders, $182,000 of the fund’s income qualifies for the dividends-received deduction.
The fund will pass through foreign source income of $7,680,000 and foreign taxes paid of $461,000.
INFORMATION ON PROXY VOTING POLICIES, PROCEDURES, AND RECORDS
A description of the policies and procedures used by T. Rowe Price funds and portfolios to determine how to vote proxies relating to portfolio securities is available in each fund’s Statement of Additional Information. You may request this document by calling 1-800-225-5132 or by accessing the SEC’s website, sec.gov.
The description of our proxy voting policies and procedures is also available on our corporate website. To access it, please visit the following Web page:
https://www.troweprice.com/corporate/en/utility/policies.html
Scroll down to the section near the bottom of the page that says, “Proxy Voting Policies.” Click on the Proxy Voting Policies link in the shaded box.
Each fund’s most recent annual proxy voting record is available on our website and through the SEC’s website. To access it through T. Rowe Price, visit the website location shown above, and scroll down to the section near the bottom of the page that says, “Proxy Voting Records.” Click on the Proxy Voting Records link in the shaded box.
HOW TO OBTAIN QUARTERLY PORTFOLIO HOLDINGS
Effective for reporting periods on or after March 1, 2019, a fund, except a money market fund, files a complete schedule of portfolio holdings with the Securities and Exchange Commission (SEC) for the first and third quarters of each fiscal year as an exhibit to its reports on Form N-PORT. Prior to March 1, 2019, a fund, including a money market fund, filed a complete schedule of portfolio holdings with the SEC for the first and third quarters of each fiscal year on Form N-Q. A money market fund files detailed month-end portfolio holdings information on Form N-MFP with the SEC each month and posts a complete schedule of portfolio holdings on its website (troweprice.com) as of each month-end for the previous six months. A fund’s Forms N-PORT, N-MFP, and N-Q are available electronically on the SEC’s website (sec.gov).
ABOUT THE PORTFOLIO’S DIRECTORS AND OFFICERS
Your fund is overseen by a Board of Directors (Board) that meets regularly to review a wide variety of matters affecting or potentially affecting the fund, including performance, investment programs, compliance matters, advisory fees and expenses, service providers, and business and regulatory affairs. The Board elects the fund’s officers, who are listed in the final table. At least 75% of the Board’s members are independent of the Boards of T. Rowe Price Associates, Inc. (T. Rowe Price), and its affiliates; “inside” or “interested” directors are employees or officers of T. Rowe Price. The business address of each director and officer is 100 East Pratt Street, Baltimore, Maryland 21202. The Statement of Additional Information includes additional information about the fund directors and is available without charge by calling a T. Rowe Price representative at 1-800-638-5660.
| INDEPENDENT DIRECTORS(a) |
| |
Name (Year of Birth)
Year Elected [Number of
T. Rowe Price Portfolios
Overseen] | | Principal Occupation(s) and Directorships of Public Companies and Other Investment Companies During the Past Five Years |
| | | |
Teresa Bryce Bazemore (1959)
2018 [189] | | President, Radian Guaranty (2008 to 2017); Chief Executive Officer, Bazemore Consulting LLC (2018 to present); Director, Chimera Investment Corporation (2017 to present); Director, Federal Home Loan Bank of Pittsburgh (2017 to present) |
| | | |
Ronald J. Daniels (1959)
2018 [189] | | President, The Johns Hopkins University(b) and Professor, Political Science Department, The Johns Hopkins University (2009 to present); Director, Lyndhurst Holdings (2015 to present) |
| | | |
Bruce W. Duncan (1951)
2013 [189] | | Chief Executive Officer and Director (January 2009 to December 2016), Chairman of the Board (January 2016 to present), and President (January 2009 to September 2016), First Industrial Realty Trust, an owner and operator of industrial properties; Chairman of the Board (2005 to September 2016) and Director (1999 to September 2016), Starwood Hotels & Resorts, a hotel and leisure company; Member, Investment Company Institute Board of Governors (2017 to present); Member, Independent Directors Council Governing Board (2017 to present); Senior Advisor, KKR (November 2018 to present); Director, Boston Properties (May 2016 to present); Director, Marriott International, Inc. (September 2016 to present) |
| | | |
Robert J. Gerrard, Jr. (1952)
2012 [189] | | Advisory Board Member, Pipeline Crisis/Winning Strategies, a collaborative working to improve opportunities for young African Americans (1997 to January 2016); Chairman of the Board, all funds (July 2018 to present) |
| | | |
Paul F. McBride (1956)
2013 [189] | | Advisory Board Member, Vizzia Technologies (2015 to present); Board Member, Dunbar Armored (2012 to 2018) |
| | | |
Cecilia E. Rouse, Ph.D. (1963)
2012 [189] | | Dean, Woodrow Wilson School (2012 to present); Professor and Researcher, Princeton University (1992 to present); Director, MDRC, a nonprofit education and social policy research organization (2011 to present); Member, National Academy of Education (2010 to present); Research Associate of Labor Studies Program at the National Bureau of Economic Research (2011 to 2015); Board Member, National Bureau of Economic Research (2011 to present); Chair of Committee on the Status of Minority Groups in the Economic Profession of the American Economic Association (2012 to 2018); Vice President (2015 to 2016) and Board Member, American Economic Association (2018 to present) |
| | | |
John G. Schreiber (1946)
2001 [189] | | Owner/President, Centaur Capital Partners, Inc., a real estate investment company (1991 to present); Cofounder, Partner, and Cochairman of the Investment Committee, Blackstone Real Estate Advisors, L.P. (1992 to 2015); Director, Blackstone Mortgage Trust, a real estate finance company (2012 to 2016); Director and Chairman of the Board, Brixmor Property Group, Inc. (2013 to present); Director, Hilton Worldwide (2007 to present); Director, Hudson Pacific Properties (2014 to 2016); Director, Invitation Homes (2014 to 2017); Director, JMB Realty Corporation (1980 to present) |
| | | |
Mark R. Tercek(c) (1957)
2009 [0] | | President and Chief Executive Officer, The Nature Conservancy (2008 to present) |
| | | |
| (a)All information about the independent directors was current as of February 19, 2019, unless otherwise indicated, except for the number of portfolios overseen, which is current as of the date of this report. |
| (b)William J. Stromberg, president and chief executive officer of T. Rowe Price Group, Inc., the parent company of the Price Funds’ investment advisor, has served on the Board of Trustees of Johns Hopkins University since 2014 and is a member of the Johns Hopkins University Board’s Compensation Committee. |
| (c)Effective February 15, 2019, Mr. Tercek resigned from his role as independent director of the Price Funds. |
| INSIDE DIRECTORS |
| |
Name (Year of Birth)
Year Elected* [Number of
T. Rowe Price Portfolios
Overseen] | | Principal Occupation(s) and Directorships of Public Companies and Other Investment Companies During the Past Five Years |
| | | |
David Oestreicher (1967)
2018 [189] | | Chief Legal Officer, Vice President, and Secretary, T. Rowe Price Group, Inc.; Director, Vice President, and Secretary, T. Rowe Price Investment Services, Inc., T. Rowe Price Retirement Plan Services, Inc., T. Rowe Price Services, Inc., and T. Rowe Price Trust Company; Vice President and Secretary, T. Rowe Price, T. Rowe Price Hong Kong (Price Hong Kong), and T. Rowe Price International; Vice President, T. Rowe Price Japan (Price Japan) and T. Rowe Price Singapore (Price Singapore); Principal Executive Officer and Executive Vice President, all funds |
| | | |
Robert W. Sharps, CFA, CPA** (1971)
2017 [189] | | Director and Vice President, T. Rowe Price; Vice President, T. Rowe Price Group, Inc., and T. Rowe Price Trust Company |
| | | |
| *Each inside director serves until retirement, resignation, or election of a successor. |
| **Mr. Sharps replaced Edward A. Wiese as director of the domestic fixed income Price Funds effective January 1, 2019. |
| OFFICERS |
| |
Name (Year of Birth)
Position Held With International Series | | Principal Occupation(s) |
| | | |
Christopher D. Alderson (1962)
President | | Director and Vice President, T. Rowe Price International; Vice President, Price Hong Kong, Price Singapore, and T. Rowe Price Group, Inc. |
| | | |
Harishankar Balkrishna (1983)
Vice President | | Vice President, T. Rowe Price Group, Inc., and T. Rowe Price International |
| | | |
Sheena L. Barbosa (1983)
Vice President | | Vice President, Price Hong Kong and T. Rowe Price Group, Inc. |
| | | |
Darrell N. Braman (1963)
Vice President and Secretary | | Vice President, Price Hong Kong, Price Singapore, T. Rowe Price, T. Rowe Price Group, Inc., T. Rowe Price International, T. Rowe Price Retirement Plan Services, Inc., and T. Rowe Price Services, Inc. |
| | | |
Richard N. Clattenburg, CFA (1979)
Executive Vice President | | Vice President, Price Singapore, T. Rowe Price, T. Rowe Price Group, Inc., and T. Rowe Price International |
| | | |
Alan S. Dupski, CPA (1982)
Assistant Treasurer | | Vice President, T. Rowe Price and T. Rowe Price Group, Inc. |
| | | |
John R. Gilner (1961)
Chief Compliance Officer | | Chief Compliance Officer and Vice President, T. Rowe Price; Vice President, T. Rowe Price Group, Inc., and T. Rowe Price Investment Services, Inc. |
| | | |
Gary J. Greb (1961)
Vice President | | Vice President, T. Rowe Price, T. Rowe Price International, and T. Rowe Price Trust Company |
| | | |
Jai Kapadia (1982)
Vice President | | Vice President, Price Hong Kong and T. Rowe Price Group, Inc. |
| | | |
Paul J. Krug, CPA (1964)
Vice President | | Vice President, T. Rowe Price, T. Rowe Price Group, Inc., and T. Rowe Price Trust Company |
| | | |
Catherine D. Mathews (1963)
Principal Financial Officer, Vice President, and Treasurer | | Vice President, T. Rowe Price, T. Rowe Price Group, Inc., and T. Rowe Price Trust Company |
| | | |
Tobias F. Mueller, CFA (1980)
Vice President | | Vice President, T. Rowe Price Group, Inc., and T. Rowe Price International |
| | | |
Oluwaseun A. Oyegunle, CFA (1984)
Vice President | | Vice President, T. Rowe Price Group, Inc., and T. Rowe Price International |
| | | |
John W. Ratzesberger (1975)
Vice President | | Vice President, T. Rowe Price, T. Rowe Price Group, Inc., and T. Rowe Price Trust Company |
| | | |
Shannon H. Rauser (1987)
Assistant Secretary | | Assistant Vice President, T. Rowe Price |
| | | |
Sebastian Schrott (1977)
Vice President | | Vice President, T. Rowe Price Group, Inc., and T. Rowe Price International |
| | | |
Bin Shen, CFA (1987)
Vice President | | Employee, T. Rowe Price |
| | | |
Megan Warren (1968)
Vice President | | Vice President, T. Rowe Price, T. Rowe Price Group, Inc., T. Rowe Price Retirement Plan Services, Inc., T. Rowe Price Services, Inc., and T. Rowe Price Trust Company; formerly, Executive Director, JPMorgan Chase (to 2017) |
| | | |
Ernest C. Yeung, CFA (1979)
Executive Vice President | | Director and Vice President, Price Hong Kong; Vice President, T. Rowe Price Group, Inc. |
| | | |
| Unless otherwise noted, officers have been employees of T. Rowe Price or T. Rowe Price International for at least 5 years. |
Item 1. (b) Notice pursuant to Rule 30e-3.
Not applicable.
Item 2. Code of Ethics.
The registrant has adopted a code of ethics, as defined in Item 2 of Form N-CSR, applicable to its principal executive officer, principal financial officer, principal accounting officer or controller, or persons performing similar functions. A copy of this code of ethics is filed as an exhibit to this Form N-CSR. No substantive amendments were approved or waivers were granted to this code of ethics during the period covered by this report.
Item 3. Audit Committee Financial Expert.
The registrant’s Board of Directors/Trustees has determined that Mr. Bruce W. Duncan qualifies as an audit committee financial expert, as defined in Item 3 of Form N-CSR. Mr. Duncan is considered independent for purposes of Item 3 of Form N-CSR.
Item 4. Principal Accountant Fees and Services.
(a) – (d) Aggregate fees billed for the last two fiscal years for professional services rendered to, or on behalf of, the registrant by the registrant’s principal accountant were as follows:

Audit fees include amounts related to the audit of the registrant’s annual financial statements and services normally provided by the accountant in connection with statutory and regulatory filings. Audit-related fees include amounts reasonably related to the performance of the audit of the registrant’s financial statements and specifically include the issuance of a report on internal controls and, if applicable, agreed-upon procedures related to fund acquisitions. Tax fees include amounts related to services for tax compliance, tax planning, and tax advice. The nature of these services specifically includes the review of distribution calculations and the preparation of Federal, state, and excise tax returns. All other fees include the registrant’s pro-rata share of amounts for agreed-upon procedures in conjunction with service contract approvals by the registrant’s Board of Directors/Trustees.
(e)(1) The registrant’s audit committee has adopted a policy whereby audit and non-audit services performed by the registrant’s principal accountant for the registrant, its investment adviser, and any entity controlling, controlled by, or under common control with the investment adviser that provides ongoing services to the registrant require pre-approval in advance at regularly scheduled audit committee meetings. If such a service is required between regularly scheduled audit committee meetings, pre-approval may be authorized by one audit committee member with ratification at the next scheduled audit committee meeting. Waiver of pre-approval for audit or non-audit services requiring fees of a de minimis amount is not permitted.
(2) No services included in (b) – (d) above were approved pursuant to paragraph (c)(7)(i)(C) of Rule 2-01 of Regulation S-X.
(f) Less than 50 percent of the hours expended on the principal accountant’s engagement to audit the registrant’s financial statements for the most recent fiscal year were attributed to work performed by persons other than the principal accountant’s full-time, permanent employees.
(g) The aggregate fees billed for the most recent fiscal year and the preceding fiscal year by the registrant’s principal accountant for non-audit services rendered to the registrant, its investment adviser, and any entity controlling, controlled by, or under common control with the investment adviser that provides ongoing services to the registrant were $3,227,000 and $2,544,000, respectively.
(h) All non-audit services rendered in (g) above were pre-approved by the registrant’s audit committee. Accordingly, these services were considered by the registrant’s audit committee in maintaining the principal accountant’s independence.
Item 5. Audit Committee of Listed Registrants.
Not applicable.
Item 6. Investments.
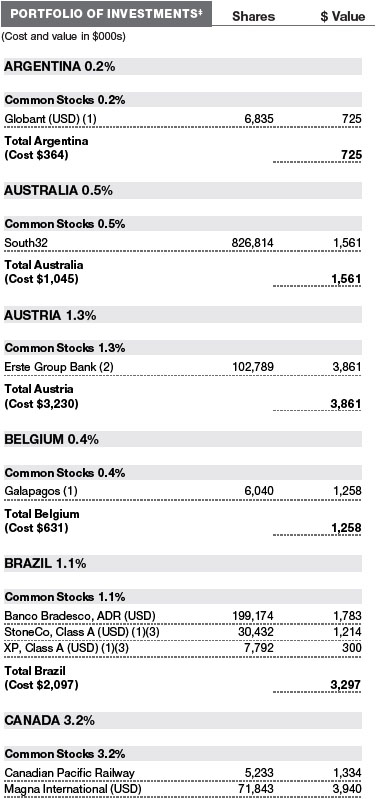
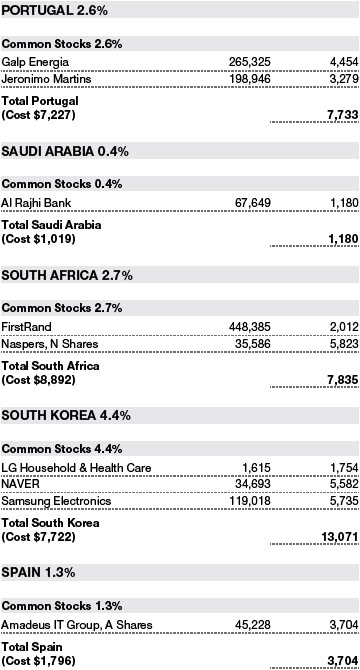
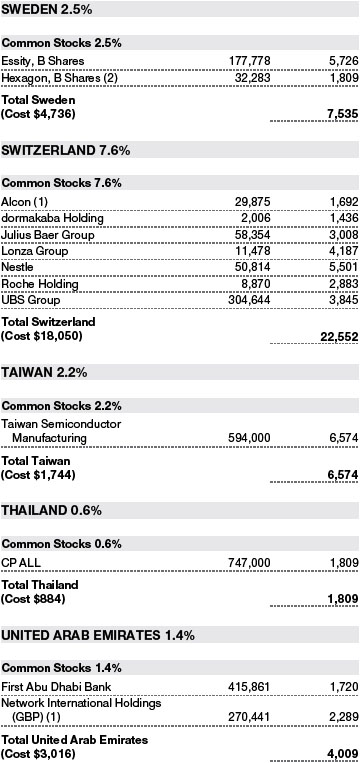
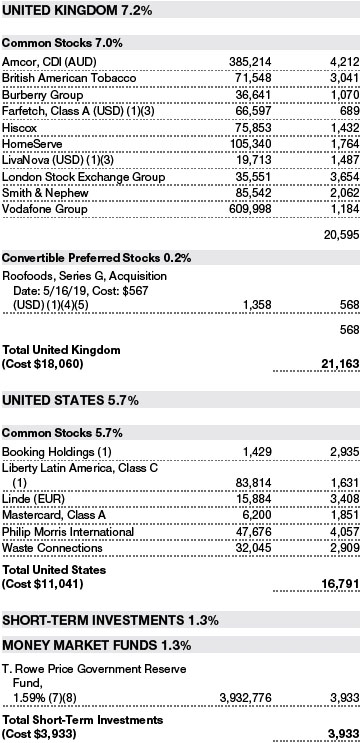
(a) Not applicable. The complete schedule of investments is included in Item 1 of this Form N-CSR.
(b) Not applicable.
Item 7. Disclosure of Proxy Voting Policies and Procedures for Closed-End Management Investment Companies.
Not applicable.
Item 8. Portfolio Managers of Closed-End Management Investment Companies.
Not applicable.
Item 9. Purchases of Equity Securities by Closed-End Management Investment Company and Affiliated Purchasers.
Not applicable.
Item 10. Submission of Matters to a Vote of Security Holders.
Not applicable.
Item 11. Controls and Procedures.
(a) The registrant’s principal executive officer and principal financial officer have evaluated the registrant’s disclosure controls and procedures within 90 days of this filing and have concluded that the registrant’s disclosure controls and procedures were effective, as of that date, in ensuring that information required to be disclosed by the registrant in this Form N-CSR was recorded, processed, summarized, and reported timely.
(b) The registrant’s principal executive officer and principal financial officer are aware of no change in the registrant’s internal control over financial reporting that occurred during the period covered by this report that has materially affected, or is reasonably likely to materially affect, the registrant’s internal control over financial reporting.
Item 12. Disclosure of Securities Lending Activities for Closed-End Management Investment Companies.
Not applicable.
Item 13. Exhibits.
(a)(1) The registrant’s code of ethics pursuant to Item 2 of Form N-CSR is attached.
(2) Separate certifications by the registrant's principal executive officer and principal financial officer, pursuant to Section 302 of the Sarbanes-Oxley Act of 2002 and required by Rule 30a-2(a) under the Investment Company Act of 1940, are attached.
(3) Written solicitation to repurchase securities issued by closed-end companies: not applicable.
(b) A certification by the registrant’s principal executive officer and principal financial officer, pursuant to Section 906 of the Sarbanes-Oxley Act of 2002 and required by Rule 30a-2(b) under the Investment Company Act of 1940, is attached.
SIGNATURES
Pursuant to the requirements of the Securities Exchange Act of 1934 and the Investment Company Act of 1940, the registrant has duly caused this report to be signed on its behalf by the undersigned, thereunto duly authorized.
T. Rowe Price International Series, Inc.
| By | | /s/ David Oestreicher |
| | | David Oestreicher |
| | | Principal Executive Officer |
| |
| Date | | February 7, 2020 | | | | |
Pursuant to the requirements of the Securities Exchange Act of 1934 and the Investment Company Act of 1940, this report has been signed below by the following persons on behalf of the registrant and in the capacities and on the dates indicated.
| By | | /s/ David Oestreicher |
| | | David Oestreicher |
| | | Principal Executive Officer |
| |
| Date | | February 7, 2020 | | | | |
| |
| |
| By | | /s/ Alan S. Dupski |
| | | Alan S. Dupski |
| | | Principal Financial Officer |
| |
| Date | | February 7, 2020 | | | | |