| UNITED STATES |
| SECURITIES AND EXCHANGE COMMISSION |
| Washington, D.C. 20549 |
| |
FORM N-CSR |
| |
CERTIFIED SHAREHOLDER REPORT OF REGISTERED |
MANAGEMENT INVESTMENT COMPANIES |
| |
| |
| |
| Investment Company Act File Number: 811-07143 |
|
| |
| T. Rowe Price Equity Series, Inc. |
|
| (Exact name of registrant as specified in charter) |
| |
| 100 East Pratt Street, Baltimore, MD 21202 |
|
| (Address of principal executive offices) |
| |
| David Oestreicher |
| 100 East Pratt Street, Baltimore, MD 21202 |
|
| (Name and address of agent for service) |
| |
| |
| Registrant’s telephone number, including area code: (410) 345-2000 |
| |
| |
| Date of fiscal year end: December 31 |
| |
| |
| Date of reporting period: June 30, 2011 |
Item 1: Report to Shareholders| Blue Chip Growth Portfolio | June 30, 2011 |
• Large-cap growth stocks generated strong gains in the first quarter, but volatility and the emergence of various headwinds diminished second-quarter results.
• The portfolio returned a solid 6.42% in the first half, outperforming its Lipper peer group.
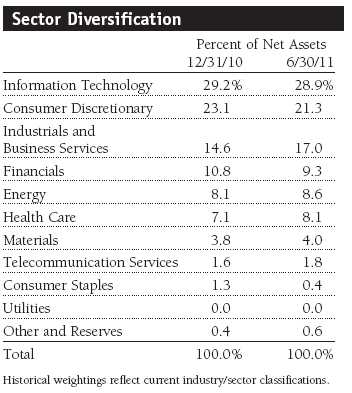
• The portfolio’s performance benefited from good gains in our technology, industrials and business services, and consumer discretionary holdings, but stock selection in the energy sector hurt our comparison with the S&P 500.
• We believe that many high-quality, large-cap growth companies could perform well even if the economy experiences only a modest recovery.
The views and opinions in this report were current as of June 30, 2011. They are not guarantees of performance or investment results and should not be taken as investment advice. Investment decisions reflect a variety of factors, and the managers reserve the right to change their views about individual stocks, sectors, and the markets at any time. As a result, the views expressed should not be relied upon as a forecast of the fund’s future investment intent. The report is certified under the Sarbanes-Oxley Act, which requires mutual funds and other public companies to affirm that, to the best of their knowledge, the information in their financial reports is fairly and accurately stated in all material respects.
Manager’s Letter
T. Rowe Price Blue Chip Growth Portfolio
Dear Investor
Global stock markets exhibited significant volatility but rebounded late in the second quarter to continue their strong performance. As of this writing, there is some evidence that a bipartisan solution to the critical U.S. structural deficit problem is emerging. Despite lackluster job growth, the prospects for more economic growth and continued strong corporate profit are intact. While valuations have increased, we maintain our view that stocks could continue to perform reasonably well. We certainly do not want to dismiss the many challenges faced by investors. However, consistent with prior letters, we would reinforce the potential advantages of following an investment plan that does not put too much emphasis on short-term market fluctuations or any particular macroeconomic risk.
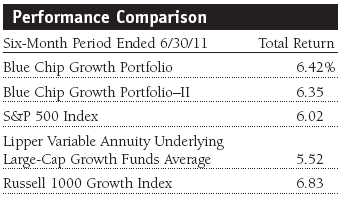
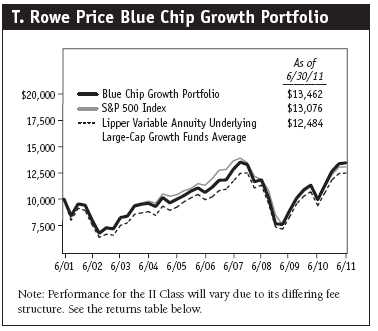
The Blue Chip Growth Portfolio produced a strong 6.42% return in the first half of 2011. Our results outperformed the Lipper style-specific peer group of large-cap growth funds and the benchmark S&P 500 Index but slightly lagged the Russell 1000 Growth Index. In general, our largest holdings generated solid gains and benefited results in the first half of 2011. As shown in the Growth of $10,000 chart on page 8, the portfolio’s 10-year return outpaced the S&P 500 and its Lipper benchmark. (Results for the II Class varied slightly, reflecting its different fee structure.)
Your fund continued to compare favorably with its competitors. Lipper ranked the Blue Chip Growth Portfolio in the top 24% of its variable annuity large-cap growth funds universe for the year, and in the top 28% for the 10-year period ended June 30, 2011. (Based on cumulative total return, Lipper ranked the Blue Chip Growth Portfolio 57 of 244, 72 of 197, and 33 of 118 funds in the variable annuity underlying large-cap growth funds universe for the 1-, 5-, and 10-year periods ended June 30, 2011, respectively. Past performance cannot guarantee future results.)
Market Environment
The primary challenges facing investors continued to be slow job growth and large structural deficits in the U.S. and many developed economies. Accommodative monetary policy and stimulus spending have contributed to the large deficits and dollar weakness that has also spurred higher commodity prices and concern about incipient inflation. Sovereign debt concerns in several European nations; fears that China’s efforts to tackle inflation could hamper growth; and increased regulation, particularly in the financial services area, also weighed on investor confidence.
Budget deficits at all levels of government in the U.S., but particularly at the federal level, have justifiably concerned investors. If interest rates were to increase significantly, interest payments would become quite burdensome and could damage U.S. creditworthiness and economic growth. Fortunately, policymakers appear to recognize the gravity of the situation and are working on plans to make large spending cuts and generate more tax revenue. While we would be generally opposed to any significant tax increases at this time, the combination of larger spending cuts with tax simplification, including eliminating some tax loopholes, could be quite positive for investor confidence and, ultimately, economic growth.
There are reasons for cautious optimism regarding other risks. The budgetary crisis in several European economies caused a significant decline in the euro and has raised questions about the effective servicing of sovereign debt by several countries. However, some euro zone economies (particularly Germany) are quite strong. Austerity measures in other economies and enhanced lending facilities stand a reasonable chance of fostering greater stability in Europe and in the euro over time. In a similar vein, serious efforts to limit inflation in China have dampened growth, but there are signs that early actions may be yielding results. The tragic earthquake in Japan also seems to be creating less disruption for commerce in the region, as relief and rebuilding efforts begin to gain traction.
However, certain risks clearly persist and cannot be solved easily. Unrest in several Middle Eastern and North African countries, including Egypt and Libya, is likely to continue, contributing to higher oil prices and economic instability. While some investors worry about the threat of deflation, a negative spiral of dollar weakness, and rising commodity prices, escalating inflation and rising interest rates could also occur. Lackluster private sector job growth is the most overarching risk to a sustained economic recovery. While deficit reduction and other policy measures could help stabilize the dollar and reduce the risk of inflation, there is no assurance that they will bolster job growth in the near term.
While recognizing the many challenges facing investors, we also want to be clear that there are several powerful positives and also solid potential rewards in many stocks. Policy actions already taken (extension of tax rates, for example) and emerging proposals could promote better growth and lead to deficit reductions. Companies are showing solid revenue growth, improved efficiency and margins, and ultimately robust earnings despite high levels of unemployment and subdued capital spending. As overall demand improves, corporate earnings could be quite vibrant. Many companies have free cash flow yields approaching 10%, which is favorable relative to the approximate 3% yield on 10-year Treasury notes. Although stocks have performed well and valuations are now more demanding, many stocks remain reasonably valued and reflect the solid opportunity that we believe still exists in this market.
Portfolio Review
As investors became more comfortable that the global economy was healing, the portfolio generated solid appreciation in technology, industrials and business services, and consumer discretionary holdings. The health care sector was also a large positive contributor as investors favored companies with consistent growth and became less concerned about health care reform and regulation. Despite the extremely high level of unemployment, the revenue and earnings growth of many substantial contributors in these and other sectors were better than expected and would be considered quite favorable even in a stronger economic environment.
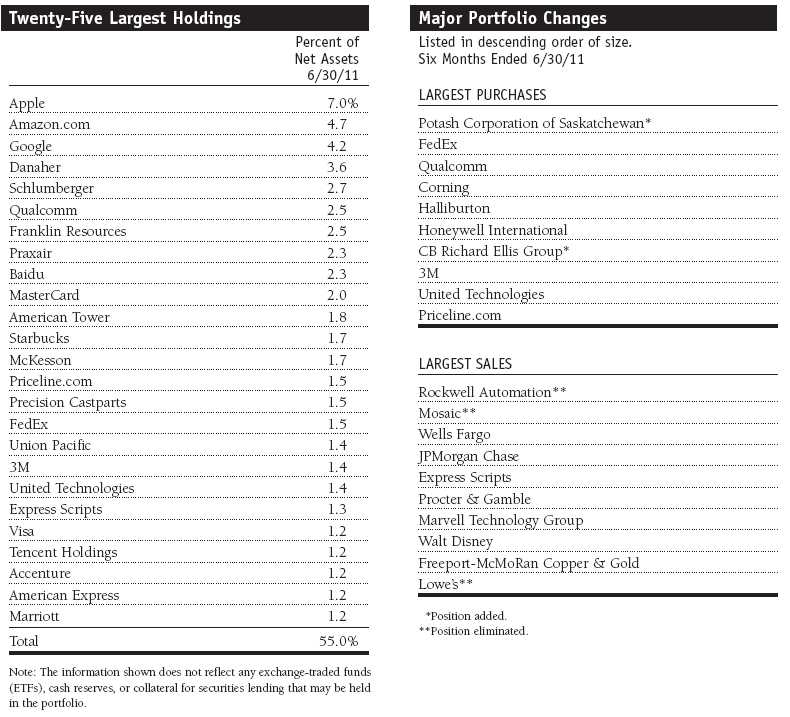
In the technology area, Baidu, the dominant online search and advertising services provider in China, was our largest contributor. While competition in certain segments of the Internet is heating up in China, Baidu is well positioned to continue generating robust growth. MasterCard and Visa were also significant contributors to performance after declining in response to the Durbin legislation passed to regulate the level of debit card transaction fees. The final guidelines issued by the Federal Reserve regarding this issue were less onerous than some had feared, and these stocks reacted quite favorably. Both companies continue to generate consistent growth in earnings and free cash flow driven by their strong global franchises. Apple’s iPhones and iMac personal computers generated strong sales despite the challenging economic environment. Additionally, the company’s new iPad is selling at a rate well above initial projections. Although we are wary of the challenge the giant company faces to innovate and grow rapidly, its prospects appear favorable, and the stock’s valuation is well below its historical and the market’s averages. (Please refer to the portfolio of investments for a complete list of holdings and the amount each represents in the portfolio.) Qualcomm also benefited from the sharp growth in the adoption of smartphones and tablets, which use its intellectual property and chipsets. Its Snapdragon platform and other chip solutions have produced market share gains recently. Leading multinational consulting and outsourcing services provider Accenture benefited from growing global demand for improved efficiency and outsourcing services. Xilinx, a leading programmable logic device (PLD) semiconductor manufacturer, also prospered. PLD solutions continue to generate market share gains versus application-specific integrated circuits. Storage giant EMC also provided solid performance. The company rolled out several new products that are well suited to meet the exploding demand in cloud-based computing and an ongoing need for better data storage solutions.
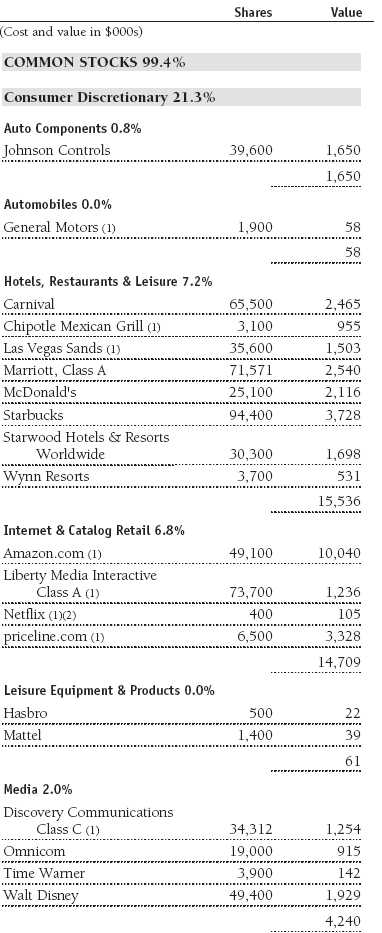
In the consumer discretionary sector, Internet retailing giant Amazon.com was the portfolio’s second-largest contributor during the past six months. As we had hoped, its Kindle electronic book reader is providing solid growth despite the entry of Apple’s iPad into the space. Investors also appear to have grown more comfortable with Amazon’s relatively high level of expense growth. The firm produced 41% unit growth in the most recent quarter and appears to be successfully expanding in several new product areas. Our large position in Starbucks performed well. Strong same-store sales and efficiency improvements continue to drive profit growth. The company also appears to be successfully growing a number of new product lines sold in grocery stores. We believe that the significant increase in coffee prices, which had crimped profits in recent quarters, is moderating. Priceline.com, a leading Internet-based travel services purveyor and a portfolio holding for several years, generated substantial gains. Several specialty retailers, including Bed Bath & Beyond and Tiffany, and luxury goods makers, including Coach and Polo Ralph Lauren, produced solid gains for the portfolio. Sales growth to China and other Asian markets are generally strong for these companies. McDonald’s also generated good earnings growth and stock performance driven by same-store sales gains in overseas locations and solid performance in its domestic operations.
In the industrials and business services sector, our longtime holding in Danaher continued to generate outstanding results. It was our fourth-largest winner overall. The company just completed the acquisition of Beckman Coulter (a health care equipment and solutions provider), which should be accretive to earnings and cash flow over time. Precision Castparts is a leading producer of forged and cast metal components used in aerospace, energy, and other applications. Its seamless extruded pipe is a major product line that should continue to generate strong profit growth. It is another longtime holding that has performed particularly well recently. United Technologies is another high-quality industrial company with exposure to the aerospace industry. The geared turbofan engine, produced by its Pratt & Whitney division, will be used extensively due to its lower fuel consumption and reduced noise profile. The company’s HVAC (heating, ventilation, and air conditioning) solutions are also selling well in global markets. Fastenal is a leading industrial parts and fasteners distributor. This well-managed company has been a portfolio holding for several years, and its solid growth resulted in recent strong stock performance. Our confidence in management and the franchise of railroad leader Union Pacific was also justified. The company continued to generate outstanding improvements in efficiency and earnings, which led to good stock performance. 3M also produced solid performance. The company extended its impressive record of innovation and strong return on invested capital.
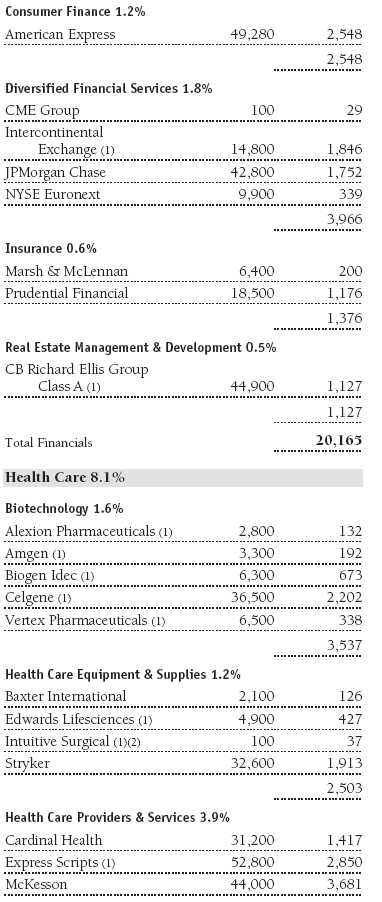
Despite inconsistent results in several other sectors, we had some winners. For example, in health care, drug distributors McKesson and Cardinal Health generated substantial performance contributions. Both companies are well positioned for the increased adoption of generic pharmaceuticals over the next several years. Allergan is a manufacturer of ophthalmology products and aesthetics solutions, such as Botox. The use of Botox in more clinical applications, such as treatment of migraine headaches, is starting to generate significant sales. The financials sector was volatile, but our large holding in Franklin Resources performed well, and the stock was the fifth-largest contributor in the first half of the year. American Express was another top performer. Its credit quality and expense management are among the best in the financial services segment. The company’s global franchise also appears to be much better positioned to generate revenue growth than most other traditional banks or lenders.
The first half of 2011 was volatile, and several of our positions declined significantly. Google was our largest negative contributor in the past six months by a considerable margin. The company produced 29% revenue growth in the first quarter, which was solidly ahead of expectations, but investors remained concerned about aggressive spending and whether the company will earn an adequate return on its new investments. The market also needs to become more comfortable with the new CEO, Larry Page, and the company’s efforts to compete with social networking companies including Facebook. Finally, antitrust investigations launched by the U.S. government have weighed on the stock. While we are concerned about these issues, we feel that the company has been disciplined in its investments and has earned strong returns in the past. We like many of the initial actions that Mr. Page is undertaking, and note that not only is he a cofounder, but also one of the company’s technology thought leaders.
Many of Google’s new product offerings in the video, display advertising, and mobile advertising areas are generating billions of dollars in revenue. Its Android operating system for mobile devices has become the dominant software for smartphones. The company’s recent new product release in the social networking market, called Google+, appears to be well conceived and could be a formidable competitor. Antitrust actions are often long running and difficult to assess, but many of Google’s products are provided to consumers at no charge. We think that the company will not be significantly damaged by any government action. Additionally, the stock trades at a steep discount to the market and its competitors’ earnings multiple.
Carnival was also a significant detractor, hurt by investor concerns about the impact of rising oil prices on travel and the company’s margins. Financial results were certainly affected by high oil prices, but the company’s overall level of business activity remained good. Carnival also has some pricing power as less capacity has been added in the cruise line segment. Lodging companies were also hurt by rising fuel costs. Our positions in Marriott and Starwood Hotels traded lower in part due to travel disruptions to important Asian locations caused by the Japanese earthquake. However, managements at both companies are confident that the recovery in lodging will continue—and recent revenue-per-available-room data generally corroborate that view.
The Japanese earthquake and other concerns including some warranted fear of an economic slowdown, caused weakness in several other holdings. Technology stocks, such as Broadcom in the semiconductor area; Juniper Networks in the network equipment area; and Corning, which produces much of the specialized glass used in liquid crystal display (or LCD) televisions, suffered as there was some slowing in their underlying businesses. Although we trimmed these holdings at higher levels, we generally feel that each company is executing well. We think they are positioned to maintain their leadership positions and can produce solid growth for the foreseeable future. Several holdings in the financials sector, including Goldman Sachs, Wells Fargo, JPMorgan Chase, and Northern Trust, were significant performance detractors. However, we also sold substantial amounts of stock in each company at higher prices. At this point, we feel that the risk/reward trade-off is perhaps becoming more attractive as several factors, including regulatory reviews and mortgage documentation concerns, move toward resolution. We will continue to be circumspect and selective in the financials sector, and this approach has helped the portfolio avoid a large portion of the underperformance in this area. However, we also want to be open to opportunities that could be created as the sector heals over the next few years.
Strategy
Additions to existing holdings such as FedEx, Qualcomm, Corning, Halliburton, Honeywell International, 3M, United Technologies, and Priceline.com were significant enough to be included in the 10 largest purchases for the past six months. Consequently, we initiated only two new positions among our largest purchases. Our top purchase was Potash Corporation of Saskatchewan, a leading fertilizers and potash provider. Global demand for increased protein in diets and a shortage of highly arable and productive farmland are contributing to tight supply/demand conditions for corn and many agricultural products. This has helped drive strong demand and pricing for fertilizer products. Potash Corp. has generated strong profit growth and stock performance since its purchase. CB Richard Ellis Group, the other new holding, is a global leader in commercial property management services, including real estate investment services. Despite lackluster conditions in many real estate markets, the level of leasing and transaction activity in many office markets and other commercial real estate areas is showing strong growth. The increased use of real estate in investment strategies has also benefited CB as it is a leading investment services provider, a position that was strengthened by the recent purchase of ING’s real estate investment group.
Our largest sales included the elimination of Rockwell Automation. Although the stock had performed well, our analysis favored redeploying the proceeds across several other industrial stocks that we believe have less cyclicality and better risk/reward profiles. We also eliminated Mosaic, a leading fertilizer provider, to fund the purchase of Potash Corp., and Lowe’s, a leading home improvement retailer. We had been interested in the home retailers because we view their business as being less susceptible to competition from Internet-based retailers. However, the slow recovery in housing dampened the results of many industries dependent on home sales and homebuilding. It also appears that Home Depot is executing somewhat better than Lowe’s. It is possible that we will reestablish a position in Lowe’s or Home Depot at some point in the future, and we will continue to carefully monitor both companies.
Outlook
On balance, we remain positive on the longer-term outlook for stocks. While the challenges we have enumerated will certainly require time to resolve and will test the patience of policymakers and investors, corporate earnings at selected companies could continue to impress, interest rates and inflation should remain at acceptable levels, and many high-quality companies’ valuations are quite reasonable.
Lackluster economic growth and job creation in the U.S. and several major developed countries continue to represent key challenges. The U.S. and several major economies also face structural deficits that could imperil prospects for growth or even stability, particularly if interest rates rise significantly. Recent growth in government outlays and the severity of the deficits that have been created will require significant spending cuts. Simplification of the tax code and closing some loopholes could be a welcome benefit of the process and could result in moderately higher tax revenues. However, we think that additional tax increases are ill-advised and that major structural changes in spending are required.
Ironically, the severe budget challenges represent an opportunity. If policymakers deal with the situation in a decisive way, it could represent an important and timely trigger for sustained growth in the U.S. It would also come at a time that European authorities could be gaining traction in devising innovative solutions to the sovereign debt problems that have plagued Greece and several other countries. At the same time, China, India, and Brazil may be entering a period in which some early actions to combat inflation could be yielding results. However, we would be quick to acknowledge that all of these policymaking situations are complex, risky, and unlikely to develop in an optimum manner.
There are other complicating factors that cause us to be circumspect. Unrest in the Middle East and the possible impact it could have on oil prices and general stability must be monitored. Major spending cuts and other policy actions could dampen rather than enhance growth in the short run. Greater confidence among business managers and investors (and stronger job growth) may also build slowly. We must also acknowledge that stocks have performed quite well. Although many stocks remain attractively valued, valuations are not as favorable as they were six months ago. Even with remedial action, continued deficits, dollar instability, a sharp increase in inflation, and higher interest rates constitute threats that must be carefully monitored. For these reasons and others, we regard the current environment as having more complexity and risk than is typical.
Despite the uncertainty surrounding how effective fiscal and monetary actions will be in healing the economy, there are several things working in our favor:
1. Although past performance cannot guarantee future results, stocks historically have performed quite well following a lackluster 10-year period of performance. Essentially, we have experienced two major bear markets in the past 10 years.
2. Stock valuations are historically attractive, especially in relation to the very low level of interest rates. In many cases, the earnings or cash flow yield on stocks exceeds 10%, while yields on 10-year Treasury notes are approximately 3%.
3. We believe that the high-quality, consistent-growth companies we seek to purchase are especially attractive and could conceivably perform well even if the economy only experiences a modest recovery. Stringent expense management could also support rapid earnings growth should revenues begin to accelerate.
4. Many large-cap growth companies have strong balance sheets with record amounts of cash and strong capitalization. This should allow them to manage through challenges and opportunistically invest in new products or businesses as change creates dislocation.
5. Many of our holdings generate significant free cash flow. Shareholder-oriented management can use this cash to increase dividends, repurchase shares, or make value-added acquisitions.
We strive to enhance returns in a difficult environment by investing in quality companies with durable, sustainable earnings and cash flow growth. We appreciate your continued confidence in this endeavor.
Respectfully submitted,

Larry J. Puglia
Chairman of the Investment Advisory Committee
July 12, 2011
The committee chairman has day-to-day responsibility for managing the portfolio and works with committee members in developing and executing its investment program.
The portfolio’s share price can fall because of weakness in the stock markets, a particular industry, or specific holdings. Stock markets can decline for many reasons, including adverse political or economic developments, changes in investor psychology, or heavy institutional selling. The prospects for an industry or company may deteriorate because of a variety of factors, including disappointing earnings or changes in the competitive environment. In addition, the investment manager’s assessment of companies held in a portfolio may prove incorrect, resulting in losses or poor performance even in rising markets. Growth stocks can be volatile because these companies usually invest a high portion of earnings in their businesses, and earnings disappointments often lead to sharply falling prices.
Dividend yield: The annual dividend of a stock divided by the stock’s price.
Free cash flow: The excess cash a company is generating from its operations that can be taken out of the business for the benefit of shareholders, such as dividends, share repurchases, investments, and acquisitions.
Lipper averages: The average return of all portfolios in a particular category as tracked by Lipper Inc.
Price/book ratio: A valuation measure that compares a stock’s market price with its book value (i.e., the company’s net worth divided by the number of outstanding shares).
Price/earnings (P/E) ratio: A valuation measure calculated by dividing the price of a stock by its current or projected earnings per share. This ratio gives investors an idea of how much they are paying for current or future earnings power.
Russell 1000 Growth Index: Market capitalization-weighted index of those firms in the Russell 1000 with higher price-to-book ratios and higher forecasted growth values.
S&P 500 Index: An unmanaged index that tracks the stocks of 500 primarily large-cap U.S. companies.
Portfolio Highlights
Performance and Expenses
T. Rowe Price Blue Chip Growth Portfolio
This chart shows the value of a hypothetical $10,000 investment in the fund over the past 10 fiscal year periods or since inception (for funds lacking 10-year records). The result is compared with benchmarks, which may include a broad-based market index and a peer group average or index. Market indexes do not include expenses, which are deducted from fund returns as well as mutual fund averages and indexes.

As a mutual fund shareholder, you may incur two types of costs: (1) transaction costs, such as redemption fees or sales loads, and (2) ongoing costs, including management fees, distribution and service (12b-1) fees, and other fund expenses. The following example is intended to help you understand your ongoing costs (in dollars) of investing in the fund and to compare these costs with the ongoing costs of investing in other mutual funds. The example is based on an investment of $1,000 invested at the beginning of the most recent six-month period and held for the entire period.
Shares of the fund are currently offered only through certain insurance companies as an investment medium for both variable annuity contracts and variable life insurance policies. Please note that the fund has two classes of shares: the original share class and II Class. II Class shares are sold through financial intermediaries, which are compensated for distribution, shareholder servicing, and/or certain administrative services under a Board-approved Rule 12b-1 plan.
Actual Expenses
The first line of the following table (“Actual”) provides information about actual account values and actual expenses. You may use the information on this line, together with your account balance, to estimate the expenses that you paid over the period. Simply divide your account value by $1,000 (for example, an $8,600 account value divided by $1,000 = 8.6), then multiply the result by the number on the first line under the heading “Expenses Paid During Period” to estimate the expenses you paid on your account during this period.
Hypothetical Example for Comparison Purposes
The information on the second line of the table (“Hypothetical”) is based on hypothetical account values and expenses derived from the fund’s actual expense ratio and an assumed 5% per year rate of return before expenses (not the fund’s actual return). You may compare the ongoing costs of investing in the fund with other funds by contrasting this 5% hypothetical example and the 5% hypothetical examples that appear in the shareholder reports of the other funds. The hypothetical account values and expenses may not be used to estimate the actual ending account balance or expenses you paid for the period.
You should also be aware that the expenses shown in the table highlight only your ongoing costs and do not reflect any transaction costs, such as redemption fees or sales loads. Therefore, the second line of the table is useful in comparing ongoing costs only and will not help you determine the relative total costs of owning different funds. To the extent a fund charges transaction costs, however, the total cost of owning that fund is higher.

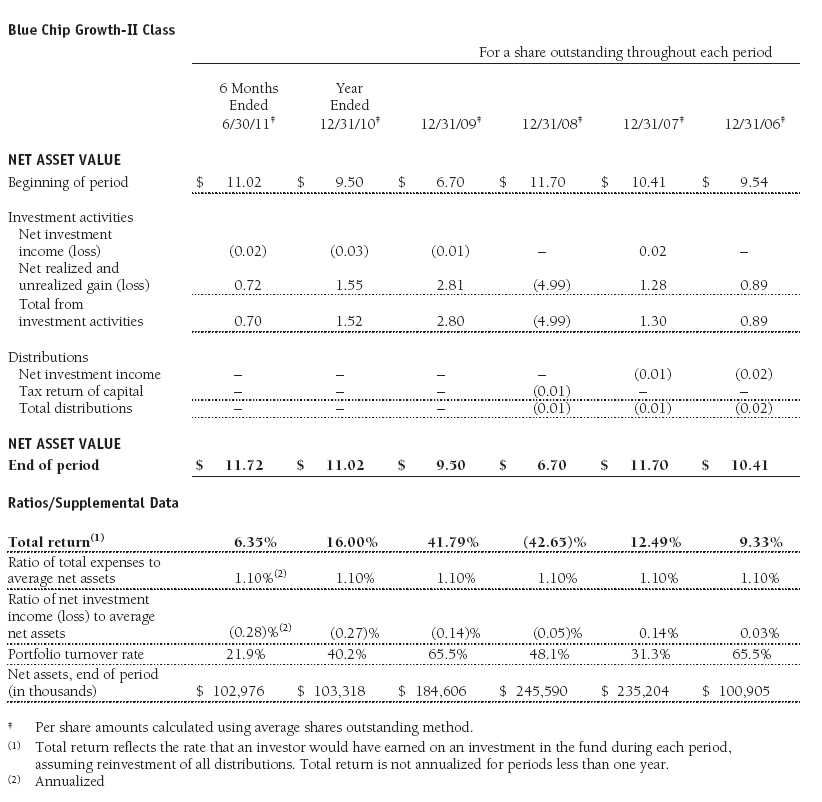
Financial Highlights
T. Rowe Price Blue Chip Growth Portfolio
(Unaudited)

The accompanying notes are an integral part of these financial statements.
Financial Highlights
T. Rowe Price Blue Chip Growth Portfolio
(Unaudited)
The accompanying notes are an integral part of these financial statements.
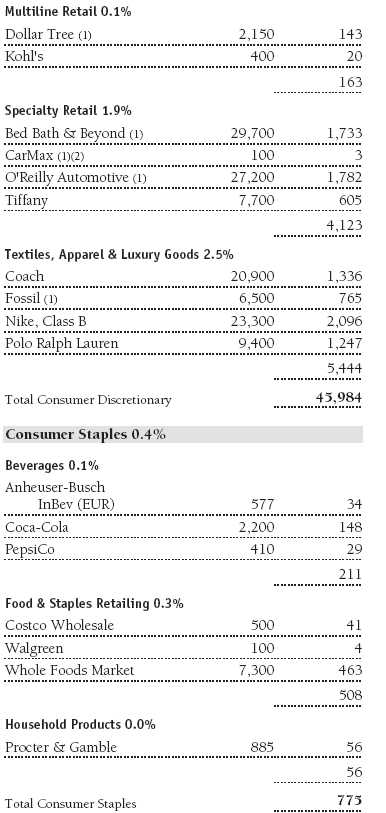
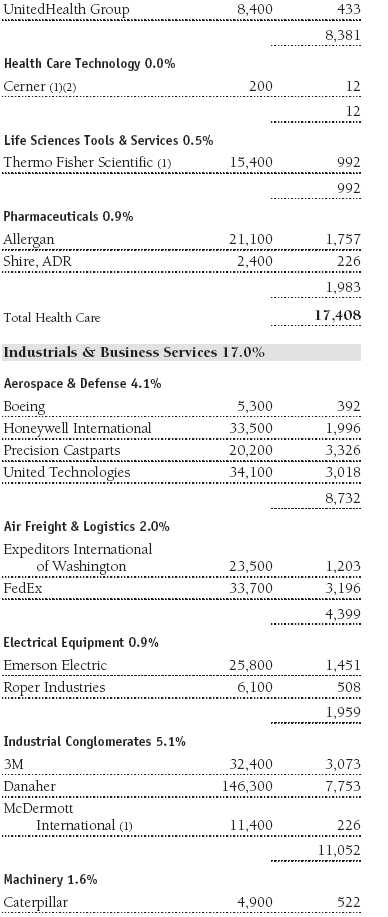
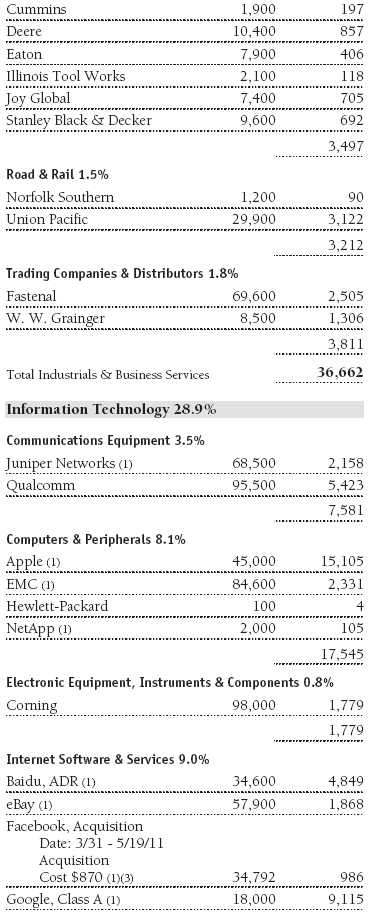
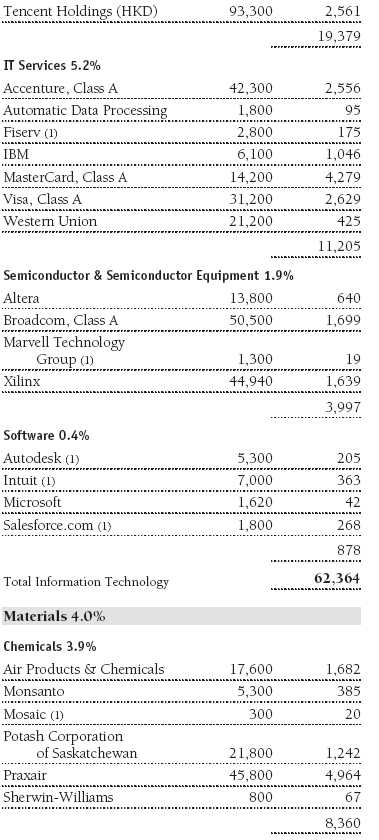
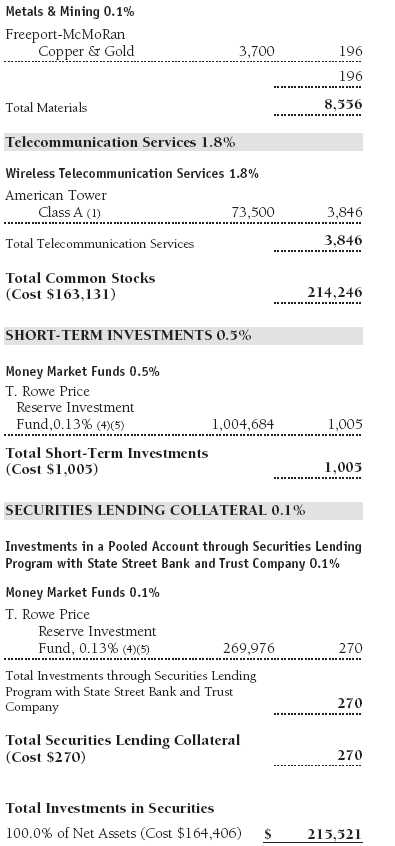
Portfolio of Investments‡
T. Rowe Price Blue Chip Growth Portfolio
June 30, 2011 (Unaudited)

The accompanying notes are an integral part of these financial statements.
Statement of Assets and Liabilities
T. Rowe Price Blue Chip Growth Portfolio
June 30, 2011 (Unaudited)
($000s, except shares and per share amounts)

The accompanying notes are an integral part of these financial statements.
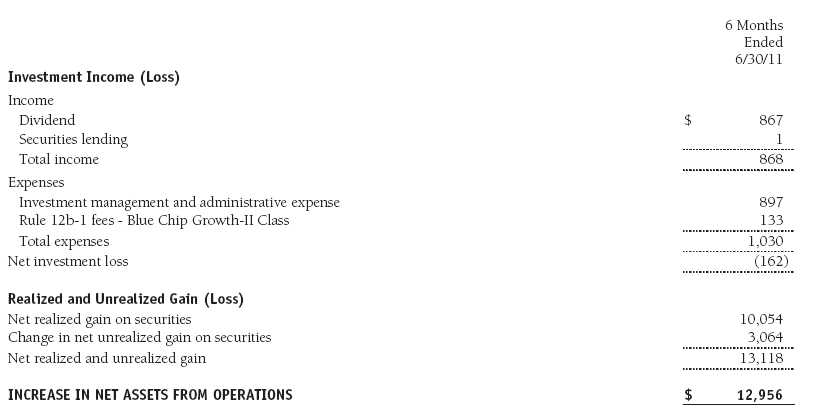
Statement of Operations
T. Rowe Price Blue Chip Growth Portfolio
(Unaudited)
($000s)
The accompanying notes are an integral part of these financial statements.
Statement of Changes in Net Assets
T. Rowe Price Blue Chip Growth Portfolio
(Unaudited)
($000s)

The accompanying notes are an integral part of these financial statements.
Notes to Financial Statements
T. Rowe Price Blue Chip Growth Portfolio
June 30, 2011 (Unaudited)
T. Rowe Price Equity Series, Inc. (the corporation), is registered under the Investment Company Act of 1940 (the 1940 Act). The Blue Chip Growth Portfolio (the fund), a diversified, open-end management investment company, is one portfolio established by the corporation. The fund seeks to provide long-term capital growth. Income is a secondary objective. Shares of the fund currently are offered only through certain insurance companies as an investment medium for both variable annuity contracts and variable life insurance policies. The fund has two classes of shares: the Blue Chip Growth Portfolio original share class (Blue Chip Growth Class), offered since December 29, 2000, and the Blue Chip Growth Portfolio–II (Blue Chip Growth–II Class), offered since April 30, 2002. Blue Chip Growth–II Class shares are sold through financial intermediaries, which it compensates for distribution, shareholder servicing, and/or certain administrative services under a Board-approved Rule 12b-1 plan. Each class has exclusive voting rights on matters related solely to that class; separate voting rights on matters that relate to both classes; and, in all other respects, the same rights and obligations as the other class.
NOTE 1 - SIGNIFICANT ACCOUNTING POLICIES
Basis of Preparation The accompanying financial statements were prepared in accordance with accounting principles generally accepted in the United States of America (GAAP), which require the use of estimates made by management. Management believes that estimates and valuations are appropriate; however, actual results may differ from those estimates, and the valuations reflected in the accompanying financial statements may differ from the value ultimately realized upon sale or maturity.
Investment Transactions, Investment Income, and Distributions Income and expenses are recorded on the accrual basis. Dividends received from mutual fund investments are reflected as dividend income; capital gain distributions are reflected as realized gain/loss. Dividend income and capital gain distributions are recorded on the ex-dividend date. Income tax-related interest and penalties, if incurred, would be recorded as income tax expense. Investment transactions are accounted for on the trade date. Realized gains and losses are reported on the identified cost basis. Distributions to shareholders are recorded on the ex-dividend date. Income distributions are declared and paid by each class annually. Capital gain distributions, if any, are generally declared and paid by the fund annually.
Currency Translation Assets, including investments, and liabilities denominated in foreign currencies are translated into U.S. dollar values each day at the prevailing exchange rate, using the mean of the bid and asked prices of such currencies against U.S. dollars as quoted by a major bank. Purchases and sales of securities, income, and expenses are translated into U.S. dollars at the prevailing exchange rate on the date of the transaction. The effect of changes in foreign currency exchange rates on realized and unrealized security gains and losses is reflected as a component of security gains and losses.
Class Accounting Blue Chip Growth–II pays distribution, shareholder servicing, and/or certain administrative expenses in the form of Rule 12b-1 fees, in an amount not exceeding 0.25% of the class’s average daily net assets. Investment income, investment management and administrative expense, and realized and unrealized gains and losses are allocated to the classes based upon the relative daily net assets of each class.
Rebates Subject to best execution, the fund may direct certain security trades to brokers who have agreed to rebate a portion of the related brokerage commission to the fund in cash. Commission rebates are reflected as realized gain on securities in the accompanying financial statements and totaled $2,000 for the six months ended June 30, 2011.
Credits Credits are earned on the fund’s temporarily uninvested cash balances held at the custodian and such credits reduce the amount paid by the manager for custody of the fund’s assets. In order to pass the benefit of custody credits to the fund, the manager has voluntarily reduced its investment management and administrative expense in the accompanying financial statements.
NOTE 2 - VALUATION
The fund’s financial instruments are reported at fair value as defined by GAAP. The fund determines the values of its assets and liabilities and computes each class’s net asset value per share at the close of the New York Stock Exchange (NYSE), normally 4 p.m. ET, each day that the NYSE is open for business.
Valuation Methods Equity securities listed or regularly traded on a securities exchange or in the over-the-counter (OTC) market are valued at the last quoted sale price or, for certain markets, the official closing price at the time the valuations are made, except for OTC Bulletin Board securities, which are valued at the mean of the latest bid and asked prices. A security that is listed or traded on more than one exchange is valued at the quotation on the exchange determined to be the primary market for such security. Listed securities not traded on a particular day are valued at the mean of the latest bid and asked prices for domestic securities and the last quoted sale price for international securities.
Investments in mutual funds are valued at the mutual fund’s closing net asset value per share on the day of valuation.
Other investments, including restricted securities, and those financial instruments for which the above valuation procedures are inappropriate or are deemed not to reflect fair value are stated at fair value as determined in good faith by the T. Rowe Price Valuation Committee, established by the fund’s Board of Directors.
For valuation purposes, the last quoted prices of non-U.S. equity securities may be adjusted under the circumstances described below. If the fund determines that developments between the close of a foreign market and the close of the NYSE will, in its judgment, materially affect the value of some or all of its portfolio securities, the fund will adjust the previous closing prices to reflect what it believes to be the fair value of the securities as of the close of the NYSE. In deciding whether it is necessary to adjust closing prices to reflect fair value, the fund reviews a variety of factors, including developments in foreign markets, the performance of U.S. securities markets, and the performance of instruments trading in U.S. markets that represent foreign securities and baskets of foreign securities. A fund may also fair value securities in other situations, such as when a particular foreign market is closed but the fund is open. The fund uses outside pricing services to provide it with closing prices and information to evaluate and/or adjust those prices. The fund cannot predict how often it will use closing prices and how often it will determine it necessary to adjust those prices to reflect fair value. As a means of evaluating its security valuation process, the fund routinely compares closing prices, the next day’s opening prices in the same markets, and adjusted prices.
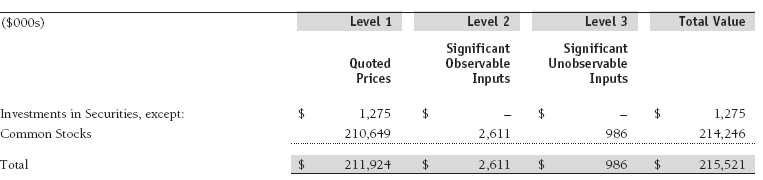
Valuation Inputs Various inputs are used to determine the value of the fund’s financial instruments. These inputs are summarized in the three broad levels listed below:
Level 1 – quoted prices in active markets for identical financial instruments
Level 2 – observable inputs other than Level 1 quoted prices (including, but not limited to, quoted prices for similar financial instruments, interest rates, prepayment speeds, and credit risk)
Level 3 – unobservable inputs
Observable inputs are those based on market data obtained from sources independent of the fund, and unobservable inputs reflect the fund’s own assumptions based on the best information available. The input levels are not necessarily an indication of the risk or liquidity associated with financial instruments at that level. For example, non-U.S. equity securities actively traded in foreign markets generally are reflected in Level 2 despite the availability of closing prices because the fund evaluates and determines whether those closing prices reflect fair value at the close of the NYSE or require adjustment, as described above. The following table summarizes the fund’s financial instruments, based on the inputs used to determine their values on June 30, 2011:
Following is a reconciliation of the fund’s Level 3 holdings for the six months ended June 30, 2011. Gain (loss) reflects both realized and change in unrealized gain (loss) on Level 3 holdings during the period, if any, and is included on the accompanying Statement of Operations. The change in unrealized gain (loss) on Level 3 instruments held at June 30, 2011, totaled $116,000 for the six months ended June 30, 2011.

NOTE 3 - OTHER INVESTMENT TRANSACTIONS
Consistent with its investment objective, the fund engages in the following practices to manage exposure to certain risks and/or to enhance performance. The investment objective, policies, program, and risk factors of the fund are described more fully in the fund’s prospectus and Statement of Additional Information.
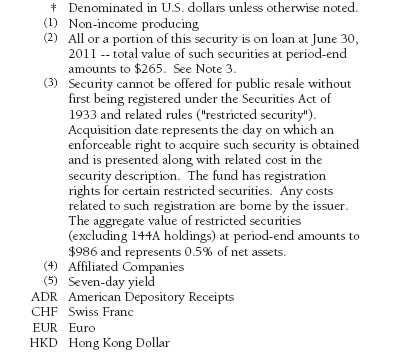
Restricted Securities The fund may invest in securities that are subject to legal or contractual restrictions on resale. Prompt sale of such securities at an acceptable price may be difficult and may involve substantial delays and additional costs.
Securities Lending The fund lends its securities to approved brokers to earn additional income. It receives as collateral cash and U.S. government securities valued at 102% to 105% of the value of the securities on loan. Cash collateral is invested by the fund’s lending agent(s) in accordance with investment guidelines approved by management. Although risk is mitigated by the collateral, the fund could experience a delay in recovering its securities and a possible loss of income or value if the borrower fails to return the securities or if collateral investments decline in value. Securities lending revenue recognized by the fund consists of earnings on invested collateral and borrowing fees, net of any rebates to the borrower and compensation to the lending agent. In accordance with GAAP, investments made with cash collateral are reflected in the accompanying financial statements, but collateral received in the form of securities are not. On June 30, 2011, the value of loaned securities was $265,000 and cash collateral investments totaled $270,000.
Other Purchases and sales of portfolio securities other than short-term securities aggregated $48,186,000 and $46,621,000, respectively, for the six months ended June 30, 2011.
NOTE 4 - FEDERAL INCOME TAXES
No provision for federal income taxes is required since the fund intends to continue to qualify as a regulated investment company under Subchapter M of the Internal Revenue Code and distribute to shareholders all of its taxable income and gains. Distributions determined in accordance with federal income tax regulations may differ in amount or character from net investment income and realized gains for financial reporting purposes. Financial reporting records are adjusted for permanent book/tax differences to reflect tax character but are not adjusted for temporary differences. The amount and character of tax-basis distributions and composition of net assets are finalized at fiscal year-end; accordingly, tax-basis balances have not been determined as of the date of this report.
The fund intends to retain realized gains to the extent of available capital loss carryforwards. As of December 31, 2010, the fund had $99,256,000 of unused capital loss carryforwards, which expire: $20,238,000 in fiscal 2016 and $79,018,000 in fiscal 2017.
At June 30, 2011, the cost of investments for federal income tax purposes was $164,406,000. Net unrealized gain aggregated $51,116,000 at period-end, of which $52,456,000 related to appreciated investments and $1,340,000 related to depreciated investments. Further, approximately $51,056,000 of the fund’s unused capital loss carryforwards are subject to certain limitations on amount and/or timing of use related to an ownership change.
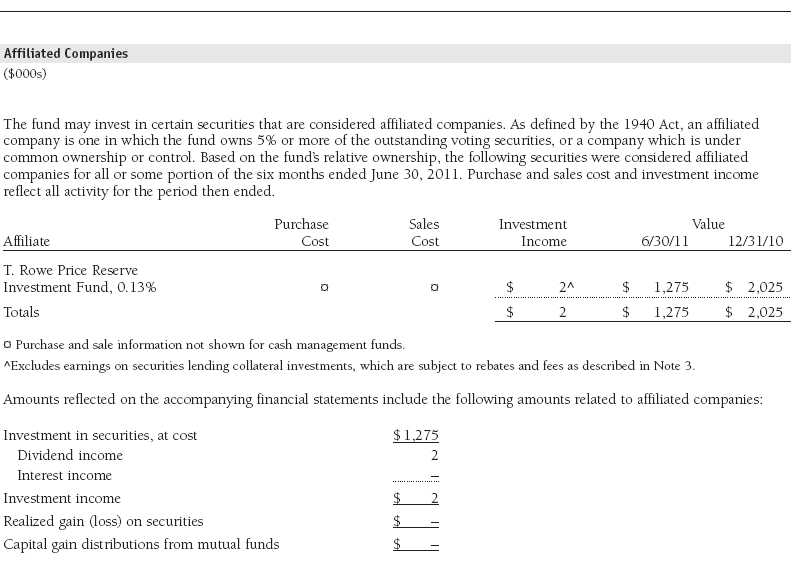
NOTE 5 - RELATED PARTY TRANSACTIONS
The fund is managed by T. Rowe Price Associates, Inc. (Price Associates), a wholly owned subsidiary of T. Rowe Price Group, Inc. (Price Group). The investment management and administrative agreement between the fund and Price Associates provides for an all-inclusive annual fee equal to 0.85% of the fund’s average daily net assets. The fee is computed daily and paid monthly. The all-inclusive fee covers investment management, shareholder servicing, transfer agency, accounting, and custody services provided to the fund, as well as fund directors’ fees and expenses; interest, taxes, brokerage commissions, and extraordinary expenses are paid directly by the fund.
The fund may invest in the T. Rowe Price Reserve Investment Fund and the T. Rowe Price Government Reserve Investment Fund (collectively, the T. Rowe Price Reserve Investment Funds), open-end management investment companies managed by Price Associates and considered affiliates of the fund. The T. Rowe Price Reserve Investment Funds are offered as cash management options to mutual funds, trusts, and other accounts managed by Price Associates and/or its affiliates and are not available for direct purchase by members of the public. The T. Rowe Price Reserve Investment Funds pay no investment management fees.
| Information on Proxy Voting Policies, Procedures, and Records |
A description of the policies and procedures used by T. Rowe Price funds and portfolios to determine how to vote proxies relating to portfolio securities is available in each fund’s Statement of Additional Information, which you may request by calling 1-800-225-5132 or by accessing the SEC’s website, sec.gov. The description of our proxy voting policies and procedures is also available on our website, troweprice.com. To access it, click on the words “Our Company” at the top of our corporate homepage. Then, when the next page appears, click on the words “Proxy Voting Policies” on the left side of the page.
Each fund’s most recent annual proxy voting record is available on our website and through the SEC’s website. To access it through our website, follow the directions above, then click on the words “Proxy Voting Records” on the right side of the Proxy Voting Policies page.
| How to Obtain Quarterly Portfolio Holdings |
The fund files a complete schedule of portfolio holdings with the Securities and Exchange Commission for the first and third quarters of each fiscal year on Form N-Q. The fund’s Form N-Q is available electronically on the SEC’s website (sec.gov); hard copies may be reviewed and copied at the SEC’s Public Reference Room, 450 Fifth St. N.W., Washington, DC 20549. For more information on the Public Reference Room, call 1-800-SEC-0330.
| Approval of Investment Management Agreement |
On March 9, 2011, the fund’s Board of Directors (Board) unanimously approved the continuation of the investment advisory contract (Contract) between the fund and its investment advisor, T. Rowe Price Associates, Inc. (Advisor). The Board considered a variety of factors in connection with its review of the Contract, also taking into account information provided by the Advisor during the course of the year, as discussed below:
Services Provided by the Advisor
The Board considered the nature, quality, and extent of the services provided to the fund by the Advisor. These services included, but were not limited to, management of the fund’s portfolio and a variety of related activities, as well as financial and administrative services, reporting, and communications. The Board also reviewed the background and experience of the Advisor’s senior management team and investment personnel involved in the management of the fund. The Board concluded that it was satisfied with the nature, quality, and extent of the services provided by the Advisor.
Investment Performance of the Fund
The Board reviewed the fund’s average annual total returns over the 1-, 3-, 5-, and 10-year periods, as well as the fund’s year-by-year returns, and compared these returns with a wide variety of previously agreed upon comparable performance measures and market data, including those supplied by Lipper and Morningstar, which are independent providers of mutual fund data. On the basis of this evaluation and the Board’s ongoing review of investment results, and factoring in the relative market conditions during certain of the performance periods, the Board concluded that the fund’s performance was satisfactory.
Costs, Benefits, Profits, and Economies of Scale
The Board reviewed detailed information regarding the revenues received by the Advisor under the Contract and other benefits that the Advisor (and its affiliates) may have realized from its relationship with the fund, including research received under “soft dollar” agreements and commission-sharing arrangements with broker-dealers. The Board considered that the Advisor may receive some benefit from soft-dollar arrangements pursuant to which research is received from broker-dealers that execute the applicable fund’s portfolio transactions. The Board also received information on the estimated costs incurred and profits realized by the Advisor and its affiliates from advising T. Rowe Price mutual funds, as well as estimates of the gross profits realized from managing the fund in particular. The Board concluded that the Advisor’s profits were reasonable in light of the services provided to the fund. The Board also considered whether the fund or other funds benefit under the fee levels set forth in the Contract from any economies of scale realized by the Advisor. The Board noted that, under the Contract, the fund pays the Advisor a single fee based on the fund’s average daily net assets and that the Advisor, in turn, pays all expenses of the fund, with certain exceptions. The Board concluded that, based on the profitability data it reviewed and consistent with this single-fee structure, the Contract provided for a reasonable sharing of any benefits from economies of scale with the fund.
Fees
The Board reviewed the fund’s single-fee structure (for the Investor Class and II Class) and compared it with fees and expenses of other comparable funds based on information and data supplied by Lipper. The information provided to the Board indicated that the fund’s management fee rate was above the median for comparable funds. (For these purposes, the Board assumed the fund’s management fee rate was equal to the single fee less the fund’s operating expenses.) The information also indicated that the total expense ratio for the Investor Class was at or below the median for comparable funds and the total expense ratio for the II Class was above the median for comparable funds. The Board also reviewed the fee schedules for institutional accounts of the Advisor and its affiliates with similar mandates. Management provided the Board with information about the Advisor’s responsibilities and services provided to institutional account clients, which are more limited than its responsibilities for the fund and other T. Rowe Price mutual funds that it advises, and showing that the Advisor performs significant additional services and assumes greater risk for the fund and other T. Rowe Price mutual funds that it advises than it does for institutional account clients. On the basis of the information provided, the Board concluded that the fees paid by the fund under the Contract were reasonable.
Approval of the Contract
As noted, the Board approved the continuation of the Contract. No single factor was considered in isolation or to be determinative to the decision. Rather, the Board was assisted by the advice of independent legal counsel and concluded, in light of a weighting and balancing of all factors considered, that it was in the best interests of the fund to approve the continuation of the Contract (including the fees to be charged for services thereunder).
Item 2. Code of Ethics.
A code of ethics, as defined in Item 2 of Form N-CSR, applicable to its principal executive officer, principal financial officer, principal accounting officer or controller, or persons performing similar functions is filed as an exhibit to the registrant’s annual Form N-CSR. No substantive amendments were approved or waivers were granted to this code of ethics during the registrant’s most recent fiscal half-year.
Item 3. Audit Committee Financial Expert.
Disclosure required in registrant’s annual Form N-CSR.
Item 4. Principal Accountant Fees and Services.
Disclosure required in registrant’s annual Form N-CSR.
Item 5. Audit Committee of Listed Registrants.
Not applicable.
Item 6. Investments.
(a) Not applicable. The complete schedule of investments is included in Item 1 of this Form N-CSR.
(b) Not applicable.
Item 7. Disclosure of Proxy Voting Policies and Procedures for Closed-End Management Investment Companies.
Not applicable.
Item 8. Portfolio Managers of Closed-End Management Investment Companies.
Not applicable.
Item 9. Purchases of Equity Securities by Closed-End Management Investment Company and Affiliated Purchasers.
Not applicable.
Item 10. Submission of Matters to a Vote of Security Holders.
Not applicable.
Item 11. Controls and Procedures.
(a) The registrant’s principal executive officer and principal financial officer have evaluated the registrant’s disclosure controls and procedures within 90 days of this filing and have concluded that the registrant’s disclosure controls and procedures were effective, as of that date, in ensuring that information required to be disclosed by the registrant in this Form N-CSR was recorded, processed, summarized, and reported timely.
(b) The registrant’s principal executive officer and principal financial officer are aware of no change in the registrant’s internal control over financial reporting that occurred during the registrant’s second fiscal quarter covered by this report that has materially affected, or is reasonably likely to materially affect, the registrant’s internal control over financial reporting.
Item 12. Exhibits.
(a)(1) The registrant’s code of ethics pursuant to Item 2 of Form N-CSR is filed with the registrant’s annual Form N-CSR.
(2) Separate certifications by the registrant's principal executive officer and principal financial officer, pursuant to Section 302 of the Sarbanes-Oxley Act of 2002 and required by Rule 30a-2(a) under the Investment Company Act of 1940, are attached.
(3) Written solicitation to repurchase securities issued by closed-end companies: not applicable.
(b) A certification by the registrant's principal executive officer and principal financial officer, pursuant to Section 906 of the Sarbanes-Oxley Act of 2002 and required by Rule 30a-2(b) under the Investment Company Act of 1940, is attached.
| | |
SIGNATURES |
| |
| | Pursuant to the requirements of the Securities Exchange Act of 1934 and the Investment |
| Company Act of 1940, the registrant has duly caused this report to be signed on its behalf by the |
| undersigned, thereunto duly authorized. |
| |
| T. Rowe Price Equity Series, Inc. |
| |
| |
| |
| By | /s/ Edward C. Bernard |
| | Edward C. Bernard |
| | Principal Executive Officer |
| |
| Date | August 17, 2011 |
| |
| |
| |
| | Pursuant to the requirements of the Securities Exchange Act of 1934 and the Investment |
| Company Act of 1940, this report has been signed below by the following persons on behalf of |
| the registrant and in the capacities and on the dates indicated. |
| |
| |
| By | /s/ Edward C. Bernard |
| | Edward C. Bernard |
| | Principal Executive Officer |
| |
| Date | August 17, 2011 |
| |
| |
| |
| By | /s/ Gregory K. Hinkle |
| | Gregory K. Hinkle |
| | Principal Financial Officer |
| |
| Date | August 17, 2011 |