| UNITED STATES |
| SECURITIES AND EXCHANGE COMMISSION |
| Washington, D.C. 20549 |
| |
FORM N-CSR |
| |
CERTIFIED SHAREHOLDER REPORT OF REGISTERED |
MANAGEMENT INVESTMENT COMPANIES |
| |
| |
| |
| Investment Company Act File Number: 811-07143 |
|
| |
| T. Rowe Price Equity Series, Inc. |
|
| (Exact name of registrant as specified in charter) |
| |
| 100 East Pratt Street, Baltimore, MD 21202 |
|
| (Address of principal executive offices) |
| |
| David Oestreicher |
| 100 East Pratt Street, Baltimore, MD 21202 |
|
| (Name and address of agent for service) |
| |
| |
| Registrant’s telephone number, including area code: (410) 345-2000 |
| |
| |
| Date of fiscal year end: December 31 |
| |
| |
| Date of reporting period: June 30, 2011 |
Item 1: Report to Shareholders| Health Sciences Portfolio | June 30, 2011 |
• Health care stocks shined in the first half of 2011, as volatility increased and the prospects for U.S. economic growth became clouded.
• The Health Sciences Portfolio returned 18.02%, surpassing the results for the S&P 500 Index and its Lipper peer group in the six-month reporting period.
• We believe that generating outperformance in the health care sector will depend more on stock selection than on an emphasis on a particular industry.
• Our focus remains on investing in companies that are developing new and important medicines for unmet medical needs, as well as companies whose business models decrease costs or improve quality in our health care system.
The views and opinions in this report were current as of June 30, 2011. They are not guarantees of performance or investment results and should not be taken as investment advice. Investment decisions reflect a variety of factors, and the managers reserve the right to change their views about individual stocks, sectors, and the markets at any time. As a result, the views expressed should not be relied upon as a forecast of the fund’s future investment intent. The report is certified under the Sarbanes-Oxley Act, which requires mutual funds and other public companies to affirm that, to the best of their knowledge, the information in their financial reports is fairly and accurately stated in all material respects.
Manager’s Letter
T. Rowe Price Health Sciences Portfolio
Dear Investor
The health care sector was the strongest performer in the S&P 500 Index in the first half of 2011. After generating lackluster results in 2010, largely due to uncertainties relating to health care reform, a confluence of factors benefited health care stocks in the past six months. The traditionally stable and defensive sector came into favor when investors became concerned about earnings growth and the durability of the economic recovery. Additionally, valuations were lower than in most other areas of the market after more than a year of underperforming, and many institutional investors that had been underrepresented in the sector began chasing the sector’s strong results. In this environment, pharmaceuticals and services stocks posted outstanding returns, and every group within the sector generated double-digit gains.
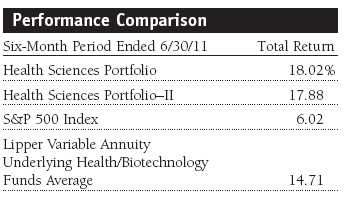
The Health Sciences Portfolio returned 18.02%, outperforming the S&P 500 Index and the Lipper health/biotechnology funds average for the six months ended June 30, 2011. In its comparison with the Lipper peer group, the portfolio benefited from stock selection, especially in the biotechnology and life sciences segments. Allocation decisions across the various groups within the sector were uniformly positive, but stock selection in the products and devices and pharmaceuticals segments detracted from our comparison with the Lipper peer group. (Results for the II Class varied slightly, reflecting its different fee structure.)
The Health Sciences Portfolio has delivered strong longer-term performance compared with the Lipper universe of health/biotechnology funds. Lipper ranked the portfolio in the top decile of its health care funds universe for the 5- and 10-year periods ended June 30, 2011. (Based on cumulative total return, Lipper ranked the Health Sciences Portfolio 6 of 26, 2 of 24, and 1 of 14 funds in the Lipper variable annuity underlying health/biotechnology funds category for the 1-, 5-, and 10-year periods ended June 30, 2011, respectively. Past performance cannot guarantee future results.)
Market Environment
Most sectors in the S&P 500 Index generated positive first-half returns, but health care stocks led the way as markets achieved greater clarity about the ultimate impact of health care reform. Investors were also attracted by the sector’s defensive attributes.
The Lipper Variable Annuity Underlying Health/Biotechnology Funds Average easily outperformed the broad-based S&P 500 Index in the past six months. Economic data prompted investors to reassess the durability of the economy’s recovery, and the remarkable market rally that started in March 2009 peaked in late April 2011 as risk became a central focus for investors. Within the Lipper average, the best-performing segments in the six-month period were pharmaceuticals and services. Biotechnology stocks, which represent more than one-third of the benchmark, posted a more modest double-digit gain. As we have written in previous shareholder reports, our portfolio holdings are selected based on their individual merit, commonly referred to as bottom-up stock selection. While we keep an eye on our overall sector allocations, we believe stock selection will have far more bearing on our performance than allocation decisions.
Health Care Reform Concerns Fade
President Obama’s health care reform bill, enacted in 2010, was one of the most sweeping policy changes since the introduction of Medicare in the late 1960s. However, the legislation brought substantial uncertainty into the marketplace, and health care stocks languished. At the same time, austerity measures, including a reduction in pharmaceutical prices in many Western European countries that are struggling with budget deficits, came into focus, and drug companies underperformed.
In 2011, the uncertainties surrounding health care reform started to ease somewhat—not fade away entirely, but diminished in terms of the magnitude of concern. There were no new policies or additional austerity measures announced in the first half of the year. Investors warmed to health care stocks as the sector was no longer roiled by front-page headlines. The reform legislation has shifted to the interpretation, rule-making, and setup phase, with the ultimate implementation set for 2014.
We believe that certain companies have benefited in the short term from the new legislation, and we think that the sector will continue to be a strong performer for the next six to 12 months. But the longer-term impact on the industry is likely to be neutral to negative. We think the legislation avoided the worst possible outcomes.
However, unintended consequences may develop from its scope, complexity, substantial requirement for regulatory issuance, and rushed enactment. There are solid investment opportunities throughout the entire health care sector. We think it is important to remember that health care legislation is just one aspect of health care investing. While we closely monitor the activities in Washington, your portfolio remains focused on company-specific analysis.
Strategy Review
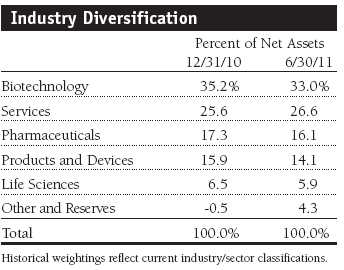
The portfolio’s large allocation to the biotechnology and pharmaceuticals segments stems from our belief that the pharmaceutical industry’s business model—the discovery, development, manufacture, and commercialization of medicines—is the primary driver of long-term value in the health care sector. Typically, large pharmaceutical companies have a broad base of revenues and income, and one drug—even if it is extremely successful—may not be enough to affect the bottom line significantly. Biotechnology companies, however, tend to be smaller, and the successful introduction of one important new medicine can materially affect a company’s revenues and earnings. Our goal in managing the portfolio is to own the best companies that can perform well, regardless of the activities in Washington. We intend to remain focused on those companies with new and important medicines or treatments for unmet medical needs.
Portfolio Review
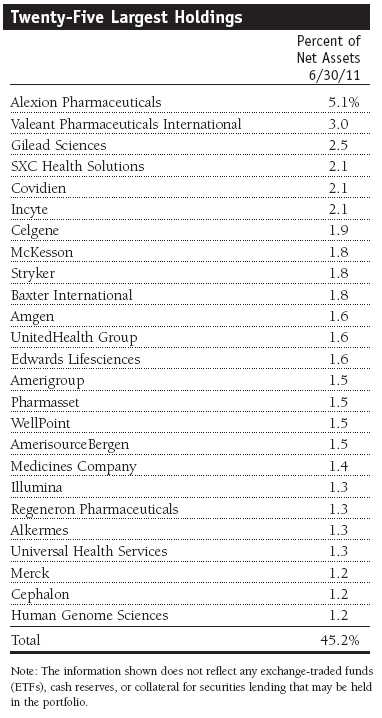
Valeant Pharmaceuticals International was the portfolio’s best contributor in the six months ended June 30, 2011. The Ontario, Canada-based specialty pharmaceutical company has a global reach and has grown rapidly through a series of acquisitions and solid internal growth. The company develops, manufactures, and markets a wide array of neurological, dermatological, and branded generic products. First-quarter revenue and earnings were solid and above the steadily rising consensus estimates. Investors bid the stock up more than 80% in the first half and have embraced the company’s aggressive acquisition strategy. Valeant is now a major force in the dermatology segment, which we view as one of the bright spots within specialty pharmaceuticals. (Please refer to the portfolio of investments for a complete list of holdings and the amount each represents in the portfolio.)
With Mike Pearson at the helm, Valeant has one of the most inspired leadership teams that we can recall. We like his business acumen, and his strategy—acquiring underperforming pharmaceutical assets and turning them around—is working well. Pearson came to the conclusion that spending a lot of money on research and development does not necessarily yield good results or returns for his shareholders. He took another tack, deciding to build Valeant through a series of acquisitions around the globe. Pearson has put together a collection of assets in a tax-efficient manner, and it has delivered tremendous returns. The stock has grown into our second-largest holding, and we have confidence that Valeant is a multiyear growth story.
Pharmasset was a small-cap when we wrote about it in our December 2010 annual report, but after gaining more than 150% in the first half of this year, it now has a $5 billion market capitalization. The company is engaged in the discovery, development, and commercialization of novel drugs to treat viral infections. Pharmasset is in the process of developing innovative new products for the treatment of chronic hepatitis C. In all, the company has three clinical-stage products and a host of preclinical product candidates in preparation for clinical development. It also has strategic collaborations with several drug companies and universities. We believe that Pharmasset is on the verge of demonstrating to the market that it is going to be a long-term key player in the biotechnology industry.
Like Pharmasset, Regeneron Pharmaceuticals, Cubist Pharmaceuticals, Incyte, and Vical are similarly well positioned in the small-cap biotech space, and each was a significant contributor for the past six months. Owning small-cap companies encompasses more risk than investing in large-caps that have a larger product base because a firm that is highly dependent on the success of a single drug can decline significantly on bad news. We manage this risk in part by owning a diversified basket of stocks and by controlling our position sizes.
Alexion Pharmaceuticals was another strong biotech contributor in the first half of 2011 (it was also a top performer in 2010). This mid-cap biotech is a longtime position in the portfolio and became our largest holding over time through appreciation. The company develops drugs for patients with life-threatening diseases and other serious medical conditions. It has only one commercial product, Soliris, and there are relatively few patients for the drug. Soliris was launched in 2007 for the treatment of PNH, a rare blood-borne genetic disease; it is a first-in-class and only-in-class product. The company continued to generate strong sales in its latest quarter. We think that the company can generate $1 billion of annual sales from Soliris for the treatment of PNH in the next three or four years.
We like the prospects for Alexion because Soliris has a long patent life and the drug requires modest commercial expenses to sell. Additionally, we believe that there is a good probability that Soliris will be approved for other rare disorders, adding to revenue in 2012 and possibly doubling the product’s long-term commercial potential. Because of these characteristics, we think that Alexion can maintain its premium valuation. To use a baseball analogy, we believe that we are only in the fourth or fifth inning of the company’s growth potential.
The portfolio also had several significant performance detractors. However, as shown in the Contributions to the Change in Net Asset Value table on page 6, the portfolio’s worst contributors paled next to the best. Community Health Systems is a health care services provider that owns or operates a network of 133 hospitals with approximately 19,500 licensed beds in the U.S. The company’s general and specialized services include acute care, emergency room, surgery, critical care, internal medicine, and diagnostics. The Tennessee-based firm is the sole provider of heath care services in approximately 60% of its markets. However, the company’s unsolicited and eventually failed takeover bid for Tenet Healthcare led to a lawsuit. Tenet accused Community Health of admitting patients for unnecessary hospital stays to inflate profits by overcharging Medicare and private insurers. Although Community Health has defended its patient admissions criteria, news of the lawsuit led to a sharp sell-off—the stock fell to under $26 from above $40 per share.
We purchased Avanir Pharmaceuticals on news of Food and Drug Administration (FDA) approval of Nuedexta, the first and only approved medicine for pseudobulbar affect and Nuedexta’s attractive commercial opportunity. Avanir is a micro-cap biopharmaceutical company that develops, manufactures, and commercializes novel therapeutic products for the treatment of central nervous system disorders. The company also has an FDA approval for Abreva, a cold sore medicine, and a marketing partnership with GlaxoSmithKline. We liked the prospects for Nuedexta as it is a highly effective medicine for a relatively common problem; there are no competing therapies; and, because of the relatively concentrated base of physicians prescribing the drug, the company incurs modest selling costs.
Avanir reported below-consensus fiscal second-quarter sales of Nuedexta in early May, which led several analysts to revise their sales and earnings forecasts. Although the stock languished in the last six months, we believe that Avanir can generate good results if the company is acquired, if it develops a partnership in which European rights to Nuedexta are sold along with the rights to develop Nuedexta for neuropathic pain, or if the company executes its significant commercial opportunity at home.
HeartWare International also disappointed in the first half. The company manufactures small implantable heart pumps or ventricular-assist devices for treatment of advanced heart failure. The Massachusetts-based small-cap company had a single patient die due to a blood clot forming in the HeartWare pump. While blood clots are a potential risk for all ventricular-assist devices, there are relatively few patients (less than 1,000) with the HeartWare implanted pumps, and the market is concerned that this clotting issue could become a more significant problem. The stock has been volatile, and after trading near $100 per share, it ebbed to about $74 at the end of the reporting period. Until we have more information about the risk of blood clots, our long-term enthusiasm for the company is mitigated.
While most of the portfolio’s investments are in U.S. common stocks, the portfolio will selectively invest in non-U.S. companies. Over the past six months, our overseas investments contributed to returns. Additionally, the portfolio writes call and put options primarily as a means of augmenting income. Normally, the portfolio will own the securities on which it writes these options. The premium income recovered by writing covered calls can help reduce, but not eliminate, volatility. Over the past six months, the options strategy benefited the portfolio’s results.
Outlook
We believe that health care can remain a strong performer over the next six to 12 months given the economic uncertainties at this point in the economic cycle. There are no indications that the economy is going to enjoy a sudden resurgence, and in the slow economic growth scenario that we expect, health care should continue to perform well. Although it has been a top performer for the past six months, valuations appear reasonable, and the asset class is still underrepresented in many investors’ portfolios.
For the sector to sustain multiyear outperformance, we think that the leading large-cap companies need to generate new products and innovative medicines. While the market has rewarded large-cap pharmaceuticals for being more thoughtful and disciplined about their capital allocation, we do not see a pipeline of products to support that long-term bullish case at this point. There are always company-specific risks, and because health care is a highly regulated industry, there are additional risks associated with regulatory actions. The biggest question about the longer-term performance in this sector is: How do we pay for the services that many Americans view as a fundamental right? The implementation of new policies will favor certain sectors and disadvantage others. The government is drafting thousands of new regulations for the legislation that goes into effect in 2014. While the market perceives that little has happened in the first half of 2011, the fact is that a tremendous amount of administration and rule making is going on behind the scenes, which could be viewed as the lull before the storm.
Regardless of investor sentiment ebbs and flows, we believe that health care will remain a growth industry. It is likely that we will see pockets of exciting performance within the two areas that the portfolio continues to emphasize—the introduction of highly innovative, important new medical products and businesses in the health care services area that provide quality outcomes in a cost-effective manner. Other positive long-term dynamics include demographics (the rising number of baby boomers reaching retirement age); the pace of scientific advances and prospects for safer and better medicines; and, finally, demand for a higher quality of life and society’s willingness to spend on health care.
As always, we appreciate your continued confidence and support.
Respectfully submitted,

Kris H. Jenner
Chairman of the portfolio’s Investment Advisory Committee
July 20, 2011
The committee chairman has day-to-day responsibility for managing the portfolio and works with committee members in developing and executing its investment program.
Growth stocks can be volatile for several reasons. Since these companies usually invest a high portion of earnings in their businesses, they may lack the dividends of value stocks that can cushion stock prices in a falling market. Also, earnings disappointments often lead to sharply falling prices because investors buy growth stocks in anticipation of superior earnings growth.
| Risk of Health Sciences Investing |
Portfolios that invest only in specific industries will experience greater volatility than funds investing in a broad range of industries. Companies in the health sciences field are subject to special risks such as increased competition within the health care industry, changes in legislation or government regulations, reductions in government funding, product liability or other litigation, and the obsolescence of popular products.
Lipper average: The average return of all portfolios in a particular category as tracked by Lipper Inc.
S&P 500 Index: An index consisting of 500 stocks chosen for market size, liquidity, and industry group representation. It is a market-value weighted index, with each stock’s weight in the index proportionate to its market value.
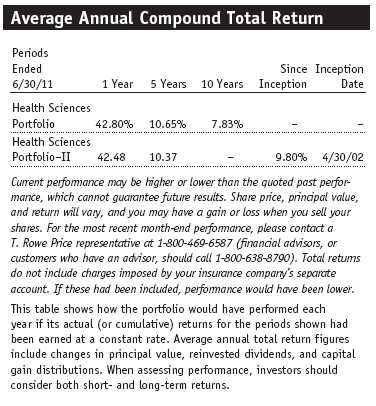
Performance and Expenses
T. Rowe Price Health Sciences Portfolio
Performance and Expenses
T. Rowe Price Health Sciences Portfolio
Portfolio Highlights

Performance and Expenses
T. Rowe Price Health Sciences Portfolio
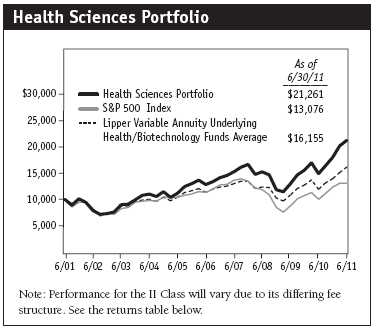
This chart shows the value of a hypothetical $10,000 investment in the portfolio over the past 10 fiscal year periods or since inception (for portfolios lacking 10-year records). The result is compared with benchmarks, which may include a broad-based market index and a peer group average or index. Market indexes do not include expenses, which are deducted from portfolio returns as well as mutual fund averages and indexes.
Fund Expense Example
As a mutual fund shareholder, you may incur two types of costs: (1) transaction costs, such as redemption fees or sales loads, and (2) ongoing costs, including management fees, distribution and service (12b-1) fees, and other fund expenses. The following example is intended to help you understand your ongoing costs (in dollars) of investing in the fund and to compare these costs with the ongoing costs of investing in other mutual funds. The example is based on an investment of $1,000 invested at the beginning of the most recent six-month period and held for the entire period.
Shares of the fund are currently offered only through certain insurance companies as an investment medium for both variable annuity contracts and variable life insurance policies. Please note that the fund has two classes of shares: the original share class and II Class. II Class shares are sold through financial intermediaries, which are compensated for distribution, shareholder servicing, and/or certain administrative services under a Board-approved Rule 12b-1 plan.
Actual Expenses
The first line of the following table (“Actual”) provides information about actual account values and actual expenses. You may use the information on this line, together with your account balance, to estimate the expenses that you paid over the period. Simply divide your account value by $1,000 (for example, an $8,600 account value divided by $1,000 = 8.6), then multiply the result by the number on the first line under the heading “Expenses Paid During Period” to estimate the expenses you paid on your account during this period.
Hypothetical Example for Comparison Purposes
The information on the second line of the table (“Hypothetical”) is based on hypothetical account values and expenses derived from the fund’s actual expense ratio and an assumed 5% per year rate of return before expenses (not the fund’s actual return). You may compare the ongoing costs of investing in the fund with other funds by contrasting this 5% hypothetical example and the 5% hypothetical examples that appear in the shareholder reports of the other funds. The hypothetical account values and expenses may not be used to estimate the actual ending account balance or expenses you paid for the period.
You should also be aware that the expenses shown in the table highlight only your ongoing costs and do not reflect any transaction costs, such as redemption fees or sales loads. Therefore, the second line of the table is useful in comparing ongoing costs only and will not help you determine the relative total costs of owning different funds. To the extent a fund charges transaction costs, however, the total cost of owning that fund is higher.

Financial Highlights
T. Rowe Price Health Sciences Portfolio
(Unaudited)
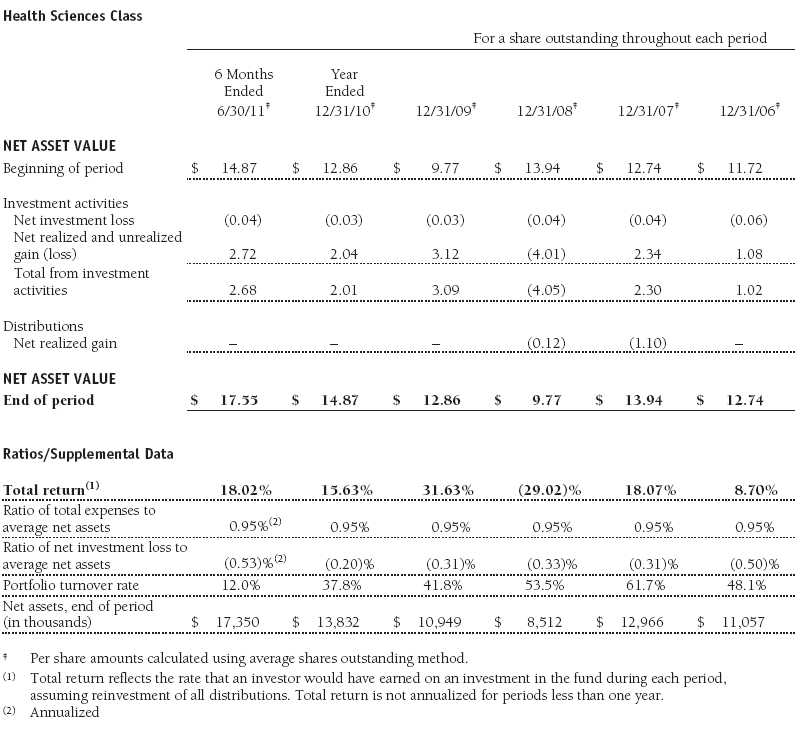
The accompanying notes are an integral part of these financial statements.
Financial Highlights
T. Rowe Price Health Sciences Portfolio
(Unaudited)
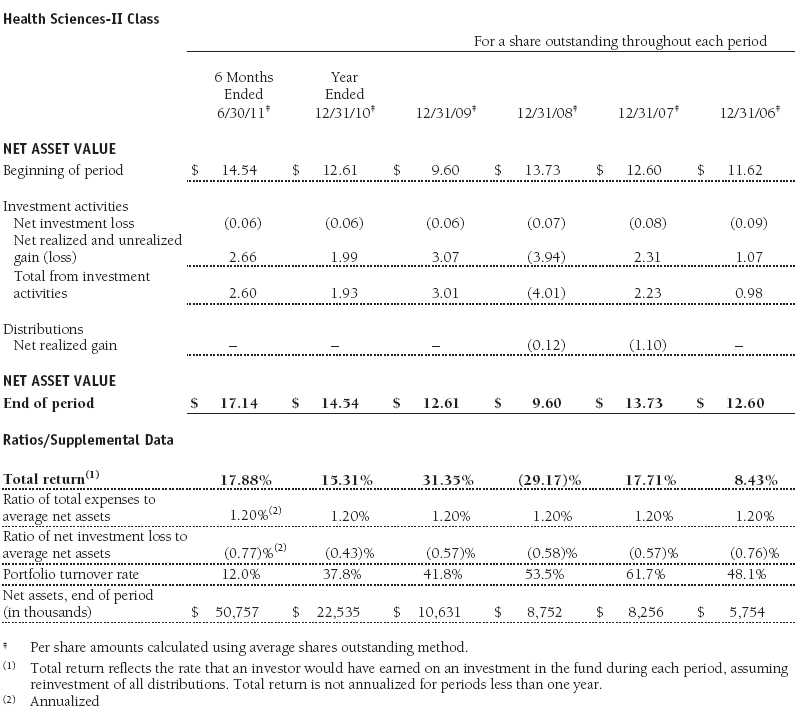
The accompanying notes are an integral part of these financial statements.
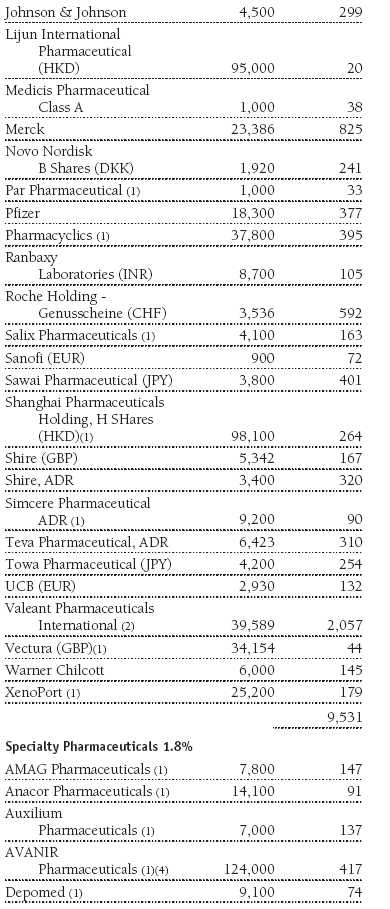
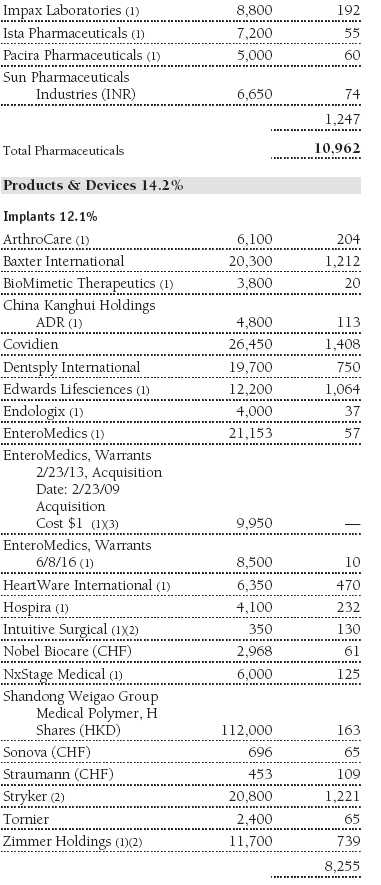
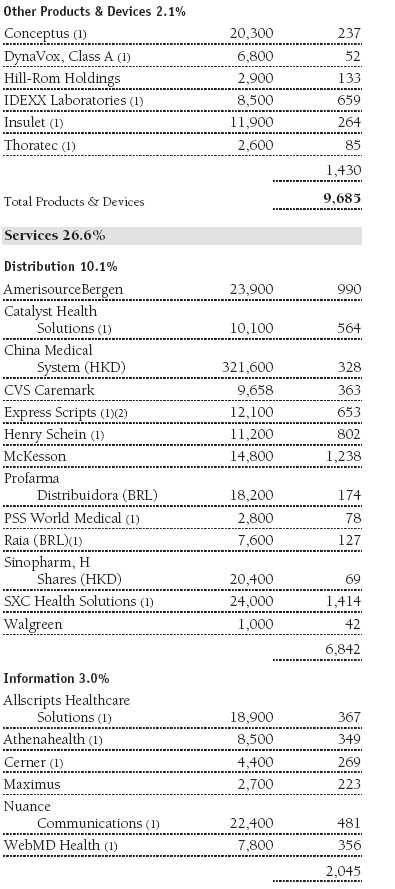
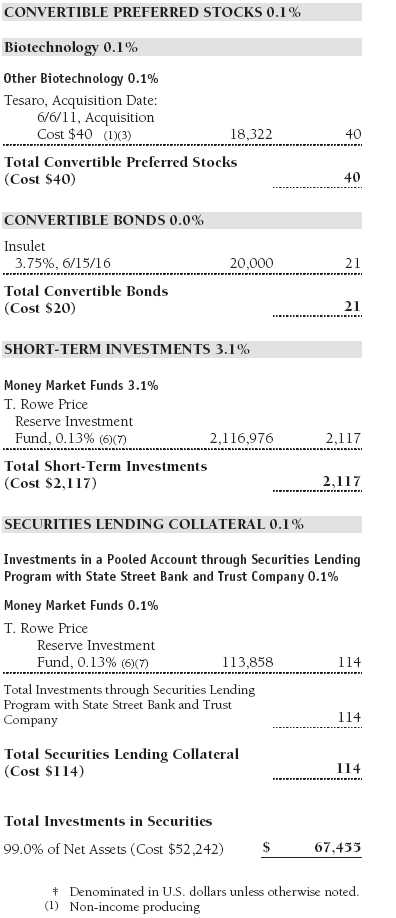
Portfolio of Investments‡
T. Rowe Price Health Sciences Portfolio
June 30, 2011 (Unaudited)

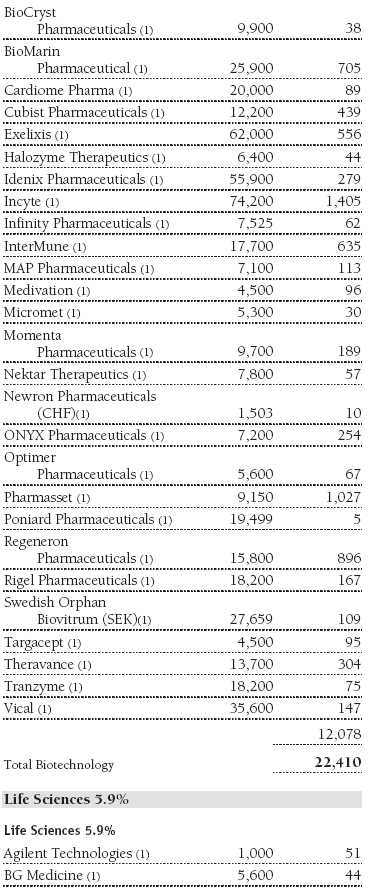


The accompanying notes are an integral part of these financial statements.
Statement of Assets and Liabilities
T. Rowe Price Health Sciences Portfolio
June 30, 2011 (Unaudited)
($000s, except shares and per share amounts)

The accompanying notes are an integral part of these financial statements.
Statement of Operations
T. Rowe Price Health Sciences Portfolio
(Unaudited)
($000s)
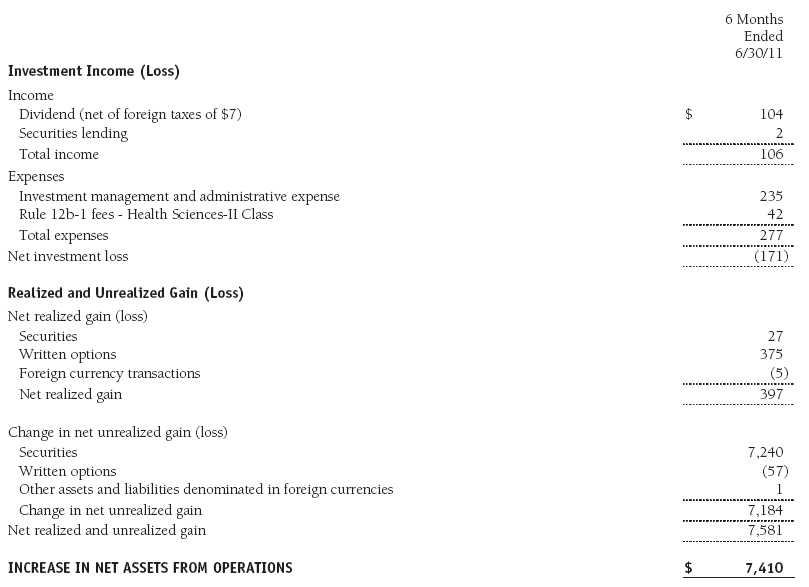
The accompanying notes are an integral part of these financial statements.
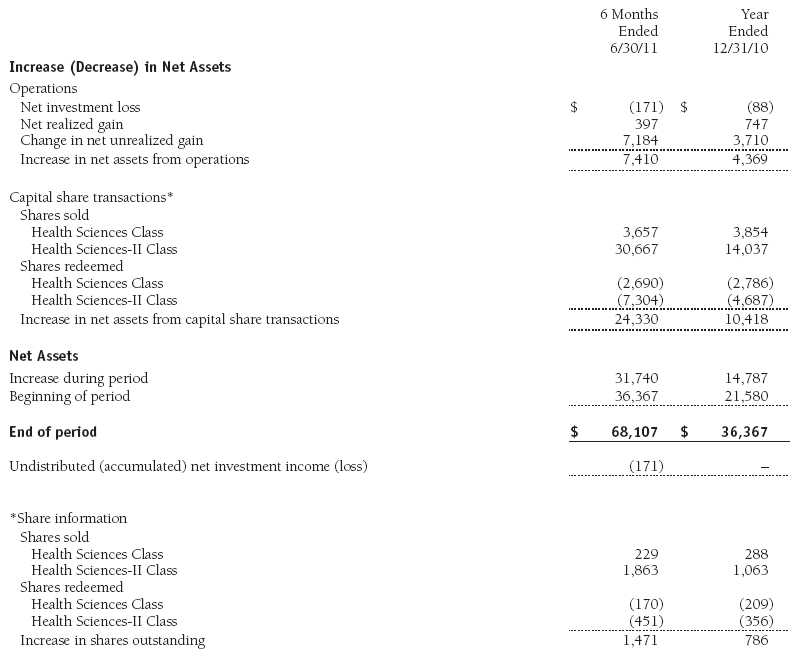
Statement of Changes in Net Assets
T. Rowe Price Health Sciences Portfolio
(Unaudited)
($000s)
The accompanying notes are an integral part of these financial statements.
Notes to Financial Statements
T. Rowe Price Health Sciences Portfolio
June 30, 2011 (Unaudited)
T. Rowe Price Equity Series, Inc. (the corporation), is registered under the Investment Company Act of 1940 (the 1940 Act). The Health Sciences Portfolio (the fund), a diversified, open-end management investment company, is one portfolio established by the corporation. The fund seeks long-term capital appreciation. Shares of the fund currently are offered only through certain insurance companies as an investment medium for both variable annuity contracts and variable life insurance policies. The fund has two classes of shares: the Health Sciences Portfolio original share class (Health Sciences Class), offered since December 29, 2000, and the Health Sciences Portfolio–II (Health Sciences–II Class), offered since April 30, 2002. Health Sciences–II Class shares are sold through financial intermediaries, which it compensates for distribution, shareholder servicing, and/or certain administrative services under a Board-approved Rule 12b-1 plan. Each class has exclusive voting rights on matters related solely to that class; separate voting rights on matters that relate to both classes; and, in all other respects, the same rights and obligations as the other class.
NOTE 1 - SIGNIFICANT ACCOUNTING POLICIES
Basis of Preparation The accompanying financial statements were prepared in accordance with accounting principles generally accepted in the United States of America (GAAP), which require the use of estimates made by management. Management believes that estimates and valuations are appropriate; however, actual results may differ from those estimates, and the valuations reflected in the accompanying financial statements may differ from the value ultimately realized upon sale or maturity.
Investment Transactions, Investment Income, and Distributions Income and expenses are recorded on the accrual basis. Premiums and discounts on debt securities are amortized for financial reporting purposes. Dividends received from mutual fund investments are reflected as dividend income; capital gain distributions are reflected as realized gain/loss. Dividend income and capital gain distributions are recorded on the ex-dividend date. Income tax-related interest and penalties, if incurred, would be recorded as income tax expense. Investment transactions are accounted for on the trade date. Realized gains and losses are reported on the identified cost basis. Distributions to shareholders are recorded on the ex-dividend date. Income distributions are declared and paid by each class annually. Capital gain distributions, if any, are generally declared and paid by the fund annually.
Currency Translation Assets, including investments, and liabilities denominated in foreign currencies are translated into U.S. dollar values each day at the prevailing exchange rate, using the mean of the bid and asked prices of such currencies against U.S. dollars as quoted by a major bank. Purchases and sales of securities, income, and expenses are translated into U.S. dollars at the prevailing exchange rate on the date of the transaction. The effect of changes in foreign currency exchange rates on realized and unrealized security gains and losses is reflected as a component of security gains and losses.
Class Accounting Health Sciences–II pays distribution, shareholder servicing, and/or certain administrative expenses in the form of Rule 12b-1 fees, in an amount not exceeding 0.25% of the class’s average daily net assets. Investment income, investment management and administrative expense, and realized and unrealized gains and losses are allocated to the classes based upon the relative daily net assets of each class.
Rebates Subject to best execution, the fund may direct certain security trades to brokers who have agreed to rebate a portion of the related brokerage commission to the fund in cash. Commission rebates are reflected as realized gain on securities in the accompanying financial statements and totaled $1,000 for the six months ended June 30, 2011.
Credits Credits are earned on the fund’s temporarily uninvested cash balances held at the custodian and such credits reduce the amount paid by the manager for custody of the fund’s assets. In order to pass the benefit of custody credits to the fund, the manager has voluntarily reduced its investment management and administrative expense in the accompanying financial statements.
NOTE 2 - VALUATION
The fund’s financial instruments are reported at fair value as defined by GAAP. The fund determines the values of its assets and liabilities and computes each class’s net asset value per share at the close of the New York Stock Exchange (NYSE), normally 4 p.m. ET, each day that the NYSE is open for business.
Valuation Methods Equity securities listed or regularly traded on a securities exchange or in the over-the-counter (OTC) market are valued at the last quoted sale price or, for certain markets, the official closing price at the time the valuations are made, except for OTC Bulletin Board securities, which are valued at the mean of the latest bid and asked prices. A security that is listed or traded on more than one exchange is valued at the quotation on the exchange determined to be the primary market for such security. Listed securities not traded on a particular day are valued at the mean of the latest bid and asked prices for domestic securities and the last quoted sale price for international securities.
Debt securities are generally traded in the OTC market. Securities with remaining maturities of one year or more at the time of acquisition are valued at prices furnished by dealers who make markets in such securities or by an independent pricing service, which considers the yield or price of bonds of comparable quality, coupon, maturity, and type, as well as prices quoted by dealers who make markets in such securities. Securities with remaining maturities of less than one year at the time of acquisition generally use amortized cost in local currency to approximate fair value. However, if amortized cost is deemed not to reflect fair value or the fund holds a significant amount of such securities with remaining maturities of more than 60 days, the securities are valued at prices furnished by dealers who make markets in such securities or by an independent pricing service.
Investments in mutual funds are valued at the mutual fund’s closing net asset value per share on the day of valuation. Purchased and written options are valued at the mean of the closing bid and asked prices.
Other investments, including restricted securities, and those financial instruments for which the above valuation procedures are inappropriate or are deemed not to reflect fair value are stated at fair value as determined in good faith by the T. Rowe Price Valuation Committee, established by the fund’s Board of Directors.
For valuation purposes, the last quoted prices of non-U.S. equity securities may be adjusted under the circumstances described below. If the fund determines that developments between the close of a foreign market and the close of the NYSE will, in its judgment, materially affect the value of some or all of its portfolio securities, the fund will adjust the previous closing prices to reflect what it believes to be the fair value of the securities as of the close of the NYSE. In deciding whether it is necessary to adjust closing prices to reflect fair value, the fund reviews a variety of factors, including developments in foreign markets, the performance of U.S. securities markets, and the performance of instruments trading in U.S. markets that represent foreign securities and baskets of foreign securities. A fund may also fair value securities in other situations, such as when a particular foreign market is closed but the fund is open. The fund uses outside pricing services to provide it with closing prices and information to evaluate and/or adjust those prices. The fund cannot predict how often it will use closing prices and how often it will determine it necessary to adjust those prices to reflect fair value. As a means of evaluating its security valuation process, the fund routinely compares closing prices, the next day’s opening prices in the same markets, and adjusted prices.
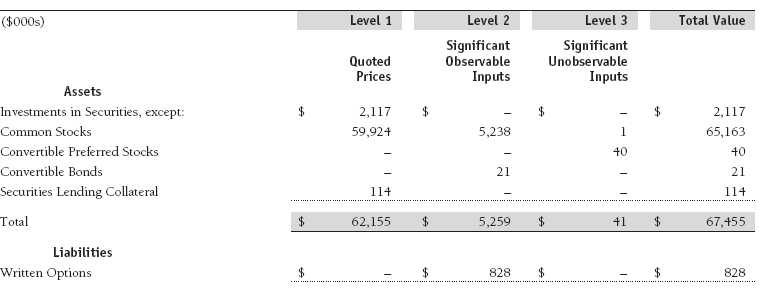
Valuation Inputs Various inputs are used to determine the value of the fund’s financial instruments. These inputs are summarized in the three broad levels listed below:
Level 1 – quoted prices in active markets for identical financial instruments
Level 2 – observable inputs other than Level 1 quoted prices (including, but not limited to, quoted prices for similar financial instruments, interest rates, prepayment speeds, and credit risk)
Level 3 – unobservable inputs
Observable inputs are those based on market data obtained from sources independent of the fund, and unobservable inputs reflect the fund’s own assumptions based on the best information available. The input levels are not necessarily an indication of the risk or liquidity associated with financial instruments at that level. For example, non-U.S. equity securities actively traded in foreign markets generally are reflected in Level 2 despite the availability of closing prices because the fund evaluates and determines whether those closing prices reflect fair value at the close of the NYSE or require adjustment, as described above. The following table summarizes the fund’s financial instruments, based on the inputs used to determine their values on June 30, 2011:
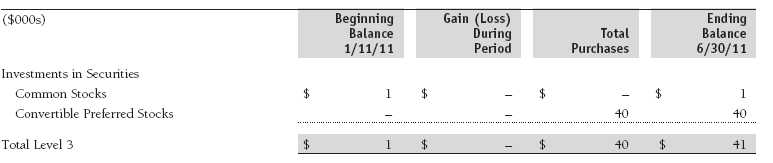
Following is a reconciliation of the fund’s Level 3 holdings for the six months ended June 30, 2011. Gain (loss) reflects both realized and change in unrealized gain (loss) on Level 3 holdings during the period, if any, and is included on the accompanying Statement of Operations. The change in unrealized gain (loss) on Level 3 instruments held at June 30, 2011, totaled $0 for the six months ended June 30, 2011.
NOTE 3 - DERIVATIVE INSTRUMENTS
During the six months ended June 30, 2011, the fund invested in derivative instruments. As defined by GAAP, a derivative is a financial instrument whose value is derived from an underlying security price, foreign exchange rate, interest rate, index of prices or rates, or other variable; it requires little or no initial investment and permits or requires net settlement. The fund invests in derivatives only if the expected risks and rewards are consistent with its investment objectives, policies, and overall risk profile, as described in its prospectus and Statement of Additional Information. The fund may use derivatives for a variety of purposes, such as seeking to hedge against declines in principal value, increase yield, invest in an asset with greater efficiency and at a lower cost than is possible through direct investment, or to adjust credit exposure. The risks associated with the use of derivatives are different from, and potentially much greater than, the risks associated with investing directly in the instruments on which the derivatives are based. Investments in derivatives can magnify returns positively or negatively; however, the fund at all times maintains sufficient cash reserves, liquid assets, or other SEC-permitted asset types to cover the settlement obligations under its open derivative contracts.
The fund values its derivatives at fair value, as described below and in Note 2, and recognizes changes in fair value currently in its results of operations. Accordingly, the fund does not follow hedge accounting, even for derivatives employed as economic hedges. The fund does not offset the fair value of derivative instruments against the right to reclaim or obligation to return collateral. As of June 30, 2011, the fund held equity derivatives with a fair value of $828,000, included in Written Options, on the accompanying Statement of Assets and Liabilities.
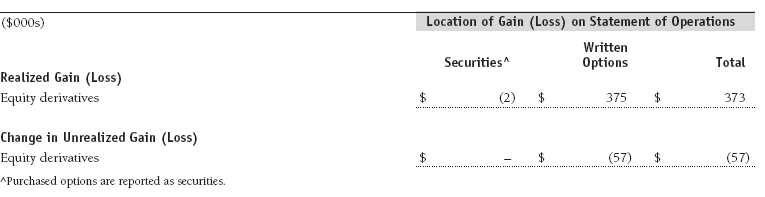
Additionally, the amount of gains and losses on derivative instruments recognized in fund earnings during the six months ended June 30, 2011, and the related location on the accompanying Statement of Operations is summarized in the following table by primary underlying risk exposure:
Counterparty risk related to exchange-traded derivatives, including futures and options contracts, is minimal because the exchange’s clearinghouse provides protection against defaults. Additionally, for exchange-traded derivatives, each broker, in its sole discretion, may change margin requirements applicable to the fund.
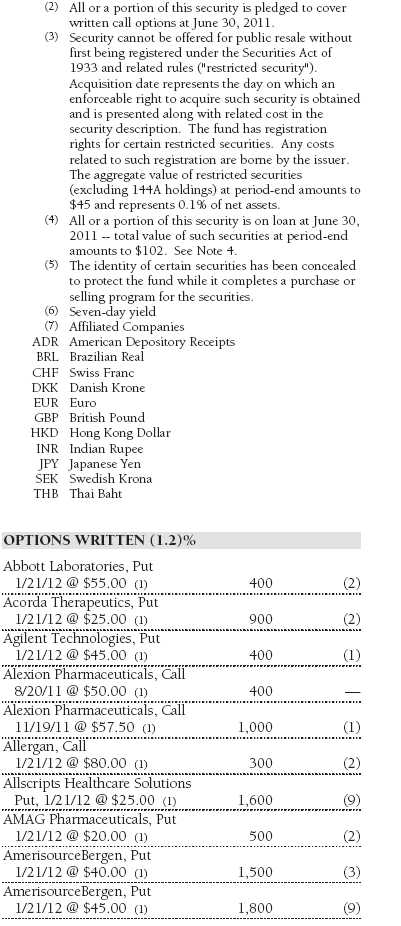
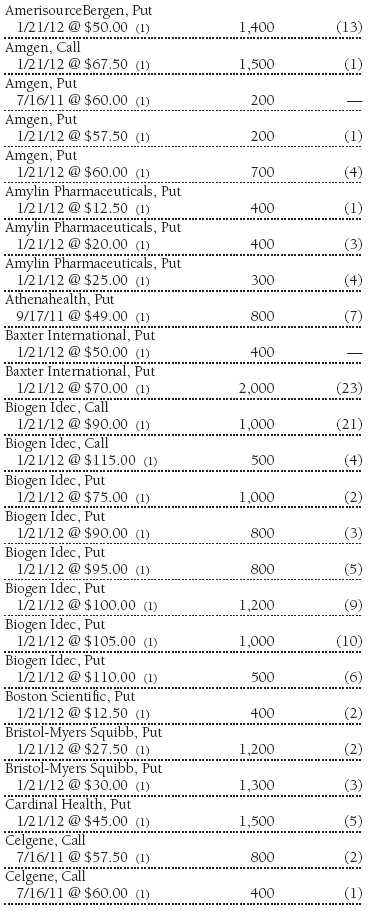
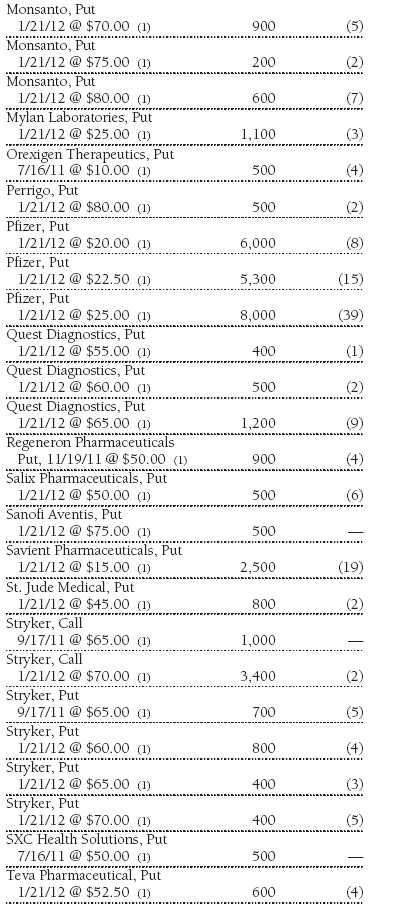
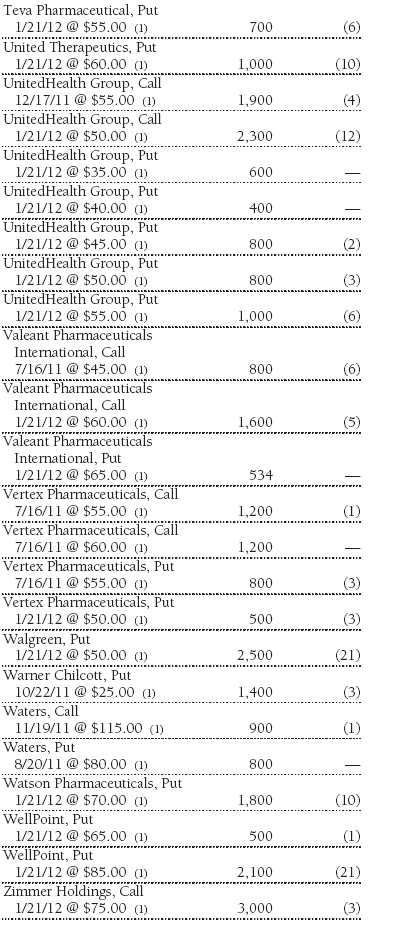
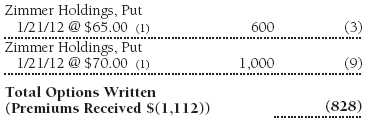
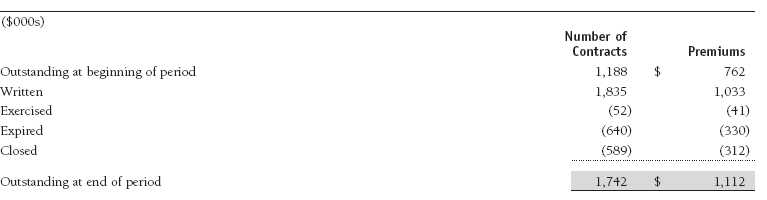
Options The fund is subject to equity price risk in the normal course of pursuing its investment objectives and uses options to help manage such risk. The fund may use call and put options to manage exposure to interest rates, security prices, foreign currencies, and credit quality; as an efficient means of adjusting exposure to all or a part of a target market; to enhance income; as a cash management tool; and/or to adjust credit exposure. Call and put options give the holder the right, in return for a premium paid, to purchase or sell, respectively, a security at a specified exercise price at any time during the period of the option. Options are included in net assets at fair value; purchased options are included in Investments in Securities; and written options are separately reflected as a liability on the accompanying Statement of Assets and Liabilities. Premiums on unexercised, expired options are recorded as realized gains or losses; premiums on exercised options are recorded as an adjustment to the proceeds from the sale or cost of the purchase. The difference between the premium and the amount received or paid in a closing transaction is also treated as realized gain or loss. Risks related to the use of options include possible illiquidity of the options markets; trading restrictions imposed by an exchange; movements in underlying security values; and for written options, potential losses in excess of the fund’s initial investment. During the six months ended June 30, 2011, the fund’s exposure to options, based on underlying notional amounts, was generally less than 1% of net assets. Transactions in written options and related premiums received during the six months ended June 30, 2011, were as follows:
NOTE 4 - OTHER INVESTMENT TRANSACTIONS
Consistent with its investment objective, the fund engages in the following practices to manage exposure to certain risks and/or to enhance performance. The investment objective, policies, program, and risk factors of the fund are described more fully in the fund’s prospectus and Statement of Additional Information.
Restricted Securities The fund may invest in securities that are subject to legal or contractual restrictions on resale. Prompt sale of such securities at an acceptable price may be difficult and may involve substantial delays and additional costs.
Securities Lending The fund lends its securities to approved brokers to earn additional income. It receives as collateral cash and U.S. government securities valued at 102% to 105% of the value of the securities on loan. Cash collateral is invested by the fund’s lending agent(s) in accordance with investment guidelines approved by management. Although risk is mitigated by the collateral, the fund could experience a delay in recovering its securities and a possible loss of income or value if the borrower fails to return the securities or if collateral investments decline in value. Securities lending revenue recognized by the fund consists of earnings on invested collateral and borrowing fees, net of any rebates to the borrower and compensation to the lending agent. In accordance with GAAP, investments made with cash collateral are reflected in the accompanying financial statements, but collateral received in the form of securities are not. On June 30, 2011, the value of loaned securities was $102,000 and cash collateral investments totaled $114,000.
Other Purchases and sales of portfolio securities other than short-term securities aggregated $27,445,000 and $6,016,000, respectively, for the six months ended June 30, 2011.
NOTE 5 - FEDERAL INCOME TAXES
No provision for federal income taxes is required since the fund intends to continue to qualify as a regulated investment company under Subchapter M of the Internal Revenue Code and distribute to shareholders all of its taxable income and gains. Distributions determined in accordance with federal income tax regulations may differ in amount or character from net investment income and realized gains for financial reporting purposes. Financial reporting records are adjusted for permanent book/tax differences to reflect tax character but are not adjusted for temporary differences. The amount and character of tax-basis distributions and composition of net assets are finalized at fiscal year-end; accordingly, tax-basis balances have not been determined as of the date of this report.
In accordance with federal tax regulations, the fund recognized capital losses in the current period for tax purposes that had been recognized in the prior fiscal year for financial reporting purposes. Such deferrals relate to net capital losses realized between November 1, 2010 and December 31, 2010, and totaled $1,000. The fund intends to retain realized gains to the extent of available capital loss carryforwards. As of December 31, 2010, the fund had $328,000 of unused capital loss carryforwards, which expire in fiscal 2017.
At June 30, 2011, the cost of investments for federal income tax purposes was $52,242,000. Net unrealized gain aggregated $15,499,000 at period-end, of which $16,609,000 related to appreciated investments and $1,110,000 related to depreciated investments.
NOTE 6 - FOREIGN TAXES
The fund is subject to foreign income taxes imposed by certain countries in which it invests. Acquisition of certain foreign currencies related to security transactions are also subject to tax. Additionally, capital gains realized by the fund upon disposition of securities issued in or by certain foreign countries are subject to capital gains tax imposed by those countries. All taxes are computed in accordance with the applicable foreign tax law, and, to the extent permitted, capital losses are used to offset capital gains. Taxes attributable to income are accrued by the fund as a reduction of income. Taxes incurred on the purchase of foreign currencies are recorded as realized loss on foreign currency transactions. Current and deferred tax expense attributable to net capital gains is reflected as a component of realized and/or change in unrealized gain/loss on securities in the accompanying financial statements. At June 30, 2011, the fund had no deferred tax liability attributable to foreign securities and no foreign capital loss carryforwards.
NOTE 7 - RELATED PARTY TRANSACTIONS
The fund is managed by T. Rowe Price Associates, Inc. (Price Associates), a wholly owned subsidiary of T. Rowe Price Group, Inc. (Price Group). The investment management and administrative agreement between the fund and Price Associates provides for an all-inclusive annual fee equal to 0.95% of the fund’s average daily net assets. The fee is computed daily and paid monthly. The all-inclusive fee covers investment management, shareholder servicing, transfer agency, accounting, and custody services provided to the fund, as well as fund directors’ fees and expenses; interest, taxes, brokerage commissions, and extraordinary expenses are paid directly by the fund.
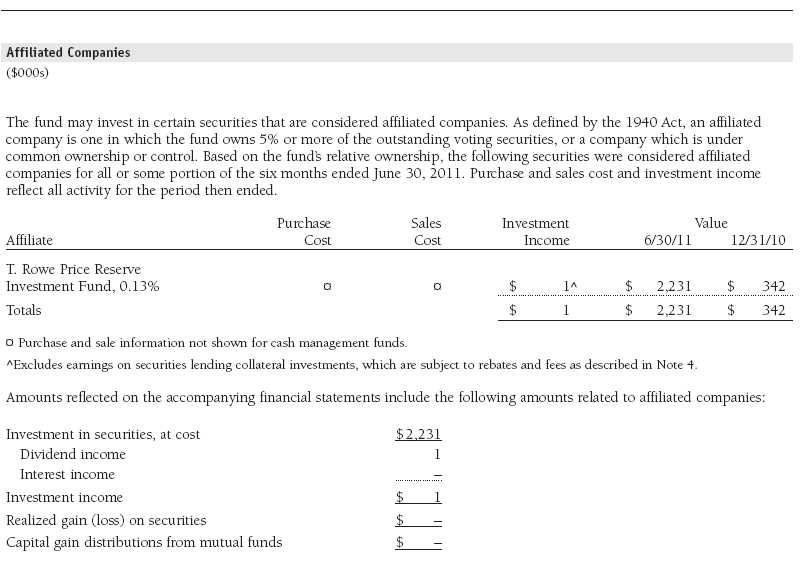
The fund may invest in the T. Rowe Price Reserve Investment Fund and the T. Rowe Price Government Reserve Investment Fund (collectively, the T. Rowe Price Reserve Investment Funds), open-end management investment companies managed by Price Associates and considered affiliates of the fund. The T. Rowe Price Reserve Investment Funds are offered as cash management options to mutual funds, trusts, and other accounts managed by Price Associates and/or its affiliates and are not available for direct purchase by members of the public. The T. Rowe Price Reserve Investment Funds pay no investment management fees.
| Information on Proxy Voting Policies, Procedures, and Records |
A description of the policies and procedures used by T. Rowe Price funds and portfolios to determine how to vote proxies relating to portfolio securities is available in each fund’s Statement of Additional Information, which you may request by calling 1-800-225-5132 or by accessing the SEC’s website, sec.gov. The description of our proxy voting policies and procedures is also available on our website, troweprice.com. To access it, click on the words “Our Company” at the top of our corporate homepage. Then, when the next page appears, click on the words “Proxy Voting Policies” on the left side of the page.
Each fund’s most recent annual proxy voting record is available on our website and through the SEC’s website. To access it through our website, follow the directions above, then click on the words “Proxy Voting Records” on the right side of the Proxy Voting Policies page.
| How to Obtain Quarterly Portfolio Holdings |
The fund files a complete schedule of portfolio holdings with the Securities and Exchange Commission for the first and third quarters of each fiscal year on Form N-Q. The fund’s Form N-Q is available electronically on the SEC’s website (sec.gov); hard copies may be reviewed and copied at the SEC’s Public Reference Room, 450 Fifth St. N.W., Washington, DC 20549. For more information on the Public Reference Room, call 1-800-SEC-0330.
| Approval of Investment Management Agreement |
On March 9, 2011, the fund’s Board of Directors (Board) unanimously approved the continuation of the investment advisory contract (Contract) between the fund and its investment advisor, T. Rowe Price Associates, Inc. (Advisor). The Board considered a variety of factors in connection with its review of the Contract, also taking into account information provided by the Advisor during the course of the year, as discussed below:
Services Provided by the Advisor
The Board considered the nature, quality, and extent of the services provided to the fund by the Advisor. These services included, but were not limited to, management of the fund’s portfolio and a variety of related activities, as well as financial and administrative services, reporting, and communications. The Board also reviewed the background and experience of the Advisor’s senior management team and investment personnel involved in the management of the fund. The Board concluded that it was satisfied with the nature, quality, and extent of the services provided by the Advisor.
Investment Performance of the Fund
The Board reviewed the fund’s average annual total returns over the 1-, 3-, 5-, and 10-year periods, as well as the fund’s year-by-year returns, and compared these returns with a wide variety of previously agreed upon comparable performance measures and market data, including those supplied by Lipper and Morningstar, which are independent providers of mutual fund data. On the basis of this evaluation and the Board’s ongoing review of investment results, and factoring in the relative market conditions during certain of the performance periods, the Board concluded that the fund’s performance was satisfactory.
Costs, Benefits, Profits, and Economies of Scale
The Board reviewed detailed information regarding the revenues received by the Advisor under the Contract and other benefits that the Advisor (and its affiliates) may have realized from its relationship with the fund, including research received under “soft dollar” agreements and commission-sharing arrangements with broker-dealers. The Board considered that the Advisor may receive some benefit from soft-dollar arrangements pursuant to which research is received from broker-dealers that execute the applicable fund’s portfolio transactions. The Board also received information on the estimated costs incurred and profits realized by the Advisor and its affiliates from advising T. Rowe Price mutual funds. The Board did not review information regarding profits realized from managing the fund in particular because the fund had not achieved sufficient scale in terms of portfolio asset size to produce meaningful profit margin percentages. The Board concluded that the Advisor’s profits were reasonable in light of the services provided to the fund. The Board also considered whether the fund or other funds benefit under the fee levels set forth in the Contract from any economies of scale realized by the Advisor. The Board noted that, under the Contract, the fund pays the Advisor a single fee based on the fund’s average daily net assets and that the Advisor, in turn, pays all expenses of the fund, with certain exceptions. The Board concluded that, based on the profitability data it reviewed and consistent with this single-fee structure, the Contract provided for a reasonable sharing of any benefits from economies of scale with the fund.
Fees
The Board reviewed the fund’s single-fee structure (for the Investor Class and II Class) and compared it with fees and expenses of other comparable funds based on information and data supplied by Lipper. The information provided to the Board indicated that the fund’s management fee rate was below the median for comparable funds. (For these purposes, the Board assumed the fund’s management fee rate was equal to the single fee less the fund’s operating expenses.) The information also indicated that the total expense ratio for the Investor Class was below the median for comparable funds and the total expense ratio for the II Class was at or below the median for comparable funds. The Board also reviewed the fee schedules for institutional accounts of the Advisor and its affiliates with similar mandates. Management provided the Board with information about the Advisor’s responsibilities and services provided to institutional account clients, which are more limited than its responsibilities for the fund and other T. Rowe Price mutual funds that it advises, and showing that the Advisor performs significant additional services and assumes greater risk for the fund and other T. Rowe Price mutual funds that it advises than it does for institutional account clients. On the basis of the information provided, the Board concluded that the fees paid by the fund under the Contract were reasonable.
Approval of the Contract
As noted, the Board approved the continuation of the Contract. No single factor was considered in isolation or to be determinative to the decision. Rather, the Board was assisted by the advice of independent legal counsel and concluded, in light of a weighting and balancing of all factors considered, that it was in the best interests of the fund to approve the continuation of the Contract (including the fees to be charged for services thereunder).
Item 2. Code of Ethics.
A code of ethics, as defined in Item 2 of Form N-CSR, applicable to its principal executive officer, principal financial officer, principal accounting officer or controller, or persons performing similar functions is filed as an exhibit to the registrant’s annual Form N-CSR. No substantive amendments were approved or waivers were granted to this code of ethics during the registrant’s most recent fiscal half-year.
Item 3. Audit Committee Financial Expert.
Disclosure required in registrant’s annual Form N-CSR.
Item 4. Principal Accountant Fees and Services.
Disclosure required in registrant’s annual Form N-CSR.
Item 5. Audit Committee of Listed Registrants.
Not applicable.
Item 6. Investments.
(a) Not applicable. The complete schedule of investments is included in Item 1 of this Form N-CSR.
(b) Not applicable.
Item 7. Disclosure of Proxy Voting Policies and Procedures for Closed-End Management Investment Companies.
Not applicable.
Item 8. Portfolio Managers of Closed-End Management Investment Companies.
Not applicable.
Item 9. Purchases of Equity Securities by Closed-End Management Investment Company and Affiliated Purchasers.
Not applicable.
Item 10. Submission of Matters to a Vote of Security Holders.
Not applicable.
Item 11. Controls and Procedures.
(a) The registrant’s principal executive officer and principal financial officer have evaluated the registrant’s disclosure controls and procedures within 90 days of this filing and have concluded that the registrant’s disclosure controls and procedures were effective, as of that date, in ensuring that information required to be disclosed by the registrant in this Form N-CSR was recorded, processed, summarized, and reported timely.
(b) The registrant’s principal executive officer and principal financial officer are aware of no change in the registrant’s internal control over financial reporting that occurred during the registrant’s second fiscal quarter covered by this report that has materially affected, or is reasonably likely to materially affect, the registrant’s internal control over financial reporting.
Item 12. Exhibits.
(a)(1) The registrant’s code of ethics pursuant to Item 2 of Form N-CSR is filed with the registrant’s annual Form N-CSR.
(2) Separate certifications by the registrant's principal executive officer and principal financial officer, pursuant to Section 302 of the Sarbanes-Oxley Act of 2002 and required by Rule 30a-2(a) under the Investment Company Act of 1940, are attached.
(3) Written solicitation to repurchase securities issued by closed-end companies: not applicable.
(b) A certification by the registrant's principal executive officer and principal financial officer, pursuant to Section 906 of the Sarbanes-Oxley Act of 2002 and required by Rule 30a-2(b) under the Investment Company Act of 1940, is attached.
| | |
SIGNATURES |
| |
| | Pursuant to the requirements of the Securities Exchange Act of 1934 and the Investment |
| Company Act of 1940, the registrant has duly caused this report to be signed on its behalf by the |
| undersigned, thereunto duly authorized. |
| |
| T. Rowe Price Equity Series, Inc. |
| |
| |
| |
| By | /s/ Edward C. Bernard |
| | Edward C. Bernard |
| | Principal Executive Officer |
| |
| Date | August 17, 2011 |
| |
| |
| |
| | Pursuant to the requirements of the Securities Exchange Act of 1934 and the Investment |
| Company Act of 1940, this report has been signed below by the following persons on behalf of |
| the registrant and in the capacities and on the dates indicated. |
| |
| |
| By | /s/ Edward C. Bernard |
| | Edward C. Bernard |
| | Principal Executive Officer |
| |
| Date | August 17, 2011 |
| |
| |
| |
| By | /s/ Gregory K. Hinkle |
| | Gregory K. Hinkle |
| | Principal Financial Officer |
| |
| Date | August 17, 2011 |