UNITED STATES
SECURITIES AND EXCHANGE COMMISSION
Washington, D.C. 20549
FORM N-CSR
CERTIFIED SHAREHOLDER REPORT OF REGISTERED
MANAGEMENT INVESTMENT COMPANIES
Investment Company Act File Number: 811-07143
T. Rowe Price Equity Series, Inc.
(Exact name of registrant as specified in charter)
100 East Pratt Street, Baltimore, MD 21202
(Address of principal executive offices)
David Oestreicher
100 East Pratt Street, Baltimore, MD 21202
(Name and address of agent for service)
Registrant’s telephone number, including area code: (410) 345-2000
Date of fiscal year end: December 31
Date of reporting period: December 31, 2024
Item 1. Reports to Shareholders
(a) Report pursuant to Rule 30e-1
Annual Shareholder Report
December 31, 2024
Health Sciences Portfolio
Health Sciences Portfolio Class (QAAGZX)
This annual shareholder report contains important information about Health Sciences Portfolio (the "fund") for the period of January 1, 2024 to December 31, 2024. You can find the fund’s prospectus, financial information on Form N‑CSR (which includes required tax information for dividends), holdings, proxy voting information, and other information atwww.troweprice.com/prospectus. You can also request this information without charge by contacting T. Rowe Price at 1‑800‑638‑5660 or info@troweprice.com or contacting your intermediary.
What were the fund costs for the last year? (based on a hypothetical $10,000 investment)
| | Costs of a $10,000 investment | Costs paid as a percentage of a $10,000 investment |
|---|
| Health Sciences Portfolio Class | $89 | 0.88% |
|---|
What drove fund performance during the past 12 months?
The health care sector posted solid advances in the first nine months of 2024; however, these returns were diminished in the fourth quarter, leaving the group with modest gains for the year. The products and devices subsector was a bright spot as a handful of growth companies with exciting new product cycles led the segment higher. Despite facing heightened concerns around increased regulatory uncertainty at the end of the period, the pharmaceuticals segment was boosted by significant demand for a new class of diabetes and weight-loss drugs. The services subsector was the laggard in the space, largely driven by utilization pressures and heightened negative sentiment around the managed care industry.
From an absolute perspective, the leading contributor to performance was the portfolio’s significant position in Eli Lilly. Shares of the pharmaceutical giant benefited from strong demand and improvements in capacity for its portfolio of incretin medicines, alongside several positive regulatory developments.
Conversely, the leading detractor from absolute performance was Elevance Health. Shares of the insurer traded sharply lower at the end of the period due to multiple factors, including (1) a challenging Medicaid environment driving an uptick in utilization, (2) uncertainty around the health care agenda of the incoming presidential administration, and (3) worsening public sentiment toward the managed care space following the tragic murder of an industry executive.
Our overarching investment philosophy remains focused on innovation, and we believe companies that are producing leading‑edge therapeutics and medical devices offer some of the market’s most attractive growth areas for investors with a multiyear horizon.
How has the fund performed?
Cumulative Returns of a Hypothetical $10,000 Investment as of December 31, 2024
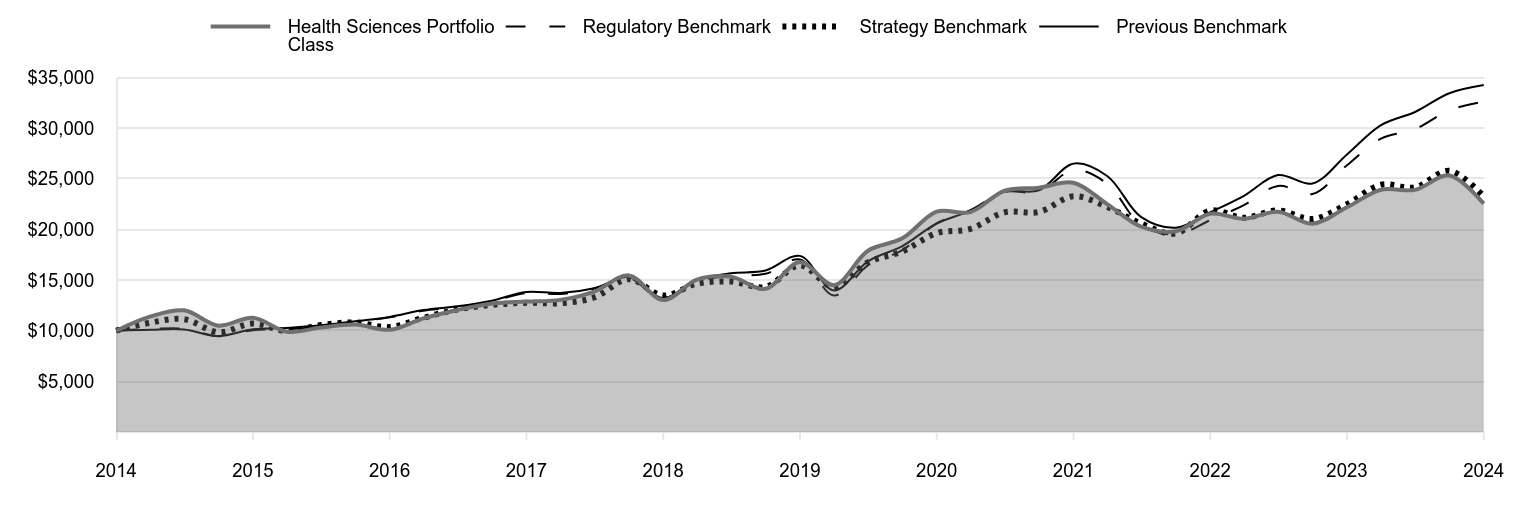
| Health Sciences Portfolio Class | Regulatory Benchmark | Strategy Benchmark | Previous Benchmark |
|---|
| 2014 | 10,000 | 10,000 | 10,000 | 10,000 |
|---|
| 2015 | 11,390 | 10,180 | 10,780 | 10,095 |
|---|
| 2015 | 12,011 | 10,194 | 11,143 | 10,123 |
|---|
| 2015 | 10,500 | 9,455 | 9,847 | 9,471 |
|---|
| 2015 | 11,276 | 10,048 | 10,714 | 10,138 |
|---|
| 2016 | 9,902 | 10,145 | 9,959 | 10,275 |
|---|
| 2016 | 10,318 | 10,412 | 10,560 | 10,527 |
|---|
| 2016 | 10,608 | 10,870 | 10,813 | 10,933 |
|---|
| 2016 | 10,094 | 11,327 | 10,357 | 11,351 |
|---|
| 2017 | 11,222 | 11,978 | 11,279 | 12,039 |
|---|
| 2017 | 12,049 | 12,339 | 12,098 | 12,411 |
|---|
| 2017 | 12,679 | 12,903 | 12,552 | 12,967 |
|---|
| 2017 | 12,878 | 13,721 | 12,753 | 13,829 |
|---|
| 2018 | 13,045 | 13,633 | 12,715 | 13,724 |
|---|
| 2018 | 13,864 | 14,163 | 13,282 | 14,195 |
|---|
| 2018 | 15,461 | 15,172 | 15,089 | 15,290 |
|---|
| 2018 | 13,021 | 13,002 | 13,471 | 13,223 |
|---|
| 2019 | 15,048 | 14,828 | 14,639 | 15,027 |
|---|
| 2019 | 15,319 | 15,435 | 14,849 | 15,674 |
|---|
| 2019 | 14,141 | 15,614 | 14,313 | 15,940 |
|---|
| 2019 | 16,790 | 17,035 | 16,449 | 17,386 |
|---|
| 2020 | 14,501 | 13,475 | 14,330 | 13,979 |
|---|
| 2020 | 17,899 | 16,443 | 16,748 | 16,850 |
|---|
| 2020 | 19,119 | 17,957 | 17,833 | 18,355 |
|---|
| 2020 | 21,763 | 20,593 | 19,630 | 20,585 |
|---|
| 2021 | 21,713 | 21,900 | 20,050 | 21,856 |
|---|
| 2021 | 23,816 | 23,705 | 21,687 | 23,724 |
|---|
| 2021 | 24,116 | 23,681 | 21,723 | 23,863 |
|---|
| 2021 | 24,614 | 25,877 | 23,282 | 26,494 |
|---|
| 2022 | 22,496 | 24,512 | 22,221 | 25,276 |
|---|
| 2022 | 20,263 | 20,418 | 20,571 | 21,206 |
|---|
| 2022 | 19,822 | 19,506 | 19,600 | 20,170 |
|---|
| 2022 | 21,544 | 20,907 | 21,862 | 21,696 |
|---|
| 2023 | 21,057 | 22,408 | 21,146 | 23,322 |
|---|
| 2023 | 21,749 | 24,288 | 21,874 | 25,361 |
|---|
| 2023 | 20,566 | 23,497 | 21,025 | 24,531 |
|---|
| 2023 | 22,182 | 26,334 | 22,488 | 27,399 |
|---|
| 2024 | 23,922 | 28,973 | 24,405 | 30,291 |
|---|
| 2024 | 23,902 | 29,904 | 24,156 | 31,589 |
|---|
| 2024 | 25,326 | 31,767 | 25,784 | 33,448 |
|---|
| 2024 | 22,549 | 32,604 | 23,270 | 34,254 |
|---|
202501-4140694, 202502-4108594
Average Annual Total Returns
| | 1 Year | 5 Years | 10 Years |
|---|
| Health Sciences Portfolio (Health Sciences Portfolio Class) | 1.66% | 6.08% | 8.47% |
|---|
| Russell 3000 Index (Regulatory Benchmark) | 23.81 | 13.86 | 12.55 |
|---|
| Russell 3000 Health Care Index (Strategy Benchmark) | 3.48 | 7.18 | 8.81 |
|---|
| S&P 500 Index (Previous Benchmark) | 25.02 | 14.53 | 13.10 |
|---|
The preceding line graph shows the value of a hypothetical $10,000 investment in the fund over the past 10 fiscal year periods or since inception (for funds lacking 10-year records). The fund’s performance information included in the line graph and table above is compared with a regulatory required index that represents an overall securities market (Regulatory Benchmark). In addition, the line graph and table may also include one or more indexes that more closely aligns to the fund's investment strategy (Strategy Benchmark(s)). Due to new SEC Rules on shareholder reporting the fund adopted a new broad-based securities market index, referred to as the Regulatory Benchmark. Market index returns do not include expenses, which are deducted from fund returns. The fund's total return figures reflect the reinvestment of dividends and capital gains, if any.Neither the fund’s returns nor the index returns reflect the deduction of taxes that a shareholder would pay on fund distributions or redemptions of fund shares.The fund’s past performance is not a good predictor of the fund’s future performance.Updated performance information can be found at www.troweprice.com.
What are some fund statistics?
- Total Net Assets (000s)$664,924
- Number of Portfolio Holdings274
- Investment Advisory Fees Paid (000s)$5,427
- Portfolio Turnover Rate49.9%
What did the fund invest in?
Industry Allocation (as a % of Net Assets)
| Other Biotechnology | 27.4% |
| Major Pharmaceuticals | 17.1 |
| Implants | 14.9 |
| Life Sciences | 10.9 |
| Payors | 10.9 |
| Other Products & Devices | 6.6 |
| Major Biotechnology | 6.5 |
| Providers | 1.8 |
| Distribution | 0.9 |
| Other | 3.0 |
Top Ten Holdings (as a % of Net Assets)
| Eli Lilly | 10.2% |
| UnitedHealth Group | 6.1 |
| Intuitive Surgical | 5.8 |
| Thermo Fisher Scientific | 4.6 |
| Stryker | 4.2 |
| Danaher | 3.7 |
| Argenx | 3.7 |
| Merck | 2.6 |
| Boston Scientific | 2.5 |
| Vertex Pharmaceuticals | 2.4 |
If you invest directly with T. Rowe Price, you can elect to receive future shareholder reports or other important documents through electronic delivery by enrolling at www.troweprice.com/paperless. If you invest through a financial intermediary such as an investment advisor, a bank, retirement plan sponsor or a brokerage firm, please contact that organization and ask if it can provide electronic delivery.
Frank Russell Company "LSE" and S&P do not accept any liability for any errors or omissions in the indexes or data, and hereby expressly disclaim all warranties of originality, accuracy, completeness, timeliness, merchantability and fitness for a particular purpose. No party may rely on any indexes or data contained in this communication. Visit www.troweprice.com/en/us/market-data-disclosures for additional legal notices & disclaimers.
Health Sciences Portfolio
Health Sciences Portfolio Class (QAAGZX)
T. Rowe Price Investment Services, Inc.
100 East Pratt Street
Baltimore, MD 21202
Annual Shareholder Report
December 31, 2024
Health Sciences Portfolio
Health Sciences Portfolio - II Class (QAAHBX)
This annual shareholder report contains important information about Health Sciences Portfolio (the "fund") for the period of January 1, 2024 to December 31, 2024. You can find the fund’s prospectus, financial information on Form N‑CSR (which includes required tax information for dividends), holdings, proxy voting information, and other information atwww.troweprice.com/prospectus. You can also request this information without charge by contacting T. Rowe Price at 1‑800‑638‑5660 or info@troweprice.com or contacting your intermediary.
What were the fund costs for the last year? (based on a hypothetical $10,000 investment)
| | Costs of a $10,000 investment | Costs paid as a percentage of a $10,000 investment |
|---|
| Health Sciences Portfolio - II Class | $114 | 1.13% |
|---|
What drove fund performance during the past 12 months?
The health care sector posted solid advances in the first nine months of 2024; however, these returns were diminished in the fourth quarter, leaving the group with modest gains for the year. The products and devices subsector was a bright spot as a handful of growth companies with exciting new product cycles led the segment higher. Despite facing heightened concerns around increased regulatory uncertainty at the end of the period, the pharmaceuticals segment was boosted by significant demand for a new class of diabetes and weight-loss drugs. The services subsector was the laggard in the space, largely driven by utilization pressures and heightened negative sentiment around the managed care industry.
From an absolute perspective, the leading contributor to performance was the portfolio’s significant position in Eli Lilly. Shares of the pharmaceutical giant benefited from strong demand and improvements in capacity for its portfolio of incretin medicines, alongside several positive regulatory developments.
Conversely, the leading detractor from absolute performance was Elevance Health. Shares of the insurer traded sharply lower at the end of the period due to multiple factors, including (1) a challenging Medicaid environment driving an uptick in utilization, (2) uncertainty around the health care agenda of the incoming presidential administration, and (3) worsening public sentiment toward the managed care space following the tragic murder of an industry executive.
Our overarching investment philosophy remains focused on innovation, and we believe companies that are producing leading‑edge therapeutics and medical devices offer some of the market’s most attractive growth areas for investors with a multiyear horizon.
How has the fund performed?
Cumulative Returns of a Hypothetical $10,000 Investment as of December 31, 2024
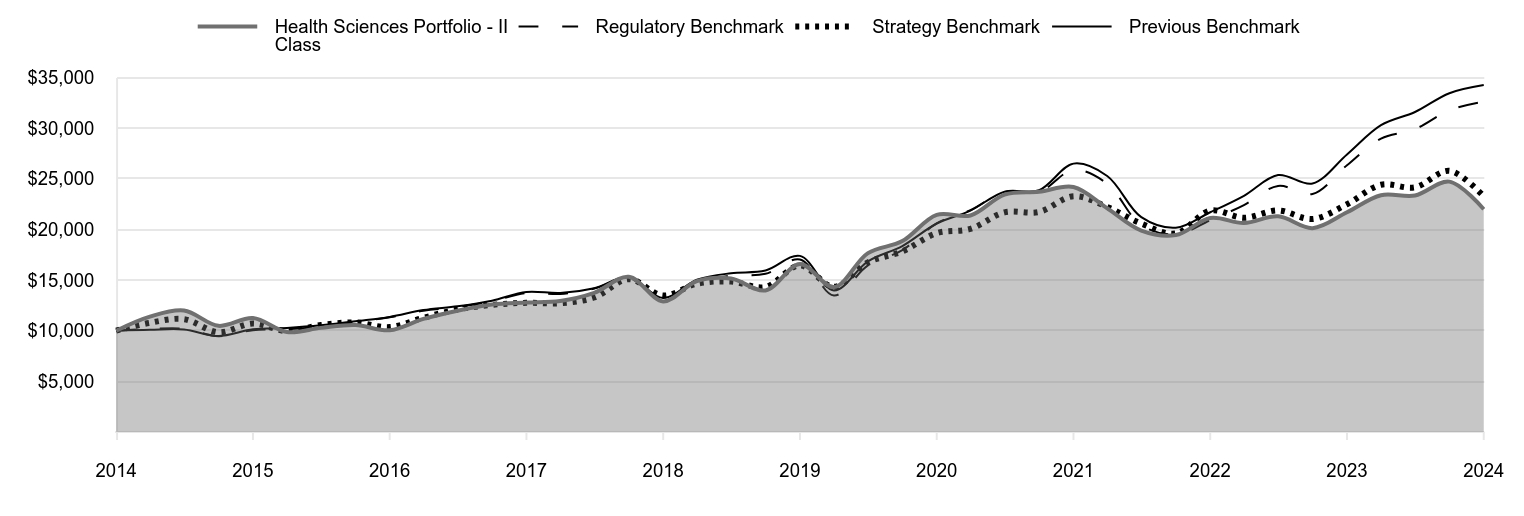
| Health Sciences Portfolio - II Class | Regulatory Benchmark | Strategy Benchmark | Previous Benchmark |
|---|
| 2014 | 10,000 | 10,000 | 10,000 | 10,000 |
|---|
| 2015 | 11,385 | 10,180 | 10,780 | 10,095 |
|---|
| 2015 | 11,994 | 10,194 | 11,143 | 10,123 |
|---|
| 2015 | 10,480 | 9,455 | 9,847 | 9,471 |
|---|
| 2015 | 11,247 | 10,048 | 10,714 | 10,138 |
|---|
| 2016 | 9,871 | 10,145 | 9,959 | 10,275 |
|---|
| 2016 | 10,280 | 10,412 | 10,560 | 10,527 |
|---|
| 2016 | 10,563 | 10,870 | 10,813 | 10,933 |
|---|
| 2016 | 10,042 | 11,327 | 10,357 | 11,351 |
|---|
| 2017 | 11,161 | 11,978 | 11,279 | 12,039 |
|---|
| 2017 | 11,976 | 12,339 | 12,098 | 12,411 |
|---|
| 2017 | 12,593 | 12,903 | 12,552 | 12,967 |
|---|
| 2017 | 12,784 | 13,721 | 12,753 | 13,829 |
|---|
| 2018 | 12,941 | 13,633 | 12,715 | 13,724 |
|---|
| 2018 | 13,744 | 14,163 | 13,282 | 14,195 |
|---|
| 2018 | 15,320 | 15,172 | 15,089 | 15,290 |
|---|
| 2018 | 12,894 | 13,002 | 13,471 | 13,223 |
|---|
| 2019 | 14,890 | 14,828 | 14,639 | 15,027 |
|---|
| 2019 | 15,147 | 15,435 | 14,849 | 15,674 |
|---|
| 2019 | 13,975 | 15,614 | 14,313 | 15,940 |
|---|
| 2019 | 16,585 | 17,035 | 16,449 | 17,386 |
|---|
| 2020 | 14,311 | 13,475 | 14,330 | 13,979 |
|---|
| 2020 | 17,654 | 16,443 | 16,748 | 16,850 |
|---|
| 2020 | 18,845 | 17,957 | 17,833 | 18,355 |
|---|
| 2020 | 21,439 | 20,593 | 19,630 | 20,585 |
|---|
| 2021 | 21,376 | 21,900 | 20,050 | 21,856 |
|---|
| 2021 | 23,437 | 23,705 | 21,687 | 23,724 |
|---|
| 2021 | 23,718 | 23,681 | 21,723 | 23,863 |
|---|
| 2021 | 24,190 | 25,877 | 23,282 | 26,494 |
|---|
| 2022 | 22,094 | 24,512 | 22,221 | 25,276 |
|---|
| 2022 | 19,889 | 20,418 | 20,571 | 21,206 |
|---|
| 2022 | 19,442 | 19,506 | 19,600 | 20,170 |
|---|
| 2022 | 21,121 | 20,907 | 21,862 | 21,696 |
|---|
| 2023 | 20,630 | 22,408 | 21,146 | 23,322 |
|---|
| 2023 | 21,294 | 24,288 | 21,874 | 25,361 |
|---|
| 2023 | 20,124 | 23,497 | 21,025 | 24,531 |
|---|
| 2023 | 21,688 | 26,334 | 22,488 | 27,399 |
|---|
| 2024 | 23,378 | 28,973 | 24,405 | 30,291 |
|---|
| 2024 | 23,344 | 29,904 | 24,156 | 31,589 |
|---|
| 2024 | 24,716 | 31,767 | 25,784 | 33,448 |
|---|
| 2024 | 21,995 | 32,604 | 23,270 | 34,254 |
|---|
202501-4140694, 202502-4108594
Average Annual Total Returns
| | 1 Year | 5 Years | 10 Years |
|---|
| Health Sciences Portfolio (Health Sciences Portfolio - II Class) | 1.42% | 5.81% | 8.20% |
|---|
| Russell 3000 Index (Regulatory Benchmark) | 23.81 | 13.86 | 12.55 |
|---|
| Russell 3000 Health Care Index (Strategy Benchmark) | 3.48 | 7.18 | 8.81 |
|---|
| S&P 500 Index (Previous Benchmark) | 25.02 | 14.53 | 13.10 |
|---|
The preceding line graph shows the value of a hypothetical $10,000 investment in the fund over the past 10 fiscal year periods or since inception (for funds lacking 10-year records). The fund’s performance information included in the line graph and table above is compared with a regulatory required index that represents an overall securities market (Regulatory Benchmark). In addition, the line graph and table may also include one or more indexes that more closely aligns to the fund's investment strategy (Strategy Benchmark(s)). Due to new SEC Rules on shareholder reporting the fund adopted a new broad-based securities market index, referred to as the Regulatory Benchmark. Market index returns do not include expenses, which are deducted from fund returns. The fund's total return figures reflect the reinvestment of dividends and capital gains, if any.Neither the fund’s returns nor the index returns reflect the deduction of taxes that a shareholder would pay on fund distributions or redemptions of fund shares.The fund’s past performance is not a good predictor of the fund’s future performance.Updated performance information can be found at www.troweprice.com.
What are some fund statistics?
- Total Net Assets (000s)$664,924
- Number of Portfolio Holdings274
- Investment Advisory Fees Paid (000s)$5,427
- Portfolio Turnover Rate49.9%
What did the fund invest in?
Industry Allocation (as a % of Net Assets)
| Other Biotechnology | 27.4% |
| Major Pharmaceuticals | 17.1 |
| Implants | 14.9 |
| Life Sciences | 10.9 |
| Payors | 10.9 |
| Other Products & Devices | 6.6 |
| Major Biotechnology | 6.5 |
| Providers | 1.8 |
| Distribution | 0.9 |
| Other | 3.0 |
Top Ten Holdings (as a % of Net Assets)
| Eli Lilly | 10.2% |
| UnitedHealth Group | 6.1 |
| Intuitive Surgical | 5.8 |
| Thermo Fisher Scientific | 4.6 |
| Stryker | 4.2 |
| Danaher | 3.7 |
| Argenx | 3.7 |
| Merck | 2.6 |
| Boston Scientific | 2.5 |
| Vertex Pharmaceuticals | 2.4 |
If you invest directly with T. Rowe Price, you can elect to receive future shareholder reports or other important documents through electronic delivery by enrolling at www.troweprice.com/paperless. If you invest through a financial intermediary such as an investment advisor, a bank, retirement plan sponsor or a brokerage firm, please contact that organization and ask if it can provide electronic delivery.
Frank Russell Company "LSE" and S&P do not accept any liability for any errors or omissions in the indexes or data, and hereby expressly disclaim all warranties of originality, accuracy, completeness, timeliness, merchantability and fitness for a particular purpose. No party may rely on any indexes or data contained in this communication. Visit www.troweprice.com/en/us/market-data-disclosures for additional legal notices & disclaimers.
Health Sciences Portfolio
Health Sciences Portfolio - II Class (QAAHBX)
T. Rowe Price Investment Services, Inc.
100 East Pratt Street
Baltimore, MD 21202
Item 1. (b) Notice pursuant to Rule 30e-3.
Not applicable.
Item 2. Code of Ethics.
The registrant has adopted a code of ethics, as defined in Item 2 of Form N-CSR, applicable to its principal executive officer, principal financial officer, principal accounting officer or controller, or persons performing similar functions. A copy of this code of ethics is filed as an exhibit to this Form N-CSR. No substantive amendments were approved or waivers were granted to this code of ethics during the period covered by this report.
Item 3. Audit Committee Financial Expert.
The registrant’s Board of Directors has determined that Mr. Paul F. McBride qualifies as an audit committee financial expert, as defined in Item 3 of Form N-CSR. Mr. McBride is considered independent for purposes of Item 3 of Form N-CSR.
Item 4. Principal Accountant Fees and Services.
(a) – (d) Aggregate fees billed for the last two fiscal years for professional services rendered to, or on behalf of, the registrant by the registrant’s principal accountant were as follows:
| | | | | | | | | | | | | | |
| | | | 2024 | | | | | | 2023 | |
| | Audit Fees | | $ | 46,029 | | | | | | | $ | 46,733 | |
| | Audit-Related Fees | | | - | | | | | | | | - | |
| | Tax Fees | | | - | | | | | | | | - | |
| | All Other Fees | | | - | | | | | | | | - | |
Audit fees include amounts related to the audit of the registrant’s annual financial statements and services normally provided by the accountant in connection with statutory and regulatory filings. Audit-related fees include amounts reasonably related to the performance of the audit of the registrant’s financial statements and specifically include the issuance of a report on internal controls and, if applicable, agreed-upon procedures related to fund acquisitions. Tax fees include amounts related to services for tax compliance, tax planning, and tax advice. The nature of these services specifically includes the review of distribution calculations and the preparation of Federal, state, and excise tax returns. All other fees include the registrant’s pro-rata share of amounts for agreed-upon procedures in conjunction with service contract approvals by the registrant’s Board of Directors/Trustees.
(e)(1) The registrant’s audit committee has adopted a policy whereby audit and non-audit services performed by the registrant’s principal accountant for the registrant, its investment adviser, and any entity controlling, controlled by, or under common control with the investment adviser that provides ongoing services to the registrant require pre-approval in advance at regularly scheduled audit committee meetings. If such a service is required between regularly scheduled audit committee meetings, pre-approval may be authorized by one audit committee member with ratification at the next scheduled audit committee meeting. Waiver of pre-approval for audit or non-audit services requiring fees of a de minimis amount is not permitted.
(2) No services included in (b) – (d) above were approved pursuant to paragraph (c)(7)(i)(C) of Rule 2-01 of Regulation S-X.
(f) Less than 50 percent of the hours expended on the principal accountant’s engagement to audit the registrant’s financial statements for the most recent fiscal year were attributed to work performed by persons other than the principal accountant’s full-time, permanent employees.
(g) The aggregate fees billed for the most recent fiscal year and the preceding fiscal year by the registrant’s principal accountant for non-audit services rendered to the registrant, its investment adviser, and any entity controlling, controlled by, or under common control with the investment adviser that provides ongoing services to the registrant were $1,262,000 and $1,524,000, respectively.
(h) All non-audit services rendered in (g) above were pre-approved by the registrant’s audit committee. Accordingly, these services were considered by the registrant’s audit committee in maintaining the principal accountant’s independence.
(i) Not applicable.
(j) Not applicable.
Item 5. Audit Committee of Listed Registrants.
Not applicable.
Item 6. Investments.
(a) Not applicable. The complete schedule of investments is included in Item 7 of this Form N-CSR.
(b) Not applicable.
Item 7. Financial Statements and Financial Highlights for Open-End Management Investment Companies.
(a – b) Report pursuant to Regulation S-X.
Financial
Statements
and
Other
Information
For
more
insights
from
T.
Rowe
Price
investment
professionals,
go
to
troweprice.com
.
Financial
Highlights
Portfolio
of
Investments
Financial
Statements
and
Notes
Additional
Fund
Information
T.
ROWE
PRICE
Health
Sciences
Portfolio
For
a
share
outstanding
throughout
each
period
The
accompanying
notes
are
an
integral
part
of
these
financial
statements.
Health
Sciences
Portfolio
Class
..
Year
..
..
Ended
.
12/31/24
12/31/23
12/31/22
12/31/21
12/31/20
NET
ASSET
VALUE
Beginning
of
period
$
55
.31
$
55
.74
$
64
.72
$
61
.04
$
49
.82
Investment
activities
Net
investment
loss
(1)(2)
(
0
.11
)
(
0
.12
)
(
0
.13
)
(
0
.26
)
(
0
.12
)
Net
realized
and
unrealized
gain/loss
1
.00
1
.68
(
7
.95
)
8
.19
14
.90
Total
from
investment
activities
0
.89
1
.56
(
8
.08
)
7
.93
14
.78
Distributions
Net
realized
gain
(
4
.94
)
(
1
.99
)
(
0
.90
)
(
4
.25
)
(
3
.56
)
NET
ASSET
VALUE
End
of
period
$
51
.26
$
55
.31
$
55
.74
$
64
.72
$
61
.04
Ratios/Supplemental
Data
Total
return
(2)(3)
1
.66
%
2
.96
%
(
12
.47
)
%
13
.10
%
29
.62
%
Ratios
to
average
net
assets:
(2)
Gross
expenses
before
waivers/payments
by
Price
Associates
0
.89
%
0
.95
%
0
.95
%
0
.95
%
0
.95
%
Net
expenses
after
waivers/payments
by
Price
Associates
0
.88
%
0
.94
%
0
.94
%
0
.94
%
0
.94
%
Net
investment
loss
(
0
.18
)
%
(
0
.21
)
%
(
0
.23
)
%
(
0
.40
)
%
(
0
.23
)
%
Portfolio
turnover
rate
49
.9
%
49
.5
%
27
.9
%
32
.3
%
38
.0
%
Net
assets,
end
of
period
(in
thousands)
$
144,197
$
154,299
$
153,188
$
178,434
$
159,718
(1)
Per
share
amounts
calculated
using
average
shares
outstanding
method.
(2)
Includes
the
impact
of
expense-related
arrangements
with
Price
Associates.
(3)
Total
return
reflects
the
rate
that
an
investor
would
have
earned
on
an
investment
in
the
fund
during
each
period,
assuming
reinvestment
of
all
distributions,
and
payment
of
no
redemption
or
account
fees,
if
applicable.
T.
ROWE
PRICE
Health
Sciences
Portfolio
For
a
share
outstanding
throughout
each
period
The
accompanying
notes
are
an
integral
part
of
these
financial
statements.
Health
Sciences
Portfolio
-
II
Class
..
Year
..
..
Ended
.
12/31/24
12/31/23
12/31/22
12/31/21
12/31/20
NET
ASSET
VALUE
Beginning
of
period
$
51
.85
$
52
.52
$
61
.19
$
57
.96
$
47
.48
Investment
activities
Net
investment
loss
(1)(2)
(
0
.24
)
(
0
.24
)
(
0
.25
)
(
0
.40
)
(
0
.24
)
Net
realized
and
unrealized
gain/loss
0
.95
1
.56
(
7
.52
)
7
.77
14
.16
Total
from
investment
activities
0
.71
1
.32
(
7
.77
)
7
.37
13
.92
Distributions
Net
realized
gain
(
4
.94
)
(
1
.99
)
(
0
.90
)
(
4
.14
)
(
3
.44
)
NET
ASSET
VALUE
End
of
period
$
47
.62
$
51
.85
$
52
.52
$
61
.19
$
57
.96
Ratios/Supplemental
Data
Total
return
(2)(3)
1
.42
%
2
.68
%
(
12
.69
)
%
12
.83
%
29
.27
%
Ratios
to
average
net
assets:
(2)
Gross
expenses
before
waivers/payments
by
Price
Associates
1
.13
%
1
.20
%
1
.20
%
1
.20
%
1
.20
%
Net
expenses
after
waivers/payments
by
Price
Associates
1
.13
%
1
.19
%
1
.19
%
1
.19
%
1
.19
%
Net
investment
loss
(
0
.43
)
%
(
0
.47
)
%
(
0
.48
)
%
(
0
.64
)
%
(
0
.47
)
%
Portfolio
turnover
rate
49
.9
%
49
.5
%
27
.9
%
32
.3
%
38
.0
%
Net
assets,
end
of
period
(in
thousands)
$
520,727
$
548,009
$
576,092
$
704,365
$
626,850
(1)
Per
share
amounts
calculated
using
average
shares
outstanding
method.
(2)
Includes
the
impact
of
expense-related
arrangements
with
Price
Associates.
(3)
Total
return
reflects
the
rate
that
an
investor
would
have
earned
on
an
investment
in
the
fund
during
each
period,
assuming
reinvestment
of
all
distributions,
and
payment
of
no
redemption
or
account
fees,
if
applicable.
T.
ROWE
PRICE
Health
Sciences
Portfolio
December
31,
2024
Shares/Par
$
Value
(Cost
and
value
in
$000s)
‡
COMMON
STOCKS
94.8%
BIOTECHNOLOGY
27.8%
International-Biotechnology
0.1%
Ideaya
Biosciences (1)
19,371
498
498
Major
Biotechnology
6.3%
Alkermes (1)
66,471
1,912
Amgen
38,406
10,010
Biogen (1)
8,175
1,250
Celldex
Therapeutics (1)
32,851
830
Exact
Sciences (1)
59,948
3,368
Exact
Sciences
CMO
Milestone,
Acquisition
Date:
1/6/21,
Cost $— (1)(2)(3)
167,424
104
Exact
Sciences
FDA
Milestone,
Acquisition
Date:
1/6/21,
Cost $— (1)(2)(3)
83,712
52
Neurocrine
Biosciences (1)
27,030
3,690
United
Therapeutics (1)
13,600
4,799
Vertex
Pharmaceuticals (1)
39,362
15,851
41,866
Other
Biotechnology
21.4%
Affinivax
Expense
Fund,
Acquisition
Date:
9/12/22,
Cost $1 (1)(2)(3)
562
—
Affinivax
Milestone
Event,
Acquisition
Date:
9/12/22,
Cost $156 (1)(2)(3)
331,976
246
Affinivax
Next
Gen.
Prod.
Milestone
Event,
Acquisition
Date:
9/12/22,
Cost $156 (1)(2)(3)
331,976
123
Agios
Pharmaceuticals (1)
51,400
1,689
Akero
Therapeutics (1)
45,821
1,275
Alector (1)
30,382
57
Allogene
Therapeutics (1)
160,368
342
Alnylam
Pharmaceuticals (1)
64,660
15,215
AnaptysBio (1)
10,500
139
Apellis
Pharmaceuticals (1)
11,061
353
Apogee
Therapeutics (1)
39,727
1,800
Arcellx (1)
44,630
3,423
Arvinas (1)
23,306
447
Ascendis
Pharma,
ADR (1)
50,917
7,010
Aura
Biosciences (1)
20,070
165
Avidity
Biosciences (1)
128,218
3,729
BeiGene,
ADR (1)
36,338
6,712
Bicycle
Therapeutics,
ADR (1)
62,846
880
Biohaven (1)
95,772
3,577
BioMarin
Pharmaceutical (1)
17,822
1,171
Blueprint
Medicines (1)
86,496
7,544
Cabaletta
Bio (1)
24,400
55
Cargo
Therapeutics (1)
60,490
872
Centessa
Pharmaceuticals,
ADR (1)
173,583
2,907
Crinetics
Pharmaceuticals (1)
57,933
2,962
Cytokinetics (1)
33,735
1,587
Day
One
Biopharmaceuticals (1)
3,030
38
Denali
Therapeutics (1)
79,760
1,625
Shares/Par
$
Value
(Cost
and
value
in
$000s)
‡
Disc
Medicine (1)
14,626
927
Dyne
Therapeutics (1)
24,193
570
Entrada
Therapeutics (1)
19,854
343
EyePoint
Pharmaceuticals (1)
26,859
200
Generation
Bio (1)
91,458
97
Ginkgo
Bioworks,
Earn
Out
Shares
$15.00,
Acquisition
Date:
9/17/21,
Cost $— (1)(2)(3)
242
—
Ginkgo
Bioworks,
Earn
Out
Shares
$17.50,
Acquisition
Date:
9/17/21,
Cost $— (1)(2)(3)
242
—
Ginkgo
Bioworks,
Earn
Out
Shares
$20.00,
Acquisition
Date:
9/17/21,
Cost $— (1)(2)(3)
242
—
Gyroscope
Therapeutics,
Milestone
Payment
1,
Acquisition
Date:
2/18/22,
Cost $253 (1)(2)(3)
253,263
—
Gyroscope
Therapeutics,
Milestone
Payment
2,
Acquisition
Date:
2/18/22,
Cost $169 (1)(2)(3)
168,785
—
Gyroscope
Therapeutics,
Milestone
Payment
3,
Acquisition
Date:
2/18/22,
Cost $169 (1)(2)(3)
168,785
—
Helix
Acquisition
Corp.
II (1)
40,147
422
IGM
Biosciences (1)
46,165
282
Immatics (1)
35,941
256
Immuneering,
Class
A (1)
29,046
64
Immunocore
Holdings,
ADR (1)
56,198
1,658
Immunome (1)
84,540
898
Insmed (1)
133,130
9,191
Ionis
Pharmaceuticals (1)
45,448
1,589
Iovance
Biotherapeutics (1)
54,449
403
Krystal
Biotech (1)
13,110
2,054
Kymera
Therapeutics (1)
68,304
2,748
Legend
Biotech,
ADR (1)
31,638
1,029
Lyell
Immunopharma (1)
285,300
183
Monte
Rosa
Therapeutics (1)
64,177
445
MoonLake
Immunotherapeutics (1)
78,080
4,228
Natera (1)
26,714
4,229
Novocure (1)
61,373
1,829
ORIC
Pharmaceuticals (1)
46,600
376
Oruka
Therapeutics
55,896
1,084
Pharvaris (1)
16,499
316
Pliant
Therapeutics (1)
27,537
363
Prelude
Therapeutics (1)
42,748
54
ProfoundBio,
Escrow
Fund
Payment,
EC,
Acquisition
Date:
5/24/24,
Cost $34 (1)(2)(3)
33,627
32
ProfoundBio,
Expense
Fund
Payment,
EC,
Acquisition
Date:
5/24/24,
Cost $— (1)(2)(3)
112
—
Protagonist
Therapeutics (1)
51,434
1,985
Prothena (1)
19,543
271
Regeneron
Pharmaceuticals (1)
16,686
11,886
Relay
Therapeutics (1)
48,819
201
Repligen (1)
12,407
1,786
Replimune
Group (1)
85,041
1,030
T.
ROWE
PRICE
Health
Sciences
Portfolio
Shares/Par
$
Value
(Cost
and
value
in
$000s)
‡
REVOLUTION
Medicines (1)
85,170
3,725
REVOLUTION
Medicines,
Warrants,
11/14/28 (1)
11,096
2
Rhythm
Pharmaceuticals (1)
15,079
844
Rocket
Pharmaceuticals (1)
53,703
675
Sage
Therapeutics (1)
14,484
79
Sana
Biotechnology (1)
115,664
188
Scholar
Rock,
Warrants,
12/31/25,
Acquisition
Date:
6/17/22,
Cost $— (1)(3)
6,855
246
Scholar
Rock
Holding (1)
108,816
4,703
SpringWorks
Therapeutics (1)
36,450
1,317
Spyre
Therapeutics (1)
20,380
475
Structure
Therapeutics,
ADR (1)
28,505
773
Tenax
Therapeutics,
Warrants,
8/29/29,
Acquisition
Date:
8/6/24,
Cost $— (1)(3)
53,640
62
Ultragenyx
Pharmaceutical (1)
31,232
1,314
Vaxcyte (1)
56,111
4,593
Voyager
Therapeutics (1)
42,811
243
WaVe
Life
Sciences (1)
96,944
1,199
Xencor (1)
33,800
777
Zai
Lab,
ADR (1)
90,020
2,358
Zentalis
Pharmaceuticals (1)
30,265
92
142,637
Total
Biotechnology
185,001
CONSUMER
NONDURABLES
0.2%
Biotechnology
0.1%
MBX
Biosciences,
Lockup
Shares,
Series
C,
Acquisition
Date:
8/2/24,
Cost $429 (1)(3)
34,687
639
639
Pharmaceuticals
0.1%
Tenax
Therapeutics,
Warrants,
Acquisition
Date:
8/6/24,
Cost $305 (1)(3)(4)
101,916
599
599
Total
Consumer
Nondurables
1,238
LIFE
SCIENCES
9.7%
Life
Sciences
9.7%
Agilent
Technologies
23,525
3,160
Bio-Techne
38,087
2,744
Bruker
14,586
855
Danaher
107,863
24,760
Ginkgo
Bioworks
Holdings (1)
2,281
22
Pacific
Biosciences
of
California (1)
81,354
149
Revvity
19,976
2,230
SomaLogic,
Warrants,
8/31/26 (1)
4,962
—
Thermo
Fisher
Scientific
58,242
30,299
Total
Life
Sciences
64,219
Shares/Par
$
Value
(Cost
and
value
in
$000s)
‡
MISCELLANEOUS
0.0%
Miscellaneous
0.0%
Orchestra
BioMed
Holdings (1)
24,783
99
Total
Miscellaneous
99
PHARMACEUTICALS
17.3%
Major
Pharmaceuticals
16.9%
AstraZeneca,
ADR
210,164
13,770
Chugai
Pharmaceutical
(JPY)
76,700
3,381
Eli
Lilly
87,928
67,880
Merck
171,723
17,083
Novo
Nordisk,
ADR
24,315
2,092
Sanofi,
ADR
137,134
6,614
Teva
Pharmaceutical
Industries,
ADR (1)
66,700
1,470
112,290
Specialty
Pharmaceuticals
0.4%
Madrigal
Pharmaceuticals (1)
7,914
2,442
2,442
Total
Pharmaceuticals
114,732
PRODUCTS
&
DEVICES
21.1%
Capital
Equipment
0.3%
PROCEPT
BioRobotics (1)
23,557
1,897
1,897
Implants
14.8%
Becton
Dickinson
&
Company
35,747
8,110
Boston
Scientific (1)
185,922
16,607
Edwards
Lifesciences (1)
47,257
3,498
Intuitive
Surgical (1)
73,749
38,494
Sonova
Holding
(CHF)
11,921
3,898
Stryker
76,874
27,679
Verily
Life
Sciences,
Series
B,
Acquisition
Date:
1/23/19,
Cost $643 (1)(2)(3)
5,220
351
98,637
Other
Products
&
Devices
6.0%
10X
Genomics,
Class
A (1)
44,877
644
Argenx,
ADR (1)
39,674
24,400
Dexcom (1)
25,744
2,002
Hologic (1)
27,356
1,972
IDEXX
Laboratories (1)
6,000
2,481
Lantheus
Holdings (1)
10,015
896
Pax
Labs,
Class
A,
Acquisition
Date:
4/18/19,
Cost $1,452 (1)(2)(3)
385,684
158
Penumbra (1)
30,257
7,185
Saluda
Medical,
Warrants,
1/20/27,
Acquisition
Date:
1/20/22,
Cost $— (1)(2)(3)
4,672
9
39,747
Total
Products
&
Devices
140,281
SERVICES
13.8%
Distribution
0.9%
Cardinal
Health
17,928
2,120
T.
ROWE
PRICE
Health
Sciences
Portfolio
Shares/Par
$
Value
(Cost
and
value
in
$000s)
‡
Cencora
8,625
1,938
McKesson
3,062
1,745
5,803
Information
0.0%
GeneDx
Holdings (1)
2,338
179
GeneDx
Holdings,
Warrants,
7/22/26 (1)
11,396
2
181
Other
Services
0.5%
ICON (1)
5,711
1,198
PrognomIQ,
Class
A,
Acquisition
Date:
11/15/19
-
9/6/24,
Cost $656 (1)(2)(3)
27,337
17
Quest
Diagnostics
15,672
2,364
3,579
Payors
10.8%
Centene (1)
34,658
2,100
Cigna
Group
32,141
8,875
Elevance
Health
33,964
12,529
Humana
5,257
1,334
Molina
Healthcare (1)
14,950
4,351
Oscar
Health,
Class
A (1)
147,077
1,977
UnitedHealth
Group
80,286
40,613
71,779
Providers
1.6%
BrightSpring
Health
Services (1)
99,302
1,691
HCA
Healthcare
16,417
4,927
Tenet
Healthcare (1)
32,572
4,112
10,730
Total
Services
92,072
Total
Miscellaneous
Common
Stocks
4.9% (5)
32,965
Total
Common
Stocks
(Cost
$351,927)
630,607
CONVERTIBLE
BONDS
0.2%
Galvanize
Therapeutics,
0.00%,
2/13/27,
Acquisition
Date:
2/28/24,
Cost $295 (1)(2)(3)
295,300
295
Galvanize
Therapeutics,
0.00%,
2/28/27,
Acquisition
Date:
12/27/24,
Cost $223 (1)(2)(3)
223,200
223
Immunocore
Holdings,
2.50%,
2/1/30 (6)
739,000
620
Kardium,
10.00%,
12/31/26,
Acquisition
Date:
5/31/24,
Cost $257 (1)(2)(3)
256,500
257
Total
Convertible
Bonds
(Cost
$1,514)
1,395
Shares/Par
$
Value
(Cost
and
value
in
$000s)
‡
CONVERTIBLE
PREFERRED
STOCKS
4.0%
BIOTECHNOLOGY
2.1%
Other
Biotechnology
2.1%
Aktis
Oncology,
Series
B,
Acquisition
Date:
9/20/24,
Cost $538 (1)(2)(3)
134,478
538
Arbor
Bio,
Series
B,
Acquisition
Date:
10/29/21,
Cost $398 (1)(2)(3)
23,994
99
Arsenal
Biosciences,
Series
C,
Acquisition
Date:
7/9/24,
Cost $651 (1)(2)(3)
35,023
651
Avalyn
Pharma,
Series
C-1,
Acquisition
Date:
9/22/23,
Cost $285 (1)(2)(3)
388,595
285
Bluejay
Therapeutics,
Series
C,
Acquisition
Date:
5/1/24,
Cost $850 (1)(2)(3)
130,259
850
Chroma
Medicine,
Series
I,
Acquisition
Date:
10/12/21
-
12/4/24,
Cost $785 (1)(2)(3)
354,997
355
Delfi
Diagnostics,
Series
A,
Acquisition
Date:
1/12/21
-
4/7/22,
Cost $320 (1)(2)(3)
154,525
749
Delfi
Diagnostics,
Series
B,
Acquisition
Date:
6/10/22,
Cost $407 (1)(2)(3)
84,104
407
Eikon
Therapeutics,
Series
B,
Acquisition
Date:
12/3/21,
Cost $810 (1)(2)(3)
45,781
243
Eikon
Therapeutics,
Series
C,
Acquisition
Date:
5/18/23,
Cost $195 (1)(2)(3)
9,072
48
EndeavorBio,
Series
B,
Acquisition
Date:
1/21/22,
Cost $398 (1)(2)(3)
84,304
550
Endeavour
Bio
Services,
Series
C,
Acquisition
Date:
4/22/24,
Cost $154 (1)(2)(3)
23,627
154
FOG
Pharma,
Series
C,
Acquisition
Date:
1/11/21
-
8/2/21,
Cost $282 (1)
(2)(3)
19,483
165
FOG
Pharma,
Series
D,
Acquisition
Date:
11/17/22,
Cost $296 (1)(2)(3)
27,546
202
FOG
Pharma,
Series
E,
Acquisition
Date:
2/29/24,
Cost $93 (1)(2)(3)
14,904
93
Generate
Bio,
Series
B,
Acquisition
Date:
9/2/21,
Cost $1,001 (1)(2)(3)
84,485
1,001
Generate
Bio,
Series
C,
Acquisition
Date:
5/9/23,
Cost $201 (1)(2)(3)
17,003
201
Genesis
Therapeutics,
Series
A,
Acquisition
Date:
11/24/20,
Cost $191 (1)(2)(3)
37,471
191
Genesis
Therapeutics,
Series
B,
Acquisition
Date:
8/10/23,
Cost $465 (1)(2)(3)
91,103
465
Insitro,
Series
B,
Acquisition
Date:
5/21/20,
Cost $248 (1)(2)(3)
39,793
728
Insitro,
Series
C,
Acquisition
Date:
4/7/21,
Cost $481 (1)(2)(3)
26,282
481
T.
ROWE
PRICE
Health
Sciences
Portfolio
Shares/Par
$
Value
(Cost
and
value
in
$000s)
‡
Kartos
Therapeutics,
Series
C,
Acquisition
Date:
8/22/23,
Cost $486 (1)(2)(3)
85,928
486
Laronde,
Series
B,
Acquisition
Date:
7/28/21,
Cost $1,471 (1)(2)(3)
52,537
116
Metsera,
Series
B,
Acquisition
Date:
11/12/24,
Cost $649 (1)(2)(3)
128,744
649
Obsidian
Therapeutics,
Series
C,
Acquisition
Date:
3/27/24,
Cost $422 (1)(2)(3)
222,385
422
Odyssey
Therapeutics,
Series
B,
Acquisition
Date:
5/13/22,
Cost $319 (1)(2)(3)
50,567
263
Odyssey
Therapeutics,
Series
C,
Acquisition
Date:
10/25/23,
Cost $25 (1)(2)(3)
4,902
25
Ring
Therapeutics,
Series
B,
Acquisition
Date:
4/12/21,
Cost $404 (1)(2)(3)
43,885
202
Ring
Therapeutics,
Series
C,
Acquisition
Date:
10/7/22,
Cost $198 (1)(2)(3)
21,482
99
SalioGen
Therapeutics,
Series
B,
Acquisition
Date:
12/10/21,
Cost $496 (1)(2)(3)
4,690
68
Scribe
Therapeutics,
Series
B,
Acquisition
Date:
3/17/21,
Cost $278 (1)(2)(3)
45,881
278
Sionna
Therapeutics,
Series
B,
Acquisition
Date:
2/2/22,
Cost $239 (1)(2)(3)
24,459
239
Sionna
Therapeutics,
Series
C,
Acquisition
Date:
3/4/24,
Cost $84 (1)(2)(3)
8,642
84
Tessera
Therapeutics,
Series
C,
Acquisition
Date:
2/25/22,
Cost $357 (1)(2)(3)
17,475
357
Third
Arc
Bio,
Series
A,
Acquisition
Date:
7/16/24,
Cost $214 (1)(2)(3)
101,574
214
Treeline
Biosciences,
Series
A,
Acquisition
Date:
4/9/21
-
9/26/22,
Cost $830 (1)(2)(3)
106,061
913
Treeline
Biosciences,
Series
A-1,
Acquisition
Date:
10/2/24,
Cost $1,060 (1)(2)(3)
123,059
1,060
Total
Biotechnology
13,931
CONSUMER
NONDURABLES
0.2%
Biotechnology
0.1%
Arbor
Bio,
Series
C,
Acquisition
Date:
10/21/24,
Cost $64 (1)(2)(3)
15,714
64
Nutcracker
Therapeutics,
Series
C,
Acquisition
Date:
8/27/21,
Cost $501 (1)(2)(3)
46,567
501
565
Health
Care
Services
0.1%
Capsule,
Series
1-D,
Acquisition
Date:
4/7/21,
Cost $553 (1)(2)(3)
38,140
49
Shares/Par
$
Value
(Cost
and
value
in
$000s)
‡
Capsule,
Series
E,
Acquisition
Date:
1/10/23,
Cost $120 (1)(2)(3)
40,875
53
Color
Health,
Series
D,
Acquisition
Date:
12/17/20,
Cost $501 (1)(2)(3)
13,310
235
Color
Health,
Series
D-1,
Acquisition
Date:
1/13/20,
Cost $430 (1)(2)(3)
20,165
242
Color
Health,
Series
E,
Acquisition
Date:
10/26/21,
Cost $199 (1)(2)(3)
1,991
79
658
Total
Consumer
Nondurables
1,223
FINANCIAL
0.1%
Investment
Dealers
0.1%
Seaport
Therapeutics,
Series
B,
Acquisition
Date:
10/18/24,
Cost $540 (1)(2)(3)
113,620
540
Total
Financial
540
LIFE
SCIENCES
0.9%
Life
Sciences
0.9%
Cellanome,
Series
A,
Acquisition
Date:
12/30/21,
Cost $497 (1)(2)(3)
89,839
673
Chromacode,
Series
D-1,
Acquisition
Date:
2/28/22,
Cost $99 (1)(2)(3)
141,298
30
Chromacode,
Series
D-2,
Acquisition
Date:
2/28/22,
Cost $99 (1)(2)(3)
141,298
65
Clear
Labs,
Series
C,
Acquisition
Date:
5/13/21,
Cost $595 (1)(2)(3)
171,440
543
Clear
Labs,
Series
D,
Acquisition
Date:
12/12/24,
Cost $58 (1)(2)(3)
18,600
58
DNA
Script,
Series
C,
Acquisition
Date:
12/16/21,
Cost $960
(EUR) (1)
(2)(3)
1,132
338
Element
Biosciences,
Series
C,
Acquisition
Date:
6/21/21,
Cost $797 (1)(2)(3)
38,785
376
Element
Biosciences,
Series
D,
Acquisition
Date:
6/28/24,
Cost $106 (1)(2)(3)
13,556
106
Element
Biosciences,
Series
D-1,
Acquisition
Date:
6/28/24,
Cost $106 (1)(2)(3)
13,556
106
Inscripta,
Series
E,
Acquisition
Date:
3/30/21,
Cost $572 (1)(2)(3)
64,740
121
Lumicks
Tech,
Series
D,
Acquisition
Date:
4/14/21,
Cost $396 (1)(2)(3)
221
205
National
Resilience,
Series
B,
Acquisition
Date:
10/23/20,
Cost $741 (1)(2)(3)
54,252
2,521
National
Resilience,
Series
C,
Acquisition
Date:
6/9/21,
Cost $854 (1)(2)(3)
19,224
893
Total
Life
Sciences
6,035
PRODUCTS
&
DEVICES
0.3%
Capital
Equipment
0.1%
Reflexion
Medical,
Series
C,
Acquisition
Date:
4/3/18,
Cost $255 (1)(2)(3)
150,708
259
T.
ROWE
PRICE
Health
Sciences
Portfolio
Shares/Par
$
Value
(Cost
and
value
in
$000s)
‡
Reflexion
Medical,
Series
D,
Acquisition
Date:
4/3/20,
Cost $97 (1)(2)(3)
51,079
89
Reflexion
Medical,
Series
E,
Acquisition
Date:
3/1/22,
Cost $199 (1)(2)(3)
83,857
151
Reflexion
Medical,
Series
F,
Acquisition
Date:
11/13/23,
Cost $125 (1)(2)(3)
83,280
110
609
Implants
0.1%
Kardium,
Series
D-5,
Acquisition
Date:
11/29/18,
Cost $391 (1)(2)(3)
403,778
343
Kardium,
Series
D-6,
Acquisition
Date:
1/8/21,
Cost $566 (1)(2)(3)
556,501
473
816
Other
Products
&
Devices
0.1%
Saluda
Medical,
Series
D,
Acquisition
Date:
1/20/22,
Cost $397 (1)(2)(3)
31,146
331
Saluda
Medical,
Series
E,
Acquisition
Date:
4/6/23,
Cost $196 (1)(2)(3)
24,280
235
566
Total
Products
&
Devices
1,991
SERVICES
0.4%
Information
0.0%
Cleerly,
Series
C,
Acquisition
Date:
7/8/22,
Cost $313 (1)(2)(3)
26,533
313
313
Other
Services
0.3%
Caris
Life
Sciences,
Series
C,
Acquisition
Date:
8/14/20,
Cost $467 (1)(2)(3)
169,277
833
Caris
Life
Sciences,
Series
D,
Acquisition
Date:
5/11/21,
Cost $826 (1)(2)(3)
101,939
502
Freenome
Holdings,
Series
B,
Acquisition
Date:
6/24/19,
Cost $325 (1)(2)(3)
71,397
396
Shares/Par
$
Value
(Cost
and
value
in
$000s)
‡
Freenome
Holdings,
Series
C,
Acquisition
Date:
8/14/20,
Cost $276 (1)(2)(3)
41,732
232
Freenome
Holdings,
Series
D,
Acquisition
Date:
11/22/21,
Cost $179 (1)(2)(3)
23,669
132
Freenome
Holdings,
Series
F,
Acquisition
Date:
1/26/24,
Cost $63 (1)(2)(3)
8,542
47
2,142
Providers
0.1%
Honor
Technology,
Series
D,
Acquisition
Date:
10/16/20,
Cost $339 (1)(2)(3)
140,829
241
Honor
Technology,
Series
E,
Acquisition
Date:
9/29/21,
Cost $300 (1)(2)(3)
94,916
162
403
Total
Services
2,858
Total
Convertible
Preferred
Stocks
(Cost
$30,683)
26,578
PREFERRED
STOCKS
0.3%
LIFE
SCIENCES
0.3%
Life
Sciences
0.3%
Sartorius
(EUR)
8,261
1,836
Total
Life
Sciences
1,836
Total
Preferred
Stocks
(Cost
$1,569)
1,836
SHORT-TERM
INVESTMENTS
0.8%
Money
Market
Funds
0.8%
T.
Rowe
Price
Government
Reserve
Fund,
4.53% (7)(8)
5,167,594
5,168
Total
Short-Term
Investments
(Cost
$5,168)
5,168
Total
Investments
in
Securities
100.1%
of
Net
Assets
(Cost
$390,861)
$
665,584
‡
Shares/Par
are
denominated
in
U.S.
dollars
unless
otherwise
noted.
(1)
Non-income
producing
(2)
See
Note
2.
Level
3
in
fair
value
hierarchy.
(3)
Security
cannot
be
offered
for
public
resale
without
first
being
registered
under
the
Securities
Act
of
1933
and
related
rules
("restricted
security").
Acquisition
date
represents
the
day
on
which
an
enforceable
right
to
acquire
such
security
is
obtained
and
is
presented
along
with
related
cost
in
the
security
description.
The
fund
may
have
registration
rights
for
certain
restricted
securities.
Any
costs
related
to
such
registration
are
generally
borne
by
the
issuer.
The
aggregate
value
of
restricted
securities
(excluding
144A
holdings)
at
period
end
amounts
to
$29,991
and
represents
4.5%
of
net
assets.
(4)
Perpetual
security
with
no
stated
maturity
date.
(5)
The
identity
of
certain
securities
has
been
concealed
to
protect
the
fund
while
it
completes
a
purchase
or
selling
program
for
the
securities.
T.
ROWE
PRICE
Health
Sciences
Portfolio
.
(6)
Security
was
purchased
pursuant
to
Rule
144A
under
the
Securities
Act
of
1933
and
may
be
resold
in
transactions
exempt
from
registration
only
to
qualified
institutional
buyers.
Total
value
of
such
securities
at
period-end
amounts
to
$620
and
represents
0.1%
of
net
assets.
(7)
Seven-day
yield
(8)
Affiliated
Companies
ADR
American
Depositary
Receipts
CHF
Swiss
Franc
EC
Escrow
CUSIP;
represents
a
beneficial
interest
in
a
residual
pool
of
assets;
the
amount
and
timing
of
future
distributions,
if
any,
is
uncertain;
when
presented,
interest
rate
and
maturity
date
are
those
of
the
original
security.
EUR
Euro
JPY
Japanese
Yen
T.
ROWE
PRICE
Health
Sciences
Portfolio
The
accompanying
notes
are
an
integral
part
of
these
financial
statements.
AFFILIATED
COMPANIES
($000s)
The
fund
may
invest
in
certain
securities
that
are
considered
affiliated
companies.
As
defined
by
the
1940
Act,
an
affiliated
company
is
one
in
which
the
fund
owns
5%
or
more
of
the
outstanding
voting
securities,
or
a
company
that
is
under
common
ownership
or
control.
The
following
securities
were
considered
affiliated
companies
for
all
or
some
portion
of
the
year
ended
December
31,
2024.
Net
realized
gain
(loss),
investment
income,
change
in
net
unrealized
gain/loss,
and
purchase
and
sales
cost
reflect
all
activity
for
the
period
then
ended.
Affiliate
Net
Realized
Gain
(Loss)
Change
in
Net
Unrealized
Gain/Loss
Investment
Income
T.
Rowe
Price
Government
Reserve
Fund,
4.53%
$
—#
$
—
$
178+
Supplementary
Investment
Schedule
Affiliate
Value
12/31/23
Purchase
Cost
Sales
Cost
Value
12/31/24
T.
Rowe
Price
Government
Reserve
Fund,
4.53%
$
13,820
¤
¤
$
5,168^
#
Capital
gain
distributions
from
underlying
Price
funds
represented
$0
of
the
net
realized
gain
(loss).
+
Investment
income
comprised
$178
of
dividend
income
and
$0
of
interest
income.
¤
Purchase
and
sale
information
not
shown
for
cash
management
funds.
^
The
cost
basis
of
investments
in
affiliated
companies
was
$5,168.
T.
ROWE
PRICE
Health
Sciences
Portfolio
December
31,
2024
Statement
of
Assets
and
Liabilities
($000s,
except
shares
and
per
share
amounts)
The
accompanying
notes
are
an
integral
part
of
these
financial
statements.
Assets
Investments
in
securities,
at
value
(cost
$390,861)
$
665,584
Receivable
for
shares
sold
405
Dividends
and
interest
receivable
310
Foreign
currency
(cost
$68)
67
Other
assets
243
Total
assets
666,609
Liabilities
Payable
for
shares
redeemed
1,051
Investment
management
fees
payable
383
Due
to
affiliates
11
Payable
for
investment
securities
purchased
2
Payable
to
directors
1
Other
liabilities
237
Total
liabilities
1,685
NET
ASSETS
$
664,924
Net
Assets
Consist
of:
Total
distributable
earnings
(loss)
$
272,661
Paid-in
capital
applicable
to
13,748,588
shares
of
$0.0001
par
value
capital
stock
outstanding;
1,000,000,000
shares
of
the
Corporation
authorized
392,263
NET
ASSETS
$
664,924
NET
ASSET
VALUE
PER
SHARE
Health
Sciences
Portfolio
Class
(Net
assets:
$144,197;
Shares
outstanding:
2,813,070)
$
51.26
Health
Sciences
Portfolio
-
II
Class
(Net
assets:
$520,727;
Shares
outstanding:
10,935,518)
$
47.62
T.
ROWE
PRICE
Health
Sciences
Portfolio
The
accompanying
notes
are
an
integral
part
of
these
financial
statements.
ok
Year
Ended
12/31/24
Investment
Income
(Loss)
Income
Dividend
(net
of
foreign
taxes
of
$2)
$
5,083
.
Interest
34
Total
income
5,117
Expenses
Investment
management
and
administrative
expenses
(1)
2,263
Investment
management
3,188
Shareholder
servicing
Health
Sciences
Portfolio
Class
$
158
Health
Sciences
Portfolio
-
II
Class
575
733
Rule
12b-1
fees
Health
Sciences
Portfolio
-
II
Class
1,419
Prospectus
and
shareholder
reports
Health
Sciences
Portfolio
Class
7
Health
Sciences
Portfolio
-
II
Class
5
12
Custody
and
accounting
161
Legal
and
audit
46
Directors
2
Miscellaneous
18
Waived
/
paid
by
Price
Associates
(
24
)
Total
expenses
7,818
Net
investment
loss
(
2,701
)
Realized
and
Unrealized
Gain
/
Loss
–
Net
realized
gain
(loss)
Securities
60,875
Foreign
currency
transactions
7
Net
realized
gain
60,882
Change
in
net
unrealized
gain
/
loss
Securities
(
45,656
)
Other
assets
and
liabilities
denominated
in
foreign
currencies
(
24
)
Change
in
net
unrealized
gain
/
loss
(
45,680
)
Net
realized
and
unrealized
gain
/
loss
15,202
INCREASE
IN
NET
ASSETS
FROM
OPERATIONS
$
12,501
(1)
Prior
to
May
1,
2024,
the
fund
operated
under
an
all-inclusive
annual
fee
which
is
represented
as
"Investment
management
and
administrative
expense"
on
the
Statement
of
Operations.
See
Note
6.
T.
ROWE
PRICE
Health
Sciences
Portfolio
Statement
of
Changes
in
Net
Assets
The
accompanying
notes
are
an
integral
part
of
these
financial
statements.
Year
.
.
.
..
.
.
.
.
.
.
.
. ..
.
..
Ended
.
.
.
.
.
.
. .
.
.
.
.
..
..
.
12/31/24
12/31/23
Increase
(Decrease)
in
Net
Assets
Operations
Net
investment
loss
$
(
2,701
)
$
(
2,873
)
Net
realized
gain
60,882
35,439
Change
in
net
unrealized
gain
/
loss
(
45,680
)
(
14,658
)
Increase
in
net
assets
from
operations
12,501
17,908
Distributions
to
shareholders
Net
earnings
Health
Sciences
Portfolio
Class
(
12,695
)
(
5,381
)
Health
Sciences
Portfolio
-
II
Class
(
49,064
)
(
20,335
)
Decrease
in
net
assets
from
distributions
(
61,759
)
(
25,716
)
Capital
share
transactions
*
Shares
sold
Health
Sciences
Portfolio
Class
12,732
12,277
Health
Sciences
Portfolio
-
II
Class
59,360
48,189
Distributions
reinvested
Health
Sciences
Portfolio
Class
12,695
5,381
Health
Sciences
Portfolio
-
II
Class
49,064
20,335
Shares
redeemed
Health
Sciences
Portfolio
Class
(
25,898
)
(
15,613
)
Health
Sciences
Portfolio
-
II
Class
(
96,079
)
(
89,733
)
Increase
(decrease)
in
net
assets
from
capital
share
transactions
11,874
(
19,164
)
Net
Assets
Decrease
during
period
(
37,384
)
(
26,972
)
Beginning
of
period
702,308
729,280
End
of
period
$
664,924
$
702,308
*Share
information
(000s)
Shares
sold
Health
Sciences
Portfolio
Class
214
223
Health
Sciences
Portfolio
-
II
Class
1,065
931
Distributions
reinvested
Health
Sciences
Portfolio
Class
249
102
Health
Sciences
Portfolio
-
II
Class
1,035
409
Shares
redeemed
Health
Sciences
Portfolio
Class
(
440
)
(
283
)
Health
Sciences
Portfolio
-
II
Class
(
1,733
)
(
1,740
)
Increase
(decrease)
in
shares
outstanding
390
(
358
)
T.
ROWE
PRICE
Health
Sciences
Portfolio
NOTES
TO
FINANCIAL
STATEMENTS
T.
Rowe
Price
Equity
Series,
Inc. (the
corporation) is
registered
under
the
Investment
Company
Act
of
1940
(the
1940
Act).
The
Health
Sciences
Portfolio
(the
fund)
is a
diversified, open-end
management
investment
company
established
by
the
corporation. The
fund
seeks long-term
capital
appreciation.
Shares
of
the
fund
currently
are
offered
only
to
insurance
company
separate
accounts
established
for
the
purpose
of
funding
variable
annuity
contracts
and
variable
life
insurance
policies.
The
fund
has
two
classes
of
shares:
the Health
Sciences
Portfolio
(Health
Sciences
Portfolio
Class)
and
the Health
Sciences
Portfolio–II
(Health
Sciences
Portfolio–II
Class). Health
Sciences
Portfolio–II
Class
shares
are
sold
through
financial
intermediaries,
which
it
compensates
for
distribution,
shareholder
servicing,
and/or
certain
administrative
services
under
a
Board-approved
Rule
12b-1
plan.
Each
class
has
exclusive
voting
rights
on
matters
related
solely
to
that
class;
separate
voting
rights
on
matters
that
relate
to
both
classes;
and,
in
all
other
respects,
the
same
rights
and
obligations
as
the
other
class.
NOTE
1
-
SIGNIFICANT
ACCOUNTING
POLICIES
Basis
of
Preparation
The fund
is
an
investment
company
and
follows
accounting
and
reporting
guidance
in
the
Financial
Accounting
Standards
Board
(FASB)
Accounting
Standards
Codification
Topic
946
(ASC
946).
The
accompanying
financial
statements
were
prepared
in
accordance
with
accounting
principles
generally
accepted
in
the
United
States
of
America
(GAAP),
including,
but
not
limited
to,
ASC
946.
GAAP
requires
the
use
of
estimates
made
by
management.
Management
believes
that
estimates
and
valuations
are
appropriate;
however,
actual
results
may
differ
from
those
estimates,
and
the
valuations
reflected
in
the
accompanying
financial
statements
may
differ
from
the
value
ultimately
realized
upon
sale
or
maturity.
Investment
Transactions,
Investment
Income,
and
Distributions
Investment
transactions
are
accounted
for
on
the
trade
date
basis.
Income
and
expenses
are
recorded
on
the
accrual
basis.
Realized
gains
and
losses
are
reported
on
the
identified
cost
basis. Premiums
and
discounts
on
debt
securities
are
amortized
for
financial
reporting
purposes. Income
tax-related
interest
and
penalties,
if
incurred,
are
recorded
as
income
tax
expense. Dividends
received
from other
investment
companies are
reflected
as
dividend income;
capital
gain
distributions
are
reflected
as
realized
gain/
loss. Dividend
income and
capital
gain
distributions
are
recorded
on
the
ex-dividend
date. Non-cash
dividends,
if
any,
are
recorded
at
the
fair
market
value
of
the
asset
received. Proceeds
from
litigation
payments,
if
any,
are
included
in
either
net
realized
gain
(loss)
or
change
in
net
unrealized
gain/loss
from
securities. Distributions
to
shareholders
are
recorded
on
the
ex-dividend
date. Income
distributions,
if
any,
are
declared
and
paid
by
each
class annually. A
capital
gain
distribution,
if
any, may
also
be
declared
and
paid
by
the
fund
annually.
Currency
Translation
Assets,
including
investments,
and
liabilities
denominated
in
foreign
currencies
are
translated
into
U.S.
dollar
values
each
day
at
the
prevailing
exchange
rate,
using
the
mean
of
the
bid
and
asked
prices
of
such
currencies
against
U.S.
dollars
as
provided
by
an
outside
pricing
service.
Purchases
and
sales
of
securities,
income,
and
expenses
are
translated
into
U.S.
dollars
at
the
prevailing
exchange
rate
on
the
respective
date
of
such
transaction.
The
effect
of
changes
in
foreign
currency
exchange
rates
on
realized
and
unrealized
security
gains
and
losses
is
not
bifurcated
from
the
portion
attributable
to
changes
in
market
prices.
Class
Accounting
Investment
income,
investment
management
and
administrative
expense,
and
realized
and
unrealized
gains
and
losses
are
allocated
to
the
classes
based
upon
the
relative
daily
net
assets
of
each
class. Health
Sciences
Portfolio–II
Class
pays
Rule
12b-1
fees,
in
an
amount
not
exceeding
0.25%
of
the
class’s
average
daily
net
assets.
Capital
Transactions
Each
investor’s
interest
in
the
net
assets
of the
fund
is
represented
by
fund
shares. The
fund’s
net
asset
value
(NAV)
per
share
is
computed
at
the
close
of
the
New
York
Stock
Exchange
(NYSE),
normally
4
p.m.
Eastern
time,
each
day
the
NYSE
is
open
for
business.
However,
the
NAV
per
share
may
be
calculated
at
a
time
other
than
the
normal
close
of
the
NYSE
if
trading
on
the
NYSE
is
restricted,
if
the
NYSE
closes
earlier,
or
as
may
be
permitted
by
the
SEC.
Purchases
and
redemptions
of
fund
shares
are
transacted
at
the
next-computed
NAV
per
share,
after
receipt
of
the
transaction
order
by
T.
Rowe
Price
Associates,
Inc.,
or
its
agents.
New
Accounting
Guidance
In December
2023,
the
FASB
issued
Accounting
Standards
Update
(ASU),
ASU
2023-09,
Income
Taxes
(Topic
740)
–
Improvements
to
Income
Taxes
Disclosures,
which
enhances
the
transparency
of
income
tax
T.
ROWE
PRICE
Health
Sciences
Portfolio
disclosures.
The
ASU
requires
public
entities,
on
an
annual
basis,
to
provide
disclosure
of
specific
categories
in
the
rate
reconciliation,
as
well
as
disclosure
of
income
taxes
paid
disaggregated
by
jurisdiction.
The
amendments
under
this
ASU
are
required
to
be
applied
prospectively
and
are
effective
for
fiscal
years
beginning
after
December
15,
2024.
Management
expects
that
adoption
of
the
guidance
will
not
have
a
material
impact
on
the
fund’s
financial
statements.
Indemnification
In
the
normal
course
of
business, the
fund
may
provide
indemnification
in
connection
with
its
officers
and
directors,
service
providers,
and/or
private
company
investments. The
fund’s
maximum
exposure
under
these
arrangements
is
unknown;
however,
the
risk
of
material
loss
is
currently
considered
to
be
remote.
NOTE
2
-
VALUATION
Fair
Value
The
fund’s
financial
instruments
are
valued
at
the
close
of
the
NYSE
and
are
reported
at
fair
value,
which
GAAP
defines
as
the
price
that
would
be
received
to
sell
an
asset
or
paid
to
transfer
a
liability
in
an
orderly
transaction
between
market
participants
at
the
measurement
date. The fund’s
Board
of
Directors
(the
Board)
has
designated
T.
Rowe
Price
Associates,
Inc.
as
the
fund’s
valuation
designee
(Valuation
Designee).
Subject
to
oversight
by
the
Board,
the
Valuation
Designee
performs
the
following
functions
in
performing
fair
value
determinations:
assesses
and
manages
valuation
risks;
establishes
and
applies
fair
value
methodologies;
tests
fair
value
methodologies;
and
evaluates
pricing
vendors
and
pricing
agents.
The
duties
and
responsibilities
of
the
Valuation
Designee
are
performed
by
its
Valuation
Committee. The
Valuation
Designee provides
periodic
reporting
to
the
Board
on
valuation
matters.
Various
valuation
techniques
and
inputs
are
used
to
determine
the
fair
value
of
financial
instruments.
GAAP
establishes
the
following
fair
value
hierarchy
that
categorizes
the
inputs
used
to
measure
fair
value:
Level
1
–
quoted
prices
(unadjusted)
in
active
markets
for
identical
financial
instruments
that
the
fund
can
access
at
the
reporting
date
Level
2
–
inputs
other
than
Level
1
quoted
prices
that
are
observable,
either
directly
or
indirectly
(including,
but
not
limited
to,
quoted
prices
for
similar
financial
instruments
in
active
markets,
quoted
prices
for
identical
or
similar
financial
instruments
in
inactive
markets,
interest
rates
and
yield
curves,
implied
volatilities,
and
credit
spreads)
Level
3
–
unobservable
inputs
(including
the Valuation
Designee’s assumptions
in
determining
fair
value)
Observable
inputs
are
developed
using
market
data,
such
as
publicly
available
information
about
actual
events
or
transactions,
and
reflect
the
assumptions
that
market
participants
would
use
to
price
the
financial
instrument.
Unobservable
inputs
are
those
for
which
market
data
are
not
available
and
are
developed
using
the
best
information
available
about
the
assumptions
that
market
participants
would
use
to
price
the
financial
instrument.
GAAP
requires
valuation
techniques
to
maximize
the
use
of
relevant
observable
inputs
and
minimize
the
use
of
unobservable
inputs.
When
multiple
inputs
are
used
to
derive
fair
value,
the
financial
instrument
is
assigned
to
the
level
within
the
fair
value
hierarchy
based
on
the
lowest-level
input
that
is
significant
to
the
fair
value
of
the
financial
instrument.
Input
levels
are
not
necessarily
an
indication
of
the
risk
or
liquidity
associated
with
financial
instruments
at
that
level
but
rather
the
degree
of
judgment
used
in
determining
those
values.
Valuation
Techniques
Equity
securities,
including
exchange-traded
funds, listed
or
regularly
traded
on
a
securities
exchange
or
in
the
over-the-counter
(OTC)
market
are
valued
at
the
last
quoted
sale
price
or,
for
certain
markets,
the
official
closing
price
at
the
time
the
valuations
are
made.
OTC
Bulletin
Board
securities
are
valued
at
the
mean
of
the
closing
bid
and
asked
prices.
A
security
that
is
listed
or
traded
on
more
than
one
exchange
is
valued
at
the
quotation
on
the
exchange
determined
to
be
the
primary
market
for
such
security.
Listed
securities
not
traded
on
a
particular
day
are
valued
at
the
mean
of
the
closing
bid
and
asked
prices
for
domestic
securities
and
the
last
quoted
sale
or
closing
price
for
international
securities.
The
last
quoted
prices
of
non-U.S.
equity
securities
may
be
adjusted
to
reflect
the
fair
value
of
such
securities
at
the
close
of
the
NYSE,
if
the Valuation
Designee
determines
that
developments
between
the
close
of
a
foreign
market
and
the
close
of
the
NYSE
will
affect
the
value
of
some
or
all
of
the
fund’s portfolio
securities.
Each
business
day,
the
Valuation
Designee uses
information
from
outside
pricing
services
to
evaluate
the
quoted
prices
of
portfolio
securities
and,
if
appropriate,
decide whether
it
is
necessary
to
adjust
quoted
prices
to
reflect
fair
value
by
reviewing
a
variety
of
T.
ROWE
PRICE
Health
Sciences
Portfolio
factors,
including
developments
in
foreign
markets,
the
performance
of
U.S.
securities
markets,
and
the
performance
of
instruments
trading
in
U.S.
markets
that
represent
foreign
securities
and
baskets
of
foreign
securities. The Valuation
Designee
uses
outside
pricing
services
to
provide
it
with
quoted
prices
and
information
to
evaluate
or
adjust
those
prices.
The Valuation
Designee
cannot
predict
how
often
it
will
use
quoted
prices
and
how
often
it
will
determine
it
necessary
to
adjust
those
prices
to
reflect
fair
value.
Debt
securities
generally
are
traded
in
the over-the-counter
(OTC)
market
and
are
valued
at
prices
furnished
by
independent
pricing
services
or
by
broker
dealers
who
make
markets
in
such
securities.
When
valuing
securities,
the
independent
pricing
services
consider
factors
such
as,
but
not
limited
to,
the
yield
or
price
of
bonds
of
comparable
quality,
coupon,
maturity,
and
type,
as
well
as
prices
quoted
by
dealers
who
make
markets
in
such
securities.
Investments
in
mutual
funds
are
valued
at
the
mutual
fund’s
closing
NAV
per
share
on
the
day
of
valuation.
Assets
and
liabilities
other
than
financial
instruments,
including
short-term
receivables
and
payables,
are
carried
at
cost,
or
estimated
realizable
value,
if
less,
which
approximates
fair
value.
Investments
for
which
market
quotations are
not
readily
available
or
deemed
unreliable
are
valued
at
fair
value
as
determined
in
good
faith
by
the
Valuation
Designee.
The
Valuation
Designee
has
adopted
methodologies
for
determining
the
fair
value
of
investments
for
which
market
quotations
are
not
readily
available
or
deemed
unreliable,
including
the
use
of
other
pricing
sources.
Factors
used
in
determining
fair
value
vary
by
type
of
investment
and
may
include
market
or
investment
specific
considerations.
The
Valuation
Designee typically
will
afford
greatest
weight
to
actual
prices
in
arm’s
length
transactions,
to
the
extent
they
represent
orderly
transactions
between
market
participants,
transaction
information
can
be
reliably
obtained,
and
prices
are
deemed
representative
of
fair
value.
However,
the
Valuation
Designee may
also
consider
other
valuation
methods
such
as
market-based
valuation
multiples;
a
discount
or
premium
from
market
value
of
a
similar,
freely
traded
security
of
the
same
issuer;
discounted
cash
flows;
yield
to
maturity;
or
some
combination.
Fair
value
determinations
are
reviewed
on
a
regular
basis.
Because
any
fair
value
determination
involves
a
significant
amount
of
judgment,
there
is
a
degree
of
subjectivity
inherent
in
such
pricing
decisions. Fair
value
prices
determined
by
the
Valuation
Designee could
differ
from
those
of
other
market
participants,
and
it
is
possible
that
the
fair
value
determined
for
a
security
may
be
materially
different
from
the
value
that
could
be
realized
upon
the
sale
of
that
security.
Valuation
Inputs
The
following
table
summarizes
the
fund’s
financial
instruments,
based
on
the
inputs
used
to
determine
their
fair
values
on
December
31,
2024
(for
further
detail
by
category,
please
refer
to
the
accompanying
Portfolio
of
Investments):
($000s)
Level
1
Level
2
Level
3
Total
Value
Assets
Common
Stocks
$
619,315
$
10,200
$
1,092
$
630,607
Convertible
Bonds
—
620
775
1,395
Convertible
Preferred
Stocks
—
—
26,578
26,578
Preferred
Stocks
—
1,836
—
1,836
Short-Term
Investments
5,168
—
—
5,168
Total
$
624,483
$
12,656
$
28,445
$
665,584
T.
ROWE
PRICE
Health
Sciences
Portfolio
Following
is
a
reconciliation
of
the
fund’s
Level
3
holdings
for
the
year ended
December
31,
2024.
Gain
(loss)
reflects
both
realized
and
change
in
unrealized
gain/loss
on
Level
3
holdings
during
the
period,
if
any,
and
is
included
on
the
accompanying
Statement
of
Operations.
The
change
in
unrealized
gain/loss
on
Level
3
instruments
held
at
December
31,
2024,
totaled $(4,434,000) for
the
year ended
December
31,
2024.
During
the
year,
transfers
into
Level
3
resulted
from
a
lack
of
observable
market
data
for
the
security.
In
accordance
with
GAAP,
the
following
table
provides
quantitative
information
about
significant
unobservable
inputs
used
to
determine
the
fair
valuations
of
the
fund’s
Level
3
assets,
by
class
of
financial
instrument.
Because
the
Valuation
Designee
considers
a
wide
variety
of
factors
and
inputs,
both
observable
and
unobservable,
in
determining
fair
values,
the
unobservable
inputs
presented
do
not
reflect
all
inputs
significant
to
the
fair
value
determination.
($000s)
Beginning
Balance
12/31/23
Gain
(Loss)
During
Period
Total
Purchases
Total
Sales
Transfer
Into
Level
3
Ending
Balance
12/31/24
Investment
in
Securities
Common
Stocks
$
1,481
$
(685)
$
690
$
(405)
$
11
$
1,092
Convertible
Bonds
—
—
775
—
—
775
Convertible
Preferred
Stocks
30,591
(7,078)
6,680
(3,615)
—
26,578
Total
$
32,072
$
(7,763)
$
8,145
$
(4,020)
$
11
$
28,445
Investments
in
Securities
Value
(000s)
Valuation
Technique(s)+
Significant
Unobservable
Input(s)
Value
or
Range
of
Input(s)
Weighted
Average
of
Input(s)*
Impact
to
Valuation
from
an
Increase
in
Input**
Common
Stocks
$
1,092
Recent
comparable
transaction
price(s)
—#
—#
—#
—#
Discount
for
illiquidity
—#
—#
—#
Discount
for
uncertainty
5%
-
100%
36%
Decrease
Market
comparable
Enterprise
value
to
sales
multiple
2.2x
–
6.9x
5.4x
Increase
Enterprise
value
to
gross
profit
multiple
5.0x
–
10.0x
8.4x
Increase
Discount
for
lack
of
marketability
10%
10%
Decrease
Expected
present
value
Discount
rate
for
cost
of
equity
6%
6%
Decrease
Discount
for
regulatory
uncertainty
30%
30%
Decrease
Options
pricing
model
Private
company
valuation
—#
—#
—#
Risk-free
rate
4%
4%
Increase
Volatility
33%
33%
Increase
Convertible
Bonds
$775
Recent
comparable
transaction
price(s)
—#
—#
—#
—#
Convertible
Preferred
Stocks
$26,578
Recent
comparable
transaction
price(s)
—#
—#
—#
—#
Conversion
ratio
—#
—#
—#
T.
ROWE
PRICE
Health
Sciences
Portfolio
+
Valuation
techniques
may
change
in
order
to
reflect the
Valuation
Designee’s
judgment
of
current
market
participant
assumptions.
*
Unobservable
inputs
were
weighted
by
the
relative
fair
value
of
the
instruments.
**
Represents
the
directional
change
in
the
fair
value
of
the
Level
3
investment(s)
that
would
have
resulted
from
an
increase
in
the
corresponding
input
at
period
end.
A
decrease
in
the
unobservable
input
would
have
had
the
opposite
effect.
Significant
increases
and
decreases
in
these
inputs
in
isolation
could
result
in
significantly
higher
or
lower
fair
value
measurements.
#
No
quantitative
unobservable
inputs
significant
to
the
valuation
technique
were
created
by
the
Valuation
Designee.
Investments
in
Securities
Value
(000s)
Valuation
Technique(s)+
Significant
Unobservable
Input(s)
Value
or
Range
of
Input(s)
Weighted
Average
of
Input(s)*
Impact
to
Valuation
from
an
Increase
in
Input**
Private
company
valuation
—#
—#
—#
Discount
for
dilution
12%
12%
Decrease
Discount
for
uncertainty
25%
-
50%
27%
Decrease
Market
comparable
Premium
for
liquidation
preference
—#
—#
—#
Conversion
ratio
—#
—#
—#
Premium
to
public
company
multiples
59%
-
147%
102%
Increase
Enterprise
value
to
sales
multiple
1.5x
–
8.7x
6.9x
Increase
Projected
enterprise
value
to
sales
multiple
4.4x
–
8.7x
7.6x
Increase
Sales
growth
rate
5%
-
124%
76%
Increase
Enterprise
value
to
gross
profit
multiple
4.9x
–
21.6x
16.0x
Increase
Projected
enterprise
value
to
gross
profit
multiple
8.1x
–
21.6x
16.7x
Increase
Gross
profit
growth
rate
61%
-
171%
116%
Increase
Enterprise
value
to
EBITDA
multiple
11.5x
-
16.1x
13.8x
Increase
EBITDA
growth
rate
56%
56%
Increase
Projected
enterprise
value
to
EBITDA
multiple
37.6x
37.6x
Increase
Probability
for
potential
outcome
10%
-
70%
35%
Increase
Discount
to
public
company
multiples
43%
-
52%
48%
Decrease
Discount
rate
for
cost
of
capital
10%
-
30%
15%
Decrease
Discount
for
uncertainty
100%
100%
Decrease
Discount
for
lack
of
marketability
10%
10%
Decrease
Options
pricing
model
Private
company
valuation
—#
—#
—#
Risk-free
rate
4%
4%
Increase
Volatility
41%
41%
Increase
T.
ROWE
PRICE
Health
Sciences
Portfolio
NOTE
3
-
OTHER
INVESTMENT
TRANSACTIONS
Consistent
with
its
investment
objective, the
fund
engages
in
the
following
practices
to
manage
exposure
to
certain
risks
and/or
to
enhance
performance.
The
investment
objective,
policies,
program,
and
risk
factors
of the
fund
are
described
more
fully
in the
fund’s prospectus
and
Statement
of
Additional
Information.
Restricted
Securities
The
fund
invests
in
securities
that
are
subject
to
legal
or
contractual
restrictions
on
resale.
Prompt
sale
of
such
securities
at
an
acceptable
price
may
be
difficult
and
may
involve
substantial
delays
and
additional
costs.
Other
Purchases
and
sales
of
portfolio
securities
other
than
in-kind
transactions,
if
any,
and short-term securities
aggregated $358,224,000 and
$402,636,000,
respectively,
for
the
year ended
December
31,
2024.
NOTE
4
-
FEDERAL
INCOME
TAXES
Generally,
no
provision
for
federal
income
taxes
is
required
since
the
fund
intends
to continue
to
qualify
as
a
regulated
investment
company
under
Subchapter
M
of
the
Internal
Revenue
Code
and
distribute
to
shareholders
all
of
its taxable
income
and
gains.
Distributions
determined
in
accordance
with
federal
income
tax
regulations
may
differ
in
amount
or
character
from
net
investment
income
and
realized
gains
for
financial
reporting
purposes.
The
fund
files
U.S.
federal,
state,
and
local
tax
returns
as
required.
The
fund’s
tax
returns
are
subject
to
examination
by
the
relevant
tax
authorities
until
expiration
of
the
applicable
statute
of
limitations,
which
is
generally
three
years
after
the
filing
of
the
tax
return
but
which
can
be
extended
to
six
years
in
certain
circumstances.
Tax
returns
for
open
years
have
incorporated
no
uncertain
tax
positions
that
require
a
provision
for
income
taxes.
Capital
accounts
within
the
financial
reporting
records
are
adjusted
for
permanent
book/tax
differences
to
reflect
tax
character
but
are
not
adjusted
for
temporary
differences.
The
permanent
book/tax
adjustments,
if
any,
have
no
impact
on
results
of
operations
or
net
assets.
The
permanent
book/tax
adjustments
relate
primarily
to
the
current
net
operating
loss
and
the
character
of
income
on
passive
foreign
investment
companies.
The
tax
character
of
distributions
paid
for
the
periods
presented
was
as
follows:
At
December
31,
2024,
the
tax-basis
cost
of
investments
(including
derivatives,
if
any)
and
gross
unrealized
appreciation
and
depreciation
were as
follows:
At
December
31,
2024,
the
tax-basis
components
of
accumulated
net
earnings
(loss)
were
as
follows:
($000s)
December
31,
2024
December
31,
2023
Long-term
capital
gain
$
61,759
$
25,716
($000s)
Cost
of
investments
$
397,299
Unrealized
appreciation
$
304,942
Unrealized
depreciation
(36,659)
Net
unrealized
appreciation
(depreciation)
$
268,283
($000s)
Undistributed
long-term
capital
gain
$
4,378
Net
unrealized
appreciation
(depreciation)
268,283
Total
distributable
earnings
(loss)
$
272,661
T.
ROWE
PRICE
Health
Sciences
Portfolio
Temporary
differences
between
book-basis
and
tax-basis
components
of
total
distributable
earnings
(loss)
arise
when
certain
items
of
income,
gain,
or
loss
are
recognized
in
different
periods
for
financial
statement
purposes
versus
for
tax
purposes;
these
differences
will
reverse
in
a
subsequent
reporting
period.
The
temporary
differences
relate
primarily
to
the
deferral
of
losses
from
wash
sales
and
the
realization
of
gains/losses
on
passive
foreign
investment
companies.
NOTE
5
-
FOREIGN TAXES
The
fund
is
subject
to
foreign
income
taxes
imposed
by
certain
countries
in
which
it
invests.
Additionally,
capital
gains
realized
upon
disposition
of
securities
issued
in
or
by
certain
foreign
countries
are
subject
to
capital
gains
tax
imposed
by
those
countries.
All
taxes
are
computed
in
accordance
with
the
applicable
foreign
tax
law,
and,
to
the
extent
permitted,
capital
losses
are
used
to
offset
capital
gains.
Taxes
attributable
to
income
are
accrued
by
the
fund
as
a
reduction
of
income.
Current
and
deferred
tax
expense
attributable
to
capital
gains
is
reflected
as
a
component
of
realized
or
change
in
unrealized
gain/loss
on
securities
in
the
accompanying
financial
statements.
To
the
extent
that
the
fund
has
country
specific
capital
loss
carryforwards,
such
carryforwards
are
applied
against
net
unrealized
gains
when
determining
the
deferred
tax
liability.
Any
deferred
tax
liability
incurred
by
the
fund
is
included
in
either
Other
liabilities
or
Deferred
tax
liability
on
the
accompanying
Statement
of
Assets
and
Liabilities.
NOTE
6
-
RELATED
PARTY
TRANSACTIONS
The
fund
is
managed
by
T.
Rowe
Price
Associates,
Inc.
(Price
Associates),
a
wholly
owned
subsidiary
of
T.
Rowe
Price
Group,
Inc.
(Price
Group).
The
investment
management
agreement
between
the
fund
and
Price
Associates
provides
for
an
annual
investment
management
fee,
which
is
computed
daily
and
paid
monthly. The
fee
consists
of
an
individual
fund
fee,
equal
to
0.37%
of
the
fund’s
average
daily
net
assets,
and
a
group
fee.
The
group
fee
rate
is
calculated
based
on
the
combined
net
assets
of
certain
mutual
funds
sponsored
by
Price
Associates
(the
group)
applied
to
a
graduated
fee
schedule,
with
rates
ranging
from
0.48%
for
the
first
$1
billion
of
assets
to
0.260%
for
assets
in
excess
of
$845
billion.
The
fund’s
group
fee
is
determined
by
applying
the
group
fee
rate
to
the
fund’s
average
daily
net
assets. At
December
31,
2024,
the
effective
annual
group
fee
rate
was
0.28%.
Prior
to
May
1,
2024,
the
fund
paid
an
annual
all-inclusive
fee
equal
to
0.95%
of
the
fund’s
average
daily
net
assets,
which
was
computed
daily
and
paid
monthly.
The
annual
all-inclusive
fee
covered
investment
management
services
and
ordinary,
recurring
operating
expenses
but
did
not
cover
interest
expense;
expenses
related
to
borrowing,
taxes,
and
brokerage;
or
nonrecurring,
extraordinary
expenses.
Prior
to
May
1,
2024,
Price
Associates
had
also
contractually
agreed,
through
April
30,
2024,
to
waive
a
portion
of
its
management
fee
in
order
to
limit
the
fund’s
management
fee
to
0.94%
of
the
fund’s
average
daily
net
assets.
Fees
waived
and
expenses
paid
under
this
agreement
are
not
subject
to
reimbursement
to
Price
Associates
by
the
fund. The
total
management
fees
waived
through
April
30,
2024
were $24,000
and
allocated
ratably
in
the
amounts
of
$5,000 and
$19,000 for
the Health
Sciences
Portfolio
Class
and Health
Sciences
Portfolio-II
Class,
respectively.
Effective
May
1,
2024, the
fund
is
subject
to
a
permanent
contractual
expense
limitation,
pursuant
to
which
Price
Associates
is
required
to
waive or
pay
any
expenses
(excluding
interest;
expenses
related
to
borrowings,
taxes,
and
brokerage;
non-recurring,
extraordinary
expenses;
acquired
fund
fees
and
expenses;
and
12b-1
fees,
if
any)
that
would
otherwise
cause
the class’s
ratio
of
annualized
total
expenses
to
average
net
assets
(net
expense
ratio)
to
exceed
0.94%.
The
agreement
may
only
be
terminated
with
approval
by
the
fund’s
shareholders.
Each
class is
required
to
repay
Price
Associates
for
expenses
previously
waived/paid
to
the
extent
the class’s
net
assets
grow
or
expenses
decline
sufficiently
to
allow
repayment
without
causing
the class’s
net
expense
ratio
(after
the
repayment
is
taken
into
account)
to
exceed
the
lesser
of:
(1)
the
expense
limitation
in
place
at
the
time
such
amounts
were
waived;
or
(2)
the class’s
current
expense
limitation.
However,
no
repayment
will
be
made
more
than
three
years
after
the
date
of
a
payment
or
waiver. No
management
fees
were
waived
or
any
expenses
paid
under
this
arrangement
during the
period May
1,
2024
through December
31,
2024.
In
addition,
the
fund
has
entered
into
service
agreements
with
Price
Associates
and
a
wholly
owned
subsidiary
of
Price
Associates,
each
an
affiliate
of
the
fund
(collectively,
Price).
Price
Associates
provides
certain
accounting
and
administrative
services
to
the
fund.
T.
Rowe
Price
Services,
Inc.
provides
shareholder
and
administrative
services
in
its
T.
ROWE
PRICE
Health
Sciences
Portfolio
capacity
as
the
fund’s
transfer
and
dividend-disbursing
agent.
Prior
to
May
1,
2024,
pursuant
to
the
annual
all-inclusive
fee
arrangement
under
the
investment
management
and
administrative
agreement,
expenses
incurred
by
the
fund
pursuant
to
these
service
agreements
were
paid
by
Price
Associates.
For
the
period
May
1,
2024
through
December
31,
2024,
expenses
incurred
pursuant
to
these
service
agreements
were
$81,000
for
Price
Associates
and
$7,000
for
T.
Rowe
Price
Services,
Inc.
All
amounts
due
to
and
due
from
Price,
exclusive
of
investment
management
fees
payable,
are
presented
net
on
the
accompanying
Statement
of
Assets
and
Liabilities.
T.
Rowe
Price
Investment
Services,
Inc.
(Investment
Services)
serves
as
distributor
to
the
fund.
Pursuant
to
an
underwriting
agreement,
no
compensation
for
any
distribution
services
provided
is
paid
to
Investment
Services
by
the
fund
(except
for
12b-1
fees
under
a
Board-approved
Rule
12b-1
plan).
The fund
may
invest
its
cash
reserves
in
certain
open-end
management
investment
companies
managed
by
Price
Associates
and
considered
affiliates
of
the
fund:
the
T.
Rowe
Price
Government
Reserve
Fund
or
the
T.
Rowe
Price
Treasury
Reserve
Fund,
organized
as
money
market
funds
(together,
the
Price
Reserve
Funds).
The
Price
Reserve
Funds
are
offered
as
short-term
investment
options
to
mutual
funds,
trusts,
and
other
accounts
managed
by
Price
Associates
or
its
affiliates
and
are
not
available
for
direct
purchase
by
members
of
the
public.
Cash
collateral
from
securities
lending,
if
any,
is
invested
in
the
T.
Rowe
Price
Government
Reserve Fund. The
Price
Reserve
Funds
pay
no
investment
management
fees.
The fund may
participate
in
securities
purchase
and
sale
transactions
with
other
funds
or
accounts
advised
by
Price
Associates
(cross
trades),
in
accordance
with
procedures
adopted
by the
fund’s
Board
and
Securities
and
Exchange
Commission
rules,
which
require,
among
other
things,
that
such
purchase
and
sale
cross
trades
be
effected
at
the
independent
current
market
price
of
the
security.
During
the
year
ended
December
31,
2024,
the
fund
had
no
purchases
or
sales
cross
trades
with
other
funds
or
accounts
advised
by
Price
Associates.
NOTE
7
-
SEGMENT
REPORTING
Operating
segments
are
defined
as
components
of
a
company
that
engage
in
business
activities
and
for
which
discrete
financial
information
is
available
and
regularly
reviewed
by
the
chief
operating
decision
maker
(CODM)
in
deciding
how
to
allocate
resources
and
assess
performance.
The
Management
Committee
of
Price
Associates
acts
as
the
fund’s
CODM.
The
fund
makes
investments
in
accordance
with
its
investment
objective
as
outlined
in
the
Prospectus
and
is
considered
one
reportable
segment
because
the
CODM
allocates
resources
and
assesses
the
operating
results
of
the
fund
on
the
whole.
The
fund’s
revenue
is
derived
from
investments
in
portfolio
of
securities.
The
CODM
allocates
resources
and
assesses
performance
based
on
the
operating
results
of
the
fund,
which
is
consistent
with
the
results
presented
in
the
statement
of
operations,
statement
of
changes
in
net
assets
and
financial
highlights.
The
CODM
compares
the
fund’s
performance
to
its
benchmark
index
and
evaluates
the
positioning
of
the
fund
in
relation
to
its
investment
objective.
The
measure
of
segment
assets
is
net
assets
of
the
fund
which
is
disclosed
in
the
statement
of
assets
and
liabilities.
The
accounting
policies
of
the
segment
are
the
same
as
those
described
in
the
summary
of
significant
accounting
policies.
The
financial
statements
include
all
details
of
the
segment
assets,
segment
revenue
and
expenses;
and
reflect
the
financial
results
of
the
segment.
NOTE
8
-
OTHER
MATTERS
Unpredictable environmental,
political,
social
and
economic
events,
including
but
not
limited
to,
environmental
or
natural
disasters,
war
and
conflict
(including
Russia’s
military
invasion
of
Ukraine
and
the
conflict
in
Israel,
Gaza
and
surrounding
areas),
terrorism,
geopolitical
developments
(including
trading
and
tariff
arrangements,
sanctions
and
cybersecurity
attacks),
and
public
health
epidemics
(including
the
global
outbreak
of
COVID-19)
and
similar
public
health
threats,
may
significantly
affect
the
economy
and
the
markets
and
issuers
in
which
a
fund
invests.
The
extent
and
duration
of
such
events
and
resulting
market
disruptions
cannot
be
predicted.
These
and
other
similar
events
may
cause
instability
across
global
markets,
including
reduced
liquidity
and
disruptions
in
trading
markets,
while
some
events
may
affect
certain
T.
ROWE
PRICE
Health
Sciences
Portfolio
geographic
regions,
countries,
sectors,
and
industries
more
significantly
than
others,
and
exacerbate
other
pre-existing
political,
social,
and
economic
risks.
The
fund’s
performance
could
be
negatively
impacted
if
the
value
of
a
portfolio
holding
were
harmed
by
these
or
such
events.
Management
actively
monitors
the
risks
and
financial
impacts
arising
from
such
events.
T.
ROWE
PRICE
Health
Sciences
Portfolio
Report
of
Independent
Registered
Public
Accounting
Firm
To
the
Board
of
Directors
of
T.
Rowe
Price
Equity
Series,
Inc.
and
Shareholders
of
T.
Rowe
Price
Health
Sciences
Portfolio
Opinion
on
the
Financial
Statements
We
have
audited
the
accompanying
statement
of
assets
and
liabilities,
including
the
portfolio
of
investments,
of
T.
Rowe
Price
Health
Sciences
Portfolio
(one
of
the
portfolios
constituting
T.
Rowe
Price
Equity
Series,
Inc.,
referred
to
hereafter
as
the
"Fund")
as
of
December
31,
2024,
the
related
statement
of
operations
for
the
year
ended
December
31,
2024,
the
statement
of
changes
in
net
assets
for
each
of
the
two
years
in
the
period
ended
December
31,
2024,
including
the
related
notes,
and
the
financial
highlights
for
each
of
the
five
years
in
the
period
ended
December
31,
2024
(collectively
referred
to
as
the
“financial
statements”).
In
our
opinion,
the
financial
statements
present
fairly,
in
all
material
respects,
the
financial
position
of
the
Fund
as
of
December
31,
2024,
the
results
of
its
operations
for
the
year
then
ended,
the
changes
in
its
net
assets
for
each
of
the
two
years
in
the
period
ended
December
31,
2024
and
the
financial
highlights
for
each
of
the
five
years
in
the
period
ended
December
31,
2024
in
conformity
with
accounting
principles
generally
accepted
in
the
United
States
of
America.
Basis
for
Opinion
These
financial
statements
are
the
responsibility
of
the
Fund’s
management.
Our
responsibility
is
to
express
an
opinion
on
the
Fund’s
financial
statements
based
on
our
audits.
We
are
a
public
accounting
firm
registered
with
the
Public
Company
Accounting
Oversight
Board
(United
States)
(PCAOB)
and
are
required
to
be
independent
with
respect
to
the
Fund
in
accordance
with
the
U.S.
federal
securities
laws
and
the
applicable
rules
and
regulations
of
the
Securities
and
Exchange
Commission
and
the
PCAOB.
We
conducted
our
audits
of
these
financial
statements
in
accordance
with
the
standards
of
the
PCAOB.
Those
standards
require
that
we
plan
and
perform
the
audit
to
obtain
reasonable
assurance
about
whether
the
financial
statements
are
free
of
material
misstatement,
whether
due
to
error
or
fraud.
Our
audits
included
performing
procedures
to
assess
the
risks
of
material
misstatement
of
the
financial
statements,
whether
due
to
error
or
fraud,
and
performing
procedures
that
respond
to
those
risks.
Such
procedures
included
examining,
on
a
test
basis,
evidence
regarding
the
amounts
and
disclosures
in
the
financial
statements.
Our
audits
also
included
evaluating
the
accounting
principles
used
and
significant
estimates
made
by
management,
as
well
as
evaluating
the
overall
presentation
of
the
financial
statements.
Our
procedures
included
confirmation
of
securities
owned
as
of
December
31,
2024
by
correspondence
with
the
custodians,
transfer
agent
and
brokers;
when
replies
were
not
received
from
brokers,
we
performed
other
auditing
procedures.
We
believe
that
our
audits
provide
a
reasonable
basis
for
our
opinion.
/s/
PricewaterhouseCoopers
LLP
Baltimore,
Maryland
February
12,
2025
We
have
served
as
the
auditor
of
one
or
more
investment
companies
in
the
T.
Rowe
Price
group
of
investment
companies
since
1973.
T.
ROWE
PRICE
Health
Sciences
Portfolio
TAX
INFORMATION
(UNAUDITED)
FOR
THE
TAX
YEAR
ENDED 12/31/24
We
are
providing
this
information
as
required
by
the
Internal
Revenue
Code.
The
amounts
shown
may
differ
from
those
elsewhere
in
this
report
because
of
differences
between
tax
and
financial
reporting
requirements.
The
fund’s
distributions
to
shareholders
included
$61,759,000
from
long-term
capital
gains,
subject
to
a
long-term
capital
gains
tax
rate
of
not
greater
than
20%.
For
taxable
non-corporate
shareholders,
$4,256,000
of
the
fund's
income
represents
qualified
dividend
income
subject
to
a
long-term
capital
gains
tax
rate
of
not
greater
than
20%.
For
corporate
shareholders,
$3,740,000
of
the
fund's
income
qualifies
for
the
dividends-received
deduction.
100
East
Pratt
Street
Baltimore,
MD
21202
T.
Rowe
Price
Investment
Services,
Inc.
Call
1-800-225-5132
to
request
a
prospectus
or
summary
prospectus;
each
includes
investment
objectives,
risks,
fees,
expenses,
and
other
information
that
you
should
read
and
consider
carefully
before
investing.
E309-050
2/25
Item 8. Changes in and Disagreements with Accountants for Open-End Management Investment Companies.
Not applicable.
Item 9. Proxy Disclosures for Open-End Management Investment Companies.
Not applicable.
Item 10. Remuneration Paid to Directors, Officers, and Others of Open-End Management Investment Companies.
Remuneration paid to Directors is included in Item 7 of this Form N-CSR.
Item 11. Statement Regarding Basis for Approval of Investment Advisory Contract.
If applicable, see Item 7.
Item 12. Disclosure of Proxy Voting Policies and Procedures for Closed-End Management Investment Companies.
Not applicable.
Item 13. Portfolio Managers of Closed-End Management Investment Companies.
Not applicable.
Item 14. Purchases of Equity Securities by Closed-End Management Investment Company and Affiliated Purchasers.
Not applicable.
Item 15. Submission of Matters to a Vote of Security Holders.
There has been no change to the procedures by which shareholders may recommend nominees to the registrant’s board of directors.
Item 16. Controls and Procedures.
(a) The registrant’s principal executive officer and principal financial officer have evaluated the registrant’s disclosure controls and procedures within 90 days of this filing and have concluded that the registrant’s disclosure controls and procedures were effective, as of that date, in ensuring that information required to be disclosed by the registrant in this Form N-CSR was recorded, processed, summarized, and reported timely.
(b) The registrant’s principal executive officer and principal financial officer are aware of no change in the registrant’s internal control over financial reporting that occurred during the period covered by this report that has materially affected, or is reasonably likely to materially affect, the registrant’s internal control over financial reporting.
Item 17. Disclosure of Securities Lending Activities for Closed-End Management Investment Companies.
Not applicable.
Item 18. Recovery of Erroneously Awarded Compensation.
Not applicable.
Item 19. Exhibits.
SIGNATURES
Pursuant to the requirements of the Securities Exchange Act of 1934 and the Investment Company Act of 1940, the registrant has duly caused this report to be signed on its behalf by the undersigned, thereunto duly authorized.
| | | | |
| T. Rowe Price Equity Series, Inc. |
| By | | /s/ David Oestreicher | | |
| | David Oestreicher | | |
| | Principal Executive Officer | | |
| | |
| Date | | February 12, 2025 | | |
Pursuant to the requirements of the Securities Exchange Act of 1934 and the Investment Company Act of 1940, this report has been signed below by the following persons on behalf of the registrant and in the capacities and on the dates indicated.
| | | | |
| By | | /s/ David Oestreicher | | |
| | David Oestreicher | | |
| | Principal Executive Officer | | |
| | |
| Date | | February 12, 2025 | | |
| | | | |
| By | | /s/ Alan S. Dupski | | |
| | Alan S. Dupski | | |
| | Principal Financial Officer | | |
| | |
| Date | | February 12, 2025 | | |