UNITED STATES
SECURITIES AND EXCHANGE COMMISSION
Washington, D.C. 20549
FORM N-CSR
CERTIFIED SHAREHOLDER REPORT OF REGISTERED
MANAGEMENT INVESTMENT COMPANIES
Investment Company Act File Number: 811-07143
| T. Rowe Price Equity Series, Inc. |
|
| (Exact name of registrant as specified in charter) |
| |
| 100 East Pratt Street, Baltimore, MD 21202 |
|
| (Address of principal executive offices) |
| |
| David Oestreicher |
| 100 East Pratt Street, Baltimore, MD 21202 |
|
| (Name and address of agent for service) |
Registrant’s telephone number, including area code: (410) 345-2000
Date of fiscal year end: December 31
Date of reporting period: June 30, 2015
Item 1. Report to Shareholders
| Health Sciences Portfolio | June 30, 2015 |
| ● | Health care stocks posted excellent gains in the first half of 2015. |
| |
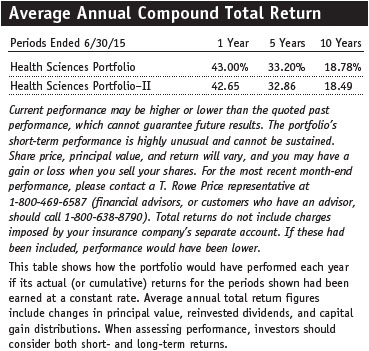
| ● | The Health Sciences Portfolio returned 20.11%, surpassing the S&P 500 Index and its Lipper peer group in the six-month reporting period. |
| |
| ● | While many factors in the health care sector are favorable, the magnitude of the portfolio’s recent gains is unlikely to be sustained. |
| |
| ● | Our focus remains on investing in companies that are developing new and effective medicines for unmet medical needs, as well as companies that reduce costs or improve the quality of the health care system. |
The views and opinions in this report were current as of June 30, 2015. They are not guarantees of performance or investment results and should not be taken as investment advice. Investment decisions reflect a variety of factors, and the managers reserve the right to change their views about individual stocks, sectors, and the markets at any time. As a result, the views expressed should not be relied upon as a forecast of the fund’s future investment intent. The report is certified under the Sarbanes-Oxley Act, which requires mutual funds and other public companies to affirm that, to the best of their knowledge, the information in their financial reports is fairly and accurately stated in all material respects.
Manager’s Letter
T. Rowe Price Health Sciences Portfolio
Dear Investor
The health care sector generated extraordinary gains in the first half of 2015. This traditionally defensive sector was the top performer in the S&P 500 Index over the past six months in a tumultuous market environment. We are pleased to report that your portfolio posted strong absolute and relative performance that was largely driven by stock selection. We remain optimistic about the long-term prospects for health care stocks, but after delivering exceptional returns in recent years,we have tempered our expectations for near-term results.
Performance Comparison
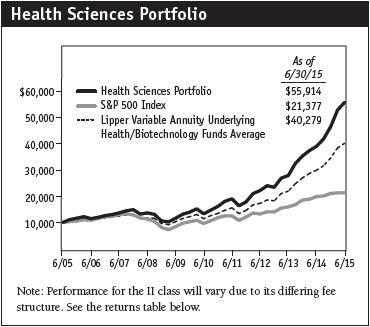
The Health Sciences Portfolio returned 20.11% in the six-month period ended June 30, 2015, significantly outperforming the S&P 500 Index and the Lipper Variable Annuity Underlying Health/Biotechnology Funds Average. Stock selection in the biotechnology, pharmaceuticals, and services segments generated a powerful relative performance contribution, while stock selection in the products and devices and life sciences sectors were modest detractors versus the Lipper benchmark.

As shown in the Growth of $10,000 chart on page 7, the portfolio significantly outperformed the S&P 500 Index over the past 10 years. The Health Sciences Portfolio has also posted consistently strong longer-term performance versus its Lipper peer group. For the 10-year period, your portfolio ranked first among all health/biotechnology portfolios for the period ended June 30, 2015. (Based on cumulative total return, Lipper ranked the Health Sciences Portfolio 5 of 22, 6 of 22, 6 of 22, and 1 of 20 portfolios in the Lipper Variable Annuity Underlying Health/Biotechnology Funds Average for the 1-, 3-, 5-, and 10-year periods ended June 30, 2015, respectively. Past performance cannot guarantee future results.)
Market Environment
Health care stocks outperformed in the first half of the year, building on 2014’s substantial gains. However, the broad market, as measured by the S&P 500 Index, sputtered to a modestly positive six-month result. The U.S. economy gained traction after an early-year slowdown. Gross domestic product contracted slightly in the first quarter of 2015, but subsequent readings led most analysts to forecast better economic growth for the rest of year. The unemployment rate declined to 5.3% in June, a seven-year low, from 5.6% in December. The Federal Reserve set the stage for its first short-term rate hike since 2006. The central bank is widely expected to start raising its benchmark rate from near zero later in the year—perhaps as early as September—though Fed Chair Janet Yellen has assured markets that rate increases will be data-dependent and gradual compared with previous tightening cycles.
Sector performance within the S&P 500 Index was mixed over the past six months. The health care and consumer discretionary sectors generated strong gains, while utilities and energy fell sharply. The other sectors posted modestly positive or negative results. Industry groups within the Lipper health/biotechnology benchmark were uniformly positive, but volatility crept into our market. Sentiment changed abruptly in June, when investors began to focus on several uncertainties, including Greece’s debt crisis and its potential expulsion from the eurozone, and a sell-off in the Chinese stocks that created global market volatility.

Within the Lipper benchmark, the best-performing segments were pharmaceuticals (21%), biotechnology (20%), services (20%), and products and devices (10%). Our overweight to the services segment contributed to relative performance. However, our significant underweight to biotech and a modest overweight to life sciences stocks hurt the portfolio’s relative results.
Your portfolio’s largest allocation differences are in biotechnology, where our 31% allocation is significantly less than the benchmark’s 46%, and in services, where our 29% allocation is about 17 percentage points overweight. As we have written in previous shareholder reports, we select companies based on their individual merits, a process commonly referred to as bottom-up stock selection. While we are mindful of our overall industry allocations and global economic conditions, we believe that stock selection will have more impact on our performance than allocation decisions or macroeconomic considerations.
Portfolio Review
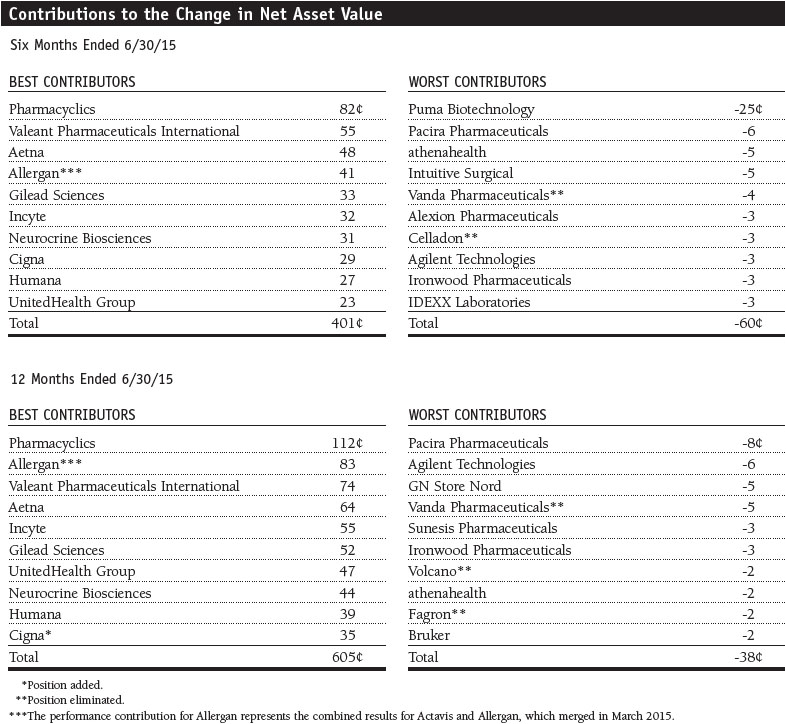
Our holdings in the pharmaceuticals industry had the largest positive impact on relative performance, thanks to stock selection. Shares of Pharmacyclics, the portfolio’s best contributor, soared after the company announced better-than-expected revenue forecasts for its leukemia drug Imbruvica, which the Food and Drug Administration also approved for the treatment of a rare type of lymphoma. Its stock surged again in March after AbbVie announced that it would acquire the company in a $21 billion deal. (Please refer to the portfolio of investments for a complete list of holdings and the amount each represents in the portfolio.)
Valeant Pharmaceuticals International, our second-best contributor, continued to make value-enhancing acquisitions with its purchase of Salix Pharmaceuticals in February. Management subsequently projected that Salix, which develops treatments for gastrointestinal disorders, would contribute $1 billion in revenue this year. Valeant also benefited from strong revenue growth in Asia and Mexico and in its contact lens and dermatology businesses. Japanese pharmaceutical company Eisai gained following better-than-expected, early-stage results for Biogen’s experimental Alzheimer’s treatment aducanumab. Research showed the monoclonal antibody was safe and well tolerated. We subsequently eliminated our position in Eisai on strength during the first quarter.
Our largest holding at the end of the period, Allergan, was among our best performers. Its strong positions in ophthalmology and dermatology have produced above-average growth and attracted several suitors, including Actavis, which acquired the company in March. Actavis, with its attractive product portfolio and growth record, was also a substantial contributor. The combined company subsequently adopted the Allergan name. We believe that it is one of the most reasonably valued health care stocks in our portfolio.
We have a modest underweight allocation in pharmaceuticals. We favor companies that develop novel therapeutics, including Eli Lilly, which has a large suite of diabetes products and several emerging cancer drugs, and Bristol-Myers Squibb, which has a compelling immuno-oncology franchise and Eliquis (apixaban), a blood thinner that holds significant growth potential.
Our services holdings generated strong gains over the six-month period. Stock selection and a substantial overweight allocation to the group contributed to relative performance. Aetna was a top contributor as speculation of consolidation in the managed care industry intensified. The company also raised its profit outlook for 2015 as it continued to benefit from higher enrollments driven by the Affordable Care Act. Shortly after the end of the reporting period, Aetna announced that it would buy Humana, which specializes in government-sponsored plans and is one of the largest providers of Medicare Advantage plans, a growing market given the aging U.S. population. The company also has a strong pharmacy benefit management business, which should be a valuable asset for Aetna.
Cigna rallied as Anthem made multiple takeover offers for the company during the second quarter. Cigna’s leading positions in commercial insurance and Medicare, and its global supplemental life and medical benefits business, made it an attractive target for a larger managed care company. Outside of managed care, we have a sizable allocation in health care providers, including best-in-class hospital operator HCA Holdings and DaVita HealthCare Partners, which provides dialysis treatments and other managed care services. We also generated good gains from drug distributors. McKesson, the largest U.S. drug distributor, stands to benefit from health care market reform, industry consolidation, and strengthening generics pricing. In December 2014, McKesson acquired Celesio, Europe’s largest drug distributor and second-largest retail pharmacy chain. The acquisition provides the company with geographic diversification as well as expanded pricing power among its suppliers.
We remain overweight in the services sector, a broad category that includes payors, providers, drug distributors, and health care information technology. Our largest allocation in this sector is in managed care, an area where we believe companies will benefit from depressed health care utilization as consumers become more selective in their health care spending. We favor companies that have shown an ability to hold down medical costs and improve outcomes, which will be increasingly important as health care costs grow. Additionally, large-scale consolidation among managed care organizations appears likely.
Within biotechnology, our largest sector exposure, stock selection more than offset the negative effects from our underweight allocation. Neurocrine Biosciences soared in January after the company announced positive results from the first phase III trial for elagolix, an experimental drug to treat endometriosis. Incyte benefited from strong U.S. sales of Jakafi (ruxolitinib), which is used to treat myelofibrosis, a fatal bone marrow disease, and the related condition, polycythemia vera. The company continued to make progress with its growing oncology pipeline and with baricitinib, a drug for rheumatoid arthritis that it is developing in a partnership with Eli Lilly.
Although we are significantly underweight in biotechnology versus the Lipper benchmark, we believe that the discovery, development, manufacturing, and commercialization of medicines are the key drivers of long-term value within the health care space. In our opinion, many of the best investments in health care will come from therapeutics companies that produce medicines to prevent disease, relieve symptoms, and provide cures. However, we do not think it is prudent for the portfolio to attempt to mirror the Lipper benchmark’s allocation to biotechnology. We rely on risk/reward analysis to select each holding and determine its allocation in the portfolio on a stock-by-stock basis.
The life sciences sector weighed on performance due to stock selection and an overweight allocation. Agilent Technologies, a global analytical instruments and software manufacturer, provides services for laboratories in the life sciences diagnostics and applied chemicals markets. The company reported weak second-quarter earnings, and its shares declined over the period. Foreign exchange headwinds weighed on scientific instrument manufacturer FEI, which has significant operations in Europe. However, core bookings and its order backlog remained healthy, and we think new product cycles will generate stronger organic revenue growth and profitability.
We are overweight the life sciences sector, the smallest sector in the portfolio. Broadly speaking, the companies in this sector provide technologies that enable experimentation. After a period of uncertainty in academic research due to federal budget cuts, we believe that the sector should benefit from an increase in research and development spending by pharmaceutical and biotechnology companies as well as from stabilization in academic end markets. Danaher and Agilent are our two largest holdings in the sector.
Stock selection in the products and devices segment detracted from relative results, although our underweight allocation was a modest contributor. Intuitive Surgical and IDEXX Laboratories were the poorest performers in the group. Intuitive, a robotic surgical systems manufacturer—most notably of the da Vinci Surgical System—fell following the release of mixed first-quarter earnings. Currency exchange headwinds could weigh on near-term revenue growth, although we think the company will benefit from a rise in the number of global procedures and a robot replacement cycle in the U.S. Similarly, foreign currency exchange hurt revenue growth at IDEXX, which reported lower-than-expected first-quarter earnings.
We are underweight the benchmark’s allocation in the products and devices segment as we believe the prevalence of high-deductible insurance plans and higher out-of-pocket expenses could restrain health care utilization rates in the near term, hurting the prospects for some companies.
While most of the portfolio’s investments are in U.S. common stocks, our overseas investments contributed to returns. Additionally, the portfolio writes call and put options primarily as a means of augmenting income. The portfolio normally owns the securities on which it writes these options. The premium income recovered by writing covered calls can help reduce, but not eliminate, volatility. Over the past six months, the options strategy modestly detracted from the portfolio’s results.
Outlook
Given the portfolio’s exceptionally strong performance, we expect health care to perform more in line with the broad market. However, we believe health care can continue to outperform if equity markets experience a downswing given the defensive nature of many companies in the sector.
We expect more merger activity as many large-cap companies with significant cash on their balance sheets look to grow through acquisitions. We have also seen innovation accelerate dramatically due to advances in technology and scientific knowledge. The reduction in time and cost of mapping the human genome has had a substantial effect on innovation and allowed scientists to gain a better understanding of the underlying causes of many diseases. We see many newly developed drugs coming to market that address significant unmet medical needs, including cancer, multiple sclerosis, and hepatitis C. Consequently, we remain focused on identifying innovative companies that have the potential to develop game-changing therapies.
We believe that we are in a “new normal” of lower health care utilization because more of the costs for health care are being footed by consumers, who have tightened their purse strings due to high-deductible health care plans, increased out-of-pocket expenses, and rising copayments for services. As such, we expect that consumers will be much more rational in health care spending.
The health care universe is diverse and dynamic, and we believe it represents one of the most attractive growth areas in the global economy. In our opinion, secular forces (including the development of new drugs and therapies to address major medical needs), breakthrough products being developed by biotechnology companies, and the development of lifesaving and lifestyle-enhancing devices, will remain in demand. However, we want to reiterate that investors should not extrapolate the Health Sciences Portfolio’s past performance into the future. Although we continue to like the sector’s prospects over the long term, the magnitude of recent gains is unlikely to be sustained.
As always, we will continue to work diligently on your behalf. Thank you for your continued support and your confidence in T. Rowe Price.
Respectfully submitted,

Taymour R. Tamaddon
President of the portfolio and chairman of its Investment Advisory Committee
July 20, 2015
The committee chairman has day-to-day responsibility for managing the portfolio and works with committee members in developing and executing its investment program.

Growth stocks can be volatile for several reasons. Since these companies usually invest a high portion of earnings in their businesses, they may lack the dividends of value stocks that can cushion stock prices in a falling market. Also, earnings disappointments often lead to sharply falling prices because investors buy growth stocks in anticipation of superior earnings growth.
| Risk of Health Sciences Investing |
Portfolios that invest only in specific industries will experience greater volatility than those investing in a broad range of industries. Companies in the health sciences field are subject to special risks such as increased competition within the health care industry, changes in legislation or government regulations, reductions in government funding, product liability or other litigation, and the obsolescence of popular products.
Gross domestic product: The total market value of all goods and services produced in a country in a given year.
Lipper average: The average return of all portfolios in a particular category as tracked by Lipper Inc.
S&P 500 Index: An index consisting of 500 stocks chosen for market size, liquidity, and industry group representation. It is a market value-weighted index, with each stock’s weight in the index proportionate to its market value.
Portfolio Highlights

Portfolio Highlights
Performance and Expenses
T. Rowe Price Health Sciences Portfolio
This chart shows the value of a hypothetical $10,000 investment in the portfolio over the past 10 fiscal year periods or since inception (for portfolios lacking 10-year records). The result is compared with benchmarks, which may include a broad-based market index and a peer group average or index. Market indexes do not include expenses, which are deducted from portfolio returns as well as mutual fund averages and indexes.
Fund Expense Example
As a mutual fund shareholder, you may incur two types of costs: (1) transaction costs, such as redemption fees or sales loads, and (2) ongoing costs, including management fees, distribution and service (12b-1) fees, and other fund expenses. The following example is intended to help you understand your ongoing costs (in dollars) of investing in the fund and to compare these costs with the ongoing costs of investing in other mutual funds. The example is based on an investment of $1,000 invested at the beginning of the most recent six-month period and held for the entire period.
Shares of the fund are currently offered only through certain insurance companies as an investment medium for both variable annuity contracts and variable life insurance policies. Please note that the fund has two classes of shares: the original share class and II Class. II Class shares are sold through financial intermediaries, which are compensated for distribution, shareholder servicing, and/or certain administrative services under a Board-approved Rule 12b-1 plan.
Actual Expenses
The first line of the following table (Actual) provides information about actual account values and actual expenses. You may use the information on this line, together with your account balance, to estimate the expenses that you paid over the period. Simply divide your account value by $1,000 (for example, an $8,600 account value divided by $1,000 = 8.6), then multiply the result by the number on the first line under the heading “Expenses Paid During Period” to estimate the expenses you paid on your account during this period.
Hypothetical Example for Comparison Purposes
The information on the second line of the table (Hypothetical) is based on hypothetical account values and expenses derived from the fund’s actual expense ratio and an assumed 5% per year rate of return before expenses (not the fund’s actual return). You may compare the ongoing costs of investing in the fund with other funds by contrasting this 5% hypothetical example and the 5% hypothetical examples that appear in the shareholder reports of the other funds. The hypothetical account values and expenses may not be used to estimate the actual ending account balance or expenses you paid for the period.
You should also be aware that the expenses shown in the table highlight only your ongoing costs and do not reflect any transaction costs, such as redemption fees or sales loads. Therefore, the second line of the table is useful in comparing ongoing costs only and will not help you determine the relative total costs of owning different funds. To the extent a fund charges transaction costs, however, the total cost of owning that fund is higher.

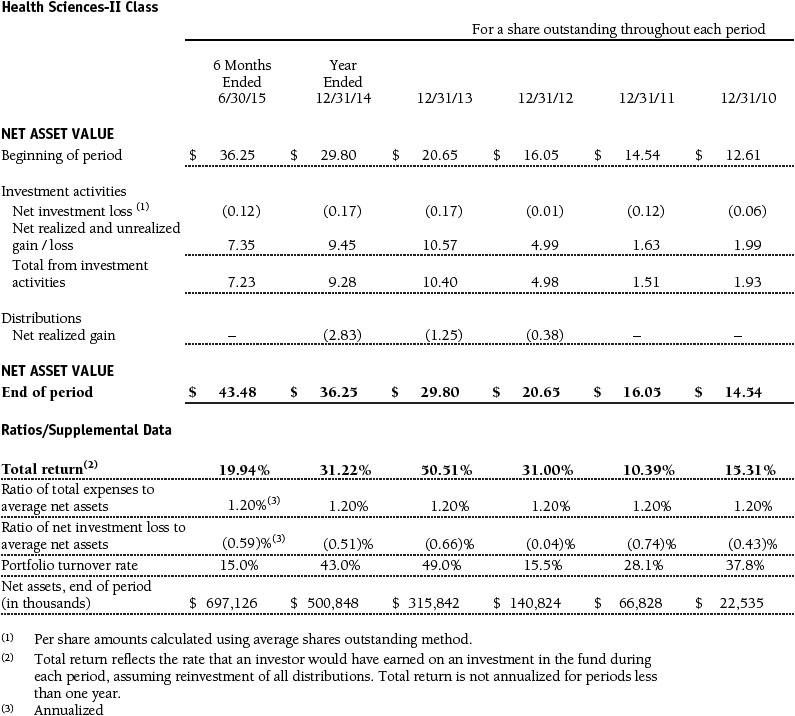
Financial Highlights
T. Rowe Price Health Sciences Portfolio
(Unaudited)
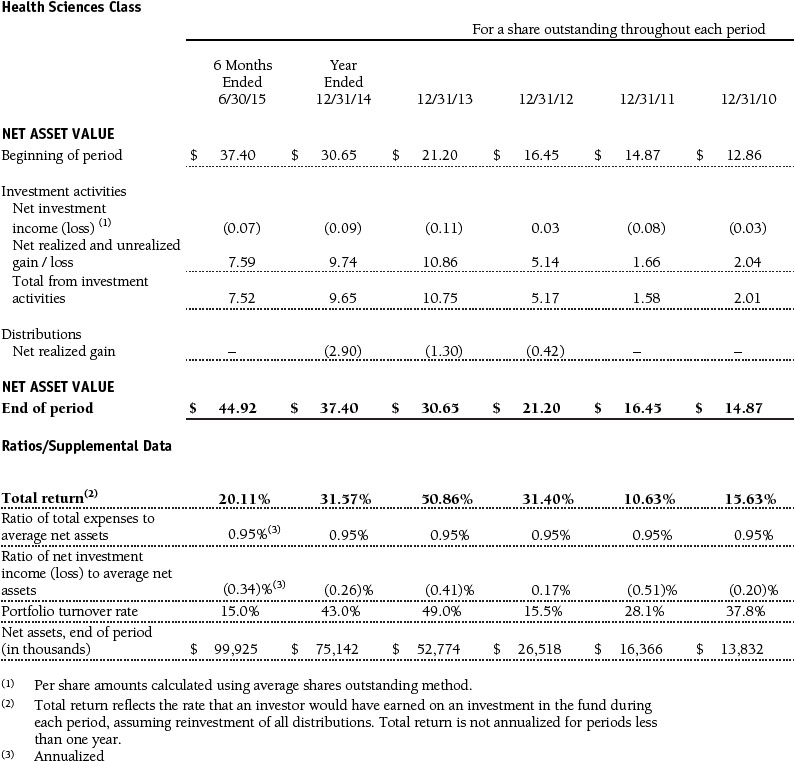
The accompanying notes are an integral part of these financial statements.
Financial Highlights
T. Rowe Price Health Sciences Portfolio
(Unaudited)
The accompanying notes are an integral part of these financial statements.
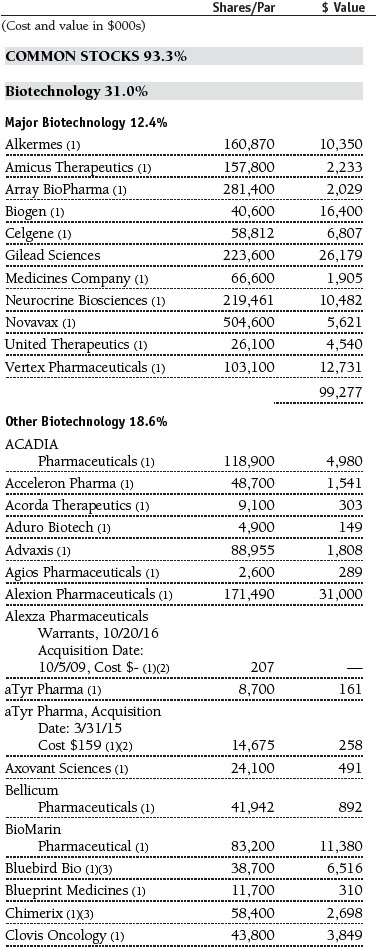
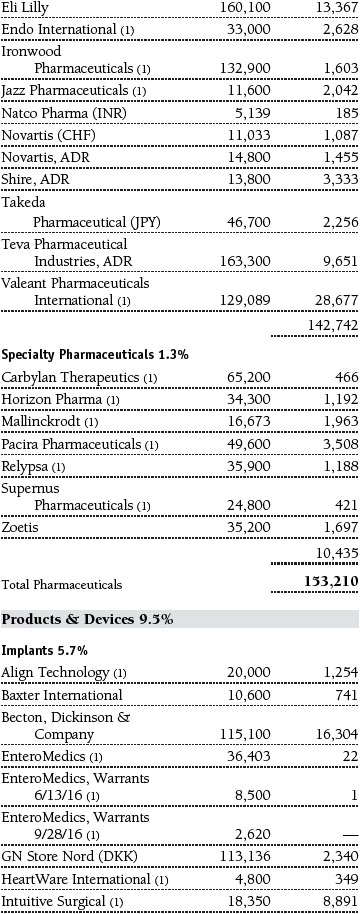
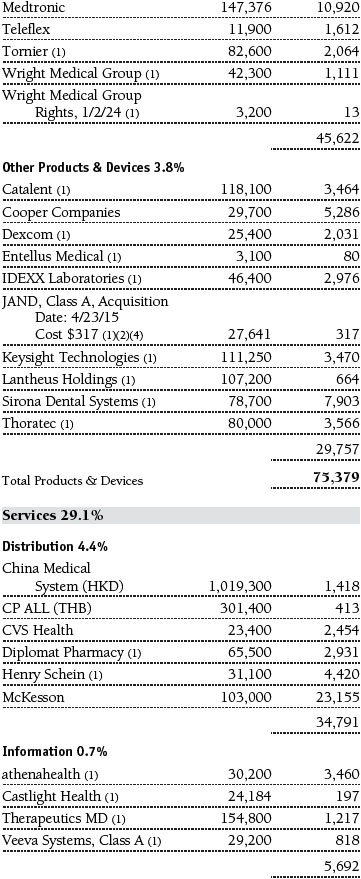
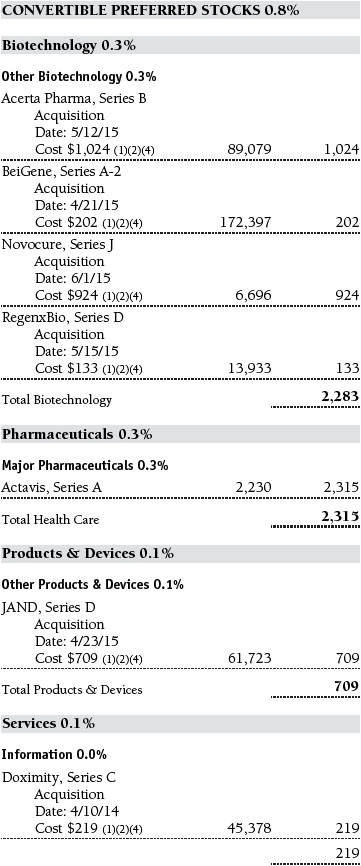
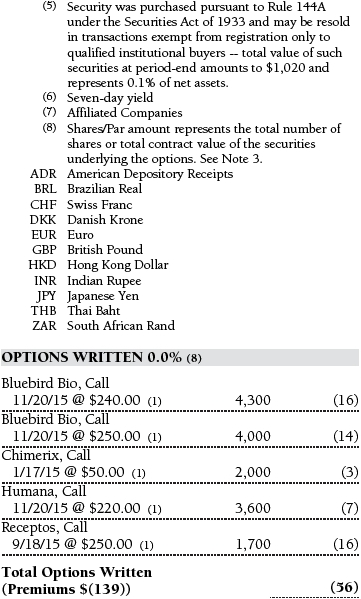
Portfolio of Investments‡
T. Rowe Price Health Sciences Portfolio
June 30, 2015 (Unaudited)


The accompanying notes are an integral part of these financial statements.
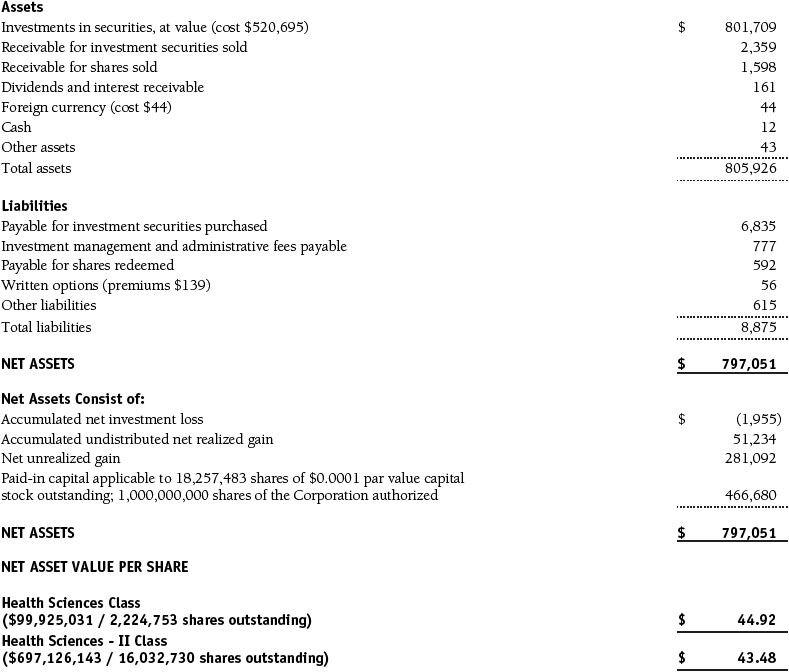
Statement of Assets and Liabilities
T. Rowe Price Health Sciences Portfolio
June 30, 2015 (Unaudited)
($000s, except shares and per share amounts)
The accompanying notes are an integral part of these financial statements.
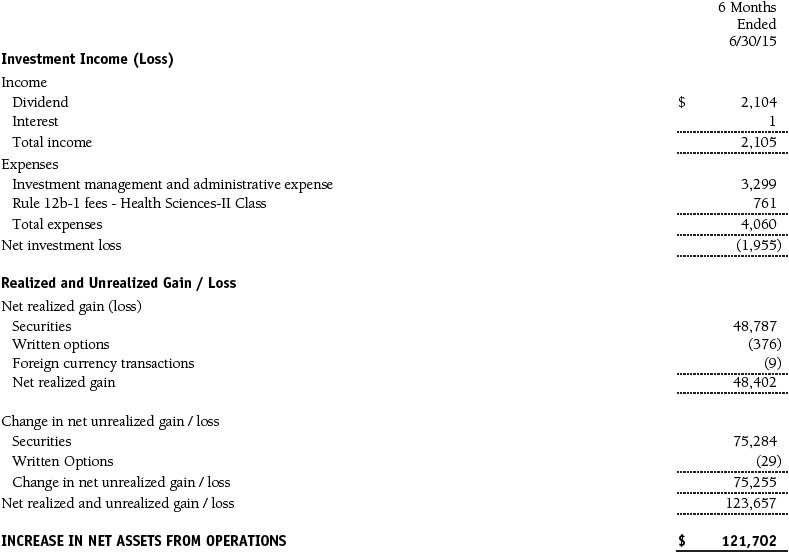
Statement of Operations
T. Rowe Price Health Sciences Portfolio
(Unaudited)
($000s)
The accompanying notes are an integral part of these financial statements.
Statement of Changes in Net Assets
T. Rowe Price Health Sciences Portfolio
(Unaudited)
($000s)

The accompanying notes are an integral part of these financial statements.
Notes to Financial Statements
T. Rowe Price Health Sciences Portfolio
June 30, 2015 (Unaudited)
T. Rowe Price Equity Series, Inc. (the corporation), is registered under the Investment Company Act of 1940 (the 1940 Act). The Health Sciences Portfolio (the fund) is a diversified, open-end management investment company established by the corporation. Shares of the fund currently are offered only through certain insurance companies as an investment medium for both variable annuity contracts and variable life insurance policies. The fund seeks long-term capital appreciation. The fund has two classes of shares: the Health Sciences Portfolio original share class (Health Sciences Class), offered since December 29, 2000, and the Health Sciences Portfolio–II (Health Sciences–II Class), offered since April 30, 2002. Health Sciences–II Class shares are sold through financial intermediaries, which it compensates for distribution, shareholder servicing, and/or certain administrative services under a Board-approved Rule 12b-1 plan. Each class has exclusive voting rights on matters related solely to that class; separate voting rights on matters that relate to both classes; and, in all other respects, the same rights and obligations as the other class.
NOTE 1 - SIGNIFICANT ACCOUNTING POLICIES
Basis of Preparation The fund is an investment company and follows accounting and reporting guidance in the Financial Accounting Standards Board (FASB) Accounting Standards Codification Topic 946 (ASC 946). The accompanying financial statements were prepared in accordance with accounting principles generally accepted in the United States of America (GAAP), including but not limited to ASC 946. GAAP requires the use of estimates made by management. Management believes that estimates and valuations are appropriate; however, actual results may differ from those estimates, and the valuations reflected in the accompanying financial statements may differ from the value ultimately realized upon sale or maturity.
Investment Transactions, Investment Income, and Distributions Income and expenses are recorded on the accrual basis. Premiums and discounts on debt securities are amortized for financial reporting purposes. Dividends received from mutual fund investments are reflected as dividend income; capital gain distributions are reflected as realized gain/loss. Earnings on investments recognized as partnerships for federal income tax purposes reflect the tax character of such earnings. Dividend income and capital gain distributions are recorded on the ex-dividend date. Income tax-related interest and penalties, if incurred, would be recorded as income tax expense. Investment transactions are accounted for on the trade date. Realized gains and losses are reported on the identified cost basis. Distributions to shareholders are recorded on the ex-dividend date. Income distributions are declared and paid by each class annually. Capital gain distributions, if any, are generally declared and paid by the fund annually.
Currency Translation Assets, including investments, and liabilities denominated in foreign currencies are translated into U.S. dollar values each day at the prevailing exchange rate, using the mean of the bid and asked prices of such currencies against U.S. dollars as quoted by a major bank. Purchases and sales of securities, income, and expenses are translated into U.S. dollars at the prevailing exchange rate on the date of the transaction. The effect of changes in foreign currency exchange rates on realized and unrealized security gains and losses is reflected as a component of security gains and losses.
Class Accounting Health Sciences–II pays distribution, shareholder servicing, and/or certain administrative expenses in the form of Rule 12b-1 fees, in an amount not exceeding 0.25% of the class’s average daily net assets. Investment income, investment management and administrative expense, and realized and unrealized gains and losses are allocated to the classes based upon the relative daily net assets of each class.
Rebates Subject to best execution, the fund may direct certain security trades to brokers who have agreed to rebate a portion of the related brokerage commission to the fund in cash. Commission rebates are reflected as realized gain on securities in the accompanying financial statements and totaled $2,000 for the six months ended June 30, 2015.
New Accounting Guidance In June 2014, FASB issued Accounting Standards Update (ASU) No. 2014-11, Transfers and Servicing (Topic 860), Repurchase-to-Maturity Transactions, Repurchase Financings, and Disclosures. The ASU changes the accounting for certain repurchase agreements and expands disclosure requirements related to repurchase agreements, securities lending, repurchase-to-maturity and similar transactions. The ASU is effective for interim and annual reporting periods beginning after December 15, 2014. Adoption will have no effect on the fund’s net assets or results of operations.
In May 2015, FASB issued ASU No. 2015-07, Fair Value Measurement (Topic 820), Disclosures for Investments in Certain Entities That Calculate Net Asset Value per Share (or Its Equivalent). The ASU removes the requirement to categorize within the fair value hierarchy all investments for which fair value is measured using the net asset value per share practical expedient and amends certain disclosure requirements for such investments. The ASU is effective for interim and annual reporting periods beginning after December 15, 2015. Adoption will have no effect on the fund’s net assets or results of operations.
NOTE 2 - VALUATION
The fund’s financial instruments are valued and each class’s net asset value (NAV) per share is computed at the close of the New York Stock Exchange (NYSE), normally 4 p.m. ET, each day the NYSE is open for business.
Fair Value The fund’s financial instruments are reported at fair value, which GAAP defines as the price that would be received to sell an asset or paid to transfer a liability in an orderly transaction between market participants at the measurement date. The T. Rowe Price Valuation Committee (the Valuation Committee) has been established by the fund’s Board of Directors (the Board) to ensure that financial instruments are appropriately priced at fair value in accordance with GAAP and the 1940 Act. Subject to oversight by the Board, the Valuation Committee develops and oversees pricing-related policies and procedures and approves all fair value determinations. Specifically, the Valuation Committee establishes procedures to value securities; determines pricing techniques, sources, and persons eligible to effect fair value pricing actions; oversees the selection, services, and performance of pricing vendors; oversees valuation-related business continuity practices; and provides guidance on internal controls and valuation-related matters. The Valuation Committee reports to the Board; is chaired by the fund’s treasurer; and has representation from legal, portfolio management and trading, operations, and risk management.
Various valuation techniques and inputs are used to determine the fair value of financial instruments. GAAP establishes the following fair value hierarchy that categorizes the inputs used to measure fair value:
Level 1 – quoted prices (unadjusted) in active markets for identical financial instruments that the fund can access at the reporting date
Level 2 – inputs other than Level 1 quoted prices that are observable, either directly or indirectly (including, but not limited to, quoted prices for similar financial instruments in active markets, quoted prices for identical or similar financial instruments in inactive markets, interest rates and yield curves, implied volatilities, and credit spreads)
Level 3 – unobservable inputs
Observable inputs are developed using market data, such as publicly available information about actual events or transactions, and reflect the assumptions that market participants would use to price the financial instrument. Unobservable inputs are those for which market data are not available and are developed using the best information available about the assumptions that market participants would use to price the financial instrument. GAAP requires valuation techniques to maximize the use of relevant observable inputs and minimize the use of unobservable inputs. When multiple inputs are used to derive fair value, the financial instrument is assigned to the level within the fair value hierarchy based on the lowest-level input that is significant to the fair value of the financial instrument. Input levels are not necessarily an indication of the risk or liquidity associated with financial instruments at that level but rather the degree of judgment used in determining those values.
Valuation Techniques Equity securities listed or regularly traded on a securities exchange or in the over-the-counter (OTC) market are valued at the last quoted sale price or, for certain markets, the official closing price at the time the valuations are made. OTC Bulletin Board securities are valued at the mean of the closing bid and asked prices. A security that is listed or traded on more than one exchange is valued at the quotation on the exchange determined to be the primary market for such security. Listed securities not traded on a particular day are valued at the mean of the closing bid and asked prices for domestic securities and the last quoted sale or closing price for international securities.
For valuation purposes, the last quoted prices of non-U.S. equity securities may be adjusted to reflect the fair value of such securities at the close of the NYSE. If the fund determines that developments between the close of a foreign market and the close of the NYSE will, in its judgment, materially affect the value of some or all of its portfolio securities, the fund will adjust the previous quoted prices to reflect what it believes to be the fair value of the securities as of the close of the NYSE. In deciding whether it is necessary to adjust quoted prices to reflect fair value, the fund reviews a variety of factors, including developments in foreign markets, the performance of U.S. securities markets, and the performance of instruments trading in U.S. markets that represent foreign securities and baskets of foreign securities. The fund may also fair value securities in other situations, such as when a particular foreign market is closed but the fund is open. The fund uses outside pricing services to provide it with quoted prices and information to evaluate or adjust those prices. The fund cannot predict how often it will use quoted prices and how often it will determine it necessary to adjust those prices to reflect fair value. As a means of evaluating its security valuation process, the fund routinely compares quoted prices, the next day’s opening prices in the same markets, and adjusted prices.
Actively traded domestic equity securities generally are categorized in Level 1 of the fair value hierarchy. Non-U.S. equity securities generally are categorized in Level 2 of the fair value hierarchy despite the availability of quoted prices because, as described above, the fund evaluates and determines whether those quoted prices reflect fair value at the close of the NYSE or require adjustment. OTC Bulletin Board securities, certain preferred securities, and equity securities traded in inactive markets generally are categorized in Level 2 of the fair value hierarchy.
Debt securities generally are traded in the OTC market. Securities with remaining maturities of one year or more at the time of acquisition are valued at prices furnished by dealers who make markets in such securities or by an independent pricing service, which considers the yield or price of bonds of comparable quality, coupon, maturity, and type, as well as prices quoted by dealers who make markets in such securities. Generally, debt securities are categorized in Level 2 of the fair value hierarchy; however, to the extent the valuations include significant unobservable inputs, the securities would be categorized in Level 3.
Investments in mutual funds are valued at the mutual fund’s closing NAV per share on the day of valuation and are categorized in Level 1 of the fair value hierarchy. Listed options, and OTC options with a listed equivalent, are valued at the mean of the closing bid and asked prices and generally are categorized in Level 2 of the fair value hierarchy. Assets and liabilities other than financial instruments, including short-term receivables and payables, are carried at cost, or estimated realizable value, if less, which approximates fair value.
Thinly traded financial instruments and those for which the above valuation procedures are inappropriate or are deemed not to reflect fair value are stated at fair value as determined in good faith by the Valuation Committee. The objective of any fair value pricing determination is to arrive at a price that could reasonably be expected from a current sale. Financial instruments fair valued by the Valuation Committee are primarily private placements, restricted securities, warrants, rights, and other securities that are not publicly traded.
Subject to oversight by the Board, the Valuation Committee regularly makes good faith judgments to establish and adjust the fair valuations of certain securities as events occur and circumstances warrant. For instance, in determining the fair value of an equity investment with limited market activity, such as a private placement or a thinly traded public company stock, the Valuation Committee considers a variety of factors, which may include, but are not limited to, the issuer’s business prospects, its financial standing and performance, recent investment transactions in the issuer, new rounds of financing, negotiated transactions of significant size between other investors in the company, relevant market valuations of peer companies, strategic events affecting the company, market liquidity for the issuer, and general economic conditions and events. In consultation with the investment and pricing teams, the Valuation Committee will determine an appropriate valuation technique based on available information, which may include both observable and unobservable inputs. The Valuation Committee typically will afford greatest weight to actual prices in arm’s length transactions, to the extent they represent orderly transactions between market participants; transaction information can be reliably obtained; and prices are deemed representative of fair value. However, the Valuation Committee may also consider other valuation methods such as market-based valuation multiples; a discount or premium from market value of a similar, freely traded security of the same issuer; or some combination. Fair value determinations are reviewed on a regular basis and updated as information becomes available, including actual purchase and sale transactions of the issue. Because any fair value determination involves a significant amount of judgment, there is a degree of subjectivity inherent in such pricing decisions, and fair value prices determined by the Valuation Committee could differ from those of other market participants. Depending on the relative significance of unobservable inputs, including the valuation technique(s) used, fair valued securities may be categorized in Level 2 or 3 of the fair value hierarchy.
Valuation Inputs The following table summarizes the fund’s financial instruments, based on the inputs used to determine their fair values on June 30, 2015:

There were no material transfers between Levels 1 and 2 during the six months ended June 30, 2015.
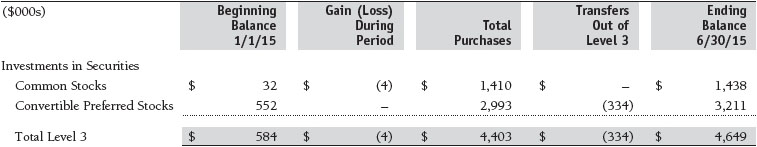
Following is a reconciliation of the fund’s Level 3 holdings for the six months ended June 30, 2015. Gain (loss) reflects both realized and change in unrealized gain/loss on Level 3 holdings during the period, if any, and is included on the accompanying Statement of Operations. The change in unrealized gain/loss on Level 3 instruments held at June 30, 2015, totaled $(4,000) for the six months ended June 30, 2015. Transfers into and out of Level 3 are reflected at the value of the financial instrument at the beginning of the period. During the six months, transfers out of Level 3 were because observable market data became available for the security.
NOTE 3 - DERIVATIVE INSTRUMENTS
During the six months ended June 30, 2015, the fund invested in derivative instruments. As defined by GAAP, a derivative is a financial instrument whose value is derived from an underlying security price, foreign exchange rate, interest rate, index of prices or rates, or other variable; it requires little or no initial investment and permits or requires net settlement. The fund invests in derivatives only if the expected risks and rewards are consistent with its investment objectives, policies, and overall risk profile, as described in its prospectus and Statement of Additional Information. The fund may use derivatives for a variety of purposes, such as seeking to hedge against declines in principal value, increase yield, invest in an asset with greater efficiency and at a lower cost than is possible through direct investment, or to adjust credit exposure. The risks associated with the use of derivatives are different from, and potentially much greater than, the risks associated with investing directly in the instruments on which the derivatives are based. The fund at all times maintains sufficient cash reserves, liquid assets, or other SEC-permitted asset types to cover its settlement obligations under open derivative contracts.
The fund values its derivatives at fair value, as described in Note 2, and recognizes changes in fair value currently in its results of operations. Accordingly, the fund does not follow hedge accounting, even for derivatives employed as economic hedges. Generally, the fund accounts for its derivatives on a gross basis. It does not offset the fair value of derivative liabilities against the fair value of derivative assets on its financial statements, nor does it offset the fair value of derivative instruments against the right to reclaim or obligation to return collateral. As of June 30, 2015, the fund held equity derivatives with a fair value of $56,000, included in Written options, on the accompanying Statement of Assets and Liabilities.
Additionally, during the six months ended June 30, 2015, the fund recognized $376,000 of realized loss on Written Options and a $(29,000) change in unrealized gain/loss on Written Options related to its investments in equity derivatives; such amounts are included on the accompanying Statement of Operations.
Counterparty Risk and Collateral The fund invests in exchange-traded or centrally cleared derivative contracts, such as futures, exchange-traded options, and centrally cleared swaps. Counterparty risk on such derivatives is minimal because the clearinghouse provides protection against counterparty defaults. For futures and centrally cleared swaps, the fund is required to deposit collateral in an amount equal to a certain percentage of the contract value (margin requirement), and the margin requirement must be maintained over the life of the contract. Each clearing broker, in its sole discretion, may adjust the margin requirements applicable to the fund.
Collateral may be in the form of cash or debt securities issued by the U.S. government or related agencies. Cash and currencies posted by the fund are reflected as cash deposits in the accompanying financial statements and generally are restricted from withdrawal by the fund; securities posted by the fund are so noted in the accompanying Portfolio of Investments; both remain in the fund’s assets. As of June 30, 2015, no margin had been posted by the fund for exchange-traded and/or centrally cleared derivatives.
Options The fund is subject to equity price risk in the normal course of pursuing its investment objectives and uses options to help manage such risk. The fund may use options to manage exposure to security prices, interest rates, foreign currencies, and credit quality; as an efficient means of adjusting exposure to all or a part of a target market; to enhance income; as a cash management tool; or to adjust credit exposure. Options are included in net assets at fair value; purchased options are included in Investments in Securities; and written options are separately reflected as a liability on the accompanying Statement of Assets and Liabilities. Premiums on unexercised, expired options are recorded as realized gains or losses; premiums on exercised options are recorded as an adjustment to the proceeds from the sale or cost of the purchase. The difference between the premium and the amount received or paid in a closing transaction is also treated as realized gain or loss. In return for a premium paid, call and put options give the holder the right, but not the obligation, to purchase or sell, respectively, a security at a specified exercise price. Risks related to the use of options include possible illiquidity of the options markets; trading restrictions imposed by an exchange or counterparty; movements in the underlying asset values; and, for written options, potential losses in excess of the fund’s initial investment. During the six months ended June 30, 2015, the volume of the fund’s activity in options, based on underlying notional amounts, was generally less than 1% of net assets. Transactions in written options and related premiums received during the six months ended June 30, 2015, were as follows:

NOTE 4 - OTHER INVESTMENT TRANSACTIONS
Consistent with its investment objective, the fund engages in the following practices to manage exposure to certain risks and/or to enhance performance. The investment objective, policies, program, and risk factors of the fund are described more fully in the fund’s prospectus and Statement of Additional Information.
Restricted Securities The fund may invest in securities that are subject to legal or contractual restrictions on resale. Prompt sale of such securities at an acceptable price may be difficult and may involve substantial delays and additional costs.
Other Purchases and sales of portfolio securities other than short-term securities aggregated $164,140,000 and $98,824,000, respectively, for the six months ended June 30, 2015.
NOTE 5 - FEDERAL INCOME TAXES
No provision for federal income taxes is required since the fund intends to continue to qualify as a regulated investment company under Subchapter M of the Internal Revenue Code and distribute to shareholders all of its taxable income and gains. Distributions determined in accordance with federal income tax regulations may differ in amount or character from net investment income and realized gains for financial reporting purposes. Financial reporting records are adjusted for permanent book/tax differences to reflect tax character but are not adjusted for temporary differences. The amount and character of tax-basis distributions and composition of net assets are finalized at fiscal year-end; accordingly, tax-basis balances have not been determined as of the date of this report.
At June 30, 2015, the cost of investments for federal income tax purposes was $522,296,000. Net unrealized gain aggregated $279,491,000 at period-end, of which $284,553,000 related to appreciated investments and $5,062,000 related to depreciated investments.
NOTE 6 - RELATED PARTY TRANSACTIONS
The fund is managed by T. Rowe Price Associates, Inc. (Price Associates), a wholly owned subsidiary of T. Rowe Price Group, Inc. (Price Group). The investment management and administrative agreement between the fund and Price Associates provides for an all-inclusive annual fee equal to 0.95% of the fund’s average daily net assets. The fee is computed daily and paid monthly. The all-inclusive fee covers investment management, shareholder servicing, transfer agency, accounting, and custody services provided to the fund, as well as fund directors’ fees and expenses. Interest, taxes, brokerage commissions, and extraordinary expenses are paid directly by the fund.
The fund may invest in the T. Rowe Price Reserve Investment Fund, the T. Rowe Price Government Reserve Investment Fund, or the T. Rowe Price Short-Term Reserve Fund (collectively, the Price Reserve Investment Funds), open-end management investment companies managed by Price Associates and considered affiliates of the fund. The Price Reserve Investment Funds are offered as short-term investment options to mutual funds, trusts, and other accounts managed by Price Associates or its affiliates and are not available for direct purchase by members of the public. The Price Reserve Investment Funds pay no investment management fees.
| Information on Proxy Voting Policies, Procedures, and Records |
A description of the policies and procedures used by T. Rowe Price funds and portfolios to determine how to vote proxies relating to portfolio securities is available in each fund’s Statement of Additional Information. You may request this document by calling 1-800-225-5132 or by accessing the SEC’s website, sec.gov.
The description of our proxy voting policies and procedures is also available on our website, troweprice.com. To access it, click on the words “Social Responsibility” at the top of our corporate homepage. Next, click on the words “Conducting Business Responsibly” on the left side of the page that appears. Finally, click on the words “Proxy Voting Policies” on the left side of the page that appears.
Each fund’s most recent annual proxy voting record is available on our website and through the SEC’s website. To access it through our website, follow the directions above to reach the “Conducting Business Responsibly” page. Click on the words “Proxy Voting Records” on the left side of that page, and then click on the “View Proxy Voting Records” link at the bottom of the page that appears.
| How to Obtain Quarterly Portfolio Holdings |
The fund files a complete schedule of portfolio holdings with the Securities and Exchange Commission for the first and third quarters of each fiscal year on Form N-Q. The fund’s Form N-Q is available electronically on the SEC’s website (sec.gov); hard copies may be reviewed and copied at the SEC’s Public Reference Room, 100 F St. N.E., Washington, DC 20549. For more information on the Public Reference Room, call 1-800-SEC-0330.
| Approval of Investment Management Agreement |
On March 13, 2015, the fund’s Board of Directors (Board), including a majority of the fund’s independent directors, approved the continuation of the investment management agreement (Advisory Contract) between the fund and its investment advisor, T. Rowe Price Associates, Inc. (Advisor). In connection with its deliberations, the Board requested, and the Advisor provided, such information as the Board (with advice from independent legal counsel) deemed reasonably necessary. The Board considered a variety of factors in connection with its review of the Advisory Contract, also taking into account information provided by the Advisor during the course of the year, as discussed below:
Services Provided by the Advisor
The Board considered the nature, quality, and extent of the services provided to the fund by the Advisor. These services included, but were not limited to, directing the fund’s investments in accordance with its investment program and the overall management of the fund’s portfolio, as well as a variety of related activities such as financial, investment operations, and administrative services; compliance; maintaining the fund’s records and registrations; and shareholder communications. The Board also reviewed the background and experience of the Advisor’s senior management team and investment personnel involved in the management of the fund, as well as the Advisor’s compliance record. The Board concluded that it was satisfied with the nature, quality, and extent of the services provided by the Advisor.
Investment Performance of the Fund
The Board reviewed the fund’s three-month, one-year, and year-by-year returns, as well as the fund’s average annualized total returns over the 3-, 5-, and 10-year periods, and compared these returns with a wide variety of previously agreed-upon comparable performance measures and market data, including those supplied by Lipper and Morningstar, which are independent providers of mutual fund data.
On the basis of this evaluation and the Board’s ongoing review of investment results, and factoring in the relative market conditions during certain of the performance periods, the Board concluded that the fund’s performance was satisfactory.
Costs, Benefits, Profits, and Economies of Scale
The Board reviewed detailed information regarding the revenues received by the Advisor under the Advisory Contract and other benefits that the Advisor (and its affiliates) may have realized from its relationship with the fund, including any research received under “soft dollar” agreements and commission-sharing arrangements with broker-dealers. The Board considered that the Advisor may receive some benefit from soft-dollar arrangements pursuant to which research is received from broker-dealers that execute the applicable fund’s portfolio transactions. The Board received information on the estimated costs incurred and profits realized by the Advisor from managing T. Rowe Price mutual funds. The Board also reviewed estimates of the profits realized from managing the fund in particular, and the Board concluded that the Advisor’s profits were reasonable in light of the services provided to the fund.
The Board also considered whether the fund benefits under the fee levels set forth in the Advisory Contract from any economies of scale realized by the Advisor. The Board noted that, under the Advisory Contract, the fund pays the Advisor a single fee based on the fund’s average daily net assets that includes investment management services and provides for the Advisor to pay all expenses of the fund’s operations except for interest, taxes, portfolio transaction fees, and any nonrecurring extraordinary expenses that may arise. The Board concluded that, based on the profitability data it reviewed and consistent with this single-fee structure, the Advisory Contract provided for a reasonable sharing of any benefits from economies of scale with the fund.
Fees
The Board was provided with information regarding industry trends in management fees and expenses, and the Board reviewed the fund’s single-fee structure for the Investor Class and II Class in comparison with fees and expenses of other comparable funds based on information and data supplied by Lipper. For these purposes, the Board assumed that the fund’s management fee rate was equal to the single fee less the fund’s operating expenses. The information provided to the Board indicated that the fund’s management fee rate was above the median for comparable funds. The information also indicated that the total expense ratio for the Investor Class was at or below the median for comparable funds and the total expense ratio for the II Class was above the median for comparable funds.
The Board also reviewed the fee schedules for institutional accounts and private accounts with similar mandates that are advised or subadvised by the Advisor and its affiliates. Management provided the Board with information about the Advisor’s responsibilities and services provided to institutional account clients, including information about how the requirements and economics of the institutional business are fundamentally different from those of the mutual fund business. The Board considered information showing that the mutual fund business is generally more complex from a business and compliance perspective than the institutional business and that the Advisor generally performs significant additional services and assumes greater risk in managing the fund and other T. Rowe Price mutual funds than it does for institutional account clients.
On the basis of the information provided and the factors considered, the Board concluded that the fees paid by the fund under the Advisory Contract are reasonable.
Approval of the Advisory Contract
As noted, the Board approved the continuation of the Advisory Contract. No single factor was considered in isolation or to be determinative to the decision. Rather, the Board concluded, in light of a weighting and balancing of all factors considered, that it was in the best interests of the fund and its shareholders for the Board to approve the continuation of the Advisory Contract (including the fees to be charged for services thereunder). The independent directors were advised throughout the process by independent legal counsel.
Item 2. Code of Ethics.
A code of ethics, as defined in Item 2 of Form N-CSR, applicable to its principal executive officer, principal financial officer, principal accounting officer or controller, or persons performing similar functions is filed as an exhibit to the registrant’s annual Form N-CSR. No substantive amendments were approved or waivers were granted to this code of ethics during the registrant’s most recent fiscal half-year.
Item 3. Audit Committee Financial Expert.
Disclosure required in registrant’s annual Form N-CSR.
Item 4. Principal Accountant Fees and Services.
Disclosure required in registrant’s annual Form N-CSR.
Item 5. Audit Committee of Listed Registrants.
Not applicable.
Item 6. Investments.
(a) Not applicable. The complete schedule of investments is included in Item 1 of this Form N-CSR.
(b) Not applicable.
Item 7. Disclosure of Proxy Voting Policies and Procedures for Closed-End Management Investment Companies.
Not applicable.
Item 8. Portfolio Managers of Closed-End Management Investment Companies.
Not applicable.
Item 9. Purchases of Equity Securities by Closed-End Management Investment Company and Affiliated Purchasers.
Not applicable.
Item 10. Submission of Matters to a Vote of Security Holders.
Not applicable.
Item 11. Controls and Procedures.
(a) The registrant’s principal executive officer and principal financial officer have evaluated the registrant’s disclosure controls and procedures within 90 days of this filing and have concluded that the registrant’s disclosure controls and procedures were effective, as of that date, in ensuring that information required to be disclosed by the registrant in this Form N-CSR was recorded, processed, summarized, and reported timely.
(b) The registrant’s principal executive officer and principal financial officer are aware of no change in the registrant’s internal control over financial reporting that occurred during the registrant’s second fiscal quarter covered by this report that has materially affected, or is reasonably likely to materially affect, the registrant’s internal control over financial reporting.
Item 12. Exhibits.
(a)(1) The registrant’s code of ethics pursuant to Item 2 of Form N-CSR is filed with the registrant’s annual Form N-CSR.
(2) Separate certifications by the registrant's principal executive officer and principal financial officer, pursuant to Section 302 of the Sarbanes-Oxley Act of 2002 and required by Rule 30a-2(a) under the Investment Company Act of 1940, are attached.
(3) Written solicitation to repurchase securities issued by closed-end companies: not applicable.
(b) A certification by the registrant's principal executive officer and principal financial officer, pursuant to Section 906 of the Sarbanes-Oxley Act of 2002 and required by Rule 30a-2(b) under the Investment Company Act of 1940, is attached.
SIGNATURES
Pursuant to the requirements of the Securities Exchange Act of 1934 and the Investment Company Act of 1940, the registrant has duly caused this report to be signed on its behalf by the undersigned, thereunto duly authorized.
T. Rowe Price Equity Series, Inc.
| | By | /s/ Edward C. Bernard |
| | Edward C. Bernard |
| | Principal Executive Officer |
| |
| Date August 17, 2015 | | |
Pursuant to the requirements of the Securities Exchange Act of 1934 and the Investment Company Act of 1940, this report has been signed below by the following persons on behalf of the registrant and in the capacities and on the dates indicated.
| | By | /s/ Edward C. Bernard |
| | Edward C. Bernard |
| | Principal Executive Officer |
| |
| Date August 17, 2015 | | |
| |
| |
| By | /s/ Catherine D. Mathews |
| | Catherine D. Mathews |
| | Principal Financial Officer |
| |
| Date August 17, 2015 | | |