UNITED STATES
SECURITIES AND EXCHANGE COMMISSION
Washington, D.C. 20549
FORM N-CSR
CERTIFIED SHAREHOLDER REPORT OF REGISTERED
MANAGEMENT INVESTMENT COMPANIES
Investment Company Act File Number: 811-07143
| T. Rowe Price Equity Series, Inc. |
|
| (Exact name of registrant as specified in charter) |
| |
| 100 East Pratt Street, Baltimore, MD 21202 |
|
| (Address of principal executive offices) |
| |
| David Oestreicher |
| 100 East Pratt Street, Baltimore, MD 21202 |
|
| (Name and address of agent for service) |
Registrant’s telephone number, including area code: (410) 345-2000
Date of fiscal year end: December 31
Date of reporting period: June 30, 2021
Item 1. Reports to Shareholders
(a) Report pursuant to Rule 30e-1.
| All-Cap Opportunities Portfolio | June 30, 2021 |
| T. ROWE PRICE ALL-CAP OPPORTUNITIES PORTFOLIO |
|
HIGHLIGHTS
| ■ | The All-Cap Opportunities Portfolio generated a 14.57% gain in the first half of 2021, underperforming its benchmark, the Russell 3000 Index. |
| |
| ■ | Within the portfolio, stock choices in the information technology and consumer discretionary sectors detracted the most from relative performance. Conversely, security selection and an overweight in communication services boosted relative results, while health care holdings also contributed. |
| |
| ■ | Given the pushes and pulls of the current market, we have evolved the portfolio not only in aggregate, but also on a stock-by-stock basis. We continue to reallocate funds to areas where we have identified product- and innovation-driven cycles that should see accelerating economic returns while also taking profits where valuations appear full. |
| |
| ■ | Over the last approximately 18 months, the pandemic and associated policy response made the stock market more macro-driven than usual. It was a “COVID-on” market until the vaccine data arrived last November, and then it was “COVID-off” through April or May. Now that the economic reopening is several months in the making, the market is searching for leadership and direction again, and the outlook for the second half of 2021 feels unusually nuanced. |

Log in to your account at troweprice.com for more information.
*Certain mutual fund accounts that are assessed an annual account service fee can also save money by switching to e-delivery.
CIO Market Commentary
Dear Investor
Global stock markets produced strong returns during the first half of 2021, while rising yields weighed on returns in some bond sectors. Investor sentiment was buoyed by the reopening of developed market economies, unprecedented fiscal and monetary stimulus, and expectations that the economy would benefit from a release of pent-up demand.
All major global and regional equity benchmarks recorded positive results during the period. Developed market stocks generally outperformed emerging markets, while in the U.S., small-cap equities outpaced large-caps and value performed better than growth. The large-cap S&P 500 Index returned 15% and finished the period at a record high. The energy sector, which was the worst performer in 2020, was the leader for the six-month period amid a sharp increase in oil prices. Financial stocks also produced strong results as banks benefited from an increase in long-term interest rates, while the real estate sector was helped by a rollback in many pandemic-related restrictions. Utilities underperformed with slight gains.
Fiscal and monetary support remained a key factor in providing a positive backdrop for markets. President Joe Biden signed the $1.9 trillion American Rescue Plan Act into law in March, and the Federal Reserve kept its short-term lending rates near zero. However, as a result of strong economic growth, central bank policymakers revised their outlook in a somewhat less dovish direction near the end of the period and indicated that rate hikes could commence in 2023, which was earlier than previously expected.
The economic recovery was evident in a variety of indicators. According to the latest estimate, U.S. gross domestic product grew at an annualized rate of 6.4% in the first quarter of 2021 following 4.3% growth in the fourth quarter of 2020. Weekly jobless claims declined throughout the period to new pandemic-era lows, although the monthly nonfarm payroll report disappointed at times as employers struggled to fill positions. Meanwhile, overall profits for companies in the S&P 500 rose by nearly 53% year over year in the first quarter, according to FactSet—the best showing since late 2009.
However, less favorably, inflation concerns led to some volatility in the equity market and caused a sharp rise in longer-term Treasury yields in the first quarter. (Bond prices and yields move in opposite directions.) While inflation measures were above the Fed’s 2% long-term inflation target toward the end of our reporting period—core consumer prices, for example, recorded their largest annual increase (3.8%) since 1992 in May—investors seemed to accept the Fed’s determination that rising price pressures were due to transitory factors arising from the reopening of the global economy.
Longer-term Treasury yields trended lower as inflation expectations began to wane later in the period, but they still finished significantly higher than they were at the end of 2020. Rising yields were a headwind for many fixed income investors; however, high yield bonds, which are less sensitive to interest rate changes, produced solid results, and investment-grade corporate bonds also performed well amid solid corporate fundamentals.
As we look ahead, the central question for investors—assuming the economy’s recovery from the pandemic continues apace—is whether the returns on financial assets will be as robust. Valuations are elevated in nearly all asset classes, and, in some areas, there are clear signs of speculation. That said, a transformed global economic landscape is generating potential opportunities as well as risks. Post-pandemic trends have the potential to create both winners and losers, giving active portfolio managers greater scope to seek excess returns. It is not an easy environment to invest in, but our investment teams remain rooted in company fundamentals and focused on the long term, and they will continue to apply strong fundamental analysis as they seek out the best investments for your portfolio.
Thank you for your continued confidence in T. Rowe Price.
Sincerely,
Robert Sharps
Group Chief Investment Officer
Management’s Discussion of Fund Performance
INVESTMENT OBJECTIVE
The portfolio seeks to provide long-term capital growth by investing primarily in the common stocks of growth companies.
PORTFOLIO COMMENTARY
How did the portfolio perform in the past six months?
The All-Cap Opportunities Portfolio returned 14.57% for the six-month period ended June 30, 2021. The portfolio underperformed its benchmark, the Russell 3000 Index, but outperformed its peer group, the Lipper Variable Annuity Underlying Multi-Cap Growth Funds Average. Effective March 1, 2021, the Russell 3000 Index—which we believe is more representative of the portfolio’s broad opportunity set—replaced the Russell 1000 Growth Index as the portfolio’s primary benchmark. (Past performance cannot guarantee future results.)
What factors influenced the portfolio’s performance?
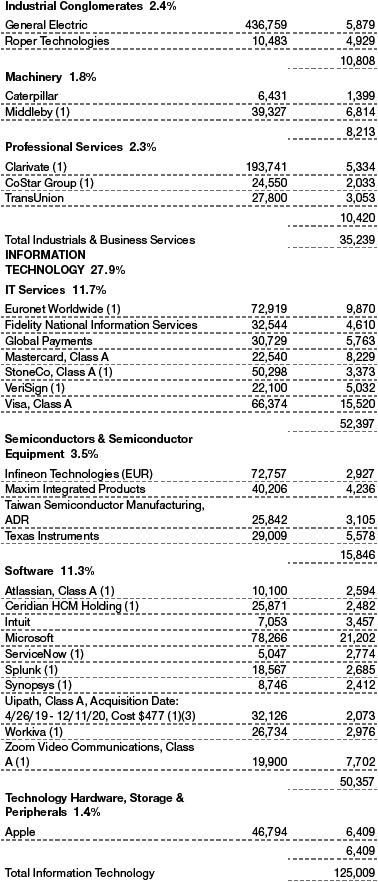
Overall, stock selection in the information technology sector drove relative underperformance during the first half of 2021. Despite robust results from its e-pay and money transfer businesses, shares of Euronet Worldwide traded lower due to weaker-than-expected electronic funds transfer revenues where transaction volumes were impacted by coronavirus-related travel restrictions in Europe. Global Payments is a U.S.-centric merchant acquirer and leading provider of cloud and enterprise applications to help businesses simplify operations and offer customer-friendly payment solutions. As with other names in the payments space, shares slid over concerns of disappointing revenue in international markets, hampered by economic restrictions related to the pandemic. (Please refer to our portfolio of investments for a complete list of holdings and the amount each represents in the portfolio.)
Consumer discretionary also hampered relative results due to security choices. Shares of Amazon.com suffered early in the year due to concerns over possible regulatory actions and extended valuations among mega-cap names that led market gains during the pandemic. The announcement of founder and CEO Jeff Bezos’ retirement also weighed on investor sentiment. Although the stock finished the period higher, its relative underperformance, combined with our substantial overweight, was a headwind. We scaled up our position in discount retailer Ross Stores midway through the period, and the stock price subsequently suffered as investors appeared concerned with management’s conservative forward guidance against the backdrop of fading COVID-19 tailwinds.
On the positive side, effective stock selection and an overweight in the communication services sector added value relative to the benchmark, led by our position in Alphabet. Shares climbed higher as the company continued to exhibit broad-based strength across all segments. Core search advertising benefited from robust retail advertising demand as e-commerce players attempt to sustain their momentum from the pandemic, while brick-and-mortar retailers look to drive traffic during the reopening stage. YouTube results were also above consensus as advertiser interest in direct response ads grew following more embedded e-commerce functionality.
The health care sector was also a source of strength. Shares of Eli Lilly spiked in January in the wake of a positive update for its Alzheimer’s treatment, donanemab. The stock later rallied further following the approval of a competitor’s Alzheimer’s treatment, which both opens the door and lowers the bar for an accelerated approval of donanemab, which we expect will garner a pricing premium given the much shorter-duration therapy. Moderna is a pioneer in a new therapeutics class of medicines based on messenger RNA (mRNA). The stock benefited from investor optimism concerning the durability of the COVID-19 vaccine market and the belief that this market will be dominated by the mRNA players.
How is the portfolio positioned?
The pronounced rotation toward value and cyclicality that occurred in late 2020 extended into the first quarter of 2021, fueled by stimulus and growing optimism around the recovery. Growth eventually reasserted its dominance late in the second quarter as market participants began to question whether inflation concerns would truly cause the U.S. Federal Reserve to tighten monetary policy on an accelerated schedule, while the emergence of the delta variant of the coronavirus worked to slow the reopening trade in June.
Given the pushes and pulls of the current market, we have evolved the portfolio not only in aggregate, but also on a stock-by-stock basis. We continue to reallocate funds to areas where we have identified product- and innovation-driven cycles that should see accelerating economic returns while also taking profits where valuations appear full.
As for our positioning in individual stocks, our largest purchase during the period was Zoom Video Communications. We initiated a stake because we appreciate the company’s distribution strength as it has distanced itself from competitors and reached a mass-market scale. Its strategy of under-monetizing its meetings and cloud phone solutions in order to gain near-term market share provides it with additional revenue potential and gives us incremental confidence in its ability to sustain its growth over the long term.
Another sizable initiation was Airbus, a global aerospace and defense company. While we acknowledge that the airline industry continues to operate amid a difficult backdrop, we believe that Airbus is in a strong position to benefit from the normalization of air travel on the other side of the coronavirus pandemic. In our view, the market underappreciates the company’s improved competitive positioning in single-aisle aircraft and solid, long-term earnings power.
As for sales, we trimmed Wix.com on strength earlier in the year before eliminating the position in May. The company has benefited from increased user engagement as social distancing measures accelerated the need for businesses to have an online presence in order to reach consumers. However, Wix.com now faces decelerating core fundamentals and increasingly challenging comparables over the near term.
What is portfolio management’s outlook?
Over the last approximately 18 months, the pandemic and associated policy response made the stock market more macro-driven than usual. It was a “COVID-on” market until the vaccine data arrived last November, and then it was “COVID-off” through April or May. Now that the economic reopening is several months in the making, the market is searching for leadership and direction again, and the outlook for the second half of 2021 feels unusually nuanced.
Macro themes, such as inflation and employment, will still play a large role in stock returns. However, the outlook is becoming less “thematic,” and success in the next year will be more about getting individual stocks right.
As such, your portfolio has adopted a more “neutral” macro stance in recent months, which is how we usually like the portfolio to be. We have dialed down the magnitude of the bet in value stocks, we have upgraded portfolio quality, and we have pivoted back thoughtfully (and slowly) toward a handful of expensive growth stocks. Specifically:
(1) For the first time in a year, we have increased exposure to secular growth stocks, especially where we believe there is robust free cash flow- and earnings-based valuation support over a three- to five-year horizon (Zoom Video Communications, Atlassian, Pinterest, Amazon.com).
(2) We have reduced our weight in financials (East West Bancorp), as our conviction in a steeper yield curve has decreased.
(3) We have reduced our weight in industrials (Fortive) as many stocks trade at extended valuations, even as we expect the Institute for Supply Management’s manufacturing index to decelerate through early- to mid-2022.
(4) We have concentrated our consumer discretionary holdings into so-called delayed reopening stocks that we think are far from peaking and will see steady fundamental improvement through at least summer 2022 (Cedar Fair, Live Nation Entertainment, Euronet Worldwide, Visa).
(5) We have maintained and increased our holdings in durable “growth at a reasonable price” stocks. These are quality companies that we expect can grow earnings far faster than the market, in most economic environments, yet trade at very reasonable multiples (T-Mobile, Ross Stores, VeriSign).
We continue to rely on our fundamental research and bottom-up stock selection process to construct your portfolio. You should expect the portfolio to maintain large positions in many durable growth companies—those that we believe have the ability to increase revenues and earnings regardless of the global economic environment. We believe that, over the longer term, strong risk-adjusted returns most often arise from owning companies that are at the forefront of innovation and riding powerful, durable trends.
As always, we will continue to work diligently on your behalf. Thank you for your continued support and your confidence in T. Rowe Price.
The views expressed reflect the opinions of T. Rowe Price as of the date of this report and are subject to change based on changes in market, economic, or other conditions. These views are not intended to be a forecast of future events and are no guarantee of future results.
RISKS OF STOCK INVESTING
The fund’s share price can fall because of weakness in the stock markets, a particular industry, or specific holdings. Stock markets can decline for many reasons, including adverse political or economic developments, changes in investor psychology, or heavy institutional selling. The prospects for an industry or company may deteriorate because of a variety of factors, including disappointing earnings or changes in the competitive environment. In addition, the investment manager’s assessment of companies held in a fund may prove incorrect, resulting in losses or poor performance even in rising markets.
RISKS OF GROWTH INVESTING
Growth stocks can be volatile for several reasons. Since these companies usually invest a high portion of earnings in their businesses, they may lack the dividends of value stocks that can cushion stock prices in a falling market. Also, earnings disappointments often lead to sharply falling prices because investors buy growth stocks in anticipation of superior earnings growth.
BENCHMARK INFORMATION
Note: Lipper, a Thomson Reuters Company, is the source for all Lipper content reflected in these materials. Copyright 2021 © Refinitiv. All rights reserved. Any copying, republication or redistribution of Lipper content is expressly prohibited without the prior written consent of Lipper. Lipper shall not be liable for any errors or delays in the content, or for any actions taken in reliance thereon.
Note: Frank Russell Company (Russell) is the source and owner of the Russell index data contained or reflected in these materials and all trademarks and copyrights related thereto. Russell® is a registered trademark of Russell. Russell is not responsible for the formatting or configuration of these materials or for any inaccuracy in T. Rowe Price Associates’ presentation thereof.
Note: ©2021, S&P Global Market Intelligence. Reproduction of any information, data or material, including ratings (Content) in any form is prohibited except with the prior written permission of the relevant party. Such party, its affiliates and suppliers (Content Providers) do not guarantee the accuracy, adequacy, completeness, timeliness or availability of any Content and are not responsible for any errors or omissions (negligent or otherwise), regardless of the cause, or for the results obtained from the use of such Content. In no event shall Content Providers be liable for any damages, costs, expenses, legal fees, or losses (including lost income or lost profit and opportunity costs) in connection with any use of the Content.
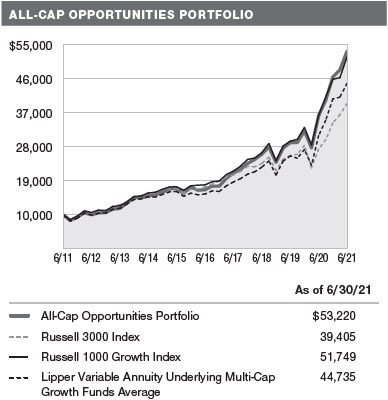
GROWTH OF $10,000
This chart shows the value of a hypothetical $10,000 investment in the portfolio over the past 10 fiscal year periods or since inception (for portfolios lacking 10-year records). The result is compared with benchmarks, which include a broad-based market index and may also include a peer group average or index. Market indexes do not include expenses, which are deducted from portfolio returns as well as mutual fund averages and indexes.
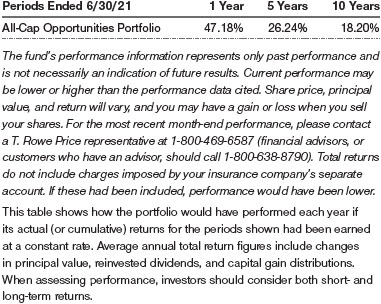
AVERAGE ANNUAL COMPOUND TOTAL RETURN
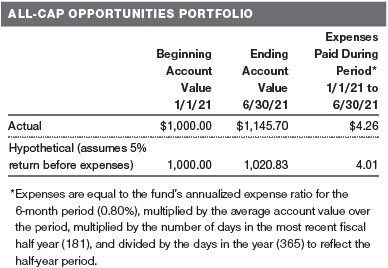
FUND EXPENSE EXAMPLE
As a mutual fund shareholder, you may incur two types of costs: (1) transaction costs, such as redemption fees or sales loads, and (2) ongoing costs, including management fees, distribution and service (12b-1) fees, and other fund expenses. The following example is intended to help you understand your ongoing costs (in dollars) of investing in the fund and to compare these costs with the ongoing costs of investing in other mutual funds. The example is based on an investment of $1,000 invested at the beginning of the most recent six-month period and held for the entire period.
Actual Expenses
The first line of the following table (Actual) provides information about actual account values and actual expenses. You may use the information on this line, together with your account balance, to estimate the expenses that you paid over the period. Simply divide your account value by $1,000 (for example, an $8,600 account value divided by $1,000 = 8.6), then multiply the result by the number on the first line under the heading “Expenses Paid During Period” to estimate the expenses you paid on your account during this period.
Hypothetical Example for Comparison Purposes
The information on the second line of the table (Hypothetical) is based on hypothetical account values and expenses derived from the fund’s actual expense ratio and an assumed 5% per year rate of return before expenses (not the fund’s actual return). You may compare the ongoing costs of investing in the fund with other funds by contrasting this 5% hypothetical example and the 5% hypothetical examples that appear in the shareholder reports of the other funds. The hypothetical account values and expenses may not be used to estimate the actual ending account balance or expenses you paid for the period.
You should also be aware that the expenses shown in the table highlight only your ongoing costs and do not reflect any transaction costs, such as redemption fees or sales loads. Therefore, the second line of the table is useful in comparing ongoing costs only and will not help you determine the relative total costs of owning different funds. To the extent a fund charges transaction costs, however, the total cost of owning that fund is higher.
Unaudited
The accompanying notes are an integral part of these financial statements.
June 30, 2021 (Unaudited)
The accompanying notes are an integral part of these financial statements.
June 30, 2021 (Unaudited)
The accompanying notes are an integral part of these financial statements.
Unaudited
The accompanying notes are an integral part of these financial statements.
Unaudited
The accompanying notes are an integral part of these financial statements.
Unaudited
| NOTES TO FINANCIAL STATEMENTS |
T. Rowe Price Equity Series, Inc. (the corporation) is registered under the Investment Company Act of 1940 (the 1940 Act). The All-Cap Opportunities Portfolio (the fund), formerly the T. Rowe Price New America Growth Portfolio, is a diversified, open-end management investment company established by the corporation. The fund seeks to provide long-term capital growth by investing primarily in the common stocks of growth companies. Shares of the fund are currently offered only to insurance company separate accounts established for the purpose of funding variable annuity contracts and variable life insurance policies.
NOTE 1 - SIGNIFICANT ACCOUNTING POLICIES
Basis of Preparation The fund is an investment company and follows accounting and reporting guidance in the Financial Accounting Standards Board (FASB) Accounting Standards Codification Topic 946 (ASC 946). The accompanying financial statements were prepared in accordance with accounting principles generally accepted in the United States of America (GAAP), including, but not limited to, ASC 946. GAAP requires the use of estimates made by management. Management believes that estimates and valuations are appropriate; however, actual results may differ from those estimates, and the valuations reflected in the accompanying financial statements may differ from the value ultimately realized upon sale or maturity.
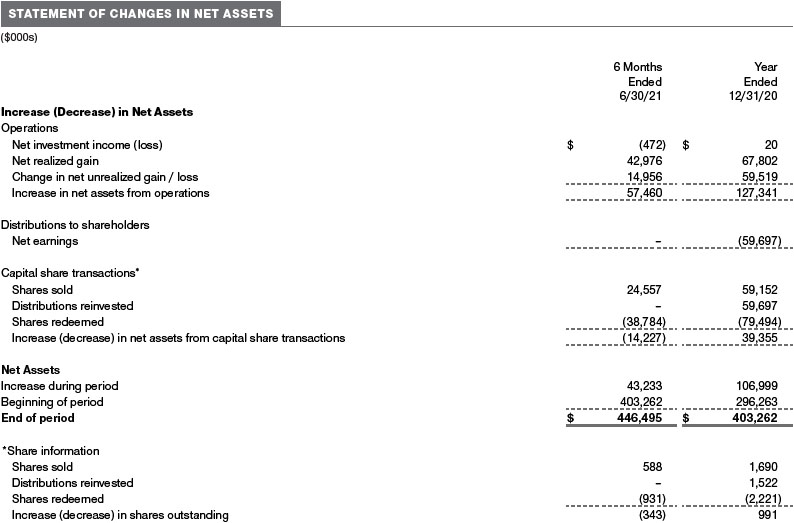
Investment Transactions, Investment Income, and Distributions Investment transactions are accounted for on the trade date basis. Income and expenses are recorded on the accrual basis. Realized gains and losses are reported on the identified cost basis. Income tax-related interest and penalties, if incurred, are recorded as income tax expense. Dividends received from mutual fund investments are reflected as dividend income; capital gain distributions are reflected as realized gain/loss. Dividend income and capital gain distributions are recorded on the ex-dividend date. Distributions from REITs are initially recorded as dividend income and, to the extent such represent a return of capital or capital gain for tax purposes, are reclassified when such information becomes available. Non-cash dividends, if any, are recorded at the fair market value of the asset received. Distributions to shareholders are recorded on the ex-dividend date. Income distributions, if any, are declared and paid annually. A capital gain distribution may also be declared and paid by the fund annually.
Currency Translation Assets, including investments, and liabilities denominated in foreign currencies are translated into U.S. dollar values each day at the prevailing exchange rate, using the mean of the bid and asked prices of such currencies against U.S. dollars as provided by an outside pricing service. Purchases and sales of securities, income, and expenses are translated into U.S. dollars at the prevailing exchange rate on the respective date of such transaction. The effect of changes in foreign currency exchange rates on realized and unrealized security gains and losses is not bifurcated from the portion attributable to changes in market prices.
Capital Transactions Each investor’s interest in the net assets of the fund is represented by fund shares. The fund’s net asset value (NAV) per share is computed at the close of the New York Stock Exchange (NYSE), normally 4 p.m. ET, each day the NYSE is open for business. However, the NAV per share may be calculated at a time other than the normal close of the NYSE if trading on the NYSE is restricted, if the NYSE closes earlier, or as may be permitted by the SEC. Purchases and redemptions of fund shares are transacted at the next-computed NAV per share, after receipt of the transaction order by T. Rowe Price Associates, Inc., or its agents.
Indemnification In the normal course of business, the fund may provide indemnification in connection with its officers and directors, service providers, and/or private company investments. The fund’s maximum exposure under these arrangements is unknown; however, the risk of material loss is currently considered to be remote.
NOTE 2 - VALUATION
Fair Value The fund’s financial instruments are valued at the close of the NYSE and are reported at fair value, which GAAP defines as the price that would be received to sell an asset or paid to transfer a liability in an orderly transaction between market participants at the measurement date. The T. Rowe Price Valuation Committee (the Valuation Committee) is an internal committee that has been delegated certain responsibilities by the fund’s Board of Directors (the Board) to ensure that financial instruments are appropriately priced at fair value in accordance with GAAP and the 1940 Act. Subject to oversight by the Board, the Valuation Committee develops and oversees pricing-related policies and procedures and approves all fair value determinations. Specifically, the Valuation Committee establishes policies and procedures used in valuing financial instruments, including those which cannot be valued in accordance with normal procedures or using pricing vendors; determines pricing techniques, sources, and persons eligible to effect fair value pricing actions; evaluates the services and performance of the pricing vendors; oversees the pricing process to ensure policies and procedures are being followed; and provides guidance on internal controls and valuation-related matters. The Valuation Committee provides periodic reporting to the Board on valuation matters.
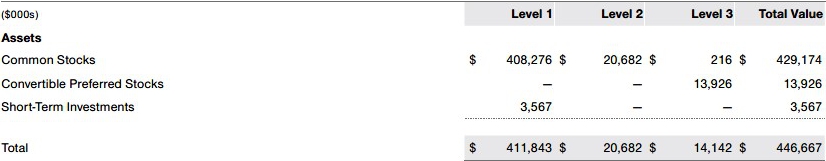
Various valuation techniques and inputs are used to determine the fair value of financial instruments. GAAP establishes the following fair value hierarchy that categorizes the inputs used to measure fair value:
Level 1 – quoted prices (unadjusted) in active markets for identical financial instruments that the fund can access at the reporting date
Level 2 – inputs other than Level 1 quoted prices that are observable, either directly or indirectly (including, but not limited to, quoted prices for similar financial instruments in active markets, quoted prices for identical or similar financial instruments in inactive markets, interest rates and yield curves, implied volatilities, and credit spreads)
Level 3 – unobservable inputs (including the fund's own assumptions in determining fair value)
Observable inputs are developed using market data, such as publicly available information about actual events or transactions, and reflect the assumptions that market participants would use to price the financial instrument. Unobservable inputs are those for which market data are not available and are developed using the best information available about the assumptions that market participants would use to price the financial instrument. GAAP requires valuation techniques to maximize the use of relevant observable inputs and minimize the use of unobservable inputs. When multiple inputs are used to derive fair value, the financial instrument is assigned to the level within the fair value hierarchy based on the lowest-level input that is significant to the fair value of the financial instrument. Input levels are not necessarily an indication of the risk or liquidity associated with financial instruments at that level but rather the degree of judgment used in determining those values.
Valuation Techniques Equity securities, including exchange-traded funds, listed or regularly traded on a securities exchange or in the over-the-counter (OTC) market are valued at the last quoted sale price or, for certain markets, the official closing price at the time the valuations are made. OTC Bulletin Board securities are valued at the mean of the closing bid and asked prices. A security that is listed or traded on more than one exchange is valued at the quotation on the exchange determined to be the primary market for such security. Listed securities not traded on a particular day are valued at the mean of the closing bid and asked prices for domestic securities and the last quoted sale or closing price for international securities.
The last quoted prices of non-U.S. equity securities may be adjusted to reflect the fair value of such securities at the close of the NYSE, if the fund determines that developments between the close of a foreign market and the close of the NYSE will affect the value of some or all of its portfolio securities. Each business day, the fund uses information from outside pricing services to evaluate and, if appropriate, decide whether it is necessary to adjust quoted prices to reflect fair value by reviewing a variety of factors, including developments in foreign markets, the performance of U.S. securities markets, and the performance of instruments trading in U.S. markets that represent foreign securities and baskets of foreign securities. The fund uses outside pricing services to provide it with quoted prices and information to evaluate or adjust those prices. The fund cannot predict how often it will use quoted prices and how often it will determine it necessary to adjust those prices to reflect fair value.
Investments in mutual funds are valued at the mutual fund’s closing NAV per share on the day of valuation. Assets and liabilities other than financial instruments, including short-term receivables and payables, are carried at cost, or estimated realizable value, if less, which approximates fair value.
Investments for which market quotations or market-based valuations are not readily available or deemed unreliable are valued at fair value as determined in good faith by the Valuation Committee, in accordance with fair valuation policies and procedures. The objective of any fair value pricing determination is to arrive at a price that could reasonably be expected from a current sale. Financial instruments fair valued by the Valuation Committee are primarily private placements, restricted securities, warrants, rights, and other securities that are not publicly traded. Factors used in determining fair value vary by type of investment and may include market or investment specific considerations. The Valuation Committee typically will afford greatest weight to actual prices in arm’s length transactions, to the extent they represent orderly transactions between market participants, transaction information can be reliably obtained, and prices are deemed representative of fair value. However, the Valuation Committee may also consider other valuation methods such as market-based valuation multiples; a discount or premium from market value of a similar, freely traded security of the same issuer; discounted cash flows; yield to maturity; or some combination. Fair value determinations are reviewed on a regular basis and updated as information becomes available, including actual purchase and sale transactions of the investment. Because any fair value determination involves a significant amount of judgment, there is a degree of subjectivity inherent in such pricing decisions, and fair value prices determined by the Valuation Committee could differ from those of other market participants.
Valuation Inputs The following table summarizes the fund’s financial instruments, based on the inputs used to determine their fair values on June 30, 2021 (for further detail by category, please refer to the accompanying Portfolio of Investments):
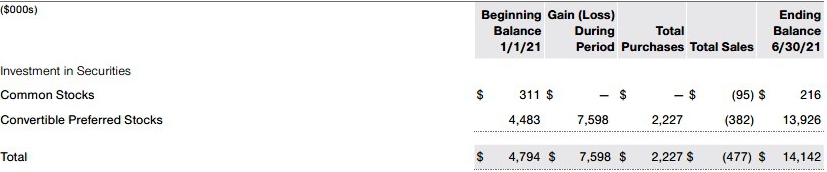
Following is a reconciliation of the fund’s Level 3 holdings for the six months ended June 30, 2021. Gain (loss) reflects both realized and change in unrealized gain/loss on Level 3 holdings during the period, if any, and is included on the accompanying Statement of Operations. The change in unrealized gain/loss on Level 3 instruments held at June 30, 2021, totaled $8,055,000 for the six months ended June 30, 2021.
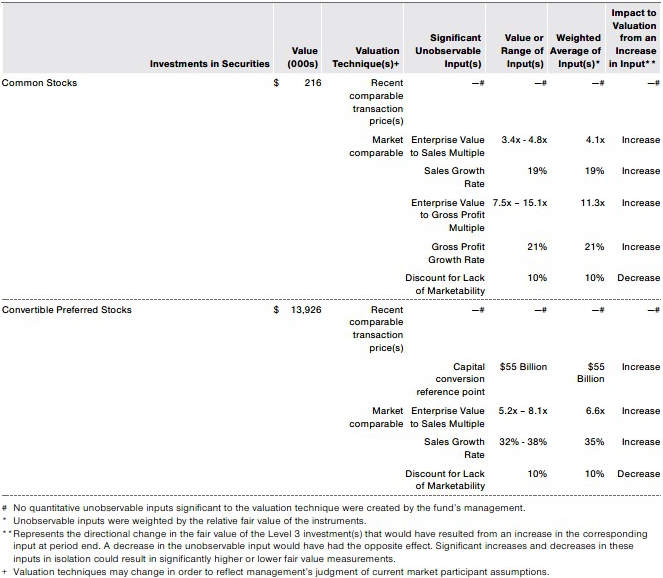
In accordance with GAAP, the following table provides quantitative information about significant unobservable inputs used to determine the fair valuations of the trust’s Level 3 assets, by class of financial instrument. Because the Valuation Committee considers a wide variety of factors and inputs, both observable and unobservable, in determining fair values, the unobservable inputs presented do not reflect all inputs significant to the fair value determination.
NOTE 3 - OTHER INVESTMENT TRANSACTIONS
Consistent with its investment objective, the fund engages in the following practices to manage exposure to certain risks and/or to enhance performance. The investment objective, policies, program, and risk factors of the fund are described more fully in the fund’s prospectus and Statement of Additional Information.
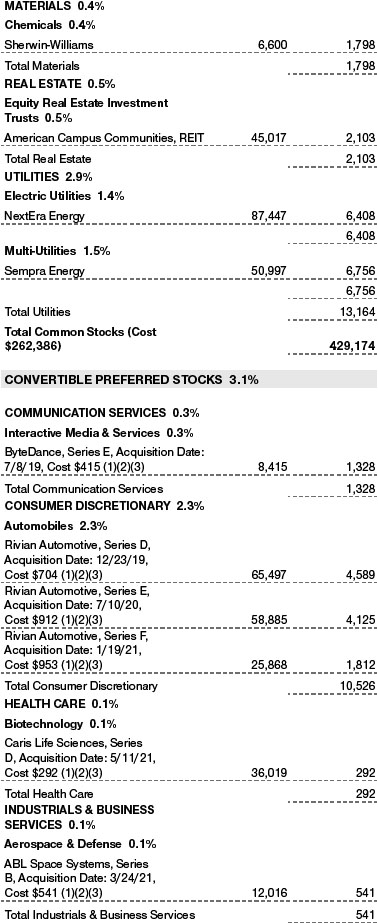
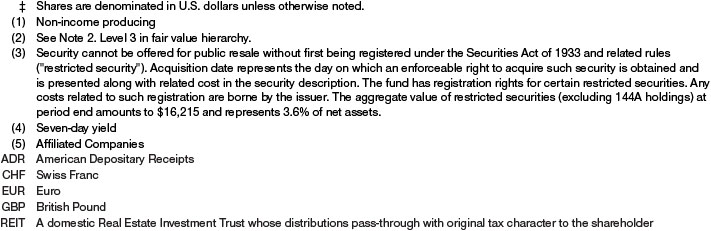
Restricted Securities The fund invests in securities that are subject to legal or contractual restrictions on resale. Prompt sale of such securities at an acceptable price may be difficult and may involve substantial delays and additional costs.
Other Purchases and sales of portfolio securities other than short-term securities aggregated $141,182,000 and $157,900,000, respectively, for the six months ended June 30, 2021.
NOTE 4 - FEDERAL INCOME TAXES
No provision for federal income taxes is required since the fund intends to continue to qualify as a regulated investment company under Subchapter M of the Internal Revenue Code and distribute to shareholders all of its taxable income and gains. Distributions determined in accordance with federal income tax regulations may differ in amount or character from net investment income and realized gains for financial reporting purposes. Financial reporting records are adjusted for permanent book/tax differences to reflect tax character but are not adjusted for temporary differences. The amount and character of tax-basis distributions and composition of net assets are finalized at fiscal year-end; accordingly, tax-basis balances have not been determined as of the date of this report.
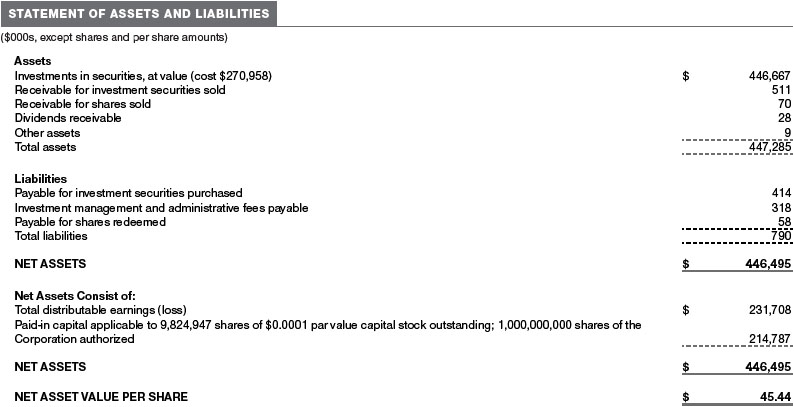
At June 30, 2021, the cost of investments for federal income tax purposes was $272,126,000. Net unrealized gain aggregated $174,541,000 at period-end, of which $176,268,000 related to appreciated investments and $1,727,000 related to depreciated investments.
NOTE 5 - RELATED PARTY TRANSACTIONS
The fund is managed by T. Rowe Price Associates, Inc. (Price Associates), a wholly owned subsidiary of T. Rowe Price Group, Inc. (Price Group). The investment management and administrative agreement between the fund and Price Associates provides for an all-inclusive annual fee equal to 0.85% of the fund’s average daily net assets. The fee is computed daily and paid monthly. The all-inclusive fee covers investment management services and ordinary, recurring operating expenses but does not cover interest expense; expenses related to borrowing, taxes, and brokerage; or nonrecurring expenses. Effective July 1, 2018, Price Associates has contractually agreed, at least through April 30, 2022 to waive a portion of its management fee in order to limit the fund’s management fee to 0.80% of the fund’s average daily net assets. Thereafter, this agreement automatically renews for one-year terms unless terminated or modified by the fund’s Board. Fees waived and expenses paid under this agreement are not subject to reimbursement to Price Associates by the fund. The total management fees waived were $104,000 for the six months ended June 30, 2021.
The fund may invest its cash reserves in certain open-end management investment companies managed by Price Associates and considered affiliates of the fund: the T. Rowe Price Government Reserve Fund or the T. Rowe Price Treasury Reserve Fund, organized as money market funds, or the T. Rowe Price Short-Term Fund, a short-term bond fund (collectively, the Price Reserve Funds). The Price Reserve Funds are offered as short-term investment options to mutual funds, trusts, and other accounts managed by Price Associates or its affiliates and are not available for direct purchase by members of the public. Cash collateral from securities lending is invested in the T. Rowe Price Short-Term Fund. The Price Reserve Funds pay no investment management fees.
The fund may participate in securities purchase and sale transactions with other funds or accounts advised by Price Associates (cross trades), in accordance with procedures adopted by the fund’s Board and Securities and Exchange Commission rules, which require, among other things, that such purchase and sale cross trades be effected at the independent current market price of the security. During the six months ended June 30, 2021, the fund had no purchases or sales cross trades with other funds or accounts advised by Price Associates.
Effective January 1, 2020, Price Associates has voluntarily agreed to reimburse the fund from its own resources on a monthly basis for the cost of investment research embedded in the cost of the fund’s securities trades. This agreement may be rescinded at any time. For the six months ended June 30, 2021, this reimbursement amounted to $9,000, which is included in Net realized gain (loss) on Securities in the Statement of Operations.
NOTE 6 - OTHER MATTERS
Unpredictable events such as environmental or natural disasters, war, terrorism, pandemics, outbreaks of infectious diseases, and similar public health threats may significantly affect the economy and the markets and issuers in which a fund invests. Certain events may cause instability across global markets, including reduced liquidity and disruptions in trading markets, while some events may affect certain geographic regions, countries, sectors, and industries more significantly than others, and exacerbate other pre-existing political, social, and economic risks. During 2020, a novel strain of coronavirus (COVID-19) resulted in disruptions to global business activity and caused significant volatility and declines in global financial markets.
These types of events, such as the global pandemic caused by COVID-19, may also cause widespread fear and uncertainty, and result in, among other things: enhanced health screenings, quarantines, cancellations, and travel restrictions, including border closings; disruptions to business operations and supply chains and customer activity; exchange trading suspensions and closures, and overall reduced liquidity of securities, derivatives, and commodities trading markets; reductions in consumer demand and economic output; and significant challenges in healthcare service preparation and delivery. The fund could be negatively impacted if the value of a portfolio holding were harmed by such political or economic conditions or events. In addition, the operations of the fund, its investment advisers, and the fund’s service providers may be significantly impacted, or even temporarily halted, as a result of any impairment to their information technology and other operation systems, extensive employee illnesses or unavailability, government quarantine measures, and restrictions on travel or meetings and other factors related to public emergencies.
Governmental and quasi-governmental authorities and regulators have in the past responded to major economic disruptions with a variety of significant fiscal and monetary policy changes, including but not limited to, direct capital infusions into companies, new monetary programs, and dramatically lower interest rates. An unexpected or quick reversal of these policies, or the ineffectiveness of these policies, could negatively impact overall investor sentiment and further increase volatility in securities markets.
INFORMATION ON PROXY VOTING POLICIES, PROCEDURES, AND RECORDS
A description of the policies and procedures used by T. Rowe Price funds to determine how to vote proxies relating to portfolio securities is available in each fund’s Statement of Additional Information. You may request this document by calling 1-800-225-5132 or by accessing the SEC’s website, sec.gov.
The description of our proxy voting policies and procedures is also available on our corporate website. To access it, please visit the following Web page:
https://www.troweprice.com/corporate/en/utility/policies.html
Scroll down to the section near the bottom of the page that says, “Proxy Voting Policies.” Click on the Proxy Voting Policies link in the shaded box.
Each fund’s most recent annual proxy voting record is available on our website and through the SEC’s website. To access it through T. Rowe Price, visit the website location shown above, and scroll down to the section near the bottom of the page that says, “Proxy Voting Records.” Click on the Proxy Voting Records link in the shaded box.
HOW TO OBTAIN QUARTERLY PORTFOLIO HOLDINGS
The fund files a complete schedule of portfolio holdings with the Securities and Exchange Commission (SEC) for the first and third quarters of each fiscal year as an exhibit to its reports on Form N-PORT. The fund’s reports on Form N-PORT are available electronically on the SEC’s website (sec.gov). In addition, most T. Rowe Price funds disclose their first and third fiscal quarter-end holdings on troweprice.com.
APPROVAL OF INVESTMENT MANAGEMENT AGREEMENT
Each year, the fund’s Board of Directors (Board) considers the continuation of the investment management agreement (Advisory Contract) between the fund and its investment advisor, T. Rowe Price Associates, Inc. (Advisor), on behalf of the fund. In that regard, at a meeting held on March 8–9, 2021 (Meeting), the Board, including all of the fund’s independent directors, approved the continuation of the fund’s Advisory Contract. At the Meeting, the Board considered the factors and reached the conclusions described below relating to the selection of the Advisor and the approval of the Advisory Contract. The independent directors were assisted in their evaluation of the Advisory Contract by independent legal counsel from whom they received separate legal advice and with whom they met separately.
In providing information to the Board, the Advisor was guided by a detailed set of requests for information submitted by independent legal counsel on behalf of the independent directors. In considering and approving the Advisory Contract, the Board considered the information it believed was relevant, including, but not limited to, the information discussed below. The Board considered not only the specific information presented in connection with the Meeting but also the knowledge gained over time through interaction with the Advisor about various topics. The Board meets regularly and, at each of its meetings, covers an extensive agenda of topics and materials and considers factors that are relevant to its annual consideration of the renewal of the T. Rowe Price funds’ advisory contracts, including performance and the services and support provided to the funds and their shareholders.
Services Provided by the Advisor
The Board considered the nature, quality, and extent of the services provided to the fund by the Advisor. These services included, but were not limited to, directing the fund’s investments in accordance with its investment program and the overall management of the fund’s portfolio, as well as a variety of related activities such as financial, investment operations, and administrative services; compliance; maintaining the fund’s records and registrations; and shareholder communications. The Board also reviewed the background and experience of the Advisor’s senior management team and investment personnel involved in the management of the fund, as well as the Advisor’s compliance record. The Board concluded that it was satisfied with the nature, quality, and extent of the services provided by the Advisor.
Investment Performance of the Fund
The Board took into account discussions with the Advisor and reports that it receives throughout the year relating to fund performance. In connection with the Meeting, the Board reviewed the fund’s net annualized total returns for the 1-, 2-, 3-, 4-, 5-, and 10-year periods as of September 30, 2020, and compared these returns with the performance of a peer group of funds with similar investment programs and a wide variety of other previously agreed-upon comparable performance measures and market data, including those supplied by Broadridge, which is an independent provider of mutual fund data.
On the basis of this evaluation and the Board’s ongoing review of investment results, and factoring in the relative market conditions during certain of the performance periods, the Board concluded that the fund’s performance was satisfactory.
Costs, Benefits, Profits, and Economies of Scale
The Board reviewed detailed information regarding the revenues received by the Advisor under the Advisory Contract and other direct and indirect benefits that the Advisor (and its affiliates) may have realized from its relationship with the fund. In considering soft-dollar arrangements pursuant to which research may be received from broker-dealers that execute the fund’s portfolio transactions, the Board noted that the Advisor bears the cost of research services for all client accounts that it advises, including the T. Rowe Price funds. The Board received information on the estimated costs incurred and profits realized by the Advisor from managing the T. Rowe Price funds. The Board also reviewed estimates of the profits realized from managing the fund in particular, and the Board concluded that the Advisor’s profits were reasonable in light of the services provided to the fund.
The Board also considered whether the fund benefits under the fee levels set forth in the Advisory Contract from any economies of scale realized by the Advisor. Under the Advisory Contract, the fund pays the Advisor a single fee, or an all-inclusive management fee, which is based on the fund’s average daily net assets. The all-inclusive management fee includes investment management services and provides for the Advisor to pay all of the fund’s ordinary, recurring operating expenses except for interest, taxes, portfolio transaction fees, and any nonrecurring extraordinary expenses that may arise. However, the fund has a contractual limitation in place whereby the Advisor has agreed to waive a portion of the management fee it is entitled to receive from the fund in order to limit the fund’s management fee rate to 0.80% of the fund’s average daily net assets. Any fees waived under this management fee waiver agreement are not subject to reimbursement to the Advisor by the fund. The Advisor has generally implemented an all-inclusive management fee structure in situations where a fixed total expense ratio is useful for purposes of providing certainty of fees and expenses for the investors in these funds, and has historically sought to set the initial all-inclusive fee rate at levels below the expense ratios of comparable funds to take into account the potential future economies of scale. Because the fund serves as an underlying option to variable annuity products, the all-inclusive fee structure is utilized to create certainty for the annuity providers’ overall pricing decisions and disclosures. Assets of the fund are included in the calculation of the group fee rate, which serves as a component of the management fee for many T. Rowe Price funds and declines at certain asset levels based on the combined average net assets of most of the T. Rowe Price funds (including the fund). Although the fund does not have a group fee component to its management fee, its assets are included in the calculation because certain resources utilized to operate the fund are shared with other T. Rowe Price funds. The Board concluded that, based on the profitability data it reviewed and consistent with this all-inclusive management fee structure, the advisory fee structure for the fund continued to be appropriate.
Fees and Expenses
The Board was provided with information regarding industry trends in management fees and expenses. Among other things, the Board reviewed data for peer groups that were compiled by Broadridge, which compared: (i) contractual management fees, total expenses, actual management fees, and nonmanagement expenses of the fund with a group of competitor funds selected by Broadridge (Expense Group) and (ii) total expenses, actual management fees, and nonmanagement expenses of the fund with a broader set of funds within the Lipper investment classification (Expense Universe). The Board considered the fund’s contractual management fee rate, actual management fee rate, and total expenses (all of which generally reflect the all-inclusive management fee rate and do not deduct the operating expenses paid by the Advisor as part of the overall management fee) in comparison with the information for the Broadridge peer groups. Broadridge generally constructed the peer groups by seeking the most comparable funds based on similar investment classifications and objectives, expense structure, asset size, and operating components and attributes and ranked funds into quintiles, with the first quintile representing the funds with the lowest relative expenses and the fifth quintile representing the funds with the highest relative expenses. The information provided to the Board indicated that the fund’s contractual management fee ranked in the fifth quintile (Expense Group), the fund’s actual management fee rate ranked in the fifth quintile (Expense Group and Expense Universe), and the fund’s total expenses ranked in the second quintile (Expense Group) and fourth quintile (Expense Universe).
The Board also reviewed the fee schedules for other investment portfolios with similar mandates that are advised or subadvised by the Advisor and its affiliates, including separately managed accounts for institutional and individual investors; subadvised funds; and other sponsored investment portfolios, including collective investment trusts and pooled vehicles organized and offered to investors outside the United States. Management provided the Board with information about the Advisor’s responsibilities and services provided to subadvisory and other institutional account clients, including information about how the requirements and economics of the institutional business are fundamentally different from those of the proprietary mutual fund business. The Board considered information showing that the Advisor’s mutual fund business is generally more complex from a business and compliance perspective than its institutional account business and considered various relevant factors, such as the broader scope of operations and oversight, more extensive shareholder communication infrastructure, greater asset flows, heightened business risks, and differences in applicable laws and regulations associated with the Advisor’s proprietary mutual fund business. In assessing the reasonableness of the fund’s management fee rate, the Board considered the differences in the nature of the services required for the Advisor to manage its mutual fund business versus managing a discrete pool of assets as a subadvisor to another institution’s mutual fund or for an institutional account and that the Advisor generally performs significant additional services and assumes greater risk in managing the fund and other T. Rowe Price funds than it does for institutional account clients, including subadvised funds.
On the basis of the information provided and the factors considered, the Board concluded that the fees paid by the fund under the Advisory Contract are reasonable.
Approval of the Advisory Contract
As noted, the Board approved the continuation of the Advisory Contract. No single factor was considered in isolation or to be determinative to the decision. Rather, the Board concluded, in light of a weighting and balancing of all factors considered, that it was in the best interests of the fund and its shareholders for the Board to approve the continuation of the Advisory Contract (including the fees to be charged for services thereunder).
Item 1. (b) Notice pursuant to Rule 30e-3.
Not applicable.
Item 2. Code of Ethics.
A code of ethics, as defined in Item 2 of Form N-CSR, applicable to its principal executive officer, principal financial officer, principal accounting officer or controller, or persons performing similar functions is filed as an exhibit to the registrant’s annual Form N-CSR. No substantive amendments were approved or waivers were granted to this code of ethics during the registrant’s most recent fiscal half-year.
Item 3. Audit Committee Financial Expert.
Disclosure required in registrant’s annual Form N-CSR.
Item 4. Principal Accountant Fees and Services.
Disclosure required in registrant’s annual Form N-CSR.
Item 5. Audit Committee of Listed Registrants.
Not applicable.
Item 6. Investments.
(a) Not applicable. The complete schedule of investments is included in Item 1 of this Form N-CSR.
(b) Not applicable.
Item 7. Disclosure of Proxy Voting Policies and Procedures for Closed-End Management Investment Companies.
Not applicable.
Item 8. Portfolio Managers of Closed-End Management Investment Companies.
Not applicable.
Item 9. Purchases of Equity Securities by Closed-End Management Investment Company and Affiliated Purchasers.
Not applicable.
Item 10. Submission of Matters to a Vote of Security Holders.
There has been no change to the procedures by which shareholders may recommend nominees to the registrant’s board of directors.
Item 11. Controls and Procedures.
(a) The registrant’s principal executive officer and principal financial officer have evaluated the registrant’s disclosure controls and procedures within 90 days of this filing and have concluded that the registrant’s disclosure controls and procedures were effective, as of that date, in ensuring that information required to be disclosed by the registrant in this Form N-CSR was recorded, processed, summarized, and reported timely.
(b) The registrant’s principal executive officer and principal financial officer are aware of no change in the registrant’s internal control over financial reporting that occurred during the period covered by this report that has materially affected, or is reasonably likely to materially affect, the registrant’s internal control over financial reporting.
Item 12. Disclosure of Securities Lending Activities for Closed-End Management Investment Companies.
Not applicable.
Item 13. Exhibits.
(a)(1) The registrant’s code of ethics pursuant to Item 2 of Form N-CSR is filed with the registrant’s annual Form N-CSR.
(2) Separate certifications by the registrant's principal executive officer and principal financial officer, pursuant to Section 302 of the Sarbanes-Oxley Act of 2002 and required by Rule 30a-2(a) under the Investment Company Act of 1940, are attached.
(3) Written solicitation to repurchase securities issued by closed-end companies: not applicable.
(b) A certification by the registrant's principal executive officer and principal financial officer, pursuant to Section 906 of the Sarbanes-Oxley Act of 2002 and required by Rule 30a-2(b) under the Investment Company Act of 1940, is attached.
SIGNATURES
Pursuant to the requirements of the Securities Exchange Act of 1934 and the Investment Company Act of 1940, the registrant has duly caused this report to be signed on its behalf by the undersigned, thereunto duly authorized.
T. Rowe Price Equity Series, Inc.
| By | | /s/ David Oestreicher |
| | | David Oestreicher |
| | | Principal Executive Officer |
| |
| Date | | August 17, 2021 | | | | |
Pursuant to the requirements of the Securities Exchange Act of 1934 and the Investment Company Act of 1940, this report has been signed below by the following persons on behalf of the registrant and in the capacities and on the dates indicated.
| By | | /s/ David Oestreicher |
| | | David Oestreicher |
| | | Principal Executive Officer |
| |
| Date | | August 17, 2021 | | | | |
| |
| |
| By | | /s/ Alan S. Dupski |
| | | Alan S. Dupski |
| | | Principal Financial Officer |
| |
| Date | | August 17, 2021 | | | | |