| | |

| | Exhibit 99.1 |
I. Executive Summary
TRANSACTION OVERVIEW
On August 17, 2015, NN, Inc. (“NN” or the “Company”) announced a definitive purchase agreement to acquire Precision Engineered Products Holdings, Inc. (“PEP” or together with NN, the “Combined Company”), a leading global manufacturer of highly engineered solutions for the medical, electrical, transportation, power distribution and other various precision end markets, for a purchase price of $615 million (excluding fees and expenses), or 8.9x LTM 6/30/2015 pro forma adjusted EBITDA of $69 million (8.2x inclusive of $6.5 million estimated synergies) (the “Transaction”). Financing for the acquisition will include a $100 million Senior Secured Revolving Credit Facility, $525 million Senior Secured Term Loan and $300 million Senior Unsecured Notes, representing senior secured and total leverage at close of 3.1x and 4.8x, respectively on LTM 6/30/2015 Pro Forma Adjusted EBITDA, After Cost Savings of $176 million.
SOURCES & USES
The following table sets forth pro forma sources & uses of funds for the Transaction:
Exhibit 1: Pro Forma Sources & Uses
($ in millions)
| | | | |
Sources | | | |
Cash | | $ | 32 | |
New Term Loan B | | | 525 | |
New Senior Unsecured Notes | | | 300 | |
| | | | |
Total Sources | | $ | 857 | |
| | | | |
| | | | |
Uses | | | |
PEP Purchase Price | | $ | 615 | |
Pay Down Existing Term Loan B | | | 206 | |
Est. Fees and Expenses | | | 36 | |
| | | | |
Total Uses | | $ | 857 | |
| | | | |
PRO FORMA CAPITALIZATION
The following table sets forth pro forma capitalization for the Transaction:
Exhibit 2: Pro Forma Capitalization
($ in millions)
| | | | | | | | | | | | | | | | |
| ($ in millions) | | PF Equity Follow-On | | | Trans. | | | PF for PEP Acquisition | | | % | |
Pro Forma Capitalization | | As of 6/30/2015 | | | Adj. | | | As of 6/30/2015 | | | Cap | |
Cash and Cash Equivalents | | $ | 48 | | | ($ | 32 | ) | | $ | 17 | | | | 1 | % |
Revolver ($100mm) | | | — | | | | — | | | | — | | | | — | |
Existing Term Loan B | | | 206 | | | | (206 | ) | | | — | | | | — | |
New Term Loan B | | | — | | | | 525 | | | | 525 | | | | 37 | % |
Capital Leases | | | 17 | | | | — | | | | 17 | | | | 1 | % |
| | | | | | | | | | | | | | | | |
Secured Debt | | $ | 223 | | | | | | | $ | 542 | | | | 38 | % |
| | | | | | | | | | | | | | | | |
New Senior Unsecured Notes | | | — | | | | 300 | | | | 300 | | | | 21 | % |
Other Debt | | | 8 | | | | — | | | | 8 | | | | 1 | % |
| | | | | | | | | | | | | | | | |
Total Debt | | $ | 231 | | | | | | | $ | 850 | | | | 60 | % |
| | | | | | | | | | | | | | | | |
Market Value Equity[1][2] | | | 569 | | | | — | | | | 569 | | | | 40 | % |
| | | | | | | | | | | | | | | | |
Total Capitalization | | $ | 800 | | | | | | | $ | 1,419 | | | | 100 | % |
| | | | | | | | | | | | | | | | |
LTM 6/30/2015 Credit Statistics | | | | | | | | | | | | | | | | |
LTM Pro Foram Adj. EBITDA After Cost Savings[3] | | | | | | | | | | $ | 176 | | | | | |
Secured Debt / Adj. EBITDA | | | | | | | | | | | 3.1x | | | | | |
Total Debt / Adj. EBITDA | | | | | | | | | | | 4.8x | | | | | |
Total Net Debt / Adj. EBITDA | | | | | | | | | | | 4.7x | | | | | |
| [1] | Reflective of proceeds received from $182 million follow-on equity offering closing 7/1/15 |
| [2] | Equity value based 26.8 million shares outstanding and on market close of $21.21 on September 14, 2015 |
| [3] | Pro Forma Adjusted EBITDA After Cost Savings includes anticipated synergies for the PEP and prior acquisitions |
| | |

| | 1 |
PRO FORMA BUSINESS DESCRIPTION
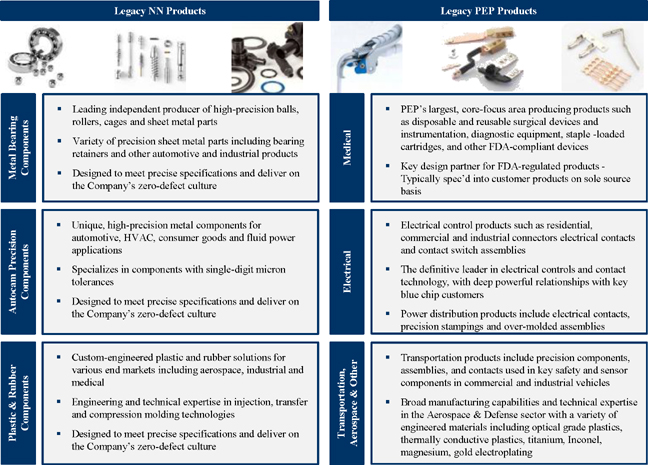
Headquartered in Johnson City, Tennessee, NN is a diversified industrial company and a leading global manufacturer of metal bearing, plastic, rubber and precision metal components. Through its three business segments the Company manufactures engineered components that take advantage of its competencies in product design and tight tolerance manufacturing processes. Similarly, PEP is a leading global manufacturer of highly engineered solutions utilized in the medical, electrical, aerospace and general industrial end markets. PEP’s products include a broad range of precision metal and plastic components, assemblies, and finished devices for the medical surgical, electrical distribution, transportation and other select industrial end markets. PEP will further NN’s manufacturing expertise with its proficiency in design and qualification engineering, rapid prototyping, high mix precision stamping and molding, and cleanroom assembly and packaging. The Combined Company is positioned as a global market leader with the ability to capitalize on opportunities across a large addressable market.
Exhibit 5: Pro Forma NN Snapshot
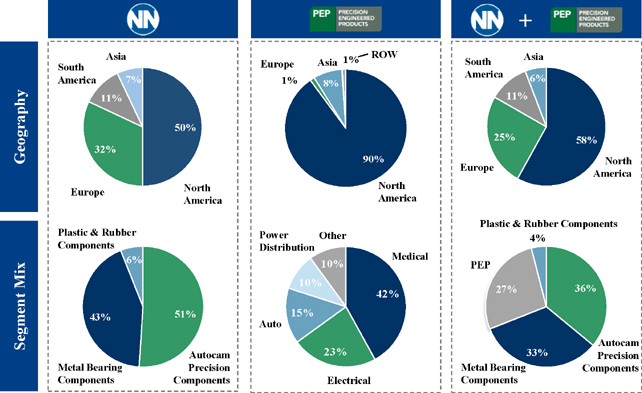
Note: Based on Historical Financials of NN and PEP for the six months ended June 30, 2015
Inclusive of PEP, NN operates 43 manufacturing facilities in 11 countries across the globe. With locations in United States, Mexico, Western Europe, Eastern Europe, Brazil, China and the Dominican Republic, the Combined Company has the breadth and scale necessary to meet the global demands of its customers. The Combined Company’s broad geographic coverage differentiates it from its competitors, allowing it to serve customers with a global footprint while being in close proximity to their operations and to provide a single solution with consistent service quality within the same platform.
| | |
| | 2 |
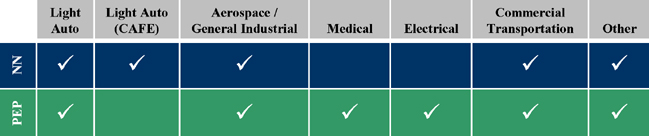
PRODUCT OVERVIEW
Over the last several years, NN has leveraged the manufacturing expertise developed in its ball and roller business and, through strategic acquisitions, effectively expanded into other attractive end markets that require high-volume and high-precision manufacturing. The Combined Company now provides services to a broad base of stable and growing end markets including light auto, aerospace / general industrial, medical, electrical, commercial transportation and other industrial end markets.
Exhibit 7: Pro Forma Summary of NN’s End Market and Product Mix
| | |
| | 3 |
SEGMENT OVERVIEW
Autocam Precision Components (36% of Pro Forma Revenue)
NN’s Autocam Precision Components (“APC”) segment manufactures highly engineered, difficult to manufacture precision metal components and subassemblies for the transportation, HVAC and fluid power markets. The Company’s entry into the precision metal components market began in 2006 with the acquisition of Whirlaway Corporation. NN dramatically expanded the segment in 2014 with the acquisition of Autocam Corporation. With the acquisition of Autocam, the Company is now one of the premier global brands in the high quality, ultra-precision end of the precision components market with a global presence.
Metal Bearing Components (33% of Pro Forma Revenue)
NN’s Metal Bearing Components (“MBC”) segment manufactures and supplies high precision bearing components, consisting of balls, cylindrical rollers, tapered rollers, and metal retainers, for leading bearing and Constant Velocity (“CV”)—joint manufacturers on a global basis. MBC positions NN as a leading independent manufacturer of precision steel bearing balls and rollers for the North American, European and Asian markets. Through a series of acquisitions and plant expansions, the Company has built upon its strong core ball business and significantly expanded its bearing component product offering.
PEP (27% of Pro Forma Revenue)
The Acquisition of PEP creates NN’s newest operating segment which offers customized, engineered and manufactured solutions to the medical, electrical, aerospace and general industrial end markets. PEP’s diverse base of blue chip customers rely on its unique range of capabilities to ensure their products fulfill safety critical functionality and performance requirements for precision applications. PEP’s diverse portfolio of custom engineered, long-life products have driven stable sales growth, high margins, and strong free cash flow.
Plastic and Rubber Components (4% of Pro Forma Revenue)
NN’s Plastic and Rubber Components (“PRC”) segment manufactures high precision rubber seals and plastic retainers for leading bearing manufacturers on a global basis. In addition, it manufactures specialized plastic products including automotive components, electronic instrument cases and other molded components used in a variety of industrial and consumer applications. Finally, the Company also manufactures rubber seals for use in various automotive, industrial and mining applications.
| | |
| | 4 |
CUSTOMERS
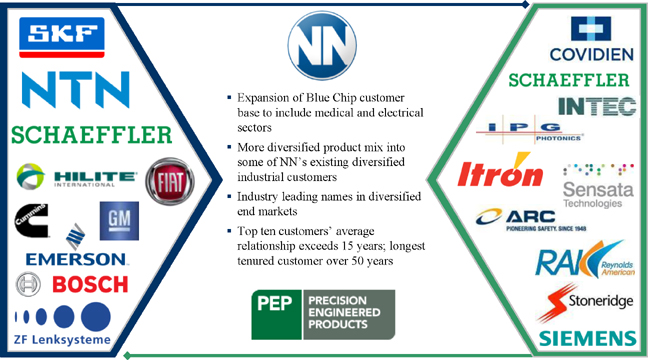
NN enjoys long-standing relationships with a diverse group of over 500 companies across the globe. The Company’s products are supplied primarily to bearing manufacturers and automotive and industrial parts manufacturers for use in a broad range of industrial applications, including transportation, electrical, agricultural, construction, alternative energy, machinery and mining. In 2014, the Company’s top 10 customers represented only 60% of total NN’s pro forma revenue. Sales to SKF, NN’s largest customer, accounted for 22% of pro forma NN revenue in 2014, but will be reduced to approximately 16% of pro forma revenue post-PEP transaction. NN enjoys longstanding relationships with each of its customers, with an average tenure of over 14 years with its top 10 customers.
Similarly, PEP has a longstanding history of entrenched customer relationships. PEP maintains deep collaborative partnerships with customers through joint development of products and solutions with customers increasingly seeking the company for its knowledge and expertise. These relationships are further strengthened by the investment of significant time and resources from OEMs, such as upfront capital expenditures, numerous process validations and adherence to stringent quality standards. PEP’s significant customer integration drives year-over-year customer retention of 97% among its top 30 customers, with an average relationship length of 17 years. In 2014, PEP’s top 10 customers comprised 43% of its total revenue with no single customer accounting for greater than 18%, a positive in an industry in which suppliers often have sizeable customer concentrations.
The following exhibit highlights NN and PEP’s top ten customer relationships.
Exhibit 8: Longstanding Customer Relationships
| | |
| | 5 |
SUMMARY HISTORICAL FINANCIAL INFORMATION
Exhibit 13: Summary Historical Financial Information
| | | | | | | | | | | | | | | | |
| | | Fiscal Year Ended December 31, | | | LTM | |
| ($ in millions) | | 2012A | | | 2013A | | | 2014A | | | 6/30/2015 | |
NN Standalone Revenue | | $ | 370 | | | $ | 373 | | | $ | 489 | | | $ | 608 | |
PEP Revenue | | | 201 | | | | 178 | | | | 204 | | | | 226 | |
Combined Pro Froma Adjustments[1] | | | | | | | | | | | | | | | 69 | |
| | | | | | | | | | | | | | | | |
Total Pro Forma Revenue | | $ | 572 | | | $ | 552 | | | $ | 693 | | | $ | 903 | |
| | | | | | | | | | | | | | | | |
% YoY Change | | | | | | | -3.5 | % | | | 25.5 | % | | | | |
NN Standalone Adjusted EBITDA | | | 46 | | | | 47 | | | | 66 | | | | 87 | |
PEP Adjusted EBITDA | | | 52 | | | | 45 | | | | 56 | | | | 63 | |
Combined Pro Froma Adjustments[1] | | | | | | | | | | | | | | | 26 | |
| | | | | | | | | | | | | | | | |
Total Pro Forma Adjusted EBITDA | | $ | 98 | | | $ | 93 | | | $ | 121 | | | $ | 176 | |
| | | | | | | | | | | | | | | | |
% of Total Pro Forma Revenue | | | 17.1 | % | | | 16.8 | % | | | 17.5 | % | | | 19.5 | % |
NN Standalone Capex | | | 17 | | | | 15 | | | | 28 | | | | 38 | |
PEP Capex | | | 2 | | | | 1 | | | | 3 | | | | 3 | |
Combined Pro Froma Adjustments[1] | | | | | | | | | | | | | | | 5 | |
| | | | | | | | | | | | | | | | |
Total Pro Forma Capex | | $ | 19 | | | $ | 17 | | | $ | 31 | | | $ | 46 | |
| | | | | | | | | | | | | | | | |
% of Total Pro Forma Revenue | | | 3.3 | % | | | 3.0 | % | | | 4.4 | % | | | 5.1 | % |
| [1]: | Provides the full year impact of all NN & PEP acquisitions made to date and expected cost savings |
| | |
| | 6 |
LONG-TERM, BLUE-CHIP CUSTOMER BASE
The PEP acquisition diversifies NN’s core customer base through the addition of blue chip customers in the Medical and Electrical end markets. Pro forma for the acquisition, sales to NN’s top customer decreases to 16% of total sales, with the overall top 15 customers representing 54% of sales.
Exhibit 18: Pro Forma Customer Overview
| | | | | | | | |
Customer | | Segment | | End Market | | Tenure | | % of Total[1] |
Customer A | | NN | | General Industrial | | 25 years | | 16% |
Customer B | | NN | | Light Auto / Trans. | | 20 years+ | | 6% |
Customer C | | PEP | | Medical | | 50 years | | 4% |
Customer D | | NN | | Light Auto | | 9 years | | 4% |
Customer E | | NN / PEP | | General Industrial | | 30 years+ | | 4% |
Customer F | | NN / PEP | | General Industrial | | 10 years+ | | 3% |
Customer G | | NN | | General Industrial | | 10 years+ | | 3% |
Customer H | | NN | | Light Auto | | 10 years | | 3% |
Customer I | | NN | | Light Auto | | 10 years+ | | 2% |
Customer J | | NN | | Transportation | | 8 years | | 2% |
Customer K | | NN | | Light Auto | | 9 years | | 2% |
Customer L | | PEP | | Medical | | 10 years | | 2% |
Customer M | | PEP | | Power Distribution | | 6 years | | 1% |
Customer N | | PEP | | Electrical Controls | | 11 years | | 1% |
Customer O | | PEP | | Medical | | 2 years | | 1% |
[1] Based on Historical Financials giving effect to Autocam and PEP acquisitions
Substantial Customer Switching Costs
NN and PEP both offer exceptional engineering solutions and manufacturing expertise, resulting in substantial customer investment into the development of high performance components. This generates significant switching costs and creates a strong competitive barrier.
| | • | | Proprietary Solutions and Technology: The legacy NN and PEP businesses consistently develop new and innovative proprietary processes that are highly valued by customers to address their technical challenges. Many of the components produced by NN and PEP have been designed and developed with their own proprietary equipment and processes in mind, creating hurdles for competitors. |
| | • | | Significant Upfront Tooling Automation Costs Incurred by the Customer:Customers who move forward with NN and PEP incur sizable upfront costs such as tooling, fixtures and automation investments. These expenses often discourage customers from considering other suppliers and are often utilized in adjacent and future product offerings. |
| | |
| | 7 |
| | • | | Spec’d into Long-life Products: Both NN and PEP’s sales and design efforts focus on partnering with customers in the early phases of product development to drive sales through a collaborative (and often sole-sourced) approach. The highly complex nature of NN and PEP’s components and assemblies requires specialized capabilities and industry expertise, resulting in the Company retaining development of the product throughout the entire product lifecycle. |
| | • | | High Cost of Failure Applications: NN and PEP’s components are typically designed as non-discretionary parts required in a final end product where high-performance and reliability are paramount. These components are also typically low in cost relative to the final product. This creates an attractive dynamic whereby customers are discouraged from identifying other competitors for components that represent a small cost relative to the total end product, yet carry significant risk in the event of failure. |
| | • | | Regulatory Certification Process: Due to stringent regulatory requirements, validating and certifying a new supplier for production development results in significant opportunity costs for customers and a delay of six to twelve months. Customers risk significant downtime and a high cost of re-validation if considering a new source for production. |
| | |
| | 8 |
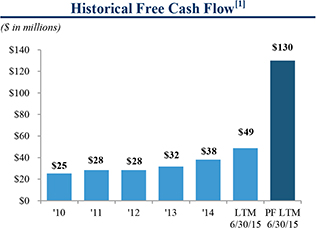
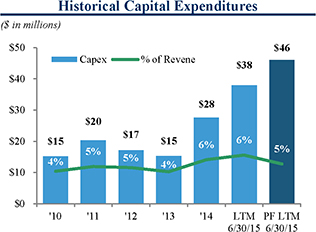
STRONG FREE CASH FLOW PROFILE
NN’s strong free cash flow profile is significantly enhanced with the acquisition of PEP, with pro forma free cash flow increasing by $81 million and capital expenditures as a percentage of revenue reduced from 6% to 5%. On a standalone basis, NN has demonstrated an ability to generate positive and growing free cash flow throughout the business cycle. Capital expenditures have remained modest and stable, averaging approximately 5.5% of total NN revenue each year since 2010 as NN has historically built its own capacity and tooling. The PEP acquisition enhances NN’s cash flow generation profile with the addition of PEP’s highly capital efficient operating model. While PEP’s dedicated tool and die design team will engineer tooling and mold designs that conform to the specific product design requirements, PEP’s customers are responsible for upfront tooling and automation, which can exceed $1 million per project. PEP’s upfront customer investment, well-invested and flexible manufacturing infrastructure, and unique working capital dynamics command minimal capital expenditure requirements resulting in free cash flow conversion in excess of 94%. With blended capacity utilization of approximately 60-65%, NN has sufficient manufacturing capacity to meet its short and mid-term volume demands, allowing the Company to focus its significant free cash flow generation toward debt repayment going forward.
Exhibit 20: Strong Free Cash Flow Profile
[1] Free Cash Flow = Adj. EBITDA - Capex
| | |
| | 9 |
V. PEP Company Overview
HISTORY
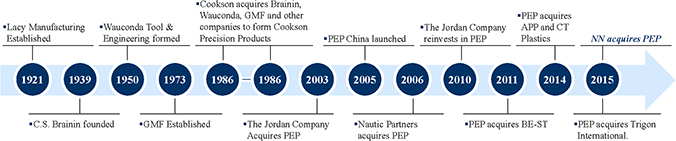
PEP became a stand-alone entity in 2003 when Cookson Group, plc divested its precision engineered components business unit through a private transaction. Through its evolution, PEP has continued to expand manufacturing capabilities, penetrate new end markets and build trusted, long-term relationships with its customers. PEP has a successful track record of executing accretive acquisitions and has acquired and integrated four companies since 2011.
Exhibit 31: PEP Timeline
PRODUCTS
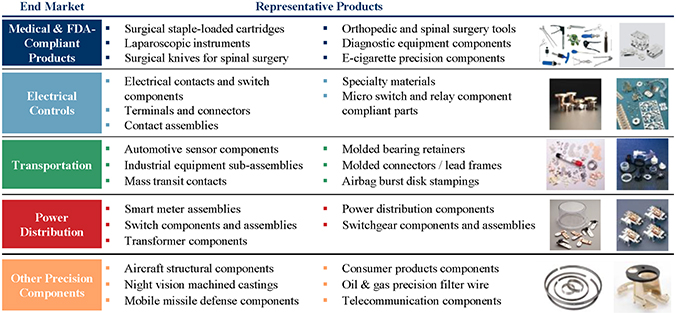
PEP offers customized, engineered and manufactured solutions across a variety of high-growth, high-margin end markets. These products serve distinct, customer-driven challenges while leveraging the company’s process experience to deliver a complete customized product solution. The components and assemblies PEP produces are mission-critical in nature and often represent a small portion of the final cost of a finished product. PEP provides leading manufacturing capabilities such as clean room technology to ensure optimal compliance with the stringent regulatory and manufacturing validation certifications required by certain end markets. As part of PEP’s sales and marketing strategy, the company sells its products across operational business units under key end market focuses, including medical and FDA-compliant products, electrical controls, transportation, power distribution and other precision components.
Exhibit 32: PEP Product Overview
| | |
| | 10 |
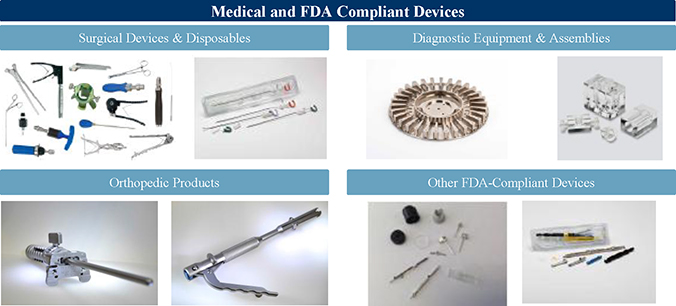
MEDICAL & FDA-COMPLIANT DEVICES
Under PEP’s Medical & FDA-Compliant Device franchise, the company markets and sells a variety of products for the medical, surgical and FDA-compliant market produced across its operating business units and facilities. The company’s ability to work with specialty metals, combinations of metals and plastic moldings and sub-micron precision tolerance components differentiate PEP in the marketplace, and provides a sustainable competitive advantage. PEP’s medical product offering includes disposable and reusable surgical devices and instrumentation, diagnostic equipment and assemblies, and other FDA-compliant devices.
Surgical Devices and Disposables:
For over 50 years, PEP and its predecessor companies have been working with leaders in the medical industry to bring innovation and world-class quality to the design and manufacture of surgical devices. The company offers a comprehensive range of FDA-regulated surgical products and disposables including surgical staple-loaded cartridges, surgery knives, precision biopsy jaws and laparoscopic products.
Diagnostic Equipment and Assemblies:
PEP’s assemblies and components are designed to serve medical practitioners in the diagnosis and care of potential illnesses. The company’s diagnostic components are utilized in a variety of related equipment including microfluidic arrays, blood analysis machines and mammography equipment.
Orthopedic Products:
With the acquisition of Trigon in April 2015 and APP in August 2014, PEP added a key platform to further penetrate the attractive orthopedics products market. Through the orthopedic products segment, the company offers comprehensive product development, prototyping, design transfer, manufacturing services, and assembly and procurement for the orthopedic and other medical markets. Key products offered include knee arthoplasty instruments, hip arthoplasty instruments, spinal instruments, and shoulder arthoplasty instruments.
Other FDA-Compliant and Drug Delivery Devices:
PEP leverages its advanced engineering capabilities and medical device expertise to develop other FDA-compliant products. Most recently, PEP entered the e-cigarette components market through a new customer opportunity and is now the leading domestic producer of high precision e-cigarette components.
Exhibit 33: Medical & FDA- Compliant Devices
| | |
| | 11 |
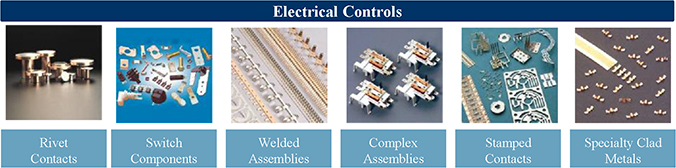
ELECTRICAL CONTROLS
PEP’s electrical controls products are used in electro-mechanical and industrial electronics end markets. Specifically, the company has a leading position for a wide range of electrical applications including contacts, connectors and micro switches for relay components. The company’s deep expertise in electrical contact metallurgy and proprietary processes are a key differentiator in the marketplace and highly sought by customers looking for comprehensive electrical controls solutions. PEP’s electrical controls products include (i) residential electrical connectivity products, (ii) commercial and industrial electrical connectivity products, and (iii) other industrial controls and switches.
Residential Electrical Connectivity Products:
The company’s residential electrical connectivity products serve a variety of applications, including make and break devices, appliance controls, lighting controls and light duty control applications. The company’s proprietary process for electrical contacts includes the machinery to manufacture composite contact rivets at high speed, in-house processing of composite rivets to enhance bonding between materials, and capabilities to fabricate powder metal contacts to specified mechanical and electrical properties.
Commercial and Industrial Electrical Facility Connectivity Products:
PEP’s commercial and industrial electrical facility connectivity products ensure heavy-duty electrical continuity is maintained throughout product life cycle. These components must meet the highest reliability standards as they can be found in mission-critical applications such as hospital equipment.
Other Industrial Controls and Switches:
The company’s differentiated metal-to-metal and metal-to-plastic manufacturing capabilities benefit other industrial applications. These products are utilized in fiber optic technology and specialty metal applications.
Exhibit 34: Electrical Control Solutions
| | |
| | 12 |
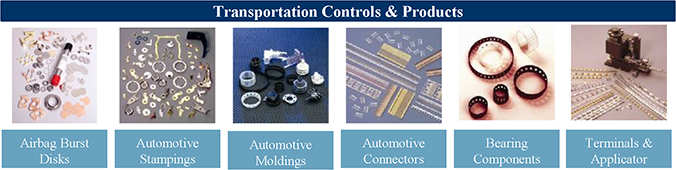
TRANSPORTATION
Under the company’s transportation business, PEP provides precision components, assemblies and contacts to the automotive and industrial vehicle end markets. The company specializes in manufacturing high-volume, under the hood components by leveraging advanced manufacturing techniques to ensure 100% conformance to customer specifications.
Vehicle Electronics and Sensor Components:
Over its nearly 100 year history, the company has developed broad capabilities in the automated production of complex transportation components. These custom designed components are engineered to critical dimensions and can be assembled through advanced processes including staking and conforming with metal and plastic components.
Vehicle Safety Components and Assemblies:
The company manufacturers vehicle safety components and is the leading provider of hybrid airbag inflator burst disks and auxiliary components.
Industrial and Commercial Vehicle Components:
PEP’s industrial and commercial vehicle components cover a broader list of automotive applications that serve off-road, specialty and agriculture applications, amongst others.
Exhibit 35: Transportation Components and Products
| | |
| | 13 |
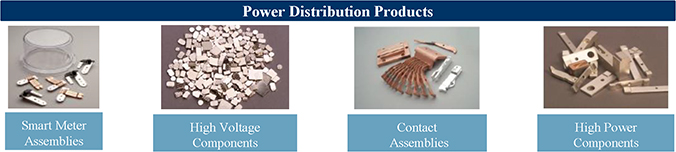
POWER DISTRIBUTION
PEP offers the leading power distribution products, specifically engineered to address high energy infrastructure and smart meter technology. The company offers unique abilities to manufacture electrical contacts, precision stampings and over-molded assemblies for power applications.
Smart Meter Components and Assemblies:
PEP’s smart meter and components operations are dedicated to customer demands for smart meter applications. Specifically, the company is the leading provider of critical switching assemblies for 200 amp smart meters and leverages its metal-to-metal technology to manufacture leading high energy infrastructure solutions.
High Voltage and Power Switch Components and Assemblies:
PEP manufacturers high voltage and power switch transformer components that are critical to the ever-growing domestic energy infrastructure development and represent a key piece for continued growth.
Exhibit 36: Power Distribution Products
OTHER RELEVANT PRODUCTS
In addition to its core product offering detailed above, PEP also engineers components and solutions for a variety of other relevant markets, including aerospace and defense, oil and gas, and general industrial sectors. Notably, the company manufactures high-grade aircraft structural components and assemblies, night vision machined castings and mobile missile defense components for use in defense applications.
Exhibit 37: Other Relevant Products and Components
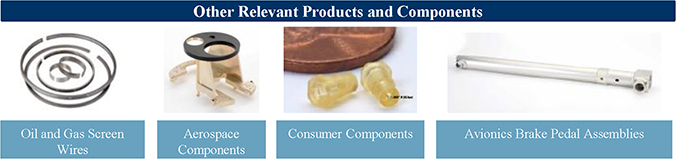
PEP’s ability to address industry-leading technical specifications and quality requirements has made the company the supplier of choice for blue chip customers. Notably, PEP’s engineered products, which are typically non-discretionary parts required in the final construction of the customer’s end products, often represent a small portion of the final loaded cost of a finished product. The mission-critical nature of the company’s products paired with the long-life of end product applications enables a long stream of recurring sales for the company.
| | |
| | 14 |
OPERATIONS OVERVIEW
Over its nearly 100-year history, PEP has evolved into an advanced technology leader and precision solutions provider by developing a broad suite of engineering capabilities and manufacturing expertise. PEP’s comprehensive range of solutions enable it to serve as a vital, collaborative partner within its customers’ design and manufacturing processes and provide precision components for an extensive array of applications across attractive markets.
Exhibit 38: PEP Capabilities
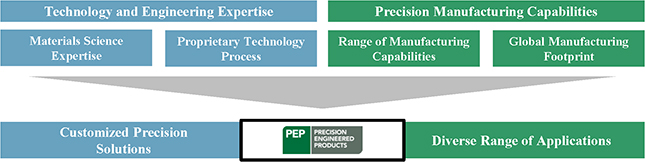
Technology & Engineering Expertise
PEP’s high performance solutions are driven by its advanced engineering capabilities and process expertise for metal and plastic applications. PEP leverages broad expertise in ferrous and non-ferrous metals and materials including precious metals, base metals, specialty metals, exotic metals and plastics. This knowledge enables PEP to provide unique alloy and material combinations to its customers. PEP’s combines its material science knowledge with an innovative proprietary process to form, mold, treat and cut materials to precisions tolerances no other competitor can provide.
Precision Manufacturing Capabilities
PEP’s capabilities are enhanced by its extensive manufacturing technology and global footprint. PEP offers a wide range of production technology within a strategic network of facilities that are highly sought after by customers looking for high performance solutions. PEP offers the widest variety of manufacturing capabilities including stamping, molding, assembly, machining and finishing operations which allow it to conform materials to within a micron. PEP operates 17 manufacturing facilities across four countries with manufacturing capabilities and certifications and provides global access to high-touch services and technical collaboration.
| | |
| | 15 |
COMPREHENSIVE DESIGNAND MANUFACTURING CAPABILITIES
PEP’s full range of customized precision engineered solutions complements customer collaboration with complete, end-to-end engineering support. The company’s engineers will take on customer projects irrespective of their production stage and develop solutions that address challenging problems. PEP’s commitment to customer collaboration is a distinct competitive advantage and is evident in the company’s entrenched customer base. The company’s product development operations can be categorized into three phases: (i) initial design, (ii) tooling and production, and (iii) comprehensive product support. The chart below illustrates the engineering activities throughout PEP’s product development operations.
Exhibit 39: PEP Product Development Operations

INITIAL DESIGN
PEP’s highly skilled engineers work closely with customers to identify and analyze key engineering problems, design customized solutions, identify appropriate materials, and perform extensive testing prior to prototyping products. These comprehensive design services shorten customers’ time from concept to market, save customers significant development costs, and ensure product quality and reliability from a design engineering perspective. Specific design services offered by PEP include:
Design Review:
PEP engineers leverage the company’s technology expertise and participate in the customer’s design failure modes and effect analysis (FMEA) to facilitate key product development requirements. Engineers will also provide key manufacturing recommendations that will benefit customers later during the production process.
Material Selection:
The company’s deep understanding of interactions between various materials enables a complete, truly engineered customer solution. Customers actively seek PEP for this invaluable expertise, particularly for critical end market applications.
Initial Prototyping:
PEP’s engineers leverage unique technology such as 3D printing to rapidly develop initial prototype designs. Product prototypes are evaluated alongside customers, thereby facilitating strong customer relationships.
| | |
| | 16 |
TOOLINGAND PRODUCTION
Once a product has achieved initial design approval, PEP engineers will develop prototype models using advanced computer simulation software models to determine whether engineering performance meets and/or exceeds expectations. These final prototype models are critical for tooling and die development and finalizing manufacturing production processes. Specifically, PEP’s tooling and production services include:
Advanced Prototyping:
The company’s advanced production technology enables rapid response time to quickly develop product prototypes for testing and analysis. This is a critical piece of product development, given the high number of iterations necessary to ensure optimal product performance.
Tooling, Automation, Process Design:
After a prototype is finalized, the company’s dedicated tool and die design team will engineer tooling and mold designs that conform to the specific product design requirements. Customers are responsible for upfront tooling and related capital expenditures, thereby discouraging supplier-switching behavior and limiting PEP’s product investments. These tooling expenses can exceed $1 million per project. In exchange for developing and designing customer products, the company will retain intellectual property ownership rights over tooling and mold designs.
Production Part Approval Process:
The company’s tooling and mold designs facilitate the initial production part approval process (PPAP), whereby PEP develops, modifies, and finalizes the complete product manufacturing process at the company’s facilities. Customers rely on PEP’s production and approval capabilities to ensure the highest level of reliability and performance standards. In this phase, process engineers will design the actual manufacturing processes necessary to build a customer’s final product.
COMPREHENSIVE PRODUCT SUPPORT
Once a product has received customer approval, PEP will provide continuous product development and supply chain support for its product lifecycle duration. This further solidifies the company’s position in typically difficult-to-change production processes and further strengthens customer relationships. Notable examples of PEP’s comprehensive product support include:
Supply Chain Management:
PEP will routinely evaluate material usage and just-in-time inventory management programs to ensure optimal supply chain management. For example, PEP’s production team will evaluate material substitution and product optimization opportunities to ensure continued high performance requirements.
High Touch Service:
The company’s engineers remain in constant contact with customers to identify manufacturing improvement efficiencies as products evolve. In conjunction with PEP’s sales team, the company will continuously reach out for ancillary and cross selling opportunities.
| | |
| | 17 |
MANUFACTURING CAPABILITIES
PEP’s well-invested, advanced manufacturing facilities support high-quality, cost-effective production allowing the company to efficiently address the unique challenges of its diverse customer base. Specifically, PEP’s comprehensive capabilities include: (i) assembly, (ii) molding, (iii) stamping, (iv) machining and (v) finishing.
Exhibit 40: PEP Manufacturing Capabilities
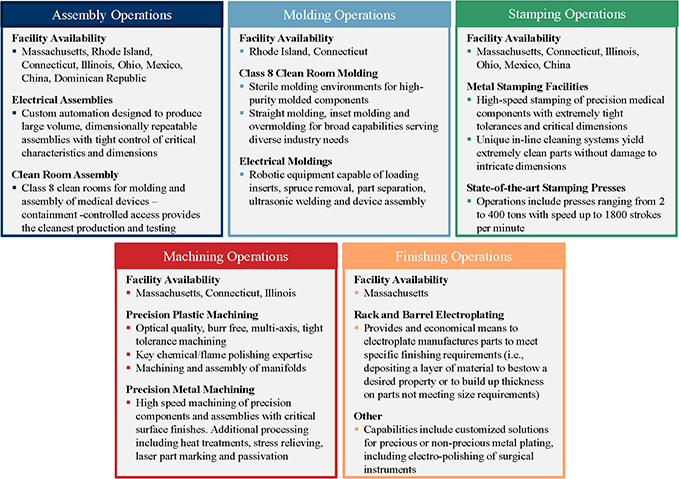
Assembly Operations
PEP’s assembly operations leverage custom automation and robotics to produce large volume, dimensionally repeatable component assemblies, with tight control of critical characteristics and product design. The company also offers Class 7 & 8 clean rooms for molding and assembly of federally regulated medical devices. These contaminant-controlled production sites adhere to stringent requirements to ensure sterilized products.
| | |
| | 18 |
Molding Operations
The company’s straight molding, micro molding, insert molding and overmolding operations utilize advanced automated machines to provide broad capabilities serving diverse industry needs. Molding processes can be performed with a host of materials including metals, and thermoplastics to manufacture high-throughput products. PEP also retains unique technology to install extremely small pressure and temperature sensors directly into mold cavities to support molding process development. This sensor technology enables PEP to monitor and better control mold filling measurement operations to prevent defects and is a key marketplace differentiator.
Stamping Operations
PEP operates over 250 power presses for high-speed stamping of precision engineered components with extremely tight tolerances and critical dimensions. This state-of-the-art stamping platform includes presses ranging from 2 to 400 tons with speeds up to 1800 strokes per minute. The company’s stamping operations provide unique in-line cleaning systems that yield extremely clean parts without damage to critical dimensions.
Machining Operations
The company’s machining capabilities enable controlled material cutting and forming to a specific final shape and size. PEP’s machining technology includes subtractive machining (i.e. controlled material removal) and additive manufacturing (i.e. controlled material addition). Notably, the company is able to utilize a variety of metals, plastics and materials for machining applications and produce smooth, burr-free surfaces essential for critical applications.
Finishing Operations
PEP’s finishing operations provide economical methods to plate metals and other materials directly to final products. Finishing processes deposit a layer of material to bestow a desired property or to build up thickness on parts not meeting size requirements. The company’s capabilities include customized solutions for precious and non-precious metal plating that cover a range of finishes as required by the customer.
| | |
| | 19 |
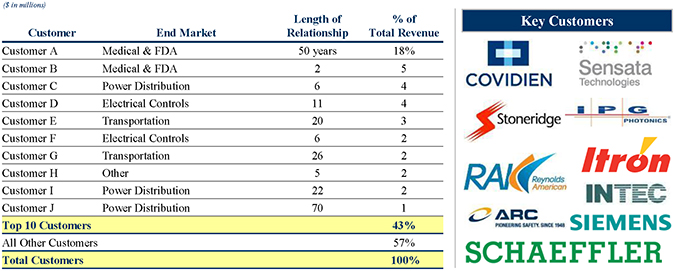
CUSTOMERS
PEP has established deep, collaborative, long-standing relationships with leading blue-chip OEMs as some of the world’s leading medical, electronics and industrial technology manufacturers rely on the company’s high-performance, technical expertise to meet rapidly changing engineering challenges. Evidencing this success, PEP’s top ten customers have an average tenure of more than 15 years with its longest tenured customer relationship over 50 years. In 2014, PEP’s top ten customers comprised 43% of its total revenue with no single customer accounting for greater than 18%, a positive in an industry in which suppliers often have sizeable customer concentrations.
PEP’s collaborative partnerships create deep, entrenched relationships with customers as they develop products and solutions and increasingly seek the company for its knowledge and expertise. By supporting customers with integrated engineering and broad manufacturing services, PEP gains a validated position in typically difficult-to-change production and development processes which often results in long-standing relationships. These relationships are further strengthened by the investment of significant time and resources from OEMs, such as upfront capital expenditures, numerous process validations and adherence to stringent quality standards.
Exhibit 41: PEP Top 10 Customer Overview
| | |
| | 20 |
SALES & MARKETING
PEP’s unified sales and marketing strategy promotes its value to customers as a key solutions partner possessing the breadth and critical mass to handle extremely complex assignments. The company’s integrated sales and marketing structure is structured to support key strategic business development initiatives at the corporate level and provide brand-specific opportunities at the business units. Specifically, PEP’s sales development efforts are designed to push new business opportunities to strategic accounts, business line specific accounts and project-based accounts. Concurrently, the company’s marketing efforts are focused on attracting and pulling customers through brand awareness, accelerated lead generation and marketing analytics. This unified approach facilitates broad promotion of PEP’s complete solution offering, yet maintains a balance with individual business unit identities and deep, long-standing historical business unit customer relationships. Exhibit below illustrates the company’s sales and marketing structure:
Exhibit 42: Sales Development & Marketing Overview
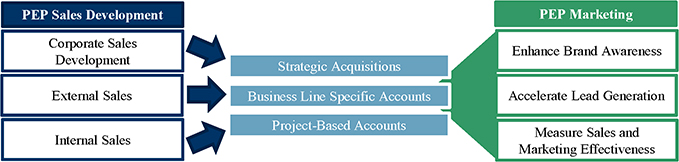
SALES
The company’s sales strategy is centralized, supported by the integration of sales efforts across the business units combined with a strong network of sales representatives selling the entire PEP line. Strategic targets are pursued at the corporate level, while other targets are pursued via external and internal sales representatives. A key tenet of PEP’s sales strategy is targeting its customers’ engineering departments and offering technical expertise, effectively anchoring PEP in the product cycle.
At all times, PEP takes a team approach to sales, bringing the company’s full suite of technical resources to bear, which is particularly important and effective in the company’s collaborative customer approach. PEP’s sales professionals are instructed to drive sales efforts to focus relentlessly on the development of new customers, opportunities and products. Business development professionals are actively involved in trade shows and events, promoting company’s capabilities and even leveraging engineering and technical expertise to corroborate PEP’s service offering.
MARKETING
The company’s marketing team has developed an extensive resource set to effectively promote the PEP brand name and products, including market-specific brochures and a detailed website. Each brochure includes product photographs, descriptions and technical information and is updated regularly to include new product offerings and changes to the company’s existing product line. The company’s website has links to the company’s business unit websites, which provide customers direct access to product information, technical data and company contact information.
| | |
| | 21 |
EMPLOYEE SUMMARY
As of March 2015, PEP employed a dedicated workforce of over 1,200 personnel with an average length of service of over 13 years. Of PEP’s total employee base, 11% are considered corporate (administration/finance and sales & marketing) and 89% are manufacturing services employees. PEP offers employees competitive compensation and benefits and as a result nearly 98% of its employee base is non-union. PEP’s Connecticut facility has less than 30 employees under a collective bargaining agreement which expires in 2017.
Exhibit 43: PEP Employee Overview
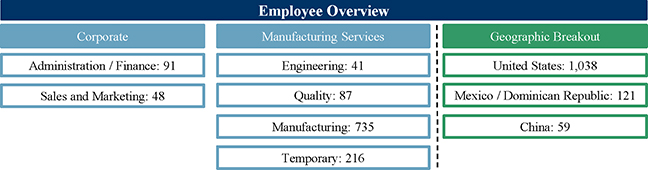
Note: Does not include employees from the Trigon acquisition
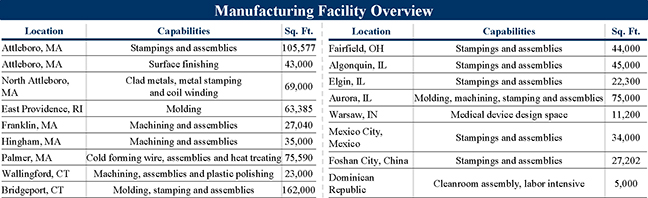
FACILITIES OVERVIEW
PEP operates 17 state-of-the-art manufacturing operations strategically located in the United States, Mexico, China and the Dominican Republic. Its manufacturing locations maintain numerous quality certifications and collectively represent over 700,000 square feet of manufacturing space and over 16,500 square feet of dedicated Class 8 clean rooms for medical applications. PEP’s facilities are currently operating between 50% and 65% capacity based on current manufacturing demands, and feature machines with advanced modifications or were built in-house and leverage the company’s proprietary technical knowledge to establish mirrored production capabilities across facilities. This enables PEP to manufacture components and assemblies using common standards across facilities and geographies.
Exhibit 44: PEP Facilities Overview
| | |
| | 22 |
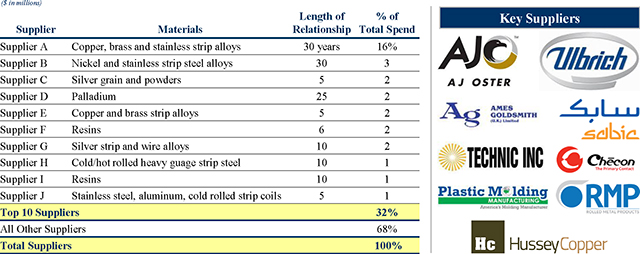
SUPPLIERS & RAW MATERIALS
PEP has developed strong, long-standing relationships with a diverse network of suppliers of raw materials, resins and components, which minimizes supplier concentration risk and provides stable supply at competitive pricing. Excluding precious metals, PEP’s top ten suppliers comprise 32% of total purchases and no single supplier accounted for more than 16% of total purchases. Notably, PEP’s tenure with its top ten suppliers averages over 13 years.
Exhibit 45: PEP Top 10 Suppliers
PEP RAW MATERIAL CONSIGNMENT
PEP carefully manages its raw material needs to minimize exposure to price volatility. The company has established consignment agreements with key suppliers to procure precious metals and eliminate exposure to commodity price fluctuations. These consignments are secured by the precious metals inventory and are not included as a component of inventories on PEP’s balance sheet. Ownership title remains with the consignor until PEP purchases it for use in its operations. In effect, PEP leases the precious metals for its on-hand stock and buys the raw material only on the same day customer shipments are priced, thereby eliminating speculation. The company leases metal via an inter-creditor agreement between two financial institutions that share the lending risk pari passu. In addition, PEP products with precious metal content are priced with a margin on the raw material cost to further protect the company and provide incremental profitability. Total spend on precious metals in 2014 accounted for approximately 35% of the company’s total material costs. The company achieves insulation from base metal and resin prices by utilizing concurrent raw material pricing with both customers and suppliers. PEP prices its products to include the cost of materials, a material cost margin and a fabrication margin. This mechanism allows PEP to pass through raw material price increases to its customers. In 2014, base metals spend represented approximately 40% of the company’s total raw material cost.
| | |
| | 23 |
LEGAL & ENVIRONMENTAL
PEP is unaware of any material pending or threatened lawsuits against the company. Management does not believe there are any other suits, claims or assessments pending that would have a material effect on its operators or financial condition. PEP management is also unaware of any environmental liabilities that would have a material adverse effect on PEP’s operation or financial conditions. In addition, management believes that the company is in compliance in all material respects with all federal, state and local environmental laws and regulations.
| | |
| | 24 |
VII.Financial Overview
PRO FORMA FINANCIAL SUMMARY
The acquisition of PEP is highly accretive to NN from both a top line and bottom line perspective. Pro forma net sales (including the full year impact of all acquisitions completed to date) as of LTM 6/30/15 are $903 million with Pro Forma Adjusted EBITDA After Cost Savings of $176 million. The acquisition of PEP builds a diversified industrial positioned to be a consistent earner throughout the business cycle and aligns NN with its adjacent market expansion goals by providing a foothold in the medical and electrical end markets. From a margin perspective, PEP’s margin profile greatly enhances NN’s margins, as Adjusted EBITDA margin increases from 14.9% for NN standalone to 19.5% pro forma for the acquisition.
The merger of NN and PEP represents a combination of two companies with highly complementary financial profiles. Both companies have a demonstrated history of strong financial performance through various business cycles and the ability to drive significant free cash flow generation. The companies’ financial strength is driven by their long term relationships with blue chip customers who rely on NN and PEP’s products for their high precision, system-critical quality. Through effective cash management and operational improvements, both companies were able to emerge from the economic downturn in greater position to gain market share post recovery. With the addition of PEP’s exceptional management team, NN is poised to execute its strategic plan to become the premiere company in its space and a leading diversified industrial into the future.
Exhibit 59: Pro Forma Income Statement
| | | | | | | | | | | | | | | | |
| | | Fiscal Year Ended December 31, | | | LTM | |
| ($ in millions) | | 2012A | | | 2013A | | | 2014A | | | 6/30/2015 | |
NN Standalone Revenue | | $ | 370 | | | $ | 373 | | | $ | 489 | | | $ | 608 | |
PEP Revenue | | | 201 | | | | 178 | | | | 204 | | | | 226 | |
Combined Pro Froma Adjustments[1] | | | | | | | | | | | | | | | 69 | |
| | | | | | | | | | | | | | | | |
Total Pro Forma Revenue | | $ | 572 | | | $ | 552 | | | $ | 693 | | | $ | 903 | |
| | | | | | | | | | | | | | | | |
% YoY Change | | | | | | | -3.5 | % | | | 25.5 | % | | | | |
NN Standalone Adjusted EBITDA[2][3] | | | 46 | | | | 47 | | | | 66 | | | | 87 | |
PEP Adjusted EBITDA | | | 52 | | | | 45 | | | | 56 | | | | 63 | |
Combined Pro Froma Adjustments[1] | | | | | | | | | | | | | | | 26 | |
| | | | | | | | | | | | | | | | |
Total Pro Forma Adjusted EBITDA | | $ | 98 | | | $ | 93 | | | $ | 121 | | | $ | 176 | |
| | | | | | | | | | | | | | | | |
% of Total Pro Forma Revenue | | | 17.1 | % | | | 16.8 | % | | | 17.5 | % | | | 19.5 | % |
NN Standalone Capex | | | 17 | | | | 15 | | | | 28 | | | | 38 | |
PEP Capex | | | 2 | | | | 1 | | | | 3 | | | | 3 | |
Combined Pro Froma Adjustments[1] | | | | | | | | | | | | | | | 5 | |
| | | | | | | | | | | | | | | | |
Total Pro Forma Capex | | $ | 19 | | | $ | 17 | | | $ | 31 | | | $ | 46 | |
| | | | | | | | | | | | | | | | |
% of Total Pro Forma Revenue | | | 3.3 | % | | | 3.0 | % | | | 4.4 | % | | | 5.1 | % |
| [1]: | Provides the full year impact of all NN & PEP acquisitions made to date and expected cost Savings |
| | |
| | 25 |
Historical Financial Summary
NN has demonstrated a history of consistent revenue and adjusted EBITDA growth driven by stable demand for the underlying end markets that NN sells into. The Company continues to grow revenue and adjusted EBITDA through strategic acquisitions into targeted end markets, continued organic growths and the successful implementation of various cost saving and pricing initiatives.
Exhibit 60: NN Historical Income Statement
| | | | | | | | | | | | | | | | | | | | | | | | |
| | | Fiscal Year Ended December 31, | | | YTD | | | YTD | | | LTM | |
($ in millions) | | 2012A | | | 2013A | | | 2014A | | | 6/30/2014 | | | 6/30/2015 | | | 6/30/2015 | |
Net Revenue | | $ | 370 | | | $ | 373 | | | $ | 489 | | | $ | 209 | | | $ | 329 | | | $ | 608 | |
| | | | | | | | | | | | | | | | | | | | | | | | |
% YoY Change | | | | | | | 1 | % | | | 31 | % | | | | | | | 57 | % | | | | |
COGS | | | 295 | | | | 295 | | | | 385 | | | | 165 | | | | 258 | | | | 478 | |
| | | | | | | | | | | | | | | | | | | | | | | | |
Gross Profit | | $ | 75 | | | $ | 78 | | | $ | 104 | | | $ | 45 | | | $ | 71 | | | $ | 130 | |
| | | | | | | | | | | | | | | | | | | | | | | | |
% of Total Revenue | | | 20 | % | | | 21 | % | | | 21 | % | | | 21 | % | | | 21 | % | | | 21 | % |
SG&A | | | 32 | | | | 33 | | | | 44 | | | | 20 | | | | 26 | | | | 50 | |
| | | | | | | | | | | | | | | | | | | | | | | | |
EBITDA | | $ | 44 | | | $ | 45 | | | $ | 60 | | | $ | 25 | | | $ | 45 | | | $ | 80 | |
| | | | | | | | | | | | | | | | | | | | | | | | |
% of Total Revenue | | | 12 | % | | | 12 | % | | | 12 | % | | | 12 | % | | | 14 | % | | | 13 | % |
EBITDA Adjustments [1] | | | 2 | | | | 3 | | | | 6 | | | | 3 | | | | 4 | | | | 7 | |
| | | | | | | | | | | | | | | | | | | | | | | | |
Adjusted EBITDA | | $ | 46 | | | $ | 47 | | | $ | 66 | | | $ | 27 | | | $ | 49 | | | $ | 87 | |
| | | | | | | | | | | | | | | | | | | | | | | | |
% of Total Revenue | | | 12 | % | | | 13 | % | | | 13 | % | | | 13 | % | | | 15 | % | | | 14 | % |
| [1] | EBITDA adjustments include Net Income from JV, Non-Cash Stock Compensation and M&A expenses |
NN, INC. MANAGEMENT DISCUSSIONAND ANALYSIS
Six Months ended June 30, 2015 vs. June 30, 2014
Revenue
Net sales increased during the first half of 2015 from the first half of 2014 principally due to sales from the companies acquired in 2014 and 2015. Three of the four companies acquired during 2014 were acquired subsequent to the first half of 2014. Additionally, sales increased from greater demand for NN’s products in the European, Asian and North American markets served by the Company’s Metal Bearing Components Segment, namely automotive and general industrial markets. This sales growth came from overall growth in the markets NN serves, from new sales programs with existing customers and sales with new customers in each of these geographic markets. Partially offsetting these increases was the impact of devaluation of the Euro on Euro denominated sales.
COGS
Cost of products sold was primarily impacted by the addition of production costs added with the four companies acquired during 2014 and 2015. Additionally, the total was impacted by increased production costs at those units that experienced higher sales volumes. Partially offsetting these increases was the impact of devaluation of the Euro on Euro denominated costs.
Selling, General and Administrative
The majority of the increase during 2015 was due to the selling, general and administrative costs carried over from the companies acquired in 2014 subsequent to the first half of 2014.
| | |
| | 26 |
PEP MANAGEMENT DISCUSSIONAND ANALYSIS
Exhibit 61: PEP Historical Income Statement
| | | | | | | | | | | | | | | | | | | | | | | | |
| | | Fiscal Year Ended December 31, | | | YTD | | | YTD | | | LTM | |
($ in millions) | | 2012A | | | 2013A | | | 2014A | | | 6/27/2014 | | | 6/26/2015 | | | 6/27/2015 | |
Net Revenue | | $ | 201 | | | $ | 178 | | | $ | 204 | | | $ | 96 | | | $ | 117 | | | $ | 226 | |
| | | | | | | | | | | | | | | | | | | | | | | | |
% YoY Change | | | | | | | (11 | %) | | | 14 | % | | | | | | | 23 | % | | | | |
COGS | | $ | 136 | | | $ | 119 | | | $ | 131 | | | $ | 63 | | | $ | 75 | | | $ | 143 | |
| | | | | | | | | | | | | | | | | | | | | | | | |
Gross Profit | | $ | 66 | | | $ | 59 | | | $ | 73 | | | $ | 33 | | | $ | 42 | | | $ | 82 | |
| | | | | | | | | | | | | | | | | | | | | | | | |
% of Total Revenue | | | 33 | % | | | 33 | % | | | 36 | % | | | 35 | % | | | 36 | % | | | 36 | % |
SG&A | | $ | 14 | | | $ | 14 | | | $ | 17 | | | $ | 9 | | | $ | 10 | | | $ | 18 | |
| | | | | | | | | | | | | | | | | | | | | | | | |
EBITDA | | $ | 52 | | | $ | 45 | | | $ | 56 | | | $ | 24 | | | $ | 33 | | | $ | 65 | |
| | | | | | | | | | | | | | | | | | | | | | | | |
% of Total Revenue | | | 26 | % | | | 25 | % | | | 27 | % | | | 25 | % | | | 28 | % | | | 29 | % |
EBITDA Adjustments | | | (0 | ) | | | (0 | ) | | | (0 | ) | | | 1 | | | | (0 | ) | | | (1 | ) |
| | | | | | | | | | | | | | | | | | | | | | | | |
Adjusted EBITDA | | $ | 52 | | | $ | 45 | | | $ | 56 | | | $ | 25 | | | $ | 33 | | | $ | 63 | |
| | | | | | | | | | | | | | | | | | | | | | | | |
% of Total Revenue | | | 26 | % | | | 25 | % | | | 27 | % | | | 26 | % | | | 28 | % | | | 28 | % |
Six Months ended June 30, 2015 vs. June 30, 2014
Revenue
Revenue increased during the six months ended June 2015 compared to the six months ended June 2014 principally due to sales from APP and Trigon which was acquired in August 2014 and April 2015, respectively. Additionally, PEP saw increased demand for the company’s products in the medical & FDA compliant devices, electrical controls, transportation, power distribution and other precision components end markets.
COGS
Cost of products sold increased during the six months ended June 2015 compared to the six months ended June 2014 primarily due to the addition of production costs associated with the APP and Trigon acquisitions described above. PEP also saw increases in material costs, and employment costs over the period at its legacy businesses.
Selling, General and Administrative
Selling, General and Administrative costs increased during the six months ended June 2015 compared to the six months ended June 2014 principally due to the increased selling, general and administrative costs from the APP and Trigon acquisitions.
| | |
| | 27 |
Twelve Months ended December 31, 2014 vs. December 31, 2013
Revenue
Revenue increased during 2014 compared to 2013 principally due to sales from the two companies acquired in 2014. Additionally, revenue increased due to greater demand for PEP’s products in the medical & FDA compliant devices, electrical controls, transportation, power distribution and other precision components end markets. PEP has continued to benefit from improved adjacent market expansion particularly with the e-cigarette program in the medical and FDA compliant device end market.
COGS
Costs of products sold increased during 2014 compared to 2013 principally due to sales from the two companies acquired in 2014. PEP saw increases in material costs, and employment costs over the period. Despite the increase in costs of products sold, PEP achieved a 2.3% increase in gross margin as the increase in costs of products sold was less than total revenue growth.
Selling, General and Administrative
Selling, General and Administrative costs increased during 2014 compared to 2013 principally due to sales from the two companies acquired in 2014. PEP saw increases in administrative salaries, benefits and related expenses and selling and distribution salaries, benefits and related expenses over the period.
Twelve Months ended December 31, 2013 vs. December 31, 2012
Revenue
Net sales decreased during 2013 compared to 2012 principally due to a decrease in sales volumes.
The reduction in price and precious metals raw material pass-through (in 2013 compared to 2012) was driven mainly by lower average precious metal markets in our business which led to lower pass-through to our customers.
Cost of Products Sold
Cost of Product sold decreased corresponding with lower sales volumes and by lower precious metal markets in 2013 compared to 2012. PEP also saw increases in employment costs. PEP was able to modestly increase margins despite the decrease in sales.
Selling, General and Administrative
PEP experienced an immaterial increase in travel, advertising and professional fees in 2013 compared to 2012.
| | |
| | 28 |
REVENUEAND EBITDA RECONCILIATION
Exhibit 62: Pro Forma Revenue Reconciliation
| | | | |
| ($ in millions) | | | |
Combined Total LTM 6/30/2015 Revenue | | $ | 834 | |
| | | | |
Autocam Full Year Adjustment (NN) | | | 41 | |
Trigon (PEP) | | | 16 | |
Caprock (NN) | | | 8 | |
APP (PEP) | | | 4 | |
| | | | |
Total Pro Forma LTM 6/30/2015 Revenue | | $ | 903 | |
| | | | |
Exhibit 63: Pro Forma EBITDA Reconciliation
| | | | |
| ($ in millions) | | | |
Combined Total LTM 6/30/2015 Adjusted EBITDA | | $ | 150 | |
| | | | |
Autocam Full Year Adjustment | | | 6 | |
Full year effect for prior acquisitions | | | 8 | |
Run rate synergies due to prior acquisitions | | | 5 | |
Anticipated synergies due to PEP | | | 7 | |
| | | | |
Pro Forma Adjusted LTM 6/30/2015 EBITDA After Cost Savings | | $ | 176 | |
| | | | |
SYNERGIES OVERVIEW
The figure below provides an overview of expected first year synergies. Anticipated synergies primarily consist of facility rationalization and Six Sigma / OpEx optimization programs. Synergies include expected fixed cost reduction and do not include the potential benefit from variable cost reduction for conservatism.
Exhibit 64: Estimated Synergies
| | | | | | | | |
Category | | Annual Target (Peak) | | | 2016 Target | |
Total Six Sigma / Opex | | $ | 8,600,000 | | | $ | 4,859,800 | |
Total Facility / Footprint Rationalization | | | 650,200 | | | | 650,200 | |
Total Product Grouping / Rationalization | | $ | 325,000 | | | $ | 125,000 | |
Total Shared Services Cost Savings | | $ | 990,000 | | | $ | 865,000 | |
| | | | | | | | |
Total Synergy Target | | $ | 10,565,200 | | | $ | 6,500,000 | |
| | | | | | | | |
Note: Management Estimates
| | |
| | 29 |