|
Exhibit 99.1 
|
Annual Investor Day
March 24, 2016 • New York City
Exhibit 99.1
Forward Looking Statements
Forward Looking Statement: With the exception of the historical information contained in this presentation, the matters described herein contain forward-looking statements that are made pursuant to the safe harbor provisions of the Private Securities Litigation Reform Act of 1995. Forward-looking statements involve a number of risks and uncertainties that may cause actual results to be materially different from such forward-looking statements. Such factors include, among others, general economic conditions and economic conditions in the industrial sector, competitive influences, risks that current customers will commence or increase captive production, risks of capacity underutilization, quality issues, availability of raw materials, currency and other risks associated with international trade, the Company’s dependence on certain major customers, and other risk factors and cautionary statements listed from time to time in the Company’s periodic reports filed with the Securities and Exchange Commission, including, but not limited to, the Company’s Annual Report on 10-K for the fiscal year ended December 31, 2015.
With respect to any non-GAAP financial measures included in the following presentation, the accompanying information required by SEC Regulation G can be found in the “Investor Relations” section of the Company’s web site, www.nninc.com, under the heading “News & Events” and subheading “Presentations.”
Disclaimer: NN disclaims any obligation to update any such factors or to publicly announce the result of any revisions to any of the forward-looking statements included herein or therein to reflect future events or developments.
www.nninc.com
2
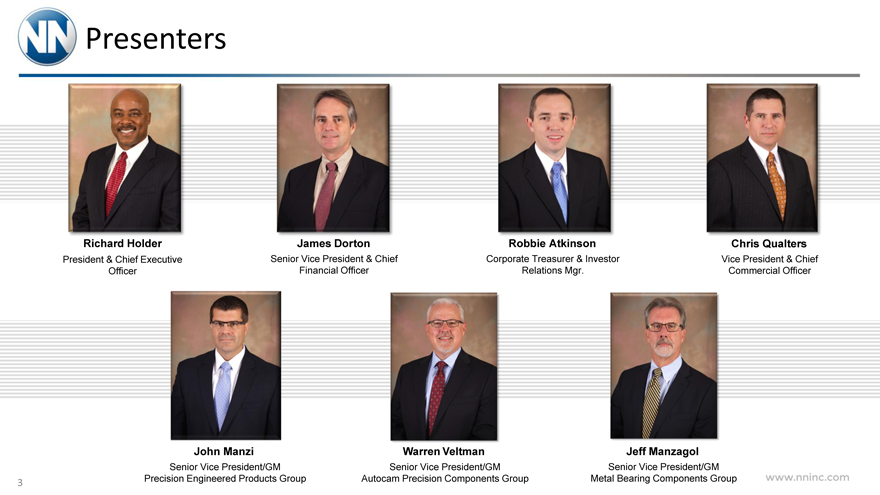
Presenters
Richard Holder
President & Chief Executive Officer
James Dorton
Senior Vice President & Chief Financial Officer
Robbie Atkinson
Corporate Treasurer & Investor Relations Mgr.
Chris Qualters
Vice President & Chief Commercial Officer
John Manzi
Senior Vice President/GM Precision Engineered Products Group
Warren Veltman
Senior Vice President/GM Autocam Precision Components Group
Jeff Manzagol
Senior Vice President/GM Metal Bearing Components Group
www.nninc.com
3
Agenda
1 Strategic Review
2 Sales Strategy
3 End Markets Discussion
4 Debt Structure Overview
5 Financial Performance
6 The NN Operating System
7 Summary / Q&A
www.nninc.com
4
Strategic Review
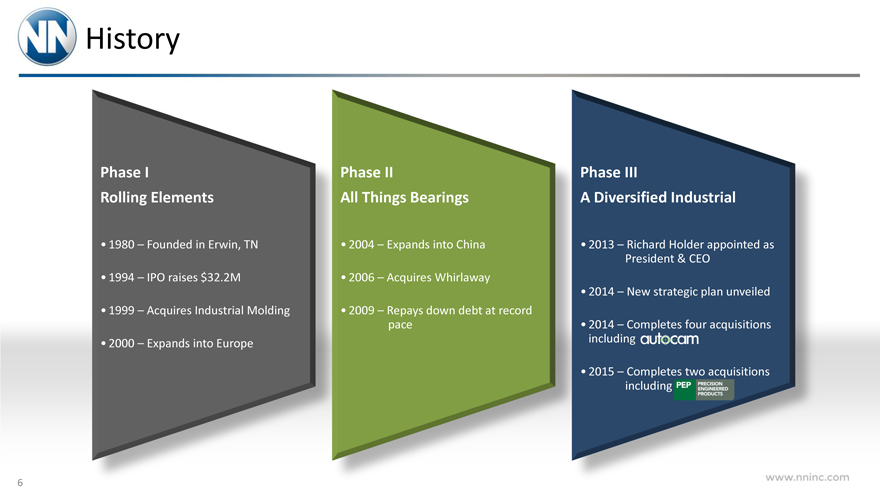
History
Phase I
Rolling Elements
1980 – Founded in Erwin, TN
1994 – IPO raises $32.2M
1999 – Acquires Industrial Molding
2000 – Expands into Europe
Phase II
All Things Bearings
2004 – Expands into China
2006 – Acquires Whirlaway
2009 – Repays down debt at record pace
Phase III
A Diversified Industrial
2013 – Richard Holder appointed as President & CEO
2014 – New strategic plan unveiled
2014 – Completes four acquisitions including
2015 – Completes two acquisitions including
PDP PRECISION ENGINEERED PRODUCTS
www.nninc.com
6
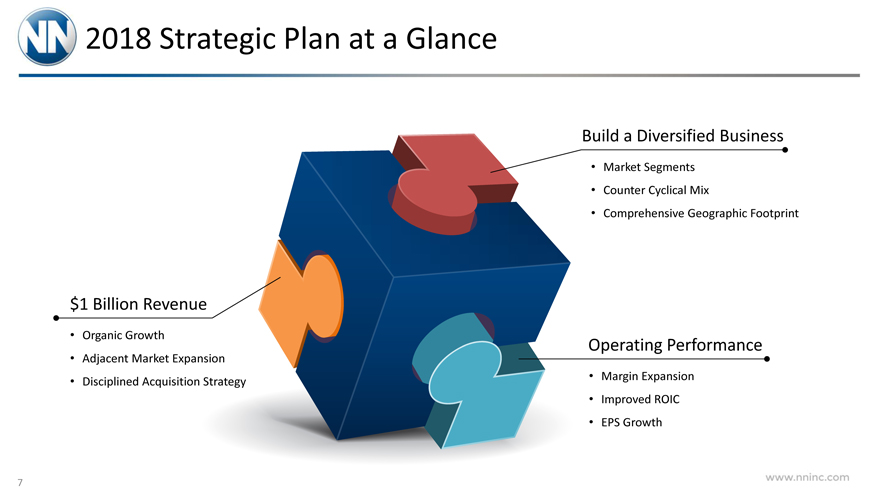
2018 Strategic Plan at a Glance
$1 Billion Revenue
Organic Growth
Adjacent Market Expansion
Disciplined Acquisition Strategy
Build a Diversified Business
Market Segments
Counter Cyclical Mix
Comprehensive Geographic Footprint
Operating Performance
Margin Expansion
Improved ROIC
EPS Growth
www.nninc.com
7
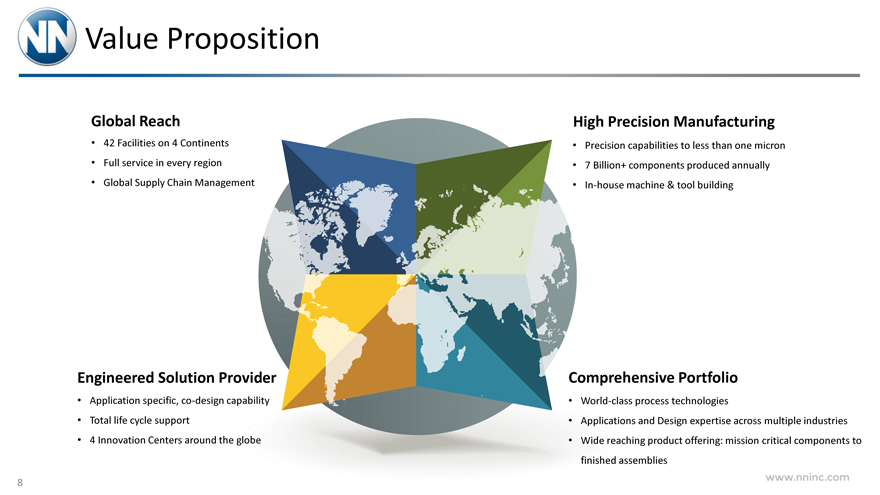
Value Proposition
Global Reach
42 Facilities on 4 Continents
Full service in every region
Global Supply Chain Management
High Precision Manufacturing
Precision capabilities to less than one micron
7 Billion+ components produced annually
In-house machine & tool building
Engineered Solution Provider
Application specific, co-design capability
Total life cycle support
4 Innovation Centers around the globe
Comprehensive Portfolio
World-class process technologies
Applications and Design expertise across multiple industries
Wide reaching product offering: mission critical components to finished assemblies
www.nninc.com
8
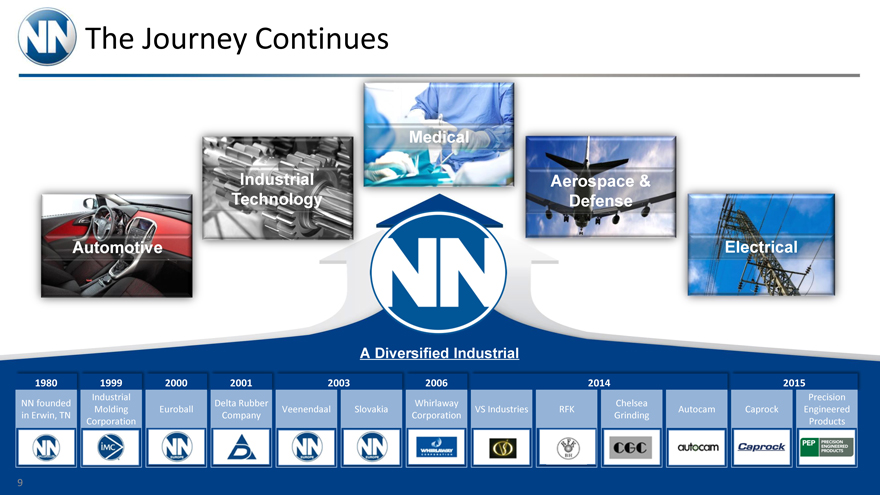
The Journey Continues
Automotive
Industrial Technology
Medical
Aerospace & Defense
Electrical
A Diversified Industrial
1980 1999 2000 2001 2003 2006 2014 2015
Industrial Precision NN founded Delta Rubber Whirlaway Chelsea Molding Euroball Veenendaal Slovakia VS Industries RFK Autocam Caprock Engineered in Erwin, TN Company Corporation Grinding Corporation Products
9
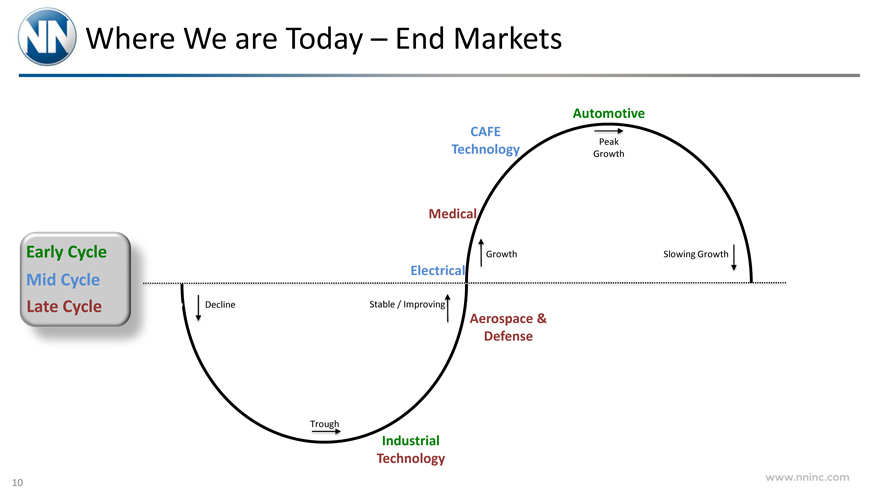
Where We are Today – End Markets
Early Cycle Mid Cycle Late Cycle
CAFE Technology
Automotive
Peak
Growth
Medical
Growth
Electrical
Stable / Improvin
Aerospace & Defense
Decline
Trough
Industrial Technology
Slowing Growt
www.nninc.com
10
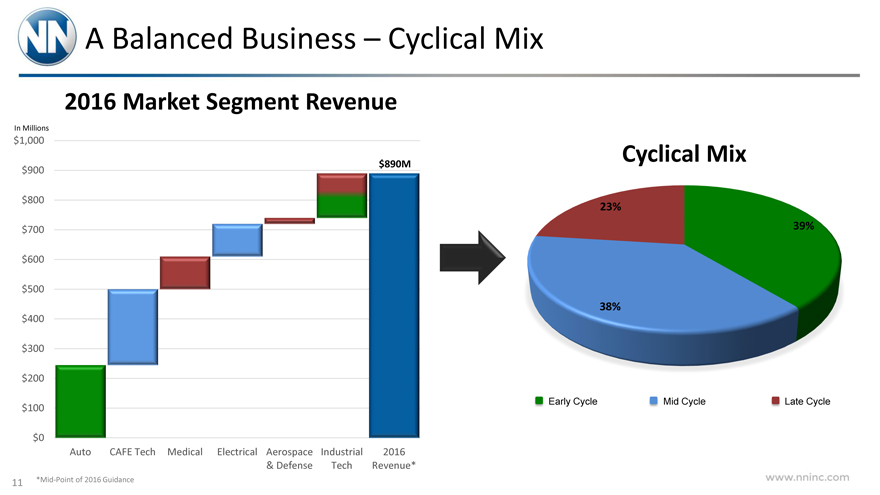
A Balanced Business – Cyclical Mix
2016 Market Segment Revenue
In Millions
$1,000 $900 $800 $700 $600 $500 $400 $300 $200 $100 $0
$890M
Auto CAFE Tech Medical Electrical Aerospace Industrial 2016
& Defense Tech Revenue*
*Mid-Point of 2016 Guidance
Cyclical Mix
23%
39%
38%
Early Cycle Mid Cycle Late Cycle
www.nninc.com
11
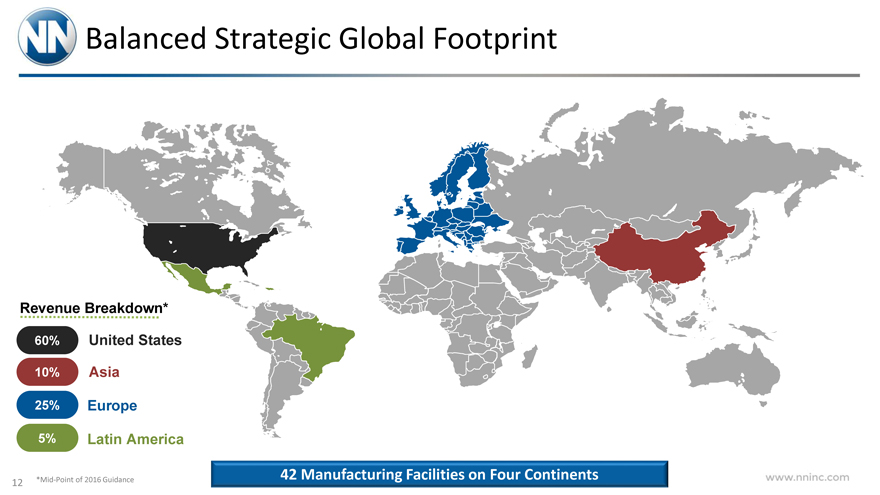
Balanced Strategic Global Footprint
Revenue Breakdown* 60% United States 10% Asia
25% Europe
5% Latin America
*Mid-Point of 2016 Guidance
42 Manufacturing Facilities on Four Continents
www.nninc.com
12
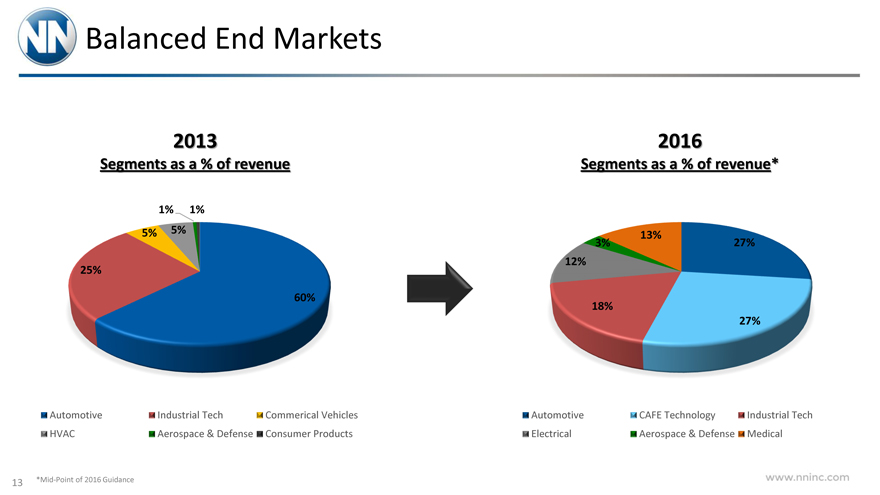
Balanced End Markets
2013
Segments as a % of revenue
1% 1%
5% 5% 25%
60%
Automotive Industrial Tech Commerical Vehicles HVAC Aerospace & Defense Consumer Products
2016
Segments as a % of revenue*
13%
3% 27% 12%
18%
27%
Automotive CAFE Technology Industrial Tech Electrical Aerospace & Defense Medical
*Mid-Point of 2016 Guidance
www.nninc.com
13
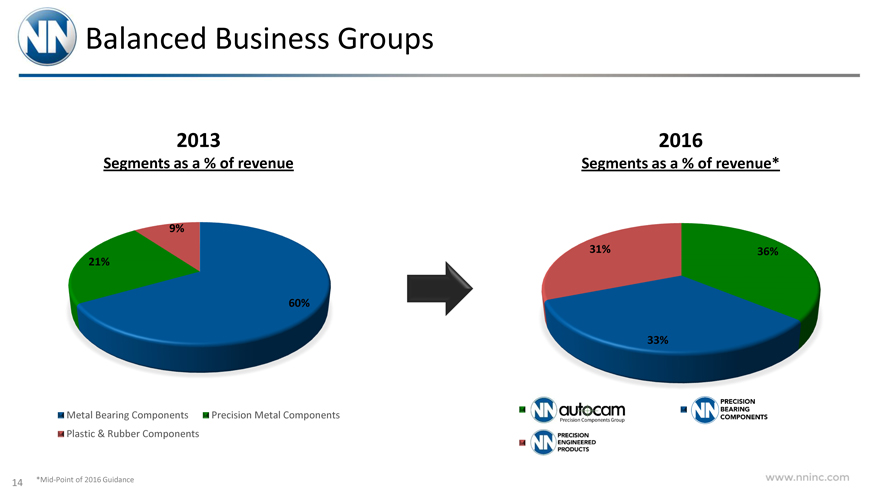
Balanced Business Groups
2013
Segments as a % of revenue
9%
21%
60%
Metal Bearing Components Precision Metal Components Plastic & Rubber Components
*Mid-Point of 2016 Guidance
2016
Segments as a % of revenue*
31% 36%
33%
www.nninc.com
14
Sales Strategy
The World of “More”
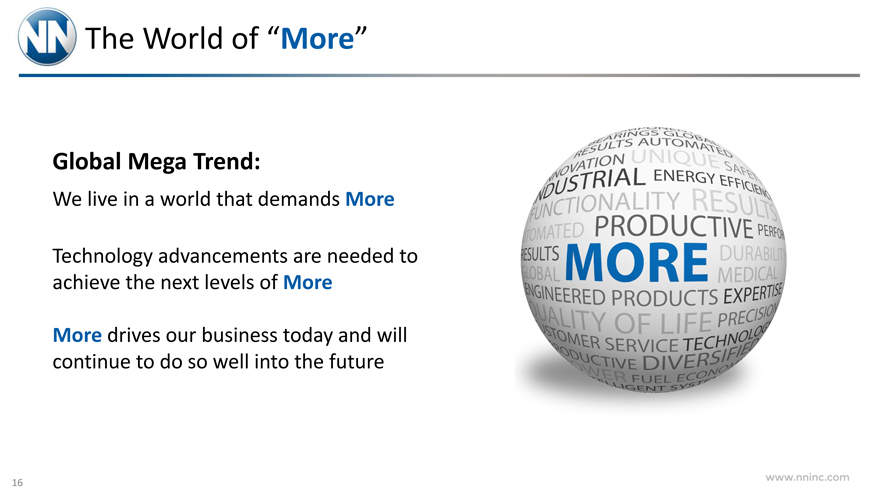
Global Mega Trend:
We live in a world that demands More
Technology advancements are needed to achieve the next levels of More
More drives our business today and will continue to do so well into the future
www.nninc.com
16
Our Customers are working on the Next Big Thing
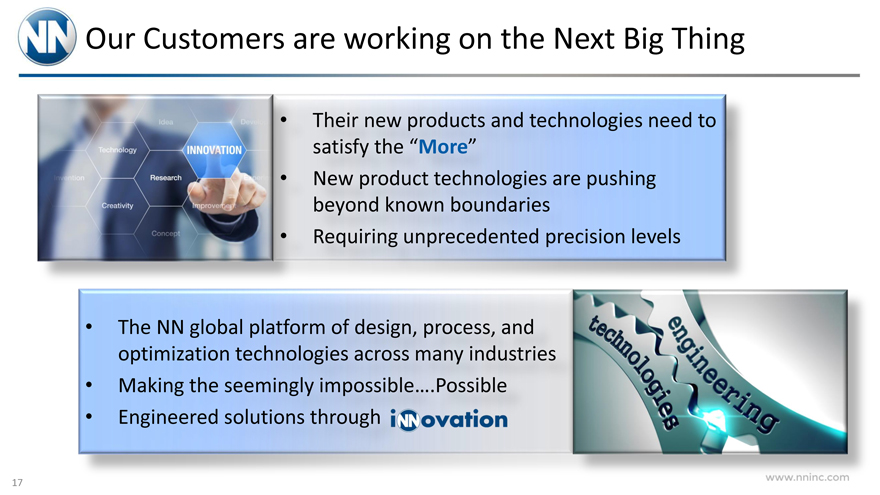
Their new products and technologies need to satisfy the “More”
New product technologies are pushing beyond known boundaries
Requiring unprecedented precision levels
The NN global platform of design, process, and optimization technologies across many industries
Making the seemingly impossible….Possible
Engineered solutions through
www.nninc.com
17
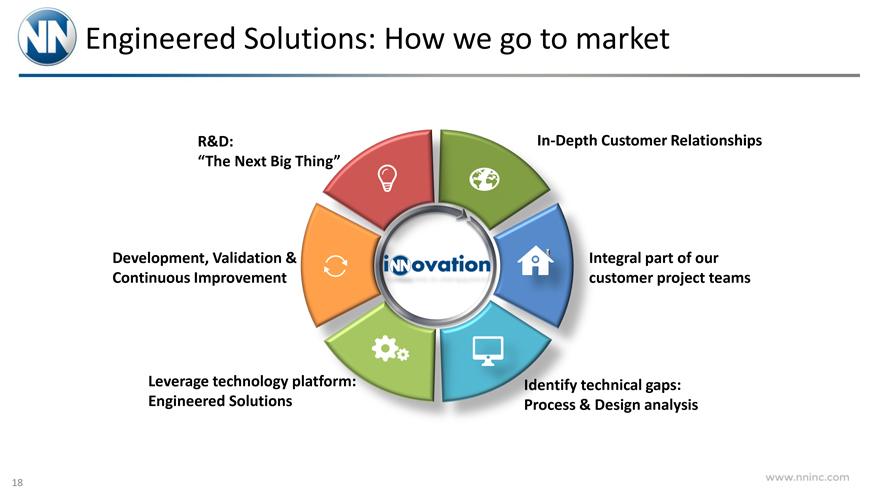
Engineered Solutions: How we go to market
R&D:
“The Next Big Thing”
In-Depth Customer Relationships
Development, Validation & Continuous Improvement
Integral part of our customer project teams
Leverage technology platform: Engineered Solutions
Identify technical gaps: Process & Design analysis
www.nninc.com
18
Innovative Solutions
Medical
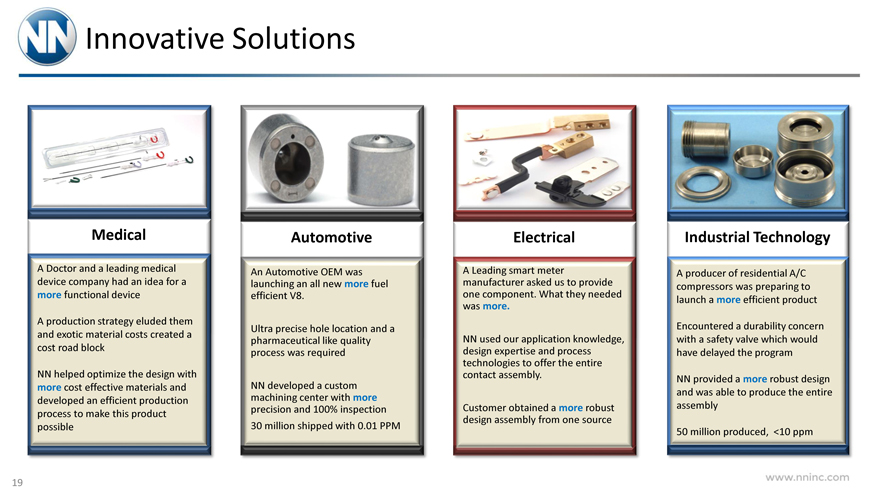
A Doctor and a leading medical device company had an idea for a more functional device
A production strategy eluded them and exotic material costs created a cost road block
NN helped optimize the design with more cost effective materials and developed an efficient production process to make this product possible
Automotive
An Automotive OEM was launching an all new more fuel efficient V8.
Ultra precise hole location and a pharmaceutical like quality process was required
NN developed a custom machining center with more precision and 100% inspection 30 million shipped with 0.01 PPM
Electrical
A Leading smart meter manufacturer asked us to provide one component. What they needed was more.
NN used our application knowledge, design expertise and process technologies to offer the entire contact assembly.
Customer obtained a more robust design assembly from one source
Industrial Technology
A producer of residential A/C compressors was preparing to launch a more efficient product
Encountered a durability concern with a safety valve which would have delayed the program
NN provided a more robust design and was able to produce the entire assembly
50 million produced, <10 ppm
www.nninc.com
19
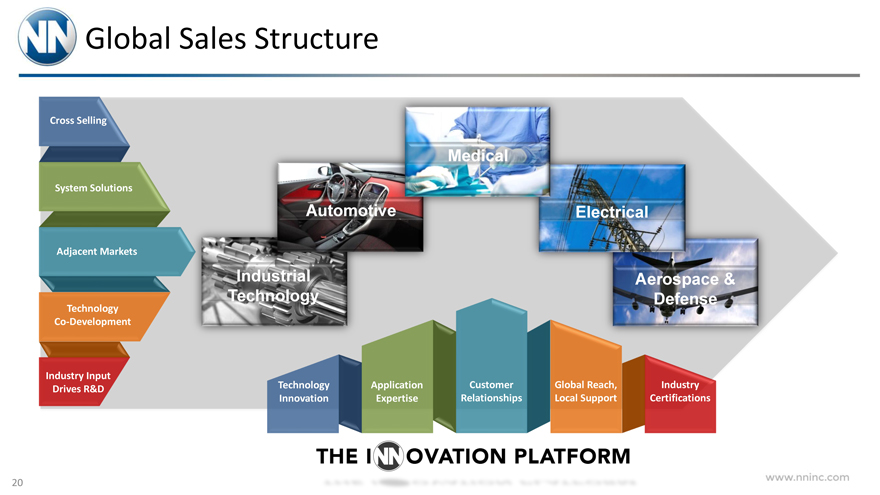
Global Sales Structure
Cross Selling System Solutions Adjacent Markets
Technology Co-Development
Industry Input Drives R&D
Industrial Technology
Automotive
Medical
Electrical
Aerospace & Defense
Technology Innovation
Application Expertise
Customer Relationships
Global Reach, Local Support
Industry Certifications
THE INNOVATION PLATFORM
www.nninc.com
20
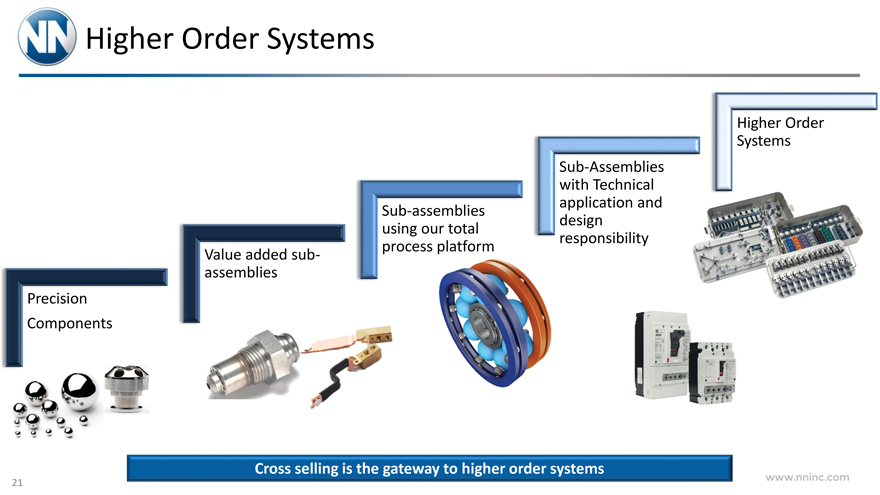
Higher Order Systems
Precision Components
Value added sub-assemblies
Sub-assemblies using our total process platform
Sub-Assemblies with Technical application and design responsibility
Higher Order Systems
Cross selling is the gateway to higher order systems
www.nninc.com
21
End Markets Discussion
Medical & Electrical
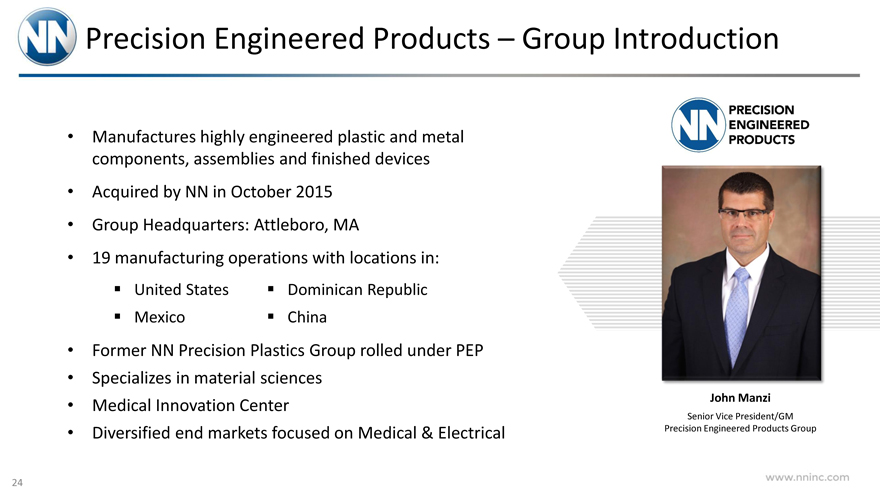
Precision Engineered Products – Group Introduction
Manufactures highly engineered plastic and metal components, assemblies and finished devices
Acquired by NN in October 2015
Group Headquarters: Attleboro, MA
19 manufacturing operations with locations in: United States Dominican Republic Mexico China
Former NN Precision Plastics Group rolled under PEP
Specializes in material sciences
Medical Innovation Center
Diversified end markets focused on Medical & Electrical
PRECISION ENGINEERED PRODUCTS
John Manzi
Senior Vice President/GM Precision Engineered Products Group
www.nninc.com
24
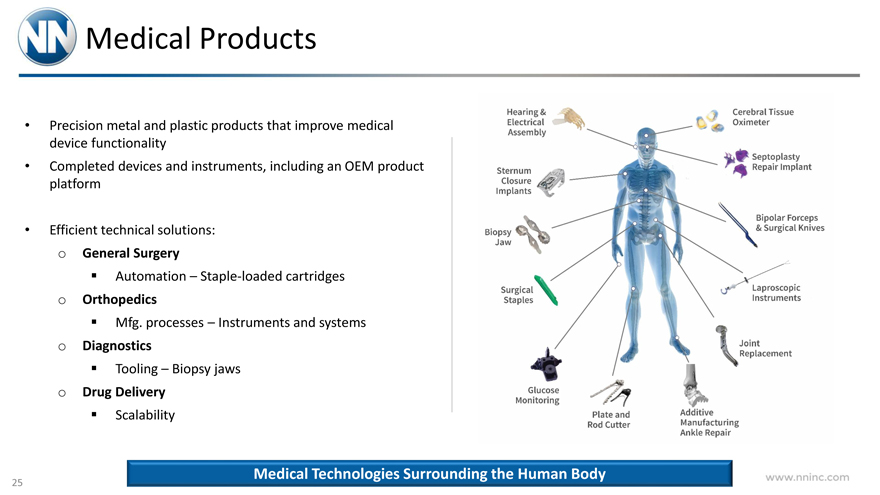
Medical Products
Precision metal and plastic products that improve medical device functionality
Completed devices and instruments, including an OEM product platform
Efficient technical solutions: o General Surgery
Automation – Staple-loaded cartridges o Orthopedics
Mfg. processes – Instruments and systems o Diagnostics
Tooling – Biopsy jaws o Drug Delivery
Scalability
Hearing & Electrical Assemble
Cerebral Tissue Oximeter
Sternum Closure Implants
Septoplasty Repair Implant
Biopsy Jaw
Bipolar Forceps & Surgical Knives
Surgical Staples
Laproscopic Instruments
Joint Replacement
Glucose Monitaring
Plate and Rod Cutter
Additive Manufacturing Ankle Repair
Medical Technologies Surrounding the Human Body
www.nninc.com
25
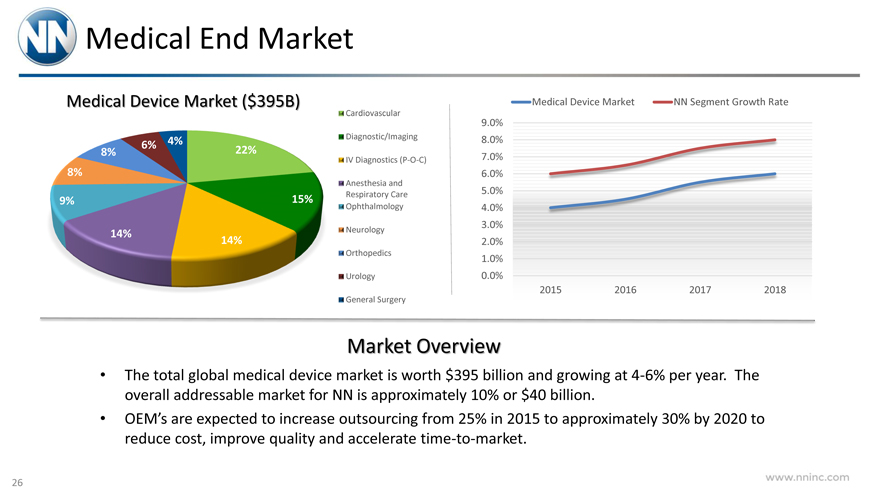
Medical End Market
Medical Device Market ($395B)
Cardiovascular Diagnostic/Imaging IV Diagnostics (P-O-C)
Anesthesia and Respiratory Care Ophthalmology
Neurology Orthopedics Urology General Surgery
Medical Device Market NN Segment Growth Rate
9.0% 8.0% 7.0% 6.0% 5.0% 4.0% 3.0% 2.0% 1.0% 0.0%
2015 2016 2017 2018
Market Overview
The total global medical device market is worth $395 billion and growing at 4-6% per year. The overall addressable market for NN is approximately 10% or $40 billion.
OEM’s are expected to increase outsourcing from 25% in 2015 to approximately 30% by 2020 to reduce cost, improve quality and accelerate time-to-market.
www.nninc.com
26
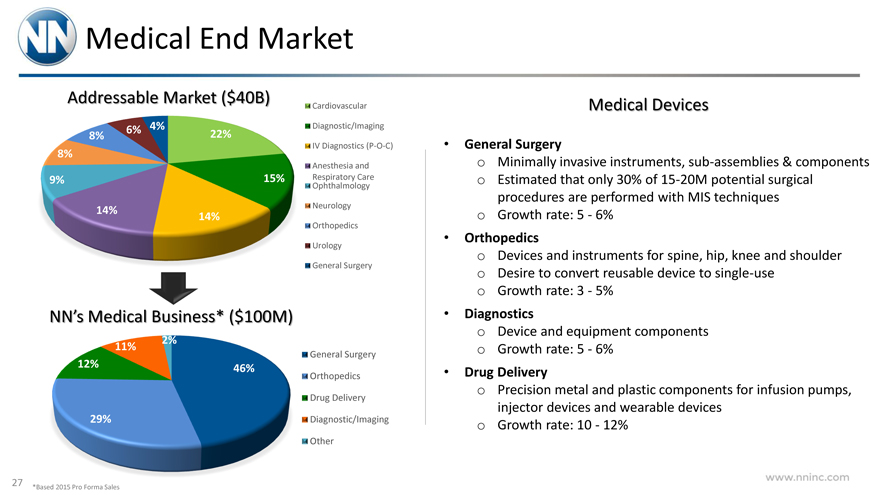
Medical End Market
Addressable Market ($40B)
6% 4%
8% 22% 8%
9% 15%
14%
14%
Cardiovascular Diagnostic/Imaging IV Diagnostics (P-O-C)
Anesthesia and Ophthalmology Respiratory Care Neurology
Orthopedics Urology General Surgery
NN’s Medical Business* ($100M)
2% 11%
12% 46%
29%
General Surgery Orthopedics Drug Delivery Diagnostic/Imaging Other
Medical Devices
General Surgery o Minimally invasive instruments, sub-assemblies & components o Estimated that only 30% of 15-20M potential surgical procedures are performed with MIS techniques o Growth rate: 5—6%
Orthopedics o Devices and instruments for spine, hip, knee and shoulder o Desire to convert reusable device to single-use o Growth rate: 3—5%
Diagnostics o Device and equipment components o Growth rate: 5—6%
Drug Delivery o Precision metal and plastic components for infusion pumps, injector devices and wearable devices o Growth rate: 10—12%
*Based 2015 Pro Forma Sales
www.nninc.com
27
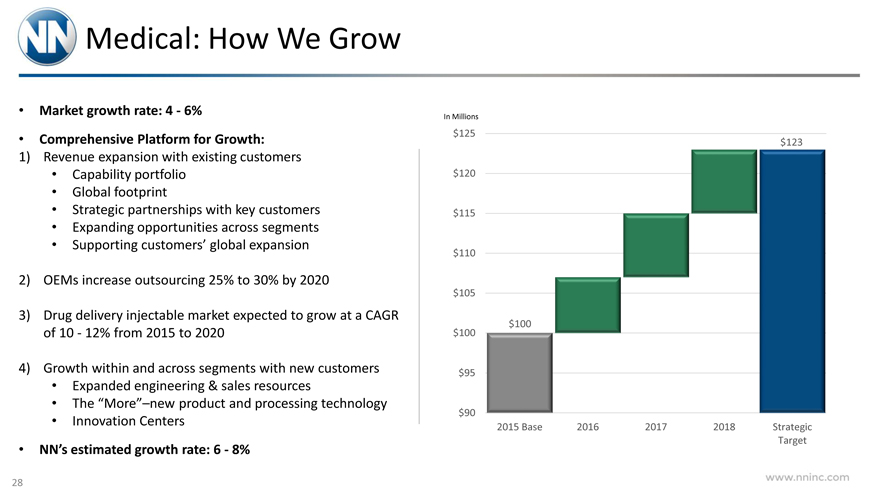
Medical: How We Grow
Market growth rate: 4—6%
Comprehensive Platform for Growth:
1) Revenue expansion with existing customers
Capability portfolio
Global footprint
Strategic partnerships with key customers
Expanding opportunities across segments
Supporting customers’ global expansion
2) OEMs increase outsourcing 25% to 30% by 2020
3) Drug delivery injectable market expected to grow at a CAGR of 10—12% from 2015 to 2020
4) Growth within and across segments with new customers
Expanded engineering & sales resources
The “More”–new product and processing technology
Innovation Centers
NN’s estimated growth rate: 6—8%
In Millions
$125 $120 $115 $110 $105 $100 $95 $90
$123
$100
2015 Base 2016 2017 2018 Strategic Target
www.nninc.com
28
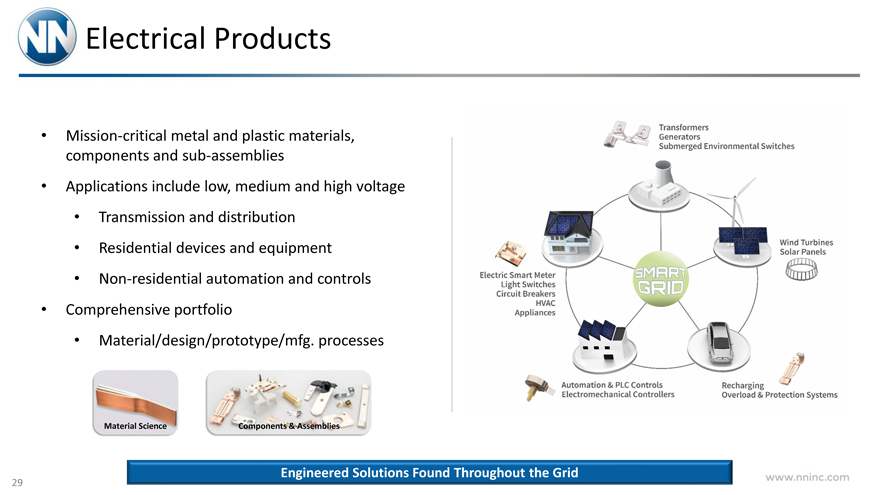
Electrical Products
Mission-critical metal and plastic materials, components and sub-assemblies
Applications include low, medium and high voltage
Transmission and distribution
Residential devices and equipment
Non-residential automation and controls
Comprehensive portfolio
Material/design/prototype/mfg. processes
Material Science
Components & Assemblies
Engineered Solutions Found Throughout the Grid
Transformers Generators Submerged Environment Switches
Electric Smart Meter Light Switches Circuit Breakers HVAC Appliances
Wind Turbines Solar Panels
Automation & PLC Controls Electromechanical Controllers
Recharging Overload & Protection Systems
www.nninc.com
29
Electrical End Market
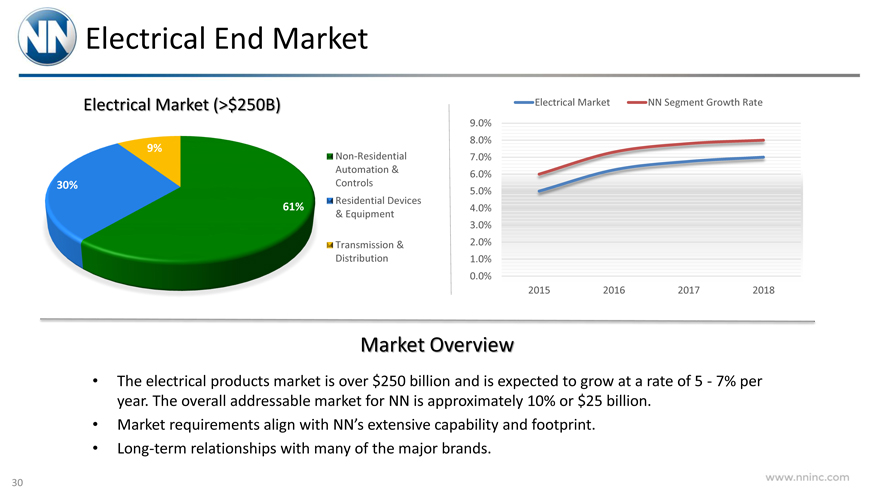
Electrical Market (>$250B)
9%
30%
61%
Non-Residential Automation & Controls Residential Devices
& Equipment
Transmission & Distribution
Non-Residential Automation & Controls Residential Devices
& Equipment
Transmission & Distribution
9.0% 8.0% 7.0% 6.0% 5.0% 4.0% 3.0% 2.0% 1.0% 0.0%
2015 2016 2017 2018
Market Overview
The electrical products market is over $250 billion and is expected to grow at a rate of 5—7% per year. The overall addressable market for NN is approximately 10% or $25 billion.
Market requirements align with NN’s extensive capability and footprint.
Long-term relationships with many of the major brands.
www.nninc.com
30
Electrical End Market
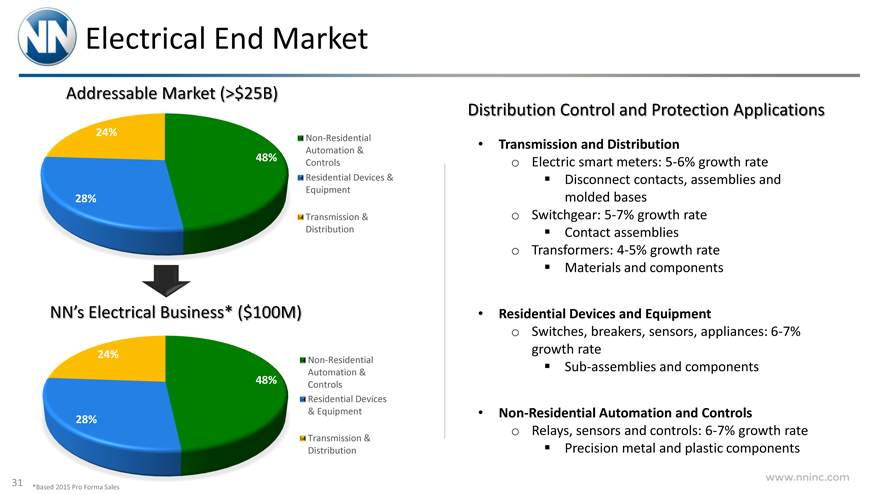
Addressable Market (>$25B)
24%
48%
28%
Non-Residential Automation & Controls Residential Devices & Equipment
Transmission & Distribution
NN’s Electrical Business* ($100M)
24%
48%
28%
Non-Residential Automation & Controls Residential Devices
& Equipment
Transmission & Distribution
Distribution Control and Protection Applications
Transmission and Distribution o Electric smart meters: 5-6% growth rate Disconnect contacts, assemblies and molded bases o Switchgear: 5-7% growth rate Contact assemblies o Transformers: 4-5% growth rate Materials and components
Residential Devices and Equipment o Switches, breakers, sensors, appliances: 6-7% growth rate Sub-assemblies and components
Non-Residential Automation and Controls o Relays, sensors and controls: 6-7% growth rate Precision metal and plastic components
www.nninc.com
31 *Based 2015 Pro Forma Sales
Electrical: How We Grow
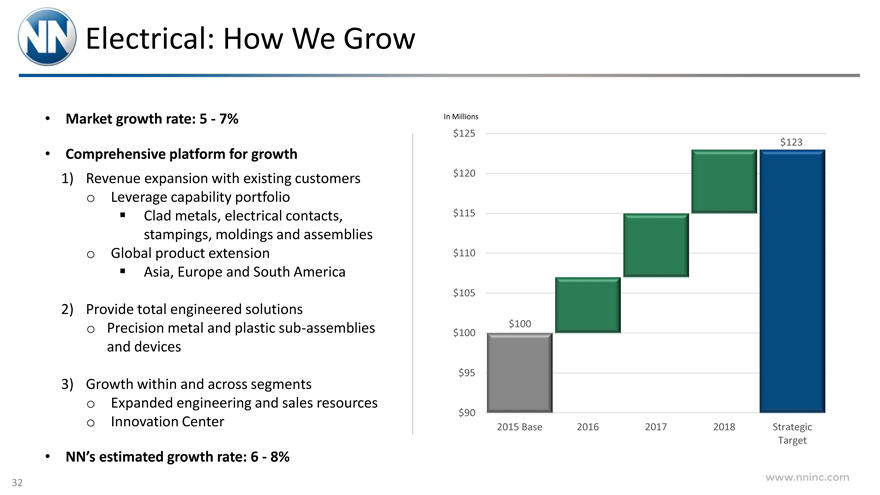
Market growth rate: 5—7%
Comprehensive platform for growth
1) Revenue expansion with existing customers o Leverage capability portfolio Clad metals, electrical contacts, stampings, moldings and assemblies o Global product extension Asia, Europe and South America
2) Provide total engineered solutions o Precision metal and plastic sub-assemblies and devices
3) Growth within and across segments o Expanded engineering and sales resources o Innovation Center
NN’s estimated growth rate: 6—8%
In Millions
$125 $120 $115 $110 $105 $100 $95 $90
$123
$100
2015 Base 2016 2017 2018 Strategic
Target
www.nninc.com
32
Industrial Technology & Aerospace
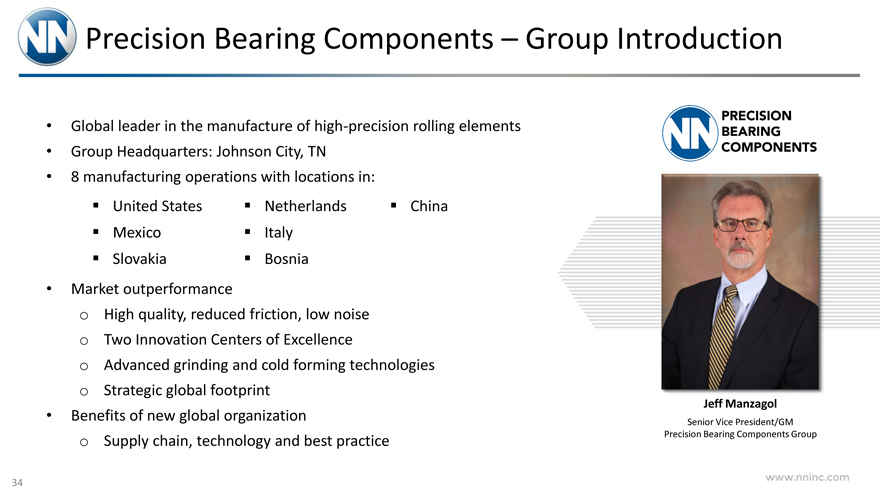
Precision Bearing Components – Group Introduction
Global leader in the manufacture of high-precision rolling elements
Group Headquarters: Johnson City, TN
8 manufacturing operations with locations in:
United States Netherlands China Mexico Italy Slovakia Bosnia
Market outperformance o High quality, reduced friction, low noise o Two Innovation Centers of Excellence o Advanced grinding and cold forming technologies o Strategic global footprint
Benefits of new global organization o Supply chain, technology and best practice
PRECISION BEARING COMPONENTS
Jeff Manzagol
Senior Vice President/GM Precision Bearing Components Group
www.nninc.com
34
Industrial Technology End Market
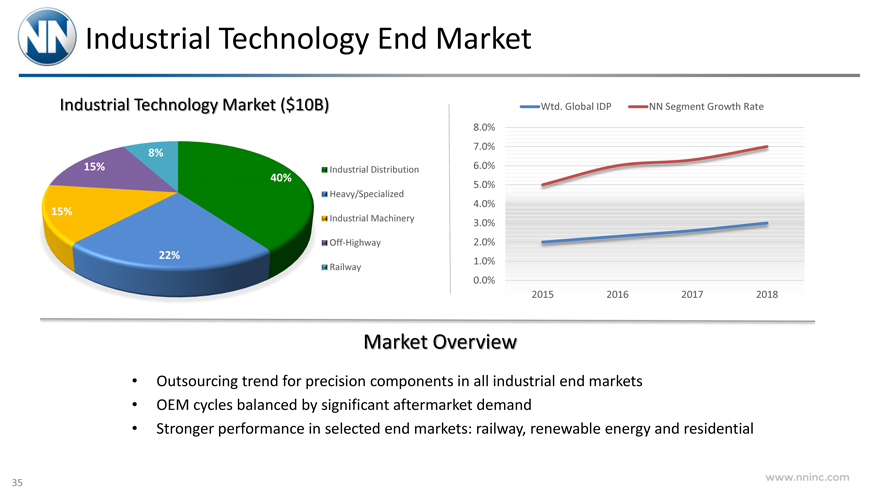
Industrial Technology Market ($10B)
8% 15%
40%
15%
22%
Industrial Distribution Heavy/Specialized Industrial Machinery Off-Highway Railway
Wtd. Global IDP NN Segment Growth Rate
8.0% 7.0% 6.0% 5.0% 4.0% 3.0% 2.0% 1.0% 0.0%
2015 2016 2017 2018
Market Overview
Outsourcing trend for precision components in all industrial end markets
OEM cycles balanced by significant aftermarket demand
Stronger performance in selected end markets: railway, renewable energy and residential
www.nninc.com
35
Industrial Technology End Market
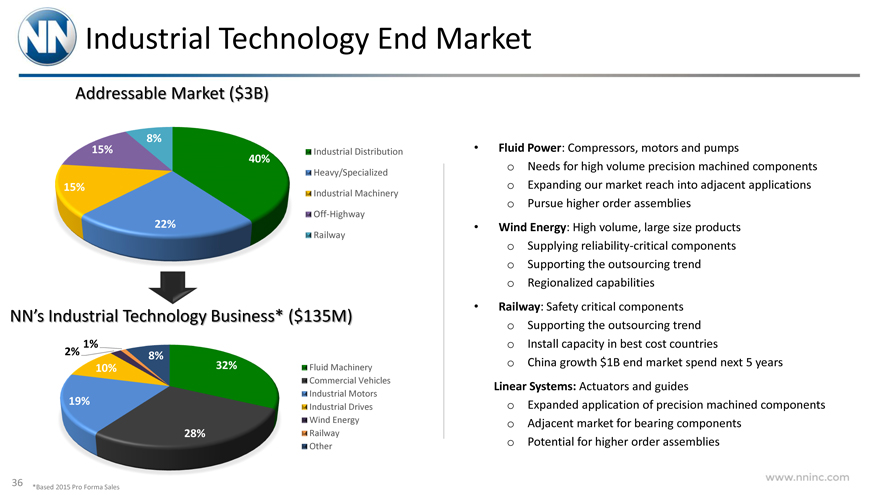
Addressable Market ($3B)
8% 15%
40%
15%
22%
Industrial Distribution Heavy/Specialized Industrial Machinery Off-Highway Railway
NN’s Industrial Technology Business* ($135M)
1%
2% 8% 32% 10%
19%
28%
Fluid Machinery Commercial Vehicles Industrial Motors Industrial Drives Wind Energy Railway Other
Fluid Power: Compressors, motors and pumps o Needs for high volume precision machined components o Expanding our market reach into adjacent applications o Pursue higher order assemblies
Wind Energy: High volume, large size products o Supplying reliability-critical components o Supporting the outsourcing trend o Regionalized capabilities
Railway: Safety critical components o Supporting the outsourcing trend o Install capacity in best cost countries o China growth $1B end market spend next 5 years Linear Systems: Actuators and guides o Expanded application of precision machined components o Adjacent market for bearing components o Potential for higher order assemblies
www.nninc.com
36 *Based 2015 Pro Forma Sales
Industrial Technology End Market: How We Grow
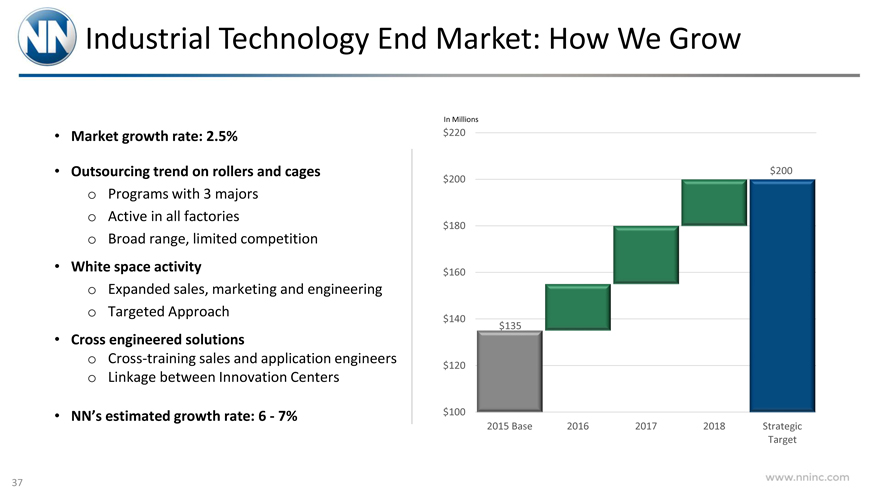
Market growth rate: 2.5%
Outsourcing trend on rollers and cages o Programs with 3 majors o Active in all factories o Broad range, limited competition
White space activity o Expanded sales, marketing and engineering o Targeted Approach
Cross engineered solutions o Cross-training sales and application engineers o Linkage between Innovation Centers
NN’s estimated growth rate: 6—7%
In Millions
$220 $200 $180 $160 $140 $120 $100
$200
$135
2015 Base 2016 2017 2018 Strategic
Target
www.nninc.com
37
Aerospace & Defense End Market
Aerospace Overview
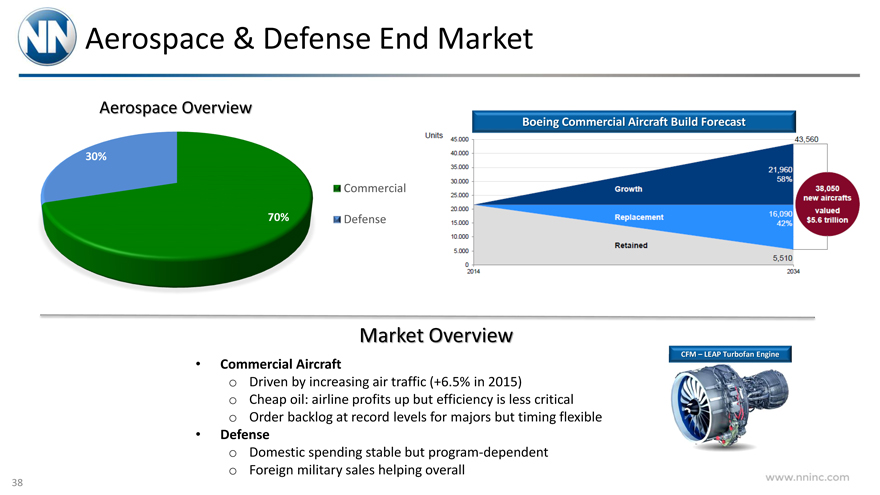
30%
70%
Commercial
Defense
Boeing Commercial Aircraft Build Forecast
Units 45,000 40,000 35,000 30,000 25,000 20,000 15,000 10,000 5,000 0 2014
Growth Replacement Retained 43,560 21,960 58% 38,050 new aircrafts valued $5.6 trillion 16,090 42% 5,510 2034 Market Overview
Commercial Aircraft o Driven by increasing air traffic (+6.5% in 2015) o Cheap oil: airline profits up but efficiency is less critical o Order backlog at record levels for majors but timing flexible
Defense o Domestic spending stable but program-dependent o Foreign military sales helping overall
CFM – LEAP Turbofan Engine
www.nninc.com
38
Aerospace & Defense: How We Grow
PEP acquisition provides market presence o Regulatory certifications o Customer access
NN capabilities fit market needs o High precision o Exacting quality standards o Manufacture complex parts & assemblies o Design & technical collaboration resources o Global footprint
Industry demand and technical drivers provide opportunities to expand our business
www.nninc.com
39
Automotive
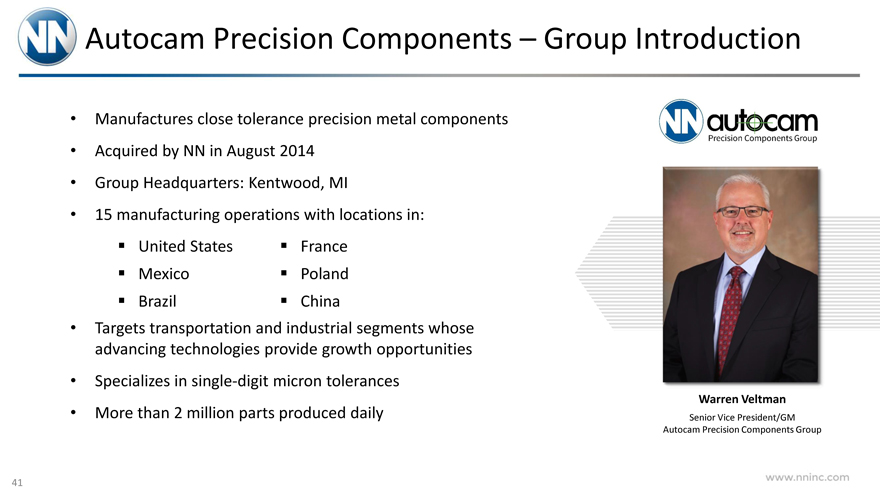
Autocam Precision Components – Group Introduction
Manufactures close tolerance precision metal components
Acquired by NN in August 2014
Group Headquarters: Kentwood, MI
15 manufacturing operations with locations in: United States France Mexico Poland Brazil China
Targets transportation and industrial segments whose advancing technologies provide growth opportunities
Specializes in single-digit micron tolerances
More than 2 million parts produced daily
Autocam Precision Components Group
Warren Veltman
Senior Vice President/GM Autocam Precision Components Group
www.nninc.com
41
Automotive End Market
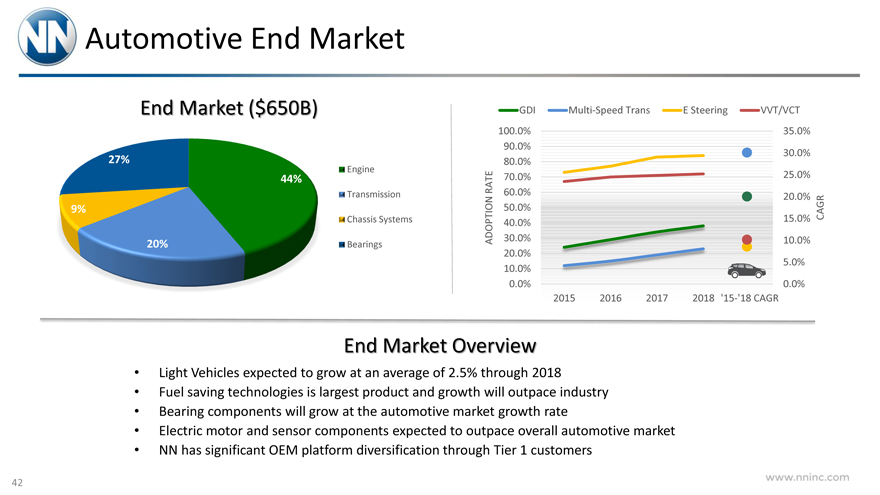
End Market ($650B)
27%
44% 9% 20%
Engine Transmission Chassis Systems Bearings
GDI Multi-Speed Trans E Steering VVT/VCT
ADOPTION RATE
100.0% 90.0% 80.0% 70.0% 60.0% 50.0% 40.0% 30.0% 20.0% 10.0% 0.0%
35.0% 30.0% 25.0% 20.0% 15.0% 10.0% 5.0% 0.0%
CAGR
2015 2016 2017 2018 ‘15-‘18 CAGR
End Market Overview
Light Vehicles expected to grow at an average of 2.5% through 2018
Fuel saving technologies is largest product and growth will outpace industry
Bearing components will grow at the automotive market growth rate
Electric motor and sensor components expected to outpace overall automotive market
NN has significant OEM platform diversification through Tier 1 customers
www.nninc.com
42
Automotive End Market
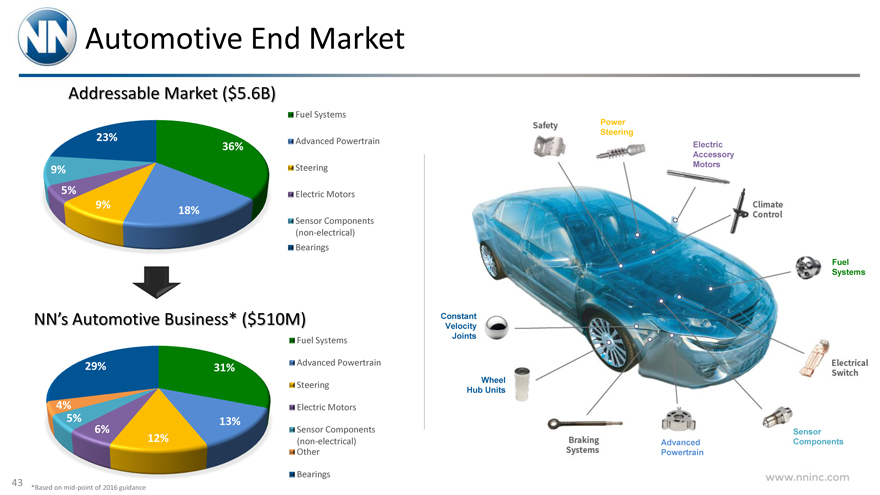
Addressable Market ($5.6B)
23%
36% 9% 5%
9% 18%
Fuel Systems
Advanced Powertrain Steering Electric Motors
Sensor Components (non-electrical) Bearings
NN’s Automotive Business* ($510M)
29% 31%
4%
5% 13% 6% 12%
Fuel Systems
Advanced Powertrain Steering Electric Motors
Sensor Components (non-electrical) Other
Bearings
Safety Power Steering Electric Accessory Motors Climate Control Fuel Systems Electrical Switch Sensor Components Advanced Powertrain Braking Systems Wheel Hub Units Constant Velocity Joints
www.nninc.com
43
*Based on mid-point of 2016 guidance
Automotive End Market: How We Grow
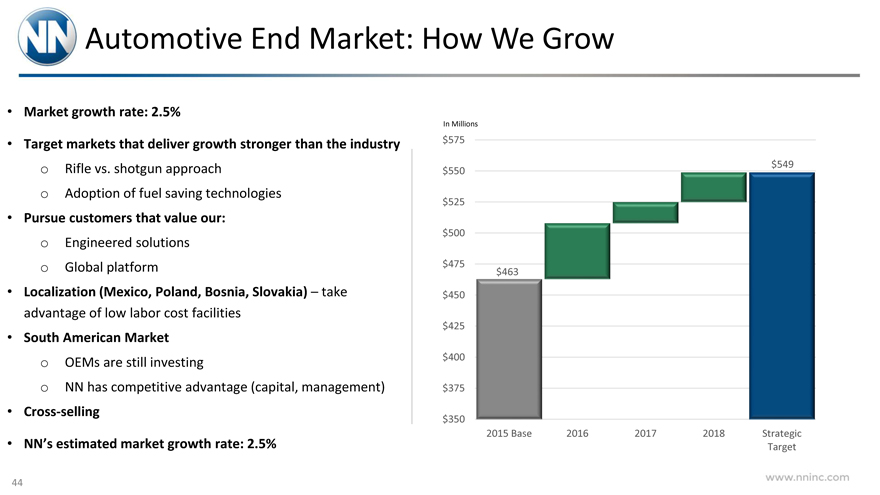
Market growth rate: 2.5%
Target markets that deliver growth stronger than the industry o Rifle vs. shotgun approach o Adoption of fuel saving technologies
Pursue customers that value our: o Engineered solutions o Global platform
Localization (Mexico, Poland, Bosnia, Slovakia) – take advantage of low labor cost facilities
South American Market o OEMs are still investing o NN has competitive advantage (capital, management)
Cross-selling
NN’s estimated market growth rate: 2.5%
In Millions
$575 $550 $525 $500 $475 $450 $425 $400 $375 $350
$549
$463
2015 Base 2016 2017 2018 Strategic
Target
www.nninc.com
44
CAFE – Requirements
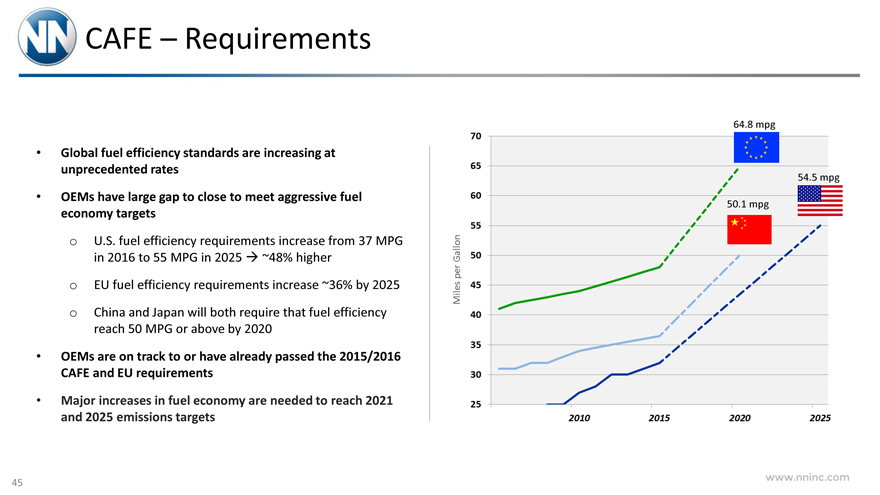
Global fuel efficiency standards are increasing at unprecedented rates
OEMs have large gap to close to meet aggressive fuel economy targets o U.S. fuel efficiency requirements increase from 37 MPG in 2016 to 55 MPG in 2025 ~48% higher o EU fuel efficiency requirements increase ~36% by 2025 o China and Japan will both require that fuel efficiency reach 50 MPG or above by 2020
OEMs are on track to or have already passed the 2015/2016 CAFE and EU requirements
Major increases in fuel economy are needed to reach 2021 and 2025 emissions targets
Miles per Gallon 70 65 60 55 50 45 40 35 30 25 64.8 mpg 54.5 mpg 50.1 mpg 2010 2015 2020 2025
www.nninc.com
45
CAFE – NN Content Per Vehicle
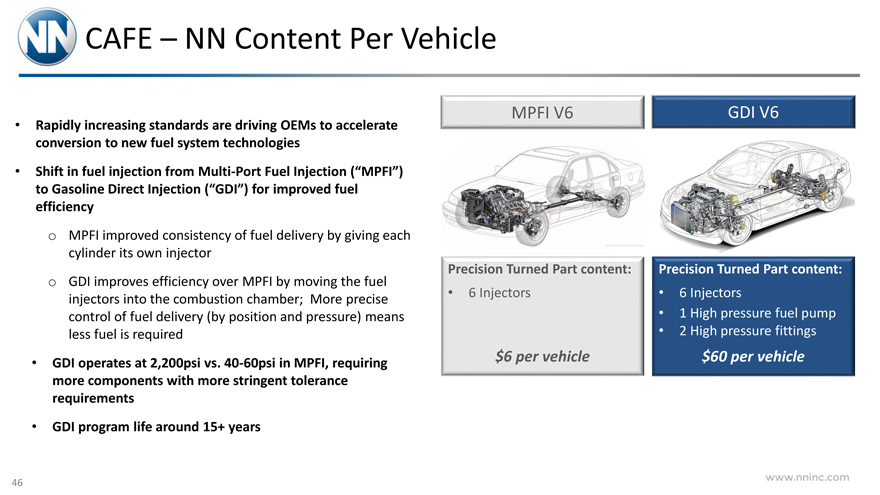
Rapidly increasing standards are driving OEMs to accelerate conversion to new fuel system technologies
Shift in fuel injection from Multi-Port Fuel Injection (“MPFI”) to Gasoline Direct Injection (“GDI”) for improved fuel efficiency o MPFI improved consistency of fuel delivery by giving each cylinder its own injector o GDI improves efficiency over MPFI by moving the fuel injectors into the combustion chamber; More precise control of fuel delivery (by position and pressure) means less fuel is required
GDI operates at 2,200psi vs. 40-60psi in MPFI, requiring more components with more stringent tolerance requirements
GDI program life around 15+ years
MPFI V6 GDI V6
Precision Turned Part content:
6 Injectors
$6 per vehicle
Precision Turned Part content:
6 Injectors
1 High pressure fuel pump
2 High pressure fittings
$60 per vehicle
www.nninc.com
46
CAFE – NN Content Per Vehicle
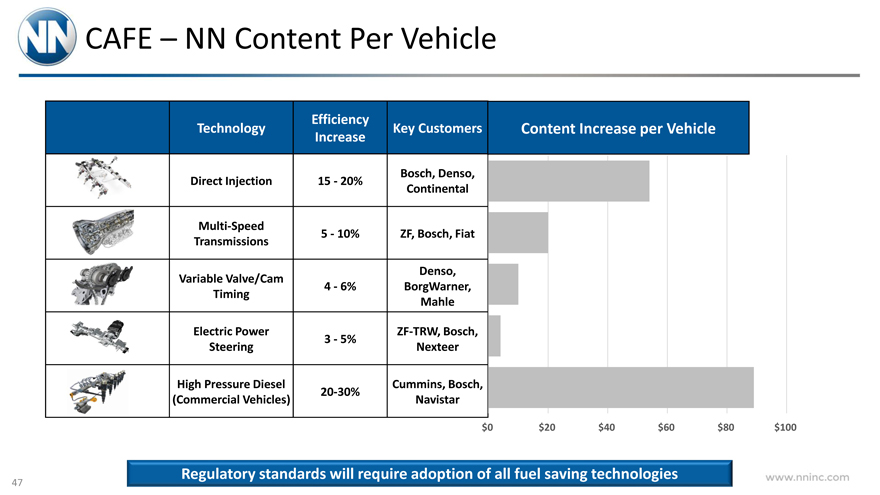
Technology
Direct Injection
Multi-Speed Transmissions
Variable Valve/Cam Timing
Electric Power Steering
High Pressure Diesel (Commercial Vehicles)
Efficiency Increase
15—20%
5—10%
4—6%
3—5% 20-30%
Key Customers
Bosch, Denso, Continental
ZF, Bosch, Fiat
Denso, BorgWarner, Mahle
ZF-TRW, Bosch, Nexteer
Cummins, Bosch, Navistar
Content Increase per Vehicle
$0 $20 $40 $60 $80 $100
Regulatory standards will require adoption of all fuel saving technologies
www.nninc.com
47
Automotive Summary
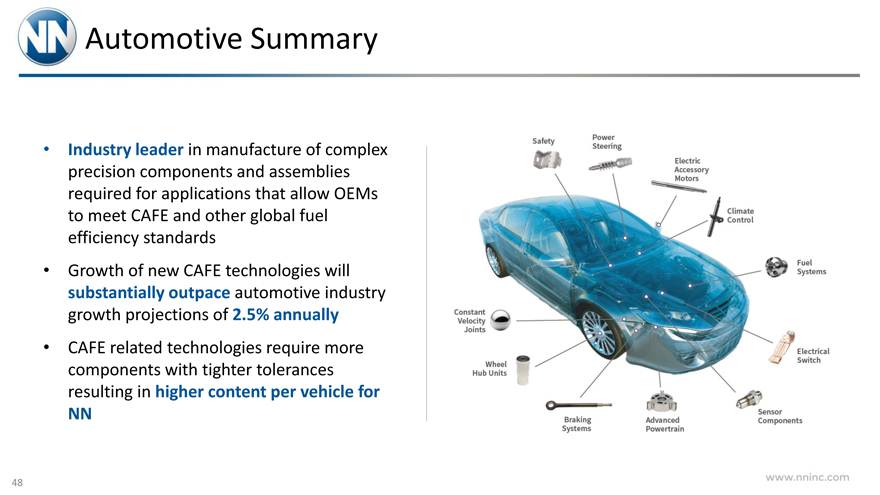
Industry leader in manufacture of complex precision components and assemblies required for applications that allow OEMs to meet CAFE and other global fuel efficiency standards
Growth of new CAFE technologies will substantially outpace automotive industry growth projections of 2.5% annually
CAFE related technologies require more components with tighter tolerances resulting in higher content per vehicle for NN
Safety Power Steering Electric Accessory Motors Climate Control Fuel Systems
Electrical Switch Sensor Components Advanced Powertrain Braking Systems Wheel Hub Units Constant Velocity Joints
www.nninc.com
48
Capital Structure Overview
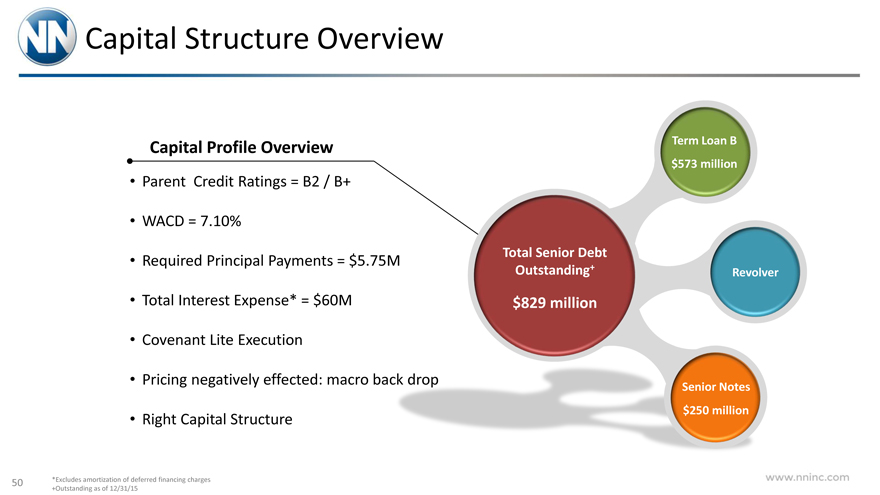
Capital Structure Overview
Capital Profile Overview
Parent Credit Ratings = B2 / B+
WACD = 7.10%
Required Principal Payments = $5.75M
Total Interest Expense* = $60M
Covenant Lite Execution
Pricing negatively effected: macro ba
Right Capital Structure
Total Senior Debt Outstanding+
$829 million
Term Loan B $573 million
Revolver
Senior Notes $250 million
www.nninc.com
50 *Excludes amortization of deferred financing charges +Outstanding as of 12/31/15
Secured Debt
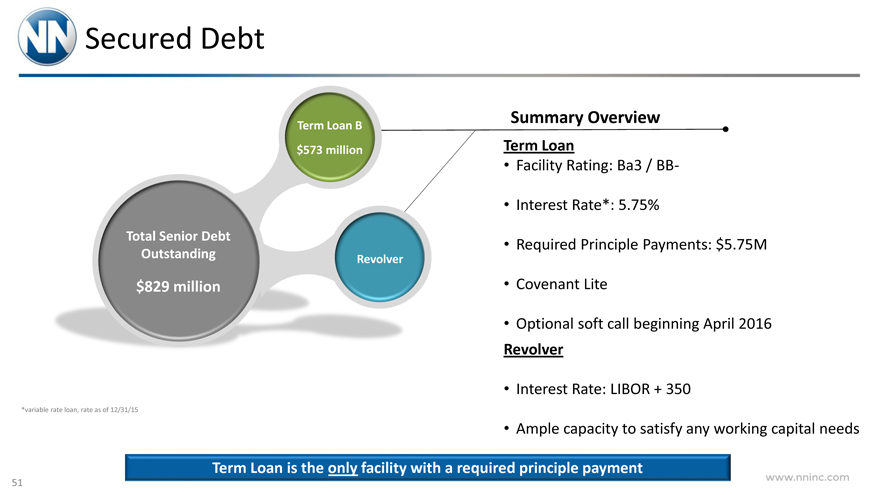
Total Senior Debt Outstanding
$829 million
Term Loan B $573 million
Revolver
*variable rate loan, rate as of 12/31/15
Summary Overview
Term Loan
Facility Rating: Ba3 / BB-
Interest Rate*: 5.75%
Required Principle Payments: $5.75M
Covenant Lite
Optional soft call beginning April 2016
Revolver
Interest Rate: LIBOR + 350
Ample capacity to satisfy any working capital needs
Term Loan is the only facility with a required principle payment
www.nninc.com
51
Senior Notes
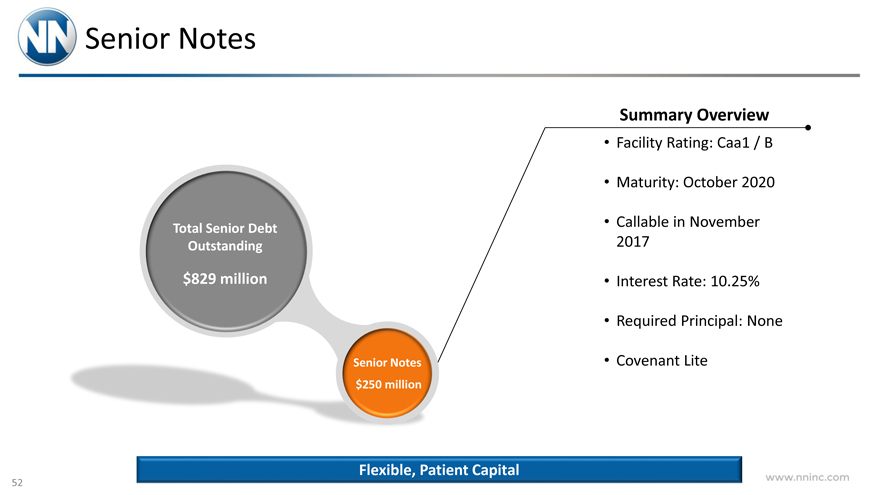
Total Senior Debt Outstanding
$829 million
Senior Notes $250 million
Summary Overview
Facility Rating: Caa1 / B
Maturity: October 2020
Callable in November 2017
Interest Rate: 10.25%
Required Principal: None
Covenant Lite
Flexible, Patient Capital
www.nninc.com
52
De-Leveraging Profile
$ In Millions
$900 $800 $700 $600 $500 $400 $300 $200 $100
$0
Net Debt Outstanding
5.50x
5.00x
4.50x
4.00x
3.50x
3.00x
2.50x
2.00x
Leverage
YE 2015 2016 2017 2018
Notes Term Loan Leverage
Institutional focus on deleveraging
Flexible call provisions & ratings increases can speed up deleveraging
Free cash flow will be directed to debt repayment
With no EBITDA growth we are still less than 3.5x levered at that end of 2018.
www.nninc.com
53
Capital Structure Summary
Correct Capital Structure
Despite pricing being wide of expectations, this structure allows for maximum flexibility
Flexible Repricing Provisions
Soft call options begin in April 2016
More to the story
Our debt service coverage is better today than post the Autocam acquisition
Power of Free Cash Flow
Significant free cash flow allows us to deleverage in less than 3 years
Continuous proactive management of the capital structure
www.nninc.com
54
Financial Performance
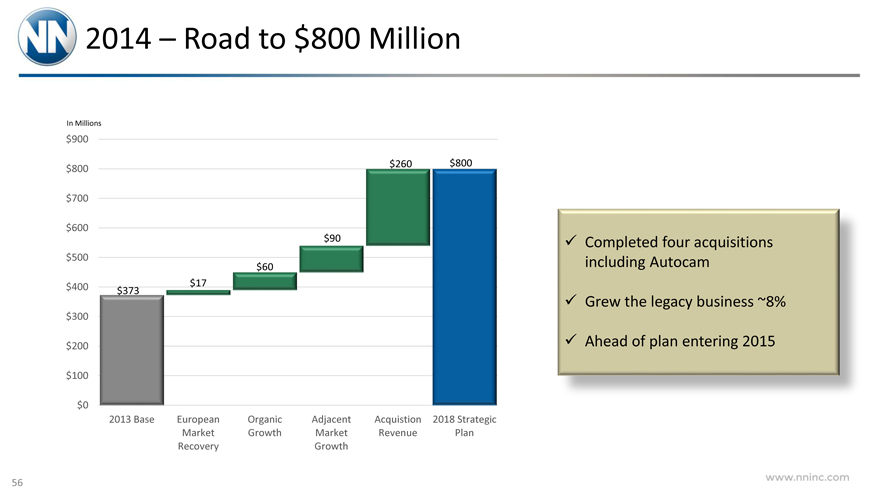
2014 – Road to $800 Million
In Millions
$900 $800 $700 $600 $500 $400 $300 $200 $100 $0
$260 $800
$90
$60 $17 $373
2013 Base European Organic Adjacent Acquistion 2018 Strategic Market Growth Market Revenue Plan Recovery Growth
Completed four acquisitions including Autocam
Grew the legacy business ~8%
Ahead of plan entering 2015
www.nninc.com
56
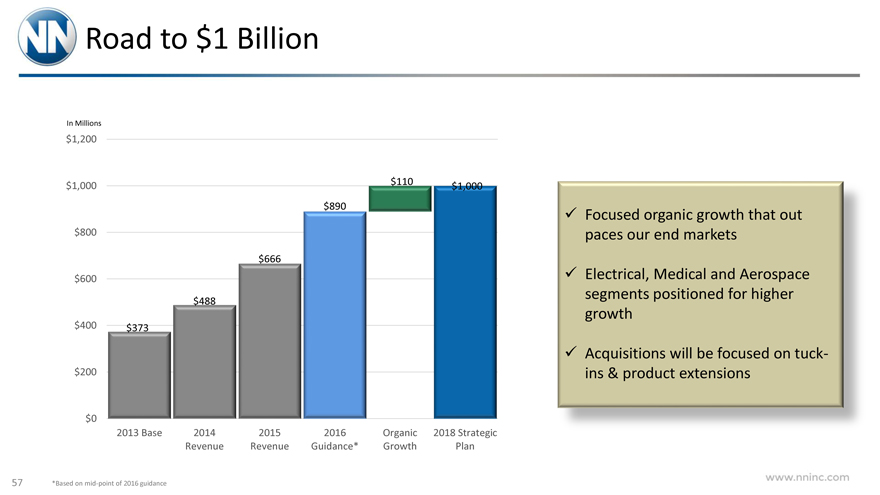
Road to $1 Billion
In Millions
$1,200 $1,000 $800 $600 $400 $200 $0
$110 $1,000 $890
$666
$488
$373
2013 Base 2014 2015 2016 Organic 2018 Strategic Revenue Revenue Guidance* Growth Plan
Focused organic growth that out paces our end markets
Electrical, Medical and Aerospace segments positioned for higher growth
Acquisitions will be focused on tuck-ins & product extensions
www.nninc.com
57 *Based on mid-point of 2016 guidance
2013—2018 Strategic Targets
EPS CAGR
Sales CAGR
ROIC
32% Gross Margin
22% EBITDA Margin
18% Operating Margin*
26%
20%
13%-16%
www.nninc.com
58 *Top to bottom of economic cycle range
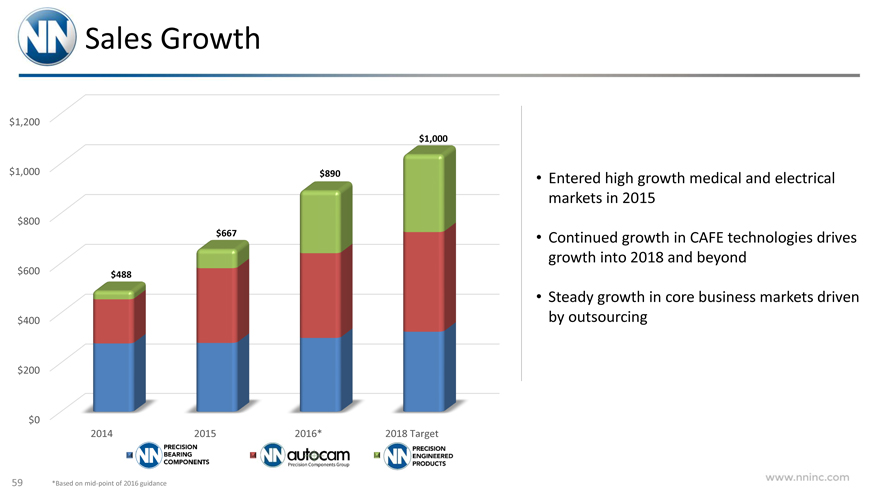
Sales Growth
$1,200 $1,000 $800 $600 $400 $200 $0
$1,000
$890
$667
$488
2014 2015 2016* 2018 Target
PRECISION BEARING COMPONENTS AUTOCAM Precision Components Group PRECISION ENGINEERED PRODUCTS • Entered high growth medical and electrical markets in 2015
Continued growth in CAFE technologies drives growth into 2018 and beyond
Steady growth in core business markets driven by outsourcing
www.nninc.com
59 *Based on mid-point of 2016 guidance
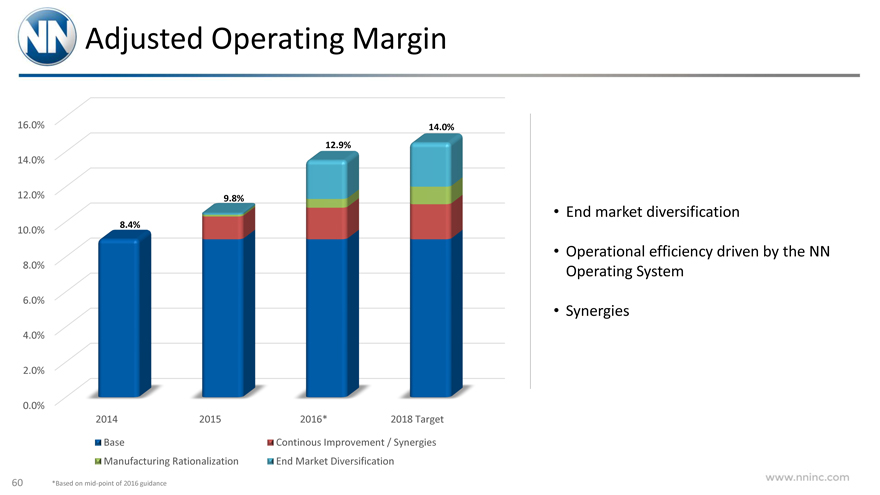
Adjusted Operating Margin
16.0% 14.0% 12.0% 10.0% 8.0% 6.0% 4.0% 2.0% 0.0%
14.0%
12.9%
9.8%
8.4%
2014 2015 2016* 2018 Target Base Continous Improvement / Synergies Manufacturing Rationalization End Market Diversification
End market diversification
Operational efficiency driven by the NN Operating System
Synergies
www.nninc.com
60 *Based on mid-point of 2016 guidance
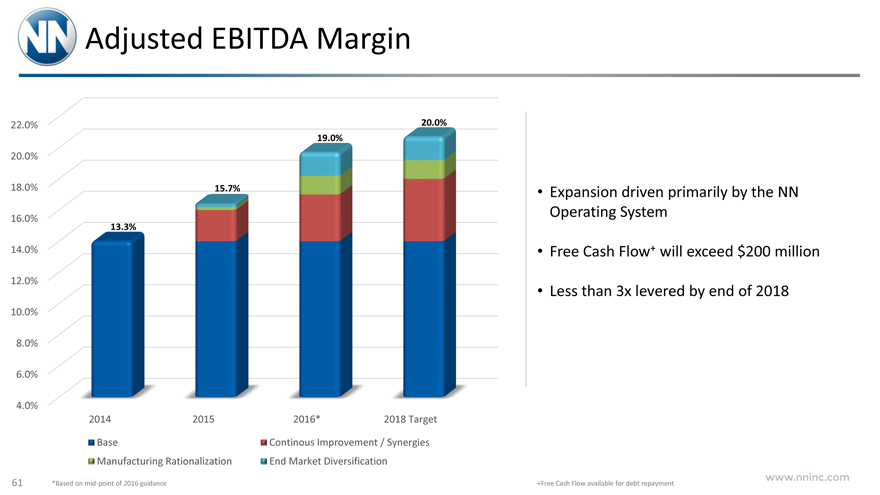
Adjusted EBITDA Margin
22.0% 20.0% 18.0% 16.0% 14.0% 12.0% 10.0% 8.0% 6.0% 4.0%
20.0% 19.0%
15.7%
13.3%
2014 2015 2016* 2018 Target Base Continous Improvement / Synergies Manufacturing Rationalization End Market Diversification
Expansion driven primarily by the NN Operating System
Free Cash Flow+ will exceed $200 million
Less than 3x levered by end of 2018
www.nninc.com
61 *Based on mid-point of 2016 guidance
+Free Cash Flow available for debt repayment
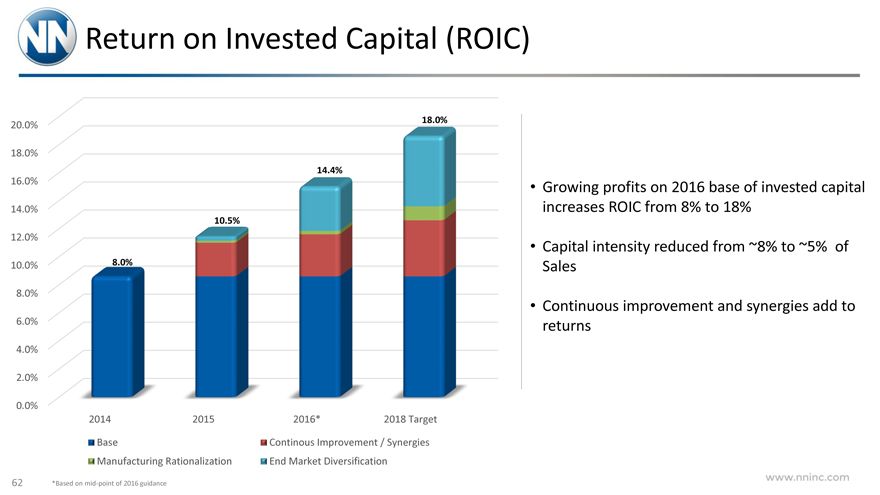
Return on Invested Capital (ROIC)
20.0% 18.0% 16.0% 14.0% 12.0% 10.0% 8.0% 6.0% 4.0% 2.0% 0.0%
18.0%
14.4%
10.5%
8.0%
2014 2015 2016* 2018 Target Base Continous Improvement / Synergies Manufacturing Rationalization End Market Diversification
Growing profits on 2016 base of invested capital increases ROIC from 8% to 18%
Capital intensity reduced from ~8% to ~5% of Sales
Continuous improvement and synergies add to returns
www.nninc.com
62 *Based on mid-point of 2016 guidance
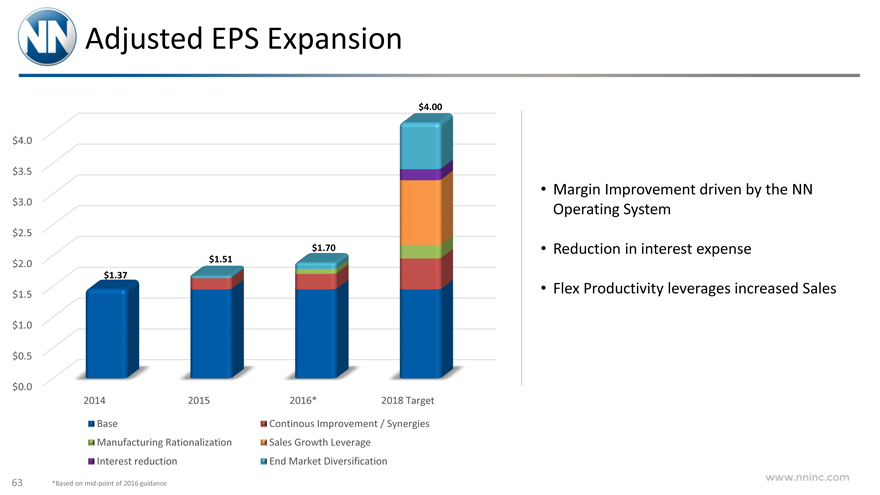
Adjusted EPS Expansion
$4.0 $3.5 $3.0 $2.5 $2.0 $1.5 $1.0 $0.5 $0.0
$4.00
$1.70
$1.51
$1.37
2014 2015 2016* 2018 Target Base Continous Improvement / Synergies Manufacturing Rationalization Sales Growth Leverage Interest reduction End Market Diversification
Margin Improvement driven by the NN Operating System
Reduction in interest expense
Flex Productivity leverages increased Sales
www.nninc.com
63 *Based on mid-point of 2016 guidance
The NN Operating System
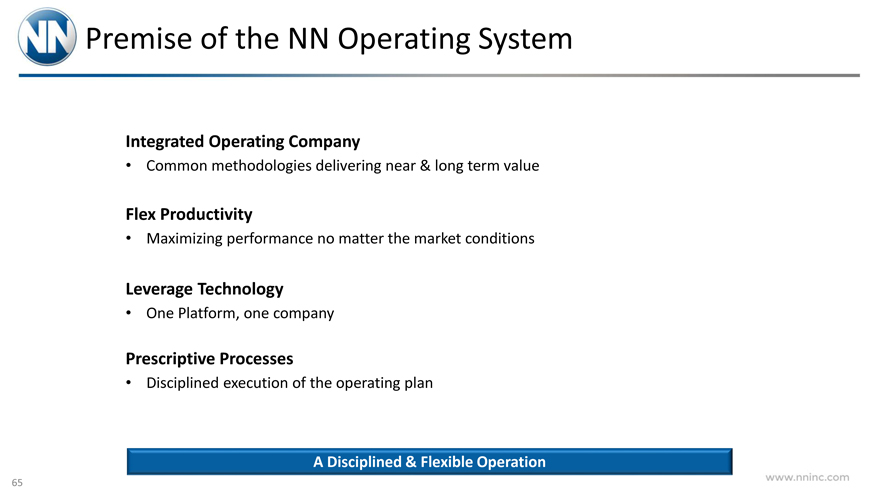
Premise of the NN Operating System
Integrated Operating Company
Common methodologies delivering near & long term value
Flex Productivity
Maximizing performance no matter the market conditions
Leverage Technology
One Platform, one company
Prescriptive Processes
Disciplined execution of the operating plan
A Disciplined & Flexible Operation
www.nninc.com
65
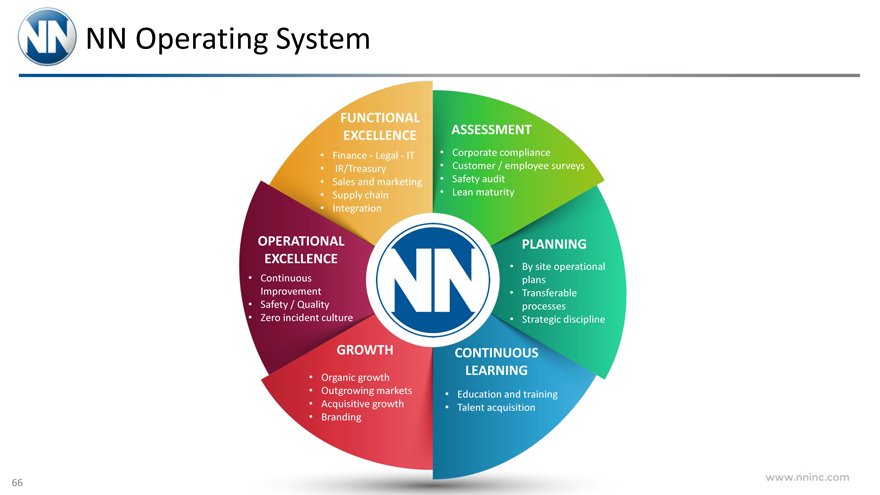
NN Operating System
FUNCTIONAL EXCELLENCE
Finance—Legal—IT
IR/Treasury
Sales and marketing
Supply chain
Integration
ASSESSMENT
Corporate compliance
Customer / employee surveys
Safety audit
Lean maturity
OPERATIONAL EXCELLENCE
Continuous Improvement
Safety / Quality
Zero incident culture
PLANNING
By site operational plans
Transferable processes
Strategic discipline
GROWTH
Organic growth
Outgrowing markets
Acquisitive growth
Branding
CONTINUOUS LEARNING
Education and training
Talent acquisition
www.nninc.com
66
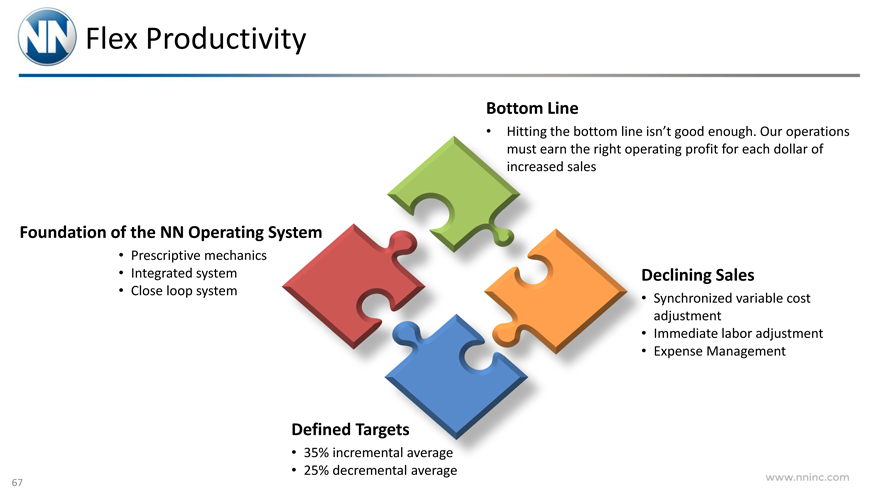
Flex Productivity
Foundation of the NN Operating System
Prescriptive mechanics
Integrated system
Close loop system
Bottom Line
Hitting the bottom line isn’t good enough. Our operations must earn the right operating profit for each dollar of increased sales
Declining Sales
Synchronized variable cost adjustment
Immediate labor adjustment
Expense Management
Defined Targets
35% incremental average
25% decremental average
www.nninc.com
67
Summary / Q&A
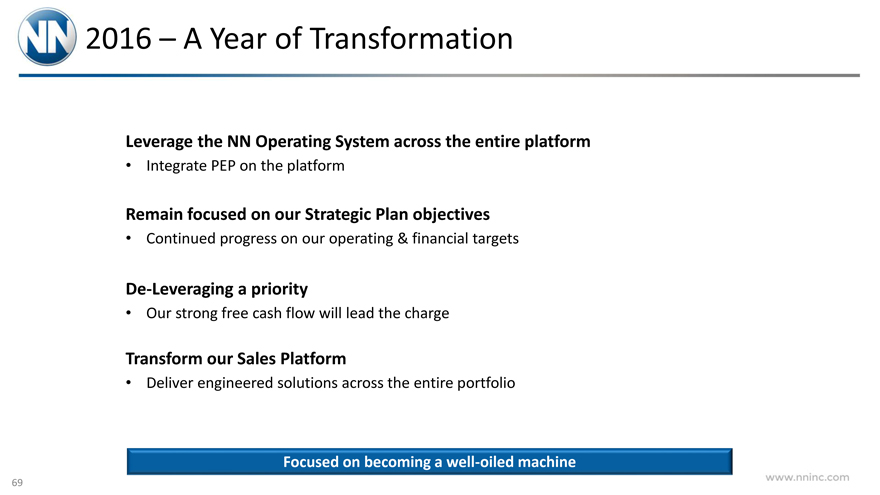
2016 – A Year of Transformation
Leverage the NN Operating System across the entire platform
Integrate PEP on the platform
Remain focused on our Strategic Plan objectives
Continued progress on our operating & financial targets
De-Leveraging a priority
Our strong free cash flow will lead the charge
Transform our Sales Platform
Deliver engineered solutions across the entire portfolio
Focused on becoming a well-oiled machine
www.nninc.com
69
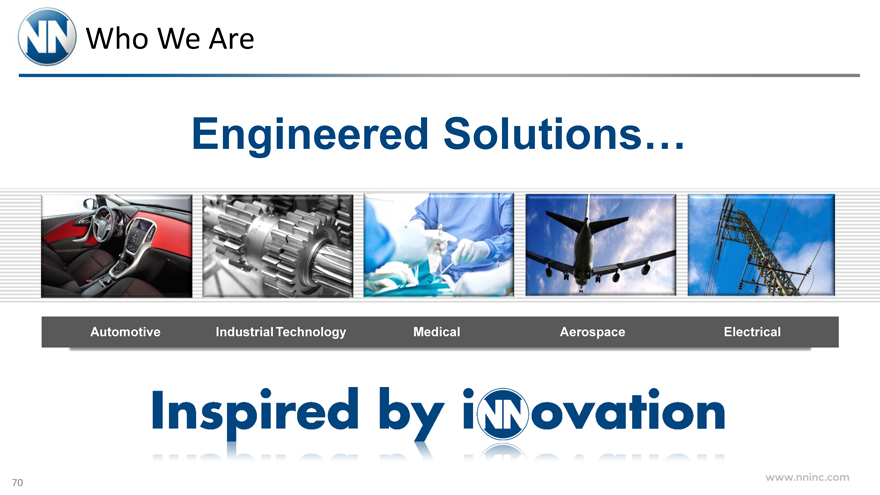
Who We Are
Engineered Solutions…
Automotive Industrial Technology Medical Aerospace Electrical
Inspired by innovation
www.nninc.com
70