EXHIBIT(a)(7)

M A X W E L L SHOE COMPANY INC.
Mark J. Cocozza
Chairman of the Board and Chief Executive Officer
Fiscal Year 2003 Accomplishments
Top Resource For Women’s Footwear
Best sales and earnings year in the Company’s history
Strong sell thru at retail prompted better then expected sales growth 2003 operating income grew 25.8%
All brands grew demonstrating success across varied footwear categories and brands
Joan & David career styling and limited distribution creates an aspirational image allowing for strong growth of better priced opportunities
AK Anne Klein achieving third year of double digit growth
Dockers grew 24% during the year
Mootsies Tootsies performed well in Kohl’s, JC Penney, and Famous Footwear
Sam & Libby regained its position as an opening price point fashion resource
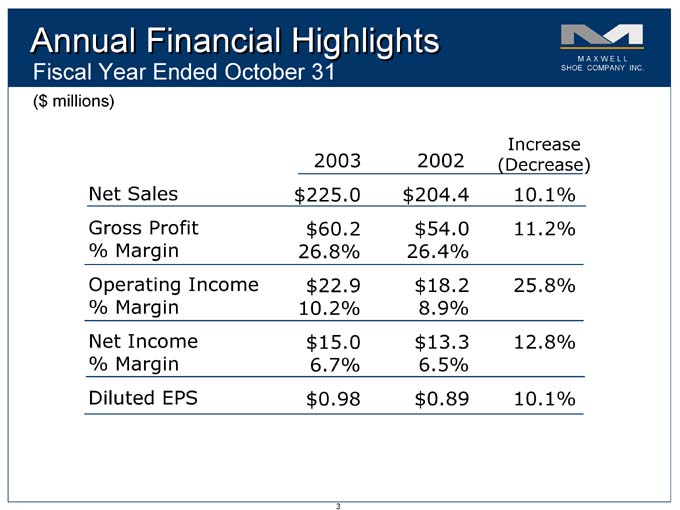
Annual Financial Highlights
Fiscal Year Ended October 31
($ millions)
Increase
2003 2002 (Decrease)
Net Sales $ 225.0 $ 204.4 10.1%
Gross Profit $ 60.2 $ 54.0 11.2%
% Margin 26.8% 26.4%
Operating Income $ 22.9 $ 18.2 25.8%
% Margin 10.2% 8.9%
Net Income $ 15.0 $ 13.3 12.8%
% Margin 6.7% 6.5%
Diluted EPS $ 0.98 $ 0.89 10.1%
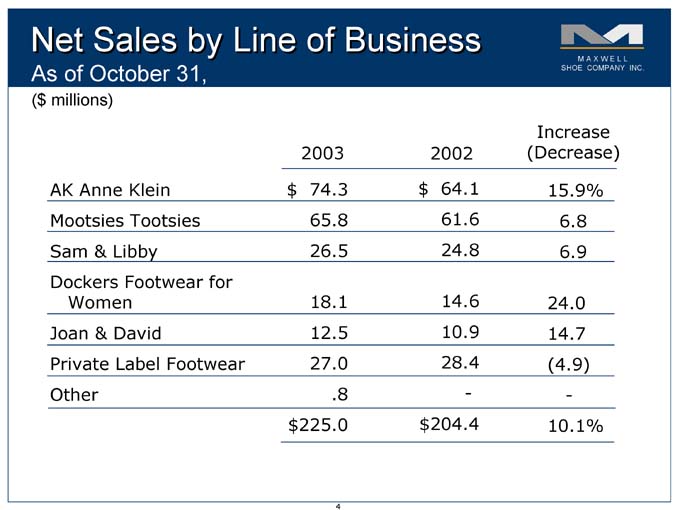
Net Sales by Line of Business
As of October 31,
($ millions)
Increase
2003 2002 (Decrease)
AK Anne Klein $ 74.3 $ 64.1 15.9%
Mootsies Tootsies 65.8 61.6 6.8
Sam & Libby 26.5 24.8 6.9
Dockers Footwear for
Women 18.1 14.6 24.0
Joan & David 12.5 10.9 14.7
Private Label Footwear 27.0 28.4 (4.9)
Other .8 — -
$ 225.0 $ 204.4 10.1%
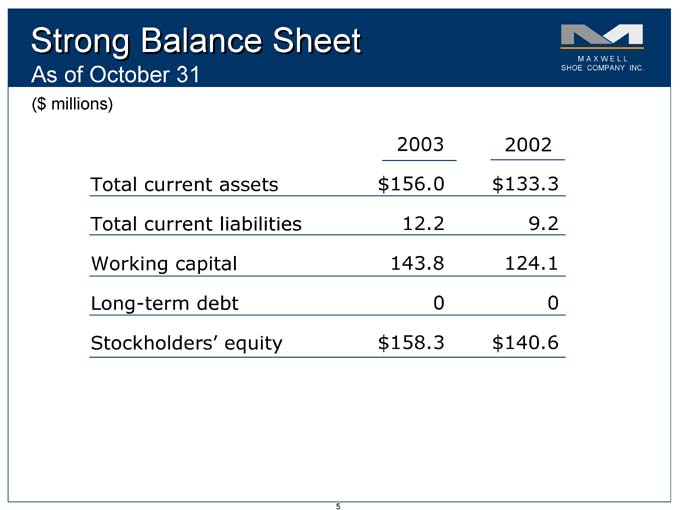
Strong Balance Sheet
As of October 31
($ millions)
2003 2002
Total current assets $ 156.0 $ 133.3
Total current liabilities 12.2 9.2
Working capital 143.8 124.1
Long-term debt 0 0
Stockholders’ equity $ 158.3 $ 140.6
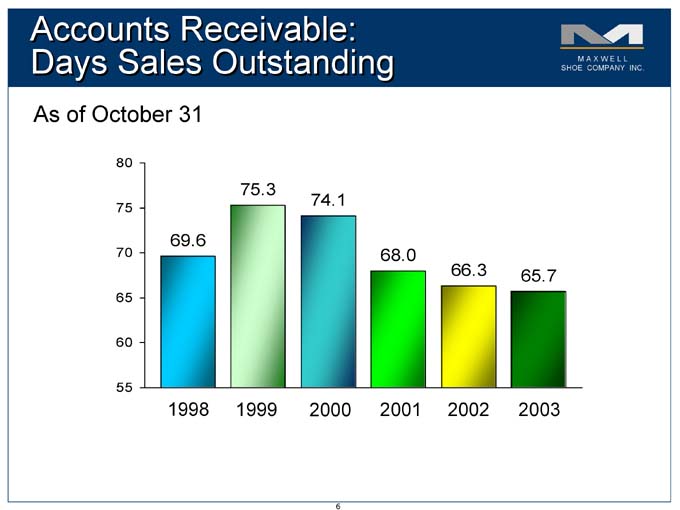
Accounts Receivable: Days Sales Outstanding
As of October 31
80
75.3
74.1
75
69.6
70 68.0
66.3 65.7
65
60
55
1998 1999 2000 2001 2002 2003
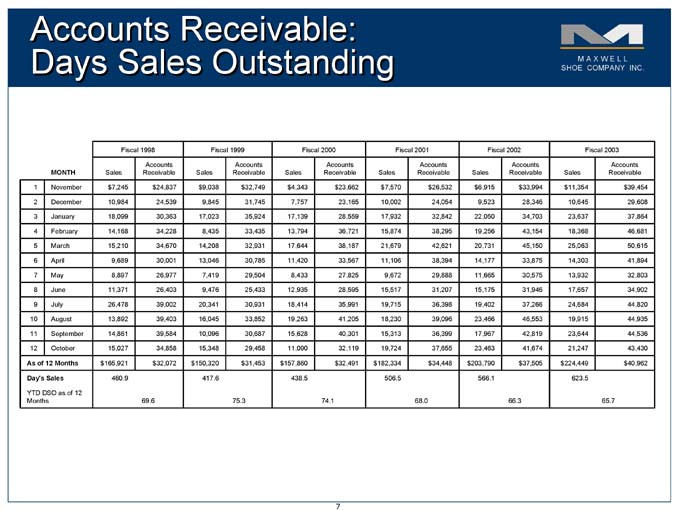
Accounts Receivable: Days Sales Outstanding
Fiscal 1998 Fiscal 1999 Fiscal 2000 Fiscal 2001 Fiscal 2002 Fiscal 2003
Accounts Accounts Accounts Accounts Accounts Accounts
MONTH Sales Receivable Sales Receivable Sales Receivable Sales Receivable Sales Receivable Sales Receivable
1 November $ 7,245 $ 24,837 $ 9,038 $ 32,749 $ 4,343 $ 23,662 $ 7,570 $ 26,532 $ 6,915 $ 33,994 $ 11,354 $ 39,454
2 December 10,984 24,539 9,845 31,745 7,757 23,165 10,002 24,054 9,523 28,346 10,645 29,608
3 January 18,099 30,363 17,023 35,924 17,139 28,559 17,932 32,842 22,050 34,703 23,637 37,864
4 February 14,168 34,228 8,435 33,435 13,794 36,721 15,874 38,295 19,256 43,154 18,368 46,681
5 March 15,210 34,670 14,208 32,931 17,644 38,187 21,679 42,621 20,731 45,150 25,063 50,615
6 April 9,689 30,001 13,046 30,785 11,420 33,567 11,106 38,394 14,177 33,875 14,303 41,894
7 May 8,897 26,977 7,419 29,504 8,433 27,825 9,672 29,888 11,665 30,575 13,932 32,803
8 June 11,371 26,403 9,476 25,433 12,935 28,595 15,517 31,207 15,175 31,946 17,657 34,902
9 July 26,478 39,002 20,341 30,931 18,414 35,991 19,715 36,398 19,402 37,266 24,684 44,820
10 August 13,892 39,403 16,045 33,852 19,263 41,205 18,230 39,096 23,466 46,553 19,915 44,935
11 September 14,861 39,584 10,096 30,687 15,628 40,301 15,313 36,399 17,967 42,819 23,644 44,536
12 October 15,027 34,858 15,348 29,458 11,090 32,119 19,724 37,655 23,463 41,674 21,247 43,430
As of 12 Months $ 165,921 $ 32,072 $ 150,320 $ 31,453 $ 157,860 $ 32,491 $ 182,334 $ 34,448 $ 203,790 $ 37,505 $ 224,449 $ 40,962
Day’s Sales 460.9 417.6 438.5 506.5 566.1 623.5
YTD DSO as of 12
Months 69.6 75.3 74.1 68.0 66.3 65.7
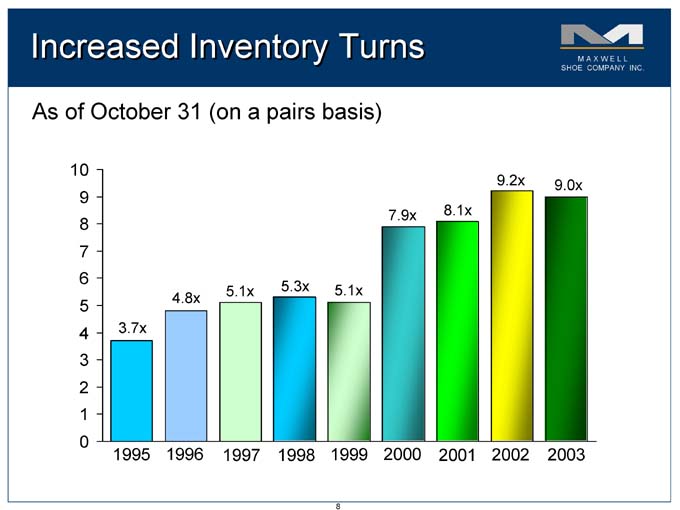
Increased Inventory Turns
As of October 31 (on a pairs basis)
10
9.2x 9.0x
9
7.9x 8.1x
8
7
6
5.1x 5.3x 5.1x
4.8x
5
4 3.7x
3
2
1
0
1995 1996 1997 1998 1999 2000 2001 2002 2003
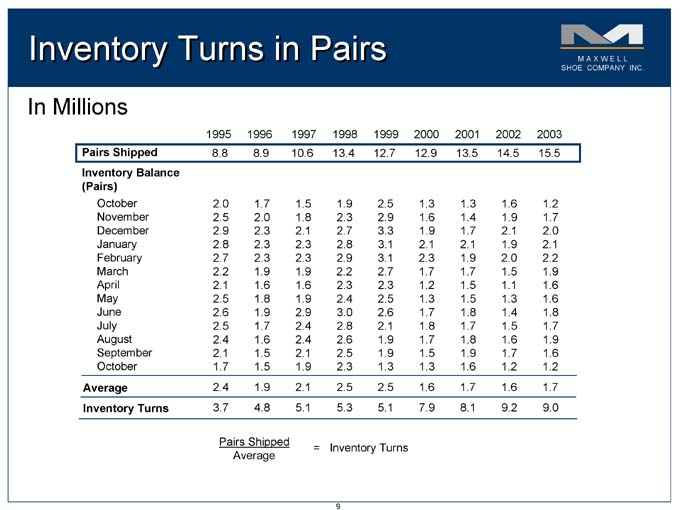
Inventory Turns in Pairs
In Millions
1995 1996 1997 1998 1999 2000 2001 2002 2003
Pairs Shipped 8.8 8.8 8.9 8.9 10.6 .6 13.4 .4 12.7 .7 12.9 .9 13.5 .5 14.5 .5 15.5 .5
Inventory Balance
(Pairs)
October 2.0 2.0 1.7 1.7 1.5 1.5 1.9 1.9 2.5 2.5 1.3 1.3 1.3 1.3 1.6 1.6 1.2 1.2
November 2.5 2.5 2.0 2.0 1.8 1.8 2.3 2.3 2.9 2.9 1.6 1.6 1.4 1.4 1.9 1.9 1.7 1.7
December 2.9 2.9 2.3 2.3 2.1 2.1 2.7 2.7 3.3 3.3 1.9 1.9 1.7 1.7 2.1 2.1 2.0 2.0
January 2.8 2.8 2.3 2.3 2.3 2.3 2.8 2.8 3.1 3.1 2.1 2.1 2.1 2.1 1.9 1.9 2.1 2.1
February 2.7 2.7 2.3 2.3 2.3 2.3 2.9 2.9 3.1 3.1 2.3 2.3 1.9 1.9 2.0 2.0 2.2 2.2
March 2.2 2.2 1.9 1.9 1.9 1.9 2.2 2.2 2.7 2.7 1.7 1.7 1.7 1.7 1.5 1.5 1.9 1.9
April 2.1 2.1 1.6 1.6 1.6 1.6 2.3 2.3 2.3 2.3 1.2 1.2 1.5 1.5 1.1 1.1 1.6 1.6
May 2.5 2.5 1.8 1.8 1.9 1.9 2.4 2.4 2.5 2.5 1.3 1.3 1.5 1.5 1.3 1.3 1.6 1.6
June 2.6 2.6 1.9 1.9 2.9 2.9 3.0 3.0 2.6 2.6 1.7 1.7 1.8 1.8 1.4 1.4 1.8 1.8
July 2.5 2.5 1.7 1.7 2.4 2.4 2.8 2.8 2.1 2.1 1.8 1.8 1.7 1.7 1.5 1.5 1.7 1.7
August 2.4 2.4 1.6 1.6 2.4 2.4 2.6 2.6 1.9 1.9 1.7 1.7 1.8 1.8 1.6 1.6 1.9 1.9
September 2.1 2.1 1.5 1.5 2.1 2.1 2.5 2.5 1.9 1.9 1.5 1.5 1.9 1.9 1.7 1.7 1.6 1.6
October 1.7 1.7 1.5 1.5 1.9 1.9 2.3 2.3 1.3 1.3 1.3 1.3 1.6 1.6 1.2 1.2 1.2 1.2
Average 2.4 2.4 1.9 1.9 2.1 2.1 2.5 2.5 2.5 2.5 1.6 1.6 1.7 1.7 1.6 1.6 1.7 1.7
Inventory Turns 3.7 3.7 4.8 4.8 5.1 5.1 5.3 5.3 5.1 5.1 7.9 7.9 8.1 8.1 9.2 9.2 9.0 9.0
Pairs Shipped
= = Inventory Turns Average
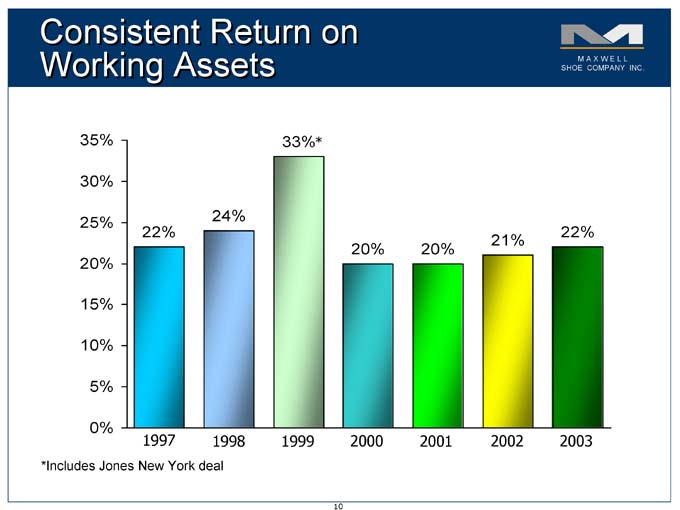
Consistent Return on Working Assets
35% 33%* *
30%
25% 24%
22% 22%
21%
20% 20%
20%
15%
10%
5%
0%
1997 1998 1999 2000 2001 2002 2003
*Includes Jones New York deal
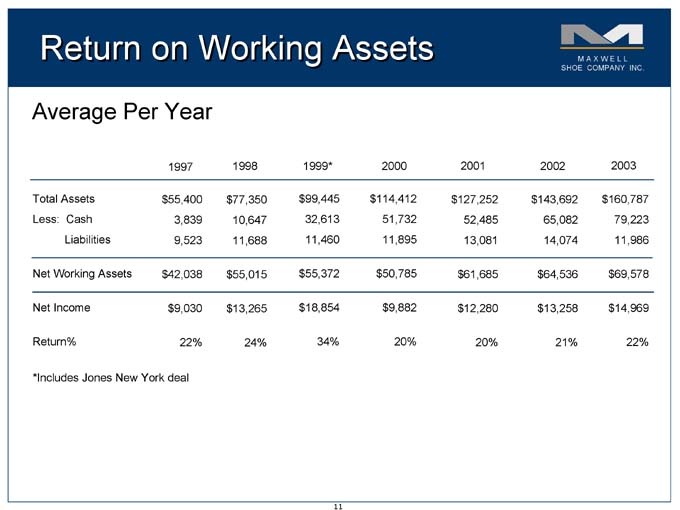
Return on Working Assets
Average Per Year
1997 1998 1999* 2000 2001 2002 2003
Total Assets $ $ 55,400 $ $ 77,350 $ $ 99,445 $ $ 114,412 $ $ 127,252 $ $ 143,692 $ $ 160,787
Less: Cash 3,839 10,647 32,613 51,732 52,485 65,082 79,223
Liabilities 9,523 11,688 11,460 11,895 13,081 14,074 11,986
Net Working Assets $ $ 42,038 $ $ 55,015 $ $ 55,372 $ $ 50,785 $ $ 61,685 $ $ 64,536 $ $ 69,578
Net Income $ $ 9,030 $ $ 13,265 $ $ 18,854 $ $ 9,882 $ $ 12,280 $ $ 13,258 $ $ 14,969
Return% 22% 24% 34% 20% 20% 21% 22%
*Includes Jones New York deal
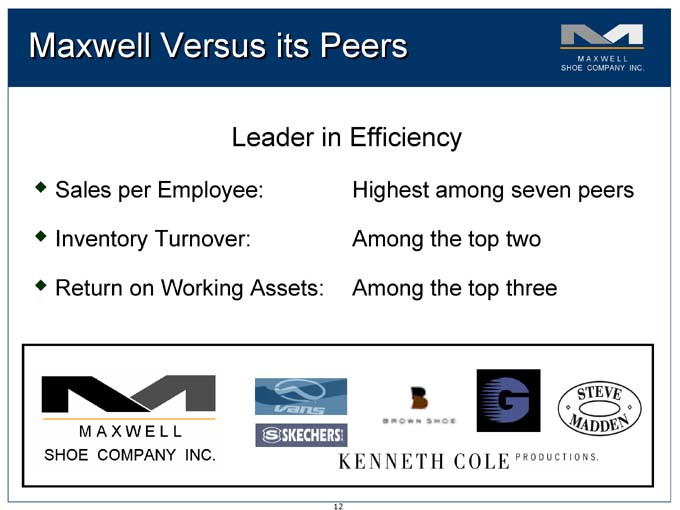
Maxwell Versus its Peers
Leader in Efficiency
Sales per Employee: Highest among seven peers
Inventory Turnover: Among the top two
Return on Working Assets: Among the top three
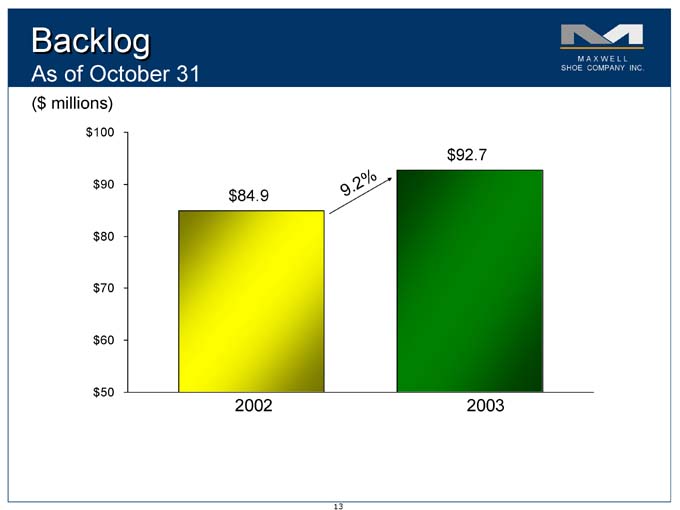
Backlog
As of October 31
($ millions)
$ 100
$ 92.7
$ 90 2 %
9 .
$ 84.9
$ 80
$ 70
$ 60
$ 50
2002 2003
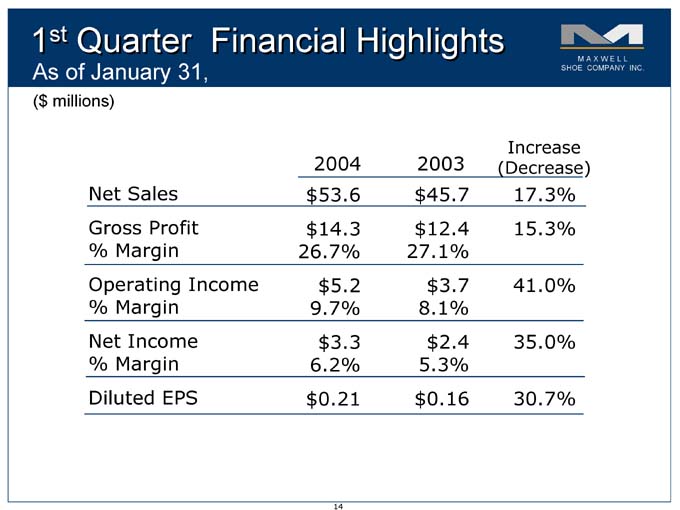
1st Quarter Financial Highlights
As of January 31,
($ millions)
Increase
2004 2003 (Decrease)
Net Sales $ 53.6 $ 45.7 17.3%
Gross Profit $ 14.3 $ 12.4 15.3%
% Margin 26.7% 27.1%
Operating Income $ 5.2 $ 3.7 41.0%
% Margin 9.7% 8.1%
Net Income $ 3.3 $ 2.4 35.0%
% Margin 6.2% 5.3%
Diluted EPS $ 0.21 $ 0.16 30.7%
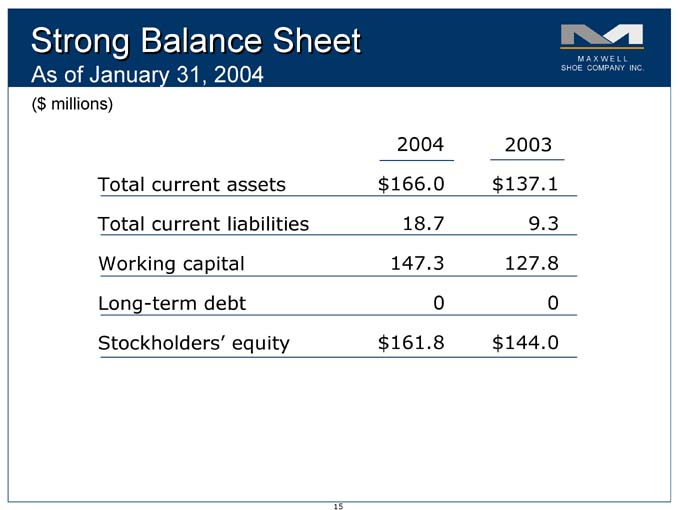
Strong Balance Sheet
As of January 31, 2004
($ millions)
2004 2003
Total current assets $ 166.0 $ 137.1
Total current liabilities 18.7 9.3
Working capital 147.3 127.8
Long-term debt 0 0
Stockholders’ equity $ 161.8 $ 144.0
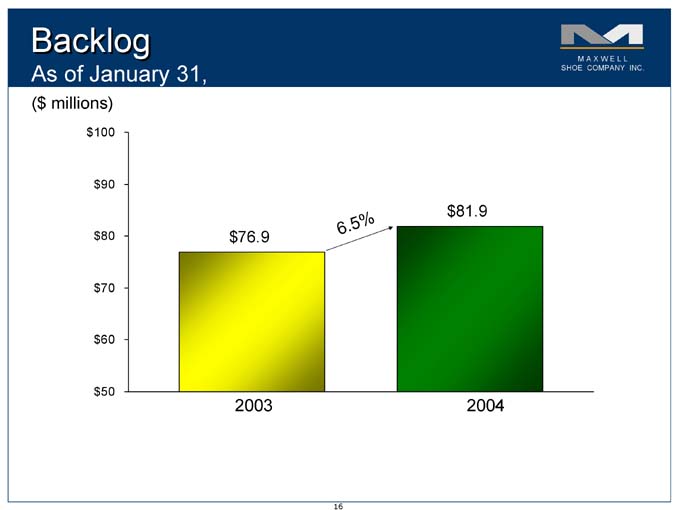
Backlog
As of January 31,
($ millions)
$ 100
$ 90
$ 81.9
. 5 %
$ 80 $ 76.9 6
$ 70
$ 60
$ 50
2003 2004
Key Investment Highlights
Strong business model with opportunities for growth
Winning formula—Diversified brand portfolio
coupled with high visibility
Future growth both internal and external
Leverage existing infrastructure and talent
Proven track record
Company has met or exceeded estimates for 17 consecutive quarters
Successful at integrating and growing acquired and licensed brands
M A X W E L L SHOE COMPANY INC.
Forward-Looking Statements
Statements made in this presentation indicating Maxwell Shoe Company Inc.’s (“Maxwell Shoe Company”), the Board of Directors’ or management’s intentions, beliefs, expectations, or predictions for the future are forward-looking statements. These statements are only predictions and may differ materially from actual future events or results. Such forward-looking statements are subject to a number of risks, assumptions and uncertainties that could cause Maxwell Shoe Company’s actual results to differ materially from those projected in such forward-looking statements. Such risks, assumptions and uncertainties include, but are not limited to: changing consumer preference, inability to successfully design, develop or market its footwear brands, the inability to successfully re-introduce the Joan & David brand into the market, competition from other footwear manufacturers or retailers, loss of key employees, general economic conditions and adverse factors impacting the retail footwear industry, and the inability by Maxwell Shoe Company to source its products due to political or economic factors, potential disruption in supply chain or customer purchasing habits due to health concerns relating to severe acute respiratory syndrome or other related illnesses; the imposition of trade or duty restrictions or work stoppages of transportation or other workers who handle or manufacture Maxwell Shoe Company’s goods. Additional risks, assumptions and uncertainties associated with Jones’s pending tender offer include: the risk that Maxwell Shoe Company’s customers may delay or refrain from purchasing Maxwell Shoe Company products due to uncertainties about Maxwell Shoe Company’s future, the risk that key employees may pursue other employment opportunities due to concerns as to their employment security with Maxwell Shoe Company, the risk that stockholder litigation commenced in connection with Jones’s offer might result in significant costs of defense, indemnification and liability, the risks that the Board of Directors’ analysis and the bases of their recommendation to the stockholders ultimately may prove to be inaccurate, and other risks discussed in documents filed by Maxwell Shoe Company with the Securities and Exchange Commission. All forward-looking statements are qualified by these cautionary statements and are made only as of the date they are made. Maxwell Shoe Company is under no obligation (and expressly disclaims any such obligation) to update or alter any forward-looking statements, whether as a result of new information, future events or otherwise.