@@EXHIBIT 99.1

Eldorado Gold Corporation
Technical Report for the Tocantinzinho Gold Project,
Brazil
| Effective Date: | May 2011 |
| Prepared By: | Stephen Juras, Ph.D, P.Geo. Sean Gregersen, P.Eng Rick Alexander, P.Eng |


Technical Report for the Tocantinzinho Gold Project, Brazil |  |
List of Abbreviations
| Abbreviation | Description or Unit |
| º | Degrees of longitude, latitude, compass bearing or gradient |
| % | Percent sign |
| ºC | Degree Celsius |
| μm | micrometer |
| Ag | Silver |
| ANFO | Ammonium Nitrate / Fuel Oil |
| ARD | Acid Rock Drainage |
| Ascii | (a standard digital data format) |
| asl | Above Sea Level |
| Au | Gold |
| BRANDT | Brandt Meio Ambiente Amazônia Ltda. |
| BTW | Drill core size (4.20 cm diameter) |
| BWI | Bond Ball Mill Work Index |
| CIM | Canadian Institute of Mining |
| CIP | Carbon in Pulp |
| cm | Centimeter |
| CV | Coefficient of variance |
| DCF | Discounted Cash flow |
| DNPM | National Department of Mineral Production |
| E | East |
| EIA | Environmental Impact Assessment |
| Eldorado | Eldorado Gold Corporation |
| Fe | Iron |
| g | Grams |
| g/t | Grams per tonne |
| Golder | Golder Associates Brasil Consultoria e Projetos |
| h | Hour |
| ha | Hectare |
| HQ | Drill core size (6.3 cm diameter) |
| ICP | Inductively Coupled Plasma |
| IP | Induced Polarization |
| IRR | Internal Rate of Return |
| kg | Kilogram |
| kg/t | Kilogram per tonne |
| km | Kilometer |
| Km/h | Kilometers per hour |
| kPa | Kilopascal |
| kt | Thousand tonnes |
| ktpd | Thousand tons per day |
| ktpy | Thousand tonnes per year |
| kV | Kilovolt |
| kW | Kilowatt |
| kWh | Kilowatt-hour |
| kWh/t | Kilowatt-hour per tonne |
| L | Liter |
| L/s | Liters per second |
| LOM | Life of Mine |
vii
Technical Report for the Tocantinzinho Gold Project, Brazil | |
| Abbreviation | Description or Unit |
| m | Meter |
| M | Million |
| Ma | Mega-annum (106 years) |
| mm | Millimeters |
| Mt | Million tonnes |
| Mtpa | Million tonnes per annum |
| Mtpy | Million tonnes per year |
| MW | Megawatt |
m2 | Square meter |
| m3 | Cubic meter |
| m3/h | Cubic meters per hour |
| m/h | Meters per hour |
| N | North |
| Nb | Number |
| NPV | Net Present Value |
| NSR | Net Smelter Return |
| NTW | Drill core size (5.71 cm diameter) |
| OK | Ordinary Kriging |
| oz | Troy ounce |
| oz/t | Ounce per tonne |
| PCA | Environmental Control Plan |
| ppb | Parts per billion |
| ppm | Parts per million |
| R$ | Reais (Brazilian currency) |
| RC | Reverse Circulation Drill Hole |
| RL | Relative level |
| ROM | Run Of Mine |
| RQD | Rock Quality Designation |
| S | South |
| s | Second |
| SEI | SEI Engenharia |
| SG | Specific gravity |
| SMU | Selective Mining Unit |
| SRM | Standard Reference Material |
| st | Short ton |
| t | Ton, tonnes (metric) |
t/m3 | Tonnes per cubic meters |
| t/h | Tonnes per hour |
| TEP | TEP Engenharia de Projetos Ltda. |
| tph | Tonnes per hour |
| tpy | Tonnes per year |
| US$ | US dollars (American currency) |
| US$/kWh | American dollars per kilowatt-hour |
| US$/oz | American dollars per ounce |
| US$/t | American dollars per tonne |
| Unamgen | Unamgen Mineração e Metalurgia S/A |
| UTM | Universal Transverse Mercator |
| V | Volt |
| VOGBR | VOGBR Recursos Hídricos & Geotecnia Ltda. |
viii
Technical Report for the Tocantinzinho Gold Project, Brazil | |
| Abbreviation | Description or Unit |
| W | Watt |
| X X | Coordinate (E-W) |
| y | Year |
| Y Y | Coordinate (N-S) |
| Z Z | Coordinate (depth or elevation) |
ix
Technical Report for the Tocantinzinho Gold Project, Brazil | |
| SECTION 1 | Executive Summary |
| 1.1 | Introduction and Property Description |
Eldorado Gold Corporation (Eldorado), an international gold mining company based in Vancouver, British Columbia, through its wholly owned subsidiary Unamgen Mineração e Metalurgia S/A (Unamgen) owns the Tocantinzinho Gold Project (the “Project”), located in the State of Pará, Northern Brazil.
Eldorado has prepared this Technical Report of the Tocantinzinho Gold Project to disclose the results of a pre-feasibility study in support of an initial declaration of mineral reserves for the Project. Golder Associates Brazil Consultoria e Projetos Ltda. (Golder) along with Eldorado and Unamgen personal prepared the pre-feasibility study.
Information and data for this report were obtained from the Project site and Eldorado. This work represents all aspects of project design including geology, mineral resources, mining, processing, infrastructure, environment and communities, costs and economical analysis.
The Qualified Persons responsible for preparing this Technical Report as defined in National Instrument 43-101 (NI 43-101), Standards of Disclosure for Mineral Projects and in compliance with 43-101F1 (the “Technical Report”) are Stephen Juras, Ph.D., P.Geo., Sean Gregersen, P.Eng, and Rick Alexander, P. Eng. All are employees of Eldorado.
The site is situated at an elevation of 120 meters above the sea level, approximately 200 km South/Southwest of the city of Itaituba, 108 km from the district of Morais Almeida, and approximately 1,150 km south west from Belém, the capital of Pará State located along the north seacoast of Brazil, at the mouth of the Amazon River. Itaituba is the local center for services and supplies.
Road access is not yet available to the property but active logging roads reach to within 12 km of Tocantinzinho. Two airstrips serve Tocantinzinho Project. One, called Pista Velha is 350 meters long and is situated between the main mineralized zone and the Tocantins river. A second airstrip, called Pista Nações Unidas is 775 meters long and is situated 2.0 km south of the camp. This airstrip is used to supply camp with personnel and supplies.
Topography within the project area is irregular with moderate relief. Elevations within the project area vary from approximately 120 meters (m) at the Tocantinzinho River to over 200 m at local topographic highs. The mean annual temperature in the region is about 27ºC. In general, the temperature amplitudes are small with a gradual increase during winter. The mean absolute values are in range 21ºC to 34ºC. The relative humidity is higher than 80% during whole year. The annual average rainfall is 2,000 mm. The rainiest trimester contributes about 40% of total annual rainfall and corresponds to the months of February, March and April.
| 1.2 | Land Tenure and Mining Rights |
Tocantinzinho Project is located in the Tapajós Gold Province, a region rich in alluvium gold deposits which has been subject to multiple exploration permit requests and artisanal mining permissions (“Permissão de Lavra Garimpeira” - PLG) for the past three decades.
The Tocantinzinho Project comprises an area of 14,000 ha represented by two core claims, DNPM numbers.- 850.706/1979 and 850.300/2003. DNPM 850.706/1979 is a Mining Concession Request, owned by Mineração Cachambix Ltda. Brazauro Recursos Minerais Ltda. owns 99% interest on Mineração Cachambix. The remaining 1% interest is owned by Brazauro Holdings (Brazil) Ltd. DNPM no. 850,300/2003 is an Exploration Permit owned by Brazauro Recursos Minerais Ltda. In July, 2010 Brazauro was acquired by Eldorado.
1
Technical Report for the Tocantinzinho Gold Project, Brazil | |
The Brazilian Federal Government is the owner of the surface rights in the area of the Tocantinzinho Project. The National Institute of Colonization and Agrarian Reform - INCRA has issued a certificate stating that there are no Indian Reserves, Traditional Communities nor small agricultural settlements in the area.
Three former gold diggers (garimpeiros) consider themselves entitled to surface rights in the area of Tocantinzinho Project. Should it be shown that the individuals concerned do have the right to occupy the land; the company shall negotiate indemnification in accordance with the principles of Brazilian Mining Code.
Eldorado has an agreement with Mr. Alan Carter and Mr. Dennis Moore which foresee the payment of a NSR Royalty of 1.5% payable in addition to down payment of US$5,500,000 in the first year of production.
| 1.3 | Geology and Mineralization |
The Tocantinzinho deposit is best classified as a granite-hosted, intrusion-related gold deposit. It is underlain by igneous rocks of the Parauari Suite which host known gold mineralization. Textural evidence and contact relationships suggest that the host granitic rocks at Tocantinzinho intruded as dyke-like bodies along a northwest-striking fault zone that cut through more regionally extensive quartz monzonites. The granitoids were likely emplaced synchronous with faulting, and both intrusive contact and vein orientations suggest the host fault zone was active during this period as a sinistral, dominantly strike-slip feature. The presence of abundant aplites, miarolitic cavities, and blebby quartz textures implies that the host granitic intrusions represent late, volatile-rich components of the parent magma. Vein textures suggest that at least some of the veins, and possibly gold mineralization, were introduced during or just after solidification of the host rocks.
Mineralized granites at Tocantinzinho are divided into two sub-units by alteration mineralogy and colour: smoky and salami granite. Grade distribution is similar in both units and therefore they have been grouped for resource estimation purposes. Both smoky and salami granites are composed dominantly of potassium-feldspar and large (mm- to cm-scale) distinctively amoeba-shaped quartz grains. Smoky mineralized granite is strongly silicified with chlorite and trace to 1% sulfides. Color ranges from grayish to greenish due to the chlorite alteration. Sheeted milimetre-scale chlorite ± sulphide veinlets are common. Salami mineralized granites are distinctively bright red due to hematite dusting on potassium feldspars. Sheeted veinlets are common and similar in scale to those in the smoky granites but are generally filled with quartz ± sulphide. Contacts are diffuse between smoky and salami granites and a complete gradation exists between the two units.
| 1.4 | Drilling, Sampling and Analyses |
Diamond drill holes are the principal source of geological and grade data for the Tocantinzinho Project. Drilling at Tocantinzinho has been carried out in nine phases. Five phases of drilling were conducted by Brazauro between 2004 and 2008 and four additional phases were drilled by Eldorado between 2008 and 2010. A total of 46,900m in 167 drill holes were drilled for resource definition purposes.
All diamond drilling in Tocantinzinho was done with wire line core rigs and mostly of HQ size. The entire lengths of the diamond drill holes were sampled, usually at two meter long intervals. Geology and geotechnical data are collected from the core and core is photographed before sampling. The core is then cut in half lengthwise, by means of a rock saw. Sample technicians then place one half of the cut core into a plastic bag which is then marked, tagged and enclosed for shipping to the laboratory.
2
Technical Report for the Tocantinzinho Gold Project, Brazil | |
Split core samples were prepared and analyzed at the ALS Chemex Laboratories facility in Vespasiano, Minas Gerais state in Brazil. The sample batches are arranged to contain regularly inserted control samples. A Standard Reference Material (SRM), a duplicate and a blank sample were inserted into the sample stream at every 10th to 15th sample. All samples were assayed for gold using 30 gram fire assay with an AA finish.
Monitoring of the quality control samples showed all data were within control throughout the preparation and analytical processes. In Eldorado’s opinion, the QA/QC results demonstrate that the Tocantinzinho Gold Project assay database is sufficiently accurate and precise for resource estimation.
| 1.5 | Metallurgical Testwork |
Based on the Tocantinzinho metallurgical testing program and the reported data it appears that direct leaching of a high grade concentrated product of either gravity or flotation is feasible as a single stage to accomplish good gold recovery. However the use of two stages of concentrate upgrading with gravity and flotation prior to leaching is beneficial when treating a partially or fully oxidized material and when gold theft or gold lock-up is an issue. A product of the combined stages is a slightly lower overall gold recovery.
The benefit of a relatively simple processing plant is the amenability of the entire composite ore body to mining at once or selectively with blending as necessary. Lleaching a relative low mass pull of high recovery gold bearing concentrate to optimize consumption of reagents (sodium cyanide) is recommended to better manage, environmentally, the tailings waste.
| 1.6 | Mineral Resources |
Eldorado has used new data from the last three years of diamond drilling campaigns to update the geologic model for the Tocantinzinho deposit. The resource work evaluated new lithology models, all constructed in 3D. To constrain gold grade interpolation for the Tocantinzinho Deposit, Eldorado created 3D mineralized envelopes, or shells. These were based on initial outlines derived by a method of Probability Assisted Constrained Kriging (PACK). The threshold value of 0.20 g/t Au was determined by inspection of histograms and probability curves as well as indicator variography.
Extreme grades were examined for gold analysis showed that extreme gold grades put about 2% of the contained gold metal at risk of being realized in future production. A hard cap of 25.0 g/t Au, applied to the assay data achieves this reduction of risk. The assays were then composited into 2.0 m fixed-length down-hole composites.
The block size used for the Tocantinzinho Model is 10 m east x 10 m north x 5 m high. Modelling consisted of grade interpolation by ordinary kriging (OK) for all domains inside and outside the mineralized shell. The search ellipsoids were oriented preferentially to the orientation of the mineralized shell for within shell runs. The model was validated by visual inspection, checks for bias and for appropriate grade smoothing.
Bulk density data were assigned by rock type. The ore hosting granite value equalled 2.62 in the primary region and 1.80 in the oxidized portion.
The mineral resources of the Tocantinzinho deposit were classified using logic consistent with the CIM definitions referred to in NI 43-101. The mineralization of the project satisfies sufficient criteria to be classified into Measured, Indicated, and Inferred mineral resource categories.
3
Technical Report for the Tocantinzinho Gold Project, Brazil | |
The Tocantinzinho mineral resources as of 31 December 2010 are shown in Table 1-1. The mineral resource is reported at a 0.3 g/t Au cutoff grade.
Table 1-1: Tocantinzinho Mineral Resources, as of 31 December 2010
| Mineral Resource Category | Tonnes (x 1000) | Grade (Au g/t) | In Situ Gold (oz x 1000) |
| Measured | 19,777 | 1.29 | 820 |
| Indicated | 50,457 | 0.97 | 1,574 |
| Measured and Indicated | 70,234 | 1.06 | 2,394 |
| Inferred | 6,950 | 0.66 | 147 |
| 1.7 | Geotechnical Analysis |
Golder Associates Brazil conducted a program of geotechnical data collection and analysis to form the basis for slope design used in the open pit. This program carried out by Golder consisted of drilling and logging 6 oriented geotechnical core holes and an additional logging of 11 exploration holes which were non-oriented. The geotechnical holes were oriented using the ACT-REFLEX device and the punch mark method. The holes were then logged for lithology, fracture orientation, fracture roughness, RQD and rock mass classification. An additional 11 exploration holes also were logged for lithology, RQD and rock mass classification.
In total 17 core holes were logged and intervals were assigned a geomechanical class designation. A series of geomechanical sections were created from the classification.
Golder Associates also conducted kinematic and limit equilibrium analysis and prepared recommendations for slope designs. Two basic analyses were performed; these were: kinematic failure analysis and overall slope failure analysis. The analyses results lead to the recommendations for 10 slope designs varying between 4 sectors and 3 rockmass classes, as shown below.
| Sector | Rock Mass * | Average Thickness (m) | Bench Geometry | IRA (foot x foot) | Overall Angle (Considering the inter Ramp Berms) | ||
| Bench Face Angle | Height (m) | Berm Width (m) | |||||
| 1 | Class V | 30 | 55° | 10 | 6,5 | 36,5° | 44,5° |
| Class III with some class II | 30 | 60° | 10 | 6,2 | 40° | ||
| Class II/I | 300 | 65° | 20 | 8,0 | 49° ** | ||
| 2 - 5 | Class V | 30 | 55° | 10 | 6,5 | 36,5° | 43° |
| Class II/I | 300 | 60° | 20 | 8,1 | 45,5° ** | ||
| 3 - 4 | Class V | 30 | 55° | 10 | 6,5 | 36,5° | 42° |
| Class III with some class II | 30 | 60° | 10 | 6,2 | 40° | ||
| Class II/I | 300 | 60° | 20 | 8,1 | 45,5° ** | ||
| 6 | Class V | 30 | 55° | 10 | 6,5 | 36,5° | 46,0° |
| Class II/I | 300 | 65° | 20 | 8,0 | 49° ** | ||
*10m berm between each class of rock mass;
**Maximum IRA height of 140m (7 benches) with a 10,5m berm every 7 benches.
4
Technical Report for the Tocantinzinho Gold Project, Brazil | |
| 1.8 | Mining and Mineral Reserves |
The mine was designed as a single open pit operation using 3 pit phases mined over 11 years, including a pre-stripping year, with a peak mining rate of 26 million tonnes of material per year. The mine will produce 4,400 ktpy of ore. The total ore to be mined is estimated as 49,047 kt with a LOM average grade of 1.25 Au g/t and an average waste: ore ratio of 3.27.
The open pit is designed to a depth of 345 m using an overall slope angle that ranges from 35-43 degrees. The mining fleet was selected to excavate a 5 m bench using 10-13 m3 shovels and 100 st haul trucks.
Mineral reserves were estimated by Eldorado from the mineral resource block model within the final pit design. The pit design was based on an optimized pit shell using US$1,000/oz gold price. Blocks above a 0.49 Au g/t cut-off grade for hard rock and 0.43 Au g/t cut-off for saprolite are considered ore. Those mineral resource blocks with a measured class converted into proven reserves, while the indicated blocks converted into probable reserves. Mineral resource blocks classed as inferred were treated as waste. No additional modifying factors were used in the reserve estimate.
Table 1-2 presents the mineral reserve estimate for the Tocantinzinho Project, as of 31 December 2010.
Table 1-2: Tocantinzinho Mineral Reserve Estimate
| Category | Tonnes (kt) | Gold Grade (g/t) | Gold Contained (oz x 1000) |
| Proven | 17,735 | 1.39 | 792 |
| Probable | 31,315 | 1.17 | 1,183 |
| Proven and Probable | 49,050 | 1.25 | 1,975 |
| 1.9 | Processing |
The process plant will have the capacity to process 4.4 million tons of ROM ore per year, with an average of 1.25 g/t of gold and metallurgical recovery of 90.1%, resulting in an average 159,000 ounces of gold per year. The process route will involve crushing, ball mill grinding, classification by hydrocyclones, gravimetry, flotation, intensive leaching and CIP (Carbon in Pulp) circuits.
The basic data of process used in this process design are presented below.
● | Feed capacity - 4.4 million tons per year. |
● | Average content of feed - 1.25 g/t of gold. |
● | Metallurgical recovery – 90.1%. |
● | Gold production capacity – 159,000 ounces per year. |
The average process operating cost is estimated to be US$11.14 / t of ore milled. The total plant capital, including the sustaining capital, is estimated in US$105.44 million.
| 1.10 | Infrastructure |
The electric power will be supplied by a 138 kV power line from the Novo Progresso substation (190 km distance). The site will be accessed from the locality of Morais Almeida using the existing Transgarimpeira Road, a distance of 30.2 km is to be upgraded and a new 67.8 km long access
5
Technical Report for the Tocantinzinho Gold Project, Brazil | |
road to be constructed. Administrative and industrial facilities will be constructed on the Tocantinzinho site to support the mine operation.
| 1.11 | Tailings Dam |
The tailings dam is intended to receive sediment from the area surrounding the main reservoir and tailings derived from the recovery process. The final dam crest elevation at 173.0m requires building three enclosure (saddle) dams. Under the final arrangement proposed the estimated capacity for tailings storage is 39.7 million cubic meters corresponding to tailings output throughout the expected 11-year mine life. Additional storage capacity available in the basin will require further design work and capital expenditure.
| 1.12 | Capital Cost |
Costs were calculated in Brazilian real and then converted to US dollars at an assumed exchange rate of 1.75 R$ = 1 US$. The capital cost (Capex) for implementation of the Tocantinzinho Project estimated by Eldorado is presented below:
| Description | Capex (US$) |
| Mine Fleet | 39,604,809 |
| Site Development | 12,972,500 |
| Plant | 101,941,494 |
| Reagents | 3,565,241 |
| Utilities Facilities | 9,981,121 |
| Infrastructure | 66,997,900 |
| Tailings | 11,037,003 |
| Camp | 5,269,500 |
| Indirects | 23,130,356 |
| EPCM | 21,960,059 |
| Owner costs | 9,150,024 |
| Taxes | 18,642,591 |
| Environmental Compensation | 1,621,263 |
| Contingency | 57,644,941 |
| Total Project Cost @ Q1 2011 | 383,518,802 |
6
Technical Report for the Tocantinzinho Gold Project, Brazil | |
| 1.13 | Operating Costs |
Operating costs (Opex) for the project have been compiled using budgetary quotations for consumables, labour rates from relevant mining operations, and logistical service rates including transportation provided by the Brazilian suppliers. Maintenance costs have been assessed ona unit cost basis. The average mining operating cost (Opex) is estimated to be US$ 1.66/t of material to be mined. The operating costs estimated by Eldorado are presented below:
| Total Opex | Year | LOM Total | |||||||||||
| 1 | 2 | 3 | 4 | 5 | 6 | 7 | 8 | 9 | 10 | 11 | 12 | ||
| Operating Costs (US$/t material moved) | |||||||||||||
| Mine | 1.02 | 1.40 | 1.49 | 1.60 | 1.62 | 1.65 | 1.91 | 2.19 | 2.44 | 2.59 | 2.67 | 1.66 | |
| Unitary Operating Cost (US$ / t ore milled) | |||||||||||||
| Mine | 5.56 | 7.64 | 8.77 | 9.46 | 9.55 | 9.74 | 8.03 | 6.08 | 5.48 | 4.18 | 3.00 | 0.00 | 7.09 |
| Plant | 11.16 | 11.16 | 11.16 | 11.16 | 11.16 | 11.16 | 11.16 | 11.16 | 11.16 | 11.16 | 11.16 | 11.16 | 11.16 |
| G&A | 2.06 | 2.06 | 2.06 | 2.06 | 2.06 | 2.06 | 2.06 | 2.06 | 2.06 | 2.06 | 2.06 | 2.06 | 2.06 |
| Total | 18.77 | 20.86 | 21.99 | 22.67 | 22.77 | 22.96 | 21.24 | 19.29 | 18.70 | 17.40 | 16.22 | 13.22 | 20.31 |
| Unitary Operating Cost (US$ / oz Au produced) | |||||||||||||
| Total | 618.19 | 621.44 | 671.72 | 674.78 | 604.96 | 590.83 | 578.06 | 475.97 | 461.79 | 419.92 | 465.51 | 508.77 | 559.41 |
| 1.14 | Economic Analysis |
The economic evaluations and sensitivity analysis were determined using a discounted cashflow model which incorporated the ore and waste production schedules generated from the mine design, operating costs as described above with the following assumptions:
| ● | Mining reserves based on Au price of US$1,000.00/oz; |
● | CFEM (state royalty): 1%; |
● | NSR royalty (Carter-Moore agreement): 1.5%; |
● | Sales and refining cost: US$5.00/oz; |
● | Au price: US$1,250.00/oz; |
● | Discount rate: 5% per year; |
● | Exchange rate: R$1.75 = US$1.00; |
In addition to the Capex estimation presented was above consideration was given to the following expenses in the Cashflow simulations:
● | Working capital: considered the mining costs estimated to the Year -1 (US$6.77 million) and the first 2 months (US$13.77 million) of total Opex estimated to the Year 1; |
● | Total Sustaining and deferred capital of US$85.1 million; |
● | Closure cost: considered a total of US$19.40 million to be realized 2 years after the mining closure; |
7
Technical Report for the Tocantinzinho Gold Project, Brazil | |
● | Salvage: considered an income (selling of mine and plant equipments) equal to the closure cost plus contingencies to be realized two years after the mine closure. |
Results from the cashflow analysis have shown positive cashflow and return on investment. The estimated NPV for the base case (5% discount rate and US$1,250/oz gold price) is US$187.21 million and the IRR is 11.79%.
| 1.15 | Sensitivity Analysis |
The project financial performance is most sensitive to the gold price. Operating and capital costs will also impact the performance. The following table has been presented to illustrate the sensitivity of the project in terms of net Present Value and IRR to variable gold prices. The base case shown uses $1,250 per ounce which represents a gold price considerably lower than current market value.
Financial Sensitiivity Analysis: Gold Price
| Discount Rate | Gold Price (US$/oz) | |||
| 1,000 | 1,250 | 1,500 | ||
| 0% | NPV (US$ x 1000) | 177,694 | 464,103 | 750,513 |
| IRR (%) | 5.12% | 11.79% | 17.35% | |
| 5% | NPV (US$ x 1000) | 2,948 | 187,213 | 371,478 |
| IRR (%) | 5.12% | 11.79% | 17.35% | |
The Tocantinzinho Project may qualify for a taxation incentive issued by the state government for development projects in Amazonas. For qualified projects this incentive is equal to a reduction in income tax of 75% for the first 10 years of operation. The following table illustrates the economic impact of operating the project under the incentive program.
Financial Sensitivity Analysis: Tax Incentive
| Discount Rate | Gold Price (US$/oz) | |||
| 1,000 | 1,250 | 1,500 | ||
| 0% | NPV (US$ x 1000) | 232,690 | 592,691 | 952,691 |
| IRR (%) | 6.45% | 14.36% | 20.88% | |
| 5% | NPV (US$ x 1000) | 36,931 | 269,635 | 502,339 |
| IRR (%) | 6.45% | 14.36% | 20.88% | |
| 1.16 | Conclusions |
The Tocantinzinho Project at pre-feasability level and considering the data and information available can be considered both technically and economically feasible.
The project financial performance is most sensitive to the gold price as shown in the tables above. Using a discounted rate of 5% the breakeven point for the gold price is US$960/oz (without taxation reduction incentive). It will be necessary to carry out additional work to increase
8
Technical Report for the Tocantinzinho Gold Project, Brazil | |
the level of accuracy of the capital and operating cost estimates, with a view to improving performance and reducing risk.
The possibility that the Tocantinzinho project will be granted with the IRPJ taxation reduction incentive is very important for the economical feasibility of the project. Eldorado will seek approval for this incentive before making a construction decision.
Extension of the mineral resources through exploration success will have a positive impact on the project economics. In addition, changes to the economics will also impact the mine design and potentially the plant throughput.
Considering the current status of the environmental permitting process, the implementation schedule for the Tocantinzinho Project will be driven by timely receipt of permitting approvals which will include the Implementation Permit (LP) and Operation Permit (LI)
Consideration must also be given at the planning stage to the impact of the wet season on construction process.
| 1.17 | Recommendations |
On the basis of the results of this study, the Tocantinzhino Gold Project should be considered for further design and analysis culminating in the preparation of a full feasibility study.
In addition to increasing the accuracy of project costing, it is recommended that the mine plan be reviewed utilizing revised costing and projected market pricing for gold.
Further work is required the review the treatment methodology for oxidized ore within the pit area and to establish the potential for treatment of the garimpeiro tailings in the immediate area.
9
Technical Report for the Tocantinzinho Gold Project, Brazil | |
| SECTION 2 | Introduction |
Eldorado Gold Corporation (Eldorado), an international gold mining company based in Vancouver, British Columbia, through its wholly owned subsidiary Unamgen Mineração e Metalurgia S/A (Unamgen) owns the Tocantinzinho Gold Project (the “Project”), located in the State of Pará, Northern Brazil.
Eldorado has prepared this Technical Report of the Tocantinzinho Gold Project to disclose the results of a pre-feasibility study in support of initial declaration of mineral reserves for the Project. Golder Associates Brazil Consultoria e Projetos Ltda. (Golder) along with Eldorado and Unamgen personal prepared the pre-feasibility study.
Information and data for this report were obtained from the Project site and Eldorado. This work represents all aspects of project design including geology, mineral resources, mining, processing, infrastructure, environment and communities, costs and economical analysis.
The Qualified Persons responsible for preparing this Technical Report as defined in National Instrument 43-101 (NI 43-101), Standards of Disclosure for Mineral Projects and in compliance with 43-101F1 (the “Technical Report”) are Stephen Juras, Ph.D., P.Geo., Sean Gregersen, P.Eng, and Rick Alexander, P. Eng. All are employees of Eldorado.
Dr. Juras, Director, Technical Services for the Company, was responsible for the preparation of the sections in this report that concerned geological information, sample preparation and analyses and mineral resource estimation. He most recently visited the Tocantinzinho Gold Project on April 18 to 20, 2009.
Mr. Gregersen, Business Development Manager, for the Company, was responsible for the preparation of the sections in this report that dealt with mineral reserves estimation and mine operations. He most recently visited the Tocantinzinho Gold Project on August 22 to 27, 2010.
Mr. Alexander, Project Director for the Company, was responsible for the preparation of the sections in this report that dealt with metallurgy, process plant, infrastructure design, capital and operating costs. He has not visited the Tocanzinho Gold Project.
10
Technical Report for the Tocantinzinho Gold Project, Brazil | |
| SECTION 3 | Reliance on other experts |
Eldorado has prepared this document with input from Unamgen staff. Third party experts have supplied additional information and the authors of this document have reasonable reliance on that information as coming from technical experts. This report therefore relies inherently on the conclusions and recommendations of the following third party consultants:
Golders Brazil
Information from their internal report on geotechnical and hydrogeological matters was incorporated into the mine design and infrastructure studies. It is summarized in Section 18 of this document. They also completed the financial model for the project which was used in Section 19 of this document.
Hatch Limited– Vancouver and Brazil.
Information from their internal reports on capital cost estimation was used in Section 19 of this document.
VOGBR Recursos Hidricos-Geotecnia (VOGBR)
Information from their reports on tailings impoundment and hydrology was used in Section 19 of this document.
Wardel Armstrong International Limited
Information from their internal reports on metallurgical testwork contributed to the definition of design parameters for the process plant described in Section 19.
SEI Consoltorio de Projectos LTDA
Information from their internal reports on process design was used in Section 19.
TEP Engenharia de Projetos Ltda
Information from their internal report on access road design and construction was used in Section 19.
11
Technical Report for the Tocantinzinho Gold Project, Brazil | |
| SECTION 4 | Property Description and Location |
| 4.1 | Project Area |
The Tocantinzinho Project comprises an area of 14,000 ha and is located in the State of Pará in northern Brazil.
| 4.2 | Location |
The Tocantinzinho Project is located in the State of Pará in northern Brazil, in the Tapajós Gold province, approximately 200 km south-southwest of the city of Itaituba; 108 km from the district of Morais Almeida, and approximately 1,150 km in S60ºW bearing from Belém, the capital of Pará State located along the north seacoast of Brazil, at the mouth of the Amazon river Figure 4-1.
The Project’s location can be found on the Vila Riozinho topographic map sheet (SB.21-Z-A, MIR 194; 1:250,000) at the central northern part. The site is situated at an elevation of 120 m above the sea level.
Approximate coordinates of the center of the Tocantinzinho Project area are as follows:
● | Geographic: S= 06º03’; W= 56º18’; |
● | UTM (Zone 21M): N= 9,330,700; E= 578,200. |
| 4.3 | Land Tenure and Mining Rights in Brazil |
| 4.3.1 | Mining Rights |
Tocantinzinho Project is located in the Tapajós Gold Province, a region rich on alluvium gold deposits. The region has been subject to multiple exploration permit requests and artisanal mining permissions (“Permissão de Lavra Garimpeira” - PLG) for the past three decades.
The National Department of Mineral Production (DNPM) claims that in the past, the agency was not able to process all the requests efficiently, which resulted in overlaps of different mining/exploration requests for the same area. DNPM installed an office in the municipality of Itaituba/PA in order to solve the issues; nonetheless, some of them may still exist today. There is a DNPM statement determining that PLG’s requests with overlaps with Tocantinzinho Project areas should be dismissed.
12
Technical Report for the Tocantinzinho Gold Project, Brazil | |

Figure 4-1: Tocantinzinho Project Location
The Tocantinzinho Project comprises an area of 14,000 ha represented by two core claims, DNPM no. 850,706/1979 and 850,300/2003. DNPM no. 850,706/1979 is a Mining Concession Request, owned by Mineração Cachambix Ltda. Brazauro Recursos Minerais Ltda. owns 99% interest on Mineração Cachambix. The remaining 1% interest is owned by Brazauro Holdings (Brazil) Ltd. DNPM no. 850,300/2003 is an Exploration Permit owned by Brazauro Recursos Minerais Ltda. In July, 2010 Brazauro was acquired by Eldorado.
Peripheral claims have an additional area of 27,865.11 ha (DNPM no. 850,017/2008, 850,198/2003, 850,879/2007 and 850,288/2008).
All claims are embedded in the municipality of Itaituba/PA. Mineral rights/claims related to the Tocantinzinho Project are summarized in Table 4-1 and can be seen in Figure 4-2.
13
Technical Report for the Tocantinzinho Gold Project, Brazil | |
Table 4-1: Tocantinzinho Project Mineral Rights
Claim DNPM no. | Type | Owner | Area (ha) | Expiration Date | Situation |
| 850,706/1979 | Mining Concession Request | Mineração Cachambix Ltda.* | 10,000.00 | May 20, 2011 | Active |
| 850,300/2003 | Exploration Permit | Brazauro Recursos Minerais Ltda. | 4,000.00 | February 25, 2012 | Active |
| 850,017/2008 | Exploration Permit | Brazauro Recursos Minerais Ltda. | 8,537.15 | March 24, 2013 | Active |
| 850,198/2003 | Exploration Permit Request | Austral - AGS do Brazil Ltda. ** | 1,827.96 | – | Active |
| 850,879/2007 | Exploration Permit Request | Brazauro Recursos Minerais Ltda. | 7,500.00 | – | Active |
| 850,288/2008 | Exploration Permit Request | Brazauro Recursos Minerais Ltda. | 10,000.00 | – | Active |
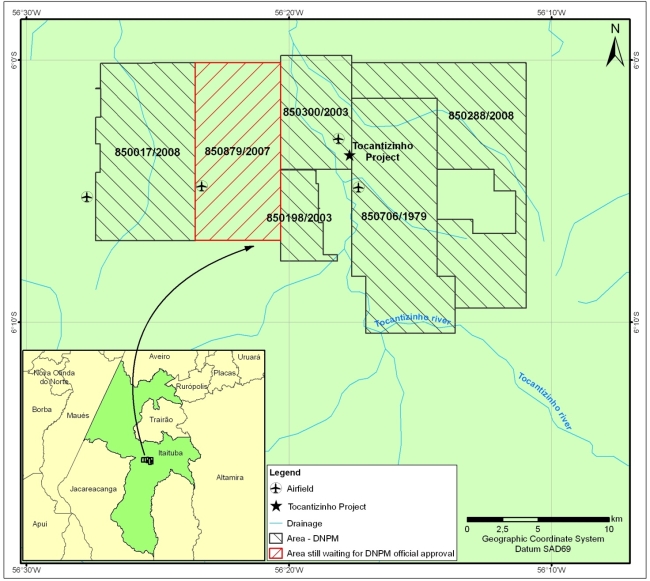
Figure 4-2: Tocantinzinho Project Mineral Rights
14
Technical Report for the Tocantinzinho Gold Project, Brazil | |
| 4.3.2 | Surface Rights |
Unamgen does not currently hold surface rights to the Project and will hold negotiations with the Brazilian Federal Government who is the owner of the surface rights in the area of the Tocantinzinho Project. The National Institute of Colonization and Agrarian Reform INCRA has issued a certificate stating that there are no Indian Reserves, Traditional Communities nor small agricultural settlements in the area.
Three former gold diggers (garimpeiros) consider themselves entitled to surface rights in the area of Tocantinzinho Project. Should it be evidenced that the individuals concerned do have the right to occupy the land; the company shall negotiate indemnification in accordance with the principles of Brazilian Mining Code.
| 4.4 | Royalties |
Currently there is an agreement with Mr. Alan Carter and Mr. Dennis Moore which foresee the payment of a NSR Royalty of 1.5% payable in addition of a down payment of US$5,500,000 in the first year of production.
Consideration has been given to State Royalty (CFEM) and the NSR Royalty based on the Alan Carter/Dennis Moore agreement.
● | State Royalty: Financial Compensation for the Exploitation of Mineral Resources (CFEM): 1% of the total value of sales revenues, excluding refining, transportation and insurance expenses; |
● | NSR Royalty: 1.5% of the total of sales revenues. |
| 4.5 | Water Rights |
Unamgen has held preliminary discussions with Brazilian Authorities regarding a permit to extract water from the river for the Project. A permit will need to be issued from the Ministry for the Interior’s Special Environment Agency (SEMA). It is reasonable to expect that that a permit will be granted and that there will be sufficient access to water to meet the processing requirements.
| 4.6 | Environmental Liabilities |
| 4.6.1 | Past Mining Activities |
Garimpeiros have been working the project areas for decades with continued activity at the site and there is expected to be environment contamination related to the past activities.
The primary method of gold extraction used by the garimpeiros was mercury and testing will need to be conducted to determine the volume of tailings and its level of mercury.
A remediation plan will be developed once data is collected and studies are completed to mitigate any potential risk.
| 4.6.2 | Environmental Studies |
Environmental studies are being completed to support the Environmental Assessment and permit application. This work is ongoing and being carried out by environmental engineering groups familiar with the Federal and State Government regulations for mining projects.
15
Technical Report for the Tocantinzinho Gold Project, Brazil | |
| 4.6.3 | Closure and Site Remediation Planning |
A closure strategy consistent with industry practice will be developed during the course of the permitting work to be done on the Tocantinzinho project. Sufficient consideration has been given to potential site specific conditions which could impact the closure strategy and costs, to assume a weighted value for closure capital will be acceptable, at this level of study. Eldorado has been engaged in the development of closure strategies at its other operations world wide and will apply this experience to the Tocantinzinho project. Concurrent reclamation has been the basis of all planning to date and is seen as the most effective way to achieve the reclamation goals for total rehabilitation of the site following mining.
| 4.7 | Permitting |
This topic is discussed in Section 19.5 of this report.
16
Technical Report for the Tocantinzinho Gold Project, Brazil | |
| SECTION 5 | Accessibility, Climate, Local Resources, Infrastructure and Physiography |
| 5.1 | Site topography |
The project site is located in the central area of the Tapajós River basin, approximately 100 km to the Southeast of the Tapajós River. The regional drainage is to the north. Topography within the project area is irregular with moderate relief. Elevations within the project area vary from approximately 120 m at the Tocantinzinho River to over 200 m at local topographic highs.
| 5.2 | Site Access |
The Tocantinzinho River and other small streams transect the region allowing access to the Property by small boats. Diamond drilling equipment and fuel are brought to the Property by boat along the river; through the village of Aruri.
Two airstrips serve Tocantinzinho Project. One, called Pista Velha is 350 m long and is situated between the main mineralized zone and the Tocantins river. A second airstrip, called Pista Nações Unidas is 775 m long and is situated 2.0 km south of the camp. This airstrip is frequently used to supply camp with personnel and supplies.
| 5.3 | Physiography and Climate |
| 5.3.1 | Climatologic aspects |
Brazil’s Northern Region is characterized by vast expanses of flat lands near sea level traversed by the Equator. The warm climate zone in the Northern Region has very distinct areas that lead to three climate subzones (subtypes): extremely wet, wet, and semi-wet.
Rain is generated by tropical instability lines (IT), where converging air leads sometimes to the formation of rain and thunderstorms and sometimes to the formation of hail and moderate to strong winds with gusts reaching 60 to 90 km/h.
The mean annual temperature in the region is about 27ºC. In general, the temperature amplitudes are small with a gradual increase during winter. The mean absolute values are in range of 21ºC to 34ºC. The relative humidity is higher than 80% during whole year.
The average annual precipitation is about 2,000 mm. The rainiest trimester contributes about 40% of total annual rainfall, corresponding to the months of February, March and April. The driest trimester, corresponding to the months of July, August and September, contribute less than 15% of total annual rainfall.
A weather station, operated by the National Meteorological Institute - INMET, close to the property is the Itaituba station, with coordinates 4º10'S and 55º21'W. The seasonal behaviour of the temperature and rainfall can be viewed on Figure 5-1 and Figur 5-2.
17
Technical Report for the Tocantinzinho Gold Project, Brazil | |

Figure 5-1: Seasonal Behaviour of the Temperature – Itaituba Station – INMET

Figure 5-2: Seasonal Behaviour of the Rainfall – Itaituba Station – INMET
| 5.4 | Infrastructure |
| 5.4.1 | Road |
Itaituba is the local center for services and supplies. The Cuiabá-Santarém Highway BR-163, extending northward from the state of Mato Grosso, reaches Itaituba via a ferry crossing of the Tapajós River. Most heavy equipment and supplies reach Itaituba by smaller ships which move along the Amazon River and Tapajós River.
Road access is not yet available to the property but active logging roads reach to within 12 km of Tocantinzinho. The logging roads extend from Mamoal, a small garimpeiro community about 40 Km to the southeast. An improved dirt road connects Mamoal to the Transgarimpeira Road, which in turns meets with the Cuiabá-Santarém Highway north of the community of Morais Almeida.
The local road from the Transgarimpeira Road to Mamoal will require improvements and additionally, a 40km road will be constructed from Momoal to the site for future access.
The main access to the project is presented in Table 5-1 and can be visualized in Figure 5-3.
18
Technical Report for the Tocantinzinho Gold Project, Brazil | |
Table 5-1: Estimated Distance of the Main Access to Tocantinzinho Project
| Access by Roads | ||||
| Route | Dist. (Km) | Access | Hours | |
| Itaituba - Morais Almeida | 300 | BR-163 | 4.5 | |
| Itaituba - Aruri | 196 | BR-230 / BR163 | 4.0 | |
| Novo Progresso - Morais Almeida | 99 | BR-163 | 2.0 | |
| Tocantinzinho Project - Deposit | 2 | unpaved road | 0.25 | |
| Access by Airway | ||||
| Route | Dist. (Km) | Access | Hours | |
| Belém - Itaituba | 900 | Commercial flight | 3 | |
| Itaituba - Tocantinzinho Project | 200 | Charter plane | 1 | |
| Access by Rivers | ||||
| Route | Dist. (Km) | Access | Hours | |
| Belém - Santarém | 970 | Pará river / Amazon river | 100 | |
| Santarém - Itaituba | 290 | Amazon river / Tapajós river | 10 | |
| Aruri - Tocantinzinho Project | 165 | Aruri Grande river / Jamanxim river / Tocantinzinho river | 70 | |
| 5.4.2 | Power |
The Tocantinzinho Project will be supplied from the Novo Progresso substation to the south, which will require the construction of approximately 190 km of transmission line and a 138 kV substation at the site.
| 5.4.3 | Water |
A water catchment facility will be installed on the right bank of the Tocantinzinho River and water will be pumped up to the project facilities. A permit will be required for water rights.
19
Technical Report for the Tocantinzinho Gold Project, Brazil | |

Figure 5-3: Main Access to the Project Tocantinzinho
20
Technical Report for the Tocantinzinho Gold Project, Brazil | |
| SECTION 6 | History |
In Tapajós Province region, the mining activity is historically related to gold mineralization. Gold is reported to have been discovered in the region through garimpeiros activities in the 1950s but the area became a significant producer by the 1980s. Unofficial data indicates that in the late 1980s, historical production, by primitive artisanal methods, amounted to between 200,000 and 1 million ounces of gold per year. By the 1990s, the gold production was estimated at 16 million ounces, but the real numbers are unknown.
At Tocantinzinho, the gold production was initiated in 1970 with intense garimpo activity in the mid-eighties to mid-nineties; however, there are no published records to support the timing and amount of production. In 1979 Mineração Aurífera Limitada obtained an exploration license with the Departamento Nacional de Produção Mineral (DNPM) over the Tocantinzinho Project area which expired in 1986. The property files were archived by the DNPM in 1992.
In 1997, Renison Goldfields (Australia) and Altoro formed a Joint Venture to explore Brazil for major gold deposits and Tocantinzinho was brought to the JV’s attention by an air charter pilot. Management and operation of the JV were executed by Altoro. The project was acquired after a visit to the property by the company geologist who collected channel samples from different garimpeiros pits and returned with good results. In 1998 the JV with Renison Goldfields was terminated due to a corporate decision and as a consequence, all properties, projects and data acquired during the Joint Venture were passed to Altoro.
Altoro’s exploration program was carried out from 1998 to early 2000 and consisted of soil geochemistry, ground magnetic survey, auger drilling and geological mapping. Solitario Resources Corporation acquired Altoro in 2000 and terminated the Tocantinzinho Project a year later due to the low gold price.
In 2003, Brazauro Resources Corp., through its Brazilian subsidiary Jaguar Resources do Brazil Ltda.,acquired the properties covering the Tocantinzinho mineralization. Based on the results of geochemical soil sampling, Brazauro initiated a drilling program that lasted until 2008 with a total of 25,635 m on 97 holes.
In July 2008, Eldorado Gold Corporation reached an agreement with Brazauro Resources Corp. which ensured that Tocantinzinho Project would be explored and developed in a timely manner through the access to Eldorado’s exploration and project development expertise in Brazil. After Eldorado took over the project, in September of the same year, the exploration works were continued in Tocantizinho with a further 62 drill holes for 19,431 m, reverse circulation and auger drilling, soil geochemistry and geological mapping in surroundings.
In July, 2010 Eldorado completed the arrangement to acquire all the issued and outstanding securities that it did not already owned of Brazauro Resources Corporation
21
Technical Report for the Tocantinzinho Gold Project, Brazil | |
| SECTION 7 | Geology |
| 7.1 | Regional Geology |
The Tapajós Gold Province is an important metallogenetic province located in the central southern portion of the Amazon craton and part of the Venturi-Tapajós (Tassinari and Macambira, 1999) or Tapajós-Parima (Santos et al., 2000) geochronological/tectonic province Figure 7-1.
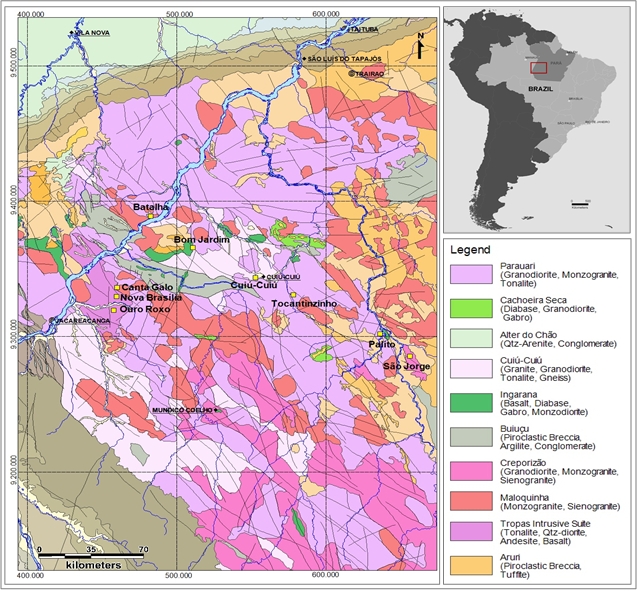
Figure 7-1: Tapajós Gold Provice Location Map.
The oldest rocks found in the Tapajós District are gneisses, schists, and metagranites of the Cuiú- Cuiú complex (2,011 – 2,033 Ma) which is the local basement for all units present in the region. The Cuiú-Cuiú complex is intruded by granites and granodiorites of the Parauari Suite
22
Technical Report for the Tocantinzinho Gold Project, Brazil | |
In general, the central-northwest portion of the Tapajós district is dominated by the Parauari granites, the southeastern portion is dominated by the Creporizão granites, and the eastern portion is dominated by the Salustiano and Aruri volcanic sequences. The Maloquinha granite is widespread throughout the district.
Gold occurrences are known in almost all rocks types. The main occurrences are in the Cuiú-Cuiú Complex (Cuiú-Cuiú), Parauari Suite (Tocantinzinho and Palito), Tropas Suite (Ouro Roxo), Creporizão Suite (São Jorge and Sucuri), Salustiano and Bom Jardim Formations (V3-Botica, Bom Jardim and Doze de Outubro) and Maloquinha Suite (Mamoal).
In the Tapajós district it has been proposed that most of the intrusions associated with significant garimpos, including the Tocantinzinho Project, align along a north-northwest trending lineament known as the Chico Torres Megashear or Tocanzinho Trend (Brandt, Meio Ambiente, October 2005). This interpreted fault zone appears as a distinct topographic lineament on satellite images and is visible on regional aeromagnetic maps as a linear magnetic anomaly.
| 7.2 | Local Geology |
The Tocantinzinho Project is underlain by igneous rocks of the Parauari Suite which host known gold mineralization. Within the Parauari Suite emplacement of batholitic granitic bodies was succeeded by a change to dominantly mafic volcanic activity, perhaps due to the onset of extensional tectonics. Extensive felsic volcanism followed, with the eruption of rhyolitic to dacitic flows and tuffs and volcaniclastic sediments of the Uatumã volcanic unit.
Textural evidence and contact relationships suggest that the host granitic rocks at Tocantinzinho intruded as dyke-like bodies along a northwest-striking fault zone that cut through more regionally extensive quartz monzonites. The granitoids were likely emplaced synchronous with faulting, and both intrusive contact and vein orientations suggest the host fault zone was active during this period as a sinistral, dominantly strike-slip feature. The presence of abundant aplites, miarolitic cavities, and blebby quartz textures (possible UST- unidirectional solidification textures) implies that the host granitic intrusions represent late, volatile-rich components of the parent magma. Vein textures suggest that at least some of the veins, and possibly gold mineralization, were introduced during or just after solidification of the host rocks, probably from magmatic/hydrothermal fluids derived largely from the parental magma.
| 7.3 | Lithology |
Surrounding the Tocantinzinho deposit is medium- to coarse-grained, isotropic granitoid unit, locally termed hematitic granite, with a composition ranging from syenogranite to monzogranite. Color ranges from pink to red due to abundant microcline and superimposed hematite alteration. The feldspars are generally fresh, except for minor sericitization of plagioclase. The primary mafic mineral is biotite and is generally strongly chloritized. The country granite displays no sign of penetrative deformation or brecciation and is unmineralized.
The host to mineralization at Tocantinzinho is similar in composition to the barren country granite, but it is hydrothermally altered and veined. It is generally coarse grained and the color ranges
23
Technical Report for the Tocantinzinho Gold Project, Brazil | |
from gray to red. The mineralized granite displays a fabric characterized by subparallel, millimeter-scale fractures, filled by quartz, chlorite and sulfide which are described as sheeted veins. Hydrothermal alteration minerals include: silica, chlorite, sericite, hematite, carbonates, and subordinate epidote and sulphides.
Closely associated with the mineralized granite, and interpreted as a very late co-magmatic intrusive phase, are centimetre- to metre-wide aplite and pegmatite dykes. It appears that the orientations of these dykes are somewhat erratic, it is not possible to correlate the dykes from section to section with the present drill spacing. In rare instances the aplite is mineralized, but mineralization is generally restricted to the dyke margins.
Figure 7-2 Shows the Tocantinzinho deposit surface lithology and structures.
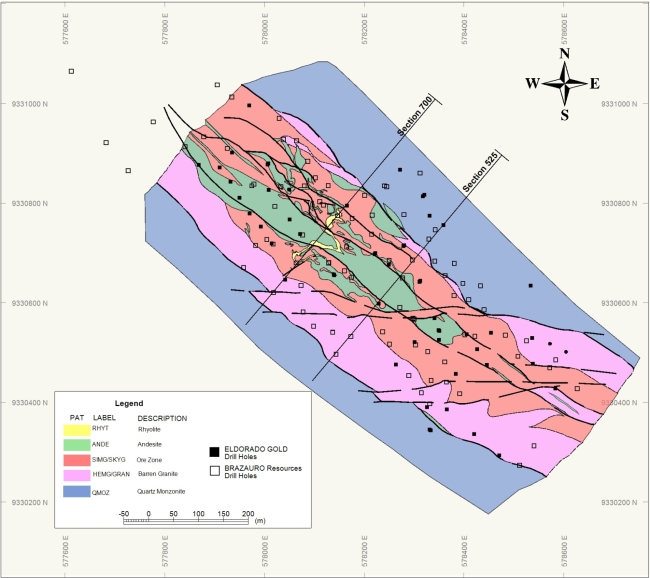
Figure 7-2: Tocantinzinho Geological Map
A large andesite body intrudes the mineralized zone. This unit forms an upward flaring cap over the main mineralized zone. At surface it varies in widths from 50 to 80 meters and has a vertical dimension of approximately 50 metres, below which there are a series of narrow andesite dykes
24
Technical Report for the Tocantinzinho Gold Project, Brazil | |
which are interpreted as feeder dykes to the larger andesite body. The rock is strongly altered, with intense carbonate, chlorite, and sericite. Millimetre-scale fractures are commonly filled by carbonate ± chlorite. Gold values in andesite are generally below the detection limit, with the exception of scattered ore-grade gold values associated with quartz-sulphide veins and along contacts.
Rhyolite dykes are exposed in the central portion of the deposit on surface and in drill core. Outcrop patterns and exposed contacts show that they cut across the andesite, making the rhyolite the youngest intrusive rock found to date. It is cream to light green colored with rare millimeter-scale quartz grains and potassium-feldspar phenocrysts in an aphanitic groundmass. Rhyolite dykes are generally 1 to 5 meters wide and typically contains less than 5 ppb Au, but values ranging from 100 to 200 ppb Au can be present where veining is intense.
The ore body is bounded on both sides by a fine to medium grained, gray-green to reddish quartz-monzonite. This unit is generally magnetic and epidote often occurs filling millimeter-scale fractures. Fine grained, disseminated pyrite is common but is not associated with gold mineralization.
| 7.4 | Structural Geology |
The Tocantinzinho deposit is hosted within fractured and hydrothermally altered granites. The ore body is localized along the northwestern-trending Tocantinzinho Trend structure which is most clearly portrayed in aeromagnetic data. This structure is interpreted as a regional fault zone which controlled emplacement of the igneous rocks and related mineralization at Tocantinzinho and at several other occurrences and deposits in the Tapajos region.
Most of the mineralized rock encountered in drilling displays a planar fabric defined by thin sheeted veinlets and fractures filled with chlorite-silica. These veinlets usually show a moderate to strong preferred orientation with east to northeast strikes and subvertical dips. However, the intensity of this fabric can be quite variable even within a single drill hole. The mineralized granite at Tocantinzinho shows no penetrative foliation except for rare instances where strings of blebbly quartz grains demonstrate a weak parallelism.
Northwest-trending, steeply dipping faults commonly define the contact between the hematized granites and the surrounding quartz-monzonite. These structures are interpreted as portions of, or splays, from the controlling Tocantinzinho Trend structure. In addition, surface mapping has identified a series of east-west trending faults within the Tocantinzinho deposit which generally show several to tens of metres of sinistral offset.
25
Technical Report for the Tocantinzinho Gold Project, Brazil | |
| SECTION 8 | Deposit Types |
The Tocantinzinho deposit is best classified as a granite-hosted, intrusion-related gold deposit. It has geological similarities to several other gold deposits of the Tapajos region. Host rocks include multiple texturally varied phases of dominantly granitic composition. Gold is disseminated, commonly shows consistent grades over wide intervals, and is generally accompanied by finely to coarsely disseminated sulphides (pyrite, locally chalcopyrite, galena, sphalerite). Isolated multi-ounce gold grades occur in intervals containing conspicuous quartz-galena-sphalerite-chalcopyrite veins, and are not volumetrically significant. Most gold-enriched zones contain common thin (<1 cm) veinlets of quartz, chlorite, sulphide, ± calcite.
26
Technical Report for the Tocantinzinho Gold Project, Brazil | |
| SECTION 9 | Mineralization |
The Tocantinzinho deposit forms a sub-vertical, northwest-trending elongate body approximately 1,000 metres long by 150 metres wide. It has been drilled to approximately 350 metres depth and remains open below this depth. Within the mineralized granite gold grades are remarkably consistent with an average of 1.1 g/t. Examples are shown in cross sections in Figure 9-1 and 9-2
.
Figure 9-1: Tocantinzinho Deposit –Section 525
27
Technical Report for the Tocantinzinho Gold Project, Brazil | |
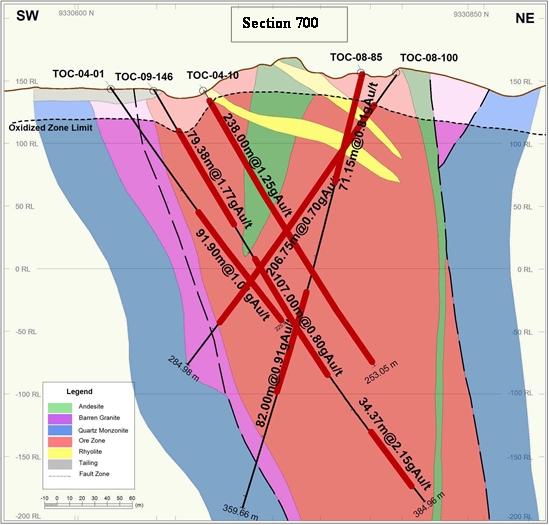
Figure 9-2: Tocantinzinho Deposit –Section 700
Mineralized granites at Tocantinzinho are divided into two sub-units by alteration mineralogy and colour: smoky and salami granite. Grade distribution is similar in both units and therefore they have been grouped for resource estimation purposes. Both smoky and salami granites are composed dominantly of potassium-feldspar and large (mm- to cm-scale) distinctively amoeba-shaped quartz grains. The textural and compositional similarity in the two granitic host units leads to the interpretation that both represent the same protolith, but have undergone different alteration processes. The blebby, amoeba-like quartz textures and rare miarolitic cavities are interpreted to reflect a late-stage, volatile rich magma.
Smoky mineralized granite is strongly silicified with chlorite and trace to 1% sulfides. Color ranges from grayish to greenish due to the chlorite alteration. Sheeted milimetre-scale chlorite ± sulphide veinlets are common. Salami mineralized granites are distinctively bright red due to hematite dusting on potassium feldspars. Sheeted veinlets are common and similar in scale to those in the smoky granites but are generally filled with quartz ± sulphide. Contacts are diffused between smoky and salami granites and a complete gradation exists between the two units.
Hydrothermal alteration at Tocantinzinho includes a probable early potassic alteration event, a chlorite±sulphide phase, silicification (both pervasive and related to quartz-sulfide veining), and a late
28
Technical Report for the Tocantinzinho Gold Project, Brazil | |
carbonate phase evidenced by fine calcite veinlets. The chlorite alteration consists of sheeted chlorite-silica veinlets. Pyrite often occurs in these veinlets but may be a later event ( Figure 9-3 and Figure 9-4).
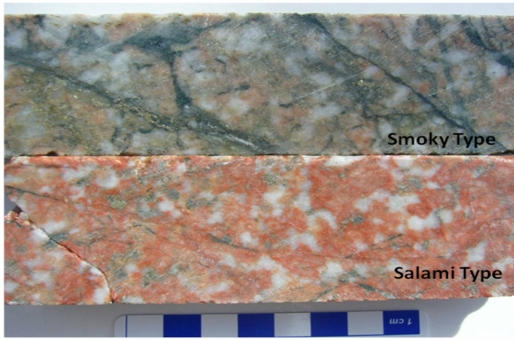
Figure 9-3: Tocantinzinho Deposit “Smoky” and “Salami” granite
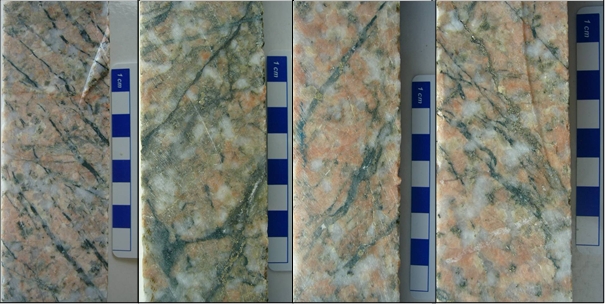
Figure 9-4: Quartz + Chlorite + Pyrite Sheeted Veins
29
Technical Report for the Tocantinzinho Gold Project, Brazil | |
| SECTION 10 | Exploration |
| 10.1 | Exploration History |
The exploration work at the Tocantinzinho Project completed up to December 2010 includes geological mapping, channel and chip sampling, soil and stream sediment geochemical surveys, a detailed topography survey, auger drilling, geophysical investigations, reverse circulation drilling, and core drilling. Petrographic and metallurgical studies were conducted on drill core by contracted consulting firms.
Earliest systematic exploration in the project area was conducted by Altoro between 1997 and 1999. Altoro’s work included soil sampling around the main garimpeiro works (over 700 samples), and a total of 476 channel samples of weathered bedrock collected from the garimpeiro pits. All of the sampled areas are now covered by either sandy tailings or water. Altoro also collected 6.0 km of magnetic data with one magnetometer along ten established grid lines, spaced 50 m apart. They drilled a total of 87 power auger holes (1,318m) in 1998, and 58 additional holes (503m) in 1999. The average saprolite intersection in all of the 145 holes was 9.10 m with an average grade of 1.00 g/t Au.
Based on results of geochemical sampling, in early 2004, Brazauro Resources Corp. (through its Brazilian subsidiary Jaguar), initiated an exploratory core drilling program of 20 holes with an average length of 227m per hole. Brazauro continued drilling until 2008, completing a total of 25,635.05 m on 97 holes. In addition to the drilling program, 106 power auger holes (934m) and over 500 channel/chip and soil samples were completed.
In September 2008, Eldorado Gold Corp. continued the exploration works with a further 62 diamond drill holes totalling 19,431 m. The drilling campaign lasted until September 2009. From 2009 to early 2010, Eldorado also completed 112 power auger holes (416 m) with an average length of 3.70 m in the main pit area, and 19 reverse circulation exploratory holes (1,229 m) in areas outside of the main deposit area. Soil (2,604), channel/chip (46) and dump (100) samples were also collected during the same period. In early 2010, 9 additional exploratory drill holes (1,770 m) were executed to test geochemical and geophysical anomalies outside the known Tocantinzinho deposit.
From April to June, 2010, exploration activities were on stand by, and then were resumed at the end of July when Eldorado completed the arrangement to acquire all the issued and outstanding securities of Brazauro Resources Corp.
In late 2010, Eldorado completed an IP geophysical survey of 45 line km, covering areas along the Tocantinzinho trend to the northwest and southeast of the deposit. Drilling for geotechnical purposes also initiated in August 2010, and was concluded with a total of 6 drill holes for 1,784 m. The geotechnical description of the oriented core holes was completed by Golder geologists.
An infill drilling campaign of approximately 4,800 m was initiated in late September, 2010. The objective of this drilling was to better define the current geological model and to upgrade portions of the resource from inferred to indicated status. This campaign was completed in late 2010 and totalled 5,352 m in 15 drillholes.
A detailed topographic survey of the Tocantinzinho area has been completed by Eldorado, totaling 2.5 k km2 covering the main pit area and other adjacent areas to the main mineralized zone. The coordinate system was based on one official, and five implemented geodesic points at Tocantinzinho Project. The compilation of data was done using the Topograph software.
A topographic aerial laser survey of the project site was carried out in September, 2010 by Geoid Ltda. A total of 53 km2 were surveyed including the deposit, probable tailings dam areas, and the future plant site. The contour interval was 1m with accuracy of approximately 0.15 cm in both the horizontal and vertical coordinates. The compilation of data, images and final report is under execution by Geoid Ltda.
30
Technical Report for the Tocantinzinho Gold Project, Brazil | |
| 10.2 | Soil Geochemistry |
Soil sampling was conducted at the Tocantinzinho project by previous operators (Altoro - between 1997 and 1999; Brazauro – between 2005 and 2007) mainly around the main garimpeiro pits with the main grid placed to cover the obviously mineralized zone. This area has now been almost completed excavated by the garimpeiros.
Eldorado carried out soil sampling campaigns from mid-2009 to early 2010 (Tab;e 10-1), covering the extensions of the main deposit area trend and adjacent areas. Samples were collected at 50 m intervals, using a hand auger with half-meter depth.
Table 10-1: Project Soil Sampling Summary
| Time Period | Samples | QC Samples |
| 2009 | 2,109 | 359 |
| 2010 | 495 | 84 |
| TZ Project TOTAL | 2,604 | 443 |
The soil sampling tested targets (Figure 10-1) along-strike southeast of the Tocantinzinho Deposit (Target 2) with 100 m spaced lines. The along-strike trend NW of the deposit (Target 1) was covered with 200 m spaced lines. The far southeast extension of target 2 (Target 4) was tested with 400 m spaced lines. Some infill lines were executed in areas with positive results. The “anomalous” results range from 100 to 200 Au ppb with some values higher than 200 Au ppb.

Figure 10-1: Tocantinzinho Project Soil Geochemistry Map
31
Technical Report for the Tocantinzinho Gold Project, Brazil | |
| 10.3 | Geophysics |
At Tocantinzinho, geophysical surveys were carried out by the previous operators, Alturo and Brazauro.
Altoro collected 6.0 km of magnetic data with a ground magnetometer survey along 50 m spaced grid lines.
In 2005 Brazauro hired Reconsult Geofísica to process and interpret the raw ground magnetic data and also interpret geophysical airborne data collected by FUGRO covering the Tocantinzinho area. Reconsult concluded that the mineralization is probably related to the main Tocantinzinho Trend structure (oriented N60W); and that mineralization is truncated to the SW by magnetic rock. Based on the magnetic and radiometric data, Reconsult considered that there exists a strong potential for continuation of mineralization to the NW.
Figure 10-2 shows the location of IP lines completed at the Tocantinzinho Project in late 2010, superimposed on gridded gold in soil data. Results of the IP survey show that both chargeability and resistivity map out geology and structural breaks in the underlying rocks but are not effective in directly detecting Tocantinzinho-style gold mineralization.

Figure 10-2: Tocantinzinho Project IP Geophysical Surveyed Lines
32
Technical Report for the Tocantinzinho Gold Project, Brazil | |
| SECTION 11 | Drilling |
| 11.1 | Core drilling |
Diamond drill holes are the principal source of geological and grade data for the Tocantinzinho Project. Drilling at Tocantinzinho has been carried out in several phases. Drilling for geotechnical purposes was executed by Eldorado from August to October, 2010. Infill drilling, aimed to detail the geological model, commenced in late September, 2010 and was finished in December, 2010. Table 11-1 summarizes the drilling that has been completed on the property. Five phases of drilling were conducted by Brazauro between 2004 and 2008.
In September 2008, Eldorado became the operator of the project and started its first drilling program at Tocantinzinho. Drilling was ongoing until the end of 2010. The locations of the drill holes for all phases are shown on a collar plan map in Figure 11-1.
Table 11-1: Project Core Drilling Summary
| Purpose | Time Period | Holes | Meters | Samples | QC Samples |
| Exploration / Resource Drilling | 2004 | TOC 04-01 to TOC 04-20 | 4,693 | 2,422 | 332 |
| Exploration / Resource Drilling | 2005 | TOC 05-21 to TOC 05-34 | 3,759 | 1,870 | 266 |
| Exploration / Resource Drilling | 2006 | TOC 06-35 to TOC 06-46 | 3,022 | 1,702 | 240 |
| Exploration / Resource Drilling | 2007 | TOC 07-47 to TOC 07-71 | 5,763 | 3,089 | 434 |
| Exploration / Resource Drilling | 2008 | TOC 08-72 to TOC 08-96 | 8,398 | 4,658 | 648 |
| Exploration / Resource Drilling | 2008 | TOC 08-97 to TOC 08-107 | 3,518 | 1,957 | 218 |
| Exploration / Resource Drilling | 2009 | TOC 09-108 to TOC 09-152 | 14,423 | 7,696 | 1,103 |
| Metallurgy (twin drilling program) | 2009 | TOC 09-11TW, 35TW, 36TW, 48TW, 75TW | 1,489 | 678 | - |
| Exploration Drilling | 2010 | TOC171 to TOC172; TOC174 to TOC179 | 1,770 | 919 | 155 |
| Geotechnical Drilling | 2010 | G-TOC001 to G-TOC006 | 1,784 | - | - |
| Upgrade inferred to indicated resource (infill) | 2010 | TOC180 to TOC194 | 3,581 | 1,915 | 327 |
| Tocantinzinho Project TOTAL | 52,200 | 26,906 | 3,723 | ||
33
Technical Report for the Tocantinzinho Gold Project, Brazil | |

Figure 11-1 Drill Hole Trace Plot
All diamond drilling by Brazauro and Eldorado were done by wire line method, conducted by Kluane International Drilling Inc. based in Vancouver, B.C, Canada. Kluane now has subsidiaries in Belém/PA and Belo Horizonte/MG in Brazil. This drilling provides light weight portable Hydrocore Gopher all-hydraulic drill rig capable of drilling about 350 m of BTW core during Brazauro’s drilling phases and about 500 m during Eldorado’s drilling phase.
The drilling phases executed by Brazauro were drilled with NTW-size (5.71 cm core diameter) and BTW-size (4.20 cm core diameter). In Eldorado’s drilling phase more powerful drill rigs were available making it possible to drill deeper and with wider diameters (HQ-size 6.5 cm core diameter, NTW-size and BTW-size).
Of the 189 drill holes completed to date, 23 were drilled for exploration in areas adjacent to the main Tocantinzinho mineralization. Six drill holes executed under Eldorado’s management were twin holes to provide larger samples for metallurgical testing and six other drill holes were executed for geotechnical purposes. The rest of the holes were drilled along the main Tocantinzinho trend.
Drill holes collars were located using a total station instrument. All drill holes were drilled at inclinations ranging from 47° to 83°, along 40° to 220° azimuths. Three of the holes were drilled parallel with the trend of the mineralization, with the purpose of crosscutting the main sheeted veins trends at the optimal intermediate angle.
Down-hole survey deviations (azimuth and inclination) were taken approximately every 60 m using the Reflex EZ Shot instrument. The geotechnical drill cores were oriented using the ACT Reflex instrument. The infill holes followed the same procedure.
34
Technical Report for the Tocantinzinho Gold Project, Brazil | |
Standard conventions of logging and sampling were used to obtain information from the drill core. The core was photographed before being sampled and logged in detail onto paper logging sheets. The data were then reviewed and entered into the project database. Regular internal checks are conducted to assure the consistency of observations from hole to hole and between different loggers. In the mineralized units, core recovery was very good, averaging 95%.
| 11.2 | Reverse circulation drilling |
From October 2009 to February 2010, a reverse circulation drilling program was carried out with 19 holes totaling 8,452 m (Table 11-2). All the holes were drilled for exploration purposes in surrounding adjacent areas to the Tocantinzinho main deposit.
No deviation measurements were made for reverse circulation holes. Reverse circulation holes were logged and sampled in a similar manner as the core holes.
Table 11-2: Project Reverse Circulation Drilling Summary
| Purpose | Time Period | Holes | Meters | Samples | QC Samples |
| Exploration | 2009 | TOCR153 to TOCR164 | 4,693 | 308 | 50 |
| Exploration | 2010 | TOCR165 to TOCR173 | 3,759 | 320 | 54 |
Tocantinzinho Project TOTAL | 8,452 | 628 | 104 | ||
| 11.3 | Power auger drilling |
Several power auger drilling campaigns were carried out in Tocantinzinho Project. The first power auger program was drilled by Altoro in 1998. The same company also executed another set of power auger holes in 1999. The third auger drilling program was conducted by Brazauro in 2008. Eldorado executed a power auger drilling campaign by the end of 2009 only in the Tocantinzinho main pit area (Table 11-3).
Table 11-3: Project Power Auger Drilling Summary
| Purpose | Time Period | # of Holes | Meters | Company |
| Exploration | 1998 | 87 | 1,318 | Altoro |
| Exploration | 1999 | 58 | 503 | Altoro |
| Exploration | 2008 | 106 | 934 | Brazauro |
| Exploration | 2009 | 112 | 416 | Eldorado |
| Tocantinzinho Project TOTAL | 363 | 3,171 | ||
Only Eldorado’s auger program is described. Power auger holes carried out by Eldorado were logged following the standard conventions established in Tocantinzinho Project and sampled at 1.00 m intervals. Most of the holes were stopped at shallow depth because of reaching the water level. Average hole length was 3.70 m.
The advantages of the power auger are that it is easily mobilized to the site and it is capable of being maintained and operated by local personnel. The limitations of the power auger sampling are that only vertical holes are possible and therefore samples are not obtained across geological features which are subvertical at Tocantinzinho. The depth limitation of the drill does not permit the sampling of fresh rock.
35
Technical Report for the Tocantinzinho Gold Project, Brazil | |
| 11.4 | Drilling logging and sampling |
The drill core was retrieved each shift from the drill site and brought to the camp site where the percent recovery and intervals are marked. The core was photographed on a tow box vertical stand and logged for geotechnical information including percent recovery, rock quality designation (RQD), joint frequency and condition, degree of breakage and weathering/alteration.
The geologist logs the full core and produces a “Summary Log”, recording lithology, alteration type and grade, texture, structure, observed sulphides as well as a brief description of important features. All the collected information is entered in the digital database (Aqcuire). While logging,the geologist measures and marks the intervals to be sampled, making sequential sample divisions and numbers in the core. An attempt is made to make 2.00 m long sample intervals, diverging from these intervals for geological reasons, such as rock type contacts.
The core is then cut in half lengthwise, by means of a rock saw, flushed regularly with fresh water. To minimize sampling bias, the core is marked with a continuous linear cutting line before being split. Both halves of the core are placed back into the core-box. Once the entire hole core or a long section of the core has been cut, the geologist makes a detailed description of each sample lithology, veining, alteration, mineralogy and record in the sampling form.
The free gold is extremely fine, generally visible only with the aid of hand lens. Two trained geotechnicians place half of the core into new sample bags and clearly mark the interval, on the ribs of the core box, with the interval footages and sample number. The samples are consistently taken from the same side of the core. The bagged sample is marked, tagged and sealed for shipping to the laboratory. Groups of bagged samples are placed in larger sacks that are marked, showing the sample numbers.
Until hole TOC-09-123 samples were shipped to SGS Geosol laboratory at Itaituba/PA. From hole TOC-09-124 forward, the samples were air shipped to ALS Chemex laboratory in Vespasiano/MG.
Samples are usually analyzed for gold only. Earlier geochemical analytical results showed that there were insignificant concentrations of other metals. Only some specific holes were analyzed for ICP multi-element analysis.
Reverse circulation chip samples were logged in a similar manner as the core and stored at the project core house. The samples were collected in 2.00 m intervals and split to get a 4.0 kg sample.
36
Technical Report for the Tocantinzinho Gold Project, Brazil | |
| SECTION 12 | Sampling Method and Approach |
All diamond drilling in Tocantinzinho was done with wire line core rigs and mostly of HQ size. Drillers placed the core into wooden core boxes with each box holding about 4 m of HQ core. The driller keeps track of the drilling depth and places footage marker wooden blocks at the end of each run. Drill core was later delivered to logging site. Sample numbers were written on wooden core boxes allowing gaps in numbering sequence for control sample insertion. The entire lengths of the diamond drill holes were sampled, usually at 2 meter long intervals. Geology and geotechnical data are collected from the core and core is photographed before sampling.
The core is then cut in half lengthwise, by means of a rock saw, flushed regularly with fresh water. To minimize sampling bias, the core is marked with a continuous linear cutting line before being split. Both halves of the core are placed back into the core-box. Sample technicians then place one half of the cut ore into a plastic bag which is then marked, tagged and enclosed for shipping to the laboratory. Groups of bagged samples are placed in larger sacks that are marked, showing the sample numbers.
Significant composited assays (by intersected ore shell thickness) for the Tocantinzinho deposit are shown in Appendix A.
37
Technical Report for the Tocantinzinho Gold Project, Brazil | |
| SECTION 13 | Sample Preparation, Analysis and Security |
Split core samples are prepared for analysis at the ALS Chemex Laboratories facility in Vespasiano, Minas Gerais state in Brazil. The samples are prepared according to the following protocol:
● | The entire sample is crushed to 70% passing 2 mm. |
● | A 1 kg subsample is riffle split from the crushed passing 2 mm sample and pulverized to 85% passing 75 µm (200 mesh) |
● | A 250 - 300 g subsample is selected by riffle splitting from the pulverized 75 µm sample |
● | A 30 g sample is taken for fire assay analysis (duplicated if sample was noted to have contained visible gold). |
The sample batches are arranged to contain regularly inserted control samples. A Standard Reference Material (SRM), a duplicate and a blank sample were inserted into the sample stream at every 10th to 15th sample. The duplicates are used to monitor precision, the blank sample can indicate sample contamination or sample mix-ups, and the SRM is used to monitor accuracy of the assay results.
All samples were assayed for gold by 30 g fire assay with an AA finish.
| 13.1 | QA/QC Program |
Assay results are provided to Eldorado in electronic format and as paper certificates. Upon receipt of assay results, values for Standard Reference Materials (SRMs) and field blanks are tabulated and compared to the established SRM pass-fail criteria:
● | automatic batch failure if the SRM result is greater than the round-robin limit of three standard deviations |
● | automatic batch failure if two consecutive SRM results are greater than two standard deviations on the same side of the mean. |
● | automatic batch failure if the field blank result is over 0.03 g/t Au. |
If a batch fails, it is re-assayed until it passes. Override allowances are made for barren batches. Batch pass/failure data are tabulated on an ongoing basis, and charts of individual reference material values with respect to round-robin tolerance limits are maintained.
| 13.1.1 | Blank Sample Performance |
Assay performance of field blanks is presented in Figure 13.1 for gold. The analytical detection limit (ADL) for gold is 0.005 g/t. The rejection threshold was chosen to equal 0.05 g/t. The results show a no evidence of contamination. Rare higher values were investigated and found to be caused by sample mix-ups.
38
Technical Report for the Tocantinzinho Gold Project, Brazil | |

Figure 13-1 Tocantinzinho Blank Data – 2008 to 2010
| 13.1.2 | Standards Performance |
Eldorado Gold strictly monitors the performance of the SRM samples as the assay results arrive at site. Seven SRM samples are used, covering a grade range between 0.8 g/t to 13.6 g/t. Examples of individual SRMs performance are shown as charted data in Figure 13-2. All samples are given a “fail” flag as a default entry in the project database. Each sample is re-assigned a date-based “pass” flag when assays have passed acceptance criteria. All data used in the updated resource estimate had passed acceptance criteria.
39
Technical Report for the Tocantinzinho Gold Project, Brazil | |


40
Technical Report for the Tocantinzinho Gold Project, Brazil | |

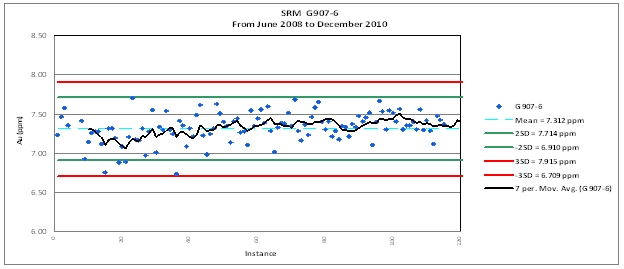
Figure 13-2: Standard Reference Material Charts, 2008 to 2010, Tocantinzinho
| 13.1.3 | Duplicates Performance |
Eldorado implemented and monitored regularly submitted field duplicates, the other half of the core sample. These data reproduced only fairly well. The filed duplicate data are shown in a relative difference chart in Figure 13-3. The large scatter around the suggested maximum difference of ±30% shows the effect of heterogeneous distribution of the gold mineralization at the core sample level. A better measure of the laboratory precision is given by the laboratory pulp duplicate data, shown in Figure 13-4. Results show the pulp data reproduced moderately well though still influenced by likely liberated gold during the sample preparation process. Patterns in both charts symmetric about zero suggesting no bias in the assay process.
41
Technical Report for the Tocantinzinho Gold Project, Brazil | |

Figure 13-3: Relative Difference Plot of Tocantinzinho Field Duplicate Data, 2008 to 2010.

Figure 13-4: Relative Difference Plot of Tocantinzinho Pulp Duplicate Data, 2008 to 2010.
42
Technical Report for the Tocantinzinho Gold Project, Brazil | |
| 13.1.4 | Specific Gravity Program |
A total of 872 samples taken from core holes were being measured for specific gravity and tabulated by rock type. Also, 59 saprolite samples were also selected and measured for specific gravity. The specific gravity for non-porous samples (the most common type) is calculated using the weights of representative samples in water (W2) and in air (W1). The bulk density is calculated by W1 / (W1-W2). Averages for key rock types are: 2.62 for the ore granites; 2.75 for the Andesite; 2.68 for the Quartz Monzonite; 2.61 for the Hematite Granite; and 1.80 for the Saprolite.
| 13.2 | Concluding Statement |
In Eldorado’s opinion, the QA/QC results demonstrate that the Tocantinzinho deposit assay database is sufficiently accurate and precise for resource estimation.
43
Technical Report for the Tocantinzinho Gold Project, Brazil | |
| SECTION 14 | Data Verification |
The Tocantinzinho assay and geology database underwent a detailed review to original source data and the core library. No errors were found in the assay data. Collar data for the older Brazauro drill holes were re-surveyed to correct incorrect topographic information. Discrepancies and inconsistencies in the geology data were checked against the core and corrected and incorporated into the current resource database.
Eldorado therefore concludes that the data supporting the Tocantinzinho resource work are sufficiently free of error to be adequate for estimation.
44
Technical Report for the Tocantinzinho Gold Project, Brazil | |
| SECTION 15 | Adjacent Properties |
There are no adjacent projects or developments to the Tocantinzinho Project.
45
Technical Report for the Tocantinzinho Gold Project, Brazil | |
| SECTION 16 | Mineral Processing and Metallurgical Testing |
| 16.1 | Metallurgical Testing Overview |
Metallurgical testwork completed for Tocantinzinho (TZ) Project has been very comprehensive, and consists of:
● | Ore variability in terms of lithology, gold head grade, sulfur head grade, depth, and composites; |
● | In addition to primary sulfide ore, metallurgical testwork for gold bearing soil; saprolite, transitional and garimpeiro tailings; |
● | Detailed chemical analyses of ore feeds, flotation concentrates and flotation tailings; |
● | Ore specific gravity; |
● | Comminution testing including crushing index, rod milling index, ball milling index, SMC index, and abrasion index; |
● | Whole ore cyanide leach at varied grind sizes; |
● | Cyanide leach of flotation concentration; |
● | Flotation circuit including rougher, cleaner batch, locked cycle test and pilot plant; |
● | Gravity concentration; |
● | Combination of gravity concentration and flotation; |
● | Thickening testing of ore feed, flotation concentrate and flotation tailing; |
● | Cyanide detoxification using Inco SO2/air, cold Caro’s acid and Combinox methods; |
● | Environmental testing includes ABA, SPLP and TCLP. |
The metallurgical testwork over the whole body profile was undertaken by Hazen Research in USA, Ralph Meyertons Consulting in USA, SGS Mineral Services in Canada, FLSmidth in UK and Wardell Armstrong International in UK
It is worthy to note that samples were classified as per the profile strata for individual and composite testing are representative of what is to be expected in practical mining and processing. Those samples in general were called:
● | SMKG (smoky granite) |
● | SMIG (salami granite) |
● | TOP (top half orebody) |
● | BOT (bottom half orebody) |
● | ALL (over all composite) |
46
Technical Report for the Tocantinzinho Gold Project, Brazil | |
Based on the data results reported independently by the laboratories, the following comments are relevant to conclusions for the conceptual processing of this ore:
| 16.1.1 | Mineralization |
The mineralization is contained in gold bearing sulfide minerals where gold is present as fine free grains. There are two types of gold association with sulfide minerals. The first association occurs with pyrite (FeS2), while the second association exits with pyrite (FeS2), chalcopyrite (CuFeS2), galena (PbS) and sphalerite (ZnS). Gold occurs as fracture fillings and, less commonly inclusions in the sulfide minerals. Sulfide minerals are present as:
● | Disseminated pyrite; |
● | Veinlets (in millimeter) of quartz, chlorite and pyrite (sheeted veins); |
● | Veins (in centimeter) of quartz, chlorite, carbonate, pyrite, chalcopyrite, galena and sphalerite.. |
Pyrite occurs as liberated angular particles ranging in size from 30 to 400 μm with an average between 100 and 200 μm. Pyrite sometimes occurs as intergrowth with galena, chalcopyrite, and rutile. Chalcopyrite occurs as irregularly shaped particles ranging in size from 50 to 100 μm. Majority of chalcopyrite is liberated, but occasionally it occurs as inclusions in pyrite or intergrowth with galena and rutile.
Gold is mainly free with its grain size ranging from 5 to 100 μm with an average range between 30 and 50 μm. The shape of gold grains is rounded, irregular shape, or elongated. Gold grains occur generally around boundaries or within fractures of sulfide minerals. Pyrite in a disseminated form and in the sheeted veinlets hosts a bulk of gold mineralization. High-grade mineralization is often intimately associated with base metal veins. Gold also occurs less frequently as liberated particles of irregular shape with a size ranging from 5 to 250 μm with an average between 100 and 200 μm. The presence of these coarse gold grains has likely caused the nugget effect encountered in head assays. However this ore is being reported as easily leachable in cyanide solution considering the retention time defined on the leaching test program.
| 16.1.2 | Grindability |
Seven core samples were selected purposely and then submitted to SGS Mineral Services in Canada for measurements of Bond crushing work index (CWi), Bond rod milling work index (RWi), Bond ball mill work index (BWi), SMC index (SMC is a shortened version of the standard JKTech drop-weight testing), Bond abrasion index and unconfined compressive strength (UCS). Based on these results, the ore samples are characterized as follows:
● | Overall, the ore sample show similar hardness and abrasiveness with the exception of “Smoky Granite” and “Salami Granite” being relatively easier to crush; |
● | Medium to hard ore in terms of crushing, with work index varying from 10.1 to 15.3 kWh/t; |
● | Moderately soft to medium ore with respect to resistance to impact breakage (A x b) based on SMC test results. The (A x b) value varies from 51.5 to 59.3; |
● | Medium ore in terms of rod milling, with work index varying from 13.2 to 14.7 kWh/t; |
● | Hard ore with respect to ball milling, with work index changing from 16.8 to 18.5 kWh/t; |
● | Strongly abrasive ore, with abrasion index varying from 0.418 to 0.717 gram. |
Medium to hard ore as per the work index and hard ore with respect to ball milling are amenable to be treated by conventional grinding circuit taking into account that the material is reported as strongly abrasive.
47
Technical Report for the Tocantinzinho Gold Project, Brazil | |
Eleven ore samples were selected for measurements of specific gravity and the results showed low specific gravity. The value of specific gravity varies from 2.60 to 2.82 t/m3 with an average of 2.67 t/m3.
| 16.1.3 | Composition of metallurgical ore samples |
Gold and sulfur are routinely assayed with all metallurgical head samples. In addition, a number of other elements including carbon, carbonate, arsenic, mercury, copper, zinc, etc are assayed as well. Findings for a few important elements beside gold are described below.
● | The level of silver in the orebody is low from 0.03 to 1.11 ppm with an average of 0.66 ppm. Silver does not contribute to the economics of this project; |
● | There is a small amount of arsenic in the orebody. Its content ranges from 1.7 to 13 ppm with an average of 3.9 ppm; |
● | Mercury level is low in the order of 0.01 ppm; |
● | There are no other carbon elements other than carbonate. This fact is also reflected in subsequent cyanide leach testing where preg-robbing does not exist at. |
● | Carbonate (CO3) level is low as well, averaging 0.65%. Nevertheless, such a low level of carbonate seems adequate to neutralize all of the acid potentially generated from the oxidation of sulfide minerals (an average sulfide content of 0.27%). It means that the ore has a positive self neutralization capacity for the occurrence of acid generation; |
● | Average levels for cadmium and chromium are 2.2 ppm and 83 ppm, respectively; |
● | Average levels for nickel, cobalt, copper, lead and zinc are 19 ppm, 3.6 ppm, 61ppm, 115 ppm, and 104 ppm respectively. |
| 16.1.4 | Heavy liquid separation |
Gold in the “float product” indicates gold locked in light gangue. Estimated compositions of the “sink product” are 75% pyrite (FeS2), 15% rutile (TiO2), 8% gangue, 2% chalcopyrite (CuFeS2).
Despite a head grade being only 1.4 to 1.6 g/t Au, a high-grade concentrate (83 to 184 g/t Au) is generated. A finer grind size reduces concentrate weight, increases concentrate gradeand with respect to the coarse fraction (+37 μm), also improves gold recovery.
| 16.1.5 | Gravity concentration |
Gravity concentration using a Knelson concentrator was evaluated twice. The first testwork program was carried out by SGS Mineral Services in Canada on four composite ore samples. In general, gold recovery increases with head grade, reaching 41.9% for a high-grade (12.3 g/t) ore sample.
The second testwork program on gravity concentration was conducted by Wardell Armstrong International in UK on three composite ore samples. Four stages of gravity concentration were applied consecutively to each ore sample as the grind size became finer. All three ore samples respond well to gravity concentration, and gold recovery is quite high reaching 73% to 90% with a mass pull being only of 4.2% and a high-grade concentrate (26 ~ 36 g/t).
In all methods tested for gravity concentration (whether heavy liquid media separation, Knelson concentrator and Mozley table), the gold recovery was good with relative low mass pull depending on the number of concentration stages and grinding size. This fact is worthy for processing flow sheet considerations.
48
Technical Report for the Tocantinzinho Gold Project, Brazil | |
| 16.1.6 | Whole ore cyanide leach testing |
In total twelve ore samples have been tested for amenability to whole ore cyanide leach. Hazen Research examined the effect of grind size on gold recovery. Gold recovery was between 85 and 89% while grind size was from 90 to 190 μm. When grind size was coarsened to 390 μm, gold recovery was reduced to 75%. Cyanide consumption was somewhat high between 2.0 and 2.4 kg/t possibly due to low pulp density being used during leach. Lime consumption was reasonable between 0.71 and 0.86 kg/t.
SGS Mineral Services investigated the whole ore cyanide leach with four composite ore samples under a much finer grind size (80% passing 45 to 75 μm). These four ore samples represent a wide range of head grades from 0.97 to 12.3 g/t. Gold recovery was high from 93% to 99%. Gold leach was essentially completed in 24 hours. Cyanide consumption was extremely low from 0.13 to 0.18 kg/t NaCN, and lime consumption was low as well from 0.37 to 0.51 kg/t CaO. These results are quite satisfactory and indicate that whole ore cyanide leach is a suitable process from the metallurgical point of view.
The third testwork program on whole ore cyanide leach was carried out by Wardell Armstrong International on seven ore samples. The impact of grind size on gold recovery was investigated in detail for each of the seven ore samples. All these seven ore samples demonstrate their great amenability to whole ore cyanide leach, and their metallurgical performance is not significantly sensitive to grind size up to 150 μm.
The most encouraging characteristic of Tocantinzinho ore is the amenability for cyanide leaching of the entire body profile, where the ore surprisingly behaves as the well known oxide deposit suitable for cyanide leaching with a corresponding low cyanide consumption to be considered in a conceptual processing. Based on the data results, this conclusion is also applicable for leaching the concentrated ore (sulfides gold bearing fraction). However the optimum recovery seems to be at a relative low particle size (top below 125 microns).
If a real differential performance is to be noted, it would be for the cyanide consumption in core samples of SMKG and SMIG ore which is slightly lower than the overall average of the global composite, “ALL”, (1.13 kg/t). The lime consumption is quite low for sulfides ore.
| 16.1.7 | Flotation testing |
Flotation testwork has been done in detail from batch rougher/scavenger, batch cleaner, locked cycle and continuous pilot plant to examine flotation kinetics, reagent selection, grind size and metallurgical performance of various ore types. In the course of conducting metallurgical testing the reagent suite was greatly simplified and the number of cleaner stages was reduced to one. Overall, flotation performance remained satisfactory.
Overall, gold recovery was acceptable and averaged 92.4% with a concentrate mass pull of only 2.4%. It is reasonable to believe gold recovery will be around 95% when concentrate mass pull is increased to 5%. It is apparent that gold recovery declined moderately as grind size became coarser. The calculated head grade was found quite variable, reflecting the likelihood of nugget effect.
The overall ore sample appeared to be suitable for concentration with proper reagent selection, in a simple process with good recovery and is optimized at relative lower particle sizing (75 microns, 80% passing). However the ore near surface seems to behave as oxide ore, but still is optimized with copper sulfate activated for flotation purpose. Based on test data results it appears that the ore deposit is amenable to cyanide leaching and flotation processing in term of gold recovery. All previous work completed and the latest series of testing seems to validate the high recovery at a relative low mass pull.
49
Technical Report for the Tocantinzinho Gold Project, Brazil | |
| 16.1.8 | Pilot plant flotation |
A pilot plant flotation campaign was undertaken by Wardell Armstrong International in 2011. A composite ore sample designated “ALL” was used. This ore sample represents a global proportion of ore types within the orebody. In total, 3,100 kg material was processed at a rate of 65 ~ 80 kg/h through crushing, grinding, rougher flotation and cleaner flotation. The purpose of the pilot plant campaign was to verify gold recovery and concentrate mass pull, and to generate tailing materials for other testing. Two grind sizes, namely 125 μm and 85 μm, were investigated. The concentrate was then used in cyanide leach testing, and the flotation tailing was subjected to slurry thickening and environmental testing.
Average gold recovery for grind size of 85 μm was 88.9% with an average concentrate mass pull of 4.8%. When grind size was coarsened to 120 μm, gold recovery went up to 93.5% at a concentrate mass pull of 4.5%. The results from 120 μm are acceptable, but somewhat poorer than batch flotation performance. In addition to equipment limitation, nugget effect may have also caused some bias in recovery calculations.
The most recent testing at pilot plant level (2011, Wardell Armstrong International) achieved consistent results with previous lab test works, in a pilot plant using the rougher-cleaning standard steps with reagents usage as: CuSO4.5H2O (50 g/t), SIBX (120 g/t), DF250 (60 g/t). There seems to be a reasonable basis from which to expect an industrial scale operation would attain a relatively high gold recovery of around 90%.
| 16.1.9 | Cyanide leach of flotation concentrate |
A number of flotation concentrate samples were leached with cyanide to evaluate their amenability to cyanide leach. The first leach test was carried out with a concentrate sample containing 144 g/t gold with a particle size 80% passing 67 μm. 98% gold recovery was achieved after 48-hour leach under conditions of 30% pulp density, pH 11.0 ~ 11.6, 4 ppm dissolved oxygen, and 2.0 g/t NaCN cyanide. Reagent consumptions were reasonable, 5.1 kg/t for sodium cyanide, and 1.1 kg/t for lime.
The second leach testwork program examined a variety of concentrates, which were generated from ore samples collected with varied gold head grades, sulfur grades and locations in the orebody. Prior to leach, the concentrates were not reground. All samples excluding LF S4 1CC demonstrate an excellent gold recovery with an average of 98%. The lower recovery with sample LF S4 1CC was caused likely by inappropriate material handling and/or assay bias. Lime consumption was 2.4 kg/t CaO, which is reasonable, but cyanide consumption was quite excessive at 19.2 kg/t NaCN.
In 2010, Wardell Armstrong International continued concentrate cyanide leach testing with seven different concentrate samples. Impacts of air sparging versus oxygen sparing, cyanide concentration and concentrate regrinding were investigated. On average, 96% gold recovery was achieved. Concentrate regrinding seems to improve gold recovery by about 2%. Oxygen sparging showed some noticeable improvement to gold leach rate.
Cyanide leaching test on flotation concentrates once again validate the previous batch testing program at corresponding relatively low cyanide and lime consumption provided the right pulp density and oxygen demand is satisfied to improve the kinetics with a reasonable retention time.
| 16.1.10 | Gravity concentration followed by flotation |
Several tests were carried out to determine whether there are improvements in gold recovery by running gravity concentration first and then floating the gravity tail. All seven samples behaved similarly. On average, gravity concentration recovered 60.5% gold in 4.42% mass. The subsequent flotation recovered another 31.7% gold in 2.27% mass from the gravity tail. Thus, the
50
Technical Report for the Tocantinzinho Gold Project, Brazil | |
ratios of recovery to mass are 60.5 / 4.42 = 13.7 for gravity concentration step, and 31.7 / 2.27 = 14.0 for flotation step. These two ratios are close enough, meaning that gravity concentration and flotation are equally effective at gold concentration. In terms of the total recovery of the combined gravity concentrate and flotation concentrate, such a combination does not improve gold recovery when compared with flotation alone. Nevertheless, such a combination is believed to be beneficial when treating partially or fully oxidized material and when gold theft or gold lock-up is an issue.
Based on the above gravity concentration and flotation testwork results, a combination of these two concentration methods is required. The combined concentrate can then be leached with cyanide for gold extraction into dore.
| 16.1.11 | Slurry thickening |
A number of thickening tests were completed out on the flotation feeds, flotation concentrates, leached flotation concentrate and flotation tailing.
Four continuous thickening tests were carried, one for each flotation tailing. Based on these testwork results, FLSmidth sized the thickeners for flotation tailing at a throughput of 576 t/h. A minimum size of 25.0 m diameter is needed to fulfill the thickening duties for all four tailing materials.
FLSmidth also size the thickeners for flotation concentrate and cyanide flotation concentrate. Based on these sizing data, it seems a diameter of 18.0 m thickener is needed for flotation concentrate.
| 16.1.12 | Cyanide detoxification |
Initial cyanide detox testwork with cyanidation tailing was undertaken by Wardell Armstrong International which achieved only limited success. The cyanide detox testwork was moved to CyPlus in Germarny in early 2011. Testwork is still ongoing as this report is prepared. The testwork is scheduled for completion in May 2011. Three cyanide detox methods, namely, Inco SO2/air, cold Caro’s acid and CombinOx, will be tested and compared.
| 16.2 | Conclusions |
Based on the Tocantinzinho metallurgical testing program and the reported data it appears that direct leaching of a high grade concentrated product of either gravity or flotation is convenient as a single stage to accomplish good recovery. However the use of two stages of concentrate upgrading with gravity and flotation prior to leaching is beneficial when treating a partially or fully oxidized material and when gold theft or gold lock-up is an issue. A result of the additional stage is a slightly lower overall gold recovery.
The benefit of a relatively simple processing plant is the amenability of the entire composite ore body to mining at once or selectively with blending as necessary. However, leaching a relative low mass pull of high recovery gold bearing concentrate to optimize consumption of reagents (sodium cyanide) is recommended to better manage the tailings waste.
51
Technical Report for the Tocantinzinho Gold Project, Brazil | |
| SECTION 17 | Mineral Resource and Mineral Reserve Estimates |
| 17.1 | Mineral Resources |
The mineral resource estimates for the Tocantinzinho Project were calculated under the direction of Dr. Stephen Juras, P.Geo. The estimates were made from a 3D block model utilizing commercial mine planning software. Projects limits, in UTM coordinates, are 577,565 to 578,935 E, 9,330,066 to 9,331,276 N, and -300 to +260 m elevation. Block model cell size was 10 m east x 10 m north x 5 m high.
| 17.1.1 | Geologic and Mineralization Models |
Eldorado has used new data from the last three years of diamond drilling campaigns to update the geologic model for the Tocantinzinho deposit. The resource work evaluated new lithology models, all constructed in 3D. These comprise the main gold bearing granitic unit, and the unmineralized hosting intrusions consisting of the Quartz Monzonite and Hematite Granite/Granite units. The deposit is cut by numerous mafic and felsic dykes (aplite and rhyolite). The former, called Andesite, was the only dyke modeled, and only for the larger bodies. The unmodeled felsic dykes and smaller Andesite dykes that intrude the granitic body will represent local areas of weaker mineralization or internal dilution in the resource model.
To constrain gold grade interpolation for the Tocantinzinho Deposit, Eldorado created 3D mineralized envelopes, or shells. These were based on initial outlines derived by a method of Probability Assisted Constrained Kriging (PACK). The threshold value of 0.20 g/t Au was determined by inspection of histograms and probability curves as well as indicator variography. Shell outline selection was done by inspecting contoured probability values. These shapes were then edited on plan and section views to be consistent with the lithology model and the drill assay data so that the boundaries did not violate data and current geologic understanding of mineralization controls. Figure 17-1 shows the relationship between the PACK, or mineralized shell, and the lithology units.

Figure 17-1: Relationship Between the PACK, or Mineralized Shell, and Lithology Units
52
Technical Report for the Tocantinzinho Gold Project, Brazil | |
| 17.1.2 | Data Analysis |
The lithology units and mineralized domain were reviewed to determine appropriate estimation or grade interpolation parameters. Several different procedures were applied to the data to discover whether statistically distinct domains could be defined using the available geological objects. The lithology categories were investigated within and outside the mineralized shell.
Descriptive statistics, histograms and cumulative probability plots, box plots and contact plots have been completed for gold in the Tocantinzinho Deposit. Results obtained were used to guide the construction of the block model and the development of estimation plans. The data analyses were conducted on 2.00 m down-hole composited assay data. Gold grades are highest and most prevalent in the ore granite phases (averaging 0.85 to 1.00 g/t). The cross cutting felsic dykes are variably mineralized but at lower grades (0.30 to 0.45 g/t). Most of the Andesite unit is unmineralized but in the central parts of the deposit, contact areas to the ore granite phase are commonly mineralized. The remaining intrusive units are barren with respect to gold except for local contact zone type mineralization. The coefficient of variance (CV) for the gold mineralized units is relatively high (greater than 2) indicating influence by outlier gold and internal barren zones.
A 20 to 40 m thick oxidized zone overlies the deposit. Contact profiles or plots, generated to explore the relationship between grade and lithology units, of gold grades within the mineralized shell across the oxidized zone boundary showed transitional trends. Thus no hard grade boundary was used during interpolation between the oxidized and primary lithologies.
| 17.1.3 | Estimation domains |
The data analyses demonstrated that the PACK shell should be treated as a single domain with respect to the gold mineralization. This mineralized shell almost wholly lies within the ore granite phases and its internal dykes. Other modeled lithologies form only a small volume within this shell and for practical purposes can be combined into a single interpolation domain with the ore granite. Units outside the mineralized shell are essentially barren and will be treated as a single domain for interpolation.
| 17.1.4 | Evaluation of Extreme Grades |
Extreme grades were examined for gold, mainly by histograms and cumulative probability plots. Analysis showed that extreme gold grades put about 2% of the contained gold metal at risk of being realized in future production. A hard cap of 25.0 g/t Au applied to the assay data achieves this reduction of risk by removing approximately 2% of contained gold metal from the final grade model. Thirty-three assay intervals were capped.
| 17.1.5 | Variography |
Variography, a continuation of data analysis, is the study of the spatial variability of an attribute. Correlograms were calculated for gold within and outside the PACK shell. Variogram model parameters and orientation data of rotated variogram axes are shown in Table 17-1 and Table 17-2.
Gold inside the mineralized shell displays one main structure: a short ranged, steeply southeast plunging structure. Outside the shell, two structures are shown: both strike northwest-southeast but the first shorter ranged structure dips westward and the second longer ranged structure dips eastward. Dips are moderate. The nugget effects for the inside shell domain is moderate whereas it is low outside the shell. The higher nugget inside the shell is likely reflective of the numerous felsic dykes cutting the ore granite phases.
53
Technical Report for the Tocantinzinho Gold Project, Brazil | |
Table `17-1: Au Variogram Parameters for Tocantinzinho Deposit
| Model | Nugget Co | Sills | Rotation Angles | Ranges | ||||||||||||
| C1 | C2 | Z1 | X1' | Y1'' | Z2 | X2' | Y2'' | Z1 | X1' | Y1'' | Z2 | X2' | Y2'' | |||
| Inside Mineralized Shell | EXP | 0.300 | 0.670 | 0.030 | -56 | 6 | 4 | -93 | 91 | 15 | 16 | 9 | 11 | 573 | 156 | 164 |
| Background Domain | EXP | 0.125 | 0.307 | 0.569 | 44 | 132 | 13 | 47 | 23 | -28 | 44 | 421 | 5 | 91 | 272 | 61 |
| Notes: | Models are exponential (EXP). The first rotation is about Z, left hand rule is positive; the second rotation is about X', right hand rule is positive; the third rotation is about Y", left hand rule is positive. |
Table 17-2: Azimuth and Dip Angles of Rotated Variogram Axes, Tocantinzinho Deposit
| Axis Azimuth | Axis Dip | |||||||||||
| Z1 | X1 | Y1 | Z2 | X2 | Y2 | Z1 | X1 | Y1 | Z2 | X2 | Y2 | |
| Inside Mineralized Shell | 162 | 34 | 304 | 102 | 12 | 87 | 83 | 4 | 6 | -1 | 0 | 89 |
| Background Domain | 242 | 144 | 224 | 173 | 125 | 47 | -41 | -9 | 48 | 55 | -25 | 23 |
| Notes: | Azimuths are in degrees. Dips are positive up and negative down. |
| 17.1.6 | Model setup |
The block size for the Tocantinzinho Model was selected based on mining selectivity considerations (open pit mining). It was assumed the smallest block size that could be selectively mined as ore or waste, referred to the selective mining unit (SMU), was approximately 10 m x 10 m x 5 m. In this case, the SMU grade-tonnage curves predicted by the restricted estimation process adequately represented the likely actual grade-tonnage distribution.
The assays were composited into 2.0 m fixed-length down-hole composites. The composite data were back-tagged by the mineralized shell and lithology units (on a majority code basis). The compositing process and subsequent back-tagging was reviewed and found to have performed as expected.
Various coding was done on the block model in preparation for grade interpolation. The block model was coded according to lithologic domain and mineralized shell (on a majority code basis). Percent below topography was also calculated into the model blocks as well as the oxidized zone.
| 17.1.7 | Estimation |
Modelling consisted of grade interpolation by ordinary kriging (OK) for all domains inside and outside the mineralized shell. Nearest-neighbour (NN) grades were also interpolated for validation purposes. Blocks and composites were matched on estimation domain.
The search ellipsoids were oriented preferentially to the orientation of the mineralized shell for within shell runs and structures defined in the spatial analysis for background runs. All searches had the longest ranges oriented NW – SE. Block discretization was 4 m x 4 m x 2 m.
A two-pass approach was instituted for interpolation. The first pass required a minimum of two holes from the same estimation domain whereas the second pass allowed a single hole to place a grade estimate in any uninterpolated block from the first pass. This approach was used to
54
Technical Report for the Tocantinzinho Gold Project, Brazil | |
enable most blocks to receive a grade estimate. Blocks received a minimum of 3 and maximum of 3 to 4 composites from a single drill hole. Maximum composite limit ranged from 9 to 12.
These parameters were based on the geological interpretation, data analyses, and variogram analyses. The number of composites used in estimating grade into a model block followed a strategy that matched composite values and model blocks sharing the same ore code or domain. The minimum and maximum number of composites was adjusted to incorporate an appropriate amount of grade smoothing. This was done by change-of-support analysis (Discrete Gaussian or Hermitian polynomial change-of-support method), as described in the validation section below.
In the background domain, an outlier restriction was used to control the effects of isolated high-grade composites. An outlier grade of 0.7 g/t Au was implemented for distances to nearest composite exceeding 20 m.
Bulk density data were assigned by rock type. The measured density data were averaged by rock type and the averages used for the assignment process. The ore hosting granite value equalled 2.62 in the primary region and 1.80 in the oxidized portion.
| 17.1.8 | Validation |
Visual inspection
Eldorado completed a detailed visual validation of the Tocantinzinho resource model. According to Eldorado the model was checked for proper coding of drillhole intervals and block model cells, in both section and plan. Coding was found to be properly done. Grade interpolation was examined relative to drill hole composite values by inspecting sections and plans. The checks showed good agreement between drill hole composite values and model cell values. The addition of the outlier restriction value succeeded in minimizing grade smearing in background regions of sparse data.
Model check for change-of-support
An independent check on the smoothing in the estimates was made using the Discrete Gaussian or Hermitian polynominal change-of-support method. This method uses the “declustered” distribution of composite grades from a nearest-neighbour or polygonal model to predict the distribution of grades in blocks. The histogram for the blocks is derived from two calculations:
● | The block-to-block or between-block variance; |
● | The frequency distribution for the composite grades transformed by means of hermite polynomials (Herco) into a less skewed distribution with the same mean as the declustered grade distribution and with the block-to-block variance of the grades. |
The distribution of hypothetical block grades derived by the Herco method is then compared to the estimated grade distribution to be validated by means of grade-tonnage curves. The grade-tonnage predictions produced for the model show that grade and tonnage estimates are validated by the change-of-support calculations over the range of mining grade cut-off values (0.3 g/t to 0.5 g/t Au).
Model checks for bias
The block model estimates were checked for global bias by comparing the average metal grades (with no cut-off) from the model with means from nearest-neighbour estimates (NN). The nearest-neighbour estimator declusters the data and produces a theoretically unbiased estimate of the average value when no cut-off grade is imposed and is a good basis for checking the performance of different estimation methods. For the mineralized shell domain, the mean of the kriged estimate (1.036 g/t) compares favourable with the NN mean (1.020 g/t).
55
Technical Report for the Tocantinzinho Gold Project, Brazil | |
The model was also checked for local trends in the grade estimates by grade slice or swath checks. This was done by plotting the mean values from the nearest-neighbour estimate versus the kriged results for benches (in 20.0 m swaths) and for northings and eastings (both in 50.0 m swaths). The kriged estimate should be smoother than the nearest-neighbour estimate, thus the nearest-neighbour estimate should fluctuate around the kriged estimate on the plots. The observed trends behave as predicted and show no significant trends of gold in the estimates in Tocantinzinho Model.
| 17.1.9 | Mineral resource classification |
The mineral resources of the Tocantinzinho deposit were classified using logic consistent with the CIM definitions referred to in NI 43-101. The mineralization of the project satisfies sufficient criteria to be classified into Measured, Indicated, and Inferred mineral resource categories.
Inspection of the Tocantinzinho Model and drill hole data on plans and sections, combined with spatial statistical work, contributed to the setup of various distance to nearest composite protocols to help guide the assignment of blocks into Measured or Indicated mineral resource categories. Reasonable grade and geologic continuity is demonstrated over most of the Tocantinzinho Deposit, which is drilled generally on 35.0 m spaced sections. A two-hole rule was used where blocks containing an estimate resulting from two or more samples, all within 45.0 m and from different holes, were classified as Indicated mineral resources.
Where the sample density was high along adjacent sections, the confidence in the grade estimates were the highest thus permissive to be classified as Measured mineral resources. A three-hole rule was used where blocks containing an estimate resulting from three or more samples, all within 45.0 m and from different holes, were classified as Measured mineral resources. Results of these assignment protocols were used to create 3D shells for tagging the model as Indicated or Measured mineral resources. Constructing these tagging shells helped eliminate the presence of artefacts common in computer based numeric assignments in resource models.
All remaining model blocks containing a gold grade estimate was assigned as Inferred mineral resources.
A test of reasonableness for the expectation of economic extraction was made on the Tocantinzinho mineral resources by developing a series of open pit designs based on optimal operational parameters and gold price assumptions. Those pit designs enveloped most of the measured and indicated mineral resources thus demonstrating the economic reasonableness test for the new estimate and reporting cut-off grade of the Tocantinzinho mineral resources.
| 17.1.10 | Mineral resource summary |
The Tocantinzinho mineral resources estimated by Eldorado as of 31 December 2010 are shown in Tab;e 17-3. The mineral resource is reported at a 0.3 g/t Au cut-off grade.
Table 17-3: Tocantinzinho Mineral Resources, as of 31 December 2010
| Mineral Resource Category | Tonnes (x 1000) | Grade (Au g/t) | In Situ Gold (oz x 1000) |
| Measured | 19,777 | 1.29 | 820 |
| Indicated | 50,457 | 0.97 | 1,574 |
| Measured+Indicated | 70,234 | 1.06 | 2,394 |
| Inferred | 6,950 | 0.66 | 147 |
56
Technical Report for the Tocantinzinho Gold Project, Brazil | |
Examples of representative sections and plans containing block model grades, drill hole composite values and domain outlines are included in Appendix B.
| 17.2 | Mineral Reserves |
| 17.2.1 | Cut-Off Grade Analysis |
Cut-off grades were estimated for various gold prices and rock types by applying the processing costs, G & A costs, NSR Royalty, Transport and refining costs and estimated recoveries. Table 17-4 provides a summary of the analysis results and the input parameters.
The reserves were calculated using a US$1,000 per oz gold price and the corresponding cut-off grade of 0.49 g/t for hard rock and 0.43 g/t for saprolite.
Table 17-4: Cut-off Grade Analysis
| Paramaters | ||
| Saprolite Milling Costs | 8.40 US$/t | |
| Hard Rock Milling Costs | 11.38 US$/t | |
| G&A Costs | 2.05 US$/t | |
| NSR Royalty + CFEM | 2.50 % | |
| Transport and Refining | 5.00 US$/oz | |
| Saprolite Recovery | 78.8 % | |
| Hard Rock Recovery | 90,1 % | |
| Cut-off Table | ||
| Gold Price (US$/oz) | Cut-off Grade (g/t) | |
| Saprolite | Hard Rock | |
| 800 | 0.53 | 0.60 |
| 850 | 0.50 | 0.56 |
| 900 | 0.47 | 0.53 |
| 950 | 0.45 | 0.50 |
| 1000 | 0.43 | 0.49 |
| 1025 | 0.41 | 0.47 |
| 1050 | 0.40 | 0.46 |
| 1100 | 0.39 | 0.44 |
| 1150 | 0.37 | 0.42 |
| 1200 | 0.35 | 0.40 |
| 17.3 | Pit Optimization |
An optimized pit shell was used as the basis for the open pit designs. This shell was created using Whittle, an industry standard software program. A block model of gold grades, density and rock type was first created in Gemcom Gems software and then exported for analysis
57
Technical Report for the Tocantinzinho Gold Project, Brazil | |
| 17.3.1 | Block model setup |
A topographic surface of the Tocantinzinho area was imported into Gemcom. This surface was derived from laser measurements. The area is covered in dense jungle with a canopy that can reach 25.0 m, so a check on the topographic surface was performed to test the accuracy compared to known surveyed ground points. Points on the surface were compared with surveyed points used in geophysical (IP) surveys and with the surveyed drillhole collars. Based on the comparison, there did not appear to be a bias in the topographic contours, and the surface was used without any further adjustments. The surface, satellite image and the comparison points are shown in Figure 17-2.
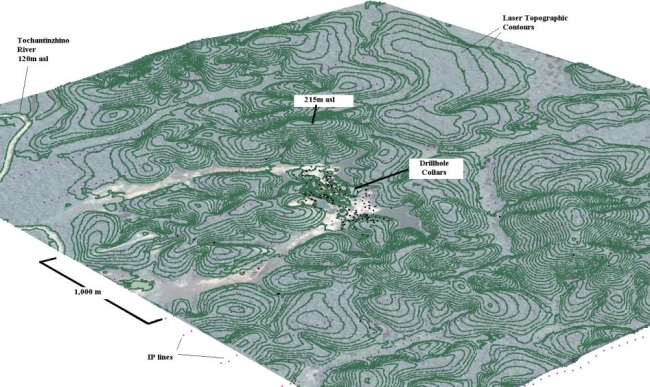
Figure 17-2: Laser Topography and Surface Survey Points – Looking North
The Tocantinzinho resource block model was imported into Gemcom software.
The blocks were populated with a value for Au grade and class using the values from the resource model. Each block was then updated with a rock type integer based on a lithological and weathering model of the deposit created by Eldorado Gold geologists familiar with the project. This model had 8 rock types and a single boundary distinction between saprolite and hard rock.
In some tropical mining operations a weathering type called “transition” is used. In the case of Tocantinzinho what could be called a transition zone is very narrow, and is thus assumed not to play a meaningful role in this level of evaluation.
The density of each block was then updated based on the rock type from the lithological model. The rock type codes and the corresponding densities used in the block model are shown in 17-5.
| 17.3.2 | Pit optimizations |
The block model, including the Au grade, density, rock type and topographic surface were exported from Gems and imported into Whittle software. Using the software, a series of optimized pit shells were developed. The parameters used to develop the shells are shown in Table 17-6.
58
Technical Report for the Tocantinzinho Gold Project, Brazil | |
Table 17-5: Rocktype and Density used in Block Model
| RockType | Weathering | Block Model Code | Density |
| Andesie | Saprolite | 11 | 1.80 |
| Hard Rock | 12 | 2.74 | |
| Hematized Granite | Saprolite | 21 | 1.80 |
| Hard Rock | 22 | 2.62 | |
| Granite | Saprolite | 31 | 1.80 |
| Hard Rock | 32 | 2.62 | |
| Quartz Monzonite | Saprolite | 41 | 1.80 |
| Hard Rock | 42 | 2.68 |
Table 17-6: Input Parameters for Pit Shell Optimizations
| Parameters | Value |
| Gold Price | 300 – 1500 US$/oz |
| Selling Costs | 5.00 US$/oz |
| Mining Costs | Saprolite: 1.20 US$/t |
| Rock: 1.75 US$/t | |
| Processing Costs | Saprolite: 8.50 US$/t |
| Rock: 11.5 US$/t | |
| G+A Costs | 2.00 US$/t |
| Metalurgical Recovery | Saprolite: 75.0% |
| Rock: 90.0% | |
| Royalty | 2.5% (NSR + CFEM) |
Slopes* | Saprolite: 30º - 36º |
| Rock: 40º - 45º |
*Variable according to sector and rock type.
The results of the pit optimization are summarized in Table 17-7. The highlighted pit shell is optimal for the US$1,000 per oz gold price. The results are graphically displayed in Figure 17-3.
Table 17-7: Results of Pit Optimizations
| Gold Price (US$/oz) | Tonnes Rock (kt) | Tonnes Ore (kt) | Strip Ratio | Grade (g/t Au) | Gold Ounces (oz) |
| 400 | 18,642 | 3,886 | 3.80 | 2.12 | 264,524 |
| 500 | 71,704 | 15,671 | 3.58 | 1.77 | 890,997 |
| 600 | 116,926 | 25,515 | 3.58 | 1.60 | 1,310,281 |
| 700 | 138,846 | 32,554 | 3.27 | 1.47 | 1,543,583 |
| 800 | 173,089 | 40,273 | 3.30 | 1.38 | 1,786,431 |
| 900 | 188,965 | 45,573 | 3.15 | 1.31 | 1,918,818 |
| 1000 | 208,624 | 50,956 | 3.09 | 1.25 | 2,043,912 |
| 1100 | 215,749 | 54,130 | 2.99 | 1.21 | 2,103,347 |
| 1200 | 226,449 | 57,498 | 2.94 | 1.17 | 2,166,548 |
| 1300 | 235,371 | 59,967 | 2.93 | 1.15 | 2,210,418 |
| 1400 | 245,638 | 62,055 | 2.96 | 1.13 | 2,248,891 |
59
Technical Report for the Tocantinzinho Gold Project, Brazil | |

Figure 17-3: Results of Pit Optimizations
| 17.3.3 | Mineral Reserve Statement |
Mineral reserves were calculated in accordance with CIM standards using the mineral resource block model within an engineered pit design. The pit design was based on an optimized pit shell as described in Section 19.1.4, using the US$1,000/oz gold price. Blocks above a 0.49 g/t cut-off grade for hard rock and 0.43 g/t cut-off for saprolite are considered ore. Those mineral resource blocks with a measured class converted into proven reserves, while the indicated blocks converted into probable reserves. Mineral resource blocks classed as inferred were treated as waste. No additional modifying factors were used in the reserve estimate.Table 17-8 presents the mineral reserve estimate for the Tocantinzinho Project, as of 31 December 2010.
Table 17-8: Tocantinzinho Mineral Reserve Estimate
| Category | Tonnes (kt) | Gold Grade (g/t) | Gold Contained (oz x 1000) |
| Proven | 17,735 | 1.39 | 792 |
| Probable | 31,315 | 1.17 | 1,183 |
| Proven and Probable | 49,050 | 1.25 | 1,975 |
60
Technical Report for the Tocantinzinho Gold Project, Brazil | |
| SECTION 18 | Other Relavant Data and Information |
| 18.1 | Geotechnical and Hydrogeological analysis |
| 18.1.1 | Geotechnical Studies and Pit Slope Design |
A program of geotechnical data collection and analysis was conducted to form the basis for slope design used in the open pit. This program was carried out by Golder and consisted of drilling and logging 6 oriented core holes and an additional logging of 11 exploration holes which were non-oriented. Golder also conducted kinematic and limit equilibrium analysis and prepared recommendations for slope designs.
Data collection by Golder
Six diamond core holes were drilled to test the rock mass in the planned pit wall, the locations of the holes are shown in Figure 18-1. The holes were oriented using the ACT REFLEX device and the punch mark method. The holes were then logged for lithology, fracture orientation, fracture roughness, RQD and rock mass classification. An additional 11 exploration holes were logged for lithology, RQD and rock mass classification.
A selected summary of the geotechnical data that was collected is presented in the sections that follow.
Table 18-1: List of Drillholes Logged by Golder

Figure 18-1: Locations of Oriented Geotechnical Drill Holes and Planned Open pit Design
61
Technical Report for the Tocantinzinho Gold Project, Brazil | |
Fracture orientation
Fracture orientations were measured by Golder from the oriented drill cores. The strike and dip of all fractures were recorded and then summarized in stereo net plots. Figure 18-2 shows all fractures measured in the 6 oriented geotechnical drillholes.

Figure 18-2: Fracture Orientations Measured in all Geotechnical Drill Holes (3980 poles)
Classification logs
In total 17 core holes were logged and intervals were assigned a geo-mechanical class designation of either Class II/I, Class III, Class IV and Class V. Generally Class V corresponds with saprolite material, while Class II/I is fresh un-weathered rock. Classes III and IV represent a rockmass which is either slightly weathered, or highly fractured. A series of geomechanical sections were created from the classification, an example section spanning G-TOC-004 and G-TOC-002 is shown in Figure 18-2.
62
Technical Report for the Tocantinzinho Gold Project, Brazil | |

Figure 18-3: Geomechanical Model of Tocantinzinho
Data analysis by Golder
Golder also analyzed the geotechnical data. Two basic analyses were preformed and these were kinematic failure analysis and overall slope failure analysis.
Kinematic analysis
Kinematic failure analysis was usued to determine the likely mode of failure on a given bench orientation. An example of the analysis is shown in Figure 18-4 and Figure 18-5. For each geotechnical hole and corresponding stereonet, Golder took the orientation of the pit wall and conducted a graphical analysis to determine which fracture planes are able to slip in a planar mode of failure and which fracture plane combinations are able to slip in a wedge plane type of failure. This analysis was used in recommending the slope design.
63
Technical Report for the Tocantinzinho Gold Project, Brazil | |

Figure 18-4: Example of Kinematic Failure Analysis (G-TOC 004 – Planar Failure Analysis
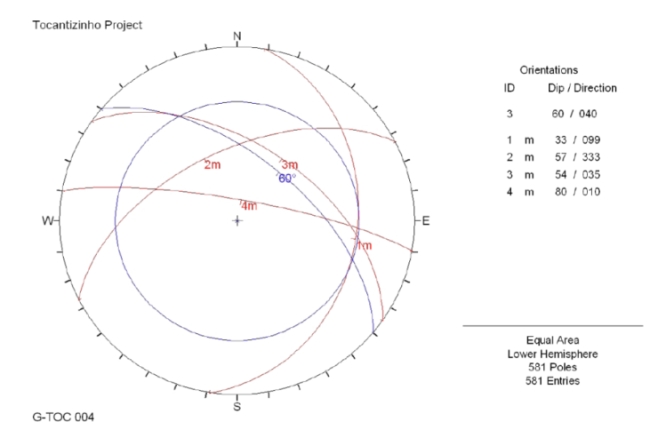
Figure 18-5: Example of Kinematic Failure Analysis (G-TOC 004 – Wedge Failure Analysis)
Slope failure analysis
An anlysis of overall slope failure using an industry standard software product based on a limit equilibrium numerical method was conducted. The input parameters were estimated from Golder’s experience with other projects. A recomenation was made to carry out additional strength testing including uniaxial compressive tests and direct shear tests in order to get site specific information. The input parameters used in the overall slope failure analysis are shown in Table 18-2.
64
Technical Report for the Tocantinzinho Gold Project, Brazil | |
Table 18-2: Input Parameters for Slope Failure Analysis
| Type | Rock Class | Cohesion (KPa) | Friction Angle (°) | Unit weight (kN/m³) |
| Granite | V/IV | 25 | 32 | 18 |
| III | 300 | 38 | 24 | |
| II/I | 700 | 42 | 27 |
The results of the overall slope failure analysis are shown in Figure 18-6 and Figure 18-7. The results indicate that a 46 degree overall slope with a 300.0 m height will have a factor of safety of 1.33 while a 42 degree slope of the same height will have a factor of safety of 1.41.

Figure 18-6: Results of Overall Slope Failure Analysis (FS=1.41)
65
Technical Report for the Tocantinzinho Gold Project, Brazil | |
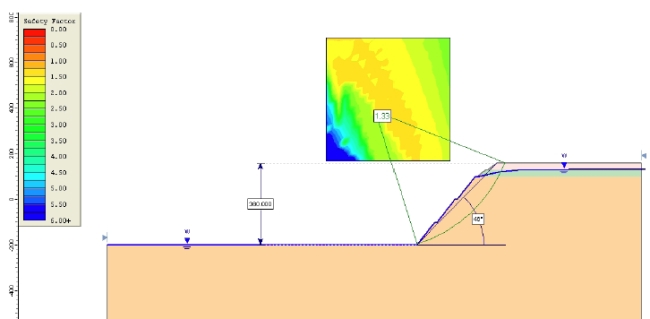
Figure 18-7: Results of Overall Slope Failure Analysis (FS=1.33)
Golder conclusions and slope design recommendations
Golder concluded that overall slope failure would not be the most critical type of failure in the open pit. They also concluded that 6 geotechnical sectors were relevant with wedge failures being most likely in sector 4 and with planar failures being the most likely in sectors 1 and 3.
Recommendations for slope design which are shown in Table 18-3, which included 10 slope designs varying between 4 sectors and 3 rock mass classes.
Table 18-3: Golder Recommendations for Slope Design
| Sector | Rock Mass * | Average Thickness (m) | Bench Geometry | IRA (foot x foot) | Overall Angle (Considering the inter Ramp Berms) | ||
| Bench Face Angle | Height (m) | Berm Width (m) | |||||
| 1 | Class V | 30 | 55° | 10 | 6.5 | 36,5° | 44,5° |
| Class III with some class II | 30 | 60° | 10 | 6.2 | 40.0° | ||
| Class II/I | 300 | 65° | 20 | 8.0 | 49.0° ** | ||
| 2 - 5 | Class V | 30 | 55° | 10 | 6.5 | 36,5° | 43.0° |
| Class II/I | 300 | 60° | 20 | 8.1 | 45.5° ** | ||
| 3 - 4 | Class V | 30 | 55° | 10 | 6.5 | 36.5° | 42.0° |
| Class III with some class II | 30 | 60° | 10 | 6.2 | 40.0° | ||
| Class II/I | 300 | 60° | 20 | 8.1 | 45.5° ** | ||
| 6 | Class V | 30 | 55° | 10 | 6.5 | 36.5° | 46,0° |
| Class II/I | 300 | 65° | 20 | 8.0 | 49.0° ** | ||
*10 m berm between each class of rock mass;
**Maximum IRA height of 140 m (7 benches) with a 10.5 m berm every 7 benches.
66
Technical Report for the Tocantinzinho Gold Project, Brazil | |
| 18.1.2 | Hydrogeological Analysis |
This section describes the hydrogeologic conditions of the Tocantinzinho Project Area. Most of the information used in this section was based on the VOGBR Report titled “Preliminary Report on Hydrogeological Pre-Feasibility Studies for the Tocantinzinho Project – Pit” (2010).
Geologic conditions
The principal geologic units in the project area consist of intrusive igneous bedrock composed of granite and quartz monzonite, altered granite, andesite, and rhyolite associated with the Tocantinzinho shear zone, and overlying saprolite and residual soils derived from deep weathering of the bedrock. Locally, the Tocantinzinho shear zone is within two extensive sub-vertical faults that strike N-NW. In the project area, the shear zone is approximately 500 to 700 m in width.
The intrusive igneous bedrock complex in the Tocantinzinho Project area is extensive and shows no foliation or cleavage features. Below approximately 70.0 m depth, the rock mass is fresh, very competent, and exhibits few fractures. Within the mineralized zone of the shear zone, however, the rock mass is more altered and fractured.
The residual soil and saprolite layer varies in thickness from 10 to 35 m. The texture of the saprolite varies, depending on the original parent rock. Saprolites derived from granitic rocks typically have a sandy-clayey texture.
Below the residual soil/saprolitic layer is a horizon of highly-fractured fresh bedrock, with thickness ranging from 20 to 70 m. The average thickness of this horizon is approximately 50 m.
Groundwater recharge in the project area is not well known, but was estimated to range from 220 to 660 mm per year, based on 10 to 30 percent of average annual rainfall. However, based on our past experience of working on projects in similar conditions (i.e. sub-tropical climates with low permeability saprolitic soil profiles), the average annual recharge rate is more likely to be in the range of 5 to 10 percent of annual rainfall, which results in a range of approximately 100 to 200 mm per year.
Hydrogeologic units
VOGBR identified three principal hydrogeologic units based on weathering profile and degree of fracturing. The three principal hydrogeologic units include:
● | Residual Soil/Saprolite (SR) - The residual soil and saprolite zone (SR) is generally uniformly distributed across the project site, but exhibits local variation in thickness, ranging from 8 to 80 m, with an average thickness of 35 m; the thicker sequences of this zone are found in topographically higher areas. Saprolite is formed from the deep weathering and oxidation of the underlying bedrock, and is comprised primarily of fine-grained soil particles, such as a silty-clay. Residual soils and saprolite derived from granitic bedrock are typically coarser with a textural composition of a sandy-clay. |
● | Highly-Fractured Rock Mass (RMF) - A horizon of highly-fractured, slightly altered bedrock underlying the saprolite is prevalent throughout the project area. This horizon ranges in thickness from 20 m to over 70 m, with an average thickness of 50 m. The primary conduit of fluid flow is through fissures and fractures in the rock. No hydraulic conductivity or permeability testing data were available to review for this report, but the hydraulic conductivity was qualitatively estimated to be “moderate”. |
● | Fresh Rock Mass (RS) - Fresh bedrock occurs below 70 m depth on average across the Tocantinzinho project area. This unit is described as very competent rock with few fractures and faulting observed in the wall rock and is anticipated to have very low |
67
Technical Report for the Tocantinzinho Gold Project, Brazil | |
| hydraulic conductivity. However, fractures and faulting are observed in the mineralized zone within the shear zone; therefore, the hydraulic conductivity in the mineralized zone is expected to be greater. Based on these observations, VOGBR separated the RS into two units based on degree of fracturing: |
| o | Fractured Fresh Rock Mass (RSF) - The fractured fresh rock mass occurs within the mineralized zone of the shear zone and is more permeable than the surrounding, slightly fractured bedrock. The orientation of the fracturing is generally in the same direction as the shear zone (NW-SE) and is sub-vertical. The depth of this unit is not known, but fracturing and faulting were observed at depths of up to 300 m. Evidence of water from staining and alteration were observed in fractures during exploratory drilling. |
| o | Slightly Fractured Fresh Rock Mass (RSPF) - This unit is primarily composed of quartz-monzonite and granite bedrock and occurs on the NE and SW sides of the shear zone. This unit is described as having fewer fractures than the RSF unit and is considered very competent and of low permeability. |
Groundwater occurrence
Springs
VOGBR identified 42 spring and seep locations during their field investigation in September 2010. Figure 18-8 is a summary of the springs and seeps in the project area, including lake water level elevations and water course elevations. Many of the springs were described as “diffuse” and were observed in mostly sandy-clayey (areno-argillaceous) soil types; higher seepage rates were typically observed from coarser-grained soil types. Measurable seepage from these springs ranged from 0.04 to 0.91 liters/second (L/s). The seepage from these springs is considered to be representative of baseflow, because they were measured at the end of the dry season.
Residual soils/saprolite (SR)
The VOGBR report, groundwater occurrence in the SR is primarily characterized by unconfined conditions and typically mimics surface topography. The occurrence of groundwater in the project area is based on depth to water measurements made in 37 exploratory drillholes.In the local highlands, groundwater was typically observed near the contact between the saprolite and the underlying bedrock. Depth to groundwater observed in the exploratory holes ranges from flowing artesian to over 18 m below collar elevation. Groundwater elevations1 ranged from 136 to 149 m. Flowing artesian conditions were observed in TOC-115 and TOC-145A, which are both deep boreholes located in topographic low areas.
Figure 18-8 presents a groundwater contour map in the Tocantinzinho Project Area in the vicinity of the proposed open pit location. The groundwater system is recharged via the infiltration of precipitation in topographically higher areas with discharge in the topographically lower areas (i.e. stream drainages and lakes). In general, localized groundwater flow is from hill tops to stream drainages or lakes. As seen on Figure 18-8 , groundwater flow in the SR unit is dissected into about four different areas due to the undulating topography. The general groundwater flow directions are summarized below:
● | Area 1 (Northwest area) – groundwater flow is ultimately to the west; |
● | Area 2 (Central area) – groundwater flow is ultimately to the south-southwest, following the main stream channel; |
68
Technical Report for the Tocantinzinho Gold Project, Brazil | |
● | Area 3 (East-Northeast area) – groundwater flow is ultimately to the north-northwest; and |
● | Area 4 (Southeast area) – groundwater flow is ultimately to the east-southeast. |

Figure 18-8: Groundwater Contour Map
Highly-fractured rock mass (RMF)
Groundwater occurrence in the highly-fractured rock mass is not well understood, but it is assumed to be fully saturated, given the overlying saturated conditions in the saprolite. The primary conduit for groundwater flow in the RMF is likely through the high density fractures with minor contribution of water from the rock matrix. The direction of groundwater flow may follow the same pathways as the overlying SR. More information about the hydraulic characteristics of this unit will be available in the future following the results of the hydrogeological field program implemented by VOGBR in 2011.
69
Technical Report for the Tocantinzinho Gold Project, Brazil | |
Fresh rock mass (RS)
Groundwater occurrence in the RS unit is not well understood, but based on the results of the drilling exploration program, groundwater will primarily occur in the fractures of the RSF unit. The RSPF unit is much more competent and less fractured than the RSF unit, and therefore may act as a barrier to groundwater flow. The groundwater occurrence in the RSF unit is under confined conditions and the general groundwater flow is likely horizontal due to the relatively low regional relief of the area. The direction of groundwater flow is presumed to be primarily in a NW-SE direction, parallel to the strike of the Tocantinzinho shear zone. Current available data show no evidence of a hydraulic connection between the deep groundwater in the pit area and the Tocantinzinho River. However, the presence of faults trending NW-SE have the potential to provide hydraulic communication between the open pit and the river and influence the quantities of groundwater inflow.
Open pit inflow
Mine inflows will be from groundwater, surface runoff, and precipitation. For the groundwater inflow component, the primary sources include the saprolite (SR), the highly-fractured rock mass horizon (RMF), and the fractured fresh rock mass within the mineralized zone (RSF). For dewatering purposes, VOGBR suggested that as the pit is excavated in the first phases of mining, the SR and RMF units will need to be dewatered and depressurized.
Dewatering or depressurization the SR using wells will probably not be effective, because of the low permeability and high storage capacity characteristics of this unit. If dewatering and depressurization of the ST unit is required for geotechnical stability purposes, horizontal drains would be required. Water from the drains would be collected on the pit benches and pumped from the pit.
Depending on the results of the planned hydraulic testing by VOGBR, the RMF and RSF units may be depressurized using dewatering wells located at the northwest and southeast ends of the pit. The RMF will likely have the best potential for dewatering from groundwater extraction wells, due to the degree of fracturing and absence of fine-grained materials.
During the later stages of mining, more of the fresh rock mass (RS) will be exposed in the pit walls. Groundwater contribution to the pit from the slightly fractured wall rock (RSPF) is expected to be minimal and can be controlled by sump pumps installed in the bottom of the pit. Groundwater inflow from the fracture rock mass (RSF) may be more of a concern, depending on the permeability of this unit and its hydraulic connection to the Tocantinzinho River.
Mine inflows from precipitation and surface water run-off from the pit slopes will occur primarily during the rainy season (i.e. November to June), with the greatest amount of inflow occurring during February and March (on average). In the dry season (i.e. July to October), evaporation exceeds monthly rainfall on average thus inflow from rainfall and surface run-off will be minimal.
A water balance should be prepared for the pit to estimate the quantities of precipitation, surface water and groundwater inflow to the open pit. The dewatering system should be designed based on the hydrogeological and hydrological investigation planned as part of the feasibility study.
Post closure conditions
The post-closure condition of the pit is expected to be a pit lake with discharge via groundwater and or surface water to the tributaries of the Tocantinzinho River. Upon completion of mining and cessation of dewatering, the pit will fill with water from groundwater, surface runoff, and precipitation. The amount of time it will take for the pit lake to reach steady-state cannot be estimated from the available data, but will depend on the ultimate pit depth and volume of excavation as well as the estimated total annual average combined inflow.
70
Technical Report for the Tocantinzinho Gold Project, Brazil | |
| SECTION 19 | Additional Requirements for Technical Reports on Development Properties and Production Properties |
| 19.1 | Mining |
This section contains the details of the mine design, reserve estimate, mining costs and mining fleet requirements for the Tocantinzinho Project carried out by Eldorado. The mine was designed as a single open pit operation using 3 pit Phases mined over 11 years, including a pre-stripping year, with a peak mining rate of 26 million tonnes of material per year. The open pit is designed to a depth of 345.0 m using an overall slope angle that ranges from 35 - 43 degrees. The mining fleet was selected to excavate a 5.0 m bench using a truck and shovel fleet. The average cost of mining a tonne of material is estimated to be US$1.66/t based on a labour rate study and quotes for diesel, explosives and tires.
| 19.1.1 | Mine Design Parameters |
The mine design parameters were prepared to take into consideration the selective mining unit (SMU) and the size of the fleet. The selective mining unit was determined to be a 10 x 10 m block in plan view and a 5.0 m face. Based on this size, a fleet of 100 st haul trucks and 10 - 13 m3 shovels was considered optimal. The SMU size also defines the drilling pattern since the burden and spacing must be matched to the face height.
Slope design
The slope design used in the open pit design was based on the geo-technical data collected, the recommendations from Golder, on experience, and best practice. Three slope designs for the open pit were used and divided between hard rock and saprolite regions and the sectors proposed by Golders. A summary of the slope design regions is shown in Figure 19-1. As shown a boundary between the saprolite and hard rock slopes was set at 100 m asl. This elevation was considered reasonable in that it is similar to the logged saprolite units from the lithology and weathering model used to populate the rock type model and it is also similar to the base of the Class III model prepared by Golder.
Direct use of the geotechnical sections prepared by Golder is not warranted since no drill holes were executed to test the saprolite/rock interface in the wall of the currently planned open pit. For the purposes of this study, 100 m asl is considered a reasonable boundary between the hard rock and saprolite slope designs. Additional drilling would be required to test this assumption, however it is not considered to be a critical component of the overall project.
71
Technical Report for the Tocantinzinho Gold Project, Brazil | |
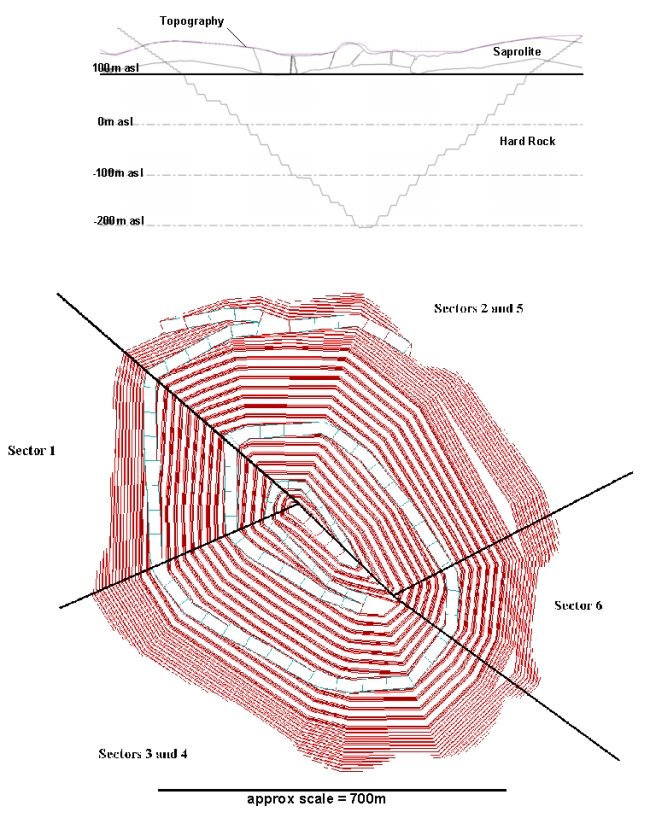
Figure 19-1: Slope Design Regions Used in Open Pit Design
The design for saprolite slopes is shown in Figure 19-2 and is based on a single bench (5.0 m) height and an inter-ramp angle of 36.5 degrees, this design is used in all sectors. A single 5.0 m bench design was used in lieu of the Golder recommendation for 10.0 m double benches, since experience with saprolite slopes indicates a 5.0 m face in saprolite performs much better especially with respect to surface water erosion. Surface ditching and run-off control measures are planned around the pit rim and are a key component of saprolite slope design.
72
Technical Report for the Tocantinzinho Gold Project, Brazil | |

Figure 19-2: Saprolite Slope Design in all Sectors
The designs for the hard rock slopes vary per sector, as recommended by Golder. The designs will utilize controlled blasting techniques including buffer blasts and pre-splits. The pre-split is planned to be for a quad bench (20 m) application and will be drilled once every 4 benches The inter-ramp slope angles per sector are the same as the Golder recommendations, however the bench face in all sectors was set at 70 degrees. This is a change from the Golder recommendation and was selected to reduce the probability of falling rocks being “kicked” into the pit on a flatter face angle which is especially relevant since the face will be excavated in 4 lifts which will tend to leave behind ledges.
 Figure 19-3: Hard Rock Slope Design Sectors 2-5 |  Figure 19-4: Hard Rock Slope Design Sectors 1 & 6 |
Ramp design
Haulage ramps were designed with consideration for the size of equipment. The base haulage unit was selected to be a 100 st CAT 777F truck which has an operating width of 6.4 m and a tire height of 2.6 m.
73
Technical Report for the Tocantinzinho Gold Project, Brazil | |
● | A berm height equal to at least half the tire height; |
● | A passing width between trucks equal to ½ the operating width; |
● | A ditch along the toe of the wall. |
Based on these factors two designs were created, including a 25.0 m wide double lane traffic design which is used in the majority of the pit. This design has a 10% gradient, and a 15.0 m wide single lane traffic design which was used to access the final 70 m of the pit (from bench -135RL to -205RL). This design utilizes a 12% gradient.
The reason for selecting a single lane design in the lower portion of the pit is because the truck requirements drop off dramatically in the final years due to a reduction in waste stripping. This will makes it possible to manage single lane traffic without causing significant truck waiting time.
Drill and blasting design
The drill and blast pattern was designed to match the 5.0 m face height, provide adequate explosive distribution for optimal fragmentation, and provide sufficient sampling points for grade control. The design is based on the following parameters:
● | 165 mm (or 6.5“) drill holes; |
● | A sub-drill of 0.5 m; |
● | Equilateral distribution of holes (3.7 x 4.3 m patterns). |
Grade control sampling
All rock units, including saprolite and hard rock will be drilled and sampled for grade control purposes. The drilling will be conducted using a Sandvik D25 drill rig equipped for a single pass and with capability for either a down the hole hammer or a top hammer as needed depending on rock conditions. Grade control samples will be collected from drill cuttings and sent to an onsite laboratory for gold content analysis.
A double pan method, in which two pans measuring approximately 20 x 10 cm are inserted into the stream of cuttings is planned. This method collects a sample from both the top portion and the bottom portion of the hole and then the samples are mixed into one bag weighing approximately five to ten kg. For this method, one full time sampler will be assigned to each drill rig.
Explosives
The explosive type and loading amounts required to develop adequate fragmentation will depend on numerous site conditions such as hardness of the rock and in-hole water conditions. These conditions will vary throughout the pit and will vary during wet and dry seasons of the year.
It is assumed that all saprolite material will be free digging and will not require blasting, while all hard rock material will require blasting. ANFO explosives are planned to be used whenever possible; however during the wet season it is assumed that some emulsion would be required as a mix with ANFO (or in a 100% emulsion product) so as to avoid problems with water. The following explosive consumption parameters were assumed in this study:
● | An average powder factor of 0.25 kg of explosives/tonne of rock; |
● | An overall mix of 70% ANFO and 30% Emulsion explosives; |
● | All blast holes tied-in with non-electric surface delays and detonation cord; |
74
Technical Report for the Tocantinzinho Gold Project, Brazil | |
● | One primer and cap per hole; |
● | Crushed rock stemming. |
These parameters were derived from experience with other operations and further study is warranted during the feasibility stage as more information on the local conditions such as hydro-geology and rock strength become available.
Mining dilution and recovery
Mining dilution and ore recovery were estimated at 0% and 100% respectively. Figure 19-5 shows a plan and section view of the orebody with the block grades. As shown, the orebody is robust and block grades above a cut-off of 0.5 g/t have continuity in plan as well as at depth. As a result, it is reasonable to assume that 100% recovery of the planned ore blocks above the cut-off grade is possible, and any diluting material would be from adjacent ore blocks. This assumption appears valid within the ore zone but could be refined along the boundary of the zone. For the purposes of this study the dilution occurring along the boundary of the ore zone was assumed to be minimal and not taken into account.
It is also noted that the selective mining unit and block size of 10 x 10 m in plan view is contrasted with a grade control sampling grid of 4.3 x 3.7 m. As such each block will have 6 grade control sampling points and thus more opportunity to be more selective in the design of the actual mining packets.

Figure 19-5: Plan View – Elevation -45m and Section View – Looking NW, Showing Block Grades
| 19.1.2 | Mine Equipment and Personnel |
The type of mining equipment was selected to match the selective mining unit (SMU) size, the pit geometry and the production requirements. The size of the fleet was estimated in order to meet the production requirements and included analysis of the haulage routes over the life of the project and the productivity assumptions for drills and loading units. The fleet was divided into minor and major fleets and the major fleet was further divided into drilling, loading/hauling and support equipment. Mine personnel requirements were estimated based on the fleet size, the shift roster, and estimates for administration staff and maintenance staff.
75
Technical Report for the Tocantinzinho Gold Project, Brazil | |
For the study based on the SMU size, a fleet of Hitachi 1900-6 front shovels equipped with a 13.0 m3 bucket were selected as the primary loading unit. This unit will be able to load a CAT 777F haul truck in an average of 4 passes and as such the combination of these units is considered a good match. In addition to the front shovel a Hitachi 1900-6 excavator with an 11.0 m3 bucket is planned for top loading and sump excavation as required. A CAT 992 loader is also planned as a backup loading unit for use when the Hitachi 1900 shovels and excavator are being maintained. The Sandvik D25 drill was selected as the primary drilling unit, as this unit has the capability of single pass drilling of the required production holes. A Sandvik Di500 was selected to drill the 20.0 m pre-split holes in the final Phase 3 pit, this unit can also be used for short horizontal dewatering holes if necessary. Support equipment was selected from Caterpillar and these units include CAT 345 excavators, CAT 730 articulated trucks and CAT D6 and CAT D9 dozers and the CAT 16M grader and CAT 834 wheel dozer.
Haulage requirements
The haul truck requirements were estimated by calculating cycle times throughout the life of the project. The cycle time represents the time required for a hauling unit to be loaded by a loading unit, travel to the destination (ore or waste), dump the load and then return back to the same loading unit. Numerous parameters are used in the cycle time calculation and these are shown in Table 19-1. The parameters were estimated from experience with similar mining fleets and were checked against manufacturer data such as rim-pull curves using various assumptions for gradient and rolling resistance.
Table 19-1: Truck Cycle Time Parameters
| Truck Speed Assumptions | |
| Speed Loaded Uphill | 10 Km/h |
| Speed Loaded on Dump or in Pit | 30 Km/h |
| Speed Empty on Dump or in Pit | 42 Km/h |
| Speed Empty Downhill | 50 Km/h |
Other Cycle Time Assumptions | |
| Dump Spotting Time | 20 seconds |
| Dumping Time | 30 seconds |
| Acceleration Time | 10 seconds |
| Shovel First Load | 10 seconds |
| Loading Spotting Time | 20 seconds |
| Shovel Loading Time | 135 seconds |
Based on these parameters, a spreadsheet analysis was conducted to calculate the average cycle time per bench for ore and waste from each of the 3 designed pit Phases. This analysis took into consideration the depth of the pit and the increase in waste dump elevation over the life of the operation. The analysis was then compared to the production schedule to derive an average cycle time by year for each pit phase which was used to calculate haulage unit requirements. The average cycle time per phase is shown in Table 19-2.
76
Technical Report for the Tocantinzinho Gold Project, Brazil | |
Table 19-2: Haulage Cycle Times in Minutes
| Year | ||||||||||||
| -1 | 1 | 2 | 3 | 4 | 5 | 6 | 7 | 8 | 9 | 10 | 11 | |
| Phase 1 Pit | ||||||||||||
| Ore | 11.1 | 14.0 | 18.3 | 21.3 | ||||||||
| Waste | 12.8 | 16.5 | 21.5 | 26.2 | ||||||||
| Phase 2 Pit | ||||||||||||
| Ore | 11.2 | 12.9 | 15.1 | 17.3 | 19.2 | 20.6 | 22.0 | 22.0 | ||||
| Waste | 13.0 | 15.2 | 17.8 | 20.3 | 22.7 | 25.1 | 27.3 | 27.3 | ||||
| Phase 3 Pit | ||||||||||||
| Ore | – | 12.2 | 12.5 | 13.8 | 14.9 | 16.7 | 20.0 | 22.0 | 24.2 | 26.1 | 28.8 | 31.0 |
| Waste | – | 13.4 | 14.3 | 15.9 | 17.4 | 19.7 | 23.9 | 26.9 | 29.4 | 31.7 | 34.7 | 37.3 |
Shift roster, equipment availability, effectiveness and net utilization
The shift roster for the mining operation was based on the following criteria which were selected due to the remote setting of the Tocantinzinho Project:
● | Two 12 hour working shifts per day, with one hour of break time for meals; |
● | A two week on, one week off rotation; |
● | Three crews: one on day shift, one on night shift and one on break. |
Based on this rotation, the total use of available time was calculated to be 22 of 24 hours per day or 92%. It was assumed that blasting operations would take place during the break period for meals and thus would not reduce the total use of availability.
The mechanical availability of the equipment was assumed from experience with other operations and from discussions with equipment manufacturers as noted in the following tables. Availability was assumed to decrease as the equipment aged and the assumptions used for the major mining fleet are shown in Table 19-3.
Table 19-3: Assumed Mechanical Availability of Major Mining Fleet
| YEAR | |||||||||||
| 1 | 2 | 3 | 4 | 5 | 6 | 7 | 8 | 9 | 10 | 11 | |
| Availability | |||||||||||
| Hitachi 1900 Front Shovel | 97% | 97% | 97% | 97% | 95% | 95% | 93% | 93% | 93% | 90% | 90% |
| Hitachi 1900 Excavator | 97% | 97% | 97% | 97% | 95% | 95% | 93% | 93% | 93% | 90% | 90% |
| CAT 992 Loader | – | 97% | 97% | 97% | 95% | 95% | 93% | 93% | 93% | 90% | 90% |
| Sandvick D25 Drills | 95% | 95% | 95% | 95% | 93% | 93% | 91% | 91% | 91% | 88% | 88% |
| CAT 777 F Haul Trucks | 95% | 95% | 95% | 95% | 93% | 93% | 91% | 91% | 91% | 88% | 88% |
| Water Truck | 95% | 95% | 95% | 95% | 93% | 93% | 91% | 91% | 91% | 88% | 88% |
| CAT 730 Articulated Truck | 95% | 95% | 95% | 95% | 93% | 93% | 91% | 91% | 91% | 88% | 88% |
| CAT D9T Dozers | 95% | 95% | 95% | 95% | 93% | 93% | 91% | 91% | 91% | 88% | 88% |
77
Technical Report for the Tocantinzinho Gold Project, Brazil | |
| YEAR | |||||||||||
| 1 | 2 | 3 | 4 | 5 | 6 | 7 | 8 | 9 | 10 | 11 | |
| CAT D6T Dozers | 95% | 95% | 95% | 95% | 93% | 93% | 91% | 91% | 91% | 88% | 88% |
| CAT 16M Grader | 95% | 95% | 95% | 95% | 93% | 93% | 91% | 91% | 91% | 88% | 88% |
| CAT 345D Excavator | 97% | 97% | 97% | 97% | 95% | 95% | 93% | 93% | 93% | 90% | 90% |
| CAT 834 Wheel Dozer | 95% | 95% | 95% | 95% | 93% | 93% | 91% | 91% | 91% | 88% | 88% |
Given that the Tocantinzinho Project is located in a remote tropical environment, an effectiveness factor was used to represent unplanned delays relating to weather conditions, absenteeism and other site specific factors. The effectiveness factor was based on experience in similar operating environments and was assumed to be 85% for all years of the operation.
The net utilization represents the actual number of hours, as a percentage of the total hours, that a unit of equipment is able to perform productive work. This number is calculated using the following equation:
Net Utilization = Ready Hours / Total Hours = Availability * Use of Availability * Effectiveness
The resultant net utilization for the major mining fleet is shown in Table 19-4.
Table 19-4: Calculated Net Utilization of the Major Mining Fleet
| YEAR | |||||||||||
| 1 | 2 | 3 | 4 | 5 | 6 | 7 | 8 | 9 | 10 | 11 | |
| NET UTILIZATION | |||||||||||
| Hitachi 1900 Front Shovel | 76% | 76% | 76% | 76% | 74% | 74% | 72% | 72% | 72% | 70% | 70% |
| Hitachi 1900 Excavator | 76% | 76% | 76% | 76% | 74% | 74% | 72% | 72% | 72% | 70% | 70% |
| CAT 992 Loader | - | 76% | 76% | 76% | 74% | 74% | 73% | 73% | 73% | 70% | 70% |
| Sandvick D25 Drills | 74% | 74% | 74% | 74% | 72% | 72% | 71% | 71% | 71% | 69% | 69% |
| CAT 777 F Haul Trucks | 70% | 74% | 74% | 74% | 73% | 73% | 71% | 71% | 71% | 69% | 69% |
| Water Truck | 37% | 37% | 37% | 37% | 36% | 36% | 35% | 35% | 35% | 34% | 29% |
| CAT 730 Articulated Truck | 73% | 73% | 73% | 73% | 66% | 66% | 60% | 53% | 45% | 37% | 37% |
| CAT D9T Dozers | 73% | 73% | 73% | 73% | 71% | 71% | 69% | 69% | 69% | 67% | 44% |
| CAT D6T Dozers | 73% | 73% | 73% | 73% | 71% | 71% | 69% | 69% | 69% | 67% | 44% |
| CAT 16M Grader | 63% | 63% | 63% | 63% | 62% | 62% | 60% | 60% | 60% | 58% | 44% |
| CAT 345D Excavator | 78% | 78% | 78% | 78% | 76% | 74% | 73% | 65% | 57% | 55% | 47% |
| CAT 834 Wheel Dozer | 65% | 65% | 65% | 65% | 64% | 64% | 64% | 64% | 64% | 61% | 44% |
Mining fleet requirements
The fleet for major mining equipment per year are shown in Table 19-5, while the minor equipment requirements are shown in Table 34. The major fleet was selected to match the expected mining conditions and to achieve the production schedule. The minor fleet requirements were selected to match the requirements for transportation of personnel, support for maintenance applications, and to provide in-pit lighting and water pumping
78
Technical Report for the Tocantinzinho Gold Project, Brazil | |
Table 19-5: Major Equipment Requirements by Year
| Year | ||||||||||||
| -1 | 1 | 2 | 3 | 4 | 5 | 6 | 7 | 8 | 9 | 10 | 11 | |
| Hitachi 1900 Front Shovel | 0 | 2 | 2 | 2 | 2 | 2 | 2 | 1 | 1 | 1 | 1 | 0 |
| Hitachi 1900 Excavator | 1 | 1 | 1 | 1 | 1 | 1 | 1 | 1 | 1 | 1 | 1 | 1 |
| CAT 992 Loader | 0 | 0 | 1 | 1 | 1 | 1 | 1 | 1 | 0 | 0 | 0 | 0 |
| Sandvick D25 Drills | 1 | 3 | 3 | 3 | 3 | 3 | 3 | 2 | 2 | 2 | 1 | 1 |
| Sandvick DI500 | 0 | 0 | 0 | 0 | 0 | 1 | 1 | 1 | 1 | 1 | 1 | 0 |
| CAT 777 F Haul Trucks | 3 | 12 | 12 | 13 | 14 | 15 | 16 | 14 | 10 | 9 | 7 | 5 |
| Water Truck | 0 | 1 | 1 | 1 | 1 | 1 | 1 | 1 | 1 | 1 | 1 | 1 |
| CAT 730 Articulated Truck | 2 | 2 | 2 | 2 | 2 | 2 | 2 | 2 | 2 | 2 | 1 | 1 |
| CAT D9T Dozers | 1 | 3 | 3 | 3 | 3 | 3 | 3 | 3 | 3 | 2 | 2 | 1 |
| CAT D6T Dozers | 1 | 2 | 2 | 2 | 2 | 2 | 2 | 2 | 2 | 2 | 1 | 1 |
| CAT 16M Grader | 1 | 1 | 2 | 2 | 2 | 2 | 2 | 2 | 1 | 1 | 1 | 1 |
| CAT 345D Excavator | 1 | 1 | 2 | 2 | 2 | 2 | 2 | 2 | 2 | 2 | 1 | 1 |
| CAT 834 Wheel Dozer | 0 | 1 | 1 | 1 | 1 | 1 | 1 | 1 | 1 | 1 | 1 | 1 |
Table 19-6: Minor Equipment Requirement by Year
| Year | ||||||||||||
| -1 | 1 | 2 | 3 | 4 | 5 | 6 | 7 | 8 | 9 | 10 | 11 | |
| CAT 980 Wheel Loader | 0 | 0 | 1 | 1 | 1 | 1 | 1 | 1 | 1 | 1 | 1 | 1 |
| Fuel and Lube Truck | 1 | 1 | 1 | 1 | 1 | 1 | 1 | 1 | 1 | 1 | 1 | 1 |
| Lo-Boy | 1 | 1 | 1 | 1 | 1 | 1 | 1 | 1 | 1 | 1 | 1 | 1 |
| Crane Truck | 1 | 1 | 1 | 1 | 1 | 1 | 1 | 1 | 1 | 1 | 1 | 1 |
| Explosives Truck | 0 | 1 | 1 | 1 | 1 | 1 | 1 | 1 | 1 | 1 | 1 | 1 |
| Forklift | 0 | 1 | 2 | 2 | 2 | 2 | 2 | 2 | 2 | 2 | 2 | 2 |
| Tire Handler | 1 | 1 | 1 | 1 | 1 | 1 | 1 | 1 | 1 | 1 | 1 | 1 |
| Tractor | 0 | 1 | 1 | 1 | 1 | 1 | 1 | 1 | 1 | 1 | 1 | 1 |
| Skidsteer | 0 | 1 | 1 | 1 | 1 | 1 | 1 | 1 | 1 | 1 | 1 | 1 |
| Welding Truck | 1 | 1 | 1 | 1 | 1 | 1 | 1 | 1 | 1 | 1 | 1 | 1 |
| Pickups | 4 | 6 | 12 | 12 | 12 | 12 | 12 | 12 | 12 | 12 | 12 | 8 |
| Light Plants | 0 | 2 | 4 | 4 | 4 | 4 | 4 | 4 | 4 | 4 | 2 | 2 |
| Diesel Pumps | 2 | 3 | 3 | 3 | 3 | 3 | 3 | 3 | 3 | 3 | 3 | 2 |
| 100 hp Electric Sump Pumps | 0 | 0 | 0 | 0 | 2 | 2 | 2 | 2 | 2 | 2 | 2 | 2 |
| 500 hp Electric Booster Pump | 0 | 0 | 0 | 0 | 0 | 0 | 0 | 1 | 1 | 1 | 1 | 1 |
| Stemming Loader | 0 | 0 | 0 | 1 | 1 | 1 | 1 | 1 | 1 | 1 | 1 | 1 |
| 5t Dump Truck | 0 | 1 | 1 | 1 | 1 | 1 | 1 | 1 | 1 | 1 | 1 | 1 |
79
Technical Report for the Tocantinzinho Gold Project, Brazil | |
Mine personnel were divided into hourly and staff positions and were divided between mine operations, mine maintenance, engineering and geology. Hourly positions were all associated with a shift roster of 2 weeks on and 1 off and as such each unit of equipment required 3 operators hired in hourly positions.
Staff positions were selected for administrative roles and generally were assumed to work a day shift only 5 days/week rotation. In some case where 24 hour support in the staff role was necessary, the staff position was planned to be on the same 2 week on one off rotation as the hourly staff.
A summary of the mine personnel requirements is shown in Table 19-13 in section 19.4
| 19.1.3 | Mining Costs |
The Mine operating costs are summarized in section 19.9.2.
| 19.1.4 | Open Pit design |
The open pits were designed using the optimized pit shells and allowing for ramp access and slope designs.
Three phases were designed to allow for optimization of the strip ratio and economics while also minimizing the early footprint of the operation. The three phases are shown in Figure 19-6, Figure 19-7, and Figure 19-8.
The first phase pit is designed to an elevation of 35.0 m asl, approximately 100 m below surface. It was designed as a low strip ratio starter pit and has a strip ratio of 1.32. The first pit will also serve as a sump for mining operations during the wet season. It will also allow early access to hard waste rock in order to have road construction material for dumps, haul roads and erosion protection. This is a key component of any operation in the tropics and use of a small aggregate plant is included in mining plan.
While the production schedule is based on a yearly pit advance the detailed yearly mining plans for operations in areas of high rainfall must plan for aggressively deepening pits in the dry season, thus allowing for dry mining faces when the wet season arrives. These details are not taken into account in this study however the design and yearly mining plan is set-up so that the average pit development over the year allows for this type of planning.
80
Technical Report for the Tocantinzinho Gold Project, Brazil | |
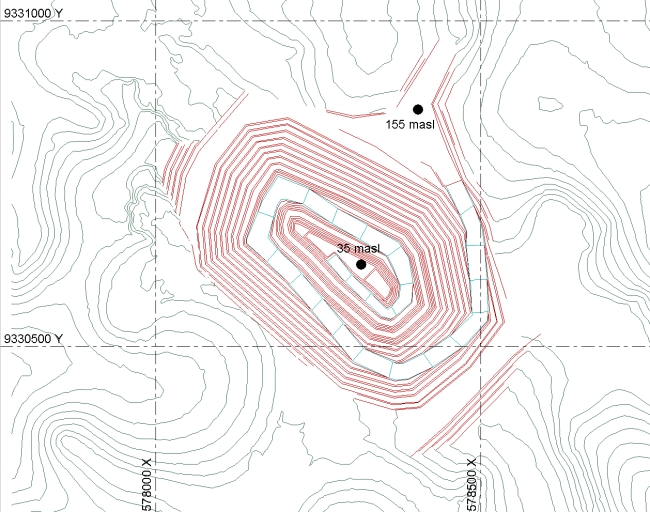
Figure 19-6: Phase 1 Pit Design
The Phase 2 pit was designed again to allow for a low strip ratio pit which can be deepened during the dry season. It was selected to allow sufficient mining width between the Phase 1 and a Phase 3 designs
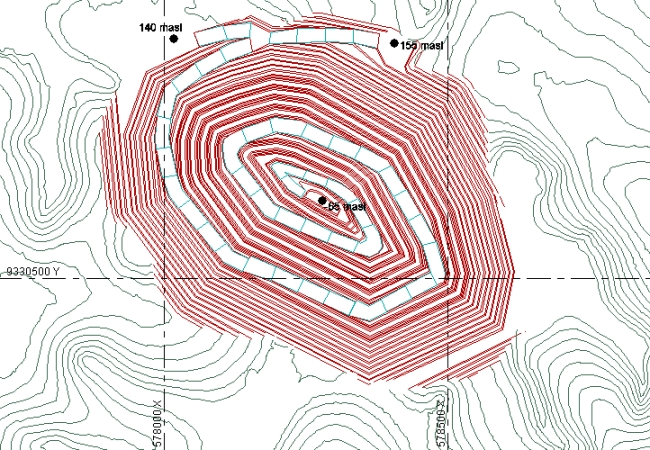
Figure 19-7: Phase 2 Pit Design
81
Technical Report for the Tocantinzinho Gold Project, Brazil | |
The Phase 3 pit was designed using the US$1,000 /oz optimized pit shell as a guide. The pit extends to the -205 elevation, which is on average 345.0 m below the original ground surface. This pit utilizes a single lane ramp from -135 and below and a double lane ramp above.

Figure 19-8: Phase 3 pit design.
A comparison between the phase 3 pit design and the US$1,000/oz optimized pit shell is shown in Table 19-7 and in Figure 19-9. The difference between the design and the shell are due to the inclusion of ramps and the application of the actual inter-ramp slope designs instead of the overall slope angles used in the optimization.
Table 19-7: Comparison Between Pit Shell and Pit Design
| Optimized Pit Shell | Designed Pit | |||
| Total Tonnage (kt) | 208,626 | 209,535 | ||
| Ore Tonnage (kt) | 50,956 | 49,050 | ||
| Strip Ratio | 3.09 | 3.27 | ||
| Grade (g/t) | 1.25 | 1.25 | ||
| Contained Gold (oz) | 2,043,911 | 1,975,000 |
82
Technical Report for the Tocantinzinho Gold Project, Brazil | |

Figure 19-9: Comparison between Pit Shell and Pit Design
| 19.1.5 | Production Schedule |
The 3 phases of the pit were scheduled using a spreadsheet and a bench by bench (top down) sequence for each pit. Several iterations of the production schedule were tested and a final version was chosen based on the following criteria:
● | Ore production of 4,400 kt per year; |
● | Minimize the amount of excess ore in each year in order to minimize re-handling; |
● | Minimize the strip ratio in the early years of the operation; |
● | Consideration of practical limits on yearly vertical advance rate in any pit. |
The final production schedule is shown in Table 19-8 and the corresponding mill feed schedule is shown in Table 19-9. The production schedule starts with a pre-stripping year (Year -1) before the mill is scheduled to be in operation. 793 kt of ore and 4,248 kt of waste is mined in the first year which will be added to the oxide ore stockpile and then later re-handled at the end of the mine life.
83
Technical Report for the Tocantinzinho Gold Project, Brazil | |
Table 19-8: Overall Ore and Waste Production Schedule
| Year | |||||||||||||
| -1 | 1 | 2 | 3 | 4 | 5 | 6 | 7 | 8 | 9 | 10 | 11 | LOM TOTAL | |
| Saprolite | |||||||||||||
| Ore (kt) | 763 | 1,760 | 221 | 32 | 0 | 0 | 0 | 0 | 0 | 0 | 0 | 0 | 2,777 |
| Waste (kt) | 4,193 | 14,406 | 11,367 | 4,421 | 0 | 0 | 0 | 0 | 0 | 0 | 0 | 0 | 34,387 |
| Total (kt) | 4,956 | 16,166 | 11,588 | 4,453 | 0 | 0 | 0 | 0 | 0 | 0 | 0 | 0 | 37,164 |
| Rock | |||||||||||||
| Ore (kt) | 29 | 2,660 | 4,202 | 4,392 | 4,411 | 4,404 | 4,420 | 4,435 | 4,420 | 4,429 | 4,408 | 4,059 | 46,271 |
| Waste (kt) | 55 | 5,174 | 8,210 | 17,083 | 21,558 | 21,596 | 21,580 | 14,015 | 7,780 | 5,471 | 2,692 | 887 | 126,100 |
| Total (kt) | 85 | 7,834 | 12,412 | 21,476 | 25,970 | 26,000 | 26,000 | 18,449 | 12,200 | 9,900 | 7,100 | 4,946 | 172,371 |
| Totals | |||||||||||||
| Ore (kt) | 793 | 4,421 | 4,423 | 4,424 | 4,411 | 4,404 | 4,420 | 4,435 | 4,420 | 4,429 | 4,408 | 4,059 | 49,047 |
| Waste (kt) | 4,248 | 19,579 | 19,577 | 21,505 | 21,558 | 21,596 | 21,580 | 14,015 | 7,780 | 5,471 | 2,692 | 887 | 160,487 |
| Total (kt) | 5,041 | 24,000 | 24,000 | 25,929 | 25,970 | 26,000 | 26,000 | 18,449 | 12,200 | 9,900 | 7,100 | 4,946 | 209,535 |
| Total (ktpd) | 13.81 | 65.75 | 65.75 | 71.04 | 71.15 | 71.23 | 71.23 | 50.55 | 33.42 | 27.12 | 19.45 | 13.55 | |
| Strip Ratio | |||||||||||||
| (t:t) | 5.36 | 4.43 | 4.43 | 4.86 | 4.89 | 4.90 | 4.88 | 3.16 | 1.76 | 1.24 | 0.61 | 0.22 | 3.27 |
Table 19-9: Overall Mill Feed Schedule
| Year | |||||||||||||
| 1 | 2 | 3 | 4 | 5 | 6 | 7 | 8 | 9 | 10 | 11 | 12 | LOM TOTAL | |
| Saprolite | |||||||||||||
| Ore (kt) | 1,752 | 220 | 32 | 0 | 0 | 0 | 0 | 0 | 0 | 0 | 290 | 483 | 2,777 |
| Grade (g/t) | 0.92 | 0.62 | 0.54 | 0.00 | 0.00 | 0.00 | 0.00 | 0.00 | 0.00 | 0.00 | 0.90 | 0.90 | 0.89 |
| Rock | |||||||||||||
| Ore (kt) | 2,648 | 4,180 | 4,368 | 4,400 | 4,400 | 4,400 | 4,400 | 4,400 | 4,400 | 4,400 | 4,110 | 165 | 46,271 |
| Grade (g/t) | 1.13 | 1.19 | 1.13 | 1.16 | 1.30 | 1.34 | 1.27 | 1.40 | 1.40 | 1.43 | 1.22 | 0.90 | 1.28 |
| Totals | |||||||||||||
| Ore (kt) | 4,400 | 4,400 | 4,400 | 4,400 | 4,400 | 4,400 | 4,400 | 4,400 | 4,400 | 4,400 | 4,400 | 647 | 49,047 |
| Grade (g/t) | 1.05 | 1.16 | 1.13 | 1.16 | 1.30 | 1.34 | 1.27 | 1.40 | 1.40 | 1.43 | 1.20 | 0.90 | 1.25 |
| (ktpd) | 12.05 | 12.05 | 12.05 | 12.05 | 12.05 | 12.05 | 12.05 | 12.05 | 12.05 | 12.05 | 12.05 | 1.77 | |
84
Technical Report for the Tocantinzinho Gold Project, Brazil | |
A visual progression of the pit development is shown in Figure 19-10 through Figure 19-12.

Figure 19-10: Open Pit Development end of Year 2

Figure 19-11: Open Pit Development end of Year 7
85
Technical Report for the Tocantinzinho Gold Project, Brazil | |
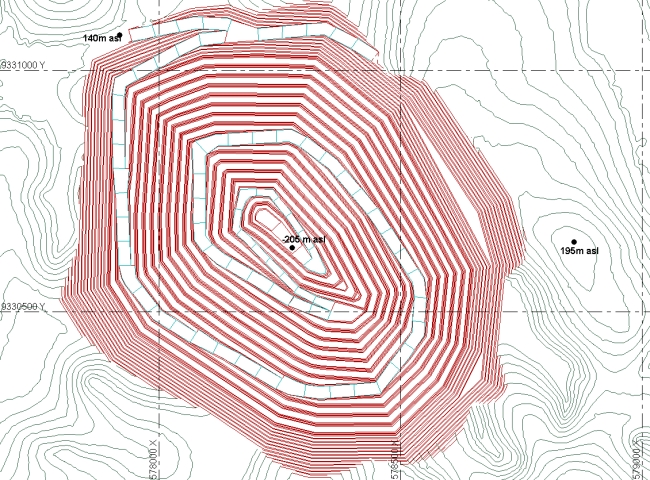
Figure 19-12: Open Pit Development end of Year 11
| 19.1.6 | Waste Rock Disposal |
A waste rock disposal area was designed to permanently store the waste rock that will be mined from the Tocantinzinho open pit. The following design criteria were used:
● | Storage capacity of a least 80,000,000 m3; |
● | Inter-ramp slope angles of 3:1 or 18.4 degrees; |
● | Ramp width of 25.0 m and gradient of 10%; |
● | A surface water drainage plan that allows for collection and settling of all water run-off; |
● | An offset distance of 300 m horizontally and 5.0 m vertically from the Tocantinzinho River. |
The planned waste rock storage area is shown in Figure 19-13. This design was selected over numerous proposed alternatives. The design allows a simple single ramp to connect with the planned open pit. It allows all surface water that comes into contact with the waste rock to be directed by gravity into one of two settling ponds, which can be accessed for cleaning. The design keeps current drainage paths on the north and south open.
86
Technical Report for the Tocantinzinho Gold Project, Brazil | |

Figure 19-13: Waste Rock Disposal Layout
The waste rock disposal area design was based on the placed density assumptions shown in Table 19-10. These parameters were estimated from experience with swell and compression factors in similar environments.
Table 19-10: Placed Density Assumptions for Waste Rock Disposal
| Saprolite | |
| In situ dry density | 1.80 |
| Swell factor | 1.30 |
| Compaction factor | 1.25 |
| Placed density in dump | 1.73 |
| Rock | |
| In situ dry density | 2.64 |
| Swell factor | 1.45 |
| Compaction factor | 1.20 |
| Placed density in dump | 2.18 |
87
Technical Report for the Tocantinzinho Gold Project, Brazil | |
| 19.1.7 | Mine Infrastructure |
Mine infrastructure was designed to support the open pit operation. Several key items were planned and these are discussed in this section. The location of the infrastructure is shown in Figure 19-14.
Fuel Storage
The fuel storage facility was designed with a capacity of 1.2 million liters of diesel fuel in two steel tanks. The size was matched to approximately 1 month of storage for use during the rainy season when delays in a regular trucking schedule are likely.
Truck Shop
The truck shop was designed to accommodate the maintenance of the mining fleet. The shop has 1,560 m2 of floor space with four work bays that can each hold a CAT 777F haul truck. Two additional smaller bays will be used for light vehicles and other equipment maintenance. The facility includes a wash ramp, tire storage yard and warehouse. Engine rebuilds and equipment overhauls are planned to be done off-site.
ROM Pad
The ROM pad is located north east of the Pit approximately 350 m by haul road from the pit ramp. The ROM pad is sized to accommodate the storage of approximately 100,000 tonnes of ROM material which is the equivalent of seven (7) days of plant feed. The ROM pad forms part of the Primary crusher and Scrubber circuit feed pad.
Oxide Ore Stockpile
The oxide ore stockpile was designed to provide storage for at least 2,000 kt of oxide ore. The mining production schedule currently envisions 1,020 kt of planned material to be stockpiled primarily during the pre-strip. The size of the storage pad was designed beyond the planned capacity in order to allow contingency for delayed start-up of the mill and also to allow flexibility in early high grade scenarios which would see additional material being added to the stockpile.
Explosive Storage
The explosive storage facility was designed according to Brazilian regulations and contains eight separate bunkers capable of storing a total of 1,800 tonnes of ammonium nitrate. In addition there are 4 additional bunkers for blasting caps and primers and one bunker for prepared emulsion explosives.
Aggregate Plant
An aggregate plant with a crusher, screen and associate conveyors is planned. This plant will have the capacity to produce a 3” crushed rock material for use on haul roads in the pit and on the dumps and a fine screened sub ½” material for drillhole stemming.
88
Technical Report for the Tocantinzinho Gold Project, Brazil | |

Figure 19-14: General Layout of Mine Infrastructure
| 19.2 | Process Plant |
| 19.2.1 | Processing plant – conceptual design |
SEI developed a metallurgical process design aimed at getting a relatively high gold recovery of 90% with an installation of processing equipment which reflects the findings from the preliminary batch and pilot plant testing.
The plant design is based on the following unit operations:
● | Reception of ROM; |
● | Crushing of ROM; |
● | Breakdown / Oxide ROM grading; |
● | Ball grinding, classification by hydrocyclones and gravimetry; |
● | Flotation, concentrate regrind and thickening; |
● | Leaching / Intensive leaching and CIP (carbon-in-pulp); |
● | Elution and regeneration of carbon; |
● | Electrolysis; |
● | Smelting. |
89
Technical Report for the Tocantinzinho Gold Project, Brazil | |
The plant is designed to handle a capacity of 4.4 million tons of ROM, with an average of 1.25 g/t of gold and metallurgical recovery of 90.1%, resulting in 159,325 ounces of gold per year.
A description of the unit operations is as follows:
ROM ore selection, Grinding and classification
The ore body has been classified into oxide and sulfide ores. The process of scrubbing the oxide ore was not clearly defined in the testwork. The solution of two distinct circuits for handling the ROM oxide and sulfide ores is based upon the mine plan identifying and delivering the ore to the correct dump hopper. The two distinct ROM handling circuits may result in a higher availability for the crushing and stockpiling circuit as a portion of the feed is sent directly to the ball mill discharge pumpbox.
The oxide ore fines broken down in the rotary scrubber are mixed with the ball mill discharge which is then sent for classification. A fraction of the classification underflow is batch concentrated by a centrifugal gravity concentrator and then sent to intensive leaching in an Acacia type reactor. The Acacia reactor normally has a washing step to remove slimy fines carried over in cyclone underflow. One or two continuous leach reactors could be justified to have continuous supply of pregnant solution for electrowinning out of one or two gravity concentrators (Knelson type).
Both the oxide and sulfide ores are amenable to cyanide leaching with a very good recovery.
There is enough flexibility in the circuit to use the cyclone underflow distributor to proportion the mass of concentrate for intensive leaching. That flexibility will allow for in plant testing to optimize recoveries.
Regrinding and Leaching of Gravity Concentrate.
The cyclone overflow is distributed to either of two batch type centrifugal gravity concentrators (Knelson type), which send concentrate to regrind bypassing flotation, or to flotation. The entire cyclone overflow can be sent to flotation putting emphasis on the efficiency of the flotation circuit. The pilot testing program indicates a high gold recovery at a relative low mass pull.
Recovery could be improved at a relativy higher mass pull reporting to the leach/CIP circuit by testing inplant operation to determine the best mass ratio reporting to the CIP circuit. However an increase in the mass ratio will result in an increase of mass in tailings which will require cyanide destruction. A high density thickening for these tailings with a backwash filtration step could be cost effective when compared with higher consumables consumption for cyanide destruction. It is felt, based on the testwork completed to date, that managing the treatment and disposal of the solids-liquid waste will require additional results from the ongoing testwork from the standpoint of the environment and surface water management.
Leaching of Concentrates
Ore concentrated, either through flotation or gravity techniques, in all individual or composite samples tested, indicated good mass pull and recovery in cyanide leaching up to a grinding size with a P80 of 125 microns.
Ore concentration in the flotation circuit is in accordance with the batch/pilot testwork, which indicates high recovery in the concentrate and subsequently low losses in the flotation tails.
The regrind mill with a recirculating load of 300% has the flexibility required to produce a product with a P80 of 60 microns. As per the testwork this product size when combined with a 48 hour retention time in the leach/CIP circuit appears to be optimum.
90
Technical Report for the Tocantinzinho Gold Project, Brazil | |
The thickening of the reground concentrate reporting to the leach/CIP is in accordance with the concept of fixing the pulp %solids to optimize the leaching and thus minimizing reagent consumption.
The selection of the CIP circuit for the adsorption in lieu of a clear pregnant solution is in accordance with the test results. The additional 8 hours retention time involved in utilizing the CIP circuit could maximize leaching of valuable gold but there will be some unnecessary dissolution of metallic ions in recirculation.
If the alternate clear pregnant solution circuit (CIL) was utilized additional equipment such as a counter current circuit or filtration of tailings would be required.
Since the cyanide leaching in a forced agitated tank with air to enhance dissolution of gold and the CIP adsorption are accepted operations, this selected circuit is a good technical choice. However there is no testing data to determine if there are effects on recovery from the interaction of the fines with CIP adsorption, washing and desorption.
Complete dissolution of metallic gold, using a 48 hour retention,at P80 of 75 microns has been proven in batch testing. This indicates that thickening and filtration with tails washing to optimize cyanide recovery and to recycle to the leaching circuit is also a technically viable option. The adoption of either of two options; a Merrill Crowe cementation process to precipitate gold out of a de-oxidized pregnant solution for drying and smelting or, the carbon adsorption in clear pregnant solution and electrowinning recovery, are potentially viable. In each case, costing the processing mechanical equipment will be necessary to evaluate the alternatives with regards to Capex and Opex as well as the operation control.
For the carbon adsorption, desorption or elution of 4.6 t of carbon pregnant with 5.0 k/t of gold in one 12.2 m3 stripping vessel is almost a standard in industry. It is considered adequate for this application, as is the use of a carbon reactivation kiln for the regeneration/activation of carbon.
Electro winning recovery and Smelting
There is sufficient flexibility in the proposed flow sheet to increase or even bypass the intensive leaching circuit. It will be worthwhile to research the possibility of doubling the capacity of this readily produced product ahead of the flotation and regrinding processes. Higher recovery downstream on the gravimetric and flotation circuits may be a possible result.
Electrowinning and smelting is a proven technical process with some advantages in controlling the process as compared with the more manual, zinc cementation process. The possible increase in mercury emissions at drying and smelting, despite low Mercury content in the ore, has been a surprise in other ore deposits. In such cases a retort system for trapping and condensing any mercury in gaseous form before exhausting it through further media adsorption is a possibility.
Tailings Thickening, Treatment and Disposal
Two sources of tailings are noted in the process. Since a clear transition between oxide and sulfide ore was not realized in all testwork, the split between the two ores reporting as tails could vary from the average analysis reported in the basic data and processing criteria
It is not expected that the neutral flotation solids tailings be categorized as class II B (inert). On the other hand, metallic ions dissolved in the associated water in pulp could report higher than predicted. In any case, the confinement of the flotation tailings in the disposal dam is will have the highest possible density to reduce the impacted area. It is felt at this stage (Pre-Feasibility), that additional testing is required to define a route.
91
Technical Report for the Tocantinzinho Gold Project, Brazil | |
The other source of tailings (cyanide leaching of concentrates) is more sensitive to the environment. At this stage (Pre-Feasibility) the additional testing is required to further define the process of confined surface disposal and recirculation of tailing water.
| 19.2.2 | General characteristics of the project |
The basic data of process used in this Project are presented below.
● | Feed capacity - 4.4 million tons per year; |
● | Average content of feed - 1.25 g/t of gold; |
● | Metallurgical recovery - 90.1%; |
● | Gold production capacity - 159,325 ounces per year. |
| 19.2.3 | Basic process route |
The process flow diagram and the simplified process flowsheet are presented in the following Figure 19-15: Process Flowsheet Block Diagram and Figure 19-16: Process Flowsheet.
92
Technical Report for the Tocantinzinho Gold Project, Brazil | |

Figure 19-15: Process Flowsheet Block Diagram
93
Technical Report for the Tocantinzinho Gold Project, Brazil | |

Figure 19-16: Process Flowsheet
94
Technical Report for the Tocantinzinho Gold Project, Brazil | |
| 19.2.4 | Process Description |
Breakdown / Grading
The oxide ore (ROM) transported by truck shall be discharged onto a fixed grizzly, with openings of 800mm square. The material passing through the grizzly will be stored in the dump hopper which will discharge via the vibrating feeder. The oversize material on the grizzly will be broken using the rock breaker.
The vibrating feeder will discharge onto conveyor which will feed the rotary scrubber. The rotary scrubber will break up the lumps and discharge onto a double deck banana type vibrating screen, with screen openings of 50 and 12 mm for the 1st and 2nd decks, respectively. Oversize material from the screen will feed the ROM primary crusher via conveyor and the undersize product will report to pump box. Pumps will transfer the slurry from the pump box to the cyclone feed pump box.
Crushing, Screening, & Stockpile
The ROM ore transported by truck shall be discharged onto a fixed grizzly, with openings of 800mm square. Any oversize material will be broken by rock breaker. The material passing though the grizzly will be stored in the dump hopper, which will discharge via vibrating grizzly feeder. The vibrating grizzly has an aperture of 180 mm to reduce the quantity of fine material reporting to the primary crusher. Powdered lime will be added for pH correction.
The vibrating grizzly feeder oversize material will feed the primary jaw crusher. The vibrating grizzly feeder undersize product and the primary crusher product will discharge directly onto the secondary screen feed conveyor. The material on this conveyor will have a P80 of 180 mm. This conveyor will be equipped with a belt scale, to control the feed to the secondary cone crusher.
The secondary crusher product with a P80 of 38 mm will discharge onto a conveyor. The tertiary crusher product (circulating load) with a P80 of 13 mm will also discharge onto a conveyor,which will transfer material to the tertiary screen feed conveyor. Material will then be fed to the double deck banana type tertiary vibrating screen with screen openings of 38 and 19 mm for the 1st and 2nd decks respectively.
Oversize material from the tertiary screen will feed the tertiary cone crusher creating 100% circulating load. The undersize product from the tertiary screen will have a particle size of less than 13 mm. This material will be transported to the crushed ore stockpile via the crushed ore stockpile feed conveyor. The conveyor will be equipped with a belt scale, to monitor the mine production. The crushed ore stockpile shall be conical with a live volume of 6,600 m3, allowing 16 hours of continueous operation for the crushing operation. The stockpile will be reclaimed via three variable speed belt feeders. The belt feeders will discharge onto the ball mill feed conveyor. This conveyor which feeds directly into the ball mill will be equipped with a belt scale, to control feed to the balls mill and a cross belt sampler.
Grinding, Classification, & Gravimetry
Crushed ore from the crushed ore stockpile will be fed directly into the ball mill via the feed conveyor. The ball mill discharge will be equipped with a trommel screen. The ball mill product will flow through the trommel screen with the slurry reporting to the cyclone feed pumpbox and the spent grinding media and trash to a tote for disposal. The screen undersize product from the oxide ore scrubbing circuit will report to the cyclone feed pumpbox as well. Cyclone feed slurry will be pumped from the cyclone feed pumpbox to classification.The classification will be conducted in a battery of eight 26” diameter hydrocyclones with seven operating and one standby. The cyclone overflow will flow by gravity to the cyclone overflow distributor. The overflow material will have a particle size of less than 0.1 mm. The distributor will feed two
95
Technical Report for the Tocantinzinho Gold Project, Brazil | |
continuous centrifugal gravity concentrators operated in parallel. Alternately, the distributors will feed the trash screen which will in turn discharge into the flotation feed tank.
The concentrate from the continuous centrifugal gravity to concentrators will feed by gravity the regrind cyclone feed pumpbox. The tailings will feed by gravity to the flotation feed tank
The cyclone underflow will be divided between the ball mill and the batch centrifugal gravity concentrator.
The product from the ball mill, with a P80 of 0.1 mm will return to the cyclone feed pump box. From there it will be pumped to classification closing the grinding cycle with a predicted circulating load of 300%.
The concentrate from the batch centrifugal gravity concentrator will flow by gravity to the intensive leach circuit. The tailings from the concentrator will flow by gravity to a pump box. The slurry will be pumped from this pumpbox to the cyclone feed pumpbox.
Intensive Leaching
The intensive leaching circuit will be a purchased package called an Acacia Dissolution Module which has facilities for leaching and separation of solid and liquid from the leached pulp.
The pregnant solution from the Acacia reactor will be transferred to the electrowinning cell. The barren solution from the electrowinning cell will be recirculated to the Acacia reactor via the barren solution tank.
The gold contained in the pregnant solution is deposited on the steel wool cathode within the electrowinning cell. The cathode are removed periodically and taken to the smelting furnace.
Flotation, Concentrate Regrind, Cconcentrate Thickening, and Flotation Tailings
Once the cyclone overflow passes through the trash screen to remove any organic material the slurry is sampled for metallurgical analysis of the flotation feed. The slurry then reports to the flotation conditioning tank, which is equipped with an agitator. The conditioned slurry then flows to the five tank type Rougher flotation cells. The reagents required for this stage of flotation will be distributed into the conditioner tank, and the first two rougher flotation cells.
The Rougher concentrate will be conducted by gravity to the flotation cleaner phase, or alternately to the regrind feed pumpbox.
The Rougher tailings will feed the five tank type Scavenger flotation cells. The Scavenger concentrate will flow by gravity to a pumpbox and then recirculate the concentrate to the Rougher flotation cells.
The Scavenger tailings will be the final flotation tailings. The Scavenger tailings will be sampled as it flows by gravity to the final tailings pumpbox. Treated tailings from the CIP circuit will also be pumped to the final tailings pumpbox. Final tailings will be pumped to the tailings dam.
The concentrate from the cleaner flotation cells will flow by gravity to a pumpbox the concentrate, will be pumped to the regrind cyclone feed pumpbox.
The Cleaner tailings will flow by gravity to a pumpbox; the tailings will then be recirculated to the Rougher flotation cells.
The classification of the regrind slurry will be conducted in a battery of five 10” diameter hydrocyclones with four operating and one standby. Cyclone feed slurry will be pumped from the cyclone feed pumpbox to classification.
The cyclone underflow will flow by gravity to the Regrind ball mill. The regrind ball mill discharge will be equipped with a trommel screen. The regrind ball mill product, with a P80 of 0.1 mm, will
96
Technical Report for the Tocantinzinho Gold Project, Brazil | |
flow through the trommel screen. The slurry reports to the regrind cyclone feed pumpbox and the spent grinding media and trash to a tote for disposal. This closes the cycle with a circulating load forecast of 300%.
Leaching, CIP, Effluent Treatment
The leach circuit feed passes through the trash screen with apertures of 0.6 mm to remove any organic materials. The trash screen underflow is sampled for metallurgical analysis and is then directed by gravity to the first, or if bypassed for maintenance, the second leach tank where reagents; sodium cyanide, leaching agent, milk of lime and pH adjuster are added. The leaching cycle will take place in six leach tanks, equipped with the agitators. Each tank will have air injected. The pulp flows by gravity from one tank to another, resulting in a total residence time of 48 hours within the leach circuit.
The leach product is sampled and flows to the CIP feed pumpbox. CIP feed pumps will transfer the slurry to the CIP circuit.
The CIP circuit consists of eight tanks, equipped with agitatorsand DSM type inter-stage screens with apertures of 0.6mm aimed at retaining carbon.
The pulp in the CIP circuit flows by gravity due to the elevation difference between each tank. The adsorption process is countercurrent to the pulp flow, i.e., regenerated carbon feeds the last tank after passing over the vibrating dewatering screen, and will subsequently be pumped by the carbon forwarding pump to the previous tank and so on until it reaches the first tank. The loaded carbon from the first CIP tank will be pumped by the carbon forwarding pump, to the loaded carbon dewatering screen.
The loaded carbon retained by the loaded carbon screen, will report to the loaded carbon tank after sampling. The loaded carbon is then is transported via an eductor to acid washing and regeneration, or directly to elution. From either of these, carbon is transported to the regeneration kiln.
The discharge from the last CIP tank will flow by gravity to the vibrating carbon safety screen. The retained carbon will be taken to the next stage of the process, elution and electrowinning. The carbon safety screen underflow will be sampled and flow by gravity to the CIP tailings thickener. Overflow from the thickener containing recovered sodium cyanide solution will be distributed to the leach and CIP circuits via pumpbox and pump. The thickener underflow will be pumped to the effluent treatment tank.
The effluent treatment tanks are equipped with agitators. Process reagents will be dosed into these tanks which will also be supplied with sparging air. The treated effluent will flow by gravity to pumpbox from which it will be pumped by pumps, one running and one standby, to three retention ponds with 4,700m3 capacity each. The treated effluent will be transferred via pumps to the final tailings pumpbox from which combined with the flotation tailings it will be pumped to the tailings dam.
Elution, Electrolysis
A solution containing 0.2% sodium hydroxide and 1.0% sodium cyanide is prepared in the electrolyte tank. The solution is pumped bya pair of pumps, one running and one standby, through the heat exchanger where it will be heated to 95°C and taken to the elution column. The
97
Technical Report for the Tocantinzinho Gold Project, Brazil | |
heated solution is used to promote desorption of loaded carbon from the CIP process which is fed into the top of the columns after dewatering by the vibrating screen.
The gold from the loaded solution fed into the three electrowinning cells will be deposited on the cathodes made up of steel wool. The cathodes are removed periodically and taken to the smelting furnace. The solution now depleted by electrolysis will be discharged into the electrolyte tank and thus returning to the elution column closing the cycle.
Acid wash / Carbon regeneration
The desorbed carbon is dewatered in the vibrating screen and discharged into the acid wash tank for acid washing with a 15% concentrate hydrochloric acid solution. The carbon is then transported via an educator to the carbon reactivation kiln feed tank. The carbon is discharged from the feed tank onto the vibrating dewatering screen and then metered via screw conveyor into the carbon reactivation kiln. Steam is injected into the carbon reactivation kiln creating an atmosphere free of combustible air to minimize the burning of carbon.
The carbon reactivation kiln discharges into the regenerated carbon storage/quench tank. New carbon will be added to this tank as required. The reactivated carbon will be distributed via an eductor to the CIP process tanks.
Reclaimed water containing fine carbon from the carbon dewatering screens will feed the fine carbon filter feed tank. This water will be transported via an eductor to the fine carbon filter press to remove the fine carbon. The filtrate will flow to the eductor feed water tank where it will be distributed to be used as transport water in the eductors.
Smelting
The cathodes from the electrowinning cells will be mixed with flux then fed into the smelting furnace. The smelted dore is then poured into the ingot moulds and cooled. Once the dore has cooled it is removed from the moulds and cleaned to remove any slag, then it is moved to a vault. The slag produced in the smelting process will be reprocessed to recover any residual gold.
The fumes generated in the gold room, the electrowinning cells, the carbon reactivation kiln and the acid wash tank will be treated prior to exhausting to the environment. This treatment will be done by the gas scrubbing system which is comprised of a wet scrubber and a baghouse dust collector.
| 19.2.5 | Reagents plant |
Preparation and distribution of Sodium cyanide
Sodium cyanide will be received in solid form in bulk bags and will be dosed in aqueous solution at 25% (w/w). The preparation of the solution will be done in batches creating enough solution for approximately eight (8) hours of operation per batch.
Preparation of the solution will involve the mixing of sodium hydroxide solution, sodium cyanide and water in the agitator equipped sodium cyanide mix tank.
98
Technical Report for the Tocantinzinho Gold Project, Brazil | |
The prepared solution is transferred from the mix tank to the sodium cyanide distribution tank. The solution will be dosed to the consumption points by the variable speed pumps, three running and one common standby pump.
Preparation and distribution of milk of lime
The lime will be received in solid form in bulk bags and will be dosed in aqueous solution at 5% (w/w). The preparation of the solution will be done in batches creating enough solution for approximately 24 hours of operation per batch.
To prepare the solution, the content of the bulk bag will be unloaded into the milk of lime mix tank partially filled with water and equipped with an agitator. After the addition of reagent a volume of water will be added until the solution reaches a dilution of 5%.
The prepared solution is transferred by gravity to the agitator equipped milk of lime distribution tank, from which it will be dosed to the consumption points. A recirculation of the solution to the distribution tank is allowed to ensure a continuous flow in the return line, preventing the sedimentation of solid in suspension and plugging of the distribution system.
Preparation and distribution of sodium hydroxide
The sodium hydroxide will be received in solid form in bulk bags and will be dosed in aqueous solution at 20% (w/w). The preparation of the solution will be done in batches creating enough solution for approximately eight (8) hours of operation per batch.
To prepare the solution, the contents of the bulk bag will be unloaded into the sodium hydroxide mix tank that is partially filled with water and equipped with an agitator. After the addition of the reagent a volume of water will be added until the solution reaches a dilution of 20%.
The prepared solution will be transferred from the mix tank to the distribution tank. The solution will be dosed to the consumption points by the variable speed pumps, four running and one common standby pump.
Preparation and distribution of collector
The collector will be received in solid form in bulk bags and will be dosed in aqueous solution at 10% (w/w). The preparation of the solution will be done in batches creating enough solution for approximately eight (8) hours of operation per batch.
To prepare the solution, the content of the bulk bag will be unloaded into the collector mixing tank which will be partially filled with water and equipped with an agitator. After the addition of the reagent a volume of water will be added until the solution reaches the dilution of 10%.
The prepared solution will be transferred from the mix tank to the distribution tank. The solution will be dosed to the consumption points by the variable speed positive displacement pumps, one running and one standby.
Storage and distribution of foam
The foam will be received in the liquid state in carboys and transferred by pump up to the storage tank.
The solution contained in the storage tank will be transferred to the distribution tank from which it will be dosed to the consumption points by a pair of variable speed positive displacement pumps, one running and one standby.
99
Technical Report for the Tocantinzinho Gold Project, Brazil | |
A 33% solution of hydrochloric acid will be delivered by tanker trucks and transferred to the two hydrochloric acid storage tanks. The solution will be distributed to the consumption points via a return loop pipe system.
For environmental protection measures, the gases generated in the storage tanks will be directed to two boxes from where they will be bubbled into treated water and discharged into a containment basin.
Preparation and distribution of copper sulfate and sodium metasulfite
Copper Sulfate
Copper sulfate will be received in solid form in bulk bags and will be dosed in aqueous solution at 10% (w/w). The preparation of the solution will be done in batches creating enough solution for approximately eight (8) hours of operation per batch.
To prepare the solution, the content of the bulk bag will be unloaded into the copper sulphate mix tank which is partially filled with water and equipped with an agitator. After the addition of the reagent a volume of water will be added until the solution reaches the dilution of 10%.
The prepared solution will be transferred from the mix tank by a pair of pumps, one running and one standby to the distribution tank from which it will be dosed to the consumption points.
Sodium Metasulfite
Sodium metasulfite will be received in solid form in bulk bags and will be dosed in aqueous solution at 10% (w/w). The preparation of the solution will be done in batches creating enough solution for approximately eight (8) hours of operation per batch.
To prepare the solution, the content of the bulk bag will be unloaded into the sodium metasulfite mix tank partially filled with water and equipped with an agitator. After the addition of the reagent a volume of water will be added until the solution reaches the dilution of 10%.
The prepared solution will be transferred from the mix tank by a pair of pumps, one running and one standby, to the distribution tank from which it will be dosed to the consumption points.
Preparation and distribution of flocculant
The flocculant will be received in solid form in bulk bags and will be dosed in aqueous solution at 10% (w/w). The preparation of the solution will be done in batches creating enough solution for approximately eight (8) hours of operation per batch.
The flocculant powder will be loaded into the receiving silo from which it will be metered via a rotary valve into a mixer/eductor which will then transfer the solution to the agitated distribution tank for distribution to the points of consumption.
| 19.2.6 | Conclusions |
Based on the batch testing and pilot plant data it could be concluded that:
● | The characterized ore is amenable to cyanide leaching at a reasonable high recovery; |
● | The ore is suitable for concentration by mean of centrifugal concentration or flotation; |
● | The concentrates are readily leached in a cyanide/oxygen enriched slurry (± 40% solids) with a particle top size of 125 microns; |
100
Technical Report for the Tocantinzinho Gold Project, Brazil | |
● | Management of tailings and treatment for disposal requires further testwork to define options for Cyanide detoxification for the next stage of development (Feasibility). |
Based on the inferred guidelines of previous testing and the conceptual processing route defined by SEI, it could be concluded that:
● | There is adequateflexibility to reclaim the ROM ore in the crushing-stockpiling of classified ore with known standard crushing-grinding equipment; |
● | There is also flexibility in the ball grinding-regrinding circuit for proportioning the concentrate mass pull for division into the intensive leaching and conventional leach/CIP recovery. The previous step (Acacia type leach) could be tested at double capacity to maximize overall plant recovery; |
● | Despite the accepted CIP recovery process and due to the Capex and Opex involved and management of slime waste, it is recommended to evaluate a process of carbon adsorption in clear pregnant solution or even the standard Merrill Crowe recovery system with thickening-filtration-washing for disposal of confined solids; |
● | Management and treatment of tailings will require additional research. |
| 19.2.7 | Plant Personnel Requirements |
A summary of the plant personnel requirements is shown in Table 19-14 on page 121.
| 19.2.8 | Production plan |
The scheduled plant feed is shown in Table 19-11.
101
Technical Report for the Tocantinzinho Gold Project, Brazil | |
Table 19-11: Scheduled Plant Feed
| Plant Feed | Year | LOM Total | |||||||||||||
| 1 | 2 | 3 | 4 | 5 | 6 | 7 | 8 | 9 | 10 | 11 | 12 | ||||
| Saprolite | Ore | kt | 1.752 | 220 | 32 | 0 | 0 | 0 | 0 | 0 | 0 | 0 | 290 | 483 | 2.777 |
| Grade | g/t | 0,92 | 0,62 | 0,54 | 0,00 | 0,00 | 0,00 | 0,00 | 0,00 | 0,00 | 0,00 | 0,90 | 0,90 | 0,89 | |
| Rock | Ore | kt | 2,648 | 4,180 | 4,368 | 4,400 | 4,400 | 4,400 | 4,400 | 4,400 | 4,400 | 4,400 | 4,110 | 165 | 46,271 |
| Grade | kt | 1.13 | 1.19 | 1.13 | 1.16 | 1.30 | 1.34 | 1.27 | 1.40 | 1.40 | 1.43 | 1.22 | 0.90 | 1.28 | |
| Totals | Ore | kt | 4,400 | 4,400 | 4,400 | 4,400 | 4,400 | 4,400 | 4,400 | 4,400 | 4,400 | 4,400 | 4,400 | 647 | 49,047 |
| Grade | kt | 1.05 | 1.16 | 1.13 | 1.16 | 1.30 | 1.34 | 1.27 | 1.40 | 1.40 | 1.43 | 1.20 | 0.90 | 1.25 | |
| kt/day | 12.05 | 12.05 | 12.05 | 12.05 | 12.05 | 12.05 | 12.05 | 12.05 | 12.05 | 12.05 | 12.05 | 1.77 | |||
| Recovery | % | 90.1 | 90.1 | 90.1 | 90.1 | 90.1 | 90.1 | 90.1 | 90.1 | 90.1 | 90.1 | 90.1 | 90.1 | ||
| Au | kg | 4,155,95 | 4,592,94 | 4,479,23 | 4,598,28 | 5,150,22 | 5,317,58 | 5,028,95 | 5,547,23 | 5,541,54 | 5,670,21 | 4,768,25 | 522,98 | 55,373 | |
| Au | oz | 133,619 | 147,669 | 144,013 | 147,840 | 165,586 | 170,967 | 161,687 | 178,350 | 178,167 | 182,304 | 153,305 | 16,815 | 1,780,322 | |
| 19.2.9 | Process Operating costs |
Process Operation Cost are summarized in Section 18.8
| 19.3 | Infrastructure |
VOGBR developed the foundation conditions for the Tocantinzinho Project, based on regional geological data, information collected during visits to the site and on site specific geological-geotechnical data.
The geological-geotechnical investigations carried out in the Tocantinzinho Project site consist of 29 auger drillholes. The depth scheduled for the auger holes was 15.0 m.
The project site has similar characteristics throughout its area. Initially,auger drilling produced a residual granite soil of silty-argillaceous texture, variegated color (yellowish, reddish), and low plasticity, underlain by granite saprolite with texture varying from argillaceous-silty with fine sand and silty-argillaceous also with fine sand, of variegated color (pink, red and white) with low to medium plasticity. The average thicknesses verified in the holes was 10.0 m for residual soil and 5.00 m for saprolite. This will vary in valley bottoms and small flooded plains.
It will be necessary to conduct further geotechnical investigation, field testing and collection of disturbed and undisturbed samples to further define the foundation conditions of Tocantinzinho.
Unamgen developed a general master plan of the project containing all structures that compose the Tocantinzinho Project. The layout of the structures is shown in Figure 19-17.
102
Technical Report for the Tocantinzinho Gold Project, Brazil | |

Figure 19-17: Master Plan
103
Technical Report for the Tocantinzinho Gold Project, Brazil | |

Figure 19-18: Processing Plant
104
Technical Report for the Tocantinzinho Gold Project, Brazil | |
| 19.3.2 | Industrial Infrastructure |
Power
The mining-metallurgical complex named Tocantinzinho Project, located in the municipality of Itaituba/PA, will require a power supply of approximately 25 MW during the final phase. After analyzing three power supply options, we have concluded that the Tocantinzinho Project mining-metallurgical complex will be supplied from the Novo Progresso substation, with the construction of approximately 190 km of transmission line and a 138 kV substation at the site.
Fuel
An area of 936 m2 will be built used to store fuels next to the shop, between the pit and the ore stockpile, as per Figure 19-17 - position 11 with two tanks installed at ground level having a, total capacity of 1,200 m3, for diesel oil storage. The fuel storage yard and fuel station areas will be fitted with surface systems for spill containment, with duly-designed water/oil separator boxes.
The Fuel Station will be located next to the mechanical shop, covering an area of 52 m2 and will be dedicated to the mine haulage vehicles. Light vehicles, such as pickup trucks and support cars, will be supplied at another facility located next to the warehouse plateau. An overhead 5,000 L fuel tank and a gas pump will be installed at that location. Spill collection systems will be also installed. These buildings have been proposed for the mine’s construction phase and will be kept during the Operating Phase. The estimate of diesel oil and lube oil consumption is 12,096,000 L/year and 650,000 L/year, respectively.
Water
The water catchment facility will be installed on the right bank of the Tocantinzinho River, at a point of coordinates 576,912 E and 9,329,779 N. The maximum expected flow is approximately 1,400 m3/h, which is significantly lower than the maximum permitted flow. The catchment facility will comprise a masonry and reinforced concrete building, in which the pumps will be installed. The infrastructure at the catchment facility will also include a water intake structure, sand traps, suction well and desliming system. A nearby substation will supply electric power. The system will have the capability to handle variations in water levels over the year. Site selection took into account potential build up of sediment around the intake system, ease of access for the construction, operation and maintenance crews, and to minimize pumping distances.
The water main will utilize an HDPE pipeline with adequate diameter and thickness for a static head of 65 m, length of 3,200 m and flow rate of 1,400 m3/h. The route was selected to minimize pumping distance. Accesses will be implemented for construction and maintenance purposes. Figure 19-17 – position 3 and 4 shows the catchment point and the water main route up to the industrial area. Water pumped to the industrial plant will be discharged into a 20,000 m3 storage and distribution pond. All industrial water will be distributed from this pond.
During the implementation and operation phases, water used for special purposes and human consumption will be extracted from neighbouring streams or drilled wells, then undergo treatment (turbidity removal and disinfection). The treatment of raw water collected for industrial use will consist solely of sediment control. The average estimated industrial water consumption during the operation phase is 1,500 m3/h. The estimate for potable water consumption is 32.0 m3/day, based on a consumption of 80 L per person per day considering 400 people on site. Both for the Implementation Phase and Operation Phase, a Water Treatment Plant will be built to supply potable water to employees. The Treatment Plant will be located next to the lodging facility, as shown in Figure 19-17 – position 20.
105
Technical Report for the Tocantinzinho Gold Project, Brazil | |
| 19.3.3 | Transport Infrastructure |
Access road
The proposed 98.0 km long access road to the Tocantinzinho Project site starts at the intersection of BR-163 and Transgarimpeira Road, located in the Morais Almeida district. This road proceeds along the Transgarimpeira Road from East to West for 30.2 km then it takes a NW direction and runs for 67.8 km until reaching the site. A ferry service is provided to cross the Jamanxim River at km post 21.1 on the Transgarimpeira Road, from BR-163 (Morais Almeida). The access road is shown in Figure 19-19.
The fleet of heavy vehicles considered for the access road will consist of 45 t semi-trailer trucks; medium vehicles will be busses and trucks, and light vehicles will be comprised of automobiles, pickup trucks, vans and small trucks required to transport several types of goods necessary for the daily activities of the mine. Traffic has been classified as medium and the estimated traffic volume of the access road can be broken down as shown in Table 19-12:
Table 19-12: Traffic Volume
| Type of Vehicle | Average Daily Volume |
| Light Vehicles | 80 |
| Medium Vehicles | 100 |
| Heavy Vehicles | 80 |
| Total | 260 |
The road access design was developed based on the following parameters:
| ● | Maximum grade | 8.0% | |
| ● | Cross-slope from centerline | 3.0% | |
| ● | Formation width | 10.0 m | |
| ● | Roadway width | 3.5 m | |
| ● | Width for shoulders and drainage devices | 1.5 m | |
| ● | Design speed | 50 km/h | |
| ● | Maximum superelevation | 8.0% | |
| ● | Maximum extra width | 0.8 m | |
| ● | Minimum horizontal curve radius | 125.0 m | |
Cut and fill slopes of the access road:
| ● | Cut slopes: | 1.0H / 1.0V; | |
| ● | Fill slopes: | 1.5H / 1.0V; |
The total volumes of the earthworks required for the access road are:
| ● | Cut Volume | 1,293,674.97 m3 | |
| ● | Fill Volume (swelling considered) | 1,774,576.78 m3 | |
| ● | Volume of Borrow Material | 480,901.81 m3 |
According to the take-off sheet developed by TEP Engenharia de Projetos Ltda, the estimated cost per km is US$224,825, with a total cost of US$15,244,000 for the 67.8 km.
106
Technical Report for the Tocantinzinho Gold Project, Brazil | |

Figure 19-19: Access Road - Plant
107
Technical Report for the Tocantinzinho Gold Project, Brazil | |
Airstrip
The existing airstrip shown in Figure 19-17 position 27 will be used
| 19.3.4 | Buildings and Facilities |
Administrative support
Administration
The Administration building will be constructed on the industrial area with a foot print of 300 m2. The overall administrative operations and mine administration will be housed in the building. A portion of the administration staff will be located in Itiatuba and at Unamgem's head office in Belo Horizonte/MG. The building will be a stick built structure and an allowance has been considered for office and IT equipment.
First aid clinic
A First Aid Clinic will be erected in the early stages of construction. The complex will include offices for the doctor and medical staff, a medical emergency area, and a garage for the site ambulance. The clinic will be a 360 m2 stick built building. An allowance is included for an ambulance and medical supplies.
Warehouse and workshop
The warehouse will be a 1,200 m2 pre-engineered building with a portion allocated for purchasing and warehouse staff offices; and workshops for maintenance support staff.
The warehouse will be used for mine and process equipment and consumables. A fenced area will be included for supplies not affected by the elements. There are separate warehouses for cyanide and reagent storage described below.
Lodgings
The lodging and its support facilities are located on the upper site area. It will accommodate up to 400 employees. The proposed work schedule and manpower loading indicates that on average 352 employees will be housed daily in the lodging complex during normal operation of the mine.
The proposed lodgings consist of eight (8) single story modular dorm complexes. Each dorm complex will consist of 50 independent single accommodation rooms containing a bed, desk and locker. In addition, a common shower room, laundry room and storage area for housekeeping will comprise each dorm complex.
Support facilities for the lodging complex consist of; a sewage treatment plant, potable water storage and distribution, fresh/fire water storage and distribution, emergency generators, liquefied petroleum gas storage tanks, an incinerator, solid waste storage, recyclable waste storage areas and a composting area.
Kitchen, cafeteria, and recreational facilities
The kitchen and dining complex will be adjacent to the lodging facilities and utilize the common support facilities. This complex will be a modular single story wooden structure of similar construction to the lodging facilities. Contained within this complex will be a large food preparation area with refrigerated and non refrigerated storage area and an eating area capable of accommodating up to 150 people per sitting.
108
Technical Report for the Tocantinzinho Gold Project, Brazil | |
Operational support
Maintenance shop
A maintenance shop will be included in the Process Plant building with equipment housed for the servicing of the process equipment. The shop space will be 300 m2 with additional space included in the Warehouse. A small portion of the space will be allocated for a supervisor’s office and a storage space. An allowance has been included for cranage and shop tools.
Truck shop
A truck shop will be supplied to accommodate the maintenance of the mining fleet and light vehicles. The shop will be 1,560 m2 and will consist of four large vehicle bays for the mining equipment and two additional bays to handle light vehicles and small projects. Additional space is included for warehousing, and maintenance offices. A portion of the shop will be allocated to a tire repair area to service the mining equipment. Allowances have been included for cranage and equipment shop tools. The truck shop will be a pre-engineered structure. A fenced area will be erected adjacent to the truck stop for warehousing spare equipment and supplies not affected by the elements. Major equipment overhauls and engine rebuilds will be completed off-site.
Vehicle wash facility
A wash pad with a pressurized washing system and access platforms for large vehicles will be located in close proximity to the truck shop. The facility will consist of a concrete pad with systems for the collection and recycling of water. The collection system will include a settlement box and oil/water separator. Any surplus waste water will be directed to a compact wastewater treatment plant (WWTP).
Fuel storage
A fuel storage facility will be constructed to accommodate 1.2 million litres of diesel fuel in two steel tanks which will be dispensed by a modular filling station to the mine fleet.
Used oil storage
A used oil area will be erected on a concrete structure with containment barriers for the storage of used oils and solvents. Tanks will be provided to store waste oil collected from the oil separator and from the servicing of equipment. Contaminated and oil soaked waste will be collected and disposed of according to applicable legislation regarding hazardous waste. For the maintenance areas environmental considerations for the control of contaminants will consist of sloped floors and floor channels directed into settling boxes with oil/water separators.
Change room
A change room will be provided for all the crew consisting of a locker room for 500 staff, shower and washing facilities, and laundry facilities. The change room will be a 300 m2 pre-engineered building erected early on to support construction and mine development.
109
Technical Report for the Tocantinzinho Gold Project, Brazil | |
A laboratory will be constructed near the process plant. The 150 m2 stick built building will house laboratory equipment to support both the process and geology departments. An allowance has been included for the laboratory and ancillary equipment. A portion of the metallurgical testing will be contracted off-site.
Fresh and fire water system
A 900 m³ Fresh/Fire water tank will be installed on the hill adjacent to the camp complex. Water will be pumped to the water tank from a stream on the project site.
The fire water system will consist of buried HDPE pipe in a closed loop around the plant and camp areas. The system will be gravity feed with a back-up diesel pump to increase system pressure if required. The bottom 500 m3 of the water tank will be dedicated to fire water.
The fresh water will be pumped through a filtration and chlorination station and distributed to the facilities through an HDPE pipe system.
Cyanide storage
Cyanide will be bulk purchased in solid form packaged in bulk bags. A 273 m2 pre-engineered building will be erected to warehouse the totes. The cyanide will be housed separately from other reagents in a secure fenced compound with containment provisions. Cyanide storage and handling will be according to applicable legislation.
Reagent storage
Reagents will be shipped in bulk, packaged in bulk bags, totes, and barrels. The regents will be stored in a 1,250 m2 sprung structure located near the process plant. The warehouse will include containment provisions. A small portion of the reagents will be temporarily stored at the process plant for daily use.
Explosive storage
The explosive storage area will consist of eight separate bunkers designed to Brazilian regulations and Brazilian army standards for the storage of 1,800 tonne of ammonium nitrate. Additionally four bunkers will be constructed in a separate area to store blasting caps and primers. Another separate bunker will be constructed for prepared emulsion explosives.
Ligneous Material Stockyard
Vegetation grubbed during construction will be stored in the Ligneous Material Stockyard. The stockyard will contain timber; the smaller ligneous material consisting of shrubs, branches, and leaves will be stored in a separate composting area for rehabilitating the mine site during closure. Timber collected during construction and operations will be stored in the stockyard until the disposal or shipment is authorized.
Disposal and Drainage
Sewage
Three wastewater treatment plants (WWTP) will be implemented as follows: one to service the accommodation area; one in the area designated for the plant and administrative area; and a smaller one in the area proposed for the shop, tire repair shop, truck washing facility and fuel
110
Technical Report for the Tocantinzinho Gold Project, Brazil | |
station. Sanitary effluents will be routed to the wastewater treatment plants (WWTP), in compliance with the effluent discharge regulations and current legislation and standards.
Waste Disposal
Solid waste will be shipped to the sanitary landfill that will be built at the mine site (1,800 m2). Waste generated by the project’s first aid clinic will disposed of according to Brazilian regulations. Tailings Dams
The tailings dam shown on the plan view in Figure 19-17 Position 10 is situated approximately at UTM Zone 21 coordinates 579,000 E and 9,329,250 N. This dam is intended to receive sediment from the area surrounding the reservoir and tailings derived from the process plant. The final dam crest elevation at 173 m requires building three enclosure (saddle) dams (Figure 19-17).
The final arrangement proposed will accommodate an estimated output 39.7 million m3, corresponding to tailings output throughout the expected 11 year mine life. Additional capacity is available with further modifications to the containment area.
The proposed containment system (final elevation at 173 m) consists of a reservoir formed by a zoned earth dam covered by an inclined filter and a downstream riprap wall. Embankment slopes will have a gradient of 2(H):1(V): upstream 1.5(H):1(V) downstream, for both placed and compacted rockfill, with varying berm slope heights and berm length of 10.0 m, as shown in Figure 19-20 and Figure 19-21.
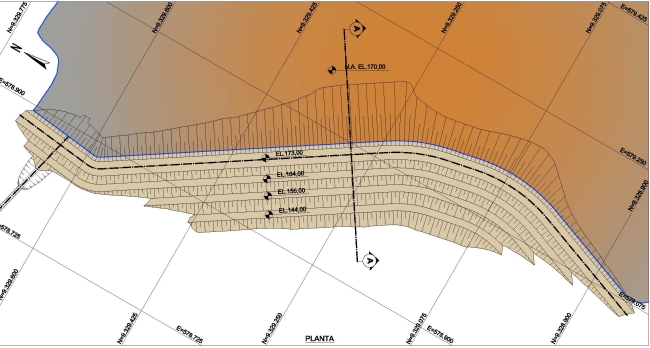
Figure 19-20: Tailings Dam – Plan
111
Technical Report for the Tocantinzinho Gold Project, Brazil | |

Figure 19-21: Tailings Dam - Cross section A-A
Stormwater Drainage
The storm water drainage structures proposed for the project have been primarily designed to collect, convey and dispose of, in safe locations, the incoming run-off within the project site.
The devices adopted for the project’s drainage system, can be summarized as: peripheral channels, surface drainage devices, pit dewatering system, sediment-containment dikes and settling ponds.
Communications
A communications network will be established using satellite technology for offsite voice, fax, and internet service. An onsite communications and LAN network will be established in conjunction with the process control system to connect all process and ancillary facilities with voice and data service. In addition a radio system for site communications will be installed consisting of radios in vehicles and hand held units. A fleet management system for managing the mine and haul truck dispatching will be also installed.
Security
The Tocantinzinho Mine will maintain a security force. Access to the mine site will be controlled by a manned gatehouse located on the access road at the entrance to the property. All vehicular traffic will be required to pass through this security check point. Security will patrol the access road. A security presence will be established at the water intake facility on the Tocantinzinho River.
There will be a security office attached to the gold room. The gold room security office will control access to and from the gold room and monitor the gold room via CCTV and direct line of sight. An outside security contractor will be retained for transportation of gold dore from the site.
112
Technical Report for the Tocantinzinho Gold Project, Brazil | |
| 19.4 | Manpower |
The manpower estimated by Eldorado to the Tocantinzinho Project is presented in Table 19-13, Table 19-14, Table 19-15, and Table 19-16.
Table 19-13: Manpower - Mine
| Function | Year | ||||||||||
| 1 | 2 | 3 | 4 | 5 | 6 | 7 | 8 | 9 | 10 | 11 | |
| MINE OPERATIONS | |||||||||||
| Staff | |||||||||||
| Mine Manager | 1 | 1 | 1 | 1 | 1 | 1 | 1 | 1 | 1 | 1 | 1 |
| Mine Superintendent | 1 | 1 | 1 | 1 | 1 | 1 | 1 | 1 | 1 | 1 | 1 |
| Mine General Forman | 3 | 3 | 3 | 3 | 3 | 3 | 3 | 3 | 3 | 3 | 1 |
| Mine Supervisor | 3 | 3 | 3 | 3 | 3 | 3 | 3 | 3 | 3 | 2 | 1 |
| Project Supervisor | 2 | 2 | 2 | 2 | 2 | 2 | 2 | 2 | 2 | 1 | 1 |
| Drill and Blast Supervisor | 3 | 3 | 3 | 3 | 3 | 3 | 3 | 3 | 3 | 3 | 2 |
| Clerk | 2 | 2 | 2 | 2 | 2 | 2 | 2 | 2 | 2 | 2 | 2 |
| Hourly | |||||||||||
| Large Excavator Operator | 9 | 12 | 12 | 12 | 12 | 12 | 9 | 6 | 6 | 6 | 3 |
| Small Excavator Operator | 3 | 6 | 6 | 6 | 6 | 6 | 6 | 6 | 6 | 3 | 3 |
| Dozer Operator | 15 | 15 | 15 | 15 | 15 | 15 | 15 | 15 | 12 | 9 | 6 |
| Grader Operator | 3 | 6 | 6 | 6 | 6 | 6 | 6 | 3 | 3 | 3 | 3 |
| Articulated Truck Operator | 6 | 6 | 6 | 6 | 6 | 6 | 6 | 6 | 6 | 3 | 3 |
| Haul Truck Operator | 36 | 36 | 39 | 42 | 45 | 48 | 42 | 30 | 27 | 21 | 15 |
| Water Truck Operator | 3 | 3 | 3 | 3 | 3 | 3 | 3 | 3 | 3 | 3 | 3 |
| Pumpman | 2 | 2 | 2 | 4 | 4 | 4 | 4 | 4 | 4 | 4 | 4 |
| Mine Helper | 3 | 3 | 3 | 6 | 6 | 6 | 6 | 6 | 6 | 6 | 6 |
| Aggregate Plant Operator | 2 | 2 | 2 | 2 | 2 | 2 | 2 | 2 | 2 | 2 | 2 |
| Aggregate Plant Loader Operator | 2 | 2 | 2 | 2 | 2 | 2 | 2 | 2 | 2 | 2 | 2 |
| Wheel Dozer Operator | 3 | 3 | 3 | 3 | 3 | 3 | 3 | 3 | 3 | 3 | 3 |
| Production Drill Operator | 9 | 9 | 9 | 9 | 9 | 9 | 9 | 6 | 3 | 2 | 2 |
| Blaster | 2 | 2 | 2 | 2 | 2 | 2 | 2 | 2 | 2 | 2 | 2 |
| Powder Truck Operator | 2 | 2 | 2 | 2 | 2 | 2 | 2 | 2 | 2 | 2 | 2 |
| Blaster Helper | 4 | 4 | 4 | 4 | 4 | 4 | 4 | 4 | 4 | 4 | 4 |
| Drill Helper | 9 | 9 | 9 | 9 | 9 | 9 | 6 | 6 | 6 | 3 | 3 |
| MINE MAINTENANCE | |||||||||||
| Staff | |||||||||||
| Maintenance Superintendent | 1 | 1 | 1 | 1 | 1 | 1 | 1 | 1 | 1 | 1 | 1 |
113
Technical Report for the Tocantinzinho Gold Project, Brazil | |
| Function | YEAR | ||||||||||
| 1 | 2 | 3 | 4 | 5 | 6 | 7 | 8 | 9 | 10 | 11 | |
| General Forman | 2 | 2 | 2 | 2 | 2 | 2 | 2 | 2 | 2 | 1 | 1 |
| Shift Forman | 0 | 6 | 6 | 6 | 6 | 6 | 6 | 6 | 6 | 2 | 0 |
| Planner | 0 | 2 | 2 | 2 | 2 | 2 | 2 | 2 | 2 | 0 | 0 |
| Clerk | 0 | 2 | 2 | 2 | 2 | 2 | 2 | 2 | 2 | 1 | 1 |
| Hourly | |||||||||||
| Mechanic | 6 | 12 | 12 | 12 | 12 | 12 | 12 | 9 | 6 | 3 | 3 |
| Welder | 3 | 6 | 6 | 6 | 6 | 6 | 6 | 6 | 3 | 2 | 2 |
| Electrician | 3 | 9 | 9 | 9 | 9 | 9 | 9 | 6 | 3 | 2 | 2 |
| Washramp Attendant | 0 | 4 | 4 | 4 | 4 | 4 | 4 | 2 | 2 | 1 | 1 |
| Tireman | 0 | 2 | 2 | 2 | 2 | 2 | 2 | 2 | 2 | 1 | 1 |
| Maintenance Helper | 3 | 6 | 9 | 9 | 9 | 9 | 9 | 6 | 6 | 2 | 2 |
| GEOLOGY | |||||||||||
| Staff | |||||||||||
| Chief Geologist | 1 | 1 | 1 | 1 | 1 | 1 | 1 | 1 | 1 | 1 | 1 |
| Senior Geologist | 2 | 2 | 2 | 2 | 2 | 2 | 2 | 2 | 2 | 2 | 2 |
| Grade Control Technicial | 2 | 2 | 2 | 2 | 2 | 2 | 2 | 2 | 2 | 1 | 1 |
| Field Geologist | 0 | 3 | 3 | 3 | 3 | 3 | 3 | 3 | 2 | 2 | 1 |
| Hourly | |||||||||||
| Sampler | 3 | 6 | 9 | 9 | 9 | 9 | 6 | 6 | 6 | 3 | 3 |
| ENGINEERING | |||||||||||
| Staff | |||||||||||
| Chief Engineer | 1 | 1 | 1 | 1 | 1 | 1 | 1 | 1 | 1 | 1 | 1 |
| Mining Engineer | 2 | 2 | 2 | 2 | 2 | 2 | 2 | 1 | 1 | 1 | 1 |
| Junior Engineer | 2 | 2 | 2 | 2 | 2 | 2 | 2 | 1 | 1 | 1 | 1 |
| Senior Surveyour | 2 | 2 | 2 | 2 | 2 | 2 | 2 | 2 | 2 | 1 | 1 |
| Clerk | 1 | 2 | 2 | 2 | 2 | 2 | 2 | 2 | 2 | 1 | 1 |
| Hourly | |||||||||||
| Instrument Man | 2 | 4 | 4 | 4 | 4 | 4 | 4 | 4 | 4 | 2 | 2 |
| Rodman | 2 | 4 | 4 | 4 | 4 | 4 | 4 | 4 | 4 | 2 | 2 |
| Total Mine Staff | 32 | 46 | 46 | 46 | 46 | 46 | 46 | 44 | 43 | 29 | 22 |
| Total Mine Hourly | 135 | 175 | 184 | 192 | 195 | 198 | 190 | 151 | 136 | 97 | 85 |
| Total Mine | 167 | 221 | 230 | 238 | 241 | 244 | 226 | 195 | 179 | 126 | 107 |
114
Technical Report for the Tocantinzinho Gold Project, Brazil | |
| Function | Year | ||||||||||
| 1 | 2 | 3 | 4 | 5 | 6 | 7 | 8 | 9 | 10 | 11 | |
| PLANT | |||||||||||
| Manager | 1 | 1 | 1 | 1 | 1 | 1 | 1 | 1 | 1 | 1 | 1 |
| Metallurgical Engineer | 1 | 1 | 1 | 1 | 1 | 1 | 1 | 1 | 1 | 1 | 1 |
| Administrative Support | 1 | 1 | 1 | 1 | 1 | 1 | 1 | 1 | 1 | 1 | 1 |
| Production Supervisor | 2 | 4 | 4 | 4 | 4 | 4 | 4 | 4 | 4 | 4 | 4 |
| Head Shift | 4 | 8 | 8 | 8 | 8 | 8 | 8 | 8 | 8 | 8 | 8 |
| Smelting Supervisor | 1 | 1 | 1 | 1 | 1 | 1 | 1 | 1 | 1 | 1 | 1 |
| Oxidezed Plant Operator | 3 | 3 | 3 | 3 | 3 | 3 | 3 | 3 | 3 | 3 | 3 |
| Crusher Operator | 8 | 16 | 16 | 16 | 16 | 16 | 16 | 16 | 16 | 16 | 16 |
| Milling Operator | 8 | 16 | 16 | 16 | 16 | 16 | 16 | 16 | 16 | 16 | 16 |
| Flotation Operator | 8 | 16 | 16 | 16 | 16 | 16 | 16 | 16 | 16 | 16 | 16 |
| Control Room Operator | 2 | 4 | 4 | 4 | 4 | 4 | 4 | 4 | 4 | 4 | 4 |
| CIP Operator | 4 | 8 | 8 | 8 | 8 | 8 | 8 | 8 | 8 | 8 | 8 |
| Desorption/Acid Washing/Carbon Regeneration Operator | 4 | 8 | 8 | 8 | 8 | 8 | 8 | 8 | 8 | 8 | 8 |
| DETOX Operator | 2 | 4 | 4 | 4 | 4 | 4 | 4 | 4 | 4 | 4 | 4 |
| ETA Operator | 2 | 4 | 4 | 4 | 4 | 4 | 4 | 4 | 4 | 4 | 4 |
| Gravimetry Operator | 4 | 8 | 8 | 8 | 8 | 8 | 8 | 8 | 8 | 8 | 8 |
| Smelting Operator | 2 | 3 | 3 | 3 | 3 | 3 | 3 | 3 | 3 | 3 | 3 |
| Reagents Preparation/Utilities Operator | 1 | 2 | 2 | 2 | 2 | 2 | 2 | 2 | 2 | 2 | 2 |
| DAM Operator | 1 | 1 | 1 | 1 | 1 | 1 | 1 | 1 | 1 | 1 | 1 |
| Frontloader Operator | 2 | 4 | 4 | 4 | 4 | 4 | 4 | 4 | 4 | 4 | 4 |
| Production Helper | 6 | 12 | 12 | 12 | 12 | 12 | 12 | 12 | 12 | 12 | 12 |
| Total processing | 67 | 125 | 125 | 125 | 125 | 125 | 125 | 125 | 125 | 125 | 125 |
| Chemist | 1 | 1 | 1 | 1 | 1 | 1 | 1 | 1 | 1 | 1 | 1 |
| Chemical Analyst | 2 | 4 | 4 | 4 | 4 | 4 | 4 | 4 | 4 | 4 | 4 |
| Laboratory Assistant | 2 | 4 | 4 | 4 | 4 | 4 | 4 | 4 | 4 | 4 | 4 |
| Laboratory Helper | 1 | 2 | 2 | 2 | 2 | 2 | 2 | 2 | 2 | 2 | 2 |
| Total Laboratory | 6 | 11 | 11 | 11 | 11 | 11 | 11 | 11 | 11 | 11 | 11 |
| Maintenance Manager | 1 | 1 | 1 | 1 | 1 | 1 | 1 | 1 | 1 | 1 | 1 |
| Mechanical Engineer | 1 | 1 | 1 | 1 | 1 | 1 | 1 | 1 | 1 | 1 | 1 |
| Maintenance Supervisor | 2 | 3 | 3 | 3 | 3 | 3 | 3 | 3 | 3 | 3 | 3 |
| Maintenance Technician | 1 | 2 | 2 | 2 | 2 | 2 | 2 | 2 | 2 | 2 | 2 |
| Mechanic | 3 | 5 | 5 | 5 | 5 | 5 | 5 | 5 | 5 | 5 | 5 |
115
Technical Report for the Tocantinzinho Gold Project, Brazil | |
| Function | YEAR | ||||||||||
| 1 | 2 | 3 | 4 | 5 | 6 | 7 | 8 | 9 | 10 | 11 | |
| Electrician | 2 | 3 | 3 | 3 | 3 | 3 | 3 | 3 | 3 | 3 | 3 |
| Mechanic - Shift | 4 | 8 | 8 | 8 | 8 | 8 | 8 | 8 | 8 | 8 | 8 |
| Electrician - Shift | 2 | 4 | 4 | 4 | 4 | 4 | 4 | 4 | 4 | 4 | 4 |
| Instrumentalist | 1 | 2 | 2 | 2 | 2 | 2 | 2 | 2 | 2 | 2 | 2 |
| Lubricators | 1 | 2 | 2 | 2 | 2 | 2 | 2 | 2 | 2 | 2 | 2 |
| Mechanical Maintenance Inspector | 1 | 1 | 1 | 1 | 1 | 1 | 1 | 1 | 1 | 1 | 1 |
| Electrical Maintenance Inspector | 1 | 1 | 1 | 1 | 1 | 1 | 1 | 1 | 1 | 1 | 1 |
| Maintenance Programmer | 1 | 1 | 1 | 1 | 1 | 1 | 1 | 1 | 1 | 1 | 1 |
| Welder | 1 | 2 | 2 | 2 | 2 | 2 | 2 | 2 | 2 | 2 | 2 |
| Toolmaker | 1 | 1 | 1 | 1 | 1 | 1 | 1 | 1 | 1 | 1 | 1 |
| Electrician Assistant | 1 | 2 | 2 | 2 | 2 | 2 | 2 | 2 | 2 | 2 | 2 |
| Mechanical Assistant | 3 | 5 | 5 | 5 | 5 | 5 | 5 | 5 | 5 | 5 | 5 |
| Engineer Assistant- Shift | 4 | 8 | 8 | 8 | 8 | 8 | 8 | 8 | 8 | 8 | 8 |
| Equipments Support Operator (Truck Munck) | 4 | 8 | 8 | 8 | 8 | 8 | 8 | 8 | 8 | 8 | 8 |
| Crane Operator | 1 | 1 | 1 | 1 | 1 | 1 | 1 | 1 | 1 | 1 | 1 |
| Auxiliary | 1 | 1 | 1 | 1 | 1 | 1 | 1 | 1 | 1 | 1 | 1 |
| Total Plant Maintenance | 37 | 62 | 62 | 62 | 62 | 62 | 62 | 62 | 62 | 62 | 62 |
| Total Plant | 110 | 198 | 198 | 198 | 198 | 198 | 198 | 198 | 198 | 198 | 198 |
Table 19-15: Manpower G&A
| Function | Year | ||||||||||
| 1 | 2 | 3 | 4 | 5 | 6 | 7 | 8 | 9 | 10 | 11 | |
| G & A | |||||||||||
| General Manager | 1 | 1 | 1 | 1 | 1 | 1 | 1 | 1 | 1 | 1 | 1 |
| Secretary | 1 | 1 | 1 | 1 | 1 | 1 | 1 | 1 | 1 | 1 | 1 |
| Environment Enginner | 1 | 1 | 1 | 1 | 1 | 1 | 1 | 1 | 1 | 1 | 1 |
| DAM Technician | 1 | 1 | 1 | 1 | 1 | 1 | 1 | 1 | 1 | 1 | 1 |
| Administrative Manager | 1 | 1 | 1 | 1 | 1 | 1 | 1 | 1 | 1 | 1 | 1 |
| Administrative Technician | 6 | 12 | 12 | 12 | 12 | 12 | 12 | 12 | 12 | 12 | 12 |
| Dressing Room Helper/ Laundry | 7 | 13 | 13 | 13 | 13 | 13 | 13 | 13 | 13 | 13 | 13 |
| General services Helper | 2 | 3 | 3 | 3 | 3 | 3 | 3 | 3 | 3 | 3 | 3 |
| Safety Supervisor | 1 | 1 | 1 | 1 | 1 | 1 | 1 | 1 | 1 | 1 | 1 |
| Watchman Turn | 23 | 45 | 45 | 45 | 45 | 45 | 45 | 45 | 45 | 45 | 45 |
116
Technical Report for the Tocantinzinho Gold Project, Brazil | |
| Function | YEAR | ||||||||||
| 1 | 2 | 3 | 4 | 5 | 6 | 7 | 8 | 9 | 10 | 11 | |
| Watchman (Gravimetry) | 1 | 2 | 2 | 2 | 2 | 2 | 2 | 2 | 2 | 2 | 2 |
| Watchman (Casting) | 1 | 2 | 2 | 2 | 2 | 2 | 2 | 2 | 2 | 2 | 2 |
| Human Resources Coordenador | 1 | 1 | 1 | 1 | 1 | 1 | 1 | 1 | 1 | 1 | 1 |
| Human Resources Technician | 3 | 5 | 5 | 5 | 5 | 5 | 5 | 5 | 5 | 5 | 5 |
| Nutritionist/ Restaurant Supervisor | 1 | 1 | 1 | 1 | 1 | 1 | 1 | 1 | 1 | 1 | 1 |
| Operational Restaurant | 12 | 23 | 23 | 23 | 23 | 23 | 23 | 23 | 23 | 23 | 23 |
| Doctor | 1 | 1 | 1 | 1 | 1 | 1 | 1 | 1 | 1 | 1 | 1 |
| Nurse Helper | 2 | 4 | 4 | 4 | 4 | 4 | 4 | 4 | 4 | 4 | 4 |
| Safety Engineer | 1 | 1 | 1 | 1 | 1 | 1 | 1 | 1 | 1 | 1 | 1 |
| Pick Up Driver | 6 | 6 | 6 | 6 | 6 | 6 | 6 | 6 | 6 | 6 | 6 |
| SafetyTechnician | 1 | 8 | 8 | 8 | 8 | 8 | 8 | 8 | 8 | 8 | 8 |
| Total G & A | 74 | 133 | 133 | 133 | 133 | 133 | 133 | 133 | 133 | 133 | 133 |
Table 19-16: Manpower Total
| Operation | Year | ||||||||||
| 1 | 2 | 3 | 4 | 5 | 6 | 7 | 8 | 9 | 10 | 11 | |
| Total Mine | 117 | 226 | 238 | 245 | 247 | 251 | 255 | 255 | 232 | 160 | 135 |
| Total Plant | 110 | 198 | 198 | 198 | 198 | 198 | 198 | 198 | 198 | 198 | 198 |
| Total G & A | 74 | 133 | 133 | 133 | 133 | 133 | 133 | 133 | 133 | 133 | 133 |
| TOTAL PROJECT | 301 | 557 | 569 | 576 | 578 | 582 | 586 | 586 | 563 | 491 | 466 |
| 19.5 | Environment and Community |
The environmental permitting process for Tocantinzinho Project is currently underway. The agency in charge of the permitting process for the Tocantinzinho Project is the Environmental Agency of Pará State (SEMA-PA). The permitting process requires an Environmental Impact Assessment (EIA) approval. The consulting company Brandt Meio Ambiente Amazônia LTDA (Brandt) was retained to prepare the EIA. Once the EIA is completed, SEMA-PA will review the document in order to decide upon the issuance of the preliminary environmental permit (LP). After the LP is granted, the project owner must prepare an Environmental Management Plan (PCA), detailing the programs proposed in the EIA, and submit this document in order to request the Implementation Permit (LI). The LI allows the project owner to construct the structures included in the EIA and PCA. After the project structures are constructed, the project owner can apply for the operation permit (LO).
A report prepared by Brandt summarises the preliminary findings of the environmental impact assessment. The report was entitled “Relatório de Viabilidade Prévia do Projeto Tocantizinho” (Tocantinzinho Project Preliminary Feasibility Report). No fatal flaw was identified in regard to environmental aspects of Tocantinzinho Project.
117
Technical Report for the Tocantinzinho Gold Project, Brazil | |
| 19.6 | Conceptual Closure Plan |
This section presents the closure concepts applicable to the Tocantinzinho Project. The objective is to provide closure guidelines for the project. In order to develope this Conceptual Closure Plan, the Tocantinzinho Project was divided into the following domains:
● | Open pit; |
● | Waste Rock Pile; |
● | Ore pile; |
● | Process Plant (includes the whole process from crushing to smelting); |
● | Tailings Dam; |
● | On site infrastructure (includes shops, office buildings, …); |
● | Camp; and |
● | Road. |
For each domain, closure criteria and assumptions were established. Based on those, closure measures were proposed at a conceptual level. The main goal of the closure measures proposed is to attain a physically and chemically stable environment that is also self sustainable from the biological point of view.
Since the region on which the project is located is remote with no affected communities, the social aspects of this closure plan become less relevant than usual. However, social issues are very dynamic and the socioeconomic environment may change over the life of the mine. The socioeconomic environment must be closely followed throughout the mine life cycle as its relevance to the closure plan may be impacted.
Open pit
As presented in section 18.1.2 the pit is expected to become a pit lake. Pit lake water quality can be a potential closure issue. If pit lake water quality is not acceptable, water treatment might be necessary. In this case a passive treatment should be pursued. Additional studies must be carried out to predict the future water quality after the lake is filled and reaches a stable condition.
Waste rock pile
The waste rock pile was designed with gentle slope angles, so pile resloping is not expected during closure. According to the available data, the waste material does not present acid rock drainage generation potential. The ARD potential of waste rock should be further assessed in the next phases of the project. Sample representativeness is a key issue and must be assessed considering lithology, spatial distribution and weathering levels.
The waste pile closure will be based on revegetation plans. The implementation of a soil layer on top of the waste rock will likely be necessary in order to allow revegetation. Native species should be prioritized for revegetation. A progressive rehabilitation approach is recommended for the waste pile. The ability to progressively rehabilitate sections of the mine site as they become
118
Technical Report for the Tocantinzinho Gold Project, Brazil | |
available is an important approach to reducing the long-term closure liability and is encouraged by most regulatory authorities. Actively rehabilitating areas during the operational stage will provide the opportunity to develop the most effective methodologies for the region. Optimization of the waste pile surface drainage system is crucial to minimize erosion and allow for good revegetation.
Ore pile
At the time of closure, all ore will have been processed so the stockpile will no longer exist. The footprint will be reclaimed through revegetation with native species.
Tailings dam
Mine tailings were not yet geochemically characterized nor tested for ARD potential and metal leaching. This will be dealt with in the next phase of the project.
Tailings geochemical characteristics are fundamental to for tailings dam closure, including cover design. Should the tailings present ARD potential, a wet cover (permanent flooding) may be recommended since this is an effective method to avoid ARD. Soil covers can also be used to control ARD, where conditions allow.
In this conceptual closure plan, a soil cover was considered for the tailings dam. The cover design (layers, materials and thickness) should be defined after proper tailings geochemical characterization is available. After the dam reservoir is covered, revegetation should be implemented in order to minimize cover erosion. The cover profile might impose some restriction on the species of plant to be used for revegetation.
A surface drainage system must be implemented on top of the cover in order to collect and lead the runoff downstream and minimize cover erosion. Typically this drainage system is formed by channels lined with crushed rock or other natural material.
Process plant, on-site infrastructure and camp
Depending upon future land use, it may be possible to maintain some structures like the camp, office buildings and shops and transfer them to the future land owner. An evaluation of potential reuse for those structures should be carried out at the time of closure. At this stage, it is proposed that none of those structures will be reused and, therefore, should all be removed. All structures will be dismantled, demolished and removed. The areas will be reclaimed through revegetation with native species.
At the time of closure equipment shall be evaluated for potential reuse. Non reusable equipment and metallic structures shall be segregated to be sold as scrap. Hazardous waste generated during demolition (e.g. material contaminated with oil) should be segregated and disposed properly. Non contaminated debris can be disposed in the waste rock pile and/or in the tailings dam.
Road
Similar to some of the on-site infrastructure, depending upon future land use, it may be possible to maintain the road and transfer it to the future land owner or to the state. At this time maintaining the road after closure represents a potential path to unwanted activities causing deforestation. It is proposed that the road pavement will be removed and its footprint will be reclaimed though revegetation with native species.
Monitoring and maintenance
Monitoring and maintenance will be necessary in the post closure period.
119
Technical Report for the Tocantinzinho Gold Project, Brazil | |
Maintenance is required to ensure a successful revegetation process. Maintenance is also recommended for drainage structures and to correct eventual erosion processes that might arise. Monitoring will demonstrate if the closure objectives have been achieved. Monitoring protocols typically include fauna, flora, geotechnical stability and water quality.
A typical post closure monitoring and maintenance period lasts at least five years. If ARD generation and/or metal leaching issues are involved, this period can be extended significantly.
Order of magnitude closure cost estimate
A preliminary closure cost estimate was prepared in order to provide an order of magnitude for closure costs. It is important to emphasize that, at this point, no engineering design has been prepared in order to estimate the closure costs. In the next stage of the Tocantinzinho Project, a conceptual closure plan with a compatible closure cost estimate should be prepared.
The criterion considered was 8% of the CAPEX of the following items: Mine, Plant, Tailings, Infrastructure, Facilities, Camp and Roads. The preliminary closure cost estimate is equivalent to US$19.40 Million.
| 19.7 | Project Implementation |
Critical Path
The critical path of the project is driven by receipt of permits and procurement of long lead equipment. Currently it is estimated permit documentation will be completed by June 2012. Major work or equipment orders will not commence prior to Board approval and a decision to proceed with implementation. The progress of the permitting and its effect on commitments required to maintain the schedule will need to be closely monitored by the Owner.
Planning and Scheduling
Currently, it is envisioned that construction activity can start in mid 2012 and the project construction will have duration of two and a half years with a plant commissioning and production in Q4 2014. The implementation schedule has made accommodation for reduced productivity during the wet season. This will have a particular impact during early stages of construction, prior to completion of the access road end enclosure of the plant facilities.
The project milestones are summarized in Table 19-17 and Project Schedule below.
120
Technical Report for the Tocantinzinho Gold Project, Brazil | |
| Permitting | ||
| Permit Application submissions | 2nd Quarter 2011 | |
| EIA Application Approval | 2nd Quarter 2012 | |
| Construction Decision – Board Approval | 2nd Quarter 2012 | |
| Engineering | ||
| Feasibility completion | 1st Quarter 2012 | |
| Preliminary Engineering completion | December 2011 | |
| Basic Engineering completion | 2nd Quarter 2012 | |
| Detailed Engineering completion | 2nd Quarter 2014 | |
| Procurement | ||
| Award Road Construction Contract | 2nd Quarter 2012 | |
| Award Powerline Contract | 3rd Quarter 2012 | |
| Major Equipment Orders | 3rd Quarter 2012 | |
| Major Equipment Deliveries | 3rd and 4th Quarter 2013 | |
| Major Construction Contract Awards | 3rd and 4th Quarter 2013 | |
| Construction | ||
| Access Road implementation | 2nd Quarter 2012 | |
| Access Road completion | 3rd Quarter 2013 | |
| Construction Infrastructure implementation | 3rd Quarter 2012 | |
| Construction Infrastructure completion | 4th Quarter 2012 | |
| Process Plant implementation | 1st Quarter 2013 | |
| Process Plant completion | 4th Quarter 2014 | |
| Power Line implementation | 3rd Quarter 2012 | |
| Power Line completion | 4th Quarter 2013 | |
| Preproduction Mining implementation | 3rd Quarter 2013 | |
| Preproduction Mining completion | 4th Quarter 2014 | |
| Tailings Impound Facility implementation | 3rd Quarter 2013 | |
| Tailings Impound Facility completion | 4th Quarter 2014 | |
| Ancillary Facilities implementation | 3rd Quarter 2013 | |
| Ancillary Facilities completion | 2nd Quarter 2014 | |
| Commissioning | 4th Quarter 2014 | |
| Start-up | 4st Quarter 2014 | |
| 19.8 | Capital Costs |
This section contains the summary of the capital costs for the Tochantinzinho Project. The capital cost for mining, processing and infrastructure is estimated at US$383.5 million. The estimate doesn’t include sustaining capital, working capital and mine site closure. The estimate was compiled by Eldorado’s engineering consultant in Vancouver with support from their Brazil office for input on local labour rates, commodity pricing and taxation. The capital cost estimate for this study has an accuracy range of ± 25%.
121
Technical Report for the Tocantinzinho Gold Project, Brazil | |
A summary of the capital cost estimate is shown in Table 19-18.
Table 19-18: Capital Cost Estimate Summary
| Description | CAPEX (US$) | |
| Mine Fleet | 39,604,809 | |
| Site Development | 12,972,500 | |
| Plant | 101,941,494 | |
| Reagents | 3,565,241 | |
| Utilities Facilities | 9,981,121 | |
| Infrastructure | 66,997,900 | |
| Tailings | 11,037,003 | |
| Camp | 5,269,500 | |
| Total Direct Less Turnkey & Mine Fleet | 165,018,759 | |
| Total Turnkey | 46,746,000 | |
| Total Mine Fleet | 39,604,809 | |
| Total Indirect Less Turnkey & Mine Fleet | 17,981,731 | |
| Total Mine Fleet Indirects (11% Freight , 2%Spares) | 5,148,625 | |
| EPCM (% of Direct & Indirect Less Turnkey & Mine Fleet) | 21,960,059 | |
| Owner (% of Direct & Indirect Less Turnkey & Mine Fleet) | 9,150,024 | |
| Taxes | 18,642,591 | |
| Environmental Compensation | 1,621,263 | |
| Contingency | 57,644,941 | |
| Total Project Cost @ Q1 2011 | 383,518,802 |
| 19.8.1 | Basis of Estimate |
The Capital cost estimate is based on a review of the consultants (Brazil/Vancouver) report with updated costs, quantities and material takeoffs to reflect the updates to the process and layout. The estimate has been developed in 2011 first quarter US$ and does not include allowances for escalation or exchange rate fluctuations. The estimate assumes that all material and equipment will be purchased new on a competitive bid basis.
The capital cost estimate includes the estimated direct costs for equipment, material and labour. In addition, cost estimates were developed for the project indirect costs including Construction Equipment, Field Indirects, Freight, Vendor Representative, Spare Parts, Initial fills, EPCM, Owner Costs, Taxes, Environmental Compensation and Contingency. The estimate was developed based on the following main sources of information:
● | Process Design Criteria; |
● | Process Flow Sheets; |
● | Preliminary Facility General Arrangement Drawings; |
● | Mechanical Equipment List; |
122
Technical Report for the Tocantinzinho Gold Project, Brazil | |
● | Local consultants report; |
● | VOGBR report; |
● | Budget Quotations from Equipment Suppliers; |
● | Current Labour and Material Costs. |
| 19.8.2 | Mine |
The estimated direct cost for the mine fleet is US$39.6 million summarized in Table 19-19. This includes the major and minor fleet. The major fleet was estimated based upon dealer quotations solicited by Eldorado Gold. Quotes were received for the Caterpillar and Sandvik equipment which includes the haul trucks, dozers, graders, excavators, wheel loaders and drills. The Hitachi Shovel pricing was estimated based on historical data. Historical data was also utilized for the minor fleet.
Table 19-19: Mining Equipment Estimate
| Mining Fleet (US$ x 1000) | |
| Caterpillar and Sandvik Equipment Budget Quotes | 25,520 |
| Hitachi Shovel Estimate | 12,600 |
| Minor Fleet Estimate | 1,485 |
| Total Mine Fleet | 39,605 |
Indirect costs have been factored from this direct cost. This includes 11% for freight and 2% for spares.
Costs estimated for clearing and grubbing of the Ultimate Pit area, the first year requirement for Waste Rock Storage and the ultimate Oxide Ore Stockpile area have been included in the Infrastructure section of the estimate. The total estimated direct cost for these items is US$1.79 million.
| 19.8.3 | Plant |
The concentrator and all related auxiliary facilities are estimated at US$101.9 million. A summary of the areas and their direct costs can be seen in Table 19-20.
Table 19-20: Plant Estimate Summary
| Plant Estimate Summary (US$ x 1000) | |
| Crushing & Coarse Ore Reclaim | 30,014 |
| Milling, Grading, Gravity Concentration | 40,323 |
| Flotation, Regrind, Concentrate and Thickening | 19,110 |
| Leach, CIP, Wastewater Treatment | 8,484 |
| Elution, Electrolysis | 763 |
| Acid Wash / Regeneration Of Carbon | 1,276 |
| Smelting | 1,221 |
| Automation and Communication | 750 |
| Total Project Cost @ Q1 2011 | 101,941 |
123
Technical Report for the Tocantinzinho Gold Project, Brazil | |
Plant Service Facilities including Potable/Fresh/Fire/Makeup water supply and distribution and compressed air supply and distribution are estimated at US$10.0 million.
Earthworks associated with the general project site development are estimated to be US$13.0 million. This figure includes clearing-grubbing, stripping and cut-to-fill of all process and facility areas as well as an allowance for pilling of the process plant major structures and equipment foundations.
| 19.8.4 | Infrastructure & Camp |
All infrastructure facilities related to the support of the overall project operation include the following: Mobile Equipment; Transmission Line; Substation; Ancillary Facilities; Waste Dump; Oxide Stockpile and Pit Clearing; Access and In Plant Roads; and Airstrip.
Ancillary Facilities consist of the following facilities;
● | Truckshop and Fuel Storage/Distribution complete with Truck Wash; |
● | Administration Offices; |
● | Work Shops and Warehouse; |
● | Change Rooms; |
● | Maintenance Shop; |
● | Laboratory building and equipment; |
● | Gate house; |
● | Ambulance Services and First Aid facility; |
● | Explosive Storage Area; |
● | Allowance for other minor facilities. |
Turnkey items such as the transmission line and the main access road are assessed as all-in costs and as such include indirect costs and applicable taxes.
Table 19-21: Infrastructure Estimate Summary
| Infrastructure Estimate Summary (US$ x1000) | |
| Plant Mobile Equipment | 3,880 |
| Transmission Line (Taxes included) | 31,884 |
| Main Substation | 6,320 |
| Ancillary Facilities | 6,900 |
| Waste Stockpile (Clearing) | 286 |
| Oxide Ore Stockpile (Clearing) | 260 |
| Roads (Access road and in plant roads) | 15,946 |
| Pit Clearing | 1,245 |
| Alternate Airstrip | 276 |
| Total Project Cost @ Q1 2011 | 66,998 |
Additionally the construction camp and it’s conversion to a permanent camp will cost $5.27 million
124
Technical Report for the Tocantinzinho Gold Project, Brazil | |
| 19.8.5 | Direct Costs |
Labour
A blended labour rate was considered throughout the project which included 25% local and 75% foreign (out-of-state) labour. The labour rate is an “All-in-rate” of US$39.70 per Manhour.
Earthworks
Quantities for tailings were taken directly from VOGBR report supplied by Eldorado, all other earthworks quantities were estimated from drawings. Earth works and site preparation unit rates are based on recent and similar projects within Brazil. The work can be generalized as cut to fill, geofabric placement, clearing and grubbing, sand/gravel fill and piles for the mill site. These unitary pricing consist of all in rates based on recent and similar projects within Brazil and can be seen in Table 19-22.
Table 19-22: Earthworks Rates
| Earthworks Rates (US$) | |
Cut to fill (m3) | 8.00 |
Geo – Lining (m2) | 12.00 |
Clearing & Grubbing (m2) | 1.30 |
Sand / Gravel Fill (m3) | 30.00 |
| Piles 20 m (ea) | 16,000.00 |
Concrete
Quantities were referenced from the local consultants’ reports. Additional quantities were based on historical information and cost data from similar sized installations.
An “All-In” unit rate for concrete of US$1,250/m3 is used throughout the estimate. Aggregate to produce gravel for concrete is assume to be available from borrow areas located on the project site. A crushing and screening plant will be installed and operated by the batch plant provider.
Structural steel
Quantities were referenced from local consultants’ reports but adjusted to correspond to the new layouts. Additional quantities were based on historical information and cost data from similar sized installations.
Structural steel costs are based on a blended rate for the different classification of extra heavy, heavy, medium, light and miscellaneous steel of US$5,900 per tonne. Pricing for steel is based on supply, fabrication, and erection. Costs for major crane usage over 100 t capacity are included in indirect costs.
Mechanical equipment
Budget quotations were solicited by Eldorado for the major equipment. The remaining equipment costing was based upon the local consultants’ reports and Eldorado’s engineering consultant’s internal database which is based upon historical data and recent quotations for similar equipment. A summary of the quoted and estimated equipment cost is presented in Table 19-23.
Installation and assembly costs were referenced from similar installations and projects within Brazil.
125
Technical Report for the Tocantinzinho Gold Project, Brazil | |
| Mechanical Equipment (US$ x 1000) | ||
| Equipment Budget Quotes | 21,110 | |
| Equipment Estimated | 28,214 | |
| Total Equipment | 49,324 | |
Piping
The capital cost for piping is factored on the mechanical equipment cost for each given facility area. This factor is based on Eldorado’s engineering consultant’s historical database.
Major pipeline line lengths were estimated from layout drawings and priced based on sizes indicated on flowsheets and Eldorado’s engineering consultant’s historical database.
Electrical
The capital cost for electrical is factored on the mechanical equipment cost for each given facility area. This factor is based on Eldorado’s engineering consultant’s historical database.
Instrumentation
The capital cost for instrumentation is factored on the mechanical equipment cost for each given facility area. This factor is based on Eldorado’s engineering consultant’s historical database.
| 19.8.6 | Indirect Costs |
Indirect costs have been estimated separately for directs and mine equipment fleet. Turnkey costs are confirmed to have an indirect allowance included in the budget quotations and thus carry no other allowance.
Construction equipment
Construction equipment cost was estimated at 1% of the direct project cost and includes costs for heavy cranes (>100 tonne capacity) and heavy mobile equipment required for construction.
Field indirect
This cost was estimate at 3.0% of the total direct cost, and includes the following:
● | Temporary Construction Facility - Works area and bays, temporary building, temporary utilities, etc; |
● | Construction Services - General and final clean up, material handling and warehousing. |
Freight
Freight is estimated at 8% for direct costs less turnkey costs and 11% for mine fleet.
Vendor representative
This cost is estimated at 1.5% of the total direct costs and it covers the vendor commissioning team and all specialized labour and equipment required to make equipment operational.
126
Technical Report for the Tocantinzinho Gold Project, Brazil | |
Spare parts
Spare parts have been considered for commissioning and capital spares, and the cost is estimated at 4% for all directs less turnkey and mine fleet. An additional allowance of 2% is applied to the mine fleet costs to cover spare parts and capital spares.
Initial fills
This cost is estimated at 2% of the overall direct cost, excluding mine fleet, and includes the following:
● | Grinding media; |
● | Reagents; |
● | Oil - for all equipment; |
● | Other consumables. |
| 19.8.7 | EPCM & Owner Costs |
Engineering procurement and construction management costs were allocated at a blended rate of 12% of the total direct and indirect cost excluding turnkey items and mine fleet.
Owner cost is estimated at 5% of the total direct and indirect cost, excluding turnkey items and mine fleet. This allowance includes the following:
● | Client Project Management; |
● | Corporate expenses; |
● | Commissioning. |
| 19.8.8 | Taxes |
Taxation is applied on total project cost before contingency. Tax rates were applied to the following cost divisions: direct, indirects and mine fleet.
Direct & indirect taxes
The tax structure in Brazil consists of Federal, State and Community taxes. Utilizing assumptions and calculations completed by Eldorado’s engineering consultant a combined tax rate of 8.04% is determined when applied to the total direct and indirect costs before contingency.
Turnkey taxes
Taxes are included in Turnkey items, thus no taxation factors are applied.
Mine fleet taxes
The mine fleet is taxed at 8.78% based on an internal study by Eldorado.
| 19.8.9 | Environmental Compensation |
An allowance of 0.5% of total project cost, including taxes before contingency.
127
Technical Report for the Tocantinzinho Gold Project, Brazil | |
| 19.8.10 | Contingency |
The contingency is to cover items not adequately defined based upon the current level of engineering. This allowance is included to cover these unknowns but is not intended to cover changes in the project scope.
Due to the higher accuracy of some portions of this estimate, contingency is applied in the following brackets and percentages:
● | Major project scope 20%; |
● | Turnkey items 15%; |
● | Mine Fleet 10%; |
● | No contingency is applied to costs for Environmental Compensation. |
| 19.8.11 | Sustaining Capital |
Sustaining capital was estimated for the LOM including mine equipment, tailings dam expansion, mine development, and factored costs for working capital, site closure. A contingency was applied to the costs. Environmental compensation, royalty prepayment was added. The applicable taxes were included in the individual area costs.
The summary of the Sustaining capital is presented in Table 19-24.
Table 19-24: Summary of Sustaining Capital
| Description | CAPEX (US$) | |
| Mine Fleet | 13,233 | |
| Plant | 3,500 | |
| Tailings | 9,426 | |
| Working capital | 20,541 | |
| Site Closure | 19,396 | |
| Total Sustaining Capital | 66,096 | |
| Royalty Prepayment | 5,500 | |
| Environmental Compensation | 745 | |
| Contingency | 12,802 | |
| Total Project Cost @ Q1 2011 | 85,143 |
Mine Fleet
The mine fleet includes additional equipment purchases in years 1 through 6 totalling $13,233,000
Plant
A sustaining cost allowance of $500,000 per year has been included for plant and infrastructure capital projects in years 4 through 10.
128
Technical Report for the Tocantinzinho Gold Project, Brazil | |
Tailings
The tailings dam will be elevated in phase two; the construction will occur in years 3 and 4 of mine life, totalling $4,713,000 each year. The cost is based on using the mine fleet for bulk earthworks and a contractor for lining and detail works of the dam construction.
Working Capital
A working capital of $13,767,000 based on 2 months of operating costs from year 1 and an additional mine development cost of $6,769,000 are included in the sustaining capital.
Site Closure
The site closure cost was based on 8% of the direct cost less the power line. A cost of $9,698,000 has applied over two years at the end of mine life.
Royalty Payment
A Royalty prepayment of $5,500,000 has been included in year 1 sustaining capital. The payment is incurred to receive a preferred royalty rate of 1.5% during the LOM.
Environmental Compensation
The environmental compensation was factored from the applicable sustaining capital estimated at $745,000.
Contingency
This cost is estimated at approximately 20% of the sustaining capital, not including the royalty prepayment and environmental compensation, totalling $12,802,000.
| 19.9 | Operating Costs |
| 19.9.1 | Project Operating costs |
The operating costs (Opex) were estimated by Eldorado and Unamgen and are based on price quotations, indices, assumptions and other considerations compatible with the present pre-feasibility phase of the project.
The summary of the operating cost (Opex) is presented in Table 19-25.
129
Technical Report for the Tocantinzinho Gold Project, Brazil | |
| Total Opex | Year | LOM Total | |||||||||||
| 1 | 2 | 3 | 4 | 5 | 6 | 7 | 8 | 9 | 10 | 11 | 12 | ||
| Operating Costs (US$ x 1000) | |||||||||||||
| Mine | 24,456 | 33,621 | 38,589 | 41,614 | 42,027 | 42,866 | 35,319 | 26,743 | 24,129 | 18,407 | 13,219 | 0 | 347,760 |
| Plant | 49,104 | 49,104 | 49,104 | 49,104 | 49,104 | 49,104 | 49,104 | 49,104 | 49,104 | 49,104 | 49,104 | 7,224 | 547,365 |
| G&A | 9,043 | 9,043 | 9,043 | 9,043 | 9,043 | 9,043 | 9,043 | 9,043 | 9,043 | 9,043 | 9,043 | 1,330 | 100,800 |
| Total | 82,602 | 91,767 | 96,736 | 99,760 | 100,174 | 101,012 | 93,465 | 84,890 | 82,275 | 76,554 | 71,366 | 8,555 | 995,925 |
| Production | |||||||||||||
| Ore milled (t) | 4,400 | 4,400 | 4,400 | 4,400 | 4,400 | 4,400 | 4,400 | 4,400 | 4,400 | 4,400 | 4,400 | 647 | 49,047 |
| Au (oz) | 133,619 | 147,669 | 144,013 | 147,840 | 165,586 | 170,967 | 161,687 | 178,350 | 178,167 | 182,304 | 153,305 | 16,815 | 1,780,322 |
| Unitary Operating Cost (US$ / t ore milled) | |||||||||||||
| Mine | 5.56 | 7.64 | 8.77 | 9.46 | 9.55 | 9.74 | 8.03 | 6.08 | 5.48 | 4.18 | 3.00 | 0.00 | 7.09 |
| Plant | 11.16 | 11.16 | 11.16 | 11.16 | 11.16 | 11.16 | 11.16 | 11.16 | 11.16 | 11.16 | 11.16 | 11.16 | 11.16 |
| G&A | 2.06 | 2.06 | 2.06 | 2.06 | 2.06 | 2.06 | 2.06 | 2.06 | 2.06 | 2.06 | 2.06 | 2.06 | 2.06 |
| Total | 18.77 | 20.86 | 21.99 | 22.67 | 22.77 | 22.96 | 21.24 | 19.29 | 18.70 | 17.40 | 16.22 | 13.22 | 20.31 |
| Unitary Operating Cost (US$ / oz Au produced) | |||||||||||||
| Total | 618.19 | 621.44 | 671.72 | 674.78 | 604.96 | 590.83 | 578.06 | 475.97 | 461.79 | 419.92 | 465.51 | 508.77 | 559.41 |
| 19.9.2 | Mine Operating Costs |
Mining costs were calculated from first principles. Quotes were received for diesel fuel, tires and explosives, while studies were conducted for transportation costs and labour costs. Other costs such as maintenance parts for the major equipment and consumable supplies were supplied by manufacturers or derived from experience with similar operations. Fuel consumption parameters for the major equipment were estimated from manufacturers’ data and from experience with similar operating environments.
Overall mining costs vary per year due to increases in haulage distance as the pit becomes deeper and as the waste dump becomes higher. Costs also vary with the amount of saprolite and hard rock in the production schedule, since saprolite does not require blasting and is associated with less wear on drills and ground engaging tools.
A schedule of expected mining costs per year broken down between mine operations, maintenance, engineering and geology is shown in Table 19-26.
130
Technical Report for the Tocantinzinho Gold Project, Brazil | |
Table 19-26: Mining Cost Schedule over the Life of Mine
| Mine Opex | Year | LOM Total | ||||||||||||||||||||
| -1 | 1 | 2 | 3 | 4 | 5 | 6 | 7 | 8 | 9 | 10 | 11 | |||||||||||
| Operating Costs (US$ x 1000) | ||||||||||||||||||||||
| Mine Operations | 5,119 | 19,405 | 23,576 | 28,157 | 30,951 | 31,348 | 31,958 | 25,862 | 19,061 | 16,994 | 13,109 | 9,119 | 254,659 | |||||||||
| Maintenance | 880 | 3,873 | 8,576 | 8,889 | 9,104 | 9,120 | 9,354 | 7,968 | 6,336 | 5,827 | 4,227 | 3,093 | 77,247 | |||||||||
| Geology | 369 | 512 | 680 | 730 | 745 | 745 | 745 | 695 | 695 | 656 | 566 | 512 | 7,648 | |||||||||
| Engineering | 401 | 665 | 789 | 814 | 814 | 814 | 809 | 794 | 652 | 652 | 505 | 495 | 8,206 | |||||||||
| Total | 6,769 | 24,456 | 33,621 | 38,589 | 41,614 | 42,027 | 42,866 | 35,319 | 26,743 | 24,129 | 18,407 | 13,219 | 347,760 | |||||||||
| Total Mining (kt) | ||||||||||||||||||||||
| Ore | 793 | 4,421 | 4,423 | 4,424 | 4,411 | 4,404 | 4,420 | 4,435 | 4,420 | 4,429 | 4,408 | 4,059 | 49,047 | |||||||||
| Waste | 4,248 | 19,579 | 19,577 | 21,505 | 21,558 | 21,596 | 21,580 | 14,015 | 7,780 | 5,471 | 2,692 | 887 | 160,487 | |||||||||
| Total | 5,041 | 24,000 | 24,000 | 25,929 | 25,970 | 26,000 | 26,000 | 18,449 | 12,200 | 9,900 | 7,100 | 4,946 | 209,535 | |||||||||
| Unitary Operating Cost (US$/t) | ||||||||||||||||||||||
| Ore | 8.54 | 5.53 | 7.60 | 8.72 | 9.43 | 9.54 | 9.70 | 7.96 | 6.05 | 5.45 | 4.18 | 3.26 | 7.09 | |||||||||
| Material moved | 1.34 | 1.02 | 1.40 | 1.49 | 1.60 | 1.62 | 1.65 | 1.91 | 2.19 | 2.44 | 2.59 | 2.67 | 1.66 | |||||||||
The overall life of mine average is estimated to be US$1.66/t of material mined and the total mining cost for the operation is estimated to be US$347,760 million.
Breakdowns of the mining consumable cost by activity and by major item over the life of mine are show in Table 19-27 and Table 19-28.
Table 19-27: Mining Cost by Activity (US$/t)
| Material | Ore | (%) | |
| (US$/t) | (US$/t) | ||
| Drilling | 0.10 | 0.42 | 5.89 |
| Blasting | 0.32 | 1.37 | 19.29 |
| Loading | 0.16 | 0.67 | 9.43 |
| Hauling | 0.35 | 1.50 | 21.21 |
| Site Work | 0.19 | 0.79 | 11.19 |
| Administration | 0.09 | 0.38 | 5.30 |
| Maintenance | 0.34 | 1.44 | 20.32 |
| Other | 0.12 | 0.52 | 7.36 |
| Total | 1.66 | 7.09 | 100.00 |
131
Technical Report for the Tocantinzinho Gold Project, Brazil | |
Table 19-28: Mining Cost Major Item (US$/t)
| Material | Ore | (%) | |
| (US$/t) | (US$/t) | ||
| Diesel Fuel | 0.53 | 2.25 | 31.66 |
| Wages - Labour | 0.18 | 0.75 | 10.60 |
| Wages - Admin | 0.09 | 0.38 | 5.30 |
| Bulk Explosives | 0.25 | 1.09 | 15.32 |
| Consumables | 0.20 | 0.84 | 11.78 |
| Maintenance Parts | 0.29 | 1.25 | 17.67 |
| Other | 0.13 | 0.54 | 7.66 |
| Total | 1.66 | 7.09 | 100.00 |
| 19.9.3 | Process Operating costs |
The processing operating costs were derived from first principle. Quotations were received for reagents and grinding media and calculated on a unit rate basis with consumptions estimated from the test work. Studies were conducted for power, transportation costs and labour costs. Other costs such as maintenance parts for the major equipment and consumable supplies were supplied by manufacturers or derived from experience from similar operations and factored from the production on a unit rate basis.
Process operating costs are presented in the following Table 19-29.
Table 19-29: Processing Operating Cost
| Plant Opex | Year | LOM Total | |||||||||||
| 1 | 2 | 3 | 4 | 5 | 6 | 7 | 8 | 9 | 10 | 11 | 12 | ||
| Operating Costs (US$ x 1000) | |||||||||||||
| Consumables | 24,416 | 24,416 | 24,416 | 24,416 | 24,416 | 24,416 | 24,416 | 24,416 | 24,416 | 24,416 | 24,416 | 2,392 | 270,966 |
| Energy | 18,348 | 18,348 | 18,348 | 18,348 | 18,348 | 18,348 | 18,348 | 18,348 | 18,348 | 18,348 | 18,348 | 2,699 | 204,527 |
| Labor Force | 4,519 | 4,519 | 4,519 | 4,519 | 4,519 | 4,519 | 4,519 | 4,519 | 4,519 | 4,519 | 4,519 | 667 | 50,377 |
| Others | 1,848 | 1,848 | 1,848 | 1,848 | 1,848 | 1,848 | 1,848 | 1,848 | 1,848 | 1,848 | 1,848 | 136 | 20,464 |
| Total | 49,131 | 49,131 | 49,131 | 49,131 | 49,131 | 49,131 | 49,131 | 49,131 | 49,131 | 49,131 | 49,131 | 5,894 | 546,334 |
| Production | |||||||||||||
| Ore milled (t) | 4,400 | 4,400 | 4,400 | 4,400 | 4,400 | 4,400 | 4,400 | 4,400 | 4,400 | 4,400 | 4,400 | 647 | 49,047 |
| Au (oz) | 133,619 | 147,669 | 144,013 | 147,840 | 165,586 | 170,967 | 161,687 | 178,350 | 178,167 | 182,304 | 153,305 | 16,815 | 1,780,322 |
| Unitary Operating Cost | |||||||||||||
| Ore milled (US$/t) | 11.17 | 11.17 | 11.17 | 11.17 | 11.17 | 11.17 | 11.17 | 11.17 | 11.17 | 11.17 | 11.17 | 9.11 | 11.14 |
| Au (US$/oz) | 367.69 | 332.71 | 341.16 | 332.32 | 296.71 | 287.37 | 303.86 | 275.47 | 275.76 | 269.50 | 320.48 | 350.54 | 306.87 |
132
Technical Report for the Tocantinzinho Gold Project, Brazil | |
| 19.9.4 | General & Administrative Operating costs |
The General & Administrative operating costs were derived from first principles. Quotations were received for materials, food, and transportation and calculated on a unit rate basis. Estimates were completed for power, and material consumption. Other costs such as services and expeditures were estimated on a unit rate basis.
General & Administrative operating costs are presented in the following Table 19-30.
Table 19-30: General & Administrative Operating Cost
| G&A Opex | Annual | Per tonne ore |
| (US$ x 1000) | (US$) | |
| Labor Force | 3,298 | 0.75 |
| Materials | 218 | 0.05 |
| Power Energy | 674 | 0.15 |
| Services | 4,230 | 0.96 |
| Others | 623 | 0.14 |
| Total | 9,043 | 2.06 |
| 19.10 | Economic Analysis |
A preliminary economic evaluation has been prepared based on information and data supplied by Eldorado and its consultants. Eldorado considers that the supplied data and information are accurate, complete and consistent with the standard of a Pre-Feasibility Study regarding the design criteria, engineering and costs of the project to ± 25%.
The conclusions contained in this preliminary economic evaluation report are not intended to be a definitive assessment of the financial viability of the project and further studies and analysis are required for that purpose. The results of further work may indicate that the assumptions in this report need to be revised or reviewed.
| 19.10.1 | Taxation |
For the purposes of this preliminary economic evaluation consideration has been given to royalties and taxation over the corporate income.
Royalties
Consideration has been given to State Royalty (CFEM) and the NSR Royalty based on the Alan Carter/Dennis Moore agreement.
● | State Royalty: Financial Compensation for the Exploitation of Mineral Resources (CFEM): 1% of the total value of sales revenues, excluding refining, transportation and insurance expenses; |
● | NSR Royalty: 1.5% of the total of sales revenues. |
Taxation over the corporate income
Consideration has been given to two federal taxes to be applied to corporate income:
● | Corporate income tax (IRPJ): 25%; |
● | Social contribution on net profit (CSLL): 9%. |
133
Technical Report for the Tocantinzinho Gold Project, Brazil | |
Assumptions
The following assumptions were used in the economic evaluation:
● | Mining reserves based on Au price of US$1,000.00/oz; |
● | CFEM (state royalty): 1.0%; |
● | NSR royalty (Carter-Moore agreement): 1.5%; |
● | Sales and refining cost: US$5.00/oz; |
● | Au price: US$1,250.00/oz; |
● | Discount rate: 5% per year; |
● | Exchange rate: R$1.75 = US$1.00; |
In addition to the Capex estimation presented in 19.8 Capital Costs consideration has been given to the following expenses on the Cashflow simulations:
● | Working capital: includes the mining costs estimated at US$6.77 million in Year -1; and a working capital of US$13.77 million equal to two months of estimated Year 1 Opex; |
● | Sustaining capital of US$85.1 million; |
● | Closure cost: considered a total of US$19.40 million to be realized on the following 2 years after the mining closure; |
● | Salvage: considered an income (selling of mine and plant equipments) equal to the closure cost plus contingencies to be realized on the following two years after the mine closure. |
| 19.10.2 | Economic Analysis |
The following Table 19-31: Summary Discounted CashFlow shows the summary of the DCF for the base case scenario.
Table 19-31: Summary Discounted CashFlow
| PRODUCTION | ||
| Ore processed (dry basis) | kt | 49,047 |
| Grade | Au g/t | 1.25 |
| Recovery | % | 90.10 |
| Gold recovered | oz | 1,780,322 |
| Unitary price | US$/oz | 1,250.00 |
| GROSS REVENUE (1) | US$ x 1000 | 2,225,403 |
| Transport & Refining | US$ x 1000 | 8,902 |
| CFEM (1.0%) | US$ x 1000 | 22,165 |
| Royalties (1.5%) | US$ x 1000 | 33,248 |
| REVENUE (less CFEM and Royalties) (2) | US$ x 1000 | 2,161,089 |
134
Technical Report for the Tocantinzinho Gold Project, Brazil | |
| OPERATING COSTS (3) | US$ x 1000 | 975,389 |
| EBITDA - Revenue before Tax (4 = 2-3) | US$ x 1000 | 1,185,700 |
| DEPRECIATION | US$ x 1000 | 373,318 |
| TAXABLE INCOME | US$ x 1000 | 812,382 |
| Tax reduction (IRPJ) | % | 0.00 |
| Tax IRPJ (25%) | US$ x 1000 | 203,095 |
| Tax CSSL (9%) | US$ x 1000 | 73,114 |
| Total income tax (5) | US$ x 1000 | 276,210 |
| NET REVENUE AFTER TAX (6 = 4-5) | US$ x 1000 | 909,490 |
| CAPEX | ||
| Mine* | US$ x 1000 | 52,828 |
| Site development | US$ x 1000 | 12,973 |
| Plant* | US$ x 1000 | 105,441 |
| Reagents | US$ x 1000 | 3,565 |
| Facilities | US$ x 1000 | 9,981 |
| Infrastructure | US$ x 1000 | 20,252 |
| Tailings* | US$ x 1000 | 20,463 |
| Camp | US$ x 1000 | 5,270 |
| Power line | US$ x 1000 | 31,500 |
| Roads | US$ x 1000 | 15,246 |
| EPCM | US$ x 1000 | 21,960 |
| Total indirects | US$ x 1000 | 23,130 |
| Taxes | US$ x 1000 | 18,643 |
| Owner costs | US$ x 1000 | 9,150 |
| Environmental compensation* | US$ x 1000 | 2,375 |
| Working Capital** | US$ x 1000 | 20,541 |
| Site closure* | US$ x 1000 | 19,396 |
| Total | US$ x 1000 | 392,714 |
| Contingencies* | US$ x 1000 | 70,448 |
| Down payment Royalty** | US$ x 1000 | 5,500 |
| Total Capex (7) | US$ x 1000 | 468,662 |
| Salvage (8) | US$ x 1000 | 23,276 |
| Net Cash Flow (9 = 6 – 7 + 8) | US$ x 1000 | 464,103 |
| NPV (@5%) | US$ x 1000 | 187,213 |
| IRR | % | 11.79 |
| Payback Period | year | 5.1 |
* Includes Capital and Sustaining Costs
** Sustaining and Deferred Capital Cost
135
Technical Report for the Tocantinzinho Gold Project, Brazil | |
| 19.10.3 | Sensitivity Analysis |
The project economics are very sensitive to the gold price variations. The following Table 19-32 illustrates the sensitivity of the project to escalating gold price and considering discount rates of 0% and 5%.
Table 19-32: Gold price sensitivity
| Discount Rate | Gold Price (US$/oz) | |||
| 1,000 | 1,250 | 1,500 | ||
| 0% | NPV (US$ x 1000) | 177,694 | 464,103 | 750,513 |
| IRR (%) | 5.12% | 11.79% | 17.35% | |
| 5% | NPV (US$ x 1000) | 2,948 | 187,213 | 371,478 |
| IRR (%) | 5.12% | 11.79% | 17.35% | |
The Tocantinzinho Project may qualify for a taxation incentive issued by the State. For qualified projects this incentive is equal to a reduction in income tax of 75% for the first 10 years of operation. Eldorado will consider the status of the incentive before making a construction decision. The following Table 19-33 illustrates the economic impact of operating the project under the incentive program.
Table 19-33: Gold price sensitivity - Taxation reduction incentive
| Discount Rate | Gold Price (US$/oz) | |||
| 1,000 | 1,250 | 1,500 | ||
| 0% | NPV (US$ x 1000) | 232,690 | 592,691 | 952,691 |
| IRR (%) | 6.45% | 14.36% | 20.88% | |
| 5% | NPV (US$ x 1000) | 36,931 | 269,635 | 502,339 |
| IRR (%) | 6.45% | 14.36% | 20.88% | |
| 19.10.4 | Conclusions |
All elements contributing to the financial analysis of the Tocantinzinho project have been developed from first principles and are considered to be accurate to a level of ± 25%. Preliminary designs of the mine, plant and infrastructure have followed conventional approaches to the operation. No reliance has been made on technology, methodologies or equipment which would introduce risk into the design phase. A conventional approach to financial analysis has been made using discounted cashflow modeling to generate a base case for operation of Tocantinzinho and examine the sensitivity of the project to prime drivers.
The project has demonstrated a positive rate of return on investment at metal prices lower than current market pricing. It can therefore be considered economically feasible at this level of study.
136
Technical Report for the Tocantinzinho Gold Project, Brazil | |
| 19.11 | Risk and opportunities |
The main risks associated to the project are related to:
● | Gold price decrease; |
● | Environmental licensing delays; |
● | Exchange rate variations (R$/US$). |
The main opportunities are related to:
● | Geological potential of the area; |
● | Possibility to add satellites orebodies to the Tocantinzinho Project; |
● | Possibility of synergies with other projects in the Tapajós region. |
| 19.12 | Conclusions and Recommendations |
The Tocantinzinho Project at pre-feasibility level and considering the data and information available can be considered both technically and economically feasible.
The project financial performance is most sensitive to the gold price as shown in the tables above. Using a discount rate of 5% the breakeven point for the gold price is US$960/oz. It will be necessary to carry out additional work to increase the level of accuracy of the capital and operating cost estimates, with a view to improving performance and reducing risk.
The possibility that the Tocantinzinho Project will be granted with the IRPJ taxation reduction incentive is very important for the economical feasibility of the project. Eldorado will seek approval for this incentive before making a construction decision.
Extension of the mineral resources through exploration success will have a positive impact on the project economics. In addition, changes to the economics will also impact the mine design and potentially the plant throughput.
Considering the current status of the environmental permitting process, the implementation schedule for the Tocantinzinho Project will be driven by timely receipt of permitting approvals which include the Implementation Permit (LP) and Operation Permit (LI).
Consideration must also be given at the planning stage to the impact of the wet season on construction progress.
On the basis of the results of this study, the following recommendations can be made:
● | Tocantinzinho Gold Project should be considered for further design and analysis culminating in the preparation of a full feasibility study. |
● | In addition to increasing the accuracy of project costing, it is recommended that the mine plan be reviewed utilizing revised costing and projected market pricing for gold. |
● | Further work is required to review the treatment methodology for oxidized ore within the pit area and to establish the potential for treatment of the garimpeiro tailings in the immediate area. |
137
Technical Report for the Tocantinzinho Gold Project, Brazil | |
| 19.13 | Project Status and Reviews |
The Tocantinzinho Project as described in this Technical Report has demonstrated a positive rate of return. The project should go to a Feasibility Phase with focus on the following aspects:
● | Geological modeling and resources/ reserves estimation should audited by an independent consultant; |
● | Consolidation of the metallurgical testworks and process design criteria; |
● | Mining planning with focus on a possible plant feed grade optimization in the first years of operation; |
● | Capex and Opex estimation review with quantitative estimations and price quotations with focus on a possible cost reduction; |
● | Environmental and legal concerns with focus on the environmental licensing process and other legal permits necessary for the project implementation and operation in accord with the Brazilian regulations; |
● | Acid drainage potential study should be complemented with focus on the flotation tailings; |
● | An application will be made for the taxation reduction incentive for companies with approved projects. The extension of this incentive after the actual deadline (31 December 2013) still requires Congressional approval. The application should be made before this date. |
138
Technical Report for the Tocantinzinho Gold Project, Brazil | |
| SECTION 20 | Conclusions and Recommendations |
The Tocantinzinho Gold Project has demonstrated acceptable economic performance at current market conditions.
In Eldorado’s opinion, the QA/QC results demonstrate that the Tocantinzinho deposit assay database is sufficiently accurate and precise for resource estimation. Eldorado therefore concludes that the data supporting the Tocantinzinho resource work are sufficiently free of error to be adequate for estimation.
Based on the Tocantinzinho metallurgical testing results the process of producing a gravity and flotation concentrate for final gold extraction using cyanide leaching will produce acceptable gold recovery in excess of 90%.
The orebody lends itself to development using open pit methods with truck and shovel equipment to support a consistent production profile for the plant feed.
The project location is amenable to development of the necessary infrastructure to support the mine operation, processing of ore on site and the support services required to maintain continuous operation over the life of the mine.
Although located in a very remote region of the Amazon basin infrastructure for development and operation of the mine can be provided at reasonable cost. Key elements such as power, access and personal are available from the immediate region. The climatic conditions will impact both construction and operations; however mitigation measures can be put in place to minimize this impact.
Regulatory approvals will define the critical path for meeting the proposed implementation schedule.
It is recommended that the project now be move to a feasibility stage supported by the various technical studies described above.
139
Technical Report for the Tocantinzinho Gold Project, Brazil | |
| SECTION 21 | References |
Not applicable for this report.
140
Technical Report for the Tocantinzinho Gold Project, Brazil | |
| SECTION 22 | Signature Page and Date |
The effective date of this report entitled “Technical Report for the Tocantinzinho Gold Project, Brazil” is 03 May 2011. It has been prepared for Eldorado Gold Corporation by S. Juras, P.Geo., S. Gregersen, P.Eng. and R. Alexander, P.Eng., each of whom are qualified persons as defined by NI43-101.
Signed the 4th day of May, 2011.
SIGNED
| “Stephen Juras” ”signed and sealed” | “Sean Gregersen” ”signed and sealed” |
| Stephen Juras, PhD, P.Geo Director, Technical Services Eldorado Gold Corp. | Sean Gregersen, P.Eng Business Development Manager Eldorado Gold Corp. |
| “Rick Alexander” ”signed and sealed” Rick Alexander, P.Eng Project Director Eldorado Gold Corp |
.
141
Technical Report for the Tocantinzinho Gold Project, Brazil | |
Appendix A table of Mineralized intersections
142
Technical Report for the Tocantinzinho Gold Project, Brazil | |
Listing of Tocantinzinho mineralized intersections contained within the gold shell and averaging >0.5 g/t Au. Coordinates represent mid-points of the respective interval.
| DH-ID | EAST | NORTH | ELEV. | Au (g/t) | Au_capped (g/t) | Length (m) |
| TOC-04-01 | 578020 | 9330624 | 139 | 0.51 | 0.51 | 7.6 |
| TOC-04-01 | 578070 | 9330711 | 0 | 0.98 | 0.98 | 95.6 |
| TOC-04-02 | 578068 | 9330639 | 130 | 2.15 | 2.15 | 19.8 |
| TOC-04-03 | 578154 | 9330653 | 127 | 0.66 | 0.66 | 42.6 |
| TOC-04-03 | 578139 | 9330626 | 84 | 0.76 | 0.76 | 39.5 |
| TOC-04-04 | 578289 | 9330677 | 128 | 0.53 | 0.53 | 6.1 |
| TOC-04-04 | 578257 | 9330634 | 50 | 1.81 | 1.65 | 173.3 |
| TOC-04-05 | 578147 | 9330713 | 60 | 1.08 | 1.08 | 212.2 |
| TOC-04-06 | 578067 | 9330829 | 91 | 1.33 | 1.33 | 130.9 |
| TOC-04-06 | 578010 | 9330798 | 4 | 0.69 | 0.69 | 10.3 |
| TOC-04-07 | 577997 | 9330912 | 84 | 0.99 | 0.99 | 24 |
| TOC-04-07 | 577970 | 9330902 | 43 | 0.6 | 0.6 | 39.4 |
| TOC-04-08 | 577913 | 9330944 | 86 | 1.28 | 1.28 | 11.3 |
| TOC-04-09 | 578177 | 9330655 | 137 | 1.08 | 1.08 | 18.3 |
| TOC-04-09 | 578206 | 9330691 | 58 | 0.91 | 0.91 | 94 |
| TOC-04-09 | 578240 | 9330728 | -23 | 0.77 | 0.77 | 76.2 |
| TOC-04-10 | 578072 | 9330697 | 109 | 0.67 | 0.67 | 75.9 |
| TOC-04-10 | 578094 | 9330735 | 35 | 1.05 | 1.05 | 48.6 |
| TOC-04-10 | 578116 | 9330770 | -31 | 2.27 | 2.02 | 84.2 |
| TOC-04-11 | 578375 | 9330672 | 130 | 0.89 | 0.89 | 32 |
| TOC-04-11 | 578322 | 9330603 | 0 | 2.03 | 1.94 | 218 |
| TOC-04-12 | 577992 | 9330956 | 89 | 1.56 | 1.56 | 8 |
| TOC-04-12 | 577976 | 9330949 | 63 | 0.63 | 0.63 | 30.9 |
| TOC-04-12 | 577916 | 9330927 | -27 | 1.14 | 1.14 | 10 |
| TOC-04-13 | 577872 | 9330991 | 48 | 2.4 | 1.83 | 38 |
| TOC-04-15 | 578068 | 9330812 | 108 | 0.96 | 0.96 | 83 |
| TOC-04-16 | 578369 | 9330557 | -11 | 1.4 | 1.4 | 203 |
| TOC-04-17 | 578268 | 9330654 | -17 | 1.54 | 1.47 | 305.2 |
| TOC-04-18 | 577993 | 9330847 | 133 | 1.24 | 1.24 | 21.1 |
| TOC-04-18 | 578037 | 9330870 | 54 | 1.25 | 1.23 | 105.2 |
| TOC-04-19 | 578076 | 9330809 | 81 | 1.02 | 1.02 | 159.3 |
| TOC-04-19 | 578147 | 9330742 | -31 | 1.59 | 1.59 | 106.6 |
| TOC-05-21 | 578253 | 9330622 | -18 | 1.3 | 1.28 | 237.6 |
| TOC-05-22 | 578267 | 9330540 | 95 | 1.35 | 1.22 | 89.3 |
| TOC-05-22 | 578314 | 9330597 | -4 | 1.61 | 1.61 | 136.2 |
| TOC-05-23 | 578287 | 9330678 | 56 | 0.65 | 0.65 | 82.3 |
| TOC-05-24 | 578426 | 9330501 | 1 | 1.4 | 1.33 | 179.8 |
| TOC-05-25 | 578214 | 9330600 | 46 | 1.35 | 1.35 | 75 |
143
Technical Report for the Tocantinzinho Gold Project, Brazil | |
| DH-ID | EAST | NORTH | ELEV. | Au (g/t) | Au_capped (g/t) | Length (m) |
| TOC-05-26 | 578121 | 9330802 | 144 | 5.7 | 5.7 | 16 |
| TOC-05-27 | 578522 | 9330520 | 138 | 1.1 | 1.1 | 5.2 |
| TOC-05-27 | 578483 | 9330471 | 61 | 0.75 | 0.75 | 126.7 |
| TOC-05-27 | 578451 | 9330429 | -4 | 0.74 | 0.74 | 7.5 |
| TOC-05-28 | 577932 | 9330751 | 52 | 0.63 | 0.63 | 17.4 |
| TOC-05-30 | 578306 | 9330476 | 100 | 1.86 | 1.86 | 22.3 |
| TOC-05-30 | 578314 | 9330487 | 80 | 1.71 | 1.71 | 6 |
| TOC-05-30 | 578363 | 9330550 | -34 | 1.08 | 1.08 | 218.6 |
| TOC-05-31 | 578251 | 9330741 | 89 | 0.53 | 0.53 | 11 |
| TOC-05-31 | 578210 | 9330689 | 8 | 0.6 | 0.6 | 87.5 |
| TOC-05-32 | 577989 | 9330728 | 127 | 1.72 | 1.51 | 45.7 |
| TOC-05-32 | 578008 | 9330762 | 79 | 1.75 | 1.6 | 46.6 |
| TOC-05-32 | 578054 | 9330824 | -16 | 0.68 | 0.68 | 42 |
| TOC-05-34 | 578425 | 9330495 | -41 | 0.61 | 0.61 | 147.3 |
| TOC-06-35 | 578162 | 9330574 | 94 | 0.58 | 0.58 | 34.8 |
| TOC-06-35 | 578221 | 9330649 | -19 | 1.74 | 1.61 | 243 |
| TOC-06-36 | 578148 | 9330714 | -36 | 1.52 | 1.52 | 223.2 |
| TOC-06-37 | 578130 | 9330682 | 137 | 0.96 | 0.96 | 20.5 |
| TOC-06-37 | 578132 | 9330687 | 116 | 4.69 | 4.69 | 8 |
| TOC-06-37 | 578135 | 9330692 | 96 | 0.53 | 0.53 | 18 |
| TOC-06-37 | 578143 | 9330707 | 32 | 1.54 | 1.54 | 62.9 |
| TOC-06-39 | 578132 | 9330686 | 140 | 1.03 | 1.03 | 17.6 |
| TOC-06-39 | 578162 | 9330743 | 64 | 0.76 | 0.76 | 90 |
| TOC-06-39 | 578192 | 9330799 | -12 | 0.57 | 0.57 | 6.6 |
| TOC-06-40 | 578048 | 9330844 | 106 | 0.98 | 0.98 | 82.2 |
| TOC-06-43 | 578316 | 9330600 | 61 | 2.57 | 2.08 | 197.9 |
| TOC-06-44 | 578335 | 9330617 | 68 | 1.17 | 1.17 | 94.5 |
| TOC-06-45 | 578357 | 9330545 | 65 | 0.88 | 0.88 | 177.1 |
| TOC-07-47 | 578412 | 9330551 | -25 | 1.06 | 1.06 | 277.5 |
| TOC-07-48 | 578352 | 9330581 | -17 | 1.94 | 1.94 | 220 |
| TOC-07-52 | 578565 | 9330461 | 119 | 0.5 | 0.5 | 6.7 |
| TOC-07-52 | 578532 | 9330422 | -38 | 0.7 | 0.7 | 78.5 |
| TOC-07-52 | 578515 | 9330405 | -105 | 0.9 | 0.9 | 27.3 |
| TOC-07-52 | 578503 | 9330395 | -147 | 0.56 | 0.56 | 51.7 |
| TOC-07-56 | 578348 | 9330461 | 67 | 0.5 | 0.5 | 8.2 |
| TOC-07-56 | 578399 | 9330518 | -33 | 1.37 | 1.31 | 210.8 |
| TOC-07-57 | 578405 | 9330541 | 36 | 2.34 | 2 | 121.1 |
| TOC-07-60 | 578294 | 9330623 | -8 | 1.99 | 1.99 | 262.3 |
| TOC-07-61 | 578176 | 9330701 | 38 | 0.94 | 0.94 | 209.5 |
| TOC-07-62 | 578096 | 9330753 | 14 | 0.63 | 0.63 | 217.4 |
| TOC-08-100 | 578146 | 9330771 | 113 | 0.51 | 0.51 | 63 |
| TOC-08-100 | 578100 | 9330719 | 11 | 0.89 | 0.89 | 125.7 |
144
Technical Report for the Tocantinzinho Gold Project, Brazil | |
| DH-ID | EAST | NORTH | ELEV. | Au (g/t) | Au_capped (g/t) | Length (m) |
| TOC-08-102 | 578221 | 9330655 | 49 | 1.99 | 1.99 | 214.6 |
| TOC-08-103 | 578246 | 9330674 | 145 | 37.76 | 12.6 | 6.1 |
| TOC-08-103 | 578227 | 9330651 | 112 | 2.23 | 2.23 | 31.7 |
| TOC-08-103 | 578190 | 9330609 | 45 | 0.93 | 0.93 | 86.5 |
| TOC-08-104 | 578229 | 9330709 | 122 | 1.23 | 1.23 | 42.7 |
| TOC-08-105 | 578191 | 9330668 | 15 | 2.03 | 2.03 | 182 |
| TOC-08-106 | 578231 | 9330672 | -26 | 1.33 | 1.33 | 134.5 |
| TOC-08-107 | 578211 | 9330715 | -119 | 1.59 | 1.59 | 190.3 |
| TOC-08-72 | 578506 | 9330491 | 141 | 1.8 | 1.8 | 16.8 |
| TOC-08-72 | 578485 | 9330471 | -3 | 1.41 | 1.41 | 25.5 |
| TOC-08-72 | 578474 | 9330464 | -68 | 0.62 | 0.62 | 88.5 |
| TOC-08-72 | 578460 | 9330455 | -144 | 0.78 | 0.64 | 64.4 |
| TOC-08-73 | 578419 | 9330530 | 123 | 0.54 | 0.54 | 33.5 |
| TOC-08-73 | 578401 | 9330506 | -18 | 1.08 | 1.08 | 218.2 |
| TOC-08-74 | 578398 | 9330532 | 124 | 1.38 | 1.38 | 30.8 |
| TOC-08-74 | 578383 | 9330513 | 31 | 1.31 | 1.31 | 133.3 |
| TOC-08-75 | 578339 | 9330518 | -17 | 1.61 | 1.61 | 227.5 |
| TOC-08-76 | 578448 | 9330477 | -8 | 0.81 | 0.81 | 147.8 |
| TOC-08-76 | 578492 | 9330511 | -96 | 1.1 | 1.1 | 52.6 |
| TOC-08-77 | 578308 | 9330523 | 118 | 0.56 | 0.56 | 36.2 |
| TOC-08-77 | 578320 | 9330536 | 71 | 0.5 | 0.5 | 6 |
| TOC-08-77 | 578354 | 9330569 | -46 | 1.43 | 1.43 | 206.4 |
| TOC-08-78 | 578272 | 9330592 | 137 | 0.78 | 0.78 | 5.4 |
| TOC-08-78 | 578308 | 9330640 | -49 | 1.73 | 1.73 | 244.5 |
| TOC-08-79 | 578256 | 9330694 | 108 | 3.13 | 3.13 | 58.8 |
| TOC-08-79 | 578270 | 9330711 | 25 | 0.88 | 0.88 | 12 |
| TOC-08-80 | 578189 | 9330690 | 74 | 0.98 | 0.98 | 169.9 |
| TOC-08-81 | 578095 | 9330774 | 14 | 0.51 | 0.51 | 280.1 |
| TOC-08-82 | 578060 | 9330839 | 23 | 0.61 | 0.61 | 122.2 |
| TOC-08-83 | 578158 | 9330743 | 0 | 0.7 | 0.7 | 148.6 |
| TOC-08-84 | 578005 | 9330729 | 141 | 0.81 | 0.81 | 6.1 |
| TOC-08-84 | 578012 | 9330742 | 101 | 0.73 | 0.73 | 43.3 |
| TOC-08-84 | 578046 | 9330794 | -34 | 1.99 | 1.99 | 6 |
| TOC-08-85 | 578142 | 9330767 | 117 | 0.66 | 0.66 | 69.8 |
| TOC-08-85 | 578131 | 9330752 | 46 | 0.54 | 0.54 | 7.6 |
| TOC-08-85 | 578109 | 9330731 | -61 | 0.81 | 0.81 | 93.8 |
| TOC-08-86 | 578019 | 9330722 | 135 | 1.04 | 1.04 | 20.1 |
| TOC-08-86 | 578023 | 9330730 | 109 | 0.84 | 0.84 | 27.6 |
| TOC-08-86 | 578030 | 9330742 | 72 | 1.58 | 1.58 | 10.5 |
| TOC-08-86 | 578059 | 9330783 | -55 | 1.73 | 1.73 | 10 |
| TOC-08-87 | 578365 | 9330596 | 112 | 1.05 | 1.05 | 60.5 |
| TOC-08-87 | 578322 | 9330552 | 31 | 2.45 | 2.39 | 108.5 |
145
Technical Report for the Tocantinzinho Gold Project, Brazil | |
| DH-ID | EAST | NORTH | ELEV. | Au (g/t) | Au_capped (g/t) | Length (m) |
| TOC-08-88 | 578462 | 9330508 | 50 | 1.56 | 1.35 | 176.1 |
| TOC-08-88 | 578432 | 9330468 | -71 | 1.04 | 1.04 | 59.8 |
| TOC-08-89 | 578107 | 9330794 | 28 | 0.86 | 0.8 | 176.8 |
| TOC-08-89 | 578157 | 9330849 | -106 | 1.05 | 1.05 | 13.4 |
| TOC-08-91 | 578426 | 9330517 | -47 | 1.51 | 1.51 | 227.3 |
| TOC-08-92 | 578259 | 9330570 | -6 | 1.64 | 1.59 | 190 |
| TOC-08-92 | 578281 | 9330586 | -118 | 2.15 | 2.15 | 25.9 |
| TOC-08-93 | 578258 | 9330654 | -62 | 1.36 | 1.36 | 165.6 |
| TOC-08-94 | 578208 | 9330770 | 26 | 0.76 | 0.76 | 46.4 |
| TOC-08-94 | 578187 | 9330726 | -53 | 1.29 | 1.29 | 68.5 |
| TOC-08-94A | 578164 | 9330723 | -92 | 0.97 | 0.97 | 169.8 |
| TOC-08-95 | 578183 | 9330602 | -8 | 1.9 | 1.9 | 130.1 |
| TOC-08-95 | 578236 | 9330662 | -148 | 0.82 | 0.82 | 117.3 |
| TOC-08-96 | 578210 | 9330669 | -85 | 1.58 | 1.58 | 274.3 |
| TOC-08-97 | 578454 | 9330476 | -106 | 1.16 | 1.16 | 146.9 |
| TOC-08-98 | 578282 | 9330677 | -153 | 1.64 | 1.64 | 166.1 |
| TOC-09-108 | 578197 | 9330742 | -111 | 0.69 | 0.69 | 164 |
| TOC-09-108 | 578149 | 9330706 | -193 | 0.72 | 0.72 | 8.7 |
| TOC-09-110 | 578067 | 9330839 | 34 | 1.25 | 1.2 | 123.4 |
| TOC-09-111 | 578206 | 9330789 | -40 | 0.55 | 0.55 | 26.1 |
| TOC-09-112 | 578087 | 9330756 | 142 | 0.8 | 0.8 | 18 |
| TOC-09-112 | 578116 | 9330791 | 93 | 0.55 | 0.55 | 31.4 |
| TOC-09-113 | 578281 | 9330603 | 42 | 0.89 | 0.84 | 213.5 |
| TOC-09-114 | 577998 | 9330814 | 98 | 0.67 | 0.67 | 37.9 |
| TOC-09-114 | 578019 | 9330838 | 49 | 0.98 | 0.98 | 34 |
| TOC-09-114 | 578035 | 9330856 | 13 | 0.77 | 0.77 | 25.3 |
| TOC-09-114 | 578050 | 9330872 | -20 | 0.86 | 0.86 | 32.7 |
| TOC-09-115 | 578323 | 9330657 | 104 | 0.81 | 0.81 | 71.5 |
| TOC-09-116 | 578362 | 9330595 | 89 | 1.48 | 1.48 | 118.4 |
| TOC-09-117 | 578387 | 9330574 | 51 | 1.32 | 1.32 | 92.1 |
| TOC-09-118 | 578424 | 9330560 | 100 | 0.8 | 0.8 | 102.2 |
| TOC-09-119 | 578423 | 9330528 | -73 | 1.23 | 1.23 | 169.2 |
| TOC-09-120 | 577994 | 9330860 | 58 | 1.15 | 1.15 | 13.7 |
| TOC-09-120 | 578016 | 9330882 | 14 | 0.77 | 0.77 | 40.4 |
| TOC-09-121 | 578493 | 9330482 | -150 | 1.2 | 1.2 | 93 |
| TOC-09-122 | 577961 | 9330933 | 95 | 0.98 | 0.98 | 108.4 |
| TOC-09-123 | 577993 | 9330969 | -39 | 2.11 | 2.11 | 10.6 |
| TOC-09-124 | 578500 | 9330441 | -101 | 0.71 | 0.71 | 177.6 |
| TOC-09-125 | 577924 | 9330952 | -22 | 0.51 | 0.51 | 32.7 |
| TOC-09-127 | 578551 | 9330444 | -115 | 0.67 | 0.67 | 42.5 |
| TOC-09-127 | 578543 | 9330437 | -147 | 0.61 | 0.61 | 14.5 |
| TOC-09-128 | 577997 | 9330868 | 104 | 0.58 | 0.58 | 18.3 |
146
Technical Report for the Tocantinzinho Gold Project, Brazil | |
| DH-ID | EAST | NORTH | ELEV. | Au (g/t) | Au_capped (g/t) | Length (m) |
| TOC-09-129 | 578518 | 9330444 | -38 | 0.99 | 0.99 | 122.6 |
| TOC-09-130 | 578061 | 9330841 | 121 | 2.72 | 2.46 | 56.5 |
| TOC-09-131 | 577929 | 9330952 | -31 | 0.94 | 0.94 | 54.3 |
| TOC-09-132 | 578508 | 9330416 | -141 | 0.76 | 0.76 | 40.2 |
| TOC-09-133 | 578472 | 9330507 | 86 | 0.63 | 0.63 | 117.4 |
| TOC-09-134 | 578017 | 9330724 | 138 | 0.7 | 0.7 | 17.9 |
| TOC-09-134 | 578077 | 9330803 | -2 | 1.13 | 1.13 | 139.1 |
| TOC-09-134 | 578120 | 9330852 | -89 | 2.26 | 2.26 | 10.5 |
| TOC-09-135 | 578345 | 9330548 | 133 | 1.05 | 1.05 | 9.1 |
| TOC-09-135 | 578324 | 9330566 | 93 | 0.89 | 0.89 | 18.2 |
| TOC-09-135 | 578282 | 9330600 | 13 | 1.37 | 1.33 | 149 |
| TOC-09-135 | 578209 | 9330670 | -124 | 0.8 | 0.8 | 167.5 |
| TOC-09-135 | 578151 | 9330737 | -220 | 0.64 | 0.64 | 20.7 |
| TOC-09-136 | 578515 | 9330445 | 91 | 1 | 1 | 75.4 |
| TOC-09-137 | 578456 | 9330542 | 92 | 0.96 | 0.96 | 63.1 |
| TOC-09-138 | 578436 | 9330526 | 38 | 0.83 | 0.83 | 128.4 |
| TOC-09-139 | 578224 | 9330750 | -165 | 1.27 | 1.27 | 158.1 |
| TOC-09-140 | 578308 | 9330530 | 124 | 0.72 | 0.72 | 33.9 |
| TOC-09-140 | 578349 | 9330579 | 33 | 2.71 | 2.71 | 122.3 |
| TOC-09-141 | 578336 | 9330560 | -81 | 1.6 | 1.38 | 219.8 |
| TOC-09-142 | 578380 | 9330455 | 2 | 0.87 | 0.87 | 8.8 |
| TOC-09-142 | 578432 | 9330514 | -125 | 1.04 | 1.04 | 180 |
| TOC-09-143 | 578142 | 9330658 | 120 | 0.69 | 0.69 | 21.8 |
| TOC-09-143 | 578156 | 9330675 | -14 | 0.75 | 0.75 | 104.6 |
| TOC-09-143 | 578172 | 9330691 | -150 | 1.49 | 1.49 | 167.9 |
| TOC-09-144 | 578158 | 9330677 | 90 | 0.89 | 0.89 | 12 |
| TOC-09-144 | 578201 | 9330729 | -41 | 1.06 | 1.06 | 234 |
| TOC-09-146 | 578067 | 9330678 | 72 | 1.72 | 1.72 | 81.5 |
| TOC-09-146 | 578114 | 9330728 | -43 | 0.66 | 0.66 | 136.4 |
| TOC-09-146 | 578168 | 9330777 | -145 | 2.48 | 2.48 | 28.1 |
| TOC-09-146 | 578181 | 9330787 | -164 | 0.52 | 0.52 | 10 |
| TOC-09-148 | 578085 | 9330809 | 70 | 0.83 | 0.83 | 110.7 |
| TOC-09-151 | 577959 | 9330875 | 81 | 0.52 | 0.52 | 19.2 |
| TOC-09-151 | 577983 | 9330901 | 31 | 0.72 | 0.72 | 71 |
| TOC-09-152 | 578218 | 9330579 | -39 | 0.75 | 0.75 | 26 |
| TOC-09-152 | 578280 | 9330641 | -176 | 0.9 | 0.9 | 164 |
| TOC180 | 578240 | 9330562 | 78 | 0.56 | 0.56 | 52.9 |
| TOC181 | 578286 | 9330565 | 135 | 1.04 | 1.04 | 20 |
| TOC183 | 578365 | 9330565 | 130 | 0.63 | 0.63 | 33 |
| TOC184 | 578380 | 9330583 | 114 | 1.78 | 1.78 | 67 |
| TOC184 | 578400 | 9330603 | 67 | 0.95 | 0.95 | 30 |
| TOC185 | 578093 | 9330725 | 139 | 0.51 | 0.51 | 50.5 |
147
Technical Report for the Tocantinzinho Gold Project, Brazil | |
| DH-ID | EAST | NORTH | ELEV. | Au (g/t) | Au_capped (g/t) | Length (m) |
| TOC185 | 578110 | 9330745 | 88 | 0.66 | 0.66 | 18.1 |
| TOC185 | 578130 | 9330769 | 28 | 0.83 | 0.83 | 33.4 |
| TOC186 | 578291 | 9330571 | 133 | 0.52 | 0.52 | 20 |
| TOC186 | 578316 | 9330596 | -50 | 1.19 | 1.19 | 259.5 |
| TOC187 | 577993 | 9330716 | 94 | 1.51 | 1.51 | 56 |
| TOC188 | 578112 | 9330681 | 119 | 1.09 | 1.09 | 65 |
| TOC188 | 578096 | 9330664 | 62 | 1.31 | 1.31 | 34.4 |
| TOC189 | 577928 | 9330950 | 127 | 0.75 | 0.75 | 37.4 |
| TOC191 | 578275 | 9330601 | 117 | 2.96 | 2.96 | 11 |
| TOC191 | 578266 | 9330589 | -28 | 1.69 | 1.6 | 197 |
| TOC192 | 578492 | 9330479 | 58 | 0.78 | 0.78 | 104 |
| TOC194 | 578328 | 9330552 | -96 | 1.72 | 1.72 | 192 |
148
Technical Report for the Tocantinzinho Gold Project, Brazil | |
Appendix B resource model figures
149
Technical Report for the Tocantinzinho Gold Project, Brazil | |

150
Technical Report for the Tocantinzinho Gold Project, Brazil | |

151
Technical Report for the Tocantinzinho Gold Project, Brazil | |

152
Technical Report for the Tocantinzinho Gold Project, Brazil | |

153
Technical Report for the Tocantinzinho Gold Project, Brazil | |
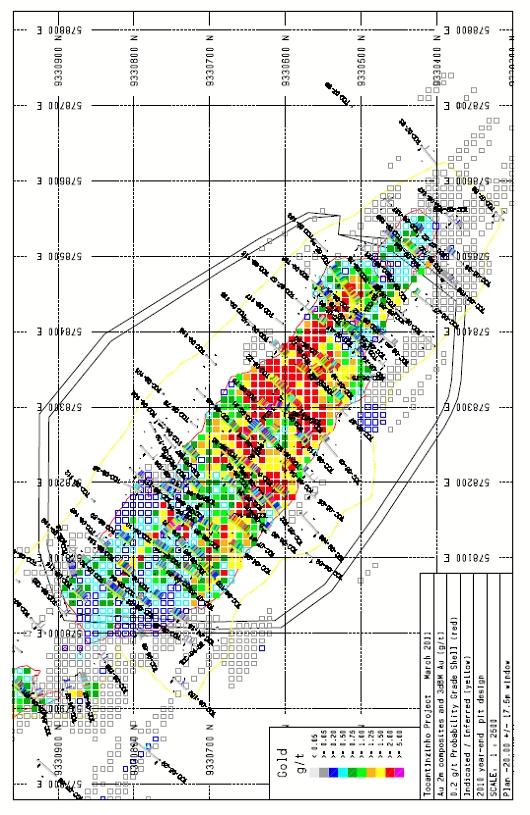
154
Technical Report for the Tocantinzinho Gold Project, Brazil | |

155