  Longbow Research Construction Materials Conference February 19, 2009 Exhibit 99.1 |
 Forward Looking Statement This presentation contains forward-looking statements within the meaning of Section 27A of the Securities Act of 1933, Section 21E of the Securities Exchange Act of 1934 and the Private Securities Litigation Reform Act of 1995. Forward-looking statements may be identified by the context of the statement and generally arise when the Company is discussing its beliefs, estimates or expectations. These statements are not historical facts or guarantees of future performance but instead represent only the Company’s beliefs at the time the statements were made regarding future events which are subject to significant risks, uncertainties and other factors many of which are outside the Company’s control. Actual results and outcomes may differ materially from what is expressed or forecast in such forward-looking statements. The principal risks and uncertainties that may affect the Company’s actual performance include the following: the cyclical and seasonal nature of the Company’s business; public infrastructure expenditures; adverse weather conditions; restrictive covenants contained in our debt agreements; availability of raw materials; changes in energy costs including, without limitation, increases in natural gas and oil; changes in the cost and availability of transportation; unexpected operational difficulties, equipment failures and catastrophic events; inability to timely execute announced capacity expansions; governmental regulation and changes in governmental and public policy (including climate change regulation); changes in economic conditions specific to any one or more of the Company’s markets; competition; announced increases in capacity in the gypsum wallboard and cement industries; changes in demand for residential housing construction or commercial construction; environmental liabilities; general economic conditions (including the possibility of the deepening of the current economic recession); and interest rates. For example, increases in interest rates, decreases in demand for construction materials or increases in the cost of energy (including natural gas and oil) could affect the revenues and operating earnings of our operations. In addition, changes in national and regional economic conditions and levels of infrastructure and construction spending could also adversely affect the Company’s results of operations. These and other factors are described in the Annual Report on Form 10-K for the Company for the fiscal year ended March 31, 2008 and in its quarterly report on Form 10-Q for the fiscal quarter ended December 31, 2008. These reports are filed with the Securities and Exchange Commission and may be obtained free of charge through the website maintained by the SEC at www.sec.gov. All forward-looking statements made in this presentation are made as of the date hereof, and the risk that actual results will differ materially from expectations expressed in this presentation will increase with the passage of time. The Company undertakes no duty to update any forward-looking statement to reflect future events or changes in the Company’s expectations. |
 3 1. Current Business Environment 2. Industry Outlook 3. Eagle at a Glance |
 4 New residential construction continues to weaken Non-residential construction’s near term outlook is weak Public construction varies from state to state Eagle Materials’ Response Intense focus on quality and customer service Minimize capital spending but maintain plants in like new condition Reduce/Eliminate low margin purchased cement sales Minimize waste and delay at our wallboard plants Minimize outside contract maintenance and overtime Find and implement lower cost energy and raw materials sources Improve financial flexibility by purchasing fixed-rate senior notes and replacing with variable- rate revolving credit facility Current Business Environment |
 5 1. Current Business Environment 2. Industry Outlook 3. Eagle at a Glance |
 6 |
 7 U.S. Cement Industry Update Current Supply/Demand Dynamics Demand anticipated to decline approximately 15% in calendar 2009 Due to the decline in demand, several plant closures have been announced Announced delays of expansion projects Landed cost of imported cement has been dramatically reduced Imports of foreign cement have been dramatically reduced |
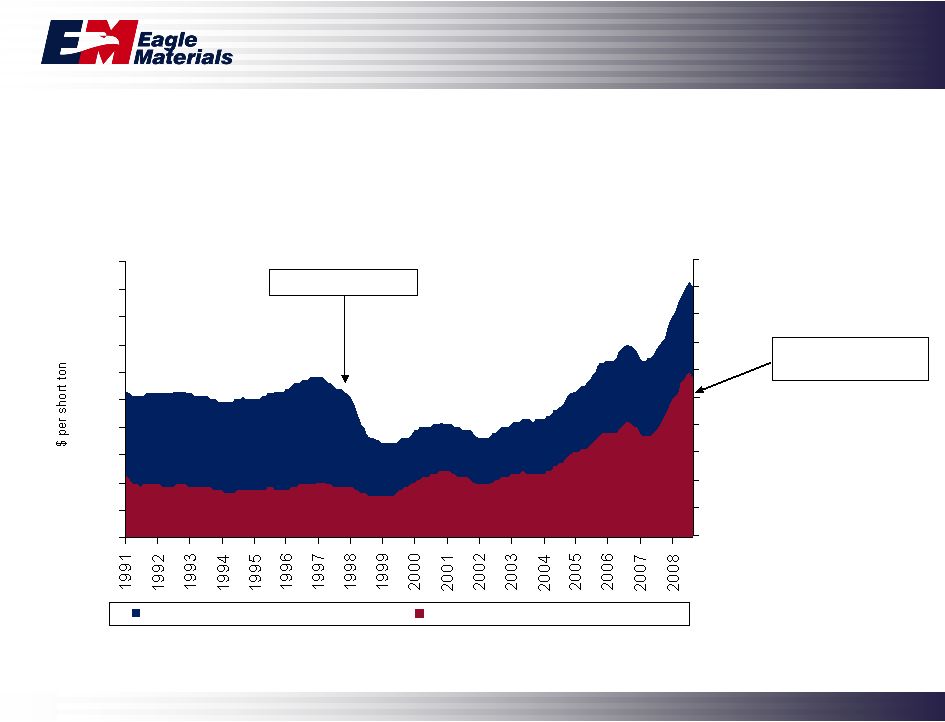 Cost of imported cement (through September 2008) Source: Portland Cement Association; Company estimates Current landed price – Mid-$50’s/ton 8 Asian Financial Crisis $0 $10 $20 $30 $40 $50 $60 $70 $80 $90 $100 Landed price of Asian imports to U.S. Handymax - Southeast Asia to U.S. Gulf $0 $10 $20 $30 $40 $50 $60 $70 $80 $90 $100 |
 9 Source: PCA Data and Company estimates U.S. Cement Industry – Consumption 30% imports 7% imports 0 20 40 60 80 100 120 140 160 Calendar Year Imports |
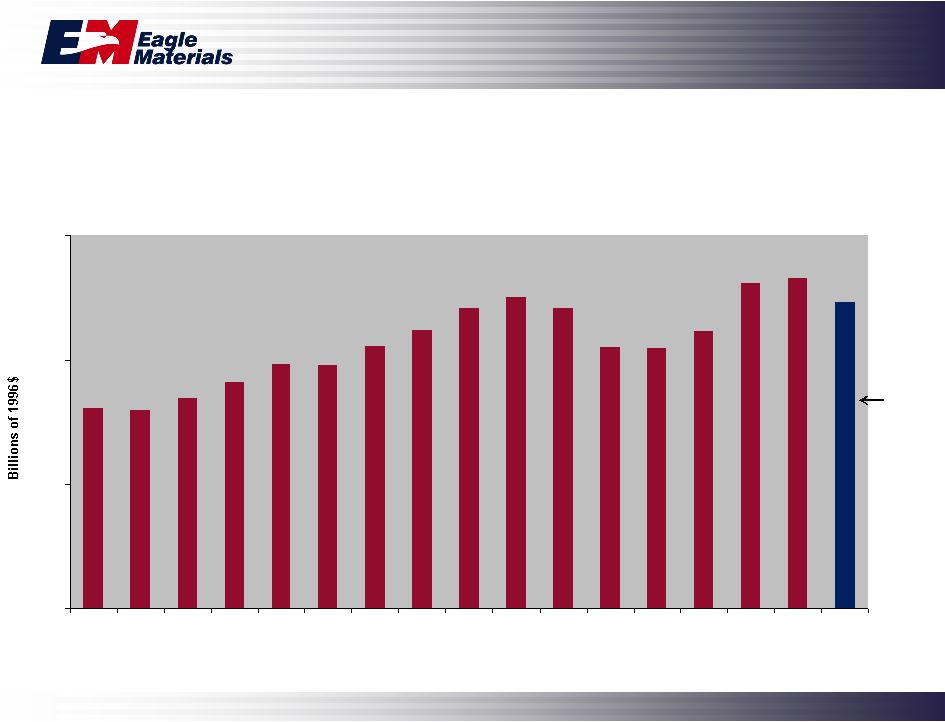 10 Public Construction Spending – Value Put in Place Source: Portland Cement Association (Projection from Fall 2008). ? $50 $100 $150 $200 1993 1994 1995 1996 1997 1998 1999 2000 2001 2002 2003 2004 2005 2006 2007 2008 2009E |
 11 Architectural Billings Index (ABI) Source: American Institute of Architects As a leading economic indicator of construction activity, the ABI reflects the approximate nine to twelve month lag between architectural billings and construction spending. Any score above 50 indicates an increase in billings. 20 30 40 50 60 70 80 Commercial/Industrial Institutional Mixed Use |
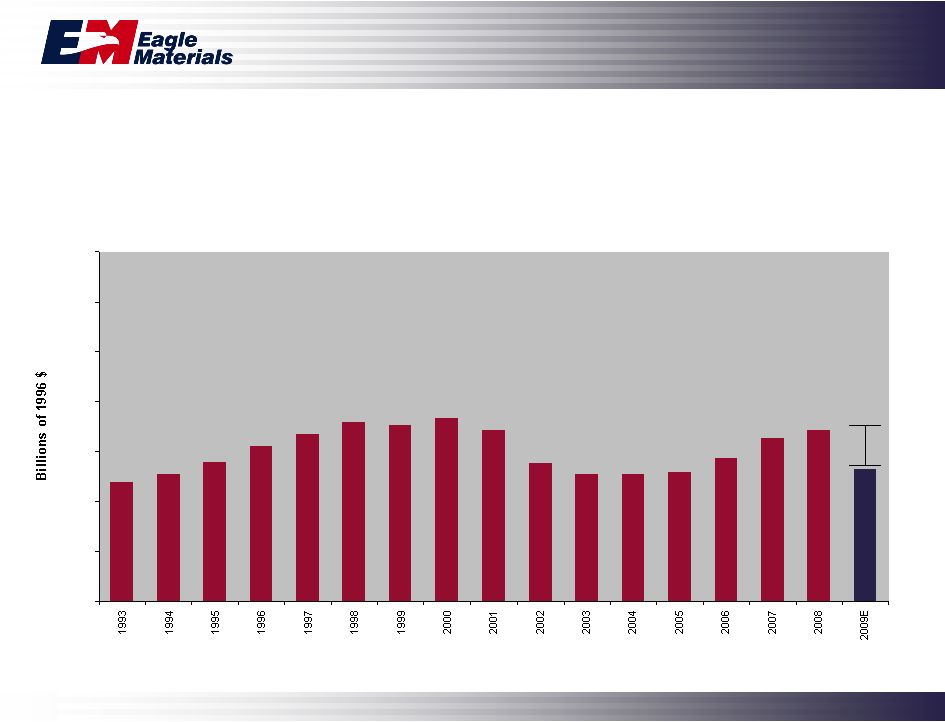 12 Private Non-Residential Construction Spending – Value Put in Place $0 $50 $100 $150 $200 $250 $300 $350 Source: U.S. Bureau of the Census; PCA (Projection from Fall 2008) -23% |
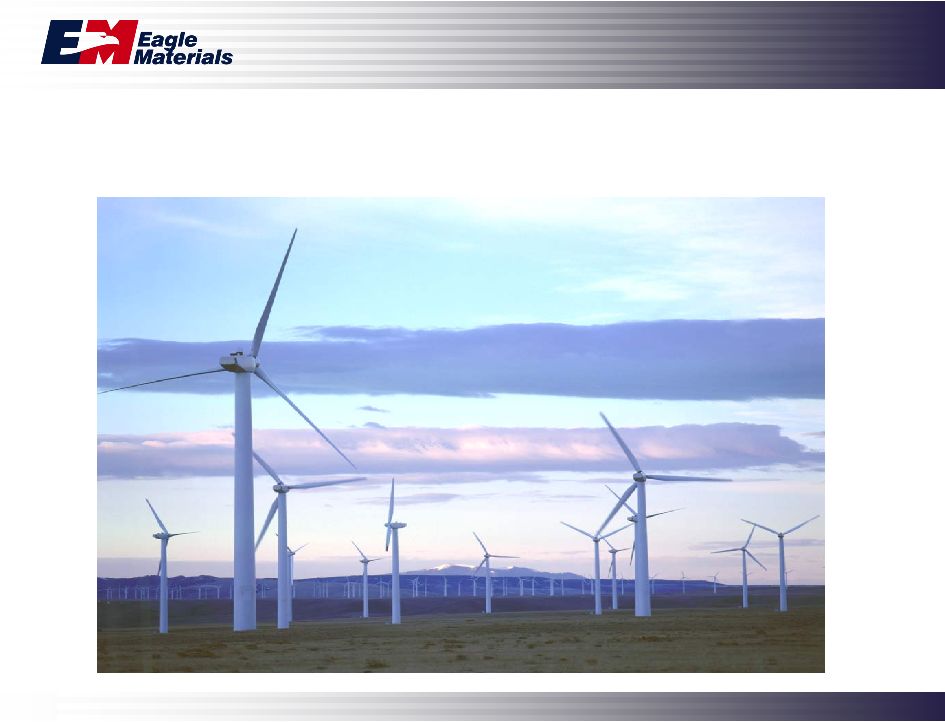 13 Wind Farms |
 14 Wind Farms |
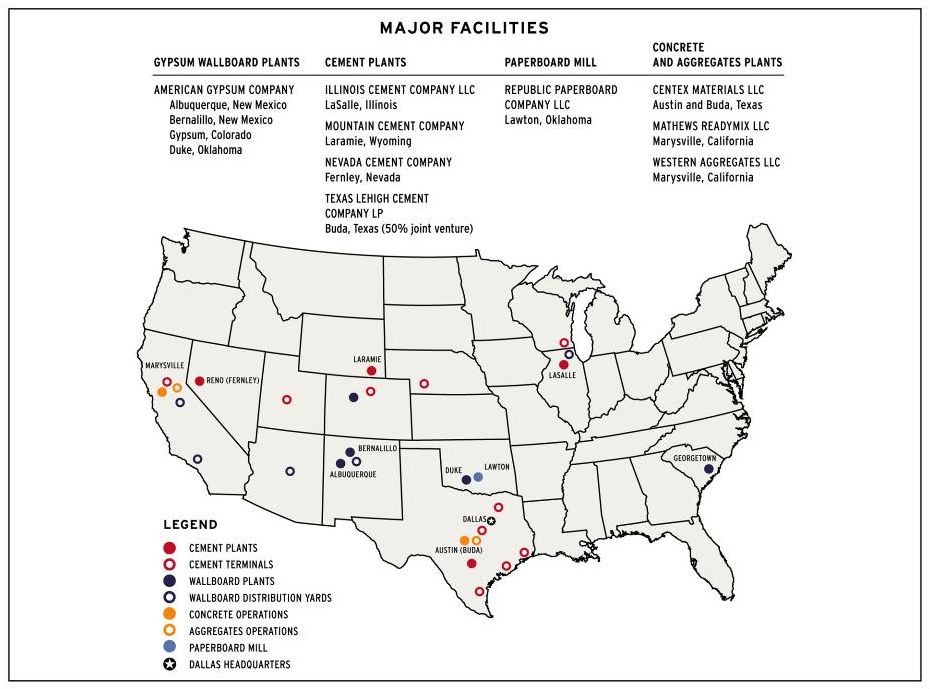
 15 Our Cement Operations Eagle Operations Overview Approximately 3.1 million tons of capacity 3.1% market share (12th in North America) Low cost producer Exceptional quality and customer service Cement Plants Cement Terminals Markets Served |
 16 |
 17 Wallboard Industry Update Wallboard demand was approximately 25 billion square feet (BSF) in calendar 2008 (down 31% from the 2005 peak) We expect demand to decline nearly 20% in calendar 2009 New plant capacity increases are operational All new plants were built in the East Older plants are closing Wallboard production capacity currently significantly greater than wallboard demand causing very low industry capacity utilization Industry capacity utilization no longer proxy for pricing – too low Wallboard margins were the lowest in the industry’s 100-year history last summer Pricing has since rebounded approximately 20% |
 18 Residential Construction Near Term Outlook Extreme low pace of new home construction Overhang of existing homes and foreclosures continues to put downward pressure on pricing and new housing starts Access to 30-year fixed-rate traditional mortgages is limited; however, interest rates are at historical lows Unemployment on the rise Additional foreclosures still loom as a risk to add to inventory • ARM resets Home prices continue to decline in bubble markets • Very depressed in outlying metropolitan bubble markets Bottom Line – Residential real estate has not yet bottomed However, demand drivers are mixed bag of positives and negatives |
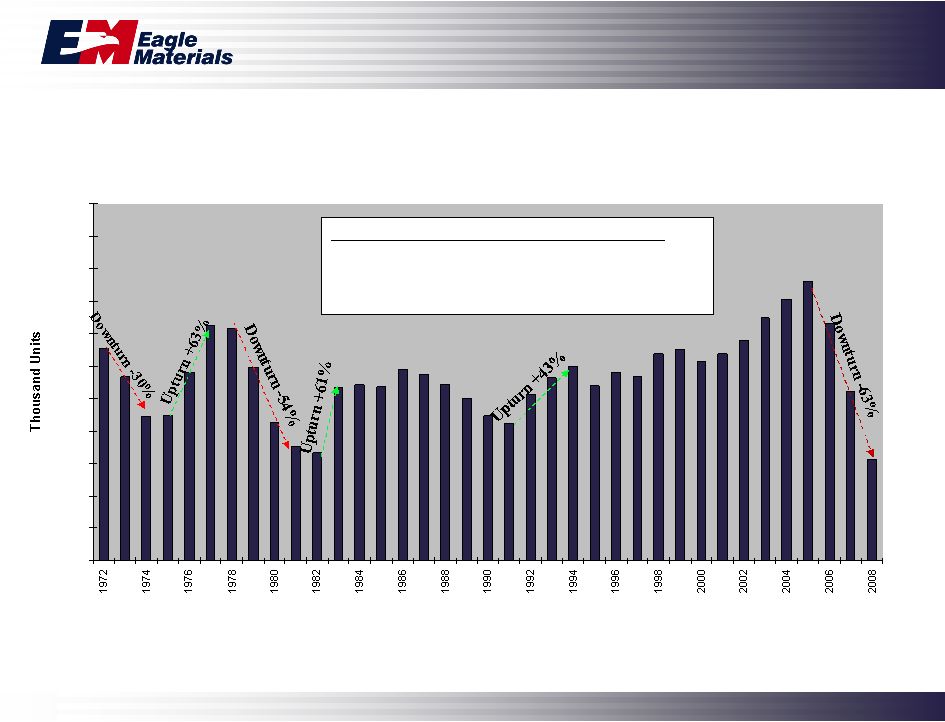 19 U.S Single Family Housing Starts – 1972-2008 0 200 400 600 800 1,000 1,200 1,400 1,600 1,800 2,000 2,200 Source: U.S Bureau of the Census; Eagle estimates Wallboard consumption by type of construction: -Single Family – approx. 10,000 sf -Multi Family – approx. 4,000 sf |
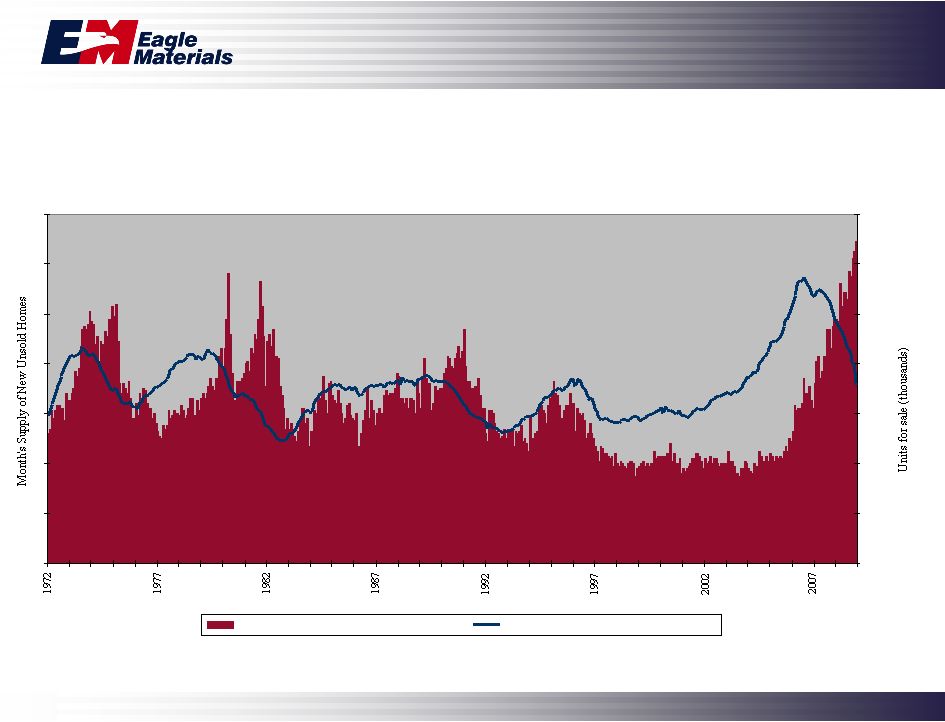 20 Home Supply – 1972 - 2008 Source: U.S Bureau of the Census 0 2 4 6 8 10 12 14 0 100 200 300 400 500 600 700 Months Supply of New Unsold Homes (L) Actual Inventory of New Unsold Homes |
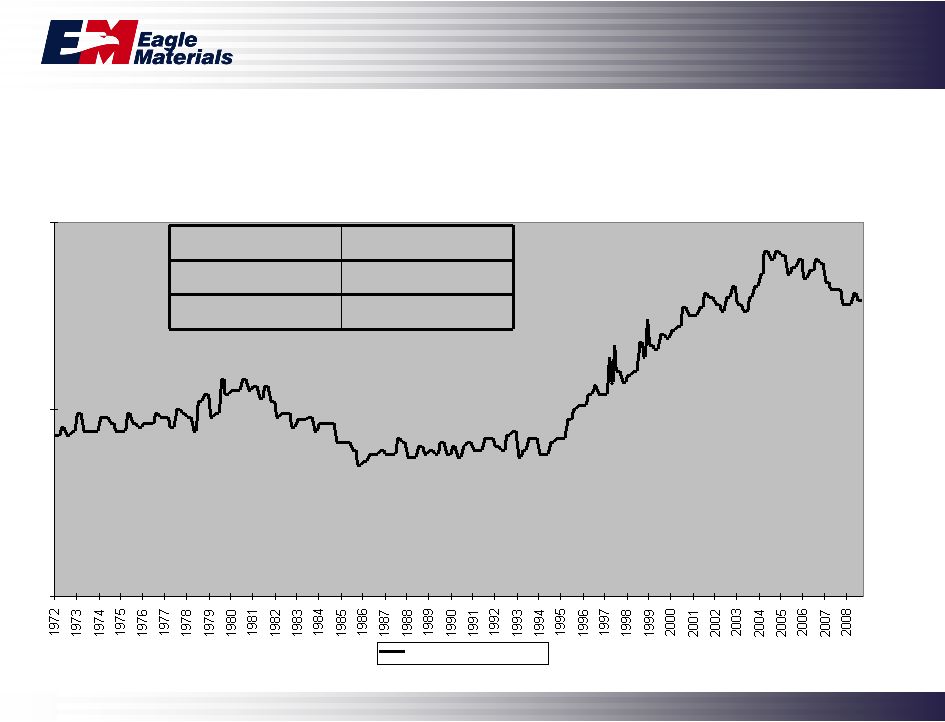 21 Home Ownership Rates – 1972 – 2008 Source: U.S. Bureau of the Census Total occupied homes 111.8 million Owner occupied 75.5 million Renter occupied 36.3 million 60.00% 65.00% 70.00% Home Ownership Rates Total occupied homes 111.8 million Owner occupied 75.5 million Renter occupied 36.3 million |
 22 Ratio of Median Existing Single Family Home Price to Median Income – 1975-2008 Source: National Association of Realtors Average Ratio – 2.9 Ratio in December - 2.9 3.6 3.9 3.9 3.7 3.3 - 0.5 1.0 1.5 2.0 2.5 3.0 3.5 4.0 4.5 |
 23 30 Year Mortgage Rates – 1977 – 2009 (January) Source: Freddie Mac Record low |
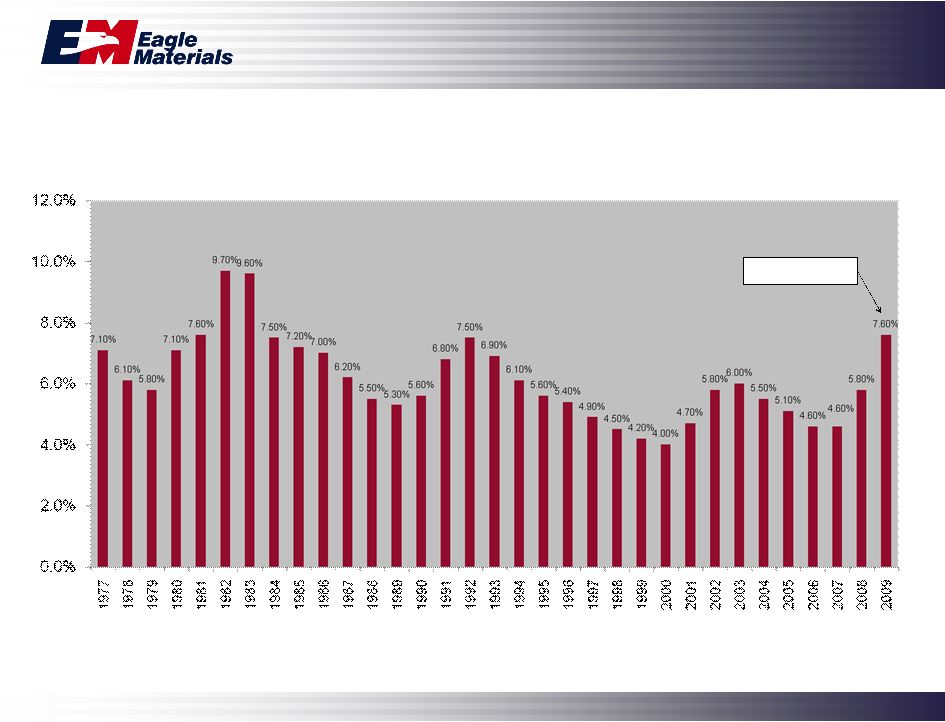 24 Unemployment Rate – 1977 – 2009 (January) Source: Department of Labor Current Month |
 25 New Home OR Existing Home? |
 26 U.S. Demand for Gypsum Wallboard (BSF) Source: Gypsum Association; Eagle estimates 10.7 13.1 15.4 16.4 16.7 14.1 13.8 13.1 16.8 18.3 19.4 20.4 20.6 20.6 20.9 20.5 18.3 20.2 21.4 23.2 23.1 24.7 25.5 27.0 29.1 28.2 29.3 29.8 31.8 34.0 36.2 35.0 30.2 24.8 20.0 - 5.0 10.0 15.0 20.0 25.0 30.0 35.0 40.0 |
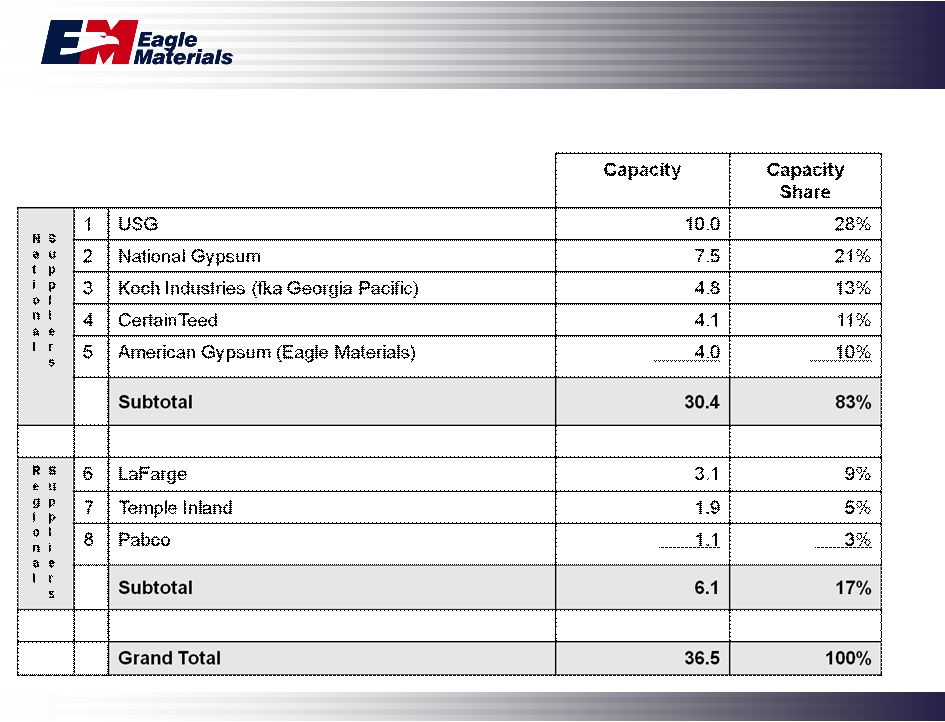 27 Estimated Capacity |
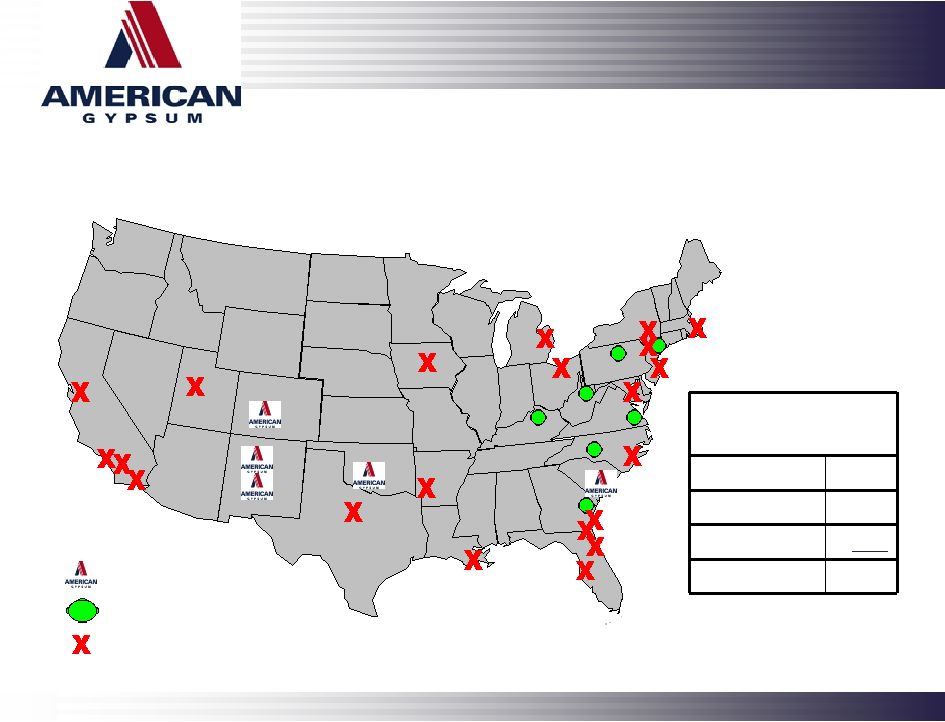 28 Wallboard Industry Capacity Expansions/Closures INDUSTRY CAPACITY ADDITIONS CAPACITY CLOSURES EAGLE PLANTS Capacity Summary (in BSF) 1/1/07 37.9 Additions 5.7 Closures (7.1) Current 36.5 |
 29 Eagle’s Wallboard Operations American Gypsum Operations Overview 18-year history Nearly 4.0 billion square feet of capacity 10% market share (5th in U.S.) Lowest cost producer Exceptional customer service Premium quality Wallboard Plants Reload/Distribution Yards Core Markets Served |
 30 |
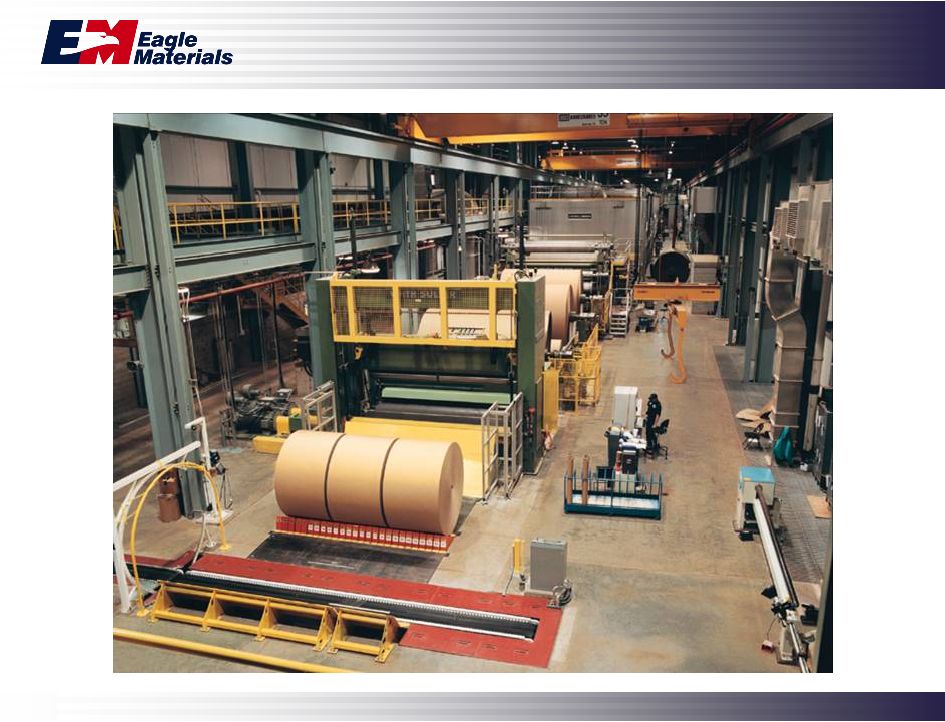
 31 Gypsum Paperboard Industry Update Nearly 100% vertically integrated One notable exception – CertainTeed – • 40% of Republic Paperboard’s capacity supplies 65% of CertainTeed’s U.S. paper needs Wallboard industry’s paperboard capacity is mostly high cost cylinder machines that produce high basis weight gypsum facing paper OCC costs are trending down Energy costs are trending down |
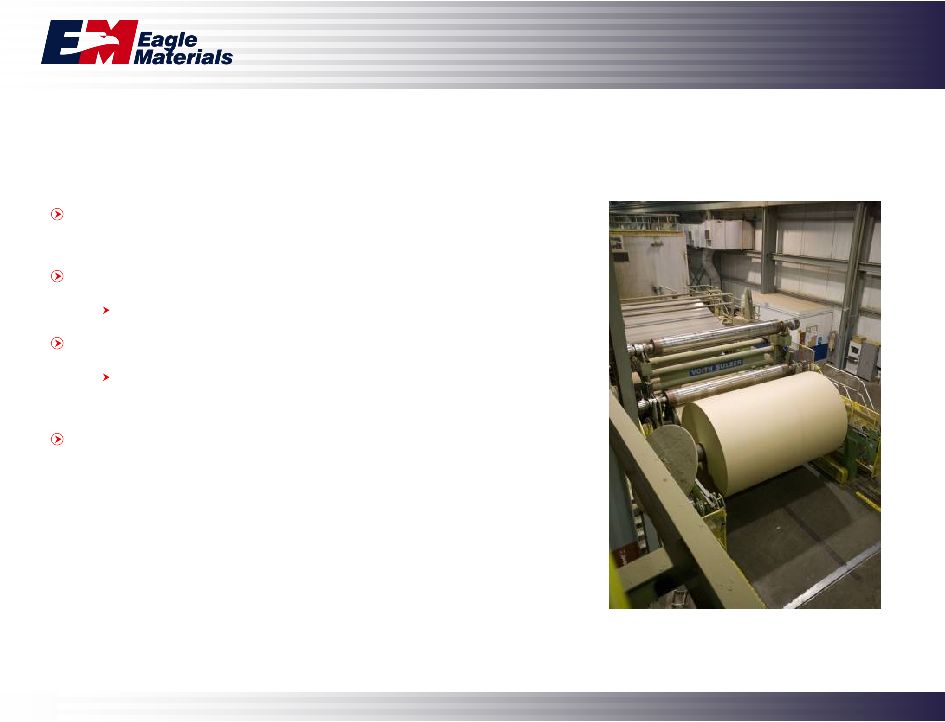  32 Eagle’s Gypsum Paperboard Overview Original design capacity of 220,000 tons has been increased to 320,000 tons Republic produces light-weight gypsum paperboard 15% lighter than gypsum industry average Superior wallboard conversion characteristics Produces uniform cross-directional strength, weight and moisture profile 40% of capacity consumed internally, 30% sold through long-term sales contract with CertainTeed, 30% sold in spot linerboard market |
 33 |
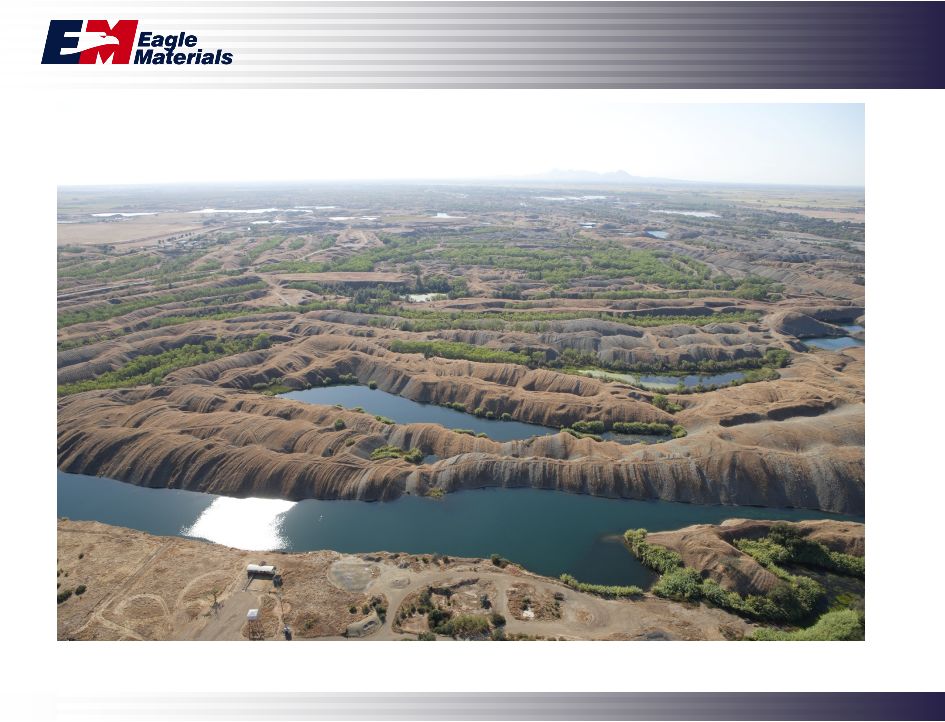
 34 Eagle’s Operations Overview Strong competitive position in local markets Capacity • Aggregates – 5.5 million tons • Concrete – 850,000 cubic yards Complimentary to Eagle’s Cement business Organic growth opportunities Vast aggregates reserves of over 1 billion tons in Northern California Exceptional quality and customer service Our Concrete and Aggregates Operations |
 35 1. Current Business Environment 2. Industry Outlook 3. Eagle at a Glance |
 36 New residential construction continues to weaken Non-residential construction’s near term outlook is weak Public construction varies from state to state Eagle Materials’ Response Intense focus on quality and customer service Minimize capital spending but maintain plants in like new condition Reduce/Eliminate low margin purchased cement sales Minimize waste and delay at our wallboard plants Minimize outside contract maintenance and overtime Find and implement lower cost energy and raw materials sources Improve financial flexibility by purchasing fixed-rate senior notes and replacing with variable- rate revolving credit facility Current Business Environment |
 37 Construction Demand Drivers • Public Infrastructure • New Residential Construction • New Non-Residential Construction • Repair and Remodel Construction Public Infrastructure , 58% New Non- Residential, 18% New Residential, 17% Other, 6% American Gypsum’s Wallboard Eagle’s Cement New Residential, 37% Repair and Remodel, 36% Other, 1% New Non- Residential, 26% |
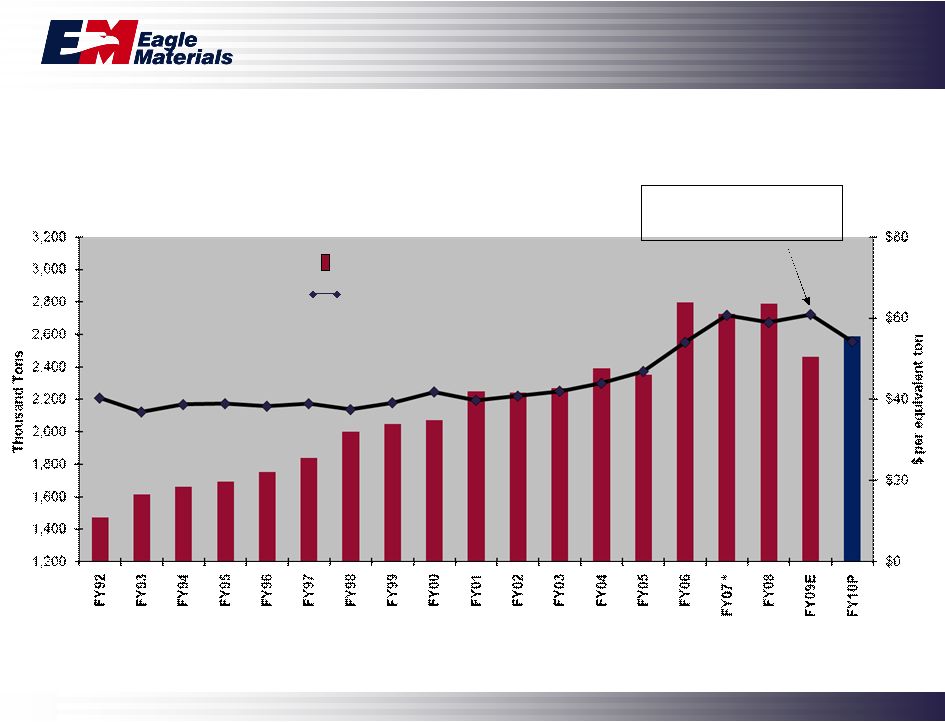 38 Our Cement Production and Cost Total Manufactured Tons Produced (L) Manufactured Cost per Equivalent Ton (R) * - Includes effect of downtime for Illinois Cement start-up Energy costs up 50% Since FY04 |
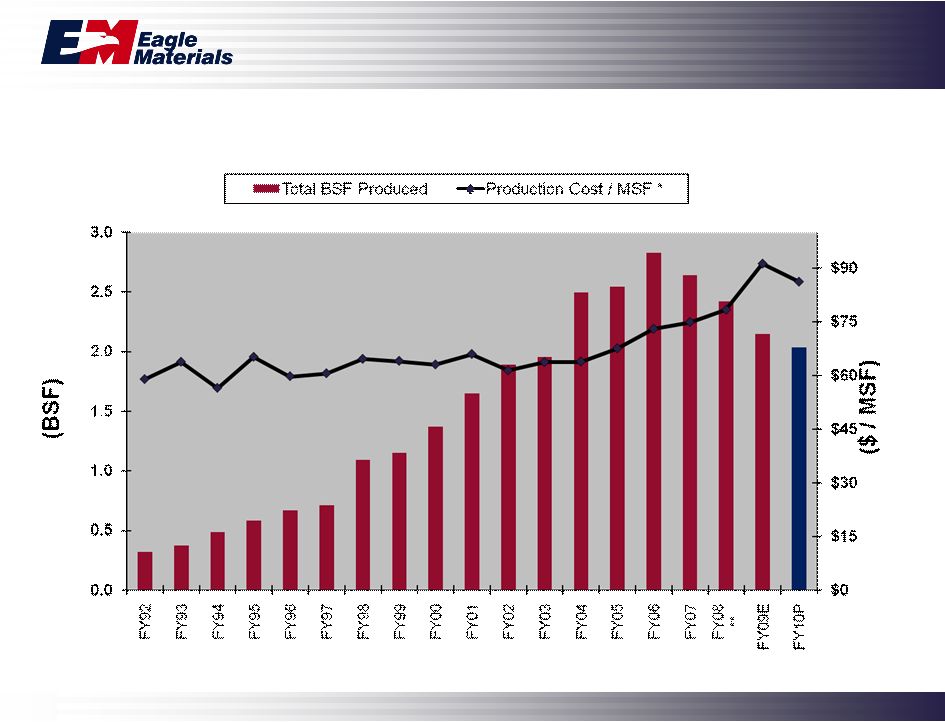 39 American Gypsum’s Wallboard Production and Cost * Before SG&A ** Includes effect from start-up of new plant in Georgetown, South Carolina |
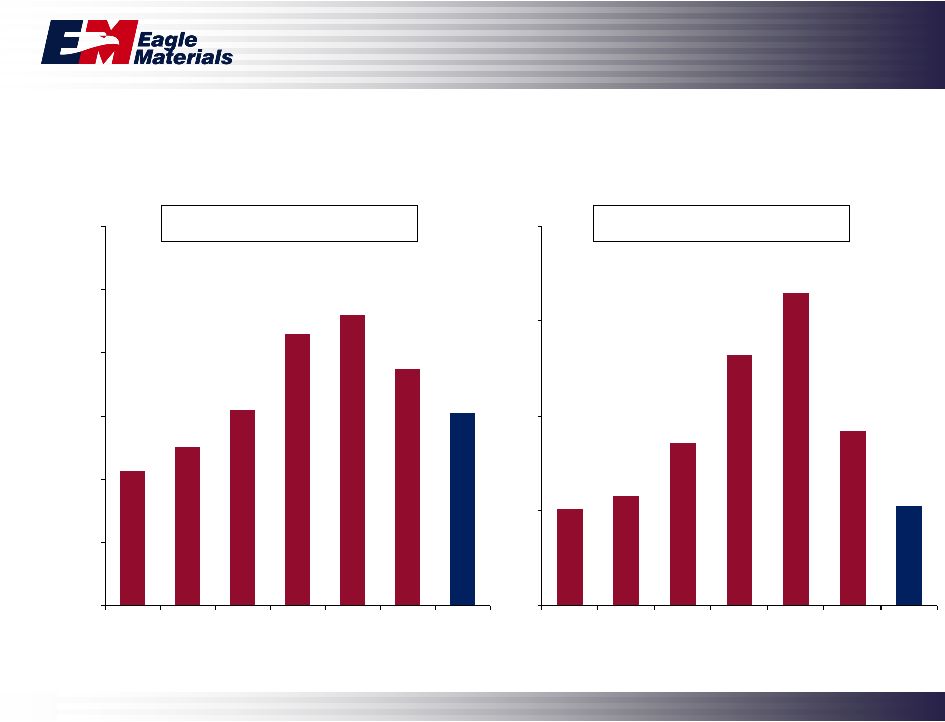 40 Financial Highlights ($ in millions) $429 $503 $617 $860 $922 $750 $610 $0 $200 $400 $600 $800 $1,000 $1,200 2003 2004 2005 2006 2007 2008 2009E For Fiscal Year Ending March 31 * Before Corporate G&A Revenues Operating Earnings * $102 $115 $172 $264 $330 $184 $105 $0 $100 $200 $300 $400 2003 2004 2005 2006 2007 2008 2009E |
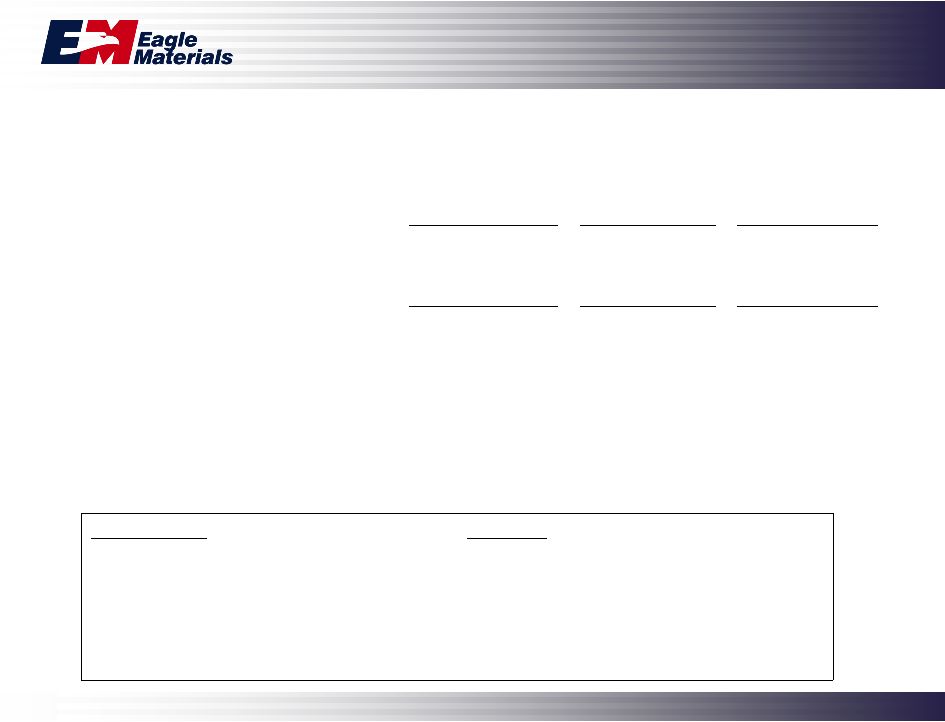 41 Dec. 31, 2008 Purchase of Senior Notes After Note Purchase Senior Notes $ 400.0 $ (100.0) $ 300.0 Revolver - 95.0 95.0 Total Debt $ 400.0 $ (5.0) $ 395.0 Cash Balance $ 47.8 $ 47.8 Quarterly Interest on Debt $ 5.9 $ 4.9 Senior Notes Revolver - No maturities until 2012 - Committed through June 2011 - Wtd average life – 7.7 years - Current rate - LIBOR plus 125 bps - Avg. Interest rate – 5.7% - Approximately $250 million remains available after note purchase Senior Note Purchase ($ in millions) |
 42 We Continue to Outperform the Group * -4.1% 3.1% 6.3% 11.2% 13.7% 15.2% -10.00% -5.00% 0.00% 5.00% 10.00% 15.00% 20.00% USG Cemex TXI (1) Vulcan Eagle Martin Marietta EBIT Margins (TTM as of 12/31/08) • Based on comparison of EBIT Margins (TTM) for each of the listed companies (1) TTM as of 11/30/08 Mean: 9% |
 43 Why Eagle Materials likes its position in bad times and in good times Premium quality products Exceptional customer service Strong long-term customer relationships Low overhead Extremely efficient modern, low-cost manufacturing plants Smart, hard working, technologically proficient employees Solid balance sheet Strong cash flow from low-cost operations during difficult times |
 44 Eagle Materials Inc. Question & Answer |
  Longbow Research Construction Materials Conference February 19, 2009 |
 46 Contact Information Steve Rowley, President and CEO Telephone: 214-432-2020 Email: srowley@eaglematerials.com Mark Dendle, Executive Vice President and CFO Telephone: 214-432-2011 Email: mdendle@eaglematerials.com Craig Kesler, Vice President - Investor Relations and Corporate Development Telephone: 214-432-2013 Email: ckesler@eaglematerials.com Eagle Materials Inc. NYSE: EXP www.eaglematerials.com |
 |