UNITED STATES
SECURITIES AND EXCHANGE COMMISSION
Washington, D.C. 20549
Form N-CSR
CERTIFIED SHAREHOLDER REPORT OF REGISTERED
MANAGEMENT INVESTMENT COMPANIES
Investment Company Act File Number: 811-08342
Global Macro Portfolio
(Exact Name of Registrant as Specified in Charter)
One Post Office Square, Boston, Massachusetts 02109
(Address of Principal Executive Offices)
Deidre E. Walsh
One Post Office Square, Boston, Massachusetts 02109
(Name and Address of Agent for Services)
(617) 482-8260
(Registrant’s Telephone Number)
October 31
Date of Fiscal Year End
October 31, 2024
Date of Reporting Period
Item 1. Reports to Stockholders
Annual Shareholder Report October 31, 2024
This annual shareholder report contains important information about the Global Macro Portfolio (the "Fund") for the period of November 1, 2023 to October 31, 2024. You can find additional information about the Fund at www.eatonvance.com/open-end-mutual-fund-documents.php and selecting Eaton Vance Global Macro Absolute Return Fund. You can also request this information by contacting us at 1-800-262-1122.
What were the Fund costs for the last year?
(based on a hypothetical $10,000 investment)
| Fund Name | Costs of a $10,000 investment | Costs paid as a percentage of a $10,000 investment |
|---|
| Global Macro Portfolio | $114 | 1.09% |
How did the Fund perform last year and what affected its performance?
Key contributors to (↑) and detractors from (↓) absolute performance:
↑ A long exposure to Surinamese sovereign credit contributed to performance following a debt restructuring that significantly reduced debt service obligations
↑ A long exposure to Egyptian local bonds contributed to returns during a period marked by positive reforms, International Monetary Fund (IMF) support, and regional support amid the Israel-Hamas conflict
↑ A long exposure to Uzbekistani local bonds, which benefited from perceptions of strengthening political institutions, contributed to returns during the period
↓ In contrast, a short exposure to South African sovereign credit detracted from returns as national elections resulted in a new coalition government expected to focus on structural reforms that may increase economic growth in South Africa
↓ Optimism about South Africa’s new government caused the South African rand to strengthen, and a short position in the currency detracted from performance
↓ Derivatives — led by credit-default swaps used to manage credit exposures and foreign exchange forwards used to manage currency exposures — hurt returns
Comparison of the change in value of a $10,000 investment for the period indicated.
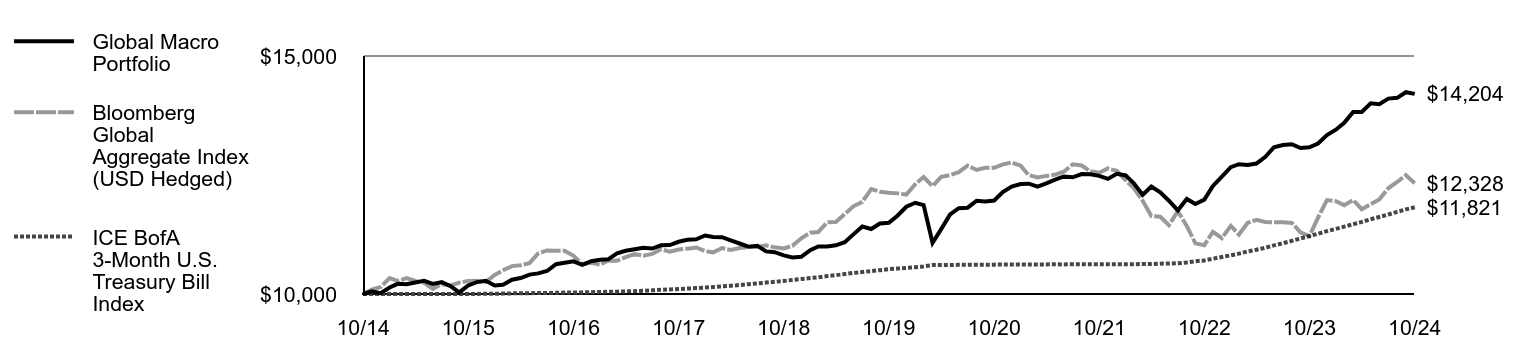
| Global Macro Portfolio | Bloomberg Global Aggregate Index (USD Hedged) | ICE BofA 3-Month U.S. Treasury Bill Index |
|---|
| 10/14 | $10,000 | $10,000 | $10,000 |
| 11/14 | $10,055 | $10,094 | $10,000 |
| 12/14 | $10,016 | $10,146 | $10,000 |
| 1/15 | $10,137 | $10,335 | $10,001 |
| 2/15 | $10,213 | $10,274 | $10,001 |
| 3/15 | $10,205 | $10,333 | $10,001 |
| 4/15 | $10,240 | $10,275 | $10,001 |
| 5/15 | $10,276 | $10,233 | $10,001 |
| 6/15 | $10,212 | $10,106 | $10,001 |
| 7/15 | $10,248 | $10,206 | $10,001 |
| 8/15 | $10,163 | $10,179 | $10,002 |
| 9/15 | $10,033 | $10,239 | $10,002 |
| 10/15 | $10,180 | $10,272 | $10,002 |
| 11/15 | $10,249 | $10,277 | $10,002 |
| 12/15 | $10,279 | $10,249 | $10,006 |
| 1/16 | $10,180 | $10,399 | $10,006 |
| 2/16 | $10,192 | $10,499 | $10,008 |
| 3/16 | $10,299 | $10,586 | $10,013 |
| 4/16 | $10,335 | $10,604 | $10,016 |
| 5/16 | $10,408 | $10,648 | $10,016 |
| 6/16 | $10,433 | $10,851 | $10,020 |
| 7/16 | $10,483 | $10,916 | $10,023 |
| 8/16 | $10,626 | $10,910 | $10,025 |
| 9/16 | $10,657 | $10,909 | $10,030 |
| 10/16 | $10,687 | $10,803 | $10,032 |
| 11/16 | $10,612 | $10,625 | $10,034 |
| 12/16 | $10,690 | $10,654 | $10,038 |
| 1/17 | $10,720 | $10,615 | $10,043 |
| 2/17 | $10,728 | $10,706 | $10,047 |
| 3/17 | $10,854 | $10,701 | $10,049 |
| 4/17 | $10,909 | $10,774 | $10,055 |
| 5/17 | $10,940 | $10,837 | $10,060 |
| 6/17 | $10,971 | $10,806 | $10,069 |
| 7/17 | $10,954 | $10,842 | $10,077 |
| 8/17 | $11,022 | $10,941 | $10,087 |
| 9/17 | $11,029 | $10,890 | $10,096 |
| 10/17 | $11,097 | $10,936 | $10,105 |
| 11/17 | $11,141 | $10,953 | $10,113 |
| 12/17 | $11,148 | $10,977 | $10,124 |
| 1/18 | $11,229 | $10,899 | $10,136 |
| 2/18 | $11,199 | $10,875 | $10,146 |
| 3/18 | $11,194 | $10,965 | $10,160 |
| 4/18 | $11,128 | $10,924 | $10,173 |
| 5/18 | $11,061 | $10,965 | $10,189 |
| 6/18 | $10,994 | $10,985 | $10,206 |
| 7/18 | $11,014 | $10,988 | $10,222 |
| 8/18 | $10,896 | $11,022 | $10,240 |
| 9/18 | $10,879 | $10,980 | $10,256 |
| 10/18 | $10,811 | $10,958 | $10,274 |
| 11/18 | $10,768 | $11,012 | $10,295 |
| 12/18 | $10,781 | $11,171 | $10,314 |
| 1/19 | $10,921 | $11,289 | $10,334 |
| 2/19 | $10,997 | $11,303 | $10,353 |
| 3/19 | $10,997 | $11,505 | $10,376 |
| 4/19 | $11,023 | $11,512 | $10,395 |
| 5/19 | $11,088 | $11,678 | $10,419 |
| 6/19 | $11,253 | $11,842 | $10,442 |
| 7/19 | $11,419 | $11,935 | $10,461 |
| 8/19 | $11,365 | $12,205 | $10,482 |
| 9/19 | $11,480 | $12,149 | $10,501 |
| 10/19 | $11,497 | $12,128 | $10,521 |
| 11/19 | $11,645 | $12,114 | $10,534 |
| 12/19 | $11,833 | $12,089 | $10,549 |
| 1/20 | $11,917 | $12,307 | $10,563 |
| 2/20 | $11,867 | $12,458 | $10,579 |
| 3/20 | $11,074 | $12,264 | $10,610 |
| 4/20 | $11,363 | $12,462 | $10,611 |
| 5/20 | $11,671 | $12,498 | $10,611 |
| 6/20 | $11,803 | $12,560 | $10,612 |
| 7/20 | $11,813 | $12,697 | $10,614 |
| 8/20 | $11,959 | $12,605 | $10,615 |
| 9/20 | $11,941 | $12,651 | $10,616 |
| 10/20 | $11,964 | $12,652 | $10,617 |
| 11/20 | $12,140 | $12,724 | $10,618 |
| 12/20 | $12,257 | $12,763 | $10,620 |
| 1/21 | $12,309 | $12,695 | $10,621 |
| 2/21 | $12,318 | $12,497 | $10,621 |
| 3/21 | $12,257 | $12,448 | $10,622 |
| 4/21 | $12,323 | $12,481 | $10,622 |
| 5/21 | $12,404 | $12,509 | $10,623 |
| 6/21 | $12,470 | $12,570 | $10,622 |
| 7/21 | $12,452 | $12,726 | $10,623 |
| 8/21 | $12,519 | $12,700 | $10,623 |
| 9/21 | $12,514 | $12,580 | $10,624 |
| 10/21 | $12,481 | $12,548 | $10,623 |
| 11/21 | $12,418 | $12,637 | $10,624 |
| 12/21 | $12,525 | $12,586 | $10,625 |
| 1/22 | $12,491 | $12,388 | $10,624 |
| 2/22 | $12,326 | $12,223 | $10,626 |
| 3/22 | $12,086 | $11,960 | $10,629 |
| 4/22 | $12,258 | $11,638 | $10,630 |
| 5/22 | $12,135 | $11,622 | $10,638 |
| 6/22 | $11,960 | $11,446 | $10,640 |
| 7/22 | $11,755 | $11,738 | $10,645 |
| 8/22 | $11,997 | $11,431 | $10,663 |
| 9/22 | $11,892 | $11,064 | $10,689 |
| 10/22 | $11,982 | $11,026 | $10,706 |
| 11/22 | $12,269 | $11,307 | $10,741 |
| 12/22 | $12,467 | $11,174 | $10,779 |
| 1/23 | $12,666 | $11,431 | $10,813 |
| 2/23 | $12,727 | $11,249 | $10,848 |
| 3/23 | $12,710 | $11,498 | $10,895 |
| 4/23 | $12,741 | $11,557 | $10,929 |
| 5/23 | $12,881 | $11,512 | $10,972 |
| 6/23 | $13,084 | $11,505 | $11,022 |
| 7/23 | $13,131 | $11,509 | $11,066 |
| 8/23 | $13,146 | $11,494 | $11,116 |
| 9/23 | $13,066 | $11,296 | $11,167 |
| 10/23 | $13,081 | $11,216 | $11,217 |
| 11/23 | $13,161 | $11,602 | $11,267 |
| 12/23 | $13,338 | $11,972 | $11,320 |
| 1/24 | $13,451 | $11,949 | $11,368 |
| 2/24 | $13,597 | $11,867 | $11,415 |
| 3/24 | $13,826 | $11,974 | $11,466 |
| 4/24 | $13,825 | $11,781 | $11,515 |
| 5/24 | $14,006 | $11,885 | $11,571 |
| 6/24 | $13,989 | $11,988 | $11,618 |
| 7/24 | $14,105 | $12,220 | $11,670 |
| 8/24 | $14,121 | $12,354 | $11,726 |
| 9/24 | $14,239 | $12,497 | $11,777 |
| 10/24 | $14,204 | $12,328 | $11,821 |
Average Annual Total Returns (%)
| Fund | 1 Year | 5 Years | 10 Years |
|---|
| Global Macro Portfolio | 8.70% | 4.32% | 3.57% |
Bloomberg Global Aggregate Index (USD Hedged)Footnote Reference1 | 9.92% | 0.33% | 2.11% |
| ICE BofA 3-Month U.S. Treasury Bill Index | 5.39% | 2.36% | 1.69% |
| Footnote | Description |
Footnote1 | In accordance with regulatory changes requiring the Fund's primary benchmark to represent the overall applicable market, the Fund's primary prospectus benchmark changed to the indicated benchmark effective May 1, 2024. |
Performance does not reflect the deduction of taxes that an investor would pay on distributions or redemptions. Performance assumes that all dividends and distributions, if any, were reinvested. For more recent performance information, visit www.eatonvance.com/performance.php.
THE FUND'S PAST PERFORMANCE IS NO GUARANTEE OF FUTURE RESULTS.
| Total Net Assets | $1,770,575,482 |
| # of Portfolio Holdings (including derivatives) | 1,187 |
| Portfolio Turnover Rate | 156% |
| Total Advisory Fees Paid | $9,804,859 |
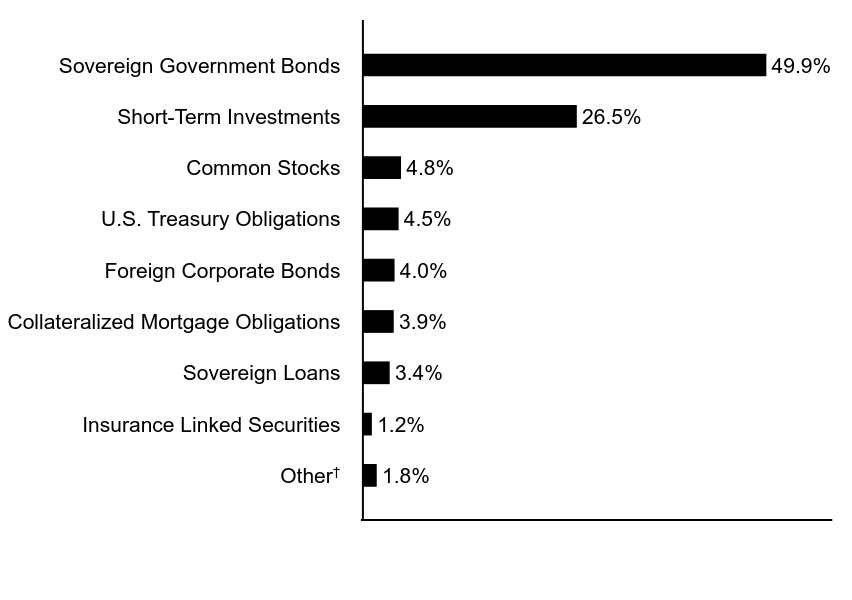
What did the Fund invest in?
The following tables reflect what the Fund invested in as of the report date.
Asset Allocation (% of total investments)
| Value | Value |
|---|
OtherFootnote Reference† | 1.8% |
| Insurance Linked Securities | 1.2% |
| Sovereign Loans | 3.4% |
| Collateralized Mortgage Obligations | 3.9% |
| Foreign Corporate Bonds | 4.0% |
| U.S. Treasury Obligations | 4.5% |
| Common Stocks | 4.8% |
| Short-Term Investments | 26.5% |
| Sovereign Government Bonds | 49.9% |
| Footnote | Description |
Footnote† | Investment types less than 1% each |
Foreign Currency Exposure (% of net assets)Footnote Reference*
| Egypt | 8.0% |
| Uzbekistan | 4.6% |
| Serbia | 3.1% |
| Singapore | 2.5% |
| Dominican Republic | 2.5% |
| India | 2.3% |
| Iceland | 2.3% |
| Other | 18.8% |
| Total Long Exposure | 44.1% |
| South Africa | (2.1)% |
| Philippines | (2.6)% |
| Euro | (9.0)% |
| Other | (8.1)% |
| Total Short Exposure | (21.8)% |
| Footnote | Description |
Footnote* | Currency exposures include all foreign exchange denominated assets and currency derivatives. |
If you wish to view additional information about the Fund, including the prospectus, statement of additional information, financial statements and holdings, please scan the QR code or visit www.eatonvance.com/open-end-mutual-fund-documents.php and select Eaton Vance Global Macro Absolute Return Fund. For proxy information, please visit www.eatonvance.com/proxyvoting.
The Funds may deliver a single copy of certain required shareholder documents (including prospectuses, shareholder reports, and proxy materials) to investors with the same last name and the same address. Your participation will continue indefinitely unless you instruct otherwise by calling 1-800-262-1122 or by contacting your financial intermediary. Your instruction will typically be effective within 30 days of receipt.
Not FDIC Insured | May Lose Value | No Bank Guarantee
Annual Shareholder Report October 31, 2024
Item 2. Code of Ethics
The registrant (sometimes referred to as the “Fund”) has adopted a code of ethics applicable to its Principal Executive Officer, Principal Financial Officer and Principal Accounting Officer. The registrant undertakes to provide a copy of such code of ethics to any person upon request, without charge, by calling 1-800-262-1122. The registrant has not amended the code of ethics as described in Form N-CSR during the period covered by this report. The registrant has not granted any waiver, including an implicit waiver, from a provision of the code of ethics as described in Form N-CSR during the period covered by this report.
Item 3. Audit Committee Financial Expert
The registrant’s Board of Trustees (the “Board”) has designated George J. Gorman and Scott E. Wennerholm, each an independent trustee, as audit committee financial experts. Mr. Gorman is a certified public accountant who is the Principal at George J. Gorman LLC (a consulting firm). Previously, Mr. Gorman served in various capacities at Ernst & Young LLP (a registered public accounting firm), including as Senior Partner. Mr. Gorman also has experience serving as an independent trustee and audit committee financial expert of other mutual fund complexes. Mr. Wennerholm is a private investor. Previously, Mr. Wennerholm served as a Trustee at Wheelock College (postsecondary institution), as a Consultant at GF Parish Group (executive recruiting firm), Chief Operating Officer and Executive Vice President at BNY Mellon Asset Management (investment management firm), Chief Operating Officer and Chief Financial Officer at Natixis Global Asset Management (investment management firm), and Vice President at Fidelity Investments Institutional Services (investment management firm).
Item 4. Principal Accountant Fees and Services
(a)-(d)
The following table presents the aggregate fees billed to the registrant for the registrant’s fiscal years ended October 31, 2023 and October 31, 2024 by the registrant’s principal accountant, Deloitte & Touche LLP (“D&T”), for professional services rendered for the audit of the registrant’s annual financial statements and fees billed for other services rendered by D&T during such periods.
| | | | | | | | |
Fiscal Years Ended | | 10/31/23 | | | 10/31/24 | |
Audit Fees | | $ | 148,900 | | | $ | 133,682 | |
Audit-Related Fees(1) | | $ | 0 | | | $ | 0 | |
Tax Fees(2) | | $ | 0 | | | $ | 0 | |
All Other Fees(3) | | $ | 6,817 | | | $ | 0 | |
| | | | | | | | |
Total | | $ | 155,717 | | | $ | 133,682 | |
| | | | | | | | |
| (1) | Audit-related fees consist of the aggregate fees billed for assurance and related services that are reasonably related to the performance of the audit of the registrant’s financial statements and are not reported under the category of audit fees. |
| (2) | Tax fees consist of the aggregate fees billed for professional services rendered by the principal accountant relating to tax compliance, tax advice, and tax planning and specifically include fees for tax return preparation and other related tax compliance/planning matters. |
| (3) | All other fees consist of the aggregate fees billed for products and services provided by the principal accountant other than audit, audit-related, and tax services. |
(e)(1) The registrant’s audit committee has adopted policies and procedures relating to the pre-approval of services provided by the registrant’s principal accountant (the “Pre-Approval Policies”). The Pre-Approval Policies establish a framework intended to assist the audit committee in the proper discharge of its pre-approval responsibilities. As a general matter, the Pre-Approval Policies (i) specify certain types of audit, audit-related, tax, and other services determined to be pre-approved by the audit committee; and (ii) delineate specific procedures governing the mechanics of the pre-approval process, including the approval and monitoring of audit and non-audit service fees. Unless a service is specifically pre-approved under the Pre-Approval Policies, it must be separately pre-approved by the audit committee.
The Pre-Approval Policies and the types of audit and non-audit services pre-approved therein must be reviewed and ratified by the registrant’s audit committee at least annually. The registrant’s audit committee maintains full responsibility for the appointment, compensation, and oversight of the work of the registrant’s principal accountant.
(e)(2) No services described in paragraphs (b)-(d) above were approved by the registrant’s audit committee pursuant to the “de minimis exception” set forth in Rule 2-01(c)(7)(i)(C) of Regulation S-X.
(f) Not applicable.
(g) The following table presents (i) the aggregate non-audit fees (i.e., fees for audit-related, tax, and other services) billed to the registrant by D&T for the registrant’s fiscal years ended October 31, 2023 and October 31, 2024; and (ii) the aggregate non-audit fees (i.e., fees for audit-related, tax, and other services) billed to the Eaton Vance organization by D&T for the same time periods.
| | | | | | | | |
Fiscal Years Ended | | 10/31/23 | | | 10/31/24 | |
Registrant | | $ | 6,817 | | | $ | 0 | |
Eaton Vance(1) | | $ | 0 | | | $ | 18,490 | |
| (1) | The investment adviser to the registrant, as well as any of its affiliates that provide ongoing services to the registrant, are subsidiaries of Morgan Stanley. |
(h) The registrant’s audit committee has considered whether the provision by the registrant’s principal accountant of non-audit services to the registrant’s investment adviser and any entity controlling, controlled by, or under common control with the adviser that provides ongoing services to the registrant that were not pre-approved pursuant to Rule 2-01(c)(7)(ii) of Regulation S-X is compatible with maintaining the principal accountant’s independence.
(i) Not applicable.
(j) Not applicable.
Item 5. Audit Committee of Listed Registrants
Not applicable.
Item 6. Schedule of Investments
| (a) | Please see schedule of investments contained in the Financial Statements and Financial Highlights included under Item 7 of this Form N-CSR. |
Item 7. Financial Statements and Financial Highlights for Open-End Management Investment Companies
Global Macro Portfolio
October 31, 2024
Consolidated Portfolio of Investments
| Collateralized Mortgage Obligations — 3.7% |
| Security | Principal
Amount
(000's omitted) | Value |
| Federal Home Loan Mortgage Corp.: | | | |
| Series 1817, Class Z, 6.50%, 2/15/26 | $ | 1 | $ 1,426 |
| Series 1927, Class ZA, 6.50%, 1/15/27 | | 13 | 13,024 |
| Series 2344, Class ZD, 6.50%, 8/15/31 | | 120 | 121,930 |
| Series 2458, Class ZB, 7.00%, 6/15/32 | | 262 | 272,277 |
| Federal National Mortgage Association: | | | |
| Series 1996-35, Class Z, 7.00%, 7/25/26 | | 2 | 2,262 |
| Series 1998-16, Class H, 7.00%, 4/18/28 | | 44 | 45,634 |
| Series 1998-44, Class ZA, 6.50%, 7/20/28 | | 66 | 67,863 |
| Series 1999-25, Class Z, 6.00%, 6/25/29 | | 75 | 74,976 |
| Series 2000-2, Class ZE, 7.50%, 2/25/30 | | 13 | 13,345 |
| Series 2000-49, Class A, 8.00%, 3/18/27 | | 9 | 9,224 |
| Series 2001-31, Class ZA, 6.00%, 7/25/31 | | 580 | 581,491 |
| Series 2001-74, Class QE, 6.00%, 12/25/31 | | 189 | 192,827 |
| Series 2009-48, Class WA, 5.788%, 7/25/39(1) | | 800 | 807,971 |
| Series 2011-38, Class SA, 0.00%, (13.157% - 30-day SOFR Average x 3, Floor 0.00%), 5/25/41(2) | | 648 | 469,404 |
| Series 2023-54, Class C, 6.50%, 11/25/53 | | 2,610 | 2,758,938 |
Interest Only:(3)
Series 2018-21, Class IO, 3.00%, 4/25/48 | | 4,034 | 651,418 |
| Government National Mortgage Association: | | | |
| Series 2023-148, Class HL, 6.50%, 10/20/53 | | 2,610 | 2,721,596 |
| Sereis 2023-151, Class GL, 6.50%, 10/20/53 | | 1,890 | 1,971,145 |
| Series 2023-155, Class CH, 6.50%, 10/20/53 | | 7,140 | 7,453,289 |
| Series 2023-165, Class EY, 6.50%, 11/20/53 | | 13,070 | 13,640,569 |
| Series 2023-169, Class JW, 6.50%, 11/20/53 | | 1,400 | 1,463,664 |
| Series 2024-1, Class GL, 6.00%, 1/20/54 | | 1,384 | 1,425,796 |
| Series 2024-3, Class CY, 6.00%, 1/20/54 | | 544 | 560,460 |
| Series 2024-6, Class CB, 6.00%, 1/20/54 | | 2,427 | 2,500,418 |
| Series 2024-6, Class LB, 6.00%, 1/20/54 | | 462 | 475,978 |
| Series 2024-25, Class GL, 6.00%, 2/20/54 | | 792 | 802,450 |
| JPM Lending Facility, 11.90%, (SOFR + 7.00%), 7/15/29(4) | | 7,013 | 7,008,335 |
| Unison Trust, Series 2021-1, Class A, 4.50%, 4/25/50(1)(5) | | 21,121 | 19,880,637 |
Total Collateralized Mortgage Obligations
(identified cost $69,796,401) | | | $ 65,988,347 |
| Security | Shares | Value |
| Argentina — 0.3% |
| Banco BBVA Argentina SA ADR(6) | | 73,365 | $ 1,010,236 |
| Security | Shares | Value |
| Argentina (continued) |
| Banco Hipotecario SA, Class D | | 453,628 | $ 156,523 |
| Banco Macro SA ADR(6) | | 15,846 | 1,239,633 |
| Banco Patagonia SA, Class B | | 1,396 | 2,306 |
| Grupo Financiero Galicia SA ADR(6) | | 30,373 | 1,601,264 |
| Grupo Supervielle SA ADR(6) | | 74,709 | 679,852 |
| | | | $ 4,689,814 |
| Belgium — 0.0%(7) |
| Cenergy Holdings SA | | 38,091 | $ 361,985 |
| | | | $ 361,985 |
| Bulgaria — 0.2% |
| Eurohold Bulgaria AD(6) | | 5,122,901 | $ 4,075,528 |
| | | | $ 4,075,528 |
| Cyprus — 0.5% |
| Bank of Cyprus Holdings PLC | | 1,975,000 | $ 9,087,334 |
| | | | $ 9,087,334 |
| Georgia — 0.7% |
| Bank of Georgia Group PLC | | 76,094 | $ 4,091,403 |
| Georgia Capital PLC(6) | | 268,333 | 3,509,628 |
| TBC Bank Group PLC | | 140,522 | 4,983,159 |
| | | | $ 12,584,190 |
| Greece — 0.7% |
| Alpha Services and Holdings SA | | 703,647 | $ 1,059,924 |
| Athens International Airport SA | | 9,630 | 82,611 |
| Eurobank Ergasias Services and Holdings SA, Class A | | 826,417 | 1,710,039 |
| Hellenic Telecommunications Organization SA | | 56,951 | 941,063 |
| Ideal Holdings SA | | 7,980 | 52,811 |
| JUMBO SA | | 33,531 | 894,930 |
| Metlen Energy & Metals SA | | 33,575 | 1,179,539 |
| Motor Oil (Hellas) Corinth Refineries SA | | 19,112 | 408,147 |
| National Bank of Greece SA | | 245,580 | 1,924,051 |
| OPAP SA | | 57,558 | 983,385 |
| Optima bank SA | | 37,037 | 519,500 |
| Piraeus Financial Holdings SA | | 335,238 | 1,263,120 |
| Public Power Corp. SA | | 60,394 | 794,030 |
| | | | $ 11,813,150 |
| Iceland — 0.2% |
| Arion Banki Hf.(5) | | 1,015,472 | $ 1,166,247 |
| Eik fasteignafelag Hf. | | 3,253,209 | 324,703 |
| Eimskipafelag Islands Hf. | | 220,734 | 582,111 |
| Hagar Hf. | | 921,987 | 638,803 |
17
See Notes to Consolidated Financial Statements.
Global Macro Portfolio
October 31, 2024
Consolidated Portfolio of Investments — continued
| Security | Shares | Value |
| Iceland (continued) |
| Heimar Hf.(6) | | 1,291,872 | $ 314,161 |
| Islandsbanki Hf. | | 668,258 | 614,561 |
| Reitir fasteignafelag Hf. | | 875,641 | 622,090 |
| Siminn Hf. | | 1,879,514 | 160,257 |
| | | | $ 4,422,933 |
| Kazakhstan — 0.1% |
| Kaspi.KZ JSC ADR | | 17,678 | $ 1,947,055 |
| | | | $ 1,947,055 |
| Luxembourg — 0.0%(7) |
| Zabka Group SA(6) | | 75,581 | $ 405,025 |
| | | | $ 405,025 |
| Malaysia — 0.3% |
| Axiata Group Bhd. | | 392,700 | $ 201,938 |
| CelcomDigi Bhd. | | 512,200 | 397,240 |
| CIMB Group Holdings Bhd. | | 419,700 | 761,054 |
| Inari Amertron Bhd. | | 324,500 | 210,365 |
| Malayan Banking Bhd. | | 378,600 | 906,676 |
| Malaysia Airports Holdings Bhd. | | 115,200 | 266,500 |
| Maxis Bhd. | | 327,300 | 269,495 |
| Petronas Chemicals Group Bhd. | | 186,600 | 229,826 |
| Public Bank Bhd. | | 417,000 | 419,620 |
| Telekom Malaysia Bhd. | | 332,900 | 492,850 |
| Tenaga Nasional Bhd. | | 343,500 | 1,098,904 |
| | | | $ 5,254,468 |
| Philippines — 0.2% |
| Ayala Corp. | | 23,190 | $ 274,330 |
| Ayala Land, Inc. | | 550,600 | 308,871 |
| Bank of the Philippine Islands | | 197,400 | 484,895 |
| BDO Unibank, Inc. | | 197,910 | 517,966 |
| International Container Terminal Services, Inc. | | 77,120 | 524,088 |
| SM Investments Corp. | | 44,540 | 718,190 |
| SM Prime Holdings, Inc. | | 1,063,200 | 559,225 |
| | | | $ 3,387,565 |
| Poland — 0.7% |
| Alior Bank SA | | 12,747 | $ 278,544 |
| Allegro.eu SA(5)(6) | | 86,656 | 762,532 |
| Asseco Poland SA | | 8,176 | 183,408 |
| Bank Millennium SA(6) | | 90,317 | 188,072 |
| Bank Polska Kasa Opieki SA | | 27,625 | 966,495 |
| Budimex SA | | 1,894 | 236,871 |
| CCC SA(6) | | 6,265 | 276,744 |
| Security | Shares | Value |
| Poland (continued) |
| CD Projekt SA | | 9,934 | $ 399,965 |
| Cyfrowy Polsat SA(6) | | 37,248 | 117,795 |
| Dino Polska SA(5)(6) | | 7,411 | 615,524 |
| Enea SA(6) | | 40,894 | 113,822 |
| Eurocash SA | | 12,785 | 27,551 |
| Grupa Azoty SA(6) | | 7,581 | 39,207 |
| Grupa Kety SA | | 1,406 | 239,644 |
| Jastrzebska Spolka Weglowa SA(6) | | 7,729 | 51,922 |
| KGHM Polska Miedz SA | | 20,962 | 784,559 |
| KRUK SA | | 2,601 | 278,667 |
| LPP SA | | 163 | 593,209 |
| mBank SA(6) | | 2,284 | 321,195 |
| Orange Polska SA | | 97,956 | 190,789 |
| ORLEN SA | | 87,109 | 1,137,388 |
| PGE Polska Grupa Energetyczna SA(6) | | 136,156 | 235,387 |
| Powszechna Kasa Oszczednosci Bank Polski SA | | 130,941 | 1,819,326 |
| Powszechny Zaklad Ubezpieczen SA | | 90,409 | 896,604 |
| Santander Bank Polska SA | | 5,403 | 605,882 |
| Tauron Polska Energia SA(6) | | 157,615 | 145,753 |
| Text SA | | 2,804 | 41,562 |
| Warsaw Stock Exchange | | 4,044 | 42,925 |
| XTB SA(5) | | 8,685 | 140,717 |
| | | | $ 11,732,059 |
| Spain — 0.0%(7) |
| AmRest Holdings SE(6) | | 11,440 | $ 59,711 |
| | | | $ 59,711 |
| United Kingdom — 0.0%(7) |
| Pepco Group NV(6)(8) | | 26,354 | $ 112,786 |
| | | | $ 112,786 |
| United States — 0.0%(7) |
| Titan Cement International SA | | 12,450 | $ 445,227 |
| | | | $ 445,227 |
| Vietnam — 0.7% |
| Bank for Foreign Trade of Vietnam JSC(6) | | 99,972 | $ 369,747 |
| Coteccons Construction JSC(6) | | 12,000 | 31,807 |
| Duc Giang Chemicals JSC | | 62,000 | 274,626 |
| FPT Corp. | | 486,028 | 2,601,913 |
| FPT Digital Retail JSC(6) | | 21,900 | 150,262 |
| Gemadept Corp. | | 83,400 | 214,673 |
| Hoa Phat Group JSC(6) | | 523,025 | 554,849 |
| Khang Dien House Trading & Investment JSC(6) | | 85,800 | 113,346 |
| KIDO Group Corp. | | 11,162 | 22,361 |
18
See Notes to Consolidated Financial Statements.
Global Macro Portfolio
October 31, 2024
Consolidated Portfolio of Investments — continued
| Security | Shares | Value |
| Vietnam (continued) |
| Military Commercial Joint Stock Bank | | 914,921 | $ 965,950 |
| Mobile World Investment Corp. | | 703,598 | 1,845,063 |
| Nam Long Investment Corp. | | 112,700 | 176,888 |
| Phat Dat Real Estate Development Corp.(6) | | 140,000 | 115,953 |
| Phu Nhuan Jewelry JSC | | 226,740 | 906,997 |
| Refrigeration Electrical Engineering Corp. | | 330,956 | 894,549 |
| SSI Securities Corp. | | 97,200 | 101,819 |
| Vietnam Dairy Products JSC | | 90,281 | 235,976 |
| Vietnam Joint Stock Commercial Bank for Industry & Trade(6) | | 286,000 | 402,478 |
| Vietnam Prosperity JSC Bank | | 551,000 | 445,071 |
| Vietnam Technological & Commercial Joint Stock Bank | | 1,180,800 | 1,112,126 |
| Vingroup JSC(6) | | 78,738 | 129,236 |
| | | | $ 11,665,690 |
Total Common Stocks
(identified cost $66,142,695) | | | $ 82,044,520 |
| Convertible Bonds — 0.0%(7) |
| Security | Principal
Amount
(000's omitted) | Value |
| China — 0.0%(7) |
| Sunac China Holdings Ltd., 1.00% PIK, 9/30/32(8) | USD | 595 | $ 65,446 |
Total Convertible Bonds
(identified cost $531,163) | | | $ 65,446 |
| Foreign Corporate Bonds — 3.9% |
| Security | Principal
Amount
(000's omitted) | Value |
| China — 0.1% |
| KWG Group Holdings Ltd., 7.875%, 8/30/24(9) | USD | 1,571 | $ 137,659 |
| Shimao Group Holdings Ltd., 5.60%, 7/15/26(8)(9) | USD | 5,100 | 343,740 |
| Sunac China Holdings Ltd.: | | | |
| 6.00%, (5.00% cash or 6.00% PIK), 9/30/26(8)(10) | USD | 506 | 88,472 |
| 6.25%, (5.25% cash or 6.25% PIK), 9/30/27(8)(10) | USD | 507 | 83,933 |
| 6.50%, (5.50% cash or 6.50% PIK), 9/30/27(8)(10) | USD | 1,016 | 160,024 |
| 6.75%, (5.75% cash or 6.75% PIK), 9/30/28(8)(10) | USD | 1,528 | 236,797 |
| 7.00%, (6.00% cash or 7.00% PIK), 9/30/29(8)(10) | USD | 1,531 | 220,142 |
| Security | Principal
Amount
(000's omitted) | Value |
| China (continued) |
| Sunac China Holdings Ltd.: (continued) | | | |
| 7.25%, (6.25% cash or 7.25% PIK), 9/30/30(8)(10) | USD | 721 | $ 99,153 |
| Times China Holdings Ltd.: | | | |
| 5.55%, 6/4/24(8)(9) | USD | 3,999 | 154,961 |
| 6.75%, 7/16/23(8)(9) | USD | 2,966 | 114,933 |
| | | | $ 1,639,814 |
| Georgia — 0.6% |
| Bank of Georgia JSC: | | | |
| 9.50% to 7/16/29(5)(11)(12) | USD | 200 | $ 196,245 |
| 9.50% to 7/16/29(8)(11)(12) | USD | 8,200 | 8,049,144 |
| TBC Bank JSC, 10.25% to 7/30/29(8)(11)(12) | USD | 3,320 | 3,296,644 |
| | | | $ 11,542,033 |
| Hungary — 0.1% |
| MBH Bank Nyrt, 8.625% to 10/19/26, 10/19/27(8)(12) | EUR | 1,243 | $ 1,442,709 |
| | | | $ 1,442,709 |
| Iceland — 0.0% |
| Wow Air Hf.: | | | |
| 0.00%(9)(11)(13) | EUR | 79 | $ 0 |
| 0.00%, (3 mo. EURIBOR + 9.00%)(9)(11)(13) | EUR | 3,600 | 0 |
| | | | $ 0 |
| India — 0.0%(7) |
| Reliance Communications Ltd., 6.50%, 11/6/20(8)(9) | USD | 1,800 | $ 30,600 |
| | | | $ 30,600 |
| Kazakhstan — 0.4% |
| Development Bank of Kazakhstan JSC, 13.00%, 4/15/27(5) | KZT | 3,466,500 | $ 7,051,718 |
| | | | $ 7,051,718 |
| Mexico — 0.0%(7) |
| Alpha Holding SA de CV: | | | |
| 9.00%, 2/10/25(8)(9) | USD | 3,667 | $ 45,840 |
| 10.00%, 12/19/22(8)(9) | USD | 1,741 | 21,764 |
| | | | $ 67,604 |
| Moldova — 0.0%(7) |
| Aragvi Finance International DAC, 8.45%, 4/29/26(8) | USD | 293 | $ 292,063 |
| | | | $ 292,063 |
19
See Notes to Consolidated Financial Statements.
Global Macro Portfolio
October 31, 2024
Consolidated Portfolio of Investments — continued
| Security | Principal
Amount
(000's omitted) | Value |
| Paraguay — 0.2% |
| Itau BBA International PLC, 9.03%, 2/19/30 | PYG | 27,417,630 | $ 3,771,569 |
| | | | $ 3,771,569 |
| Saint Lucia — 0.0%(7) |
| Digicel Intermediate Holdings Ltd./Digicel International Finance Ltd./DIFL U.S., 12.00%, (9.00% cash and 3.00% PIK), 5/25/27 | USD | 48 | $ 48,382 |
| | | | $ 48,382 |
| Supranational — 0.3% |
| European Bank for Reconstruction & Development: | | | |
| 17.20%, 4/9/26(8) | USD | 2,600 | $ 2,595,468 |
| 17.35%, 3/1/27(8) | USD | 1,000 | 980,392 |
| International Finance Corp., 16.00%, 2/21/25 | UZS | 16,000,000 | 1,253,864 |
| | | | $ 4,829,724 |
| Uzbekistan — 1.7% |
| Ipoteka-Bank ATIB, 20.50%, 4/25/27(8) | UZS | 42,080,000 | $ 3,291,650 |
| Jscb Agrobank, 9.25%, 10/2/29(8) | USD | 7,973 | 8,138,032 |
| Uzbek Industrial & Construction Bank ATB, 21.00%, 7/24/27(8) | UZS | 232,110,000 | 18,541,675 |
| | | | $ 29,971,357 |
| Venezuela — 0.5% |
| Petroleos de Venezuela SA: | | | |
| 5.375%, 4/12/27(8)(9) | USD | 18,366 | $ 1,825,227 |
| 5.50%, 4/12/37(8)(9) | USD | 4,827 | 477,913 |
| 6.00%, 10/28/22(8)(9) | USD | 4,204 | 336,309 |
| 6.00%, 5/16/24(8)(9) | USD | 19,598 | 1,891,247 |
| 6.00%, 11/15/26(8)(9) | USD | 10,434 | 1,017,323 |
| 8.50%, 10/27/20(8)(9) | USD | 939 | 851,039 |
| 9.00%, 11/17/21(8)(9) | USD | 5,842 | 600,143 |
| 9.75%, 5/17/35(8)(9) | USD | 7,081 | 803,739 |
| 12.75%, 2/17/22(8)(9) | USD | 3,893 | 437,428 |
| | | | $ 8,240,368 |
Total Foreign Corporate Bonds
(identified cost $89,148,165) | | | $ 68,927,941 |
| Insurance Linked Securities — 1.2% |
| Security | Shares | Value |
| Reinsurance Side Cars — 0.8% | | | |
| Eden Re II Ltd.: | | | |
| Series 2021A, 0.00%, 3/21/25(5)(13)(14)(15) | | 160,708 | $ 3,696 |
| Series 2022A, 0.00%, 3/20/26(5)(13)(14)(15) | | 10,974 | 7,045 |
| Series 2022B, 0.00%, 3/20/26(5)(13)(14)(15) | | 9,412 | 8,957 |
| Series 2023B, 0.00%, 3/19/27(5)(13)(14)(15) | | 7,394 | 154,242 |
| Series 2024A, 0.00%, 3/17/28(5)(13)(14)(15) | | 3,000,000 | 3,428,100 |
| Series 2024B, 0.00%, 3/17/28(5)(13)(14)(15) | | 2,700,000 | 3,129,300 |
| Mt. Logan Re Ltd., Series A-1(6)(13)(15)(16) | | 4,400 | 7,647,627 |
| | | | $ 14,378,967 |
| Segregated Account/Funds — 0.4% | | | |
| PartnerRe ILS Fund SAC Ltd.(13)(15)(16) | | 5,700,000 | $ 6,427,890 |
| | | | $ 6,427,890 |
Total Insurance Linked Securities
(identified cost $15,917,573) | | | $ 20,806,857 |
| Loan Participation Notes — 0.9% |
| Security | Principal
Amount
(000's omitted) | Value |
| Uzbekistan — 0.9% |
| Daryo Finance BV (borrower - Uzbek Industrial and Construction Bank ATB), 18.75%, 6/15/25(8)(13)(17) | UZS | 75,986,720 | $ 5,976,207 |
| Europe Asia Investment Finance BV (borrower - Joint Stock Commercial Bank “Asaka”), 18.70%, 7/21/26(8)(13)(17) | UZS | 125,249,130 | 9,795,491 |
Total Loan Participation Notes
(identified cost $17,773,977) | | | $ 15,771,698 |
| Security | Shares | Value |
| Vietnam — 0.0%(7) |
| Gemadept Corp., Exp. 11/26/24(6) | | 83,400 | $ 39,918 |
| SSI Securities Corp., Exp. 11/7/24(6) | | 81,000 | 3,717 |
Total Rights
(identified cost $37,136) | | | $ 43,635 |
20
See Notes to Consolidated Financial Statements.
Global Macro Portfolio
October 31, 2024
Consolidated Portfolio of Investments — continued
| Senior Floating-Rate Loans — 0.4%(18) |
| Borrower/Description | Principal
Amount
(000's omitted) | Value |
| Argentina — 0.2% |
| Provincia De Neuquen: | | | |
| Term Loan, 4.658%, (SOFR), 11/28/27 | $ | 1,196 | $ 1,207,868 |
| Term Loan, 12.068%, (SOFR + 7.41%), 11/1/27 | | 1,397 | 1,411,193 |
| Term Loan, 12.719%, (SOFR + 7.41%), 11/1/27 | | 1,177 | 1,188,371 |
| | | | $ 3,807,432 |
| Uzbekistan — 0.2% |
| Navoi Mining & Metallurgical Co., Term Loan, 9.407%, (SOFR + 4.76%), 4/23/27 | $ | 2,744 | $ 2,736,737 |
| | | | $ 2,736,737 |
Total Senior Floating-Rate Loans
(identified cost $6,574,296) | | | $ 6,544,169 |
| Sovereign Government Bonds — 48.2% |
| Security | Principal
Amount
(000's omitted) | Value |
| Albania — 1.4% |
| Albania Government International Bonds: | | | |
| 3.50%, 11/23/31(8) | EUR | 3,050 | $ 3,157,947 |
| 5.90%, 6/9/28(8) | EUR | 6,602 | 7,549,845 |
| Albanian Government Bonds: | | | |
| 4.30%, 7/10/27 | ALL | 257,400 | 2,889,677 |
| 4.70%, 2/23/27 | ALL | 78,200 | 886,669 |
| 4.95%, 7/22/29 | ALL | 373,900 | 4,229,455 |
| 5.25%, 1/26/29 | ALL | 487,600 | 5,581,188 |
| 6.13%, 7/25/34 | ALL | 36,300 | 410,683 |
| | | | $ 24,705,464 |
| Angola — 1.5% |
| Angola Government International Bonds: | | | |
| 8.75%, 4/14/32(8) | USD | 9,313 | $ 8,463,189 |
| 9.125%, 11/26/49(8) | USD | 12,823 | 10,755,291 |
| 9.375%, 5/8/48(8) | USD | 9,624 | 8,239,275 |
| | | | $ 27,457,755 |
| Armenia — 1.0% |
| Republic of Armenia Treasury Bonds: | | | |
| 9.00%, 4/29/26 | AMD | 254,810 | $ 655,408 |
| 9.25%, 4/29/28 | AMD | 1,439,030 | 3,665,833 |
| Security | Principal
Amount
(000's omitted) | Value |
| Armenia (continued) |
| Republic of Armenia Treasury Bonds: (continued) | | | |
| 9.60%, 10/29/33 | AMD | 3,896,075 | $ 9,890,935 |
| 9.75%, 10/29/50 | AMD | 618,877 | 1,568,134 |
| 9.75%, 10/29/52 | AMD | 673,150 | 1,702,058 |
| | | | $ 17,482,368 |
| Bahamas — 0.3% |
| Bahamas Government International Bonds: | | | |
| 6.00%, 11/21/28(8) | USD | 2,350 | $ 2,236,730 |
| 6.95%, 11/20/29(8) | USD | 588 | 562,128 |
| 8.95%, 10/15/32(8) | USD | 3,110 | 3,198,353 |
| | | | $ 5,997,211 |
| Barbados — 0.5% |
| Barbados Government International Bonds, 6.50%, 10/1/29(8) | USD | 9,176 | $ 8,878,070 |
| | | | $ 8,878,070 |
| Benin — 1.4% |
| Benin Government International Bonds: | | | |
| 4.875%, 1/19/32(8) | EUR | 8,006 | $ 7,792,084 |
| 4.95%, 1/22/35(8) | EUR | 3,809 | 3,461,987 |
| 6.875%, 1/19/52(8) | EUR | 13,654 | 12,407,103 |
| 7.96%, 2/13/38(8) | USD | 1,471 | 1,450,682 |
| | | | $ 25,111,856 |
| Cameroon — 1.9% |
| Republic of Cameroon International Bonds: | | | |
| 5.95%, 7/7/32(8) | EUR | 14,643 | $ 12,851,842 |
| 9.50%, 7/31/31(8) | USD | 21,392 | 20,542,898 |
| | | | $ 33,394,740 |
| Colombia — 0.7% |
| Titulos De Tesoreria B, 2.25%, 4/18/29 | COP | 59,194,433 | $ 11,760,602 |
| | | | $ 11,760,602 |
| Czech Republic — 2.3% |
| Czech Republic Government Bonds: | | | |
| 2.00%, 10/13/33 | CZK | 514,000 | $ 18,723,403 |
| 4.90%, 4/14/34 | CZK | 499,080 | 22,764,601 |
| | | | $ 41,488,004 |
21
See Notes to Consolidated Financial Statements.
Global Macro Portfolio
October 31, 2024
Consolidated Portfolio of Investments — continued
| Security | Principal
Amount
(000's omitted) | Value |
| Dominican Republic — 2.3% |
| Dominican Republic Bonds: | | | |
| 8.00%, 1/15/27(8) | DOP | 96,000 | $ 1,518,672 |
| 8.00%, 2/12/27(8) | DOP | 490,340 | 7,741,671 |
| 11.25%, 9/15/35(5) | DOP | 106,250 | 1,930,022 |
| 12.00%, 8/8/25(5) | DOP | 332,200 | 5,588,278 |
| 12.75%, 9/23/29(5) | DOP | 368,500 | 6,825,288 |
| 13.00%, 6/10/34(8) | DOP | 232,600 | 4,607,457 |
| 13.625%, 2/3/33(5) | DOP | 206,150 | 4,131,867 |
| Dominican Republic Central Bank Notes: | | | |
| 8.00%, 3/12/27(8) | DOP | 31,580 | 503,904 |
| 12.00%, 10/3/25(5) | DOP | 138,420 | 2,335,613 |
| 13.00%, 12/5/25(5) | DOP | 216,700 | 3,671,218 |
| 13.00%, 1/30/26(5) | DOP | 161,230 | 2,745,875 |
| | | | $ 41,599,865 |
| Ecuador — 1.2% |
| Ecuador Government International Bonds: | | | |
| 0.00%, 7/31/30(8) | USD | 12,657 | $ 6,943,350 |
| 5.00%, 7/31/40(8) | USD | 1,130 | 484,775 |
| 5.00%, 7/31/40(8) | USD | 1,709 | 733,027 |
| 6.90%, 7/31/30(8) | USD | 20,098 | 13,873,728 |
| | | | $ 22,034,880 |
| Egypt — 3.9% |
| Egypt Government Bonds, 24.458%, 10/1/27 | EGP | 3,479,554 | $ 69,790,717 |
| | | | $ 69,790,717 |
| El Salvador — 0.4% |
| El Salvador Government International Bonds: | | | |
| 7.65%, 6/15/35(8) | USD | 730 | $ 637,832 |
| 8.25%, 4/10/32(8) | USD | 1,451 | 1,361,088 |
| 9.25%, 4/17/30(8) | USD | 4,539 | 4,510,631 |
| | | | $ 6,509,551 |
| Ethiopia — 1.1% |
| Ethiopia International Bonds, 6.625%, 12/11/24(8)(9) | USD | 24,115 | $ 18,900,131 |
| | | | $ 18,900,131 |
| Georgia — 0.4% |
| Georgia Government International Bonds, 2.75%, 4/22/26(8) | USD | 1,214 | $ 1,139,337 |
| Georgia Treasury Bonds: | | | |
| 8.00%, 7/13/34 | GEL | 2,496 | 881,832 |
| 8.25%, 8/28/29 | GEL | 10,600 | 3,891,952 |
| Security | Principal
Amount
(000's omitted) | Value |
| Georgia (continued) |
| Georgia Treasury Bonds: (continued) | | | |
| 8.375%, 7/25/31 | GEL | 2,338 | $ 856,860 |
| | | | $ 6,769,981 |
| Ghana — 0.5% |
| Ghana Cocoa Bonds: | | | |
| 13.00%, 8/30/27 | GHS | 4,122 | $ 177,386 |
| 13.00%, 8/28/28 | GHS | 4,122 | 159,617 |
| Ghana Government International Bonds: | | | |
| 0.00%, 7/3/26(5) | USD | 11 | 10,472 |
| 0.00%, 7/3/26(8) | USD | 559 | 520,022 |
| 0.00%, 1/3/30(5) | USD | 19 | 14,764 |
| 0.00%, 1/3/30(8) | USD | 1,503 | 1,142,366 |
| 5.00% to 7/3/28, 7/3/29(5)(19) | USD | 85 | 73,258 |
| 5.00% to 7/3/28, 7/3/29(8)(19) | USD | 4,717 | 4,057,020 |
| 5.00% to 7/3/28, 7/3/35(5)(19) | USD | 49 | 34,079 |
| 5.00% to 7/3/28, 7/3/35(8)(19) | USD | 3,667 | 2,562,717 |
| Republic of Ghana Government Bonds: | | | |
| 8.95%, (5.00% cash and 3.95% PIK), 2/11/31 | GHS | 165 | 5,167 |
| 9.25%, (5.00% cash and 4.25% PIK), 2/8/33 | GHS | 4,122 | 115,217 |
| 9.70%, (5.00% cash and 4.70% PIK), 2/5/36 | GHS | 4,122 | 107,860 |
| | | | $ 8,979,945 |
| Greece — 0.0%(7) |
| Hellenic Republic Government Bonds, 0.00%, GDP-Linked, 10/15/42 | EUR | 230,127 | $ 650,833 |
| | | | $ 650,833 |
| Iceland — 1.8% |
| Republic of Iceland: | | | |
| 6.50%, 1/24/31 | ISK | 3,198,073 | $ 22,942,671 |
| 7.00%, 9/17/35 | ISK | 732,032 | 5,559,023 |
| 8.00%, 6/12/25 | ISK | 600,760 | 4,364,104 |
| | | | $ 32,865,798 |
| India — 1.6% |
| Export-Import Bank of India: | | | |
| 2.25%, 1/13/31(8) | USD | 10,000 | $ 8,536,492 |
| 3.25%, 1/15/30(8) | USD | 10,500 | 9,647,153 |
| India Government Bonds, 7.30%, 6/19/53 | INR | 871,190 | 10,833,957 |
| | | | $ 29,017,602 |
22
See Notes to Consolidated Financial Statements.
Global Macro Portfolio
October 31, 2024
Consolidated Portfolio of Investments — continued
| Security | Principal
Amount
(000's omitted) | Value |
| Ivory Coast — 0.2% |
| Ivory Coast Government International Bonds, 6.625%, 3/22/48(8) | EUR | 3,806 | $ 3,348,771 |
| | | | $ 3,348,771 |
| Jordan — 0.1% |
| Jordan Government International Bonds, 7.50%, 1/13/29(8) | USD | 1,159 | $ 1,183,014 |
| | | | $ 1,183,014 |
| Kazakhstan — 0.2% |
| Kazakhstan Government Bonds: | | | |
| 5.00%, 4/18/28 | KZT | 432,660 | $ 703,674 |
| 5.50%, 9/20/28 | KZT | 22,984 | 37,964 |
| 10.55%, 7/28/29 | KZT | 1,226,683 | 2,316,000 |
| 14.00%, 5/12/31 | KZT | 50,566 | 112,733 |
| 14.00%, 5/19/32 | KZT | 34,476 | 77,323 |
| | | | $ 3,247,694 |
| Montenegro — 0.4% |
| Montenegro Government International Bonds: | | | |
| 2.875%, 12/16/27(8) | EUR | 1,264 | $ 1,305,759 |
| 7.25%, 3/12/31(8) | USD | 5,839 | 6,074,604 |
| | | | $ 7,380,363 |
| New Zealand — 1.7% |
| New Zealand Government Bonds: | | | |
| 2.75%, 4/15/37(8)(20) | NZD | 17,000 | $ 8,306,829 |
| 4.25%, 5/15/34 | NZD | 26,957 | 15,833,471 |
| 5.00%, 5/15/54(20) | NZD | 9,230 | 5,512,531 |
| | | | $ 29,652,831 |
| Paraguay — 0.5% |
| Paraguay Government Bonds: | | | |
| 7.90%, 2/9/31(5) | PYG | 58,682,000 | $ 7,566,310 |
| 7.90%, 2/9/31(8) | PYG | 8,730,000 | 1,125,624 |
| | | | $ 8,691,934 |
| Peru — 1.2% |
| Peru Government Bonds: | | | |
| 5.40%, 8/12/34 | PEN | 14,048 | $ 3,344,911 |
| 6.90%, 8/12/37 | PEN | 30,325 | 7,832,676 |
| 7.60%, 8/12/39(5)(8) | PEN | 35,455 | 9,644,853 |
| | | | $ 20,822,440 |
| Security | Principal
Amount
(000's omitted) | Value |
| Philippines — 1.0% |
| Philippines Government International Bonds, 6.25%, 1/14/36 | PHP | 1,024,000 | $ 17,347,157 |
| | | | $ 17,347,157 |
| Poland — 1.4% |
| Republic of Poland Government Bonds, 2.00%, 8/25/36(21) | PLN | 113,043 | $ 24,546,198 |
| | | | $ 24,546,198 |
| Serbia — 3.0% |
| Serbia Treasury Bonds: | | | |
| 4.50%, 8/20/32 | RSD | 2,267,950 | $ 20,575,097 |
| 7.00%, 10/26/31 | RSD | 3,075,080 | 32,291,055 |
| | | | $ 52,866,152 |
| South Africa — 6.0% |
| Republic of South Africa Government Bonds: | | | |
| 8.50%, 1/31/37 | ZAR | 392,908 | $ 18,702,995 |
| 8.875%, 2/28/35 | ZAR | 1,707,843 | 86,805,331 |
| | | | $ 105,508,326 |
| South Korea — 1.3% |
| Korea Treasury Bonds, 1.875%, 12/10/24 | KRW | 31,500,000 | $ 22,799,666 |
| | | | $ 22,799,666 |
| Sri Lanka — 1.4% |
| Sri Lanka Government International Bonds: | | | |
| 5.75%, 4/18/23(8)(9) | USD | 6,007 | $ 3,669,735 |
| 6.20%, 5/11/27(8)(9) | USD | 3,050 | 1,883,375 |
| 6.35%, 6/28/24(8)(9) | USD | 2,900 | 1,775,708 |
| 6.825%, 7/18/26(8)(9) | USD | 17,130 | 10,620,600 |
| 6.85%, 3/14/24(8)(9) | USD | 2,711 | 1,656,151 |
| 6.85%, 11/3/25(8)(9) | USD | 7,100 | 4,452,913 |
| | | | $ 24,058,482 |
| Suriname — 1.4% |
| Suriname Government International Bonds: | | | |
| 0.00%, Oil-Linked, 12/31/50(5) | USD | 9,342 | $ 9,528,840 |
| 0.00%, Oil-Linked, 12/31/50(8) | USD | 587 | 598,740 |
| 7.95%, (4.95% cash and 3.00% PIK), 7/15/33(5) | USD | 13,711 | 13,059,491 |
| 7.95%, (4.95% cash and 3.00% PIK), 7/15/33(8) | USD | 1,834 | 1,746,885 |
| | | | $ 24,933,956 |
23
See Notes to Consolidated Financial Statements.
Global Macro Portfolio
October 31, 2024
Consolidated Portfolio of Investments — continued
| Security | Principal
Amount
(000's omitted) | Value |
| Tajikistan — 0.0%(7) |
| Republic of Tajikistan International Bonds, 7.125%, 9/14/27(8) | USD | 426 | $ 416,730 |
| | | | $ 416,730 |
| Tunisia — 0.4% |
| Tunisian Republic: | | | |
| 3.50%, 2/3/33 | JPY | 300,000 | $ 1,257,636 |
| 4.20%, 3/17/31 | JPY | 30,000 | 147,480 |
| 5.75%, 1/30/25(8) | USD | 1,984 | 1,941,757 |
| 6.375%, 7/15/26(8) | EUR | 4,054 | 4,090,087 |
| | | | $ 7,436,960 |
| Turkey — 1.4% |
| Turkiye Government Bonds: | | | |
| 17.30%, 7/19/28 | TRY | 50,058 | $ 1,009,733 |
| 26.20%, 10/5/33 | TRY | 330,383 | 8,981,308 |
| 27.70%, 9/27/34 | TRY | 153,631 | 4,375,998 |
| 30.00%, 9/12/29 | TRY | 47,055 | 1,293,748 |
| 50.00% (TLREF), 9/6/28(1) | TRY | 71,404 | 2,034,904 |
| 50.223% (TLREF), 6/16/27(1) | TRY | 75,510 | 2,202,054 |
| 52.191% (TLREF), 5/17/28(1) | TRY | 143,332 | 4,130,753 |
| | | | $ 24,028,498 |
| Ukraine — 0.9% |
| Ukraine Government International Bonds: | | | |
| 0.00% to 2/1/27, 2/1/34(8)(19) | USD | 1,914 | $ 721,583 |
| 0.00% to 2/1/27, 2/1/35(8)(19) | USD | 2,297 | 1,126,201 |
| 0.00% to 2/1/27, 2/1/36(8)(19) | USD | 5,264 | 2,557,187 |
| 0.00%, GDP-Linked, 8/1/41(8)(22) | USD | 10,013 | 7,262,494 |
| 1.75% to 8/1/25, 2/1/29(8)(19) | USD | 3,159 | 1,904,268 |
| 1.75% to 8/1/25, 2/1/34(8)(19) | USD | 788 | 376,604 |
| 1.75% to 8/1/25, 2/1/35(8)(19) | USD | 2,871 | 1,336,986 |
| 1.75% to 8/1/25, 2/1/36(8)(19) | USD | 3,350 | 1,538,733 |
| | | | $ 16,824,056 |
| Uruguay — 0.2% |
| Uruguay Government Bonds: | | | |
| 3.40%, 5/16/45 | UYU | 112,908 | $ 2,739,895 |
| 3.875%, 7/2/40(21) | UYU | 11,819 | 303,650 |
| | | | $ 3,043,545 |
| Uzbekistan — 1.0% |
| National Bank of Uzbekistan, 19.875%, 7/5/27(8) | UZS | 90,660,000 | $ 7,185,089 |
| Security | Principal
Amount
(000's omitted) | Value |
| Uzbekistan (continued) |
| Republic of Uzbekistan Bonds: | | | |
| 16.25%, 10/12/26(8) | UZS | 112,430,000 | $ 8,852,524 |
| 16.625%, 5/29/27(8) | UZS | 12,500,000 | 969,735 |
| | | | $ 17,007,348 |
| Venezuela — 0.3% |
| Venezuela Government International Bonds: | | | |
| 6.00%, 12/9/20(8)(9) | USD | 4,201 | $ 518,686 |
| 7.00%, 3/31/38(8)(9) | USD | 1,930 | 268,119 |
| 7.65%, 4/21/25(8)(9) | USD | 3,577 | 499,967 |
| 7.75%, 10/13/19(8)(9) | USD | 5,188 | 672,783 |
| 8.25%, 10/13/24(8)(9) | USD | 5,785 | 805,288 |
| 9.00%, 5/7/23(8)(9) | USD | 1,213 | 172,195 |
| 9.25%, 9/15/27(9) | USD | 5,251 | 810,623 |
| 9.25%, 5/7/28(8)(9) | USD | 5,836 | 871,592 |
| 9.375%, 1/13/34(9) | USD | 496 | 84,684 |
| 11.75%, 10/21/26(8)(9) | USD | 2,020 | 326,101 |
| 11.95%, 8/5/31(8)(9) | USD | 2,081 | 326,791 |
| 12.75%, 8/23/22(8)(9) | USD | 1,908 | 303,439 |
| | | | $ 5,660,268 |
Total Sovereign Government Bonds
(identified cost $849,762,315) | | | $ 854,199,762 |
| Borrower/Description | Principal
Amount
(000's omitted) | Value |
| Bahamas — 0.5% |
| Commonwealth of the Bahamas, 10.512%, (3 mo. EURIBOR + 6.85%), 11/24/28(4) | EUR | 8,010 | $ 8,689,352 |
| | | | $ 8,689,352 |
| Ivory Coast — 0.1% |
| Republic of Ivory Coast, Term Loan, 9.426%, (6 mo. EURIBOR + 5.75%), 1/6/28(4) | EUR | 1,866 | $ 2,056,293 |
| | | | $ 2,056,293 |
| Kenya — 0.1% |
| Government of Kenya, Term Loan, 12.142%, (6 mo. SOFR + 6.45%), 6/29/25(4) | USD | 1,536 | $ 1,557,233 |
| | | | $ 1,557,233 |
24
See Notes to Consolidated Financial Statements.
Global Macro Portfolio
October 31, 2024
Consolidated Portfolio of Investments — continued
| Borrower/Description | Principal
Amount
(000's omitted) | Value |
| Tanzania — 2.6% |
| Government of the United Republic of Tanzania, Term Loan, 12.022%, (6 mo. SOFR + 6.30%), 4/28/31(4) | USD | 44,930 | $ 45,851,006 |
| | | | $ 45,851,006 |
Total Sovereign Loans
(identified cost $57,389,169) | | | $ 58,153,884 |
| U.S. Government Agency Mortgage-Backed Securities — 0.3% |
| Security | Principal
Amount
(000's omitted) | Value |
| Federal Home Loan Mortgage Corp.: | | | |
| 4.50%, with maturity at 2035 | $ | 83 | $ 81,047 |
| 4.528%, (COF + 1.254%), with maturity at 2029(23) | | 4 | 3,966 |
| 4.616%, (COF + 1.253%), with maturity at 2035(23) | | 89 | 86,264 |
| 4.854%, (COF + 1.251%), with maturity at 2030(23) | | 76 | 74,484 |
| 6.60%, with maturity at 2030 | | 228 | 232,009 |
| 7.00%, with various maturities to 2035 | | 411 | 414,451 |
| 7.141%, (1 yr. CMT + 2.327%), with maturity at 2036(23) | | 326 | 330,908 |
| 7.50%, with various maturities to 2035 | | 767 | 797,379 |
| 8.00%, with various maturities to 2030 | | 89 | 91,966 |
| 8.50%, with maturity at 2025 | | 0(24) | 319 |
| 9.00%, with maturity at 2027 | | 0(24) | 48 |
| Federal National Mortgage Association: | | | |
| 4.513%, (COF + 1.254%), with maturity at 2034(23) | | 73 | 70,450 |
| 4.532%, (COF + 1.254%), with maturity at 2035(23) | | 59 | 58,586 |
| 4.539%, (COF + 1.299%), with maturity at 2033(23) | | 297 | 289,580 |
| 4.609%, (COF + 1.35%), with maturity at 2027(23) | | 14 | 14,059 |
| 4.674%, (COF + 1.40%), with maturity at 2025(23) | | 3 | 3,083 |
| 5.32%, (COF + 1.793%), with maturity at 2035(23) | | 589 | 578,053 |
| 6.00%, with maturity at 2033 | | 35 | 35,570 |
| 6.35%, (COF + 2.004%), with maturity at 2032(23) | | 124 | 127,011 |
| 6.50%, with maturity at 2030 | | 310 | 313,763 |
| 6.525%, (1 yr. CMT + 2.15%), with maturity at 2028(23) | | 6 | 6,224 |
| 7.00%, with various maturities to 2031 | | 339 | 345,839 |
| 7.50%, with maturity at 2027 | | 1 | 858 |
| Security | Principal
Amount
(000's omitted) | Value |
| Federal National Mortgage Association: (continued) | | | |
| 8.00%, with maturity at 2026 | $ | 0(24) | $ 50 |
| 8.50%, with various maturities to 2037 | | 481 | 506,357 |
| 9.00%, with various maturities to 2032 | | 20 | 20,478 |
| 9.50%, with various maturities to 2031 | | 0(24) | 156 |
| 11.50%, with maturity at 2031 | | 47 | 51,039 |
| Government National Mortgage Association: | | | |
| 6.50%, with maturity at 2032 | | 102 | 104,883 |
| 7.00%, with various maturities to 2031 | | 134 | 137,658 |
| 7.50%, with maturity at 2028 | | 8 | 8,219 |
| 9.00%, with maturity at 2025 | | 0(24) | 71 |
Total U.S. Government Agency Mortgage-Backed Securities
(identified cost $5,121,645) | | | $ 4,784,828 |
| U.S. Government Guaranteed Small Business Administration Loans — 0.2% |
| Security | Principal
Amount
(000's omitted) | Value |
SBA IO Trust:
Interest Only:(25)(26)
Series 2018-2, Class A, 2.533%, 7/25/44(5) | $ | 61,952 | $ 3,280,162 |
Total U.S. Government Guaranteed Small Business Administration Loans
(identified cost $15,077,187) | | | $ 3,280,162 |
| U.S. Treasury Obligations — 4.3% |
| Security | Principal
Amount
(000's omitted) | Value |
| U.S. Treasury Inflation-Indexed Notes, 2.125%, 4/15/29(27) | $ | 76,431 | $ 77,264,005 |
Total U.S. Treasury Obligations
(identified cost $77,882,151) | | | $ 77,264,005 |
| Short-Term Investments — 25.6% |
| Security | Shares | Value |
| Morgan Stanley Institutional Liquidity Funds - Government Portfolio, Institutional Class, 4.78%(28) | | 128,853,494 | $ 128,853,494 |
Total Affiliated Fund
(identified cost $128,853,494) | | | $ 128,853,494 |
25
See Notes to Consolidated Financial Statements.
Global Macro Portfolio
October 31, 2024
Consolidated Portfolio of Investments — continued
| Repurchase Agreements — 5.5% |
| Description | Principal
Amount
(000's omitted) | Value |
| Bank of America: | | | |
| Dated 9/19/24 with an interest rate of 1.50%, collateralized by USD 2,270,000 Nigeria Government International Bonds, 9.248%, due 1/21/49 and a market value, including accrued interest, of $2,120,169(29) | USD | 2,088 | $ 2,088,400 |
| Dated 9/19/24 with an interest rate of 4.40%, collateralized by USD 1,037,000 Kazakhstan Government International Bonds, 6.50%, due 7/21/45 and a market value, including accrued interest, of $1,180,063(29) | USD | 1,247 | 1,246,992 |
| Dated 10/28/24 with an interest rate of 4.55%, collateralized by USD 2,871,000 Senegal Government International Bonds, 6.25%, due 5/23/33 and a market value, including accrued interest, of $2,456,300(29) | USD | 2,487 | 2,487,004 |
| Dated 10/28/24 with an interest rate of 4.55%, collateralized by USD 5,106,000 Senegal Government International Bonds, 6.75%, due 3/13/48 and a market value, including accrued interest, of $3,662,757(29) | USD | 3,708 | 3,708,232 |
| Dated 10/30/24 with an interest rate of 4.48%, collateralized by USD 5,518,000 Panama Government International Bonds, 4.50%, due 4/1/56 and a market value, including accrued interest, of $3,572,984(29) | USD | 3,559 | 3,559,110 |
| Dated 10/30/24 with an interest rate of 4.50%, collateralized by USD 2,192,000 Senegal Government International Bonds, 6.75%, due 3/13/48 and a market value, including accrued interest, of $1,572,418(29) | USD | 1,586 | 1,586,460 |
| Barclays Bank PLC: | | | |
| Dated 9/17/24 with an interest rate of 2.10%, collateralized by EUR 2,000,000 Republic of Poland Government International Bonds, 2.75%, due 5/25/32 and a market value, including accrued interest, of $2,133,921(29) | EUR | 2,043 | 2,221,729 |
| Dated 9/17/24 with an interest rate of 2.25%, collateralized by EUR 1,200,000 Republic of Poland Government International Bonds, 1.00%, due 3/7/29 and a market value, including accrued interest, of $1,231,866(29) | EUR | 1,185 | 1,288,984 |
| Dated 9/17/24 with an interest rate of 2.60%, collateralized by EUR 4,000,000 Republic of Poland Government International Bonds, 1.00%, due 3/7/29 and a market value, including accrued interest, of $4,106,221(29) | EUR | 3,950 | 4,296,612 |
| Dated 9/19/24 with an interest rate of 4.45%, collateralized by USD 4,548,000 Kazakhstan Government International Bonds, 4.875%, due 10/14/44 and a market value, including accrued interest, of $4,288,046(29) | USD | 4,827 | 4,826,565 |
| Dated 9/19/24 with an interest rate of 4.45%, collateralized by USD 2,972,000 Republic of Armenia International Bonds, 3.60%, due 2/2/31 and a market value, including accrued interest, of $2,523,059(29) | USD | 2,649 | 2,648,795 |
| Description | Principal
Amount
(000's omitted) | Value |
| Barclays Bank PLC: (continued) | | | |
| Dated 10/15/24 with an interest rate of 3.50%, collateralized by USD 1,137,000 Bahrain Government International Bonds, 7.50%, due 2/12/36 and a market value, including accrued interest, of $1,213,669(29) | USD | 1,283 | $ 1,283,389 |
| Dated 10/15/24 with an interest rate of 4.50%, collateralized by USD 2,273,000 Bahrain Government International Bonds, 6.00%, due 9/19/44 and a market value, including accrued interest, of $1,963,594(29) | USD | 2,077 | 2,076,954 |
| Dated 10/18/24 with an interest rate of 4.50%, collateralized by USD 3,410,000 Bahrain Government International Bonds, 5.625%, due 5/18/34 and a market value, including accrued interest, of $3,253,305(29) | USD | 3,428 | 3,428,471 |
| Dated 10/21/24 with an interest rate of 4.40%, collateralized by USD 4,856,000 Panama Government International Bonds, 6.853%, due 3/28/54 and a market value, including accrued interest, of $4,517,344(29) | USD | 4,920 | 4,919,735 |
| Dated 10/22/24 with an interest rate of 4.00%, collateralized by USD 2,428,000 Panama Government International Bonds, 6.853%, due 3/28/54 and a market value, including accrued interest, of $2,258,672(29) | USD | 2,416 | 2,415,860 |
| Dated 10/23/24 with an interest rate of 4.45%, collateralized by USD 4,392,000 Romania Government International Bonds, 6.125%, due 1/22/44 and a market value, including accrued interest, of $4,215,215 | USD | 4,496 | 4,496,310 |
| Dated 10/23/24 with an interest rate of 4.60%, collateralized by USD 2,254,000 Romania Government International Bonds, 7.125%, due 1/17/33 and a market value, including accrued interest, of $2,438,080(29) | USD | 2,584 | 2,583,647 |
| Dated 10/24/24 with an interest rate of 4.30%, collateralized by USD 2,082,000 Romania Government International Bonds, 6.125%, due 1/22/44 and a market value, including accrued interest, of $1,998,196 | USD | 2,126 | 2,126,242 |
| Dated 10/24/24 with an interest rate of 4.55%, collateralized by USD 4,392,000 Romania Government International Bonds, 5.75%, due 3/24/35 and a market value, including accrued interest, of $4,169,759(29) | USD | 4,441 | 4,441,410 |
| Dated 10/28/24 with an interest rate of 4.30%, collateralized by USD 1,756,000 Romania Government International Bonds, 6.125%, due 1/22/44 and a market value, including accrued interest, of $1,685,318 | USD | 1,771 | 1,771,365 |
| Dated 10/28/24 with an interest rate of 4.55%, collateralized by USD 2,196,000 Romania Government International Bonds, 6.375%, due 1/30/34 and a market value, including accrued interest, of $2,238,028(29) | USD | 2,348 | 2,347,767 |
| Nomura International PLC: | | | |
| Dated 9/19/24 with an interest rate of 2.90%, collateralized by EUR 1,956,000 Republic of Poland Government International Bonds, 1.00%, due 3/7/29 and a market value, including accrued interest, of $2,000,598(29) | USD | 2,052 | 2,051,555 |
26
See Notes to Consolidated Financial Statements.
Global Macro Portfolio
October 31, 2024
Consolidated Portfolio of Investments — continued
| Description | Principal
Amount
(000's omitted) | Value |
| Nomura International PLC: (continued) | | | |
| Dated 9/19/24 with an interest rate of 4.30%, collateralized by USD 4,489,000 Zambia Government International Bonds, 0.50%, due 12/31/53 and a market value, including accrued interest, of $2,450,682(29) | USD | 2,288 | $ 2,288,445 |
| Dated 9/19/24 with an interest rate of 4.35%, collateralized by USD 5,257,000 Republic of Azerbaijan International Bonds, 3.50%, due 9/1/32 and a market value, including accrued interest, of $4,606,942(29) | USD | 4,944 | 4,943,562 |
| Dated 9/19/24 with an interest rate of 4.40%, collateralized by USD 1,485,000 Bahrain Government International Bonds, 5.625%, due 5/18/34 and a market value, including accrued interest, of $1,416,762(29) | USD | 1,589 | 1,588,834 |
| Dated 9/19/24 with an interest rate of 4.45%, collateralized by USD 2,273,000 Bahrain Government International Bonds, 7.50%, due 2/12/36 and a market value, including accrued interest, of $2,426,270(29) | USD | 2,598 | 2,598,366 |
| Dated 9/19/24 with an interest rate of 4.45%, collateralized by USD 555,000 Kazakhstan Government International Bonds, 6.50%, due 7/21/45 and a market value, including accrued interest, of $631,567(29) | USD | 700 | 700,279 |
| Dated 9/19/24 with an interest rate of 4.45%, collateralized by USD 2,497,000 Nigeria Government International Bonds, 7.143%, due 2/23/30 and a market value, including accrued interest, of $2,290,822(29) | USD | 2,401 | 2,400,824 |
| Dated 9/19/24 with an interest rate of 4.45%, collateralized by USD 1,067,000 Nigeria Government International Bonds, 7.696%, due 2/23/38 and a market value, including accrued interest, of $884,469(29) | USD | 919 | 919,487 |
| Dated 9/19/24 with an interest rate of 4.50%, collateralized by USD 5,983,000 Nigeria Government International Bonds, 7.375%, due 9/28/33 and a market value, including accrued interest, of $5,511,652(29) | USD | 5,542 | 5,542,143 |
| Dated 9/19/24 with an interest rate of 4.50%, collateralized by USD 1,492,000 Nigeria Government International Bonds, 8.25%, due 9/28/51 and a market value, including accrued interest, of $1,205,883(29) | USD | 1,313 | 1,313,170 |
| Dated 9/19/24 with an interest rate of 4.55%, collateralized by USD 626,000 Republic of Azerbaijan International Bonds, 3.50%, due 9/1/32 and a market value, including accrued interest, of $548,592(29) | USD | 589 | 588,676 |
| Dated 10/8/24 with an interest rate of 4.30%, collateralized by USD 3,367,000 Zambia Government International Bonds, 0.50%, due 12/31/53 and a market value, including accrued interest, of $1,838,148(29) | USD | 1,891 | 1,891,412 |
| Dated 10/24/24 with an interest rate of 3.75%, collateralized by USD 4,133,000 Bahrain Government International Bonds, 7.50%, due 9/20/47 and a market value, including accrued interest, of $4,153,734(29) | USD | 4,403 | 4,402,949 |
| Description | Principal
Amount
(000's omitted) | Value |
| Nomura International PLC: (continued) | | | |
| Dated 10/29/24 with an interest rate of 4.55%, collateralized by USD 1,104,000 Panama Government International Bonds, 4.50%, due 4/1/56 and a market value, including accrued interest, of $714,856(29) | USD | 746 | $ 746,293 |
| Dated 10/29/24 with an interest rate of 4.55%, collateralized by USD 1,103,000 Panama Government International Bonds, 4.50%, due 5/15/47 and a market value, including accrued interest, of $786,052(29) | USD | 821 | 821,360 |
| Dated 10/29/24 with an interest rate of 4.55%, collateralized by USD 1,545,000 Panama Government International Bonds, 6.853%, due 3/28/54 and a market value, including accrued interest, of $1,437,252(29) | USD | 1,504 | 1,503,826 |
| Dated 10/30/24 with an interest rate of 4.50%, collateralized by USD 1,315,000 Senegal Government International Bonds, 6.25%, due 5/23/33 and a market value, including accrued interest, of $1,125,056(29) | USD | 1,190 | 1,189,792 |
Total Repurchase Agreements
(identified cost $97,511,829) | | | $ 97,341,006 |
| Sovereign Government Securities — 5.4% |
| Security | Principal
Amount
(000's omitted) | Value |
| Egypt — 2.9% |
| Egypt Treasury Bills: | | | |
| 0.00%, 12/3/24 | EGP | 248,925 | $ 4,979,025 |
| 0.00%, 12/17/24 | EGP | 166,225 | 3,287,232 |
| 0.00%, 4/1/25 | EGP | 2,402,725 | 43,956,103 |
| | | | $ 52,222,360 |
| Kazakhstan — 0.4% |
| National Bank of Kazakhstan Notes, 0.00%, 11/13/24 | KZT | 3,534,139 | $ 7,252,007 |
| | | | $ 7,252,007 |
| Nigeria — 2.0% |
| Nigeria OMO Bills: | | | |
| 0.00%, 1/28/25 | NGN | 710,322 | $ 396,118 |
| 0.00%, 2/25/25 | NGN | 1,185,489 | 647,310 |
| 0.00%, 4/1/25 | NGN | 3,194,531 | 1,730,367 |
| 0.00%, 5/20/25 | NGN | 7,855,656 | 4,029,842 |
| 0.00%, 5/27/25 | NGN | 7,150,997 | 3,649,480 |
| 0.00%, 6/10/25 | NGN | 433,890 | 218,995 |
| 0.00%, 6/17/25 | NGN | 5,649,845 | 2,839,237 |
27
See Notes to Consolidated Financial Statements.
Global Macro Portfolio
October 31, 2024
Consolidated Portfolio of Investments — continued
| Security | Principal
Amount
(000's omitted) | Value |
| Nigeria (continued) |
| Nigeria OMO Bills: (continued) | | | |
| 0.00%, 8/19/25 | NGN | 1,614,712 | $ 775,137 |
| 0.00%, 9/30/25 | NGN | 11,716,888 | 5,457,827 |
| 0.00%, 10/7/25 | NGN | 12,709,484 | 6,202,375 |
| Nigeria Treasury Bills: | | | |
| 0.00%, 2/6/25 | NGN | 1,477,509 | 818,407 |
| 0.00%, 2/20/25 | NGN | 6,098,016 | 3,342,239 |
| 0.00%, 3/6/25 | NGN | 2,660,526 | 1,442,937 |
| 0.00%, 3/27/25 | NGN | 5,259,554 | 2,808,112 |
| 0.00%, 4/10/25 | NGN | 2,758,663 | 1,457,629 |
| | | | $ 35,816,012 |
| Pakistan — 0.1% |
| Pakistan Treasury Bills: | | | |
| 0.00%, 11/14/24 | PKR | 238,000 | $ 850,909 |
| 0.00%, 11/14/24 | PKR | 83,000 | 296,745 |
| | | | $ 1,147,654 |
Total Sovereign Government Securities
(identified cost $101,539,663) | | | $ 96,438,033 |
| U.S. Treasury Obligations — 7.4% |
| Security | Principal
Amount
(000's omitted) | Value |
| U.S. Treasury Bills: | | | |
| 0.00%, 11/7/24 | $ | 18,553 | $ 18,538,610 |
| 0.00%, 11/14/24 | | 35,675 | 35,615,334 |
| 0.00%, 11/21/24(30) | | 1,639 | 1,634,805 |
| 0.00%, 12/12/24(30) | | 45,524 | 45,286,599 |
| 0.00%, 1/16/25(30) | | 30,000 | 29,718,040 |
Total U.S. Treasury Obligations
(identified cost $130,792,581) | | | $ 130,793,388 |
Total Short-Term Investments
(identified cost $458,697,567) | | | $ 453,425,921 |
| | | |
Total Purchased Options and Swaptions — 0.1%
(identified cost $2,517,198) | | | $ 1,588,032 |
Total Investments — 96.7%
(identified cost $1,732,368,638) | | | $1,712,889,207 |
Total Written Options — (0.0)%(7)
(premiums received $77,130) | | | $ (81,190) |
| Securities Sold Short — (11.0)% |
| Common Stocks — (0.9)% |
| Security | Shares | Value |
| Australia — (0.0)%(7) |
| EBOS Group Ltd. | | (13,109) | $ (285,823) |
| | | | $ (285,823) |
| New Zealand — (0.9)% |
| a2 Milk Co. Ltd.(6) | | (219,100) | $ (828,780) |
| Air New Zealand Ltd. | | (613,098) | (188,929) |
| Auckland International Airport Ltd. | | (443,683) | (1,936,027) |
| Chorus Ltd. | | (121,036) | (633,089) |
| Contact Energy Ltd. | | (288,819) | (1,483,141) |
| Fisher & Paykel Healthcare Corp. Ltd. | | (123,800) | (2,653,170) |
| Fletcher Building Ltd.(6) | | (334,575) | (594,923) |
| Freightways Group Ltd. | | (24,409) | (153,023) |
| Goodman Property Trust | | (295,174) | (372,077) |
| Infratil Ltd. | | (200,950) | (1,508,626) |
| Kiwi Property Group Ltd. | | (332,828) | (185,914) |
| Mainfreight Ltd. | | (21,500) | (921,255) |
| Mercury NZ Ltd. | | (220,708) | (868,725) |
| Meridian Energy Ltd. | | (454,417) | (1,613,803) |
| Precinct Properties New Zealand Ltd. | | (369,107) | (277,974) |
| Ryman Healthcare Ltd.(6) | | (195,753) | (579,510) |
| SKYCITY Entertainment Group Ltd. | | (187,468) | (153,478) |
| Spark New Zealand Ltd. | | (705,779) | (1,224,517) |
| | | | $ (16,176,961) |
Total Common Stocks
(proceeds $17,101,285) | | | $ (16,462,784) |
| Exchange-Traded Funds — (5.3)% |
| Security | Shares | Value |
| United States — (5.3)% |
| iShares iBoxx $ Investment Grade Corporate Bond ETF | | (514,541) | $ (56,079,824) |
| iShares JPMorgan USD Emerging Markets Bond ETF | | (410,237) | (37,298,748) |
Total Exchange-Traded Funds
(proceeds $93,650,143) | | | $ (93,378,572) |
28
See Notes to Consolidated Financial Statements.
Global Macro Portfolio
October 31, 2024
Consolidated Portfolio of Investments — continued
| Sovereign Government Bonds — (4.8)% |
| Security | Principal
Amount
(000's omitted) | Value |
| Armenia — (0.1)% |
| Republic of Armenia International Bonds, 3.60%, 2/2/31(8) | USD | (2,972) | $ (2,496,608) |
| | | | $ (2,496,608) |
| Azerbaijan — (0.3)% |
| Republic of Azerbaijan International Bonds, 3.50%, 9/1/32(8) | USD | (5,883) | $ (5,121,216) |
| | | | $ (5,121,216) |
| Bahrain — (0.8)% |
| Bahrain Government International Bonds: | | | |
| 5.625%, 5/18/34(8) | USD | (4,895) | $ (4,545,397) |
| 6.00%, 9/19/44(8) | USD | (2,273) | (1,947,682) |
| 7.50%, 2/12/36(8) | USD | (3,137) | (3,296,901) |
| 7.50%, 9/20/47(8) | USD | (4,133) | (4,118,431) |
| | | | $ (13,908,411) |
| Kazakhstan — (0.3)% |
| Kazakhstan Government International Bonds: | | | |
| 4.875%, 10/14/44(8) | USD | (4,548) | $ (4,277,576) |
| 6.50%, 7/21/45(8) | USD | (1,592) | (1,782,885) |
| | | | $ (6,060,461) |
| Nigeria — (0.7)% |
| Nigeria Government International Bonds: | | | |
| 7.143%, 2/23/30(8) | USD | (2,497) | $ (2,257,132) |
| 7.375%, 9/28/33(8) | USD | (5,983) | (5,070,406) |
| 7.696%, 2/23/38(8) | USD | (1,067) | (868,958) |
| 8.25%, 9/28/51(8) | USD | (1,492) | (1,194,600) |
| 9.248%, 1/21/49(8) | USD | (2,270) | (2,061,855) |
| | | | $ (11,452,951) |
| Panama — (0.8)% |
| Panama Government International Bonds: | | | |
| 4.50%, 5/15/47 | USD | (1,103) | $ (763,165) |
| 4.50%, 4/1/56 | USD | (6,622) | (4,263,007) |
| 6.853%, 3/28/54 | USD | (8,829) | (8,157,805) |
| | | | $ (13,183,977) |
| Poland — (0.5)% |
| Republic of Poland Government International Bonds: | | | |
| 1.00%, 3/7/29(8) | EUR | (7,156) | $ (7,268,190) |
| Security | Principal
Amount
(000's omitted) | Value |
| Poland (continued) |
Republic of Poland Government International Bonds:
(continued) | | | |
| 2.75%, 5/25/32(8) | EUR | (2,000) | $ (2,107,696) |
| | | | $ (9,375,886) |
| Romania — (0.8)% |
| Romania Government International Bonds: | | | |
| 5.75%, 3/24/35(8) | USD | (4,392) | $ (4,143,804) |
| 6.125%, 1/22/44(8) | USD | (6,150) | (5,798,864) |
| 6.375%, 1/30/34(8) | USD | (2,196) | (2,202,641) |
| 7.125%, 1/17/33(8) | USD | (2,254) | (2,391,685) |
| | | | $ (14,536,994) |
| Senegal — (0.5)% |
| Senegal Government International Bonds: | | | |
| 6.25%, 5/23/33(8) | USD | (4,186) | $ (3,466,531) |
| 6.75%, 3/13/48(8) | USD | (7,298) | (5,169,493) |
| | | | $ (8,636,024) |
Total Sovereign Government Bonds
(proceeds $83,082,232) | | | $ (84,772,528) |
Total Securities Sold Short
(proceeds $193,833,660) | | | $(194,613,884) |
| | | |
| Other Assets, Less Liabilities — 14.3% | | | $ 252,381,349 |
| Net Assets — 100.0% | | | $1,770,575,482 |
| The percentage shown for each investment category in the Consolidated Portfolio of Investments is based on net assets. |
| (1) | Weighted average fixed-rate coupon that changes/updates monthly. Rate shown is the rate at October 31, 2024. |
| (2) | Inverse floating-rate security whose coupon varies inversely with changes in the interest rate index. The stated interest rate represents the coupon rate in effect at October 31, 2024. |
| (3) | Interest only security that entitles the holder to receive only interest payments on the underlying mortgages. Principal amount shown is the notional amount of the underlying mortgages on which coupon interest is calculated. |
| (4) | Variable rate security. The stated interest rate represents the rate in effect at October 31, 2024. |
| (5) | Security exempt from registration under Rule 144A of the Securities Act of 1933, as amended. These securities may be sold in certain transactions in reliance on an exemption from registration (normally to qualified institutional buyers). At October 31, 2024, the aggregate value of these securities is $106,985,350 or 6.0% of the Portfolio's net assets. |
29
See Notes to Consolidated Financial Statements.
Global Macro Portfolio
October 31, 2024
Consolidated Portfolio of Investments — continued
| (6) | Non-income producing security. |
| (7) | Amount is less than 0.05% or (0.05)%, as applicable. |
| (8) | Security exempt from registration under Regulation S of the Securities Act of 1933, as amended, which exempts from registration securities offered and sold outside the United States. Security may not be offered or sold in the United States except pursuant to an exemption from, or in a transaction not subject to, the registration requirements of the Securities Act of 1933, as amended. At October 31, 2024, the aggregate value of these securities is $304,237,180 or 17.2% of the Portfolio's net assets. |
| (9) | Issuer is in default with respect to interest and/or principal payments or has declared bankruptcy and is non-income producing. For a variable rate security, interest rate has been adjusted to reflect non-accrual status. |
| (10) | Represents a payment-in-kind security which may pay interest in additional principal at the issuer’s discretion. |
| (11) | Perpetual security with no stated maturity date but may be subject to calls by the issuer. |
| (12) | Security converts to variable rate after the indicated fixed-rate coupon period. |
| (13) | For fair value measurement disclosure purposes, security is categorized as Level 3 (see Note 10). |
| (14) | Quantity held represents principal in USD. |
| (15) | Security is subject to risk of loss depending on the occurrence, frequency and severity of the loss events that are covered by underlying reinsurance contracts and that may occur during a specified risk period. |
| (16) | Restricted security (see Note 5). |
| (17) | Limited recourse note whose payments by the issuer are limited to amounts received by the issuer from the borrower pursuant to a loan agreement with the borrower. |
| (18) | Senior floating-rate loans (Senior Loans) often require prepayments from excess cash flows or permit the borrowers to repay at their election. The degree to which borrowers repay, whether as a contractual requirement or at their election, cannot be predicted with accuracy. As a result, the actual remaining maturity may be substantially less than the stated maturities shown. However, Senior Loans will typically have an expected average life of approximately two to four years. Senior Loans typically have rates of interest which are redetermined periodically by reference to a base lending rate, plus a spread. These base lending rates are primarily the Secured Overnight Financing Rate (“SOFR”) and secondarily, the prime rate offered by one or more major United States banks (the “Prime Rate”). Base lending rates may be subject to a floor, or minimum rate. Rates for SOFR are generally 1 or 3-month tenors and may also be subject to a credit spread adjustment. Senior Loans are generally subject to contractual restrictions that must be satisfied before they can be bought or sold. |
| (19) | Step coupon security. Interest rate represents the rate in effect at October 31, 2024. |
| (20) | Security (or a portion thereof) has been pledged for the benefit of the counterparty for reverse repurchase agreements. |
| (21) | Inflation-linked security whose principal is adjusted for inflation based on changes in a designated inflation index or inflation rate for the applicable country. Interest is calculated based on the inflation-adjusted principal. |
| (22) | Amounts payable in respect of the security are contingent upon and determined by reference to Ukraine’s GDP and Real GDP Growth Rate. Principal amount represents the notional amount used to calculate payments due to the security holder and does not represent an entitlement for payment. |
| (23) | Adjustable rate mortgage security whose interest rate generally adjusts monthly based on a weighted average of interest rates on the underlying mortgages. The coupon rate may not reflect the applicable index value as interest rates on the underlying mortgages may adjust on various dates and at various intervals and may be subject to lifetime ceilings and lifetime floors and lookback periods. Rate shown is the coupon rate at October 31, 2024. |
| (24) | Principal amount is less than $500. |
| (25) | Interest only security that entitles the holder to receive only a portion of the interest payments on the underlying loans. Principal amount shown is the notional amount of the underlying loans on which coupon interest is calculated. |
| (26) | The stated interest rate represents the weighted average fixed interest rate at October 31, 2024 of all interest only securities comprising the trust. |
| (27) | Inflation-linked security whose principal is adjusted for inflation based on changes in the U.S. Consumer Price Index. Interest is calculated based on the inflation-adjusted principal. |
| (28) | May be deemed to be an affiliated investment company (see Note 9). The rate shown is the annualized seven-day yield as of October 31, 2024. |
| (29) | Open repurchase agreement with no specific maturity date. Either party may terminate the agreement upon demand. |
| (30) | Security (or a portion thereof) has been pledged to cover collateral requirements on open derivative contracts. |
30
See Notes to Consolidated Financial Statements.
Global Macro Portfolio
October 31, 2024
Consolidated Portfolio of Investments — continued
| Purchased Currency Options (OTC) — 0.0%(1) |
| Description | Counterparty | Notional Amount | Exercise
Price | Expiration
Date | Value |
| Put EUR vs. Call USD | Bank of America, N.A. | EUR | 34,790,000 | USD | 1.07 | 11/21/24 | $ 96,953 |
| Put EUR vs. Call USD | BNP Paribas | EUR | 42,170,000 | USD | 1.07 | 11/21/24 | 117,520 |
| Put USD vs. Call INR | JPMorgan Chase Bank, N.A. | USD | 15,600,000 | INR | 85.50 | 1/25/29 | 86,190 |
| Put USD vs. Call INR | JPMorgan Chase Bank, N.A. | USD | 8,400,000 | INR | 85.50 | 1/25/29 | 46,410 |
| Put USD vs. Call INR | JPMorgan Chase Bank, N.A. | USD | 8,000,000 | INR | 85.50 | 1/30/29 | 44,328 |
| Total | | | | | | | $391,401 |
| (1) | Amount is less than 0.05%. |
| Purchased Interest Rate Swaptions (OTC) — 0.0%(1) |
| Description | Counterparty | Notional Amount | Expiration
Date | Value |
| Option to enter into interest rate swap expiring 11/21/26 to pay SAIBOR and receive 4.41% | JPMorgan Chase Bank, N.A. | SAR | 176,292,000 | 11/19/24 | $28 |
| Option to enter into interest rate swap expiring 11/25/26 to pay SAIBOR and receive 4.30% | JPMorgan Chase Bank, N.A. | SAR | 117,528,000 | 11/21/24 | 3 |
| Total | | | | | $31 |
| (1) | Amount is less than 0.05%. |
| Purchased Put Options (Exchange-Traded) — 0.1% |
| Description | Number of
Contracts | Notional
Amount | Exercise
Price | Expiration
Date | Value |
| ICE Brent Crude Oil Futures 04/2025 | 147 | $ | 10,754,520 | $ | 60.00 | 2/25/25 | $ 164,640 |
| ICE Brent Crude Oil Futures 04/2025 | 90 | | 6,584,400 | | 70.00 | 2/25/25 | 352,800 |
| ICE Brent Crude Oil Futures 05/2025 | 339 | | 24,801,240 | | 50.00 | 3/26/25 | 149,160 |
| ICE Brent Crude Oil Futures 05/2025 | 170 | | 12,437,200 | | 55.00 | 3/26/25 | 141,100 |
| ICE Brent Crude Oil Futures 05/2025 | 113 | | 8,267,080 | | 60.00 | 3/26/25 | 174,020 |
| ICE Brent Crude Oil Futures 05/2025 | 79 | | 5,779,640 | | 65.00 | 3/26/25 | 214,880 |
| Total | | | | | | | $1,196,600 |
31
See Notes to Consolidated Financial Statements.
Global Macro Portfolio
October 31, 2024
Consolidated Portfolio of Investments — continued
| Written Currency Options (OTC) — (0.0)%(1) |
| Description | Counterparty | Notional Amount | Exercise
Price | Expiration
Date | Value |
| Call USD vs. Put CNH | Citibank, N.A. | USD | 1,000,000 | CNH | 7.30 | 11/21/24 | $ (1,608) |
| Call USD vs. Put CNH | Deutsche Bank AG | USD | 16,700,000 | CNH | 7.30 | 11/21/24 | (26,854) |
| Put USD vs. Call CNH | Citibank, N.A. | USD | 1,000,000 | CNH | 6.98 | 11/21/24 | (2,979) |
| Put USD vs. Call CNH | Deutsche Bank AG | USD | 16,700,000 | CNH | 6.98 | 11/21/24 | (49,749) |
| Total | | | | | | | $(81,190) |
| (1) | Amount is less than (0.05)%. |
| Forward Foreign Currency Exchange Contracts (Centrally Cleared) |
| Currency Purchased | Currency Sold | Settlement
Date | Value/Unrealized
Appreciation
(Depreciation) |
| BRL | 7,396,000 | USD | 1,321,824 | 12/3/24 | $ (46,942) |
| USD | 1,311,903 | BRL | 7,396,000 | 12/3/24 | 37,022 |
| CLP | 72,000,000 | USD | 76,571 | 12/18/24 | (1,705) |
| CLP | 145,000,000 | USD | 153,831 | 12/18/24 | (3,060) |
| CLP | 362,000,000 | USD | 383,365 | 12/18/24 | (6,956) |
| CLP | 215,000,000 | USD | 232,734 | 12/18/24 | (9,177) |
| CLP | 1,191,000,000 | USD | 1,267,021 | 12/18/24 | (28,615) |
| CLP | 1,483,000,000 | USD | 1,572,224 | 12/18/24 | (30,195) |
| CLP | 1,029,000,000 | USD | 1,111,231 | 12/18/24 | (41,273) |
| CLP | 3,323,000,000 | USD | 3,528,238 | 12/18/24 | (72,970) |
| CLP | 2,154,000,000 | USD | 2,333,189 | 12/18/24 | (93,452) |
| CLP | 9,768,000,000 | USD | 10,366,235 | 12/18/24 | (209,433) |
| COP | 1,640,000,000 | USD | 385,519 | 12/18/24 | (17,080) |
| COP | 13,751,430,000 | USD | 3,257,436 | 12/18/24 | (168,069) |
| EUR | 618,096 | USD | 686,321 | 12/18/24 | (12,731) |
| EUR | 687,279 | USD | 763,141 | 12/18/24 | (14,156) |
| EUR | 1,342,901 | USD | 1,488,346 | 12/18/24 | (24,875) |
| EUR | 1,550,000 | USD | 1,721,089 | 12/18/24 | (31,925) |
| EUR | 1,770,319 | USD | 1,962,056 | 12/18/24 | (32,792) |
| EUR | 1,941,857 | USD | 2,152,173 | 12/18/24 | (35,970) |
| EUR | 1,991,146 | USD | 2,206,800 | 12/18/24 | (36,883) |
| EUR | 1,897,000 | USD | 2,106,391 | 12/18/24 | (39,072) |
| EUR | 2,114,511 | USD | 2,343,526 | 12/18/24 | (39,168) |
| EUR | 2,929,208 | USD | 3,252,534 | 12/18/24 | (60,332) |
| EUR | 5,725,000 | USD | 6,356,926 | 12/18/24 | (117,917) |
| EUR | 6,401,185 | USD | 7,096,065 | 12/18/24 | (120,162) |
| EUR | 8,155,181 | USD | 9,040,466 | 12/18/24 | (153,087) |
| EUR | 9,231,009 | USD | 10,233,081 | 12/18/24 | (173,283) |
| EUR | 15,762,478 | USD | 17,502,341 | 12/18/24 | (324,657) |
| EUR | 19,731,720 | USD | 21,909,708 | 12/18/24 | (406,410) |
| EUR | 26,959,000 | USD | 29,934,734 | 12/18/24 | (555,269) |
32
See Notes to Consolidated Financial Statements.
Global Macro Portfolio
October 31, 2024
Consolidated Portfolio of Investments — continued
| Forward Foreign Currency Exchange Contracts (Centrally Cleared) (continued) |
| Currency Purchased | Currency Sold | Settlement
Date | Value/Unrealized
Appreciation
(Depreciation) |
| IDR | 3,036,870,225 | USD | 200,689 | 12/18/24 | $ (7,656) |
| IDR | 14,000,000,000 | USD | 925,436 | 12/18/24 | (35,549) |
| IDR | 50,927,752,508 | USD | 3,357,136 | 12/18/24 | (119,997) |
| IDR | 203,205,080,479 | USD | 13,409,336 | 12/18/24 | (492,938) |
| IDR | 558,815,591,000 | USD | 36,880,649 | 12/18/24 | (1,360,451) |
| INR | 571,000,000 | USD | 6,773,428 | 12/18/24 | 5,969 |
| INR | 571,000,000 | USD | 6,773,750 | 12/18/24 | 5,647 |
| INR | 684,200,000 | USD | 8,118,659 | 12/18/24 | 4,744 |
| INR | 414,000,000 | USD | 4,911,323 | 12/18/24 | 4,036 |
| KRW | 264,000,000 | USD | 197,397 | 12/18/24 | (5,053) |
| KRW | 471,000,000 | USD | 353,320 | 12/18/24 | (10,162) |
| KRW | 471,000,000 | USD | 353,488 | 12/18/24 | (10,330) |
| KRW | 640,000,000 | USD | 479,616 | 12/18/24 | (13,330) |
| KRW | 697,000,000 | USD | 521,433 | 12/18/24 | (13,618) |
| KRW | 1,382,509,967 | USD | 1,037,754 | 12/18/24 | (30,494) |
| KRW | 7,793,344,000 | USD | 5,975,254 | 12/18/24 | (297,234) |
| PEN | 26,100,000 | USD | 6,840,340 | 12/18/24 | 73,047 |
| PEN | 1,042,000 | USD | 275,669 | 12/18/24 | 337 |
| PEN | 1,068,000 | USD | 282,824 | 12/18/24 | 69 |
| PEN | 49,778,309 | USD | 13,211,505 | 12/18/24 | (26,191) |
| PHP | 428,100,000 | USD | 7,347,464 | 12/18/24 | (3,683) |
| TWD | 215,000,000 | USD | 6,757,819 | 12/18/24 | 4,505 |
| TWD | 100,000,000 | USD | 3,143,589 | 12/18/24 | 1,678 |
| TWD | 66,000,000 | USD | 2,074,493 | 12/18/24 | 1,383 |
| TWD | 31,000,000 | USD | 974,513 | 12/18/24 | 520 |
| TWD | 10,000,000 | USD | 314,698 | 12/18/24 | (171) |
| TWD | 36,000,000 | USD | 1,133,287 | 12/18/24 | (991) |
| TWD | 68,800,000 | USD | 2,165,804 | 12/18/24 | (1,860) |
| TWD | 17,000,000 | USD | 536,955 | 12/18/24 | (2,260) |
| TWD | 24,000,000 | USD | 757,576 | 12/18/24 | (2,712) |
| TWD | 117,000,000 | USD | 3,683,183 | 12/18/24 | (3,221) |
| TWD | 24,000,000 | USD | 758,845 | 12/18/24 | (3,981) |
| TWD | 65,000,000 | USD | 2,049,116 | 12/18/24 | (4,692) |
| TWD | 227,120,000 | USD | 7,149,670 | 12/18/24 | (6,140) |
| TWD | 55,000,000 | USD | 1,737,208 | 12/18/24 | (7,311) |
| TWD | 78,000,000 | USD | 2,462,121 | 12/18/24 | (8,813) |
| TWD | 78,000,000 | USD | 2,466,247 | 12/18/24 | (12,939) |
| TWD | 214,000,000 | USD | 6,746,320 | 12/18/24 | (15,448) |
| USD | 15,410,229 | COP | 65,055,050,887 | 12/18/24 | 795,099 |
| USD | 8,419,376 | COP | 35,675,000,000 | 12/18/24 | 404,706 |
| USD | 52,503,812 | EUR | 47,373,007 | 12/18/24 | 877,505 |
| USD | 47,905,450 | EUR | 43,224,009 | 12/18/24 | 800,652 |
| USD | 44,984,900 | EUR | 40,588,862 | 12/18/24 | 751,841 |
| USD | 29,776,607 | EUR | 26,816,591 | 12/18/24 | 552,336 |
33
See Notes to Consolidated Financial Statements.
Global Macro Portfolio
October 31, 2024
Consolidated Portfolio of Investments — continued
| Forward Foreign Currency Exchange Contracts (Centrally Cleared) (continued) |
| Currency Purchased | Currency Sold | Settlement
Date | Value/Unrealized
Appreciation
(Depreciation) |
| USD | 29,879,832 | EUR | 26,959,900 | 12/18/24 | $ 499,387 |
| USD | 28,963,269 | EUR | 26,132,905 | 12/18/24 | 484,068 |
| USD | 26,502,828 | EUR | 23,912,905 | 12/18/24 | 442,946 |
| USD | 24,353,766 | EUR | 21,973,855 | 12/18/24 | 407,029 |
| USD | 23,230,194 | EUR | 20,960,081 | 12/18/24 | 388,250 |
| USD | 16,916,979 | EUR | 15,235,306 | 12/18/24 | 313,799 |
| USD | 17,199,852 | EUR | 15,519,039 | 12/18/24 | 287,464 |
| USD | 14,273,008 | EUR | 12,878,214 | 12/18/24 | 238,547 |
| USD | 12,951,327 | EUR | 11,685,691 | 12/18/24 | 216,458 |
| USD | 8,894,144 | EUR | 8,010,000 | 12/18/24 | 164,980 |
| USD | 7,759,453 | EUR | 7,001,179 | 12/18/24 | 129,685 |
| USD | 6,758,883 | EUR | 6,087,000 | 12/18/24 | 125,373 |
| USD | 6,635,059 | EUR | 5,986,664 | 12/18/24 | 110,893 |
| USD | 5,709,878 | EUR | 5,142,274 | 12/18/24 | 105,914 |
| USD | 4,491,374 | EUR | 4,052,466 | 12/18/24 | 75,065 |
| USD | 4,159,400 | EUR | 3,752,091 | 12/18/24 | 70,434 |
| USD | 3,630,943 | EUR | 3,270,000 | 12/18/24 | 67,352 |
| USD | 3,934,101 | EUR | 3,549,651 | 12/18/24 | 65,751 |
| USD | 3,273,835 | EUR | 2,953,907 | 12/18/24 | 54,716 |
| USD | 3,249,555 | EUR | 2,932,000 | 12/18/24 | 54,310 |
| USD | 3,181,797 | EUR | 2,870,863 | 12/18/24 | 53,178 |
| USD | 2,210,929 | EUR | 1,991,146 | 12/18/24 | 41,011 |
| USD | 2,343,526 | EUR | 2,114,511 | 12/18/24 | 39,168 |
| USD | 1,965,727 | EUR | 1,770,319 | 12/18/24 | 36,463 |
| USD | 1,717,875 | EUR | 1,550,000 | 12/18/24 | 28,711 |
| USD | 1,377,625 | EUR | 1,243,000 | 12/18/24 | 23,024 |
| USD | 934,061 | EUR | 842,782 | 12/18/24 | 15,611 |
| USD | 907,430 | EUR | 818,754 | 12/18/24 | 15,166 |
| USD | 685,040 | EUR | 618,096 | 12/18/24 | 11,449 |
| USD | 611,917 | EUR | 552,119 | 12/18/24 | 10,227 |
| USD | 244,689 | EUR | 220,778 | 12/18/24 | 4,090 |
| USD | 131,366 | EUR | 118,528 | 12/18/24 | 2,196 |
| USD | 78,408 | EUR | 70,746 | 12/18/24 | 1,310 |
| USD | 68,139 | EUR | 61,480 | 12/18/24 | 1,139 |
| USD | 17,495,342 | IDR | 270,457,000,000 | 12/18/24 | 304,186 |
| USD | 10,626,451 | IDR | 164,269,000,000 | 12/18/24 | 184,962 |
| USD | 6,898,043 | IDR | 106,627,671,479 | 12/18/24 | 120,430 |
| USD | 6,070,132 | IDR | 93,867,000,000 | 12/18/24 | 103,630 |
| USD | 6,069,457 | IDR | 93,867,000,000 | 12/18/24 | 102,955 |
| USD | 3,035,671 | IDR | 46,933,000,000 | 12/18/24 | 52,452 |
| USD | 1,148,149 | IDR | 17,749,000,000 | 12/18/24 | 19,963 |
| USD | 697,416 | IDR | 10,781,000,000 | 12/18/24 | 12,139 |
| USD | 452,704 | IDR | 6,997,752,508 | 12/18/24 | 7,904 |
| USD | 398,351 | IDR | 6,160,000,000 | 12/18/24 | 6,801 |
34
See Notes to Consolidated Financial Statements.
Global Macro Portfolio
October 31, 2024
Consolidated Portfolio of Investments — continued
| Forward Foreign Currency Exchange Contracts (Centrally Cleared) (continued) |
| Currency Purchased | Currency Sold | Settlement
Date | Value/Unrealized
Appreciation
(Depreciation) |
| USD | 398,307 | IDR | 6,160,000,000 | 12/18/24 | $ 6,756 |
| USD | 199,217 | IDR | 3,080,000,000 | 12/18/24 | 3,442 |
| USD | 68,440 | IDR | 1,058,000,000 | 12/18/24 | 1,190 |
| USD | 41,595 | IDR | 643,000,000 | 12/18/24 | 724 |
| USD | 27,033 | IDR | 417,870,225 | 12/18/24 | 472 |
| USD | 23,733 | IDR | 367,000,000 | 12/18/24 | 405 |
| USD | 23,730 | IDR | 367,000,000 | 12/18/24 | 403 |
| USD | 11,901 | IDR | 184,000,000 | 12/18/24 | 206 |
| USD | 3,950,283 | KRW | 5,260,000,000 | 12/18/24 | 117,989 |
| USD | 5,085,216 | KRW | 6,830,000,000 | 12/18/24 | 109,063 |
| USD | 4,320,726 | KRW | 5,809,000,000 | 12/18/24 | 88,445 |
| USD | 3,798,571 | KRW | 5,103,000,000 | 12/18/24 | 80,663 |
| USD | 3,797,016 | KRW | 5,103,000,000 | 12/18/24 | 79,108 |
| USD | 3,580,354 | KRW | 4,811,206,452 | 12/18/24 | 75,039 |
| USD | 2,394,644 | KRW | 3,219,000,000 | 12/18/24 | 49,367 |
| USD | 1,668,735 | PEN | 6,319,000 | 12/18/24 | (5,046) |
| USD | 7,549,407 | PEN | 28,593,000 | 12/18/24 | (24,327) |
| USD | 10,764,186 | PEN | 41,071,827 | 12/18/24 | (114,949) |
| USD | 14,519,098 | PEN | 55,688,000 | 12/18/24 | (231,579) |
| USD | 10,809,555 | PHP | 605,000,000 | 12/18/24 | 431,168 |
| USD | 10,940,984 | PHP | 613,461,000 | 12/18/24 | 417,454 |
| USD | 11,208,577 | PHP | 632,500,000 | 12/18/24 | 358,444 |
| USD | 4,229,240 | PHP | 236,870,000 | 12/18/24 | 165,887 |
| USD | 4,127,285 | PHP | 231,000,000 | 12/18/24 | 164,628 |
| USD | 4,173,355 | PHP | 234,000,000 | 12/18/24 | 159,235 |
| USD | 3,864,623 | PHP | 217,130,000 | 12/18/24 | 139,897 |
| USD | 4,270,778 | PHP | 241,000,000 | 12/18/24 | 136,577 |
| USD | 4,200,042 | PHP | 237,000,000 | 12/18/24 | 134,459 |
| USD | 1,611,582 | PHP | 90,261,000 | 12/18/24 | 63,212 |
| USD | 1,453,140 | PHP | 81,240,139 | 12/18/24 | 59,518 |
| USD | 1,260,619 | PHP | 70,336,000 | 12/18/24 | 54,050 |
| USD | 1,472,643 | PHP | 82,739,000 | 12/18/24 | 53,309 |
| USD | 1,612,675 | PHP | 91,000,000 | 12/18/24 | 51,628 |
| USD | 2,948,669 | PHP | 169,000,000 | 12/18/24 | 49,582 |
| USD | 2,774,191 | PHP | 159,000,000 | 12/18/24 | 46,648 |
| USD | 2,546,793 | PHP | 146,000,000 | 12/18/24 | 42,256 |
| USD | 1,072,215 | PHP | 60,400,000 | 12/18/24 | 36,091 |
| USD | 2,042,295 | PHP | 117,010,000 | 12/18/24 | 35,063 |
| USD | 621,920 | PHP | 34,476,566 | 12/18/24 | 30,497 |
| USD | 275,879 | PHP | 15,365,000 | 12/18/24 | 12,303 |
| USD | 2,155,374 | TWD | 69,000,000 | 12/18/24 | (14,860) |
| USD | 3,470,091 | TWD | 110,800,000 | 12/18/24 | (14,865) |
| USD | 2,404,342 | TWD | 77,000,000 | 12/18/24 | (17,514) |
| USD | 3,022,723 | TWD | 96,800,000 | 12/18/24 | (21,895) |
35
See Notes to Consolidated Financial Statements.
Global Macro Portfolio
October 31, 2024
Consolidated Portfolio of Investments — continued
| Forward Foreign Currency Exchange Contracts (Centrally Cleared) (continued) |
| Currency Purchased | Currency Sold | Settlement
Date | Value/Unrealized
Appreciation
(Depreciation) |
| USD | 5,449,421 | TWD | 174,000,000 | 12/18/24 | $ (23,344) |
| USD | 3,089,888 | TWD | 99,000,000 | 12/18/24 | (23,927) |
| | | | | | $7,179,713 |
| Forward Foreign Currency Exchange Contracts (OTC) |
| Currency Purchased | Currency Sold | Counterparty | Settlement
Date | Unrealized
Appreciation | Unrealized
(Depreciation) |
| MYR | 5,555,000 | USD | 1,267,021 | Barclays Bank PLC | 11/4/24 | $ 1,534 | $ — |
| MYR | 5,555,000 | USD | 1,267,021 | Barclays Bank PLC | 11/4/24 | 1,534 | — |
| MYR | 3,602,000 | USD | 821,568 | Barclays Bank PLC | 11/4/24 | 994 | — |
| MYR | 6,691,000 | USD | 1,459,483 | Goldman Sachs International | 11/4/24 | 68,491 | — |
| MYR | 4,000,000 | USD | 912,346 | Goldman Sachs International | 11/4/24 | 1,104 | — |
| MYR | 19,301,000 | USD | 4,211,434 | State Street Bank and Trust Company | 11/4/24 | 196,194 | — |
| USD | 1,336,622 | MYR | 5,555,000 | Barclays Bank PLC | 11/4/24 | 68,067 | — |
| USD | 1,335,016 | MYR | 5,555,000 | Barclays Bank PLC | 11/4/24 | 66,461 | — |
| USD | 825,408 | MYR | 3,602,000 | Barclays Bank PLC | 11/4/24 | 2,846 | — |
| USD | 915,856 | MYR | 4,000,000 | Goldman Sachs International | 11/4/24 | 2,405 | — |
| USD | 1,526,127 | MYR | 6,691,000 | Goldman Sachs International | 11/4/24 | — | (1,847) |
| USD | 1,749,369 | MYR | 7,280,000 | State Street Bank and Trust Company | 11/4/24 | 86,889 | — |
| TRY | 57,524,000 | USD | 1,455,486 | Standard Chartered Bank | 11/6/24 | 220,451 | — |
| USD | 1,550,918 | TRY | 57,524,000 | Standard Chartered Bank | 11/6/24 | — | (125,020) |
| EUR | 11,843,954 | USD | 12,810,662 | Bank of America, N.A. | 11/8/24 | 74,800 | — |
| EUR | 3,577,369 | USD | 3,856,834 | Barclays Bank PLC | 11/8/24 | 35,114 | — |
| EUR | 1,664,898 | USD | 1,801,000 | Citibank, N.A. | 11/8/24 | 10,301 | — |
| EUR | 30,402 | USD | 33,006 | HSBC Bank USA, N.A. | 11/8/24 | 69 | — |
| EUR | 3,033,244 | USD | 3,280,248 | JPMorgan Chase Bank, N.A. | 11/8/24 | 19,727 | — |
| EUR | 801,502 | USD | 886,178 | JPMorgan Chase Bank, N.A. | 11/8/24 | — | (14,195) |
| EUR | 14,075,931 | USD | 15,175,811 | Standard Chartered Bank | 11/8/24 | 137,898 | — |
| EUR | 12,695,420 | USD | 13,730,112 | Standard Chartered Bank | 11/8/24 | 81,690 | — |
| EUR | 79,422 | USD | 86,043 | Standard Chartered Bank | 11/8/24 | 363 | — |
| EUR | 586,126 | USD | 640,647 | Standard Chartered Bank | 11/8/24 | — | (2,980) |
| EUR | 224,360 | USD | 241,909 | UBS AG | 11/8/24 | 2,180 | — |
| EUR | 624,785 | USD | 679,404 | UBS AG | 11/8/24 | 322 | — |
| EUR | 25,857 | USD | 27,964 | UBS AG | 11/8/24 | 167 | — |
| EUR | 1,051,694 | USD | 1,155,445 | UBS AG | 11/8/24 | — | (11,269) |
| KZT | 1,012,105,261 | USD | 2,070,804 | ICBC Standard Bank plc | 11/8/24 | 1,017 | — |
| TRY | 405,628,000 | USD | 10,290,508 | Standard Chartered Bank | 11/8/24 | 1,507,196 | — |
| TRY | 397,488,006 | USD | 10,110,421 | Standard Chartered Bank | 11/8/24 | 1,450,531 | — |
| TRY | 164,477,855 | USD | 4,265,539 | Standard Chartered Bank | 11/8/24 | 518,305 | — |
| TRY | 123,570,426 | USD | 3,168,498 | Standard Chartered Bank | 11/8/24 | 425,552 | — |
| TRY | 123,570,426 | USD | 3,168,498 | Standard Chartered Bank | 11/8/24 | 425,552 | — |
36
See Notes to Consolidated Financial Statements.
Global Macro Portfolio
October 31, 2024
Consolidated Portfolio of Investments — continued
| Forward Foreign Currency Exchange Contracts (OTC) (continued) |
| Currency Purchased | Currency Sold | Counterparty | Settlement
Date | Unrealized
Appreciation | Unrealized
(Depreciation) |
| USD | 408,651 | EUR | 377,107 | BNP Paribas | 11/8/24 | $ — | $ (1,617) |
| USD | 654,800 | EUR | 605,314 | BNP Paribas | 11/8/24 | — | (3,744) |
| USD | 11,472,820 | EUR | 10,596,241 | BNP Paribas | 11/8/24 | — | (55,210) |
| USD | 12,457,403 | EUR | 11,507,518 | BNP Paribas | 11/8/24 | — | (62,038) |
| USD | 3,714,278 | EUR | 3,431,828 | Goldman Sachs International | 11/8/24 | — | (19,331) |
| USD | 1,239,931 | EUR | 1,121,453 | JPMorgan Chase Bank, N.A. | 11/8/24 | 19,861 | — |
| USD | 885,665 | EUR | 801,038 | JPMorgan Chase Bank, N.A. | 11/8/24 | 14,187 | — |
| USD | 533,261 | EUR | 482,307 | JPMorgan Chase Bank, N.A. | 11/8/24 | 8,542 | — |
| USD | 1,403,267 | EUR | 1,300,667 | JPMorgan Chase Bank, N.A. | 11/8/24 | — | (11,775) |
| USD | 11,473,115 | EUR | 10,596,241 | JPMorgan Chase Bank, N.A. | 11/8/24 | — | (54,915) |
| USD | 1,238,153 | EUR | 1,117,339 | Standard Chartered Bank | 11/8/24 | 22,560 | — |
| USD | 3,634,682 | EUR | 3,358,281 | Standard Chartered Bank | 11/8/24 | — | (18,912) |
| USD | 833,662 | EUR | 766,562 | State Street Bank and Trust Company | 11/8/24 | — | (308) |
| USD | 657,348 | EUR | 605,314 | UBS AG | 11/8/24 | — | (1,195) |
| USD | 828,728 | EUR | 766,558 | UBS AG | 11/8/24 | — | (5,238) |
| USD | 1,216,370 | LKR | 373,000,000 | Standard Chartered Bank | 11/8/24 | — | (56,472) |
| USD | 1,780,129 | TRY | 68,922,689 | Standard Chartered Bank | 11/8/24 | — | (224,490) |
| USD | 2,894,180 | TRY | 108,185,321 | Standard Chartered Bank | 11/8/24 | — | (252,393) |
| USD | 2,787,285 | TRY | 107,673,663 | Standard Chartered Bank | 11/8/24 | — | (344,407) |
| USD | 4,227,914 | TRY | 157,827,590 | Standard Chartered Bank | 11/8/24 | — | (362,507) |
| USD | 5,345,692 | TRY | 197,631,802 | Standard Chartered Bank | 11/8/24 | — | (402,436) |
| USD | 3,716,379 | TRY | 143,412,512 | Standard Chartered Bank | 11/8/24 | — | (454,778) |
| USD | 4,645,474 | TRY | 179,400,336 | Standard Chartered Bank | 11/8/24 | — | (572,391) |
| USD | 6,503,664 | TRY | 251,680,800 | Standard Chartered Bank | 11/8/24 | — | (816,480) |
| KZT | 642,992,000 | USD | 1,304,905 | JPMorgan Chase Bank, N.A. | 11/12/24 | 10,084 | — |
| KZT | 428,661,000 | USD | 869,936 | JPMorgan Chase Bank, N.A. | 11/12/24 | 6,723 | — |
| KZT | 740,284,292 | USD | 1,512,173 | JPMorgan Chase Bank, N.A. | 11/12/24 | 1,790 | — |
| KZT | 1,063,498,000 | USD | 2,174,843 | JPMorgan Chase Bank, N.A. | 11/12/24 | 128 | — |
| KZT | 35,552,953 | USD | 72,624 | JPMorgan Chase Bank, N.A. | 11/12/24 | 86 | — |
| KZT | 288,634,728 | USD | 598,207 | JPMorgan Chase Bank, N.A. | 11/12/24 | — | (7,917) |
| KZT | 1,056,973,000 | USD | 2,174,842 | JPMorgan Chase Bank, N.A. | 11/12/24 | — | (13,216) |
| KZT | 1,154,281,092 | USD | 2,379,961 | JPMorgan Chase Bank, N.A. | 11/12/24 | — | (19,330) |
| ISK | 258,611,053 | EUR | 1,672,234 | Citibank, N.A. | 11/18/24 | 66,320 | — |
| ISK | 242,562,322 | EUR | 1,573,956 | Citibank, N.A. | 11/18/24 | 56,223 | — |
| KZT | 204,782,217 | USD | 422,885 | ICBC Standard Bank plc | 11/18/24 | — | (4,610) |
| KZT | 952,577,000 | USD | 1,959,833 | Citibank, N.A. | 11/25/24 | — | (17,012) |
| EGP | 23,324,710 | USD | 450,719 | HSBC Bank USA, N.A. | 11/27/24 | 20,614 | — |
| CZK | 208,000,000 | EUR | 8,277,764 | BNP Paribas | 12/5/24 | — | (74,631) |
| EUR | 4,146,066 | CZK | 103,908,583 | BNP Paribas | 12/5/24 | 49,070 | — |
| EUR | 4,151,640 | CZK | 104,091,417 | Standard Chartered Bank | 12/5/24 | 47,281 | — |
| EUR | 7,872,831 | PLN | 34,020,000 | Barclays Bank PLC | 12/5/24 | 83,215 | — |
| PLN | 33,000,000 | EUR | 7,658,222 | BNP Paribas | 12/5/24 | — | (104,068) |
| PLN | 1,020,000 | EUR | 237,098 | Citibank, N.A. | 12/5/24 | — | (3,640) |
| SEK | 41,725,389 | EUR | 3,683,206 | HSBC Bank USA, N.A. | 12/5/24 | — | (89,217) |
37
See Notes to Consolidated Financial Statements.
Global Macro Portfolio
October 31, 2024
Consolidated Portfolio of Investments — continued
| Forward Foreign Currency Exchange Contracts (OTC) (continued) |
| Currency Purchased | Currency Sold | Counterparty | Settlement
Date | Unrealized
Appreciation | Unrealized
(Depreciation) |
| SEK | 43,272,611 | EUR | 3,819,618 | HSBC Bank USA, N.A. | 12/5/24 | $ — | $ (92,345) |
| SEK | 6,644,000 | EUR | 585,055 | Societe Generale | 12/5/24 | — | (12,652) |
| VND | 14,366,900,000 | USD | 576,290 | Deutsche Bank AG | 12/5/24 | — | (7,727) |
| USD | 4,337,898 | HKD | 33,700,000 | BNP Paribas | 12/9/24 | — | (22) |
| USD | 11,933,727 | HKD | 92,700,000 | Deutsche Bank AG | 12/9/24 | 1,229 | — |
| UYU | 73,381,000 | USD | 1,777,210 | Citibank, N.A. | 12/9/24 | — | (12,884) |
| VND | 11,197,000,000 | USD | 451,856 | JPMorgan Chase Bank, N.A. | 12/9/24 | — | (8,722) |
| UYU | 29,680,000 | USD | 710,898 | Citibank, N.A. | 12/10/24 | 2,618 | — |
| VND | 28,469,000,000 | USD | 1,154,461 | Deutsche Bank AG | 12/12/24 | — | (27,732) |
| TRY | 256,907,557 | USD | 6,600,118 | Standard Chartered Bank | 12/16/24 | 582,839 | — |
| USD | 6,714,377 | TRY | 256,907,557 | Standard Chartered Bank | 12/16/24 | — | (468,580) |
| AUD | 27,218,042 | USD | 18,140,820 | HSBC Bank USA, N.A. | 12/18/24 | — | (220,930) |
| AUD | 13,000,000 | USD | 8,660,171 | UBS AG | 12/18/24 | — | (101,195) |
| CAD | 181,000 | USD | 133,974 | Bank of America, N.A. | 12/18/24 | — | (3,773) |
| CAD | 1,314,000 | USD | 978,804 | BNP Paribas | 12/18/24 | — | (33,586) |
| CAD | 1,839,000 | USD | 1,368,247 | BNP Paribas | 12/18/24 | — | (45,374) |
| CAD | 1,760,000 | USD | 1,311,660 | BNP Paribas | 12/18/24 | — | (45,615) |
| CAD | 2,364,000 | USD | 1,760,618 | BNP Paribas | 12/18/24 | — | (60,089) |
| CAD | 2,783,000 | USD | 2,072,156 | BNP Paribas | 12/18/24 | — | (70,222) |
| CAD | 4,159,000 | USD | 3,098,055 | BNP Paribas | 12/18/24 | — | (106,303) |
| CAD | 5,822,000 | USD | 4,331,667 | BNP Paribas | 12/18/24 | — | (143,646) |
| CAD | 5,573,000 | USD | 4,153,342 | BNP Paribas | 12/18/24 | — | (144,438) |
| CAD | 7,486,000 | USD | 5,575,290 | BNP Paribas | 12/18/24 | — | (190,280) |
| CAD | 8,810,000 | USD | 6,559,718 | BNP Paribas | 12/18/24 | — | (222,297) |
| CAD | 649,000 | USD | 480,695 | Standard Chartered Bank | 12/18/24 | — | (13,841) |
| CNH | 7,911,247 | USD | 1,132,962 | Bank of America, N.A. | 12/18/24 | — | (18,826) |
| CNH | 8,093,000 | USD | 1,159,095 | Bank of America, N.A. | 12/18/24 | — | (19,363) |
| CNH | 7,883,000 | USD | 1,129,012 | Citibank, N.A. | 12/18/24 | — | (18,854) |
| CNH | 8,036,000 | USD | 1,150,827 | Citibank, N.A. | 12/18/24 | — | (19,122) |
| CNH | 8,408,000 | USD | 1,203,703 | Citibank, N.A. | 12/18/24 | — | (19,610) |
| CNH | 8,261,000 | USD | 1,183,303 | Citibank, N.A. | 12/18/24 | — | (19,912) |
| CNH | 83,819,115 | USD | 11,947,794 | Citibank, N.A. | 12/18/24 | — | (143,601) |
| CNH | 3,889,000 | USD | 555,925 | HSBC Bank USA, N.A. | 12/18/24 | — | (8,239) |
| CNH | 5,260,000 | USD | 752,432 | HSBC Bank USA, N.A. | 12/18/24 | — | (11,670) |
| CNH | 10,552,267 | USD | 1,509,271 | HSBC Bank USA, N.A. | 12/18/24 | — | (23,202) |
| CNH | 24,443,733 | USD | 3,496,212 | HSBC Bank USA, N.A. | 12/18/24 | — | (53,817) |
| CNH | 6,306,000 | USD | 904,899 | JPMorgan Chase Bank, N.A. | 12/18/24 | — | (16,829) |
| CNH | 7,672,753 | USD | 1,099,644 | UBS AG | 12/18/24 | — | (19,096) |
| CNH | 8,514,000 | USD | 1,219,037 | UBS AG | 12/18/24 | — | (20,016) |
| CNH | 8,514,000 | USD | 1,219,277 | UBS AG | 12/18/24 | — | (20,256) |
| CNH | 8,198,000 | USD | 1,175,923 | UBS AG | 12/18/24 | — | (21,404) |
| EUR | 38,751,790 | CZK | 974,355,634 | JPMorgan Chase Bank, N.A. | 12/18/24 | 326,275 | — |
| EUR | 1,227,051 | CZK | 30,852,367 | JPMorgan Chase Bank, N.A. | 12/18/24 | 10,331 | — |
| EUR | 626,092 | CZK | 15,742,155 | JPMorgan Chase Bank, N.A. | 12/18/24 | 5,271 | — |
38
See Notes to Consolidated Financial Statements.
Global Macro Portfolio
October 31, 2024
Consolidated Portfolio of Investments — continued
| Forward Foreign Currency Exchange Contracts (OTC) (continued) |
| Currency Purchased | Currency Sold | Counterparty | Settlement
Date | Unrealized
Appreciation | Unrealized
(Depreciation) |
| EUR | 6,901,130 | PLN | 29,818,009 | BNP Paribas | 12/18/24 | $ 82,184 | $ — |
| EUR | 1,216,627 | PLN | 5,226,751 | BNP Paribas | 12/18/24 | 21,968 | — |
| EUR | 1,295,854 | PLN | 5,654,780 | Citibank, N.A. | 12/18/24 | 1,530 | — |
| EUR | 6,370,132 | PLN | 27,503,046 | HSBC Bank USA, N.A. | 12/18/24 | 81,014 | — |
| EUR | 42,077,939 | PLN | 182,294,257 | JPMorgan Chase Bank, N.A. | 12/18/24 | 379,782 | — |
| EUR | 6,313,619 | PLN | 27,245,162 | UBS AG | 12/18/24 | 83,760 | — |
| EUR | 1,223,787 | PLN | 5,258,727 | UBS AG | 12/18/24 | 21,794 | — |
| EUR | 119 | PLN | 513 | UBS AG | 12/18/24 | 2 | — |
| ILS | 19,839,828 | USD | 5,327,931 | Bank of America, N.A. | 12/18/24 | — | (9,442) |
| ILS | 111,168,743 | USD | 29,906,581 | Barclays Bank PLC | 12/18/24 | — | (105,433) |
| ILS | 68,921,429 | USD | 18,592,239 | Barclays Bank PLC | 12/18/24 | — | (116,383) |
| ISK | 258,611,215 | EUR | 1,657,658 | Bank of America, N.A. | 12/18/24 | 73,236 | — |
| ISK | 242,562,321 | EUR | 1,561,996 | Citibank, N.A. | 12/18/24 | 60,836 | — |
| JPY | 848,610,000 | USD | 5,999,919 | Goldman Sachs International | 12/18/24 | — | (382,692) |
| JPY | 1,283,966,653 | USD | 9,078,017 | Goldman Sachs International | 12/18/24 | — | (579,021) |
| JPY | 63,000,000 | USD | 438,004 | Standard Chartered Bank | 12/18/24 | — | (20,986) |
| KES | 111,536,419 | USD | 845,620 | Standard Chartered Bank | 12/18/24 | 12,675 | — |
| MXN | 53,000,000 | USD | 2,626,279 | Goldman Sachs International | 12/18/24 | 2,574 | — |
| MXN | 797,000 | USD | 39,834 | Standard Chartered Bank | 12/18/24 | — | (302) |
| MXN | 3,900,000 | USD | 194,924 | Standard Chartered Bank | 12/18/24 | — | (1,480) |
| MXN | 32,900,000 | USD | 1,644,355 | Standard Chartered Bank | 12/18/24 | — | (12,482) |
| MYR | 3,602,000 | USD | 827,304 | Barclays Bank PLC | 12/18/24 | — | (3,551) |
| MYR | 10,577,000 | USD | 2,453,320 | Barclays Bank PLC | 12/18/24 | — | (34,430) |
| MYR | 4,754,000 | USD | 1,096,554 | Credit Agricole Corporate and Investment Bank | 12/18/24 | — | (9,346) |
| MYR | 11,167,000 | USD | 2,575,772 | Credit Agricole Corporate and Investment Bank | 12/18/24 | — | (21,952) |
| MYR | 4,000,000 | USD | 917,958 | Goldman Sachs International | 12/18/24 | — | (3,184) |
| MYR | 3,878,000 | USD | 899,351 | Goldman Sachs International | 12/18/24 | — | (12,478) |
| MYR | 8,762,000 | USD | 2,018,894 | Goldman Sachs International | 12/18/24 | — | (15,082) |
| NOK | 57,837,000 | EUR | 4,892,795 | UBS AG | 12/18/24 | — | (73,098) |
| NZD | 21,000,000 | USD | 12,990,795 | Bank of America, N.A. | 12/18/24 | — | (434,090) |
| NZD | 6,609,088 | USD | 4,087,959 | Goldman Sachs International | 12/18/24 | — | (136,132) |
| PLN | 29,610,146 | EUR | 6,786,012 | Bank of America, N.A. | 12/18/24 | — | (8,585) |
| PLN | 53,140,024 | EUR | 12,259,041 | BNP Paribas | 12/18/24 | — | (103,117) |
| PLN | 15,119,270 | EUR | 3,465,101 | Standard Chartered Bank | 12/18/24 | — | (4,480) |
| PLN | 31,587,806 | EUR | 7,237,155 | Standard Chartered Bank | 12/18/24 | — | (6,875) |
| PLN | 52,837,011 | EUR | 12,187,673 | Standard Chartered Bank | 12/18/24 | — | (100,932) |
| SGD | 13,408,000 | USD | 10,366,772 | Bank of America, N.A. | 12/18/24 | — | (192,946) |
| SGD | 2,000,000 | USD | 1,544,464 | Citibank, N.A. | 12/18/24 | — | (26,888) |
| SGD | 8,000,000 | USD | 6,185,751 | Citibank, N.A. | 12/18/24 | — | (115,448) |
| SGD | 10,038,000 | USD | 7,764,386 | Citibank, N.A. | 12/18/24 | — | (147,674) |
| SGD | 3,000,000 | USD | 2,316,132 | Goldman Sachs International | 12/18/24 | — | (39,769) |
| SGD | 15,592,000 | USD | 12,058,135 | HSBC Bank USA, N.A. | 12/18/24 | — | (227,115) |
| SGD | 1,400,000 | USD | 1,058,491 | Standard Chartered Bank | 12/18/24 | 3,811 | — |
39
See Notes to Consolidated Financial Statements.
Global Macro Portfolio
October 31, 2024
Consolidated Portfolio of Investments — continued
| Forward Foreign Currency Exchange Contracts (OTC) (continued) |
| Currency Purchased | Currency Sold | Counterparty | Settlement
Date | Unrealized
Appreciation | Unrealized
(Depreciation) |
| SGD | 5,380,000 | USD | 4,154,995 | Standard Chartered Bank | 12/18/24 | $ — | $ (72,717) |
| TRY | 64,327,715 | USD | 1,541,892 | Standard Chartered Bank | 12/18/24 | 253,248 | — |
| USD | 7,446,997 | CAD | 10,053,000 | Bank of America, N.A. | 12/18/24 | 215,431 | — |
| USD | 8,076,399 | CAD | 10,900,000 | Standard Chartered Bank | 12/18/24 | 235,549 | — |
| USD | 8,070,779 | CAD | 10,897,000 | Standard Chartered Bank | 12/18/24 | 232,088 | — |
| USD | 4,020,923 | CAD | 5,521,131 | Standard Chartered Bank | 12/18/24 | 49,331 | — |
| USD | 3,910,903 | CAD | 5,368,869 | Standard Chartered Bank | 12/18/24 | 48,839 | — |
| USD | 11,107,060 | CNH | 78,361,200 | Bank of America, N.A. | 12/18/24 | 71,502 | — |
| USD | 2,993,462 | CNH | ��� 21,119,115 | Bank of America, N.A. | 12/18/24 | 19,270 | — |
| USD | 5,985,976 | CNH | 42,000,000 | BNP Paribas | 12/18/24 | 71,142 | — |
| USD | 4,396,795 | CNH | 31,000,000 | BNP Paribas | 12/18/24 | 31,085 | — |
| USD | 1,567,756 | CNH | 11,000,000 | BNP Paribas | 12/18/24 | 18,632 | — |
| USD | 1,134,657 | CNH | 8,000,000 | BNP Paribas | 12/18/24 | 8,022 | — |
| USD | 2,996,833 | CNH | 21,100,000 | Goldman Sachs International | 12/18/24 | 25,333 | — |
| USD | 809,571 | CNH | 5,700,000 | Goldman Sachs International | 12/18/24 | 6,844 | — |
| USD | 3,123,314 | CNH | 22,000,000 | Standard Chartered Bank | 12/18/24 | 25,068 | — |
| USD | 851,813 | CNH | 6,000,000 | Standard Chartered Bank | 12/18/24 | 6,837 | — |
| USD | 6,672,016 | CNH | 47,000,000 | UBS AG | 12/18/24 | 53,035 | — |
| USD | 4,408,833 | CNH | 31,000,000 | UBS AG | 12/18/24 | 43,123 | — |
| USD | 2,707,204 | CNH | 19,000,000 | UBS AG | 12/18/24 | 31,446 | — |
| USD | 3,974,221 | CNH | 28,000,000 | UBS AG | 12/18/24 | 30,999 | — |
| USD | 1,703,493 | CNH | 12,000,000 | UBS AG | 12/18/24 | 13,541 | — |
| USD | 1,137,763 | CNH | 8,000,000 | UBS AG | 12/18/24 | 11,128 | — |
| USD | 712,422 | CNH | 5,000,000 | UBS AG | 12/18/24 | 8,275 | — |
| USD | 993,555 | CNH | 7,000,000 | UBS AG | 12/18/24 | 7,750 | — |
| USD | 2,469,699 | ILS | 9,119,293 | BNP Paribas | 12/18/24 | 25,078 | — |
| USD | 7,289,486 | ILS | 26,880,707 | Citibank, N.A. | 12/18/24 | 83,540 | — |
| USD | 44,379,772 | ILS | 163,930,000 | JPMorgan Chase Bank, N.A. | 12/18/24 | 434,846 | — |
| USD | 1,244,640 | JPY | 176,038,075 | Goldman Sachs International | 12/18/24 | 79,387 | — |
| USD | 758,751 | KES | 111,536,419 | Standard Chartered Bank | 12/18/24 | — | (99,544) |
| USD | 4,363,066 | MXN | 85,900,000 | JPMorgan Chase Bank, N.A. | 12/18/24 | 102,340 | — |
| USD | 2,837,249 | MXN | 56,768,126 | Standard Chartered Bank | 12/18/24 | 21,493 | — |
| USD | 2,492,736 | MYR | 10,381,000 | Barclays Bank PLC | 12/18/24 | 118,670 | — |
| USD | 7,973,889 | MYR | 34,570,000 | Credit Agricole Corporate and Investment Bank | 12/18/24 | 67,959 | — |
| USD | 1,767,347 | MYR | 7,361,000 | Goldman Sachs International | 12/18/24 | 83,935 | — |
| USD | 7,169,150 | NZD | 11,848,258 | Australia and New Zealand Banking Group Limited | 12/18/24 | 84,622 | — |
| USD | 20,723,412 | NZD | 33,500,000 | Bank of America, N.A. | 12/18/24 | 692,477 | — |
| USD | 3,093,046 | NZD | 5,000,000 | Bank of America, N.A. | 12/18/24 | 103,355 | — |
| USD | 6,983,858 | NZD | 11,290,949 | Goldman Sachs International | 12/18/24 | 232,567 | — |
| USD | 1,292,740 | NZD | 2,090,000 | Goldman Sachs International | 12/18/24 | 43,049 | — |
| USD | 347,310 | NZD | 560,000 | Goldman Sachs International | 12/18/24 | 12,464 | — |
| USD | 130,575 | NZD | 211,104 | Goldman Sachs International | 12/18/24 | 4,348 | — |
| USD | 9,254,690 | NZD | 15,215,936 | Standard Chartered Bank | 12/18/24 | 156,498 | — |
40
See Notes to Consolidated Financial Statements.
Global Macro Portfolio
October 31, 2024
Consolidated Portfolio of Investments — continued
| Forward Foreign Currency Exchange Contracts (OTC) (continued) |
| Currency Purchased | Currency Sold | Counterparty | Settlement
Date | Unrealized
Appreciation | Unrealized
(Depreciation) |
| USD | 3,181,345 | THB | 106,437,000 | Standard Chartered Bank | 12/18/24 | $ 17,814 | $ — |
| USD | 2,751,199 | THB | 92,000,000 | Standard Chartered Bank | 12/18/24 | 16,766 | — |
| USD | 1,649,415 | TRY | 64,327,715 | Standard Chartered Bank | 12/18/24 | — | (145,724) |
| USD | 22,109,100 | ZAR | 396,725,820 | BNP Paribas | 12/18/24 | — | (309,312) |
| USD | 24,400,941 | ZAR | 437,850,627 | BNP Paribas | 12/18/24 | — | (341,376) |
| USD | 6,067,347 | ZAR | 104,668,947 | Citibank, N.A. | 12/18/24 | 152,653 | — |
| USD | 17,306,831 | ZAR | 298,641,485 | HSBC Bank USA, N.A. | 12/18/24 | 431,025 | — |
| USD | 6,119,870 | ZAR | 105,731,295 | Standard Chartered Bank | 12/18/24 | 145,145 | — |
| USD | 1,341,558 | ZAR | 23,990,000 | Standard Chartered Bank | 12/18/24 | — | (14,083) |
| USD | 9,153,861 | ZAR | 164,132,391 | State Street Bank and Trust Company | 12/18/24 | — | (121,027) |
| USD | 10,102,755 | ZAR | 181,146,441 | State Street Bank and Trust Company | 12/18/24 | — | (133,573) |
| USD | 18,336,289 | ZAR | 315,672,045 | UBS AG | 12/18/24 | 498,110 | — |
| USD | 7,323,131 | ZAR | 131,047,433 | UBS AG | 12/18/24 | — | (82,173) |
| USD | 8,082,251 | ZAR | 144,631,879 | UBS AG | 12/18/24 | — | (90,691) |
| USD | 23,639,436 | ZAR | 420,250,071 | UBS AG | 12/18/24 | — | (108,298) |
| USD | 26,089,912 | ZAR | 463,813,415 | UBS AG | 12/18/24 | — | (119,524) |
| VND | 17,449,000,000 | USD | 710,464 | Citibank, N.A. | 12/18/24 | — | (19,834) |
| ZAR | 49,861,815 | USD | 2,896,686 | Bank of America, N.A. | 12/18/24 | — | (79,066) |
| ZAR | 158,452,998 | USD | 9,186,480 | Barclays Bank PLC | 12/18/24 | — | (232,526) |
| ZAR | 101,758,806 | USD | 5,910,652 | BNP Paribas | 12/18/24 | — | (160,406) |
| ZAR | 145,369,723 | USD | 8,442,794 | HSBC Bank USA, N.A. | 12/18/24 | — | (228,158) |
| ZAR | 50,126,388 | USD | 2,915,511 | JPMorgan Chase Bank, N.A. | 12/18/24 | — | (82,941) |
| ZAR | 101,430,270 | USD | 5,889,405 | JPMorgan Chase Bank, N.A. | 12/18/24 | — | (157,724) |
| TRY | 177,014,356 | USD | 4,504,791 | Standard Chartered Bank | 12/20/24 | 425,625 | — |
| TRY | 177,001,200 | USD | 4,506,177 | Standard Chartered Bank | 12/20/24 | 423,873 | — |
| USD | 1,112,642 | TRY | 43,467,211 | Standard Chartered Bank | 12/20/24 | — | (98,059) |
| USD | 2,549,179 | TRY | 97,914,732 | Standard Chartered Bank | 12/20/24 | — | (178,060) |
| USD | 5,460,825 | TRY | 212,633,613 | Standard Chartered Bank | 12/20/24 | — | (461,701) |
| UZS | 5,274,882,202 | USD | 401,406 | ICBC Standard Bank plc | 12/20/24 | 7,714 | — |
| TRY | 169,761,372 | USD | 4,015,677 | Standard Chartered Bank | 1/6/25 | 637,666 | — |
| TRY | 80,088,000 | USD | 1,894,580 | Standard Chartered Bank | 1/6/25 | 300,718 | — |
| TRY | 60,062,400 | USD | 1,420,923 | Standard Chartered Bank | 1/6/25 | 225,453 | — |
| TRY | 57,009,900 | USD | 1,347,568 | Standard Chartered Bank | 1/6/25 | 215,135 | — |
| USD | 9,329,233 | TRY | 366,921,672 | Standard Chartered Bank | 1/6/25 | — | (728,486) |
| UZS | 15,376,313,000 | USD | 1,098,308 | JPMorgan Chase Bank, N.A. | 1/6/25 | 89,090 | — |
| SAR | 5,828,000 | USD | 1,549,641 | Standard Chartered Bank | 1/8/25 | 1,247 | — |
| USD | 9,979,232 | OMR | 3,844,000 | Standard Chartered Bank | 1/8/25 | — | (5,546) |
| TRY | 72,990,000 | USD | 1,699,432 | Standard Chartered Bank | 1/15/25 | 280,780 | — |
| USD | 1,821,093 | TRY | 72,990,000 | Standard Chartered Bank | 1/15/25 | — | (159,119) |
| UYU | 49,655,000 | USD | 1,178,614 | Bank of America, N.A. | 1/15/25 | 9,952 | — |
| ISK | 257,285,403 | EUR | 1,658,836 | Citibank, N.A. | 1/17/25 | 53,495 | — |
| ISK | 243,888,397 | EUR | 1,572,459 | Citibank, N.A. | 1/17/25 | 50,709 | — |
| UZS | 16,702,683,000 | USD | 1,187,113 | ICBC Standard Bank plc | 1/23/25 | 94,606 | — |
| UZS | 11,266,196,720 | USD | 806,168 | ICBC Standard Bank plc | 1/23/25 | 58,370 | — |
41
See Notes to Consolidated Financial Statements.
Global Macro Portfolio
October 31, 2024
Consolidated Portfolio of Investments — continued
| Forward Foreign Currency Exchange Contracts (OTC) (continued) |
| Currency Purchased | Currency Sold | Counterparty | Settlement
Date | Unrealized
Appreciation | Unrealized
(Depreciation) |
| TRY | 99,122,295 | USD | 2,283,293 | Standard Chartered Bank | 1/29/25 | $ 363,651 | $ — |
| TRY | 54,319,443 | USD | 1,237,947 | Standard Chartered Bank | 1/29/25 | 212,589 | — |
| TRY | 51,738,000 | USD | 1,191,278 | Standard Chartered Bank | 1/29/25 | 190,323 | — |
| USD | 8,592,493 | OMR | 3,310,000 | BNP Paribas | 1/29/25 | — | (4,979) |
| USD | 144,803 | TRY | 5,863,846 | Standard Chartered Bank | 1/29/25 | — | (11,784) |
| USD | 4,957,451 | TRY | 199,315,892 | Standard Chartered Bank | 1/29/25 | — | (365,043) |
| USD | 2,428,849 | LKR | 751,000,000 | JPMorgan Chase Bank, N.A. | 2/7/25 | — | (113,757) |
| TRY | 182,511,329 | USD | 4,260,550 | Standard Chartered Bank | 2/10/25 | 552,029 | — |
| TRY | 102,687,143 | USD | 2,372,642 | Standard Chartered Bank | 2/10/25 | 335,080 | — |
| USD | 7,029,731 | TRY | 285,198,472 | Standard Chartered Bank | 2/10/25 | — | (490,572) |
| UZS | 16,619,585,000 | USD | 1,187,113 | ICBC Standard Bank plc | 2/10/25 | 79,766 | — |
| EGP | 160,694,420 | USD | 2,669,343 | Citibank, N.A. | 2/13/25 | 453,060 | — |
| USD | 754,045 | LKR | 233,000,000 | Deutsche Bank AG | 2/13/25 | — | (34,234) |
| USD | 381,568 | LKR | 118,000,000 | JPMorgan Chase Bank, N.A. | 2/13/25 | — | (17,646) |
| USD | 1,193,209 | LKR | 369,000,000 | JPMorgan Chase Bank, N.A. | 2/13/25 | — | (55,182) |
| UZS | 12,273,226,786 | USD | 873,539 | JPMorgan Chase Bank, N.A. | 2/13/25 | 61,083 | — |
| USD | 2,821,869 | LKR | 869,700,000 | JPMorgan Chase Bank, N.A. | 2/14/25 | — | (120,123) |
| EUR | 4,891,268 | ISK | 740,000,000 | Bank of America, N.A. | 2/18/25 | 4,432 | — |
| EUR | 4,705,489 | ISK | 711,893,449 | Bank of America, N.A. | 2/18/25 | 4,263 | — |
| UZS | 14,963,793,783 | USD | 1,064,281 | JPMorgan Chase Bank, N.A. | 2/18/25 | 73,320 | — |
| EGP | 53,831,741 | USD | 889,781 | Citibank, N.A. | 2/20/25 | 152,819 | — |
| EGP | 33,046,461 | USD | 533,869 | Citibank, N.A. | 2/20/25 | 106,167 | — |
| EGP | 27,805,651 | USD | 444,890 | Citibank, N.A. | 2/20/25 | 93,643 | — |
| NGN | 1,567,021,679 | USD | 851,642 | Standard Chartered Bank | 2/24/25 | 48,003 | — |
| NGN | 794,156,367 | USD | 425,821 | Standard Chartered Bank | 2/24/25 | 30,113 | — |
| TRY | 109,548,623 | USD | 2,602,435 | Standard Chartered Bank | 2/24/25 | 246,962 | — |
| USD | 2,646,400 | TRY | 109,548,623 | Standard Chartered Bank | 2/24/25 | — | (202,997) |
| NGN | 1,216,220,810 | USD | 735,321 | JPMorgan Chase Bank, N.A. | 2/25/25 | — | (37,412) |
| EGP | 13,292,925 | USD | 245,938 | Goldman Sachs International | 2/26/25 | 10,804 | — |
| EGP | 29,051,345 | USD | 444,890 | Citibank, N.A. | 2/27/25 | 115,952 | — |
| EGP | 25,014,906 | USD | 450,719 | HSBC Bank USA, N.A. | 2/27/25 | 32,199 | — |
| UZS | 13,634,050,578 | USD | 968,671 | ICBC Standard Bank plc | 2/28/25 | 64,374 | — |
| USD | 843,687 | ARS | 1,002,300,000 | Bank of America, N.A. | 3/3/25 | — | (54,451) |
| UZS | 5,369,835,218 | USD | 384,383 | ICBC Standard Bank plc | 3/5/25 | 21,808 | — |
| UZS | 4,968,301,730 | USD | 352,237 | JPMorgan Chase Bank, N.A. | 3/17/25 | 22,082 | — |
| VND | 17,471,000,000 | USD | 708,188 | Citibank, N.A. | 3/19/25 | — | (16,415) |
| UZS | 4,160,754,064 | USD | 294,880 | JPMorgan Chase Bank, N.A. | 3/20/25 | 18,285 | — |
| KES | 113,812,672 | USD | 840,635 | Standard Chartered Bank | 3/21/25 | 16,636 | — |
| USD | 758,751 | KES | 113,812,672 | Standard Chartered Bank | 3/21/25 | — | (98,519) |
| UYU | 61,100,000 | USD | 1,421,757 | Citibank, N.A. | 3/31/25 | 25,615 | — |
| USD | 1,041,989 | ARS | 1,276,437,000 | Goldman Sachs International | 4/3/25 | — | (73,144) |
| USD | 1,687,408 | ARS | 2,063,700,000 | Goldman Sachs International | 4/3/25 | — | (115,501) |
| USD | 1,687,408 | ARS | 2,063,700,000 | Goldman Sachs International | 4/3/25 | — | (115,501) |
| KES | 165,880,000 | USD | 1,219,716 | Standard Chartered Bank | 4/4/25 | 25,496 | — |
42
See Notes to Consolidated Financial Statements.
Global Macro Portfolio
October 31, 2024
Consolidated Portfolio of Investments — continued
| Forward Foreign Currency Exchange Contracts (OTC) (continued) |
| Currency Purchased | Currency Sold | Counterparty | Settlement
Date | Unrealized
Appreciation | Unrealized
(Depreciation) |
| USD | 1,138,113 | KES | 165,880,000 | Standard Chartered Bank | 4/4/25 | $ — | $ (107,098) |
| UZS | 4,142,721,282 | USD | 291,741 | JPMorgan Chase Bank, N.A. | 4/4/25 | 18,522 | — |
| TRY | 75,590,000 | USD | 1,646,854 | Standard Chartered Bank | 4/8/25 | 240,495 | — |
| TRY | 67,960,000 | USD | 1,482,236 | Standard Chartered Bank | 4/8/25 | 214,605 | — |
| USD | 3,359,440 | TRY | 143,550,000 | Standard Chartered Bank | 4/8/25 | — | (224,752) |
| KES | 201,497,151 | USD | 1,480,411 | Standard Chartered Bank | 4/9/25 | 30,334 | — |
| USD | 1,380,117 | KES | 201,497,151 | Standard Chartered Bank | 4/9/25 | — | (130,628) |
| ETB | 12,054,000 | USD | 92,759 | ICBC Standard Bank plc | 4/11/25 | — | (1,933) |
| KZT | 469,702,212 | USD | 939,404 | Bank of America, N.A. | 4/11/25 | — | (9,123) |
| UYU | 20,303,181 | USD | 478,736 | Citibank, N.A. | 4/15/25 | 1,119 | — |
| UZS | 3,689,671,414 | USD | 257,659 | Standard Chartered Bank | 4/15/25 | 17,673 | — |
| KES | 201,290,134 | USD | 1,483,347 | Standard Chartered Bank | 4/16/25 | 23,290 | — |
| USD | 1,380,117 | KES | 201,290,134 | Standard Chartered Bank | 4/16/25 | — | (126,519) |
| UZS | 12,250,550,000 | USD | 859,989 | ICBC Standard Bank plc | 4/17/25 | 53,572 | — |
| UZS | 16,829,055,017 | USD | 1,236,521 | ICBC Standard Bank plc | 4/25/25 | 15,180 | — |
| KES | 261,304,500 | USD | 1,914,319 | Standard Chartered Bank | 5/5/25 | 33,493 | — |
| USD | 845,646 | KES | 130,652,250 | Standard Chartered Bank | 5/5/25 | — | (128,260) |
| USD | 845,646 | KES | 130,652,250 | Standard Chartered Bank | 5/5/25 | — | (128,260) |
| UZS | 3,152,164,000 | USD | 219,778 | JPMorgan Chase Bank, N.A. | 6/9/25 | 11,640 | — |
| USD | 17,699,754 | BHD | 6,766,439 | Standard Chartered Bank | 6/18/25 | — | (196,456) |
| USD | 5,911,596 | SAR | 22,308,000 | Standard Chartered Bank | 6/18/25 | — | (17,982) |
| UZS | 5,267,367,000 | USD | 367,961 | Standard Chartered Bank | 6/23/25 | 17,140 | — |
| UZS | 8,036,734,000 | USD | 563,191 | ICBC Standard Bank plc | 6/27/25 | 23,684 | — |
| UZS | 8,076,175,636 | USD | 563,192 | ICBC Standard Bank plc | 6/30/25 | 26,040 | — |
| USD | 1,689,843 | ARS | 2,362,400,000 | Goldman Sachs International | 8/26/25 | — | (164,997) |
| USD | 1,677,815 | ARS | 2,362,363,000 | Goldman Sachs International | 8/26/25 | — | (176,996) |
| UZS | 8,779,301,000 | USD | 618,261 | ICBC Standard Bank plc | 8/29/25 | 11,288 | — |
| UZS | 8,779,301,000 | USD | 618,261 | JPMorgan Chase Bank, N.A. | 8/29/25 | 11,288 | — |
| UZS | 8,794,758,000 | USD | 618,261 | JPMorgan Chase Bank, N.A. | 9/4/25 | 11,258 | — |
| UZS | 4,050,152,000 | USD | 284,221 | Citibank, N.A. | 9/8/25 | 5,336 | — |
| USD | 916,787 | NGN | 1,792,318,000 | Goldman Sachs International | 10/7/25 | — | (13,339) |
| NGN | 215,900,000 | USD | 113,632 | JPMorgan Chase Bank, N.A. | 10/9/25 | — | (1,684) |
| USD | 889,798 | NGN | 1,727,142,000 | JPMorgan Chase Bank, N.A. | 10/10/25 | — | (5,376) |
| EGP | 614,910,000 | USD | 10,769,002 | JPMorgan Chase Bank, N.A. | 10/15/25 | — | (34,403) |
| USD | 1,327,359 | NGN | 2,601,623,022 | JPMorgan Chase Bank, N.A. | 10/15/25 | — | (18,233) |
| UZS | 11,412,500,000 | USD | 711,059 | Standard Chartered Bank | 3/25/26 | 51,582 | — |
| UZS | 6,387,596,000 | USD | 396,745 | Deutsche Bank AG | 10/5/26 | 2,233 | — |
| UZS | 3,518,712,735 | USD | 218,554 | Deutsche Bank AG | 10/7/26 | 1,082 | — |
| UZS | 2,119,371,000 | USD | 118,170 | Deutsche Bank AG | 10/25/27 | — | (1,942) |
| | | | | | | $19,749,667 | $(17,285,961) |
43
See Notes to Consolidated Financial Statements.
Global Macro Portfolio
October 31, 2024
Consolidated Portfolio of Investments — continued
| Futures Contracts |
| Description | Number of
Contracts | Position | Expiration
Date | Notional
Amount | Value/Unrealized
Appreciation
(Depreciation) |
| Commodity Futures | | | | | |
| Brent Crude Oil | 124 | Long | 11/29/24 | $ 9,028,440 | $ (146,543) |
| Equity Futures | | | | | |
| Nikkei 225 Index | 45 | Long | 12/12/24 | 11,367,552 | 591,193 |
| SET50 Index | 654 | Long | 12/27/24 | 3,632,709 | 107,921 |
| Euro Stoxx 50 Index | (197) | Short | 12/20/24 | (10,360,833) | 41,716 |
| S&P/TSX 60 Index | (88) | Short | 12/19/24 | (18,294,596) | (319,379) |
| STOXX Europe 600 Index | (225) | Short | 12/20/24 | (6,195,687) | 207,391 |
| Interest Rate Futures | | | | | |
| U.S. 5-Year Treasury Note | 283 | Long | 12/31/24 | 30,347,328 | (755,068) |
| U.S. 10-Year Treasury Note | 712 | Long | 12/19/24 | 78,653,750 | (2,296,963) |
| U.S. Ultra-Long Treasury Bond | 25 | Long | 12/19/24 | 3,140,625 | 3,594 |
| Euro-Bobl | (53) | Short | 12/6/24 | (6,811,435) | 31,708 |
| Euro-Bund | (467) | Short | 12/6/24 | (66,951,657) | 986,838 |
| Euro-Buxl | (31) | Short | 12/6/24 | (4,463,212) | 18,883 |
| Euro-Schatz | (53) | Short | 12/6/24 | (6,142,110) | 3,171 |
| Japan 10-Year Bond | (1) | Short | 12/13/24 | (948,993) | 329 |
| U.S. 2-Year Treasury Note | (5) | Short | 12/31/24 | (1,029,727) | 7,686 |
| U.S. Long Treasury Bond | (76) | Short | 12/19/24 | (8,965,625) | 496,852 |
| U.S. Ultra 10-Year Treasury Note | (47) | Short | 12/19/24 | (5,346,250) | 160,719 |
| | | | | | $(859,952) |
| Inflation Swaps (Centrally Cleared) |
Notional Amount
(000's omitted) | Portfolio
Pays/Receives
Return on
Reference Index | Reference Index | Portfolio
Pays/Receives
Rate | Annual
Rate | Termination
Date | Value/Unrealized
Appreciation
(Depreciation) |
| EUR | 5,900 | Receives | Eurostat Eurozone HICP ex Tobacco NSA
(pays upon termination) | Pays | 2.20%
(pays upon termination) | 10/15/36 | $ 537,136 |
| EUR | 5,900 | Receives | Eurostat Eurozone HICP ex Tobacco NSA
(pays upon termination) | Pays | 2.20%
(pays upon termination) | 10/15/36 | 537,135 |
| EUR | 5,900 | Receives | Eurostat Eurozone HICP ex Tobacco NSA
(pays upon termination) | Pays | 2.20%
(pays upon termination) | 10/15/36 | 536,312 |
| EUR | 6,070 | Receives | Eurostat Eurozone HICP ex Tobacco NSA
(pays upon termination) | Pays | 2.08%
(pays upon termination) | 1/15/37 | 603,418 |
| EUR | 5,900 | Pays | Eurostat Eurozone HICP ex Tobacco NSA
(pays upon termination) | Receives | 2.29%
(pays upon termination) | 10/15/46 | (535,561) |
| EUR | 5,900 | Pays | Eurostat Eurozone HICP ex Tobacco NSA
(pays upon termination) | Receives | 2.29%
(pays upon termination) | 10/15/46 | (535,561) |
44
See Notes to Consolidated Financial Statements.
Global Macro Portfolio
October 31, 2024
Consolidated Portfolio of Investments — continued
| Inflation Swaps (Centrally Cleared) (continued) |
Notional Amount
(000's omitted) | Portfolio
Pays/Receives
Return on
Reference Index | Reference Index | Portfolio
Pays/Receives
Rate | Annual
Rate | Termination
Date | Value/Unrealized
Appreciation
(Depreciation) |
| EUR | 5,900 | Pays | Eurostat Eurozone HICP ex Tobacco NSA
(pays upon termination) | Receives | 2.29%
(pays upon termination) | 10/15/46 | $(538,060) |
| EUR | 6,070 | Pays | Eurostat Eurozone HICP ex Tobacco NSA
(pays upon termination) | Receives | 2.18%
(pays upon termination) | 1/15/47 | (678,429) |
| EUR | 2,590 | Pays | Eurostat Eurozone HICP ex Tobacco NSA
(pays upon termination) | Receives | 2.64%
(pays upon termination) | 3/13/53 | 298,428 |
| USD | 28,400 | Pays | Return on CPI-U (NSA)
(pays upon termination) | Receives | 2.75%
(pays upon termination) | 10/29/36 | (836,610) |
| USD | 9,970 | Pays | Return on CPI-U (NSA)
(pays upon termination) | Receives | 2.67%
(pays upon termination) | 1/7/37 | (306,006) |
| USD | 19,000 | Receives | Return on CPI-U (NSA)
(pays upon termination) | Pays | 2.62%
(pays upon termination) | 10/29/46 | 449,108 |
| USD | 9,450 | Receives | Return on CPI-U (NSA)
(pays upon termination) | Pays | 2.62%
(pays upon termination) | 10/29/46 | 219,512 |
| USD | 9,950 | Receives | Return on CPI-U (NSA)
(pays upon termination) | Pays | 2.54%
(pays upon termination) | 1/7/47 | 318,241 |
| USD | 3,510 | Receives | Return on CPI-U (NSA)
(pays upon termination) | Pays | 2.40%
(pays upon termination) | 3/13/53 | 59,731 |
| | | | | | | | $128,794 |
| Interest Rate Swaps (Centrally Cleared) |
Notional Amount
(000's omitted) | Portfolio
Pays/
Receives
Floating
Rate | Floating Rate | Annual
Fixed Rate | Termination
Date | Value | Unamortized
Upfront
Receipts
(Payments) | Unrealized
Appreciation
(Depreciation) |
| COP | 240,629,000 | Pays | Colombia Overnight Interbank Reference Rate
(pays quarterly) | 8.82%
(pays quarterly) | 4/11/25 | $ 10,506 | $ — | $ 10,506 |
| COP | 79,600,000 | Pays | Colombia Overnight Interbank Reference Rate
(pays upon termination) | 8.81%
(pays upon termination) | 4/15/25 | (1,751) | — | (1,751) |
| COP | 78,685,000 | Pays | Colombia Overnight Interbank Reference Rate
(pays upon termination) | 8.78%
(pays upon termination) | 4/17/25 | (2,923) | — | (2,923) |
| COP | 75,518,000 | Pays | Colombia Overnight Interbank Reference Rate
(pays upon termination) | 8.76%
(pays upon termination) | 4/18/25 | (3,169) | — | (3,169) |
| COP | 38,768,000 | Pays | Colombia Overnight Interbank Reference Rate
(pays upon termination) | 8.72%
(pays upon termination) | 4/24/25 | (837) | — | (837) |
| COP | 39,209,000 | Pays | Colombia Overnight Interbank Reference Rate
(pays upon termination) | 8.73%
(pays upon termination) | 4/25/25 | 359 | — | 359 |
| COP | 118,947,000 | Pays | Colombia Overnight Interbank Reference Rate
(pays upon termination) | 8.70%
(pays upon termination) | 4/29/25 | 2,382 | — | 2,382 |
45
See Notes to Consolidated Financial Statements.
Global Macro Portfolio
October 31, 2024
Consolidated Portfolio of Investments — continued
| Interest Rate Swaps (Centrally Cleared) (continued) |
Notional Amount
(000's omitted) | Portfolio
Pays/
Receives
Floating
Rate | Floating Rate | Annual
Fixed Rate | Termination
Date | Value | Unamortized
Upfront
Receipts
(Payments) | Unrealized
Appreciation
(Depreciation) |
| COP | 39,473,000 | Pays | Colombia Overnight Interbank Reference Rate
(pays upon termination) | 8.70%
(pays upon termination) | 4/30/25 | $ 1,249 | $ — | $ 1,249 |
| COP | 8,017,000 | Pays | Colombia Overnight Interbank Reference Rate
(pays upon termination) | 8.60%
(pays upon termination) | 5/1/25 | (504) | — | (504) |
| COP | 56,485,000 | Pays | Colombia Overnight Interbank Reference Rate
(pays upon termination) | 8.61%
(pays upon termination) | 5/1/25 | (2,627) | — | (2,627) |
| COP | 53,615,000 | Pays | Colombia Overnight Interbank Reference Rate
(pays upon termination) | 8.45%
(pays upon termination) | 7/16/25 | (10,558) | — | (10,558) |
| COP | 107,231,000 | Pays | Colombia Overnight Interbank Reference Rate
(pays upon termination) | 8.46%
(pays upon termination) | 7/17/25 | (18,850) | — | (18,850) |
| COP | 74,387,000 | Pays | Colombia Overnight Interbank Reference Rate
(pays upon termination) | 8.45%
(pays upon termination) | 7/21/25 | (10,383) | — | (10,383) |
| COP | 52,523,000 | Pays | Colombia Overnight Interbank Reference Rate
(pays upon termination) | 8.55%
(pays upon termination) | 7/25/25 | 4,286 | — | 4,286 |
| COP | 80,514,000 | Pays | Colombia Overnight Interbank Reference Rate
(pays upon termination) | 8.20%
(pays upon termination) | 10/16/25 | (41,672) | — | (41,672) |
| COP | 40,806,000 | Pays | Colombia Overnight Interbank Reference Rate
(pays upon termination) | 8.21%
(pays upon termination) | 10/17/25 | (20,145) | — | (20,145) |
| COP | 104,303,000 | Pays | Colombia Overnight Interbank Reference Rate
(pays upon termination) | 8.21%
(pays upon termination) | 10/17/25 | (51,493) | — | (51,493) |
| COP | 41,253,000 | Pays | Colombia Overnight Interbank Reference Rate
(pays quarterly) | 7.12%
(pays quarterly) | 9/18/26 | (159,387) | — | (159,387) |
| COP | 50,522,000 | Pays | Colombia Overnight Interbank Reference Rate
(pays quarterly) | 7.27%
(pays quarterly) | 9/18/26 | (164,388) | — | (164,388) |
| COP | 10,588,000 | Pays | Colombia Overnight Interbank Reference Rate
(pays quarterly) | 7.28%
(pays quarterly) | 9/18/26 | (33,783) | — | (33,783) |
| COP | 11,311,000 | Receives | Colombia Overnight Interbank Reference Rate
(pays quarterly) | 7.56%
(pays quarterly) | 9/18/34 | 200,360 | — | 200,360 |
| COP | 2,864,000 | Receives | Colombia Overnight Interbank Reference Rate
(pays quarterly) | 7.63%
(pays quarterly) | 9/18/34 | 47,373 | — | 47,373 |
| COP | 13,811,000 | Receives | Colombia Overnight Interbank Reference Rate
(pays quarterly) | 7.64%
(pays quarterly) | 9/18/34 | 226,286 | — | 226,286 |
| EUR | 2,000 | Receives | 1-day Euro Short-Term Rate
(pays annually) | 2.60%
(pays annually) | 1/24/28 | (8,588) | 21 | (8,567) |
| EUR | 3,629 | Pays | 6-month EURIBOR
(pays semi-annually) | 3.03%
(pays annually) | 10/10/29 | 118,834 | — | 118,834 |
| EUR | 1,200 | Pays | 6-month EURIBOR
(pays semi-annually) | 3.17%
(pays annually) | 10/17/29 | 48,198 | — | 48,198 |
46
See Notes to Consolidated Financial Statements.
Global Macro Portfolio
October 31, 2024
Consolidated Portfolio of Investments — continued
| Interest Rate Swaps (Centrally Cleared) (continued) |
Notional Amount
(000's omitted) | Portfolio
Pays/
Receives
Floating
Rate | Floating Rate | Annual
Fixed Rate | Termination
Date | Value | Unamortized
Upfront
Receipts
(Payments) | Unrealized
Appreciation
(Depreciation) |
| EUR | 1,781 | Pays | 6-month EURIBOR
(pays semi-annually) | 3.01%
(pays annually) | 10/27/29 | $ 58,100 | $ — | $ 58,100 |
| EUR | 400 | Pays | 6-month EURIBOR
(pays semi-annually) | 3.26%
(pays annually) | 10/17/32 | 26,813 | — | 26,813 |
| EUR | 800 | Pays | 6-month EURIBOR
(pays semi-annually) | 3.31%
(pays annually) | 10/18/32 | 57,122 | — | 57,122 |
| EUR | 800 | Pays | 6-month EURIBOR
(pays semi-annually) | 3.20%
(pays annually) | 10/19/32 | 50,279 | — | 50,279 |
| GBP | 5,154 | Pays | 1-day Sterling Overnight Index Average
(pays annually) | 4.56%
(pays annually) | 10/2/28 | 106,221 | — | 106,221 |
| GBP | 3,359 | Pays | 1-day Sterling Overnight Index Average
(pays annually) | 3.61%
(pays annually) | 12/20/28 | (136,393) | — | (136,393) |
| GBP | 3,359 | Pays | 1-day Sterling Overnight Index Average
(pays annually) | 3.64%
(pays annually) | 12/20/28 | (130,422) | — | (130,422) |
| GBP | 3,359 | Pays | 1-day Sterling Overnight Index Average
(pays annually) | 3.69%
(pays annually) | 12/20/28 | (120,338) | — | (120,338) |
| GBP | 3,422 | Pays | 1-day Sterling Overnight Index Average
(pays annually) | 3.72%
(pays annually) | 12/20/28 | (117,508) | — | (117,508) |
| GBP | 4,702 | Pays | 1-day Sterling Overnight Index Average
(pays annually) | 4.27%
(pays annually) | 12/20/28 | (5,619) | — | (5,619) |
| GBP | 4,698 | Pays | 1-day Sterling Overnight Index Average
(pays annually) | 4.28%
(pays annually) | 12/20/28 | (2,822) | — | (2,822) |
| GBP | 10,164 | Pays | 1-day Sterling Overnight Index Average
(pays annually) | 4.39%
(pays annually) | 12/20/28 | 59,057 | — | 59,057 |
| GBP | 5,082 | Pays | 1-day Sterling Overnight Index Average
(pays annually) | 4.59%
(pays annually) | 12/20/28 | 89,228 | — | 89,228 |
| GBP | 5,472 | Pays | 1-day Sterling Overnight Index Average
(pays annually) | 3.73%
(pays annually) | 3/20/29 | (159,506) | — | (159,506) |
| GBP | 5,472 | Pays | 1-day Sterling Overnight Index Average
(pays annually) | 3.76%
(pays annually) | 3/20/29 | (151,445) | — | (151,445) |
| GBP | 5,536 | Pays | 1-day Sterling Overnight Index Average
(pays annually) | 3.76%
(pays annually) | 3/20/29 | (152,726) | — | (152,726) |
| GBP | 5,472 | Pays | 1-day Sterling Overnight Index Average
(pays annually) | 3.77%
(pays annually) | 3/20/29 | (147,576) | — | (147,576) |
| GBP | 5,495 | Pays | 1-day Sterling Overnight Index Average
(pays annually) | 3.83%
(pays annually) | 3/20/29 | (128,602) | — | (128,602) |
| GBP | 2,074 | Pays | 1-day Sterling Overnight Index Average
(pays annually) | 4.03%
(pays annually) | 6/20/29 | (14,128) | — | (14,128) |
47
See Notes to Consolidated Financial Statements.
Global Macro Portfolio
October 31, 2024
Consolidated Portfolio of Investments — continued
| Interest Rate Swaps (Centrally Cleared) (continued) |
Notional Amount
(000's omitted) | Portfolio
Pays/
Receives
Floating
Rate | Floating Rate | Annual
Fixed Rate | Termination
Date | Value | Unamortized
Upfront
Receipts
(Payments) | Unrealized
Appreciation
(Depreciation) |
| GBP | 2,074 | Pays | 1-day Sterling Overnight Index Average
(pays annually) | 4.05%
(pays annually) | 6/20/29 | $ (11,406) | $ — | $ (11,406) |
| GBP | 2,153 | Pays | 1-day Sterling Overnight Index Average
(pays annually) | 4.13%
(pays annually) | 6/20/29 | (2,564) | — | (2,564) |
| GBP | 2,100 | Pays | 1-day Sterling Overnight Index Average
(pays annually) | 4.14%
(pays annually) | 6/20/29 | (451) | — | (451) |
| GBP | 2,393 | Pays | 1-day Sterling Overnight Index Average
(pays annually) | 3.78%
(pays annually) | 12/18/29 | (31,923) | — | (31,923) |
| GBP | 2,397 | Pays | 1-day Sterling Overnight Index Average
(pays annually) | 3.81%
(pays annually) | 12/18/29 | (28,640) | — | (28,640) |
| INR | 1,195,000 | Pays | 1-day INR FBIL MIBOR
(pays semi-annually) | 5.94%
(pays semi-annually) | 12/18/29 | (202,281) | — | (202,281) |
| INR | 520,000 | Pays | 1-day INR FBIL MIBOR
(pays semi-annually) | 5.94%
(pays semi-annually) | 12/18/29 | (87,507) | — | (87,507) |
| INR | 522,000 | Pays | 1-day INR FBIL MIBOR
(pays semi-annually) | 5.95%
(pays semi-annually) | 12/18/29 | (87,147) | — | (87,147) |
| INR | 405,070 | Pays | 1-day INR FBIL MIBOR
(pays semi-annually) | 5.95%
(pays semi-annually) | 12/18/29 | (67,005) | — | (67,005) |
| KRW | 13,156,000 | Pays | 3-month KRW Certificate of Deposit Rate
(pays quarterly) | 3.02%
(pays quarterly) | 9/18/34 | 12,047 | — | 12,047 |
| KRW | 12,669,000 | Pays | 3-month KRW Certificate of Deposit Rate
(pays quarterly) | 3.03%
(pays quarterly) | 9/18/34 | 19,810 | — | 19,810 |
| MXN | 1,271,820 | Pays | Mexico Interbank TIIE 28 Day
(pays monthly) | 10.39%
(pays monthly) | 8/5/25 | 45,180 | — | 45,180 |
| MXN | 821,320 | Pays | Mexico Interbank TIIE 28 Day
(pays monthly) | 10.39%
(pays monthly) | 8/5/25 | 30,003 | — | 30,003 |
| MXN | 1,152,350 | Pays | Mexico Interbank TIIE 28 Day
(pays monthly) | 9.98%
(pays monthly) | 9/11/25 | (148,475) | — | (148,475) |
| MXN | 496,000 | Pays | Mexico Interbank TIIE 28 Day
(pays monthly) | 9.56%
(pays monthly) | 10/16/26 | (134,410) | — | (134,410) |
| MXN | 255,000 | Pays | Mexico Interbank TIIE 28 Day
(pays monthly) | 9.57%
(pays monthly) | 10/16/26 | (65,584) | — | (65,584) |
| MXN | 509,000 | Pays | Mexico Interbank TIIE 28 Day
(pays monthly) | 9.54%
(pays monthly) | 10/19/26 | (142,042) | — | (142,042) |
| MXN | 451,700 | Pays | Mexico Interbank TIIE 28 Day
(pays monthly) | 9.57%
(pays monthly) | 10/19/26 | (113,600) | — | (113,600) |
| NZD | 17,020 | Pays | 3-month NZD Bank Bill
(pays quarterly) | 3.51%
(pays semi-annually) | 9/18/29 | (140,054) | — | (140,054) |
| NZD | 13,000 | Pays | 3-month NZD Bank Bill
(pays quarterly) | 3.54%
(pays semi-annually) | 9/18/29 | (96,311) | — | (96,311) |
48
See Notes to Consolidated Financial Statements.
Global Macro Portfolio
October 31, 2024
Consolidated Portfolio of Investments — continued
| Interest Rate Swaps (Centrally Cleared) (continued) |
Notional Amount
(000's omitted) | Portfolio
Pays/
Receives
Floating
Rate | Floating Rate | Annual
Fixed Rate | Termination
Date | Value | Unamortized
Upfront
Receipts
(Payments) | Unrealized
Appreciation
(Depreciation) |
| NZD | 17,000 | Pays | 3-month NZD Bank Bill
(pays quarterly) | 3.54%
(pays semi-annually) | 9/18/29 | $ (124,550) | $ — | $ (124,550) |
| NZD | 15,000 | Pays | 3-month NZD Bank Bill
(pays quarterly) | 3.55%
(pays semi-annually) | 9/18/29 | (107,026) | — | (107,026) |
| NZD | 19,290 | Pays | 3-month NZD Bank Bill
(pays quarterly) | 3.70%
(pays semi-annually) | 9/18/29 | (57,832) | — | (57,832) |
| NZD | 11,010 | Pays | 3-month NZD Bank Bill
(pays quarterly) | 3.81%
(pays semi-annually) | 9/18/29 | 1,010 | — | 1,010 |
| NZD | 16,000 | Pays | 3-month NZD Bank Bill
(pays quarterly) | 3.82%
(pays semi-annually) | 9/18/29 | 3,217 | — | 3,217 |
| NZD | 18,000 | Pays | 3-month NZD Bank Bill
(pays quarterly) | 3.85%
(pays semi-annually) | 9/18/29 | 19,369 | — | 19,369 |
| NZD | 6,235 | Receives | 3-month NZD Bank Bill
(pays quarterly) | 4.08%
(pays semi-annually) | 5/15/34 | 19,485 | — | 19,485 |
| NZD | 8,389 | Receives | 3-month NZD Bank Bill
(pays quarterly) | 4.10%
(pays semi-annually) | 5/15/34 | 17,414 | — | 17,414 |
| NZD | 7,360 | Receives | 3-month NZD Bank Bill
(pays quarterly) | 4.16%
(pays semi-annually) | 5/15/34 | (4,960) | — | (4,960) |
| NZD | 4,059 | Receives | 3-month NZD Bank Bill
(pays quarterly) | 4.16%
(pays semi-annually) | 5/15/34 | (3,703) | — | (3,703) |
| TWD | 108,000 | Receives | 3-month TWD TAIBOR
(pays quarterly) | 1.26%
(pays quarterly) | 3/20/29 | 96,548 | — | 96,548 |
| TWD | 143,600 | Receives | 3-month TWD TAIBOR
(pays quarterly) | 1.27%
(pays quarterly) | 3/20/29 | 125,393 | — | 125,393 |
| TWD | 145,900 | Receives | 3-month TWD TAIBOR
(pays quarterly) | 1.32%
(pays quarterly) | 3/20/29 | 117,309 | — | 117,309 |
| TWD | 343,900 | Receives | 3-month TWD TAIBOR
(pays quarterly) | 1.33%
(pays quarterly) | 3/20/29 | 270,563 | — | 270,563 |
| TWD | 118,000 | Receives | 3-month TWD TAIBOR
(pays quarterly) | 1.35%
(pays quarterly) | 3/20/29 | 89,979 | — | 89,979 |
| TWD | 473,400 | Receives | 3-month TWD TAIBOR
(pays quarterly) | 1.36%
(pays quarterly) | 3/20/29 | 354,436 | — | 354,436 |
| TWD | 143,600 | Receives | 3-month TWD TAIBOR
(pays quarterly) | 1.37%
(pays quarterly) | 3/20/29 | 105,527 | — | 105,527 |
| TWD | 143,600 | Receives | 3-month TWD TAIBOR
(pays quarterly) | 1.38%
(pays quarterly) | 3/20/29 | 104,534 | — | 104,534 |
| TWD | 566,200 | Receives | 3-month TWD TAIBOR
(pays quarterly) | 1.64%
(pays quarterly) | 6/19/29 | 227,387 | — | 227,387 |
| TWD | 229,200 | Receives | 3-month TWD TAIBOR
(pays quarterly) | 1.95%
(pays quarterly) | 6/19/29 | (14,091) | — | (14,091) |
| TWD | 413,000 | Receives | 3-month TWD TAIBOR
(pays quarterly) | 1.90%
(pays quarterly) | 9/18/29 | 17,205 | — | 17,205 |
| TWD | 427,000 | Receives | 3-month TWD TAIBOR
(pays quarterly) | 1.90%
(pays quarterly) | 9/18/29 | 12,878 | — | 12,878 |
| TWD | 200,691 | Receives | 3-month TWD TAIBOR
(pays quarterly) | 1.62%
(pays quarterly) | 12/18/29 | 101,797 | — | 101,797 |
| TWD | 217,718 | Receives | 3-month TWD TAIBOR
(pays quarterly) | 1.62%
(pays quarterly) | 12/18/29 | 110,100 | — | 110,100 |
| TWD | 200,691 | Receives | 3-month TWD TAIBOR
(pays quarterly) | 1.63%
(pays quarterly) | 12/18/29 | 98,729 | — | 98,729 |
49
See Notes to Consolidated Financial Statements.
Global Macro Portfolio
October 31, 2024
Consolidated Portfolio of Investments — continued
| Interest Rate Swaps (Centrally Cleared) (continued) |
Notional Amount
(000's omitted) | Portfolio
Pays/
Receives
Floating
Rate | Floating Rate | Annual
Fixed Rate | Termination
Date | Value | Unamortized
Upfront
Receipts
(Payments) | Unrealized
Appreciation
(Depreciation) |
| USD | 7,000 | Receives | SOFR
(pays annually) | 3.35%
(pays annually) | 9/18/29 | $ 150,523 | $ — | $ 150,523 |
| USD | 12,190 | Receives | SOFR
(pays annually) | 3.35%
(pays annually) | 9/18/29 | 258,797 | — | 258,797 |
| USD | 9,000 | Receives | SOFR
(pays annually) | 3.36%
(pays annually) | 9/18/29 | 189,844 | — | 189,844 |
| USD | 10,000 | Receives | SOFR
(pays annually) | 3.36%
(pays annually) | 9/18/29 | 209,846 | — | 209,846 |
| USD | 11,310 | Receives | SOFR
(pays annually) | 3.38%
(pays annually) | 9/18/29 | 228,435 | — | 228,435 |
| USD | 10,000 | Receives | SOFR
(pays annually) | 3.40%
(pays annually) | 9/18/29 | 191,832 | — | 191,832 |
| USD | 6,390 | Receives | SOFR
(pays annually) | 3.42%
(pays annually) | 9/18/29 | 117,349 | — | 117,349 |
| USD | 10,000 | Receives | SOFR
(pays annually) | 3.42%
(pays annually) | 9/18/29 | 182,962 | — | 182,962 |
| Total | | | | | | $1,166,456 | $21 | $1,166,477 |
| Interest Rate Swaps (OTC) |
| Counterparty | Notional Amount
(000's omitted) | Portfolio
Pays/Receives
Floating Rate | Floating Rate | Annual
Fixed Rate | Termination
Date | Value/Unrealized
Appreciation
(Depreciation) |
| Citibank, N.A. | MYR | 64,000 | Receives | 3-month MYR KLIBOR
(pays quarterly) | 3.62%
(pays quarterly) | 3/20/29 | $ (44,664) |
| JPMorgan Chase Bank, N.A. | MYR | 37,100 | Receives | 3-month MYR KLIBOR
(pays quarterly) | 3.63%
(pays quarterly) | 3/20/29 | (29,829) |
| JPMorgan Chase Bank, N.A. | MYR | 39,000 | Receives | 3-month MYR KLIBOR
(pays quarterly) | 3.63%
(pays quarterly) | 3/20/29 | (30,980) |
| Nomura International PLC | MYR | 78,000 | Receives | 3-month MYR KLIBOR
(pays quarterly) | 3.60%
(pays quarterly) | 3/20/29 | (39,384) |
| Standard Chartered Bank | MYR | 39,000 | Receives | 3-month MYR KLIBOR
(pays quarterly) | 3.62%
(pays quarterly) | 3/20/29 | (27,217) |
| Total | | | | | | | $(172,074) |
| Credit Default Swaps - Buy Protection (Centrally Cleared) | |
| Reference Entity | Notional
Amount
(000's omitted) | Contract
Annual
Fixed Rate* | Termination
Date | Value | Unamortized
Upfront
Receipts
(Payments) | Unrealized
Appreciation
(Depreciation) |
| Austria | | $4,140 | 1.00%
(pays quarterly)(1) | 12/20/29 | $ (172,788) | $ 165,335 | $ (7,453) |
| Export-Import Bank of India | | 19,000 | 1.00%
(pays quarterly)(1) | 12/20/29 | (456,628) | 398,815 | (57,813) |
50
See Notes to Consolidated Financial Statements.
Global Macro Portfolio
October 31, 2024
Consolidated Portfolio of Investments — continued
| Credit Default Swaps - Buy Protection (Centrally Cleared) (continued) | |
| Reference Entity | Notional
Amount
(000's omitted) | Contract
Annual
Fixed Rate* | Termination
Date | Value | Unamortized
Upfront
Receipts
(Payments) | Unrealized
Appreciation
(Depreciation) |
| Finland | | $4,420 | 0.25%
(pays quarterly)(1) | 12/20/29 | $ (16,483) | $ 7,425 | $ (9,058) |
| Germany | | 17,910 | 0.25%
(pays quarterly)(1) | 12/20/29 | (130,858) | 123,464 | (7,394) |
| Hungary | | 4,410 | 1.00%
(pays quarterly)(1) | 12/20/29 | 37,977 | (58,401) | (20,424) |
| Malaysia | | 111,910 | 1.00%
(pays quarterly)(1) | 12/20/29 | (3,173,365) | 3,130,499 | (42,866) |
| Poland | | 19,300 | 1.00%
(pays quarterly)(1) | 6/20/29 | (322,714) | 205,965 | (116,749) |
| Poland | | 7,920 | 1.00%
(pays quarterly)(1) | 12/20/29 | (126,988) | 99,529 | (27,459) |
| Qatar | | 5,300 | 1.00%
(pays quarterly)(1) | 12/20/29 | (148,184) | 142,097 | (6,087) |
| Romania | | 3,920 | 1.00%
(pays quarterly)(1) | 12/20/29 | 74,946 | (101,071) | (26,125) |
| Saudi Arabia | | 24,613 | 1.00%
(pays quarterly)(1) | 12/20/29 | (456,865) | 458,524 | 1,659 |
| South Africa | | 150,650 | 1.00%
(pays quarterly)(1) | 12/20/29 | 5,906,397 | (6,441,315) | (534,918) |
| South Africa | | 9,666 | 1.00%
(pays quarterly)(1) | 6/20/31 | 707,133 | (977,746) | (270,613) |
| Sweden | | 8,470 | 0.25%
(pays quarterly)(1) | 12/20/29 | (65,913) | 46,216 | (19,697) |
| Turkey | | 43,550 | 1.00%
(pays quarterly)(1) | 12/20/29 | 3,087,212 | (3,380,361) | (293,149) |
| United Kingdom | | 17,630 | 1.00%
(pays quarterly)(1) | 12/20/29 | (673,497) | 641,934 | (31,563) |
| Total | | | | | $4,069,382 | $(5,539,091) | $(1,469,709) |
| Credit Default Swaps - Sell Protection (OTC) |
| Reference Entity | Counterparty | Notional
Amount**
(000's omitted) | Contract Annual
Fixed Rate* | Current
Market
Annual
Fixed Rate*** | Termination
Date | Value | Unamortized
Upfront
Receipts
(Payments) | Unrealized
Appreciation
(Depreciation) |
| Panama | Bank of America, N.A. | $ 2,208 | 1.00%
(pays quarterly)(1) | 1.74% | 12/20/29 | $ (70,967) | $ 80,872 | $ 9,905 |
| Panama | Citibank, N.A. | 6,621 | 1.00%
(pays quarterly)(1) | 1.74 | 12/20/29 | (212,622) | 190,053 | (22,569) |
| Panama | Goldman Sachs International | 6,600 | 1.00%
(pays quarterly)(1) | 1.74 | 12/20/29 | (211,948) | 216,445 | 4,497 |
| Panama | Goldman Sachs International | 6,620 | 1.00%
(pays quarterly)(1) | 1.74 | 12/20/29 | (212,590) | 200,078 | (12,512) |
| Panama | Goldman Sachs International | 11,040 | 1.00%
(pays quarterly)(1) | 1.74 | 12/20/29 | (378,819) | 391,698 | 12,879 |
| Petroleos Mexicanos | Bank of America, N.A. | 18,707 | 1.00%
(pays quarterly)(1) | 1.48 | 3/20/25 | (12,244) | 118,847 | 106,603 |
51
See Notes to Consolidated Financial Statements.
Global Macro Portfolio
October 31, 2024
Consolidated Portfolio of Investments — continued
| Credit Default Swaps - Sell Protection (OTC) (continued) |
| Reference Entity | Counterparty | Notional
Amount**
(000's omitted) | Contract Annual
Fixed Rate* | Current
Market
Annual
Fixed Rate*** | Termination
Date | Value | Unamortized
Upfront
Receipts
(Payments) | Unrealized
Appreciation
(Depreciation) |
| Petroleos Mexicanos | Citibank, N.A. | $ 3,085 | 1.00%
(pays quarterly)(1) | 1.48% | 12/20/24 | $ 1,568 | $ 2,503 | $ 4,071 |
| Petroleos Mexicanos | Deutsche Bank AG | 25,105 | 4.00%
(pays monthly) | 2.44 | 7/6/26 | 305,014 | — | 305,014 |
| Vietnam | Bank of America, N.A. | 1,000 | 1.00%
(pays quarterly)(1) | 1.00 | 12/20/29 | 1,215 | (2,752) | (1,537) |
| Vietnam | BNP Paribas | 2,000 | 1.00%
(pays quarterly)(1) | 1.00 | 12/20/29 | 2,431 | (5,503) | (3,072) |
| Vietnam | Goldman Sachs International | 5,600 | 1.00%
(pays quarterly)(1) | 1.00 | 12/20/29 | 6,806 | (15,409) | (8,603) |
| Total | | $88,586 | | | | $(782,156) | $1,176,832 | $394,676 |
| Credit Default Swaps - Buy Protection (OTC) |
| Reference Entity | Counterparty | Notional
Amount
(000's omitted) | Contract
Annual
Fixed Rate* | Termination
Date | Value | Unamortized
Upfront
Receipts
(Payments) | Unrealized
Appreciation
(Depreciation) |
| Czech Republic | JPMorgan Chase Bank, N.A. | $ 3,580 | 1.00%
(pays quarterly)(1) | 12/20/29 | $(119,968) | $ 117,586 | $ (2,382) |
| Dubai | Barclays Bank PLC | 3,357 | 1.00%
(pays quarterly)(1) | 12/20/24 | (7,651) | (1,497) | (9,148) |
| Dubai | Barclays Bank PLC | 5,058 | 1.00%
(pays quarterly)(1) | 12/20/24 | (11,527) | (2,257) | (13,784) |
| Saudi Arabia | Barclays Bank PLC | 14,533 | 1.00%
(pays quarterly)(1) | 6/20/31 | (223,853) | (177,597) | (401,450) |
| Saudi Arabia | Barclays Bank PLC | 28,800 | 1.00%
(pays quarterly)(1) | 12/20/34 | (123,927) | 118,039 | (5,888) |
| Total | | | | | $(486,926) | $54,274 | $(432,652) |
| * | The contract annual fixed rate represents the fixed rate of interest received by the Portfolio (as a seller of protection) or paid by the Portfolio (as a buyer of protection) on the notional amount of the credit default swap contract. |
| ** | If the Portfolio is the seller of credit protection, the notional amount is the maximum potential amount of future payments the Portfolio could be required to make if a credit event, as defined in the credit default swap agreement, were to occur. At October 31, 2024, such maximum potential amount for all open credit default swaps in which the Portfolio is the seller was $88,586,000. |
| *** | Current market annual fixed rates, utilized in determining the net unrealized appreciation or depreciation as of period end, serve as an indicator of the market’s perception of the current status of the payment/performance risk associated with the credit derivative. The current market annual fixed rate of a particular reference entity reflects the cost, as quoted by the pricing vendor, of selling protection against default of that entity as of period end and may include upfront payments required to be made to enter into the agreement. The higher the fixed rate, the greater the market perceived risk of a credit event involving the reference entity. A rate identified as “Defaulted” indicates a credit event has occurred for the reference entity. |
| (1) | Upfront payment is exchanged with the counterparty as a result of the standardized trading coupon. |
52
See Notes to Consolidated Financial Statements.
Global Macro Portfolio
October 31, 2024
Consolidated Portfolio of Investments — continued
| Total Return Swaps (OTC) |
| Counterparty | Notional Amount
(000's omitted) | Portfolio Receives | Portfolio Pays | Termination
Date | Value/Unrealized
Appreciation
(Depreciation) |
| BNP Paribas | USD | 74,500 | Excess Return on Bloomberg Commodity 3 Month Forward Index (pays upon termination) | Excess Return on Bloomberg Commodity Index + 0.12% (pays upon termination) | 2/26/25 | $ 42,480 |
| Citibank, N.A. | USD | 16,415 | Excess Return on Bloomberg Commodity 3 Month Forward Index (pays upon termination) | Excess Return on Bloomberg Commodity Index + 0.12% (pays upon termination) | 2/18/25 | 10,430 |
| Citibank, N.A. | USD | 8,600 | Excess Return on Citi Commodities F6 vs F0 Carry Index (pays upon termination) | Excess Return on Citi Commodities Index + 0.20% (pays upon termination) | 2/14/25 | 14,927 |
| JPMorgan Chase Bank, N.A. | USD | 6,500 | Excess Return on USD - SOFR Compunded Index minus 0.50% plus Negative Return on J.P.Morgan EMBI Global Diversified Index (pays upon termination) | Positive Return on J.P. Morgan EMBI Global Diversified Index (pays upon termination) | 12/9/24 | 131,664 |
| | | | | | | $199,501 |
| Abbreviations: |
| ADR | – American Depositary Receipt |
| CMT | – Constant Maturity Treasury |
| COF | – Cost of Funds 11th District |
| CPI-U (NSA) | – Consumer Price Index All Urban Non-Seasonally Adjusted |
| EURIBOR | – Euro Interbank Offered Rate |
| FBIL | – Financial Benchmarks India Ltd. |
| GDP | – Gross Domestic Product |
| HICP | – Harmonised Indices of Consumer Prices |
| |
| KLIBOR | – Kuala Lumpur Interbank Offered Rate |
| MIBOR | – Mumbai Interbank Offered Rate |
| OTC | – Over-the-counter |
| PIK | – Payment In Kind |
| SAIBOR | – Saudi Arabian Interbank Offered Rate |
| SOFR | – Secured Overnight Financing Rate |
| TAIBOR | – Taipei Interbank Offered Rate |
| TLREF | – Turkish Lira Overnight Reference Rate |
| Currency Abbreviations: |
| ALL | – Albanian Lek |
| AMD | – Armenian Dram |
| ARS | – Argentine Peso |
| AUD | – Australian Dollar |
| BHD | – Bahraini Dinar |
| BRL | – Brazilian Real |
| CAD | – Canadian Dollar |
| CLP | – Chilean Peso |
| CNH | – Yuan Renminbi Offshore |
| COP | – Colombian Peso |
| CZK | – Czech Koruna |
| DOP | – Dominican Peso |
| EGP | – Egyptian Pound |
| ETB | – Ethiopian Birr |
| EUR | – Euro |
| GBP | – British Pound Sterling |
| |
| GEL | – Georgian Lari |
| GHS | – Ghanaian Cedi |
| HKD | – Hong Kong Dollar |
| IDR | – Indonesian Rupiah |
| ILS | – Israeli Shekel |
| INR | – Indian Rupee |
| ISK | – Icelandic Krona |
| JPY | – Japanese Yen |
| KES | – Kenyan Shilling |
| KRW | – South Korean Won |
| KZT | – Kazakhstani Tenge |
| LKR | – Sri Lankan Rupee |
| MXN | – Mexican Peso |
| MYR | – Malaysian Ringgit |
| NGN | – Nigerian Naira |
| NOK | – Norwegian Krone |
53
See Notes to Consolidated Financial Statements.
Global Macro Portfolio
October 31, 2024
Consolidated Portfolio of Investments — continued
| |
| NZD | – New Zealand Dollar |
| OMR | – Omani Rial |
| PEN | – Peruvian Sol |
| PHP | – Philippine Peso |
| PKR | – Pakistan Rupee |
| PLN | – Polish Zloty |
| PYG | – Paraguayan Guarani |
| RSD | – Serbian Dinar |
| SAR | – Saudi Riyal |
| SEK | – Swedish Krona |
| |
| SGD | – Singapore Dollar |
| THB | – Thai Baht |
| TRY | – Turkish Lira |
| TWD | – New Taiwan Dollar |
| USD | – United States Dollar |
| UYU | – Uruguayan Peso |
| UZS | – Uzbekistani Som |
| VND | – Viet Nam Dong |
| ZAR | – South African Rand |
54
See Notes to Consolidated Financial Statements.
Global Macro Portfolio
October 31, 2024
Consolidated Statement of Assets and Liabilities
| | October 31, 2024 |
| Assets | |
| Unaffiliated investments, at value (identified cost $1,603,515,144) | $1,584,035,713 |
| Affiliated investments, at value (identified cost $128,853,494) | 128,853,494 |
| Deposits for derivatives collateral: | |
| Centrally cleared derivatives | 42,016,498 |
| OTC derivatives | 2,431,000 |
| Cash collateral for securities sold short | 166,238,757 |
| Foreign currency, at value (identified cost $25,675,491) | 25,635,677 |
| Interest and dividends receivable | 20,926,997 |
| Dividends receivable from affiliated investments | 401,870 |
| Receivable for investments sold | 25,312,486 |
| Receivable for variation margin on open futures contracts | 277,863 |
| Receivable for open forward foreign currency exchange contracts | 19,749,667 |
| Receivable for open swap contracts | 642,470 |
| Upfront payments on open OTC swap contracts | 205,015 |
| Receivable for closed swap contracts | 398,262 |
| Tax reclaims receivable | 1,005 |
| Trustees' deferred compensation plan | 291,615 |
| Total assets | $2,017,418,389 |
| Liabilities | |
| Cash collateral due to brokers | $2,431,000 |
| Payable for reverse repurchase agreements, including accrued interest of $14,990 | 13,782,333 |
| Written options outstanding, at value (premiums received $77,130) | 81,190 |
| Payable for investments purchased | 9,803,656 |
| Payable for securities sold short, at value (proceeds $193,833,660) | 194,613,884 |
| Payable for variation margin on open centrally cleared derivatives | 654,536 |
| Payable for open forward foreign currency exchange contracts | 17,285,961 |
| Payable for open swap contracts | 653,019 |
| Upfront receipts on open OTC swap contracts | 1,436,121 |
| Due to custodian | 2,544,268 |
| Payable to affiliates: | |
| Investment adviser fee | 872,017 |
| Trustees' fees | 9,045 |
| Trustees' deferred compensation plan | 291,615 |
| Interest payable on securities sold short | 1,299,526 |
| Accrued foreign capital gains taxes | 9,574 |
| Accrued expenses and other liabilities | 1,075,162 |
| Total liabilities | $246,842,907 |
| Net Assets applicable to investors' interest in Portfolio | $1,770,575,482 |
55
See Notes to Consolidated Financial Statements.
Global Macro Portfolio
October 31, 2024
Consolidated Statement of Operations
| | Year Ended |
| | October 31, 2024 |
| Investment Income | |
| Dividend income (net of foreign taxes withheld of $261,383) | $3,289,376 |
| Dividend income from affiliated investments | 7,076,568 |
| Interest income (net of foreign taxes withheld of $1,190,792) | 126,920,437 |
| Other income | 925,252 |
| Total investment income | $138,211,633 |
| Expenses | |
| Investment adviser fee | $10,004,746 |
| Trustees’ fees and expenses | 105,169 |
| Custodian fee | 1,323,564 |
| Legal and accounting services | 170,518 |
| Interest expense and fees | 801,300 |
| Interest and dividend expense on securities sold short | 6,154,237 |
| Miscellaneous | 72,788 |
| Total expenses | $18,632,322 |
| Deduct: | |
| Waiver and/or reimbursement of expenses by affiliates | $199,887 |
| Total expense reductions | $199,887 |
| Net expenses | $18,432,435 |
| Net investment income | $119,779,198 |
| Realized and Unrealized Gain (Loss) | |
| Net realized gain (loss): | |
| Investment transactions (net of foreign capital gains taxes of $162,318) | $(9,604,414) |
| Written options | 229,223 |
| Securities sold short | (2,380,519) |
| Futures contracts | (9,503,565) |
| Swap contracts | (22,500,761) |
| Foreign currency transactions | 2,163,700 |
| Forward foreign currency exchange contracts | (17,734,848) |
| Net realized loss | $(59,331,184) |
| Change in unrealized appreciation (depreciation): | |
| Investments (including net increase in accrued foreign capital gains taxes of $6,527) | $81,021,383 |
| Written options | (62,547) |
| Securities sold short | (5,913,890) |
| Futures contracts | (4,683,987) |
| Swap contracts | 486,090 |
| Foreign currency | 394,571 |
| Forward foreign currency exchange contracts | 9,199,002 |
| Net change in unrealized appreciation (depreciation) | $80,440,622 |
| Net realized and unrealized gain | $21,109,438 |
| Net increase in net assets from operations | $140,888,636 |
56
See Notes to Consolidated Financial Statements.
Global Macro Portfolio
October 31, 2024
Consolidated Statements of Changes in Net Assets
| | Year Ended October 31, |
| | 2024 | 2023 |
| Increase (Decrease) in Net Assets | | |
| From operations: | | |
| Net investment income | $119,779,198 | $113,439,876 |
| Net realized loss | (59,331,184) | (180,694,373) |
| Net change in unrealized appreciation (depreciation) | 80,440,622 | 230,134,183 |
| Net increase in net assets from operations | $140,888,636 | $162,879,686 |
| Capital transactions: | | |
| Contributions | $161,853,240 | $98,428,362 |
| Withdrawals | (324,302,845) | (324,965,141) |
| Net decrease in net assets from capital transactions | $(162,449,605) | $(226,536,779) |
| Net decrease in net assets | $(21,560,969) | $(63,657,093) |
| Net Assets | | |
| At beginning of year | $1,792,136,451 | $1,855,793,544 |
| At end of year | $1,770,575,482 | $1,792,136,451 |
57
See Notes to Consolidated Financial Statements.
Global Macro Portfolio
October 31, 2024
Consolidated Financial Highlights
| | Year Ended October 31, |
| Ratios/Supplemental Data | 2024 | 2023 | 2022 | 2021 | 2020 |
| Ratios (as a percentage of average daily net assets):(1) | | | | | |
| Total expenses(2) | 1.10% | 1.02% | 0.73% | 0.70% | 0.66% |
| Net expenses(2) | 1.09%(3) | 1.01%(3) | 0.73%(3) | 0.70% | 0.66% |
| Net investment income | 7.07% | 6.26% | 5.49% | 4.60% | 4.53% |
| Portfolio Turnover | 156% | 96% | 81% | 88% | 81% |
| Total Return | 8.70% | 9.29% | (3.93)% | 4.52% | 4.03% |
| Net assets, end of year (000’s omitted) | $1,770,575 | $1,792,136 | $1,855,794 | $2,563,864 | $3,165,729 |
| (1) | Total expenses do not reflect amounts reimbursed and/or waived by the adviser and certain of its affiliates, if applicable. Net expenses are net of all reductions and represent the net expenses paid by the Portfolio. |
| (2) | Includes interest and/or dividend expense, including on securities sold short and/or reverse repurchase agreements if applicable, of 0.41%, 0.37%, 0.08%, 0.06% and 0.01% of average daily net assets for the years ended October 31, 2024, 2023, 2022, 2021 and 2020, respectively. |
| (3) | Includes a reduction by the investment adviser of a portion of its adviser fee due to the Portfolio’s investment in the Liquidity Fund (equal to 0.01%, 0.01% and less than 0.01% of average daily net assets for the years ended October 31, 2024, 2023 and 2022, respectively). |
58
See Notes to Consolidated Financial Statements.
Global Macro Portfolio
October 31, 2024
Notes to Consolidated Financial Statements
1 Significant Accounting Policies
Global Macro Portfolio (the Portfolio) is a Massachusetts business trust registered under the Investment Company Act of 1940, as amended (the 1940 Act), as a non-diversified, open-end management investment company. The Portfolio’s investment objective is total return. The Declaration of Trust permits the Trustees to issue interests in the Portfolio. At October 31, 2024, Eaton Vance Global Macro Absolute Return Fund held an interest of approximately 100% in the Portfolio.
The Portfolio seeks to gain exposure to the commodity markets, in whole or in part, through investments in Eaton Vance GMP Commodity Subsidiary, Ltd. (the Subsidiary), a wholly-owned subsidiary of the Portfolio organized under the laws of the Cayman Islands with the same objective and investment policies and restrictions as the Portfolio. The Portfolio may invest up to 25% of its total assets in the Subsidiary. The net assets of the Subsidiary at October 31, 2024 were $12,067,884 or 0.7% of the Portfolio’s consolidated net assets. The accompanying consolidated financial statements include the accounts of the Subsidiary. Intercompany balances and transactions have been eliminated in consolidation.
The following is a summary of significant accounting policies of the Portfolio. The policies are in conformity with accounting principles generally accepted in the United States of America (U.S. GAAP). The Portfolio is an investment company and follows accounting and reporting guidance in the Financial Accounting Standards Board (FASB) Accounting Standards Codification Topic 946.
A Investment Valuation—The following methodologies are used to determine the market value or fair value of investments.
Debt Obligations. Debt obligations are generally valued on the basis of valuations provided by third party pricing services, as derived from such services’ pricing models. Inputs to the models may include, but are not limited to, reported trades, executable bid and ask prices, broker/dealer quotations, prices or yields of securities with similar characteristics, interest rates, anticipated prepayments, benchmark curves or information pertaining to the issuer, as well as industry and economic events. The pricing services may use a matrix approach, which considers information regarding securities with similar characteristics to determine the valuation for a security. Short-term debt obligations purchased with a remaining maturity of sixty days or less for which a valuation from a third party pricing service is not readily available may be valued at amortized cost, which approximates fair value.
Senior Floating-Rate Loans. Interests in senior floating-rate loans are valued generally at the average mean of bid and ask quotations obtained from a third party pricing service.
Equity Securities. Equity securities (common stocks and exchange-traded funds) listed on a U.S. securities exchange generally are valued at the last sale or closing price on the day of valuation or, if no sales took place on such date, at the mean between the closing bid and ask prices on the exchange where such securities are principally traded. Equity securities listed on the NASDAQ National Market System are valued at the NASDAQ official closing price. Unlisted or listed securities for which closing sales prices or closing quotations are not available are valued at the mean between the latest available bid and ask prices.
Derivatives. U.S. exchange-traded options are valued at the mean between the bid and ask prices at valuation time as reported by the Options Price Reporting Authority. Non-U.S. exchange-traded options and over-the-counter options (including options on securities, indices and foreign currencies) are valued by a third party pricing service using techniques that consider factors including the value of the underlying instrument, the volatility of the underlying instrument and the period of time until option expiration. Futures contracts are valued at the closing settlement price established by the board of trade or exchange on which they are traded, with adjustments for fair valuation for certain foreign futures contracts as described below. Forward foreign currency exchange contracts are generally valued at the mean of the average bid and average ask prices that are reported by currency dealers to a third party pricing service at the valuation time. Such third party pricing service valuations are supplied for specific settlement periods and the Portfolio’s forward foreign currency exchange contracts are valued at an interpolated rate between the closest preceding and subsequent settlement period reported by the third party pricing service. Swaps and options on interest rate swaps (“swaptions”) are normally valued using valuations provided by a third party pricing service. Such pricing service valuations are based on the present value of fixed and projected floating rate cash flows over the term of the swap contract, and in the case of credit default swaps, based on credit spread quotations obtained from broker/dealers and expected default recovery rates determined by the pricing service using proprietary models. In the case of total return swaps, pricing service valuations are based on the value of the underlying index or instrument and reference interest rate. Future cash flows on swaps are discounted to their present value using swap rates provided by electronic data services or by broker/dealers. Alternatively, swaptions may be valued at the valuation provided by a broker/dealer (usually the counterparty to the option),
so determined using similar techniques as those employed by the pricing service.
Foreign Securities, Financial Futures Contracts and Currencies. Foreign securities, financial futures contracts and currencies are valued in U.S. dollars, based on foreign currency exchange rate quotations supplied by a third party pricing service. The pricing service uses a proprietary model to determine the exchange rate. Inputs to the model include reported trades and implied bid/ask spreads. The daily valuation of exchange-traded foreign securities and certain exchange-traded foreign financial futures contracts generally is determined as of the close of trading on the principal exchange on which such securities and contracts trade. Events occurring after the close of trading on foreign exchanges may result in adjustments to the valuation of foreign securities and certain foreign financial futures contracts to more accurately reflect their fair value as of the close of regular trading on the New York Stock Exchange. When valuing foreign equity securities and foreign financial futures contracts that meet certain criteria, the Portfolio’s Trustees have approved the use of a fair value service that values such securities and foreign financial futures contracts to reflect market trading that occurs after the close of the applicable foreign markets of comparable securities or other instruments that have a strong correlation to the fair-valued securities and foreign financial futures contracts.
Global Macro Portfolio
October 31, 2024
Notes to Consolidated Financial Statements — continued
Other. Investments in management investment companies (including money market funds) that do not trade on an exchange are valued at the net asset value as of the close of each business day.
Fair Valuation. In connection with Rule 2a-5 of the 1940 Act, the Trustees have designated the Portfolio’s investment adviser as its valuation designee. Investments for which valuations or market quotations are not readily available or are deemed unreliable are valued by the investment adviser, as valuation designee, at fair value using methods that most fairly reflect the security’s “fair value”, which is the amount that the Portfolio might reasonably expect to receive for the security upon its current sale in the ordinary course. Each such determination is based on a consideration of relevant factors, which are likely to vary from one pricing context to another. These factors may include, but are not limited to, the type of security, the existence of any contractual restrictions on the security’s disposition, the price and extent of public trading in similar securities of the issuer or of comparable companies or entities, quotations or relevant information obtained from broker/dealers or other market participants, information obtained from the issuer, analysts, and/or the appropriate stock exchange (for exchange-traded securities), an analysis of the company’s or entity’s financial statements, and an evaluation of the forces that influence the issuer and the market(s) in which the security is purchased and sold.
B Investment Transactions—Investment transactions for financial statement purposes are accounted for on a trade date basis. Realized gains and losses on investments sold are determined on the basis of identified cost.
C Income—Interest income is recorded on the basis of interest accrued, adjusted for amortization of premium or accretion of discount. Inflation adjustments to the principal amount of inflation-adjusted bonds and notes are reflected as interest income. Deflation adjustments to the principal amount of an inflation-adjusted bond or note are reflected as reductions to interest income to the extent of interest income previously recorded on such bond or note. Dividend income is recorded on the ex-dividend date for dividends received in cash and/or securities. However, if the ex-dividend date has passed, certain dividends from foreign securities are recorded as the Portfolio is informed of the ex-dividend date. Withholding taxes on foreign interest, dividends and capital gains have been provided for in accordance with the Portfolio's understanding of the applicable countries’ tax rules and rates. In consideration of recent decisions rendered by European courts, the Portfolio has filed additional tax reclaims for previously withheld taxes on dividends earned in certain European Union countries (the “EU reclaims”). These filings are subject to various administrative and judicial proceedings within these countries. Due to the uncertainty as to the ultimate resolution of these proceedings, the likelihood of receipt of these EU reclaims, and the potential timing of payment, the EU reclaims are recorded as income only when the likelihood of their receipt becomes certain.
D Federal and Other Taxes—The Portfolio has elected to be treated as a partnership for federal tax purposes. No provision is made by the Portfolio for federal or state taxes on any taxable income of the Portfolio because each investor in the Portfolio is ultimately responsible for the payment of any taxes on its share of taxable income. Since at least one of the Portfolio’s investors is a regulated investment company that invests all or substantially all of its assets in the Portfolio, the Portfolio normally must satisfy the applicable source of income and diversification requirements (under the Internal Revenue Code) in order for its investors to satisfy them. The Portfolio will allocate, at least annually among its investors, each investor’s distributive share of the Portfolio’s net investment income, net realized capital gains and losses and any other items of income, gain, loss, deduction or credit.
In addition to the requirements of the Internal Revenue Code, the Portfolio may also be subject to local taxes on the recognition of capital gains in certain countries. In determining the daily net asset value, the Portfolio estimates the accrual for such taxes, if any, based on the unrealized appreciation on certain portfolio securities and the related tax rates. Taxes attributable to unrealized appreciation are included in the change in unrealized appreciation (depreciation) on investments. Capital gains taxes on securities sold are included in net realized gain (loss) on investments.
The Subsidiary is treated as a controlled foreign corporation under the Internal Revenue Code and is not expected to be subject to U.S. federal income tax. The Portfolio is treated as a U.S. shareholder of the Subsidiary. As a result, the Portfolio is required to include in gross income for U.S. federal tax purposes all of the Subsidiary’s income, whether or not such income is distributed by the Subsidiary. If a net loss is realized by the Subsidiary, such loss is not generally available to offset the income earned by the Portfolio.
As of October 31, 2024, the Portfolio had no uncertain tax positions that would require financial statement recognition, de-recognition, or disclosure. The Portfolio files a U.S. federal income tax return annually after its fiscal year-end, which is subject to examination by the Internal Revenue Service for a period of three years from the date of filing.
E Foreign Currency Translation—Investment valuations, other assets, and liabilities initially expressed in foreign currencies are translated each business day into U.S. dollars based upon current exchange rates. Purchases and sales of foreign investment securities and income and expenses denominated in foreign currencies are translated into U.S. dollars based upon currency exchange rates in effect on the respective dates of such transactions. Recognized gains or losses on investment transactions attributable to changes in foreign currency exchange rates are recorded for financial statement purposes as net realized gains and losses on investments. That portion of unrealized gains and losses on investments that results from fluctuations in foreign currency exchange rates is not separately disclosed.
F Unfunded Loan Commitments—The Portfolio may enter into certain loan agreements all or a portion of which may be unfunded. The Portfolio is obligated to fund these commitments at the borrower's discretion. These commitments, if any, are disclosed in the accompanying Consolidated Portfolio of Investments.
Global Macro Portfolio
October 31, 2024
Notes to Consolidated Financial Statements — continued
G Use of Estimates—The preparation of the consolidated financial statements in conformity with U.S. GAAP requires management to make estimates and assumptions that affect the reported amounts of assets and liabilities at the date of the consolidated financial statements and the reported amounts of income and expense during the reporting period. Actual results could differ from those estimates.
H Indemnifications—Under the Portfolio’s organizational documents, its officers and Trustees may be indemnified against certain liabilities and expenses arising out of the performance of their duties to the Portfolio. Under Massachusetts law, if certain conditions prevail, interestholders in the Portfolio could be deemed to have personal liability for the obligations of the Portfolio. However, the Portfolio’s Declaration of Trust contains an express disclaimer of liability on the part of Portfolio interestholders. Additionally, in the normal course of business, the Portfolio enters into agreements with service providers that may contain indemnification clauses. The Portfolio’s maximum exposure under these arrangements is unknown as this would involve future claims that may be made against the Portfolio that have not yet occurred.
I Financial and Commodities Futures Contracts—Upon entering into a financial or commodities futures contract, the Portfolio is required to deposit with the broker, either in cash or securities, an amount equal to a certain percentage of the contract amount (initial margin). Subsequent payments, known as variation margin, are made or received by the Portfolio each business day, depending on the daily fluctuations in the value of the underlying security, index or commodity, and are recorded as unrealized gains or losses by the Portfolio. Gains (losses) are realized upon the expiration or closing of the financial or commodities futures contracts. Should market conditions change unexpectedly, the Portfolio may not achieve the anticipated benefits of the financial or commodities futures contracts and may realize a loss. Futures contracts have minimal counterparty risk as they are exchange traded and the clearinghouse for the exchange is substituted as the counterparty, guaranteeing counterparty performance.
J Forward Foreign Currency Exchange Contracts—The Portfolio may enter into forward foreign currency exchange contracts for the purchase or sale of a specific foreign currency at a fixed price on a future date. The forward foreign currency exchange contracts are adjusted by the daily exchange rate of the underlying currency and any gains or losses are recorded as unrealized until such time as the contracts have been closed. While forward foreign currency exchange contracts are privately negotiated agreements between the Portfolio and a counterparty, certain contracts may be “centrally cleared”, whereby all payments made or received by the Portfolio pursuant to the contract are with a central clearing party (CCP) rather than the original counterparty. The CCP guarantees the performance of the original parties to the contract. Upon entering into centrally cleared contracts, the Portfolio is required to deposit with the CCP, either in cash or securities, an amount of initial margin determined by the CCP, which is subject to adjustment. For centrally cleared contracts, the daily change in valuation is recorded as a receivable or payable for variation margin and settled in cash with the CCP daily. Risks may arise upon entering these contracts from the potential inability of counterparties to meet the terms of their contracts and from movements in the value of a foreign currency relative to the U.S. dollar. In the case of centrally cleared contracts, counterparty risk is minimal due to protections provided by the CCP.
K Purchased Options—Upon the purchase of a call or put option, the premium paid by the Portfolio is included in the Consolidated Statement of Assets and Liabilities as an investment. The amount of the investment is subsequently marked-to-market to reflect the current market value of the option purchased, in accordance with the Portfolio’s policies on investment valuations discussed above. Premiums paid for purchasing options that expire are treated as realized losses. Premiums paid for purchasing options that are exercised or closed are added to the amounts paid or offset against the proceeds on the underlying investment transaction to determine the realized gain or loss. An option on a futures contract gives the holder the right to enter into a specified futures contract. As the purchaser of an index option, the Portfolio has the right to receive a cash payment equal to any depreciation in the value of the index below the exercise price of the option (in the case of a put) or equal to any appreciation in the value of the index over the exercise price of the option (in the case of a call) as of the valuation date of the option. The risk associated with purchasing options is limited to the premium originally paid. Purchased options traded over-the-counter involve risk that the issuer or counterparty will fail to perform its contractual obligations.
L Written Options—Upon the writing of a call or a put option, the premium received by the Portfolio is included in the Consolidated Statement of Assets and Liabilities as a liability. The amount of the liability is subsequently marked-to-market to reflect the current market value of the option written, in accordance with the Portfolio’s policies on investment valuations discussed above. Premiums received from writing options that expire are treated as realized gains. Premiums received from writing options that are exercised or are closed are added to or offset against the proceeds or amount paid on the transaction to determine the realized gain or loss. When an index option is exercised, the Portfolio is required to deliver an amount of cash determined by the excess of the exercise price of the option over the value of the index (in the case of a put) or the excess of the value of the index over the exercise price of the option (in the case of a call) at contract termination. The Portfolio, as a writer of an option, may have no control over whether the underlying instrument may be sold (call) or purchased (put) and, as a result, bears the market risk of an unfavorable change in the price of the instrument underlying the written option. The Portfolio may also bear the risk of not being able to enter into a closing transaction if a liquid secondary market does not exist.
M Interest Rate Swaps—Swap contracts are privately negotiated agreements between the Portfolio and a counterparty. Certain swap contracts may be centrally cleared. Pursuant to interest rate swap agreements, the Portfolio either makes floating-rate payments to the counterparty (or CCP in the case of centrally cleared swaps) based on a benchmark interest rate in exchange for fixed-rate payments or the Portfolio makes fixed-rate payments to the counterparty (or CCP in the case of a centrally cleared swap) in exchange for payments on a floating benchmark interest rate. Payments received or made, including amortization of upfront payments/receipts, if any (which are amortized over the life of the swap contract), are recorded as realized gains or losses. During the term of the outstanding swap agreement, changes in the underlying value of the swap are recorded as unrealized gains or losses. For centrally cleared swaps, the daily change in valuation is recorded as a receivable or payable for variation margin and settled in cash with the CCP daily. The value of
Global Macro Portfolio
October 31, 2024
Notes to Consolidated Financial Statements — continued
the swap is determined by changes in the relationship between two rates of interest. The Portfolio is exposed to credit loss in the event of non-performance by the swap counterparty. In the case of centrally cleared swaps, counterparty risk is minimal due to protections provided by the CCP. Risk may also arise from movements in interest rates.
N Inflation Swaps—Pursuant to inflation swap agreements, the Portfolio either makes floating-rate payments to the counterparty (or CCP in the case of centrally cleared swaps) based on a benchmark index in exchange for fixed-rate payments or the Portfolio makes fixed-rate payments to the counterparty (or CCP in the case of centrally cleared swaps) in exchange for floating-rate payments based on the return of a benchmark index. By design, the benchmark index is an inflation index, such as the Consumer Price Index. The accounting policy for payments received or made and changes in the underlying value of the inflation swap are the same as for interest rate swaps as described above. The value of the swap is determined by changes in the relationship between the rate of interest and the benchmark index. The Portfolio is exposed to credit loss in the event of nonperformance by the swap counterparty. In the case of centrally cleared swaps, counterparty risk is minimal due to protections provided by the CCP. Risk may also arise from the unanticipated movements in value of interest rates or the index.
O Cross-Currency Swaps—Cross-currency swaps are interest rate swaps in which interest cash flows are exchanged between two parties based on the notional amounts of two different currencies. The notional amounts are typically determined based on the spot exchange rates at the inception of the trade. Cross-currency swaps also involve the exchange of the notional amounts at the start of the contract at the current spot rate with an agreement to re-exchange such amounts at a later date at either the same exchange rate, a specified rate or the then current spot rate. The entire principal value of a cross-currency swap is subject to the risk that the counterparty to the swap will default on its contractual delivery obligations.
P Credit Default Swaps—When the Portfolio is the buyer of a credit default swap contract, the Portfolio is entitled to receive the par (or other agreed-upon) value of a referenced debt obligation (or basket of debt obligations) from the counterparty (or CCP in the case of a centrally cleared swap) to the contract if a credit event by a third party, such as a U.S. or foreign corporate issuer or sovereign issuer, on the debt obligation occurs. In return, the Portfolio pays the counterparty a periodic stream of payments over the term of the contract provided that no credit event has occurred. If no credit event occurs, the Portfolio would have spent the stream of payments and received no proceeds from the contract. When the Portfolio is the seller of a credit default swap contract, it receives the stream of payments, but is obligated to pay to the buyer of the protection an amount up to the notional amount of the swap and in certain instances take delivery of securities of the reference entity upon the occurrence of a credit event, as defined under the terms of that particular swap agreement. Credit events are contract specific but may include bankruptcy, failure to pay, restructuring, obligation acceleration and repudiation/moratorium. If the Portfolio is a seller of protection and a credit event occurs, the maximum potential amount of future payments that the Portfolio could be required to make would be an amount equal to the notional amount of the agreement. This potential amount would be partially offset by any recovery value of the respective referenced obligation, or net amount received from the settlement of a buy protection credit default swap agreement entered into by the Portfolio for the same referenced obligation. As the seller, the Portfolio may create economic leverage to its portfolio because, in addition to its total net assets, the Portfolio is subject to investment exposure on the notional amount of the swap. The interest fee paid or received on the swap contract, which is based on a specified interest rate on a fixed notional amount, is accrued daily as a component of unrealized appreciation (depreciation) and is recorded as realized gain upon receipt or realized loss upon payment. The Portfolio also records an increase or decrease to unrealized appreciation (depreciation) in an amount equal to the daily valuation. For centrally cleared swaps, the daily change in valuation is recorded as a receivable or payable for variation margin and settled in cash with the CCP daily. All upfront payments and receipts, if any, are amortized over the life of the swap contract as realized gains or losses. Those upfront payments or receipts for non-centrally cleared swaps are recorded as other assets or other liabilities, respectively, net of amortization. For financial reporting purposes, unamortized upfront payments or receipts, if any, are netted with unrealized appreciation or depreciation on swap contracts to determine the market value of swaps as presented in Notes 6 and 10. These transactions involve certain risks, including the risk that the seller may be unable to fulfill the transaction. In the case of centrally cleared swaps, counterparty risk is minimal due to protections provided by the CCP.
Q Total Return Swaps—In a total return swap, the buyer receives a periodic return equal to the total return of a specified security, securities or index for a specified period of time. In return, the buyer pays the counterparty a fixed or variable stream of payments, typically based upon short-term interest rates, possibly plus or minus an agreed upon spread. During the term of the outstanding swap agreement, changes in the underlying value of the swap are recorded as unrealized gains and losses. Periodic payments received or made are recorded as realized gains or losses. The Portfolio is exposed to credit loss in the event of nonperformance by the swap counterparty. Risk may also arise from the unanticipated movements in value of exchange rates, interest rates, securities, or the index.
R Swaptions—A purchased swaption contract grants the Portfolio, in return for payment of the purchase price, the right, but not the obligation, to enter into a new swap agreement or to shorten, extend, cancel or otherwise modify an existing swap agreement, at some designated future time on specified terms. When the Portfolio purchases a swaption, the premium paid to the writer is recorded as an investment and subsequently marked-to-market to reflect the current value of the swaption. A written swaption gives the Portfolio the obligation, if exercised by the purchaser, to enter into a swap contract according to the terms of the underlying agreement. When the Portfolio writes a swaption, the premium received by the Portfolio is recorded as a liability and subsequently marked-to-market to reflect the current value of the swaption. When a swaption is exercised, the cost of the swap is adjusted by the amount of the premium paid or received. When a swaption expires or an unexercised swaption is closed, a gain or loss is recognized in the amount of the premium paid or received, plus the cost to close. The Portfolio’s risk for purchased swaptions is limited to the premium paid. The writer of a swaption bears the risk of unfavorable changes in the preset terms of the underlying swap contract. Purchased swaptions traded over-the-counter involve risk that the issuer or counterparty will fail to perform its contractual obligations.
Global Macro Portfolio
October 31, 2024
Notes to Consolidated Financial Statements — continued
S Repurchase Agreements—A repurchase agreement is the purchase by the Portfolio of securities from a counterparty in exchange for cash that is coupled with an agreement to resell those securities to the counterparty at a specified date and price. When a repurchase agreement is entered, the Portfolio typically receives securities with a value that equals or exceeds the repurchase price, including any accrued interest earned on the agreement. The value of such securities will be marked-to-market daily, and cash or additional securities will be exchanged between the parties as needed. Except in the case of a repurchase agreement entered to settle a short sale, the value of the securities delivered to the Portfolio will be at least equal to 90% of the repurchase price during the term of the repurchase agreement. The terms of a repurchase agreement entered to settle a short sale may provide that the cash purchase price paid by the Portfolio is more than the value of purchased securities that effectively collateralize the repurchase price payable by the counterparty. In the event of insolvency of the counterparty to a repurchase agreement, recovery of the repurchase price owed to the Portfolio may be delayed. Such an insolvency also may result in a loss to the extent that the value of the purchased securities decreases during the delay or that value has otherwise not been maintained at an amount at least equal to the repurchase price.
T Reverse Repurchase Agreements—Under a reverse repurchase agreement, the Portfolio temporarily transfers possession of a portfolio security to another party, such as a bank or broker/dealer, in return for cash. At the same time, the Portfolio agrees to repurchase the security at an agreed upon time and price, which reflects an interest payment. In periods of increased demand for a security, the Portfolio may receive a payment from the counterparty for the use of the security, which is recorded as interest income. Because the Portfolio retains effective control over the transferred security, the transaction is accounted for as a secured borrowing. The Portfolio may enter into such agreements when it believes it is able to invest the cash acquired at a rate higher than the cost of the agreement, which would increase earned income. When the Portfolio enters into a reverse repurchase agreement, any fluctuations in the market value of either the securities transferred to another party or the securities in which the proceeds may be invested would affect the market value of the Portfolio’s assets. Because reverse repurchase agreements may be considered to be the practical equivalent of borrowing funds (and the counterparty making a loan), they constitute a form of leverage. The Portfolio segregates cash or liquid assets equal to its obligation to repurchase the security. During the term of the agreement, the Portfolio may also be obligated to pledge additional cash and/or securities in the event of a decline in the fair value of the transferred security. In the event the counterparty to a reverse repurchase agreement becomes insolvent, recovery of the security transferred by the Portfolio may be delayed or the Portfolio may incur a loss equal to the amount by which the value of the security transferred by the Portfolio exceeds the repurchase price payable by the Portfolio.
U Securities Sold Short—A short sale is a transaction in which the Portfolio sells a security it does not own in anticipation of a decline in the market value of that security. To complete such a transaction, the Portfolio must borrow the security to make delivery to the buyer with an obligation to replace such borrowed security at a later date. Until the security is replaced, the Portfolio is required to repay the lender any dividends or interest, which accrue during the period of the loan. The proceeds received from a short sale are recorded as a liability and the Portfolio records an unrealized gain or loss to the extent of the difference between the proceeds received and the value of the open short position on the day of determination. A gain, limited to the price at which the Portfolio sold the security short, or a loss, potentially unlimited as there is no upward limit on the price of a security, is recorded when the short position is terminated. Interest and dividends payable on securities sold short are recorded as an expense.
V Stripped Mortgage-Backed Securities—The Portfolio may invest in Interest Only (IO) and Principal Only (PO) securities, forms of stripped mortgage-backed securities, whereby the IO security receives all the interest and the PO security receives all the principal on a pool of mortgage assets. The yield to maturity on an IO security is extremely sensitive to the rate of principal payments (including prepayments) on the related underlying mortgage assets, and a rapid rate of principal payments may have a material adverse effect on the yield to maturity from these securities. If the underlying mortgages experience greater than anticipated prepayments of principal, the Portfolio may fail to recoup its initial investment in an IO security. The market value of IO and PO securities can be unusually volatile due to changes in interest rates.
2 Investment Adviser Fee and Other Transactions with Affiliates
The investment adviser fee is earned by Boston Management and Research (BMR), an indirect, wholly-owned subsidiary of Morgan Stanley, as compensation for investment advisory services rendered to the Portfolio and the Subsidiary. The Portfolio and Subsidiary each pay BMR a fee computed at an annual rate as a percentage of its respective average daily net assets as follows and is payable monthly:
| Average Daily Net Assets | Annual Fee Rate |
| Up to $500 million | 0.615% |
| $500 million but less than $1 billion | 0.595% |
| $1 billion but less than $1.5 billion | 0.575% |
| $1.5 billion but less than $2 billion | 0.555% |
| $2 billion but less than $3 billion | 0.520% |
| $3 billion but less than $5 billion | 0.490% |
| $5 billion but less than $10 billion | 0.475% |
| $10 billion and over | 0.465% |
Global Macro Portfolio
October 31, 2024
Notes to Consolidated Financial Statements — continued
BMR contractually agreed to reduce its investment advisory fee rate on average daily net assets of $5 billion and over from 0.490% to the rates as stated above. This contractual reduction cannot be terminated or reduced without Trustee and shareholder approval. In determining the investment adviser fee for the Portfolio and Subsidiary, the applicable advisory fee rate is based on the average daily net assets of the Portfolio (inclusive of its interest in the Subsidiary). Such fee rate is then assessed separately on the Portfolio’s average daily net assets (exclusive of its interest in the Subsidiary) and the Subsidiary’s average daily net assets to determine the amount of the investment adviser fee. For the year ended October 31, 2024, the Portfolio’s investment adviser fee amounted to $10,004,746 or 0.59% of the Portfolio’s consolidated average daily net assets.
The Portfolio may invest in a money market fund, the Institutional Class of the Morgan Stanley Institutional Liquidity Funds - Government Portfolio (the “Liquidity Fund”), an open-end management investment company managed by Morgan Stanley Investment Management Inc., a wholly-owned subsidiary of Morgan Stanley. The investment adviser fee paid by the Portfolio is reduced by an amount equal to its pro rata share of the advisory and administration fees paid by the Portfolio due to its investment in the Liquidity Fund. For the year ended October 31, 2024, the investment adviser fee paid was reduced by $199,887 relating to the Portfolio’s investment in the Liquidity Fund.
Pursuant to an investment sub-advisory agreement, BMR has delegated a portion of the investment management of the Portfolio to Eaton Vance Advisers International Ltd. (EVAIL), an affiliate of BMR and an indirect, wholly-owned subsidiary of Morgan Stanley. BMR pays EVAIL a portion of its investment adviser fee for sub-advisory services provided to the Portfolio.
Trustees and officers of the Portfolio who are members of BMR’s organization receive remuneration for their services to the Portfolio out of the investment adviser fee. Trustees of the Portfolio who are not affiliated with the investment adviser may elect to defer receipt of all or a percentage of their annual fees in accordance with the terms of the Trustees Deferred Compensation Plan. Certain officers and Trustees of the Portfolio are officers of the above organization.
3 Purchases and Sales of Investments
Purchases and sales of investments, other than short-term obligations and including maturities, paydowns and securities sold short, for the year ended October 31, 2024 were as follows:
| | Purchases | Sales |
| Investments (non-U.S. Government) | $1,631,596,894 | $1,495,866,472 |
| U.S. Government and Agency Securities | 98,254,061 | 155,780,957 |
| | $1,729,850,955 | $1,651,647,429 |
4 Federal Income Tax Basis of Investments
The cost and unrealized appreciation (depreciation) of investments of the Portfolio, including open derivative contracts, reverse repurchase agreements and the Portfolio's investment in the Subsidiary at October 31, 2024, as determined on a federal income tax basis, were as follows:
| Aggregate cost | $1,896,752,850 |
| Gross unrealized appreciation | $56,959,380 |
| Gross unrealized depreciation | (237,807,832) |
| Net unrealized depreciation | $(180,848,452) |
Global Macro Portfolio
October 31, 2024
Notes to Consolidated Financial Statements — continued
5 Restricted Securities
At October 31, 2024, the Portfolio owned the following securities (representing 0.8% of net assets) which were restricted as to public resale and not registered under the Securities Act of 1933 (excluding Rule 144A securities). The Portfolio has various registration rights (exercisable under a variety of circumstances) with respect to these securities. The value of these securities is determined based on valuations provided by brokers when available, or if not available, they are valued at fair value using methods determined in good faith by or at the direction of the Trustees’ valuation designee.
| Description | Date(s) of
Acquisition | Shares | Cost | Value |
| Insurance Linked Securities | | | | |
| Mt. Logan Re Ltd., Series A-1 | 12/30/20 | 4,400 | $ 4,400,000 | $ 7,647,627 |
| PartnerRe ILS Fund SAC Ltd. | 1/2/24 | 5,700,000 | 5,700,000 | 6,427,890 |
| Total Restricted Securities | | | $10,100,000 | $14,075,517 |
6 Financial Instruments
The Portfolio may trade in financial instruments with off-balance sheet risk in the normal course of its investing activities. These financial instruments may include written options, swaptions, forward foreign currency exchange contracts, futures contracts and swap contracts and may involve, to a varying degree, elements of risk in excess of the amounts recognized for financial statement purposes. The notional or contractual amounts of these instruments represent the investment the Portfolio has in particular classes of financial instruments and do not necessarily represent the amounts potentially subject to risk. The measurement of the risks associated with these instruments is meaningful only when all related and offsetting transactions are considered. A summary of obligations under these financial instruments at October 31, 2024 is included in the Consolidated Portfolio of Investments. At October 31, 2024, the Portfolio had sufficient cash and/or securities to cover commitments under these contracts.
In the normal course of pursuing its investment objective, the Portfolio is subject to the following risks:
Commodity Risk: The Portfolio invests in commodities-linked derivative instruments, including commodity futures contracts and options thereon and total return swap contracts based on commodity indices, that provide exposure to the investment returns of certain commodities. Commodities-linked derivative instruments are used to enhance total return and/or as a substitute for the purchase or sale of commodities and to manage certain investment risks.
Credit Risk: The Portfolio enters into credit default swap contracts to manage certain investment risks and/or to enhance total return or as a substitute for the purchase or sale of securities.
Equity Price Risk: During the year ended October 31, 2024, the Portfolio entered into equity index futures contracts and total return swaps to enhance total return and/or to manage certain investment risks.
Foreign Exchange Risk: The Portfolio engages in forward foreign currency exchange contracts, currency options and cross-currency swaps to enhance total return, to seek to hedge against fluctuations in currency exchange rates and/or as a substitute for the purchase or sale of securities or currencies.
Interest Rate Risk: During the year ended October 31, 2024, the Portfolio utilized various interest rate derivatives including interest rate futures contracts, interest rate swaps and swaptions, inflation swaps, total return swaps and cross-currency swaps to enhance total return, to seek to hedge against fluctuations in interest rates and/or to change the effective duration of its portfolio.
The Portfolio enters into over-the-counter (OTC) derivatives that may contain provisions whereby the counterparty may terminate the contract under certain conditions, including but not limited to a decline in the Portfolio’s net assets below a certain level over a certain period of time, which would trigger a payment by the Portfolio for those derivatives in a liability position. At October 31, 2024, the fair value of derivatives with credit-related contingent features in a net liability position was $19,125,341. The aggregate fair value of assets pledged as collateral by the Portfolio for such liability was $4,389,096 at October 31, 2024.
The OTC derivatives in which the Portfolio invests (except for written options as the Portfolio, not the counterparty, is obligated to perform) are subject to the risk that the counterparty to the contract fails to perform its obligations under the contract. To mitigate this risk, the Portfolio (and Subsidiary) has entered into an International Swaps and Derivatives Association, Inc. Master Agreement (“ISDA Master Agreement”) or similar agreement with substantially all its derivative counterparties. An ISDA Master Agreement is a bilateral agreement between the Portfolio and a counterparty that governs certain OTC derivatives and typically contains, among other things, set-off provisions in the event of a default and/or termination event as defined under the relevant ISDA Master Agreement. Under an ISDA Master Agreement, the Portfolio (and Subsidiary) may, under certain circumstances, offset with the counterparty certain derivative financial instruments’ payables and/or receivables with collateral held and/or posted and create one single net payment. The provisions of the ISDA Master Agreement typically permit a single net payment in the event of default including the bankruptcy or insolvency of the counterparty. However, bankruptcy or insolvency laws of a particular jurisdiction may impose restrictions on or prohibitions against the right of offset in bankruptcy or
Global Macro Portfolio
October 31, 2024
Notes to Consolidated Financial Statements — continued
insolvency. Certain ISDA Master Agreements allow counterparties to OTC derivatives to terminate derivative contracts prior to maturity in the event the Portfolio’s net assets decline by a stated percentage or the Portfolio fails to meet the terms of its ISDA Master Agreements, which would cause the counterparty to accelerate payment by the Portfolio of any net liability owed to it.
The collateral requirements for derivatives traded under an ISDA Master Agreement are governed by a Credit Support Annex to the ISDA Master Agreement. Collateral requirements are determined at the close of business each day and are typically based on changes in market values for each transaction under an ISDA Master Agreement and netted into one amount for such agreement. Generally, the amount of collateral due from or to a counterparty is subject to a minimum transfer threshold amount before a transfer is required, which may vary by counterparty. Collateral pledged for the benefit of the Portfolio (and Subsidiary) and/or counterparty is held in segregated accounts by the Portfolio’s custodian and cannot be sold, re-pledged, assigned or otherwise used while pledged. The portion of such collateral representing cash, if any, is reflected as deposits for derivatives collateral and, in the case of cash pledged by a counterparty for the benefit of the Portfolio, a corresponding liability on the Consolidated Statement of Assets and Liabilities. Securities pledged by the Portfolio as collateral, if any, are identified as such in the Consolidated Portfolio of Investments. The carrying amount of the liability for cash collateral due to brokers at October 31, 2024 approximated its fair value. If measured at fair value, such liability would have been considered as Level 2 in the fair value hierarchy (see Note 10) at October 31, 2024. Because the Subsidiary is not registered under the 1940 Act, it may not be able to negotiate terms with its counterparties that are equivalent to those a registered portfolio may negotiate. As a result, the Subsidiary may have greater exposure to those counterparties than a registered portfolio.
Global Macro Portfolio
October 31, 2024
Notes to Consolidated Financial Statements — continued
The fair value of open derivative instruments (not considered to be hedging instruments for accounting disclosure purposes) by risk exposure at October 31, 2024 was as follows:
| | Fair Value |
| Consolidated Statement of Assets and Liabilities Caption | Commodity | Credit | Equity
Price | Foreign
Exchange | Interest
Rate | Total |
| Unaffiliated investments, at value | $1,196,600 | $ — | $ — | $391,401 | $31 | $1,588,032 |
| Not applicable | — | 9,813,665* | 948,221* | 13,076,860* | 9,904,962* | 33,743,708 |
| Receivable for open forward foreign currency exchange contracts | — | — | — | 19,749,667 | — | 19,749,667 |
| Receivable/Payable for open swap contracts; Upfront payments/receipts on open OTC swap contracts | 67,837 | 317,034 | — | — | 131,664 | 516,535 |
| Total Asset Derivatives | $1,264,437 | $10,130,699 | $948,221 | $33,217,928 | $10,036,657 | $55,597,942 |
| Derivatives not subject to master netting or similar agreements | $1,196,600 | $9,813,665 | $948,221 | $13,076,860 | $9,904,962 | $34,940,308 |
| Total Asset Derivatives subject to master netting or similar agreements | $67,837 | $317,034 | $ — | $20,141,068 | $131,695 | $20,657,634 |
| Written options outstanding, at value | $ — | $ — | $ — | $(81,190) | $ — | $(81,190) |
| Not applicable | (146,543)* | (5,744,283)* | (319,379)* | (5,897,147)* | (9,951,963)* | (22,059,315) |
| Payable for open forward foreign currency exchange contracts | — | — | — | (17,285,961) | — | (17,285,961) |
| Payable/Receivable for open swap contracts; Upfront payments/receipts on open OTC swap contracts | — | (1,586,116) | — | — | (172,074) | (1,758,190) |
| Total Liability Derivatives | $(146,543) | $(7,330,399) | $(319,379) | $(23,264,298) | $(10,124,037) | $(41,184,656) |
| Derivatives not subject to master netting or similar agreements | $(146,543) | $(5,744,283) | $(319,379) | $(5,897,147) | $(9,951,963) | $(22,059,315) |
| Total Liability Derivatives subject to master netting or similar agreements | $ — | $(1,586,116) | $ — | $(17,367,151) | $(172,074) | $(19,125,341) |
| * | Only the current day’s variation margin on open futures contracts and centrally cleared derivatives is reported within the Consolidated Statement of Assets and Liabilities as Receivable or Payable for variation margin on open futures contracts and centrally cleared derivatives, as applicable. |
The Portfolio's derivative assets and liabilities at fair value by risk, which are reported gross in the Consolidated Statement of Assets and Liabilities, are presented in the table above. The following tables present the Portfolio's derivative assets and liabilities by counterparty, net of amounts available for offset under a master netting agreement and net of the related collateral received by the Portfolio (and Subsidiary) for such assets and pledged by the Portfolio (and Subsidiary) for such liabilities as of October 31, 2024.
| Counterparty | Derivative
Assets Subject to
Master Netting
Agreement | Derivatives
Available
for Offset | Non-cash
Collateral
Received(a) | Cash
Collateral
Received(a) | Net Amount
of Derivative
Assets(b) | Total Cash
Collateral
Received |
| Australia and New Zealand Banking Group Limited | $84,622 | $ — | $ — | $ — | $84,622 | $ — |
| Bank of America, N.A. | 1,366,886 | (912,876) | (454,010) | — | — | — |
| Barclays Bank PLC | 378,435 | (378,435) | — | — | — | — |
Global Macro Portfolio
October 31, 2024
Notes to Consolidated Financial Statements — continued
| Counterparty | Derivative
Assets Subject to
Master Netting
Agreement | Derivatives
Available
for Offset | Non-cash
Collateral
Received(a) | Cash
Collateral
Received(a) | Net Amount
of Derivative
Assets(b) | Total Cash
Collateral
Received |
| BNP Paribas | $469,612 | $(427,132) | $ — | $ — | $42,480 | $ — |
| Citibank, N.A. | 1,518,861 | (842,767) | — | (676,094) | — | 941,000 |
| Credit Agricole Corporate and Investment Bank | 67,959 | (31,298) | — | — | 36,661 | — |
| Deutsche Bank AG | 309,558 | (148,238) | — | (130,000) | 31,320 | 130,000 |
| Goldman Sachs International | 580,111 | (580,111) | — | — | — | — |
| HSBC Bank USA, N.A. | 564,921 | (564,921) | — | — | — | — |
| ICBC Standard Bank plc | 457,419 | (6,543) | — | (280,000) | 170,876 | 280,000 |
| JPMorgan Chase Bank, N.A. | 1,965,164 | (972,157) | — | (993,007) | — | 1,080,000 |
| Standard Chartered Bank | 11,805,371 | (8,482,350) | (1,217,425) | — | 2,105,596 | — |
| State Street Bank and Trust Company | 283,083 | (254,908) | — | — | 28,175 | — |
| UBS AG | 805,632 | (673,453) | (132,179) | — | — | — |
| | $20,657,634 | $(14,275,189) | $(1,803,614) | $(2,079,101) | $2,499,730 | $2,431,000 |
| Counterparty | Derivative
Liabilities Subject to
Master Netting
Agreement | Derivatives
Available
for Offset | Non-cash
Collateral
Pledged(a) | Cash
Collateral
Pledged(a) | Net Amount
of Derivative
Liabilities(c) | Total Cash
Collateral
Pledged |
| Bank of America, N.A. | $(912,876) | $912,876 | $ — | $ — | $ — | $ — |
| Barclays Bank PLC | (859,281) | 378,435 | 291,472 | — | (189,374) | — |
| BNP Paribas | (2,282,370) | 427,132 | 1,677,234 | — | (178,004) | — |
| Citibank, N.A. | (842,767) | 842,767 | — | — | — | — |
| Credit Agricole Corporate and Investment Bank | (31,298) | 31,298 | — | — | — | — |
| Deutsche Bank AG | (148,238) | 148,238 | — | — | — | — |
| Goldman Sachs International | (2,652,371) | 580,111 | 1,887,107 | — | (185,153) | — |
| HSBC Bank USA, N.A. | (954,693) | 564,921 | 389,772 | — | — | — |
| ICBC Standard Bank plc | (6,543) | 6,543 | — | — | — | — |
| JPMorgan Chase Bank, N.A. | (972,157) | 972,157 | — | — | — | — |
| Nomura International PLC | (39,384) | — | 39,384 | — | — | — |
| Societe Generale | (12,652) | — | — | — | (12,652) | — |
| Standard Chartered Bank | (8,482,350) | 8,482,350 | — | — | — | — |
| State Street Bank and Trust Company | (254,908) | 254,908 | — | — | — | — |
| UBS AG | (673,453) | 673,453 | — | — | — | — |
| | $(19,125,341) | $14,275,189 | $4,284,969 | $ — | $(565,183) | $ — |
| Total — Deposits for derivatives collateral — OTC derivatives | | | | $2,431,000 |
| (a) | In some instances, the total collateral received and/or pledged may be more than the amount shown due to overcollateralization. |
| (b) | Net amount represents the net amount due from the counterparty in the event of default. |
| (c) | Net amount represents the net amount payable to the counterparty in the event of default. |
Information with respect to reverse repurchase agreements at October 31, 2024 is included at Note 8.
Global Macro Portfolio
October 31, 2024
Notes to Consolidated Financial Statements — continued
The effect of derivative instruments (not considered to be hedging instruments for accounting disclosure purposes) on the Consolidated Statement of Operations by risk exposure for the year ended October 31, 2024 was as follows:
| Consolidated Statement of Operations Caption | Commodity | Credit | Equity
Price | Foreign
Exchange | Interest
Rate | Total |
| Net realized gain (loss): | | | | | | |
| Investment transactions(1) | $(972,240) | $ — | $ — | $(1,888,076) | $ — | $(2,860,316) |
| Written options | — | — | — | 229,223 | — | 229,223 |
| Futures contracts | (513,100) | — | (4,376,756) | — | (4,613,709) | (9,503,565) |
| Swap contracts | 1,990,123 | (24,324,721) | 530,118 | — | (696,281) | (22,500,761) |
| Forward foreign currency exchange contracts | — | — | — | (17,734,848) | — | (17,734,848) |
| Total | $504,783 | $(24,324,721) | $(3,846,638) | $(19,393,701) | $(5,309,990) | $(52,370,267) |
| Change in unrealized appreciation (depreciation): | | | | | | |
| Investments(1) | $(523,520) | $ — | $ — | $(175,609) | $(152,366) | $(851,495) |
| Written options | — | — | — | (62,547) | — | (62,547) |
| Futures contracts | 119,616 | — | (273,311) | — | (4,530,292) | (4,683,987) |
| Swap contracts | 47,668 | (3,403,291) | 652,560 | — | 3,189,153 | 486,090 |
| Forward foreign currency exchange contracts | — | — | — | 9,199,002 | — | 9,199,002 |
| Total | $(356,236) | $(3,403,291) | $379,249 | $8,960,846 | $(1,493,505) | $4,087,063 |
| (1) | Relates to purchased options. |
The average notional cost of futures contracts and average notional amounts of other derivative contracts outstanding during the year ended October 31, 2024, which are indicative of the volume of these derivative types, were approximately as follows:
Futures
Contracts — Long | Futures
Contracts — Short | Forward
Foreign Currency
Exchange Contracts* | Purchased
Swaptions | Swap
Contracts |
| $50,748,000 | $334,139,000 | $1,962,048,000 | $18,066,000 | $2,238,033,000 |
| * | The average notional amount for forward foreign currency exchange contracts is based on the absolute value of notional amounts of currency purchased and currency sold. |
The average principal amount of purchased and written currency options contracts outstanding during the year ended October 31, 2024, which are indicative of the volume of these derivative types, were approximately $59,944,000 and $15,172,000, respectively.
The average number of purchased options contracts outstanding during the year ended October 31, 2024, which is indicative of the volume of this derivative type, was 521.
7 Line of Credit
The Portfolio participates with other portfolios and funds managed by BMR and its affiliates in a $650 million unsecured revolving line of credit agreement with a group of banks, which is in effect through October 21, 2025. Borrowings are made by the Portfolio solely for temporary purposes related to redemptions and other short-term cash needs. Interest is charged to the Portfolio based on its borrowings generally at an amount above either the Secured Overnight Financing Rate (SOFR) or Federal Funds rate. In addition, a fee computed at an annual rate of 0.15% on the daily unused portion of the line of credit is allocated among the participating portfolios and funds at the end of each quarter. In connection with the renewal of the agreement in October 2024, an arrangement fee of $150,000 was incurred that was allocated to the participating portfolios and funds. Because the line of credit is not available exclusively to the Portfolio, it may be unable to borrow some or all of its requested amounts at any particular time. The Portfolio did not have any significant borrowings or allocated fees during the year ended October 31, 2024.
Global Macro Portfolio
October 31, 2024
Notes to Consolidated Financial Statements — continued
8 Reverse Repurchase Agreements
Reverse repurchase agreements outstanding as of October 31, 2024 were as follows:
| Counterparty | Trade
Date | Maturity
Date | Interest
Rate Paid
(Received) | | Principal
Amount | Value
Including
Accrued
Interest |
| JPMorgan Chase Bank, N.A. | 10/22/24 | On Demand(1) | 4.90% | NZD | 23,033,866 | $13,782,333 |
| Total | | | | | | $13,782,333 |
| (1) | Open reverse repurchase agreement with no specific maturity date. Either party may terminate the agreement upon demand. |
At October 31, 2024, the type of securities pledged as collateral for all open reverse repurchase agreements was Sovereign Government Bonds.
For the year ended October 31, 2024, the average borrowings under settled reverse repurchase agreements and the average annual interest rate paid were approximately $13,495,000 and 5.61%, respectively. Based on the short-term nature of the borrowings under the reverse repurchase agreements, the carrying value of the payable for reverse repurchase agreements approximated its fair value at October 31, 2024. If measured at fair value, borrowings under the reverse repurchase agreements would have been considered as Level 2 in the fair value hierarchy (see Note 10) at October 31, 2024.
Reverse repurchase agreements entered into by the Portfolio are subject to Master Repurchase Agreements (MRA), which permit the Portfolio, under certain circumstances, including an event of default (such as bankruptcy or insolvency), to offset payables and/or receivables under the MRA with collateral held and/or posted to the counterparty and create one single net payment due to or from the Portfolio.
The following tables present the Portfolio’s repurchase and reverse repurchase agreements net of amounts available for offset under an MRA and net of the related collateral pledged by the Portfolio as of October 31, 2024.
| Counterparty | Repurchase
Agreements | Liabilities
Available for
Offset | Securities
Collateral
Received(a) | Cash
Collateral
Received(a) | Net
Amount(b) |
| Bank of America, N.A. | $14,676,198 | $ — | $(14,564,691) | $ — | $111,507 |
| Barclays Bank PLC | 47,173,835 | — | (44,234,293) | — | 2,939,542 |
| Nomura International PLC | 35,490,973 | — | (34,029,337) | — | 1,461,636 |
| | $97,341,006 | $ — | $(92,828,321) | $ — | $4,512,685 |
| Counterparty | Reverse
Repurchase
Agreements* | Assets
Available for
Offset | Securities
Collateral
Pledged(a) | Cash
Collateral
Pledged(a) | Net
Amount(c) |
| JPMorgan Chase Bank, N.A. | $(13,782,333) | $ — | $13,782,333 | $ — | $ — |
| * | Including accrued interest. |
| (a) | In some instances, the total collateral received and/or pledged may be more than the amount shown due to overcollateralization. |
| (b) | Net amount represents the net amount receivable from the counterparty in the event of default. |
| (c) | Net amount represents the net amount payable to the counterparty in the event of default. |
Global Macro Portfolio
October 31, 2024
Notes to Consolidated Financial Statements — continued
9 Affiliated Investments
At October 31, 2024, the value of the Portfolio's investment in funds that may be deemed to be affiliated was $128,853,494, which represents 7.3% of the Portfolio's net assets. Transactions in such investments by the Portfolio for the year ended October 31, 2024 were as follows:
| Name | Value,
beginning
of period | Purchases | Sales
proceeds | Net realized
gain (loss) | Change in
unrealized
appreciation
(depreciation) | Value, end
of period | Dividend
income | Shares,
end of period |
| Short-Term Investments |
| Liquidity Fund | $283,898,491 | $1,334,470,942 | $(1,489,515,939) | $ — | $ — | $128,853,494 | $7,076,568 | 128,853,494 |
10 Fair Value Measurements
Under generally accepted accounting principles for fair value measurements, a three-tier hierarchy to prioritize the assumptions, referred to as inputs, is used in valuation techniques to measure fair value. The three-tier hierarchy of inputs is summarized in the three broad levels listed below.
| • | Level 1 – quoted prices in active markets for identical investments |
| • | Level 2 – other significant observable inputs (including quoted prices for similar investments, interest rates, prepayment speeds, credit risk, etc.) |
| • | Level 3 – significant unobservable inputs (including a fund's own assumptions in determining the fair value of investments) |
In cases where the inputs used to measure fair value fall in different levels of the fair value hierarchy, the level disclosed is determined based on the lowest level input that is significant to the fair value measurement in its entirety. The inputs or methodology used for valuing securities are not necessarily an indication of the risk associated with investing in those securities.
At October 31, 2024, the hierarchy of inputs used in valuing the Portfolio's investments and open derivative instruments, which are carried at fair value, were as follows:
| Asset Description | Level 1 | Level 2 | Level 3 | Total |
| Collateralized Mortgage Obligations | $ — | $ 65,988,347 | $ — | $ 65,988,347 |
| Common Stocks | 16,129,228 | 65,915,292* | — | 82,044,520 |
| Convertible Bonds | — | 65,446 | — | 65,446 |
| Foreign Corporate Bonds | — | 68,927,941 | 0 | 68,927,941 |
| Insurance Linked Securities | — | — | 20,806,857 | 20,806,857 |
| Loan Participation Notes | — | — | 15,771,698 | 15,771,698 |
| Rights | — | 43,635 | — | 43,635 |
| Senior Floating-Rate Loans | — | 6,544,169 | — | 6,544,169 |
| Sovereign Government Bonds | — | 854,199,762 | — | 854,199,762 |
| Sovereign Loans | — | 58,153,884 | — | 58,153,884 |
| U.S. Government Agency Mortgage-Backed Securities | — | 4,784,828 | — | 4,784,828 |
| U.S. Government Guaranteed Small Business Administration Loans | — | 3,280,162 | — | 3,280,162 |
| U.S. Treasury Obligations | — | 77,264,005 | — | 77,264,005 |
| Short-Term Investments: | | | | |
| Affiliated Fund | 128,853,494 | — | — | 128,853,494 |
| Repurchase Agreements | — | 97,341,006 | — | 97,341,006 |
| Sovereign Government Securities | — | 96,438,033 | — | 96,438,033 |
| U.S. Treasury Obligations | — | 130,793,388 | — | 130,793,388 |
| Purchased Currency Options | — | 391,401 | — | 391,401 |
| Purchased Interest Rate Swaptions | — | 31 | — | 31 |
Global Macro Portfolio
October 31, 2024
Notes to Consolidated Financial Statements — continued
| Asset Description (continued) | Level 1 | Level 2 | Level 3 | Total |
| Purchased Put Options | $ 1,196,600 | $ — | $ — | $ 1,196,600 |
| Total Investments | $146,179,322 | $1,530,131,330 | $36,578,555 | $1,712,889,207 |
| Forward Foreign Currency Exchange Contracts | $ — | $ 32,826,527 | $ — | $ 32,826,527 |
| Futures Contracts | 2,025,092 | 632,909 | — | 2,658,001 |
| Swap Contracts | — | 18,525,382 | — | 18,525,382 |
| Total | $148,204,414 | $1,582,116,148 | $36,578,555 | $1,766,899,117 |
| Liability Description | | | | |
| Securities Sold Short | $(93,378,572) | $ (101,235,312) | $ — | $ (194,613,884) |
| Written Currency Options | — | (81,190) | — | (81,190) |
| Forward Foreign Currency Exchange Contracts | — | (23,183,108) | — | (23,183,108) |
| Futures Contracts | (3,517,953) | — | — | (3,517,953) |
| Swap Contracts | — | (14,402,405) | — | (14,402,405) |
| Total | $(96,896,525) | $ (138,902,015) | $ — | $ (235,798,540) |
| * | Includes foreign equity securities whose values were adjusted to reflect market trading of comparable securities or other correlated instruments that occurred after the close of trading in their applicable foreign markets. |
The following is a reconciliation of Level 3 investments for which significant unobservable inputs were used to determine fair value:
| | Common
Stocks | Foreign
Corporate
Bonds | Insurance
Linked Securities | Loan
Participation
Notes | Senior
Floating-Rate
Loans | Miscellaneous | Total |
| Balance as of October 31, 2023 | $572,723 | $0 | $15,481,804 | $21,688,264 | $278,045 | $0 | $38,020,836 |
| Realized gains (losses) | (273,212) | — | 1,470,879 | (1,554,468) | (283,405) | 263,333 | (376,873) |
| Change in net unrealized appreciation (depreciation) | (299,511) | — | 2,972,432 | 1,269,224 | 479,191 | — | 4,421,336 |
| Cost of purchases | — | — | 11,400,000 | — | — | — | 11,400,000 |
| Proceeds from sales, including return of capital | — | — | (10,518,258) | (6,023,615) | (489,492) | (263,333) | (17,294,698) |
| Accrued discount (premium) | — | — | — | 392,293 | 15,661 | — | 407,954 |
| Transfers to Level 3 | — | — | — | — | — | — | — |
| Transfers from Level 3 | — | — | — | — | — | — | — |
| Balance as of October 31, 2024 | $ — | $0 | $20,806,857 | $15,771,698 | $ — | $ — | $36,578,555 |
| Change in net unrealized appreciation (depreciation) on investments still held as of October 31, 2024 | $ — | $ — | $4,174,532 | $(3,966) | $ — | $ — | $4,170,566 |
Global Macro Portfolio
October 31, 2024
Notes to Consolidated Financial Statements — continued
The following is a summary of quantitative information about significant unobservable valuation inputs for Level 3 investments held as of October 31, 2024:
| Type of Investment | Fair Value as of
October 31, 2024 | Valuation Technique | Unobservable Input | Range of Unobservable Input | Impact to
Valuation from an
Increase to Input* |
| Foreign Corporate Bonds | $0 | Estimated Recovery Value | Estimated Recovery Value Percentage | 0% | Increase |
| Insurance Linked Securities*** | 14,075,517 | Adjusted Net Asset Value | Adjustment to Net Asset Value | N/A | Increase |
| Loan Participation Notes | 15,771,698 | Matrix Pricing | Adjusted Credit Spread to the Central Bank of Uzbekistan Quoted Policy Rate | 5.10% - 6.10%** | Decrease |
| * | Represents the directional change in the fair value of the Level 3 investments that would result from an increase to the corresponding unobservable input. A decrease to the unobservable input would have the opposite effect. |
| ** | The weighted average of the unobservable input is 5.72% based on relative principal amounts. |
| *** | The Portfolio’s investments in Reinsurance Side Cars of $6,731,340 were primarily valued on the basis of broker quotations. |
11 Risks and Uncertainties
Risks Associated with Foreign Investments
Foreign investments can be adversely affected by political, economic and market developments abroad, including the imposition of economic and other sanctions by the United States or another country, and by acts of terrorism and war. There may be less publicly available information about foreign issuers because they may not be subject to reporting practices, requirements or regulations comparable to those to which United States companies are subject. Foreign markets may be smaller, less liquid and more volatile than the major markets in the United States. Trading in foreign markets typically involves higher expense than trading in the United States. The Portfolio may have difficulties enforcing its legal or contractual rights in a foreign country. Securities that trade or are denominated in currencies other than the U.S. dollar may be adversely affected by fluctuations in currency exchange rates.
Emerging market securities often involve greater risks than developed market securities. Investment markets within emerging market countries are typically smaller, less liquid, less developed and more volatile than those in more developed markets like the United States, and may be focused in certain economic sectors. The information available about an emerging market issuer may be less reliable than for comparable issuers in more developed capital markets. Governmental actions can have a significant effect on the economic conditions in emerging market countries. It may be more difficult to make a claim or obtain a judgment in the courts of these countries than it is in the United States. The possibility of fraud, negligence, undue influence being exerted by an issuer or refusal to recognize ownership exists in some emerging markets. Disruptions due to work stoppages and trading improprieties in foreign securities markets have caused such markets to close. Emerging market securities are also subject to speculative trading, which contributes to their volatility.
Economic data as reported by sovereign entities may be delayed, inaccurate or fraudulent. In the event of a default by a sovereign entity, there are typically no assets to be seized or cash flows to be attached. Furthermore, the willingness or ability of a sovereign entity to restructure defaulted debt may be limited. Therefore, losses on sovereign defaults may far exceed the losses from the default of a similarly rated U.S. debt issuer.
Global Macro Portfolio
October 31, 2024
Report of Independent Registered Public Accounting Firm
To the Trustees and Investors of Global Macro Portfolio:
Opinion on the Financial Statements and Financial Highlights
We have audited the accompanying consolidated statement of assets and liabilities of Global Macro Portfolio and subsidiary (the “Portfolio”), including the consolidated portfolio of investments, as of October 31, 2024, the related consolidated statement of operations for the year then ended, the consolidated statements of changes in net assets for each of the two years in the period then ended, the consolidated financial highlights for each of the five years in the period then ended, and the related notes (collectively referred to as the "financial statements and financial highlights”). In our opinion, the financial statements and financial highlights present fairly, in all material respects, the financial position of the Portfolio as of October 31, 2024, and the results of its operations for the year then ended, the changes in its net assets for each of the two years in the period then ended, and the financial highlights for each of the five years in the period then ended, in conformity with accounting principles generally accepted in the United States of America.
Basis for Opinion
These financial statements and financial highlights are the responsibility of the Portfolio’s management. Our responsibility is to express an opinion on the Portfolio’s financial statements and financial highlights based on our audits. We are a public accounting firm registered with the Public Company Accounting Oversight Board (United States) (PCAOB) and are required to be independent with respect to the Portfolio in accordance with the U.S. federal securities laws and the applicable rules and regulations of the Securities and Exchange Commission and the PCAOB.
We conducted our audits in accordance with the standards of the PCAOB. Those standards require that we plan and perform the audit to obtain reasonable assurance about whether the financial statements and financial highlights are free of material misstatement, whether due to error or fraud. The Portfolio is not required to have, nor were we engaged to perform, an audit of its internal control over financial reporting. As part of our audits, we are required to obtain an understanding of internal control over financial reporting but not for the purpose of expressing an opinion on the effectiveness of the Portfolio’s internal control over financial reporting. Accordingly, we express no such opinion.
Our audits included performing procedures to assess the risks of material misstatement of the financial statements and financial highlights, whether due to error or fraud, and performing procedures that respond to those risks. Such procedures included examining, on a test basis, evidence regarding the amounts and disclosures in the financial statements and financial highlights. Our audits also included evaluating the accounting principles used and significant estimates made by management, as well as evaluating the overall presentation of the financial statements and financial highlights. Our procedures included confirmation of securities and senior loans owned as of October 31, 2024, by correspondence with the custodian, brokers, and agent banks; when replies were not received from brokers and agent banks, we performed other auditing procedures. We believe that our audits provide a reasonable basis for our opinion.
/s/ Deloitte & Touche LLP
Boston, Massachusetts
December 20, 2024
We have served as the auditor of one or more Eaton Vance investment companies since 1959.
Eaton Vance
Global Macro Absolute Return Fund
October 31, 2024
Board of Trustees’ Contract Approval
Overview of the Contract Review Process
The Investment Company Act of 1940, as amended (the “1940 Act”), provides, in substance, that the investment advisory agreement between a fund and its investment adviser will continue in effect from year-to-year only if its continuation is approved on an annual basis by a vote of the fund’s board of trustees, including a majority of the trustees who are not “interested persons” of the fund (“independent trustees”), cast in person at a meeting called for the purpose of considering such approval.
At a meeting held on June 6, 2024, the Boards of Trustees/Directors (collectively, the “Board”) that oversee the registered investment companies advised by Eaton Vance Management or its affiliate, Boston Management and Research (the “Eaton Vance Funds”), including a majority of the independent trustees (the “Independent Trustees”), voted to approve the continuation of existing investment advisory agreements and sub-advisory agreements1 for each of the Eaton Vance Funds for an additional one-year period. The Board relied upon the affirmative recommendation of its Contract Review Committee, which is a committee comprised of all of the Independent Trustees. Prior to making its recommendation, the Contract Review Committee reviewed information furnished by the adviser and sub-adviser to each of the Eaton Vance Funds (including information specifically requested by the Board) for a series of meetings held between April and June 2024, as well as certain additional information provided in response to specific requests from the Independent Trustees as members of the Contract Review Committee. Members of the Contract Review Committee also considered information received at prior meetings of the Board and its committees, to the extent such information was relevant to the Contract Review Committee’s annual evaluation of the investment advisory agreements and sub-advisory agreements.
In connection with its evaluation of the investment advisory agreements and sub-advisory agreements, the Board considered various information relating to the Eaton Vance Funds. This included information applicable to all or groups of Eaton Vance Funds, which is referenced immediately below, and information applicable to the particular Eaton Vance Fund covered by this report (each “Eaton Vance Fund” is referred to below as a “fund”). (For funds that invest through one or more underlying portfolios, references to “each fund” in this section may include information that was considered at the portfolio-level.)
Information about Fees, Performance and Expenses
• A report from an independent data provider comparing advisory and other fees paid by each fund to such fees paid by comparable funds, as identified by the independent data provider (“comparable funds”);
• A report from an independent data provider comparing each fund’s total expense ratio (and its components) to those of comparable funds;
• A report from an independent data provider comparing the investment performance of each fund (including, as relevant, total return data, income data, Sharpe ratios, and information ratios) to the investment performance of comparable funds and, as applicable, benchmark indices, over various time periods;
• In certain instances, data regarding investment performance relative to customized groups of peer funds and blended indices identified by the adviser in consultation with the Portfolio Management Committee of the Board (a committee exclusively comprised of Independent Trustees);
• Comparative information concerning the fees charged and services provided by the adviser and sub-adviser to each fund in managing other accounts (which may include other funds, collective investment trusts and institutional accounts) with the same or substantially similar investment objective as the fund and with a significant overlap in holdings based on criteria set by the Board, if any;
• Profitability analyses with respect to the adviser and sub-adviser to each of the funds;
Information about Portfolio Management and Trading
• Descriptions of the investment management services provided to each fund, as well as each of the funds’ investment strategies and policies;
• The procedures and processes used by the adviser to determine the value of fund assets, including, when necessary, the determination of “fair value” by the adviser in its role as each funds’ valuation designee and actions taken to monitor and test the effectiveness of such procedures and processes;
• Information about the policies and practices of each fund’s adviser and sub-adviser with respect to trading, including their processes for seeking best execution of portfolio transactions;
• Information about the allocation of brokerage transactions and the benefits, if any, received by the adviser and sub-adviser to each fund as a result of brokerage allocation, including, as applicable, information concerning the acquisition of research through client commission arrangements and policies with respect to “soft dollars”;
• Data relating to the portfolio turnover rate of each fund and related information regarding active management in the context of particular strategies;
Information about each Adviser and Sub-adviser
• Reports detailing the financial results and condition of the adviser and sub-adviser to each fund;
• Information regarding the individual investment professionals whose responsibilities include portfolio management and investment research for the funds, and, for portfolio managers and certain other investment professionals, information relating to their responsibilities with respect to managing other funds and investment accounts, as applicable;
1 Not all Eaton Vance Funds have entered into a sub-advisory agreement with a sub-adviser. Accordingly, references to “sub-adviser” or “sub-advisory agreement” in this “Overview” section may not be applicable to the particular Eaton Vance Fund covered by this report. Eaton Vance Management and Boston Management and Research are referred to collectively as the “adviser.”
Eaton Vance
Global Macro Absolute Return Fund
October 31, 2024
Board of Trustees’ Contract Approval — continued
• Information regarding the adviser’s and its parent company’s (Morgan Stanley’s) efforts to retain and attract talented investment professionals, including in the context of a competitive marketplace for talent;
• Information regarding the adviser’s compensation methodology for its investment professionals and the incentives and accountability it creates, along with investment professionals’ investments in the fund(s) they manage;
• The personal trading codes of ethics of the adviser and its affiliates and the sub-adviser of each fund, together with information relating to compliance with, and the administration of, such codes;
• Policies and procedures relating to proxy voting, including regular reporting with respect to fund proxy voting activities;
• Information regarding the handling of corporate actions and class actions, as well as information regarding litigation and other regulatory matters;
• Information concerning the resources devoted to compliance efforts undertaken by the adviser and its affiliates and the sub-adviser of each fund, including descriptions of their various compliance programs and their record of compliance and remediation;
• Information concerning the business continuity and disaster recovery plans of the adviser and its affiliates and the sub-adviser of each fund;
• A description of the adviser’s oversight of sub-advisers, including with respect to regulatory and compliance issues, investment management and other matters;
Other Relevant Information
• Information regarding ongoing initiatives to further integrate and harmonize, where applicable, the investment management and other departments of the adviser and its affiliates with the overall investment management infrastructure of Morgan Stanley, in light of Morgan Stanley’s acquisition of Eaton Vance Corp. on March 1, 2021;
• Information concerning the nature, cost, and character of the administrative and other non-investment advisory services provided by the adviser and its affiliates;
• Information concerning oversight of the relationship with the custodian, subcustodians, fund accountants, and other third-party service providers by the adviser and/or administrator to each of the funds;
• Information concerning efforts to implement policies and procedures with respect to various regulations applicable to the funds, including Rule 12d1-4 (the Fund-of-Funds Rule), Rule 18f-4 (the Derivatives Rule), and Rule 2a-5 (the Fair Valuation Rule);
• For an Eaton Vance Fund structured as an exchange-listed closed-end fund, information concerning the benefits of the closed-end fund structure, as well as, where relevant, the closed-end fund’s market prices (including as compared to the closed-end fund’s net asset value (NAV)), trading volume data, continued use of auction preferred shares (where applicable), distribution rates, and other relevant matters;
• The risks that the adviser and/or its affiliates incur in connection with the management and operation of the funds, including, among others, litigation, regulatory, entrepreneurial, and other business risks (and the associated costs of such risks); and
• The terms of each investment advisory agreement and sub-advisory agreement.
During the various meetings of the Board and its committees over the course of the year leading up to the June 6, 2024 meeting, the Board and its committees received information from portfolio managers and other investment professionals of the adviser and sub-advisers of the funds regarding investment and performance matters, and considered various investment and trading strategies used in pursuing the funds’ investment objectives. The Board and its committees also received information regarding risk management techniques employed in connection with the management of the funds. The Board and its committees evaluated issues pertaining to industry and regulatory developments, compliance procedures, fund governance, and other issues with respect to the funds, and received and participated in reports and presentations provided by the adviser and sub-advisers, with respect to such matters. In addition to the formal meetings of the Board and its committees, the Independent Trustees held regular video or telephone conferences to discuss, among other topics, matters relating to the continuation of investment advisory agreements and sub-advisory agreements.
The Contract Review Committee was advised throughout the contract review process by Kirkland & Ellis LLP, independent legal counsel for the Independent Trustees. The members of the Contract Review Committee, with the advice of such counsel, exercised their own business judgment in determining the material factors to be considered in evaluating each investment advisory agreement and sub-advisory agreement and the weight to be given to each such factor. The conclusions reached with respect to each investment advisory agreement and sub-advisory agreement were based on a comprehensive evaluation of all the information provided and not any single factor. Moreover, each member of the Contract Review Committee may have placed varying emphasis on particular factors in reaching conclusions with respect to each investment advisory agreement and sub-advisory agreement. In evaluating each investment advisory agreement and sub-advisory agreement, including the fee structures and other terms contained in such agreements, the members of the Contract Review Committee were also informed by multiple years of analysis and discussion with the adviser and sub-adviser to each of the Eaton Vance Funds.
Results of the Contract Review Process
Based on its consideration of the foregoing, and such other information it deemed relevant, including the factors and conclusions described below, the Contract Review Committee concluded that the continuation of the investment advisory agreement between Eaton Vance Global Macro Absolute Return Fund (the “Fund”) and Eaton Vance Management (“EVM”), as well as the investment advisory agreement between Global Macro Portfolio (the “Portfolio”), the portfolio in which the Fund invests, and Boston Management and Research (“BMR”) (EVM, with respect to the Fund, and BMR, with respect to the Portfolio, are each referred to herein as the “Adviser”), and the sub-advisory agreement between EVM and Eaton Vance Advisers International Ltd. (the “Sub-adviser”), an affiliate of the Advisers, with respect to the Fund, and the sub-advisory agreement between BMR and the Sub-adviser, with respect to
Eaton Vance
Global Macro Absolute Return Fund
October 31, 2024
Board of Trustees’ Contract Approval — continued
the Portfolio, including their respective fee structures, are in the interests of shareholders and, therefore, recommended to the Board approval of each agreement. Based on the recommendation of the Contract Review Committee, the Board, including a majority of the Independent Trustees, voted to approve continuation of the investment advisory agreements for the Fund and the Portfolio (together, the “investment advisory agreements”) and the sub-advisory agreements for the Fund and the Portfolio (together, the “sub-advisory agreements”).
Nature, Extent and Quality of Services
In considering whether to approve the investment advisory agreements and sub-advisory agreements for the Fund and the Portfolio, the Board evaluated the nature, extent and quality of services provided to the Fund and to the Portfolio by the applicable Adviser and the Sub-adviser, respectively.
The Board considered each Adviser’s and the Sub-adviser’s management capabilities and investment processes in light of the types of investments held by the Fund and the Portfolio, including the education and experience of the investment professionals who provide services to the Fund and the Portfolio, including recent changes to such personnel. The Board considered each Adviser’s expertise with respect to global markets and in-house research capabilities. The Board also considered the resources available to the Sub-adviser in fulfilling its duties under the sub-advisory agreements and the abilities and experience of the Sub-adviser’s investment professionals in implementing the investment strategies of the Fund and the Portfolio. In particular, the Board considered the expertise of the Sub-adviser’s investment professionals with respect to global markets and in-house research capabilities. The Board considered the international investment capabilities of the Sub-adviser, which is based in London, and the benefits to the Fund and the Portfolio of having portfolio management services involving investments in international securities provided by investment professionals located abroad. The Board also took into account the resources dedicated to portfolio management and other services, the compensation methods of each Adviser and other factors, including the reputation and resources of each Adviser to recruit and retain highly qualified research, advisory and supervisory investment professionals. In addition, the Board considered the time and attention devoted to the Eaton Vance Funds, including the Fund and the Portfolio, by senior management, as well as the infrastructure, operational capabilities and support staff in place to assist in the portfolio management and operations of the Fund and the Portfolio, including the provision of administrative services. The Board also considered the business-related and other risks to which each Adviser or its affiliates may be subject in managing the Fund and the Portfolio.
The Board noted that, under the terms of the investment advisory agreement of the Fund, EVM may invest assets of the Fund directly in securities, for which it would receive a fee, or in the Portfolio, for which it receives no separate fee but for which BMR receives an advisory fee from the Portfolio. The Board considered the potential benefits to the Fund of the ability to make direct investments, such as an improved ability to manage the Fund’s general market exposures, either by investing in specific securities or through the use of certain derivatives.
The Board considered the compliance programs of each Adviser and relevant affiliates thereof, including the Sub-adviser. The Board considered compliance and reporting matters regarding, among other things, personal trading by investment professionals, disclosure of portfolio holdings, compliance with policies and procedures, portfolio valuation, business continuity and the allocation of investment opportunities. The Board also considered relevant examinations of the Adviser and its affiliates by regulatory authorities, such as the Securities and Exchange Commission and the Financial Industry Regulatory Authority.
The Board considered other administrative services provided or overseen by EVM and its affiliates, including transfer agency and accounting services. The Board evaluated the benefits to shareholders of investing in a fund that is a part of a large fund complex offering exposure to a variety of asset classes and investment disciplines, as well as the ability, in many cases, to exchange an investment among different funds without incurring additional sales charges.
After consideration of the foregoing factors, among others, the Board concluded that the nature, extent and quality of services provided by each Adviser and the Sub-adviser, taken as a whole, are appropriate and consistent with the terms of the applicable investment advisory agreement and the applicable sub-advisory agreement.
Fund Performance
The Board compared the Fund’s investment performance to that of comparable funds identified by an independent data provider (the peer group), as well as an appropriate benchmark index. The Board’s review included comparative performance data with respect to the Fund for the one-, three-, five- and ten-year periods ended December 31, 2023. In this regard, the Board noted that the performance of the Fund was consistent with the median performance of the Fund’s peer group for the three-year period. The Board also noted that the performance of the Fund was higher than its benchmark index for the three-year period. The Board concluded that the performance of the Fund was satisfactory.
Management Fees and Expenses
The Board considered contractual fee rates payable by the Portfolio and by the Fund for advisory and administrative services (referred to collectively as “management fees”). As part of its review, the Board considered the Fund’s management fees and total expense ratio for the one-year period ended December 31, 2023, as compared to those of comparable funds, before and after giving effect to any undertaking to waive fees or reimburse expenses. The Board also considered factors that had an impact on the Fund’s total expense ratio relative to comparable funds. The Board noted that the Portfolio has established a wholly-owned subsidiary to accommodate the Portfolio’s commodity-related investments. The subsidiary is managed by BMR pursuant to a separate investment advisory agreement that is subject to annual approval by the Board. The subsidiary’s fee rates are the same as those charged to the Portfolio, and the Portfolio will not pay any additional management fees with respect to its assets invested in the subsidiary.
Eaton Vance
Global Macro Absolute Return Fund
October 31, 2024
Board of Trustees’ Contract Approval — continued
After considering the foregoing information, and in light of the nature, extent and quality of the services provided by each Adviser and the Sub-adviser, the Board concluded that the management fees charged for advisory and related services are reasonable.
Profitability and “Fall-Out” Benefits
The Board considered the level of profits realized by each Adviser and relevant affiliates thereof, including the Sub-adviser, in providing investment advisory and administrative services to the Fund, to the Portfolio and to all Eaton Vance Funds as a group. The Board considered the level of profits realized without regard to marketing support or other payments by each Adviser and its affiliates to third parties in respect of distribution or other services.
The Board concluded that, in light of the foregoing factors and the nature, extent and quality of the services rendered, the profits realized by each Adviser and its affiliates, including the Sub-adviser, are not excessive.
The Board also considered direct or indirect fall-out benefits received by each Adviser and its affiliates, including the Sub-adviser, in connection with their respective relationships with the Fund and the Portfolio, including the benefits of research services that may be available to each Adviser or the Sub-adviser as a result of securities transactions effected for the Fund and the Portfolio and other investment advisory clients.
Economies of Scale
In reviewing management fees and profitability, the Board also considered the extent to which the applicable Adviser and its affiliates, on the one hand, and the Fund and the Portfolio, on the other hand, can expect to realize benefits from economies of scale as the assets of the Fund and the Portfolio increase. The Board acknowledged the difficulty in accurately measuring the benefits resulting from economies of scale, if any, with respect to the management of any specific fund or group of funds. To assist in the evaluation of the sharing of any economies of scale, the Board received data showing for recent years, asset levels, Adviser profitability and total expense ratios. Based upon the foregoing, the Board concluded that the Fund currently shares in the benefits from economies of scale, if any, when they are realized by each Adviser. The Board also concluded that the structure of the advisory fees, which include breakpoints at several asset levels, will allow the Fund and the Portfolio to continue to benefit from any economies of scale in the future.
This Page Intentionally Left Blank
This Page Intentionally Left Blank
Item 8. Changes in and Disagreements with Accountants for Open-End Management Investment Companies
Not applicable.
Item 9. Proxy Disclosures for Open-End Management Investment Companies
Not applicable.
Item 10. Remuneration Paid to Directors, Officers, and Others of Open-End Management Investment Companies
The information is disclosed as part of the Financial Statements included in Item 7 of this Form N-CSR.
Item 11. Statement Regarding Basis for Approval of Investment Advisory Contract
The information is included in Item 7 of this Form N-CSR.
Item 12. Disclosure of Proxy Voting Policies and Procedures for Closed-End Management Investment Companies
Not applicable.
Item 13. Portfolio Managers of Closed-End Management Investment Companies
Not applicable.
Item 14. Purchases of Equity Securities by Closed-End Management Investment Company and Affiliated Purchasers
Not applicable.
Item 15. Submission of Matters to a Vote of Security Holders
There have been no material changes to the procedures by which shareholders may recommend nominee to the Portfolio’s Board of Trustees since the Portfolio last provided disclosure in response to this item.
Item 16. Controls and Procedures
| (a) | It is the conclusion of the registrant’s principal executive officer and principal financial officer that the effectiveness of the registrant’s current disclosure controls and procedures (such disclosure controls and procedures having been evaluated within 90 days of the date of this filing) provide reasonable assurance that the information required to be disclosed by the registrant has been recorded, processed, summarized and reported within the time period specified in the Commission’s rules and forms and that the information required to be disclosed by the registrant has been accumulated and communicated to the registrant’s principal executive officer and principal financial officer in order to allow timely decisions regarding required disclosure. |
| (b) | There have been no changes in the registrant’s internal control over financial reporting during the period covered by this report that has materially affected, or is reasonably likely to materially affect, the registrant’s internal control over financial reporting. |
Item 17. Disclosure of Securities Lending Activities for Closed-End Management Investment Companies
Not applicable.
Item 18. Recovery of Erroneously Awarded Compensation
Not applicable.
Item 19. Exhibits
Signatures
Pursuant to the requirements of the Securities Exchange Act of 1934 and the Investment Company Act of 1940, the registrant has duly caused this report to be signed on its behalf by the undersigned, thereunto duly authorized.
| | |
| Global Macro Portfolio |
| |
| By: | | /s/ Kenneth A. Topping |
| �� | Kenneth A. Topping |
| | Principal Executive Officer |
| |
| Date: | | December 23, 2024 |
Pursuant to the requirements of the Securities Exchange Act of 1934 and the Investment Company Act of 1940, this report has been signed below by the following persons on behalf of the registrant and in the capacities and on the dates indicated.
| | |
| By: | | /s/ James F. Kirchner |
| | James F. Kirchner |
| | Principal Financial Officer |
| |
| Date: | | December 23, 2024 |
| |
| By: | | /s/ Kenneth A. Topping |
| | Kenneth A. Topping |
| | Principal Executive Officer |
| |
| Date: | | December 23, 2024 |