UNITED STATES
SECURITIES AND EXCHANGE COMMISSION
Washington, D.C. 20549
FORM N-CSR
CERTIFIED SHAREHOLDER REPORT OF REGISTERED MANAGEMENT
INVESTMENT COMPANIES |
| | Investment Company Act file number 811-07177
Name of Fund: BlackRock Mid Cap Value Opportunities Fund of BlackRock Mid Cap Value
Opportunities Series, Inc.
Fund Address: 100 Bellevue Parkway, Wilmington, DE 19809
Name and address of agent for service: Donald C. Burke, Chief Executive Officer, BlackRock Mid
Cap Value Opportunities Fund of BlackRock Mid Cap Value Opportunities Series, Inc., 800
Scudders Mill Road, Plainsboro, NJ, 08536. Mailing address: P.O. Box 9011, Princeton, NJ,
08543-9011
Registrant’s telephone number, including area code: (800) 441-7762
Date of fiscal year end: 01/31/2008
Date of reporting period: 02/01/2007 – 01/31/2008
Item 1 – Report to Stockholders |
EQUITIES FIXED INCOME REAL ESTATE LIQUIDITY ALTERNATIVES BLACKROCK SOLUTIONS

| | BlackRock Mid Cap Value
Opportunities Fund
OF BLACKROCK MID CAP VALUE OPPORTUNITIES
SERIES, INC. |
| | ANNUAL REPORT | JANUARY 31, 2008 |
NOT FDIC INSURED
MAY LOSE VALUE
NO BANK GUARANTEE |
| Table of Contents | | |
| |
|
| |
| | | Page |
| |
|
| |
| A Letter to Shareholders | | 3 |
| Annual Report: | | |
| Fund Summary | | 4 |
| About Fund Performance | | 6 |
| Disclosure of Expenses | | 6 |
| Portfolio Information | | 7 |
| Financial Statements: | | |
| Schedule of Investments | | 8 |
| Statement of Assets and Liabilities | | 10 |
| Statement of Operations | | 11 |
| Statements of Changes in Net Assets | | 12 |
| Financial Highlights | | 13 |
| Notes to Financial Statements | | 16 |
| Report of Independent Registered Public Accounting Firm | | 21 |
| Proxy Results | | 22 |
| Important Tax Information | | 23 |
| Officers and Directors | | 24 |
| BlackRock Fund Information | | 28 |
| Mutual Fund Family | | 30 |
2 BLACKROCK MID CAP VALUE OPPORTUNITIES FUND
| | Dear Shareholder
Financial markets weathered intense bouts of volatility in 2007, only to enter the new year with no relief. While most
major market indexes managed to post positive returns in 2007, January proved to be a trying month as fears of an
economic recession swelled.
The Federal Reserve Board (the “Fed”), after cutting interest rates 100 basis points (1%) between September 2007
and 2007 year-end, more than matched those cuts in January alone. The Fed, responding to a slowing economy and
continued fallout from the subprime mortgage crisis, cut interest rates 75 basis points in a rare unscheduled session
on January 22, and quickly followed with another 50-basis-point cut at its regular meeting on January 30. This brought
the target short-term interest rate to 3% as of the conclusion of this reporting period. In a statement accompanying its
action, the central bank cited “a deepening housing contraction” and “considerable stress in the credit markets.”
To be sure, subprime mortgage woes dominated headlines for much of 2007, spawning a widespread liquidity and
credit crisis with ramifications across global markets. The reverberations continue to be felt as stocks grapple with
recession fears, heightened volatility and weakening earnings growth. Small-cap and value-oriented stocks suffered
most in 2007, while large-cap and growth-oriented stocks fared better. International markets, which outperformed
the U.S. in 2007, generally experienced greater declines in January as investors grew increasingly risk averse.
The reaction has been similar in fixed income markets, with fears related to the economic slowdown, housing collapse
and subprime fallout prompting a flight to quality. Investors have largely shunned bonds associated with the housing
and credit markets in favor of higher-quality government issues. The yield on 10-year Treasury issues, which touched
5.30% in June 2007 (its highest level in five years), fell to 4.04% by year-end and to 3.67% by the end of January,
while prices correspondingly rose. The tax-exempt bond market set a new-issuance record in 2007, but has struggled
with additional concerns around the creditworthiness of bond insurers.
Against this volatile backdrop, the major benchmark indexes posted mixed results for the current reporting period: |
| Total Returns as of January 31, 2008 | | 6-month | | 12-month |
| |
| |
|
| U.S. equities (S&P 500 Index) | | –4.32% | | – 2.31% |
| |
| |
|
| Small cap U.S. equities (Russell 2000 Index) | | –7.51 | | – 9.79 |
| |
| |
|
| International equities (MSCI Europe, Australasia, Far East Index) | | –7.52 | | +0.22 |
| |
| |
|
| Fixed income (Lehman Brothers U.S. Aggregate Bond Index) | | +6.82 | | +8.81 |
| |
| |
|
| Tax-exempt fixed income (Lehman Brothers Municipal Bond Index) | | +3.71 | | +4.93 |
| |
| |
|
| High yield bonds (Lehman Brothers U.S. Corporate High Yield 2% Issuer Capped Index) | | +1.34 | | – 0.44 |
| |
| |
|
| Past performance is no guarantee of future results. Index performance shown for illustrative purposes only. You cannot invest directly |
| in an index. | | | | |

As you navigate the current uncertainties, we encourage you to review your investment goals with your financial
professional and to make portfolio changes, as needed. For more up-to-date commentary on the economy and
financial markets, we invite you to visit www.blackrock.com/funds. As always, we thank you for entrusting BlackRock
with your investment assets, and we look forward to continuing to serve you in the months and years ahead. |
THIS PAGE NOT PART OF YOUR FUND REPORT
3
Fund Summary
Portfolio Management Commentary |
How did the Fund perform?
• The Fund underperformed its benchmark in a challenging 12-month
period for equity markets, particularly for value-oriented investors.
What factors influenced performance?
• The Fund’s fiscal year was marked by increased market volatility stem-
ming from a U.S. economic slowdown, a mortgage market crisis and
tightening credit market conditions. Against this backdrop, investors
sought the relative safety of large cap stocks, and small cap issues
lagged. The growth style of investing outperformed value across the mar-
ket-capitalization spectrum.
• Despite solid performance from our biotechnology holdings, stock selec-
tion in healthcare detracted from Fund results relative to the benchmark.
Specialty pharmaceutical stocks, Medicis Pharmaceutical Corp. and
King Pharmaceuticals, Inc., detracted from performance, as did holdings
in healthcare equipment & supply manufacturers.
• On the positive side, specific stock selection in information technology
(IT), consumer staples, telecommunication services and utilities con-
tributed favorably to performance. Software company VMware, Inc. was a
key contributor, as was BEA Systems, Inc., which rose sharply on news of
a takeover from Oracle Corp. In IT services, Global Payments Inc. was a
standout performer. Within consumer staples, Alberto-Culver Co. and
Smithfield Foods both added value, and in telecommunication services,
Canadian company BCE Inc. was the most notable individual contributor.
Utilities names that performed particularly well included Puget Energy,
Inc. and Questar Corp. |
• An overweighted position in the surging energy sector benefited fund
performance relative to the benchmark, but was offset by stock selec-
tion. Similarly, underweighted investments in the consumer discretionary
sector benefited relative performance, while a value bias in specific
fund holdings caused performance to lag the benchmark index. Specific
detractors included investments in apparel manufacturer Jones Apparel
Group Inc. and recreational equipment provider Brunswick Corp.
Describe recent portfolio activity.
• During the fiscal year, we increased exposure to utilities by adding to
our existing position in OGE Energy Corp. and establishing new positions
in Wisconsin Energy Corp. and Alliant Energy Corp. We also increased
exposure to healthcare holdings, particularly within the pharmaceuticals
and biotechnology subsectors. New positions included PDL BioPharma
Inc. and ImClone Systems, Inc.
• We reduced the Fund’s weightings in IT and industrials.We sold BEA
Systems after the takeover announcement from Oracle, and we liquidat-
ed positions in BISYS Group Inc. and Computer Sciences Corp. In indus-
trials, we sold construction and engineering firm Chicago Bridge & Iron
Co. and trimmed exposure to the machinery, aerospace & defense and
road & rail subsectors.
Describe Fund positioning at period-end.
• Relative to its benchmark, the Fund ended the period overweight in IT,
energy and healthcare and underweight in consumer discretionary and
industrials. The Fund’s largest absolute weightings were in financials, IT,
healthcare, industrials and energy. |
| Expense Example | | | | | | | | | | | | |
| |
| |
| |
| |
| |
| |
|
| |
| | | | | Actual | | | | | | Hypothetical** | | |
| | |
| |
| |
| |
| |
| |
|
| | | Beginning | | Ending | | | | Beginning | | Ending | | |
| | | Account Value | | Account Value | | Expenses Paid | | Account Value | | Account Value | | Expenses Paid |
| | | August 1, 2007 | | Janauary 31, 2008 | | During the Period* | | August 1, 2007 | | January 31, 2008 | | During the Period* |
| |
| |
| |
| |
| |
| |
|
| Institutional | | $1,000 | | $936.50 | | $ 4.59 | | $1,000 | | $1,020.46 | | $ 4.79 |
| Investor A | | $1,000 | | $934.70 | | $ 6.19 | | $1,000 | | $1,018.80 | | $ 6.46 |
| Investor B | | $1,000 | | $931.30 | | $10.03 | | $1,000 | | $1,014.82 | | $10.46 |
| Investor C | | $1,000 | | $930.00 | | $10.80 | | $1,000 | | $1,014.01 | | $11.27 |
| Class R | | $1,000 | | $932.80 | | $ 8.33 | | $1,000 | | $1,016.58 | | $ 8.69 |
| |
| |
| |
| |
| |
| |
|
| * | For each class of the Fund, expenses are equal to the annualized expense ratio for the class (.94% for Institutional, 1.27% for Investor A, 2.06% for Investor B, 2.22% for Investor C and 1.71% for Class R), multiplied by the average account value over the period, multiplied by 184/365 (to reflect the one-half year period shown). |
| |
| ** | Hypothetical 5% annual return before expenses is calculated by pro-rating the number of days in the most recent fiscal half year divided by 365. See “Disclosure of Expenses” on page 6 for further information on how expenses were calculated. |
| |
4 BLACKROCK MID CAP VALUE OPPORTUNITIES FUND
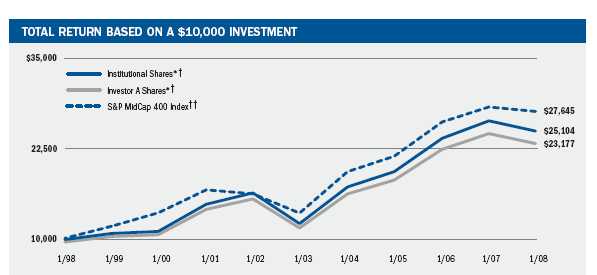
* Assuming maximum sales charge, if any, transaction costs and other operating expenses, including advisory fees.
† The Fund invests in common stocks of mid cap companies.
† † This unmanaged Index is a market value-weighted index that consists of 400 domestic stocks and measures the performance of the mid-size company segment of the U. S. market.
| Performance Summary for the Period Ended January 31, 2008 | | | | | | | | | | | | | | |
| |
| |
| |
| |
| |
| |
| |
|
| |
| | | | | | | | | Average Annual Total Returns* | | | | | | |
| | | | |
| |
| |
| |
| |
| |
|
| | | | | 1 Year | | 5 Years | | | | 10 Years |
| | | | |
| |
| |
| |
|
| | | 6-Month | | w/o sales | | w/sales | | w/o sales | | w/sales | | w/o sales | | w/sales |
| | | Total Returns | | charge | | charge | | charge | | charge | | charge | | charge |
| |
| |
| |
| |
| |
| |
| |
|
| Institutional | | –6.35% | | –5.36% | | — | | +15.50% | | — | | + 9.64% | | — |
| Investor A | | –6.53 | | –5.64 | | –10.60% | | +15.19 | | +13.95% | | + 9.36 | | | | +8.77% |
| Investor B | | –6.87 | | –6.38 | | – 9.89 | | +14.31 | | +14.07 | | + 8.65 | | | | +8.65 |
| Investor C | | –7.00 | | –6.50 | | – 7.27 | | +14.25 | | +14.25 | | + 8.44 | | | | +8.44 |
| Class R | | –6.72 | | –6.02 | | — | | +14.98 | | — | | + 9.12 | | | | — |
| S&P MidCap 400 Index | | –5.44 | | –2.23 | | — | | +15.41 | | — | | +10.70 | | — |
| |
| |
| |
| |
| |
| |
| |
|
| * | Assuming maximum sales charges. See “About Fund Performance” on page 6 for a detailed description of share classes, including any related sales charges and fees. Past performance is not indicative of future results. |
| |
| BLACKROCK MID CAP VALUE OPPORTUNITIES FUND |
• Institutional Shares are not subject to any sales charge. Institutional
Shares bear no ongoing distribution or service fees and are available
only to eligible investors.
• Investor A Shares incur a maximum initial sales charge (front-end load)
of 5.25% and a service fee of 0.25% per year (but no distribution fee).
• Investor B Shares are subject to a maximum contingent deferred sales
charge of 4.50% declining to 0% after six years. In addition, Investor B
Shares are subject to a distribution fee of 0.75% per year and a service
fee of 0.25% per year. These shares automatically convert to Investor A
Shares after approximately eight years. (There is no initial sales charge
for automatic share conversions.) All returns for periods greater than
eight years reflect this conversion.
• Investor C Shares are subject to a distribution fee of 0.75% and a service
fee of 0.25% per year. In addition, Investor C Shares are subject to a 1%
contingent deferred sales charge if redeemed within one year of purchase.
• Class R Shares do not incur a maximum initial sales charge (front-end
load) or deferred sales charge. These shares are subject to a distribution
fee of 0.25% per year and a service fee of 0.25% per year. Class R
Shares are available only to certain retirement plans. Prior to inception,
Class R Share performance results are those of Institutional Shares
(which have no distribution or service fees) restated to reflect Class R
Share fees. |
Performance information reflects past performance and does not guar-
antee future results. Current performance may be lower or higher than the
performance data quoted. Refer to www.blackrock.com/funds to obtain
performance data current to the most recent month-end. Performance
results do not reflect the deduction of taxes that a shareholder would
pay on fund distributions or the redemption of fund shares. Figures
shown in the performance tables on page 5 assume reinvestment of all
dividends and capital gain distributions, if any, at net asset value on the
ex-dividend date. Investment return and principal value of shares will
fluctuate so that shares, when redeemed, may be worth more or less than
their original cost. Dividends paid to each class of shares will vary
because of the different levels of service, distribution and transfer
agency fees applicable to each class, which are deducted from the
income available to be paid to shareholders. |
| | Disclosure of Expenses
Shareholders of this Fund may incur the following charges: (a) expenses
related to transactions, including sales charges, redemption fees and
exchange fees; and (b) operating expenses including advisory fees, distri-
bution fees including 12b-1 fees, and other Fund expenses. The expense
example on page 4 (which is based on a hypothetical investment of
$1,000 invested on August 1, 2007 and held through January 31, 2008)
is intended to assist shareholders both in calculating expenses based on
an investment in the Fund and in comparing these expenses with similar
costs of investing in other mutual funds.
The table provides information about actual account values and actual
expenses. In order to estimate the expenses a shareholder paid during the
period covered by this report, shareholders can divide their account value
by $1,000 and then multiply the result by the number corresponding
to their share class under the heading entitled “Expenses Paid During
the Period.” |
The table also provides information about hypothetical account values
and hypothetical expenses based on the Fund’s actual expense ratio and
an assumed rate of return of 5% per year before expenses. In order to
assist shareholders in comparing the ongoing expenses of investing in this
Fund and other funds, compare the 5% hypothetical example with the 5%
hypothetical examples that appear in other funds’ shareholder reports.
The expenses shown in the table are intended to highlight shareholders’
ongoing costs only and do not reflect any transactional expenses, such as
sales charges, redemption fees or exchange fees. Therefore, the hypotheti-
cal table is useful in comparing ongoing expenses only, and will not help
shareholders determine the relative total expenses of owning different
funds. If these transactional expenses were included, shareholder expenses
would have been higher. |
6 BLACKROCK MID CAP VALUE OPPORTUNITIES FUND
| Portfolio Information | | | | | | |
| |
| |
| |
|
| |
| As of January 31, 2008 | | | | | | |
| |
| |
| |
|
| |
| | | Percent of | | | | Percent of |
| Ten Largest Equity Holdings | | Net Assets | | Five Largest Industries | | Net Assets |
| |
| |
| |
|
| OGE Energy Corp. | | 2.8% | | Multi-Utilities | | 7.8% |
| Wisconsin Energy Corp. | | 2.5 | | Oil, Gas & Consumable Fuels | | 7.6 |
| Alliant Energy Corp. | | 2.5 | | Pharmaceuticals | | 5.3 |
| Convergys Corp. | | 2.4 | | Insurance | | 5.1 |
| Cabot Oil & Gas Corp. Class A | | 2.3 | | Software | | 5.0 |
| Medicis Pharmaceutical Corp. Class A | | 2.3 | | | | |
| Plains Exploration & Production Co. | | 2.3 | | | | Percent of |
| TIBCO Software, Inc. | | 2.3 | | | | Long-Term |
| Newfield Exploration Co. | | 2.3 | | Sector Representation | | Investments |
| Alberto-Culver Co. | | 2.2 | | | | |
| | | | | Financials | | 18.0% |
| | | | | Information Technology | | 17.1 |
| | | | | Health Care | | 14.6 |
| | | | | Industrials | | 12.6 |
| | | | | Energy | | 12.0 |
| | | | | Consumer Discretionary | | 8.4 |
| | | | | Utilities | | 8.1 |
| | | | | Materials | | 6.9 |
| | | | | Consumer Staples | | 2.3 |
| | | | |
| |
|
| | | | | For Fund compliance purposes, the Fund’s industry and sector classifications |
| | | | | refer to any one or more of the industry and sector sub-classifications used by |
| | | | | one or more widely recognized market indexes or ratings group indexes, and/or |
| | | | | as defined by Fund management. This definition may not apply for purposes |
| | | | | of this report which may combine industry and sector sub-classifications for |
| | | | | reporting ease. | | |
| BLACKROCK MID CAP VALUE OPPORTUNITIES FUND |
Schedule of Investments as of January 31, 2008 (Percentages shown are based on Net Assets)
| Common Stocks | | Shares | | Value |
| |
| |
|
| |
| Aerospace & Defense — 3.2% | | | | |
| Curtiss-Wright Corp. | | 70,700 | | $ 2,948,190 |
| DRS Technologies, Inc. | | 65,200 | | 3,499,284 |
| Spirit AeroSystems Holdings, Inc. Class A (b) | | 206,000 | | 5,689,720 |
| | | | |
|
| | | | | 12,137,194 |
| |
| |
|
| Airlines — 0.3% | | | | |
| Continental Airlines, Inc. Class B (b) | | 34,500 | | 938,745 |
| |
| |
|
| Biotechnology — 3.9% | | | | |
| Amylin Pharmaceuticals, Inc. (a)(b) | | 66,400 | | 1,968,760 |
| Cephalon, Inc. (b) | | 52,300 | | 3,432,449 |
| Human Genome Sciences, Inc. (a)(b) | | 311,400 | | 1,737,612 |
| ImClone Systems, Inc. (b) | | 70,300 | | 3,055,941 |
| PDL BioPharma, Inc. (b) | | 288,800 | | 4,311,784 |
| | | | |
|
| | | | | 14,506,546 |
| |
| |
|
| Capital Markets — 2.3% | | | | |
| Invesco Ltd. (f) | | 96,700 | | 2,632,174 |
| Investment Technology Group, Inc. (b) | | 18,900 | | 887,733 |
| TD Ameritrade Holding Corp. (b) | | 264,500 | | 4,962,020 |
| | | | |
|
| | | | | 8,481,927 |
| |
| |
|
| Chemicals — 1.8% | | | | |
| Hercules, Inc. | | 371,800 | | 6,517,654 |
| |
| |
|
| Commercial Banks — 1.9% | | | | |
| The Colonial BancGroup, Inc. (a) | | 71,300 | | 1,119,410 |
| Cullen/Frost Bankers, Inc. | | 112,200 | | 6,108,168 |
| | | | |
|
| | | | | 7,227,578 |
| |
| |
|
| Commercial Services & Supplies — 3.8% | | | | |
| Allied Waste Industries, Inc. (b) | | 698,500 | | 6,880,225 |
| Cintas Corp. | | 216,800 | | 7,115,376 |
| | | | |
|
| | | | | 13,995,601 |
| |
| |
|
| Communications Equipment — 2.2% | | | | |
| Tellabs, Inc. (b) | | 1,205,400 | | 8,220,828 |
| |
| |
|
| Containers & Packaging — 1.7% | | | | |
| Pactiv Corp. (b) | | 36,800 | | 1,052,848 |
| Smurfit-Stone Container Corp. (b) | | 536,100 | | 5,087,589 |
| | | | |
|
| | | | | 6,140,437 |
| |
| |
|
| Electrical Equipment — 1.2% | | | | |
| Hubbell, Inc. Class B | | 90,500 | | 4,315,040 |
| |
| |
|
| Electronic Equipment & Instruments — 2.6% | | | | |
| Ingram Micro, Inc. Class A (b) | | 320,400 | | 5,696,712 |
| Tech Data Corp. (b) | | 114,300 | | 3,929,634 |
| | | | |
|
| | | | | 9,626,346 |
| |
| |
|
| Energy Equipment & Services — 4.0% | | | | |
| BJ Services Co. (a) | | 310,600 | | 6,755,550 |
| Dresser-Rand Group, Inc. (b) | | 45,300 | | 1,436,010 |
| Rowan Cos., Inc. | | 198,800 | | 6,767,152 |
| | | | |
|
| | | | | 14,958,712 |
| |
| |
|
| Health Care Equipment & Supplies — 2.3% | | | | |
| Edwards Lifesciences Corp. (a)(b) | | 141,500 | | 6,547,205 |
| St. Jude Medical, Inc. (b) | | 51,900 | | 2,102,469 |
| | | | |
|
| | | | | 8,649,674 |
| |
| |
|
| Common Stocks | | Shares | | Value |
| |
| |
|
| |
| Health Care Providers & Services — 1.0% | | | | |
| LifePoint Hospitals, Inc. (b) | | 134,700 | | $ 3,636,900 |
| |
| |
|
| Health Care Technology — 0.6% | | | | |
| HLTH Corp. (b) | | 205,543 | | 2,300,026 |
| |
| |
|
| Hotels, Restaurants & Leisure — 0.3% | | | | |
| Darden Restaurants, Inc. | | 34,400 | | 974,208 |
| |
| |
|
| Household Durables — 1.4% | | | | |
| KB Home | | 14,600 | | 401,500 |
| Newell Rubbermaid, Inc. | | 197,400 | | 4,761,288 |
| | | | |
|
| | | | | 5,162,788 |
| |
| |
|
| IT Services — 2.4% | | | | |
| Convergys Corp. (b) | | 565,200 | | 8,766,252 |
| |
| |
|
| Insurance — 5.1% | | | | |
| Conseco, Inc. (b) | | 463,800 | | 5,584,152 |
| HCC Insurance Holdings, Inc. | | 292,400 | | 8,146,264 |
| Reinsurance Group of America, Inc. | | 74,900 | | 4,341,953 |
| RenaissanceRe Holdings Ltd. | | 16,300 | | 928,937 |
| | | | |
|
| | | | | 19,001,306 |
| |
| |
|
| Internet Software & Services — 2.0% | | | | |
| CNET Networks, Inc. (b) | | 926,400 | | 7,309,296 |
| |
| |
|
| Life Sciences Tools & Services — 1.0% | | | | |
| Affymetrix, Inc. (a)(b) | | 186,600 | | 3,743,196 |
| |
| |
|
| Machinery — 1.7% | | | | |
| Dover Corp. | | 48,800 | | 1,969,568 |
| Timken Co. | | 149,300 | | 4,513,339 |
| | | | |
|
| | | | | 6,482,907 |
| |
| |
|
| Media — 2.1% | | | | |
| Harte-Hanks, Inc. | | 493,800 | | 7,910,676 |
| |
| |
|
| Metals & Mining — 1.9% | | | | |
| Nucor Corp. (a) | | 122,700 | | 7,092,060 |
| |
| |
|
| Multi-Utilities — 7.8% | | | | |
| Alliant Energy Corp. | | 248,622 | | 9,174,152 |
| OGE Energy Corp. | | 322,300 | | 10,548,879 |
| Wisconsin Energy Corp. | | 205,600 | | 9,360,968 |
| | | | |
|
| | | | | 29,083,999 |
| |
| |
|
| Oil, Gas & Consumable Fuels — 7.6% | | | | |
| Cabot Oil & Gas Corp. Class A | | 221,000 | | 8,550,490 |
| Newfield Exploration Co. (b) | | 167,500 | | 8,354,900 |
| Noble Energy, Inc. | | 38,700 | | 2,808,846 |
| Plains Exploration & Production Co. (b) | | 174,300 | | 8,477,952 |
| | | | |
|
| | | | | 28,192,188 |
| |
| |
|
| Paper & Forest Products — 1.4% | | | | |
| Weyerhaeuser Co. | | 75,400 | | 5,106,088 |
| |
| |
|
| Personal Products — 2.2% | | | | |
| Alberto-Culver Co. | | 310,800 | | 8,326,332 |
| |
| |
|
| Pharmaceuticals — 5.3% | | | | |
| Endo Pharmaceuticals Holdings, Inc. (b) | | 177,400 | | 4,637,236 |
| King Pharmaceuticals, Inc. (b) | | 632,400 | | 6,633,876 |
| Medicis Pharmaceutical Corp. Class A (a) | | 420,600 | | 8,542,386 |
| | | | |
|
| | | | | 19,813,498 |
| |
| |
|
8 BLACKROCK MID CAP VALUE OPPORTUNITIES FUND
Schedule of Investments (concluded) (Percentages shown are based on Net Assets)
| Common Stocks | | Shares | | Value |
| |
| |
|
| |
| Real Estate Investment Trusts (REITs) — 4.3% | | | | |
| Alexandria Real Estate Equities, Inc. | | 22,600 | | $ 2,219,998 |
| Brandywine Realty Trust (a) | | 117,600 | | 2,216,760 |
| Cousins Properties, Inc. (a) | | 30,600 | | 813,960 |
| Dupont Fabros Technology, Inc. | | 339,500 | | 5,849,585 |
| FelCor Lodging Trust, Inc. | | 359,800 | | 4,860,898 |
| | | | |
|
| | | | | 15,961,201 |
| |
| |
|
| Road & Rail — 1.2% | | | | |
| J.B. Hunt Transport Services, Inc. (a) | | 144,300 | | 4,487,730 |
| |
| |
|
| Semiconductors & Semiconductor | | | | |
| Equipment — 2.5% | | | | |
| Microchip Technology, Inc. (a) | | 179,100 | | 5,715,081 |
| Micron Technology, Inc. (b) | | 486,600 | | 3,420,798 |
| | | | |
|
| | | | | 9,135,879 |
| |
| |
|
| Software — 5.0% | | | | |
| Cadence Design Systems, Inc. (b) | | 216,100 | | 2,193,415 |
| Novell, Inc.(a)(b) | | 290,300 | | 1,846,308 |
| Parametric Technology Corp. (b) | | 364,300 | | 5,992,735 |
| TIBCO Software, Inc. (b) | | 1,136,900 | | 8,458,536 |
| | | | |
|
| | | | | 18,490,994 |
| |
| |
|
| Specialty Retail — 3.5% | | | | |
| American Eagle Outfitters, Inc. | | 127,700 | | 2,940,931 |
| Foot Locker, Inc. (a) | | 434,300 | | 5,945,567 |
| The Gap, Inc. | | 221,300 | | 4,231,256 |
| | | | |
|
| | | | | 13,117,754 |
| |
| |
|
| Textiles, Apparel & Luxury Goods — 0.9% | | | | |
| Jones Apparel Group, Inc. (a) | | 195,300 | | 3,281,040 |
| Common Stocks | | Shares | | Value |
| |
| |
|
| Thrifts & Mortgage Finance — 3.8% | | | | |
| People's United Financial, Inc. | | 485,100 | | $ 8,193,339 |
| Sovereign Bancorp, Inc. (a) | | 466,000 | | 5,811,020 |
| | | | |
|
| | | | | 14,004,359 |
| |
| |
|
| Trading Companies & Distributors — 0.8% | | | | |
| United Rentals, Inc. (b) | | 160,600 | | 2,930,950 |
| |
| |
|
| Total Common Stocks (Cost — $389,561,760) — 97.0% | | 360,027,909 |
| |
|
| |
| |
| |
| Exchange-Traded Funds | | | | |
| |
| |
|
| KBW Bank ETF | | 16,900 | | 786,695 |
| MidCap SPDR Trust Series 1 (a) | | 37,300 | | 5,437,967 |
| |
| |
|
| Total Exchange-Traded Funds (Cost — $6,232,552) — 1.7% | | 6,224,662 |
| |
|
| |
| |
| | | Beneficial | | |
| Short-Term Securities | | Interest | | |
| |
| |
|
| BlackRock Liquidity Series, LLC Cash Sweep | | | | |
| Series, 4.49% (c)(d) | | $ 6,246,057 | | 6,246,057 |
| BlackRock Liquidity Series, LLC Money Market | | | | |
| Series, 4.16% (c)(d)(e) | | 40,101,550 | | 40,101,550 |
| |
| |
|
| Total Short-Term Investments (Cost — $46,347,607) — 12.5% | | 46,347,607 |
| |
|
| Total Investments (Cost — $442,141,919*) — 111.2% | | 412,600,178 |
| Liabilities in Excess of Other Assets — (11.2%) | | | | (41,654,305) |
| | | | |
|
| Net Assets — 100.0% | | | | $370,945,873 |
| | |
| |
|
* The cost and unrealized appreciation (depreciation) of investments as of January 31,
2008, as computed for federal income tax purposes, were as follows: |
| Aggregate cost | | $ 448,711,830 |
| | |
|
| Gross unrealized appreciation | | $ 15,267,312 |
| Gross unrealized depreciation | | (51,378,964) |
| | |
|
| Net unrealized depreciation | | $ (36,111,652) |
| | |
|
| (a) | Security, or a portion of security, is on loan. |
| |
| (b) | Non-income producing security. |
| |
(c) Investments in companies considered to be an affiliate of the Fund, for purposes
of Section 2(a)(3) of the Investment Company Act of 1940, were as follows: |
| | | Net | | Interest |
| Affiliate | | Activity | | Income |
| |
| |
|
| |
| BlackRock Liquidity Series, LLC | | | | |
| Cash Sweep Series | | $ 2,099,700 | | $278,463 |
| BlackRock Liquidity Series, LLC | | | | |
| Money Market Series | | $(34,365,367) | | $154,321 |
| |
| |
|
(d) Rate shown is the effective yield as of January 31, 2008. (e) Security purchased with cash proceeds from securities loans. (f) Depositary receipts.
• For Fund compliance purposes, the Fund’s industry classifications refer to any one or more of the industry sub-classifications used by one or more widely recognized market indexes or ratings group indexes, and/or as defined by Fund management.
This definition may not apply for purposes of this report, which may combine industry sub-classifications for reporting ease. Industry classifications are unaudited.
| See Notes to Financial Statements. |
| BLACKROCK MID CAP VALUE OPPORTUNITIES FUND |
| Statement of Assets and Liabilities | | |
| |
| As of January 31, 2008 | | |
| |
|
| |
| Assets | | |
| |
|
| |
| Investments at value — unaffiliated (including securities loaned of $38,385,888) (identified cost — $ 395,794,312) | | $ 366,252,571 |
| Investments at value — affiliated (identified cost — $46,347,607) | | 46,347,607 |
| Investments sold receivable | | 9,778,575 |
| Capital shares sold receivable | | 578,544 |
| Dividends receivable | | 369,429 |
| Securities lending income receivable | | 22,767 |
| Prepaid expenses | | 22,863 |
| | |
|
| Total assets | | 423,372,356 |
| |
|
| |
| |
| Liabilities | | |
| |
|
| |
| Collateral received at value — securities loaned | | 40,101,550 |
| Bank overdraft | | 830,481 |
| Investments purchased payable | | 7,058,444 |
| Capital shares redeemed payable | | 3,763,546 |
| Investment advisory fees payable | | 206,787 |
| Service and distribution fees payable | | 159,273 |
| Other affiliates | | 202,785 |
| Accrued expenses | | 103,617 |
| | |
|
| Total liabilities | | 52,426,483 |
| |
|
| |
| |
| Net Assets | | |
| |
|
| |
| Net assets | | $ 370,945,873 |
| |
|
| |
| |
| Net Assets Consist of | | |
| |
|
| |
| Institutional Shares of Capital Stock, $.10 par value, 20,000,000 shares authorized | | $ 533,708 |
| Investor A Shares of Capital Stock, $.10 par value, 40,000,000 shares authorized | | 759,812 |
| Investor B Shares of Capital Stock, $.10 par value, 40,000,000 shares authorized | | 340,486 |
| Investor C Shares of Capital Stock, $.10 par value, 40,000,000 shares authorized | | 634,886 |
| Class R Shares of Capital Stock, $.10 par value, 40,000,000 shares authorized | | 363,475 |
| Paid-in capital in excess of par | | 401,630,119 |
| Undistributed net investment income | | 223,173 |
| Accumulated net realized loss | | (3,998,045) |
| Net unrealized depreciation | | (29,541,741) |
| | |
|
| Net Assets | | $ 370,945,873 |
| |
|
| |
| |
| Net Asset Value | | |
| |
|
| |
| Institutional — Based on net assets of $78,987,957 and 5,337,080 shares outstanding | | $ 14.80 |
| | |
|
| Investor A — Based on net assets of $110,361,534 and 7,598,122 shares outstanding | | $ 14.52 |
| | |
|
| Investor B — Based on net assets of $46,499,114 and 3,404,855 shares outstanding | | $ 13.66 |
| | |
|
| Investor C — Based on net assets of $85,547,480 and 6,348,861 shares outstanding | | $ 13.47 |
| | |
|
| Class R — Based on net assets of $49,549,788 and 3,634,750 shares outstanding | | $ 13.63 |
| | |
|
| See Notes to Financial Statements. |
10 BLACKROCK MID CAP VALUE OPPORTUNITIES FUND
| Statement of Operations | | |
| |
| For the Year Ended January 31, 2008 | | |
| |
|
| |
| Investment Income | | |
| |
|
| |
| Dividends (net of $13,168 foreign withholding tax) | | $ 5,003,703 |
| Interest from affiliates | | 278,463 |
| Securities lending | | 154,321 |
| | |
|
| Total income | | 5,436,487 |
| |
|
| |
| |
| Expenses | | |
| |
|
| |
| Investment advisory | | 2,888,958 |
| Service and distribution fees — Investor C | | 1,064,085 |
| Service and distribution fees — Investor B | | 674,223 |
| Transfer agent — Investor C | | 402,579 |
| Service fees — Investor A | | 309,865 |
| Transfer agent — Investor A | | 303,606 |
| Service and distribution fees — Class R | | 220,673 |
| Transfer agent — Investor B | | 180,491 |
| Accounting services | | 168,156 |
| Transfer agent — Institutional | | 166,633 |
| Transfer agent — Class R | | 165,345 |
| Registration | | 85,622 |
| Printing | | 83,706 |
| Audit and legal | | 60,031 |
| Custodian | | 49,059 |
| Directors | | 23,877 |
| Pricing | | 1,114 |
| Miscellaneous | | 35,904 |
| | |
|
| Total expenses | | 6,883,927 |
| | |
|
| Net investment loss | | (1,447,440) |
| |
|
| |
| |
| Net Realized & Unrealized Gain (Loss) | | |
| |
|
| |
| Net realized gain on: | | |
| Investments | | 57,919,304 |
| Foreign currency transactions | | 2,085 |
| | |
|
| | | 57,921,389 |
| Net change in unrealized appreciation/depreciation on investments | | (79,473,487) |
| | |
|
| Total net realized and unrealized loss | | (21,552,098) |
| | |
|
| Net Decrease in Net Assets Resulting from Operations | | $ (22,999,538) |
| | |
|
| See Notes to Financial Statements. |
| BLACKROCK MID CAP VALUE OPPORTUNITIES FUND |
| Statements of Changes in Net Assets | | | | |
| |
| | | For the Year Ended |
| | | January 31, |
| | |
|
| Increase (Decrease) in Net Assets: | | 2008 | | 2007 |
| |
| |
|
| Operations | | | | |
| |
| |
|
| Net investment loss | | $ (1,447,440) | | $ (1,246,525) |
| Net realized gain | | 57,921,389 | | 66,616,748 |
| Net change in unrealized appreciation/depreciation | | (79,473,487) | | (25,324,531) |
| | |
| |
|
| Net increase (decrease) in net assets resulting from operations | | (22,999,538) | | 40,045,692 |
| |
| |
|
| |
| Distributions to Shareholders | | | | |
| |
| |
|
| Net realized gains: | | | | |
| Institutional | | (16,404,288) | | (16,441,539) |
| Investor A | | (21,699,293) | | (17,285,826) |
| Investor B | | (10,264,778) | | (12,037,808) |
| Investor C | | (17,255,111) | | (15,733,221) |
| Class R | | (9,034,045) | | (4,311,442) |
| | |
| |
|
| Decrease in net assets resulting from distributions to shareholders | | (74,657,515) | | (65,809,836) |
| |
| |
|
| |
| Capital Share Transactions | | | | |
| |
| |
|
| Net increase in net assets derived from capital share transactions | | 20,597,208 | | 26,982,831 |
| |
| |
|
| |
| Net Assets | | | | |
| |
| |
|
| Total increase (decrease) in net assets | | (77,059,845) | | 1,218,687 |
| Beginning of year | | 448,005,718 | | 446,787,031 |
| | |
| |
|
| End of year | | $ 370,945,873 | | $ 448,005,718 |
| | |
| |
|
| End of year undistributed net investment income | | $ 223,173 | | — |
| | |
| |
|
| See Notes to Financial Statements. |
12 BLACKROCK MID CAP VALUE OPPORTUNITIES FUND
| Financial Highlights | | | | | | | | | | | | | | | | | | | | |
| |
| | | | | Institutional | | | | | | | | | | Investor A | | |
| | |
| |
| |
| |
| |
| |
| |
| |
|
| | | | | For the Year Ended January 31, | | | | | | For the Year Ended January 31, |
| | |
| |
| |
| |
| |
|
| | | 2008 | | 2007 | | 2006 | | 2005 | | 2004 | | 2008 | | 2007 | | 2006 | | 2005 | | 2004 |
| |
| |
| |
| |
| |
| |
| |
| |
| |
| |
|
| Per Share Operating Performance | | | | | | | | | | | | | | | | | | | | |
| |
| |
| |
| |
| |
| |
| |
| |
| |
| |
|
| Net asset value, beginning of year | | $ 18.79 | | $ 19.89 | | $ 19.58 | | $ 17.56 | | $ 12.38 | | $ 18.49 | | $ 19.63 | | $ 19.33 | | $ 17.39 | | $ 12.29 |
| | |
| |
| |
| |
| |
| |
| |
| |
| |
| |
|
| Net investment income (loss)1 | | .05 | | .05 | | .07 | | .01 | | (.01) | | —2 | | —3 | | .03 | | (.04) | | (.05) |
| Net realized and unrealized gain (loss) | | (.81) | | 1.79 | | 4.34 | | 2.14 | | 5.19 | | (.79) | | 1.76 | | 4.28 | | 2.11 | | 5.15 |
| | |
| |
| |
| |
| |
| |
| |
| |
| |
| |
|
| Total from investment operations | | (.76) | | 1.84 | | 4.41 | | 2.15 | | 5.18 | | (.79) | | 1.76 | | 4.31 | | 2.07 | | 5.10 |
| | |
| |
| |
| |
| |
| |
| |
| |
| |
| |
|
| Less distributions from net realized gains | | (3.23) | | (2.94) | | (4.10) | | (.13) | | — | | (3.18) | | (2.90) | | (4.01) | | (.13) | | — |
| | |
| |
| |
| |
| |
| |
| |
| |
| |
| |
|
| Net asset value, end of year | | $ 14.80 | | $ 18.79 | | $ 19.89 | | $ 19.58 | | $ 17.56 | | $ 14.52 | | $ 18.49 | | $ 19.63 | | $ 19.33 | | $ 17.39 |
| |
| |
| |
| |
| |
| |
| |
| |
| |
| |
|
| |
| Total Investment Return4 | | | | | | | | | | | | | | | | | | | | |
| |
| |
| |
| |
| |
| |
| |
| |
| |
| |
|
| Based on net asset value | | (5.36%) | | 10.09% | | 23.90% | | 12.24% | | 41.84% | | (5.64%) | | 9.76% | | 23.66% | | 11.90% | | 41.50% |
| |
| |
| |
| |
| |
| |
| |
| |
| |
| |
|
| |
| Ratios to Average Net Assets | | | | | | | | | | | | | | | | | | | | |
| |
| |
| |
| |
| |
| |
| |
| |
| |
| |
|
| Expenses | | .93% | | 1.01% | | 1.01% | | 1.01% | | 1.09% | | 1.24% | | 1.26% | | 1.26% | | 1.26% | | 1.34% |
| | |
| |
| |
| |
| |
| |
| |
| |
| |
| |
|
| Net investment income (loss) | | .29% | | .28% | | .34% | | .04% | | (.09%) | | (.02%) | | —5 | | .13% | | (.20%) | | (.34%) |
| |
| |
| |
| |
| |
| |
| |
| |
| |
| |
|
| |
| Supplemental Data | | | | | | | | | | | | | | | | | | | | |
| |
| |
| |
| |
| |
| |
| |
| |
| |
| |
|
| Net assets, end of year (in thousands) | | $ 78,988 | | $105,207 | | $114,921 | | $126,651 | | $ 91,845 | | $110,362 | | $121,065 | | $ 98,343 | | $ 85,184 | | $ 62,061 |
| | |
| |
| |
| |
| |
| |
| |
| |
| |
| |
|
| Portfolio turnover | | 148% | | 99% | | 110% | | 82% | | 86% | | 148% | | 99% | | 110% | | 82% | | 86% |
| | |
| |
| |
| |
| |
| |
| |
| |
| |
| |
|
| 1 | Based on average shares outstanding. |
| |
| 2 | Amount is less than ($.01) per share. |
| |
| 3 | Amount is less than $.01 per share. |
| |
| 4 | Total investment returns exclude the effects of any sales charges. |
| |
| 5 | Amount is less than .01%. |
| |
| See Notes to Financial Statements. |
| BLACKROCK MID CAP VALUE OPPORTUNITIES FUND |
| Financial Highlights (continued) | | | | | | | | | | | | | | | | | | |
| |
| | | | | | | Investor B | | | | | | | | | | Investor C | | | | |
| | |
| |
| |
| |
| |
| |
| |
| |
| |
| |
|
| | | | | For the Year Ended January 31, | | | | | | For the Year Ended January 31, |
| | |
| |
| |
| |
| |
|
| | | 2008 | | 2007 | | 2006 | | 2005 | | 2004 | | 2008 | | 2007 | | 2006 | | | | 2005 | | 2004 |
| |
| |
| |
| |
| |
| |
| |
| |
| |
| |
| |
|
| Per Share Operating Performance | | | | | | | | | | | | | | | | | | | | | | |
| |
| |
| |
| |
| |
| |
| |
| |
| |
| |
| |
|
| Net asset value, beginning of year | | $ 17.54 | | $ 18.73 | | $ 18.43 | | $ 16.72 | | $ 11.90 | | $ 17.36 | | $ 18.61 | | $ 18.39 | | $ 16.68 | | $ 11.88 |
| | |
| |
| |
| |
| |
| |
| |
| |
| |
| |
|
| Net investment loss1 | | (.14) | | (.14) | | (.13) | | (.17) | | (.16) | | (.16) | | (.14) | | (.13) | | | | (.18) | | (.16) |
| Net realized and unrealized gain (loss) | | (.74) | | 1.67 | | 4.09 | | 2.01 | | 4.98 | | (.72) | | 1.65 | | 4.07 | | | | 2.02 | | 4.96 |
| | |
| |
| |
| |
| |
| |
| |
| |
| |
| |
| |
|
| Total from investment operations | | (.88) | | 1.53 | | 3.96 | | 1.84 | | 4.82 | | (.88) | | 1.51 | | 3.94 | | | | 1.84 | | 4.80 |
| | |
| |
| |
| |
| |
| |
| |
| |
| |
| |
| |
|
| Less distributions from net realized gains | | (3.00) | | (2.72) | | (3.66) | | (.13) | | — | | (3.01) | | (2.76) | | (3.72) | | | | (.13) | | — |
| | |
| |
| |
| |
| |
| |
| |
| |
| |
| |
| |
|
| Net asset value, end of year | | $ 13.66 | | $ 17.54 | | $ 18.73 | | $ 18.43 | | $ 16.72 | | $ 13.47 | | $ 17.36 | | $ 18.61 | | $ 18.39 | | $ 16.68 |
| |
| |
| |
| |
| |
| |
| |
| |
| |
| |
|
| |
| Total Investment Return2 | | | | | | | | | | | | | | | | | | | | | | |
| |
| |
| |
| |
| |
| |
| |
| |
| |
| |
| |
|
| Based on net asset value | | (6.38%) | | 8.94% | | 22.69% | | 11.00% | | 40.50% | | (6.50%) | | 8.90% | | 22.65% | | | | 11.03% | | 40.40% |
| |
| |
| |
| |
| |
| |
| |
| |
| |
| |
| |
|
| |
| Ratios to Average Net Assets | | | | | | | | | | | | | | | | | | | | | | |
| |
| |
| |
| |
| |
| |
| |
| |
| |
| |
| |
|
| Expenses | | 2.04% | | 2.03% | | 2.04% | | 2.05% | | 2.15% | | 2.15% | | 2.04% | | 2.05% | | | | 2.06% | | 2.16% |
| | |
| |
| |
| |
| |
| |
| |
| |
| |
| |
| |
|
| Net investment loss | | (.83%) | | (.75%) | | (.67%) | | (.99%) | | (1.14%) | | (.93%) | | (.78%) | | (.67%) | | | | (1.00%) | | (1.15%) |
| |
| |
| |
| |
| |
| |
| |
| |
| |
| |
| |
|
| |
| Supplemental Data | | | | | | | | | | | | | | | | | | | | | | |
| |
| |
| |
| |
| |
| |
| |
| |
| |
| |
| |
|
| Net assets, end of year (in thousands) | | $ 46,499 | | $ 78,174 | | $112,073 | | $125,145 | | $139,610 | | $ 85,547 | | $111,084 | | $103,468 | | $ 89,771 | | $ 84,755 |
| | |
| |
| |
| |
| |
| |
| |
| |
| |
| |
|
| Portfolio turnover | | 148% | | 99% | | 110% | | 82% | | 86% | | 148% | | 99% | | 110% | | | | 82% | | 86% |
| | |
| |
| |
| |
| |
| |
| |
| |
| |
| |
| |
|
| 1 | Based on average shares outstanding. |
| |
| 2 | Total investment returns exclude the effects of sales charges. |
| |
| See Notes to Financial Statements. |
14 BLACKROCK MID CAP VALUE OPPORTUNITIES FUND
| Financial Highlights (concluded) | | | | | | | | | | |
| |
| | | | | | | Class R | | | | |
| | | | | | | | | | | For the Period |
| | | | | For the Year Ended | | | | February 4, |
| | | | | | | | | | | 2003(1) to |
| | | | | January 31, | | | | January 31, |
| | | 2008 | | 2007 | | 2006 | | 2005 | | 2004 |
| Per Share Operating Performance | | | | | | | | | | |
| |
| |
| |
| |
| |
|
| |
| Net asset value, beginning of period | | $ 17.58 | | $ 18.81 | | $ 18.71 | | $ 16.87 | | $ 11.81 |
| | |
| |
| |
| |
| |
|
| Net investment loss2 | | (.07) | | (.05) | | (.02) | | (.08) | | (.09) |
| Net realized and unrealized gain (loss) | | (.74) | | 1.69 | | 4.11 | | 2.05 | | 5.15 |
| | |
| |
| |
| |
| |
|
| Total from investment operations | | (.81) | | 1.64 | | 4.09 | | 1.97 | | 5.06 |
| | |
| |
| |
| |
| |
|
| Less distributions from net realized gains | | (3.14) | | (2.87) | | (3.99) | | (.13) | | — |
| | |
| |
| |
| |
| |
|
| Net asset value, end of period | | $ 13.63 | | $ 17.58 | | $ 18.81 | | $ 18.71 | | $ 16.87 |
| |
| |
| |
| |
| |
|
| |
| Total Investment Return | | | | | | | | | | |
| |
| |
| |
| |
| |
|
| |
| Based on net asset value | | (6.02%) | | 9.55% | | 23.26% | | 11.68% | | 42.85%3 |
| |
| |
| |
| |
| |
|
| |
| Ratios to Average Net Assets | | | | | | | | | | |
| |
| |
| |
| |
| |
|
| |
| Expenses | | 1.64% | | 1.51% | | 1.51% | | 1.51% | | 1.53%4 |
| | |
| |
| |
| |
| |
|
| Net investment loss | | (.39%) | | (.28%) | | (.11%) | | (.45%) | | (.58%)4 |
| |
| |
| |
| |
| |
|
| |
| Supplemental Data | | | | | | | | | | |
| |
| |
| |
| |
| |
|
| |
| Net assets, end of period (in thousands) | | $ 49,550 | | $ 32,476 | | $ 17,981 | | $ 7,356 | | $ 467 |
| | |
| |
| |
| |
| |
|
| Portfolio turnover | | 148% | | 99% | | 110% | | 82% | | 86% |
| | |
| |
| |
| |
| |
|
| 1 | Commencement of operations. |
| |
| 2 | Based on average shares outstanding. |
| |
| 3 | Aggregate total investment return. |
| |
| 4 | Annualized. |
| |
| See Notes to Financial Statements. |
| BLACKROCK MID CAP VALUE OPPORTUNITIES FUND |
Notes to Financial Statements
1. Significant Accounting Policies:
BlackRock Mid Cap Value Opportunities Fund (the “Fund”), a series of
BlackRock Mid Cap Value Opportunities Series, Inc. (the “Company”)
are registered under the Investment Company Act of 1940, as amended,
(the “1940 Act”), as a diversified, open-end management investment
company. The Fund’s financial statements are prepared in conformity with
accounting principles generally accepted in the United States of America,
which may require the use of management accruals and estimates.
Actual results may differ from these estimates. The Fund offers multiple
classes of shares. Institutional Shares are sold only to certain eligible
investors. Investor A Shares are sold with a front-end sales charge.
Investor B and Investor C Shares may be subject to a contingent deferred
sales charge. Class R Shares are sold only to certain retirement plans.
All classes of shares have identical voting, dividend, liquidation and other
rights and the same terms and conditions, except that Investor A, Investor
B, Investor C and Class R Shares bear certain expenses related to the
shareholder servicing of such shares, and Investor B, Investor C and
Class R Shares also bear certain expenses related to the distribution
of such shares. Each class has exclusive voting rights with respect to
matters relating to its shareholder servicing and distribution expenditures
(except that Investor B shareholders may vote on material changes to
the Investor A distribution plan). Income, expenses (other than expenses
attributable to a specific class) and realized and unrealized gains and
losses are allocated daily to each class based on its relative net assets.
The following is a summary of significant accounting policies followed by
the Fund:
Valuation of Investments: Equity investments traded on a national
securities exchange or on the NASDAQ National Market System are
valued at the last reported sale price that day or the NASDAQ official
closing price, if applicable. Equity investments traded on a national
securities exchange for which there were no sales on that day and
equity investments traded on other over-the-counter markets for which
market quotations are readily available are valued at the mean of the
bid and asked prices.
In the event that application of these methods of valuation results in a
price for an investment which is deemed not to be representative of
the market value of such investment, the investment will be valued by,
under the direction of, or in accordance with, a method approved by the
Fund’s Board of Directors (the “Board”) as reflecting fair value (“Fair
Value Assets”). When determining the price for Fair Value Assets, the
investment advisor and/or sub-advisor seeks to determine the price
that the Fund might reasonably expect to receive from the current sale
of that asset in an arm's-length transaction. Fair value determinations
shall be based upon all available factors that the investment advisor |
and/or sub-advisor deems relevant. The pricing of all Fair Value Assets
is subsequently reported to the Board or a committee thereof.
Generally, trading in foreign securities is substantially completed each
day at various times prior to the close of business on the New York Stock
Exchange (“NYSE”). The values of such securities used in computing the
net assets of the Fund are determined as of such times. Foreign curren-
cy exchange rates will be determined as of the close of business on the
NYSE. Occasionally, events affecting the values of such securities and
such exchange rates may occur between the times at which they are
determined and the close of business on the NYSE that may not be
reflected in the computation of the Fund’s net assets. If events (for
example, a company announcement, market volatility or a natural
disaster) occur during such periods that are expected to materially affect
the value of such securities, those securities may be valued at their fair
value as determined in good faith by the Company’s Board of Directors
or BlackRock Advisors, LLC (the “Manager”), an indirect, wholly owned
subsidiary of BlackRock, Inc., using a pricing service and/or procedures
approved by the Company’s Board of Directors.
Foreign Currency Transactions: Foreign currency amounts are translated
into United States dollars on the following basis: (i) market value of
investment securities, assets and liabilities at the current rate of
exchange; and (ii) purchases and sales of investment securities, income
and expenses at the rates of exchange prevailing on the respective dates
of such transactions. The Fund does not isolate the portion of operations
arising as a result of changes in the foreign exchange rates from the
fluctuations arising from changes in the market prices of securities held
at period end and sold during the period.
The Fund reports foreign currency related transactions as components of
realized gains for financial reporting purposes, whereas such compo-
nents are treated as ordinary income for Federal income tax purposes.
Income Taxes: It is the Fund’s policy to comply with the requirements of
the Internal Revenue Code applicable to regulated investment compa-
nies and to distribute substantially all of its taxable income to
its shareholders. Therefore, no federal income tax provision is required.
Under the applicable foreign tax law, a withholding tax may be imposed
on interest, dividends and capital gains at various rates.
Effective July 31, 2007, the Fund implemented Financial Accounting
Standards Board (“FASB”) Interpretation No. 48, “Accounting for
Uncertainty in Income Taxes — an interpretation of FASB Statement No.
109” (“FIN 48”). FIN 48 prescribes the minimum recognition threshold a
tax position must meet in connection with accounting for uncertainties in
income tax positions taken or expected to be taken by an entity, includ-
ing investment companies, before being measured and recognized in the |
16 BLACKROCK MID CAP VALUE OPPORTUNITIES FUND
Notes to Financial Statements (continued)
financial statements. Management has evaluated the application of FIN
48 to the Fund, and has determined that the adoption of FIN 48 does
not have a material impact on the Fund’s financial statements. The Fund
files U.S. federal and various state and local tax returns. No income tax
returns are currently under examination. The statute of limitations on the
Fund’s U.S. federal tax return remains open for the years ended January
31, 2005 through January 31, 2007. The statutes of limitations on the
Fund’s state and local tax returns may remain open for an additional
year depending upon the jurisdiction.
Investment Transactions and Investment Income: Investment transac-
tions are recorded on the dates the transactions are entered into (the
trade dates). Realized gains and losses on security transactions are
determined on the identified cost basis. Dividend income is recorded on
the ex-dividend dates. Dividends from foreign securities where the ex-
dividend date may have passed are subsequently recorded when the
Fund has determined the ex-dividend date. Upon notification from
issuers, some of the dividend income received from a real estate invest-
ment trust (“REIT”) may be redesignated as a reduction of cost of the
related investment and/or realized gain. Interest income is recognized on
the accrual basis.
Dividends and Distributions: Dividends and Distributions paid by the
Fund are recorded on the ex-dividend dates.
Bank Overdraft: The Fund recorded a bank overdraft, which resulted from
a failed sale trade.
Securities Lending: The Fund may lend securities to financial institutions
that provide cash or securities issued or guaranteed by the U.S. govern-
ment as collateral, which will be maintained at all times in an amount
equal to at least 100% of the current market value of the loaned securi-
ties. The market value of the loaned securities is determined at the close
of business of the Fund and any additional required collateral is deliv-
ered to the Fund on the next business day. Where the Fund receives
securities as collateral for the loaned securities it collects a fee from the
borrower. The Fund typically receives the income on the loaned securities
but does not receive the income on the collateral. Where the Fund
receives cash collateral, it may invest such collateral and retain the
amount earned on such investment, net of any amount rebated to the
borrower. The Fund may receive a flat fee for its loans. Loans of securi-
ties are terminable at any time and the borrower, after notice, is required
to return borrowed securities within the standard time period for settle-
ment of securities transactions. The Fund may pay reasonable lending
agent, administrative and custodial fees in connection with its loans. In
the event that the borrower defaults on its obligation to return borrowed |
securities because of insolvency or for any other reason, the Fund could
experience delays and costs in gaining access to the collateral. The Fund
also could suffer a loss where the value of the collateral falls below the
market value of the borrowed securities, in the event of borrower default
or in the event of losses on investments made with cash collateral.
Recent Accounting Pronouncement: In September 2006, Statement of
Financial Accounting Standards No. 157, “Fair Value Measurements”
(“FAS 157”), was issued and is effective for fiscal years beginning after
November 15, 2007. FAS 157 defines fair value, establishes a frame-
work for measuring fair value and expands disclosures about fair value
measurements. The impact on the Fund’s financial statement disclo-
sures, if any, is currently being assessed.
In addition, in February 2007, Statement of Financial Accounting
Standards No. 159, “The Fair Value Option for Financial Assets and
Financial Liabilities” (“FAS 159”), was issued and is effective for fiscal
years beginning after November 15, 2007. FAS 159 permits entities to
choose to measure many financial instruments and certain other items
at fair value that are not currently required to be measured at fair value.
FAS 159 also establishes presentation and disclosure requirements
designed to facilitate comparisons between entities that choose different
measurement attributes for similar types of assets and liabilities. The
impact on the Fund’s financial statement disclosures, if any, is currently
being assessed.
Reclassifications: U.S. generally accepted accounting principles require
that certain components of net assets be adjusted to reflect permanent
differences between financial and tax reporting. Accordingly, during the
current year, $1,670,613 has been reclassified between accumulated
net realized capital losses and accumulated distributions in excess of
net investment income as a result of a permanent difference attributable
to a net operating loss and foreign currency transactions. This reclassifi-
cation has no effect on net assets or net asset values per share.
2. Investment Advisory Agreement and Other Transactions
with Affiliates:
The Fund entered into an Investment Advisory Agreement with the
Manager to provide advisory and administration services. The Fund has
also entered into separate Distribution Agreements with FAM Distributors,
Inc. (“FAMD”) and BlackRock Distributors, Inc. and its affiliates (“BDI”)
(collectively, the “Distributor”) and has adopted separate Distribution
Plans with respect to its Investor A, Investor B, Investor C and Class R
Shares. FAMD is a wholly owned subsidiary of Merrill Lynch Group, Inc., |
| BLACKROCK MID CAP VALUE OPPORTUNITIES FUND |
Notes to Financial Statements (continued)
and BDI is an affiliate of BlackRock, Inc. Merrill Lynch & Co., Inc.
(“Merrill Lynch”) and The PNC Financial Services Group, Inc. (“PNC”)
are principal owners of BlackRock, Inc.
The Manager is responsible for the management of the Fund’s portfolio
and provides the necessary personnel, facilities, equipment and certain
other services necessary to the operations of the Fund. For such services,
the Fund pays the Manager a monthly fee at an annual rate of .65%,
of the average daily value of the Fund’s net assets. In addition, the
Manager has entered into a separate sub-advisory agreement with
BlackRock Investment Management, LLC (“BIM”), an affiliate of the
Manager, under which the Manager pays BIM for services it provides a
monthly fee that is a percentage of the management fee paid by the
Fund to the Manager. For the year ended January 31, 2008, the Fund
reimbursed the Manager $8,217 for certain accounting services, which
are included in accounting services in Statement of Operations.
Pursuant to the Distribution Plans adopted by the Company in accor-
dance with Rule 12b-1 under the 1940 Act, the Fund pays the
Distributor ongoing service fees and distribution fees. The fees are
accrued daily and paid monthly at annual rates based upon the average
daily net assets of the shares as follows: |
| | | Service | | Distribution |
| | | Fee | | Fee |
| |
| |
|
| Investor A | | .25% | | — |
| Investor B | | .25% | | .75% |
| Investor C | | .25% | | .75% |
| Class R | | .25% | | .25% |
| |
| |
|
Pursuant to sub-agreements with each Distributor, broker-dealers,
including Merrill Lynch, Pierce, Fenner & Smith Incorporated (“MLPF&S”),
a wholly owned subsidiary of Merrill Lynch, provide shareholder servicing
and distribution services to the Fund. The on-going service fee compen-
sates the Distributor and each broker-dealer (including MLPF&S) for pro-
viding shareholder servicing to Investor A, Investor B, Investor C and
Class R shareholders. The ongoing distribution fee compensates each
Distributor and MLPF&S for providing shareholder and distribution-
related services to Investor B, Investor C and Class R shareholders.
For the year ended January 31, 2008, the Distributor earned under-
writing discounts and direct commissions and MLPF&S and BDI earned
dealer concessions on sales of the Fund’s Investor A Shares which
totaled $24,102. |
For the year ended January 31, 2008, affiliates received contingent
deferred sales charges of $58,649 and $6,469 relating to transactions
in Investor B and Investor C Shares, respectively. Furthermore MLPF&S
received contingent deferred sales charges of $403 relating to transac-
tions subject to front-end sales charge waivers in Investor A Shares.
The Manager maintains a call center, which is responsible for providing
certain shareholder services to the Fund, such as responding to share-
holder inquiries and processing transactions based upon instructions
from shareholders with respect to the subscription and redemption of
Fund shares. During the year ended January 31, 2008, the following
amounts have been accrued by the Fund to reimburse the Manager for
costs incurred running the call center, which are a component of the
transfer agent fees in the accompanying Statement of Operations. |
| | | Call Center |
| | | Fees |
| |
|
| Institutional | | $ 694 |
| Investor A | | $3,557 |
| Investor B | | $1,936 |
| Investor C | | $2,368 |
| Class R | | $ 535 |
| |
|
The Fund has received an exemptive order from the SEC permitting it to
lend portfolio securities to MLPF&S, or its affiliates. As of January 31,
2008, the Fund lent securities with a value of $4,662,034 to its affili-
ates. Pursuant to that order, the Fund has retained BIM as the securities
lending agent for a fee based on a share of the returns on investment of
cash collateral. BIM may, on behalf of the Fund, invest cash collateral
received by the Fund for such loans, among other things, in a private
investment company managed by the Manager or in registered money
market funds advised by the Manager or its affiliates. For the year
ended January 31, 2008, BIM received $45,343 in securities lending
agent fees.
In addition, MLPF&S received $387,877 in commissions on the execu-
tion of portfolio security transactions for the Fund for the year ended
January 31, 2008.
PFPC Inc., an indirect, wholly owned subsidiary of PNC and an affiliate of
the Manager, is the Fund’s transfer agent.
Certain officers and/or directors of the Company are officers and/or
directors of BlackRock, Inc. or its affiliates.
3. Investments:
Purchases and sales of investments, excluding short-term securities,
for the year ended January 31, 2008 were $650,401,984 and
$705,206,509, respectively. |
18 BLACKROCK MID CAP VALUE OPPORTUNITIES FUND
| Notes to Financial Statements (continued) | | | | | |
| |
| 4. Capital Share Transactions: | | | | | | | |
| Transactions in capital shares for each class were as follows: | | | | | | | |
| | | For the | | For the | | |
| | | Year Ended | | Year Ended | | |
| |
January 31, 2008 | |
January 31, 2007 |
| | | Shares | Dollar Amount | | Shares | | Dollar Amount |
| |
|
| |
| |
|
| Institutional | | | | | | | |
| |
|
| |
| |
|
| Shares sold | | 759,760 | $ 13,996,980 | | 1,017,656 | | $ 19,775,896 |
| Shares issued to shareholders in reinvestment | | | | | | | |
| of distributions | | 952,586 | 15,787,671 | | 867,983 | | 15,926,489 |
| | |
|
| |
| |
|
| Total issued | | 1,712,346 | 29,784,651 | | 1,885,639 | | 35,702,385 |
| Shares redeemed | | (1,975,610) | (35,480,385) | | (2,063,926) | | (39,234,724) |
| | |
|
| |
| |
|
| Net decrease | | (263,264) | $ (5,695,734) | | (178,287) | | $ (3,532,339) |
| |
|
| |
| |
|
| |
| Investor A | | | | | | | |
| |
|
| |
| |
|
| Shares sold and automatic conversion of shares | | 2,508,506 | $ 45,861,040 | | 2,565,590 | | $ 48,869,192 |
| Shares issued to shareholders in reinvestment | | | | | | | |
| of distributions | | 1,256,230 | 20,391,674 | | 864,301 | | 15,628,167 |
| | |
|
| |
| |
|
| Total issued | | 3,764,736 | 66,252,714 | | 3,429,891 | | 64,497,359 |
| Shares redeemed | | (2,713,211) | (48,364,071) | | (1,894,057) | | (35,757,555) |
| | |
|
| |
| |
|
| Net increase | | 1,051,525 | $ 17,888,643 | | 1,535,834 | | $ 28,739,804 |
| |
|
| |
| |
|
| |
| Investor B | | | | | | | |
| |
|
| |
| |
|
| Shares sold | | 247,707 | $ 4,330,349 | | 410,924 | | $ 7,482,953 |
| Shares issued to shareholders in reinvestment | | | | | | | |
| of distributions | | 599,653 | 9,243,706 | | 629,280 | | 10,790,352 |
| | |
|
| |
| |
|
| Total issued | | 847,360 | 13,574,055 | | 1,040,204 | | 18,273,305 |
| Shares redeemed and automatic conversion of shares | | (1,900,057) | (32,227,289) | | (2,567,838) | | (46,724,129) |
| | |
|
| |
| |
|
| Net decrease | | (1,052,697) | $(18,653,234) | | (1,527,634) | | $(28,450,824) |
| |
|
| |
| |
|
| |
| Investor C | | | | | | | |
| |
|
| |
| |
|
| Shares sold | | 1,194,420 | $ 20,139,951 | | 1,297,431 | | $ 23,302,291 |
| Shares issued to shareholders in reinvestment | | | | | | | |
| of distributions | | 1,059,172 | 16,067,913 | | 849,262 | | 14,441,263 |
| | |
|
| |
| |
|
| Total issued | | 2,253,592 | 36,207,864 | | 2,146,693 | | 37,743,554 |
| Shares redeemed | | (2,301,942) | (38,923,786) | | (1,310,320) | | (23,587,163) |
| | |
|
| |
| |
|
| Net increase (decrease) | | (48,350) | $ (2,715,922) | | 836,373 | | $ 14,156,391 |
| |
|
| |
| |
|
| |
| Class R | | | | | | | |
| |
|
| |
| |
|
| Shares sold | | 2,168,206 | $ 37,016,938 | | 1,271,414 | | $ 22,998,456 |
| Shares issued to shareholders in reinvestment | | | | | | | |
| of distributions | | 596,521 | 9,023,516 | | 249,194 | | 4,291,601 |
| | |
|
| |
| |
|
| Total issued | | 2,764,727 | 46,040,454 | | 1,520,608 | | 27,290,057 |
| Shares redeemed | | (977,406) | (16,266,999) | | (628,987) | | (11,220,258) |
| | |
|
| |
| |
|
| Net increase | | 1,787,321 | $ 29,773,455 | | 891,621 | | $ 16,069,799 |
| | |
|
| |
| |
|
| BLACKROCK MID CAP VALUE OPPORTUNITIES FUND |
| Notes to Financial Statements (concluded) |
5. Short-Term Borrowings:
The Company, on behalf of the Fund, along with certain other funds man-
aged by the Manager and its affiliates, is party to a $500,000,000 credit
agreement with a group of lenders. The Fund may borrow under the credit
agreement to fund shareholder redemptions and for other lawful purposes
other than for leverage. The Fund may borrow up to the maximum amount
allowable under the Fund’s current Prospectus and Statement of Additional
Information, subject to various other legal, regulatory or contractual limits.
On November 21, 2007, the credit agreement was renewed for one year
under substantially the same terms. The Fund pays a commitment fee of
.06% per annum based on the Fund’s pro rata share of the unused portion
of the credit agreement, which is included in miscellaneous expenses in
the Statement of Operations. Amounts borrowed under the credit agree-
ment bear interest at a rate equal to, at the Fund’s election, the federal
funds rate plus .35% or a base rate as defined in the credit agreement.
The Fund did not borrow under the credit agreement during the year ended
January 31, 2008. |
6. Distribution to Shareholders:
The tax character of distributions paid during the fiscal years ended
January 31, 2008 and January 31, 2007 was as follows: |
| | | 1/31/2008 | | 1/31/2007 |
| | |
| |
|
| Distributions paid from: | | | | |
| Ordinary income | | $35,635,002 | | $35,097,673 |
| Net long-term capital gains | | 39,022,513 | | 30,712,163 |
| | |
| |
|
| Total taxable distributions | | $74,657,515 | | $65,809,836 |
| | |
| |
|
| |
| As of January 31, 2008, the components of accumulated losses on a tax |
| basis were as follows: | | | | |
| |
| |
|
| Undistributed ordinary income — net | | | | $ 2,649,085 |
| Undistributed long-term capital gains — net | | | | 145,954 |
| | | | |
|
| Total undistributed earnings — net | | | | 2,795,039 |
| Unrealized losses — net | | | | (36,111,652)* |
| | | | |
|
| Total accumulated losses — net | | | | $ (33,316,613) |
| | | | |
|
| * | The difference between book-basis and tax-basis net unrealized gains is attributable primarily to the tax deferral of losses on wash sales and the timing of income recognition on partnership interests. |
| |
20 BLACKROCK MID CAP VALUE OPPORTUNITIES FUND
Report of Independent Registered Public Accounting Firm
To the Shareholders and Board of Directors of BlackRock
Mid Cap Value Opportunities Fund of BlackRock Mid Cap
Value Opportunities Series, Inc.:
We have audited the accompanying statement of assets and liabilities,
including the schedule of investments, of BlackRock Mid Cap Value
Opportunities Fund of BlackRock Mid Cap Value Opportunities Series,
Inc. (the “Fund”) as of January 31, 2008, and the related statement of
operations for the year then ended, the statements of changes in net
assets for each of the two years in the period then ended, and the finan-
cial highlights for each of the five years in the period then ended. These
financial statements and financial highlights are the responsibility of the
Fund’s management. Our responsibility is to express an opinion on these
financial statements and financial highlights based on our audits.
We conducted our audits in accordance with the standards of the Public
Company Accounting Oversight Board (United States). Those standards
require that we plan and perform the audit to obtain reasonable assur-
ance about whether the financial statements and financial highlights
are free of material misstatement. The Fund is not required to have, nor
were we engaged to perform, an audit of its internal control over finan-
cial reporting. Our audits included consideration of internal control over
financial reporting as a basis for designing audit procedures that are
appropriate in the circumstances, but not for the purpose of express-
ing an opinion on the effectiveness of the Fund’s internal control over
financial reporting. Accordingly, we express no such opinion. An audit |
also includes examining, on a test basis, evidence supporting the
amounts and disclosures in the financial statements, assessing the
accounting principles used and significant estimates made by manage-
ment, as well as evaluating the overall financial statement presentation.
Our procedures included confirmation of securities owned as of January
31, 2008, by correspondence with the custodian and brokers; where
replies were not received from brokers, we performed other auditing
procedures. We believe that our audits provide a reasonable basis for
our opinion.
In our opinion, the financial statements and financial highlights referred
to above present fairly, in all material respects, the financial position of
BlackRock Mid Cap Value Opportunities Fund of BlackRock Mid Cap
Value Opportunities Series, Inc. as of January 31, 2008, the results of
its operations for the year then ended, the changes in net assets
for each of the two years in the period then ended, and the financial
highlights for each of the five years in the period then ended, in con-
formity with accounting principles generally accepted in the United
States of America. |
Deloitte & Touche LLP
Princeton, New Jersey
March 25, 2008 |
| BLACKROCK MID CAP VALUE OPPORTUNITIES FUND |
Proxy Results
During the six-month period ended January 31, 2008, BlackRock Mid Cap Value Opportunities Fund of BlackRock Mid Cap Value Opportunities Series, Inc.’s shareholders voted on the following proposal, which was approved at a special shareholders’ meeting on September 7, 2007. This proposal was a part of the reorganization of the Fund’s Board of Directors that took effect on November 1, 2007. A description of the proposal and number of shares voted are as follows:
| | | | | Shares Voted | | Shares Withheld |
| | | | | For | | From Voting |
| |
| |
| |
|
| To elect the Fund’s Board of Directors: | | James H. Bodurtha | | 18,223,929 | | 447,161 |
| | | Bruce R. Bond | | 18,224,438 | | 446,652 |
| | | Donald W. Burton | | 18,224,438 | | 446,652 |
| | | Richard S. Davis | | 18,223,720 | | 447,370 |
| | | Stuart E. Eizenstat | | 18,220,475 | | 450,615 |
| | | Laurence D. Fink | | 18,223,736 | | 447,354 |
| | | Kenneth A. Froot | | 18,224,422 | | 446,668 |
| | | Henry Gabbay | | 18,224,422 | | 446,668 |
| | | Robert M. Hernandez | | 18,223,929 | | 447,161 |
| | | John F. O’Brien | | 18,224,007 | | 447,083 |
| | | Roberta Cooper Ramo | | 18,223,991 | | 447,099 |
| | | Jean Margo Reid | | 18,224,438 | | 446,652 |
| | | David H. Walsh | | 18,223,991 | | 447,099 |
| | | Fred G. Weiss | | 18,223,288 | | 447,802 |
| | | Richard R. West | | 18,221,852 | | 449,238 |
| |
| |
| |
|
22 BLACKROCK MID CAP VALUE OPPORTUNITIES FUND
Important Tax Information
The following information is provided with respect to the ordinary income distributions paid by BlackRock Mid Cap Value Opportunities Fund of BlackRock Mid Cap Value Opportunities Series, Inc. during the fiscal year ended January 31, 2008:
| | | Record Date | | July 18, 2007 | | December 13, 2007 |
| | | Payable Date | | July 20, 2007 | | December 17, 2007 |
| |
| |
| |
|
| Qualified Dividend Income for Individuals | | | | — | | 11.80%* |
| Dividends Qualifying for the Dividends Received Deduction for Corporations | | | | 8.83%* | | 11.41%* |
| Short-Term Capital Gains Dividends for Non-U.S. Residents | | | | 100%** | | 100%** |
| |
| |
| |
|
| * | The Fund hereby designates the percentage indicated above or the maximum amount allowable by law. |
| |
| ** | Represents the portion of the taxable ordinary income dividends eligible for exemption from U.S. withholding tax for nonresident aliens and foreign corporations. |
| |
Additionally, the Fund distributed long-term capital gains of $.332564 per share to shareholders of record on July 18, 2007 and $1.299626 per share to shareholders of record on December 13, 2007.
| BLACKROCK MID CAP VALUE OPPORTUNITIES FUND |
| Officers and Directors | | | | | | | | |
| |
| | | | | | | | | Number of | | |
| | | | | | | | | BlackRock- | | |
| | | Position(s) | | Length of | | | | Advised Funds | | |
| Name, Address | | Held with | | Time Served | | | | and Portfolios | | Public |
| and Year of Birth | | Fund | | as a Director** | | Principal Occupation(s) During Past 5 Years | | Overseen | | Directorships |
| |
| |
| |
| |
| |
|
| |
| Non-Interested Directors* | | | | | | | | |
| |
| |
| |
| |
|
| James H. Bodurtha | | Director | | Since | | Director, The China Business Group, Inc. (consulting firm) since 1996 | | 37 Funds | | None |
| 40 East 52nd Street | | | | 2002 | | and formerly Executive Vice President thereof from 1996 to 2003; | | 101 Portfolios | | |
| New York, NY 10022 | | | | | | Chairman of the Board, Berkshire Holding Corporation since 1980. | | | | |
| 1944 | | | | | | | | | | |
| |
| |
| |
| |
| |
|
| Bruce R. Bond | | Director | | Since | | Formerly Trustee and Member of the Governance Committee, State | | 37 Funds | | None |
| 40 East 52nd Street | | | | 2007 | | Street Research Mutual Funds from 1997 to 2005; Formerly Board | | 101 Portfolios | | |
| New York, NY 10022 | | | | | | Member of Governance, Audit and Finance Committee, Avaya Inc. | | | | |
| 1946 | | | | | | (computer equipment) from 2003 to 2007. | | | | |
| |
| |
| |
| |
| |
|
| Donald W. Burton | | Director | | Since | | Managing General Partner, The Burton Partnership, LP (an investment | | 37 Funds | | Knology, Inc. (tele- |
| 40 East 52nd Street | | | | 2007 | | partnership) since 1979; Managing General Partner, The South Atlantic | | 101 Portfolios | | communications) |
| New York, NY 10022 | | | | | | Venture Funds since 1983; Member of the Investment Advisory Council | | | | Capital Southwest |
| 1944 | | | | | | of the Florida State Board of Administration from 2001 to 2007. | | | | (financial) |
| |
| |
| |
| |
| |
|
| Honorable | | Director | | Since | | Partner and Head of International Practice, Covington and Burling | | 37 Funds | | UPS Corporation |
| Stuart E. Eizenstat | | | | 2007 | | (law firm) since 2001; International Advisory Board Member, The Coca | | 101 Portfolios | | (delivery service) |
| 40 East 52nd Street | | | | | | Cola Company since 2002; Advisory Board Member BT Americas | | | | |
| New York, NY 10022 | | | | | | (telecommunications) since 2004; Member of the Board of Directors, | | | | |
| 1943 | | | | | | Chicago Climate Exchange (environmental) since 2006; Member of the | | | | |
| | | | | | | International Advisory Board GML (energy) since 2003. | | | | |
| |
| |
| |
| |
| |
|
| |
| Kenneth A. Froot | | Director | | Since | | Professor, Harvard University since 1992. | | 37 Funds | | None |
| 40 East 52nd Street | | | | 2005 | | | | 101 Portfolios | | |
| New York, NY 10022 | | | | | | | | | | |
| 1957 | | | | | | | | | | |
| |
| |
| |
| |
| |
|
| Robert M. Hernandez | | Director, Chair | | Since | | Formerly Director, Vice Chairman and Chief Financial Officer of USX | | 37 Funds | | ACE Limited |
| 40 East 52nd Street | | of the Board of | | 2007 | | Corporation (energy and steel business) from 1991 to 2001. | | 101 Portfolios | | (insurance company); |
| New York, NY 10022 | | Directors, and | | | | | | | | Eastman Chemical |
| 1944 | | Member | | | | | | | | Company (chemical); |
| | | of the Audit | | | | | | | | RTI International |
| | | Committee | | | | | | | | Metals, Inc. (metals); |
| | | | | | | | | | | TYCO Electronics |
| | | | | | | | | | | (electronics) |
| |
| |
| |
| |
| |
|
| |
| John F. O’Brien | | Director | | Since | | Trustee, Woods Hole Oceanographic Institute since 2003; Formerly | | 37 Funds | | Cabot Corporation |
| 40 East 52nd Street | | | | 2007 | | Director, Allmerica Financial Corporation from 1995 to 2003; Formerly | | 101 Portfolios | | (chemicals); LKQ |
| New York, NY 10022 | | | | | | Director, ABIOMED from 1989 to 2006; Formerly Director, Ameresco, | | | | Corporation (auto |
| 1943 | | | | | | Inc. (energy solutions company) from 2006 to 2007. | | | | parts manufacturing); |
| | | | | | | | | | | TJX Companies, Inc. |
| | | | | | | | | | | (retailer) |
| |
| |
| |
| |
| |
|
| |
| Roberta Cooper Ramo | | Director | | Since | | Shareholder, Modrall, Sperling, Roehl, Harris & Sisk, .A. (law firm) | | 37 Funds | | None |
| 40 East 52nd Street | | | | 2002 | | since 1993; Chairman of the Board, Cooper’s Inc., (retail) since 2000; | | 101 Portfolios | | |
| New York, NY 10022 | | | | | | Director of ECMC Group (service provider to students, schools and | | | | |
| 1942 | | | | | | lenders) since 2001; President Elect, The American Law Institute, | | | | |
| | | | | | | (non-profit), 2007; Formerly President, American Bar Association from | | | | |
| | | | | | | 1995 to 1996. | | | | |
| |
| |
| |
| |
| |
|
| |
| Jean Margo Reid | | Director | | Since | | Self-employed consultant since 2001; Director and Secretary, SCB, | | 37 Funds | | None |
| 40 East 52nd Street | | | | 2007 | | Inc. (holding company) since 1998; Director and Secretary, SCB | | 101 Portfolios | | |
| New York, NY 10022 | | | | | | Partners, Inc. (holding company) since 2000; Director, Covenant | | | | |
| 1945 | | | | | | House (non-profit) from 2001 to 2004. | | | | |
| | |
| |
| | | |
| |
|
24 BLACKROCK MID CAP VALUE OPPORTUNITIES FUND
| Officers and Directors (continued) | | | | |
| |
| | | | | | | | | Number of | | |
| | | | | | | | | BlackRock- | | |
| | | Position(s) | | Length of | | | | Advised Funds | | |
| Name, Address | | Held with | | Time Served | | | | and Portfolios | | Public |
| and Year of Birth | | Fund | | as a Director** | | Principal Occupation(s) During Past 5 Years | | Overseen | | Directorships |
| |
| |
| |
| |
| |
|
| |
| Non-Interested Directors* (concluded) | | | | | | | | |
| |
| |
| |
| |
|
| |
| David H. Walsh | | Director | | Since | | Director, National Museum of Wildlife Art since 2007; Director, | | 37 Funds | | None |
| 40 East 52nd Street | | | | 2007 | | Ruckleshaus Institute and Haub School of Natural Resources at the | | 101 Portfolios | | |
| New York, NY 10022 | | | | | | University of Wyoming since 2006; Director, The American Museum | | | | |
| 1941 | | | | | | of Fly Fishing since 1997; Formerly Consultant with Putnam Investments | | | | |
| | | | | | | from 1993 to 2003; Formerly Director, The National Audubon Society | | | | |
| | | | | | | from 1998 to 2005. | | | | |
| |
| |
| |
| |
| |
|
| |
| Fred G. Weiss | | Director and Vice | | Since | | Managing Director, FGW Associates (consulting and investment | | 37 Funds | | Watson |
| 40 East 52nd Street | | Chair of the | | 2007 | | company) since 1997; Director, Michael J. Fox Foundation for | | 101 Portfolios | | Pharmaceutical Inc. |
| New York, NY 10022 | | Board of Directors | | | | Parkinson’s Research since 2000; Formerly Director of BTG | | | | |
| 1941 | | and Chair of the | | | | International Plc (a global technology commercialization company) | | | | |
| | | Audit Committee | | | | from 2001 to 2007. | | | | |
| |
| |
| |
| |
| |
|
| |
| Richard R. West | | Director | | Since | | Dean Emeritus, New York University’s Leonard N. Stern School of | | 37 Funds | | Bowne & Co., Inc. |
| 40 East 52nd Street | | and Member | | 2007 | | Business Administration since 1995. | | 101 Portfolios | | (financial printers); |
| New York, NY 10022 | | of the Audit | | | | | | | | Vornado Realty Trust |
| 1938 | | Committee | | | | | | | | (real estate |
| | | | | | | | | | | company); |
| | | | | | | | | | | Alexander’s Inc. |
| | | | | | | | | | | (real estate |
| | | | | | | | | | | company) |
| | |
| |
| |
| |
| | |
* Directors serve until their resignation, removal or death, or until December 31 of the year in which they turn 72.
** Following the combination of Merrill Lynch Investment Managers, L. . (“MLIM”) and BlackRock, Inc. (“BlackRock”) in September 2006, the various legacy MLIM and legacy BlackRock Fund boards were realigned and consolidated into three new Fund boards in 2007. As a result, although the chart shows certain directors as joining the Fund’s board in 2007, those directors first became a member of the board of directors of other legacy MLIM or legacy BlackRock Funds as follows: James H. Bodurtha since 1995; Bruce R. Bond since 2005; Donald W. Burton since 2002; Stuart E.Eizenstat since 2001; Kenneth A. Froot since 2005; Robert M. Hernandez since 1996; John F. O’Brien since 2004; Roberta Cooper Ramo since 2000; Jean Margo Reid since 2004; David H. Walsh since 2003; Fred G. Weiss since 1998 and Richard R. West since 1978.
| BLACKROCK MID CAP VALUE OPPORTUNITIES FUND |
| Officers and Directors (continued) | | | | |
| |
| | | | | | | | | Number of | | |
| | | | | | | | | BlackRock- | | |
| | | Position(s) | | Length of | | | | Advised Funds | | |
| Name, Address | | Held with | | Time Served | | | | and Portfolios | | Public |
| and Year of Birth | | Fund | | as a Director | | Principal Occupation(s) During Past 5 Years | | Overseen | | Directorships |
| |
| |
| |
| |
| |
|
| |
| Interested Directors* | | | | | | | | | | |
| |
| |
| |
| |
| |
|
| |
| Richard S. Davis | | Director | | Since | | Managing Director, BlackRock, Inc. since 2005; Formerly Chief | | 185 Funds | | None |
| 40 East 52nd Street | | | | 2007 | | Executive Officer, State Street Research & Management Company | | 292 Portfolios | | |
| New York, NY 10022 | | | | | | from 2000 to 2005; Formerly Chairman of the Board of Trustees, | | | | |
| 1945 | | | | | | State Street Research Mutual Funds from 2000 to 2005; Formerly | | | | |
| Chairman, SSR Realty from 2000 to 2004. |
|
| |
| Laurence D. Fink | | Director | | Since | | Chairman and Chief Executive Officer of BlackRock, Inc. since its | | 37 Funds | | None |
| 40 East 52nd Street | | | | 2007 | | formation in 1998 and of BlackRock, Inc.’s predecessor entities since | | 101 Portfolios | | |
| New York, NY 10022 | | | | | | 1988 and Chairman of the Executive and Management Committees; | | | | |
| 1952 | | | | | | Formerly Managing Director, The First Boston Corporation, Member of | | | | |
| | | | | | | its Management Committee, Co-head of its Taxable Fixed Income | | | | |
| | | | | | | Division and Head of its Mortgage and Real Estate Products Group; | | | | |
| | | | | | | Chairman of the Board of several of BlackRock’s alternative investment | | | | |
| | | | | | | vehicles; Director of several of BlackRock’s offshore funds; Member of | | | | |
| | | | | | | the Board of Trustees of New York University, Chair of the Financial Affairs | | | | |
| | | | | | | Committee and a member of the Executive Committee, the Ad Hoc | | | | |
| | | | | | | Committee on Board Governance, and the Committee on Trustees; Co- | | | | |
| | | | | | | Chairman of the NYU Hospitals Center Board of Trustees, Chairman of | | | | |
| | | | | | | the Development/Trustee Stewardship Committee and Chairman of the | | | | |
| | | | | | | Finance Committee; Trustee, The Boys’ Club of New York. | | | | |
| |
| |
| |
| |
| |
|
| |
| Henry Gabbay | | Director | | Since | | Consultant, BlackRock, Inc. since 2007; Formerly Managing Director, | | 184 Funds | | None |
| 40 East 52nd Street | | | | 2007 | | BlackRock, Inc. from 1989 to 2007; Formerly Chief Administrative | | 291 Portfolios | | |
| New York, NY 10022 | | | | | | Officer, BlackRock Advisors, LLC from 1998 to 2007; Formerly President | | | | |
| 1947 | | | | | | of BlackRock Funds and BlackRock Bond Allocation Target Shares from | | | | |
| | | | | | | 2005 to 2007 and Treasurer of certain closed-end funds in the | | | | |
| BlackRock fund complex from 1989 to 2006. |
| * | Messrs. Davis, Fink and Gabbay are all “interested persons,” as defined in the Investment Company Act of 1940, of the Fund based on their positions with BlackRock, Inc. and its affiliates. Directors serve until their resignation, removal or death, or until December 31 of the year in which they turn 72. |
| |
26 BLACKROCK MID CAP VALUE OPPORTUNITIES FUND
| Officers and Directors (concluded) | | | | |
| |
| |
| | | Position(s) | | | | Length of | | | | | | | | |
| Name, Address | | Held with | | | | Time Served | | | | | | | | |
| and Year of Birth | | Fund | | | | as a Director | | Principal Occupation(s) During Past 5 Years | | | | |
| |
| |
| |
| |
| |
| |
|
| Fund Officers* | | | | | | | | | | | | | | |
| |
| |
| |
| |
| |
| |
| |
|
| Donald C. Burke | | Fund | | | | Since | | Managing Director of BlackRock, Inc. since 2006; Formerly Managing Director of Merrill Lynch Investment |
| 40 East 52nd Street | | President | | | | 2007 | | Managers, L (“MLIM”) and Fund Asset Management, L (“FAM”) in 2006; First Vice President thereof from |
| New York, NY 10022 | | and Chief | | | | | | 1997 to 2005; Treasurer thereof from 1999 to 2006 and Vice President thereof from 1990 to 1997. |
| 1960 | | Executive | | | | | | | | | | | | |
| | | Officer | | | | | | | | | | | | |
| |
| |
| |
| |
| |
| |
| |
|
| Anne F. Ackerley | | Vice | | | | Since | | Managing Director of BlackRock, Inc. since 2000 and First Vice President and Chief Operating Officer of Mergers |
| 40 East 52nd Street | | President | | | | 2007 | | and Acquisitions Group from 1997 to 2000; First Vice President and Chief Operating Officer of Public Finance |
| New York, NY 10022 | | | | | | | | Group thereof from 1995 to 1997; First Vice President of Emerging Markets Fixed Income Research of Merrill |
| 1962 | | | | | | | | Lynch & Co., Inc. from 1994 to 1995. | | | | |
| |
| |
| |
| |
| |
| |
|
| Neal J. Andrews | | Chief | | | | Since | | Managing Director of BlackRock, Inc. since 2006; Formerly Senior Vice President and Line of Business Head of |
| 40 East 52nd Street | | Financial | | | | 2007 | | Fund Accounting and Administration at PFPC Inc. from 1992 to 2006. | | |
| New York, NY 10022 | | Officer | | | | | | | | | | | | |
| 1966 | | | | | | | | | | | | | | |
| |
| |
| |
| |
| |
| |
| |
|
| Jay M. Fife | | Treasurer | | | | Since | | Managing Director of BlackRock, Inc. since 2007 and Director in 2006; Formerly Assistant Treasurer of the |
| 40 East 52nd Street | | | | | | 2007 | | MLIM/FAM advised funds from 2005 to 2006; Director of MLIM Fund Services Group from 2001 to 2006. |
| New York, NY 10022 | | | | | | | | | | | | | | |
| 1970 | | | | | | | | | | | | | | |
| |
| |
| |
| |
| |
| |
| |
|
| Brian . Kindelan | | Chief | | | | Since | | Chief Compliance Officer of the Funds since 2007; Managing Director and Senior Counsel thereof since 2005; |
| 40 East 52nd Street | | Compliance | | 2007 | | Director and Senior Counsel of BlackRock Advisors, Inc. from 2001 to 2004 and Vice President and Senior |
| New York, NY 10022 | | Officer | | | | | | Counsel thereof from 1998 to 2000; Senior Counsel of The PNC Bank Corp. from 1995 to 1998. |
| 1959 | | | | | | | | | | | | | | |
| |
| |
| |
| |
| |
| |
| |
|
| Howard Surloff | | Secretary | | | | Since | | Managing Director of BlackRock, Inc. and General Counsel of U.S. Funds at BlackRock, Inc. since 2006; Formerly |
| 40 East 52nd Street | | | | | | 2007 | | General Counsel (U.S.) of Goldman Sachs Asset Management, L from 1993 to 2006. | | |
| New York, NY 10022 | | | | | | | | | | | | | | |
| 1965 | | | | | | | | | | | | | | |
| | |
| |
| |
| |
| |
| |
| |
|
| | | * Officers of the Fund serve at the pleasure of the Board of Directors. | | | | |
| |
| |
| |
|
| | | Further information about the Fund’s Officers and Directors is available in the Fund’s Statement of Additional Information, which can be obtained |
| | | without charge by calling (800) 441-7762. | | | | | | |
| |
| |
| |
| |
|
| |
| Custodian | | | | Transfer Agent | | | | Accounting Agent | | Independent Registered Public | | Legal Counsel |
| The Bank of New York Mellon | | PFPC Inc. | | | | State Street Bank and | | Accounting Firm | | Willkie Farr & |
| New York, NY 10286 | | | | Wilmington, DE 19809 | | Trust Company | | Deloitte & Touche LLP | | Gallagher LLP |
| | | | | | | | | | | Princeton, NJ 08540 | | Princeton, NJ 08540 | | New York, NY 10019 |
| BLACKROCK MID CAP VALUE OPPORTUNITIES FUND |
| | BlackRock Fund Information
BlackRock Privacy Principles
BlackRock is committed to maintaining the privacy of its current and
former fund investors and individual clients (collectively, “Clients”) and
to safeguarding their nonpublic personal information. The following infor-
mation is provided to help you understand what personal information
BlackRock collects, how we protect that information and why in certain
cases we share such information with select parties.
If you are located in a jurisdiction where specific laws, rules or regulations
require BlackRock to provide you with additional or different privacy-related
rights beyond what is set forth below, then BlackRock will comply with
those specific laws, rules or regulations.
BlackRock obtains or verifies personal nonpublic information from and
about you from different sources, including the following: (i) information
we receive from you or, if applicable, your financial intermediary, on appli-
cations, forms or other documents; (ii) information about your trans-
actions with us, our affiliates, or others; (iii) information we receive from
a consumer reporting agency; and (iv) from visits to our websites. |
BlackRock does not sell or disclose to nonaffiliated third parties any non-
public personal information about its Clients, except as permitted by law
or as is necessary to respond to regulatory requests or to service Client
accounts. These nonaffiliated third parties are required to protect the
confidentiality and security of this information and to use it only for its
intended purpose.
We may share information with our affiliates to service your account or to
provide you with information about other BlackRock products or services
that may be of interest to you. In addition, BlackRock restricts access
to nonpublic personal information about its Clients to those BlackRock
employees with a legitimate business need for the information. BlackRock
maintains physical, electronic and procedural safeguards that are designed
to protect the nonpublic personal information of its Clients, including proce-
dures relating to the proper storage and disposal of such information. |
| | Availability of Additional Information
Electronic copies of most financial reports and prospectuses are available
on the Fund’s website or shareholders can sign up for e-mail notifications
of quarterly statements, annual and semi-annual reports and prospectuses
by enrolling in the Fund’s electronic delivery program.
To enroll:
Shareholders Who Hold Accounts with Investment Advisers, Banks or
Brokerages:
Please contact your financial advisor. Please note that not all investment
advisers, banks or brokerages may offer this service. |
Shareholders Who Hold Accounts Directly with BlackRock:
1) Access the BlackRock website at
http://www.blackrock.com/edelivery
2) Click on the applicable link and follow the steps to sign up
3) Log into your account |
The Fund will mail only one copy of shareholder documents, including
prospectuses, annual and semi-annual reports and proxy statements, to
shareholders with multiple accounts at the same address. This practice is
commonly called “householding” and it is intended to reduce expenses
and eliminate duplicate mailings of shareholder documents. Mailings of
your shareholder documents may be householded indefinitely unless you
instruct us otherwise. If you do not want the mailing of these documents
to be combined with those for other members of your household, please
contact the Fund at (800) 441-7762. |
28 BLACKROCK MID CAP VALUE OPPORTUNITIES FUND
Availability of Additional Information (concluded)
Availability of Proxy Voting Policies and Procedures
A description of the policies and procedures that the Fund uses to
determine how to vote proxies relating to portfolio securities is available
(1) without charge, upon request, by calling toll-free (800) 441-7762;
(2) at www.blackrock.com; and (3) on the Securities and Exchange
Commission’s (the “SEC”) website at http://www.sec.gov.
Availability of Proxy Voting Record
Information about how the Fund votes proxies relating to securities
held in the Fund’s portfolios during the most recent 12-month period
ended June 30 is available upon request and without charge (1) at
www.blackrock.com or by calling (800) 441-7762 and (2) on the SEC’s
website at http://www.sec.gov. |
Availability of Quarterly Portfolio Schedule
The Fund files its complete schedule of portfolio holdings with the SEC
for the first and third quarters of each fiscal year on Form N-Q. The Fund’s
Forms N-Q are available on the SEC’s website at http://www.sec.gov and
may also be reviewed and copied at the SEC’s Public Reference Room
in Washington, D.C. Information on the operation of the Public Reference
Room may be obtained by calling (800) SEC-0330. The Fund’s Forms
N-Q may also be obtained upon request and without charge by calling
(800) 441-7762. |
Shareholder Privileges
Account Information
Call us at (800) 441-7762 from 8:00 AM – 6:00 PM EST to get infor-
mation about your account balances, recent transactions and share
prices. You can also reach us on the web at www.blackrock.com/funds.
Automatic Investment Plans
Investor Class shareholders who want to invest regularly can arrange to
have $50 or more automatically deducted from their checking or savings
account and invested in any of the BlackRock funds. |
| | Systematic Withdrawal Plans
Investor Class shareholders can establish a systematic withdrawal plan
and receive periodic payments of $50 or more from their BlackRock
funds, as long as their account is at least $10,000.
Retirement Plans
Shareholders may make investments in conjunction with Traditional,
Rollover, Roth, Coverdell, Simple IRAs, SEP IRAs and 403(b) Plans. |
| BLACKROCK MID CAP VALUE OPPORTUNITIES FUND |
A World-Class Mutual Fund Family
BlackRock offers a diverse lineup of open-end mutual funds crossing all investment styles and managed by experts in equity, fixed income and tax-exempt investing.
| Equity Funds | | | | |
| |
| |
|
| |
| BlackRock All-Cap Global Resources Portfolio | | BlackRock Global Opportunities Portfolio | | BlackRock Mid-Cap Growth Equity Portfolio |
| BlackRock Asset Allocation Portfolio† | | BlackRock Global Resources Portfolio | | BlackRock Mid-Cap Value Equity Portfolio |
| BlackRock Aurora Portfolio | | BlackRock Global Science & Technology | | BlackRock Mid Cap Value Opportunities Fund |
| BlackRock Balanced Capital Fund† | | Opportunities Portfolio | | BlackRock Natural Resources Trust |
| BlackRock Basic Value Fund | | BlackRock Global SmallCap Fund | | BlackRock Pacific Fund |
| BlackRock Capital Appreciation Portfolio | | BlackRock Healthcare Fund | | BlackRock Small Cap Core Equity Portfolio |
| BlackRock Developing Capital Markets Fund | | BlackRock Health Sciences Opportunities Portfolio* | | BlackRock Small Cap Growth Equity Portfolio |
| BlackRock Equity Dividend Fund | | BlackRock Index Equity Portfolio* | | BlackRock Small Cap Growth Fund II |
| BlackRock EuroFund | | BlackRock International Fund | | BlackRock Small Cap Index Fund |
| BlackRock Focus Growth Fund | | BlackRock International Index Fund | | BlackRock Small Cap Value Equity Portfolio* |
| BlackRock Focus Value Fund | | BlackRock International Opportunities Portfolio | | BlackRock Small/Mid-Cap Growth Portfolio |
| BlackRock Fundamental Growth Fund | | BlackRock International Value Fund | | BlackRock S&P 500 Index Fund |
| BlackRock Global Allocation Fund† | | BlackRock Large Cap Core Fund | | BlackRock Technology Fund |
| BlackRock Global Dynamic Equity Fund | | BlackRock Large Cap Growth Fund | | BlackRock U.S. Opportunities Portfolio |
| BlackRock Global Financial Services Fund | | BlackRock Large Cap Value Fund | | BlackRock Utilities and Telecommunications Fund |
| BlackRock Global Growth Fund | | BlackRock Latin America Fund | | BlackRock Value Opportunities Fund |
| |
| |
|
| |
| Fixed Income Funds | | | | |
| |
| |
|
| |
| BlackRock Commodity Strategies Fund | | BlackRock Income Builder Portfolio | | BlackRock Low Duration Bond Portfolio |
| BlackRock Emerging Market Debt Portfolio | | BlackRock Inflation Protected Bond Portfolio | | BlackRock Managed Income Portfolio |
| BlackRock Enhanced Income Portfolio | | BlackRock Intermediate Bond Portfolio II | | BlackRock Short-Term Bond Fund |
| BlackRock GNMA Portfolio | | BlackRock Intermediate Government | | BlackRock Strategic Income Portfolio |
| BlackRock Government Income Portfolio | | Bond Portfolio | | BlackRock Total Return Fund |
| BlackRock High Income Fund | | BlackRock International Bond Portfolio | | BlackRock Total Return Portfolio II |
| BlackRock High Yield Bond Portfolio | | BlackRock Long Duration Fund Portfolio | | BlackRock World Income Fund |
| BlackRock Income Portfolio | | | | |
| |
| |
|
| |
| Municipal Bond Funds | | | | |
| |
| |
|
| BlackRock AMT-Free Municipal Bond Portfolio | | BlackRock Intermediate Municipal Fund | | BlackRock New York Municipal Bond Fund |
| BlackRock California Insured Municipal Bond Fund | | BlackRock Kentucky Municipal Bond Portfolio | | BlackRock Ohio Municipal Bond Portfolio |
| BlackRock Delaware Municipal Bond Portfolio | | BlackRock Municipal Insured Fund | | BlackRock Pennsylvania Municipal Bond Fund |
| BlackRock Florida Municipal Bond Fund | | BlackRock National Municipal Fund | | BlackRock Short-Term Municipal Fund |
| BlackRock High Yield Municipal Fund | | BlackRock New Jersey Municipal Bond Fund | | |
| |
| |
|
| |
| Target Risk & Target Date Funds | | | | |
| |
| |
|
| |
| BlackRock Prepared Portfolios | | BlackRock Lifecycle Prepared Portfolios | | |
| Conservative Prepared Portfolio | | Prepared Portfolio 2010 | | Prepared Portfolio 2030 |
| Moderate Prepared Portfolio | | Prepared Portfolio 2015 | | Prepared Portfolio 2035 |
| Growth Prepared Portfolio | | Prepared Portfolio 2020 | | Prepared Portfolio 2040 |
| Aggressive Growth Prepared Portfolio | | Prepared Portfolio 2025 | | Prepared Portfolio 2045 |
| | | | | Prepared Portfolio 2050 |
| * See the prospectus for information on specific limitations on investments in the fund. | | |
| † Mixed asset fund. | | | | |
BlackRock mutual funds are distributed by BlackRock Distributors, Inc. and certain funds are also distributed by FAM Distributors, Inc. You should consider the investment objectives, risks, charges and expenses of the funds under consideration carefully before investing. Each fund’s prospectus contains this and other information and is available at www.blackrock.com or by calling (800) 882-0052 or from your financial advisor. The prospectus should be read carefully before investing.
30 BLACKROCK MID CAP VALUE OPPORTUNITIES FUND

#MIDCAPVAL-1/08
Item 2 – Code of Ethics – The registrant (or the “Fund”) has adopted a code of ethics, as of the end
of the period covered by this report, applicable to the registrant's principal executive officer,
principal financial officer and principal accounting officer, or persons performing similar
functions. During the period covered by this report, there have been no amendments to or
waivers granted under the code of ethics. A copy of the code of ethics is available without
charge at www.blackrock.com.
Item 3 – Audit Committee Financial Expert – The registrant's board of directors or trustees, as
applicable (the “board of directors”) has determined that (i) the registrant has the following
audit committee financial experts serving on its audit committee and (ii) each audit
committee financial expert is independent:
Joe Grills (not reappointed to the Audit Committee, effective November 1, 2007)
Robert M. Hernandez (term began, effective November 1, 2007)
Robert S. Salomon, Jr. (term ended, effective November 1, 2007)
Fred G. Weiss (term began, effective November 1, 2007)
Richard R. West (term began, effective November 1, 2007)
Under applicable securities laws, a person determined to be an audit committee financial
expert will not be deemed an “expert” for any purpose, including without limitation for the
purposes of Section 11 of the Securities Act of 1933, as a result of being designated or
identified as an audit committee financial expert. The designation or identification as an
audit committee financial expert does not impose on such person any duties, obligations, or
liabilities greater than the duties, obligations, and liabilities imposed on such person as a
member of the audit committee and board of directors in the absence of such designation or
identification.
Item 4 – Principal Accountant Fees and Services |
| | | (a) Audit Fees | | (b) Audit-Related Fees1 | | (c) Tax Fees2 | | (d) All Other Fees3 |
| |
| |
| |
| |
|
| | | Current | | Previous | | Current | | Previous | | Current | | Previous | | Current | | Previous |
| | | Fiscal Year | | Fiscal Year | | Fiscal Year | | Fiscal Year | | Fiscal Year | | Fiscal Year | | Fiscal Year | | Fiscal Year |
| Entity Name | | End | | End | | End | | End | | End | | End | | End | | End |
| |
| |
| |
| |
| |
| |
| |
| |
|
| |
| BlackRock Mid Cap | | | | | | | | | | | | | | | | |
| Value Opportunities | | | | | | | | | | | | | | | | |
| Fund of BlackRock | | $28,000 | | $29,000 | | $0 | | $0 | | $6,100 | | $6,100 | | $1,049 | | $0 |
| Mid Cap Value | | | | | | | | | | | | | | | | |
| Opportunities Series, | | | | | | | | | | | | | | | | |
| Inc. | | | | | | | | | | | | | | | | |
| |
| |
| |
| |
| |
| |
| |
| |
|
1 The nature of the services include assurance and related services reasonably related to the performance of the audit of financial statements not included in Audit Fees.
2 The nature of the services include tax compliance, tax advice and tax planning.
3 The nature of the services include a review of compliance procedures and attestation thereto.
| | (e)(1) Audit Committee Pre-Approval Policies and Procedures:
The registrant’s audit committee (the “Committee”) has adopted policies and
procedures with regard to the pre-approval of services. Audit, audit-related and tax
compliance services provided to the registrant on an annual basis require specific pre-
approval by the Committee. The Committee also must approve other non-audit services
provided to the registrant and those non-audit services provided to the registrant’s affiliated
service providers that relate directly to the operations and the financial reporting of the
registrant. Certain of these non-audit services that the Committee believes are a) consistent
with the SEC’s auditor independence rules and b) routine and recurring services that will
not impair the independence of the independent accountants may be approved by the |
| | Committee without consideration on a specific case-by-case basis (“general pre-approval”).
The term of any general pre-approval is 12 months from the date of the pre-approval, unless
the Committee provides for a different period. Tax or other non-audit services provided to
the registrant which have a direct impact on the operation or financial reporting of the
registrant will only be deemed pre-approved provided that any individual project does not
exceed $10,000 attributable to the registrant or $50,000 for all of the registrants the
Committee oversees. For this purpose, multiple projects will be aggregated to determine if
they exceed the previously mentioned cost levels.
Any proposed services exceeding the pre-approved cost levels will require specific
pre-approval by the Committee, as will any other services not subject to general pre-
approval (e.g., unanticipated but permissible services). The Committee is informed of each
service approved subject to general pre-approval at the next regularly scheduled in-person
board meeting. At this meeting, an analysis of such services is presented to the Committee
for ratification. The Committee may delegate to one or more of its members the authority to
approve the provision of and fees for any specific engagement of permitted non-audit
services, including services exceeding pre-approved cost levels.
(e)(2) None of the services described in each of Items 4(b) through (d) were approved by
the audit committee pursuant to paragraph (c)(7)(i)(C) of Rule 2-01 of Regulation S-X. |
| (f) Not Applicable | | | | |
| |
| (g) Affiliates’ Aggregate Non-Audit Fees: | | |
| |
|
| |
| | | Current Fiscal Year | | Previous Fiscal Year |
| Entity Name | | End | | End |
| |
| |
|
| BlackRock Mid Cap Value | | | | |
| Opportunities Fund of | | $294,649 | | $3,057,433 |
| BlackRock Mid Cap Value | | | | |
| Opportunities Series, Inc. | | | | |
| |
| |
|
| | (h) The registrant’s audit committee has considered and determined that the provision of
non-audit services that were rendered to the registrant’s investment adviser (not including
any non-affiliated sub-adviser whose role is primarily portfolio management and is
subcontracted with or overseen by the registrant’s investment adviser), and any entity
controlling, controlled by, or under common control with the investment adviser that
provides ongoing services to the registrant that were not pre-approved pursuant to paragraph
(c)(7)(ii) of Rule 2-01 of Regulation S-X is compatible with maintaining the principal
accountant’s independence. |
Regulation S-X Rule 2-01(c)(7)(ii) – $287,500, 0%
Item 5 – Audit Committee of Listed Registrants – Not Applicable
Item 6 – Schedule of Investments – The registrant’s Schedule of Investments is included as part of
the Report to Stockholders filed under Item 1 of this form.
Item 7 – Disclosure of Proxy Voting Policies and Procedures for Closed-End Management
Investment Companies – Not Applicable
Item 8 – Portfolio Managers of Closed-End Management Investment Companies – Not Applicable |
| | Item 9 – Purchases of Equity Securities by Closed-End Management Investment Company and
Affiliated Purchasers – Not Applicable
Item 10 – Submission of Matters to a Vote of Security Holders – The registrant’s Nominating and
Governance Committee will consider nominees to the Board recommended by shareholders
when a vacancy becomes available. Shareholders who wish to recommend a nominee
should send nominations which include biographical information and set forth the
qualifications of the proposed nominee to the registrant’s Secretary. There have been no
material changes to these procedures.
Item 11 – Controls and Procedures |
11(a) – The registrant’s principal executive and principal financial officers or persons performing
similar functions have concluded that the registrant’s disclosure controls and procedures (as
defined in Rule 30a-3(c) under the Investment Company Act of 1940, as amended (the
“1940 Act”)) are effective as of a date within 90 days of the filing of this report based on the
evaluation of these controls and procedures required by Rule 30a-3(b) under the 1940 Act
and Rule 15d-15(b) under the Securities Exchange Act of 1934, as amended.
11(b) – There were no changes in the registrant’s internal control over financial reporting (as
defined in Rule 30a-3(d) under the 1940 Act) that occurred during the second fiscal quarter
of the period covered by this report that have materially affected, or are reasonably likely to
materially affect, the registrant’s internal control over financial reporting. |
| | Item 12 – Exhibits attached hereto
12(a)(1) – Code of Ethics – See Item 2
12(a)(2) – Certifications – Attached hereto
12(a)(3) – Not Applicable
12(b) – Certifications – Attached hereto |
Pursuant to the requirements of the Securities Exchange Act of 1934 and the Investment
Company Act of 1940, the registrant has duly caused this report to be signed on its behalf by
the undersigned, thereunto duly authorized.
BlackRock Mid Cap Value Opportunities Fund of BlackRock Mid Cap Value Opportunities
Series, Inc.
By: /s/ Donald C. Burke
Donald C. Burke
Chief Executive Officer (principal executive officer) of
BlackRock Mid Cap Value Opportunities Fund of BlackRock Mid Cap Value
Opportunities Series, Inc.
Date: March 24, 2008 |
Pursuant to the requirements of the Securities Exchange Act of 1934 and the Investment
Company Act of 1940, this report has been signed below by the following persons on behalf
of the registrant and in the capacities and on the dates indicated.
By: /s/ Donald C. Burke
Donald C. Burke
Chief Executive Officer (principal executive officer) of
BlackRock Mid Cap Value Opportunities Fund of BlackRock Mid Cap Value
Opportunities Series, Inc.
Date: March 24, 2008
By: /s/ Neal J. Andrews
Neal J. Andrews
Chief Financial Officer (principal financial officer) of
BlackRock Mid Cap Value Opportunities Fund of BlackRock Mid Cap Value
Opportunities Series, Inc.
Date: March 24, 2008 |