UNITED STATES
SECURITIES AND EXCHANGE COMMISSION
Washington, D.C. 20549
FORM N-CSR
CERTIFIED SHAREHOLDER REPORT OF REGISTERED MANAGEMENT INVESTMENT COMPANIES
Investment Company Act file number 811-07177
| | |
| Name of Fund: | | BlackRock Mid Cap Value Opportunities Fund of BlackRock Mid Cap Value Opportunities Series, Inc. |
| |
| Fund Address: | | 100 Bellevue Parkway, Wilmington, DE 19809 |
Name and address of agent for service: John M. Perlowski, Chief Executive Officer, BlackRock Mid Cap Value
Opportunities Fund of BlackRock Mid Cap Value Opportunities Series, Inc., 55 East 52nd Street, New York, NY 10055
Registrant’s telephone number, including area code: (800) 441-7762
Date of fiscal year end: 01/31/2013
Date of reporting period: 01/31/2013
| | | | |
| Item 1 | | – | | Report to Stockholders |
JANUARY 31, 2013
| | | | | | |
ANNUAL REPORT | | | | | |  |
BlackRock Mid Cap Value Opportunities Fund | of BlackRock Mid Cap Value Opportunities Series, Inc.
|
| Not FDIC Insured • May Lose Value • No Bank Guarantee |
| | | | | | |
| | | | | | | |
| 2 | | BLACKROCK MID CAP VALUE OPPORTUNITIES FUND | | JANUARY 31, 2013 | | |
Financial markets have substantially improved over the past year, providing investors with considerable relief compared to where things were during the global turmoil seen in 2011. Despite a number of headwinds, higher-risk asset classes boasted strong returns as investors sought meaningful yields in the ongoing low-interest-rate environment.
Rising investor confidence drove equity markets higher in early 2012, while climbing US Treasury yields pressured higher-quality fixed income assets. The second quarter, however, brought a market reversal as Europe’s debt crisis boiled over once again. Political instability in Greece and severe deficit and liquidity problems in Spain raised the specter of a euro collapse. Alongside the drama in Europe, investors were discouraged by gloomy economic reports from various parts of the world. A slowdown in China, a key powerhouse for global growth, emerged as a particular concern. But as the outlook for the global economy worsened, investors grew increasingly optimistic that the world’s largest central banks would soon intervene to stimulate growth. This theme, along with the European Central Bank’s (“ECB’s”) firm commitment to preserve the euro currency bloc, drove most asset classes higher through the summer. Policy relief came in early September, when the ECB announced its decision to support the eurozone’s troubled peripheral countries with unlimited purchases of short term sovereign debt. Days later, the US Federal Reserve announced its own much-anticipated stimulus package.
Although financial markets world-wide were buoyed by accommodative monetary policy, risk assets weakened in the fall. Global trade slowed as many European countries fell into recession and growth continued to decelerate in China, where a once-a-decade leadership change compounded uncertainty. In the United States, stocks slid on lackluster corporate earnings reports and market volatility rose during the lead up to the US Presidential election. In the post-election environment, investors grew increasingly concerned over automatic tax increases and spending cuts that had been scheduled to take effect at the beginning of 2013 (known as the “fiscal cliff”). There was widespread fear that the fiscal cliff would push the nation into recession unless politicians could agree upon alternate measures to reduce the deficit before the end of 2012. Worries that bipartisan gridlock would preclude a timely budget deal triggered higher levels of volatility in financial markets around the world in the months leading up to the last day of the year. Ultimately, the United States averted the worst of the fiscal cliff with a last-minute tax deal; however, decisions relating to spending cuts and the debt ceiling continue to weigh on investors’ minds.
Investors shook off the nerve-wracking finale to 2012 and began the New Year with a powerful equity rally. Key indicators signaled broad-based improvements in the world’s major economies, particularly China. In the United States, economic data was mixed, but pointed to a continued recovery. The risk of inflation remained low and the US Federal Reserve showed no signs of curtailing its stimulus programs. Additionally, January saw the return of funds that investors had pulled out of the market in late 2012 amid uncertainty about tax-rate increases ahead of the fiscal cliff deadline. In fixed income markets, rising US Treasuries yields dragged down higher-quality asset classes, while high yield bonds continued to benefit from investor demand for yield in the low-rate environment.
On the whole, riskier asset classes outperformed lower-risk investments for the 6- and 12-month periods ended January 31, 2013. International equities were the strongest performers. US stocks and high yield bonds also generated significant returns. Emerging market equities were particularly volatile, but still posted gains for both the 6- and 12-month periods. US Treasury yields remained low, but experienced increasing volatility in recent months. Rising yields near the end of the period resulted in negative returns for Treasuries and investment-grade bonds for the 6-month period. Tax-exempt municipal bonds, however, benefited from favorable supply-and-demand dynamics. Near-zero short term interest rates continued to keep yields on money market securities near their all-time lows.
While investors continue to face a host of unknowns, we believe new opportunities abound. BlackRock was built to provide the global market insight, breadth of capabilities, unbiased investment advice and deep risk management expertise these times require. We encourage you to visit www.blackrock.com/newworld for more information.
Sincerely,

Rob Kapito
President, BlackRock Advisors, LLC

“Despite a number of headwinds, higher-risk asset classes boasted strong returns as investors sought meaningful yields in the ongoing low-interest-rate environment.”
Rob Kapito
President, BlackRock Advisors, LLC
| | | | | | | | |
| Total Returns as of January 31, 2013 | |
| | | 6-month | | | 12-month | |
US large cap equities
(S&P 500® Index) | | | 9.91 | % | | | 16.78 | % |
US small cap equities
(Russell 2000® Index) | | | 15.51 | | | | 15.47 | |
International equities
(MSCI Europe, Australasia, Far East Index) | | | 18.61 | | | | 17.25 | |
Emerging market equities (MSCI Emerging Markets Index) | | | 13.11 | | | | 7.64 | |
3-month Treasury bill
(BofA Merrill Lynch
3-Month US Treasury Bill Index) | | | 0.07 | | | | 0.11 | |
US Treasury securities
(BofA Merrill Lynch
10-Year US Treasury Index) | | | (2.90 | ) | | | 1.28 | |
US investment grade
bonds (Barclays US Aggregate Bond Index) | | | (0.29 | ) | | | 2.59 | |
Tax-exempt municipal
bonds (S&P Municipal Bond Index) | | | 2.21 | | | | 5.50 | |
US high yield bonds
(Barclays US Corporate High Yield 2% Issuer Capped Index) | | | 7.37 | | | | 13.87 | |
| Past performance is no guarantee of future results. Index performance is shown for illustrative purposes only. You cannot invest directly in an index. | |
| | | | | | |
| | | | | | | |
| | THIS PAGE NOT PART OF YOUR FUND REPORT | | | | 3 |
| | |
| Fund Summary as of January 31, 2013 | | |
BlackRock Mid Cap Value Opportunities Fund’s (the “Fund”) investment objective is to seek capital appreciation and, secondarily, income, by investing in securities, primarily equity securities that Fund management believes are undervalued and therefore represent an investment value.
| | |
| Portfolio Management Commentary | | |
How did the Fund perform?
| Ÿ | | For the 12-month period ended January 31, 2013, the Fund underperformed its benchmark, the S&P MidCap 400® Value Index. |
What factors influenced performance?
| Ÿ | | Stock selection in various sectors led to the Fund’s underperformance relative to the benchmark index. In the industrials sector, the Fund’s holdings within the machinery, aerospace & defense and commercial services & supplies industries detracted from results. Exposure to fuel companies hurt performance in the energy sector. Within information technology (“IT”), selection among communications equipment, software, computers & peripherals and semiconductors names had a negative impact. In financials, the Fund’s positions in capital markets, insurance, commercial banks and thrifts were detractors. Stock selection within the materials sector also hindered performance for the period. |
| Ÿ | | Contributing positively to the Fund’s performance was stock selection in the health care sector, where holdings in the health care providers & services industry boosted returns. Selection among hotels, restaurants & leisure companies led to strong performance in the consumer discretionary sector. In utilities, stock selection and an underweight to multi-utilities had a positive impact. An underweight to food retailers proved advantageous in the consumer staples sector. |
Describe recent portfolio activity.
| Ÿ | | During the period, the Fund added to holdings in the energy sector, notably within the equipment & services industry. Conversely, the Fund decreased exposure to financials and consumer discretionary as well as industrials, with notable reductions in machinery companies. The Fund also decreased its allocation to utilities, mostly by reducing holdings of multi-utilities names. |
Describe portfolio positioning at period end.
| Ÿ | | Relative to the S&P MidCap 400® Value Index, the Fund ended the period overweight in health care, consumer discretionary, energy and IT, and underweight in financials, utilities, industrials, materials, consumer staples and telecommunication services. |
The views expressed reflect the opinions of BlackRock as of the date of this report and are subject to change based on changes in market, economic or other conditions. These views are not intended to be a forecast of future events and are no guarantee of future results.
| | |
| Ten Largest Holdings | | Percent of
Long-Term Investments |
| | | | |
Tenet Healthcare Corp. | | | 2 | % |
Omnicare, Inc. | | | 2 | |
Universal Health Services, Inc., Class B | | | 2 | |
Endo Health Solutions, Inc. | | | 2 | |
CareFusion Corp. | | | 2 | |
SM Energy Co. | | | 1 | |
Hospira, Inc. | | | 1 | |
Owens & Minor, Inc. | | | 1 | |
Forest City Enterprises, Inc., Class A | | | 1 | |
DuPont Fabros Technology, Inc. | | | 1 | |
| | |
| Sector Allocation | | Percent of
Long-Term Investments |
| | | | |
Financials | | | 22 | % |
Health Care | | | 14 | |
Information Technology | | | 13 | |
Industrials | | | 12 | |
Consumer Discretionary | | | 12 | |
Energy | | | 10 | |
Materials | | | 8 | |
Utilities | | | 5 | |
Consumer Staples | | | 4 | |
For Fund compliance purposes, the Fund’s sector classifications refer to any one or more of the sector sub-classifications used by one or more widely recognized market indexes or ratings group indexes, and/or as defined by Fund management. These definitions may not apply for purposes of this report, which may combine such sector sub-classifications for reporting ease.
| | | | | | |
| | | | | | | |
| 4 | | BLACKROCK MID CAP VALUE OPPORTUNITIES FUND | | JANUARY 31, 2013 | | |
| | |
| Total Return Based on a $10,000 Investment | | |
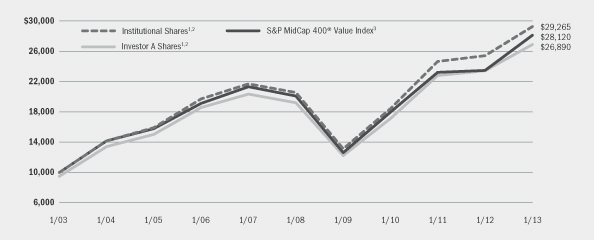
| | 1 | | Assuming maximum sales charges, if any, transaction costs and other operating expenses, including investment advisory fees. Institutional Shares do not have a sales charge. |
| | 2 | | The Fund normally invests at least 80% of its assets in equity securities of mid cap companies. |
| | 3 | | This unmanaged index measures the performance of the mid-capitalization value sector of the US equity market. It is a subset of the S&P MidCap 400® Index and consists of those stocks in the S&P MidCap 400® Index exhibiting the strongest value characteristics, as determined by the index provider, representing approximately 50% of the market capitalization of the S&P MidCap 400® Index. |
| | |
| Performance Summary for the Period Ended January 31, 2013 | | |
| | | | | | | | | | | | | | | | | | | | | | | | | | | | |
| | | | | | Average Annual Total Returns4 | |
| | | | | | 1 Year | | | 5 Years | | | 10 Years | |
| | | 6-Month
Total Returns | | | w/o sales
charge | | | w/sales
charge | | | w/o sales
charge | | | w/sales
charge | | | w/o sales
charge | | | w/sales
charge | |
Institutional | | | 18.78 | % | | | 15.12 | % | | | N/A | | | | 7.33 | % | | | N/A | | | | 11.34 | % | | | N/A | |
Investor A | | | 18.60 | | | | 14.74 | | | | 8.72 | % | | | 6.95 | | | | 5.80 | % | | | 10.99 | | | | 10.40 | % |
Investor B | | | 18.15 | | | | 13.71 | | | | 9.21 | | | | 6.03 | | | | 5.71 | | | | 10.29 | | | | 10.29 | |
Investor C | | | 18.12 | | | | 13.74 | | | | 12.74 | | | | 5.90 | | | | 5.90 | | | | 10.00 | | | | 10.00 | |
Class R | | | 18.45 | | | | 14.37 | | | | N/A | | | | 6.54 | | | | N/A | | | | 10.68 | | | | N/A | |
S&P MidCap 400® Value Index | | | 17.95 | | | | 19.76 | | | | N/A | | | | 6.96 | | | | N/A | | | | 10.89 | | | | N/A | |
| | 4 | | Assuming maximum sales charges, if any. Average annual total returns with and without sales charges reflect reductions for distribution and service fees. See “About Fund Performance” on page 6 for a detailed description of share classes, including any related sales charges and fees. |
| | | | N/A — Not applicable as share class and index do not have a sales charge. |
| | | | Past performance is not indicative of future results. |
| | | | | | | | | | | | | | | | | | | | | | | | | | | | |
| | | Actual | | | Hypothetical6 | | | | |
| | | Beginning
Account Value
August 1, 2012 | | | Ending
Account Value
January 31, 2013 | | | Expenses Paid
During the Period5 | | | Beginning
Account Value
August 1, 2012 | | | Ending
Account Value
January 31, 2013 | | | Expenses Paid
During the Period5 | | | Annualized
Expense Ratio | |
Institutional | | $ | 1,000.00 | | | $ | 1,187.80 | | | $ | 5.17 | | | $ | 1,000.00 | | | $ | 1,020.41 | | | $ | 4.77 | | | | 0.94 | % |
Investor A | | $ | 1,000.00 | | | $ | 1,186.00 | | | $ | 7.09 | | | $ | 1,000.00 | | | $ | 1,018.65 | | | $ | 6.55 | | | | 1.29 | % |
Investor B | | $ | 1,000.00 | | | $ | 1,181.50 | | | $ | 11.63 | | | $ | 1,000.00 | | | $ | 1,014.48 | | | $ | 10.74 | | | | 2.12 | % |
Investor C | | $ | 1,000.00 | | | $ | 1,181.20 | | | $ | 11.84 | | | $ | 1,000.00 | | | $ | 1,014.28 | | | $ | 10.94 | | | | 2.16 | % |
Class R | | $ | 1,000.00 | | | $ | 1,184.50 | | | $ | 8.90 | | | $ | 1,000.00 | | | $ | 1,016.99 | | | $ | 8.21 | | | | 1.62 | % |
| | 5 | | For each class of the Fund, expenses are equal to the annualized expense ratio for the class, multiplied by the average account value over the period, multiplied by 184/366 (to reflect the one-half year period shown). |
| | 6 | | Hypothetical 5% annual return before expenses is calculated by pro rating the number of days in the most recent fiscal half year divided by 366. |
| | | | See “Disclosure of Expenses” on page 6 for further information on how expenses were calculated. |
| | | | | | |
| | | | | | | |
| | BLACKROCK MID CAP VALUE OPPORTUNITIES FUND | | JANUARY 31, 2013 | | 5 |
| Ÿ | | Institutional Shares are not subject to any sales charge. These shares bear no ongoing distribution or service fees and are available only to eligible investors. |
| Ÿ | | Investor A Shares are subject to a maximum initial sales charge (front-end load) of 5.25% and a service fee of 0.25% per year (but no distribution fee). |
| Ÿ | | Investor B Shares are subject to a maximum contingent deferred sales charge (“CDSC”) of 4.50% declining to 0% after six years. In addition, these shares are subject to a distribution fee of 0.75% per year and a service fee of 0.25% per year. These shares automatically convert to Investor A Shares after approximately eight years. (There is no initial sales charge for automatic share conversions.) All returns for periods greater than eight years reflect this conversion. These shares are only available through exchanges and dividend reinvestments by existing shareholders and for purchase by certain qualified employee benefit plans. |
| Ÿ | | Investor C Shares are subject to a 1.00% CDSC if redeemed within one year of purchase. In addition, these shares are subject to a distribution fee of 0.75% per year and a service fee of 0.25% per year. |
| Ÿ | | Class R Shares are not subject to any sales charge. These shares are subject to a distribution fee of 0.25% per year and a service fee of 0.25% per year. These shares are available only to certain retirement plans and other similar plans. Prior to February 4, 2003, Class R Share performance results are those of Institutional Shares (which have no distribution or service fees) restated to reflect Class R Share fees. |
Performance information reflects past performance and does not guarantee future results. Current performance may be lower or higher than the performance data quoted. Refer to www.blackrock.com/funds to obtain performance data current to the most recent month end. Performance results do not reflect the deduction of taxes that a shareholder would pay on fund distributions or the redemption of fund shares. Figures shown in the performance table on the previous page assume reinvestment of all dividends and capital gain distributions, if any, at net asset value (“NAV”) on the ex-dividend date. Investment return and principal value of shares will fluctuate so that shares, when redeemed, may be worth more or less than their original cost. Dividends paid to each class of shares will vary because of the different levels of service, distribution and transfer agency fees applicable to each class, which are deducted from the income available to be paid to shareholders. The Fund’s investment advisor waived a portion of its investment advisory fee. Without such waiver, the Fund’s performance would have been lower.
Shareholders of the Fund may incur the following charges: (a) transactional expenses, such as sales charges; and (b) operating expenses, including investment advisory fees, service and distribution fees, including 12b-1 fees, and other Fund expenses. The expense example shown on the previous page (which is based on a hypothetical investment of $1,000 invested on August 1, 2012 and held through January 31, 2013) is intended to assist shareholders both in calculating expenses based on an investment in the Fund and in comparing these expenses with similar costs of investing in other mutual funds.
The expense example provides information about actual account values and actual expenses. In order to estimate the expenses a shareholder paid during the period covered by this report, shareholders can divide their account value by $1,000 and then multiply the result by the number corresponding to their share class under the heading entitled “Expenses Paid During the Period.”
The expense example also provides information about hypothetical account values and hypothetical expenses based on the Fund’s actual expense ratio and an assumed rate of return of 5% per year before expenses. In order to assist shareholders in comparing the ongoing expenses of investing in this Fund and other funds, compare the 5% hypothetical example with the 5% hypothetical examples that appear in other funds’ shareholder reports.
The expenses shown in the expense example are intended to highlight shareholders’ ongoing costs only and do not reflect any transactional expenses, such as sales charges, if any. Therefore, the hypothetical example is useful in comparing ongoing expenses only, and will not help shareholders determine the relative total expenses of owning different funds. If these transactional expenses were included, shareholder expenses would have been higher.
| | | | | | |
| | | | | | | |
| 6 | | BLACKROCK MID CAP VALUE OPPORTUNITIES FUND | | JANUARY 31, 2013 | | |
| | |
Schedule of Investments January 31, 2013 | | (Percentages shown are based on Net Assets) |
| | | | | | | | |
| Common Stocks | | Shares | | | Value | |
Aerospace & Defense — 1.4% | | | | | | | | |
Alliant Techsystems, Inc. | | | 20,900 | | | $ | 1,352,648 | |
Curtiss-Wright Corp. | | | 55,000 | | | | 1,960,750 | |
Spirit AeroSystems Holdings, Inc., Class A (a) | | | 196,400 | | | | 3,130,616 | |
| | | | | | | | |
| | | | | | | | 6,444,014 | |
Air Freight & Logistics — 0.3% | | | | | | | | |
UTI Worldwide Inc. | | | 80,000 | | | | 1,180,800 | |
Airlines — 1.2% | | | | | | | | |
Delta Air Lines, Inc. (a) | | | 395,100 | | | | 5,487,939 | |
Auto Components — 0.5% | | | | | | | | |
Lear Corp. | | | 47,700 | | | | 2,337,300 | |
Automobiles — 0.3% | | | | | | | | |
Thor Industries, Inc. | | | 38,810 | | | | 1,633,125 | |
Biotechnology — 0.8% | | | | | | | | |
United Therapeutics Corp. (a) | | | 70,916 | | | | 3,821,663 | |
Capital Markets — 1.8% | | | | | | | | |
Eaton Vance Corp. | | | 107,600 | | | | 3,895,120 | |
Federated Investors, Inc., Class B | | | 73,000 | | | | 1,727,180 | |
Jefferies Group, Inc. | | | 138,400 | | | | 2,758,312 | |
| | | | | | | | |
| | | | | | | | 8,380,612 | |
Chemicals — 3.3% | | | | | | | | |
Albemarle Corp. | | | 75,200 | | | | 4,610,512 | |
Axiall Corp. (b) | | | 52,300 | | | | 2,938,214 | |
Cytec Industries, Inc. | | | 22,000 | | | | 1,612,600 | |
Huntsman Corp. | | | 79,600 | | | | 1,403,348 | |
Rockwood Holdings, Inc. | | | 91,100 | | | | 4,985,903 | |
| | | | | | | | |
| | | | | | | | 15,550,577 | |
Commercial Banks — 4.4% | | | | | | | | |
Associated Banc-Corp. | | | 200,000 | | | | 2,854,000 | |
FirstMerit Corp. | | | 180,300 | | | | 2,745,969 | |
Fulton Financial Corp. | | | 283,200 | | | | 3,084,048 | |
Hancock Holding Co. | | | 87,600 | | | | 2,647,272 | |
Synovus Financial Corp. | | | 1,163,300 | | | | 3,001,314 | |
TCF Financial Corp. | | | 189,083 | | | | 2,582,874 | |
Webster Financial Corp. | | | 86,900 | | | | 1,933,525 | |
Zions Bancorporation | | | 82,700 | | | | 1,928,564 | |
| | | | | | | | |
| | | | | | | | 20,777,566 | |
Commercial Services & Supplies — 0.8% | | | | | | | | |
ACCO Brands Corp. (a)(b) | | | 475,800 | | | | 3,963,414 | |
Communications Equipment — 0.6% | | | | | | | | |
Polycom, Inc. (a)(b) | | | 273,400 | | | | 3,015,602 | |
Computers & Peripherals — 1.4% | | | | | | | | |
Diebold, Inc. | | | 96,000 | | | | 2,826,240 | |
NCR Corp. (a) | | | 135,925 | | | | 3,774,637 | |
| | | | | | | | |
| | | | | | | | 6,600,877 | |
Construction & Engineering — 1.3% | | | | | | | | |
Jacobs Engineering Group, Inc. (a) | | | 49,400 | | | | 2,376,634 | |
KBR, Inc. | | | 114,800 | | | | 3,584,056 | |
| | | | | | | | |
| | | | | | | | 5,960,690 | |
Construction Materials — 0.4% | | | | | | | | |
Martin Marietta Materials, Inc. | | | 20,300 | | | | 2,004,219 | |
Consumer Finance — 0.4% | | | | | | | | |
Discover Financial Services | | | 53,100 | | | | 2,038,509 | |
| Common Stocks | | Shares | | | Value | |
Containers & Packaging — 2.4% | | | | | | | | |
Owens-Illinois, Inc. (a) | | | 160,200 | | | $ | 3,812,760 | |
Packaging Corp. of America | | | 36,800 | | | | 1,414,224 | |
Rock-Tenn Co., Class A | | | 74,700 | | | | 5,897,565 | |
| | | | | | | | |
| | | | | | | | 11,124,549 | |
Diversified Consumer Services — 0.4% | | | | | | | | |
Regis Corp. | | | 105,011 | | | | 1,863,945 | |
Electric Utilities — 2.5% | | | | | | | | |
Hawaiian Electric Industries, Inc. | | | 67,800 | | | | 1,828,566 | |
NV Energy, Inc. | | | 307,600 | | | | 5,822,868 | |
PNM Resources, Inc. | | | 193,200 | | | | 4,126,752 | |
| | | | | | | | |
| | | | | | | | 11,778,186 | |
Electrical Equipment — 0.6% | | | | | | | | |
AMETEK, Inc. | | | 66,150 | | | | 2,711,489 | |
Electronic Equipment, Instruments & Components — 1.3% | | | | | | | | |
Arrow Electronics, Inc. (a) | | | 82,000 | | | | 3,150,440 | |
Ingram Micro, Inc., Class A (a) | | | 171,181 | | | | 3,112,071 | |
| | | | | | | | |
| | | | | | | | 6,262,511 | |
Energy Equipment & Services — 3.7% | | | | | | | | |
Dresser-Rand Group, Inc. (a) | | | 40,900 | | | | 2,496,945 | |
McDermott International, Inc. (a)(b) | | | 278,100 | | | | 3,384,477 | |
Oil States International, Inc. (a)(b) | | | 48,200 | | | | 3,739,356 | |
Patterson-UTI Energy, Inc. | | | 166,400 | | | | 3,384,576 | |
Superior Energy Services, Inc. (a) | | | 184,400 | | | | 4,604,468 | |
| | | | | | | | |
| | | | | | | | 17,609,822 | |
Food Products — 2.4% | | | | | | | | |
Flowers Foods, Inc. | | | 17,600 | | | | 473,088 | |
Ingredion, Inc. | | | 38,700 | | | | 2,556,909 | |
The J.M. Smucker Co. | | | 23,200 | | | | 2,056,216 | |
Smithfield Foods, Inc. (a) | | | 165,800 | | | | 3,864,798 | |
Tyson Foods, Inc., Class A | | | 117,000 | | | | 2,588,040 | |
| | | | | | | | |
| | | | | | | | 11,539,051 | |
Gas Utilities — 1.2% | | | | | | | | |
UGI Corp. | | | 162,700 | | | | 5,733,548 | |
Health Care Equipment & Supplies — 3.0% | | | | | | | | |
Alere, Inc. (a)(b) | | | 230,792 | | | | 4,906,638 | |
CareFusion Corp. (a) | | | 230,328 | | | | 7,149,381 | |
Teleflex, Inc. | | | 31,223 | | | | 2,341,725 | |
| | | | | | | | |
| | | | | | | | 14,397,744 | |
Health Care Providers & Services — 7.3% | | | | | | | | |
Omnicare, Inc. | | | 231,404 | | | | 9,013,186 | |
Owens & Minor, Inc. | | | 207,612 | | | | 6,355,003 | |
Tenet Healthcare Corp. (a)(b) | | | 287,574 | | | | 11,166,498 | |
Universal Health Services, Inc., Class B | | | 136,939 | | | | 7,756,225 | |
| | | | | | | | |
| | | | | | | | 34,290,912 | |
Hotels, Restaurants & Leisure — 0.8% | | | | | | | | |
Wyndham Worldwide Corp. | | | 65,800 | | | | 3,670,982 | |
Household Durables — 1.6% | | | | | | | | |
Jarden Corp. (a) | | | 40,650 | | | | 2,391,846 | |
Lennar Corp., Class A | | | 55,270 | | | | 2,295,916 | |
NVR, Inc. (a) | | | 2,949 | | | | 3,036,467 | |
| | | | | | | | |
| | | | | | | | 7,724,229 | |
See Notes to Financial Statements.
| | | | | | |
| | | | | | | |
| | BLACKROCK MID CAP VALUE OPPORTUNITIES FUND | | JANUARY 31, 2013 | | 7 |
| | |
Schedule of Investments (continued) | | (Percentages shown are based on Net Assets) |
| | | | | | | | |
| Common Stocks | | Shares | | | Value | |
Household Products — 1.2% | | | | | | | | |
The Clorox Co. | | | 18,700 | | | $ | 1,466,267 | |
Energizer Holdings, Inc. | | | 47,900 | | | | 4,167,779 | |
| | | | | | | | |
| | | | | | | | 5,634,046 | |
Insurance — 6.9% | | | | | | | | |
Alleghany Corp. (a) | | | 6,532 | | | | 2,355,374 | |
American Financial Group, Inc. | | | 46,300 | | | | 1,970,528 | |
Arthur J Gallagher & Co. | | | 59,500 | | | | 2,198,525 | |
Everest Re Group Ltd. | | | 33,700 | | | | 3,902,797 | |
Fidelity National Financial, Inc., Class A | | | 122,100 | | | | 3,064,710 | |
HCC Insurance Holdings, Inc. | | | 74,600 | | | | 2,885,528 | |
Kemper Corp. | | | 108,800 | | | | 3,624,128 | |
Old Republic International Corp. | | | 346,000 | | | | 3,944,400 | |
Protective Life Corp. | | | 167,235 | | | | 5,291,315 | |
W.R. Berkley Corp. | | | 84,800 | | | | 3,491,216 | |
| | | | | | | | |
| | | | | | | | 32,728,521 | |
IT Services — 1.5% | | | | | | | | |
Acxiom Corp. (a) | | | 79,852 | | | | 1,415,776 | |
Amdocs Ltd. | | | 75,600 | | | | 2,698,164 | |
VeriFone Systems, Inc. (a) | | | 86,300 | | | | 2,996,336 | |
| | | | | | | | |
| | | | | | | | 7,110,276 | |
Leisure Equipment & Products — 0.8% | | | | | | | | |
Mattel, Inc. | | | 104,500 | | | | 3,932,335 | |
Machinery — 5.0% | | | | | | | | |
AGCO Corp. (a) | | | 36,100 | | | | 1,913,300 | |
Crane Co. | | | 31,976 | | | | 1,607,753 | |
Dover Corp. | | | 64,800 | | | | 4,482,864 | |
Kennametal, Inc. | | | 44,100 | | | | 1,808,541 | |
Navistar International Corp. (a) | | | 36,100 | | | | 941,849 | |
Parker Hannifin Corp. | | | 53,600 | | | | 4,983,192 | |
SPX Corp. | | | 57,500 | | | | 4,291,225 | |
Timken Co. | | | 70,900 | | | | 3,800,949 | |
| | | | | | | | |
| | | | | | | | 23,829,673 | |
Metals & Mining — 0.9% | | | | | | | | |
Carpenter Technology Corp. | | | 53,200 | | | | 2,783,956 | |
Cliffs Natural Resources, Inc. | | | 40,900 | | | | 1,525,979 | |
| | | | | | | | |
| | | | | | | | 4,309,935 | |
Multi-Utilities — 1.0% | | | | | | | | |
MDU Resources Group, Inc. | | | 85,000 | | | | 1,982,200 | |
OGE Energy Corp. | | | 47,900 | | | | 2,812,209 | |
| | | | | | | | |
| | | | | | | | 4,794,409 | |
Oil, Gas & Consumable Fuels — 5.8% | | | | | | | | |
Africa Oil Corp. (a) | | | 502,727 | | | | 4,077,664 | |
Arch Coal, Inc. | | | 225,500 | | | | 1,605,560 | |
Bill Barrett Corp. (a)(b) | | | 113,200 | | | | 1,807,804 | |
Oasis Petroleum, Inc. (a)(b) | | | 160,156 | | | | 5,746,397 | |
SM Energy Co. | | | 112,400 | | | | 6,537,184 | |
Ultra Petroleum Corp. (a) | | | 100,300 | | | | 1,827,466 | |
Whiting Petroleum Corp. (a) | | | 119,800 | | | | 5,700,084 | |
| | | | | | | | |
| | | | | | | | 27,302,159 | |
Paper & Forest Products — 0.5% | | | | | | | | |
MeadWestvaco Corp. | | | 70,800 | | | | 2,219,580 | |
Pharmaceuticals — 2.9% | | | | | | | | |
Endo Health Solutions, Inc. (a) | | | 228,042 | | | | 7,219,809 | |
| Common Stocks | | Shares | | | Value | |
Pharmaceuticals (concluded) | | | | | | | | |
Hospira, Inc. (a)(b) | | | 189,581 | | | $ | 6,468,504 | |
| | | | | | | | |
| | | | | | | | 13,688,313 | |
Professional Services — 0.8% | | | | | | | | |
FTI Consulting, Inc. (a)(b) | | | 13,457 | | | | 437,353 | |
Manpower, Inc. | | | 63,600 | | | | 3,275,400 | |
| | | | | | | | |
| | | | | | | | 3,712,753 | |
Real Estate Investment Trusts (REITs) — 3.9% | | | | | | | | |
American Campus Communities, Inc. | | | 45,958 | | | | 2,140,264 | |
BioMed Realty Trust, Inc. | | | 142,832 | | | | 2,906,631 | |
CommonWealth REIT | | | 126,629 | | | | 2,081,781 | |
Corporate Office Properties Trust | | | 131,018 | | | | 3,466,736 | |
DuPont Fabros Technology, Inc. (b) | | | 249,548 | | | | 5,899,315 | |
Omega Healthcare Investors, Inc. (b) | | | 83,067 | | | | 2,123,193 | |
| | | | | | | | |
| | | | | | | | 18,617,920 | |
Real Estate Management & Development — 1.8% | | | | | | | | |
CBRE Group, Inc., Class A (a) | | | 95,350 | | | | 2,057,653 | |
Forest City Enterprises, Inc., Class A (a) | | | 373,118 | | | | 6,309,425 | |
| | | | | | | | |
| | | | | | | | 8,367,078 | |
Road & Rail — 0.8% | | | | | | | | |
Con-way, Inc. | | | 122,700 | | | | 3,850,326 | |
Semiconductors & Semiconductor Equipment — 3.2% | | | | | |
Atmel Corp. (a) | | | 174,800 | | | | 1,171,160 | |
Fairchild Semiconductor International, Inc. (a) | | | 230,100 | | | | 3,398,577 | |
Microchip Technology, Inc. | | | 108,600 | | | | 3,632,670 | |
ON Semiconductor Corp. (a) | | | 469,300 | | | | 3,684,005 | |
RF Micro Devices, Inc. (a)(b) | | | 608,100 | | | | 3,040,500 | |
| | | | | | | | |
| | | | | | | | 14,926,912 | |
Software — 4.7% | | | | | | | | |
Check Point Software Technologies Ltd. (a) | | | 89,000 | | | | 4,450,000 | |
Compuware Corp. (a) | | | 305,000 | | | | 3,544,100 | |
Electronic Arts, Inc. (a) | | | 250,500 | | | | 3,940,365 | |
Informatica Corp. (a) | | | 81,900 | | | | 3,031,119 | |
PTC, Inc. (a) | | | 183,900 | | | | 4,262,802 | |
Synopsys, Inc. (a) | | | 86,300 | | | | 2,885,872 | |
| | | | | | | | |
| | | | | | | | 22,114,258 | |
Specialty Retail — 4.9% | | | | | | | | |
Abercrombie & Fitch Co., Class A | | | 45,527 | | | | 2,276,350 | |
American Eagle Outfitters, Inc. | | | 117,263 | | | | 2,369,885 | |
Ascena Retail Group, Inc. (a)(b) | | | 144,200 | | | | 2,444,190 | |
Aéropostale, Inc. (a) | | | 93,386 | | | | 1,263,513 | |
Chico’s FAS, Inc. | | | 135,500 | | | | 2,429,515 | |
Dick’s Sporting Goods, Inc. | | | 71,100 | | | | 3,383,649 | |
Foot Locker, Inc. | | | 61,057 | | | | 2,097,308 | |
Limited Brands, Inc. | | | 28,746 | | | | 1,380,383 | |
Signet Jewelers Ltd. | | | 28,800 | | | | 1,802,304 | |
Staples, Inc. | | | 271,500 | | | | 3,659,820 | |
| | | | | | | | |
| | | | | | | | 23,106,917 | |
Textiles, Apparel & Luxury Goods — 2.2% | | | | | |
Hanesbrands, Inc. (a) | | | 94,200 | | | | 3,530,616 | |
PVH Corp. | | | 39,300 | | | | 4,671,591 | |
Wolverine World Wide, Inc. | | | 50,300 | | | | 2,162,900 | |
| | | | | | | | |
| | | | | | | | 10,365,107 | |
See Notes to Financial Statements.
| | | | | | |
| | | | | | | |
| 8 | | BLACKROCK MID CAP VALUE OPPORTUNITIES FUND | | JANUARY 31, 2013 | | |
| | |
Schedule of Investments (continued) | | (Percentages shown are based on Net Assets) |
| | | | | | | | |
| Common Stocks | | Shares | | | Value | |
Thrifts & Mortgage Finance — 2.2% | | | | | | | | |
First Niagara Financial Group, Inc. | | | 353,700 | | | $ | 2,773,008 | |
New York Community Bancorp, Inc. | | | 338,500 | | | | 4,518,975 | |
Washington Federal, Inc. | | | 177,400 | | | | 3,120,466 | |
| | | | | | | | |
| | | | | | | | 10,412,449 | |
Total Long-Term Investments
(Cost — $369,803,112) — 97.1% | | | | | | | 458,926,842 | |
| Short-Term Securities | | Shares | | | Value | |
BlackRock Liquidity Funds, TempCash, Institutional Class, 0.12% (c)(d) | | | 11,116,978 | | | $ | 11,116,978 | |
| | | Beneficial Interest (000) | | | | |
BlackRock Liquidity Series LLC,
Money Market Series, 0.28% (c)(d)(e) | | $ | 43,639 | | | | 43,639,391 | |
Total Short-Term Securities
(Cost — $54,756,369) — 11.6% | | | | | | | 54,756,369 | |
| Total Investments (Cost — $424,559,481) — 108.7% | | | | 513,683,211 | |
| Liabilities in Excess of Other Assets — (8.7)% | | | | | | | (40,977,617 | ) |
| | | | | | | | |
Net Assets — 100.0% | | | | | | $ | 472,705,594 | |
| | | | | | | | |
|
| Notes to Schedule of Investments |
| (a) | | Non-income producing security. |
| (b) | | Security, or a portion of security, is on loan. |
| (c) | | Investments in issuers considered to be an affiliate of the Fund during the year ended January 31, 2013, for purposes of Section 2(a)(3) of the Investment Company Act of 1940, as amended, were as follows: |
| | | | | | | | | | | | | | | | |
| Affiliate | | Shares/Beneficial
Interest Held at
January 31,
2012 | | | Net
Activity | | | Shares/Beneficial
Interest Held at
January 31,
2013 | | | Income | |
BlackRock Liquidity Funds, TempCash, Institutional Class | | | — | | | | 11,116,978 | | | | 11,116,978 | | | $ | 8,936 | |
BlackRock Liquidity Series, LLC Money Market Series | | $ | 47,654,480 | | | $ | (4,015,089 | ) | | $ | 43,639,391 | | | $ | 76,846 | |
| (d) | | Represents the current yield as of report date. |
| (e) | | Security was purchased with the cash collateral from loaned securities. The Fund may withdraw up to 25% of its investment daily, although the manager of the BlackRock Liquidity Series LLC, Money Market Series, in its sole discretion, may permit an investor to withdraw more than 25% on any one day. |
| Ÿ | | For Fund compliance purposes, the Fund’s industry classifications refer to any one or more of the industry sub-classifications used by one or more widely recognized market indexes or rating group indexes, and/or as defined by Fund management. These definitions may not apply for purposes of this report, which may combine such industry sub-classifications for reporting ease. |
| Ÿ | | Fair Value Measurements — Various inputs are used in determining the fair value of investments. These inputs to valuation techniques are categorized into a disclosure hierarchy consisting of three broad levels for financial statement purposes as follows: |
| Ÿ | | Level 1 — unadjusted price quotations in active markets/exchanges for identical assets and liabilities that the Fund has the ability to access |
| Ÿ | | Level 2 — other observable inputs (including, but not limited to, quoted prices for similar assets or liabilities in markets that are active, quoted prices for identical or similar assets or liabilities in markets that are not active, inputs other than quoted prices that are observable for the assets or liabilities (such as interest rates, yield curves, volatilities, prepayment speeds, loss severities, credit risks and default rates) or other market-corroborated inputs) |
| Ÿ | | Level 3 — unobservable inputs based on the best information available in the circumstances, to the extent observable inputs are not available (including the Fund’s own assumptions used in determining the fair value of investments) |
The hierarchy gives the highest priority to unadjusted quoted prices in active markets for identical assets or liabilities (Level 1 measurements) and the lowest priority to unobservable inputs (Level 3 measurements). Accordingly, the degree of judgment exercised in determining fair value is greatest for instruments categorized in Level 3. The inputs used to measure fair value may fall into different levels of the fair value hierarchy. In such cases, for disclosure purposes, the level in the fair value hierarchy within which the fair value measurement falls in its entirety is determined based on the lowest level input that is significant to the fair value measurement in its entirety.
Changes in valuation techniques may result in transfers into or out of an assigned level within the disclosure hierarchy. In accordance with the Fund’s policy, transfers between different levels of the fair value disclosure hierarchy are deemed to have occurred as of the beginning of the reporting period. The categorization of a value determined for investments is based on the pricing transparency of the investment and is not necessarily an indication of the risks associated with investing in those securities. For information about the Fund’s policy regarding valuation of investments and other significant accounting policies, please refer to Note 1 of the Notes to Financial Statements.
See Notes to Financial Statements.
| | | | | | |
| | | | | | | |
| | BLACKROCK MID CAP VALUE OPPORTUNITIES FUND | | JANUARY 31, 2013 | | 9 |
| | |
Schedule of Investments (concluded) | | |
The following table summarizes the Fund’s investments categorized in the disclosure hierarchy as of January 31, 2013:
| | | | | | | | | | | | | | | | |
| | | Level 1 | | | Level 2 | | | Level 3 | | | Total | |
Assets: | | | | | | | | | | | | | | | | |
| Investments: | | | | | | | | | | | | | | | | |
Long-Term Investments1 | | $ | 458,926,842 | | | | — | | | | — | | | $ | 458,926,842 | |
Short-Term Securities | | | 11,116,978 | | | $ | 43,639,391 | | | | — | | | | 54,756,369 | |
| | | | |
Total | | $ | 470,043,820 | | | $ | 43,639,391 | | | | — | | | $ | 513,683,211 | |
| | | | |
| | 1 | | See above Schedule of Investments for values in each industry. |
Certain of the Fund’s assets and liabilities are held at carrying amount, which approximates fair value for financial statement purposes. As of January 31, 2013, such assets and liabilities are categorized within the disclosure hierarchy as follows:
| | | | | | | | | | | | | | | | |
| | | Level 1 | | | Level 2 | | | Level 3 | | | Total | |
Assets: | | | | | | | | | | | | | | | | |
Cash | | $ | 12,142 | | | | — | | | | — | | | $ | 12,142 | |
Foreign currency at value | | | 979 | | | | — | | | | — | | | | 979 | |
Liabilities: | | | | | | | | | | | | | | | | |
Collateral on securities loaned at value | | | — | | | $ | (43,639,391 | ) | | | — | | | | (43,639,391 | ) |
| | | | |
Total | | $ | 13,121 | | | $ | (43,639,391 | ) | | | — | | | $ | (43,626,270 | ) |
| | | | |
There were no transfers between levels during the year ended January 31, 2013.
See Notes to Financial Statements.
| | | | | | |
| | | | | | | |
| 10 | | BLACKROCK MID CAP VALUE OPPORTUNITIES FUND | | JANUARY 31, 2013 | | |
| | |
| Statement of Assets and Liabilities | | |
| | | | |
| January 31, 2013 | | | |
| | | | |
| Assets | |
Investments at value — unaffiliated (including securities loaned at value of $42,600,790) (cost — $369,803,112) | | $ | 458,926,842 | |
Investments at value — affiliated (cost — $54,756,369) | | | 54,756,369 | |
Cash | | | 12,142 | |
Investments sold receivable | | | 10,880,045 | |
Capital shares sold receivable | | | 882,924 | |
Dividends receivable | | | 130,806 | |
Securities lending income receivable — affiliated | | | 13,653 | |
Foreign currency at value (cost — $984) | | | 979 | |
Prepaid expenses | | | 2,465 | |
| | | | |
Total assets | | | 525,606,225 | |
| | | | |
| | | | |
| Liabilities | | | | |
Collateral on securities loaned at value | | | 43,639,391 | |
Investments purchased payable | | | 6,794,537 | |
Capital shares redeemed payable | | | 1,739,157 | |
Investment advisory fees payable | | | 252,683 | |
Service and distribution fees payable | | | 120,348 | |
Officer’s and Directors’ fees payable | | | 1,352 | |
Other affiliates payable | | | 1,010 | |
Other accrued expenses payable | | | 352,153 | |
| | | | |
Total liabilities | | | 52,900,631 | |
| | | | |
Net Assets | | $ | 472,705,594 | |
| | | | |
| | | | |
| Net Assets Consist of | | | | |
Paid-in capital | | $ | 394,445,794 | |
Undistributed net investment income | | | 341,115 | |
Accumulated net realized loss | | | (11,205,040 | ) |
Net unrealized appreciation/depreciation | | | 89,123,725 | |
| | | | |
Net Assets | | $ | 472,705,594 | |
| | | | |
| | | | |
| Net Asset Value | | | | |
Institutional — Based on net assets of $133,748,324 and 6,545,609 shares outstanding, 20 million shares authorized, $0.10 par value | | $ | 20.43 | |
| | | | |
Investor A — Based on net assets of $215,469,452 and 10,806,792 shares outstanding, 40 million shares authorized, $0.10 par value | | $ | 19.94 | |
| | | | |
Investor B — Based on net assets of $3,309,720 and 182,279 shares outstanding, 40 million shares authorized, $0.10 par value | | $ | 18.16 | |
| | | | |
Investor C — Based on net assets of $61,755,960 and 3,469,447 shares outstanding, 40 million shares authorized, $0.10 par value | | $ | 17.80 | |
| | | | |
Class R — Based on net assets of $58,422,138 and 3,149,954 shares outstanding, 40 million shares authorized, $0.10 par value | | $ | 18.55 | |
| | | | |
| | | | | | |
| See Notes to Financial Statements. | | | | |
| | | | | | | |
| | BLACKROCK MID CAP VALUE OPPORTUNITIES FUND | | JANUARY 31, 2013 | | 11 |
| | | | |
| Year Ended January 31, 2013 | | | |
| | | | |
| Investment Income | |
Dividends — unaffiliated | | $ | 6,976,543 | |
Securities lending — affiliated — net | | | 76,846 | |
Dividends — affiliated | | | 8,936 | |
| | | | |
Total income | | | 7,062,325 | |
| | | | |
| | | | |
| Expenses | | | | |
Investment advisory | | | 2,846,346 | |
Service — Investor A | | | 478,638 | |
Service and distribution — Investor B | | | 42,337 | |
Service and distribution — Investor C | | | 596,143 | |
Service and distribution — Class R | | | 284,023 | |
Transfer agent — Institutional | | | 178,482 | |
Transfer agent — Investor A | | | 490,661 | |
Transfer agent — Investor B | | | 17,712 | |
Transfer agent — Investor C | | | 245,979 | |
Transfer agent — Class R | | | 197,432 | |
Accounting services | | | 107,275 | |
Professional | | | 106,602 | |
Printing | | | 63,606 | |
Custodian | | | 51,544 | |
Registration | | | 45,948 | |
Officer and Directors | | | 19,596 | |
Miscellaneous | | | 24,547 | |
| | | | |
Total expenses | | | 5,796,871 | |
Less fees waived by Manager | | | (4,330 | ) |
| | | | |
Total expenses after fees waived | | | 5,792,541 | |
| | | | |
Net investment income | | | 1,269,784 | |
| | | | |
| | | | |
| Realized and Unrealized Gain (Loss) | | | | |
| Net realized gain (loss) from: | | | | |
Investments | | | 44,227,044 | |
Foreign currency transactions | | | (28,665 | ) |
| | | | |
| | | 44,198,379 | |
| | | | |
| Net change in unrealized appreciation/depreciation on: | | | | |
Investments | | | 15,892,625 | |
Foreign currency translations | | | (5 | ) |
| | | | |
| | | 15,892,620 | |
| | | | |
Total realized and unrealized gain | | | 60,090,999 | |
| | | | |
Net Increase in Net Assets Resulting from Operations | | $ | 61,360,783 | |
| | | | |
| | | | | | |
| See Notes to Financial Statements. | | | | |
| | | | | | | |
| 12 | | BLACKROCK MID CAP VALUE OPPORTUNITIES FUND | | JANUARY 31, 2013 | | |
| | |
| Statements of Changes in Net Assets | | |
| | | | | | | | |
| | | Year Ended January 31, | |
| Increase (Decrease) in Net Assets: | | 2013 | | | 2012 | |
| | | | | | | | |
| Operations | | | | | | | | |
Net investment income | | $ | 1,269,784 | | | $ | 842,834 | |
Net realized gain | | | 44,198,379 | | | | 27,452,774 | |
Net change in unrealized appreciation/depreciation | | | 15,892,620 | | | | (18,920,173 | ) |
| | | | | | | | |
Net increase in net assets resulting from operations | | | 61,360,783 | | | | 9,375,435 | |
| | | | | | | | |
| | | | | | | | |
| Dividends to Shareholders From1 | | | | | | | | |
Net investment income: | | | | | | | | |
Institutional | | | (1,200,172 | ) | | | (569,780 | ) |
Investor A | | | (674,665 | ) | | | (706,649 | ) |
| | | | | | | | |
Decrease in net assets resulting from dividends to shareholders | | | (1,874,837 | ) | | | (1,276,429 | ) |
| | | | | | | | |
| | | | | | | | |
| Capital Share Transactions | | | | | | | | |
Net increase (decrease) in net assets derived from capital share transactions | | | (16,441,923 | ) | | | 34,879,662 | |
| | | | | | | | |
| | | | | | | | |
| Net Assets | | | | | | | | |
Total increase in net assets | | | 43,044,023 | | | | 42,978,668 | |
Beginning of year | | | 429,661,571 | | | | 386,682,903 | |
| | | | | | | | |
End of year | | $ | 472,705,594 | | | $ | 429,661,571 | |
| | | | | | | | |
Undistributed net investment income | | $ | 341,115 | | | $ | 974,833 | |
| | | | | | | | |
| | 1 | | Dividends are determined in accordance with federal income tax regulations. |
| | | | | | |
| See Notes to Financial Statements. | | | | |
| | | | | | | |
| | BLACKROCK MID CAP VALUE OPPORTUNITIES FUND | | JANUARY 31, 2013 | | 13 |
| | | | | | | | | | | | | | | | | | | | |
| | | Institutional | |
| | | Year Ended January 31, | |
| | | 2013 | | | 2012 | | | 2011 | | | 2010 | | | 2009 | |
| | | | | | | | | | | | | | | | | | | | |
| Per Share Operating Performance | | | | | | | | | | | | | | | | | | | | |
Net asset value, beginning of year | | $ | 17.92 | | | $ | 17.48 | | | $ | 13.08 | | | $ | 9.37 | | | $ | 14.80 | |
| | | | |
Net investment income1 | | | 0.13 | | | | 0.12 | | | | 0.14 | | | | 0.06 | | | | 0.11 | |
Net realized and unrealized gain (loss) | | | 2.56 | | | | 0.43 | | | | 4.26 | | | | 3.73 | | | | (5.42 | ) |
| | | | |
Net increase (decrease) from investment operations | | | 2.69 | | | | 0.55 | | | | 4.40 | | | | 3.79 | | | | (5.31 | ) |
| | | | |
| Dividends and distributions from:2 | | | | | | | | | | | | | | | | | | | | |
Net investment income | | | (0.18 | ) | | | (0.11 | ) | | | — | | | | (0.08 | ) | | | — | |
Net realized gain | | | — | | | | — | | | | — | | | | — | | | | (0.12 | ) |
| | | | |
Total dividends and distributions | | | (0.18 | ) | | | (0.11 | ) | | | — | | | | (0.08 | ) | | | (0.12 | ) |
| | | | |
Net asset value, end of year | | $ | 20.43 | | | $ | 17.92 | | | $ | 17.48 | | | $ | 13.08 | | | $ | 9.37 | |
| | | | |
| | | | | | | | | | | | | | | | | | | | |
| Total Investment Return3 | | | | | | | | | | | | | | | | | | | | |
Based on net asset value | | | 15.12% | | | | 3.10% | | | | 33.64% | | | | 40.63% | 4 | | | (36.16)% | |
| | | | |
| | | | | | | | | | | | | | | | | | | | |
| Ratios to Average Net Assets | | | | | | | | | | | | | | | | | | | | |
Total expenses | | | 0.89% | | | | 0.89% | | | | 0.94% | | | | 1.04% | | | | 0.98% | |
| | | | |
Total expenses after fees waived | | | 0.89% | | | | 0.88% | | | | 0.94% | | | | 1.04% | | | | 0.98% | |
| | | | |
Total expenses after fees waived and excluding excise tax | | | 0.89% | | | | 0.88% | | | | 0.94% | | | | 1.04% | | | | 0.98% | |
| | | | |
Net investment income | | | 0.73% | | | | 0.70% | | | | 0.93% | | | | 0.53% | | | | 0.84% | |
| | | | |
| | | | | | | | | | | | | | | | | | | | |
| Supplemental Data | | | | | | | | | | | | | | | | | | | | |
Net assets, end of year (000) | | $ | 133,748 | | | $ | 120,322 | | | $ | 83,905 | | | $ | 60,549 | | | $ | 46,590 | |
| | | | |
Portfolio turnover | | | 55% | | | | 68% | | | | 54% | | | | 106% | | | | 154% | |
| | | | |
| | 1 | | Based on average shares outstanding. |
| | 2 | | Dividends and distributions are determined in accordance with federal income tax regulations. |
| | 3 | | Where applicable, total investment returns include the reinvestment of dividends and distributions. |
| | 4 | | Includes proceeds received from a settlement of litigation, which impacted the Fund’s total investment return. Not including these proceeds, the total investment return would have been 40.20%. |
| | | | | | |
| See Notes to Financial Statements. | | | | |
| | | | | | | |
| 14 | | BLACKROCK MID CAP VALUE OPPORTUNITIES FUND | | JANUARY 31, 2013 | | |
| | |
| Financial Highlights (continued) | | |
| | | | | | | | | | | | | | | | | | | | |
| | | Investor A | |
| | | Year Ended January 31, | |
| | | 2013 | | | 2012 | | | 2011 | | | 2010 | | | 2009 | |
| | | | | | | | | | | | | | | | | | | | |
| Per Share Operating Performance | | | | | | | | | | | | | | | | | | | | |
Net asset value, beginning of year | | $ | 17.44 | | | $ | 17.04 | | | $ | 12.79 | | | $ | 9.16 | | | $ | 14.52 | |
| | | | | | | | | | | | | | | | | | | | |
Net investment income1 | | | 0.07 | | | | 0.06 | | | | 0.09 | | | | 0.02 | | | | 0.06 | |
Net realized and unrealized gain (loss) | | | 2.49 | | | | 0.41 | | | | 4.16 | | | | 3.65 | | | | (5.30 | ) |
| | | | | | | | | | | | | | | | | | | | |
Net increase (decrease) from investment operations | | | 2.56 | | | | 0.47 | | | | 4.25 | | | | 3.67 | | | | (5.24 | ) |
| | | | | | | | | | | | | | | | | | | | |
| Dividends and distributions from:2 | | | | | | | | | | | | | | | | | | | | |
Net investment income | | | (0.06 | ) | | | (0.07 | ) | | | – | | | | (0.04 | ) | | | – | |
Net realized gain | | | – | | | | – | | | | – | | | | – | | | | (0.12 | ) |
| | | | | | | | | | | | | | | | | | | | |
Total dividends and distributions | | | (0.06 | ) | | | (0.07 | ) | | | – | | | | (0.04 | ) | | | (0.12 | ) |
| | | | | | | | | | | | | | | | | | | | |
Net asset value, end of year | | $ | 19.94 | | | $ | 17.44 | | | $ | 17.04 | | | $ | 12.79 | | | $ | 9.16 | |
| | | | | | | | | | | | | | | | | | | | |
| | | | | | | | | | | | | | | | | | | | |
| Total Investment Return3 | | | | | | | | | | | | | | | | | | | | |
Based on net asset value | | | 14.74% | | | | 2.73% | | | | 33.23% | | | | 40.10% | 4 | | | (36.39)% | |
| | | | | | | | | | | | | | | | | | | | |
| | | | | | | | | | | | | | | | | | | | |
| Ratios to Average Net Assets | | | | | | | | | | | | | | | | | | | | |
Total expenses | | | 1.25% | | | | 1.22% | | | | 1.28% | | | | 1.42% | | | | 1.36% | |
| | | | | | | | | | | | | | | | | | | | |
Total expenses after fees waived | | | 1.25% | | | | 1.21% | | | | 1.28% | | | | 1.42% | | | | 1.36% | |
| | | | | | | | | | | | | | | | | | | | |
Total expenses after fees waived and excluding excise tax | | | 1.25% | | | | 1.21% | | | | 1.28% | | | | 1.42% | | | | 1.36% | |
| | | | | | | | | | | | | | | | | | | | |
Net investment income | | | 0.37% | | | | 0.36% | | | | 0.59% | | | | 0.17% | | | | 0.46% | |
| | | | | | | | | | | | | | | | | | | | |
| | | | | | | | | | | | | | | | | | | | |
| Supplemental Data | | | | | | | | | | | | | | | | | | | | |
Net assets, end of year (000) | | $ | 215,469 | | | $ | 182,931 | | | $ | 152,037 | | | $ | 101,184 | | | $ | 64,948 | |
| | | | | | | | | | | | | | | | | | | | |
Portfolio turnover | | | 55% | | | | 68% | | | | 54% | | | | 106% | | | | 154% | |
| | | | | | | | | | | | | | | | | | | | |
| | 1 | | Based on average shares outstanding. |
| | 2 | | Dividends and distributions are determined in accordance with federal income tax regulations. |
| | 3 | | Where applicable, total investment returns exclude the effects of any sales charges and include the reinvestment of dividends and distributions. |
| | 4 | | Includes proceeds received from a settlement of litigation, which impacted the Fund’s total investment return. Not including these proceeds, the total investment return would have been 39.66%. |
| | | | | | |
| See Notes to Financial Statements. | | | | |
| | | | | | | |
| | BLACKROCK MID CAP VALUE OPPORTUNITIES FUND | | JANUARY 31, 2013 | | 15 |
| | |
| Financial Highlights (continued) | | |
| | | | | | | | | | | | | | | | | | | | |
| | | Investor B | |
| | | Year Ended January 31, | |
| | | 2013 | | | 2012 | | | 2011 | | | 2010 | | | 2009 | |
| | | | | | | | | | | | | | | | | | | | |
| Per Share Operating Performance | | | | | | | | | | | | | | | | | | | | |
Net asset value, beginning of year | | $ | 15.97 | | | $ | 15.69 | | | $ | 11.88 | | | $ | 8.55 | | | $ | 13.66 | |
| | | | | | | | | | | | | | | | | | | | |
Net investment loss1 | | | (0.10 | ) | | | (0.09 | ) | | | (0.04 | ) | | | (0.08 | ) | | | (0.04 | ) |
Net realized and unrealized gain (loss) | | | 2.29 | | | | 0.37 | | | | 3.85 | | | | 3.41 | | | | (4.96 | ) |
| | | | | | | | | | | | | | | | | | | | |
Net increase (decrease) from investment operations | | | 2.19 | | | | 0.28 | | | | 3.81 | | | | 3.33 | | | | (5.00 | ) |
| | | | | | | | | | | | | | | | | | | | |
Distributions from net realized gain2 | | | — | | | | — | | | | — | | | | — | | | | (0.11 | ) |
| | | | | | | | | | | | | | | | | | | | |
Net asset value, end of year | | $ | 18.16 | | | $ | 15.97 | | | $ | 15.69 | | | $ | 11.88 | | | $ | 8.55 | |
| | | | | | | | | | | | | | | | | | | | |
| | | | | | | | | | | | | | | | | | | | |
| Total Investment Return3 | | | | | | | | | | | | | | | | | | | | |
Based on net asset value | | | 13.71% | | | | 1.78% | | | | 32.07% | | | | 38.95% | 4 | | | (36.91)% | |
| | | | | | | | | | | | | | | | | | | | |
| | | | | | | | | | | | | | | | | | | | |
| Ratios to Average Net Assets | | | | | | | | | | | | | | | | | | | | |
Total expenses | | | 2.16% | | | | 2.15% | | | | 2.17% | | | | 2.26% | | | | 2.12% | |
| | | | | | | | | | | | | | | | | | | | |
Total expenses after fees waived | | | 2.16% | | | | 2.15% | | | | 2.17% | | | | 2.26% | | | | 2.12% | |
| | | | | | | | | | | | | | | | | | | | |
Total expenses after fees waived and excluding excise tax | | | 2.16% | | | | 2.15% | | | | 2.17% | | | | 2.26% | | | | 2.12% | |
| | | | | | | | | | | | | | | | | | | | |
Net investment loss | | | (0.60)% | | | | (0.56)% | | | | (0.27)% | | | | (0.77)% | | | | (0.34)% | |
| | | | | | | | | | | | | | | | | | | | |
| | | | | | | | | | | | | | | | | | | | |
| Supplemental Data | | | | | | | | | | | | | | | | | | | | |
Net assets, end of year (000) | | $ | 3,310 | | | $ | 5,893 | | | $ | 8,551 | | | $ | 12,708 | | | $ | 20,131 | |
| | | | | | | | | | | | | | | | | | | | |
Portfolio turnover | | | 55% | | | | 68% | | | | 54% | | | | 106% | | | | 154% | |
| | | | | | | | | | | | | | | | | | | | |
| | 1 | | Based on average shares outstanding. |
| | 2 | | Distributions are determined in accordance with federal income tax regulations. |
| | 3 | | Where applicable, total investment returns exclude the effects of any sales charges and include the reinvestment of dividends and distributions. |
| | 4 | | Includes proceeds received from a settlement of litigation, which impacted the Fund’s total investment return. Not including these proceeds, the total investment return would have been 38.60% |
| | | | | | |
| See Notes to Financial Statements. | | | | |
| | | | | | | |
| 16 | | BLACKROCK MID CAP VALUE OPPORTUNITIES FUND | | JANUARY 31, 2013 | | |
| | |
| Financial Highlights (continued) | | |
| | | | | | | | | | | | | | | | | | | | |
| | | Investor C | |
| | | Year Ended January 31, | |
| | | 2013 | | | 2012 | | | 2011 | | | 2010 | | | 2009 | |
| | | | | | | | | | | | | | | | | | | | |
| Per Share Operating Performance | | | | | | | | | | | | | | | | | | | | |
Net asset value, beginning of year | | $ | 15.65 | | | $ | 15.39 | | | $ | 11.67 | | | $ | 8.41 | | | $ | 13.47 | |
| | | | |
Net investment loss1 | | | (0.09 | ) | | | (0.09 | ) | | | (0.05 | ) | | | (0.09 | ) | | | (0.06 | ) |
Net realized and unrealized gain (loss) | | | 2.24 | | | | 0.35 | | | | 3.77 | | | | 3.35 | | | | (4.90 | ) |
| | | | |
Net increase (decrease) from investment operations | | | 2.15 | | | | 0.26 | | | | 3.72 | | | | 3.26 | | | | (4.96 | ) |
| | | | |
Distributions from net realized gain2 | | | — | | | | — | | | | — | | | | — | | | | (0.10 | ) |
| | | | |
Net asset value, end of year | | $ | 17.80 | | | $ | 15.65 | | | $ | 15.39 | | | $ | 11.67 | | | $ | 8.41 | |
| | | | |
| | | | | | | | | | | | | | | | | | | | |
| Total Investment Return3 | | | | | | | | | | | | | | | | | | | | |
Based on net asset value | | | 13.74% | | | | 1.69% | | | | 31.88% | | | | 38.76% | 4 | | | (37.06)% | |
| | | | |
| | | | | | | | | | | | | | | | | | | | |
| Ratios to Average Net Assets | | | | | | | | | | | | | | | | | | | | |
Total expenses | | | 2.16% | | | | 2.17% | | | | 2.27% | | | | 2.48% | | | | 2.35% | |
| | | | |
Total expenses after fees waived | | | 2.16% | | | | 2.16% | | | | 2.27% | | | | 2.47% | | | | 2.35% | |
| | | | |
Total expenses after fees waived and excluding excise tax | | | 2.16% | | | | 2.16% | | | | 2.27% | | | | 2.47% | | | | 2.35% | |
| | | | |
Net investment loss | | | (0.55)% | | | | (0.58)% | | | | (0.39)% | | | | (0.92)% | | | | (0.54)% | |
| | | | |
| | | | | | | | | | | | | | | | | | | | |
| Supplemental Data | | | | | | | | | | | | | | | | | | | | |
Net assets, end of year (000) | | $ | 61,756 | | | $ | 63,272 | | | $ | 70,795 | | | $ | 57,113 | | | $ | 47,034 | |
| | | | |
Portfolio turnover | | | 55% | | | | 68% | | | | 54% | | | | 106% | | | | 154% | |
| | | | |
| | 1 | | Based on average shares outstanding. |
| | 2 | | Distributions are determined in accordance with federal income tax regulations. |
| | 3 | | Where applicable, total investment returns exclude the effects of any sales charges and include the reinvestment of dividends and distributions. |
| | 4 | | Includes proceeds received from a settlement of litigation, which impacted the Fund’s total investment return. Not including these proceeds, the total investment return would have been 38.29% |
| | | | | | |
| See Notes to Financial Statements. | | | | |
| | | | | | | |
| | BLACKROCK MID CAP VALUE OPPORTUNITIES FUND | | JANUARY 31, 2013 | | 17 |
| | |
| Financial Highlights (concluded) | | |
| | | | | | | | | | | | | | | | | | | | |
| | | Class R | |
| | | Year Ended January 31, | |
| | | 2013 | | | 2012 | | | 2011 | | | 2010 | | | 2009 | |
| | | | | | | | | | | | | | | | | | | | |
| Per Share Operating Performance | | | | | | | | | | | | | | | | | | | | |
Net asset value, beginning of year | | $ | 16.22 | | | $ | 15.85 | | | $ | 11.94 | | | $ | 8.56 | | | $ | 13.63 | |
| | | | |
Net investment income (loss)1 | | | (0.00 | )2 | | | (0.00 | )2 | | | 0.03 | | | | (0.02 | ) | | | 0.01 | |
Net realized and unrealized gain (loss) | | | 2.33 | | | | 0.37 | | | | 3.88 | | | | 3.40 | | | | (4.97 | ) |
| | | | |
Net increase (decrease) from investment operations | | | 2.33 | | | | 0.37 | | | | 3.91 | | | | 3.38 | | | | (4.96 | ) |
| | | | |
| Dividends and distributions from:3 | | | | | | | | | | | | | | | | | | | | |
Net investment income | | | — | | | | — | | | | — | | | | (0.00 | )2 | | | — | |
Net realized gain | | | — | | | | — | | | | — | | | | — | | | | (0.11 | ) |
| | | | |
Total dividends and distributions | | | — | | | | — | | | | — | | | | (0.00 | )2 | | | (0.11 | ) |
| | | | |
Net asset value, end of year | | $ | 18.55 | | | $ | 16.22 | | | $ | 15.85 | | | $ | 11.94 | | | $ | 8.56 | |
| | | | |
| | | | | | | | | | | | | | | | | | | | |
| Total Investment Return4 | | | | | | | | | | | | | | | | | | | | |
Based on net asset value | | | 14.37% | | | | 2.33% | | | | 32.75% | | | | 39.50% | 5 | | | (36.66)% | |
| | | | |
| | | | | | | | | | | | | | | | | | | | |
| Ratios to Average Net Assets | | | | | | | | | | | | | | | | | | | | |
Total expenses | | | 1.59% | | | | 1.60% | | | | 1.65% | | | | 1.81% | | | | 1.78% | |
| | | | |
Total expenses after fees waived | | | 1.59% | | | | 1.60% | | | | 1.65% | | | | 1.80% | | | | 1.78% | |
| | | | |
Total expenses after fees waived and excluding excise tax | | | 1.59% | | | | 1.60% | | | | 1.65% | | | | 1.80% | | | | 1.78% | |
| | | | |
Net investment income (loss) | | | 0.01% | | | | (0.02)% | | | | 0.22% | | | | (0.22)% | | | | 0.07% | |
| | | | |
| | | | | | | | | | | | | | | | | | | | |
| Supplemental Data | | | | | | | | | | | | | | | | | | | | |
Net assets, end of year (000) | | $ | 58,422 | | | $ | 57,244 | | | $ | 71,394 | | | $ | 50,310 | | | $ | 33,540 | |
| | | | |
Portfolio turnover | | | 55% | | | | 68% | | | | 54% | | | | 106% | | | | 154% | |
| | | | |
| | 1 | | Based on average shares outstanding. |
| | 2 | | Amount is greater than $(0.01) per share. |
| | 3 | | Dividends and distributions are determined in accordance with federal income tax regulations. |
| | 4 | | Where applicable, total investment returns include the reinvestment of dividends and distributions. |
| | 5 | | Includes proceeds received from a settlement of litigation, which impacted the Fund’s total investment return. Not including these proceeds, the total investment return would have been 39.15%. |
| | | | | | |
| See Notes to Financial Statements. | | | | |
| | | | | | | |
| 18 | | BLACKROCK MID CAP VALUE OPPORTUNITIES FUND | | JANUARY 31, 2013 | | |
| | |
| Notes to Financial Statements | | |
1. Organization and Significant Accounting Policies:
BlackRock Mid Cap Value Opportunities Fund (the “Fund”) of BlackRock Mid Cap Value Opportunities Series, Inc. (the “Corporation”) is registered under the Investment Company Act of 1940, as amended (the “1940 Act”), as a diversified, open-end management investment company. The Corporation is organized as a Maryland corporation. The Fund’s financial statements are prepared in conformity with accounting principles generally accepted in the United States of America (“US GAAP”), which may require management to make estimates and assumptions that affect the reported amounts of assets and liabilities in the financial statements and the reported amounts of increases and decreases in net assets from operations during the reporting period. Actual results could differ from those estimates. The Fund offers multiple classes of shares. Institutional Shares are sold without a sales charge and only to certain eligible investors. Investor A Shares are generally sold with a front-end sales charge. Investor B and Investor C Shares may be subject to a CDSC. Class R Shares are sold without a sales charge and only to certain retirement and other similar plans. All classes of shares have identical voting, dividend, liquidation and other rights and the same terms and conditions, except that Investor A, Investor B, Investor C and Class R Shares bear certain expenses related to the shareholder servicing of such shares, and Investor B, Investor C and Class R Shares also bear certain expenses related to the distribution of such shares. Investor B Shares automatically convert to Investor A Shares after approximately eight years. Investor B Shares are only available through exchanges and dividend reinvestments by existing shareholders and for purchase by certain qualified employee benefit plans. Each class has exclusive voting rights with respect to matters relating to its shareholder servicing and distribution expenditures (except that Investor B shareholders may vote on material changes to the Investor A distribution and service plan).
The following is a summary of significant accounting policies followed by the Fund:
Valuation: US GAAP defines fair value as the price the Fund would receive to sell an asset or pay to transfer a liability in an orderly transaction between market participants at the measurement date. The Fund determines the fair values of its financial instruments at market value using independent dealers or pricing services under policies approved by the Board of Directors of the Fund (the “Board”). The BlackRock Global Valuation Methodologies Committee (the “Global Valuation Committee”) is the committee formed by management to develop global pricing policies and procedures and to provide oversight of the pricing function for the Fund for all financial instruments.
Equity investments traded on a recognized securities exchange or the NASDAQ Global Market System (“NASDAQ”) are valued at the last reported sale price that day or the NASDAQ official closing price, if applicable. For equity investments traded on more than one exchange, the last reported sale price on the exchange where the stock is primarily traded is used. Equity investments traded on a recognized exchange for which there were no sales on that day are valued at the last available bid (long positions) or ask (short positions) price. If no bid or ask price is available, the prior day’s price will be used, unless it is determined that such prior day’s price no longer reflects the fair value of the security. Investments in open-end registered investment companies are valued at NAV each business day. Short-term securities with remaining maturities of 60 days or less may be valued at amortized cost, which approximates fair value.
The Fund values its investments in BlackRock Liquidity Series, LLC Money Market Series (the “Money Market Series”) at fair value, which is ordinarily based upon its pro rata ownership in the underlying fund’s net assets. The Money Market Series seeks current income consistent with maintaining liquidity and preserving capital. Although the Money Market Series is not registered under the 1940 Act, its investments will follow the parameters of investments by a money market fund that is subject to Rule 2a-7 under the 1940 Act. The Fund may withdraw up to 25% of its investment daily, although the manager of the Money Market Series, in its sole discretion, may permit an investor to withdraw more than 25% on any one day.
In the event that application of these methods of valuation results in a price for an investment that is deemed not to be representative of the market value of such investment, or if a price is not available, the investment will be valued by the Global Valuation Committee, or its delegate, in accordance with a policy approved by the Board as reflecting fair value (“Fair Value Assets”). When determining the price for Fair Value Assets, the Global Valuation Committee, or its delegate, seeks to determine the price that the Fund might reasonably expect to receive from the current sale of that asset in an arm’s-length transaction. Fair value determinations shall be based upon all available factors that the Global Valuation Committee, or its delegate, deems relevant consistent with the principles of fair value measurements, which include the market approach, income approach and/or in the case of recent investments, the cost approach, as appropriate. A market approach generally consists of using comparable market transactions. The income approach generally is used to discount future cash flows to present value and adjusted for liquidity as appropriate. These factors include but are not limited to: (i) attributes specific to the investment or asset; (ii) the principal market for the investment or asset; (iii) the customary participants in the principal market for the investment or asset; (iv) data assumptions by market participants for the investment or asset, if reasonably available; (v) quoted prices for similar investments or assets in active markets; and (vi) other factors, such as future cash flows, interest rates, yield curves, volatilities, prepayment speeds, loss severities, credit risks, recovery rates, liquidation amounts and/or default rates. Due to the inherent uncertainty of valuations of such investments, the fair values may differ from the values that would have
| | | | | | |
| | | | | | | |
| | BLACKROCK MID CAP VALUE OPPORTUNITIES FUND | | JANUARY 31, 2013 | | 19 |
| | |
| Notes to Financial Statements (continued) | | |
been used had an active market existed. The Global Valuation Committee, or its delegate, employs various methods for calibrating valuation approaches for investments where an active market does not exist, including regular due diligence of the Fund’s pricing vendors, a regular review of key inputs and assumptions, transactional back-testing or disposition analysis to compare unrealized gains and losses to realized gains and losses, reviews of missing or stale prices and large movements in market values and reviews of any market related activity. The pricing of all Fair Value Assets is subsequently reported to the Board or a committee thereof on a quarterly basis.
Generally, trading in foreign instruments is substantially completed each day at various times prior to the close of business on the New York Stock Exchange (“NYSE”). Occasionally, events affecting the values of such instruments may occur between the foreign market close and the close of business on the NYSE that may not be reflected in the computation of the Fund’s net assets. If events (for example, a company announcement, market volatility or a natural disaster) occur during such periods that are expected to affect the value of such instruments materially, those instruments may be Fair Value Assets and valued at their fair value, as determined in good faith by the Global Valuation Committee using a pricing service and/or policies approved by the Board. Each business day, the Fund uses a pricing service to assist with the valuation of certain foreign exchange-traded equity securities and foreign exchange-traded and over-the-counter options (the “Systematic Fair Value Price”). Using current market factors, the Systematic Fair Value Price is designed to value such foreign securities and foreign options at fair value as of the close of business on the NYSE, which follows the close of the local markets.
Foreign Currency: The Fund’s books and records are maintained in US dollars. Purchases and sales of investment securities are recorded at the rates of exchange prevailing on the respective date of such transactions. Generally, when the US dollar rises in value against a foreign currency, the Fund’s investments denominated in that currency will lose value because that currency is worth fewer US dollars; the opposite effect occurs if the US dollar falls in relative value.
The Fund does not isolate the portion of the results of operations arising as a result of changes in the foreign exchange rates from the changes in the market prices of investments held or sold for financial reporting purposes. Accordingly, the effects of changes in foreign currency exchange rates on investments are not segregated in the Statement of Operations from the effects of changes in market prices of those investments but are included as a component of net realized and unrealized gain (loss) from investments. The Fund reports realized currency gains (losses) on foreign currency related transactions as components of net realized gain (loss) for financial reporting purposes, whereas such components are treated as ordinary income for federal income tax purposes.
Investment Transactions and Investment Income: For financial reporting purposes, investment transactions are recorded on the dates the transactions are entered into (the trade dates). Realized gains and losses on investment transactions are determined on the identified cost basis. Dividend income is recorded on the ex-dividend dates. Upon notification from issuers, some of the dividend income received from a real estate investment trust may be redesignated as a reduction of cost of the related investment and/or realized gain. Interest income, including amortization and accretion of premiums and discounts on debt securities, is recognized on the accrual basis. Income and realized and unrealized gains and losses are allocated daily to each class based on its relative net assets.
Dividends and Distributions: Dividends and distributions paid by the Fund are recorded on the ex-dividend dates. The portion of distributions that exceeds a Fund’s current and accumulated earnings and profits, which are measured on a tax basis, will constitute a nontaxable return of capital. Distributions in excess of a Fund’s taxable income and net capital gains, but not in excess of a Fund’s earnings and profits, will be taxable to shareholders as ordinary income and will not constitute a nontaxable return of capital. Capital losses carried forward from years beginning before 2011 do not reduce earnings and profits, even if such carried forward losses offset current year realized gains. The character and timing of dividends and distributions are determined in accordance with federal income tax regulations, which may differ from US GAAP.
Securities Lending: The Fund may lend securities to approved borrowers, such as banks, brokers and other financial institutions. The borrower pledges cash, securities issued or guaranteed by the US government or irrevocable letters of credit issued by a bank as collateral. The initial collateral received by the Fund has a value of at least 102% of the current value of the loaned securities for securities traded on US exchanges and a value of at least 105% for all other securities. The collateral is maintained thereafter in an amount equal to at least 100% of the current market value of the loaned securities. The market value of the loaned securities is determined at the close of business of the Fund and any additional required collateral is delivered to the Fund on the next business day. Securities lending income, as disclosed in the Statement of Operations, represents the income earned from the investment of the cash collateral, net of rebates paid to, or fees paid by, borrowers and less the fees paid to the securities lending agent. During the term of the loan, the Fund earns dividend or interest income on the securities loaned but does not receive interest income on the securities received as collateral. Loans of securities are terminable at any time and the borrower, after notice, is required to return borrowed securities within the standard time period for settlement of securities transactions. The risks of securities lending include the risk that the borrower may not provide additional collateral when required or may not return the securities when due. To mitigate this risk the Fund benefits from a borrower default indemnity provided by BlackRock, Inc.
| | | | | | |
| | | | | | | |
| 20 | | BLACKROCK MID CAP VALUE OPPORTUNITIES FUND | | JANUARY 31, 2013 | | |
| | |
| Notes to Financial Statements (continued) | | |
(“BlackRock”). BlackRock’s indemnity allows for full replacement of securities lent. The Fund also could suffer a loss if the value of an investment purchased with cash collateral falls below the market value of loaned securities or if the value of an investment purchased with cash collateral falls below the value of the original cash collateral received. During the year ended January 31, 2013, any securities on loan were collateralized by cash.
Income Taxes: It is the Fund’s policy to comply with the requirements of the Internal Revenue Code of 1986, as amended, applicable to regulated investment companies and to distribute substantially all of its taxable income to its shareholders. Therefore, no federal income tax provision is required.
The Fund files US federal and various state and local tax returns. No income tax returns are currently under examination. The statute of limitations on the Fund’s US federal tax returns remains open for each of the four years ended January 31, 2013. The statutes of limitations on the Fund’s state and local tax returns may remain open for an additional year depending upon the jurisdiction. Management does not believe there are any uncertain tax positions that require recognition of a tax liability.
Recent Accounting Standards: In December 2011, the Financial Accounting Standards Board (the “FASB”) issued guidance that will expand current disclosure requirements on the offsetting of certain assets and liabilities. The new disclosures will be required for investments and derivative financial instruments subject to master netting or similar agreements, which are eligible for offset in the Statement of Assets and Liabilities and will require an entity to disclose both gross and net information about such investments and transactions in the financial statements. In January 2013, the FASB issued guidance that clarifies which investments and transactions are subject to the offsetting disclosure requirements. The scope of the disclosure requirements for offsetting will be limited to derivative instruments, repurchase agreements and reverse repurchase agreements, and securities borrowing and securities lending transactions. The guidance is effective for financial statements with fiscal years beginning on or after January 1, 2013, and interim periods within those fiscal years. Management is evaluating the impact of this guidance on the Fund’s financial statement disclosures.
Other: Expenses directly related to the Fund or its classes are charged to the Fund or class. Other operating expenses shared by several funds are pro-rated among those funds on the basis of relative net assets or other appropriate methods. Expenses directly related to the Fund and other shared expenses pro-rated to the Fund are allocated daily to each class based on its relative net assets or other appropriate methods.
The Fund has an arrangement with the custodian whereby fees may be reduced by credits earned on uninvested cash balances, which, if applicable, are shown as fees paid indirectly in the Statement of Operations. The custodian imposes fees on overdrawn cash balances, which can be offset by accumulated credits earned or may result in additional custody charges.
2. Derivative Financial Instruments:
The Fund engages in various portfolio investment strategies using derivative contracts both to increase the return of the Fund and/or to economically hedge, or protect, its exposure to certain risks such as equity risk. These contracts may be transacted on an exchange.
Losses may arise if the value of the contract decreases due to an unfavorable change in the market rates or values of the underlying instrument or if the counterparty does not perform under the contract.
Foreign Currency Exchange Contracts: The Fund enters into foreign currency exchange contracts as an economic hedge against either specific transactions or portfolio instruments or to obtain exposure to foreign currencies (foreign currency exchange rate risk). A foreign currency exchange contract is an agreement between two parties to buy and sell a currency at a set exchange rate on a future date. Foreign currency exchange contracts, when used by the Fund, help to manage the overall exposure to the currencies in which some of the investments held by the Fund are denominated. The contract is marked-to-market daily and the change in market value is recorded by the Fund as an unrealized gain or loss. When the contract is closed, the Fund records a realized gain or loss equal to the difference between the value at the time it was opened and the value at the time it was closed. The use of foreign currency exchange contracts involves the risk that the value of a foreign currency exchange contract changes unfavorably due to movements in the value of the referenced foreign currencies and the risk that the counterparty to the contract does not perform its obligations under the agreement.
|
| Derivative Financial Instruments Categorized by Risk Exposure: |
| | | | | | | | |
The Effect of Derivative Financial Instruments in the
Statement of Operations
Year Ended January 31, 2013 | |
| | | Net Realized Loss From | |
| | | Foreign Currency
Exchange Contracts | |
Foreign currency transactions | | | | | | $ | (36,935 | ) |
For the year ended January 31, 2013, the actual contract amounts of derivative financial instruments were as follows:
| | | | |
Foreign currency contracts: | |
Average number of contracts — US dollars purchased | | | 1 | |
Average number of contracts — US dollars sold | | | 13 | |
Average US dollar amounts purchased | | $ | 586,462 | |
Average US dollar amounts sold | | $ | 1,772,641 | |
| | | | | | |
| | | | | | | |
| | BLACKROCK MID CAP VALUE OPPORTUNITIES FUND | | JANUARY 31, 2013 | | 21 |
| | |
| Notes to Financial Statements (continued) | | |
3. Investment Advisory Agreement and Other Transactions with Affiliates:
The PNC Financial Services Group, Inc. (“PNC”) is the largest stockholder and an affiliate, for 1940 Act purposes, of BlackRock.
The Corporation, on behalf of the Fund, entered into an Investment Advisory Agreement with BlackRock Advisors, LLC (the “Manager”), the Fund’s investment advisor, an indirect, wholly owned subsidiary of BlackRock, to provide investment advisory and administration services. The Manager is responsible for the management of the Fund’s portfolio and provides the necessary personnel, facilities, equipment and certain other services necessary to the operations of the Fund. For such services, the Fund pays the Manager a monthly fee based on a percentage of the Fund’s average daily net assets at the following annual rates:
| | | | |
| Average Daily Net Assets | | Investment Advisory Fee | |
First $1 Billion | | | 0.65 | % |
$1 Billion — $3 Billion | | | 0.61 | % |
$3 Billion — $5 Billion | | | 0.59 | % |
$5 Billion — $10 Billion | | | 0.57 | % |
Greater than $10 Billion | | | 0.55 | % |
The Manager voluntarily agreed to waive its investment advisory fees by the amount of investment advisory fees the Fund pays to the Manager indirectly through its investment in affiliated money market funds. However, the Manager does not waive its investment advisory fees by the amount of investment advisory fees paid in connection with the Fund’s investment in other affiliated investment companies, if any. This amount is shown as fees waived by Manager in the Statement of Operations.
The Manager entered into a sub-advisory agreement with BlackRock Investment Management, LLC (“BIM”), an affiliate of the Manager. The Manager pays BIM for services it provides, a monthly fee that is a percentage of the investment advisory fees paid by the Fund to the Manager.
For the year ended January 31, 2013, the Fund reimbursed the Manager $4,299 for certain accounting services, which is included in accounting services in the Statement of Operations.
The Corporation, on behalf of the Fund, entered into a Distribution Agreement and Distribution and Service Plan with BlackRock Investments, LLC (“BRIL”), an affiliate of the Manager. Pursuant to the Distribution and Service Plan and in accordance with Rule 12b-1 under the 1940 Act, the Fund pays BRIL ongoing service and distribution fees. The fees are accrued daily and paid monthly at annual rates based upon the average daily net assets of the shares of the Fund as follows:
| | | | | | | | |
| | | Service Fee | | | Distribution Fee | |
Investor A | | | 0.25 | % | | | — | |
Investor B | | | 0.25 | % | | | 0.75 | % |
Investor C | | | 0.25 | % | | | 0.75 | % |
Class R | | | 0.25 | % | | | 0.25 | % |
Pursuant to written agreements, certain financial intermediaries, some of which may be affiliates, provide the Fund with sub-accounting, recordkeeping, sub-transfer agency and other administrative services with respect to sub-accounts they service. For these services, these entities receive an asset based fee or an annual fee per shareholder account, which will vary depending on share class and/or net assets. For the year ended January 31, 2013, the Fund paid $5,298 to affiliates in return for services to Institutional shareholders, which is included in transfer agent – class specific in the Statement of Operations.
The Manager maintains a call center, which is responsible for providing certain shareholder services to the Fund, such as responding to shareholder inquiries and processing transactions based upon instructions from shareholders with respect to the subscription and redemption of Fund shares. For the year ended January 31, 2013, the Fund reimbursed the Manager the following amounts for costs incurred in running the call center, which are included in transfer agent — class specific in the Statement of Operations:
| | | | |
Institutional | | $ | 1,819 | |
Investor A | | $ | 6,054 | |
Investor B | | $ | 300 | |
Investor C | | $ | 2,107 | |
Class R | | $ | 1,351 | |
Pursuant to sub-agreements with BRIL, broker-dealers and BRIL provide shareholder servicing and distribution services to the Fund. The ongoing service and/or distribution fee compensates BRIL and each broker-dealer for providing shareholder servicing and/or distribution related services to Investor A, Investor B, Investor C and Class R shareholders.
For the year ended January 31, 2013, affiliates earned underwriting discounts, direct commissions and dealer concessions on sales of the Fund’s Investor A Shares, which totaled $10,568.
For the year ended January 31, 2013, affiliates received CDSC as follows.
| | | | |
Investor A | | $ | 2,883 | |
Investor B | | $ | 3,453 | |
Investor C | | $ | 3,537 | |
The Corporation, on behalf of the Fund, received an exemptive order from the SEC permitting it, among other things, to pay an affiliated securities lending agent a fee based on a share of the income derived from the securities lending activities and has retained BIM as the securities lending agent. BIM may, on behalf of the Fund, invest cash collateral received by the Fund for such loans in a private investment company managed by the Manager or in registered money market funds advised by the Manager or its affiliates. The market value of securities on loan and the value of the related collateral, if applicable, is shown in the Statement of Assets and Liabilities as securities loaned at value and collateral on securities loaned at value, respectively. The cash collateral
| | | | | | |
| | | | | | | |
| 22 | | BLACKROCK MID CAP VALUE OPPORTUNITIES FUND | | JANUARY 31, 2013 | | |
| | |
| Notes to Financial Statements (continued) | | |
invested by BIM, if any, is disclosed in the Schedule of Investments. Securities lending income is equal to the total of income earned from the reinvestment of cash collateral, net of rebates paid to, or fees paid by, borrowers of securities. The Fund retains 65% of securities lending income and pays a fee to BIM equal to 35% of such income. The Fund benefits from a borrower default indemnity provided by BlackRock. As securities lending agent, BIM bears all operational costs directly related to securities lending as well as the cost of borrower default indemnification. BIM does not receive any fees for managing the cash collateral. The share of income earned by the Fund is shown as securities lending — affiliated — net in the Statement of Operations. For the year ended January 31, 2013, BIM received $41,527 in securities lending agent fees related to securities lending activities for the Fund.
Certain officers and/or directors of the Corporation are officers and/or directors of BlackRock or its affiliates. The Fund reimburses the Manager for a portion of the compensation paid to the Corporation’s Chief Compliance Officer, which is included in officer and directors in the Statement of Operations.
4. Investments:
Purchases and sales of investments, excluding short-term securities for the year ended January 31, 2013, were $237,711,112 and $266,274,369, respectively.
5. Income Tax Information:
US GAAP requires that certain components of net assets be adjusted to reflect permanent differences between financial and tax reporting. These reclassifications have no effect on net assets or net asset values per share. The following permanent difference as of January 31, 2013 attributable to foreign currency transactions was reclassified to the following accounts:
| | | | |
Undistributed net investment income | | $ | (28,665 | ) |
Accumulated net realized loss | | $ | 28,665 | |
The tax character of distributions paid during the fiscal years ended January 31, 2013 and January 31, 2012 was as follows:
| | | | | | | | |
| | | 1/31/13 | | | 1/31/12 | |
Ordinary income | | $ | 1,874,837 | | | $ | 1,276,429 | |
As of January 31, 2013, the tax components of accumulated net earnings were as follows:
| | | | |
Undistributed ordinary income | | $ | 376,479 | |
Capital loss carryforwards | | | (7,578,786 | ) |
Net unrealized gains1 | | | 85,462,107 | |
| | | | |
Total | | $ | 78,259,800 | |
| | | | |
| 1 | | The difference between book-basis and tax-basis net unrealized gains was attributable primarily to the tax deferral of losses on wash sales and the realization for tax purposes of unrealized gains on investments in passive foreign investment companies. |
As of January 31, 2013, the Fund had a capital loss carryforward of $7,578,786 available to offset future realized capital gains, all of which expires January 31, 2018.
During the year ended January 31, 2013, the Fund utilized $43,698,566 of its capital loss carryforward.
As of January 31, 2013, gross unrealized appreciation and gross unrealized depreciation based on cost for federal income tax purposes were as follows:
| | | | |
Tax cost | | $ | 428,221,100 | |
| | | | |
Gross unrealized appreciation | | $ | 97,993,060 | |
Gross unrealized depreciation | | | (12,530,949 | ) |
| | | | |
Net unrealized appreciation | | $ | 85,462,111 | |
| | | | |
6. Borrowings:
The Corporation, on behalf of the Fund, along with certain other funds managed by the Manager and its affiliates, is a party to a $500 million credit agreement with a group of lenders. The Fund may borrow under the credit agreement to fund shareholder redemptions. Effective November 2011 to November 2012, the credit agreement had the following terms: a commitment fee of 0.065% per annum based on the Fund’s pro rata share of the unused portion of the credit agreement and interest at a rate equal to the higher of (a) the one-month London Interbank Offered Rate (“LIBOR”) plus 0.80% per annum or (b) the Fed Funds rate plus 0.80% per annum on amounts borrowed. In addition, the Fund paid administration and arrangement fees which were allocated to the Fund based on its net assets as of October 31, 2011. The credit agreement, which expired in November 2012, was renewed with the same terms until November 2013. Effective November 2012 to November 2013, the credit agreement has the following terms: a commitment fee of 0.065% per annum based on the Fund’s pro rata share of the unused portion of the credit agreement and interest at a rate equal to the higher of (a) the one-month LIBOR plus 0.80% per annum or (b) the Fed Funds rate plus 0.80% per annum on amounts borrowed. In addition, the Fund paid administration and arrangement fees, which were allocated to the Fund based on its net assets as of October 31, 2012. The Fund did not borrow under the credit agreement during the year ended January 31, 2013.
7. Concentration, Market and Credit Risk:
In the normal course of business, the Fund invests in securities and enters into transactions where risks exist due to fluctuations in the market (market risk) or failure of the issuer of a security to meet all its obligations (issuer credit risk). The value of securities held by the Fund may decline in response to certain events, including those directly involving the issuers whose securities are owned by the Fund; conditions affecting the general economy; overall market changes; local, regional
or global political, social or economic instability; and currency and interest rate and price fluctuations. Similar to issuer credit risk, the Fund
| | | | | | |
| | | | | | | |
| | BLACKROCK MID CAP VALUE OPPORTUNITIES FUND | | JANUARY 31, 2013 | | 23 |
| | |
| Notes to Financial Statements (concluded) | | |
may be exposed to counterparty credit risk, or the risk that an entity with which the Fund has unsettled or open transactions may fail to or be unable to perform on its commitments. The Fund manages counterparty credit risk by entering into transactions only with counterparties that it believes have the financial resources to honor their obligations and by monitoring the financial stability of those counterparties. Financial assets, which potentially expose the Fund to market, issuer and counterparty credit risks, consist principally of financial instruments and receivables due from counterparties. The extent of the Fund’s exposure to market, issuer and counterparty credit risks with respect to these financial assets is generally approximated by their value recorded in the Statement of Assets and Liabilities, less any collateral held by the Fund.
As of January 31, 2013, the Fund invested a significant portion of its assets in securities in the financials sector. Changes in economic conditions affecting the financials sector would have a greater impact on the Fund and could affect the value, income and/or liquidity of positions in such securities.
8. Capital Share Transactions:
Transactions in capital shares for each class were as follows:
| | | | | | | | | | | | | | | | | | |
| | | Year Ended
January 31, 2013 | | | | | Year Ended
January 31, 2012 | |
| | | Shares | | | Amount | | | | | Shares | | | Amount | |
| Institutional | | | | | | | | | | | | | | |
Shares sold | | | 1,888,571 | | | $ | 34,730,587 | | | | | | 4,109,012 | | | $ | 70,370,880 | |
Shares issued to shareholders in reinvestment of dividends | | | 49,590 | | | | 896,458 | | | | | | 28,586 | | | | 530,557 | |
Shares redeemed | | | (2,108,196 | ) | | | (38,891,473 | ) | | | | | (2,221,075 | ) | | | (37,522,051 | ) |
| | | | | | | | | | |
Net increase (decrease) | | | (170,035 | ) | | $ | (3,264,428 | ) | | | | | 1,916,523 | | | $ | 33,379,386 | |
| | | | | | | | | | |
| | | | | | | | | | | | | | | | | | |
| Investor A | | | | | | | | | | | | | | |
Shares sold and automatic conversion of shares | | | 3,866,900 | | | $ | 69,098,382 | | | | | | 5,469,175 | | | $ | 94,004,870 | |
Shares issued to shareholders in reinvestment of dividends | | | 36,713 | | | | 646,934 | | | | | | 37,113 | | | | 671,759 | |
Shares redeemed | | | (3,587,308 | ) | | | (64,488,246 | ) | | | | | (3,939,272 | ) | | | (66,582,858 | ) |
| | | | | | | | | | |
Net increase | | | 316,305 | | | $ | 5,257,070 | | | | | | 1,567,016 | | | $ | 28,093,771 | |
| | | | | | | | | | |
| | | | | | | | | | | | | | | | | | |
| Investor B | | | | | | | | | | | | | | |
Shares sold | | | 15,377 | | | $ | 250,230 | | | | | | 30,429 | | | $ | 474,758 | |
Shares redeemed and automatic conversion of shares | | | (202,139 | ) | | | (3,271,140 | ) | | | | | (206,367 | ) | | | (3,218,072 | ) |
| | | | | | | | | | |
Net decrease | | | (186,762 | ) | | $ | (3,020,910 | ) | | | | | (175,938 | ) | | $ | (2,743,314 | ) |
| | | | | | | | | | |
| | | | | | | | | | | | | | | | | | |
| Investor C | | | | | | | | | | | | | | |
Shares sold | | | 484,576 | | | $ | 7,786,792 | | | | | | 737,500 | | | $ | 11,284,800 | |
Shares redeemed | | | (1,057,026 | ) | | | (16,909,232 | ) | | | | | (1,297,082 | ) | | | (19,790,286 | ) |
| | | | | | | | | | |
Net decrease | | | (572,450 | ) | | $ | (9,122,440 | ) | | | | | (559,582 | ) | | $ | (8,505,486 | ) |
| | | | | | | | | | |
| | | | | | | | | | | | | | | | | | |
| Class R | | | | | | | | | | | | | | |
Shares sold | | | 1,137,552 | | | $ | 18,985,817 | | | | | | 1,722,287 | | | $ | 27,355,609 | |
Shares redeemed | | | (1,516,976 | ) | | | (25,277,032 | ) | | | | | (2,696,984 | ) | | | (42,700,304 | ) |
| | | | | | | | | | |
Net decrease | | | (379,424 | ) | | $ | (6,291,215 | ) | | | | | (974,697 | ) | | $ | (15,344,695 | ) |
| | | | | | | | | | |
Total Net Increase (Decrease) | | | (992,366 | ) | | $ | (16,441,923 | ) | | | | | 1,773,322 | | | $ | 34,879,662 | |
| | | | | | | | | | |
9. Subsequent Events:
Management has evaluated the impact of all subsequent events on the Fund through the date the financial statements were issued and has determined that there were no subsequent events requiring adjustment or additional disclosure in the financial statements.
| | | | | | |
| | | | | | | |
| 24 | | BLACKROCK MID CAP VALUE OPPORTUNITIES FUND | | JANUARY 31,2013 | | |
| | |
| Report of Independent Registered Public Accounting Firm | | |
To the Shareholders of BlackRock Mid Cap Value Opportunities Fund and Board of Directors of BlackRock Mid Cap Value Opportunities Series, Inc.:
We have audited the accompanying statement of assets and liabilities of BlackRock Mid Cap Value Opportunities Fund (the “Fund”) of BlackRock Mid Cap Value Opportunities Series, Inc., including the schedule of investments, as of January 31, 2013, and the related statement of operations for the year then ended, the statements of changes in net assets for each of the two years in the period then ended, and the financial highlights for each of the five years in the period then ended. These financial statements and financial highlights are the responsibility of the Fund’s management. Our responsibility is to express an opinion on these financial statements and financial highlights based on our audits.
We conducted our audits in accordance with the standards of the Public Company Accounting Oversight Board (United States). Those standards require that we plan and perform the audit to obtain reasonable assurance about whether the financial statements and financial highlights are free of material misstatement. The Fund is not required to have, nor were we engaged to perform, an audit of its internal control over financial reporting. Our audits included consideration of internal control over financial reporting as a basis for designing audit procedures that are appropriate in the circumstances, but not for the purpose of expressing an opinion on the effectiveness of the Fund’s internal control over financial reporting. Accordingly, we express no such opinion. An audit also includes examining, on a test basis, evidence supporting the amounts and disclosures in the financial statements, assessing the accounting principles used and significant estimates made by management, as well as evaluating the overall financial statement presentation. Our procedures included confirmation of securities owned as of January 31, 2013, by correspondence with the custodian and brokers; where replies were not received from brokers, we performed other auditing procedures. We believe that our audits provide a reasonable basis for our opinion.
In our opinion, the financial statements and financial highlights referred to above present fairly, in all material respects, the financial position of BlackRock Mid Cap Value Opportunities Fund of BlackRock Mid Cap Value Opportunities Series, Inc. as of January 31, 2013, the results of its operations for the year then ended, the changes in its net assets for each of the two years in the period then ended, and the financial highlights for each of the five years in the period then ended, in conformity with accounting principles generally accepted in the United States of America.
Deloitte & Touche LLP
Boston, Massachusetts
March 27, 2013
Important Tax Information (Unaudited)
All of the ordinary income distributions paid by BlackRock Mid Cap Value Opportunities Fund of BlackRock Mid Cap Value Opportunities Series, Inc. during the fiscal year ended January 31, 2013 qualify for the dividends received deduction for corporations and consist entirely of qualified dividend income for individuals.
| | | | | | |
| | | | | | | |
| | BLACKROCK MID CAP VALUE OPPORTUNITIES FUND | | JANUARY 31, 2013 | | 25 |
| | | | | | | | | | |
Name, Address and Year of Birth | | Position(s) Held with Corporation | | Length of Time Served as a Director2 | | Principal Occupation(s) During Past Five Years | | Number of BlackRock-
Advised Registered
Investment Companies
(“RICs”) Consisting of
Investment Portfolios
(“Portfolios”) Overseen | | Public Directorships |
| Independent Directors1 |
Robert M. Hernandez 55 East 52nd Street New York, NY 10055 1944 | | Chairman of the Board and Director | | Since 2007 | | Director, Vice Chairman and Chief Financial Officer of USX Corporation (energy and steel business) from 1991 to 2001; Director, TE Connectivity (electronics) from 2006 to 2012. | | 29 RICs consisting of 83 Portfolios | | ACE Limited (insurance company); Eastman Chemical Company; RTI International Metals, Inc. (metals) |
Fred G. Weiss 55 East 52nd Street New York, NY 10055 1941 | | Vice Chairman of the Board and Director | | Since 2007 | | Managing Director, FGW Associates (consulting and investment company) since 1997; Director and Treasurer, Michael J. Fox Foundation for Parkinson’s Research since 2000; Director, BTG International Plc (medical technology commercialization company) from 2001 to 2007. | | 29 RICs consisting of 83 Portfolios | | Actavis, Inc. (pharmaceuticals) |
James H. Bodurtha 55 East 52nd Street New York, NY 10055 1944 | | Director | | Since 2002 | | Director, The China Business Group, Inc. (consulting and investing firm) since 1996 and Executive Vice President thereof from 1996 to 2003; Chairman of the Board, Berkshire Holding Corporation since 1980. | | 29 RICs consisting of 83 Portfolios | | None |
Bruce R. Bond 55 East 52nd Street New York, NY 10055 1946 | | Director | | Since 2007 | | Trustee and Member of the Governance Committee, State Street Research Mutual Funds from 1997 to 2005; Board Member of Governance, Audit and Finance Committee, Avaya Inc. (computer equipment) from 2003 to 2007. | | 29 RICs consisting of 83 Portfolios | | None |
Donald W. Burton 55 East 52nd Street New York, NY 10055 1944 | | Director | | Since 2007 | | Managing General Partner, The Burton Partnership, LP (an investment partnership) since 1979; Managing General Partner, The South Atlantic Venture Funds from 1983 to 2012; Director, IDology, Inc. (technology solutions) since 2006; Director, Knology, Inc. (telecommunications) from 1996 to 2012; Director, Capital Southwest from 2006 to 2012. | | 29 RICs consisting of 83 Portfolios | | None |
Honorable Stuart E. Eizenstat 55 East 52nd Street New York, NY 10055 1943 | | Director | | Since 2007 | | Partner and Head of International Practice, Covington and Burling LLP (law firm) since 2001; International Advisory Board Member, The Coca-Cola Company from 2002 to 2011; Advisory Board Member, Veracity Worldwide, LLC (risk management) since 2007; Member of the International Advisory Board GML Ltd. (energy) since 2003; Advisory Board Member, BT Americas (telecommunications) from 2004 to 2010. | | 29 RICs consisting of 83 Portfolios | | Alcatel-Lucent (tele- communications); Global Specialty Metallurgical; UPS Corporation (delivery service) |
Kenneth A. Froot 55 East 52nd Street New York, NY 10055 1957 | | Director | | Since 2005 | | Professor, Harvard University since 1992. | | 29 RICs consisting of 83 Portfolios | | None |
John F. O’Brien 55 East 52nd Street New York, NY 10055 1943 | | Director | | Since 2007 | | Chairman of the Corporation, Woods Hole Oceanographic Institute since 2009 and Trustee thereof from 2003 to 2009; Director, Ameresco, Inc. (energy solutions company) from 2006 to 2007. | | 29 RICs consisting of 83 Portfolios | | Cabot Corporation (chemicals); LKQ Corporation (auto parts manufacturing); TJX Companies, Inc. (retailer) |
Roberta Cooper Ramo 55 East 52nd Street New York, NY 10055 1942 | | Director | | Since 2002 | | Shareholder and attorney, Modrall, Sperling, Roehl, Harris & Sisk, P.A. (law firm) since 1993; Chairman of the Board, Cooper’s Inc. (retail) since 1999; Director, ECMC Group (service provider to students, schools and lenders) since 2001; President, The American Law Institute (non-profit) since 2008. | | 29 RICs consisting of 83 Portfolios | | None |
| | | | | | |
| | | | | | | |
| 26 | | BLACKROCK MID CAP VALUE OPPORTUNITIES FUND | | JANUARY 31, 2013 | | |
| | |
| Officers and Directors (continued) | | |
| | | | | | | | | | |
Name, Address and Year of Birth | | Position(s) Held with Corporation | | Length of Time Served as a Director2 | | Principal Occupation(s) During Past Five Years | | Number of BlackRock-
Advised Registered
Investment Companies
(“RICs”) Consisting of
Investment Portfolios
(“Portfolios”) Overseen | | Public Directorships |
| Independent Directors1 (concluded) |
David H. Walsh 55 East 52nd Street New York, NY 10055 1941 | | Director | | Since 2007 | | Director, National Museum of Wildlife Art since 2007; Trustee, University of Wyoming Foundation from 2008 to 2012; Director, Ruckelshaus Institute and Haub School of Natural Resources at the University of Wyoming from 2006 to 2008; Director, The American Museum of Fly Fishing since 1997. | | 29 RICs consisting of 83 Portfolios | | None |
| | 1 Each Independent Director holds office until his or her successor is duly elected and qualifies or until his or her earlier death, resignation or removal as provided by the Corporation’s by-laws or charter or statute. In no event may an Independent Director hold office beyond December 31 of the year in which he or she turns 74. |
| | 2 Date shown is the earliest date a person has served for the Corporation covered by this annual report. Following the combination of Merrill Lynch Investment Managers, L.P. (“MLIM”) and BlackRock, Inc. (“BlackRock”) in September 2006, the various legacy MLIM and legacy BlackRock Fund boards were realigned and consolidated into three new fund boards in 2007. As a result, although the chart shows certain Directors as joining the Corporation’s board in 2007, those Directors first became members of the boards of other legacy MLIM or legacy BlackRock Funds as follows: James H. Bodurtha, 1995; Bruce R. Bond, 2005; Donald W. Burton, 2002; Honorable Stuart E. Eizenstat, 2001; Kenneth A. Froot, 2005; Robert M. Hernandez, 1996; John F. O’Brien, 2004; Roberta Cooper Ramo, 1999; David H. Walsh, 2003; and Fred G. Weiss, 1998. |
| Interested Directors3 |
Paul L. Audet 55 East 52nd Street New York, NY 10055 1953 | | Director | | Since 2011 | | Senior Managing Director of BlackRock and Head of U.S. Mutual Funds since 2011; Chair of the U.S. Mutual Funds Committee reporting to the Global Executive Committee since 2011; Head of BlackRock’s Real Estate business from 2008 to 2011; Member of BlackRock’s Global Operating and Corporate Risk Management Committees and of the BlackRock Alternative Investors Executive Committee and Investment Committee for the Private Equity Fund of Funds business since 2008; Head of BlackRock’s Global Cash Management business from 2005 to 2010; Acting Chief Financial Officer of BlackRock from 2007 to 2008; Chief Financial Officer of BlackRock from 1998 to 2005. | | 155 RICs consisting of 278 Portfolios | | None |
Laurence D. Fink 55 East 52nd Street New York, NY 10055 1952 | | Director | | Since 2007 | | Chairman and Chief Executive Officer of BlackRock since its formation in 1998 and of BlackRock’s predecessor entities since 1988 and Chairman of the Executive and Management Committees; Formerly Managing Director, The First Boston Corp- oration, Member of its Management Committee, Co-head of its Taxable Fixed Income Division and Head of its Mortgage and Real Estate Products Group; Chairman of the Board of several of BlackRock’s alternative investment vehicles; Director of several of BlackRock’s offshore funds; Member of the Board of Trustees of New York University, Chair of the Financial Affairs Committee and a member of the Executive Committee, the Ad Hoc Committee on Board Governance, and the Committee on Trustees; Co-Chairman of the NYU Hospitals Center Board of Trustees, Chairman of the Development/Trustee Stewardship Committee and Chairman of the Finance Committee; Trustee, The Boys’ Club of New York. | | 29 RICs consisting of 83 Portfolios | | BlackRock |
Henry Gabbay 55 East 52nd Street New York, NY 10055 1947 | | Director | | Since 2007 | | Consultant, BlackRock from 2007 to 2008; Managing Director, BlackRock from 1989 to 2007; Chief Administrative Officer, BlackRock Advisors, LLC from 1998 to 2007; President of BlackRock Funds and BlackRock Bond Allocation Target Shares from 2005 to 2007 and Treasurer of certain closed-end funds in the BlackRock fund complex from 1989 to 2006. | | 155 RICs consisting of 278 Portfolios | | None |
| | 3 Messrs. Audet and Fink are both “interested persons,” as defined in the 1940 Act, of the Corporation based on their positions with BlackRock and its affiliates. Mr. Gabbay is an “interested person” of the Corporation based on his former positions with BlackRock and its affiliates as well as his ownership of BlackRock and The PNC Financial Services Group, Inc. securities. Mr. Audet and Mr. Gabbay are also Directors of the BlackRock registered closed-end funds and Directors of other BlackRock registered open-end funds. Interested Directors serve until their resignation, removal or death, or until December 31 of the year in which they turn 72. |
| | | | | | |
| | | | | | | |
| | BLACKROCK MID CAP VALUE OPPORTUNITIES FUND | | JANUARY 31, 2013 | | 27 |
| | |
| Officers and Directors (concluded) | | |
| | | | | | |
Name, Address and Year of Birth | | Position(s) Held with Corporation | | Length of Time Served | | Principal Occupation(s) During Past Five Years |
| Officers1 |
John Perlowski 55 East 52nd Street New York, NY 10055 1964 | | President and Chief Executive Officer | | Since 2010 | | Managing Director of BlackRock since 2009; Global Head of BlackRock Fund Administration since 2009; Managing Director and Chief Operating Officer of the Global Product Group at Goldman Sachs Asset Management, L.P. from 2003 to 2009; Treasurer of Goldman Sachs Mutual Funds from 2003 to 2009 and Senior Vice President thereof from 2007 to 2009; Director of Goldman Sachs Offshore Funds from 2002 to 2009; Director of Family Resource Network (charitable foundation) since 2009. |
Brendan Kyne 55 East 52nd Street New York, NY 10055 1977 | | Vice President | | Since 2009 | | Managing Director of BlackRock since 2010; Director of BlackRock from 2008 to 2009; Head of Product Development and Management for BlackRock’s U.S. Retail Group since 2009 and Co-head thereof from 2007 to 2009; Vice President of BlackRock from 2005 to 2008. |
Neal Andrews 55 East 52nd Street New York, NY 10055 1966 | | Chief Financial Officer | | Since 2007 | | Managing Director of BlackRock since 2006; Senior Vice President and Line of Business Head of Fund Accounting and Administration at PNC Global Investment Servicing (U.S.) Inc. from 1992 to 2006. |
Jay Fife 55 East 52nd Street New York, NY 10055 1970 | | Treasurer | | Since 2007 | | Managing Director of BlackRock since 2007; Director of BlackRock in 2006; Assistant Treasurer of the MLIM and Fund Asset Management, L.P. advised funds from 2005 to 2006; Director of MLIM Fund Services Group from 2001 to 2006. |
Brian Kindelan 55 East 52nd Street New York, NY 10055 1959 | | Chief Compliance Officer and Anti-Money Laundering Officer | | Since 2007 | | Chief Compliance Officer of the BlackRock-advised funds since 2007; Managing Director and Senior Counsel of BlackRock since 2005. |
Benjamin Archibald 55 East 52nd Street New York, NY 10055 1975 | | Secretary | | Since 2012 | | Director of BlackRock since 2010; Assistant Secretary to the funds from 2010 to 2012; General Counsel and Chief Operating Officer of Uhuru Capital Management from 2009 to 2010; Executive Director and Counsel of Goldman Sachs Asset Management from 2005 to 2009. |
| | 1 Officers of the Corporation serve at the pleasure of the Board. |
| | | Further information about the Corporation’s Officers and Directors is available in the Fund’s Statement of Additional Information, which can be obtained without charge by calling (800) 441-7762. |
| | | | | | | | |
Investment Advisor BlackRock Advisors, LLC Wilmington, DE 19809 | | Custodian The Bank of New York Mellon New York, NY 10286 | | Accounting Agent State Street Bank and Trust Company Boston, MA 02110 | | Legal Counsel Willkie Farr & Gallagher LLP New York, NY 10019 | | Address of the Fund 100 Bellevue Parkway Wilmington, DE 19809 |
| | | | |
Sub-Advisor BlackRock Investment Management, LLC Princeton, NJ 08540 | | Transfer Agent BNY Mellon Investment Servicing (US) Inc. Wilmington, DE 19809 | | Distributor BlackRock Investments, LLC New York, NY 10022 | | Independent Registered Public Accounting Firm Deloitte & Touche LLP Boston, MA 02116 | | |
| | | | | | |
| | | | | | | |
| 28 | | BLACKROCK MID CAP VALUE OPPORTUNITIES FUND | | JANUARY 31, 2013 | | |
Electronic Delivery
Electronic copies of most financial reports and prospectuses are available on the Fund’s website or shareholders can sign up for e-mail notifications of quarterly statements, annual and semi-annual reports and prospectuses by enrolling in the Fund’s electronic delivery program.
To enroll:
Shareholders Who Hold Accounts with Investment Advisors, Banks or Brokerages:
Please contact your financial advisor. Please note that not all investment advisors, banks or brokerages may offer this service.
Shareholders Who Hold Accounts Directly with BlackRock:
| 1) | Access the BlackRock website at |
| | http://www.blackrock.com/edelivery |
| 2) | Select “eDelivery” under the “More Information” section |
Householding
The Fund will mail only one copy of shareholder documents, including prospectuses, annual and semi-annual reports and proxy statements, to shareholders with multiple accounts at the same address. This practice is commonly called “householding” and is intended to reduce expenses and eliminate duplicate mailings of shareholder documents. Mailings of your shareholder documents may be householded indefinitely unless you instruct us otherwise. If you do not want the mailing of these documents to be combined with those for other members of your household, please call the Fund at (800) 441-7762.
Availability of Quarterly Schedule of Investments
The Fund files its complete schedule of portfolio holdings with the SEC for the first and third quarters of each fiscal year on Form N-Q. The Fund’s Forms N-Q are available on the SEC’s website at http://www.sec.gov and may also be reviewed and copied at the SEC’s Public Reference Room in Washington, DC. Information on how to access documents on the SEC’s website without charge may be obtained by calling (800) SEC-0330. The Fund’s Forms N-Q may also be obtained upon request and without charge by calling (800) 441-7762.
Availability of Proxy Voting Policies and Procedures
A description of the policies and procedures that the Fund uses to determine how to vote proxies relating to portfolio securities is available (1) without charge, upon request, by calling (800) 441-7762; (2) at http://www.blackrock.com; and (3) on the SEC’s website at http://www.sec.gov.
Availability of Proxy Voting Record
Information about how the Fund voted proxies relating to securities held in the Fund’s portfolio during the most recent 12-month period ended June 30 is available upon request and without charge (1) at http://www.blackrock.com or by calling (800) 441-7762 and (2) on the SEC’s website at http://www.sec.gov.
Account Information
Call us at (800) 441-7762 from 8:00 AM to 6:00 PM EST on any business day to get information about your account balances, recent transactions and share prices. You can also reach us on the Web at http://www.blackrock.com/funds.
Automatic Investment Plans
Investor Class shareholders who want to invest regularly can arrange to have $50 or more automatically deducted from their checking or savings account and invested in any of the BlackRock funds.
Systematic Withdrawal Plans
Investor Class shareholders can establish a systematic withdrawal plan and receive periodic payments of $50 or more from their BlackRock funds, as long as their account balance is at least $10,000.
Retirement Plans
Shareholders may make investments in conjunction with Traditional, Rollover, Roth, Coverdell, Simple IRAs, SEP IRAs and 403(b) Plans.
| | | | | | |
| | | | | | | |
| | BLACKROCK MID CAP VALUE OPPORTUNITIES FUND | | JANUARY 31, 2013 | | 29 |
| | |
| Additional Information (concluded) | | |
| | |
| BlackRock Privacy Principles | | |
BlackRock is committed to maintaining the privacy of its current and former fund investors and individual clients (collectively, “Clients”) and to safeguarding their non-public personal information. The following information is provided to help you understand what personal information BlackRock collects, how we protect that information and why in certain cases we share such information with select parties.
If you are located in a jurisdiction where specific laws, rules or regulations require BlackRock to provide you with additional or different privacy-related rights beyond what is set forth below, then BlackRock will comply with those specific laws, rules or regulations.
BlackRock obtains or verifies personal non-public information from and about you from different sources, including the following: (i) information we receive from you or, if applicable, your financial intermediary, on applications, forms or other documents; (ii) information about your transactions with us, our affiliates, or others; (iii) information we receive from a consumer reporting agency; and (iv) from visits to our websites.
BlackRock does not sell or disclose to non-affiliated third parties any non-public personal information about its Clients, except as permitted by law or as is necessary to respond to regulatory requests or to service Client accounts. These non-affiliated third parties are required to protect the confidentiality and security of this information and to use it only for its intended purpose.
We may share information with our affiliates to service your account or to provide you with information about other BlackRock products or services that may be of interest to you. In addition, BlackRock restricts access to non-public personal information about its Clients to those BlackRock employees with a legitimate business need for the information. BlackRock maintains physical, electronic and procedural safeguards that are designed to protect the non-public personal information of its Clients, including procedures relating to the proper storage and disposal of such information.
| | | | | | |
| | | | | | | |
| 30 | | BLACKROCK MID CAP VALUE OPPORTUNITIES FUND | | JANUARY 31, 2013 | | |
| | |
| A World-Class Mutual Fund Family | | |
BlackRock offers a diverse lineup of open-end mutual funds crossing all investment styles and managed by experts in equity, fixed income and tax-exempt investing.
BlackRock ACWI ex-US Index Fund
BlackRock All-Cap Energy & Resources Portfolio
BlackRock Basic Value Fund
BlackRock Capital Appreciation Fund
BlackRock China Fund
BlackRock Commodity Strategies Fund
BlackRock Disciplined Small Cap Core Fund
BlackRock Emerging Markets Fund
BlackRock Emerging Markets Long/Short Equity Fund
BlackRock Energy & Resources Portfolio
BlackRock Equity Dividend Fund
BlackRock EuroFund
BlackRock Flexible Equity Fund
BlackRock Focus Growth Fund
BlackRock Global Dividend Income Portfolio
BlackRock Global Long/Short Equity Fund
BlackRock Global Opportunities Portfolio
BlackRock Global SmallCap Fund
BlackRock Health Sciences Opportunities Portfolio
BlackRock Index Equity Portfolio
BlackRock India Fund
BlackRock International Fund
BlackRock International Index Fund
BlackRock International Opportunities Portfolio
BlackRock Large Cap Core Fund
BlackRock Large Cap Core Plus Fund
BlackRock Large Cap Growth Fund
BlackRock Large Cap Value Fund
BlackRock Latin America Fund
BlackRock Long-Horizon Equity Fund
BlackRock Mid-Cap Growth Equity Portfolio
BlackRock Mid Cap Value Opportunities Fund
BlackRock Natural Resources Trust
BlackRock Pacific Fund
BlackRock Real Estate Securities Fund
BlackRock Russell 1000 Index Fund
BlackRock Science & Technology Opportunities Portfolio
BlackRock Small Cap Growth Equity Portfolio
BlackRock Small Cap Growth Fund II
BlackRock Small Cap Index Fund
BlackRock S&P 500 Index Fund
BlackRock S&P 500 Stock Fund
BlackRock U.S. Opportunities Portfolio
BlackRock Value Opportunities Fund
BlackRock World Gold Fund
| | |
| Taxable Fixed Income Funds | | |
BlackRock Bond Index Fund
BlackRock Core Bond Portfolio
BlackRock CoreAlpha Bond Fund
BlackRock Emerging Market Local Debt Portfolio
BlackRock Floating Rate Income Portfolio
BlackRock Global Long/Short Credit Fund
BlackRock GNMA Portfolio
BlackRock High Yield Bond Portfolio
BlackRock Inflation Protected Bond Portfolio
BlackRock International Bond Portfolio
BlackRock Long Duration Bond Portfolio
BlackRock Low Duration Bond Portfolio
BlackRock Secured Credit Portfolio
BlackRock Strategic Income Opportunities Portfolio
BlackRock Total Return Fund
BlackRock U.S. Government Bond Portfolio
BlackRock U.S. Mortgage Portfolio
BlackRock World Income Fund
| | |
| Municipal Fixed Income Funds | | |
BlackRock California Municipal Bond Fund
BlackRock High Yield Municipal Fund
BlackRock Intermediate Municipal Fund
BlackRock National Municipal Fund
BlackRock New Jersey Municipal Bond Fund
BlackRock New York Municipal Bond Fund
BlackRock Pennsylvania Municipal Bond Fund
BlackRock Short-Term Municipal Fund
| | | | | | | | | | | | | | | | |
BlackRock Balanced Capital Fund | | LifePath Active Portfolios | | | | LifePath Index Portfolios |
BlackRock Global Allocation Fund | | | | 2015 | | 2040 | | | | | | | | Retirement | | 2040 |
BlackRock Managed Volatility Portfolio | | | | 2020 | | 2045 | | | | | | | | 2020 | | 2045 |
BlackRock Multi-Asset Income Portfolio | | | | 2025 | | 2050 | | | | | | | | 2025 | | 2050 |
BlackRock Multi-Asset Real Return Fund | | | | 2030 | | 2055 | | | | | | | | 2030 | | 2055 |
BlackRock Strategic Risk Allocation Fund | | | | 2035 | | | | | | | | | | 2035 | | |
| | | | | | | | | | | | | | | | |
| BlackRock Prepared Portfolios | | LifePath Portfolios | | | | | | | | |
Conservative Prepared Portfolio | | | | Retirement | | 2040 | | | | | | | | | | |
Moderate Prepared Portfolio | | | | 2020 | | 2045 | | | | | | | | | | |
Growth Prepared Portfolio | | | | 2025 | | 2050 | | | | | | | | | | |
Aggressive Growth Prepared Portfolio | | | | 2030 | | 2055 | | | | | | | | | | |
| | | | 2035 | | | | | | | | | | | | |
BlackRock mutual funds are currently distributed by BlackRock Investments, LLC. You should consider the investment objectives, risks, charges and expenses of the funds under consideration carefully before investing. Each fund’s prospectus contains this and other information and is available at www.blackrock.com or by calling (800) 441-7762 or from your financial advisor. The prospectus should be read carefully before investing.
| | | | | | |
| | | | | | | |
| | BLACKROCK MID CAP VALUE OPPORTUNITIES FUND | | JANUARY 31, 2013 | | 31 |
This report is transmitted to shareholders only. It is not authorized for use as an offer of sale or a solicitation of an offer to buy shares of the Fund unless accompanied or preceded by the Fund’s current prospectus. Past performance results shown in this report should not be considered a representation of future performance. Investment returns and principal value of shares will fluctuate so that shares, when redeemed, may be worth more or less than their original cost. Statements and other information herein are as dated and are subject to change.

| | |
| #MIDCAPVAL-1/13-AR | | |
| |
| |  |
| | | | |
| Item 2 | | – | | Code of Ethics – The registrant (or the “Fund”) has adopted a code of ethics, as of the end of the period covered by this report, applicable to the registrant’s principal executive officer, principal financial officer, principal accounting officer or controller, or persons performing similar functions. During the period covered by this report, there have been no amendments to or waivers granted under the code of ethics. A copy of the code of ethics is available without charge at www.blackrock.com. |
| | |
| Item 3 | | – | | Audit Committee Financial Expert – The registrant’s board of directors (the “board of directors”), has determined that (i) the registrant has the following audit committee financial experts serving on its audit committee and (ii) each audit committee financial expert is independent: Robert M. Hernandez Fred G. Weiss Stuart E. Eizenstat Under applicable securities laws, a person determined to be an audit committee financial expert will not be deemed an “expert” for any purpose, including without limitation for the purposes of Section 11 of the Securities Act of 1933, as a result of being designated or identified as an audit committee financial expert. The designation or identification of a person as an audit committee financial expert does not impose on such person any duties, obligations, or liabilities greater than the duties, obligations, and liabilities imposed on such person as a member of the audit committee and board of directors in the absence of such designation or identification. |
| | |
| Item 4 | | – | | Principal Accountant Fees and Services The following table presents fees billed by Deloitte & Touche LLP (“D&T”) in each of the last two fiscal years for the services rendered to the Fund: |
| | | | | | | | | | | | | | | | |
| | | (a) Audit Fees | | (b) Audit-Related Fees1 | | (c) Tax Fees2 | | (d) All Other Fees3 |
| Entity Name | | Current
Fiscal Year
End | | Previous
Fiscal Year
End | | Current
Fiscal Year
End | | Previous
Fiscal Year
End | | Current
Fiscal Year
End | | Previous
Fiscal Year
End | | Current
Fiscal Year
End | | Previous
Fiscal Year
End |
| | | | | | | | | | | | | | | | | |
| BlackRock Mid Cap Value Opportunities Fund of BlackRock Mid Cap Value Opportunities Series, Inc. | | $29,863 | | $29,600 | | $0 | | $400 | | $12,850 | | $12,350 | | $0 | | $0 |
| | | | |
| | | | The following table presents fees billed by D&T that were required to be approved by the registrant’s audit committee (the “Committee”) for services that relate directly to the operations or financial reporting of the Fund and that are rendered on behalf of BlackRock Advisors, LLC (“Investment Adviser” or “BlackRock”) and entities controlling, controlled by, or under common control with BlackRock (not including any sub-adviser whose role is primarily portfolio management and is subcontracted with or overseen by another investment adviser) that provide ongoing services to the Fund (“Fund Service Providers”): |
| | | | |
| | | Current Fiscal Year End | | Previous Fiscal Year End |
(b) Audit-Related Fees1 | | $0 | | $0 |
(c) Tax Fees2 | | $0 | | $0 |
(d) All Other Fees3 | | $2,865,000 | | $2,970,000 |
2
1 The nature of the services includes assurance and related services reasonably related to the performance of the audit of financial statements not included in Audit Fees.
2 The nature of the services includes tax compliance, tax advice and tax planning.
3 Aggregate fees borne by BlackRock in connection with the review of compliance procedures and attestation thereto performed by D&T with respect to all of the registered closed-end funds and some of the registered open-end funds advised by BlackRock.
| | | | |
(e)(1) Audit Committee Pre-Approval Policies and Procedures: |
| | | | The Committee has adopted policies and procedures with regard to the pre-approval of services. Audit, audit-related and tax compliance services provided to the registrant on an annual basis require specific pre-approval by the Committee. The Committee also must approve other non-audit services provided to the registrant and those non-audit services provided to the Investment Adviser and Fund Service Providers that relate directly to the operations and the financial reporting of the registrant. Certain of these non-audit services that the Committee believes are (a) consistent with the SEC’s auditor independence rules and (b) routine and recurring services that will not impair the independence of the independent accountants may be approved by the Committee without consideration on a specific case-by-case basis (“general pre-approval”). The term of any general pre-approval is 12 months from the date of the pre-approval, unless the Committee provides for a different period. Tax or other non-audit services provided to the registrant which have a direct impact on the operations or financial reporting of the registrant will only be deemed pre-approved provided that any individual project does not exceed $10,000 attributable to the registrant or $50,000 per project. For this purpose, multiple projects will be aggregated to determine if they exceed the previously mentioned cost levels. |
| | |
| | | | Any proposed services exceeding the pre-approved cost levels will require specific pre-approval by the Committee, as will any other services not subject to general pre-approval (e.g., unanticipated but permissible services). The Committee is informed of each service approved subject to general pre-approval at the next regularly scheduled in-person board meeting. At this meeting, an analysis of such services is presented to the Committee for ratification. The Committee may delegate to the Committee Chairman the authority to approve the provision of and fees for any specific engagement of permitted non-audit services, including services exceeding pre-approved cost levels. |
| | |
| | | | (e)(2) None of the services described in each of Items 4(b) through (d) were approved by the Committee pursuant to the de minimus exception in paragraph (c)(7)(i)(C) of Rule 2-01 of Regulation S-X. |
| | |
| | | | (f) Not Applicable |
| | |
| | | | (g) The aggregate non-audit fees paid to the accountant for services rendered by the accountant to the registrant, the Investment Adviser and the Fund Service Providers were: |
| | | | | | |
| Entity Name | | Current Fiscal Year End | | Previous Fiscal Year End | | |
| | | | | | |
| BlackRock Mid Cap Value Opportunities Fund of BlackRock Mid Cap Value Opportunities Series, Inc. | | $12,850 | | $12,350 | |
| | | | |
| | |
| | | | Additionally, SSAE 16 Review (Formerly, SAS No. 70) fees for the current and previous fiscal years of $2,865,000 and $2,970,000, respectively, were billed by D&T to the Investment Adviser. |
3
| | | | |
| | | | (h) The Committee has considered and determined that the provision of non-audit services that were rendered to the Investment Adviser and the Fund Service Providers that were not pre-approved pursuant to paragraph (c)(7)(ii) of Rule 2-01 of Regulation S-X is compatible with maintaining the principal accountant’s independence. |
| | |
| Item 5 | | – | | Audit Committee of Listed Registrants – Not Applicable |
| | |
| Item 6 | | – | | Investments |
| | | | (a) The registrant’s Schedule of Investments is included as part of the Report to Stockholders filed under Item 1 of this Form. |
| | | | (b) Not Applicable due to no such divestments during the semi-annual period covered since the previous Form N-CSR filing. |
| | |
| Item 7 | | – | | Disclosure of Proxy Voting Policies and Procedures for Closed-End Management Investment Companies – Not Applicable |
| | |
| Item 8 | | – | | Portfolio Managers of Closed-End Management Investment Companies – Not Applicable |
| | |
| Item 9 | | – | | Purchases of Equity Securities by Closed-End Management Investment Company and Affiliated Purchasers – Not Applicable |
| | |
| Item 10 | | – | | Submission of Matters to a Vote of Security Holders – There have been no material changes to these procedures. |
| | |
| Item 11 | | – | | Controls and Procedures |
| | |
| | | | (a) The registrant’s principal executive and principal financial officers, or persons performing similar functions, have concluded that the registrant’s disclosure controls and procedures (as defined in Rule 30a-3(c) under the Investment Company Act of 1940, as amended (the “1940 Act”)) are effective as of a date within 90 days of the filing of this report based on the evaluation of these controls and procedures required by Rule 30a-3(b) under the 1940 Act and Rule 15d-15(b) under the Securities Exchange Act of 1934, as amended. |
| | |
| | | | (b) There were no changes in the registrant’s internal control over financial reporting (as defined in Rule 30a-3(d) under the 1940 Act) that occurred during the second fiscal quarter of the period covered by this report that have materially affected, or are reasonably likely to materially affect, the registrant’s internal control over financial reporting. |
| | |
| Item 12 | | – | | Exhibits attached hereto |
| | |
| | | | (a)(1) Code of Ethics – See Item 2 |
| | |
| | | | (a)(2) Certifications – Attached hereto |
| | |
| | | | (a)(3) Not Applicable |
| | |
| | | | (b) Certifications – Attached hereto |
4
Pursuant to the requirements of the Securities Exchange Act of 1934 and the Investment Company Act of 1940, the registrant has duly caused this report to be signed on its behalf by the undersigned, thereunto duly authorized.
BlackRock Mid Cap Value Opportunities Fund of BlackRock Mid Cap Value Opportunities Series, Inc.
| | |
| By: | | /s/ John M. Perlowski |
|
John M. Perlowski |
Chief Executive Officer (principal executive officer) of |
|
BlackRock Mid Cap Value Opportunities Fund of BlackRock Mid Cap Value Opportunities Series, Inc. |
Date: April 3, 2013
Pursuant to the requirements of the Securities Exchange Act of 1934 and the Investment Company Act of 1940, this report has been signed below by the following persons on behalf of the registrant and in the capacities and on the dates indicated.
| | |
| By: | | /s/ John M. Perlowski |
|
John M. Perlowski |
Chief Executive Officer (principal executive officer) of |
|
BlackRock Mid Cap Value Opportunities Fund of BlackRock Mid Cap Value Opportunities Series, Inc. |
Date: April 3, 2013
|
Neal J. Andrews |
Chief Financial Officer (principal financial officer) of |
|
BlackRock Mid Cap Value Opportunities Fund of BlackRock Mid Cap Value Opportunities Series, Inc. |
Date: April 3, 2013
5