As filed with the Securities and Exchange Commission on September 3rd, 2014
UNITED STATES
SECURITIES AND EXCHANGE COMMISSION
Washington, D.C. 20549
FORM N-CSR
CERTIFIED SHAREHOLDER REPORT OF REGISTERED
MANAGEMENT INVESTMENT COMPANIES
Investment Company Act file number 811-8352
LKCM Funds
(Exact name of registrant as specified in charter)
c/o Luther King Capital Management Corporation
301 Commerce Street, Suite 1600
Fort Worth, TX 76102
(Address of principal executive offices) (Zip code)
K&L Gates LLP
1601 K Street, NW
Washington, DC 20006
(Name and address of agent for service)
1-800-688-LKCM and 1-800-423-6369
Registrant’s telephone number, including area code
Date of fiscal year end: December 31
Date of reporting period: June 30, 2014
Item 1. Report to Stockholders.
1
LKCM
FUNDS
LKCM Small Cap Equity Fund
LKCM Small-Mid Cap Equity Fund
LKCM Equity Fund
LKCM Balanced Fund
LKCM Fixed Income Fund
Semi-Annual Report
June 30, 2014
Dear Fellow Shareholders:
We report the following performance information for the LKCM Funds:
| | | | | | | | | | | | | | | | | | | | | | | | | | | | | | | | | | | | |
Funds | | Inception
Date | | | NAV @
6/30/14 | | | Net
Expense
Ratio*, ** | | | Gross
Expense
Ratio** | | | Six Month
Total
Return
Ended
6/30/14 | | | One Year
Total
Return
Ended
6/30/14 | | | Five Year
Average
Annualized
Return
Ended
6/30/14 | | | Ten Year
Average
Annualized
Return
Ended
6/30/14 | | | Avg.
Annual
Total
Return
Since
Incept. | |
LKCM Equity Fund - | | | | | | | | | | | | | | | | | | | | | | | | | | | | | | | | | | | | |
Institutional Class | | | 1/3/96 | | | $ | 23.61 | | | | 0.81% | | | | 0.94% | | | | 5.21% | | | | 22.35% | | | | 18.46% | | | | 8.68% | | | | 8.70% | |
S&P 500® Index1 | | | | | | | | | | | | | | | | | | | 7.14% | | | | 24.61% | | | | 18.83% | | | | 7.78% | | | | 8.40% | |
LKCM Small Cap Equity Fund - | | | | | | | | | | | | | | | | | | | | | | | | | | | | | | | | | | | | |
Institutional Class | | | 7/14/94 | | | $ | 28.12 | | | | N/A | | | | 0.95% | | | | -0.74% | | | | 19.75% | | | | 20.12% | | | | 8.88% | | | | 11.49% | |
Russell 2000® Index2 | | | | | | | | | | | | | | | | | | | 3.19% | | | | 23.64% | | | | 20.21% | | | | 8.70% | | | | 9.71% | |
LKCM Small Cap Equity Fund - | | | | | | | | | | | | | | | | | | | | | | | | | | | | | | | | | | | | |
Adviser Class | | | 6/5/03 | | | $ | 27.19 | | | | N/A | | | | 1.20% | | | | -0.87% | | | | 19.45% | | | | 19.82% | | | | 8.61% | | | | 10.82% | |
Russell 2000® Index2 | | | | | | | | | | | | | | | | | | | 3.19% | | | | 23.64% | | | | 20.21% | | | | 8.70% | | | | 10.50% | |
LKCM Small-Mid Cap Equity Fund - | | | | | | | | | | | | | | | | | | | | | | | | | | | | | | | | | | | | |
Institutional Class | | | 5/2/11 | | | $ | 12.99 | | | | 1.01% | | | | 1.19% | | | | 0.15% | | | | 23.48% | | | | N/A | | | | N/A | | | | 8.60% | |
Russell 2500® Index3 | | | | | | | | | | | | | | | | | | | 5.95% | | | | 25.58% | | | | N/A | | | | N/A | | | | 13.39% | |
LKCM Balanced Fund | | | 12/30/97 | | | $ | 20.38 | | | | 0.80% | | | | 1.04% | | | | 4.60% | | | | 17.84% | | | | 13.94% | | | | 8.00% | | | | 6.58% | |
S&P 500® Index1 | | | | | | | | | | | | | | | | | | | 7.14% | | | | 24.61% | | | | 18.83% | | | | 7.78% | | | | 6.29% | |
Barclays U.S. Intermediate | | | | | | | | | | | | | | | | | | | | | | | | | | | | | | | | | | | | |
Government/Credit Bond Index4 | | | | | | | | | | | | | | | | | | | 2.25% | | | | 2.86% | | | | 4.09% | | | | 4.33% | | | | 5.14% | |
LKCM Fixed Income Fund | | | 12/30/97 | | | $ | 11.01 | | | | 0.65% | | | | 0.72% | | | | 1.86% | | | | 2.91% | | | | 4.43% | | | | 4.54% | | | | 4.93% | |
Barclays U.S. Intermediate | | | | | | | | | | | | | | | | | | | | | | | | | | | | | | | | | | | | |
Government/Credit Bond Index4 | | | | | | | | | | | | | | | | | | | 2.25% | | | | 2.86% | | | | 4.09% | | | | 4.33% | | | | 5.14% | |
Performance data quoted represents past performance and does not guarantee future results. The investment return and principal value of an investment will fluctuate so that an investor’s shares, when redeemed, may be worth more or less than the original cost. Current performance of the Fund may be lower or higher than the performance quoted. Performance data current to the most recent month end may be obtained by calling 1-800-688-LKCM. The Funds impose a 1.00% redemption fee on shares held less than 30 days. If reflected, the fee would reduce performance shown.
| * | Luther King Capital Management Corporation, the Funds’ adviser, has contractually agreed to waive all or a portion of its management fee and/or reimburse the Fund to maintain designated expense ratios through April 30, 2015. This expense limitation excludes interest, taxes, brokerage commissions, indirect fees and expenses related to investments in other investment companies, including money market funds, and extraordinary expenses. Investment performance reflects fee waivers, if any, in effect. In the absence of such waivers, total return would be reduced. Investment performance is based upon the net expense ratio. |
| ** | Expense ratios above are as of December 31, 2013, the Funds’ prior fiscal year end, as reported in the Funds’ current prospectus. Expense ratios reported for other periods in the financial highlights of this report for the Funds’ fiscal year ended December 31, 2013 may differ. |
| 1 | The S&P 500® Index is an unmanaged capitalization-weighted index of 500 stocks designed to measure performance of the broad domestic economy through changes in the aggregate market value of 500 stocks representing all major industries. |
| 2 | The Russell 2000® Index is an unmanaged index which measures the performance of the 2,000 smallest companies in the Russell 3000® Index. |
| 3 | The Russell 2500® Index is an unmanaged index which measures the performance of the 2,500 smallest companies in the Russell 3000® Index. |
| 4 | The Barclays U.S. Intermediate Government/Credit Bond Index is an unmanaged market value weighted index measuring both the principal price changes of, and income provided by, the underlying universe of securities that comprise the index. Securities included in the index must meet the following criteria: fixed as opposed to variable rate; remaining maturity of one to ten years; minimum outstanding par value of $250 million; rated investment grade or higher by Moody’s Investors Service or equivalent; must be dollar denominated and non-convertible; and must be publicly issued. |
Note: These indices defined above are not available for direct investment and the index performance therefore does not include expenses.
2014 Review
During the first half of the year, investors continue to favor stocks that looked like bonds and bonds that looked like stocks. The best performing sector of the Standard & Poor’s 500® Index for the first half of the year was the Utilities sector (a sector the Funds are normally underweight) which we believe reflects investor appetite for dividend income rather than an expression of an undervalued sector. In the fixed income marketplace, high yield corporate bonds continued to outperform their investment grade counterparts during the first half of the year. The strong performance of high yield bonds warrants close watch from the vantage of both equity and fixed income investors. Investors have bid up the price of high yield bonds to the point that yields have dropped meaningfully, as the yield premium for corporations with higher financial risk relative to investment grade companies has meaningfully narrowed. In essence, the combined forces of the Federal Reserve and the global savings glut have, in our view, contributed to a low cost of capital for companies, regardless of financial risk profile.
2
Equity markets, as measured by the Standard & Poor’s 500® Index, posted solid returns and we believe now reflect a valuation that aligns more closely with our near-term growth prospects for the economy. Low volatility continued to be a hallmark of the current environment. Not only do interest rates and oil prices demonstrate low volatility, but the Standard & Poor’s 500® Index finished the second quarter with fifty-one consecutive days with a daily price change of less than one percent. The last time we witnessed such a streak was 1995. More broadly, the equity markets, as measured by the Standard & Poor’s Index, have not experienced a double digit correction since 2012.
Near-zero interest rate monetary policy at home and abroad continued to hamper investors’ hunt for yield. Because this dynamic has implications for both equity and fixed income markets, investors are currently on “rate watch” as central banks begin to condition markets for higher rates through forward guidance. In the interim, corporate earnings continued to grow at a high single digit pace that we consider supportive of the market’s current rate of appreciation. While we do not believe the low volatility in equities, interest rates, and energy is concerning, we would not be surprised to see greater volatility going forward possibly at the actual time of interest rate hikes expected next year.
LKCM Equity Fund
The LKCM Equity Fund returned 5.21% for the six months ended June 30, 2014 against the 7.14% return for the Fund’s benchmark, the Standard & Poor’s 500® Index for the same period. The Fund benefited from stock selection in the Consumer Staples and Materials sectors but this was more than offset by our stock selection in the Consumer Discretionary, Energy and Financial Sectors. Our underweight position in the Utilities sector also had a negative impact on returns as companies in this sector benefited from investors seeking yield in response to lower bond yields. We believe the Fund can benefit in the future from our investment in what we view as higher quality companies identified by our investment strategy.
LKCM Small Cap Equity Fund
The LKCM Small Cap Equity Fund Institutional Class declined 0.74% for the six months ended June 30, 2014 against the 3.19% return for the Fund’s benchmark, the Russell 2000® Index during the same period. During the period, both our stock selection and sector allocation decisions detracted from results. Positive stock selection in the Energy sector was more than offset by weakness in the Technology, Industrials and Financials sectors. Sector allocation decisions were a marginal drag with our underweight in the Utilities sector accounting for much of the shortfall. Our investment strategy for the Fund focuses on higher quality companies and it had difficulty overcoming two powerful forces that we believe continued to drive the markets: “reach for yield” and focus on lower quality companies. We continue to have an economic growth focus in the Fund’s portfolio and believe the Fund can benefit from an expanding economy.
LKCM Small-Mid Cap Equity Fund
The LKCM Small-Mid Cap Equity Fund returned 0.15% for the six months ended June 30, 2014 against the 5.95% return of the Fund’s benchmark, the Russell 2500® Index during the same period. During the period, both our stock selection and sector allocation decisions detracted from results. Positive stock selection in the Energy and Materials sectors was more than offset by weakness in the Technology, Consumer Discretionary and Financials sectors. Sector allocation decisions were a marginal drag with our underweight in the Utilities sector accounting for much of the shortfall. Our investment strategy for the Fund focuses on what we view as higher quality companies and it had difficulty overcoming two powerful forces that we believe continued to drive the markets: “reach for yield” and focus on lower quality companies. We continue to have an economic growth focus in the Fund’s portfolio and believe the Fund can benefit from an expanding economy.
LKCM Fixed Income Fund
The LKCM Fixed Income Fund lagged its benchmark, the Barclays Intermediate Government/Credit Bond Index, during the six months ended June 30, 2014, advancing 1.86% versus 2.25% for the benchmark. During this period, the yield curve flattened as interest rates rose on the short end and declined in both the intermediate and long end of the curve. This flattening trend was a reversal of the steepening experienced throughout 2013 and led to longer duration issues outperforming their shorter duration counterparts. As a result, the Fund’s 3.0 year defensive duration posture, relative to the 3.9 year duration for the benchmark, was the primary contributor detracting from performance as interest rates on intermediate and longer-dated securities declined and prices rose. The Fund’s overweight position in the corporate bond sector, relative to the benchmark, was additive to performance as credit spreads tightened in the first half of the year and corporate bonds outperformed government bonds. In addition, the Fund’s relative exposure to fixed income securities with ratings of BBB as well as BB, was additive to performance as those securities outperformed the benchmark.
LKCM Balanced Fund
The LKCM Balanced Fund advanced 4.60% for the six months ended June 30, 2014 against the 7.14% return for the Standard & Poor’s 500® Index and the 2.25% return for the Barclays U.S. Intermediate Government/Credit Bond Index during the same period. Both the equity as well as the fixed income sectors of the Fund’s portfolio generated positive returns during the period. The equity sector was led by stock selection in Energy, Consumer Staples and Consumer Discretionary sectors, while stock selection in the Information Technology sector posted positive absolute returns but lagged the benchmark. We believe the fixed income portion of the Fund’s portfolio remains
3
conservatively positioned from a maturity and quality standpoint. The Fund’s investment objective emphasizes current income and long-term capital appreciation, and the Fund invests in a blend of equity securities, fixed income securities and cash and cash equivalents in an effort to attain the desired risk/reward profile.
J. Luther King, Jr., CFA, CIC
August 12, 2014
The information provided herein represents the opinion of J. Luther King, Jr., CFA, CIC and is not intended to be a forecast of future events, a guarantee of future results, nor investment advice.
Please refer to the Schedule of Investments found on pages 8-21 of the report for more information on Fund holdings. Fund holdings and sector allocations are subject to change and are not recommendations to buy or sell any securities.
Mutual fund investing involves risk. Principal loss is possible. Past performance is not a guarantee of future results. Small and medium capitalization funds typically carry additional risks, since smaller companies generally have a higher risk of failure, and, historically, their stocks have experienced a greater degree of market volatility than stocks on average. Investments in debt securities typically decrease in value when interest rates rise. This risk is greater for longer-term debt securities. Investments in Mortgage Backed Securities include additional risks that investors should be aware of such as credit risk, prepayment risk, possible illiquidity and default, as well as increased susceptibility to adverse economic developments. These risks are discussed in the Fund’s summary and statutory prospectuses.
Duration is a commonly used measure of the potential volatility of the price of a debt security, or the aggregate market value of a portfolio of debt securities, prior to maturity. Securities with a longer duration generally have more volatile prices than securities of comparable quality with a shorter duration.
BBB and BB refer to bond ratings. Bond ratings are grades given to bonds that indicate their credit quality as determined by private independent rating services such as Standard & Poor’s, Moody’s and Fitch. These firms evaluate a bond issuer’s financial strength, or its ability to pay a bond’s principal and interest in a timely fashion. Ratings are expressed as letters ranging from ‘AAA’, which is the highest grade, to ‘D’, which is the lowest grade.
Stocks and bonds are not guaranteed. Bonds traditionally experience less volatility than stocks but have less growth potential. High yield bonds are subject to certain risks including market, greater price volatility, credit, liquidity, issuer, interest-rate, and inflation. Lower-rated and non-rated securities involve greater risk than higher rated securities. Stocks, investment grade bonds and high yield bonds as well as other asset classes have different risk profiles which should be considered when investing. High yield securities have greater price volatility and credit and liquidity risks (presenting a greater risk of loss to principal and interest) than other higher-rated, investment grade securities.
Must be preceded or accompanied by a prospectus.
Quasar Distributors, LLC, distributor.
4
LKCM Funds Expense Example — June 30, 2014 (Unaudited)
As a shareholder of the Funds, you incur two types of costs: (1) transaction costs, including redemption fees; and (2) ongoing costs, including management fees, distribution and/or service (12b-1) fees and other Fund expenses. This Example is intended to help you understand your ongoing costs (in dollars) of investing in the Funds and to compare these costs with the ongoing costs of investing in other mutual funds. The Example is based on an investment of $1,000 invested at the beginning of the period and held for the entire period (1/1/14-/6/30/14).
ACTUAL EXPENSES
The first line of the tables below provides information about actual account values and actual expenses. Although the Funds charge no sales load, you will be assessed fees for outgoing wire transfers, returned checks and stop payment orders at prevailing rates charged by U.S. Bancorp Fund Services, LLC, the Funds’ transfer agent. If you request that a redemption be made by wire transfer, currently a $15.00 fee is charged by the Funds’ transfer agent. You will be charged a redemption fee equal to 1.00% of the net amount of the redemption if you redeem your shares of the LKCM Small Cap Equity, Small-Mid Cap Equity, Equity, Balanced and Fixed Income Funds within 30 days of purchase, unless otherwise determined by the Funds in their discretion. To the extent the Funds invest in shares of other investment companies as part of their investment strategies, you will indirectly bear your proportionate share of any fees and expenses charged by the underlying funds in which the Funds invest in addition to the expenses of the Funds. Actual expenses of the underlying funds are expected to vary among the various underlying funds. These expenses are not included in the example below. The example below includes management fees, registration fees and other expenses. However, the example below does not include portfolio trading commissions and related expenses and other extraordinary expenses as determined under generally accepted accounting principles. You may use the information in this line, together with the amount you invested, to estimate the expenses that you paid over the period. Simply divide your account value by $1,000 (for example, an $8,600 account value divided by $1,000 = 8.6), then multiply the result by the number in the first line under the heading entitled “Expenses Paid During Period” to estimate the expenses you paid on your account during this period.
HYPOTHETICAL EXAMPLES FOR COMPARISON PURPOSES
The second line of the tables below provides information about hypothetical account values and hypothetical expenses based on the Funds’ actual expense ratios and an assumed rate of return of 5% per year before expenses, which are not the Funds’ actual returns. The hypothetical account values and expenses may not be used to estimate the actual ending account balance or expenses you paid for the period. You may use this information to compare the ongoing costs of investing in the Funds and other funds. To do so, compare this 5% hypothetical example with the 5% hypothetical examples that appear in the shareholder reports of the other funds. Please note that the expenses shown in the table are meant to highlight your ongoing costs only and do not reflect any transactional costs, such as redemption fees. Therefore, the second line of the table is useful in comparing ongoing costs only, and will not help you determine the relative total costs of owning different funds. In addition, if these transactions costs were included, your costs would have been higher.
| | | | | | | | | | | | |
| | | LKCM Small Cap Equity Fund – Institutional Class | |
| | | Beginning
Account Value
1/1/14 | | | Ending
Account Value
6/30/14 | | | Expenses Paid
During the Period*
1/1/14–6/30/14 | |
Actual | | $ | 1,000.00 | | | $ | 992.60 | | | $ | 4.64 | |
Hypothetical (5% return before expense) | | $ | 1,000.00 | | | $ | 1,020.13 | | | $ | 4.71 | |
| * | Expenses are equal to the Fund’s annualized net expense ratio of 0.94%, multiplied by the average account value over the period, multiplied by 181/365 to reflect the one-half year period. |
| | | | | | | | | | | | |
| | | LKCM Small Cap Equity Fund – Adviser Class | |
| | | Beginning
Account Value
1/1/14 | | | Ending
Account Value
6/30/14 | | | Expenses Paid
During the Period*
1/1/14–6/30/14 | |
Actual | | $ | 1,000.00 | | | $ | 991.30 | | | $ | 5.88 | |
Hypothetical (5% return before expense) | | $ | 1,000.00 | | | $ | 1,018.89 | | | $ | 5.96 | |
| * | Expenses are equal to the Fund’s annualized net expense ratio of 1.19%, multiplied by the average account value over the period, multiplied by 181/365 to reflect the one-half year period. |
5
| | | | | | | | | | | | |
| | | LKCM Small-Mid Cap Equity Fund | |
| | | Beginning
Account Value
1/1/14 | | | Ending
Account Value
6/30/14 | | | Expenses Paid
During the Period*
1/1/14–6/30/14 | |
Actual | | $ | 1,000.00 | | | $ | 1,001.50 | | | $ | 4.96 | |
Hypothetical (5% return before expense) | | $ | 1,000.00 | | | $ | 1,019.84 | | | $ | 5.01 | |
| * | Expenses are equal to the Fund’s annualized net expense ratio of 1.00%, multiplied by the average account value over the period, multiplied by 181/365 to reflect the one-half year period. |
| | | | | | | | | | | | |
| | | LKCM Equity Fund | |
| | | Beginning
Account Value
1/1/14 | | | Ending
Account Value
6/30/14 | | | Expenses Paid
During the Period*
1/1/14–6/30/14 | |
Actual | | $ | 1,000.00 | | | $ | 1,052.10 | | | $ | 4.07 | |
Hypothetical (5% return before expense) | | $ | 1,000.00 | | | $ | 1,020.83 | | | $ | 4.01 | |
| * | Expenses are equal to the Fund’s annualized net expense ratio of 0.80%, multiplied by the average account value over the period, multiplied by 181/365 to reflect the one-half year period. |
| | | | | | | | | | | | |
| | | LKCM Balanced Fund | |
| | | Beginning
Account Value
1/1/14 | | | Ending
Account Value
6/30/14 | | | Expenses Paid
During the Period*
1/1/14–6/30/14 | |
Actual | | $ | 1,000.00 | | | $ | 1,046.00 | | | $ | 4.06 | |
Hypothetical (5% return before expense) | | $ | 1,000.00 | | | $ | 1,020.83 | | | $ | 4.01 | |
| * | Expenses are equal to the Fund’s annualized net expense ratio of 0.80%, multiplied by the average account value over the period, multiplied by 181/365 to reflect the one-half year period. |
| | | | | | | | | | | | |
| | | LKCM Fixed Income Fund | |
| | | Beginning
Account Value
1/1/14 | | | Ending
Account Value
6/30/14 | | | Expenses Paid
During the Period*
1/1/14–6/30/14 | |
Actual | | $ | 1,000.00 | | | $ | 1,018.60 | | | $ | 3.25 | |
Hypothetical (5% return before expense) | | $ | 1,000.00 | | | $ | 1,021.57 | | | $ | 3.26 | |
| * | Expenses are equal to the Fund’s annualized net expense ratio of 0.65%, multiplied by the average account value over the period, multiplied by 181/365 to reflect the one-half year period. |
6
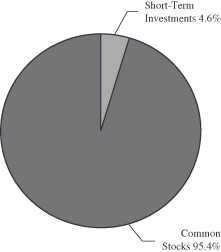
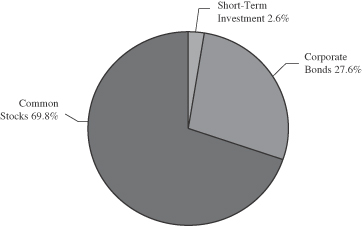
ALLOCATION OF PORTFOLIO HOLDINGS — LKCM Funds — June 30, 2014 (Unaudited)
Percentages represent market value as a percentage of total investments.
LKCM Small Cap Equity Fund
LKCM Equity Fund
LKCM Fixed Income Fund
LKCM Small-Mid Cap Equity Fund
LKCM Balanced Fund
7
|
| LKCM SMALL CAP EQUITY FUND |
| SCHEDULEOF INVESTMENTS |
| June 30, 2014 (Unaudited) |
| | | | | | | | |
| COMMON STOCKS - 97.1% | | Shares | | | Value | |
Aerospace & Defense - 2.5% | | | | | | | | |
Hexcel Corporation (a) | | | 298,160 | | | $ | 12,194,744 | |
Teledyne Technologies Incorporated (a) | | | 143,915 | | | | 13,984,221 | |
| | | | | | | | |
| | | | | | | 26,178,965 | |
| | | | | | | | |
Auto Components - 1.0% | | | | | | | | |
Dorman Products, Inc. (a) | | | 211,310 | | | | 10,421,809 | |
| | | | | | | | |
Automobiles - 1.9% | | | | | | | | |
Thor Industries, Inc. | | | 177,397 | | | | 10,088,567 | |
Winnebago Industries, Inc. (a) | | | 374,911 | | | | 9,440,259 | |
| | | | | | | | |
| | | | | | | 19,528,826 | |
| | | | | | | | |
Banks - 9.1% | | | | | | | | |
BancorpSouth, Inc. | | | 628,474 | | | | 15,441,606 | |
Columbia Banking System, Inc. | | | 478,240 | | | | 12,582,494 | |
Community Bank System, Inc. | | | 224,915 | | | | 8,141,923 | |
Hancock Holding Company | | | 251,750 | | | | 8,891,810 | |
Hanmi Financial Corporation | | | 432,595 | | | | 9,119,103 | |
Home Bancshares Inc. | | | 460,338 | | | | 15,108,293 | |
Prosperity Bancshares, Inc. | | | 174,560 | | | | 10,927,456 | |
Texas Capital Bancshares, Inc. (a) | | | 269,640 | | | | 14,547,078 | |
| | | | | | | | |
| | | | | | | 94,759,763 | |
| | | | | | | | |
Biotechnology - 1.3% | | | | | | | | |
EXACT Sciences Corporation (a) | | | 794,860 | | | | 13,536,466 | |
| | | | | | | | |
Building Products - 0.5% | | | | | | | | |
PGT, Inc. (a) | | | 589,806 | | | | 4,995,657 | |
| | | | | | | | |
Capital Markets - 1.1% | | | | | | | | |
Evercore Partners Inc. - Class A | | | 207,440 | | | | 11,956,842 | |
| | | | | | | | |
Chemicals - 1.4% | | | | | | | | |
PolyOne Corporation | | | 336,680 | | | | 14,187,695 | |
| | | | | | | | |
Commercial Services & Supplies - 1.0% | |
MSA Safety Incorporated | | | 182,610 | | | | 10,496,423 | |
| | | | | | | | |
Communications Equipment - 3.7% | | | | | |
Allot Communications Ltd. (a) (b) | | | 536,930 | | | | 7,006,937 | |
Ciena Corporation (a) | | | 621,675 | | | | 13,465,480 | |
Infinera Corporation (a) | | | 943,300 | | | | 8,678,360 | |
Sonus Networks, Inc. (a) | | | 2,459,660 | | | | 8,830,179 | |
| | | | | | | | |
| | | | | | | 37,980,956 | |
| | | | | | | | |
Construction & Engineering - 0.9% | | | | | |
Primoris Services Corporation | | | 338,660 | | | | 9,766,954 | |
| | | | | | | | |
Construction Materials - 1.1% | | | | | |
Headwaters Incorporated (a) | | | 861,170 | | | | 11,961,652 | |
| | | | | | | | |
Containers & Packaging - 1.2% | | | | | |
Greif, Inc. - Class A | | | 230,925 | | | | 12,599,268 | |
| | | | | | | | |
Diversified Consumer Services - 2.2% | | | | | |
DeVry Education Group Inc. | | | 197,755 | | | | 8,372,947 | |
Hillenbrand, Inc. | | | 431,570 | | | | 14,077,813 | |
| | | | | | | | |
| | | | | | | 22,450,760 | |
| | | | | | | | |
| | | | | | | | |
| COMMON STOCKS | | Shares | | | Value | |
Diversified Financials - 2.6% | | | | | |
HFF, Inc. - Class A | | | 439,733 | | | $ | 16,353,670 | |
MarketAxess Holdings Inc. | | | 197,695 | | | | 10,687,392 | |
| | | | | | | | |
| | | | | | | 27,041,062 | |
| | | | | | | | |
Diversified Telecommunication Services - 0.6% | |
Ruckus Wireless, Inc. (a) | | | 527,990 | | | | 6,288,361 | |
| | | | | | | | |
Electrical Equipment & Instruments - 3.1% | | | | | |
Belden Inc. | | | 244,325 | | | | 19,096,442 | |
Franklin Electric Co., Inc. | | | 331,870 | | | | 13,384,317 | |
| | | | | | | | |
| | | | | | | 32,480,759 | |
| | | | | | | | |
Electronic Equipment & Instruments - 1.0% | | | | | |
Coherent, Inc. (a) | | | 151,585 | | | | 10,030,379 | |
| | | | | | | | |
Energy Equipment & Services - 0.5% | | | | | |
Atwood Oceanics, Inc. (a) | | | 105,910 | | | | 5,558,157 | |
| | | | | | | | |
Food & Drug Retailing - 0.7% | | | | | |
The Chefs’ Warehouse, Inc. (a) | | | 364,956 | | | | 7,215,180 | |
| | | | | | | | |
Food Products - 1.4% | | | | | |
Post Holdings, Inc. (a) | | | 281,220 | | | | 14,316,910 | |
| | | | | | | | |
Health Care Equipment & Supplies - 8.1% | | | | | |
CONMED Corporation | | | 178,545 | | | | 7,882,762 | |
Cyberonics, Inc. (a) | | | 224,370 | | | | 14,014,150 | |
Cynosure, Inc. - Class A (a) | | | 393,393 | | | | 8,359,601 | |
DexCom Inc. (a) | | | 368,485 | | | | 14,614,115 | |
Endologix, Inc. (a) | | | 696,553 | | | | 10,594,571 | |
MWI Veterinary Supply, Inc. (a) | | | 105,290 | | | | 14,950,127 | |
The Spectranetics Corporation (a) | | | 608,643 | | | | 13,925,752 | |
| | | | | | | | |
| | | | | | | 84,341,078 | |
| | | | | | | | |
Health Care Providers & Services - 3.1% | | | | | |
Acadia Healthcare Company, Inc. (a) | | | 283,683 | | | | 12,907,576 | |
Team Health Holdings, Inc. (a) | | | 379,540 | | | | 18,954,228 | |
| | | | | | | | |
| | | | | | | 31,861,804 | |
| | | | | | | | |
Hotels, Restaurants & Leisure - 2.3% | | | | | |
La Quinta-Holdings, Inc. (a) | | | 549,915 | | | | 10,525,373 | |
Orient-Express Hotels Ltd - Class A (a) (b) | | | 929,682 | | | | 13,517,577 | |
| | | | | | | | |
| | | | | | | 24,042,950 | |
| | | | | | | | |
Industrial Conglomerates - 0.7% | | | | | |
Raven Industries, Inc. | | | 232,275 | | | | 7,697,593 | |
| | | | | | | | |
Internet Software & Services - 4.3% | | | | | |
E2open, Inc. (a) | | | 308,365 | | | | 6,373,905 | |
Euronet Worldwide, Inc. (a) | | | 316,180 | | | | 15,252,523 | |
LogMeIn, Inc. (a) | | | 319,890 | | | | 14,913,272 | |
SPS Commerce, Inc. (a) | | | 132,160 | | | | 8,351,190 | |
| | | | | | | | |
| | | | | | | 44,890,890 | |
| | | | | | | | |
IT Consulting & Services - 2.3% | | | | | |
Acxiom Corporation (a) | | | 532,060 | | | | 11,540,381 | |
Sapient Corporation (a) | | | 759,850 | | | | 12,347,563 | |
| | | | | | | | |
| | | | | | | 23,887,944 | |
| | | | | | | | |
The accompanying notes are an integral part of these financial statements.
8
|
| LKCM SMALL CAP EQUITY FUND |
| SCHEDULEOF INVESTMENTS, CONTINUED |
| June 30, 2014 (Unaudited) |
| | | | | | | | |
| COMMON STOCKS | | Shares | | | Value | |
Leisure Equipment & Products - 1.2% | | | | | |
Pool Corporation | | | 213,355 | | | $ | 12,067,359 | |
| | | | | | | | |
Machinery - 5.9% | | | | | | | | |
Actuant Corporation - Class A | | | 227,115 | | | | 7,851,366 | |
Barnes Group Inc. | | | 341,745 | | | | 13,170,852 | |
Chart Industries, Inc. (a) | | | 94,245 | | | | 7,797,831 | |
Harsco Corporation | | | 342,770 | | | | 9,127,965 | |
The Manitowoc Company, Inc. | | | 441,725 | | | | 14,515,083 | |
TriMas Corporation (a) | | | 227,075 | | | | 8,658,370 | |
| | | | | | | | |
| | | | | | | 61,121,467 | |
| | | | | | | | |
Marine - 0.8% | | | | | | | | |
Diana Shipping Inc. (a) (b) | | | 812,750 | | | | 8,850,848 | |
| | | | | | | | |
Media - 1.4% | | | | | | | | |
The E.W. Scripps Company - Class A (a) | | | 664,605 | | | | 14,063,042 | |
| | | | | | | | |
Metals & Mining - 3.0% | | | | | | | | |
Carpenter Technology Corporation | | | 134,430 | | | | 8,502,698 | |
Commercial Metals Company | | | 558,440 | | | | 9,666,596 | |
Worthington Industries, Inc. | | | 292,180 | | | | 12,575,427 | |
| | | | | | | | |
| | | | | | | 30,744,721 | |
| | | | | | | | |
Oil & Gas & Consumable Fuels - 8.1% | | | | | |
Athlon Energy Inc. (a) | | | 466,225 | | | | 22,238,932 | |
Bill Barrett Corporation (a) | | | 548,095 | | | | 14,677,984 | |
Matador Resources Company (a) | | | 374,271 | | | | 10,958,655 | |
Parsley Energy, Inc. - Class A (a) | | | 501,810 | | | | 12,078,567 | |
Sanchez Energy Corporation (a) | | | 328,743 | | | | 12,357,449 | |
Synergy Resources Corporation (a) | | | 875,670 | | | | 11,602,628 | |
| | | | | | | | |
| | | | | | | 83,914,215 | |
| | | | | | | | |
Pharmaceuticals - 2.1% | | | | | | | | |
Akorn, Inc. (a) | | | 662,633 | | | | 22,032,547 | |
| | | | | | | | |
Real Estate - 0.9% | | | | | | | | |
Kennedy-Wilson Holdings, Inc. | | | 368,972 | | | | 9,895,829 | |
| | | | | | | | |
Semiconductor Equipment & Products - 1.3% | | | | | |
Rambus Inc. (a) | | | 970,695 | | | | 13,880,939 | |
| | | | | | | | |
Software - 4.8% | | | | | |
ACI Worldwide, Inc. (a) | | | 246,445 | | | | 13,759,024 | |
Aspen Technology, Inc. (a) | | | 184,335 | | | | 8,553,144 | |
Bottomline Technologies (de) Inc. (a) | | | 218,740 | | | | 6,544,701 | |
Interactive Intelligence Group, Inc. (a) | | | 271,320 | | | | 15,229,192 | |
IntraLinks Holdings, Inc. (a) | | | 616,369 | | | | 5,479,520 | |
| | | | | | | | |
| | | | | | | 49,565,581 | |
| | | | | | | | |
Specialty Retail - 0.7% | | | | | |
Pier 1 Imports, Inc. | | | 453,485 | | | | 6,988,204 | |
| | | | | | | | |
Textiles, Apparel & Luxury Goods - 4.1% | | | | | |
Kate Spade & Company (a) | | | 219,770 | | | | 8,382,028 | |
Movado Group, Inc. | | | 290,830 | | | | 12,118,886 | |
Oxford Industries, Inc. | | | 171,145 | | | | 11,410,237 | |
Skechers U.S.A., Inc. - Class A (a) | | | 228,970 | | | | 10,463,929 | |
| | | | | | | | |
| | | | | | | 42,375,080 | |
| | | | | | | | |
| | | | | | | | |
| COMMON STOCKS | | Shares | | | Value | |
Thrifts & Mortgage Finance - 0.8% | | | | | |
Capitol Federal Financial Inc. | | | 725,120 | | | $ | 8,817,459 | |
| | | | | | | | |
Trading Companies & Distributors - 2.4% | | | | | |
Aceto Corporation | | | 209,785 | | | | 3,805,500 | |
MRC Global Inc. (a) | | | 256,560 | | | | 7,258,083 | |
WESCO International, Inc. (a) | | | 162,980 | | | | 14,078,212 | |
| | | | | | | | |
| | | | | | | 25,141,795 | |
| | | | | | | | |
TOTAL COMMON STOCKS | | | | | | | | |
(Cost $740,817,926) | | | | | | | 1,009,934,189 | |
| | | | | | | | |
| | | | | | | | |
| SHORT-TERM INVESTMENTS - 3.1% | | | | |
Money Market Funds (c) - 3.1% | | | | | | | | |
Dreyfus Government Cash Management Fund - Institutional Shares, 0.01% | | | 941,557 | | | | 941,557 | |
Federated Government Obligations
Fund - Institutional Shares, 0.01% | | | 30,795,423 | | | | 30,795,423 | |
| | | | | | | | |
TOTAL SHORT-TERM INVESTMENTS | | | | | |
(Cost $31,736,980) | | | | | | | 31,736,980 | |
| | | | | | | | |
Total Investments - 100.2% | | | | | | | | |
(Cost $772,554,906) | | | | | | | 1,041,671,169 | |
Liabilities in Excess of Other Assets - (0.2)% | | | | (2,054,143 | ) |
| | | | | | | | |
TOTAL NET ASSETS - 100.0% | | | | | | $ | 1,039,617,026 | |
| | | | | | | | |
| (a) | Non-income producing security. |
| (b) | Security issued by non-U.S. incorporated company. |
| (c) | The rate quoted is the annualized seven-day yield of the fund at period end. |
The Global Industry Classification Standard (GICS®) was developed by and/or is the exclusive property of MSCI, Inc. and Standard & Poor Financial Services LLC (“S&P”). GICS is a service mark of MSCI and S&P and has been licensed for use by U.S. Bancorp Fund Services, LLC.
The accompanying notes are an integral part of these financial statements.
9
|
| LKCM SMALL-MID CAP EQUITY FUND |
| SCHEDULEOF INVESTMENTS |
| June 30, 2014 (Unaudited) |
| | | | | | | | |
| COMMON STOCKS - 95.5% | | Shares | | | Value | |
Aerospace & Defense - 7.3% | | | | | |
B/E Aerospace, Inc. (a) | | | 126,955 | | | $ | 11,742,069 | |
Hexcel Corporation (a) | | | 233,295 | | | | 9,541,766 | |
Teledyne Technologies Incorporated (a) | | | 76,760 | | | | 7,458,769 | |
| | | | | | | | |
| | | | | | | 28,742,604 | |
| | | | | | | | |
Banks - 8.6% | | | | | | | | |
BancorpSouth, Inc. | | | 327,235 | | | | 8,040,164 | |
Comerica Incorporated | | | 196,880 | | | | 9,875,501 | |
Prosperity Bancshares, Inc. | | | 88,265 | | | | 5,525,389 | |
Texas Capital Bancshares, Inc. (a) | | | 101,520 | | | | 5,477,004 | |
Zions Bancorporation | | | 174,660 | | | | 5,147,230 | |
| | | | | | | | |
| | | | | | | 34,065,288 | |
| | | | | | | | |
Biotechnology - 1.2% | | | | | | | | |
Covance Inc. (a) | | | 56,450 | | | | 4,830,991 | |
| | | | | | | | |
Capital Markets - 5.8% | | | | | | | | |
Affiliated Managers Group, Inc. (a) | | | 37,180 | | | | 7,636,772 | |
E*Trade Financial Corporation (a) | | | 384,690 | | | | 8,178,510 | |
Evercore Partners Inc. - Class A | | | 121,580 | | | | 7,007,871 | |
| | | | | | | | |
| | | | | | | 22,823,153 | |
| | | | | | | | |
Chemicals - 3.3% | | | | | | | | |
FMC Corporation | | | 78,680 | | | | 5,601,229 | |
PolyOne Corporation | | | 179,130 | | | | 7,548,538 | |
| | | | | | | | |
| | | | | | | 13,149,767 | |
| | | | | | | | |
Communications Equipment - 3.6% | | | | | | | | |
Ciena Corporation (a) | | | 382,180 | | | | 8,278,019 | |
Finisar Corporation (a) | | | 309,765 | | | | 6,117,859 | |
| | | | | | | | |
| | | | | | | 14,395,878 | |
| | | | | | | | |
Construction Materials - 1.7% | | | | | | | | |
Martin Marietta Materials, Inc. | | | 49,675 | | | | 6,559,584 | |
| | | | | | | | |
Diversified Consumer Services - 2.0% | | | | | | | | |
Hillenbrand, Inc. | | | 248,385 | | | | 8,102,319 | |
| | | | | | | | |
Diversified Financials - 2.0% | | | | | | | | |
Jones Lang LaSalle Incorporated | | | 62,660 | | | | 7,919,597 | |
| | | | | | | | |
Electrical Equipment & Instruments - 4.8% | | | | | |
Acuity Brands, Inc. | | | 63,225 | | | | 8,740,856 | |
Belden Inc. | | | 131,925 | | | | 10,311,258 | |
| | | | | | | | |
| | | | | | | 19,052,114 | |
| | | | | | | | |
Electronic Equipment & Instruments - 2.2% | | | | | |
Trimble Navigation Limited (a) | | | 232,510 | | | | 8,591,245 | |
| | | | | | | | |
Food Products - 3.0% | | | | | |
Post Holdings, Inc. (a) | | | 149,535 | | | | 7,612,827 | |
The WhiteWave Foods Company (a) | | | 136,590 | | | | 4,421,418 | |
| | | | | | | | |
| | | | | | | 12,034,245 | |
| | | | | | | | |
Health Care Equipment & Supplies - 5.8% | | | | | |
Cyberonics, Inc. (a) | | | 124,440 | | | | 7,772,523 | |
DexCom Inc. (a) | | | 113,320 | | | | 4,494,271 | |
MWI Veterinary Supply, Inc. (a) | | | 35,090 | | | | 4,982,429 | |
PerkinElmer, Inc. | | | 126,760 | | | | 5,937,438 | |
| | | | | | | | |
| | | | | | | 23,186,661 | |
| | | | | | | | |
| | | | | | | | |
| COMMON STOCKS | | Shares | | | Value | |
Health Care Providers & Services - 4.0% | | | | | |
Acadia Healthcare Company, Inc. (a) | | | 114,185 | | | $ | 5,195,418 | |
Team Health Holdings, Inc. (a) | | | 214,700 | | | | 10,722,118 | |
| | | | | | | | |
| | | | | | | 15,917,536 | |
| | | | | | | | |
Household Durables - 1.6% | | | | | | | | |
D.R. Horton, Inc. | | | 250,180 | | | | 6,149,424 | |
| | | | | | | | |
Insurance - 1.9% | | | | | | | | |
Genworth Financial, Inc. - Class A (a) | | | 431,340 | | | | 7,505,316 | |
| | | | | | | | |
IT Consulting & Services - 3.0% | | | | | | | | |
Acxiom Corporation (a) | | | 223,940 | | | | 4,857,259 | |
Sapient Corporation (a) | | | 438,350 | | | | 7,123,187 | |
| | | | | | | | |
| | | | | | | 11,980,446 | |
| | | | | | | | |
Leisure Equipment & Products - 2.9% | | | | | | | | |
Polaris Industries Inc. | | | 44,265 | | | | 5,765,073 | |
Pool Corporation | | | 99,850 | | | | 5,647,516 | |
| | | | | | | | |
| | | | | | | 11,412,589 | |
| | | | | | | | |
Machinery - 2.9% | | | | | | | | |
Chart Industries, Inc. (a) | | | 44,170 | | | | 3,654,626 | |
The Middleby Corporation (a) | | | 93,330 | | | | 7,720,257 | |
| | | | | | | | |
| | | | | | | 11,374,883 | |
| | | | | | | | |
Marine - 2.3% | | | | | | | | |
Kirby Corporation (a) | | | 79,445 | | | | 9,306,187 | |
| | | | | | | | |
Metals & Mining - 1.9% | | | | | | | | |
Allegheny Technologies Incorporated | | | 165,920 | | | | 7,482,992 | |
| | | | | | | | |
Oil & Gas & Consumable Fuels - 8.8% | | | | | | | | |
Athlon Energy Inc. (a) | | | 222,086 | | | | 10,593,502 | |
Laredo Petroleum, Inc. (a) | | | 271,345 | | | | 8,406,268 | |
Memorial Resource Development Corp. (a) | | | 255,845 | | | | 6,232,384 | |
Oasis Petroleum Inc. (a) | | | 173,150 | | | | 9,677,354 | |
| | | | | | | | |
| | | | | | | 34,909,508 | |
| | | | | | | | |
Pharmaceuticals - 3.3% | | | | | | | | |
Akorn, Inc. (a) | | | 389,760 | | | | 12,959,520 | |
| | | | | | | | |
Software - 5.2% | | | | | | | | |
ACI Worldwide, Inc. (a) | | | 138,820 | | | | 7,750,320 | |
Aspen Technology, Inc. (a) | | | 135,145 | | | | 6,270,728 | |
Interactive Intelligence Group, Inc. (a) | | | 118,980 | | | | 6,678,347 | |
| | | | | | | | |
| | | | | | | 20,699,395 | |
| | | | | | | | |
Specialty Retail - 1.0% | | | | | | | | |
Tractor Supply Company | | | 62,690 | | | | 3,786,476 | |
| | | | | | | | |
Textiles, Apparel & Luxury Goods - 2.4% | | | | | |
Kate Spade & Company (a) | | | 245,905 | | | | 9,378,817 | |
| | | | | | | | |
Trading Companies & Distributors - 3.0% | | | | | |
MRC Global Inc. (a) | | | 152,295 | | | | 4,308,426 | |
WESCO International, Inc. (a) | | | 88,275 | | | | 7,625,195 | |
| | | | | | | | |
| | | | | | | 11,933,621 | |
| | | | | | | | |
TOTAL COMMON STOCKS | | | | | | | | |
(Cost $279,924,213) | | | | | | | 378,250,156 | |
| | | | | | | | |
The accompanying notes are an integral part of these financial statements.
10
|
| LKCM SMALL-MID CAP EQUITY FUND |
| SCHEDULEOF INVESTMENTS, CONTINUED |
| June 30, 2014 (Unaudited) |
| | | | | | | | |
| SHORT-TERM INVESTMENTS - 4.6% | | Shares | | | Value | |
Money Market Funds (b) - 4.6% | | | | | | | | |
Dreyfus Government Cash Management Fund - Institutional Shares, 0.01% | | | 4,853,475 | | | $ | 4,853,475 | |
Federated Government Obligations Fund - Institutional Shares, 0.01% | | | 11,764,504 | | | | 11,764,504 | |
Invesco Short Term Investments Trust -Treasury Portfolio - Institutional Shares, 0.01% | | | 1,715,916 | | | | 1,715,916 | |
| | | | | | | | |
TOTAL SHORT-TERM INVESTMENTS | |
(Cost $18,333,895) | | | | | | | 18,333,895 | |
| | | | | | | | |
Total Investments - 100.1% | | | | | | | | |
(Cost $298,258,108) | | | | | | | 396,584,051 | |
Liabilities in Excess of Other
Assets - (0.1)% | | | | | | | (247,521 | ) |
| | | | | | | | |
TOTAL NET ASSETS - 100.0% | | | | | | $ | 396,336,530 | |
| | | | | | | | |
| (a) | Non-income producing security. |
| (b) | The rate quoted is the annualized seven-day yield of the fund at period end. |
The Global Industry Classification Standard (GICS®) was developed by and/or is the exclusive property of MSCI, Inc. and Standard & Poor Financial Services LLC (“S&P”). GICS is a service mark of MSCI and S&P and has been licensed for use by U.S. Bancorp Fund Services, LLC.
The accompanying notes are an integral part of these financial statements.
11
|
| LKCM EQUITY FUND |
| SCHEDULEOF INVESTMENTS |
| June 30, 2014 (Unaudited) |
| | | | | | | | |
| COMMON STOCKS - 98.5% | | Shares | | | Value | |
Aerospace & Defense - 2.6% | |
Honeywell International Inc. | | | 60,000 | | | $ | 5,577,000 | |
Rockwell Collins, Inc. | | | 40,000 | | | | 3,125,600 | |
| | | | | | | | |
| | | | | | | 8,702,600 | |
| | | | | | | | |
Auto Components - 1.1% | |
Gentex Corporation | | | 125,000 | | | | 3,636,250 | |
| | | | | | | | |
Banks - 9.7% | |
Bank of America Corporation | | | 276,663 | | | | 4,252,311 | |
Comerica Incorporated | | | 120,000 | | | | 6,019,200 | |
Cullen/Frost Bankers, Inc. | | | 50,850 | | | | 4,038,507 | |
Glacier Bancorp, Inc. | | | 60,000 | | | | 1,702,800 | |
Prosperity Bancshares, Inc. | | | 40,000 | | | | 2,504,000 | |
SunTrust Banks, Inc. | | | 109,604 | | | | 4,390,736 | |
Wells Fargo & Company | | | 120,000 | | | | 6,307,200 | |
Zions Bancorporation | | | 110,000 | | | | 3,241,700 | |
| | | | | | | | |
| | | | | | | 32,456,454 | |
| | | | | | | | |
Beverages - 2.3% | |
The Coca-Cola Company | | | 65,000 | | | | 2,753,400 | |
PepsiCo, Inc. | | | 55,000 | | | | 4,913,700 | |
| | | | | | | | |
| | | | | | | 7,667,100 | |
| | | | | | | | |
Biotechnology - 2.7% | |
Amgen Inc. | | | 40,000 | | | | 4,734,800 | |
Celgene Corporation (a) | | | 50,000 | | | | 4,294,000 | |
| | | | | | | | |
| | | | | | | 9,028,800 | |
| | | | | | | | |
Chemicals - 4.8% | |
E. I. du Pont de Nemours and Company | | | 90,000 | | | | 5,889,600 | |
FMC Corporation | | | 55,000 | | | | 3,915,450 | |
Monsanto Company | | | 50,000 | | | | 6,237,000 | |
| | | | | | | | |
| | | | | | | 16,042,050 | |
| | | | | | | | |
Commercial Services & Supplies - 0.9% | |
Waste Connections, Inc. | | | 65,000 | | | | 3,155,750 | |
| | | | | | | | |
Communication Equipment - 0.8% | |
QUALCOMM Incorporated | | | 33,000 | | | | 2,613,600 | |
| | | | | | | | |
Computers & Peripherals - 5.0% | |
Apple Inc. | | | 98,000 | | | | 9,107,140 | |
EMC Corporation | | | 83,000 | | | | 2,186,220 | |
International Business Machines Corporation | | | 30,000 | | | | 5,438,100 | |
| | | | | | | | |
| | | | | | | 16,731,460 | |
| | | | | | | | |
Construction Materials - 2.0% | |
Martin Marietta Materials, Inc. | | | 50,000 | | | | 6,602,500 | |
| | | | | | | | |
Containers & Packaging - 1.4% | |
Ball Corporation | | | 75,000 | | | | 4,701,000 | |
| | | | | | | | |
Diversified Financials - 0.7% | |
JPMorgan Chase & Co. | | | 40,000 | | | | 2,304,800 | |
| | | | | | | | |
Diversified Telecommunication Services - 1.0% | |
Verizon Communications, Inc. | | | 70,000 | | | | 3,425,100 | |
| | | | | | | | |
| | | | | | | | |
| COMMON STOCKS | | Shares | | | Value | |
Electrical Equipment & Instruments - 2.6% | | | | | |
Emerson Electric Co. | | | 40,000 | | | $ | 2,654,400 | |
Franklin Electric Co., Inc. | | | 70,000 | | | | 2,823,100 | |
Roper Industries, Inc. | | | 23,000 | | | | 3,358,230 | |
| | | | | | | | |
| | | | | | | 8,835,730 | |
| | | | | | | | |
Electronic Equipment & Instruments - 2.2% | |
National Instruments Corporation | | | 55,000 | | | | 1,781,450 | |
Trimble Navigation Limited (a) | | | 155,000 | | | | 5,727,250 | |
| | | | | | | | |
| | | | | | | 7,508,700 | |
| | | | | | | | |
Food & Drug Retailing - 1.1% | |
Walgreen Co. | | | 50,000 | | | | 3,706,500 | |
| | | | | | | | |
Food Products - 0.9% | |
The WhiteWave Foods Company (a) | | | 90,000 | | | | 2,913,300 | |
| | | | | | | | |
Health Care Equipment & Supplies - 4.8% | |
Covidien PLC (b) | | | 60,000 | | | | 5,410,800 | |
PerkinElmer, Inc. | | | 100,000 | | | | 4,684,000 | |
Thermo Fisher Scientific Inc. | | | 50,000 | | | | 5,900,000 | |
| | | | | | | | |
| | | | | | | 15,994,800 | |
| | | | | | | | |
Household Durables - 1.7% | |
Jarden Corporation (a) | | | 95,000 | | | | 5,638,250 | |
| | | | | | | | |
Household Products - 2.7% | |
Kimberly-Clark Corporation | | | 45,000 | | | | 5,004,900 | |
The Procter & Gamble Company | | | 50,000 | | | | 3,929,500 | |
| | | | | | | | |
| | | | | | | 8,934,400 | |
| | | | | | | | |
Industrial Conglomerates - 0.5% | |
Raven Industries, Inc. | | | 52,500 | | | | 1,739,850 | |
| | | | | | | | |
Insurance - 1.7% | |
Prudential Financial, Inc. | | | 65,000 | | | | 5,770,050 | |
| | | | | | | | |
Internet Catalog & Retail - 0.9% | |
Amazon.com, Inc. (a) | | | 9,500 | | | | 3,085,410 | |
| | | | | | | | |
Internet Software & Services - 5.4% | |
Akamai Technologies, Inc. (a) | | | 90,000 | | | | 5,495,400 | |
eBay Inc. (a) | | | 65,000 | | | | 3,253,900 | |
Google Inc. - Class A (a) | | | 8,000 | | | | 4,677,360 | |
Google Inc. - Class C (a) | | | 8,000 | | | | 4,602,240 | |
| | | | | | | | |
| | | | | | | 18,028,900 | |
| | | | | | | | |
Machinery - 7.9% | |
Danaher Corporation | | | 75,000 | | | | 5,904,750 | |
Dover Corporation | | | 50,000 | | | | 4,547,500 | |
Generac Holdings Inc. (a) | | | 92,000 | | | | 4,484,080 | |
The Gorman-Rupp Company | | | 41,000 | | | | 1,450,170 | |
Pall Corporation | | | 55,000 | | | | 4,696,450 | |
Valmont Industries, Inc. | | | 35,000 | | | | 5,318,250 | |
| | | | | | | | |
| | | | | | | 26,401,200 | |
| | | | | | | | |
Marine - 1.6% | |
Kirby Corporation (a) | | | 45,000 | | | | 5,271,300 | |
| | | | | | | | |
The accompanying notes are an integral part of these financial statements.
12
|
| LKCM EQUITY FUND |
| SCHEDULEOF INVESTMENTS, CONTINUED |
| June 30, 2014 (Unaudited) |
| | | | | | | | |
| COMMON STOCKS | | Shares | | | Value | |
Media - 2.9% | |
Liberty Media Corporation - Class A (a) | | | 28,000 | | | $ | 3,827,040 | |
Time Warner Cable Inc. | | | 23,000 | | | | 3,387,900 | |
Time Warner Inc. | | | 34,000 | | | | 2,388,500 | |
| | | | | | | | |
| | | | | | | 9,603,440 | |
| | | | | | | | |
Metals & Mining - 0.9% | |
Carpenter Technology Corporation | | | 47,000 | | | | 2,972,750 | |
| | | | | | | | |
Oil & Gas & Consumable Fuels - 10.1% | | | | | |
Cabot Oil & Gas Corporation | | | 120,000 | | | | 4,096,800 | |
Chevron Corporation | | | 28,000 | | | | 3,655,400 | |
ConocoPhillips | | | 50,000 | | | | 4,286,500 | |
EOG Resources, Inc. | | | 60,000 | | | | 7,011,600 | |
Exxon Mobil Corporation | | | 55,000 | | | | 5,537,400 | |
Memorial Resource Development Corp. (a) | | | 86,130 | | | | 2,098,127 | |
Noble Energy, Inc. | | | 35,000 | | | | 2,711,100 | |
Range Resources Corporation | | | 48,000 | | | | 4,173,600 | |
| | | | | | | | |
| | | | | | | 33,570,527 | |
| | | | | | | | |
Paper & Forest Products - 0.8% | |
International Paper Company | | | 50,000 | | | | 2,523,500 | |
| | | | | | | | |
Pharmaceuticals - 5.8% | |
Abbott Laboratories | | | 90,000 | | | | 3,681,000 | |
AbbVie Inc. | | | 63,500 | | | | 3,583,940 | |
Johnson & Johnson | | | 38,000 | | | | 3,975,560 | |
Merck & Co., Inc. | | | 80,000 | | | | 4,628,000 | |
Pfizer Inc. | | | 115,000 | | | | 3,413,200 | |
| | | | | | | | |
| | | | | | | 19,281,700 | |
| | | | | | | | |
Road & Rail - 3.0% | |
Kansas City Southern | | | 28,000 | | | | 3,010,280 | |
Union Pacific Corporation | | | 70,000 | | | | 6,982,500 | |
| | | | | | | | |
| | | | | | | 9,992,780 | |
| | | | | | | | |
Software - 2.2% | |
Adobe Systems Incorporated (a) | | | 45,000 | | | | 3,256,200 | |
Microsoft Corporation | | | 100,000 | | | | 4,170,000 | |
| | | | | | | | |
| | | | | | | 7,426,200 | |
| | | | | | | | |
Specialty Retail - 2.7% | |
The Home Depot, Inc. | | | 50,000 | | | | 4,048,000 | |
Tiffany & Co. | | | 25,000 | | | | 2,506,250 | |
Tractor Supply Company | | | 40,000 | | | | 2,416,000 | |
| | | | | | | | |
| | | | | | | 8,970,250 | |
| | | | | | | | |
Textiles, Apparel & Luxury Goods - 1.1% | |
V.F. Corporation | | | 60,000 | | | | 3,780,000 | |
| | | | | | | | |
TOTAL COMMON STOCKS | | | | | | | | |
(Cost $220,476,748) | | | | | | | 329,017,001 | |
| | | | | | | | |
| | | | | | | | |
| SHORT-TERM INVESTMENT - 1.5% | | Shares | | | Value | |
Money Market Fund (c) - 1.5% | | | | | | | | |
Federated Government Obligations
Fund - Institutional Shares, 0.01% | | | 5,123,225 | | | $ | 5,123,225 | |
| | | | | | | | |
TOTAL SHORT-TERM INVESTMENT | |
(Cost $5,123,225) | | | | | | | 5,123,225 | |
| | | | | | | | |
Total Investments - 100.0% | | | | | | | | |
(Cost $225,599,973) | | | | | | | 334,140,226 | |
Liabilities in Excess of Other Assets - 0.0% | | | | (56,891 | ) |
| | | | | | | | |
TOTAL NET ASSETS - 100.0% | | | | | | $ | 334,083,335 | |
| | | | | | | | |
| (a) | Non-income producing security. |
| (b) | Security issued by non-U.S. incorporated company. |
| (c) | The rate quoted is the annualized seven-day yield of the fund at period end. |
The Global Industry Classification Standard (GICS®) was developed by and/or is the exclusive property of MSCI, Inc. and Standard & Poor Financial Services LLC (“S&P”). GICS is a service mark of MSCI and S&P and has been licensed for use by U.S. Bancorp Fund Services, LLC.
The accompanying notes are an integral part of these financial statements.
13
|
| LKCM BALANCED FUND |
| SCHEDULEOF INVESTMENTS |
| June 30, 2014 (Unaudited) |
| | | | | | | | |
| COMMON STOCKS - 69.6% | | Shares | | | Value | |
Aerospace & Defense - 2.2% | |
General Dynamics Corporation | | | 1,400 | | | $ | 163,170 | |
Honeywell International Inc. | | | 3,400 | | | | 316,030 | |
Rockwell Collins, Inc. | | | 4,400 | | | | 343,816 | |
| | | | | | | | |
| | | | | | | 823,016 | |
| | | | | | | | |
Air Freight & Logistics - 0.7% | |
United Parcel Service, Inc. - Class B | | | 2,600 | | | | 266,916 | |
| | | | | | | | |
Banks - 6.1% | |
Bank of America Corporation | | | 11,000 | | | | 169,070 | |
Comerica Incorporated | | | 9,500 | | | | 476,520 | |
Cullen/Frost Bankers, Inc. | | | 3,900 | | | | 309,738 | |
SunTrust Banks, Inc. | | | 11,300 | | | | 452,678 | |
Wells Fargo & Company | | | 9,071 | | | | 476,772 | |
Zions Bancorporation | | | 13,300 | | | | 391,951 | |
| | | | | | | | |
| | | | | | | 2,276,729 | |
| | | | | | | | |
Beverages - 1.8% | |
The Coca-Cola Company | | | 8,600 | | | | 364,296 | |
PepsiCo, Inc. | | | 3,600 | | | | 321,624 | |
| | | | | | | | |
| | | | | | | 685,920 | |
| | | | | | | | |
Biotechnology - 1.3% | |
Celgene Corporation (a) | | | 5,800 | | | | 498,104 | |
| | | | | | | | |
Chemicals - 3.9% | |
Air Products and Chemicals, Inc. | | | 2,500 | | | | 321,550 | |
Airgas, Inc. | | | 3,000 | | | | 326,730 | |
E. I. du Pont de Nemours and Company | | | 4,200 | | | | 274,848 | |
FMC Corporation | | | 4,300 | | | | 306,117 | |
Monsanto Company | | | 1,900 | | | | 237,006 | |
| | | | | | | | |
| | | | | | | 1,466,251 | |
| | | | | | | | |
Commercial Services & Supplies - 0.7% | |
Waste Management, Inc. | | | 6,100 | | | | 272,853 | |
| | | | | | | | |
Communication Equipment - 0.4% | |
QUALCOMM Incorporated | | | 2,000 | | | | 158,400 | |
| | | | | | | | |
Computers & Peripherals - 2.9% | |
Apple Inc. | | | 5,950 | | | | 552,934 | |
EMC Corporation | | | 9,400 | | | | 247,596 | |
International Business Machines Corporation | | | 1,500 | | | | 271,905 | |
| | | | | | | | |
| | | | | | | 1,072,435 | |
| | | | | | | | |
Construction Materials - 1.0% | |
Martin Marietta Materials, Inc. | | | 2,700 | | | | 356,535 | |
| | | | | | | | |
Containers & Packaging - 1.0% | |
Ball Corporation | | | 5,700 | | | | 357,276 | |
| | | | | | | | |
Diversified Financials - 1.1% | |
JPMorgan Chase & Co. | | | 7,300 | | | | 420,626 | |
| | | | | | | | |
Diversified Telecommunication Services - 1.2% | |
AT&T Inc. | | | 7,400 | | | | 261,664 | |
Verizon Communications, Inc. | | | 3,841 | | | | 187,940 | |
| | | | | | | | |
| | | | | | | 449,604 | |
| | | | | | | | |
| | | | | | | | |
| COMMON STOCKS | | Shares | | | Value | |
Electrical Equipment & Instruments - 0.5% | |
Emerson Electric Co. | | | 3,000 | | | $ | 199,080 | |
| | | | | | | | |
Electronic Equipment & Instruments - 1.2% | |
National Instruments Corporation | | | 7,500 | | | | 242,925 | |
Trimble Navigation Limited (a) | | | 6,000 | | | | 221,700 | |
| | | | | | | | |
| | | | | | | 464,625 | |
| | | | | | | | |
Energy Equipment & Services - 1.1% | |
Schlumberger Limited (b) | | | 3,395 | | | | 400,440 | |
| | | | | | | | |
Food & Drug Retailing - 2.9% | |
CVS Caremark Corporation | | | 4,700 | | | | 354,239 | |
Walgreen Co. | | | 5,200 | | | | 385,476 | |
Wal-Mart Stores, Inc. | | | 4,300 | | | | 322,801 | |
| | | | | | | | |
| | | | | | | 1,062,516 | |
| | | | | | | | |
Health Care Equipment & Supplies - 2.1% | |
Covidien PLC (b) | | | 4,600 | | | | 414,828 | |
Thermo Fisher Scientific Inc. | | | 3,100 | | | | 365,800 | |
| | | | | | | | |
| | | | | | | 780,628 | |
| | | | | | | | |
Hotels, Restaurants & Leisure - 0.7% | |
Yum! Brands, Inc. | | | 3,000 | | | | 243,600 | |
| | | | | | | | |
Household Products - 2.2% | |
Colgate-Palmolive Company | | | 4,700 | | | | 320,446 | |
Kimberly-Clark Corporation | | | 2,100 | | | | 233,562 | |
The Procter & Gamble Company | | | 3,500 | | | | 275,065 | |
| | | | | | | | |
| | | | | | | 829,073 | |
| | | | | | | | |
Industrial Conglomerates - 0.7% | |
General Electric Company | | | 9,400 | | | | 247,032 | |
| | | | | | | | |
Insurance - 1.8% | |
MetLife, Inc. | | | 6,300 | | | | 350,028 | |
Prudential Financial, Inc. | | | 3,400 | | | | 301,818 | |
| | | | | | | | |
| | | | | | | 651,846 | |
| | | | | | | | |
Internet Catalog & Retail - 1.1% | |
Amazon.com, Inc. (a) | | | 1,300 | | | | 422,214 | |
| | | | | | | | |
Internet Software & Services - 3.0% | |
Akamai Technologies, Inc. (a) | | | 6,600 | | | | 402,996 | �� |
eBay Inc. (a) | | | 6,000 | | | | 300,360 | |
Google Inc. - Class A (a) | | | 350 | | | | 204,634 | |
Google Inc. - Class C (a) | | | 350 | | | | 201,348 | |
| | | | | | | | |
| | | | | | | 1,109,338 | |
| | | | | | | | |
IT Consulting & Services - 1.5% | |
Accenture PLC - Class A (b) | | | 3,200 | | | | 258,688 | |
Automatic Data Processing, Inc. | | | 3,700 | | | | 293,336 | |
| | | | | | | | |
| | | | | | | 552,024 | |
| | | | | | | | |
Machinery - 1.8% | |
Danaher Corporation | | | 4,900 | | | | 385,777 | |
Pall Corporation | | | 3,200 | | | | 273,248 | |
| | | | | | | | |
| | | | | | | 659,025 | |
| | | | | | | | |
The accompanying notes are an integral part of these financial statements.
14
|
| LKCM BALANCED FUND |
| SCHEDULEOF INVESTMENTS, CONTINUED |
| June 30, 2014 (Unaudited) |
| | | | | | | | |
| COMMON STOCKS | |
Shares | | | Value | |
Media - 4.9% | |
CBS Corporation - Class B | | | 5,600 | | | $ | 347,984 | |
DIRECTV (a) | | | 4,400 | | | | 374,044 | |
Liberty Media Corporation - Class A (a) | | | 2,500 | | | | 341,700 | |
Time Inc. (a) | | | 725 | | | | 17,559 | |
Time Warner Inc. | | | 5,800 | | | | 407,450 | |
The Walt Disney Company | | | 4,000 | | | | 342,960 | |
| | | | | | | | |
| | | | | | | 1,831,697 | |
| | | | | | | | |
Metals & Mining - 0.4% | |
Commercial Metals Company | | | 9,500 | | | | 164,445 | |
| | | | | | | | |
Oil & Gas & Consumable Fuels - 7.8% | |
Cabot Oil & Gas Corporation | | | 10,200 | | | | 348,228 | |
Chevron Corporation | | | 2,695 | | | | 351,832 | |
Devon Energy Corporation | | | 1,700 | | | | 134,980 | |
EOG Resources, Inc. | | | 3,800 | | | | 444,068 | |
Exxon Mobil Corporation | | | 3,227 | | | | 324,895 | |
Pioneer Natural Resources Company | | | 1,400 | | | | 321,734 | |
Range Resources Corporation | | | 4,000 | | | | 347,800 | |
SM Energy Company | | | 3,400 | | | | 285,940 | |
The Williams Companies, Inc. | | | 5,700 | | | | 331,797 | |
| | | | | | | | |
| | | | | | | 2,891,274 | |
| | | | | | | | |
Pharmaceuticals - 4.0% | |
Abbott Laboratories | | | 10,200 | | | | 417,180 | |
AbbVie Inc. | | | 8,200 | | | | 462,808 | |
Merck & Co., Inc. | | | 5,200 | | | | 300,820 | |
Pfizer Inc. | | | 10,000 | | | | 296,800 | |
| | | | | | | | |
| | | | | | | 1,477,608 | |
| | | | | | | | |
Real Estate Investment Trust - 0.9% | |
American Tower Corporation | | | 3,800 | | | | 341,924 | |
| | | | | | | | |
Road & Rail - 0.8% | |
Union Pacific Corporation | | | 3,000 | | | | 299,250 | |
| | | | | | | | |
Software - 1.9% | |
Adobe Systems Incorporated (a) | | | 4,100 | | | | 296,676 | |
Citrix Systems, Inc. (a) | | | 4,000 | | | | 250,200 | |
Nuance Communications, Inc. (a) | | | 8,000 | | | | 150,160 | |
| | | | | | | | |
| | | | | | | 697,036 | |
| | | | | | | | |
Specialty Retail - 1.8% | |
The Home Depot, Inc. | | | 4,400 | | | | 356,224 | |
O’Reilly Automotive, Inc. (a) | | | 2,100 | | | | 316,260 | |
| | | | | | | | |
| | | | | | | 672,484 | |
| | | | | | | | |
Textiles, Apparel & Luxury Goods - 1.0% | |
V.F. Corporation | | | 5,700 | | | | 359,100 | |
| | | | | | | | |
Thrifts & Mortgage Finance - 0.6% | |
Capitol Federal Financial Inc. | | | 19,500 | | | | 237,120 | |
| | | | | | | | |
Trading Companies & Distributors - 0.6% | |
MRC Global Inc. (a) | | | 8,000 | | | | 226,320 | |
| | | | | | | | |
TOTAL COMMON STOCKS | | | | | | | | |
(Cost $14,675,686) | | | | | | | 25,924,364 | |
| | | | | | | | |
| | | | | | | | |
| CORPORATE BONDS - 27.6% | | Principal
Amount | | | Value | |
Banks - 2.4% | | | | | | | | |
Bank of America Corporation | | | | | | | | |
1.350%, 11/21/2016 | | $ | 250,000 | | | $ | 250,882 | |
BB&T Corporation | | | | | | | | |
2.150%, 03/22/2017 | | | | | | | | |
Callable 02/22/2017 | | | 200,000 | | | | 204,828 | |
SunTrust Banks, Inc. | | | | | | | | |
3.500%, 01/20/2017 | | | | | | | | |
Callable 12/20/2016 | | | 300,000 | | | | 317,829 | |
Wells Fargo & Company | | | | | | | | |
2.625%, 12/15/2016 | | | 100,000 | | | | 104,003 | |
| | | | | | | | |
| | | | | | | 877,542 | |
| | | | | | | | |
Beverages - 0.6% | | | | | | | | |
Anheuser-Busch InBev Worldwide Inc. | | | | | | | | |
1.375%, 07/15/2017 | | | 100,000 | | | | 100,411 | |
The Coca-Cola Company | | | | | | | | |
5.350%, 11/15/2017 | | | 100,000 | | | | 113,698 | |
| | | | | | | | |
| | | | | | | 214,109 | |
| | | | | | | | |
Biotechnology - 2.0% | | | | | | | | |
Amgen Inc. | | | | | | | | |
2.125%, 05/15/2017 | | | 225,000 | | | | 230,772 | |
Celgene Corporation | | | | | | | | |
2.450%, 10/15/2015 | | | 245,000 | | | | 249,909 | |
Gilead Sciences, Inc. | | | | | | | | |
2.050%, 04/01/2019 | | | 250,000 | | | | 250,449 | |
| | | | | | | | |
| | | | | | | 731,130 | |
| | | | | | | | |
Capital Markets - 0.1% | | | | | | | | |
The Goldman Sachs Group, Inc. | | | | | | | | |
5.500%, 11/15/2014 | | | 35,000 | | | | 35,658 | |
| | | | | | | | |
Chemicals - 3.1% | | | | | | | | |
Air Products and Chemicals, Inc.: | | | | | | | | |
2.000%, 08/02/2016 | | | 100,000 | | | | 102,685 | |
1.200%, 10/15/2017 | | | 150,000 | | | | 149,944 | |
Eastman Chemical Company: | | | | | | | | |
3.000%, 12/15/2015 | | | 200,000 | | | | 206,373 | |
2.400%, 06/01/2017 | | | 160,000 | | | | 164,841 | |
ECOLAB INC. | | | | | | | | |
1.450%, 12/08/2017 | | | 250,000 | | | | 250,529 | |
The Sherwin-Williams Company | | | | | | | | |
1.350%, 12/15/2017 | | | 300,000 | | | | 300,640 | |
| | | | | | | | |
| | | | | | | 1,175,012 | |
| | | | | | | | |
Commercial Services & Supplies - 0.6% | | | | | |
Waste Management, Inc. | | | | | | | | |
2.600%, 09/01/2016 | | | 200,000 | | | | 207,034 | |
| | | | | | | | |
Computers & Peripherals - 1.6% | | | | | | | | |
Hewlett-Packard Company: | | | | | | | | |
2.650%, 06/01/2016 | | | 100,000 | | | | 103,276 | |
3.000%, 09/15/2016 | | | 175,000 | | | | 182,334 | |
NetApp, Inc. | | | | | | | | |
2.000%, 12/15/2017 | | | 300,000 | | | | 304,672 | |
| | | | | | | | |
| | | | | | | 590,282 | |
| | | | | | | | |
The accompanying notes are an integral part of these financial statements.
15
|
| LKCM BALANCED FUND |
| SCHEDULEOF INVESTMENTS, CONTINUED |
| June 30, 2014 (Unaudited) |
| | | | | | | | |
| CORPORATE BONDS | | Principal
Amount | | | Value | |
Consumer Services - 0.6% | | | | | | | | |
The Western Union Company | | | | | | | | |
2.875%, 12/10/2017 | | $ | 225,000 | | | $ | 231,888 | |
| | | | | | | | |
Diversified Financials - 0.8% | | | | | | | | |
JPMorgan Chase & Co. | | | | | | | | |
2.000%, 08/15/2017 | | | 300,000 | | | | 305,316 | |
| | | | | | | | |
Diversified Telecommunication Services - 1.2% | | | | | |
AT&T Inc. | | | | | | | | |
2.400%, 08/15/2016 | | | 200,000 | | | | 206,200 | |
Verizon Communications, Inc.: | | | | | | | | |
3.000%, 04/01/2016 | | | 100,000 | | | | 103,721 | |
2.000%, 11/01/2016 | | | 150,000 | | | | 153,227 | |
| | | | | | | | |
| | | | | | | 463,148 | |
| | | | | | | | |
Electrical Equipment & Instruments - 0.8% | | | | | |
Roper Industries, Inc. | | | | | | | | |
1.850%, 11/15/2017 | | | 300,000 | | | | 302,744 | |
| | | | | | | | |
Energy Equipment & Services - 0.5% | | | | | |
National Oilwell Varco, Inc. | | | | | | | | |
1.350%, 12/01/2017 | | | 200,000 | | | | 200,222 | |
| | | | | | | | |
Food & Drug Retailing - 1.7% | | | | | | | | |
CVS Caremark Corporation: | | | | | | | | |
3.250%, 05/18/2015 | | | 50,000 | | | | 51,285 | |
5.750%, 06/01/2017 | | | 100,000 | | | | 112,712 | |
2.250%, 12/05/2018 | | | | | | | | |
Callable 11/05/2018 | | | 150,000 | | | | 151,992 | |
Walgreen Co. | | | | | | | | |
1.800%, 09/15/2017 | | | 300,000 | | | | 302,832 | |
| | | | | | | | |
| | | | | | | 618,821 | |
| | | | | | | | |
Health Care Equipment & Supplies - 0.3% | | | | | |
DENTSPLY International Inc. | | | | | | | | |
2.750%, 08/15/2016 | | | 100,000 | | | | 103,619 | |
| | | | | | | | |
Health Care Providers & Services - 1.5% | | | | | | | | |
Express Scripts Holding Co | | | | | | | | |
3.125%, 05/15/2016 | | | 200,000 | | | | 208,460 | |
McKesson Corporation | | | | | | | | |
3.250%, 03/01/2016 | | | 250,000 | | | | 260,147 | |
Medco Health Solutions, Inc. | | | | | | | | |
2.750%, 09/15/2015 | | | 97,000 | | | | 99,348 | |
| | | | | | | | |
| | | | | | | 567,955 | |
| | | | | | | | |
Insurance - 0.6% | | | | | | | | |
Prudential Financial, Inc. | | | | | | | | |
3.000%, 05/12/2016 | | | 200,000 | | | | 208,113 | |
| | | | | | | | |
Internet Catalog & Retail - 0.8% | | | | | | | | |
Amazon.com, Inc. | | | | | | | | |
1.200%, 11/29/2017 | | | 295,000 | | | | 293,467 | |
| | | | | | | | |
Internet Software & Services - 0.7% | | | | | |
eBay Inc.: | | | | | | | | |
1.625%, 10/15/2015 | | | 200,000 | | | | 203,219 | |
1.350%, 07/15/2017 | | | 70,000 | | | | 70,381 | |
| | | | | | | | |
| | | | | | | 273,600 | |
| | | | | | | | |
| | | | | | | | |
| CORPORATE BONDS | | Principal
Amount | | | Value | |
Media - 0.8% | | | | | | | | |
DIRECTV Holdings LLC | | | | | | | | |
2.400%, 03/15/2017 | | $ | 300,000 | | | $ | 309,156 | |
| | | | | | | | |
Oil & Gas & Consumable Fuels - 1.9% | | | | | | | | |
Apache Corporation | | | | | | | | |
5.625%, 01/15/2017 | | | 75,000 | | | | 83,564 | |
Devon Energy Corporation | | | | | | | | |
1.875%, 05/15/2017 | | | | | | | | |
Callable 04/15/2017 | | | 100,000 | | | | 101,796 | |
Noble Holding International Limited: (b) | | | | | | | | |
3.050%, 03/01/2016 | | | 160,000 | | | | 165,042 | |
2.500%, 03/15/2017 | | | 150,000 | | | | 153,555 | |
Occidental Petroleum Corporation | | | | | | | | |
1.750%, 02/15/2017 | | | 200,000 | | | | 203,830 | |
| | | | | | | | |
| | | | | | | 707,787 | |
| | | | | | | | |
Pharmaceuticals - 2.0% | | | | | | | | |
AbbVie Inc.: | | | | | | | | |
1.200%, 11/06/2015 | | | 225,000 | | | | 226,594 | |
2.000%, 11/06/2018 | | | 134,000 | | | | 133,973 | |
Merck & Co., Inc. | | | | | | | | |
1.100%, 01/31/2018 | | | 275,000 | | | | 270,853 | |
Teva Pharmaceutical Industries Ltd. (b) | | | | | | | | |
2.400%, 11/10/2016 | | | 100,000 | | | | 103,252 | |
| | | | | | | | |
| | | | | | | 734,672 | |
| | | | | | | | |
Semiconductor Equipment & Products - 1.9% | | | | | |
Applied Materials, Inc. | | | | | | | | |
2.650%, 06/15/2016 | | | 200,000 | | | | 207,157 | |
Broadcom Corporation | | | | | | | | |
2.700%, 11/01/2018 | | | 300,000 | | | | 310,756 | |
Intel Corporation | | | | | | | | |
1.350%, 12/15/2017 | | | 200,000 | | | | 200,224 | |
| | | | | | | | |
| | | | | | | 718,137 | |
| | | | | | | | |
Software - 1.1% | | | | | | | | |
Oracle Corporation | | | | | | | | |
1.200%, 10/15/2017 | | | 200,000 | | | | 199,893 | |
Symantec Corporation | | | | | | | | |
2.750%, 09/15/2015 | | | 200,000 | | | | 204,598 | |
| | | | | | | | |
| | | | | | | 404,491 | |
| | | | | | | | |
TOTAL CORPORATE BONDS | | | | | | | | |
(Cost $10,173,356) | | | | | | | 10,273,903 | |
| | | | | | | | |
The accompanying notes are an integral part of these financial statements.
16
|
| LKCM BALANCED FUND |
| SCHEDULEOF INVESTMENTS, CONTINUED |
| June 30, 2014 (Unaudited) |
| | | | | | | | |
| SHORT-TERM INVESTMENT - 2.6% | | Shares | | | Value | |
Money Market Fund (c) - 2.6% | | | | | | | | |
Federated Government Obligations
Fund - Institutional Shares, 0.01% | | | 971,092 | | | $ | 971,092 | |
| | | | | | | | |
TOTAL SHORT-TERM INVESTMENT | | | | | | | | |
(Cost $971,092) | | | | | | | 971,092 | |
| | | | | | | | |
Total Investments - 99.8% | | | | | | | | |
(Cost $25,820,134) | | | | | | | 37,169,359 | |
Other Assets in Excess of
Liabilities - 0.2% | | | | | | | 63,086 | |
| | | | | | | | |
TOTAL NET ASSETS - 100.0% | | | | | | $ | 37,232,445 | |
| | | | | | | | |
| (a) | Non-income producing security. |
| (b) | Security issued by non-U.S. incorporated company. |
| (c) | The rate quoted is the annualized seven-day yield of the fund at period end. |
The Global Industry Classification Standard (GICS®) was developed by and/or is the exclusive property of MSCI, Inc. and Standard & Poor Financial Services LLC (“S&P”). GICS is a service mark of MSCI and S&P and has been licensed for use by U.S. Bancorp Fund Services, LLC.
The accompanying notes are an integral part of these financial statements.
17
|
| LKCM FIXED INCOME FUND |
| SCHEDULEOF INVESTMENTS |
| June 30, 2014 (Unaudited) |
| | | | | | | | |
| CORPORATE BONDS - 90.5% | | Principal
Amount | | | Value | |
Aerospace & Defense - 0.6% | | | | | | | | |
Lockheed Martin Corporation | | | | | | | | |
7.650%, 05/01/2016 | | $ | 1,250,000 | | | $ | 1,410,194 | |
| | | | | | | | |
Banks - 10.0% | | | | | |
Bank of America Corporation (a) | | | | | | | | |
1.300%, 03/22/2018 | | | 5,548,000 | | | | 5,624,529 | |
BB&T Corporation | | | | | | | | |
3.200%, 03/15/2016 | | | | | | | | |
Callable 02/16/2016 | | | 3,080,000 | | | | 3,204,518 | |
Branch Banking & Trust Company (a): | | | | | | | | |
0.862%, 09/13/2016 | | | 2,325,000 | | | | 2,316,993 | |
0.793%, 05/23/2017 | | | 2,534,000 | | | | 2,516,840 | |
Comerica Incorporated: | | | | | | | | |
3.000%, 09/16/2015 | | | 892,000 | | | | 917,678 | |
2.125%, 05/23/2019 | | | | | | | | |
Callable 04/23/2019 | | | 1,000,000 | | | | 1,000,222 | |
SunTrust Banks, Inc. | | | | | | | | |
3.500%, 01/20/2017 | | | | | | | | |
Callable 12/20/2016 | | | 875,000 | | | | 926,999 | |
Wells Fargo & Company: | | | | | | | | |
2.625%, 12/15/2016 | | | 3,000,000 | | | | 3,120,090 | |
0.856%, 04/23/2018 (a) | | | 2,500,000 | | | | 2,524,028 | |
| | | | | | | | |
| | | | | | | 22,151,897 | |
| | | | | | | | |
Beverages - 0.9% | | | | | |
The Coca-Cola Company | | | | | | | | |
5.350%, 11/15/2017 | | | 1,500,000 | | | | 1,705,470 | |
PepsiCo, Inc. | | | | | | | | |
7.900%, 11/01/2018 | | | 214,000 | | | | 266,626 | |
| | | | | | | | |
| | | | | | | 1,972,096 | |
| | | | | | | | |
Biotechnology - 6.5% | | | | | |
Amgen Inc.: | | | | | | | | |
2.500%, 11/15/2016 | | | 1,000,000 | | | | 1,036,358 | |
2.125%, 05/15/2017 | | | 2,350,000 | | | | 2,410,284 | |
Celgene Corporation: | | | | | | | | |
2.450%, 10/15/2015 | | | 5,279,000 | | | | 5,384,765 | |
1.900%, 08/15/2017 | | | 3,865,000 | | | | 3,924,351 | |
Gilead Sciences, Inc. | | | | | | | | |
2.050%, 04/01/2019 | | | 1,550,000 | | | | 1,552,787 | |
| | | | | | | | |
| | | | | | | 14,308,545 | |
| | | | | | | | |
Building Products - 0.7% | | | | | |
Masco Corporation | | | | | | | | |
7.125%, 03/15/2020 | | | 1,350,000 | | | | 1,595,322 | |
| | | | | | | | |
Capital Markets - 3.2% | | | | | |
Morgan Stanley (a): | | | | | | | | |
3.000%, 08/30/2015 | | | 1,000,000 | | | | 1,023,481 | |
1.509%, 04/25/2018 | | | 2,500,000 | | | | 2,551,933 | |
1.079%, 01/24/2019 | | | 3,500,000 | | | | 3,527,328 | |
| | | | | | | | |
| | | | | | | 7,102,742 | |
| | | | | | | | |
| | | | | | | | |
| CORPORATE BONDS | | Principal
Amount | | | Value | |
Chemicals - 5.4% | | | | | | | | |
Airgas, Inc. | | | | | | | | |
2.950%, 06/15/2016 | | | | | | | | |
Callable 05/15/2016 | | $ | 950,000 | | | $ | 984,993 | |
Cytec Industries Inc. | | | | | | | | |
6.000%, 10/01/2015 | | | 2,500,000 | | | | 2,632,368 | |
Eastman Chemical Company: | | | | | | | | |
3.000%, 12/15/2015 | | | 2,625,000 | | | | 2,708,648 | |
2.400%, 06/01/2017 | | | 1,650,000 | | | | 1,699,926 | |
ECOLAB INC. | | | | | | | | |
3.000%, 12/08/2016 | | | 1,760,000 | | | | 1,841,824 | |
The Lubrizol Corporation | | | | | | | | |
5.500%, 10/01/2014 | | | 1,579,000 | | | | 1,600,086 | �� |
The Sherwin-Williams Company | | | | | | | | |
1.350%, 12/15/2017 | | | 350,000 | | | | 350,746 | |
| | | | | | | | |
| | | | | | | 11,818,591 | |
| | | | | | | | |
Commercial Services & Supplies - 2.0% | | | | | |
Republic Services, Inc. | | | | | | | | |
5.500%, 09/15/2019 | | | 1,000,000 | | | | 1,148,906 | |
Waste Management, Inc. | | | | | | | | |
2.600%, 09/01/2016 | | | 3,225,000 | | | | 3,338,417 | |
| | | | | | | | |
| | | | | | | 4,487,323 | |
| | | | | | | | |
Communications Equipment - 1.3% | | | | | |
Cisco Systems, Inc.: | | | | | | | | |
5.500%, 02/22/2016 | | | 1,000,000 | | | | 1,081,167 | |
4.950%, 02/15/2019 | | | 700,000 | | | | 790,186 | |
Harris Corporation | | | | | | | | |
6.375%, 06/15/2019 | | | 900,000 | | | | 1,039,952 | |
| | | | | | | | |
| | | | | | | 2,911,305 | |
| | | | | | | | |
Computers & Peripherals - 2.7% | | | | | |
Hewlett-Packard Company: | | | | | | | | |
1.167%, 01/14/2019 (a) | | | 2,000,000 | | | | 2,018,154 | |
4.650%, 12/09/2021 | | | 2,000,000 | | | | 2,185,476 | |
International Business Machines Corporation | | | | | | | | |
5.700%, 09/14/2017 | | | 1,500,000 | | | | 1,710,233 | |
| | | | | | | | |
| | | | | | | 5,913,863 | |
| | | | | | | | |
Consumer Finance - 3.0% | | | | | |
American Express Company (a) | | | | | | | | |
0.818%, 05/22/2018 | | | 3,533,000 | | | | 3,562,801 | |
American Express Credit Corporation | | | | | | | | |
2.800%, 09/19/2016 | | | 2,900,000 | | | | 3,021,176 | |
| | | | | | | | |
| | | | | | | 6,583,977 | |
| | | | | | | | |
Consumer Services - 2.7% | | | | | |
The Western Union Company: | | | | | | | | |
5.930%, 10/01/2016 | | | 1,000,000 | | | | 1,098,281 | |
2.875%, 12/10/2017 | | | 2,250,000 | | | | 2,318,882 | |
3.650%, 08/22/2018 | | | 2,500,000 | | | | 2,619,815 | |
| | | | | | | | |
| | | | | | | 6,036,978 | |
| | | | | | | | |
The accompanying notes are an integral part of these financial statements.
18
|
| LKCM FIXED INCOME FUND |
| SCHEDULEOF INVESTMENTS, CONTINUED |
| June 30, 2014 (Unaudited) |
| | | | | | | | |
| CORPORATE BONDS | | Principal
Amount | | | Value | |
Containers & Packaging - 3.4% | | | | | |
Ball Corporation: | | | | | | | | |
6.750%, 09/15/2020 | | | | | | | | |
Callable 03/15/2015 | | $ | 2,000,000 | | | $ | 2,142,500 | |
5.750%, 05/15/2021 | | | | | | | | |
Callable 11/15/2015 | | | 5,000,000 | | | | 5,343,750 | |
| | | | | | | | |
| | | | | | | 7,486,250 | |
| | | | | | | | |
Diversified Financials - 4.0% | | | | | |
JPMorgan Chase & Co.: | | | | | | | | |
3.450%, 03/01/2016 | | | 4,125,000 | | | | 4,306,269 | |
2.000%, 08/15/2017 | | | 1,375,000 | | | | 1,399,366 | |
1.129%, 01/25/2018 (a) | | | 3,000,000 | | | | 3,044,916 | |
| | | | | | | | |
| | | | | | | 8,750,551 | |
| | | | | | | | |
Diversified Telecommunication Services - 9.4% | | | | | |
AT&T Inc. (a): | | | | | | | | |
1.137%, 11/27/2018 | | | 3,000,000 | | | | 3,061,716 | |
0.901%, 03/11/2019 | | | 1,500,000 | | | | 1,511,412 | |
CenturyLink, Inc.: | | | | | | | | |
5.150%, 06/15/2017 | | | 2,000,000 | | | | 2,170,000 | |
6.150%, 09/15/2019 | | | 1,402,000 | | | | 1,535,190 | |
5.800%, 03/15/2022 | | | 4,000,000 | | | | 4,185,000 | |
Verizon Communications Inc. (a): | | | | | | | | |
1.761%, 09/15/2016 | | | 4,000,000 | | | | 4,112,408 | |
1.981%, 09/14/2018 | | | 4,000,000 | | | | 4,224,484 | |
| | | | | | | | |
| | | | | | | 20,800,210 | |
| | | | | | | | |
Electrical Equipment & Instruments - 1.6% | | | | | |
Roper Industries, Inc. | | | | | | | | |
1.850%, 11/15/2017 | | | 3,395,000 | | | | 3,426,054 | |
| | | | | | | | |
Energy Equipment & Services - 1.8% | | | | | |
Weatherford International, Inc. | | | | | | | | |
6.350%, 06/15/2017 | | | 1,550,000 | | | | 1,762,434 | |
Weatherford International Ltd. (b) | | | | | | | | |
4.500%, 04/15/2022 | | | | | | | | |
Callable 01/15/2022 | | | 2,000,000 | | | | 2,129,916 | |
| | | | | | | | |
| | | | | | | 3,892,350 | |
| | | | | | | | |
Food & Drug Retailing - 5.3% | | | | | |
CVS Caremark Corporation: | | | | | | | | |
5.750%, 06/01/2017 | | | 2,750,000 | | | | 3,099,575 | |
2.250%, 12/05/2018 | | | | | | | | |
Callable 11/05/2018 | | | 1,725,000 | | | | 1,747,908 | |
4.125%, 05/15/2021 | | | | | | | | |
Callable 02/15/2021 | | | 2,000,000 | | | | 2,164,496 | |
Walgreen Co. | | | | | | | | |
1.800%, 09/15/2017 | | | 4,550,000 | | | | 4,592,947 | |
| | | | | | | | |
| | | | | | | 11,604,926 | |
| | | | | | | | |
Food Products - 0.3% | | | | | |
Kraft Foods Group, Inc. | | | | | | | | |
2.250%, 06/05/2017 | | | 555,000 | | | | 570,527 | |
| | | | | | | | |
| | | | | | | | |
| CORPORATE BONDS | | Principal
Amount | | | Value | |
Health Care Equipment & Supplies - 1.2% | | | | | |
DENTSPLY International Inc. | | | | | | | | |
2.750%, 08/15/2016 | | $ | 1,446,000 | | | $ | 1,498,326 | |
PerkinElmer, Inc. | | | | | | | | |
5.000%, 11/15/2021 | | | | | | | | |
Callable 08/15/2021 | | | 1,094,000 | | | | 1,184,335 | |
| | | | | | | | |
| | | | | | | 2,682,661 | |
| | | | | | | | |
Health Care Providers & Services - 3.8% | | | | | |
Express Scripts Holding Co: | | | | | | | | |
3.125%, 05/15/2016 | | | 2,760,000 | | | | 2,876,745 | |
2.650%, 02/15/2017 | | | 3,105,000 | | | | 3,227,837 | |
McKesson Corporation | | | | | | | | |
3.250%, 03/01/2016 | | | 2,275,000 | | | | 2,367,336 | |
| | | | | | | | |
| | | | | | | 8,471,918 | |
| | | | | | | | |
Hotels, Restaurants & Leisure - 0.5% | | | | | |
McDonald’s Corporation | | | | | | | | |
5.350%, 03/01/2018 | | | 1,000,000 | | | | 1,136,554 | |
| | | | | | | | |
Household Durables - 0.5% | | | | | |
Jarden Corporation | | | | | | | | |
7.500%, 05/01/2017 | | | 890,000 | | | | 1,014,600 | |
| | | | | | | | |
Household Products - 0.5% | | | | | |
The Procter & Gamble Company | | | | | | | | |
8.000%, 09/01/2024 | | | | | | | | |
Putable 09/1/2014 | | | 775,000 | | | | 1,091,263 | |
| | | | | | | | |
Insurance - 1.4% | | | | | |
Prudential Financial, Inc. | | | | | | | | |
3.000%, 05/12/2016 | | | 3,023,000 | | | | 3,145,628 | |
| | | | | | | | |
Internet Catalog & Retail - 1.1% | | | | | |
Amazon.com, Inc. | | | | | | | | |
1.200%, 11/29/2017 | | | 2,525,000 | | | | 2,511,880 | |
| | | | | | | | |
Media - 0.8% | | | | | |
The Walt Disney Company | | | | | | | | |
5.625%, 09/15/2016 | | | 1,500,000 | | | | 1,660,156 | |
| | | | | | | | |
Metals & Mining - 0.2% | | | | | |
Alcoa Inc. | | | | | | | | |
5.550%, 02/01/2017 | | | 500,000 | | | | 545,870 | |
| | | | | | | | |
Multiline Retail - 2.3% | | | | | |
Family Dollar Stores, Inc. | | | | | | | | |
5.000%, 02/01/2021 | | | 4,500,000 | | | | 4,835,664 | |
Kohl’s Corporation | | | | | | | | |
6.250%, 12/15/2017 | | | 282,000 | | | | 325,054 | |
| | | | | | | | |
| | | | | | | 5,160,718 | |
| | | | | | | | |
Oil & Gas & Consumable Fuels - 7.8% | | | | | |
Anadarko Petroleum Corporation: | | | | | | | | |
5.950%, 09/15/2016 | | | 2,000,000 | | | | 2,216,274 | |
6.375%, 09/15/2017 | | | 2,000,000 | | | | 2,304,376 | |
Devon Energy Corporation | | | | | | | | |
2.400%, 07/15/2016 | | | | | | | | |
Callable 06/15/2016 | | | 1,000,000 | | | | 1,031,939 | |
The accompanying notes are an integral part of these financial statements.
19
|
| LKCM FIXED INCOME FUND |
| SCHEDULEOF INVESTMENTS, CONTINUED |
| June 30, 2014 (Unaudited) |
| | | | | | | | |
| CORPORATE BONDS | | Principal
Amount | | | Value | |
Oil & Gas & Consumable Fuels - 7.8%, Continued | | | | | |
Enterprise Products Operating LLC | | | | | | | | |
3.200%, 02/01/2016 | | $ | 2,229,000 | | | $ | 2,316,450 | |
Noble Holding International Ltd. (b) | | | | | | | | |
3.450%, 08/01/2015 | | | 4,855,000 | | | | 4,994,751 | |
Range Resources Corporation | | | | | | | | |
5.000%, 08/15/2022 | | | | | | | | |
Callable 02/15/2017 | | | 4,100,000 | | | | 4,366,500 | |
| | | | | | | | |
| | | | | | | 17,230,290 | |
| | | | | | | | |
Real Estate Investment Trusts - 0.9% | | | | | |
American Tower Corporation: | | | | | | | | |
5.050%, 09/01/2020 | | | 1,250,000 | | | | 1,394,694 | |
4.700%, 03/15/2022 | | | 450,000 | | | | 484,702 | |
| | | | | | | | |
| | | | | | | 1,879,396 | |
| | | | | | | | |
Road & Rail - 0.1% | | | | | |
Burlington Northern Santa Fe Corporation | | | | | | | | |
5.650%, 05/01/2017 | | | 185,000 | | | | 207,837 | |
| | | | | | | | |
Semiconductor Equipment & Products - 2.3% | |
Analog Devices, Inc. | | | | | | | | |
3.000%, 04/15/2016 | | | 1,050,000 | | | | 1,088,983 | |
Applied Materials, Inc. | | | | | | | | |
2.650%, 06/15/2016 | | | 1,192,000 | | | | 1,234,655 | |
Broadcom Corporation | | | | | | | | |
2.700%, 11/01/2018 | | | 1,700,000 | | | | 1,760,948 | |
Texas Instruments Incorporated | | | | | | | | |
2.375%, 05/16/2016 | | | 1,000,000 | | | | 1,034,144 | |
| | | | | | | | |
| | | | | | | 5,118,730 | |
| | | | | | | | |
Software - 1.6% | | | | | |
Symantec Corporation: | | | | | | | | |
2.750%, 09/15/2015 | | | 2,300,000 | | | | 2,352,879 | |
2.750%, 06/15/2017 | | | | | | | | |
Callable 05/15/2017 | | | 1,160,000 | | | | 1,191,835 | |
| | | | | | | | |
| | | | | | | 3,544,714 | |
| | | | | | | | |
Specialty Retail - 0.7% | | | | | |
Lowe’s Companies, Inc. | | | | | | | | |
5.000%, 10/15/2015 | | | 525,000 | | | | 554,550 | |
O’Reilly Automotive, Inc. | | | | | | | | |
4.875%, 01/14/2021 | | | | | | | | |
Callable 10/14/2020 | | | 1,000,000 | | | | 1,095,185 | |
| | | | | | | | |
| | | | | | | 1,649,735 | |
| | | | | | | | |
TOTAL CORPORATE BONDS | | | | | | | | |
(Cost $193,523,670) | | | | | | | 199,875,651 | |
| | | | | | | | |
| | | | | | | | |
| PREFERRED STOCK - 0.9% | |
Shares | | | Value | |
Capital Markets - 0.9% | | | | | | | | |
Merrill Lynch Preferred Capital Trust III | | | | | | | | |
Callable 08/01/2014 | | | 75,000 | | | $ | 1,933,500 | |
| | | | | | | | |
TOTAL PREFERRED STOCK | | | | | | | | |
(Cost $1,820,339) | | | | | | | 1,933,500 | |
| | | | | | | | |
| | | | | | | | |
| U.S. GOVERNMENT ISSUES - 0.7% | | Principal
Amount | | | | |
U.S. Treasury Notes - 0.7% | | | | | | | | |
4.250%, 11/15/2014 | | $ | 500,000 | | | | 507,773 | |
4.250%, 08/15/2015 | | | 500,000 | | | | 522,969 | |
4.500%, 02/15/2016 | | | 500,000 | | | | 534,063 | |
| | | | | | | | |
TOTAL U.S. GOVERNMENT ISSUES | | | | | | | | |
(Cost $1,493,914) | | | | | | | 1,564,805 | |
| | | | | | | | |
| | | | | | | | |
U.S. GOVERNMENT SPONSORED
ENTITIES - 6.7% | | | | | | |
Fannie Mae - 0.9% | | | | | | | | |
5.000%, 03/15/2016 | | | 1,000,000 | | | | 1,078,185 | |
1.250%, 12/27/2019 | | | | | | | | |
Callable 09/27/2014 | | | 1,000,000 | | | | 1,001,013 | |
| | | | | | | | |
| | | | | | | 2,079,198 | |
| | | | | | | | |
Federal Home Loan Banks - 4.4% | | | | | | | | |
4.875%, 05/17/2017 | | | 1,000,000 | | | | 1,114,108 | |
1.000%, 01/28/2019 | | | | | | | | |
Callable 07/28/2014 | | | 2,250,000 | | | | 2,250,180 | |
1.000%, 04/16/2019 | | | | | | | | |
Callable 07/16/2014 | | | 1,845,000 | | | | 1,844,458 | |
0.630%, 04/30/2019 | | | | | | | | |
Callable 07/30/2014 | | | 2,500,000 | | | | 2,500,502 | |
1.000%, 04/25/2028 | | | | | | | | |
Callable 07/25/2014 | | | 2,000,000 | | | | 1,970,822 | |
| | | | | | | | |
| | | | | | | 9,680,070 | |
| | | | | | | | |
Freddie Mac - 1.4% | | | | | | | | |
0.750%, 09/20/2017 | | | | | | | | |
Callable 09/20/2014 | | | 2,500,000 | | | | 2,502,060 | |
5.125%, 11/17/2017 | | | 500,000 | | | | 566,935 | |
| | | | | | | | |
| | | | | | | 3,068,995 | |
| | | | | | | | |
TOTAL U.S. GOVERNMENT SPONSORED ENTITIES | | | | | | | | |
(Cost $14,611,294) | | | | | | | 14,828,263 | |
| | | | | | | | |
The accompanying notes are an integral part of these financial statements.
20
|
| LKCM FIXED INCOME FUND |
| SCHEDULEOF INVESTMENTS, CONTINUED |
| June 30, 2014 (Unaudited) |
| | | | | | | | |
| SHORT-TERM INVESTMENT - 0.7% | | Shares | | | Value | |
Money Market Fund (c) - 0.7% | | | | | | | | |
Federated Government Obligations
Fund - Institutional Shares, 0.01% | | | 1,647,908 | | | $ | 1,647,908 | |
| | | | | | | | |
TOTAL SHORT-TERM INVESTMENT | | | | | | | | |
(Cost $1,647,908) | | | | | | | 1,647,908 | |
| | | | | | | | |
Total Investments - 99.5% | | | | | | | | |
(Cost $213,097,125) | | | | | | | 219,850,127 | |
Other Assets in Excess of
Liabilities - 0.5% | | | | | | | 1,111,384 | |
| | | | | | | | |
TOTAL NET ASSETS - 100.0% | | | | | | $ | 220,961,511 | |
| | | | | | | | |
| (b) | Security issued by non-U.S. incorporated company. |
| (c) | The rate quoted is the annualized seven-day yield of the fund at period end. |
The Global Industry Classification Standard (GICS®) was developed by and/or is the exclusive property of MSCI, Inc. and Standard & Poor Financial Services LLC (“S&P”). GICS is a service mark of MSCI and S&P and has been licensed for use by U.S. Bancorp Fund Services, LLC.
The accompanying notes are an integral part of these financial statements.
21
|
| STATEMENTOF ASSETSAND LIABILITIES |
| June 30, 2014 (Unaudited) |
| | | | | | | | | | | | | | | | | | | | | | | | | | | | | | |
| | | | | LKCM Small Cap
Equity Fund | | | | | LKCM Small-Mid Cap
Equity Fund | | | | | LKCM
Equity Fund | | | | | LKCM
Balanced
Fund | | | | | LKCM Fixed
Income Fund | |
| | | | | | | | | | | | | | | | | | | | | | | | | | | | | | |
Assets: | | | | | | | | | | | | | | | | | | | | | | | | | | | | | | |
Investments, at value* | | | | $ | 1,041,671,169 | | | | | $ | 396,584,051 | | | | | $ | 334,140,226 | | | | | $ | 37,169,359 | | | | | $ | 219,850,127 | |
Dividends and interest receivable | | | | | 429,256 | | | | | | 121,898 | | | | | | 221,578 | | | | | | 75,278 | | | | | | 1,508,098 | |
Receivable for Fund shares sold | | | | | 578,322 | | | | | | 576,986 | | | | | | 388,830 | | | | | | 41,253 | | | | | | 35,366 | |
Other assets | | | | | 91,343 | | | | | | 54,285 | | | | | | 58,563 | | | | | | 11,796 | | | | | | 22,702 | |
| | | | | | | | | | | | | | | | | | | | | | | | | | | | | | |
Total assets | | | | | 1,042,770,090 | | | | | | 397,337,220 | | | | | | 334,809,197 | | | | | | 37,297,686 | | | | | | 221,416,293 | |
| | | | | | | | | | | | | | | | | | | | | | | | | | | | | | |
Liabilities: | | | | | | | | | | | | | | | | | | | | | | | | | | | | | | |
Payable for investment advisory fees | | | | | 1,891,520 | | | | | | 554,335 | | | | | | 468,455 | | | | | | 40,562 | | | | | | 243,896 | |
Payable for Fund shares redeemed | | | | | 888,130 | | | | | | 192,501 | | | | | | 142,780 | | | | | | 3,000 | | | | | | 125,062 | |
Payable for administrative fees | | | | | 131,311 | | | | | | 53,427 | | | | | | 46,951 | | | | | | 4,312 | | | | | | 28,806 | |
Payable for accounting and
transfer agent fees and expenses | | | | | 54,357 | | | | | | 135,920 | | | | | | 22,731 | | | | | | 8,361 | | | | | | 17,638 | |
Payable for custody fees and expenses | | | | | 23,082 | | | | | | 7,168 | | | | | | 6,023 | | | | | | 1,038 | | | | | | 4,037 | |
Payable for distribution expense (Note B) | | | | | 16,393 | | | | | | — | | | | | | — | | | | | | — | | | | | | — | |
Accrued expenses and other liabilities | | | | | 148,271 | | | | | | 57,339 | | | | | | 38,922 | | | | | | 7,968 | | | | | | 35,343 | |
| | | | | | | | | | | | | | | | | | | | | | | | | | | | | | |
Total liabilities | | | | | 3,153,064 | | | | | | 1,000,690 | | | | | | 725,862 | | | | | | 65,241 | | | | | | 454,782 | |
| | | | | | | | | | | | | | | | | | | | | | | | | | | | | | |
Net assets | | | | $ | 1,039,617,026 | | | | | $ | 396,336,530 | | | | | $ | 334,083,335 | | | | | $ | 37,232,445 | | | | | $ | 220,961,511 | |
| | | | | | | | | | | | | | | | | | | | | | | | | | | | | | |
Net assets consist of: | | | | | | | | | | | | | | | | | | | | | | | | | | | | | | |
Paid in capital | | | | $ | 656,310,734 | | | | | $ | 291,978,560 | | | | | $ | 218,313,351 | | | | | $ | 25,345,122 | | | | | $ | 213,242,815 | |
Accumulated net investment income (loss) | | | | | (821,325 | ) | | | | | (1,126,645 | ) | | | | | 1,080,636 | | | | | | 1,644 | | | | | | 44,449 | |
Accumulated net realized gain on securities | | | | | 115,011,354 | | | | | | 7,158,672 | | | | | | 6,149,095 | | | | | | 536,454 | | | | | | 921,245 | |
Net unrealized appreciation on investments | | | | | 269,116,263 | | | | | | 98,325,943 | | | | | | 108,540,253 | | | | | | 11,349,225 | | | | | | 6,753,002 | |
| | | | | | | | | | | | | | | | | | | | | | | | | | | | | | |
Net assets | | | | $ | 1,039,617,026 | | | | | $ | 396,336,530 | | | | | $ | 334,083,335 | | | | | $ | 37,232,445 | | | | | $ | 220,961,511 | |
| | | | | | | | | | | | | | | | | | | | | | | | | | | | | | |
| | | | | | | | | | |
INSTITUTIONAL CLASS | | | | | | | | | | | | | | | | | | | | | | | | | | | | | | |
Net assets | | | | $ | 1,018,119,903 | | | | | $ | 396,336,530 | | | | | $ | 334,083,335 | | | | | $ | 37,232,445 | | | | | $ | 220,961,511 | |
Shares of beneficial interest outstanding
(unlimited shares of no par value authorized) | | | | | 36,209,494 | | | | | | 30,519,450 | | | | | | 14,150,951 | | | | | | 1,826,470 | | | | | | 20,060,582 | |
Net asset value per share
(offering and redemption price) | | | | $ | 28.12 | | | | | $ | 12.99 | | | | | $ | 23.61 | | | | | $ | 20.38 | | | | | $ | 11.01 | |
| | | | | | | | | | | | | | | | | | | | | | | | | | | | | | |
| | | | | | | | | | |
ADVISER CLASS** | | | | | | | | | | | | | | | | | | | | | | | | | | | | | | |
Net assets | | | | $ | 21,497,123 | | | | | | | | | | | | | | | | | | | | | | | | | |
Shares of beneficial interest outstanding
(unlimited shares of no par value authorized) | | | | | 790,666 | | | | | | | | | | | | | | | | | | | | | | | | | |
Net asset value per share
(offering and redemption price) | | | | $ | 27.19 | | | | | | | | | | | | | | | | | | | | | | | | | |
| | | | | | | | | | | | | | | | | | | | | | | | | | | | | | |
| | | | | | | | | | |
* Cost of Investments | | | | $ | 772,554,906 | | | | | $ | 298,258,108 | | | | | $ | 225,599,973 | | | | | $ | 25,820,134 | | | | | $ | 213,097,125 | |
| | | | | | | | | | | | | | | | | | | | | | | | | | | | | | |
| ** | Currently, Adviser Class shares are authorized only for the Small Cap Equity, Small-Mid Cap Equity and Equity Funds and are offered only by the Small Cap Equity Fund. |
The accompanying notes are an integral part of these financial statements.
22
|
| STATEMENTOF OPERATIONS |
| For the Six Months Ended June 30, 2014 (Unaudited) |
| | | | | | | | | | | | | | | | | | | | | | | | | | | | | | |
| | | | | LKCM Small Cap
Equity Fund | | | | | LKCM Small-Mid Cap
Equity Fund | | | | | LKCM Equity
Fund | | | | | LKCM
Balanced
Fund | | | | | LKCM
Fixed
Income Fund | |
| | | | | | | | | | | | | | | | | | | | | | | | | | | | | | |
Investment Income: | | | | | | | | | | | | | | | | | | | | | | | | | | | | | | |
Dividends* | | | | $ | 4,036,368 | | | | | $ | 697,367 | | | | | $ | 2,368,524 | | | | | $ | 336,466 | | | | | $ | 65,625 | |
Interest | | | | | 1,247 | | | | | | 847 | | | | | | 744 | | | | | | 84,416 | | | | | | 2,714,945 | |
| | | | | | | | | | | | | | | | | | | | | | | | | | | | | | |
Total income | | | | | 4,037,615 | | | | | | 698,214 | | | | | | 2,369,268 | | | | | | 420,882 | | | | | | 2,780,570 | |
| | | | | | | | | | | | | | | | | | | | | | | | | | | | | | |
| | | | | | | | | | |
Expenses: | | | | | | | | | | | | | | | | | | | | | | | | | | | | | | |
Investment advisory fees | | | | | 3,857,801 | | | | | | 1,368,645 | | | | | | 1,127,553 | | | | | | 115,570 | | | | | | 540,038 | |
Distribution expense – Adviser Class (Note B) | | | | | 44,271 | | | | | | — | | | | | | — | | | | | | — | | | | | | — | |
Administrative fees | | | | | 396,196 | | | | | | 158,335 | | | | | | 141,710 | | | | | | 12,533 | | | | | | 85,450 | |
Accounting and transfer agent fees and expenses | | | | | 180,505 | | | | | | 422,325 | | | | | | 73,069 | | | | | | 24,196 | | | | | | 51,826 | |
Professional fees | | | | | 70,819 | | | | | | 25,903 | | | | | | 23,192 | | | | | | 4,138 | | | | | | 16,044 | |
Custody fees and expenses | | | | | 69,735 | | | | | | 21,668 | | | | | | 17,793 | | | | | | 2,913 | | | | | | 11,971 | |
Trustees’ fees | | | | | 69,631 | | | | | | 22,200 | | | | | | 18,144 | | | | | | 1,991 | | | | | | 14,631 | |
Federal and state registration | | | | | 42,927 | | | | | | 31,809 | | | | | | 36,147 | | | | | | 9,424 | | | | | | 14,804 | |
Reports to shareholders | | | | | 12,858 | | | | | | 27,492 | | | | | | 4,160 | | | | | | 674 | | | | | | 1,585 | |
Other | | | | | 114,197 | | | | | | 35,184 | | | | | | 26,524 | | | | | | 3,133 | | | | | | 25,250 | |
| | | | | | | | | | | | | | | | | | | | | | | | | | | | | | |
Total expenses | | | | | 4,858,940 | | | | | | 2,113,561 | | | | | | 1,468,292 | | | | | | 174,572 | | | | | | 761,599 | |
Less, expense waiver and/or
reimbursement (Note B) | | | | | — | | | | | | (288,702 | ) | | | | | (179,660 | ) | | | | | (32,332 | ) | | | | | (59,550 | ) |
| | | | | | | | | | | | | | | | | | | | | | | | | | | | | | |
Net expenses | | | | | 4,858,940 | | | | | | 1,824,859 | | | | | | 1,288,632 | | | | | | 142,240 | | | | | | 702,049 | |
| | | | | | | | | | | | | | | | | | | | | | | | | | | | | | |
Net investment income (loss) | | | | | (821,325 | ) | | | | | (1,126,645 | ) | | | | | 1,080,636 | | | | | | 278,642 | | | | | | 2,078,521 | |
| | | | | | | | | | | | | | | | | | | | | | | | | | | | | | |
| | | | | | | | | | |
Realized and Unrealized Gain (Loss) on Investments: | | | | | | | | | | | | | | | | | | | | | | | | | | | | | | |
Net realized gain on investments | | | | | 87,753,199 | | | | | | 12,790,944 | | | | | | 6,543,338 | | | | | | 569,673 | | | | | | 1,151,972 | |
Net change in unrealized
appreciation/depreciation on investments | | | | | (96,110,235 | ) | | | | | (10,401,765 | ) | | | | | 9,152,330 | | | | | | 808,480 | | | | | | 835,364 | |
| | | | | | | | | | | | | | | | | | | | | | | | | | | | | | |
| | | | | | | | | | |
Net realized and unrealized
gain (loss) on investments | | | | | (8,357,036 | ) | | | | | 2,389,179 | | | | | | 15,695,668 | | | | | | 1,378,153 | | | | | | 1,987,336 | |
| | | | | | | | | | | | | | | | | | | | | | | | | | | | | | |
| | | | | | | | | | |
Net Increase (Decrease) in Net Assets Resulting
from Operations | | | | $ | (9,178,361 | ) | | | | $ | 1,262,534 | | | | | $ | 16,776,304 | | | | | $ | 1,656,795 | | | | | $ | 4,065,857 | |
| | | | | | | | | | | | | | | | | | | | | | | | | | | | | | |
| | | | | | | | | | |
* Net of foreign taxes withheld | | | | $ | 1,646 | | | | | $ | – | | | | | $ | – | | | | | $ | – | | | | | $ | – | |
| | | | | | | | | | | | | | | | | | | | | | | | | | | | | | |
The accompanying notes are an integral part of these financial statements.
23
|
| STATEMENTSOF CHANGESIN NET ASSETS |
| | | | | | | | | | | | | | | | | | | | | | | | |
| | | | | LKCM Small Cap
Equity Fund | | | | | LKCM Small-Mid Cap
Equity Fund | |
| | | | | | | | | | | | | | | | | | | | | | | | |
| | | | | Six Months Ended
June 30, 2014
(Unaudited) | | | | | Year Ended
December 31,
2013 | | | | | Six Months Ended
June 30, 2014
(Unaudited) | | | | | Year Ended
December 31,
2013 | |
Operations: | | | | | | | | | | | | | | | | | | | | | | | | |
Net investment loss | | | | $ | (821,325 | ) | | | | $ | (2,418,900 | ) | | | | $ | (1,126,645 | ) | | | | $ | (1,815,616 | ) |
Net realized gain on investments | | | | | 87,753,199 | | | | | | 105,100,295 | | | | | | 12,790,944 | | | | | | 362,333 | |
Net change in unrealized
appreciation/depreciation on investments | | | | | (96,110,235 | ) | | | | | 197,156,682 | | | | | | (10,401,765 | ) | | | | | 92,231,060 | |
| | | | | | | | | | | | | | | | | | | | | | | | |
Net increase (decrease) in net assets resulting
from operations | | | | | (9,178,361 | ) | | | | | 299,838,077 | | | | | | 1,262,534 | | | | | | 90,777,777 | |
| | | | | | | | | | | | | | | | | | | | | | | | |
| | | | | | | | |
Dividends and Distributions to
Institutional Class Shareholders: | | | | | | | | | | | | | | | | | | | | | | | | |
Net investment income | | | | | — | | | | | | (120,236 | ) | | | | | — | | | | | | — | |
Net realized gain on investments | | | | | — | | | | | | (80,953,459 | ) | | | | | — | | | | | | — | |
| | | | | | | | | | | | | | | | | | | | | | | | |
| | | | | — | | | | | | (81,073,695 | ) | | | | | — | | | | | | — | |
| | | | | | | | | | | | | | | | | | | | | | | | |
| | | | | | | | |
Dividends and Distributions
to Adviser Class Shareholders: | | | | | | | | | | | | | | | | | | | | | | | | |
Net realized gain on investments | | | | | — | | | | | | (3,215,054 | ) | | | | | — | | | | | | — | |
| | | | | | | | | �� | | | | | | | | | | | | | | | |
| | | | | | | | |
Net increase (decrease) in net assets from
Fund share transactions (Note C) | | | | | (39,964,163 | ) | | | | | 12,488,180 | | | | | | 28,651,301 | | | | | | 25,481,047 | |
| | | | | | | | | | | | | | | | | | | | | | | | |
| | | | | | | | |
Total increase (decrease) in net assets | | | | | (49,142,524 | ) | | | | | 228,037,508 | | | | | | 29,913,835 | | | | | | 116,258,824 | |
| | | | | | | | |
Net Assets: | | | | | | | | | | | | | | | | | | | | | | | | |
Beginning of period | | | | | 1,088,759,550 | | | | | | 860,722,042 | | | | | | 366,422,695 | | | | | | 250,163,871 | |
| | | | | | | | | | | | | | | | | | | | | | | | |
End of period* | | | | $ | 1,039,617,026 | | | | | $ | 1,088,759,550 | | | | | $ | 396,336,530 | | | | | $ | 366,422,695 | |
| | | | | | | | | | | | | | | | | | | | | | | | |
| | | | | | | | |
* Including accumulated net investment loss of | | | | $ | (821,325 | ) | | | | $ | — | | | | | $ | (1,126,645 | ) | | | | $ | — | |
| | | | | | | | | | | | | | | | | | | | | | | | |
The accompanying notes are an integral part of these financial statements.
24
|
| STATEMENTSOF CHANGESIN NET ASSETS |
| | | | | | | | | | | | | | | | | | | | | | | | |
| | | | | LKCM Equity Fund | | | | | LKCM Balanced Fund | |
| | | | | | | | | | | | | | | | | | | | | | | | |
| | | | | Six Months Ended
June 30, 2014
(Unaudited) | | | | | Year Ended
December 31,
2013 | | | | | Six Months Ended
June 30, 2014
(Unaudited) | | | | | Year Ended
December 31,
2013 | |
Operations: | | | | | | | | | | | | | | | | | | | | | | | | |
Net investment income | | | | $ | 1,080,636 | | | | | $ | 1,660,296 | | | | | $ | 278,642 | | | | | $ | 272,081 | |
Net realized gain on investments | | | | | 6,543,338 | | | | | | 5,864,180 | | | | | | 569,673 | | | | | | 296,012 | |
Net change in unrealized
appreciation/depreciation on investments | | | | | 9,152,330 | | | | | | 65,864,138 | | | | | | 808,480 | | | | | | 5,221,417 | |
| | | | | | | | | | | | | | | | | | | | | | | | |
Net increase in net assets resulting from operations | | | | | 16,776,304 | | | | | | 73,388,614 | | | | | | 1,656,795 | | | | | | 5,789,510 | |
| | | | | | | | | | | | | | | | | | | | | | | | |
| | | | | | | | |
Dividends and Distributions to Shareholders: | | | | | | | | | | | | | | | | | | | | | | | | |
Net investment income | | | | | — | | | | | | (1,708,848 | ) | | | | | (276,998 | ) | | | | | (272,556 | ) |
Net realized gain on investments | | | | | — | | | | | | (6,674,882 | ) | | | | | — | | | | | | (56,337 | ) |
| | | | | | | | | | | | | | | | | | | | | | | | |
| | | | | — | | | | | | (8,383,730 | ) | | | | | (276,998 | ) | | | | | (328,893 | ) |
| | | | | | | | | | | | | | | | | | | | | | | | |
| | | | | | | | |
Net increase (decrease) in net assets from
Fund share transactions (Note C) | | | | | (6,624,597 | ) | | | | | 97,797,389 | | | | | | 520,364 | | | | | | 8,071,183 | |
| | | | | | | | | | | | | | | | | | | | | | | | |
| | | | | | | | |
Total increase in net assets | | | | | 10,151,707 | | | | | | 162,802,273 | | | | | | 1,900,161 | | | | | | 13,531,800 | |
| | | | | | | | |
Net Assets: | | | | | | | | | | | | | | | | | | | | | | | | |
Beginning of period | | | | | 323,931,628 | | | | | | 161,129,355 | | | | | | 35,332,284 | | | | | | 21,800,484 | |
| | | | | | | | | | | | | | | | | | | | | | | | |
End of period* | | | | $ | 334,083,335 | | | | | $ | 323,931,628 | | | | | $ | 37,232,445 | | | | | $ | 35,332,284 | |
| | | | | | | | | | | | | | | | | | | | | | | | |
| | | | | | | | |
* Including accumulated net investment income of | | | | $ | 1,080,636 | | | | | $ | — | | | | | $ | 1,644 | | | | | $ | — | |
| | | | | | | | | | | | | | | | | | | | | | | | |
The accompanying notes are an integral part of these financial statements.
25
|
| STATEMENTSOF CHANGESIN NET ASSETS |
| | | | | | | | | | | | |
| | | | | LKCM Fixed Income Fund | |
| | | | | | | | | | | | |
| | | | | Six Months Ended
June 30, 2014
(Unaudited) | | | | | Year Ended
December 31,
2013 | |
Operations: | | | | | | | | | | | | |
Net investment income | | | | $ | 2,078,521 | | | | | $ | 5,201,042 | |
Net realized gain on investments | | | | | 1,151,972 | | | | | | 431,378 | |
Net change in unrealized
appreciation/depreciation on investments | | | | | 835,364 | | | | | | (5,509,584 | ) |
| | | | | | | | | | | | |
Net increase in net assets resulting from operations | | | | | 4,065,857 | | | | | | 122,836 | |
| | | | | | | | | | | | |
| | | | |
Dividends and Distributions to Shareholders: | | | | | | | | | | | | |
Net investment income | | | | | (2,034,072 | ) | | | | | (5,205,420 | ) |
Net realized gain on investments | | | | | — | | | | | | (1,231,771 | ) |
| | | | | | | | | | | | |
| | | | | (2,034,072 | ) | | | | | (6,437,191 | ) |
| | | | | | | | | | | | |
| | | | |
Net increase (decrease) in net assets from
Fund share transactions (Note C) | | | | | (2,174,706 | ) | | | | | 21,539,078 | |
| | | | | | | | | | | | |
| | | | |
Total increase (decrease) in net assets | | | | | (142,921 | ) | | | | | 15,224,723 | |
| | | | |
Net Assets: | | | | | | | | | | | | |
Beginning of period | | | | | 221,104,432 | | | | | | 205,879,709 | |
| | | | | | | | | | | | |
End of period* | | | | $ | 220,961,511 | | | | | $ | 221,104,432 | |
| | | | | | | | | | | | |
| | | | |
* Including accumulated net investment income of | | | | $ | 44,449 | | | | | $ | — | |
| | | | | | | | | | | | |
The accompanying notes are an integral part of these financial statements.
26
|
| FINANCIAL HIGHLIGHTS |
| SELECTED DATAFOR EACH SHAREOF CAPITAL STOCK OUTSTANDING |
| | | | | | | | | | | | | | | | | | | | | | | | | | | | | | | | | | | | |
| | | | | LKCM Small Cap Equity Fund – Institutional Class | |
| | | | | | | | | | | | | | | | | | | | | | | | | | | | | | | | | | | | |
| | | | | Six Months
Ended
June 30, 2014
(Unaudited) | | | | | Year
Ended
December 31,
2013 | | | | | Year
Ended
December 31,
2012 | | | | | Year
Ended
December 31,
2011 | | | | | Year
Ended
December 31,
2010 | | | | | Year
Ended
December 31,
2009 | |
Net Asset Value – Beginning of Period | | | | $ | 28.33 | | | | | $ | 22.69 | | | | | $ | 22.45 | | | | | $ | 21.49 | | | | | $ | 16.16 | | | | | $ | 12.24 | |
| | | | | | | | | | | | | | | | | | | | | | | | | | | | | | | | | | | | |
Net investment income (loss) | | | | | (0.02 | )(1) | | | | | (0.06 | )(2) | | | | | 0.13 | (1) | | | | | (0.08 | )(1) | | | | | (0.07 | )(1) | | | | | (0.05 | )(1) |
Net realized and unrealized gain (loss) on investments | | | | | (0.19 | ) | | | | | 8.02 | | | | | | 2.01 | | | | | | 1.04 | | | | | | 5.40 | | | | | | 3.97 | |
| | | | | | | | | | | | | | | | | | | | | | | | | | | | | | | | | | | | |
Total from investment operations | | | | | (0.21 | ) | | | | | 7.96 | | | | | | 2.14 | | | | | | 0.96 | | | | | | 5.33 | | | | | | 3.92 | |
| | | | | | | | | | | | | | | | | | | | | | | | | | | | | | | | | | | | |
Dividends from net investment income | | | | | — | | | | | | — | | | | | | (0.13 | ) | | | | | — | | | | | | — | | | | | | — | |
Distributions from net realized gains | | | | | — | | | | | | (2.32 | ) | | | | | (1.77 | ) | | | | | — | | | | | | — | | | | | | — | |
| | | | | | | | | | | | | | | | | | | | | | | | | | | | | | | | | | | | |
Total dividends and distributions | | | | | — | | | | | | (2.32 | ) | | | | | (1.90 | ) | | | | | — | | | | | | — | | | | | | — | |
| | | | | | | | | | | | | | | | | | | | | | | | | | | | | | | | | | | | |
Net Asset Value – End of Period | | | | $ | 28.12 | | | | | $ | 28.33 | | | | | $ | 22.69 | | | | | $ | 22.45 | | | | | $ | 21.49 | | | | | $ | 16.16 | |
| | | | | | | | | | | | | | | | | | | | | | | | | | | | | | | | | | | | |
Total Return | | | | | -0.74% | (4) | | | | | 35.11% | | | | | | 9.74% | | | | | | 4.47% | | | | | | 32.98% | | | | | | 32.03% | |
| | | | | | | | | | | | |
Ratios and Supplemental Data: | | | | | | | | | | | | | | | | | | | | | | | | | | | | | | | | | | | | |
Net assets, end of period (thousands) | | | | $ | 1,018,120 | | | | | $ | 1,047,607 | | | | | $ | 819,985 | | | | | $ | 785,280 | | | | | $ | 690,511 | | | | | $ | 529,166 | |
Ratio of expenses to average net assets: | | | | | 0.94% | (5) | | | | | 0.95% | | | | | | 0.94% | | | | | | 0.95% | | | | | | 0.96% | | | | | | 1.00% | |
Ratio of net investment income (loss) to average net assets: | | | | | (0.15)% | (5) | | | | | (0.23)% | | | | | | 0.53% | | | | | | (0.33)% | | | | | | (0.38)% | | | | | | (0.35)% | |
Portfolio turnover rate(3) | | | | | 26% | | | | | | 47% | | | | | | 49% | | | | | | 50% | | | | | | 57% | | | | | | 59% | |
| (1) | Net investment income (loss) per share represents net investment income (loss) divided by the average shares outstanding throughout the period. |
| (2) | Net investment loss per share is calculated using the ending balance of undistributed net investment loss prior to considerations of adjustments for permanent book and tax differences. |
| (3) | Portfolio turnover is calculated on the basis of the Fund as a whole without distinguishing between the classes of shares issued. |
| | | | | | | | | | | | | | | | | | | | | | | | | | | | | | | | | | | | |
| | | | | LKCM Small Cap Equity Fund – Adviser Class | |
| | | | | | | | | | | | | | | | | | | | | | | | | | | | | | | | | | | | |
| | | | | Six Months
Ended
June 30, 2014
(Unaudited) | | | | | Year
Ended
December 31,
2013 | | | | | Year
Ended
December 31,
2012 | | | | | Year
Ended
December 31,
2011 | | | | | Year
Ended
December 31,
2010 | | | | | Year
Ended
December 31,
2009 | |
Net Asset Value – Beginning of Period | | | | $ | 27.43 | | | | | $ | 22.07 | | | | | $ | 21.88 | | | | | $ | 21.00 | | | | | $ | 15.83 | | | | | $ | 12.02 | |
| | | | | | | | | | | | | | | | | | | | | | | | | | | | | | | | | | | | |
Net investment income (loss) | | | | | (0.05 | )(1) | | | | | (0.13 | )(2) | | | | | 0.07 | (1) | | | | | (0.13 | )(1) | | | | | (0.11 | )(1) | | | | | (0.08 | )(1) |
Net realized and unrealized gain (loss) on investments | | | | | (0.19 | ) | | | | | 7.81 | | | | | | 1.95 | | | | | | 1.01 | | | | | | 5.28 | | | | | | 3.89 | |
| | | | | | | | | | | | | | | | | | | | | | | | | | | | | | | | | | | | |
Total from investment operations | | | | | (0.24 | ) | | | | | 7.68 | | | | | | 2.02 | | | | | | 0.88 | | | | | | 5.17 | | | | | | 3.81 | |
| | | | | | | | | | | | | | | | | | | | | | | | | | | | | | | | | | | | |
Dividends from net investment income | | | | | — | | | | | | — | | | | | | (0.06 | ) | | | | | — | | | | | | — | | | | | | — | |
Distributions from net realized gains | | | | | — | | | | | | (2.32 | ) | | | | | (1.77 | ) | | | | | — | | | | | | — | | | | | | — | |
| | | | | | | | | | | | | | | | | | | | | | | | | | | | | | | | | | | | |
Total dividends and distributions | | | | | — | | | | | | (2.32 | ) | | | | | (1.83 | ) | | | | | — | | | | | | — | | | | | | — | |
| | | | | | | | | | | | | | | | | | | | | | | | | | | | | | | | | | | | |
Net Asset Value – End of Period | | | | $ | 27.19 | | | | | $ | 27.43 | | | | | $ | 22.07 | | | | | $ | 21.88 | | | | | $ | 21.00 | | | | | $ | 15.83 | |
| | | | | | | | | | | | | | | | | | | | | | | | | | | | | | | | | | | | |
Total Return | | | | | -0.87% | (4) | | | | | 34.81% | | | | | | 9.45% | | | | | | 4.19% | | | | | | 32.66% | | | | | | 31.70% | |
| | | | | | | | | | | | |
Ratios and Supplemental Data: | | | | | | | | | | | | | | | | | | | | | | | | | | | | | | | | | | | | |
Net assets, end of period (thousands) | | | | $ | 21,497 | | | | | $ | 41,153 | | | | | $ | 40,737 | | | | | $ | 43,124 | | | | | $ | 44,124 | | | | | $ | 35,725 | |
Ratio of expenses to average net assets: | | | | | 1.19% | (5) | | | | | 1.20% | | | | | | 1.19% | | | | | | 1.20% | | | | | | 1.21% | | | | | | 1.25% | |
Ratio of net investment income (loss) to average net assets: | | | | | (0.40)% | (5) | | | | | (0.48)% | | | | | | 0.28% | | | | | | (0.58)% | | | | | | (0.63)% | | | | | | (0.60)% | |
Portfolio turnover rate(3) | | | | | 26% | | | | | | 47% | | | | | | 49% | | | | | | 50% | | | | | | 57% | | | | | | 59% | |
| (1) | Net investment income (loss) per share represents net investment income (loss) divided by the average shares outstanding throughout the period. |
| (2) | Net investment loss per share is calculated using the ending balance of undistributed net investment loss prior to considerations of adjustments for permanent book and tax differences. |
| (3) | Portfolio turnover is calculated on the basis of the Fund as a whole without distinguishing between the classes of shares issued. |
The accompanying notes are an integral part of these financial statements.
27
|
| FINANCIAL HIGHLIGHTS |
| SELECTED DATAFOR EACH SHAREOF CAPITAL STOCK OUTSTANDING |
| | | | | | | | | | | | | | | | | | | | | | | | |
| | | | | LKCM Small-Mid Cap Equity Fund | | | |
| | | | | | | | | | | | | | | | | | | | | | | | |
| | | | | Six Months
Ended
June 30, 2014
(Unaudited) | | | | | Year
Ended
December 31,
2013 | | | | | Year
Ended
December 31,
2012 | | | | | May 2, 2011(1)
through
December 31,
2011 | |
Net Asset Value – Beginning of Period | | | | $ | 12.97 | | | | | $ | 9.68 | | | | | $ | 8.86 | | | | | $ | 10.00 | |
| | | | | | | | | | | | | | | | | | | | | | | | |
Net investment loss | | | | | (0.04 | )(2) | | | | | (0.06 | )(2) | | | | | (0.03 | )(3) | | | | | (0.02 | )(3) |
Net realized and unrealized gain (loss) on investments | | | | | 0.06 | | | | | | 3.35 | | | | | | 0.85 | | | | | | (1.12 | ) |
| | | | | | | | | | | | | | | | | | | | | | | | |
Total from investment operations | | | | | 0.02 | | | | | | 3.29 | | | | | | 0.82 | | | | | | (1.14 | ) |
| | | | | | | | | | | | | | | | | | | | | | | | |
Net Asset Value – End of Period | | | | $ | 12.99 | | | | | $ | 12.97 | | | | | $ | 9.68 | | | | | $ | 8.86 | |
| | | | | | | | | | | | | | | | | | | | | | | | |
Total Return | | | | | 0.15% | (4) | | | | | 33.99% | | | | | | 9.26% | | | | | | -11.40% | (4) |
| | | | | | | | |
Ratios and Supplemental Data: | | | | | | | | | | | | | | | | | | | | | | | | |
Net assets, end of period (thousands) | | | | $ | 396,337 | | | | | $ | 366,423 | | | | | $ | 250,164 | | | | | $ | 23,755 | |
Ratio of expenses to average net assets: | | | | | | | | | | | | | | | | | | | | | | | | |
Before expense waiver and/or reimbursement | | | | | 1.16% | (5) | | | | | 1.18% | | | | | | 1.18% | | | | | | 2.14% | (5) |
After expense waiver and/or reimbursement | | | | | 1.00% | (5) | | | | | 1.00% | | | | | | 1.00% | | | | | | 1.00% | (5) |
Ratio of net investment loss to average net assets: | | | | | | | | | | | | | | | | | | | | | | | | |
Before expense waiver and/or reimbursement | | | | | (0.78)% | (5) | | | | | (0.77)% | | | | | | (0.50)% | | | | | | (1.55)% | (5) |
After expense waiver and/or reimbursement | | | | | (0.62)% | (5) | | | | | (0.59)% | | | | | | (0.32)% | | | | | | (0.41)% | (5) |
Portfolio turnover rate | | | | | 27% | | | | | | 49% | | | | | | 56% | | | | | | 36% | |
| (1) | Commencement of operations. |
| (2) | Net investment loss per shares is calculated using the ending balance of undistributed net investment loss prior to considerations of adjustments for permanent book and tax differences. |
| (3) | Net investment loss per share represents net investment loss divided by the average shares outstanding throughout the period. |
| | | | | | | | | | | | | | | | | | | | | | | | | | | | | | | | | | | | |
| | | | | LKCM Equity Fund | |
| | | | | | | | | | | | | | | | | | | | | | | | | | | | | | | | | | | | |
| | | | | Six Months
Ended
June 30, 2014
(Unaudited) | | | | | Year
Ended
December 31,
2013(1) | | | | | Year
Ended
December 31,
2012 | | | | | Year
Ended
December 31,
2011 | | | | | Year
Ended
December 31,
2010 | | | | | Year
Ended
December 31,
2009 | |
Net Asset Value – Beginning of Period | | | | $ | 22.44 | | | | | $ | 17.62 | | | | | $ | 15.34 | | | | | $ | 15.18 | | | | | $ | 13.02 | | | | | $ | 10.33 | |
| | | | | | | | | | | | | | | | | | | | | | | | | | | | | | | | | | | | |
Net investment income | | | | | 0.08 | | | | | | 0.14 | (2) | | | | | 0.14 | (2) | | | | | 0.11 | (2) | | | | | 0.08 | | | | | | 0.10 | |
Net realized and unrealized gain on investments | | | | | 1.09 | | | | | | 5.27 | | | | | | 2.27 | | | | | | 0.39 | | | | | | 2.24 | | | | | | 2.69 | |
| | | | | | | | | | | | | | | | | | | | | | | | | | | | | | | | | | | | |
Total from investment operations | | | | | 1.17 | | | | | | 5.41 | | | | | | 2.41 | | | | | | 0.50 | | | | | | 2.32 | | | | | | 2.79 | |
| | | | | | | | | | | | | | | | | | | | | | | | | | | | | | | | | | | | |
Dividends from net investment income | | | | | — | | | | | | (0.12 | ) | | | | | (0.12 | ) | | | | | (0.10 | ) | | | | | (0.08 | ) | | | | | (0.10 | ) |
Distributions from net realized gains | | | | | — | | | | | | (0.47 | ) | | | | | (0.01 | ) | | | | | (0.24 | ) | | | | | (0.08 | ) | | | | | — | |
| | | | | | | | | | | | | | | | | | | | | | | | | | | | | | | | | | | | |
Total dividends and distributions | | | | | — | | | | | | (0.59 | ) | | | | | (0.13 | ) | | | | | (0.34 | ) | | | | | (0.16 | ) | | | | | (0.10 | ) |
| | | | | | | | | | | | | | | | | | | | | | | | | | | | | | | | | | | | |
Net Asset Value – End of Period | | | | $ | 23.61 | | | | | $ | 22.44 | | | | | $ | 17.62 | | | | | $ | 15.34 | | | | | $ | 15.18 | | | | | $ | 13.02 | |
| | | | | | | | | | | | | | | | | | | | | | | | | | | | | | | | | | | | |
Total Return | | | | | 5.21% | (3) | | | | | 30.74% | | | | | | 15.69% | | | | | | 3.30% | | | | | | 17.77% | | | | | | 27.01% | |
| | | | | | | | | | | | |
Ratios and Supplemental Data: | | | | | | | | | | | | | | | | | | | | | | | | | | | | | | | | | | | | |
Net assets, end of period (thousands) | | | | $ | 334,083 | | | | | $ | 323,932 | | | | | $ | 161,129 | | | | | $ | 102,548 | | | | | $ | 72,370 | | | | | $ | 49,157 | |
Ratio of expenses to average net assets: | | | | | | | | | | | | | | | | | | | | | | | | | | | | | | | | | | | | |
Before expense waiver and/or reimbursement | | | | | 0.91% | (4) | | | | | 0.93% | | | | | | 0.96% | | | | | | 0.99% | | | | | | 1.04% | | | | | | 1.13% | |
After expense waiver and/or reimbursement | | | | | 0.80% | (4) | | | | | 0.80% | | | | | | 0.80% | | | | | | 0.80% | | | | | | 0.80% | | | | | | 0.80% | |
Ratio of net investment income to average net assets: | | | | | | | | | | | | | | | | | | | | | | | | | | | | | | | | | | | | |
Before expense waiver and/or reimbursement | | | | | 0.56% | (4) | | | | | 0.53% | | | | | | 0.69% | | | | | | 0.54% | | | | | | 0.39% | | | | | | 0.62% | |
After expense waiver and/or reimbursement | | | | | 0.67% | (4) | | | | | 0.66% | | | | | | 0.85% | | | | | | 0.73% | | | | | | 0.63% | | | | | | 0.95% | |
Portfolio turnover rate | | | | | 7% | | | | | | 17% | | | | | | 12% | | | | | | 20% | | | | | | 23% | | | | | | 26% | |
| (1) | On May 10, 2013, The Armstrong Fund was reorganized into the LKCM Equity Fund. Activity after May 10, 2013, reflects the funds combined operations. |
| (2) | Net investment income per share represents net investment income divided by the average shares outstanding throughout the period. |
The accompanying notes are an integral part of these financial statements.
28
|
| FINANCIAL HIGHLIGHTS |
| SELECTED DATAFOR EACH SHAREOF CAPITAL STOCK OUTSTANDING |
| | | | | | | | | | | | | | | | | | | | | | | | | | | | | | | | | | | | |
| | | | | LKCM Balanced Fund | |
| | | | | | | | | | | | | | | | | | | | | | | | | | | | | | | | | | | | |
| | | | | Six Months
Ended
June 30, 2014
(Unaudited) | | | | | Year
Ended
December 31,
2013 | | | | | Year
Ended
December 31,
2012 | | | | | Year
Ended
December 31,
2011 | | | | | Year
Ended
December 31,
2010 | | | | | Year
Ended
December 31,
2009 | |
Net Asset Value – Beginning of Period | | | | $ | 19.63 | | | | | $ | 16.11 | | | | | $ | 14.53 | | | | | $ | 14.25 | | | | | $ | 13.09 | | | | | $ | 10.85 | |
| | | | | | | | | | | | | | | | | | | | | | | | | | | | | | | | | | | | |
Net investment income | | | | | 0.15 | | | | | | 0.17 | | | | | | 0.19 | | | | | | 0.17 | | | | | | 0.18 | | | | | | 0.22 | |
Net realized and unrealized gain on investments | | | | | 0.75 | | | | | | 3.55 | | | | | | 1.58 | | | | | | 0.28 | | | | | | 1.16 | | | | | | 2.24 | |
| | | | | | | | | | | | | | | | | | | | | | | | | | | | | | | | | | | | |
Total from investment operations | | | | | 0.90 | | | | | | 3.72 | | | | | | 1.77 | | | | | | 0.45 | | | | | | 1.34 | | | | | | 2.46 | |
| | | | | | | | | | | | | | | | | | | | | | | | | | | | | | | | | | | | |
Dividends from net investment income | | | | | (0.15 | ) | | | | | (0.17 | ) | | | | | (0.19 | ) | | | | | (0.17 | ) | | | | | (0.18 | ) | | | | | (0.22 | ) |
Distributions from net realized gains | | | | | — | | | | | | (0.03 | ) | | | | | — | | | | | | — | | | | | | — | | | | | | — | |
| | | | | | | | | | | | | | | | | | | | | | | | | | | | | | | | | | | | |
Total dividends and distributions | | | | | (0.15 | ) | | | | | (0.20 | ) | | | | | (0.19 | ) | | | | | (0.17 | ) | | | | | (0.18 | ) | | | | | (0.22 | ) |
| | | | | | | | | | | | | | | | | | | | | | | | | | | | | | | | | | | | |
Net Asset Value – End of Period | | | | $ | 20.38 | | | | | $ | 19.63 | | | | | $ | 16.11 | | | | | $ | 14.53 | | | | | $ | 14.25 | | | | | $ | 13.09 | |
| | | | | | | | | | | | | | | | | | | | | | | | | | | | | | | | | | | | |
Total Return | | | | | 4.60% | (1) | | | | | 23.18% | | | | | | 12.20% | | | | | | 3.16% | | | | | | 10.31% | | | | | | 22.90% | |
| | | | | | | | | | | | |
Ratios and Supplemental Data: | | | | | | | | | | | | | | | | | | | | | | | | | | | | | | | | | | | | |
Net assets, end of period (thousands) | | | | $ | 37,232 | | | | | $ | 35,332 | | | | | $ | 21,800 | | | | | $ | 18,560 | | | | | $ | 16,486 | | | | | $ | 13,476 | |
Ratio of expenses to average net assets: | | | | | | | | | | | | | | | | | | | | | | | | | | | | | | | | | | | | |
Before expense waiver and/or reimbursement | | | | | 0.98% | (2) | | | | | 1.04% | | | | | | 1.10% | | | | | | 1.14% | | | | | | 1.25% | | | | | | 1.41% | |
After expense waiver and/or reimbursement | | | | | 0.80% | (2) | | | | | 0.80% | | | | | | 0.80% | | | | | | 0.80% | | | | | | 0.80% | | | | | | 0.80% | |
Ratio of net investment income to average net assets: | | | | | | | | | | | | | | | | | | | | | | | | | | | | | | | | | | | | |
Before expense waiver and/or reimbursement | | | | | 1.39% | (2) | | | | | 0.72% | | | | | | 0.91% | | | | | | 0.83% | | | | | | 0.89% | | | | | | 1.28% | |
After expense waiver and/or reimbursement | | | | | 1.57% | (2) | | | | | 0.96% | | | | | | 1.21% | | | | | | 1.17% | | | | | | 1.34% | | | | | | 1.89% | |
Portfolio turnover rate | | | | | 13% | | | | | | 10% | | | | | | 15% | | | | | | 34% | | | | | | 13% | | | | | | 22% | |
| | | | | | | | | | | | | | | | | | | | | | | | | | | | | | | | | | | | |
| | | | | LKCM Fixed Income Fund | |
| | | | | | | | | | | | | | | | | | | | | | | | | | | | | | | | | | | | |
| | | | | Six Months
Ended
June 30, 2014
(Unaudited) | | | | | Year
Ended
December 31,
2013 | | | | | Year
Ended
December 31,
2012 | | | | | Year
Ended
December 31,
2011 | | | | | Year
Ended
December 31,
2010 | | | | | Year
Ended
December 31,
2009 | |
Net Asset Value – Beginning of Period | | | | $ | 10.91 | | | | | $ | 11.23 | | | | | $ | 11.04 | | | | | $ | 11.03 | | | | | $ | 10.85 | | | | | $ | 10.20 | |
| | | | | | | | | | | | | | | | | | | | | | | | | | | | | | | | | | | | |
Net investment income | | | | | 0.10 | | | | | | 0.27 | | | | | | 0.34 | | | | | | 0.37 | | | | | | 0.40 | | | | | | 0.43 | |
Net realized and unrealized gain (loss) on investments | | | | | 0.10 | | | | | | (0.26 | ) | | | | | 0.25 | | | | | | 0.09 | | | | | | 0.22 | | | | | | 0.65 | |
| | | | | | | | | | | | | | | | | | | | | | | | | | | | | | | | | | | | |
Total from investment operations | | | | | 0.20 | | | | | | 0.01 | | | | | | 0.59 | | | | | | 0.46 | | | | | | 0.62 | | | | | | 1.08 | |
| | | | | | | | | | | | | | | | | | | | | | | | | | | | | | | | | | | | |
Dividends from net investment income | | | | | (0.10 | ) | | | | | (0.27 | ) | | | | | (0.34 | ) | | | | | (0.37 | ) | | | | | (0.40 | ) | | | | | (0.43 | ) |
Distributions from net realized gains | | | | | — | | | | | | (0.06 | ) | | | | | (0.06 | ) | | | | | (0.08 | ) | | | | | (0.04 | ) | | | | | — | |
| | | | | | | | | | | | | | | | | | | | | | | | | | | | | | | | | | | | |
Total dividends and distributions | | | | | (0.10 | ) | | | | | (0.33 | ) | | | | | (0.40 | ) | | | | | (0.45 | ) | | | | | (0.44 | ) | | | | | (0.43 | ) |
| | | | | | | | | | | | | | | | | | | | | | | | | | | | | | | | | | | | |
Net Asset Value – End of Period | | | | $ | 11.01 | | | | | $ | 10.91 | | | | | $ | 11.23 | | | | | $ | 11.04 | | | | | $ | 11.03 | | | | | $ | 10.85 | |
| | | | | | | | | | | | | | | | | | | | | | | | | | | | | | | | | | | | |
Total Return | | | | | 1.86% | (1) | | | | | 0.07% | | | | | | 5.44% | | | | | | 4.22% | | | | | | 5.82% | | | | | | 10.77% | |
| | | | | | | | | | | | |
Ratios and Supplemental Data: | | | | | | | | | | | | | | | | | | | | | | | | | | | | | | | | | | | | |
Net assets, end of period (thousands) | | | | $ | 220,962 | | | | | $ | 221,104 | | | | | $ | 205,880 | | | | | $ | 178,116 | | | | | $ | 162,353 | | | | | $ | 149,218 | |
Ratio of expenses to average net assets: | | | | | | | | | | | | | | | | | | | | | | | | | | | | | | | | | | | | |
Before expense waiver and/or reimbursement | | | | | 0.71% | (2) | | | | | 0.72% | | | | | | 0.71% | | | | | | 0.72% | | | | | | 0.73% | | | | | | 0.76% | |
After expense waiver and/or reimbursement | | | | | 0.65% | (2) | | | | | 0.65% | | | | | | 0.65% | | | | | | 0.65% | | | | | | 0.65% | | | | | | 0.65% | |
Ratio of net investment income to average net assets: | | | | | | | | | | | | | | | | | | | | | | | | | | | | | | | | | | | | |
Before expense waiver and/or reimbursement | | | | | 1.87% | (2) | | | | | 2.34% | | | | | | 2.98% | | | | | | 3.31% | | | | | | 3.55% | | | | | | 4.00% | |
After expense waiver and/or reimbursement | | | | | 1.93% | (2) | | | | | 2.41% | | | | | | 3.04% | | | | | | 3.38% | | | | | | 3.63% | | | | | | 4.11% | |
Portfolio turnover rate | | | | | 21% | | | | | | 30% | | | | | | 31% | | | | | | 24% | | | | | | 20% | | | | | | 30% | |
The accompanying notes are an integral part of these financial statements.
29
|
| LKCM FUNDS |
| NOTESTOTHE FINANCIAL STATEMENTS (UNAUDITED) |
A. Organization and Significant Accounting Policies: LKCM Funds (the “Trust”) is registered under the Investment Company Act of 1940 (“1940 Act”) as an open-end, management investment company. The Trust was organized as a Delaware business trust on February 10, 1994 and consists of eight diversified series, five of which are presented herein and include the LKCM Small Cap Equity Fund, LKCM Small-Mid Cap Equity Fund, LKCM Equity Fund, LKCM Balanced Fund and LKCM Fixed Income Fund (collectively, the “Funds”), the assets of which are invested in separate, independently managed portfolios. Investment operations of the Funds began on July 14, 1994 (LKCM Small Cap Equity Fund), January 3, 1996 (LKCM Equity Fund), December 30, 1997 (LKCM Balanced Fund and LKCM Fixed Income Fund), and May 2, 2011 (LKCM Small-Mid Cap Equity Fund). The Small Cap Equity Fund and the Equity Fund created a second class of shares, Adviser Class Shares, and renamed the initial class as Institutional Class Shares on May 1, 2003. The Small Cap Equity Adviser Class Shares were initially sold on June 5, 2003 and are subject to expenses pursuant to the Rule 12b-1 plan described in Note B. The Equity Fund and Small-Mid Cap Equity Fund Adviser Class Shares have not yet commenced operations. Each Fund charges a 1% redemption fee for redemptions on Fund shares held for less than 30 days.
The LKCM Small Cap Equity Fund seeks to maximize long-term capital appreciation by investing under normal circumstances at least 80% of its net assets in equity securities of smaller companies (those with market capitalizations at the time of investment between $600 million and $4.5 billion) which Luther King Capital Management Corporation (the “Adviser”) believes are likely to have above-average growth in revenue and/or earnings and potential for above-average capital appreciation. The LKCM Small-Mid Cap Equity Fund seeks to maximize long-term capital appreciation by investing under normal circumstances at least 80% of its net assets in equity securities of small-mid capitalization companies (those with market capitalizations at the time of investment between $1.25 billion and $10 billion) which the Adviser believes are likely to have above-average growth in revenue and/or earnings and potential for above average capital appreciation. The LKCM Equity Fund seeks to maximize long-term capital appreciation by investing under normal circumstances at least 80% of its net assets in equity securities of companies which the Adviser believes are likely to have above-average growth in revenue and/or earnings, above-average returns on shareholders’ equity, and/or potential for above-average capital appreciation. The LKCM Balanced Fund seeks to provide investors with current income and long-term capital appreciation by investing primarily in a portfolio of equity and fixed income securities and cash equivalent securities with at least 25% of the Fund’s total assets invested in fixed income securities under normal circumstances. The LKCM Fixed Income Fund seeks current income by investing under normal circumstances at least 80% of its net assets in a portfolio of investment grade corporate and U.S. government fixed income securities.
The following is a summary of significant accounting policies followed by the Funds in preparation of the financial statements.
1. Security Valuation: Securities listed on a U.S. securities exchange for which market quotations are readily available are valued at the last quoted sale price taken from the exchange where the security is primarily traded. Nasdaq National Market securities are valued at the Nasdaq Official Closing Price (“NOCP”). Unlisted U.S. securities and listed U.S. securities not traded on the valuation date for which market quotations are readily available are valued at the mean of the most recent quoted bid and asked price. Securities listed on a foreign exchange for which market quotations are readily available are valued at the last quoted sales price available before the time when assets are valued. Debt securities (other than obligations having a maturity of 60 days or less) are normally valued at the mean of the bid and ask price and/or by using a combination of daily quotes or matrix evaluations provided by an independent pricing service. Debt securities purchased with remaining maturities of 60 days or less are valued at amortized cost. Other assets and securities for which no quotations are readily available (including restricted securities) are valued in good faith at fair value using methods determined by the Board of Trustees. The Board has adopted specific procedures for valuing portfolio securities and delegated the implementation of these procedures to the Adviser. The procedures authorize the Adviser to make all determinations regarding the fair value of a portfolio security and to report such determinations to the Board of Trustees. The Funds may also use independent pricing services to assist in pricing portfolio securities.
The Trust has adopted accounting standards which establish an authoritative definition of fair value and set out a hierarchy for measuring fair value. These standards require additional disclosures about the various inputs and valuation techniques used to develop the measurements of fair value and a discussion of changes in valuation techniques and related inputs during the period. These standards define fair value as the price that would be received to sell an asset or paid to transfer a liability in an orderly transaction between market participants at the measurement date. The fair value hierarchy is organized into three levels based upon the assumptions (referred to as “inputs”) used in pricing the asset or liability. These standards state that “observable inputs” reflect the assumptions market participants would use in pricing the asset or liability based on market data obtained from independent sources and “unobservable inputs” reflect an entity’s own assumptions about the assumptions market participants would use in pricing the asset or liability. These inputs are summarized in the three broad levels listed below.
30
| | | | |
| Level 1 | | – | | Quoted unadjusted prices for identical instruments in active markets to which the Trust has access at the date of measurement. |
| Level 2 | | – | | Quoted prices for similar instruments in active markets; quoted prices for identical or similar instruments in markets that are not active; and model-derived valuations in which all significant inputs and significant value drivers are observable in active markets. Level 2 inputs are those in markets for which there are few transactions, the prices are not current, little public information exists or instances where prices vary substantially over time or among brokered market makers. |
| Level 3 | | – | | Model derived valuations in which one or more significant inputs or significant value drivers are unobservable. Unobservable inputs are those inputs that reflect the Trust’s own assumptions that market participants would use to price the asset or liability based on the best available information. |
The inputs or methodology used for valuing securities are not necessarily an indication of the risk associated with investing in those securities. The following is a summary of the inputs used to value the Funds’ investments as of June 30, 2014:
| | | | | | | | | | | | | | | | |
| LKCM Small Cap Equity Fund | | | | | | | | | | | | |
Description | | Level 1 | | | Level 2 | | | Level 3 | | | Total | |
Common Stocks | | $ | 1,009,934,189 | | | $ | — | | | $ | — | | | $ | 1,009,934,189 | |
Money Market Funds | | | 31,736,980 | | | | — | | | | — | | | | 31,736,980 | |
| | | | | | | | | | | | | | | | |
Total Investments* | | $ | 1,041,671,169 | | | $ | — | | | $ | — | | | $ | 1,041,671,169 | |
| | | | | | | | | | | | | | | | |
| | | |
| LKCM Small-Mid Cap Equity Fund | | | | | | | | | | |
Description | | Level 1 | | | Level 2 | | | Level 3 | | | Total | |
Common Stocks | | $ | 378,250,156 | | | $ | — | | | $ | — | | | $ | 378,250,156 | |
Money Market Funds | | | 18,333,895 | | | | — | | | | — | | | | 18,333,895 | |
| | | | | | | | | | | | | | | | |
Total Investments* | | $ | 396,584,051 | | | $ | — | | | $ | — | | | $ | 396,584,051 | |
| | | | | | | | | | | | | | | | |
| | | | |
| LKCM Equity Fund | | | | | | | | | | | | |
Description | | Level 1 | | | Level 2 | | | Level 3 | | | Total | |
Common Stocks | | $ | 329,017,001 | | | $ | — | | | $ | — | | | $ | 329,017,001 | |
Money Market Fund | | | 5,123,225 | | | | — | | | | — | | | | 5,123,225 | |
| | | | | | | | | | | | | | | | |
Total Investments* | | $ | 334,140,226 | | | $ | — | | �� | $ | — | | | $ | 334,140,226 | |
| | | | | | | | | | | | | | | | |
| | | | |
| LKCM Balanced Fund | | | | | | | | | | | | |
Description | | Level 1 | | | Level 2 | | | Level 3 | | | Total | |
Common Stocks | | $ | 25,924,364 | | | $ | — | | | $ | — | | | $ | 25,924,364 | |
Corporate Bonds | | | — | | | | 10,273,903 | | | | — | | | | 10,273,903 | |
Money Market Fund | | | 971,092 | | | | — | | | | — | | | | 971,092 | |
| | | | | | | | | | | | | | | | |
Total Investments* | | $ | 26,895,456 | | | $ | 10,273,903 | | | $ | — | | | $ | 37,169,359 | |
| | | | | | | | | | | | | | | | |
| | | | |
| LKCM Fixed Income Fund | | | | | | | | | | | | |
Description | | Level 1 | | | Level 2 | | | Level 3 | | | Total | |
Preferred Stock | | $ | 1,933,500 | | | $ | — | | | $ | — | | | $ | 1,933,500 | |
Corporate Bonds | | | — | | | | 199,875,651 | | | | — | | | | 199,875,651 | |
U.S. Government Issues | | | — | | | | 1,564,805 | | | | — | | | | 1,564,805 | |
U.S. Government Sponsored Entities | | | — | | | | 14,828,263 | | | | — | | | | 14,828,263 | |
Money Market Fund | | | 1,647,908 | | | | — | | | | — | | | | 1,647,908 | |
| | | | | | | | | | | | | | | | |
Total Investments* | | $ | 3,581,408 | | | $ | 216,268,719 | | | $ | — | | | $ | 219,850,127 | |
| | | | | | | | | | | | | | | | |
| | * | Additional information regarding the industry classifications of these investments is disclosed in the Schedule of Investments. |
There were no significant transfers into or out of Level 1, Level 2 or Level 3 fair value measurements during the reporting period, as compared to their classification from the previous annual report.
2. Federal Income Taxes: The Funds have elected to be treated as “regulated investment companies” under Subchapter M of the Internal Revenue Code and each Fund intends to distribute all of its investment company net taxable income and net capital gains to shareholders. Therefore, no federal income tax provision is recorded.
3. Distributions to Shareholders: The LKCM Small Cap Equity, LKCM Small-Mid Cap Equity and LKCM Equity Funds generally intend to pay dividends and net capital gain distributions, if any, at least on an annual basis. The LKCM Balanced and LKCM Fixed Income Funds generally intend to pay dividends on a quarterly basis and net capital gain distributions, if any, at least on an annual basis.
31
4. Foreign Securities: Investing in securities of foreign companies and foreign governments involves special risks and considerations not typically associated with investing in U.S. companies and securities of the U.S. government. These risks include devaluation of currencies and future adverse political and economic developments. Moreover, securities of many foreign companies and foreign governments and their markets may be less liquid and their prices more volatile than those of securities of comparable U.S. companies and securities of the U.S. government.
5. Expense Allocation: Expenses incurred by the Funds are allocated among the Funds based upon (i) relative average net assets, (ii) a specific identification basis as incurred, or (iii) evenly among the Funds, depending on the nature of the expense. Expenses that are directly attributable to a class of shares, such as Rule 12b-1 distribution fees, are charged to that class. For multi-class Funds, income, unrealized and realized gains/losses are generally allocated between the Fund’s classes in proportion to their respective net assets.
6. Use of Estimates: The preparation of financial statements in conformity with accounting principles generally accepted in the United States of America requires management to make estimates and assumptions that affect the reported amounts of assets and liabilities and disclosure of contingent assets and liabilities at the date of the financial statements and the reported amounts of revenues and expenses during the reporting period. Actual results could differ from those estimates.
7. Guarantees and Indemnifications: In the normal course of business, the Funds enter into contracts with service providers that contain general indemnification clauses. The Funds’ maximum exposure under these arrangements is unknown as this would involve future claims against the Funds that have not yet occurred. Based on experience, the Funds expect the risk of loss to be remote.
8. Other: Security and shareholder transactions are recorded on the trade date. Realized gains and losses on sales of investments are calculated on the identified cost basis. Dividend income and dividends and distributions to shareholders are recorded on the ex-dividend date. Interest income is recognized on the accrual basis. All discounts and premiums are amortized on the effective interest method for tax and financial reporting purposes.
Generally accepted accounting principles require that certain components of net assets be adjusted to reflect permanent differences between financial and tax reporting. These reclassifications have no effect on net assets or net asset values per share.
9. Restricted and Illiquid Securities: The Funds are permitted to invest in securities that are subject to legal or contractual restrictions on resale or are illiquid. Restricted securities generally may be resold in transactions exempt from registration. A security may be considered illiquid if it lacks a readily available market or if its valuation has not changed for a certain period of time. Disposal of these securities may involve time-consuming negotiations and expense, and prompt sale at the current valuation may be difficult.
B. Investment Advisory and Other Agreements: Luther King Capital Management Corporation (the “Adviser”) serves as the investment adviser to the Funds under an Investment Advisory Agreement (the “Agreement”). The Adviser receives a fee, computed daily and payable quarterly, at the annual rates presented below as applied to each Fund’s average daily net assets. The Adviser has contractually agreed to waive all or a portion of its management fee and/or reimburse the Funds through April 30, 2015 in order to limit each Fund’s operating expenses to the annual cap rates presented below. This expense limitation excludes interest, taxes, brokerage commissions, costs relating to investments in other investment companies, including money market funds, and extraordinary expenses. For the six months ended June 30, 2014, the Adviser waived the following management fees to meet its expense cap obligations:
| | | | | | | | | | | | | | | | | | | | |
| | | LKCM
Small Cap
Equity Fund | | | LKCM
Small-Mid Cap
Equity Fund | | | LKCM
Equity
Fund | | | LKCM
Balanced
Fund | | | LKCM
Fixed
Income Fund | |
Annual Advisory Rate | | | 0.75% | | | | 0.75% | | | | 0.70% | | | | 0.65% | | | | 0.50% | |
Annual Cap on Expenses | | | 1.00% | (Inst.) | | | 1.00% | | | | 0.80% | | | | 0.80% | | | | 0.65% | |
| | | 1.25% | (Adviser) | | | | | | | | | | | | | | | | |
Fees Waived in 2014 | | | — | | | | $288,702 | | | | $179,660 | | | | $32,332 | | | | $59,550 | |
U.S. Bancorp Fund Services, LLC serves as transfer agent and administrator for the Trust and serves as accounting services agent for the Trust. U.S. Bank, N.A. serves as custodian for the Trust.
Distribution services are performed pursuant to a distribution contract with Quasar Distributors, LLC, the Trust’s principal underwriter.
The Small Cap Equity Fund, Small-Mid Cap Equity and the Equity Fund have adopted a Rule 12b-1 plan under which the Adviser Class of each Fund may pay up to 1.00% of its average daily net assets for distribution and other services. However, the Board of Trustees has currently only authorized a fee of 0.25% of each Fund’s average daily net assets. For the six months ended June 30, 2014, fees incurred by the Small Cap Equity Fund pursuant to the 12b-1 Plan were $44,271. The Adviser Class shares of the Equity Fund and the Small-Mid Cap Equity Fund have not yet commenced operations.
32
C. Fund Shares: At June 30, 2014, there was an unlimited number of shares of beneficial interest, no par value, authorized. The following table summarizes the activity in shares of each Fund:
| | | | | | | | | | | | | | | | |
| Small Cap Equity Fund | | | | | | | | | | | | |
| | | Six Months Ended
June 30, 2014 | | | Year Ended
December 31, 2013 | |
| | | Institutional Class | | | Institutional Class | |
| | | Shares | | | Amount | | | Shares | | | Amount | |
Shares sold | | | 3,141,842 | | | $ | 86,448,907 | | | | 7,160,666 | | | $ | 184,699,527 | |
Shares issued to shareholders in reinvestment of distributions | | | — | | | | — | | | | 2,344,622 | | | | 66,376,248 | |
Shares redeemed | | | (3,912,897 | ) | | | (107,432,974 | ) | | | (8,669,045 | ) | | | (229,999,280 | ) |
Redemption fee | | | | | | | 712 | | | | | | | | 5,464 | |
| | | | | | | | | | | | | | | | |
Net increase (decrease) | | | (771,055 | ) | | $ | (20,983,355 | ) | | | 836,243 | | | $ | 21,081,959 | |
| | | | | | | | | | | | | | | | |
Shares Outstanding: | | | | | | | | | | | | | | | | |
Beginning of period | | | 36,980,549 | | | | | | | | 36,144,306 | | | | | |
| | | | | | | | | | | | | | | | |
End of period | | | 36,209,494 | | | | | | | | 36,980,549 | | | | | |
| | | | | | | | | | | | | | | | |
| | |
| | | Six Months Ended
June 30, 2014 | | | Year Ended
December 31, 2013 | |
| | | Adviser Class | | | Adviser Class | |
| | | Shares | | | Amount | | | Shares | | | Amount | |
Shares sold | | | 63,883 | | | $ | 1,700,348 | | | | 240,019 | | | $ | 5,993,032 | |
Shares issued to shareholders in reinvestment of distributions | | | — | | | | — | | | | 116,816 | | | | 3,201,933 | |
Shares redeemed | | | (773,694 | ) | | | (20,682,155 | ) | | | (702,113 | ) | | | (17,789,230 | ) |
Redemption fee | | | | | | | 999 | | | | | | | | 486 | |
| | | | | | | | | | | | | | | | |
Net decrease | | | (709,811 | ) | | $ | (18,980,808 | ) | | | (345,278 | ) | | $ | (8,593,779 | ) |
| | | | | | | | | | | | | | | | |
Shares Outstanding: | | | | | | | | | | | | | | | | |
Beginning of period | | | 1,500,477 | | | | | | | | 1,845,755 | | | | | |
| | | | | | | | | | | | | | | | |
End of period | | | 790,666 | | | | | | | | 1,500,477 | | | | | |
| | | | | | | | | | | | | | | | |
Total Net Increase (Decrease) | | | | | | $ | (39,964,163 | ) | | | | | | $ | 12,488,180 | |
| | | | | | | | | | | | | | | | |
| | | | |
| Small-Mid Cap Equity Fund | | | | | | | | | | | | |
| | |
| | | Six Months Ended
June 30, 2014 | | | Year Ended
December 31, 2013 | |
| | | Shares | | | Amount | | | Shares | | | Amount | |
Shares sold | | | 5,051,139 | | | $ | 63,880,850 | | | | 9,711,405 | | | $ | 105,122,031 | |
Shares redeemed | | | (2,774,833 | ) | | | (35,229,549 | ) | | | (7,314,011 | ) | | | (79,641,825 | ) |
Redemption fee | | | | | | | — | | | | | | | | 841 | |
| | | | | | | | | | | | | | | | |
Net increase | | | 2,276,306 | | | $ | 28,651,301 | | | | 2,397,394 | | | $ | 25,481,047 | |
| | | | | | | | | | | | | | | | |
Shares Outstanding: | | | | | | | | | | | | | | | | |
Beginning of period | | | 28,243,144 | | | | | | | | 25,845,750 | | | | | |
| | | | | | | | | | | | | | | | |
End of period | | | 30,519,450 | | | | | | | | 28,243,144 | | | | | |
| | | | | | | | | | | | | | | | |
33
| | | | | | | | | | | | | | | | |
| Equity Fund | | | | | | | | | | | | |
| | | Six Months Ended
June 30, 2014 | | | Year Ended
December 31, 2013 | |
| | | Shares | | | Amount | | | Shares | | | Amount | |
Shares sold | | | 2,502,150 | | | $ | 56,237,938 | | | | 5,470,658 | | | $ | 101,665,684 | |
Proceeds from reorganization | | | — | | | | — | | | | 767,299 | | | | 15,482,266 | |
Shares issued to shareholders in reinvestment of distributions | | | — | | | | — | | | | 326,996 | | | | 7,314,894 | |
Shares redeemed | | | (2,786,892 | ) | | | (62,863,194 | ) | | | (1,272,966 | ) | | | (26,674,481 | ) |
Redemption fee | | | | | | | 659 | | | | | | | | 8,816 | |
Capital contribution* | | | | | | | — | | | | | | | | 210 | |
| | | | | | | | | | | | | | | | |
Net increase (decrease) | | | (284,742 | ) | | $ | (6,624,597 | ) | | | 5,291,987 | | | $ | 97,797,389 | |
| | | | | | | | | | | | | | | | |
Shares Outstanding: | | | | | | | | | | | | | | | | |
Beginning of period | | | 14,435,693 | | | | | | | | 9,143,706 | | | | | |
| | | | | | | | | | | | | | | | |
End of period | | | 14,150,951 | | | | | | | | 14,435,693 | | | | | |
| | | | | | | | | | | | | | | | |
| | | | |
| Balanced Fund | | | | | | | | | | | | |
| | | Six Months Ended
June 30, 2014 | | | Year Ended
December 31, 2013 | |
| | | Shares | | | Amount | | | Shares | | | Amount | |
Shares sold | | | 198,183 | | | $ | 3,923,240 | | | | 646,104 | | | $ | 11,580,995 | |
Shares issued to shareholders in reinvestment of distributions | | | 12,716 | | | | 256,992 | | | | 16,446 | | | | 304,154 | |
Shares redeemed | | | (184,662 | ) | | | (3,659,888 | ) | | | (215,795 | ) | | | (3,825,436 | ) |
Redemption fee | | | | | | | 20 | | | | | | | | 11,470 | |
| | | | | | | | | | | | | | | | |
Net increase | | | 26,237 | | | $ | 520,364 | | | | 446,755 | | | $ | 8,071,183 | |
| | | | | | | | | | | | | | | | |
Shares Outstanding: | | | | | | | | | | | | | | | | |
Beginning of period | | | 1,800,233 | | | | | | | | 1,353,478 | | | | | |
| | | | | | | | | | | | | | | | |
End of period | | | 1,826,470 | | | | | | | | 1,800,233 | | | | | |
| | | | | | | | | | | | | | | | |
| | | | |
| Fixed Income Fund | | | | | | | | | | | | |
| | | Six Months Ended
June 30, 2014 | | | Year Ended
December 31, 2013 | |
| | | Shares | | | Amount | | | Shares | | | Amount | |
Shares sold | | | 1,241,072 | | | $ | 13,648,569 | | | | 4,508,561 | | | $ | 50,115,815 | |
Shares issued to shareholders in reinvestment of distributions | | | 168,097 | | | | 1,847,262 | | | | 523,187 | | | | 5,755,116 | |
Shares redeemed | | | (1,610,454 | ) | | | (17,670,592 | ) | | | (3,095,802 | ) | | | (34,333,599 | ) |
Redemption fee | | | | | | | 55 | | | | | | | | 1,738 | |
Capital contribution* | | | | | | | — | | | | | | | | 8 | |
| | | | | | | | | | | | | | | | |
Net increase (decrease) | | | (201,285 | ) | | $ | (2,174,706 | ) | | | 1,935,946 | | | $ | 21,539,078 | |
| | | | | | | | | | | | | | | | |
Shares Outstanding: | | | | | | | | | | | | | | | | |
Beginning of period | | | 20,261,867 | | | | | | | | 18,325,921 | | | | | |
| | | | | | | | | | | | | | | | |
End of period | | | 20,060,582 | | | | | | | | 20,261,867 | | | | | |
| | | | | | | | | | | | | | | | |
| * | A capital contribution of $210 and $8 was made to the Equity Fund and Fixed Income Fund, respectively, by the Adviser for trade commission adjustments. |
D. Security Transactions: Purchases and sales of investment securities, other than short-term investments, for the six months ended June 30, 2014 were as follows:
| | | | | | | | | | | | | | | | |
| | | Purchases | | | Sales | |
| | | U.S.
Government | | | Other | | | U.S.
Government | | | Other | |
LKCM Small Cap Equity Fund | | $ | — | | | $ | 267,592,463 | | | $ | — | | | $ | 336,248,724 | |
LKCM Small-Mid Cap Equity Fund | | | — | | | | 115,083,983 | | | | — | | | | 94,228,510 | |
LKCM Equity Fund | | | — | | | | 38,317,938 | | | | — | | | | 20,633,963 | |
LKCM Balanced Fund | | | — | | | | 4,948,404 | | | | — | | | | 4,409,141 | |
LKCM Fixed Income Fund | | | 9,592,897 | | | | 34,869,251 | | | | 4,500,000 | | | | 39,834,796 | |
34
E. Tax Information: At December 31, 2013, the components of accumulated earnings (losses) on a tax basis were as follows:
| | | | | | | | | | | | | | | | | | | | |
| | | LKCM
Small Cap
Equity Fund | | | LKCM
Small-Mid Cap
Equity Fund | | | LKCM
Equity
Fund | | | LKCM
Balanced
Fund | | | LKCM
Fixed
Income Fund | |
Cost of Investments | | $ | 724,436,624 | | | $ | 258,005,916 | | | $ | 224,509,998 | | | $ | 24,623,109 | | | $ | 213,489,969 | |
| | | | | | | | | | | | | | | | | | | | |
Gross Unrealized Appreciation | | | 368,669,429 | | | | 109,826,203 | | | | 99,641,613 | | | | 10,589,097 | | | | 6,484,025 | |
Gross Unrealized Depreciation | | | (3,487,343 | ) | | | (1,450,239 | ) | | | (253,690 | ) | | | (48,352 | ) | | | (566,387 | ) |
| | | | | | | | | | | | | | | | | | | | |
Net Unrealized Appreciation | | $ | 365,182,086 | | | $ | 108,375,964 | | | $ | 99,387,923 | | | $ | 10,540,745 | | | $ | 5,917,638 | |
| | | | | | | | | | | | | | | | | | | | |
Undistributed Ordinary Income | | | — | | | | — | | | | — | | | | — | | | | — | |
Undistributed Long-Term Capital Gain | | | 27,302,567 | | | | — | | | | — | | | | — | | | | — | |
| | | | | | | | | | | | | | | | | | | | |
Total Distributable Earnings | | $ | 27,302,567 | | | $ | — | | | $ | — | | | $ | — | | | $ | — | |
| | | | | | | | | | | | | | | | | | | | |
Other Accumulated Losses | | $ | — | | | $ | (5,280,528 | ) | | $ | (394,243 | ) | | $ | (33,219 | ) | | $ | (230,727 | ) |
| | | | | | | | | | | | | | | | | | | | |
Total Accumulated Gains | | $ | 392,484,653 | | | $ | 103,095,436 | | | $ | 98,993,680 | | | $ | 10,507,526 | | | $ | 5,686,911 | |
| | | | | | | | | | | | | | | | | | | | |
The difference between book-basis and tax-basis unrealized appreciation is attributable primarily to the tax deferral of losses on wash sales.
At December 31, 2013, the capital loss carryforwards were as follows:
| | | | | | | | |
| | | Month/Year Expiring | | | Short-Term | |
LKCM Small-Mid Cap Equity Fund | | | Unexpiring Losses | | | $ | 1,923,553 | |
To the extent the Funds realize future net capital gains, taxable distributions will be reduced by any unused capital loss carryforwards as permitted by the Internal Revenue Code.
During the year ended December 31, 2013, the LKCM Small-Mid Cap Equity Fund and the LKCM Balanced Fund utilized capital loss carryforwards of $3,324,324 and $180,429, respectively.
At December 31, 2013, the following Funds deferred, on a tax basis, post-October capital losses of:
| | | | |
LKCM Small-Mid Cap Equity Fund | | $ | 3,356,975 | |
LKCM Equity Fund | | | 394,243 | |
LKCM Balanced Fund | | | 33,219 | |
LKCM Fixed Income Fund | | | 230,727 | |
The tax components of dividends paid during the periods shown below were as follows:
| | | | | | | | | | | | | | | | |
| | | Six Months Ended June 30, 2014 | | | Year Ended December 31, 2013 | |
| | | Ordinary
Income | | | Long-Term
Capital Gain | | | Ordinary
Income | | | Long-Term
Capital Gain | |
LKCM Small Cap Equity Fund | | $ | — | | | $ | — | | | $ | 120,236 | | | $ | 84,168,513 | |
LKCM Small-Mid Cap Equity Fund | | | — | | | | — | | | | — | | | | — | |
LKCM Equity Fund | | | — | | | | — | | | | 1,708,848 | | | | 6,674,882 | |
LKCM Balanced Fund | | | 276,998 | | | | — | | | | 272,177 | | | | 56,716 | |
LKCM Fixed Income Fund | | | 2,034,072 | | | | — | | | | 5,204,352 | | | | 1,232,839 | |
The Funds designated as long-term capital gain dividend, pursuant to Internal Revenue Code Section 852(b)(3), the amount necessary to reduce earnings and profits of the Funds related to net capital gain to zero for the tax year ended December 31, 2013.
The Trust has adopted financial reporting rules regarding recognition and measurement of tax positions taken or expected to be taken on a tax return. The Trust has reviewed all open tax years and major jurisdictions and concluded that there is no impact on the Funds’ financial position or results of operations. Tax years that remain open to examination by major tax jurisdictions include tax years ended December 31, 2010 through December 31, 2013. There is no tax liability resulting from unrecognized tax benefits relating to uncertain income tax positions taken or expected to be taken on tax returns as of December 31, 2013. The Funds are not aware of any tax positions for which it is reasonably possible that the total amounts of unrecognized tax benefits will significantly change in the next twelve months. If applicable, the Funds would recognize interest accrued related to unrecognized tax benefits in “interest expense” and penalties in “other expense” on the statement of operations.
F. Subsequent Events: In preparing these financial statements, the Trust has evaluated events after June 30, 2014 and determined that there were no significant subsequent events that would require adjustment to or additional disclosure in these financial statements.
35
|
| LKCM FUNDS |
| ADDITIONAL INFORMATION |
| June 30, 2014 (Unaudited) |
Availability of Proxy Voting Information: A description of the policies and procedures that the Funds use to determine how to vote proxies relating to their portfolio securities, as well as the proxy voting record, is available without charge, upon request, by calling toll-free 1-800-688-LKCM or on the SEC website at http://www.sec.gov.
The actual voting records relating to portfolio securities during the twelve month period ended June 30 (as filed with the SEC on Form N-PX) are available without charge, upon request, by calling the Funds toll free at 1-800-688-LKCM or by accessing the SEC’s website at www.sec.gov.
Availability of Quarterly Portfolio Schedule: The Funds’ are required to file complete schedules of portfolio holdings with the SEC for the first and third fiscal quarters on Form N-Q. Once filed, the Funds’ Form N-Q is available without charge upon request on the SEC’s website(http://www.sec.gov) and may be available by calling 1-800-688-LKCM. You can also obtain copies of Form N-Q by (i) visiting the SEC’s Public Reference Room in Washington, DC (information on the operation of the Public Reference Room may be obtained by calling 1-800-SEC-0330); (ii) sending your request and a duplicating fee to the SEC’s Public Reference Room, Washington, DC 20549; or (iii) sending your request electronically to publicinfosec.gov.
RENEWAL OF INVESTMENT ADVISORY AGREEMENT WITH RESPECT TO LKCM FUNDS
Introduction. At a meeting held on February 25, 2014, the Board of Trustees of LKCM Funds, including the independent Trustees (the “Board”), approved the renewal of the Investment Advisory Agreement (the “Agreement”) between Luther King Capital Management Corporation (“LKCM”) and LKCM Funds (the “Trust”), on behalf of the LKCM Small Cap Equity Fund, LKCM Small-Mid Cap Equity Fund, LKCM Equity Fund, LKCM Balanced Fund and LKCM Fixed Income Fund (each, a “Fund” and collectively, the “Funds”).
In voting to approve the renewal of the Agreement, the Board considered the overall fairness of the Agreement and factors it deemed relevant with respect to each Fund including, but not limited to: (1) the nature, extent and quality of the services provided to each Fund; (2) the performance of each Fund as compared to a relevant benchmark and other similar funds; (3) the level of the fees and the overall expenses of each Fund and how those compared to other similar funds and other institutional portfolios; (4) the costs of services provided to the Funds and the profitability of LKCM; (5) whether the fee levels reflect economies of scale for the benefit of investors; and (6) any other benefits derived by LKCM from its relationship with the Funds. The Board did not identify any single factor or item of information as all-important or controlling.
In considering the approval of the Agreement, the Board considered a broad range of information provided by LKCM, including but not limited to, reports relating to each Fund’s performance and expenses, information regarding other clients, certain portfolio compliance policies and the background and experience of the portfolio managers. In addition, the Board considered a memorandum from its legal counsel regarding the Board’s fiduciary duties in considering the renewal of the Agreement. The Board also meets each quarter to review various aspects of the Funds.
Nature, Extent and Quality of Services. The Board reviewed and considered the nature, extent and quality of the advisory services provided by LKCM to each Fund under the Agreement. The Board considered that LKCM has provided investment management services to individuals, foundations, endowments and corporations since 1979. The Board also considered LKCM’s financial resources, insurance coverage, culture of compliance and support for compliance operations that support the Funds. The Board considered LKCM’s representation that it has invested considerable resources into the firm and its personnel to augment investment management and client service. The Board reviewed the portfolio managers and other key personnel who provide services to each Fund, and considered LKCM’s representation that the firm historically has experienced very low personnel turnover. The Board also considered LKCM’s representation that the firm has implemented a compensation structure designed to attract and retain highly qualified investment professionals.
In addition, the Board considered LKCM’s summary of its procedures for monitoring the Funds’ key service providers. The Board also considered LKCM’s description of its best execution practices, and noted LKCM’s representation that its soft dollar and commission sharing arrangements for client transactions (including those for the Funds) comply with the safe harbor provided by Section 28(e) of the Securities Exchange Act of 1934, as amended.
Performance of the LKCM Funds. The Board considered the performance of each Fund compared to the Fund’s benchmark index (“Benchmark”) and peer group funds compiled by Lipper, Inc. (“Lipper Index”) for various time periods ended December 31, 2013. The Board also considered LKCM’s discussion of each Fund’s performance.
The Board considered the performance of the Institutional Class of the Small Cap Equity Fund because the Institutional Class has been in existence for the longest period of time of any share class of the Fund and has the longest performance history. The Board noted that the
36
Institutional Class of the Small Cap Equity Fund outperformed its Benchmark and the Lipper Index for the three-year, five-year, ten-year and since-inception periods, but underperformed its Benchmark and the Lipper Index for the one-year period.
The Board noted that the Small-Mid Cap Equity Fund underperformed its Benchmark and the Lipper Index for the one-year and since-inception periods.
With respect to the underperformance of the Institutional Class of the Small Cap Equity Fund for the one-year period and the Small-Mid Cap Equity Fund for the one-year and since-inception periods, the Board noted LKCM’s explanation that, in 2013, the positive performance of the Funds’ Benchmarks had been driven by lower-quality companies and that the Funds traditionally focus their investments in higher-quality companies.
The Board noted that the Equity Fund outperformed its Benchmark for the five-year, ten-year and since-inception periods, but underperformed the Benchmark for the one-year and three-year periods. The Board also noted that the Equity Fund outperformed the Lipper Index for the three-year, five-year, ten-year and since-inception periods, but underperformed the Lipper Index for the one-year period. The Board noted LKCM’s explanation that certain stock selection and sector allocations as well as a higher cash position detracted from the Fund’s relative performance.
The Board noted that the Balanced Fund outperformed its Benchmark for the ten-year and since-inception periods, but underperformed its Benchmark for the one-year, three-year and five-year periods. The Board also noted that the Balanced Fund outperformed the Lipper Index for the one-year, three-year, ten-year and since-inception periods, and performed in line with the Lipper Index for the five-year period. The Board also noted LKCM’s explanation that the Fund’s allocation to fixed-income securities, which is required to be at least 25% of total assets under the Fund’s investment guidelines, detracted from the Fund’s relative performance in light of the strong performance of the equity markets during the year.
The Board noted that the Fixed Income Fund outperformed its Benchmark for the one-year, three-year, five-year and ten-year periods, but underperformed its Benchmark for the since-inception period. The Board also noted that the Fixed Income Fund outperformed the Lipper Index for the one-year, three-year, ten-year and since-inception periods, but underperformed the Lipper Index for the five-year period.
Fees and Expenses. The Board considered the advisory fee rates of each Fund and the net expense ratios (after fee waivers and/or expense reimbursements) of each Fund relative to similar funds and LKCM’s other clients. The Board also considered that LKCM contractually agreed to continue its fee waivers and expense caps for each Fund through April 30, 2015. The Board compared the contractual advisory fee rate and the net expense ratio of each Fund to a category of similar funds compiled by Lipper, Inc. (“Lipper Category”). The first quartile in the Lipper Category represents those funds with the lowest fees or expenses. The Board considered that, although the Funds’ contractual advisory fee rates may be higher than those of their peers, the expense cap arrangements cause the Funds’ overall net expense ratios to be lower than, or in line with, those of their peers. As such, the Trustees gave less weight to the contractual advisory fee rate for each Fund and more weight to each Fund’s net expense ratio.
The Board noted that the contractual advisory fee rate and the net expense ratio for the Institutional Class of the Small Cap Equity Fund were in the second and first quartile of the Lipper Category, respectively. In this case, the advisory fee rate and the net expense ratio were lower than the average of the Lipper Category.
The Board noted that the contractual advisory fee rate and the net expense ratio for the Small-Mid Cap Equity Fund were in the second and first quartile of the Lipper Category, respectively. In this case, the advisory fee rate and the net expense ratio were lower than the average of the Lipper Category.
The Board noted that the contractual advisory fee rate and the net expense ratio for the Equity Fund were in the third and first quartile of the Lipper Category, respectively. In this case, the advisory fee rate was higher than the average of the Lipper Category and the net expense ratio was lower than the average of the Lipper Category.
The Board noted that the contractual advisory fee rate and the net expense ratio for the Balanced Fund were in the third and second quartile of the Lipper Category, respectively. In this case, the advisory fee rate was higher than the average of the Lipper Category and the net expense ratio was lower than the average of the Lipper Category.
The Board noted that the contractual advisory fee rate and the net expense ratio for the Fixed Income Fund were in the third and second quartile of the Lipper Category, respectively. In this case, the advisory fee rate was higher than the average of the Lipper Category and the net expense ratio was slightly lower than the average of the Lipper Category.
The Board considered the advisory fee rates charged by LKCM to the mutual funds it subadvises and LKCM’s other separately managed portfolios. The Board noted that the fee rates charged by LKCM to the Funds and clients with separately managed portfolios differ primarily as a result of the greater regulatory compliance expenses that LKCM incurs in connection with its management of the Funds. The Board also noted LKCM’s representation that the subadvisory fee rates it charges other funds reflect the narrower scope of investment management and compliance services provided by LKCM in a subadvisory capacity.
37
Costs, Profitability and Economies of Scale. The Board considered LKCM’s costs in rendering services to the Funds and the profitability of LKCM. The Board reviewed the fees paid by each Fund to LKCM for the last three calendar years. The Board also reviewed the estimated profit and loss statement provided by LKCM on a Fund-by-Fund basis. In this regard, the Board noted that LKCM estimated that it made a profit on the Small Cap Equity, Small-Mid Cap Equity and Equity Funds, but not the Balanced and Fixed Income Funds. With respect to economies of scale, the Board considered that the Funds generally benefit from competitive net expense ratios despite not having reached an asset size at which economies of scale traditionally would be considered to exist.
Benefits Derived by LKCM from its Relationship with the Funds. In addition, the Board noted that LKCM believes that both LKCM and the Funds benefit from LKCM’s soft dollar and commission sharing arrangements for third-party and proprietary research used by LKCM in connection with its investment process. The Board also noted that LKCM believes that its relationship with the Funds provides an indirect benefit to both parties in the form of enhanced recognition among institutional investors, consultants and other members of the financial community. The Board considered the indirect benefits to LKCM, in the form of additional clients with separately managed portfolios or subadvisory relationships with other mutual funds, which also may attract additional investors to the Funds.
Conclusion. Based on its evaluation of these and other factors, the Board: (1) concluded that the fees paid to LKCM under the Agreement are fair and reasonable; (2) determined that shareholders would benefit from LKCM’s continued management of the Funds; and (3) approved the renewal of the Agreement with respect to the Funds.
38
LKCM FUNDS
PRIVACY NOTICE
Our Commitment to Your Privacy
At LKCM Funds, we are committed to safeguarding the confidentiality and privacy of nonpublic personal information about our current and former shareholders. This privacy notice describes the policies and procedures we have implemented to protect the privacy of your nonpublic personal information as well as the sources through which we may obtain nonpublic personal information about you.
How We Protect Your Nonpublic Personal Information
Protecting your nonpublic personal information is an important priority at LKCM Funds. Accordingly, we have implemented policies and procedures designed to safeguard your nonpublic personal information, such as your tax identification number, account and investment history, account numbers, account balances and nonpublic contact information, from unauthorized access. Pursuant to these policies and procedures, we maintain various physical, technological, and administrative safeguards to protect the security and confidentiality of your nonpublic personal information, and we adapt these safeguards to respond to evolving technological and other standards.
We do not disclose nonpublic personal information about you to outside firms, organizations or individuals except as authorized by you or your representatives or as required or permitted by law. We may disclose nonpublic personal information about you to nonaffiliated third parties, such as custodians, brokers, auditors, accountants, and systems and administrative service providers, in connection with the services we provide to you or on your behalf. When we provide nonpublic personal information about you to nonaffiliated third parties for these purposes, we expect them to safeguard your nonpublic personal information, use your nonpublic personal information only for the intended purposes and otherwise abide by applicable law.
How We Obtain Your Nonpublic Personal Information
We collect nonpublic personal information about you from various sources, including documents, new account applications and other information that you or your representatives, custodians, attorneys, accountants or similar parties provide to us, communications that we have with you or your representatives, custodians, attorneys, accountants or similar parties, and documents and other information related to your accounts or investment experience with us.
Please do not hesitate to contact Jacob D. Smith, our Chief Compliance Officer, if you have any questions regarding the measures we have implemented to protect the privacy of your nonpublic personal information.
U.S. Bancorp Fund Services, LLC
P.O. Box 701
Milwaukee, WI 53201-0701
LKCM FUNDS
P.O. Box 701
Milwaukee, WI 53201-0701
| | | | |
Officers and Trustees | | | | |
J. Luther King, Jr., CFA, CIC | | H. Kirk Downey | | Larry J. Lockwood |
Trustee, President | | Chairman of the Board | | Trustee |
| | |
Paul W. Greenwell | | Richard J. Howell | | Richard Lenart |
Vice President | | Trustee | | Secretary & Treasurer |
| | |
Steven R. Purvis, CFA | | Earle A. Shields, Jr. | | Jacob D. Smith |
Trustee, Vice President | | Trustee | | Chief Financial Officer |
| | | | | Chief Compliance Officer |
Investment Adviser | | | | |
Luther King Capital Management Corporation | | |
301 Commerce Street, Suite 1600 | | | | |
Fort Worth, TX 76102 | | | | |
Administrator, Transfer Agent, Dividend Paying Agent & Shareholder Servicing Agent | | |
U.S. Bancorp Fund Services, LLC | | | | |
P.O. Box 701 | | | | |
Milwaukee, WI 53201-0701 | | | | |
Custodian | | | | |
U.S. Bank, N.A. | | | | |
1555 N. River Center Drive, Suite 302 | | | | |
Milwaukee, WI 53212 | | | | |
Independent Registered Public Accounting Firm | | |
Deloitte & Touche LLP | | | | |
555 E. Wells St., Suite 1400 | | | | |
Milwaukee, WI 53202 | | | | |
Distributor | | | | |
Quasar Distributors, LLC | | | | |
615 E. Michigan Street | | | | |
Milwaukee, WI 53202 | | | | |

LKCM Aquinas Value Fund
LKCM Aquinas Growth Fund
LKCM Aquinas Small Cap Fund
Semi-Annual Report
June 30, 2014
Dear Fellow Shareholders:
We report the following performance information for the LKCM Aquinas Funds:
| | | | | | | | | | | | | | | | | | | | | | | | | | | | | | | | |
Funds | | Inception
Date | | | NAV@
6/30/14 | | | Net
Expense
Ratio*, ** | | | Gross
Expense
Ratio** | | | Six Month
Total
Return
Ended
6/30/14 | | | One Year
Total
Return
Ended
6/30/14 | | | Five Year
Average
Annualized
Return
Ended
6/30/14 | | | Avg.
Annual
Total
Return
Since
Incept.*** | |
LKCM Aquinas Value Fund | | | 7/11/05 | | | $ | 18.86 | | | | 1.50 | % | | | 1.52 | % | | | 4.84 | % | | | 22.22 | % | | | 17.90 | % | |
| 7.95
| %
|
Russell 1000 Value® Index(1) | | | | | | | | | | | | | | | | | | | 8.28 | % | | | 23.81 | % | | | 19.23 | % | |
| 7.20
| %
|
LKCM Aquinas Growth Fund | | | 7/11/05 | | | $ | 21.42 | | | | 1.51 | % | | | 1.59 | % | | | -0.09 | % | | | 18.68 | % | | | 15.24 | % | |
| 5.83
| %
|
Russell 1000 Growth® Index(2) | | | | | | | | | | | | | | | | | | | 6.31 | % | | | 26.92 | % | | | 19.24 | % | |
| 8.72
| %
|
LKCM Aquinas Small Cap Fund | | | 7/11/05 | | | $ | 9.32 | | | | 1.50 | % | | | 2.25 | % | | | -0.75 | % | | | 19.38 | % | | | 19.32 | % | |
| 7.40
| %
|
Russell 2000® Index(3) | | | | | | | | | | | | | | | | | | | 3.19 | % | | | 23.64 | % | | | 20.21 | % | |
| 8.22
| %
|
Performance data quoted represents past performance and does not guarantee future results. The investment return and principal value of an investment will fluctuate so that an investor’s shares, when redeemed, may be worth more or less than the original cost. Current performance of the Fund may be lower or higher than the performance quoted. Performance data current to the most recent month end may be obtained by calling 1-800-423-6369. The Funds impose a 1.00% redemption fee on shares held less than 30 days. If reflected, the fee would reduce performance shown.
| * | Luther King Capital Management Corporation, the Funds’ adviser, has contractually agreed to waive all or a portion of its management fee and/or reimburse the Fund to maintain designated expense ratios through April 30, 2015. This expense limitation excludes interest, taxes, brokerage commissions, indirect fees and expenses relating to investments in other investment companies, including money market funds, and extraordinary expenses. Investment performance reflects fee waivers, if any, in effect. In the absence of such waivers, total return would be reduced. Investment performance is based upon the net expense ratio. |
| ** | Expense ratios above are as of December 31, 2013, the Funds’ prior fiscal year end, as reported in the Funds’ current prospectus. Expense ratios reported for other periods in the financial highlights of this report for the Funds’ fiscal year ended December 31, 2013 may differ. |
| *** | On July 11, 2005, the Aquinas Funds merged into the LKCM Aquinas Funds. Due to the change in adviser and investment technique, performance is being quoted for the period after the merger. |
| (1) | The Russell 1000 Value® Index is an unmanaged index which measures the performance of those Russell 1000 companies with lower price-to-book ratios and lower forecasted growth values. |
| (2) | The Russell 1000 Growth® Index is an unmanaged index which measures the performance of those Russell 1000 companies with higher price-to-book ratios and higher forecasted growth values. |
| (3) | The Russell 2000® Index is an unmanaged index which measures the performance of the 2000 smallest companies in the Russell 3000® Index. |
Note: These indices defined above are not available for direct investment and the index performance therefore does not include expenses.
2014 Review
During the first half of the year, investors continued to favor stocks that looked like bonds and bonds that looked like stocks. The best performing sector of the Standard & Poor’s 500® Index for the first half of the year was the Utilities sector (a sector the Funds are normally underweight) which we believe reflects investor appetite for dividend income rather than an expression of an undervalued sector. In the fixed income marketplace, high yield corporate bonds continued to outperform their investment grade counterparts during the first half of the year. The strong performance of high yield bonds warrants close watch from the vantage of both equity and fixed income investors. Investors have bid up the price of high yield bonds to the point that yields have dropped meaningfully, as the yield premium for corporations with higher financial risk relative to investment grade companies has meaningfully narrowed. In essence, the combined forces of the Federal Reserve and the global savings glut have, in our view, contributed to a low cost of capital for companies, regardless of financial risk profile.
Equity markets, as measured by the Standard & Poor’s 500® Index, posted solid returns and we believe now reflect a valuation that aligns more closely with our near-term growth prospects for the economy. Low volatility continued to be a hallmark of the current environment. Not only do interest rates and oil prices demonstrate low volatility, but the Standard & Poor’s 500® Index finished the second quarter with fifty-one consecutive days with a daily price change of less than one percent. The last time we witnessed such a streak was 1995. More broadly, the equity markets, as measured by the Standard & Poor’s Index, have not experienced a double digit correction since 2012.
Near-zero interest rate monetary policy at home and abroad continued to hamper investors’ hunt for yield. Because this dynamic has implications for both equity and fixed income markets, investors are currently on “rate watch” as central banks begin to condition markets for higher rates through forward guidance. In the interim, corporate earnings continued to grow at a high single digit pace that we consider supportive of the market’s current rate of appreciation. While we do not believe the low volatility in equities, interest rates, and energy is concerning, we would not be surprised to see greater volatility going forward possibly at the actual time of interest rate hikes expected next year.
LKCM Aquinas Value Fund
The LKCM Aquinas Value Fund returned 4.84% for the six months ended June 30, 2014 against the 8.28% return for the Fund’s benchmark, the Russell 1000 Value® Index. The Fund benefited from stock selection in the Consumer Staples, Energy and Healthcare
2
sectors but this was more than offset by our stock selection in the Consumer Discretionary, Technology, Financials and Materials sectors. Our underweight position in the Utilities sector also had a negative impact on returns, which was offset by returns from our overweight positions in the Financials and Technology sectors. We continue to believe the Fund is well positioned with a strong emphasis on what we view as high quality companies with reasonable valuations relative to their earnings growth rates, which we believe can provide an opportunity to add value for the Fund and its shareholders during the remainder of 2014. We continue to emphasize holdings where we believe meaningful dividend increases or share buybacks are likely during the remainder of 2014.
LKCM Aquinas Small Cap Fund
The LKCM Aquinas Small Cap Fund declined 0.75% for the six months ended June 30, 2014 against the 3.19% return for the Fund’s benchmark, the Russell 2000® Index. During the period, both our stock selection and sector allocation decisions detracted from results. Positive stock selection in the Energy sector was more than offset by weakness in the Technology, Industrials and Financials sectors. Sector allocation decisions were a marginal drag with our underweight in the Utilities sector accounting for much of the shortfall. Our investment strategy for the Fund focuses on what we view as higher quality companies and it had difficulty overcoming two powerful forces that we believe continued to drive the markets: “reach for yield” and focus on lower quality companies. We continue to have an economic growth focus in the Fund’s portfolio and believe the Fund can benefit from an expanding economy.
LKCM Aquinas Growth Fund
The LKCM Aquinas Growth Fund declined 0.09% for the six months ended June 30, 2014 against the 6.31% return of the Fund’s benchmark, the Russell 1000 Growth® Index. During the period, both our stock selection and sector allocation decisions detracted from our results. Positive stock selection in the Technology sector was more than offset by weakness in stock selection in the Energy, Consumer Discretionary and Financials sectors. Sector allocation decisions were positive to our relative performance with our overweight position in the Energy sector accounting for most of the contribution. Our investment strategy for the Fund focuses on what we view as higher quality companies and it had difficulty overcoming the “reach for yield” focus of the market during the period. We continue to believe the Fund maintains a portfolio of high quality growth companies that we believe well positions the Fund for the remainder of 2014.

J. Luther King, Jr., CFA, CIC
August 12, 2014
The information provided herein represents the opinion of J. Luther King, Jr., CFA, CIC and is not intended to be a forecast of future events, a guarantee of future results, nor investment advice.
Please refer to the Schedule of Investments found on pages 6-11 of the report for more information on Fund holdings. Fund holdings and sector allocations are subject to change and are not recommendations to buy or sell any securities.
Mutual fund investing involves risk. Principal loss is possible. Past performance is not a guarantee of future results. Small and medium capitalization funds typically carry additional risks, since smaller companies generally have a higher risk of failure, and, historically, their stocks have experienced a greater degree of market volatility than stocks on average. These risks are discussed in the Funds’ summary and statutory prospectuses. Since the Funds practice socially responsible investing within the framework provided by the United States Conference of Catholic Bishop’s socially responsible investment guidelines, the Funds may forego a profitable investment opportunity or sell a security when it may be disadvantageous to do so.
The Standard & Poor’s 500® Index is a broad based unmanaged index of 500 stocks, which is widely recognized as representative of the equity market in general. One cannot invest directly in an index.
Investments in debt securities typically decrease in value when interest rates rise. This risk is usually greater for longer term debt securities. Stocks and bonds are not guaranteed. Bonds traditionally experience less volatility than stocks but have less growth potential. High yield bonds are subject to certain risks including market, greater price volatility, credit, liquidity, issuer, interest-rate, and inflation. Lower-rated and non-rated securities involve greater risk than higher rated securities. Stocks, investment grade bonds and high yield bonds as well as other asset classes have different risk profiles which should be considered when investing. High yield securities have greater price volatility and credit and liquidity risks (presenting a greater risk of loss to principal and interest) than other higher-rated, investment grade securities.
Must be preceded or accompanied by a prospectus.
Quasar Distributors, LLC, distributor.
3
LKCM Aquinas Funds Expense Example — June 30, 2014 (Unaudited)
As a shareholder of the Funds, you incur two types of costs: (1) transaction costs, including redemption fees; and (2) ongoing costs, including management fees, distribution and/or service (12b-1) fees and other Fund expenses. This Example is intended to help you understand your ongoing costs (in dollars) of investing in the Funds and to compare these costs with the ongoing costs of investing in other mutual funds. The Example is based on an investment of $1,000 invested at the beginning of the period and held for the entire period (1/1/14 - 6/30/14).
ACTUAL EXPENSES
The first line of the tables below provides information about actual account values and actual expenses. Although the Funds charge no sales load, you will be assessed fees for outgoing wire transfers, returned checks and stop payment orders at prevailing rates charged by U.S. Bancorp Fund Services, LLC, the Funds’ transfer agent. If you request that a redemption be made by wire transfer, currently a $15 fee is charged by the Funds’ transfer agent. You will be charged a redemption fee equal to 1.00% of the net amount of the redemption if you redeem your shares of the LKCM Aquinas Value, Aquinas Growth and Aquinas Small Cap Funds within 30 days of purchase, unless otherwise determined by the Funds in their discretion. To the extent the Funds invest in shares of other investment companies as part of their investment strategies, you will indirectly bear your proportionate share of any fees and expenses charged by the underlying funds in which the Funds invest in addition to the expenses of the Funds. Actual expenses of the underlying funds are expected to vary among the various underlying funds. These expenses are not included in the example below. The example below includes management fees, registration fees and other expenses. However, the example below does not include portfolio trading commissions and related expenses and other extraordinary expenses as determined under generally accepted accounting principles. You may use the information in this line, together with the amount you invested, to estimate the expenses that you paid over the period. Simply divide your account value by $1,000 (for example, an $8,600 account value divided by $1,000 = 8.6), then multiply the result by the number in the first line under the heading entitled “Expenses Paid During Period” to estimate the expenses you paid on your account during this period.
HYPOTHETICAL EXAMPLES FOR COMPARISON PURPOSES
The second line of the tables below provides information about hypothetical account values and hypothetical expenses based on the Funds’ actual expense ratios and an assumed rate of return of 5% per year before expenses, which are not the Funds’ actual returns. The hypothetical account values and expenses may not be used to estimate the actual ending account balance or expenses you paid for the period. You may use this information to compare the ongoing costs of investing in the Funds and other funds. To do so, compare this 5% hypothetical example with the 5% hypothetical examples that appear in the shareholder reports of the other funds. Please note that the expenses shown in the table are meant to highlight your ongoing costs only and do not reflect any transactional costs, such as redemption fees. Therefore, the second line of the table is useful in comparing ongoing costs only, and will not help you determine the relative total costs of owning different funds. In addition, if these transactions costs were included, your costs would have been higher.
| | | | | | | | | | | | |
| | | LKCM Aquinas Value Fund | |
| | | Beginning
Account Value
1/1/14 | | | Ending
Account Value
6/30/14 | | | Expenses Paid
During the Period*
1/1/14 – 6/30/14 | |
Actual | | $ | 1,000.00 | | | $ | 1,048.40 | | | $ | 7.57 | |
Hypothetical (5% return before expenses) | | $ | 1,000.00 | | | $ | 1,017.41 | | | $ | 7.45 | |
| * | Expenses are equal to the Fund’s annualized net expense ratio of 1.49%, multiplied by the average account value over the period, multiplied by 181/365 to reflect the one-half year period. |
| | | | | | | | | | | | |
| | | LKCM Aquinas Growth Fund | |
| | | Beginning
Account Value
1/1/14 | | | Ending
Account Value
6/30/14 | | | Expenses Paid
During the Period*
1/1/14 – 6/30/14 | |
Actual | | $ | 1,000.00 | | | $ | 999.10 | | | $ | 7.44 | |
Hypothetical (5% return before expenses) | | $ | 1,000.00 | | | $ | 1,017.36 | | | $ | 7.50 | |
| * | Expenses are equal to the Fund’s annualized net expense ratio of 1.50%, multiplied by the average account value over the period, multiplied by 181/365 to reflect the one-half year period. |
| | | | | | | | | | | | |
| | | LKCM Aquinas Small Cap Fund | |
| | | Beginning
Account Value
1/1/14 | | | Ending
Account Value
6/30/14 | | | Expenses Paid
During the Period*
1/1/14 – 6/30/14 | |
Actual | | $ | 1,000.00 | | | $ | 992.50 | | | $ | 7.41 | |
Hypothetical (5% return before expenses) | | $ | 1,000.00 | | | $ | 1,017.36 | | | $ | 7.50 | |
| * | Expenses are equal to the Fund’s annualized net expense ratio of 1.50%, multiplied by the average account value over the period, multiplied by 181/365 to reflect the one-half year period. |
4
ALLOCATION OF PORTFOLIO HOLDINGS — LKCM Aquinas Funds — June 30, 2014 (Unaudited)
Percentages represent market value as a percentage of total investments.
LKCM Aquinas Value Fund
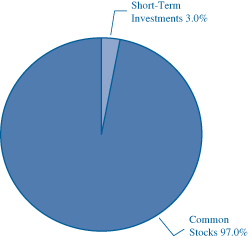
LKCM Aquinas Small Cap Fund
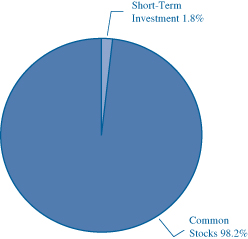
LKCM Aquinas Growth Fund
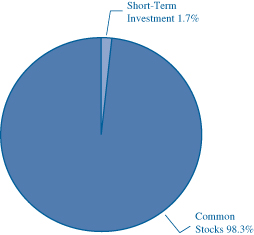
5
|
| LKCM AQUINAS VALUE FUND |
| SCHEDULEOF INVESTMENTS |
| June 30, 2014 (Unaudited) |
| | | | | | | | |
| COMMON STOCKS - 97.2% | | Shares | | | Value | |
Aerospace & Defense - 2.2% | |
Honeywell International Inc. | | | 15,000 | | | $ | 1,394,250 | |
| | | | | | | | |
Auto Components - 2.2% | |
The Goodyear Tire & Rubber Company | | | 50,000 | | | | 1,389,000 | |
| | | | | | | | |
Banks - 8.4% | |
BOK Financial Corporation | | | 17,500 | | | | 1,165,500 | |
Cullen/Frost Bankers, Inc. | | | 15,000 | | | | 1,191,300 | |
SunTrust Banks, Inc. | | | 35,000 | | | | 1,402,100 | |
Zions Bancorporation | | | 50,000 | | | | 1,473,500 | |
| | | | | | | | |
| | | | | | | 5,232,400 | |
| | | | | | | | |
Beverages - 2.8% | | | | | | | | |
The Coca-Cola Company | | | 20,000 | | | | 847,200 | |
PepsiCo, Inc. | | | 10,000 | | | | 893,400 | |
| | | | | | | | |
| | | | | | | 1,740,600 | |
| | | | | | | | |
Chemicals - 5.3% | | | | | | | | |
FMC Corporation | | | 24,000 | | | | 1,708,560 | |
Monsanto Company | | | 12,500 | | | | 1,559,250 | |
| | | | | | | | |
| | | | | | | 3,267,810 | |
| | | | | | | | |
Computers & Peripherals - 2.9% | |
EMC Corporation | | | 40,000 | | | | 1,053,600 | |
International Business Machines Corporation | | | 4,020 | | | | 728,706 | |
| | | | | | | | |
| | | | | | | 1,782,306 | |
| | | | | | | | |
Construction Materials - 2.7% | | | | | | | | |
Martin Marietta Materials, Inc. | | | 12,500 | | | | 1,650,625 | |
| | | | | | | | |
Diversified Financials - 2.3% | | | | | | | | |
JPMorgan Chase & Co. | | | 25,000 | | | | 1,440,500 | |
| | | | | | | | |
Diversified Telecommunication Services - 1.5% | |
Verizon Communications, Inc. | | | 18,812 | | | | 920,471 | |
| | | | | | | | |
Electrical Equipment & Instruments - 2.1% | |
Roper Industries, Inc. | | | 9,000 | | | | 1,314,090 | |
| | | | | | | | |
Electronic Equipment & Instruments - 3.5% | |
National Instruments Corporation | | | 25,000 | | | | 809,750 | |
Trimble Navigation Limited (a) | | | 36,100 | | | | 1,333,895 | |
| | | | | | | | |
| | | | | | | 2,143,645 | |
| | | | | | | | |
Energy Equipment & Services - 1.6% | |
Schlumberger Limited (b) | | | 8,400 | | | | 990,780 | |
| | | | | | | | |
Food & Drug Retailing - 2.4% | | | | | | | | |
CVS Caremark Corporation | | | 20,000 | | | | 1,507,400 | |
| | | | | | | | |
Food Products - 3.3% | | | | | | | | |
Kraft Foods Group, Inc. | | | 15,000 | | | | 899,250 | |
Mondelez International, Inc. - Class A | | | 29,700 | | | | 1,117,017 | |
| | | | | | | | |
| | | | | | | 2,016,267 | |
| | | | | | | | |
Health Care Equipment & Supplies - 3.7% | |
Covidien PLC (b) | | | 15,000 | | | | 1,352,700 | |
DENTSPLY International Inc. | | | 20,000 | | | | 947,000 | |
| | | | | | | | |
| | | | | | | 2,299,700 | |
| | | | | | | | |
| | | | | | | | |
| COMMON STOCKS | | Shares | | | Value | |
Household Durables - 2.2% | | | | | | | | |
Whirlpool Corporation | | | 10,000 | | | $ | 1,392,200 | |
| | | | | | | | |
Insurance - 5.6% | | | | | | | | |
MetLife, Inc. | | | 35,000 | | | | 1,944,600 | |
Prudential Financial, Inc. | | | 17,500 | | | | 1,553,475 | |
| | | | | | | | |
| | | | | | | 3,498,075 | |
| | | | | | | | |
Internet Software & Services - 4.1% | | | | | | | | |
Akamai Technologies, Inc. (a) | | | 25,000 | | | | 1,526,500 | |
eBay Inc. (a) | | | 20,000 | | | | 1,001,200 | |
| | | | | | | | |
| | | | | | | 2,527,700 | |
| | | | | | | | |
Machinery - 6.4% | | | | | | | | |
Barnes Group Inc. | | | 30,000 | | | | 1,156,200 | |
Danaher Corporation | | | 17,500 | | | | 1,377,775 | |
Dover Corporation | | | 16,000 | | | | 1,455,200 | |
| | | | | | | | |
| | | | | | | 3,989,175 | |
| | | | | | | | |
Metals & Mining - 1.3% | | | | | | | | |
Commercial Metals Company | | | 45,000 | | | | 778,950 | |
| | | | | | | | |
Multiline Retail - 1.5% | | | | | | | | |
Kohl’s Corporation | | | 18,000 | | | | 948,240 | |
| | | | | | | | |
Oil & Gas & Consumable Fuels - 13.2% | |
Cabot Oil & Gas Corporation | | | 40,000 | | | | 1,365,600 | |
ConocoPhillips | | | 11,000 | | | | 943,030 | |
Exxon Mobil Corporation | | | 4,000 | | | | 402,720 | |
Gulfport Energy Corporation (a) | | | 25,000 | | | | 1,570,000 | |
Noble Energy, Inc. | | | 16,500 | | | | 1,278,090 | |
Range Resources Corporation | | | 10,000 | | | | 869,500 | |
The Williams Companies, Inc. | | | 30,000 | | | | 1,746,300 | |
| | | | | | | | |
| | | | | | | 8,175,240 | |
| | | | | | | | |
Paper & Forest Products - 2.0% | | | | | | | | |
International Paper Company | | | 25,000 | | | | 1,261,750 | |
| | | | | | | | |
Pharmaceuticals - 2.3% | | | | | | | | |
AbbVie Inc. | | | 25,000 | | | | 1,411,000 | |
| | | | | | | | |
Software - 5.7% | | | | | | | | |
Adobe Systems Incorporated (a) | | | 22,500 | | | | 1,628,100 | |
Citrix Systems, Inc. (a) | | | 18,500 | | | | 1,157,175 | |
Nuance Communications, Inc. (a) | | | 40,000 | | | | 750,800 | |
| | | | | | | | |
| | | | | | | 3,536,075 | |
| | | | | | | | |
Specialty Retail - 4.7% | | | | | | | | |
The Home Depot, Inc. | | | 10,000 | | | | 809,600 | |
Pier 1 Imports, Inc. | | | 60,000 | | | | 924,600 | |
Tiffany & Co. | | | 12,000 | | | | 1,203,000 | |
| | | | | | | | |
| | | | | | | 2,937,200 | |
| | | | | | | | |
Thrifts & Mortgage Finance - 1.3% | | | | | | | | |
Capitol Federal Financial Inc. | | | 65,000 | | | | 790,400 | |
| | | | | | | | |
TOTAL COMMON STOCKS | | | | | | | | |
(Cost $36,427,334) | | | | | | | 60,335,849 | |
| | | | | | | | |
The accompanying notes are an integral part of these financial statements.
6
|
| LKCM AQUINAS VALUE FUND |
| SCHEDULEOF INVESTMENTS, CONTINUED |
| June 30, 2014 (Unaudited) |
| | | | | | | | |
| SHORT-TERM INVESTMENTS - 3.0% | | Shares | | | Value | |
Money Market Funds (c) - 3.0% | | | | | | | | |
Dreyfus Government Cash Management Fund - Institutional Shares, 0.01% | | | 8,289 | | | $ | 8,289 | |
Federated Government Obligations
Fund -Institutional Shares, 0.01% | | | 1,834,277 | | | | 1,834,277 | |
| | | | | | | | |
TOTAL SHORT-TERM INVESTMENTS | | | | | | | | |
(Cost $1,842,566) | | | | | | | 1,842,566 | |
| | | | | | | | |
Total Investments - 100.2% | | | | | | | | |
(Cost $38,269,900) | | | | | | | 62,178,415 | |
Liabilities in Excess of Other Assets - (0.2)% | | | | (98,542 | ) |
| | | | | | | | |
TOTAL NET ASSETS - 100.0% | | | | | | $ | 62,079,873 | |
| | | | | | | | |
| (a) | Non-income producing security. |
| (b) | Security issued by non-U.S. incorporated company. |
| (c) | The rate quoted is the annualized seven-day yield of the fund at period end. |
The Global Industry Classification Standard (GICS®) was developed by and/or is the exclusive property of MSCI, Inc. and Standard & Poor Financial Services LLC (“S&P”). GICS is a service mark of MSCI and S&P and has been licensed for use by U.S. Bancorp Fund Services, LLC.
The accompanying notes are an integral part of these financial statements.
7
|
| LKCM AQUINAS GROWTH FUND |
| SCHEDULEOF INVESTMENTS |
| June 30, 2014 (Unaudited) |
| | | | | | | | |
| COMMON STOCKS - 98.6% | | Shares | | | Value | |
Aerospace & Defense - 2.2% | | | | | | | | |
Honeywell International Inc. | | | 7,675 | | | $ | 713,391 | |
| | | | | | | | |
Banks - 4.4% | | | | | | | | |
Comerica Incorporated | | | 12,975 | | | | 650,826 | |
Cullen/Frost Bankers, Inc. | | | 3,000 | | | | 238,260 | |
Texas Capital Bancshares, Inc. (a) | | | 10,000 | | | | 539,500 | |
| | | | | | | | |
| | | | | | | 1,428,586 | |
| | | | | | | | |
Beverages - 1.3% | | | | | | | | |
The Coca-Cola Company | | | 10,000 | | | | 423,600 | |
| | | | | | | | |
Biotechnology - 1.2% | | | | | | | | |
Amgen Inc. | | | 3,275 | | | | 387,662 | |
| | | | | | | | |
Chemicals - 1.3% | | | | | | | | |
FMC Corporation | | | 6,000 | | | | 427,140 | |
| | | | | | | | |
Communication Equipment - 2.4% | | | | | | | | |
QUALCOMM Incorporated | | | 10,000 | | | | 792,000 | |
| | | | | | | | |
Computers & Peripherals - 5.4% | | | | | | | | |
Apple Inc. | | | 10,500 | | | | 975,765 | |
EMC Corporation | | | 30,000 | | | | 790,200 | |
| | | | | | | | |
| | | | | | | 1,765,965 | |
| | | | | | | | |
Consumer Finance - 2.6% | | | | | | | | |
American Express Company | | | 8,750 | | | | 830,112 | |
| | | | | | | | |
Containers & Packaging - 0.8% | | | | | | | | |
Greif, Inc. - Class A | | | 5,000 | | | | 272,800 | |
| | | | | | | | |
Electrical Equipment & Instruments - 6.7% | | | | | |
AMETEK, Inc. | | | 10,000 | | | | 522,800 | |
Emerson Electric Co. | | | 12,000 | | | | 796,320 | |
Roper Industries, Inc. | | | 6,000 | | | | 876,060 | |
| | | | | | | | |
| | | | | | | 2,195,180 | |
| | | | | | | | |
Electronic Equipment & Instruments - 4.3% | | | | | |
National Instruments Corporation | | | 18,000 | | | | 583,020 | |
Trimble Navigation Limited (a) | | | 22,000 | | | | 812,900 | |
| | | | | | | | |
| | | | | | | 1,395,920 | |
| | | | | | | | |
Energy Equipment & Services - 3.0% | | | | | | | | |
Halliburton Company | | | 6,750 | | | | 479,318 | |
Schlumberger Limited (b) | | | 4,200 | | | | 495,390 | |
| | | | | | | | |
| | | | | | | 974,708 | |
| | | | | | | | |
Food & Drug Retailing - 3.8% | | | | | | | | |
CVS Caremark Corporation | | | 9,375 | | | | 706,594 | |
Walgreen Co. | | | 7,000 | | | | 518,910 | |
| | | | | | | | |
| | | | | | | 1,225,504 | |
| | | | | | | | |
Food Products - 1.5% | | | | | | | | |
The WhiteWave Foods Company (a) | | | 15,125 | | | | 489,596 | |
| | | | | | | | |
Health Care Equipment & Supplies - 5.0% | | | | | |
Covidien PLC (b) | | | 10,000 | | | | 901,800 | |
Zimmer Holdings, Inc. | | | 6,950 | | | | 721,827 | |
| | | | | | | | |
| | | | | | | 1,623,627 | |
| | | | | | | | |
| | | | | | | | |
| COMMON STOCKS | | Shares | | | Value | |
Health Care Providers & Services - 4.0% | | | | | |
Express Scripts Holding Co (a) | | | 8,000 | | | $ | 554,640 | |
McKesson Corporation | | | 4,000 | | | | 744,840 | |
| | | | | | | | |
| | | | | | | 1,299,480 | |
| | | | | | | | |
Hotels, Restaurants & Leisure - 2.2% | | | | | | | | |
Yum! Brands, Inc. | | | 8,800 | | | | 714,560 | |
| | | | | | | | |
Household Products - 3.2% | | | | | | | | |
Colgate-Palmolive Company | | | 12,000 | | | | 818,160 | |
The Procter & Gamble Company | | | 3,000 | | | | 235,770 | |
| | | | | | | | |
| | | | | | | 1,053,930 | |
| | | | | | | | |
Insurance - 1.9% | | | | | | | | |
Prudential Financial, Inc. | | | 7,000 | | | | 621,390 | |
| | | | | | | | |
Internet Catalog & Retail - 2.5% | | | | | | | | |
Amazon.com, Inc. (a) | | | 2,500 | | | | 811,950 | |
| | | | | | | | |
Internet Software & Services - 10.7% | | | | | | | | |
Akamai Technologies, Inc. (a) | | | 17,000 | | | | 1,038,020 | |
Facebook, Inc. - Class A (a) | | | 14,000 | | | | 942,060 | |
Google Inc. - Class A (a) | | | 1,000 | | | | 584,670 | |
Google Inc. - Class C (a) | | | 1,000 | | | | 575,280 | |
Yahoo! Inc. (a) | | | 10,000 | | | | 351,300 | |
| | | | | | | | |
| | | | | | | 3,491,330 | |
| | | | | | | | |
Machinery - 4.9% | | | | | | | | |
Danaher Corporation | | | 11,000 | | | | 866,030 | |
Dover Corporation | | | 8,025 | | | | 729,874 | |
| | | | | | | | |
| | | | | | | 1,595,904 | |
| | | | | | | | |
Oil & Gas & Consumable Fuels - 6.3% | | | | | |
Cabot Oil & Gas Corporation | | | 20,000 | | | | 682,800 | |
Memorial Resource Development Corp. (a) | | | 20,000 | | | | 487,200 | |
Range Resources Corporation | | | 10,000 | | | | 869,500 | |
| | | | | | | | |
| | | | | | | 2,039,500 | |
| | | | | | | | |
Pharmaceuticals - 2.8% | | | | | | | | |
AbbVie Inc. | | | 16,000 | | | | 903,040 | |
| | | | | | | | |
Software - 5.4% | | | | | | | | |
ACI Worldwide, Inc. (a) | | | 8,000 | | | | 446,640 | |
Aspen Technology, Inc. (a) | | | 15,000 | | | | 696,000 | |
Citrix Systems, Inc. (a) | | | 10,000 | | | | 625,500 | |
| | | | | | | | |
| | | | | | | 1,768,140 | |
| | | | | | | | |
Specialty Retail - 4.7% | | | | | | | | |
The Home Depot, Inc. | | | 6,000 | | | | 485,760 | |
O’Reilly Automotive, Inc. (a) | | | 3,000 | | | | 451,800 | |
Tractor Supply Company | | | 10,000 | | | | 604,000 | |
| | | | | | | | |
| | | | | | | 1,541,560 | |
| | | | | | | | |
Textiles, Apparel & Luxury Goods - 4.1% | | | | | |
NIKE, Inc. - Class B | | | 6,000 | | | | 465,300 | |
V.F. Corporation | | | 14,000 | | | | 882,000 | |
| | | | | | | | |
| | | | | | | 1,347,300 | |
| | | | | | | | |
TOTAL COMMON STOCKS | | | | | | | | |
(Cost $20,567,900) | | | | | | | 32,133,875 | |
| | | | | | | | |
The accompanying notes are an integral part of these financial statements.
8
|
| LKCM AQUINAS GROWTH FUND |
| SCHEDULEOF INVESTMENTS, CONTINUED |
| June 30, 2014 (Unaudited) |
| | | | | | | | |
| SHORT-TERM INVESTMENT - 1.7% | | Shares | | | Value | |
Money Market Fund (c) - 1.7% | | | | | | | | |
Federated Government Obligations Fund - Institutional Shares, 0.01% | | | 569,838 | | | $ | 569,838 | |
| | | | | | | | |
TOTAL SHORT-TERM INVESTMENT | | | | | | | | |
(Cost $569,838) | | | | | | | 569,838 | |
| | | | | | | | |
Total Investments - 100.3% | | | | | | | | |
(Cost $21,137,738) | | | | | | | 32,703,713 | |
Liabilities in Excess of Other Assets - (0.3)% | | | | (106,941 | ) |
| | | | | | | | |
TOTAL NET ASSETS - 100.0% | | | | | | $ | 32,596,772 | |
| | | | | | | | |
| (a) | Non-income producing security. |
| (b) | Security issued by non-U.S. incorporated company. |
| (c) | The rate quoted is the annualized seven-day yield of the fund at period end. |
The Global Industry Classification Standard (GICS®) was developed by and/or is the exclusive property of MSCI, Inc. and Standard & Poor Financial Services LLC (“S&P”). GICS is a service mark of MSCI and S&P and has been licensed for use by U.S. Bancorp Fund Services, LLC.
The accompanying notes are an integral part of these financial statements.
9
|
| LKCM AQUINAS SMALL CAP FUND |
| SCHEDULEOF INVESTMENTS |
| June 30, 2014 (Unaudited) |
| | | | | | | | |
| COMMON STOCKS - 98.3% | | Shares | | | Value | |
Aerospace & Defense - 2.6% | |
Hexcel Corporation (a) | | | 4,145 | | | $ | 169,530 | |
Teledyne Technologies Incorporated (a) | | | 1,980 | | | | 192,397 | |
| | | | | | | | |
| | | | | | | 361,927 | |
| | | | | | | | |
Auto Components - 1.0% | |
Dorman Products, Inc. (a) | | | 2,900 | | | | 143,028 | |
| | | | | | | | |
Automobiles - 1.9% | |
Thor Industries, Inc. | | | 2,440 | | | | 138,763 | |
Winnebago Industries, Inc. (a) | | | 4,951 | | | | 124,666 | |
| | | | | | | | |
| | | | | | | 263,429 | |
| | | | | | | | |
Banks - 8.9% | |
BancorpSouth, Inc. | | | 8,883 | | | | 218,255 | |
Columbia Banking System, Inc. | | | 6,605 | | | | 173,777 | |
Community Bank System, Inc. | | | 3,095 | | | | 112,039 | |
Hancock Holding Company | | | 1,880 | | | | 66,402 | |
Hanmi Financial Corporation | | | 5,945 | | | | 125,321 | |
Home Bancshares Inc. | | | 6,385 | | | | 209,556 | |
Prosperity Bancshares, Inc. | | | 2,355 | | | | 147,423 | |
Texas Capital Bancshares, Inc. (a) | | | 3,710 | | | | 200,154 | |
| | | | | | | | |
| | | | | | | 1,252,927 | |
| | | | | | | | |
Biotechnology - 1.3% | |
EXACT Sciences Corporation (a) | | | 10,810 | | | | 184,094 | |
| | | | | | | | |
Building Products - 0.5% | |
PGT, Inc. (a) | | | 8,109 | | | | 68,683 | |
| | | | | | | | |
Capital Markets - 1.2% | |
Evercore Partners Inc. - Class A | | | 2,960 | | | | 170,614 | |
| | | | | | | | |
Chemicals - 1.4% | |
PolyOne Corporation | | | 4,730 | | | | 199,322 | |
| | | | | | | | |
Commercial Services & Supplies - 1.0% | |
MSA Safety Incorporated | | | 2,515 | | | | 144,562 | |
| | | | | | | | |
Communications Equipment - 3.8% | |
Allot Communications Ltd. (a) (b) | | | 7,660 | | | | 99,963 | |
Ciena Corporation (a) | | | 8,255 | | | | 178,803 | |
Infinera Corporation (a) | | | 14,740 | | | | 135,608 | |
Sonus Networks, Inc. (a) | | | 33,120 | | | | 118,901 | |
| | | | | | | | |
| | | | | | | 533,275 | |
| | | | | | | | |
Construction & Engineering - 0.9% | |
Primoris Services Corporation | | | 4,655 | | | | 134,250 | |
| | | | | | | | |
Construction Materials - 1.2% | |
Headwaters Incorporated (a) | | | 12,425 | | | | 172,583 | |
| | | | | | | | |
Containers & Packaging - 1.3% | |
Greif, Inc. - Class A | | | 3,255 | | | | 177,593 | |
| | | | | | | | |
Diversified Consumer Services - 2.2% | |
DeVry Education Group Inc. | | | 2,705 | | | | 114,530 | |
Hillenbrand, Inc. | | | 6,060 | | | | 197,677 | |
| | | | | | | | |
| | | | | | | 312,207 | |
| | | | | | | | |
Diversified Financials - 2.6% | |
HFF, Inc. - Class A | | | 6,085 | | | | 226,301 | |
MarketAxess Holdings Inc. | | | 2,705 | | | | 146,233 | |
| | | | | | | | |
| | | | | | | 372,534 | |
| | | | | | | | |
| | | | | | | | |
| COMMON STOCKS | | Shares | | | Value | |
Electrical Equipment & Instruments - 3.3% | |
Belden Inc. | | | 3,505 | | | $ | 273,951 | |
Franklin Electric Co., Inc. | | | 4,570 | | | | 184,308 | |
| | | | | | | | |
| | | | | | | 458,259 | |
| | | | | | | | |
Electronic Equipment & Instruments - 1.0% | |
Coherent, Inc. (a) | | | 2,140 | | | | 141,604 | |
| | | | | | | | |
Energy Equipment & Services - 0.5% | |
Atwood Oceanics, Inc. (a) | | | 1,460 | | | | 76,621 | |
| | | | | | | | |
Food & Drug Retailing - 0.7% | |
The Chefs’ Warehouse, Inc. (a) | | | 5,019 | | | | 99,225 | |
| | | | | | | | |
Food Products - 1.4% | |
Post Holdings, Inc. (a) | | | 3,870 | | | | 197,022 | |
| | | | | | | | |
Health Care Equipment & Supplies - 8.1% | |
CONMED Corporation | | | 2,360 | | | | 104,194 | |
Cyberonics, Inc. (a) | | | 2,880 | | | | 179,885 | |
Cynosure, Inc. - Class A (a) | | | 5,427 | | | | 115,324 | |
DexCom Inc. (a) | | | 4,875 | | | | 193,342 | |
Endologix, Inc. (a) | | | 9,695 | | | | 147,461 | |
MWI Veterinary Supply, Inc. (a) | | | 1,440 | | | | 204,466 | |
The Spectranetics Corporation (a) | | | 8,368 | | | | 191,460 | |
| | | | | | | | |
| | | | | | | 1,136,132 | |
| | | | | | | | |
Health Care Providers & Services - 3.1% | |
Acadia Healthcare Company, Inc. (a) | | | 3,905 | | | | 177,678 | |
Team Health Holdings, Inc. (a) | | | 5,135 | | | | 256,442 | |
| | | | | | | | |
| | | | | | | 434,120 | |
| | | | | | | | |
Hotels, Restaurants & Leisure - 2.4% | |
La Quinta-Holdings, Inc. (a) | | | 7,555 | | | | 144,603 | |
Orient-Express Hotels Ltd - Class A (a) (b) | | | 12,895 | | | | 187,493 | |
| | | | | | | | |
| | | | | | | 332,096 | |
| | | | | | | | |
Industrial Conglomerates - 0.7% | |
Raven Industries, Inc. | | | 3,145 | | | | 104,225 | |
| | | | | | | | |
Internet Software & Services - 4.6% | |
E2open, Inc. (a) | | | 4,275 | | | | 88,364 | |
Euronet Worldwide, Inc. (a) | | | 4,425 | | | | 213,462 | |
LogMeIn, Inc. (a) | | | 4,820 | | | | 224,708 | |
SPS Commerce, Inc. (a) | | | 1,835 | | | | 115,954 | |
| | | | | | | | |
| | | | | | | 642,488 | |
| | | | | | | | |
IT Consulting & Services - 2.3% | |
Acxiom Corporation (a) | | | 7,390 | | | | 160,289 | |
Sapient Corporation (a) | | | 10,045 | | | | 163,231 | |
| | | | | | | | |
| | | | | | | 323,520 | |
| | | | | | | | |
Leisure Equipment & Products - 1.2% | |
Pool Corporation | | | 2,980 | | | | 168,549 | |
| | | | | | | | |
Machinery - 5.9% | |
Actuant Corporation - Class A | | | 3,120 | | | | 107,859 | |
Barnes Group Inc. | | | 4,695 | | | | 180,945 | |
Chart Industries, Inc. (a) | | | 1,272 | | | | 105,245 | |
Harsco Corporation | | | 4,645 | | | | 123,696 | |
The Manitowoc Company, Inc. | | | 5,980 | | | | 196,503 | |
TriMas Corporation (a) | | | 3,244 | | | | 123,694 | |
| | | | | | | | |
| | | | | | | 837,942 | |
| | | | | | | | |
The accompanying notes are an integral part of these financial statements.
10
|
| LKCM AQUINAS SMALL CAP FUND |
| SCHEDULEOF INVESTMENTS, CONTINUED |
| June 30, 2014 (Unaudited) |
| | | | | | | | |
| COMMON STOCKS | | Shares | | | Value | |
Marine - 0.8% | |
Diana Shipping Inc. (a) (b) | | | 10,735 | | | $ | 116,904 | |
| | | | | | | | |
Media - 1.4% | |
The E.W. Scripps Company - Class A (a) | | | 9,160 | | | | 193,825 | |
| | | | | | | | |
Metals & Mining - 3.0% | |
Carpenter Technology Corporation | | | 1,835 | | | | 116,064 | |
Commercial Metals Company | | | 7,745 | | | | 134,066 | |
Worthington Industries, Inc. | | | 4,020 | | | | 173,021 | |
| | | | | | | | |
| | | | | | | 423,151 | |
| | | | | | | | |
Oil & Gas & Consumable Fuels - 8.3% | |
Athlon Energy Inc. (a) | | | 6,493 | | | | 309,716 | |
Bill Barrett Corporation (a) | | | 7,540 | | | | 201,921 | |
Matador Resources Company (a) | | | 5,140 | | | | 150,499 | |
Parsley Energy, Inc. - Class A (a) | | | 6,895 | | | | 165,963 | |
Sanchez Energy Corporation (a) | | | 4,714 | | | | 177,199 | |
Synergy Resources Corporation (a) | | | 11,995 | | | | 158,934 | |
| | | | | | | | |
| | | | | | | 1,164,232 | |
| | | | | | | | |
Pharmaceuticals - 2.2% | |
Akorn, Inc. (a) | | | 9,126 | | | | 303,440 | |
| | | | | | | | |
Real Estate - 0.9% | |
Kennedy-Wilson Holdings, Inc. | | | 4,950 | | | | 132,759 | |
| | | | | | | | |
Semiconductor Equipment & Products - 1.5% | |
Rambus Inc. (a) | | | 14,805 | | | | 211,712 | |
| | | | | | | | |
Software - 5.0% | |
ACI Worldwide, Inc. (a) | | | 3,360 | | | | 187,589 | |
Aspen Technology, Inc. (a) | | | 2,535 | | | | 117,624 | |
Bottomline Technologies (de) Inc. (a) | | | 3,035 | | | | 90,807 | |
Interactive Intelligence Group, Inc. (a) | | | 3,730 | | | | 209,365 | |
IntraLinks Holdings, Inc. (a) | | | 11,425 | | | | 101,568 | |
| | | | | | | | |
| | | | | | | 706,953 | |
| | | | | | | | |
Specialty Retail - 0.7% | |
Pier 1 Imports, Inc. | | | 6,230 | | | | 96,004 | |
| | | | | | | | |
Textiles, Apparel & Luxury Goods - 4.1% | |
Kate Spade & Company (a) | | | 2,975 | | | | 113,467 | |
Movado Group, Inc. | | | 4,005 | | | | 166,888 | |
Oxford Industries, Inc. | | | 2,270 | | | | 151,341 | |
Skechers U.S.A., Inc. - Class A (a) | | | 3,150 | | | | 143,955 | |
| | | | | | | | |
| | | | | | | 575,651 | |
| | | | | | | | |
Thrifts & Mortgage Finance - 0.9% | |
Capitol Federal Financial Inc. | | | 9,975 | | | | 121,296 | |
| | | | | | | | |
Trading Companies & Distributors - 2.5% | |
Aceto Corporation | | | 2,885 | | | | 52,334 | |
MRC Global Inc. (a) | | | 3,975 | | | | 112,453 | |
WESCO International, Inc. (a) | | | 2,255 | | | | 194,787 | |
| | | | | | | | |
| | | | | | | 359,574 | |
| | | | | | | | |
TOTAL COMMON STOCKS | | | | | | | | |
(Cost $10,750,399) | | | | | | | 13,848,332 | |
| | | | | | | | |
| | | | | | | | |
| SHORT-TERM INVESTMENT - 1.9% | | Shares | | | Value | |
Money Market Fund (c) - 1.9% | | | | | | | | |
Federated Government Obligations
Fund - Institutional Shares, 0.01% | | | 259,470 | | | $ | 259,470 | |
| | | | | | | | |
TOTAL SHORT-TERM INVESTMENT | |
(Cost $259,470) | | | | | | | 259,470 | |
| | | | | | | | |
Total Investments - 100.2% | | | | | | | | |
(Cost $11,009,869) | | | | | | | 14,107,802 | |
Liabilities in Excess of Other Assets - (0.2)% | | | | (21,767 | ) |
| | | | | | | | |
TOTAL NET ASSETS - 100.0% | | | | | | $ | 14,086,035 | |
| | | | | | | | |
| (a) | Non-income producing security. |
| (b) | Security issued by non-U.S. incorporated company. |
| (c) | The rate quoted is the annualized seven-day yield of the fund at period end. |
The Global Industry Classification Standard (GICS®) was developed by and/or is the exclusive property of MSCI, Inc. and Standard & Poor Financial Services LLC (“S&P”). GICS is a service mark of MSCI and S&P and has been licensed for use by U.S. Bancorp Fund Services, LLC.
The accompanying notes are an integral part of these financial statements.
11
|
| STATEMENTOF ASSETSAND LIABILITIES |
| June 30, 2014 (Unaudited) |
| | | | | | | | | | | | | | | | | | |
| | | | | LKCM
Aquinas
Value Fund | | | | | LKCM
Aquinas
Growth Fund | | | | | LKCM
Aquinas Small
Cap Fund | |
| | | | | | | | | | | | | | | | | | |
Assets: | | | | | | | | | | | | | | | | | | |
Investments, at value* | | | | $ | 62,178,415 | | | | | $ | 32,703,713 | | | | | $ | 14,107,802 | |
Dividends and interest receivable | | | | | 46,674 | | | | | | 23,279 | | | | | | 5,934 | |
Receivable for Fund shares sold | | | | | 74,796 | | | | | | 7,294 | | | | | | 479 | |
Other assets | | | | | 17,488 | | | | | | 16,240 | | | | | | 13,057 | |
| | | | | | | | | | | | | | | | | | |
Total assets | | | | | 62,317,373 | | | | | | 32,750,526 | | | | | | 14,127,272 | |
| | | | | | | | | | | | | | | | | | |
Liabilities: | | | | | | | | | | | | | | | | | | |
Payable for investment advisory fees | | | | | 135,028 | | | | | | 91,645 | | | | | | 10,468 | |
Payable for distribution expense (Note B) | | | | | 55,392 | | | | | | 32,522 | | | | | | 7,926 | |
Payable for Fund shares redeemed | | | | | 10,833 | | | | | | — | | | | | | 20 | |
Payable for accounting and transfer agent fees and expenses | | | | | 12,378 | | | | | | 11,099 | | | | | | 7,658 | |
Payable for administrative fees | | | | | 9,567 | | | | | | 6,795 | | | | | | 4,015 | |
Payable for reports to shareholders | | | | | 2,088 | | | | | | 1,429 | | | | | | 515 | |
Payable for custody fees and expenses | | | | | 1,153 | | | | | | 1,000 | | | | | | 5,092 | |
Accrued expenses and other liabilities | | | | | 11,061 | | | | | | 9,264 | | | | | | 5,543 | |
| | | | | | | | | | | | | | | | | | |
Total liabilities | | | | | 237,500 | | | | | | 153,754 | | | | | | 41,237 | |
| | | | | | | | | | | | | | | | | | |
Net assets | | | | $ | 62,079,873 | | | | | $ | 32,596,772 | | | | | $ | 14,086,035 | |
| | | | | | | | | | | | | | | | | | |
Net assets consist of: | | | | | | | | | | | | | | | �� | | | |
Paid in capital | | | | $ | 34,810,344 | | | | | $ | 15,209,295 | | | | | $ | 9,682,818 | |
Accumulated net investment income (loss) | | | | | 484,548 | | | | | | (93,708 | ) | | | | | (50,930 | ) |
Accumulated net realized gain on securities | | | | | 2,876,466 | | | | | | 5,915,210 | | | | | | 1,356,214 | |
Net unrealized appreciation on investments | | | | | 23,908,515 | | | | | | 11,565,975 | | | | | | 3,097,933 | |
| | | | | | | | | | | | | | | | | | |
Net assets | | | | $ | 62,079,873 | | | | | $ | 32,596,772 | | | | | $ | 14,086,035 | |
| | | | | | | | | | | | | | | | | | |
| | | | | | |
Net assets | | | | $ | 62,079,873 | | | | | $ | 32,596,772 | | | | | $ | 14,086,035 | |
Shares of beneficial interest outstanding
(unlimited shares of no par value authorized) | | | | | 3,290,979 | | | | | | 1,522,047 | | | | | | 1,510,674 | |
Net asset value per share
(offering and redemption price) | | | | $ | 18.86 | | | | | $ | 21.42 | | | | | $ | 9.32 | |
| | | | | | | | | | | | | | | | | | |
| | | | | | |
* Cost of Investments | | | | $ | 38,269,900 | | | | | $ | 21,137,738 | | | | | $ | 11,009,869 | |
| | | | | | | | | | | | | | | | | | |
The accompanying notes are an integral part of these financial statements.
12
|
| STATEMENTOF OPERATIONS |
| For the six months ended June 30, 2014 (Unaudited) |
| | | | | | | | | | | | | | | | | | |
| | | | | LKCM
Aquinas
Value Fund | | | | | LKCM
Aquinas
Growth Fund | | | | | LKCM
Aquinas Small
Cap Fund | |
| | | | | | | | | | | | | | | | | | |
Investment Income: | | | | | | | | | | | | | | | | | | |
Dividends* | | | | $ | 923,358 | | | | | $ | 225,454 | | | | | $ | 53,822 | |
Interest | | | | | 55 | | | | | | 53 | | | | | | 20 | |
| | | | | | | | | | | | | | | | | | |
Total income | | | | | 923,413 | | | | | | 225,507 | | | | | | 53,842 | |
| | | | | | | | | | | | | | | | | | |
| | | | | | |
Expenses: | | | | | | | | | | | | | | | | | | |
Investment advisory fees | | | | | 265,535 | | | | | | 191,529 | | | | | | 69,848 | |
Distribution expense (Note B) | | | | | 73,760 | | | | | | 53,202 | | | | | | 17,462 | |
Accounting and transfer agent fees and expenses | | | | | 37,189 | | | | | | 33,771 | | | | | | 22,752 | |
Administrative fees | | | | | 28,332 | | | | | | 20,494 | | | | | | 11,965 | |
Federal and state registration | | | | | 11,691 | | | | | | 10,822 | | | | | | 9,987 | |
Professional fees | | | | | 5,763 | | | | | | 4,732 | | | | | | 2,842 | |
Trustees’ fees | | | | | 3,703 | | | | | | 2,843 | | | | | | 982 | |
Reports to shareholders | | | | | 3,699 | | | | | | 2,820 | | | | | | 1,371 | |
Custody fees and expenses | | | | | 3,496 | | | | | | 2,650 | | | | | | 14,006 | |
Other | | | | | 5,697 | | | | | | 4,530 | | | | | | 1,448 | |
| | | | | | | | | | | | | | | | | | |
Total expenses | | | | | 438,865 | | | | | | 327,393 | | | | | | 152,663 | |
Less, expense waiver and/or
reimbursement (Note B) | | | | | — | | | | | | (8,178 | ) | | | | | (47,891 | ) |
| | | | | | | | | | | | | | | | | | |
Net expenses | | | | | 438,865 | | | | | | 319,215 | | | | | | 104,772 | |
| | | | | | | | | | | | | | | | | | |
Net investment income (loss) | | | | | 484,548 | | | | | | (93,708 | ) | | | | | (50,930 | ) |
| | | | | | | | | | | | | | | | | | |
| | | | | | |
Realized and Unrealized Gain (Loss) on Investments: | | | | | | | | | | | | | | | | | | |
Net realized gain on investments | | | | | 2,873,832 | | | | | | 5,787,030 | | | | | | 854,701 | |
Net change in unrealized appreciation/depreciation on investments | | | | | (441,557 | ) | | | | | (5,752,431 | ) | | | | | (945,994 | ) |
| | | | | | | | | | | | | | | | | | |
Net realized and unrealized gain (loss) on investments | | | | | 2,432,275 | | | | | | 34,599 | | | | | | (91,293 | ) |
| | | | | | | | | | | | | | | | | | |
| | | | | | |
Net Increase (Decrease) in Net Assets Resulting from Operations | | | | $ | 2,916,823 | | | | | $ | (59,109 | ) | | | | $ | (142,223 | ) |
| | | | | | | | | | | | | | | | | | |
| | | | | | |
* Net of foreign taxes withheld | | | | $ | — | | | | | $ | — | | | | | $ | 23 | |
| | | | | | | | | | | | | | | | | | |
The accompanying notes are an integral part of these financial statements.
13
|
| STATEMENTSOF CHANGESIN NET ASSETS |
| | | | | | | | | | | | | | | | | | | | | | | | |
| | | | | LKCM Aquinas
Value Fund | | | | | LKCM Aquinas
Growth Fund | |
| | | | | | | | | | | | | | | | | | | | | | | | |
| | | | | Six Months Ended
June 30, 2014
(Unaudited) | | | | | Year Ended
December 31,
2013 | | | | | Six Months Ended
June 30, 2014
(Unaudited) | | | | | Year Ended
December 31,
2013 | |
Operations: | | | | | | | | | | | | | | | | | | | | | | | | |
Net investment income (loss) | | | | $ | 484,548 | | | | | $ | 123,340 | | | | | $ | (93,708 | ) | | | | $ | (240,022 | ) |
Net realized gain on investments | | | | | 2,873,832 | | | | | | 2,468,837 | | | | | | 5,787,030 | | | | | | 3,706,417 | |
Net change in unrealized appreciation/depreciation
on investments | | | | | (441,557 | ) | | | | | 12,541,076 | | | | | | (5,752,431 | ) | | | | | 6,003,811 | |
| | | | | | | | | | | | | | | | | | | | | | | | |
Net increase (decrease) in net assets resulting from operations | | | | | 2,916,823 | | | | | | 15,133,253 | | | | | | (59,109 | ) | | | | | 9,470,206 | |
| | | | | | | | | | | | | | | | | | | | | | | | |
| | | | | | | | |
Dividends and Distributions to Shareholders: | | | | | | | | | | | | | | | | | | | | | | | | |
Net investment income | | | | | — | | | | | | (131,454 | ) | | | | | — | | | | | | — | |
Net realized gain on investments | | | | | — | | | | | | (2,858,568 | ) | | | | | — | | | | | | (3,854,604 | ) |
| | | | | | | | | | | | | | | | | | | | | | | | |
| | | | | — | | | | | | (2,990,022 | ) | | | | | — | | | | | | (3,854,604 | ) |
| | | | | | | | | | | | | | | | | | | | | | | | |
| | | | | | | | |
Net increase (decrease) in net assets from
Fund share transactions (Note C) | | | | | 102,374 | | | | | | 15,560 | | | | | | (11,280,767 | ) | | | | | 3,005,783 | |
| | | | | | | | | | | | | | | | | | | | | | | | |
| | | | | | | | |
Total increase (decrease) in net assets | | | | | 3,019,197 | | | | | | 12,158,791 | | | | | | (11,339,876 | ) | | | | | 8,621,385 | |
| | | | | | | | |
Net Assets: | | | | | | | | | | | | | | | | | | | | | | | | |
Beginning of period | | | | | 59,060,676 | | | | | | 46,901,885 | | | | | | 43,936,648 | | | | | | 35,315,263 | |
| | | | | | | | | | | | | | | | | | | | | | | | |
End of period* | | | | $ | 62,079,873 | | | | | $ | 59,060,676 | | | | | $ | 32,596,772 | | | | | $ | 43,936,648 | |
| | | | | | | | | | | | | | | | | | | | | | | | |
| | | | | | | | |
* Including undistributed net investment income (loss) of | | | | $ | 484,548 | | | | | $ | — | | | | | $ | (93,708 | ) | | | | $ | — | |
| | | | | | | | | | | | | | | | | | | | | | | | |
| | | | | | | | | | | | |
| | | | | LKCM Aquinas
Small Cap Fund | |
| | | | | | | | | | | | |
| | | | | Six Months Ended
June 30, 2014
(Unaudited) | | | | | Year Ended
December 31,
2013 | |
Operations: | | | | | | | | | | | | |
Net investment loss | | | | $ | (50,930 | ) | | | | $ | (106,330 | ) |
Net realized gain on investments | | | | | 854,701 | | | | | | 1,044,718 | |
Net change in unrealized appreciation/depreciation
on investments | | | | | (945,994 | ) | | | | | 2,923,892 | |
| | | | | | | | | | | | |
Net increase (decrease) in net assets resulting from operations | | | | | (142,223 | ) | | | | | 3,862,280 | |
| | | | | | | | | | | | |
| | | | |
Dividends and Distributions to Shareholders: | | | | | | | | | | | | |
Net realized gain on investments | | | | | — | | | | | | (498,077 | ) |
| | | | | | | | | | | | |
| | | | |
Net decrease in net assets from
Fund share transactions (Note C) | | | | | (445,174 | ) | | | | | (374,684 | ) |
| | | | | | | | | | | | |
| | | | |
Total increase (decrease) in net assets | | | | | (587,397 | ) | | | | | 2,989,519 | |
| | | | |
Net Assets: | | | | | | | | | | | | |
Beginning of period | | | | | 14,673,432 | | | | | | 11,683,913 | |
| | | | | | | | | | | | |
End of period* | | | | $ | 14,086,035 | | | | | $ | 14,673,432 | |
| | | | | | | | | | | | |
| | | | |
* Including undistributed net investment loss of | | | | $ | (50,930 | ) | | | | $ | — | |
| | | | | | | | | | | | |
The accompanying notes are an integral part of these financial statements.
14
|
| FINANCIAL HIGHLIGHTS |
| SELECTED DATAFOR EACH SHAREOF CAPITAL STOCK OUTSTANDING |
| | | | | | | | | | | | | | | | | | | | | | | | | | | | | | | | | | | | |
| | | | | LKCM Aquinas Value Fund | |
| | | | | | | | | | | | | | | | | | | | | | | | | | | | | | | | | | | | |
| | | | | Six Months
Ended
June 30, 2014
(Unaudited) | | | | | Year
Ended
December 31,
2013 | | | | | Year
Ended
December 31,
2012 | | | | | Year
Ended
December 31,
2011 | | | | | Year
Ended
December 31,
2010 | | | | | Year
Ended
December 31,
2009 | |
Net Asset Value – Beginning of Period | | | | $ | 17.99 | | | | | $ | 14.18 | | | | | $ | 12.72 | | | | | $ | 12.68 | | | | | $ | 10.82 | | | | | $ | 8.15 | |
| | | | | | | | | | | | | | | | | | | | | | | | | | | | | | | | | | | | |
Net investment income | | | | | 0.15 | | | | | | 0.04 | | | | | | 0.07 | | | | | | 0.02 | | | | | | 0.00 | (1) | | | | | 0.02 | |
Net realized and unrealized gain on investments | | | | | 0.72 | | | | | | 4.72 | | | | | | 1.46 | | | | | | 0.04 | | | | | | 1.87 | | | | | | 2.67 | |
| | | | | | | | | | | | | | | | | | | | | | | | | | | | | | | | | | | | |
Total from investment operations | | | | | 0.87 | | | | | | 4.76 | | | | | | 1.53 | | | | | | 0.06 | | | | | | 1.87 | | | | | | 2.69 | |
| | | | | | | | | | | | | | | | | | | | | | | | | | | | | | | | | | | | |
Dividends from net investment income | | | | | — | | | | | | (0.04 | ) | | | | | (0.07 | ) | | | | | (0.02 | ) | | | | | (0.01 | ) | | | | | (0.02 | ) |
Distributions from net realized gains | | | | | — | | | | | | (0. 91 | ) | | | | | — | | | | | | — | | | | | | — | | | | | | — | |
| | | | | | | | | | | | | | | | | | | | | | | | | | | | | | | | | | | | |
Total dividends and distributions | | | | | — | | | | | | (0.95 | ) | | | | | (0.07 | ) | | | | | (0.02 | ) | | | | | (0.01 | ) | | | | | (0.02 | ) |
| | | | | | | | | | | | | | | | | | | | | | | | | | | | | | | | | | | | |
Net Asset Value – End of Period | | | | $ | 18.86 | | | | | $ | 17.99 | | | | | $ | 14.18 | | | | | $ | 12.72 | | | | | $ | 12.68 | | | | | $ | 10.82 | |
| | | | | | | | | | | | | | | | | | | | | | | | | | | | | | | | | | | | |
Total Return | | | | | 4.84% | (2) | | | | | 33.60% | | | | | | 12.01% | | | | | | 0.46% | | | | | | 17.25% | | | | | | 32.94% | |
| | | | | | | | | | | | |
Ratios and Supplemental Data: | | | | | | | | | | | | | | | | | | | | | | | | | | | | | | | | | | | | |
Net assets, end of period (thousands) | | | | $ | 62,080 | | | | | $ | 59,061 | | | | | $ | 46,902 | | | | | $ | 42,056 | | | | | $ | 38,354 | | | | | $ | 36,536 | |
Ratio of expenses to average net assets: | | | | | | | | | | | | | | | | | | | | | | | | | | | | | | | | | | | | |
Before expense waiver and/or reimbursement | | | | | 1.49% | (3) | | | | | 1.52% | | | | | | 1.54% | | | | | | 1.55% | | | | | | 1.57% | | | | | | 1.65% | |
After expense waiver and/or reimbursement | | | | | 1.49% | (3) | | | | | 1.50% | | | | | | 1.50% | | | | | | 1.50% | | | | | | 1.50% | | | | | | 1.50% | |
Ratio of net investment income (loss) to average net assets: | | | | | | | | | | | | | | | | | | | | | | | | | | | | | | | | | | | | |
Before expense waiver and/or reimbursement | | | | | 1.65% | (3) | | | | | 0.21% | | | | | | 0.44% | | | | | | 0.11% | | | | | | (0.06)% | | | | | | 0.04% | |
After expense waiver and/or reimbursement | | | | | 1.65% | (3) | | | | | 0.23% | | | | | | 0.48% | | | | | | 0.16% | | | | | | 0.01% | | | | | | 0.19% | |
Portfolio turnover rate | | | | | 14% | | | | | | 9% | | | | | | 28% | | | | | | 29% | | | | | | 31% | | | | | | 29% | |
| (1) | Amount is less than $0.005. |
| | | | | | | | | | | | | | | | | | | | | | | | | | | | | | | | | | | | |
| | | | | LKCM Aquinas Growth Fund | |
| | | | | | | | | | | | | | | | | | | | | | | | | | | | | | | | | | | | |
| | | | | Six Months
Ended
June 30, 2014
(Unaudited) | | | | | Year
Ended
December 31,
2013 | | | | | Year
Ended
December 31,
2012 | | | | | Year
Ended
December 31,
2011 | | | | | Year
Ended
December 31,
2010 | | | | | Year
Ended
December 31,
2009 | |
Net Asset Value – Beginning of Period | | | | $ | 21.44 | | | | | $ | 18.53 | | | | | $ | 16.86 | | | | | $ | 16.61 | | | | | $ | 14.25 | | | | | $ | 10.96 | |
| | | | | | | | | | | | | | | | | | | | | | | | | | | | | | | | | | | | |
Net investment loss | | | | | (0.05 | )(1) | | | | | (0.13 | )(1) | | | | | (0.07 | )(2) | | | | | (0.10 | )(2) | | | | | (0.08 | )(2) | | | | | (0.04 | )(2) |
Net realized and unrealized gain on investments | | | | | 0.03 | | | | | | 5.07 | | | | | | 1.84 | | | | | | 0.35 | | | | | | 2.44 | | | | | | 3.33 | |
| | | | | | | | | | | | | | | | | | | | | | | | | | | | | | | | | | | | |
Total from investment operations | | | | | (0.02 | ) | | | | | 4.94 | | | | | | 1.77 | | | | | | 0.25 | | | | | | 2.36 | | | | | | 3.29 | |
| | | | | | | | | | | | | | | | | | | | | | | | | | | | | | | | | | | | |
Distributions from net realized gains | | | | | — | | | | | | (2.03 | ) | | | | | (0.10 | ) | | | | | — | | | | | | — | | | | | | — | |
| | | | | | | | | | | | | | | | | | | | | | | | | | | | | | | | | | | | |
Net Asset Value – End of Period | | | | $ | 21.42 | | | | | $ | 21.44 | | | | | $ | 18.53 | | | | | $ | 16.86 | | | | | $ | 16.61 | | | | | $ | 14.25 | |
| | | | | | | | | | | | | | | | | | | | | | | | | | | | | | | | | | | | |
Total Return | | | | | -0.09% | (3) | | | | | 26.74% | | | | | | 10.52% | | | | | | 1.51% | | | | | | 16.56% | | | | | | 30.02% | |
| | | | | | | | | | | | |
Ratios and Supplemental Data: | | | | | | | | | | | | | | | | | | | | | | | | | | | | | | | | | | | | |
Net assets, end of period (thousands) | | | | $ | 32,597 | | | | | $ | 43,937 | | | | | $ | 35,315 | | | | | $ | 33,698 | | | | | $ | 31,099 | | | | | $ | 34,071 | |
Ratio of expenses to average net assets: | | | | | | | | | | | | | | | | | | | | | | | | | | | | | | | | | | | | |
Before expense waiver and/or reimbursement | | | | | 1.54% | (4) | | | | | 1.58% | | | | | | 1.58% | | | | | | 1.60% | | | | | | 1.63% | | | | | | 1.66% | |
After expense waiver and/or reimbursement | | | | | 1.50% | (4) | | | | | 1.50% | | | | | | 1.50% | | | | | | 1.50% | | | | | | 1.50% | | | | | | 1.50% | |
Ratio of net investment loss to average net assets: | | | | | | | | | | | | | | | | | | | | | | | | | | | | | | | | | | | | |
Before expense waiver and/or reimbursement | | | | | (0.48)% | (4) | | | | | (0.69)% | | | | | | (0.44)% | | | | | | (0.71)% | | | | | | (0.65)% | | | | | | (0.46)% | |
After expense waiver and/or reimbursement | | | | | (0.44)% | (4) | | | | | (0.61)% | | | | | | (0.36)% | | | | | | (0.61)% | | | | | | (0.52)% | | | | | | (0.30)% | |
Portfolio turnover rate | | | | | 23% | | | | | | 44% | | | | | | 42% | | | | | | 50% | | | | | | 46% | | | | | | 47% | |
| (1) | Net investment loss per share represents net investment loss divided by the average shares outstanding during the period. |
| (2) | Net investment loss per share is calculated using the ending balance of accumulated net investment loss prior to considerations of adjustments for permanent book and tax differences. |
The accompanying notes are an integral part of these financial statements.
15
|
| FINANCIAL HIGHLIGHTS |
| SELECTED DATAFOR EACH SHAREOF CAPITAL STOCK OUTSTANDING |
| | | | | | | | | | | | | | | | | | | | | | | | | | | | | | | | | | | | |
| | | | | LKCM Aquinas Small Cap Fund | |
| | | | | | | | | | | | | | | | | | | | | | | | | | | | | | | | | | | | |
| | | | | Six Months
Ended
June 30, 2014
(Unaudited) | | | | | Year
Ended
December 31,
2013 | | | | | Year
Ended
December 31,
2012 | | | | | Year
Ended
December 31,
2011 | | | | | Year
Ended
December 31,
2010 | | | | | Year
Ended
December 31,
2009 | |
Net Asset Value – Beginning of Period | | | | $ | 9.39 | | | | | $ | 7.34 | | | | | $ | 7.35 | | | | | $ | 7.07 | | | | | $ | 5.25 | | | | | $ | 4.03 | |
| | | | | | | | | | | | | | | | | | | | | | | | | | | | | | | | | | | | |
Net investment loss | | | | | (0.03 | )(1) | | | | | (0.07 | )(1) | | | | | (0.00 | )(1)(2) | | | | | (0.06 | )(1) | | | | | (0.05 | )(1) | | | | | (0.04 | )(3) |
Net realized and unrealized gain (loss) on investments | | | | | (0.04 | ) | | | | | 2.45 | | | | | | 0.59 | | | | | | 0.34 | | | | | | 1.87 | | | | | | 1.26 | |
| | | | | | | | | | | | | | | | | | | | | | | | | | | | | | | | | | | | |
Total from investment operations | | | | | (0.07 | ) | | | | | 2.38 | | | | | | 0.59 | | | | | | 0.28 | | | | | | 1.82 | | | | | | 1.22 | |
| | | | | | | | | | | | | | | | | | | | | | | | | | | | | | | | | | | | |
Distributions from net realized gains | | | | | — | | | | | | (0.33 | ) | | | | | (0.60 | ) | | | | | — | | | | | | — | | | | | | — | |
| | | | | | | | | | | | | | | | | | | | | | | | | | | | | | | | | | | | |
Net Asset Value – End of Period | | | | $ | 9.32 | | | | | $ | 9.39 | | | | | $ | 7.34 | | | | | $ | 7.35 | | | | | $ | 7.07 | | | | | $ | 5.25 | |
| | | | | | | | | | | | | | | | | | | | | | | | | | | | | | | | | | | | |
Total Return | | | | | -0.75% | (4) | | | | | 32.41% | | | | | | 8.16% | | | | | | 3.96% | | | | | | 34.67% | | | | | | 30.27% | |
| | | | | | | | | | | | |
Ratios and Supplemental Data: | | | | | | | | | | | | | | | | | | | | | | | | | | | | | | | | | | | | |
Net assets, end of period (thousands) | | | | $ | 14,086 | | | | | $ | 14,673 | | | | | $ | 11,684 | | | | | $ | 11,037 | | | | | $ | 6,505 | | | | | $ | 5,265 | |
Ratio of expenses to average net assets: | | | | | | | | | | | | | | | | | | | | | | | | | | | | | | | | | | | | |
Before expense waiver and/or reimbursement | | | | | 2.19% | (5) | | | | | 2.25% | | | | | | 2.32% | | | | | | 2.44% | | | | | | 3.26% | | | | | | 3.68% | |
After expense waiver and/or reimbursement | | | | | 1.50% | (5) | | | | | 1.50% | | | | | | 1.50% | | | | | | 1.50% | | | | | | 1.50% | | | | | | 1.50% | |
Ratio of net investment loss to average net assets: | | | | | | | | | | | | | | | | | | | | | | | | | | | | | | | | | | | | |
Before expense waiver and/or reimbursement | | | | | (1.42)% | (5) | | | | | (1.54)% | | | | | | (0.84)% | | | | | | (1.81)% | | | | | | (2.70)% | | | | | | (3.03)% | |
After expense waiver and/or reimbursement | | | | | (0.73)% | (5) | | | | | (0.79)% | | | | | | (0.02)% | | | | | | (0.87)% | | | | | | (0.94)% | | | | | | (0.85)% | |
Portfolio turnover rate | | | | | 27% | | | | | | 60% | | | | | | 82% | | | | | | 70% | | | | | | 84% | | | | | | 66% | |
| (1) | Net investment loss per share is calculated using the ending balance of undistributed net investment loss prior to considerations of adjustments for permanent book and tax differences. |
| (3) | Net investment loss per share represents net investment loss divided by the average shares outstanding throughout the period. |
The accompanying notes are an integral part of these financial statements.
16
|
| LKCM FUNDS |
| NOTESTOTHE FINANCIAL STATEMENTS (UNAUDITED) |
A. Organization and Significant Accounting Policies: LKCM Funds (the “Trust”) is registered under the Investment Company Act of 1940 (“1940 Act”) as an open-end, management investment company. The Trust was organized as a Delaware business trust on February 10, 1994 and consists of eight diversified series of shares, three of which are the LKCM Aquinas Value, LKCM Aquinas Growth and LKCM Aquinas Small Cap Funds (collectively, the “Funds”) and are reported here. On July 11, 2005, the Funds acquired the assets and assumed the liabilities of the Aquinas Funds. The LKCM Aquinas Value, LKCM Aquinas Growth and LKCM Aquinas Small Cap Funds are subject to expenses pursuant to the Rule 12b-1 plan described in Note B. Each Fund charges a 1% redemption fee for redemptions on Fund shares held for less than 30 days, unless otherwise determined by the Funds in their discretion.
The LKCM Aquinas Value Fund seeks to maximize long-term capital appreciation, while incorporating Catholic values investing principles in the investment process. The LKCM Aquinas Value Fund seeks to achieve its investment objective by investing under normal circumstances in equity securities of companies that Luther King Capital Management Corporation (the “Adviser”) believes to be undervalued relative to a company’s earnings. The LKCM Aquinas Growth Fund seeks to maximize long-term capital appreciation, while incorporating Catholic values investing principles in the investment process. The LKCM Aquinas Growth Fund seeks to achieve its investment objective by investing under normal circumstances in equity securities of companies that the Adviser believes generally have above-average growth in revenue and/or earnings, above-average returns on shareholders’ equity, and/or potential for above-average capital appreciation. The LKCM Aquinas Small Cap Fund seeks to maximize long-term capital appreciation, while incorporating Catholic values investing principles in the investment process. The LKCM Aquinas Small Cap Fund seeks to achieve its investment objective by investing under normal circumstances at least 80% of its net assets in equity securities of smaller companies (those with market capitalizations at the time of investment between $600 million and $4.5 billion) that the Adviser believes are likely to have above-average growth in revenue and/or earnings and potential for above-average capital appreciation.
The LKCM Aquinas Funds practice socially responsible investing within the framework provided by the United States Conference of Catholic Bishops’ Socially Responsible Investing Guidelines (“Guidelines”). Each Fund’s investment approach incorporates the Guidelines through a combination of screening portfolio companies based on criteria set forth in the Guidelines, dialogue with companies whose policies and practices may conflict with the Guidelines, and potentially excluding from each Fund’s portfolio the securities of those companies that are unwilling to alter their policies and practices over a reasonable period of time. The Adviser monitors companies selected for the Funds for policies on various issues contemplated by the Guidelines. If a Fund invests in a company whose policies and practices are inconsistent with the Guidelines, the Adviser may attempt to influence the company, sell the company’s securities or otherwise exclude future investments in such company.
The following is a summary of significant accounting policies followed by the Funds in preparation of the financial statements.
1. Security Valuation: Securities listed on a U.S. securities exchange for which market quotations are readily available are valued at the last quoted sale price, taken from the exchange where the security is primarily traded. Nasdaq National Market securities are valued at the Nasdaq Official Closing Price (“NOCP”). Unlisted U.S. securities and listed U.S. securities not traded on the valuation date for which market quotations are readily available are valued at the mean of the most recent quoted bid and asked price. Securities listed on a foreign exchange for which market quotations are readily available are valued at the last quoted sales price available before the time when assets are valued. Debt securities (other than obligations having a maturity of 60 days or less) are normally valued at the mean of bid and ask price and/or by using a combination of daily quotes or matrix evaluations provided by an independent pricing service. Debt securities purchased with remaining maturities of 60 days or less are valued at amortized cost. Other assets and securities for which no quotations are readily available (including restricted securities) are valued in good faith at fair value using methods determined by the Board of Trustees. The Board has adopted specific procedures for valuing portfolio securities and delegated the implementation of these procedures to the Adviser. The procedures authorize the Adviser to make all determinations regarding the fair value of a portfolio security and to report such determinations to the Board of Trustees. The Funds may also use independent pricing services to assist in pricing portfolio securities.
The Trust has adopted accounting standards which establish an authoritative definition of fair value and set out a hierarchy for measuring fair value. These standards require additional disclosures about the various inputs and valuation techniques used to develop the measurements of fair value and a discussion of changes in valuation techniques and related inputs during the period. These standards define fair value as the price that would be received to sell an asset or paid to transfer a liability in an orderly transaction between market participants at the measurement date. The fair value hierarchy is organized into three levels based upon the assumptions (referred to as “inputs”) used in pricing the asset or liability. These standards state that “observable inputs” reflect the assumptions market participants would use in pricing the asset or liability based on market data obtained from independent sources and “unobservable inputs” reflect an entity’s own assumptions about the assumptions market participants would use in pricing the asset or liability. These inputs are summarized in the three broad levels listed below.
17
| | | | |
| Level 1 | | – | | Quoted unadjusted prices for identical instruments in active markets to which the Trust has access at the date of measurement. |
| Level 2 | | – | | Quoted prices for similar instruments in active markets; quoted prices for identical or similar instruments in markets that are not active; and model-derived valuations in which all significant inputs and significant value drivers are observable in active markets. Level 2 inputs are those in markets for which there are few transactions, the prices are not current, little public information exists or instances where prices vary substantially over time or among brokered market makers. |
| Level 3 | | – | | Model derived valuations in which one or more significant inputs or significant value drivers are unobservable. Unobservable inputs are those inputs that reflect the Trust’s own assumptions that market participants would use to price the asset or liability based on the best available information. |
The inputs or methodology used for valuing securities are not necessarily an indication of the risk associated with investing in those securities. The following is a summary of the inputs used to value the Funds’ net assets as of June 30, 2014.
| | | | | | | | | | | | | | | | |
| LKCM Aquinas Value Fund | | | | | | | | | | | | |
Description | | Level 1 | | | Level 2 | | | Level 3 | | | Total | |
Common Stocks | | $ | 60,335,849 | | | $ | — | | | $ | — | | | $ | 60,335,849 | |
Money Market Funds | | | 1,842,566 | | | | — | | | | — | | | | 1,842,566 | |
| | | | | | | | | | | | | | | | |
Total Investments* | | $ | 62,178,415 | | | $ | — | | | $ | — | | | $ | 62,178,415 | |
| | | | | | | | | | | | | | | | |
| | | | |
| LKCM Aquinas Growth Fund | | | | | | | | | | | | |
Description | | Level 1 | | | Level 2 | | | Level 3 | | | Total | |
Common Stocks | | $ | 32,133,875 | | | $ | — | | | $ | — | | | $ | 32,133,875 | |
Money Market Fund | | | 569,838 | | | | — | | | | — | | | | 569,838 | |
| | | | | | | | | | | | | | | | |
Total Investments* | | $ | 32,703,713 | | | $ | — | | | $ | — | | | $ | 32,703,713 | |
| | | | | | | | | | | | | | | | |
| | | | |
| LKCM Aquinas Small Cap Fund | | | | | | | | | | | | |
Description | | Level 1 | | | Level 2 | | | Level 3 | | | Total | |
Common Stocks | | $ | 13,848,332 | | | $ | — | | | $ | — | | | $ | 13,848,332 | |
Money Market Fund | | | 259,470 | | | | — | | | | — | | | | 259,470 | |
| | | | | | | | | | | | | | | | |
Total Investments* | | $ | 14,107,802 | | | $ | — | | | $ | — | | | $ | 14,107,802 | |
| | | | | | | | | | | | | | | | |
| | * | Additional information regarding the industry classifications of these investments is disclosed in the Schedule of Investments. |
There were no transfers into or out of Level 1, Level 2 or Level 3 fair value measurements during the reporting period, as compared to their classification from the previous annual report.
2. Federal Income Taxes: The Funds have elected to be treated as “regulated investment companies” under Subchapter M of the Internal Revenue Code and each Fund intends to distribute all of its investment company net taxable income and net capital gains to shareholders. Therefore, no federal income tax provision is recorded.
3. Distributions to Shareholders: The LKCM Aquinas Value, LKCM Aquinas Growth and LKCM Aquinas Small Cap Funds generally intend to pay dividends and net capital gain distributions, if any, at least on an annual basis.
4. Foreign Securities: Investing in securities of foreign companies and foreign governments involves special risks and considerations not typically associated with investing in U.S. companies and securities of the U.S. government. These risks include devaluation of currencies and future adverse political and economic developments. Moreover, securities of many foreign companies and foreign governments and their markets may be less liquid and their prices more volatile than those of securities of comparable U.S. companies and securities of the U.S. government.
5. Expense Allocation: Expenses incurred by the Funds are allocated among the Funds based upon (i) relative average net assets, (ii) a specific identification basis as incurred, or (iii) evenly among the Funds, depending on the nature of the expense.
6. Use of Estimates: The preparation of financial statements in conformity with accounting principles generally accepted in the United States of America requires management to make estimates and assumptions that affect the reported amounts of assets and liabilities and disclosure of contingent assets and liabilities at the date of the financial statements and the reported amounts of revenues and expenses during the reporting period. Actual results could differ from those estimates.
7. Guarantees and Indemnifications: In the normal course of business, the Funds enter into contracts with service providers that contain general indemnification clauses. The Funds’ maximum exposure under these arrangements is unknown as this would involve future claims against the Funds that have not yet occurred. Based on experience, the Funds expect the risk of loss to be remote.
18
8. Other: Security and shareholder transactions are recorded on the trade date. Realized gains and losses on sales of investments are calculated on the identified cost basis. Dividend income and dividends and distributions to shareholders are recorded on the ex-dividend date. Interest income is recognized on the accrual basis. All discounts and premiums are amortized based on the effective interest method for tax and financial reporting purposes.
Generally accepted accounting principles require that certain components of net assets be adjusted to reflect permanent differences between financial and tax reporting. These reclassifications have no effect on net assets or net asset values per share.
9. Restricted and Illiquid Securities: The Funds are permitted to invest in securities that are subject to legal or contractual restrictions on resale or are illiquid. Restricted securities generally may be resold in transactions exempt from registration. A security may be considered illiquid if it lacks a readily available market or if its valuation has not changed for a certain period of time. Disposal of these securities may involve time-consuming negotiations and expense, and prompt sale at the current valuation may be difficult.
B. Investment Advisory and Other Agreements: Luther King Capital Management Corporation serves as the investment adviser to the Funds under an Investment Advisory Agreement (the “Agreement”). The Adviser receives a fee, computed daily and payable quarterly, at the annual rates presented below as applied to each Fund’s average daily net assets. The Adviser has contractually agreed to waive all or a portion of its management fee and/or reimburse the Funds through April 30, 2015 in order to limit each Fund’s operating expenses to the annual cap rates identified below. This expense limitation excludes interest, taxes, brokerage commissions, indirect fees and expenses relating to investments in other investment companies, including money market funds, and extraordinary expenses. For the six months ended June 30, 2014, the Adviser waived the following management fees to meet its expense cap obligations:
| | | | | | | | | | | | |
| | | LKCM
Aquinas
Value Fund | | | LKCM
Aquinas
Growth Fund | | | LKCM
Aquinas Small
Cap Fund | |
Annual Advisory Rate | | | 0.90% | | | | 0.90% | | | | 1.00% | |
Annual Cap on Expenses | | | 1.50% | | | | 1.50% | | | | 1.50% | |
Fees Waived in 2014 | | | $— | | | | $8,178 | | | | $47,891 | |
U.S. Bancorp Fund Services, LLC serves as transfer agent and administrator for the Trust and serves as accounting services agent for the Funds. U.S. Bank, N.A. serves as custodian for the Funds.
Distribution services are performed pursuant to a distribution contract with Quasar Distributors, LLC, the Trust’s principal underwriter.
The LKCM Funds have adopted a Rule 12b-1 plan for the LKCM Aquinas Value, LKCM Aquinas Growth and LKCM Aquinas Small Cap Funds, under which each Fund may pay up to 1.00% of its average daily net assets for distribution and other services. However, the Board of Trustees has currently only authorized a fee of 0.25% of the average daily net assets for the LKCM Aquinas Value, LKCM Aquinas Growth and LKCM Aquinas Small Cap Funds. For the six months ended June 30, 2014, fees incurred by the LKCM Aquinas Value, LKCM Aquinas Growth and LKCM Aquinas Small Cap Funds pursuant to the 12b-1 Plan were $73,760, $53,202, and $17,462, respectively.
C. Fund Shares: At June 30, 2014, there was an unlimited number of shares of beneficial interest, no par value, authorized. The following table summarizes the activity in shares of each Fund:
| | | | | | | | | | | | | | | | |
| Aquinas Value Fund | | | | | | | | | | | | |
| | | Six Months Ended
June 30, 2014 | | | Year Ended
December 31, 2013 | |
| | | Shares | | | Amount | | | Shares | | | Amount | |
Shares sold | | | 248,604 | | | $ | 4,448,690 | | | | 488,234 | | | $ | 8,240,129 | |
Shares issued to shareholders in
reinvestment of distributions | | | — | | | | — | | | | 137,289 | | | | 2,456,110 | |
Shares redeemed | | | (241,307 | ) | | | (4,346,533 | ) | | | (648,635 | ) | | | (10,681,106 | ) |
Redemption fee | | | | | | | 217 | | | | | | | | 427 | |
| | | | | | | | | | | | | | | | |
Net increase (decrease) | | | 7,297 | | | $ | 102,374 | | | | (23,112 | ) | | $ | 15,560 | |
| | | | | | | | | | | | | | | | |
Shares Outstanding: | | | | | | | | | | | | | | | | |
Beginning of period | | | 3,283,682 | | | | | | | | 3,306,794 | | | | | |
| | | | | | | | | | | | | | | | |
End of period | | | 3,290,979 | | | | | | | | 3,283,682 | | | | | |
| | | | | | | | | | | | | | | | |
19
| | | | | | | | | | | | | | | | |
| Aquinas Growth Fund | | | | | | | | | | | | |
| | | Six Months Ended
June 30, 2014 | | | Year Ended
December 31, 2013 | |
| | | Shares | | | Amount | | | Shares | | | Amount | |
Shares sold | | | 90,605 | | | $ | 1,905,759 | | | | 300,220 | | | $ | 6,243,697 | |
Shares issued to shareholders in
reinvestment of distributions | | | — | | | | — | | | | 170,134 | | | | 3,632,369 | |
Shares redeemed | | | (617,581 | ) | | | (13,186,624 | ) | | | (326,763 | ) | | | (6,871,397 | ) |
Redemption fee | | | | | | | 98 | | | | | | | | 1,114 | |
| | | | | | | | | | | | | | | | |
Net increase (decrease) | | | (526,976 | ) | | $ | (11,280,767 | ) | | | 143,591 | | | $ | 3,005,783 | |
| | | | | | | | | | | | | | | | |
Shares Outstanding: | | | | | | | | | | | | | | | | |
Beginning of period | | | 2,049,023 | | | | | | | | 1,905,432 | | | | | |
| | | | | | | | | | | | | | | | |
End of period | | | 1,522,047 | | | | | | | | 2,049,023 | | | | | |
| | | | | | | | | | | | | | | | |
| | | | |
| Aquinas Small Cap Fund | | | | | | | | | | | | |
| | | Six Months Ended
June 30, 2014 | | | Year Ended
December 31, 2013 | |
| | | Shares | | | Amount | | | Shares | | | Amount | |
Shares sold | | | 178,180 | | | $ | 1,643,446 | | | | 481,118 | | | $ | 3,995,065 | |
Shares issued to shareholders in
reinvestment of distributions | | | — | | | | — | | | | 49,791 | | | | 467,039 | |
Shares redeemed | | | (230,114 | ) | | | (2,089,256 | ) | | | (559,805 | ) | | | (4,837,281 | ) |
Redemption fee | | | | | | | 636 | | | | | | | | 493 | |
| | | | | | | | | | | | | | | | |
Net decrease | | | (51,934 | ) | | $ | (445,174 | ) | | | (28,896 | ) | | $ | (374,684 | ) |
| | | | | | | | | | | | | | | | |
Shares Outstanding: | | | | | | | | | | | | | | | | |
Beginning of period | | | 1,562,608 | | | | | | | | 1,591,504 | | | | | |
| | | | | | | | | | | | | | | | |
End of period | | | 1,510,674 | | | | | | | | 1,562,608 | | | | | |
| | | | | | | | | | | | | | | | |
D. Security Transactions: Purchases and sales of investment securities, other than short-term investments, for the six months ended June 30, 2014 were as follows:
| | | | | | | | | | | | | | | | |
| | | Purchases | | | Sales | |
| | | U.S.
Government | | | Other | | | U.S.
Government | | | Other | |
LKCM Aquinas Value Fund | | $ | — | | | $ | 8,013,699 | | | $ | — | | | $ | 8,621,726 | |
LKCM Aquinas Growth Fund | | | — | | | | 9,236,576 | | | | — | | | | 20,746,153 | |
LKCM Aquinas Small Cap Fund | | | — | | | | 3,749,875 | | | | — | | | | 4,207,211 | |
E. Tax Information: At December 31, 2013, the components of accumulated earnings (losses) on a tax basis were as follows:
| | | | | | | | | | | | |
| | | LKCM
Aquinas
Value Fund | | | LKCM
Aquinas
Growth Fund | | | LKCM
Aquinas Small
Cap Fund | |
Cost of Investments | | $ | 34,785,473 | | | $ | 26,293,626 | | | $ | 10,665,808 | |
| | | | | | | | | | | | |
Gross Unrealized Appreciation | | $ | 24,382,092 | | | $ | 17,559,999 | | | $ | 4,078,373 | |
Gross Unrealized Depreciation | | | (32,020 | ) | | | (241,593 | ) | | | (43,215 | ) |
| | | | | | | | | | | | |
Net Unrealized Appreciation | | $ | 24,350,072 | | | $ | 17,318,406 | | | $ | 4,035,158 | |
| | | | | | | | | | | | |
Undistributed Ordinary Income | | $ | 2,634 | | | $ | — | | | $ | — | |
Undistributed Long-Term Capital Gain | | | — | | | | 128,180 | | | | 510,282 | |
| | | | | | | | | | | | |
Total Distributable Earnings | | $ | 2,634 | | | $ | 128,180 | | | $ | 510,282 | |
| | | | | | | | | | | | |
Total Accumulated Gains | | $ | 24,352,706 | | | $ | 17,446,586 | | | $ | 4,545,440 | |
| | | | | | | | | | | | |
The difference between book-basis and tax-basis unrealized appreciation, if any, is attributable primarily to the tax deferral of losses on wash sales.
To the extent the Funds realize future net capital gains, taxable distributions will be reduced by any unused capital loss carryforwards as permitted by the Internal Revenue Code. The Funds currently have no unused capital loss carryforwards.
20
The tax components of dividends paid during the periods shown below were as follows:
| | | | | | | | | | | | | | | | |
| | | Six Months Ended June 30, 2014 | | | Year Ended December 31, 2013 | |
| | | Ordinary
Income | | | Long-Term
Capital Gain | | | Ordinary
Income | | | Long-Term
Capital Gain | |
LKCM Aquinas Value Fund | | $ | — | | | $ | — | | | $ | 507,623 | | | $ | 2,482,399 | |
LKCM Aquinas Growth Fund | | | — | | | | — | | | | — | | | | 3,854,604 | |
LKCM Aquinas Small Cap Fund | | | — | | | | — | | | | — | | | | 498,077 | |
The Funds designated as long-term capital gain dividend, pursuant to Internal Revenue Code Section 852(b)(3), the amount necessary to reduce earnings and profits of the Funds related to net capital gain to zero for the tax year ended December 31, 2013.
The Trust has adopted financial reporting rules regarding recognition and measurement of tax positions taken or expected to be taken on a tax return. The Trust has reviewed all open tax years and major jurisdictions and concluded that there is no impact on the Funds’ financial position or results of operations. Tax years that remain open to examination by major tax jurisdictions include tax years ended December 31, 2010 through December 31, 2013. There is no tax liability resulting from unrecognized tax benefits relating to uncertain income tax positions taken or expected to be taken on tax returns as of December 31, 2013. The Funds are not aware of any tax positions for which it is reasonably possible that the total amounts of unrecognized tax benefits will significantly change in the next twelve months. If applicable, the Funds would recognize interest accrued related to unrecognized tax benefits in “interest expense” and penalties in “other expense” on the statement of operations.
F. Subsequent Events: In preparing these financial statements, the Trust has evaluated events after June 30, 2014 and determined that there were no significant subsequent events that would require adjustment to or additional disclosure in these financial statements.
21
|
| LKCM FUNDS |
| ADDITIONAL INFORMATION |
| June 30, 2014 (Unaudited) |
Availability of Proxy Voting Information: A description of the policies and procedures that the Funds use to determine how to vote proxies relating to their portfolio securities, as well as the proxy voting record, is available without charge, upon request, by calling toll-free 1-800-423-6369 or on the SEC website at http://www.sec.gov. The actual voting records relating to portfolio securities during the twelve month periods ended June 30 (as filed with the SEC on Form N-PX) are available without charge, upon request, by calling the Funds toll free at 1-800-423-6369 or by accessing the SEC’s website at www.sec.gov.
Availability of Quarterly Portfolio Schedule: The Funds’ are required to file complete schedules of portfolio holdings with the SEC for the first and third fiscal quarters on Form N-Q. Once filed, the Funds’ Form N-Q is available without charge upon request on the SEC’s website (http://www.sec.gov) and may be available by calling 1-800-423-6369. You can also obtain copies of Form N-Q by (i) visiting the SEC’s Public Reference Room in Washington, DC (information on the operation of the Public Reference Room may be obtained by calling 1-800-SEC-0330); (ii) sending your request and a duplicating fee to the SEC’s Public Reference Room, Washington, DC 20549; or (iii) sending your request electronically to publicinfosec.gov.
RENEWAL OF INVESTMENT ADVISORY AGREEMENT WITH RESPECT TO LKCM AQUINAS FUNDS
Introduction. At a meeting held on February 25, 2014, the Board of Trustees of LKCM Funds, including the independent Trustees (the “Board”), approved the renewal of the Investment Advisory Agreement (the “Agreement”) between Luther King Capital Management Corporation (“LKCM”) and LKCM Funds (the “Trust”), on behalf of the LKCM Aquinas Small Cap Fund, LKCM Aquinas Value Fund and LKCM Aquinas Growth Fund (each, an “Aquinas Fund” and collectively, the “Aquinas Funds”).
In voting to approve the renewal of the Agreement, the Board considered the overall fairness of the Agreement and factors it deemed relevant with respect to each Aquinas Fund including, but not limited to: (1) the nature, extent and quality of the services provided to each Aquinas Fund; (2) the performance of each Aquinas Fund as compared to a relevant benchmark and other similar funds; (3) the level of the fees and the overall expenses of each Aquinas Fund and how those compared to other similar funds and other institutional portfolios; (4) the costs of services provided to the Aquinas Funds and the profitability of LKCM; (5) whether the fee levels reflect economies of scale for the benefit of investors; and (6) any other benefits derived by LKCM from its relationship with the Aquinas Funds. The Board did not identify any single factor or item of information as all-important or controlling.
In considering the approval of the Agreement, the Board considered a broad range of information provided by LKCM, including but not limited to, reports relating to the Aquinas Funds’ Catholic-values investing mandate, each Aquinas Fund’s performance and expenses, information regarding other clients, certain portfolio compliance policies and the background and experience of the portfolio managers. In addition, the Board considered a memorandum from its legal counsel regarding the Board’s fiduciary duties in considering the renewal of the Agreement. The Board also meets each quarter to review various aspects of the Aquinas Funds.
Nature, Extent and Quality of Services. The Board reviewed and considered the nature, extent and quality of the advisory services provided by LKCM to each Aquinas Fund under the Agreement. The Board considered that LKCM has provided investment management services to individuals, foundations, endowments and corporations since 1979. The Board also considered LKCM’s financial resources, insurance coverage, culture of compliance and support for compliance operations that support the Aquinas Funds. The Board considered LKCM’s representation that it has invested considerable resources into the firm and its personnel to augment investment management and client service. The Board reviewed the portfolio managers and other key personnel who provide services to each Aquinas Fund, and considered LKCM’s representation that the firm historically has experienced very low personnel turnover. The Board also considered LKCM’s representation that the firm has implemented a compensation structure designed to attract and retain highly qualified investment professionals.
In addition, the Board considered LKCM’s summary of its procedures for monitoring the Aquinas Funds’ key service providers. The Board also considered LKCM’s description of its best execution practices, and noted LKCM’s representation that its soft dollar and commission sharing arrangements for client transactions (including those for the Aquinas Funds) comply with the safe harbor provided by Section 28(e) of the Securities Exchange Act of 1934, as amended.
Performance of the Aquinas Funds. The Board considered the performance of each Aquinas Fund compared to the Aquinas Fund’s benchmark index (“Benchmark”) and peer group of funds compiled by Lipper, Inc. (“Lipper Index”) for various periods ended December 31, 2013. In considering this comparative data, the Board noted that each Aquinas Fund is managed in accordance with its Catholic-values investing guidelines, which generally are not applicable to the Benchmark or the funds included in the respective Lipper Indexes. The Board also considered LKCM’s discussion of each Fund’s performance.
The Board noted that the Aquinas Small Cap Fund outperformed its Benchmark and the Lipper Index for the five-year period, but underperformed its Benchmark and the Lipper Index for the one-year period, three-year and since-inception periods. The Board noted LKCM’s explanation that, in 2013, the positive performance of the Benchmark had been driven by lower-quality companies and that the Aquinas Small Cap Fund traditionally focuses its investments in higher-quality companies.
22
The Board noted that the Aquinas Value Fund outperformed its Benchmark and the Lipper Index for the one-year, five-year and since-inception periods, but underperformed its Benchmark and the Lipper Index during the three-year period. The Board noted LKCM’s explanation that certain stock selection and sector allocations detracted from the Aquinas Value Fund’s performance.
The Board noted that the Aquinas Growth Fund underperformed its Benchmark and the Lipper Index for all years presented. The Board noted LKCM’s explanation that certain stock selection and sector allocations detracted from the Aquinas Growth Fund’s performance. The Board also noted LKCM’s explanation that, in 2013, the positive performance of the Benchmark had been driven by lower-quality companies and that the Aquinas Growth Fund traditionally focuses its investments in higher-quality companies. Additionally, the Board noted that the Aquinas Growth Fund had retained a new lead portfolio manager during the fourth quarter of 2013.
Fees and Expenses. The Board considered the advisory fee rates and the net expense ratios (after fee waivers and/or expense reimbursements) of each Aquinas Fund relative to similar funds and LKCM’s other clients. The Board also considered that LKCM contractually agreed to continue its fee waivers and expense caps for each Aquinas Fund until April 30, 2015. The Board noted that the fee rates for the Aquinas Funds may be higher than other similar funds due to the additional services LKCM provides in managing the Aquinas Funds in accordance with the socially responsible investing guidelines provided by the United States Conference of Catholic Bishops. The Board compared the contractual advisory fee rate and the net expense ratio of each Aquinas Fund to a category of similar funds compiled by Lipper, Inc. (“Lipper Category”). The first quartile in the Lipper Category represents those funds with the lowest fees or expenses.
The Board noted that the contractual advisory fee rate and the net expense ratio for the Aquinas Small Cap Fund were in the third quartile and second quartile of the Lipper Category, respectively. In this case, the advisory fee rate was higher than the average of the Lipper Category and the net expense ratio was lower than the average of the Lipper Category.
The Board noted that the contractual advisory fee rate and the net expense ratio for the Aquinas Value Fund were in the fourth quartile of the Lipper Category. In this case, the advisory fee rate and net expense ratio were both higher than the average of the Lipper Category.
The Board noted that the contractual advisory fee rate and the net expense ratio for the Aquinas Growth Fund were in the fourth quartile and third quartile of the Lipper Category, respectively. In this case, the advisory fee rate and net expense ratio were both higher than the average of the Lipper Category.
The Board considered the advisory fee rates charged by LKCM to other mutual funds it subadvises and LKCM’s other separately managed portfolios. The Board noted that the fee rates charged by LKCM to the Aquinas Funds and clients with separately managed portfolios differ primarily as a result of the greater regulatory compliance expenses that LKCM incurs in connection with its management of the Aquinas Funds. The Board also noted LKCM’s representation that the subadvisory fee rates it charges other funds reflect the narrower scope of investment management and compliance services provided by LKCM in a subadvisory capacity.
Costs, Profitability and Economies of Scale. The Board considered LKCM’s costs in rendering services to the Aquinas Funds and the profitability of LKCM. The Board reviewed the fees paid by each Aquinas Fund to LKCM for the last three calendar years. The Board also reviewed the estimated profit and loss statement provided by LKCM on a Fund-by-Fund basis. In this regard, the Board noted that LKCM estimated it made a profit on the Aquinas Value Fund and Aquinas Growth Fund, but not the Aquinas Small Cap Fund. With respect to economies of scale, the Board considered that the asset levels in the Aquinas Funds are relatively low. Based on these asset levels, the Board noted that LKCM believes that economies of scale likely cannot be achieved until assets increase in the Aquinas Funds.
Benefits Derived by LKCM from its Relationship with the Funds. In addition, the Board noted that LKCM believes that both LKCM and the Aquinas Funds benefit from LKCM’s soft dollar and commission sharing arrangements for third-party and proprietary research used by LKCM in connection with its investment process. The Board also noted that LKCM believes its relationship with the Aquinas Funds provides an indirect benefit to both parties in the form of enhanced recognition among institutional investors, consultants and other members of the financial community. The Board considered the indirect benefits to LKCM, in the form of additional clients with separately managed portfolios or subadvisory relationships with other mutual funds, which also may attract additional investors to the Aquinas Funds.
Conclusion. Based on its evaluation of these and other factors, the Board: (1) concluded that the fees paid to LKCM under the Agreement are fair and reasonable; (2) determined that shareholders would benefit from LKCM’s continued management of the Aquinas Funds; and (3) approved the renewal of the Agreement with respect to the Aquinas Funds.
23
LKCM FUNDS
PRIVACY NOTICE
Our Commitment to Your Privacy
At LKCM Funds, we are committed to safeguarding the confidentiality and privacy of nonpublic personal information about our current and former shareholders. This privacy notice describes the policies and procedures we have implemented to protect the privacy of your nonpublic personal information as well as the sources through which we may obtain nonpublic personal information about you.
How We Protect Your Nonpublic Personal Information
Protecting your nonpublic personal information is an important priority at LKCM Funds. Accordingly, we have implemented policies and procedures designed to safeguard your nonpublic personal information, such as your tax identification number, account and investment history, account numbers, account balances and nonpublic contact information, from unauthorized access. Pursuant to these policies and procedures, we maintain various physical, technological, and administrative safeguards to protect the security and confidentiality of your nonpublic personal information, and we adapt these safeguards to respond to evolving technological and other standards.
We do not disclose nonpublic personal information about you to outside firms, organizations or individuals except as authorized by you or your representatives or as required or permitted by law. We may disclose nonpublic personal information about you to nonaffiliated third parties, such as custodians, brokers, auditors, accountants, and systems and administrative service providers, in connection with the services we provide to you or on your behalf. When we provide nonpublic personal information about you to nonaffiliated third parties for these purposes, we expect them to safeguard your nonpublic personal information, use your nonpublic personal information only for the intended purposes and otherwise abide by applicable law.
How We Obtain Your Nonpublic Personal Information
We collect nonpublic personal information about you from various sources, including documents, new account applications and other information that you or your representatives, custodians, attorneys, accountants or similar parties provide to us, communications that we have with you or your representatives, custodians, attorneys, accountants or similar parties, and documents and other information related to your accounts or investment experience with us.
Please do not hesitate to contact Jacob D. Smith, our Chief Compliance Officer, if you have any questions regarding the measures we have implemented to protect the privacy of your nonpublic personal information.
U.S. Bancorp Fund Services, LLC
P.O. Box 701
Milwaukee, WI 53201-0701
LKCM FUNDS
P.O. Box 701
Milwaukee, WI 53201-0701
| | | | |
Officers and Trustees | | | | |
J. Luther King, Jr., CFA, CIC | | H. Kirk Downey | | Larry J. Lockwood |
Trustee, President | | Chairman of the Board | | Trustee |
| | |
Paul W. Greenwell | | Richard J. Howell | | Richard Lenart |
Vice President | | Trustee | | Secretary & Treasurer |
| | |
Steven R. Purvis, CFA | | Earle A. Shields, Jr. | | Jacob D. Smith |
Trustee, Vice President | | Trustee | | Chief Financial Officer |
| | | | | Chief Compliance Officer |
Investment Adviser | | | | |
Luther King Capital Management Corporation | | |
301 Commerce Street, Suite 1600 | | | | |
Fort Worth, TX 76102 | | | | |
Administrator, Transfer Agent, Dividend Paying Agent & Shareholder Servicing Agent | | |
U.S. Bancorp Fund Services, LLC | | | | |
P.O. Box 701 | | | | |
Milwaukee, WI 53201-0701 | | | | |
Custodian | | | | |
U.S. Bank, N.A. | | | | |
1555 N. River Center Drive, Suite 302 | | | | |
Milwaukee, WI 53212 | | | | |
Independent Registered Public Accounting Firm | | |
Deloitte & Touche LLP | | | | |
555 E. Wells St., Suite 1400 | | | | |
Milwaukee, WI 53202 | | | | |
Distributor | | | | |
Quasar Distributors, LLC | | | | |
615 E. Michigan Street | | | | |
Milwaukee, WI 53202 | | | | |
Item 2. Code of Ethics.
Not applicable for semi-annual reports.
Item 3. Audit Committee Financial Expert.
Not applicable for semi-annual reports.
Item 4. Principal Accountant Fees and Services.
Not applicable for semi-annual reports.
Item 5. Audit Committee of Listed Registrants.
Not applicable to registrants who are not listed issuers (as defined in Rule 10A-3 under the Securities Exchange Act of 1934).
Item 6. Schedule of Investments.
Schedule of Investments is included as part of the report to shareholders filed under Item 1 of this Form.
Item 7. Disclosure of Proxy Voting Policies and Procedures for Closed-End Management Investment Companies.
Not applicable to open-end investment companies.
Item 8. Portfolio Managers of Closed-End Management Investment Companies.
Not applicable to open-end investment companies.
Item 9. Purchases of Equity Securities by Closed-End Management Investment Company and Affiliated Purchasers.
Not applicable to open-end investment companies.
Item 10. Submission of Matters to a Vote of Security Holders.
There have been no material changes to the procedures by which shareholders may recommend nominees to the registrant’s board of trustees.
Item 11. Controls and Procedures.
| (a) | The registrant’s Chief Executive Officer and Chief Financial Officer have reviewed the registrant’s disclosure controls and procedures (as defined in Rule 30a-3(c) under the Investment Company Act of 1940 (the “Act”)) as of a date within 90 days of the filing of this |
2
| | report, as required by Rule 30a-3(b) under the Act and Rules 13a-15(b) or 15d-15(b) under the Securities Exchange Act of 1934. Based on their review, such officers have concluded that the disclosure controls and procedures are reasonably designed to ensure that information required to be disclosed in this report is recorded, processed, summarized and reported within the required time periods and that information required to be disclosed by the registrant in reports that it files or submits on Form N-CSR is accumulated and communicated to the registrant’s management, including its principal executive and financial officers, as appropriate to allow timely decisions regarding required disclosure. |
| (b) | There were no changes in the registrant’s internal control over financial reporting (as defined in Rule 30a-3(d) under the Act) that occurred during the second fiscal quarter of the period covered by this report that have materially affected, or are reasonably likely to materially affect, the registrant’s internal control over financial reporting. |
Item 12. Exhibits.
| (a) | (1) Any code of ethics or amendment thereto, that is subject of the disclosure required by Item 2, to the extent that the registrant intends to satisfy Item 2 requirements through filing an exhibit. Not applicable. |
(2) A separate certification for each principal executive and principal financial officer pursuant to Section 302 of the Sarbanes-Oxley Act of 2002. Filed herewith.
(3) Any written solicitation to purchase securities under Rule 23c-1 under the Act sent or given during the period covered by the report by or on behalf of the registrant to 10 or more persons. Not applicable to open-end investment companies.
| (b) | Certification pursuant to Section 906 of the Sarbanes-Oxley Act of 2002. Furnished herewith. |
3
SIGNATURES
Pursuant to the requirements of the Securities Exchange Act of 1934 and the Investment Company Act of 1940, the registrant has duly caused this report to be signed on its behalf by the undersigned, thereunto duly authorized.
| | | | |
| (Registrant) | | LKCM Funds | | |
| | |
| By (Signature and Title) | | /s/ Luther King | | |
| | J. Luther King, Jr., President | | |
| | |
| Date 8-29-14 | | | | |
Pursuant to the requirements of the Securities Exchange Act of 1934 and the Investment Company Act of 1940, this report has been signed below by the following persons on behalf of the registrant and in the capacities and on the dates indicated.
| | | | |
| By (Signature and Title) | | /s/ Luther King | | |
| | J. Luther King, Jr., President | | |
| | |
| Date 8-29-14 | | | | |
| | |
| By (Signature and Title) | | /s/ Jacob D. Smith | | |
| | Jacob D. Smith, Chief Financial Officer | | |
| | |
| Date 8-29-14 | | | | |
4