As filed with the U.S. Securities and Exchange Commission on September 8, 2022
UNITED STATES
SECURITIES AND EXCHANGE COMMISSION
Washington, D.C. 20549
FORM N-CSR
CERTIFIED SHAREHOLDER REPORT OF REGISTERED
MANAGEMENT INVESTMENT COMPANIES
Investment Company Act file number 811-08352
LKCM Funds
(Exact name of registrant as specified in charter)
c/o Luther King Capital Management Corporation
301 Commerce Street, Suite 1600
Fort Worth, TX 76102
(Address of principal executive offices) (Zip code)
K&L Gates LLP
1601 K Street, NW
Washington, DC 20006
(Name and address of agent for service)
1-800-688-LKCM and 1-800-423-6369
Registrant’s telephone number, including area code
Date of fiscal year end: December 31
Date of reporting period: June 30, 2022
Item 1. Reports to Stockholders.
| | (a) | Include a copy of the report transmitted to stockholders pursuant to Rule 30e-1 under the Act (17 CFR 270.30e-1). |
LKCM
FUNDS
LKCM Small Cap Equity Fund
LKCM Small-Mid Cap Equity Fund
LKCM Equity Fund
LKCM Balanced Fund
LKCM Fixed Income Fund
LKCM International Equity Fund
Semi-Annual Report
June 30, 2022
Dear Fellow Shareholders:
We report the following performance information for the LKCM Funds for indicated periods ended June 30, 2022:
| | | | | | | | | | | | | | | | | | | | | | | | | | | | | | | | | | | | | | | | | | | | | |
Funds | | Inception
Date | | NAV @
6/30/22 | | Net
Expense
Ratio*, ** | | Gross
Expense
Ratio** | | Six Month
Total
Return
Ended
6/30/22 | | One Year
Total
Return
Ended
6/30/22 | | Five Year
Average
Annualized
Return
Ended
6/30/22 | | Ten Year
Average
Annualized
Return
Ended
6/30/22 | | Avg.
Annual
Total
Return
Since
Incept. |
LKCM Small Cap Equity Fund | | | | 07/14/1994 | | | | $ | 16.20 | | | | | 1.00% | | | | | 1.03% | | | | | -24.79% | | | | | -26.77% | | | | | 7.98% | | | | | 8.26% | | | | | 9.87% | |
Russell 2000® Index(1) | | | | | | | | | | | | | | | | | | | | | | | | -23.43% | | | | | -25.20% | | | | | 5.17% | | | | | 9.35% | | | | | 8.63% | |
LKCM Small-Mid Cap Equity Fund | | | | 05/02/2011 | | | | $ | 8.57 | | | | | 1.00% | | | | | 1.74% | | | | | -21.88% | | | | | -20.37% | | | | | 10.11% | | | | | 8.72% | | | | | 7.13% | |
Russell 2500® Index(2) | | | | | | | | | | | | | | | | | | | | | | | | -21.81% | | | | | -21.00% | | | | | 7.04% | | | | | 10.49% | | | | | 8.78% | |
LKCM Equity Fund | | | | 01/03/1996 | | | | $ | 31.32 | | | | | 0.80% | | | | | 0.96% | | | | | -19.05% | | | | | -13.02% | | | | | 11.03% | | | | | 11.70% | | | | | 8.86% | |
S&P 500® Index(3) | | | | | | | | | | | | | | | | | | | | | | | | -19.96% | | | | | -10.62% | | | | | 11.31% | | | | | 12.96% | | | | | 9.08% | |
LKCM Balanced Fund | | | | 12/30/1997 | | | | $ | 24.45 | | | | | 0.80% | | | | | 0.96% | | | | | -15.91% | | | | | -11.51% | | | | | 6.99% | | | | | 8.45% | | | | | 6.59% | |
S&P 500® Index(3) | | | | | | | | | | | | | | | | | | | | | | | | -19.96% | | | | | -10.62% | | | | | 11.31% | | | | | 12.96% | | | | | 7.70% | |
Bloomberg U.S. Intermediate | | | | | | | | | | | | | | | | | | | | | | | | | | | | | | | | | | | | | | | | | | | | | |
Government/Credit Bond Index(4) | | | | | | | | | | | | | | | | | | | | | | | | -6.77% | | | | | -7.28% | | | | | 1.13% | | | | | 1.45% | | | | | 3.92% | |
LKCM Fixed Income Fund | | | | 12/30/1997 | | | | $ | 10.29 | | | | | 0.50% | | | | | 0.78% | | | | | -4.68% | | | | | -5.43% | | | | | 1.03% | | | | | 1.46% | | | | | 3.72% | |
Bloomberg U.S. Intermediate | | | | | | | | | | | | | | | | | | | | | | | | | | | | | | | | | | | | | | | | | | | | | |
Government/Credit Bond Index(4) | | | | | | | | | | | | | | | | | | | | | | | | -6.77% | | | | | -7.28% | | | | | 1.13% | | | | | 1.45% | | | | | 3.92% | |
LKCM International Equity Fund | | | | 05/01/2019 | | | | $ | 10.86 | | | | | 1.00% | | | | | 1.40% | | | | | -25.10% | | | | | -22.41% | | | | | N/A | | | | | N/A | | | | | 3.12% | |
MSCI/EAFE® Index(5) | | | | | | | | | | | | | | | | | | | | | | | | -19.25% | | | | | -17.33% | | | | | N/A | | | | | N/A | | | | | 1.71% | |
Performance data quoted represents past performance and does not guarantee future results. The investment return and principal value of an investment will fluctuate so that an investor’s shares, when redeemed, may be worth more or less than the original cost. Current performance of the Funds may be lower or higher than the performance quoted. Performance data current to the most recent month end may be obtained by calling 1-800-688-LKCM. Returns would have been lower if Luther King Capital Management Corporation, the Funds’ investment adviser, had not waived a portion of its management fee and/or reimbursed certain expenses of the Funds. Please see Note B to the Notes to the Financial Statements for specific information regarding management fee waiver and/or expense reimbursement arrangements for the Funds. The Funds impose a 1.00% redemption fee on shares held less than 30 days. If reflected, the fee would reduce performance shown.
| * | Luther King Capital Management Corporation, the Funds’ investment adviser, has contractually agreed to waive all or a portion of its management fee and/or reimburse expenses of each Fund to maintain the expense ratios designated in the Funds’ prospectus through May 1, 2023. This expense limitation excludes interest, taxes, brokerage commissions, indirect fees and expenses related to investments in other investment companies, including money market funds, and extraordinary expenses. Investment performance, which is based on the net expense ratio, reflects fee waivers, if any, in effect during the relevant period. In the absence of such waivers, total return would be reduced. LKCM waived management fees and/or reimbursed expenses for each Fund during the six months ended June 30, 2022. |
| ** | Expense ratios above are as reported in the Funds’ current prospectus dated May 1, 2022. Expense ratios reported for other periods in the financial highlights of this report may differ. |
| (1) | The Russell 2000® Index is an unmanaged index which measures the performance of the 2,000 smallest companies in the Russell 3000® Index. |
| (2) | The Russell 2500® Index is an unmanaged index which measures the performance of the 2,500 smallest companies in the Russell 3000® Index. |
| (3) | The S&P 500® Index is an unmanaged capitalization-weighted index of 500 selected stocks that is generally considered representative of the performance of large capitalization companies in the U.S. stock market. |
| (4) | The Bloomberg U.S. Intermediate Government/Credit Bond Index is an unmanaged market value weighted index measuring both the principal price changes of, and income provided by, the underlying universe of securities that comprise the index. Securities included in the index must meet the following criteria: fixed as opposed to variable rate; remaining maturity of one to ten years; minimum outstanding par value of $250 million; rated investment grade or higher by Moody’s Investors Service or equivalent; must be dollar denominated and non-convertible; and must be publicly issued. |
| (5) | The Morgan Stanley Capital International Europe, Australasia and Far East Index (“MSCI/EAFE® Index”) is an unmanaged index composed of large-cap and mid-cap securities across 21 European and Pacific Basin countries. The MSCI/EAFE® Index is a recognized international index and is weighted by market capitalization. |
Note: The indices defined above are not available for direct investment and the index performance therefore does not include fees, expenses or taxes.
1H2022 Review
The Federal Reserve is battling broad-based inflation and has indicated a willingness to take significant actions in an effort to restore price stability. Since the beginning of the year, financial conditions have been tightening as capital markets have internalized the Federal Reserve’s anti-inflation campaign. We believe the tightening of financial conditions, including, among others, increased borrowing costs and a rising U.S. dollar, have amplified the risk of a potential recession. While the magnitude of the Federal Reserve’s financial tightening may be historically smaller than that of other cycles, the pace of its tightening efforts has been rapid, contributing in part to the historically large swings in asset values observed during the first half of 2022.
Although we believe the need for more restrictive monetary policy that seeks to reduce inflation threatens the current economic expansion, the crucial underpinnings of the economy remain solid in our view. For example, we believe that most consumers have historically low household debt-to-income ratios, significantly higher bank deposits than in the period preceding the pandemic, and experienced rapid wage growth. Even as consumer pessimism towards the economy appears to grow, consumers in the aggregate appear relatively well positioned for an economic downturn in our view. In addition, we believe that companies are likely to post record
2
earnings this year as many firms have passed along rising input costs to their customers. However, we believe the trajectory of future corporate earnings ultimately will depend heavily on whether or not the economy enters a recession.
The first half of 2022 has been marked by the worst start for the S&P 500® Index since 1970, declining 19.96% for the six months ended June 30, 2022. The NASDAQ Index, which is primarily comprised of growth-oriented companies, corrected even harder during the first half of 2022, declining 29.22% for the six months ended June 30, 2022 and marking its worst first half on record. We believe the performance of equities in the second half of 2022 will depend greatly on the shifting outlook for inflation, interest rates, and corporate profits.
These developments, among others, have caused many Americans to become increasingly worried about a potential recession. The closely watched monthly University of Michigan Consumer Sentiment Index dates to 1966 and seeks to assess near-time consumer attitudes on business climate, personal finance, and spending. The recent June 2022 reading of this index was the lowest reading on record. The University of Michigan commentary indicates that approximately 79% of consumers expect difficult times in the year ahead for business conditions. We believe that it is not only consumers who are anxious about the current economic environment, but also corporate executives and lawmakers who appear to be expressing similar concerns. Regardless of what economic data suggest about the current health of the economy, we believe that consumers are generally pessimistic about future business and market conditions.
We believe the odds that the current economic expansion falters have steadily increased during the past several months. The Federal Reserve has clearly and unequivocally declared its intent to fight inflation in our view, having increased its benchmark interest rate by 0.25% in March 2022, 0.50% in May 2022, and 0.75% in June 2022. The last time the Federal Reserve increased its benchmark rate by 0.75% was November 1994. Interestingly, we believe that period marked the last time the Federal Reserve successfully engineered a so-called soft economic landing, which generally involves the Federal Reserve increasing its benchmark interest rate to reduce inflation while not simultaneously triggering a recession.
Financial conditions have historically had a significant influence on the spending, saving, and investment plans of businesses and households. The Federal Reserve has historically used its monetary tools, primarily its benchmark interest rate, in an effort to influence financial conditions. In our view, four of the primary financial conditions the Federal Reserve seeks to influence are the level of interest rates at different maturities, credit spreads, the U.S. dollar, and equity market levels. We believe each of these items directly influences the economy, and the interplay of these elements collectively encourages or discourages economic behavior. For example, the overall level of interest rates is a key component of mortgage rates and corporate borrowing costs. With housing prices rapidly increasing year-over-year, the Federal Reserve appears anxious to cool the upward pressure on the housing component of inflation. We believe the recent rise in mortgage rates should cool the sharp increase in residential real estate activity and values.
The global energy crisis continues to spur headline inflation, and more critically, is applying further supply side pressure on the global economy in our view. We believe that manufacturing facilities in Europe that produce steel, fertilizer, and chemicals are facing significant challenges from surging electricity costs, and European natural gas futures have risen to levels roughly ten times higher than a year ago. In our view, energy rationing is likely in parts of Europe if Russia further curtails energy exports. Domestically, we have encountered similar challenges with gasoline prices rising over 60% over the past twelve months and high electricity costs contributing to pressure on consumers and businesses.
Examining the recessions that have occurred since World War II, we believe the equity market has historically begun to discount a recession on average seven months prior to the official start of the recession. In our view, the sequence of events each cycle is remarkably consistent with the equity market generally peaking prior to the recession and then generally bottoming prior to the end of the recession. A notable exception to this view was the 2000 recession when the market bottomed following the conclusion of the recession. During the first half of 2022, the decline in the S&P 500® Index appears based in part on the impact of both higher interest rates and mounting recession concerns. If a recession were to materialize, we would anticipate a decline in corporate earnings. In our view, the worst periods of earnings contractions have historically been accompanied by concentrated sector weakness, although major losses in specific sectors do not necessarily communicate the breadth or narrowness of the economic contraction. For example, only one sector of the market accounted for almost half of the earnings decline in 1990 (autos), 2001 (technology), and 2008 (financials). Today we do not believe that we currently see any one sector of the economy that could trigger the magnitude of earnings decline that occurred in these three earnings drawdown periods.
Many asset values have historically taken their cues from the anticipated direction of monetary policy. We believe these values certainly include the Treasury market, as yields on 1- to 3-year Treasury bonds historically have begun to rise ahead of the Federal Reserve’s monetary policy actions. We believe the outlook for intermediate to longer-term bond yields is cloudier because inflation expectations are a key component of longer-term bond yields. In our view, the concern for inflation is the key reason why the return on the 10-Year Treasury note fell 11.34% during the first half of 2022.
2H2022 Outlook
High inflation is contributing to consumer uneasiness in our view. The record low June 2022 reading of the University of Michigan Consumer Sentiment Index eclipsed the previous low in November 2008. We believe the economy, however, faces the opposite set of problems it confronted in 2008. Fourteen years ago, we believe that demand was too weak, there were not enough jobs, and deflation was a concern. Today, we believe the economy is overheating, there are nearly two job openings per unemployed worker, and inflation is at a forty-year high. In our view, the challenge for policymakers is to strike a balance between the appropriate amount of tightening to lower
3
inflation, while preserving the economic expansion. We believe the equity market has already digested the unfolding economic slowdown, and if the current slowdown presages a recession, then the equity market may have to reprice lower as corporate earnings will likely be at risk.
LKCM Equity Fund
The LKCM Equity Fund returned -19.05% for the six months ended June 30, 2022, as compared to the -19.96% return for the S&P 500® Index, the Fund’s benchmark. The Fund’s relative performance benefited from strong sector allocation decisions, particularly the Fund’s underweight positions in the Communication Services and Consumer Discretionary sectors and overweight positions in the Energy and Industrials sectors. The Fund’s stock selection decisions in the Industrials, Healthcare and Information Technology sectors detracted from the Fund’s relative performance. We believe that the Fund benefits from the efforts of our experienced portfolio management and proprietary internal research teams. We remain committed to our investment strategy for the Fund that focuses on investments in companies that we believe are high quality and have solid balance sheets and cash flows and we believe the Fund remains well-positioned for the anticipated economic and capital market environment.
LKCM Balanced Fund
The LKCM Balanced Fund returned -15.91% for the six months ended June 30, 2022, as compared to the -19.96% return for the S&P 500® Index and the -6.77% return for the Bloomberg Intermediate Government/Credit Bond Index. The Fund’s equity portfolio benefited from an overweight position in the Energy sector and an underweight position in the Consumer Discretionary sector relative to the benchmark, as well as solid stock selection in the Information Technology and Materials sectors relative to the benchmark. Stock selection decisions in the Healthcare and Financials sectors detracted from the Fund’s relative performance during the period. While the Fund’s fixed income portfolio generated a negative return during the first half of 2022 as interest rates moved dramatically higher, our long-standing strategy of maintaining a relatively short duration was beneficial for returns relative to the longer duration benchmark. The Fund’s fixed income portfolio remains focused on investments in high quality bonds with intermediate maturities. We believe the Fund remains well-positioned for the anticipated economic and capital market environment.
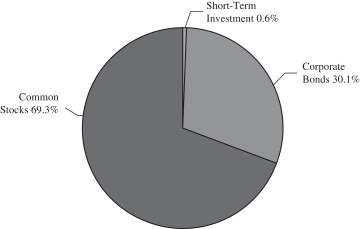
LKCM Fixed Income Fund
The first half of 2022 produced negative returns across the bond market regardless of quality or tenor although lower quality and longer duration issues generally fared the worst. The 10-year Treasury, down 11.34% for the six months ended June 30, 2022, produced its worst first half total return in its history. In this environment, the LKCM Fixed Income Fund returned -4.68% on a total return basis during the six months ended June 30, 2022 compared to its benchmark, the Bloomberg Intermediate Government/Credit Bond Index, which returned -6.77% during this period. During the first half of 2022, Treasury yields rose sharply with portions of the curve inverting at times as it flattened significantly. This flattening of the curve was largely the result of the Federal Reserve tightening monetary policy by increasing the federal funds rate a total of 1.50% during this period after maintaining aggressively easy policy while inflation continued to accelerate. The Federal Reserve also began the process of quantitative tightening by beginning to reduce the size of its balance sheet, which had grown to unprecedented levels during the pandemic. Both extraordinarily accommodative monetary and fiscal policy created outsized demand while pandemic-induced supply chain bottlenecks continued to suppress supply, ultimately leading to the very definition of inflation of “too much money chasing too few goods.” Within this backdrop fixed income securities were negatively impacted by rising rates with shorter-duration securities outperforming their longer-duration counterparts and higher quality issues outperforming lower-quality issues. While the Fund’s defensive duration posture of 2.6 years relative to the 4.1 year duration of the benchmark was additive to the Fund’s relative performance, the Fund’s overweight position in corporate bonds detracted from relative performance as credit spreads widened. The Fund remains focused on investments in the short-to-intermediate sector in an effort to reduce interest rate risk and on investment-grade corporate bonds with strong underlying company fundamentals in an effort to mitigate credit risk and achieve a sustainable cash flow stream.
LKCM International Equity Fund
The LKCM International Equity Fund returned -25.10% for the six months ended June 30, 2022, as compared to the -19.25% return for the MSCI EAFE® Index, the Fund’s benchmark. Strong stock selection in the Materials, Energy and Consumer Staples sectors relative to the benchmark partially offset some of the negative stock selection effect in other sectors. The Fund’s underweight position in the Consumer Discretionary sector and overweight position in the Energy sector benefited the Fund’s performance relative to the benchmark. The positive attribution from our sector allocation decisions relative to the benchmark were partially offset by our overweight position in the Industrials sector and our underweight position in the Utilities sector. The Fund’s performance relative to the benchmark was strong during the second quarter of 2022, which partially offset the Fund’s relative underperformance during the first quarter of 2022. The Fund suffered during the first quarter of 2022 from an acute deflation in valuation metrics for growth-oriented companies relative to more value-oriented constituents in the benchmark. We believe the current investment environment remains challenging with economic uncertainty and persistent inflation, along with less accommodative central bank policies in many developed markets, weighing on the shorter-term outlook. Geopolitical and global challenges have also presented additional considerations as Russia threatens energy restrictions and China wrestles with overextended property markets. Our investment strategy and discipline for the Fund is anchored with a long-term investment horizon and focus on companies that we believe are high quality companies with strategic advantages, strong balance sheets and attractive returns on invested capital, which we believe have generally outperformed the benchmark over multiple market cycles. We continue to believe that the Fund is well-positioned for the remainder of 2022.
4
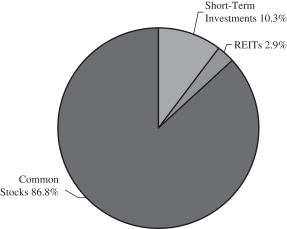
LKCM Small Cap Equity Fund
The LKCM Small Cap Equity Fund returned -24.79% for the six months ended June 30, 2022, as compared to the -23.43% return for the Russell 2000® Index, the Fund’s benchmark. Solid stock selection in the Communication Services and Financials sectors relative to the benchmark partially offset some of the negative stock selection effect in other sectors. The Fund benefited from the sector allocation decisions relative to the benchmark, including an underweight position in the Healthcare sector and overweight positions in the Energy, Consumer Staples and Industrials sectors. The positive attribution from our sector allocation decisions relative to the benchmark were partially offset by our underweight position in the Utilities sector. The Fund’s performance relative to the benchmark was strong during the second quarter of 2022, which partially offset the Fund’s relative underperformance during the first quarter of 2022. We believe the current investment environment remains challenging with economic uncertainty and persistent inflation, along with a less accommodative Federal Reserve, weighing on the shorter-term outlook. Our investment strategy and discipline for the Fund is anchored with a long-term investment horizon and focus on companies that we believe are high quality companies with strategic advantages, strong balance sheets and attractive returns on invested capital, which we believe have generally outperformed the benchmark over multiple market cycles, which we believe have generally outperformed the benchmark over multiple market cycles. We believe the Fund remains well-positioned for the anticipated economic and capital market environment.
LKCM Small-Mid Cap Equity Fund
The LKCM Small-Mid Cap Equity Fund returned -21.88% for the six months ended June 30, 2022, as compared to the -21.81% return for the Russell 2500® Index, the Fund’s benchmark. The Fund’s relative performance benefited from an overweight position in the Energy sector, which was partially offset by the Fund’s underweight position in the Utilities sector. Stock selection decisions in the Healthcare and Industrials sectors detracted from the Fund’s relative performance, which was partially offset by strong stock selection in the Financials sector. We remain committed to our investment strategy that focuses on companies that we believe are high quality and have solid cash flows, balance sheets and management teams. We believe the Fund remains well-positioned for the anticipated economic and capital market environment.
J. Luther King, Jr., CFA, CIC
August 1, 2022
The information provided herein represents the opinion of J. Luther King, Jr., CFA, CIC and is not intended to be a forecast of future events, a guarantee of future results, or investment advice.
Please refer to the Schedule of Investments found on pages 8-22 of the report for more information on Fund holdings. Fund holdings and sector allocations are subject to change and are not recommendations to buy or sell any securities.
Mutual fund investing involves risk. Principal loss is possible. Past performance is not a guarantee of future results. Investments in equity securities are subject to market risks and significant fluctuations in value. Small and medium capitalization funds typically carry additional risks, since smaller companies generally have a higher risk of failure, and, historically, their stocks have experienced a greater degree of market volatility than stocks on average. Non-U.S. investments carry potential risks not associated with domestic investments, including currency exchange rate fluctuations, political and financial instability, less liquidity, greater volatility, different regulatory and financial reporting standards, and delays in transaction settlement. Investments in debt securities typically decrease in value when interest rates rise. This risk is greater for longer-term debt securities. Investments in mortgage backed securities include additional risks that investors should be aware of such as credit risk, prepayment risk, possible illiquidity and default, as well as increased susceptibility to adverse economic developments. These and other risks are discussed in the Funds’ summary and statutory prospectuses.
Earnings growth is not a measure of future performance.
Duration is a measure of the sensitivity of the price of a bond or other debt instrument to a change in interest rates. Securities with a longer duration generally have more volatile prices than securities of comparable quality with a shorter duration.
Spread is the percentage point difference between yields of various classes of bonds compared to treasury bonds.
Yield curve is a line that plots yields (interest rates) of bonds having equal credit quality but differing maturity dates. The slope of the yield curve gives an idea of future interest rate changes and economic activity.
Bond ratings are grades given to bonds that indicate their credit quality as determined by a private independent rating service such as S&P Global. The firm evaluates a bond issuer’s financial strength, or its ability to pay a bond’s principal and interest in a timely fashion. Ratings are expressed as letters ranging from ‘AAA’, which is the highest grade, to ‘D’, which is the lowest grade. In limited situations when the rating agency has not issued a formal rating, the rating agency will classify the security as nonrated.
Cash flow is the net amount of cash and cash-equivalents being transferred into and out of a business.
Investors should consider the investment objective, risks and charges and expenses of a Fund carefully before investing. Each Fund’s summary prospectus and prospectus contain this and other information about the Fund. Investors can obtain a summary prospectus and/or the prospectus by calling 1-800-688-LKCM. The summary prospectus and/or prospectus should be read carefully before investing in a Fund.
Quasar Distributors, LLC, distributor.
5
LKCM Funds Expense Example — June 30, 2022 (Unaudited)
As a shareholder of the Funds, you incur two types of costs: (1) transaction costs, including redemption fees; and (2) ongoing costs, including management fees, distribution and/or service (12b-1) fees and other Fund expenses. This Example is intended to help you understand your ongoing costs (in dollars) of investing in the Funds and to compare these costs with the ongoing costs of investing in other mutual funds. The Example is based on an investment of $1,000 invested at the beginning of the period and held for the entire period (01/01/2022-06/30/2022).
ACTUAL EXPENSES
The third and fourth columns of the table below provide information about actual account values and actual expenses. You may use the information in these columns, together with the amount you invested, to estimate the expenses that you paid over the period. Simply divide your account value by $1,000 (for example, an $8,600 account value divided by $1,000 = 8.6), then multiply the result by the number in the fourth column under the heading entitled “Expenses Paid During Period” to estimate the expenses you paid on your account during this period. Although the Funds charge no sales load, you will be assessed fees for outgoing wire transfers, returned checks and stop payment orders at prevailing rates charged by U.S. Bancorp Fund Services, LLC (doing business as U.S. Bank Global Fund Services), the Funds’ transfer agent. If you request that a redemption be made by wire transfer, currently a $15.00 fee is charged by the Funds’ transfer agent. You will be charged a redemption fee equal to 1.00% of the net amount of the redemption if you redeem your shares of the Funds within 30 days of purchase, unless otherwise determined by the Funds in their discretion. To the extent the Funds invest in shares of other investment companies as part of their investment strategies, you will indirectly bear your proportionate share of any fees and expenses charged by the underlying funds in which the Funds invest in addition to the expenses of the Funds. Actual expenses of the underlying funds are expected to vary among the various underlying funds. These expenses are not included in the example below. The example below includes management fees, registration fees and other expenses. However, the example below does not include portfolio trading commissions and related expenses and other extraordinary expenses as determined under generally accepted accounting principles.
HYPOTHETICAL EXAMPLES FOR COMPARISON PURPOSES
The fifth and sixth columns of the table below provide information about hypothetical account values and hypothetical expenses based on the Funds’ actual expense ratios and an assumed rate of return of 5% per year before expenses, which are not the Funds’ actual returns. The hypothetical account values and expenses may not be used to estimate the actual ending account balance or expenses you paid for the period. You may use this information to compare the ongoing costs of investing in the Funds and other funds. To do so, compare this 5% hypothetical example with the 5% hypothetical examples that appear in the shareholder reports of the other funds. Please note that the expenses shown in the table are meant to highlight your ongoing costs only and do not reflect any transactional costs, such as redemption fees. Therefore, the fifth and sixth columns of the table are useful in comparing ongoing costs only, and will not help you determine the relative total costs of owning different funds. In addition, if these transaction costs were included, your costs would have been higher.
| | | | | | | | | | | | | | | | | | | | | | | | | | | | | | |
| | | | | | | Actual | | Hypothetical (5% return
before expenses) |
| | | Fund’s
Annualized
Expense
Ratio(1) | | Beginning
Account Value
01/01/2022 | | Ending
Account Value
06/30/2022 | | Expenses
Paid
During
Period(1) | | Ending
Account Value
06/30/2022 | | Expenses
Paid
During
Period(1) |
LKCM Small Cap Equity Fund | | | | 1.00 | % | | | $ | 1,000.00 | | | | $ | 752.10 | | | | $ | 4.34 | | | | $ | 1,019.84 | | | | $ | 5.01 | |
LKCM Small-Mid Cap Equity Fund | | | | 1.00 | % | | | $ | 1,000.00 | | | | $ | 781.20 | | | | $ | 4.42 | | | | $ | 1,019.84 | | | | $ | 5.01 | |
LKCM Equity Fund | | | | 0.80 | % | | | $ | 1,000.00 | | | | $ | 809.50 | | | | $ | 3.59 | | | | $ | 1,020.83 | | | | $ | 4.01 | |
LKCM Balanced Fund | | | | 0.80 | % | | | $ | 1,000.00 | | | | $ | 840.90 | | | | $ | 3.65 | | | | $ | 1,020.83 | | | | $ | 4.01 | |
LKCM Fixed Income Fund | | | | 0.50 | % | | | $ | 1,000.00 | | | | $ | 953.20 | | | | $ | 2.42 | | | | $ | 1,022.32 | | | | $ | 2.51 | |
LKCM International Equity Fund | | | | 1.00 | % | | | $ | 1,000.00 | | | | $ | 749.00 | | | | $ | 4.34 | | | | $ | 1,019.84 | | | | $ | 5.01 | |
| (1) | Expenses are equal to the annualized net expense ratio for the Fund, multiplied by the average account value over the period, multiplied by 181/365 (to reflect the one-half year period). |
6
ALLOCATION OF PORTFOLIO HOLDINGS — LKCM Funds — June 30, 2022 (Unaudited)
Percentages represent market value as a percentage of total investments.
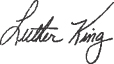
LKCM Small Cap Equity Fund
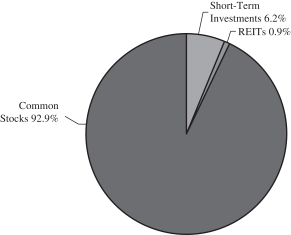
LKCM Equity Fund
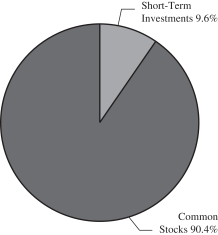
LKCM Fixed Income Fund
LKCM Small-Mid Cap Equity Fund
LKCM Balanced Fund
LKCM International Equity Fund

7
|
| LKCM SMALL CAP EQUITY FUND |
| SCHEDULEOF INVESTMENTS |
| June 30, 2022 (Unaudited) |
| | | | | | | | | | |
| COMMON STOCKS - 93.1% | | Shares | | Value |
| Aerospace & Defense - 3.6% | | | | |
Hexcel Corp. | | | | 35,325 | | | | $ | 1,847,851 | |
Mercury Systems, Inc. (a) | | | | 42,800 | | | | | 2,753,324 | |
Triumph Group, Inc. (a) | | | | 111,098 | | | | | 1,476,492 | |
| | | | | | | | | | |
| | | | | | | | | 6,077,667 | |
| | | | | | | | | | |
| Auto Components - 0.8% | | | | |
Fox Factory Holding Corp. (a) | | | | 16,290 | | | | | 1,311,996 | |
| | | | | | | | | | |
| Banks - 8.9% | | | | |
Cadence Bank | | | | 114,529 | | | | | 2,689,141 | |
Comerica, Inc. | | | | 31,215 | | | | | 2,290,557 | |
Cullen/Frost Bankers, Inc. | | | | 21,375 | | | | | 2,489,119 | |
Glacier Bancorp, Inc. | | | | 43,655 | | | | | 2,070,120 | |
Pinnacle Financial Partners, Inc. | | | | 35,705 | | | | | 2,581,828 | |
Seacoast Banking Corp. of Florida | | | | 92,175 | | | | | 3,045,462 | |
| | | | | | | | | | |
| | | | | | | | | 15,166,227 | |
| | | | | | | | | | |
| Beverages - 3.1% | | | | |
Celsius Holdings, Inc. (a) | | | | 48,000 | | | | | 3,132,480 | |
Primo Water Corp. (b) | | | | 160,000 | | | | | 2,140,800 | |
| | | | | | | | | | |
| | | | | | | | | 5,273,280 | |
| | | | | | | | | | |
| Biotechnology - 0.8% | | | | |
Neogen Corp. (a) | | | | 55,450 | | | | | 1,335,790 | |
| | | | | | | | | | |
| Building Products - 3.1% | | | | |
CSW Industrials, Inc. | | | | 17,750 | | | | | 1,828,783 | |
PGT Innovations, Inc. (a) | | | | 101,185 | | | | | 1,683,718 | |
Zurn Elkay Water Solutions Corp. | | | | 60,995 | | | | | 1,661,504 | |
| | | | | | | | | | |
| | | | | | | | | 5,174,005 | |
| | | | | | | | | | |
| Chemicals - 3.6% | | | | |
Avient Corp. | | | | 40,000 | | | | | 1,603,200 | |
Ecovyst, Inc. | | | | 315,000 | | | | | 3,102,750 | |
Ferroglobe Representation & Warranty Insurance Trust (a)(c) | | | | 302,970 | | | | | — | |
Quaker Chemical Corp. | | | | 9,340 | | | | | 1,396,517 | |
| | | | | | | | | | |
| | | | | | | | | 6,102,467 | |
| | | | | | | | | | |
| Commercial Services & Supplies - 1.1% | | | | |
Driven Brands Holdings Inc. (a) | | | | 68,000 | | | | | 1,872,720 | |
| | | | | | | | | | |
| Communications Equipment - 1.1% | | | | |
Lumentum Holdings, Inc. (a) | | | | 23,330 | | | | | 1,852,869 | |
| | | | | | | | | | |
| Construction & Engineering - 1.6% | | | | |
NV5 Global, Inc. (a) | | | | 23,342 | | | | | 2,724,945 | |
| | | | | | | | | | |
| Construction Materials - 0.8% | | | | |
Eagle Materials, Inc. | | | | 11,875 | | | | | 1,305,537 | |
| | | | | | | | | | |
| Energy Equipment & Services - 1.1% | | | | |
Weatherford International Public Limited Co. (a)(b) | | | | 86,789 | | | | | 1,837,323 | |
| | | | | | | | | | |
| Food Products - 1.3% | | | | |
Utz Brands, Inc. | | | | 158,661 | | | | | 2,192,695 | |
| | | | | | | | | | |
| Health Care Equipment & Supplies - 4.8% |
Alphatec Holdings, Inc. (a) | | | | 232,000 | | | | | 1,517,280 | |
Cerus Corp. (a) | | | | 325,000 | | | | | 1,719,250 | |
| | | | | | | | | | |
| COMMON STOCKS | | Shares | | Value |
| Health Care Equipment & Supplies - 4.8%, Continued |
Enovis Corp. (a) | | | | 28,500 | | | | $ | 1,567,500 | |
Omnicell, Inc. (a) | | | | 7,500 | | | | | 853,125 | |
STAAR Surgical Co. (a) | | | | 35,000 | | | | | 2,482,550 | |
| | | | | | | | | | |
| | | | | | | | | 8,139,705 | |
| | | | | | | | | | |
| Health Care Providers & Services - 6.6% | | | | |
HealthEquity, Inc. (a) | | | | 44,000 | | | | | 2,701,160 | |
Medpace Holdings, Inc. (a) | | | | 19,750 | | | | | 2,955,982 | |
Progyny, Inc. (a) | | | | 53,370 | | | | | 1,550,399 | |
R1 RCM Inc. (a) | | | | 106,100 | | | | | 2,223,856 | |
U.S. Physical Therapy, Inc. | | | | 16,015 | | | | | 1,748,838 | |
| | | | | | | | | | |
| | | | | | | | | 11,180,235 | |
| | | | | | | | | | |
| Hotels, Restaurants & Leisure - 4.4% | | | | |
Everi Holdings, Inc. (a) | | | | 148,000 | | | | | 2,413,880 | |
Playa Hotels & Resorts NV (a)(b) | | | | 269,190 | | | | | 1,849,335 | |
Red Rock Resorts, Inc. - Class A | | | | 67,500 | | | | | 2,251,800 | |
Wingstop, Inc. | | | | 12,855 | | | | | 961,169 | |
| | | | | | | | | | |
| | | | | | | | | 7,476,184 | |
| | | | | | | | | | |
| Household Durables - 0.8% | | | | |
Sonos, Inc. (a) | | | | 78,500 | | | | | 1,416,140 | |
| | | | | | | | | | |
| Insurance - 2.2% | | | | |
Goosehead Insurance, Inc. - Class A | | | | 10,595 | | | | | 483,874 | |
Palomar Holdings, Inc. (a) | | | | 50,000 | | | | | 3,220,000 | |
| | | | | | | | | | |
| | | | | | | | | 3,703,874 | |
| | | | | | | | | | |
| Internet & Catalog Retail - 1.0% | | | | |
Magnite, Inc. (a) | | | | 200,000 | | | | | 1,776,000 | |
| | | | | | | | | | |
| IT Consulting & Services - 3.6% | | | | |
LiveRamp Holdings, Inc. (a) | | | | 70,135 | | | | | 1,810,184 | |
Perficient Inc. (a) | | | | 25,450 | | | | | 2,333,510 | |
Repay Holdings Corp. (a) | | | | 145,000 | | | | | 1,863,250 | |
| | | | | | | | | | |
| | | | | | | | | 6,006,944 | |
| | | | | | | | | | |
| Leisure Equipment & Products - 2.0% | | | | |
Callaway Golf Company (a) | | | | 115,000 | | | | | 2,346,000 | |
YETI Holdings, Inc. (a) | | | | 25,535 | | | | | 1,104,899 | |
| | | | | | | | | | |
| | | | | | | | | 3,450,899 | |
| | | | | | | | | | |
| Machinery - 7.7% | | | | |
Alamo Group, Inc. | | | | 17,135 | | | | | 1,995,028 | |
Altra Industrial Motion Corp. | | | | 49,000 | | | | | 1,727,250 | |
ESAB Corp. (a) | | | | 37,000 | | | | | 1,618,750 | |
Evoqua Water Technologies Corp. (a) | | | | 55,250 | | | | | 1,796,177 | |
Helios Technologies, Inc. | | | | 35,295 | | | | | 2,338,294 | |
ITT, Inc. | | | | 20,375 | | | | | 1,370,015 | |
Watts Water Technologies, Inc. - Class A | | | | 17,525 | | | | | 2,152,771 | |
| | | | | | | | | | |
| | | | | | | | | 12,998,285 | |
| | | | | | | | | | |
| Marine - 1.7% | | | | |
Kirby Corp. (a) | | | | 46,370 | | | | | 2,821,151 | |
| | | | | | | | | | |
| Media & Entertainment - 1.5% | | | | |
Nexstar Media Group, Inc. - Class A | | | | 16,000 | | | | | 2,606,080 | |
| | | | | | | | | | |
The accompanying notes are an integral part of these financial statements.
8
|
| LKCM SMALL CAP EQUITY FUND |
| SCHEDULEOF INVESTMENTS, CONTINUED |
| June 30, 2022 (Unaudited) |
| | | | | | | | | | |
| COMMON STOCKS | | Shares | | Value |
| Oil, Gas & Consumable Fuels - 6.8% | | | | |
CNX Resources Corp. (a) | | | | 180,000 | | | | $ | 2,962,800 | |
HF Sinclair Corp. | | | | 91,625 | | | | | 4,137,785 | |
Magnolia Oil & Gas Corp. - Class A | | | | 145,000 | | �� | | | 3,043,550 | |
Northern Oil and Gas, Inc. | | | | 55,000 | | | | | 1,389,300 | |
| | | | | | | | | | |
| | | | | | | | | 11,533,435 | |
| | | | | | | | | | |
| Personal Products - 1.5% | | | | |
BellRing Brands, Inc. (a) | | | | 101,375 | | | | | 2,523,224 | |
| | | | | | | | | | |
| Professional Services - 1.5% | | | | |
Upwork, Inc. (a) | | | | 125,760 | | | | | 2,600,717 | |
| | | | | | | | | | |
| Real Estate Development - 0.7% | | | | |
FirstService Corp. (b) | | | | 9,995 | | | | | 1,211,394 | |
| | | | | | | | | | |
| Software - 6.9% | | | | |
ACI Worldwide, Inc. (a) | | | | 70,000 | | | | | 1,812,300 | |
Altair Engineering, Inc. - Class A (a) | | | | 36,190 | | | | | 1,899,975 | |
Model N, Inc. (a) | | | | 63,650 | | | | | 1,628,167 | |
Nutanix, Inc. - Class A (a) | | | | 78,000 | | | | | 1,141,140 | |
Q2 Holdings, Inc. (a) | | | | 35,000 | | | | | 1,349,950 | |
Sprout Social, Inc. - Class A (a) | | | | 38,250 | | | | | 2,221,178 | |
Workiva Inc. (a) | | | | 24,520 | | | | | 1,618,075 | |
| | | | | | | | | | |
| | | | | | | | | 11,670,785 | |
| | | | | | | | | | |
| Software & Services - 0.8% | | | | |
Alarm.com Holdings, Inc. (a) | | | | 22,430 | | | | | 1,387,520 | |
| | | | | | | | | | |
| Specialty Retail - 2.8% | | | | |
Academy Sports and Outdoors, Inc. | | | | 53,000 | | | | | 1,883,620 | |
Leslie’s, Inc. (a) | | | | 97,000 | | | | | 1,472,460 | |
Petco Health & Wellness Co, Inc. (a) | | | | 96,000 | | | | | 1,415,040 | |
| | | | | | | | | | |
| | | | | | | | | 4,771,120 | |
| | | | | | | | | | |
| Technology Hardware, Storage & Peripherals - 1.3% | | |
Avid Technology, Inc. (a) | | | | 84,585 | | | | | 2,194,981 | |
| | | | | | | | | | |
| Thrifts & Mortgage Finance - 1.7% | | | | |
Home BancShares, Inc. | | | | 137,301 | | | | | 2,851,742 | |
| | | | | | | | | | |
| Trading Companies & Distributors - 1.9% | | |
Global Industrial Co. | | | | 65,265 | | | | | 2,203,999 | |
Textainer Group Holdings Ltd. (b) | | | | 35,000 | | | | | 959,350 | |
| | | | | | | | | | |
| | | | | | | | | 3,163,349 | |
| | | | | | | | | | |
TOTAL COMMON STOCKS
(Cost $131,833,382) | | | | | | | | | 157,711,285 | |
| | | | | | | | | | |
| | | | | | | | | | |
| REITS - 0.9% | | | | |
| Equity Real Estate Investment Trusts (REITs) - 0.9% | | |
Pebblebrook Hotel Trust | | | | 92,000 | | | | | 1,524,440 | |
| | | | | | | | | | |
TOTAL REITS
(Cost $2,195,070) | | | | | | | | | 1,524,440 | |
| | | | | | | | | | |
| | | | | | | | | | |
| SHORT-TERM INVESTMENTS - 6.2% | | Shares | | Value |
| Money Market Funds - 6.2% | | | | |
Fidelity Investments Money Market Government Portfolio - Class I, 1.21% (d) | | | | 324,409 | | | | $ | 324,409 | |
Invesco Short-Term Investments Trust - Government & Agency Portfolio - Institutional Shares, 1.38% (d) | | | | 5,120,409 | | | | | 5,120,409 | |
MSILF Government Portfolio, 1.39% (d) | | | | 5,120,409 | | | | | 5,120,409 | |
| | | | | | | | | | |
| | | | | | | | | 10,565,227 | |
| | | | | | | | | | |
TOTAL SHORT-TERM INVESTMENTS
(Cost $10,565,227) | | | | | | | | | 10,565,227 | |
| | | | | | | | | | |
Total Investments - 100.2%
(Cost $144,593,679) | | | | | | | | | 169,800,952 | |
Liabilities in Excess of Other Assets - (0.2)% | | | | | (326,731 | ) |
| | | | | | | | | | |
TOTAL NET ASSETS - 100.0% | | | | | | | | $ | 169,474,221 | |
| | | | | | | | | | |
| (a) | Non-income producing security. |
| (b) | Security issued by non-U.S. incorporated company. |
| (c) | Securities for which market quotations are not readily available. These securities have been valued at their fair value under procedures approved by the Fund’s Board of Trustees. Level 3 security. |
| (d) | The rate quoted is the annualized seven-day yield of the Fund at period end. |
Investments are classified by industry pursuant to the Global Industry Classification Standard (GICS®), which was developed by and/or is the exclusive property of Morgan Stanley Capital International, Inc. (“MSCI”) and Standard & Poor’s Financial Services LLC (“S&P”). GICS is a service mark of MSCI and S&P and has been licensed for use by U.S. Bancorp Fund Services, LLC.
The accompanying notes are an integral part of these financial statements.
9
|
| LKCM SMALL-MID CAP EQUITY FUND |
| SCHEDULEOF INVESTMENTS |
| June 30, 2022 (Unaudited) |
| | | | | | | | | | |
| COMMON STOCKS - 87.0% | | Shares | | Value |
| Aerospace & Defense - 1.8% | | | | |
Axon Enterprise, Inc. (a) | | | | 2,925 | | | | $ | 272,522 | |
| | | | | | | | | | |
| Banks - 5.7% | | | | |
Cadence Bank | | | | 10,270 | | | | | 241,139 | |
Cullen/Frost Bankers, Inc. | | | | 2,735 | | | | | 318,491 | |
Zions Bancorp N.A. | | | | 5,940 | | | | | 302,346 | |
| | | | | | | | | | |
| | | | | | | | | 861,976 | |
| | | | | | | | | | |
| Biotechnology - 3.8% | | | | |
Charles River Laboratories International, Inc. (a) | | | | 1,205 | | | | | 257,834 | |
Natera, Inc. (a) | | | | 2,480 | | | | | 87,891 | |
Neogen Corp. (a) | | | | 9,330 | | | | | 224,760 | |
| | | | | | | | | | |
| | | | | | | | | 570,485 | |
| | | | | | | | | | |
| Building Products - 4.5% | | | | |
Builders FirstSource, Inc. (a) | | | | 3,350 | | | | | 179,895 | |
CSW Industrials, Inc. | | | | 2,050 | | | | | 211,212 | |
Trex Co., Inc. (a) | | | | 2,035 | | | | | 110,745 | |
Zurn Elkay Water Solutions Corp. | | | | 6,560 | | | | | 178,694 | |
| | | | | | | | | | |
| | | | | | | | | 680,546 | |
| | | | | | | | | | |
| Capital Markets - 3.4% | | | | |
LPL Financial Holdings, Inc. | | | | 2,820 | | | | | 520,234 | |
| | | | | | | | | | |
| Chemicals - 2.8% | | | | |
FMC Corp. | | | | 2,510 | | | | | 268,595 | |
Quaker Chemical Corp. | | | | 1,028 | | | | | 153,707 | |
| | | | | | | | | | |
| | | | | | | | | 422,302 | |
| | | | | | | | | | |
| Commercial Services & Supplies - 2.4% | | | | |
Driven Brands Holdings Inc. (a) | | | | 13,185 | | | | | 363,115 | |
| | | | | | | | | | |
| Construction & Engineering - 2.0% | | | | |
WillScot Mobile Mini Holdings Corp. (a) | | | | 9,210 | | | | | 298,588 | |
| | | | | | | | | | |
| Construction Materials - 1.6% | | | | |
Eagle Materials, Inc. | | | | 2,160 | | | | | 237,470 | |
| | | | | | | | | | |
| Containers & Packaging - 1.7% | | | | |
Crown Holdings, Inc. | | | | 2,710 | | | | | 249,781 | |
| | | | | | | | | | |
| Electronic Equipment & Instruments - 1.8% | | | | |
Trimble, Inc. (a) | | | | 4,565 | | | | | 265,820 | |
| | | | | | | | | | |
| Food Products - 1.6% | | | | |
Utz Brands, Inc. | | | | 17,510 | | | | | 241,988 | |
| | | | | | | | | | |
| Health Care Equipment & Supplies - 4.2% | | |
Enovis Corp. (a) | | | | 4,328 | | | | | 238,040 | |
Omnicell, Inc. (a) | | | | 1,925 | | | | | 218,969 | |
STAAR Surgical Co. (a) | | | | 2,390 | | | | | 169,522 | |
| | | | | | | | | | |
| | | | | | | | | 626,531 | |
| | | | | | | | | | |
| Health Care Providers & Services - 1.5% | | | | |
R1 RCM Inc. (a) | | | | 10,770 | | | | | 225,739 | |
| | | | | | | | | | |
| Hotels, Restaurants & Leisure - 1.4% | | | | |
Wingstop, Inc. | | | | 2,755 | | | | | 205,991 | |
| | | | | | | | | | |
| | | | | | | | | | |
| COMMON STOCKS | | Shares | | Value |
| Insurance - 2.6% | | | | |
Palomar Holdings, Inc. (a) | | | | 6,035 | | | | $ | 388,654 | |
| | | | | | | | | | |
| IT Consulting & Services - 7.3% | | | | |
Black Knight, Inc. (a) | | | | 6,880 | | | | | 449,883 | |
Broadridge Financial Solutions, Inc. | | | | 2,775 | | | | | 395,576 | |
Perficient Inc. (a) | | | | 2,775 | | | | | 254,440 | |
| | | | | | | | | | |
| | | | | | | | | 1,099,899 | |
| | | | | | | | | | |
| Leisure Equipment & Products - 3.7% | | | | |
Pool Corp. | | | | 1,000 | | | | | 351,230 | |
YETI Holdings, Inc. (a) | | | | 4,640 | | | | | 200,773 | |
| | | | | | | | | | |
| | | | | | | | | 552,003 | |
| | | | | | | | | | |
| Machinery - 2.3% | | | | |
ESAB Corp. (a) | | | | 2,628 | | | | | 114,975 | |
ITT, Inc. | | | | 3,470 | | | | | 233,323 | |
| | | | | | | | | | |
| | | | | | | | | 348,298 | |
| | | | | | | | | | |
| Marine - 1.9% | | | | |
Kirby Corp. (a) | | | | 4,790 | | | | | 291,424 | |
| | | | | | | | | | |
| Media - 1.9% | | | | |
Cable One, Inc. | | | | 226 | | | | | 291,386 | |
| | | | | | | | | | |
| Media & Entertainment - 2.0% | | | | |
Nexstar Media Group, Inc. - Class A | | | | 1,840 | | | | | 299,699 | |
| | | | | | | | | | |
| Multiline Retail - 0.8% | | | | |
Five Below, Inc. (a) | | | | 1,040 | | | | | 117,967 | |
| | | | | | | | | | |
| Oil, Gas & Consumable Fuels - 7.8% | | | | |
CNX Resources Corp. (a) | | | | 21,400 | | | | | 352,244 | |
Diamondback Energy Inc. | | | | 2,535 | | | | | 307,115 | |
HF Sinclair Corp. | | | | 8,130 | | | | | 367,151 | |
Marathon Oil Corp. | | | | 6,620 | | | | | 148,818 | |
| | | | | | | | | | |
| | | | | | | | | 1,175,328 | |
| | | | | | | | | | |
| Personal Products - 1.6% | | | | |
BellRing Brands, Inc. (a) | | | | 9,955 | | | | | 247,780 | |
| | | | | | | | | | |
| Pharmaceuticals - 1.7% | | | | |
Horizon Therapeutics PLC (a)(b) | | | | 3,135 | | | | | 250,048 | |
| | | | | | | | | | |
| Real Estate Development - 1.8% | | |
FirstService Corp. (b) | | | | 2,245 | | | | | 272,094 | |
| | | | | | | | | | |
| Real Estate Management & Development - 1.4% | | |
Colliers International Group, Inc. (b) | | | | 1,990 | | | | | 218,323 | |
| | | | | | | | | | |
| Software - 4.6% | | | | |
Altair Engineering, Inc. - Class A (a) | | | | 3,950 | | | | | 207,375 | |
Paylocity Holding Corp. (a) | | | | 1,725 | | | | | 300,875 | |
Sprout Social, Inc. - Class A (a) | | | | 3,120 | | | | | 181,178 | |
| | | | | | | | | | |
| | | | | | | | | 689,428 | |
| | | | | | | | | | |
| Specialty Retail - 3.7% | | | | |
Academy Sports and Outdoors, Inc. | | | | 7,520 | | | | | 267,260 | |
Leslie’s, Inc. (a) | | | | 19,210 | | | | | 291,608 | |
| | | | | | | | | | |
| | | | | | | | | 558,868 | |
| | | | | | | | | | |
The accompanying notes are an integral part of these financial statements.
10
|
| LKCM SMALL-MID CAP EQUITY FUND |
| SCHEDULEOF INVESTMENTS, CONTINUED |
| June 30, 2022 (Unaudited) |
| | | | | | | | | | |
| COMMON STOCKS | | Shares | | Value |
| Trading Companies & Distributors - 1.7% | | | | |
Watsco, Inc. | | | | 1,045 | | | | $ | 249,567 | |
| | | | | | | | | | |
TOTAL COMMON STOCKS
(Cost $12,265,308) | | | | 13,093,854 |
| | | | | | | | | | |
| | | | | | | | | | |
| REITS - 3.0% | | | | |
| Equity Real Estate Investment Trusts (REITs) - 1.4% | | |
Camden Property Trust | | | | 1,580 | | | | | 212,479 | |
| | | | | | | | | | |
| Real Estate Management & Development - 1.6% | | |
DigitalBridge Group, Inc. (a) | | | | 47,130 | | | | | 229,994 | |
| | | | | | | | | | |
TOTAL REITS
(Cost $588,140) | | | | | | | | | 442,473 | |
| | | | | | | | | | |
| | | | | | | | | | |
| SHORT-TERM INVESTMENTS - 10.3% | | | | |
| Money Market Funds - 10.3% | | | | |
Fidelity Investments Money Market Government Portfolio - Class I, 1.21% (c) | | | | 454,817 | | | | | 454,817 | |
First American Government Obligations Fund - Class Z, 1.26% (c) | | | | 180,773 | | | | | 180,772 | |
Invesco Short-Term Investments Trust - Government & Agency Portfolio - Institutional Shares, 1.38% (c) | | | | 454,817 | | | | | 454,817 | |
MSILF Government Portfolio, 1.39% (c) | | | | 454,817 | | | | | 454,817 | |
| | | | | | | | | | |
| | | | | | | | | 1,545,223 | |
| | | | | | | | | | |
TOTAL SHORT-TERM INVESTMENTS
(Cost $1,545,223) | | | | | | | | | 1,545,223 | |
| | | | | | | | | | |
Total Investments - 100.3%
(Cost $14,398,671) | | | | | | | | | 15,081,550 | |
Liabilities in Excess of Other Assets - (0.2)% | | | | | (38,096 | ) |
| | | | | | | | | | |
TOTAL NET ASSETS - 100.0% | | | | $ | 15,043,454 | |
| | | | | | | | | | |
| (a) | Non-income producing security. |
| (b) | Security is issued by non-U.S. incorporated company. |
| (c) | The rate quoted is the annualized seven-day yield of the Fund at period end. |
Investments are classified by industry pursuant to the Global Industry Classification Standard (GICS®), which was developed by and/or is the exclusive property of Morgan Stanley Capital International, Inc. (“MSCI”) and Standard & Poor’s Financial Services LLC (“S&P”). GICS is a service mark of MSCI and S&P and has been licensed for use by U.S. Bancorp Fund Services, LLC. The accompanying notes are an integral part of these financial statements.
The accompanying notes are an integral part of these financial statements.
11
|
| LKCM EQUITY FUND |
| SCHEDULEOF INVESTMENTS |
| June 30, 2022 (Unaudited) |
| | | | | | | | | | |
| COMMON STOCKS - 90.5% | | Shares | | Value |
| Aerospace & Defense - 2.0% | | | | |
Honeywell International, Inc. | | | | 50,000 | | | | $ | 8,690,500 | |
| | | | | | | | | | |
| Banks - 5.1% | | | | |
Bank of America Corp. | | | | 160,000 | | | | | 4,980,800 | |
Comerica, Inc. | | | | 100,000 | | | | | 7,338,000 | |
Cullen/Frost Bankers, Inc. | | | | 65,000 | | | | | 7,569,250 | |
Glacier Bancorp, Inc. | | | | 60,000 | | | | | 2,845,200 | |
| | | | | | | | | | |
| | | | | | | | | 22,733,250 | |
| | | | | | | | | | |
| Beverages - 3.9% | | | | |
The Coca-Cola Co. | | | | 95,000 | | | | | 5,976,450 | |
Keurig Dr Pepper, Inc. | | | | 110,000 | | | | | 3,892,900 | |
PepsiCo, Inc. | | | | 45,000 | | | | | 7,499,700 | |
| | | | | | | | | | |
| | | | | | | | | 17,369,050 | |
| | | | | | | | | | |
| Biotechnology - 2.1% | | | | |
Amgen, Inc. | | | | 28,000 | | | | | 6,812,400 | |
Neogen Corp. (a) | | | | 100,000 | | | | | 2,409,000 | |
| | | | | | | | | | |
| | | | | | | | | 9,221,400 | |
| | | | | | | | | | |
| Chemicals - 6.6% | | | | |
Air Products & Chemicals, Inc. | | | | 25,000 | | | | | 6,012,000 | |
DuPont de Nemours, Inc. | | | | 85,000 | | | | | 4,724,300 | |
Ecolab, Inc. | | | | 45,000 | | | | | 6,919,200 | |
FMC Corp. | | | | 110,000 | | | | | 11,771,100 | |
| | | | | | | | | | |
| | | | | | | | | 29,426,600 | |
| | | | | | | | | | |
| Commercial Services & Supplies - 3.9% | | | | |
Cintas Corp. | | | | 16,000 | | | | | 5,976,480 | |
Waste Connections, Inc. (b) | | | | 90,000 | | | | | 11,156,400 | |
| | | | | | | | | | |
| | | | | | | | | 17,132,880 | |
| | | | | | | | | | |
| Computers & Peripherals - 3.0% | | | | |
Apple, Inc. | | | | 96,000 | | | | | 13,125,120 | |
| | | | | | | | | | |
| Construction Materials - 1.2% | | | | |
Martin Marietta Materials, Inc. | | | | 18,000 | | | | | 5,386,320 | |
| | | | | | | | | | |
| Diversified Financials - 1.7% | | | | |
JPMorgan Chase & Co. | | | | 68,000 | | | | | 7,657,480 | |
| | | | | | | | | | |
| Electrical Equipment & Instruments - 2.5% | | |
Franklin Electric Co., Inc. | | | | 85,000 | | | | | 6,227,100 | |
Rockwell Automation, Inc. | | | | 25,000 | | | | | 4,982,750 | |
| | | | | | | | | | |
| | | | | | | | | 11,209,850 | |
| | | | | | | | | | |
| Electronic Equipment & Instruments - 2.5% | | |
National Instruments Corp. | | | | 75,000 | | | | | 2,342,250 | |
Trimble, Inc. (a) | | | | 150,000 | | | | | 8,734,500 | |
| | | | | | | | | | |
| | | | | | | | | 11,076,750 | |
| | | | | | | | | | |
| Electronic Equipment, Instruments & Components - 1.7% |
Teledyne Technologies, Inc. (a) | | | | 20,000 | | | | | 7,502,200 | |
| | | | | | | | | | |
| Health Care Equipment & Supplies - 1.8% |
Alcon, Inc. (b) | | | | 60,000 | | | | | 4,193,400 | |
Stryker Corp. | | | | 20,000 | | | | | 3,978,600 | |
| | | | | | | | | | |
| | | | | | | | | 8,172,000 | |
| | | | | | | | | | |
| | | | | | | | | | |
| COMMON STOCKS | | Shares | | Value |
| Household Durables - 1.2% | | | | |
Newell Brands, Inc. | | | | 290,000 | | | | $ | 5,521,600 | |
| | | | | | | | | | |
| Household Products - 2.5% | | | | |
Kimberly-Clark Corp. | | | | 50,000 | | | | | 6,757,500 | |
The Procter & Gamble Co. | | | | 30,000 | | | | | 4,313,700 | |
| | | | | | | | | | |
| | | | | | | | | 11,071,200 | |
| | | | | | | | | | |
| Internet & Catalog Retail - 1.2% | | | | |
Amazon.com, Inc. (a) | | | | 50,000 | | | | | 5,310,500 | |
| | | | | | | | | | |
| IT Consulting & Services - 1.1% | | | | |
PayPal Holdings, Inc. (a) | | | | 70,000 | | | | | 4,888,800 | |
| | | | | | | | | | |
| Life Sciences Tools & Services - 4.0% | | | | |
Danaher Corp. | | | | 35,750 | | | | | 9,063,340 | |
Thermo Fisher Scientific, Inc. | | | | 15,575 | | | | | 8,461,586 | |
| | | | | | | | | | |
| | | | | | | | | 17,524,926 | |
| | | | | | | | | | |
| Machinery - 6.9% | | | | |
Generac Holdings, Inc. (a) | | | | 35,000 | | | | | 7,370,300 | |
IDEX Corp. | | | | 20,000 | | | | | 3,632,600 | |
The Toro Co. | | | | 80,000 | | | | | 6,063,200 | |
Valmont Industries, Inc. | | | | 40,000 | | | | | 8,985,200 | |
Xylem, Inc. | | | | 60,000 | | | | | 4,690,800 | |
| | | | | | | | | | |
| | | | | | | | | 30,742,100 | |
| | | | | | | | | | |
| Marine - 1.5% | | | | |
Kirby Corp. (a) | | | | 110,000 | | | | | 6,692,400 | |
| | | | | | | | | | |
| Media & Entertainment - 2.2% | | | | |
Alphabet, Inc. - Class A (a) | | | | 4,500 | | | | | 9,806,670 | |
| | | | | | | | | | |
| Metals & Mining - 1.8% | | | | |
Newmont Goldcorp Corp. | | | | 130,000 | | | | | 7,757,100 | |
| | | | | | | | | | |
| Oil & Gas & Consumable Fuels - 5.6% | | | | |
Chevron Corp. | | | | 42,500 | | | | | 6,153,150 | |
ConocoPhillips | | | | 100,000 | | | | | 8,981,000 | |
Coterra Energy, Inc. | | | | 384,000 | | | | | 9,903,360 | |
| | | | | | | | | | |
| | | | | | | | | 25,037,510 | |
| | | | | | | | | | |
| Oil, Gas & Consumable Fuels - 0.5% | | | | |
Kimbell Royalty Partners, LP | | | | 130,000 | | | | | 2,038,400 | |
| | | | | | | | | | |
| Personal Products - 1.1% | | | | |
The Estee Lauder Cos., Inc. - Class A | | | | 20,000 | | | | | 5,093,400 | |
| | | | | | | | | | |
| Pharmaceuticals - 5.3% | | | | |
Merck & Co., Inc. | | | | 80,000 | | | | | 7,293,600 | |
Pfizer, Inc. | | | | 130,000 | | | | | 6,815,900 | |
Zoetis, Inc. | | | | 53,500 | | | | | 9,196,115 | |
| | | | | | | | | | |
| | | | | | | | | 23,305,615 | |
| | | | | | | | | | |
| Road & Rail - 1.2% | | | | |
Union Pacific Corp. | | | | 24,000 | | | | | 5,118,720 | |
| | | | | | | | | | |
| Semiconductor & Semiconductor Equipment - 1.1% | | |
Intel Corp. | | | | 125,000 | | | | | 4,676,250 | |
| | | | | | | | | | |
| Software - 10.7% | | | | |
Adobe, Inc. (a) | | | | 25,000 | | | | | 9,151,500 | |
Microsoft Corp. | | | | 85,000 | | | | | 21,830,550 | |
Oracle Corp. | | | | 120,000 | | | | | 8,384,400 | |
The accompanying notes are an integral part of these financial statements.
12
|
| LKCM EQUITY FUND |
| SCHEDULEOF INVESTMENTS, CONTINUED |
| June 30, 2022 (Unaudited) |
| | | | | | | | | | |
| COMMON STOCKS | | Shares | | Value |
| Software - 10.7%, Continued | | | | |
Roper Technologies, Inc. | | | | 20,000 | | | | $ | 7,893,000 | |
| | | | | | | | | | |
| | | | | | | | | 47,259,450 | |
| | | | | | | | | | |
| Software & Services - 1.9% | | | | |
Akamai Technologies, Inc. (a) | | | | 90,000 | | | | | 8,219,700 | |
| | | | | | | | | | |
| Specialty Retail - 1.9% | | | | |
The Home Depot, Inc. | | | | 30,000 | | | | | 8,228,100 | |
| | | | | | | | | | |
| Trading Companies & Distributors - 0.9% | | |
Fortress Transportation and Infrastructure Investors LLC | | | | 200,000 | | | | | 3,868,000 | |
| | | | | | | | | | |
TOTAL COMMON STOCKS
(Cost $217,730,259) | | | | | | | | | 400,863,841 | |
| | | | | | | | | | |
| | | | | | | | | | |
| SHORT-TERM INVESTMENTS - 9.6% | | |
| Money Market Funds - 9.6% | | | | |
Fidelity Investments Money Market Government Portfolio - Class I, 1.21% (c) | | | | 13,385,751 | | | | | 13,385,751 | |
First American Government Obligations Fund - Class Z, 1.26% (c) | | | | 2,561,250 | | | | | 2,561,249 | |
Invesco Short-Term Investments Trust - Government & Agency Portfolio - Institutional Shares, 1.38% (c) | | | | 13,385,751 | | | | | 13,385,751 | |
MSILF Government Portfolio, 1.39% (c) | | | | 13,385,751 | | | | | 13,385,751 | |
| | | | | | | | | | |
| | | | | | | | | 42,718,502 | |
| | | | | | | | | | |
TOTAL SHORT-TERM INVESTMENTS
(Cost $42,718,502) | | 42,718,502 |
| | | | | | | | | | |
Total Investments - 100.1%
(Cost $260,448,761) | | | | 443,582,343 |
Liabilities in Excess of Other Assets - (0.1)% | | | | | (428,631 | ) |
| | | | | | | | | | |
TOTAL NET ASSETS - 100.0% | | | | | | | | $ | 443,153,712 | |
| | | | | | | | | | |
| (a) | Non-income producing security. |
| (b) | Security issued by non-U.S. incorporated company. |
| (c) | The rate quoted is the annualized seven-day yield of the Fund at period end. |
Investments are classified by industry pursuant to the Global Industry Classification Standard (GICS®), which was developed by and/or is the exclusive property of Morgan Stanley Capital International, Inc. (“MSCI”) and Standard & Poor’s Financial Services LLC (“S&P”). GICS is a service mark of MSCI and S&P and has been licensed for use by U.S. Bancorp Fund Services, LLC.
The accompanying notes are an integral part of these financial statements.
13
|
| LKCM BALANCED FUND |
| SCHEDULEOF INVESTMENTS |
| June 30, 2022 (Unaudited) |
| | | | | | | | | | |
| COMMON STOCKS - 69.3% | | Shares | |
Value |
| Aerospace & Defense - 2.2% | | | | |
Honeywell International, Inc. | | | | 5,700 | | | | $ | 990,717 | |
L3Harris Technologies, Inc. | | | | 5,850 | | | | | 1,413,945 | |
| | | | | | | | | | |
| | | | | | | | | 2,404,662 | |
| | | | | | | | | | |
| Banks - 3.3% | | | | |
Bank of America Corp. | | | | 47,900 | | | | | 1,491,127 | |
Cullen/Frost Bankers, Inc. | | | | 11,600 | | | | | 1,350,820 | |
Zions Bancorp N.A. | | | | 15,100 | | | | | 768,590 | |
| | | | | | | | | | |
| | | | | | | | | 3,610,537 | |
| | | | | | | | | | |
| Beverages - 2.3% | | | | |
The Coca-Cola Co. | | | | 21,400 | | | | | 1,346,274 | |
PepsiCo, Inc. | | | | 7,550 | | | | | 1,258,283 | |
| | | | | | | | | | |
| | | | | | | | | 2,604,557 | |
| | | | | | | | | | |
| Biotechnology - 1.0% | | | | |
Charles River Laboratories International, Inc. (a) | | | | 5,250 | | | | | 1,123,342 | |
| | | | | | | | | | |
| Chemicals - 6.0% | | | | |
Air Products and Chemicals, Inc. | | | | 6,000 | | | | | 1,442,880 | |
Corteva, Inc. | | | | 18,858 | | | | | 1,020,972 | |
DuPont de Nemours, Inc. | | | | 12,658 | | | | | 703,532 | |
Ecolab, Inc. | | | | 5,700 | | | | | 876,432 | |
FMC Corp. | | | | 13,900 | | | | | 1,487,439 | |
Linde PLC (b) | | | | 3,900 | | | | | 1,121,367 | |
| | | | | | | | | | |
| | | | | | | | | 6,652,622 | |
| | | | | | | | | | |
| Commercial Services & Supplies - 3.2% | | | | |
Cintas Corp. | | | | 3,700 | | | | | 1,382,061 | |
Waste Connections, Inc. (b) | | | | 10,400 | | | | | 1,289,184 | |
Waste Management, Inc. | | | | 5,550 | | | | | 849,039 | |
| | | | | | | | | | |
| | | | | | | | | 3,520,284 | |
| | | | | | | | | | |
| Communications Equipment - 1.4% | | | | |
QUALCOMM, Inc. | | | | 12,300 | | | | | 1,571,202 | |
| | | | | | | | | | |
| Computers & Peripherals - 2.0% | | | | |
Apple, Inc. | | | | 15,950 | | | | | 2,180,684 | |
| | | | | | | | | | |
| Construction Materials - 1.0% | | | | |
Martin Marietta Materials, Inc. | | | | 3,800 | | | | | 1,137,112 | |
| | | | | | | | | | |
| Diversified Financials - 2.5% | | | | |
JPMorgan Chase & Co. | | | | 13,000 | | | | | 1,463,930 | |
Moody’s Corp. | | | | 4,650 | | | | | 1,264,661 | |
| | | | | | | | | | |
| | | | | | | | | 2,728,591 | |
| | | | | | | | | | |
| Diversified Telecommunication Services - 1.2% | | |
Verizon Communications, Inc. | | | | 26,341 | | | | | 1,336,806 | |
| | | | | | | | | | |
| Electrical Equipment & Instruments - 1.7% | | | | |
Emerson Electric Co. | | | | 12,800 | | | | | 1,018,112 | |
Rockwell Automation, Inc. | | | | 4,175 | | | | | 832,119 | |
| | | | | | | | | | |
| | | | | | | | | 1,850,231 | |
| | | | | | | | | | |
| Electronic Equipment & Instruments - 0.9% | | |
Trimble, Inc. (a) | | | | 16,750 | | | | | 975,353 | |
| | | | | | | | | | |
| | | | | | | | | | |
| COMMON STOCKS | | Shares | |
Value |
| Electronic Equipment, Instruments & Components - 1.0% |
Teledyne Technologies, Inc. (a) | | | | 2,950 | | | | $ | 1,106,575 | |
| | | | | | | | | | |
| Food & Drug Retailing - 1.0% | | | | |
Walmart, Inc. | | | | 9,100 | | | | | 1,106,378 | |
| | | | | | | | | | |
| Health Care Equipment & Supplies - 2.3% | | | | |
Alcon, Inc. (b) | | | | 17,900 | | | | | 1,251,031 | |
PerkinElmer, Inc. | | | | 9,350 | | | | | 1,329,757 | |
| | | | | | | | | | |
| | | | | | | | | 2,580,788 | |
| | | | | | | | | | |
| Household Durables - 0.7% | | | | |
Newell Brands, Inc. | | | | 40,000 | | | | | 761,600 | |
| | | | | | | | | | |
| Household Products - 2.3% | | | | |
Colgate-Palmolive Co. | | | | 16,100 | | | | | 1,290,254 | |
Kimberly-Clark Corp. | | | | 6,000 | | | | | 810,900 | |
The Procter & Gamble Co. | | | | 3,250 | | | | | 467,317 | |
| | | | | | | | | | |
| | | | | | | | | 2,568,471 | |
| | | | | | | | | | |
| Internet & Catalog Retail - 1.2% | | | | |
Amazon.com, Inc. (a) | | | | 12,200 | | | | | 1,295,762 | |
| | | | | | | | | | |
| IT Consulting & Services - 2.6% | | | | |
Broadridge Financial Solutions, Inc. | | | | 9,450 | | | | | 1,347,097 | |
PayPal Holdings, Inc. (a) | | | | 6,100 | | | | | 426,024 | |
Visa, Inc. - Class A | | | | 5,650 | | | | | 1,112,429 | |
| | | | | | | | | | |
| | | | | | | | | 2,885,550 | |
| | | | | | | | | | |
| Life Sciences Tools & Services - 2.5% | | | | |
Danaher Corp. | | | | 5,100 | | | | | 1,292,952 | |
Thermo Fisher Scientific, Inc. | | | | 2,600 | | | | | 1,412,528 | |
| | | | | | | | | | |
| | | | | | | | | 2,705,480 | |
| | | | | | | | | | |
| Machinery - 1.5% | | | | |
Fortive Corp. | | | | 9,350 | | | | | 508,453 | |
Xylem, Inc. | | | | 14,800 | | | | | 1,157,064 | |
| | | | | | | | | | |
| | | | | | | | | 1,665,517 | |
| | | | | | | | | | |
| Media & Entertainment - 3.4% | | | | |
Alphabet, Inc. - Class C (a) | | | | 750 | | | | | 1,640,587 | |
The Walt Disney Co. (a) | | | | 13,700 | | | | | 1,293,280 | |
Meta Platforms, Inc. (a) | | | | 5,175 | | | | | 834,469 | |
| | | | | | | | | | |
| | | | | | | | | 3,768,336 | |
| | | | | | | | | | |
| Metals & Mining - 1.0% | | | | |
Newmont Goldcorp Corp. | | | | 18,100 | | | | | 1,080,027 | |
| | | | | | | | | | |
| Oil & Gas & Consumable Fuels - 5.7% | | |
Chevron Corp. | | | | 8,395 | | | | | 1,215,428 | |
ConocoPhillips | | | | 15,600 | | | | | 1,401,036 | |
Coterra Energy, Inc. | | | | 24,000 | | | | | 618,960 | |
EOG Resources, Inc. | | | | 4,450 | | | | | 491,458 | |
Kinder Morgan, Inc. | | | | 80,000 | | | | | 1,340,800 | |
Pioneer Natural Resources Co. | | | | 5,650 | | | | | 1,260,402 | |
| | | | | | | | | | |
| | | | | | | | | 6,328,084 | |
| | | | | | | | | | |
| Personal Products - 1.0% | | | | |
The Estee Lauder Cos., Inc. - Class A | | | | 4,600 | | | | | 1,171,482 | |
| | | | | | | | | | |
The accompanying notes are an integral part of these financial statements.
14
|
| LKCM BALANCED FUND |
| SCHEDULEOF INVESTMENTS, CONTINUED |
| June 30, 2022 (Unaudited) |
| | | | | | | | | | |
| COMMON STOCKS | | Shares | |
Value |
| Pharmaceuticals - 3.6% | | | | |
Abbott Laboratories | | | | 10,000 | | | | $ | 1,086,500 | |
Merck & Co., Inc. | | | | 16,300 | | | | | 1,486,071 | |
Zoetis, Inc. | | | | 8,026 | | | | | 1,379,589 | |
| | | | | | | | | | |
| | | | | | | | | 3,952,160 | |
| | | | | | | | | | |
| Real Estate Investment Trusts - 1.3% | | | | |
American Tower Corp. | | | | 5,500 | | | | | 1,405,745 | |
| | | | | | | | | | |
| Road & Rail - 1.0% | | | | |
Union Pacific Corp. | | | | 5,275 | | | | | 1,125,052 | |
| | | | | | | | | | |
| Software - 5.2% | | | | |
Adobe, Inc. (a) | | | | 1,850 | | | | | 677,211 | |
Microsoft Corp. | | | | 6,750 | | | | | 1,733,602 | |
Oracle Corp. | | | | 16,500 | | | | | 1,152,855 | |
Roper Technologies, Inc. | | | | 2,600 | | | | | 1,026,090 | |
Salesforce, Inc. (a) | | | | 6,850 | | | | | 1,130,524 | |
| | | | | | | | | | |
| | | | | | | | | 5,720,282 | |
| | | | | | | | | | |
| Software & Services - 1.0% | | | | |
Akamai Technologies, Inc. (a) | | | | 12,800 | | | | | 1,169,024 | |
| | | | | | | | | | |
| Specialty Retail - 1.2% | | | | |
The Home Depot, Inc. | | | | 5,000 | | | | | 1,371,350 | |
| | | | | | | | | | |
| Textiles, Apparel & Luxury Goods - 1.1% | | | | |
NIKE, Inc. - Class B | | | | 12,000 | | | | | 1,226,400 | |
| | | | | | | | | | |
TOTAL COMMON STOCKS
(Cost $49,571,584) | | | | | | | | | 76,690,046 | |
| | | | | | | | | | |
| | | | | | | | | | |
| CORPORATE BONDS - 30.2% | | Principal
Amount | | |
| Aerospace & Defense - 1.9% | | | | |
Honeywell International, Inc.: | | | | | | | | | | |
2.300%, 08/15/2024 | | | | | | | | | | |
Callable 07/15/2024 | | | $ | 250,000 | | | | | 245,676 | |
1.350%, 06/01/2025 | | | | | | | | | | |
Callable 05/01/2025 | | | | 750,000 | | | | | 707,598 | |
L3Harris Technologies, Inc. | | | | | | | | | | |
3.850%, 06/15/2023 | | | | | | | | | | |
Callable 05/15/2023 | | | | 900,000 | | | | | 899,558 | |
Raytheon Technologies Corp. | | | | | | | | | | |
3.700%, 12/15/2023 | | | | | | | | | | |
Callable 09/15/2023 | | | | 250,000 | | | | | 249,677 | |
| | | | | | | | | | |
| | | | | | | | | 2,102,509 | |
| | | | | | | | | | |
| Banks - 1.8% | | | | |
Comerica Bank | | | | | | | | | | |
2.500%, 07/23/2024 | | | | 300,000 | | | | | 291,887 | |
Comerica, Inc. | | | | | | | | | | |
3.700%, 07/31/2023 | | | | | | | | | | |
Callable 06/30/2023 | | | | 475,000 | | | | | 475,104 | |
The Bank of New York Mellon Corp. | | | | | | | | | | |
2.200%, 08/16/2023 | | | | | | | | | | |
Callable 06/16/2023 | | | | 200,000 | | | | | 198,105 | |
| | | | | | | | | | |
| CORPORATE BONDS | | Principal
Amount | | |
| Banks - 1.8%, Continued | | | | |
Truist Bank: | | | | | | | | | | |
3.200%, 04/01/2024 | | | | | | | | | | |
Callable 03/01/2024 | | | $ | 250,000 | | | | $ | 249,235 | |
4.050%, 11/03/2025 | | | | | | | | | | |
Callable 09/03/2025 | | | | 385,000 | | | | | 388,355 | |
3.300%, 05/15/2026 | | | | | | | | | | |
Callable 04/15/2026 | | | | 400,000 | | | | | 386,519 | |
| | | | | | | | | | |
| | | | | | | | | 1,989,205 | |
| | | | | | | | | | |
| Beverages - 1.0% | | | | |
Keurig Dr Pepper, Inc. | | | | | | | | | | |
2.550%, 09/15/2026 | | | | | | | | | | |
Callable 06/15/2026 | | | | 750,000 | | | | | 699,765 | |
PepsiCo, Inc. | | | | | | | | | | |
2.375%, 10/06/2026 | | | | | | | | | | |
Callable 07/06/2026 | | | | 435,000 | | | | | 417,513 | |
| | | | | | | | | | |
| | | | | | | | | 1,117,278 | |
| | | | | | | | | | |
| Biotechnology - 1.1% | | | | |
AbbVie, Inc. | | | | | | | | | | |
3.200%, 05/14/2026 | | | | | | | | | | |
Callable 02/14/2026 | | | | 600,000 | | | | | 579,019 | |
Amgen, Inc.: | | | | | | | | | | |
3.625%, 05/22/2024 | | | | | | | | | | |
Callable 02/22/2024 | | | | 250,000 | | | | | 249,923 | |
2.600%, 08/19/2026 | | | | | | | | | | |
Callable 05/19/2026 | | | | 450,000 | | | | | 426,993 | |
| | | | | | | | | | |
| | | | | | | | | 1,255,935 | |
| | | | | | | | | | |
| Chemicals - 1.0% | | | | |
Air Products and Chemicals, Inc. | | | | | | | | | | |
1.850%, 05/15/2027 | | | | | | | | | | |
Callable 03/15/2027 | | | | 675,000 | | | | | 615,719 | |
Ecolab, Inc. | | | | | | | | | | |
2.700%, 11/01/2026 | | | | | | | | | | |
Callable 08/01/2026 | | | | 500,000 | | | | | 481,751 | |
| | | | | | | | | | |
| | | | | | | | | 1,097,470 | |
| | | | | | | | | | |
| Communications Equipment - 1.2% | | | | |
Cisco Systems, Inc. | | | | | | | | | | |
2.200%, 09/20/2023 | | | | | | | | | | |
Callable 07/20/2023 | | | | 750,000 | | | | | 744,257 | |
QUALCOMM, Inc. | | | | | | | | | | |
2.900%, 05/20/2024 | | | | | | | | | | |
Callable 03/20/2024 | | | | 600,000 | | | | | 598,221 | |
| | | | | | | | | | |
| | | | | | | | | 1,342,478 | |
| | | | | | | | | | |
| Computers & Peripherals - 0.3% |
Apple, Inc.: | | | | | | | | | | |
2.500%, 02/09/2025 | | | | 250,000 | | | | | 245,686 | |
3.200%, 05/13/2025 | | | | 55,000 | | | | | 55,195 | |
| | | | | | | | | | |
| | | | | | | | | 300,881 | |
| | | | | | | | | | |
The accompanying notes are an integral part of these financial statements.
15
|
| LKCM BALANCED FUND |
| SCHEDULEOF INVESTMENTS, CONTINUED |
| June 30, 2022 (Unaudited) |
| | | | | | | | | | |
| CORPORATE BONDS | | Principal
Amount | | Value |
| Consumer Finance - 0.9% | | | | |
American Express Co.: | | | | | | | | | | |
3.700%, 08/03/2023 | | | | | | | | | | |
Callable 07/03/2023 | | | $ | 300,000 | | | | $ | 301,345 | |
3.000%, 10/30/2024 | | | | | | | | | | |
Callable 09/29/2024 | | | | 650,000 | | | | | 639,954 | |
| | | | | | | | | | |
| | | | | | | | | 941,299 | |
| | | | | | | | | | |
| Diversified Financials - 0.8% | | | | |
JPMorgan Chase & Co.: | | | | | | | | | | |
3.375%, 05/01/2023 | | | | 225,000 | | | | | 225,132 | |
3.875%, 02/01/2024 | | | | 275,000 | | | | | 277,128 | |
3.875%, 09/10/2024 | | | | 200,000 | | | | | 200,008 | |
3.200%, 06/15/2026 | | | | | | | | | | |
Callable 03/15/2026 | | | | 200,000 | | | | | 193,558 | |
| | | | | | | | | | |
| | | | | | | | | 895,826 | |
| | | | | | | | | | |
| Diversified Telecommunication Services - 1.1% |
AT&T, Inc. | | | | | | | | | | |
1.700%, 03/25/2026 | | | | | | | | | | |
Callable 03/25/2023 | | | | 250,000 | | | | | 229,105 | |
Verizon Communications, Inc.: | | | | | | | | | | |
3.500%, 11/01/2024 | | | | | | | | | | |
Callable 08/01/2024 | | | | 750,000 | | | | | 748,856 | |
2.625%, 08/15/2026 | | | | 250,000 | | | | | 236,962 | |
| | | | | | | | | | |
| | | | | | | | | 1,214,923 | |
| | | | | | | | | | |
| Electrical Equipment & Instruments - 0.2% |
Emerson Electric Co. | | | | | | | | | | |
3.150%, 06/01/2025 | | | | | | | | | | |
Callable 03/01/2025 | | | | 200,000 | | | | | 198,346 | |
| | | | | | | | | | |
| Electronic Equipment & Instruments - 0.5% |
Trimble, Inc. | | | | | | | | | | |
4.150%, 06/15/2023 | | | | | | | | | | |
Callable 05/15/2023 | | | | 500,000 | | | | | 499,178 | |
| | | | | | | | | | |
| Food & Drug Retailing - 0.6% | | |
Walmart, Inc. | | | | | | | | | | |
3.550%, 06/26/2025 | | | | | | | | | | |
Callable 04/26/2025 | | | | 700,000 | | | | | 706,988 | |
| | | | | | | | | | |
| Food & Staples Retailing - 0.6% | | | | |
Costco Wholesale Corp. | | | | | | | | | | |
1.375%, 06/20/2027 | | | | | | | | | | |
Callable 04/20/2027 | | | | 690,000 | | | | | 621,531 | |
| | | | | | | | | | |
| Hotels, Restaurants & Leisure - 0.5% | | | | |
McDonald’s Corp. | | | | | | | | | | |
1.450%, 09/01/2025 | | | | | | | | | | |
Callable 08/01/2025 | | | | 600,000 | | | | | 559,417 | |
| | | | | | | | | | |
| Internet & Catalog Retail - 0.2% | | | | |
Amazon.com, Inc. | | | | | | | | | | |
1.200%, 06/03/2027 | | | | | | | | | | |
Callable 04/03/2027 | | | | 260,000 | | | | | 232,251 | |
| | | | | | | | | | |
| | | | | | | | | | |
| CORPORATE BONDS | | Principal
Amount | | Value |
| IT Services - 1.3% | | | | |
PayPal Holdings, Inc. | | | | | | | | | | |
1.650%, 06/01/2025 | | | | | | | | | | |
Callable 05/01/2025 | | | $ | 700,000 | | | | $ | 661,624 | |
Visa Inc. | | | | | | | | | | |
3.150%, 12/14/2025 | | | | | | | | | | |
Callable 09/14/2025 | | | | 300,000 | | | | | 297,116 | |
Visa, Inc. | | | | | | | | | | |
1.900%, 04/15/2027 | | | | | | | | | | |
Callable 02/15/2027 | | | | 500,000 | | | | | 462,315 | |
| | | | | | | | | | |
| | | | | | | | | 1,421,055 | |
| | | | | | | | | | |
| Life Sciences Tools & Services - 0.9% | | | | |
Danaher Corp. | | | | | | | | | | |
3.350%, 09/15/2025 | | | | | | | | | | |
Callable 06/15/2025 | | | | 250,000 | | | | | 247,520 | |
Thermo Fisher Scientific, Inc. | | | | | | | | | | |
1.215%, 10/18/2024 | | | | | | | | | | |
Callable 10/18/2022 | | | | 750,000 | | | | | 712,074 | |
| | | | | | | | | | |
| | | | | | | | | 959,594 | |
| | | | | | | | | | |
| Machinery - 0.6% | | | | |
Illinois Tool Works, Inc. | | | | | | | | | | |
3.500%, 03/01/2024 | | | | | | | | | | |
Callable 12/01/2023 | | | | 715,000 | | | | | 718,486 | |
| | | | | | | | | | |
| Media & Entertainment - 1.4% | | | | |
Alphabet, Inc.: | | | | | | | | | | |
3.375%, 02/25/2024 | | | | 600,000 | | | | | 604,181 | |
1.998%, 08/15/2026 | | | | | | | | | | |
Callable 05/15/2026 | | | | 200,000 | | | | | 189,653 | |
The Walt Disney Co. | | | | | | | | | | |
1.750%, 08/30/2024 | | | | | | | | | | |
Callable 07/30/2024 | | | | 810,000 | | | | | 782,200 | |
| | | | | | | | | | |
| | | | | | | | | 1,576,034 | |
| | | | | | | | | | |
| Multiline Retail - 0.6% | | | | |
Dollar Tree, Inc. | | | | | | | | | | |
4.000%, 05/15/2025 | | | | | | | | | | |
Callable 03/15/2025 | | | | 715,000 | | | | | 711,820 | |
| | | | | | | | | | |
| Oil & Gas & Consumable Fuels - 2.4% | | | | |
Chevron Corp. | | | | | | | | | | |
1.995%, 05/11/2027 | | | | | | | | | | |
Callable 03/11/2027 | | | | 400,000 | | | | | 368,555 | |
Enterprise Products Operating, LLC | | | | | | | | | | |
3.750%, 02/15/2025 | | | | | | | | | | |
Callable 11/15/2024 | | | | 665,000 | | | | | 658,415 | |
Exxon Mobil Corp.: | | | | | | | | | | |
2.709%, 03/06/2025 | | | | | | | | | | |
Callable 12/06/2024 | | | | 255,000 | | | | | 249,963 | |
3.043%, 03/01/2026 | | | | | | | | | | |
Callable 12/01/2025 | | | | 400,000 | | | | | 393,478 | |
Kinder Morgan, Inc. | | | | | | | | | | |
3.150%, 01/15/2023 | | | | | | | | | | |
Callable 12/15/2022 | | | | 500,000 | | | | | 499,371 | |
The accompanying notes are an integral part of these financial statements.
16
|
| LKCM BALANCED FUND |
| SCHEDULEOF INVESTMENTS, CONTINUED |
| June 30, 2022 (Unaudited) |
| | | | | | | | | | |
| CORPORATE BONDS | | Principal
Amount | | Value |
| Oil & Gas & Consumable Fuels - 2.4%, Continued |
Schlumberger Investment SA | | | | | | | | | | |
3.650%, 12/01/2023 | | | | | | | | | | |
Callable 09/01/2023 (b) | | | $ | 500,000 | | | | $ | 502,248 | |
| | | | | | | | | | |
| | | | | | | | | 2,672,030 | |
| | | | | | | | | | |
| Personal Products - 0.7% | | | | |
The Estee Lauder Cos., Inc. | | | | | | | | | | |
2.000%, 12/01/2024 | | | | | | | | | | |
Callable 11/01/2024 | | | | 805,000 | | | | | 780,957 | |
| | | | | | | | | | |
| Pharmaceuticals - 2.7% | | | | |
Abbott Laboratories: | | | | | | | | | | |
3.400%, 11/30/2023 | | | | | | | | | | |
Callable 09/30/2023 | | | | 480,000 | | | | | 481,687 | |
3.875%, 09/15/2025 | | | | | | | | | | |
Callable 06/15/2025 | | | | 255,000 | | | | | 258,039 | |
Bristol-Myers Squibb Co. | | | | | | | | | | |
3.625%, 05/15/2024 | | | | | | | | | | |
Callable 02/15/2024 | | | | 250,000 | | | | | 250,939 | |
Johnson & Johnson | | | | | | | | | | |
0.550%, 09/01/2025 | | | | | | | | | | |
Callable 08/01/2025 | | | | 735,000 | | | | | 678,721 | |
Pfizer, Inc. | | | | | | | | | | |
0.800%, 05/28/2025 | | | | | | | | | | |
Callable 04/28/2025 | | | | 800,000 | | | | | 746,343 | |
Zoetis Inc. | | | | | | | | | | |
4.500%, 11/13/2025 | | | | | | | | | | |
Callable 08/13/2025 | | | | 600,000 | | | | | 608,973 | |
| | | | | | | | | | |
| | | | | | | | | 3,024,702 | |
| | | | | | | | | | |
| Real Estate Investment Trusts - 1.1% | | |
American Tower Corp.: | | | | | | | | | | |
2.400%, 03/15/2025
Callable 02/15/2025 | | | | 600,000 | | | | | 568,084 | |
3.375%, 10/15/2026
Callable 07/15/2026 | | | | 635,000 | | | | | 601,690 | |
| | | | | | | | | | |
| | | | | | | | | 1,169,774 | |
| | | | | | | | | | |
| Road & Rail - 0.2% | | |
Union Pacific Corp. | | | | | | | | | | |
3.750%, 07/15/2025
Callable 05/15/2025 | | | | 200,000 | | | | | 200,611 | |
| | | | | | | | | | |
| Semiconductor Equipment & Products - 0.7% | | |
Intel Corp. | | | | | | | | | | |
2.875%, 05/11/2024
Callable 03/11/2025 | | | | 255,000 | | | | | 254,921 | |
3.700%, 07/29/2025
Callable 04/29/2025 | | | | 500,000 | | | | | 504,266 | |
| | | | | | | | | | |
| Semiconductors & Semiconductor Equipment - 0.4% | | |
NVIDIA Corp. | | | | | | | | | | |
3.200%, 09/16/2026
Callable 06/16/2026 | | | | 400,000 | | | | | 396,509 | |
| | | | | | | | | | |
| | | | | | | | | 651,430 | |
| | | | | | | | | | |
| | | | | | | | | | |
| CORPORATE BONDS | | Principal
Amount | | Value |
| Software - 2.4% | | |
Adobe, Inc. | | | | | | | | | | |
1.900%, 02/01/2025
Callable 01/01/2025 | | | $ | 755,000 | | | | $ | 728,412 | |
Fortinet, Inc. | | | | | | | | | | |
1.000%, 03/15/2026
Callable 02/15/2026 | | | | 600,000 | | | | | 529,020 | |
Microsoft Corp. | | | | | | | | | | |
3.125%, 11/03/2025
Callable 08/03/2025 | | | | 230,000 | | | | | 230,447 | |
Oracle Corp.: | | | | | | | | | | |
2.500%, 04/01/2025
Callable 03/01/2025 | | | | 500,000 | | | | | 476,109 | |
2.950%, 05/15/2025
Callable 02/15/2025 | | | | 500,000 | | | | | 479,727 | |
Roper Technologies, Inc. | | | | | | | | | | |
1.000%, 09/15/2025
Callable 08/15/2025 | | | | 250,000 | | | | | 226,527 | |
| | | | | | | | | | |
| | | | | | | | | 2,670,242 | |
| | | | | | | | | | |
| Specialty Retail - 1.1% | | | | |
Lowe’s Cos, Inc. | | | | | | | | | | |
2.500%, 04/15/2026
Callable 01/15/2026 | | | | 800,000 | | | | | 758,066 | |
The Home Depot, Inc. | | | | | | | | | | |
2.800%, 09/14/2027
Callable 06/14/2027 | | | | 500,000 | | | | | 478,075 | |
| | | | | | | | | | |
| | | | | | | | | 1,236,141 | |
| | | | | | | | | | |
TOTAL CORPORATE BONDS
(Cost $35,108,336) | | | | | 33,372,657 | |
| | | | | | | | | | |
| | | | | | | | | | |
| SHORT-TERM INVESTMENTS - 0.6% | | | | |
| Money Market Funds - 0.6% | | | | |
Invesco Short-Term Investments Trust -
Government & Agency Portfolio -
Institutional Shares, 1.38% (c) | | | | 643,720 | | | | | 643,720 | |
| | | | | | | | | | |
TOTAL SHORT-TERM INVESTMENTS
(Cost $643,720) | | | | | | | | | 643,720 | |
| | | | | | | | | | |
Total Investments - 100.1%
(Cost $85,323,640) | | | | | 110,706,423 | |
Liabilities in Excess of Other Assets - (0.1)% | | | | | (136,747 | ) |
| | | | | | | | | | |
TOTAL NET ASSETS - 100.0% | | | | $ | 110,569,676 | |
| | | | | | | | | | |
| (a) | Non-income producing security. |
| (b) | Security issued by non-U.S. incorporated company. |
| (c) | The rate quoted is the annualized seven-day yield of the Fund at period end. |
Investments are classified by industry pursuant to the Global Industry Classification Standard (GICS®), which was developed by and/or is the exclusive property of Morgan Stanley Capital International, Inc. (“MSCI”) and Standard & Poor’s Financial Services LLC (“S&P”). GICS is a service mark of MSCI and S&P and has been licensed for use by U.S. Bancorp Fund Services, LLC.
The accompanying notes are an integral part of these financial statements.
17
|
| LKCM FIXED INCOME FUND |
| SCHEDULEOF INVESTMENTS |
| June 30, 2022 (Unaudited) |
| | | | | | | | | | |
| CORPORATE BONDS - 67.0% | | Principal
Amount | | Value |
| Aerospace & Defense - 5.1% | | |
Honeywell International, Inc.: | | | | | | | | | | |
2.300%, 08/15/2024 | | | | | | | | | | |
Callable 07/15/2024 | | | $ | 3,105,000 | | | | $ | 3,051,299 | |
1.350%, 06/01/2025 | | | | | | | | | | |
Callable 05/01/2025 | | | | 3,000,000 | | | | | 2,830,390 | |
L3Harris Technologies, Inc. | | | | | | | | | | |
3.850%, 06/15/2023 | | | | | | | | | | |
Callable 05/15/2023 | | | | 6,650,000 | | | | | 6,646,732 | |
Raytheon Technologies Corp. | | | | | | | | | | |
3.700%, 12/15/2023 | | | | | | | | | | |
Callable 09/15/2023 | | | | 1,750,000 | | | | | 1,747,743 | |
| | | | | | | | | | |
| | | | | | | | | 14,276,164 | |
| | | | | | | | | | |
| Banks - 4.5% | | | | |
Bank of America Corp.: | | | | | | | | | | |
3.300%, 01/11/2023 | | | | 2,000,000 | | | | | 2,003,896 | |
4.450%, 03/03/2026 | | | | 2,000,000 | | | | | 1,995,824 | |
Comerica, Inc. | | | | | | | | | | |
3.700%, 07/31/2023 | | | | | | | | | | |
Callable 06/30/2023 | | | | 2,000,000 | | | | | 2,000,437 | |
Truist Bank: | | | | | | | | | | |
3.200%, 04/01/2024 | | | | | | | | | | |
Callable 03/01/2024 | | | | 2,500,000 | | | | | 2,492,349 | |
3.300%, 05/15/2026 | | | | | | | | | | |
Callable 04/15/2026 | | | | 2,000,000 | | | | | 1,932,595 | |
Wells Fargo & Co. | | | | | | | | | | |
4.125%, 08/15/2023 | | | | 2,000,000 | | | | | 2,016,630 | |
| | | | | | | | | | |
| | | | | | | | | 12,441,731 | |
| | | | | | | | | | |
| Beverages - 0.8% | | | | |
Keurig Dr Pepper, Inc. | | | | | | | | | | |
2.550%, 09/15/2026 | | | | | | | | | | |
Callable 06/15/2026 | | | | 2,225,000 | | | | | 2,075,968 | |
| | | | | | | | | | |
| Biotechnology - 3.2% | | | | |
AbbVie, Inc. | | | | | | | | | | |
2.900%, 11/06/2022 | | | | 3,487,000 | | | | | 3,487,343 | |
Amgen, Inc.: | | | | | | | | | | |
2.250%, 08/19/2023 | | | | | | | | | | |
Callable 06/19/2023 | | | | 2,350,000 | | | | | 2,324,626 | |
2.600%, 08/19/2026 | | | | | | | | | | |
Callable 05/19/2026 | | | | 1,000,000 | | | | | 948,873 | |
2.200%, 02/21/2027 | | | | | | | | | | |
Callable 12/21/2026 | | | | 2,500,000 | | | | | 2,304,081 | |
| | | | | | | | | | |
| | | | | | | | | 9,064,923 | |
| | | | | | | | | | |
| Chemicals - 2.0% | | | | |
Air Products and Chemicals, Inc. | | | | | | | | | | |
1.500%, 10/15/2025 | | | | | | | | | | |
Callable 09/15/2025 | | | | 4,000,000 | | | | | 3,773,451 | |
Ecolab, Inc. | | | | | | | | | | |
2.700%, 11/01/2026 | | | | | | | | | | |
Callable 08/01/2026 | | | | 2,000,000 | | | | | 1,927,004 | |
| | | | | | | | | | |
| | | | | | | | | 5,700,455 | |
| | | | | | | | | | |
| | | | | | | | | | |
| CORPORATE BONDS | | Principal
Amount | | Value |
| Communications Equipment - 1.4% | | | | |
QUALCOMM, Inc. | | | | | | | | | | |
2.900%, 05/20/2024 | | | | | | | | | | |
Callable 03/20/2024 | | | $ | 4,000,000 | | | | $ | 3,988,139 | |
| | | | | | | | | | |
| Computers & Peripherals - 1.3% | | | | |
Apple, Inc.: | | | | | | | | | | |
2.400%, 05/03/2023 | | | | 1,250,000 | | | | | 1,244,702 | |
2.500%, 02/09/2025 | | | | 2,515,000 | | | | | 2,471,606 | |
| | | | | | | | | | |
| | | | | | | | | 3,716,308 | |
| | | | | | | | | | |
| Consumer Finance - 2.7% | | | | |
American Express Co.: | | | | | | | | | | |
3.400%, 02/27/2023 | | | | | | | | | | |
Callable 01/27/2023 | | | | 2,500,000 | | | | | 2,509,139 | |
2.500%, 07/30/2024 | | | | | | | | | | |
Callable 06/30/2024 | | | | 1,063,000 | | | | | 1,036,247 | |
3.000%, 10/30/2024 | | | | | | | | | | |
Callable 09/29/2024 | | | | 2,000,000 | | | | | 1,969,089 | |
4.200%, 11/06/2025 | | | | | | | | | | |
Callable 10/06/2025 | | | | 2,000,000 | | | | | 2,022,853 | |
| | | | | | | | | | �� |
| | | | | | | | | 7,537,328 | |
| | | | | | | | | | |
| Containers & Packaging - 1.5% | | | | |
Ball Corp. | | | | | | | | | | |
5.250%, 07/01/2025 | | | | 4,252,000 | | | | | 4,256,550 | |
| | | | | | | | | | |
| Diversified Financials - 4.1% | | | | |
JPMorgan Chase & Co.: | | | | | | | | | | |
3.375%, 05/01/2023 | | | | 3,788,000 | | | | | 3,790,225 | |
2.700%, 05/18/2023 | | | | | | | | | | |
Callable 03/18/2023 | | | | 1,855,000 | | | | | 1,847,438 | |
3.875%, 02/01/2024 | | | | 1,750,000 | | | | | 1,763,542 | |
3.300%, 04/01/2026 | | | | | | | | | | |
Callable 01/01/2026 | | | | 3,500,000 | | | | | 3,408,526 | |
3.200%, 06/15/2026 | | | | | | | | | | |
Callable 03/15/2026 | | | | 636,000 | | | | | 615,513 | |
| | | | | | | | | | |
| | | | | | | | | 11,425,244 | |
| | | | | | | | | | |
| Diversified Telecommunication Services - 4.2% | | |
AT&T, Inc.: | | | | | | | | | | |
1.700%, 03/25/2026 | | | | | | | | | | |
Callable 03/25/2023 | | | | 1,450,000 | | | | | 1,328,813 | |
4.250%, 03/01/2027 | | | | | | | | | | |
Callable 12/01/2026 | | | | 4,000,000 | | | | | 3,998,971 | |
Verizon Communications, Inc.: | | | | | | | | | | |
3.500%, 11/01/2024 | | | | | | | | | | |
Callable 08/01/2024 | | | | 1,750,000 | | | | | 1,747,330 | |
4.125%, 03/16/2027 | | | | 2,000,000 | | | | | 1,998,306 | |
2.100%, 03/22/2028 | | | | | | | | | | |
Callable 01/22/2028 | | | | 3,000,000 | | | | | 2,672,770 | |
| | | | | | | | | | |
| | | | | | | | | 11,746,190 | |
| | | | | | | | | | |
| Electrical Equipment & Instruments - 3.1% | | |
Emerson Electric Co. | | | | | | | | | | |
3.150%, 06/01/2025 | | | | | | | | | | |
Callable 03/01/2025 | | | | 6,500,000 | | | | | 6,446,250 | |
The accompanying notes are an integral part of these financial statements.
18
|
| LKCM FIXED INCOME FUND |
| SCHEDULEOF INVESTMENTS, CONTINUED |
| June 30, 2022 (Unaudited) |
| | | | | | | | | | |
| CORPORATE BONDS | | Principal
Amount | | Value |
| Electrical Equipment & Instruments - 3.1%, Continued |
Rockwell Automation, Inc. | | | | | | | | | | |
0.350%, 08/15/2023 | | | | | | | | | | |
Callable 08/15/2022 | | | $ | 825,000 | | | | $ | 799,236 | |
2.875%, 03/01/2025 | | | | | | | | | | |
Callable 12/01/2024 | | | | 1,440,000 | | | | | 1,415,242 | |
| | | | | | | | | | |
| | | | | | | | | 8,660,728 | |
| | | | | | | | | | |
| Electronic Equipment & Instruments - 1.6% | | |
Trimble, Inc. | | | | | | | | | | |
4.150%, 06/15/2023 | | | | | | | | | | |
Callable 05/15/2023 | | | | 4,500,000 | | | | | 4,492,603 | |
| | | | | | | | | | |
| Household Products - 0.3% | | | | |
The Procter & Gamble Co. | | | | | | | | | | |
8.000%, 09/01/2024 | | | | 775,000 | | | | | 844,189 | |
| | | | | | | | | | |
| Life Sciences Tools & Services - 3.3% | | | | |
Danaher Corp. | | | | | | | | | | |
3.350%, 09/15/2025 | | | | | | | | | | |
Callable 06/15/2025 | | | | 5,500,000 | | | | | 5,445,441 | |
Thermo Fisher Scientific, Inc. | | | | | | | | | | |
1.215%, 10/18/2024 | | | | | | | | | | |
Callable 10/18/2022 | | | | 4,000,000 | | | | | 3,797,730 | |
| | | | | | | | | | |
| | | | | | | | | 9,243,171 | |
| | | | | | | | | | |
| Media & Entertainment - 1.4% | | | | |
Alphabet, Inc. | | | | | | | | | | |
3.375%, 02/25/2024 | | | | 4,000,000 | | | | | 4,027,871 | |
| | | | | | | | | | |
| Multiline Retail - 1.1% | | | | |
Dollar Tree, Inc. | | | | | | | | | | |
4.000%, 05/15/2025 | | | | | | | | | | |
Callable 03/15/2025 | | | | 3,000,000 | | | | | 2,986,657 | |
| | | | | | | | | | |
| Oil & Gas & Consumable Fuels - 5.2% | | | | |
Chevron Corp.: | | | | | | | | | | |
2.355%, 12/05/2022 | | | | | | | | | | |
Callable 09/05/2022 | | | | 1,000,000 | | | | | 999,356 | |
2.954%, 05/16/2026 | | | | | | | | | | |
Callable 02/16/2026 | | | | 1,870,000 | | | | | 1,828,014 | |
Enterprise Products Operating, LLC | | | | | | | | | | |
3.750%, 02/15/2025 | | | | | | | | | | |
Callable 11/15/2024 | | | | 2,963,000 | | | | | 2,933,662 | |
Kinder Morgan Energy Partners, L.P. | | | | | | | | | | |
3.450%, 02/15/2023 | | | | | | | | | | |
Callable 100.00, 11/15/2022 | | | | 1,360,000 | | | | | 1,361,636 | |
4.250%, 09/01/2024 | | | | | | | | | | |
Callable 06/01/2024 | | | | 3,000,000 | | | | | 3,006,232 | |
Kinder Morgan, Inc. | | | | | | | | | | |
3.150%, 01/15/2023 | | | | | | | | | | |
Callable 12/15/2022 | | | | 4,350,000 | | | | | 4,344,526 | |
| | | | | | | | | | |
| | | | | | | | | 14,473,426 | |
| | | | | | | | | | |
| Personal Products - 0.2% | | | | |
The Estee Lauder Cos., Inc. | | | | | | | | | | |
2.000%, 12/01/2024 | | | | | | | | | | |
Callable 11/01/2024 | | | | 556,000 | | | | | 539,394 | |
| | | | | | | | | | |
| | | | | | | | | | |
| CORPORATE BONDS | | Principal
Amount | | Value |
| Pharmaceuticals - 4.3% | | | | |
Abbott Laboratories: | | | | | | | | | | |
3.400%, 11/30/2023 | | | | | | | | | | |
Callable 09/30/2023 | | | $ | 1,750,000 | | | | $ | 1,756,150 | |
2.950%, 03/15/2025 | | | | | | | | | | |
Callable 12/15/2024 | | | | 3,925,000 | | | | | 3,877,045 | |
Bristol-Myers Squibb Co. | | | | | | | | | | |
3.625%, 05/15/2024 | | | | | | | | | | |
Callable 02/15/2024 | | | | 4,750,000 | | | | | 4,767,843 | |
Zoetis, Inc. | | | | | | | | | | |
3.250%, 02/01/2023 | | | | | | | | | | |
Callable 11/01/2022 | | | | 1,664,000 | | | | | 1,658,726 | |
| | | | | | | | | | |
| | | | | | | | | 12,059,764 | |
| | | | | | | | | | |
| Real Estate Investment Trusts - 3.5% | | | | |
American Tower Corp.: | | | | | | | | | | |
3.500%, 01/31/2023 | | | | 3,500,000 | | | | | 3,499,980 | |
5.000%, 02/15/2024 | | | | 2,500,000 | | | | | 2,532,976 | |
3.375%, 10/15/2026 | | | | | | | | | | |
Callable 07/15/2026 | | | | 4,030,000 | | | | | 3,818,598 | |
| | | | | | | | | | |
| | | | | | | | | 9,851,554 | |
| | | | | | | | | | |
| Road & Rail - 4.7% | | | | |
Burlington Northern Santa Fe, LLC: | | | | | | | | | | |
3.000%, 03/15/2023 | | | | | | | | | | |
Callable 12/15/2022 | | | | 4,695,000 | | | | | 4,692,779 | |
3.000%, 04/01/2025 | | | | | | | | | | |
Callable 01/01/2025 | | | | 2,250,000 | | | | | 2,220,920 | |
Union Pacific Corp.: | | | | | | | | | | |
3.250%, 01/15/2025 | | | | | | | | | | |
Callable 10/15/2024 | | | | 3,295,000 | | | | | 3,271,203 | |
3.750%, 07/15/2025 | | | | | | | | | | |
Callable 05/15/2025 | | | | 3,025,000 | | | | | 3,034,234 | |
| | | | | | | | | | |
| | | | | | | | | 13,219,136 | |
| | | | | | | | | | |
| Semiconductor Equipment & Products - 0.8% | | |
Intel Corp. | | | | | | | | | | |
3.700%, 07/29/2025 | | | | | | | | | | |
Callable 04/29/2025 | | | | 2,250,000 | | | | | 2,269,195 | |
| | | | | | | | | | |
| Semiconductors & Semiconductor Equipment - 1.3% | | |
NVIDIA Corp. | | | | | | | | | | |
1.550%, 06/15/2028 | | | | | | | | | | |
Callable 04/15/2028 | | | | 4,000,000 | | | | | 3,514,199 | |
| | | | | | | | | | |
| Software - 4.1% | | | | |
Adobe, Inc. | | | | | | | | | | |
1.900%, 02/01/2025 | | | | | | | | | | |
Callable 01/01/2025 | | | | 4,280,000 | | | | | 4,129,275 | |
Oracle Corp.: | | | | | | | | | | |
2.500%, 10/15/2022 | | | | 3,000,000 | | | | | 2,994,130 | |
2.650%, 07/15/2026 | | | | | | | | | | |
Callable 04/15/2026 | | | | 2,000,000 | | | | | 1,849,363 | |
2.300%, 03/25/2028 | | | | | | | | | | |
Callable 01/25/2028 | | | | 3,000,000 | | | | | 2,588,493 | |
| | | | | | | | | | |
| | | | | | | | | 11,561,261 | |
| | | | | | | | | | |
The accompanying notes are an integral part of these financial statements.
19
|
| LKCM FIXED INCOME FUND |
| SCHEDULEOF INVESTMENTS, CONTINUED |
| June 30, 2022 (Unaudited) |
| | | | | | | | | | |
| CORPORATE BONDS | | Principal
Amount | | Value |
| Specialty Retail - 1.3% | | | | |
Lowe’s Cos, Inc. | | | | | | | | | | |
2.500%, 04/15/2026 | | | | | | | | | | |
Callable 01/15/2026 | | | $ | 1,000,000 | | | | $ | 947,582 | |
The Home Depot, Inc. | | | | | | | | | | |
2.700%, 04/01/2023 | | | | | | | | | | |
Callable 01/01/2023 | | | | 2,750,000 | | | | | 2,749,401 | |
| | | | | | | | | | |
| | | | | | | | | 3,696,983 | |
| | | | | | | | | | |
TOTAL CORPORATE BONDS
(Cost $194,363,901) | | | | | | | | | 187,669,131 | |
| | | | | | | | | | |
| | | | | | | | | | |
| U.S. GOVERNMENT ISSUES - 6.1% | | | | |
| U.S. Treasury Inflation Indexed Bonds - 1.6% | | |
0.625%, 01/15/2024 | | | | 4,336,675 | | | | | 4,410,704 | |
| | | | | | | | | | |
| U.S. Treasury Notes - 4.5% | | | | |
1.750%, 07/15/2022 | | | | 2,000,000 | | | | | 2,000,416 | |
1.375%, 02/15/2023 | | | | 2,000,000 | | | | | 1,984,202 | |
2.000%, 02/15/2023 | | | | 2,000,000 | | | | | 1,991,936 | |
2.750%, 05/31/2023 | | | | 750,000 | | | | | 748,979 | |
2.000%, 02/15/2025 | | | | 2,000,000 | | | | | 1,950,781 | |
2.875%, 06/15/2025 | | | | 1,000,000 | | | | | 997,031 | |
2.000%, 08/15/2025 | | | | 1,000,000 | | | | | 970,195 | |
1.625%, 02/15/2026 | | | | 2,000,000 | | | | | 1,903,828 | |
| | | | | | | | | | |
| | | | | | | | | 12,547,368 | |
| | | | | | | | | | |
TOTAL U.S. GOVERNMENT ISSUES
(Cost $17,077,517) | | | | | | | | | 16,958,072 | |
| | | | | | | | | | |
| | | | | | | | | | |
U.S. GOVERNMENT SPONSORED
ENTITIES - 25.2% | | | | |
| Fannie Mae - 0.6% | | | | |
0.500%, 06/17/2025 | | | | 1,852,000 | | | | | 1,720,098 | |
| | | | | | | | | | |
| Federal Home Loan Banks - 21.0% | | | | |
0.500%, 12/17/2024 (a) | | | | 2,500,000 | | | | | 2,415,669 | |
3.050%, 12/30/2024 | | | | | | | | | | |
Callable 06/30/2023 | | | | 2,500,000 | | | | | 2,484,743 | |
3.000%, 01/27/2025 | | | | | | | | | | |
Callable 07/27/2022 | | | | 2,200,000 | | | | | 2,190,062 | |
2.000%, 04/14/2025 | | | | | | | | | | |
Callable 04/14/2023 | | | | 5,000,000 | | | | | 4,947,488 | |
3.250%, 06/09/2025 | | | | | | | | | | |
Callable 06/09/2023 | | | | 1,000,000 | | | | | 992,079 | |
0.500%, 10/28/2025 (a) | | | | | | | | | | |
Callable 10/28/2022 | | | | 3,000,000 | | | | | 2,848,113 | |
2.500%, 11/12/2025 (a) | | | | | | | | | | |
Callable 05/12/2023 | | | | 1,505,000 | | | | | 1,498,057 | |
0.300%, 01/27/2026 (a) | | | | 3,000,000 | | | | | 2,781,792 | |
1.000%, 02/17/2026 (a) | | | | | | | | | | |
Callable 02/17/2023 | | | | 2,500,000 | | | | | 2,413,584 | |
2.375%, 03/13/2026 | | | | 3,575,000 | | | | | 3,487,994 | |
0.500%, 03/30/2026 (a) | | | | | | | | | | |
Callable 03/30/2022 | | | | 3,000,000 | | | | | 2,814,056 | |
0.500%, 05/26/2026 (a) | | | | 2,500,000 | | | | | 2,348,890 | |
| | | | | | | | | | |
U.S. GOVERNMENT SPONSORED
ENTITIES | | Principal
Amount | | Value |
| Federal Home Loan Banks - 21.0%, Continued | | |
0.625%, 10/28/2026 (a) | | | $ | 3,000,000 | | | | $ | 2,821,698 | |
1.250%, 11/10/2026 | | | | | | | | | | |
Callable 11/10/2022 | | | | 3,000,000 | | | | | 2,803,467 | |
0.750%, 01/25/2027 (a) | | | | 2,500,000 | | | | | 2,375,189 | |
1.500%, 03/10/2027 (a) | | | | | | | | | | |
Callable 09/10/2022 | | | | 3,150,000 | | | | | 3,086,002 | |
3.500%, 05/24/2027 (a) | | | | | | | | | | |
Callable 08/24/2022 | | | | 2,650,000 | | | | | 2,641,670 | |
0.650%, 01/27/2028 (a) | | | | | | | | | | |
Callable 07/27/2021 | | | | 4,000,000 | | | | | 3,597,638 | |
1.000%, 11/16/2028 (a) | | | | | | | | | | |
Callable 08/16/2022 | | | | 3,000,000 | | | | | 2,778,774 | |
2.820%, 06/27/2029 | | | | | | | | | | |
Callable 07/08/2022 | | | | 4,000,000 | | | | | 3,797,176 | |
1.000%, 01/27/2031 (a) | | | | | | | | | | |
Callable 07/27/2022 | | | | 4,000,000 | | | | | 3,495,384 | |
| | | | | | | | | | |
| | | | | | | | | 58,619,525 | |
| | | | | | | | | | |
| Freddie Mac - 3.6% | | | | |
0.750%, 05/28/2025 | | | | | | | | | | |
Callable 05/28/2023 | | | | 3,500,000 | | | | | 3,270,646 | |
3.375%, 06/30/2027 (a) | | | | | | | | | | |
Callable 09/30/2022 | | | | 1,895,000 | | | | | 1,895,615 | |
1.000%, 09/30/2031 (a) | | | | 3,000,000 | | | | | 2,670,307 | |
1.250%, 12/15/2033 (a) | | | | 2,500,000 | | | | | 2,234,893 | |
| | | | | | | | | | |
| | | | | | | | | 10,071,461 | |
| | | | | | | | | | |
TOTAL U.S. GOVERNMENT SPONSORED ENTITIES
(Cost $74,512,501) | | | | | | | | | 70,411,084 | |
| | | | | | | | | | |
| | | | | | | | | | |
| SHORT-TERM INVESTMENTS - 1.2% | | |
| Money Market Funds - 1.2% | | | | |
Invesco Short-Term Investments Trust - Government & Agency Portfolio - Institutional Shares, 1.38% (b) | | | | 3,456,120 | | | | | 3,456,120 | |
| | | | | | | | | | |
TOTAL SHORT-TERM INVESTMENTS
(Cost $3,456,120) | | | | | 3,456,120 | |
| | | | | | | | | | |
Total Investments - 99.5%
(Cost $289,410,039) | | | | | | | | | 278,494,407 | |
Other Assets in Excess of Liabilities - 0.5% | | | | | 1,403,885 | |
| | | | | | | | | | |
TOTAL NET ASSETS - 100.0% | | | | | | | | $ | 279,898,292 | |
| | | | | | | | | | |
| (a) | Step-up bond that pays an initial coupon rate for the first period and then a higher coupon rate for the following periods. Rate as of period end. |
| (b) | The rate quoted is the annualized seven-day yield of the Fund at period end. |
Investments are classified by industry pursuant to the Global Industry Classification Standard (GICS®), which was developed by and/or is the exclusive property of Morgan Stanley Capital International, Inc. (“MSCI”) and Standard & Poor’s Financial Services LLC (“S&P”). GICS is a service mark of MSCI and S&P and has been licensed for use by U.S. Bancorp Fund Services, LLC.
The accompanying notes are an integral part of these financial statements.
20
|
| LKCM INTERNATIONAL EQUITY FUND |
| SCHEDULEOF INVESTMENTS |
| June 30, 2022 (Unaudited) |
| | | | | | | | | | |
| COMMON STOCKS - 90.2% | | Shares | | Value |
| AUSTRALIA - 5.1% |
| Diversified Operations - 2.3% |
BHP Billiton Ltd. | | | | 34,000 | | | | $ | 973,543 | |
| | | | | | | | | | |
| Oil, Gas & Consumable Fuels - 0.3% |
Woodside Energy Group Ltd. | | | | 6,143 | | | | | 135,014 | |
| | | | | | | | | | |
| Pharmaceuticals - 2.5% |
CSL Ltd. | | | | 5,950 | | | | | 1,104,766 | |
| | | | | | | | | | |
Total Australia | | | | | | | | | 2,213,323 | |
| | | | | | | | | | |
| FRANCE - 15.2% |
| Aerospace & Defense - 2.3% |
Safran SA | | | | 10,000 | | | | | 995,659 | |
| | | | | | | | | | |
| Capital Markets - 2.4% |
Euronext NV | | | | 12,250 | | | | | 1,004,662 | |
| | | | | | | | | | |
| Chemicals - 2.2% |
Air Liquide SA | | | | 7,150 | | | | | 962,414 | |
| | | | | | | | | | |
| Electrical Equipment & Instruments - 1.8% |
Schneider Electric SA | | | | 6,425 | | | | | 765,578 | |
| | | | | | | | | | |
| IT Consulting & Services - 2.2% |
Cap Gemini | | | | 5,600 | | | | | 965,781 | |
| | | | | | | | | | |
| Oil & Gas & Consumable Fuels - 2.1% |
TOTAL SA | | | | 17,000 | | | | | 894,832 | |
| | | | | | | | | | |
| Specialty Retail - 2.2% |
LVMH Moet Hennessy Louis Vuitton SE | | | | 1,575 | | | | | 965,287 | |
| | | | | | | | | | |
Total France | | | | | | | | | 6,554,213 | |
| | | | | | | | | | |
| GERMANY - 8.5% |
| Insurance - 2.1% |
Allianz SE | | | | 4,600 | | | | | 881,871 | |
| | | | | | | | | | |
| Pharmaceuticals - 0.8% |
Bayer AG | | | | 6,050 | | | | | 361,286 | |
| | | | | | | | | | |
| Semiconductor Equipment & Products - 1.9% |
Infineon Technologies AG | | | | 33,000 | | | | | 802,746 | |
| | | | | | | | | | |
| Software - 2.0% |
SAP SE | | | | 9,500 | | | | | 865,933 | |
| | | | | | | | | | |
| Textiles, Apparel & Luxury Goods - 1.7% |
Adidas AG | | | | 4,100 | | | | | 728,290 | |
| | | | | | | | | | |
Total Germany | | | | | | | | | 3,640,126 | |
| | | | | | | | | | |
| IRELAND - 2.2% |
| Construction Materials - 2.2% |
CRH PLC | | | | 28,000 | | | | | 966,251 | |
| | | | | | | | | | |
Total Ireland | | | | | | | | | 966,251 | |
| | | | | | | | | | |
| ITALY - 0.9% |
| Textiles, Apparel & Luxury Goods - 0.9% |
Moncler SpA | | | | 8,830 | | | | | 380,451 | |
| | | | | | | | | | |
Total Italy | | | | | | | | | 380,451 | |
| | | | | | | | | | |
| | | | | | | | | | |
| COMMON STOCKS | | Shares | | Value |
| JAPAN - 5.1% |
| Building Products - 2.0% |
Daikin Industries Ltd. | | | | 5,450 | | | | $ | 875,047 | |
| | | | | | | | | | |
| Computers & Peripherals - 2.1% |
Nidec Corp. | | | | 14,250 | | | | | 883,028 | |
| | | | | | | | | | |
| Personal Products - 1.0% |
Shiseido Co., Ltd. | | | | 11,000 | | | | | 443,379 | |
| | | | | | | | | | |
Total Japan | | | | | | | | | 2,201,454 | |
| | | | | | | | | | |
| NETHERLANDS - 6.6% |
| Banks - 2.0% |
ING Groep NV | | | | 89,000 | | | | | 876,797 | |
| | | | | | | | | | |
| Professional Services - 2.6% |
Wolters Kluwer NV | | | | 11,250 | | | | | 1,090,331 | |
| | | | | | | | | | |
| Semiconductor Equipment & Products - 2.0% |
ASML Holding NV | | | | 1,800 | | | | | 850,392 | |
| | | | | | | | | | |
Total Netherlands | | | | | | | | | 2,817,520 | |
| | | | | | | | | | |
| NORWAY - 5.9% |
| Chemicals - 1.9% |
Elkem ASA | | | | 252,000 | | | | | 809,452 | |
| | | | | | | | | | |
| Diversified Telecommunication Services - 2.2% |
Telenor ASA | | | | 72,500 | | | | | 968,834 | |
| | | | | | | | | | |
| Oil, Gas & Consumable Fuels - 1.8% |
Aker BP ASA | | | | 21,873 | | | | | 757,509 | |
| | | | | | | | | | |
Total Norway | | | | | | | | | 2,535,795 | |
| | | | | | | | | | |
| SPAIN - 1.8% |
| Machinery - 1.8% |
Fluidra SA | | | | 37,500 | | | | | 763,012 | |
| | | | | | | | | | |
Total Spain | | | | | | | | | 763,012 | |
| | | | | | | | | | |
| SWEDEN - 5.1% |
| Banks - 2.2% |
Nordea Bank Abp | | | | 106,500 | | | | | 940,771 | |
| | | | | | | | | | |
| Hotels, Restaurants & Leisure - 2.1% |
Evolution AB | | | | 9,750 | | | | | 891,940 | |
| | | | | | | | | | |
| Oil & Gas & Consumable Fuels - 0.0% |
Lundin Petroleum AB | | | | 23,000 | | | | | 15,639 | |
| | | | | | | | | | |
| Tobacco - 0.8% |
Swedish Match AB | | | | 32,000 | | | | | 326,481 | |
| | | | | | | | | | |
Total Sweden | | | | | | | | | 2,174,831 | |
| | | | | | | | | | |
| SWITZERLAND - 14.6% |
| Banks - 2.1% |
Julius Baer Group Ltd. | | | | 19,500 | | | | | 904,607 | |
| | | | | | | | | | |
| Electrical Equipment & Instruments - 2.4% |
ABB Ltd. | | | | 37,892 | | | | | 1,016,195 | |
| | | | | | | | | | |
| Food Products - 0.9% |
Nestle SA | | | | 3,250 | | | | | 379,836 | |
| | | | | | | | | | |
The accompanying notes are an integral part of these financial statements.
21
|
| LKCM INTERNATIONAL EQUITY FUND |
| SCHEDULEOF INVESTMENTS, CONTINUED |
| June 30, 2022 (Unaudited) |
| | | | | | | | | | |
| COMMON STOCKS | | Shares | | Value |
| Health Care Equipment & Supplies - 2.6% |
Alcon, Inc. | | | | 16,175 | | | | $ | 1,134,216 | |
| | | | | | | �� | | | |
| Pharmaceuticals - 4.8% |
Lonza Group AG | | | | 1,675 | | | | | 894,680 | |
Roche Holding AG | | | | 3,500 | | | | | 1,170,049 | |
| | | | | | | | | | |
| | | | | | | | | 2,064,729 | |
| | | | | | | | | | |
| Software - 1.8% |
Temenos AG | | | | 9,250 | | | | | 791,616 | |
| | | | | | | | | | |
Total Switzerland | | | | | | | | | 6,291,199 | |
| | | | | | | | | | |
| UNITED KINGDOM - 19.2% |
| Banks - 2.2% |
Barclays PLC | | | | 500,000 | | | | | 934,979 | |
| | | | | | | | | | |
| Beverages - 2.5% |
Diageo PLC | | | | 25,000 | | | | | 1,079,819 | |
| | | | | | | | | | |
| Commercial Services & Supplies - 2.1% |
Rentokil Initial Plc | | | | 156,000 | | | | | 904,326 | |
| | | | | | | | | | |
| Hotels, Restaurants & Leisure - 2.9% |
Compass Group PLC | | | | 17,500 | | | | | 359,299 | |
InterContinental Hotels Group PLC | | | | 17,000 | | | | | 903,517 | |
| | | | | | | | | | |
| | | | | | | | | 1,262,816 | |
| | | | | | | | | | |
| Insurance - 2.1% |
Prudential PLC | | | | 73,000 | | | | | 908,064 | |
| | | | | | | | | | |
| Oil, Gas & Consumable Fuels - 2.2% |
Shell Plc | | | | 36,000 | | | | | 937,540 | |
| | | | | | | | | | |
| Personal Products - 2.5% | | |
Unilever PLC | | | | 23,150 | | | | | 1,055,173 | |
| | | | | | | | | | |
| Specialty Retail - 0.8% | | |
Burberry Group PLC | | | | 17,780 | | | | | 356,693 | |
| | | | | | | | | | |
| Trading Companies & Distributors - 1.9% | | |
Ashtead Group PLC | | | | 19,500 | | | | | 820,337 | |
| | | | | | | | | | |
Total United Kingdom | | | | | | | | | 8,259,747 | |
| | | | | | | | | | |
TOTAL COMMON STOCKS
(Cost $43,511,719) | | | | | | | | | 38,797,922 | |
| | | | | | | | | | |
| | | | | | | | | | |
| PREFERRED STOCKS - 1.6% | | | | |
| Health Care Equipment & Supplies - 1.6% | | |
Sartorius AG | | | | 1,900 | | | | | 666,843 | |
| | | | | | | | | | |
TOTAL PREFERRED STOCKS
(Cost $557,271) | | | | | | | | | 666,843 | |
| | | | | | | | | | |
| | | | | | | | | | |
| SHORT-TERM INVESTMENTS - 7.9% | | | | |
| Money Market Funds - 7.9% | | |
Fidelity Investments Money Market Government Portfolio - Class I, 1.21% (a) | | | | 858,831 | | | | | 858,831 | |
MSILF Government Portfolio, 1.39% (a) | | | | 1,271,445 | | | | | 1,271,445 | |
| | | | | | | | | | |
| SHORT-TERM INVESTMENTS | | Shares | | Value |
| Money Market Funds - 7.9%, Continued | | |
Invesco Short-Term Investments Trust - Government & Agency Portfolio - Institutional Shares, 1.38% (a) | | | | 1,271,445 | | | | $ | 1,271,445 | |
| | | | | | | | | | |
| | | | | | | | | 3,401,721 | |
| | | | | | | | | | |
TOTAL SHORT-TERM INVESTMENTS
(Cost $3,401,721) | | | | | 3,401,721 | |
| | | | | | | | | | |
Total Investments - 99.7%
(Cost $47,470,711) | | | | | 42,866,486 | |
Other Assets in Excess of Liabilities - 0.3% | | | | | 143,019 | |
| | | | | | | | | | |
TOTAL NET ASSETS - 100.0% | | | | $ | 43,009,505 | |
| | | | | | | | | | |
| (a) | The rate quoted is the annualized seven-day yield of the Fund at period end. |
Investments are classified by industry pursuant to the Global Industry Classification Standard (GICS®), which was developed by and/or is the exclusive property of Morgan Stanley Capital International, Inc. (“MSCI”) and Standard & Poor’s Financial Services LLC (“S&P”). GICS is a service mark of MSCI and S&P and has been licensed for use by U.S. Bancorp Fund Services, LLC.
The accompanying notes are an integral part of these financial statements.
22
|
| STATEMENTOF ASSETSAND LIABILITIES |
| June 30, 2022 (Unaudited) |
| | | | | | | | | | | | | | | | | | | | | | | | | | | | | | | | | | | | | | | | | | | | | | | | | | | | | | | | | | | | |
| | | | | | | | | | | | |
| | | | | LKCM
Small Cap
Equity Fund | | | | LKCM
Small-Mid Cap
Equity Fund | | | | LKCM
Equity
Fund | | | | LKCM
Balanced
Fund | | | | LKCM
Fixed
Income Fund | | | | LKCM
International
Equity Fund |
| | | | | | | | | | | | | | | | | | | | | | | | | | | | | | | | | | | | | | | | | | | | | | | | | | | | | | | | | | | | |
Assets | | | | | | | | | | | | | | | | | | | | | | | | | | | | | | | | | | | | | | | | | | | | | | | | | | | | | | | | | | | | |
Investments, at value* | | | | | | | | $ | 169,800,952 | | | | | | | | | $ | 15,081,550 | | | | | | | | | $ | 443,582,343 | | | | | | | | | $ | 110,706,423 | | | | | | | | | $ | 278,494,407 | | | | | | | | | $ | 42,866,486 | |
Dividends and interest receivable | | | | | | | | | 105,129 | | | | | | | | | | 12,088 | | | | | | | | | | 559,549 | | | | | | | | | | 282,533 | | | | | | | | | | 1,868,622 | | | | | | | | | | 184,487 | |
Receivable for Fund shares sold | | | | | | | | | 47,765 | | | | | | | | | | — | | | | | | | | | | 23,000 | | | | | | | | | | 1,248 | | | | | | | | | | — | | | | | | | | | | — | |
Prepaid expenses and other assets | | | | | | | | | 14,030 | | | | | | | | | | 12,316 | | | | | | | | | | 17,980 | | | | | | | | | | 16,764 | | | | | | | | | | 11,725 | | | | | | | | | | 10,633 | |
| | | | | | | | | | | | | | | | | | | | | | | | | | | | | | | | | | | | | | | | | | | | | | | | | | | | | | | | | | | | |
Total assets | | | | | | | | | 169,967,883 | | | | | | | | | | 15,107,338 | | | | | | | | | | 444,182,872 | | | | | | | | | | 111,006,968 | | | | | | | | | | 280,374,754 | | | | | | | | | | 43,186,543 | |
| | | | | | | | | | | | | | | | | | | | | | | | | | | | | | | | | | | | | | | | | | | | | | | | | | | | | | | | | | | | |
Liabilities | | | | | | | | | | | | | | | | | | | | | | | | | | | | | | | | | | | | | | | | | | | | | | | | | | | | | | | | | | | | |
Payable for investment advisory fees (Note B) | | | | | | | | | 313,659 | | | | | | | | | | — | | | | | | | | | | 619,987 | | | | | | | | | | 135,353 | | | | | | | | | | 135,401 | | | | | | | | | | 54,453 | |
Payable for administrative fees | | | | | | | | | 61,227 | | | | | | | | | | 25,658 | | | | | | | | | | 190,851 | | | | | | | | | | 59,084 | | | | | | | | | | 134,918 | | | | | | | | | | 17,999 | |
Payable for accounting and transfer agent fees and expenses | | | | | | | | | 48,929 | | | | | | | | | | 23,779 | | | | | | | | | | 73,482 | | | | | | | | | | 36,953 | | | | | | | | | | 60,033 | | | | | | | | | | 30,845 | |
Payable for professional fees | | | | | | | | | 27,062 | | | | | | | | | | 8,993 | | | | | | | | | | 49,032 | | | | | | | | | | 20,061 | | | | | | | | | | 32,163 | | | | | | | | | | 9,290 | |
Payable for custody fees and expenses | | | | | | | | | 12,114 | | | | | | | | | | 2,987 | | | | | | | | | | 26,134 | | | | | | | | | | 7,173 | | | | | | | | | | 15,052 | | | | | | | | | | 23,479 | |
Payable for reports to shareholders | | | | | | | | | 11,023 | | | | | | | | | | 1,001 | | | | | | | | | | 21,026 | | | | | | | | | | 6,753 | | | | | | | | | | 14,863 | | | | | | | | | | 844 | |
Payable for trustees’ fees and officer compensation (Note B) | | | | | | | | | 15,733 | | | | | | | | | | 1,247 | | | | | | | | | | 39,812 | | | | | | | | | | 11,064 | | | | | | | | | | 29,914 | | | | | | | | | | 1,160 | |
Accrued expenses and other liabilities | | | | | | | | | 3,915 | | | | | | | | | | 220 | | | | | | | | | | 5,586 | | | | | | | | | | 961 | | | | | | | | | | 4,118 | | | | | | | | | | 960 | |
| | | | | | | | | | | | | | | | | | | | | | | | | | | | | | | | | | | | | | | | | | | | | | | | | | | | | | | | | | | | |
Total liabilities | | | | | | | | | 493,662 | | | | | | | | | | 63,885 | | | | | | | | | | 1,029,160 | | | | | | | | | | 437,293 | | | | | | | | | | 476,462 | | | | | | | | | | 177,040 | |
| | | | | | | | | | | | | | | | | | | | | | | | | | | | | | | | | | | | | | | | | | | | | | | | | | | | | | | | | | | | |
Net assets | | | | | | | | $ | 169,474,221 | | | | | | | | | $ | 15,043,453 | | | | | | | | | $ | 443,153,712 | | | | | | | | | $ | 110,569,675 | | | | | | | | | $ | 279,898,292 | | | | | | | | | $ | 43,009,503 | |
| | | | | | | | | | | | | | | | | | | | | | | | | | | | | | | | | | | | | | | | | | | | | | | | | | | | | | | | | | | | |
Net assets consist of: | | | | | | | | | | | | | | | | | | | | | | | | | | | | | | | | | | | | | | | | | | | | | | | | | | | | | | | | | | | | |
Paid-in capital | | | | | | | | $ | 135,059,923 | | | | | | | | | $ | 13,238,081 | | | | | | | | | $ | 240,087,717 | | | | | | | | | $ | 84,041,528 | | | | | | | | | $ | 291,127,042 | | | | | | | | | $ | 46,267,066 | |
Total distributable earnings | | | | | | | | | 34,414,298 | | | | | | | | | | 1,805,372 | | | | | | | | | | 203,065,995 | | | | | | | | | | 26,528,147 | | | | | | | | | | (11,228,750 | ) | | | | | | | | | (3,257,563 | ) |
| | | | | | | | | | | | | | | | | | | | | | | | | | | | | | | | | | | | | | | | | | | | | | | | | | | | | | | | | | | | |
Net assets | | | | | | | | $ | 169,474,221 | | | | | | | | | $ | 15,043,453 | | | | | | | | | $ | 443,153,712 | | | | | | | | | $ | 110,569,675 | | | | | | | | | $ | 279,898,292 | | | | | | | | | $ | 43,009,503 | |
| | | | | | | | | | | | | | | | | | | | | | | | | | | | | | | | | | | | | | | | | | | | | | | | | | | | | | | | | | | | |
Shares of beneficial interest outstanding
(unlimited shares of no par value authorized) | | | | | | | | | 10,464,197 | | | | | | | | | | 1,754,624 | | | | | | | | | | 14,151,134 | | | | | | | | | | 4,522,505 | | | | | | | | | | 27,207,100 | | | | | | | | | | 3,961,294 | |
Net asset value per share
(offering and redemption price) | | | | | | | | $ | 16.20 | | | | | | | | | $ | 8.57 | | | | | | | | | $ | 31.32 | | | | | | | | | $ | 24.45 | | | | | | | | | $ | 10.29 | | | | | | | | | $ | 10.86 | |
| | | | | | | | | | | | | | | | | | | | | | | | | | | | | | | | | | | | | | | | | | | | | | | | | | | | | | | | | | | | |
| | | | | | | | | | | | |
* Cost of Investments | | | | | | | | $ | 144,593,679 | | | | | | | | | $ | 14,398,670 | | | | | | | | | $ | 260,448,761 | | | | | | | | | $ | 85,323,639 | | | | | | | | | $ | 289,410,039 | | | | | | | | | $ | 47,470,711 | |
| | | | | | | | | | | | | | | | | | | | | | | | | | | | | | | | | | | | | | | | | | | | | | | | | | | | | | | | | | | | |
The accompanying notes are an integral part of these financial statements.
23
|
| STATEMENTOF OPERATIONS |
| Six Months Ended June 30, 2022 (Unaudited) |
| | | | | | | | | | | | | | | | | | | | | | | | | | | | | | | | | | | | | | | | | | | | | | | | | | | | | | | | | | | | |
| | | | | | | | | | | | |
| | | | | LKCM
Small Cap
Equity Fund | | | | LKCM
Small-Mid Cap
Equity Fund | | | | LKCM
Equity
Fund | | | | LKCM
Balanced
Fund | | | | LKCM
Fixed
Income Fund | | | | LKCM
International
Equity Fund |
| | | | | | | | | | | | | | | | | | | | | | | | | | | | | | | | | | | | | | | | | | | | | | | | | | | | | | | | | | | | |
Investment Income: | | | | | | | | | | | | | | | | | | | | | | | | | | | | | | | | | | | | | | | | | | | | | | | | | | | | | | | | | | | | |
Dividends* | | | | | | | | $ | 563,998 | | | | | | | | | $ | 67,725 | | | | | | | | | $ | 3,587,399 | | | | | | | | | $ | 750,399 | | | | | | | | | $ | — | | | | | | | | | $ | 1,846,522 | |
Interest | | | | | | | | | 16,604 | | | | | | | | | | 2,579 | | | | | | | | | | 69,715 | | | | | | | | | | 338,161 | | | | | | | | | | 2,703,338 | | | | | | | | | | 5,161 | |
| | | | | | | | | | | | | | | | | | | | | | | | | | | | | | | | | | | | | | | | | | | | | | | | | | | | | | | | | | | | |
Total investment income | | | | | | | | | 580,602 | | | | | | | | | | 70,304 | | | | | | | | | | 3,657,114 | | | | | | | | | | 1,088,560 | | | | | | | | | | 2,703,338 | | | | | | | | | | 1,851,683 | |
| | | | | | | | | | | | | | | | | | | | | | | | | | | | | | | | | | | | | | | | | | | | | | | | | | | | | | | | | | | | |
| | | | | | | | | | | | |
Expenses: | | | | | | | | | | | | | | | | | | | | | | | | | | | | | | | | | | | | | | | | | | | | | | | | | | | | | | | | | | | | |
Investment advisory fees (Note B) | | | | | | | | | 729,367 | | | | | | | | | | 63,919 | | | | | | | | | | 1,713,303 | | | | | | | | | | 415,531 | | | | | | | | | | 712,803 | | | | | | | | | | 217,536 | |
Administrative fees | | | | | | | | | 76,846 | | | | | | | | | | 29,505 | | | | | | | | | | 230,806 | | | | | | | | | | 70,385 | | | | | | | | | | 157,529 | | | | | | | | | | 22,210 | |
Accounting and transfer agent fees and expenses | | | | | | | | | 72,434 | | | | | | | | | | 31,950 | | | | | | | | | | 135,482 | | | | | | | | | | 57,662 | | | | | | | | | | 90,622 | | | | | | | | | | 40,551 | |
Professional fees | | | | | | | | | 39,213 | | | | | | | | | | 5,184 | | | | | | | | | | 83,577 | | | | | | | | | | 24,776 | | | | | | | | | | 49,818 | | | | | | | | | | 9,302 | |
Trustees’ fees and officer compensation (Note B) | | | | | | | | | 55,400 | | | | | | | | | | 4,036 | | | | | | | | | | 128,251 | | | | | | | | | | 34,796 | | | | | | | | | | 80,527 | | | | | | | | | | 9,704 | |
Federal and state registration | | | | | | | | | 24,307 | | | | | | | | | | 10,227 | | | | | | | | | | 37,453 | | | | | | | | | | 11,086 | | | | | | | | | | 25,064 | | | | | | | | | | 13,846 | |
Custody fees and expenses | | | | | | | | | 12,236 | | | | | | | | | | 2,960 | | | | | | | | | | 26,372 | | | | | | | | | | 7,197 | | | | | | | | | | 15,054 | | | | | | | | | | 21,607 | |
Reports to shareholders | | | | | | | | | 8,616 | | | | | | | | | | 776 | | | | | | | | | | 16,135 | | | | | | | | | | 5,211 | | | | | | | | | | 10,206 | | | | | | | | | | 1,100 | |
Other | | | | | | | | | 6,278 | | | | | | | | | | 434 | | | | | | | | | | 9,457 | | | | | | | | | | 2,635 | | | | | | | | | | 3,143 | | | | | | | | | | 1,522 | |
| | | | | | | | | | | | | | | | | | | | | | | | | | | | | | | | | | | | | | | | | | | | | | | | | | | | | | | | | | | | |
Total expenses | | | | | | | | | 1,024,697 | | | | | | | | | | 148,991 | | | | | | | | | | 2,380,836 | | | | | | | | | | 629,279 | | | | | | | | | | 1,144,766 | | | | | | | | | | 337,378 | |
Less, expense waiver and/or reimbursement (Note B) | | | | | | | | | (52,468 | ) | | | | | | | | | (63,766 | ) | | | | | | | | | (422,768 | ) | | | | | | | | | (117,857 | ) | | | | | | | | | (431,963 | ) | | | | | | | | | (95,668 | ) |
| | | | | | | | | | | | | | | | | | | | | | | | | | | | | | | | | | | | | | | | | | | | | | | | | | | | | | | | | | | | |
Net expenses | | | | | | | | | 972,229 | | | | | | | | | | 85,225 | | | | | | | | | | 1,958,068 | | | | | | | | | | 511,422 | | | | | | | | | | 712,803 | | | | | | | | | | 241,710 | |
| | | | | | | | | | | | | | | | | | | | | | | | | | | | | | | | | | | | | | | | | | | | | | | | | | | | | | | | | | | | |
Net investment income (loss) | | | | | | | | | (391,627 | ) | | | | | | | | | (14,921 | ) | | | | | | | | | 1,699,046 | | | | | | | | | | 577,138 | | | | | | | | | | 1,990,535 | | | | | | | | | | 1,609,973 | |
| | | | | | | | | | | | | | | | | | | | | | | | | | | | | | | | | | | | | | | | | | | | | | | | | | | | | | | | | | | | |
| | | | | | | | | | | | |
Realized and Unrealized Gain (Loss): | | | | | | | | | | | | | | | | | | | | | | | | | | | | | | | | | | | | | | | | | | | | | | | | | | | | | | | | | | | | |
Net realized gain (loss) on: | | | | | | | | | | | | | | | | | | | | | | | | | | | | | | | | | | | | | | | | | | | | | | | | | | | | | | | | | | | | |
Investments | | | | | | | | $ | 9,809,018 | | | | | | | | | $ | 1,137,416 | | | | | | | | | $ | 18,233,325 | | | | | | | | | $ | 1,129,499 | | | | | | | | | $ | (658,857 | ) | | | | | | | | $ | (810,122 | ) |
Foreign currency translation | | | | | | | | | — | | | | | | | | | | 4 | | | | | | | | | | 55 | | | | | | | | | | 19 | | | | | | | | | | — | | | | | | | | | | (19,494 | ) |
Net change in unrealized depreciation on: | | | | | | | | | | | | | | | | | | | | | | | | | | | | | | | | | | | | | | | | | | | | | | | | | | | | | | | | | | | | |
Investments | | | | | | | | | (65,967,967 | ) | | | | | | | | | (5,384,246 | ) | | | | | | | | | (123,768,563 | ) | | | | | | | | | (24,051,541 | ) | | | | | | | | | (15,307,343 | ) | | | | | | | | | (15,005,637 | ) |
Foreign currency translation | | | | | | | | | — | | | | | | | | | | (9 | ) | | | | | | | | | (13 | ) | | | | | | | | | (5 | ) | | | | | | | | | — | | | | | | | | | | (6,541 | ) |
| | | | | | | | | | | | | | | | | | | | | | | | | | | | | | | | | | | | | | | | | | | | | | | | | | | | | | | | | | | | |
| | | | | | | | | | | | |
Net Realized and Unrealized Loss | | | | | | | | | (56,158,949 | ) | | | | | | | | | (4,246,835 | ) | | | | | | | | | (105,535,196 | ) | | | | | | | | | (22,922,028 | ) | | | | | | | | | (15,966,200 | ) | | | | | | | | | (15,841,794 | ) |
| | | | | | | | | | | | | | | | | | | | | | | | | | | | | | | | | | | | | | | | | | | | | | | | | | | | | | | | | | | | |
| | | | | | | | | | | | |
Net Decrease in Net Assets Resulting from Operations | | | | | | | | $ | (56,550,576 | ) | | | | | | | | $ | (4,261,756 | ) | | | | | | | | $ | (103,836,150 | ) | | | | | | | | $ | (22,344,890 | ) | | | | | | | | $ | (13,975,665 | ) | | | | | | | | $ | (14,231,821 | ) |
| | | | | | | | | | | | | | | | | | | | | | | | | | | | | | | | | | | | | | | | | | | | | | | | | | | | | | | | | | | | |
The accompanying notes are an integral part of these financial statements.
24
|
| STATEMENTSOF CHANGESIN NET ASSETS |
| | | | | | | | | | | | | | | | | | | | | | | | | | | | | | | | | | | | | | | | |
| | | | |
| | | | | LKCM
Small Cap
Equity Fund | | | | LKCM
Small-Mid Cap
Equity Fund |
| | | | | | | | | | | | | | | | | | | | | | | | | | | | | | | | | | | | | | | | |
| | | | | | | | |
| | | | | Six Months
Ended
June 30, 2022
(Unaudited) | | | | Year Ended
December 31,
2021 | | | | Six Months
Ended
June 30, 2022
(Unaudited) | | | | Year Ended
December 31,
2021 |
Operations: | | | | | | | | | | | | | | | | | | | | | | | | | | | | | | | | | | | | | | | | |
Net investment loss | | | | | | | | $ | (391,627 | ) | | | | | | | | $ | (732,120 | ) | | | | | | | | $ | (14,921 | ) | | | | | | | | $ | (78,691 | ) |
Net realized gain | | | | | | | | | 9,809,018 | | | | | | | | | | 29,340,979 | | | | | | | | | | 1,137,420 | | | | | | | | | | 2,253,060 | |
Net change in unrealized appreciation (depreciation) | | | | | | | | | (65,967,967 | ) | | | | | | | | | 829,538 | | | | | | | | | | (5,384,255 | ) | | | | | | | | | 96,333 | |
| | | | | | | | | | | | | | | | | | | | | | | | | | | | | | | | | | | | | | | | |
Net increase (decrease) in net assets resulting from operations | | | | | | | | | (56,550,576 | ) | | | | | | | | | 29,438,397 | | | | | | | | | | (4,261,756 | ) | | | | | | | | | 2,270,702 | |
| | | | | | | | | | | | | | | | | | | | | | | | | | | | | | | | | | | | | | | | |
| | | | | | | | |
Distributions to Shareholders | | | | | | | | | — | | | | | | | | | | (30,592,443 | ) | | | | | | | | | — | | | | | | | | | | (2,133,969 | ) |
| | | | | | | | | | | | | | | | | | | | | | | | | | | | | | | | | | | | | | | | |
| | | | | | | | |
Net increase (decrease) in net assets from
Fund share transactions (Note C) | | | | | | | | | (3,174,434 | ) | | | | | | | | | 27,674,863 | | | | | | | | | | 4,950,586 | | | | | | | | | | (890,465 | ) |
| | | | | | | | | | | | | | | | | | | | | | | | | | | | | | | | | | | | | | | | |
| | | | | | | | |
Total increase (decrease) in net assets | | | | | | | | | (59,725,010 | ) | | | | | | | | | 26,520,817 | | | | | | | | | | 688,830 | | | | | | | | | | (753,732 | ) |
| | | | | | | | |
Net Assets: | | | | | | | | | | | | | | | | | | | | | | | | | | | | | | | | | | | | | | | | |
Beginning of period | | | | | | | | | 229,199,231 | | | | | | | | | | 202,678,414 | | | | | | | | | | 14,354,623 | | | | | | | | | | 15,108,355 | |
| | | | | | | | | | | | | | | | | | | | | | | | | | | | | | | | | | | | | | | | |
End of period | | | | | | | | $ | 169,474,221 | | | | | | | | | $ | 229,199,231 | | | | | | | | | $ | 15,043,453 | | | | | | | | | $ | 14,354,623 | |
| | | | | | | | | | | | | | | | | | | | | | | | | | | | | | | | | | | | | | | | |
The accompanying notes are an integral part of these financial statements.
25
|
| STATEMENTSOF CHANGESIN NET ASSETS |
| | | | | | | | | | | | | | | | | | | | | | | | | | | | | | | | | | | | | | | | |
| | | | |
| | | | | LKCM
Equity Fund | | | | LKCM
Balanced Fund |
| | | | | | | | | | | | | | | | | | | | | | | | | | | | | | | | | | | | | | | | |
| | | | | | | | |
| | | | | Six Months
Ended
June 30, 2022
(Unaudited) | | | | Year Ended
December 31,
2021 | | | | Six Months
Ended
June 30, 2022
(Unaudited) | | | | Year Ended
December 31,
2021 |
Operations: | | | | | | | | | | | | | | | | | | | | | | | | | | | | | | | | | | | | | | | | |
Net investment income | | | | | | | | $ | 1,699,046 | | | | | | | | | $ | 2,188,034 | | | | | | | | | $ | 577,138 | | | | | | | | | $ | 941,306 | |
Net realized gain | | | | | | | | | 18,233,380 | | | | | | | | | | 33,687,396 | | | | | | | | | | 1,129,518 | | | | | | | | | | 5,267,252 | |
Net change in unrealized appreciation (depreciation) | | | | | | | | | (123,768,576 | ) | | | | | | | | | 65,351,081 | | | | | | | | | | (24,051,546 | ) | | | | | | | | | 11,493,740 | |
| | | | | | | | | | | | | | | | | | | | | | | | | | | | | | | | | | | | | | | | |
Net increase (decrease) in net assets resulting from operations | | | | | | | | | (103,836,150 | ) | | | | | | | | | 101,226,511 | | | | | | | | | | (22,344,890 | ) | | | | | | | | | 17,702,298 | |
| | | | | | | | | | | | | | | | | | | | | | | | | | | | | | | | | | | | | | | | |
| | | | | | | | |
Distributions to Shareholders | | | | | | | | | — | | | | | | | | | | (34,873,796 | ) | | | | | | | | | (561,288 | ) | | | | | | | | | (6,153,028 | ) |
| | | | | | | | | | | | | | | | | | | | | | | | | | | | | | | | | | | | | | | | |
| | | | | | | | |
Net increase (decrease) in net assets resulting from
Fund share transactions (Note C) | | | | | | | | | 4,293,506 | | | | | | | | | | 26,690,707 | | | | | | | | | | (11,424,760 | ) | | | | | | | | | 7,844,345 | |
| | | | | | | | | | | | | | | | | | | | | | | | | | | | | | | | | | | | | | | | |
| | | | | | | | |
Total increase (decrease) in net assets | | | | | | | | | (99,542,644 | ) | | | | | | | | | 93,043,422 | | | | | | | | | | (34,330,938 | ) | | | | | | | | | 19,393,615 | |
| | | | | | | | |
Net Assets: | | | | | | | | | | | | | | | | | | | | | | | | | | | | | | | | | | | | | | | | |
Beginning of period | | | | | | | | | 542,696,356 | | | | | | | | | | 449,652,934 | | | | | | | | | | 144,900,613 | | | | | | | | | | 125,506,998 | |
| | | | | | | | | | | | | | | | | | | | | | | | | | | | | | | | | | | | | | | | |
End of period | | | | | | | | $ | 443,153,712 | | | | | | | | | $ | 542,696,356 | | | | | | | | | $ | 110,569,675 | | | | | | | | | $ | 144,900,613 | |
| | | | | | | | | | | | | | | | | | | | | | | | | | | | | | | | | | | | | | | | |
The accompanying notes are an integral part of these financial statements.
26
|
| STATEMENTSOF CHANGESIN NET ASSETS |
| | | | | | | | | | | | | | | | | | | | | | | | | | | | | | | | | | | | | | | | |
| | | | |
| | | | | LKCM
Fixed Income Fund | | | | LKCM
International Equity Fund |
| | | | | | | | | | | | | | | | | | | | | | | | | | | | | | | | | | | | | | | | |
| | | | | | | | |
| | | | | Six Months
Ended
June 30, 2022
(Unaudited) | | | | Year Ended
December 31,
2021 | | | | Six Months
Ended
June 30, 2022
(Unaudited) | | | | Year Ended
December 31,
2021 |
Operations: | | | | | | | | | | | | | | | | | | | | | | | | | | | | | | | | | | | | | | | | |
Net investment income | | | | | | | | $ | 1,990,535 | | | | | | | | | $ | 3,880,841 | | | | | | | | | $ | 1,609,973 | | | | | | | | | $ | 329,440 | |
Net realized gain (loss) | | | | | | | | | (658,857 | ) | | | | | | | | | 1,731,290 | | | | | | | | | | (829,616 | ) | | | | | | | | | 1,512,938 | |
Net change in unrealized appreciation (depreciation) | | | | | | | | | (15,307,343 | ) | | | | | | | | | (10,167,137 | ) | | | | | | | | | (15,012,178 | ) | | | | | | | | | 5,382,308 | |
| | | | | | | | | | | | | | | | | | | | | | | | | | | | | | | | | | | | | | | | |
Net increase (decrease) in net assets resulting from operations | | | | | | | | | (13,975,665 | ) | | | | | | | | | (4,555,006 | ) | | | | | | | | | (14,231,821 | ) | | | | | | | | | 7,224,686 | |
| | | | | | | | | | | | | | | | | | | | | | | | | | | | | | | | | | | | | | | | |
| | | | | | | | |
Distributions to Shareholders | | | | | | | | | (1,966,633 | ) | | | | | | | | | (3,924,713 | ) | | | | | | | | | — | | | | | | | | | | (680,356 | ) |
| | | | | | | | | | | | | | | | | | | | | | | | | | | | | | | | | | | | | | | | |
| | | | | | | | |
Net increase in net assets from
Fund share transactions (Note C) | | | | | | | | | 95,854 | | | | | | | | | | 14,367,868 | | | | | | | | | | 1,737,150 | | | | | | | | | | 16,665,163 | |
| | | | | | | | | | | | | | | | | | | | | | | | | | | | | | | | | | | | | | | | |
| | | | | | | | |
Total increase (decrease) in net assets | | | | | | | | | (15,846,444 | ) | | | | | | | | | 5,888,149 | | | | | | | | | | (12,494,671 | ) | | | | | | | | | 23,209,493 | |
| | | | | | | | |
Net Assets: | | | | | | | | | | | | | | | | | | | | | | | | | | | | | | | | | | | | | | | | |
Beginning of period | | | | | | | | | 295,744,736 | | | | | | | | | | 289,856,587 | | | | | | | | | | 55,504,174 | | | | | | | | | | 32,294,681 | |
| | | | | | | | | | | | | | | | | | | | | | | | | | | | | | | | | | | | | | | | |
End of period | | | | | | | | $ | 279,898,292 | | | | | | | | | $ | 295,744,736 | | | | | | | | | $ | 43,009,503 | | | | | | | | | $ | 55,504,174 | |
| | | | | | | | | | | | | | | | | | | | | | | | | | | | | | | | | | | | | | | | |
The accompanying notes are an integral part of these financial statements.
27
|
| FINANCIAL HIGHLIGHTS |
| SELECTED DATAFOR EACH SHAREOF CAPITAL STOCK OUTSTANDING |
| | | | | | | | | | | | | | | | | | | | | | | | | | | | | | | | | | | | | | | | | | | | | | | | | | | | | | | | | | | | |
| | |
| | | | | LKCM Small Cap Equity Fund |
| | | | | | | | | | | | | | | | | | | | | | | | | | | | | | | | | | | | | | | | | | | | | | | | | | | | | | | | | | | | |
| | | | | | | | | | | | |
| | | | | Six Months
Ended
June 30, 2022
(Unaudited) | | | | Year
Ended
December 31,
2021 | | | | Year
Ended
December 31,
2020 | | | | Year
Ended
December 31,
2019 | | | | Year
Ended
December 31,
2018 | | | | Year
Ended
December 31,
2017 |
Net Asset Value – Beginning of Period | | | | | | | | $ | 21.54 | | | | | | | | | $ | 21.77 | | | | | | | | | $ | 16.78 | | | | | | | | | $ | 14.39 | | | | | | | | | $ | 18.44 | | | | | | | | | $ | 18.82 | |
| | | | | | | | | | | | | | | | | | | | | | | | | | | | | | | | | | | | | | | | | | | | | | | | | | | | | | | | | | | | |
Net investment loss | | | | | | | | | (0.04 | )(1) | | | | | | | | | (0.08 | )(1) | | | | | | | | | (0.02 | )(1) | | | | | | | | | (0.02 | )(1) | | | | | | | | | (0.03 | )(2) | | | | | | | | | (0.04 | )(1) |
Net realized and unrealized gain (loss) on investments | | | | | | | | | (5.30 | ) | | | | | | | | | 3.23 | | | | | | | | | | 5.85 | | | | | | | | | | 3.29 | | | | | | | | | | (1.05 | ) | | | | | | | | | 3.27 | |
| | | | | | | | | | | | | | | | | | | | | | | | | | | | | | | | | | | | | | | | | | | | | | | | | | | | | | | | | | | | |
Total from investment operations | | | | | | | | | (5.34 | ) | | | | | | | | | 3.15 | | | | | | | | | | 5.83 | | | | | | | | | | 3.27 | | | | | | | | | | (1.08 | ) | | | | | | | | | 3.23 | |
| | | | | | | | | | | | | | | | | | | | | | | | | | | | | | | | | | | | | | | | | | | | | | | | | | | | | | | | | | | | |
Distributions from net realized gains | | | | | | | | | — | | | | | | | | | | (3.38 | ) | | | | | | | | | (0.84 | ) | | | | | | | | | (0.88 | ) | | | | | | | | | (2.97 | ) | | | | | | | | | (3.61 | ) |
| | | | | | | | | | | | | | | | | | | | | | | | | | | | | | | | | | | | | | | | | | | | | | | | | | | | | | | | | | | | |
Total dividends and distributions | | | | | | | | | — | | | | | | | | | | (3.38 | ) | | | | | | | | | (0.84 | ) | | | | | | | | | (0.88 | ) | | | | | | | | | (2.97 | ) | | | | | | | | | (3.61 | ) |
| | | | | | | | | | | | | | | | | | | | | | | | | | | | | | | | | | | | | | | | | | | | | | | | | | | | | | | | | | | | |
Net Asset Value – End of Period | | | | | | | | $ | 16.20 | | | | | | | | | $ | 21.54 | | | | | | | | | $ | 21.77 | | | | | | | | | $ | 16.78 | | | | | | | | | $ | 14.39 | | | | | | | | | $ | 18.44 | |
| | | | | | | | | | | | | | | | | | | | | | | | | | | | | | | | | | | | | | | | | | | | | | | | | | | | | | | | | | | | |
Total Return | | | | | | | | | -24.79% | (3) | | | | | | | | | 14.49% | | | | | | | | | | 34.79% | | | | | | | | | | 22.70% | | | | | | | | | | -5.70% | | | | | | | | | | 17.04% | |
| | | | | | | | | | | | |
Ratios and Supplemental Data: | | | | | | | | | | | | | | | | | | | | | | | | | | | | | | | | | | | | | | | | | | | | | | | | | | | | | | | | | | | | |
Net assets, end of period (thousands) | | | | | | | | $ | 169,474 | | | | | | | | | $ | 229,199 | | | | | | | | | $ | 202,678 | | | | | | | | | $ | 180,682 | | | | | | | | | $ | 160,322 | | | | | | | | | $ | 201,139 | |
Ratio of expenses to average net assets: | | | | | | | | | | | | | | | | | | | | | | | | | | | | | | | | | | | | | | | | | | | | | | | | | | | | | | | | | | | | |
Before expense waiver and/or reimbursement | | | | | | | | | 1.05% | (4) | | | | | | | | | 1.03% | | | | | | | | | | 1.07% | | | | | | | | | | 1.07% | | | | | | | | | | 1.08% | | | | | | | | | | 1.10% | |
After expense waiver and/or reimbursement | | | | | | | | | 1.00% | (4) | | | | | | | | | 1.00% | | | | | | | | | | 1.00% | | | | | | | | | | 1.00% | | | | | | | | | | 1.00% | | | | | | | | | | 1.00% | |
Ratio of net investment loss to average net assets: | | | | | | | | | | | | | | | | | | | | | | | | | | | | | | | | | | | | | | | | | | | | | | | | | | | | | | | | | | | | |
Before expense waiver and/or reimbursement | | | | | | | | | (0.45)% | (4) | | | | | | | | | (0.35)% | | | | | | | | | | (0.20)% | | | | | | | | | | (0.20)% | | | | | | | | | | (0.25)% | | | | | | | | | | (0.28)% | |
After expense waiver and/or reimbursement | | | | | | | | | (0.40)% | (4) | | | | | | | | | (0.32)% | | | | | | | | | | (0.13)% | | | | | | | | | | (0.13)% | | | | | | | | | | (0.17)% | | | | | | | | | | (0.18)% | |
Portfolio turnover rate | | | | | | | | | 40% | (3) | | | | | | | | | 42% | | | | | | | | | | 60% | | | | | | | | | | 63% | | | | | | | | | | 45% | | | | | | | | | | 42% | |
| (1) | Net investment loss per share represents net investment loss divided by the average shares outstanding throughout the period. |
| (2) | Net investment loss per share is calculated using the ending balance of undistributed net investment loss prior to considerations of adjustments for permanent book and tax differences. |
| | | | | | | | | | | | | | | | | | | | | | | | | | | | | | | | | | | | | | | | | | | | | | | | | | | | | | | | | | | | |
| | |
| | | | | LKCM Small-Mid Cap Equity Fund |
| | | | | | | | | | | | | | | | | | | | | | | | | | | | | | | | | | | | | | | | | | | | | | | | | | | | | | | | | | | | |
| | | | | | | | | | | | |
| | | | | Six Months
Ended
June 30, 2022
(Unaudited) | | | | Year
Ended
December 31,
2021 | | | | Year
Ended
December 31,
2020 | | | | Year
Ended
December 31,
2019 | | | | Year
Ended
December 31,
2018 | | | | Year
Ended
December 31,
2017 |
Net Asset Value – Beginning of Period | | | | | | | | $ | 10.97 | | | | | | | | | $ | 11.15 | | | | | | | | | $ | 9.09 | | | | | | | | | $ | 7.92 | | | | | | | | | $ | 10.60 | | | | | | | | | $ | 9.56 | |
| | | | | | | | | | | | | | | | | | | | | | | | | | | | | | | | | | | | | | | | | | | | | | | | | | | | | | | | | | | | |
Net investment loss | | | | | | | | | (0.01 | )(1) | | | | | | | | | (0.06 | )(1) | | | | | | | | | (0.02 | )(1) | | | | | | | | | (0.02 | )(1) | | | | | | | | | (0.03 | )(2) | | | | | | | | | (0.01 | )(1) |
Net realized and unrealized gain (loss) on investments | | | | | | | | | (2.39 | ) | | | | | | | | | 1.77 | | | | | | | | | | 2.80 | | | | | | | | | | 2.48 | | | | | | | | | | (0.93 | ) | | | | | | | | | 2.32 | |
| | | | | | | | | | | | | | | | | | | | | | | | | | | | | | | | | | | | | | | | | | | | | | | | | | | | | | | | | | | | |
Total from investment operations | | | | | | | | | (2.40 | ) | | | | | | | | | 1.71 | | | | | | | | | | 2.78 | | | | | | | | | | 2.46 | | | | | | | | | | (0.96 | ) | | | | | | | | | 2.31 | |
| | | | | | | | | | | | | | | | | | | | | | | | | | | | | | | | | | | | | | | | | | | | | | | | | | | | | | | | | | | | |
Distributions from net realized gains | | | | | | | | | — | | | | | | | | | | (1.89 | ) | | | | | | | | | (0.72 | ) | | | | | | | | | (1.29 | ) | | | | | | | | | (1.72 | ) | | | | | | | | | (1.27 | ) |
| | | | | | | | | | | | | | | | | | | | | | | | | | | | | | | | | | | | | | | | | | | | | | | | | | | | | | | | | | | | |
Net Asset Value – End of Period | | | | | | | | $ | 8.57 | | | | | | | | | $ | 10.97 | | | | | | | | | $ | 11.15 | | | | | | | | | $ | 9.09 | | | | | | | | | $ | 7.92 | | | | | | | | | $ | 10.60 | |
| | | | | | | | | | | | | | | | | | | | | | | | | | | | | | | | | | | | | | | | | | | | | | | | | | | | | | | | | | | | |
Total Return | | | | | | | | | -21.88% | (3) | | | | | | | | | 15.37% | | | | | | | | | | 30.66% | | | | | | | | | | 31.05% | | | | | | | | | | -8.89% | | | | | | | | | | 24.13% | |
| | | | | | | | | | | | |
Ratios and Supplemental Data: | | | | | | | | | | | | | | | | | | | | | | | | | | | | | | | | | | | | | | | | | | | | | | | | | | | | | | | | | | | | |
Net assets, end of period (thousands) | | | | | | | | $ | 15,043 | | | | | | | | | $ | 14,355 | | | | | | | | | $ | 15,108 | | | | | | | | | $ | 12,590 | | | | | | | | | $ | 12,162 | | | | | | | | | $ | 19,378 | |
Ratio of expenses to average net assets: | | | | | | | | | | | | | | | | | | | | | | | | | | | | | | | | | | | | | | | | | | | | | | | | | | | | | | | | | | | | |
Before expense waiver and/or reimbursement | | | | | | | | | 1.75% | (4) | | | | | | | | | 1.74% | | | | | | | | | | 1.98% | | | | | | | | | | 1.95% | | | | | | | | | | 1.75% | | | | | | | | | | 1.76% | |
After expense waiver and/or reimbursement | | | | | | | | | 1.00% | (4) | | | | | | | | | 1.00% | | | | | | | | | | 1.00% | | | | | | | | | | 1.00% | | | | | | | | | | 1.00% | | | | | | | | | | 1.00% | |
Ratio of net investment loss to average net assets: | | | | | | | | | | | | | | | | | | | | | | | | | | | | | | | | | | | | | | | | | | | | | | | | | | | | | | | | | | | | |
Before expense waiver and/or reimbursement | | | | | | | | | (0.93)% | (4) | | | | | | | | | (1.23)% | | | | | | | | | | (1.25)% | | | | | | | | | | (1.20)% | | | | | | | | | | (1.05)% | | | | | | | | | | (0.94)% | |
After expense waiver and/or reimbursement | | | | | | | | | (0.18)% | (4) | | | | | | | | | (0.49)% | | | | | | | | | | (0.27)% | | | | | | | | | | (0.25)% | | | | | | | | | | (0.30)% | | | | | | | | | | (0.18)% | |
Portfolio turnover rate | | | | | | | | | 57% | (3) | | | | | | | | | 50% | | | | | | | | | | 76% | | | | | | | | | | 68% | | | | | | | | | | 56% | | | | | | | | | | 63% | |
| (1) | Net investment loss per share represents net investment loss divided by the average shares outstanding throughout the period. |
| (2) | Net investment loss per share is calculated using the ending balance of undistributed net investment loss prior to considerations of adjustments for permanent book and tax differences. |
The accompanying notes are an integral part of these financial statements.
28
|
| FINANCIAL HIGHLIGHTS |
| SELECTED DATAFOR EACH SHAREOF CAPITAL STOCK OUTSTANDING |
| | | | | | | | | | | | | | | | | | | | | | | | | | | | | | | | | | | | | | | | | | | | | | | | | | | | | | | | | | | | |
| | |
| | | | | LKCM Equity Fund |
| | | | | | | | | | | | | | | | | | | | | | | | | | | | | | | | | | | | | | | | | | | | | | | | | | | | | | | | | | | | |
| | | | | | | | | | | | |
| | | | | Six Months
Ended
June 30, 2022
(Unaudited) | | | | Year
Ended
December 31,
2021 | | | | Year
Ended
December 31,
2020 | | | | Year
Ended
December 31,
2019 | | | | Year
Ended
December 31,
2018 | | | | Year
Ended
December 31,
2017 |
Net Asset Value – Beginning of Period | | | | | | | | $ | 38.69 | | | | | | | | | $ | 33.74 | | | | | | | | | $ | 29.02 | | | | | | | | | $ | 23.34 | | | | | | | | | $ | 26.02 | | | | | | | | | $ | 22.42 | |
| | | | | | | | | | | | | | | | | | | | | | | | | | | | | | | | | | | | | | | | | | | | | | | | | | | | | | | | | | | | |
Net investment income | | | | | | | | | 0.12 | (1) | | | | | | | | | 0.16 | (1) | | | | | | | | | 0.17 | (1) | | | | | | | | | 0.22 | (1) | | | | | | | | | 0.21 | | | | | | | | | | 0.17 | |
Net realized and unrealized gain (loss) on investments | | | | | | | | | (7.49 | ) | | | | | | | | | 7.43 | | | | | | | | | | 6.44 | | | | | | | | | | 6.75 | | | | | | | | | | (1.08 | ) | | | | | | | | | 4.69 | |
| | | | | | | | | | | | | | | | | | | | | | | | | | | | | | | | | | | | | | | | | | | | | | | | | | | | | | | | | | | | |
Total from investment operations | | | | | | | | | (7.37 | ) | | | | | | | | | 7.59 | | | | | | | | | | 6.61 | | | | | | | | | | 6.97 | | | | | | | | | | (0.87 | ) | | | | | | | | | 4.86 | |
| | | | | | | | | | | | | | | | | | | | | | | | | | | | | | | | | | | | | | | | | | | | | | | | | | | | | | | | | | | | |
Distributions from net investment income | | | | | | | | | — | | | | | | | | | | (0.17 | ) | | | | | | | | | (0.17 | ) | | | | | | | | | (0.23 | ) | | | | | | | | | (0.21 | ) | | | | | | | | | (0.17 | ) |
Distributions from net realized gains | | | | | | | | | — | | | | | | | | | | (2.47 | ) | | | | | | | | | (1.72 | ) | | | | | | | | | (1.06 | ) | | | | | | | | | (1.60 | ) | | | | | | | | | (1.09 | ) |
| | | | | | | | | | | | | | | | | | | | | | | | | | | | | | | | | | | | | | | | | | | | | | | | | | | | | | | | | | | | |
Total dividends and distributions | | | | | | | | | — | | | | | | | | | | (2.64 | ) | | | | | | | | | (1.89 | ) | | | | | | | | | (1.29 | ) | | | | | | | | | (1.81 | ) | | | | | | | | | (1.26 | ) |
| | | | | | | | | | | | | | | | | | | | | | | | | | | | | | | | | | | | | | | | | | | | | | | | | | | | | | | | | | | | |
Redemption fees | | | | | | | | | 0.00 | (2) | | | | | | | | | — | | | | | | | | | | — | | | | | | | | | | — | | | | | | | | | | — | | | | | | | | | | — | |
| | | | | | | | | | | | | | | | | | | | | | | | | | | | | | | | | | | | | | | | | | | | | | | | | | | | | | | | | | | | |
Net Asset Value – End of Period | | | | | | | | $ | 31.32 | | | | | | | | | $ | 38.69 | | | | | | | | | $ | 33.74 | | | | | | | | | $ | 29.02 | | | | | | | | | $ | 23.34 | | | | | | | | | $ | 26.02 | |
| | | | | | | | | | | | | | | | | | | | | | | | | | | | | | | | | | | | | | | | | | | | | | | | | | | | | | | | | | | | |
Total Return | | | | | | | | | -19.05% | (3) | | | | | | | | | 22.48% | | | | | | | | | | 22.83% | | | | | | | | | | 29.85% | | | | | | | | | | -3.28% | | | | | | | | | | 21.69% | |
| | | | | | | | | | | | |
Ratios and Supplemental Data: | | | | | | | | | | | | | | | | | | | | | | | | | | | | | | | | | | | | | | | | | | | | | | | | | | | | | | | | | | | | |
Net assets, end of period (thousands) | | | | | | | | $ | 443,154 | | | | | | | | | $ | 542,696 | | | | | | | | | $ | 449,653 | | | | | | | | | $ | 381,307 | | | | | | | | | $ | 308,667 | | | | | | | | | $ | 340,601 | |
Ratio of expenses to average net assets: | | | | | | | | | | | | | | | | | | | | | | | | | | | | | | | | | | | | | | | | | | | | | | | | | | | | | | | | | | | | |
Before expense waiver and/or reimbursement | | | | | | | | | 0.97% | (4) | | | | | | | | | 0.96% | | | | | | | | | | 0.98% | | | | | | | | | | 0.99% | | | | | | | | | | 0.98% | | | | | | | | | | 0.99% | |
After expense waiver and/or reimbursement | | | | | | | | | 0.80% | (4) | | | | | | | | | 0.80% | | | | | | | | | | 0.80% | | | | | | | | | | 0.80% | | | | | | | | | | 0.80% | | | | | | | | | | 0.80% | |
Ratio of net investment income to average net assets: | | | | | | | | | | | | | | | | | | | | | | | | | | | | | | | | | | | | | | | | | | | | | | | | | | | | | | | | | | | | |
Before expense waiver and/or reimbursement | | | | | | | | | 0.52% | (4) | | | | | | | | | 0.27% | | | | | | | | | | 0.37% | | | | | | | | | | 0.61% | | | | | | | | | | 0.56% | | | | | | | | | | 0.50% | |
After expense waiver and/or reimbursement | | | | | | | | | 0.69% | (4) | | | | | | | | | 0.43% | | | | | | | | | | 0.55% | | | | | | | | | | 0.80% | | | | | | | | | | 0.74% | | | | | | | | | | 0.69% | |
Portfolio turnover rate | | | | | | | | | 11% | (3) | | | | | | | | | 11% | | | | | | | | | | 10% | | | | | | | | | | 9% | | | | | | | | | | 16% | | | | | | | | | | 11% | |
| (1) | Net investment income per share represents net investment income divided by the average shares outstanding throughout the period. |
| | | | | | | | | | | | | | | | | | | | | | | | | | | | | | | | | | | | | | | | | | | | | | | | | | | | | | | | | | | | |
| | |
| | | | | LKCM Balanced Fund |
| | | | | | | | | | | | | | | | | | | | | | | | | | | | | | | | | | | | | | | | | | | | | | | | | | | | | | | | | | | | |
| | | | | | | | | | | | |
| | | | | Six Months
Ended
June 30, 2022
(Unaudited) | | | | Year
Ended
December 31,
2021 | | | | Year
Ended
December 31,
2020 | | | | Year
Ended
December 31,
2019 | | | | Year
Ended
December 31,
2018 | | | | Year
Ended
December 31,
2017 |
Net Asset Value – Beginning of Period | | | | | | | | $ | 29.21 | | | | | | | | | $ | 26.76 | | | | | | | | | $ | 24.22 | | | | | | | | | $ | 21.07 | | | | | | | | | $ | 22.18 | | | | | | | | | $ | 20.46 | |
| | | | | | | | | | | | | | | | | | | | | | | | | | | | | | | | | | | | | | | | | | | | | | | | | | | | | | | | | | | | |
Net investment income | | | | | | | | | 0.12 | (1) | | | | | | | | | 0.20 | (1) | | | | | | | | | 0.24 | (1) | | | | | | | | | 0.27 | (1) | | | | | | | | | 0.23 | | | | | | | | | | 0.20 | |
Net realized and unrealized gain (loss) on investments | | | | | | | | | (4.76 | ) | | | | | | | | | 3.54 | | | | | | | | | | 3.42 | | | | | | | | | | 4.32 | | | | | | | | | | (0.70 | ) | | | | | | | | | 2.43 | |
| | | | | | | | | | | | | | | | | | | | | | | | | | | | | | | | | | | | | | | | | | | | | | | | | | | | | | | | | | | | |
Total from investment operations | | | | | | | | | (4.64 | ) | | | | | | | | | 3.74 | | | | | | | | | | 3.66 | | | | | | | | | | 4.59 | | | | | | | | | | (0.47 | ) | | | | | | | | | 2.63 | |
| | | | | | | | | | | | | | | | | | | | | | | | | | | | | | | | | | | | | | | | | | | | | | | | | | | | | | | | | | | | |
Distributions from net investment income | | | | | | | | | (0.12 | ) | | | | | | | | | (0.20 | ) | | | | | | | | | (0.24 | ) | | | | | | | | | (0.27 | ) | | | | | | | | | (0.23 | ) | | | | | | | | | (0.20 | ) |
Distributions from net realized gains | | | | | | | | | — | | | | | | | | | | (1.09 | ) | | | | | | | | | (0.88 | ) | | | | | | | | | (1.17 | ) | | | | | | | | | (0.41 | ) | | | | | | | | | (0.71 | ) |
| | | | | | | | | | | | | | | | | | | | | | | | | | | | | | | | | | | | | | | | | | | | | | | | | | | | | | | | | | | | |
Total dividends and distributions | | | | | | | | | (0.12 | ) | | | | | | | | | (1.29 | ) | | | | | | | | | (1.12 | ) | | | | | | | | | (1.44 | ) | | | | | | | | | (0.64 | ) | | | | | | | | | (0.91 | ) |
| | | | | | | | | | | | | | | | | | | | | | | | | | | | | | | | | | | | | | | | | | | | | | | | | | | | | | | | | | | | |
Redemption fees | | | | | | | | | 0.00 | (2) | | | | | | | | | — | | | | | | | | | | — | | | | | | | | | | — | | | | | | | | | | — | | | | | | | | | | — | |
| | | | | | | | | | | | | | | | | | | | | | | | | | | | | | | | | | | | | | | | | | | | | | | | | | | | | | | | | | | | |
Net Asset Value – End of Period | | | | | | | | $ | 24.45 | | | | | | | | | $ | 29.21 | | | | | | | | | $ | 26.76 | | | | | | | | | $ | 24.22 | | | | | | | | | $ | 21.07 | | | | | | | | | $ | 22.18 | |
| | | | | | | | | | | | | | | | | | | | | | | | | | | | | | | | | | | | | | | | | | | | | | | | | | | | | | | | | | | | |
Total Return | | | | | | | | | -15.91% | (3) | | | | | | | | | 14.01% | | | | | | | | | | 15.28% | | | | | | | | | | 21.85% | | | | | | | | | | -2.15% | | | | | | | | | | 12.88% | |
| | | | | | | | | | | | |
Ratios and Supplemental Data: | | | | | | | | | | | | | | | | | | | | | | | | | | | | | | | | | | | | | | | | | | | | | | | | | | | | | | | | | | | | |
Net assets, end of period (thousands) | | | | | | | | $ | 110,570 | | | | | | | | | $ | 144,901 | | | | | | | | | $ | 125,507 | | | | | | | | | $ | 103,825 | | | | | | | | | $ | 85,907 | | | | | | | | | $ | 83,430 | |
Ratio of expenses to average net assets: | | | | | | | | | | | | | | | | | | | | | | | | | | | | | | | | | | | | | | | | | | | | | | | | | | | | | | | | | | | | |
Before expense waiver and/or reimbursement | | | | | | | | | 0.98% | (4) | | | | | | | | | 0.96% | | | | | | | | | | 0.99% | | | | | | | | | | 1.00% | | | | | | | | | | 1.00% | | | | | | | | | | 1.02% | |
After expense waiver and/or reimbursement | | | | | | | | | 0.80% | (4) | | | | | | | | | 0.80% | | | | | | | | | | 0.80% | | | | | | | | | | 0.80% | | | | | | | | | | 0.80% | | | | | | | | | | 0.80% | |
Ratio of net investment income to average net assets: | | | | | | | | | | | | | | | | | | | | | | | | | | | | | | | | | | | | | | | | | | | | | | | | | | | | | | | | | | | | |
Before expense waiver and/or reimbursement | | | | | | | | | 0.72% | (4) | | | | | | | | | 0.53% | | | | | | | | | | 0.78% | | | | | | | | | | 0.95% | | | | | | | | | | 0.83% | | | | | | | | | | 0.73% | |
After expense waiver and/or reimbursement | | | | | | | | | 0.90% | (4) | | | | | | | | | 0.69% | | | | | | | | | | 0.97% | | | | | | | | | | 1.15% | | | | | | | | | | 1.03% | | | | | | | | | | 0.95% | |
Portfolio turnover rate | | | | | | | | | 17% | (3) | | | | | | | | | 11% | | | | | | | | | | 18% | | | | | | | | | | 17% | | | | | | | | | | 17% | | | | | | | | | | 15% | |
| (1) | Net investment income per share represents net investment income divided by the average shares outstanding throughout the period. |
The accompanying notes are an integral part of these financial statements.
29
|
| FINANCIAL HIGHLIGHTS |
| SELECTED DATAFOR EACH SHAREOF CAPITAL STOCK OUTSTANDING |
| | | | | | | | | | | | | | | | | | | | | | | | | | | | | | | | | | | | | | | | | | | | | | | | | | | | | | | | | | | | |
| | |
| | | | | LKCM Fixed Income Fund |
| | | | | | | | | | | | | | | | | | | | | | | | | | | | | | | | | | | | | | | | | | | | | | | | | | | | | | | | | | | | |
| | | | | | | | | | | | |
| | | | | Six Months
Ended
June 30, 2022
(Unaudited) | | | | Year
Ended
December 31,
2021 | | | | Year
Ended
December 31,
2020 | | | | Year
Ended
December 31,
2019 | | | | Year
Ended
December 31,
2018 | | | | Year
Ended
December 31,
2017 |
Net Asset Value – Beginning of Period | | | | | | | | $ | 10.87 | | | | | | | | | $ | 11.19 | | | | | | | | | $ | 10.92 | | | | | | | | | $ | 10.47 | | | | | | | | | $ | 10.68 | | | | | | | | | $ | 10.67 | |
| | | | | | | | | | | | | | | | | | | | | | | | | | | | | | | | | | | | | | | | | | | | | | | | | | | | | | | | | | | | |
Net investment income | | | | | | | | | 0.07 | (1) | | | | | | | | | 0.15 | (1) | | | | | | | | | 0.19 | (1) | | | | | | | | | 0.25 | (1) | | | | | | | | | 0.24 | | | | | | | | | | 0.21 | |
Net realized and unrealized gain (loss) on investments | | | | | | | | | (0.58 | ) | | | | | | | | | (0.32 | ) | | | | | | | | | 0.27 | | | | | | | | | | 0.45 | | | | | | | | | | (0.21 | ) | | | | | | | | | 0.02 | |
| | | | | | | | | | | | | | | | | | | | | | | | | | | | | | | | | | | | | | | | | | | | | | | | | | | | | | | | | | | | |
Total from investment operations | | | | | | | | | (0.51 | ) | | | | | | | | | (0.17 | ) | | | | | | | | | 0.46 | | | | | | | | | | 0.70 | | | | | | | | | | 0.03 | | | | | | | | | | 0.23 | |
| | | | | | | | | | | | | | | | | | | | | | | | | | | | | | | | | | | | | | | | | | | | | | | | | | | | | | | | | | | | |
Distributions from net investment income | | | | | | | | | (0.07 | ) | | | | | | | | | (0.15 | ) | | | | | | | | | (0.19 | ) | | | | | | | | | (0.25 | ) | | | | | | | | | (0.24 | ) | | | | | | | | | (0.21 | ) |
Distributions from net realized gains | | | | | | | | | — | | | | | | | | | | (0.00 | )(2) | | | | | | | | | — | | | | | | | | | | — | | | | | | | | | | — | | | | | | | | | | (0.01 | ) |
| | | | | | | | | | | | | | | | | | | | | | | | | | | | | | | | | | | | | | | | | | | | | | | | | | | | | | | | | | | | |
Total dividends and distributions | | | | | | | | | (0.07 | ) | | | | | | | | | (0.15 | ) | | | | | | | | | (0.19 | ) | | | | | | | | | (0.25 | ) | | | | | | | | | (0.24 | ) | | | | | | | | | (0.22 | ) |
| | | | | | | | | | | | | | | | | | | | | | | | | | | | | | | | | | | | | | | | | | | | | | | | | | | | | | | | | | | | |
Net Asset Value – End of Period | | | | | | | | $ | 10.29 | | | | | | | | | $ | 10.87 | | | | | | | | | $ | 11.19 | | | | | | | | | $ | 10.92 | | | | | | | | | $ | 10.47 | | | | | | | | | $ | 10.68 | |
| | | | | | | | | | | | | | | | | | | | | | | | | | | | | | | | | | | | | | | | | | | | | | | | | | | | | | | | | | | | |
Total Return | | | | | | | | | -4.68% | (3) | | | | | | | | | -1.54% | | | | | | | | | | 4.29% | | | | | | | | | | 6.70% | | | | | | | | | | 0.26% | | | | | | | | | | 2.15% | |
| | | | | | | | | | | | |
Ratios and Supplemental Data: | | | | | | | | | | | | | | | | | | | | | | | | | | | | | | | | | | | | | | | | | | | | | | | | | | | | | | | | | | | | |
Net assets, end of period (thousands) | | | | | | | | $ | 279,898 | | | | | | | | | $ | 295,745 | | | | | | | | | $ | 289,857 | | | | | | | | | $ | 275,917 | | | | | | | | | $ | 249,286 | | | | | | | | | $ | 248,976 | |
Ratio of expenses to average net assets: | | | | | | | | | | | | | | | | | | | | | | | | | | | | | | | | | | | | | | | | | | | | | | | | | | | | | | | | | | | | |
Before expense waiver and/or reimbursement | | | | | | | | | 0.80% | (4) | | | | | | | | | 0.78% | | | | | | | | | | 0.79% | | | | | | | | | | 0.79% | | | | | | | | | | 0.78% | | | | | | | | | | 0.80% | |
After expense waiver and/or reimbursement | | | | | | | | | 0.50% | (4) | | | | | | | | | 0.50% | | | | | | | | | | 0.50% | | | | | | | | | | 0.50% | | | | | | | | | | 0.50% | | | | | | | | | | 0.50% | |
Ratio of net investment income to average net assets: | | | | | | | | | | | | | | | | | | | | | | | | | | | | | | | | | | | | | | | | | | | | | | | | | | | | | | | | | | | | |
Before expense waiver and/or reimbursement | | | | | | | | | 1.09% | (4) | | | | | | | | | 1.05% | | | | | | | | | | 1.46% | | | | | | | | | | 2.02% | | | | | | | | | | 1.96% | | | | | | | | | | 1.66% | |
After expense waiver and/or reimbursement | | | | | | | | | 1.39% | (4) | | | | | | | | | 1.33% | | | | | | | | | | 1.75% | | | | | | | | | | 2.31% | | | | | | | | | | 2.24% | | | | | | | | | | 1.96% | |
Portfolio turnover rate | | | | | | | | | 21% | (3) | | | | | | | | | 31% | | | | | | | | | | 46% | | | | | | | | | | 37% | | | | | | | | | | 23% | | | | | | | | | | 28% | |
| (1) | Net investment income per share represents net investment income divided by the average shares outstanding during the period. |
| | | | | | | | | | | | | | | | | | | | | | | | | | | | | | | | | | | | | | | | |
| | |
| | | | | LKCM International Equity Fund |
| | | | | | | | | | | | | | | | | | | | | | | | | | | | | | | | | | | | | | | | |
| | | | | | | | |
| | | | | Six Months
Ended
June 30, 2022
(Unaudited) | | | | Year
Ended
December 31,
2021 | | | | Year
Ended
December 31,
2020 | | | | May 1, 2019(1)
through
December 31,
2019 |
Net Asset Value – Beginning of Period | | | | | | | | $ | 14.50 | | | | | | | | | $ | 12.44 | | | | | | | | | $ | 10.89 | | | | | | | | | $ | 10.00 | |
| | | | | | | | | | | | | | | | | | | | | | | | | | | | | | | | | | | | | | | | |
Net investment income | | | | | | | | | 0.41 | (2) | | | | | | | | | 0.10 | (2) | | | | | | | | | 0.03 | (2) | | | | | | | | | 0.02 | (2) |
Net realized and unrealized gain on investments | | | | | | | | | (4.05 | ) | | | | | | | | | 2.14 | | | | | | | | | | 1.54 | | | | | | | | | | 0.88 | |
| | | | | | | | | | | | | | | | | | | | | | | | | | | | | | | | | | | | | | | | |
Total from investment operations | | | | | | | | | (3.64 | ) | | | | | | | | | 2.24 | | | | | | | | | | 1.57 | | | | | | | | | | 0.90 | |
| | | | | | | | | | | | | | | | | | | | | | | | | | | | | | | | | | | | | | | | |
Distributions from net investment income | | | | | | | | | — | | | | | | | | | | (0.08 | ) | | | | | | | | | (0.02 | ) | | | | | | | | | (0.01 | ) |
Distributions from return of capital | | | | | | | | | — | | | | | | | | | | — | | | | | | | | | | (0.00 | )(3) | | | | | | | | | — | |
Distributions from net realized gains | | | | | | | | | — | | | | | | | | | | (0.10 | ) | | | | | | | | | — | | | | | | | | | | (0.00 | )(3) |
| | | | | | | | | | | | | | | | | | | | | | | | | | | | | | | | | | | | | | | | |
Total dividends and distributions | | | | | | | | | — | | | | | | | | | | (0.18 | ) | | | | | | | | | (0.02 | ) | | | | | | | | | (0.01 | ) |
| | | | | | | | | | | | | | | | | | | | | | | | | | | | | | | | | | | | | | | | |
Net Asset Value – End of Period | | | | | | | | $ | 10.86 | | | | | | | | | $ | 14.50 | | | | | | | | | $ | 12.44 | | | | | | | | | $ | 10.89 | |
| | | | | | | | | | | | | | | | | | | | | | | | | | | | | | | | | | | | | | | | |
Total Return | | | | | | | | | -25.10% | (4) | | | | | | | | | 18.00% | | | | | | | | | | 14.45% | | | | | | | | | | 8.97% | (4) |
| | | | | | | | | |
Ratios and Supplemental Data: | | | | | | | | | | | | | | | | | | | | | | | | | | | | | | | | | | | | | | | | |
Net assets, end of period (thousands) | | | | | | | | $ | 43,010 | | | | | | | | | $ | 55,504 | | | | | | | | | $ | 32,295 | | | | | | | | | $ | 10,645 | |
Ratio of expenses to average net assets: | | | | | | | | | | | | | | | | | | | | | | | | | | | | | | | | | | | | | | | | |
Before expense waiver and/or reimbursement | | | | | | | | | 1.40% | (5) | | | | | | | | | 1.40% | | | | | | | | | | 1.88% | | | | | | | | | | 4.09% | (5) |
After expense waiver and/or reimbursement | | | | | | | | | 1.00% | (5) | | | | | | | | | 1.00% | | | | | | | | | | 1.00% | | | | | | | | | | 1.00% | (5) |
Ratio of net investment income (loss) to average net assets: | | | | | | | | | | | | | | | | | | | | | | | | | | | | | | | | | | | | | | | | |
Before expense waiver and/or reimbursement | | | | | | | | | 6.27% | (5) | | | | | | | | | 0.29% | | | | | | | | | | (0.55)% | | | | | | | | | | (2.76)% | (5) |
After expense waiver and/or reimbursement | | | | | | | | | 6.67% | (5) | | | | | | | | | 0.69% | | | | | | | | | | 0.33% | | | | | | | | | | 0.33% | (5) |
Portfolio turnover rate | | | | | | | | | 36% | (4) | | | | | | | | | 15% | | | | | | | | | | 6% | | | | | | | | | | 2% | (4) |
| (1) | Commencement of operations. |
| (2) | Net investment income per share represents net investment income divided by the average shares outstanding during the period. |
The accompanying notes are an integral part of these financial statements.
30
|
| LKCM FUNDS |
| NOTESTOTHE FINANCIAL STATEMENTS (UNAUDITED) |
| June 30, 2022 |
A. Organization and Significant Accounting Policies: LKCM Funds (the “Trust”) is registered under the Investment Company Act of 1940 (“1940 Act”) as an open-end, management investment company. The Trust was organized as a Delaware statutory trust on February 10, 1994 and consists of seven diversified series as of June 30, 2022, six of which are presented herein and include the LKCM Small Cap Equity Fund, LKCM Small-Mid Cap Equity Fund, LKCM Equity Fund, LKCM Balanced Fund, LKCM Fixed Income Fund and LKCM International Equity Fund (collectively, the “Funds”). The assets of the Funds are invested in separate, independently managed portfolios. Investment operations of the Funds began on July 14, 1994 (LKCM Small Cap Equity Fund), January 3, 1996 (LKCM Equity Fund), December 30, 1997 (LKCM Balanced Fund and LKCM Fixed Income Fund), May 2, 2011 (LKCM Small-Mid Cap Equity Fund) and May 1, 2019 (LKCM International Equity Fund). The LKCM Small Cap Equity Fund, LKCM Small-Mid Cap Equity Fund and LKCM Equity Fund previously had two share classes—Institutional Class shares and Adviser Class shares. The Board of Trustees of the Trust approved the (i) liquidation and termination of Adviser Class shares of the LKCM Small Cap Equity Fund, which took place on October 31, 2018, and (ii) termination of Adviser Class shares of the LKCM Equity Fund and LKCM Small-Mid Cap Equity Fund, which had not commenced operations and had no assets or shareholders, on September 24, 2018. Each Fund charges a 1% redemption fee for redemptions of Fund shares held for less than 30 days, unless otherwise determined by a Fund in its discretion.
The LKCM Small Cap Equity Fund seeks to maximize long-term capital appreciation by investing under normal circumstances at least 80% of its net assets (plus any borrowings for investment purposes) in equity securities of smaller companies (those with market capitalizations at the time of investment between $1.2 billion and $7 billion) which Luther King Capital Management Corporation (the “Adviser”) believes are likely to have above-average growth in revenue and/or earnings and potential for above-average capital appreciation. The LKCM Small-Mid Cap Equity Fund seeks to maximize long-term capital appreciation by investing under normal circumstances at least 80% of its net assets (plus any borrowings for investment purposes) in equity securities of small-mid capitalization companies (those with market capitalizations at the time of investment between $2 billion and $20 billion) which the Adviser believes are likely to have above-average growth in revenue and/or earnings and potential for above-average capital appreciation. The LKCM Equity Fund seeks to maximize long-term capital appreciation by investing under normal circumstances at least 80% of its net assets (plus any borrowings for investment purposes) in equity securities of companies which the Adviser believes are likely to have above-average growth in revenue and/or earnings, above-average returns on shareholders’ equity, potential for above-average capital appreciation and/or companies that the Adviser believes have attractive relative valuations. The LKCM Balanced Fund seeks current income and long-term capital appreciation by investing primarily in a portfolio of equity and fixed income securities with at least 25% of the Fund’s total assets invested in fixed income securities under normal circumstances. The LKCM Fixed Income Fund seeks current income by investing under normal circumstances at least 80% of its net assets (plus any borrowings for investment purposes) in a portfolio of investment grade corporate and U.S. Government fixed income securities. The LKCM International Equity Fund seeks to maximize long-term capital appreciation by investing primarily in equity securities of non-U.S. companies and invests under normal circumstances at least 80% of its net assets (plus any borrowings for investment purposes) in equity securities.
The following is a summary of significant accounting policies followed by the Funds in preparation of the financial statements. The Funds are investment companies and, accordingly, follow the investment company accounting and reporting guidance of the Financial Accounting Standards Board Accounting Standards Codification Topic 946, Investment Companies.
1. Security Valuation: Equity securities listed or traded on a U.S. securities exchange for which market quotations are readily available are valued at the last quoted sale price on the exchange on which the security is primarily traded. Nasdaq Global Market securities are valued at the Nasdaq Official Closing Price (“NOCP”). Unlisted U.S. equity securities and listed U.S. equity securities not traded on a particular valuation date are valued at the mean of the most recent quoted bid and ask price on the relevant exchanges or markets. Equity securities listed on a foreign exchange for which market quotations are readily available are valued at the last quoted sales price on the exchange on which the security is primarily traded. Debt securities are normally valued at the mean of the closing bid and ask price and/or by using a combination of broker quotations or evaluated prices provided by an independent pricing service. Futures and options on futures are valued at the settlement prices established each day on the principal exchange on which they are traded. Forward contracts are valued based on the forward rate using information provided by an independent pricing service. Other assets and securities for which no market or broker quotations or evaluated prices are readily available are valued in good faith at fair value using guidelines approved by the Board of Trustees. The Board of Trustees has established policies and procedures that authorize the Adviser to fair value a security in good faith under certain circumstances. The Funds may use prices provided by independent pricing services to assist in the fair valuation of the Funds’ portfolio securities. For foreign securities held by the LKCM International Equity Fund, such fair value prices generally will be based on such independent pricing services’ proprietary multi-factor models that measure movements in relevant indices, market indicators or other factors between the time the relevant foreign markets have closed and the time the Fund calculates its net asset value, and therefore may differ from quoted or official closing prices for such foreign securities in such foreign markets.
The Trust has adopted accounting standards which establish an authoritative definition of fair value and set out a hierarchy for measuring fair value. These standards require additional disclosures about the various inputs and valuation techniques used to
31
develop the measurements of fair value and a discussion of changes in valuation techniques and related inputs during the period. These standards define fair value as the price that would be received to sell an asset or paid to transfer a liability in an orderly transaction between market participants at the measurement date. The fair value hierarchy is organized into three levels based upon the assumptions (referred to as “inputs”) used in pricing the asset or liability. These standards state that “observable inputs” reflect the assumptions market participants would use in pricing the asset or liability based on market data obtained from independent sources and “unobservable inputs” reflect an entity’s own assumptions about the assumptions market participants would use in pricing the asset or liability. These inputs are summarized in the three broad levels listed below.
| | | | |
| Level 1 | | – | | Quoted unadjusted prices for identical instruments in active markets to which the Trust has access at the date of measurement. |
| | |
| Level 2 | | – | | Quoted prices for similar instruments in active markets; quoted prices for identical or similar instruments in markets that are not active; and model-derived valuations in which all significant inputs and significant value drivers are observable in active markets. Level 2 inputs are those in markets for which there are few transactions, the prices are not current, little public information exists or instances where prices vary substantially over time or among brokered market makers. |
| | |
| Level 3 | | – | | Model derived valuations in which one or more significant inputs or significant value drivers are unobservable. Unobservable inputs are those inputs that reflect the Trust’s own assumptions that market participants would use to price the asset or liability based on the best available information. |
The inputs or methodology used for valuing securities are not necessarily an indication of the risk associated with investing in those securities. As of June 30, 2022, the Funds’ assets carried at fair value were classified as follows:
| | | | | | | | | | | | | | | | | | | | |
| LKCM Small Cap Equity Fund | | | | | | | | |
| | | | |
Description | | Level 1 | | Level 2 | | Level 3 | | Total |
Common Stocks | | | $ | 157,711,285 | | | | $ | — | | | | $ | 0 | (1) | | | $ | 157,711,285 | |
REITs | | | | 1,524,440 | | | | | — | | | | | — | | | | | 1,524,440 | |
Short-Term Investments | | | | 10,565,227 | | | | | — | | | | | — | | | | | 10,565,227 | |
| | | | | | | | | | | | | | | | | | | | |
Total Investments* | | | $ | 169,800,952 | | | | $ | — | | | | $ | 0 | | | | $ | 169,800,952 | |
| | | | | | | | | | | | | | | | | | | | |
| | | | |
| LKCM Small-Mid Cap Equity Fund | | | | | | | | |
| | | | |
Description | | Level 1 | | Level 2 | | Level 3 | | Total |
Common Stocks | | | $ | 13,093,854 | | | | $ | — | | | | $ | — | | | | $ | 13,093,854 | |
REITs | | | | 442,473 | | | | | — | | | | | — | | | | | 442,473 | |
Short-Term Investments | | | | 1,545,223 | | | | | — | | | | | — | | | | | 1,545,223 | |
| | | | | | | | | | | | | | | | | | | | |
Total Investments* | | | $ | 15,081,550 | | | | $ | — | | | | $ | — | | | | $ | 15,081,550 | |
| | | | | | | | | | | | | | | | | | | | |
| | | | |
| LKCM Equity Fund | | | | | | | | |
| | | | |
Description | | Level 1 | | Level 2 | | Level 3 | | Total |
Common Stocks | | | $ | 400,863,841 | | | | $ | — | | | | $ | — | | | | $ | 400,863,841 | |
Short-Term Investments | | | | 42,718,502 | | | | | — | | | | | — | | | | | 42,718,502 | |
| | | | | | | | | | | | | | | | | | | | |
Total Investments* | | | $ | 443,582,343 | | | | $ | — | | | | $ | — | | | | $ | 443,582,343 | |
| | | | | | | | | | | | | | | | | | | | |
| | | | |
| LKCM Balanced Fund | | | | | | | | |
| | | | |
Description | | Level 1 | | Level 2 | | Level 3 | | Total |
Common Stocks | | | $ | 76,690,046 | | | | $ | — | | | | $ | — | | | | $ | 76,690,046 | |
Corporate Bonds | | | | — | | | | | 33,372,657 | | | | | — | | | | | 33,372,657 | |
Short-Term Investment | | | | 643,720 | | | | | — | | | | | — | | | | | 643,720 | |
| | | | | | | | | | | | | | | | | | | | |
Total Investments* | | | $ | 77,333,766 | | | | $ | 33,372,657 | | | | $ | — | | | | $ | 110,706,423 | |
| | | | | | | | | | | | | | | | | | | | |
| | | | |
| LKCM Fixed Income Fund | | | | | | | | |
| | | | |
Description | | Level 1 | | Level 2 | | Level 3 | | Total |
Corporate Bonds | | | $ | — | | | | $ | 187,669,131 | | | | $ | — | | | | $ | 187,669,131 | |
U.S. Government Issues | | | | — | | | | | 16,958,072 | | | | | — | | | | | 16,958,072 | |
U.S. Government Sponsored Entities | | | | — | | | | | 70,411,084 | | | | | — | | | | | 70,411,084 | |
Short-Term Investment | | | | 3,456,120 | | | | | — | | | | | — | | | | | 3,456,120 | |
| | | | | | | | | | | | | | | | | | | | |
Total Investments* | | | $ | 3,456,120 | | | | $ | 275,038,287 | | | | $ | — | | | | $ | 278,494,407 | |
| | | | | | | | | | | | | | | | | | | | |
32
| | | | | | | | | | | | | | | | | | | | |
| LKCM International Equity Fund | | | | | | | | |
| | | | |
Description | | Level 1 | | Level 2 | | Level 3 | | Total |
Common Stocks | | | $ | — | | | | $ | 38,797,922 | | | | $ | — | | | | $ | 38,797,922 | |
Preferred Stock | | | | — | | | | | 666,843 | | | | | — | | | | | 666,843 | |
Short-Term Investments | | | | 3,401,721 | | | | | — | | | | | — | | | | | 3,401,721 | |
| | | | | | | | | | | | | | | | | | | | |
Total Investments* | | | $ | 3,401,721 | | | | $ | 39,464,765 | | | | $ | — | | | | $ | 42,866,486 | |
| | | | | | | | | | | | | | | | | | | | |
| | (1) | Level 3 security valued at $0. |
| | * | Additional information regarding the industry classifications of these investments is disclosed in the Schedule of Investments. |
There were no transfers into or out of Level 1, Level 2 or Level 3 fair value measurements during the reporting period. Transfers between levels are recognized at the end of the reporting period.
Below is a reconciliation of Level 3 assets held by the LKCM Small Cap Equity Fund for which significant observable inputs were used to determine fair value.
| | | | | |
| | | Level 3 |
Description | | Common Stocks |
Balance as of December 31, 2021 | | | $ | 0 | |
Purchases | | | | — | |
Sales proceeds | | | | — | |
Accreted discounts, net | | | | | |
Realized gain (loss) | | | | — | |
Change in unrealized appreciation/depreciation | | | | — | |
Transfers into/(out of) Level 3 | | | | — | |
| | | | | |
Balance as of June 30, 2022 | | | $ | 0 | |
| | | | | |
| Change in unrealized appreciation/depreciation during the period for Level 3 investments held at June 30, 2022 | | | | | |
| | | $ | — | |
| | | | | |
2. Federal Income Taxes: The Funds have elected to be treated as “regulated investment companies” under Subchapter M of the Internal Revenue Code and each Fund intends to distribute all of its investment company net taxable income and net capital gains to shareholders. Therefore, no federal income tax provision is recorded.
3. Distributions to Shareholders: The LKCM Small Cap Equity Fund, LKCM Small-Mid Cap Equity Fund, LKCM Equity Fund and LKCM International Equity Fund generally intend to declare and pay income dividends and distribute net capital gains, if any, at least on an annual basis. The LKCM Balanced Fund and LKCM Fixed Income Fund generally intend to declare and pay income dividends on a quarterly basis and distribute net capital gains, if any, at least on an annual basis.
4. Foreign Securities: Investing in securities of foreign companies and foreign governments involves special risks and considerations not typically associated with investing in securities of U.S. issuers. These risks include devaluation of currencies and future adverse political and economic developments. Moreover, securities of many foreign companies and foreign governments and their markets may be less liquid and their prices more volatile than those of securities of comparable U.S. companies and securities of the U.S. government.
5. Expense Allocation: Expenses incurred by the Funds in the Trust are allocated among the Funds based upon (i) relative average net assets, (ii) a specific identification basis as incurred, or (iii) evenly among the Funds, depending on the nature of the expense.
6. Use of Estimates: The preparation of financial statements in conformity with accounting principles generally accepted in the United States of America requires management to make estimates and assumptions that affect the reported amounts of assets and liabilities and disclosure of contingent assets and liabilities at the date of the financial statements and the reported amounts of revenues and expenses during the reporting period. Actual results could differ from those estimates.
7. Guarantees and Indemnifications: In the normal course of business, the Funds enter into contracts with service providers that contain general indemnification clauses. The Funds’ maximum exposure under these arrangements is unknown as this would involve future claims against the Funds that have not yet occurred. Based on experience, the Funds expect the risk of loss to be remote.
8. Security Transactions and Investment Income: Security and shareholder transactions are recorded on the trade date. Realized gains and losses on sales of investments are calculated on the identified cost basis. Dividend income and dividends and distributions to shareholders are recorded on the ex-dividend date. Withholding taxes on foreign dividends have been provided for in accordance with the Funds’ understanding of the applicable jurisdiction’s tax rules and rates. Interest income is recognized on the accrual basis. All discounts and premiums are amortized based on the effective interest method for tax and financial reporting purposes. The Funds may hold the securities of real estate investment trusts (“REITs”). Distributions from such investments may include income, capital gains and return of capital.
33
9. Other: Distributions from net investment income and realized capital gains are determined in accordance with income tax regulations, which may differ from U.S. GAAP. Certain capital accounts in the consolidated financial statements are periodically adjusted for permanent differences in order to reflect their tax character. These permanent differences are primarily due to the varying treatment of income and gain/loss on portfolio securities held by the Fund and have no impact on net assets or NAV per share.
10. Restricted and Illiquid Securities: The Funds are permitted to invest in securities that are subject to legal or contractual restrictions on resale including investments considered by the Funds to be illiquid. Restricted securities generally may be resold in transactions exempt from registration. Illiquid investments are investments that the Funds reasonably expect cannot be sold or disposed of in current market conditions within seven calendar days or less in the ordinary course of business without the sale or disposition significantly changing the market value of the investment. A security may be considered illiquid if it lacks a readily available market or if its valuation has not changed for a certain period of time. Disposal of these securities may involve time-consuming negotiations and expense, and prompt sale at the current valuation may be difficult.
B. Investment Advisory and Other Agreements: The Adviser serves as the investment adviser to the Funds under an Investment Advisory Agreement (the “Agreement”). The Adviser receives a fee, computed daily and payable quarterly, at the annual rates presented below as applied to each Fund’s average daily net assets. The Adviser has contractually agreed to waive all or a portion of its management fee and/or reimburse expenses of the Funds through May 1, 2023 in order to limit each Fund’s operating expenses to the annual cap rates presented below. This expense limitation excludes interest, taxes, brokerage commissions, indirect fees and expenses relating to investments in other investment companies, including money market funds, and extraordinary expenses.
For the six months ended June 30, 2022, the Adviser waived the following management fees and/or reimbursed expenses to meet its expense cap obligations:
| | | | | | | | | | | | | | | | | | | | | | | | | | | | | | |
| | | LKCM
Small Cap
Equity Fund | | LKCM
Small-Mid Cap
Equity Fund | | LKCM
Equity
Fund | | LKCM
Balanced
Fund | | LKCM
Fixed
Income Fund | | LKCM
International
Equity Fund |
Annual Management Fee Rate | | | | 0.75% | | | | | 0.75% | | | | | 0.70% | | | | | 0.65% | | | | | 0.50% | | | | | 0.90% | |
Annual Cap on Expenses | | | | 1.00% | | | | | 1.00% | | | | | 0.80% | | | | | 0.80% | | | | | 0.50% | | | | | 1.00% | |
Fees Waived and/or Expenses Reimbursed in 2022 | | | | $52,468 | | | | | $63,766 | | | | | $422,768 | | | | | $117,857 | | | | | $431,963 | | | | | $95,668 | |
The Trust reimburses the Adviser for a portion of compensation paid to the Trust’s Chief Compliance Officer. This compensation is reported as part of the “Trustees’ fees and officer compensation” expense on the Statement of Operations.
U.S. Bancorp Fund Services, LLC (“U.S. Bancorp”), doing business as U.S. Bank Global Fund Services, serves as transfer agent and administrator for the Trust and serves as accounting services agent for the Trust. U.S. Bank, N.A. serves as custodian for the Funds.
Distribution services are performed pursuant to a distribution contract with Quasar Distributors, LLC (“Quasar”), the Trust’s principal underwriter.
The Funds have adopted a Distribution Plan pursuant to Rule 12b-1 under the 1940 Act, under which each Fund may pay an annualized fee of up to 0.75% of its average daily net assets for distribution and other services. Currently, the Board of Trustees has not authorized payments under this plan and, as a result, the Funds currently neither accrue nor pay any fees under the plan.
C. Fund Shares: At June 30, 2022, there was an unlimited number of shares of beneficial interest, no par value, authorized, for each Fund. The following tables summarize the activity in shares of each Fund:
| | | | | | | | | | | | | | | | | | | | |
| LKCM Small Cap Equity Fund | | | | | | | | |
| | | Six Months Ended
June 30, 2022 | | Year Ended
December 31, 2021 |
| | | Shares | | Amount | | Shares | | Amount |
Shares sold | | | | 149,278 | | | | $ | 2,813,145 | | | | | 742,164 | | | | $ | 17,323,790 | |
Shares issued to shareholders in reinvestment of distributions | | | | — | | | | | — | | | | | 1,370,179 | | | | | 29,486,241 | |
Shares redeemed | | | | (323,561 | ) | | | | (5,987,579 | ) | | | | (785,462 | ) | | | | (19,135,168 | ) |
| | | | | | | | | | | | | | | | | | | | |
Net increase (decrease) | | | | (174,284 | ) | | | $ | (3,174,434 | ) | | | | 1,326,881 | | | | $ | 27,674,863 | |
| | | | | | | | | | | | | | | | | | | | |
Shares Outstanding: | | | | | | | | | | | | | | | | | | | | |
Beginning of period | | | | 10,638,481 | | | | | | | | | | 9,311,600 | | | | | | |
| | | | | | | | | | | | | | | | | | | | |
End of period | | | | 10,464,197 | | | | | | | | | | 10,638,481 | | | | | | |
| | | | | | | | | | | | | | | | | | | | |
34
| | | | | | | | | | | | | | | | | | | | |
| LKCM Small-Mid Cap Equity Fund | | | | | | | | |
| | | Six Months Ended
June 30, 2022 | | Year Ended
December 31, 2021 |
| | | Shares | | Amount | | Shares | | Amount |
Shares sold | | | | 542,320 | | | | $ | 5,894,725 | | | | | 107,747 | | | | $ | 1,343,832 | |
Shares issued to shareholders in reinvestment of distributions | | | | — | | | | | — | | | | | 191,747 | | | | | 2,099,630 | |
Shares redeemed | | | | (96,594 | ) | | | | (944,916 | ) | | | | (345,703 | ) | | | | (4,333,927 | ) |
Redemption fee | | | | | | | | | 777 | | | | | | | | | | — | |
| | | | | | | | | | | | | | | | | | | | |
Net increase (decrease) | | | | 445,727 | | | | $ | 4,950,586 | | | | | (46,209 | ) | | | $ | (890,465 | ) |
| | | | | | | | | | | | | | | | | | | | |
Shares Outstanding: | | | | | | | | | | | | | | | | | | | | |
Beginning of period | | | | 1,308,897 | | | | | | | | | | 1,355,106 | | | | | | |
| | | | | | | | | | | | | | | | | | | | |
End of period | | | | 1,754,624 | | | | | | | | | | 1,308,897 | | | | | | |
| | | | | | | | | | | | | | | | | | | | |
| | | | |
| LKCM Equity Fund | | | | | | | | |
| | | Six Months Ended
June 30, 2022 | | Year Ended
December 31, 2021 |
| | | Shares | | Amount | | Shares | | Amount |
Shares sold | | | | 598,881 | | | | $ | 20,783,302 | | | | | 786,326 | | | | $ | 29,544,937 | |
Shares issued to shareholders in reinvestment of distributions | | | | — | | | | | — | | | | | 858,852 | | | | | 33,323,438 | |
Shares redeemed | | | | (473,439 | ) | | | | (16,491,124 | ) | | | | (946,112 | ) | | | | (36,177,759 | ) |
Redemption fee | | | | | | | | | 1,328 | | | | | | | | | | 91 | |
| | | | | | | | | | | | | | | | | | | | |
Net increase | | | | 125,442 | | | | $ | 4,293,506 | | | | | 699,066 | | | | $ | 26,690,707 | |
| | | | | | | | | | | | | | | | | | | | |
Shares Outstanding: | | | | | | | | | | | | | | | | | | | | |
Beginning of period | | | | 14,025,692 | | | | | | | | | | 13,326,626 | | | | | | |
| | | | | | | | | | | | | | | | | | | | |
End of period | | | | 14,151,134 | | | | | | | | | | 14,025,692 | | | | | | |
| | | | | | | | | | | | | | | | | | | | |
| | | | |
| LKCM Balanced Fund | | | | | | | | |
| | | Six Months Ended
June 30, 2022 | | Year Ended
December 31, 2021 |
| | | Shares | | Amount | | Shares | | Amount |
Shares sold | | | | 260,375 | | | | $ | 6,992,047 | | | | | 300,183 | | | | $ | 8,545,296 | |
Shares issued to shareholders in reinvestment of distributions | | | | 21,123 | | | | | 547,049 | | | | | 205,971 | | | | | 6,005,184 | |
Shares redeemed | | | | (719,946 | ) | | | | (18,964,242 | ) | | | | (235,087 | ) | | | | (6,706,546 | ) |
Redemption fee | | | | | | | | | 386 | | | | | | | | | | 411 | |
| | | | | | | | | | | | | | | | | | | | |
Net increase (decrease) | | | | (438,448 | ) | | | $ | (11,424,760 | ) | | | | 271,067 | | | | $ | 7,844,345 | |
| | | | | | | | | | | | | | | | | | | | |
Shares Outstanding: | | | | | | | | | | | | | | | | | | | | |
Beginning of period | | | | 4,960,953 | | | | | | | | | | 4,689,886 | | | | | | |
| | | | | | | | | | | | | | | | | | | | |
End of period | | | | 4,522,505 | | | | | | | | | | 4,960,953 | | | | | | |
| | | | | | | | | | | | | | | | | | | | |
| | | | |
| LKCM Fixed Income Fund | | | | | | | | |
| | | Six Months Ended
June 30, 2022 | | Year Ended
December 31, 2021 |
| | | Shares | | Amount | | Shares | | Amount |
Shares sold | | | | 1,076,001 | | | | $ | 11,345,536 | | | | | 2,477,664 | | | | $ | 27,346,315 | |
Shares issued to shareholders in reinvestment of distributions | | | | 173,813 | | | | | 1,800,795 | | | | | 325,856 | | | | | 3,573,515 | |
Shares redeemed | | | | (1,251,807 | ) | | | | (13,050,478 | ) | | | | (1,499,784 | ) | | | | (16,551,962 | ) |
| | | | | | | | | | | | | | | | | | | | |
Net increase | | | | (1,992 | ) | | | $ | 95,854 | | | | | 1,303,736 | | | | $ | 14,367,868 | |
| | | | | | | | | | | | | | | | | | | | |
Shares Outstanding: | | | | | | | | | | | | | | | | | | | | |
Beginning of period | | | | 27,209,092 | | | | | | | | | | 25,905,356 | | | | | | |
| | | | | | | | | | | | | | | | | | | | |
End of period | | | | 27,207,100 | | | | | | | | | | 27,209,092 | | | | | | |
| | | | | | | | | | | | | | | | | | | | |
35
| | | | | | | | | | | | | | | | | | | | |
| LKCM International Equity Fund | | | | | | | | |
| | | Six Months Ended
June 30, 2022 | | Year Ended
December 31, 2021 |
| | | Shares | | Amount | | Shares | | Amount |
Shares sold | | | | 186,979 | | | | $ | 2,429,777 | | | | | 1,230,967 | | | | $ | 16,639,624 | |
Shares issued to shareholders in reinvestment of distributions | | | | — | | | | | — | | | | | 34,722 | | | | | 504,168 | |
Shares redeemed | | | | (53,010 | ) | | | | (692,627 | ) | | | | (33,414 | ) | | | | (478,629 | ) |
| | | | | | | | | | | | | | | | | | | | |
Net increase | | | | 133,969 | | | | $ | 1,737,150 | | | | | 1,232,275 | | | | $ | 16,665,163 | |
| | | | | | | | | | | | | | | | | | | | |
Shares Outstanding: | | | | | | | | | | | | | | | | | | | | |
Beginning of period | | | | 3,827,325 | | | | | | | | | | 2,595,050 | | | | | | |
| | | | | | | | | | | | | | | | | | | | |
End of period | | | | 3,961,294 | | | | | | | | | | 3,827,325 | | | | | | |
| | | | | | | | | | | | | | | | | | | | |
D. Security Transactions: Purchases and sales of investment securities, other than short-term investments, for the six months ended June 30, 2022 were as follows:
| | | | | | | | | | | | | | | | | | | | |
| | | Purchases | | Sales |
| | | U.S.
Government | | Other | | U.S.
Government | | Other |
LKCM Small Cap Equity Fund | | | $ | — | | | | $ | 40,523,672 | | | | $ | — | | | | $ | 40,707,489 | |
LKCM Small-Mid Cap Equity Fund | | | | — | | | | | 8,008,896 | | | | | — | | | | | 4,559,708 | |
LKCM Equity Fund | | | | — | | | | | 26,630,990 | | | | | — | | | | | 42,365,949 | |
LKCM Balanced Fund | | | | — | | | | | 11,631,609 | | | | | — | | | | | 22,180,967 | |
LKCM Fixed Income Fund | | | | 1,736,504 | | | | | 30,247,885 | | | | | 2,000,000 | | | | | 29,138,165 | |
LKCM International Equity Fund | | | | — | | | | | 10,580,742 | | | | | — | | | | | 9,018,281 | |
E. Tax Information: At December 31, 2021, the components of accumulated earnings (losses) on a tax basis were as follows:
| | | | | | | | | | | | | | | | | | | | | | | | | | | | | | |
| | | LKCM
Small Cap
Equity Fund | | LKCM
Small-Mid Cap
Equity Fund | | LKCM
Equity
Fund | | LKCM
Balanced
Fund | | LKCM
Fixed
Income Fund | | LKCM
International
Equity Fund |
Tax cost | | | $ | 133,319,138 | | | | $ | 8,300,997 | | | | $ | 236,077,358 | | | | $ | 95,142,756 | | | | $ | 289,772,389 | | | | $ | 45,104,249 | |
| | | | | | | | | | | | | | | | | | | | | | | | | | | | | | |
Gross unrealized appreciation | | | $ | 94,870,888 | | | | $ | 6,173,503 | | | | $ | 310,956,837 | | | | $ | 50,434,674 | | | | $ | 5,759,386 | | | | $ | 12,232,249 | |
Gross unrealized depreciation | | | | (3,785,514 | ) | | | | (106,375 | ) | | | | (4,054,693 | ) | | | | (1,000,349 | ) | | | | (1,367,675 | ) | | | | (1,831,714 | ) |
| | | | | | | | | | | | | | | | | | | | | | | | | | | | | | |
Net unrealized appreciation | | | $ | 91,085,374 | | | | $ | 6,067,128 | | | | $ | 306,902,144 | | | | $ | 49,434,325 | | | | $ | 4,391,711 | | | | $ | 10,400,535 | |
| | | | | | | | | | | | | | | | | | | | | | | | | | | | | | |
Undistributed ordinary income | | | | — | | | | | — | | | | | — | | | | | — | | | | | — | | | | | 909 | |
Undistributed long-term capital gain | | | | 1,095,408 | | | | | — | | | | | — | | | | | — | | | | | 321,837 | | | | | 578,109 | |
| | | | | | | | | | | | | | | | | | | | | | | | | | | | | | |
Distributable earnings | | | $ | 1,095,408 | | | | $ | — | | | | $ | — | | | | $ | — | | | | $ | 321,837 | | | | $ | 579,018 | |
| | | | | | | | | | | | | | | | | | | | | | | | | | | | | | |
Other accumulated losses | | | | (1,215,908 | ) | | | | — | | | | | — | | | | | — | | | | | — | | | | | (5,296 | ) |
| | | | | | | | | | | | | | | | | | | | | | | | | | | | | | |
Total distributable earnings | | | $ | 90,964,874 | | | | $ | 6,067,128 | | | | $ | 306,902,144 | | | | $ | 49,434,325 | | | | $ | 4,713,548 | | | | $ | 10,974,257 | |
| | | | | | | | | | | | | | | | | | | | | | | | | | | | | | |
The difference between book cost of investments and tax cost of investments is attributable primarily to the tax deferral of losses on wash sales.
Net investment income and realized gains and losses for federal income tax purposes may differ from that reported on the financial statements because of permanent book-to-tax differences. GAAP requires that permanent differences between financial reporting and tax reporting be reclassified between various components of net assets. These differences are primarily due to net operating losses, swap contract adjustments, dividend reclasses, and dividends on redemption adjustments with differing book and tax methods.
To the extent the Funds realize future net capital gains, taxable distributions will be reduced by any unused capital loss carryforwards as permitted by the Internal Revenue Code. During the fiscal year ended December 31, 2021, the LKCM Fixed Income Fund used $1,340,959 and the LKCM International Equity Fund used $559,952 in capital loss carryforwards. At December 31, 2021, none of the Funds had capital loss carryforwards.
At December 31, 2021, the following Fund deferred, on a tax basis, late-year ordinary losses of:
| | | | | | | | | | |
LKCM International Equity Fund | | | $ | 5,295 | | | | | | |
At December 31, 2021, the following Fund deferred, on a tax basis, post-October capital losses of:
| | | | | | | | | | |
LKCM Small Cap Equity Fund | | | $ | 1,215,908 | | | | | | |
36
The tax components of dividends paid during the periods shown below for the Funds were as follows:
| | | | | | | | | | | | | | | | | | | | |
| | | Six Months Ended
June 30, 2022 | | Year Ended
December 31, 2021 |
| | | Ordinary
Income | | Long-Term
Capital Gains | | Ordinary
Income | | Long-Term
Capital Gains |
LKCM Small Cap Equity Fund | | | $ | — | | | | $ | — | | | | $ | 1,146,597 | | | | $ | 29,445,846 | |
LKCM Small-Mid Cap Equity Fund | | | | — | | | | | — | | | | | — | | | | | 2,133,969 | |
LKCM Equity Fund | | | | — | | | | | — | | | | | 2,188,898 | | | | | 32,684,898 | |
LKCM Balanced Fund | | | | 561,288 | | | | | — | | | | | 970,003 | | | | | 5,183,025 | |
LKCM Fixed Income Fund | | | | 1,966,633 | | | | | — | | | | | 3,880,841 | | | | | 43,872 | |
LKCM International Equity Fund | | | | — | | | | | — | | | | | 284,654 | | | | | 395,702 | |
The Funds designated earnings and profits distributed to shareholders upon the redemption of shares during 2021 in determining undistributed net capital gains as of December 31, 2021.
The Trust has adopted financial reporting rules regarding recognition and measurement of tax positions taken or expected to be taken on a tax return. The Trust has reviewed all open tax years and major jurisdictions and concluded that there is no impact on the Funds’ financial position or results of operations. Tax years that remain open to examination by major tax jurisdictions include tax years ended December 31, 2018 through December 31, 2021 (LKCM Small Cap Equity Fund, LKCM Small-Mid Cap Equity Fund, LKCM Equity Fund, LKCM Balanced Fund and LKCM Fixed Income Fund) and December 31, 2019 through December 31, 2021 (LKCM International Equity Fund). There is no tax liability resulting from unrecognized tax benefits relating to uncertain income tax positions taken or expected to be taken on tax returns as of December 31, 2021. The Funds are not aware of any tax positions for which it is reasonably possible that the total amounts of unrecognized tax benefits will significantly change in the next twelve months. If applicable, the Funds would recognize interest accrued related to unrecognized tax benefits in “interest expense” and penalties in “other expense” on the statement of operations.
F. Other Matters: The global outbreak of COVID-19 and other variants and the ensuing pandemic has adversely impacted global economic and commercial activity and has contributed to significant volatility and uncertainty in global financial markets. The global impact of the COVID-19 pandemic continues to rapidly evolve and its long-term implications for economies, markets, sectors, industries and issuers remains uncertain. The financial and operational performance of the issuers of securities in which the Funds invest depends upon future developments with respect to the COVID-19 pandemic, including, without limitation, the scope, duration and spread of COVID-19 as well as the development, efficacy and administration of COVID-19 vaccines, and such future developments and uncertainties with respect thereto may adversely affect, among other things, the value and liquidity of the Funds’ investment, the Funds’ ability to satisfy redemption requests, and Funds’ financial and operational performance.
G. Accounting Pronouncement: In December 2020, the SEC adopted a new rule providing a framework for fund valuation practices (“Rule 2a-5”). Rule 2a-5 establishes requirements for determining fair value in good faith for purposes of the 1940 Act. Rule 2a-5 will permit fund boards to designate certain parties to perform fair value determinations, subject to board oversight and certain other conditions. Rule 2a-5 also defines when market quotations are “readily available” for purposes of the 1940 Act and the threshold for determining whether a fund must fair value a security. In connection with Rule 2a-5, the SEC also adopted related recordkeeping requirements and is rescinding previously issued guidance, including with respect to the role of a board in determining fair value and the accounting and auditing of fund investments.
H. Subsequent Events: In preparing these financial statements, management has evaluated the Funds’ related events and transactions that occurred subsequent to June 30, 2022 through the date the financial statements were issued and has determined that there were no significant subsequent events requiring recognition or disclosure in the financial statements.
37
|
| LKCM FUNDS |
| ADDITIONAL INFORMATION |
| June 30, 2022 (Unaudited) |
Availability of Proxy Voting Information: A description of the policies and procedures that the Funds use to determine how to vote proxies relating to their portfolio securities, as well as information regarding how the Funds voted proxies relating to portfolio securities during the most recent 12-month period ended June 30, is available without charge, upon request, by calling toll-free 1-800-688-LKCM or on the SEC website at http://www.sec.gov.
The actual voting records relating to portfolio securities during the twelve month period ended June 30 (as filed with the SEC on Form N-PX) are available without charge, upon request, by calling the Funds toll free at 1-800-688-LKCM or by accessing the SEC’s website at www.sec.gov.
Availability of Quarterly Portfolio Schedule: The Funds file a complete schedule of portfolio holdings with the U.S. Securities and Exchange Commission (the “SEC”) for the first and third quarters of each fiscal year on Part F of Form N-PORT. The Funds’ Part F of Form N-PORT are available on the SEC’s website at www.sec.gov and may be reviewed and copied at the SEC’s Public Reference Room in Washington, D.C. Information on the operation of the Public Reference Room may be obtained by calling 1-800-732-0330. The Funds’ Form Part F of Form N-PORT may also be obtained by calling toll-free 1-800-688-LKCM.
38
RENEWAL OF INVESTMENT ADVISORY AGREEMENT WITH RESPECT TO LKCM SMALL CAP EQUITY FUND, LKCM SMALL-MID CAP EQUITY FUND, LKCM EQUITY FUND, LKCM BALANCED FUND, LKCM FIXED INCOME FUND AND LKCM INTERNATIONAL EQUITY FUND
(Unaudited)
Introduction. At a meeting held on February 22, 2022, the Board of Trustees of LKCM Funds, including the independent Trustees (the “Board”), approved the renewal of the Investment Advisory Agreement (the “Agreement”) between Luther King Capital Management Corporation (“LKCM”) and LKCM Funds, on behalf of the LKCM Small Cap Equity Fund (the “Small Cap Equity Fund”), LKCM Small-Mid Cap Equity Fund (the “Small-Mid Cap Equity Fund”), LKCM Equity Fund (the “Equity Fund”), LKCM Balanced Fund (the “Balanced Fund”), LKCM Fixed Income Fund (the “Fixed Income Fund”) and LKCM International Equity Fund (the “International Equity Fund” and collectively, the “Funds”).
In voting to approve the renewal of the Agreement, the Board considered information furnished throughout the year at regularly scheduled Board meetings, as well as information prepared specifically in connection with the annual renewal process. The Board also considered the overall fairness of the Agreement and factors it deemed relevant with respect to each Fund, including, but not limited to: (1) the nature, extent and quality of the services provided to each Fund; (2) the performance of each Fund as compared to a relevant benchmark, peer groups of funds compiled by Broadridge Financial Solutions, Inc. (“Broadridge”) and Lipper, Inc. (“Lipper”) and an account managed by LKCM pursuant to similar investment strategies (“Similar Account”) or a composite (“Composite”) of Similar Accounts; (3) the contractual advisory fee rate, actual advisory fee rate, total expense ratio, and net expense ratio of each Fund, how those compared to a peer group of funds compiled by Broadridge, and how each applicable Fund’s contractual advisory fee rate compared to the Similar Accounts; (4) the costs of services provided to the Funds and the profitability of LKCM with respect to such services; (5) the extent to which economies of scale would be realized by LKCM as a Fund grows and whether the fee levels reflect economies of scale for the benefit of investors; and (6) any other benefits derived by LKCM from its relationship with the Funds. The Board did not identify any single factor or item of information as controlling, and each Board member may have accorded different weights to the various factors in reaching his conclusions with respect to the Agreement.
In considering the renewal of the Agreement, the Board requested and considered a broad range of information provided by LKCM, including, but not limited to, reports relating to each Fund’s performance and expenses, information regarding the Similar Accounts, certain portfolio compliance policies and the background and experience of the portfolio managers. In addition, the Board considered a memorandum from its legal counsel regarding the Board’s legal duties in considering the renewal of the Agreement. The Board also meets each quarter to review the Funds’ performance and expenses and various aspects of the Funds’ operations.
Nature, Extent and Quality of Services. The Board reviewed and considered the nature, extent and quality of the advisory services provided by LKCM to each Fund under the Agreement. The Board considered that LKCM was established in 1979 and provides investment management services to private funds, foundations, endowments, pension plans, trusts, estates, high net worth individuals and other clients. The Board recognized that LKCM is responsible for managing the Funds, including identifying investments for the Funds, monitoring the Funds’ investment programs, executing trades and overseeing the Funds’ performance and compliance with applicable rules and regulations and the Funds’ investment policies. The Board considered LKCM’s financial resources, insurance coverage, culture of compliance and compliance operations that support the Funds. The Board also considered LKCM’s representation that it has invested considerable resources into the firm and its personnel to augment investment management and client services. The Board reviewed information regarding the portfolio managers and other key personnel who provide services to each Fund and considered LKCM’s representation that the firm historically has experienced low personnel turnover. The Board also considered LKCM’s representation that the firm has implemented a compensation structure designed to attract and retain highly qualified investment professionals.
The Board also reviewed the compliance services provided to the Funds by LKCM, including LKCM’s oversight of the Funds’ day-to-day operations. The Board considered the quality of LKCM’s compliance personnel. In addition, the Board considered LKCM’s summary of its oversight of the Funds’ key service providers. The Board also considered LKCM’s description of its best execution practices and noted LKCM’s representation that its soft-dollar and commission-sharing arrangements for client transactions (including those for the Funds) comply with the requirements of the safe harbor provided by Section 28(e) of the Securities Exchange Act of 1934, as amended.
Performance of the Funds. The Board considered the performance of each Fund compared to the Fund’s benchmark index (“benchmark”), peer groups of funds compiled by Broadridge and Lipper, and a Lipper peer group index (“Lipper Index”) for various time periods ended December 31, 2021. Additionally, the Board considered LKCM’s discussion of each Fund’s performance.
The Board noted LKCM’s representation that its investment strategy for the Funds focuses on investments in higher quality companies that meet LKCM’s stringent investment criteria, which LKCM believes have not been characteristics that have driven the performance of certain funds’ benchmarks in prior years, and considered that these factors had affected the performance of the Small Cap Equity Fund and Small-Mid Cap Equity Fund during the longer-term periods ended December 31, 2021. The Board also considered certain additional factors cited by LKCM as contributing to or detracting from a Fund’s performance during the prior year.
The Board noted that the Small Cap Equity Fund outperformed its benchmark, the Russell 2000 Index, and its Lipper Index for the three-year, five-year and since-inception periods, but underperformed its benchmark and its Lipper Index for the one-year and ten-year periods.
39
The Board noted that the Small-Mid Cap Equity Fund outperformed its benchmark, the Russell 2500 Index, and its Lipper Index for the three-year and five-year periods, but underperformed its benchmark and its Lipper Index for the one-year, ten-year, and since-inception periods.
The Board noted that the Equity Fund underperformed its benchmark, the S&P 500 Index, for all relevant periods. The Board also noted that the Equity Fund outperformed its Lipper Index for the three-year, five-year and since-inception periods, but underperformed its Lipper Index for the one-year and ten-year periods.
The Board noted that the Balanced Fund had underperformed its benchmark, the S&P 500 Index, and outperformed the Bloomberg U.S. Intermediate Government/Credit Bond Index for all relevant periods. The Board also compared the Balanced Fund’s performance to a custom blended index that reflected the Fund’s historical allocation to equity and fixed income securities (“Blended Index”). The Board noted that the Balanced Fund performed in line with the Blended Index for the since-inception period, but underperformed the Blended Index for the one-year, three-year, five-year and ten-year periods. The Board also noted that the Balanced Fund outperformed its Lipper Index for the ten-year and since-inception periods, but underperformed the Lipper Index for the one-year, three-year, and five-year periods.
The Board noted that the Fixed Income Fund underperformed its benchmark, the Bloomberg U.S. Intermediate Government/Credit Bond Index, for all relevant periods. The Board noted that the Fixed Income Fund outperformed its Lipper Index for the since-inception period, but underperformed its Lipper Index for the one-year, three-year, five-year and ten-year periods.
The Board noted that the International Equity Fund outperformed its benchmark, the MSCI EAFE Index, and its Lipper Index for the one-year and since-inception periods.
The Board also considered the performance of each Fund against its Similar Account or Composite, as applicable. The Board considered LKCM’s explanation that underperformance, if any, generally was attributable to tax considerations attendant to the management of a Fund that do not apply to non-taxable portfolios included in the Composite as well as the timing of cash flows resulting from shareholder purchases and redemptions. In the case of the International Equity Fund, the Board also considered LKCM’s explanation that the Fund’s underperformance relative to a private investment partnership with a similar investment strategy was attributable to the timing of cash flows associated with the investment of Fund assets, as the Fund realized net subscriptions during the year.
Fees and Expenses. The Board considered each Fund’s contractual advisory fee rate, effective advisory fee rate (the contractual advisory fee rate net of fee waivers and/or expense reimbursements), total expense ratio and net expense ratio (the total expense ratio, including Rule 12b-1 fees and non-Rule 12b-1 service fees, after fee waivers and/or expense reimbursements). The Board also considered that LKCM had contractually agreed to continue the current fee waivers and expense caps in effect for each Fund through May 1, 2022, and that LKCM intends to propose at the upcoming Board meeting that it contractually agree to continue the current fee waiver through May 1, 2023.
The Board compared the contractual advisory fee rate, effective advisory fee rate, total expense ratio, and net expense ratio of each Fund to a category of similar funds compiled by Broadridge (“Expense Group”) and a broader category comprised of the Fund, the Expense Group and other similar retail funds (“Expense Universe”). The Broadridge reports did not include a comparison of a Fund’s contractual advisory fee rate or total expense ratio relative to the Expense Universe. For the Expense Group, contractual advisory fee rates were compared at a Fund’s asset level and did not include the Funds’ administrative expenses. The first quartile in an Expense Group and Expense Universe represents those funds with the lowest fees or expenses.
The Board generally considered that, although certain of the Funds’ contractual advisory fee rates are higher than those of their peers, the expense cap arrangements generally cause the Funds’ effective advisory fee rates and overall net expense ratios to be lower than, or in line with, those of their peers.
The Board noted that the contractual advisory fee rate for the Small Cap Equity Fund was in the first quartile of its Expense Group and the Fund’s effective advisory fee rate was in the second quartile of its Expense Group and Expense Universe. The Board also considered that the Small Cap Equity Fund’s net expense ratio was in the first quartile of its Expense Group and Expense Universe. In this case, the Small Cap Equity Fund’s contractual advisory fee rate was lower than the median of its Expense Group, and its effective advisory fee rate and net expense ratio were lower than the median of its Expense Group and Expense Universe, as applicable.
The Board noted that the contractual advisory fee rate for the Small-Mid Cap Equity Fund was in the first quartile of its Expense Group and the Fund’s effective advisory fee rate was in the first quartile of its Expense Group and Expense Universe. The Board also considered that the Small-Mid Cap Equity Fund’s net expense ratio was in the first quartile of its Expense Group and Expense Universe. In this case, the Small-Mid Cap Equity Fund’s contractual advisory fee rate was lower than the median of its Expense Group, and its effective advisory fee rate and net expense ratio were lower than the median of its Expense Group and Expense Universe, as applicable.
The Board noted that the contractual advisory fee rate for the Equity Fund was in the first quartile of its Expense Group and the Fund’s effective advisory fee rate was in the first quartile of its Expense Group and in the second quartile of its Expense Universe. The Board also considered that the Equity Fund’s net expense ratio was in the first quartile of its Expense Group and second quartile of its Expense Universe. In this case, the Equity Fund’s contractual advisory fee rate was lower than the median of its Expense Group, and its effective advisory fee rate and net expense ratio were lower than the median of its Expense Group and Expense Universe, as applicable.
40
The Board noted that the contractual advisory fee rate for the Balanced Fund was in the first quartile of its Expense Group and the Fund’s effective advisory fee rate was in the first quartile of its Expense Group and Expense Universe. The Board also considered that the Balanced Fund’s net expense ratio was in the first quartile of its Expense Group and in the second quartile of its Expense Universe. In this case, the Balanced Fund’s contractual advisory fee rate was lower than the median of its Expense Group, and its effective advisory fee rate and net expense ratio were lower than the median of its Expense Group and Expense Universe, as applicable.
The Board noted that the contractual advisory fee rate for the Fixed Income Fund was in the fourth quartile of its Expense Group and the Fund’s effective advisory fee rate was in the first quartile of its Expense Group and Expense Universe. The Board also considered that the Fixed Income Fund’s net expense ratio was in the first quartile of its Expense Group and the second quartile of its Expense Universe. In this case, the Fixed Income Fund’s contractual advisory fee rate was higher than the median of its Expense Group and its effective advisory fee rate and net expense ratio were lower than the median of its Expense Group and Expense Universe, as applicable.
The Board noted that the contractual advisory fee rate for the International Equity Fund was in the fourth quartile of its Expense Group and the Fund’s effective advisory fee rate was in the first quartile of its Expense Group and Expense Universe. The Board also considered that the International Equity Fund’s net expense ratio was in the second quartile of its Expense Group and Expense Universe. In this case, the International Equity Fund’s contractual advisory fee rate was higher than the median of its Expense Group, and its effective advisory fee rate and net expense ratio were lower than the median of its Expense Group and Expense Universe, as applicable.
The Board also considered the advisory fee rates generally charged by LKCM to Similar Accounts and noted LKCM’s explanation that the fee rates charged by LKCM to the Funds and its Similar Accounts differ primarily as a result of the greater regulatory, compliance and related expenses incurred by LKCM in providing investment management services to the Funds as compared to the Similar Accounts.
Costs, Profitability and Economies of Scale. The Board considered LKCM’s costs in rendering services to the Funds and the profitability of LKCM. The Board reviewed the fees paid by each Fund to LKCM for the last three calendar years. The Board also reviewed the estimated profit and loss analysis provided by LKCM on a Fund-by-Fund basis for the past calendar year, before and after any distribution payments made by LKCM. The Board noted that, during the year, LKCM had invested significant resources to cap the Funds’ net expense ratios and facilitate the distribution of the Funds. With respect to economies of scale, the Board considered that the Funds generally benefit from competitive effective advisory fee rates and net expense ratios despite not having reached an asset size at which economies of scale traditionally would be considered to exist. The Board also considered that, while there are no breakpoints in the Funds’ advisory fee rate schedules, LKCM waives fees and/or reimburses expenses to maintain the Funds’ effective advisory fee rates and net expense ratios at competitive levels.
Benefits Derived by LKCM from Its Relationship with the Funds. The Board requested and considered information regarding the potential fall-out benefits to LKCM from its association with the Funds. The Board noted that LKCM believes that both LKCM and the Funds benefit from LKCM’s soft-dollar and commission-sharing arrangements, which enhance the level of research that LKCM is able to perform on the Funds’ portfolio companies. The Board also noted that LKCM believes its relationship with the Funds provides an indirect benefit to both parties in the form of enhanced recognition among institutional and other investors, consultants and other members of the financial community. The Board considered the potential indirect benefits to LKCM of this recognition, in the form of additional clients with separately managed portfolios or subadvisory relationships with other mutual funds, which also may attract additional investors to the Funds.
Conclusion. Based on its evaluation of these and other factors, the Board: (1) concluded that the fees paid to LKCM under the Agreement are fair and reasonable; (2) determined that shareholders would benefit from LKCM’s continued management of the Funds; and (3) approved the renewal of the Agreement with respect to the Funds.
41
ANNUAL REPORT REGARDING LIQUIDITY RISK MANAGEMENT PROGRAM
(Unaudited)
Pursuant to Rule 22e-4 under the Investment Company Act of 1940, as amended (the “Liquidity Rule”), LKCM Funds (the “Trust”) has adopted a liquidity risk management program (“Program”). The Program sets forth the Trust’s policies and procedures with respect to the management of liquidity risk for the separate series of the Trust (each, a “Fund”). Liquidity risk is generally defined as the risk that a Fund could not meet a request to redeem shares issued by the Fund without significant dilution of the interest of the remaining shareholders of the Fund.
As required by the Liquidity Rule, the Program addresses: (1) the assessment, management and periodic review of each Fund’s liquidity risk; (2) the liquidity classification of each Fund’s portfolio investments as a highly liquid, moderately liquid, less liquid or illiquid investment; (3) the determination of a highly liquid investment minimum (“HLIM”) for a Fund that does not primarily hold highly liquid investments, and procedures to respond to a shortfall in a Fund’s HLIM; (4) a limitation on each Fund’s investment in illiquid investments of 15% of the Fund’s net assets; and (5) redemptions in kind.
The Trust’s board of trustees (“Board”) has reviewed and approved the Program. The Board has designated Luther King Capital Management Corporation (“LKCM”), the Trust’s investment adviser, as the Program administrator (“Administrator”) with responsibility for administering the Program.
At a meeting of the Board held on May 24, 2022, the Board reviewed a written report (“Report”) from the Administrator addressing the operation of the Program and assessing the adequacy and effectiveness of its implementation, for the period April 1, 2021 through March 31, 2022 (the “Reporting Period”). The Report reflected that each Fund was invested primarily in highly liquid assets and had sufficient cash flows to manage its liquidity requirements, and no liquidity events impacting a Fund’s ability to timely meet redemption requests occurred during the Reporting Period. The Report stated that no material changes had been made to the Program during the Reporting Period, and concluded that the Program continues to be adequate and effective in managing the Funds’ potential liquidity risks and otherwise maintaining compliance with the Liquidity Rule.
42
LKCM FUNDS
PRIVACY NOTICE
Our Commitment to Your Privacy
At LKCM Funds, we are committed to safeguarding the confidentiality and privacy of nonpublic personal information about our current and former shareholders. This privacy notice describes the types of nonpublic personal information we collect about you and the sources through which we obtain this information, the purposes for which we obtain and use your nonpublic information, and the policies and procedures we have implemented to protect the privacy of your nonpublic personal information.
How We Protect Your Nonpublic Personal Information
Protecting your nonpublic personal information is an important priority at LKCM Funds. Accordingly, we have implemented policies and procedures designed to safeguard your nonpublic personal information, such as your tax identification number, account and investment history, account numbers, account balances and nonpublic contact information, from unauthorized access or use. Pursuant to these policies and procedures, we maintain various physical, technological, and administrative safeguards to protect the security and confidentiality of your nonpublic personal information, and we adapt these safeguards to respond to evolving technological and other standards.
We do not disclose nonpublic personal information about you to non-affiliated firms, organizations or individuals except as authorized by you or your representatives or as required or permitted by law. We may disclose nonpublic personal information about you to nonaffiliated third parties, such as custodians, brokers, auditors, accountants, and systems and administrative service providers, in connection with the services we provide to you or on your behalf. When we provide nonpublic personal information about you to nonaffiliated third parties for these purposes, we expect them to safeguard your nonpublic personal information, use your nonpublic personal information only for the intended purposes and otherwise abide by applicable law.
How We Obtain Your Nonpublic Personal Information
We collect nonpublic personal information about you from various sources, including documents, new account applications and other information that you or your representatives, custodians, attorneys, accountants or similar parties provide to us, communications that we have with you or your representatives, custodians, attorneys, accountants or similar parties, and documents and other information related to your accounts or investment experience with us.
Please do not hesitate to contact Jacob D. Smith, our Chief Compliance Officer, if you have any questions regarding this privacy notice or the measures we have implemented to protect the privacy of your nonpublic personal information.
U.S. Bancorp Fund Services, LLC
P.O. Box 701
Milwaukee, WI 53201-0701
LKCM FUNDS
P.O. Box 701
Milwaukee, WI 53201-0701
| | | | |
Officers and Trustees |
J. Luther King, Jr., CFA, CIC Trustee, President and Chief Executive Officer | | Richard J. Howell Trustee | | Richard Lenart Secretary & Treasurer |
| | |
Paul W. Greenwell Vice President | | Larry J. Lockwood Chairman of the Board of Trustees | | Jacob D. Smith Chief Financial Officer Chief Compliance Officer |
| | |
Steven R. Purvis, CFA Trustee | | Mauricio Rodriguez Trustee | | |
|
Investment Adviser |
Luther King Capital Management Corporation 301 Commerce Street, Suite 1600 Fort Worth, TX 76102 |
Administrator, Transfer Agent, Dividend Paying Agent & Shareholder Servicing Agent |
U.S. Bancorp Fund Services, LLC P.O. Box 701 Milwaukee, WI 53201-0701 |
Custodian |
U.S. Bank, N.A. 1555 N. River Center Drive, Suite 302 Milwaukee, WI 53212 |
Independent Registered Public Accounting Firm |
Deloitte & Touche LLP 555 E. Wells St., Suite 1400 Milwaukee, WI 53202 |
Distributor |
Quasar Distributors, LLC 111 East Kilbourn Avenue, Suite 2200 Milwaukee, WI 53202 |

LKCM Aquinas Catholic Equity Fund
Semi-Annual Report
June 30, 2022
Dear Fellow Shareholders:
We report the following performance information for the LKCM Aquinas Catholic Equity Fund for indicated periods ended June 30, 2022:
| | | | | | | | | | | | | | | | | | | | | | | | | | | | | | | | | | | | | | | | | | | | | |
Fund | | Inception
Date | | NAV @
6/30/22 | | Net
Expense
Ratio*, ** | | Gross
Expense
Ratio** | | Six Month
Total
Return
Ended
6/30/22 | | One Year
Total
Return
Ended
6/30/22 | | Five Year
Average
Annualized
Return
Ended
6/30/22 | | Ten Year
Average
Annualized
Return
Ended
6/30/22 | | Avg.
Annual
Total
Return
Since
Incept.*** |
LKCM Aquinas Catholic Equity Fund(1) | | | | 07/11/2005 | | | | $ | 15.60 | | | | | 1.00% | | | | | 1.40% | | | | | -20.08% | | | | | -12.16% | | | | | 10.80% | | | | | 11.18% | | | | | 8.09% | |
S&P 500 ® Index(2) | | | | | | | | | | | | | | | | | | | | | | | | -19.96% | | | | | -10.62% | | | | | 11.31% | | | | | 12.96% | | | | | 9.12% | |
Performance data quoted represents past performance and does not guarantee future results. The investment return and principal value of an investment will fluctuate so that an investor’s shares, when redeemed, may be worth more or less than the original cost. Current performance of the Fund may be lower or higher than the performance quoted. Performance data current to the most recent month end may be obtained by calling 1-800-423-6369. Returns would have been lower if Luther King Capital Management Corporation, the Funds’ investment adviser, had not waived a portion of its management fee and/or reimbursed certain expenses of the Fund. Please see Note B to the Notes to the Financial Statements for specific information regarding management fee waiver and/or expense reimbursement arrangements for the Fund. The Fund imposes a 1.00% redemption fee on shares held less than 30 days. If reflected, the fee would reduce performance shown.
| * | Luther King Capital Management Corporation, the Fund’s investment adviser, has contractually agreed to waive all or a portion of its management fee and/or reimburse expenses of the Fund to maintain an expense ratio of 1.00% per annum through May 1, 2023. This expense limitation excludes interest, taxes, brokerage commissions, indirect fees and expenses related to investments in other investment companies, including money market funds, and extraordinary expenses. Investment performance, which is based on the net expense ratio, reflects fee waivers, if any, in effect during the relevant period. In the absence of such waivers, total return would be reduced. LKCM waived management fees and/or reimbursed expenses for the Fund during the six months ended June 30, 2022. |
| ** | Expense ratios above are as reported in the Fund’s current prospectus dated May 1, 2022. Expense ratios reported for other periods in the financial highlights of this report may differ. |
| *** | The assets of the Aquinas Value Fund, Aquinas Growth Fund and Aquinas Small-Cap Fund were acquired by the LKCM Aquinas Value Fund, LKCM Aquinas Growth Fund and LKCM Aquinas Small Cap Fund, respectively, on July 11, 2005. Due to the change in adviser and investment technique, performance is being quoted for the period after the merger. The LKCM Aquinas Small Cap Fund and LKCM Aquinas Growth Fund were reorganized into the LKCM Aquinas Value Fund effective upon the close of business on July 29, 2016, after which the LKCM Aquinas Value Fund’s name, investment strategies and expenses changed to those of the LKCM Aquinas Catholic Equity Fund. The performance shown prior to August 1, 2016 is that of the LKCM Aquinas Value Fund. |
| (1) | Effective upon the close of business on July 29, 2016, the LKCM Aquinas Small Cap Fund and the LKCM Aquinas Growth Fund reorganized into the LKCM Aquinas Value Fund (the “Reorganizations”). Immediately after the Reorganizations were completed, the LKCM Aquinas Value Fund changed its name to the LKCM Aquinas Catholic Equity Fund and its investment strategies and expenses, including the expense limitation agreement, changed to the investment strategies and expenses, including the expense limitation agreement, of the LKCM Aquinas Catholic Equity Fund. The Fund’s performance prior to August 1, 2016 reflects the Fund’s prior investment strategies. |
| (2) | The S&P 500® Index is an unmanaged capitalization-weighted index of 500 selected stocks that is generally considered representative of the performance of large capitalization companies in the U.S. stock market. |
Note: The index defined above is not available for direct investment and the index performance therefore does not include fees, expenses or taxes.
1H2022 Review
The Federal Reserve is battling broad-based inflation and has indicated a willingness to take significant actions in an effort to restore price stability. Since the beginning of the year, financial conditions have been tightening as capital markets have internalized the Federal Reserve’s anti-inflation campaign. We believe the tightening of financial conditions, including, among others, increased borrowing costs and a rising U.S. dollar, have amplified the risk of a potential recession. While the magnitude of the Federal Reserve’s financial tightening may be historically smaller than that of other cycles, the pace of its tightening efforts has been rapid, contributing in part to the historically large swings in asset values observed during the first half of 2022.
Although we believe the need for more restrictive monetary policy that seeks to reduce inflation threatens the current economic expansion, the crucial underpinnings of the economy remain solid in our view. For example, we believe that most consumers have historically low household debt-to-income ratios, significantly higher bank deposits than in the period preceding the pandemic, and experienced rapid wage growth. Even as consumer pessimism towards the economy appears to grow, consumers in the aggregate appear relatively well positioned for an economic downturn in our view. In addition, we believe that companies are likely to post record earnings this year as many firms have passed along rising input costs to their customers. However, we believe the trajectory of future corporate earnings ultimately will depend heavily on whether or not the economy enters a recession.
The first half of 2022 has been marked by the worst start for the S&P 500® Index since 1970, declining 19.96% for the six months ended June 30, 2022. The NASDAQ Index, which is primarily comprised of growth-oriented companies, corrected even harder during the first half of 2022, declining 29.22% for the six months ended June 30, 2022 and marking its worst first half on record. We believe the performance of equities in the second half of 2022 will depend greatly on the shifting outlook for inflation, interest rates, and corporate profits.
2
These developments, among others, have caused many Americans to become increasingly worried about a potential recession. The closely watched monthly University of Michigan Consumer Sentiment Index dates to 1966 and seeks to assess near-time consumer attitudes on business climate, personal finance, and spending. The recent June 2022 reading of this index was the lowest reading on record. The University of Michigan commentary indicates that approximately 79% of consumers expect difficult times in the year ahead for business conditions. We believe that it is not only consumers who are anxious about the current economic environment, but also corporate executives and lawmakers who appear to be expressing similar concerns. Regardless of what economic data suggest about the current health of the economy, we believe that consumers are generally pessimistic about future business and market conditions.
We believe the odds that the current economic expansion falters have steadily increased during the past several months. The Federal Reserve has clearly and unequivocally declared its intent to fight inflation in our view, having increased its benchmark interest rate by 0.25% in March 2022, 0.50% in May 2022, and 0.75% in June 2022. The last time the Federal Reserve increased its benchmark rate by 0.75% was November 1994. Interestingly, we believe that period marked the last time the Federal Reserve successfully engineered a so-called soft economic landing, which generally involves the Federal Reserve increasing its benchmark interest rate to reduce inflation while not simultaneously triggering a recession.
Financial conditions have historically had a significant influence on the spending, saving, and investment plans of businesses and households. The Federal Reserve has historically used its monetary tools, primarily its benchmark interest rate, in an effort to influence financial conditions. In our view, four of the primary financial conditions the Federal Reserve seeks to influence are the level of interest rates at different maturities, credit spreads, the U.S. dollar, and equity market levels. We believe each of these items directly influences the economy, and the interplay of these elements collectively encourages or discourages economic behavior. For example, the overall level of interest rates is a key component of mortgage rates and corporate borrowing costs. With housing prices rapidly increasing year-over-year, the Federal Reserve appears anxious to cool the upward pressure on the housing component of inflation. We believe the recent rise in mortgage rates should cool the sharp increase in residential real estate activity and values.
The global energy crisis continues to spur headline inflation, and more critically, is applying further supply side pressure on the global economy in our view. We believe that manufacturing facilities in Europe that produce steel, fertilizer, and chemicals are facing significant challenges from surging electricity costs, and European natural gas futures have risen to levels roughly ten times higher than a year ago. In our view, energy rationing is likely in parts of Europe if Russia further curtails energy exports. Domestically, we have encountered similar challenges with gasoline prices rising over 60% over the past twelve months and high electricity costs contributing to pressure on consumers and businesses.
Examining the recessions that have occurred since World War II, we believe the equity market has historically begun to discount a recession on average seven months prior to the official start of the recession. In our view, the sequence of events each cycle is remarkably consistent with the equity market generally peaking prior to the recession and then generally bottoming prior to the end of the recession. A notable exception to this view was the 2000 recession when the market bottomed following the conclusion of the recession. During the first half of 2022, the decline in the S&P 500® Index appears based in part on the impact of both higher interest rates and mounting recession concerns. If a recession were to materialize, we would anticipate a decline in corporate earnings. In our view, the worst periods of earnings contractions have historically been accompanied by concentrated sector weakness, although major losses in specific sectors do not necessarily communicate the breadth or narrowness of the economic contraction. For example, only one sector of the market accounted for almost half of the earnings decline in 1990 (autos), 2001 (technology), and 2008 (financials). Today we do not believe that we currently see any one sector of the economy that could trigger the magnitude of earnings decline that occurred in these three earnings drawdown periods.
Many asset values have historically taken their cues from the anticipated direction of monetary policy. We believe these values certainly include the Treasury market, as yields on 1- to 3-year Treasury bonds historically have begun to rise ahead of the Federal Reserve’s monetary policy actions. We believe the outlook for intermediate to longer-term bond yields is cloudier because inflation expectations are a key component of longer-term bond yields. In our view, the concern for inflation is the key reason why the return on the 10-Year Treasury note fell 11.34% during the first half of 2022.
2H2022 Outlook
High inflation is contributing to consumer uneasiness in our view. The record low June 2022 reading of the University of Michigan Consumer Sentiment Index eclipsed the previous low in November 2008. We believe the economy, however, faces the opposite set of problems it confronted in 2008. Fourteen years ago, we believe that demand was too weak, there were not enough jobs, and deflation was a concern. Today, we believe the economy is overheating, there are nearly two job openings per unemployed worker, and inflation is at a forty-year high. In our view, the challenge for policymakers is to strike a balance between the appropriate amount of tightening to lower inflation, while preserving the economic expansion. We believe the equity market has already digested the unfolding economic slowdown, and if the current slowdown presages a recession, then the equity market may have to reprice lower as corporate earnings will likely be at risk.
LKCM Aquinas Catholic Equity Fund
During the six months ended June 30, 2022, the LKCM Aquinas Catholic Equity Fund returned -20.08% against the -19.96% return for the Fund’s benchmark, the S&P 500® Index. During the first half of 2022, the Fund’s relative performance benefited from an overweight position in the Energy sector, which was partially offset by underweight positions in the Healthcare and Utilities sectors. The Fund’s
3
underweight position in the Healthcare sector was largely driven by the Fund’s Catholic values investing mandate, which restricts the Fund’s investments in various areas within the Healthcare sector. The Fund’s relative performance benefited from stock in the Communication Services and Financial sectors, which was offset by stock selection decisions in the Healthcare, Consumer Discretionary and Industrials sectors.
During the first half of 2022, the equity markets have been materially impacted by the extended fallout related to the Russian invasion of Ukraine. While the Fund’s direct exposure to the Russian invasion is very limited, we believe the negative resulting impacts on inflation, particularly energy and food prices, has contributed to the Federal Reserve becoming increasingly aggressive in its efforts to reduce the overall level of inflation. In our view, the Federal Reserve’s monetary policy efforts have in turn resulted in meaningful valuation compression (in the form of lower price-earnings ratios) as investors lost the support given by low interest rates which had prevailed since the onset of the COVID pandemic in 2020.
Our current view is that the guidance provided by management teams concerning corporate profit growth expectations will likely be negatively impacted by the economic impact of higher inflation in the months ahead. We also believe that the strong U.S. dollar, which impacts foreign earnings when converted into U.S. dollars, will also have a negative impact on corporate profit growth expectations. However, we believe the equity markets have largely discounted these factors, and we expect equity markets should stabilize once the Federal Reserve cuts back on its aggressive monetary policy efforts. In the event that inflation proves more persistent, we believe that higher and more persistent interest rates could further dampen the economy, which would negatively impact corporate profits more severely and likely result in further declines in the equity markets. However, in our view, we believe that it would be unlikely for any resulting recession to be severe or meaningfully extended.
We remain focused on the core tenets of our investment strategy for the Fund, and in particular having a long-term investment horizon with a focus on competitively advantaged companies with strong balance sheets and solid cash flow characteristics. The broad-based decline in equity valuations has allowed us to identify selective companies whose valuations were previously considered as fully valued in our view, and we have opportunistically added companies to the Fund’s portfolio where appropriate. We believe that the Fund is well-positioned for the anticipated economic and capital markets environment.
J. Luther King, Jr., CFA, CIC
August 1, 2022
4
The information provided herein represents the opinion of J. Luther King, Jr., CFA, CIC and is not intended to be a forecast of future events, a guarantee of future results, or investment advice.
Please refer to the Schedule of Investments found on pages 8-9 the report for more information on Fund holdings. Fund holdings and sector allocations are subject to change and are not recommendations to buy or sell any securities.
Mutual fund investing involves risk. Principal loss is possible. Past performance is not a guarantee of future results. Investments in equity securities are subject to market risks and significant fluctuations in value. Small and medium capitalization funds typically carry additional risks, since smaller companies generally have a higher risk of failure, and, historically, their stocks have experienced a greater degree of market volatility than stocks on average. These and other risks are discussed in the Fund’s summary and statutory prospectuses. Since the Fund practices socially responsible investing within the framework provided by the United States Conference of Catholic Bishops’ Socially Responsible Investing Guidelines, the Fund may forego a profitable investment opportunity or sell a security when it may be disadvantageous to do so.
Earnings growth is not a measure of future performance.
Performance data quoted represents past performance; past performance does not guarantee future results. The investment return and principal value of an investment will fluctuate so that an investor’s shares, when redeemed, may be worth more or less than their original cost. Current performance of the Fund may be lower or higher than the performance quoted. Performance data current to the most recent month end may be obtained by calling 1-800-423-6369. Returns would have been lower if LKCM had not waived a portion of its management fee and/or reimbursed certain expenses of the Fund. Please see Note B to the Notes to the Financial Statements for specific information regarding management fee waiver and/or expense reimbursement arrangements for the Fund.
Price-earnings ratio is the ratio of a company’s share price to the company’s earnings per share.
Cash flow is the net amount of cash and cash-equivalents being transferred into and out of a business.
Investors should consider the investment objective, risks and charges and expenses of the Fund carefully before investing. The Fund’s summary prospectus and prospectus contain this and other information about the Fund. Investors can obtain the summary prospectus and/or the prospectus by calling 1-800-423-6369. The summary prospectus and/or prospectus should be read carefully before investing in the Fund.
Quasar Distributors, LLC, distributor.
5
LKCM Aquinas Catholic Equity Fund Expense Example — June 30, 2022 (Unaudited)
As a shareholder of the Fund, you incur two types of costs: (1) transaction costs, including redemption fees; and (2) ongoing costs, including management fees, distribution and/or service (12b-1) fees and other Fund expenses. This Example is intended to help you understand your ongoing costs (in dollars) of investing in the Fund and to compare these costs with the ongoing costs of investing in other mutual funds. The Example is based on an investment of $1,000 invested at the beginning of the period and held for the entire period (01/01/2022-06/30/2022).
ACTUAL EXPENSES
The third and fourth columns of the table below provide information about actual account values and actual expenses. You may use the information in these columns, together with the amount you invested, to estimate the expenses that you paid over the period. Simply divide your account value by $1,000 (for example, an $8,600 account value divided by $1,000 = 8.6), then multiply the result by the number in the fourth column under the heading entitled “Expenses Paid During Period” to estimate the expenses you paid on your account during this period. Although the Fund charges no sales load, you will be assessed fees for outgoing wire transfers, returned checks and stop payment orders at prevailing rates charged by U.S. Bancorp Fund Services, LLC (doing business as U.S. Bank Global Fund Services), the Fund’s transfer agent. If you request that a redemption be made by wire transfer, currently a $15.00 fee is charged by the Fund’s transfer agent. You will be charged a redemption fee equal to 1.00% of the net amount of the redemption if you redeem your shares of the Fund within 30 days of purchase, unless otherwise determined by the Fund in its discretion. To the extent the Fund invests in shares of other investment companies as part of its investment strategy, you will indirectly bear your proportionate share of any fees and expenses charged by the underlying funds in which the Fund invests in addition to the expenses of the Fund. Actual expenses of the underlying funds are expected to vary among the various underlying funds. These expenses are not included in the example below. The example below includes management fees, registration fees and other expenses. However, the example below does not include portfolio trading commissions and related expenses and other extraordinary expenses as determined under generally accepted accounting principles.
HYPOTHETICAL EXAMPLES FOR COMPARISON PURPOSES
The fifth and sixth columns of the table below provide information about hypothetical account values and hypothetical expenses based on the Fund’s actual expense ratio and an assumed rate of return of 5% per year before expenses, which is not the Fund’s actual return. The hypothetical account values and expenses may not be used to estimate the actual ending account balance or expenses you paid for the period. You may use this information to compare the ongoing costs of investing in the Fund and other funds. To do so, compare this 5% hypothetical example with the 5% hypothetical examples that appear in the shareholder reports of the other funds. Please note that the expenses shown in the table are meant to highlight your ongoing costs only and do not reflect any transactional costs, such as redemption fees. Therefore, the fifth and sixth columns of the table are useful in comparing ongoing costs only, and will not help you determine the relative total costs of owning different funds. In addition, if these transaction costs were included, your costs would have been higher.
| | | | | | | | | | | | | | | | | | | | | | | | | | | | | | |
| | | Fund’s
Annualized
Expense
Ratio(1) | | Beginning
Account Value
01/01/2022 | | Actual | | Hypothetical
(5% return before expenses) |
| | | Ending
Account Value
06/30/2022 | | Expenses Paid
During Period(1) | | Ending
Account Value
06/30/2022 | | Expenses Paid
During Period(1) |
LKCM Aquinas Catholic Equity Fund | | | | 1.00 | % | | | $ | 1,000.00 | | | | $ | 799.20 | | | | $ | 4.46 | | | | $ | 1,019.84 | | | | $ | 5.01 | |
| (1) | Expenses are equal to the annualized net expense ratio for the Fund, multiplied by the average account value over the period, multiplied by 181/365 (to reflect the one-half year period). |
6
ALLOCATION OF PORTFOLIO HOLDINGS — LKCM Aquinas Catholic Equity Fund — June 30, 2022 (Unaudited)
Percentages represent market value as a percentage of total investments.
LKCM Aquinas Catholic Equity Fund
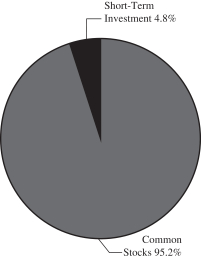
7
|
| LKCM AQUINAS CATHOLIC EQUITY FUND |
| SCHEDULEOF INVESTMENTS |
| June 30, 2022 (Unaudited) |
| | | | | | | | | | |
| COMMON STOCKS - 95.5% | | Shares | | Value |
| Aerospace & Defense - 2.5% | | | | |
Honeywell International, Inc. | | | | 7,000 | | | | $ | 1,216,670 | |
| | | | | | | | | | |
| Banks - 8.3% | | | | |
Comerica, Inc. | | | | 15,000 | | | | | 1,100,700 | |
Cullen/Frost Bankers, Inc. | | | | 4,000 | | | | | 465,800 | |
Truist Financial Corp. | | | | 32,375 | | | | | 1,535,546 | |
Zions Bancorp N.A. | | | | 19,000 | | | | | 967,100 | |
| | | | | | | | | | |
| | | | | | | | | 4,069,146 | |
| | | | | | | | | | |
| Beverages - 5.3% | | | | |
Keurig Dr Pepper, Inc. | | | | 22,500 | | | | | 796,275 | |
PepsiCo, Inc. | | | | 11,000 | | | | | 1,833,260 | |
| | | | | | | | | | |
| | | | | | | | | 2,629,535 | |
| | | | | | | | | | |
| Chemicals - 8.3% | | | | |
Air Products & Chemicals, Inc. | | | | 4,000 | | | | | 961,920 | |
Corteva, Inc. | | | | 20,000 | | | | | 1,082,800 | |
DuPont de Nemours, Inc. | | | | 14,500 | | | | | 805,910 | |
Ecolab, Inc. | | | | 5,000 | | | | | 768,800 | |
The Sherwin-Williams Co. | | | | 2,100 | | | | | 470,211 | |
| | | | | | | | | | |
| | | | | | | | | 4,089,641 | |
| | | | | | | | | | |
| Communications Equipment - 1.1% | | | | |
QUALCOMM, Inc. | | | | 4,200 | | | | | 536,508 | |
| | | | | | | | | | |
| Computers & Peripherals - 3.3% | | | | |
Apple, Inc. | | | | 12,000 | | | | | 1,640,640 | |
| | | | | | | | | | |
| Construction Materials - 1.2% | | | | |
Martin Marietta Materials, Inc. | | | | 2,000 | | | | | 598,480 | |
| | | | | | | | | | |
| Consumer Finance - 2.1% | | | | |
American Express Company | | | | 7,500 | | | | | 1,039,650 | |
| | | | | | | | | | |
| Electronic Equipment & Instruments - 2.7% | | |
Trimble, Inc. (a) | | | | 22,500 | | | | | 1,310,175 | |
| | | | | | | | | | |
Electronic Equipment, Instruments &
Components - 1.3% | | |
Teledyne Technologies, Inc. (a) | | | | 1,700 | | | | | 637,687 | |
| | | | | | | | | | |
| Food Products - 1.0% | | | | |
The Kraft Heinz Company | | | | 13,000 | | | | | 495,820 | |
| | | | | | | | | | |
| Health Care Equipment & Supplies - 3.6% | | | | |
Alcon, Inc. | | | | 15,000 | | | | | 1,048,350 | |
Stryker Corp. | | | | 3,700 | | | | | 736,041 | |
| | | | | | | | | | |
| | | | | | | | | 1,784,391 | |
| | | | | | | | | | |
| Internet & Catalog Retail - 1.7% | | | | |
Amazon.com, Inc. (a) | | | | 8,000 | | | | | 849,680 | |
| | | | | | | | | | |
| IT Consulting & Services - 3.0% | | | | |
Black Knight, Inc. (a) | | | | 6,000 | | | | | 392,340 | |
Broadridge Financial Solutions, Inc. | | | | 5,500 | | | | | 784,025 | |
PayPal Holdings, Inc. (a) | | | | 4,200 | | | | | 293,328 | |
| | | | | | | | | | |
| | | | | | | | | 1,469,693 | |
| | | | | | | | | | |
| | | | | | | | | | |
| COMMON STOCKS | | Shares | | Value |
| Machinery - 1.6% | | | | |
Xylem, Inc. | | | | 10,000 | | | | $ | 781,800 | |
| | | | | | | | | | |
| Marine - 2.0% | | | | |
Kirby Corp. (a) | | | | 16,500 | | | | | 1,003,860 | |
| | | | | | | | | | |
| Media & Entertainment - 4.4% | | | | |
Alphabet, Inc. - Class A (a) | | | | 1,000 | | | | | 2,179,260 | |
| | | | | | | | | | |
| Oil & Gas & Consumable Fuels - 10.7% | | |
Chevron Corp. | | | | 6,500 | | | | | 941,070 | |
Devon Energy Corp. | | | | 32,000 | | | | | 1,763,520 | |
Kinder Morgan, Inc. | | | | 52,500 | | | | | 879,900 | |
Pioneer Natural Resources Co. | | | | 7,500 | | | | | 1,673,100 | |
| | | | | | | | | | |
| | | | | | | | | 5,257,590 | |
| | | | | | | | | | |
| Pharmaceuticals - 3.5% | | | | |
Zoetis, Inc. | | | | 10,000 | | | | | 1,718,900 | |
| | | | | | | | | | |
| Professional Services - 3.7% | | |
Dun & Bradstreet Holdings, Inc. (a) | | | | 45,000 | | | | | 676,350 | |
Verisk Analytics, Inc. | | | | 6,500 | | | | | 1,125,085 | |
| | | | | | | | | | |
| | | | | | | | | 1,801,435 | |
| | | | | | | | | | |
| Real Estate Management & Development - 0.9% | | |
Zillow Group, Inc. (a) | | | | 14,000 | | | | | 445,340 | |
| | | | | | | | | | |
| Semiconductor & Semiconductor Equipment - 1.5% | | |
Intel Corporation | | | | 20,000 | | | | | 748,200 | |
| | | | | | | | | | |
| Software - 12.7% | | | | |
Adobe, Inc. (a) | | | | 3,700 | | | | | 1,354,422 | |
Microsoft Corp. | | | | 7,500 | | | | | 1,926,225 | |
Oracle Corp. | | | | 20,000 | | | | | 1,397,400 | |
Roper Technologies, Inc. | | | | 4,000 | | | | | 1,578,600 | |
| | | | | | | | | | |
| | | | | | | | | 6,256,647 | |
| | | | | | | | | | |
| Software & Services - 2.3% | | | | |
Akamai Technologies, Inc. (a) | | | | 12,500 | | | | | 1,141,625 | |
| | | | | | | | | | |
| Specialty Retail - 5.2% | | | | |
The Home Depot, Inc. | | | | 4,000 | | | | | 1,097,080 | |
Leslie’s, Inc. (a) | | | | 44,500 | | | | | 675,510 | |
Petco Health & Wellness Co, Inc. (a) | | | | 52,000 | | | | | 766,480 | |
| | | | | | | | | | |
| | | | | | | | | 2,539,070 | |
| | | | | | | | | | |
| Textiles, Apparel & Luxury Goods - 1.6% | | | | |
Tapestry, Inc. | | | | 25,000 | | | | | 763,000 | |
| | | | | | | | | | |
TOTAL COMMON STOCKS
(Cost $27,527,202) | | | | | | | | | 47,004,443 | |
| | | | | | | | | | |
| | | | | | | | | | |
The accompanying notes are an integral part of these financial statements.
8
|
| LKCM AQUINAS CATHOLIC EQUITY FUND |
| SCHEDULEOF INVESTMENTS, CONTINUED |
| June 30, 2022 (Unaudited) |
| | | | | | | | | | |
| SHORT-TERM INVESTMENTS - 4.8% | | Shares | | Value |
| Money Market Funds - 4.8% | | | | |
Invesco Short-Term Investments Trust - Government & Agency Portfolio - Institutional Shares, 1.38% (b) | | | | 1,490,548 | | | | $ | 1,490,548 | |
MSILF Government Portfolio, 1.39% | | | | 858,506 | | | | | 858,506 | |
| | | | | | | | | | |
| | | | | | | | | 2,349,054 | |
| | | | | | | | | | |
TOTAL SHORT-TERM INVESTMENTS
(Cost $2,349,054) | | | | | | | | | 2,349,054 | |
| | | | | | | | | | |
Total Investments - 100.3%
(Cost $29,876,256) | | | | | | | | | 49,353,497 | |
Liabilities in Excess of Other Assets - (0.3)% | | | | | | | | | (160,718 | ) |
| | | | | | | | | | |
TOTAL NET ASSETS - 100.0% | | | | | | | | $ | 49,192,779 | |
| | | | | | | | | | |
| (a) | Non-income producing security. |
| (b) | The rate quoted is the annualized seven-day yield of the Fund at period end. |
Investments are classified by industry pursuant to the Global Industry Classification Standard (GICS®), which was developed by and/or is the exclusive property of Morgan Stanley Capital International, Inc. (“MSCI”) and Standard & Poor’s Financial Services LLC (“S&P”). GICS is a service mark of MSCI and S&P and has been licensed for use by U.S. Bancorp Fund Services, LLC.
The accompanying notes are an integral part of these financial statements.
9
|
| STATEMENTOF ASSETSAND LIABILITIES |
| June 30, 2022 (Unaudited) |
| | | | | | | | | | |
|
| LKCM Aquinas Catholic Equity Fund |
| | | | | | | | | | |
Assets | | | | | | | | | | |
Investments, at value* | | | | | | | | $ | 49,353,497 | |
Dividends and interest receivable | | | | | | | | | 35,226 | |
Receivable for Fund shares sold | | | | | | | | | 664 | |
Prepaid expenses and other assets | | | | | | | | | 14,596 | |
| | | | | | | | | | |
Total assets | | | | | | | | | 49,403,983 | |
| | | | | | | | | | |
Liabilities | | | | | | | | | | |
Payable for investment advisory fees (Note B) | | | | | | | | | 59,304 | |
Payable for distribution expense (Note B) | | | | | | | | | 61,601 | |
Payable for administrative fees | | | | | | | | | 33,914 | |
Payable for accounting and transfer agent fees and expenses | | | | | | | | | 30,272 | |
Payable for professional fees | | | | | | | | | 13,535 | |
Payable for custody fees and expenses | | | | | | | | | 3,249 | |
Payable for reports to shareholders | | | | | | | | | 4,596 | |
Payable for trustees’ fees and officer compensation (Note B) | | | | | | | | | 4,212 | |
Accrued expenses and other liabilities | | | | | | | | | 521 | |
| | | | | | | | | | |
Total liabilities | | | | | | | | | 211,204 | |
| | | | | | | | | | |
Net assets | | | | | | | | $ | 49,192,779 | |
| | | | | | | | | | |
Net assets consist of: | | | | | | | | | | |
Paid-in capital | | | | | | | | $ | 24,768,645 | |
Total distributable earnings | | | | | | | | | 24,424,134 | |
| | | | | | | | | | |
Net assets | | | | | | | | $ | 49,192,779 | |
| | | | | | | | | | |
Shares of beneficial interest outstanding
(unlimited shares of no par value authorized) | | | | | | | | | 3,154,020 | |
Net asset value per share
(offering and redemption price) | | | | | | | | $ | 15.60 | |
| | | | | | | | | | |
| | |
* Cost of Investments | | | | | | | | $ | 29,876,256 | |
| | | | | | | | | | |
The accompanying notes are an integral part of these financial statements.
10
|
| STATEMENTOF OPERATIONS |
| For the Six Months Ended June 30, 2022 (Unaudited) |
| | | | | | | | | | |
|
| LKCM Aquinas Catholic Equity Fund |
| | | | | | | | | | |
Investment Income: | | | | | | | | | | |
Dividends* | | | | | | | | $ | 521,603 | |
Interest | | | | | | | | | 3,237 | |
| | | | | | | | | | |
Total investment income | | | | | | | | | 524,840 | |
| | | | | | | | | | |
| | |
Expenses: | | | | | | | | | | |
Investment advisory fees (Note B) | | | | | | | | | 254,899 | |
Administrative fees | | | | | | | | | 38,943 | |
Accounting and transfer agent fees and expenses | | | | | | | | | 38,410 | |
Distribution expense (Note B) | | | | | | | | | 28,322 | |
Professional fees | | | | | | | | | 12,428 | |
Trustees’ fees and officer compensation (Note B) | | | | | | | | | 14,914 | |
Federal and state registration | | | | | | | | | 12,963 | |
Custody fees and expenses | | | | | | | | | 3,418 | |
Reports to shareholders | | | | | | | | | 4,735 | |
Other | | | | | | | | | 1,238 | |
| | | | | | | | | | |
Total expenses | | | | | | | | | 410,270 | |
Less, expense waiver and/or reimbursement (Note B) | | | | | | | | | (127,048 | ) |
| | | | | | | | | | |
Net expenses | | | | | | | | | 283,222 | |
| | | | | | | | | | |
Net investment income | | | | | | | | | 241,618 | |
| | | | | | | | | | |
| | |
Realized and Unrealized Gain (Loss): | | | | | | | | | | |
Net realized gain on:
Investments | | | | | | | | $ | 4,811,667 | |
Net change in unrealized depreciation on:
Investments | | | | | | | | | (17,610,276 | ) |
| | | | | | | | | | |
| | |
Net Realized and Unrealized Loss | | | | | | | | | (12,798,609 | ) |
| | | | | | | | | | |
| | |
Net Decrease in Net Assets Resulting from Operations | | | | | | | | $ | (12,556,991 | ) |
| | | | | | | | | | |
The accompanying notes are an integral part of these financial statements.
11
|
| STATEMENTSOF CHANGESIN NET ASSETS |
| | | | | | | | | | | | | | | | | | | | |
|
| LKCM Aquinas Catholic Equity Fund |
| |
| | | | |
| | | | | Six Months
Ended
June 30,
2022
(Unaudited) | | | | Year Ended
December 31,
2021 |
Operations: | | | | | | | | | | | | | | | | | | | | |
Net investment income | | | | | | | | $ | 241,618 | | | | | | | | | $ | 147,922 | |
Net realized gain on investments | | | | | | | | | 4,811,667 | | | | | | | | | | 6,253,404 | |
Net change in unrealized
appreciation (depreciation) on investments | | | | | | | | | (17,610,276 | ) | | | | | | | | | 6,910,981 | |
| | | | | | | | | | | | | | | | | | | | |
Net increase (decrease) in net assets resulting from operations | | | | | | | | | (12,556,991 | ) | | | | | | | | | 13,312,307 | |
| | | | | | | | | | | | | | | | | | | | |
| | | | |
Distributions to Shareholders | | | | | | | | | — | | | | | | | | | | (7,216,137 | ) |
| | | | | | | | | | | | | | | | | | | | |
| | | | |
Net increase (decrease) in net assets from Fund share transactions (Note C) | | | | | | | | | (2,166,238 | ) | | | | | | | | | 3,957,949 | |
| | | | | | | | | | | | | | | | | | | | |
| | | | |
Total increase (decrease) in net assets | | | | | | | | | (14,723,229 | ) | | | | | | | | | 10,054,119 | |
| | | | |
Net Assets: | | | | | | | | | | | | | | | | | | | | |
Beginning of period | | | | | | | | | 63,916,008 | | | | | | | | | | 53,861,889 | |
| | | | | | | | | | | | | | | | | | | | |
End of period | | | | | | | | $ | 49,192,779 | | | | | | | | | $ | 63,916,008 | |
| | | | | | | | | | | | | | | | | | | | |
The accompanying notes are an integral part of these financial statements.
12
|
| FINANCIAL HIGHLIGHTS |
| SELECTED DATAFOR EACH SHAREOF CAPITAL STOCK OUTSTANDING |
| | | | | | | | | | | | | | | | | | | | | | | | | | | | | | | | | | | | | | | | | | | | | | | | | | | | | | | | | | | | |
| | |
| | | | | LKCM Aquinas Catholic Equity Fund |
| | | | | | | | | | | | | | | | | | | | | | | | | | | | | | | | | | | | | | | | | | | | | | | | | | | | | | | | | | | | |
| | | | |
| | | | | Six Months
Ended
June 30,
2022
(Unaudited) | | | | Year Ended December 31, |
| | | | | | | 2021 | | | | 2020 | | | | 2019 | | | | 2018 | | | | 2017 |
Net Asset Value – Beginning of Period | | | | | | | | $ | 19.52 | | | | | | | | | $ | 17.53 | | | | | | | | | $ | 15.06 | | | | | | | | | $ | 12.80 | | | | | | | | | $ | 17.19 | | | | | | | | | $ | 15.40 | |
| | | | | | | | | | | | | | | | | | | | | | | | | | | | | | | | | | | | | | | | | | | | | | | | | | | | | | | | | | | | |
Net investment income | | | | | | | | | 0.08 | (1) | | | | | | | | | 0.05 | (1) | | | | | | | | | 0.06 | (1) | | | | | | | | | 0.07 | (1) | | | | | | | | | 0.06 | | | | | | | | | | 0.05 | |
Net realized and unrealized gain (loss) on investments | | | | | | | | | (4.00) | | | | | | | | | | 4.40 | | | | | | | | | | 3.59 | | | | | | | | | | 3.92 | | | | | | | | | | (1.46) | | | | | | | | | | 3.16 | |
| | | | | | | | | | | | | | | | | | | | | | | | | | | | | | | | | | | | | | | | | | | | | | | | | | | | | | | | | | | | |
Total from investment operations | | | | | | | | | (3.92) | | | | | | | | | | 4.45 | | | | | | | | | | 3.65 | | | | | | | | | | 3.99 | | | | | | | | | | (1.40) | | | | | | | | | | 3.21 | |
| | | | | | | | | | | | | | | | | | | | | | | | | | | | | | | | | | | | | | | | | | | | | | | | | | | | | | | | | | | | |
Distributions from net investment income | | | | | | | | | — | | | | | | | | | | (0.05) | | | | | | | | | | (0.06) | | | | | | | | | | (0.08) | | | | | | | | | | (0.07) | | | | | | | | | | (0.05) | |
Distributions from net realized gains | | | | | | | | | — | | | | | | | | | | (2.41) | | | | | | | | | | (1.12) | | | | | | | | | | (1.65) | | | | | | | | | | (2.92) | | | | | | | | | | (1.37) | |
| | | | | | | | | | | | | | | | | | | | | | | | | | | | | | | | | | | | | | | | | | | | | | | | | | | | | | | | | | | | |
Total dividends and distributions | | | | | | | | | — | | | | | | | | | | (2.46) | | | | | | | | | | (1.18) | | | | | | | | | | (1.73) | | | | | | | | | | (2.99) | | | | | | | | | | (1.42) | |
| | | | | | | | | | | | | | | | | | | | | | | | | | | | | | | | | | | | | | | | | | | | | | | | | | | | | | | | | | | | |
Net Asset Value – End of Period | | | | | | | | $ | 15.60 | | | | | | | | | $ | 19.52 | | | | | | | | | $ | 17.53 | | | | | | | | | $ | 15.06 | | | | | | | | | $ | 12.80 | | | | | | | | | $ | 17.19 | |
| | | | | | | | | | | | | | | | | | | | | | | | | | | | | | | | | | | | | | | | | | | | | | | | | | | | | | | | | | | | |
Total Return | | | | | | | | | -20.08% | (2) | | | | | | | | | 25.34% | | | | | | | | | | 24.28% | | | | | | | | | | 31.16% | | | | | | | | | | -7.96% | | | | | | | | | | 20.79% | |
| | | | | | | | | | | | |
Ratios and Supplemental Data: | | | | | | | | | | | | | | | | | | | | | | | | | | | | | | | | | | | | | | | | | | | | | | | | | | | | | | | | | | | | |
Net assets, end of period (thousands) | | | | | | | | $ | 49,193 | | | | | | | | | $ | 63,916 | | | | | | | | | $ | 53,862 | | | | | | | | | $ | 47,408 | | | | | | | | | $ | 45,332 | | | | | | | | | $ | 71,058 | |
Ratio of expenses to average net assets: | | | | | | | | | | | | | | | | | | | | | | | | | | | | | | | | | | | | | | | | | | | | | | | | | | | | | | | | | | | | |
Before expense waiver and/or reimbursement | | | | | | | | | 1.45% | (3) | | | | | | | | | 1.40% | | | | | | | | | | 1.48% | | | | | | | | | | 1.51% | | | | | | | | | | 1.44% | | | | | | | | | | 1.43% | |
After expense waiver and/or reimbursement | | | | | | | | | 1.00% | (3) | | | | | | | | | 1.00% | | | | | | | | | | 1.00% | | | | | | | | | | 1.00% | | | | | | | | | | 1.00% | | | | | | | | | | 1.00% | |
Ratio of net investment income (loss) to average net assets: | | | | | | | | | | | | | | | | | | | | | | | | | | | | | | | | | | | | | | | | | | | | | | | | | | | | | | | | | | | | |
Before expense waiver and/or reimbursement | | | | | | | | | 0.40% | (3) | | | | | | | | | (0.15)% | | | | | | | | | | (0.12)% | | | | | | | | | | (0.05)% | | | | | | | | | | (0.12)% | | | | | | | | | | (0.14)% | |
After expense waiver and/or reimbursement | | | | | | | | | 0.85% | (3) | | | | | | | | | 0.25% | | | | | | | | | | 0.36% | | | | | | | | | | 0.46% | | | | | | | | | | 0.32% | | | | | | | | | | 0.29% | |
Portfolio turnover rate | | | | | | | | | 15% | (2) | | | | | | | | | 18% | | | | | | | | | | 17% | | | | | | | | | | 12% | | | | | | | | | | 14% | | | | | | | | | | 18% | |
| (1) | Net investment income per share represents net investment income divided by the average shares outstanding throughout the period. |
The accompanying notes are an integral part of these financial statements.
13
|
| LKCM FUNDS |
| NOTESTOTHE FINANCIAL STATEMENTS (Unaudited) |
| June 30, 2022 |
A. Organization and Significant Accounting Policies: LKCM Funds (the “Trust”) is registered under the Investment Company Act of 1940 (“1940 Act”) as an open-end, management investment company. The Trust was organized as a Delaware statutory trust on February 10, 1994 and consists of seven diversified series as of June 30, 2022, one of which is presented herein: the LKCM Aquinas Catholic Equity Fund (the “Fund”). On July 11, 2005, the LKCM Aquinas Funds acquired the assets and assumed the liabilities of the Aquinas Funds. Effective upon the close of business on July 29, 2016, the LKCM Aquinas Small Cap Fund and the LKCM Aquinas Growth Fund reorganized into the LKCM Aquinas Value Fund, which changed its name immediately thereafter to the LKCM Aquinas Catholic Equity Fund and its investment strategies and expenses, including the expense limitation agreement, changed to the investment strategies and expenses, including the expense limitation agreement, of the LKCM Aquinas Catholic Equity Fund. The Fund is subject to expenses pursuant to the Rule 12b-1 plan described in Note B. The Fund charges a 1% redemption fee for redemptions of Fund shares held for less than 30 days, unless otherwise determined by the Fund in its discretion.
The LKCM Aquinas Catholic Equity Fund seeks to maximize long-term capital appreciation, while incorporating Catholic values investing principles in the investment process. The LKCM Aquinas Catholic Equity Fund seeks to achieve its investment objective by investing under normal circumstances at least 80% of its net assets (plus any borrowings for investment purposes) in equity securities of companies that Luther King Capital Management Corporation (the “Adviser”) believes are likely to have above-average growth in revenue and/or earnings, above-average returns on shareholders’ equity, potential for above-average capital appreciation, and/or companies the Adviser believes have attractive relative valuations.
The Fund practices socially responsible investing within the framework provided by the United States Conference of Catholic Bishops’ Socially Responsible Investment Guidelines (the “Guidelines”). The Fund’s investment approach incorporates the Guidelines through a combination of screening portfolio companies based on criteria set forth in the Guidelines, dialogue with companies whose policies and practices conflict with the Guidelines, and/or potentially excluding from the Fund’s portfolio the securities of those companies that are unwilling to alter their policies and practices over a reasonable period of time. The Adviser monitors companies selected for the Fund for policies on various issues contemplated by the Guidelines. If the Fund invests in a company whose policies and practices are inconsistent with the Guidelines, the Adviser may attempt to influence the company, sell the company’s securities or otherwise exclude future investments in such company.
The following is a summary of significant accounting policies followed by the Fund in preparation of the financial statements. The Fund is an investment company and, accordingly, follows the investment company accounting and reporting guidance of the Financial Accounting Standards Board Accounting Standards Codification Topic 946, Investment Companies.
1. Security Valuation: Equity securities listed or traded on a U.S. securities exchange for which market quotations are readily available are valued at the last quoted sale price on the exchange on which the security is primarily traded. Nasdaq Global Market securities are valued at the Nasdaq Official Closing Price (“NOCP”). Unlisted U.S. equity securities and listed U.S. equity securities not traded on a particular valuation date are valued at the mean of the most recent quoted bid and ask price on the relevant exchanges or markets. Equity securities listed on a foreign exchange for which market quotations are readily available are valued at the last quoted sales price on the exchange on which the security is primarily traded. Debt securities are normally valued at the mean of the closing bid and ask price and/or by using a combination of broker quotations or evaluated prices provided by an independent pricing service. Futures and options on futures are valued at the settlement prices established each day on the principal exchange on which they are traded. Forward contracts are valued based on the forward rate using information provided by an independent pricing service. Other assets and securities for which no market or broker quotations or evaluated prices are readily available are valued in good faith at fair value using guidelines approved by the Board of Trustees. The Board of Trustees has established policies and procedures that authorize the Adviser to fair value a security in good faith under certain circumstances. The Fund may use prices provided by independent pricing services to assist in the fair valuation of the Fund’s portfolio securities.
The Trust has adopted accounting standards which establish an authoritative definition of fair value and set out a hierarchy for measuring fair value. These standards require additional disclosures about the various inputs and valuation techniques used to develop the measurements of fair value and a discussion of changes in valuation techniques and related inputs during the period. These standards define fair value as the price that would be received to sell an asset or paid to transfer a liability in an orderly transaction between market participants at the measurement date. The fair value hierarchy is organized into three levels based upon the assumptions (referred to as “inputs”) used in pricing the asset or liability. These standards state that “observable inputs” reflect the assumptions market participants would use in pricing the asset or liability based on market data obtained from independent sources and “unobservable inputs” reflect an entity’s own assumptions about the assumptions market participants would use in pricing the asset or liability. These inputs are summarized in the three broad levels listed below.
| | | | |
| Level 1 | | – | | Quoted unadjusted prices for identical instruments in active markets to which the Trust has access at the date of measurement. |
14
| | | | |
| | |
| Level 2 | | – | | Quoted prices for similar instruments in active markets; quoted prices for identical or similar instruments in markets that are not active; and model-derived valuations in which all significant inputs and significant value drivers are observable in active markets. Level 2 inputs are those in markets for which there are few transactions, the prices are not current, little public information exists or instances where prices vary substantially over time or among brokered market makers. |
| | |
| Level 3 | | – | | Model derived valuations in which one or more significant inputs or significant value drivers are unobservable. Unobservable inputs are those inputs that reflect the Trust’s own assumptions that market participants would use to price the asset or liability based on the best available information. |
The inputs or methodology used for valuing securities are not necessarily an indication of the risk associated with investing in those securities. As of June 30, 2022, the Fund’s assets carried at fair value were classified as follows:
| | | | | | | | | | | | | | | | | | | | |
| LKCM Aquinas Catholic Equity Fund | | | | | | | | |
| | | | |
Description | | Level 1 | | Level 2 | | Level 3 | | Total |
Common Stocks | | | $ | 47,004,443 | | | | $ | — | | | | $ | — | | | | $ | 47,004,443 | |
Short-Term Investments | | | | 2,349,054 | | | | | — | | | | | — | | | | | 2,349,054 | |
| | | | | | | | | | | | | | | | | | | | |
Total Investments* | | | $ | 49,353,497 | | | | $ | — | | | | $ | — | | | | $ | 49,353,497 | |
| | | | | | | | | | | | | | | | | | | | |
| | * | Additional information regarding the industry classifications of these investments is disclosed in the Schedule of Investments. |
2. Federal Income Taxes: The Fund has elected to be treated as a “regulated investment company” under Subchapter M of the Internal Revenue Code and the Fund intends to distribute all of its investment company net taxable income and net capital gains to shareholders. Therefore, no federal income tax provision is recorded.
3. Distributions to Shareholders: The Fund generally intends to declare and pay income dividends and distribute net capital gain, if any, at least on an annual basis.
4. Foreign Securities: Investing in securities of foreign companies and foreign governments involves special risks and considerations not typically associated with investing in securities of U.S. issuers. These risks include devaluation of currencies and future adverse political and economic developments. Moreover, securities of many foreign companies and foreign governments and their markets may be less liquid and their prices more volatile than those of securities of comparable U.S. companies and securities of the U.S. government.
5. Expense Allocation: Expenses incurred by the Funds in the Trust are allocated among the Funds based upon (i) relative average net assets, (ii) a specific identification basis as incurred, or (iii) evenly among the Funds, depending on the nature of the expense.
6. Use of Estimates: The preparation of financial statements in conformity with accounting principles generally accepted in the United States of America requires management to make estimates and assumptions that affect the reported amounts of assets and liabilities and disclosure of contingent assets and liabilities at the date of the financial statements and the reported amounts of revenues and expenses during the reporting period. Actual results could differ from those estimates.
7. Guarantees and Indemnifications: In the normal course of business, the Fund enters into contracts with service providers that contain general indemnification clauses. The Fund’s maximum exposure under these arrangements is unknown as this would involve future claims against the Fund that have not yet occurred. Based on experience, the Fund expects the risk of loss to be remote.
8. Security Transactions and Investment Income: Security and shareholder transactions are recorded on the trade date. Realized gains and losses on sales of investments are calculated on the identified cost basis. Dividend income and dividends and distributions to shareholders are recorded on the ex-dividend date. Withholding taxes on foreign dividends have been provided for in accordance with the Fund’s understanding of the applicable jurisdiction’s tax rules and rates. Interest income is recognized on the accrual basis. All discounts and premiums are amortized based on the effective interest method for tax and financial reporting purposes. The Fund may hold the securities of real estate investment trusts (“REITs”). Distributions from such investments may include income, capital gains and return of capital.
9. Other: Distributions from net investment income and realized capital gains are determined in accordance with income tax regulations, which may differ from U.S. GAAP. Certain capital accounts in the consolidated financial statements are periodically adjusted for permanent differences in order to reflect their tax character. These permanent differences are primarily due to the varying treatment of income and gain/loss on portfolio securities held by the Fund and have no impact on net assets or NAV per share.
10. Restricted and Illiquid Securities: The Fund is permitted to invest in securities that are subject to legal or contractual restrictions on resale including investments considered by the Fund to be illiquid. Restricted securities generally may be resold in transactions exempt from registration. Illiquid investments are investments that the Fund reasonably expects cannot be sold or disposed of in current market conditions within seven calendar days or less in the ordinary course of business without the sale or disposition significantly changing the market value of the investment. A security may be considered illiquid if it lacks a readily available market or if its valuation has not changed for a certain period of time. Disposal of these securities may involve time-consuming negotiations and expense, and prompt sale at the current valuation may be difficult.
15
B. Investment Advisory and Other Agreements: The Adviser serves as the investment adviser to the Fund under an Investment Advisory Agreement (the “Agreement”). The Adviser receives a fee, computed daily and payable quarterly, at the annual rate presented below as applied to the Fund’s average daily net assets. The Adviser has contractually agreed to waive all or a portion of its management fee and/or reimburse expenses of the Fund through May 1, 2023 in order to limit the Fund’s operating expenses to the annual cap rate presented below. This expense limitation excludes interest, taxes, brokerage commissions, indirect fees and expenses relating to investments in other investment companies, including money market funds, and extraordinary expenses.
For the six months ended June 30, 2022, the Adviser waived the following management fees and/or reimbursed expenses to meet its expense cap obligations:
| | | | | |
| | | LKCM Aquinas
Catholic Equity
Fund |
Annual Management Fee Rate | | | | 0.90% | |
Annual Cap on Expenses | | | | 1.00% | |
Fees Waived and/or Expenses Reimbursed in 2022 | | | $ | 127,048 | |
The Trust reimburses the Adviser for a portion of compensation paid to the Trust’s Chief Compliance Officer. This compensation is reported as part of the “Trustees’ fees and officer compensation” expense on the Statement of Operations.
U.S. Bancorp Fund Services, LLC (“U.S. Bancorp”), doing business as U.S. Bank Global Fund Services, serves as transfer agent and administrator for the Fund and serves as accounting services agent for the Fund. U.S. Bank, N.A. serves as custodian for the Fund.
Distribution services are performed pursuant to a distribution contract with Quasar Distributors, LLC (“Quasar”), the Trust’s principal underwriter.
The Trust has adopted a Distribution Plan pursuant to Rule 12b-1 of the 1940 Act the Fund, under which the Fund may pay an annualized fee of up to 1.00% of its average daily net assets for distribution and other services. However, the Board of Trustees has currently only authorized an annual fee of 0.10% of the average daily net assets for the Fund. Prior to August 1, 2016, the Fund assessed an annual Rule 12b-1 fee of 0.25% of the average daily net assets for the Fund. For the six months ended June 30, 2022, fees incurred by the Fund pursuant to the 12b-1 Plan were $28,322.
C. Fund Shares: At June 30, 2022, there was an unlimited number of shares of beneficial interest, no par value, authorized for the Fund. The following table summarizes the activity in shares of the Fund:
| | | | | | | | | | | | | | | | | | | | |
| | | Six Months Ended
June 30, 2022 | | Year Ended
December 31, 2021 |
| | | Shares | | Amount | | Shares | | Amount |
Shares sold | | | | 51,503 | | | | $ | 937,858 | | | | | 147,648 | | | | $ | 2,968,608 | |
Shares issued to shareholders in reinvestment of distributions | | | | — | | | | | — | | | | | 347,962 | | | | | 6,820,061 | |
Shares redeemed | | | | (171,207 | ) | | | | (3,104,303 | ) | | | | (293,618 | ) | | | | (5,830,731 | ) |
Redemption fee | | | | | | | | | 207 | | | | | | | | | | 11 | |
| | | | | | | | | | | | | | | | | | | | |
Net decrease | | | | (119,704 | ) | | | $ | (2,166,238 | ) | | | | 201,993 | | | | $ | 3,957,949 | |
| | | | | | | | | | | | | | | | | | | | |
Shares Outstanding: | | | | | | | | | | | | | | | | | | | | |
Beginning of period | | | | 3,273,724 | | | | | | | | | | 3,071,731 | | | | | | |
| | | | | | | | | | | | | | | | | | | | |
End of period | | | | 3,154,020 | | | | | | | | | | 3,273,724 | | | | | | |
| | | | | | | | | | | | | | | | | | | | |
D. Security Transactions: Purchases and sales of investment securities, other than short-term investments, for the Fund for the six months ended June 30, 2022 were as follows:
| | | | | | | | | | | | | | | | | | | | |
| | | Purchases | | Sales |
| | | U.S.
Government | | Other | | U.S.
Government | | Other |
| | | $ | — | | | | $ | 4,494,178 | | | | $ | — | | | | $ | 8,734,165 | |
16
E. Tax Information: At December 31, 2021, the components of accumulated earnings (losses) on a tax basis for the Fund were as follows:
| | | | |
Tax cost | | $ | 26,964,909 | |
| | | | |
Gross unrealized appreciation | | | 37,254,567 | |
Gross unrealized depreciation | | | (167,050 | ) |
| | | | |
Net unrealized appreciation | | | 37,087,517 | |
| | | | |
Undistributed ordinary income | | | 5,437 | |
Undistributed long-term capital gain | | | — | |
| | | | |
Distributable earnings | | | 5,437 | |
| | | | |
Other accumulated losses | | | (111,829 | ) |
| | | | |
Total distributable earnings | | | 36,981,125 | |
| | | | |
At December 31, 2021, the Fund deferred, on a tax basis, post-October capital losses of $111,829.
The tax components of dividends paid during the periods shown below for the Fund were as follows:
| | | | | | | | | | | | | | | | | | | | |
| | | Six Months Ended June 30, 2022 | | Year Ended December 31, 2021 |
| | | Ordinary
Income | | Long-Term
Capital Gains | | Ordinary
Income | | Long-Term
Capital Gains |
LKCM Aquinas Catholic Equity Fund | | | $ | — | | | | $ | — | | | | $ | 147,922 | | | | $ | 7,068,215 | |
The Fund designated earnings and profits distributed to shareholders upon the redemption of shares during 2021 in determining undistributed net capital gains as of December 31, 2021.
The Trust has adopted financial reporting rules regarding recognition and measurement of tax positions taken or expected to be taken on a tax return. The Trust has reviewed all open tax years and major jurisdictions and concluded that there is no impact on the Fund’s financial position or results of operations. Tax years that remain open to examination by major tax jurisdictions include tax years ended December 31, 2018 through December 31, 2021. There is no tax liability resulting from unrecognized tax benefits relating to uncertain income tax positions taken or expected to be taken on tax returns as of December 31, 2021. The Fund is not aware of any tax positions for which it is reasonably possible that the total amounts of unrecognized tax benefits will significantly change in the next twelve months. If applicable, the Fund would recognize interest accrued related to unrecognized tax benefits in “interest expense” and penalties in “other expense” on the statement of operations.
F. Other Matters: The global outbreak of COVID-19 and other variants and the ensuing pandemic has adversely impacted global economic and commercial activity and has contributed to significant volatility and uncertainty in global financial markets. The global impact of the COVID-19 pandemic continues to rapidly evolve and its long-term implications for economies, markets, sectors, industries and issuers remains uncertain. The financial and operational performance of the issuers of securities in which the Fund invests depends upon future developments with respect to the COVID-19 pandemic, including, without limitation, the scope, duration and spread of COVID-19 as well as the development, efficacy and administration of COVID-19 vaccines, and such future developments and uncertainties with respect thereto may adversely affect, among other things, the value and liquidity of the Fund’s investment, the Fund’s ability to satisfy redemption requests, and Fund’s financial and operational performance.
G. Accounting Pronouncement: In December 2020, the SEC adopted a new rule providing a framework for fund valuation practices (“Rule 2a-5”). Rule 2a-5 establishes requirements for determining fair value in good faith for purposes of the 1940 Act. Rule 2a-5 will permit fund boards to designate certain parties to perform fair value determinations, subject to board oversight and certain other conditions. Rule 2a-5 also defines when market quotations are “readily available” for purposes of the 1940 Act and the threshold for determining whether a fund must fair value a security. In connection with Rule 2a-5, the SEC also adopted related recordkeeping requirements and is rescinding previously issued guidance, including with respect to the role of a board in determining fair value and the accounting and auditing of fund investments.
H. Subsequent Events: In preparing these financial statements, management has evaluated the Fund’s related events and transactions that occurred subsequent to June 30, 2022 through the date the financial statements were issued and has determined that there were no significant subsequent events requiring recognition or disclosure in the financial statements.
17
|
| LKCM AQUINAS CATHOLIC EQUITY FUND |
| ADDITIONAL INFORMATION |
| June 30, 2022 (Unaudited) |
Availability of Proxy Voting Information: A description of the policies and procedures that the Fund uses to determine how to vote proxies relating to its portfolio securities, as well as information regarding how the Fund voted proxies relating to portfolio securities during the most recent 12-month period ended June 30, is available without charge, upon request, by calling toll-free 1-800-423-6369 or on the SEC website at http://www.sec.gov.
The actual voting records relating to portfolio securities during the twelve month period ended June 30 (as filed with the SEC on Form N-PX) are available without charge, upon request, by calling the Fund toll free at 1-800-423-6369 or by accessing the SEC’s website at www.sec.gov.
Availability of Quarterly Portfolio Schedule: The Fund files a complete schedule of portfolio holdings with the U.S. Securities and Exchange Commission (the “SEC”) for the first and third quarters of each fiscal year on Part F of Form N-PORT. The Fund’s Part F of Form N-PORT is available on the SEC’s website at www.sec.gov and may be reviewed and copied at the SEC’s Public Reference Room in Washington, D.C. Information on the operation of the Public Reference Room may be obtained by calling 1-800-732-0330. The Fund’s Part F of Form N-PORT may also be obtained by calling toll-free 1-800-423-6369.
18
RENEWAL OF INVESTMENT ADVISORY AGREEMENT
WITH RESPECT TO LKCM AQUINAS CATHOLIC EQUITY FUND
(Unaudited)
Introduction. At a meeting held on February 22, 2022, the Board of Trustees of LKCM Funds, including the independent Trustees (the “Board”), approved the renewal of the Investment Advisory Agreement (the “Agreement”) between Luther King Capital Management Corporation (“LKCM”) and LKCM Funds, on behalf of the LKCM Aquinas Catholic Equity Fund (the “Fund”).
In voting to approve the renewal of the Agreement, the Board considered information furnished throughout the year at regularly scheduled Board meetings, as well as information prepared specifically in connection with the annual renewal process. The Board also considered the overall fairness of the Agreement and factors it deemed relevant with respect to the Fund, including, but not limited to: (1) the nature, extent and quality of the services provided to the Fund; (2) the performance of the Fund as compared to a relevant benchmark and peer groups of funds compiled by Broadridge Financial Solutions, Inc. (“Broadridge”) and Lipper, Inc. (“Lipper”); (3) the contractual advisory fee rate, actual advisory fee rate, total expense ratio, and net expense ratio of the Fund and how those compared to a peer group of funds compiled by Broadridge; (4) the costs of services provided to the Fund and the profitability of LKCM with respect to such services; (5) the extent to which economies of scale would be realized by LKCM as the Fund grows and whether the fee levels reflect economies of scale for the benefit of investors; and (6) any other benefits derived by LKCM from its relationship with the Fund. The Board did not identify any single factor or item of information as controlling, and each Board member may have accorded different weights to the various factors in reaching his conclusions with respect to the Agreement.
In considering the renewal of the Agreement, the Board requested and considered a broad range of information provided by LKCM, including, but not limited to, the Fund’s Catholic values investing mandate, reports relating to the Fund’s performance and expenses, certain portfolio compliance policies and the background and experience of the portfolio managers. In addition, the Board considered a memorandum from its legal counsel regarding the Board’s legal duties in considering the renewal of the Agreement. The Board also meets each quarter to review the Fund’s performance and expenses and various aspects of the Fund’s operations.
Nature, Extent and Quality of Services. The Board reviewed and considered the nature, extent and quality of the advisory services provided by LKCM to the Fund under the Agreement. The Board considered that LKCM was established in 1979 and provides investment management services to private funds, foundations, endowments, pension plans, trusts, estates, high net worth individuals and other clients. The Board recognized that LKCM is responsible for managing the Fund, including identifying investments for the Fund, monitoring the Fund’s investment program, executing trades and overseeing the Fund’s performance and compliance with applicable rules and regulations and the Fund’s investment policies. The Board considered LKCM’s financial resources, insurance coverage, culture of compliance and compliance operations that support the Fund. The Board also considered LKCM’s representation that it has invested considerable resources into the firm and its personnel to augment investment management and client services. The Board reviewed information regarding the portfolio managers and other key personnel who provide services to the Fund and considered LKCM’s representation that the firm historically has experienced low personnel turnover. The Board also considered LKCM’s representation that the firm has implemented a compensation structure designed to attract and retain highly qualified investment professionals.
The Board also reviewed the compliance services provided to the Fund by LKCM, including LKCM’s oversight of the Fund’s day-to-day operations. The Board considered the quality of LKCM’s compliance personnel. In addition, the Board considered LKCM’s summary of its oversight of the Fund’s key service providers. The Board also considered LKCM’s description of its best execution practices and noted LKCM’s representation that its soft-dollar and commission-sharing arrangements for client transactions (including those for the Fund) comply with the requirements of the safe harbor provided by Section 28(e) of the Securities Exchange Act of 1934, as amended.
Performance of the Fund. The Board considered the performance of the Fund compared to the Fund’s benchmark index, the S&P 500 Index (“benchmark”), peer groups of funds compiled by Broadridge and Lipper, and a Lipper peer group index (“Lipper Index”) for various time periods ended December 31, 2021. The Board noted that, in 2016, upon the closing of the reorganizations of the LKCM Aquinas Small Cap Fund and LKCM Aquinas Growth Fund into the Fund (the “Reorganization”), the Fund’s name, investment strategies, expenses, benchmark index and Lipper index changed and considered this in reviewing the Fund’s longer-term performance against its current benchmark and Lipper Index. The Board also considered LKCM’s discussion of the Fund’s performance.
The Board noted that the Fund outperformed its current benchmark for the three-year period, but underperformed its benchmark for the one-year, five-year, ten-year and since-inception periods. The Board also noted that the Fund outperformed its Lipper Index for the three-year and five-year periods, but underperformed its Lipper Index for the one-year, ten-year and since-inception periods. In considering the comparative performance data, the Board noted that the Fund is managed in accordance with its Catholic values investing guidelines, which restrict the Fund’s investments and generally are not applicable to the benchmark or the funds included in the Lipper Index. The Board noted LKCM’s representation that the Fund’s stringent investment criteria and value investing strategy prior to the Reorganization contributed to longer-term underperformance. The Board also considered certain additional factors cited by LKCM as contributing to or detracting from the Fund’s performance during the prior year.
Fees and Expenses. The Board considered the contractual advisory fee rate, effective advisory fee rate (the contractual advisory fee rate net of fee waivers and/or expense reimbursements), total expense ratio and net expense ratio (the total expense ratio, including
19
Rule 12b-1 fees and non-Rule 12b-1 service fees, after fee waivers and/or expense reimbursements) of the Fund. The Board also considered that LKCM had contractually agreed to continue the current fee waivers and expense caps in effect for the Fund through May 1, 2022, and that LKCM intends to propose at the upcoming Board meeting that it contractually agree to continue the current fee waiver through May 1, 2023.
The Board compared the Fund’s contractual advisory fee rate, effective advisory fee rate, total expense ratio, and net expense ratio to a category of similar funds compiled by Broadridge (“Expense Group”) and a broader category comprised of the Fund, the Expense Group and other similar retail funds (“Expense Universe”). The Broadridge reports did not include a comparison of the Fund’s contractual advisory fee rate and total expense ratio relative to the Expense Universe. For the Expense Group, contractual advisory fee rates were compared at the Fund’s asset level. The first quartile in an Expense Group and Expense Universe represents those funds with the lowest fees or expenses.
The Board noted that the Fund’s contractual advisory fee rate was in the fourth quartile of its Expense Group and the Fund’s effective advisory fee rate was in the second quartile of its Expense Group and Expense Universe. The Board also considered that the Fund’s net expense ratio was in the second quartile of its Expense Group and third quartile of its Expense Universe. In this case, the Fund’s contractual advisory fee rate was higher than the median of its Expense Group, its effective advisory fee rate was lower than the median of its Expense Group and Expense Universe, and its net expense ratio was equal to the median of its Expense Group and higher than the median of its Expense Universe.
The Board considered that, although the Fund’s contractual advisory fee rate was higher than those of its peers, the expense cap arrangements caused the Fund’s effective advisory fee rate to be lower than those of its peers.
Costs, Profitability and Economies of Scale. The Board considered LKCM’s costs in rendering services to the Fund and the profitability of LKCM. The Board reviewed the fees paid by the Fund to LKCM for the last three calendar years. The Board also reviewed the estimated profit and loss statement provided by LKCM for the past calendar year, before and after any distribution payments made by LKCM. The Board noted that, during the year, LKCM had invested significant resources to cap the Fund’s net expense ratio and facilitate the distribution of the Fund. With respect to economies of scale, the Board considered that the Fund generally benefits from a competitive effective advisory fee rate and net expense ratio despite not having reached an asset size at which economies of scale traditionally would be considered to exist. The Board also considered that, while there are no breakpoints in the Fund’s advisory fee rate schedule, LKCM waives fees and/or reimburses expenses to maintain the Fund’s effective advisory fee rate and net expense ratio at a competitive level.
Benefits Derived by LKCM from Its Relationship with the Fund. The Board requested and considered information regarding the potential fall-out benefits to LKCM from its association with the Fund. The Board noted that LKCM believes that both LKCM and the Fund benefit from LKCM’s soft-dollar and commission-sharing arrangements, which enhance the level of research that LKCM performs on the Fund’s portfolio companies. The Board also noted that LKCM believes its relationship with the Fund provides an indirect benefit to both parties in the form of enhanced recognition among institutional and other investors, consultants and other members of the financial community. The Board considered the potential indirect benefits to LKCM of this recognition, in the form of additional clients with separately managed portfolios or subadvisory relationships with other mutual funds, which also may attract additional investors to the Fund.
Conclusion. Based on its evaluation of these and other factors, the Board: (1) concluded that the fees paid to LKCM under the Agreement are fair and reasonable; (2) determined that shareholders would benefit from LKCM’s continued management of the Fund; and (3) approved the renewal of the Agreement with respect to the Fund.
20
ANNUAL REPORT REGARDING LIQUIDITY RISK MANAGEMENT PROGRAM
(Unaudited)
Pursuant to Rule 22e-4 under the Investment Company Act of 1940, as amended (the “Liquidity Rule”), LKCM Funds (the “Trust”) has adopted a liquidity risk management program (“Program”). The Program sets forth the Trust’s policies and procedures with respect to the management of liquidity risk for the separate series of the Trust (each, a “Fund”). Liquidity risk is generally defined as the risk that a Fund could not meet a request to redeem shares issued by the Fund without significant dilution of the interest of the remaining shareholders of the Fund.
As required by the Liquidity Rule, the Program addresses: (1) the assessment, management and periodic review of each Fund’s liquidity risk; (2) the liquidity classification of each Fund’s portfolio investments as a highly liquid, moderately liquid, less liquid or illiquid investment; (3) the determination of a highly liquid investment minimum (“HLIM”) for a Fund that does not primarily hold highly liquid investments, and procedures to respond to a shortfall in a Fund’s HLIM; (4) a limitation on each Fund’s investment in illiquid investments of 15% of the Fund’s net assets; and (5) redemptions in kind.
The Trust’s board of trustees (“Board”) has reviewed and approved the Program. The Board has designated Luther King Capital Management Corporation (“LKCM”), the Trust’s investment adviser, as the Program administrator (“Administrator”) with responsibility for administering the Program.
At a meeting of the Board held on May 24, 2022, the Board reviewed a written report (“Report”) from the Administrator addressing the operation of the Program and assessing the adequacy and effectiveness of its implementation, for the period April 1, 2021 through March 31, 2022 (the “Reporting Period”). The Report reflected that each Fund was invested primarily in highly liquid assets and had sufficient cash flows to manage its liquidity requirements, and no liquidity events impacting a Fund’s ability to timely meet redemption requests occurred during the Reporting Period. The Report stated that no material changes had been made to the Program during the Reporting Period, and concluded that the Program continues to be adequate and effective in managing the Funds’ potential liquidity risks and otherwise maintaining compliance with the Liquidity Rule.
21
LKCM FUNDS
PRIVACY NOTICE
Our Commitment to Your Privacy
At LKCM Funds, we are committed to safeguarding the confidentiality and privacy of nonpublic personal information about our current and former shareholders. This privacy notice describes the types of nonpublic personal information we collect about you and the sources through which we obtain this information, the purposes for which we obtain and use your nonpublic information, and the policies and procedures we have implemented to protect the privacy of your nonpublic personal information.
How We Protect Your Nonpublic Personal Information
Protecting your nonpublic personal information is an important priority at LKCM Funds. Accordingly, we have implemented policies and procedures designed to safeguard your nonpublic personal information, such as your tax identification number, account and investment history, account numbers, account balances and nonpublic contact information, from unauthorized access or use. Pursuant to these policies and procedures, we maintain various physical, technological, and administrative safeguards to protect the security and confidentiality of your nonpublic personal information, and we adapt these safeguards to respond to evolving technological and other standards.
We do not disclose nonpublic personal information about you to non-affiliated firms, organizations or individuals except as authorized by you or your representatives or as required or permitted by law. We may disclose nonpublic personal information about you to nonaffiliated third parties, such as custodians, brokers, auditors, accountants, and systems and administrative service providers, in connection with the services we provide to you or on your behalf. When we provide nonpublic personal information about you to nonaffiliated third parties for these purposes, we expect them to safeguard your nonpublic personal information, use your nonpublic personal information only for the intended purposes and otherwise abide by applicable law.
How We Obtain Your Nonpublic Personal Information
We collect nonpublic personal information about you from various sources, including documents, new account applications and other information that you or your representatives, custodians, attorneys, accountants or similar parties provide to us, communications that we have with you or your representatives, custodians, attorneys, accountants or similar parties, and documents and other information related to your accounts or investment experience with us.
Please do not hesitate to contact Jacob D. Smith, our Chief Compliance Officer, if you have any questions regarding this privacy notice or the measures we have implemented to protect the privacy of your nonpublic personal information.
U.S. Bancorp Fund Services, LLC
P.O. Box 701
Milwaukee, WI 53201-0701
LKCM FUNDS
P.O. Box 701
Milwaukee, WI 53201-0701
| | | | |
Officers and Trustees |
J. Luther King, Jr., CFA, CIC Trustee, President and Chief Executive Officer | | Richard J. Howell Trustee | | Richard Lenart Secretary & Treasurer |
| | |
Paul W. Greenwell Vice President | | Larry J. Lockwood Chairman of the Board of Trustees | | Jacob D. Smith Chief Financial Officer Chief Compliance Officer |
| | |
Steven R. Purvis, CFA Trustee | | Mauricio Rodriguez Trustee | | |
|
Investment Adviser |
Luther King Capital Management Corporation 301 Commerce Street, Suite 1600 Fort Worth, TX 76102 |
Administrator, Transfer Agent, Dividend Paying Agent & Shareholder Servicing Agent |
U.S. Bancorp Fund Services, LLC P.O. Box 701 Milwaukee, WI 53201-0701 |
Custodian |
U.S. Bank, N.A. 1555 N. River Center Drive, Suite 302 Milwaukee, WI 53212 |
Independent Registered Public Accounting Firm |
Deloitte & Touche LLP 555 E. Wells St., Suite 1400 Milwaukee, WI 53202 |
Distributor |
Quasar Distributors, LLC 111 East Kilbourn Avenue, Suite 2200 Milwaukee, WI 53202 |
Item 2. Code of Ethics.
Not applicable for Semi-Annual Reports.
Item 3. Audit Committee Financial Expert.
Not applicable for Semi-Annual Reports.
Item 4. Principal Accountant Fees and Services.
Not applicable for Semi-Annual Reports.
Item 5. Audit Committee of Listed Registrants.
Not applicable to registrants who are not listed issuers (as defined in Rule 10A-3 under the Securities Exchange Act of 1934).
Item 6. Investments.
(a) The Schedules of Investments are included as part of the report to shareholders filed under Item 1 of this Form N-CSR.
(b) Not Applicable.
Item 7. Disclosure of Proxy Voting Policies and Procedures for Closed-End Management Investment Companies.
Not applicable to open-end investment companies.
Item 8. Portfolio Managers of Closed-End Management Investment Companies.
Not applicable to open-end investment companies.
Item 9. Purchases of Equity Securities by Closed-End Management Investment Company and Affiliated Purchasers.
Not applicable to open-end investment companies.
1
Item 10. Submission of Matters to a Vote of Security Holders.
There have been no material changes to the procedures by which shareholders may recommend nominees to the registrant’s board of trustees.
Item 11. Controls and Procedures.
| (a) | The registrant’s President and Chief Financial Officer have reviewed the registrant’s disclosure controls and procedures (as defined in Rule 30a-3(c) under the Investment Company Act of 1940 (the “Act”)) as of a date within 90 days of the filing of this report, as required by Rule 30a-3(b) under the Act and Rules 13a-15(b) or 15d-15(b) under the Securities Exchange Act of 1934. Based on their review, such officers have concluded that the disclosure controls and procedures are reasonably designed to ensure that information within the required time periods and that information required to be disclosed by the registrant in reports that it files or submits on Form N-CSR is accumulated and communicated to the registrant’s management, including its principal executive and financial officers, as appropriate to allow timely decisions regarding required disclosure. |
| (b) | There were no changes in the registrant’s internal control over financial reporting (as defined in Rule 30a-3(d) under the Act) that occurred during the second fiscal quarter of the period covered by this report that have materially affected, or are reasonably likely to materially affect, the registrant’s internal control over financial reporting. |
Item 12. Disclosure of Securities Lending Activities for Closed-End Management Investment Companies
Not applicable to open-end investment companies.
Item 13. Exhibits.
| (a) | (1) Any code of ethics or amendment thereto, that is subject of the disclosure required by Item 2, to the extent that the registrant intends to satisfy Item 2 requirements through filing an exhibit. Not applicable. |
(2) A separate certification for each principal executive and principal financial officer pursuant to Section 302 of the Sarbanes-Oxley Act of 2002. Filed herewith.
(3) Any written solicitation to purchase securities under Rule 23c-1 under the Act sent or given during the period covered by the report by or on behalf of the registrant to 10 or more persons. Not applicable to open-end investment companies.
(4) There was no change in the registrant’s independent public accountant for the period covered by this report.
2
SIGNATURES
Pursuant to the requirements of the Securities Exchange Act of 1934 and the Investment Company Act of 1940, the registrant has duly caused this report to be signed on its behalf by the undersigned, thereunto duly authorized.
| | | | |
| (Registrant) LKCM Funds |
| | |
| By (Signature and Title) | | /s/ J. Luther King, Jr. | | |
| | J. Luther King, Jr., President | | |
| | |
| Date 9/1/2022 | | | | |
Pursuant to the requirements of the Securities Exchange Act of 1934 and the Investment Company Act of 1940, this report has been signed below by the following persons on behalf of the registrant and in the capacities and on the dates indicated.
| | | | |
| By (Signature and Title) | | /s/ J. Luther King, Jr. | | |
| | J. Luther King, Jr., President | | |
| | |
| Date 9/1/2022 | | | | |
| | |
| By (Signature and Title) | | /s/ Jacob D. Smith | | |
| | Jacob D. Smith, Chief Financial Officer | | |
| | |
| Date 9/1/2022 | | | | |
* Print the name and title of each signing officer under his or her signature.
3